Embed Size (px)
Citation preview

© 2009 Dwight Jaffee and Nancy Wallace, Slide 1 Fisher Center for Real Estate at Haas School
Market Mechanisms for Financing Green Real Estate Investments
Dwight Jaffee and Nancy Wallace
Presentation to Conference on Green Building, the Economy, and Public Policy
December 3, 2009

© 2009 Dwight Jaffee and Nancy Wallace, Slide 2 Fisher Center for Real Estate at Haas School
Starting point:
– Buildings consume almost 40% of U.S. energy.
– U.S. buildings appear less efficient than Europe.
Why is there not a major retrofit of existing stock?
– No mystery: U.S. energy prices far less.
– First best solution: Raise U.S. energy prices.
Energy Consumption and U.S. Real Estate
Table 1.1: Buildings Share of U.S. Primary Energy Consumption (Percent), 2006ResidentialBuildings
Commercial Buildings
TotalBuildings
Industry Transportation Total Total Consumption(quads)
20.9% 18.0% 38.9% 32.7% 28.4% 100% 99.5
Source: U.S. Department of Energy (2009)

© 2009 Dwight Jaffee and Nancy Wallace, Slide 3 Fisher Center for Real Estate at Haas School
Government Interventions to Stimulate Energy-Efficient Investments
Building codes:– Primarily apply to new construction;
– Prescriptive in nature, do not encourage innovation.
Disclosure certificates:– Will raise sales prices based on certificate or benefit;
– But are the required investments NPV positive?
– Do they stimulate energy-efficient investments?
Government subsidies:– Certainly limited with current fiscal deficits.
Overall, there are certainly benefits, but limited.

© 2009 Dwight Jaffee and Nancy Wallace, Slide 4 Fisher Center for Real Estate at Haas School
Private Market Failures that Inhibit Energy Efficient Investments
Three key steps in investment process:
1) Identification of worthwhile investments;
2) Computation of comparative NPV;
3) Mortgage market funding of investments.
This identifies two frictions that inhibit energy-efficient investments in commercial real estate:– Limited information on efficient investments;– Limited mortgage loan funding of
investments.

© 2009 Dwight Jaffee and Nancy Wallace, Slide 5 Fisher Center for Real Estate at Haas School
Commercial Mortgage Underwriting Commercial mortgage underwriting standards:
– Loan to value ratio (LTVR, say 65%);
– Debt service coverage ratio (DSCR, say 1.25);
– Both ratios based on net operating income (NOI).
Energy costs disappear inside NOI:– With triple net lease, tenant pays own energy bill.
– Standard ARGUS software has no energy input.
– Lenders see no trace of energy costs.
Result is that loan rate, size, and default risk determined by NOI, LTVR, DSCR alone.

© 2009 Dwight Jaffee and Nancy Wallace, Slide 6 Fisher Center for Real Estate at Haas School
Why Tenants Do Not Pay Higher Rents if Offered Lower Energy Costs
Three key conditions must be met:1) Tenants must be confident of lower energy costs
before they will offer to pay higher rents;
2) Landlords must be confident of higher rents before they will make energy-saving investments;
3) Actual investments must be demonstrably NPV >0 before (1) and (2) will occur.
All steps fail from imperfect information regarding the energy savings and investment productivity.
Thus both lenders and tenants require better tools to measure energy costs and future savings.

© 2009 Dwight Jaffee and Nancy Wallace, Slide 7 Fisher Center for Real Estate at Haas School
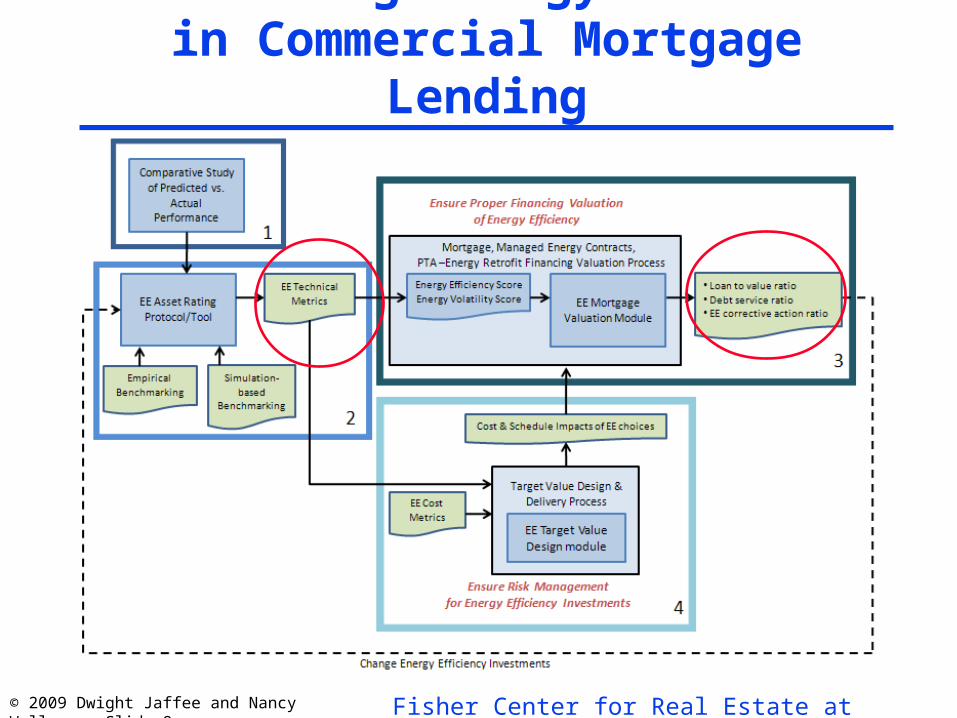
Three Proposed Disclosures Energy Efficiency Score will provide reliable
indication of the impact of investments on energy costs, and therefore on rents and property NOI.
Energy Volatility Score will provide reliable indication of impact of energy cost volatility on rent and NOI volatility.
Energy Efficiency Action Ratio will provide comparative NPV information to evaluate alternative energy-saving investments.
© 2009 Dwight Jaffee and Nancy Wallace, Slide 8 Fisher Center for Real Estate at Haas School
Embedding Energy Scores in Commercial Mortgage Lending

© 2009 Dwight Jaffee and Nancy Wallace, Slide 9 Fisher Center for Real Estate at Haas School
Property Tax AssessedEnergy Retrofit Financing
AKA as PACE (Property Accessed Clean Energy). States now allow jurisdictions to create voluntary,
individual, clean energy assessment districts.– Energy loans have same seniority as property taxes.
– Greatly lower interest cost, expands availability.
– Available for both residential and commercial. But same information requirements still exist:
– Cities must have means to evaluate investments.
– Commercial lenders must be satisfied that NPV > 0 before they will allow creation of senior lien.

© 2009 Dwight Jaffee and Nancy Wallace, Slide 10 Fisher Center for Real Estate at Haas School
Monte Carlo Simulation of Stochastic Energy Prices on Building NOI
Mortgage risk/default are based on tail risks: lender’s main concern is the worst outcomes.– Requires stochastic simulation of future energy
price paths, with focus on the worst paths.
– Alternative energy paths create NOI distribution, with worst outcomes creating default.
– Default can be tenant/lease, or owner/mortgage. Can be integrated with additional state variables,
such as interest rates, economy, property prices.– This methodology is already well developed and
accepted in commercial mortgage lending.

© 2009 Dwight Jaffee and Nancy Wallace, Slide 11 Fisher Center for Real Estate at Haas School
Prototype Building in San Diego CALocation San Diego
Square Feet 225,000
Office Tenant FIRE
Sale Price $127 Million
NOI at sale $8.86 Million

© 2009 Dwight Jaffee and Nancy Wallace, Slide 12 Fisher Center for Real Estate at Haas School
Energy Prices We model both electricity and natural gas prices,
as the exponential of an Orenstein Uhlenbeck process, assuming correlation of 0.90:
det = αe [θe(t) – et] dt + ve(et, t, …) dwte
dgt = αg [θg(t) – gt] dt + vg(gt, t, …) dwtg
Processes calibrated to history:Natural Gas Daily Spot Prices
0
2
4
6
8
10
12
1/1/2006
3/1/2006
5/1/2006
7/1/2006
9/1/2006
11/1/2006
1/1/2007
3/1/2007
5/1/2007
7/1/2007
9/1/2007
11/1/2007
1/1/2008
3/1/2008
Date
Pric
e (
$/m
mB
TU
)

© 2009 Dwight Jaffee and Nancy Wallace, Slide 13 Fisher Center for Real Estate at Haas School
Representative Paths for Monthly Electricity Spot Price (2008-2016)

© 2009 Dwight Jaffee and Nancy Wallace, Slide 14 Fisher Center for Real Estate at Haas School
Simulated Electric Power Costs

© 2009 Dwight Jaffee and Nancy Wallace, Slide 15 Fisher Center for Real Estate at Haas School
Simulated Natural Gas Costs

© 2009 Dwight Jaffee and Nancy Wallace, Slide 16 Fisher Center for Real Estate at Haas School
PV Simulations
Almost 10% of paths create negative equity and possible default

© 2009 Dwight Jaffee and Nancy Wallace, Slide 17 Fisher Center for Real Estate at Haas School
Conclusions Existing U.S. buildings require significant energy
saving investments:– Current government actions helpful but limited.– Market failures appear to inhibit private actions.
We focus on informational frictions that impede the recognition of investment opportunities by property owners, tenants and mortgage lenders.
Our prototype Monte Carlo simulation tool indicates it is practical to develop scores that measure the impact of alternative energy investments on property rents and NOI.