Embed Size (px)
Citation preview

© 2008 Borrell Associates Inc.
Upcoming Reports for 2008/2009Upcoming Reports for 2008/2009
September 4, 2008
TVB Annual Forecasting Conference
Gordon Borrell, CEO, Borrell Associates Inc.

© 2008 Borrell Associates Inc.
Local vs. National Online Advertising
Source: Borrell Associates Inc., as of Q1 2008 data

© 2008 Borrell Associates Inc.
LocalLocal Interactive Spending through 2013 Interactive Spending through 2013

© 2008 Borrell Associates Inc.
Local Video Dominates by 2013Local Video Dominates by 2013
Source: Borrell Associates 2008
$14.1$14.1
$23.0$23.0
+ 5x
- 43%

© 2008 Borrell Associates Inc.
Local TV Interactive Revenues through 2010Local TV Interactive Revenues through 2010
($ in millions)
$75 $119
$283
$447
$772
$1,158
$1,448
$1,665
2003 2004 2005 2006 2007 2008p 2009f 2010f
+50%

© 2008 Borrell Associates Inc.
2007 TV Interactive Revenue2007 TV Interactive Revenue By Market SizeBy Market Size
Source: Borrell Associates Inc. n=613
DMA Market Size
Avg. Share of Local Online Advertising
Lowest Highest
Markets 1-20 0.5% <1.0% 3.7%
Markets 21-50 1.2% 0.2% 11.1%
Markets 51-100 1.1% <0.1% 7.1%
Markets 101-210 1.8% <0.1% 18.5%
Average/ Range 1.0% <1.0% 18.1%

© 2008 Borrell Associates Inc.
Fourth Annual Benchmarking ReportFourth Annual Benchmarking Report
BenchmarkingLocal TV InteractiveAdvertising
• Revenues• Expenses• # of salespeople• $ from video streaming• $ from banners• $ from “up-selling”• $ from mobile adv.• ?• ? • ?
January 2009

© 2008 Borrell Associates Inc.
Interactive Advertising How-To ReportInteractive Advertising How-To Report
• Benchmarking• Top performers• Video streaming• Mobile advertising• Email advertising• Banner advertising• Branded vs. separate sites• ?• ? • ?
November 2008
How to IncreaseInteractive AdvertisingNOW

© 2008 Borrell Associates Inc.
New Local Brands Are EmergingNew Local Brands Are Emerging

© 2008 Borrell Associates Inc.
CAGR High for TV SitesCAGR High for TV Sites
Revenue ($ billions)* CAGR**
Website Type 2002 2003 2004 2005 2006 2007 2008
Local Online $1.7 $2.1 $2.7 $4.8 $5.7 $8.7 $13.1 40.5%
Local Newspapers 0.66 0.81 1.2 2.0 2.6 3.1 3.7 33. 5%
Local TV 0.06 0.08 0.12 0.28 0.45 0.77 1.16 67.2%
Local Radio N/A 0.02 0.03 0.06 0.13 0.19 0.26 69.9%
© 2008 Borrell Associates Inc.
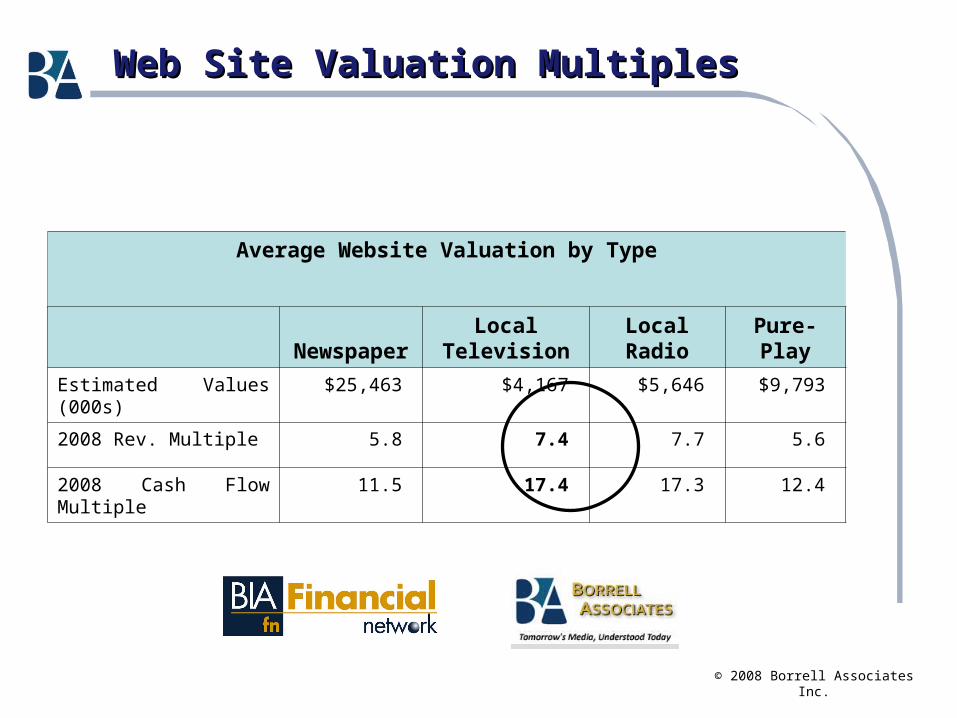
Web Site Valuation MultiplesWeb Site Valuation Multiples
Average Website Valuation by Type
Newspaper
Local Television
Local Radio
Pure-Play
Estimated Values (000s)
$25,463 $4,167 $5,646 $9,793
2008 Rev. Multiple 5.8 7.4 7.7 5.6
2008 Cash Flow Multiple
11.5 17.4 17.3 12.4