Embed Size (px)
Citation preview

© 2003 Anita Lee-Post
ForecastingPart 3
ForecastingPart 3
ByBy
Anita Lee-PostAnita Lee-Post
ByBy
Anita Lee-PostAnita Lee-Post

© 2003 Anita Lee-Post
Selecting a forecasting modelSelecting a forecasting model
Qualitative Model
Quantitative Model
Qualitative Quantitative
Basis of forecast
Time series Model
Causal Model
Time series Causal factors
Data Pattern
Level/Trend/Seasonal Model
Model Strength
Data Type
Forecast Accuracy
* MAD/MSE* Tracking Signal
CorrelationCoefficient
LinearRegression Linear
Relation

© 2003 Anita Lee-Post
Forecast accuracyForecast accuracy
• A good forecast is A good forecast is accurateaccurate but not but not perfect, i.e., actual value perfect, i.e., actual value forecast forecast valuevalue
• Overall accuracy measures:Overall accuracy measures:
1. Mean absolute deviation1. Mean absolute deviation2. Mean squared error2. Mean squared error
• Forecast accuracy has to be Forecast accuracy has to be monitoredmonitored by using a “tracking signal”by using a “tracking signal”

© 2003 Anita Lee-Post
Overall error measuresOverall error measures
1.1. Mean absolute deviation (MAD):Mean absolute deviation (MAD):
2.2. Mean squared error (MSE):Mean squared error (MSE):
• The forecast technique giving the lowest MAD/MSE is preferred The forecast technique giving the lowest MAD/MSE is preferred
• MSE magnifies large errors through the squaring processMSE magnifies large errors through the squaring process
points data ofnumber : , periodfor Forecast
, periodfor Actual : where,1
nt:F
tAn
FAMAD
t
t
n
ttt
pointsdata ofnumber : , periodfor Forecast :
, periodfor Actual : where,1
2
ntF
tAn
FA
MSE
t
t
n
ttt

© 2003 Anita Lee-Post
Tracking signalTracking signal
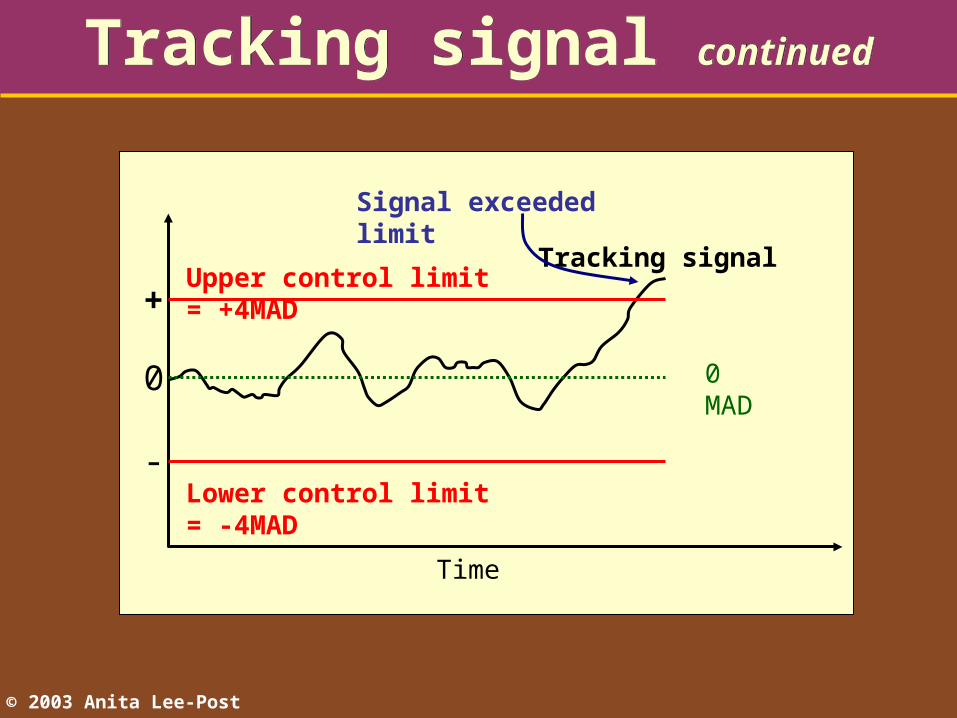
A way to monitor forecast accuracy is by A way to monitor forecast accuracy is by comparing a measure called:comparing a measure called:
against predetermined control limits against predetermined control limits (usually +/-4 MAD) in a control chart(usually +/-4 MAD) in a control chart
A way to monitor forecast accuracy is by A way to monitor forecast accuracy is by comparing a measure called:comparing a measure called:
against predetermined control limits against predetermined control limits (usually +/-4 MAD) in a control chart(usually +/-4 MAD) in a control chart
MADErrorForecast of Sum Cumulative
Signal Tracking
© 2003 Anita Lee-Post
Tracking signal continuedTracking signal continued
Time
Lower control limit = -4MAD
Upper control limit = +4MAD
Signal exceeded limit
Tracking signal
0 MAD
+
0
-
© 2003 Anita Lee-Post
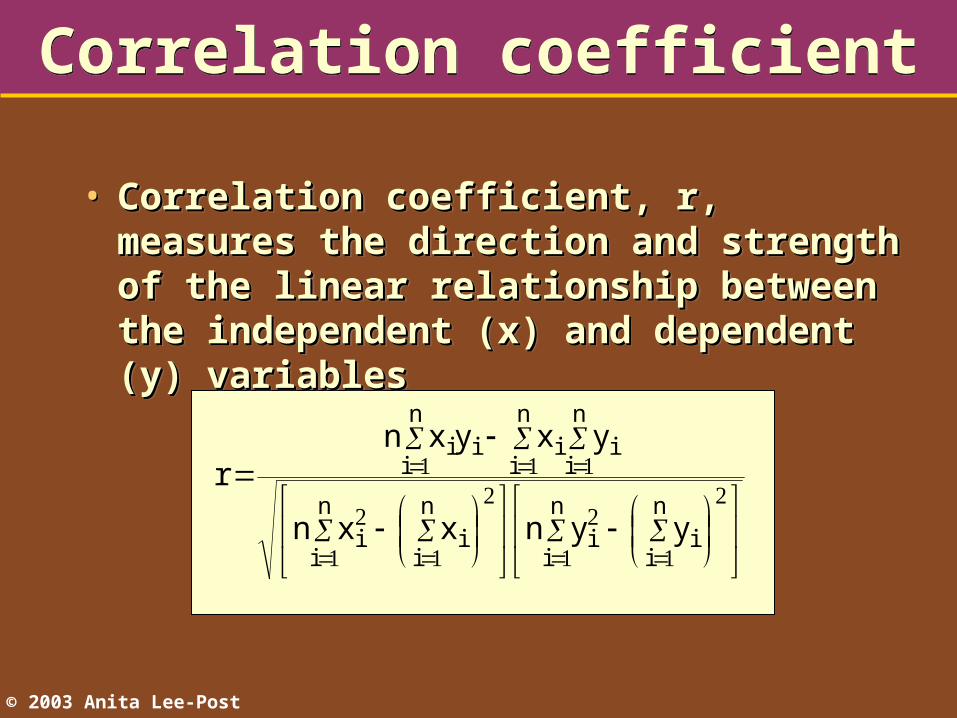
Correlation coefficientCorrelation coefficient
• Correlation coefficient, r, measures the Correlation coefficient, r, measures the direction and strength of the linear direction and strength of the linear relationship between the independent (x) relationship between the independent (x) and dependent (y) variablesand dependent (y) variables
• Correlation coefficient, r, measures the Correlation coefficient, r, measures the direction and strength of the linear direction and strength of the linear relationship between the independent (x) relationship between the independent (x) and dependent (y) variablesand dependent (y) variables
n
i
n
iii
n
i
n
iii
n
i
n
i
n
iiiii
yynxxn
yxyxnr

© 2003 Anita Lee-Post
Correlation coefficient continuedCorrelation coefficient continued
r = +1: a perfect positive linear relationshipr = +1: a perfect positive linear relationship r = 0: no relationshipr = 0: no relationship r = -1: a perfect negative linear relationshipr = -1: a perfect negative linear relationship
r = +1: a perfect positive linear relationshipr = +1: a perfect positive linear relationship r = 0: no relationshipr = 0: no relationship r = -1: a perfect negative linear relationshipr = -1: a perfect negative linear relationship
r = 1 r = -1
r = .89 r = 0
Y
XYi = a + b X i
Y
X
Y
X
Y
XYi = a + b X i Yi = a + b X i
Yi = a + b X i

© 2003 Anita Lee-Post
Using Excel for forecastingUsing Excel for forecasting
1.1. Enter the following demand figures for Enter the following demand figures for C&A’s product in an Excel worksheetC&A’s product in an Excel worksheet
1.1. Enter the following demand figures for Enter the following demand figures for C&A’s product in an Excel worksheetC&A’s product in an Excel worksheet
Jan Feb Mar Apr May Jun
650 700 810 800 900 700

© 2003 Anita Lee-Post
Using Excel for forecasting continuedUsing Excel for forecasting continued
2.2. Invoke the data Invoke the data analysis tool:analysis tool:
Tools Tools Data Analysis Data Analysis
If “Data Analysis” is not If “Data Analysis” is not found, thenfound, then
Tools Tools Add-ins Add-ins select “Analysis select “Analysis ToolPak”ToolPak”
2.2. Invoke the data Invoke the data analysis tool:analysis tool:
Tools Tools Data Analysis Data Analysis
If “Data Analysis” is not If “Data Analysis” is not found, thenfound, then
Tools Tools Add-ins Add-ins select “Analysis select “Analysis ToolPak”ToolPak”

© 2003 Anita Lee-Post
Using Excel for forecasting continuedUsing Excel for forecasting continued
3.3. Select “Moving Average” from the list Select “Moving Average” from the list of data analysis options” to compute of data analysis options” to compute a 3-month moving average:a 3-month moving average:
3.3. Select “Moving Average” from the list Select “Moving Average” from the list of data analysis options” to compute of data analysis options” to compute a 3-month moving average:a 3-month moving average:

© 2003 Anita Lee-Post
Using Excel for forecasting continuedUsing Excel for forecasting continued
• Input RangeInput Range: cell range of : cell range of the time seriesthe time series
• Labels in First RowLabels in First Row: leave : leave it unchecked if your cell it unchecked if your cell range above contains data range above contains data points onlypoints only
• IntervalInterval: parameter n : parameter n (number of data points (number of data points used in moving average used in moving average computation)computation)
• Output RangeOutput Range: starting : starting cell address for forecast cell address for forecast values (need to offset the values (need to offset the input range by one row) input range by one row)
4.4. Fill in the Moving Average Parameters: Fill in the Moving Average Parameters:

© 2003 Anita Lee-Post
Using Excel for forecasting continuedUsing Excel for forecasting continued
• Excel-generated moving average forecasts:Excel-generated moving average forecasts:
© 2003 Anita Lee-Post
Using Excel for forecasting continuedUsing Excel for forecasting continued
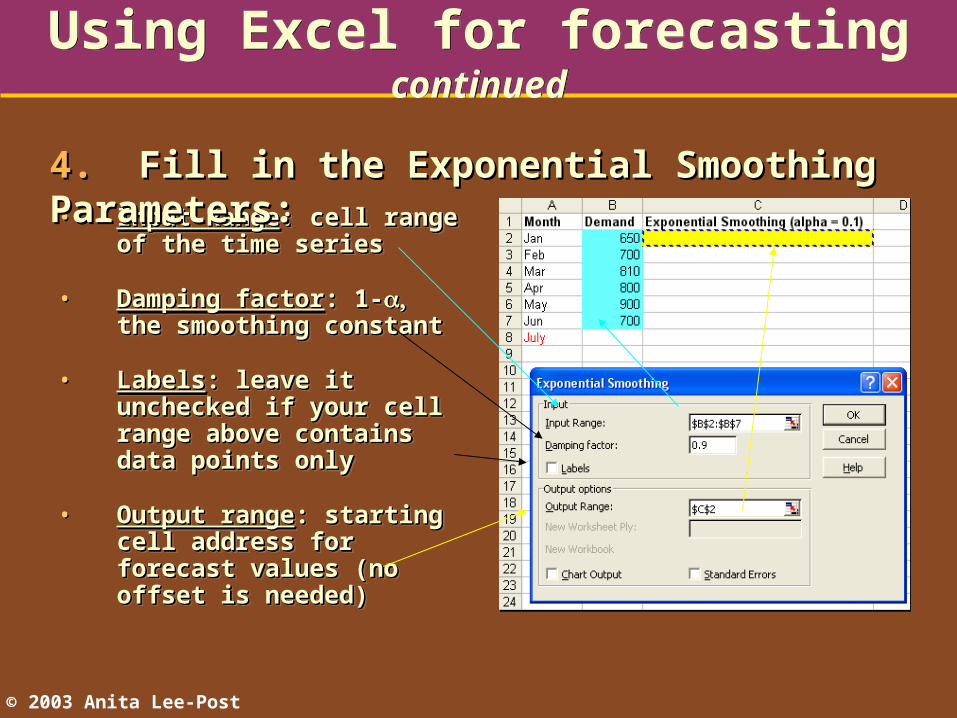
• Input RangeInput Range: cell range of : cell range of the time seriesthe time series
• Damping factorDamping factor: 1-: 1- the the smoothing constantsmoothing constant
• LabelsLabels: leave it unchecked : leave it unchecked if your cell range above if your cell range above contains data points onlycontains data points only
• Output rangeOutput range: starting cell : starting cell address for forecast address for forecast values (no offset is values (no offset is needed) needed)
4.4. Fill in the Exponential Smoothing Parameters: Fill in the Exponential Smoothing Parameters:

© 2003 Anita Lee-Post
Using Excel for forecasting continuedUsing Excel for forecasting continued
• Excel-generated exponential smoothing Excel-generated exponential smoothing forecasts:forecasts:
Copy the formula in cell C7 to cell C8 Copy the formula in cell C7 to cell C8 to compute the forecast for Julyto compute the forecast for July

© 2003 Anita Lee-Post
Using Excel for forecasting continuedUsing Excel for forecasting continued
• Input Y RangeInput Y Range: cell range : cell range of the dependent variableof the dependent variable
• Input X RangeInput X Range: cell range : cell range of the independent of the independent variablevariable
• LabelsLabels: have it checked as : have it checked as column headings are column headings are included in our input included in our input rangesranges
• Output rangeOutput range: starting cell : starting cell address for regression address for regression analysis outputanalysis output
4.4. Fill in the Regression Parameters: Fill in the Regression Parameters:

© 2003 Anita Lee-Post
Excel-generated regression analysis report:Excel-generated regression analysis report:
Enter the formula =D17+D18*A8 in cell Enter the formula =D17+D18*A8 in cell B8 to compute the forecast for JulyB8 to compute the forecast for July

© 2003 Anita Lee-Post
Excel can be used to compute MAD and MSE:Excel can be used to compute MAD and MSE:
A B C D E
1 Month Demand 3-month Moving Average
Absolute Deviation Squared Error
… … … … …
5 Apr 800 720 =ABS(B5-C5) =(B5-C5)^2
6 May 900 770 =ABS(B6-C6) =(B6-C6)^2
7 Jun 700 836.7 =ABS(B7-C7) =(B7-C7)^2
8
9 MAD =AVERAGE(D5:D7)
10 MSE ==AVERAGE(E5:E7))

© 2003 Anita Lee-Post
Excel can be used to compute MAD and MSE:Excel can be used to compute MAD and MSE:
A B C D E
1 Month Demand Exp. Smooth. (
Absolute Deviation Squared Error
… … … … …
5 Apr 800 670.5 =ABS(B5-C5) =(B5-C5)^2
6 May 900 683.5 =ABS(B6-C6) =(B6-C6)^2
7 Jun 700 705.1 =ABS(B7-C7) =(B7-C7)^2
8
9 MAD =AVERAGE(D5:D7)
10 MSE =AVERAGE(E5:E7)

© 2003 Anita Lee-Post
Excel can be used to compute Tracking Signals:Excel can be used to compute Tracking Signals:
A B C D E F
1 Month Demand 3-month Moving Average
Error Cumulative Sum of Error
TrackingSignal
… … … … … …
5 Apr 800 720 =B5-C5 =D5 =E5/$D$9
6 May 900 770 =B6-C6 =E5+D6 =E6/$D$9
7 Jun 700 836.7 =B7-C7 =E6+D7 =E7/$D$9
8
9 MAD 116