Embed Size (px)
Citation preview

© 2002 Society of Industrial and Office REALTORS®
WEALTH BUILDINGWEALTH BUILDINGin the 21in the 21stst CENTURY CENTURY
ROBERT J. NAHIGIAN, FRICS, SIOR, CREROBERT J. NAHIGIAN, FRICS, SIOR, CRE SIOR 2006 FALL SIOR 2006 FALL AUBURNDALE REALTY CO. CONFERENCENEWTON, MASS.

INVESTMENT CHOICES
STOCKS REAL ESTATE
BONDS
MUTUAL FUNDS
COMPANIES COMMODITIES
BTSBTSEXISTINGEXISTING
SPECSPEC

REAL ESTATE CYCLESSECULAR
PEAK?? PEAK
BID-ASK SPREADS
“Denial Phase”“YIELD CHASERS”
RECOVERY
BOTTOM
BUY LOW/SELL HIGH
© 2002 Society of Industrial and Office REALTORS®
Why Real Estate?
• Why do people invest in real estate?
• TO MAKE MONEY?
• Really?

© 2002 Society of Industrial and Office REALTORS®
MILLIONAIRE PROFILEIdentifying the RE Investor
• MILLIONAIRES = $1-10 ML
• AVER. HSHLD NET WORTH = $3.7 MILL
• AVERAGE HSHLD INCOME = $131,000
• MANY BETWEEN = $50-75,000
• Source: Money Fall 2002, Millionaire Next Door/

© 2002 Society of Industrial and Office REALTORS®
U.S. AVERAGE MILLIONAIREU.S. AVERAGE MILLIONAIRE
• Aver. Median Hsehld Income Aver. Median Hsehld Income = $ 131,000= $ 131,000
• Aver. Income Aver. Income = $ 247,000= $ 247,000
• Aver. Hsehld Net Worth ’05 Aver. Hsehld Net Worth ’05 = $ 2.2 Million= $ 2.2 Million
• Total Hsehlds Millionaires ’05 Total Hsehlds Millionaires ’05 = 8.9 Million= 8.9 Million
• Total Hsehlds ’05 Millionaires w/o RE = 2.5 MillionTotal Hsehlds ’05 Millionaires w/o RE = 2.5 Million
• Source: Wikipedia.org/Millionaire Next DoorSource: Wikipedia.org/Millionaire Next Door

© 2002 Society of Industrial and Office REALTORS®
ALL U.S. NET WORTHCAN THEY INVEST?CAN THEY INVEST?
• Median Income 2004 = $ 44,389
• Aver. US Salary ‘06 = $ 17.00 / Hour
• Net Worth 2004 = $ 100,894
• Aver. Median Hshld Net Worth 2005 = $40,200
• Source: US Census Bureau/CNN Money 8/20/04

© 2002 Society of Industrial and Office REALTORS®
BIG HAT, NO CATTLEBIG HAT, NO CATTLE

© 2002 Society of Industrial and Office REALTORS®
Wealth BuildingWealth Building
• Biggest Consumption Category
• Income Taxes
• Lifestyle

© 2002 Society of Industrial and Office REALTORS®
HOW DID THEY GET HOW DID THEY GET THERE?THERE?

© 2002 Society of Industrial and Office REALTORS®
Wealth BuildingWealth Building
• Income Taxes: 2003
Income FederalEarners Revenues
1% = 34.27%
5% = 54.36%
50% = 96.54%Source: TaxFoundation 2/2/06; IRS 2003
© 2002 Society of Industrial and Office REALTORS®
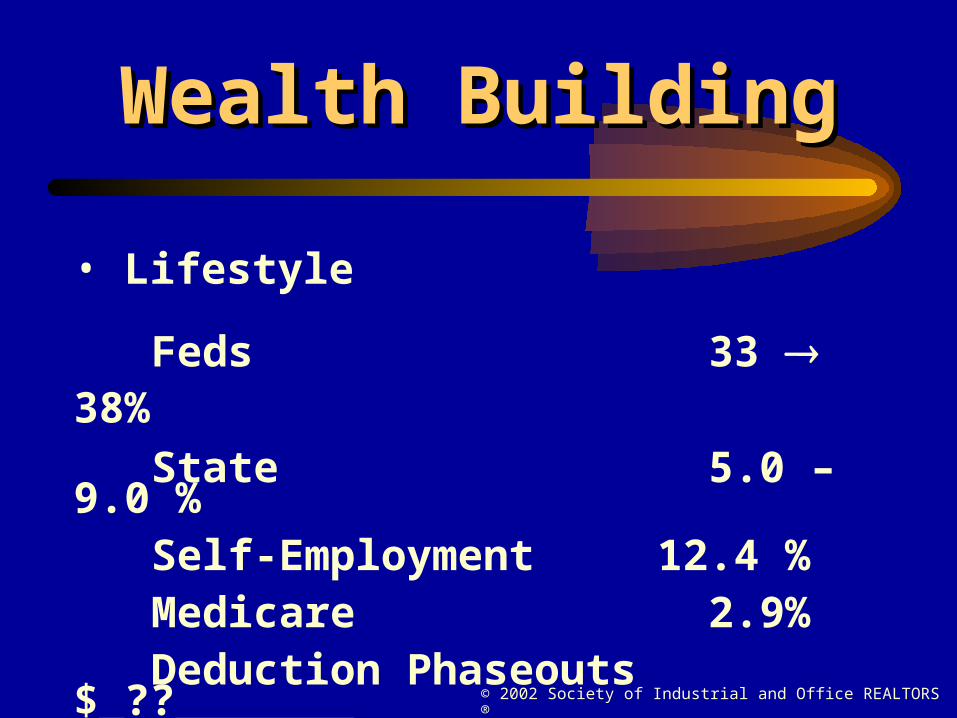
Wealth BuildingWealth Building
• Lifestyle
Feds 33 38%
State 5.0 –9.0 %Self-Employment 12.4 %Medicare 2.9%Deduction Phaseouts $_??_______
60%/92%

© 2002 Society of Industrial and Office REALTORS®
BUILDING WEALTH
• INCOME IS NOT WEALTH
• BEING RICH IS NOT BEING WEALTHY
• CONSUMPTION vs. ACCUMULATION

© 2002 Society of Industrial and Office REALTORS®
Investing
• Discretionary Income (Surplus)
• Placing It/ Commodity
• Future Consumption

© 2002 Society of Industrial and Office REALTORS®
U.S. MILLIONAIRES ’05 U.S. MILLIONAIRES ’05 INVESTMENTSINVESTMENTS
• Investment Real Estate Investment Real Estate = 46% of mllnres= 46% of mllnres
• Investment Real Estate ’04 = 13% of portfolioInvestment Real Estate ’04 = 13% of portfolio
• Stocks and BondsStocks and Bonds = 70%= 70%
• Mutual FundsMutual Funds = 68%= 68%
• Source: CNN Money 3/29/06/6/9/05Source: CNN Money 3/29/06/6/9/05
© 2002 Society of Industrial and Office REALTORS®
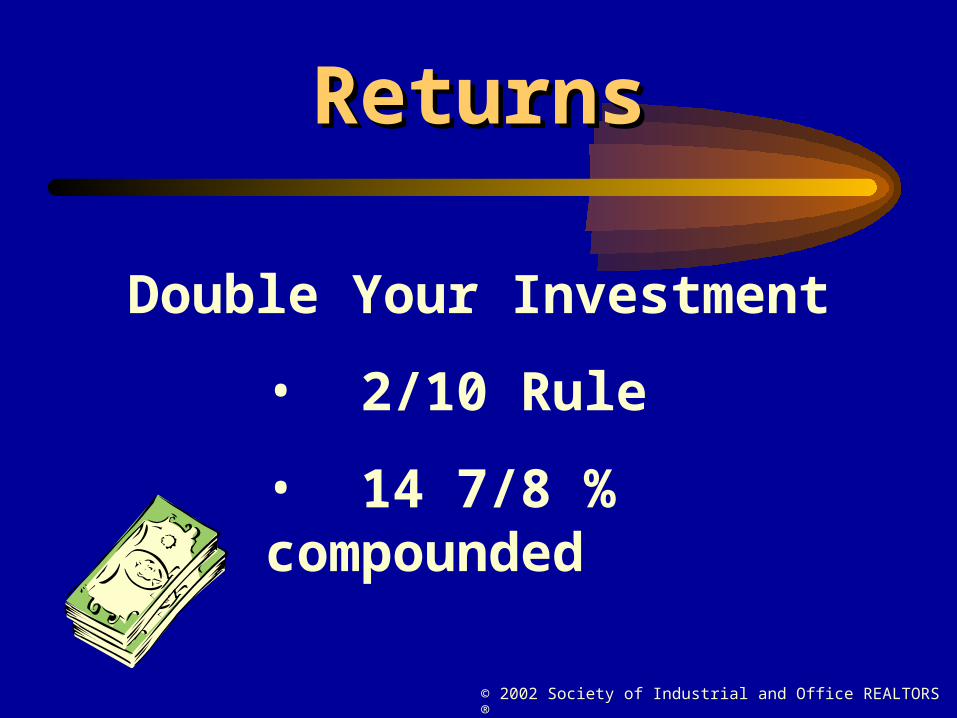
ReturnsReturns
Double Your Investment
• 2/10 Rule
• 14 7/8 % compounded

© 2002 Society of Industrial and Office REALTORS®
WHAT YOU NEED TO SAVE
• T.ROWE: NEED 15% OF SALARY
• FIDELITY: NEED 14% OF SALARY
• THE OLD 10% MAY NOT WORK
• SOURCE: WALL ST. J 7/1/06

© 2002 Society of Industrial and Office REALTORS®
After Tax Household Savings RateAfter Tax Household Savings RateWHICH COUNTRIES CAN INVEST?WHICH COUNTRIES CAN INVEST?
U.S. 2000 = - 1.3% LBYM
U.S. 2005 = - 0.5%
Japan 2004 = 7.7% = $117,000
French 2004 = 16.0%
Your Client: 15-20% = $ 2.24 Tril. 9/06
Source: US New 2/10/03; 3/24/03; MSNBC 1/30/06/Las Vegas Journal 3/2/06

© 2002 Society of Industrial and Office REALTORS®
NATIONAL SAVINGS RATE
• US: 2004 13.6% OF GDP
• JAPAN: 2004 25% OF GDP
• CHINA: 2004 50% OF GDP
• Source: Boston Globe 1/30/05

© 2002 Society of Industrial and Office REALTORS®
U.S. CONSUMER DEBT
• 2004 U.S. Average Credit Card Debt: $9,312
• Aug. 2006: US Households at Record Debt
• 2006 Consumer Debt = $2.17 Trillion
• Source: Smart Money 9/05MSNBC 8/9/06

© 2002 Society of Industrial and Office REALTORS®
U.S. CONSUMER DEBTU.S. CONSUMER DEBT
• June, 2006 = 90,000 Homes Foreclosed
• June, 2006 = 17% higher than June, 2005
• 2006 AMR To Reset = $1. 0 Trillion
• A House = ATM • Source: Investor Business 8/24/06

© 2002 Society of Industrial and Office REALTORS®
ENTRANCE STRATEGIESENTRANCE STRATEGIESWHEN INVESTINGWHEN INVESTING
PERSONAL GOALS/OBJECTIVESPERSONAL GOALS/OBJECTIVES RISK THRESHOLDRISK THRESHOLD AGEAGE MARITAL STATUSMARITAL STATUS RETIREMENT ($1,300,000.00)RETIREMENT ($1,300,000.00) TUITION ($200,000 per child)TUITION ($200,000 per child)

© 2002 Society of Industrial and Office REALTORS®
THANK YOU
SIOR SIOR