Embed Size (px)
Citation preview

- 1 -
Measuring Subjective Expectations in Developing Countries:
A Critical Review and New Evidence#
Adeline Delavande, RAND and Nova - Lisbon School of Business and Economic
Xavier Giné, World Bank and BREAD
David McKenzie, World Bank, BREAD and IZA
Abstract
The majority of economic decisions are forward looking and thus involve expectations of future
outcomes. Understanding the expectations that individuals have is thus of crucial importance to
designing and evaluating policies in health, education, finance, migration, social protection, and
many other areas. However, the majority of developing country surveys are static in nature and
many do not elicit subjective expectations of individuals. Possible reasons given for not
collecting this information include fears that poor, illiterate individuals do not understand
probability concepts, that it takes far too much time to ask such questions, or that the answers
add little value. This paper provides a critical review and new analysis of subjective expectations
data from developing countries and refutes each of these concerns. We find that people in
developing countries can generally understand and answer probabilistic questions, such
questions are not prohibitive in time to ask, and the expectations are useful predictors of future
behavior and economic decisions. The paper discusses the different methods used for eliciting
such information, the key methodological issues involved, and the open research questions. The
available evidence suggests that collecting expectations data is both feasible and valuable,
suggesting that it should be incorporated into more developing country surveys.
Keywords: Subjective Expectations; Survey Methodology; Development.
JEL Codes: D84; C81; O12.
# We thank the editor and three anonymous referees for their detailed and constructive comments, many of the
researchers working in this area for generously sharing their experiences and questionnaires, and Orazio Attanasio
for comments on a first draft of this paper. All opinions expressed in this paper are our own, and do not necessarily
represent those of our respective employers.

- 2 -
1. Introduction
Most economic decisions involve uncertainty and are therefore shaped not only by
preferences but also by expectations of future outcomes.1 Understanding the expectations that
individuals have is thus critical for understanding their behavior and for modeling the effects of
policies. For example, -several explanations could rationalize why youths in developing
countries do not go to school. One possibility is that they expect low returns to schooling.
Another alternative is that they face high attendance cost. Without data on expectations we
cannot separate these two explanations, yet doing so is important for designing policies that
promote schooling.
While elicitation of expectations questions have been increasingly used in major surveys
in the United States (see Manski, 2004, and Hurd, 2009, for a recent review), many of the major
surveys in developing countries are static in nature and do not contain information on the
subjective expectations of individuals.2 When surveys do ask about the future, it is more
common to ask respondents to answer on a Likert scale (e.g. very likely, likely, not very likely)
or to give point answers (e.g. I think my income will be $300 next year) than to elicit subjective
probabilities or statistical concepts such as moments of subjective distributions. Yet such
quantities are needed to assess whether individuals have accurate expectations about the future,
and for use in economic models which require quantitative measures of probabilities and
uncertainty.
Possible reasons given for not collecting subjective probabilities include fears that poor
illiterate individuals do not understand probability concepts, that it takes far too much time to ask
such questions, or that the answers are of little value. As data collection is becoming more
common, a few innovative surveys have experimented with eliciting probabilistic subjective
expectations in developing countries. We review these experiences to ask what has been learned
from existing work, and conduct new analysis of expectations survey data collected in several
1 Clearly expectations are only one aspect of decision-making. There is also a growing literature in development
economics seeking better measurement of other aspects of decision-making, such as risk and time preferences, and
other aspects of preferences such as trust and reciprocity. See Cardenas and Carpenter (2008) for a recent review of
the literature in these areas. 2 For example, some of the best known large scale development surveys such as the World Bank‟s Living Standards
Measurement Surveys (LSMS), ORC-Macro‟s Demographic and Health Surveys (DHS), and the Indonesian Family
Life Survey (IFLS) do not include any probabilistic measures of expectations, although they sometimes do ask non-
probabilistic questions about the future.

- 3 -
developing countries. The results refute each one of the arguments made for not collecting
expectations information. People in developing countries do appear to understand probabilistic
questions, they are not prohibitive in terms of time to ask, and expectations do provide
meaningful information about economic behavior.
The remainder of the paper is structured as follows. Section 2 describes and critiques the
different methods which have been used to elicit expectations in developing country surveys.
Section 3 digs deeper into some of the practical issues involved in asking these questions, while
Section 4 discusses whether we can conclude that such methods “work”. Section 5 outlines areas
for future work and Section 6 concludes.
2. Methods for collecting expectations data
It is not uncommon for surveys in both developed and developing countries to ask
individuals perceptions about future events, but until recently there has been little attempt to
generate answers in probabilistic form. This is also the case in most recent large scale surveys in
developing countries, if they ask about expectations at all. For example, the 2nd
round of the
Mexican Family Life Survey fielded in 2005 asks “Do you think there will be an economic crisis
when President Fox‟s presidency is over?” with answers on a Likert scale of “very likely, likely,
unlikely, or very unlikely”.3 The fourth round of the Indonesian Family Life Survey, fielded in
2007, asks parents about the education prospects of their children by asking “What is the highest
education level do you expect”, with the answer a single number, the level of education. In
contrast, a number of recent surveys have asked subjective probabilities of certain events
happening. This section discusses the methods that have been used in measuring these subjective
probabilities in developing country surveys, and compares them to these non-cardinal measures.
In developing countries, most data collection is done in person, that is, with an
enumerator visiting the home or workplace of the respondent. In this paper we focus on methods
for eliciting expectations that can be collected in the course of a one-on-one interview.4 These
methods have also been used in online surveys, although the use of such surveys is rare in
3 Although the full survey does not ask probabilistic expectations, an experimental module administered to a
subsample of participants did ask some questions in this format. 4 The interested reader can consult Chapter 10 in Tourangeau, Rips and Rasinski (2000) for a critical comparison of
different modes of data collection.

- 4 -
developing countries, and is typically restricted only to surveys of highly educated and/or
wealthy individuals.5
2.1 Non-probabilistic methods of eliciting expectations
Likert scales have been commonly used to assess the likelihood that a perceived event
will occur. They are less commonly used to collect data about perceptions of the distribution of
future events occurring, but in principal one could also ask, for example, how likely is it that next
month‟s profits will be under $300, how likely is it they will be between $301 and $500, etc.,
with the interviewee each time answering on a Likert scale ranging from very likely to very
unlikely.
One of the problems with a Likert scale is the difficulty in making interpersonal
comparisons, as different respondents may interpret the scales differently. McFadden et al.
(2005) illustrate this point with an example of a health status measure that uses a Likert scale
ranging from Excellent to Poor. Sixty-two percent of Danish men, but only 14 percent of French
men reported their health to be “Excellent”, yet French men enjoy two more years of life
expectancy. One response to this problem has been the use of vignettes to try and “anchor” the
Likert scale to allow comparisons across individuals.6 The use of such methods can help improve
comparability across individuals, but still results in only an ordinal, and usually quite coarse,
assessment of the likelihood of a given event happening.
Manski (2004) provides a detailed argument of other reasons to prefer subjective
probabilities to Likert scales and other non-cardinal measures. The main reason for most
economic applications is that once one has probabilities, they can be used to calculate the
moments of a distribution of interest and the likelihood of compound events, used for expected
utility calculations, and incorporated into dynamic models.
A second non-probabilistic alternative is to just ask people “what do you think” or “what
do you expect”. For example, the Mexican Family Life Survey second round asks “Today a
dollar is worth approximately $11.50 pesos, how much do you think it will be worth in
December of 2006?”, and Jensen (2010) and Nguyen (2008) ask students “how much do you
5 An example is the survey of the top academic achievers from a number of Pacific Islands discussed in Gibson and
McKenzie (2009), which used the percent chance formulation to ask expectations questions about migration using
online and in-person questionnaires. 6 See the anchoring vignettes website of Gary King for good coverage of these approaches.
http://gking.harvard.edu/vign/. See Kapteyn, Smith and van Soest (2007) for an application.

- 5 -
think you will earn” under different scenarios. A common critique of such approaches is that it is
not clear whether individuals answer with a mean, mode, median, or something else. In contrast,
eliciting subjective probabilities allows any desired statistical concept of interest to be calculated.
2.2 Eliciting subjective probabilities without visual aids.
In developed country surveys, the standard method of eliciting subjective probabilities is
to simply ask people these probabilities directly. For example, Dominitz and Manski (1997) ask
individuals the percent chance that they will be employed at a specified future date. They then
elicit a cumulative distribution function for income by first asking individuals what the lowest
and highest amount they could earn would be, and then use these answers to define four
threshold levels, Y1, Y2, Y3 and Y4. Respondents are then asked “what is the percent chance that
your income will be less than Y1” and similarly the percent chance it will be less than Y2, less
than Y3, and less than Y4. Interviewers can either prompt respondents to ensure that the answers
are non-decreasing, or the answers can be checked for this to see whether individuals understand
probability.
An example of the use of this same percent chance formulation in a developing country is
McKenzie et al. (2007), who ask Tongans their expectations of income if they were to migrate to
New Zealand, and similarly ask Tongan migrants in New Zealand their expectations of income if
they had stayed in Tonga. They find that these questions appear to be understood by their survey
respondents, who have accurate expectations about incomes in Tonga, but underestimate how
much they could earn in New Zealand. The average education level in their sample was 11 to 12
years, with no one having below 8 years of education.
A related method of eliciting a distribution by directly asking about probabilities is found
in Attanasio, Meghir and Vera-Hernandez (2005), who elicit income expectations in Colombia,
and Attanasio and Kaufmann (2009) who elicit income expectations of junior high school
students in Mexico. In both cases they ask respondents what is the maximum and the minimum
amount they could earn. The enumerator then computes the midpoint M and then asks: “From
zero to one hundred, what is the probability that your earnings at that age will be at least M?”
These methods of eliciting distributions directly give probabilistic measures of certain
percentiles of the subjective distribution. However, to move from these percentiles to means,
medians, standard deviations, and other moments of interest requires imposing further

- 6 -
assumptions. In the case of the percent chance formulation used by Dominitz and Manski (1997)
and McKenzie et al. (2007), the authors fit a log-normal distribution to the four percentiles
elicited, and then use this to recover these moments. In both cases the log-normal appears to fit
well for income. Attanasio and Kaufmann (2009) assume that the minimum and maximum
elicited are truly the minimum and maximum of the subjective distribution, a point which we
will return to, and then fit a step-wise uniform, bi-triangular, and triangular distribution to their
data in order to recover the moments of interest.
2.3 Using visual aids to elicit subjective probabilities
The above studies have shown that in some settings, the same percent chance
formulations used in developed countries have been successfully employed in developing
countries. However, in many settings it is felt that simply asking respondents for a probability or
percent chance is too abstract, and visual aids are needed to help them express probabilistic
concepts. This commonly involves asking respondents to allocate stones, balls, beans, or sticks
into a number of bins.
An example of this method is given in Luseno et al. (2003) and Lybbert et al. (2007),
who ask pastoralists with little formal education in Ethiopia and Kenya to allocate 12 stones
across three different piles on the ground, one for „„above normal,‟‟ one for „„normal,‟‟ and one
for „„below normal,‟‟ with the number of stones in each pile representing the individual‟s
prediction about the likelihood that rainfall in the coming long rains season would be in each of
the given states. They found only 16 of the 244 households gave degenerate forecasts in which
all 12 stones were placed in a single pile.
A second example is provided by Hill (2007), who collects expectations from coffee
farmers in Uganda about coffee prices. The respondents were given twenty beans and a handout
marked with three squares of different price categories (less than $0.10 (200 shillings), between
$0.10 and $0.20 (between 200 and 400 shillings), and more than $0.20 (400 shillings)). They
were asked to place beans on the squares in accordance with what they thought was the chance
of that outcome. If the respondent thought one option was very likely they were instructed to put
many beans on the corresponding square, if the respondent thought the option was unlikely they
were instructed to place few beans there.

- 7 -
A notable feature of several of these applications using visual aids is that they never
explicitly tell respondents to interpret the answers as probabilities. A concern then is that if
respondents are asked to allocate the stones or beans to different piles in accordance with how
“likely” they think each state is, there may be interpersonal differences in how “likely” is
interpreted, in a similar manner to Likert scales. For example, one person may use one of ten
stones to conceptualize an unlikely event, whereas another person may use zero or two stones to
again indicate they consider this event unlikely.
In contrast, Delavande and Kohler (2009a), in a survey in Malawi, explicitly link the
number of beans placed in a pile to a probability. Their instructions to the respondents read:
“I will ask you several questions about the chance or likelihood that certain events are going to happen. There are 10
beans in the cup. I would like you to choose some beans out of these 10 beans and put them in the plate to express
what you think the likelihood or chance is of a specific event happening. One bean represents one chance out of 10.
If you do not put any beans in the plate, it means you are sure that the event will NOT happen. As you add beans, it
means that you think the likelihood that the event happens increases. For example, if you put one or two beans, it
means you think the event is not likely to happen but it is still possible. If you pick 5 beans, it means that it is just as
likely it happens as it does not happen (fifty-fifty). If you pick 6 beans, it means the event is slightly more likely to
happen than not to happen. If you put 10 beans in the plate, it means you are sure the event will happen. There is not
a right or wrong answer, I just want to know what you think. Let me give you an example. Imagine that we are
playing Bawo. Say, when asked about the chance that you will win, you put 7 beans in the plate. This means that
you believe you would win 7 out of 10 games on average if we play for a long time.”
Delavande and Kohler (2009a) use this elicitation method to ask respondents point
estimates about a number of events, ranging from going to market within the next two weeks, to
experiencing a food shortage, and to contracting HIV/AIDS. They also use it to elicit a
subjective mortality curve by asking respondents the likelihood that they would die within a one-
year, five-year and ten-year period. While it is clearer that we are asking probabilities when this
is made explicit in the question, it is not clear how much difference this makes in practice. In
future research it would be of interest to compare in an experimental setting the results from
eliciting distributions when stones and beans are explicitly linked to probabilities in this manner,
to the results from simply asking respondents to allocate stones or beans to piles in accordance
with how “likely” they think each outcome is.
- 8 -
A further example where a more visual and descriptive use of probabilities was used
comes from Sri Lanka. In pilot fieldwork, one of the authors tried using the percent chance
formulation to ask microenterprise owners their expectations of profits three months into the
future. Respondents, who typically had between 6 and 10 years education, struggled with this
format, and a decision was made to employ a more visual representation. However, a second
issue which arose was the difficulty respondents had in separating variability in sales due to
seasonality, from the stochastic variability within a given month. The solution that was used was
to move from the more abstract stones or beans, to ask microentrepreneurs to think of a fixed
number of businesses just like theirs. De Mel et al. (2008) ended up using the following
formulation:
“Think now about 20 businesses that are JUST LIKE YOURS. The owners have the same age, education,
experience, skill level, commitment and similar locations to you. Think about all the reasons why your profits may
be higher or lower IN DECEMBER. For example, you might have a big customer come along, a family member
could get sick, some inputs may not be available, you could find some inputs more cheaply than usual, etc. Taking
all these different possibilities into account, mark how many of the 20 businesses you think would end up with
PROFITS in DECEMBER in each of the intervals given”.
2.4 Comparing Likert responses to subjective probabilities
In practice one would hope to see some correlation between Likert and subjective
probabilities. Figure 1 provides a first comparison of Likert responses to subjective probabilities
in a developing country context. Delavande and Kohler (2009a) elicit from individuals in Malawi
the probability that they are HIV positive, and also ask them how likely they think it is that they
are HIV positive, with the answer on a Likert scale of No likelihood, low, medium, and high. We
see almost all individuals who say the probability is zero also say there is “no likelihood” on the
Likert scale, and the majority of individuals who think the probability is 0.8 or higher say that
the likelihood is “high” on the Likert scale. However, it is also clear that different individuals
associate the same subjective probability with different Likert grades. For example, 53 percent of
individuals who think the subjective probability they have HIV is 0.6 answer “high” on the
Likert scale, 35 percent answer “medium”, 6 percent answer “low”, and 6 percent answer “no
likelihood”.

- 9 -
Only 5 percent of the sample (130 observations) actually have HIV.7 It is the case that
both higher Likert scores and higher subjective probabilities are positively associated with
actually being HIV positive. The subjective probabilities explain slightly more of the variation in
the data (pseudo-R2 of 0.0819 vs. 0.0576 for the Likert scale). However, there appears to be
additional independent information in both variables: conditional on one‟s Likert score, those
with higher subjective probabilities are marginally more likely to have HIV and vice versa.
Given the small sample size, it would be useful to compare Likert and subjective probabilities in
other settings to confirm that the subjective probabilities add information above and beyond that
revealed in a Likert score. But even if the Likert scale was as good or even better for predicting
actual status, in many applications users may still prefer subjective probabilities for the reasons
argued above – in particular, to have answers on a cardinal scale which can be used in
calculations where probabilities are required.
2.5. What should we expect from asking “what do you expect” in lieu of subjective expectations?
When the desired quantity is a subjective mean or other point estimate from a continuous
distribution, non-probabilistic elicitation methods often just ask individuals “what do you
expect?” This has the advantage of being quick and easy to ask and for people to answer.
However, as noted above, there are theoretical reasons to prefer the subjective mean over such
questions, since it is not clear what quantity is being elicited in these non-probabilistic methods.
However, we are not aware of any empirical evidence which compares the simpler “what do you
expect” approach to the more formal methods for eliciting subjective expectations discussed in
this paper in a developing country.8
We therefore compare the two methods using panel data on Sri Lankan microenterprises,
collected by de Mel et al. (2008), who use the elicited subjective distribution to measure the
uncertainty individuals have about future profits. They elicited expectations about future profits
7 The project tested individuals to ascertain their true status, with these subjective probability and Likert questions
asked of individuals before the results of these tests were revealed to them. 8 Engelberg et al. (2009) compare point predictions of GDP growth and inflation with the subjective probability
distributions held by professional forecasters. They find that point predictions are quite close to the central
tendencies of subjective distributions but that the deviations between point predictions and the central tendencies
tend to be asymmetric, with forecasters tending to report point predictions that give a more favorable view of the
economy than do their subjective means/medians/modes. Delavande and Rohwedder (2007) compare individuals‟
point expectations about Social Security expected claiming age with their elicited subjective distributions and find
that respondents are more likely to report the median or the mode than the mean of their distribution when providing
a point estimate.

- 10 -
of the enterprise in two ways. The first was to directly ask the owner “How much do you expect
the profits of your business to be in December?”, two months into the future. Secondly, they
elicited expectations of the full subjective distribution of future profits as explained above. We
use the elicited subjective distribution to calculate the subjective mean, median, and mode of
future profits.9
Figure 2 plots the subjective mean, median and mode against the individual‟s answer to
the simple “what do you expect” question (hereafter referred to as the “point expectation”) for
the 564 microenterprises answering all questions. Figure 2 shows a strong positive association
between the different measures: the correlation between the point expectation and the subjective
mean and median is 0.90. Nevertheless, there is considerable scatter around the 45 degree line.
Only 19 percent of the point expectations are within 10 percent of the subjective mean, only 34
percent are within 25 percent of the subjective mean, and 29 percent differ in magnitude by 50
percent or more.
In terms of whether the point expectation gives a mean, median, or mode, we find that in
only 23 percent of cases is it closest to the mean, in 55 percent it is closest to both the median
and the mode, in 11 percent of cases it is closest to the median alone, and in 7 percent of cases it
is closest to the mode alone. Thus the point expectation is not giving the mean in the majority of
cases.
Thus we have seen that the simple expectation, although correlated with the subjective
mean and median, can differ substantially from them. Using the follow-up data, we can then
examine which does a better job of predicting future outcomes. The subsequent wave of the Sri
Lankan Microenterprise Surveys collected data on December 2005 profits, allowing us to see
which method gets closer to the realized profits. A first measure of fit is obtained by comparing
the mean and median absolute error between the two methods. The mean (median) absolute error
is 3798 (2000) when the simple what to expect question is used, versus 3047 (1852) when the
subjective mean taken from eliciting the full distribution is used. Thus the mean absolute error is
25 percent higher using the point expectation.
9 The subjective mean is estimated by taking midpoints of each profit interval to discretize the distribution. For the
end points, we added the length of the previous interval to the endpoint. E.g. if the last two intervals were 9000 to
9,999 in profits, and 10,000 and above, the last interval was assigned value 11,000 in calculating the mean. Since
there were few observations in the last intervals, this choice makes little difference to the results.

- 11 -
Table 1 regresses actual December profits on the different elicited expectations. Columns
1 to 3 use the simple what do you expect question, and columns 4 to 6 the subjective mean. Both
are positively associated with true profits, but the coefficient is substantially larger for the
subjective mean: for each 100 rupees more of higher expected profits according to the simple
expectation, true profits are 26 rupees higher, compared to 47 rupees higher with the subjective
mean. We can reject that either coefficient is one, consistent with attenuation bias due to the
expected mean equal to the true mean and some measurement error – or with those who give
very high expectations being too optimistic and those who give very low expectations being too
pessimistic.
Columns 3 and 6 of Table 1 add actual September 2005 profits, collected at the same
time as the expectations questions were asked. They show that the expectations continue to have
predictive power about future profitability, even conditional on current profitability. Part of the
reason for the relatively poor performance of the point expectation appears to be the presence of
outliers. The standard deviation of the point expectation is 1.8 times that of the subjective mean.
Eliciting subjective expectations, by forcing microenterprise owners to consider the likelihood of
each different range of profits occurring, seems less prone to outliers than a one-off casual
answer to the point expectation. Even after we trim the top and bottom 1 percent of the simple
expectation and the subjective mean, the mean squared error from using the simple expectation is
still 1.63 times that using the subjective mean. Hence, in this case at least, there is considerable
accuracy gain from eliciting the subjective mean rather than simply asking “what do you
expect”. Comparisons in other settings would be useful to see how generalizable this finding is.
2.6. Do respondents understand probabilities?
We have argued that there are a number of theoretical and conceptual reasons for
preferring the elicitation of subjective probabilities to non-probabilistic subjective expectations,
an argument also made forcefully in Manski (2004). However, when it comes to developing
countries, there could be concerns that it may not be possible to gather subjective probabilities
because poor illiterate individuals do not understand the concept of probability. As a first step to
alleviating these doubts, we review here evidence that shows that elicited probabilistic
expectations follow basic properties of probabilities in a developing country context, with later

- 12 -
sections of the paper providing further evidence that the probabilities elicited are useful for the
types of analysis desired by economists.
Delavande and Kohler (2009a) ask respondents in rural Malawi to allocate 10 beans to
reflect the likelihood of some events occurring. They evaluate whether respondents understand
the concept of probability by asking about two nested events: going to the market within (a) two
days, and (b) two weeks. If respondents understand the concept of probability, they should
provide an answer for the two-week period that is larger than or equal to the one of the two-day
period.10
A remarkably high number of respondents provided an answer for the event “going to
the market within two days” smaller than or equal to for the event “going to the market within
two weeks.” Only 19 respondents out of 3,222 (0.6%) violated the property of the probability of
nested events. This high consistency rate is not driven by the fact that respondents provided the
same answers to both questions (only 6% of the respondents did). Adding 2 and 3 beans was the
most common action taken by respondents when the length of time increases from two days to
two weeks.
Attanasio, Meghir and Vera-Hernandez (2005) elicit income expectations in Colombia.
They first ask about the minimum and maximum expected household income in the next month.
Using a ruler they then ask respondents the probability that actual income would fall between the
minimum and the mid-point between the minimum and the maximum (group A), or the
probability that actual income would fall between the mid-point and the maximum (group B).
Respondents were randomly allocated into group A or B. To evaluate whether respondents
understand basic probability law, they test the hypothesis that the sum of the averages of the
probabilities answered by group A and B equals 1, and cannot reject it. This leads them to
conclude that one cannot reject the hypothesis that respondents‟ answers conform to the basic
laws of probabilities.
Mahajan et al. (2008) use 10 stones as a visual aid to get participants in Orissa, India to
express probabilities and ask individuals the maximum and minimum income their household
would earn in the next agricultural year. Unlike many applications, they do not force individuals
10
Interviewers were instructed to leave the number of beans on the plate after the respondents had responded to the
likelihood of going to the market within two days, thereby ensuring that s/he remembers the answer when answering
about the two-week period in the next question. This has the advantage of reducing measurement error from recall,
and anchors responses. Nevertheless, it is possible that if removing beans is viewed differently by respondents than
adding beans, it might artificially induce a gradient. In future methodological experiments it would be useful to
experiment as to the sensitivity of responses to such questions to the ordering of the two nested events, and to
whether the beans are left on the table or removed.

- 13 -
to use only 10 stones, but instead give them 10 stones to express the probability that earnings
would be above the midpoint, and separately 10 stones to express the probability that earnings
would be below the midpoint.11
They find that only 513 out of the 1945 individuals have
probabilities adding exactly to one. However, the mean sum of probabilities is 1.13, which falls
to 1.06 if they exclude individuals who say the probability that income is below the midpoint (or
above the midpoint) is exactly zero or one. Since the stones only allow individuals to express
probabilities in multiples of 0.1, the fact that the sum of the probabilities is within 0.1 of unity
when no restrictions were put on this is encouraging. Nevertheless, there are a minority of
observations who have probabilities which sum to something more substantially different than
one, indicating that not everyone understood the concept.
Finally we note that work by developmental psychologists in developed countries has
found that children as young as five or six are capable of understanding probabilities when visual
aids are provided (see Reyna and Brainerd, 1995 for a review), and that the concept of
probability can be communicated to children in experimental economic games (see Harbaugh et
al. 2002). It therefore seems unreasonable to argue that adults in developing countries are unable
to understand risk and probabilities, or to cite this as a reason for not asking these questions.
3. Practical issues in eliciting probabilistic expectations
There are a number of issues that researchers face when deciding how to implement
subjective expectations questions in practice. This section discusses some of these practical
questions of implementation, drawing on our own experiences implementing these questions in
the field as well as on discussions with other researchers.
3.1. How burdensome is it to ask these questions?
As well as a concern that individuals may not understand expectations (or at least not be
able to formulate them in terms of probabilities), the other main reason commonly expressed for
not eliciting expectations questions is that these questions are too costly in terms of the quality
of enumerators and survey time. Enumerators need to be at least high school graduates with an
11
Note that they do not ask the probability that earnings would be exactly the midpoint. If the midpoint is a round
number, it is conceivable there could be mass on this point, especially for wage earnings. This description also does
not appear in later versions of the paper.
- 14 -
understanding of the concept of probability. These are not hard requirements to meet since
enumerators are typically educated and have basic knowledge of mathematics and statistics.
In any event, the quality of the enumerators may still affect the accuracy with which
probabilities are elicited – some enumerators may do a better job explaining expectations
questions than others. We check this using the Sri Lanka microenterprise dataset of de Mel et al.
(2008). 19 enumerators were used by the survey firm (AC Nielsen Lanka) to interview 587
microenterprise owners spread over 24 geographic areas, with multiple enumerators used per
geographic area. Assignment of enumerators to firms within geographic areas was not explicitly
randomized, but in practice was “close to random”.12
We regress the absolute value of the
difference between the realization and subjective mean of profits against enumerator fixed
effects and geographical dummies. The enumerator fixed effects are jointly insignificant (p-
value=0.43) when the mean from the subjective distribution is used as expectation, but they are
jointly significant (p-value=0.03) when the “what do you expect” question is used instead. The
F-test of enumerator effects in the simple expectation question becomes insignificant once
outliers are removed, so perhaps some of the enumerators are better than others at identifying
and double-checking unbelievable answers. This is the only example we are aware of testing for
enumerator effects in expectations questions, so this issue deserves further research.
In terms of survey time, eliciting a point estimate may take from 2 to 5 minutes, while
eliciting a full distribution can take up to 10 minutes if the support also needs to be elicited. But
because there is a fixed cost of explaining the question first, subsequent elicitations can be
obtained much quickly. Despite the fact that eliciting expectations can take some time, our
experience has been that interviewees respond well to such questions. If visual aids are used, the
questions provide a nice break from more tedious survey questions. Indeed, item non-response
on the expectations questions in all of the datasets we have collected have been negligible.
It is true that many of the surveys which have elicited probabilistic expectations in
developing countries have been specialized surveys with relatively small sample sizes, leading
some to wonder if these questions can be scaled up into large-scale nationally representative
surveys. However, several recent surveys have demonstrated that it is feasible to include such
12
By this we mean that although no random number generator was used to assign enumerators to firms to interview,
there was no systematic assignment of firms to enumerators. A enumerator was given a stack of firms to interview,
and then given more once those were finished, and if a respondent was not available on the first visit, the given firm
might then be given to another enumerator to interview the next day depending on work loads.

- 15 -
questions in large surveys. For example, Delavande and Kohler (2009a) include a large number
of expectations questions in a survey of over 3,000 adults in Malawi, and Attanasio and
Kaufmann (2009) include them in a survey of 23,000 young adults in Mexico.
3.2 Do we need to incentivize people to respond accurately?
A second practical issue that often comes up when measuring other parameters of the
decision process such as risk aversion and time preferences is whether respondents should be
provided with monetary incentives for their answers. The fear is that respondents will not
provide accurate enough answers if not rewarded properly. This issue has received less attention
in surveys of subjective expectations. One reason is that even if one believes that respondents
should be rewarded, it is not clear how, since the scoring rule may affect the elicitation process
itself. One of the first studies to reward respondents is Grisley and Kellogg (1983) who surveyed
farmers in northern Thailand about their price, yield and net income expectations at harvest time.
Farmers were rewarded based on their accuracy yet critics thought that the rule followed could
induce farmers to misrepresent their beliefs since risk aversion could influence their answers.
Nelson and Bessler (1989) run an forecasting lab experiment where subjects were rewarded
using either a linear or quadratic rule and show that for the untrained subject, that is, the one that
was unfamiliar with the questions and methods as most respondents would be, the scoring rule
does not matter. In the end, the question of whether financial rewards lead to more accuracy has
not been yet settled, because Grisley and Kellogg (1983) did not randomize the provision of
rewards. All of the recent studies reviewed here do not provide monetary rewards during the
elicitation process. As the next section shows, even without payment, the answers received from
such questions appear reasonable, and as such, there seems to have been a de facto decision that
payments are not needed.
3.3 Practical issues in the use of visual aids and in eliciting distributions
The use of these various forms of visual aids has the advantage of allowing respondents
to better conceptualize probabilities, and by giving a fixed number of stones, beans, balls or
businesses to allocate, ensures that the probabilities add up to one. A practical issue which then
arises is how many stones to use, and how many bins or piles to give respondents to place them
in. Ten and twenty stones appear to be the most common choices in the literature, and are easily
- 16 -
interpreted as probabilities. One hundred stones would be likely to tax the patience of a
respondent. An exception is Luseno et al. (2003) and Lybbert et al. (2007) who use 12 stones,
with three states of nature. The advantage of 12 stones in their setting is that it allows
respondents to answer with a uniform distribution, which would not be possible with 10 stones.
Nevertheless, 20 stones would still allow respondents to give close to a uniform distribution,
while allowing easier to calculate probabilities to be expressed by other respondents.
The number of bins to use depends on whether the outcome of interest is discrete or
continuous, and on how individualized the support given to each respondent is. Most outcomes
of interest are continuous, such as prices, incomes, and rainfall, and so allowing more bins with
narrower intervals can provide more precision in estimating subjective means. These visual aid
methods typically provide a histogram of the subjective distribution. As with the percent chance
methods, further assumptions are needed to calculate many of the moments of interest. A
common approach is to use the midpoints of intervals to discretize the continuous variable, and
then use the elicited probabilities along with these midpoints to calculate moments of interest.13
The support of the distribution over which the respondent should answer can either be
predetermined or elicited directly from the respondent. Because eliciting the support usually
involves some real time calculations, enumerators using paper and pencil methods are less likely
to make mistakes with a pre-determined support. In addition, if the whole distribution needs to
be compared across respondents, then a pre-determined (common) support is required. However,
if the likelihood of the event is very different across respondents, then a pre-determined support
may jeopardize accuracy if the intervals are too coarse. In the end, pilot testing will be necessary
to refine the support so that no probability mass is allocated to the extremes of the support and
that the grid of the support is fine enough so that the probability mass is distributed across
several grid points.
If the event is discrete, then the support can easily be pre-determined. For example, Giné,
Townsend and Vickery (2008) elicit the probability that the monsoon will start in a given 15-day
13
For example, Hill (2007, p.40) writes “For each farmer the beans were split into seven 100 shilling intervals from
100 to 800. A common lower and upper limit was placed on the data. The class mark for each of these 100 shilling
classes was taken as the midpoint of the class. The mean was calculated as i
i
i xf
7
1
where is xi the given class mark
for class i and fi is the probability the price would fall into this class.

- 17 -
period and so the support they use contains all 15-day periods spanning two months prior to the
normal onset and three months afterwards. An example of a pre-determined support with a
continuous outcome comes from the panel data on Sri Lankan microenterprises, collected by de
Mel et al. (2008). Microenterprise owners were first asked how much they expected profits to be
in the following two months, and based on their answer they were then given a grid with between
17 and 29 profit range bins. The bins were wider at the end points and narrower in the middle to
cover a wide range of answers while distinguishing the distribution more finely around the
majority of points. They find that only 17 percent of owners allocating any mass to the extreme
points of the distribution, with most of this coming from poor owners allocating mass to the
chance their profits could be very low or zero, suggesting that for most owners this
predetermined support did not constrain the respondents‟ answers.
If the support needs to be elicited directly from the respondents, enumerators typically
ask for the maximum and minimum of the support, and compute one or several midpoints in
between. For example, Giné and Klonner (2007) elicit expectations about future fish catches
among boat owners in India. They ask owners what the minimum and maximum number of
catches they expect is, and use this to compute the midpoint M. They then compute two
additional midpoints, the first between the minimum and M and the second between M and the
maximum so they end up with a 5 point support. Similarly Attanasio and Kaufmann (2009) ask
the maximum and minimum, and then use this to arrive at a midpoint.
3.4. Is a self-reported maximum actually a maximum?
Several of the methods of eliciting the subjective distribution ask respondents for a
maximum and a minimum, and then assume that the distribution is truly bounded by the elicited
maximum and minimum. However, just as simply asking what you expect is unlikely to give you
a statistical mean, we believe that in practice individuals are unlikely to reply with a statistical
maximum or minimum to such questions, but rather answer with some percentiles on their
subjective earnings.
To demonstrate this in practice, we use McKenzie et al. (2007)‟s data on expectations of
incomes in New Zealand for Tongans in Tonga, and on expectations of income in Tonga for
Tongan migrants in New Zealand. The survey first asked individuals what the lowest amount and
the highest amount they think they could be earning per week if they were in the other country

- 18 -
was. The midpoint of this high and low was then used to define four threshold values, and
respondents were asked the percent chance that their income would be less than each of these
four threshold values. It transpires that for 95 individuals, the top threshold value was exactly
equal to their reported highest amount.14
Table 2 then tabulates these respondents‟ answers of the
percent chance of being above the self-reported maximum.15
Only 17 percent say there is 0
percent chance of being above the maximum, with a median of 5 percent and mean of 9 percent
as the chance of being above. There are a few observations with even higher reports. These
results are then consistent with individuals giving the 95th
or 90th
percentile of their subjective
distribution as the answer when asked for a maximum, and suggest caution in assuming that one
gets a true maximum through a non-probabilistic question.
3.5 Choosing which method to use
At present it seems unlikely that any one particular method of eliciting expectations will
dominate in all survey contexts: some methods will likely work better in some applications,
while others will work better in others. The education level of the participants (and the
enumerators) and the extent to which there are local parallels in games of chance are important
factors in deciding which method to use. Researchers should therefore allow sufficient time in
piloting to contextualize the method to their local context, and to make sure that respondents
appear to understand the concept of probability used in the questions they pose. Nevertheless, it
would also be useful for several future methodological studies to randomize the expectations
elicitation method across different subsamples, in order that explicit comparison of methods may
be made.16
14
Respondents were asked a maximum and a minimum for the income they could earn. The midpoint of this was
then used to choose which of 26 pre-assigned sets of Y1, Y2, Y3, and Y4 thresholds to ask the respondent about. For
example, if the respondent said a minimum income of $300 and maximum of $500, the midpoint would be $400.
Anyone with a midpoint between $400 and $449 was asked the percent chance their income was less than thresholds
Y1=350, Y2=400, Y3=450, and Y4=500. Thus in this example, the Y4 threshold and maximum would coincide. In
contrast, if they said a maximum of $550, they would still be asked about the same thresholds, but the maximum and
upper threshold would not coincide. 15
Calculated as 100 minus the percent chance of being below this threshold. 16
Clearly if one wishes to also use the elicited expectations for substantive purposes, then this will limit the amount
of randomizing of elicitation methods that one would wish to do to sub-samples of the overall study. However, we
believe that given the growing interest in measuring subjective expectations, there is value in including such
questions purely for conducting methodological comparisons.

- 19 -
4. What do we know about whether these methods “work”?
Subjective expectations aim to measure something which is not directly verifiable – how
an individual thinks. How do we then know whether the questions “work” in capturing the
information we would like them to measure? Manski (2004) outlines several levels of checks that
have been used in the developed country literature. The most basic is whether or not people will
answer the questions, using more than 0, 50 and 100 percent as answers, with measures which
are internally consistent. The existing evidence from developing countries shows this is the case.
When beans or other visual aids are used, it is rare for individuals to give degenerate
distributions.17
When the percent chance formulation is used, the majority of answers are a
multiple of five. However, we also find individuals giving responses like 92 percent or 98
percent when asked about events which are very likely to occur. This is an area for future
investigation, since the use of visual aids may need refinement when the future event being asked
about is highly likely (being employed in one year) or highly unlikely (dying in the next year).
Second, one can ask whether the answers seem sensible, in terms of varying with
observed characteristics in ways that are expected. Third, one can evaluate how accurate the
expectations are. Fourth, and most importantly, one can examine whether the expectations
elicited predict choice behavior. We summarize here what the existing literature shows for each
of these.
4.1. Individuals’ expectations and observable characteristics
A common approach to validating elicited expectations in developed countries is to test
whether they vary with risk factors in the same way as the actual outcomes do (e.g., Hurd and
McGarry, 1995). This is a useful first check, although it is not clear what to make of deviations.
For example, if subjective expectations of mortality are not correlated with education in the same
way as actual mortality is, it is not clear whether this reflects differences in understanding (or
answering) of the expectations questions by education level, or deviations from rational
expectations for some education groups. Nevertheless, the few papers which have undertaken a
systematic comparison between risk factors or characteristics and subjective expectations in
developing countries do generally show associations which are consistent with the view that
people at least qualitatively adjust their subjective probabilities to reflect known risk factors.
17
An exception is Mahajan et al. (2008) who find significant use of focal answers or 0, 5 or 10 fingers when asking
people expectations of the likelihood of getting malaria with and without bednets.

- 20 -
For example, Delavande and Kohler (2009a) find that, despite substantial heterogeneity
in beliefs, the median and percentiles of the distribution of beliefs vary with observable
characteristics in the a priori expected direction. For example, respondents‟ subjective
probabilities about experiencing food shortages and the need to rely on family members for
financial assistance in the next 12 months vary meaningfully with respondents‟ socioeconomic
status (SES). Those who have more education, are married, own relatively more land and have
any savings report lower subjective probabilities of experiencing a food shortage and the need to
rely on financial assistance than their counterparts who have lower education, are
divorced/separated/widowed, own little land or do not have savings. Similarly, 1-year, 5-year
and 10-year mortality expectations vary with age, education, HIV status (not known to the
respondents at the time of the survey), number of sexual partners and the time horizon as
expected, e.g., respondents who have more sexual partners (and are thus at higher risk of being
infected with HIV) tend to report a higher probability of dying within the next years.
Similarly re-assuring associations are found regarding income expectations. For example,
Attanasio, Meghir and Vera-Hernandez (2005) find that the minimum and maximum expected
household incomes increase with education level of the household head and spouse, and with the
household size. McKenzie, Gibson and Stillman (2007) find that education and current income
are both positively associated with a higher median of the distribution of income that Tongans
expect to earn if they move to New Zealand.
In a number of studies, past outcomes experienced by individuals are found to be
correlated with expectations about future outcomes. For example, Hill (2006) shows that the
most recent price received by a farmer in Uganda is a strong predictor of both expected price and
expected variance. In Malawi, respondents who went to the market more frequently in the past
month report a higher probability of going to the market in the next 2 days and 2 weeks
(Delavande and Kohler, 2009a). In Colombia, Attanasio, Meghir and Vera-Hernandez (2005)
find that households who experienced greater income volatility in the past 3 years report a wider
range of expected income, as measured by the difference between the reported maximum and
minimum income.

- 21 -
4.2 Accuracy
In a stationary environment one can compare expectations to historical realizations in
order to assess accuracy. In Giné, Townsend, and Vickery (2009), respondents are instructed to
place 10 stones in different boxes, each representing a 15-day period, according to the likelihood
that the monsoon would start in each period. They find that the lower and upper bound of both
the subjective and historical distributions are remarkably similar. In Malawi, the ordering of the
mean and percentiles by region of the distribution of answering regarding experiencing food
shortage is consistent with historical regional variation in drought and food shortage, and the
patterns of answers of beliefs about infant mortality match that of actual regional variations
(Delavande and Kohler, 2009a).
Comparing expectations to historic realizations has the advantage of not requiring follow-
up data collection, but the data generating process must be stationary.18
In contrast, if the data is
non-stationary (exhibits trends, etc.) such comparisons will be less useful. Moreover, in some
cases the main reason for collecting expectations behavior will be to be able to predict the future
for individuals in a study. Assessing accuracy then requires comparing subjective expectations to
future realizations of the outcomes.
The available evidence seems to suggest that the expectations are indeed informative of
future events, with people more likely to experience an event typically giving a higher elicited
expectation of such an event occurring. The accuracy of these expectations has been found to be
high for reasonably common, regularly occurring events, but less accurate for rare or
unexperienced events.
An early example showing reasonably accurate expectations of common events is found
in work by Ravallion (1985), who asked rice traders in Bangladesh whether they thought the
price would go up, go down, or stay the same, and the amount of change. Expectations were
found to track prices fairly well on average, although there was a tendency to overestimate price
changes, providing a rational for over-hoarding that may have amplified severity of the 1974
crisis. More recently, reasonably accurate expectations have been found in several agricultural
contexts. For example, Luseno et al. (2003) find pastoralists in Ethiopia and Kenya have
reasonably accurate perceptions of rainfall. In a more complicated elicitation, Santos and Barrett
18
Giné, Townsend and Vickery (2009) show that there is no observable time trend in the historical data of the onset
of the monsoon, and thus, the subjective expectation can be compared to a historical that weighs each year equally.

- 22 -
(2006) elicit both expectations for rainfall next year, and of herd size next year, and show that
Ethiopian herders‟ expectations of herd size vary with rainfall in a way which matches well the
nonstationary herd dynamics that herd history data would suggest.
However, recent studies have also shown that in a context of incomplete information,
expectations can be quite inaccurate, even if they do help predict future outcomes. Jensen (2010)
finds school children in rural Dominican Republic significantly understate the returns to
education, which he attributes in part to adults with education migrating to cities, leaving
children in rural areas with little information about the earnings and jobs that education brings. A
related finding can be found in McKenzie et al. (2007), who show that Tongans dramatically
underestimate the earnings possible when migrating to New Zealand. Delavande and Kohler
(2009a) find in Malawi that the subjective expectation of being infected with HIV remains low
for those who are later found to have been infected. In the same study, they show that individuals
dramatically overestimate the likelihood of a rare event (death in the next year or next five years)
occurring.
In the presence of unexpected aggregate shocks, naive comparisons of expectations to
realizations will not be an effective way of assessing validity. However, if the shock is
observable (e.g. a drought or economic crisis), one can take it into account when assessing
accuracy. One can also examine whether it is likely that an unobservable aggregate shock is
driving the measured inaccuracy of expectations. For example, McKenzie et al. (2007 show that
an aggregate positive shock to the earnings of immigrants appears unlikely to explain the
underestimation of incomes that can be earned abroad, since it would require all individuals to
get a draw above the 95th
percentile of their individual subjective earnings distributions.
Even if aggregate shocks can be ruled out, evaluation of the accuracy of subjective
expectations is in effect a joint hypothesis test of respondents understanding the question and
having rational expectations. Whenever expectations are not accurate, further work is then
needed to understand whether this really reflects inaccurate expectations rather than incomplete
comprehension. As a trial run, surveys always include probabilistic questions with known
probabilities, such as the probability of heads after a coin toss or the probability that it will rain
on the day of the interview. McKenzie et al. (2007) go further and compare the accuracy of a
familiar event to that of a relatively unfamiliar one. They find that Tongans have accurate
expectations about incomes they could earn in Tonga, but inaccurate expectations about incomes
- 23 -
they could earn abroad. They argue from this that it appears the survey participants do
understand the questions, since they could answer accurately for an event they are more familiar
with.
4.3. Accuracy and forecasting horizon
Another aspect that may affect the accuracy of the beliefs is the horizon of the event.
Table 3 presents some supporting evidence using a sample of 232 boatowners from coastal
Tamilnadu, India19
. During a survey in the months of November 2005 to January 2006,
boatowners were asked to predict daily catches for the second week of April 2006 as well as for
the following week. Columns 1 through 4 in Panel A of Table 3 regress the rupee value of
average daily catches during the second week of April 2006 against the mean of the elicited
subjective distribution and a constant (column 1), the mean of the elicited subjective distribution
alone (column 2), the mean of the subjective distribution and the catches obtained the day when
the distribution was elicited (column 3), and the variables in columns 3 plus the average catches
during the previous week.
As expected, and similarly to Table 1 columns 4-6, the coefficient on the mean of the
subjective distribution is always positive and significant, even in columns 3 and 4 which control
for current and past catches. In addition, when the constant is omitted from the regression, the
point estimate on the mean of the subjective distribution is very close to 1, indicating that
expectations are on average unbiased. This is not true however when the constant is included
column 1.
Columns 5-8 report the same regressions as columns 1-4 but for expectations and
outcomes of the following week‟s average daily catches. Notice that the coefficient and R-
squared in column (5) are significantly higher than those in column (1) suggesting that
expectations are more accurate when the horizon is (much) shorter. However, column (6)
suggests that boatowners tend to overpredict short-term catches. Perhaps more interestingly, the
coefficient on the mean of the subjective distribution in columns 7 and 8 is no longer significant
once we add current catches. The reason may be that over such a short horizon (one week), the
process is very stationary and so expectations do not add additional explanatory power over and
beyond that of current catches.
19
See Giné and Klonner (2007) for further details.

- 24 -
Panel B regresses the standard deviation of catches in the second week of April (columns
1-3) and the week following the survey (columns 5-7) on the standard deviation of the elicited
distribution. Interestingly, the coefficient on the standard deviation of the subjective distribution
is always significant, suggesting that the elicited subjective distribution can explain not only the
first but also the second moment. That is, individuals who express more uncertainty about their
average catch also experience more variability in future catches, even conditional on the
variability experienced in present catches.
4.4 Do subjective expectations predict choice behavior?
Ultimately one would like to know whether the elicited expectations are being used by
agents in taking decisions. Economic theory gives many examples of cases where expectations
should matter for predicting behavior. For example, investment decisions should depend on the
expectations of the return and riskiness of the project, while classic theories of migration such as
Sjaastad (1962) and Harris and Todaro (1970) assume that expectations of incomes and
employment probabilities in the migrant destination should be important determinants of the
migration decision. Ultimately, it is an empirical question whether expectations themselves yield
any additional predictive power for choice beyond that offered by correlates of expectations,
such as socioeconomic characteristics and current levels of the outcome of interest. Several
recent studies provide evidence that they do.
Expectations have been found to be associated with agricultural decisions in several
studies. Hill (2007) finds that Ugandan farmers‟ expectations about future coffee prices are
significantly associated with the share of labor allocated to coffee. The more beans the farmer
placed in the bottom category (corresponding to a negative return), the less labor the farmer had
allocated to coffee, conditional on a host of farmer and land characteristics: a difference of 50
percent in the subjective expectation of a negative return is associated with a 10 percentage point
reduction in the share of labor allocated to coffee.20
Giné, Townsend and Vickery (2009) find
Indian farmers who believe the monsoon is likely to start later are more likely to plant later, less
likely to replant, have purchased a lower share of total production inputs before the onset of the
20
She interprets this as evidence that downside risk is influencing behavior under uncertainty, but as the
specification does not also include a measure of the average expected return, the measure used reflects both the
mean and variance of expected prices.

- 25 -
monsoon, and are more likely to buy weather insurance even after controlling for a wide range of
farmer characteristics, including proxies for risk aversion and discount rates.
Bellemare (2008) shows how eliciting expectations can help explain the institution of
reverse share tenancy in Madagascar, where poorer landlords enter share-cropping agreements
with richer tenants – a contrast to standard share-cropping agreements where richer and
presumably less risk-averse landlords share some of the risk encountered by poorer tenants.
Bellemare hypothesizes that the risk of land expropriation will depend on the form of tenancy.
The landlords were given 20 tokens, and asked to distribute them between two boxes, where one
box represents a state of world where the landlord lost her claim to the land as a result of the
contract signed, and the other box one where she kept her claim to the land. The landlord did this
for both a sharecropping and a fixed rent contract, allowing calculation of the subjective
expectations of the landlord of asset loss under the two alternative contracts. The results show
that the expected chance of losing their claim to land is on average greater than with a fixed rent
contract, and that the larger the gap in expectations between the two contract types, the more
likely the landlord is to enter a sharecropping contract.
McKenzie et al. (2007) provide evidence that subjective expectations predict migration
behavior. They find that, even conditional on current income and employment in Tonga,
individuals who expect to earn more in New Zealand are more likely to apply to work in New
Zealand. Moreover, the effect is large in size: for a given income level and employment status in
Tonga, an additional NZ$100 per week in median expected income in New Zealand is associated
with a 10 percentage point increase in the likelihood of applying for migration.
In many of the existing studies, the research question of interest has been whether first
moments predict behavior. However, there are many economic models where other moments of
the distribution are also important. As soon as one moves from risk neutrality to risk aversion,
individuals will also care about second moments in making their decisions. An example where
eliciting the whole subjective distribution allows the authors to examine the impacts of both first
and second moments is provided by Giné and Klonner (2007). They study the amount of credit
that auctioneers give to their client boatowners after they have adopted a new fishing vessel.
Since the boatowner‟s ability is uncertain, and because contracts between the auctioneer and the
boatowner are not exclusive, the amount of debt that an auctioneer is willing to extend should
depend positively on mean of the prior distribution but negatively on its variance. The reason is

- 26 -
that because of competition, auctioneers cannot profit from ex-post better boatowners, but will
make a loss from ex-post worse boatowners. As a result, they will offer a smaller amount
initially and increase it as the variance of the prior, and thus the scope for mistakes, decreases.
By directly eliciting the auctioneers‟ prior distributions, the authors find that indeed the amount
of debt relates to these two moments as theory predicts.
The above studies show strong associations between subjective expectations and
economic behavior. However, one concern could be that these measures are merely proxying for
other unobserved characteristics of individuals which are determining behavior, so that the
observed relationships may not be causal. To address this concern, one needs to think of
exogenous determinants of expectations. Since our knowledge of what determines expectations
is still very much in its incipient stages (see next section), it is hard to think of instrumental
variables to do this. However, experiments which explicitly change expectations offer one
avenue forward.
The most striking example is Jensen (2010), who finds that while the measured returns to
schooling in the Dominican Republic are high, the returns perceived by students are extremely
low. He finds that when students at a randomly selected subset of schools were informed of the
returns estimated from earnings data, their perceived returns increased when re-interviewed 4 to
6 months later, and that four years later they had completed on average 0.20 years more
schooling. He finds further that the effects are non-existent for poorer households, but large for
students from households with above the median income per capita. One can interpret this as
showing that a change in subjective expectations causally affects schooling behavior for
individuals who aren‟t liquidity constrained. Nguyen (2008) uses a similar approach in
Madagascar, and finds that providing statistics on actual returns reduces the dispersion in
perceived returns, and improves test scores, particularly for those underestimating the returns.21
Finally, using a Likert scale for beliefs about HIV status, de Paula et al. (2008) find that
individuals who revise their beliefs about being HIV positive downwards are less likely to
engage in extra-marital affairs, possibly since learning that you are HIV negative enhances the
marginal value of staying negative, and causes people to avoid risky behaviors.
21
Related evidence on the interaction between expectations and liquidity constraints is seen in Attanasio and
Kaufmann (2009) who find that expected returns, perceived employment probabilities, and earnings risks are
significant predictors of college and high school attendance choices in Mexico, but only for richer individuals.

- 27 -
4.5 Which expectations affect behavior?
These studies demonstrate that subjective expectations can predict economic behavior in
developing countries. However, the existing studies do not allow us to say which measure of
subjective expectations predicts behavior better. That is, is behavior guided more by the median,
the mean, the mode, or other moments of the subjective earnings distribution? The answer to this
is likely to depend on the behavior under study, and on the degree of skewness in the subjective
earnings distribution. Nevertheless, we can examine how sensitive the results of two such studies
are to alternative measures of expectations.
Table 4, panel A examines the sensitivity of the finding of McKenzie et al. (2007) to
different moments and quantiles of Tongans‟ subjective distributions of earnings in New
Zealand. Column 1 repeats the specification used in that paper, showing a higher median
earnings expected is associated with a greater likelihood of migration. Columns 2 through 6
show the results when the mean, 10th
, 25th
, 75th
and 90th
percentiles are used instead of the
median. The point estimates are very similar across these specifications, and are always
statistically significant, in each case indicating that a NZ$100 increase in earnings expected at
this point in the distribution is associated with a 9-11 percentage point increase in the likelihood
of applying to migrate, conditional on current income and employment in Tonga. The level of
significance and pseudo R-squared are greater for larger quantiles of the distribution, suggesting
that it is the “upside” expectations that have the greatest predictive power. Columns 7 and 8 add
the standard deviation of the expected earnings distribution. This has a positive sign, which is
significant at the 10 percent level when used with the median, but not quite significant at the 10
percent level using the mean. Since most of the risk of earnings with migration is upside
potential compared to the low earnings in Tonga, this shows that as well as the average earnings,
the upside potential perceived helps predict migration decisions.
In Table 5, the same specifications are run using data from Gine et al. (2008). Column 1
repeats the specification used of the paper, showing that mean expectation of a later onset of the
monsoon is correlated with a lower likelihood of replanting. Columns 2 through 6 show the
results when the median, 10th
, 25th
, 75th
and 90th
percentiles are used instead of the mean, and
again show the point estimates are of similar size and significance across specifications.

- 28 -
5. Areas for Future Research
We have argued that it does appear useful to elicit probabilistic expectations from
individuals in developing country contexts, and that the resulting answers one gets are
informative about the likelihood of future events occurring and about choice behavior.
Nevertheless, the literature is still in its infancy, and many fertile areas for future research
remain. In addition to the methodological areas deserving further exploration which have been
discussed above, we outline here some of these additional open areas.
5.1. How do individuals form subjective expectations?
Little is known about how individuals use available information to formulate their
subjective expectations.22
Subjective expectations depend both on which information individuals
use, and how they update their expectations to incorporate this information. There is evidence to
suggest that social networks and neighbours‟ outcomes matter for providing information, and
that individual‟s may overweight the negative experiences of a small number of people they
know. For example, the results in Jensen (2010) are consistent with students making inference
about the return to schooling based on the experience of people in their community. As a result
of economic segregation, students in low income communities may underestimate the returns to
education, and therefore under-invest in education. Delavande and Kohler (2008) find that
respondents whose parents are dead expect to die sooner and respondents who have more than 3
relatives who are sick or died from AIDS report higher mortality expectations in the short-term.
Both the number of known people who died in traffic accident in the past two years and the
number of funerals attended last month increase mortality expectations. Giné, Townsend and
Vickery (2009) show that the presence of an elder in the household improves accuracy about the
onset of the monsoon.23
McKenzie et al. (2007) show that having one person in a neighbourhood
around you who failed to get a job in New Zealand is associated with respondents thinking it less
likely they will get a job. However such evidence only shows an association between
22
There is a long and extensive literature in psychology and behavioral economics literature which suggests that
individuals use heuristics or ``rules of thumb'' to form expectations (Kahneman, Slovic and Tversky, 1982;
Rabin, 1998 or, more recently, DellaVigna, 2007 for a review). There is also a related economic literature about how
individuals form beliefs (such as a belief in market institutions) that has some parallels (see e.g. Di Tella et al, 2007
and its references). 23
The P-value is 0.12 depending on the specification. Rosenzweig and Wolpin (1985) suggest that that in India, the
predominance of intergenerational family extension, kin labor and the scarcity of land sales can be explained by the
fact that elders have specific experiential knowledge about farming practices.

- 29 -
expectations and contextual outcomes, and one can not conclude that the effects are necessarily
causal.
A few studies have analyzed how providing information influence beliefs. Lybbert et al.
(2003) provide computer-based climate forecast to pastoralists in southern Ethiopia and northern
Kenya and observe their ex-post beliefs about the rain season. They find that the beliefs of
pastoralist receiving and believing computer-based forecasts are consistent with updating in
response to forecast information, albeit with a systematic bias toward optimism. Nguyen (2008)
uses a randomized intervention to provide various types of information about the return to
schooling (mean earnings by education, the story of a role model, or both) to students in
Madagascar. Her results suggest that students and their parents are able to process new
information. She finds that informing students about the mean earnings reduce the gap between
perceived and actual returns, and improve test score. A role model story alone or combined with
information about the mean earnings has a smaller effect.
Nevertheless, it is not always the case that providing information has lead to individuals‟
updating their subjective expectations. An exception is found in Delavande and Kohler (2009b),
who look at whether providing individuals with information about their HIV status changes their
expectations of whether they are HIV positive two years later. Surprisingly they find that, among
HIV positive individuals, learning one‟s status has no significant impact of being HIV positive
two years later, although the sample involved is small. They speculate this could arise from
individuals forgetting the information, from them not believing the test results if they are
asymptomatic, or from them being too embarrassed to acknowledge this information in their
responses. Clearly more work is needed to understand what drives elicited expectations in such
cases.
5.2 Whose expectations matter?
There is a rich literature which shows that the unitary household model is unlikely to
provide an adequate model of household decision-making in many settings. This then leads to
the question of whose expectations matter for behavior. For example, do schooling decisions
reflect the expectations of parents or of children (or of both) as to returns to schooling? Attanasio
and Kaufmann (2009) find that both mothers‟ and youths‟ expectations appear to matter in terms
of high school attendance, whereas only the expectations of youths appear to matter for college

- 30 -
decisions. There are a wide range of other questions where having intra-household information
on expectations would be of interest. For example, do household savings and consumption
decision reflect the expectations of the household head alone about future income, or also the
expectations of other household members? Attanasio (2009) offers the further example of asking
villagers expectations of the incomes of their neighbors and comparing this to the expectations
elicited from the neighbor him or herself to understand better the relevance of asymmetric
information. This is precisely what Giné and Klonner (2007) do to assess the extent to which the
ability of boatowners is public information. They collect expectations of future catches from both
the auctioneers and boatowners and compare them to actual catches. They find that auctioneers
are better at predicting catches than boatowners. Perhaps more importantly, auctioneers are as
accurate predicting their own clients‟ catches as they are predicting those of other boatowners in
the village, suggesting that information is indeed public.
5.3. Incorporating subjective expectations into estimating economic models
The collection of subjective probabilities allows the calculation of expectations and
moments needed for the economic modeling of behavior. However, given the relative newness of
data collection in this area, there are currently not many examples where this has been done. A
recent exception is Kaufmann (2009), who models the choice of whether or not to attend college
among Mexican youth. She notes that in the absence of expectations data, it is difficult to
determine whether individuals do not attend college because they expect low returns to
schooling, or because they face high attendance costs which prevent them attending despite high
expected returns. However, with subjective expectations of the return to additional schooling,
she is able to estimate the costs facing poor and wealthier individuals, and conclude that credit
constraints appear to be preventing a sizeable fraction of poor individuals with high expected
returns from attending college. Given that almost all economic decision models involve forward-
looking behavior, the incorporation of subjective expectations into structural modeling of
decisions seems one of the most important uses of this tool going forward. It would also be
useful to test whether subjective expectations improve our ability to construct counterfactuals in
such models relative to what one would obtain by assuming rational expectations, as we are
unaware of work which does this with developing country data.

- 31 -
6. Conclusions
Despite the importance of expectations for understanding and predicting the majority of
economic decisions, probabilistic expectations questions are rarely included in developing
country surveys. This paper has shown through the lens of the existing literature and our own
experiences that these questions can be profitably included in developing country surveys in a
variety of contexts. One should not use as an excuse fears that poor, illiterate individuals do not
understand probabilities, since there is now sufficient evidence to suggest that they can. The
questions do not take a prohibitive amount of time, and they can play a strong role in predicting
future outcomes and future behaviors. This is not to argue that we should ask expectations about
every conceivable future outcome, or that asking expectations will always be justified at the
margin compared to other questions of interest, or even that they will always be preferred to non-
probabilistic questions about the future. But given that expectations, together with preferences,
are the foundation of economic decision-making, we do argue that such questions should be
asked much more often than they currently are.
References
Attanasio, Orazio (2009) “Expectations and Perceptions in Developing Countries: Their
Measurement and Their Use." American Economic Review Papers and Proceedings, 99(2):
87–92
Attanasio, Orazio and Katja Kaufmann (2009) “Educational choices, subjective expectations,
and credit constraints”, NBER Working Paper No. 15087.
Attanasio, Orazio, Costas Meghir, and Marcos Vera-Hernández (2005) “Elicitation, Validation,
and Use of Probability Distributions of Future Income in Developing Countries,” Paper
prepared for the 2005 Econometric Society Meeting.
Bellemare, Marc (2008) “Insecure Land Rights and Reverse Share Tenancy in Madagascar”,
Mimeo. Duke University.
Cardenas, Juan Camilo and Jeffrey Carpenter (2008) “Behavioral Development Economics:
Lessons from field labs in the developing world”, Journal of Development Studies 44(3): 311-
38.
Delavande, Adeline and Hans-Peter Kohler (2009a) “Subjective Expectations in the Context of
HIV/AIDS in Malawi”, Demographic Research 20(31): 817-74.
Delavande Adeline and Hans-Peter Kohler (2009b) “The impact of HIV Testing on Subjective
Expectations and Risky Behavior in Malawi,” Working Paper, University of Pennsylvania.
Delavande Adeline and Hans-Peter Kohler (2008) “Subjective Mortality Expectations and
HIV/AIDS in Malawi,” Working Paper, University of Pennsylvania.
Delavande Adeline and Susann Rohwedder (2007) “Eliciting Subjective Probabilities about
Social Security Expectations,” Mimeo. Rand.
DellaVigna, Stefano (2007) “Psychology and Economics: Evidence from the Field”. Working
Paper, UC Berkeley.

- 32 -
De Mel, Suresh, David McKenzie and Christopher Woodruff (2008) “Returns to capital: Results
from a randomized experiment”, Quarterly Journal of Economics, 123(4): 1329-1372.
De Paula, Aureo, Gil Shapira and Petra Todd (2008) “How Beliefs about HIV Status Affect
Risky Behaviors: Evidence from Malawi”, PIER Working Paper No. 08-035.
Di Tella, Rafael, Sebastian Galiani and Ernesto Schargrodsky (2007) “The Formation of Beliefs:
Evidence from the Allocation of Land Titles to Squatters”, Quarterly Journal of Economics
122(1): 209-41.
Dominitz, Jeff and Charles Manski (1997) “Using Expectations Data to Study Subjective Income
Expectations”, Journal of the American Statistical Association 92(439): 855-67.
Engelberg Joseph, Charles Manski and Jared Williams (2009) “Comparing the Point Predictions
and Subjective Probability Distributions of Professional Forecasters,” Journal of Business and
Economic Statistics 27(1): 30-41
Gibson, John and David McKenzie (2009) “The Microeconomic Determinants of Emigration and
Return Migration of the Best and Brightest: Evidence from the Pacific”, Center for Global
Development Working Paper No. 173.
Giné, Xavier and Stefan Klonner (2007) “Technology Adoption with Uncertain Profits: The
Case of Fibre Boats in South India, Mimeo World Bank.
Giné, Xavier, Robert Townsend, and James Vickery (2009) “Forecasting When it Matters:
Evidence from Semi-Arid India”.
Grisley, W. and E.D. Kellogg (1983) “Farmers‟ Subjective Probabilities in Northern Thailand:
An Elicitation Analysis” American Journal of Agricultural Economics 65: 74-82
Harris, John and Michael Todaro (1970) “Migration, Unemployment and Development: A Two-
Sector Analysis”, American Economic Review 60(1): 126-142.
Harbaugh, William, Kate Krause and Lise Vesterlund (2002) “Risk Attitudes of Children and
Adults: Choices Over Small and Large Probability Gains and Losses”, Experimental
Economics 5(1): 53-84.
Hill, Ruth Vargas (2006) “Coffee Price Risk in the Market: Exporter, Producer and Trader Data
from Uganda”, Mimeo. IFPRI.
Hill, Ruth Vargas (2007) Using Stated Preferences and Beliefs to Identify the Impact of Risk on
Poor households, Mimeo. IFPRI.
Hurd, Michael. (2009), “Subjective Probabilities in Household Surveys,” Annual Review of
Economics, 1, 543-564.
Hurd, Michael and Kathleen McGarry (1995), “Evaluation of the Subjective Probabilities of
Survival in the Health and Retirement Study,” Journal of Human Resources, 30, S268-S292.
Jensen, Robert (2010) “The Perceived Returns to Education and the Demand for Schooling”,
Quarterly Journal of Economics, forthcoming.
Kahneman, D. P. Slovic and A. Tversky (1982) Judgment under Uncertainty: Heuristics
and Biases. Cambridge University Press, Cambridge, UK.
Kapteyn, Arie, James P. Smith and Arthur van Soest (2007). “Vignettes and Self-Reports of
Work Disability in the United States and the Netherlands.” American Economic Review,
97(1): 461-473.
Kaufmann, Katja (2009) “Understanding the Income Gradient in College Attendance in Mexico:
The Role of Heterogeneity in Expected Returns to College”, Mimeo. Bocconi University.
Luseno, Winnie K., John G. McPeak, Christopher B. Barrett, Getachew Gebru and Peter D.
Little (2003), “The Value of Climate Forecast Information for Pastoralists: Evidence from
Southern Ethiopia and Northern Kenya,” World Development, vol. 31, no. 9, pp. 1477-1494

- 33 -
Lybbert, Travis, Christopher B. Barrett, John McPeak and Winnie K. Luseno (2007), “Bayesian
herders: asymmetric updating of rainfall beliefs in response to external forecasts”, World
Development 35(3): 480-497.
Mahajan, Aprajit, Alessandro Tarozzi, Joanne Yoong, and Brian Blackburn (2008) “Bednets,
Information, and Malaria in Orissa”, Mimeo. Stanford University.
Manski, Charles (2004) “Measuring Expectations”, Econometrica 72(5): 1329-76
McFadden, Daniel L. Albert C. Bemmaor, Francis G. Caro, Jeff Dominitz, Byung-Hill Jun,
Arthur Lewbel, Rosa Matzkin, Francesca Molinari, Norbert Schwarz, Robert J. Willis and
Joachim K. Winter (2005) “Statistical Analysis of Choice Experiments and Surveys”
Marketing Letters 16 (3-4): 183-196.
McKenzie, David, John Gibson and Steven Stillman (2007) “A land of milk and honey with
streets paved with gold: Do emigrants have over-optimistic expectations about incomes
abroad?” World Bank Policy Research Working Paper No. 4141.
Nelson, Robert G. and David A. Bessler (1989) “Subjective Probabilities and Scoring Rules:
Experimental Evidence” American Journal of Agricultural Economics 71(2): 363-369.
Nguyen, Trang (2008) “Information, Role Models and Perceived Returns to Education:
Experimental Evidence from Madagascar”, Mimeo MIT.
Norris, Patricia E. and Randall A. Kramer. (1990) “The Elicitation of Subjective Probabilities
with Applications in Agricultural Economics” Review of Marketing and Agricultural
Economics 58(2-3):127-147.
Rabin, Mathew (1998) “Psychology and Economics”. Journal of Economic Literature, 36:11-
46.Ravallion, Martin (1985) “The Information Efficiency of Trader‟s Price Expectations in a
Bangladesh Rice Market” Oxford Bulletin of Economics and Statistics 47 (2): 171-184.Reyna,
Valerie and Charles Brainerd (1995) “Fuzzy-trace Theory: An Interim Synthesis.” Learning
and Individual Differences, 7: 1-75
Rosenzweig, Mark and Kenneth Wolpin (1985) “Specific Experience, Household Structure, and
Inter-generational Transfers: Farm Family Land and Labor Arrangements in Developing
Countries”. Quarterly Journal of Economics, 100(Supplement):961-987.
Santos, Carlos and Christopher Barrett (2006) “Heterogeneous wealth dynamics: on the roles of
risk and ability”, Mimeo. Cornell University.
Sjaastad, Larry (1962) “The Costs and Returns of Human Migration”, Journal of Political
Economy 70(5): 80-93.
Tourangeau, Roger Lance J. Rips and Kenneth Rasinski (2000) The Psychology of Survey
Response New York NY and Cambridge, UK: Cambridge University Press.

- 34 -
Figure 1: Subjective Probability Vs Likert Response
0
0.1
0.2
0.3
0.4
0.5
0.6
0.7
0.8
0.9
1
0 0.1 0.2 0.3 0.4 0.5 0.6 0.7 0.8 0.9 1
Subjective Probability of Being Infected with HIV/AIDS
Pro
po
rtio
n a
nsw
eri
ng
Lik
ert
Scale
wit
h g
iven
Cate
go
ry
No likelihood
Low
Medium
High
Don't Know
Source: Malawi data from Delavande and Kohler (2008a).
Figure 2: Comparison of Simple “What do You Expect” and Mean, Median and Mode of
Subjective Distribution of Future Profits for Sri Lankan Microenterprises
Source: Sri Lankan microenterprise data from De Mel et al. (2008).
0
20000
40000
60000
0 20000 40000 60000Simple question: what do you expect?
Mean of subjective distribution Median of subjective distribution
Mode of subjective distribution 45 degree line
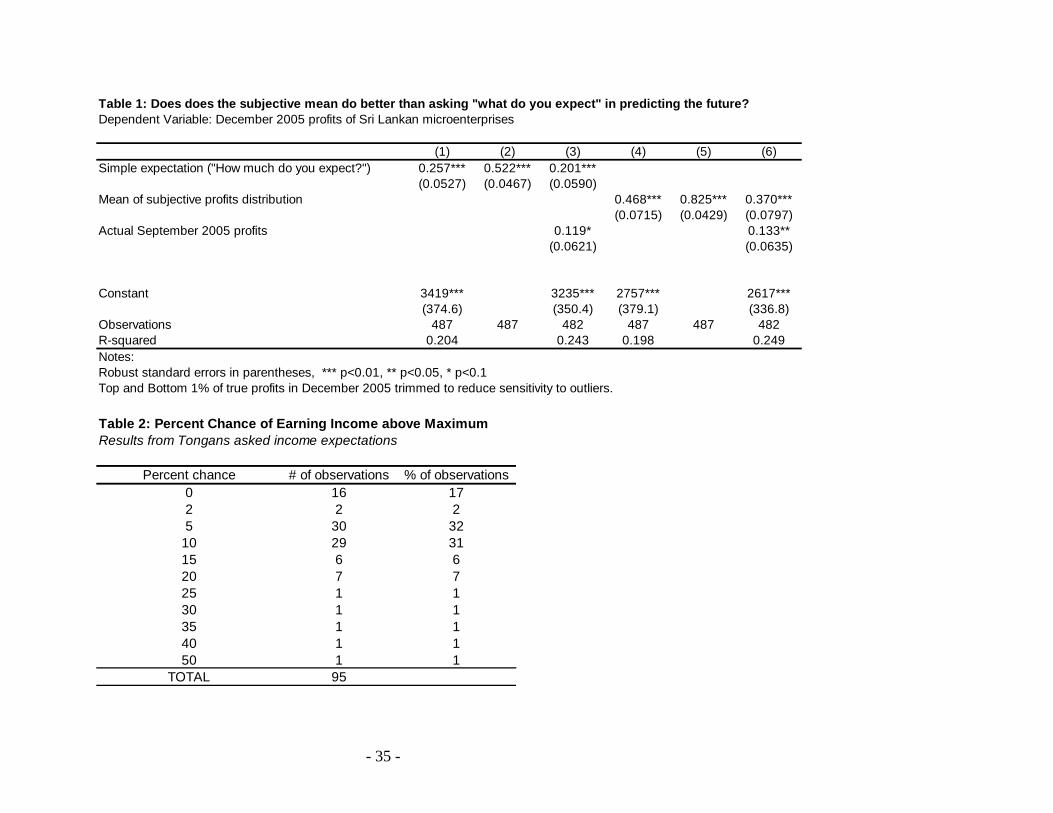
- 35 -
Table 1: Does does the subjective mean do better than asking "what do you expect" in predicting the future?
Dependent Variable: December 2005 profits of Sri Lankan microenterprises
(1) (2) (3) (4) (5) (6)
Simple expectation ("How much do you expect?") 0.257*** 0.522*** 0.201***
(0.0527) (0.0467) (0.0590)
Mean of subjective profits distribution 0.468*** 0.825*** 0.370***
(0.0715) (0.0429) (0.0797)
Actual September 2005 profits 0.119* 0.133**
(0.0621) (0.0635)
Constant 3419*** 3235*** 2757*** 2617***
(374.6) (350.4) (379.1) (336.8)
Observations 487 487 482 487 487 482
R-squared 0.204 0.243 0.198 0.249
Notes:
Robust standard errors in parentheses, *** p<0.01, ** p<0.05, * p<0.1
Top and Bottom 1% of true profits in December 2005 trimmed to reduce sensitivity to outliers. Table 2: Percent Chance of Earning Income above Maximum
Results from Tongans asked income expectations
Percent chance # of observations % of observations
0 16 17
2 2 2
5 30 32
10 29 31
15 6 6
20 7 7
25 1 1
30 1 1
35 1 1
40 1 1
50 1 1
TOTAL 95
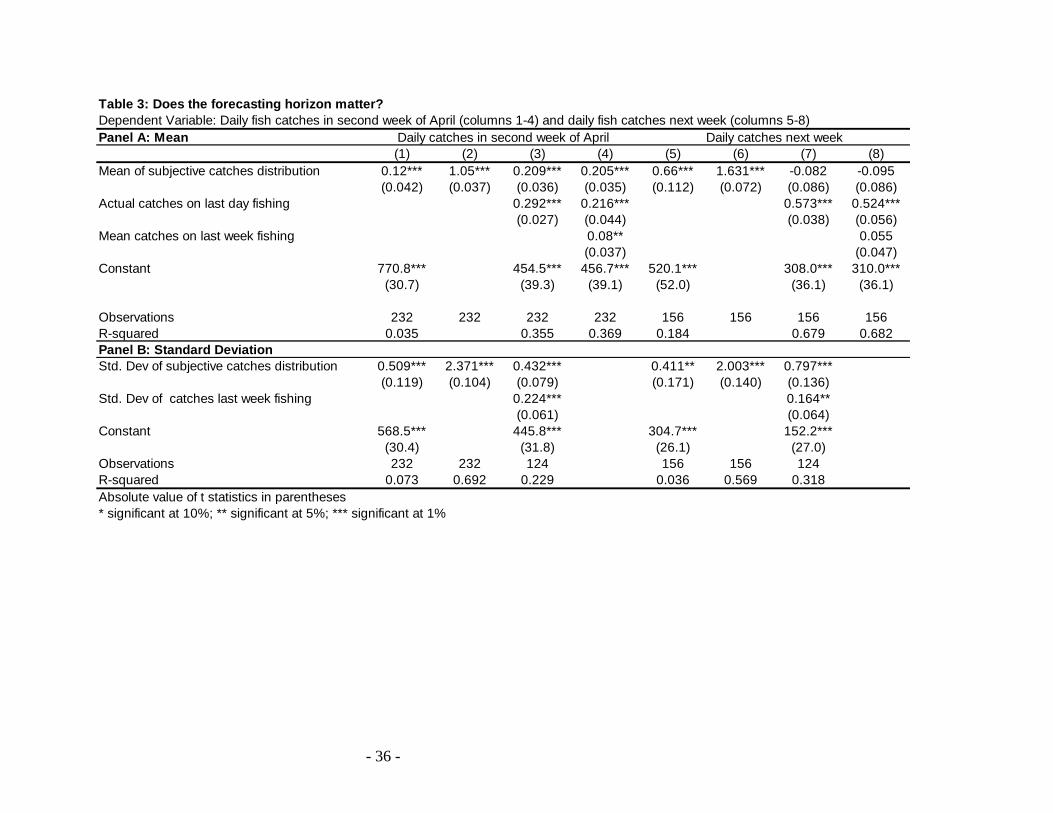
- 36 -
Table 3: Does the forecasting horizon matter?
Dependent Variable: Daily fish catches in second week of April (columns 1-4) and daily fish catches next week (columns 5-8)
Panel A: Mean
(1) (2) (3) (4) (5) (6) (7) (8)
Mean of subjective catches distribution 0.12*** 1.05*** 0.209*** 0.205*** 0.66*** 1.631*** -0.082 -0.095
(0.042) (0.037) (0.036) (0.035) (0.112) (0.072) (0.086) (0.086)
Actual catches on last day fishing 0.292*** 0.216*** 0.573*** 0.524***
(0.027) (0.044) (0.038) (0.056)
Mean catches on last week fishing 0.08** 0.055
(0.037) (0.047)
Constant 770.8*** 454.5*** 456.7*** 520.1*** 308.0*** 310.0***
(30.7) (39.3) (39.1) (52.0) (36.1) (36.1)
Observations 232 232 232 232 156 156 156 156
R-squared 0.035 0.355 0.369 0.184 0.679 0.682
Panel B: Standard Deviation
Std. Dev of subjective catches distribution 0.509*** 2.371*** 0.432*** 0.411** 2.003*** 0.797***
(0.119) (0.104) (0.079) (0.171) (0.140) (0.136)
Std. Dev of catches last week fishing 0.224*** 0.164**
(0.061) (0.064)
Constant 568.5*** 445.8*** 304.7*** 152.2***
(30.4) (31.8) (26.1) (27.0)
Observations 232 232 124 156 156 124
R-squared 0.073 0.692 0.229 0.036 0.569 0.318
Absolute value of t statistics in parentheses
* significant at 10%; ** significant at 5%; *** significant at 1%
Daily catches in second week of April Daily catches next week

- 37 -
Table 4: How sensitive are migration decisions to the expectations metric used?
Marginal effects for a probit for the likelihood of applying to migrate under the Pacific Access Category
(1) (2) (3) (4) (5) (6) (7) (8)
Median of subjective distribution 0.103 0.097
(2.19)** (2.04)**
Mean of subjective distribution 0.115 0.097
(2.44)** (2.02)**
10th percentile of subjective distribution 0.102
(1.76)*
25th percentile of subjective distribution 0.103
(1.94)*
75th percentile of subjective distribution 0.102
(2.47)**
90th percentile of subjective distribution 0.092
(2.67)***
Standard deviation of subjective distribution 0.087 0.073
(1.85)* (1.54)
Current income in Tonga 0.036 0.029 0.055 0.047 0.025 0.020 0.027 0.027
(0.41) (0.33) (0.63) (0.54) (0.28) (0.22) (0.31) (0.31)
Current employment in Tonga -0.058 -0.056 -0.061 -0.060 -0.054 -0.048 -0.047 -0.045
(0.45) (0.43) (0.47) (0.46) (0.42) (0.37) (0.36) (0.35)
Observations 128 128 128 128 128 128 128 128
Pseudo R-squared 0.037 0.045 0.026 0.030 0.046 0.053 0.062 0.061
Notes:
T-statistics in parentheses, *, **, and *** indicate significance at the 10%, 5% and 1% levels respectively
Mean and quantiles are for the unconditional earnings distribution. See McKenzie et al. (2007) for details of how these are calculated.
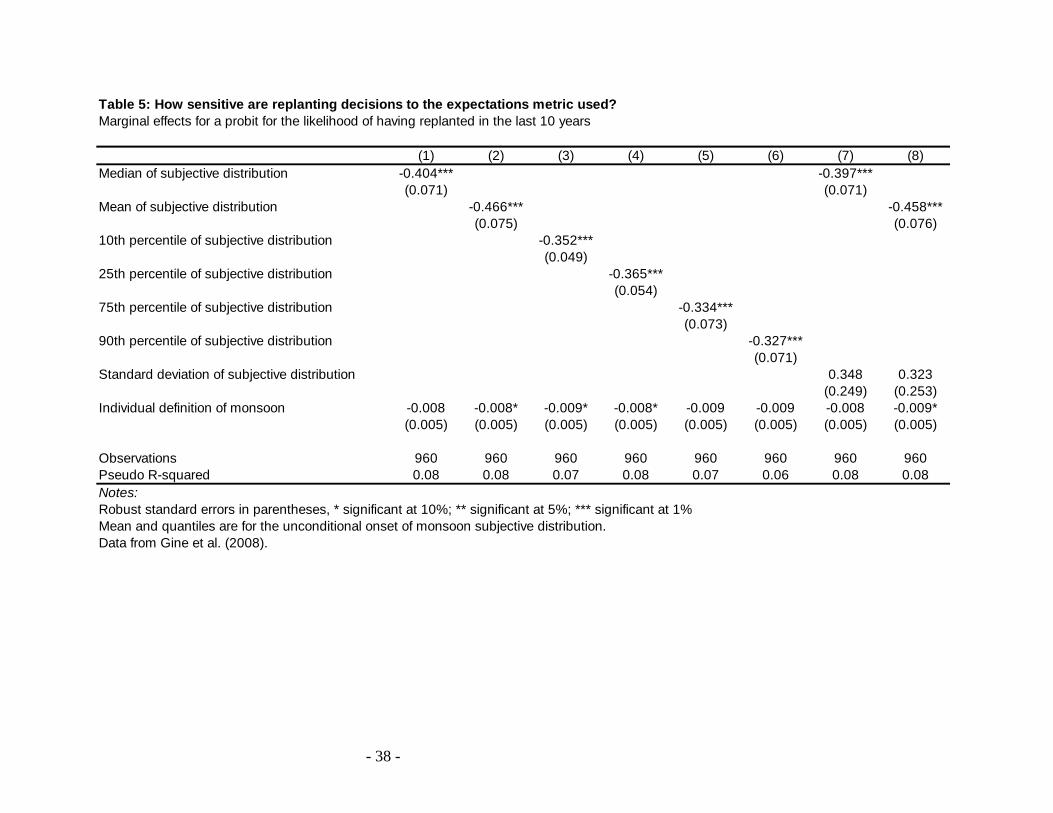
- 38 -
Table 5: How sensitive are replanting decisions to the expectations metric used?
Marginal effects for a probit for the likelihood of having replanted in the last 10 years
(1) (2) (3) (4) (5) (6) (7) (8)
Median of subjective distribution -0.404*** -0.397***
(0.071) (0.071)
Mean of subjective distribution -0.466*** -0.458***
(0.075) (0.076)
10th percentile of subjective distribution -0.352***
(0.049)
25th percentile of subjective distribution -0.365***
(0.054)
75th percentile of subjective distribution -0.334***
(0.073)
90th percentile of subjective distribution -0.327***
(0.071)
Standard deviation of subjective distribution 0.348 0.323
(0.249) (0.253)
Individual definition of monsoon -0.008 -0.008* -0.009* -0.008* -0.009 -0.009 -0.008 -0.009*
(0.005) (0.005) (0.005) (0.005) (0.005) (0.005) (0.005) (0.005)
Observations 960 960 960 960 960 960 960 960
Pseudo R-squared 0.08 0.08 0.07 0.08 0.07 0.06 0.08 0.08
Notes:
Robust standard errors in parentheses, * significant at 10%; ** significant at 5%; *** significant at 1%
Mean and quantiles are for the unconditional onset of monsoon subjective distribution.
Data from Gine et al. (2008).
![· OECD Guidelines on Measuring Subjective Well-being-:HSTCQE=V^V[Y]: OECD Guidelines on Measuring Subjective Well-being Being able to measure people’s quality of life is fundament](https://img.dokumen.tips/doc/110x75/5fc5165b47cddc37eb740caf/oecd-guidelines-on-measuring-subjective-well-being-hstcqevvy-oecd-guidelines.jpg)


![Guidelines OECD Guidelines on Measuring Subjective Well-being€¦ · OECD Guidelines on Measuring Subjective Well-being-:HSTCQE=V^V[Y]: OECD Guidelines on Measuring Subjective Well-being](https://img.dokumen.tips/doc/110x75/600dac959ab70e25e9371c99/guidelines-oecd-guidelines-on-measuring-subjective-well-oecd-guidelines-on-measuring.jpg)