Embed Size (px)
Citation preview


Summary
Preeclampsia is defined as hypertension associated with proteinuria
arising de novo after the 20th week of gestation in a previously normotensive
woman and resolving completely by the 6th postpartum week. It is a major
cause of morbidity and mortality during pregnancy. In UK, preeclampsia
affects 3-5% of pregnancies. Its aetiology remains incompletely understood,
and is considered as a disease of theories. One of these theories refers to the
effect of heavy metals, trace, and ultra trace elements in the corresponding
patients. In the present study some trace and ultra trace elements were
estimated to identity their role in the pathogenesis of pre-eclampsia. This
study was carried out in Babylon Teaching Hospital for Gynecology and
Pediatrics, in Babylon Province, Hilla City. All samples were collected from
November 2014 till February 2015. This is a case control study which
included 120 women, sixty were patients diagnosed with preeclampsia in the
third trimester and the other sixty were healthy pregnant women (controls) in
the third trimester. Cases with age over 40, BMI > 30, previous history of
pre-eclampsia, family history of pre-eclampsia, multiple pregnancy and
hydrops fetalis, pre-existing hypertension or renal disease, pre-existing
vascular disease, antiphospholipid syndrome, and smoking were excluded.
Serum levels of iron, zinc, magnesium were measured by using a
colorimetric method, while serum concentrations of copper, chromium,
cobalt, manganese, molybdenum, and selenium were measured by using
graphite furnace atomic absorption spectrophotometric technique.
The results were expressed as mean ± standard error of mean. T-test
and the linear regression analysis were used for the determination of the
level of significance. Statistical analysis were performed with Statistical

Package for the Social Sciences (SPSS) version 21.0 software. A P value of
< 0.05 was considered to be statistically significant.
Serum total iron level was significantly higher in patients with pre-
eclampsia compared to control group (186.498 µg/dl versus 94.392 ,
P value < 0.05). While no significant difference was found in molybdenum
5). Finally,
serum total concentrations of the other elements were significantly lower in
patients with pre-eclampsia compared to control group as illustrated below:
Copper (143.153 µg/dl versus 209.657 µg/dl, P value < 0.05)
Chromium (0.382 µg/dl versus 0.678 µg/dl, P value < 0.05)
Cobalt (0.143 µg/dl versus 0.330 µg/dl, P value < 0.05)
Magnesium (2.115 mg/dl versus 2.456 mg/dl, P value < 0.05)
Manganese (7.617 µg/dl versus 10.847 µg/dl, P value < 0.05)
Selenium (2.546 µg/dl versus 4.306 µg/dl, P value < 0.05)
Zinc (57.283 µg/dl versus 87.535 µg/dl, P value < 0.05).
In conclusion, alteration in the levels of serum trace and ultra trace
elements could contribute to the pathogenesis of pre-eclampsia.

Contents
NO. SUBJECT PAGE
NO.
1 Summary I
2 Contents III
3 List of Tables VII
4 List of Figures VIII
5 Abbreviations IX
Chapter One
Introduction 1.1. General Introduction 1
1.2. Proteinuria 1
1.3. Hypertension 1
1.3.1. Classification of Hypertensive Disorders During Pregnancy
2
1.3.6. Pre-eclampsia (PE) 3
1.3.6.3. Incidence of Pre-eclampsia 4
1.3.6.4. Risk Factors for Pre-eclampsia 4
1.3.6.5. Aetiology and Pathogenesis of Pre-eclampsia 4
1.3.6.7. Symptoms and Signs of Pre-eclampsia 10
1.3.6.8. Symptoms and Signs of Severe Pre-eclampsia 10
1.4. The Mineral Elements 11
1.4.1. Classification of Mineral Elements 11
1.4.2. Categories of Trace Elements 11
1.4.3. Individual Trace Elements 13

1.4.3.1. Iron (Fe) 13
1.4.3.2. Zinc (Zn) 14
1.4.3.3. Magnesium (Mg) 16
1.4.3.4. Copper (Cu) 17
1.4.3.5. Cobalt (Co) 19
1.4.3.6. Chromium (Cr) 20
1.4.3.7. Selenium (Se) 21
1.4.3.8. Molybdenum (Mo) 22
1.4.3.9. Manganese (Mn) 24
1.5. Methods of Trace Elements Estimations 26
1.6. Aim of the Study 27
Chapter Two
Materials and Methods2.1. Materials 28
2.1.1. Study Settings 28
2.1.2. Study Design 28
2.1.3. Study Population 28
2.1.4. Ethical Issues 28
2.1.5. Data Collection 29
2.1.6. Study Instruments 29
2.2. Blood Collection 30
2.3. Chemicals 31
2.4. Instruments 32
2.5. Methods 33
2.5.1. Determination of Urinary Creatinine Concentration 33

2.5.2. Determination of Urinary Total Protein Concentration 34
2.5.3. Determination of Serum Iron Concentration 35
2.5.4. Determination of Serum Zinc Concentration 36
2.5.5. Determination of Serum Magnesium Concentration 37
2.5.6. Determination of Serum Copper Concentration 40
2.5.7. Determination of Serum Cobalt Concentration 43
2.5.8. Determination of Serum Chromium Concentration 46
2.5.9. Determination of Serum Selenium Concentration 50
2.5.10. Determination of Serum Molybdenum Concentration 53
2.5.11. Determination of Serum Manganese Concentration 57
2.6. Conversion of Parts Per Billion (ppb) to
Microgram/Deciliter (µg/dl) and Milligram/Deciliter
(mg/dl)
60
2.7. Statistical Analysis 60
Chapter Three
Results and Discussion3.1. Demographic Characteristics in Patients and Control 61
3.1.1. Age Distribution in Patients and Control 61
3.1.2. Distribution of Patients and Control Group by
Gestational Age
61
3.1.3. Distribution of Patients and Control Group by Body
Mass Index
62
3.1.4. Distribution of Patients and Control Group by Blood
Pressure
62
3.1.4.1. Distribution of Patients and Control Group by
Diastolic Blood Pressure
62

3.1.4.2 Distribution of Patients and Control Group by
Systolic Blood Pressure
62
3.1.5. Distribution of Patients and Control Group by Urinary Total Proteins/Creatinine Ratio
63
3.1.6. Distribution of Patients and Control Group by Parity 64
3.2. Trace and Ultra Trace Elements Studies in Pre-
eclamptic and Healthy Pregnant Women
64
3.2.1. Iron (Fe) Concentrations in Patients and Control 64
3.2.2. Zinc (Zn) Concentrations in Patients and Control 65
3.2.3. Magnesium (Mg) Concentrations in Patients and
Control
67
3.2.4. Copper (Cu) Concentrations in Patients and Control 69
3.2.5. Cobalt (Co) Concentrations in Patients and Control 70
3.2.6. Chromium (Cr) Concentrations in Patients and
Control
72
3.2.7. Selenium (Se) Concentrations in Patients and Control 74
3.2.8. Molybdenum (Mo) Concentrations in Patients and Control
76
3.2.9. Manganese (Mn) Concentrations in Patients and
Control
76
Conclusions 78
Recommendations 79
References 80

List of Tables
TABLE
NO.
TITLE OF TABLE PAGE
NO.
1-1 Some examples of inherited immunogenetic factors 7 2-1 Chemicals used in the study 31 2-2 Instruments and Tools 32 2-3 Ideal conditions of copper determination 42 2-4 Ideal conditions of cobalt determination 45 2-5 Ideal conditions of chromium determination 49 2-6 Ideal conditions of selenium determination 52 2-7 Ideal conditions of molybdenum determination 56 2-8 Ideal conditions of manganese determination 59 3.1 Demographic characteristics of patients and control 61

List of Figures
TABLE
NO.
TITLE OF FIGURES PAGE
NO.
1.1 Normal placental implantation 5 1.2 Placenta in pre-eclamptic or fetal growth restricted
pregnancy 6
2.1 Standard curve of copper determination 42 2.2 Standard curve of cobalt determination 46 2.3 Standard curve of chromium determination 49 2.4 Standard curve of selenium determination 53 2.5 Standard curve of molybdenum determination 56 2.6 Standard curve of manganese determination 59 3.1 Serum iron concentrations (µg/dl) in patients and
control (mean ±SEM) 64
3.2 Serum zinc concentrations (µg/dl) in patients and control (mean ±SEM)
66
3.3 Serum magnesium concentrations (mg/dl) in patients and control (mean ±SEM)
67
3.4 Serum copper concentrations (µg/dl) in patients and control (mean ±SEM)
69
3.5 Serum cobalt concentrations (µg/dl) in patients and control (mean ±SEM)
70
3.6 The relationship between iron level and cobalt concentrations in the sera of pre-eclamptic and normotensive pregnants
71
3.7 Serum chromium concentrations (µg/dl) in patients and
control (mean ±SEM)
72
3.8 The relationship between iron level and chromium concentrations in the sera of pre-eclamptic and normotensive pregnants
73
3.9 Serum selenium concentrations (µg/dl) in patients and control (mean ±SEM)
75
3.10 Serum molybdenum concentrations (µg/dl) in patients and control (mean ±SEM)
76
3.11 Serum manganese concentrations (µg/dl) in patients and control (mean ±SEM)
77

Abbreviations
ABBREVIATION DETAILS
5-Br-PAPS 2-(5-Brom-2-pyridylazo)-5-(N-propyl-N-sulfopropyl
amino)-phenol
AMP Adenosine monophosphate
As Absorbance of sample
Ast Absorbance of standard
ATP Adenosine triphosphate
ATP7A Menkes copper transporter ATP7A
ATP7B Copper-transporting P-type adenosine triphosphate
BMI Body mass index
BP Blood pressure
ºC Centigrade
CAB Chromazurol B
CNS Central nervous system
CTMA Cetyltrimethyl-ammonium bromide
Cu-Zn SOD Copper-zinc super oxide dismutase
dl Deciliter
DMT 1 Divalent metal transporter 1
DNA Deoxyribonucleic acid
EGTA Ethylene glycol tetra acetic acid
FAAS Flame atomic absorption spectrometry
FAD Oxidized flavin adenine dinucleotide
GFAAS Graphite furnace atomic absorption spectrometry
HDL-Cholesterol High density lipoprotein cholesterol

HELLP Syndrome Hemolysis, elevated liver enzymes, low platelet
syndrome
HLA-A,-B ,-D, la, -
ll
Human leukocyte antigens -A, -B, -D, la, -ll
ICP-AES Inductively coupled plasma atomic emission
spectrometry
ICP-MS Inductively coupled plasma mass spectrometry
IL Interleukins
ISSHP International Society for the Study of Hypertension in
Pregnancy
KCN Potassium cyanide
KIR Killer- immunoglobulin-Like receptors
mA Milli Amper
mmHg Millimeter of mercury
mmol Millimole
NADH Reduced nicotinamide adenine dinucleotide
ng Nanograms
NICE National Institute for Health and Care Excellence for
use in pregnancy
NK-Cell Natural killer cell
nm Nanometer
O.D. Optical density
O2 Superoxide anion
OH- Hydroxyl anion
OH. Hydroxyl radical
P. Value Probability

PE Pre-eclampsia
ppb Parts per billion
ppm Parts per million
PTH Parathyroid hormones
Q.S. Quaternary Surfactant
RBC Red blood cell
RE System Reticuloendothelial system
Redox reaction Oxidation - reduction reaction
ROS Reactive oxygen species
SEM Standard error of mean
sFLT-1 Soluble FMS-like tyrosine kinase-1
SPSS Statistical Package for the Social Sciences
TNF- Tumour necrosis factor-
V Volume of solution


Chapter One Introduction
2
more apart with the patient at rest [5].
1.3.1. Classification of Hypertensive Disorders During Pregnancy
Pregnant women with hypertension can be broadly divided into one of
three categories: chronic hypertension, non-proteinuric gestational
hypertension (also known as gestational hypertension) and pre-eclampsia. It's
important to distinguish between them as management and prognosis are
different. The International Society for the Study of Hypertension in
Pregnancy (ISSHP) uses the term gestational hypertension in women who
were previously normotensive.
1.3.2. The Classification of International Society for the Study of
Hypertension in Pregnancy (ISSHP):
A. Gestational hypertension and/or proteinuria developing during
pregnancy, labour or the puerperium in a previously normotensive non-
proteinuric woman
1. Gestational hypertension (without proteinuria).
2. Gestational proteinuria (without hypertension).
3. Gestational proteinuric hypertension (pre-eclampsia).
B. Chronic hypertension (before the 20th week of pregnancy) and chronic
renal disease (proteinuria before the 20th week of pregnancy).
1. Chronic hypertension (without proteinuria).
2. Chronic renal disease (proteinuria with or without hypertension).
3. Chronic hypertension with superimposed pre-eclampsia (new
onset proteinuria).
C. Unclassified hypertension and/or proteinuria.
D. Eclampsia [6].

Chapter One Introduction
3
1.3.3. Gestational Hypertension
Hypertension arising for the first time after the twentieth week of
gestation, in the absence of proteinuria (< 300 mg in a 24-hour urine
collection), has neither a significant maternal nor fetal consequences. Blood
pressure returns to normal by 6 weeks postpartum or before this time [7,8].
1.3.4. Chronic Hypertension
Hypertension which is apparent prior to, in the first half of, or persisting
more than 6 weeks after pregnancy [9].
1.3.5. Pre-eclampsia Superimposed on Chronic Hypertension
Chronic hypertension in pregnancy may be complicated by
preeclampsia. This condition will be determined when there is a new outset of
proteinuria or sudden deterioration of either hypertension or proteinuria, or
evolution of other signs and symptoms of preeclampsia after the twentieth
week of gestation [8,10].
1.3.6. Pre-eclampsia
Preeclampsia is defined as hypertension associated with proteinuria
arising de novo after the 20th week of gestation in a previously normotensive
woman and resolving completely by the 6th postpartum week . It is a leading
cause of fetal and maternal morbidity and mortality [12].
1.3.6.1. Eclampsia
It is a serious life-threatening complication of pre-eclampsia when tonic-
clonic convulsion occur in a woman with established pre-eclampsia, in the
absence of any other neurological or metabolic cause.
1.3.6.2. Severe Pre-eclampsia
It is a pre-eclampsia with severe hypertension and/or with symptoms of
imminent eclampsia, and/or biochemical and/or hematological impairment.
Chapter One Introduction
4
1.3.6.3. Incidence of Pre-eclampsia
Hypertensive disorders affect about 6-12% of pregnant women [3]. In
UK, preeclampsia affects 3-5% of pregnancies [12].
1.3.6.4. Risk Factors for Pre-eclampsia
First pregnancy.
Multiparous with:
pre-eclampsia in any previous pregnancy,
ten years or more since last pregnancy.
Age 40 years or more.
Body mass index of 35 or more.
Family history of pre-eclampsia (in mother or sister).
Booking diastolic blood pressure of 80 mmHg or more.
Booking proteinuria (of
.
Multiple pregnancy.
Certain underling medical conditions :
pre-existing hypertension.
pre-existing renal disease.
pre-existing diabetes.
antiphospholipid antibodies [13] [14].
1.3.6.5. Aetiology and Pathogenesis of Pre-eclampsia
The aetiology remains incompletely understood, and many theories have
been considered.
Factors that are likely to be involved in the aetiology of this disease are :
Placental implantation with abnormal trophoblastic invasion of uterine vessels.

Chapter One Introduction
5
Immunological maladaptive tolerance between maternal, placental and fetal tissues.
Maternal maladaptation to cardiovascular or inflammatory changes of normal pregnancy.
Genetic factors including inherited predisposing genes as well as epigenetic influences.
Nutritional factors [15].
1.3.6.5.1. Abnormal Trophoblastic Invasion:
In normal placental implantation, the extra villous trophoblast
proliferates from an anchoring villous, as shown in Figure 1-1. The
cytotrophoblast invade the uterine spiral arteries in the inner part of the
myometrium. Invasion of the spiral arteries is associated with degeneration of
the tunica media and replacement by fibrinoid material resulting in loss of
resistance and marked dilatation of the spiral artery and increased intervillous
blood flow [16].
Figure (1.1): Normal placental implantation [17].
In pre-eclamptic patients, the placenta suffers from defective
implantation, as shown in Figure 1-2. The disease process is composed of two
phases. The first phase is characterized by patchy trophoblast invasion so that
the spiral arteries retain their muscular walls which will prevent the

Chapter One Introduction
6
development of high-flow, low-impedence uteroplacental circulation. The
pre-eclamptic placenta will get high resistance, so the flow of blood will be
decreased and the perfusion will be inefficient. These will cause ischemia and
hypoxia of the placenta. This probably results in the production of reactive
oxygen species. Once the normal endogenous antioxidants are overwhelmed,
a condition of oxidative stress exists. This is probably fundamental to the
clinical syndrome of pre-eclampsia [13].
Either through oxidative stress or other vasoactive substances being
released from the placenta, activation of the vascular endothelium all over the
body will occur. In the second phase of pre-eclampsia, all maternal organs are
affected by the general vascular endothelial dysfunction [18].
Figure (1.2): Placenta in pre-eclamptic or fetal growth restricted
pregnancy [17].
1.3.6.5.2. Immunological Changes
There is maternal immune tolerance to parental derived placental and
fetal antigens. Loss of this tolerance or perhaps its disregulation leads to pre-
eclampsia. There are many inferential data that suggest an immune mediated
disorder. As a risk of pre-eclampsia is appreciably increased in circumstances
Chapter One Introduction
7
where formation of blocking antibodies to placental antigenic sites might be
impaired. In this case, the first pregnancy would carry a higher risk [19].
Some women have elevated serum levels of antiangiogenic factors. The gene
for one of these factors, soluble FMS-like tyrosine kinase-1(sFLT-1), is on
chromosome 13 [20]. There are inherited immunogenetic factors that may
modify genotype and phenotype expression in PE. Some examples of these
factors are shown in table (1-1) [21].
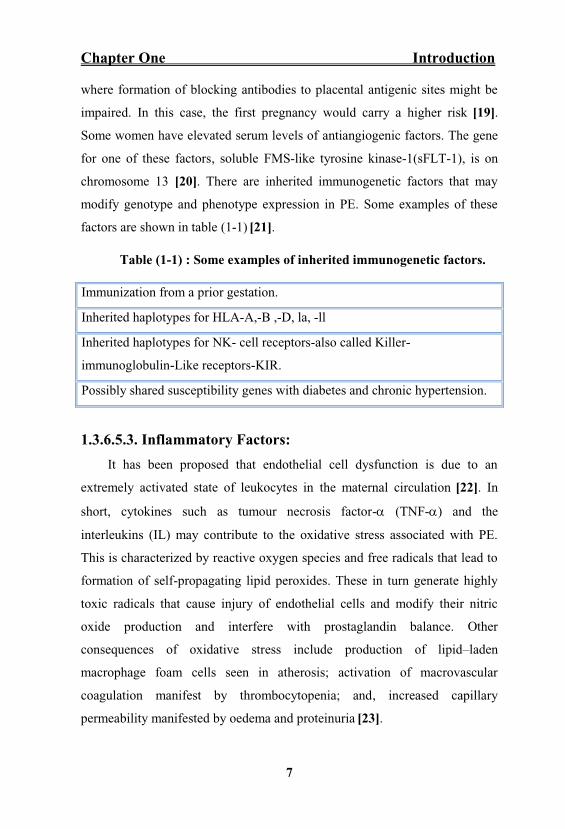
Table (1-1) : Some examples of inherited immunogenetic factors.
1.3.6.5.3. Inflammatory Factors:
It has been proposed that endothelial cell dysfunction is due to an
extremely activated state of leukocytes in the maternal circulation [22]. In
short, cytokines such as tumour necrosis factor- (TNF- ) and the
interleukins (IL) may contribute to the oxidative stress associated with PE.
This is characterized by reactive oxygen species and free radicals that lead to
formation of self-propagating lipid peroxides. These in turn generate highly
toxic radicals that cause injury of endothelial cells and modify their nitric
oxide production and interfere with prostaglandin balance. Other
consequences of oxidative stress include production of lipid laden
macrophage foam cells seen in atherosis; activation of macrovascular
coagulation manifest by thrombocytopenia; and, increased capillary
permeability manifested by oedema and proteinuria [23].
Immunization from a prior gestation.
Inherited haplotypes for HLA-A,-B ,-D, la, -ll
Inherited haplotypes for NK- cell receptors-also called Killer-
immunoglobulin-Like receptors-KIR.
Possibly shared susceptibility genes with diabetes and chronic hypertension.

Chapter One Introduction
8
1.3.6.5.4. Genetic Factors
The incidence risk of PE is (20% to 40%) for daughters of pre-eclamptic
mothers; 11 to 37 percent for sisters of pre-eclamptic women; and 22 to 47
percent in twin pregnancies [24].
1.3.6.5.5. Nutritional Factors
In general, diet rich in fruits and vegetables that have antioxidant activity
is associated with decreased blood pressure [25]. The incidence of PE was
doubled in women whose daily intake of ascorbic acid was less than 85 mg.
These studies were followed by randomized trials to study dietary
supplementation [26]. Calcium supplementation in populations with a low
dietary calcium intake had a small effect to lower perinatal mortality rates, but
no effect on the incidence of PE. In a number of trials, supplementation with
antioxidant vitamins C and E showed no beneficial effect [27].
1.3.6.6. Pathophysiology of Pre-eclampsia
Vasospasm and endothelial cell dysfunction, with subsequent platelet
activation and micro-aggregate formation, account for many of the
pathological features of pre-eclampsia seen in almost every major organ
system [13].
1.3.6.6.1. Cardiovascular System
Pre-eclampsia is characterized by lack of normal intravascular volume
expansion, a reduction in normal circulating blood volume, and a loss of
normal refractoriness to endogenous vasopressors, including
angiotensin II [28].
1.3.6.6.2. Central Nervous System (CNS)
In the brain, oedema and cerebral vasospasm, ischemia, and ionic shifts
between intracellular and extracellular compartments are believed to incite
eclamptic seizures. A new onset headache and increased reflex irritability or
Chapter One Introduction
9
hyperreflexia are extremely concerning signs of CNS involvement and may
show imminent seizures [29].
1.3.6.6.3. Liver Function
Abnormal liver function tests and elevation of liver enzymes above the
normal non-pregnant reference ranges associated with PE may reflect liver
dysfunction secondary to vasoconstriction in the hepatic vein.
Histopathological examination of the liver in pre-eclampsia reveals periportal
fibrin deposition, hemorrhage, and hepatocellular necrosis. Subcapsular
hematoma is one of the most severe sequelae of severe PE and HELLP
Syndrome (hemolysis, elevated liver enzymes, and low platelet) [30].
1.3.6.6.4. Renal System
In the kidney, a highly characteristic lesion called
seen with other hypertensive disorder) and is associated with impaired
glomerular filtration and selective loss of intermediate weight proteins, such
as albumin and transferrin, leading to proteinuria. Which causes a reduction in
plasma oncotic pressure and exacerbates the development of oedema [13].
1.3.6.6.5. Coagulation System
In Pre-eclampsia, organ perfusion is further comprised by activation of
the coagulation cascade. Altered platelet function is seen in most women
with PE. In normal pregnancy, there is increased biosynthesis of eicosanoids,
particularly prostacyclin and thromboxane A Prostacyclin is a vasodilator
with platelet- inhibitory properties and thromboxane A is a vasoconstriction
with a tendency to promote platelet aggregation. Prostacyclin and
thromboxane A usually increase in proportion to one another and
consequently there is a net neutralization, and homeostasis is maintained. In
women with preeclampsia, this homeostasis is disrupted due to a relative

Chapter One Introduction
10
deficiency of prostacyclin. This occurs either because of a reduction in
prostacyclin synthesis or because of an increased production of thromboxane
A This imbalance leads to platelet stimulation and also vasoconstriction and
hypertension [31].
1.3.6.7. Symptoms and Signs of Pre-eclampsia:
May be asymptomatic,
Headache,
Visual disturbances,
Epigastric and right upper abdominal pain,
Elevation of blood pressure,
Fluid retention (non-dependent oedema),
Oedema (progressive) [32].
1.3.6.8. Symptoms and Signs of Severe Pre-eclampsia:
Frontal headache,
Visual disturbances (blurred vision and flashing lights),
Epigastric pain,
General malaise and nausea,
Restlessness,
Agitation,
Hyper-reflexia and clonus,
Facial (especially periorbital) oedema,
Right upper quadrant tenderness,
Poor urine output,
Papilloedema [13].

Chapter One Introduction
11
1.4. The Mineral Elements
The mineral elements constitute only a small proportion of the body
weight. There is a wide variation in their body content. For instance, calcium
constitutes about 2% of body weight while cobalt about 0.00004%.
1.4.1. Classification of Mineral Elements
The body's minerals are classified as principal elements (macrominerals)
and trace elements (microminerals). The seven principal elements constitute
60-80% of the body's inorganic material. These are calcium, phosphorus,
magnesium, sodium, potassium, chloride and sulfur [33]. The principal
elements are required in amounts greater than 100 mg/day. The trace elements
are required in amounts less than 100 mg/day [34].
The term "trace element" was originally used to describe the residual
amount of inorganic analyte quantitatively determined in a sample. More
sensitive analytical methods now provide accurate determination of most
inorganic micronutrients present at very low concentrations in body fluids
and tissue. Those present at (µg/dl) in body fluids and in tissue (mg/kg)
are however still widely referred to as trace elements and those found at
ng/dl or µg/kg as the "ultratrace elements." The corresponding dietary
requirements are quoted in mg/day or µg/day, respectively [35].
1.4.2. Categories of Trace Elements:
Essential trace elements: Iron, copper, iodine, magnesium, manganese,
zinc, molybdenum, cobalt, fluorine, selenium and chromium.
Possibly essential trace elements: Nickel, vanadium, cadmium and
barium.
Non-essential trace elements: Aluminium, lead, mercury, boron, silver,
bismuth, etc. [33].
Chapter One Introduction
12
Pregnancy is a period of rapid growth and cell differentiation for both
the mother and fetus. Consequently, it is a period during which both are
vulnerable to changes in dietary supply, especially of those micronutrients
that are marginal under normal circumstances. Essential trace elements are
involved in various biochemical pathways [36]. Their specific and the most
important functions are the catalytic role in chemical reactions and in
structural function in large molecules such as enzymes and hormones [37].
Alterations in concentrations and homeostasis of each of these micronutrients
in body are well-known contributors in pathophysiology of various disorders
and disease [36]. Trace elements such as zinc (Zn), selenium (Se) and copper
(Cu) display antioxidant activity, while others such as calcium (Ca) and
magnesium (Mg) are essential micronutrients [38]. Despite several studies
on pre-eclampsia, its aetiology has not yet been fully elucidated. Some studies
have shown that changes in the levels of serum trace elements in pre-
eclamptic patients may implicate its pathogenesis [39] while others have
failed to show an association of serum levels of trace elements and prevalence
of pre-eclampsia [40].
It has been reported that there is an increased incidence of pre-eclampsia
in zinc-deficient regions and it was later found that zinc supplementation
reduced the high incidence of the disease. Furthermore, decreased levels of
zinc, selenium and copper have been observed in patients with pre-eclampsia.
Ugwuja and et al. reported that only copper was found to be statistically
significant. The previous study on serum calcium and magnesium levels in
pregnant women showed that there is significant difference between patients
with pre-eclampsia and normal control group [41].

Chapter One Introduction
13
1.4.3. Individual Trace Elements
1.4.3.1. Iron (Fe):
1.4.3.1.1. Functions of Iron:
Iron mainly exerts its functions through the compounds in which it is
present. Hemoglobin and myoglobin are required for the transport of O2 and
CO2. Cytochromes and certain non-heme proteins are necessary for electron
transport chain and oxidative phosphorylation. Peroxidase, the lysosomal
enzyme, is required for phagocytosis and killing of bacteria by neutrophils.
Iron is associated with effective immunocompetence of the body [33].
1.4.3.1.2. Dietary Sources of Iron:
Exogenous: Foods rich in iron include:
Animal Sources: Meat, fish, liver, spleen, red marrow are very
rich sources (2.0 to 6.0 mg/100 gm). Also it is found in shellfish.
Vegetable Sources: Cereals (2.0 to 8.0 mg/100 gm) are the major
rich source. Legumes, molasses, nuts, amaranth leaves, and dates
are other good sources.
Endogenous: Fe is utilised from ferritin of Reticuloendothelial (RE)
System and intestinal mucosal cel
is also reutilised [42].
1.4.3.1.3. Absorption, Transport, and Metabolism of Iron:
The iron exist in two oxidized states ferric (Fe+3) and ferrous (Fe+2) ionic
forms. The intestinal mucosal cells take up ferric form of iron during its
absorption. Ferritin is the storage form of iron. Free iron acts as prooxidant
agent and it is released from ferritin by the reducing agents that convert Fe3+
into Fe2+. Under stress or pathological conditions, it undergoes Fenton
reaction and Haber Weiss reaction to generate Reactive Oxygen Species

Chapter One Introduction
14
(ROS), which in turn damage the biological macro molecules. Transferrin, the
iron transfer protein may also undergo glycation due to stress or pathological
conditions causing increased free iron levels. Glycated transferrin also
enhances the production of free oxygen radicals such as hydroxide which
amplify the oxidative effects of iron [43].
1.4.3.1.4. Clinical Significance of Iron:
In pre-eclampsia, when tissues become ischemic, ROS such as
superoxide and hydrogen peroxide are produced, but these ROS may not be
able to initiate any cellular damage directly. The transition of metal ions such
as iron, arising from ischemic placenta by destruction of red blood cells
(RBCs) from thrombotic, necrotic and hemorrhagic areas can generate highly
reactive hydroxyl radical by Fenton reaction. This radical can initiate lipid
peroxidation, which if uncontrolled, results in endothelial cell damage .
Fe2+ + H2O23+ + OH + OH- (Fenton reaction)
Fe3+ + O2.- 2+ + O2
O2.- + H2O2 2 + OH. + OH- (HABER WEISS REACTION) [44].
1.4.3.2. Zinc (Zn):
1.4.3.2.1. Functions of Zinc:
Zinc is important for the activity of a number of enzymes like carbonic
anhydrase, alkaline phosphatase, alcohol dehydrogenase, porphobilinogin
synthase, leucine amino peptidase, carboxy peptidase, aldolase in glycolysis,
DNA and RNA polymerases as zinc has crucial role in DNA synthesis [45].
Release of vitamin A from liver requires zinc [46]. Retinene reductase (zinc
enzyme) participates in the regeneration of rhodopsin (visual cycle) [47].
Insulin is secreted, stored as a complex of zinc. Zinc is important for wound
healing [45].
Chapter One Introduction
15
1.4.3.2.2. Dietary Sources of Zinc
Good sources for zinc are liver, milk, fish, dairy products, cereals,
legumes, oil seeds, yeast and spinach, etc. [42].
1.4.3.2.3. Absorption, Transport, Metabolism, and Excretion of
Zinc
It is absorbed in duodenum and ileum [48]. Absorption of zinc from the
intestine appears to be controlled in a manner similar to iron. It is transported
bound to a protein ( 2-macroglobulin and transferrin). It is excreted in urine
and feces [49]. Diets rich in calcium, phosphates interfere with Zn absorption
[50]. It is bound as complex of protein metallothionein. The sulfur groups of
the protein chelate zinc [51].
1.4.3.2.4. Clinical Significance of Zinc:
Alteration of zinc (Zn) may play a role in the several diseases [52].
Normal homeostasis of Zn is regulated by the actions of Zn transporters like
zinc-related protein. These transporters control the level of Zn inside and
outside the cell [53]. It has been shown that zinc performs a considerable role
for optimal function of more than 300 different enzymes [54]. Some studies
have indicated that decreased zinc concentration is associated with fetal
malformations, fetal growth restriction, preterm delivery, pre-eclampsia, and
bleeding after delivery [55,56]. Serum or placental Zn levels have been shown
to be low [57] or without change [58] in pre-eclamptic women. It has been
revealed that concentrations of zinc and copper are reduced in pre-eclamptic
patients [59]. While study of Ugwuja et al. [60] showed that only copper was
statistically different. There are also contradictory studies on the relationship
between serum trace element levels and event of pre-eclampsia [39]. Studies
have indicated the possible association of trace elements with fetal growth

Chapter One Introduction
16
and development and its relationship to newborn body weight, neonatal
morbidity and mortality [61].
1.4.3.3. Magnesium (Mg):
1.4.3.3.1. Functions of Magnesium:
Magnesium is required for the formation of bones and teeth [62]. Mg2+
serves as a cofactor for several enzymes requiring ATP, e.g. hexokinase,
glucokinase, phosphofructokinase, adenylate cyclase [63]. Mg2+ is necessary
for proper neuromuscular function. Low Mg2+ levels lead to neuromuscular
irritability [64].
1.4.3.3.2. Dietary Sources of Magnesium:
Magnesium is widely distributed in plant and animal foods and in
beverages. Green leafy vegetables, such as spinach, legumes, nuts, seeds, and
whole grains, are good sources [65].
1.4.3.3.3. Absorption, Transport, Metabolism, and Excretion of
Magnesium:
Magnesium is absorbed by the intestinal cells through a specific carrier
system [66]. Consumption of large amounts of calcium, phosphate and
alcohol diminishes Mg absorption. Para thyroid hormones increase Mg
absorption [67]. Magnesium is lost from the body in faeces, sweat and urine
[68].
1.4.3.3.4. Clinical Significance of Magnesium:
Decrease in serum magnesium levels than the normal range is called as
hypomagnesaemia. Magnesium is present in most common food stuffs, low
dietary intakes of magnesium are associated with nutritional insufficiency,
accompanied by intestinal malabsorption, severe vomiting, diarrhea or other

Chapter One Introduction
17
causes of intestinal loss. Symptoms of hypomagnesaemia are impaired
neuromuscular function, tetany, hyper irritability, and tremor, convulsions and
muscle weakness [69].
Increase in serum magnesium more than the normal levels is called as
hypermagnesaemia. It is uncommon but is occasionally seen in renal failure.
It is rarely caused by intravenous injection of magnesium salts and
adrenocortical hypofunction. The most common manifestation of
hypermagnesaemia is depression of the neuromuscular
system [70].
1.4.3.4. Copper (Cu):
Copper (Cu) is an important essential trace element for humans and
animals. In biological systems, copper shifts between the cuprous (Cu1+) and
cupric (Cu2+) forms, though the majority of the body's copper is in the
Cu2+ form. The ability of copper to easily exchange between these
ions explains its important role in oxidation-reduction (redox) reactions and
in scavenging free radicals [71].
1.4.3.4.1. Functions of Copper
Copper has been found to be an important constituent of vital Cu-
dependent enzymes such as lysyl oxidase, cytochrome oxidase, tyrosinase,
dopamine- -hydroxylase, peptidylglycine alpha-amidating monooxygenase,
monoamine oxidase, ceruloplasmin (copper oxidase), and copper-zinc
superoxide dismutase (Cu-Zn SOD), functioning as antioxidants and as
oxidoreductases and these enzymes act as antioxidant defense system [72].
Thus as a part of powerful antioxidant it helps to protect the cell from
damage. Copper is also present in ceruloplasmin and promotes the absorption
of iron from the gastrointestinal tract [73].
Copper deficiency is rare, but cases have been identified in human,
which manifested as neutropenia, anemia and skeletal abnormalities with

Chapter One Introduction
18
atherogenic and electrocardiographic irregularities and is linked to low birth
weight of neonates [74].
1.4.3.4.2. Dietary Sources of Copper
Average diet provides 2 to 4 mg/day in the form of meat, shellfish,
legumes, nuts and cereals [42].
1.4.3.4.3. Absorption, Transport, Metabolism, and Excretion of
Copper
Not all dietary copper is absorbed, the proportion varying from 35% to
70% for reasons that are still not fully understood, although an increased
intake of zinc reduces absorption. From the gut, copper is carried to the liver
bound to albumin and there it is incorporated into caeruloplasmin.
Caeruloplasmin is then secreted into the blood and accounts for 80 90% of
the circulating copper. The main route for excretion of copper is in the bile,
with very little in the urine. Normal copper homoeostasis, therefore, depends
on the balance between intestinal absorption and biliary excretion [75].
1.4.3.4.4. Clinical Significance of Copper
Copper can produce the highly reactive hydroxyl radical. The generation
of this radical can cause lipid peroxidation process which may cause
endothelial cell damage [76].
Many studies have shown that copper concentration is increased in pre-
eclamptic patients [77].
1.4.3.4.4.1. Inborn Errors of Copper Metabolism:
autosomal
recessive defect in ATP7B resulting in copper storage disease. It affects
primarily liver, CNS, and cornea of eye [78].
Menkes Kinky Hair Syndrome is an X-linked neurodegenerative
disease associated with mutation in ATP7A transporter resulting in low

Chapter One Introduction
19
serum copper levels and symptoms of copper deficiency including
brittle, kinky hair and death by year 3 of life is usual [79].
Cobalt (Co):
Cobalt forms an integral part of vitamin B12 and is required as a
constituent of this vitamin [80].
1.4.3.5.1. Functions of Cobalt:
In formation of cobamide coenzyme (Adenosyl co-enzyme), cobalt of
B12 undergoes successive reduction in a series of steps catalysed by the
[81]. Cobalt is
required to maintain normal bone marrow function and required for
development [82] and maturation of red blood cells [83]. A deficiency of
cobalt results in decreased B12 supply which produces nutritional macrocytic
anaemia [84]. Excess of cobalt results in overproduction of red blood cells
causing polycythaemia. The polycythaemic effect may be due to inhibition of
certain respiratory enzymes, e.g. cytochrome oxidase, succinate
dehydrogenase, etc. leading to relative anoxia [85]. Cobalt may act as a
cofactor for enzyme like glycylglycine dipeptidase of intestinal juice [86].
1.4.3.5.2. Dietary sources of Cobalt:
Main sources are foods from animal sources [87].
1.4.3.5.3. Absorption, Transport, Metabolism, and Excretion of
Cobalt:
About 70 to 80 percent of the dietary cobalt is absorbed readily from the
intestine. Isotopic studies have shown that about 65 per cent of the ingested
cobalt is excreted almost completely through the kidney. Cobalt is stored
mainly in the liver which is the principal storage site and only trace amount
present in other tissues [42].
Chapter One Introduction
20
1.4.3.5.4. Clinical Significance of Cobalt:
Cobalt deficiency results in anorexia, fatty liver, macrocytic anaemia,
wasting and haemosiderosis of spleen [88]. Toxicity is rare and has been
described in dialysis patients and heavy drinkers of beer that is contaminated
with cobalt, leading to cardiomyopathy
1.4.3.6. Chromium (Cr):
Chromium is an insulin cofactor. Chromium deficiency can occur in
long-term parenteral nutrition, leading to glucose intolerance and
neuropathy [89].
1.4.3.6.1. Functions of Chromium:
The main biological role of chromium in man appears to potentiate the
action of insulin, as part of a low molecular weight chromium binding
substance (chromodulin) [90]. Chromium may also be important in gene
expression, lipoprotein metabolism and in maintaining nucleic acid structure
[91].
1.4.3.6.2. Dietary Sources of Chromium:
Dietary sources of chromium include yeast, meat, whole grains,
mushrooms and nuts [75].
1.4.3.6.3. Absorption, Transport, Metabolism, and Excretion of
Chromium:
Chromium is absorbed poorly in the diet. It is absorbed mainly in the
small intestine by a pathway it appears to share with zinc [42]. Hexavalent
chromium is better absorbed and much more toxic than trivalent
chromium [92]. Both transferrin and albumin are involved in chromium
absorption and transport [93]. Transferrin binds the newly absorbed
chromium at site B, while albumin acts as an acceptor and transporter of

Chapter One Introduction
21
chromium if the transferrin sites are saturated [94]. Other plasma proteins,
- -globulins and lipoproteins, bind chromium [95].
1.4.3.6.4. Clinical Significance of Chromium:
Impaired Glucose Tolerance and Diabetes: A lot of adults are thought
to have impaired glucose tolerance and it has been suggested that poor
chromium nutritional status may be a factor. However, the variability of
dietary chromium intake and the lack of an easily usable laboratory or
clinical marker to identify those patients with poor chromium status create
difficulties. Chromium therapy in the control and prevention of diabetes
is of considerable interest and the subject of much controversy [96].
Cardiovascular Disease: Chromium depletion has long been thought to
be associated with an increased cardiovascular risk. It has been found that
chromium supplementation increase HDL cholesterol and decrease insulin
levels [97].
1.4.3.7. Selenium (Se):
1.4.3.7.1. Functions of Selenium:
Glutathione peroxidase is a selenium dependent enzyme. The enzyme
has a role in oxidative damage by free radicals. The enzyme is critically
important for the membrane stability of RBCs. Selenium has sparing action
on vitamin E, by three ways. It promotes digestion, absorption of lipids and
vitamin E. It is a part of glutathione peroxidase, prevents peroxidation of poly
unsaturated fatty acids in the membranes. This in turn reduces the requirement
of vitamin E. It helps in the retention of vitamin E in the blood. It is a cofactor
for an enzyme involved in the synthesis of thyroid hormone [98].
1.4.3.7.2. Dietary Sources of Selenium:
Selenium is rich in liver, kidney, finger nails. Usually plant products are
good sources than animal based diet [99].
Chapter One Introduction
22
1.4.3.7.3. Absorption, Transport, Metabolism, and Excretion of
Selenium:
Selenium is absorbed from upper segment of the small intestine. The
absorption is increased with deficiency [100]. Status is measured by
measuring selenium or
or selenium levels in whole blood or urine. RBC selenium is an indicator of
long-term status [101]. Selenium is stored in the body as selenocysteine in
selenoproteins [102]. It is excreted in urine, feces and in breath as dimethyl
selenide with a garlic-like odor [103].
1.4.3.7.4. Clinical Significance of Selenium:
1.4.3.7.4.1. Deficiency of Selenium
A range of deficiency states has been identified in humans [35].
1.4.3.7.4.2. Severe Deficiency of Selenium
Keshan Disease: It is strongly supported by nutritional, biological,
geological and chemical (selenium deficiency) factors [104].
Kashin-Beck Disease. A type of severe arthritis is described in parts of
China and neighboring areas of Russia where soil selenium is
particularly low [105].
1.4.3.7.4.3. Toxicity of Selenium
Areas of China and the United States have high amounts of selenium in
soil, and locally produced food contains excess selenium. Clinical signs of
selenosis are garlic odor in the breath, hair loss, and nail damage. The
tolerable upper limit
children [35].
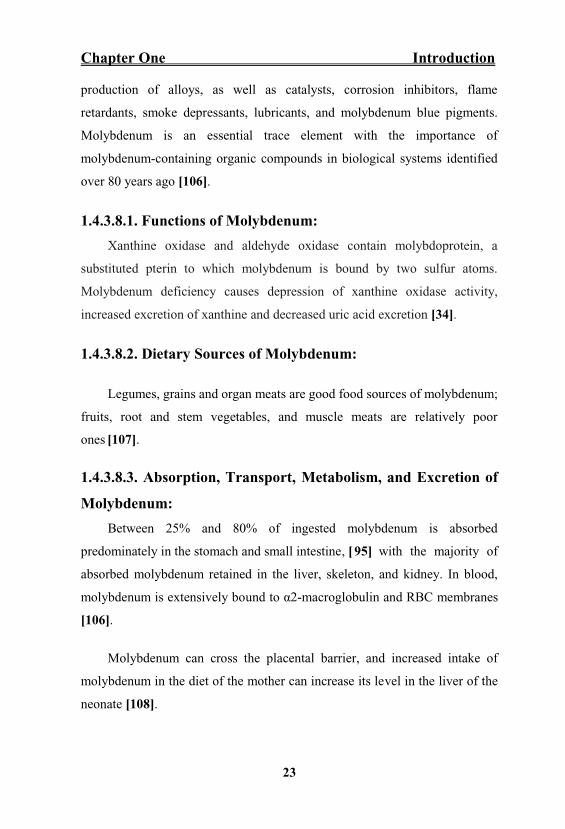
1.4.3.8. Molybdenum (Mo):
Molybdenum (Mo) is a hard, silvery white metal occurring naturally as
molybdenite, wulfenite, and powelite. Most molybdenum is used for the
Chapter One Introduction
23
production of alloys, as well as catalysts, corrosion inhibitors, flame
retardants, smoke depressants, lubricants, and molybdenum blue pigments.
Molybdenum is an essential trace element with the importance of
molybdenum-containing organic compounds in biological systems identified
over 80 years ago [106].
1.4.3.8.1. Functions of Molybdenum:
Xanthine oxidase and aldehyde oxidase contain molybdoprotein, a
substituted pterin to which molybdenum is bound by two sulfur atoms.
Molybdenum deficiency causes depression of xanthine oxidase activity,
increased excretion of xanthine and decreased uric acid excretion [34].
1.4.3.8.2. Dietary Sources of Molybdenum:
Legumes, grains and organ meats are good food sources of molybdenum;
fruits, root and stem vegetables, and muscle meats are relatively poor
ones [107].
1.4.3.8.3. Absorption, Transport, Metabolism, and Excretion of
Molybdenum:
Between 25% and 80% of ingested molybdenum is absorbed
predominately in the stomach and small intestine, [ 95] with the majority of
absorbed molybdenum retained in the liver, skeleton, and kidney. In blood,
molybdenum is extensively bo -macroglobulin and RBC membranes
[106].
Molybdenum can cross the placental barrier, and increased intake of
molybdenum in the diet of the mother can increase its level in the liver of the
neonate [108].

Chapter One Introduction
24
1.4.3.8.4. Clinical Significance of Molybdenum:
Molybdenum is vital to human health through its inclusion in at least
three enzymes: xanthine oxidase, aldehyde oxidase, and sulfite oxidase. The
active site of these enzymes binds molybdenum in the form of a cofactor
molybdopterin [109]. Dietary molybdenum deficiency is rare with a single
disease [106]. Molybdenum cofactor deficiency is a recessively inherited
error of metabolism due to a lack of functional molybdopterin. The symptoms
include seizures, anterior lens dislocation, decreased brain weight, and usually
death prior to 1 year of age [109]. Molybdenum toxicity is rarely reported, as
there are few known cases of human exposure to excess molybdenum. High
dietary and occupational exposures to molybdenum have been linked to
elevated uric acid in blood and an increased incidence of gout [95].
Molybdenum is rapidly eliminated in both urine and bile, with urine excretion
predominating when intake is high [106].
1.4.3.9. Manganese (Mn):
1.4.3.9.1. Functions of Manganese:
Manganese is a component of certain enzymes (e.g. pyruvate
carboxylase, mitochondrial superoxide dismutase, arginase) and is also an
activator of many others (e.g. hydrolases, glycosyl transferases, kinases,
decarboxylases), so deficiency could potentially affect the metabolism of
carbohydrates, glycosaminoglycans and cholesterol.
1.4.3.9.2. Dietary Sources of Manganese:
Good dietary sources of manganese include leafy vegetables, unrefined
cereals and tea [75].
Chapter One Introduction
25
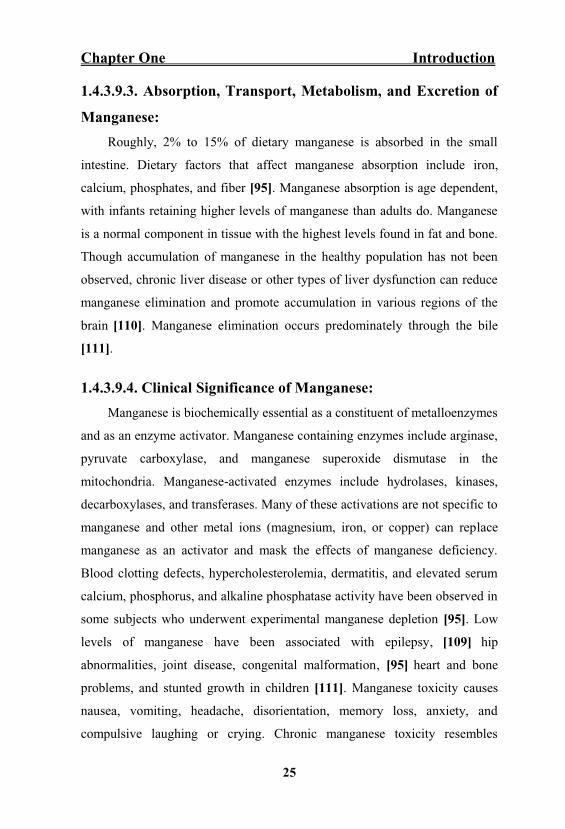
1.4.3.9.3. Absorption, Transport, Metabolism, and Excretion of
Manganese:
Roughly, 2% to 15% of dietary manganese is absorbed in the small
intestine. Dietary factors that affect manganese absorption include iron,
calcium, phosphates, and fiber [95]. Manganese absorption is age dependent,
with infants retaining higher levels of manganese than adults do. Manganese
is a normal component in tissue with the highest levels found in fat and bone.
Though accumulation of manganese in the healthy population has not been
observed, chronic liver disease or other types of liver dysfunction can reduce
manganese elimination and promote accumulation in various regions of the
brain [110]. Manganese elimination occurs predominately through the bile
[111].
1.4.3.9.4. Clinical Significance of Manganese:
Manganese is biochemically essential as a constituent of metalloenzymes
and as an enzyme activator. Manganese containing enzymes include arginase,
pyruvate carboxylase, and manganese superoxide dismutase in the
mitochondria. Manganese-activated enzymes include hydrolases, kinases,
decarboxylases, and transferases. Many of these activations are not specific to
manganese and other metal ions (magnesium, iron, or copper) can replace
manganese as an activator and mask the effects of manganese deficiency.
Blood clotting defects, hypercholesterolemia, dermatitis, and elevated serum
calcium, phosphorus, and alkaline phosphatase activity have been observed in
some subjects who underwent experimental manganese depletion [95]. Low
levels of manganese have been associated with epilepsy, [109] hip
abnormalities, joint disease, congenital malformation, [95] heart and bone
problems, and stunted growth in children [111]. Manganese toxicity causes
nausea, vomiting, headache, disorientation, memory loss, anxiety, and
compulsive laughing or crying. Chronic manganese toxicity resembles
Chapter One Introduction
26
-like faces
[109]. A clinical condition named locura manganica (manganese madness)
was described in Chilean manganese miners with acute manganese aerosol
intoxication [112].
1.5. Methods of Trace Elements Estimations:
Commonly used techniques for trace-element analysis in human
biological material are flame atomic absorption spectrometry (FAAS),
graphite furnace atomic absorption spectrometry (GFAAS), inductively
coupled plasma atomic emission spectrometry (ICP-AES), and inductively
coupled plasma mass spectrometry (ICP-MS) [113].

Chapter One Introduction
27
1.6. Aim of the Study
To assess the role of trace and ultra-trace elements in the pathogenesis
of pre-eclampsia.


Chapter Two Subjects, Materials and Methods
29
2.1.5. Data Collection:
Exclusion Criteria:
Age over 40,
BMI > 30,
Previous history of pre-eclampsia,
Family history of pre-eclampsia,
Conditions in which the placenta is enlarged like multiple pregnancy
and hydrops fetalis,
Pre-existing hypertension or renal disease,
Pre-existing vascular disease (as in diabetes or autoimmune vasculitis),
Antiphospholipid Syndrome,
Smoking [3].
2.1.6. Study Instruments:
a- Questionnaire: included sociodemographic characteristics (name,
age, occupation, educational level, residence, and gestational age),
information about current pregnancy (symptomatology like oliguria,
haematuria, right hypochondrial pain, presence of ecchymosis and
bruises , any complications like intrauterine growth retardation,
oligohydramnios, HELLP Syndrome, and eclamptic fit), past
obstetrical, medical, social and family history.
b- Investigations: included assessment of proteinuria, haematological,
biochemical and coagulation profile. Ultrasound and Doppler study
of umbilical artery. All these were done to diagnose and assess the
severity of PE.

Chapter Two Subjects, Materials and Methods
30
c- Anthropometric measurement: Include: weight (Kg), height (m) and
BMI.
Body Mass Index (BMI) was calculated by weight (in kilograms)
divided by the square of height (in meters); weight and height were measured
by the same scale for the whole sample subjects.
BMI = Weight (kg) / Square Height (m2).
2.2. Blood Collection:
Venous blood samples were drawn from all subjects using 5 ml
disposable syringe. Five milliliters of blood were obtained from each subject
by venepuncture and pushed slowly into plain disposable tubes. Blood was
allowed to clot at for 10-15 minutes and then centrifuged at 2000 xg for
approximately 10-15 minutes then the sera were divided into five aliquots and
stored at - (the concentrations of serum iron (Fe), zinc
(Zn), magnesium (Mg), copper (Cu), cobalt (Co), chromium (Cr), selenium
(Se), molybdenum (Mo), and manganese (Mn) were measured.)
Urine samples were collected for measurement of urinary
protein/creatinine ratio [114].

Chapter Two Subjects, Materials and Methods
31
2.3. Chemicals:
Chemicals and kits used in this study are listed in table (2-1):
Table (2-1): Chemicals used in the study
Origin Chemical SubstanceNo.
SYRBIO (Syria)Creatinine Kit1
SYRBIO (Syria)Total Protein Kit2
Spectrum (Egypt) Total Iron Kit3
Spectrum (Egypt) Zinc Kit4
Biolabo SA (France) Magnesium Kit 5
Fluka (Switzerland)Standard Solution of Copper (1000 ppm) 6
Fluka (Switzerland)Standard Solution of Cobalt (1000 ppm) 7
Fluka (Switzerland)Standard Solution of Chromium
(1000 ppm)
8
Fluka (Switzerland)Standard Solution of Manganese (1000
ppm)
10
Fluka (Switzerland)Standard Solution of Molybdenum (1000
ppm)
11
Fluka (Switzerland)Standard Solution of Selenium (1000
ppm)
12
Germany)FischerNitric Acid (HNO3) 2% 13
Chapter Two Subjects, Materials and Methods
32
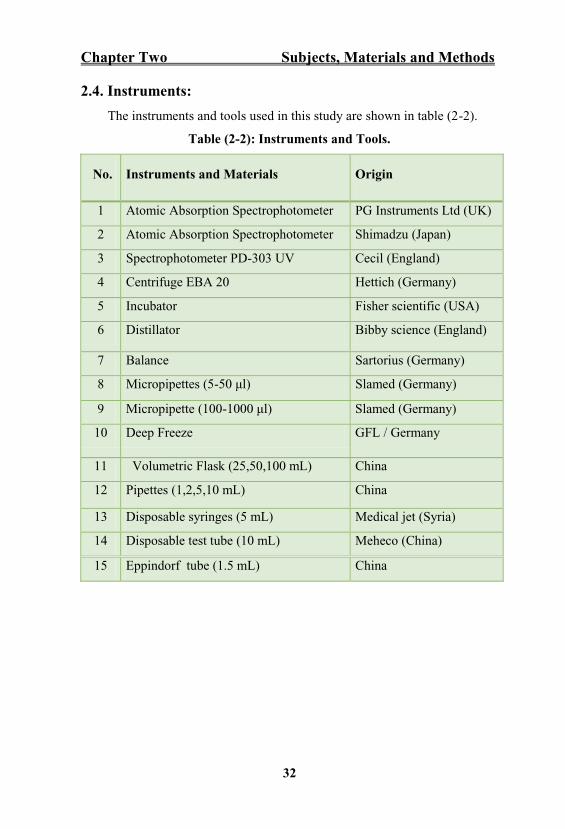
2.4. Instruments:
The instruments and tools used in this study are shown in table (2-2).
Table (2-2): Instruments and Tools.
Origin Instruments and Materials No.
PG Instruments Ltd (UK)Atomic Absorption Spectrophotometer 1
Shimadzu (Japan) Atomic Absorption Spectrophotometer 2
Cecil (England) Spectrophotometer PD-303 UV 3
Hettich (Germany) Centrifuge EBA 20 4
Fisher scientific (USA)Incubator 5
Bibby science (England)Distillator 6
Sartorius (Germany)Balance7
Slamed (Germany) Micropipettes (5-50 ) 8
Slamed (Germany) Micropipette (100-1000 )9
GFL / Germany Deep Freeze10
China Volumetric Flask (25,50,100 mL)11
ChinaPipettes (1,2,5,10 mL)12
Medical jet (Syria)Disposable syringes (5 mL)13
Meheco (China)Disposable test tube (10 mL) 14
ChinaEppindorf tube (1.5 mL)15

Chapter Two Subjects, Materials and Methods
33
2.5. Methods:
2.5.1. Determination of Urinary Creatinine Concentration.
Principle:
Creatinine, in alkaline picrate solution, forms a color complex. The rate
of formation of complex is measured, the effect of bilirubin and glucose are
reduced by using the kinetic procedure [115].
Samples:
Urine was diluted 1/50 with distilled water.
Reagents
R1 Sodium hydroxide 313 mmol/l
R2 Picric Acid 35 mmol/l
R3 Standard 2 mg/l
Reagents are stable at room temperature up to the expiry date.
Preparation of working reagent:
The reagent was prepared by mixing proportionally 1/1 the reagents R1
and R2. Stability: 1 month at 20º-25º C.
Procedure:
Wavelength 500 nm (480-520 nm)
Temperature 25 ºC
Cuvette 1 cm light path
Measurement Against air or distilled water
Method Kinetic increasing
If the absorbance of the working reagent is higher than 0.4 at 492 nm the
sample must be diluted.

Chapter Two Subjects, Materials and Methods
34
Standard Sample
Standard 100 µl -
Sample - 100 µl
Working reagent 1 ml 1ml
Solutions have been mixed, and after 30 seconds, the absorbance has
been read (A1) and exactly 1 minute after first reading (A2).
Calculation:
Concentration of creatinine in urine =
[ (A2 A1) Sample) ÷ ( (A2 A1) Standard) ] X 100
100 = Standard concentration x dilution factor.
2.5.2. Determination of Urinary Total Protein Concentration:
Principle:
Proteins modify spectrum of absorption of the complex pyrogallol red
molybdate. Globlins together with albumin react. The absorbance read at 598
nm which is proportional to the concentration in proteins.
Reagents:
1.R1: Pyrogallol reagent
Pyrogallol red 0.06 mmol/l
Sodium molybdate 0.04 mmol/l
Succinic acid 50 mmol/l
Detergent Q.S.
Quaternary Surfactant (Q.S.) is a powerful acid liquid detergent
sanitizer. It is a blend of quaternary ammonium compound, acids, and
nonionic surface active agents.
2. R2: Standard 100 mg/dl 1 g/l.

Chapter Two Subjects, Materials and Methods
35
Preparation:
The reagent was ready for use and stable up to the date of expiration as
specified. Contamination after opening must be avoided.
Procedure:
Wavelength 600 nm
Temperature 37º C (25º C 30º C)
Cuvette 1 cm light path
Method Endpoint increasing
If the absorbance of the working reagent is higher than 0.25 at 600 nm
the reagent cannot be used.
Blank Standard Sample
Sample - - 50 µl
Standard - 50 µl -
Reagent 3 ml 3 ml 3 ml
Solutions have been mixed, and after 10 minutes incubation at room
temperature absorbance (A) was read against the blank, the final color is
stable for at least 30 minutes.
Calculation:
The conc. of protein (g/l) = [ (ASample) ÷ (AStandard) ] x Standard
concentration (g/l)
2.5.3. Determination of Serum Iron Concentration:
Principle:
Serum iron was measured by colorimetric method. Iron reacts with
chromazurol B (CAB ) and cetyltrimethyl-ammonium bromide (CTMA) to
form a colored ternary complex with an absorbance measured at 623 nm. The

Chapter Two Subjects, Materials and Methods
36
intensity of the color produced, is directly proportional to the concentration of
iron in the sample [116].
Reagents:
Composition Reagents
200 µg/dl
35.8 µmol/l
Standard Iron (ST)
50 mM
0.13 mM
0.82 mM
Acetate buffer PH 4.7
Chromazurol B
Cetyltrimethyl-ammonium bromide
Preservatives and stabilizers
Procedure:
Sample Standard Reagent : Blank
1 ml 1 ml 1 mlReagent (R)
- 40 µl - Standard
40 µl - - Sample
The tubes were mixed, and incubated for 5 minutes at 37 ºC. The
absorbance of the standard and sample against reagent blank were read.
Calculation:
Iron [ (ASample) ÷ (AStandard) ] x 200 (Standard Concentration)
2.5.4. Determination of Serum Zinc Concentration:
Principle:
Serum zinc was estimated by spectrophotometric method. Zinc forms
with 2-(5-Brom-2-pyridylazo)-5-(N-propyl-N-sulfopropylamino)-phenol a red
chelate complex. The increase in absorbance can be measured and is
proportional to the concentration of total zinc in the sample [117].

Chapter Two Subjects, Materials and Methods
37
Reagents:
Composition Reagents
200 µg/dl (30.6 µmol/l) Standard (St.)
0.02 mmol/l
200 mmol/l
170 mmol/l
4 mmol/l
1%
Reagent (R)
5-Br-PAPS
Bicarbonate buffer pH 9.8
Sodium Citrate
Dimethylglyoxime
Detergent
Procedure:
The tubes were mixed, and then incubated for 5 min at 37 ºC. The
absorbance of the sample (As) and the absorbance of standard (Ast) were
measured against reagent blank.
Calculation:
[ (Aspecimen) ÷ (Astandard) ] x 200
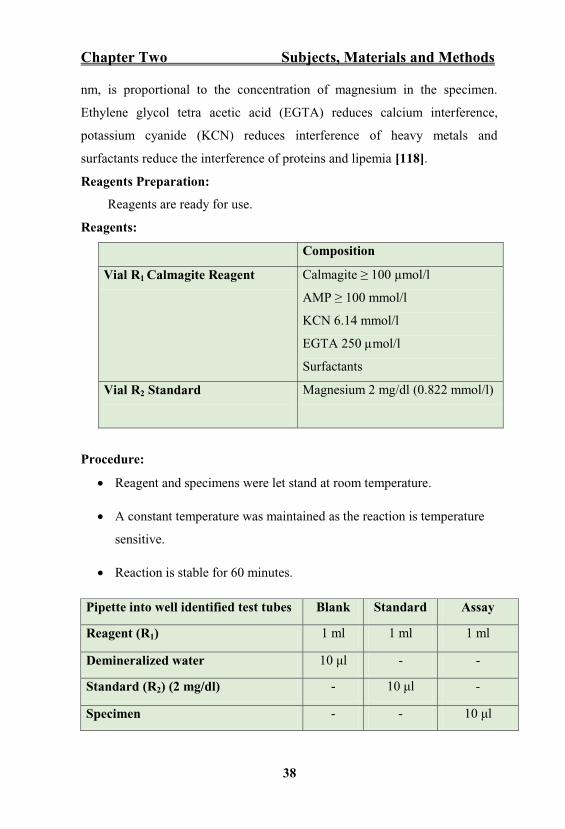
2.5.5. Determination of Serum Magnesium Concentration:
Principle:
Serum magnesium was measured by Gindler, Heth and Khayam-Bashi
method. Calmagite, a metallochromic indicator (1-[1-hydoxy-4-methyl-2-
phenolazo]-2-naphtol-4-sulfonic acid), forms in basic buffered medium a
colored complex with the magnesium. The absorbance, measured at 510-550
Sample Standard Blank
1 ml1 ml1 mlReagent (R)
-- Standard (St)
- - Sample
Chapter Two Subjects, Materials and Methods
38
nm, is proportional to the concentration of magnesium in the specimen.
Ethylene glycol tetra acetic acid (EGTA) reduces calcium interference,
potassium cyanide (KCN) reduces interference of heavy metals and
surfactants reduce the interference of proteins and lipemia [118].
Reagents Preparation:
Reagents are ready for use.
Reagents:
Composition
KCN 6.14 mmol/l
EGTA 250 µmol/l
Surfactants
Vial R1 Calmagite Reagent
Magnesium 2 mg/dl (0.822 mmol/l)Vial R2 Standard
Procedure:
Reagent and specimens were let stand at room temperature.
A constant temperature was maintained as the reaction is temperature
sensitive.
Reaction is stable for 60 minutes.
Assay Standard Blank Pipette into well identified test tubes
1 ml1 ml1 mlReagent (R1)
-- Demineralized water
- Standard (R2) (2 mg/dl)
10 Specimen

Chapter Two Subjects, Materials and Methods
39
Calculation:
Magnesium conc (mg/dl) = [ (Abs (Assay)) ÷ (Abs (Standard)) ] X 2 mg/dl
(Standard concentration)
Determination of Serum Cu, Co, Cr, Se, Mo, and Mn
Concentration:
Graphite furnace atomic absorption spectrophotometer was used to
determine the trace elements in serum samples.
Principle:
In the atomic absorption spectrometry techniques, the samples are
vaporized into free, neutral atoms and illuminated by a light source that emits
the atomic spectrum of the element under analysis. The absorbance gives a
quantitative measure of the concentration of the element. Inductively coupled
plasma atomic emission spectrometry (ICP-AES) and inductively coupled
plasma mass spectrometry (ICP-MS) are multi-element techniques. In ICP-
AES the atoms of the sample are excited by, for example, argon plasma at
very high temperatures. The emitted light is directed to a detector, and the
optical signals are processed to values for the concentrations of the elements.
In ICP-MS a mass spectrometer separates and detects ions produced by the
ICP, according to their mass-to-charge ratio. Dilution of biological fluids is
commonly needed to reduce the effect of the matrix. Digestion using acids
and microwave energy in closed vessels at elevated pressure is often used.
Matrix and spectral interferences may cause problems. Precautions should be
taken against trace-element contamination during collection, storage and
processing of samples. For clinical problems requiring the analysis of only
one or a few elements, the use of FAAS may be sufficient, unless the higher
sensitivity of GFAAS is required. For screening of multiple elements,
however, the ICP techniques are preferable [113].

Chapter Two Subjects, Materials and Methods
40
2.5.6. Determination of Serum Copper Concentration:
Sample Digestion:
One milliliter of serum was transferred to a Teflon beaker and 10 ml of
concentrated nitric acid and 2.5 ml concentrate perchloric acid were added.
The sample was then brought very slowly to boiling on a hot plate and heated
to dryness. If sample blackening occurred during the fuming stage, nitric acid
was added dropwise, then the sample was cooled, dissolved again in distilled
water and concentrated HCl (10:1) and brought to a volume of 25 ml in a
volumetric flask. The solution was analyzed against calibration curves [119].
Preparation of standard solutions and standard curve of copper from
stock solutions (1000 Cu ppm):
Five different standard solutions of copper (0, 25, 50, 75,100) ppb were
prepared from stock solution of (1000) ppm using dilution law
(N1 V1 = N2 V2). Dilutions were carried out in stages and acidified by using nitric
1. Preparation of 100 ppm : 5 ml of 1000 ppm copper solution was diluted by
distilled water since the solution was completed to 50 ml.
N1 V1 = N2 V2
1000 ppm X V1 = 100 ppm X 50 ml
V1= 5 ml
2. Preparation of 10 ppm : 5 ml of 100 ppm copper solution was diluted by
distilled water since the solution was completed to 50 ml.
N1 V1 = N2 V2
100 ppm X V1 = 10 ppm X 50 ml
V1= 5 ml
3. Preparation of 1 ppm (1000 ppb) : 5 ml of 10 ppm copper solution was
diluted by distilled water since the solution was completed to 50 ml.
N1 V1 = N2 V2
10 ppm X V1 = 1 ppm X 50 ml

Chapter Two Subjects, Materials and Methods
41
V1= 5 ml
4. Preparation of 100 ppb : 5 ml of 1000 ppb copper solution was diluted by
distilled water since the solution was completed to 50 ml.
N1 V1 = N2 V2
1000 ppb X V1 = 100 ppb X 50 ml
V1= 5 ml
5. Preparation of 75 ppb : 3.75 ml of 1000 ppb copper solution was diluted by
distilled water since the solution was completed to 50 ml.
N1 V1 = N2 V2
1000 ppb X V1 = 75 ppb X 50 ml
V1= 3.75 ml
6. Preparation of 50 ppb : 2.5 ml of 1000 ppb copper solution was diluted by
distilled water since the solution was completed to 50 ml.
N1 V1 = N2 V2
1000 ppb X V1 = 50 ppb X 50 ml
V1= 2.5 ml
7. Preparation of 25 ppb : 1.25 ml of 1000 ppb copper solution was diluted by
distilled water since the solution was completed to 50 ml.
N1 V1 = N2 V2
1000 ppb X V1 = 25 ppb X 50 ml
V1= 1.25 ml
8. Preparation of 0 ppb : this means pure distilled water was used as standard
solution.
N1 V1 = N2 V2
1000 ppb X V1 = 0 ppb X 50 ml
V1= 0 ml
9. Preparation of standard curve of copper : It was prepared by addition of 10
µl of (0, 25, 50, 75, 100) ppb copper solution to the graphite tube of graphite

Chapter Two Subjects, Materials and Methods
42
furnace atomic absorption instrument. Standard curve of copper was drawn by
instrument after it measured the absorbencies of them.
10. Concentrations of serum copper in patients and control were measured by
the same instrument dependence on the previous standard curve.
Condition of Copper Determination:
Table (2-3): Ideal conditions of copper determination.
Variable Ideal condition
Wavelength 324.7 nm
Band width 0.4 nm
Lamp Current 3.0 mA
Integration Time 3.0 sec.
Sample Size 10 µl
Acidity 0.1% Nitric Acid
Fig (2.1): Standard curve of copper determination.
Chapter Two Subjects, Materials and Methods
43
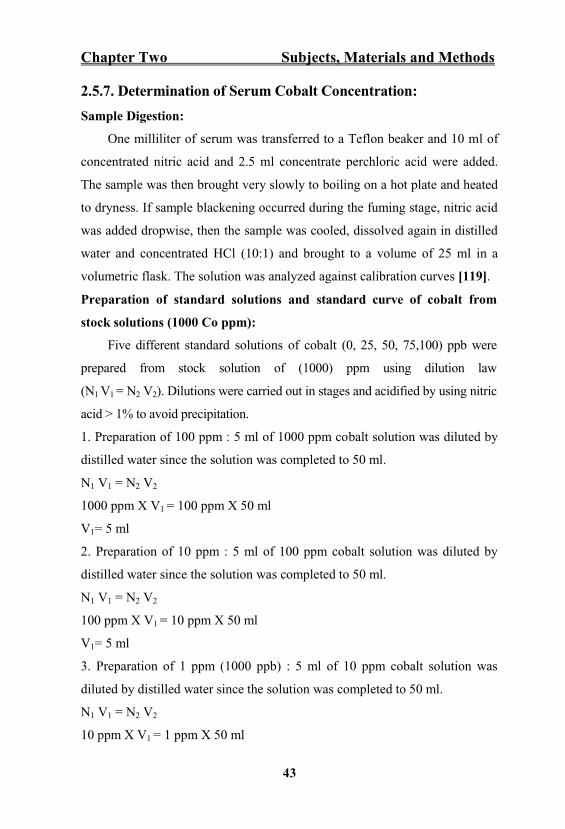
2.5.7. Determination of Serum Cobalt Concentration:
Sample Digestion:
One milliliter of serum was transferred to a Teflon beaker and 10 ml of
concentrated nitric acid and 2.5 ml concentrate perchloric acid were added.
The sample was then brought very slowly to boiling on a hot plate and heated
to dryness. If sample blackening occurred during the fuming stage, nitric acid
was added dropwise, then the sample was cooled, dissolved again in distilled
water and concentrated HCl (10:1) and brought to a volume of 25 ml in a
volumetric flask. The solution was analyzed against calibration curves [119].
Preparation of standard solutions and standard curve of cobalt from
stock solutions (1000 Co ppm):
Five different standard solutions of cobalt (0, 25, 50, 75,100) ppb were
prepared from stock solution of (1000) ppm using dilution law
(N1 V1 = N2 V2). Dilutions were carried out in stages and acidified by using nitric
1. Preparation of 100 ppm : 5 ml of 1000 ppm cobalt solution was diluted by
distilled water since the solution was completed to 50 ml.
N1 V1 = N2 V2
1000 ppm X V1 = 100 ppm X 50 ml
V1= 5 ml
2. Preparation of 10 ppm : 5 ml of 100 ppm cobalt solution was diluted by
distilled water since the solution was completed to 50 ml.
N1 V1 = N2 V2
100 ppm X V1 = 10 ppm X 50 ml
V1= 5 ml
3. Preparation of 1 ppm (1000 ppb) : 5 ml of 10 ppm cobalt solution was
diluted by distilled water since the solution was completed to 50 ml.
N1 V1 = N2 V2
10 ppm X V1 = 1 ppm X 50 ml
Chapter Two Subjects, Materials and Methods
44
V1= 5 ml
4. Preparation of 100 ppb : 5 ml of 1000 ppb cobalt solution was diluted by
distilled water since the solution was completed to 50 ml.
N1 V1 = N2 V2
1000 ppb X V1 = 100 ppb X 50 ml
V1= 5 ml
5. Preparation of 75 ppb : 3.75 ml of 1000 ppb cobalt solution was diluted by
distilled water since the solution was completed to 50 ml.
N1 V1 = N2 V2
1000 ppb X V1 = 75 ppb X 50 ml
V1= 3.75 ml
6. Preparation of 50 ppb : 2.5 ml of 1000 ppb cobalt solution was diluted by
distilled water since the solution was completed to 50 ml.
N1 V1 = N2 V2
1000 ppb X V1 = 50 ppb X 50 ml
V1= 2.5 ml
7. Preparation of 25 ppb : 1.25 ml of 1000 ppb cobalt solution was diluted by
distilled water since the solution was completed to 50 ml.
N1 V1 = N2 V2
1000 ppb X V1 = 25 ppb X 50 ml
V1= 1.25 ml
8. Preparation of 0 ppb : this means pure distilled water was used as standard
solution.
N1 V1 = N2 V2
1000 ppb X V1 = 0 ppb X 50 ml
V1= 0 ml
9. Preparation of standard curve of cobalt: It was prepared by addition of 10
µl of (0, 25, 50, 75, 100) ppb cobalt solution to the graphite tube of graphite

Chapter Two Subjects, Materials and Methods
45
furnace atomic absorption instrument. Standard curve of cobalt was drawn by
instrument after it measured the absorbencies of them.
10. Concentrations of serum cobalt in patients and control were measured by
the same instrument dependence on the previous standard curve.
Condition of Cobalt Determination:
Table (2-4): Ideal conditions of cobalt determination.
Variable Ideal condition
Wavelength 240.7 nm
Band width 0.2 nm
Lamp Current 7.0 mA
Integration Time 3.0 sec.
Sample Size 10 µl
Acidity 0.1% Nitric Acid

Chapter Two Subjects, Materials and Methods
46
Fig (2.2): Standard curve of cobalt determination.
2.5.8. Determination of Serum Chromium Concentration:
Sample Digestion:
One milliliter of serum was transferred to a Teflon beaker and 10 ml of
concentrated nitric acid and 2.5 ml concentrate perchloric acid were added.
The sample was then brought very slowly to boiling on a hot plate and heated
to dryness. If sample blackening occurred during the fuming stage, nitric acid
was added dropwise, then the sample was cooled, dissolved again in distilled
water and concentrated HCl (10:1) and brought to a volume of 25 ml in a
volumetric flask. The solution was analyzed against calibration curves [119].
Chapter Two Subjects, Materials and Methods
47
Preparation of standard solutions and standard curve of chromium from
stock solutions (1000 Cr ppm):
Five different standard solutions of chromium (0, 25, 50, 75,100) ppb
were prepared from stock solution of (1000) ppm using dilution law
(N1 V1 = N2 V2). Dilutions were carried out in stages and acidified using nitric
1. Preparation of 100 ppm : 5 ml of 1000 ppm chromium solution was diluted
by distilled water since the solution was completed to 50 ml.
N1 V1 = N2 V2
1000 ppm X V1 = 100 ppm X 50 ml
V1= 5 ml
2. Preparation of 10 ppm : 5 ml of 100 ppm chromium solution was diluted by
distilled water since the solution was completed to 50 ml.
N1 V1 = N2 V2
100 ppm X V1 = 10 ppm X 50 ml
V1= 5 ml
3. Preparation of 1 ppm (1000 ppb) : 5 ml of 10 ppm chromium solution was
diluted by distilled water since the solution was completed to 50 ml.
N1 V1 = N2 V2
10 ppm X V1 = 1 ppm X 50 ml
V1= 5 ml
4. Preparation of 100 ppb : 5 ml of 1000 ppb chromium solution was diluted
by distilled water since the solution was completed to 50 ml.
N1 V1 = N2 V2
1000 ppb X V1 = 100 ppb X 50 ml
V1= 5 ml
5. Preparation of 75 ppb : 3.75 ml of 1000 ppb chromium solution was diluted
by distilled water since the solution was completed to 50 ml.
N1 V1 = N2 V2
Chapter Two Subjects, Materials and Methods
48
1000 ppb X V1 = 75 ppb X 50 ml
V1= 3.75 ml
6. Preparation of 50 ppb : 2.5 ml of 1000 ppb chromium solution was diluted
by distilled water since the solution was completed to 50 ml.
N1 V1 = N2 V2
1000 ppb X V1 = 50 ppb X 50 ml
V1= 2.5 ml
7. Preparation of 25 ppb : 1.25 ml of 1000 ppb chromium solution was diluted
by distilled water since the solution was completed to 50 ml.
N1 V1 = N2 V2
1000 ppb X V1 = 25 ppb X 50 ml
V1= 1.25 ml
8. Preparation of 0 ppb : this means pure distilled water was used as standard
solution.
N1 V1 = N2 V2
1000 ppb X V1 = 0 ppb X 50 ml
V1= 0 ml
9. Preparation of standard curve of chromium: It was prepared by addition of
10 µl of (0, 25, 50, 75, 100) ppb copper solution to the graphite tube of
graphite furnace atomic absorption instrument. Standard curve of chromium
was drawn by instrument after it measured the absorbencies of them.
10. Concentrations of serum chromium in patients and control were measured
by the same instrument dependence on the previous standard curve.

Chapter Two Subjects, Materials and Methods
49
Condition of Chromium Determination:
Table (2-5): Ideal conditions of chromium determination.
Variable Ideal condition
Wavelength 357.9 nm
Band width 0.4 nm
Lamp Current 5.0 mA
Integration Time 3.0 sec.
Sample Size 10 µl
Acidity 0.1% Nitric Acid
Fig (2.3): Standard curve of chromium determination.

Chapter Two Subjects, Materials and Methods
50
2.5.9. Determination of Serum Selenium Concentration:
Sample Digestion:
One milliliter of serum was transferred to a Teflon beaker and 10 ml of
concentrated nitric acid and 2.5 ml concentrate perchloric acid were added.
The sample was then brought very slowly to boiling on a hot plate and heated
to dryness. If sample blackening occurred during the fuming stage, nitric acid
was added dropwise, then the sample was cooled, dissolved again in distilled
water and concentrated HCl (10:1) and brought to a volume of 25 ml in a
volumetric flask. The solution was analyzed against calibration curves[119].
Preparation of standard solutions and standard curve of selenium from
stock solutions (1000 Se ppm):
Five different standard solutions of selenium (0, 10, 20, 30, 40) ppb were
prepared from stock solution of (1000) ppm using dilution law
(N1 V1 = N2 V2). Dilutions were carried out in stages and acidified using nitric
1. Preparation of 100 ppm : 5 ml of 1000 ppm selenium solution was diluted
by distilled water since the solution was completed to 50 ml.
N1 V1 = N2 V2
1000 ppm X V1 = 100 ppm X 50 ml
V1= 5 ml
2. Preparation of 10 ppm : 5 ml of 100 ppm selenium solution was diluted by
distilled water since the solution was completed to 50 ml.
N1 V1 = N2 V2
100 ppm X V1 = 10 ppm X 50 ml
V1= 5 ml
3. Preparation of 1 ppm (1000 ppb) : 5 ml of 10 ppm selenium solution was
diluted by distilled water since the solution was completed to 50 ml.
N1 V1 = N2 V2
10 ppm X V1 = 1 ppm X 50 ml

Chapter Two Subjects, Materials and Methods
51
V1= 5 ml
4. Preparation of 100 ppb : 5 ml of 1000 ppb selenium solution was diluted by
distilled water since the solution was completed to 50 ml.
N1 V1 = N2 V2
1000 ppb X V1 = 100 ppb X 50 ml
V1= 5 ml
5. Preparation of 40 ppb : 20 ml of 1000 ppb selenium solution was diluted by
distilled water since the solution was completed to 50 ml.
N1 V1 = N2 V2
1000 ppb X V1 = 40 ppb X 50 ml
V1= 20 ml
6. Preparation of 30 ppb : 15 ml of 1000 ppb selenium solution was diluted by
distilled water since the solution was completed to 50 ml.
N1 V1 = N2 V2
1000 ppb X V1 = 30 ppb X 50 ml
V1= 15 ml
7. Preparation of 20 ppb : 10 ml of 1000 ppb selenium solution was diluted by
distilled water since the solution was completed to 50 ml.
N1 V1 = N2 V2
1000 ppb X V1 = 20 ppb X 50 ml
V1= 10ml
8. Preparation of 10 ppb : 5 ml of 1000 ppb selenium solution was diluted by
distilled water since the solution was completed to 50 ml.
N1 V1 = N2 V2
1000 ppb X V1 = 10 ppb X 50 ml
V1= 5 ml
9. Preparation of 0 ppb : this means pure distilled water was used as standard
solution.
N1 V1 = N2 V2

Chapter Two Subjects, Materials and Methods
52
1000 ppb X V1 = 0 ppb X 50 ml
V1= 0 ml
10. Preparation of standard curve of selenium : It was prepared by addition of
10 µl of (0, 25, 50, 75, 100) ppb selenium solution to the graphite tube of
graphite furnace atomic absorption instrument. Standard curve of selenium
was drawn by instrument after it measured the absorbencies of them.
11. Concentrations of serum selenium in patients and control were measured
by the same instrument dependence on the previous standard curve.
Condition of Selenium Determination:
Table (2-6): Ideal conditions of selenium determination.
Variable Ideal condition
Wavelength 196.0 nm
Band width 0.4 nm
Lamp Current 5.0 mA
Integration Time 3.0 sec.
Sample Size 10 µl
Acidity 0.1% Nitric Acid
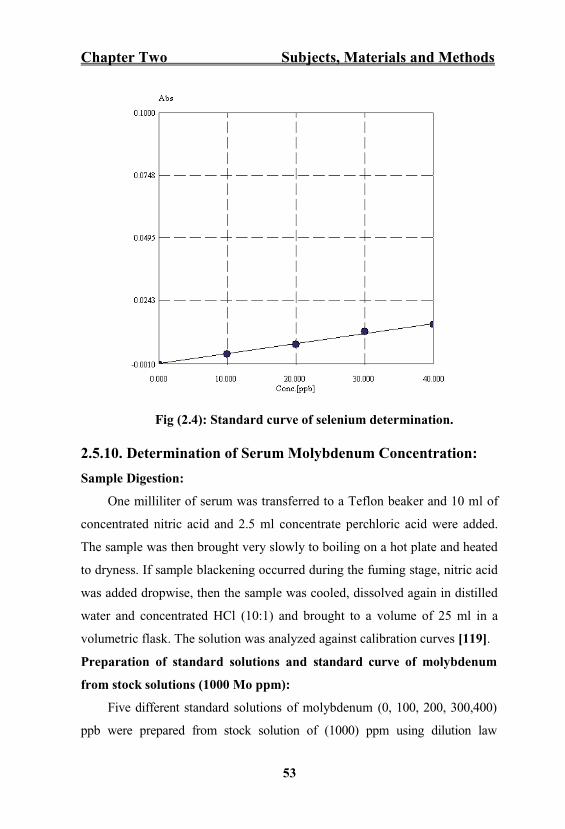
Chapter Two Subjects, Materials and Methods
53
Fig (2.4): Standard curve of selenium determination.
2.5.10. Determination of Serum Molybdenum Concentration:
Sample Digestion:
One milliliter of serum was transferred to a Teflon beaker and 10 ml of
concentrated nitric acid and 2.5 ml concentrate perchloric acid were added.
The sample was then brought very slowly to boiling on a hot plate and heated
to dryness. If sample blackening occurred during the fuming stage, nitric acid
was added dropwise, then the sample was cooled, dissolved again in distilled
water and concentrated HCl (10:1) and brought to a volume of 25 ml in a
volumetric flask. The solution was analyzed against calibration curves [119].
Preparation of standard solutions and standard curve of molybdenum
from stock solutions (1000 Mo ppm):
Five different standard solutions of molybdenum (0, 100, 200, 300,400)
ppb were prepared from stock solution of (1000) ppm using dilution law

Chapter Two Subjects, Materials and Methods
54
(N1 V1 = N2 V2). Dilutions were carried out in stages and acidified using nitric
1. Preparation of 100 ppm : Five ml of 1000 ppm molybdenum solution was
diluted by distilled water since the solution was completed to 50 ml.
N1 V1 = N2 V2
1000 ppm X V1 = 100 ppm X 50 ml
V1= 5 ml
2. Preparation of 10 ppm : Five ml of 100 ppm molybdenum solution was
diluted by distilled water since the solution was completed to 50 ml.
N1 V1 = N2 V2
100 ppm X V1 = 10 ppm X 50 ml
V1= 5 ml
3. Preparation of 1 ppm (1000 ppb) : Five ml of 10 ppm molybdenum solution
was diluted by distilled water since the solution was completed to 50 ml.
N1 V1 = N2 V2
10 ppm X V1 = 1 ppm X 50 ml
V1= 5 ml
4. Preparation of 400 ppb : 20 ml of 1000 ppb molybdenum solution was
diluted by distilled water since the solution was completed to 50 ml.
N1 V1 = N2 V2
1000 ppb X V1 = 400 ppb X 50 ml
V1= 20 ml
5. Preparation of 300 ppb : 15 ml of 1000 ppb molybdenum solution was
diluted by distilled water since the solution was completed to 50 ml.
N1 V1 = N2 V2
1000 ppb X V1 = 300 ppb X 50 ml
V1= 15 ml
6. Preparation of 200 ppb : 10 ml of 1000 ppb molybdenum solution was
diluted by distilled water since the solution was completed to 50 ml.

Chapter Two Subjects, Materials and Methods
55
N1 V1 = N2 V2
1000 ppb X V1 = 200 ppb X 50 ml
V1= 10 ml
7. Preparation of 100 ppb : Five ml of 1000 ppb molybdenum solution was
diluted by distilled water since the solution was completed to 50 ml.
N1 V1 = N2 V2
1000 ppb X V1 = 100 ppb X 50 ml
V1= 5 ml
8. Preparation of 0 ppb : this means pure distilled water was used as standard
solution.
N1 V1 = N2 V2
1000 ppb X V1 = 0 ppb X 50 ml
V1= 0 ml
10. Preparation of standard curve of molybdenum: It was prepared by addition
of 10 µl of (0, 25, 50, 75, 100) ppb molybdenum solution to the graphite tube
of graphite furnace atomic absorption instrument. Standard curve of
molybdenum was drawn by instrument after it measured the absorbencies of
them.
11. Concentrations of serum molybdenum in patients and control were
measured by the same instrument dependence on the previous standard curve.

Chapter Two Subjects, Materials and Methods
56
Condition of Molybdenum Determination:
Table (2-7): Ideal conditions of molybdenum determination.
Variable Ideal condition
Wavelength 313.3 nm
Band width 0.4 nm
Lamp Current 5.0 mA
Integration Time 3.0 sec.
Sample Size 10 µl
Acidity 0.1% Nitric Acid
Fig (2.5): Standard curve of molybdenum determination.

Chapter Two Subjects, Materials and Methods
57
2.5.11. Determination of Serum Manganese Concentration:
Sample Digestion:
One milliliter of serum was transferred to a Teflon beaker and 10 ml of
concentrated nitric acid and 2.5 ml concentrate perchloric acid were added.
The sample was then brought very slowly to boiling on a hot plate and heated
to dryness. If sample blackening occurred during the fuming stage, nitric acid
was added dropwise, then the sample was cooled, dissolved again in distilled
water and concentrated HCl (10:1) and brought to a volume of 25 ml in a
volumetric flask. The solution was analyzed against calibration curves[119].
Preparation of standard solutions and standard curve of manganese from
stock solutions (1000 Cu ppm):
Four different standard solutions of manganese (5, 10, 15, 20) ppb were
prepared from stock solution of (1000) ppm using dilution law
(N1 V1 = N2 V2). Dilutions were carried out in stages and acidified using nitric
1. Preparation of 100 ppm : Five ml of 1000 ppm selenium solution was
diluted by distilled water since the solution was completed to 50 ml.
N1 V1 = N2 V2
1000 ppm X V1 = 100 ppm X 50 ml
V1= 5 ml
2. Preparation of 10 ppm : Five ml of 100 ppm selenium solution was diluted
by distilled water since the solution was completed to 50 ml.
N1 V1 = N2 V2
100 ppm X V1 = 10 ppm X 50 ml
V1= 5 ml
3. Preparation of 1 ppm (1000 ppb) : Five ml of 10 ppm selenium solution
was diluted by distilled water since the solution was completed to 50 ml.
N1 V1 = N2 V2
10 ppm X V1 = 1 ppm X 50 ml

Chapter Two Subjects, Materials and Methods
58
V1= 5 ml
4. Preparation of 100 ppb : Five ml of 1000 ppb selenium solution was diluted
by distilled water since the solution was completed to 50 ml.
N1 V1 = N2 V2
1000 ppb X V1 = 100 ppb X 50 ml
V1= 5 ml
5. Preparation of 20 ppb : 10 ml of 1000 ppb selenium solution was diluted by
distilled water since the solution was completed to 50 ml.
N1 V1 = N2 V2
1000 ppb X V1 = 20 ppb X 50 ml
V1= 10 ml
6. Preparation of 15 ppb : 7.5 ml of 1000 ppb selenium solution was diluted
by distilled water since the solution was completed to 50 ml.
N1 V1 = N2 V2
1000 ppb X V1 = 15 ppb X 50 ml
V1= 7.5 ml
7. Preparation of 10 ppb : 5 ml of 1000 ppb selenium solution was diluted by
distilled water since the solution was completed to 50 ml.
N1 V1 = N2 V2
1000 ppb X V1 = 10 ppb X 50 ml
V1= 5 ml
8. Preparation of 5 ppb : 2.5 ml of 1000 ppb selenium solution was diluted by
distilled water since the solution was completed to 50 ml.
N1 V1 = N2 V2
1000 ppb X V1 = 5 ppb X 50 ml
V1= 2.5 ml
9. Preparation of standard curve of selenium : It was prepared by addition of
10 µl of (0, 25, 50, 75, 100) ppb selenium solution to the graphite tube of

Chapter Two Subjects, Materials and Methods
59
graphite furnace atomic absorption instrument. Standard curve of selenium
was drawn by instrument after it measured the absorbencies of them.
10. Concentrations of serum selenium in patients and control were measured
by the same instrument dependence on the previous standard curve.
Condition of Manganese Determination:
Table (2-8): Ideal conditions of manganese determination.
Variable Ideal condition
Wavelength 279.5 nm
Band width 0.2 nm
Lamp Current 20 mA
Integration Time 3.0 sec.
Sample Size 10 µl
Acidity 0.1% Nitric Acid
Fig (2.6): Standard curve of manganese determination.

Chapter Two Subjects, Materials and Methods
60
2.6. Conversion of Parts Per Billion (ppb) to Microgram / Deciliter
(µg/dl) and Milligram/Deciliter (mg/dl).
Parts per billion: Nanograms of solute per gram of solution; for aqueous
solutions the units are often expressed as micrograms of solute per liter of
solution (ppb) [133].
ppb = µg/liter = ng/mL
1 ppb = 1 µg/liter = 0.1 µg/dl
= 0.0001 mg/dl
2.7. Statistical Analysis
The results were expressed as mean ± standard error of mean. T-test and
the linear regression analysis were used for determination of the level of
significance. Statistical analyses were performed with Statistical Package for
the Social Sciences (SPSS) version 21.0 software. A P value of < 0.05 was
considered to be statistically significant.


Chapter Three Results and Discussion
62
of gestational ages for patients (36.93± 0.46 weeks) and control
(37.28± 0.28 weeks), (P. value ).
3.1.3. Distribution of Patients and Control Group by Body
Mass Index:
There were no statistically significant differences between the means
of body mass index of patients (28.30 ± 0.20 Kg/m2) and the mean of
body mass index of control (27.83 ± 0.24Kg/m2), (P. value 0.05), as
shown in Table 3.1.
3.1.4. Distribution of Patients and Control Group by Blood
Pressure:
3.1.4.1. Distribution of Patients and Control by Diastolic
Blood Pressure:
There were statistically significant differences between the mean of
diastolic blood pressure of patients (106.42 ± 2.03 mmHg) and the mean
of diastolic blood pressure of control (77.60 ± 0.69 mmHg),
5), as shown in Table 3.1.
3.1.4.2 Distribution of Patients and Control Group by
Systolic Blood Pressure:
Table 3.1demonstrated that there was statistically significant
differences between the mean of systolic blood pressure of patients and
the mean of systolic blood pressure of control
(159.63 ± 2.63mmHg, 115.62 ± 0.90mmHg) respectively, (P. value
0.05) .

Chapter Three Results and Discussion
63
3.1.5. Distribution of Patients and Control Group by
Urinary Total Proteins/Creatinine Ratio:
Table 3.1 showed the distribution of urinary total proteins/creatinine
ratio in both groups. There were statistically significant differences
between mean of urinary total proteins/creatinine ratio for patients
(38.82±0.31) and control (27.94±0.19), (P. value < 0.05).
The reliable detection of proteinuria is essential in differentiating
those pregnancies with pre-eclampsia from those with gestational or
chronic hypertension and, in the process, identifying those pregnancies
most prone to adverse outcomes. The measurement of significant
proteinuria, traditionally 300 mg excretion in a 24-hour period, is also
prone to collection and measurement error. The collection of 24-hour
urine samples is not practical as a routine test and so urine dipstick
screening is employed as a first-line screening test with secondary tests
employed to confirm positive dipstick diagnoses. Visual dipstick reading
is unreliable but the use of automated dipstick readers significantly
improves the accuracy of dipstick testing [120] and as such is
recommended by The National Institute for Health and Care Excellence
(NICE) for use in pregnancy.
NICE also recommends that quantification of proteinuria should
follow diagnosis. There are two methods that NICE supports. The first is
the 24-hour urine protein estimation and this requires that an assessment
of sample completeness is undertaken, with measurement of creatinine
excretion being the most common. NICE also supports the use of the
protein/creatinine ratio test. This test is done on a 'spot' urine sample and
is therefore much quicker. This test has been shown in numerous studies
to be comparable to the 24-hour urine protein estimation. The threshold

Chapter Three Results and Discussion
64
for defining significant proteinuria by this test is 30 mg protein/mmol
creatinine [3].
3.1.6. Distribution of Patients and Control Group by Parity:
Table 3.1 revealed the deference in parity between patients and
control. Fifty one percent of patients were primigravida while (6.7 %)
were primigravida in the control group. This result can be explained by
the fact that first pregnancy is regarded as a risk factor for pre-eclampsia.
3.2. Trace and Ultra Trace Elements Studies in Patients and
Control.
3.2.1. Iron (Fe) Concentrations in Patients and Control.
Figure 3.6 showed that the mean serum iron level was significantly
higher in patients than in control (186.498± 5.514 µg/dl vs. 94.392 ±
9.962 µg/dl), (P. value < 0.05).
Figure (3.1): Serum iron concentrations (µg/dl) in patients
and control (mean ±SEM).
An imbalance between pro-oxidants and anti-oxidants results in
oxidative stress which increases the potential for the development of pre
P. Value < 0.05

Chapter Three Results and Discussion
65
eclampsia [121]. Free iron acts as pro-oxidant agent and it is released
from ferritin by the reducing agents that convert Fe3+ into Fe2+. Under
stress or pathological conditions, it undergoes Fenton reaction and Haber
Weiss reaction to generate ROS, which in turn damage the biological
macro molecules [43]. The elevated serum iron levels are due to
hemolysis caused by physical destruction of red blood cells (RBCs) as a
result of vasospam or abnormal endothelial cell erythrocyte interactions.
Excess iron is a causative factor of oxidative stress (i.e., in its radical
form) involved in the pathogenesis of pre eclampsia [122]. The excess
iron released from destruction of RBCs can react with free radicals
produced from cell membrane (as it is rich in polyunsaturated fatty acids)
and circulating lipoproteins initiates lipid peroxidation [123]. In addition
to this the damaged placenta is a site for release of free radicals (FR) in
pre-eclampsia. The elevation or excess iron can also react with these
released FR of placenta and can initiate and propagate lipid peroxidation
both in placenta and systemic vasculature. This is one of the significant
etiologic factors in the endothelial cell damage in pre-eclampsia [124].
The present study findings were agreed with Osman R, et al. [125]
Hameed R, et al. [126].
3.2.2. Zinc (Zn) Concentrations in Patients and Control.
Figure 3.11showed that the mean serum zinc level was significantly
lower in patients than in control (57.283 ± 1.740 µg/dl vs. 87.535 ± 3.710
µg/dl), (P. value 0.05).

Chapter Three Results and Discussion
66
Figure (3.2) : Serum zinc concentrations (µg/dl) in patients and
control (mean ±SEM).
Zn deficiency has been associated with complications of pregnancy
part of which is pre-eclampsia. Zn is passively transferred from mother to
fetus across the placenta and there is also decreased Zn binding capacity
of maternal blood during pregnancy, which facilitates efficient transfer of
Zn from mother to fetus. During pregnancy, there is a decline in
circulating Zn and this increases as the pregnancy progresses possibly due
to decrease in Zn binding and increased transfer of Zn from the mother to
the fetus. Zn deficiency is also related to hemodilution and increased
urinary excretion [127]. In pregnant women with preeclampsia, low
serum zinc may be partly due to reduced concentrations of Zn-binding
protein and estrogen caused by increased lipid peroxidation [128,129].
This leads us to hypothesize that zinc may play a role in pre-eclampsia
through an increase of lipid peroxidation. The association between zinc
and pre-eclampsia although attempts to modify the frequency of pre-
eclampsia with zinc supplementation has not been successful. Recently,
the role of oxidative stress or excessive lipid peroxidation has been
implicated in pre-eclampsia. There is an imbalance between antioxidant
enzyme activities and pro-oxidant production.
P. Value < 0.05

Chapter Three Results and Discussion
67
Maternal zinc deficiency is related with serum cortisol level that
increases during normal pregnancy and it is much higher in preeclampsia.
Ihan N, et al. have noted that women with preeclampsia as compared with
normotensive pregnant women had lower zinc concentrations [130]. Zinc
deficiency in the placental tissue might cause insufficiency of superoxide
dismutase, an antioxidant enzyme. Furthermore, deficiency in placental
zinc also plays a role in the biosynthesis of connective tissue, maintaining
its integrity, which might have an impact on the structure of the spiral
arteries [131]. Similar results were obtained by earlier studies by Jain S,
et al. [55], Mohammed K, et al. [132] Adeniyi A, et al. [133] Sarwar M,
et al. [134].
3.2.3. Magnesium (Mg) Concentrations in Patients and
Control.
Figure 3.7 illustrated that the mean serum magnesium level was
significantly lower in patients than in control (2.115 ± 0.077 mg/dl vs.
2.456 ± 0.092 mg/dl), (P. value 0.05).
Figure (3.3): Serum magnesium concentrations (mg/dl) in
patients and control (mean ±SEM).
P. Value < 0.05

Chapter Three Results and Discussion
68
The role of magnesium in obstetrics and its relationship to both
foetal and maternal wellbeing has been established. The low
concentration of magnesium in serum exposes the subject to a risk of
pregnancy complications which includes pre-eclampsia. This is usually
due to a defect in an enzymatic process which occurs as a result of low
circulating magnesium to function as a co-factor. In this study, it has been
found a decrease in serum magnesium in pregnant women with pre-
eclampsia. This is consistent with the view of Lu and Nightingale who
reported a reduced mortality rate from 16% to 8% in Bangladesh as a
result of the introduction of a low dose of magnesium sulphate in pre-
eclampsia patients [135]. The findings of this study were agree with Jain
S, et al. [55] Nourmohammadi I, et al. [136].
Magnesium is very important for cellular metabolism such as muscle
contractility, secretions, neuronal activity, as well as cellular death. In the
present study, low dietary intake and accelerated metabolism might be
other contributing factors in hypomagnesaemia. This is suggestive of
some role of this element in the rise of blood pressure. Although, calcium
(Ca) alone might play a role in the rise of blood pressure, a proper
balance of Ca and Mg is of vital importance to control blood pressure
because blood vessels need Ca to contract, but they also require sufficient
Mg to relax and open up [137].
During pregnancy, there is a progressive decline in concentration of
Mg in maternal serum possibly due to hemodilution, increased urinary
excretion, and increased transfer of these minerals from the mother to the
growing fetus [138].
Hypoproteinaemia is another contributing factor since extracellular
magnesium accounts for about 1% of the total body magnesium content.
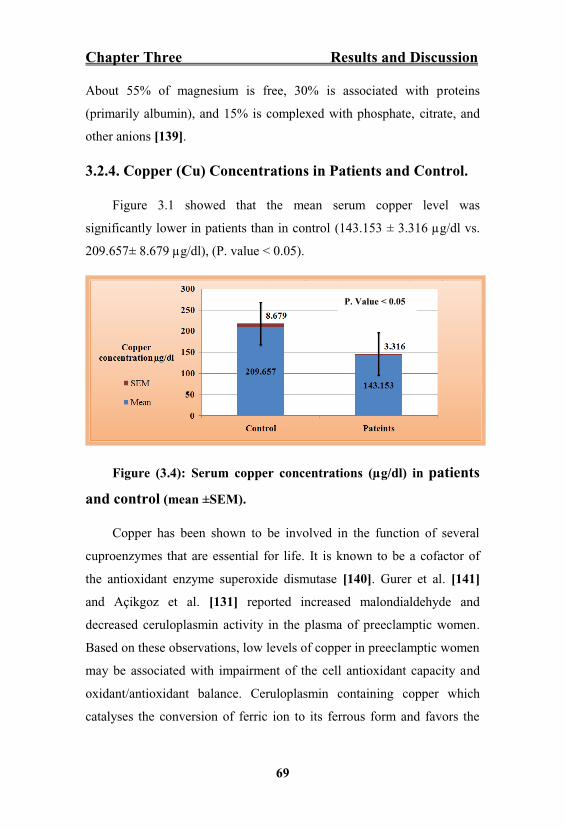
Chapter Three Results and Discussion
69
About 55% of magnesium is free, 30% is associated with proteins
(primarily albumin), and 15% is complexed with phosphate, citrate, and
other anions [139].
3.2.4. Copper (Cu) Concentrations in Patients and Control.
Figure 3.1 showed that the mean serum copper level was
significantly lower in patients than in control (143.153 ± 3.316 µg/dl vs.
209.657± 8.679 µg/dl), 5).
Figure (3.4): Serum copper concentrations (µg/dl) in patients
and control (mean ±SEM).
Copper has been shown to be involved in the function of several
cuproenzymes that are essential for life. It is known to be a cofactor of
the antioxidant enzyme superoxide dismutase [140]. Gurer et al. [141]
and Açikgoz et al. [131] reported increased malondialdehyde and
decreased ceruloplasmin activity in the plasma of preeclamptic women.
Based on these observations, low levels of copper in preeclamptic women
may be associated with impairment of the cell antioxidant capacity and
oxidant/antioxidant balance. Ceruloplasmin containing copper which
catalyses the conversion of ferric ion to its ferrous form and favors the
P. Value < 0.05

Chapter Three Results and Discussion
70
absorption of iron from the gastro-intestinal tract. It also plays a role in
the mobilization of iron to plasma from the tissue stores. Findings of
present study indicated a decrease in the serum concentrations of copper
in preeclamptic patients when compared to control subjects. Previous
study have shown that copper deficiency is related more to fetal
complications like birth defect than to maternal complication [73].
3.2.5. Cobalt (Co) Concentrations in Patients and Control.
Figure 3.4 illustrated that the mean serum cobalt level was
significantly lower in patients than in control (0.143 ± 0.007 µg/dl vs.
0.330 ± 0.007µg/dl), (P. value 0.05).
Figure (3.5): Serum cobalt concentrations (µg/dl) in patients
and control (mean ±SEM).
Figure 3.5 demonstrated that there was a significant negative
correlation between serum cobalt concentration and serum iron
concentration in both patients and control groups (P. value < 0.05).
P. Value < 0.05

Chapter Three Results and Discussion
71
Figure (3.6): The relationship between iron level and cobalt
concentrations in the sera of pre-eclamptic and normotensive
pregnants.
In present study the heavy metal Co was decreased in PE; the level
was similar to that reported in a previous study by Vigeh et at. [141].
Cobalt is absorbed in the same pathway of iron. So any alteration in
iron absorption will affect that of cobalt. Iron is mainly absorbed in the
duodenum and upper jejunum. A transporter protein called divalent metal
transporter 1 (DMT1) facilitates transfer of iron across the intestinal
epithelial cells. DMT1 also facilitates uptake of other trace metals
(manganese, copper, cobalt, and zinc). Iron within the enterocyte is
released via ferroportin into the bloodstream. Iron is then bound in the
bloodstream by the transport glycoprotein named transferrin [142].
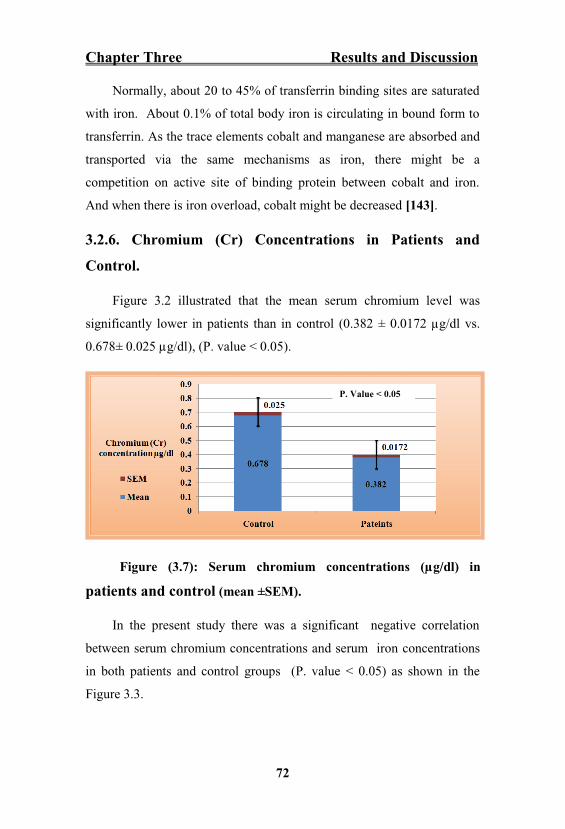
Chapter Three Results and Discussion
72
Normally, about 20 to 45% of transferrin binding sites are saturated
with iron. About 0.1% of total body iron is circulating in bound form to
transferrin. As the trace elements cobalt and manganese are absorbed and
transported via the same mechanisms as iron, there might be a
competition on active site of binding protein between cobalt and iron.
And when there is iron overload, cobalt might be decreased [143].
3.2.6. Chromium (Cr) Concentrations in Patients and
Control.
Figure 3.2 illustrated that the mean serum chromium level was
significantly lower in patients than in control (0.382 ± 0.0172 µg/dl vs.
0.678± 0.025 µg/dl), (P. value < 0.05).
Figure (3.7): Serum chromium concentrations (µg/dl) in
patients and control (mean ±SEM).
In the present study there was a significant negative correlation
between serum chromium concentrations and serum iron concentrations
in both patients and control groups (P. value < 0.05) as shown in the
Figure 3.3.
P. Value < 0.05

Chapter Three Results and Discussion
73
Figure (3.8): The relationship between iron level and chromium
concentrations in the sera of pre-eclamptic and normotensive
pregnants.
To understand the causes of chromium deficiency in subjects with
PE, an interaction between chromium and iron metabolism should be
explained. There are relatively few papers on the effect of Cr
supplementation on the metabolism of other mineral substances. The
relation between Cr and Fe has been investigated most since both these
minerals are transported as transferrin-bound. At low Fe saturation, Cr
and Fe bind preferentially to different binding sites. When, however, the
Fe concentration is high, the two minerals compete for the same binding
sites. This seems to be the reason why a lower Cr retention has been
identified in patients suffering from hemochromatosis than in healthy
subjects or patients with Fe deficiency [144].
Chapter Three Results and Discussion
74
Evidence that Cr may impair Fe metabolism has been published by
Ani M. et al. [145]. Fe homeostasis alteration has been reported by other
authors too, the most significant alteration being detected in association
with Cr-picolinate supplementation [146]. Alteration of Fe metabolism in
association with Cr supplementation has also been reported by Anderson
R. et al. [147], decreased tissue Fe concentrations were detected in
response to Cr supplementation.
Increasing of cortisol secretion is another factor that might
contributes to decrease level of chromium. A number of studies confirm
the association between Cr and the metabolism during increased
physiological, pathological and nutritional stress. Cr demand in humans
and animals increases during periods of higher stress e.g., fatigue,
trauma, gestation and different forms of nutritional (high-carbohydrate
diet), metabolic, physical, and emotional stress as well as environmental
effects. Under stress, secretion of the cortisol increases, acting as an
insulin antagonist through increasing blood glucose concentration and
reduction of glucose utilization by peripheral tissues. Increased blood
glucose levels stimulate the mobilization of the Cr reserve, Cr being then
irreversibly excreted in urine. Cr excretion in urine is enhanced by all
stress-inducing factors [144].
3.2.7. Selenium (Se) Concentrations in Patients and Control.
Figure 3.10 illustrated that the mean serum selenium level was
significantly lower in patients than in control (2.546 ± 0.068µg/dl vs.
4.306 ± 0.050µg/dl), (P. value <0.05).

Chapter Three Results and Discussion
75
Figure (3.9): Serum selenium concentrations (µg/dl) in
patients and control (mean ±SEM).
Selenium is known to behave as an antioxidant and peroxynitrite
scavenger when incorporated into selenoproteins. It is the main element
in glutathione peroxidase, an active enzyme in oxidative stress that
reduces the formation of free radicals and peroxidation of lipoproteins.
The low concentration of selenium in serum exposes the subject to an
accumulation of free radicals and its associated pathogenesis of disease
such as preeclampsia. On the other hand, low concentration of this
element in blood might be an indication of active production of free
radical and increased scavenging activity of either selenium or
glutathione peroxidase. This study suggests that pre-eclampsia is
associated with oxidative stress. This study agrees with the view of
Witzum [148] who reported that increased oxidative stress as a result of
peroxidation of low density lipoproteins is a common phenomenon in
pre-eclampsia. Supplementation with this trace element may help reduce
the pathogenesis of this disease and its complications [149]. Results of
this study were also agreement with view of Rayman M et al [150]
Mistry H. et al. [151] .
P. Value < 0.05
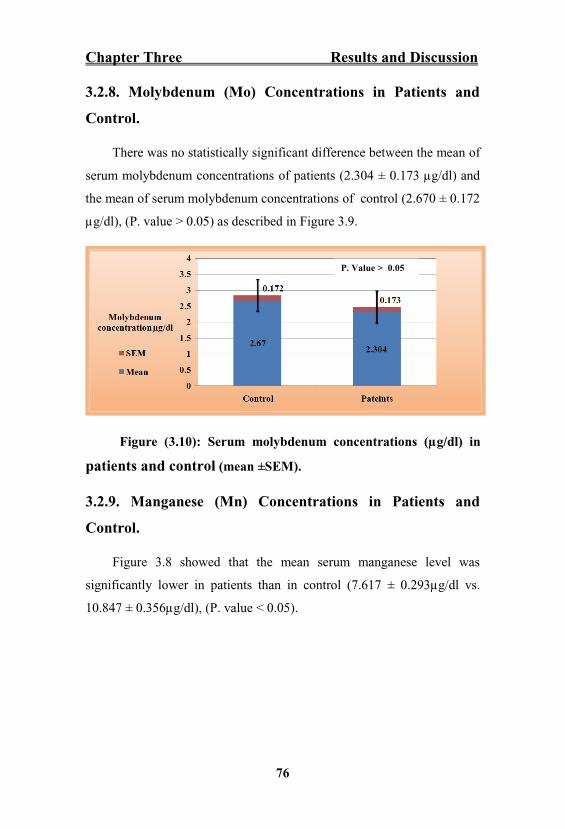
Chapter Three Results and Discussion
76
3.2.8. Molybdenum (Mo) Concentrations in Patients and
Control.
There was no statistically significant difference between the mean of
serum molybdenum concentrations of patients (2.304 ± 0.173 µg/dl) and
the mean of serum molybdenum concentrations of control (2.670 ± 0.172
µg/dl), (P. value 0.05) as described in Figure 3.9.
Figure (3.10): Serum molybdenum concentrations (µg/dl) in
patients and control (mean ±SEM).
3.2.9. Manganese (Mn) Concentrations in Patients and
Control.
Figure 3.8 showed that the mean serum manganese level was
significantly lower in patients than in control (7.617 ± 0.293µg/dl vs.
10.847 ± 0.356µg/dl), (P. value < 0.05).
P. Value 0.05

Chapter Three Results and Discussion
77
Figure (3.11): Serum manganese concentrations (µg/dl) in
patients and control (mean ±SEM).
Several studies reported that low level of manganese in serum may
cause accumulation of superoxides which could consequently trigger
preeclampsia and its complications Hofmeyr G, et al [152] Lou G, et al.
[153]. Results of this study agree with earlier findings by Mohammed K,
et al. [ 132] Ohad K, et al. [154].
Another mechanism by which manganese deficiency is involved in
the pathogenesis of pre-eclampsia is through impairment of endothelial
function. Manganese is an active element with arginine which is the
precursor of the key determinant of endothelial function, nitric oxide, due
to its function in the increase of smooth muscle relaxation, endothelial
cell proliferation, decrease in endothelin-1-release, leukocyte adhesion,
platelet aggregation, superoxide production, expression of monocytes
chemotactic peptides, proliferation of smooth muscle cells and
endothelial cell apoptosis [153]. Thus, reduction in serum manganese
concentration in the blood of pre-eclamptic pregnant women as reported
in the current study may be a cause rather than a resultant effect.
P. Value < 0.05


Chapter Four References
81
9. Seely E , Ecker J. Chronic hypertension in pregnancy. The new England
journal of medicine 2011; 365(5):439-46.
10. Meads C, Cnossen J, Meher S. Methods of prediction and prevention of
pre-eclampsia: systematic reviews of accuracy and effectiveness literature
with economic modelling. Health Technol Assess 2008; 12(6):1-2.
11. Sibai B. Diagnosis and management of gestational hypertension and
preeclampsia. Obstet Gynecol. 2003; 102:181 192.
12. Elisabeth B, Lars J, Tom L. Pre pregnancy cardiovascular risk factors as
predictors of pre-eclampsia: population based cohort study. British Medical
Journal 2007; 335: 978-981.
13. Baker P, Kenny L. Pre-eclampsia and other disorders of placentation.
Obstetrics by ten teachers. HODDER ARNOLD. 19th edition. 2011. Chapter
10. 120-131.
14. Verghese L, Alam S, Beski S. Antenatal screening for pre-eclampsia:
Evaluation of the NICE Antenatal screening for pre-eclampsia: Evaluation of
the NICE and preeclampsia community guidlines. Journal of Obstetrics and
Gynecology 2012; 32: 128 129.
15. Lindheimer M, Talor S, Cunningham F. Hypertensive disorder in
pregnancy .J Am Soc Hyper 2009; 6:484.
16. Redman C, Sargent I. Circulating microparticles in normal pregnancy and
preeclampsia. Placenta 22 (suppl A) 2008; S73.
17. Powe C, Levine R, Karumanchi S. Pre-eclampsia, a Disease of the
Maternal Endothelium the Role of Antiangiogenic Factors and Implications
for Later Cardiovascular Disease. Circulation 2011; 123: 2856-2869.
Chapter Four References
82
18. Baker P. Disorders of placentation. Obstetrics by ten teachers. HODDER
ARNOLD. 18th edition. 2006. Chapter 13. 156-170.
19. Labarrere C. Histopathological hallmark of immune aggression. Placenta
1988; 9:108.
20. Bdolah Y, Palomaki GE, Yaron Y. Circulating angiogenic proteins in
trisomy 13.Am J Obstet Gynecol 2006; 194(1):239.
21. Ward K , Lindheimer M. Genetic factors in the aetiology of
preeclampsia/eclampsia. In Lindheimer MD, Roberts JM, Canningham FG,
Eds: chesley s Hypertensive Disorders of pregnancy, 3rd ed. New York,
Elsevier. In press, 2009; 51.
22. Gervasi M, Chaiworapongsa T, Pacora P. Phenotypic and metabolic
characteristics of monocytes and granulocytes in preeclampsia. Am J Obstet
Gynecol 2001; 185:792.
23. Manten G, Van der Hoek Y, Marko J. The role of lipoprotein (a) in
pregnancies complicated by preeclampsia. Med Hypotheses 2005; 64:162.
24. Nilsson E, Ros H, Cnattinggius S. The importance of genetic and
environmental effects for preeclampsia and gestational hypertension: A
family study. Br J Obstet Gynecol 2004; 111:200.
25. John J, Ziebland S, Yudkin P. Effect of fruit and vegetable consumption
on plasma antioxidant concentrations and blood pressure: Arondomized
controlled trial. Lancet 2002; 359:1969.
26. Zhang C, Williams M, King I. Vitamin C and the risk of preeclampsia-
results from dietary questionnaire and plasma assay. Epidemiology 2002;
13:382.

Chapter Four References
83
27. Villar J, Hany A, Merialdi M. World Health Organization randomized
trial of calcium supplementation among low calcium intake pregnant women.
Am J Obstet Gynecol 2006; 194:639.
28. David A. Hypertensive in pregnancy. In: Alan HD, Lauren N, Neri L, eds.
Current Diagnosis & Treatment Obstetrics & Gynecology.10th Ed. New York;
McGraw-Hill, 2007:p322.
29. Lony C. hypertensive disorders of pregnancy. Essentials of obstetrics and
gynecology.5th ed. Philadelphia; Saunders Elsevier, 2010: p 174.
30. Norwitz E, Hsu C, Repke J. Acute complications of preeclampsia. Clin
Obstet Gynecolo.2002; 45:308-29.
31. Brunner S. Preeclampsia. In: Marilyn Sawyer sommers . Diseases and
disorders: a nursing therapeutics manual .4th ed. philadelphia ; F.A. Davids
company, 2011:P 825.
32. Campbell S and Lees C. Disorders of placentation. Obstetrics by ten
teachers. ARNOLD. 17th edition. 2000. Chapter 11. 157-174.
33. Satyanarayana U, Chakrapani U. Mineral Metabolism. Biochemistry.
ELSEVIER. 4th edition. 2013. Chapter 18. 403-424.
34. Vasudevan D, Sreekumari U, Vaidyanathan K. Mineral Metabolism and
Abnormalities. Textbook of Biochemistry for Medical Students. JAYPEE. 6th
edition. 2011. Chapter 35. 411-431.
35. Tietz N. Trace elements. Fundamentals of clinical chemistry.
SAUNDERS. 3th edition. 1987. Chapter 17. 517-532.
36. Al-Jameil N, Tabassum H, Al-Mayouf H. Analysis of serum trace
elements-copper, manganese and zinc in preeclamptic pregnant women by
inductively coupled plasma optical emission spectrometry: a prospective case

Chapter Four References
84
controlled study in Riyadh, Saudi Arabia. Int J Clin Exp Pathol. 2014; 7(5):
1900 1910.
37. Black R. Micronutrients in pregnancy. Br J Nutr. 2001; 85: 193 197.
38. Rathore S, Gupta A, Batra H. Comparative study of trace elements and
serum ceruloplasmin level in normal and pre-eclamptic pregnancies with their
cord blood. Biomed Res. 2011; 22:207 10.
39. James D, Seely P, Weiner C. High risk pregnancy: management
options. 3rd edition. Philadelphia: Sauders; 2006. pp. 920 5.
40. Caughey A, Stotland N, Washington A. Maternal ethnicity, paternal
ethnicity and parental ethnic discordance: Predictors of pre-eclampsia. Obstet
Gynecol. 2005; 106:156 61.
41. Farzin L , Sajadi F. Comparison of serum trace element levels in patients
with or without pre-eclampsia. J Res Med Sci. 2012 Oct; 17(10): 938 941.
42. Chatterjea M , Shinde R. Metabolism of minerals and trace elements.
Textbook of Medical Biochemistry. ELSEVIER. 8th edition. 2012. Chapter
34. 607-634.
43. Prakash M. Role of non transferrin bound iron in chronic renal failure
and other disease conditions. Indian Journal of Nephrology. 2007; 17(4): 188-
193.
44. Sabitha A , Kandi S. Role of Antioxidant Enzymes in Glucose and Lipid
Metabolism in Association with Obesity and Type 2 Diabetes. American
Journal of Medical Sciences and Medicine (2014): 2(1); 21-24.
45. Osredkar J and Sustar N. Copper , Zinc, Biological Role and Significance
of Copper/Zinc Imbalance. J Clinic Toxicol 2011: S3:001.
Chapter Four References
85
46. Christian P, Keith P, Interactions between zinc and vitamin A. Am J Clin
Nutr 1998; 68:435 41.
47. Kiser P, Golczak M, Palczewski K. Chemistry of the Retinoid (Visual)
Cycle. Chem Rev. 2014:8; 114(1): 194 232.
48. Lee H, Prasad A, Brewer G. Zinc absorption in human small intestine.
The American Physiological Society 1989: 256 (1); 87-91.
49. Akhtar S, Ur-Rehman Z, Anjum F. Bioavailability of Iron and Zinc
Fortified Whole Wheat Flour in Rats. Pakistan J. Zoo 2010: 42(6); 771-779.
50. Wood R , Zheng J. High dietary calcium intakes reduce zinc absorption
and balance in humans. Am J Clin Nutr1997:65(6); 1803-9.
51. Maret W , Vallee B. Thiolate ligands in metallothionein confer redox
activity on zinc clusters. Proc. Natl. Acad. Sci 1998: 95; 3478 3482.
52. Fukada T, Yamasaki S, Nishida K. Zinc homeostasis and signaling in
health and diseases: zinc signaling. J. Biol. Inorg. Chem., 2011, 16, 1123-
1134.
53. Hojyo S, Fukada T, Shimoda S. The zinc transporter SLC39A14/ZIP14
controls G-protein coupled receptor-mediated signaling required for systemic
growth. PLoS One., 2011, 6(3), e18059.
54. Bader A, Hussain T, Mosawi M. Serum zinc and copper concentrations in
pregnant women from Kuwait. J. Trace. Elem. Exp. Med., 1997: 10; 209-215.
55. Jain S, Sharma P, Kulshreshtha S. The role of serum calcium, magnesium,
and zinc in pre-eclampsia. Biol. Trace elem. Res., 2010, 133(2), 162-170.

Chapter Four References
86
56. Bahadoran P, Zendehdel M, Movahedian A. The relationship between
serum zinc level and pre-eclampsia. Iran J. Nurs. Midwifery Res., 2010, 15,
120-124.
57. Brophy M, Harris N, Crawford I. Elevated copper and lowered zinc in the
placenta of pre-eclamptic. Clin. Chim. Acta, 1985, 145, 107-11.
58. Diaz E, Halhali A, Luna C. Newborn birth weight correlates with
placental zinc, umbilical insulin-like growth factor I, and leptin levels in
preeclampsia. Arch. Med. Res., 2002, 33, 40-7.
59. Akinloye O, Oyewale O, Oguntibeju O. Evaluation of trace elements in
pregnant women with pre-eclampsia. Afr. J. Biotechnol., 2010, 9(32), 5196-
5202.
60. Ugwuja E, Ejikeme B, Ugwuja N. Comparison of Plasma Copper, Iron
and Zinc Levels in Hypertensive and Non-hypertensive Pregnant Women in
Abakaliki, South Eastern Nigeria. Pak J. Nutr., 2010, 9, 1136-40.
61. Nbofung C, Atinmo T, Omololu A. Neonatal, maternal and intrapartum
factors and their relationship to cord and maternal plasma trace element
concentration. Biol. Trace Elem. Res., 1986, 9, 209.
62. Rahnama M, Marciniak A. Influence of estrogen deficiency on the level
of magnesium in rat mandible and teeth. Bull. Vet. Inst. Pulawy 2002: 46;
267-271.
63. Hanley-Trawick S, Carpen M, Dunaway-Mariano D. Investigation of the
substrate structure and metal cofactor requirements of the rat liver
mitochondrial ATP synthase/ATPase complex. Arch Biochem Biophys. 1989
Jan; 268(1):116-23.

Chapter Four References
87
64. Foldes F, Chaudhry I, Kinjo M. Inhibition of mobilization of
acetylcholine: the weak link in neuromuscular transmission during partial
neuromuscular block with d-tubocurarine. Anesthesiology 1989; 71(2):218-
23.
65. Rude R. Magnesium. Encyclopedia of Dietary Supplements. 2nd Ed. New
York, NY: Informa Healthcare; 2010:527-37.
66. Fine K, Santa-Ana C, Porter J. Intestinal absorption of magnesium from
food and supplements. J Clin Invest. 1991; 88(2): 396 402.
67. Moe S. Disorders Involving Calcium, Phosphorus, and Magnesium. Prim
Care. 2008; 35(2): 215 VI.
68. Swaminathan R. Magnesium Metabolism and its Disorders. Clin Biochem
Rev. 2003 May; 24(2): 47 66.
69. Hess M, Hoenderop J, Bindels R. Hypomagnesaemia induced by proton
pump inhibition. Aliment Pharmacol Ther. 2012 Dec; 36(11-12):1109.
70. Unterbuchner C, Ziegledder R, Graf B. Magnesium induced
recurarisation after reversal of rocuronium-induced neuromuscular block with
sugammadex. Acta Anaesthesiologica Scandinavica 2015: 59(4); 536 540.
71. Langley A , Charles T. Copper and Anesthesia: Clinical Relevance and
Management of Copper Related Disorders. Hindawi Publishing Corporation
2013; 2013:1-10.
72. Jaiser S , Winston G. Copper deficiency myelopathy: Review. J Neurol.
2010; 257:869 81.
73. Ziael S, Ranjkesh F, Faghihzadeh S. Evaluation of 24-hourcopper in pre-
eclamptic vs. normotensive pregnant and non-pregnant women. Int J Fertil
Steril. 2008; 2:9 12.

Chapter Four References
88
74. Giles E , Doyle L. Copper in extremely low-birth weight or very preterm
infants. Am Acad Pediatr.2007; 8:159 64.
75. Marshall W, Lapsley M, Day A. Clinical biochemistry of nutrition.
Clinical Biochemistry. ELSEVIER. 3th edition. 2014. Chapter 10. 180-199.
76. Fang Y, Yang S, Wu G. Free radicals, antioxidants, and nutrition.
Nutrition, 2002, 18, 872-879.
77. Ilhan N, Simsek M. The changes of trace elements, malondialdehyde
levels and superoxide dismutase activities in pregnancy with or without
preeclampsia. Clin. Biochem. 2002, 35, 393-397.
78. Ala A, Walker A, Ashkan K. Wilson's disease. Lancet 2007:369 (9559);
397 408.
79. Tümer Z , Møller L. Menkes disease. Eur J Hum Genet. May 2010;
18(5):511-8.
80. Zhang Y, Rodionov D, Gelfand M. Comparative genomic analyses of
nickel, cobalt and vitamin B12 utilization. BMC Genomics 2009:10(78); 1-
26.
81. Frey B, McCloskey J, Kersten W. New function of vitamin B12:
cobamide-dependent reduction of epoxyqueuosine to queuosine in tRNAs of
Escherichia coli and Salmonella typhimurium. J. Bacteriol. 1988: 170 (5);
2078-2082.
82. Tsay T, Chen M, Oyen O. The effect of cobalt-60 irradiation on bone
marrow cellularity and alveolar osteoclasts. Proc Natl Sci Counc Repub China
B. 1995; 19(3):185-95.
83. Simonsen L, Brown A, Harbak H. Cobalt uptake and binding in human
red blood cells. Blood Cells Mol Dis. 2011 Apr 15; 46(4):266-76.

Chapter Four References
89
84. Sesso R, Iunes Y, Melo A. Myeloneuropathy following nitrous oxide
anesthesia in a patient with macrocytic anaemia.Neuroradiology1999; 41(8):
588-590.
85. European Food Safety Authority (EFSA). Scientific Opinion on the use of
cobalt compounds as additives in animal nutrition. EFSA Journal 2009;
7(12):1-45.
86. Wilcox H , Fried M. Studies on rat-liver glycylglycine dipeptidase.
Biochem J. 1963; 87(1): 192 199.
87. Gál J, Hursthouse A, Tatner P. Cobalt and secondary poisoning in the
terrestrial food chain: Data review and research gaps to support risk
assessment. Environment International 2008; 34 (6): 821 838.
88. Vanek V, Buchman A, Howard L. Recommendations for Changes in
Commercially Available Parenteral Multivitamin and Multi Trace Element
Products. Nutrition in Clinical Practice 2012: 20(10) ; 1-53.
89. Crook A. Vitamins, trace elements and metals. Clinical chemistry and
metabolic medicine. HODDER ARNOLD. 8th edition. 2012. Chapter 15.
224-234.
90. Anderson R .Chromium and insulin resistance. Nutrition Research
Reviews 2003: 16; 267 275.
91. Arita A , Costa M. Epigenetics in metal carcinogenesis: Nickel, Arsenic,
Chromium and Cadmium. Metallomics. 2009; 1: 222 228.
92. Nordberg G, Nogawa K, Nordberg M. Cadmium. Handbook on the
Toxicology of Metals. Amsterdam; Boston, MA: Academic Press; 2007:445-
486.

Chapter Four References
90
93. Herold D , Fitzgerald R. Chromium. In: Seiler H, Sigel A, Sigel H, eds.
Handbook on Metals in Clinical and Analytical Chemistry. New York, NY:
Marcel Dekker; 1994: 321-332.
94. Offenbacher E , Pi-Sunyer FX. Chromium in human nutrition. Ann Rev
Nutr. 1988; 8:543-563.
95. Shenkin A, Baines M, Lyon T. Vitamins and trace elements. Textbook of
Clinical Chemistry and Molecular Diagnostics. Philadelphia, PA: Elsevier
Saunders; 2006:1075-1164.
96. Uusitupa M, Mykkänen L, Siitonen O. Chromium supplementation in
impaired glucose tolerance of elderly: effects on blood glucose, plasma
insulin, C-peptide and lipid levels.Br J Nutr. 1992; 68(1):209-16.
97. Hummel M, Standl E, Schnell O. Chromium in metabolic and
cardiovascular disease. Horm Metab Res. 2007; 39(10):743-51.
98. Rahman K. Studies on free radicals, antioxidants, and co-factors. Clinical
Interventions in Aging 2007:2(2); 219 236.
99. Burdon R. The Suffering Gene: The main defense forces Environmental
Threats to Our Health. McGill-Queen's University Press. 2nd edition. 2003.
Chapter 9. 113-120.
100. Mykkanen H , Humaloja T. Intestinal Absorption of 75Se-Labeled
Sodium Selenide and Selenomethionine in Chicks: Effects of Time, Segment,
Selenium Concentration and Method of Measurement. JN the journal of
nutrition 1986:142-148.
101. Ashton K, Hooper L, Harvey L. Methods of assessment of selenium
status in humans. Am J Clin Nutr 2009; 89:2025 39.

Chapter Four References
91
102. Johanssona L, Gafvelinb G, Elias S. Selenocysteine in proteins
properties and biotechnological use. Biochimica et Biophysica Acta
2005:1726; 1 13.
103. Sardesai V. Inorganic Elements (Minerals). Introduction to clinical
nutrition. CRC Press. 3rd edition. 2012. Chapter 6. 103-147.
104. Liu Y, Chiba M, Inaba Y. Keshan disease-a review from the aspect of
history and etiology. Nihon Eiseigaku Zasshi 2002; 56(4):641-8.
105. Schepman K, Raoul H, Engelbert H. Kashin Beck Disease: more than
just osteoarthrosis. Int Orthop. 2011 May; 35(5): 767 776.
106. Turnlund J, Friberg L. Molybdenum. Handbook on the Toxicology of
Metals. Amsterdam; Boston, MA: Academic Press; 2007:731-741.
107. Tsongas T. Molybdenum in the diet: an estimate of average daily intake
in the United States. American Journal of Clinical Nutrition 1980, 33:1103
1107.
108. Anke M, Giel M. Molybdenum. Handbook on Metals in Clinical and
Analytical Chemistry. New York, NY: Marcel Dekker; 1994; 495-501.
109. Jacobs D, DeMott W, Oxley D. Jacobs & DeMott Laboratory Test
Handbook. 5th ed. Lexi-
Lexi-Comp; 2001:1031.
110.
Metals. Amsterdam; Boston, MA: Academic Press; 2007:645-674.
111. Kaiser J. State Court to rule on manganese fume claims. Science (New
York, NY). 2003; 300(5621):927.

Chapter Four References
92
112. Donaldson J. The physiopathologic significance of manganese in brain:
its relation to schizophrenia and neurodegenerative disorders.
Neurotoxicology. 1987; 8(3):451-462.
113. Bolann B, Rahil-Khazen R, Henriksen H. Evaluation of methods for
trace-element determination with emphasis on their usability in the clinical
routine laboratory. Scand J Clin Lab Invest. 2007; 67(4):353-66.
114. Burnett D , Crocker J. The science of laboratory diagnosis, 2nd
edition . Jone Wiley &Sons Ltd, USA ,2005 : pp 374-380.
115. Jaffe J. Phisiol. Chem., 10, 391, 1886.
116. Bauer J. Haemoglobin, porphyrin, and iron metabolism. In: Kaplan LA,
PesceA J, ed. Clinical Chemistry, theory, analysis, and correlation. ST. Louis:
Mosby Company: 1984:611-655.
117. Johnsen R. Evaluation of a commercially available kit for the
colorimetric determination of zinc. International Journal of Andrology. 1987;
10 (2): 435-440.
118. Young D. Effect of Drugs on Clinical laboratory Tests, 4th Ed. (1995)
410-414.
119. Selvaraju R, Ganapathi Raman R, Narayanaswamy R, Valliappan R,
Baskaran R. Trace element analysis in hepatitis B affected human blood
serum by inductively coupled plasma atomic emission spectroscopy.
Romanian J. Biophys., Vol. 19, No. 1, P. 35 42, Bucharest, 2009.
120. Mustafa R, Ahmed S, Gupta A. A Comprehensive Review of
Hypertension in Pregnancy. Journal of Pregnancy 2012. Volume 2012:
Article ID 105918; 1-19.

Chapter Four References
93
121. Mohanty S, Nayak N, Nanda N. Serum lipids and malondialdehyde
levels in primiparous patients with pregnancy induced hypertension. Indian
Journal of Clinical Biochemistry. 2006; 21(1): 189-192.
122. Zafar T , Iqbal Z. Iron status in pre eclampsia. Journal of professional
Medicine. 2008; 15(1): 74-80.
123. Vitoratos N, Salamalekis E, Dalamaga N. Defective antioxidant
mechanisms via changes in serum ceruloplasmin and total iron binding
capacity of serum in women with pre eclampsia. European Journal of
Obstetrics and Gynecology& Reproductive Biology 1999; 84(1): 63-67.
124. Hubel C, Boberts J, Tayler R. Lipid peroxidation in pre eclampsia; a new
prospectives on pre eclampsia. American journal of Obstetrics and
Gynecology. 1989; 161: 1025-1034.
125. Osman R, Modawe G, AbdElkarim A. Assessment of Iron Status in
Pregnant Ladies with Pre-eclampsia. International Journal of Research in
Pharmacy and Biosciences 2015: 2(2); 8-11.
126. Hameed R , Aboud W. Total Iron Binding Capacity (TIBC), free Iron ,
Ceruloplasmin, Transferrin and ferritin concentration, in pregnant women
with pre-eclampsia. Magazine of Al-Kufa University for Biology 2013: 5(2);
ISSN: 2073-8854.
127. Tamura T, Goldenberg R, Johnston K. Maternal plasma zinc
concentrations and pregnancy outcome. Am J Clin Nutr. 2000; 71:109 113.
128. Bassiouni B, Foda F, Rafei A. Maternal and fetal plasma zinc in
preeclampsia. Eur J Obstet Gynecol Reprod Biol 1979; 9: 75-80.
129. Yousef M, El Hendy H, El-Demerdash F. Dietary zinc deficiency
induced changes in the activity of enzymes and the levels of free radicals,

Chapter Four References
94
lipids and protein electrophoretic behavior in growing rats. Toxicology 2002;
175: 223-234.
130. Ihan N , Simsek M. The changes of trace elements, malondialdehyde
levels and superoxide dismutase activities in pregnancy with or without
preeclampsia. Clin Bioch, 2002; 35: 393-7.
131. Açikgoz S, Harma M, Mungan G. Comparison of angiotensin-converting
enzyme, malonaldehyde, zinc, and copper levels in preeclampsia. Biol Trace
Elem Res. 2006; 113(1):1-8.
132. Mahomed K, Williams M, Woelk G. Leckocyte selenium, zinc and
copper concentrations in pre-eclampsia and normotensive pregnant women.
Biol. Trace Elem. Res.2004; 75: 107-118.
133. Adeniyi A. The implication of hypozincemia in pregnancy. Acta Obstet
Gynecol Scand 1987; 66: 579-581.
134. Sarwar M, Ahmed S, Shahid Ullah M. Comparative study of serum
zinc, copper, manganese and iron in preeclamptic pregnant women. Biol.
Trace Elem. Res2013. 154, 14 20.
135. Lu J , Nightingale C. Magnesium sulphate in eclampsia and pre-
eclampsia: pharmacokinet principles. Clin. Phamacokinet 2000. 38: 304-314.
136. Nourmohammadi I, Akbaryan A, Fatemi S. Serum zinc concentration in
Iranian preeclamptic and normotensive pregnant women. Middle East J. Fam.
Med 2008: 6 (4), 30 32.
137. Touyz R. Role of magnesium in pathogenesis of hypertension. Mol
Aspects Med. 2003; 24:107 36.

Chapter Four References
95
138. Kumru S, Aydin S, Simsek M. Comparison of Serum Copper, Zinc,
Calcium, and Magnesium Levels in Pre-Eclamptic and Healthy Pregnant
Women. Biol Trace Elem Res. 2003; 94:105 12.
139. Al-Rubaye F. Trace Elements Homeostasis in Preeclampsia. IRAQI J
MED SCI, 2009; 7 (2):116-123.
140. Prohaska J , Brokate B. Lower copper, zinc superoxide dismutase protein
but not mRNA in organs of copper-deficient rats. Arch Biochem Biophys
2001; 393: 170-176.
141. Vigeh M, Yokoyama K, Ramezanzadeh F. Lead and other trace metals in
pre-eclampsia: a case control study in Tehran, Iran. Environ Res 2006; 100:
268 275.
142. Fuqua B, Vulpe C, Anderson G. Intestinal iron absorption. J Trace Elem
Med Biol. 2012;26(2-3):115- 119.
143. Nemeth E. Iron regulation and erythropoiesis.CurrOpinHematol.2008;
15:169-175.
144. Pechov A , Pavlata L. Chromium as an essential nutrient: a review.
Veterinarni Medicina 2007. 52; (1): 1 18.
145. Ani M, Moshtaghie A. The effect of chromium on parameters related to
iron metabolism. Biological Trace Element Research 1992; 32: 57 64.
146. Lukaski H, Siders W, Penland J. Chromium picolinate supplementation
in women: effects on body weight, composition, and iron status. Nutrition
2007; 23(3):187-195.
147. Anderson R, Bryden N, Polansky M. Dietary chromium effects on tissue
chromium concentrations and chromium absorption in rats. Journal of Trace
Elements in Experimental Medicine1996; 9: 11 25.

Chapter Four References
96
148. Witztum J. The oxidation hypothesis of atherosclerosis. Lancet 2001;
344:793 795.
149. Rayman M, Bode P, Redman C. Low selenium status is associated with
the occurrence of the pregnancy disease preeclampsia in women from the
United kingdom. Am J Obstet Gynaecol. 2003;189:134 9.
150. Rayman M, Abou-Shakra F, Ward N. Comparison of selenium levels in
pre-eclamptic and normal pregnancies. Biological Trace Element Research
1996. 55(1-2): 9-20.
151. Mistry H, Wilson V, Margret M. Reduced Selenium Concentrations and
Glutathione Peroxidase Activity in Pre-eclamptic Pregnancies. Hypertension
2008; 52:881-888.
152. Hofmeyr G, Duley L, Atallah A. Dietary calcium supplementation for
prevention of pre-eclampsia and related problems: a systematic review and
commentary. Br J Obstet Gynaecol 2007; 114: 933-943.
153. Lou G, Amirabi A, Yazdian M. Evaluation of serum calcium,
magnesium, copper and zinc levels in women with pre-eclampsia. Iran J Med
Sci 2008; 33: 231-234.
154. Ohad K, Tal O, Lazer T. Severe preeclampsia is associated with
abnormal trace elements concentrations in maternal and foetal blood. Am J
Obstet Gynecol 2009; 201: 280-281.