Embed Size (px)
Citation preview

Journal o f Applied Geophysics, 30 ( 1993 ) 149-160 149 Elsevier Science Publishers B.V., Amsterdam
Zoning of the Italian territory in terms of expected peak ground acceleration derived from complete synthetic seismograms
Giovanni Costa a, Giuliano Francesco Panza a'c, Peter Suhadolc a and Franco Vaccar i a'b'l alstituto di Geodesia e Geofisica, Universitit degli Studi di Trieste, Via dell'Universiti~ 7, 34100 Trieste, Italy
bCNR, Gruppo Nazionale per la Difesa dai Terremoti, Roma, Italy Clnternational Center for Theoretical Physics, Strada Costiera 11, 34100 Trieste, Italy
(Accepted after revision September 30, 1992)
ABSTRACT
Costa, G., Panza, G.F., Suhadolc, P. and Vaccari, F., 1993. Zoning of the Italian territory in terms of expected peak ground acceleration derived from complete synthetic seismograms. In: R. Cassinis, K. Helbig and G.F. Panza (Editors), Geo- physical Exploration in Areas of Complex Geology, II. J. Appl. Geophys., 30:149-160.
An automatic procedure for the seismic zonation of a territory is presented. The results consist of deterministic compu- tation of acceleration time series distributed on a regular grid over the territory. For the estimation of the accelerations, complete synthetic seismograms are computed by the modal summation technique. A first rough zonation can be accom- plished by considering a map showing the distribution of peak ground acceleration. In this work the new procedure has been applied to the Italian territory. The structural and source models necessary to compute the synthetic signals have been fixed after an extensive bibliographic research. Seismogenic areas have been defined in the framework of the GNDT (Gruppo Nazionale per la Difesa dai Terremoti of the Consiglio Nazionale delle Ricerche, Rome) research activities dedicated to the definition of the kinematic model of Italy. Information on historical and recent seismicity has been taken from the most updated Italian earthquake catalogues. The estimated peak ground accelerations have been found to he compatible with available data, both in terms of intensity (historical earthquakes) and accelerations (recent earthquakes).
Introduction
The zonation of a territory in terms of se- ismic hazard is an essential preventive coun- termeasure in countries with high seismic risk, especially for densely populated areas. Maxi- m u m expected peak ground acceleration (PGA), at different frequencies, is a very im- portant parameter considered by civil engi- neers when designing or reinforcing constructions.
We have developed a deterministic proce- dure which allows us to estimate PGA (rou- tinely at frequencies as high as 10 Hz) starting from the available information on Earth struc-
tAuthors listed in alphabetical order.
ture parameters, seismic sources, and the level of seismicity of the investigated area. Theoret- ical accelerations are computed by the modal summation technique (Panza, 1985; Florsch et al., 1991 ). The use of synthetic seismograms allows us to estimate, in a realistic way, the se- ismic hazard, also in those areas for which scarce (or none) historical or instrumental in- formation is available. It is also possible to simulate quite easily different kinds of source mechanisms, to consider different structural models, and to compare the relative results in order to evaluate the influence of each param- eter. To reduce the amount of computations, the seismic sources have been grouped in ho- mogeneous seismogenic areas, and for each group the representative focal mechanism has
0926-9851/93/$06.00 © 1993 Elsevier Science Publishers B.V. All rights reserved.

150 G. COSTA ET AL.
] POLYGONS~ F O C A L SEISMOGENIC EARTHQUAKE REGIONA i _ MECHANISMS AREAS CATALOGUE ]
i
STRUCTURAL MODELS
I I
SEISMIC SOURCES
[ RECEIVERS
ASSOCIATED WITH EACH SOURCE
r TIME SERIES PARAMETERS
[ L
SYNTHETIC SEISMOGRAMS
I HORIZONTAL COMPONENTS
[
i
P-SV SYNTHETIC
SEISMOGRAMS
I
COMPONENT [ !
(a)
FOCAL MECHANISMS
OBSERVED EVENTS: - [ o c a t i o n o r i e n t a t i o n magnitude
EXTRACTION OF SIGNIFICANT PARAMETERS
FORTHE WHOLE SEISMOGENIC
AREA
t I
SEISMOGENIC SEISMIC1TY AREAS CATALOGUE
EXPECTED EVENTS OBSERVED EVENTb: k~cation - k ) c a t i c m
mo:hanism type - magnilude I
[
DISCRETIZE D AND SMOOTItE D
SEISMICITY
- - 7 ...................... i C H O I C E OF THE [ CHOICE OF l
REPRESENTATIVE MAXIMUM FOCAL MAGNITUDE
MECHANISM [
r t
[ I
I SEISMIC SOURCES ]
( b ) v
Fig. 1. (a)Flow-chart of the procedure. ( b ) D e t a i l con- cerning the definition of seismic sources.
been kept constant. The seismic moment as- sociated with each source is determined from the analysis of the maximum magnitude ob- served in the epicentral area in the past.
One way of representing the result of the procedure is to analyse the synthetic seismo- grams and to map the distribution of PGA over the investigated territory. The synthetic sig- nals used for the prediction of the accelera- tions can be conveniently used as input data for more detailed zoning, based on the 2-D modelling of wave propagation (F~ih et al., 1990; Iodice et al., 1992). In this way, also the local soil effects can be taken into account.
The flow-chart of the procedure is shown in Fig. 1. In the following text, references to the flow chart are written in italics.
Data
To compute the synthetic seismograms, the structures containing the source and the re- ceivers must be defined, as well as the source characteristics. On the basis of the geologic characteristics, the Italian territory has been divided into 16 polygons (Fig. 2 ). Then a fiat, layered structural model has been associated with each polygon. The different layers are de- scribed by their thickness, density, P- and S- wave velocities, and attenuation. The layering has been defined after an extensive biblio- graphic research, taking into account available DSS data (e.g. Schiitte, 1978; Italian Explosion Seismology Group and Institute of Geophysics ETH, 1981; Nicolich, 1981; Bottari et al., 1982; Miller et al., 1982; Kern and Schenk, 1985; Scarascia and Pellis, 1985; Nicolich, 1989; Ni- colas et al., 1990) and indirectly relevant data (e.g. Woollard, 1975 ).
The definition of the seismic sources has re- quired the analysis of several data sets. To limit the spatial distribution of sources, we have used the 57 seismogenic areas (see Fig. 3) defined by the GNDT ( 1992 ) on the basis of seismolog- ical data and seismotectonic observations (e.g. Patacca et al., 1993 ).

ZONING OF ITALY IN EXPECTED PEAK GROUND ACCELERATION FROM SYNTHETIC SEISMOGRAMS 151
6 8 10 12 14 16 18 20
40
38 ~
36 ~ --, I I 36 6 8 110 12 ll4 116 18 20
Fig. 2. Regional polygons associated with different struc- tural models. The grid of dots represent the location of the receivers where synthetic seismograms have been computed.
6 8 10 12 14 16 18 20 : i • ~ ~ : I , 48 48
46 - 46
44 44
1
38 38
36 6~ • 8 7 - ~ .... 10r • 12; ll4 16~ 118 20 36
Fig. 3. Seismogenic zones defined by G N D T ( 1 9 9 2 ) .
C= compressional areas; E = extensional areas; F = areas of fracture in foreland zones; T= transition areas; TP=areas of transpression; U=uncertain areas; V= volcanic areas.
For the definition of the source mecha- nisms, 305 fault-plane solutions, distributed over the whole territory, have been grouped in a database (Suhadolc, 1990; Suhadolc et al., 1992). The computer file contains a standard definition of the focal mechanisms, both as a function of strike, dip and rake of the nodal planes and as a function of the direction of compressional, tensional and null axes.
For the analysis of seismicity, an earthquake catalogue (PFGING) has been prepared, merg- ing the data from the PFG (1985) catalogue, for the period 1000-1979, with the data from XNG (1980-1991) bulletins, for the period 1980-1991. The original catalogues have been corrected for some obvious mistakes, like the presence of double or multiple events, time disorder and evident errors in the focal depths. Furthermore, only main shocks shallower than 50 km have been considered, removing after- shocks according to the algorithm suggested by Keilis-Borok et al. (1980).
We have considered only earthquakes that occurred within the PFG polygon (PFG, 1985 ). Therefore, the seismicity might be underesti- mated near political borders, and this could also have influenced the results (PGA distri- bution) in the regions close to these boundaries.
Computations
To derive the distribution of the maximum observed magnitude over the territory, the im- age of the seismicity given by the earthquake catalogue has been smoothed. At first, the area has been subdivided into 0.2 ° X 0.2 ° cells. Each cell has been assigned the magnitude value of the most energetic event that occurred within it. The smoothing obtained through this dis- cretization, however, was not found to be sat- isfactory, because not each cell does contain a statistically meaningful number of events. Therefore, the maximum magnitude to be as- sociated with each cell has been searched for also in the cell surroundings, through the ap-
152 G. COSTA ET AL
plication of a centred smoothing window. More details about the discretization and smoothing of seismicity are given in Appendix 1.
For the definition of the seismic sources that are used to generate the synthetic seismo- grams, only the cells located within a seismo- genic area are retained. The map shown in Fig. 4 is the result of the application of this method to the PFGING earthquake catalogue.
A double-couple point source is then placed
46
44
42
6 8 10 12
48
4 0 X ~ . . . . .7 40
14 16 18 20
' ' ' ) . - 48
. . . . 7 " 4 6
4 4
\ . : , . (
'~'\ 4 2
38 38
36 36
6 8 10 12 14 16 18 20
Fig. 4. Smoothed magnitude distribution for the cells be- longing to the seismogenic zones shown in Fig. 3.
TABLE 1
The moment-magnitude relation
Magnitude Mo ( ~ nz) ( N . m )
8.00~> M > 7.75 4.00X 10¹⁸ 7 .75 />M> 7.50 2.50X 10 Is 7.50~>M> 7.25 1.60X 10 ~s 7.25>~M> 7.00 1.25X10 TM
7.00>~M> 6.75 5.00X 10¹⁷ 6.75>~M> 6.50 3.15X10¹⁷ 6.50>~M> 6.00 1.60X 10¹⁷ 6.00>~M> 5.50 4.00X 10¹⁶ 5.50>~M> 5.00 1.40X 10¹⁶ 5.00>~M 4.00X 10¹⁵
48
6 8 10 ~2 14 16 t 8 20
48
46 . . . . . . . [ : ! i i i ! i i : i i i i ! ! ! ~ ~ " - - : - ~ 46
o ~ o o o , .~. ooooo . . . . . .
44 " " ~ 2 " ~ : : : : : : : : ~ ' ~ m 44
. . . . , , 00oo., .~
42
40
38
PGA g
4( (
C (
. . . . oou.ou~oo,~. ~- 42
) 38
o ~
36 36
Fig. 5. Estimated distribution o f horizontal peak ground acceleration.
TABLE 2
The intensity-acceleration relation
Intensity Acceleration '
cm-s -2 ~
Xll 492.5 0.50 Xl 370.9 0.38 X 284.4 0.29 IX 222.1 0.23 VIII t76.5 0.18 VII 142.9 0.15 VI 117.7 0.12 V 98.7 0.10 IV 84.3 0.09
~Estimates from Boschi et al., 1969.
in the centre of each cell. The orientation of the double couple associated with each source is obtained from the database of the fault-plane solutions. For each seismogenic area, a repre- sentative focal mechanism is selected through an automatic procedure. As a first simple hy- pothesis, the tensor elements of these mecha- nisms have been defined as the arithmetic av- erage of the tensor elements of the available

Z O N I N G O F I T A L Y I N E X P E C T E D P E A K G R O U N D A C C E L E R A T I O N F R O M S Y N T H E T I C S E I S M O G R A M S 153
P G A 0.1 g
] ~ P G A 0,1 - 0.2 g
4 [3 1 2 l b 21~
TE~IE (S)
Fig. 6. Comparison between NS acceleration recorded at the station of Sturno during the Irpinia earthquake of 23 November 1980 (above) and one synthetic signal com- puted for that area (below) on the basis of the procedure described in this work. Accelerations have been low-pass filtered with a cut-off frequency of I Hz.
6 8 10 12 14 16 18 20 48 ~ I ,___ I , i , L , _ I ' ~ ' 48
46 - 46
44 44
42 1 - 42
40 40
38_ -38
3 6 S - - ~ - / f ' ~ I 36 6 8 10 112 114 16 118 20
Fig. 7. Seismogenic zones given by GNDT as a preliminary result in the seismogenic zonation of the Italian territory. This model, that we refer to as Model A, must be com- pared with the one shown in Fig. 3. C=compressional areas; E = extensional areas; F = areas of fracture in fore- land zones; T= transition areas.
mechanisms. This procedure appears to be reasonable when the mechanisms are not too different to average, and this condition has been checked for each seismogenic area.
Once the structures and the sources have been defined, receivers are placed on a grid
6 8 10 12 14 16 18 20
' L
4 2 . . . . . . . . . 42
[ Magnitudo ' " - ' ~ ) ~
I . . . . , , o ~, / 40 40
i * 6 5 0 6 7 5
i o 6 O 0 6 5 0 I /
38 I - 5 5o 6 0 0 ~38 i
i 5 oo 5 5o s oo
6 8 10 12 14 16 16 20
Fig. 8. Smoothed magnitude distribution for the cells be- longing to the seismogenic zones shown in Fig. 7.
6 8 10 12 14 16 18 20 48 , I , _ I , I ~ I , I ' ~ ~ -48
46- • 46
44 44
I • 0 .30 0 .40 *o . * 0 2 0 0 3 0 ~, o. o O l O 0 .20 o . "
3 6 ~ - , I T I 7 - ' I ' - - I ' I ' 36
6 8 10 12 14 16 18 20
Fig. 9. Estimated distribution of the horizontal peak ground acceleration obtained using the seismogenic zones of Fig. 7. For a stability test it should be compared with Fig. 5.

154 G. COSTA ET AL.
6 8 10
48
46
44
42
40
38
z l - z 2
1o o 20
1 0 0 - O
20 0 "0
12 14 16 18 20
l
%
f \ _ \~
o~ y
4 8
4 6
4 4
4 2
' , 4 0
3 8
3 6 3 6
6 8 10 12 14 16 18 20
Fig. 10. Map of the relevant discrepancies between the PGA values shown in Figs. 5 and 9.
(0.2 ° X 0.2 o ) covering the whole territory and synthetic seismograms are efficiently com- puted by the modal summation technique (Panza, 1985; Florsch et al., 1991 ). In this first example, the synthetic signals are computed for an upper frequency content of 1 Hz, and the point-source approximation is still acceptable. This is fully justified by practical considera- tions, because, for instance, several-story buildings have a peak response in the fre- quency range below 1 Hz (e.g. Manos and De- mosthenous, 1992 ). When shorter periods are considered, it will be no longer possible to ne- glect the finite dimensions of the faults and the rupturing process at the source.
To reduce the number of the computed seis- mograms, the source-receiver distance is kept below an upper threshold, which is taken to be a function of the magnitude associated with the source. The maximum source-receiver dis- tance has been set equal to 25, 50, and 90 km for M < 6, 6 ~< M < 7 and M >/7, respectively. All seismograms have been computed for a con- stant hypocentral depth ( 10 km) , but it is also possible to assign to each source an average
depth determined from the analysis of cata- logues of past seismicity. The reason to keep the hypocentral depth fixed and shallow is to be found in the large errors affecting the hy- pocentral depth estimates in the PFG1NG cata- logue and in the fact that strong ground mo- tion is mainly controlled by shallow sources (e.g. Vaccari et al., 1990).
P-SV (radial and vertical components ) and SH (transverse component) synthetic seismo- grams are originally computed for a seismic moment of 1 X 10⁻⁷ N.m. The amplitudes are then properly scaled according to the (smoothed) magnitude associated with the cell of the source. For the moment -magni tude re- lation, we have chosen the one given by Boore ( 1987 ). To obtain the values given in Table 1, which are valid for the frequency of 1 Hz, we have used the scaling law proposed by Gusev (1983). The idea of a constant magnitude within each seismogenic area (choosing the maximum available value) has been discarded because, for the larger seismogenic areas, it leads to an over-estimation of the seismicity.
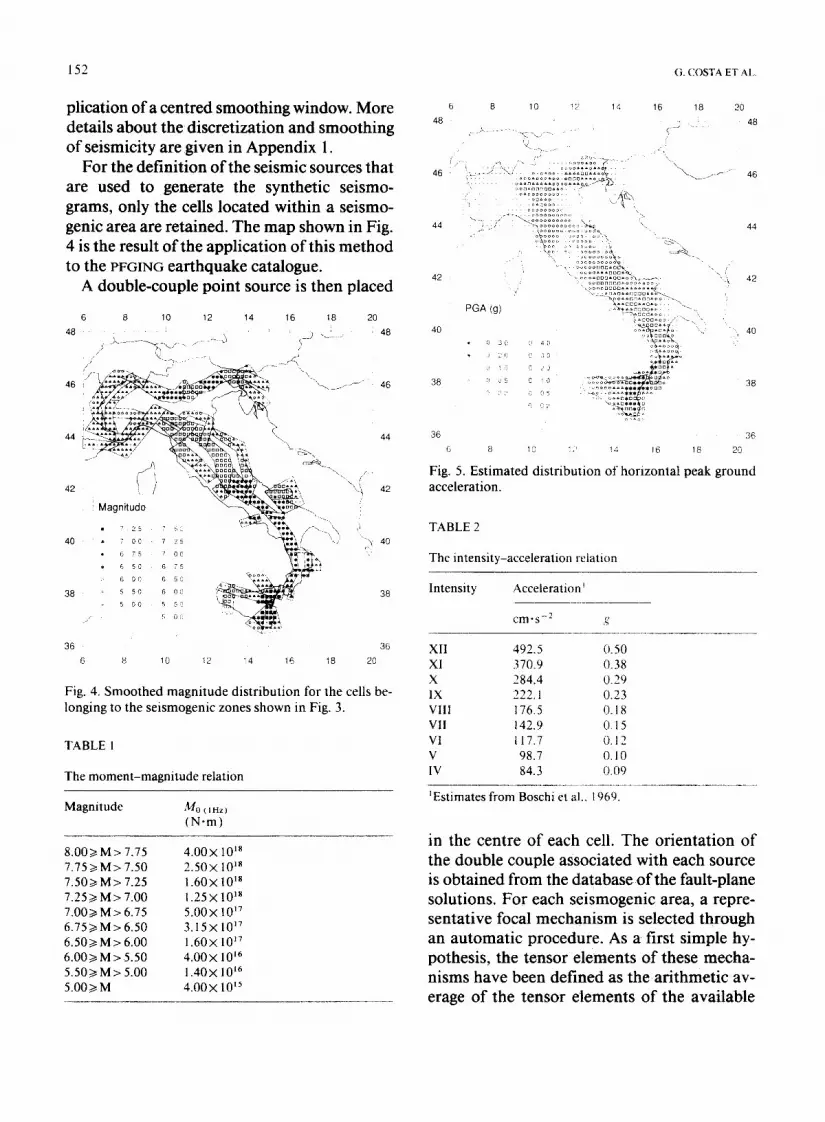
At each receiver, the horizontal components are first rotated to a reference system common to the whole territory (N-S- and E-W-direc- tions) and then the vector sum is computed. For the significant parameters representative of the strong ground motion we have, for the mo- ment, focused our attention on the peak ground acceleration values ( P(iA ). As we compute the complete time series, we are not limited to this choice, and it is also possible to consider other parameters, like Arias (1970) intensity or other integral quantities that can be of interest in seismic engineering. Because recordings of many different sources are associated to each receiver, but one single value is to be plotted on a map (Fig. 5 ), only the maximum value of the analysed parameter is considered.
Discussion and conclusions
The intensity-acceleration relation pro- posed by Boschi et al. ( 1969 ) has been used to

ZONING OF ITALY IN EXPECTED PEAK GROUND ACCELERATION FROM SYNTHETIC SEISMOGRAMS 15 5
o oloi01olololoi olo OlOlOlololol
Iol IololOlolololol Io lo lo lo lo lo l Iolol I I o l o l o l o l e l o l o l l
~ 1 o l IololelelOl Iol , . ~ ' 1 Io lo lo lo le lo l ° l ° l
n = I / I Iolol io lo lo lo lo l / I I o l o l o l o l o l o l o l o l
_ J - L - - M IoMoIoNoBoL L _1 Io lo lo lo lo lo lo l Iol
. I I Iol Io lo lo lo lo lo lo l /
• ' . ' : . - . ' . M.M4.014.~4.0M4.0~ol I01 I01010101010101 ~ I01 I01010101010101 "" " " ' . . . . • • 14.014.0l-1+.015.~4.014.014.0~01 I0101 I010101010101 - / ~ Io lo l IO101Olololol
, : ~ i : : ~ M Ma0M+013*0E0l Iol to lo lo lo lo lo lo l • 1 1 = Z Iol IolOlOlOlolOlOl • Iolololololel Iolol . . . . . . . . : . . . . . . Fol+.ol~q+01~oM-M~,01 I01ololololol Iolol I - I
i M M+0M+sM M 10l IolololOlol Iol lot I o le le le l t l Iol i . i+.oM4.o14.~4.0M3.+~.ol i iolo io lo lo lo lo l o I O - - - - - - - - I ~ I Io Io Io Io l t l l lO Io I F~4.0L4.01-t3.014.oM3914.0L [ lotol lololololol I lolol lolllololol [ _ M+.oM+.~+.0M+.sM i iolololololololo I I IololololOlolOloi
.- • f..:.x+. M.M+.0M+.0M+.0~.0t lot iololololololol ~ Ioi lolotolololOlol ' ." + . - M++01+.0M+.~4.0M-~+01 Iololololololol Jol ~ N ~ Iololololololol lot • - " . : . . . - . : M_M+.014.~..0140M4.01 Iol Iololololololol ~ rll=__ I j Iol Iololololololol
I'~] no ]'~4<M~ ~ "---I lot IolOlOlOlOloloi I l IolOI lOlOlOlOlOlol
I:Z]~ lil m~ I -~ ~ Iol lOlOlOlelOlOlOl '-'q F-" lolololOlOlOl IOlol
I I - - I IololOlOlOlOlOl I "~ r - - - ' ~ Iol IOlOlOlOlOl IOl
' - - ' ' U k l IololOlOlOlOlOlOl I l o l o l IOlOlolOlOl
o o o OlOlOlOlOl lo o o o 0 0 0 0 Iololololoi0101 I01 Iol IolololololOlol
a) b ) c ) d ) e)
Fig. 11. Discretization and smoothing of seismicity, a=dis t r ibu t ion of epicentres; b - d e f i n i t i o n of cells and choice of maximum magnitude; e = graphic representation of b; d = smoothing windows of radius n = 1, n = 2, n = 3; e = smoothed distribution of magnitude.
compare the results of Fig. 5 with the historical data, for which only macroseismic intensity estimates exist (see Table 2 ). We have checked that the computed PGA values are compatible with the above ment ioned relation.
A more quantitative check has been made using the observed accelerograms recorded during the Irpinia earthquake on 23 Novem- ber 1980. It is well known that the source rup- turing process of that event is very complex (e.g. Bernard and Zollo, 1989), and the di- mension of the source has been estimated to be of the order of several tens of kilometres. Nevertheless, it seems that the signal recorded at the station of Sturno is mostly due to a sin- gle sub-event that occurred rather close to the
station itself, while the energy contributions coming from other regions of the source seem irrelevant (Vaccari et al., 1990). We have low- pass filtered the NS accelerogram recorded at Sturno with a cut-off frequency at 1 Hz to compare it with one of the computed signals for the Irpinia region (Fig. 6 ). The early phases and the PGA of the two time series are in very good agreement. The late part of the observed recording is more complicated and this is re- lated to the complexity of the source, which has been neglected in the computat ion of the syn- thetic signal.
The definition of seismogenic structures of the Italian territory, given by GNDT ( 1982 ), is the final result of a fruitful cooperation be-

156 G. COSTA ET A L
E3o,, <4
I • 4<M.<_6
I ~ ] M>6
0 0 0 0 < 3 0 o
o o o l l o • !a •
0 o o o o 0 o 0 0 0
o 0 o 0 0
o o
l l l o l l l l I IOlOlOI I I I IolOlOI I I
I ,°,., I o l o ~ I IOlOIOl I IO~lol
IolOlolol IOlOlOlOI 11010101 Iioi Ioi II Ioloi
I o l i i i Iololoi I ] lOlOlOl I I Iolol I I Iololol
nelolol I n l iOlOlOl
I IololOl I I lolololol I I I nololol I I I ioi Ioi I I I 1o101
a) b)
Fig. 12. Hypothetical seismogenic zone (a) and its inter- section with the example data of Fig. 1 le (b).
tween structural geologists and seismologists from all over Italy. In developing the project, several proposals have been made and some provisional hypothesis have been considered. Taking advantage of those existing alterna- tives, it has been possible to test the stability of our results, namely the PGA distribution, ver- sus the distribution of seismogenic structures. Model A is one intermediate result of the GNDT project, as it does not include the Alpine Arc (Fig. 7) and can be compared with the more recent, presently accepted, model of Fig. 3, which was used to compute the PGA distribu- tion shown in Fig, 5. In the common regions, some relevant differences can be evidenced in the Lazio and Toscana regions, as well as in the
Gargano peninsula. Furthermore, in the more recent model, the Calabrian Arc is character- ised by a much more simplified zonation. The smoothed magnitudes associated with the seis- mogenic zones of Model A are given in Fig. 8. Figure 9 shows the P(~A distribution obtained using Model A and should be compared with Fig. 5. It can be noticed that in the common areas the regions where max imum accelera- tions are expected to occur are almost the same, and also the PGA values do not differ too much. Relevant discrepancies, between 0.1 and 0.2 g, can only be found in relation with the Cala- brian Arc (see Fig. 10) where, due to the larger spatial extension of seismogenic areas, Model A implies PGA values also in the class 0.40-0.50 g.
This comparison shows one important ad- vantage of the procedure, namely the possibil- ity of easily testing the influence of any param- eter that is used as input data. An important stability test will be performed as soon as the revised earthquake catalogue by GNDT will be available. Stability tests are currently being performed analysing the catalogues in differ- ent periods of time.
Appendix 1. Discret izat ion and smooth ing of se ismicity
The first problem to tackle in the definition of seismic sources is the handling of seismicity data. What is needed for the procedure de- scribed in this paper and will be used in the computat ion of synthetic seismograms is a dis- tribution over the territory of the max imum magnitude. Data available from earthquake catalogues are, on the contrary, discrete and punctual. Furthermore, a 2-dimensional dis- tribution requires a large amount of samples to be well determined, but earthquake catalogues are both incomplete and affected by errors, so a smoothed distribution is preferable (Panza et al., 1990). A smooth distribution can be misleading in the fact that it assignes some val- ues also to areas where data are absent. To

ZONING OF ITALY IN EXPECTED PEAK GROUND ACCELERATION FROM SYNTHETIC SEISMOGRAMS 157
8 10 12 14 16 18 20 48 ~ ~ ' 48
( iagn i tudo - - i • : : ~ , i i i ~ : ~ i ! i :. I':i
36 , ~ , ~ v" "~ "v 7 " ' ~ ' t " I 8 10 12 14 16 18 20
6 8 10 12 14 16 18 20 48 . . . . ~ ~ ' - ~ ' ~ ~ 4 8
46 i - : : . . ?~?Z . . . . . . ... ~ 46
44 i f 44
. . . . : iii i!ii : :
40 ~ \ ° ' % ~ / ' : / : ~ 40
~ ~/~ . . - " • L
3 6 ~ T i " . . . . . . " " " ' I I I 36 I 6 8 10 12 14 16 18 20
6 8 10 12 14 16 18 20 48 ' J ' I , ] ] I ~ I , I , 48
46- -46
44- 44
42 - 42
• 7 . 2 5 7 5 0 . • . . . . . . =~o o,
40- , 7.00 7 2 s " °°." ..0 . .. 40
o , . o o , , o : :Z : : ' ~ i ; !E ! !F : " , ,T;. ",. : • s so s oo • ~ "°°." . . . . .
/ . ( . " . . . . . . . . (c ) 36
36 I I I I 116 118 6 8 10 12 14 20
6 8 10 12 14 16 18 20 48 ~ ~ , , : . . . . . " . . . . " " " " ' /[ 48
o .. 42 i i 42
_ Magnitudo : , - i : ~ i ! i ! ; ~ ! i : o ~ i i t
1 ] ~ !~ I~ '~ • 6 7 5 7 O0 " .. .'~'~uo
~ ~ . o.'?. ! ° 6 .00 6 so o .":°: : ; : :~::-=;:- ' i~" * " ~'t." :': :::. 3 ~ ~ - " "=" :" : . . . . /~38
I ~ / Z- r . . . . . :~' . . . . ( d ) !
3 6 ~ T I I - " T " i -36 6 8 10 12 14 16 18 20
Fig. 13. M a g n i t u d e d i s t r i b u t i o n a f t e r t h e a p p l i c a t i o n o f d i s c r e t i z a t i o n a n d s m o o t h i n g t o t h e s e i s m i c i t y d a t a g i v e n i n cat - a l o g u e PFGING a f t e r a f t e r s h o c k r e m o v a l . R a d i u s o f s m o o t h i n g w i n d o w : ( a ) n = 0; ( b ) n = 1; ( c ) n = 2; ( d ) n = 3.

158
6
48
46
8 10 12 14 16 18 20
._~ ~L -. 48
7 - / 46
44
42
40
44
~'~, 42 / /
)
", 4o
38
36
38
36
8 t0 12 14 16 18 20
Fig. 14. Intersection between the seismogenic zones of Fig. 3 and the seismicity image of Fig. 13a.
avoid this drawback, we have decided to rep- resent seismicity by cells. The size of the cells can be related with errors in the location of earthquakes. On the basis of experience (Su- hadolc, 1990) the dimensions of 0.2 ° X0.2 ° have been chosen, even if for historical earth- quakes such a resolution could be considered optimistic.
The smoothing procedure is shown in Fig. 11. At first, the punctual distribution of epi- centres given in Fig. 11 a is discretised into cells (Fig. 1 lb) and the maximum magnitude of the events pertinent to each cell is retained. In case the earthquake catalogue contains different es- timates of the magnitude (e.g. magnitude computed from body waves, from surface waves, from macroseismic intensity), the maximum between them is considered. It is then convenient to represent the data graphi- cally, where symbols are associated with mag- nitude ranges (Fig. 11 c).
In most cases, the smoothing obtained by just considering ceils is not enough, because from a statistical point of view single cells do not con-
G, C O S T A E T AL.
tain a meaningful number of events. A cen- tered smoothing window is then considered. Earthquake magnitudes are analysed not only in the central cell, but also in neighboring ones. The maximum value of magnitude found in the window is assigned to the central cell only if the cell itself contains a min imum number of earthquakes. For this purpose, several thresh- olds have been tested (one to four earth- quakes): the increase in the threshold is re- lated to a more stable representation of seismicity, because sporadic events, that could be the result of mislocations or singularities of the seismic regime, are eliminated. We have noticed that only areas with very low seismic- ity, not included in the seismogenic areas shown in Fig. 3, are sensible to modifications of the threshold in the range 1 to 3. Therefore, taking into consideration only the seismogenic areas, stability is already ensured if the lower threshold (one earthquake) is selected.
Three possible smoothing windows are shown in Fig. 11 d. Their "radius" is expressed in terms of number of cells, n. In the example, the values n = 1, n = 2 and n = 3 are considered. By applying those windows to the distribution of Fig. 1 lc, the results of Fig. 1 le are obtained. At a first glance, it appears that the distribu- tion of maximum magnitude given by the win- dow with n = 3 is quite exaggerated with re- spect to the starting data of Fig. 11 c, but its intersection with an hypothetic seismogenic area (shown in Fig. 12a) gives quite reasona- ble results (Fig. 12b ).
The smoothing algorithm has been applied to the catalogue of main shocks for the Italian territory. Windows of radius n = 0 (which cor- responds to considering just the central cell), n = 1, n = 2 and n = 3 have been used, obtaining the results shown in Fig. 13a-d, respectively. The intersection of the map of Fig. 13d with the seismogenic areas of Fig. 3, defined by GNOT ( 1 9 9 2 ) , is already shown in Fig. 4. The radius n = 3 has been selected because a good degree of homogeneity in the distribution of magnitude seems appropriate within each seis-

ZONING OF ITALY IN EXPECTED PEAK GROUND ACCELERATION FROM SYNTHETIC SEISMOGRAMS 159
mogenic area. This condition is not verified if the smoothing is not applied (see Fig. 14 ).
Acknowledgements
This study has been made possible by the CNR contracts 90.02382.CT15, 90.01026.PF54. We would like to thank ENEA for allowing us the use of the IBM3090E com- puter at the ENEA INFO aOL Computer Center. This research has been carded out in the framework of the activities of the ILP Task Group II.4.
References
Arias, A., 1970. A measure of earthquake intensity. In: R. Hansen (Editor), Seismic Design for Nuclear Power Plants. Cambridge, MA, pp. 438-483.
Bernard, P. and Zollo, A., 1989. The Irpinia (Italy) 1980 earthquake: detailed analysis of a complex normal faulting. J. Geophys. Res., 94: 1631-1647.
Boore, D.M., 1987. The prediction of strong ground mo- tion. In: M.O. Erdik and M.N. ToksiSz (Editors), Strong Ground Motion Seismology. Reidel, Dor- drecht, pp. 109-141.
Boschi, E., Caputo, M. and Panza, G.F., 1969. Stability of seismic activity in Italy with special reference to Gar- fagnana, Mugello and Forlivese. Rapp. CNEN RT/ ING(69)24, pp. 1-24.
Bottari, A., Caccamo, D., Carapezza, E., Cosentino, M., Cosentino, P., Federico, B., Fradella, P., Hoang Trong, P., Lo Giudice, E., Lombardo, G., Neff, G. and Pa- tan~, G., 1982. Crustal regional travel times of P and S waves in Sicily. CNR, Roma. Atti 2 °Conv. GNGTS, pp. 605-614.
F~ih, D., Suhadolc, P. and Panza, G.F., 1990. Estimation of strong ground motion in laterally heterogenenous media: modal summation-finite differences. Proc. 9th Eur. Conf. Earthquake Eng., Sept. 11-16, 1990, Mos- cow. 4A, pp. 100-109.
Florsch, N., F~ih, D., Suhadolc, P. and Panza, G.F., 1991. Complete synthetic seismograms for high-frequency multimode Love waves. Pure Appl. Geophys., 136: 529-560.
GNDT, 1992. Convegno Nazionale sul Modello Sismotet- tonico d'Italia. Milano, 25-26 May.
Gusev, A.A., 1983. Descriptive statistical model of earth- quake source radiation and its application to an esti- mation of short period strong motion. Geophys. J.R. Astron. Soc., 74: 787-800.
ING, 1980-1991. Istituto Nazionale di Geofisica. Seis- mological reports. ING, Roma.
Iodice, C., F~ih, D., Suhadolc, P. and Panza, G.F., 1992. Un metodo generale per la zonazione sismica rapida ed accurata di grandi metropoli: applicazione aUa citth di RomP. Rend. Fis. Accad. Lincei, 3: 195-217.
Italian Explosion Seismology Group and Institute of Geo- physics, ETH, Ziirich, 1981. Crust and upper mantle structures in the Southern Alps from deep seismic sounding profiles ( 1977, 1978 ) and surface waves dis- persion analysis. Boll. Geofis. Teor. Appl., 23: 297-330.
Keilis-Borok, V.I., Knopoff, L., Rotwain, I.M. and Sidor- enko, T.M., 1980. Bursts of seismicity as long-term precursors of strong earthquakes. J. Geophys. Res., 85: 803-812.
Kern, H. and Schenk, V., 1985. Elastic wave velocities from a lower crustal section in Southern Calabria (It- aly). Phys. Earth Planet. Inter., 40: 147-160.
Manos, G.C. and Demosthenous, M., 1992. Design of R.C. structures according to the Greek Seismic Code Pro- visions. Bull. IISEE, 26: 559-578.
Miller, H., Mueller, St. and Perrier, G., 1982. Structure and dynamics of the Alps: a geophysical inventory. In: H. Berkhemer and U. HsiJ (Editors) Alpine-Mediter- ranean Geodynamics. Am. Geophys. Union, Geo- phys. Set., 7, pp. 175-203.
Nicolas, A., Polino, R., Hirn, A., Nicolich, R. and ECORS- CROP Working Group, 1990. ECORS-CRoP traverse and deep structures of the Western Alps: a synthesis. In: R. Roure, P. Heitzman and R. Polino (Editors), Deep Structure of the Alps. M6m. Soc. Geol. Fr. Ital. Suisse, pp. 15-27.
Nicolich, R., 1981. I1 profilo Latina-Pescara e le registra- zioni mediante OBS nel Mar Tirreno. CNR, RomP. Atti 1 o Conv. GNGTS, pp. 621-634.
Nicolich, R., 1989. Crustal structures from seismic stud- ies in the frame of the European Geotraverse (South- ern Segment) and CROP projects. Atti Conv. Lincei, 80: 41-61.
Panza, G. F., 1985. Synthetic seismograms: The Rayleigh waves modal summation. J. Geophys., 58: 125-145.
Panza, G. F., Prozorov, A. and Suhadolc, P., 1990. Is there a correlation between lithosphere structure and statis- tical properties of seismicity? In: R. Cassinis and G.F. Panza (Editors), The Structure of the Alpine-Medi- terranean area: Contribution of Geophysical Methods. Terra Nova, 2: 585-595.
Patacca, E., Sartori, R. and Scandone, P., 1992. Tyrrhen- ian basin and Apenninic arcs: kinematic relations since late Tortonian times. Mem. Soc. Geol. Ital., in press.
PFG, 1985. Catalogo dei terremoti italiani dall'anno 1000 al 1980 [Edited by D. Postpischl]. CNR, Prog. Final. Geodin., RomP, pp. 1-239.
Scarascia, S. and Pellis, G., 1985. Crustal structure of the Northern Apennine. Part A--The upper crust. In- D.A. Gaison and St. Mueller (Editors), Proc. 2nd Work- shop on the European Geotraverse (EGT) Project, The Southern Segment. European Science Fundation, Strasbourg, pp. 137-142.

160 G. COSTA ET AL,
SchiJtte, K.G., 1978. Crustal structure of Southern Italy. In: H. Closs, D. Roeder and K. Schmidt (Editors), Alps, Apennines and Hellenides. IUGG, 38: 374-388.
Suhadolc, P., 1990. Fault-plane solutions and seismicity around the EGT southern segment. In: R. Freeman and St. Mueller (Editors), Proc. 6th Workshop on the Eu- ropean Geotraverse (EGT), Data compilations and synoptic interpretation. European Science Founda- tion, Strasbourg, pp. 371-382.
Suhadolc, P., Panza, G.F., Marson, 1., Costa, G. and Vac-
cari, F., 1992. Analisi della sismicit/l e meccanismi tb- cali nell'area italiana. Atti Conv. Gruppo Naz. Difesa Terremoti, Pisa, 1990, 1:157-168.
Vaccari, F., Suhadolc, P. and Panza, G.F., 1990. Irpinia, Italy, 1980 earthquake: waveform modelling of strong motion data. Geophys. J. Int., 101 : 631-647.
Woollard, G.P., 1975. Regional changes in gravity and their relation to crustal parameters. Bur: Grav. Int. Bull. Inf.. 36:106-110.


