Embed Size (px)
Citation preview
Shipping and Transport Logistics
Y.H. Venus LunKee-hung LaiChristina W.Y. WongT.C.E. Cheng
Green Shipping Management

Shipping and Transport Logistics

More information about this series at http://www.springer.com/series/10193

Y.H. Venus Lun • Kee-hung LaiChristina W.Y. Wong • T.C.E. Cheng
Green Shipping Management
123
Y.H. Venus LunShipping Research CentreThe Hong Kong Polytechnic UniversityHong KongChina
Kee-hung LaiShipping Research CentreThe Hong Kong Polytechnic UniversityHong KongChina
Christina W.Y. WongShipping Research CentreThe Hong Kong Polytechnic UniversityHong KongChina
T.C.E. ChengShipping Research CentreThe Hong Kong Polytechnic UniversityHong KongChina
ISSN 2365-9947 ISSN 2365-9955 (electronic)Shipping and Transport LogisticsISBN 978-3-319-26480-6 ISBN 978-3-319-26482-0 (eBook)DOI 10.1007/978-3-319-26482-0
Library of Congress Control Number: 2015955378
Springer Cham Heidelberg New York Dordrecht London© Springer International Publishing Switzerland 2016This work is subject to copyright. All rights are reserved by the Publisher, whether the whole or partof the material is concerned, specifically the rights of translation, reprinting, reuse of illustrations,recitation, broadcasting, reproduction on microfilms or in any other physical way, and transmissionor information storage and retrieval, electronic adaptation, computer software, or by similar or dissimilarmethodology now known or hereafter developed.The use of general descriptive names, registered names, trademarks, service marks, etc. in thispublication does not imply, even in the absence of a specific statement, that such names are exempt fromthe relevant protective laws and regulations and therefore free for general use.The publisher, the authors and the editors are safe to assume that the advice and information in thisbook are believed to be true and accurate at the date of publication. Neither the publisher nor theauthors or the editors give a warranty, express or implied, with respect to the material contained herein orfor any errors or omissions that may have been made.
Printed on acid-free paper
Springer International Publishing AG Switzerland is part of Springer Science+Business Media(www.springer.com)
Contents
Part I Green Shipping Practices
1 Introduction to Green Shipping Practices . . . . . . . . . . . . . . . . . . . 31.1 Green Shipping . . . . . . . . . . . . . . . . . . . . . . . . . . . . . . . . . . . 31.2 Greenhouse Gas Emissions: China . . . . . . . . . . . . . . . . . . . . . . 51.3 Theoretical Perspective . . . . . . . . . . . . . . . . . . . . . . . . . . . . . . 61.4 Industry Practice . . . . . . . . . . . . . . . . . . . . . . . . . . . . . . . . . . 91.5 Key Players. . . . . . . . . . . . . . . . . . . . . . . . . . . . . . . . . . . . . . 10
1.5.1 Transport Operators . . . . . . . . . . . . . . . . . . . . . . . . . . . 111.5.2 Primary Customers. . . . . . . . . . . . . . . . . . . . . . . . . . . . 121.5.3 Transport Facilitators . . . . . . . . . . . . . . . . . . . . . . . . . . 12
1.6 Importance of GSPs . . . . . . . . . . . . . . . . . . . . . . . . . . . . . . . . 13References . . . . . . . . . . . . . . . . . . . . . . . . . . . . . . . . . . . . . . . . . . 14
2 Adoption of Green Shipping Practices . . . . . . . . . . . . . . . . . . . . . . 172.1 Sustainable Shipping Initiatives . . . . . . . . . . . . . . . . . . . . . . . . 172.2 Sustainable Economy . . . . . . . . . . . . . . . . . . . . . . . . . . . . . . . 192.3 GSPs as a Means of Comparative Advantage. . . . . . . . . . . . . . . 202.4 Basis of GSP Adoption. . . . . . . . . . . . . . . . . . . . . . . . . . . . . . 22
2.4.1 Stakeholder Theory . . . . . . . . . . . . . . . . . . . . . . . . . . . 222.4.2 Institutional Theory . . . . . . . . . . . . . . . . . . . . . . . . . . . 22
2.5 Drivers for Adopting GSPs . . . . . . . . . . . . . . . . . . . . . . . . . . . 232.5.1 Regulatory Requirements . . . . . . . . . . . . . . . . . . . . . . . 232.5.2 Norms on Environmental Protection . . . . . . . . . . . . . . . . 242.5.3 Customer Demand . . . . . . . . . . . . . . . . . . . . . . . . . . . . 252.5.4 Productivity Gains . . . . . . . . . . . . . . . . . . . . . . . . . . . . 26
References . . . . . . . . . . . . . . . . . . . . . . . . . . . . . . . . . . . . . . . . . . 28
3 Measures for Evaluating Green Shipping Practices . . . . . . . . . . . . 313.1 Defining GSPs. . . . . . . . . . . . . . . . . . . . . . . . . . . . . . . . . . . . 313.2 Conceptualization of GSPs . . . . . . . . . . . . . . . . . . . . . . . . . . . 333.3 Maersk . . . . . . . . . . . . . . . . . . . . . . . . . . . . . . . . . . . . . . . . . 35
v
3.3.1 Company Policies and Procedures . . . . . . . . . . . . . . . . . 363.3.2 Shipping Documentation. . . . . . . . . . . . . . . . . . . . . . . . 373.3.3 Shipping Equipment . . . . . . . . . . . . . . . . . . . . . . . . . . . 373.3.4 Shipper Cooperation. . . . . . . . . . . . . . . . . . . . . . . . . . . 373.3.5 Shipping Materials . . . . . . . . . . . . . . . . . . . . . . . . . . . . 383.3.6 Shipping Design and Compliance. . . . . . . . . . . . . . . . . . 38
3.4 Measurement Scales . . . . . . . . . . . . . . . . . . . . . . . . . . . . . . . . 383.5 Insights from the Measurement Scales . . . . . . . . . . . . . . . . . . . 39Appendix 3.1 . . . . . . . . . . . . . . . . . . . . . . . . . . . . . . . . . . . . . . . . 41References . . . . . . . . . . . . . . . . . . . . . . . . . . . . . . . . . . . . . . . . . . 42
Part II Green Shipping Networks
4 Green Management Practices . . . . . . . . . . . . . . . . . . . . . . . . . . . . 454.1 Fundamentals of Green Management Practices. . . . . . . . . . . . . . 454.2 Review of Literature on Green Management Practices . . . . . . . . 47
4.2.1 Cooperation with Supply Chain Partners . . . . . . . . . . . . . 484.2.2 Environmentally Friendly Operations . . . . . . . . . . . . . . . 494.2.3 Internal Management Support . . . . . . . . . . . . . . . . . . . . 49
4.3 Adoption of Green Management Practices . . . . . . . . . . . . . . . . . 504.3.1 Adoption of Supply Chain Partners . . . . . . . . . . . . . . . . 514.3.2 Adoption of Environmentally Friendly Operations . . . . . . 524.3.3 Adoption of Internal Management Support . . . . . . . . . . . 54
4.4 Green Management Practices and Firm Performance. . . . . . . . . . 554.5 Implications of Adopting Green Management Practices . . . . . . . . 55Appendix 4.1: Case Study as a Study Method . . . . . . . . . . . . . . . . . 56References . . . . . . . . . . . . . . . . . . . . . . . . . . . . . . . . . . . . . . . . . . 57
5 Development of a Green Shipping Network . . . . . . . . . . . . . . . . . . 615.1 Operating Environment of Container Shipping . . . . . . . . . . . . . . 61
5.1.1 Containerization. . . . . . . . . . . . . . . . . . . . . . . . . . . . . . 615.1.2 Concentration . . . . . . . . . . . . . . . . . . . . . . . . . . . . . . . 625.1.3 Collaboration. . . . . . . . . . . . . . . . . . . . . . . . . . . . . . . . 625.1.4 Competition . . . . . . . . . . . . . . . . . . . . . . . . . . . . . . . . 63
5.2 Port Evolution and Environmental Operations . . . . . . . . . . . . . . 635.3 Benefit Transfer Approach . . . . . . . . . . . . . . . . . . . . . . . . . . . 655.4 Equivalent Container Distance . . . . . . . . . . . . . . . . . . . . . . . . . 675.5 Formulation of a Green Shipping Network . . . . . . . . . . . . . . . . 685.6 Operations of a Green Shipping Network . . . . . . . . . . . . . . . . . 69
5.6.1 Advantages of Developing Green Shipping Networks . . . . 695.6.2 Green Shipping Networks
and Regional Competitiveness . . . . . . . . . . . . . . . . . . . . 71
vi Contents
Appendix 5.1: 4S Framework . . . . . . . . . . . . . . . . . . . . . . . . . . . . . 72Appendix 5.2: Formulas to Determine Voyage Distance. . . . . . . . . . . 73Appendix 5.3: Voyage Distance (in Equivalent Container Distance). . . 74References . . . . . . . . . . . . . . . . . . . . . . . . . . . . . . . . . . . . . . . . . . 75
6 Evaluation of Green Shipping Networks . . . . . . . . . . . . . . . . . . . . 776.1 Development of Green Shipping Networks . . . . . . . . . . . . . . . . 77
6.1.1 Benefits of Green Shipping Networks. . . . . . . . . . . . . . . 776.1.2 Importance of Green Shipping Networks. . . . . . . . . . . . . 786.1.3 Establishment of Green Shipping Networks. . . . . . . . . . . 79
6.2 Concept of Network . . . . . . . . . . . . . . . . . . . . . . . . . . . . . . . . 806.2.1 Spatial and Corporate Networks. . . . . . . . . . . . . . . . . . . 806.2.2 Liner Shipping Networks . . . . . . . . . . . . . . . . . . . . . . . 81
6.3 Green Management Practices and Green Shipping Networks . . . . 846.3.1 Cooperation with Partners (CP) . . . . . . . . . . . . . . . . . . . 846.3.2 Green Operations (GOs) . . . . . . . . . . . . . . . . . . . . . . . . 856.3.3 Management Support (MS) . . . . . . . . . . . . . . . . . . . . . . 85
6.4 Green Shipping Networks and Firm Performance . . . . . . . . . . . . 86References . . . . . . . . . . . . . . . . . . . . . . . . . . . . . . . . . . . . . . . . . . 88
Part III Greening and Firm Performance
7 Shipping Operations and Green Capability . . . . . . . . . . . . . . . . . . 937.1 Shipping Operations . . . . . . . . . . . . . . . . . . . . . . . . . . . . . . . . 937.2 Fleet Mix and Firm Performance . . . . . . . . . . . . . . . . . . . . . . . 947.3 Firm Growth and Firm Performance . . . . . . . . . . . . . . . . . . . . . 967.4 Shipping Capacity and Firm Performance . . . . . . . . . . . . . . . . . 997.5 Green Capability . . . . . . . . . . . . . . . . . . . . . . . . . . . . . . . . . . 103
7.5.1 Elements of Green Capability . . . . . . . . . . . . . . . . . . . . 1037.5.2 Green Shipping Routines . . . . . . . . . . . . . . . . . . . . . . . 104
References . . . . . . . . . . . . . . . . . . . . . . . . . . . . . . . . . . . . . . . . . . 106
8 Relativity Between Greening and Performance . . . . . . . . . . . . . . . 1098.1 Green Operations . . . . . . . . . . . . . . . . . . . . . . . . . . . . . . . . . . 1098.2 Model Development . . . . . . . . . . . . . . . . . . . . . . . . . . . . . . . . 110
8.2.1 Conceptual Background . . . . . . . . . . . . . . . . . . . . . . . . 1108.2.2 Green Shipping Routines and Firm Performance . . . . . . . 1118.2.3 Environmental Performance and Financial
Performance . . . . . . . . . . . . . . . . . . . . . . . . . . . . . . . . 1128.3 Greening and Performance Relativity . . . . . . . . . . . . . . . . . . . . 113
8.3.1 Components of Greening and Performance Relativity . . . . 1138.3.2 Greening and Performance Relativity Score. . . . . . . . . . . 113
Contents vii
8.4 Case Study: Relativity Between Greening and Performancein Hong Kong . . . . . . . . . . . . . . . . . . . . . . . . . . . . . . . . . . . . 1148.4.1 Data Source and Analysis . . . . . . . . . . . . . . . . . . . . . . . 1148.4.2 Results . . . . . . . . . . . . . . . . . . . . . . . . . . . . . . . . . . . . 1158.4.3 Financial and Environmental Performances . . . . . . . . . . . 116
Appendix 8.1: Items to Measure Greening Capability . . . . . . . . . . . . 118References . . . . . . . . . . . . . . . . . . . . . . . . . . . . . . . . . . . . . . . . . . 119
9 Greening Propensity . . . . . . . . . . . . . . . . . . . . . . . . . . . . . . . . . . . 1219.1 Logistics Service Providers . . . . . . . . . . . . . . . . . . . . . . . . . . . 1219.2 Natural-Resource-Based View . . . . . . . . . . . . . . . . . . . . . . . . . 1239.3 Service Bundling . . . . . . . . . . . . . . . . . . . . . . . . . . . . . . . . . . 124
9.3.1 Bundling Logistics Activities. . . . . . . . . . . . . . . . . . . . . 1249.3.2 Dynamic Bundling Logistics Activities . . . . . . . . . . . . . . 126
9.4 Outputs and Inputs of Greening Capability . . . . . . . . . . . . . . . . 1289.4.1 Outputs of Greening Capability . . . . . . . . . . . . . . . . . . . 1289.4.2 Inputs of Greening Capability . . . . . . . . . . . . . . . . . . . . 129
Appendix 9.1: Rotated Factor Matrix . . . . . . . . . . . . . . . . . . . . . . . . 131Appendix 9.2: Inputs and Outputs of Greening Capability . . . . . . . . . 132References . . . . . . . . . . . . . . . . . . . . . . . . . . . . . . . . . . . . . . . . . . 133
viii Contents

Part IGreen Shipping Practices
Chapter 1Introduction to Green Shipping Practices
1.1 Green Shipping
Shipping refers to the business of transporting goods. Global economic develop-ment is supported by the commercial shipping industry which facilitates thecompletion of trade transactions. Global trade volume has significantly grown withrapid increases in global sourcing activities and dispersed production sites. On theother hand, public concerns about environmental issues such as air pollution andresource depletion caused by shipping activities have been growing rapidly with theglobalization of business activities. Environmentally friendly operations have beenwidely discussed (e.g., Revkin 2009; Rosenthal 2009). As transport service pro-viders that facilitate trade flows in the global supply chain (Wong et al. 2009a, b, c;Yang et al. 2009), many shipping firms have begun to respond to environmentalconcerns by embracing green shipping practices (GSPs) to green their operations.GSPs are environmental management practices undertaken by shipping firms inperforming shipping activities. GSPs include calculating the carbon footprint ofshipping routes and using alternative shipping equipment with the aim to reduceenvironmental damage in transporting cargoes. An example is the operations ofRiver Shuttle Containers, a service provided by the CMA CGM to transfer con-tainers between main and feeder ports by ships that have a higher carrying capacitythan trucks. Compared with the use of trucks, the use of feeder ships to provideshuttle services reduces carbon emissions.
As shown in Fig. 1.1, there are several reasons for examining the use of greenmanagement in the shipping industry, as follows.
• First, cargo movement has long been a neglected source of pollution despite thefact that the shipping industry plays an important role in stoking economicdevelopment by providing low-cost shipment services to facilitate global trade
The research of this chapter is based on Lai et al. (2011) and Tain et al. (2014).
© Springer International Publishing Switzerland 2016Y.H.V. Lun et al., Green Shipping Management,Shipping and Transport Logistics, DOI 10.1007/978-3-319-26482-0_1
3
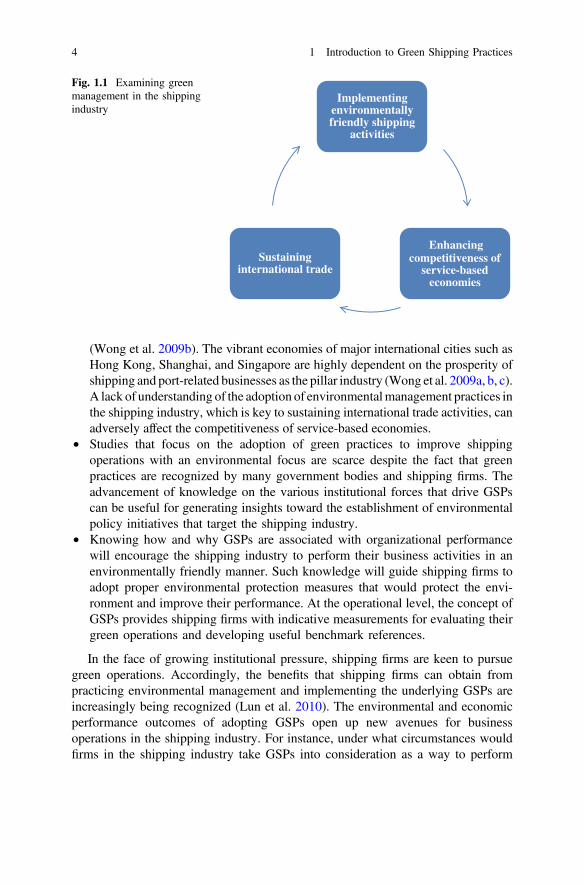
(Wong et al. 2009b). The vibrant economies of major international cities such asHong Kong, Shanghai, and Singapore are highly dependent on the prosperity ofshipping and port-related businesses as the pillar industry (Wong et al. 2009a, b, c).A lack of understanding of the adoption of environmentalmanagement practices inthe shipping industry, which is key to sustaining international trade activities, canadversely affect the competitiveness of service-based economies.
• Studies that focus on the adoption of green practices to improve shippingoperations with an environmental focus are scarce despite the fact that greenpractices are recognized by many government bodies and shipping firms. Theadvancement of knowledge on the various institutional forces that drive GSPscan be useful for generating insights toward the establishment of environmentalpolicy initiatives that target the shipping industry.
• Knowing how and why GSPs are associated with organizational performancewill encourage the shipping industry to perform their business activities in anenvironmentally friendly manner. Such knowledge will guide shipping firms toadopt proper environmental protection measures that would protect the envi-ronment and improve their performance. At the operational level, the concept ofGSPs provides shipping firms with indicative measurements for evaluating theirgreen operations and developing useful benchmark references.
In the face of growing institutional pressure, shipping firms are keen to pursuegreen operations. Accordingly, the benefits that shipping firms can obtain frompracticing environmental management and implementing the underlying GSPs areincreasingly being recognized (Lun et al. 2010). The environmental and economicperformance outcomes of adopting GSPs open up new avenues for businessoperations in the shipping industry. For instance, under what circumstances wouldfirms in the shipping industry take GSPs into consideration as a way to perform
Implementing environmentally friendly shipping
activities
Enhancing competitiveness of
service-based economies
Sustaining international trade
Fig. 1.1 Examining greenmanagement in the shippingindustry
4 1 Introduction to Green Shipping Practices
environmentally friendly operations? Do they adopt GSPs to satisfy regulatory orshipper requirements, or compete with competitors? How do the institutional forcesfrom different stakeholders affect the adoption of GSPs and firm performanceoutcomes? Issues on the ways in which institutional forces affect the adoption ofGSPs and their association with performance outcomes are still underexplored.
1.2 Greenhouse Gas Emissions: China
The globalization of production activities together with the uneven distribution ofmarkets and raw material supplies has accelerated the growth in the demand forfreight transport in recent years. The rapid development of the freight transportindustry and the related environmental problems that pertain to energy consump-tion, air pollution, and greenhouse gas (GHG) emissions have led the world toquestion about these issues. According to statistics from the International EnergyAgency (IEA), the freight transport sector is one of the largest and fastest growingsectors of oil consumption. Following the power generation sector, the globaltransport sector is the second largest sector for generating GHG emissions andcauses 23 % of the total GHG emissions worldwide (IEA 2012).
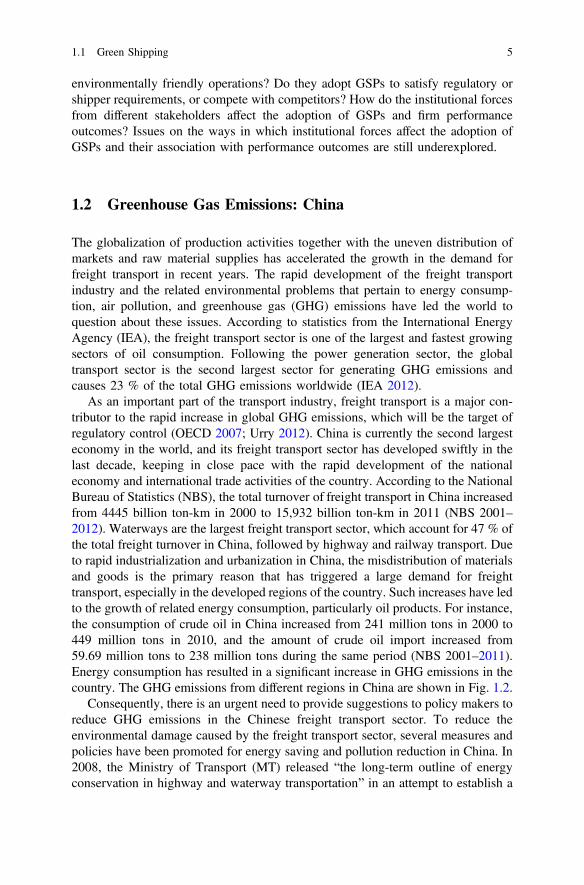
As an important part of the transport industry, freight transport is a major con-tributor to the rapid increase in global GHG emissions, which will be the target ofregulatory control (OECD 2007; Urry 2012). China is currently the second largesteconomy in the world, and its freight transport sector has developed swiftly in thelast decade, keeping in close pace with the rapid development of the nationaleconomy and international trade activities of the country. According to the NationalBureau of Statistics (NBS), the total turnover of freight transport in China increasedfrom 4445 billion ton-km in 2000 to 15,932 billion ton-km in 2011 (NBS 2001–2012). Waterways are the largest freight transport sector, which account for 47 % ofthe total freight turnover in China, followed by highway and railway transport. Dueto rapid industrialization and urbanization in China, the misdistribution of materialsand goods is the primary reason that has triggered a large demand for freighttransport, especially in the developed regions of the country. Such increases have ledto the growth of related energy consumption, particularly oil products. For instance,the consumption of crude oil in China increased from 241 million tons in 2000 to449 million tons in 2010, and the amount of crude oil import increased from59.69 million tons to 238 million tons during the same period (NBS 2001–2011).Energy consumption has resulted in a significant increase in GHG emissions in thecountry. The GHG emissions from different regions in China are shown in Fig. 1.2.
Consequently, there is an urgent need to provide suggestions to policy makers toreduce GHG emissions in the Chinese freight transport sector. To reduce theenvironmental damage caused by the freight transport sector, several measures andpolicies have been promoted for energy saving and pollution reduction in China. In2008, the Ministry of Transport (MT) released “the long-term outline of energyconservation in highway and waterway transportation” in an attempt to establish a
1.1 Green Shipping 5
framework of energy conservation in the transport sector (MT 2008). The NationalStatistics Bureau established a statistics reporting system in 2007 that includedenergy consumption from highway and waterway transport, as well as ports tocollect energy consumption data in different Chinese regions. Meanwhile, with thesupport of the MT, the Research Institute of Highway of MT, China WaterborneTransport Research Institute, and Water Transport Planning and Design Co., Ltd.have conducted studies on the statistics and analytical methods for improvingenergy consumption efficiency in highway, waterway transport and ports since2006. Moreover, in 1999, China started to promote the use of vehicles that usecompressed natural gas and liquefied petroleum gas (Yan and Crookes 2009). Since2002, China has promoted E10 (a 10 % bioethanol and 90 % gasoline blend byvolume) to replace the traditional transport fuel in a few of the maingrain-producing regions, including five provinces, such as Heilongjiang, Jilin,Liaoning, and Anhui, and 27 cities in four provinces that include Hubei, Shandong,Hebei, and Jiangsu (Yan and Crookes 2009).
1.3 Theoretical Perspective
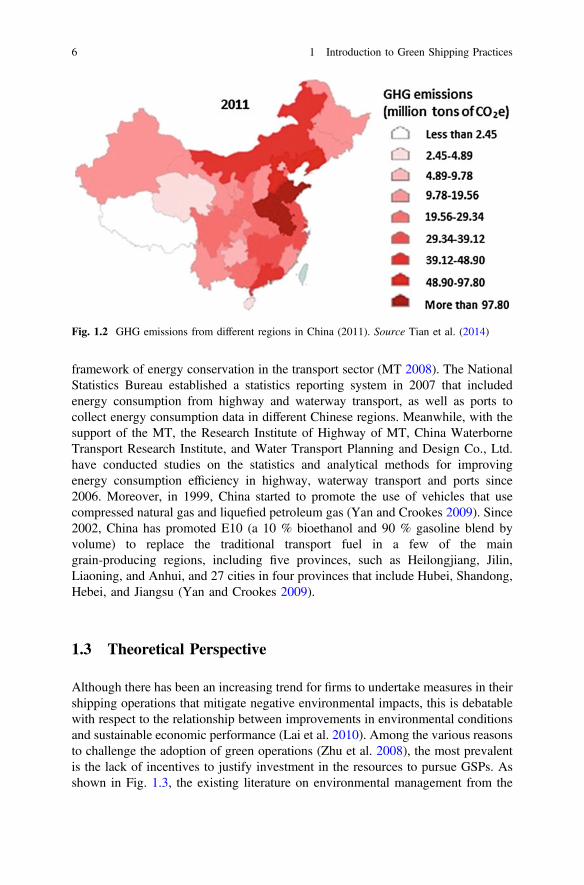
Although there has been an increasing trend for firms to undertake measures in theirshipping operations that mitigate negative environmental impacts, this is debatablewith respect to the relationship between improvements in environmental conditionsand sustainable economic performance (Lai et al. 2010). Among the various reasonsto challenge the adoption of green operations (Zhu et al. 2008), the most prevalentis the lack of incentives to justify investment in the resources to pursue GSPs. Asshown in Fig. 1.3, the existing literature on environmental management from the
Fig. 1.2 GHG emissions from different regions in China (2011). Source Tian et al. (2014)
6 1 Introduction to Green Shipping Practices
perspective of economic regulation (Stigler 1971) and transaction cost economics(Williamson 1985) is built on organizational goals toward maximizing returns.
The economic regulation theory implies that the establishment of environmentalincentives such as monetary subsidies in exchange for green practices will increasethe economic returns of businesses firms. Transaction cost economics suggest thatthere is the need for governance mechanisms to reduce the cost of trade coordi-nation, minimize the opportunistic behavior of trading partners, and prevent the lossof specific investments made in economic exchanges. As economic theories assumethat business activities are entirely driven by economic motivation, these theoreticalperspectives may have overlooked the environmentally responsible actions taken byfirms.
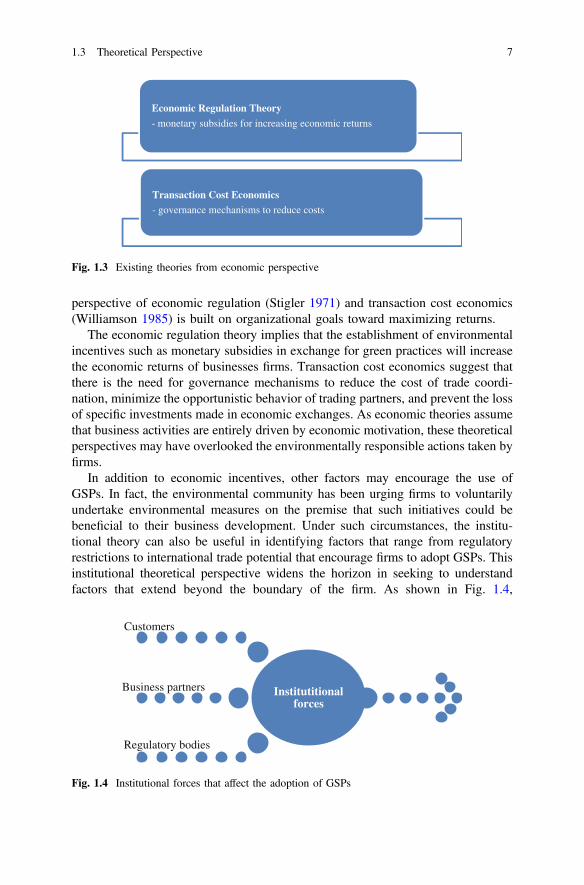
In addition to economic incentives, other factors may encourage the use ofGSPs. In fact, the environmental community has been urging firms to voluntarilyundertake environmental measures on the premise that such initiatives could bebeneficial to their business development. Under such circumstances, the institu-tional theory can also be useful in identifying factors that range from regulatoryrestrictions to international trade potential that encourage firms to adopt GSPs. Thisinstitutional theoretical perspective widens the horizon in seeking to understandfactors that extend beyond the boundary of the firm. As shown in Fig. 1.4,
Economic Regulation Theory
- monetary subsidies for increasing economic returns
Transaction Cost Economics- governance mechanisms to reduce costs
Fig. 1.3 Existing theories from economic perspective
Institutitional forces
Customers
Business partners
Regulatory bodies
Fig. 1.4 Institutional forces that affect the adoption of GSPs
1.3 Theoretical Perspective 7
customers (e.g., shippers) and business partners (e.g., terminal operators) may havea stake or vested interest in environmental and productivity performance whichcontribute to the institutional forces.
Balancing economic and environmental performance has become increasinglyimportant for firms that are facing pressure from regulations and the community(Guide and Van Wassenhove 2009). In the late 1970s, policy makers in a handful ofcountries such as Germany and the Netherlands began to take a proactive approachto address environmental problems. In examining these role models of environ-mental protection, it is found that there are two important components in theirenvironmental initiatives, which are (1) the development of appropriate strategiesthat allows these policy makers to take advantage of emerging opportunities forenvironmental preservation and (2) to take advantage of the opportunity when itarises. As a result of the increasing environmental awareness in global businessoperations, shipping firms are increasingly expected to embrace green practices thatrender their systems and processes environmentally friendly. However, the chal-lenge for them is to determine how to profit from their shipping operations whilereducing their adverse impacts on the environment (Cheng and Tsai 2009).
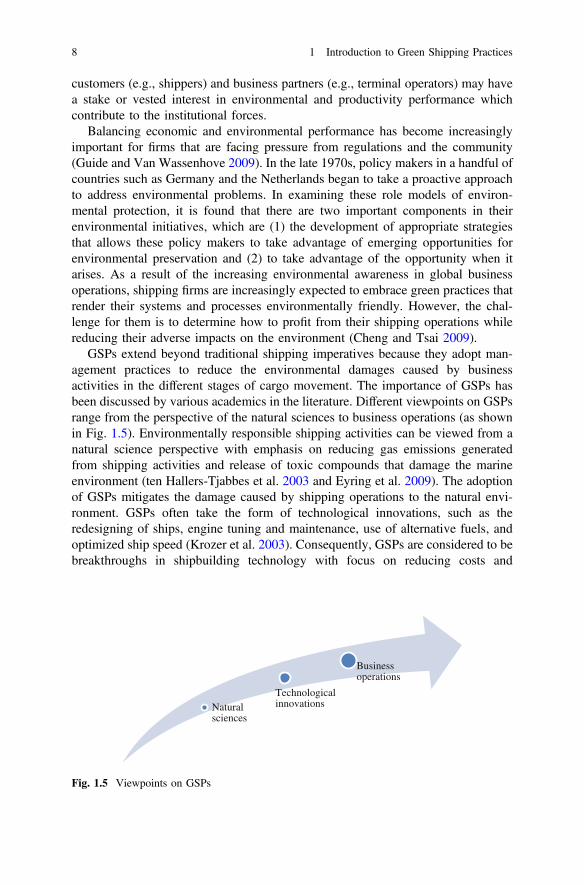
GSPs extend beyond traditional shipping imperatives because they adopt man-agement practices to reduce the environmental damages caused by businessactivities in the different stages of cargo movement. The importance of GSPs hasbeen discussed by various academics in the literature. Different viewpoints on GSPsrange from the perspective of the natural sciences to business operations (as shownin Fig. 1.5). Environmentally responsible shipping activities can be viewed from anatural science perspective with emphasis on reducing gas emissions generatedfrom shipping activities and release of toxic compounds that damage the marineenvironment (ten Hallers-Tjabbes et al. 2003 and Eyring et al. 2009). The adoptionof GSPs mitigates the damage caused by shipping operations to the natural envi-ronment. GSPs often take the form of technological innovations, such as theredesigning of ships, engine tuning and maintenance, use of alternative fuels, andoptimized ship speed (Krozer et al. 2003). Consequently, GSPs are considered to bebreakthroughs in shipbuilding technology with focus on reducing costs and
Natural sciences
Technological innovations
Business operations
Fig. 1.5 Viewpoints on GSPs
8 1 Introduction to Green Shipping Practices
improving productivity through the efficient use of energy, while minimizing theadverse environmental impacts from shipping operations.
1.4 Industry Practice
Industrialization and globalization have bolstered international trade in which thetotal seaborne trade volume has tripled since 1990. Although shipping by watercauses relatively less pollution compared to other transportation modes (e.g., byroad and air), it can significantly harm the environment due to its large industrialscale. Shipping activities can damage the environment in various ways, e.g., con-sumption of natural resources (e.g., fuel consumption), emissions of GHGs (e.g.,CO2), and discharge of waste from vessel operations (e.g., ballast water and oil). Inview of the growing emphasis on environmental protection as part of corporatesocial responsibility, shipping firms have begun to recognize the importance of“greening” their activities in serving the global community through their role insupporting international trade.
There are many firms that are placing importance on environmental protectionwhen performing shipping activities. For instance, mega carriers (e.g.,Hapag-Lloyd, APL, K Line, Maersk, NKY, and OOCL) and giant shippers (e.g.,IKEA, Mattel, Nike, Home Depot, and HP) are members of the Clean CargoWorking Group with the mission to “work with business to create a just clean andsustainable world.” By connecting different stakeholders (e.g., manufacturers,retails, and freight carriers), the Clean Cargo Working Group is a business-to-business collaboration dedicated to integrating environmentally and sociallyresponsible business principles into transport management. One of its environ-mental projects entitled “Beyond Monitoring” aims to collaborate with multiplestakeholders in the transport chain to address the problems of non-compliance withcodes of conduct and regulations to improve the well-being of the environment inthe global shipping community. According to Hapag-Lloyd, the benefits of suchinitiatives vary from sharing structured environmental data to improvingdecision-making through a better understanding of the environmental expectationsand industrial specifications for green operations.
The increasing pressure from the community and customers on environmentallyresponsible operations has prompted shipping firms to implement GSPs as a meansof greening their operations. Many mega carriers, such as the OOCL, Hapag-Lloyd,and CMA CGM, value the potential performance benefits of environmental man-agement and embrace GSPs as part of their operations strategy to seek sustainablegrowth in their business. Meanwhile, due to stricter regulations that mandateenvironmentally responsible practices (e.g., the International Maritime OrganizationInternational Convention for the Prevention of Pollution from Ships), shippingfirms are expected to effectively integrate environmental concerns into their dailyoperations. They find it advantageous to pursue proactive environment-based
1.3 Theoretical Perspective 9
operations such as GSPs to cope with institutional pressure (e.g., stricter regulatoryrequirements), which will continue to increase in the years ahead.
1.5 Key Players
GSPs can be viewed as business practices that are expected or requested by thestakeholders of shipping firms. Driven by the environmental expectations of theirstakeholders, firms in the shipping industry adhere to green operations by satisfyingvarious requirements such as obtaining ISO 14000 certification (Celik 2009) andspecific environmental protection standards that are mandated for cargo consign-ment. The shipping industry is essential to the economic development of countries,as global trade needs the transportation of goods from the place of production to theplace of consumption (Goulielmos 2010). Furthermore, although sea transportationcauses relatively less pollution as compared to other transportation sectors such asaviation and trucking, the shipping industry has had a long history of significantenvironmental challenges, including the heavy use of natural resources (e.g., fuel)and disposal of shipping wastes (e.g., ballast water and oily water), which areconsumed and generated in shipping operations. GSPs are concerned with handlingand distributing cargoes in a sustainable way, by taking into account environmentalissues such as waste reduction and resource conservation in performing shippingactivities.
Shipping is likened to “the business of transportation.” Shipping, particularly seatransportation, is one of the most internationalized industries in the world andfundamental to supporting international trade as a cost-effective means to movelarge volumes of cargo around the world (Lun and Browne 2009; Lun et al. 2009,2010). The shipping industry has made it possible for economies such as HongKong to evolve into an established member of the international trade community.Shipping includes all activities that involve the moving of cargo to, from, andbetween different parties of the transportation chain, including shippers, carriers,and consignees (Lun et al. 2008; Papadopoulou et al. 2010). Examples of theseactivities include cargo tracking, equipment booking, cargo loading/unloading,issuance of bill of lading, and carriage of goods (Lai 2004).
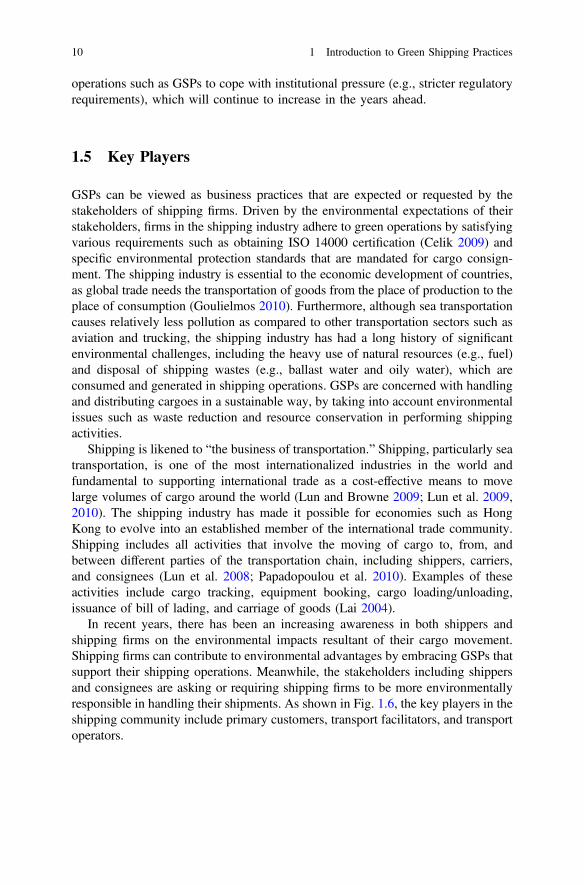
In recent years, there has been an increasing awareness in both shippers andshipping firms on the environmental impacts resultant of their cargo movement.Shipping firms can contribute to environmental advantages by embracing GSPs thatsupport their shipping operations. Meanwhile, the stakeholders including shippersand consignees are asking or requiring shipping firms to be more environmentallyresponsible in handling their shipments. As shown in Fig. 1.6, the key players in theshipping community include primary customers, transport facilitators, and transportoperators.
10 1 Introduction to Green Shipping Practices
1.5.1 Transport Operators
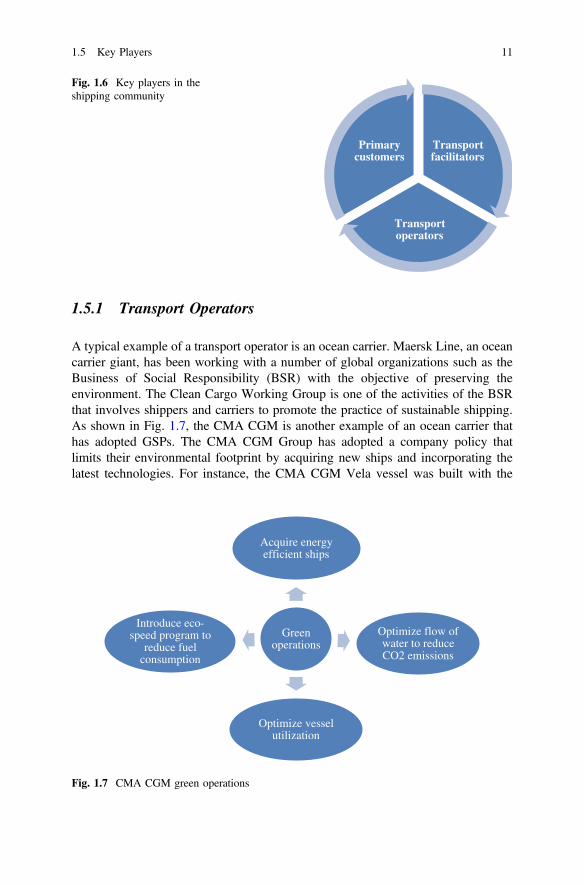
A typical example of a transport operator is an ocean carrier. Maersk Line, an oceancarrier giant, has been working with a number of global organizations such as theBusiness of Social Responsibility (BSR) with the objective of preserving theenvironment. The Clean Cargo Working Group is one of the activities of the BSRthat involves shippers and carriers to promote the practice of sustainable shipping.As shown in Fig. 1.7, the CMA CGM is another example of an ocean carrier thathas adopted GSPs. The CMA CGM Group has adopted a company policy thatlimits their environmental footprint by acquiring new ships and incorporating thelatest technologies. For instance, the CMA CGM Vela vessel was built with the
Transport facilitators
Transport operators
Primary customers
Fig. 1.6 Key players in theshipping community
Green operations
Acquire energy efficient ships
Optimize flow of water to reduce CO2 emissions
Optimize vessel utilization
Introduce eco-speed program to
reduce fuel consumption
Fig. 1.7 CMA CGM green operations
1.5 Key Players 11
latest generation of engines that consume significantly less fuel. The CMA CGMThalassa is equipped with an innovative rudder to optimize the flow of water so asto reduce CO2 emissions. Furthermore, the CMA CGM has introduced the“eco-speed” program to reduce the speed of its vessels. This program has enabledthe reduction of fuel consumption and CO2 emissions while optimizing vesselutilization.
1.5.2 Primary Customers
In addition to examining GSPs from the perspective of carriers (e.g., theCMA CGM and Maersk), the perspective of the primary customers is also worthyof examination. For example, as transportation accounts for more than 80 % ofIKEA’s total emission of CO2, IKEA has promulgated an environmental policy thatstrives for minimal environmental damage by working with its carriers to reduceCO2 emissions through better scheduling and transportation utilization. Similarly,Wal-Mart has introduced sustainability programs and measures to govern itsshipping activities. The shipping firms hired to ship and store Wal-Mart’s cargoesare required to demonstrate environmental commitments that encompass a broadarray of factors, including fuel use and standards for utilizing facilities andequipment. These green initiatives aim to reduce environmental degradationwhereby the shipping firms are required to audit their respective environmentalimpacts, efforts, and improvements related to their operations on behalf ofWal-Mart.
1.5.3 Transport Facilitators
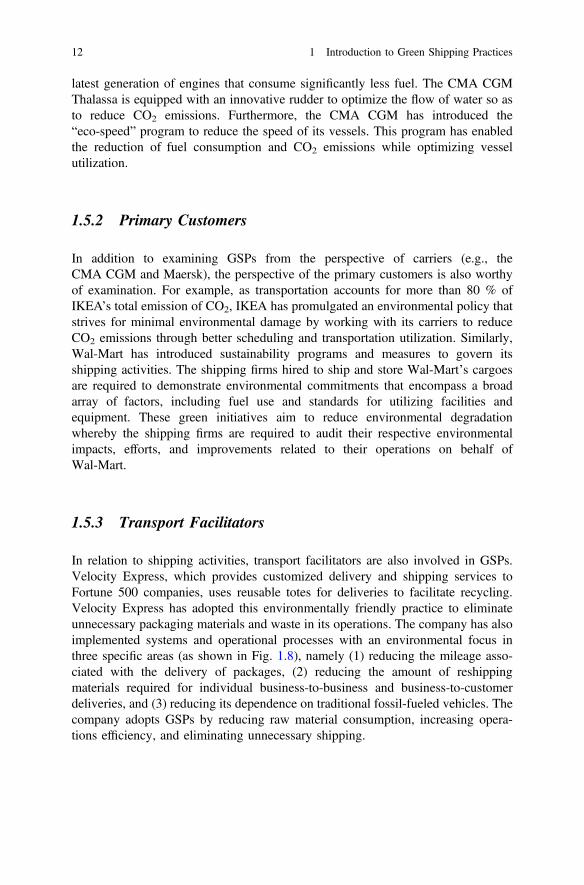
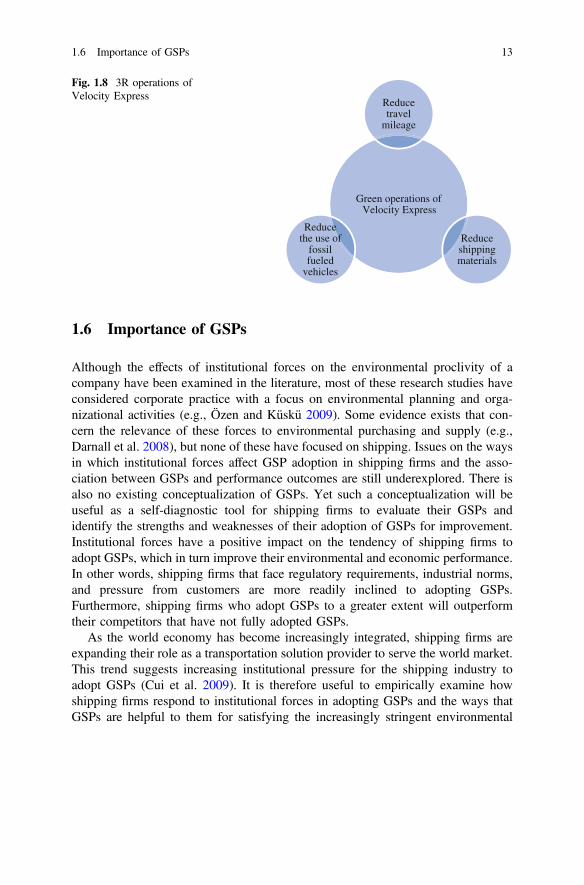
In relation to shipping activities, transport facilitators are also involved in GSPs.Velocity Express, which provides customized delivery and shipping services toFortune 500 companies, uses reusable totes for deliveries to facilitate recycling.Velocity Express has adopted this environmentally friendly practice to eliminateunnecessary packaging materials and waste in its operations. The company has alsoimplemented systems and operational processes with an environmental focus inthree specific areas (as shown in Fig. 1.8), namely (1) reducing the mileage asso-ciated with the delivery of packages, (2) reducing the amount of reshippingmaterials required for individual business-to-business and business-to-customerdeliveries, and (3) reducing its dependence on traditional fossil-fueled vehicles. Thecompany adopts GSPs by reducing raw material consumption, increasing opera-tions efficiency, and eliminating unnecessary shipping.
12 1 Introduction to Green Shipping Practices
1.6 Importance of GSPs
Although the effects of institutional forces on the environmental proclivity of acompany have been examined in the literature, most of these research studies haveconsidered corporate practice with a focus on environmental planning and orga-nizational activities (e.g., Özen and Küskü 2009). Some evidence exists that con-cern the relevance of these forces to environmental purchasing and supply (e.g.,Darnall et al. 2008), but none of these have focused on shipping. Issues on the waysin which institutional forces affect GSP adoption in shipping firms and the asso-ciation between GSPs and performance outcomes are still underexplored. There isalso no existing conceptualization of GSPs. Yet such a conceptualization will beuseful as a self-diagnostic tool for shipping firms to evaluate their GSPs andidentify the strengths and weaknesses of their adoption of GSPs for improvement.Institutional forces have a positive impact on the tendency of shipping firms toadopt GSPs, which in turn improve their environmental and economic performance.In other words, shipping firms that face regulatory requirements, industrial norms,and pressure from customers are more readily inclined to adopting GSPs.Furthermore, shipping firms who adopt GSPs to a greater extent will outperformtheir competitors that have not fully adopted GSPs.
As the world economy has become increasingly integrated, shipping firms areexpanding their role as a transportation solution provider to serve the world market.This trend suggests increasing institutional pressure for the shipping industry toadopt GSPs (Cui et al. 2009). It is therefore useful to empirically examine howshipping firms respond to institutional forces in adopting GSPs and the ways thatGSPs are helpful to them for satisfying the increasingly stringent environmental
Green operations of Velocity Express
Reduce travel
mileage
Reduce shipping materials
Reduce the use of
fossil fueled
vehicles
Fig. 1.8 3R operations ofVelocity Express
1.6 Importance of GSPs 13
requirements of their shipping services. Empirical verification of the conceptual-ization of GSPs and the associated propositions in further research needs a carefulresearch design and appropriate measurement items. In this regard, we have iden-tified the conditions that lead to the adoption of GSPs and provided direction forenvironment-based shipping research.
References
Celik M (2009) A hybrid design methodology for structuring an integrated environmentalmanagement system (IEMS) for shipping business. J Environ Manage 90(3):1469–1475
Cheng YH, Tsai YL (2009) Factors influencing shippers to use multiple country consolidationservices in international distribution centers. Int J Prod Econ 122(1):78–88
Cui L, Sjoholm L, Wang Y (2009) The use of third party logistics services by Swedishmanufacturing firms: current situation and future prospects. Int J Shipping Transp Logistics 1(4):396
Darnall N, Jason Jolley G, Handfield R (2008) Environmental mangament systems and greensupply chain management : complements for sustainability ? Bus Strategy Environ 18(October2006):30–45
Eyring V et al (2009) Transport impacts on atmosphere and climate: shipping. Atmos Environ 44(37):4735–4771
Goulielmos AM (2010) What can we learn from 259 years of shipping cycles? Int J ShippingTransp Logistics 2(2):125
Guide VDR, Van Wassenhove LN (2009) OR FORUM–the evolution of closed-loop supply chainresearch. Oper Res 57(1):10–18
IEA (2012) CO2 emissions from fuel combustion. IEA (International Energy Agency), PairsKrozer J, Mass K, Kothuis B (2003) Demonstration of environmentally sound and cost-effective
shipping. J Clean Prod 11:767–777Lai KH (2004) Service capability and performance of logistics service providers. Transp Res
Part E Logistics Transp Rev 40(5):385–399Lai KH, Cheng TCE, Tang AKY (2010) Green retailing: factors for success. Calif Manage Rev 52
(2):6–31Lai KH, Lun YHV, Wong CWY, Cheng TCE (2011) Green practices in the shipping industry:
conceptualization, adoption, and implications. Resour Conserv Recycl 55(6):631–638Lun YHV, Browne M (2009) Fleet mix in container shipping operations. Int J Shipping Transp
Logistics 1(2):103–118Lun YHV, Wong CW, Lai KH, Cheng TCE (2008) Institutional perspective on the adoption of
technology for the security enhancement of container transport. Transp Rev 28(1):21–33Lun YHV, Lu CS, Lai KH (2009) Introduction to the special issue on transport logistics and
distribution. Int J Prod Econ 122(1):1–3Lun YHV, Lai KH, Cheng TCE (2010) Shipping and logistics management. Springer, LondonMoT (2008) The long-term outline of energy conservation in highway and waterway
transportation. MT (Ministry of Trasnport), BeijingNBS (2011) 2001–2011 China energy statistical yearbook. NBS (National Bureau of Statistics),
BeijingNBS (2012) 2001–2012 China statistical yearbook. NBS (National Bureau of Statistics), BeijingOECD (2007) Cutting transport CO2 emissions: what progress?. OECD (Organization for
economic cooperation and development), ParisÖzen Ş, Küskü F (2009) Corporate environmental citizenship variation in developing countries: an
institutional framework. J Bus Ethics 89(2):297–313
14 1 Introduction to Green Shipping Practices
Papadopoulou EM, Manthou V, Vlachopoulou M (2010) Ocean carriers’ transition from transportproviders to supply chain integrators: a case study. Int J Shipping Transp Logistics 2(1):76–94
Revkin AC (2009) Obama speaks on climate at the U.N. In: The New York Times, The New YorkTimes, New York
Rosenthal E (2009) Biggest obstacle to global climate deal may be how to pay for it. In:International herald tribune. The New York Times, New York
Stigler GJ (1971) The theory of economic regulation. Bell J Econ Manage Sci 2(1):3–21ten Hallers-Tjabbes CC et al (2003) Imposex and organotin concentrations in Buccinum undatum
and Neptunea antiqua from the North Sea: relationship to shipping density and hydrographicalconditions. Mar Environ Res 55(3):203–233
Tian Y, Zhu QH, Lai KH, Lun YHV (2014) Analysis of greenhouse gas emission of freighttransport sector in China. J Transp Geogr 40:43–52
Urry J (2012) Changing transport and changing climates. J Transp Geogr 24:533–535Williamson OE (1985) The economic institutions of capitalism. Free Press, NewYorkWong CWY, Lai KH, Cheng TCE (2009a) Complementarities and alignment of information
systems management and supply chain management. Int J Shipping Transp Logistics 1(2):156–171
Wong CWY, Lai KH, Ngai EWT (2009b) The Role of supplier operational adaptation on theperformance of IT-enabled transport logistics under environmental uncertainty. Int J Prod Econ122(1):47–55. Retrieved (http://dx.doi.org/10.1016/j.ijpe.2008.12.023)
Wong CWY, Lai KH, Teo TSH (2009c) Institutional pressures and mindful IT management: thecase of a container terminal in China. Inf Manage 46(8):434–441
Yan X, Crookes RJ (2009) Reduction potentials of energy demand and GHG emissions in China’sroad transport sector. Energy Policy 37(2):658–668
Yang CC, Marlow PB, Lu CS (2009) Assessing resources, logistics service capabilities, innovationcapabilities and the performance of container shipping services in Taiwan. Int J Prod Econ 122(1):4–20
Zhu Q, Sarkis J, Lai KH (2008) Confirmation of a measurement model for green supply Chainmanagement practices implementation. Int J Prod Econ 111(2):261–273
References 15
Chapter 2Adoption of Green Shipping Practices
2.1 Sustainable Shipping Initiatives
International trade has grown significantly following rapid increases in globalsourcing activities and dispersed production sites. On the other hand, carbondioxide emissions by the shipping industry are estimated to increase significantly asinternational trade continues to flourish and prosper. As shipping firms play animperative role in facilitating global cargo flow, the sustainable development ofshipping operations has attracted increasing attention from different stakeholders,including shippers, governments, and the public. Many shipping firms are lookingfor ways to enhance the environmental sustainability of their operations. As sea-borne trade has grown significantly in the past decades, there have been increasingconcerns about the environmental impacts caused by shipping activities. To addressthese concerns, a growing number of shipping firms have begun to adopt greenoperations as a means to achieve environmental sustainability. Green operations inthe shipping industry are environmentally sustainable ways to perform shippingactivities. In addition, a shipping firm operates in a transport chain where variousoperators (e.g., ocean carriers, freight agents, land transport service providers,warehouse operators, and barge operators) in the shipping community are closelylinked, in which the environmental performance of each operator affects the envi-ronmental sustainability of the shipping chain.
Due to the imperative role of shipping in facilitating global cargo flow, the sus-tainable development of shipping operations has become a concern to differentgroups of stakeholders. After identifying improvements to environmental manage-ment within the shipping industry as one of the key issues, the World Wildlife Fund(WWF) has introduced sustainable shipping initiatives (as shown in Fig. 2.1) whichare “innovative schemes that encourage shipping firms to go beyond standard
The research of the chapter is based on Lai et al. (2011) and Lun (2011).
© Springer International Publishing Switzerland 2016Y.H.V. Lun et al., Green Shipping Management,Shipping and Transport Logistics, DOI 10.1007/978-3-319-26482-0_2
17
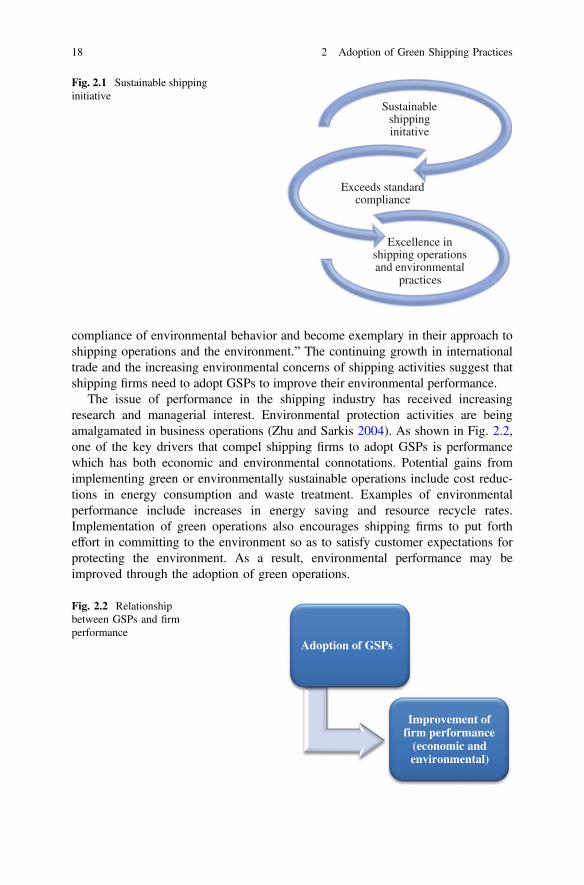
compliance of environmental behavior and become exemplary in their approach toshipping operations and the environment.” The continuing growth in internationaltrade and the increasing environmental concerns of shipping activities suggest thatshipping firms need to adopt GSPs to improve their environmental performance.
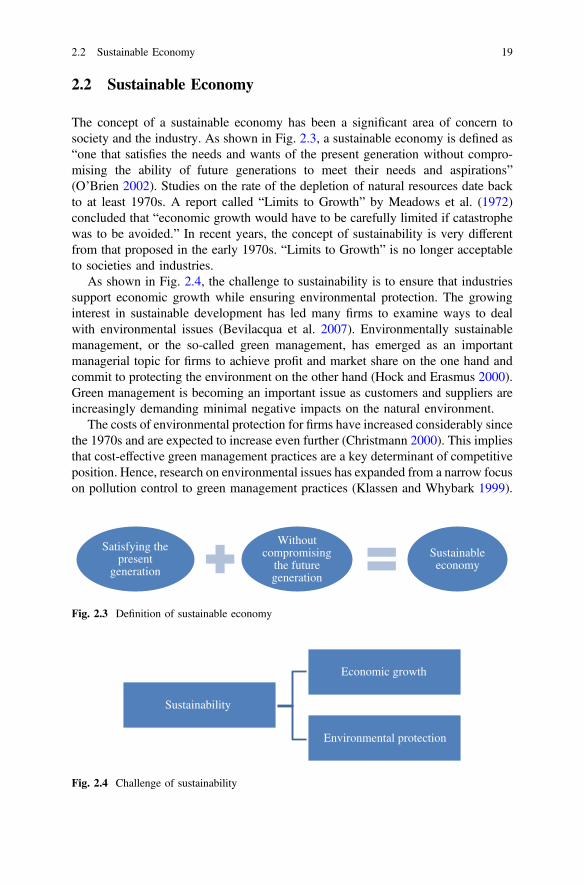
The issue of performance in the shipping industry has received increasingresearch and managerial interest. Environmental protection activities are beingamalgamated in business operations (Zhu and Sarkis 2004). As shown in Fig. 2.2,one of the key drivers that compel shipping firms to adopt GSPs is performancewhich has both economic and environmental connotations. Potential gains fromimplementing green or environmentally sustainable operations include cost reduc-tions in energy consumption and waste treatment. Examples of environmentalperformance include increases in energy saving and resource recycle rates.Implementation of green operations also encourages shipping firms to put fortheffort in committing to the environment so as to satisfy customer expectations forprotecting the environment. As a result, environmental performance may beimproved through the adoption of green operations.
Sustainable shipping initative
Exceeds standard compliance
Excellence in shipping operations and environmental
practices
Fig. 2.1 Sustainable shippinginitiative
Adoption of GSPs
Improvement of firm performance
(economic and environmental)
Fig. 2.2 Relationshipbetween GSPs and firmperformance
18 2 Adoption of Green Shipping Practices
2.2 Sustainable Economy
The concept of a sustainable economy has been a significant area of concern tosociety and the industry. As shown in Fig. 2.3, a sustainable economy is defined as“one that satisfies the needs and wants of the present generation without compro-mising the ability of future generations to meet their needs and aspirations”(O’Brien 2002). Studies on the rate of the depletion of natural resources date backto at least 1970s. A report called “Limits to Growth” by Meadows et al. (1972)concluded that “economic growth would have to be carefully limited if catastrophewas to be avoided.” In recent years, the concept of sustainability is very differentfrom that proposed in the early 1970s. “Limits to Growth” is no longer acceptableto societies and industries.
As shown in Fig. 2.4, the challenge to sustainability is to ensure that industriessupport economic growth while ensuring environmental protection. The growinginterest in sustainable development has led many firms to examine ways to dealwith environmental issues (Bevilacqua et al. 2007). Environmentally sustainablemanagement, or the so-called green management, has emerged as an importantmanagerial topic for firms to achieve profit and market share on the one hand andcommit to protecting the environment on the other hand (Hock and Erasmus 2000).Green management is becoming an important issue as customers and suppliers areincreasingly demanding minimal negative impacts on the natural environment.
The costs of environmental protection for firms have increased considerably sincethe 1970s and are expected to increase even further (Christmann 2000). This impliesthat cost-effective green management practices are a key determinant of competitiveposition. Hence, research on environmental issues has expanded from a narrow focuson pollution control to green management practices (Klassen and Whybark 1999).
Satisfying the present
generation
Without compromising
the future generation
Sustainable economy
Fig. 2.3 Definition of sustainable economy
Sustainability
Economic growth
Environmental protection
Fig. 2.4 Challenge of sustainability
2.2 Sustainable Economy 19
The environmental management literature (Shrivastava 1995) has suggested thatfirms can improve their competitive positions and simultaneously reduce the negativeeffects of their activities on the natural environment by implementing GSPs.Consequently, firms cannot neglect economic and environmental performance. Theintegration of environmental components into management practices has becomeincreasingly important in order to gain a competitive advantage. However, manyfirms are still reluctant to take a more active approach in incorporating GSPs due to “aperceived lack of evidence that the benefits exceed the costs of pursuing these ini-tiatives” (Montabon et al. 2007). There is therefore the need to examine performanceimprovement opportunities through the implementation of GSPs.
2.3 GSPs as a Means of Comparative Advantage
The study of GSPs is focused on identifying best practices that simultaneouslyreduce the negative impacts of firm activities on the natural environment andcontribute to better firm performance. Unlike regulatory requirements which arederived from the outside, GSPs consist of operational processes that arise fromwithin a firm. GSPs are a collection of internal efforts in business planning andimplementation. GSPs consist of a business policy and a set of business processesthat require firms to assess their environmental impacts, determine environmentalgoals, implement environmental operations, monitor goal attainment, and undergomanagement reviews.
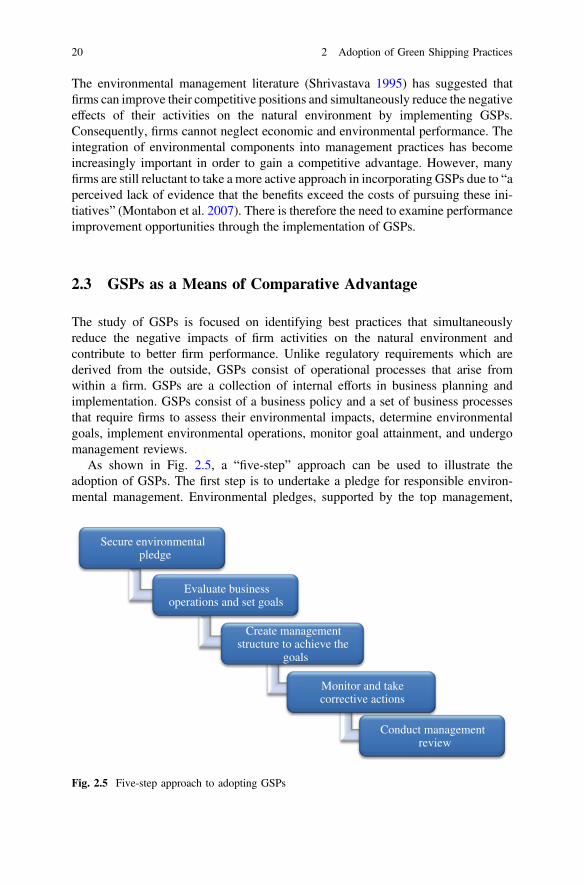
As shown in Fig. 2.5, a “five-step” approach can be used to illustrate theadoption of GSPs. The first step is to undertake a pledge for responsible environ-mental management. Environmental pledges, supported by the top management,
Secure environmental pledge
Evaluate business operations and set goals
Create management structure to achieve the
goals
Monitor and take corrective actions
Conduct management review
Fig. 2.5 Five-step approach to adopting GSPs
20 2 Adoption of Green Shipping Practices
entail commitment toward the continual improvement of pollution prevention andcompliance with relevant environmental legislation (Starkey 1998). The secondstep is the evaluation of business operations and goal setting. During this stage,decisions are made on ways to translate environmental policy into action andbusiness priorities (Netherwood 1998). The third stage involves the creation of amanagement structure and linkage with business partners to realize the environ-mental goals. As GSPs are a tool to improve environmental management in a firm,the fourth stage, i.e., monitoring and taking corrective actions if necessary, iscrucial for continuous environmental improvement. The final stage is a manage-ment review to provide critical assessments and present new environmental con-cerns and recommendations.
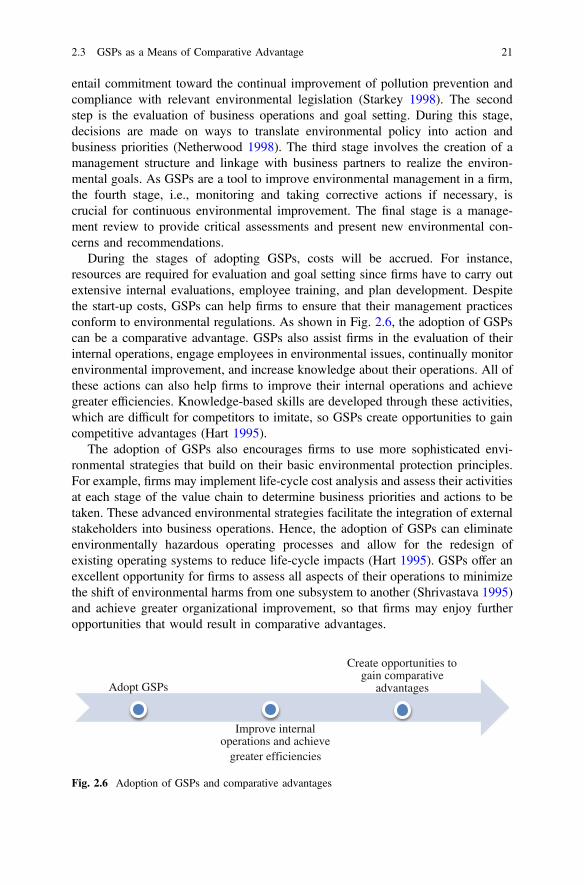
During the stages of adopting GSPs, costs will be accrued. For instance,resources are required for evaluation and goal setting since firms have to carry outextensive internal evaluations, employee training, and plan development. Despitethe start-up costs, GSPs can help firms to ensure that their management practicesconform to environmental regulations. As shown in Fig. 2.6, the adoption of GSPscan be a comparative advantage. GSPs also assist firms in the evaluation of theirinternal operations, engage employees in environmental issues, continually monitorenvironmental improvement, and increase knowledge about their operations. All ofthese actions can also help firms to improve their internal operations and achievegreater efficiencies. Knowledge-based skills are developed through these activities,which are difficult for competitors to imitate, so GSPs create opportunities to gaincompetitive advantages (Hart 1995).
The adoption of GSPs also encourages firms to use more sophisticated envi-ronmental strategies that build on their basic environmental protection principles.For example, firms may implement life-cycle cost analysis and assess their activitiesat each stage of the value chain to determine business priorities and actions to betaken. These advanced environmental strategies facilitate the integration of externalstakeholders into business operations. Hence, the adoption of GSPs can eliminateenvironmentally hazardous operating processes and allow for the redesign ofexisting operating systems to reduce life-cycle impacts (Hart 1995). GSPs offer anexcellent opportunity for firms to assess all aspects of their operations to minimizethe shift of environmental harms from one subsystem to another (Shrivastava 1995)and achieve greater organizational improvement, so that firms may enjoy furtheropportunities that would result in comparative advantages.
Adopt GSPs
Improve internal operations and achieve
greater efficiencies
Create opportunities to gain comparative
advantages
Fig. 2.6 Adoption of GSPs and comparative advantages
2.3 GSPs as a Means of Comparative Advantage 21
2.4 Basis of GSP Adoption
2.4.1 Stakeholder Theory
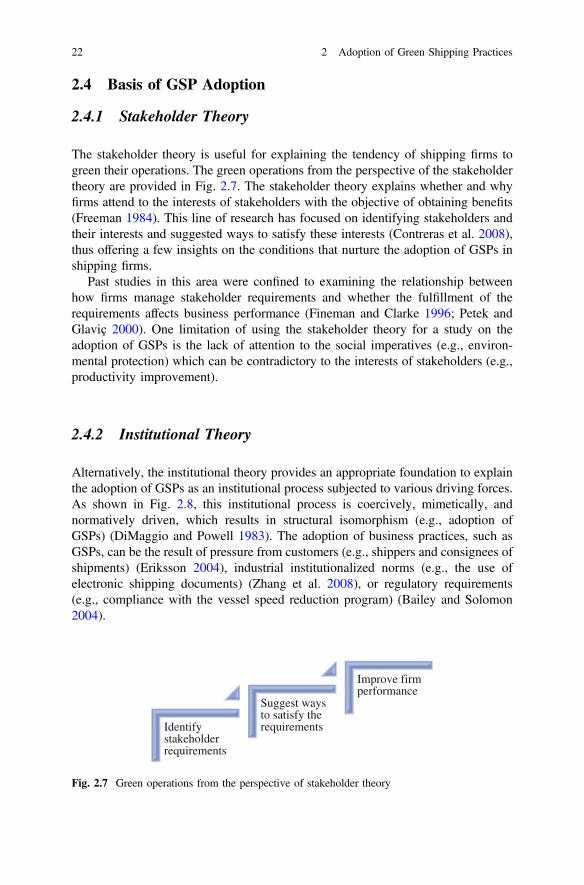
The stakeholder theory is useful for explaining the tendency of shipping firms togreen their operations. The green operations from the perspective of the stakeholdertheory are provided in Fig. 2.7. The stakeholder theory explains whether and whyfirms attend to the interests of stakeholders with the objective of obtaining benefits(Freeman 1984). This line of research has focused on identifying stakeholders andtheir interests and suggested ways to satisfy these interests (Contreras et al. 2008),thus offering a few insights on the conditions that nurture the adoption of GSPs inshipping firms.
Past studies in this area were confined to examining the relationship betweenhow firms manage stakeholder requirements and whether the fulfillment of therequirements affects business performance (Fineman and Clarke 1996; Petek andGlaviç 2000). One limitation of using the stakeholder theory for a study on theadoption of GSPs is the lack of attention to the social imperatives (e.g., environ-mental protection) which can be contradictory to the interests of stakeholders (e.g.,productivity improvement).
2.4.2 Institutional Theory
Alternatively, the institutional theory provides an appropriate foundation to explainthe adoption of GSPs as an institutional process subjected to various driving forces.As shown in Fig. 2.8, this institutional process is coercively, mimetically, andnormatively driven, which results in structural isomorphism (e.g., adoption ofGSPs) (DiMaggio and Powell 1983). The adoption of business practices, such asGSPs, can be the result of pressure from customers (e.g., shippers and consignees ofshipments) (Eriksson 2004), industrial institutionalized norms (e.g., the use ofelectronic shipping documents) (Zhang et al. 2008), or regulatory requirements(e.g., compliance with the vessel speed reduction program) (Bailey and Solomon2004).
Identify stakeholder requirements
Suggest ways to satisfy the requirements
Improve firm performance
Fig. 2.7 Green operations from the perspective of stakeholder theory
22 2 Adoption of Green Shipping Practices
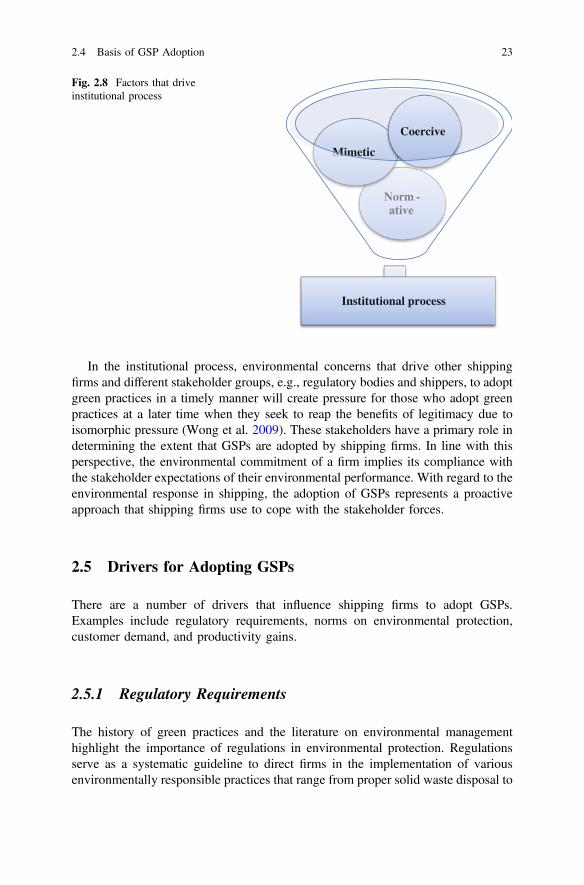
In the institutional process, environmental concerns that drive other shippingfirms and different stakeholder groups, e.g., regulatory bodies and shippers, to adoptgreen practices in a timely manner will create pressure for those who adopt greenpractices at a later time when they seek to reap the benefits of legitimacy due toisomorphic pressure (Wong et al. 2009). These stakeholders have a primary role indetermining the extent that GSPs are adopted by shipping firms. In line with thisperspective, the environmental commitment of a firm implies its compliance withthe stakeholder expectations of their environmental performance. With regard to theenvironmental response in shipping, the adoption of GSPs represents a proactiveapproach that shipping firms use to cope with the stakeholder forces.
2.5 Drivers for Adopting GSPs
There are a number of drivers that influence shipping firms to adopt GSPs.Examples include regulatory requirements, norms on environmental protection,customer demand, and productivity gains.
2.5.1 Regulatory Requirements
The history of green practices and the literature on environmental managementhighlight the importance of regulations in environmental protection. Regulationsserve as a systematic guideline to direct firms in the implementation of variousenvironmentally responsible practices that range from proper solid waste disposal to
Institutional process
Coercive
Fig. 2.8 Factors that driveinstitutional process
2.4 Basis of GSP Adoption 23
reduction in gas emissions. For example, there are international laws, such as theEuropean Community Directives on Waste Electrical and Electronic Equipment(WEEE) which encourage manufacturers to collect and recycle products, andRegistration, Evaluation, Authorization, and Restriction of Chemicals (REACH)which ensures that the industry adheres to determining the hazards and relaying theinformation to consumers. In line with these regulations, the EnvironmentalProtection Agency (EPA) in the USA proposed regulations to reduce emissionsfrom ships in 2009. While legislative measures are essential for environmentalprotection, the enforcement of these regulations is crucial to achieving the goals forenvironmental protection.
From the regulatory perspective, the International Maritime Organization(IMO) International Convention for the Prevention of Pollution from Ships is one ofthe most important conventions that regulate and prevent marine pollution by ships.It has been modified by the Protocol of 1978 related thereto (MARPOL 73/78),which covers accidental and operational oil pollution, as well as pollution bychemicals, goods in packaged form, and sewage, garbage, and air pollution.The IMO also holds secretariat responsibilities for the Convention on thePrevention of Marine Pollution by Dumping of Wastes and Other Matter (LDC),1972, generally known as the London Convention, which has been updated by the1996 Protocol. Prior research has argued that loose regulatory enforcement is foundto be insufficient in driving the environmental actions of firms (Economy andLieberthal 2007). By failing to appreciate the dire consequences of the prosecutionof heavy polluters, shipping firms are less keen to comply with environmentalregulations. Alternatively, shipping firms will find it in their best interests to focuson environmental protection when they are mandated by regulations to undertakerelated actions.
2.5.2 Norms on Environmental Protection
It is commonly seen that industries establish their own norms of practice in supportof their own sustainable development. Many industrial associations, e.g., theMarine Environmental Protection Committee (MEPC), often lead the developmentand promotion of good practices for environmental protection and provide assis-tance (e.g., sharing best practices) to their members to guide their environmentalefforts. In recognizing the imperative environmental degradation caused by ship-ping activities, the MEPC has recently considered proposals on reducing the carbonfootprint of the shipping industry with particular focus on the recycling ofend-of-life ships and reducing the levels of harmful emissions. An example thatillustrates such a green practice is a project launched by Maersk Line to develop anenvironmentally friendly “ship-recycling” process that replaced the previous pro-cedure of ship scrapping. Maersk’s vessels are also designed and built withmaterials with a high recycling ratio.
24 2 Adoption of Green Shipping Practices
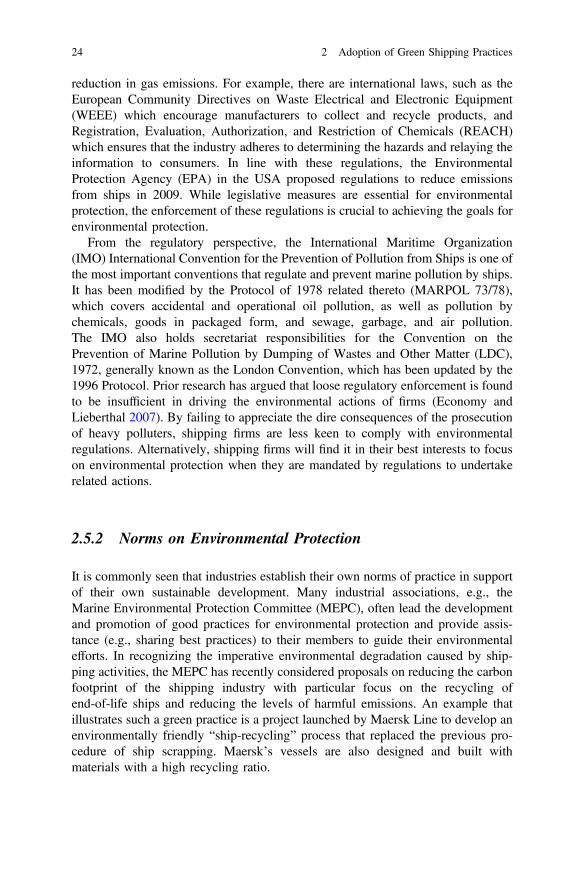
These industry-initiated programs provide direction and guidelines on theenvironmental responsibilities that are expected of shipping firms, thus dictatingtheir practices through peer pressure. Similarly, the Shipping industry guidance onEnvironmental Compliance: A framework for ensuring compliance with MARPOLprepared by the International Chamber of Shipping (ICS) (www.ics-shipping.org)provides a framework to ensure environmental compliance. The suggested elementsof the framework that are to be reviewed by shipping companies are shown in Fig.2.9. This framework aims to facilitate sustainable development of the shippingindustry and promote eco-efficiency in ocean transportation. The development ofindustrial norms in environmental protection which is granted legitimacy in theshipping industry can increase the rate that GSPs are adopted and shipping firmscan benefit from the assistance provided by the related associations, such as the ICSand IMO, to facilitate their efforts in GSP adoption.
2.5.3 Customer Demand
Shipping firms are compelled by increasingly greater environmental awareness tocarry out more environmentally friendly operations. Vessel operations inevitablygenerate pollutants such as oily waste. If a shipping firm is accused of pollution,customers may give their business to another firm to avoid backlash for beingenvironmentally irresponsible. To reduce the discharge of oily water, mega ship-ping firms, such as Maersk Line, have installed polishing filters in the oil–waterseparator on its vessels. This practice ensures that oily water is treated, thus
Responsibility• senior
management support environmental compliance
• serious action taken against non-compliance to environmental responsibility
Review • review existing
practices• assess
operational processes
• ensure staff members are properly trained to comply with environmental regulations
Control • environmental
equipment are verified to be properly functioning
• deliberate non-compliance is discouraged
Documentation and auditing• implement sound
documentary system to avoid falsifications
• establish internal and external reporting systems
• conduct environmental auditing
Fig. 2.9 Elements of environmental compliance framework
2.5 Drivers for Adopting GSPs 25
resulting in effluent concentrations below 5 parts per million (pmm), which is wellbelow the regulatory requirements of 15 pmm.
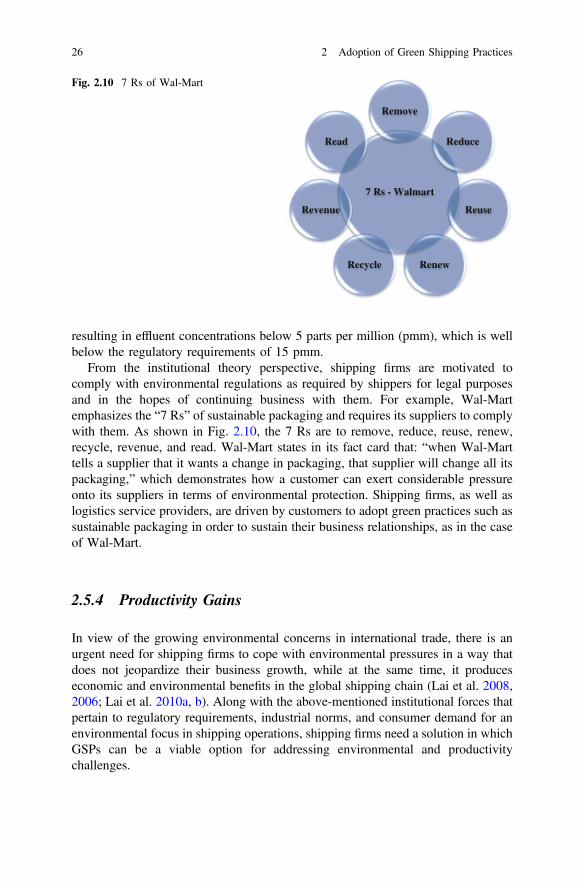
From the institutional theory perspective, shipping firms are motivated tocomply with environmental regulations as required by shippers for legal purposesand in the hopes of continuing business with them. For example, Wal-Martemphasizes the “7 Rs” of sustainable packaging and requires its suppliers to complywith them. As shown in Fig. 2.10, the 7 Rs are to remove, reduce, reuse, renew,recycle, revenue, and read. Wal-Mart states in its fact card that: “when Wal-Marttells a supplier that it wants a change in packaging, that supplier will change all itspackaging,” which demonstrates how a customer can exert considerable pressureonto its suppliers in terms of environmental protection. Shipping firms, as well aslogistics service providers, are driven by customers to adopt green practices such assustainable packaging in order to sustain their business relationships, as in the caseof Wal-Mart.
2.5.4 Productivity Gains
In view of the growing environmental concerns in international trade, there is anurgent need for shipping firms to cope with environmental pressures in a way thatdoes not jeopardize their business growth, while at the same time, it produceseconomic and environmental benefits in the global shipping chain (Lai et al. 2008,2006; Lai et al. 2010a, b). Along with the above-mentioned institutional forces thatpertain to regulatory requirements, industrial norms, and consumer demand for anenvironmental focus in shipping operations, shipping firms need a solution in whichGSPs can be a viable option for addressing environmental and productivitychallenges.
7 Rs - Walmart
Remove
Reduce
Reuse
RenewRecycle
Revenue
Read
Fig. 2.10 7 Rs of Wal-Mart
26 2 Adoption of Green Shipping Practices
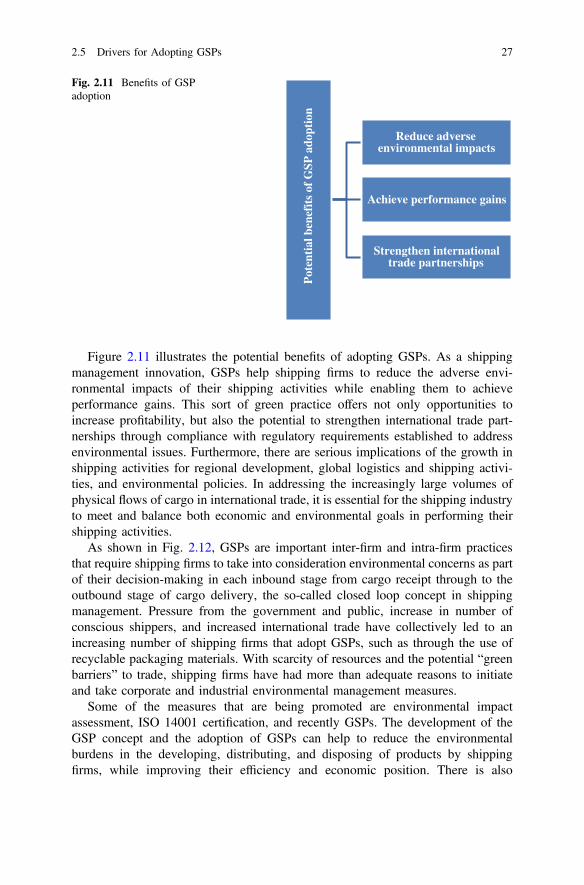
Figure 2.11 illustrates the potential benefits of adopting GSPs. As a shippingmanagement innovation, GSPs help shipping firms to reduce the adverse envi-ronmental impacts of their shipping activities while enabling them to achieveperformance gains. This sort of green practice offers not only opportunities toincrease profitability, but also the potential to strengthen international trade part-nerships through compliance with regulatory requirements established to addressenvironmental issues. Furthermore, there are serious implications of the growth inshipping activities for regional development, global logistics and shipping activi-ties, and environmental policies. In addressing the increasingly large volumes ofphysical flows of cargo in international trade, it is essential for the shipping industryto meet and balance both economic and environmental goals in performing theirshipping activities.
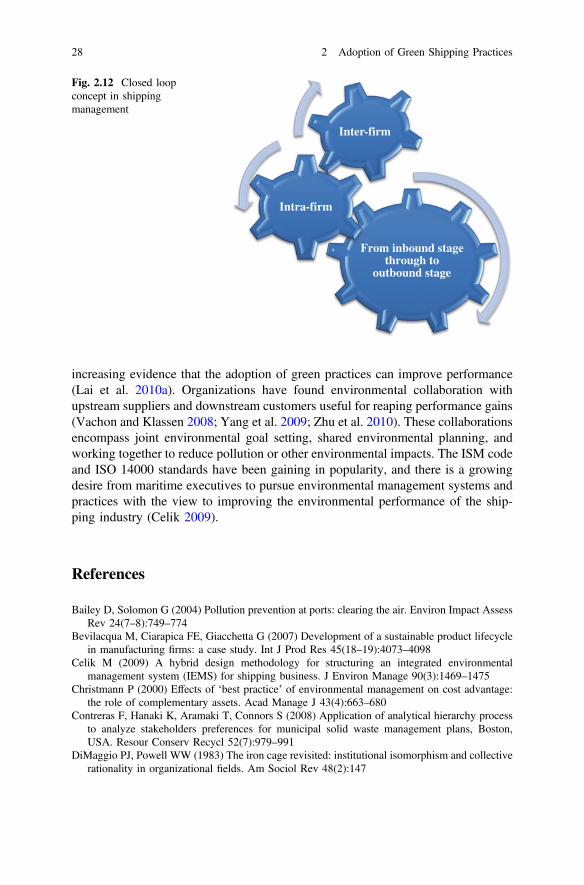
As shown in Fig. 2.12, GSPs are important inter-firm and intra-firm practicesthat require shipping firms to take into consideration environmental concerns as partof their decision-making in each inbound stage from cargo receipt through to theoutbound stage of cargo delivery, the so-called closed loop concept in shippingmanagement. Pressure from the government and public, increase in number ofconscious shippers, and increased international trade have collectively led to anincreasing number of shipping firms that adopt GSPs, such as through the use ofrecyclable packaging materials. With scarcity of resources and the potential “greenbarriers” to trade, shipping firms have had more than adequate reasons to initiateand take corporate and industrial environmental management measures.
Some of the measures that are being promoted are environmental impactassessment, ISO 14001 certification, and recently GSPs. The development of theGSP concept and the adoption of GSPs can help to reduce the environmentalburdens in the developing, distributing, and disposing of products by shippingfirms, while improving their efficiency and economic position. There is also
Pot
enti
al b
enef
its
of G
SP a
dopt
ion
Reduce adverse environmental impacts
Achieve performance gains
Strengthen international trade partnerships
Fig. 2.11 Benefits of GSPadoption
2.5 Drivers for Adopting GSPs 27
increasing evidence that the adoption of green practices can improve performance(Lai et al. 2010a). Organizations have found environmental collaboration withupstream suppliers and downstream customers useful for reaping performance gains(Vachon and Klassen 2008; Yang et al. 2009; Zhu et al. 2010). These collaborationsencompass joint environmental goal setting, shared environmental planning, andworking together to reduce pollution or other environmental impacts. The ISM codeand ISO 14000 standards have been gaining in popularity, and there is a growingdesire from maritime executives to pursue environmental management systems andpractices with the view to improving the environmental performance of the ship-ping industry (Celik 2009).
References
Bailey D, Solomon G (2004) Pollution prevention at ports: clearing the air. Environ Impact AssessRev 24(7–8):749–774
Bevilacqua M, Ciarapica FE, Giacchetta G (2007) Development of a sustainable product lifecyclein manufacturing firms: a case study. Int J Prod Res 45(18–19):4073–4098
Celik M (2009) A hybrid design methodology for structuring an integrated environmentalmanagement system (IEMS) for shipping business. J Environ Manage 90(3):1469–1475
Christmann P (2000) Effects of ‘best practice’ of environmental management on cost advantage:the role of complementary assets. Acad Manage J 43(4):663–680
Contreras F, Hanaki K, Aramaki T, Connors S (2008) Application of analytical hierarchy processto analyze stakeholders preferences for municipal solid waste management plans, Boston,USA. Resour Conserv Recycl 52(7):979–991
DiMaggio PJ, Powell WW (1983) The iron cage revisited: institutional isomorphism and collectiverationality in organizational fields. Am Sociol Rev 48(2):147
From inbound stage through to
outbound stage
Intra-firm
Inter-firm
Fig. 2.12 Closed loopconcept in shippingmanagement
28 2 Adoption of Green Shipping Practices
Economy E, Lieberthal K (2007) Scorched earth: Will environmental risks in China overwhelm itsopportunities? Harvard Bus Rev 85(6):88–96
Eriksson C (2004) Can green consumerism replace environmental regulation?—Adifferentiated-products example. Resour Energy Econ 26(3):281–293
Fineman S, Clarke K (1996) Green stakeholders: industry interpretations and response*. J ManageStud 33(6):715–730
Freeman RE (1984) Strategic management: a stakeholder approach. University of Chicago Press,Chicago
Hart SL (1995) A natural-resource-based view of the firm. Acad Manage Rev 20(4):986–1014Hock V, Erasmus RI (2000) From reversed logistics to green supply chain. Logistics Solutions
2:28–33Klassen RD, Whybark CD (1999) The impact of environmental technologies on manufacturing
performance. Acad Manage J 42(6):599–615Lai KH, Wong CWY, Edwin Cheng TC (2006) Institutional isomorphism and the adoption of
information technology for supply chain management. Comput Ind 57(1):93–98Lai KH, Bao Y, Li X (2008) Channel relationship and business uncertainty: evidence from the
Hong Kong market. Ind Mark Manage 37(6):713–724Lai KH, Wong CWY, Cheng TCE (2010a) Bundling digitized logistics activities and its
performance implications. Ind Mark Manage 39(2):273–286Lai KH, Cheng TCE, Tang AKY (2010b) Green retailing: factors for success. Calif Manage Rev
52(2):6–31Lai KH, Lun YHV, Wong CWY, Cheng TCE (2011) Green practices in the shipping industry:
conceptualization, adoption, and implications. Resour Conserv Recycl 55(6):631–638Lun YHV (2011) Green management practices and firm performance: A case of container terminal
operations. Resour Conserv Recycl 55(6):559–566Meadows DH, Meadows DL, Randers J,Behrens WW (1972) The limits to growth: a report for the
club Rome’s project on the predicament of mankind. Earth Island, LondonMontabon F, Sroufe R, Narasimhan R (2007) An examination of corporate reporting,
environmental management practice and firm performance. J Oper Manage 25(5):998–1014Netherwood A (1998) Environmental management systems. Corporate environment managementO’Brien C (2002) Global manufacturing and the sustainable economy. Int J Prod Res 40
(15):3867–3877Petek J, Glaviç P (2000) Improving the sustainability of regional cleaner production programs.
Resour Conserv Recycl 29(1–2):19–31Shrivastava P (1995) Environmental technologies and competitive advantage. Strateg Manage
16:183–200Starkey R (1998) The standardization of environmental management systems. In: Corporate
environmental management, 61–89Vachon S, Klassen RD (2008) Environmental management and manufacturing performance: the
role of collaboration in the supply chain. Int J Prod Econ 111(2):299–315Wong CWY, Lai KH, Teo TSH (2009) Institutional pressures and mindful IT management: the
case of a container terminal in China. Inf Manage 46(8):434–441Yang J, Wong CWY, Lai KH, Ntoko AN (2009) The antecedents of dyadic quality performance
and its effect on buyer–supplier relationship improvement. Int J Prod Econ 120(1):243–51.Retrieved (http://dx.doi.org/10.1016/j.ijpe.2008.07.033)
Zhang B et al (2008) Why do firms engage in environmental management? An empirical study inChina. J Clean Prod 16(10):1036–1045
Zhu Q, Sarkis J (2004) Relationships between operational practices and performance among earlyadopters of green supply chain management practices in Chinese manufacturing enterprises.J Oper Manage 22:265–289
Zhu Q, Geng Y, Lai KH (2010) Circular economy practices among Chinese manufacturers varyingin environmental-oriented supply chain cooperation and the performance implications.J Environ Manage 91(6):1324–1331
References 29
Chapter 3Measures for Evaluating Green ShippingPractices
3.1 Defining GSPs
As ships serve more than 80 % of the world trade by volume (UNCTAD 2011), seatransportation is the most popular shipping method used by traders. Public concernsover environmentally friendly operations and resource conservation in the shippingsector have been on the rise. Shipping facilitates global trade but generates envi-ronmental pollution (e.g., CO2 emissions and oil spills). While most shippingresearch studies have focused on cost saving and service enhancement in order toachieve productivity gains, the environmental management aspect of shippingoperations has remained largely unexplored (Lun et al. 2011). Due to increasingenvironmental awareness in the business sector, the shipping industry is alsoincreasingly expected to take environmental responsibility, such that shippingoperations and processes become more environmentally friendly in serving worldtrade. In response, shipping firms are pursuing GSPs in hopes of mitigating theenvironmental damages caused by their activities (Yang 2012).
As shown in Fig. 3.1, shipping encompasses all activities that pertain to themovement of cargo among different parties within a transportation chain, wherebythe activities involve the integration of upstream shippers and downstream con-signees (Lun et al. 2010). Therefore, the implementation of GSPs requires thecoordination of shipping activities with other transport and logistics service pro-viders, e.g., logistics services providers, intermodal transport operators, and othertrade-related firms, along the transportation chain. However, stakeholders, such asshippers, consignees, and carriers, tend to emphasize the performance areas thatserve their best interest. For instance, carriers may focus on operational efficiency,while shippers and consignees are more concerned with service effectiveness along
This research is based on Lai et al. (2013) and Lun et al. (2014).
© Springer International Publishing Switzerland 2016Y.H.V. Lun et al., Green Shipping Management,Shipping and Transport Logistics, DOI 10.1007/978-3-319-26482-0_3
31
the same transportation chain (Lai et al. 2002). The differences in the views onGSPs would lead to inconsistency in the performance measures valued by differentmember firms and as a consequence, compromise chain-wide performance.
Shipping activities involve coordination with various parties along the transportchain. The nature of such operations suggests that the effective implementation ofGSPs necessitates cross-functional cooperation rather than confinement to a singleorganizational unit (as shown in Fig. 3.2). For example, GSPs require cooperationwith equipment suppliers for the selection of environmentally friendly shippingfacilities (Wong et al. 2012). Examples include the eco-labeling of resources suchas shipping crates and totes for reuse, cooperation with equipment suppliers onenvironmental objectives, and environmental audits of the internal managementsystems of suppliers. Cooperation with customers and shippers on eco-designs incargo handling and shipments is also highly desirable which includes customerinvolvement in cleaner deliveries, such as the enforcement of programs for recy-cling, vehicle idling, packing waste collection, and the use of green packingmaterials.
Figure 3.3 illustrates the definition of GSPs. GSPs can be broadly defined as “thehandling and distribution of cargoes in an environmentally sustainable way with aview to reducing waste creation and conserving resources in performing shippingactivities” (Lai et al. 2013). GSP implementation is increasingly recognized as animportant management approach to help reduce the environmental damages causedby shipping activities. GSPs are concerned with the handling and distributing ofcargoes in a sustainable way, by taking account of environmental issues such aswaste reduction and resource conservation in shipping management.
Upstream shipper
Shipping activities
Downstream consignee
Fig. 3.1 Transport chain
Necessitates cross-
functional cooperation
Confined to a single
organizatio-nal unit
Fig. 3.2 Coordination alongthe transport chain
32 3 Measures for Evaluating Green Shipping Practices
3.2 Conceptualization of GSPs
Different interpretations of GSPs can lead to inconsistency in terms of performanceevaluation, which compromises the implementation outcomes. GSPs have beenconceptualized in various ways, which range from the perspective of the naturalsciences to that of technological advancement, as well as business management. Asshown in Fig. 3.4, the natural sciences consider GSPs as the helpful means forshipping firms to reduce the damages caused by their operations to the naturalenvironment. Corbett et al. (2007) and Eyring et al. (2009) examinedemission-related atmospheric problems that originated from shipping activities andindicated that there is association between vessel operations and atmospheric pol-lution consequences (e.g., global warming, acid rain, and climate changes). In theirstudies, these authors have analyzed adverse environmental impacts instigated byshipping activities and provided recommendations to mitigate the relevantproblems.
Green shipping practices
Perform shipping activities in an
environmentally sustainable way
Fig. 3.3 Green shipping practices
Less pollution generated in
shipping operations, e.g., ballast
water discharge, and
emission
Less damage to the natural
environment, e.g., global
warming, acid rain, and
climate change
Fig. 3.4 Conceptualizationof GSPs from perspective ofnatural sciences
3.2 Conceptualization of GSPs 33
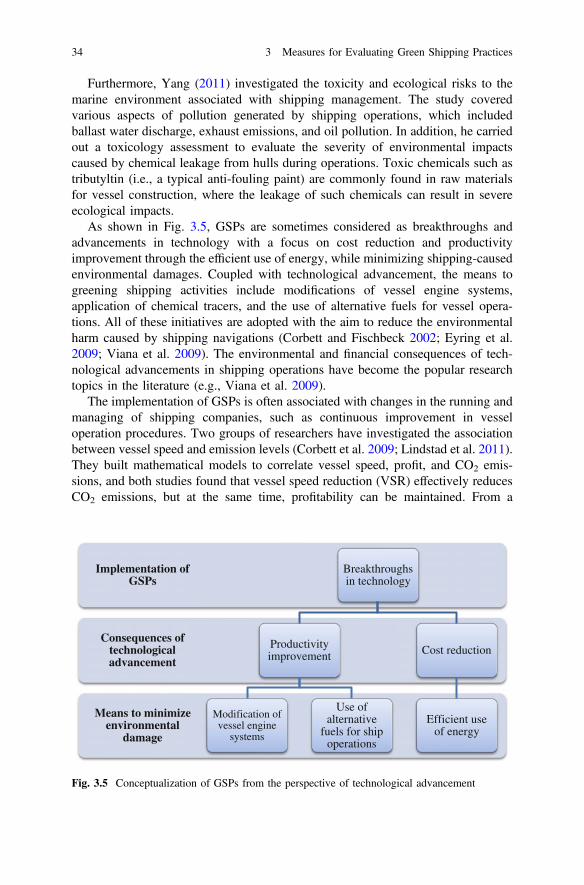
Furthermore, Yang (2011) investigated the toxicity and ecological risks to themarine environment associated with shipping management. The study coveredvarious aspects of pollution generated by shipping operations, which includedballast water discharge, exhaust emissions, and oil pollution. In addition, he carriedout a toxicology assessment to evaluate the severity of environmental impactscaused by chemical leakage from hulls during operations. Toxic chemicals such astributyltin (i.e., a typical anti-fouling paint) are commonly found in raw materialsfor vessel construction, where the leakage of such chemicals can result in severeecological impacts.
As shown in Fig. 3.5, GSPs are sometimes considered as breakthroughs andadvancements in technology with a focus on cost reduction and productivityimprovement through the efficient use of energy, while minimizing shipping-causedenvironmental damages. Coupled with technological advancement, the means togreening shipping activities include modifications of vessel engine systems,application of chemical tracers, and the use of alternative fuels for vessel opera-tions. All of these initiatives are adopted with the aim to reduce the environmentalharm caused by shipping navigations (Corbett and Fischbeck 2002; Eyring et al.2009; Viana et al. 2009). The environmental and financial consequences of tech-nological advancements in shipping operations have become the popular researchtopics in the literature (e.g., Viana et al. 2009).
The implementation of GSPs is often associated with changes in the running andmanaging of shipping companies, such as continuous improvement in vesseloperation procedures. Two groups of researchers have investigated the associationbetween vessel speed and emission levels (Corbett et al. 2009; Lindstad et al. 2011).They built mathematical models to correlate vessel speed, profit, and CO2 emis-sions, and both studies found that vessel speed reduction (VSR) effectively reducesCO2 emissions, but at the same time, profitability can be maintained. From a
Means to minimize environmental
damage
Consequences of technological advancement
Implementation of GSPs
Breakthroughs in technology
Productivity improvement
Modification of vessel engine
systems
Use of alternative
fuels for ship operations
Cost reduction
Efficient use of energy
Fig. 3.5 Conceptualization of GSPs from the perspective of technological advancement
34 3 Measures for Evaluating Green Shipping Practices
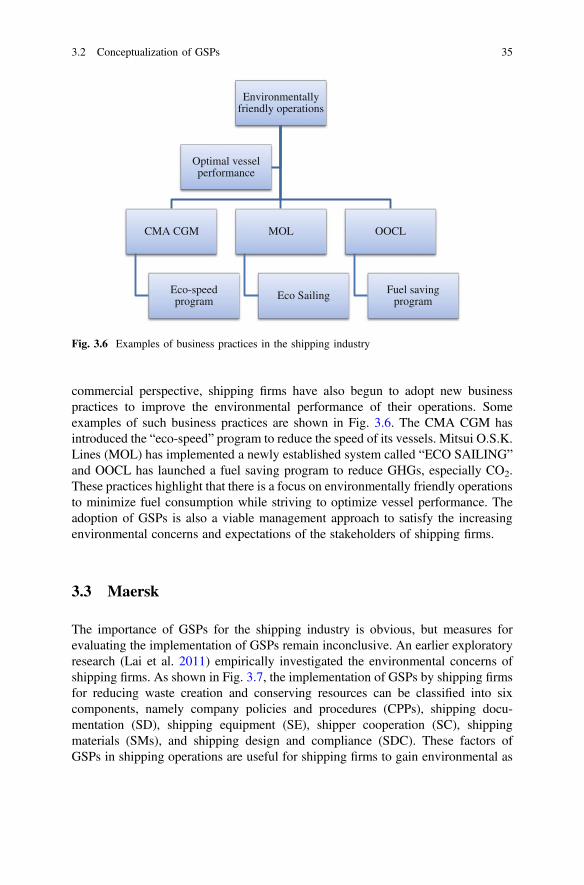
commercial perspective, shipping firms have also begun to adopt new businesspractices to improve the environmental performance of their operations. Someexamples of such business practices are shown in Fig. 3.6. The CMA CGM hasintroduced the “eco-speed” program to reduce the speed of its vessels. Mitsui O.S.K.Lines (MOL) has implemented a newly established system called “ECO SAILING”and OOCL has launched a fuel saving program to reduce GHGs, especially CO2.These practices highlight that there is a focus on environmentally friendly operationsto minimize fuel consumption while striving to optimize vessel performance. Theadoption of GSPs is also a viable management approach to satisfy the increasingenvironmental concerns and expectations of the stakeholders of shipping firms.
3.3 Maersk
The importance of GSPs for the shipping industry is obvious, but measures forevaluating the implementation of GSPs remain inconclusive. An earlier exploratoryresearch (Lai et al. 2011) empirically investigated the environmental concerns ofshipping firms. As shown in Fig. 3.7, the implementation of GSPs by shipping firmsfor reducing waste creation and conserving resources can be classified into sixcomponents, namely company policies and procedures (CPPs), shipping docu-mentation (SD), shipping equipment (SE), shipper cooperation (SC), shippingmaterials (SMs), and shipping design and compliance (SDC). These factors ofGSPs in shipping operations are useful for shipping firms to gain environmental as
Environmentally friendly operations
CMA CGM
Eco-speed program
MOL
Eco Sailing
OOCL
Fuel saving program
Optimal vessel performance
Fig. 3.6 Examples of business practices in the shipping industry
3.2 Conceptualization of GSPs 35
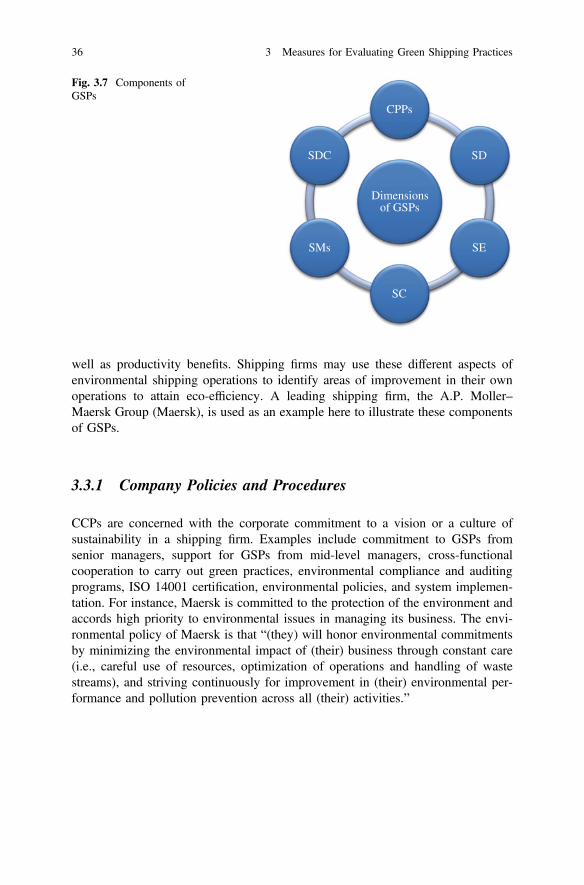
well as productivity benefits. Shipping firms may use these different aspects ofenvironmental shipping operations to identify areas of improvement in their ownoperations to attain eco-efficiency. A leading shipping firm, the A.P. Moller–Maersk Group (Maersk), is used as an example here to illustrate these componentsof GSPs.
3.3.1 Company Policies and Procedures
CCPs are concerned with the corporate commitment to a vision or a culture ofsustainability in a shipping firm. Examples include commitment to GSPs fromsenior managers, support for GSPs from mid-level managers, cross-functionalcooperation to carry out green practices, environmental compliance and auditingprograms, ISO 14001 certification, environmental policies, and system implemen-tation. For instance, Maersk is committed to the protection of the environment andaccords high priority to environmental issues in managing its business. The envi-ronmental policy of Maersk is that “(they) will honor environmental commitmentsby minimizing the environmental impact of (their) business through constant care(i.e., careful use of resources, optimization of operations and handling of wastestreams), and striving continuously for improvement in (their) environmental per-formance and pollution prevention across all (their) activities.”
Dimensions of GSPs
CPPs
SD
SE
SC
SMs
SDC
Fig. 3.7 Components ofGSPs
36 3 Measures for Evaluating Green Shipping Practices
3.3.2 Shipping Documentation
SD is concerned with the documents involved in performing shipping activitiessuch as booking requests and confirmations, shipping instructions, invoices, andremittance advices (Wong et al. 2009). To reduce the use of paper and simplifyshipping processes, Maersk offers “End-to-End EDI Solutions” to automaticallysynchronize the sharing of data across its customers and business partners, thereforesignificantly cutting down on paperwork, and reducing the processing speed and thepossibility of errors by transferring data without manual intervention.
3.3.3 Shipping Equipment
SE is concerned with the use of environmentally friendly shipping equipment andfacilities. Examples include the eco-labeling of resources such as shipping cratesand totes for reuse, cooperating with equipment suppliers to meet environmentalobjectives, environmental auditing of internal management of suppliers, ISO 14001certification of suppliers, and evaluation of green practices with respect tosecond-tier equipment of suppliers. A container is the most important equipment incontainer shipping. Chlorofluorocarbon (CFC) is used in many refrigerated con-tainers, which has been attributed to contributing to the deterioration of the pro-tective ozone layer and the worsening of global warming. To eliminate the emissionof ozone depleting substances, Maersk has eliminated the use of CFC and now usesother types of refrigerants which are more environmentally friendly. In addition,Maersk has developed and uses alternative materials for container flooring. So far,Maersk has produced more than 10,000 containers with floorboards made ofbamboo, which is a quick growing grass that can be harvested every three to fouryears.
3.3.4 Shipper Cooperation
SC is about cooperating with shippers to meet environmental objectives. Examplesinclude working with customers on eco-designing in cargo handling and shipments,involving customers in cleaner delivery, such as enforcement of programs forrecycling, vehicle idling, packing waste collection, and using green packingmaterials. Maersk has collaborated with a number of firms to embark on environ-mental management initiatives. For instance, the Clean Cargo Working Group(CCWG) involves shippers and carriers in the shipping industry who are dedicatedto sustainable product transportation by ocean.
3.3 Maersk 37
3.3.5 Shipping Materials
SMs are concerned with recovery from used shipping resources to reduce costs andimprove operations. Examples include the sale of excess equipment and facilities,used SMs such as packaging and cartons, and used oil. For instance, Maersk has acompany policy on vessel recycling. This policy requires a vessel to be rigorouslychecked before it is delivered to a recycling yard. This stringent checking procedureensures that recycled ships are free from oil spillage, toxic water discharge, andharms generated from the disposal of all the SMs. The procedure involves theconducting of a radiation survey and auditing hazardous materials with the aim tominimizing the environmental impacts caused by vessel recycling. On the otherhand, new vessels are designed and built to ensure a very high recycling ratio.
3.3.6 Shipping Design and Compliance
SDC is concerned with minimizing the life-cycle environmental damage of ship-ping activities by taking measures that comply with regulatory requirements.Examples include the design of shipping activities and equipment for reducedconsumption of materials and energy, design of shipping activities for reuse,recycling and recovery of materials, and design of equipment to avoid or reduce theuse of polluting energy. Optimized voyage planning is an essential means of fuelsaving. Maersk has developed the Voyage Efficiency System (VES) to identify themost fuel-efficient route and pursue a just-in-time steady running strategy. Inaddition, Maersk participates in the VSR Program launched by the Los AngelesHarbor Commission, under which vessels reduce their speed to a voluntary 12-knotspeed limit within 20 nautical miles of Point Fermin.
3.4 Measurement Scales
Given the divergent viewpoints on GSPs, it would be difficult for shipping firmsand the related parties involved to effectively evaluate the performance of theirpractices on a chain-wide basis. To advance knowledge in the emerging butneglected research area of green shipping, it would be helpful to understand theconstruct of implementing GSPs and develop an empirically validated measurementscale for evaluating the implementation of GSPs in shipping firms. Measurementsare a fundamental activity of science and usually associated with other scientificquestions (Devellis 1991). The absence of measurement scales for evaluating thescale and scope of shipping firms in greening their activities is a potential barrier totheir effective implementation of GSPs. It is therefore essential to investigate theconstruct of implementing GSPs and develop a valid and reliable scale and related
38 3 Measures for Evaluating Green Shipping Practices
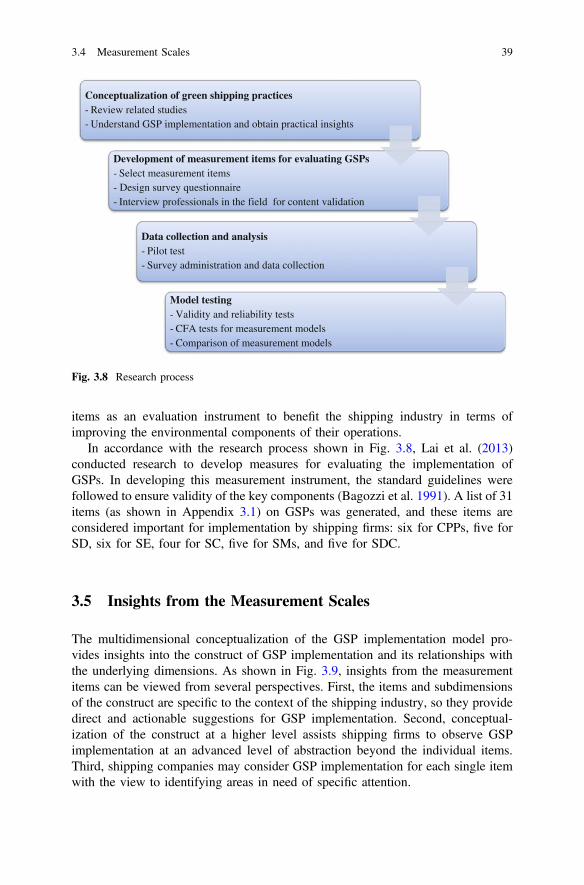
items as an evaluation instrument to benefit the shipping industry in terms ofimproving the environmental components of their operations.
In accordance with the research process shown in Fig. 3.8, Lai et al. (2013)conducted research to develop measures for evaluating the implementation ofGSPs. In developing this measurement instrument, the standard guidelines werefollowed to ensure validity of the key components (Bagozzi et al. 1991). A list of 31items (as shown in Appendix 3.1) on GSPs was generated, and these items areconsidered important for implementation by shipping firms: six for CPPs, five forSD, six for SE, four for SC, five for SMs, and five for SDC.
3.5 Insights from the Measurement Scales
The multidimensional conceptualization of the GSP implementation model pro-vides insights into the construct of GSP implementation and its relationships withthe underlying dimensions. As shown in Fig. 3.9, insights from the measurementitems can be viewed from several perspectives. First, the items and subdimensionsof the construct are specific to the context of the shipping industry, so they providedirect and actionable suggestions for GSP implementation. Second, conceptual-ization of the construct at a higher level assists shipping firms to observe GSPimplementation at an advanced level of abstraction beyond the individual items.Third, shipping companies may consider GSP implementation for each single itemwith the view to identifying areas in need of specific attention.
Conceptualization of green shipping practices- Review related studies- Understand GSP implementation and obtain practical insights
Development of measurement items for evaluating GSPs- Select measurement items- Design survey questionnaire - Interview professionals in the field for content validation
Data collection and analysis- Pilot test- Survey administration and data collection
Model testing- Validity and reliability tests- CFA tests for measurement models- Comparison of measurement models
Fig. 3.8 Research process
3.4 Measurement Scales 39
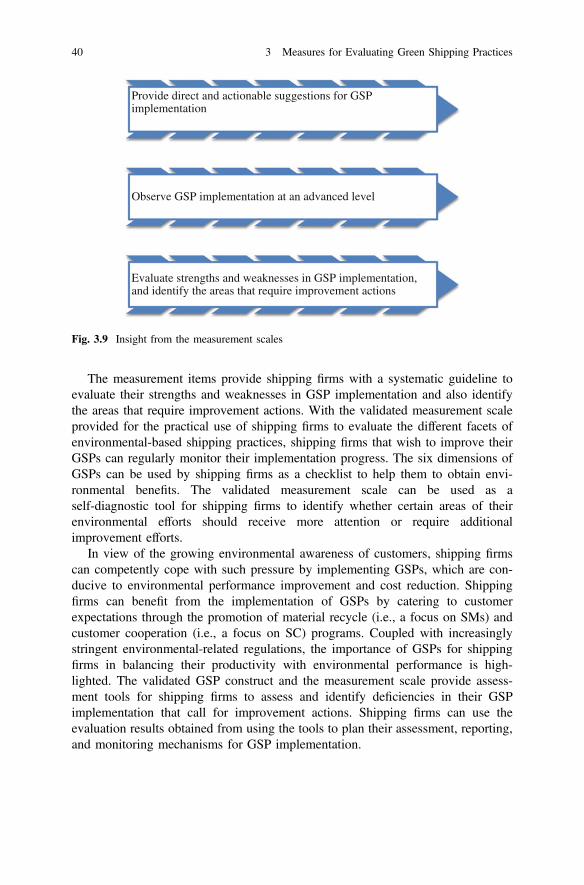
The measurement items provide shipping firms with a systematic guideline toevaluate their strengths and weaknesses in GSP implementation and also identifythe areas that require improvement actions. With the validated measurement scaleprovided for the practical use of shipping firms to evaluate the different facets ofenvironmental-based shipping practices, shipping firms that wish to improve theirGSPs can regularly monitor their implementation progress. The six dimensions ofGSPs can be used by shipping firms as a checklist to help them to obtain envi-ronmental benefits. The validated measurement scale can be used as aself-diagnostic tool for shipping firms to identify whether certain areas of theirenvironmental efforts should receive more attention or require additionalimprovement efforts.
In view of the growing environmental awareness of customers, shipping firmscan competently cope with such pressure by implementing GSPs, which are con-ducive to environmental performance improvement and cost reduction. Shippingfirms can benefit from the implementation of GSPs by catering to customerexpectations through the promotion of material recycle (i.e., a focus on SMs) andcustomer cooperation (i.e., a focus on SC) programs. Coupled with increasinglystringent environmental-related regulations, the importance of GSPs for shippingfirms in balancing their productivity with environmental performance is high-lighted. The validated GSP construct and the measurement scale provide assess-ment tools for shipping firms to assess and identify deficiencies in their GSPimplementation that call for improvement actions. Shipping firms can use theevaluation results obtained from using the tools to plan their assessment, reporting,and monitoring mechanisms for GSP implementation.
Provide direct and actionable suggestions for GSP implementation
Observe GSP implementation at an advanced level
Evaluate strengths and weaknesses in GSP implementation, and identify the areas that require improvement actions
Fig. 3.9 Insight from the measurement scales
40 3 Measures for Evaluating Green Shipping Practices
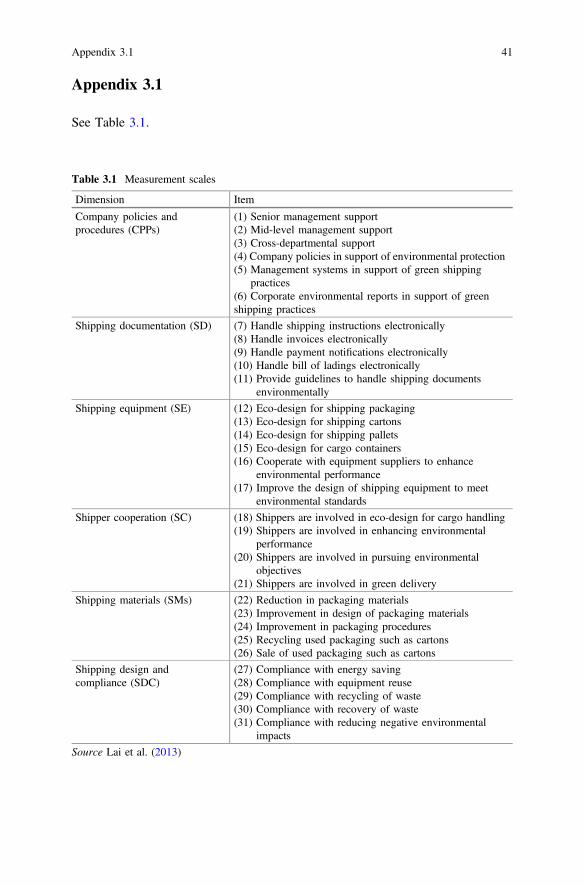
Appendix 3.1
See Table 3.1.
Table 3.1 Measurement scales
Dimension Item
Company policies andprocedures (CPPs)
(1) Senior management support(2) Mid-level management support(3) Cross-departmental support(4) Company policies in support of environmental protection(5) Management systems in support of green shipping
practices(6) Corporate environmental reports in support of greenshipping practices
Shipping documentation (SD) (7) Handle shipping instructions electronically(8) Handle invoices electronically(9) Handle payment notifications electronically(10) Handle bill of ladings electronically(11) Provide guidelines to handle shipping documents
environmentally
Shipping equipment (SE) (12) Eco-design for shipping packaging(13) Eco-design for shipping cartons(14) Eco-design for shipping pallets(15) Eco-design for cargo containers(16) Cooperate with equipment suppliers to enhance
environmental performance(17) Improve the design of shipping equipment to meet
environmental standards
Shipper cooperation (SC) (18) Shippers are involved in eco-design for cargo handling(19) Shippers are involved in enhancing environmental
performance(20) Shippers are involved in pursuing environmental
objectives(21) Shippers are involved in green delivery
Shipping materials (SMs) (22) Reduction in packaging materials(23) Improvement in design of packaging materials(24) Improvement in packaging procedures(25) Recycling used packaging such as cartons(26) Sale of used packaging such as cartons
Shipping design andcompliance (SDC)
(27) Compliance with energy saving(28) Compliance with equipment reuse(29) Compliance with recycling of waste(30) Compliance with recovery of waste(31) Compliance with reducing negative environmental
impacts
Source Lai et al. (2013)
Appendix 3.1 41
References
Bagozzi RP, Yi Y, Phillips LW (1991) Assessing construct validity in organizational research.Adm Sci Q 36(3):421–458
Corbett JJ, Fischbeck PS (2002) Commercial marine emissions and life-cycle analysis of retrofitcontrols in a changing science and policy environment. Naval Eng J 114:93–106. Retrieved(http://dx.doi.org/10.1111/j.1559-3584.2002.tb00113.x)
Corbett JJ et al (2007) Mortality from ship emissions: a global assessment. Environ Sci Technol 41(24):8512–8518
Corbett JJ, Wang H, Winebrake JJ (2009) The effectiveness and costs of speed reductions onemissions from international shipping. Transp Res Part D Transp Environ 14(8):593–598.Retrieved (http://dx.doi.org/10.1016/j.trd.2009.08.005)
DeVellis RF (1991) Scale development: theory and application. Sage Publications Inc, NewburyPark
Eyring V et al (2009) Transport impacts on atmosphere and climate: shipping. Atmos Environ 44(37):4735–4771
Lai KH, Ngai EWT, Cheng TCE (2002) Measures for evaluating supply chain performance intransport logistics. Transp Res Part E Logistics Transp Rev 38:439–456
Lai KH, Lun VYH, Wong CWY, Cheng TCE (2011) Green shipping practice in the shippingindustry: conceptualization, adoption, and implications. Resour Conserv Recycl 55(6):631–38.Retrieved (http://dx.doi.org/10.1016/j.resconrec.2010.12.004)
Lai KH, Lun YHV, Wong CWY, Ngai EWT, Cheng TCE (2013) Measures for evaluating greenshipping practice implementation. Int J Shipping Transp Logistics 5(2):217–35
Lindstad H, Asbjørnslett BE, Strømman AH (2011) Reductions in greenhouse gas emissions andcost by shipping at lower speed. Energy Policy 39:3456–3464
Lun YHV, Pang KW, Photis MP (2010) Organisational growth and firm performance in theinternational container shipping industry. Int J Shipping Transp Logistics 2(2):206
Lun YHV, Lai KH, Ng CT, Wong CWY, Cheng TCE (2011) Research in shipping and transportlogistics. Int J Shipping Transp Logistics 3(1):1–5
Lun YHV, Lai KH, Wong WYC, Cheng TCE (2014) Green shipping practices and firmperformance. Marit Policy Manage 41(2):134–148
UNCTAD (2011) Review of maritime transport. In: United Nations on trade and conferenceViana M et al (2009) Chemical tracers of particulate emissions from commercial shipping. Environ
Sci Technol 43(19):7472–7477Wong CWY, Lai KH, Teo TSH (2009) Institutional pressures and mindful IT management: the
case of a container terminal in China. Inf Manage 46(8):434–441Wong CWY, Lai KH, Venus Lun YH, Cheng TCE (2012) A study on the antecedents of supplier
commitment in support of logistics operations. Int J Shipping Transp Logistics 4(1):5–16Yang M (2011) Shipping and maritime transport. In: Jerome ON (ed) Encyclopedia of
environmental health, pp 33–40Yang CC (2012) The effect of environmental management on environmental performance and firm
performance in Taiwanese maritime firms. Int J Shipping Trans Logistics 4(4):393–407
42 3 Measures for Evaluating Green Shipping Practices

Part IIGreen Shipping Networks
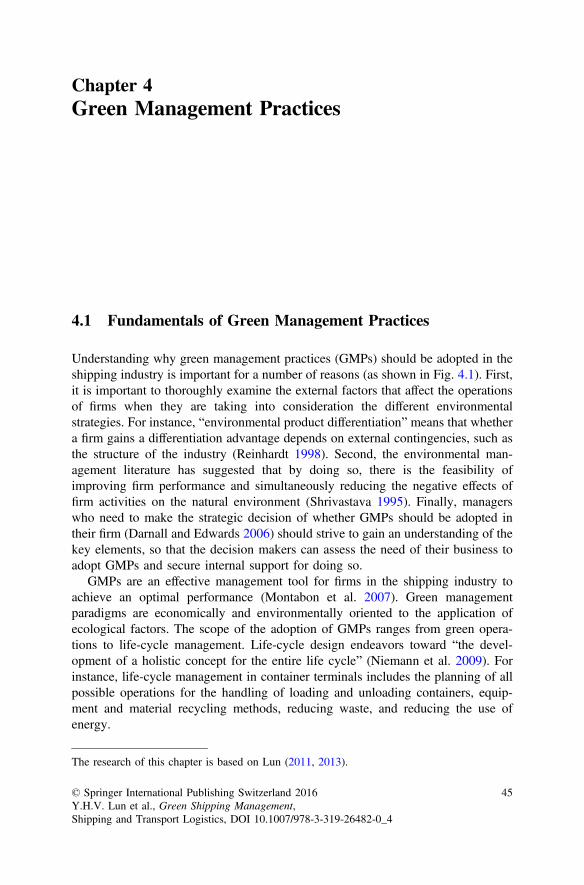
Chapter 4Green Management Practices
4.1 Fundamentals of Green Management Practices
Understanding why green management practices (GMPs) should be adopted in theshipping industry is important for a number of reasons (as shown in Fig. 4.1). First,it is important to thoroughly examine the external factors that affect the operationsof firms when they are taking into consideration the different environmentalstrategies. For instance, “environmental product differentiation” means that whethera firm gains a differentiation advantage depends on external contingencies, such asthe structure of the industry (Reinhardt 1998). Second, the environmental man-agement literature has suggested that by doing so, there is the feasibility ofimproving firm performance and simultaneously reducing the negative effects offirm activities on the natural environment (Shrivastava 1995). Finally, managerswho need to make the strategic decision of whether GMPs should be adopted intheir firm (Darnall and Edwards 2006) should strive to gain an understanding of thekey elements, so that the decision makers can assess the need of their business toadopt GMPs and secure internal support for doing so.
GMPs are an effective management tool for firms in the shipping industry toachieve an optimal performance (Montabon et al. 2007). Green managementparadigms are economically and environmentally oriented to the application ofecological factors. The scope of the adoption of GMPs ranges from green opera-tions to life-cycle management. Life-cycle design endeavors toward “the devel-opment of a holistic concept for the entire life cycle” (Niemann et al. 2009). Forinstance, life-cycle management in container terminals includes the planning of allpossible operations for the handling of loading and unloading containers, equip-ment and material recycling methods, reducing waste, and reducing the use ofenergy.
The research of this chapter is based on Lun (2011, 2013).
© Springer International Publishing Switzerland 2016Y.H.V. Lun et al., Green Shipping Management,Shipping and Transport Logistics, DOI 10.1007/978-3-319-26482-0_4
45
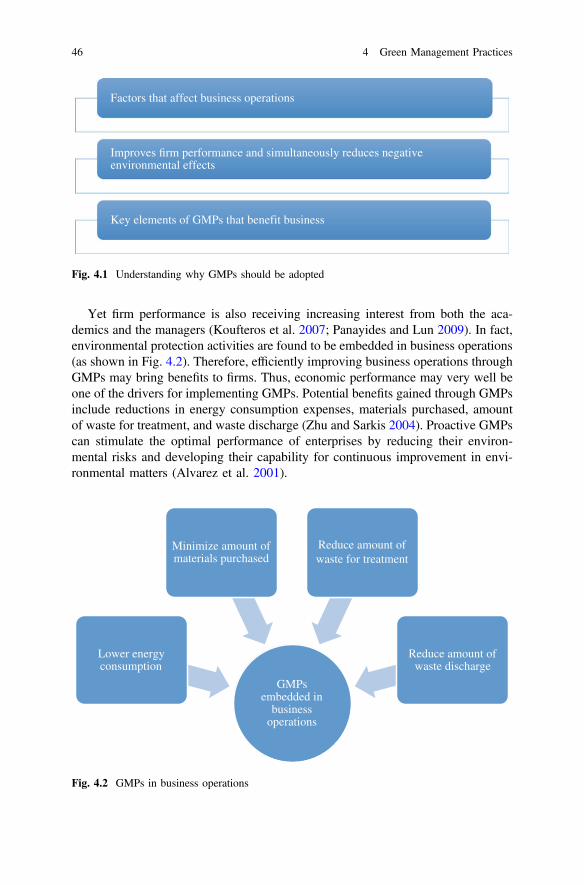
Yet firm performance is also receiving increasing interest from both the aca-demics and the managers (Koufteros et al. 2007; Panayides and Lun 2009). In fact,environmental protection activities are found to be embedded in business operations(as shown in Fig. 4.2). Therefore, efficiently improving business operations throughGMPs may bring benefits to firms. Thus, economic performance may very well beone of the drivers for implementing GMPs. Potential benefits gained through GMPsinclude reductions in energy consumption expenses, materials purchased, amountof waste for treatment, and waste discharge (Zhu and Sarkis 2004). Proactive GMPscan stimulate the optimal performance of enterprises by reducing their environ-mental risks and developing their capability for continuous improvement in envi-ronmental matters (Alvarez et al. 2001).
Factors that affect business operations
Improves firm performance and simultaneously reduces negative environmental effects
Key elements of GMPs that benefit business
Fig. 4.1 Understanding why GMPs should be adopted
GMPs embedded in
business operations
Lower energy consumption
Minimize amount of materials purchased
Reduce amount of waste for treatment
Reduce amount of waste discharge
Fig. 4.2 GMPs in business operations
46 4 Green Management Practices
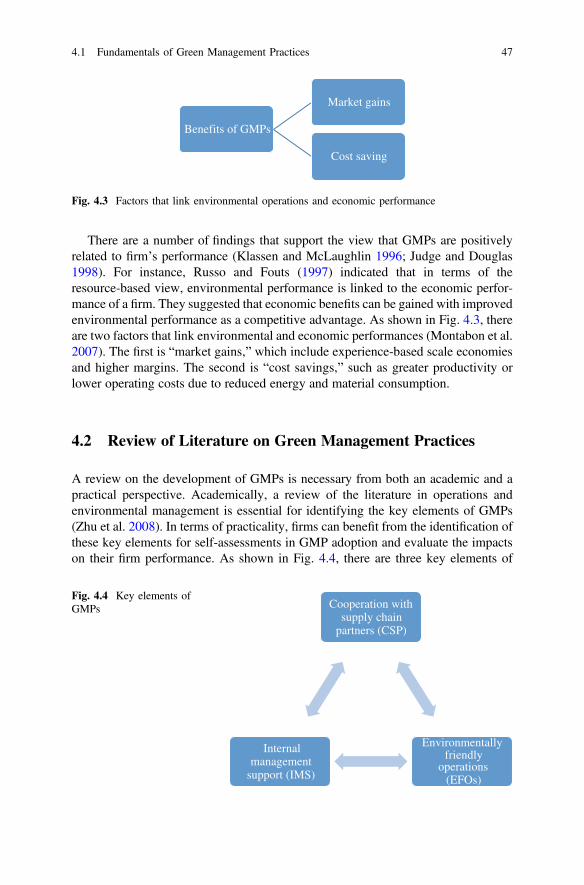
There are a number of findings that support the view that GMPs are positivelyrelated to firm’s performance (Klassen and McLaughlin 1996; Judge and Douglas1998). For instance, Russo and Fouts (1997) indicated that in terms of theresource-based view, environmental performance is linked to the economic perfor-mance of a firm. They suggested that economic benefits can be gained with improvedenvironmental performance as a competitive advantage. As shown in Fig. 4.3, thereare two factors that link environmental and economic performances (Montabon et al.2007). The first is “market gains,” which include experience-based scale economiesand higher margins. The second is “cost savings,” such as greater productivity orlower operating costs due to reduced energy and material consumption.
4.2 Review of Literature on Green Management Practices
A review on the development of GMPs is necessary from both an academic and apractical perspective. Academically, a review of the literature in operations andenvironmental management is essential for identifying the key elements of GMPs(Zhu et al. 2008). In terms of practicality, firms can benefit from the identification ofthese key elements for self-assessments in GMP adoption and evaluate the impactson their firm performance. As shown in Fig. 4.4, there are three key elements of
Benefits of GMPs
Market gains
Cost saving
Fig. 4.3 Factors that link environmental operations and economic performance
Cooperation with supply chain
partners (CSP)
Environmentally friendly
operations (EFOs)
Internal management
support (IMS)
Fig. 4.4 Key elements ofGMPs
4.1 Fundamentals of Green Management Practices 47
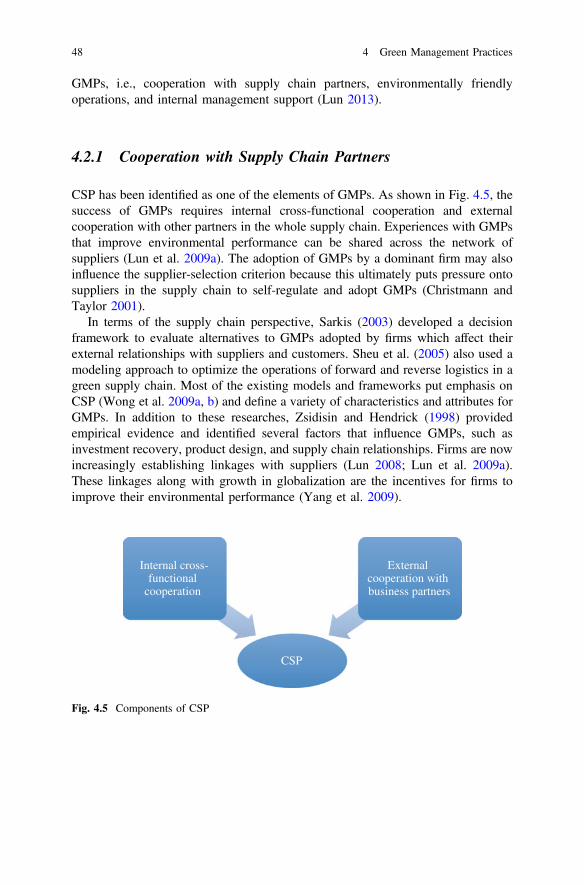
GMPs, i.e., cooperation with supply chain partners, environmentally friendlyoperations, and internal management support (Lun 2013).
4.2.1 Cooperation with Supply Chain Partners
CSP has been identified as one of the elements of GMPs. As shown in Fig. 4.5, thesuccess of GMPs requires internal cross-functional cooperation and externalcooperation with other partners in the whole supply chain. Experiences with GMPsthat improve environmental performance can be shared across the network ofsuppliers (Lun et al. 2009a). The adoption of GMPs by a dominant firm may alsoinfluence the supplier-selection criterion because this ultimately puts pressure ontosuppliers in the supply chain to self-regulate and adopt GMPs (Christmann andTaylor 2001).
In terms of the supply chain perspective, Sarkis (2003) developed a decisionframework to evaluate alternatives to GMPs adopted by firms which affect theirexternal relationships with suppliers and customers. Sheu et al. (2005) also used amodeling approach to optimize the operations of forward and reverse logistics in agreen supply chain. Most of the existing models and frameworks put emphasis onCSP (Wong et al. 2009a, b) and define a variety of characteristics and attributes forGMPs. In addition to these researches, Zsidisin and Hendrick (1998) providedempirical evidence and identified several factors that influence GMPs, such asinvestment recovery, product design, and supply chain relationships. Firms are nowincreasingly establishing linkages with suppliers (Lun 2008; Lun et al. 2009a).These linkages along with growth in globalization are the incentives for firms toimprove their environmental performance (Yang et al. 2009).
CSP
Internal cross-functional
cooperation
External cooperation with business partners
Fig. 4.5 Components of CSP
48 4 Green Management Practices
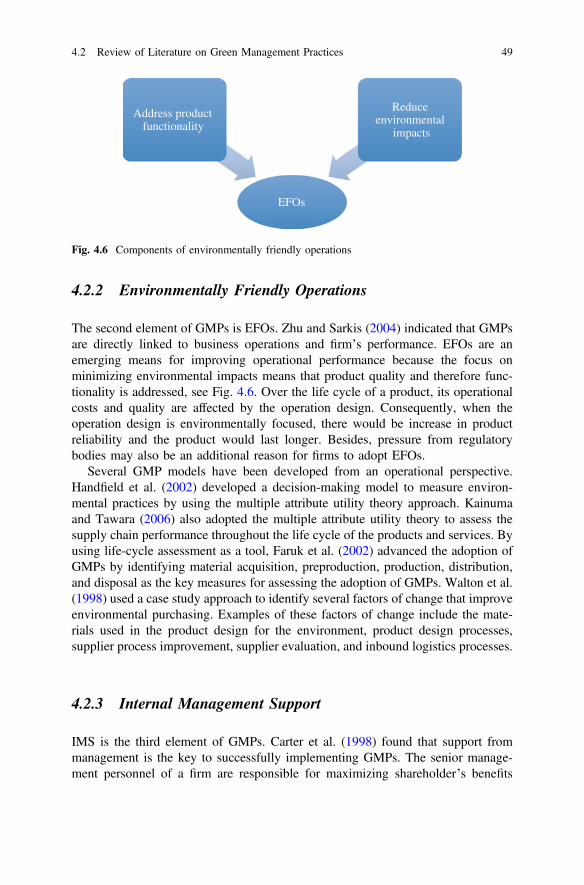
4.2.2 Environmentally Friendly Operations
The second element of GMPs is EFOs. Zhu and Sarkis (2004) indicated that GMPsare directly linked to business operations and firm’s performance. EFOs are anemerging means for improving operational performance because the focus onminimizing environmental impacts means that product quality and therefore func-tionality is addressed, see Fig. 4.6. Over the life cycle of a product, its operationalcosts and quality are affected by the operation design. Consequently, when theoperation design is environmentally focused, there would be increase in productreliability and the product would last longer. Besides, pressure from regulatorybodies may also be an additional reason for firms to adopt EFOs.
Several GMP models have been developed from an operational perspective.Handfield et al. (2002) developed a decision-making model to measure environ-mental practices by using the multiple attribute utility theory approach. Kainumaand Tawara (2006) also adopted the multiple attribute utility theory to assess thesupply chain performance throughout the life cycle of the products and services. Byusing life-cycle assessment as a tool, Faruk et al. (2002) advanced the adoption ofGMPs by identifying material acquisition, preproduction, production, distribution,and disposal as the key measures for assessing the adoption of GMPs. Walton et al.(1998) used a case study approach to identify several factors of change that improveenvironmental purchasing. Examples of these factors of change include the mate-rials used in the product design for the environment, product design processes,supplier process improvement, supplier evaluation, and inbound logistics processes.
4.2.3 Internal Management Support
IMS is the third element of GMPs. Carter et al. (1998) found that support frommanagement is the key to successfully implementing GMPs. The senior manage-ment personnel of a firm are responsible for maximizing shareholder’s benefits
EFOs
Address product functionality
Reduce environmental
impacts
Fig. 4.6 Components of environmentally friendly operations
4.2 Review of Literature on Green Management Practices 49
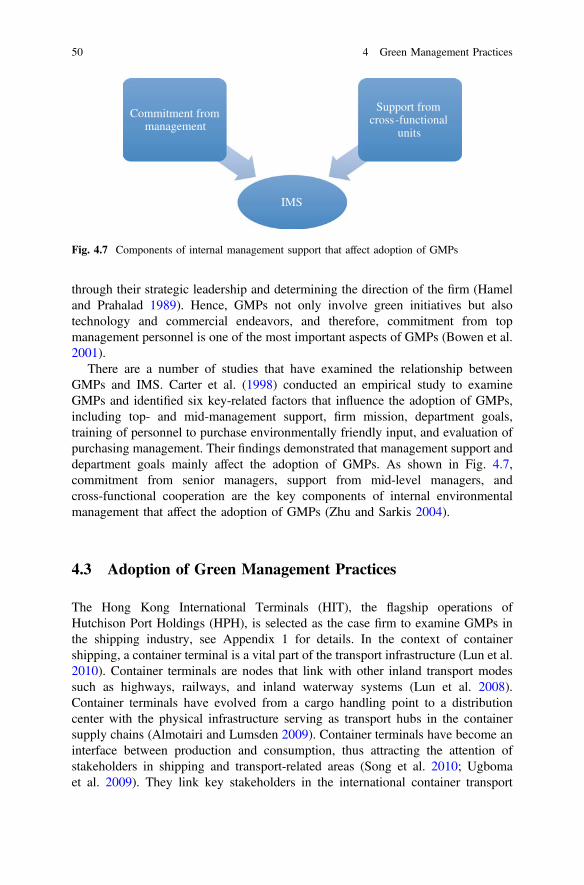
through their strategic leadership and determining the direction of the firm (Hameland Prahalad 1989). Hence, GMPs not only involve green initiatives but alsotechnology and commercial endeavors, and therefore, commitment from topmanagement personnel is one of the most important aspects of GMPs (Bowen et al.2001).
There are a number of studies that have examined the relationship betweenGMPs and IMS. Carter et al. (1998) conducted an empirical study to examineGMPs and identified six key-related factors that influence the adoption of GMPs,including top- and mid-management support, firm mission, department goals,training of personnel to purchase environmentally friendly input, and evaluation ofpurchasing management. Their findings demonstrated that management support anddepartment goals mainly affect the adoption of GMPs. As shown in Fig. 4.7,commitment from senior managers, support from mid-level managers, andcross-functional cooperation are the key components of internal environmentalmanagement that affect the adoption of GMPs (Zhu and Sarkis 2004).
4.3 Adoption of Green Management Practices
The Hong Kong International Terminals (HIT), the flagship operations ofHutchison Port Holdings (HPH), is selected as the case firm to examine GMPs inthe shipping industry, see Appendix 1 for details. In the context of containershipping, a container terminal is a vital part of the transport infrastructure (Lun et al.2010). Container terminals are nodes that link with other inland transport modessuch as highways, railways, and inland waterway systems (Lun et al. 2008).Container terminals have evolved from a cargo handling point to a distributioncenter with the physical infrastructure serving as transport hubs in the containersupply chains (Almotairi and Lumsden 2009). Container terminals have become aninterface between production and consumption, thus attracting the attention ofstakeholders in shipping and transport-related areas (Song et al. 2010; Ugbomaet al. 2009). They link key stakeholders in the international container transport
IMS
Commitment from management
Support from cross-functional
units
Fig. 4.7 Components of internal management support that affect adoption of GMPs
50 4 Green Management Practices
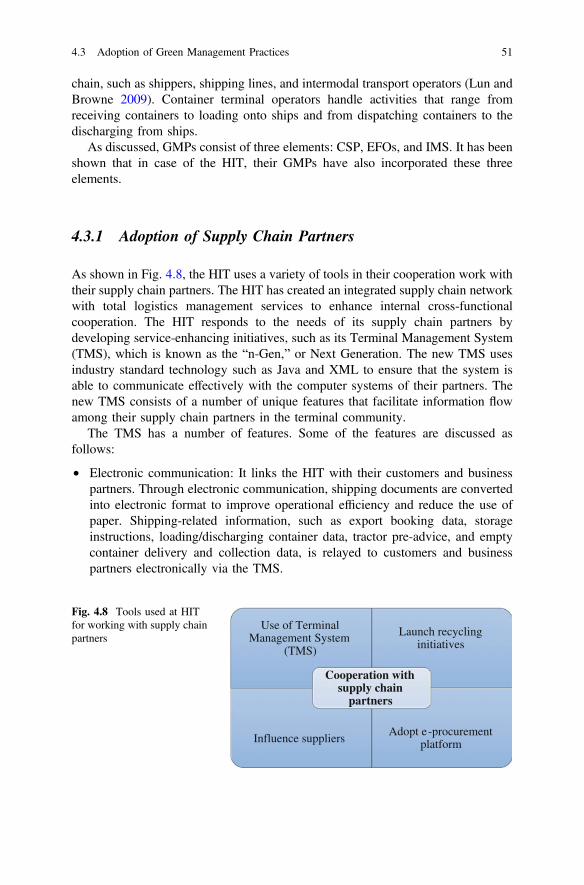
chain, such as shippers, shipping lines, and intermodal transport operators (Lun andBrowne 2009). Container terminal operators handle activities that range fromreceiving containers to loading onto ships and from dispatching containers to thedischarging from ships.
As discussed, GMPs consist of three elements: CSP, EFOs, and IMS. It has beenshown that in case of the HIT, their GMPs have also incorporated these threeelements.
4.3.1 Adoption of Supply Chain Partners
As shown in Fig. 4.8, the HIT uses a variety of tools in their cooperation work withtheir supply chain partners. The HIT has created an integrated supply chain networkwith total logistics management services to enhance internal cross-functionalcooperation. The HIT responds to the needs of its supply chain partners bydeveloping service-enhancing initiatives, such as its Terminal Management System(TMS), which is known as the “n-Gen,” or Next Generation. The new TMS usesindustry standard technology such as Java and XML to ensure that the system isable to communicate effectively with the computer systems of their partners. Thenew TMS consists of a number of unique features that facilitate information flowamong their supply chain partners in the terminal community.
The TMS has a number of features. Some of the features are discussed asfollows:
• Electronic communication: It links the HIT with their customers and businesspartners. Through electronic communication, shipping documents are convertedinto electronic format to improve operational efficiency and reduce the use ofpaper. Shipping-related information, such as export booking data, storageinstructions, loading/discharging container data, tractor pre-advice, and emptycontainer delivery and collection data, is relayed to customers and businesspartners electronically via the TMS.
Use of Terminal Management System
(TMS)
Launch recycling initiatives
Influence suppliersAdopt e-procurement
platform
Cooperation with supply chain
partners
Fig. 4.8 Tools used at HITfor working with supply chainpartners
4.3 Adoption of Green Management Practices 51
• Tractor Appointment System: a scheduling system for collecting containersfrom truckers. The system allows business partners to contact the HIT by phoneor electronically. This appointment system improves cost efficiency and cus-tomer service by ensuring a rapid turnaround time. The system also benefitstraffic flow because the HIT can schedule vehicle arrivals to avoid congestion inthe port area.
• Barge Identity Card System (BID): It is used to verify the identity of bargevessels with bar coding instead of using a manual verification process. BID hasthe benefits of streamlining barge movement, reducing paper work, strength-ening terminal security, and extending linkages with barge operators.
To improve the external cooperation with business partners, the HIT hasundertaken recycling initiatives, influenced their suppliers to adopt GMPs, and usee-procurement platforms. In their GMPs, the HIT has launched recycling initiativesfor materials such as paper and polystyrene. The HIT also influences its businesspartners to adopt GMPs by stipulating on the contracts to their suppliers that theyare to use environmentally friendly materials and dispose of hazardous substancesin a responsible manner. To reduce the amount of paper used, their procurementdepartment has developed an e-procurement platform to remove the need of staffmembers and vendors to print and circulate paper documents. The adoption ofe-procurement reduces the use of more than 250,000 sheets of paper a year. As aresult, the HIT reduced their paper consumption by 21 % in 2007.
Accordingly, CSP has been identified as one of the elements of GMPs. Thesuccess of GMPs requires internal cross-functional cooperation and externalcooperation with other partners in the whole supply chain. GMPs can be sharedacross networks of suppliers to improve environmental performance (Lun et al.2009b). Adoption of GMPs by a dominant firm may also influencesupplier-selection, which places pressure onto suppliers in the supply chain toself-regulate and adopt GMPs (Christmann and Taylor 2001).
4.3.2 Adoption of Environmentally Friendly Operations
The HIT actively participates in the reduction of pollution and promotes theadoption of GMPs throughout the business community. In early 2007, they laun-ched the Environmental Protection Program to demonstrate their commitment to theClean Air Charter in Hong Kong, which encourages the reduction of sulfur dioxideemissions, one of the root causes of acid rain and smog. The Clean Air Charter,which was drawn up in accordance with internationally recognized protocols, asksbusiness enterprises to pledge to reduce the energy consumption of their businessactivities and quantify the total amount of their emissions. The EPD identifies waysto reduce negative impacts on the environment and contributes to the sustainabledevelopment of Hong Kong. As part of their commitment, the HIT has madebuilding operations environmentally friendly by installing energy-saving lighting
52 4 Green Management Practices
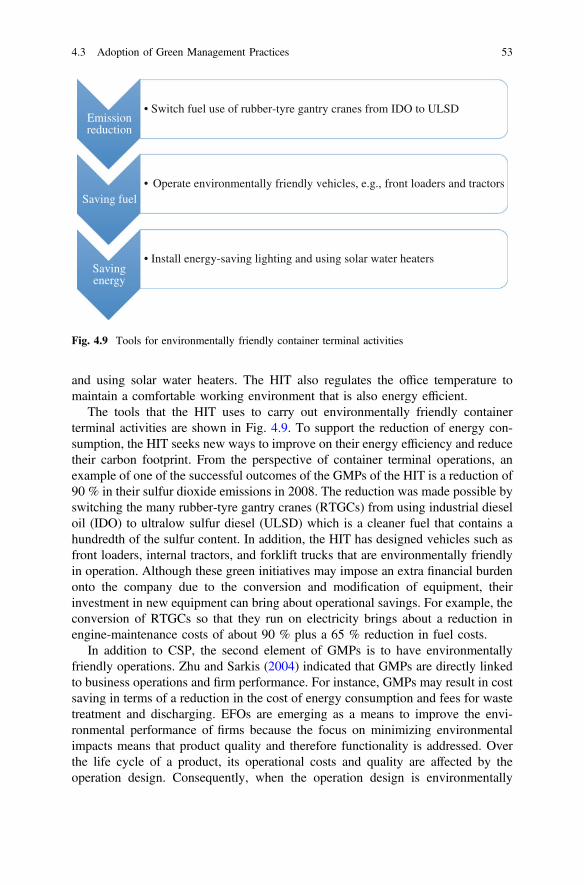
and using solar water heaters. The HIT also regulates the office temperature tomaintain a comfortable working environment that is also energy efficient.
The tools that the HIT uses to carry out environmentally friendly containerterminal activities are shown in Fig. 4.9. To support the reduction of energy con-sumption, the HIT seeks new ways to improve on their energy efficiency and reducetheir carbon footprint. From the perspective of container terminal operations, anexample of one of the successful outcomes of the GMPs of the HIT is a reduction of90 % in their sulfur dioxide emissions in 2008. The reduction was made possible byswitching the many rubber-tyre gantry cranes (RTGCs) from using industrial dieseloil (IDO) to ultralow sulfur diesel (ULSD) which is a cleaner fuel that contains ahundredth of the sulfur content. In addition, the HIT has designed vehicles such asfront loaders, internal tractors, and forklift trucks that are environmentally friendlyin operation. Although these green initiatives may impose an extra financial burdenonto the company due to the conversion and modification of equipment, theirinvestment in new equipment can bring about operational savings. For example, theconversion of RTGCs so that they run on electricity brings about a reduction inengine-maintenance costs of about 90 % plus a 65 % reduction in fuel costs.
In addition to CSP, the second element of GMPs is to have environmentallyfriendly operations. Zhu and Sarkis (2004) indicated that GMPs are directly linkedto business operations and firm performance. For instance, GMPs may result in costsaving in terms of a reduction in the cost of energy consumption and fees for wastetreatment and discharging. EFOs are emerging as a means to improve the envi-ronmental performance of firms because the focus on minimizing environmentalimpacts means that product quality and therefore functionality is addressed. Overthe life cycle of a product, its operational costs and quality are affected by theoperation design. Consequently, when the operation design is environmentally
Emission reduction
• Switch fuel use of rubber-tyre gantry cranes from IDO to ULSD
Saving fuel • Operate environmentally friendly vehicles, e.g., front loaders and tractors
Saving energy
• Install energy-saving lighting and using solar water heaters
Fig. 4.9 Tools for environmentally friendly container terminal activities
4.3 Adoption of Green Management Practices 53
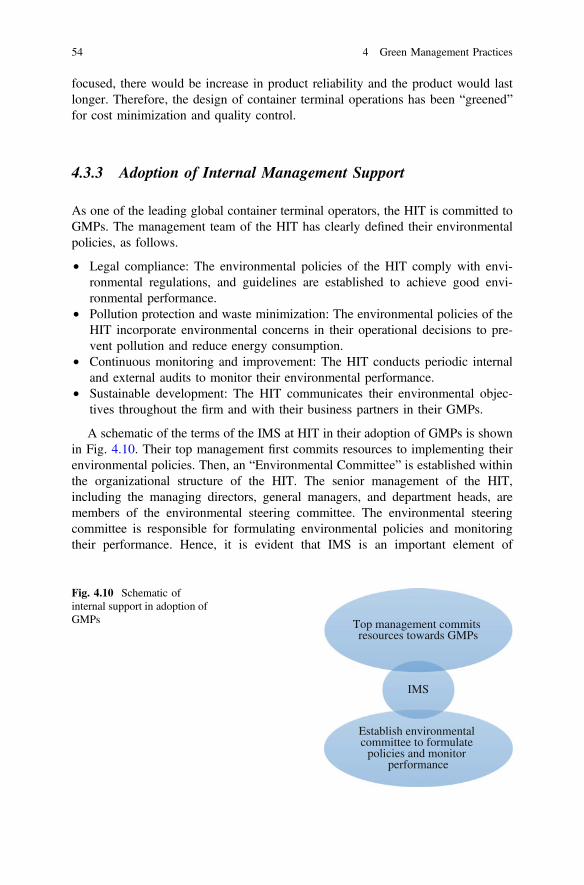
focused, there would be increase in product reliability and the product would lastlonger. Therefore, the design of container terminal operations has been “greened”for cost minimization and quality control.
4.3.3 Adoption of Internal Management Support
As one of the leading global container terminal operators, the HIT is committed toGMPs. The management team of the HIT has clearly defined their environmentalpolicies, as follows.
• Legal compliance: The environmental policies of the HIT comply with envi-ronmental regulations, and guidelines are established to achieve good envi-ronmental performance.
• Pollution protection and waste minimization: The environmental policies of theHIT incorporate environmental concerns in their operational decisions to pre-vent pollution and reduce energy consumption.
• Continuous monitoring and improvement: The HIT conducts periodic internaland external audits to monitor their environmental performance.
• Sustainable development: The HIT communicates their environmental objec-tives throughout the firm and with their business partners in their GMPs.
A schematic of the terms of the IMS at HIT in their adoption of GMPs is shownin Fig. 4.10. Their top management first commits resources to implementing theirenvironmental policies. Then, an “Environmental Committee” is established withinthe organizational structure of the HIT. The senior management of the HIT,including the managing directors, general managers, and department heads, aremembers of the environmental steering committee. The environmental steeringcommittee is responsible for formulating environmental policies and monitoringtheir performance. Hence, it is evident that IMS is an important element of
IMS
Top management commits resources towards GMPs
Establish environmental committee to formulate
policies and monitor performance
Fig. 4.10 Schematic ofinternal support in adoption ofGMPs
54 4 Green Management Practices
implementing GMPs at the HIT, which resonates with the findings of Carter et al.(1998) that support from management is one of the means to successfully carry outGMPs.
4.4 Green Management Practices and Firm Performance
To investigate the performance implications of GMPs, Lun (2011) examined thefirm performance of global container terminals based on terminal throughput,profitability, and efficiency and cost-effectiveness in their operations. In the results,it was found that the HIT has a good performance. Hence, with the use of a casestudy approach, the elements of GMPs at the HIT are verified and their relationshipwith firm performance is also validated. GMPs should be well rounded and includevarious elements. From a research perspective, the identification of components ofGMPs could be used as the basis for the development of a resource for the orga-nizational adoption of GMPs. Practically, firms should strive to improve how theyimplement the many components of GMPs in order to fully realize the relatedbenefits, which include improvement in firm performance, such as improved ter-minal throughput, increased profitability, and efficiency and cost-effectiveness inoperations.
GMPs provide insight into an emerging field that involves the relationshipsbetween sustainability and operational practices and firm performance. Thefollowing are important learnings from the adoption of GMPs: (1) There will be awin–win relationship in terms of economic and environmental performance,(2) quality management with the use of CSP and EFOs are key elements of GMPs,and (3) IMS is important for firms that wish to adopt GMPs. There is also a positiverelationship between the adoption of GMPs and the firm’s performance. GMPs canbe an important prototype for firms to achieve the objectives of profitability andgain market shares on the one hand, and contribute to a sustainable economy on theother hand. Hence, firms should strive to adopt GMPs to fully realize and takeadvantage of the related benefits. Firms should also incorporate performancemeasurement systems, and benchmarking of their GMPs for continuous improve-ment to obtain a good overview of how the adoption of GMPs affects their firmperformance.
4.5 Implications of Adopting Green ManagementPractices
It is time for the container terminal industry to examine their sustainability prac-tices. GMPs are promoted as a good resource for managers from several perspec-tives. First, while other studies have indicated that external drivers are important for
4.3 Adoption of Green Management Practices 55
adopting sustainable operations, the internal operations of a firm (i.e., EFOs) areequally as important. Second, there are three key components of GMPs, which inthis chapter, have been validated with a case firm, the HIT. The GMPs at the HITcan serve as a benchmark for other operators. Third, by understanding the keycomponents of GMPs and their correlation with firm performance, managers ofcontainer terminal operators can make the strategic decision to whether their firmwould adopt GMPs. Fourth, research on “best practices” in the adoption of GMPsand their effects on firm performance in the container terminal industry has so farbeen absent although the application of sustainability practices has been activelydebated. The GMPs here provide insight for managers to better understand the bestpractices in adopting GMPs.
Theoretically, it is proposed here that there is correlation between the use ofGMPs and the opportunities to gain comparative advantages. The adoption ofGMPs involves a set of business processes that require firms to assess their envi-ronmental impacts, determine environmental goals, implement environmentaloperations, monitor goal attainment, and undergo management reviews. Duringthese stages, firms have the opportunity to scrutinize their internal operations,engage employees in environmental issues, carry out continuous monitoring forenvironmental improvement, and improve their knowledge about their own oper-ations. These actions facilitate the improvement of internal operations and createopportunities to gain competitive advantages. GMPs also provide opportunities forfirms to evaluate their internal operations and linkages with other firms to achievegreater organizational efficiency. As the adoption of GMPs results in continualimprovements in their environmental and organizational practices, firms willtherefore find opportunities that will give them comparative advantages.
Appendix 4.1: Case Study as a Study Method
A case study
Lun (2011) used a case study as the research method to examine the key elementsof GMPs. A case study is “an empirical inquiry that investigates a contemporaryphenomenon within its real-life context” (Yin 1994). A case study is used togenerate theories or test theories (Eisenhardt 1989). A theory is an analytical toolfor understanding, explaining, and making predictions about a given subject matter.The case study method involves an in-depth examination of a single instance orevent (i.e., a case). It provides a systematic way to look at a case, collect data,analyze information, and report the results.
A case study is a research strategy for investigating a phenomenon within itsreal-life context. Case study research relies on multiple sources of evidence andbenefits from prior model development, and can be based on any mix of quanti-tative and qualitative evidence (Eisenhardt 1989). It is an excellent research methodfor understanding a complex issue and extending experiences to what is already
56 4 Green Management Practices
known through previous research. A case study is the analysis of a limited numberof events and their relationships, and widely used to examine real-life situations,and provide a foundation for the application of constructs. It is a common practicein case study research to divide the factors of interest into parameters, i.e.,dependent and independent variables (Meredith 1998). In case studies, attempts aremade to monitor and selectively observe how the independent variables influencethe dependent variables.
Case firm: HIT
The HIT, the flagship operations of the HPH, is selected as the case firm to illustratethe application of the research model in a real-life situation. The HPH is one of theworld’s largest container terminal operators with interests in more than 300 berthsin 50 ports that span 25 countries throughout the world. The history of the HPHbegan in 1866 when the Hong Kong and Whampoa Dock Company was estab-lished in Hong Kong. In 1969, the HIT was established. Drawing on the operatingcapability of the HIT, the HPH has expanded worldwide and become the top globalcontainer terminal operator. The HIT is the flagship operations of the HPH Group,the world’s leading port investor and operator. By pioneering terminal managementtechniques and cutting-edge technology, the HIT has become the center of excel-lence for the HPH Group. The HIT has diversified its business activities from thetraditional role of a container port operator to developing excellence in terminaloperations based on the principles of efficiency and state-of-the-art operations.
References
Almotairi B, Lumsden K (2009) Port logistics platform integration in supply chain management.Int J Shipping Transp Logistics 1(2):194–210
Alvarez G, Jimenez JB, Lorente JC (2001) Ananalysis of environmental management,organizational context and performance of Spanish hotels. Omega 29(6):457–471
Bowen FE, Cousins PD, Lamming RC, Farukt AC (2001) The role of supply managementcapabilities in green supply. Prod Oper Manag 10(2):174–89
Carter CR, Ellram LM, Ready KJ (1998) Environmental purchasing: benchmarking our Germancounterparts. Int J Purchasing Mater Manag 34(4):28–38
Christmann P, Taylor G (2001) Globalization and the environment: determinants of firmself-regulation in China. J Int Bus Stud 32(3):439–458
Darnall N, Edwards D (2006) Predicting the cost of environmental management system adoption:the role of capabilities, resources and ownership structure. Strateg Manag J 27:301–20
Eisenhardt KM (1989) Building theories from case study research. Acad Manag Rev 14(4):532–550
Faruk AC, Lamming RC, Cousins PD, Bowen FE (2002) Analyzing, mapping, and managingenvironmental impacts along the supply chain. J Ind Ecol 5(2):13–36
Hamel G, Prahalad CK (1989) Strategic intent. Harvard Bus Rev 67(3):63–76Handfield R, Walton SV, Sroufe R, Melnyk SA (2002) Applying environmental criteria to supplier
assessment: a study of the application of the analytical hierarchy process. Eur J Oper Res 141(1):70–87
Appendix 4.1: Case Study as a Study Method 57
Judge WQ, Douglas DJ (1998) Performance implications of incorporating natural environmentalissue into the strategic planning process: an empirical assessment. J Manag Stud 35(2):241–62
Kainuma Y, Tawara N (2006) A multiple attribute utility theory approach to learn and greensupply chain management. Int J Prod Econ 101(1):99–108
Klassen RD, McLaughlin CP (1996) The impact of environmental management on firmperformance. Manag Sci 42(8):1199–214
Koufteros XA, Nahm AY, Cheng TCE, Lai K (2007) An empirical assessment of a nomologicalnetwork of constructs: from customer orientation to pull production and performance. Int JProd Econ 106(2):468–92
Lun YHV (2008) Adoption of electronic commerce by logistics service providers in Hong Kong.Saarbrucken, Germany: VDM
Lun YHV (2011) Green management practices and firm performance: a case of container terminaloperations. Resour, Conserv Recycl 55(6):559–66
Lun YHV (2013) Development of green shipping network to enhance environmental andeconomic performance. Pol Marit Res 79(1):13–19
Lun YHV, Browne M (2009) Fleet mix in container shipping operations. Int J Shipping TranspLogistics 1(2):103–18
Lun YHV, Wong CWY, Lai K, Cheng TCE (2008) Institutional perspective on the adoption oftechnology for security enhancement of container transport. Transp Rev 28(1):21–33
Lun YHV, Lai K, Cheng TCE (2009a) A descriptive framework for the development andoperation of liner shipping network. Transp Rev 29(4):439–57
Lun YHV, Lu CS, Lai K (2009b) Introduction to the special issue on transport logistics andphysical distribution. Int J Prod Econ 122:1–3
Lun YHV, Pang KW, Panayides PM (2010) Organizational growth and firm performance in theinternational container shipping industry. Int Shipping Transp Logistics 2(2):206–23
Montabon F, Sroufe R, Narasimhan R (2007) An examination of corporate reporting,environmental management practices and firm performance. J Oper Manag 25:998–1014
Meredith J (1998) Building operations management theory through case field research. J OperManag 21:329–351
Niemann J, Tichkiewitch S, Westkämper E (2009) Design of sustainable product life cycles.Springer, Berlin
Panayides PM, Lun YHV (2009) The impact of trust on innovativeness and supply chainperformance. Int J Prod Econ 122:35–46
Reinhardt FL (1998) Environmental product differentiation: implications for corporate strategy.Calif Manag Rev 40(4):43–73
Russo MV, Fouts PA (1997) A resource based perspective on corporate environmentalperformance and profitability. Acad Manag J 40(3):354–559
Sarkis J (2003) A strategic decision marking framework for green supply chain management.J Clear Prod 11(4):397–409
Sheu JB, Chou YH, Hu CC (2005) An integrated logistics operational model for green supplychain management. Transp Res Part E 41(4):287–313
Shrivastava P (1995) Environmental technologies and competitive advantage. Strateg Manag J6:183–200
Song DP, Dong JX, Roe M (2010) Optimal container dispatching policy and its structure in ashuttle service with finite capacity and random demands. Int J Shipping Transp Logistics2(1):44–58
Ugboma C, Ugboma O, Damachi B (2009) A comparative assessment of service qualityperspectives and satisfaction in ports: evidence from Nigeria. Int J Shipping Transp Logistics1(2):172–93
Walton SV, Handfield RB, Melnyk SA (1998) The green supply chain: integrating suppliers intoenvironmental management process. Int J Purchasing Mater Manag (Spring) 34:2–11
WongCWY, Lai KH, Cheng TCE (2009a) Complementarities and alignment of information systemsmanagement and supply chain management. Int J Shipping Transp Logistics 1(2):156–71
58 4 Green Management Practices

Wong CWY, Lai K, Ngai EWT (2009b) The role of supplier operational adaptation on theperformance of IT–enabled logistics under environmental uncertainty. Int J Prod Econ 122(1):47–55
Yang J, Wong CWY, Lai K, Ntoko AN (2009) The antecedents of dyadic quality performance andits effect on buyer–supplier relationship improvement. Int J Prod Econ 120(1):243–51
Yin RK (1994) Case study research: Design and methods. SageZhu Q, Sarkis J (2004) Relationships between operational practices and performance among early
adopters of green supply chain management practices in Chinese manufacturing enterprise.J Manag 22:265–289
Zhu Q, Sarkis J, Lai K (2008) Confirmation of a measurement model for green supply chainmanagement practices implementation. Int J Prod Econ 111(2):261–73
Zsidisin GA, Hendrick TE (1998) Purchasing’s involvement in environmental issues: a multi–country perspective. Ind Manag Data Syst 7:313–20
References 59
Chapter 5Development of a Green ShippingNetwork
5.1 Operating Environment of Container Shipping
Global economic development has close ties to the commercial shipping industry.The shipping business is essential for promoting economic activities betweencountries that span different geographic regions. Global trade relies on ships totransport cargo from production sites to consumption regions. As an importantelement of economic development, shipping has a long history which dates back to1700 BC. Global trade relies on ships to transport cargo to facilitate the completionof economic exchange. Shipping cargo by sea transport is the primary means tofacilitate industry specialization across countries and the scale economy of pro-duction, which lead to lower product prices and greater product availability, whichin turn, foster international trade growth. The advent of containerization has pro-foundly changed the relationship among the players in the chain of cargo transport.The cost of transporting cargo via containers today is only a tenth of that in the erabefore containerization (Song et al. 2010). The operating environment of containershipping is driven by the 4Cs (Lun and Browne 2009): containerization, concen-tration, collaboration, and competition (as shown in Fig. 5.1).
5.1.1 Containerization
Since the introduction of container ships in 1956, the container transport industry hasrapidly grown (Song et al. 2005). The use of containers has greatly improved theefficiency of loading and discharging cargoes. Containerization also contributes tothe growth in global production, distribution, and consumption due to the scale
The research of this paper is based on Lun and Browne (2009) and Lun et al. (2013).
© Springer International Publishing Switzerland 2016Y.H.V. Lun et al., Green Shipping Management,Shipping and Transport Logistics, DOI 10.1007/978-3-319-26482-0_5
61
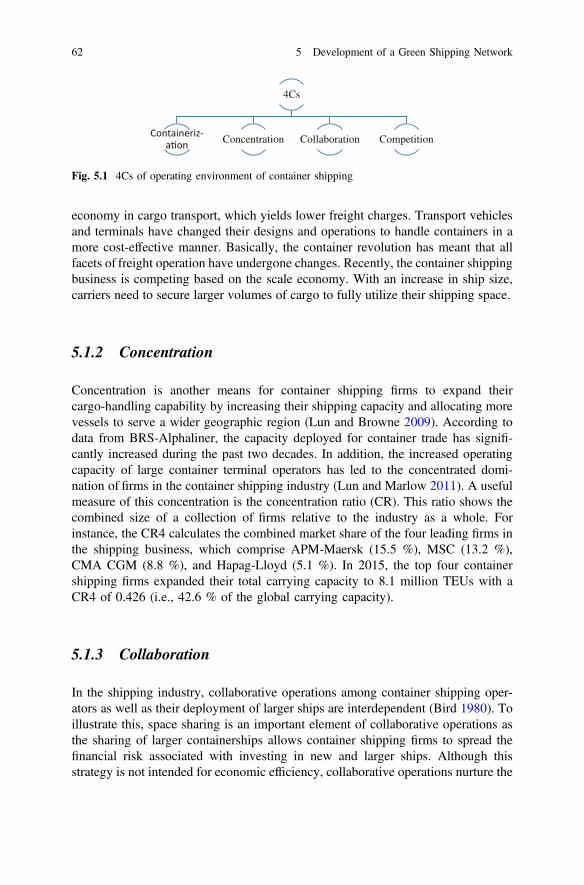
economy in cargo transport, which yields lower freight charges. Transport vehiclesand terminals have changed their designs and operations to handle containers in amore cost-effective manner. Basically, the container revolution has meant that allfacets of freight operation have undergone changes. Recently, the container shippingbusiness is competing based on the scale economy. With an increase in ship size,carriers need to secure larger volumes of cargo to fully utilize their shipping space.
5.1.2 Concentration
Concentration is another means for container shipping firms to expand theircargo-handling capability by increasing their shipping capacity and allocating morevessels to serve a wider geographic region (Lun and Browne 2009). According todata from BRS-Alphaliner, the capacity deployed for container trade has signifi-cantly increased during the past two decades. In addition, the increased operatingcapacity of large container terminal operators has led to the concentrated domi-nation of firms in the container shipping industry (Lun and Marlow 2011). A usefulmeasure of this concentration is the concentration ratio (CR). This ratio shows thecombined size of a collection of firms relative to the industry as a whole. Forinstance, the CR4 calculates the combined market share of the four leading firms inthe shipping business, which comprise APM-Maersk (15.5 %), MSC (13.2 %),CMA CGM (8.8 %), and Hapag-Lloyd (5.1 %). In 2015, the top four containershipping firms expanded their total carrying capacity to 8.1 million TEUs with aCR4 of 0.426 (i.e., 42.6 % of the global carrying capacity).
5.1.3 Collaboration
In the shipping industry, collaborative operations among container shipping oper-ators as well as their deployment of larger ships are interdependent (Bird 1980). Toillustrate this, space sharing is an important element of collaborative operations asthe sharing of larger containerships allows container shipping firms to spread thefinancial risk associated with investing in new and larger ships. Although thisstrategy is not intended for economic efficiency, collaborative operations nurture the
4Cs
Concentration Collaboration Competition
Fig. 5.1 4Cs of operating environment of container shipping
62 5 Development of a Green Shipping Network
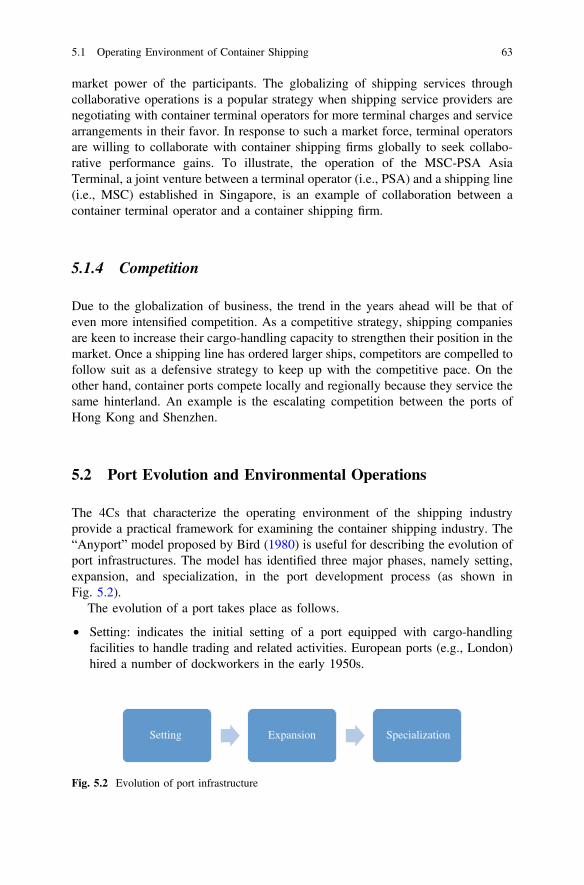
market power of the participants. The globalizing of shipping services throughcollaborative operations is a popular strategy when shipping service providers arenegotiating with container terminal operators for more terminal charges and servicearrangements in their favor. In response to such a market force, terminal operatorsare willing to collaborate with container shipping firms globally to seek collabo-rative performance gains. To illustrate, the operation of the MSC-PSA AsiaTerminal, a joint venture between a terminal operator (i.e., PSA) and a shipping line(i.e., MSC) established in Singapore, is an example of collaboration between acontainer terminal operator and a container shipping firm.
5.1.4 Competition
Due to the globalization of business, the trend in the years ahead will be that ofeven more intensified competition. As a competitive strategy, shipping companiesare keen to increase their cargo-handling capacity to strengthen their position in themarket. Once a shipping line has ordered larger ships, competitors are compelled tofollow suit as a defensive strategy to keep up with the competitive pace. On theother hand, container ports compete locally and regionally because they service thesame hinterland. An example is the escalating competition between the ports ofHong Kong and Shenzhen.
5.2 Port Evolution and Environmental Operations
The 4Cs that characterize the operating environment of the shipping industryprovide a practical framework for examining the container shipping industry. The“Anyport” model proposed by Bird (1980) is useful for describing the evolution ofport infrastructures. The model has identified three major phases, namely setting,expansion, and specialization, in the port development process (as shown inFig. 5.2).
The evolution of a port takes place as follows.
• Setting: indicates the initial setting of a port equipped with cargo-handlingfacilities to handle trading and related activities. European ports (e.g., London)hired a number of dockworkers in the early 1950s.
Setting Expansion Specialization
Fig. 5.2 Evolution of port infrastructure
5.1 Operating Environment of Container Shipping 63
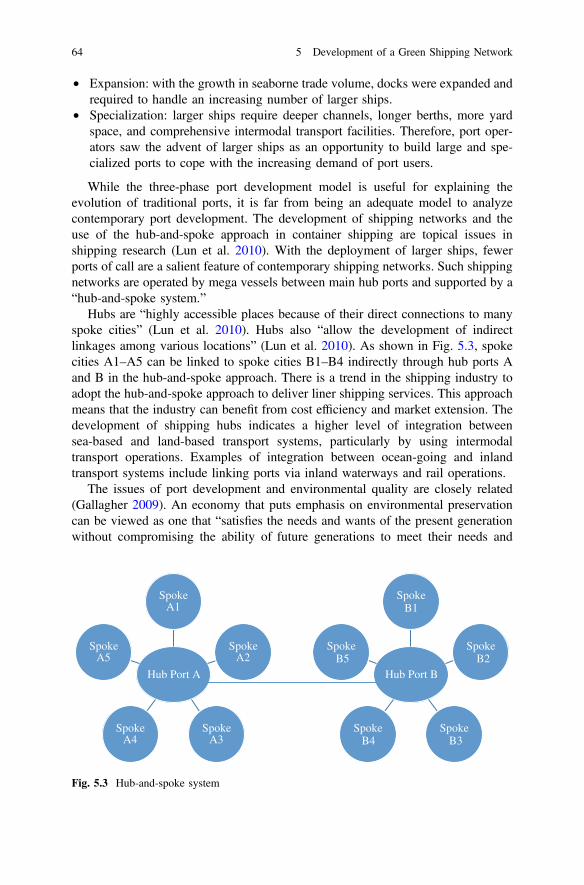
• Expansion: with the growth in seaborne trade volume, docks were expanded andrequired to handle an increasing number of larger ships.
• Specialization: larger ships require deeper channels, longer berths, more yardspace, and comprehensive intermodal transport facilities. Therefore, port oper-ators saw the advent of larger ships as an opportunity to build large and spe-cialized ports to cope with the increasing demand of port users.
While the three-phase port development model is useful for explaining theevolution of traditional ports, it is far from being an adequate model to analyzecontemporary port development. The development of shipping networks and theuse of the hub-and-spoke approach in container shipping are topical issues inshipping research (Lun et al. 2010). With the deployment of larger ships, fewerports of call are a salient feature of contemporary shipping networks. Such shippingnetworks are operated by mega vessels between main hub ports and supported by a“hub-and-spoke system.”
Hubs are “highly accessible places because of their direct connections to manyspoke cities” (Lun et al. 2010). Hubs also “allow the development of indirectlinkages among various locations” (Lun et al. 2010). As shown in Fig. 5.3, spokecities A1–A5 can be linked to spoke cities B1–B4 indirectly through hub ports Aand B in the hub-and-spoke approach. There is a trend in the shipping industry toadopt the hub-and-spoke approach to deliver liner shipping services. This approachmeans that the industry can benefit from cost efficiency and market extension. Thedevelopment of shipping hubs indicates a higher level of integration betweensea-based and land-based transport systems, particularly by using intermodaltransport operations. Examples of integration between ocean-going and inlandtransport systems include linking ports via inland waterways and rail operations.
The issues of port development and environmental quality are closely related(Gallagher 2009). An economy that puts emphasis on environmental preservationcan be viewed as one that “satisfies the needs and wants of the present generationwithout compromising the ability of future generations to meet their needs and
Hub Port A
Spoke A1
Spoke A2
Spoke A3
Spoke A4
Spoke A5
Hub Port B
Spoke B1
Spoke B2
Spoke B3
Spoke B4
Spoke B5
Fig. 5.3 Hub-and-spoke system
64 5 Development of a Green Shipping Network
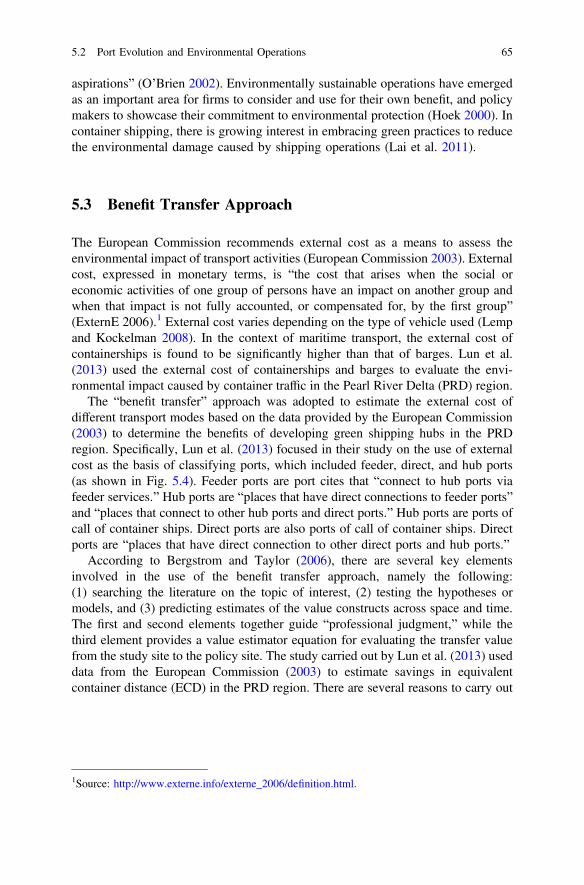
aspirations” (O’Brien 2002). Environmentally sustainable operations have emergedas an important area for firms to consider and use for their own benefit, and policymakers to showcase their commitment to environmental protection (Hoek 2000). Incontainer shipping, there is growing interest in embracing green practices to reducethe environmental damage caused by shipping operations (Lai et al. 2011).
5.3 Benefit Transfer Approach
The European Commission recommends external cost as a means to assess theenvironmental impact of transport activities (European Commission 2003). Externalcost, expressed in monetary terms, is “the cost that arises when the social oreconomic activities of one group of persons have an impact on another group andwhen that impact is not fully accounted, or compensated for, by the first group”(ExternE 2006).1 External cost varies depending on the type of vehicle used (Lempand Kockelman 2008). In the context of maritime transport, the external cost ofcontainerships is found to be significantly higher than that of barges. Lun et al.(2013) used the external cost of containerships and barges to evaluate the envi-ronmental impact caused by container traffic in the Pearl River Delta (PRD) region.
The “benefit transfer” approach was adopted to estimate the external cost ofdifferent transport modes based on the data provided by the European Commission(2003) to determine the benefits of developing green shipping hubs in the PRDregion. Specifically, Lun et al. (2013) focused in their study on the use of externalcost as the basis of classifying ports, which included feeder, direct, and hub ports(as shown in Fig. 5.4). Feeder ports are port cites that “connect to hub ports viafeeder services.” Hub ports are “places that have direct connections to feeder ports”and “places that connect to other hub ports and direct ports.” Hub ports are ports ofcall of container ships. Direct ports are also ports of call of container ships. Directports are “places that have direct connection to other direct ports and hub ports.”
According to Bergstrom and Taylor (2006), there are several key elementsinvolved in the use of the benefit transfer approach, namely the following:(1) searching the literature on the topic of interest, (2) testing the hypotheses ormodels, and (3) predicting estimates of the value constructs across space and time.The first and second elements together guide “professional judgment,” while thethird element provides a value estimator equation for evaluating the transfer valuefrom the study site to the policy site. The study carried out by Lun et al. (2013) useddata from the European Commission (2003) to estimate savings in equivalentcontainer distance (ECD) in the PRD region. There are several reasons to carry out
1Source: http://www.externe.info/externe_2006/definition.html.
5.2 Port Evolution and Environmental Operations 65
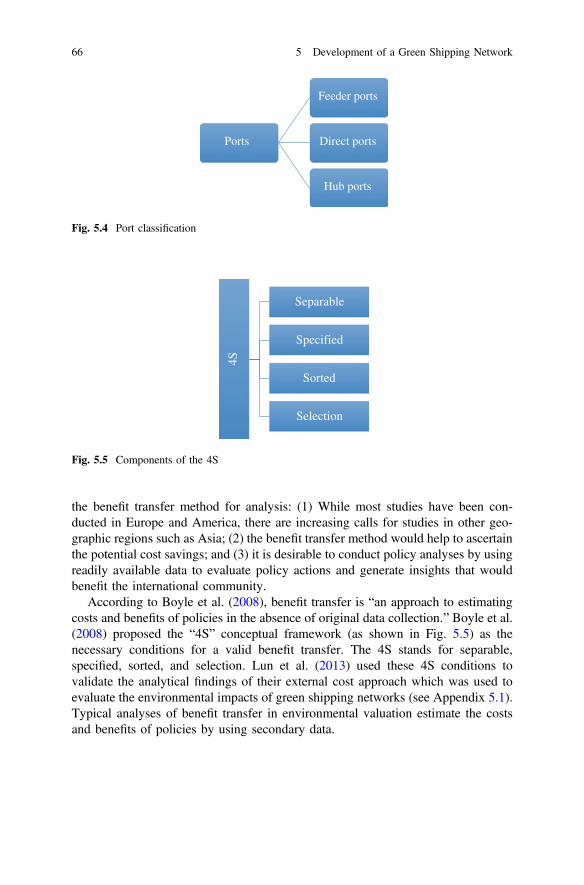
the benefit transfer method for analysis: (1) While most studies have been con-ducted in Europe and America, there are increasing calls for studies in other geo-graphic regions such as Asia; (2) the benefit transfer method would help to ascertainthe potential cost savings; and (3) it is desirable to conduct policy analyses by usingreadily available data to evaluate policy actions and generate insights that wouldbenefit the international community.
According to Boyle et al. (2008), benefit transfer is “an approach to estimatingcosts and benefits of policies in the absence of original data collection.” Boyle et al.(2008) proposed the “4S” conceptual framework (as shown in Fig. 5.5) as thenecessary conditions for a valid benefit transfer. The 4S stands for separable,specified, sorted, and selection. Lun et al. (2013) used these 4S conditions tovalidate the analytical findings of their external cost approach which was used toevaluate the environmental impacts of green shipping networks (see Appendix 5.1).Typical analyses of benefit transfer in environmental valuation estimate the costsand benefits of policies by using secondary data.
4S
Separable
Specified
Sorted
Selection
Fig. 5.5 Components of the 4S
Ports
Feeder ports
Direct ports
Hub ports
Fig. 5.4 Port classification
66 5 Development of a Green Shipping Network
5.4 Equivalent Container Distance
An ECD2 determined by barges can be calculated by using the ratio of the externalcost of barges to that of containerships for each route. The next step is use the portsin the PRD region as example to examine the ECD. There are four key containerports in the PRD region, namely the ports of Hong Kong (HK), Yantian (YT),Chiwan (CW), and Shekou (SK). The external costs of containership transportbetween these ports and their trade ports are based on the direct voyage distancebetween the port of loading and the port of discharge. An alternative route totransport containers is to deliver the containers from a port of loading to a shippinghub by barges and then ship the containers to the discharging port by container-ships. Reductions in external cost are possible when the alternative route is shorterthan the direct route in terms of the ECD.
The ports of HK, YT, CW, and SK in the PRD region are selected to examinemissing text. Here, these ports are interchangeably called ports of loading andorigins of container transport demand. There are two primary destinations or portsof discharge: Trans-Pacific (TP) and the Asia–Europe (AE) trades (see Fig. 5.6). Interms of trade volume, both TP and AE trades are known as the head hauls incontainer shipping. The ports of Los Angeles, Long Beach, and New York are thedischarging ports for TP trade, and the ports of Rotterdam, Hamburg, Antwerp, andBremerhaven are the discharging ports for AE trade in this study. The voyagedistances (km) between the four selected ports of loading in the PRD region can bedetermined by using a port distance calculator.
The external costs of different transport modes are taken from the EuropeanCommission (2003), in which an external cost is defined as one that “arises whenthe social or economic activities of one group of persons have an impact on anothergroup and when that impact is not fully accounted, or compensated for, by the firstgroup.” The European Commission (2003) provided a comparison of the externalcosts of different transport modes. To estimate the external cost, the costs due tovehicle use, vehicle production, fuel production, and infrastructure use are included.The external cost is expressed per TEU-km for containerships or barges. Accordingto the European Commission (2003), the high air pollution cost of containerships ismainly caused by their high nitrogen oxide (NOx) emissions. Risks of accidents andimpacts from noise are very low for containerships as well as barges. However, theEuropean Commission (2003) has identified that air pollution and the resultantglobal warming are the dominating costs in this industry.
2According to the study conducted by the European Commission (2003), the external costs of acontainership and a barge, expressed as a monetary value per 100 TEU-km, have been estimated as€6.79 and €3.54, respectively. With ECD as the unit of measure, the external costs of the voyagedistances in the PRD region can be compared. Barge distance is converted into ECD by multi-plying the barge distance with the ratio of the external cost of the barge transport to that of thecontainership transport. Therefore, 1 barge distance = (3.54/6.79) = 0.521 ECD.
5.4 Equivalent Container Distance 67
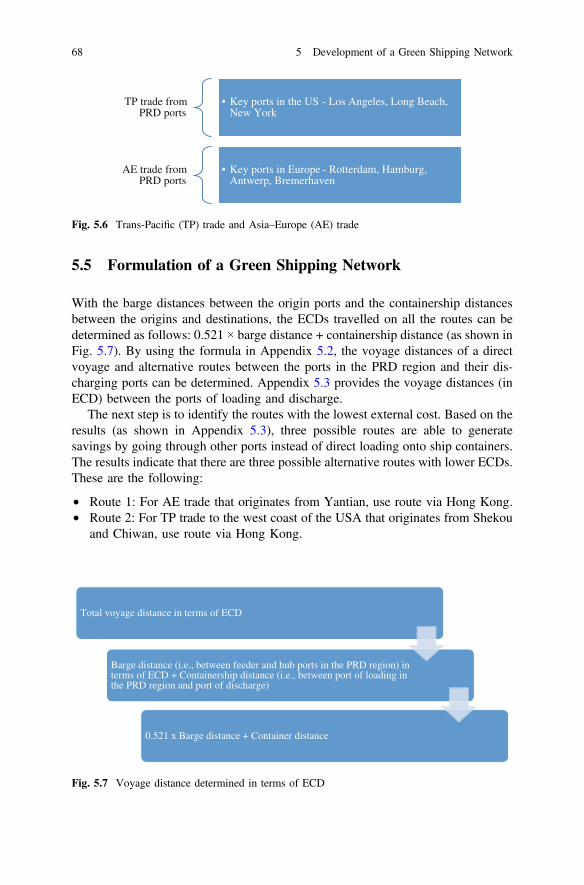
5.5 Formulation of a Green Shipping Network
With the barge distances between the origin ports and the containership distancesbetween the origins and destinations, the ECDs travelled on all the routes can bedetermined as follows: 0.521 × barge distance + containership distance (as shown inFig. 5.7). By using the formula in Appendix 5.2, the voyage distances of a directvoyage and alternative routes between the ports in the PRD region and their dis-charging ports can be determined. Appendix 5.3 provides the voyage distances (inECD) between the ports of loading and discharge.
The next step is to identify the routes with the lowest external cost. Based on theresults (as shown in Appendix 5.3), three possible routes are able to generatesavings by going through other ports instead of direct loading onto ship containers.The results indicate that there are three possible alternative routes with lower ECDs.These are the following:
• Route 1: For AE trade that originates from Yantian, use route via Hong Kong.• Route 2: For TP trade to the west coast of the USA that originates from Shekou
and Chiwan, use route via Hong Kong.
Total voyage distance in terms of ECD
Barge distance (i.e., between feeder and hub ports in the PRD region) in terms of ECD + Containership distance (i.e., between port of loading in the PRD region and port of discharge)
0.521 x Barge distance + Container distance
Fig. 5.7 Voyage distance determined in terms of ECD
TP trade from PRD ports
• Key ports in the US - Los Angeles, Long Beach, New York
AE trade from PRD ports
• Key ports in Europe - Rotterdam, Hamburg, Antwerp, Bremerhaven
Fig. 5.6 Trans-Pacific (TP) trade and Asia–Europe (AE) trade
68 5 Development of a Green Shipping Network
• Route 3: For TP trade to the east coast of the USA that originates from HongKong, Shekou, or Chiwan, use route via Yantian.
It is considered economical to develop green shipping networks between theports of Hong Kong and Shenzhen to minimize external cost. Based on our results,three potential green shipping networks in the PRD region are identified, namelythe ports of east Shenzhen (i.e., Yantian), Hong Kong, and west Shenzhen (eitherShekou or Chiwan). The suggested networks are as follows:
• Network 1: For maritime AE trade that originates east of Shenzhen (i.e.,Yantian), use route via Hong Kong.
• Network 2: For maritime TP trade to the west coast that originates west ofShenzhen (i.e., Shekou and Chiwan), use route via Hong Kong.
• Network 3: For maritime TP trade to the east coast that originates in Hong Kongand west of Shenzhen (i.e., Shekou and Chiwan), use route via Yantian.
The green shipping hubs in the PRD region can be identified with the devel-opment of these green shipping networks. As the external cost of goods vehicles isthe highest among other transport modes, the use of trucking for cargo deliveryshould be minimized. For inland transport, all of the containers should be consignedfrom the shipper’s warehouse to the nearest port within the PRD region. The portscan then be classified into feeder, direct, or hub ports. Feeder ports have higherexternal costs when they act as ports of loading for containerships as opposed to theuse of barges to transport containers to hub ports. Hence, it is more practical forfeeder ports to transport their containers to a green shipping hub to minimize thetotal external cost. Direct ports serve as ports of call for containerships. Hub portsare ports of loading that handle containers from feeder ports and also their directcontainers.
5.6 Operations of a Green Shipping Network
5.6.1 Advantages of Developing Green Shipping Networks
A shipping network emerges when individuals see the potential benefits from abusiness environment and come together to work with each other. With thedevelopment of green shipping hubs, there is a trend in the shipping industrytoward the use of the hub-and-spoke approach. In a shipping hub, the firmsinvolved in upstream and downstream activities work together and their collectiveactions lead to the emergence of corporate networks. Market forces are of criticalimportance in determining the locations of ports (Asteris and Collins 2007). Lunand Browne (2009) pointed out that a shipping hub usually has two key charac-teristics: (1) tendency to be geographically central to a region, sometimes with ahinterland to attract large volumes of containers for transport, and (2) excellent
5.5 Formulation of a Green Shipping Network 69
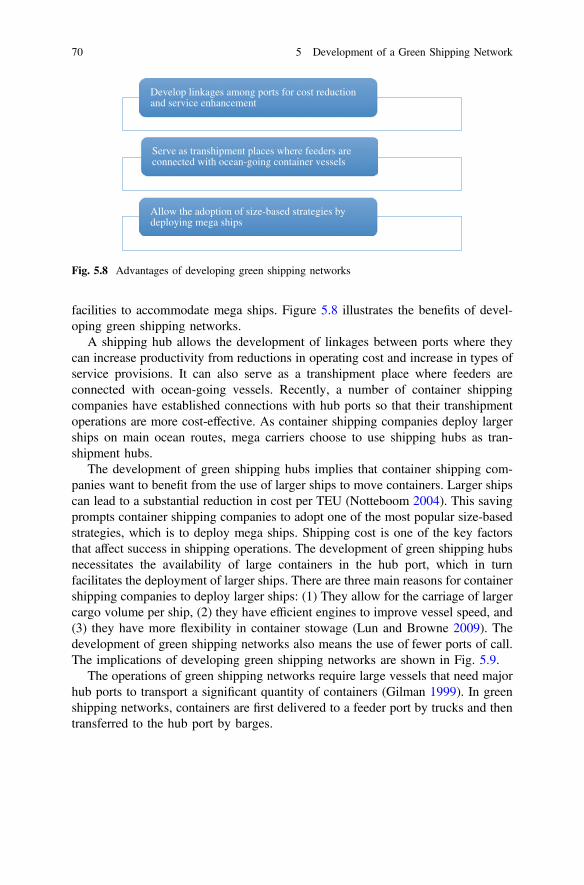
facilities to accommodate mega ships. Figure 5.8 illustrates the benefits of devel-oping green shipping networks.
A shipping hub allows the development of linkages between ports where theycan increase productivity from reductions in operating cost and increase in types ofservice provisions. It can also serve as a transhipment place where feeders areconnected with ocean-going vessels. Recently, a number of container shippingcompanies have established connections with hub ports so that their transhipmentoperations are more cost-effective. As container shipping companies deploy largerships on main ocean routes, mega carriers choose to use shipping hubs as tran-shipment hubs.
The development of green shipping hubs implies that container shipping com-panies want to benefit from the use of larger ships to move containers. Larger shipscan lead to a substantial reduction in cost per TEU (Notteboom 2004). This savingprompts container shipping companies to adopt one of the most popular size-basedstrategies, which is to deploy mega ships. Shipping cost is one of the key factorsthat affect success in shipping operations. The development of green shipping hubsnecessitates the availability of large containers in the hub port, which in turnfacilitates the deployment of larger ships. There are three main reasons for containershipping companies to deploy larger ships: (1) They allow for the carriage of largercargo volume per ship, (2) they have efficient engines to improve vessel speed, and(3) they have more flexibility in container stowage (Lun and Browne 2009). Thedevelopment of green shipping networks also means the use of fewer ports of call.The implications of developing green shipping networks are shown in Fig. 5.9.
The operations of green shipping networks require large vessels that need majorhub ports to transport a significant quantity of containers (Gilman 1999). In greenshipping networks, containers are first delivered to a feeder port by trucks and thentransferred to the hub port by barges.
Develop linkages among ports for cost reduction and service enhancement
Serve as transhipment places where feeders are connected with ocean-going container vessels
Allow the adoption of size-based strategies by deploying mega ships
Fig. 5.8 Advantages of developing green shipping networks
70 5 Development of a Green Shipping Network
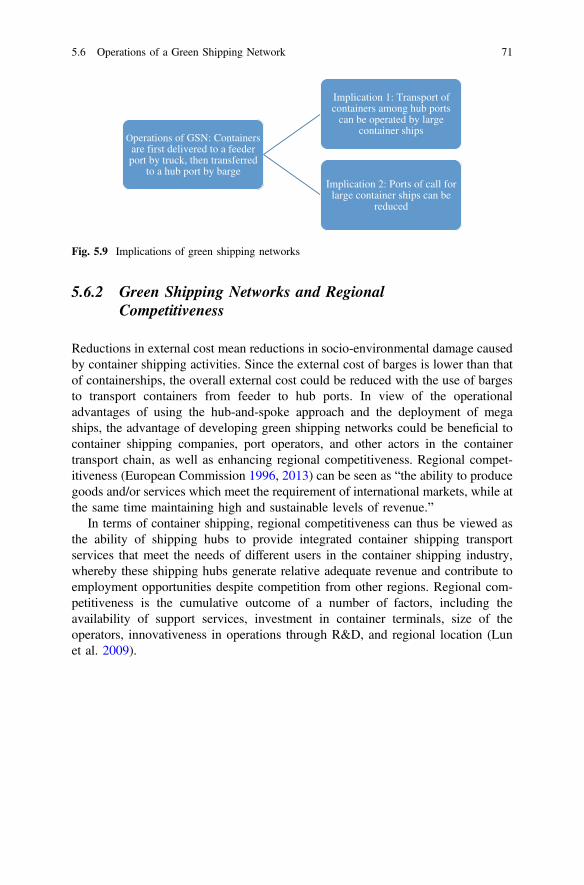
5.6.2 Green Shipping Networks and RegionalCompetitiveness
Reductions in external cost mean reductions in socio-environmental damage causedby container shipping activities. Since the external cost of barges is lower than thatof containerships, the overall external cost could be reduced with the use of bargesto transport containers from feeder to hub ports. In view of the operationaladvantages of using the hub-and-spoke approach and the deployment of megaships, the advantage of developing green shipping networks could be beneficial tocontainer shipping companies, port operators, and other actors in the containertransport chain, as well as enhancing regional competitiveness. Regional compet-itiveness (European Commission 1996, 2013) can be seen as “the ability to producegoods and/or services which meet the requirement of international markets, while atthe same time maintaining high and sustainable levels of revenue.”
In terms of container shipping, regional competitiveness can thus be viewed asthe ability of shipping hubs to provide integrated container shipping transportservices that meet the needs of different users in the container shipping industry,whereby these shipping hubs generate relative adequate revenue and contribute toemployment opportunities despite competition from other regions. Regional com-petitiveness is the cumulative outcome of a number of factors, including theavailability of support services, investment in container terminals, size of theoperators, innovativeness in operations through R&D, and regional location (Lunet al. 2009).
Operations of GSN: Containers are first delivered to a feeder port by truck, then transferred
to a hub port by barge
Implication 1: Transport of containers among hub ports
can be operated by large container ships
Implication 2: Ports of call for large container ships can be
reduced
Fig. 5.9 Implications of green shipping networks
5.6 Operations of a Green Shipping Network 71
Appendix 5.1: 4S Framework
According to Boyle et al. (2008), the benefit transfer method is “an approach toestimating costs and benefits of policies in the absence of original data collection.”Boyle et al. (2008) proposed the “4S” conceptual framework, with each S stipu-lating the necessary conditions for a valid benefit transfer. These include that theutility is to be separable, the sites of study and modeling are specified, there is to beno sorting between the sites of study and policy, and finally, there are to be noselection issues. Lun et al. (2013) adopted the 4S framework to develop anapproach for evaluating green shipping networks.
Separable: The first assumption of the benefit transfer approach is that the utilityneeds to be separable, which is routinely applied for computational convenience.This is to guarantee that the study “should use the available information” and “doesnot depend on the variables that the researcher is unable to measure for the initialstudy.” To meet this condition, an ECD is developed as the measuring unit in thisstudy to compare the external costs of different shipping routes. The calculation ofthe ECD depends on the external costs of barge transport and containershiptransport, which are compiled from the European Commission (2003).
Specification: The second assumption in the 4S framework is that the sites ofstudy and modeling are specified, which means “all of the components of the studyare correctly specified and estimated using appropriate methods.” As shown inAppendix 5.2, a step-by-step approach is used to formulate a model to calculate theminimum external cost in determining the shortest shipping route.
Sorting: The next assumption is sorting, in that “the policy site and study siteshare the same functional relationship.” Therefore, ECD is used as the key unit ofmeasurement to compare the external cost of various routings. The barge distance isconverted into ECD by multiplying the barge distance with the ratio of the externalcost of barge transport to that of containership transport. Based on the data from theEuropean Commission (2003), one unit of barge distance equals 0.521 ECD.3
Selection: The last assumption in the 4S framework is that there is not to beselection issues; adequate data must be available to examine the external cost at thestudy and the policy sites. Therefore, the ECD was determined by using datacollected from the European Commission (2003). To compare the savings with theuse of the ECD, the voyage distances between the ports of loading and dischargeare obtained by using a port distance calculator.
3Lun et al. (2013) converted barge distance into ECD by multiplying the barge distance with theratio of the external cost of barge transport to that of containership transport. Therefore, 1 bargedistance = (3.54/6.79) = 0.521 equivalent containership distance.
72 5 Development of a Green Shipping Network
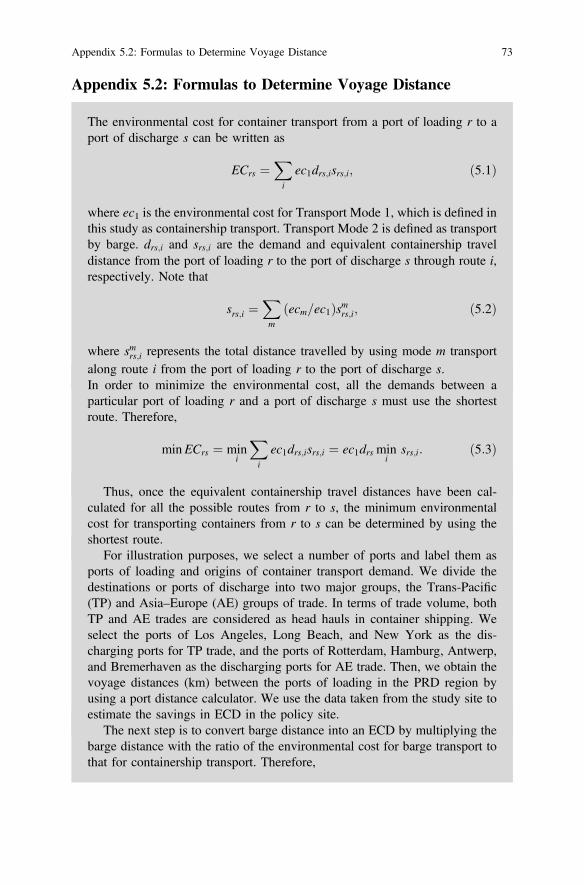
Appendix 5.2: Formulas to Determine Voyage Distance
The environmental cost for container transport from a port of loading r to aport of discharge s can be written as
ECrs ¼X
i
ec1drs;isrs;i; ð5:1Þ
where ec1 is the environmental cost for Transport Mode 1, which is defined inthis study as containership transport. Transport Mode 2 is defined as transportby barge. drs;i and srs;i are the demand and equivalent containership traveldistance from the port of loading r to the port of discharge s through route i,respectively. Note that
srs;i ¼X
m
ðecm=ec1Þsmrs;i; ð5:2Þ
where smrs;i represents the total distance travelled by using mode m transportalong route i from the port of loading r to the port of discharge s.In order to minimize the environmental cost, all the demands between aparticular port of loading r and a port of discharge s must use the shortestroute. Therefore,
minECrs ¼ mini
X
i
ec1drs;isrs;i ¼ ec1drs mini
srs;i: ð5:3Þ
Thus, once the equivalent containership travel distances have been cal-culated for all the possible routes from r to s, the minimum environmentalcost for transporting containers from r to s can be determined by using theshortest route.
For illustration purposes, we select a number of ports and label them asports of loading and origins of container transport demand. We divide thedestinations or ports of discharge into two major groups, the Trans-Pacific(TP) and Asia–Europe (AE) groups of trade. In terms of trade volume, bothTP and AE trades are considered as head hauls in container shipping. Weselect the ports of Los Angeles, Long Beach, and New York as the dis-charging ports for TP trade, and the ports of Rotterdam, Hamburg, Antwerp,and Bremerhaven as the discharging ports for AE trade. Then, we obtain thevoyage distances (km) between the ports of loading in the PRD region byusing a port distance calculator. We use the data taken from the study site toestimate the savings in ECD in the policy site.
The next step is to convert barge distance into an ECD by multiplying thebarge distance with the ratio of the environmental cost for barge transport tothat for containership transport. Therefore,
Appendix 5.2: Formulas to Determine Voyage Distance 73
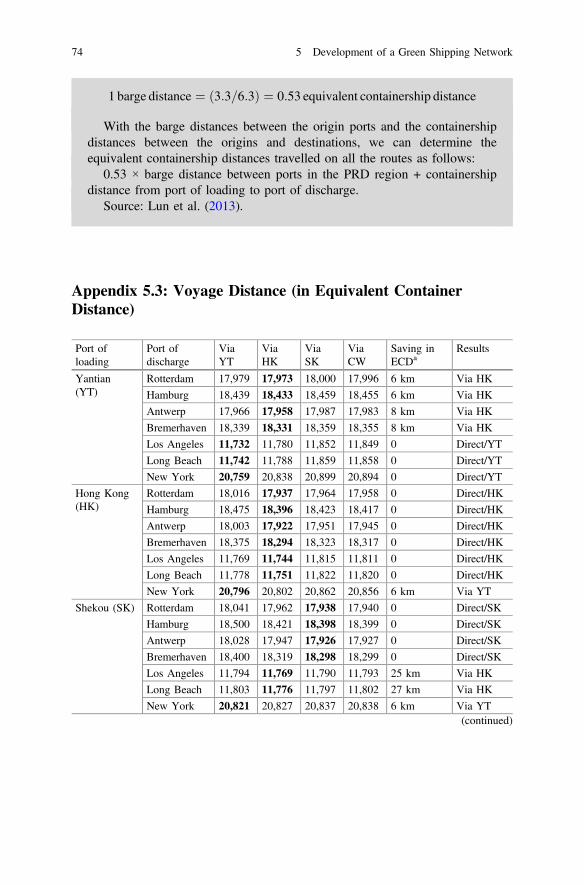
1 barge distance ¼ 3:3=6:3ð Þ ¼ 0:53 equivalent containership distance
With the barge distances between the origin ports and the containershipdistances between the origins and destinations, we can determine theequivalent containership distances travelled on all the routes as follows:
0.53 × barge distance between ports in the PRD region + containershipdistance from port of loading to port of discharge.
Source: Lun et al. (2013).
Appendix 5.3: Voyage Distance (in Equivalent ContainerDistance)
Port ofloading
Port ofdischarge
ViaYT
ViaHK
ViaSK
ViaCW
Saving inECDa
Results
Yantian(YT)
Rotterdam 17,979 17,973 18,000 17,996 6 km Via HK
Hamburg 18,439 18,433 18,459 18,455 6 km Via HK
Antwerp 17,966 17,958 17,987 17,983 8 km Via HK
Bremerhaven 18,339 18,331 18,359 18,355 8 km Via HK
Los Angeles 11,732 11,780 11,852 11,849 0 Direct/YT
Long Beach 11,742 11,788 11,859 11,858 0 Direct/YT
New York 20,759 20,838 20,899 20,894 0 Direct/YT
Hong Kong(HK)
Rotterdam 18,016 17,937 17,964 17,958 0 Direct/HK
Hamburg 18,475 18,396 18,423 18,417 0 Direct/HK
Antwerp 18,003 17,922 17,951 17,945 0 Direct/HK
Bremerhaven 18,375 18,294 18,323 18,317 0 Direct/HK
Los Angeles 11,769 11,744 11,815 11,811 0 Direct/HK
Long Beach 11,778 11,751 11,822 11,820 0 Direct/HK
New York 20,796 20,802 20,862 20,856 6 km Via YT
Shekou (SK) Rotterdam 18,041 17,962 17,938 17,940 0 Direct/SK
Hamburg 18,500 18,421 18,398 18,399 0 Direct/SK
Antwerp 18,028 17,947 17,926 17,927 0 Direct/SK
Bremerhaven 18,400 18,319 18,298 18,299 0 Direct/SK
Los Angeles 11,794 11,769 11,790 11,793 25 km Via HK
Long Beach 11,803 11,776 11,797 11,802 27 km Via HK
New York 20,821 20,827 20,837 20,838 6 km Via YT(continued)
74 5 Development of a Green Shipping Network
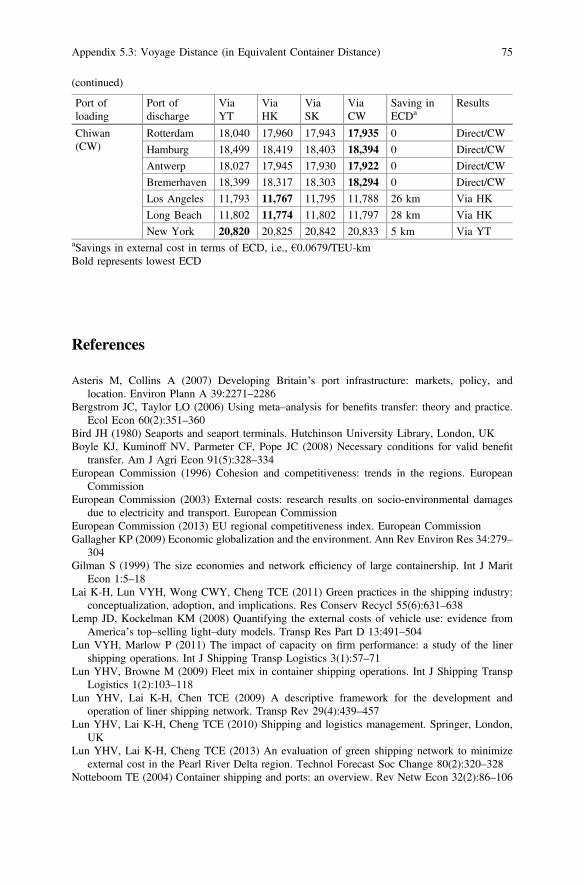
(continued)
Port ofloading
Port ofdischarge
ViaYT
ViaHK
ViaSK
ViaCW
Saving inECDa
Results
Chiwan(CW)
Rotterdam 18,040 17,960 17,943 17,935 0 Direct/CW
Hamburg 18,499 18,419 18,403 18,394 0 Direct/CW
Antwerp 18,027 17,945 17,930 17,922 0 Direct/CW
Bremerhaven 18,399 18,317 18,303 18,294 0 Direct/CW
Los Angeles 11,793 11,767 11,795 11,788 26 km Via HK
Long Beach 11,802 11,774 11,802 11,797 28 km Via HK
New York 20,820 20,825 20,842 20,833 5 km Via YTaSavings in external cost in terms of ECD, i.e., €0.0679/TEU-kmBold represents lowest ECD
References
Asteris M, Collins A (2007) Developing Britain’s port infrastructure: markets, policy, andlocation. Environ Plann A 39:2271–2286
Bergstrom JC, Taylor LO (2006) Using meta–analysis for benefits transfer: theory and practice.Ecol Econ 60(2):351–360
Bird JH (1980) Seaports and seaport terminals. Hutchinson University Library, London, UKBoyle KJ, Kuminoff NV, Parmeter CF, Pope JC (2008) Necessary conditions for valid benefit
transfer. Am J Agri Econ 91(5):328–334European Commission (1996) Cohesion and competitiveness: trends in the regions. European
CommissionEuropean Commission (2003) External costs: research results on socio-environmental damages
due to electricity and transport. European CommissionEuropean Commission (2013) EU regional competitiveness index. European CommissionGallagher KP (2009) Economic globalization and the environment. Ann Rev Environ Res 34:279–
304Gilman S (1999) The size economies and network efficiency of large containership. Int J Marit
Econ 1:5–18Lai K-H, Lun VYH, Wong CWY, Cheng TCE (2011) Green practices in the shipping industry:
conceptualization, adoption, and implications. Res Conserv Recycl 55(6):631–638Lemp JD, Kockelman KM (2008) Quantifying the external costs of vehicle use: evidence from
America’s top–selling light–duty models. Transp Res Part D 13:491–504Lun VYH, Marlow P (2011) The impact of capacity on firm performance: a study of the liner
shipping operations. Int J Shipping Transp Logistics 3(1):57–71Lun YHV, Browne M (2009) Fleet mix in container shipping operations. Int J Shipping Transp
Logistics 1(2):103–118Lun YHV, Lai K-H, Chen TCE (2009) A descriptive framework for the development and
operation of liner shipping network. Transp Rev 29(4):439–457Lun YHV, Lai K-H, Cheng TCE (2010) Shipping and logistics management. Springer, London,
UKLun YHV, Lai K-H, Cheng TCE (2013) An evaluation of green shipping network to minimize
external cost in the Pearl River Delta region. Technol Forecast Soc Change 80(2):320–328Notteboom TE (2004) Container shipping and ports: an overview. Rev Netw Econ 32(2):86–106
Appendix 5.3: Voyage Distance (in Equivalent Container Distance) 75

O’Brien C (2002) Global manufacturing and the sustainable economy. Int J Prod Res 40(5):3867–3877
Song DP, Zhang J, Carter J, Field T, Marshall J, Polak J, Schmacher K, Sinha-Ray P, Woods J(2005) On cost–efficiency of the global container shipping network. Marit Policy Manag 32(1):5–30
Song DP, Dong JX, Roe M (2010) Optimal container dispatching policy and its structure in ashuttle service with finite capacity and random demands. Int J Shipping Transp Logistics 2(1):44–58
Van Hoek RI (2000) From reversed logistics to green supply chain. Logistics Solutions 2:28–33
76 5 Development of a Green Shipping Network
Chapter 6Evaluation of Green Shipping Networks
6.1 Development of Green Shipping Networks
6.1.1 Benefits of Green Shipping Networks
The cost for firms to reduce CO2 emissions in their environmental protectionendeavors has considerably increased in the past few decades. The environmental-related costs are anticipated to continue to increase. In the context of shippingoperations, initiatives to reduce CO2 emissions include: (1) the use of shore power,(2) reduction in vessel speed, and (3) the use of cleaner fuel. However, there areextra operational costs incurred to upgrade the related equipment with the use ofshore power, modify operational procedures to manage reduced vessel speed, andcompliance with environmental regulations in the use of cleaner fuel. Yet to remaincompetitive, cost-effective green shipping operations are essential for shippingfirms (Lun et al. 2010). The integration of both environmental concerns andcommercial operations into shipping management has become increasinglyimportant for shipping firms (Lun 2011). For instance, in intermodal transportoperations, the accessibility of road transport is the highest among all of thetransport modes. However, the level of CO2 emissions in trucking is also thehighest. Hence, containers should be first trucked to the nearest port to reduce theenvironmental impacts.
From the perspective of container port operations, ports in the region can beclassified into feeder, hub, and direct ports. To enjoy scale operations, greenshipping networks can be established by using a hub-and-spoke system to supportlarge containerships that run back and forth between major hub ports (Lun andBrowne 2009). Such a system requires the delivery of containers to feeder port firstby trucks, and then transferred to the hub port by barge. Under the hub-and-spoke
The research of this chapter is based on Lun (2013) and Lun et al. (2010).
© Springer International Publishing Switzerland 2016Y.H.V. Lun et al., Green Shipping Management,Shipping and Transport Logistics, DOI 10.1007/978-3-319-26482-0_6
77
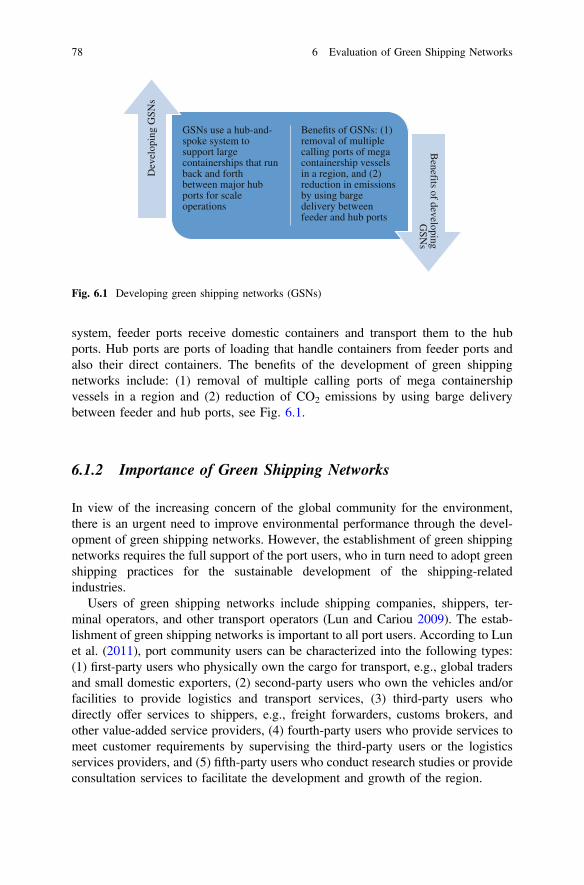
system, feeder ports receive domestic containers and transport them to the hubports. Hub ports are ports of loading that handle containers from feeder ports andalso their direct containers. The benefits of the development of green shippingnetworks include: (1) removal of multiple calling ports of mega containershipvessels in a region and (2) reduction of CO2 emissions by using barge deliverybetween feeder and hub ports, see Fig. 6.1.
6.1.2 Importance of Green Shipping Networks
In view of the increasing concern of the global community for the environment,there is an urgent need to improve environmental performance through the devel-opment of green shipping networks. However, the establishment of green shippingnetworks requires the full support of the port users, who in turn need to adopt greenshipping practices for the sustainable development of the shipping-relatedindustries.
Users of green shipping networks include shipping companies, shippers, ter-minal operators, and other transport operators (Lun and Cariou 2009). The estab-lishment of green shipping networks is important to all port users. According to Lunet al. (2011), port community users can be characterized into the following types:(1) first-party users who physically own the cargo for transport, e.g., global tradersand small domestic exporters, (2) second-party users who own the vehicles and/orfacilities to provide logistics and transport services, (3) third-party users whodirectly offer services to shippers, e.g., freight forwarders, customs brokers, andother value-added service providers, (4) fourth-party users who provide services tomeet customer requirements by supervising the third-party users or the logisticsservices providers, and (5) fifth-party users who conduct research studies or provideconsultation services to facilitate the development and growth of the region.
GSNs use a hub-and-spoke system to support large containerships that run back and forth between major hub ports for scale operations
Benefits of GSNs: (1) removal of multiple calling ports of mega containership vessels in a region, and (2) reduction in emissions by using barge delivery between feeder and hub ports
Dev
elop
ing
GSN
sB
enefits of developing G
SNs
Fig. 6.1 Developing green shipping networks (GSNs)
78 6 Evaluation of Green Shipping Networks
Port operations are closely linked to environmental quality (Gallagher 2009).The challenge of today’s shipping industry is to enhance economic performancewhile reducing negative environmental impacts. Environmentally sustainableoperations have emerged as an important area for firms to consider and use for theirown benefit, and policy makers to showcase their commitment to environmentalprotection (Hock and Erasmus 2000; Sarkis et al. 2010). For the past few decades,greenhouse gas emissions have increased by approximately 70 % (Metz et al.2007). Increases in greenhouse gas emissions due to transportation-related activitieshave become a serious concern. There is therefore pressure on shipping firms toadopt green operations that would reduce the environmental damage caused byglobal trade activities (Lai et al. 2011).
6.1.3 Establishment of Green Shipping Networks
Liner shipping involves many components to be successful. For instance, a regularpublicized schedule of shipping services between seaports is made available. Linershipping must meet the shipping demand for regular freight transport. Theiroperations are to fully utilize the capacity of their fleets. Operating large containerships involve significant capital investment and high daily operating costs (Lun andMarlow 2011). Shipping firms can increase their efficiency by improving fleetutilization through ship routing, which is the assignment of the port sequences to bevisited by ships (Zhang et al. 2011). Furthermore, the factors that need to beconsidered by shipping firms in planning their liner shipping services include scopeof their services and fleet mix (Lun and Browne 2009). In planning a liner serviceroute, the shipping routes must be carefully determined. With increasing signifi-cance placed on pendulum services and transshipment networks, most liner servicesprovide line-bundling services on their main shipping routes. By the overlay ofroundtrips, shipping firms can offer a desired calling frequency to customers.
However, in facing environmental concerns, it is essential for all resources to beefficiently and effectively used. The doubling or tripling of ports of call involveslonger voyage distances which are really a waste of resources. Estimation of thedirect voyage distance between the ports of loading and discharging can be usefulfor identifying the relative environmental cost of containership transport betweenthe two ports. An alternative means of transporting containers is to develop ashipping network to transport containers from a feeder to a hub port by barge, andthen ship the containers to a discharging port by containership. Reductions inenvironmental damage can be realized when the alternative route is shorter than thedirect route in terms of the ECD travelled. These shipping routes also avoid dou-bling or tripling of the ports of call. As a result, the shortest route for any givenorigin and destination that originates in this region is the route with the lowestenvironmental cost for container shipping.
The components of a green shipping network are shown in Fig. 6.2. To improveenvironmental performance, green shipping networks should be developed with
6.1 Development of Green Shipping Networks 79
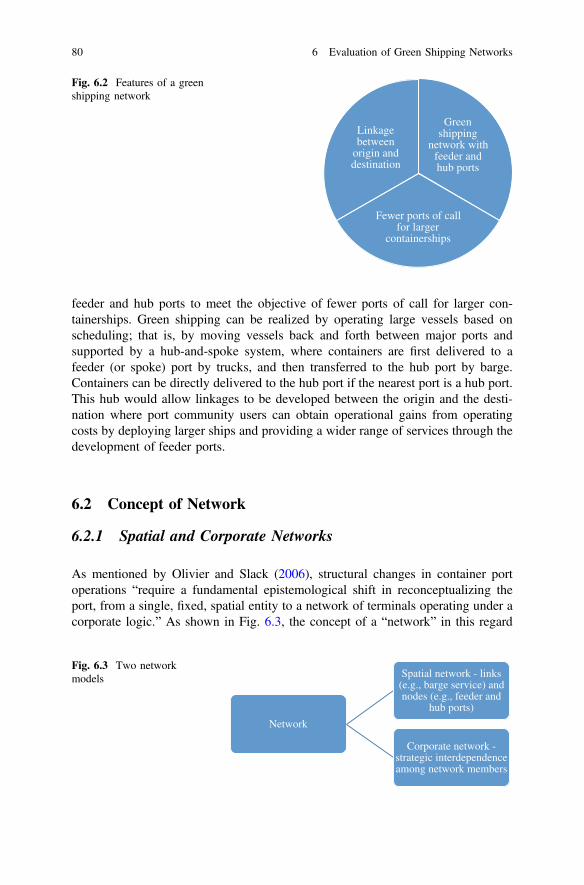
feeder and hub ports to meet the objective of fewer ports of call for larger con-tainerships. Green shipping can be realized by operating large vessels based onscheduling; that is, by moving vessels back and forth between major ports andsupported by a hub-and-spoke system, where containers are first delivered to afeeder (or spoke) port by trucks, and then transferred to the hub port by barge.Containers can be directly delivered to the hub port if the nearest port is a hub port.This hub would allow linkages to be developed between the origin and the desti-nation where port community users can obtain operational gains from operatingcosts by deploying larger ships and providing a wider range of services through thedevelopment of feeder ports.
6.2 Concept of Network
6.2.1 Spatial and Corporate Networks
As mentioned by Olivier and Slack (2006), structural changes in container portoperations “require a fundamental epistemological shift in reconceptualizing theport, from a single, fixed, spatial entity to a network of terminals operating under acorporate logic.” As shown in Fig. 6.3, the concept of a “network” in this regard
Network
Spatial network - links (e.g., barge service) and nodes (e.g., feeder and
hub ports)
Corporate network - strategic interdependence among network members
Fig. 6.3 Two networkmodels
Green shipping
network with feeder and hub ports
Fewer ports of call for larger
containerships
Linkage between
origin and destination
Fig. 6.2 Features of a greenshipping network
80 6 Evaluation of Green Shipping Networks
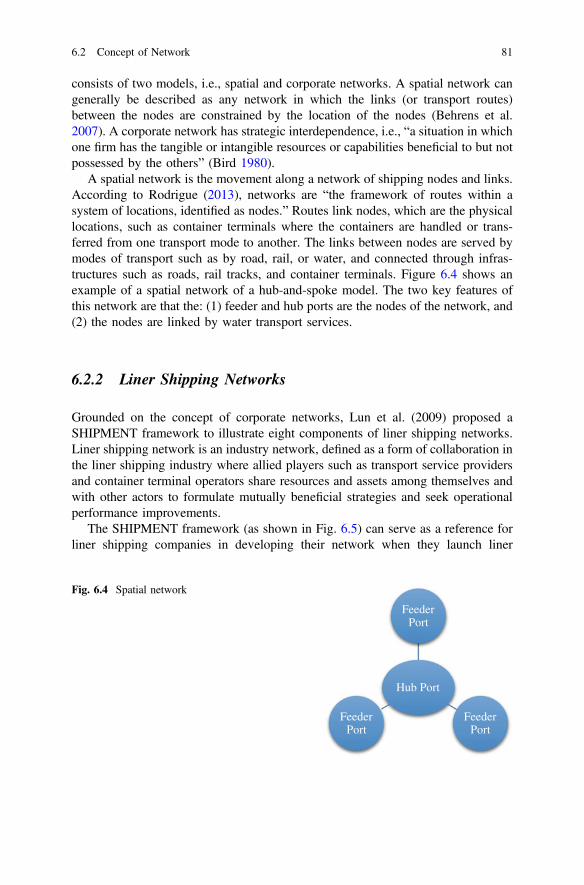
consists of two models, i.e., spatial and corporate networks. A spatial network cangenerally be described as any network in which the links (or transport routes)between the nodes are constrained by the location of the nodes (Behrens et al.2007). A corporate network has strategic interdependence, i.e., “a situation in whichone firm has the tangible or intangible resources or capabilities beneficial to but notpossessed by the others” (Bird 1980).
A spatial network is the movement along a network of shipping nodes and links.According to Rodrigue (2013), networks are “the framework of routes within asystem of locations, identified as nodes.” Routes link nodes, which are the physicallocations, such as container terminals where the containers are handled or trans-ferred from one transport mode to another. The links between nodes are served bymodes of transport such as by road, rail, or water, and connected through infras-tructures such as roads, rail tracks, and container terminals. Figure 6.4 shows anexample of a spatial network of a hub-and-spoke model. The two key features ofthis network are that the: (1) feeder and hub ports are the nodes of the network, and(2) the nodes are linked by water transport services.
6.2.2 Liner Shipping Networks
Grounded on the concept of corporate networks, Lun et al. (2009) proposed aSHIPMENT framework to illustrate eight components of liner shipping networks.Liner shipping network is an industry network, defined as a form of collaboration inthe liner shipping industry where allied players such as transport service providersand container terminal operators share resources and assets among themselves andwith other actors to formulate mutually beneficial strategies and seek operationalperformance improvements.
The SHIPMENT framework (as shown in Fig. 6.5) can serve as a reference forliner shipping companies in developing their network when they launch liner
Hub Port
Feeder Port
Feeder Port
Feeder Port
Fig. 6.4 Spatial network
6.2 Concept of Network 81
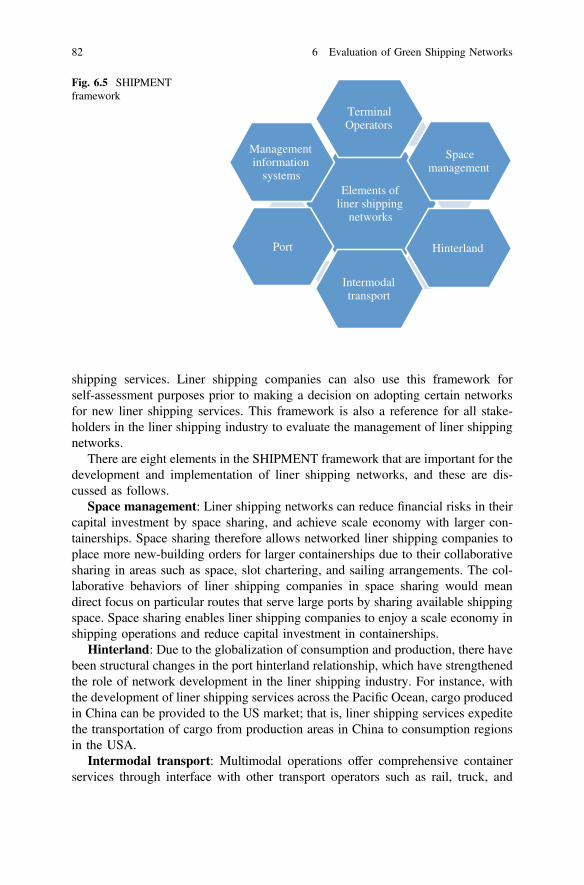
shipping services. Liner shipping companies can also use this framework forself-assessment purposes prior to making a decision on adopting certain networksfor new liner shipping services. This framework is also a reference for all stake-holders in the liner shipping industry to evaluate the management of liner shippingnetworks.
There are eight elements in the SHIPMENT framework that are important for thedevelopment and implementation of liner shipping networks, and these are dis-cussed as follows.
Space management: Liner shipping networks can reduce financial risks in theircapital investment by space sharing, and achieve scale economy with larger con-tainerships. Space sharing therefore allows networked liner shipping companies toplace more new-building orders for larger containerships due to their collaborativesharing in areas such as space, slot chartering, and sailing arrangements. The col-laborative behaviors of liner shipping companies in space sharing would meandirect focus on particular routes that serve large ports by sharing available shippingspace. Space sharing enables liner shipping companies to enjoy a scale economy inshipping operations and reduce capital investment in containerships.
Hinterland: Due to the globalization of consumption and production, there havebeen structural changes in the port hinterland relationship, which have strengthenedthe role of network development in the liner shipping industry. For instance, withthe development of liner shipping services across the Pacific Ocean, cargo producedin China can be provided to the US market; that is, liner shipping services expeditethe transportation of cargo from production areas in China to consumption regionsin the USA.
Intermodal transport: Multimodal operations offer comprehensive containerservices through interface with other transport operators such as rail, truck, and
Elements of liner shipping
networks
Terminal Operators
Space management
Hinterland
Intermodal transport
Port
Management information
systems
Fig. 6.5 SHIPMENTframework
82 6 Evaluation of Green Shipping Networks
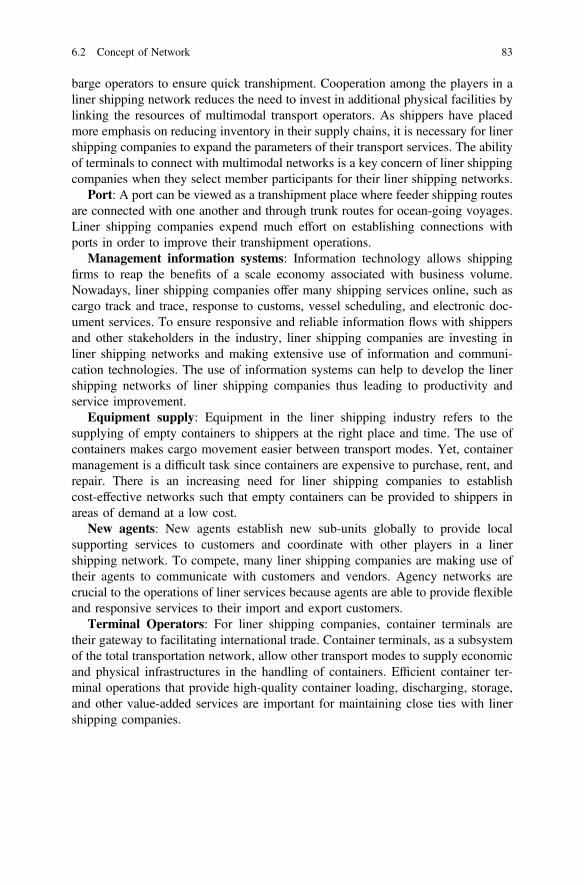
barge operators to ensure quick transhipment. Cooperation among the players in aliner shipping network reduces the need to invest in additional physical facilities bylinking the resources of multimodal transport operators. As shippers have placedmore emphasis on reducing inventory in their supply chains, it is necessary for linershipping companies to expand the parameters of their transport services. The abilityof terminals to connect with multimodal networks is a key concern of liner shippingcompanies when they select member participants for their liner shipping networks.
Port: A port can be viewed as a transhipment place where feeder shipping routesare connected with one another and through trunk routes for ocean-going voyages.Liner shipping companies expend much effort on establishing connections withports in order to improve their transhipment operations.
Management information systems: Information technology allows shippingfirms to reap the benefits of a scale economy associated with business volume.Nowadays, liner shipping companies offer many shipping services online, such ascargo track and trace, response to customs, vessel scheduling, and electronic doc-ument services. To ensure responsive and reliable information flows with shippersand other stakeholders in the industry, liner shipping companies are investing inliner shipping networks and making extensive use of information and communi-cation technologies. The use of information systems can help to develop the linershipping networks of liner shipping companies thus leading to productivity andservice improvement.
Equipment supply: Equipment in the liner shipping industry refers to thesupplying of empty containers to shippers at the right place and time. The use ofcontainers makes cargo movement easier between transport modes. Yet, containermanagement is a difficult task since containers are expensive to purchase, rent, andrepair. There is an increasing need for liner shipping companies to establishcost-effective networks such that empty containers can be provided to shippers inareas of demand at a low cost.
New agents: New agents establish new sub-units globally to provide localsupporting services to customers and coordinate with other players in a linershipping network. To compete, many liner shipping companies are making use oftheir agents to communicate with customers and vendors. Agency networks arecrucial to the operations of liner services because agents are able to provide flexibleand responsive services to their import and export customers.
Terminal Operators: For liner shipping companies, container terminals aretheir gateway to facilitating international trade. Container terminals, as a subsystemof the total transportation network, allow other transport modes to supply economicand physical infrastructures in the handling of containers. Efficient container ter-minal operations that provide high-quality container loading, discharging, storage,and other value-added services are important for maintaining close ties with linershipping companies.
6.2 Concept of Network 83
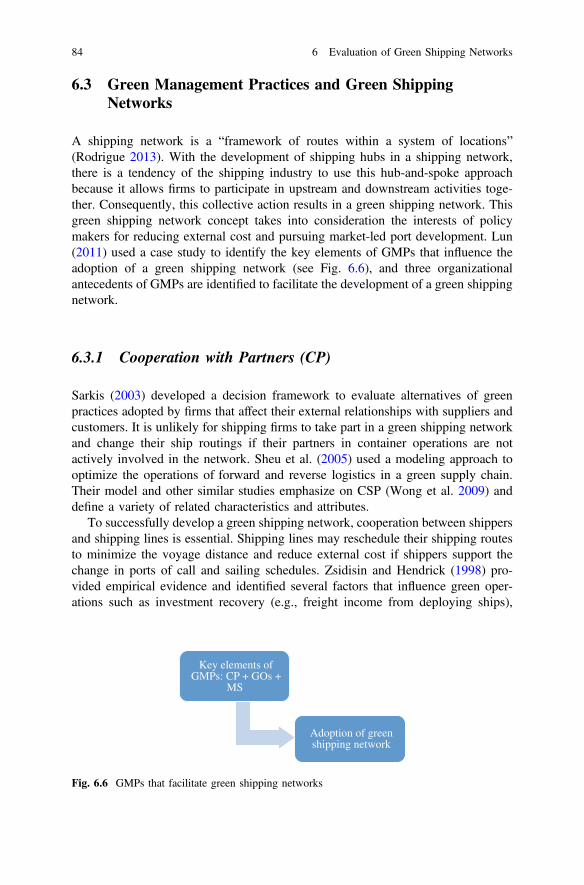
6.3 Green Management Practices and Green ShippingNetworks
A shipping network is a “framework of routes within a system of locations”(Rodrigue 2013). With the development of shipping hubs in a shipping network,there is a tendency of the shipping industry to use this hub-and-spoke approachbecause it allows firms to participate in upstream and downstream activities toge-ther. Consequently, this collective action results in a green shipping network. Thisgreen shipping network concept takes into consideration the interests of policymakers for reducing external cost and pursuing market-led port development. Lun(2011) used a case study to identify the key elements of GMPs that influence theadoption of a green shipping network (see Fig. 6.6), and three organizationalantecedents of GMPs are identified to facilitate the development of a green shippingnetwork.
6.3.1 Cooperation with Partners (CP)
Sarkis (2003) developed a decision framework to evaluate alternatives of greenpractices adopted by firms that affect their external relationships with suppliers andcustomers. It is unlikely for shipping firms to take part in a green shipping networkand change their ship routings if their partners in container operations are notactively involved in the network. Sheu et al. (2005) used a modeling approach tooptimize the operations of forward and reverse logistics in a green supply chain.Their model and other similar studies emphasize on CSP (Wong et al. 2009) anddefine a variety of related characteristics and attributes.
To successfully develop a green shipping network, cooperation between shippersand shipping lines is essential. Shipping lines may reschedule their shipping routesto minimize the voyage distance and reduce external cost if shippers support thechange in ports of call and sailing schedules. Zsidisin and Hendrick (1998) pro-vided empirical evidence and identified several factors that influence green oper-ations such as investment recovery (e.g., freight income from deploying ships),
Key elements of GMPs: CP + GOs +
MS
Adoption of green shipping network
Fig. 6.6 GMPs that facilitate green shipping networks
84 6 Evaluation of Green Shipping Networks
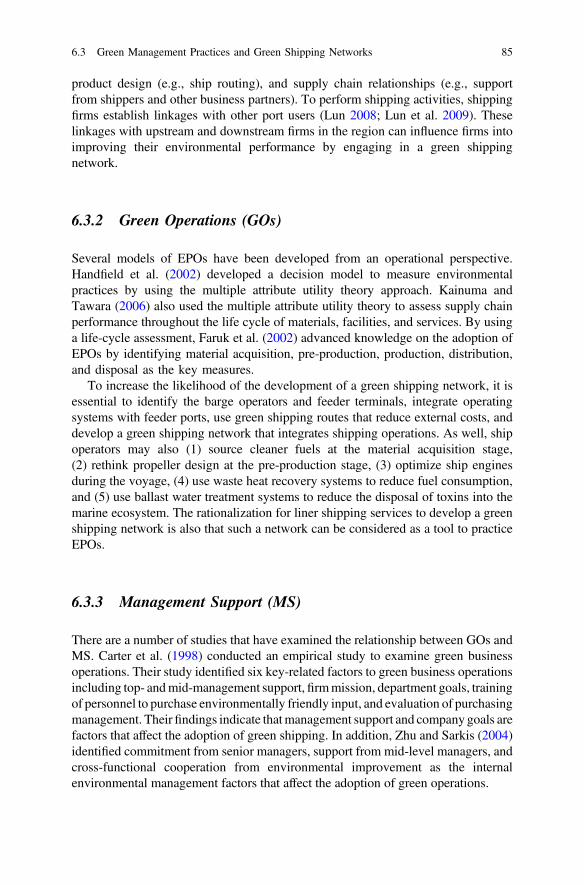
product design (e.g., ship routing), and supply chain relationships (e.g., supportfrom shippers and other business partners). To perform shipping activities, shippingfirms establish linkages with other port users (Lun 2008; Lun et al. 2009). Theselinkages with upstream and downstream firms in the region can influence firms intoimproving their environmental performance by engaging in a green shippingnetwork.
6.3.2 Green Operations (GOs)
Several models of EPOs have been developed from an operational perspective.Handfield et al. (2002) developed a decision model to measure environmentalpractices by using the multiple attribute utility theory approach. Kainuma andTawara (2006) also used the multiple attribute utility theory to assess supply chainperformance throughout the life cycle of materials, facilities, and services. By usinga life-cycle assessment, Faruk et al. (2002) advanced knowledge on the adoption ofEPOs by identifying material acquisition, pre-production, production, distribution,and disposal as the key measures.
To increase the likelihood of the development of a green shipping network, it isessential to identify the barge operators and feeder terminals, integrate operatingsystems with feeder ports, use green shipping routes that reduce external costs, anddevelop a green shipping network that integrates shipping operations. As well, shipoperators may also (1) source cleaner fuels at the material acquisition stage,(2) rethink propeller design at the pre-production stage, (3) optimize ship enginesduring the voyage, (4) use waste heat recovery systems to reduce fuel consumption,and (5) use ballast water treatment systems to reduce the disposal of toxins into themarine ecosystem. The rationalization for liner shipping services to develop a greenshipping network is also that such a network can be considered as a tool to practiceEPOs.
6.3.3 Management Support (MS)
There are a number of studies that have examined the relationship between GOs andMS. Carter et al. (1998) conducted an empirical study to examine green businessoperations. Their study identified six key-related factors to green business operationsincluding top- andmid-management support,firmmission, department goals, trainingof personnel to purchase environmentally friendly input, and evaluation of purchasingmanagement. Theirfindings indicate thatmanagement support and company goals arefactors that affect the adoption of green shipping. In addition, Zhu and Sarkis (2004)identified commitment from senior managers, support from mid-level managers, andcross-functional cooperation from environmental improvement as the internalenvironmental management factors that affect the adoption of green operations.
6.3 Green Management Practices and Green Shipping Networks 85
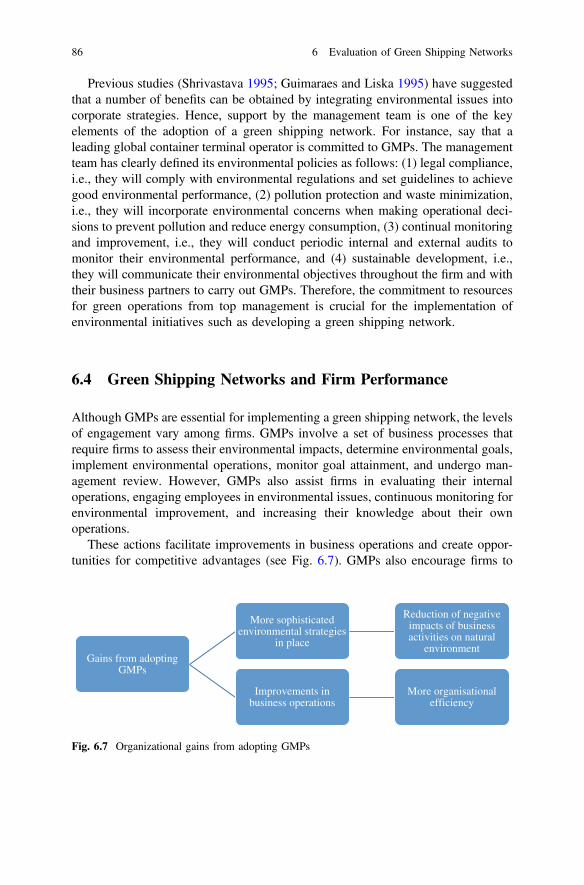
Previous studies (Shrivastava 1995; Guimaraes and Liska 1995) have suggestedthat a number of benefits can be obtained by integrating environmental issues intocorporate strategies. Hence, support by the management team is one of the keyelements of the adoption of a green shipping network. For instance, say that aleading global container terminal operator is committed to GMPs. The managementteam has clearly defined its environmental policies as follows: (1) legal compliance,i.e., they will comply with environmental regulations and set guidelines to achievegood environmental performance, (2) pollution protection and waste minimization,i.e., they will incorporate environmental concerns when making operational deci-sions to prevent pollution and reduce energy consumption, (3) continual monitoringand improvement, i.e., they will conduct periodic internal and external audits tomonitor their environmental performance, and (4) sustainable development, i.e.,they will communicate their environmental objectives throughout the firm and withtheir business partners to carry out GMPs. Therefore, the commitment to resourcesfor green operations from top management is crucial for the implementation ofenvironmental initiatives such as developing a green shipping network.
6.4 Green Shipping Networks and Firm Performance
Although GMPs are essential for implementing a green shipping network, the levelsof engagement vary among firms. GMPs involve a set of business processes thatrequire firms to assess their environmental impacts, determine environmental goals,implement environmental operations, monitor goal attainment, and undergo man-agement review. However, GMPs also assist firms in evaluating their internaloperations, engaging employees in environmental issues, continuous monitoring forenvironmental improvement, and increasing their knowledge about their ownoperations.
These actions facilitate improvements in business operations and create oppor-tunities for competitive advantages (see Fig. 6.7). GMPs also encourage firms to
Gains from adopting GMPs
More sophisticated environmental strategies
in place
Reduction of negative impacts of business activities on natural
environment
Improvements in business operations
More organisational efficiency
Fig. 6.7 Organizational gains from adopting GMPs
86 6 Evaluation of Green Shipping Networks
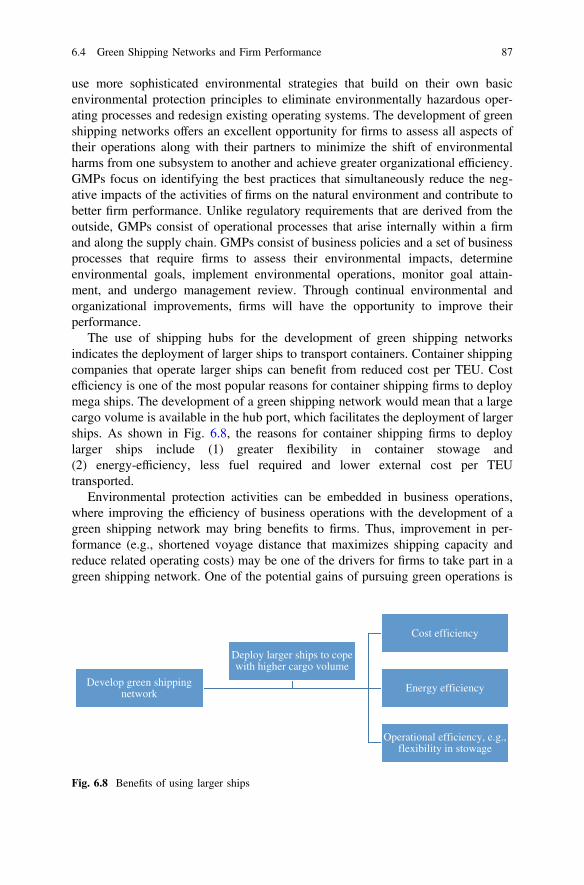
use more sophisticated environmental strategies that build on their own basicenvironmental protection principles to eliminate environmentally hazardous oper-ating processes and redesign existing operating systems. The development of greenshipping networks offers an excellent opportunity for firms to assess all aspects oftheir operations along with their partners to minimize the shift of environmentalharms from one subsystem to another and achieve greater organizational efficiency.GMPs focus on identifying the best practices that simultaneously reduce the neg-ative impacts of the activities of firms on the natural environment and contribute tobetter firm performance. Unlike regulatory requirements that are derived from theoutside, GMPs consist of operational processes that arise internally within a firmand along the supply chain. GMPs consist of business policies and a set of businessprocesses that require firms to assess their environmental impacts, determineenvironmental goals, implement environmental operations, monitor goal attain-ment, and undergo management review. Through continual environmental andorganizational improvements, firms will have the opportunity to improve theirperformance.
The use of shipping hubs for the development of green shipping networksindicates the deployment of larger ships to transport containers. Container shippingcompanies that operate larger ships can benefit from reduced cost per TEU. Costefficiency is one of the most popular reasons for container shipping firms to deploymega ships. The development of a green shipping network would mean that a largecargo volume is available in the hub port, which facilitates the deployment of largerships. As shown in Fig. 6.8, the reasons for container shipping firms to deploylarger ships include (1) greater flexibility in container stowage and(2) energy-efficiency, less fuel required and lower external cost per TEUtransported.
Environmental protection activities can be embedded in business operations,where improving the efficiency of business operations with the development of agreen shipping network may bring benefits to firms. Thus, improvement in per-formance (e.g., shortened voyage distance that maximizes shipping capacity andreduce related operating costs) may be one of the drivers for firms to take part in agreen shipping network. One of the potential gains of pursuing green operations is
Develop green shipping network
Cost efficiency
Energy efficiency
Operational efficiency, e.g., flexibility in stowage
Deploy larger ships to cope with higher cargo volume
Fig. 6.8 Benefits of using larger ships
6.4 Green Shipping Networks and Firm Performance 87
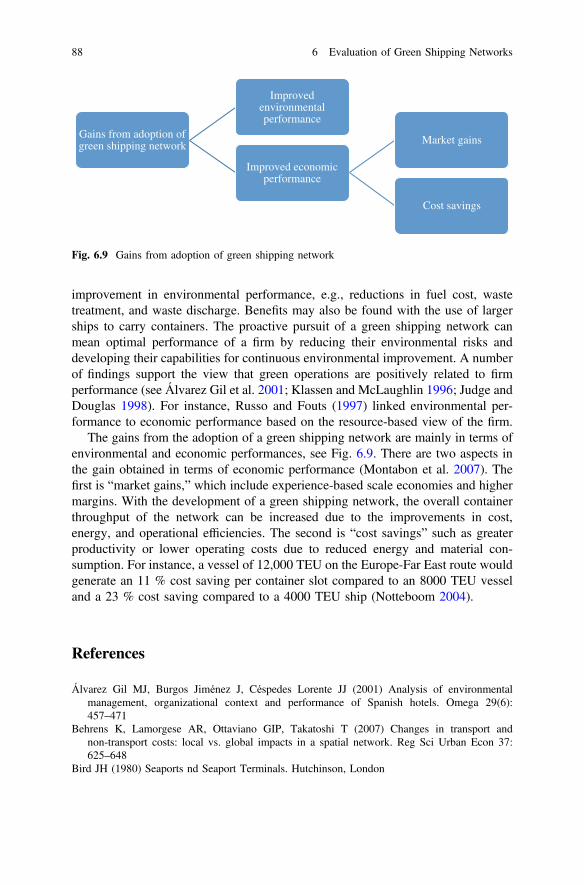
improvement in environmental performance, e.g., reductions in fuel cost, wastetreatment, and waste discharge. Benefits may also be found with the use of largerships to carry containers. The proactive pursuit of a green shipping network canmean optimal performance of a firm by reducing their environmental risks anddeveloping their capabilities for continuous environmental improvement. A numberof findings support the view that green operations are positively related to firmperformance (see Álvarez Gil et al. 2001; Klassen and McLaughlin 1996; Judge andDouglas 1998). For instance, Russo and Fouts (1997) linked environmental per-formance to economic performance based on the resource-based view of the firm.
The gains from the adoption of a green shipping network are mainly in terms ofenvironmental and economic performances, see Fig. 6.9. There are two aspects inthe gain obtained in terms of economic performance (Montabon et al. 2007). Thefirst is “market gains,” which include experience-based scale economies and highermargins. With the development of a green shipping network, the overall containerthroughput of the network can be increased due to the improvements in cost,energy, and operational efficiencies. The second is “cost savings” such as greaterproductivity or lower operating costs due to reduced energy and material con-sumption. For instance, a vessel of 12,000 TEU on the Europe-Far East route wouldgenerate an 11 % cost saving per container slot compared to an 8000 TEU vesseland a 23 % cost saving compared to a 4000 TEU ship (Notteboom 2004).
References
Álvarez Gil MJ, Burgos Jiménez J, Céspedes Lorente JJ (2001) Analysis of environmentalmanagement, organizational context and performance of Spanish hotels. Omega 29(6):457–471
Behrens K, Lamorgese AR, Ottaviano GIP, Takatoshi T (2007) Changes in transport andnon-transport costs: local vs. global impacts in a spatial network. Reg Sci Urban Econ 37:625–648
Bird JH (1980) Seaports nd Seaport Terminals. Hutchinson, London
Gains from adoption of green shipping network
Improved environmental performance
Improved economic performance
Market gains
Cost savings
Fig. 6.9 Gains from adoption of green shipping network
88 6 Evaluation of Green Shipping Networks
Carter CR., Ellram LM, Ready KJ (1998) Environmental purchasing: benchmarking our Germancounterparts. Int J Purchasing Mater Manage
Faruk AC, Lamming RC, Cousins PD, Bowen FE (2002) Analyzing, mapping, and managingenvironmental impacts along the supply chain. J Ind Ecol 5(2):13–36
Gallagher KP (2009) Economic globalization and the environment. Ann Rev Environ Resour34:279–304
Guimaraes T, Liska K (1995) Exploring the business benefits of environmental stewardship. BusStrategy Environ 4(1):9–22
Handfield R, Walton SV, Sroufe R, Melnyk SA (2002) Applying environmental criteria to supplierassessment: a study in the application of the analytical hierarch process. Eur J Oper Res 141(1):70–87
Hock van, Erasmus RI (2000) From reversed logistics to green supply chian. Logistics Solution2:28–33
Judge WQ, Douglas TJ (1998) Performance implications of incorporating natural environmentalissue into the strategic planning process: an empirical assessment. J Manage Stud 35(2):241–62
Kainuma Y, Tawara N (2006) A multiple attribute utility theory approach to learn and greensupply chain management. Int J Prod Econ 101(1):99–108
Klassen K, Robert D, McLaughlin CP (1996) The impact of environmental management on firmperformance. Manage Sci 42(8):1199–214
Lai K, Lun VYH, Wong CWY, Cheng TCE (2011) Green shipping practices in the shippingindustry: conceptualization, adoption, and implications. Resour Conserv Recycl 55(6):631–638
Lun VYH (2008) Adoption of electronic commerce by logistics service providers in Hong Kong.VDM, Saarbrucken
Lun VYH (2011) Green management practices and firm performance: a case of container terminaloperations. Resour Conserv Recycl 55(6):559–566
Lun YHV (2013) Development of green shipping network to enhance environmental andeconomic performance. Polish Marit Res 79(1):13–19
Lun VYH, Browne M (2009) Fleet mix in container shipping operations. Int J Shipping TranspLogistics 1(2):103–118
Lun VYH, Cariou P (2009) An analytical framework for managing container terminals. Int JShipping Transp Logistics 1(4):419–436
Lun VYH, Marlow P (2011) The impact of capacity on firm performance: a study of the linershipping operations. Int J Shipping Transp Logistics 3(1):57–71
Lun VYH, Lai K, Cheng TCE (2009) A descriptive framework for the development and operationof liner shipping network. Transp Rev 29(4):439–457
Lun VYH, Lai K, Cheng TCE (2010) Shipping and logistics management. Springer, LondonLun VYH, Lai K, Ng CT, Wong CWY, Cheng TCE (2011) Research in shipping and transport
logistics. Int J Shipping Transp Logistics 3(1):1–5Metz B, Davidson OR, Bosch PR, Dave R, Meyer LA (2007) Contribution of working group III to
the fourth assessment report of the intergovernmental panel on climate change. CambridgeUniversity Press, Cambridge
Montabon F, Sroufe R, Narasimhan R (2007) An examination of corporate reporting,environmental management practices and firm performance. J Oper Manage 25:998–1014
Notteboom TE (2004) Container shipping and ports: an overview. Rev Network Econ 32(2):86–106
Olivier D, Slack B (2006) Rethinking the port. Environ Plann A 38:1409–1427Rodrigue JP, Ducruet C (2013) The Geogr Transp Netw. Routledge, New YorkRusso MV, Fouts PA (1997) A resource based perspective on corporate environmental
performance and profitability. Acad Manage J 40(3):354–559Sarkis J (2003) A strategic decision marking framework for green supply chain management.
J Clear Prod 11(4):397–409Sarkis J, Zhu Q, Lai K (2010) An organizational theoretic review of green supply chain
management. Int J Prod Econ 130(1):1–15
References 89

Sheu J-B, Chou Y-H, Hu C-C (2005) An integrated logistics operational model for green supplychain management. Transp Res Part E 41(4):287–313
Shrivastava P (1995) Environmental technologies and competitive advantage. Strateg Manage J6:183–200
Wong CWY, Lai K, Ngai EWT (2009) The role of supplier operational adaptation on theperformance of IT enabled logistics under environmental uncertainty. Int J Prod Econ 122(1):47–55
Zhang F, Ng CT, Tang G, Cheng TCE, Lun YHV (2011) Inverse scheduling: applications inshipping. Int J Shipping Transp Logistics 3(3):312–322
Zhu Q, Sarkis J (2004) Relationships between operational practices and performance among earlyadopters of green supply chain management practices in Chinese manufacturing enterprise.J Manage 22:265–289
Zsidisin GA, Hendrick TE (1998) Purchasing’s involvement in environmental issues: amulti-country perspective. Ind Manage Data Syst 7:313–320
90 6 Evaluation of Green Shipping Networks

Part IIIGreening and Firm Performance
Chapter 7Shipping Operations and GreenCapability
7.1 Shipping Operations
Shipping operations contribute to the growth of international trade activities, whichdepend very much on ships to carry cargo from places of production to con-sumption. Seaborne trade has significantly increased in the past decades. However,there have been increasing concerns about the environmental impacts caused byshipping activities in international trade. Shipping firms are now facing newchallenges in the current competitive business environment. Consequently, greenshipping has emerged in importance in shipping operations.
Shipping activities involve the transport of cargo between two physical locations(Lun and Quaddus 2009; Lun et al. 2010). Shipping is one of the most interna-tionalized industries that support global trade as a cost-effective means to movelarge volumes of cargo around the world. Shipping includes all of the activities thatinvolve the moving of cargo to, from, and between key actors of the transportationchain, including shippers, consignees, and carriers (Lun et al. 2008). Shipping isessential to economic development, as global businesses need cargo transportationfrom the place of production to the place of consumption. Although the environ-mental impacts caused by sea transportation are relatively less compared to othertransport modes (e.g., air and road transport), shipping operations have historicallyfaced significant environmental challenges.
Green shipping is concerned with shipping goods in an environmentally friendlymanner. With increasing concern on the development of sustainable economies,shipping firms now voluntarily adopt sustainability as part of their business routineprovided that these environmental initiatives will produce outputs such as envi-ronmental as well as better short-term and long-term economic performances. Thisis because integration of environmental practices into business routines has become
The research of this paper is based on Lun and Brown (2009), Lun et al. (2010, 2014), Lun andMarlow (2011).
© Springer International Publishing Switzerland 2016Y.H.V. Lun et al., Green Shipping Management,Shipping and Transport Logistics, DOI 10.1007/978-3-319-26482-0_7
93
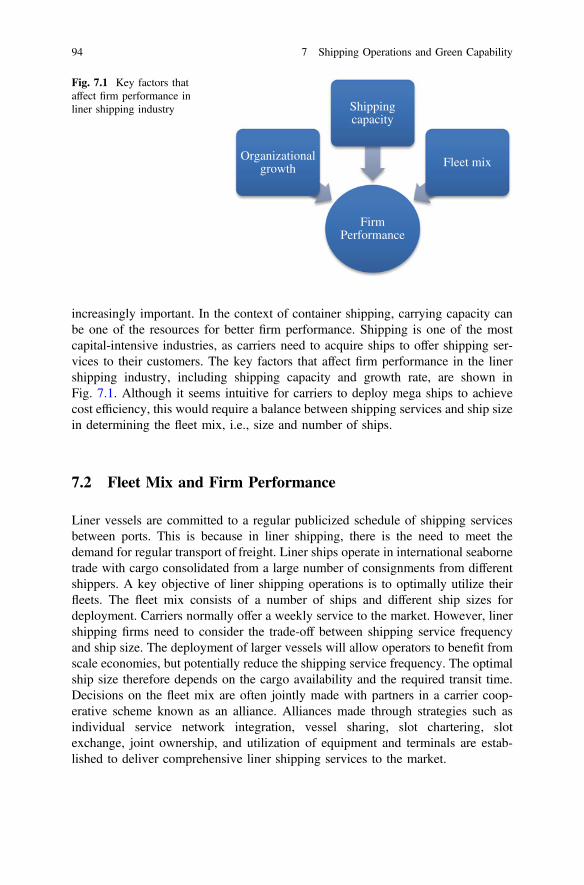
increasingly important. In the context of container shipping, carrying capacity canbe one of the resources for better firm performance. Shipping is one of the mostcapital-intensive industries, as carriers need to acquire ships to offer shipping ser-vices to their customers. The key factors that affect firm performance in the linershipping industry, including shipping capacity and growth rate, are shown inFig. 7.1. Although it seems intuitive for carriers to deploy mega ships to achievecost efficiency, this would require a balance between shipping services and ship sizein determining the fleet mix, i.e., size and number of ships.
7.2 Fleet Mix and Firm Performance
Liner vessels are committed to a regular publicized schedule of shipping servicesbetween ports. This is because in liner shipping, there is the need to meet thedemand for regular transport of freight. Liner ships operate in international seabornetrade with cargo consolidated from a large number of consignments from differentshippers. A key objective of liner shipping operations is to optimally utilize theirfleets. The fleet mix consists of a number of ships and different ship sizes fordeployment. Carriers normally offer a weekly service to the market. However, linershipping firms need to consider the trade-off between shipping service frequencyand ship size. The deployment of larger vessels will allow operators to benefit fromscale economies, but potentially reduce the shipping service frequency. The optimalship size therefore depends on the cargo availability and the required transit time.Decisions on the fleet mix are often jointly made with partners in a carrier coop-erative scheme known as an alliance. Alliances made through strategies such asindividual service network integration, vessel sharing, slot chartering, slotexchange, joint ownership, and utilization of equipment and terminals are estab-lished to deliver comprehensive liner shipping services to the market.
Firm Performance
Organizational growth
Shipping capacity
Fleet mix
Fig. 7.1 Key factors thataffect firm performance inliner shipping industry
94 7 Shipping Operations and Green Capability
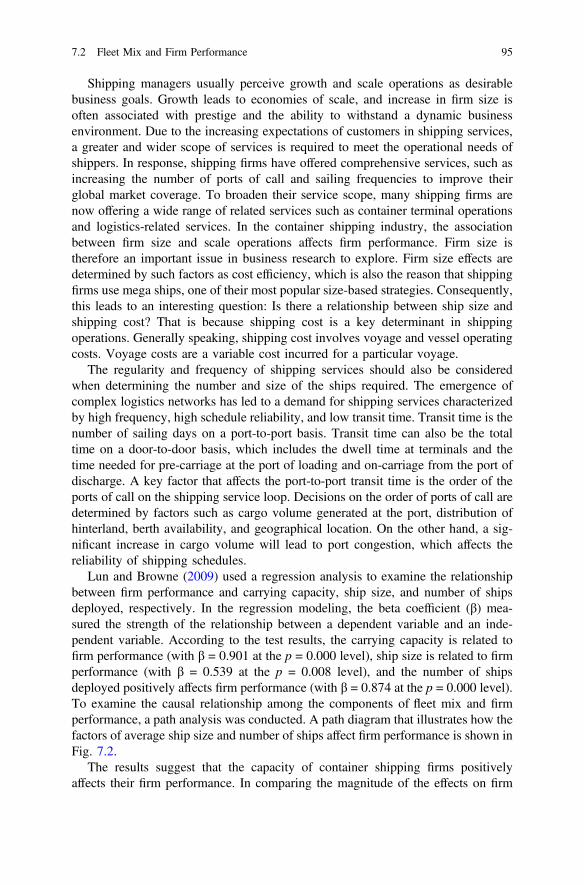
Shipping managers usually perceive growth and scale operations as desirablebusiness goals. Growth leads to economies of scale, and increase in firm size isoften associated with prestige and the ability to withstand a dynamic businessenvironment. Due to the increasing expectations of customers in shipping services,a greater and wider scope of services is required to meet the operational needs ofshippers. In response, shipping firms have offered comprehensive services, such asincreasing the number of ports of call and sailing frequencies to improve theirglobal market coverage. To broaden their service scope, many shipping firms arenow offering a wide range of related services such as container terminal operationsand logistics-related services. In the container shipping industry, the associationbetween firm size and scale operations affects firm performance. Firm size istherefore an important issue in business research to explore. Firm size effects aredetermined by such factors as cost efficiency, which is also the reason that shippingfirms use mega ships, one of their most popular size-based strategies. Consequently,this leads to an interesting question: Is there a relationship between ship size andshipping cost? That is because shipping cost is a key determinant in shippingoperations. Generally speaking, shipping cost involves voyage and vessel operatingcosts. Voyage costs are a variable cost incurred for a particular voyage.
The regularity and frequency of shipping services should also be consideredwhen determining the number and size of the ships required. The emergence ofcomplex logistics networks has led to a demand for shipping services characterizedby high frequency, high schedule reliability, and low transit time. Transit time is thenumber of sailing days on a port-to-port basis. Transit time can also be the totaltime on a door-to-door basis, which includes the dwell time at terminals and thetime needed for pre-carriage at the port of loading and on-carriage from the port ofdischarge. A key factor that affects the port-to-port transit time is the order of theports of call on the shipping service loop. Decisions on the order of ports of call aredetermined by factors such as cargo volume generated at the port, distribution ofhinterland, berth availability, and geographical location. On the other hand, a sig-nificant increase in cargo volume will lead to port congestion, which affects thereliability of shipping schedules.
Lun and Browne (2009) used a regression analysis to examine the relationshipbetween firm performance and carrying capacity, ship size, and number of shipsdeployed, respectively. In the regression modeling, the beta coefficient (β) mea-sured the strength of the relationship between a dependent variable and an inde-pendent variable. According to the test results, the carrying capacity is related tofirm performance (with β = 0.901 at the p = 0.000 level), ship size is related to firmperformance (with β = 0.539 at the p = 0.008 level), and the number of shipsdeployed positively affects firm performance (with β = 0.874 at the p = 0.000 level).To examine the causal relationship among the components of fleet mix and firmperformance, a path analysis was conducted. A path diagram that illustrates how thefactors of average ship size and number of ships affect firm performance is shown inFig. 7.2.
The results suggest that the capacity of container shipping firms positivelyaffects their firm performance. In comparing the magnitude of the effects on firm
7.2 Fleet Mix and Firm Performance 95
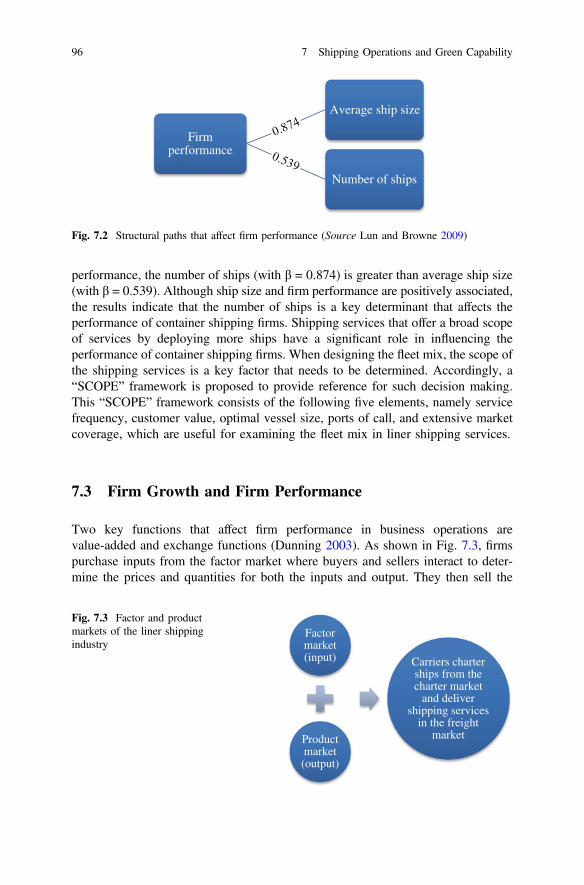
performance, the number of ships (with β = 0.874) is greater than average ship size(with β = 0.539). Although ship size and firm performance are positively associated,the results indicate that the number of ships is a key determinant that affects theperformance of container shipping firms. Shipping services that offer a broad scopeof services by deploying more ships have a significant role in influencing theperformance of container shipping firms. When designing the fleet mix, the scope ofthe shipping services is a key factor that needs to be determined. Accordingly, a“SCOPE” framework is proposed to provide reference for such decision making.This “SCOPE” framework consists of the following five elements, namely servicefrequency, customer value, optimal vessel size, ports of call, and extensive marketcoverage, which are useful for examining the fleet mix in liner shipping services.
7.3 Firm Growth and Firm Performance
Two key functions that affect firm performance in business operations arevalue-added and exchange functions (Dunning 2003). As shown in Fig. 7.3, firmspurchase inputs from the factor market where buyers and sellers interact to deter-mine the prices and quantities for both the inputs and output. They then sell the
Firm performance
Average ship size
Number of ships
Fig. 7.2 Structural paths that affect firm performance (Source Lun and Browne 2009)
Factor market (input)
Product market (output)
Carriers charter ships from the charter market
and deliver shipping services
in the freight market
Fig. 7.3 Factor and productmarkets of the liner shippingindustry
96 7 Shipping Operations and Green Capability
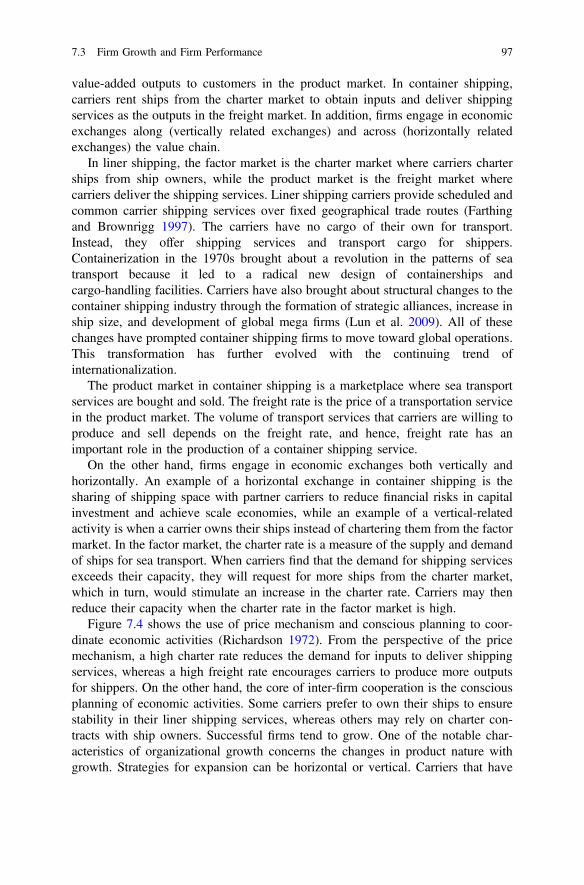
value-added outputs to customers in the product market. In container shipping,carriers rent ships from the charter market to obtain inputs and deliver shippingservices as the outputs in the freight market. In addition, firms engage in economicexchanges along (vertically related exchanges) and across (horizontally relatedexchanges) the value chain.
In liner shipping, the factor market is the charter market where carriers charterships from ship owners, while the product market is the freight market wherecarriers deliver the shipping services. Liner shipping carriers provide scheduled andcommon carrier shipping services over fixed geographical trade routes (Farthingand Brownrigg 1997). The carriers have no cargo of their own for transport.Instead, they offer shipping services and transport cargo for shippers.Containerization in the 1970s brought about a revolution in the patterns of seatransport because it led to a radical new design of containerships andcargo-handling facilities. Carriers have also brought about structural changes to thecontainer shipping industry through the formation of strategic alliances, increase inship size, and development of global mega firms (Lun et al. 2009). All of thesechanges have prompted container shipping firms to move toward global operations.This transformation has further evolved with the continuing trend ofinternationalization.
The product market in container shipping is a marketplace where sea transportservices are bought and sold. The freight rate is the price of a transportation servicein the product market. The volume of transport services that carriers are willing toproduce and sell depends on the freight rate, and hence, freight rate has animportant role in the production of a container shipping service.
On the other hand, firms engage in economic exchanges both vertically andhorizontally. An example of a horizontal exchange in container shipping is thesharing of shipping space with partner carriers to reduce financial risks in capitalinvestment and achieve scale economies, while an example of a vertical-relatedactivity is when a carrier owns their ships instead of chartering them from the factormarket. In the factor market, the charter rate is a measure of the supply and demandof ships for sea transport. When carriers find that the demand for shipping servicesexceeds their capacity, they will request for more ships from the charter market,which in turn, would stimulate an increase in the charter rate. Carriers may thenreduce their capacity when the charter rate in the factor market is high.
Figure 7.4 shows the use of price mechanism and conscious planning to coor-dinate economic activities (Richardson 1972). From the perspective of the pricemechanism, a high charter rate reduces the demand for inputs to deliver shippingservices, whereas a high freight rate encourages carriers to produce more outputsfor shippers. On the other hand, the core of inter-firm cooperation is the consciousplanning of economic activities. Some carriers prefer to own their ships to ensurestability in their liner shipping services, whereas others may rely on charter con-tracts with ship owners. Successful firms tend to grow. One of the notable char-acteristics of organizational growth concerns the changes in product nature withgrowth. Strategies for expansion can be horizontal or vertical. Carriers that have
7.3 Firm Growth and Firm Performance 97
extensive resources tend to adopt vertical expansion which allows them to controlthe inputs by owning their ships instead of chartering them from the factor market.
Scale economies in operations allow geographical expansion and facilitate theinternationalization of businesses, and hence cost advantage, as a result of reduc-tions in the per-unit operating cost. Due to the advantages of having scale opera-tions, large carriers can leverage their capacity to achieve continuous growth.A firm can be viewed as a collection of resources where capacity is one of theirresources to obtain potential high returns in container shipping. Production pro-cesses with increasing returns to scale yield higher returns. Scale economies in theuse of resources are a good example of a barrier to the entry of products. Thisstandard view of growth suggests that expansion will be easier and more favorablefor performance gains.
Lun et al. (2010) examined the exchange function in the container shippingindustry by collecting secondary data from the container shipping industry. Asshown in Fig. 7.5, the findings indicate that the price in the factor market (i.e.,charter rate) is not significant in affecting the total production capacity, while theprice in the product market (i.e., freight rate) is positively related to the totalproduction capacity of the industry. The study also illustrated the relationshipbetween firm size and the level of vertical expansion. In container shipping, largefirms tend to have a higher level of vertical integration and hence, larger carrierstend to own ships instead of chartering them from the charter market.
To understand the level of vertical integration, Lun et al. (2010) developed aregression equation1 as a useful reference for managers in predicting the volume ofnew orders by carriers. More importantly, objective data were used to validate therelationship between firm capacity and firm performance, and in another regressionequation2 that implies net profit increases by USD 1000 for an increase of 1 TEU incapacity. This empirically tested equation provides a useful guideline for managers
Price mechanism Conscious planning
High charter rate reduces the demand for inputs to deliver shipping services
Higher freight rate encourages carriers to produce more outputs
Carriers own their ships to ensure stability of inputs
Carriers charter ships from the charter market to reduce capital investment
Fig. 7.4 Price mechanismand conscious planning tocoordinate economicactivities
1NO (new order) = 37,882.024 + 0.338 FC (firm capacity).2NP (net profit) = 150.12 + 0.001 FC (firm capacity).
98 7 Shipping Operations and Green Capability
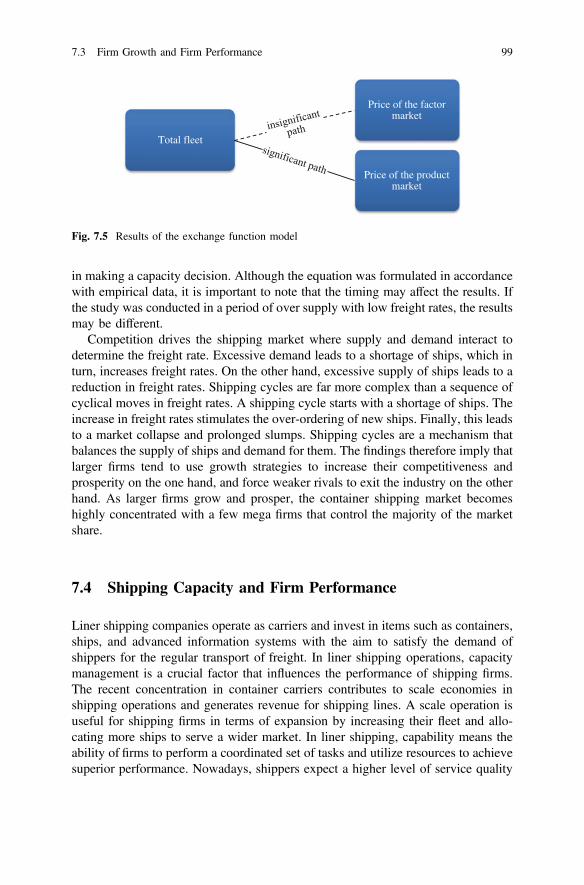
in making a capacity decision. Although the equation was formulated in accordancewith empirical data, it is important to note that the timing may affect the results. Ifthe study was conducted in a period of over supply with low freight rates, the resultsmay be different.
Competition drives the shipping market where supply and demand interact todetermine the freight rate. Excessive demand leads to a shortage of ships, which inturn, increases freight rates. On the other hand, excessive supply of ships leads to areduction in freight rates. Shipping cycles are far more complex than a sequence ofcyclical moves in freight rates. A shipping cycle starts with a shortage of ships. Theincrease in freight rates stimulates the over-ordering of new ships. Finally, this leadsto a market collapse and prolonged slumps. Shipping cycles are a mechanism thatbalances the supply of ships and demand for them. The findings therefore imply thatlarger firms tend to use growth strategies to increase their competitiveness andprosperity on the one hand, and force weaker rivals to exit the industry on the otherhand. As larger firms grow and prosper, the container shipping market becomeshighly concentrated with a few mega firms that control the majority of the marketshare.
7.4 Shipping Capacity and Firm Performance
Liner shipping companies operate as carriers and invest in items such as containers,ships, and advanced information systems with the aim to satisfy the demand ofshippers for the regular transport of freight. In liner shipping operations, capacitymanagement is a crucial factor that influences the performance of shipping firms.The recent concentration in container carriers contributes to scale economies inshipping operations and generates revenue for shipping lines. A scale operation isuseful for shipping firms in terms of expansion by increasing their fleet and allo-cating more ships to serve a wider market. In liner shipping, capability means theability of firms to perform a coordinated set of tasks and utilize resources to achievesuperior performance. Nowadays, shippers expect a higher level of service quality
Total fleet
Price of the factor market
Price of the product market
Fig. 7.5 Results of the exchange function model
7.3 Firm Growth and Firm Performance 99
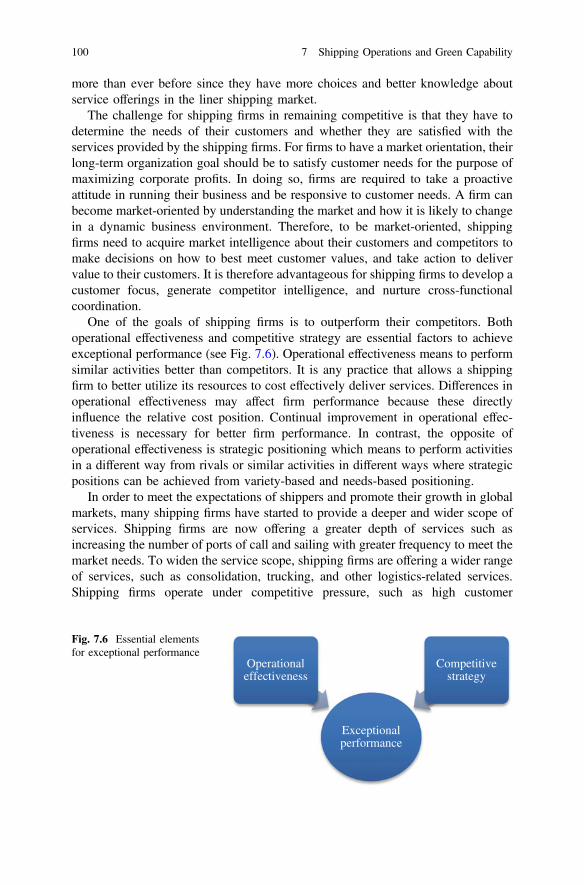
more than ever before since they have more choices and better knowledge aboutservice offerings in the liner shipping market.
The challenge for shipping firms in remaining competitive is that they have todetermine the needs of their customers and whether they are satisfied with theservices provided by the shipping firms. For firms to have a market orientation, theirlong-term organization goal should be to satisfy customer needs for the purpose ofmaximizing corporate profits. In doing so, firms are required to take a proactiveattitude in running their business and be responsive to customer needs. A firm canbecome market-oriented by understanding the market and how it is likely to changein a dynamic business environment. Therefore, to be market-oriented, shippingfirms need to acquire market intelligence about their customers and competitors tomake decisions on how to best meet customer values, and take action to delivervalue to their customers. It is therefore advantageous for shipping firms to develop acustomer focus, generate competitor intelligence, and nurture cross-functionalcoordination.
One of the goals of shipping firms is to outperform their competitors. Bothoperational effectiveness and competitive strategy are essential factors to achieveexceptional performance (see Fig. 7.6). Operational effectiveness means to performsimilar activities better than competitors. It is any practice that allows a shippingfirm to better utilize its resources to cost effectively deliver services. Differences inoperational effectiveness may affect firm performance because these directlyinfluence the relative cost position. Continual improvement in operational effec-tiveness is necessary for better firm performance. In contrast, the opposite ofoperational effectiveness is strategic positioning which means to perform activitiesin a different way from rivals or similar activities in different ways where strategicpositions can be achieved from variety-based and needs-based positioning.
In order to meet the expectations of shippers and promote their growth in globalmarkets, many shipping firms have started to provide a deeper and wider scope ofservices. Shipping firms are now offering a greater depth of services such asincreasing the number of ports of call and sailing with greater frequency to meet themarket needs. To widen the service scope, shipping firms are offering a wider rangeof services, such as consolidation, trucking, and other logistics-related services.Shipping firms operate under competitive pressure, such as high customer
Exceptional performance
Operational effectiveness
Competitive strategy
Fig. 7.6 Essential elementsfor exceptional performance
100 7 Shipping Operations and Green Capability
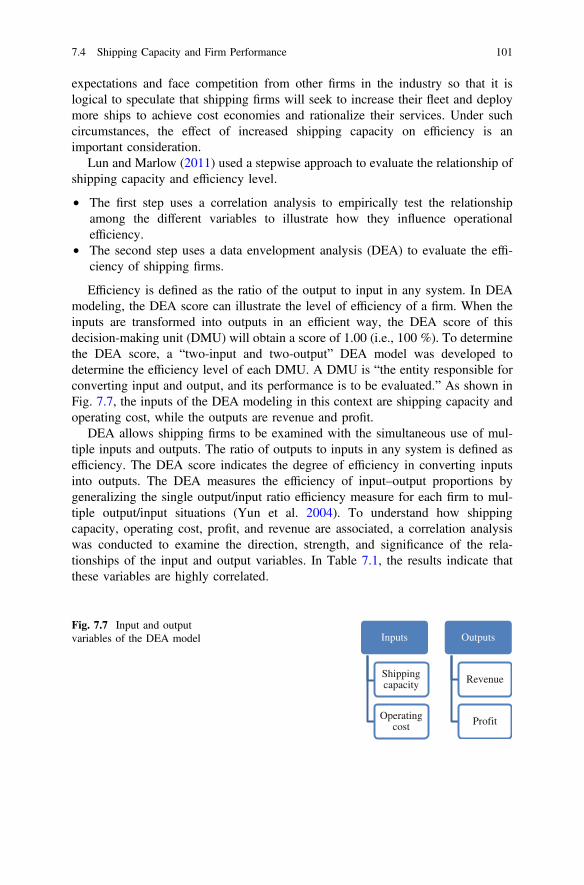
expectations and face competition from other firms in the industry so that it islogical to speculate that shipping firms will seek to increase their fleet and deploymore ships to achieve cost economies and rationalize their services. Under suchcircumstances, the effect of increased shipping capacity on efficiency is animportant consideration.
Lun and Marlow (2011) used a stepwise approach to evaluate the relationship ofshipping capacity and efficiency level.
• The first step uses a correlation analysis to empirically test the relationshipamong the different variables to illustrate how they influence operationalefficiency.
• The second step uses a data envelopment analysis (DEA) to evaluate the effi-ciency of shipping firms.
Efficiency is defined as the ratio of the output to input in any system. In DEAmodeling, the DEA score can illustrate the level of efficiency of a firm. When theinputs are transformed into outputs in an efficient way, the DEA score of thisdecision-making unit (DMU) will obtain a score of 1.00 (i.e., 100 %). To determinethe DEA score, a “two-input and two-output” DEA model was developed todetermine the efficiency level of each DMU. A DMU is “the entity responsible forconverting input and output, and its performance is to be evaluated.” As shown inFig. 7.7, the inputs of the DEA modeling in this context are shipping capacity andoperating cost, while the outputs are revenue and profit.
DEA allows shipping firms to be examined with the simultaneous use of mul-tiple inputs and outputs. The ratio of outputs to inputs in any system is defined asefficiency. The DEA score indicates the degree of efficiency in converting inputsinto outputs. The DEA measures the efficiency of input–output proportions bygeneralizing the single output/input ratio efficiency measure for each firm to mul-tiple output/input situations (Yun et al. 2004). To understand how shippingcapacity, operating cost, profit, and revenue are associated, a correlation analysiswas conducted to examine the direction, strength, and significance of the rela-tionships of the input and output variables. In Table 7.1, the results indicate thatthese variables are highly correlated.
Inputs
Shipping capacity
Operating cost
Outputs
Revenue
Profit
Fig. 7.7 Input and outputvariables of the DEA model
7.4 Shipping Capacity and Firm Performance 101
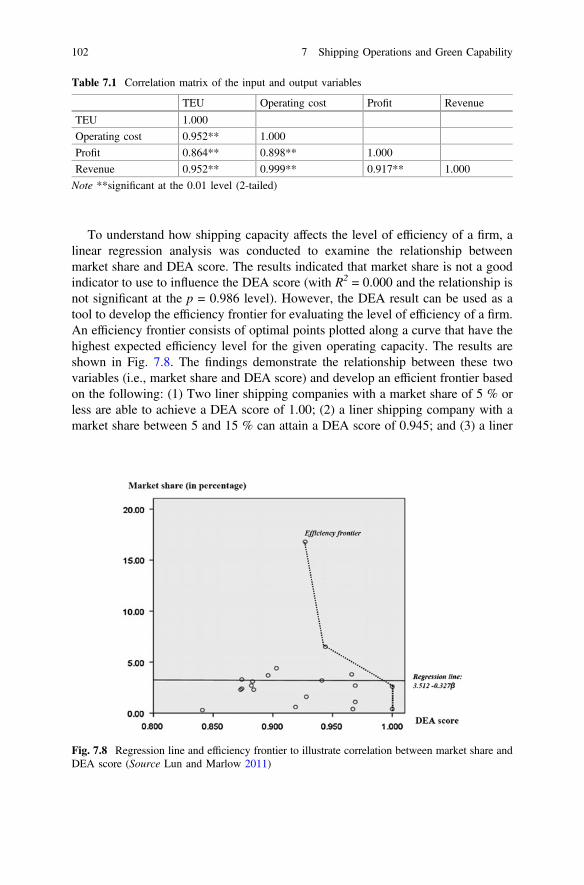
To understand how shipping capacity affects the level of efficiency of a firm, alinear regression analysis was conducted to examine the relationship betweenmarket share and DEA score. The results indicated that market share is not a goodindicator to use to influence the DEA score (with R2 = 0.000 and the relationship isnot significant at the p = 0.986 level). However, the DEA result can be used as atool to develop the efficiency frontier for evaluating the level of efficiency of a firm.An efficiency frontier consists of optimal points plotted along a curve that have thehighest expected efficiency level for the given operating capacity. The results areshown in Fig. 7.8. The findings demonstrate the relationship between these twovariables (i.e., market share and DEA score) and develop an efficient frontier basedon the following: (1) Two liner shipping companies with a market share of 5 % orless are able to achieve a DEA score of 1.00; (2) a liner shipping company with amarket share between 5 and 15 % can attain a DEA score of 0.945; and (3) a liner
Table 7.1 Correlation matrix of the input and output variables
TEU Operating cost Profit Revenue
TEU 1.000
Operating cost 0.952** 1.000
Profit 0.864** 0.898** 1.000
Revenue 0.952** 0.999** 0.917** 1.000
Note **significant at the 0.01 level (2-tailed)
Fig. 7.8 Regression line and efficiency frontier to illustrate correlation between market share andDEA score (Source Lun and Marlow 2011)
102 7 Shipping Operations and Green Capability
shipping company with a market share of 15 % or more can attain a DEA score of0.928.
Although the findings indicated a strong relationship between the input variables(i.e., shipping capacity and operating cost) and output variables (i.e., revenue andprofit), it is also necessary to evaluate the efficiency of converting these inputs intooutputs. The findings indicated that small operators, with a market share of 5 % orless, for liner shipping companies can efficiently operate their business. The car-rying capacity in term of TEU is not a key determinant that affects the level ofefficiency of a firm. Strategic positions may also be important for shipping firms tosucceed. Accordingly, firms in the shipping industry should focus their strategicpositions on variety-based and needs-based positioning. The former is based on aselection of a variety of shipping services. Variety-based positioning improves firmperformance when firms can best produce a subset of shipping services with dis-tinctive sets of activities. On the other hand, the latter emphasizes services that meetmost of the needs of a particular group of customers. In addition to strategicpositioning, productivity and operational efficiency are also important factors thatinfluence shipping firms.
A strategy for expansion that liner shipping companies tend to adopt is toincrease their carrying capacity, but this could mean failure to achieve high oper-ational efficiency levels. Hence, they may need to revisit their business operationsby developing positioning strategies. From a management perspective, the findingsindicate that efficient liner shipping operations will need to minimize inputs whilemaximizing output levels to strive for high operating efficiency. Although there is acorrelation between market share and profitability (with a correlation coefficient of0.864), increasing the market share implies extra investment in ships and otherrelated facilities. Investment means risk and the return on the investment relies ongrowth in trade volume. In addition to the increase of market share, the findingsprovide an alternative solution for firms to make effective business decisions toimprove their operational performance and increase their competitiveness in theliner shipping industry. Shipping firms are now facing new challenges in the currentcompetitive business environment with environmental concerns and green opera-tions. These are therefore the key issues that they need to address, as greening isbecoming a significant issue in shipping operations.
7.5 Green Capability
7.5.1 Elements of Green Capability
Although research has been conducted to investigate the relationship between firmcapability and business performance, the fundamental issue of the transformation ofbusiness activities into performance outputs has not been adequately addressed.Firm capability is a “high-level routine (or collection of routines) that, together with
7.4 Shipping Capacity and Firm Performance 103
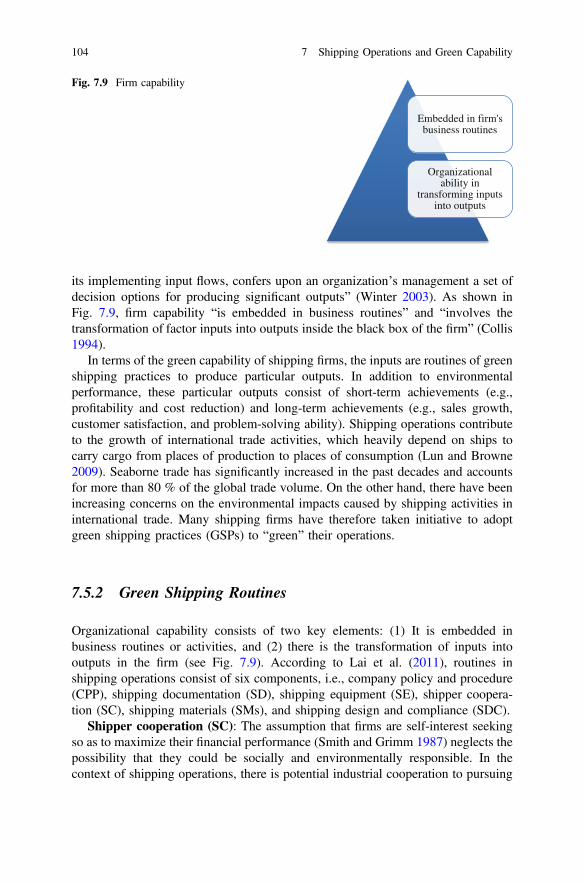
its implementing input flows, confers upon an organization’s management a set ofdecision options for producing significant outputs” (Winter 2003). As shown inFig. 7.9, firm capability “is embedded in business routines” and “involves thetransformation of factor inputs into outputs inside the black box of the firm” (Collis1994).
In terms of the green capability of shipping firms, the inputs are routines of greenshipping practices to produce particular outputs. In addition to environmentalperformance, these particular outputs consist of short-term achievements (e.g.,profitability and cost reduction) and long-term achievements (e.g., sales growth,customer satisfaction, and problem-solving ability). Shipping operations contributeto the growth of international trade activities, which heavily depend on ships tocarry cargo from places of production to places of consumption (Lun and Browne2009). Seaborne trade has significantly increased in the past decades and accountsfor more than 80 % of the global trade volume. On the other hand, there have beenincreasing concerns on the environmental impacts caused by shipping activities ininternational trade. Many shipping firms have therefore taken initiative to adoptgreen shipping practices (GSPs) to “green” their operations.
7.5.2 Green Shipping Routines
Organizational capability consists of two key elements: (1) It is embedded inbusiness routines or activities, and (2) there is the transformation of inputs intooutputs in the firm (see Fig. 7.9). According to Lai et al. (2011), routines inshipping operations consist of six components, i.e., company policy and procedure(CPP), shipping documentation (SD), shipping equipment (SE), shipper coopera-tion (SC), shipping materials (SMs), and shipping design and compliance (SDC).
Shipper cooperation (SC): The assumption that firms are self-interest seekingso as to maximize their financial performance (Smith and Grimm 1987) neglects thepossibility that they could be socially and environmentally responsible. In thecontext of shipping operations, there is potential industrial cooperation to pursuing
Embedded in firm's business routines
Organizational ability in
transforming inputs into outputs
Fig. 7.9 Firm capability
104 7 Shipping Operations and Green Capability
GSPs. Many mega carriers (e.g., APL, Hapag–Lloyd, K Line, Maersk, NKY, andOOCL) and giant shippers (e.g., IKEA, Mattel, Nike, Home Depot, and HP) aremembers of the Clean Cargo Working Group, which endeavors to “work withbusiness to create a just clean and sustainable world.” The Clean Cargo WorkingGroup connects leading shippers and cargo carriers and is a business-to-businesscollaboration dedicated to integrating environmentally and socially responsiblebusiness concepts into transport operations with the objective of allowing coop-eration between stakeholders in a shipping chain to improve environmental per-formance and the well-being of the global shipping community.
Shipping design for compliance (SDC): Balancing economic and environ-mental performance is essential for shipping firms in the face of competition andpressure from the community (Guide and Van Wassenhove 2009). In the 1970s,policy makers in some of the developed countries (e.g., Germany and theNetherlands) began to take on a more strategic and proactive approach to addressenvironmental issues. They have subsequently become role models in environ-mental performance. With increasing environmental awareness in global businessesoperations, shipping firms are now being expected to consider GSPs, comply withthe related regulatory requirements, and make their business processes environ-mentally friendly to the international community.
Shipping documentation (SD): Shipping firms face the challenge of findingways to efficiently produce outputs (e.g., improve firm performance) while reducingadverse environmental impacts (Cheng and Tsai 2009). GSPs are more than thetraditional shipping operations for the low cost transport of goods because theyemphasize the adoption of management practices that prevent or reduce the envi-ronmental damages caused by activities in different stages of cargo movement, suchas in the use of SD processes, which include booking and confirmation of shippingspace. Other types of documentation used in shipping activities include bills oflading, cargo manifests, arrival notices, and invoices. The use of paperless docu-mentation system reduces environmental damages.
Shipping materials (SMs): The environmental responsibility of shippingactivities can be viewed from different perspectives. For instance, Corbett et al.(2007) examined how shipping activities affect air quality, deterioration of humanhealth, and climate change. ten Hallers-Tjabbes et al. (2003) investigated chemicalsthat may release toxic compounds which could damage the marine environment.The use of SMs that are not environmentally friendly may create pollution or causeother damages to the environment. To address this issue, shipping firms could usereusable totes for deliveries to facilitate recycling. One such example is VelocityExpress, which provides customized delivery and shipping services to Fortune 500companies who benefit from their environmentally friendly operations that elimi-nate unnecessary packaging materials and waste. Shipping firms, such as VelocityExpress, incorporate an environment focus in the development of their operationalprocesses to reduce the mileage associated with the delivery of packages and theamount of reshipping materials. The adoption of these shipping practices reducesraw material consumption, increases operation efficiency, and eliminates wastefrom shipping activities while benefiting from performance gain.
7.5 Green Capability 105
Shipping equipment (SE): From the perspective of shipping operations, ship-ping firms use company policies to reduce fuel usage to limit their environmentalimpacts. For instance, the vessel CMA CMG Vela was built with the latest gen-eration of engines that significantly reduce fuel (−3 % on average) and oil (−25 %)consumption. In addition, another vessel, the CMA CGM Thalassa, is equippedwith an innovative rudder that optimizes the flow of water and reduces fuel con-sumption. Hence, shipping operations can now involve the use of environmentallyfriendly SE, such as in the ship design (Krozer et al. 2003). Another type of SE inthe transport of goods is the use of environmentally friendly packaging equipment.The focus on the use of environmentally friendly SE to reduce cost and improveproductivity is considered as a breakthrough in GSPs.
Company policy and procedure (CPP): Alternatively, GSPs can be viewed asshipping practices found in CPP that are anticipated or requested by stakeholders.Firm performance is contingent on the business operations environment(Aragón-Correa and Sharma 2003). Driven by the expectations of their stake-holders, shipping firms green their operations through various formal means interms of CPP, e.g., obtaining ISO 14000 certification in compliance with the ISMCode (Celik 2009). For example, Maersk was awarded ISO 14001 certification in2003 and has been working with a number of organizations, such as Business ofSocial Responsibility (BSR), to preserve the environment. Support by the firm topromote the adoption of GSP is essential.
References
Aragón-Correa JA, Sharma S (2003) A contingent resource-based view of proactive corporateenvironmental strategy. Acad Manage Rev 28(1):71–88
Celik Metin (2009) A hybrid design methodology for Structuring an integrated environmentalmanagement system (IEMS) for shipping business. J Environ Manage 90(3):1469–1475
Cheng YH, Tsai YL (2009) Factors influencing shippers to use multiple country consolidationservices in international distribution centers. Int J Prod Econ 122(1):78–88
Collis DJ (1994) How valuable are organizational capabilities. Strateg Manage J 15:143–152Corbett JJ et al (2007) Mortality from ship emissions: a global assessment. Environ Sci Technol 41
(24):8512–8518Dunning JH (2003) Some antecedents of internationalization theory. J Int Bus Stud 34(2):108–115Farthing B, Brownrigg M (1997) Farthing on international shipping, 3rd edn. LLP, LondonRichardson GB (1972) The organisation of industry. Econ J 82(327):883–896Guide VDR, Van Wassenhove LN (2009) The evolution of closed-loop supply chain research.
Oper Res 57(1):10–21ten Hallers-Tjabbes CC et al (2003) Imposex and organotin concentrations in Buccinum undatum
and Neptunea antiqua from the North Sea: relationship to shipping density and hydrographicalconditions. Mar Environ Res 55(3):203–233
Krozer J, Mass K, Kothuis B (2003) Demonstration of environmentally sound and cost-effectiveshipping. J Clean Prod 11(7):767–777
Lai K, Lun YHV, Wong CWY, Cheng TCE (2011) Green shipping practices in the shippingindustry: conceptualization, adoption, and implications. Resour Conserv Recycl 55(6):631–638
106 7 Shipping Operations and Green Capability
Lun YHV, Marlow P (2011) The impact of capacity on firm performance: a study of the linershipping industry. Int J Shipping Transp Logistics 3(1):57–71
Lun YHV, Lai K, Cheng TCE (2009) Intermodal transport capability. Shipping Transp LogisticsBook Ser 1:17–33
Lun YHV, Wong CWY, Lai K, Cheng TCE (2008) Institutional perspective on the adoption oftechnology for the security enhancement of container transport. Transp Rev 28(1):21–33
Lun YHV, Browne M (2009) Fleet mix in container shipping operations. Int J Shipping TranspLogistics 1(2):103–118
Lun YHV, Pang KW, Panayides PM (2010) Organisational growth and firm performance in theinternational container shipping industry. Int J Shipping Transp Logistics 2(2):203–226
Lun YHV, Quaddus MA (2009) An empirical model of the bulk shipping market. Int J ShippingTransp Logistics 1(1):37–54
Lun YHV, Lai K, Wong CWY, Cheng TCE (2014) Green shipping practices and firmperformance. Marit Policy Manage 41(2):134–148
Smith KG, Grimm CM (1987) Environmental variation, strategic change and firm performance: astudy of railroad deregulation. Strateg Manage J 8(4):363–376
Winter SG (2003) Understanding dynamic capabilities. Strateg Manage J 24(10 SPEC ISS):991–995
Yun YB, Nakayama H, Tanino T (2004) A Generalized model for data envelopment analysis.Eur J Oper Res 87–105
References 107
Chapter 8Relativity Between Greeningand Performance
8.1 Green Operations
Ships transport goods between geographical points and facilitate global tradeactivities (Lun and Browne 2009). Shipping, which involves the movement of cargobetween different physical locations, is one of the world’s most internationalizedindustries that support global trade as a cost-effective means to move large volumesof cargo around the world (Lun and Marlow 2011). Shipping includes all activitiesthat move cargo to, from, and between the key actors in the transport chain (Zhanget al. 2011). Shipping activities contribute to the specialization of industrial activitiesand allow for mass production (Wong et al. 2012). The importance of shipping hasincreased in the past centuries with industrialization, globalization, e-commerce, andthe adoption of offshoring and outsourcing strategies.
With the significant growth in the global trade volume in the past decades, whichhas induced increasing concerns about the environmental impacts caused byshipping activities, shipping firms are now giving increasingly more attention totheir environmental performance, e.g., CO2 emission rate, energy usage, wastereduction, and recycling rate. Many firms in the shipping community now employbusiness routines that “green” their operations. Firms in the shipping communityare part of a transport chain along with other involved parties, and they need to haveclose operational linkages with one another for sustainability and exceptionalperformance. Nowadays, shipping firms face a number of new challenges. Amongthem, the implementation of green operations to cope with the various institutionalpressures and the balancing of environmental performance with improved economicperformance are important management issues that face many shipping firms.
The ability of an organization to green operations has become a competitivepriority for many shipping firms. This ability, which is referred to as “greening
The research of this paper is based on Lun et al. (2015a, b).
© Springer International Publishing Switzerland 2016Y.H.V. Lun et al., Green Shipping Management,Shipping and Transport Logistics, DOI 10.1007/978-3-319-26482-0_8
109
capability,” is concerned with implementing environmentally sustainable businessroutines for performing shipping operations. Lun et al. (2015a, b) examinedgreening capability with a focus on assessing the ability of shipping firms tosimultaneously mitigate environmental harms while improving the operationalefficiency of their operations. They used a data envelopment analysis (DEA) tocalculate the efficiency score of each firm for benchmarking purposes. The DEA is anonparametric operations research method to measure the productive efficiency offirms. The DEA measures efficiency by combining all of the inputs and outputs toobtain a single ratio (Cooper et al. 2007). However, the DEA does not necessarilyprovide a general equation on the relationship between inputs and outputs (Lun andCariou 2009).
To examine the greening capability of shipping firms and the performanceimplications, Lun et al. (2015a, b) established an integrated model related to thegreen operations of shipping firms and their performance. By doing so, they pro-posed the Greening and Performance Relativity (GPR) model to examine thegreening capability of shipping firms and the performance outcomes of firms.
8.2 Model Development
8.2.1 Conceptual Background
The importance of organizational capability to business operations and firm per-formance has been widely discussed by many researchers (e.g., Drnevich andKriaucinas 2011; Danneels 2011; Mahmood et al. 2011). Previous studies havegenerally argued that organizational capability yields competitive advantages tofirms (Ray et al. 2004; Salanova et al. 2005). Although prior research has examinedthe linkage between firm capability and business performance (Lun 2011), thefundamental issue of transforming business routines into performance outputs hasnot been adequately addressed (e.g., Sroufe 2003). Organizational capability is acollection of routines undertaken by firms to produce significant outputs (Winter2003). As discussed in Chap. 7, organizational capability “is embedded in routines”and “involves the transformation of physical inputs into outputs inside the “blackbox” of the firm” (Collis 1994).
However, much less has been discussed about the importance of greeningcapability, and how the related inputs are transformed into outputs. Therefore, in theGPR model, the greening capability of shipping firms is incorporated as animportant element. Greening capability in shipping operations is concerned with thephysical movement of cargo in an environmentally sustainable manner.Specifically, the greening capability of shipping firms comprises six components(Lai et al. 2011), namely company policy and procedure (CPP), shipping docu-mentation (SD), shipping equipment (SE), shipper cooperation (SC), shippingmaterials (SMs), and shipping design and compliance (SDC). Shipping firms are
110 8 Relativity Between Greening and Performance
now increasingly incorporating green operations into their business routines as aviable way to improve their environmental performance.
8.2.2 Green Shipping Routines and Firm Performance
In examining the greening capability of shipping firms, the inputs are green ship-ping routines, while the output is environmental performance. That is, greenshipping routines and environmental performance are proportional, i.e.,
g a pe; ð8:1Þ
whereg green shipping routines andpe environmental performance.
Hence,
g ¼ kepe; ð8:2Þ
where ke is a constant of GPRe > 0, which is defined as the “relativity betweengreening and environmental performance.” It follows that
ke ¼ g=pe: ð8:3Þ
A key driver that motivates shipping firms to pursue green shipping routines isperformance gain. Gain in firm performance consists of both environmental andfinancial performance outcomes, i.e.,
g ¼ kfpf ; ð8:4Þ
wherekf is a constant of GPRf > 0, which is defined as the “relativity between greening
and financial performance” andpf financial performance.
It follows that
kf ¼ g=pf : ð8:5Þ
8.2 Model Development 111
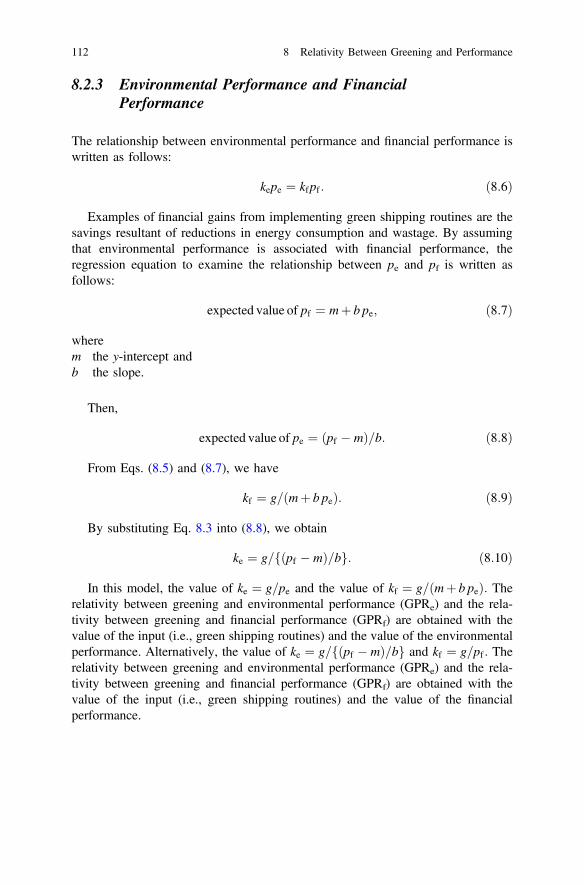
8.2.3 Environmental Performance and FinancialPerformance
The relationship between environmental performance and financial performance iswritten as follows:
kepe ¼ kfpf : ð8:6Þ
Examples of financial gains from implementing green shipping routines are thesavings resultant of reductions in energy consumption and wastage. By assumingthat environmental performance is associated with financial performance, theregression equation to examine the relationship between pe and pf is written asfollows:
expected value of pf ¼ mþ b pe; ð8:7Þ
wherem the y-intercept andb the slope.
Then,
expected value of pe ¼ ðpf � mÞ=b: ð8:8Þ
From Eqs. (8.5) and (8.7), we have
kf ¼ g=ðmþ b peÞ: ð8:9Þ
By substituting Eq. 8.3 into (8.8), we obtain
ke ¼ g=fðpf � mÞ=bg: ð8:10Þ
In this model, the value of ke ¼ g=pe and the value of kf ¼ g=ðmþ b peÞ: Therelativity between greening and environmental performance (GPRe) and the rela-tivity between greening and financial performance (GPRf) are obtained with thevalue of the input (i.e., green shipping routines) and the value of the environmentalperformance. Alternatively, the value of ke ¼ g= ðpf � mÞ=bf g and kf ¼ g=pf : Therelativity between greening and environmental performance (GPRe) and the rela-tivity between greening and financial performance (GPRf) are obtained with thevalue of the input (i.e., green shipping routines) and the value of the financialperformance.
112 8 Relativity Between Greening and Performance
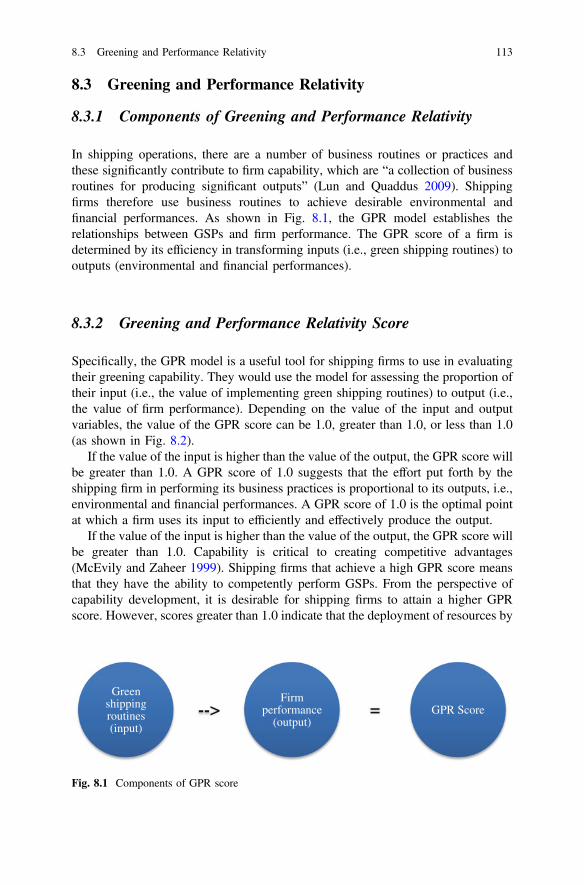
8.3 Greening and Performance Relativity
8.3.1 Components of Greening and Performance Relativity
In shipping operations, there are a number of business routines or practices andthese significantly contribute to firm capability, which are “a collection of businessroutines for producing significant outputs” (Lun and Quaddus 2009). Shippingfirms therefore use business routines to achieve desirable environmental andfinancial performances. As shown in Fig. 8.1, the GPR model establishes therelationships between GSPs and firm performance. The GPR score of a firm isdetermined by its efficiency in transforming inputs (i.e., green shipping routines) tooutputs (environmental and financial performances).
8.3.2 Greening and Performance Relativity Score
Specifically, the GPR model is a useful tool for shipping firms to use in evaluatingtheir greening capability. They would use the model for assessing the proportion oftheir input (i.e., the value of implementing green shipping routines) to output (i.e.,the value of firm performance). Depending on the value of the input and outputvariables, the value of the GPR score can be 1.0, greater than 1.0, or less than 1.0(as shown in Fig. 8.2).
If the value of the input is higher than the value of the output, the GPR score willbe greater than 1.0. A GPR score of 1.0 suggests that the effort put forth by theshipping firm in performing its business practices is proportional to its outputs, i.e.,environmental and financial performances. A GPR score of 1.0 is the optimal pointat which a firm uses its input to efficiently and effectively produce the output.
If the value of the input is higher than the value of the output, the GPR score willbe greater than 1.0. Capability is critical to creating competitive advantages(McEvily and Zaheer 1999). Shipping firms that achieve a high GPR score meansthat they have the ability to competently perform GSPs. From the perspective ofcapability development, it is desirable for shipping firms to attain a higher GPRscore. However, scores greater than 1.0 indicate that the deployment of resources by
Green shipping routines (input)
-->Firm
performance (output)
= GPR Score
Fig. 8.1 Components of GPR score
8.3 Greening and Performance Relativity 113
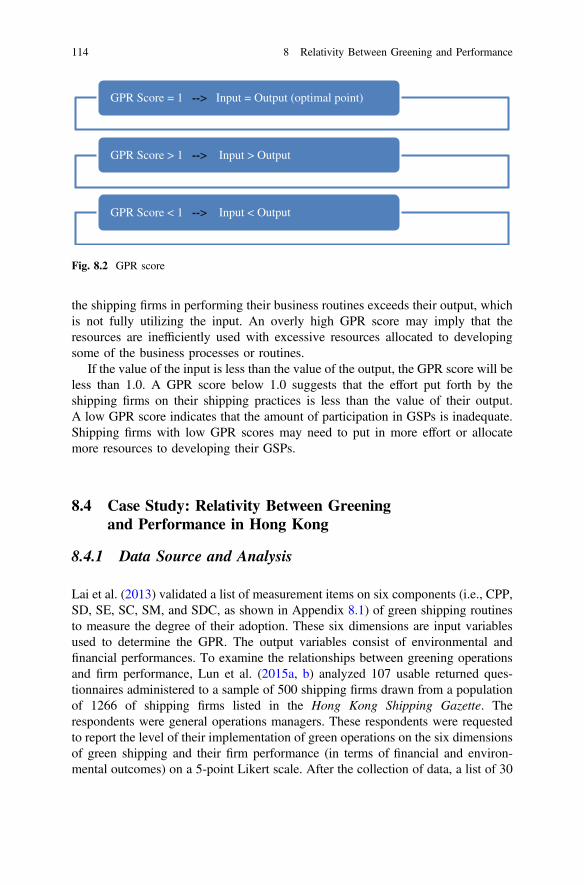
the shipping firms in performing their business routines exceeds their output, whichis not fully utilizing the input. An overly high GPR score may imply that theresources are inefficiently used with excessive resources allocated to developingsome of the business processes or routines.
If the value of the input is less than the value of the output, the GPR score will beless than 1.0. A GPR score below 1.0 suggests that the effort put forth by theshipping firms on their shipping practices is less than the value of their output.A low GPR score indicates that the amount of participation in GSPs is inadequate.Shipping firms with low GPR scores may need to put in more effort or allocatemore resources to developing their GSPs.
8.4 Case Study: Relativity Between Greeningand Performance in Hong Kong
8.4.1 Data Source and Analysis
Lai et al. (2013) validated a list of measurement items on six components (i.e., CPP,SD, SE, SC, SM, and SDC, as shown in Appendix 8.1) of green shipping routinesto measure the degree of their adoption. These six dimensions are input variablesused to determine the GPR. The output variables consist of environmental andfinancial performances. To examine the relationships between greening operationsand firm performance, Lun et al. (2015a, b) analyzed 107 usable returned ques-tionnaires administered to a sample of 500 shipping firms drawn from a populationof 1266 of shipping firms listed in the Hong Kong Shipping Gazette. Therespondents were general operations managers. These respondents were requestedto report the level of their implementation of green operations on the six dimensionsof green shipping and their firm performance (in terms of financial and environ-mental outcomes) on a 5-point Likert scale. After the collection of data, a list of 30
GPR Score = 1 --> Input = Output (optimal point)
GPR Score > 1 --> Input > Output
GPR Score < 1 --> Input < Output
Fig. 8.2 GPR score
114 8 Relativity Between Greening and Performance
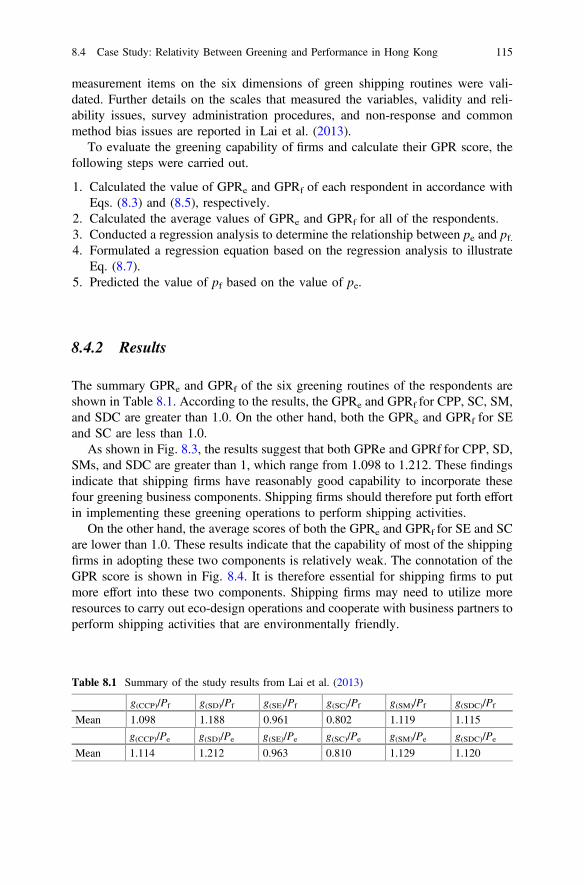
measurement items on the six dimensions of green shipping routines were vali-dated. Further details on the scales that measured the variables, validity and reli-ability issues, survey administration procedures, and non-response and commonmethod bias issues are reported in Lai et al. (2013).
To evaluate the greening capability of firms and calculate their GPR score, thefollowing steps were carried out.
1. Calculated the value of GPRe and GPRf of each respondent in accordance withEqs. (8.3) and (8.5), respectively.
2. Calculated the average values of GPRe and GPRf for all of the respondents.3. Conducted a regression analysis to determine the relationship between pe and pf.4. Formulated a regression equation based on the regression analysis to illustrate
Eq. (8.7).5. Predicted the value of pf based on the value of pe.
8.4.2 Results
The summary GPRe and GPRf of the six greening routines of the respondents areshown in Table 8.1. According to the results, the GPRe and GPRf for CPP, SC, SM,and SDC are greater than 1.0. On the other hand, both the GPRe and GPRf for SEand SC are less than 1.0.
As shown in Fig. 8.3, the results suggest that both GPRe and GPRf for CPP, SD,SMs, and SDC are greater than 1, which range from 1.098 to 1.212. These findingsindicate that shipping firms have reasonably good capability to incorporate thesefour greening business components. Shipping firms should therefore put forth effortin implementing these greening operations to perform shipping activities.
On the other hand, the average scores of both the GPRe and GPRf for SE and SCare lower than 1.0. These results indicate that the capability of most of the shippingfirms in adopting these two components is relatively weak. The connotation of theGPR score is shown in Fig. 8.4. It is therefore essential for shipping firms to putmore effort into these two components. Shipping firms may need to utilize moreresources to carry out eco-design operations and cooperate with business partners toperform shipping activities that are environmentally friendly.
Table 8.1 Summary of the study results from Lai et al. (2013)
g(CCP)/Pf g(SD)/Pf g(SE)/Pf g(SC)/Pf g(SM)/Pf g(SDC)/Pf
Mean 1.098 1.188 0.961 0.802 1.119 1.115
g(CCP)/Pe g(SD)/Pe g(SE)/Pe g(SC)/Pe g(SM)/Pe g(SDC)/Pe
Mean 1.114 1.212 0.963 0.810 1.129 1.120
8.4 Case Study: Relativity Between Greening and Performance in Hong Kong 115
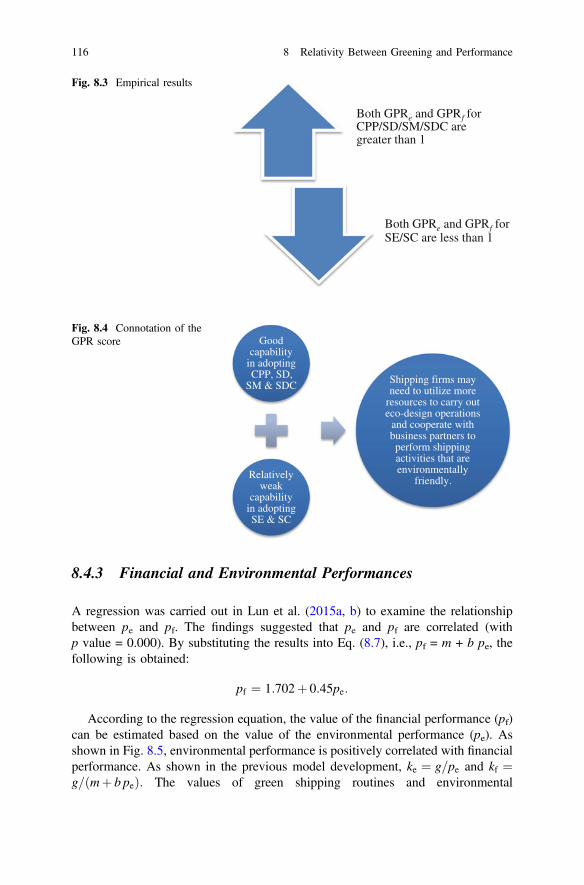
8.4.3 Financial and Environmental Performances
A regression was carried out in Lun et al. (2015a, b) to examine the relationshipbetween pe and pf. The findings suggested that pe and pf are correlated (withp value = 0.000). By substituting the results into Eq. (8.7), i.e., pf = m + b pe, thefollowing is obtained:
pf ¼ 1:702þ 0:45pe:
According to the regression equation, the value of the financial performance (pf)can be estimated based on the value of the environmental performance (pe). Asshown in Fig. 8.5, environmental performance is positively correlated with financialperformance. As shown in the previous model development, ke ¼ g=pe and kf ¼g=ðmþ b peÞ: The values of green shipping routines and environmental
Both GPRe and GPRf for CPP/SD/SM/SDC are greater than 1
Both GPRe and GPRf for SE/SC are less than 1
Fig. 8.3 Empirical results
Good capability
in adopting CPP, SD,
SM & SDC
Relatively weak
capability in adopting SE & SC
Shipping firms may need to utilize more
resources to carry out eco-design operations
and cooperate with business partners to perform shipping activities that are environmentally
friendly.
Fig. 8.4 Connotation of theGPR score
116 8 Relativity Between Greening and Performance
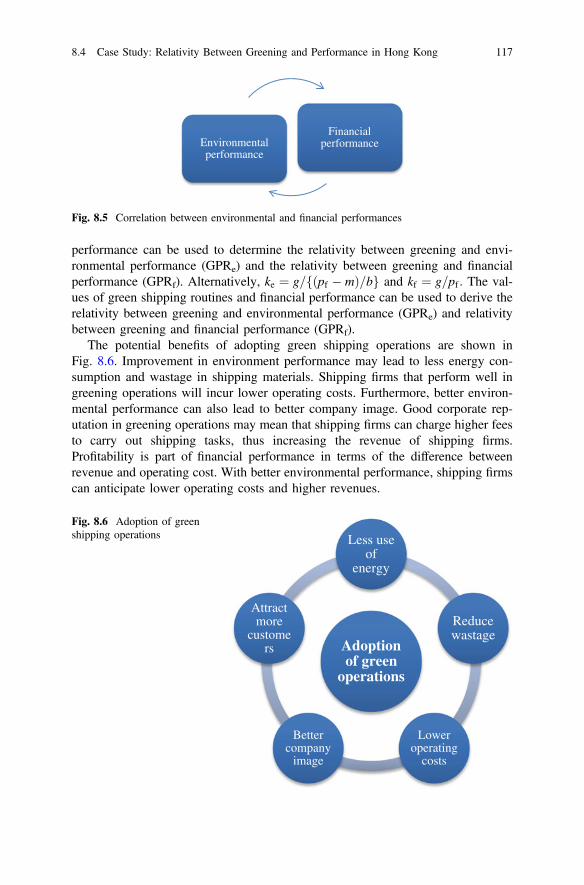
performance can be used to determine the relativity between greening and envi-ronmental performance (GPRe) and the relativity between greening and financialperformance (GPRf). Alternatively, ke ¼ g= ðpf � mÞ=bf g and kf ¼ g=pf : The val-ues of green shipping routines and financial performance can be used to derive therelativity between greening and environmental performance (GPRe) and relativitybetween greening and financial performance (GPRf).
The potential benefits of adopting green shipping operations are shown inFig. 8.6. Improvement in environment performance may lead to less energy con-sumption and wastage in shipping materials. Shipping firms that perform well ingreening operations will incur lower operating costs. Furthermore, better environ-mental performance can also lead to better company image. Good corporate rep-utation in greening operations may mean that shipping firms can charge higher feesto carry out shipping tasks, thus increasing the revenue of shipping firms.Profitability is part of financial performance in terms of the difference betweenrevenue and operating cost. With better environmental performance, shipping firmscan anticipate lower operating costs and higher revenues.
Environmental performance
Financial performance
Fig. 8.5 Correlation between environmental and financial performances
Adoption of green
operations
Less use of
energy
Reduce wastage
Lower operating
costs
Better company
image
Attract more
customers
Fig. 8.6 Adoption of greenshipping operations
8.4 Case Study: Relativity Between Greening and Performance in Hong Kong 117
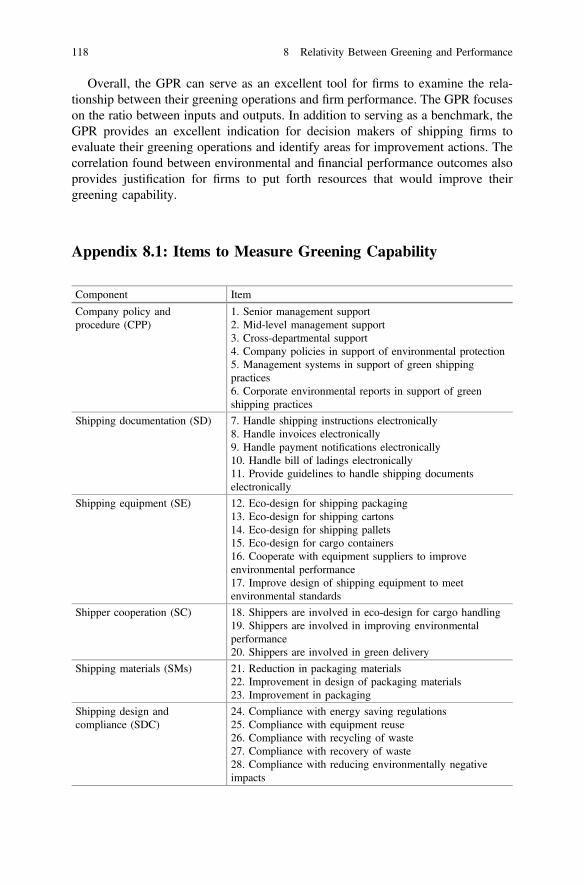
Overall, the GPR can serve as an excellent tool for firms to examine the rela-tionship between their greening operations and firm performance. The GPR focuseson the ratio between inputs and outputs. In addition to serving as a benchmark, theGPR provides an excellent indication for decision makers of shipping firms toevaluate their greening operations and identify areas for improvement actions. Thecorrelation found between environmental and financial performance outcomes alsoprovides justification for firms to put forth resources that would improve theirgreening capability.
Appendix 8.1: Items to Measure Greening Capability
Component Item
Company policy andprocedure (CPP)
1. Senior management support2. Mid-level management support3. Cross-departmental support4. Company policies in support of environmental protection5. Management systems in support of green shippingpractices6. Corporate environmental reports in support of greenshipping practices
Shipping documentation (SD) 7. Handle shipping instructions electronically8. Handle invoices electronically9. Handle payment notifications electronically10. Handle bill of ladings electronically11. Provide guidelines to handle shipping documentselectronically
Shipping equipment (SE) 12. Eco-design for shipping packaging13. Eco-design for shipping cartons14. Eco-design for shipping pallets15. Eco-design for cargo containers16. Cooperate with equipment suppliers to improveenvironmental performance17. Improve design of shipping equipment to meetenvironmental standards
Shipper cooperation (SC) 18. Shippers are involved in eco-design for cargo handling19. Shippers are involved in improving environmentalperformance20. Shippers are involved in green delivery
Shipping materials (SMs) 21. Reduction in packaging materials22. Improvement in design of packaging materials23. Improvement in packaging
Shipping design andcompliance (SDC)
24. Compliance with energy saving regulations25. Compliance with equipment reuse26. Compliance with recycling of waste27. Compliance with recovery of waste28. Compliance with reducing environmentally negativeimpacts
118 8 Relativity Between Greening and Performance
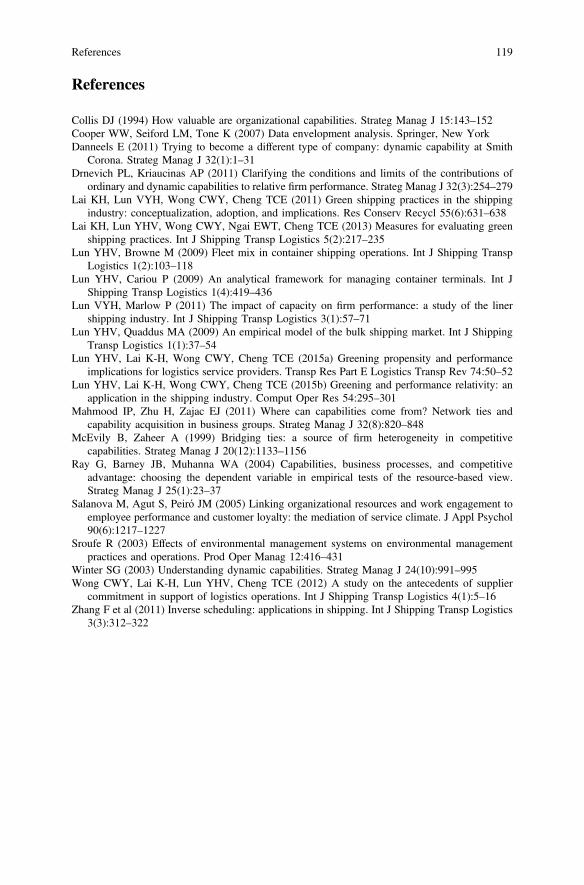
References
Collis DJ (1994) How valuable are organizational capabilities. Strateg Manag J 15:143–152Cooper WW, Seiford LM, Tone K (2007) Data envelopment analysis. Springer, New YorkDanneels E (2011) Trying to become a different type of company: dynamic capability at Smith
Corona. Strateg Manag J 32(1):1–31Drnevich PL, Kriaucinas AP (2011) Clarifying the conditions and limits of the contributions of
ordinary and dynamic capabilities to relative firm performance. Strateg Manag J 32(3):254–279Lai KH, Lun VYH, Wong CWY, Cheng TCE (2011) Green shipping practices in the shipping
industry: conceptualization, adoption, and implications. Res Conserv Recycl 55(6):631–638Lai KH, Lun YHV, Wong CWY, Ngai EWT, Cheng TCE (2013) Measures for evaluating green
shipping practices. Int J Shipping Transp Logistics 5(2):217–235Lun YHV, Browne M (2009) Fleet mix in container shipping operations. Int J Shipping Transp
Logistics 1(2):103–118Lun YHV, Cariou P (2009) An analytical framework for managing container terminals. Int J
Shipping Transp Logistics 1(4):419–436Lun VYH, Marlow P (2011) The impact of capacity on firm performance: a study of the liner
shipping industry. Int J Shipping Transp Logistics 3(1):57–71Lun YHV, Quaddus MA (2009) An empirical model of the bulk shipping market. Int J Shipping
Transp Logistics 1(1):37–54Lun YHV, Lai K-H, Wong CWY, Cheng TCE (2015a) Greening propensity and performance
implications for logistics service providers. Transp Res Part E Logistics Transp Rev 74:50–52Lun YHV, Lai K-H, Wong CWY, Cheng TCE (2015b) Greening and performance relativity: an
application in the shipping industry. Comput Oper Res 54:295–301Mahmood IP, Zhu H, Zajac EJ (2011) Where can capabilities come from? Network ties and
capability acquisition in business groups. Strateg Manag J 32(8):820–848McEvily B, Zaheer A (1999) Bridging ties: a source of firm heterogeneity in competitive
capabilities. Strateg Manag J 20(12):1133–1156Ray G, Barney JB, Muhanna WA (2004) Capabilities, business processes, and competitive
advantage: choosing the dependent variable in empirical tests of the resource-based view.Strateg Manag J 25(1):23–37
Salanova M, Agut S, Peiró JM (2005) Linking organizational resources and work engagement toemployee performance and customer loyalty: the mediation of service climate. J Appl Psychol90(6):1217–1227
Sroufe R (2003) Effects of environmental management systems on environmental managementpractices and operations. Prod Oper Manag 12:416–431
Winter SG (2003) Understanding dynamic capabilities. Strateg Manag J 24(10):991–995Wong CWY, Lai K-H, Lun YHV, Cheng TCE (2012) A study on the antecedents of supplier
commitment in support of logistics operations. Int J Shipping Transp Logistics 4(1):5–16Zhang F et al (2011) Inverse scheduling: applications in shipping. Int J Shipping Transp Logistics
3(3):312–322
References 119
Chapter 9Greening Propensity
9.1 Logistics Service Providers
Shipping, which involves the moving of goods from the suppliers to the customers,is closely linked to the supply chain and logistics activities. Logistics is “the processof planning, implementing, and controlling the effective and efficent flow of goodsand service from the point of origin to the point of consumption” (Ballou 2007),whereas the supply chain involves multiple firms. Supply chain collaborationinvolves relationship development among the different parties in a supply chainwith the aim of mutual improvement in performance. Driven by growth in globalproduction and consumption, supply chain activities have expanded in both scopeand volume in recent decades. To outperform the competition, many manufacturersand retailers now dedicate resources that focus on their core businesses.Accordingly, many of them have chosen to outsource their non-core activities suchas logistics operations to logistics service providers (LSPs).
Due to the increase in outsourced activities at the global level, LSPs have afacilitating role in enterprises to improve their supply chain operations. Customersof LSPs (e.g., traders, manufacturers, and retailers) increasingly request more,better, and faster services to support their global production and marketing activities(McGinnis and Kohn 2002). Hence, this gives a competitive advantage to LSPs inproviding comprehensive services that better satisfy customer needs (Lieb andMiller 2002). In general, LSPs range from traditional freight forwarders to fullyfledged service providers. To meet the growing requirements of customer forlogistics operations, many LSPs have taken measures to broaden the scope of theirservices (Murphy and Daley 2001; Murphy and Wood 2004). LSPs can providedifferent logistics service bundles, which are “a group of highly related and com-
The research of this chapter is based on Lun et al. (2015).
© Springer International Publishing Switzerland 2016Y.H.V. Lun et al., Green Shipping Management,Shipping and Transport Logistics, DOI 10.1007/978-3-319-26482-0_9
121
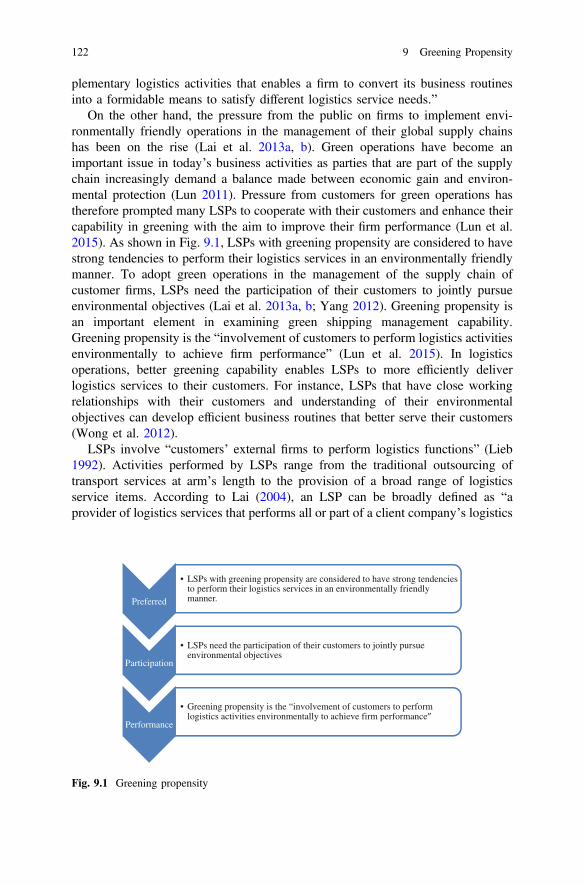
plementary logistics activities that enables a firm to convert its business routinesinto a formidable means to satisfy different logistics service needs.”
On the other hand, the pressure from the public on firms to implement envi-ronmentally friendly operations in the management of their global supply chainshas been on the rise (Lai et al. 2013a, b). Green operations have become animportant issue in today’s business activities as parties that are part of the supplychain increasingly demand a balance made between economic gain and environ-mental protection (Lun 2011). Pressure from customers for green operations hastherefore prompted many LSPs to cooperate with their customers and enhance theircapability in greening with the aim to improve their firm performance (Lun et al.2015). As shown in Fig. 9.1, LSPs with greening propensity are considered to havestrong tendencies to perform their logistics services in an environmentally friendlymanner. To adopt green operations in the management of the supply chain ofcustomer firms, LSPs need the participation of their customers to jointly pursueenvironmental objectives (Lai et al. 2013a, b; Yang 2012). Greening propensity isan important element in examining green shipping management capability.Greening propensity is the “involvement of customers to perform logistics activitiesenvironmentally to achieve firm performance” (Lun et al. 2015). In logisticsoperations, better greening capability enables LSPs to more efficiently deliverlogistics services to their customers. For instance, LSPs that have close workingrelationships with their customers and understanding of their environmentalobjectives can develop efficient business routines that better serve their customers(Wong et al. 2012).
LSPs involve “customers’ external firms to perform logistics functions” (Lieb1992). Activities performed by LSPs range from the traditional outsourcing oftransport services at arm’s length to the provision of a broad range of logisticsservice items. According to Lai (2004), an LSP can be broadly defined as “aprovider of logistics services that performs all or part of a client company’s logistics
Preferred
• LSPs with greening propensity are considered to have strong tendencies to perform their logistics services in an environmentally friendly manner.
Participation
• LSPs need the participation of their customers to jointly pursue environmental objectives
Performance
• Greening propensity is the “involvement of customers to perform logistics activities environmentally to achieve firm performance
Fig. 9.1 Greening propensity
122 9 Greening Propensity
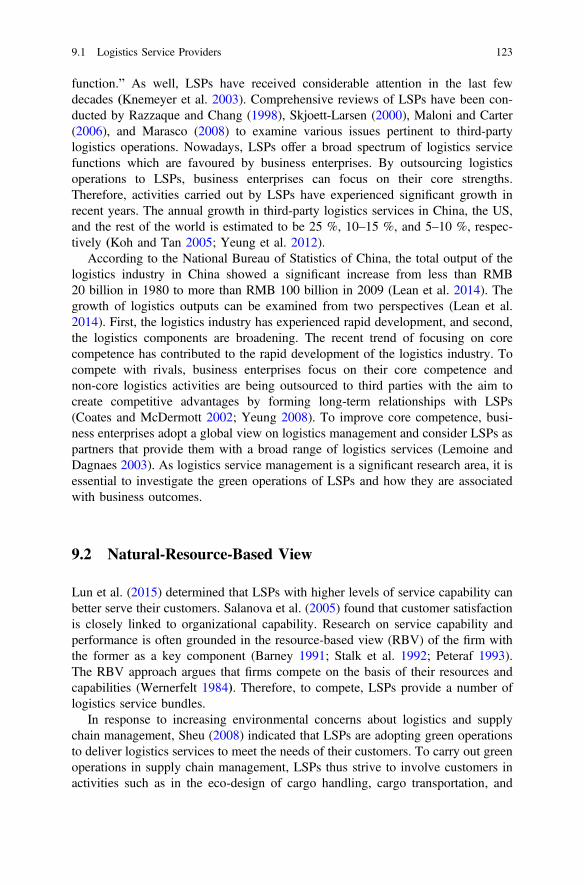
function.” As well, LSPs have received considerable attention in the last fewdecades (Knemeyer et al. 2003). Comprehensive reviews of LSPs have been con-ducted by Razzaque and Chang (1998), Skjoett-Larsen (2000), Maloni and Carter(2006), and Marasco (2008) to examine various issues pertinent to third-partylogistics operations. Nowadays, LSPs offer a broad spectrum of logistics servicefunctions which are favoured by business enterprises. By outsourcing logisticsoperations to LSPs, business enterprises can focus on their core strengths.Therefore, activities carried out by LSPs have experienced significant growth inrecent years. The annual growth in third-party logistics services in China, the US,and the rest of the world is estimated to be 25 %, 10–15 %, and 5–10 %, respec-tively (Koh and Tan 2005; Yeung et al. 2012).
According to the National Bureau of Statistics of China, the total output of thelogistics industry in China showed a significant increase from less than RMB20 billion in 1980 to more than RMB 100 billion in 2009 (Lean et al. 2014). Thegrowth of logistics outputs can be examined from two perspectives (Lean et al.2014). First, the logistics industry has experienced rapid development, and second,the logistics components are broadening. The recent trend of focusing on corecompetence has contributed to the rapid development of the logistics industry. Tocompete with rivals, business enterprises focus on their core competence andnon-core logistics activities are being outsourced to third parties with the aim tocreate competitive advantages by forming long-term relationships with LSPs(Coates and McDermott 2002; Yeung 2008). To improve core competence, busi-ness enterprises adopt a global view on logistics management and consider LSPs aspartners that provide them with a broad range of logistics services (Lemoine andDagnaes 2003). As logistics service management is a significant research area, it isessential to investigate the green operations of LSPs and how they are associatedwith business outcomes.
9.2 Natural-Resource-Based View
Lun et al. (2015) determined that LSPs with higher levels of service capability canbetter serve their customers. Salanova et al. (2005) found that customer satisfactionis closely linked to organizational capability. Research on service capability andperformance is often grounded in the resource-based view (RBV) of the firm withthe former as a key component (Barney 1991; Stalk et al. 1992; Peteraf 1993).The RBV approach argues that firms compete on the basis of their resources andcapabilities (Wernerfelt 1984). Therefore, to compete, LSPs provide a number oflogistics service bundles.
In response to increasing environmental concerns about logistics and supplychain management, Sheu (2008) indicated that LSPs are adopting green operationsto deliver logistics services to meet the needs of their customers. To carry out greenoperations in supply chain management, LSPs thus strive to involve customers inactivities such as in the eco-design of cargo handling, cargo transportation, and
9.1 Logistics Service Providers 123
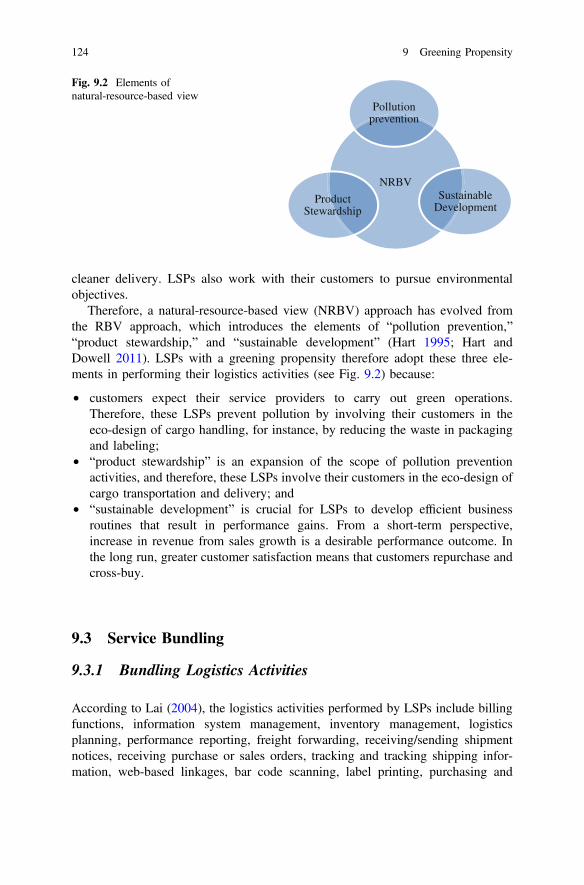
cleaner delivery. LSPs also work with their customers to pursue environmentalobjectives.
Therefore, a natural-resource-based view (NRBV) approach has evolved fromthe RBV approach, which introduces the elements of “pollution prevention,”“product stewardship,” and “sustainable development” (Hart 1995; Hart andDowell 2011). LSPs with a greening propensity therefore adopt these three ele-ments in performing their logistics activities (see Fig. 9.2) because:
• customers expect their service providers to carry out green operations.Therefore, these LSPs prevent pollution by involving their customers in theeco-design of cargo handling, for instance, by reducing the waste in packagingand labeling;
• “product stewardship” is an expansion of the scope of pollution preventionactivities, and therefore, these LSPs involve their customers in the eco-design ofcargo transportation and delivery; and
• “sustainable development” is crucial for LSPs to develop efficient businessroutines that result in performance gains. From a short-term perspective,increase in revenue from sales growth is a desirable performance outcome. Inthe long run, greater customer satisfaction means that customers repurchase andcross-buy.
9.3 Service Bundling
9.3.1 Bundling Logistics Activities
According to Lai (2004), the logistics activities performed by LSPs include billingfunctions, information system management, inventory management, logisticsplanning, performance reporting, freight forwarding, receiving/sending shipmentnotices, receiving purchase or sales orders, tracking and tracking shipping infor-mation, web-based linkages, bar code scanning, label printing, purchasing and
NRBV
Pollution prevention
Sustainable Development
Product Stewardship
Fig. 9.2 Elements ofnatural-resource-based view
124 9 Greening Propensity
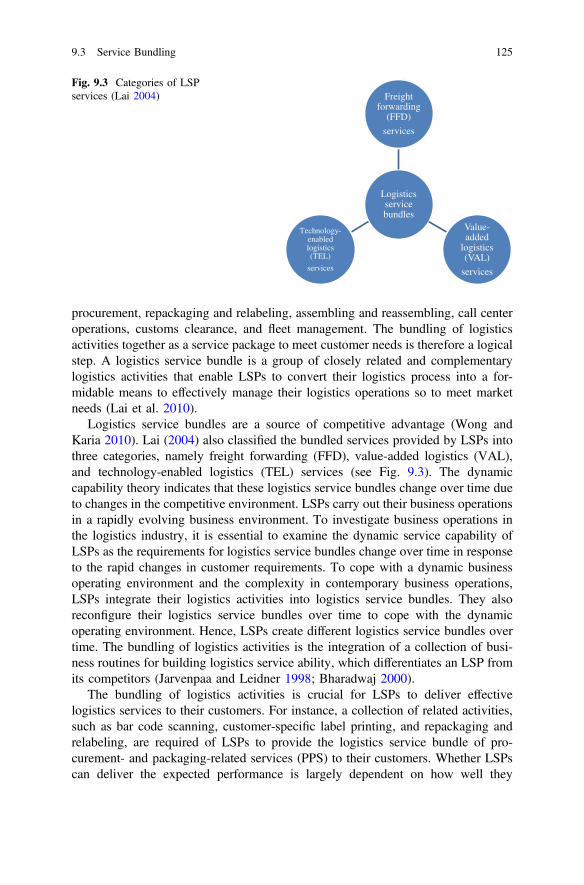
procurement, repackaging and relabeling, assembling and reassembling, call centeroperations, customs clearance, and fleet management. The bundling of logisticsactivities together as a service package to meet customer needs is therefore a logicalstep. A logistics service bundle is a group of closely related and complementarylogistics activities that enable LSPs to convert their logistics process into a for-midable means to effectively manage their logistics operations so to meet marketneeds (Lai et al. 2010).
Logistics service bundles are a source of competitive advantage (Wong andKaria 2010). Lai (2004) also classified the bundled services provided by LSPs intothree categories, namely freight forwarding (FFD), value-added logistics (VAL),and technology-enabled logistics (TEL) services (see Fig. 9.3). The dynamiccapability theory indicates that these logistics service bundles change over time dueto changes in the competitive environment. LSPs carry out their business operationsin a rapidly evolving business environment. To investigate business operations inthe logistics industry, it is essential to examine the dynamic service capability ofLSPs as the requirements for logistics service bundles change over time in responseto the rapid changes in customer requirements. To cope with a dynamic businessoperating environment and the complexity in contemporary business operations,LSPs integrate their logistics activities into logistics service bundles. They alsoreconfigure their logistics service bundles over time to cope with the dynamicoperating environment. Hence, LSPs create different logistics service bundles overtime. The bundling of logistics activities is the integration of a collection of busi-ness routines for building logistics service ability, which differentiates an LSP fromits competitors (Jarvenpaa and Leidner 1998; Bharadwaj 2000).
The bundling of logistics activities is crucial for LSPs to deliver effectivelogistics services to their customers. For instance, a collection of related activities,such as bar code scanning, customer-specific label printing, and repackaging andrelabeling, are required of LSPs to provide the logistics service bundle of pro-curement- and packaging-related services (PPS) to their customers. Whether LSPscan deliver the expected performance is largely dependent on how well they
Logistics service bundles
Freight forwarding
(FFD)
services
Value-added
logistics (VAL)
services
Technology-enabled logistics (TEL)
services
Fig. 9.3 Categories of LSPservices (Lai 2004)
9.3 Service Bundling 125
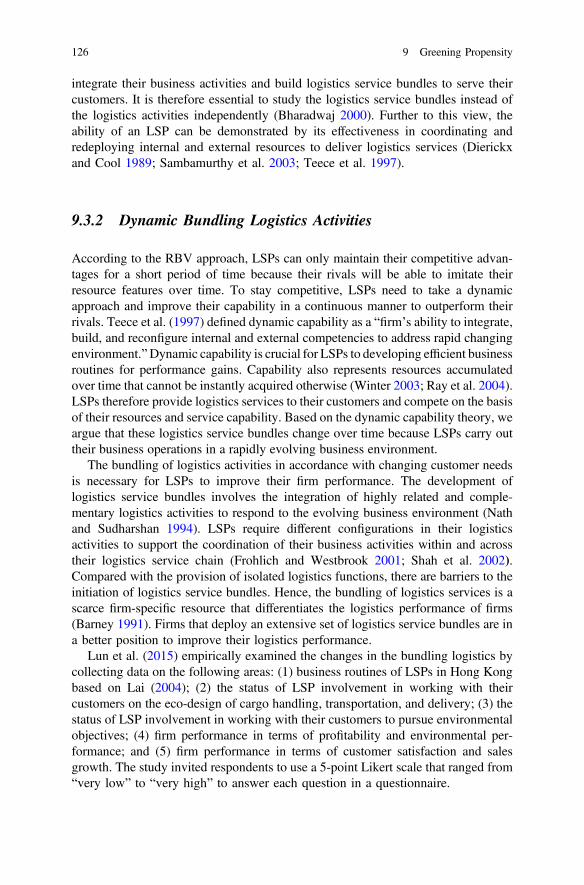
integrate their business activities and build logistics service bundles to serve theircustomers. It is therefore essential to study the logistics service bundles instead ofthe logistics activities independently (Bharadwaj 2000). Further to this view, theability of an LSP can be demonstrated by its effectiveness in coordinating andredeploying internal and external resources to deliver logistics services (Dierickxand Cool 1989; Sambamurthy et al. 2003; Teece et al. 1997).
9.3.2 Dynamic Bundling Logistics Activities
According to the RBV approach, LSPs can only maintain their competitive advan-tages for a short period of time because their rivals will be able to imitate theirresource features over time. To stay competitive, LSPs need to take a dynamicapproach and improve their capability in a continuous manner to outperform theirrivals. Teece et al. (1997) defined dynamic capability as a “firm’s ability to integrate,build, and reconfigure internal and external competencies to address rapid changingenvironment.”Dynamic capability is crucial for LSPs to developing efficient businessroutines for performance gains. Capability also represents resources accumulatedover time that cannot be instantly acquired otherwise (Winter 2003; Ray et al. 2004).LSPs therefore provide logistics services to their customers and compete on the basisof their resources and service capability. Based on the dynamic capability theory, weargue that these logistics service bundles change over time because LSPs carry outtheir business operations in a rapidly evolving business environment.
The bundling of logistics activities in accordance with changing customer needsis necessary for LSPs to improve their firm performance. The development oflogistics service bundles involves the integration of highly related and comple-mentary logistics activities to respond to the evolving business environment (Nathand Sudharshan 1994). LSPs require different configurations in their logisticsactivities to support the coordination of their business activities within and acrosstheir logistics service chain (Frohlich and Westbrook 2001; Shah et al. 2002).Compared with the provision of isolated logistics functions, there are barriers to theinitiation of logistics service bundles. Hence, the bundling of logistics services is ascarce firm-specific resource that differentiates the logistics performance of firms(Barney 1991). Firms that deploy an extensive set of logistics service bundles are ina better position to improve their logistics performance.
Lun et al. (2015) empirically examined the changes in the bundling logistics bycollecting data on the following areas: (1) business routines of LSPs in Hong Kongbased on Lai (2004); (2) the status of LSP involvement in working with theircustomers on the eco-design of cargo handling, transportation, and delivery; (3) thestatus of LSP involvement in working with their customers to pursue environmentalobjectives; (4) firm performance in terms of profitability and environmental per-formance; and (5) firm performance in terms of customer satisfaction and salesgrowth. The study invited respondents to use a 5-point Likert scale that ranged from“very low” to “very high” to answer each question in a questionnaire.
126 9 Greening Propensity
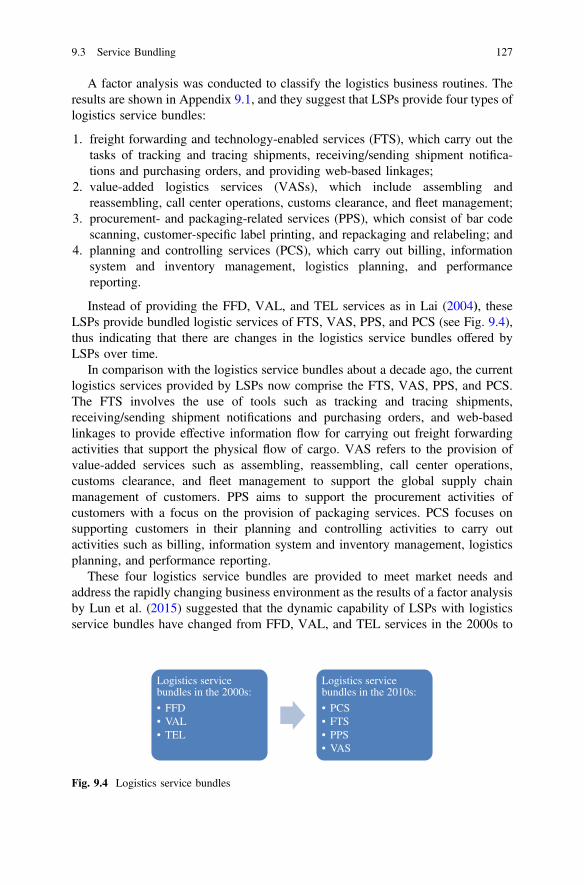
A factor analysis was conducted to classify the logistics business routines. Theresults are shown in Appendix 9.1, and they suggest that LSPs provide four types oflogistics service bundles:
1. freight forwarding and technology-enabled services (FTS), which carry out thetasks of tracking and tracing shipments, receiving/sending shipment notifica-tions and purchasing orders, and providing web-based linkages;
2. value-added logistics services (VASs), which include assembling andreassembling, call center operations, customs clearance, and fleet management;
3. procurement- and packaging-related services (PPS), which consist of bar codescanning, customer-specific label printing, and repackaging and relabeling; and
4. planning and controlling services (PCS), which carry out billing, informationsystem and inventory management, logistics planning, and performancereporting.
Instead of providing the FFD, VAL, and TEL services as in Lai (2004), theseLSPs provide bundled logistic services of FTS, VAS, PPS, and PCS (see Fig. 9.4),thus indicating that there are changes in the logistics service bundles offered byLSPs over time.
In comparison with the logistics service bundles about a decade ago, the currentlogistics services provided by LSPs now comprise the FTS, VAS, PPS, and PCS.The FTS involves the use of tools such as tracking and tracing shipments,receiving/sending shipment notifications and purchasing orders, and web-basedlinkages to provide effective information flow for carrying out freight forwardingactivities that support the physical flow of cargo. VAS refers to the provision ofvalue-added services such as assembling, reassembling, call center operations,customs clearance, and fleet management to support the global supply chainmanagement of customers. PPS aims to support the procurement activities ofcustomers with a focus on the provision of packaging services. PCS focuses onsupporting customers in their planning and controlling activities to carry outactivities such as billing, information system and inventory management, logisticsplanning, and performance reporting.
These four logistics service bundles are provided to meet market needs andaddress the rapidly changing business environment as the results of a factor analysisby Lun et al. (2015) suggested that the dynamic capability of LSPs with logisticsservice bundles have changed from FFD, VAL, and TEL services in the 2000s to
Logistics service bundles in the 2000s:
• FFD• VAL• TEL
Logistics service bundles in the 2010s:
• PCS• FTS• PPS• VAS
Fig. 9.4 Logistics service bundles
9.3 Service Bundling 127
PCS, FTS, PPS, and VAS in the 2010s. In line with the notion of dynamic capa-bility that suggests the importance of the evolution of organizational practices tomeet the ever-changing needs of the business environment, logistics service bundleschange over time to enable LSPs to better serve their customers. The FFD and TELbundles of services have evolved into the FTS bundle of services, which focuses onFFD with technological support. The VAL bundle of services in the 2000s is similarto the VAS bundle, which indicates that value-added services are still important inthe current logistics industry. In addition, two new bundles of logistics services areidentified, i.e., PPS and PCS. The emergence of PPS and PCS indicates the trendsof outsourcing procurement-related activities and planning/controlling functions.Resources such as human capital and business operating systems are essential forLSPs in delivering services to their customers. The availability of the differentlogistics service bundles indicates that LSPs respond to the changing requirementsof a dynamic business environment with different resources and different logisticsservice bundles to meet the needs of their customers.
9.4 Outputs and Inputs of Greening Capability
9.4.1 Outputs of Greening Capability
Capabilities are complex and embedded in firms. LSPs with higher levels of firmcapability are more likely to achieve better firm performance as they are capable ofintegrating their activities into bundles to meet market needs. Logistics servicebundles enable LSPs to practice novel forms of logistics business that was previ-ously not practical or possible (Straub et al. 2002). Resource bundling involves boththe internal operations of an organization and external parties such as customers(Straub and Watson 1979). Resource bundling also requires the involvement ofexternal parties to achieve the outcomes that they desire (Barney 1991), which isparticularly pertinent to logistics activities as specific logistics activities serve dif-ferent purposes (Singh et al. 2007), such as meeting customer expectations in anenvironmentally friendly manner. To pursue environmentally friendly operations,LSPs with a greening propensity may involve their customers in the eco-design ofcargo handling, transportation, and delivery.
Due to the increasing demand for environmental protection, green operationshave evolved as a competitive priority for LSPs for improving the outcomes of theirenvironmental and economic performances. LSPs with a greening propensity have abetter company image which allows them to gain support from their businesspartners. Green operations can even include the implementation of environmentallysustainable business routines. From the perspective of LSPs, the adoption of greenoperations requires cooperation with parties in the supply chain to deliver envi-ronmentally friendly logistics services.
128 9 Greening Propensity
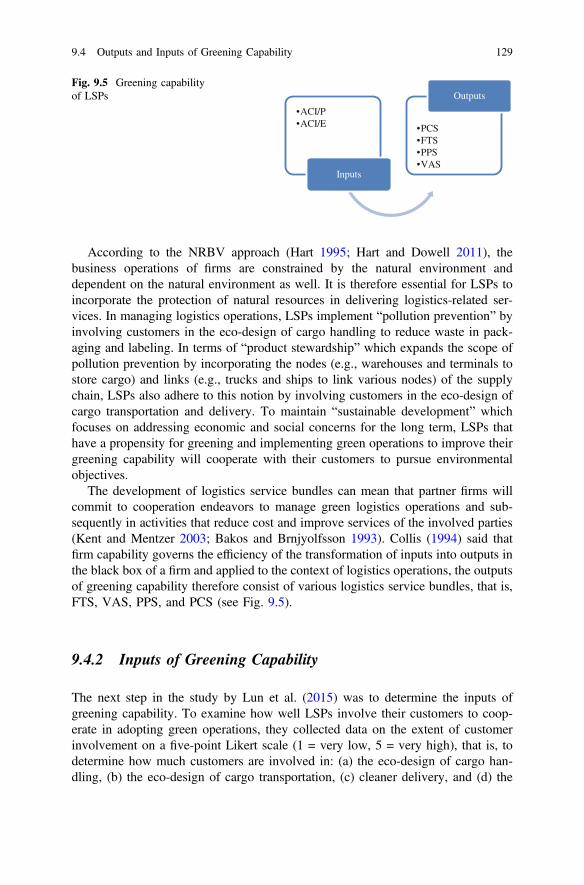
According to the NRBV approach (Hart 1995; Hart and Dowell 2011), thebusiness operations of firms are constrained by the natural environment anddependent on the natural environment as well. It is therefore essential for LSPs toincorporate the protection of natural resources in delivering logistics-related ser-vices. In managing logistics operations, LSPs implement “pollution prevention” byinvolving customers in the eco-design of cargo handling to reduce waste in pack-aging and labeling. In terms of “product stewardship” which expands the scope ofpollution prevention by incorporating the nodes (e.g., warehouses and terminals tostore cargo) and links (e.g., trucks and ships to link various nodes) of the supplychain, LSPs also adhere to this notion by involving customers in the eco-design ofcargo transportation and delivery. To maintain “sustainable development” whichfocuses on addressing economic and social concerns for the long term, LSPs thathave a propensity for greening and implementing green operations to improve theirgreening capability will cooperate with their customers to pursue environmentalobjectives.
The development of logistics service bundles can mean that partner firms willcommit to cooperation endeavors to manage green logistics operations and sub-sequently in activities that reduce cost and improve services of the involved parties(Kent and Mentzer 2003; Bakos and Brnjyolfsson 1993). Collis (1994) said thatfirm capability governs the efficiency of the transformation of inputs into outputs inthe black box of a firm and applied to the context of logistics operations, the outputsof greening capability therefore consist of various logistics service bundles, that is,FTS, VAS, PPS, and PCS (see Fig. 9.5).
9.4.2 Inputs of Greening Capability
The next step in the study by Lun et al. (2015) was to determine the inputs ofgreening capability. To examine how well LSPs involve their customers to coop-erate in adopting green operations, they collected data on the extent of customerinvolvement on a five-point Likert scale (1 = very low, 5 = very high), that is, todetermine how much customers are involved in: (a) the eco-design of cargo han-dling, (b) the eco-design of cargo transportation, (c) cleaner delivery, and (d) the
•ACI/P•ACI/E
Inputs
•PCS•FTS•PPS•VAS
OutputsFig. 9.5 Greening capabilityof LSPs
9.4 Outputs and Inputs of Greening Capability 129
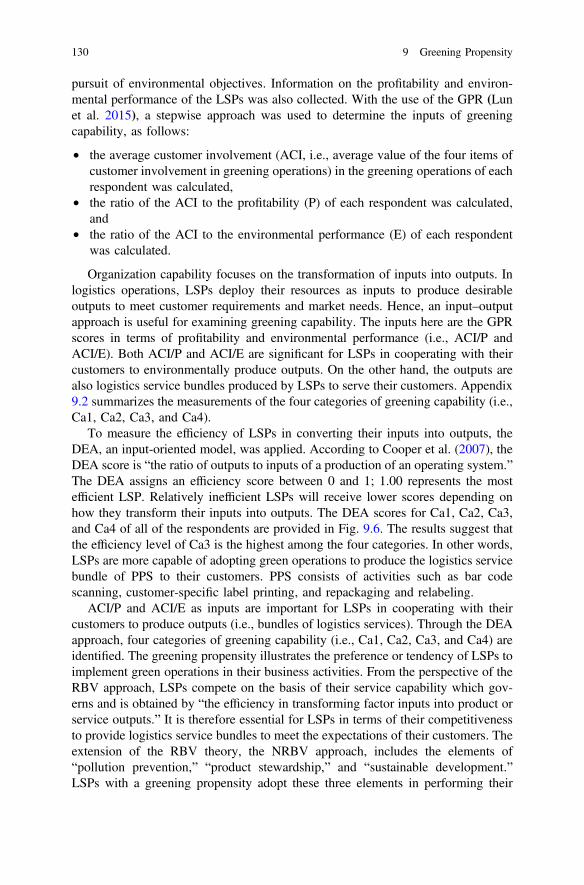
pursuit of environmental objectives. Information on the profitability and environ-mental performance of the LSPs was also collected. With the use of the GPR (Lunet al. 2015), a stepwise approach was used to determine the inputs of greeningcapability, as follows:
• the average customer involvement (ACI, i.e., average value of the four items ofcustomer involvement in greening operations) in the greening operations of eachrespondent was calculated,
• the ratio of the ACI to the profitability (P) of each respondent was calculated,and
• the ratio of the ACI to the environmental performance (E) of each respondentwas calculated.
Organization capability focuses on the transformation of inputs into outputs. Inlogistics operations, LSPs deploy their resources as inputs to produce desirableoutputs to meet customer requirements and market needs. Hence, an input–outputapproach is useful for examining greening capability. The inputs here are the GPRscores in terms of profitability and environmental performance (i.e., ACI/P andACI/E). Both ACI/P and ACI/E are significant for LSPs in cooperating with theircustomers to environmentally produce outputs. On the other hand, the outputs arealso logistics service bundles produced by LSPs to serve their customers. Appendix9.2 summarizes the measurements of the four categories of greening capability (i.e.,Ca1, Ca2, Ca3, and Ca4).
To measure the efficiency of LSPs in converting their inputs into outputs, theDEA, an input-oriented model, was applied. According to Cooper et al. (2007), theDEA score is “the ratio of outputs to inputs of a production of an operating system.”The DEA assigns an efficiency score between 0 and 1; 1.00 represents the mostefficient LSP. Relatively inefficient LSPs will receive lower scores depending onhow they transform their inputs into outputs. The DEA scores for Ca1, Ca2, Ca3,and Ca4 of all of the respondents are provided in Fig. 9.6. The results suggest thatthe efficiency level of Ca3 is the highest among the four categories. In other words,LSPs are more capable of adopting green operations to produce the logistics servicebundle of PPS to their customers. PPS consists of activities such as bar codescanning, customer-specific label printing, and repackaging and relabeling.
ACI/P and ACI/E as inputs are important for LSPs in cooperating with theircustomers to produce outputs (i.e., bundles of logistics services). Through the DEAapproach, four categories of greening capability (i.e., Ca1, Ca2, Ca3, and Ca4) areidentified. The greening propensity illustrates the preference or tendency of LSPs toimplement green operations in their business activities. From the perspective of theRBV approach, LSPs compete on the basis of their service capability which gov-erns and is obtained by “the efficiency in transforming factor inputs into product orservice outputs.” It is therefore essential for LSPs in terms of their competitivenessto provide logistics service bundles to meet the expectations of their customers. Theextension of the RBV theory, the NRBV approach, includes the elements of“pollution prevention,” “product stewardship,” and “sustainable development.”LSPs with a greening propensity adopt these three elements in performing their
130 9 Greening Propensity
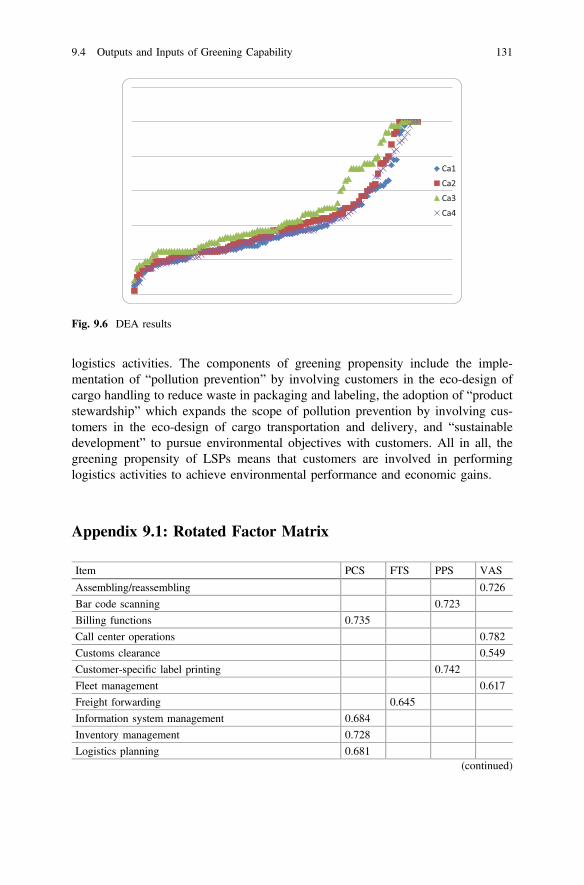
logistics activities. The components of greening propensity include the imple-mentation of “pollution prevention” by involving customers in the eco-design ofcargo handling to reduce waste in packaging and labeling, the adoption of “productstewardship” which expands the scope of pollution prevention by involving cus-tomers in the eco-design of cargo transportation and delivery, and “sustainabledevelopment” to pursue environmental objectives with customers. All in all, thegreening propensity of LSPs means that customers are involved in performinglogistics activities to achieve environmental performance and economic gains.
Appendix 9.1: Rotated Factor Matrix
Item PCS FTS PPS VAS
Assembling/reassembling 0.726
Bar code scanning 0.723
Billing functions 0.735
Call center operations 0.782
Customs clearance 0.549
Customer-specific label printing 0.742
Fleet management 0.617
Freight forwarding 0.645
Information system management 0.684
Inventory management 0.728
Logistics planning 0.681(continued)
Fig. 9.6 DEA results
9.4 Outputs and Inputs of Greening Capability 131
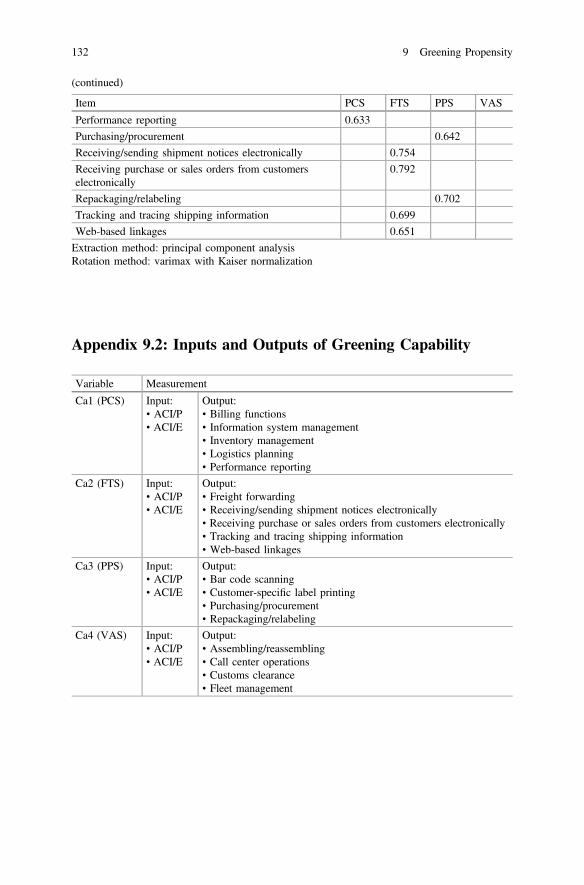
(continued)
Item PCS FTS PPS VAS
Performance reporting 0.633
Purchasing/procurement 0.642
Receiving/sending shipment notices electronically 0.754
Receiving purchase or sales orders from customerselectronically
0.792
Repackaging/relabeling 0.702
Tracking and tracing shipping information 0.699
Web-based linkages 0.651
Extraction method: principal component analysisRotation method: varimax with Kaiser normalization
Appendix 9.2: Inputs and Outputs of Greening Capability
Variable Measurement
Ca1 (PCS) Input:• ACI/P• ACI/E
Output:• Billing functions• Information system management• Inventory management• Logistics planning• Performance reporting
Ca2 (FTS) Input:• ACI/P• ACI/E
Output:• Freight forwarding• Receiving/sending shipment notices electronically• Receiving purchase or sales orders from customers electronically• Tracking and tracing shipping information• Web-based linkages
Ca3 (PPS) Input:• ACI/P• ACI/E
Output:• Bar code scanning• Customer-specific label printing• Purchasing/procurement• Repackaging/relabeling
Ca4 (VAS) Input:• ACI/P• ACI/E
Output:• Assembling/reassembling• Call center operations• Customs clearance• Fleet management
132 9 Greening Propensity
References
Bakos JY, Brynjolfsson E (1993) From vendors to partners: information technology andincomplete contracts in buyer-supplier relationships. J Organ Comput 3(3):301–329
Ballou RH (2007) The evolution and future of logistics and supply chain management. Eur BusRev 19(4):332–348
Barney J (1991) Firm resources and sustained competitive advantage. J Manag 17(1):99–120Bharadwaj AS (2000) A resource-based perspective on information technology capability and firm
performance: an empirical investigation. MIS Q 24(1):169–196Coates TT, McDermott CM (2002) An exploratory analysis of new competencies: a resource based
view perspective. J Oper Manag 20(5):435–450Collis DJ (1994) How valuable are organizational capabilities. Strateg Manag J 15:143–152Cooper WW, Seiford LM, Tobe K (2007) Data Development Analysis, SpringerDierickx I, Cool K (1989) Asset stock accumulation and the sustainability of competitive
advantage: reply. Manag Sci 35(12):1514Frohlich MT, Westbrook R (2001) Arcs of integration: an international study of supply chain
strategies. J Oper Manag 19(2):185–200Hart SL (1995) A natural-resource-based view of the firm. Acad Manag Rev 20(4):986–1014Hart SL, Dowell G (2011) Invited editorial: a natural-resource-based view of the firm: fifteen years
after. J Manag 37(5):1464–1479Jarvenpaa SL, Leidner DE (1998) An information company in Mexico: extending the
resource-based view of the firm to a developing country context. Inf Syst Res 9(4):342–361Kent JL, Mentzer JT (2003) The effect of investment in interorganizational information technology
in a retail supply chain. J Bus Logistics 24(2):155–175Knemeyer AM, Corsi TM, Murphy PR (2003) Logistics outsourcing relationships: customer
perspectives. J Bus Logistics 24(1):77–109Koh SCL, Tan Z (2005) Using e-commerce to gain a competitive advantage in 3PL enterprises in
China. Int J Logistics Syst Manag 1(2/3):187–210Lai K (2004) Service capability and performance of logistics service providers. Transp Res Part E
Logistics Transp Rev 40(5):385–399Lai K, Wong CWY, Cheng TCE (2010) Bundling digitized logistics activities and its performance
implications. Ind Mark Manag 39(2):273–286Lai K, Lun YHV, Cheng TCE (2013a) Measures for evaluating green shipping practices
implementation. Int J Shipping Transp Logistics 5(2):217–235Lai K, Lun YHV, Wong CWY, Cheng TCE (2013b) Measures for evaluating green shipping
practices implementation. Int J Shipping Transp Logistics 5(2):217–235Lean H, Hooi WH, Hong Junjie (2014) Logistics and economic development: experience from
China. Transp Policy 32:96–104Lemoine W, Dagnæs L (2003) Globalisation strategies and business organisation of a network of
logistics service providers. Int J Phys Distrib Logistics Manag 33(3):209–228Lieb RC (1992) The use of third-party logistics service by large American manufacturers. J Bus
Logistics 13(2):29–42Lieb R, Miller J (2002) The use of third-party logistics services by large US manufacturers, the
2000 survey. Int J Logistics Res Appl 5(1):1–12Lun YHV (2011) Green management practices and firm performance: a case of container terminal
operations. Resour Conserv Recycl 55(6):559–566Lun YHV, Lai K, Wong CWY, Cheng TCE (2015) Greening propensity and performance
implications for logistics service providers. Transp Res Part E Logistics Transp Rev 74:50–52Maloni MJ, Carter CR (2006) Opportunities for research in third-party logistics. Transp J 45
(2):23–38Marasco A (2008) Third-party logistics: a literature review. Int J Prod Econ 113(1):127–147McGinnis MA, Kohn JW (2002) Logistics strategy—revisited. J Bus Logistics 23(2):1–17
References 133
Murphy PR, Daley JM (2001) Profiling international freight forwarders: an update. Int J PhysDistrib Logistics Manag 31(3):152–168
Murphy PR, Wood DF (2004) Contemporary logistics. Pearson, New JerseyNath D, Sudharshan D (1994) Measuring strategy coherence through patterns of strategic choices.
Strateg Manag J 15(1):43–61Peteraf MA (1993) The cornerstones of competitive advantage: a resource-based view. Strateg
Manag J 14(3):179–191Ray G, Barney JB, Muhanna WA (2004) Capabilities, business processes, and competitive
advantage: choosing the dependent variable in empirical tests of the resource-based view.Strateg Manag J 25(1):23–37
Razzaque MA, Chang CS (1998) Outsourcing of logistics functions: a literature survey. Int J PhysDistrib Logistics Manag 28(2):89–107
Salanova M, Agut S, Peiró JM (2005) Linking organizational resources and work engagement toemployee performance and customer loyalty: the mediation of service climate. J Appl Psychol90(6):1217–1227
Sambamurthy V, Bharadwaj A, Grover V (2003) Shaping agility through digital options:reconceptualizing the role of information technology in contemporary firms. MIS Q 27(2):237–263
Shah R, Goldstein SM, Ward PT (2002) Aligning supply chain management characteristics andinterorganizational information system types: an exploratory study. IEEE Trans Eng Manag 49(3):282–292
Sheu J-B (2008) Green supply chain management, reverse logistics and nuclear power generation.Transp Res Part E Logistics Transp Rev 44(1):19–46
Singh N, Lai K, Cheng TCE (2007) Intra-organizational perspectives on IT-enabled supply chains.Commun ACM 50(1):59–65
Skjoett-Larsen T (2000) Third party logistics—from an interorganizational point of view. Int JPhys Distrib Logistics Manag 25(2):43–64
Stalk G, Evans P, Shulman LE (1992) Competing on capabilities: the new rules of corporatestrategy. Harvard Bus Rev 70(2):57–69
Straub DW, Hoffman DL, Weber BW, Steinfield C (2002) Measuring e-commerce in net-enabledorganizations: an introduction to the special issue. Inf Syst Res 13(2):115–124
Straub DW, Watson RT (1979) Research commentary: transformational issues in researching ISand netenabled organizations. Inf Syst Res 12(4):337–345
Teece DJ, Pisano G, Shuen A (1997) Dynamic capabilities and strategic management. StrategManag J 18(7):509–533
Wernerfelt B (1984) A resource-based view of the firm. Strateg Manag J 5(2):171–80. http://doi.wiley.com/10.1002/smj.4250050207
Winter, SG (2003) Understanding dynamic capabilities. Strateg Manag J 24(10 Spec Issue):991–995
Wong CY, Karia N (2010) Explaining the competitive advantage of logistics service providers: aresource-based view approach. Int J Prod Econ 128:51–67
Wong CWY, Lai K, Lun YHV, Cheng TCE (2012) A study on the antecedents of suppliercommitment in support of logistics operations. Int J Shipping Transp Logistics 4(1):5–16
Yang C-C (2012) The effect of environmental management on environmental performance andfirm performance in Taiwanese maritime firms. Int J Shipping Transp Logistics 4(4):393–407
Yeung ACL (2008) Strategic supply management, quality initiatives, and organizationalperformance. J Oper Manag 26(4):490–502
Yeung K, Zhou H, Yeung ACL, Cheng TCE (2012) The impact of third-party logistics providerscapabilities on exporters performance. Int J Prod Econ 135(2):741–753
134 9 Greening Propensity


