Embed Size (px)
Citation preview
Yard 520 Sampling and Analysis Plan Pines Area of Investigation AOC II Docket No. V-W-’04-C-784
Appendix C Quality Assurance Project Plan
ENSR Corporation June 3, 2005 Revised September 2, 2005 Revised April 18, 2008 Document Number 01776-028-100
Section: Approval QUALITY ASSURANCE PROJECT PLAN Date: April 2008 YARD 520 SAP Revision: 2 PINES AREA OF INVESTIGATION Page 1 of 1
AOC II – Docket No. V-W-’04-C-784 – Yard520 - AppC QAPP April 18, 2008
QUALITY ASSURANCE PROJECT PLAN YARD 520 SAP
PINES AREA OF INVESTIGATION Revision 2
Prepared by: ENSR Corporation Prepared for: Brown Inc. and NIPSCO
April 18, 2008
ENSR Project Manager Lisa JN Bradley
Date
April 18, 2008 ENSR Project Quality Assurance Officer Debra Simmons
Date
USEPA Region V Remedial Project Manager Timothy Drexler
Date
USEPA Region V QAPP Reviewer Warren Layne
Date
Columbia Analytical Services QA Manager Lisa Reyes
Date
General Engineering Laboratories QA Manager Robert Pullano
Date
Section: Distribution QUALITY ASSURANCE PROJECT PLAN Date: April 2008 YARD 520 SAP Revision: 2 PINES AREA OF INVESTIGATION Page 1 of 1
AOC II – Docket No. V-W-’04-C-784 – Yard520 - AppC QAPP June 3, 2005April 18, 2008
DISTRIBUTION LIST
Timothy Drexler, USEPA Warren Layne, USEPA Kevin Herron, IDEM Lisa JN Bradley, ENSR Valerie Blumenfeld, Brown Inc. Dan Sullivan, NiSource Elizabeth Perry, ENSR Debra L. Simmons, ENSR Janice Jaeger, Columbia Analytical Services Lisa Reyes, Columbia Analytical Services Edith Kent, General Engineering Laboratories Robert Pullano, General Engineering Laboratories Gary Torosian, GeoTesting Express, Inc.
Section: Contents QUALITY ASSURANCE PROJECT PLAN Date: June 2005 YARD 520 SAP Revision: 0 PINES AREA OF INVESTIGATION Page i of xii
AOC II – Docket No. V-W-’04-C-784 – Yard520 - AppC QAPP June 3, 2005
CONTENTS
QAPP APPROVAL SHEET DISTRIBUTION LIST TABLE OF CONTENTS ACRONYMS STANDARD CHEMICAL ABBREVIATIONS DISCLAIMER
SECTION A – PROJECT MANAGEMENT.......................................................................................... A-1
A1 Introduction............................................................................................................................ A-1
A2 Project Schedule ................................................................................................................... A-2
A3 Distribution List ...................................................................................................................... A-2
A4 Project/Task Organization..................................................................................................... A-2 A4.1 Management Responsibilities .................................................................................... A-2 A4.2 Quality Assurance Responsibilities............................................................................ A-4 A4.3 Laboratory Responsibilities ........................................................................................ A-5 A4.4 Field Responsibilities.................................................................................................. A-7
A5 Problem Definition and Background ..................................................................................... A-9 A5.1 Site Background and Description............................................................................... A-9 A5.2 Problem Definition ...................................................................................................... A-9
A6 Project/Task Description ..................................................................................................... A-10 A6.1 Project/Task Summary............................................................................................. A-11
A7 Quality Objectives and Criteria for Measurement Data ...................................................... A-12 A7.1 Data Quality Objectives............................................................................................ A-12 A7.2 Data Quality Objectives for Measurement Data ...................................................... A-13
A8 Special Training/Certification .............................................................................................. A-15 A8.1 Training..................................................................................................................... A-15
Section: Contents QUALITY ASSURANCE PROJECT PLAN Date: September 2005 YARD 520 SAP Revision: 1 PINES AREA OF INVESTIGATION Page ii of xii
CONTENTS (Cont’d)
AOC II – Docket No. V-W-’04-C-784 – Yard520 - AppC QAPP September 2, 2005
A8.2 Certifications............................................................................................................. A-16
A9 Documents and Records..................................................................................................... A-16 A9.1 Project Files.............................................................................................................. A-16 A9.2 Field Records ........................................................................................................... A-17 A9.3 Laboratory Records and Deliverables...................................................................... A-19
A10 References .......................................................................................................................... A-20
SECTION B – MEASUREMENT/DATA ACQUISITION...................................................................... B-1
B1 Sampling Process Design..................................................................................................... B-1
B2 Sampling Methods Requirements......................................................................................... B-1 B2.1 Field Measurements................................................................................................... B-1 B2.2 Sampling Procedures................................................................................................. B-1 B2.3 Cleaning and Decontamination of Equipment/Sample Containers ........................... B-2 B2.4 Inspection and Acceptance Requirements for Supplies/Sample Containers ............ B-2
B3 Sample Handling and Custody ............................................................................................. B-3 B3.1 Sample Containers, Preservation, and Holding Times.............................................. B-3 B3.2 Sample Labeling......................................................................................................... B-4 B3.3 Custody Procedures................................................................................................... B-4
B4 Analytical Methods ................................................................................................................ B-7 B4.1 Field Analytical Procedures........................................................................................ B-8 B4.2 Laboratory Analytical Procedures .............................................................................. B-8 B4.3 List of Project Target Constituents and Detection Limits ........................................... B-8 B4.4 List of Associated Quality Control Samples............................................................... B-9
B5 Quality Control....................................................................................................................... B-9 B5.1 Field............................................................................................................................ B-9 B5.2 Analytical Quality Control Checks............................................................................ B-10
B6 Instrument/Equipment Testing, Inspection, and Maintenance ........................................... B-10
Section: Contents QUALITY ASSURANCE PROJECT PLAN Date: June 2005 YARD 520 SAP Revision: 0 PINES AREA OF INVESTIGATION Page iii of xii
CONTENTS (Cont’d)
AOC II – Docket No. V-W-’04-C-784 – Yard520 - AppC QAPP June 3, 2005
B6.1 Field Equipment Maintenance.................................................................................. B-11
B7 Laboratory Instrument Preventative Maintenance.............................................................. B-11
B8 Instrument/Equipment Calibration and Frequency ............................................................. B-11 B8.1 Field Instruments...................................................................................................... B-11 B8.2 Analytical Instrumentation ........................................................................................ B-11
B9 Inspection/Acceptance of Supplies and Consumables....................................................... B-12
B10 Non-Direct Measurements .................................................................................................. B-12
B11 Data Management............................................................................................................... B-13
SECTION C – PROJECT ASSESSMENT/OVERSIGHT..................................................................... C-1
C1 Assessment and Response Actions ..................................................................................... C-1 C1.1 Assessments .............................................................................................................. C-1 C1.2 Assessment Findings and Corrective Action Responses.......................................... C-4
C2 Reports to Management........................................................................................................ C-6
SECTION D – DATA VALIDATION AND USABILITY........................................................................ D-1
D1 Data Review, Verification, and Validation ............................................................................. D-1 D1.1 Field Data Review ...................................................................................................... D-1 D1.2 Internal Laboratory Review ........................................................................................ D-1 D1.3 Validation of Analytical Data ...................................................................................... D-1
D2 Validation and Verification Methods...................................................................................... D-3 D2.1 Field Data Verification ................................................................................................ D-3 D2.2 Laboratory Data Verification....................................................................................... D-3 D2.3 Validation of Analytical Deliverables .......................................................................... D-5 D2.4 Verification during Data Management........................................................................ D-6
D3 Usability/Reconciliation with Data Quality Objectives........................................................... D-6
Section: Contents QUALITY ASSURANCE PROJECT PLAN Date: June 2005 YARD 520 SAP Revision: 0 PINES AREA OF INVESTIGATION Page iv of xii
CONTENTS (Cont’d)
AOC II – Docket No. V-W-’04-C-784 – Yard520 - AppC QAPP June 3, 2005
D3.1 Comparison to Measurement Criteria ........................................................................ D-7 D3.2 Overall Assessment of Environmental Data ............................................................ D-10
Section: Contents QUALITY ASSURANCE PROJECT PLAN Date: June 2005 YARD 520 SAP Revision: 0 PINES AREA OF INVESTIGATION Page v of xii
CONTENTS (Cont’d)
AOC II – Docket No. V-W-’04-C-784 – Yard520 - AppC QAPP June 3, 2005
ATTACHMENT A LABORATORY STANDARD OPERATING PROCEDURES
ATTACHMENT B ENSR DATA VALIDATION PROTOCOLS
Section: Contents QUALITY ASSURANCE PROJECT PLAN Date: June 2005 YARD 520 SAP Revision: 0 PINES AREA OF INVESTIGATION Page vi of xii
AOC II – Docket No. V-W-’04-C-784 – Yard520 - AppC QAPP June 3, 2005
LIST OF TABLES
Table A-1 Sample Summary
Table A-2 Laboratory Parameters by Sample Medium
Table A-3 Target Analytes, Reporting Limits, and Data Quality Levels for PAHs in Soil and CCBs
Table A-4 Target Analytes, Reporting Limits, and Data Quality Levels for PCDDs/PCDFs in Soil and CCBs
Table A-5 Target Analytes, Reporting Limits, and Data Quality Levels for Radionuclides in Soil and CCBs
Table A-6 Target Analytes, Reporting Limits, and Data Quality Levels for Metals and Sulfur in Soil
Table A-7 Quality Control Performance Criteria
Table B-1 Summary of Sample Container, Preservation, and Holding Time Requirements
Table B-2 Analytical Methodologies
Table B-3 Analytical Quality Control Checks
Table B-4 Maintenance Procedures and Schedule for Analytical Instruments
Table B-5 Laboratory Equipment Monitoring
Table B-6 Analytical Instrument Calibration
Section: Contents QUALITY ASSURANCE PROJECT PLAN Date: June 2005 YARD 520 SAP Revision: 0 PINES AREA OF INVESTIGATION Page vii of xii
AOC II – Docket No. V-W-’04-C-784 – Yard520 - AppC QAPP June 3, 2005
LIST OF FIGURES
Figure A-1 Project Organization Chart
Figure B-1 Example of Sample Label
Figure B-2 Example of Chain-of-Custody Record
Figure C-1 Example of Internal Field TSA Checklist
Figure C-2 Example of Laboratory Audit Checklist
Section: Contents QUALITY ASSURANCE PROJECT PLAN Date: June 2005 YARD 520 SAP Revision: 0 PINES AREA OF INVESTIGATION Page viii of xii
AOC II – Docket No. V-W-’04-C-784 – Yard520 - AppC QAPP June 3, 2005
ACRONYMS
AOC I Administrative Order on Consent, 2003 and as amended, 2004; Docket No. V-W-03-730
AOC II Administrative Order on Consent, 2004; Docket No. V-W-’04-C-784 bgs Below Ground Surface CAS Columbia Analytical Services CCB Coal Combustion By-product CCBK Continuing Calibration Blank CCV Continuing Calibration Verification CLP Contract Laboratory Program COC Chain of Custody COPC Constituents of Potential Concern COPEC Constituents of Potential Ecological Concern CVAAS Cold Vapor Atomic Absorption Spectroscopy DOE Department of Energy DOT Department of Transportation DQL Data Quality Level DQO Data Quality Objective EDD Electronic Data Deliverable ENSR ENSR Corporation ERA Ecological Risk Assessment ESL Ecological Screening Level FS Feasibility Study FSP Field Sampling Plan GC Gas Chromatography GC/MS Gas Chromatography/Mass Spectroscopy GEL General Engineering Laboratory GFAAS Graphite Furnace Atomic Absorption Spectroscopy GPS Global Positioning System HASP Health and Safety Plan HHRA Human Health Risk Assessment HRGC/HRMS High Resolution Gas Chromatography/High Resolution Mass Spectroscopy IATA International Air Transport Association ICAO International Civil Aviation Organization ICBK Initial Calibration Blank ICP Inductively Coupled Plasma
Section: Contents QUALITY ASSURANCE PROJECT PLAN Date: April 2008 YARD 520 SAP Revision: 2 PINES AREA OF INVESTIGATION Page ix of xii
AOC II – Docket No. V-W-’04-C-784 – Yard520 - AppC QAPP April 18, 2008
ICP-AES Inductively Coupled Plasma-Atomic Emission Spectroscopy ICP-MS Inductively Coupled Plasma-Mass Spectrometry ICV Initial Calibration Verification ID Identification IDL Instrument Detection Limit IDEM Indiana Department of Environmental Management LCS Laboratory Control Sample LIMS Laboratory Information Management System MARLAP Multi-Agency Radiological Laboratory Analytical Protocols Manual MDA Minimum Detectable Activity MDL Method Detection Limit mg/kg Milligram per Kilogram mg/L Milligram per Liter MS/MSD Matrix Spike/Matrix Spike Duplicate MSR Management System Review NIPSCO Northern Indiana Public Service Company ORNL Oak Ridge National Laboratory OSWER Office of Solid Waste and Emergency Response PAH Polynuclear Aromatic Hydrocarbon PCDD Polychlorinated Dibenzodioxin PCDF Polychlorinated Dibenzofuran pCi/g Picocuries per Gram PE Performance Evaluation PRG Preliminary Remediation Goal QA Quality Assurance QAPP Quality Assurance Project Plan QA/QC Quality Assurance/Quality Control QC Quality Control %R Percent Recovery RAL Removal Action Level RI Remedial Investigation RI/FS Remedial Investigation and Feasibility Study RL Reporting Limit RPD Relative Percent Difference RPM Remedial Project Manager RSD Relative Standard Deviation SAP Sampling and Analysis Plan SMS Site Management Strategy SOP Standard Operating Procedure SOW Statement of Work
Section: Contents QUALITY ASSURANCE PROJECT PLAN Date: April 2008 YARD 520 SAP Revision: 2 PINES AREA OF INVESTIGATION Page x of xii
AOC II – Docket No. V-W-’04-C-784 – Yard520 - AppC QAPP April 18, 2008
TAL Target Analyte List TBD To Be Determined TSA Technical System Audit ug/kg Micrograms per Kilogram US United States USEPA United States Environmental Protection Agency
Section: Contents QUALITY ASSURANCE PROJECT PLAN Date: April 2008 YARD 520 SAP Revision: 2 PINES AREA OF INVESTIGATION Page xi of xii
AOC II – Docket No. V-W-’04-C-784 – Yard520 - AppC QAPP April 18, 2008
STANDARD CHEMICAL ABBREVIATIONS
Ac Actinium Al Aluminum Ag Silver As Arsenic B Boron Ba Barium Be Beryllium Ca Calcium Cd Cadmium Co Cobalt Cr Chromium Cs Cesium Cu Copper Fe Iron K Potassium Hg Mercury Li Lithium Mg Magnesium Mo Molybdenum Mn Manganese Na Sodium Ni Nickel Pa Protactinium Pb Lead Po Polonium Ra Radium S Sulphur Sb Antimony Se Selenium Si Silicon Sr Strontium Th Thorium Tl Thallium U Uranium V Vanadium Zn Zinc
Section: Contents QUALITY ASSURANCE PROJECT PLAN Date: September 2005 YARD 520 SAP Revision: 1 PINES AREA OF INVESTIGATION Page xii of xii
AOC II – Docket No. V-W-’04-C-784 – Yard520 - AppC QAPP September 2, 2005
DISCLAIMER
This document is a document prepared under a federal administrative order on consent and revised based on comments received from the U.S. Environmental Protection Agency (USEPA). This document has been approved by USEPA, and is the final version of the document.
Section: A QUALITY ASSURANCE PROJECT PLAN Date: June 2005 YARD 520 SAP Revision: 0 PINES AREA OF INVESTIGATION Page 1 of 21
AOC II – Docket No. V-W-’04-C-784 – Yard520 - AppC QAPP June 3, 2005
SECTION A – PROJECT MANAGEMENT
A1 Introduction
In April 2004, the United States Environmental Protection Agency (USEPA) and the Respondents (Brown Inc., Ddalt Corp., Bulk Transport Corp., and Northern Indiana Public Service Company [NIPSCO]), signed an Administrative Order on Consent (AOC II) (Docket No. V-W-’04-C-784) to conduct a Remedial Investigation and Feasibility Study (RI/FS) at the Pines Area of Investigation, or Area of Investigation, as set forth in Exhibit I to AOC II, located in the environs of the Town of Pines, Indiana.
In June 2004, the Respondents submitted the first major document for the RI/FS, a Site Management Strategy (SMS) document (ENSR, 2005a), which outlined a preliminary conceptual model, data gaps, and the strategy for certain elements of the RI/FS. A revised SMS, based on comments received from the USEPA, was submitted in September 2004, and conditionally approved by USEPA in November 2004. The final SMS was submitted in January 2005. The SMS serves as the basis for development of the RI/FS Work Plan (ENSR, 2005b), including the Field Sampling Plan (FSP), Quality Assurance Project Plan (QAPP), and other supporting documents.
The SMS indicates that a baseline human health risk assessment (HHRA) and ecological risk assessment (ERA) will be conducted to evaluate the potential human health and ecological risks of potential exposures to coal combustion by-product (CCB)-derived constituents present in samples of environmental media within the Area of Investigation. As part of the HHRA and ERA, the presence of CCB-derived constituents within the Area of Investigation will be evaluated, and a subset of the constituents identified as constituents of potential concern (COPCs) or constituents of potential ecological concern (COPECs) will be quantitatively evaluated in the risk assessment. The purpose of the Yard 520 Sampling and Analysis Plan (SAP) is to determine whether additional parameter groups, specifically, polychlorinated dibenzodioxins and dibenzofurans (PCDDs and PCDFs), radionuclides, and polynuclear aromatic hydrocarbons (PAHs), may be present at concentrations of potential concern in CCBs in the Area of Investigation, and whether the analytical program for the RI should include any of these constituents.
This document provides the QAPP for the Yard 520 sampling program, and incorporates the SAP by reference. The QAPP presents the organization, objectives, planned activities, and specific quality assurance/quality control (QA/QC) procedures associated with the Yard 520 sampling program. Specific protocols for sampling, sample handling and storage, chain-of-custody, and laboratory and
Section: A QUALITY ASSURANCE PROJECT PLAN Date: June 2005 YARD 520 SAP Revision: 0 PINES AREA OF INVESTIGATION Page 2 of 21
AOC II – Docket No. V-W-’04-C-784 – Yard520 - AppC QAPP June 3, 2005
field analyses are described. All QA/QC procedures are structured in accordance with applicable technical standards, USEPA’s requirements, regulations, and guidance. This QAPP has been prepared in accordance with the USEPA QAPP policy as presented in the Region 5 Instructions on the Preparation of a Superfund Division Quality Assurance Project Plan (USEPA, 2000a).
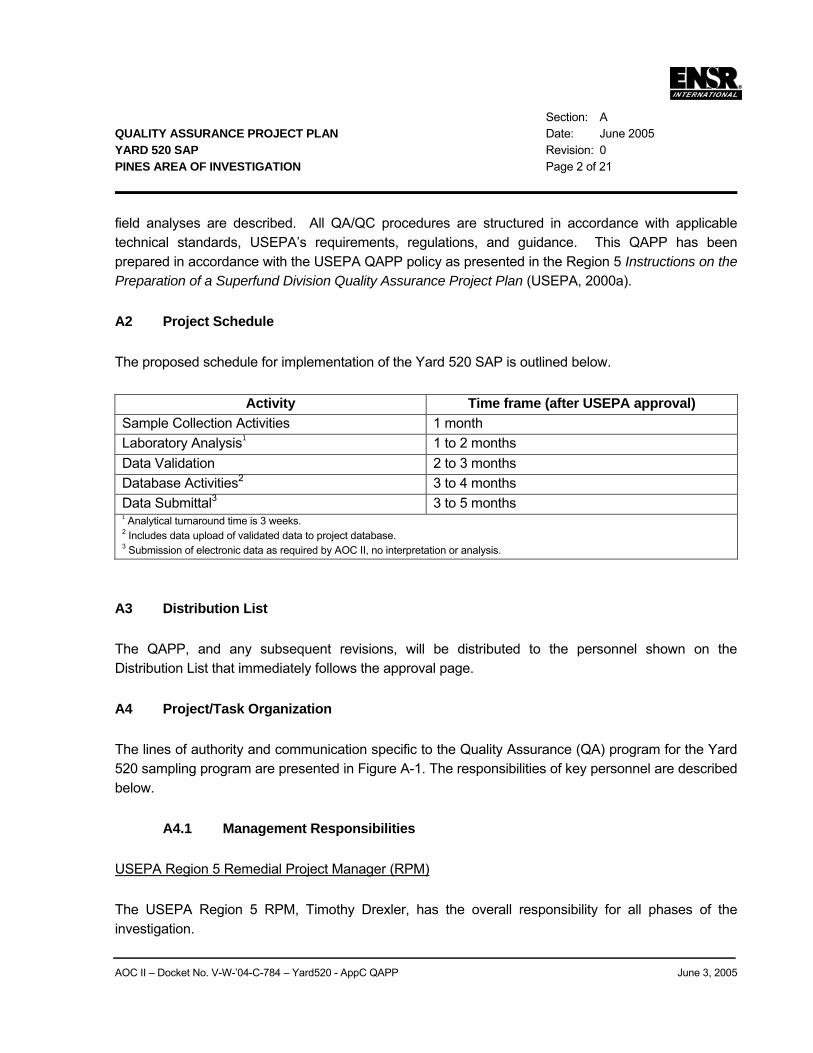
A2 Project Schedule
The proposed schedule for implementation of the Yard 520 SAP is outlined below.
Activity Time frame (after USEPA approval) Sample Collection Activities 1 month Laboratory Analysis1 1 to 2 months Data Validation 2 to 3 months Database Activities2 3 to 4 months Data Submittal3 3 to 5 months 1 Analytical turnaround time is 3 weeks. 2 Includes data upload of validated data to project database. 3 Submission of electronic data as required by AOC II, no interpretation or analysis.
A3 Distribution List
The QAPP, and any subsequent revisions, will be distributed to the personnel shown on the Distribution List that immediately follows the approval page.
A4 Project/Task Organization
The lines of authority and communication specific to the Quality Assurance (QA) program for the Yard 520 sampling program are presented in Figure A-1. The responsibilities of key personnel are described below.
A4.1 Management Responsibilities
USEPA Region 5 Remedial Project Manager (RPM)
The USEPA Region 5 RPM, Timothy Drexler, has the overall responsibility for all phases of the investigation.
Section: A QUALITY ASSURANCE PROJECT PLAN Date: June 2005 YARD 520 SAP Revision: 0 PINES AREA OF INVESTIGATION Page 3 of 21
AOC II – Docket No. V-W-’04-C-784 – Yard520 - AppC QAPP June 3, 2005
Respondents’ Project Managers
The Project Managers for the individual Respondents are Dan Sullivan of NiSource and Val Blumenfeld of Brown Inc. They will be responsible for project direction and decisions concerning technical issues and strategies, budget, and schedule.
ENSR Project Manager
The ENSR Project Manager, Lisa JN Bradley, will be responsible for technical, financial, scheduling matters. The ENSR Project Manager also will be responsible for project coordination between the Respondents and USEPA as required.
ENSR Task Manager
The ENSR Task Manager, Paytha Elliot, will have the overall responsibility for implementing the sampling activities described in the Yard 520 SAP. Specific responsibilities of the ENSR Task Manager will include, but not be limited to, the following:
• Providing personnel and equipment for sampling activities;
• Ensuring that ENSR’s associates perform their designated duties in accordance with the SAP and the Health and Safety Plan (HASP);
• Ensuring required QA/QC procedures are properly implemented and documented;
• Ensuring that sampling activities are properly carried out and completed within the approved schedule;
• Communicating any request for modifications, if necessary, to the approved SAP to the ENSR Project Manager; and
• Promptly notifying the ENSR Project Manager if unforeseen field conditions and/or analytical issues are encountered that affect achievement of the project data quality objectives (DQOs).
ENSR Health and Safety Manager
The ENSR Regional Health and Safety Manager, Joseph Sanders, will be responsible for ensuring the objectives of ENSR’s corporate health and safety program are carried out. The ENSR Regional Health
Section: A QUALITY ASSURANCE PROJECT PLAN Date: April 2008 YARD 520 SAP Revision: 2 PINES AREA OF INVESTIGATION Page 4 of 21
AOC II – Docket No. V-W-’04-C-784 – Yard520 - AppC QAPP April 18, 2008
and Safety Manager will also be responsible for the coordination and communication of health and safety issues for field personnel.
A4.2 Quality Assurance Responsibilities
ENSR Project QA Officer
The ENSR Project QA Officer, Debra (McGrath) Simmons, has the overall responsibility for quality assurance. The ENSR Project QA Officer communicates directly to the ENSR Project Manager on matters pertaining to QA, data validation, and laboratory analyses. Specific responsibilities include:
• Reviewing and approving the QAPP;
• Reviewing and approving QA procedures, including any modifications to existing approved procedures;
• Ensuring that QA audits of the various phases of the project are conducted as required by this QAPP;
• Providing technical assistance to project staff;
• Ensuring that data validation/data assessment is conducted in accordance with the QAPP; and
• Reporting on the adequacy and efficiency of the QA Program to the ENSR Project Manager and recommending corrective actions, if necessary.
ENSR Data Validator
The ENSR Data Validator reports to the ENSR Project QA Officer. The Data Validator is responsible for validating the analytical data in accordance with the QAPP.
USEPA Region 5 Quality Assurance Plan Reviewer
The USEPA Region 5 Quality Assurance Plan Reviewer, Warren Layne, has the responsibility to review and approve all QAPPs. Additional USEPA responsibilities include:
• Conducting external performance and system audits of the selected laboratory;
• Evaluating results of performance evaluation sample data; and
Section: A QUALITY ASSURANCE PROJECT PLAN Date: April 2008 YARD 520 SAP Revision: 2 PINES AREA OF INVESTIGATION Page 5 of 21
AOC II – Docket No. V-W-’04-C-784 – Yard520 - AppC QAPP April 18, 2008
• Reviewing and evaluating analytical field and laboratory procedures.
A4.3 Laboratory Responsibilities
Columbia Analytical Services (CAS), located in Rochester, NY will perform the chemical analyses (metals, sulfur, and total organic carbon [TOC]) of all native soil and suspected CCB materials. CAS Rochester will oversee the analyses of polychlorinated dibenzodioxins (PCDDs) and polychlorinated dibenzofurans (PCDFs) by the CAS laboratory in Houston, TX. The radionuclide analyses, and boron and total uranium analyses by inductively coupled plasma-mass spectrometry (ICP-MS), will be performed by General Engineering Laboratories LLC (GEL) located in Charleston, SC. The grain size distribution and bulk density tests will be performed by GeoTesting Express, Inc. (GTX) located in Boxborough, MA.
Laboratory Director
The Laboratory Directors are ultimately responsible for the data produced by their laboratories. Specific responsibilities include:
• Ensuring that resources are adequately allocated to specific projects and that sufficient staffing, equipment, and support are provided.
• Overseeing the technical operations’ Section Managers and the Laboratory QA Manager.
The Laboratory Directors are Mike Perry (CAS), Carey Bocklet (GEL), and Gary Torosian (GTX).
Section Manager
The individual Laboratory Section Managers report to the Laboratory Director. Specific responsibilities include:
• Supervision of employees within their specific analytical area;
• Overseeing and supporting the development, implementation, and operation of analytical technical programs;
• Coordinating sample flow and for implementing QA and QC activities in their area of authority; and
• Working in conjunction with the Laboratory QA Manager to ensure that QA/QC recommendations are reviewed and that corrective actions are implemented and effective.
Section: A QUALITY ASSURANCE PROJECT PLAN Date: April 2008 YARD 520 SAP Revision: 2 PINES AREA OF INVESTIGATION Page 6 of 21
AOC II – Docket No. V-W-’04-C-784 – Yard520 - AppC QAPP April 18, 2008
Laboratory QA Manager
The Laboratory QA Manager reports to the Laboratory Director. Specific responsibilities include:
• Monitoring the QA and QC activities of the laboratory to ensure conformance with authorized policies, procedures, and good laboratory practices, and recommending improvements as appropriate;
• Informing specific Section Managers of noncompliance with the approved QA/QC criteria;
• Ensuring that all records, logs, Standard Operating Procedures (SOPs), project plans, and analytical results are maintained in a retrievable fashion; and
• Ensuring that SOPs and other controlled documents are distributed to all appropriate laboratory personnel for use in the project.
The QA Managers are Lisa Reyes (CAS), Robert Pullano(GEL), and Gary Torosian (GTX).
Laboratory Project Manager
The Laboratory Project Manager is ultimately responsible for all laboratory analyses and is the primary point of contact for issues surrounding this QAPP, including resolving technical problems, modifications to SOPs, etc. The Laboratory Project Manager is responsible for the coordination of routine day-to-day project activities including project initiation, status tracking, data review and requests, inquiries and general communication related to the project. Final approval of data packages is the responsibility of the Laboratory Project Manager.
The Laboratory Project Manager is the primary point of contact between the laboratory and ENSR. Specific responsibilities of the Laboratory Project Manager include:
• Monitoring analytical and QA project requirements for a specified project;
• Acting as a liaison between ENSR and the laboratory staff;
• Reviewing project data packages for completeness and compliance to ENSR needs;
• Monitoring, reviewing, and evaluating the progress and performance of projects; and
• Providing all analytical deliverables to ENSR in a timely manner.
The Laboratory Project Managers are Janice Jaeger (CAS), Edith Kent (GEL), and Joe Tomei (GTX).
Section: A QUALITY ASSURANCE PROJECT PLAN Date: April 2008 YARD 520 SAP Revision: 2 PINES AREA OF INVESTIGATION Page 7 of 21
AOC II – Docket No. V-W-’04-C-784 – Yard520 - AppC QAPP April 18, 2008
Laboratory Staff
Laboratory staff includes the Laboratory Director, the Laboratory Supervisor, Section Managers, Group Leaders, Chemists, and Technicians. These individuals are responsible for the actual preparation, analysis, reporting, and reviewing of the analytical information. The analysts are responsible for understanding and implementing SOPs and for conformance with the Quality Assurance Program. Analysts are also responsible for the initial review of data that they generate during the analytical process and the identification of nonconforming events within their scope of concern. These individuals, in conjunction with laboratory management and the laboratory QA Manager, may also be responsible for implementing corrective actions.
Sample Receipt Personnel
Sample receipt personnel, or sample custodians, are responsible for the initial assessment of samples, including documentation of sample conditions upon receipt, and accuracy and clarity of requests on the Chain-of-Custody (COC) forms that accompany the samples. Sample receipt personnel, along with laboratory management, are responsible for the resolution and documentation of any issues associated with the initial assessment of the sample integrity on arrival. Resolution may include discussions with laboratory personnel, client contacts, and/or laboratory management.
Following the initial assessment, sample receipt personnel are responsible for the accurate input of sample information into the data management system and the assignation of laboratory batch identification and individual sample identifiers. Sample receipt personnel also initiate the internal COC process and begin laboratory tracking.
Sample custodians are Greg Esmerian (CAS), Pete Wilber (GEL), and Joe Tomei (GTX).
A4.4 Field Responsibilities
ENSR Field Operations Leader
The ENSR Field Operations Leader (Paytha Elliott) has overall responsibility for completion of all field activities in accordance with the SAP and QAPP and is the communication link between the ENSR Project Manager and the field team. Specific responsibilities of the ENSR Field Operations Leader include:
Section: A QUALITY ASSURANCE PROJECT PLAN Date: June 2005 YARD 520 SAP Revision: 0 PINES AREA OF INVESTIGATION Page 8 of 21
AOC II – Docket No. V-W-’04-C-784 – Yard520 - AppC QAPP June 3, 2005
• Coordinating activities in the field;
• Assigning specific duties to field team members;
• Mobilizing and demobilizing of the field team and subcontractors to and from the Yard 520 sampling area;
• Directing the activities of subcontractors during the Yard 520 sampling program;
• Resolving any logistical problems that could potentially hinder field activities, such as equipment malfunctions or availability, personnel conflicts, or weather dependent working conditions; and
• Implementing field QC including issuance and tracking of measurement and test equipment; the proper labeling, handling, storage, shipping, and COC procedures used at the time of sampling; and control and collection of all field documentation.
ENSR Field Staff
The field staff reports directly to the ENSR Field Operations Leader. The responsibilities of the field staff include:
• Collecting samples, conducting field measurements, and decontaminating equipment according to documented procedures stated in the SAP;
• Ensuring that field instruments are properly operated, calibrated, and maintained, and that adequate documentation is kept for all instruments;
• Collecting the required QC samples and thoroughly documenting QC sample collection;
• Ensuring that field documentation and data are complete and accurate; and
• Communicating and documenting any nonconformance or potential data quality issues to the ENSR Field Operations Leader as well as documenting subsequent corrective action and effectiveness of corrective action.
Subcontractors
ENSR subcontractors will provide drilling services. The subcontractors are responsible for conducting the work in accordance with the project plans and contractual agreements and for communicating any issues concerning the budget, schedule, or achievement of the technical specifications to the ENSR Field Operations Leader.
Section: A QUALITY ASSURANCE PROJECT PLAN Date: June 2005 YARD 520 SAP Revision: 0 PINES AREA OF INVESTIGATION Page 9 of 21
AOC II – Docket No. V-W-’04-C-784 – Yard520 - AppC QAPP June 3, 2005
A5 Problem Definition and Background
A5.1 Site Background and Description
Between 2000 and 2004, the Indiana Department of Environmental Management (IDEM) and USEPA responded to homeowners by conducting sampling of private water supply wells in a portion of the Town of Pines. In some of these samples, boron (B) and molybdenum (Mo) were detected at concentrations above USEPA’s Removal Action Levels (RALs) (USEPA, 1998). These concentrations in groundwater are suspected by the USEPA to be derived from coal combustion by-products (CCBs). CCBs have been disposed at a permitted Restricted Waste Facility known as Yard 520, and CCBs are suspected to have been used as fill in areas within the Area of Investigation outside of Yard 520. Yard 520 is operated by Brown Inc., and most of the CCBs at Yard 520 were generated during combustion of coal at NIPSCO’s Michigan City Generating Station.
To address the boron and molybdenum detections above the USEPA RALs, the Respondents agreed to extend the municipal water service from Michigan City to selected portions of the Town of Pines. This agreement was documented in an Administrative Order on Consent, referred to as AOC I. Additional sampling of other private wells indicated some concentrations near or exceeding USEPA RALs. To address this, the Respondents voluntarily approached the USEPA to discuss extending the municipal water service to a larger area under an amendment to AOC I.
The Respondents also signed AOC II to conduct an RI/FS for the Area of Investigation, as identified in the Order. Under the Statement of Work (SOW), Task 1 is the preparation of a Site Management Strategy (SMS). A draft SMS document, which outlined a preliminary conceptual model, data gaps, and the strategy for certain elements of the RI/FS, was submitted in June 2004. The SMS was conditionally approved by USEPA in November 2004. Task 1 of the SOW was completed with the submission of the Final SMS in January 2005 (ENSR, 2005a). The SMS serves as the basis for development of the RI/FS work plans prepared under Task 2 of the SOW.
A5.2 Problem Definition
The SMS indicates that a baseline human health risk assessment (HHRA) and ecological risk assessment (ERA) will be conducted to evaluate the potential human health and ecological risks of potential exposures to CCB-derived constituents present in samples of environmental media within the
Section: A QUALITY ASSURANCE PROJECT PLAN Date: April 2008 YARD 520 SAP Revision: 2 PINES AREA OF INVESTIGATION Page 10 of 21
AOC II – Docket No. V-W-’04-C-784 – Yard520 - AppC QAPP April 18, 2008
Area of Investigation. As part of the HHRA and ERA, the presence of CCB-derived constituents within the Area of Investigation will be evaluated, and a subset of the constituents identified as constituents of potential concern (COPCs) or constituents of potential ecological concern (COPECs) will be quantitatively evaluated in the risk assessment. The purpose of this Yard 520 SAP is to determine whether additional parameter groups, specifically, PCDDs/PCDFs, radionuclides, and PAHs, may be present at concentrations of potential concern in CCBs in the Area of Investigation, and whether the analytical program for the RI should include any of these constituents.
A6 Project/Task Description
The objective for this SAP is to determine whether or not PCDDs/PCDFs, radionuclides, and PAHs are present in the CCBs within the Pines Area of Investigation at concentrations warranting further evaluation. Background samples will also be collected from areas where there are no CCBs to determine site-specific background concentrations. To accomplish this objective, the following tasks will be implemented:
• Borings will be advanced at Yard 520 to collect samples of CCBs. Sample locations will be selected to ensure that the material encountered consists of CCBs. During sampling, any other materials encountered (e.g., interim cover) will be omitted from the sample submitted for laboratory analysis. Yard 520 was selected as the location for the sample collection because it is known to have received CCBs, and the CCBs within Yard 520 are less likely to have been affected by other sources, including atmospheric deposition and roadway runoff. The Type III (South) Area of Yard 520 was selected as the location for the sample collection because this area was known to have received CCBs only. The Type II (North) Area received a small amount of other wastes, some of which may not be easily distinguishable from CCBs (such as steel slag). The sample locations in the Type III (South) Area were laid out in two triangular grids.
• Surface soil samples will be collected from within or nearby the Area of Investigation to determine site-specific background conditions. Samples will consist of native soils. Surface soil samples will be collected to document the typical background exposure point concentrations within the Area of Investigation.
• All samples will be submitted for laboratory analysis of PCDDs/PCDFs, radionuclides, and PAHs. Background samples will be analyzed for radionuclides, TOC, metals, grain size distribution, bulk density tests, and sulfur.. Additional volume will be also be collected (approximately 1 to 2 liters in volume) and retained and may be used for later visual inspection and chemical/physical analysis, if needed.
Section: A QUALITY ASSURANCE PROJECT PLAN Date: April 2008 YARD 520 SAP Revision: 2 PINES AREA OF INVESTIGATION Page 11 of 21
AOC II – Docket No. V-W-’04-C-784 – Yard520 - AppC QAPP April 18, 2008
• The concentrations of constituents in the CCB samples will be compared to concentrations in background samples and to risk-based screening levels. The screening levels to be used are presented in the HHRA Work Plan and the ERA Work Plan, which are components of the overall RI/FS Work Plan (ENSR, 2005b).
A6.1 Project/Task Summary
The number of field and QC samples that will be collected for each analytical parameter is presented in Table A-1. A summary of analytical parameters by medium is presented in Table A-2. Target compounds for each analyses are presented with their respective laboratory reporting limits, method detection limits (MDLs), and data quality levels (DQLs) in Tables A-3 (PAHs), Table A-4 (PCDDs/PCDFs), A-5 (radionuclides), and A-6 (metals, TOC, and sulfur).
All data generated through field activities or through the analytical program will be reviewed internally through a tiered review process and validated prior to reporting. All of the data except grain size distribution and bulk density will be validated, either as full or limited validation. The data will be validated using USEPA guidance, Multi-Agency Radiological Laboratory Analytical Protocols Manual (MARLAP), and Department of Energy (DOE) guidance in conjunction with ENSR data validation protocols (provided as an attachment). The USEPA and DOE guidance, and MARLAP will be modified to reflect any differences in analytical methodology and to incorporate the project-specific acceptance criteria defined in Section A7 of this QAPP or the method criteria, whichever is more stringent. A complete description of the data verification and data validation procedures to be used is included in Section D1 of this QAPP.
ENSR’s Project QA Officer and/or Field Operations Leader will be responsible for internal technical system audits (TSAs) to verify that field sampling procedures and field sampling measurements are properly followed. Additionally, laboratory TSAs are conducted periodically by ENSR’s Project QA Officer or other qualified personnel. TSAs are conducted at project start up and then periodically while the project is under way. A detailed discussion of the QA assessments that will be performed during the course of the project is provided in Section C1 of this QAPP.
Validated project data will be compared to the project measurement criteria (Relative Percent Difference (RPD) values for precision, for example). Sensitivity, representativeness, and completeness assessments will also be performed. A complete description of how validated data will be reconciled with DQOs and how the overall assessment of the data will be performed is included in Section D3 of this QAPP.
Section: A QUALITY ASSURANCE PROJECT PLAN Date: April 2008 YARD 520 SAP Revision: 2 PINES AREA OF INVESTIGATION Page 12 of 21
AOC II – Docket No. V-W-’04-C-784 – Yard520 - AppC QAPP April 18, 2008
QA reports will be generated by the ENSR Project QA Officer on an as-needed basis. A complete listing and description of all documents and reports that will be generated and maintained in the project files is included in Section A9 of this QAPP.
A7 Quality Objectives and Criteria for Measurement Data
A7.1 Data Quality Objectives
The Yard 520 investigation will consist of a sampling program and chemical analyses of suspected CCB materials and native soil. The field investigation is designed to provide information on the presence of PCDDs/PCDFs, PAHs, and radionuclides in CCBs in the Area of Investigation, to determine site-specific background concentrations of metals, radionuclides, sulfur, and TOC, and to determine site-specific background soil characteristics (i.e. soil distribution, bulk density). Therefore, the sampling and analysis program incorporates the following QA elements:
• A sampling program designed to obtain sufficient data to determine levels of constituents in media of interest,
• The use of sample collection and handling procedures that will ensure the representativeness and integrity of the samples,
• An analytical program designed to generate definitive data of sufficient quality and sensitivity to meet the project objectives (see Section A5.2), and
• Data deliverables that will allow verification and validation of the data and reproducibility of the reported results.
At the completion of the work outlined in the SAP, it is possible that additional information may be needed to meet RI objectives. At this time, it is not possible to anticipate what additional work may be needed, as it is dependent on the results of the activities proposed. AOC II allows for additional phases of work. If needed, a memorandum documenting the need for additional data will be submitted to USEPA, per AOC II Section VIII. 32.
The design of the Yard 520 SAP was based on the DQO process (USEPA, 2000b), a multi-step, iterative process that ensures that the type, quantity, and quality of environmental data used in decision-making is appropriate for its intended application. This process is summarized below.
Section: A QUALITY ASSURANCE PROJECT PLAN Date: April 2008 YARD 520 SAP Revision: 2 PINES AREA OF INVESTIGATION Page 13 of 21
AOC II – Docket No. V-W-’04-C-784 – Yard520 - AppC QAPP April 18, 2008
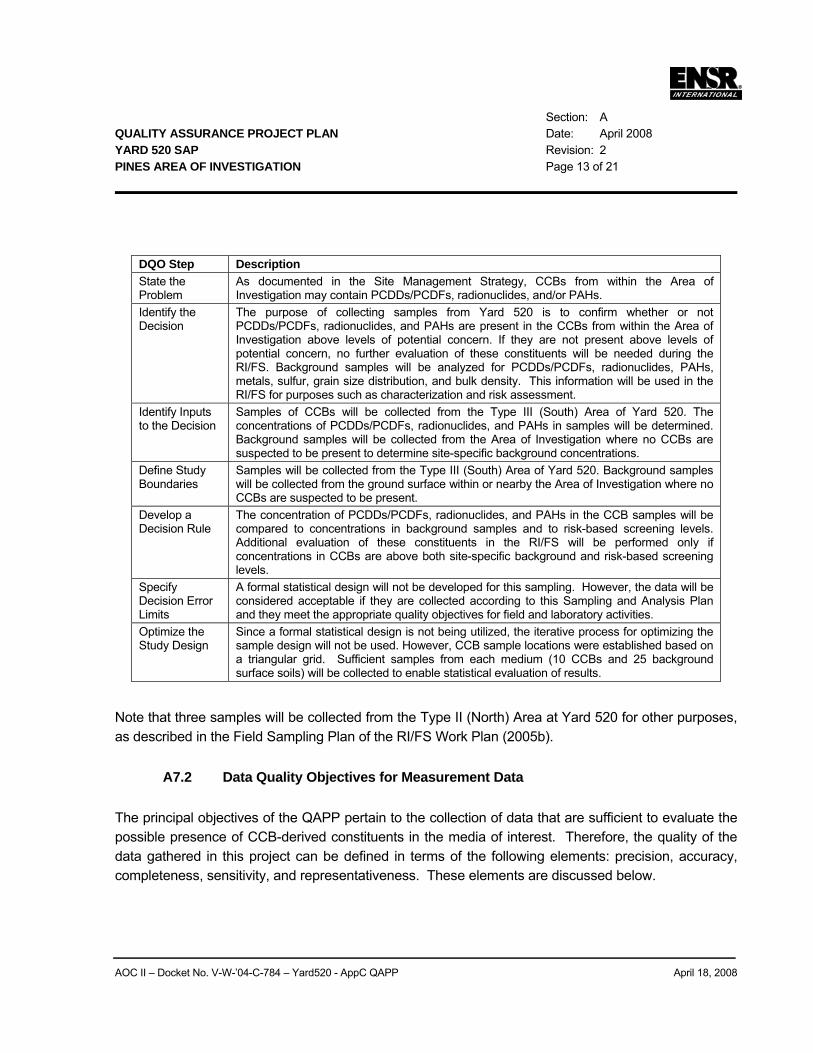
DQO Step Description State the Problem
As documented in the Site Management Strategy, CCBs from within the Area of Investigation may contain PCDDs/PCDFs, radionuclides, and/or PAHs.
Identify the Decision
The purpose of collecting samples from Yard 520 is to confirm whether or not PCDDs/PCDFs, radionuclides, and PAHs are present in the CCBs from within the Area of Investigation above levels of potential concern. If they are not present above levels of potential concern, no further evaluation of these constituents will be needed during the RI/FS. Background samples will be analyzed for PCDDs/PCDFs, radionuclides, PAHs, metals, sulfur, grain size distribution, and bulk density. This information will be used in the RI/FS for purposes such as characterization and risk assessment.
Identify Inputs to the Decision
Samples of CCBs will be collected from the Type III (South) Area of Yard 520. The concentrations of PCDDs/PCDFs, radionuclides, and PAHs in samples will be determined. Background samples will be collected from the Area of Investigation where no CCBs are suspected to be present to determine site-specific background concentrations.
Define Study Boundaries
Samples will be collected from the Type III (South) Area of Yard 520. Background samples will be collected from the ground surface within or nearby the Area of Investigation where no CCBs are suspected to be present.
Develop a Decision Rule
The concentration of PCDDs/PCDFs, radionuclides, and PAHs in the CCB samples will be compared to concentrations in background samples and to risk-based screening levels. Additional evaluation of these constituents in the RI/FS will be performed only if concentrations in CCBs are above both site-specific background and risk-based screening levels.
Specify Decision Error Limits
A formal statistical design will not be developed for this sampling. However, the data will be considered acceptable if they are collected according to this Sampling and Analysis Plan and they meet the appropriate quality objectives for field and laboratory activities.
Optimize the Study Design
Since a formal statistical design is not being utilized, the iterative process for optimizing the sample design will not be used. However, CCB sample locations were established based on a triangular grid. Sufficient samples from each medium (10 CCBs and 25 background surface soils) will be collected to enable statistical evaluation of results.
Note that three samples will be collected from the Type II (North) Area at Yard 520 for other purposes, as described in the Field Sampling Plan of the RI/FS Work Plan (2005b).
A7.2 Data Quality Objectives for Measurement Data
The principal objectives of the QAPP pertain to the collection of data that are sufficient to evaluate the possible presence of CCB-derived constituents in the media of interest. Therefore, the quality of the data gathered in this project can be defined in terms of the following elements: precision, accuracy, completeness, sensitivity, and representativeness. These elements are discussed below.
Section: A QUALITY ASSURANCE PROJECT PLAN Date: April 2008 YARD 520 SAP Revision: 2 PINES AREA OF INVESTIGATION Page 14 of 21
AOC II – Docket No. V-W-’04-C-784 – Yard520 - AppC QAPP April 18, 2008
Precision
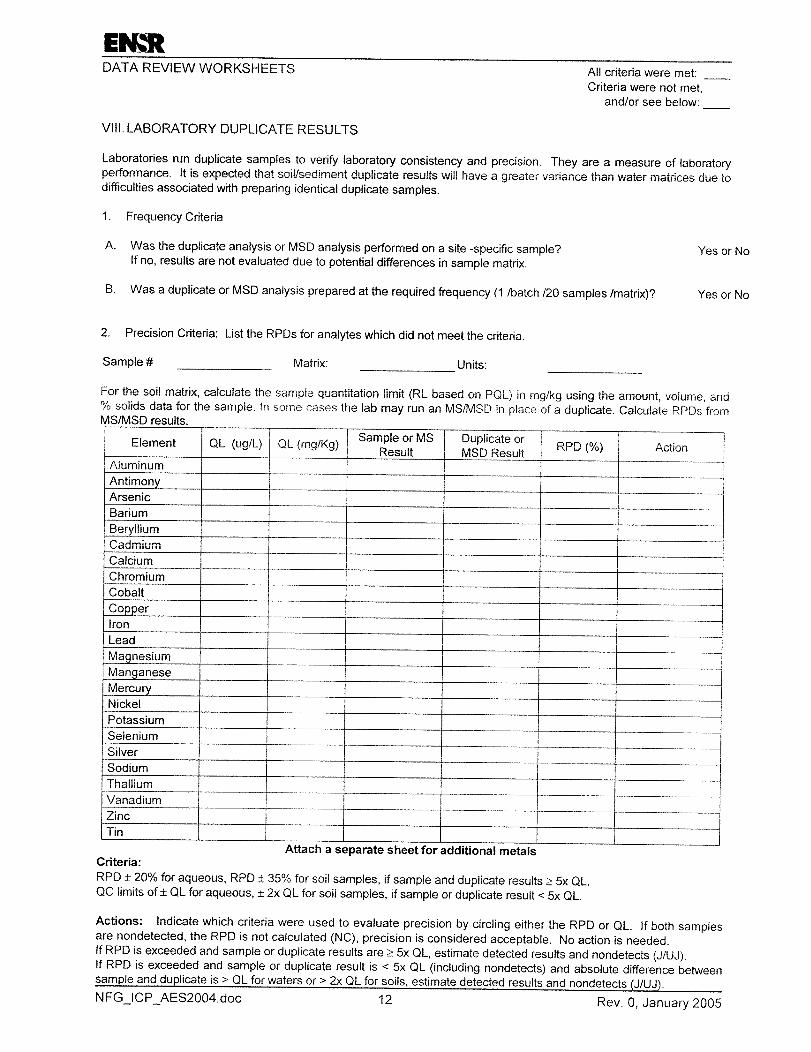
Precision is a measure of the degree to which two or more measurements are in agreement. Field precision is assessed through the collection and measurement of field duplicates at a rate of one duplicate per ten field samples. Precision will be measured through the calculation of relative percent difference (RPD). The objectives for field precision RPDs are 25% RPD for aqueous samples and 30% RPD for solid samples.
Precision in the laboratory is assessed through the calculation of RPD for duplicate samples, either as matrix spike/matrix spike duplicates (MS/MSDs) or as laboratory duplicates, depending on the method. The parameters that will be evaluated for precision are indicated in Table A-7 along with the applicable precision control limits.
Accuracy
Accuracy is the degree of agreement between the observed value and an accepted reference or true value. Accuracy in the field is assessed through the use of equipment blanks and through the adherence to all sample handling, preservation, and holding time requirements. Field rinsate blanks will be collected at a rate of one per ten samples (or less) collected per sampling event. The parameters that will be evaluated for accuracy using blanks are indicated in Table A-7 along with the applicable blank control limits.
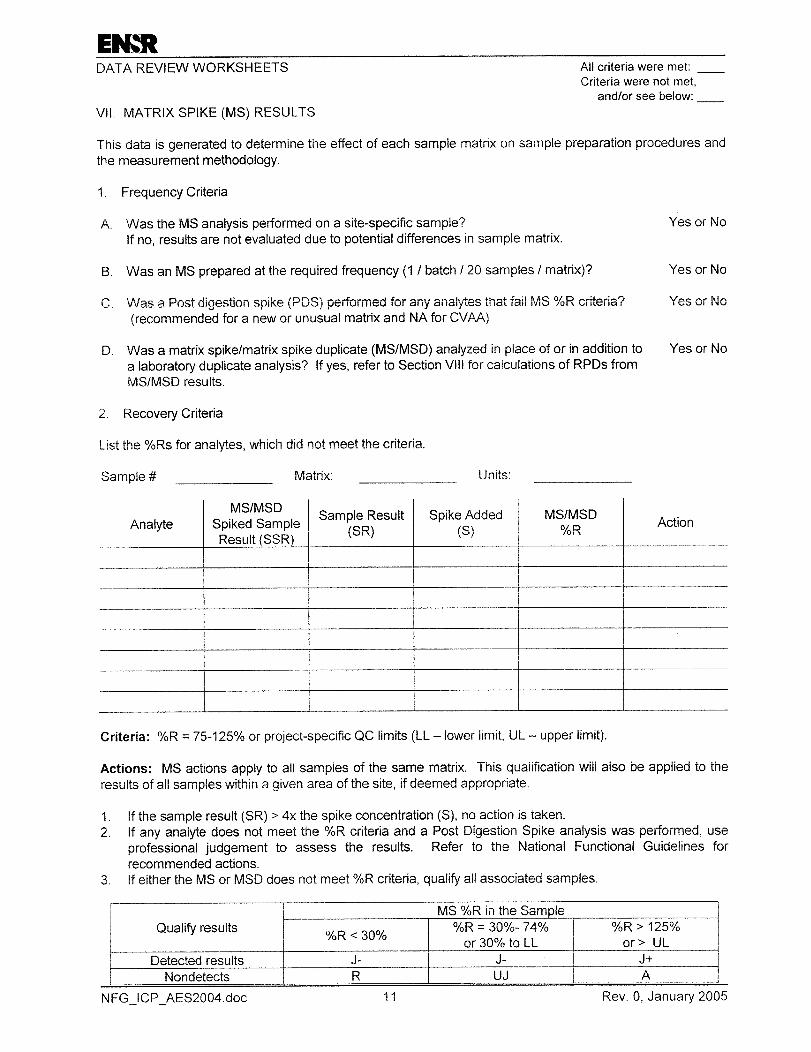
Laboratory accuracy is assessed through the analysis of MS/MSDs, laboratory control samples (LCSs), and the subsequent determination of percent recoveries (%Rs). The parameters that will be evaluated for accuracy utilizing MS/MSDs and LCSs are indicated in Table A-7 along with the applicable %R control limits.
Completeness
Completeness is a measure of the amount of valid data obtained from a measurement system compared to the amount that was expected to be obtained under normal conditions. "Normal conditions" are defined as the conditions expected if the sampling plan was implemented as planned.
Field completeness is a measure of the amount of valid samples obtained during all sampling for the project. The field completeness objective is greater than 90 percent.
Laboratory completeness is a measure of the amount of valid measurements obtained from all the measurements taken in the project. The laboratory completeness objective is greater than 95 percent.
Section: A QUALITY ASSURANCE PROJECT PLAN Date: September 2005 YARD 520 SAP Revision: 1 PINES AREA OF INVESTIGATION Page 15 of 21
AOC II – Docket No. V-W-’04-C-784 – Yard520 - AppC QAPP September 2, 2005
Representativeness
Representativeness is the extent to which the sampling design adequately reflects the environmental conditions of the site. The data will be considered representative of the site if all sampling and analysis activities are conducted according to the Yard 520 SAP and QAPP.
Sensitivity
Sensitivity of analytical data is demonstrated by the laboratory reporting limits. The target reporting limits for the constituents to be analyzed are presented in Tables A-3 (PAHs), A-4 (PCDDs/PCDFs), A-5 (radionuclides) and A-6 (metals and sulfur). These tables also contain the DQLs, which were developed using human health and ecological risk screening levels, including USEPA Region 9 Preliminary Remediation Goals (PRGs), USEPA Region 5 Ecological Screening Levels (ESLs), and Oak Ridge National Laboratory (ORNL) Phytotoxicity Screening Values. The target reporting limits were selected in part by consideration of the DQLs to be achieved and in part by consideration of the likelihood of detectable concentrations above the DQL, as in the case of several of the metals, the actual ability of the laboratory to attain reporting limits at the DQLs, and the cost-effectiveness of implementing additional, more sensitive methods in the initial stage of the investigation. The laboratories will use their most recent detection limit study results to report analytical results.
Alternative analytical methods will be evaluated if the need arises, and the QAPP will be amended, if necessary.
A8 Special Training/Certification
A8.1 Training
Field personnel will be experienced in the suspected CCB materials and native soil sampling techniques proposed in the SAP. Data validators will be familiar with the USEPA and DOE validation guidelines. Additionally, prior to starting work, personnel will be given instruction specific to the project, covering the following areas:
• Organization and lines of communication and authority;
• Overview of the SAP;
• QAPP requirements;
Section: A QUALITY ASSURANCE PROJECT PLAN Date: September 2005 YARD 520 SAP Revision: 1 PINES AREA OF INVESTIGATION Page 16 of 21
AOC II – Docket No. V-W-’04-C-784 – Yard520 - AppC QAPP September 2, 2005
• QA/QC requirements;
• Documentation requirements; and
• Health and safety requirements.
Instructions will be provided and documented by the ENSR Project Manager, ENSR Task Manager, ENSR Field Operations Leader, ENSR Health and Safety Officer, and ENSR Project QA Officer.
Personnel responsible for shipping samples will also be trained in the appropriate regulations, e.g., Department of Transportation (DOT), International Civil Aviation Organization (ICAO), and International Air Transport Association (IATA).
A8.2 Certifications
Laboratories utilized for routine testing of native soils and suspected CCB materials will have appropriate certification for the test methods.
As specified in the RI/FS Work Plan (ENSR, 2005b), the RI Task Manager, Ms. Elizabeth Perry, is a Professional Geologist licensed to practice in Indiana. This certification will be maintained throughout the project.
A9 Documents and Records
A9.1 Project Files
The project files will be the central repository for all documents which constitute evidence relevant to sampling and analysis activities as described in this QAPP. ENSR is the custodian of the project files and will maintain the contents of the project files for the investigation, including all relevant records, reports, logs, field notebooks, pictures, subcontractor reports, and data reviews in a secured, limited access area and under custody of the ENSR Project Manager.
The project files will include at a minimum:
• Field logbooks;
• Field data and data deliverables;
Section: A QUALITY ASSURANCE PROJECT PLAN Date: September 2005 YARD 520 SAP Revision: 1 PINES AREA OF INVESTIGATION Page 17 of 21
AOC II – Docket No. V-W-’04-C-784 – Yard520 - AppC QAPP September 2, 2005
• Photographs;
• Drawings;
• Sample collection logs;
• Laboratory data deliverables;
• Data validation reports;
• Data assessment reports;
• Progress reports, QA reports, interim project reports, etc.; and
• All custody documentation (COC forms, airbills, etc.).
Electronic versions of correspondence, reports, drawings, and statistical analyses will be stored in the project-specific network file. The original electronic data deliverables (EDDs) received from the laboratories, and the project database, will also be stored on the network, which is backed up daily and periodically archived off-site in accordance with ENSR Information Management policy.
Records associated with this sampling will be retained with all the project records for the duration of AOC II and for a minimum of 10 years after its termination. USEPA, NIPSCO and Brown Inc. will be notified in writing 90 days prior to destruction of the records (per AOC II Section XIII. 44.).
A9.2 Field Records
Field logbooks will provide the primary means of recording the data collection activities performed during the sampling activities. As such, entries will be described in as much detail as possible so that persons going to the field could reconstruct a particular situation without reliance on memory.
Field logbooks will be bound field survey books or notebooks. Logbooks will be assigned to field personnel, but will be stored in the project files when not in use. Each logbook will be identified by a project-specific document number.
Entries into the logbook will contain a variety of information. At the beginning of each entry, the date, start time, weather, names of all sampling team members present, and the signature of the person making the entry will be entered. The names of visitors to the work location, and the purpose of their visit, will also be recorded in the field logbook.
Section: A QUALITY ASSURANCE PROJECT PLAN Date: September 2005 YARD 520 SAP Revision: 1 PINES AREA OF INVESTIGATION Page 18 of 21
AOC II – Docket No. V-W-’04-C-784 – Yard520 - AppC QAPP September 2, 2005
Measurements made and samples collected will be recorded. All entries will be made in permanent ink, signed, and dated and no erasures or obliterations will be made. If an incorrect entry is made, the information will be crossed out with a single strike mark and the correct entry will be made, signed and dated by the person making the correction. Whenever a sample is collected, or a measurement is made, a detailed description of the sampling location, which includes compass and distance measurements, or latitude and longitude information (e.g., obtained by using a Global Positioning System (GPS)) unit will be recorded. All equipment used to make measurements will be identified, along with the date of calibration. The coordinate system that the GPS unit displays will be recorded.
Information specific to sample collection will include:
• Sample identification number;
• Time and date of sample collection;
• Sample description (color, texture, etc.);
• Samplers’ initials;
• Requested analyses;
• Depth of sample interval below ground surface (bgs) as measured with a steel measuring tape; and
• Location (GPS coordinates and description).
To streamline data recording, information will be recorded on standardized forms when this approach is logical. Examples of these forms are presented in the field SOPs included in Appendix B of the SAP.
Descriptions of geologic materials and CCBs will be logged in accordance with Indiana guidance (IDEM, 1988).
Representative photographs of sample locations will be taken with a digital camera and the camera picture frame number, date, direction facing, and subject will also be recorded in the logbook.
COC forms will be maintained as part of the field records as described in Section B3.3.1.
Section: A QUALITY ASSURANCE PROJECT PLAN Date: April 2008 YARD 520 SAP Revision: 2 PINES AREA OF INVESTIGATION Page 19 of 21
AOC II – Docket No. V-W-’04-C-784 – Yard520 - AppC QAPP April 18, 2008
A9.3 Laboratory Records and Deliverables
Laboratory data reduction procedures will be performed according to the following protocol. All information related to analysis will be documented in controlled laboratory logbooks, instrument printouts, or other approved forms. All entries that are not generated by an automated data system will be made neatly and legibly in permanent, waterproof ink. Information will not be erased or obliterated. Corrections will be made by drawing a single line through the error and entering the correct information adjacent to the cross-out. All changes will be initialed, dated, and, if appropriate, accompanied by a brief explanation. Unused pages or portions of pages will be crossed out to prevent future data entry. Analytical laboratory records will be reviewed by the supervisory personnel on a regular basis, and by the Laboratory QA Manager periodically, to verify adherence to documentation requirements.
Data deliverables will be provided within standard turnaround time (21 calendar days). The laboratory will provide at least one copy of a hard copy report and one copy of an EDD. The format of the EDD is discussed in Section B11. The hard copy data package for routine chemical and radiological analysis will be equivalent to a Contract Laboratory Program (CLP) deliverable (i.e., consisting of all the information presented in a CLP package, including CLP-like summary forms). This information is summarized below:
• Analytical report;
• Chain of custody information;
• Notes concerning special client requests and telephone records;
• Instrument raw data;
• Standards information;
• Preparation information;
• Sample results, including units;
• Detection limits and reporting limits, including units;
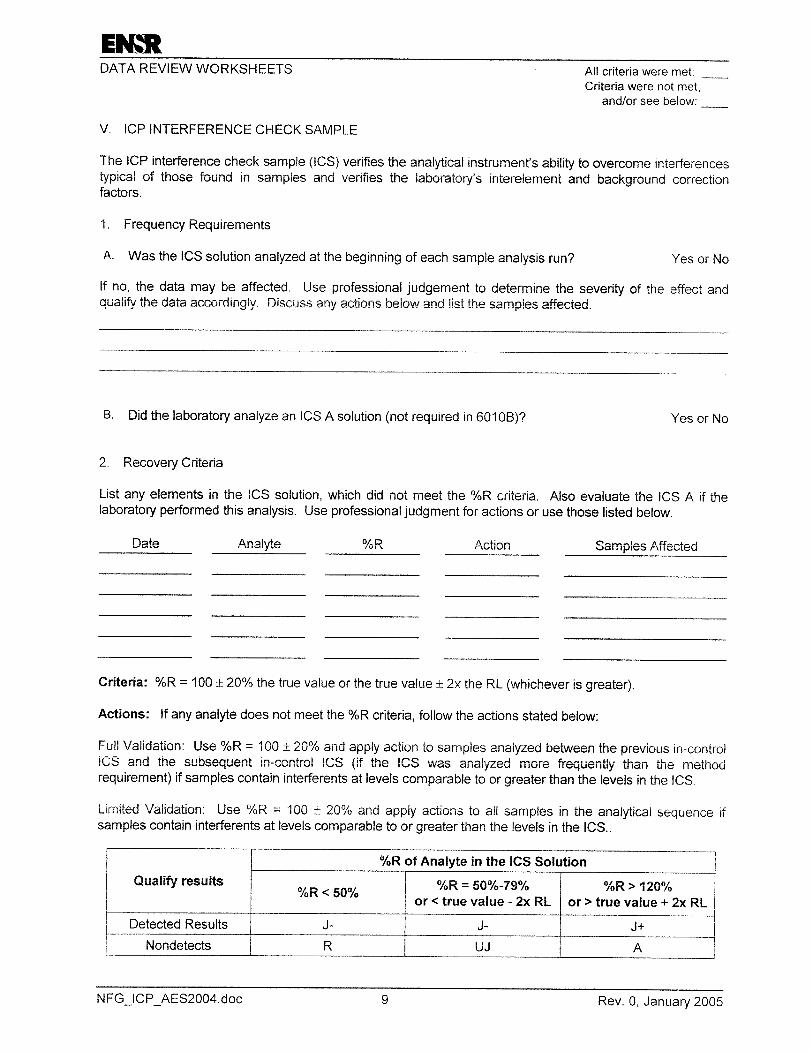
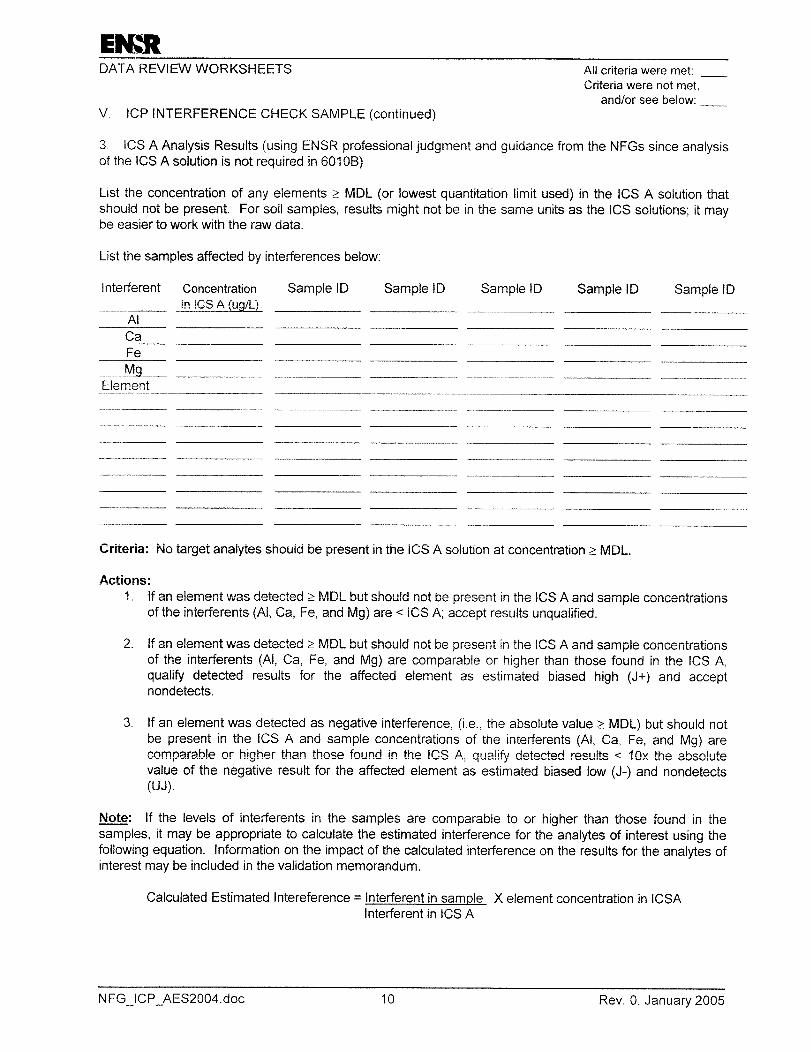
• Results for MS/MSDs, method or preparation/calibration blanks, LCSs, laboratory duplicates, inductively coupled plasma (ICP) serial dilutions, and ICP interference check samples; and
• Raw data for samples and laboratory QC samples, including labeled and dated chromatograms/spectra.
Data packages for grain size distribution/bulk density tests will include, at a minimum, chain-of-custody records, sample results, QC summaries, and a narrative addressing any problems encountered.
Section: A QUALITY ASSURANCE PROJECT PLAN Date: April 2008 YARD 520 SAP Revision: 2 PINES AREA OF INVESTIGATION Page 20 of 21
AOC II – Docket No. V-W-’04-C-784 – Yard520 - AppC QAPP April 18, 2008
A10 References
This QAPP was prepared using the following documents:
DOE. 1982. EML Procedures Manual. HASL-300.
DOE. 1997. Evaluation of Radiochemical Data Usability.
ENSR. 2005a. Site Management Strategy. Pines Area of Investigation. AOC II. Docket No. V-W-’04-C-784. January 2005.
ENSR. 2005b. RI/FS Work Plan, Pines Area of Investigation, Volumes 1 through 7. May 23, 2005. Conditionally approved August 18, 2005, and to be finalized September 16, 2005, and Volume 3 revised March 31, 2008.
IDEM. 1988. Technical Guidance Document, Volume 1 – Requirements for Describing Unconsolidated Deposits. Indiana Department of Environmental Management. Draft, Revised November 18, 1988.
MARLAP. 2004. Multi-Agency Radiological Laboratory Analytical Protocols Manual.
USEPA. 1992. Specifications and Guidance for Contaminant-Free Sample Containers. United States Environmental Protection Agency, Office of Solid Waste and Emergency Response. December 1992.
USEPA. 1997a. Test Methods for Evaluating Solid Waste, Physical/Chemical Methods, SW-846. Third Edition. United States Environmental Protection Agency. May 1986, revised June 1997.
USEPA. 1997b. Region 5 Standard Operating Procedure for Validation of CLP Organic Data. April 1991, Revised February 1997.
USEPA. 1998. Clarification to the 1994 Revised Interim Soil Lead Guidance for CERCLA Sites and RCRA Corrective Action Facilities. OSWER Directive 9200.4-27. August 1998.
U.S. EPA. 1999. Contract Laboratory Program, National Functional Guidelines for Organic Data Review. United States Environmental Protection Agency, Office of Solid Waste and Emergency Response. October 1999.
USEPA. 2000a. Instructions on the Preparation of a Superfund Division Quality Assurance Project Plan. United States Environmental Protection Agency, Region 5. Revision 0. June 2000.
Section: A QUALITY ASSURANCE PROJECT PLAN Date: September 2005 YARD 520 SAP Revision: 1 PINES AREA OF INVESTIGATION Page 21 of 21
AOC II – Docket No. V-W-’04-C-784 – Yard520 - AppC QAPP September 2, 2005
USEPA. 2000b. Guidance for the Data Quality Objectives Process, EPA QA/G-4. EPA/600/R-96/055. U.S. Environmental Protection Agency. August, 2000.
USEPA. 2001. EPA Requirements for Quality Assurance Project Plans, EPA QA/R-5. United States Environmental Protection Agency, Quality Staff. March 2001.
USEPA. 2002. National Functional Guidelines for Dioxin Data Review. United States Environmental Protection Agency.
USEPA. 2004. Contract Laboratory Program, National Functional Guidelines for Inorganic Data Review. United States Environmental Protection Agency, Office of Solid Waste and Emergency Response. October 2004.
Section: B QUALITY ASSURANCE PROJECT PLAN Date: June 2005 YARD 520 SAP Revision: 0 PINES AREA OF INVESTIGATION Page 1 of 14
AOC II – Docket No. V-W-’04-C-784 – Yard520 - AppC QAPP June 3, 2005
SECTION B – MEASUREMENT/DATA ACQUISITION
B1 Sampling Process Design
The rationale for the sample design is provided in Sections 4.2 (CCBs) and 4.3 (background soil samples) of the SAP.
B2 Sampling Methods Requirements
B2.1 Field Measurements
The field measurements taken in conjunction with the native soil and suspected CCB sampling at Yard 520 will be limited to GPS measurements. These measurements will be taken as described in Section 4.4.1 of the SAP
B2.2 Sampling Procedures
The SOPs that will be utilized for sampling of CCBs and native soils are listed below and provided in Appendix B of the SAP.
• ENSR SOP No. 7116Pines – Subsurface Soil Sampling by GeoProbe™ Methods
• ENSR SOP No. 7110Pines – Surface Soil Sampling
B2.2.1 GeoProbe™ Sampling of Yard 520 Locations
CCB materials will be collected in accordance with Section 4.4.3 of the SAP.
B2.2.2 Surface Soil Sampling at Background Locations
Surface soils will be collected in accordance with Section 4.4.4 of the SAP.
Section: B QUALITY ASSURANCE PROJECT PLAN Date: June 2005 YARD 520 SAP Revision: 0 PINES AREA OF INVESTIGATION Page 2 of 14
AOC II – Docket No. V-W-’04-C-784 – Yard520 - AppC QAPP June 3, 2005
B2.3 Cleaning and Decontamination of Equipment/Sample Containers
Guidance on equipment decontamination is included in ENSR SOP No. 7600Pines (Appendix B of the SAP). In general, equipment used will be decontaminated using the following procedure:
• Tap water rinse to remove gross contamination;
• Non-phosphate and non-borate detergent water rinse;
• Tap water rinse;
• 10% nitric acid rinse (metal sample locations only);
• Tap water rinse;
• Pesticide-grade methanol rinse (twice);
• Deionized water rinse;
• Air dry or wrap in aluminum foil for later use.
If sample collection tools consist entirely of disposable implements and bowls, then no equipment decontamination is necessary for these items.
Non-disposable and non-dedicated sampling equipment will be decontaminated prior to initial use and between samples. The effectiveness of the decontamination procedures is measured by collecting and analyzing equipment blank samples.
Sample containers will be purchased new. Specifications for these containers are addressed in Section B3.1.
B2.4 Inspection and Acceptance Requirements for Supplies/Sample Containers
For this project, critical supplies for field activities will be tracked through ENSR’s system in the following manner.
Section: B QUALITY ASSURANCE PROJECT PLAN Date: June 2005 YARD 520 SAP Revision: 0 PINES AREA OF INVESTIGATION Page 3 of 14
AOC II – Docket No. V-W-’04-C-784 – Yard520 - AppC QAPP June 3, 2005
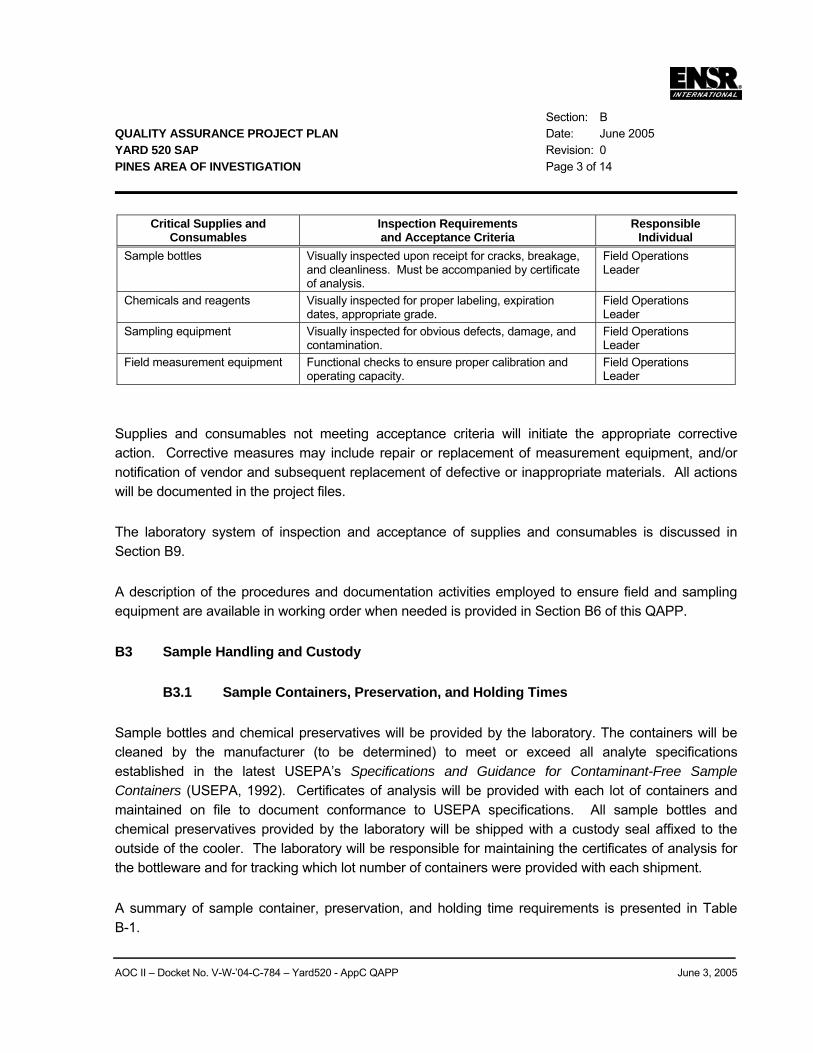
Critical Supplies and Consumables
Inspection Requirements and Acceptance Criteria
Responsible Individual
Sample bottles Visually inspected upon receipt for cracks, breakage, and cleanliness. Must be accompanied by certificate of analysis.
Field Operations Leader
Chemicals and reagents Visually inspected for proper labeling, expiration dates, appropriate grade.
Field Operations Leader
Sampling equipment Visually inspected for obvious defects, damage, and contamination.
Field Operations Leader
Field measurement equipment Functional checks to ensure proper calibration and operating capacity.
Field Operations Leader
Supplies and consumables not meeting acceptance criteria will initiate the appropriate corrective action. Corrective measures may include repair or replacement of measurement equipment, and/or notification of vendor and subsequent replacement of defective or inappropriate materials. All actions will be documented in the project files.
The laboratory system of inspection and acceptance of supplies and consumables is discussed in Section B9.
A description of the procedures and documentation activities employed to ensure field and sampling equipment are available in working order when needed is provided in Section B6 of this QAPP.
B3 Sample Handling and Custody
B3.1 Sample Containers, Preservation, and Holding Times
Sample bottles and chemical preservatives will be provided by the laboratory. The containers will be cleaned by the manufacturer (to be determined) to meet or exceed all analyte specifications established in the latest USEPA’s Specifications and Guidance for Contaminant-Free Sample Containers (USEPA, 1992). Certificates of analysis will be provided with each lot of containers and maintained on file to document conformance to USEPA specifications. All sample bottles and chemical preservatives provided by the laboratory will be shipped with a custody seal affixed to the outside of the cooler. The laboratory will be responsible for maintaining the certificates of analysis for the bottleware and for tracking which lot number of containers were provided with each shipment.
A summary of sample container, preservation, and holding time requirements is presented in Table B-1.
Section: B QUALITY ASSURANCE PROJECT PLAN Date: June 2005 YARD 520 SAP Revision: 0 PINES AREA OF INVESTIGATION Page 4 of 14
AOC II – Docket No. V-W-’04-C-784 – Yard520 - AppC QAPP June 3, 2005
B3.2 Sample Labeling
Immediately upon collection, each sample will be labeled with an adhesive label. Samples will be assigned unique sample identifications (IDs) based on an alphanumeric code that identifies the matrix, location, date, and type of sample, as described below.
• Name of location in five digits (e.g., SS002, etc.). These location names will correspond to logs of the geologic materials, as well as sample locations posted on maps. Names of borings at Yard 520 will start with CB001; background samples will start at SS001.
• Single letter signifying depth of sample (A, B, C, etc. for samples taken at increasing depth, X if this field is not being used). The actual depth measured in the field in feet will be recorded in the field records.
• Two letters signifying the sample matrix (CB for CCBs, SS for surface soil).
• Sampling date consisting of the number corresponding to the month (2 digits), day (2 digits) and year (2 digits), for example, 061405 for samples collected on June 14, 2005.
• Letter denoting the type of sample. Codes for this field include: S – sample; D – field duplicate; B – equipment rinsate blank.
No dashes will be used to separate fields. An example sample ID for this sampling would be: SS001ASS101105D indicating a surface soil sample collected at location SS001 on October 11, 2005. This sample is a field duplicate, and the A represents the sample depth. The sample depth of 0 to 6 inches for this surface sample will be recorded in the field logbook.
Samples designated as MS/MSDs will be noted as such in the comments field of the COC form.
The sample identification code will be recorded on the label, in the field logbook, on the COC form, and will be carried through the analytical process to reporting. An example of a sample label is included as Figure B-1.
B3.3 Custody Procedures
Custody is one of several factors that are necessary for the admissibility of environmental data as evidence in a court of law. Custody procedures help to satisfy the two major requirements for admissibility: relevance and authenticity. Sample custody is addressed in two parts: field sample collection and laboratory analysis.
Section: B QUALITY ASSURANCE PROJECT PLAN Date: June 2005 YARD 520 SAP Revision: 0 PINES AREA OF INVESTIGATION Page 5 of 14
AOC II – Docket No. V-W-’04-C-784 – Yard520 - AppC QAPP June 3, 2005
A sample is considered to be under a person's custody if:
• The item is in the actual possession of a person;
• The item is in the view of the person after being in actual possession of the person;
• The item was in the actual physical possession of the person but is locked up to prevent tampering; and
• The item is in a designated and identified secure area.
B3.3.1 Field Custody Procedures
The field sampler (to be determined) is personally responsible for the care and custody of the samples until they are transferred or dispatched properly. Field procedures have been designed such that as few people as possible will handle the samples.
All sample containers will be identified by the use of adhesive sample labels (Figure B-1) which will include sample numbers, project identification (i.e., ENSR project number), date/time of collection, preservation, sampler’s initials, and type of analysis. The sample numbering system is presented in Section B.3.2 of the QAPP. Sample labels will be completed for each sample using waterproof ink unless prohibited by weather conditions. For example, a logbook notation would explain that a pencil was used to fill out the sample label because the pen would not function in freezing weather.
Samples will be accompanied by a properly completed COC form. The sample numbers and locations will be listed on the COC form. When transferring the possession of samples, the individuals relinquishing and receiving will sign, date, and note the time on the record. This record documents the transfer of custody of samples from the sampler to another person, to the permanent laboratory, or to/from a secure storage location. ENSR SOP No. 1007Pines – Chain-of-Custody Procedures (Appendix B of the SAP) includes additional information. An example COC form is presented as Figure B-2.
All sample shipments will be accompanied by the COC record identifying the contents. The original record will accompany the shipment, and the pink and yellow copies will be retained by the sampler and placed in the project files.
Samples will be properly packaged on ice at 4 ± 2°C for shipment and dispatched to the appropriate laboratory for analysis, with a separate signed custody record enclosed in and secured to the inside
Section: B QUALITY ASSURANCE PROJECT PLAN Date: June 2005 YARD 520 SAP Revision: 0 PINES AREA OF INVESTIGATION Page 6 of 14
AOC II – Docket No. V-W-’04-C-784 – Yard520 - AppC QAPP June 3, 2005
top of each sample box or cooler. Shipping containers will be locked and secured with strapping tape and custody seals for shipment to the laboratory. The custody seals will be attached to the front right and back left of the cooler and covered with clear plastic tape after being signed by field personnel. The cooler will be strapped shut with strapping tape in at least two locations. ENSR SOP No. 7510Pines – Packaging and Shipment of Environmental Samples (Appendix B of the SAP) includes a detailed description of these procedures.
If the samples are sent by common carrier, the waybill will be retained as part of the permanent documentation. Commercial carriers are not required to sign off on the custody forms since the custody forms will be sealed inside the sample cooler and the custody seals will remain intact.
Whenever possible, samples will be transported to the laboratory the same day the samples are collected in the field by overnight carrier.
B3.3.2 Laboratory Custody Procedures
Samples will be received and logged in by a designated sample custodian or his/her designee. Upon sample receipt, the sample custodian will:
• Examine the shipping containers to verify and document that the custody tape is intact;
• Examine all sample containers for damage;
• Determine if the temperature required for the requested testing program has been maintained during shipment and document the temperature on the COC form;
• Compare samples received against those listed on the COC;
• Verify that sample holding times have not been exceeded;
• Examine all shipping records for accuracy and completeness;
• Determine sample pH (if applicable) and record on COC;
• Sign and date the COC immediately (if shipment is accepted) and attach the waybill;
• Note any problems associated with the coolers and/or samples on the cooler receipt form and notify the Laboratory Project Manager, who will be responsible for contacting the client;
Section: B QUALITY ASSURANCE PROJECT PLAN Date: April 2008 YARD 520 SAP Revision: 2 PINES AREA OF INVESTIGATION Page 7 of 14
AOC II – Docket No. V-W-’04-C-784 – Yard520 - AppC QAPP April 18, 2008
• Attach laboratory sample container labels with unique laboratory identification and test; and
• Place the samples in the proper laboratory storage.
Following receipt, samples will be logged in according to the following procedure:
• The samples will be entered into the laboratory information management system (LIMS). At a minimum, the following information will be entered: project name or identification, unique sample numbers (both client and internal laboratory), type of sample, required tests, date and time of laboratory receipt of samples, and field ID provided by field personnel.
• The appropriate laboratory personnel will be notified of sample arrival.
• The completed COC, waybills, and any additional documentation will be placed in the project file.
Specific details of laboratory custody procedures for sample receiving, sample identification, sample control, record retention, and data purging to the final evidence file are described in the laboratory SOPs (Attachment A).
B4 Analytical Methods
All PAH, TOC, sulfur, and metals, except boron and total uranium, analyses will be performed by:
Columbia Analytical Services Contact: Janice Jaeger Phone: 585-288-5380 1 Mustard Street Rochester, NY 14609
CAS Rochester will subcontract the PCDDs/PCDF analysis to their Houston, TX facility:
Columbia Analytical Services Contact: Karen Verschoor Phone: 713-266-1599 10655 Richmond Avenue, Suite 130A Houston, TX 77042
Radionuclide analyses, and boron and total uranium analyses by ICP-MS will be performed by:
General Engineering Laboratories, LLC Contact: Edith Kent Phone: 843-769-7385 2040 Savage Road Charleston, SC 29417
Section: B QUALITY ASSURANCE PROJECT PLAN Date: April 2008 YARD 520 SAP Revision: 2 PINES AREA OF INVESTIGATION Page 8 of 14
AOC II – Docket No. V-W-’04-C-784 – Yard520 - AppC QAPP April 18, 2008
Grain size distribution and bulk density tests will be performed by:
GeoTesting Express Contact: Joe Tomei Phone: 800-434-1062 1145 Massachusetts Ave. Boxborough, MA 01719
B4.1 Field Analytical Procedures
There are no field analyses associated with the Yard 520 sampling.
B4.2 Laboratory Analytical Procedures
The laboratories named above will implement the project-required SOPs. These laboratory SOPs for sample preparation and analysis are based primarily on SW-846 Third Edition, November 1986 (including all final updates through Final Update III; USEPA, 1997a), American Society for Testing and Materials (ASTM), and the DOE HASL 300 method (DOE, 1982). These SOPs provide sufficient detail and are specific to the analyses to be performed for this investigation. Attachment A of the QAPP contains the laboratory SOPs. Laboratory Instrument Detection Limits (IDLs) and MDLs are listed in Tables A-3 (PAHs), A-4 (PCDDs/PCDFs), A-5 (radionuclides) and A-6 (metals, grain size distribution, bulk density tests, TOC, and sulfur). The CAS Rochester laboratory SOP for performing MDL studies is included in Attachment A-1; no SOPs for MDL studies are included for GEL, GTX, and CAS Houston as MDL studies are not applicable to radionuclide, grain size distribution, bulk density tests, and PCDD/PCDF analyses. A list of the laboratory SOPs included in Attachment A is provided in the Table B-2.
Table B-2 summarizes the analyte groups of interest, appropriate laboratory SOP number, and reference method for the organic and inorganic analytes evaluated in the investigation.
B4.3 List of Project Target Constituents and Detection Limits
A complete listing of project target constituents and reporting limits for each analyte group listed in Table B-2 can be found in Tables A-3 (PAHs), A-4 (PCDDs/PCDFs), A-5 (radionuclides) and A-6 (metals, grain size distribution, bulk density tests, TOC, and sulfur) of this QAPP.
Section: B QUALITY ASSURANCE PROJECT PLAN Date: April 2008 YARD 520 SAP Revision: 2 PINES AREA OF INVESTIGATION Page 9 of 14
AOC II – Docket No. V-W-’04-C-784 – Yard520 - AppC QAPP April 18, 2008
B4.4 List of Associated Quality Control Samples
The analytical laboratory SOPs listed in Table B-2 includes a QC section which addresses the minimum QC requirements for the analysis of specific analyte groups. Section B5 of this QAPP contains a complete list of the associated QC samples for every analyte group.
B5 Quality Control
QC is the overall system of technical activities that measure the attributes and performance of a process, item or service against defined standards to verify that they meet the stated requirements. Acceptable limits of performance are defined for each QC check and sample used in the project.
B5.1 Field
QC samples will include equipment blanks, field duplicates, and MS/MSDs. These samples will be collected as described below:
B5.1.1 Equipment Blanks
Equipment blanks will be prepared by routing laboratory grade and organic free water (provided by the laboratory) through non-disposable or non-dedicated sampling equipment after equipment decontamination and before field sample collection. Equipment blanks will be collected for all solid samples collected with non-disposable or non-dedicated equipment and will be collected at a frequency of one per 10 samples collected using a particular type of equipment. Equipment blanks will be analyzed for the same parameters as their associated samples. The parameters for which accuracy will be evaluated utilizing blanks are indicated in Table A-7.
B5.1.2 Field Duplicates
Field duplicates will be collected at a frequency of one field duplicate for every 10 or less investigative samples of each medium. Field duplicates will be collected by alternately filling two sets of identical sample containers from the interim container used to collect the sample. All field duplicates will be analyzed for the same parameters as their associated samples. Whenever possible, collection of field duplicate samples will occur at locations where detectable concentrations of target analytes are expected. The analyses for which precision will be evaluated utilizing field duplicates are indicated in Table A-7.
Section: B QUALITY ASSURANCE PROJECT PLAN Date: April 2008 YARD 520 SAP Revision: 2 PINES AREA OF INVESTIGATION Page 10 of 14
AOC II – Docket No. V-W-’04-C-784 – Yard520 - AppC QAPP April 18, 2008
B5.1.3 MS/MSDs
MS/MSD or MS/duplicate samples will be collected at a frequency of one for every 20 or less investigative samples. For those samples designated as MS/MSDs or MS/duplicates, sufficient additional volume (based on the individual laboratory’s requirements) will be collected. The parameters for which accuracy will be evaluated utilizing MS/MSDs are indicated in Table A-7.
B5.2 Analytical Quality Control Checks
Each laboratory has a QC program in place to ensure the reliability and validity of the analysis performed at the laboratories. All analytical procedures are documented in writing as SOPs and each SOP includes a QC section which addresses the minimum QC requirements for the procedure. The internal QC checks differ slightly for each individual procedure but in general the QC requirements include the following:
• Blanks (method, reagent/preparation, instrument, calibration);
• MS/MSDs;
• Surrogate spikes;
• Tracers;
• Laboratory duplicates;
• Laboratory control samples (LCSs);
• Internal standard areas;
• Inductively coupled plasma (ICP) interference checks; and
• Serial dilutions.
Table B-3 summarizes the QC for each method.
B6 Instrument/Equipment Testing, Inspection, and Maintenance
This section describes the procedures used to verify that all instruments and equipment are maintained in sound operating condition and in working order when needed.
Section: B QUALITY ASSURANCE PROJECT PLAN Date: June 2005 YARD 520 SAP Revision: 0 PINES AREA OF INVESTIGATION Page 11 of 14
AOC II – Docket No. V-W-’04-C-784 – Yard520 - AppC QAPP June 3, 2005
B6.1 Field Equipment Maintenance
Specific preventative maintenance procedures to be followed for field equipment are based on those recommended by the manufacturer. The GPS will be checked and calibrated daily before use and periodically throughout the day as specified in Section 4.4.1 of the SAP. Critical spare parts will be kept on site to reduce potential downtime. Backup instruments and equipment will be available on site or within 1-day shipment to avoid delays in the field schedule.
B7 Laboratory Instrument Preventative Maintenance
As part of their QA manual, a routine preventative maintenance program is conducted by the laboratories to minimize the occurrence of instrument failure and other system malfunctions. Designated laboratory employees regularly perform routine scheduled maintenance and repair of (or coordinate with the vendor for repair of) all instruments. All maintenance that is performed is documented in the laboratories’ operating record. All laboratory instruments are maintained in accordance with manufacturer’s specifications. Table B-4 provides the frequency with which components of key analytical instruments will be serviced. Table B-5 provides a summary of the monitoring of laboratory equipment.
B8 Instrument/Equipment Calibration and Frequency
Calibration is required to ensure that field and laboratory analytical systems are operating correctly and functioning at the proper sensitivity to meet established detection limits.
B8.1 Field Instruments
Field instrumentation is limited to the GPS unit. Calibration of this instrument will be performed according to the manufacturer’s instructions and Section 4.4.1 of the SAP. All calibration procedures will be documented in the field records. Calibration records will include the date/time of calibration, name of the person performing the calibration, reference standard used, and the results of the calibration.
B8.2 Analytical Instrumentation
Calibration procedures for laboratory instruments will consist of initial calibrations, initial calibration verifications, and continuing calibration verification. The SOP for each analysis performed in the laboratory describes the calibration procedures, their frequency, acceptance criteria, and the
Section: B QUALITY ASSURANCE PROJECT PLAN Date: June 2005 YARD 520 SAP Revision: 0 PINES AREA OF INVESTIGATION Page 12 of 14
AOC II – Docket No. V-W-’04-C-784 – Yard520 - AppC QAPP June 3, 2005
conditions that will require recalibration. This information is summarized in Table B-6. The SOPs are included as Attachment A.
The laboratory maintains documentation for each instrument which includes the following information: instrument identification, serial number, date of calibration, analyst, calibration solutions, and the samples associated with these calibrations.
B9 Inspection/Acceptance of Supplies and Consumables
Inspection and acceptance procedures for field materials are discussed in Section B2.4.
The laboratory system of inspection and acceptance of supplies and consumables includes:
• Approval of purchase orders by the Laboratory Director or Section Managers to ensure that materials and supplies of the appropriate quality are ordered.
• Purchasing of supplies, reagents/chemicals, and bottles through established and approved vendors.
• Inspection of items upon receipt for damage, completeness of the order, and conformance to specifications.
• Logging in of each lot of reagents and verifying the quality through batch analysis.
B10 Non-Direct Measurements
The suitability of use of non-direct data (historical reports, maps, literature searches, previously collected analytical data) will be evaluated and limitations potentially placed on its use. Section B10 of the RI/FS QAPP (ENSR, 2005b) presents a summary of the criteria and limitations.
The data necessary to meet the Yard 520 sampling program objectives specified in Section A7 will be generated during the sampling program proposed in the Yard 520 SAP and will come from the following sources:
• Field records (sample locations, sample observations);
• Field measurements (GPS);
• Laboratory results for chemical and radionuclide analyses of soil and CCBs.
Section: B QUALITY ASSURANCE PROJECT PLAN Date: June 2005 YARD 520 SAP Revision: 0 PINES AREA OF INVESTIGATION Page 13 of 14
AOC II – Docket No. V-W-’04-C-784 – Yard520 - AppC QAPP June 3, 2005
The data collected under this QAPP have been designed to be of sufficient quality to meet the program objectives.
B11 Data Management
Data management operations include data recording, validation, transformation, transmittal, reduction, analysis, tracking, storage and retrieval.
All data will be entered into an EQuIS database system. EDDs provided by the laboratories will be in an EQuIS-compatible format that will minimize manipulation of the data.
Upon receipt from the laboratory, hard copy and EDD will be assigned a unique identifier, which allows the data to be tracked from receipt, through validation, to data loading and storage. The electronic data will be imported into the EQuIS database system concurrent with the data validation process. Data qualifiers generated during data validation will be entered manually. Definitions of all qualifiers are maintained within the database structure and electronic versions of the data validation reports are stored in the project files maintained on the network drive. Data collected in the field will also be entered into the system and integrated with laboratory data.
As data are loaded into the system, a variety of quality checks are performed to ensure data integrity. These checks include:
• Audits to ensure that laboratories reported all requested analyses;
• Checks that all analytes are consistently and correctly identified;
• Reviews to ensure that units of measurement are provided and are consistent;
• Queries to determine that any codes used in the database are documented properly;
• Reports to review sample definitions (depths, dates, locations);
• Proofing manually entered data against the hard-copy original; and
• Reports to review groupings of sampling locations and coordinate systems.
Records of the checks are maintained on file.
Section: B QUALITY ASSURANCE PROJECT PLAN Date: June 2005 YARD 520 SAP Revision: 0 PINES AREA OF INVESTIGATION Page 14 of 14
AOC II – Docket No. V-W-’04-C-784 – Yard520 - AppC QAPP June 3, 2005
At a minimum, the database will contain the following fields:
Sample identifier; Sample location; Sample media type; Sampling date; Analysis date; Laboratory analysis identifier (test method); Analyte name; Concentration value; Quantitation limits; Measurement units; and Data qualifiers.
Data will be loaded into a “temporary” database until data validation is complete, at which time the database will be finalized. Any changes made to the database after finalization will be documented, including a description of the change, date of change, person responsible, and reason for change.
Once all data quality checks are performed, the data will be exported to a variety of formats to meet project needs. Cross-tab tables showing concentrations by sample location will be prepared. Statistical analyses will be performed as required. Data can be accessed by a variety of mapping and visualization tools.
The project database will be maintained on a secure network drive which is backed up regularly. Access to the database will be limited to authorized users and will be controlled by password access. Data will be retained in accordance with the requirements stated in Section A9.1 of this QAPP.
Section: C QUALITY ASSURANCE PROJECT PLAN Date: June 2005 YARD 520 SAP Revision: 0 PINES AREA OF INVESTIGATION Page 1 of 7
AOC II – Docket No. V-W-’04-C-784 – Yard520 - AppC QAPP June 3, 2005
SECTION C – PROJECT ASSESSMENT/OVERSIGHT
C1 Assessment and Response Actions
This section identifies the number, frequency, and type of planned assessment activities that will be performed for the project.
C1.1 Assessments
C1.1.1 Field Sampling Technical System Audit
The USEPA is responsible for the external TSAs of field activities, including field sampling and measurements, for compliance of requirements specified for this project.
The Project QA Officer and/or Field Operations Leader of ENSR will be responsible for periodic internal TSAs to verify that field sampling procedures and field sampling measurements are properly followed. The TSAs will include examination of
• Field sampling records;
• Field measurement results;
• Field instrument operating and calibration records;
• Sample collection, handling, and packaging procedures;
• QA procedures;
• Chain-of-custody; and
• Sample documentation, etc.
An example of the checklist used during the internal field TSAs is included as Figure C-1. Results of internal field TSAs will be documented in the QA reports to management (Section C2).
Section: C QUALITY ASSURANCE PROJECT PLAN Date: June 2005 YARD 520 SAP Revision: 0 PINES AREA OF INVESTIGATION Page 2 of 7
AOC II – Docket No. V-W-’04-C-784 – Yard520 - AppC QAPP June 3, 2005
C1.1.2 Fixed Laboratory Technical System Audits
The USEPA is responsible for the external TSAs of laboratory activities for compliance of requirements specified for this project.
System audits are performed as described in the laboratory QA manual for internal auditing or as required by accreditation authorities.
Laboratory TSAs are conducted at project start up and then periodically as the project progresses, by ENSR or another qualified party, as part of their analytical subcontractor monitoring program. The laboratory TSA includes a review of the following areas:
• QA organization and procedures;
• Personnel training and qualifications;
• Sample log-in procedures;
• Sample storage facilities;
• Analyst technique;
• Adherence to laboratory SOPs and project QAPP;
• Compliance with QA/QC objectives;
• Instrument calibration and maintenance;
• Facility security;
• Bottleware preparation;
• Waste management;
• Data archival;
• Data recording, reduction, review, and reporting; and
• Cleanliness and housekeeping.
An example of the laboratory TSA checklist is included as Figure C-2.
Section: C QUALITY ASSURANCE PROJECT PLAN Date: June 2005 YARD 520 SAP Revision: 0 PINES AREA OF INVESTIGATION Page 3 of 7
AOC II – Docket No. V-W-’04-C-784 – Yard520 - AppC QAPP June 3, 2005
Preliminary results of the systems audit will be discussed with the Laboratory Director, Laboratory Project Manager, and Laboratory QA Manager. A written report that summarizes audit findings and recommends corrective actions will be prepared and submitted to the Laboratory Director for response, and to the ENSR Project Manager. The results of the audit, including resolution of any deficiencies, will be included in the QA reports to management, as described in Section C2.
C1.1.3 Performance Evaluation Sample Assessment
Continuous performance auditing is accomplished through the regular use of LCS, matrix spike samples, duplicate samples, QC samples, proficiency testing, and through continuing calibration verification samples. Federal and State agencies may administer the proficiency testing.
Prior to the initiation of this project, the results of recent (within 6 months of the start of the program) Performance Evaluation (PE) samples analyzed by the laboratories will be reviewed and evaluated to ensure the acceptability of results for the parameters and matrices of interest. In the event that PE results are not current, not acceptable, or are not available for the target parameters, PE samples will be purchased from a commercial vendor and submitted to the laboratories for analysis prior to the start of the analytical program. The results of the PE samples analyzed by CAS and GEL will be reviewed by the ENSR Project QA Officer. Any deficiencies will be communicated to the ENSR Project Manager, the laboratory, and to the USEPA RPM. Corrective actions, which may include internal laboratory actions, the analysis of additional PE samples, or selection of another analytical subcontractor, will be documented in the QA reports to management (Section C2).
C1.1.4 Data Validation Technical System Audits
Data validation and verification will be performed as described in Section D2. In summary, a subset of data received will be subjected to a full data validation. The remainder of the data will receive a limited data validation. Data will be qualified and the results of the validation will be summarized in a validation memo. Each data validation technical systems audit will be reviewed by a validator other than the one performing the validation. This review will verify that the analytical deliverable package was complete and that any missing information requested from the laboratory was supplied, that validation worksheets were filled out accurately and completely, that validation actions were consistent with the validation guidelines established for this program and/or best professional judgment, and that the validation reports and data qualifiers accurately reflect the validation actions as documented on the worksheets.
Section: C QUALITY ASSURANCE PROJECT PLAN Date: June 2005 YARD 520 SAP Revision: 0 PINES AREA OF INVESTIGATION Page 4 of 7
AOC II – Docket No. V-W-’04-C-784 – Yard520 - AppC QAPP June 3, 2005
C1.1.5 Data Package Technical System Audits
Audits of analytical data packages will be conducted for 100% of the packages received as part of the data validation process (Section D1). The review will include an evaluation of the package to ensure that (1) all required deliverables are provided, (2) each package contains the information necessary to reproduce the reported results, and (3) the QC acceptance criteria specified in the QAPP were met. Any deficiencies will be communicated to the laboratory and documented in the data validation reports.
C1.1.6 Management System Review (MSR)
On a quarterly basis, at a minimum, all projects within ENSR are reviewed. The review includes the following elements:
• Progress towards completion of the scope of work;
• Schedule versus approved plan;
• Costs and invoicing versus approved plan, including adherence to purchasing policy;
• Project task structure and associated budgets;
• Senior review assignments and documentation;
• Compliance with hard copy and electronic file management requirements;
• Client relationship development; and
• Future needs.
Documentation of the review will be maintained with the project files.
C1.2 Assessment Findings and Corrective Action Responses
Corrective action is the process of identifying, recommending, approving, and implementing measures to counter unacceptable procedures or out-of-limit QC performance that can affect data quality. Corrective action can occur during field activities, laboratory analyses, data validation, and data assessment. All corrective action proposed and implemented should be documented in the QA reports to management (Section C2). Corrective action should only be implemented after approval by the ENSR Project Manager, or their designee.
Section: C QUALITY ASSURANCE PROJECT PLAN Date: June 2005 YARD 520 SAP Revision: 0 PINES AREA OF INVESTIGATION Page 5 of 7
AOC II – Docket No. V-W-’04-C-784 – Yard520 - AppC QAPP June 3, 2005
C1.2.1 Field Corrective Action
Corrective action in the field may be needed when the sample frequency is changed (i.e., more/fewer samples, sample locations other than those specified in the QAPP, etc.), or when sampling procedures and/or field analytical procedures require modification, etc. due to unexpected conditions. The field team may identify the need for corrective action. The Field Operations Leader will approve the corrective action and notify the Project Manager. The Project Manager will approve the corrective measure. The Field Operations Leader will ensure that the field team implements the corrective action. Refer to ENSR No. SOP 100Pines - Field Change Order Procedures (Appendix B of the SAP) for further discussion of field corrective actions.
Corrective action resulting from internal field audits will be implemented immediately if data may be adversely affected due to unapproved or improper use of approved methods. The QA auditor will identify deficiencies and recommend corrective action to the Field Operations Leader. The Field Operations Leader and field team will perform implementation of corrective actions. Corrective action will be documented in QA reports to the project management team (Section C2).
Corrective actions will be implemented and documented in the field record book. Documentation will include:
• A description of the circumstances that initiated the corrective action;
• The action taken in response;
• The final resolution;
• Any necessary approvals; and
• Effectiveness of corrective action.
No staff member will initiate corrective action without prior communication of findings through the proper channels.
If at any time a corrective action issue is identified which directly impacts the project DQOs, the USEPA RPM will be notified.
Section: C QUALITY ASSURANCE PROJECT PLAN Date: June 2005 YARD 520 SAP Revision: 0 PINES AREA OF INVESTIGATION Page 6 of 7
AOC II – Docket No. V-W-’04-C-784 – Yard520 - AppC QAPP June 3, 2005
C1.2.2 Laboratory Corrective Action
Corrective action in the laboratory is specified in laboratory SOPs and may occur prior to, during, and after initial analyses. A number of conditions such as broken sample containers, multiple phases, low/high pH readings, and potentially high concentration samples may be identified during sample log-in or analysis. Following consultation with laboratory analysts and supervisory personnel, it may be necessary for the Laboratory QA Manager to approve the implementation of corrective action. If the nonconformance causes project objectives not to be achieved, the ENSR Project QA Officer will be notified, who will in turn notify the ENSR Project Manager, who will communicate with the Respondent Project Managers and other members of the project team, as necessary. The USEPA RPM will also be notified in those cases where the nonconformance affects the achievement of the project DQOs.
These corrective actions are performed prior to release of the data from the laboratory. The corrective action will be documented in both the laboratory’s corrective action files, and in the narrative data report generated by the laboratory. If the corrective action does not rectify the situation, the laboratory will contact the ENSR Project QA Officer, who will determine the action to be taken and inform the appropriate personnel.
C1.2.3 Corrective Action During Data Validation and Data Assessment
The need for corrective action may be identified during either data validation or data assessment. Potential types of corrective action may include resampling by the field team or reinjection/reanalysis of samples by the laboratory. These actions are dependent upon the ability to mobilize the field team and whether the data to be collected are necessary to meet the required QA objectives. If the data validator or data assessor identifies a corrective action situation that impacts the achievement of the project objectives, the ENSR Project Manager will be responsible for informing the appropriate personnel, including the USEPA RPM.
C2 Reports to Management
QA reports will be prepared by the ENSR Project QA Officer and submitted on an as-needed basis to the ENSR Project Manager. QA reports will document any problems identified during the sampling and analysis programs and the corrective measures taken in response. The QA reports will include:
• All results of field and laboratory audits;
• Problems noted and actions taken during data validation and assessment; and
Section: C QUALITY ASSURANCE PROJECT PLAN Date: June 2005 YARD 520 SAP Revision: 0 PINES AREA OF INVESTIGATION Page 7 of 7
AOC II – Docket No. V-W-’04-C-784 – Yard520 - AppC QAPP June 3, 2005
• Significant QA/QC problems, recommended corrective actions, and the outcome of corrective actions.
A summary of QA issues, audit findings, and significant nonconformances will be included in the status reports to the USEPA. A complete listing and description of all documents and reports that will be maintained in the project files is included in Section A9 of this QAPP.
Section: D QUALITY ASSURANCE PROJECT PLAN Date: June 2005 YARD 520 SAP Revision: 0 PINES AREA OF INVESTIGATION Page 1 of 10
AOC II – Docket No. V-W-’04-C-784 – Yard520 - AppC QAPP June 3, 2005
SECTION D – DATA VALIDATION AND USABILITY
This element details the QA activities that will be performed to ensure that the collected data are scientifically defensible, properly documented, of known quality, and meet project objectives. Two steps are completed to ensure that project data quality needs are met:
• Data Verification/Validation
• Data Usability Assessment
D1 Data Review, Verification, and Validation
All data generated through field activities or through the analytical program, will be reduced and validated prior to reporting. No data will be disseminated until it has been subjected to the procedures summarized below.
D1.1 Field Data Review
The field data verification includes verification of sampling design, sample collection procedures and sample handling. Field data will be reviewed daily by the Field Operations Leader to ensure that the records are complete, accurate, and legible and to verify that the sampling procedures are in accordance with the protocols specified in the SAP and QAPP (refer to Section D2.1 for the specific elements reviewed).
D1.2 Internal Laboratory Review
Prior to the release of any data from the laboratory, the data will be reviewed and approved by laboratory personnel. The review will consist of a tiered approach (Section D2.2) that will include reviews by the person performing the work, by a qualified peer, and by supervisory and/or QA personnel.
D1.3 Validation of Analytical Data
Analytical data validation includes the verification and validation of analytical procedures, QC, calibration, and data reduction. Validation of the laboratory deliverables will be performed by ENSR. One hundred percent of the analytical data will receive validation, either as full or limited validation.
Section: D QUALITY ASSURANCE PROJECT PLAN Date: April 2008 YARD 520 SAP Revision: 2 PINES AREA OF INVESTIGATION Page 2 of 10
AOC II – Docket No. V-W-’04-C-784 – Yard520 - AppC QAPP April 18, 2008
Ten percent of the routine chemical and radionuclide data will be subjected to full validation and the remainder will receive limited validation. The grain size distribution and bulk density test data will not be validated, but will be reviewed for completeness of deliverables. The ten percent of data selected for full validation will be representative of all matrices and analyses. It is expected that full validation will occur early in the validation process to identify any potential systematic problem and then will be performed periodically as needed.
For full validation, the data will be reviewed for the following, where applicable to the method:
• Completeness of deliverable;
• Technical holding times and sample preservation;
• Laboratory and field blank contamination;
• Surrogate recoveries;
• Tracer recoveries;
• Field and laboratory duplicates;
• MS/MSD recoveries and RPDs;
• Post-digestion spike recoveries;
• LCS recoveries;
• Initial and continuing calibrations;
• Instrument tuning,
• Internal standard performance,
• ICP serial dilution results;
• ICP interference check sample results; and
• Calculation and transcription verifications (i.e., verifying summary data against raw data).
Limited validation will be limited to information presented on summary forms and will include the following:
• Completeness of deliverable;
• Technical holding times and sample preservation;
Section: D QUALITY ASSURANCE PROJECT PLAN Date: June 2005 YARD 520 SAP Revision: 0 PINES AREA OF INVESTIGATION Page 3 of 10
AOC II – Docket No. V-W-’04-C-784 – Yard520 - AppC QAPP June 3, 2005
• Laboratory and field blank contamination;
• Initial and continuing calibrations;
• Surrogate recoveries;
• Tracer recoveries;
• Field and laboratory duplicates;
• MS/MSD recoveries and RPDs; and
• LCS recoveries.
The discovery of significant anomalies or discrepancies during validation using the summary forms may result in an in-depth review of the raw data and the incorporation of additional review elements into the validation of all data.
D2 Validation and Verification Methods
D2.1 Field Data Verification
Field records will be reviewed by the Field Operations Leader to ensure that:
• Logbooks and standardized forms have been filled out completely and that the information recorded accurately reflects the activities that were performed.
• Records are legible and in accordance with good recordkeeping practices, i.e., entries are signed and dated, data are not obliterated, changes are initialed, dated, and explained.
• Sample collection, handling, preservation, storage, and shipping procedures were conducted in accordance with the protocols described in the SAP and QAPP, and that any deviations were documented and approved by the appropriate personnel.
D2.2 Laboratory Data Verification
Prior to being released as final, laboratory data will proceed through a tiered review process. Data verification starts with the analyst who performs a 100 percent review of the data to ensure the work was done correctly the first time. The data reduction and initial verification process must ensure that:
Section: D QUALITY ASSURANCE PROJECT PLAN Date: June 2005 YARD 520 SAP Revision: 0 PINES AREA OF INVESTIGATION Page 4 of 10
AOC II – Docket No. V-W-’04-C-784 – Yard520 - AppC QAPP June 3, 2005
• Sample preparation and analysis information is correct and complete;
• Analytical results are correct and complete;
• Reporting limits are correct;
• The appropriate SOPs have been followed and are identified in the project records;
• Proper documentation procedures have been followed; and
• All nonconformances have been documented.
Following the completion of the initial verification by the analyst performing the data reduction, a systematic check of the data will be performed by an experienced peer or supervisor. This check will be performed to ensure that initial review has been completed correctly and thoroughly and will include a review of:
• Adherence to the requested analytical method SOP;
• Correctness of numerical input when computer programs are used (checked randomly);
• Correct identification and quantitation of constituents with appropriate qualifiers;
• Numerical correctness of calculations and formulas (checked randomly);
• Acceptability of QC data;
• Documentation that instruments were operating according to method specifications (calibrations, performance checks, etc.);
• Documentation of dilution factors, standard concentrations, etc.; and
• Sample holding time assessment.
A third-level review will be performed by the Laboratory Project Manager before results are submitted to clients. This review serves to verify the completeness of the data report and to ensure that project requirements are met for the analyses performed. A narrative to accompany the final report will be prepared by the Laboratory Project Manager.
Section: D QUALITY ASSURANCE PROJECT PLAN Date: April 2008 YARD 520 SAP Revision: 2 PINES AREA OF INVESTIGATION Page 5 of 10
AOC II – Docket No. V-W-’04-C-784 – Yard520 - AppC QAPP April 18, 2008
D2.3 Validation of Analytical Deliverables
Validation will be performed as described in Section D.1.3 of the QAPP using the following documents in conjunction with ENSR data validation protocols (Attachment B):
• Contract Laboratory Program National Functional Guidelines for Inorganic Data Review (USEPA, 2004),
• Region 5, Standard Operating Procedure for Validation of CLP Organic Data (USEPA, 1997b),
• Contract Laboratory Program National Functional Guidelines for Organic Data Review (USEPA, 1999),
• Multi-Agency Radiological Laboratory Analytical Protocols Manual (MARLAP, 2004),
• Evaluation of Radiochemical Data Usability (DOE, 1997); and
• Contract Laboratory Program, National Functional Guidelines for Chlorinated Dioxin/Furan Data Review (USEPA, 2002).
All guidelines will be modified to reflect any differences in analytical methodologies. Acceptance/rejection criteria will be the project-specific criteria defined in Section A.7 of this QAPP or the method criteria, whichever is more stringent.
Upon completion of the validation, a report will be prepared. This report will summarize the samples reviewed, elements reviewed, any nonconformances with the established criteria, and validation actions (including application of data qualifiers). Data qualifiers will be consistent with the USEPA guidelines as shown below:
• J - The result is an estimated quantity; the associated numerical value is the approximate concentration of the analyte in the sample.
• J+ - the result is an estimated quantity, but the result may be biased high (this qualifier will be used only for metals data).
• J- – The result is an estimated quantity, but the result may be biased low (this qualifier will be used only for metals data).
• UJ - The analyte was not detected above the sample reporting limit; and the reporting limit is approximate.
• U - The analyte was analyzed for, but was not detected above the sample reporting limit.
Section: D QUALITY ASSURANCE PROJECT PLAN Date: April 2008 YARD 520 SAP Revision: 2 PINES AREA OF INVESTIGATION Page 6 of 10
AOC II – Docket No. V-W-’04-C-784 – Yard520 - AppC QAPP April 18, 2008
• R – The data are unusable. The sample result is rejected due to serious deficiencies. The presence or absence of the analyte cannot be verified.
• B – The result may be a false positive (totally attributed to blank contamination) (this qualifier will be used for radiochemical data only).
• JB – The result may be biased high (partially attributed to blank contamination) (this qualifier will be used for radiochemical data only).
D2.4 Verification During Data Management
Data provided electronically used to facilitate data handling will be verified against the hard copy data report during data validation.
D3 Usability/Reconciliation with Data Quality Objectives
This element describes how the verified/validated project data will reconcile with the project DQOs, how data quality issues will be addressed and how limitations on the use of the data will be reported and handled. The purpose of this section is to indicate the methods by which it will be ensured that the data collected for this investigation falls in line with the DQOs as described in Sections A.7 of this QAPP. To meet these DQOs, a combination of statistical procedures and qualitative evaluations will be used to check the quality of the data. These procedures will be used by the laboratory, in generating the data, and by the Data Validator, in the evaluation of the data for ultimate use in accordance with the RI/FS Work Plan (ENSR, 2005b).
The data generated must meet the data user’s needs as defined in the project DQOs in Sections A.7 of this QAPP. The primary objectives for assessing the usability of the data are to ensure (1) data are representative of conditions in the Area of Investigation; (2) data meet the project reporting limit requirements; and (3) data are of the quality needed in order to meet the overall objective of the RI/FS.
Results for QC samples, including field and laboratory blanks, spikes, and duplicates will be evaluated using the equations described below to determine the validity and usability of the data. In addition, the data will be reviewed for indications of interferences to results caused by sample matrices, contamination during sampling, contamination in the laboratory, and sample preservation and storage anomalies (i.e., sample holding time or analytical instrument problems).
Data will be qualified for precision and accuracy by the Data Validator. The Data Validator will apply the standard data validation qualifiers to data to indicate the level of uncertainty in the associated result. In general, data that are left unqualified, data qualified “U” (non-detected), data qualified “J (+/-)” (detected as an estimated result), and data qualified “UJ” (non-detected at an estimated detection reporting limit) are considered valid and usable for project objectives. Data that are qualified “R”
Section: D QUALITY ASSURANCE PROJECT PLAN Date: June 2005 YARD 520 SAP Revision: 0 PINES AREA OF INVESTIGATION Page 7 of 10
AOC II – Docket No. V-W-’04-C-784 – Yard520 - AppC QAPP June 3, 2005
(rejected), due to severe exceedances of QC requirements, will be considered invalid and unusable for making project decisions.
D3.1 Comparison to Measurement Criteria
D3.1.1 Precision Assessment
The RPD, as a measure of variability between the matrix spike and matrix spike duplicate or sample and matrix duplicate (laboratory duplicates), and field duplicates, will be calculated to compare to precision and representativeness DQOs. The RPD of duplicate measurements is calculated according to the following formula:
where:
Sample 1 = Initial sample or spiked sample result
Sample 2 = Duplicate sample or duplicate spiked sample result
In the event of precision results that do not meet the measurement performance criteria established for this project the results will be inspected to determine if the reduced precision can be attributed to sampling techniques (field duplicates) or sample contamination (field and laboratory blanks). If precision has been determined to be affected by sampling or contamination the data users must decide how to use data near the project action limits that may be affected. Data of reduced precision might be usable with appropriate acknowledgement of the uncertainty associated with results that are near action levels.
D3.1.2 Accuracy Assessment
Accuracy, as a measure of bias, will be evaluated based on the percent recoveries (%Rs) of the matrix spike sample, matrix spike duplicate sample, LCS, surrogates, internal standards, and initial and continuing calibration check samples. These QC results will be compared to the project measurement performance criteria for accuracy.
RPD = |Result in Sample 1 - Result in Sample 2| x 100 Average (Result in Sample 1 and Result in Sample 2)
Section: D QUALITY ASSURANCE PROJECT PLAN Date: April 2008 YARD 520 SAP Revision: 2 PINES AREA OF INVESTIGATION Page 8 of 10
AOC II – Docket No. V-W-’04-C-784 – Yard520 - AppC QAPP April 18, 2008
The increase in concentration of the analyte observed in the spiked sample, due to the addition of a known quantity of the analyte, compared to the reported value of the same analyte in the unspiked sample determines the %R.
Percent recoveries for spiked samples and QC are determined using the following equation:
% R = (Result in Spiked Sample - Result in Original Unspiked Sample) x 100 Known Amount of Spike Added
Percent recoveries for LCS are determined using the following equation:
% R = Result for constituent in LCS x 100 Verified amount of constituent in LCS from vendor information
Additionally, field and laboratory blanks will be used to evaluate whether field or laboratory procedures represent a possible source of contamination in the samples. Unmonitored contamination can allow false positive results to be reported and treated as true sample components when, in fact, they are not. This type of error will adversely affect the accuracy of the reported results. Several types of blanks, including field blanks, method blanks, and instrument blanks, will be used in this project as described in Section B5.B.
Specific DQOs for blanks have been defined for this program in Sections B5.B. In general, the procedure for assessing blank samples for potential contamination is as follows.
• Tabulate blank constituent results.
• Identify blank samples for which constituents are reported above the method detection limits.
• If no constituents are detected above the instrument or method detection limits in any blanks, the associated data are reported unqualified and no blank actions are taken.
• If constituents are detected above instrument or method detection limits in the blanks, the associated sample constituent results may be qualified during data validation. This qualification may result in the negation of results at raised reporting limits due to blank actions.
Thus potential false results will be reported with elevated reported limits. These elevated limits will be recognized in the data available for the end user. Bias that does not meet the limits of the measurement criteria objectives will be indicated by the results of LCS, MS, and calibration analyses.
Section: D QUALITY ASSURANCE PROJECT PLAN Date: April 2008 YARD 520 SAP Revision: 2 PINES AREA OF INVESTIGATION Page 9 of 10
AOC II – Docket No. V-W-’04-C-784 – Yard520 - AppC QAPP April 18, 2008
Bias indicated by these measurement criteria objectives will need to be evaluated to determine the effect on the use of the data. High bias on nondetect results, results that are well below action levels, or well over action levels may have little effect on the use of the data. Low bias for results that are well below the action levels or well over the action levels may have little effect on the use of the data. For results near the action levels with a high or low bias or indeterminate bias, the data will need to be reviewed carefully to establish if the data is usable for the intended purposes. Sample reanalysis, analysis of archived material, and/or recollection of the sample may be appropriate depending on criticalness of the missing data, logistical constraints, cost, and schedule.
D3.1.3 Completeness Assessment
Completeness is the ratio of the number of valid sample results to the total number of results planned for collection. The goal of this program is to generate valid, usable data. However, in environmental sampling and analysis, some data may be lost due to sampling location logistics, field or laboratory errors, or matrix effects that may cause the rejection of results for some constituents. The overall completeness goal of collection of valid data is 90% for the field and 95% for analytical data. The Data Validator will assess the completeness of the overall data generation against the project goals of a minimum of 90% as valid and usable results. Valid and usable results are defined as those that are not rejected during validation (e.g., due to severe holding time or spike recovery noncompliances) or during the overall assessment (e.g., improper sampling technique). Following completion of the sampling, analysis, and data validation, the percent completeness will be calculated and compared to the project objectives stated in Section A7.2 using the following equation.
Number of valid/usable results obtained % Completeness = Number of valid/usable results planned x 100
If this goal is not met, data gaps may exist that will require evaluation to determine the effect on the intended use of the data. Sample reanalysis, analysis of archived material, and/or recollection of the sample may be appropriate depending on criticalness of the missing data logistical constraints, cost, and schedule.
D3.1.4 Sensitivity
Sensitivity is evaluated by verifying that laboratory reporting limits meet the target reporting limits stated in Tables A-3 through A-6. The failure to calibrate with a standard at the laboratory reporting limit or the presence of excessive dilutions may result in elevated detection limits. The effect of these
Section: D QUALITY ASSURANCE PROJECT PLAN Date: April 2008 YARD 520 SAP Revision: 2 PINES AREA OF INVESTIGATION Page 10 of 10
AOC II – Docket No. V-W-’04-C-784 – Yard520 - AppC QAPP April 18, 2008
elevated limits will need to be reviewed in light of the historical data and project action levels to determine if adequate information is available to satisfy the DQOs.
D3.1.5 Representativeness
Representativeness expresses the degree to which data accurately and precisely represents a characteristic of a population, parameter variations at a sampling point, a process condition, or an environmental condition within a defined spatial and/or temporal boundary.
Measures to Ensure Representativeness of Field Data
Representativeness is dependent upon the proper design of the sampling program and will be satisfied by ensuring that the SAP and QAPP are followed and that proper sampling techniques are used. In designing the sampling program, media of interest have been specified.
Measures to Ensure Representativeness of Laboratory Data
Representativeness in the laboratory is ensured by using the proper analytical procedures, appropriate methods, meeting sample holding times, and analyzing and assessing field duplicate samples. The sampling network was designed to provide data representative of the Area of Investigation. During development of this network, consideration was given to past facility processes, existing analytical data, physical setting and processes, and media of interest. The rationale of the sampling network is discussed in detail in Section 2.0 of the SAP.
D3.2 Overall Assessment of Environmental Data
Data assessment will involve data evaluation and usability to determine if the data collected are of the appropriate quality, quantity, and representativeness to the project decision. This evaluation will be performed by the Project Manager in concert with other users of the data. The QC results associated with each analytical parameter for each matrix type will be compared to the objectives presented in this QAPP. Data generated in association with QC results meeting these objectives and/or the data validation criteria will be considered usable. Data that does not meet the objectives and/or the data validation criteria might still be usable. This assessment may require various statistical procedures to establish outliers, correlations between data sets, adequate sampling location coverage, etc., in order to assess the effect of qualification or rejection of data. The effect of the qualification of data or loss of data deemed unacceptable for use, for whatever reason, will be discussed and decisions made on corrective action for potential data gaps.
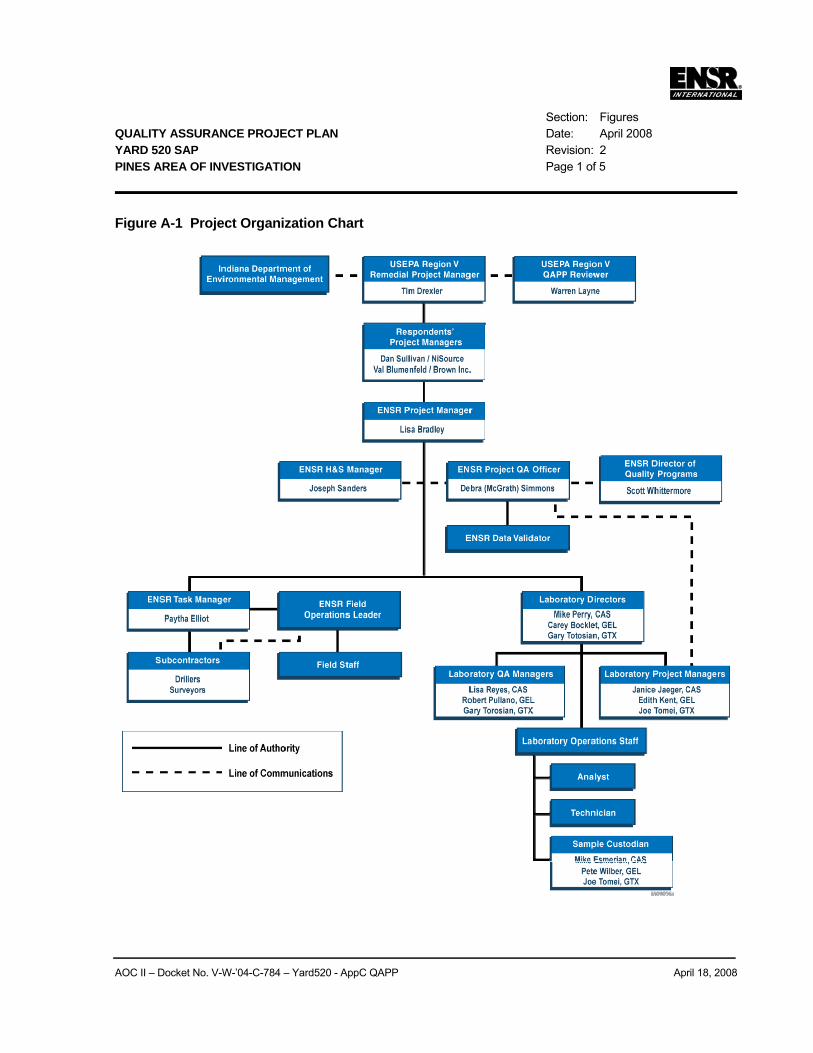
Section: Figures QUALITY ASSURANCE PROJECT PLAN Date: April 2008 YARD 520 SAP Revision: 2 PINES AREA OF INVESTIGATION Page 1 of 5
AOC II – Docket No. V-W-’04-C-784 – Yard520 - AppC QAPP April 18, 2008
Figure A-1 Project Organization Chart
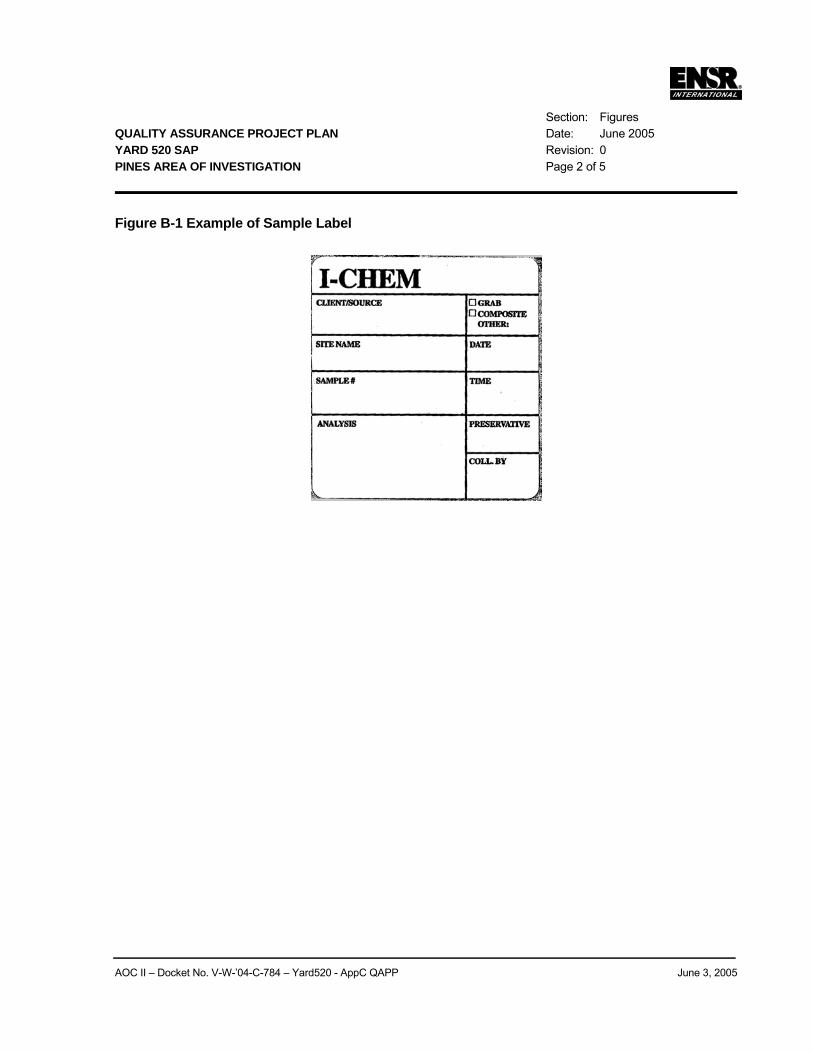
Section: Figures QUALITY ASSURANCE PROJECT PLAN Date: June 2005 YARD 520 SAP Revision: 0 PINES AREA OF INVESTIGATION Page 2 of 5
AOC II – Docket No. V-W-’04-C-784 – Yard520 - AppC QAPP June 3, 2005
Figure B-1 Example of Sample Label
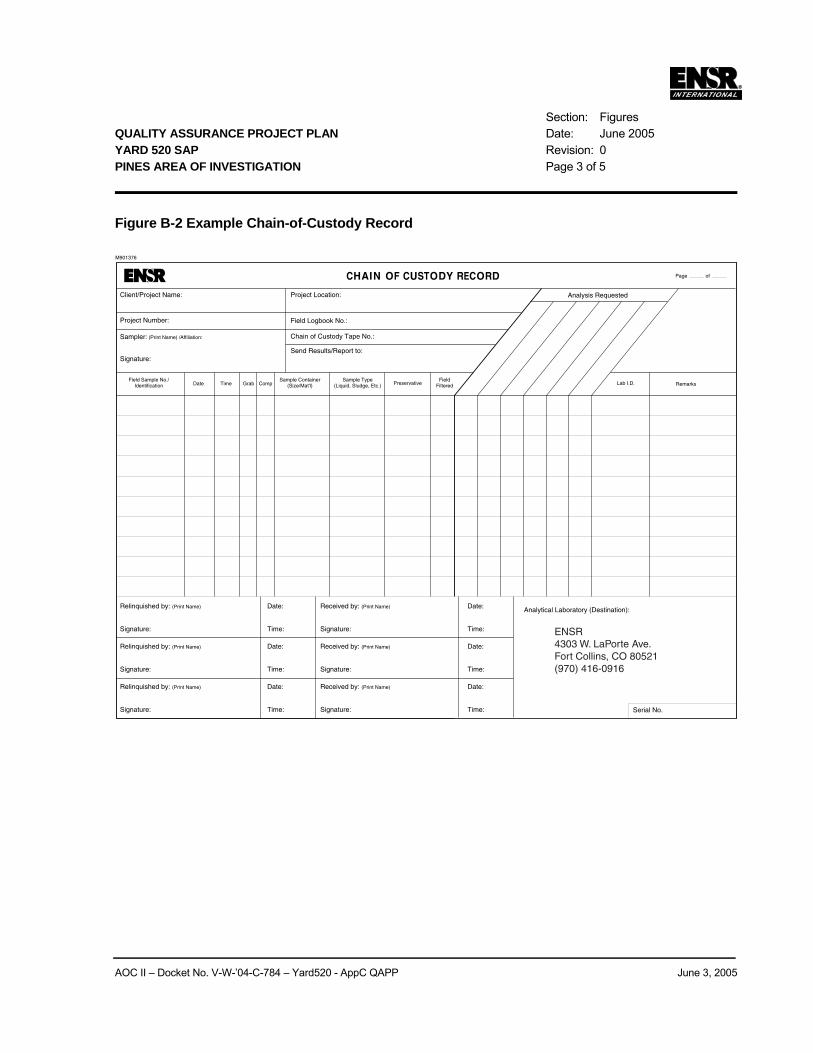
Section: Figures QUALITY ASSURANCE PROJECT PLAN Date: June 2005 YARD 520 SAP Revision: 0 PINES AREA OF INVESTIGATION Page 3 of 5
AOC II – Docket No. V-W-’04-C-784 – Yard520 - AppC QAPP June 3, 2005
Figure B-2 Example Chain-of-Custody Record
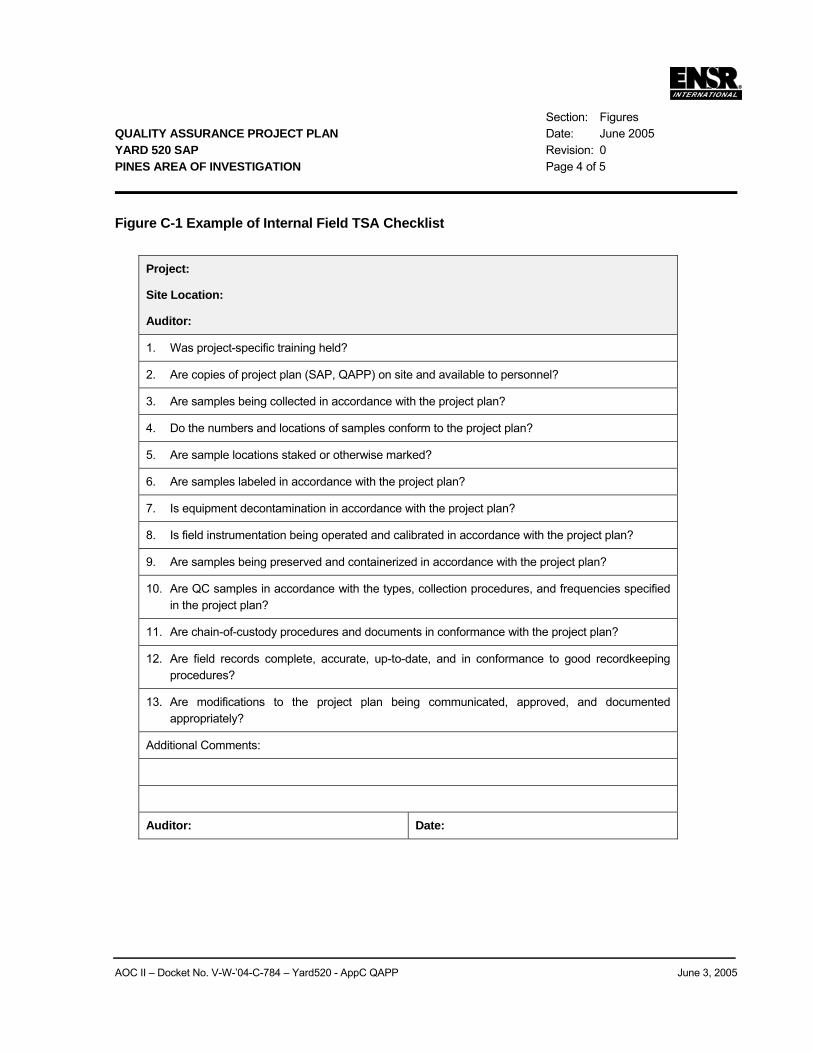
Section: Figures QUALITY ASSURANCE PROJECT PLAN Date: June 2005 YARD 520 SAP Revision: 0 PINES AREA OF INVESTIGATION Page 4 of 5
AOC II – Docket No. V-W-’04-C-784 – Yard520 - AppC QAPP June 3, 2005
Figure C-1 Example of Internal Field TSA Checklist
Project:
Site Location:
Auditor:
1. Was project-specific training held?
2. Are copies of project plan (SAP, QAPP) on site and available to personnel?
3. Are samples being collected in accordance with the project plan?
4. Do the numbers and locations of samples conform to the project plan?
5. Are sample locations staked or otherwise marked?
6. Are samples labeled in accordance with the project plan?
7. Is equipment decontamination in accordance with the project plan?
8. Is field instrumentation being operated and calibrated in accordance with the project plan?
9. Are samples being preserved and containerized in accordance with the project plan?
10. Are QC samples in accordance with the types, collection procedures, and frequencies specified in the project plan?
11. Are chain-of-custody procedures and documents in conformance with the project plan?
12. Are field records complete, accurate, up-to-date, and in conformance to good recordkeeping procedures?
13. Are modifications to the project plan being communicated, approved, and documented appropriately?
Additional Comments:
Auditor: Date:
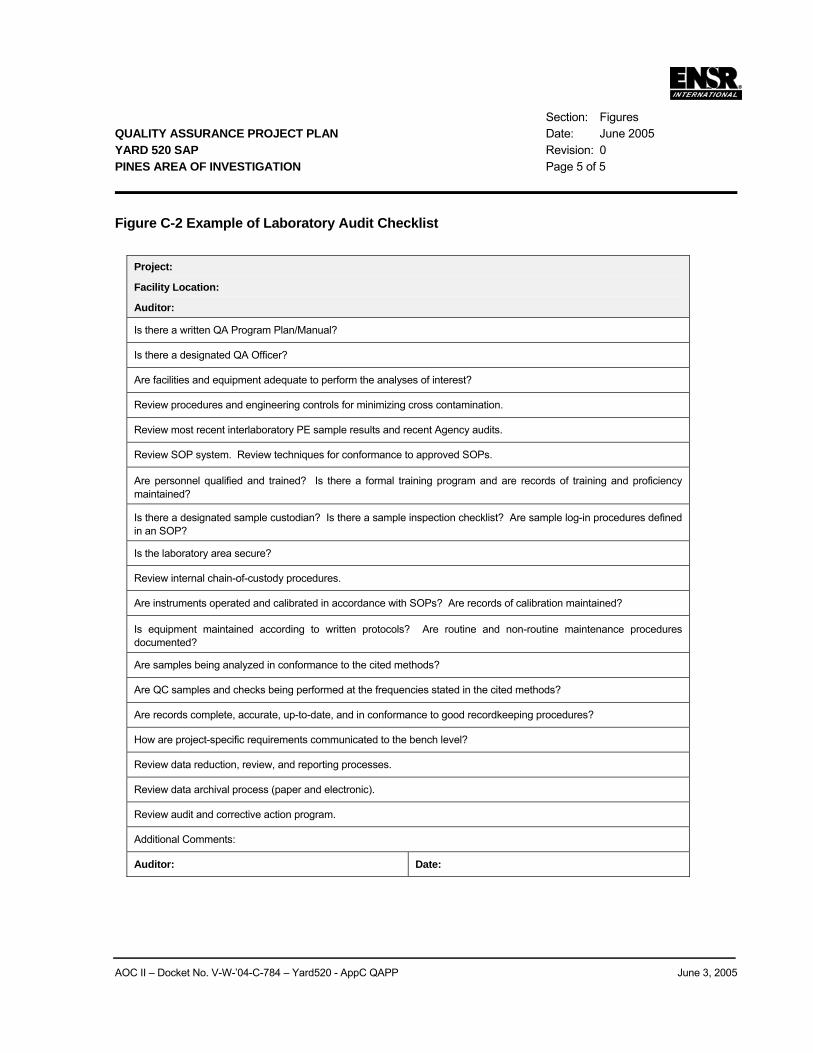
Section: Figures QUALITY ASSURANCE PROJECT PLAN Date: June 2005 YARD 520 SAP Revision: 0 PINES AREA OF INVESTIGATION Page 5 of 5
AOC II – Docket No. V-W-’04-C-784 – Yard520 - AppC QAPP June 3, 2005
Figure C-2 Example of Laboratory Audit Checklist
Project:
Facility Location:
Auditor:
Is there a written QA Program Plan/Manual?
Is there a designated QA Officer?
Are facilities and equipment adequate to perform the analyses of interest?
Review procedures and engineering controls for minimizing cross contamination.
Review most recent interlaboratory PE sample results and recent Agency audits.
Review SOP system. Review techniques for conformance to approved SOPs.
Are personnel qualified and trained? Is there a formal training program and are records of training and proficiency maintained?
Is there a designated sample custodian? Is there a sample inspection checklist? Are sample log-in procedures defined in an SOP?
Is the laboratory area secure?
Review internal chain-of-custody procedures.
Are instruments operated and calibrated in accordance with SOPs? Are records of calibration maintained?
Is equipment maintained according to written protocols? Are routine and non-routine maintenance procedures documented?
Are samples being analyzed in conformance to the cited methods?
Are QC samples and checks being performed at the frequencies stated in the cited methods?
Are records complete, accurate, up-to-date, and in conformance to good recordkeeping procedures?
How are project-specific requirements communicated to the bench level?
Review data reduction, review, and reporting processes.
Review data archival process (paper and electronic).
Review audit and corrective action program.
Additional Comments:
Auditor: Date:
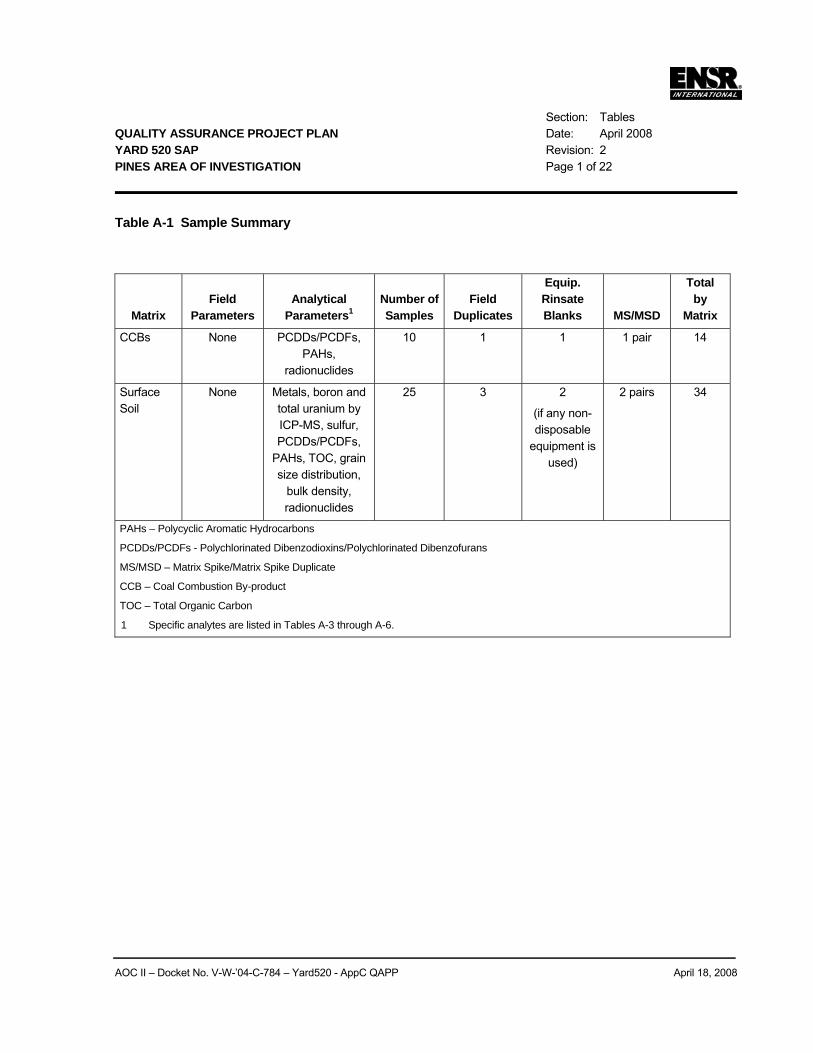
Section: Tables QUALITY ASSURANCE PROJECT PLAN Date: April 2008 YARD 520 SAP Revision: 2 PINES AREA OF INVESTIGATION Page 1 of 22
AOC II – Docket No. V-W-’04-C-784 – Yard520 - AppC QAPP April 18, 2008
Table A-1 Sample Summary
Matrix Field
Parameters Analytical
Parameters1 Number of Samples
Field Duplicates
Equip. Rinsate Blanks MS/MSD
Total by
Matrix
CCBs None PCDDs/PCDFs, PAHs,
radionuclides
10 1 1 1 pair 14
Surface Soil
None Metals, boron and total uranium by ICP-MS, sulfur, PCDDs/PCDFs,
PAHs, TOC, grain size distribution,
bulk density, radionuclides
25 3 2
(if any non-disposable
equipment is used)
2 pairs 34
PAHs – Polycyclic Aromatic Hydrocarbons
PCDDs/PCDFs - Polychlorinated Dibenzodioxins/Polychlorinated Dibenzofurans
MS/MSD – Matrix Spike/Matrix Spike Duplicate
CCB – Coal Combustion By-product
TOC – Total Organic Carbon
1 Specific analytes are listed in Tables A-3 through A-6.
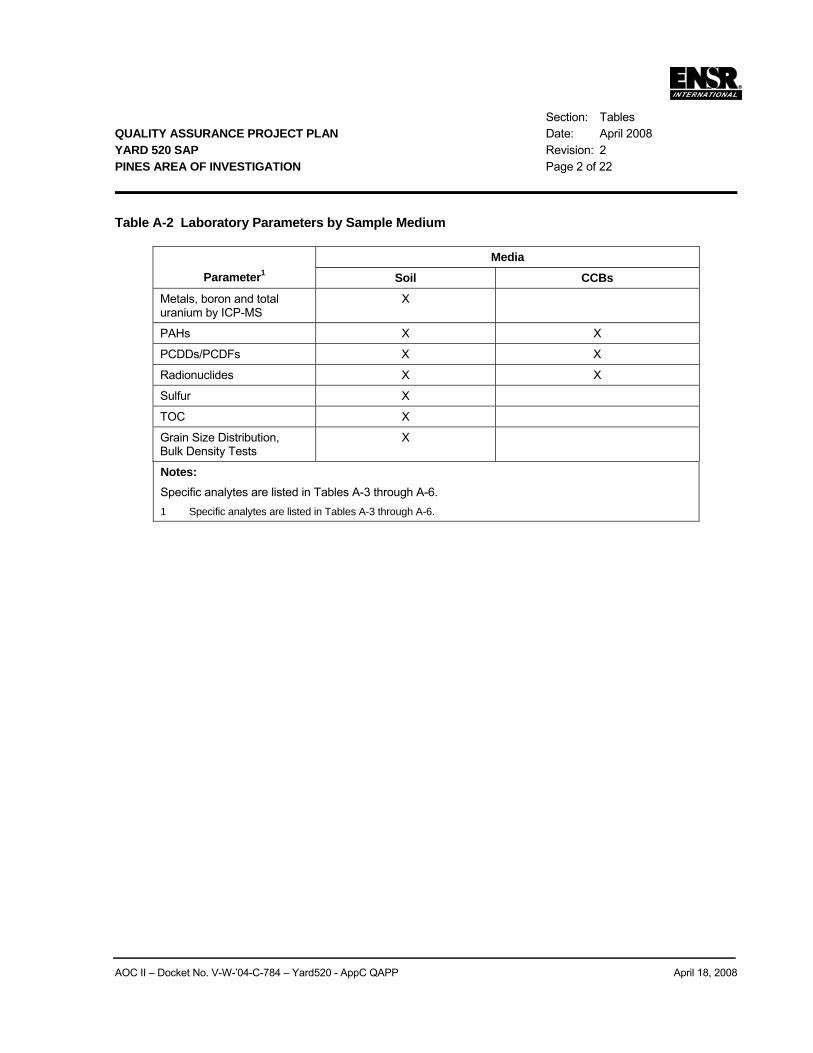
Section: Tables QUALITY ASSURANCE PROJECT PLAN Date: April 2008 YARD 520 SAP Revision: 2 PINES AREA OF INVESTIGATION Page 2 of 22
AOC II – Docket No. V-W-’04-C-784 – Yard520 - AppC QAPP April 18, 2008
Table A-2 Laboratory Parameters by Sample Medium
Media Parameter1 Soil CCBs
Metals, boron and total uranium by ICP-MS
X
PAHs X X
PCDDs/PCDFs X X
Radionuclides X X
Sulfur X
TOC X
Grain Size Distribution, Bulk Density Tests
X
Notes: Specific analytes are listed in Tables A-3 through A-6. 1 Specific analytes are listed in Tables A-3 through A-6.
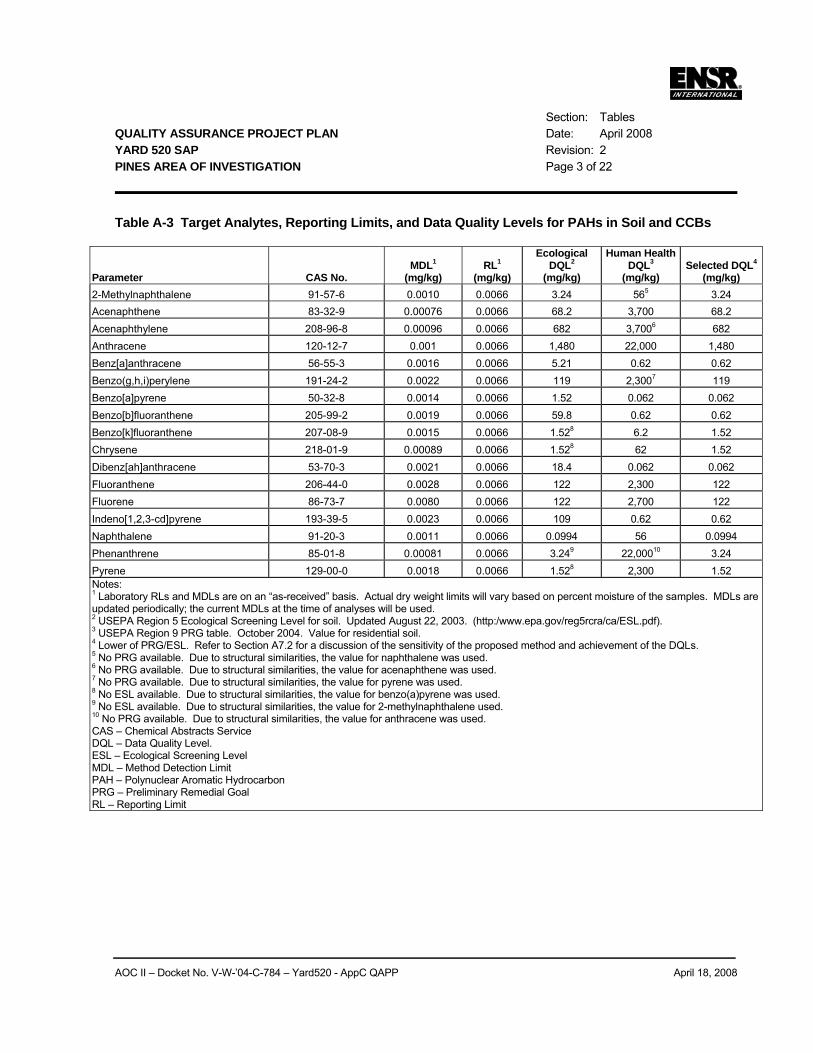
Section: Tables QUALITY ASSURANCE PROJECT PLAN Date: April 2008 YARD 520 SAP Revision: 2 PINES AREA OF INVESTIGATION Page 3 of 22
AOC II – Docket No. V-W-’04-C-784 – Yard520 - AppC QAPP April 18, 2008
Table A-3 Target Analytes, Reporting Limits, and Data Quality Levels for PAHs in Soil and CCBs
Parameter CAS No. MDL1
(mg/kg) RL1
(mg/kg)
Ecological DQL2
(mg/kg)
Human Health DQL3
(mg/kg) Selected DQL4
(mg/kg) 2-Methylnaphthalene 91-57-6 0.0010 0.0066 3.24 565 3.24 Acenaphthene 83-32-9 0.00076 0.0066 68.2 3,700 68.2 Acenaphthylene 208-96-8 0.00096 0.0066 682 3,7006 682 Anthracene 120-12-7 0.001 0.0066 1,480 22,000 1,480 Benz[a]anthracene 56-55-3 0.0016 0.0066 5.21 0.62 0.62 Benzo(g,h,i)perylene 191-24-2 0.0022 0.0066 119 2,3007 119 Benzo[a]pyrene 50-32-8 0.0014 0.0066 1.52 0.062 0.062 Benzo[b]fluoranthene 205-99-2 0.0019 0.0066 59.8 0.62 0.62 Benzo[k]fluoranthene 207-08-9 0.0015 0.0066 1.528 6.2 1.52 Chrysene 218-01-9 0.00089 0.0066 1.528 62 1.52 Dibenz[ah]anthracene 53-70-3 0.0021 0.0066 18.4 0.062 0.062 Fluoranthene 206-44-0 0.0028 0.0066 122 2,300 122 Fluorene 86-73-7 0.0080 0.0066 122 2,700 122 Indeno[1,2,3-cd]pyrene 193-39-5 0.0023 0.0066 109 0.62 0.62 Naphthalene 91-20-3 0.0011 0.0066 0.0994 56 0.0994 Phenanthrene 85-01-8 0.00081 0.0066 3.249 22,00010 3.24 Pyrene 129-00-0 0.0018 0.0066 1.528 2,300 1.52 Notes: 1 Laboratory RLs and MDLs are on an “as-received” basis. Actual dry weight limits will vary based on percent moisture of the samples. MDLs are updated periodically; the current MDLs at the time of analyses will be used. 2 USEPA Region 5 Ecological Screening Level for soil. Updated August 22, 2003. (http:/www.epa.gov/reg5rcra/ca/ESL.pdf). 3 USEPA Region 9 PRG table. October 2004. Value for residential soil. 4 Lower of PRG/ESL. Refer to Section A7.2 for a discussion of the sensitivity of the proposed method and achievement of the DQLs. 5 No PRG available. Due to structural similarities, the value for naphthalene was used. 6 No PRG available. Due to structural similarities, the value for acenaphthene was used. 7 No PRG available. Due to structural similarities, the value for pyrene was used. 8 No ESL available. Due to structural similarities, the value for benzo(a)pyrene was used. 9 No ESL available. Due to structural similarities, the value for 2-methylnaphthalene used. 10 No PRG available. Due to structural similarities, the value for anthracene was used. CAS – Chemical Abstracts Service DQL – Data Quality Level. ESL – Ecological Screening Level MDL – Method Detection Limit PAH – Polynuclear Aromatic Hydrocarbon PRG – Preliminary Remedial Goal RL – Reporting Limit
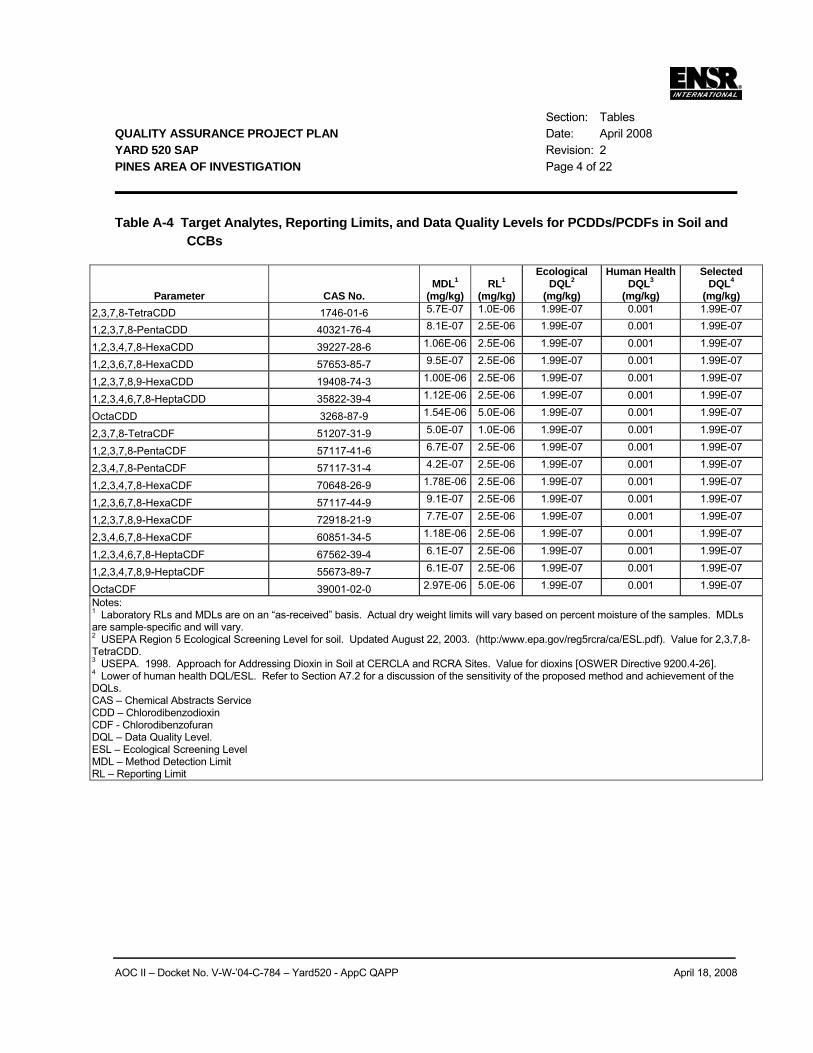
Section: Tables QUALITY ASSURANCE PROJECT PLAN Date: April 2008 YARD 520 SAP Revision: 2 PINES AREA OF INVESTIGATION Page 4 of 22
AOC II – Docket No. V-W-’04-C-784 – Yard520 - AppC QAPP April 18, 2008
Table A-4 Target Analytes, Reporting Limits, and Data Quality Levels for PCDDs/PCDFs in Soil and CCBs
Parameter CAS No. MDL1
(mg/kg) RL1
(mg/kg)
Ecological DQL2
(mg/kg)
Human Health DQL3
(mg/kg)
Selected DQL4
(mg/kg) 2,3,7,8-TetraCDD 1746-01-6 5.7E-07 1.0E-06 1.99E-07 0.001 1.99E-07
1,2,3,7,8-PentaCDD 40321-76-4 8.1E-07 2.5E-06 1.99E-07 0.001 1.99E-07
1,2,3,4,7,8-HexaCDD 39227-28-6 1.06E-06 2.5E-06 1.99E-07 0.001 1.99E-07
1,2,3,6,7,8-HexaCDD 57653-85-7 9.5E-07 2.5E-06 1.99E-07 0.001 1.99E-07
1,2,3,7,8,9-HexaCDD 19408-74-3 1.00E-06 2.5E-06 1.99E-07 0.001 1.99E-07
1,2,3,4,6,7,8-HeptaCDD 35822-39-4 1.12E-06 2.5E-06 1.99E-07 0.001 1.99E-07
OctaCDD 3268-87-9 1.54E-06 5.0E-06 1.99E-07 0.001 1.99E-07
2,3,7,8-TetraCDF 51207-31-9 5.0E-07 1.0E-06 1.99E-07 0.001 1.99E-07
1,2,3,7,8-PentaCDF 57117-41-6 6.7E-07 2.5E-06 1.99E-07 0.001 1.99E-07
2,3,4,7,8-PentaCDF 57117-31-4 4.2E-07 2.5E-06 1.99E-07 0.001 1.99E-07
1,2,3,4,7,8-HexaCDF 70648-26-9 1.78E-06 2.5E-06 1.99E-07 0.001 1.99E-07
1,2,3,6,7,8-HexaCDF 57117-44-9 9.1E-07 2.5E-06 1.99E-07 0.001 1.99E-07
1,2,3,7,8,9-HexaCDF 72918-21-9 7.7E-07 2.5E-06 1.99E-07 0.001 1.99E-07
2,3,4,6,7,8-HexaCDF 60851-34-5 1.18E-06 2.5E-06 1.99E-07 0.001 1.99E-07
1,2,3,4,6,7,8-HeptaCDF 67562-39-4 6.1E-07 2.5E-06 1.99E-07 0.001 1.99E-07
1,2,3,4,7,8,9-HeptaCDF 55673-89-7 6.1E-07 2.5E-06 1.99E-07 0.001 1.99E-07
OctaCDF 39001-02-0 2.97E-06 5.0E-06 1.99E-07 0.001 1.99E-07 Notes: 1 Laboratory RLs and MDLs are on an “as-received” basis. Actual dry weight limits will vary based on percent moisture of the samples. MDLs are sample-specific and will vary. 2 USEPA Region 5 Ecological Screening Level for soil. Updated August 22, 2003. (http:/www.epa.gov/reg5rcra/ca/ESL.pdf). Value for 2,3,7,8-TetraCDD. 3 USEPA. 1998. Approach for Addressing Dioxin in Soil at CERCLA and RCRA Sites. Value for dioxins [OSWER Directive 9200.4-26]. 4 Lower of human health DQL/ESL. Refer to Section A7.2 for a discussion of the sensitivity of the proposed method and achievement of the DQLs. CAS – Chemical Abstracts Service CDD – Chlorodibenzodioxin CDF - Chlorodibenzofuran DQL – Data Quality Level. ESL – Ecological Screening Level MDL – Method Detection Limit RL – Reporting Limit
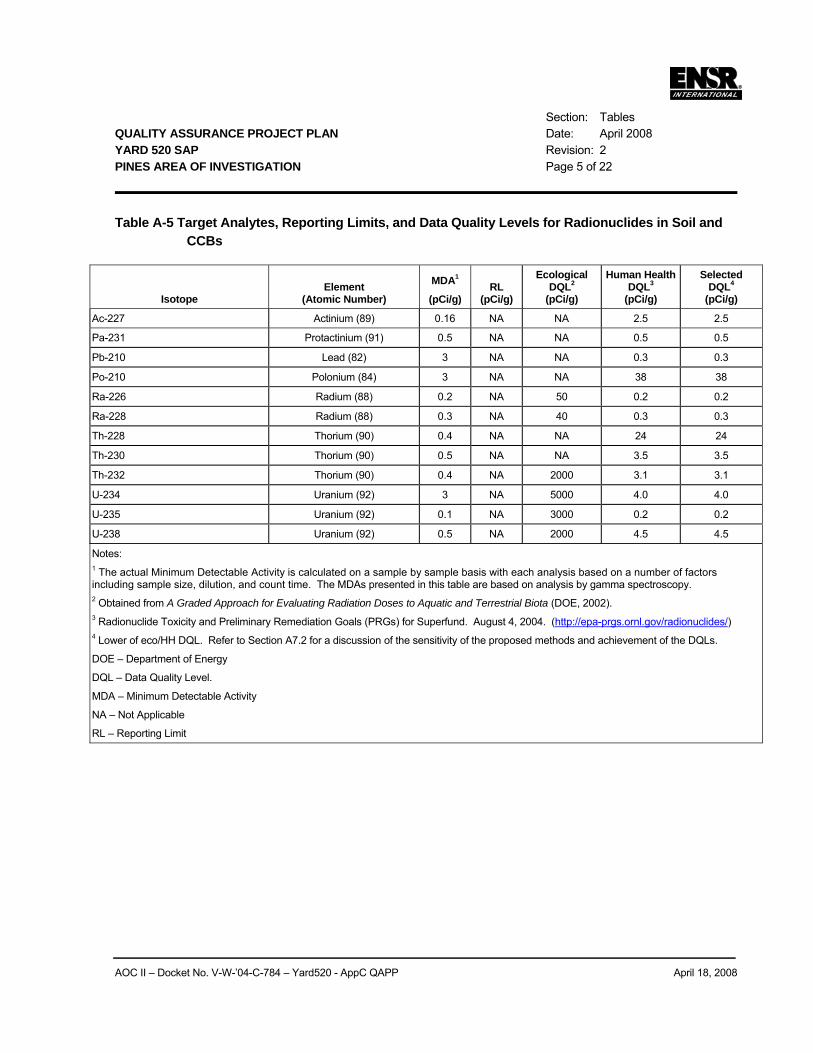
Section: Tables QUALITY ASSURANCE PROJECT PLAN Date: April 2008 YARD 520 SAP Revision: 2 PINES AREA OF INVESTIGATION Page 5 of 22
AOC II – Docket No. V-W-’04-C-784 – Yard520 - AppC QAPP April 18, 2008
Table A-5 Target Analytes, Reporting Limits, and Data Quality Levels for Radionuclides in Soil and CCBs
Isotope Element
(Atomic Number)
MDA1
(pCi/g) RL
(pCi/g)
Ecological DQL2
(pCi/g)
Human Health DQL3
(pCi/g)
Selected DQL4
(pCi/g)
Ac-227 Actinium (89) 0.16 NA NA 2.5 2.5
Pa-231 Protactinium (91) 0.5 NA NA 0.5 0.5
Pb-210 Lead (82) 3 NA NA 0.3 0.3
Po-210 Polonium (84) 3 NA NA 38 38
Ra-226 Radium (88) 0.2 NA 50 0.2 0.2
Ra-228 Radium (88) 0.3 NA 40 0.3 0.3
Th-228 Thorium (90) 0.4 NA NA 24 24
Th-230 Thorium (90) 0.5 NA NA 3.5 3.5
Th-232 Thorium (90) 0.4 NA 2000 3.1 3.1
U-234 Uranium (92) 3 NA 5000 4.0 4.0
U-235 Uranium (92) 0.1 NA 3000 0.2 0.2
U-238 Uranium (92) 0.5 NA 2000 4.5 4.5
Notes: 1 The actual Minimum Detectable Activity is calculated on a sample by sample basis with each analysis based on a number of factors including sample size, dilution, and count time. The MDAs presented in this table are based on analysis by gamma spectroscopy. 2 Obtained from A Graded Approach for Evaluating Radiation Doses to Aquatic and Terrestrial Biota (DOE, 2002). 3 Radionuclide Toxicity and Preliminary Remediation Goals (PRGs) for Superfund. August 4, 2004. (http://epa-prgs.ornl.gov/radionuclides/) 4 Lower of eco/HH DQL. Refer to Section A7.2 for a discussion of the sensitivity of the proposed methods and achievement of the DQLs.
DOE – Department of Energy
DQL – Data Quality Level.
MDA – Minimum Detectable Activity
NA – Not Applicable
RL – Reporting Limit
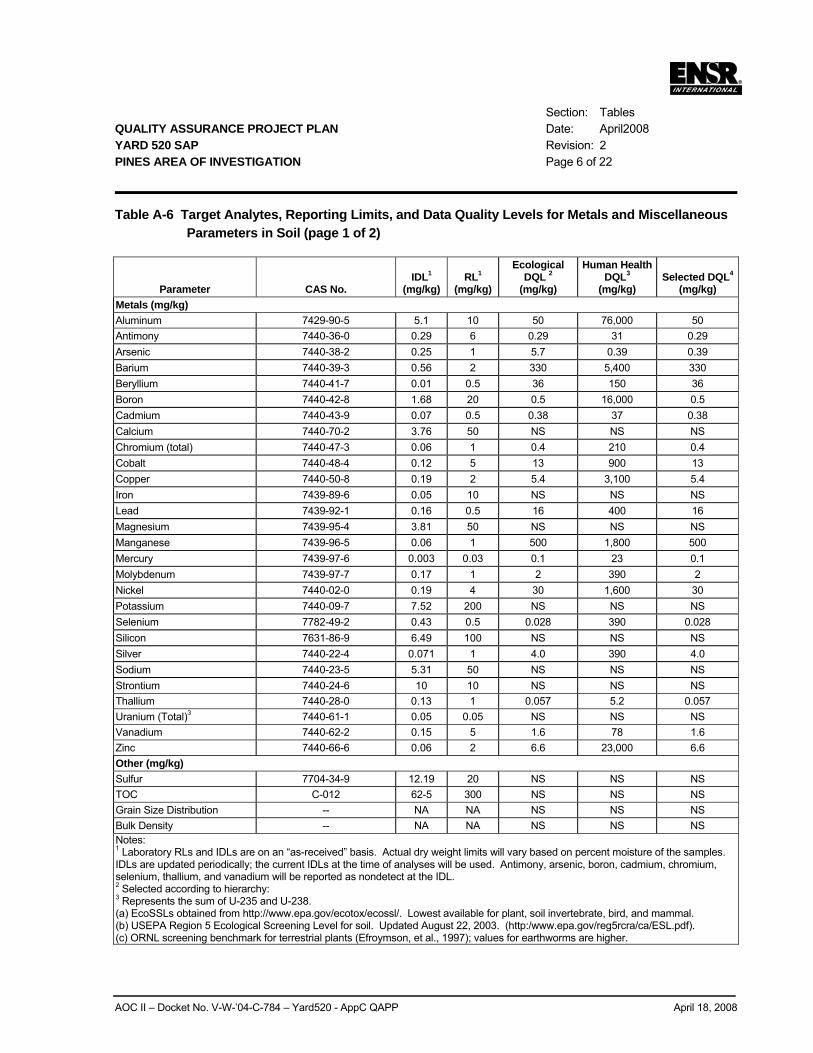
Section: Tables QUALITY ASSURANCE PROJECT PLAN Date: April2008 YARD 520 SAP Revision: 2 PINES AREA OF INVESTIGATION Page 6 of 22
AOC II – Docket No. V-W-’04-C-784 – Yard520 - AppC QAPP April 18, 2008
Table A-6 Target Analytes, Reporting Limits, and Data Quality Levels for Metals and Miscellaneous Parameters in Soil (page 1 of 2)
Parameter CAS No. IDL1
(mg/kg) RL1
(mg/kg)
Ecological DQL 2
(mg/kg)
Human Health DQL3
(mg/kg) Selected DQL4
(mg/kg) Metals (mg/kg) Aluminum 7429-90-5 5.1 10 50 76,000 50 Antimony 7440-36-0 0.29 6 0.29 31 0.29 Arsenic 7440-38-2 0.25 1 5.7 0.39 0.39 Barium 7440-39-3 0.56 2 330 5,400 330 Beryllium 7440-41-7 0.01 0.5 36 150 36 Boron 7440-42-8 1.68 20 0.5 16,000 0.5 Cadmium 7440-43-9 0.07 0.5 0.38 37 0.38 Calcium 7440-70-2 3.76 50 NS NS NS Chromium (total) 7440-47-3 0.06 1 0.4 210 0.4 Cobalt 7440-48-4 0.12 5 13 900 13 Copper 7440-50-8 0.19 2 5.4 3,100 5.4 Iron 7439-89-6 0.05 10 NS NS NS Lead 7439-92-1 0.16 0.5 16 400 16 Magnesium 7439-95-4 3.81 50 NS NS NS Manganese 7439-96-5 0.06 1 500 1,800 500 Mercury 7439-97-6 0.003 0.03 0.1 23 0.1 Molybdenum 7439-97-7 0.17 1 2 390 2 Nickel 7440-02-0 0.19 4 30 1,600 30 Potassium 7440-09-7 7.52 200 NS NS NS Selenium 7782-49-2 0.43 0.5 0.028 390 0.028 Silicon 7631-86-9 6.49 100 NS NS NS Silver 7440-22-4 0.071 1 4.0 390 4.0 Sodium 7440-23-5 5.31 50 NS NS NS Strontium 7440-24-6 10 10 NS NS NS Thallium 7440-28-0 0.13 1 0.057 5.2 0.057 Uranium (Total)3 7440-61-1 0.05 0.05 NS NS NS Vanadium 7440-62-2 0.15 5 1.6 78 1.6 Zinc 7440-66-6 0.06 2 6.6 23,000 6.6 Other (mg/kg) Sulfur 7704-34-9 12.19 20 NS NS NS TOC C-012 62-5 300 NS NS NS Grain Size Distribution -- NA NA NS NS NS Bulk Density -- NA NA NS NS NS Notes: 1 Laboratory RLs and IDLs are on an “as-received” basis. Actual dry weight limits will vary based on percent moisture of the samples. IDLs are updated periodically; the current IDLs at the time of analyses will be used. Antimony, arsenic, boron, cadmium, chromium, selenium, thallium, and vanadium will be reported as nondetect at the IDL. 2 Selected according to hierarchy: 3 Represents the sum of U-235 and U-238. (a) EcoSSLs obtained from http://www.epa.gov/ecotox/ecossl/. Lowest available for plant, soil invertebrate, bird, and mammal. (b) USEPA Region 5 Ecological Screening Level for soil. Updated August 22, 2003. (http:/www.epa.gov/reg5rcra/ca/ESL.pdf). (c) ORNL screening benchmark for terrestrial plants (Efroymson, et al., 1997); values for earthworms are higher.
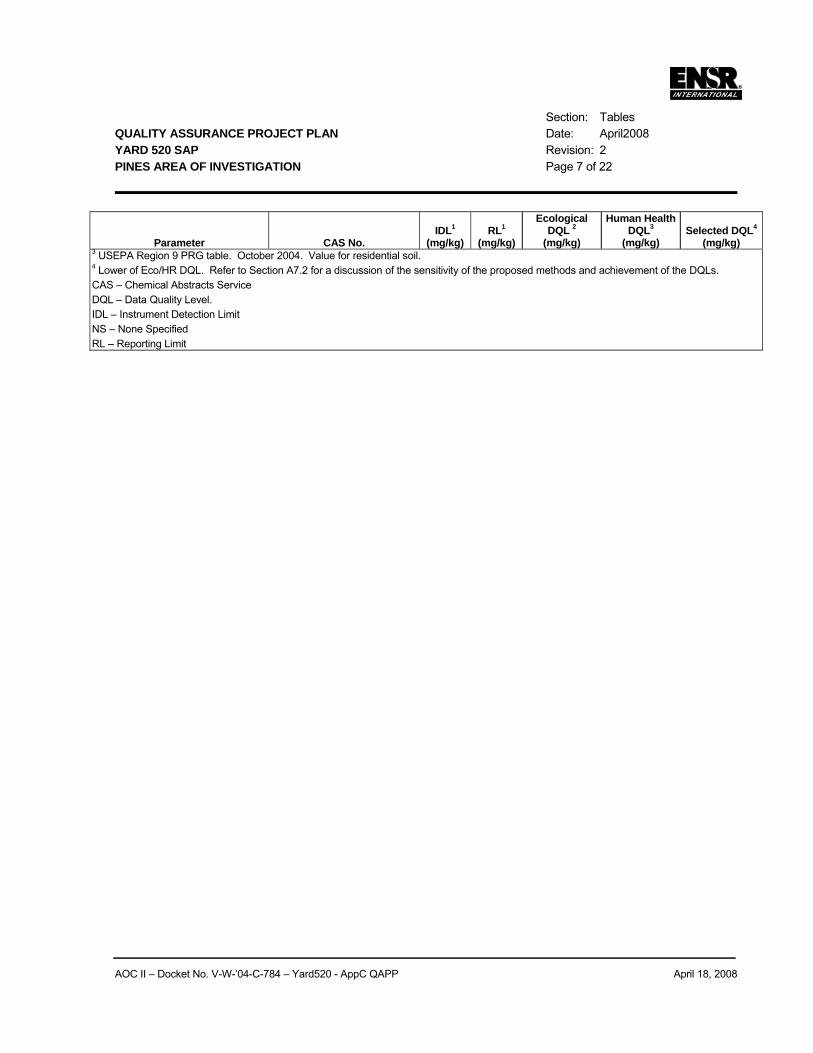
Section: Tables QUALITY ASSURANCE PROJECT PLAN Date: April2008 YARD 520 SAP Revision: 2 PINES AREA OF INVESTIGATION Page 7 of 22
AOC II – Docket No. V-W-’04-C-784 – Yard520 - AppC QAPP April 18, 2008
Parameter CAS No. IDL1
(mg/kg) RL1
(mg/kg)
Ecological DQL 2
(mg/kg)
Human Health DQL3
(mg/kg) Selected DQL4
(mg/kg) 3 USEPA Region 9 PRG table. October 2004. Value for residential soil. 4 Lower of Eco/HR DQL. Refer to Section A7.2 for a discussion of the sensitivity of the proposed methods and achievement of the DQLs. CAS – Chemical Abstracts Service DQL – Data Quality Level. IDL – Instrument Detection Limit NS – None Specified RL – Reporting Limit
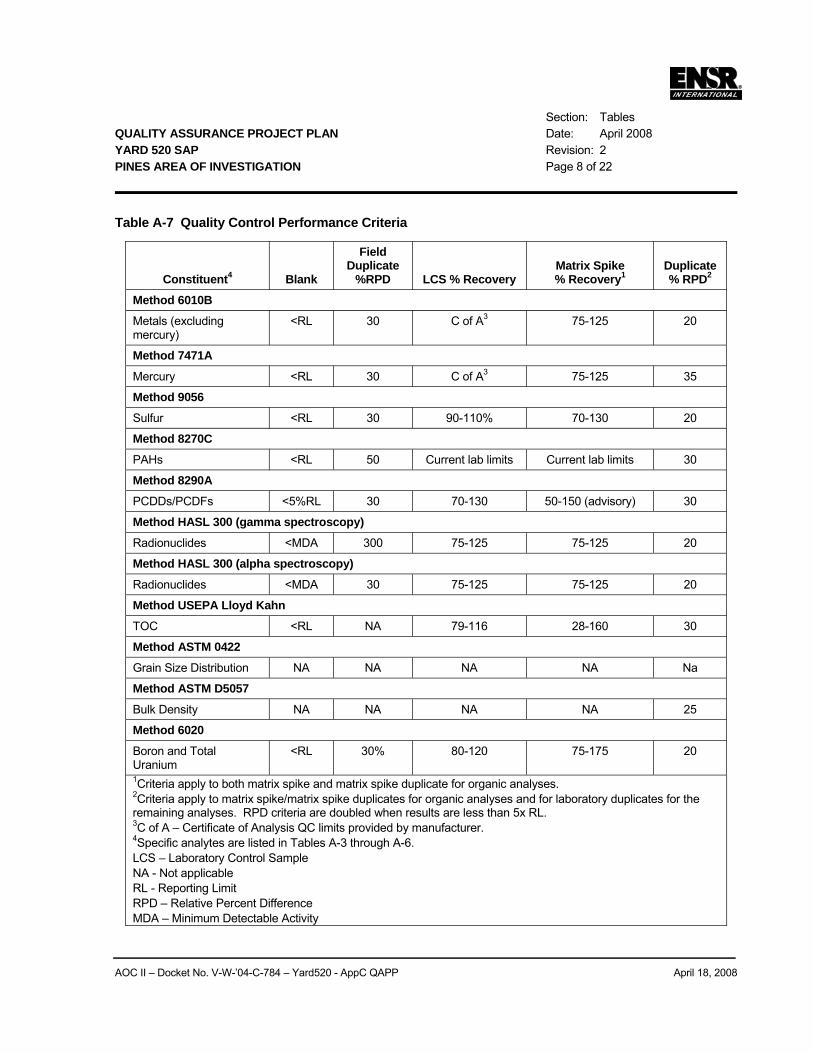
Section: Tables QUALITY ASSURANCE PROJECT PLAN Date: April 2008 YARD 520 SAP Revision: 2 PINES AREA OF INVESTIGATION Page 8 of 22
AOC II – Docket No. V-W-’04-C-784 – Yard520 - AppC QAPP April 18, 2008
Table A-7 Quality Control Performance Criteria
Constituent4
Blank
Field Duplicate
%RPD LCS % Recovery Matrix Spike % Recovery1
Duplicate% RPD2
Method 6010B
Metals (excluding mercury)
<RL 30 C of A3 75-125 20
Method 7471A
Mercury <RL 30 C of A3 75-125 35
Method 9056
Sulfur <RL 30 90-110% 70-130 20
Method 8270C
PAHs <RL 50 Current lab limits Current lab limits 30
Method 8290A
PCDDs/PCDFs <5%RL 30 70-130 50-150 (advisory) 30
Method HASL 300 (gamma spectroscopy)
Radionuclides <MDA 300 75-125 75-125 20
Method HASL 300 (alpha spectroscopy)
Radionuclides <MDA 30 75-125 75-125 20
Method USEPA Lloyd Kahn
TOC <RL NA 79-116 28-160 30
Method ASTM 0422
Grain Size Distribution NA NA NA NA Na
Method ASTM D5057
Bulk Density NA NA NA NA 25
Method 6020
Boron and Total Uranium
<RL 30% 80-120 75-175 20
1Criteria apply to both matrix spike and matrix spike duplicate for organic analyses. 2Criteria apply to matrix spike/matrix spike duplicates for organic analyses and for laboratory duplicates for the remaining analyses. RPD criteria are doubled when results are less than 5x RL. 3C of A – Certificate of Analysis QC limits provided by manufacturer. 4Specific analytes are listed in Tables A-3 through A-6. LCS – Laboratory Control Sample NA - Not applicable RL - Reporting Limit RPD – Relative Percent Difference MDA – Minimum Detectable Activity
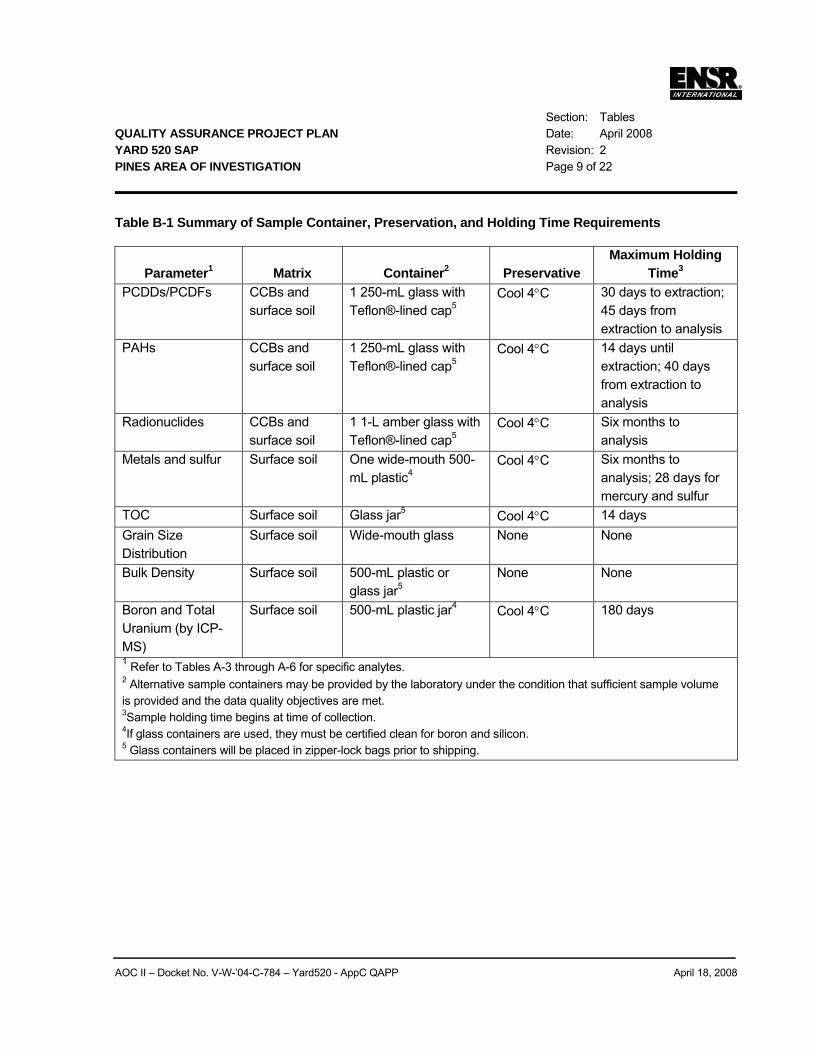
Section: Tables QUALITY ASSURANCE PROJECT PLAN Date: April 2008 YARD 520 SAP Revision: 2 PINES AREA OF INVESTIGATION Page 9 of 22
AOC II – Docket No. V-W-’04-C-784 – Yard520 - AppC QAPP April 18, 2008
Table B-1 Summary of Sample Container, Preservation, and Holding Time Requirements
Parameter1 Matrix Container2 Preservative Maximum Holding
Time3 PCDDs/PCDFs CCBs and
surface soil 1 250-mL glass with Teflon®-lined cap5
Cool 4°C 30 days to extraction; 45 days from extraction to analysis
PAHs CCBs and surface soil
1 250-mL glass with Teflon®-lined cap5
Cool 4°C 14 days until extraction; 40 days from extraction to analysis
Radionuclides CCBs and surface soil
1 1-L amber glass with Teflon®-lined cap5
Cool 4°C Six months to analysis
Metals and sulfur Surface soil One wide-mouth 500-mL plastic4
Cool 4°C Six months to analysis; 28 days for mercury and sulfur
TOC Surface soil Glass jar5 Cool 4°C 14 days Grain Size Distribution
Surface soil Wide-mouth glass None None
Bulk Density Surface soil 500-mL plastic or glass jar5
None None
Boron and Total Uranium (by ICP-MS)
Surface soil 500-mL plastic jar4 Cool 4°C 180 days
1 Refer to Tables A-3 through A-6 for specific analytes. 2 Alternative sample containers may be provided by the laboratory under the condition that sufficient sample volume is provided and the data quality objectives are met. 3Sample holding time begins at time of collection. 4If glass containers are used, they must be certified clean for boron and silicon. 5 Glass containers will be placed in zipper-lock bags prior to shipping.
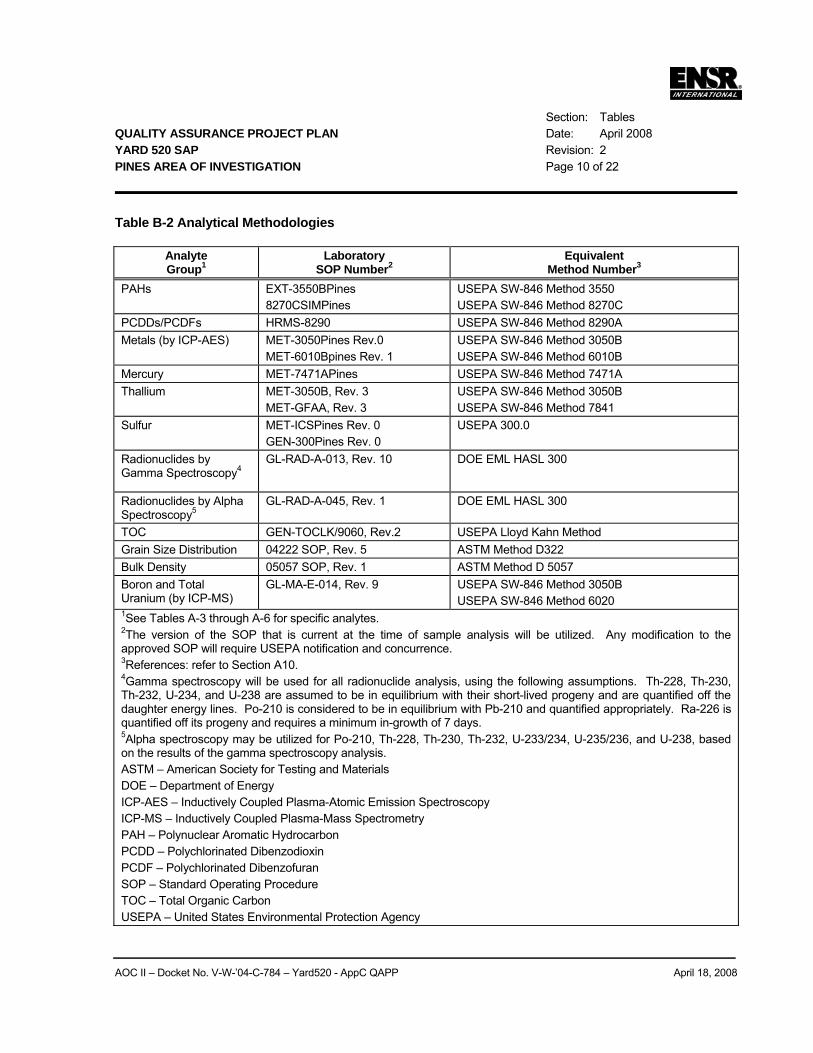
Section: Tables QUALITY ASSURANCE PROJECT PLAN Date: April 2008 YARD 520 SAP Revision: 2 PINES AREA OF INVESTIGATION Page 10 of 22
AOC II – Docket No. V-W-’04-C-784 – Yard520 - AppC QAPP April 18, 2008
Table B-2 Analytical Methodologies
Analyte Group1
Laboratory SOP Number2
Equivalent Method Number3
PAHs EXT-3550BPines 8270CSIMPines
USEPA SW-846 Method 3550 USEPA SW-846 Method 8270C
PCDDs/PCDFs HRMS-8290 USEPA SW-846 Method 8290A Metals (by ICP-AES) MET-3050Pines Rev.0
MET-6010Bpines Rev. 1 USEPA SW-846 Method 3050B USEPA SW-846 Method 6010B
Mercury MET-7471APines USEPA SW-846 Method 7471A Thallium MET-3050B, Rev. 3
MET-GFAA, Rev. 3 USEPA SW-846 Method 3050B USEPA SW-846 Method 7841
Sulfur MET-ICSPines Rev. 0 GEN-300Pines Rev. 0
USEPA 300.0
Radionuclides by Gamma Spectroscopy4
GL-RAD-A-013, Rev. 10 DOE EML HASL 300
Radionuclides by Alpha Spectroscopy5
GL-RAD-A-045, Rev. 1 DOE EML HASL 300
TOC GEN-TOCLK/9060, Rev.2 USEPA Lloyd Kahn Method Grain Size Distribution 04222 SOP, Rev. 5 ASTM Method D322 Bulk Density 05057 SOP, Rev. 1 ASTM Method D 5057 Boron and Total Uranium (by ICP-MS)
GL-MA-E-014, Rev. 9 USEPA SW-846 Method 3050B USEPA SW-846 Method 6020
1See Tables A-3 through A-6 for specific analytes. 2The version of the SOP that is current at the time of sample analysis will be utilized. Any modification to the approved SOP will require USEPA notification and concurrence. 3References: refer to Section A10. 4Gamma spectroscopy will be used for all radionuclide analysis, using the following assumptions. Th-228, Th-230, Th-232, U-234, and U-238 are assumed to be in equilibrium with their short-lived progeny and are quantified off the daughter energy lines. Po-210 is considered to be in equilibrium with Pb-210 and quantified appropriately. Ra-226 is quantified off its progeny and requires a minimum in-growth of 7 days. 5Alpha spectroscopy may be utilized for Po-210, Th-228, Th-230, Th-232, U-233/234, U-235/236, and U-238, based on the results of the gamma spectroscopy analysis. ASTM – American Society for Testing and Materials DOE – Department of Energy ICP-AES – Inductively Coupled Plasma-Atomic Emission Spectroscopy ICP-MS – Inductively Coupled Plasma-Mass Spectrometry PAH – Polynuclear Aromatic Hydrocarbon PCDD – Polychlorinated Dibenzodioxin PCDF – Polychlorinated Dibenzofuran SOP – Standard Operating Procedure TOC – Total Organic Carbon USEPA – United States Environmental Protection Agency
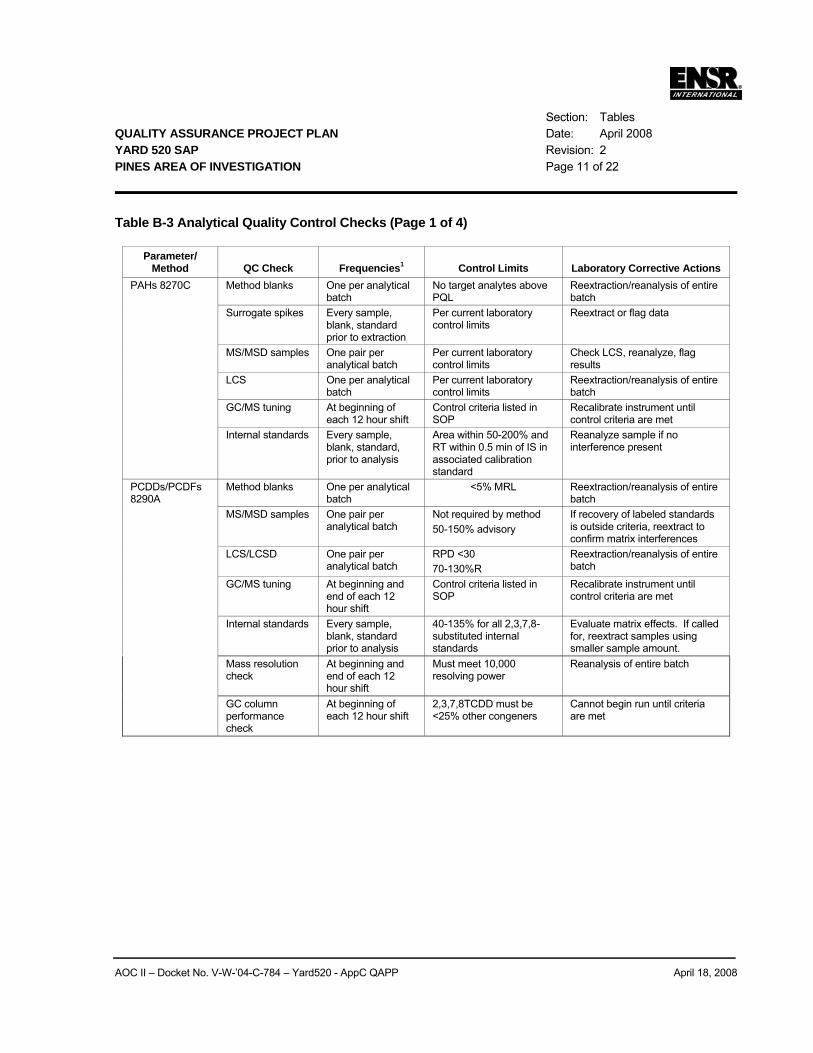
Section: Tables QUALITY ASSURANCE PROJECT PLAN Date: April 2008 YARD 520 SAP Revision: 2 PINES AREA OF INVESTIGATION Page 11 of 22
AOC II – Docket No. V-W-’04-C-784 – Yard520 - AppC QAPP April 18, 2008
Table B-3 Analytical Quality Control Checks (Page 1 of 4)
Parameter/ Method QC Check Frequencies1 Control Limits Laboratory Corrective Actions
PAHs 8270C Method blanks One per analytical batch
No target analytes above PQL
Reextraction/reanalysis of entire batch
Surrogate spikes Every sample, blank, standard prior to extraction
Per current laboratory control limits
Reextract or flag data
MS/MSD samples One pair per analytical batch
Per current laboratory control limits
Check LCS, reanalyze, flag results
LCS One per analytical batch
Per current laboratory control limits
Reextraction/reanalysis of entire batch
GC/MS tuning At beginning of each 12 hour shift
Control criteria listed in SOP
Recalibrate instrument until control criteria are met
Internal standards Every sample, blank, standard, prior to analysis
Area within 50-200% and RT within 0.5 min of IS in associated calibration standard
Reanalyze sample if no interference present
PCDDs/PCDFs 8290A
Method blanks One per analytical batch
<5% MRL Reextraction/reanalysis of entire batch
MS/MSD samples One pair per analytical batch
Not required by method 50-150% advisory
If recovery of labeled standards is outside criteria, reextract to confirm matrix interferences
LCS/LCSD One pair per analytical batch
RPD <30 70-130%R
Reextraction/reanalysis of entire batch
GC/MS tuning At beginning and end of each 12 hour shift
Control criteria listed in SOP
Recalibrate instrument until control criteria are met
Internal standards Every sample, blank, standard prior to analysis
40-135% for all 2,3,7,8-substituted internal standards
Evaluate matrix effects. If called for, reextract samples using smaller sample amount.
Mass resolution check
At beginning and end of each 12 hour shift
Must meet 10,000 resolving power
Reanalysis of entire batch
GC column performance check
At beginning of each 12 hour shift
2,3,7,8TCDD must be <25% other congeners
Cannot begin run until criteria are met
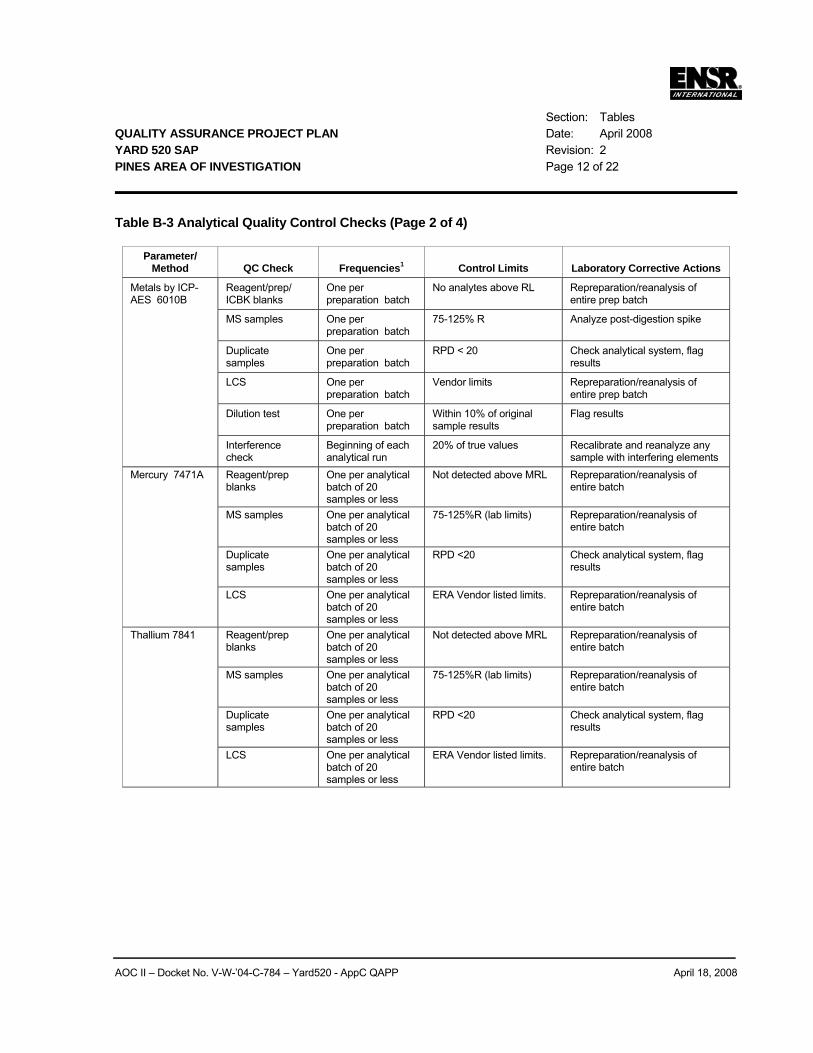
Section: Tables QUALITY ASSURANCE PROJECT PLAN Date: April 2008 YARD 520 SAP Revision: 2 PINES AREA OF INVESTIGATION Page 12 of 22
AOC II – Docket No. V-W-’04-C-784 – Yard520 - AppC QAPP April 18, 2008
Table B-3 Analytical Quality Control Checks (Page 2 of 4)
Parameter/ Method QC Check Frequencies1 Control Limits Laboratory Corrective Actions
Reagent/prep/ ICBK blanks
One per preparation batch
No analytes above RL Repreparation/reanalysis of entire prep batch
MS samples One per preparation batch
75-125% R Analyze post-digestion spike
Duplicate samples
One per preparation batch
RPD < 20 Check analytical system, flag results
LCS One per preparation batch
Vendor limits Repreparation/reanalysis of entire prep batch
Dilution test One per preparation batch
Within 10% of original sample results
Flag results
Metals by ICP-AES 6010B
Interference check
Beginning of each analytical run
20% of true values Recalibrate and reanalyze any sample with interfering elements
Reagent/prep blanks
One per analytical batch of 20 samples or less
Not detected above MRL Repreparation/reanalysis of entire batch
MS samples One per analytical batch of 20 samples or less
75-125%R (lab limits) Repreparation/reanalysis of entire batch
Duplicate samples
One per analytical batch of 20 samples or less
RPD <20 Check analytical system, flag results
Mercury 7471A
LCS One per analytical batch of 20 samples or less
ERA Vendor listed limits. Repreparation/reanalysis of entire batch
Reagent/prep blanks
One per analytical batch of 20 samples or less
Not detected above MRL Repreparation/reanalysis of entire batch
MS samples One per analytical batch of 20 samples or less
75-125%R (lab limits) Repreparation/reanalysis of entire batch
Duplicate samples
One per analytical batch of 20 samples or less
RPD <20 Check analytical system, flag results
Thallium 7841
LCS One per analytical batch of 20 samples or less
ERA Vendor listed limits. Repreparation/reanalysis of entire batch
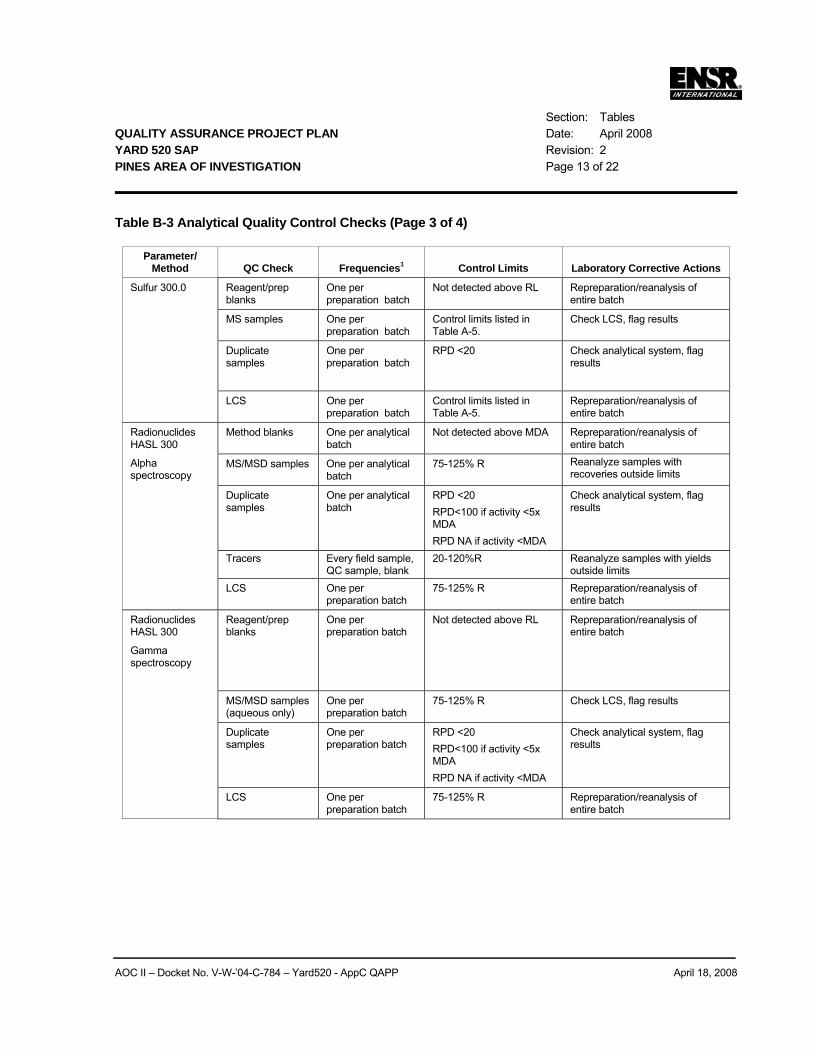
Section: Tables QUALITY ASSURANCE PROJECT PLAN Date: April 2008 YARD 520 SAP Revision: 2 PINES AREA OF INVESTIGATION Page 13 of 22
AOC II – Docket No. V-W-’04-C-784 – Yard520 - AppC QAPP April 18, 2008
Table B-3 Analytical Quality Control Checks (Page 3 of 4)
Parameter/ Method QC Check Frequencies1 Control Limits Laboratory Corrective Actions
Reagent/prep blanks
One per preparation batch
Not detected above RL Repreparation/reanalysis of entire batch
MS samples One per preparation batch
Control limits listed in Table A-5.
Check LCS, flag results
Duplicate samples
One per preparation batch
RPD <20 Check analytical system, flag results
Sulfur 300.0
LCS One per preparation batch
Control limits listed in Table A-5.
Repreparation/reanalysis of entire batch
Method blanks One per analytical batch
Not detected above MDA Repreparation/reanalysis of entire batch
MS/MSD samples One per analytical batch
75-125% R Reanalyze samples with recoveries outside limits
Duplicate samples
One per analytical batch
RPD <20 RPD<100 if activity <5x MDA RPD NA if activity <MDA
Check analytical system, flag results
Tracers Every field sample, QC sample, blank
20-120%R Reanalyze samples with yields outside limits
Radionuclides HASL 300
Alpha spectroscopy
LCS One per preparation batch
75-125% R Repreparation/reanalysis of entire batch
Radionuclides HASL 300
Gamma spectroscopy
Reagent/prep blanks
One per preparation batch
Not detected above RL Repreparation/reanalysis of entire batch
MS/MSD samples (aqueous only)
One per preparation batch
75-125% R Check LCS, flag results
Duplicate samples
One per preparation batch
RPD <20 RPD<100 if activity <5x MDA RPD NA if activity <MDA
Check analytical system, flag results
LCS One per preparation batch
75-125% R Repreparation/reanalysis of entire batch
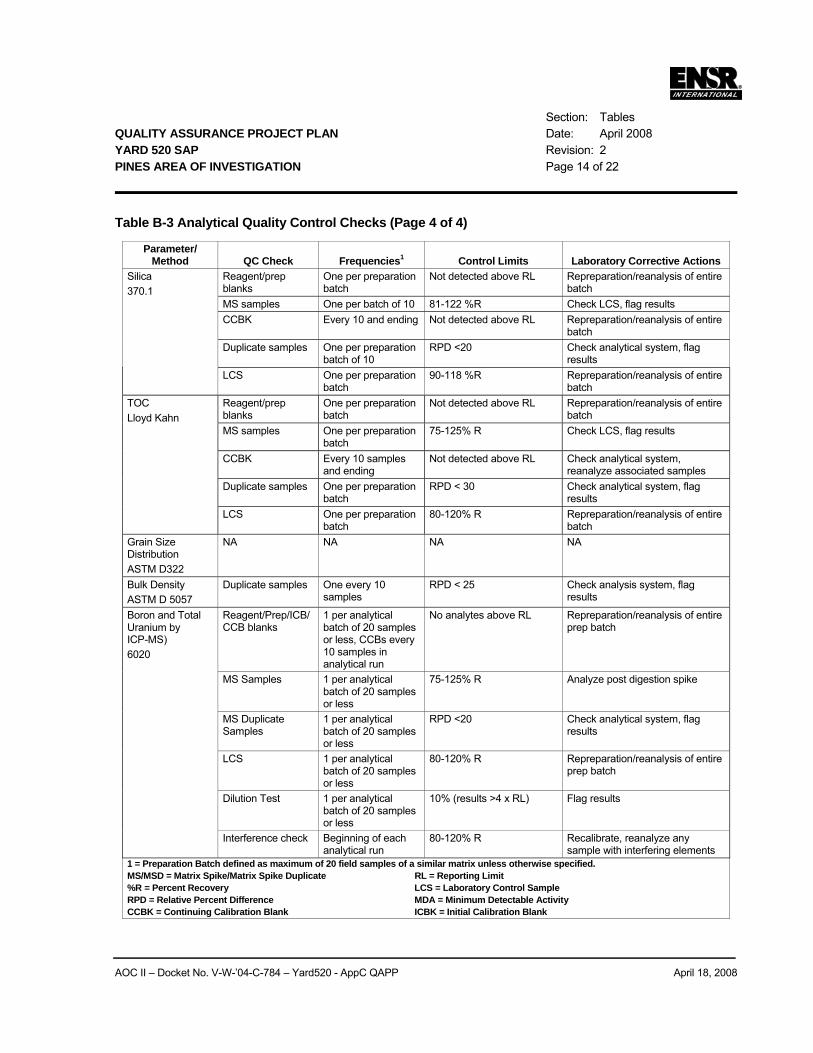
Section: Tables QUALITY ASSURANCE PROJECT PLAN Date: April 2008 YARD 520 SAP Revision: 2 PINES AREA OF INVESTIGATION Page 14 of 22
AOC II – Docket No. V-W-’04-C-784 – Yard520 - AppC QAPP April 18, 2008
Table B-3 Analytical Quality Control Checks (Page 4 of 4)
Parameter/ Method QC Check Frequencies1 Control Limits Laboratory Corrective Actions
Reagent/prep blanks
One per preparation batch
Not detected above RL Repreparation/reanalysis of entire batch
MS samples One per batch of 10 81-122 %R Check LCS, flag results CCBK Every 10 and ending Not detected above RL Repreparation/reanalysis of entire
batch Duplicate samples One per preparation
batch of 10 RPD <20 Check analytical system, flag
results
Silica 370.1
LCS One per preparation batch
90-118 %R Repreparation/reanalysis of entire batch
Reagent/prep blanks
One per preparation batch
Not detected above RL Repreparation/reanalysis of entire batch
MS samples One per preparation batch
75-125% R Check LCS, flag results
CCBK Every 10 samples and ending
Not detected above RL Check analytical system, reanalyze associated samples
Duplicate samples One per preparation batch
RPD < 30 Check analytical system, flag results
TOC Lloyd Kahn
LCS One per preparation batch
80-120% R Repreparation/reanalysis of entire batch
Grain Size Distribution ASTM D322
NA NA NA NA
Bulk Density ASTM D 5057
Duplicate samples One every 10 samples
RPD < 25 Check analysis system, flag results
Boron and Total Uranium by ICP-MS) 6020
Reagent/Prep/ICB/CCB blanks
1 per analytical batch of 20 samples or less, CCBs every 10 samples in analytical run
No analytes above RL Repreparation/reanalysis of entire prep batch
MS Samples 1 per analytical batch of 20 samples or less
75-125% R Analyze post digestion spike
MS Duplicate Samples
1 per analytical batch of 20 samples or less
RPD <20 Check analytical system, flag results
LCS 1 per analytical batch of 20 samples or less
80-120% R Repreparation/reanalysis of entire prep batch
Dilution Test 1 per analytical batch of 20 samples or less
10% (results >4 x RL) Flag results
Interference check Beginning of each analytical run
80-120% R Recalibrate, reanalyze any sample with interfering elements
1 = Preparation Batch defined as maximum of 20 field samples of a similar matrix unless otherwise specified. MS/MSD = Matrix Spike/Matrix Spike Duplicate RL = Reporting Limit %R = Percent Recovery LCS = Laboratory Control Sample RPD = Relative Percent Difference MDA = Minimum Detectable Activity CCBK = Continuing Calibration Blank ICBK = Initial Calibration Blank
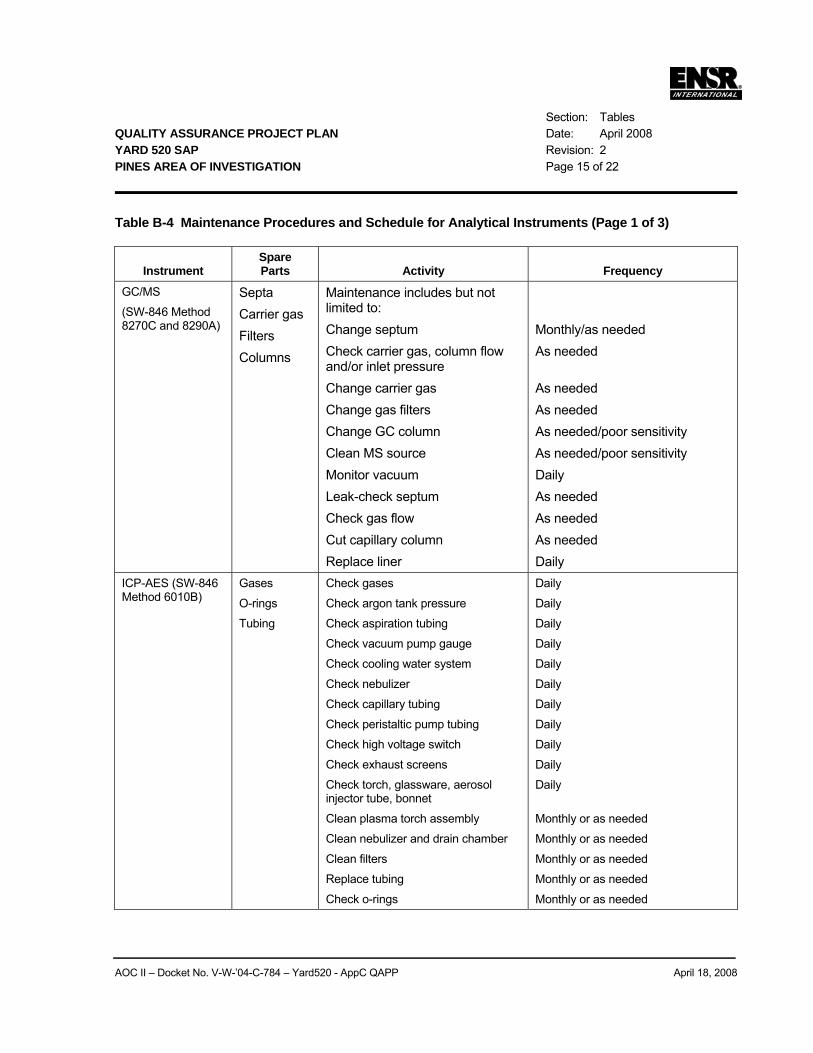
Section: Tables QUALITY ASSURANCE PROJECT PLAN Date: April 2008 YARD 520 SAP Revision: 2 PINES AREA OF INVESTIGATION Page 15 of 22
AOC II – Docket No. V-W-’04-C-784 – Yard520 - AppC QAPP April 18, 2008
Table B-4 Maintenance Procedures and Schedule for Analytical Instruments (Page 1 of 3)
Instrument Spare Parts Activity Frequency
GC/MS
(SW-846 Method 8270C and 8290A)
Septa Carrier gas Filters Columns
Maintenance includes but not limited to: Change septum Check carrier gas, column flow and/or inlet pressure Change carrier gas Change gas filters Change GC column Clean MS source Monitor vacuum Leak-check septum Check gas flow Cut capillary column Replace liner
Monthly/as needed As needed As needed As needed As needed/poor sensitivity As needed/poor sensitivity Daily As needed As needed As needed Daily
ICP-AES (SW-846 Method 6010B)
Gases
O-rings
Tubing
Check gases
Check argon tank pressure
Check aspiration tubing
Check vacuum pump gauge
Check cooling water system
Check nebulizer
Check capillary tubing
Check peristaltic pump tubing
Check high voltage switch
Check exhaust screens
Check torch, glassware, aerosol injector tube, bonnet
Clean plasma torch assembly
Clean nebulizer and drain chamber
Clean filters
Replace tubing
Check o-rings
Daily
Daily
Daily
Daily
Daily
Daily
Daily
Daily
Daily
Daily
Daily
Monthly or as needed
Monthly or as needed
Monthly or as needed
Monthly or as needed
Monthly or as needed
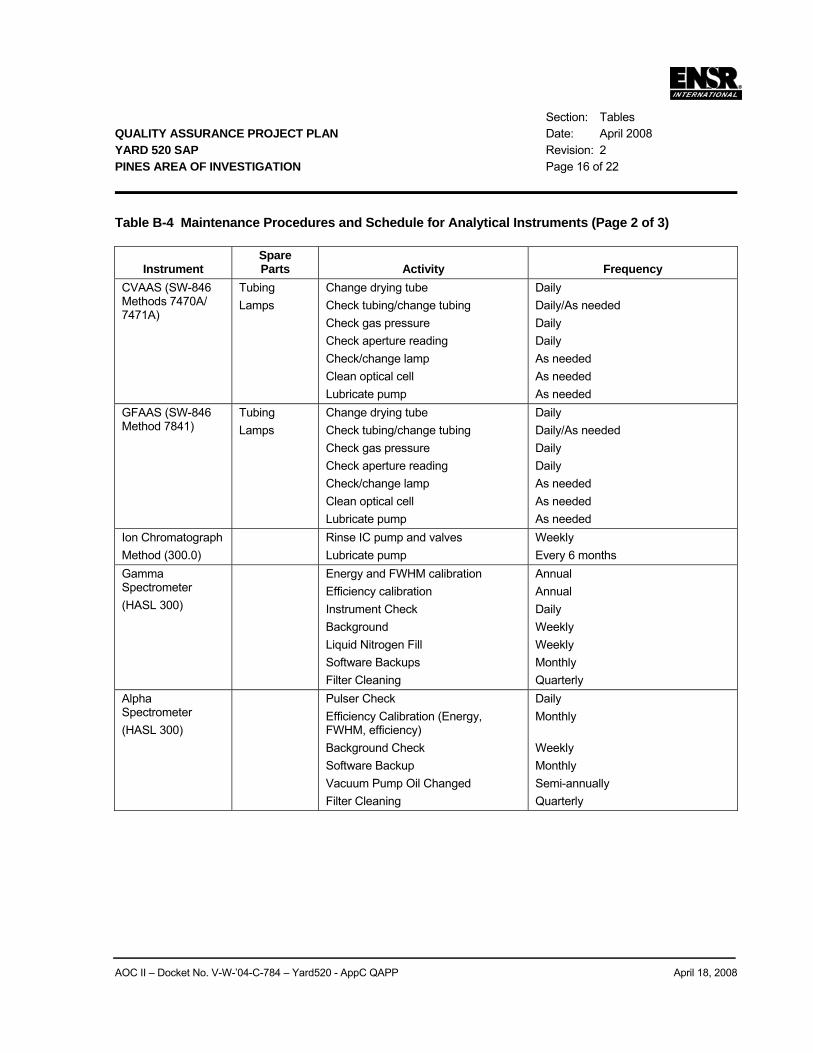
Section: Tables QUALITY ASSURANCE PROJECT PLAN Date: April 2008 YARD 520 SAP Revision: 2 PINES AREA OF INVESTIGATION Page 16 of 22
AOC II – Docket No. V-W-’04-C-784 – Yard520 - AppC QAPP April 18, 2008
Table B-4 Maintenance Procedures and Schedule for Analytical Instruments (Page 2 of 3)
Instrument Spare Parts Activity Frequency
CVAAS (SW-846 Methods 7470A/ 7471A)
Tubing Lamps
Change drying tube Check tubing/change tubing Check gas pressure Check aperture reading Check/change lamp Clean optical cell Lubricate pump
Daily Daily/As needed Daily Daily As needed As needed As needed
GFAAS (SW-846 Method 7841)
Tubing Lamps
Change drying tube Check tubing/change tubing Check gas pressure Check aperture reading Check/change lamp Clean optical cell Lubricate pump
Daily Daily/As needed Daily Daily As needed As needed As needed
Ion Chromatograph Method (300.0)
Rinse IC pump and valves Lubricate pump
Weekly Every 6 months
Gamma Spectrometer (HASL 300)
Energy and FWHM calibration Efficiency calibration Instrument Check Background Liquid Nitrogen Fill Software Backups Filter Cleaning
Annual Annual Daily Weekly Weekly Monthly Quarterly
Alpha Spectrometer (HASL 300)
Pulser Check Efficiency Calibration (Energy, FWHM, efficiency) Background Check Software Backup Vacuum Pump Oil Changed Filter Cleaning
Daily Monthly Weekly Monthly Semi-annually Quarterly
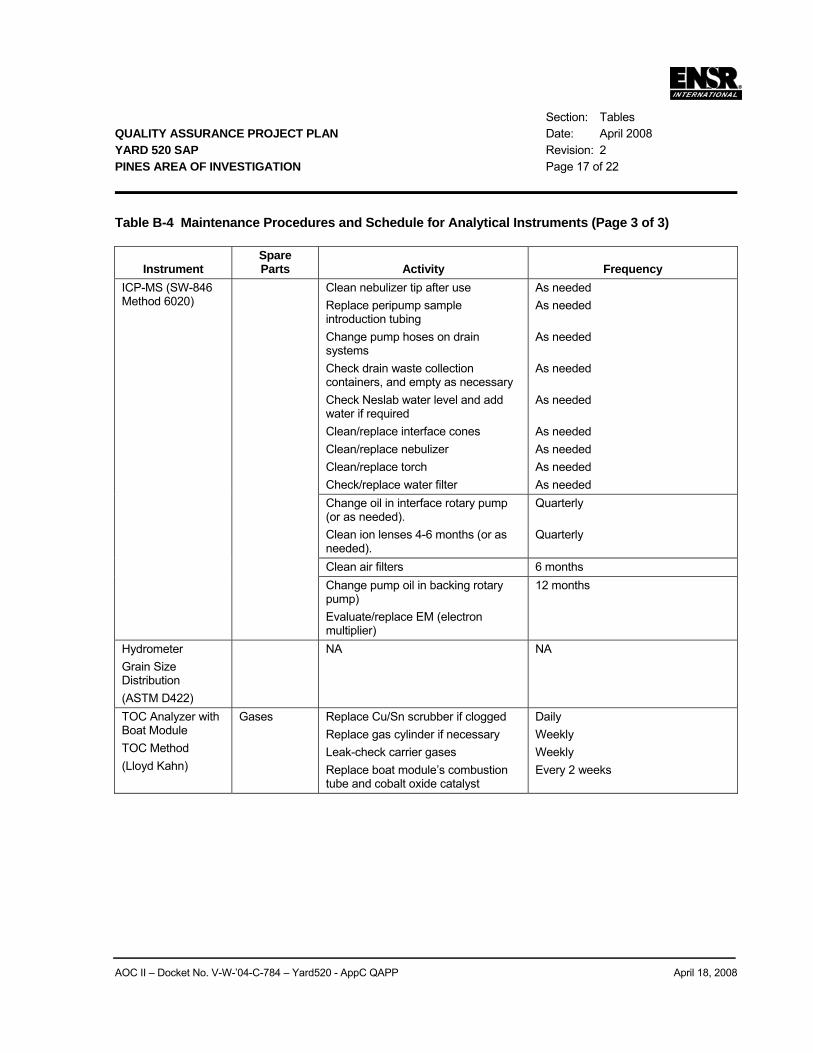
Section: Tables QUALITY ASSURANCE PROJECT PLAN Date: April 2008 YARD 520 SAP Revision: 2 PINES AREA OF INVESTIGATION Page 17 of 22
AOC II – Docket No. V-W-’04-C-784 – Yard520 - AppC QAPP April 18, 2008
Table B-4 Maintenance Procedures and Schedule for Analytical Instruments (Page 3 of 3)
Instrument Spare Parts Activity Frequency
Clean nebulizer tip after use Replace peripump sample introduction tubing Change pump hoses on drain systems Check drain waste collection containers, and empty as necessary Check Neslab water level and add water if required Clean/replace interface cones Clean/replace nebulizer Clean/replace torch Check/replace water filter
As needed As needed As needed As needed As needed As needed As needed As needed As needed
Change oil in interface rotary pump (or as needed). Clean ion lenses 4-6 months (or as needed).
Quarterly Quarterly
Clean air filters 6 months
ICP-MS (SW-846 Method 6020)
Change pump oil in backing rotary pump) Evaluate/replace EM (electron multiplier)
12 months
Hydrometer Grain Size Distribution (ASTM D422)
NA NA
TOC Analyzer with Boat Module TOC Method (Lloyd Kahn)
Gases Replace Cu/Sn scrubber if clogged Replace gas cylinder if necessary Leak-check carrier gases Replace boat module’s combustion tube and cobalt oxide catalyst
Daily Weekly Weekly Every 2 weeks
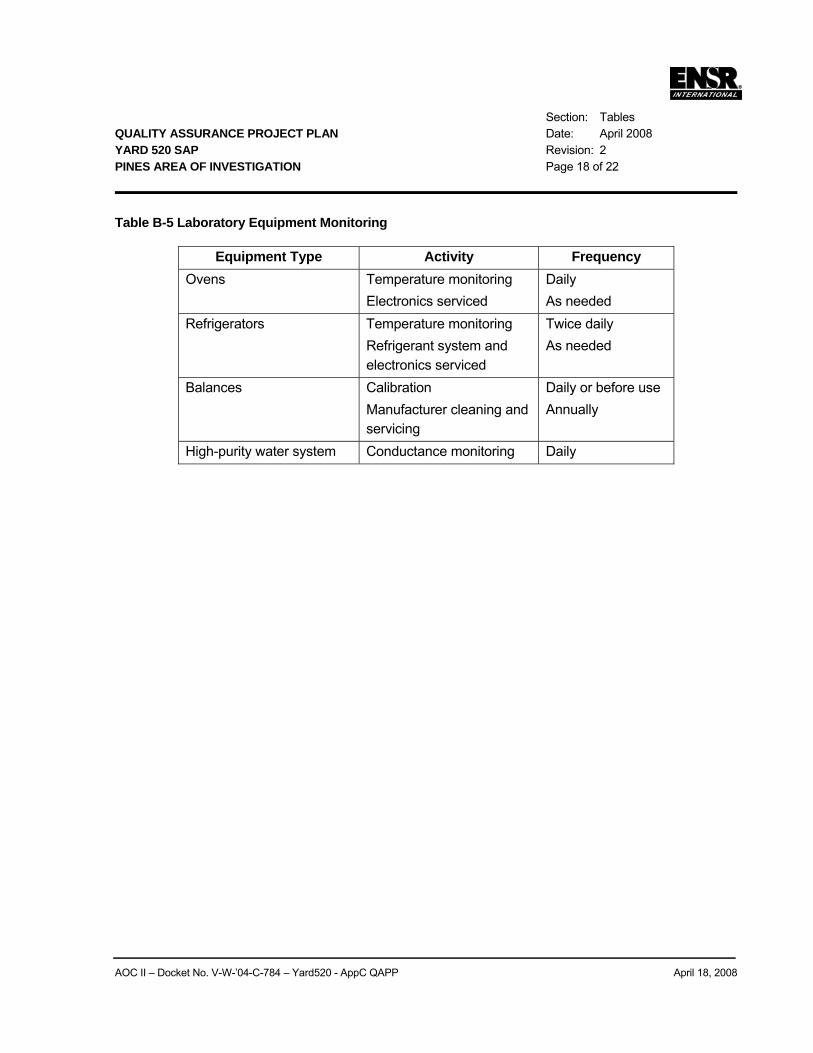
Section: Tables QUALITY ASSURANCE PROJECT PLAN Date: April 2008 YARD 520 SAP Revision: 2 PINES AREA OF INVESTIGATION Page 18 of 22
AOC II – Docket No. V-W-’04-C-784 – Yard520 - AppC QAPP April 18, 2008
Table B-5 Laboratory Equipment Monitoring
Equipment Type Activity Frequency Ovens Temperature monitoring
Electronics serviced Daily As needed
Refrigerators Temperature monitoring Refrigerant system and electronics serviced
Twice daily As needed
Balances Calibration Manufacturer cleaning and servicing
Daily or before use Annually
High-purity water system Conductance monitoring Daily
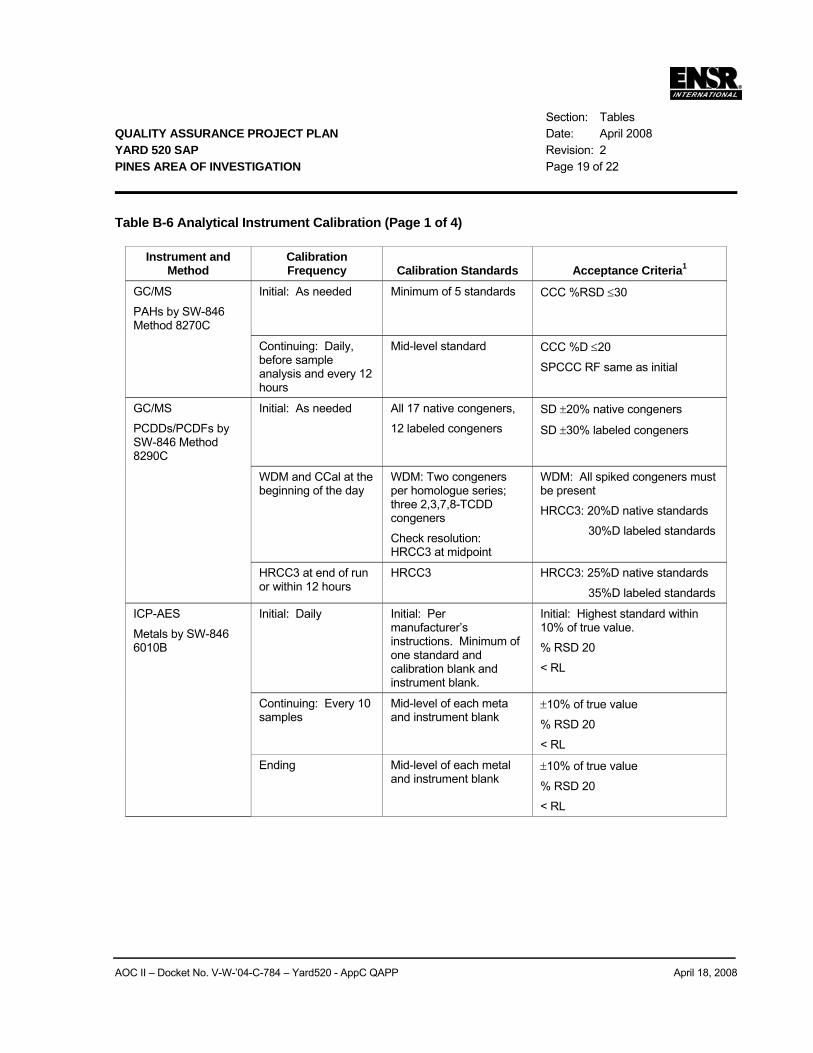
Section: Tables QUALITY ASSURANCE PROJECT PLAN Date: April 2008 YARD 520 SAP Revision: 2 PINES AREA OF INVESTIGATION Page 19 of 22
AOC II – Docket No. V-W-’04-C-784 – Yard520 - AppC QAPP April 18, 2008
Table B-6 Analytical Instrument Calibration (Page 1 of 4)
Instrument and Method
Calibration Frequency Calibration Standards Acceptance Criteria1
GC/MS
PAHs by SW-846 Method 8270C
Initial: As needed Minimum of 5 standards CCC %RSD ≤30
Continuing: Daily, before sample analysis and every 12 hours
Mid-level standard CCC %D ≤20
SPCCC RF same as initial
GC/MS
PCDDs/PCDFs by SW-846 Method 8290C
Initial: As needed
All 17 native congeners,
12 labeled congeners SD ±20% native congeners
SD ±30% labeled congeners
WDM and CCal at the beginning of the day
WDM: Two congeners per homologue series; three 2,3,7,8-TCDD congeners
Check resolution: HRCC3 at midpoint
WDM: All spiked congeners must be present
HRCC3: 20%D native standards
30%D labeled standards
HRCC3 at end of run or within 12 hours
HRCC3 HRCC3: 25%D native standards
35%D labeled standards
ICP-AES
Metals by SW-846 6010B
Initial: Daily Initial: Per manufacturer’s instructions. Minimum of one standard and calibration blank and instrument blank.
Initial: Highest standard within 10% of true value.
% RSD 20
< RL
Continuing: Every 10 samples
Mid-level of each meta and instrument blank
±10% of true value
% RSD 20
< RL
Ending Mid-level of each metal and instrument blank
±10% of true value
% RSD 20
< RL
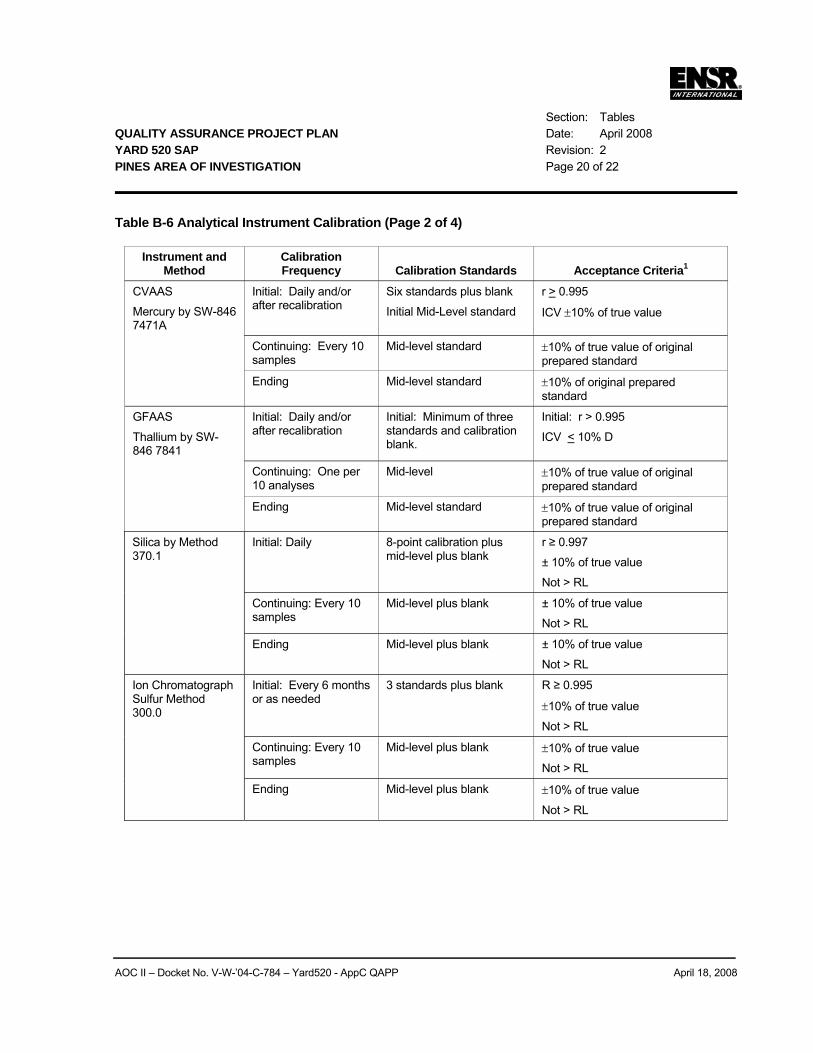
Section: Tables QUALITY ASSURANCE PROJECT PLAN Date: April 2008 YARD 520 SAP Revision: 2 PINES AREA OF INVESTIGATION Page 20 of 22
AOC II – Docket No. V-W-’04-C-784 – Yard520 - AppC QAPP April 18, 2008
Table B-6 Analytical Instrument Calibration (Page 2 of 4)
Instrument and Method
Calibration Frequency Calibration Standards Acceptance Criteria1
CVAAS
Mercury by SW-846 7471A
Initial: Daily and/or after recalibration
Six standards plus blank
Initial Mid-Level standard
r > 0.995
ICV ±10% of true value
Continuing: Every 10 samples
Mid-level standard ±10% of true value of original prepared standard
Ending Mid-level standard ±10% of original prepared standard
GFAAS
Thallium by SW-846 7841
Initial: Daily and/or after recalibration
Initial: Minimum of three standards and calibration blank.
Initial: r > 0.995
ICV < 10% D
Continuing: One per 10 analyses
Mid-level ±10% of true value of original prepared standard
Ending Mid-level standard ±10% of true value of original prepared standard
Silica by Method 370.1
Initial: Daily 8-point calibration plus mid-level plus blank
r ≥ 0.997
± 10% of true value
Not > RL
Continuing: Every 10 samples
Mid-level plus blank ± 10% of true value
Not > RL
Ending Mid-level plus blank ± 10% of true value
Not > RL
Ion Chromatograph Sulfur Method 300.0
Initial: Every 6 months or as needed
3 standards plus blank R ≥ 0.995
±10% of true value
Not > RL
Continuing: Every 10 samples
Mid-level plus blank ±10% of true value
Not > RL
Ending Mid-level plus blank ±10% of true value
Not > RL
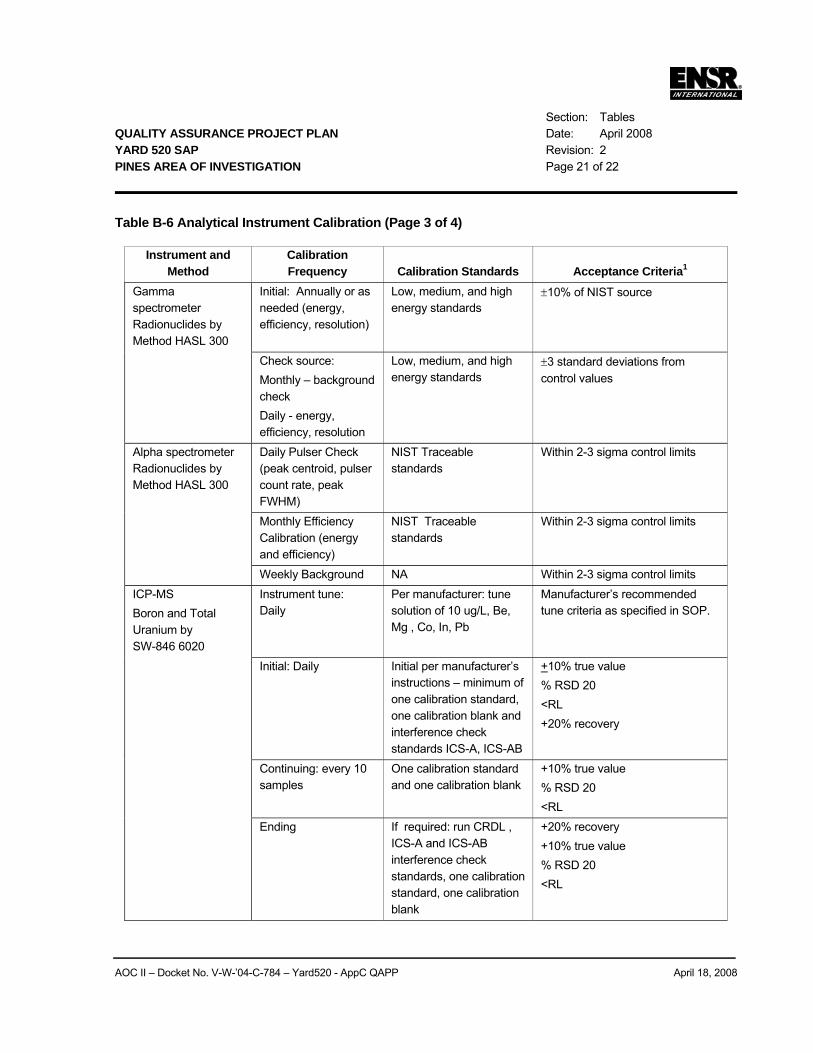
Section: Tables QUALITY ASSURANCE PROJECT PLAN Date: April 2008 YARD 520 SAP Revision: 2 PINES AREA OF INVESTIGATION Page 21 of 22
AOC II – Docket No. V-W-’04-C-784 – Yard520 - AppC QAPP April 18, 2008
Table B-6 Analytical Instrument Calibration (Page 3 of 4)
Instrument and Method
Calibration Frequency Calibration Standards Acceptance Criteria1
Gamma spectrometer Radionuclides by Method HASL 300
Initial: Annually or as needed (energy, efficiency, resolution)
Low, medium, and high energy standards
±10% of NIST source
Check source: Monthly – background check Daily - energy, efficiency, resolution
Low, medium, and high energy standards
±3 standard deviations from control values
Alpha spectrometer Radionuclides by Method HASL 300
Daily Pulser Check (peak centroid, pulser count rate, peak FWHM)
NIST Traceable standards
Within 2-3 sigma control limits
Monthly Efficiency Calibration (energy and efficiency)
NIST Traceable standards
Within 2-3 sigma control limits
Weekly Background NA Within 2-3 sigma control limits ICP-MS Boron and Total Uranium by SW-846 6020
Instrument tune: Daily
Per manufacturer: tune solution of 10 ug/L, Be, Mg , Co, In, Pb
Manufacturer’s recommended tune criteria as specified in SOP.
Initial: Daily Initial per manufacturer’s instructions – minimum of one calibration standard, one calibration blank and interference check standards ICS-A, ICS-AB
+10% true value % RSD 20 <RL +20% recovery
Continuing: every 10 samples
One calibration standard and one calibration blank
+10% true value % RSD 20 <RL
Ending If required: run CRDL , ICS-A and ICS-AB interference check standards, one calibration standard, one calibration blank
+20% recovery +10% true value % RSD 20 <RL
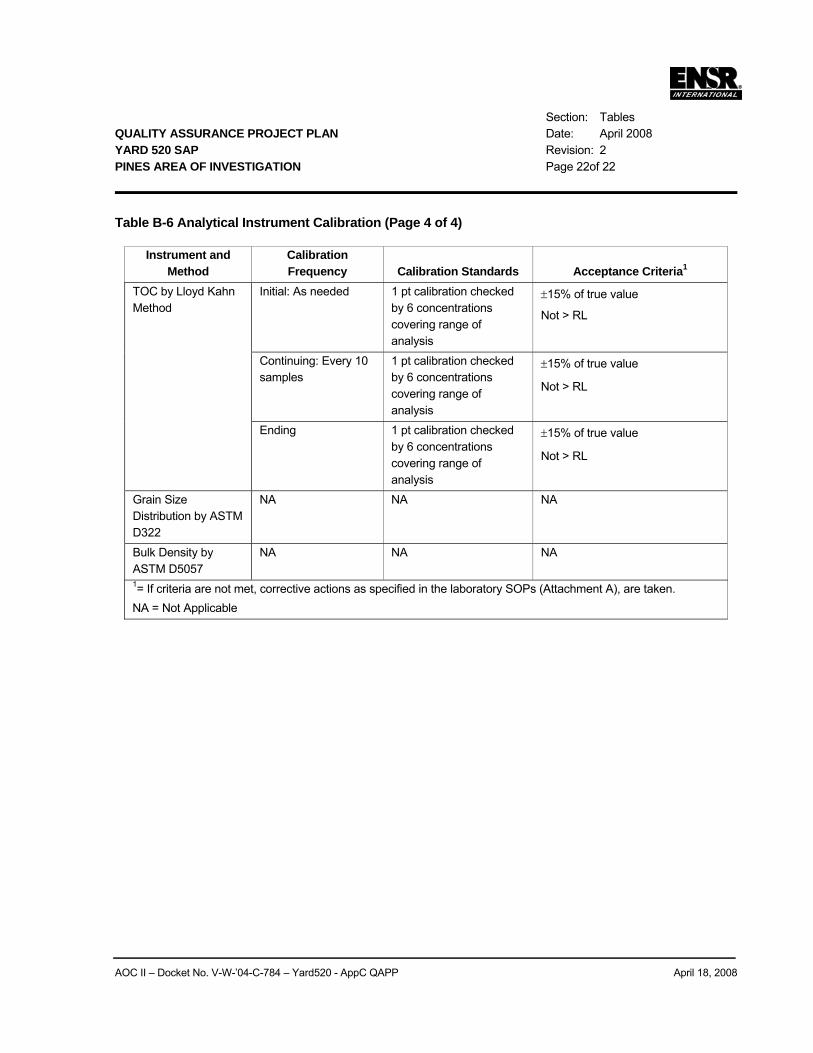
Section: Tables QUALITY ASSURANCE PROJECT PLAN Date: April 2008 YARD 520 SAP Revision: 2 PINES AREA OF INVESTIGATION Page 22of 22
AOC II – Docket No. V-W-’04-C-784 – Yard520 - AppC QAPP April 18, 2008
Table B-6 Analytical Instrument Calibration (Page 4 of 4)
Instrument and Method
Calibration Frequency Calibration Standards Acceptance Criteria1
TOC by Lloyd Kahn Method
Initial: As needed 1 pt calibration checked by 6 concentrations covering range of analysis
±15% of true value
Not > RL
Continuing: Every 10 samples
1 pt calibration checked by 6 concentrations covering range of analysis
±15% of true value
Not > RL
Ending 1 pt calibration checked by 6 concentrations covering range of analysis
±15% of true value
Not > RL
Grain Size Distribution by ASTM D322
NA NA NA
Bulk Density by ASTM D5057
NA NA NA
1= If criteria are not met, corrective actions as specified in the laboratory SOPs (Attachment A), are taken. NA = Not Applicable
AOC II – Docket No. V-W-’04-C-784 – Yard520 - AppC QAPP September 2, 2005
ATTACHMENT A
LABORATORY STANDARD OPERATING PROCEDURES
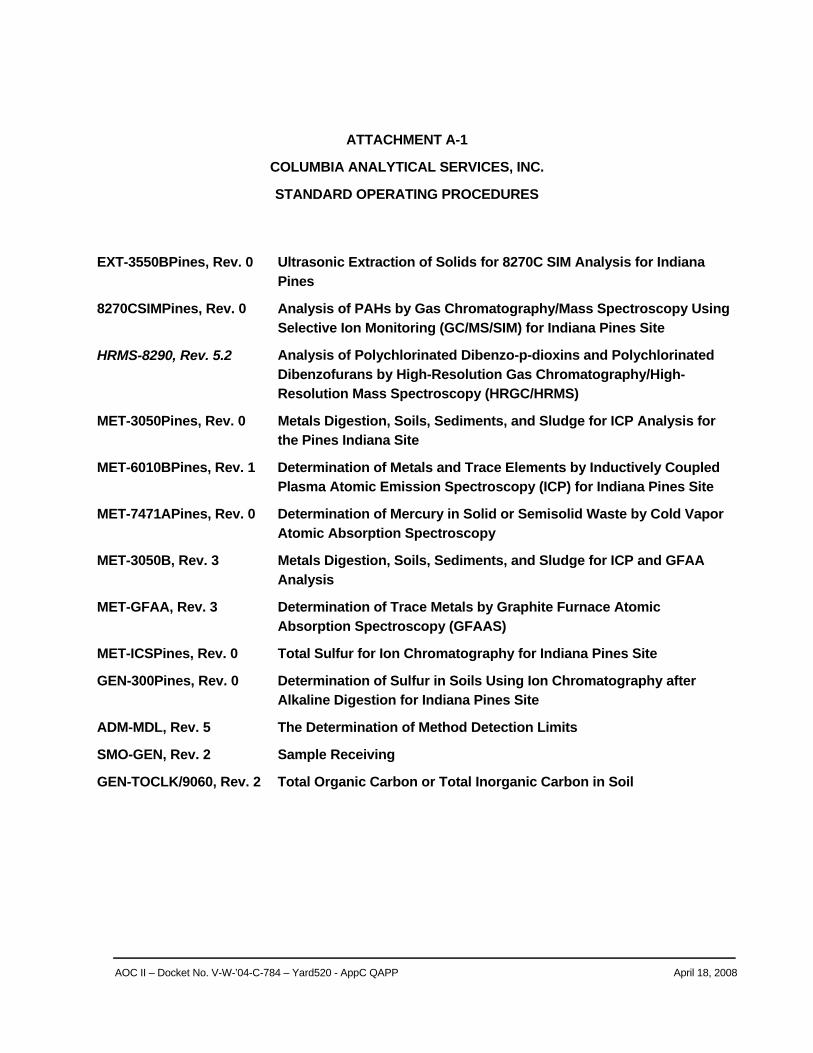
AOC II – Docket No. V-W-’04-C-784 – Yard520 - AppC QAPP April 18, 2008
ATTACHMENT A-1
COLUMBIA ANALYTICAL SERVICES, INC.
STANDARD OPERATING PROCEDURES
EXT-3550BPines, Rev. 0 Ultrasonic Extraction of Solids for 8270C SIM Analysis for Indiana Pines
8270CSIMPines, Rev. 0 Analysis of PAHs by Gas Chromatography/Mass Spectroscopy Using Selective Ion Monitoring (GC/MS/SIM) for Indiana Pines Site
HRMS-8290, Rev. 5.2 Analysis of Polychlorinated Dibenzo-p-dioxins and Polychlorinated Dibenzofurans by High-Resolution Gas Chromatography/High-Resolution Mass Spectroscopy (HRGC/HRMS)
MET-3050Pines, Rev. 0 Metals Digestion, Soils, Sediments, and Sludge for ICP Analysis for the Pines Indiana Site
MET-6010BPines, Rev. 1 Determination of Metals and Trace Elements by Inductively Coupled Plasma Atomic Emission Spectroscopy (ICP) for Indiana Pines Site
MET-7471APines, Rev. 0 Determination of Mercury in Solid or Semisolid Waste by Cold Vapor Atomic Absorption Spectroscopy
MET-3050B, Rev. 3 Metals Digestion, Soils, Sediments, and Sludge for ICP and GFAA Analysis
MET-GFAA, Rev. 3 Determination of Trace Metals by Graphite Furnace Atomic Absorption Spectroscopy (GFAAS)
MET-ICSPines, Rev. 0 Total Sulfur for Ion Chromatography for Indiana Pines Site
GEN-300Pines, Rev. 0 Determination of Sulfur in Soils Using Ion Chromatography after Alkaline Digestion for Indiana Pines Site
ADM-MDL, Rev. 5 The Determination of Method Detection Limits
SMO-GEN, Rev. 2 Sample Receiving
GEN-TOCLK/9060, Rev. 2 Total Organic Carbon or Total Inorganic Carbon in Soil
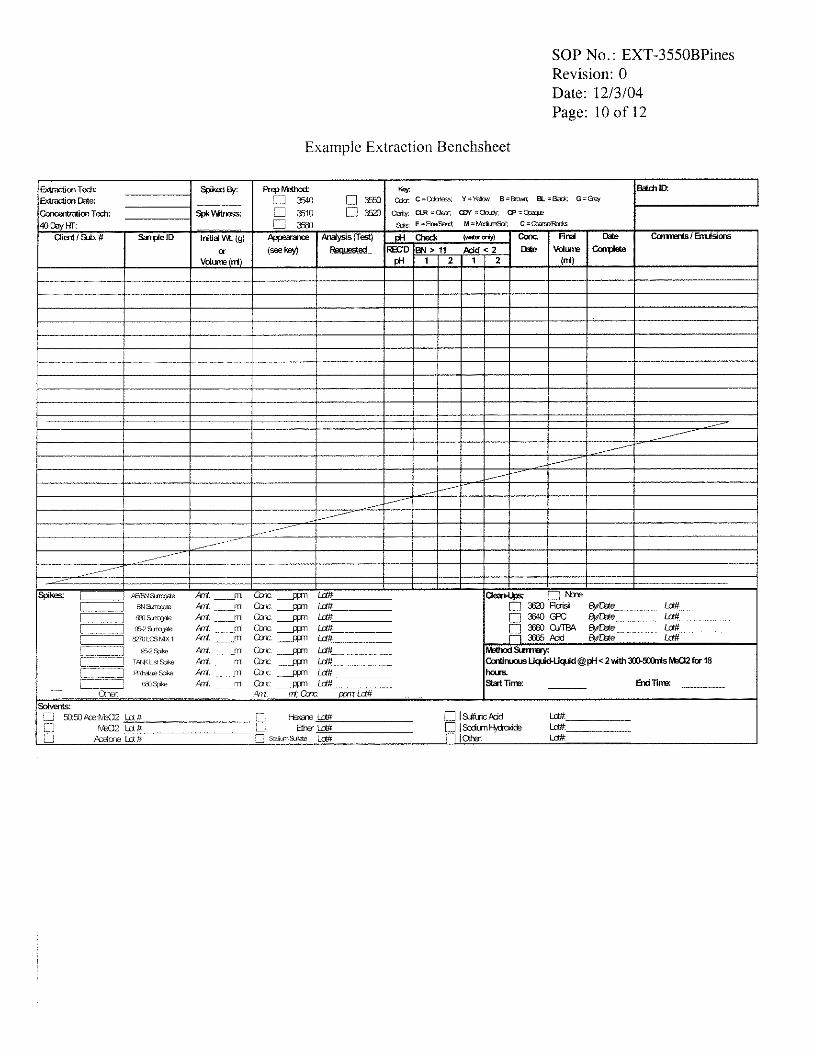
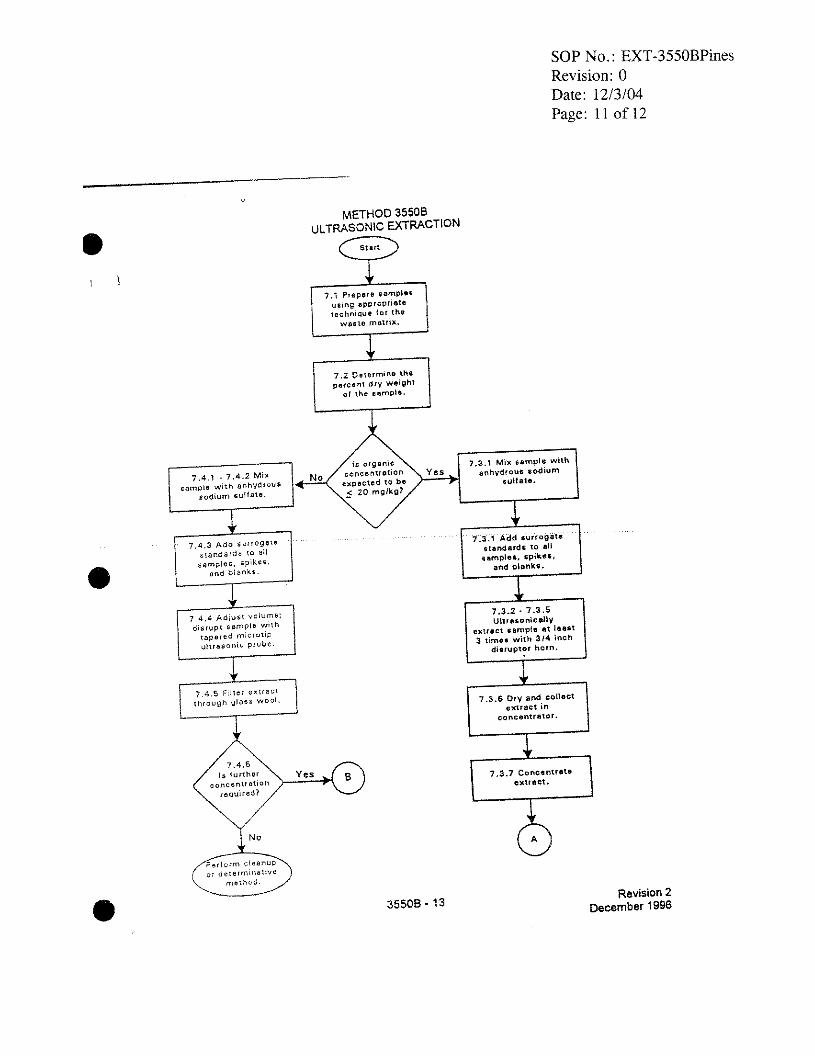
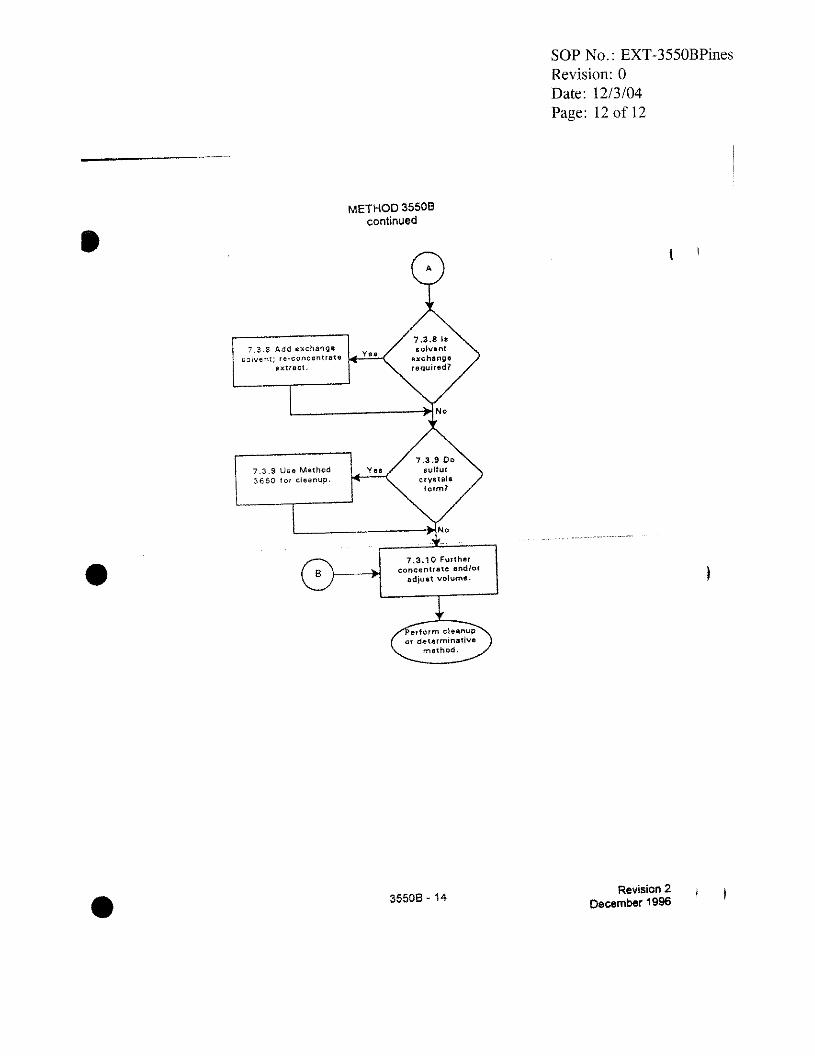
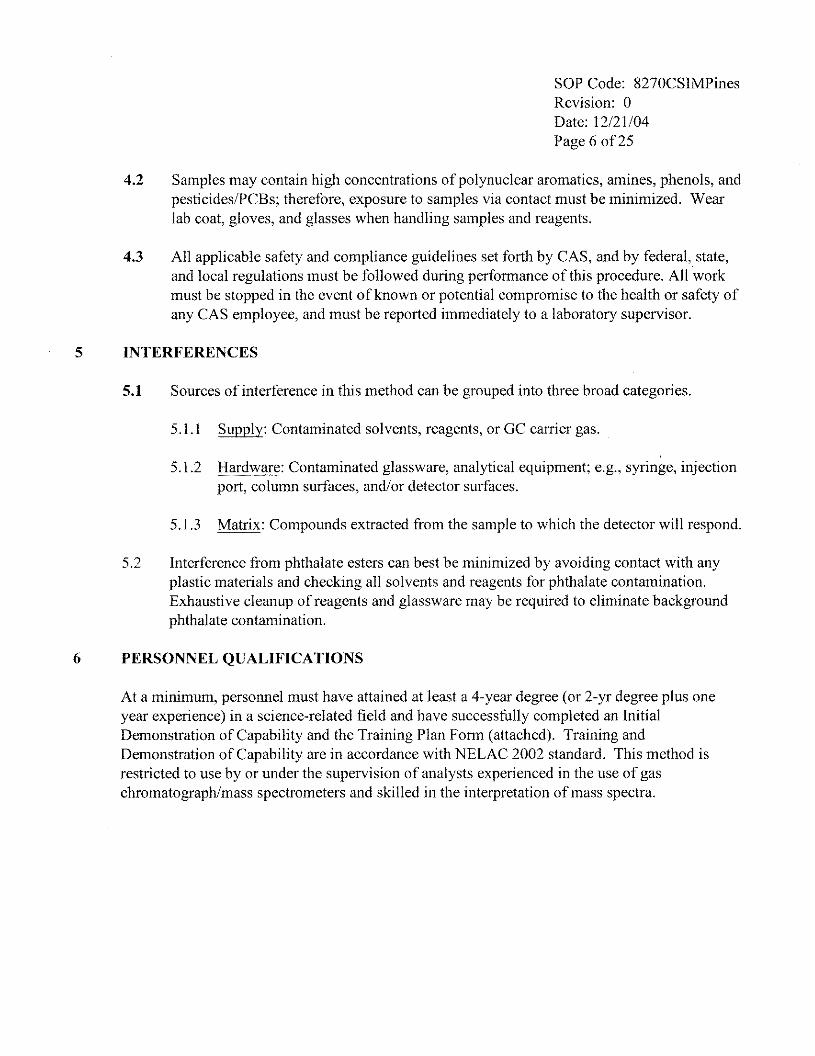
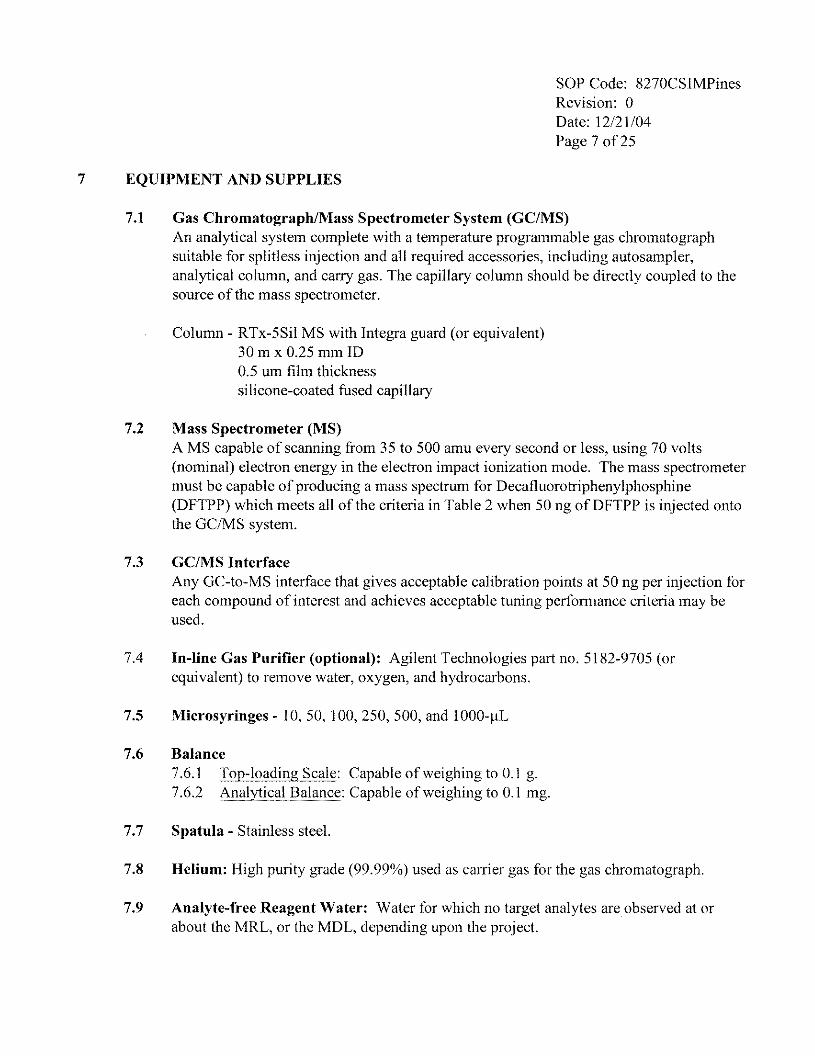
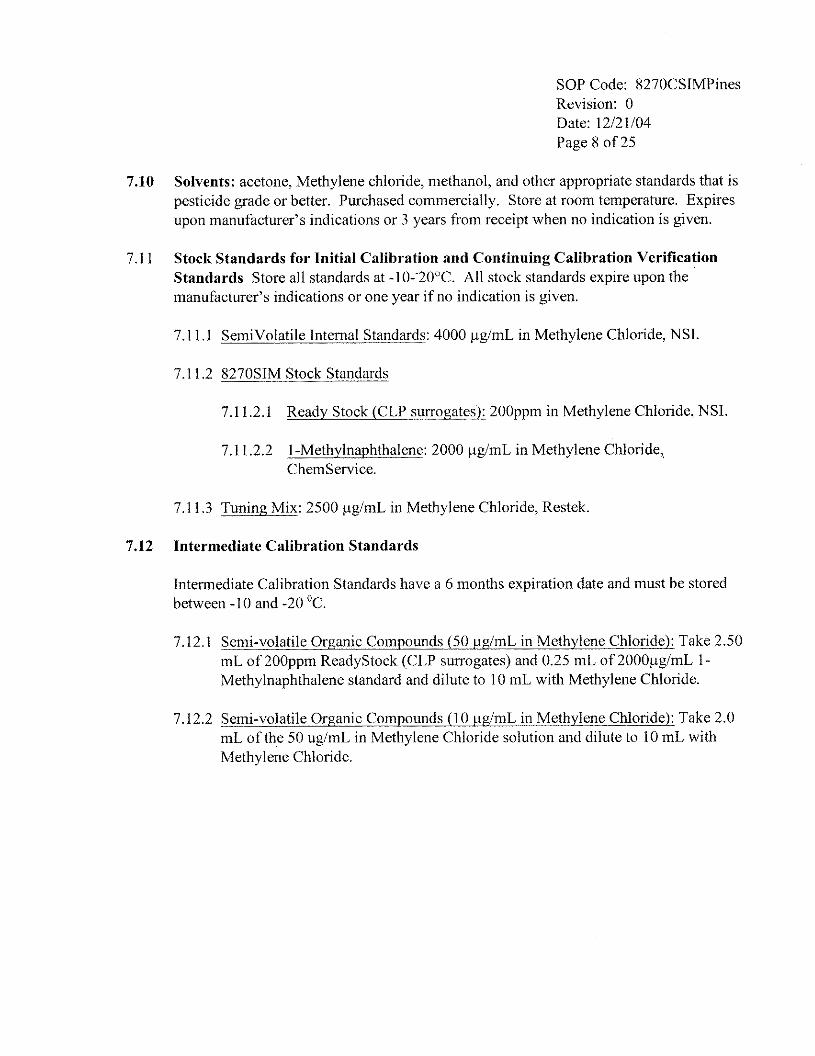
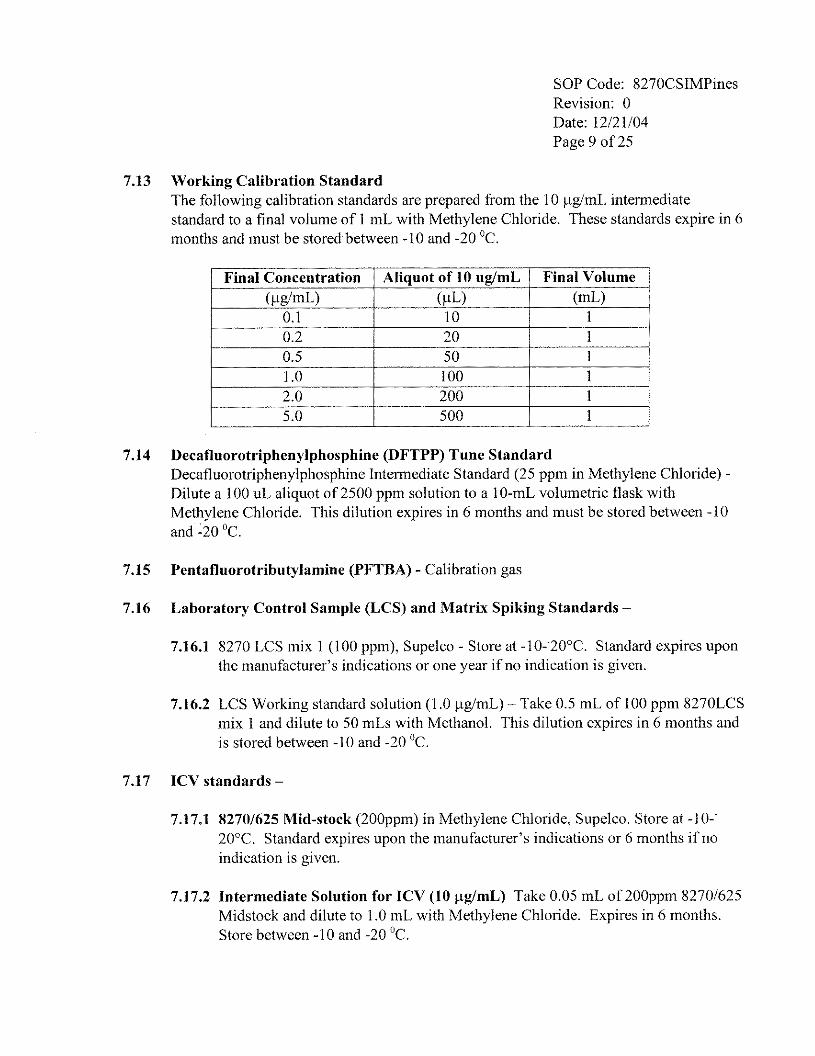
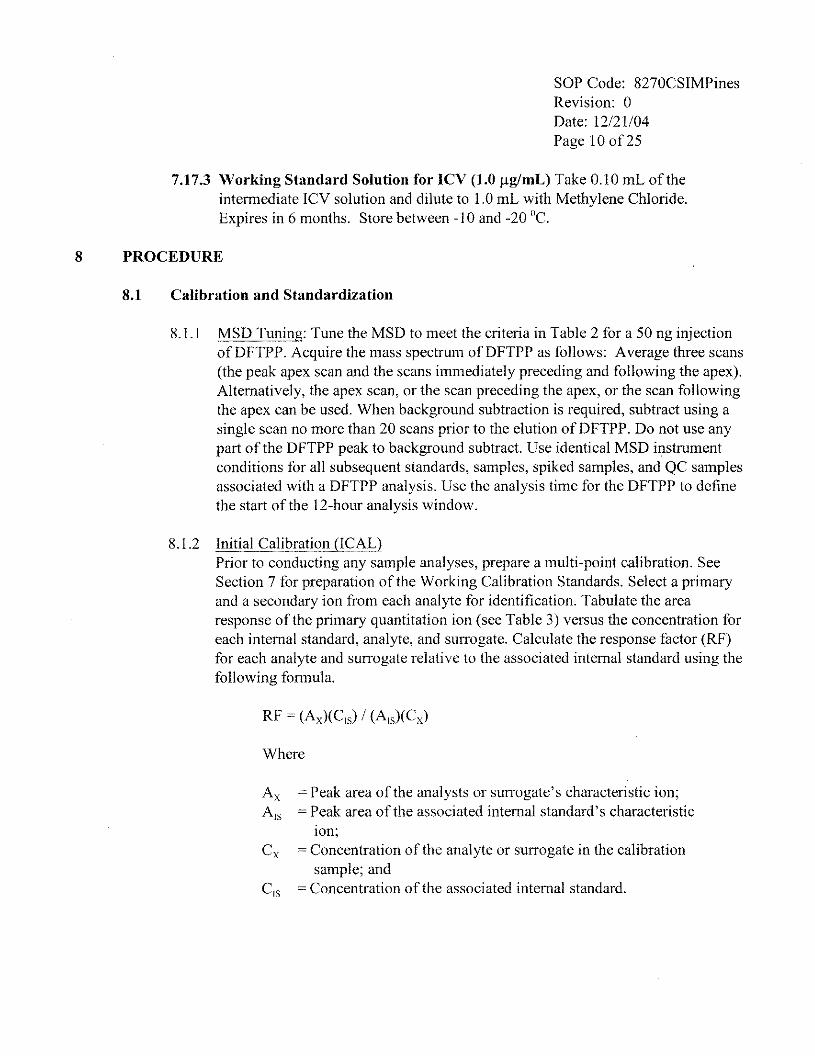
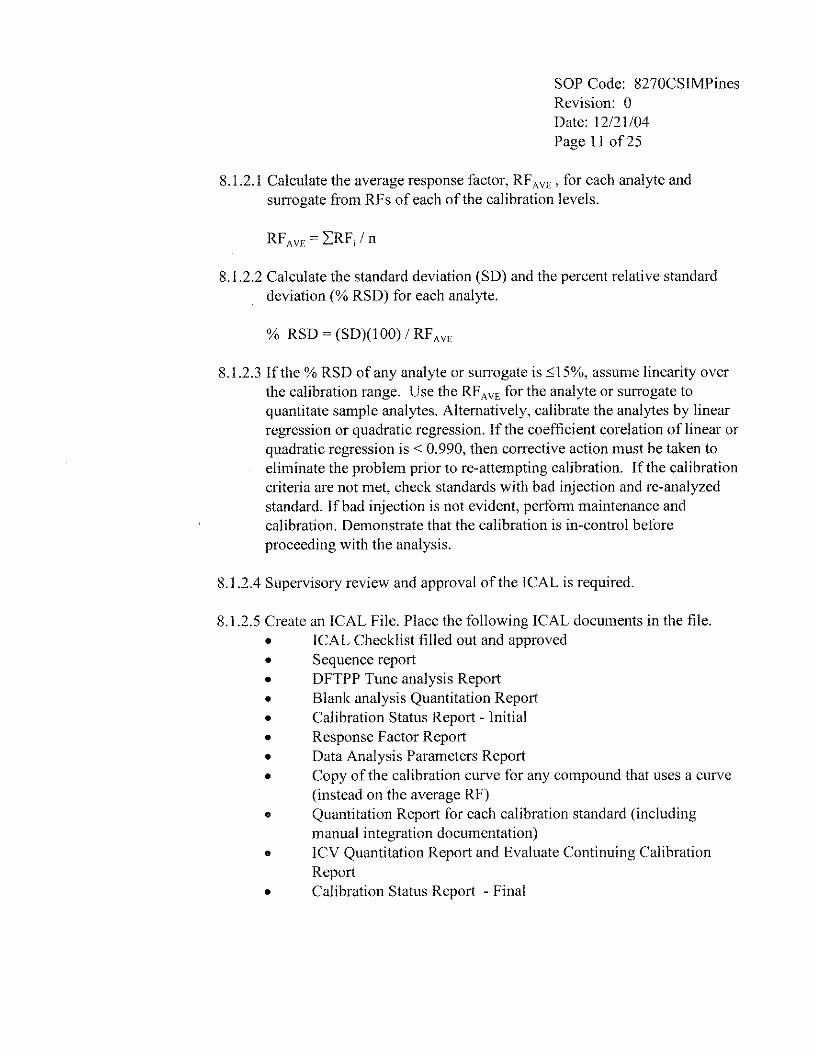
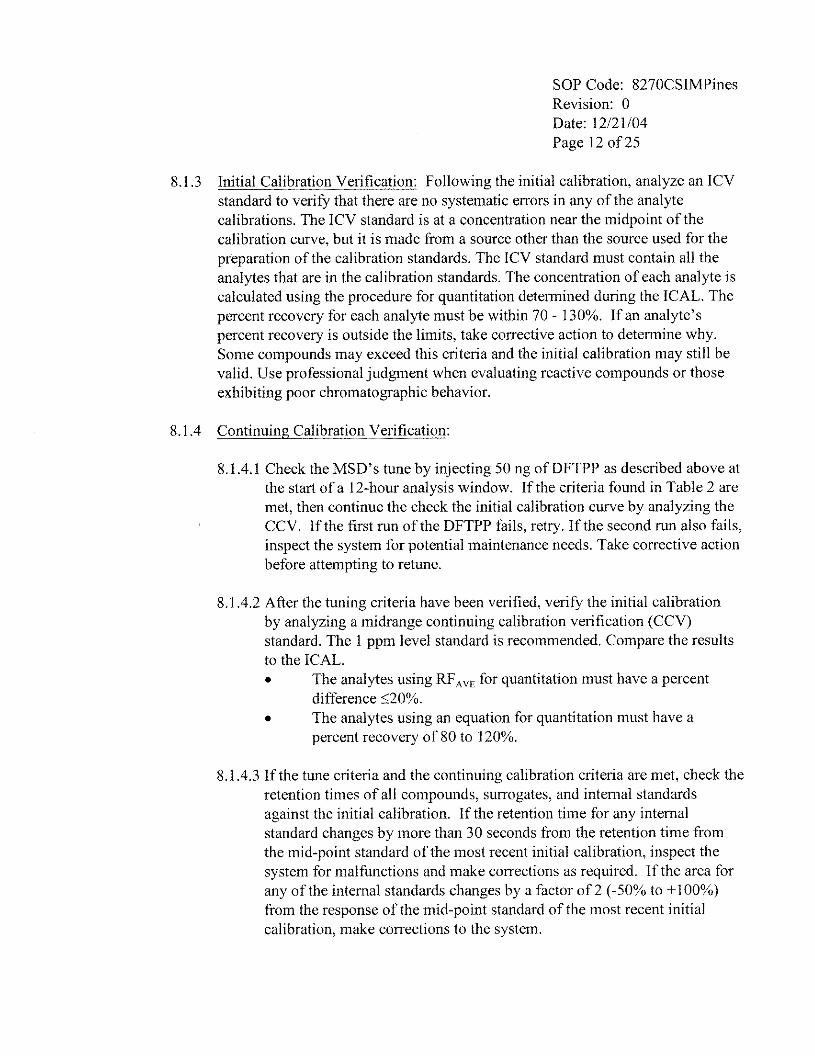
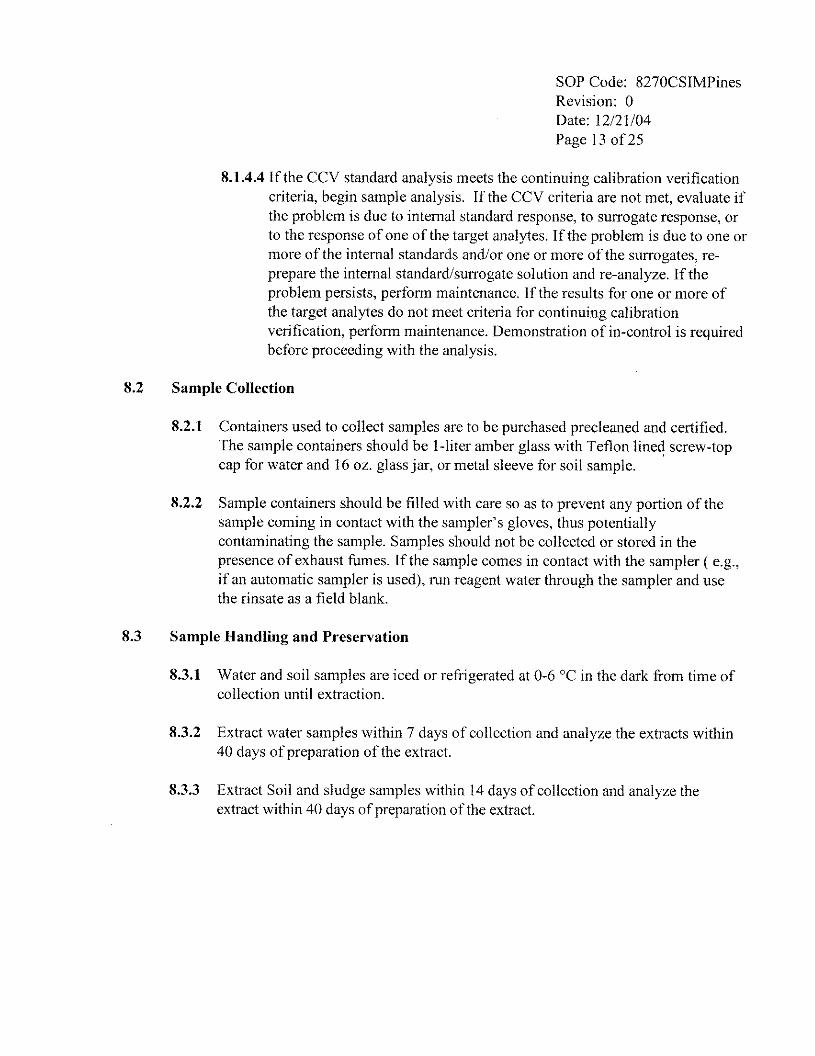
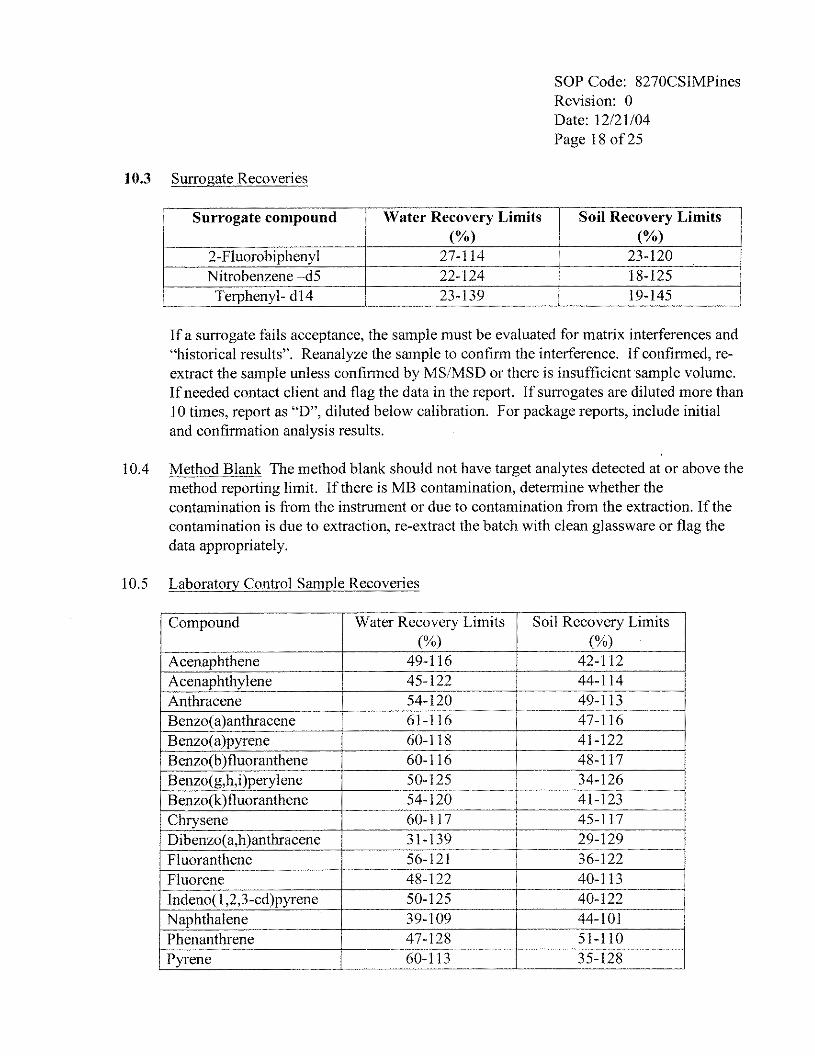
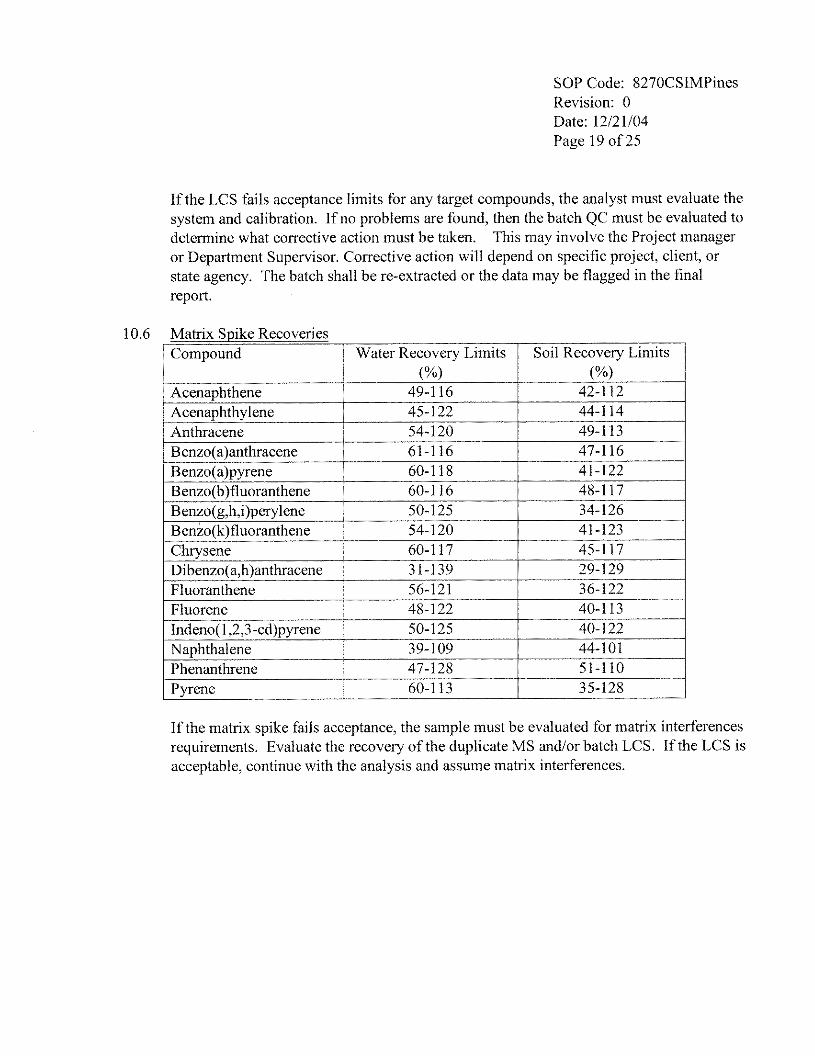
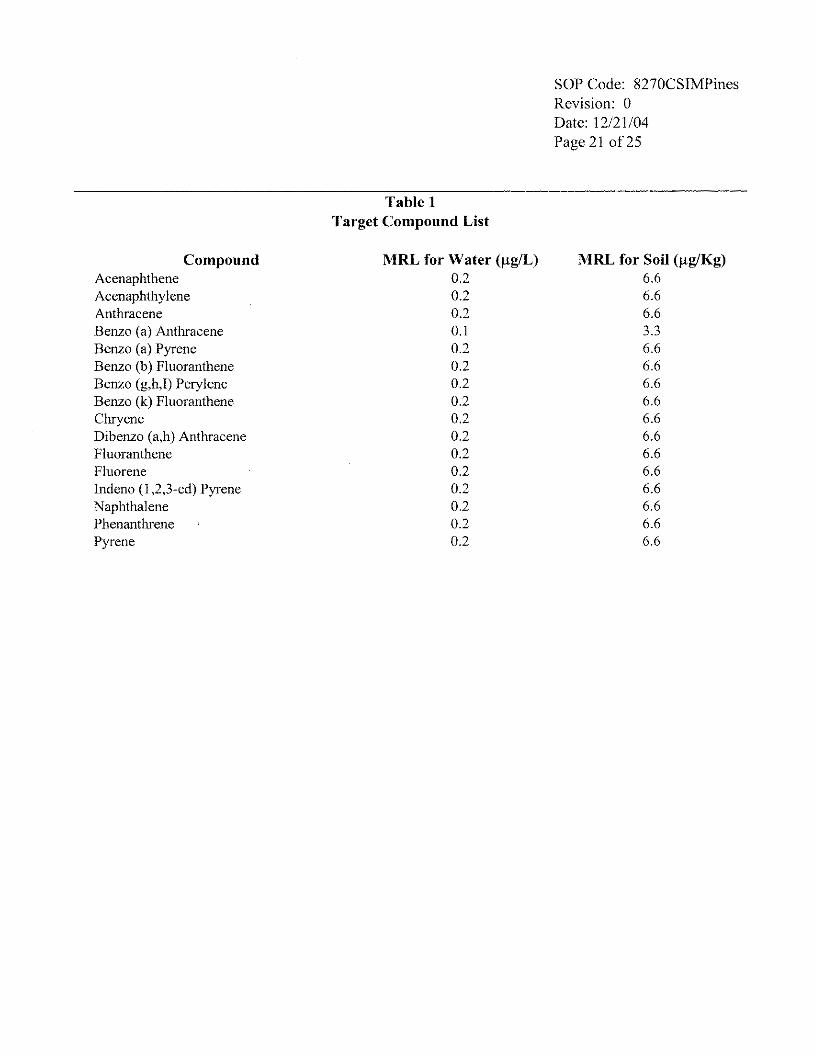
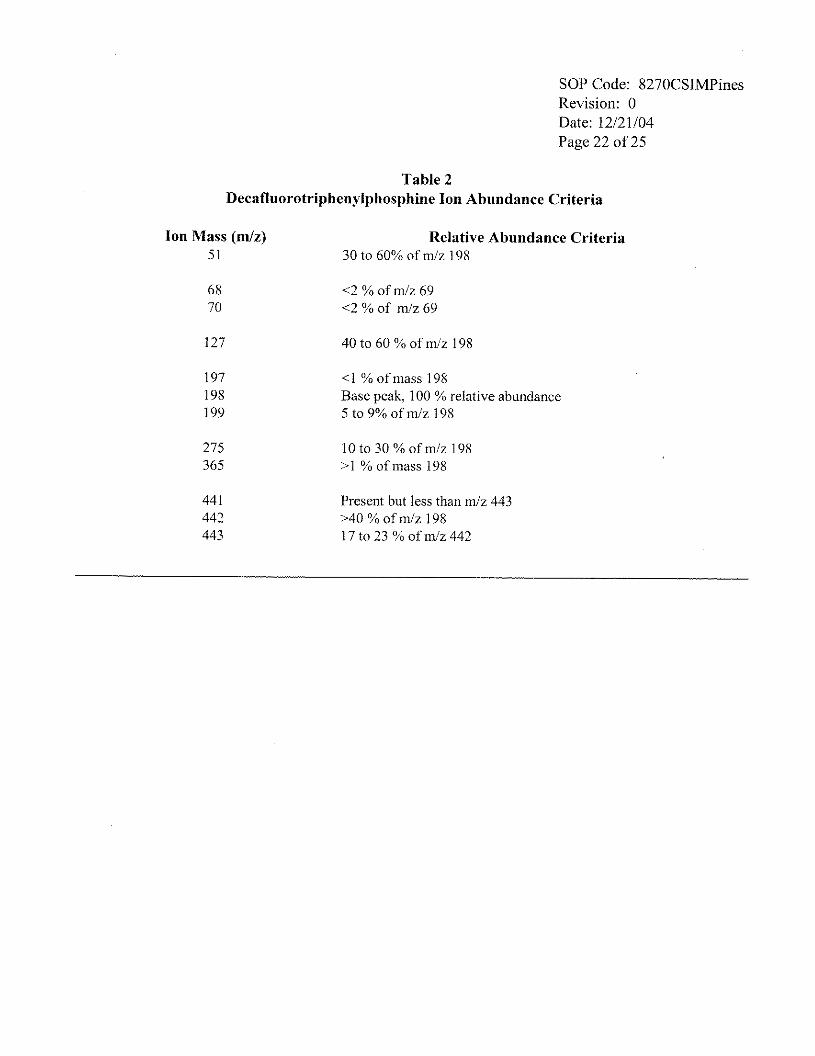
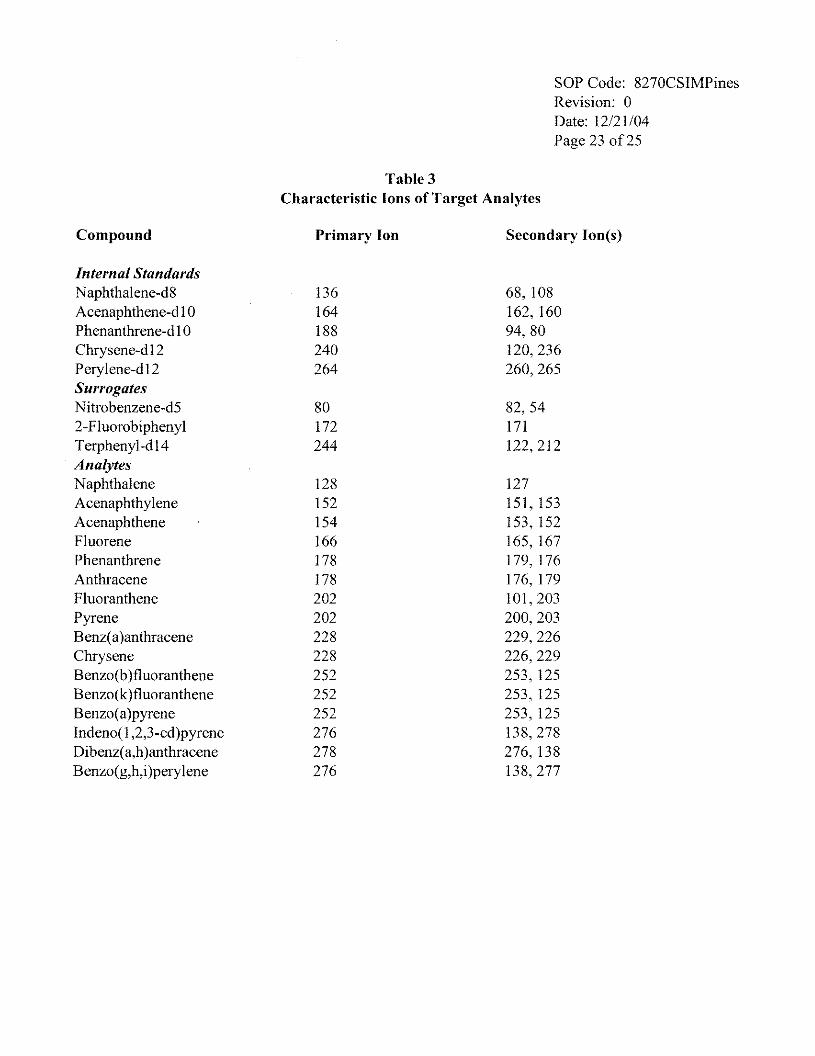
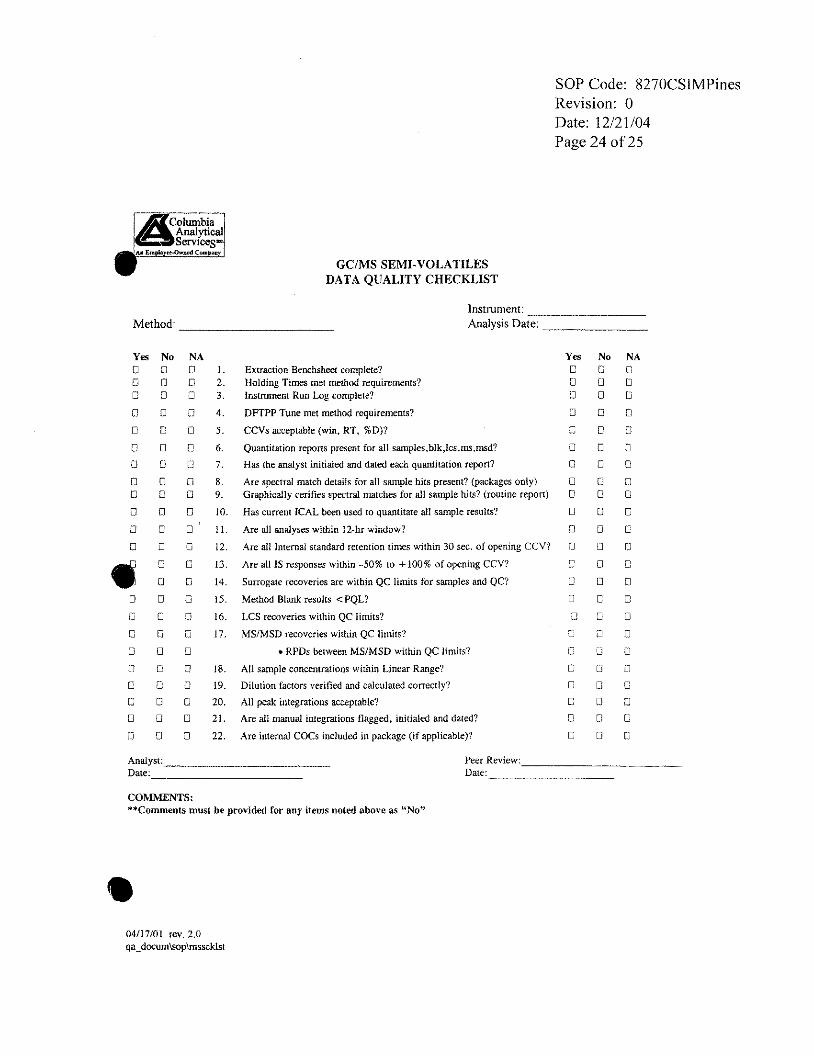
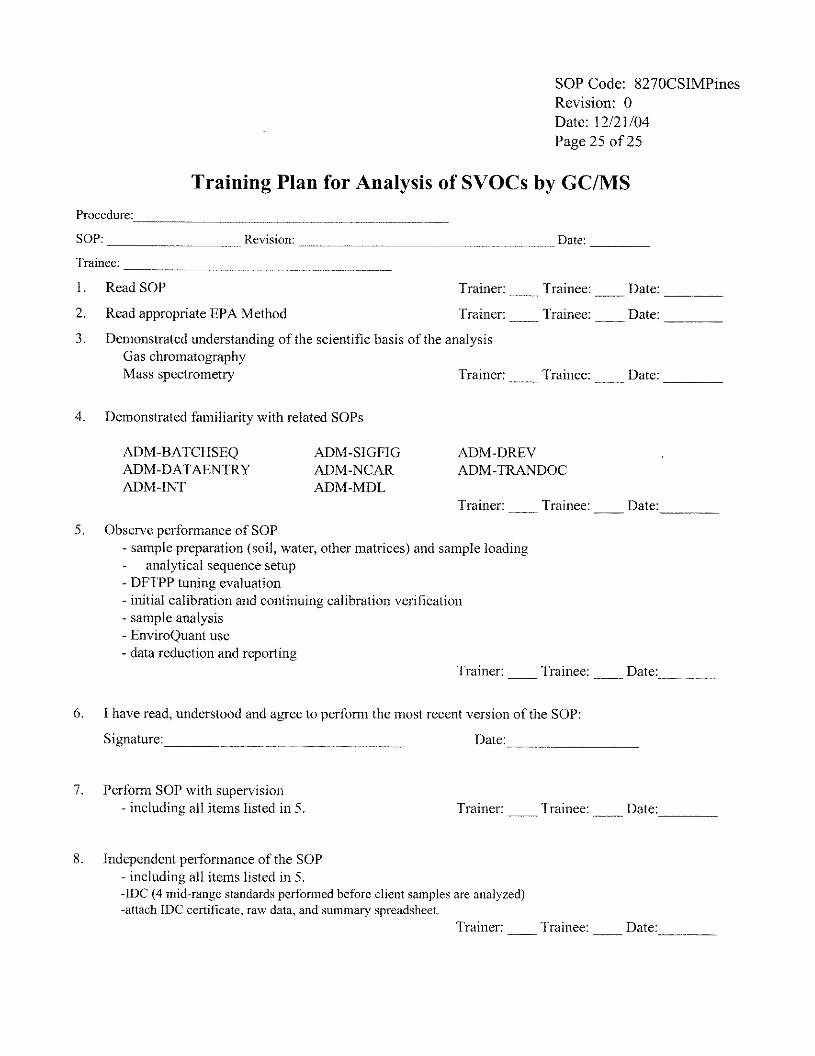
SOP Code: HRMS-8290 Date: 12/07/04 Authors: XL, JF, AV, RD, KV
SOP_8290_rklv.doc 2
TABLE OF CONTENTS Page1.0 Application…………………………………………………………………………… 3 2.0 Method Summary……………………………………………………………………… 4 3.0 Definitions……………………………………………………………………………… 6 4.0 Health and Safety Warnings…………………………………………………………… 7 5.0 Cautions…….…………………………………………………………………………. 7 6.0 Interferences……………………………………………………………………………. 8 7.0 Personnel Qualifications ……………………………………………………………….. 8 8.0 Equipment and Supplies ……………………………………………………………….. 10 9.0 Instrument Calibration and Standarization………………...…………………………… 16 10.0 Sample Collection……………………………………….. …………………………… 22 11.0 Sample Handling and Preservation……………………………………………………. 22 12.0 Sample Preparation and Analysis ……………………………………………………. 22 13.0 Data Analysis and Calculations ………………………………………………………. 33 14.0 Data and Records Management ……………………………………………………….. 38 15.0 Quality Assurance Requirements………………………………………………………. 40 16.0 References………………………………………………………………………………. 48
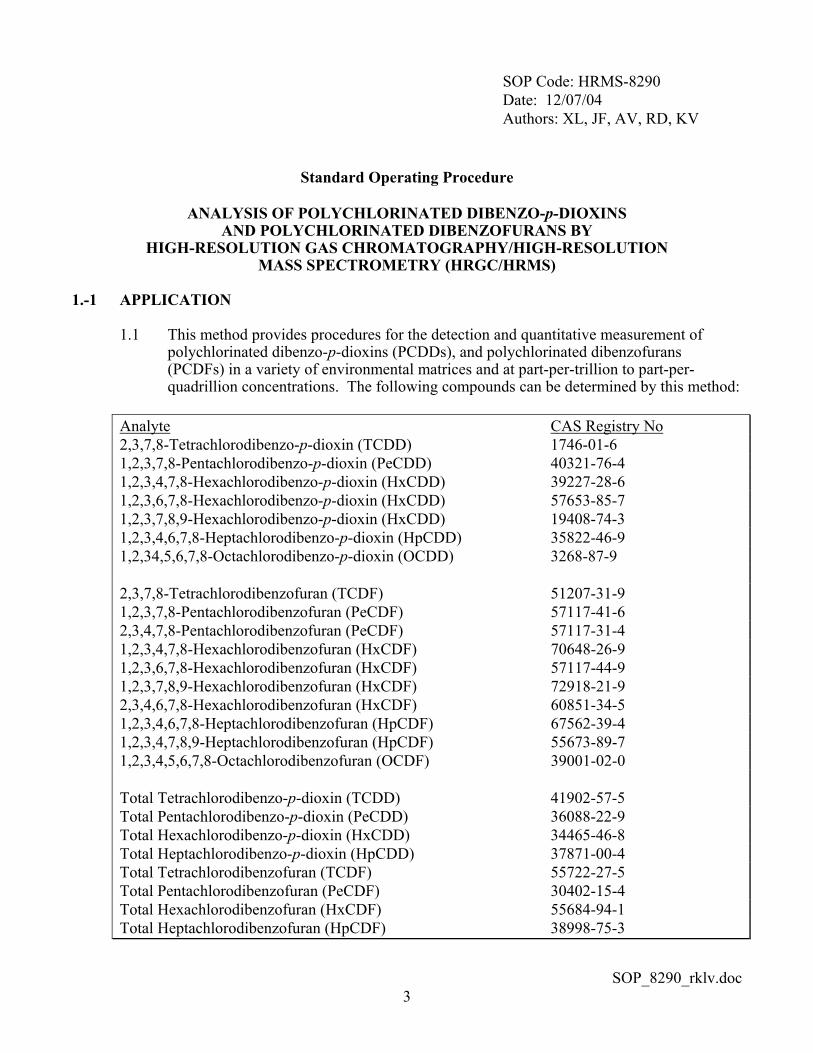
SOP Code: HRMS-8290 Date: 12/07/04 Authors: XL, JF, AV, RD, KV
SOP_8290_rklv.doc 3
Standard Operating Procedure
ANALYSIS OF POLYCHLORINATED DIBENZO-p-DIOXINS AND POLYCHLORINATED DIBENZOFURANS BY
HIGH-RESOLUTION GAS CHROMATOGRAPHY/HIGH-RESOLUTION MASS SPECTROMETRY (HRGC/HRMS)
1.-1 APPLICATION
1.1 This method provides procedures for the detection and quantitative measurement of polychlorinated dibenzo-p-dioxins (PCDDs), and polychlorinated dibenzofurans (PCDFs) in a variety of environmental matrices and at part-per-trillion to part-per- quadrillion concentrations. The following compounds can be determined by this method: Analyte CAS Registry No 2,3,7,8-Tetrachlorodibenzo-p-dioxin (TCDD) 1746-01-6 1,2,3,7,8-Pentachlorodibenzo-p-dioxin (PeCDD) 40321-76-4 1,2,3,4,7,8-Hexachlorodibenzo-p-dioxin (HxCDD) 39227-28-6 1,2,3,6,7,8-Hexachlorodibenzo-p-dioxin (HxCDD) 57653-85-7 1,2,3,7,8,9-Hexachlorodibenzo-p-dioxin (HxCDD) 19408-74-3 1,2,3,4,6,7,8-Heptachlorodibenzo-p-dioxin (HpCDD) 35822-46-9 1,2,34,5,6,7,8-Octachlorodibenzo-p-dioxin (OCDD) 3268-87-9 2,3,7,8-Tetrachlorodibenzofuran (TCDF) 51207-31-9 1,2,3,7,8-Pentachlorodibenzofuran (PeCDF) 57117-41-6 2,3,4,7,8-Pentachlorodibenzofuran (PeCDF) 57117-31-4 1,2,3,4,7,8-Hexachlorodibenzofuran (HxCDF) 70648-26-9 1,2,3,6,7,8-Hexachlorodibenzofuran (HxCDF) 57117-44-9 1,2,3,7,8,9-Hexachlorodibenzofuran (HxCDF) 72918-21-9 2,3,4,6,7,8-Hexachlorodibenzofuran (HxCDF) 60851-34-5 1,2,3,4,6,7,8-Heptachlorodibenzofuran (HpCDF) 67562-39-4 1,2,3,4,7,8,9-Heptachlorodibenzofuran (HpCDF) 55673-89-7 1,2,3,4,5,6,7,8-Octachlorodibenzofuran (OCDF) 39001-02-0 Total Tetrachlorodibenzo-p-dioxin (TCDD) 41902-57-5 Total Pentachlorodibenzo-p-dioxin (PeCDD) 36088-22-9 Total Hexachlorodibenzo-p-dioxin (HxCDD) 34465-46-8 Total Heptachlorodibenzo-p-dioxin (HpCDD) 37871-00-4 Total Tetrachlorodibenzofuran (TCDF) 55722-27-5 Total Pentachlorodibenzofuran (PeCDF) 30402-15-4 Total Hexachlorodibenzofuran (HxCDF) 55684-94-1 Total Heptachlorodibenzofuran (HpCDF) 38998-75-3
SOP Code: HRMS-8290 Date: 12/07/04 Authors: XL, JF, AV, RD, KV
SOP_8290_rklv.doc 4
1.2 The analytical method calls for the use of high-resolution gas chromatography and high-resolution mass spectrometry (HRGC/HRMS) on purified sample extracts. Table 1 lists the various sample types covered by this analytical protocol, the 2,3,7,8-TCDD-based method calibration limits (MCLs), and other pertinent information. Samples containing concentrations of specific congeneric analytes (PCDDs and PCDFs – see Table 4) considered within the scope of this method that are greater than ten times the upper MCLs must be analyzed by a protocol designed for such concentration levels, e.g., Method 8280. An optional method for reporting the analytical results using a 2,3,7,8 TCDD toxicity equivalency factor (TEF) is described. The sensitivity of this method is dependent upon the level of interferences within a given matrix (see Table 1.) The calibration range of the method for a 1L water sample is 10 to 2000ppq for TCDD/TCDF and PeCDD/PeCDF, and 1.0 to 200ppt for a 10g soil, sediment, fly ash, or tissue sample for the same analytes. Analysis of a one tenth aliquot of the sample permits measurement of concentrations up to 10 times the upper MCL. The actual limits of detection and quantitation will differ from the lower MCL, depending on the complexity of the matrix.
1.3 This method is designed for use by analysts who are experienced with residue analysis and skilled in HRGC/HRMS.
1.4 Because of the extreme toxicity of many of these compounds, the analyst must take the
necessary precautions to prevent exposure to materials known or believed to contain PCDDs or PCDFs. It is the responsibility of the laboratory personnel to ensure that safe handling procedures are employed.
2.0 METHOD SUMMARY
2.1 This procedure uses matrix specific extraction, analyte specific cleanup, and HRGC/HRMS analysis techniques.
2.2 If interferences are encountered, the method provides selected cleanup procedures to aid
the analyst in their elimination. A simplified analysis flow chart is presented at the end of this method.
2.3 A specified amount (see Table 1) of soil, sediment, fly ash, water, sludge (including
paper pulp), still bottom, fuel oil, chemical reactor residue, fish tissue, or human adipose tissue is spiked with a solution containing specified amounts of each of the nine isotopically labeled PCDDs/PCDFs. The sample is then extracted according to a matrix specific extraction procedure. Aqueous samples that are judged to contain 1 percent or more solids, and solid samples that show an aqueous phase, are filtered. The solid phase (including the filter) and the aqueous phase are extracted separately, and the extracts combined before extract cleanup.
SOP Code: HRMS-8290 Date: 12/07/04 Authors: XL, JF, AV, RD, KV
SOP_8290_rklv.doc 5
The extraction procedures are: 2.3.1 Toluene: Soxhlet extractions for soil, sediment, fly ash, and paper pulp samples; 2.3.2 Methylene chloride: Jar/Separatory Funnel extraction for water samples; 2.3.3 Toluene: Dean-Stark extraction for fuel oil and chemical samples 2.3.4 Toluene extraction for still bottom samples and sludge samples 2.3.5 Hexane/methylene chloride: Soxhlet extraction for fish tissue samples 2.3.6 Methylene chloride extraction for human adipose tissue samples. 2.3.7 As an option, all solid samples (wet or dry) may be extracted with toluene using a
Soxhlet/Dean Stark extraction system. The decision for the selection of an extraction procedure for chemical reactor residue samples is based on the appearance (consistency, viscosity) of the samples.
2.4 The extracts are submitted to a sulfuric acid washing treatment and dried. Following a
solvent exchange step, the extracts can be cleaned up by column chromatography on silica gel, alumina or activated carbon.
2.5 The preparation of the final extract for HRGC/HRMS analysis is accomplished by adding
10 to 50µL (depending on the matrix) of a nonane solution containing 50pg/µL of the recovery standards 13C12 -1,2,3,4-TCDD and 13C12 -1,2,3,7,8,9-HxCDD. The former is used to determine the percent recoveries of tetra- and pentachlorinated PCDD/PCDF congeners, while the latter is used to determine the percent recoveries of the hexa-, hepta- and octachlorinated PCDD/PCDF congeners.
2.6 One µL of the concentrated extract are injected into an HRGC/HRMS system capable of
performing selected ion monitoring at resolving powers of at least 10,000 (10 percent valley definition).
2.7 The identification of OCDD and nine of the fifteen 2,3,7,8-substituted congeners, for which
a 13C12-labeled standard is available in the sample fortification and recovery standard solutions, is based on their elution at their exact retention time (within 0.005 retention time units measured in the routine calibration) and the simultaneous detection of the two most abundant ions in the molecular ion region. The remaining six 2,3,7,8-substituted congeners (i.e., 2,3,4,7,8-PeCDF; 1,2,3,4,7,8-HxCDD; 1,2,3,6,7,8-HxCDF; 1,2,3,7,8,9-HxCDF; 2,3,4,6,7,8-HxCDF, and 1,2,3,4,7,8,9-HpCDF), for which no carbon-labeled internal standards are available in the sample fortification solution, and all other PCDD/PCDF congeners are identified when their relative retention times fall within their respective PCDD/PCDF retention time windows, as established from the routine calibration data, and the simultaneous detection of the two most abundant ions in the molecular ion region. The identification of OCDF is based on its retention time relative to 13C12 -OCDD and the simultaneous detection of the two most abundant ions in the molecular ion region. Identification is also based on a comparison of the ratios of the integrated ion abundance of the molecular ion species to their theoretical abundance ratios.
SOP Code: HRMS-8290 Date: 12/07/04 Authors: XL, JF, AV, RD, KV
SOP_8290_rklv.doc 6
2.8 Quantitation of the individual congeners, total PCDDs and total PCDFs is achieved in
conjunction with the establishment of a multipoint (five points) calibration curve for each homologue, during which each calibration solution is analyzed once.
3.0 DEFINITIONS
3.1. Abbreviations
PCDD = Polychlorinated dibenzo-p-dioxin PCDF = Polychlorinated dibenzofuran TCDD = Tetrachlorodibenzo-p-dioxin PeCDD = Pentachlorodibenzo-p-dioxin HxCDD = Hexachlorodibenzo-p-dioxin HpCDD = Heptachlorodibenzo-p-dioxin OCDD = Octachlorodibenzo-p-dioxin TCDF = Tetrachlorodibenzofuran PeCDF = Pentachlorodibenzofuran HxCDF = Hexachlorodibenzofuran HpCDF = Heptachlorodibenzofuran OCDF = Octachlorodibenzofuran HxCDPE = Hexachlorodiphenyl ether HpCDPE = Heptachlorodiphenyl ether OCDPE = Octachlorodiphenyl ether NCDPE = Nonachlorodiphenyl ether DCDPE = Decachlorodiphenyl ether PFK = Perfluorokerosene CS = Cleanup standard IS = Internal standard RS = Recovery standard HRGC = High-resolution gas chromatography HRMS = High-resolution mass spectrometry TEF = Toxicity equivalence factor TEQ = Toxicity equivalent
SOP Code: HRMS-8290 Date: 12/07/04 Authors: XL, JF, AV, RD, KV
SOP_8290_rklv.doc 7
3.2 Isotope-Labeled Standards
3.2.1 Recovery standards are added to the sample extract immediately before analysis by HRGC/HRMS. Recoveries of the cleanup and internal standards are determined by comparing the peak areas of the cleanup and internal standards with the peak areas of the recovery standards.
3.2.2 The cleanup standard is added to the sample extract prior to initiation of cleanup
procedures. Loss of cleanup standard reflects losses occurring during cleanup. Generally, greater losses of cleanup standard occur when exhaustive cleanup techniques are indicated.
3.2.3 Internal standards are added to the sample before extraction. Losses of internal
standards reflect losses occurring during both extraction and cleanup. It is difficult to recover the internal standard (and the analytes) from some sample matrices. Severe losses of internal standards may result in impaired detection limits.
3.3 Toxicity Equivalence Factors
3.3.1 Not all of the 17 regulated dioxin/furan isomers have the same degree of toxicity.
Toxicity Equivalence Factors (TEF), relative to the most toxic dioxin/furan isomer, 2,3,7,8-TCDD, have been established. The concentration of each 2,3,7,8-congener is multiplied by the appropriate toxicity equivalence factor (TEF). The individual results of these calculations are summed to determine the 2,3,7,8-TCDD toxicity equivalent (TEQ). Table 8
4.0 HEALTH and SAFETY WARNINGS
4.1. This method is to be used only by analysts experienced with residue analysis and skilled
in mass spectral analytical techniques. 4.2 Safety training for working with PCDDs and PCDFs is required prior handling these
chemicals. 4.3. Because of the extreme toxicity of these compounds, the analyst must take necessary
precautions to prevent exposure to self, or to others, of materials known or believed to contain PCDDs or PCDFs.
5.0 CAUTIONS
5.1 Low-level contamination is always a possibility for HRGC/HRMS analysis, due to the
chemical properties of dioxins/furans.
SOP Code: HRMS-8290 Date: 12/07/04 Authors: XL, JF, AV, RD, KV
SOP_8290_rklv.doc 8
5.1.1. When HRGC/HRMS glassware becomes contaminated, it is discarded. 5.1.2 Disposable glassware and material is used whenever possible during extraction
and cleanup.
6.0 INTERFERENCES
6.1 Solvents, reagents, glassware and other sample processing hardware may yield discrete artifacts or elevated baselines that may cause misinterpretation of the chromatographic data. All of these materials must be demonstrated to be free from interferences under the conditions of analysis by performing laboratory method blanks. Analysts should avoid using PVC gloves.
6.2 The use of high purity reagents and solvents helps minimize interference problems. Purification of solvents by distillation in all-glass systems may be necessary.
6.3 Interferences coextracted from the sample will vary considerably from matrix to matrix. PCDDs and PCDFs are often associated with other interfering chlorinated substances such as polychlorinated biphenyls (PCBs), polychlorinated diphenyl ethers (PCDPEs), polychlorinated naphthalenes, and polychlorinated alkyldibenzofurans. These analytes may be found at concentrations several orders of magnitude higher than the analytes of interest. Retention times of target analytes must be verified using reference standards. These values must correspond to the established retention time windows. While cleanup techniques are provided as part of this method, unique samples may require additional cleanup steps to achieve lower detection limits. 6.4 A high-resolution capillary column (60m DB-5, J&W Scientific, or equivalent) is used in this method. However, no single column is known to resolve all isomers. The 60m DB-5 GC column is capable of 2,3,7,8-TCDD isomer specificity. In order to determine the concentration of the 2,3,7,8-TCDF (if detected on the DB-5 column), the sample extract must be reanalyzed on a column capable of 2,3,7,8-TCDF isomer specificity
(e.g., DB-225, SP-2330, SP-2331, or equivalent).
7.0 PERSONNEL QUALIFICATIONS All analysts must demonstrate proficiency in the method by completing the following Training Plan:
SOP Code: HRMS-8290 Date: 12/07/04 Authors: XL, JF, AV, RD, KV
SOP_8290_rklv.doc 9
Training Plan for Analysis of Method 8290 by HRMS SOP File: HRMS-8290 (Rev. 4/01-09-01)
Trainee: ________________________________________
1. Read and study SOP Trainer: ____ Trainee: ____ Date: ________
2. Read Methods 8000B and 8290 Trainer: ____ Trainee: ____ Date: ________
3. Demonstrated scientific understanding of the analysis Trainer: ____ Trainee: ____ Date: ________ Sample preparation HR-Gas chromatography HR-Mass spectrometry
4. Demonstrated familiarity with related SOPs Trainer: ____ Trainee: ____ Date: ________ SOP for Analytical Batches and Analytical Sequences SOP for Making Entries into Logbooks and onto Benchsheets SOP for Manual Integration of Chromatographic Peaks SOP for Significant Figures SOP for Nonconformity and Corrective Action Documentation SOP for Determination of Method Detection Limits
5. Observe performance of SOP Trainer: ____ Trainee: ____ Date: ________ - sample preparation (soil, water, other matrices) and sample loading - analytical sequence setup - initial calibration and continuing calibration verification - sample analysis - software introduction - data reduction and reporting
6. Perform SOP with supervision Trainer: ____ Trainee: ____ Date: ________ - sample preparation (soil, water, other matrices) and sample loading - analytical sequence setup - initial calibration and continuing calibration verification - sample analysis - software use - data reduction and reporting
7. Independent performance of the SOP Trainer: ____ Trainee: ____ Date: ________ - sample preparation (soil, water, other matrices) and sample loading - analytical sequence setup - initial calibration and continuing calibration verification - sample analysis -software proficiency - data reduction and reporting - initial demonstration of competency - IPR study
SOP Code: HRMS-8290 Date: 12/07/04 Authors: XL, JF, AV, RD, KV
SOP_8290_rklv.doc 10
single blind PE sample
8. Instrument operation and maintenance Trainer: ____ Trainee: ____ Date: ________ - autosampler - gas chromatograph and capillary column installation - mass spectrometer - data system
8.0 EQUIPMENT AND SUPPLIES
8.1 High-Resolution Gas Chromatograph/High-Resolution Mass Spectrometer/Data System (HRGC/HRMS/DS) - The GC must be equipped for temperature programming, and all required accessories must be available, such as syringes, gases, and capillary columns.
8.1.1 GC Injection Port - The GC injection port must be designed for capillary columns. The use of splitless injection techniques is recommended. On column 1µL injections can be used on the 60m DB-5 column. The use of a moving needle injection port is also acceptable. When using the method described in this protocol, a 2µL injection volume is used consistently (i.e., the injection volumes for all extracts, blanks, calibration solutions and the performance check samples are 2µL). One-µL injections are allowed; however, laboratories must remain consistent throughout the analyses by using the same injection volume at all times. 8.1.2 Gas Chromatograph/Mass Spectrometer (GC/MS) Interface – The GC/MS
interface components should withstand 350oC. The interface must be designed so that the separation of 2,3,7,8-TCDD from the other TCDD isomers achieved in the gas chromatographic column is not appreciably degraded. Cold spots or active surfaces (adsorption sites) in the GC/MS interface can cause peak tailing and peak broadening. It is recommended that the GC column be fitted directly into the mass spectrometer ion source without being exposed to the ionizing electron beam. Graphite ferrules should be avoided in the injection port because they may adsorb PCDD and PCDF compounds. Vespel or equivalent, ferrules are recommended.
8.1.3 Mass Spectrometer - The static resolving power of the instrument must be maintained at a minimum of 10,000 (10 percent valley). Figure 4 8.1.4 Data System - A dedicated data system is employed to control the rapid multiple-
ion monitoring process and to acquire the data. Quantitation data (peak areas or peak heights) and SIM traces (displays of intensities of each ion signal being monitored including the lock-mass ion as a function of time) must be acquired
SOP Code: HRMS-8290 Date: 12/07/04 Authors: XL, JF, AV, RD, KV
SOP_8290_rklv.doc 11
during the analyses and stored. Quantitations may be reported based upon computer generated peak areas or upon measured peak heights (chart recording). The data system must be capable of acquiring data at a minimum of 10 ions in a single scan. It is also recommended to have a data system capable of switching to different sets of ions (descriptors) at specified times during an HRGC/HRMS acquisition. The data system should be able to provide hard copies of individual ion chromatograms for selected gas chromatographic time intervals. It should also be able to acquire mass spectral peak profiles and provide hard copies of peak profiles to demonstrate the required resolving power. The data system should permit the measurement of noise on the base line.
8.2 GC Columns
8.2.1 In order to have an isomer specific determination for 2,3,7,8-TCDD and to allow the detection of OCDD/OCDF within a reasonable time interval in one HRGC/HRMS analysis, use of the 60m DB-5 fused silica capillary column is recommended. Minimum acceptance criteria must be demonstrated and documented. At the beginning of each 12 hour period (after mass resolution and GC resolution are demonstrated) during which sample extracts or concentration calibration solutions will be analyzed, column operating conditions must be attained for the required separation on the column to be used for samples. Isomer specificity for all 2,3,7,8-substituted PCDDs/PCDFs cannot be achieved on the 60m DB-5 GC column alone. In order to determine the proper concentrations of the individual 2,3,7,8-substituted congeners, the sample extract must be reanalyzed on another GC column that resolves the isomers.
8.2.2 30m DB-225 fused silica capillary column, (J&W Scientific) or equivalent.
8.3 Miscellaneous Equipment and Materials - The following list of items does not necessarily constitute an exhaustive compendium of the equipment needed for this analytical method.
8.3.1 Nitrogen evaporation apparatus with variable flow rate. 8.3.2 Balances capable of accurately weighing to 0.001g.
8.3.3 Centrifuge.
8.3.4 Water bath, capable of being temperature controlled within + 2oC. 8.3.5 Stainless steel or glass container large enough to hold contents of one pint sample
container.
SOP Code: HRMS-8290 Date: 12/07/04 Authors: XL, JF, AV, RD, KV
SOP_8290_rklv.doc 12
8.3.6 250mL polypropylene beaker.
8.3.7 Drying oven.
8.3.8 20mL scintillation vials.
8.3.9 Laboratory hoods.
8.3.10 Pipets, disposable, Pasteur, 150mm long x 5mm ID.
8.3.11 Pipets, disposable, serological, 10mL, for the preparation of the carbon columns.
8.3.12 2mL screw-top vials.
8.3.13 Electric meat grinder with a 3 to 5mm hole size inner plate.
8.3.14 Carbon, 120-440 mesh, activated just before use. 8.3.15 Teflon boiling chips (or equivalent).
NOTE: Teflon boiling chips may float in methylene chloride, may not work in the presence of any water phase, and may be penetrated by nonpolar organic compounds.
8.3.16 6mL and 60mL polypropylene reservoirs.
8.3.17 Frits that fit in the polypropylene reservoirs.
8.3.18 Glass fiber filters, 0.50µm, Whatman GFF, or equivalent.
8.3.19 Dean-Stark trap, 5 or 10mL.
8.3.20 All glass Soxhlet apparatus, 500mL flask.
8.3.21 Soxhlet/Dean Stark extractor (optional), all glass, 500mL flask.
8.3.22 Glass funnels, sized to hold 170mL of liquid.
8.3.23 Desiccator.
8.3.24 2-liter Separatory funnels/Screw top jars
8.3.25 Rotary evaporator with a temperature controlled water bath.
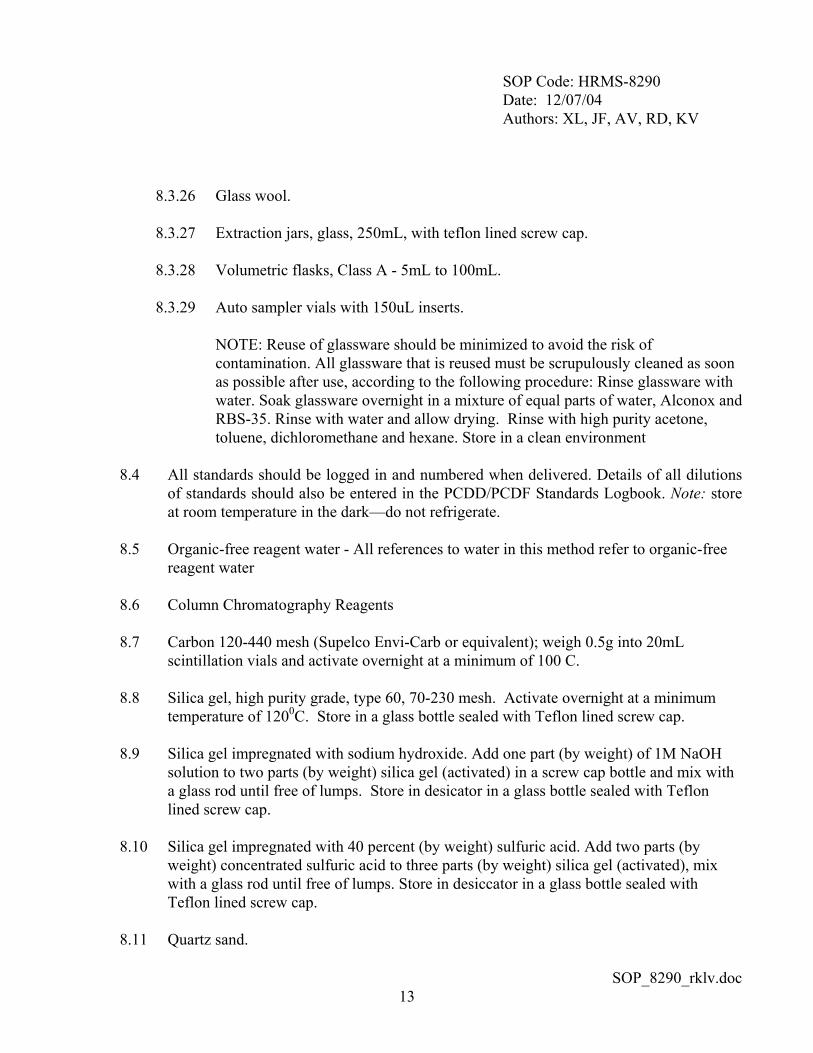
SOP Code: HRMS-8290 Date: 12/07/04 Authors: XL, JF, AV, RD, KV
SOP_8290_rklv.doc 13
8.3.26 Glass wool.
8.3.27 Extraction jars, glass, 250mL, with teflon lined screw cap.
8.3.28 Volumetric flasks, Class A - 5mL to 100mL.
8.3.29 Auto sampler vials with 150uL inserts.
NOTE: Reuse of glassware should be minimized to avoid the risk of contamination. All glassware that is reused must be scrupulously cleaned as soon as possible after use, according to the following procedure: Rinse glassware with water. Soak glassware overnight in a mixture of equal parts of water, Alconox and RBS-35. Rinse with water and allow drying. Rinse with high purity acetone, toluene, dichloromethane and hexane. Store in a clean environment
8.4 All standards should be logged in and numbered when delivered. Details of all dilutions of standards should also be entered in the PCDD/PCDF Standards Logbook. Note: store at room temperature in the dark—do not refrigerate.
8.5 Organic-free reagent water - All references to water in this method refer to organic-free
reagent water 8.6 Column Chromatography Reagents 8.7 Carbon 120-440 mesh (Supelco Envi-Carb or equivalent); weigh 0.5g into 20mL
scintillation vials and activate overnight at a minimum of 100 C.
8.8 Silica gel, high purity grade, type 60, 70-230 mesh. Activate overnight at a minimum temperature of 1200C. Store in a glass bottle sealed with Teflon lined screw cap.
8.9 Silica gel impregnated with sodium hydroxide. Add one part (by weight) of 1M NaOH solution to two parts (by weight) silica gel (activated) in a screw cap bottle and mix with a glass rod until free of lumps. Store in desicator in a glass bottle sealed with Teflon lined screw cap.
8.10 Silica gel impregnated with 40 percent (by weight) sulfuric acid. Add two parts (by weight) concentrated sulfuric acid to three parts (by weight) silica gel (activated), mix with a glass rod until free of lumps. Store in desiccator in a glass bottle sealed with Teflon lined screw cap.
8.11 Quartz sand.
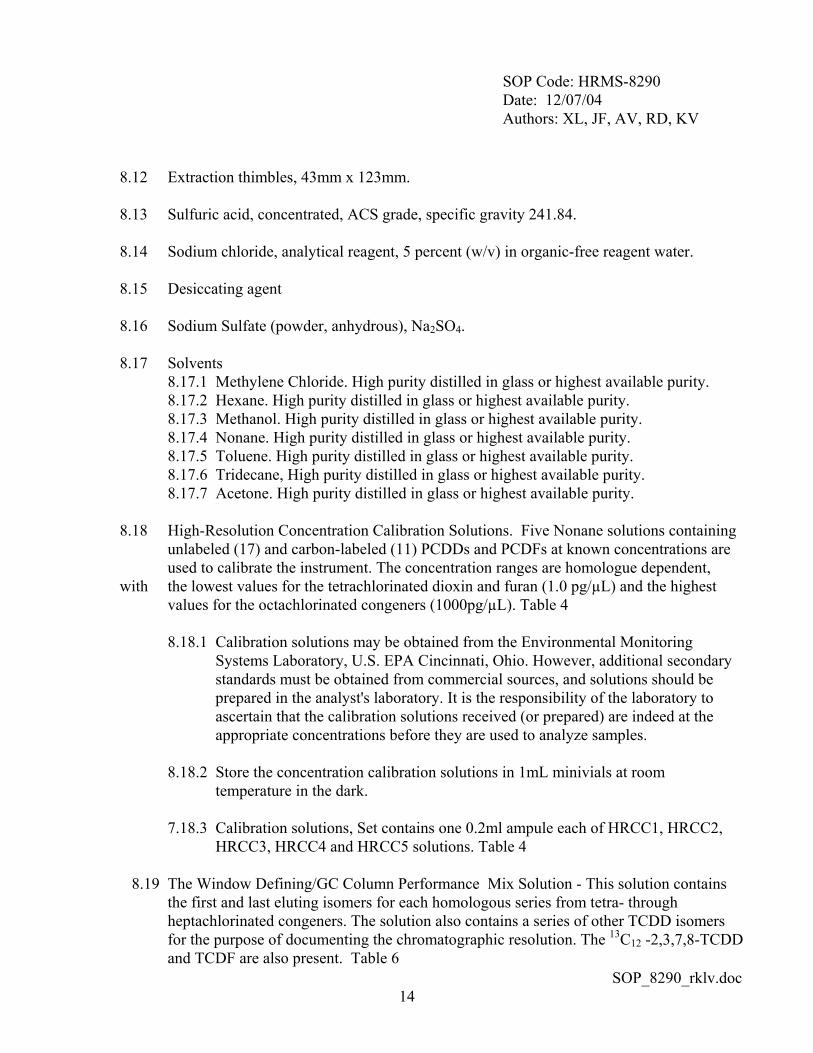
SOP Code: HRMS-8290 Date: 12/07/04 Authors: XL, JF, AV, RD, KV
SOP_8290_rklv.doc 14
8.12 Extraction thimbles, 43mm x 123mm.
8.13 Sulfuric acid, concentrated, ACS grade, specific gravity 241.84. 8.14 Sodium chloride, analytical reagent, 5 percent (w/v) in organic-free reagent water. 8.15 Desiccating agent
8.16 Sodium Sulfate (powder, anhydrous), Na2SO4.
8.17 Solvents
8.17.1 Methylene Chloride. High purity distilled in glass or highest available purity. 8.17.2 Hexane. High purity distilled in glass or highest available purity. 8.17.3 Methanol. High purity distilled in glass or highest available purity. 8.17.4 Nonane. High purity distilled in glass or highest available purity. 8.17.5 Toluene. High purity distilled in glass or highest available purity. 8.17.6 Tridecane, High purity distilled in glass or highest available purity. 8.17.7 Acetone. High purity distilled in glass or highest available purity.
8.18 High-Resolution Concentration Calibration Solutions. Five Nonane solutions containing unlabeled (17) and carbon-labeled (11) PCDDs and PCDFs at known concentrations are used to calibrate the instrument. The concentration ranges are homologue dependent, with the lowest values for the tetrachlorinated dioxin and furan (1.0 pg/µL) and the highest values for the octachlorinated congeners (1000pg/µL). Table 4
8.18.1 Calibration solutions may be obtained from the Environmental Monitoring Systems Laboratory, U.S. EPA Cincinnati, Ohio. However, additional secondary standards must be obtained from commercial sources, and solutions should be prepared in the analyst's laboratory. It is the responsibility of the laboratory to ascertain that the calibration solutions received (or prepared) are indeed at the appropriate concentrations before they are used to analyze samples.
8.18.2 Store the concentration calibration solutions in 1mL minivials at room temperature in the dark.
7.18.3 Calibration solutions, Set contains one 0.2ml ampule each of HRCC1, HRCC2,
HRCC3, HRCC4 and HRCC5 solutions. Table 4
8.19 The Window Defining/GC Column Performance Mix Solution - This solution contains the first and last eluting isomers for each homologous series from tetra- through heptachlorinated congeners. The solution also contains a series of other TCDD isomers for the purpose of documenting the chromatographic resolution. The 13C12 -2,3,7,8-TCDD and TCDF are also present. Table 6
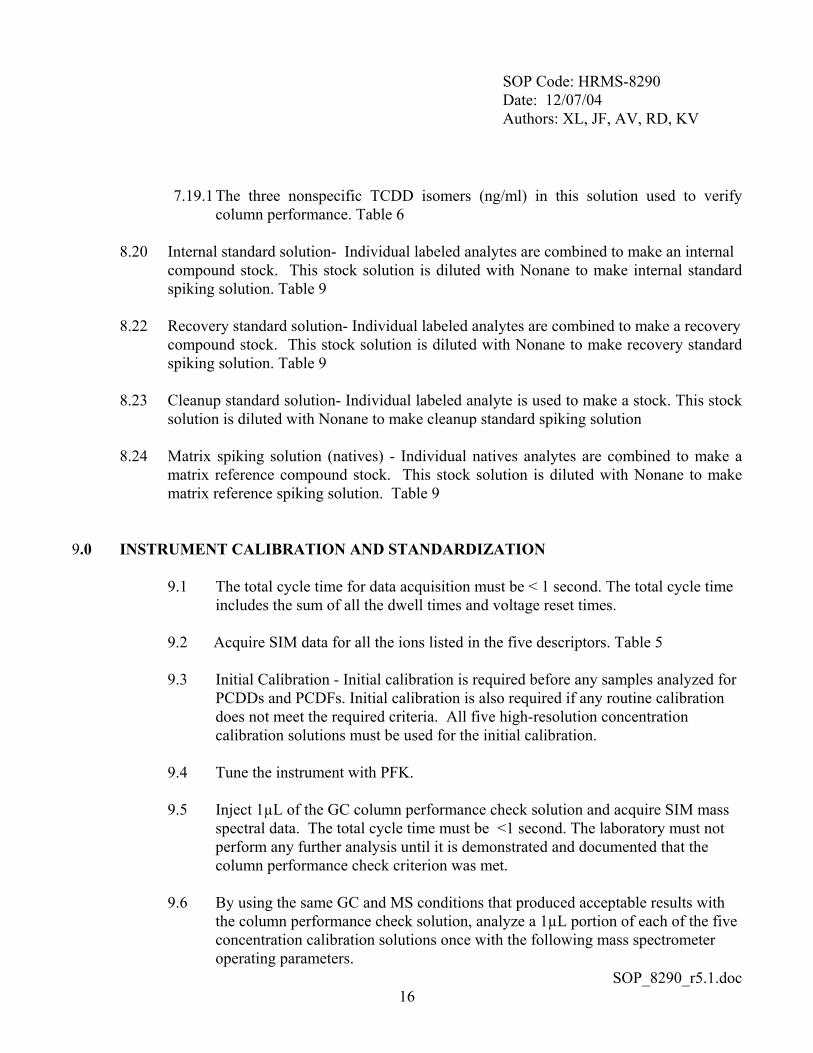
SOP Code: HRMS-8290 Date: 12/07/04 Authors: XL, JF, AV, RD, KV
SOP_8290_r5.1.doc 16
7.19.1 The three nonspecific TCDD isomers (ng/ml) in this solution used to verify column performance. Table 6
8.20 Internal standard solution- Individual labeled analytes are combined to make an internal
compound stock. This stock solution is diluted with Nonane to make internal standard spiking solution. Table 9
8.22 Recovery standard solution- Individual labeled analytes are combined to make a recovery
compound stock. This stock solution is diluted with Nonane to make recovery standard spiking solution. Table 9
8.23 Cleanup standard solution- Individual labeled analyte is used to make a stock. This stock
solution is diluted with Nonane to make cleanup standard spiking solution
8.24 Matrix spiking solution (natives) - Individual natives analytes are combined to make a matrix reference compound stock. This stock solution is diluted with Nonane to make matrix reference spiking solution. Table 9
9.0 INSTRUMENT CALIBRATION AND STANDARDIZATION
9.1 The total cycle time for data acquisition must be < 1 second. The total cycle time includes the sum of all the dwell times and voltage reset times.
9.2 Acquire SIM data for all the ions listed in the five descriptors. Table 5 9.3 Initial Calibration - Initial calibration is required before any samples analyzed for
PCDDs and PCDFs. Initial calibration is also required if any routine calibration does not meet the required criteria. All five high-resolution concentration calibration solutions must be used for the initial calibration.
9.4 Tune the instrument with PFK.
9.5 Inject 1µL of the GC column performance check solution and acquire SIM mass
spectral data. The total cycle time must be <1 second. The laboratory must not perform any further analysis until it is demonstrated and documented that the column performance check criterion was met.
9.6 By using the same GC and MS conditions that produced acceptable results with
the column performance check solution, analyze a 1µL portion of each of the five concentration calibration solutions once with the following mass spectrometer operating parameters.
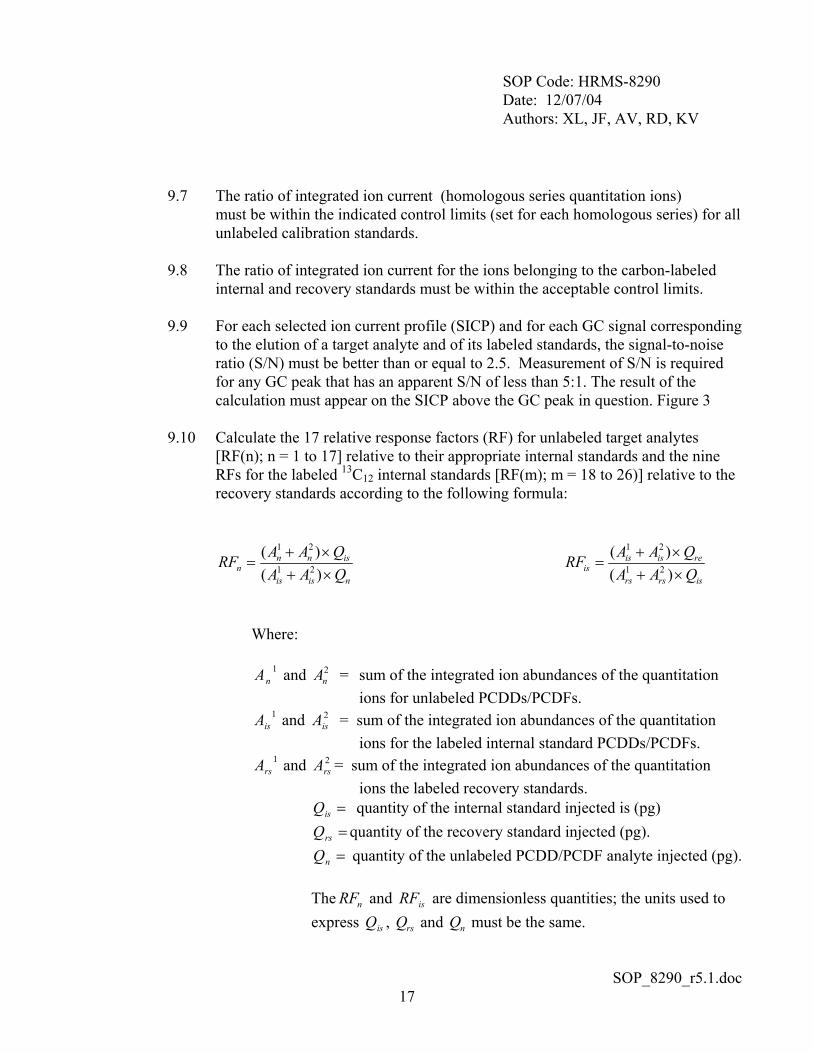
SOP Code: HRMS-8290 Date: 12/07/04 Authors: XL, JF, AV, RD, KV
SOP_8290_r5.1.doc 17
9.7 The ratio of integrated ion current (homologous series quantitation ions)
must be within the indicated control limits (set for each homologous series) for all unlabeled calibration standards.
9.8 The ratio of integrated ion current for the ions belonging to the carbon-labeled
internal and recovery standards must be within the acceptable control limits.
9.9 For each selected ion current profile (SICP) and for each GC signal corresponding to the elution of a target analyte and of its labeled standards, the signal-to-noise ratio (S/N) must be better than or equal to 2.5. Measurement of S/N is required for any GC peak that has an apparent S/N of less than 5:1. The result of the calculation must appear on the SICP above the GC peak in question. Figure 3
9.10 Calculate the 17 relative response factors (RF) for unlabeled target analytes
[RF(n); n = 1 to 17] relative to their appropriate internal standards and the nine RFs for the labeled 13C12 internal standards [RF(m); m = 18 to 26)] relative to the recovery standards according to the following formula:
nisis
isnnn QAA
QAARF×+×+
=)()(
21
21
isrsrs
reisisis QAA
QAARF×+×+
=)()(
21
21
Where:
1nA and 2
nA = sum of the integrated ion abundances of the quantitation ions for unlabeled PCDDs/PCDFs.
1isA and 2
isA = sum of the integrated ion abundances of the quantitation ions for the labeled internal standard PCDDs/PCDFs.
1rsA and 2
rsA = sum of the integrated ion abundances of the quantitation ions the labeled recovery standards.
=isQ quantity of the internal standard injected is (pg) =rsQ quantity of the recovery standard injected (pg). =nQ quantity of the unlabeled PCDD/PCDF analyte injected (pg).
The nRF and isRF are dimensionless quantities; the units used to express isQ , rsQ and nQ must be the same.
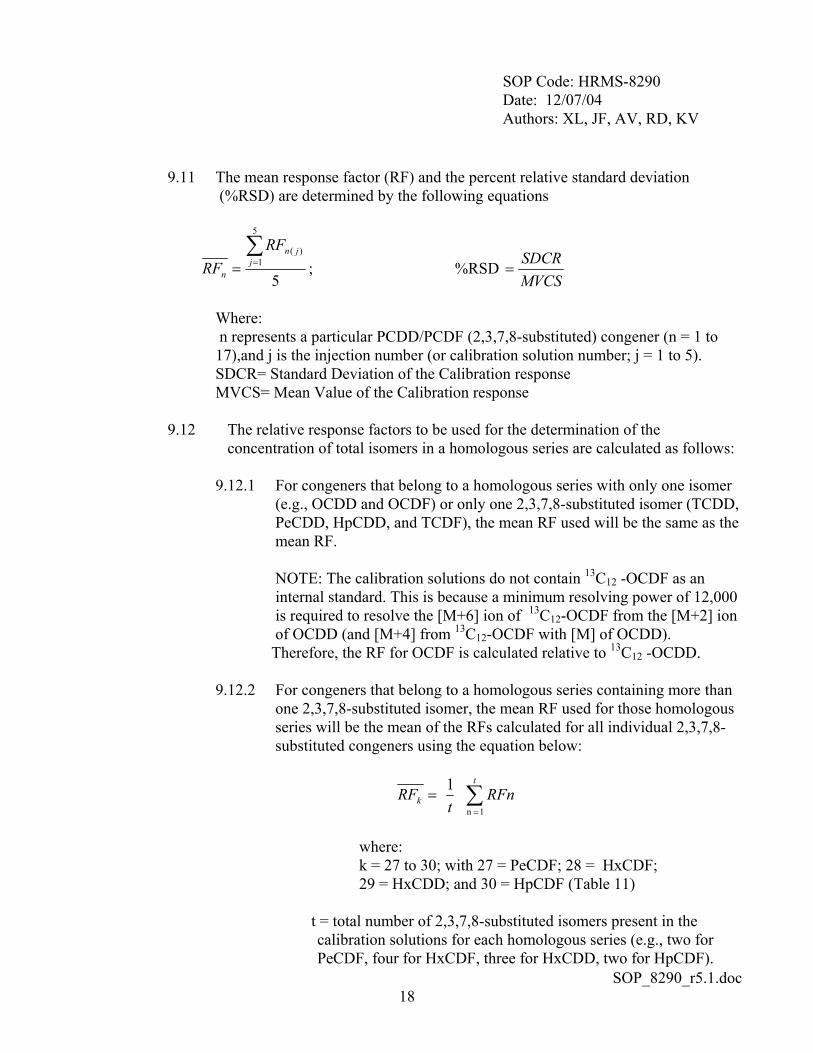
SOP Code: HRMS-8290 Date: 12/07/04 Authors: XL, JF, AV, RD, KV
SOP_8290_r5.1.doc 18
9.11 The mean response factor (RF) and the percent relative standard deviation (%RSD) are determined by the following equations
5
5
1)(∑
== jjn
n
RFRF ; %RSD
MVCSSDCR
=
Where: n represents a particular PCDD/PCDF (2,3,7,8-substituted) congener (n = 1 to 17),and j is the injection number (or calibration solution number; j = 1 to 5). SDCR= Standard Deviation of the Calibration response
MVCS= Mean Value of the Calibration response
9.12 The relative response factors to be used for the determination of the concentration of total isomers in a homologous series are calculated as follows:
9.12.1 For congeners that belong to a homologous series with only one isomer
(e.g., OCDD and OCDF) or only one 2,3,7,8-substituted isomer (TCDD, PeCDD, HpCDD, and TCDF), the mean RF used will be the same as the mean RF.
NOTE: The calibration solutions do not contain 13C12 -OCDF as an internal standard. This is because a minimum resolving power of 12,000 is required to resolve the [M+6] ion of 13C12-OCDF from the [M+2] ion of OCDD (and [M+4] from 13C12-OCDF with [M] of OCDD).
Therefore, the RF for OCDF is calculated relative to 13C12 -OCDD.
9.12.2 For congeners that belong to a homologous series containing more than one 2,3,7,8-substituted isomer, the mean RF used for those homologous series will be the mean of the RFs calculated for all individual 2,3,7,8-substituted congeners using the equation below:
=kRF t1 ∑
=
t
RFn1 n
where: k = 27 to 30; with 27 = PeCDF; 28 = HxCDF; 29 = HxCDD; and 30 = HpCDF (Table 11)
t = total number of 2,3,7,8-substituted isomers present in the
calibration solutions for each homologous series (e.g., two for PeCDF, four for HxCDF, three for HxCDD, two for HpCDF).
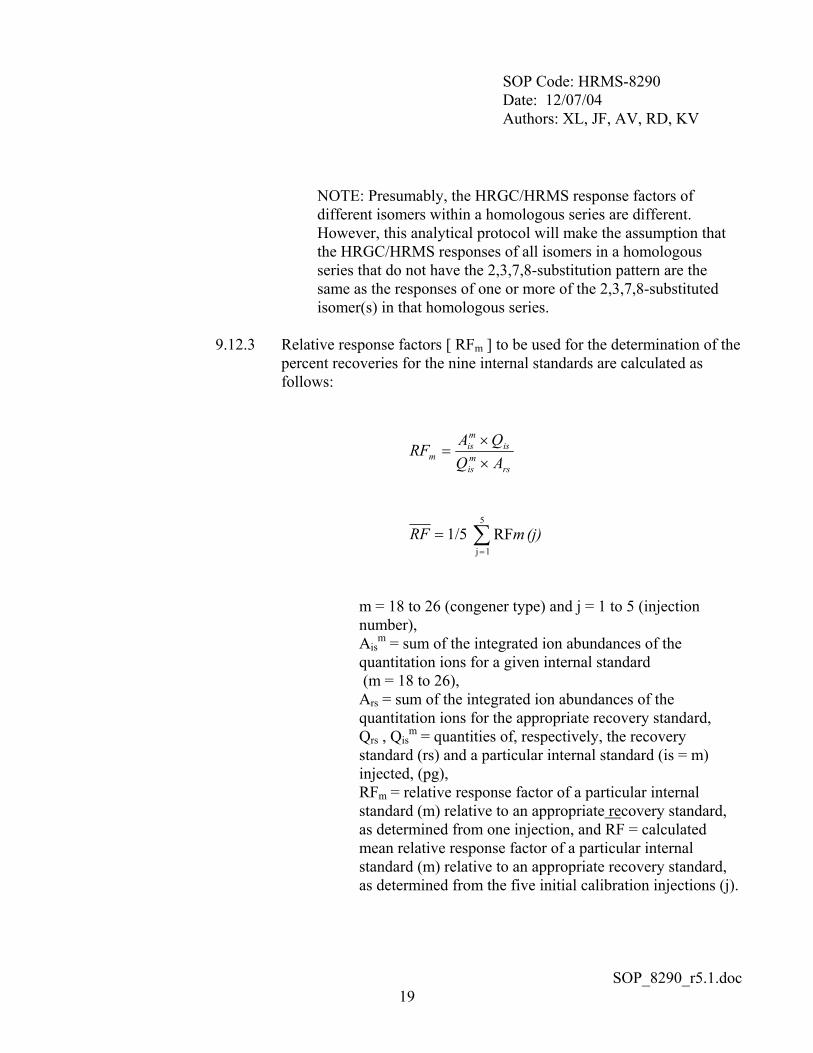
SOP Code: HRMS-8290 Date: 12/07/04 Authors: XL, JF, AV, RD, KV
SOP_8290_r5.1.doc 19
NOTE: Presumably, the HRGC/HRMS response factors of different isomers within a homologous series are different. However, this analytical protocol will make the assumption that the HRGC/HRMS responses of all isomers in a homologous series that do not have the 2,3,7,8-substitution pattern are the same as the responses of one or more of the 2,3,7,8-substituted isomer(s) in that homologous series.
9.12.3 Relative response factors [ RFm ] to be used for the determination of the
percent recoveries for the nine internal standards are calculated as follows:
rsmis
ismis
m AQQA
RF××
=
=RF 1/5 ∑=
5
1 jRF (j) m
m = 18 to 26 (congener type) and j = 1 to 5 (injection number), Ais
m = sum of the integrated ion abundances of the quantitation ions for a given internal standard (m = 18 to 26), Ars = sum of the integrated ion abundances of the quantitation ions for the appropriate recovery standard, Qrs , Qis
m = quantities of, respectively, the recovery standard (rs) and a particular internal standard (is = m) injected, (pg), RFm = relative response factor of a particular internal standard (m) relative to an appropriate recovery standard, as determined from one injection, and RF = calculated mean relative response factor of a particular internal standard (m) relative to an appropriate recovery standard, as determined from the five initial calibration injections (j).
SOP Code: HRMS-8290 Date: 12/07/04 Authors: XL, JF, AV, RD, KV
SOP_8290_r5.1.doc 20
9.12.4 Criteria for Acceptable Calibration - The criteria listed below for acceptable calibration must be met before sample analyses are performed.
9.12.4.1 The percent relative standard deviations for the mean
response factors [RFn and RFm] from the 17 unlabeled standards must not exceed + 20 percent, and those for the nine labeled reference compounds must not exceed + 30 percent.
9.12.4.2 The S/N for the GC signals present in every SICP
(including the ones for the labeled standards) must be > 10.
9.12.4.3 The ion abundance ratios must be within the specified control limits.
NOTE: If the criterion for acceptable calibration is met, the analyte
specific RF can then be considered independent of the analyte quantity for the calibration concentration range. The mean RFs will be used for all calculations until the routine calibration criteria are no longer met. At such time, new mean RFs will be calculated from a new set of injections of the calibration solutions.
9.12.5 Routine Calibration (Continuing Calibration Check) – Routine
calibrations must be performed at the beginning of a 12-hour period after successful mass resolution and GC resolution performance checks.
A routine calibration is also required at the end of a 12-hour shift. Inject 1µL of the concentration calibration solution HRCC-3 standard. By using the same HRGC/HRMS conditions, determine and document an acceptable calibration.
9.12.6 Criteria for Acceptable Routine Calibration - The following criteria must
be met before further analysis is performed.
9.12.6.1 The measured RFs [RFn for the unlabeled standards] obtained during the routine calibration runs must be within + 20 percent of the mean values established during the initial calibration.
9.12.6.2 The measured RFs [RFm for the labeled standards] obtained
during the routine calibration runs must be within + 30
SOP Code: HRMS-8290 Date: 12/07/04 Authors: XL, JF, AV, RD, KV
SOP_8290_r5.1.doc 21
percent of the mean values established during the initial calibration.
9.12.6.3 The ion abundance ratios must be within the allowed control
limits.
9.12.6.4 If either one these criteria, is not satisfied, repeat one more time. If these criteria are still not satisfied, the entire routine calibration process must be reviewed. It is realized that it may not always be possible to achieve all RF criteria. For example, it has occurred that the RF criteria for 13C12 -HpCDD and 13C12 -OCDD were not met, however, the RF values for the corresponding unlabeled compounds were routinely within the criteria established in the method. In these cases, 24 of the 26 RF parameters have met the QC criteria, and the data quality for the unlabeled HpCDD and OCDD values were not compromised as a result of the calibration event. In these situations, the analyst must assess the effect on overall data quality as required for the data quality objectives and decide on appropriate action. Corrective action would be in order, for example, if the compounds for which the RF criteria were not met included both the unlabeled and the corresponding internal standard compounds.
NOTE: An initial calibration must be carried out whenever the HRCC-3, the sample fortification, or the recovery standard solution is replaced by a new solution from a different lot.
SOP Code: HRMS-8290 Date: 12/07/04 Authors: XL, JF, AV, RD, KV
SOP_8290_r5.1.doc 22
10.0 SAMPLE COLLECTION
10.1. Samples are typically delivered by a express shipping service or by the client. 11.0 SAMPLE HANDLING AND PRESERVATION
11.1 Samples are logged into the Sample Receiving Logbook, and labeled. A database entry is also made, which triggers the printing of a set of tracking forms.
11.2 Storage and Holding Times - All samples, except fish and adipose tissue samples, must be stored at 40C in the dark, extracted within 30 days and completely analyzed within 45 days of extraction. Fish and adipose tissue samples must be stored at -100C +20C in the dark, extracted within 30 days and completely analyzed within 45 days of collection. Whenever samples are analyzed after the holding time expiration date, the results should be considered to be minimum concentrations and should be identified as such.
NOTE: The holding times listed in this method are recommendations. PCDDs and PCDFs are very stable in a variety of matrices, and holding times may be as high as a year for certain matrices. Sample extracts, however, should always be analyzed within 45 days of extraction.
11.3. Fish and tissue samples must be shipped on dry ice and arrive at 4+2 degrees C
12.0 SAMPLE PREPARATION AND ANALYSIS
12.1. Before extraction, a visual inspection of a sample is done If it is not homogeneous, the entire contents of the sample container is transferred to a sheet of aluminum foil and then mixed thoroughly with a polystyrene spoon prior to removing an aliquot for analysis.
12.2 If a soil, sediment, or paper pulp sample contains more than 25 percent water, the two
phases are separated, the aqueous phase is discarded, and the remaining solid phase is analyzed.
12.2.1 Transfer an estimated 50g aliquot of the sample to a centrifuge tube. Centrifuge for 15 minutes at 1000rpm.
12.2.2. Thoroughly mix the solid with a polystyrene spoon, and weigh out aliquots for
analysis and dry weight determination.
12.2.3. Return the remaining sample to the original sample container.
SOP Code: HRMS-8290 Date: 12/07/04 Authors: XL, JF, AV, RD, KV
SOP_8290_r5.1.doc 23
12.3. If a water sample has a solids content greater than or equal to 1 percent, then the solid phase is separated from the aqueous phase, and both phases are extracted separately.
12.3.1. Filter the sample through a 0.5µm filter.
12.3.2. Extract the filter and solids as for a soil sample. Extract the aqueous filtrate as for
a water sample.
12.3.3 Combine the two extracts and proceed with the cleanup and analysis. 12.4 Addition of Internal Standard
12.4.1 Use a portion of 10g of the sample to be analyzed. Transfer the sample
portion to a tared extraction thimble and determine its weight.
12.4.2 Except for adipose tissue, add 100µL of internal standard solution to the sample(s).
12.4.3 For water samples, mix the internal standard solution with
10.0mL acetone in a pre-labeled scintillation vial and add to the corresponding sample container.
12.5 Extraction of Fish and Tissue
12.5.1 To a tared thimble, add approximately 30g anhydrous sodium sulfate to a
20g portion of a homogeneous fish samples and mix thoroughly with a pasteur pipet. After breaking up any lumps, place the spiked 200 µL of internal standard into the fish/Sodium Sulfate mixture in the Soxhlet apparatus. Add approximately 270mL Hexane/Methylene Chloride (1:1) to the Soxhlet apparatus and reflux for 16 hours. The solvent must cycle completely through the system five times per hour.
NOTE: As an option, a rotary evaporator may be used in place of the KD apparatus for the concentration of the extracts.
12.5.2 Evaporate the extract to 5-10 mL. Do not allow the extract to go to dryness.
12.5.3 To a tarred 20 mL scintilation vial, transfer exactly one half of the extract.
Weigh the scint vial containing the extract, record the weight and allow to dry in a gravity oven overnight before weighing a second time.
12.5.4 Add 500uL tridecane to the 500mL flask.. Concentrate the extract on a rotary evaporator to an apparent volume of 0.5mL.
SOP Code: HRMS-8290 Date: 12/07/04 Authors: XL, JF, AV, RD, KV
SOP_8290_r5.1.doc 24
12.5.5 Add 20mL hexane to the 500mL flask. Again concentrate to 0.5mL, using either a rotary evaporator or by air-drying in the hood.
12.5.6 Add 30mL Hexane and decant the contents of the 500mL flask into a 250mL
screw top flask. Rinse the 500mL flask with an additional 30mL portion of hexane in the sonicator and add the rinse to the jar.
12.5.7 Spike with 100 µL cleanup standard and proceed with sulfuric acid clean up.
12.6 Fuel Oil/Chemical 12.6.1 Extract sample by mixing 1g of sample with 60mL hexane in a 250mL jar. Spike
with 100 µL internal spiking standard.
12.6.2 The sample extract volume should be in 60 mL hexane. Partition the Hexane extract against approximately 10mL of concentrated sulfuric acid. Shake for 30 seconds. Allow a minimum of 1 hour for separation. Remove and discard the sulfuric acid layer (bottom). Repeat the acid washing until little color is visible in the acid layer (perform a maximum of four acid washings).
12.6.3 Partition the extract against 20mL of 5 percent (w/v) sodium chloride/HPLC water. Shake for 30 seconds. Allow a minimum 20 minutes for separation. Remove and discard the aqueous layer (bottom).
12.6.4 Add 500uL tridecane to each sample jar and allow to evaporate until near dryness,
using a rotary evaporator or by air-drying under the hood. The tridecane will prevent the sample from going to complete dryness. The sample is now ready for column cleanup
12.7 Fly Ash
NOTE: Because of the tendency of fly ash to "fly", all handling steps should be performed in a hood in order to minimize contamination.
12.7.1 Weigh about 10g fly ash to two decimal places in a tared 250 mL extraction jar.
Add 100µL internal standard solution to the sample(s). Add 150mL of 1M HCl to the fly ash sample. Seal the jar with the Teflon lined screw cap and shake for 3 hours at room temperature.
SOP Code: HRMS-8290 Date: 12/07/04 Authors: XL, JF, AV, RD, KV
SOP_8290_r5.1.doc 25
12.7.1 Rinse a 0.5um filter with organic-free reagent water. Assemble a Buchner funnel into a 1L flask and place the filter in the funnel. Pour the sample on the filter and filter the fly ash cake with approximately 500mL organic-free reagent water. A disposable filter apparatus can be used.
12.7.2 Place the sample and the filter paper into an extraction thimble. Add 10g
anhydrous powdered sodium sulfate.
12.7.3 Extract in a Soxhlet extraction apparatus charged with approximately 270mL toluene for 16 hours using a five cycle/hour schedule.
NOTE: As an option, a Soxhlet/Dean Stark extractor system may be used, with toluene as the solvent. No sodium sulfate is added when using this option.
12.7.4 Cool and add 0.5mL tridecane to the 500mL round bottom flask.
Concentrate the extract to near dryness on a rotary evaporator at 40-500C. Add 20mL Hexane and evaporate to near dryness, or alternatively, air-dry under the hood.
12.7.5 Transfer the concentrate to a 250 screw top jar using
20mL Hexane. Rinse the flask in a sonicator with two 20mL portions of hexane and add the rinses to the jar.
12.7.6 The sample is now ready for sulfuric acid clean up.
12.8 Aqueous samples
12.8.1 Allow the sample to come to ambient temperature. Spike 100µL internal standard
solution into a 20 mL scintillation vial. Add 10 mL acetone and pour into the appropriate sample jar.
12.8.2 When the sample is judged to contain 1 percent or more solids, the sample
must be filtered through a 0.5µm filter. If the suspended solids content is too great to filter through the filter, centrifuge the sample, decant, and then filter the aqueous phase.
12.8.3 Combine the solids from the centrifuge bottle(s) with the particulates on
the filter and with the filter itself and proceed with the Soxhlet extraction.
12.8.4 Pour the aqueous filtrate into a 2L screw top jar/or 2L separatory funnel. Add 100mL Methylene Chloride to the sample bottle, seal and shake for 30 seconds to rinse the inner surface. Pour the solvent from the sample jar to the 2L jar/or 2L
SOP Code: HRMS-8290 Date: 12/07/04 Authors: XL, JF, AV, RD, KV
SOP_8290_r5.1.doc 26
separatory funnel. Close and shake the 2L jar/or 2L separatory funnel for 3 minutes. Periodic venting is necessary. 12.8.5 Allow the organic layer to separate from the water phase for a minimum of
10minutes. If the emulsion interface between layers is more than one third the volume of the solvent layer, the analyst must employ mechanical techniques to complete the phase separation (e.g., centrifuge the extract).
12.8.6 Transfer the Methylene Chloride 250mL glass jar.
12.8.7 Repeat the extraction once more with fresh 50mL portions of methylene chloride.
Transfer to a 250 mL screw top jar.
12.8.8 After extracting the water sample, pour into a 1L graduated cylinder and record the volume.
12.8.9 If the extract is colorless or has a light tint, add 500 µL tridecane and
evaporate to near 500 µL and proceed with the silica gel/carbon column clean up. If the extract has a medium to dark tint, evaporate to near 500 µL (using a rotary evaporator or by air-drying under the hood), and proceed to sulfuric acid clean up. Spike 100 µL of cleanup standard before proceeding with cleanup.
12.9 Soil/Sediment/Paper Pulp
12.9.1 Add approximately 20g anhydrous powdered sodium to an extraction thimble. Tare the thimble. Transfer 10g of sample to the thimble. Spike with internal standard solution.
NOTE: As an option, a Soxhlet/Dean Stark extractor system may be used, with toluene as the solvent. See Tables 15, 16, 17.
12.9.2 Add approximately 270mL toluene to the Soxhlet apparatus and reflux for
16 hours. The solvent must cycle completely through the system five times per hour.
12.9.3 Cool the extraction apparatus. Add 500 uL tridecane to the flask and concentrate to near dryness on a rotary evaporator at 45- 50°C. Add 20mL Hexane to the flask and evaporate to near dryness, with either a rotary evaporator or by air-drying under the hood.
12.9.4 Transfer the extract to a 250mL screw top jar with 30mL hexane. Rinse
SOP Code: HRMS-8290 Date: 12/07/04 Authors: XL, JF, AV, RD, KV
SOP_8290_r5.1.doc 27
the 500mL flat bottom in a sonicator with an additional 30mL rinse of Hexane and transfer to the screw top jar. Final volume should be approximately 60mL hexane.
12.9.5 If the extract is colorless or has a light tint, add 500 µL tridecane and
evaporate to near 500 µL and proceed with the silica gel/carbon column clean up. If the extract has a medium to dark tint, proceed to sulfuric acid clean up.
12.9.6 Transfer approximately 1g of sample into a tarred 20 mL scint vial. Weigh and
Record the weight of the vial containing the sample. Place in a gravity oven and allow drying overnight. Re-weigh the dried sample and record the weight.
12.10 Clean up Procedures
All samples must be spiked with 100µL cleanup standard solution before any clean up procedure is performed.
12.10.1 Sulfuric Acid Clean up
12.10.1.1 The sample extract volume should be in 60 mL hexane. Partition the
Hexane extract against approximately 10mL of concentrated sulfuric acid. Shake for 30 seconds. Allow a minimum of 1 hour for separation. Remove and discard the sulfuric acid layer (bottom). Repeat the acid washing until little color is visible in the acid layer (perform a maximum of four acid washings).
12.10.1.2 Partition the extract against 20mL of 5 percent (w/v) sodium
chloride/HPLC water. Shake for 30 seconds. Allow a minimum 20 minutes for separation. Remove and discard the aqueous layer (bottom).
12.10.1.3 Add 500uL tridecane to each sample jar and allow to evaporate
until near dryness, by air-drying under the hood. The tridecane will prevent the sample from going to complete dryness.
12.10.1.4 The sample is now ready for column cleanup.
12.10.2 Silica/Carbon Column Cleanup 12.10.2.1 Pack a 6mL column as follows: Insert a frit at the bottom of the
column. Remove the pre-weighed, activated carbon from the oven, and add approximately 2ml toluene. Cool down is not necessary.
SOP Code: HRMS-8290 Date: 12/07/04 Authors: XL, JF, AV, RD, KV
SOP_8290_r5.1.doc 28
Transfer the slurry to the 6mL column and allow the carbon to settle. Rinse the 20mL vial with addition rinses of toluene until most of the carbon has been transferred. Rinse the column sides of residual carbon. Allow the toluene to completely drain. Insert a frit on top and push down to the top of the carbon. Elute with 5mL dichloromethane then 5mL hexane. Discard the eluate. Check the column for channeling. If channeling is observed, discard the column. Do not tap a wetted column.
12.10.2.2 Pack a 60ml reservoir, with silica gel as follows: Insert a frit and
push it to the bottom. Place 1 teaspoon activated neutral silica gel in the column and tap the column gently to settle the silica gel. Add 1 teaspoon sodium hydroxide-impregnated silica gel, 2 teaspoon sulfuric acid-impregnated silica gel, and 1 teaspoon sodium sulfate. Tap the column gently after each addition. Elute with 30mL hexane and stop the flow just before exposure of the top layer of sodium sulfate to air. Discard the eluate. Check the column for channeling. If channeling is observed, discard the column. Do not tap the wetted column.
12.10.2.3 Place the silica gel column on top of the vacuum manifold and the
carbon column of the bottom opposite the silica gel column. The column is now ready for loading the sample extract.
12.10.2.4 Transfer the 2mL extract to the silica gel column and allow eluting
until the extract level is at the top of the sodium sulfate. A slow vacuum can be used to facilitate the extract into the column.
12.10.2.5 Rinse the flask containing the extract with 5mL hexane and load
into the Silica Gel column. Allow eluting until the extract level is at the top of the sodium sulfate. A slow vacuum can be used to facilitate the extract into the column.
12.10.2.6 Slowly add 30mL of Hexane to the Silica Gel column. Add another 30mL, then 20mL more of Hexane when space permits for a total of 80mL.
NOTE: At this point, neither pressure nor vacuum is necessary. Do not adjust the drip rate.
12.10.2.7 Remove the used silica gel column when the drip form the carbon
column stops. Reverse the carbon column by placing on top of the
SOP Code: HRMS-8290 Date: 12/07/04 Authors: XL, JF, AV, RD, KV
SOP_8290_r5.1.doc 29
manifold. Elute the column with 5mL Dichloromethane, then 5mL of 1:1 Ethyl Acetate/Hexane.
12.10.2.8 Place a labeled 20mL scintillation vial under the carbon column
and elute with a total of approximately 20mL Toluene. Be sure to collect the Toluene. Allow the extract to evaporate to dryness under the fume hood.
12.10.2.9 Add approximately 2mL hexane to the scintillation vial. Vortex and sonicate, then transfer the extract to a clear 2mL screw top vial. Allow evaporation to dryness under the fume hood.
NOTE: If possible, transfer the extract to the labeled autosampler vial when the volume reaches approximately 150µL.
12.10.2.10 Add 160uL Hexane to the 2mL vial. Rinse the sides of the 2mL
vial with only the 160uL that was added. Transfer to an appropriately labeled autosampler vial. Allow sample to evaporate to dryness, under the hood.
12.10.2.11 The sample is ready to be spiked with 20uL recovery standard
solution. 12.11 Chromatographic/Mass Spectrometric Conditions and Data Acquisition Parameters
12.11.1 Gas Chromatograph
Column coating: DB-5 Film thickness: 0.25µm Column dimension: 60 m x 0.25mm Injector temperature: 3000C Splitless valve time: 1 min Interface temperature: 3000C Temperature program:
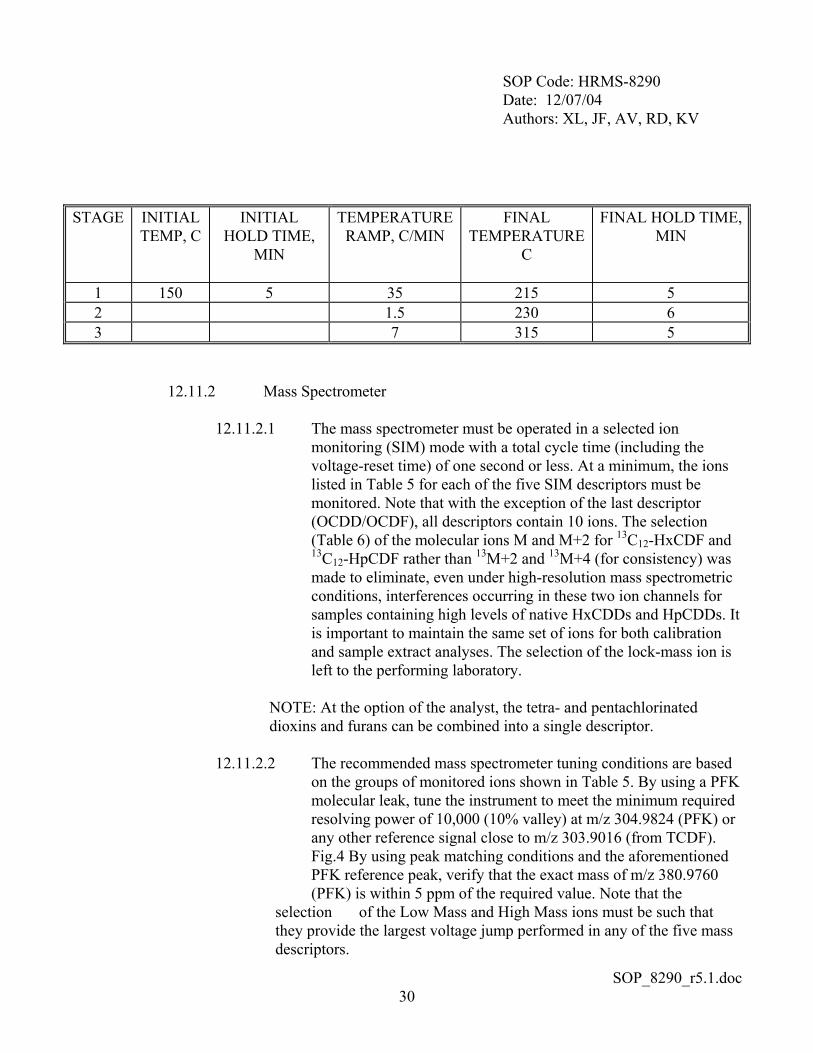
SOP Code: HRMS-8290 Date: 12/07/04 Authors: XL, JF, AV, RD, KV
SOP_8290_r5.1.doc 30
STAGE INITIAL TEMP, C
INITIAL HOLD TIME,
MIN
TEMPERATURE RAMP, C/MIN
FINAL TEMPERATURE
C
FINAL HOLD TIME, MIN
1 150 5 35 215 5 2 1.5 230 6 3 7 315 5
12.11.2 Mass Spectrometer
12.11.2.1 The mass spectrometer must be operated in a selected ion monitoring (SIM) mode with a total cycle time (including the voltage-reset time) of one second or less. At a minimum, the ions listed in Table 5 for each of the five SIM descriptors must be monitored. Note that with the exception of the last descriptor (OCDD/OCDF), all descriptors contain 10 ions. The selection (Table 6) of the molecular ions M and M+2 for 13C12-HxCDF and 13C12-HpCDF rather than 13M+2 and 13M+4 (for consistency) was made to eliminate, even under high-resolution mass spectrometric conditions, interferences occurring in these two ion channels for samples containing high levels of native HxCDDs and HpCDDs. It is important to maintain the same set of ions for both calibration and sample extract analyses. The selection of the lock-mass ion is left to the performing laboratory.
NOTE: At the option of the analyst, the tetra- and pentachlorinated dioxins and furans can be combined into a single descriptor.
12.11.2.2 The recommended mass spectrometer tuning conditions are based
on the groups of monitored ions shown in Table 5. By using a PFK molecular leak, tune the instrument to meet the minimum required resolving power of 10,000 (10% valley) at m/z 304.9824 (PFK) or any other reference signal close to m/z 303.9016 (from TCDF). Fig.4 By using peak matching conditions and the aforementioned PFK reference peak, verify that the exact mass of m/z 380.9760 (PFK) is within 5 ppm of the required value. Note that the selection of the Low Mass and High Mass ions must be such that they provide the largest voltage jump performed in any of the five mass descriptors.
SOP Code: HRMS-8290 Date: 12/07/04 Authors: XL, JF, AV, RD, KV
SOP_8290_r5.1.doc 31
12.12 Analysis
12.12.1 Remove the sample or blank extract from storage. With a stream of dry, purified nitrogen, reduce the extract volume to dryness.
12.12.12 Inject a 1µL aliquot of the extract into the GC, operated under the conditions
that have been established to produce acceptable results with the performance check solution.
12.12.3 Acquire SIM data. Use the same acquisition and mass spectrometer operating
conditions previously used to determine the relative response factors.
NOTE: The acquisition period must at least encompass the PCDD/PCDF overall retention time window previously determined. Selected ion current profiles (SICP) for the lock-mass ions (one per mass descriptor) must also be recorded and included in the data package. These SICPs must be true representations of the evolution of the lock-mass ions amplitudes during the HRGC/HRMS run. The analyst may be required to monitor a PFK ion, not as a lock-mass, but as a regular ion, in order to meet this requirement. It is recommended to examine the lock-mass ion SICP for obvious basic sensitivity and stability changes of the instrument during the GC/MS run that could affect the measurements. Report any discrepancies in the case narrative.
12.12.4 Identification Criteria - For a gas chromatographic peak to be identified as a
PCDD or PCDF, it must meet all of the following criteria:
12.12.4.1Retention Times
12.12.4.1.1 For 2,3,7,8-substituted congeners, which have an isotopically labeled internal or recovery standard present in the sample extract (this represents a total of 10 congeners including OCDD), the retention time (RRT; at maximum peak height) of the sample components must be within -1 to +3 seconds of the isotopically labeled standard.
SOP Code: HRMS-8290 Date: 12/07/04 Authors: XL, JF, AV, RD, KV
SOP_8290_r5.1.doc 32
12.12.4.1.2 For 2,3,7,8-substituted compounds that do not have an isotopically labeled internal standard present in the sample extract, the retention time must fall within 0.005 retention time units of the relative retention times measured in the routine calibration. Identification of OCDF is based on its
retention time relative to 13C12 -OCDD as determined from the daily routine calibration results.
12.12.4.1.3 For non-2,3,7,8-substituted compounds (tetra through octa;
totaling 119 congeners), the retention time must be within the corresponding homologous retention time windows established by analyzing the column performance check solution.
12.12.4.1.4 The ion current responses for both ions used for
quantitative purposes (e.g., for TCDDs: m/z 319.8965 and 321.8936) must reach maximum simultaneously (+ 2 seconds).
12.12.4.1.5 The ion current responses for both ions used for the labeled
standards (e.g., for 13C12 -TCDD: m/z 331.9368 and m/z 333.9339) must reach maximum simultaneously (+ 2 seconds).
NOTE: The analyst is required to verify the presence of 1,2,8,9-TCDD and 1,3,4,6,8-PeCDF in the SICPs of the daily performance checks. Should either one compound be missing, the analyst is required to take corrective action as it may indicate a potential problem with the ability to detect all the PCDDs/PCDFs.
12.12.4.2 Abundance Ratios
12.12.4.2.1 The integrated ion currents for the two ions used for
quantitation purposes must have a ratio between the lower and upper limits established for the homologous series to which the peak is assigned. Table 7
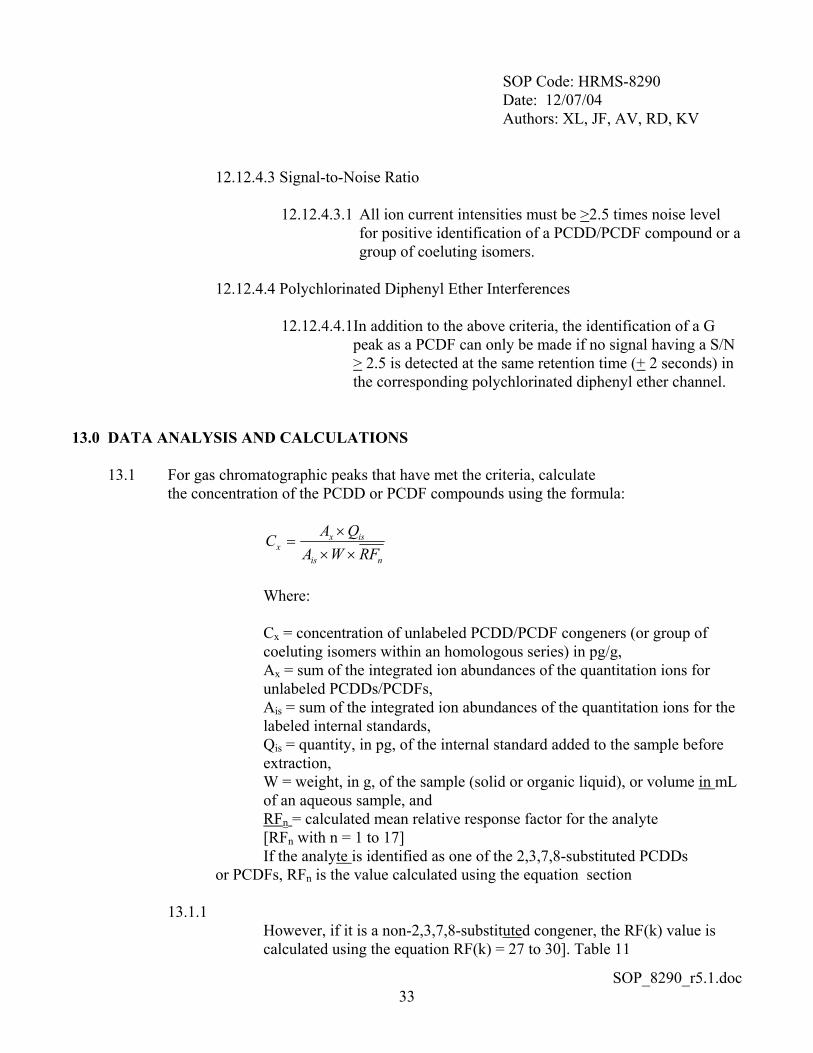
SOP Code: HRMS-8290 Date: 12/07/04 Authors: XL, JF, AV, RD, KV
SOP_8290_r5.1.doc 33
12.12.4.3 Signal-to-Noise Ratio
12.12.4.3.1 All ion current intensities must be >2.5 times noise level for positive identification of a PCDD/PCDF compound or a group of coeluting isomers.
12.12.4.4 Polychlorinated Diphenyl Ether Interferences
12.12.4.4.1In addition to the above criteria, the identification of a G
peak as a PCDF can only be made if no signal having a S/N > 2.5 is detected at the same retention time (+ 2 seconds) in the corresponding polychlorinated diphenyl ether channel.
13.0 DATA ANALYSIS AND CALCULATIONS
13.1 For gas chromatographic peaks that have met the criteria, calculate the concentration of the PCDD or PCDF compounds using the formula:
nis
isxx RFWA
QAC××
×=
Where: Cx = concentration of unlabeled PCDD/PCDF congeners (or group of coeluting isomers within an homologous series) in pg/g, Ax = sum of the integrated ion abundances of the quantitation ions for unlabeled PCDDs/PCDFs, Ais = sum of the integrated ion abundances of the quantitation ions for the labeled internal standards, Qis = quantity, in pg, of the internal standard added to the sample before extraction, W = weight, in g, of the sample (solid or organic liquid), or volume in mL of an aqueous sample, and RFn = calculated mean relative response factor for the analyte [RFn with n = 1 to 17] If the analyte is identified as one of the 2,3,7,8-substituted PCDDs
or PCDFs, RFn is the value calculated using the equation section
13.1.1 However, if it is a non-2,3,7,8-substituted congener, the RF(k) value is calculated using the equation RF(k) = 27 to 30]. Table 11
SOP Code: HRMS-8290 Date: 12/07/04 Authors: XL, JF, AV, RD, KV
SOP_8290_r5.1.doc 34
13.2 Calculate the percent recovery of the nine internal standards measured in the sample
extract, using the formula:
% Recovery = 100×××
×
nrsis
rsis
RFAQQA
where: Ais = sum of the integrated ion abundances of the quantitation ions for the labeled internal standard, Ars = sum of the integrated ion abundances of the quantitation ions for the labeled recovery standard; the selection of the recovery standard depends on the type of congeners, Qis = quantity, in pg, of the internal standard added to the sample before extraction, Qrs = quantity, in pg, of the recovery standard added to the cleaned-up sample residue before HRGC/HRMS analysis, and RFm = calculated mean relative response factor for the labeled internal standard relative to the appropriate recovery standard. This represents the mean [RF with m = 18 to 26]. (Table 10)
NOTE: For human adipose tissue, adjust the percent recoveries by adding 1 percent to the calculated value to compensate for the 1 percent of the extract diverted for the lipid determination.
13.3 If the concentration in the final extract of any of the fifteen 2,3,7,8-substituted
PCDD/PCDF compounds exceeds the upper method calibration limits (MCL) listed in Table 1 (e.g., 200 pg/µL for TCDD in soil), the linear range of response versus concentration may have been exceeded, and a second analysis of the sample (using a one tenth aliquot) should be undertaken. The volumes of the internal and recovery standard solutions should remain the same as described for the sample preparation. For the other congeners (including OCDD), however, report the measured concentration and indicate that the value exceeds the MCL.
13.4 If a smaller sample size would not be representative of the entire sample, one of
the following options is recommended:
(1) Re-extract an additional aliquot of sufficient size to insure that it is representative of the entire sample. Spike it with a higher concentration of internal standard. Prior to GC/MS analysis, dilute the sample so that it has a concentration of internal standard equivalent to that present in the calibration standard. Then, analyze the diluted extract.
SOP Code: HRMS-8290 Date: 12/07/04 Authors: XL, JF, AV, RD, KV
SOP_8290_r5.1.doc 35
(2) Re-extract an additional aliquot of sufficient size to insure that it is
representative of the entire sample. Spike it with a higher concentration of internal standard. Immediately following extraction, transfer the sample to a volumetric flask and dilute to known volume. Remove an appropriate aliquot and proceed with cleanup and analysis.
(3) Use the original analysis data to quantitate the internal standard recoveries.
Respike the original extract (note that no additional cleanup is necessary) with 100 times the usual quantity of internal standards. Dilute the re-spiked extract by a factor of 100. Reanalyze the diluted sample using the internal standard recoveries calculated from the initial analysis to correct the results for losses during isolation and cleanup.
13.5 The total concentration for each homologous series of PCDD and PCDF is
calculated by summing up the concentrations of all positively identified isomers of each homologous series. Therefore, the total should also include the 2,3,7,8-substituted congeners. The total number of GC signals included in the homologous total concentration value must be specified in the report. If an isomer is not detected, use zero (0) in this calculation.
13.6 Sample Specific Estimated Detection Limit - The sample specific estimated
detection limit (EDL) is the concentration of a given analyte required to produce a signal with a peak height of at least 2.5 times the background signal level. An EDL is calculated for each 2,3,7,8-substituted congener that is not identified, regardless of whether or not other non-2,3,7,8-substituted isomers are present. Two methods of calculation can be used, as follows, depending on the type of response produced during the analysis of a particular sample.
13.6.1 Samples giving a response for both quantitation ions that are less than
2.5 times the background level.
13.6.2 Use the expression for EDL (specific 2,3,7,8-substituted PCDD/PCDF) below to calculate an EDL for each absent 2,3,7,8-substituted PCDD/PCDF (i.e., S/N < 2.5). The background level is determined by measuring the range of the noise (peak to peak) for the two quantitation ions of a particular 2,3,7,8-substituted isomer within an homologous series, in the region of the SICP trace corresponding to the elution of the internal standard (if the congener possesses an internal standard) or in the region of the SICP where the congener is expected to elute by comparison with the routine calibration data (those congeners that do not have a 13C12-labeled standard), multiplying that noise height by 2.5,
SOP Code: HRMS-8290 Date: 12/07/04 Authors: XL, JF, AV, RD, KV
SOP_8290_r5.1.doc 36
and relating the product to an estimated concentration that would produce that peak height.
Use the formula:
nis
isx
RFWHQH
EDL××××
=5.2
where: EDL = estimated detection limit for homologous 2,3,7,8-substituted PCDDs/PCDFs. Hx = sum of the height of the noise level for each
quantitation ion for the unlabeled PCDDs/PCDFs His = sum of the height of the signal level for each quantitation ion for the labeled internal standard.
13.6.3 Samples characterized by a response above the background level with a S/N of at least 2.5 for both quantitation ions.
13.6.4 When the response of a signal having the same retention time as a
2,3,7,8-substituted congener has a S/N in excess of 2.5 and does not meet any of the other qualitative identification criteria, calculate the "Estimated Maximum Possible Concentration" (EMPC), except that A should represent the sum of the x area under the smaller peak and of the other peak area calculated using the theoretical chlorine isotope ratio.
13.6.5 The relative percent difference (RPD) of any duplicate sample results
are calculated as follows:
( ) 100
22121
×+−
=SSSS
RPD
S1 and S2 represent sample and duplicate sample results.
13.6.6 The 2,3,7,8-TCDD toxicity equivalents of PCDDs and PCDFs present in
the sample are calculated, if requested by the data user, according to the method recommended by the Chlorinated Dioxins Workgroup (CDWG) of the EPA and the Center for Disease Control (CDC). This method assigns a 2,3,7,8-TCDD toxicity equivalency factor (TEF) to each of the fifteen 2,3,7,8-substituted PCDDs and PCDFs and to OCDD and OCDF.
SOP Code: HRMS-8290 Date: 12/07/04 Authors: XL, JF, AV, RD, KV
SOP_8290_r5.1.doc 37
(Table 8) The 2,3,7,8-TCDD equivalent of the PCDDs and PCDFs present in the sample is calculated by summing the TEF times their
concentration for each of the compounds or groups of compounds. The exclusion of other homologous series such as mono-, di-, and tri- chlorinated dibenzodioxins and dibenzofurans does not mean that they are non-toxic. The above procedure for calculating the 2,3,7,8-TCDD toxicity equivalents is not claimed by the CDWG to be based on a thoroughly established scientific foundation. The procedure, rather, represents a "consensus recommendation on science policy". Since the procedure may be changed in the future, reporting requirements for PCDD and PCDF data would still include the reporting of the analyte concentrations of the PCDD/PCDF congeners.
13.7 Two GC Column TEF Determination
13.7.1 The concentration of 2,3,7,8-TCDD (see note below), is calculated from
the analysis of the sample extract on the 60m DB-5 fused silica capillary column. The chromatographic separation between the 2,3,7,8-TCDD and its close eluters (1,2,3,7/1,2,3,8-TCDD and 1,2,3,9-TCDD) must be equal or less than 25 percent valley. Figure 5
13.7.2 The concentration of the 2,3,7,8-TCDF is obtained from the analysis of
the sample extract on the 30m DB-225 fused silica capillary column. However, the GC/MS conditions must be altered so that:
(1) only the first three descriptors (i.e., tetra-, penta-, and
hexachlorinated congeners) are used; (2) and the switching time between descriptor 2
(pentachlorinatedcongeners) and descriptor 3 (hexachlorinated congeners) takes place following the elution of 13C12 -1,2,3,7,8-PeCDD.
(3) The chromatographic separation between the 2,3,7,8-TCDF
and its close eluters (2,3,4,7-TCDF and 1,2,3,9-TCDF) must be equal or less than 25 percent valley. Figure 6
NOTE: The confirmation and quantitation of 2,3,7,8-TCDD may be accomplished on the SP-2330 GC column instead of the DB-5 column.
13.7.3 For a gas chromatographic peak to be identified as a 2,3,7,8-substituted
PCDD/PCDF congener, it must meet the ion abundance and signal-to-
SOP Code: HRMS-8290 Date: 12/07/04 Authors: XL, JF, AV, RD, KV
SOP_8290_r5.1.doc 38
noise ratio criteria, respectively. In addition, the retention time identification criterion applies here for congeners for which a carbon-labeled analogue is available in the sample extract. However, the relative retention time (RRT) of the 2,3,7,8-substituted congeners for which no carbon-labeled analogues are available must fall within 0.006 units of the carbon-labeled standard RRT. Experimentally, this is accomplished by using the attributions described and the results from the routine calibration run on the SP-2330.
14.0 DATA AND RECORDS MANAGEMENT
14.1 CAS reports the analytical data produced in its laboratories to the client via the certified analytical report. This report typically includes a transmittal letter, a case narrative, client project information, specific test results, quality control data, chain of custody information, and any other project-specific support documentation. The following procedures describe our data reduction, validation and reporting procedures.
14.2 All data is initially reviewed and processed by analysts using appropriate methods (e.g. chromatographic software, instrument printouts, hand calculation, etc.) A file of all raw data is printed, reviewed for completeness and quality criteria against an in-house checklist and signed off by the analyst. The operations manager reviews all reported data against the raw data; validating completeness and quality. The final report data package is then reviewed by the project manager for compliance with previously established project requirements. Typically, all data is reported in the units and MCLs listed in Appendix C.
14.3 Assessment of the analytical data includes a check on data consistency by looking for
comparability of duplicate analyses, comparability of previous data from the same sampling location (if available), adherence to accuracy and precision control limits, and anomalous low or high parameter values. The results of this review will be discussed with either the departmental supervisor or lab director for resolution prior to final release of the package.
14.4 Once the data has been checked for accuracy and acceptability, the final report and raw data is forwarded to the lab director or quality assurance coordinator, who further reviews the data package for errors. When the entire data set has been found to be acceptable the lab director signs the report, the report is distributed and the raw data is filed for approximately one year, and then archived. All hard copy and electronic backups are archived in a secured file room for a period of at least 5 years from the date of the final report. It is not unusual to have various clients require 10-year retention of records, therefore, the archivist, project chemist, and possibly the client are consulted prior to destruction of the records.
14.5 The integrity of the data generated in the laboratory is primarily assessed by the analyst, supervisor and project chemist through the use of a variety of measures that may include
SOP Code: HRMS-8290 Date: 12/07/04 Authors: XL, JF, AV, RD, KV
SOP_8290_r5.1.doc 39
reagent blanks, laboratory fortified blanks, duplicates, matrix spikes and QC samples. The numerical criteria for evaluation of these QC samples are listed in Appendix C; these various QC sample analyses are evaluated using the flow diagrams found in Figures 12-1 through 12-9. Other validation measures of the data include a check of the linearity of the calibration curve, an accuracy check of the QC standards and a check of the system sensitivity. Data transcriptions and calculations are also reviewed. Specific calculations used for determining the concentration or value of the measured parameters from the raw data are given in each of the analytical methods or CAS SOPs.
14.6 When an analyst determines that the data has met the data quality objectives (and/or any client-specific data quality objectives) of the method and has qualified any anomalies in a clear, acceptable fashion, the data is validated by the supervisor. Prior to release of the report to the client, the project manager must also review the entire body of data for completeness and to ensure that any and all client-specified objectives were successfully achieved. If required, samples exceeding any established state/federal maximum contaminant level or reportable concentration level, must be reported to the client. A case narrative may be written by the project manager to explain any unusual problems with a specific analysis or sample, client-specific objectives, exceedences, etc... The original raw data, along with a copy of the final report, is archived. CAS maintains control of analytical results by adhering to standard operating procedures and by observing sample custody requirements. All data are calculated and reported in units consistent with project specifications, to enable easy comparison of data from report to report. Typical qualifiers used to flag analytical results are listed in Appendix D.
14.7 A document control system ensures that all documents are accounted for when the project is complete. A service request number is assigned to each project for reporting and filing purposes. This number is associated with each order number (sample).
14.7.1 The archiving system includes all of the following items for each set of analyses performed:
Chain-of-custody documentation Benchsheets describing sample preparation Sample analysis sequence Analysis benchsheets and instrument printouts Chromatograms and peak integration reports for all samples, standards, blanks,
spikes and reruns Log book ID number for the appropriate standards Copies of report submitted to the client Copies of Nonconformity and Corrective Action Report (NCAR) forms, if
needed
SOP Code: HRMS-8290 Date: 12/07/04 Authors: XL, JF, AV, RD, KV
SOP_8290_r5.1.doc 40
14.7.2 Individual sets of analyses are indexed by analysis date and/or service request number. Since many analyses are performed with computer-based data systems, the final sample concentrations can be automatically calculated. If additional calculations are needed, they are written on the integration report or securely stapled to the chromatogram, if done on a separate sheet.
14.7.3 The archive room is an off-site file room in which files shall be maintained for a
period of at least five years (from date of report issue). It is not unusual to have various clients require a 10-year retention of records, therefore, the archivist, project manager, and possibly the client are consulted prior to destruction of the records. The archive cabinet and/or off site storage area is kept locked and access keys are controlled. All documents must be signed out if needed outside of the archive room and returned in a timely manner. A designated archivist monitors filing, incoming, and outgoing data from the archive.
15.0 QUALITY CONTROL AND QUALITY ASSURANCE
15.1 Refer to Chapter One for specific quality control (QC) procedures. Quality control to validate sample extraction is covered in Method 3500. If extract cleanup was performed, follow the QC in Method 3600 and in the specific cleanup method. 15.2 System Performance Criteria - System performance criteria are presented below. The laboratory may use the recommended GC column. It must be documented that all applicable system performance criteria were met before analysis of any sample is performed. Figure 3 provides a typical 12-hour analysis sequence, whereby the response factors and mass spectrometer resolving power checks must be performed at the beginning and the end of each 12-hour period of operation. A GC column performance check is only required at the beginning of each 12-hour period during which samples are analyzed. An HRGC/HRMS method blank run is required between a calibration run and the first sample run. The same method blank extract may thus be analyzed more than once if the number of samples within a batch requires more than 12 hours of analyses.
15.2.1 GC Column Performance
15.2.1.1 Inject 1µL of the column performance check solution and acquire selected ion monitoring (SIM) data within a total cycle time of < 1 second.
15.2.1.2 The chromatographic separation between 2,3,7,8-TCDD and the
peaks representing any other unlabeled TCDD isomers must be resolved with a valley of < 25 percent, where:
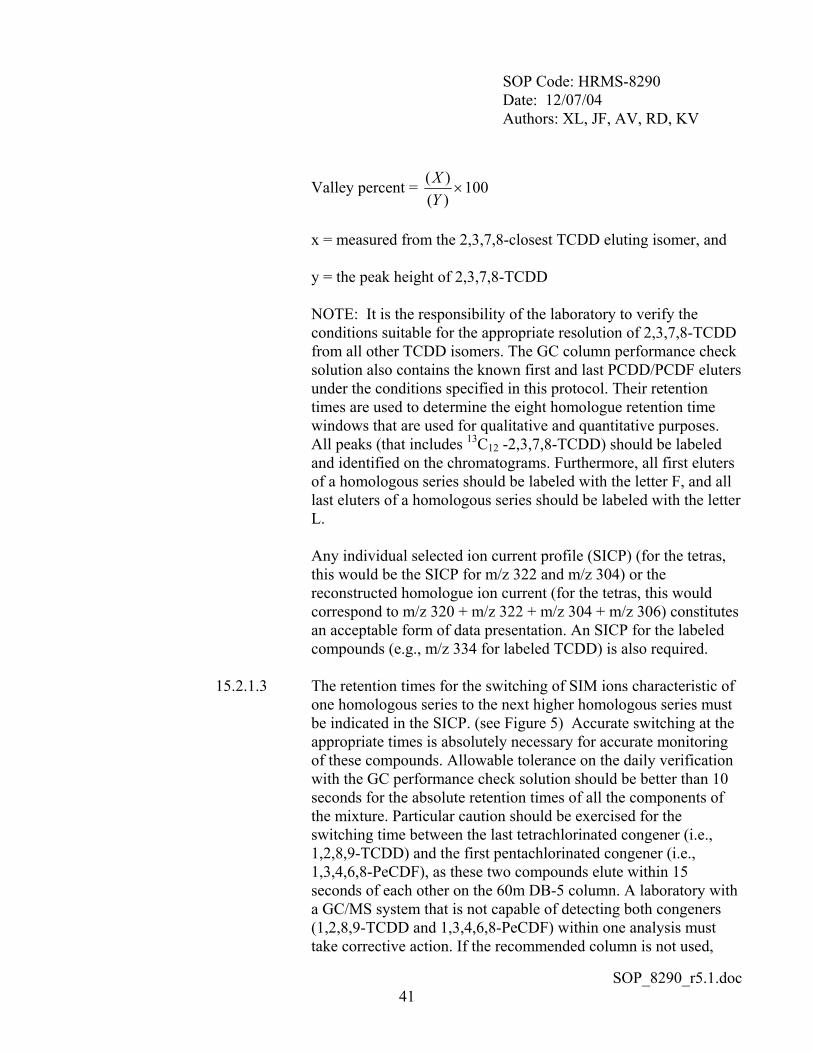
SOP Code: HRMS-8290 Date: 12/07/04 Authors: XL, JF, AV, RD, KV
SOP_8290_r5.1.doc 41
Valley percent = 100)()(×
YX
x = measured from the 2,3,7,8-closest TCDD eluting isomer, and y = the peak height of 2,3,7,8-TCDD NOTE: It is the responsibility of the laboratory to verify the conditions suitable for the appropriate resolution of 2,3,7,8-TCDD from all other TCDD isomers. The GC column performance check solution also contains the known first and last PCDD/PCDF eluters under the conditions specified in this protocol. Their retention times are used to determine the eight homologue retention time windows that are used for qualitative and quantitative purposes. All peaks (that includes 13C12 -2,3,7,8-TCDD) should be labeled and identified on the chromatograms. Furthermore, all first eluters of a homologous series should be labeled with the letter F, and all last eluters of a homologous series should be labeled with the letter L. Any individual selected ion current profile (SICP) (for the tetras, this would be the SICP for m/z 322 and m/z 304) or the reconstructed homologue ion current (for the tetras, this would correspond to m/z 320 + m/z 322 + m/z 304 + m/z 306) constitutes an acceptable form of data presentation. An SICP for the labeled compounds (e.g., m/z 334 for labeled TCDD) is also required.
15.2.1.3 The retention times for the switching of SIM ions characteristic of
one homologous series to the next higher homologous series must be indicated in the SICP. (see Figure 5) Accurate switching at the appropriate times is absolutely necessary for accurate monitoring of these compounds. Allowable tolerance on the daily verification with the GC performance check solution should be better than 10 seconds for the absolute retention times of all the components of the mixture. Particular caution should be exercised for the switching time between the last tetrachlorinated congener (i.e., 1,2,8,9-TCDD) and the first pentachlorinated congener (i.e., 1,3,4,6,8-PeCDF), as these two compounds elute within 15 seconds of each other on the 60m DB-5 column. A laboratory with a GC/MS system that is not capable of detecting both congeners (1,2,8,9-TCDD and 1,3,4,6,8-PeCDF) within one analysis must take corrective action. If the recommended column is not used,
SOP Code: HRMS-8290 Date: 12/07/04 Authors: XL, JF, AV, RD, KV
SOP_8290_r5.1.doc 42
then the first and last eluting isomer of each homologue must be determined experimentally on the column which is used, and the appropriate isomers must then be used for window definition and switching times.
15.2.2 Mass Spectrometer Performance
15.2.2.1 Chromatography time for PCDDs and PCDFs exceeds the long
term mass stability of the mass spectrometer. Because the instrument is operated in the high-resolution mode, mass drifts of a few ppm (e.g., 5 ppm in mass) can have serious adverse effects on instrument performance. Therefore, a mass drift correction is mandatory. To that effect, it is recommended to select a lock-mass ion from the reference compound (PFK is recommended) used for tuning the mass spectrometer. The selection of the lock-mass ion is dependent on the masses of the ions monitored within each descriptor. However, an acceptable lock-mass ion at any mass between the lightest and heaviest ion in each descriptor can be used to monitor and correct mass drifts. The level of the reference compound (PFK) metered into the ion chamber during HRGC/HRMS analyses should be adjusted so that the amplitude of the most intense selected lock-mass ion signal (regardless of the descriptor number) does not exceed 10 percent of the full scale deflection for a given set of detector parameters. Under those conditions, sensitivity changes that might occur during the analysis can be more effectively monitored. NOTE: Excessive PFK (or any other reference substance) may cause noise problems and contamination of the ion source resulting in an increase in downtime for source cleaning.
15.2.2.1 Documentation of the instrument resolving power must then be accomplished by recording the peak profile of the high-mass reference signal (m/z 380.9760) obtained during the above peak matching experiment by using the low-mass PFK ion at m/z 304.9824 as a reference. The minimum resolving power of 10,000 must be demonstrated on the high-mass ion while it is transmitted at a lower accelerating voltage than the low-mass reference ion, which is transmitted at full sensitivity. The format of the peak profile representation must allow manual determination of the resolution, i.e., the horizontal axis must be a calibrated mass scale (amu or ppm per division). The result of the peak width measurement (performed at 5 percent of the maximum, which
SOP Code: HRMS-8290 Date: 12/07/04 Authors: XL, JF, AV, RD, KV
SOP_8290_r5.1.doc 43
corresponds to the 10 percent valley definition) must appear on the hard copy and cannot exceed 100ppm at m/z 380.9760 (or 0.038amu at that particular mass).
15.3 Quality Control Samples
15.3.1 Performance Evaluation Samples - Included among the samples in all batches may be samples (blind or double blind) containing known amounts of unlabeled 2,3,7,8-substituted PCDDs/PCDFs or other PCDD/PCDF congeners.
15.3.2 Performance Check Solutions 15.3.2.1 At the beginning of each 12-hour period during which samples are
to be analyzed, an aliquot of the 1) GC column performance check solution and 2) high-resolution concentration. calibration solution, HRCC-3, shall be analyzed to demonstrate adequate GC resolution and sensitivity, response factor reproducibility, and mass range calibration, and to establish the PCDD/PCDF retention time windows. A mass resolution check shall also be performed to demonstrate adequate mass resolution using an appropriate reference compound (PFK is recommended). If the required criteria are not met, remedial action must be taken before any samples are analyzed.
15.3.2.2 To validate positive sample data, the routine or continuing
calibration and the mass resolution check must be performed also at the end of each 12-hour period during which samples are analyzed. Furthermore, an HRGC/HRMS method blank run must be recorded following a calibration run and the first sample run.
15.3.2.3 If the laboratory operates only during one period (shift) each day
of 12 hours or less, the GC performance check solution must be analyzed only once (at the beginning of the period) to validate the data acquired during the period. However, the mass resolution and continuing calibration checks must be performed at the beginning as well as at the end of the period.
15.3.2.4 If the laboratory operates during consecutive 12-hour periods
(shifts), analysis of the GC performance check solution must be performed at the beginning of each 12-hour period. The mass
SOP Code: HRMS-8290 Date: 12/07/04 Authors: XL, JF, AV, RD, KV
SOP_8290_r5.1.doc 44
resolution and continuing calibration checks from the previous period can be used for the beginning of the next period.
15.3.2.5 Results of at least one analysis of the GC column performance
check solution and of two mass resolution and continuing calibration checks must be reported with the sample data collected during a 12-hour period.
15.3.2.6 Deviations from criteria specified for the GC performance check or for the mass resolution check invalidate all positive sample data collected between analyses of the performance check solution, and the extracts from those positive samples shall be reanalyzed. 15.3.2.7 If the continuing calibration check performed at the end of a 12-
hour period fails by no more than 25 percent RPD for the 17 unlabeled compounds, and 35 percent RPD for the 9 labeled reference compounds, use the mean RFs from the two daily routine calibration runs to compute the analyte concentrations, instead of the RFs obtained from the initial calibration.
15.3.2.8 A new initial calibration (new RFs) is required immediately (within two hours) following the analysis of the samples, whenever the RPD from the end-of-shift routine calibration exceeds 25 percent or 35 percent, respectively. Failure to perform a new initial calibration immediately following the analysis of the samples will automatically require reanalysis of all positive sample extracts analyzed before the failed end-of-shift continuing calibration check.
15.3.3 The GC column performance check mixture, high-resolution concentration calibration solutions, and the sample fortification solutions may be obtained from the EMSL-CIN. However, if not available from the EMSL-CIN, standards can be obtained from other sources, and solutions can be prepared in the laboratory. Concentrations of all solutions containing 2,3,7,8-substituted PCDDs/PCDFs, which are not obtained from the EMSL-CIN, must be verified by comparison with the EPA standard solutions that are available from the EMSL-CIN.
15.3.4 Field Blanks - Each batch of samples usually contains a field blank sample of
uncontaminated soil, sediment or water that is to be fortified before analysis. In addition to this field blank, a batch of samples may include a rinsate, which is a portion of the solvent (usually trichloroethylene) that was used to rinse sampling equipment. The rinsate is analyzed to assure the sampling equipment has not contaminated any samples.
SOP Code: HRMS-8290 Date: 12/07/04 Authors: XL, JF, AV, RD, KV
SOP_8290_r5.1.doc 45
15.3.5 Fortified Field Blank
15.3.5.1 Weigh a 10g portion or use 1L (for aqueous samples) of the
specified field blank sample and add 100µL of the solution containing the nine internal standards diluted.
15.3.5.2 Add 20µL of the recovery standard solution and analyze a 1µL aliquot of the concentrated extract.
15.3.5.2.1 Calculate the concentration of 2,3,7,8-substituted PCDDs/PCDFs and the percent recovery of the internal standards. 15.3.5.2.2 Extract and analyze a new simulated fortified field blank whenever new lots of solvents or reagents are used for sample extraction or for column chromatographic procedures.
15.3.6 Rinsate Sample
15.3.6.1 The rinsate sample must be fortified like a regular sample.
15.3.6.2 Take a 100mL (+ 0.5mL) portion of the sampling equipment rinse
solvent (rinsate sample), filter, if necessary, and add 100µL of the solution containing the nine internal standards.
15.3.6.3 Using a KD apparatus, concentrate to approximately 5mL.
NOTE: As an option, a rotary evaporator may be used in place of
the KD apparatus for the concentration of the rinsate.
15.3.6.4 Transfer the 5mL concentrate from the KD concentrator tube in 1mL portions to a 1mL minivial, reducing the volume in the minivial as necessary with a gentle stream of dry nitrogen.
15.3.6.5 Rinse the KD concentrator tube with two 0.5mL portions of hexane
and transfer the rinses to the 1mL minivial. Blow down with dry nitrogen as necessary.
15.3.6.6 Just before analysis, add 20µL recovery standard solution and
reduce the volume to its final volume, No.column chromatography is required.
SOP Code: HRMS-8290 Date: 12/07/04 Authors: XL, JF, AV, RD, KV
SOP_8290_r5.1.doc 46
15.3.6.7 Analyze an aliquot following the same procedures used to analyze
samples.
15.3.6.8 Report percent recovery of the internal standard and the presence of any PCDD/PCDF compounds in µg/L of rinsate solvent.
15.3.7 Duplicate Analyses, if specified by the project instructions: 15.3.7.1 In each batch of samples, locate the sample specified for duplicate
analysis, and analyze a second 10g soil or sediment sample portion or 1L water sample, or an appropriate amount of the type of matrix under consideration.
15.3.7.2 The results of the laboratory duplicates (percent recovery and
concentrations of 2,3,7,8-substituted PCDD/PCDF compounds) should agree within 25 percent relative difference (difference expressed as percentage of the mean). Report all results.
15.3.7.3 Recommended actions to help locate problems:
15.3.7.4 Verify satisfactory instrument performance.
15.3.7.5 If possible, verify that no error was made while weighing the
sample portions.
15.3.7.6 Review the analytical procedures with the performing laboratory personnel.
15.3.8 Matrix Spike and Matrix Spike Duplicate
15.3.8.1 Locate the sample for the MS and MSD analyses (the sample may
be labeled "double volume").
15.3.8.2 Add an appropriate volume of the matrix spike fortification solution and of the sample fortification solution, adjusting the fortification level.
15.3.8.3 Analyze the MS and MSD samples.
SOP Code: HRMS-8290 Date: 12/07/04 Authors: XL, JF, AV, RD, KV
SOP_8290_r5.1.doc 47
15.3.8.4 The results obtained from the MS and MSD samples (concentrations of 2,3,7,8-substituted PCDDs/PCDFs) should agree within 20 percent relative difference.
15.3.9 Percent Recovery of the Internal Standards
15.3.9.1 For each sample, method blank and rinsate, calculate the percent recovery. The percent recovery should be between 40 percent and 135 percent for all 2,3,7,8-substituted internal standards.
NOTE: A low or high percent recovery for a blank does not require discarding the analytical data but it may indicate a potential problem with future analytical data.
15.4 Identification Criteria
15.4.1 If either one of the identification criteria is not met for a homologous series, it is reported that the sample does not contain unlabeled 2,3,7,8-substituted PCDD/PCDF isomers for that homologous series at the calculated detection limit.
15.4.2 If the first initial identification criteria are met, but the criteria appearing are not met, that sample is presumed to contain interfering contaminants. This must be noted on the analytical report form, and the sample should be rerun or the extract reanalyzed.
15.5 Unused portions of samples and sample extracts should be preserved for 90 days after
sample receipt to allow further analyses.
15.6 Reuse of glassware is to be minimized to avoid the risk of contamination.
SOP Code: HRMS-8290 Date: 12/07/04 Authors: XL, JF, AV, RD, KV
SOP_8290_r5.1.doc 48
16.0 REFERENCES 1. "Control of Interferences in the Analysis of Human Adipose Tissue for 2,3,7,8-Tetrachlorodibenzo-
p-dioxin". D. G. Patterson, J.S. Holler, D.F. Grote, L.R. Alexander, C.R. Lapeza, R.C. O'Connor and J.A. Liddle. Environ. Toxicol. Chem. 5, 355-360 (1986).
2. "Method 8290: Analytical Procedures and Quality Assurance for Multimedia Analysis of
Polychlorinated Dibenzo-p-Dioxins and Dibenzofurans by High-Resolution Gas Chromatography/High-Resolution Mass Spectrometry". Y. Tondeur and W.F. Beckert. U.S. Environmental Protection Agency, Environmental Monitoring Systems Laboratory, Las Vegas, NV.
3. "Carcinogens - Working with Carcinogens", Department of Health, Education, and Welfare, Public
Health Service, Center for Disease Control. National Institute for Occupational Safety and Health. Publication No. 77-206, August 1977.
4. "OSHA Safety and Health Standards, General Industry", (29 CFR 1910), Occupational Safety and
Health Administration, OSHA 2206 (revised January 1976). 5. "Safety in Academic Chemistry Laboratories", American Chemical Society Publication, Committee
on Chemical Safety (3rd Edition, 1979.)
6. "Hybrid HRGC/MS/MS Method for the Characterization of Tetrachlorinated Dibenzodioxins in Environmental Samples." Y. Tondeur, W.J. Niederhut, S.R. Missler, and J.E. Campana, Mass Spectrom. 14, 449-456 (1987).
6. USEPA National Dioxin Study - Phase II, "Analytical Procedures and Quality Assurance Plan for
the Determination of PCDD/PCDF in Fish", EPA-Duluth, October 26, 1987.
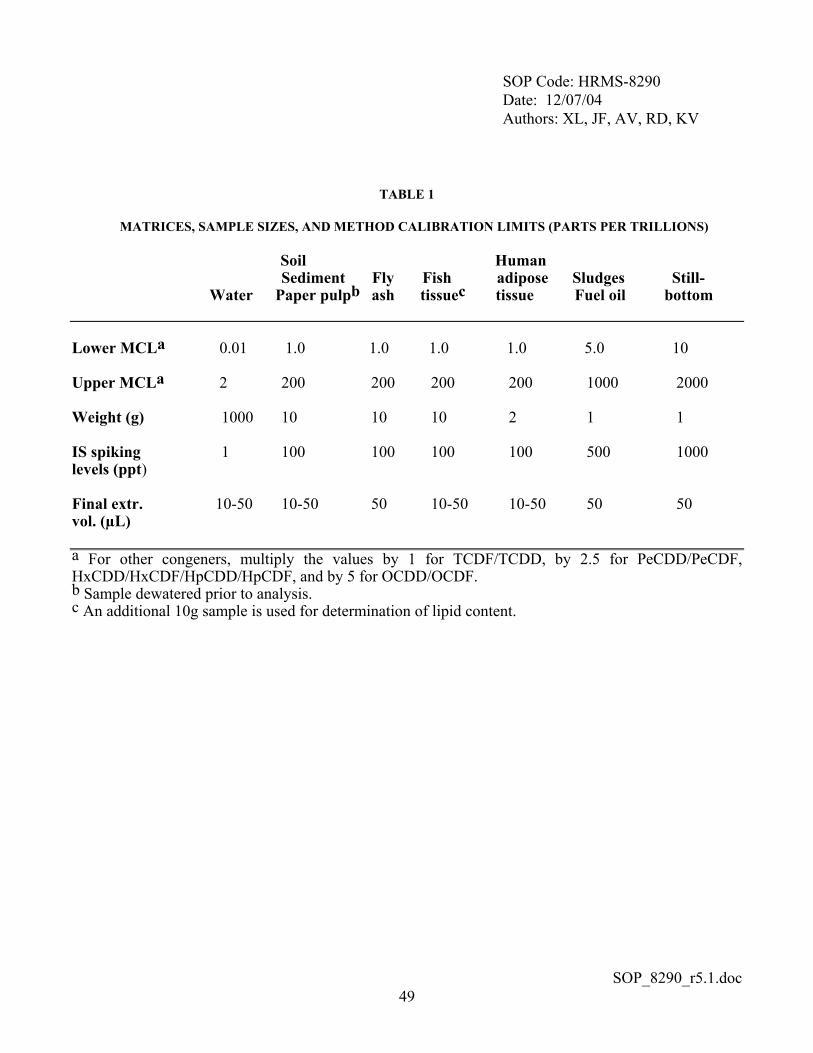
SOP Code: HRMS-8290 Date: 12/07/04 Authors: XL, JF, AV, RD, KV
SOP_8290_r5.1.doc 49
TABLE 1
MATRICES, SAMPLE SIZES, AND METHOD CALIBRATION LIMITS (PARTS PER TRILLIONS) Soil Human Sediment Fly Fish adipose Sludges Still- Water Paper pulpb ash tissuec tissue Fuel oil bottom Lower MCLa 0.01 1.0 1.0 1.0 1.0 5.0 10 Upper MCLa 2 200 200 200 200 1000 2000 Weight (g) 1000 10 10 10 2 1 1 IS spiking 1 100 100 100 100 500 1000 levels (ppt) Final extr. 10-50 10-50 50 10-50 10-50 50 50 vol. (µL) a For other congeners, multiply the values by 1 for TCDF/TCDD, by 2.5 for PeCDD/PeCDF, HxCDD/HxCDF/HpCDD/HpCDF, and by 5 for OCDD/OCDF. b Sample dewatered prior to analysis. c An additional 10g sample is used for determination of lipid content.
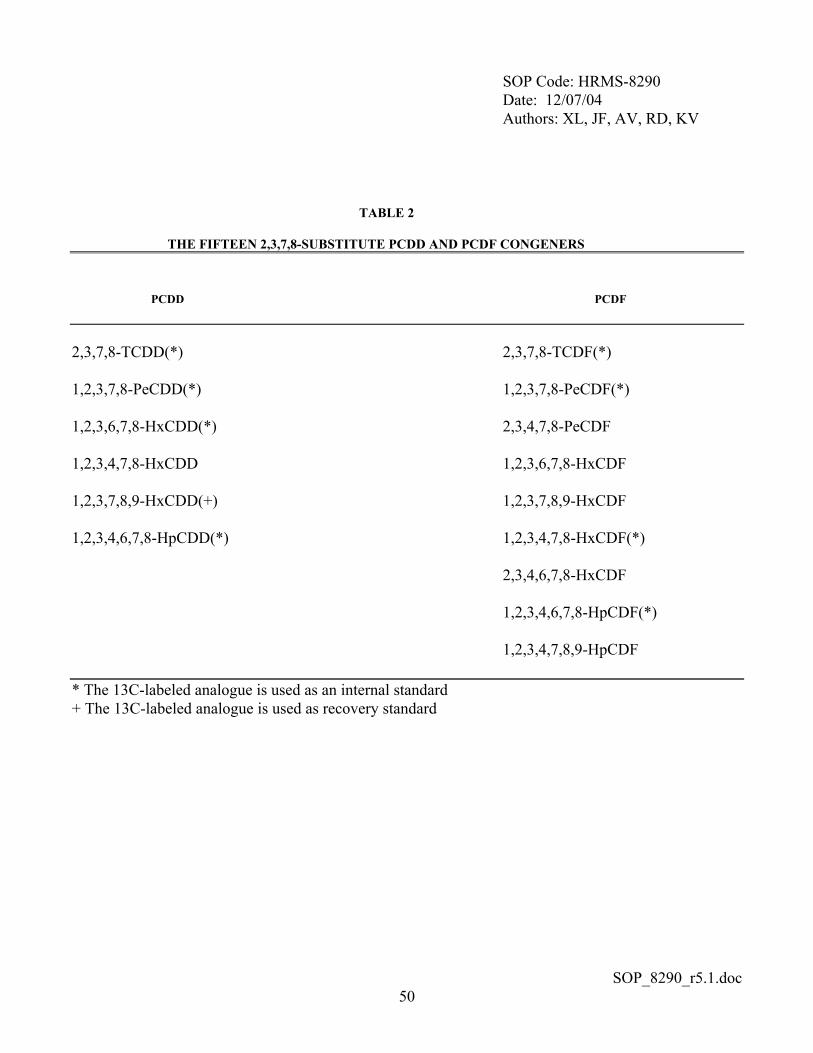
SOP Code: HRMS-8290 Date: 12/07/04 Authors: XL, JF, AV, RD, KV
SOP_8290_r5.1.doc 50
TABLE 2
THE FIFTEEN 2,3,7,8-SUBSTITUTE PCDD AND PCDF CONGENERS PCDD PCDF 2,3,7,8-TCDD(*) 2,3,7,8-TCDF(*) 1,2,3,7,8-PeCDD(*) 1,2,3,7,8-PeCDF(*) 1,2,3,6,7,8-HxCDD(*) 2,3,4,7,8-PeCDF 1,2,3,4,7,8-HxCDD 1,2,3,6,7,8-HxCDF 1,2,3,7,8,9-HxCDD(+) 1,2,3,7,8,9-HxCDF 1,2,3,4,6,7,8-HpCDD(*) 1,2,3,4,7,8-HxCDF(*) 2,3,4,6,7,8-HxCDF 1,2,3,4,6,7,8-HpCDF(*) 1,2,3,4,7,8,9-HpCDF * The 13C-labeled analogue is used as an internal standard + The 13C-labeled analogue is used as recovery standard
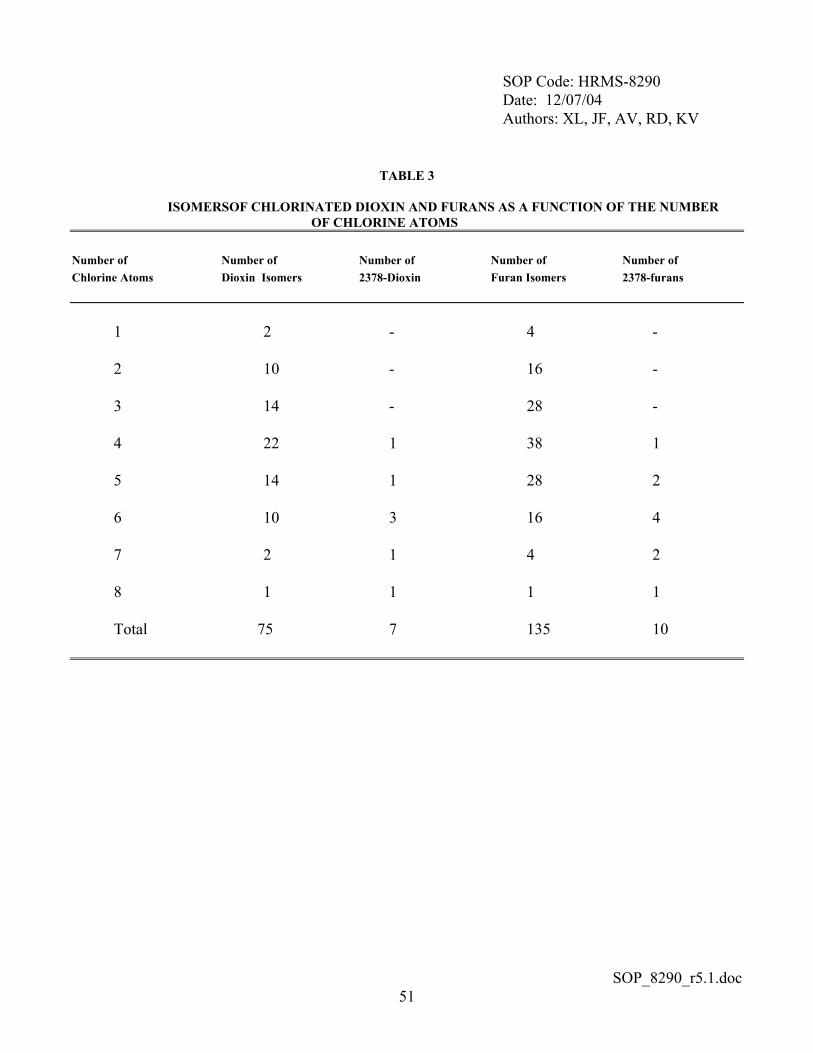
SOP Code: HRMS-8290 Date: 12/07/04 Authors: XL, JF, AV, RD, KV
SOP_8290_r5.1.doc 51
TABLE 3
ISOMERSOF CHLORINATED DIOXIN AND FURANS AS A FUNCTION OF THE NUMBER OF CHLORINE ATOMS
Number of Number of Number of Number of Number of Chlorine Atoms Dioxin Isomers 2378-Dioxin Furan Isomers 2378-furans
1 2 - 4 - 2 10 - 16 - 3 14 - 28 - 4 22 1 38 1 5 14 1 28 2 6 10 3 16 4 7 2 1 4 2 8 1 1 1 1 Total 75 7 135 10
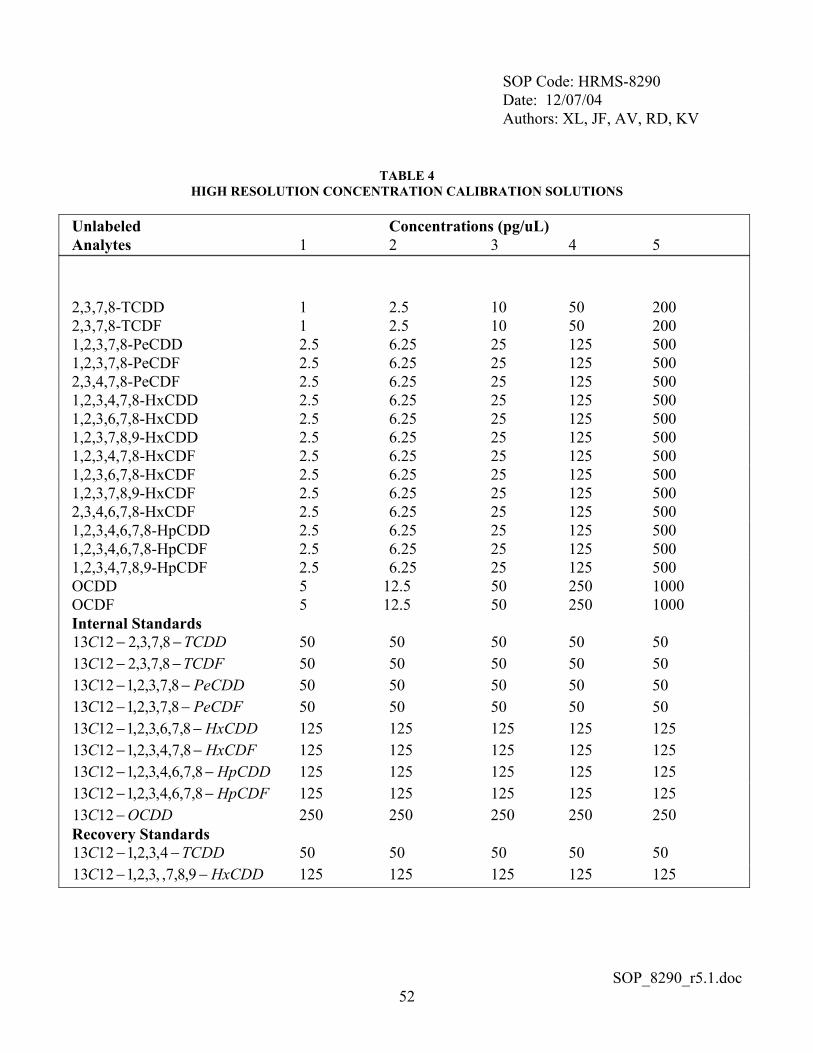
SOP Code: HRMS-8290 Date: 12/07/04 Authors: XL, JF, AV, RD, KV
SOP_8290_r5.1.doc 52
TABLE 4 HIGH RESOLUTION CONCENTRATION CALIBRATION SOLUTIONS
Unlabeled Concentrations (pg/uL) Analytes 1 2 3 4 5
2,3,7,8-TCDD 1 2.5 10 50 200 2,3,7,8-TCDF 1 2.5 10 50 200 1,2,3,7,8-PeCDD 2.5 6.25 25 125 500 1,2,3,7,8-PeCDF 2.5 6.25 25 125 500 2,3,4,7,8-PeCDF 2.5 6.25 25 125 500 1,2,3,4,7,8-HxCDD 2.5 6.25 25 125 500 1,2,3,6,7,8-HxCDD 2.5 6.25 25 125 500 1,2,3,7,8,9-HxCDD 2.5 6.25 25 125 500 1,2,3,4,7,8-HxCDF 2.5 6.25 25 125 500 1,2,3,6,7,8-HxCDF 2.5 6.25 25 125 500 1,2,3,7,8,9-HxCDF 2.5 6.25 25 125 500 2,3,4,6,7,8-HxCDF 2.5 6.25 25 125 500 1,2,3,4,6,7,8-HpCDD 2.5 6.25 25 125 500 1,2,3,4,6,7,8-HpCDF 2.5 6.25 25 125 500 1,2,3,4,7,8,9-HpCDF 2.5 6.25 25 125 500 OCDD 5 12.5 50 250 1000 OCDF 5 12.5 50 250 1000 Internal Standards
TCDDC −− 8,7,3,21213 50 50 50 50 50 TCDFC −− 8,7,3,21213 50 50 50 50 50
PeCDDC −− 8,7,3,2,11213 50 50 50 50 50 PeCDFC −− 8,7,3,2,11213 50 50 50 50 50
HxCDDC −− 8,7,6,3,2,11213 125 125 125 125 125 HxCDFC −− 8,7,4,3,2,11213 125 125 125 125 125
HpCDDC −− 8,7,6,4,3,2,11213 125 125 125 125 125 HpCDFC −− 8,7,6,4,3,2,11213 125 125 125 125 125
OCDDC −1213 250 250 250 250 250 Recovery Standards
TCDDC −− 4,3,2,11213 50 50 50 50 50 HxCDDC −− 9,8,7,,3,2,11213 125 125 125 125 125
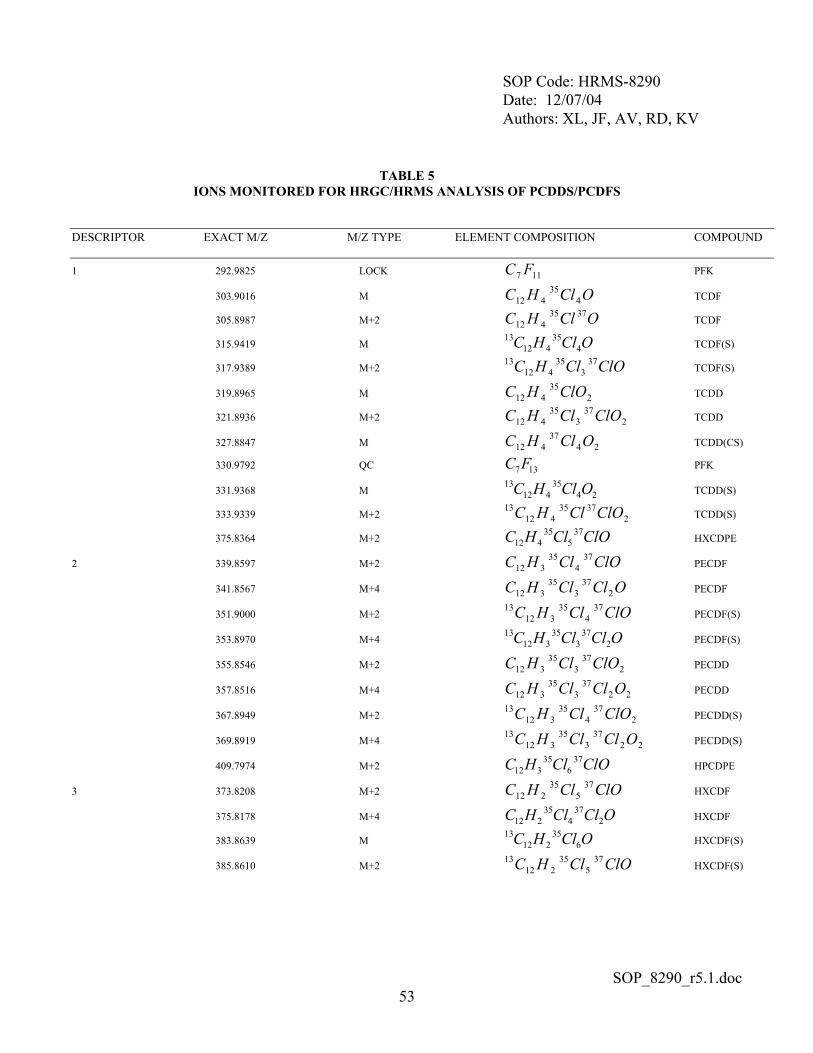
SOP Code: HRMS-8290 Date: 12/07/04 Authors: XL, JF, AV, RD, KV
SOP_8290_r5.1.doc 53
TABLE 5 IONS MONITORED FOR HRGC/HRMS ANALYSIS OF PCDDS/PCDFS
DESCRIPTOR EXACT M/Z M/Z TYPE ELEMENT COMPOSITION COMPOUND
1 292.9825 LOCK 117 FC PFK
303.9016 M OClHC 435
412 TCDF
305.8987 M+2 OClHC 3735412 TCDF
315.9419 M OClHC 435
41213
TCDF(S)
317.9389 M+2 ClOClHC 373
35412
13 TCDF(S)
319.8965 M 235
412 ClOHC TCDD
321.8936 M+2 237
335
412 ClOClHC TCDD
327.8847 M 2437
412 OClHC TCDD(CS)
330.9792 QC 137FC PFK
331.9368 M 2435
41213 OClHC TCDD(S)
333.9339 M+2 23735
41213 ClOClHC TCDD(S)
375.8364 M+2 ClOClHC 375
35412 HXCDPE
2 339.8597 M+2 ClOClHC 374
35312 PECDF
341.8567 M+4 OClClHC 237
335
312 PECDF
351.9000 M+2 ClOClHC 374
35312
13 PECDF(S)
353.8970 M+4 OClClHC 237
335
31213
PECDF(S)
355.8546 M+2 237
335
312 ClOClHC PECDD
357.8516 M+4 2237
335
312 OClClHC PECDD
367.8949 M+2 237
435
31213 ClOClHC PECDD(S)
369.8919 M+4 2237
335
31213 OClClHC PECDD(S)
409.7974 M+2 ClOClHC 376
35312 HPCDPE
3 373.8208 M+2 ClOClHC 375
35212 HXCDF
375.8178 M+4 OClClHC 237
435
212 HXCDF
383.8639 M OClHC 635
21213
HXCDF(S)
385.8610 M+2 ClOClHC 375
35212
13 HXCDF(S)
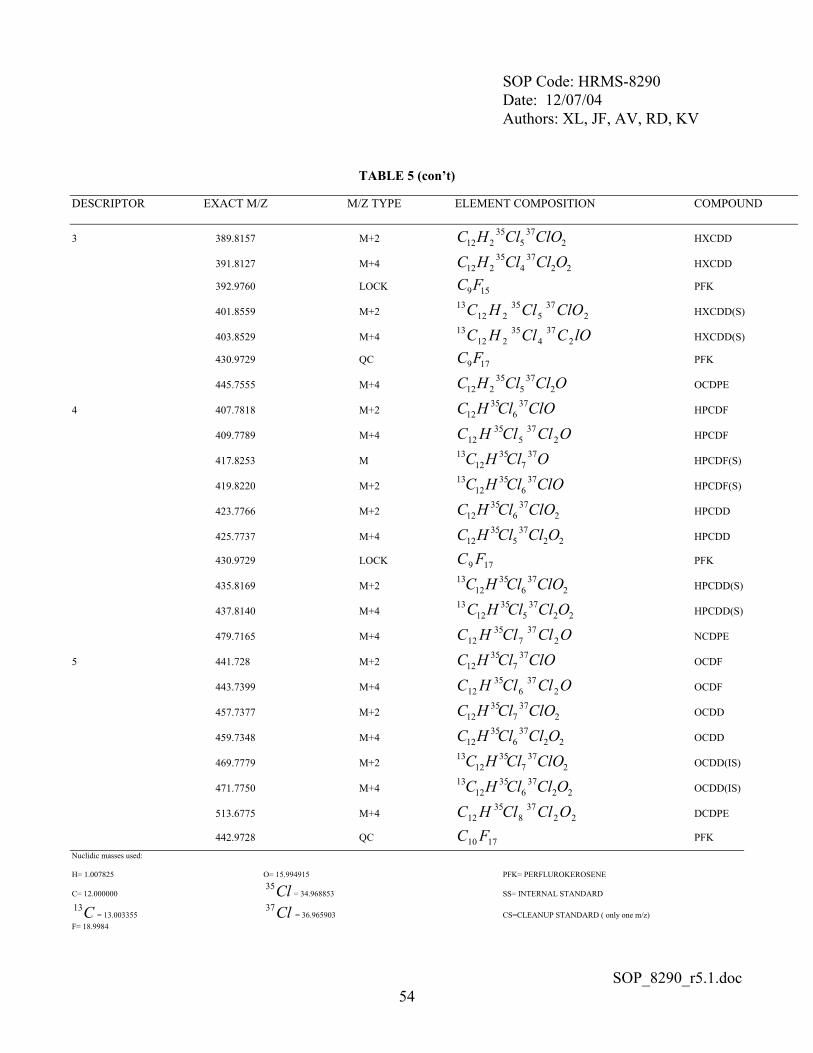
SOP Code: HRMS-8290 Date: 12/07/04 Authors: XL, JF, AV, RD, KV
SOP_8290_r5.1.doc 54
TABLE 5 (con’t) DESCRIPTOR EXACT M/Z M/Z TYPE ELEMENT COMPOSITION COMPOUND
3 389.8157 M+2 237
535
212 ClOClHC HXCDD
391.8127 M+4 2237
435
212 OClClHC HXCDD
392.9760 LOCK 159FC PFK
401.8559 M+2 237
535
21213 ClOClHC HXCDD(S)
403.8529 M+4 lOCClHC 237
435
21213
HXCDD(S)
430.9729 QC 179FC PFK
445.7555 M+4 OClClHC 237
535
212 OCDPE
4 407.7818 M+2 ClOClHC 376
3512 HPCDF
409.7789 M+4 OClClHC 237
535
12 HPCDF
417.8253 M OClHC 377
3512
13 HPCDF(S)
419.8220 M+2 ClOClHC 376
3512
13 HPCDF(S)
423.7766 M+2 237
635
12 ClOClHC HPCDD
425.7737 M+4 2237
535
12 OClClHC HPCDD
430.9729 LOCK 179 FC PFK
435.8169 M+2 237
635
1213 ClOClHC HPCDD(S)
437.8140 M+4 2237
535
1213 OClClHC HPCDD(S)
479.7165 M+4 OClClHC 237
735
12 NCDPE
5 441.728 M+2 ClOClHC 377
3512 OCDF
443.7399 M+4 OClClHC 237
635
12 OCDF
457.7377 M+2 237
735
12 ClOClHC OCDD
459.7348 M+4 2237
635
12 OClClHC OCDD
469.7779 M+2 237
735
1213 ClOClHC OCDD(IS)
471.7750 M+4 2237
635
1213 OClClHC OCDD(IS)
513.6775 M+4 2237
835
12 OClClHC DCDPE
442.9728 QC 1710 FC PFK Nuclidic masses used: H= 1.007825 O= 15.994915 PFK= PERFLUROKEROSENE
C= 12.000000 Cl35= 34.968853 SS= INTERNAL STANDARD
C13= 13.003355 Cl37
= 36.965903 CS=CLEANUP STANDARD ( only one m/z) F= 18.9984
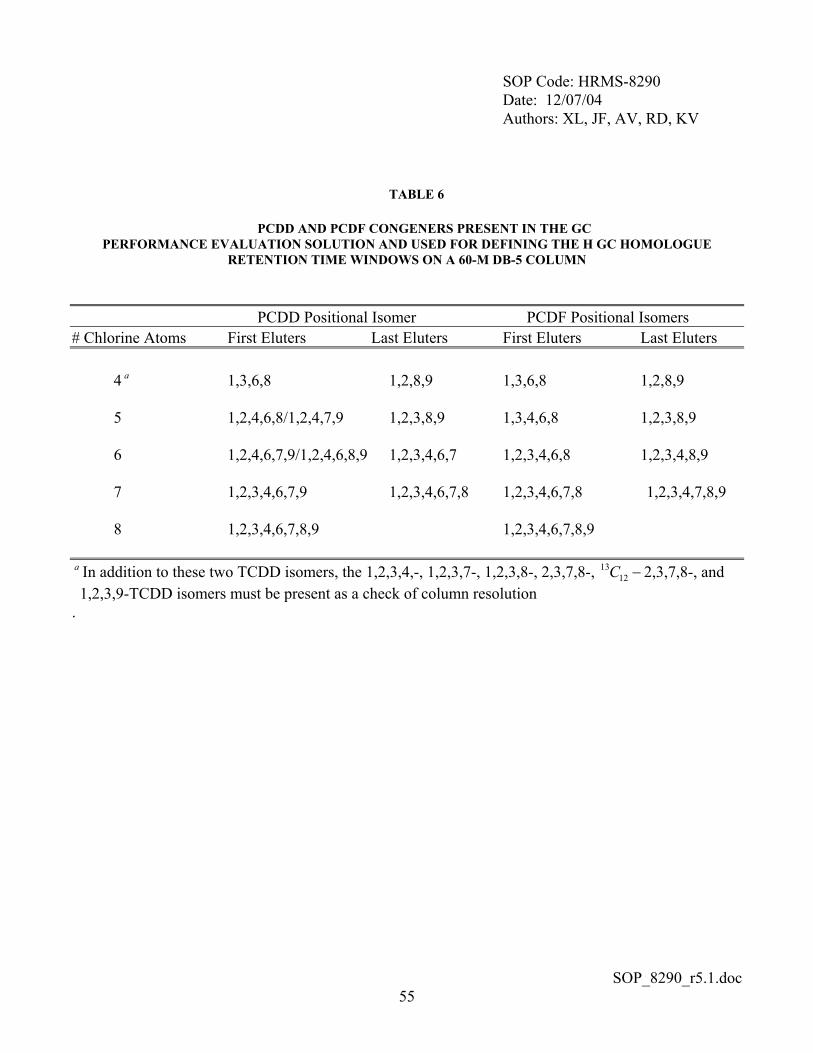
SOP Code: HRMS-8290 Date: 12/07/04 Authors: XL, JF, AV, RD, KV
SOP_8290_r5.1.doc 55
TABLE 6 PCDD AND PCDF CONGENERS PRESENT IN THE GC
PERFORMANCE EVALUATION SOLUTION AND USED FOR DEFINING THE H GC HOMOLOGUE RETENTION TIME WINDOWS ON A 60-M DB-5 COLUMN
PCDD Positional Isomer PCDF Positional Isomers # Chlorine Atoms First Eluters Last Eluters First Eluters Last Eluters 4 a 1,3,6,8 1,2,8,9 1,3,6,8 1,2,8,9 5 1,2,4,6,8/1,2,4,7,9 1,2,3,8,9 1,3,4,6,8 1,2,3,8,9 6 1,2,4,6,7,9/1,2,4,6,8,9 1,2,3,4,6,7 1,2,3,4,6,8 1,2,3,4,8,9 7 1,2,3,4,6,7,9 1,2,3,4,6,7,8 1,2,3,4,6,7,8 1,2,3,4,7,8,9 8 1,2,3,4,6,7,8,9 1,2,3,4,6,7,8,9 a In addition to these two TCDD isomers, the 1,2,3,4,-, 1,2,3,7-, 1,2,3,8-, 2,3,7,8-, −12
13C 2,3,7,8-, and 1,2,3,9-TCDD isomers must be present as a check of column resolution .
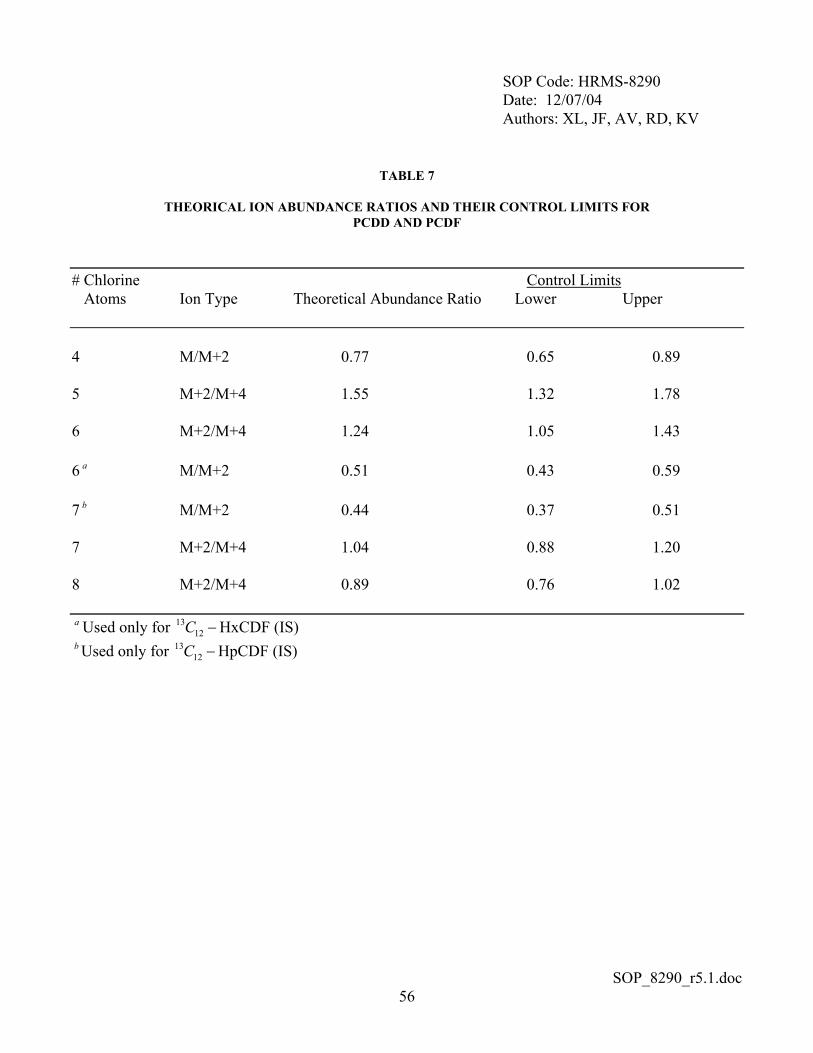
SOP Code: HRMS-8290 Date: 12/07/04 Authors: XL, JF, AV, RD, KV
SOP_8290_r5.1.doc 56
TABLE 7
THEORICAL ION ABUNDANCE RATIOS AND THEIR CONTROL LIMITS FOR PCDD AND PCDF
# Chlorine Control Limits Atoms Ion Type Theoretical Abundance Ratio Lower Upper 4 M/M+2 0.77 0.65 0.89 5 M+2/M+4 1.55 1.32 1.78 6 M+2/M+4 1.24 1.05 1.43 6 a M/M+2 0.51 0.43 0.59 7 b M/M+2 0.44 0.37 0.51 7 M+2/M+4 1.04 0.88 1.20 8 M+2/M+4 0.89 0.76 1.02 a Used only for −12
13C HxCDF (IS) b Used only for −12
13C HpCDF (IS)
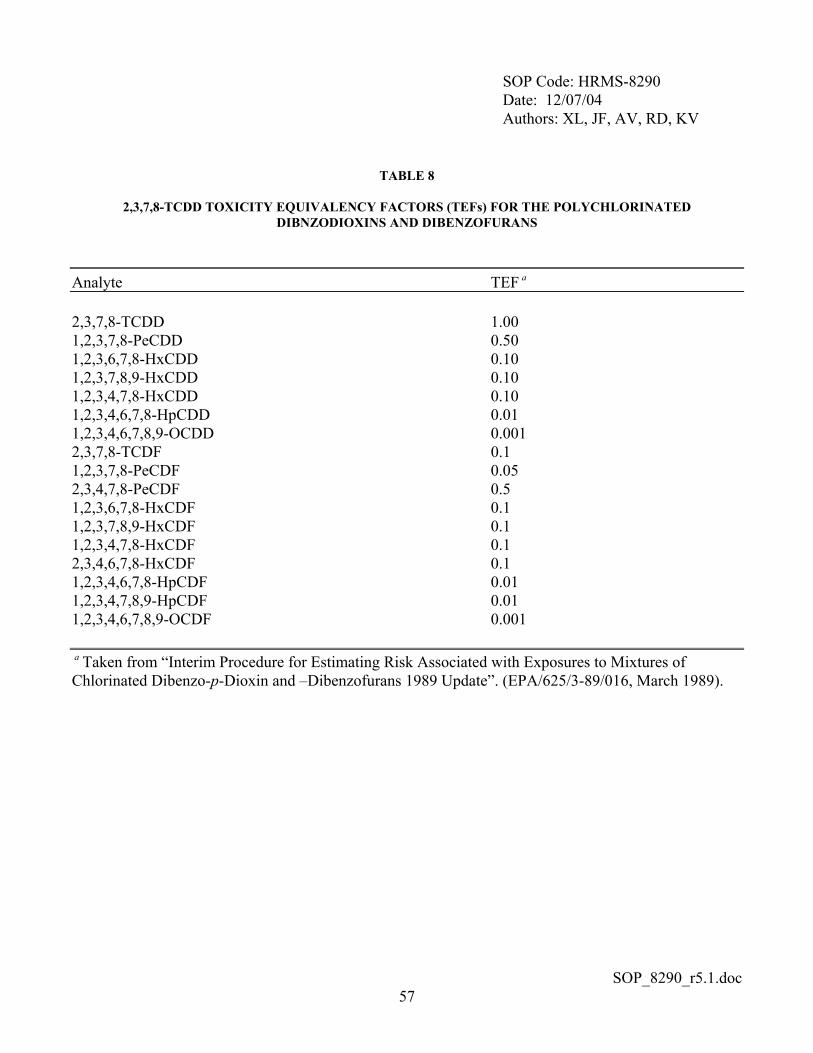
SOP Code: HRMS-8290 Date: 12/07/04 Authors: XL, JF, AV, RD, KV
SOP_8290_r5.1.doc 57
TABLE 8
2,3,7,8-TCDD TOXICITY EQUIVALENCY FACTORS (TEFs) FOR THE POLYCHLORINATED DIBNZODIOXINS AND DIBENZOFURANS
Analyte TEF a 2,3,7,8-TCDD 1.00 1,2,3,7,8-PeCDD 0.50 1,2,3,6,7,8-HxCDD 0.10 1,2,3,7,8,9-HxCDD 0.10 1,2,3,4,7,8-HxCDD 0.10 1,2,3,4,6,7,8-HpCDD 0.01 1,2,3,4,6,7,8,9-OCDD 0.001 2,3,7,8-TCDF 0.1 1,2,3,7,8-PeCDF 0.05 2,3,4,7,8-PeCDF 0.5 1,2,3,6,7,8-HxCDF 0.1 1,2,3,7,8,9-HxCDF 0.1 1,2,3,4,7,8-HxCDF 0.1 2,3,4,6,7,8-HxCDF 0.1 1,2,3,4,6,7,8-HpCDF 0.01 1,2,3,4,7,8,9-HpCDF 0.01 1,2,3,4,6,7,8,9-OCDF 0.001 a Taken from “Interim Procedure for Estimating Risk Associated with Exposures to Mixtures of Chlorinated Dibenzo-p-Dioxin and –Dibenzofurans 1989 Update”. (EPA/625/3-89/016, March 1989).
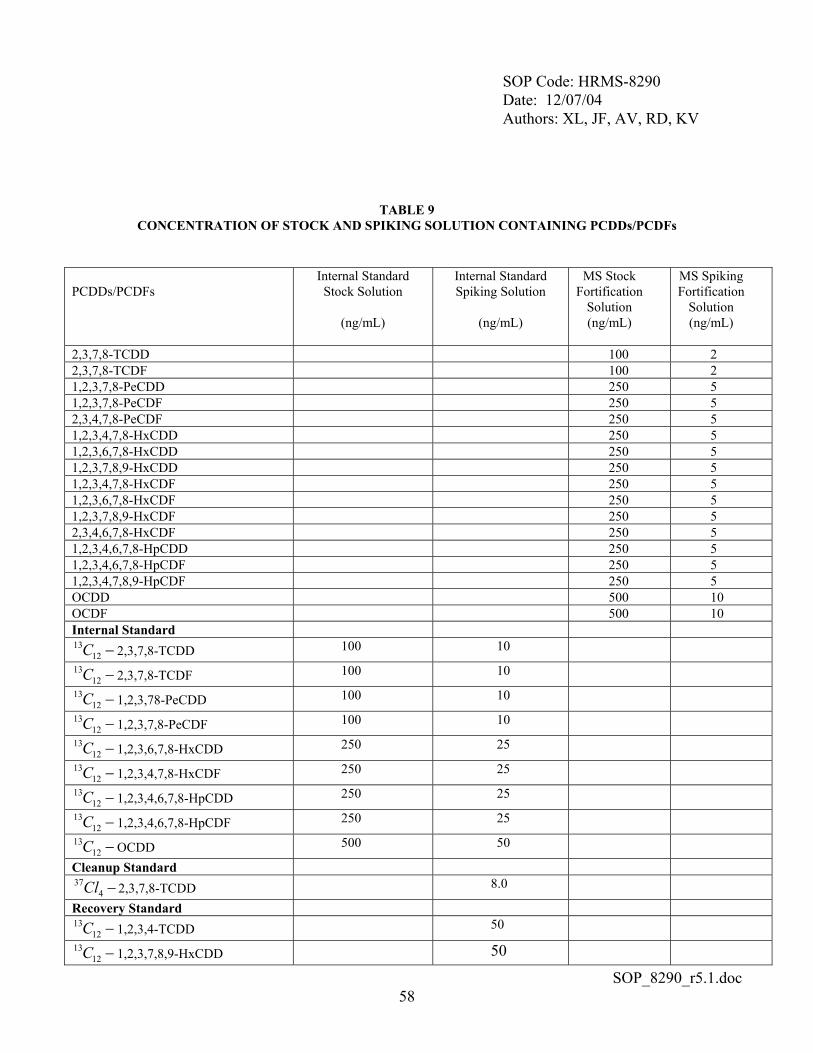
SOP Code: HRMS-8290 Date: 12/07/04 Authors: XL, JF, AV, RD, KV
SOP_8290_r5.1.doc 58
TABLE 9 CONCENTRATION OF STOCK AND SPIKING SOLUTION CONTAINING PCDDs/PCDFs
PCDDs/PCDFs
Internal Standard Stock Solution
(ng/mL)
Internal Standard Spiking Solution
(ng/mL)
MS Stock Fortification
Solution (ng/mL)
MS Spiking Fortification
Solution (ng/mL)
2,3,7,8-TCDD 100 2 2,3,7,8-TCDF 100 2 1,2,3,7,8-PeCDD 250 5 1,2,3,7,8-PeCDF 250 5 2,3,4,7,8-PeCDF 250 5 1,2,3,4,7,8-HxCDD 250 5 1,2,3,6,7,8-HxCDD 250 5 1,2,3,7,8,9-HxCDD 250 5 1,2,3,4,7,8-HxCDF 250 5 1,2,3,6,7,8-HxCDF 250 5 1,2,3,7,8,9-HxCDF 250 5 2,3,4,6,7,8-HxCDF 250 5 1,2,3,4,6,7,8-HpCDD 250 5 1,2,3,4,6,7,8-HpCDF 250 5 1,2,3,4,7,8,9-HpCDF 250 5 OCDD 500 10 OCDF 500 10 Internal Standard
−1213C 2,3,7,8-TCDD 100 10
−1213C 2,3,7,8-TCDF 100 10
−1213C 1,2,3,78-PeCDD 100 10
−1213C 1,2,3,7,8-PeCDF 100 10
−1213C 1,2,3,6,7,8-HxCDD 250 25
−1213C 1,2,3,4,7,8-HxCDF 250 25
−1213C 1,2,3,4,6,7,8-HpCDD 250 25
−1213C 1,2,3,4,6,7,8-HpCDF 250 25
−1213C OCDD 500 50
Cleanup Standard −4
37Cl 2,3,7,8-TCDD 8.0
Recovery Standard −12
13C 1,2,3,4-TCDD 50
−1213C 1,2,3,7,8,9-HxCDD 50
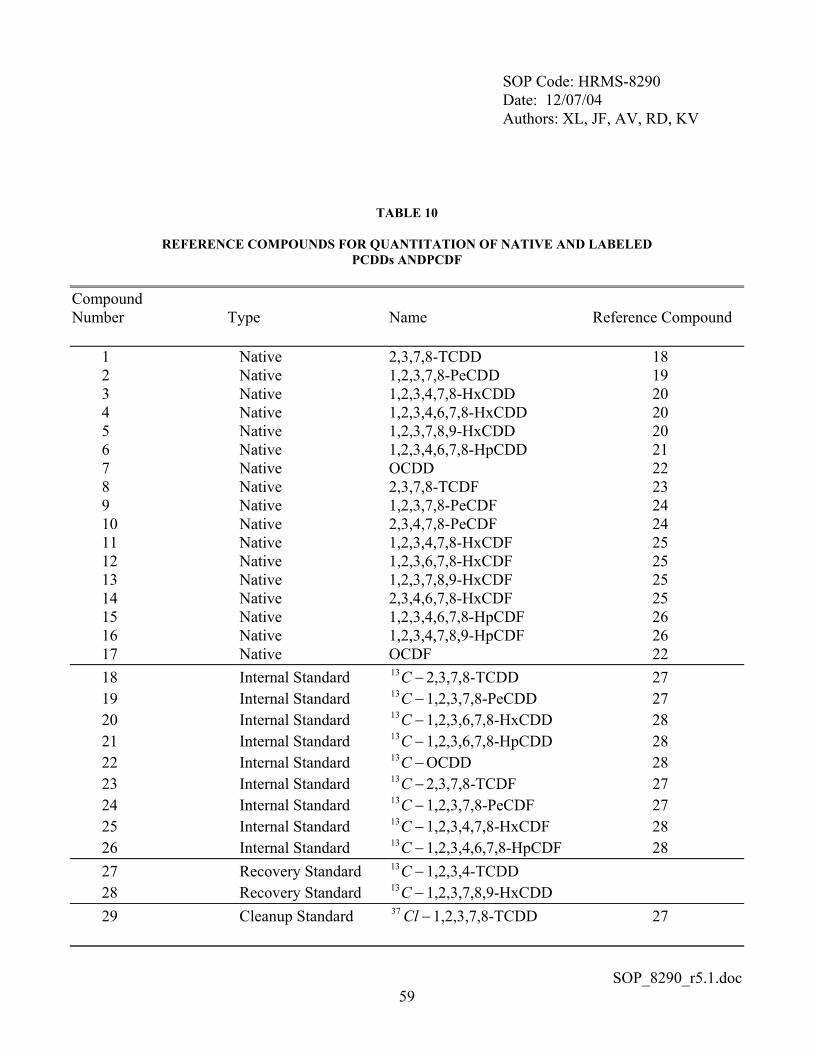
SOP Code: HRMS-8290 Date: 12/07/04 Authors: XL, JF, AV, RD, KV
SOP_8290_r5.1.doc 59
TABLE 10
REFERENCE COMPOUNDS FOR QUANTITATION OF NATIVE AND LABELED PCDDs ANDPCDF
Compound Number Type Name Reference Compound 1 Native 2,3,7,8-TCDD 18 2 Native 1,2,3,7,8-PeCDD 19 3 Native 1,2,3,4,7,8-HxCDD 20 4 Native 1,2,3,4,6,7,8-HxCDD 20 5 Native 1,2,3,7,8,9-HxCDD 20 6 Native 1,2,3,4,6,7,8-HpCDD 21 7 Native OCDD 22 8 Native 2,3,7,8-TCDF 23 9 Native 1,2,3,7,8-PeCDF 24 10 Native 2,3,4,7,8-PeCDF 24 11 Native 1,2,3,4,7,8-HxCDF 25 12 Native 1,2,3,6,7,8-HxCDF 25 13 Native 1,2,3,7,8,9-HxCDF 25 14 Native 2,3,4,6,7,8-HxCDF 25 15 Native 1,2,3,4,6,7,8-HpCDF 26 16 Native 1,2,3,4,7,8,9-HpCDF 26 17 Native OCDF 22 18 Internal Standard −C13 2,3,7,8-TCDD 27 19 Internal Standard −C13 1,2,3,7,8-PeCDD 27 20 Internal Standard −C13 1,2,3,6,7,8-HxCDD 28 21 Internal Standard −C13 1,2,3,6,7,8-HpCDD 28 22 Internal Standard −C13 OCDD 28 23 Internal Standard −C13 2,3,7,8-TCDF 27 24 Internal Standard −C13 1,2,3,7,8-PeCDF 27 25 Internal Standard −C13 1,2,3,4,7,8-HxCDF 28 26 Internal Standard −C13 1,2,3,4,6,7,8-HpCDF 28 27 Recovery Standard −C13 1,2,3,4-TCDD 28 Recovery Standard −C13 1,2,3,7,8,9-HxCDD 29 Cleanup Standard −Cl37 1,2,3,7,8-TCDD 27
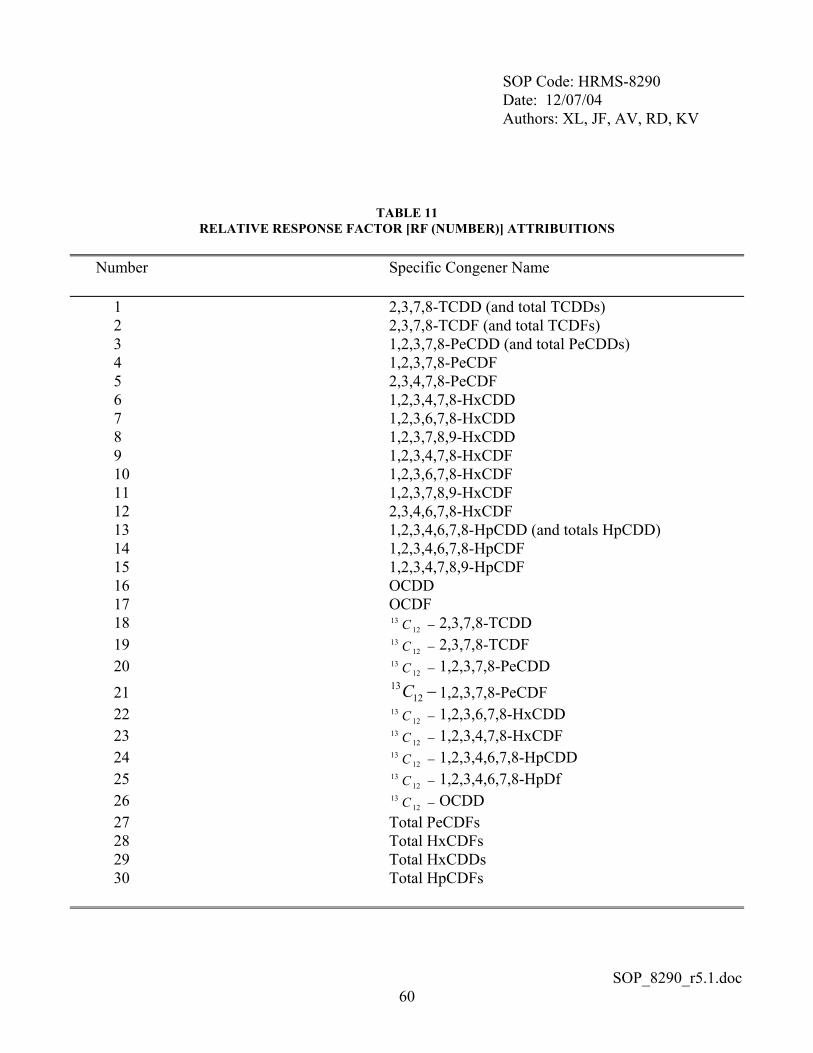
SOP Code: HRMS-8290 Date: 12/07/04 Authors: XL, JF, AV, RD, KV
SOP_8290_r5.1.doc 60
TABLE 11 RELATIVE RESPONSE FACTOR [RF (NUMBER)] ATTRIBUITIONS
Number Specific Congener Name 1 2,3,7,8-TCDD (and total TCDDs) 2 2,3,7,8-TCDF (and total TCDFs) 3 1,2,3,7,8-PeCDD (and total PeCDDs) 4 1,2,3,7,8-PeCDF 5 2,3,4,7,8-PeCDF 6 1,2,3,4,7,8-HxCDD 7 1,2,3,6,7,8-HxCDD 8 1,2,3,7,8,9-HxCDD 9 1,2,3,4,7,8-HxCDF 10 1,2,3,6,7,8-HxCDF 11 1,2,3,7,8,9-HxCDF 12 2,3,4,6,7,8-HxCDF 13 1,2,3,4,6,7,8-HpCDD (and totals HpCDD) 14 1,2,3,4,6,7,8-HpCDF 15 1,2,3,4,7,8,9-HpCDF 16 OCDD 17 OCDF 18 −12
13 C 2,3,7,8-TCDD 19 −12
13 C 2,3,7,8-TCDF 20 −12
13 C 1,2,3,7,8-PeCDD
21 −1213C 1,2,3,7,8-PeCDF
22 −1213 C 1,2,3,6,7,8-HxCDD
23 −1213 C 1,2,3,4,7,8-HxCDF
24 −1213 C 1,2,3,4,6,7,8-HpCDD
25 −1213 C 1,2,3,4,6,7,8-HpDf
26 −1213 C OCDD
27 Total PeCDFs 28 Total HxCDFs 29 Total HxCDDs 30 Total HpCDFs
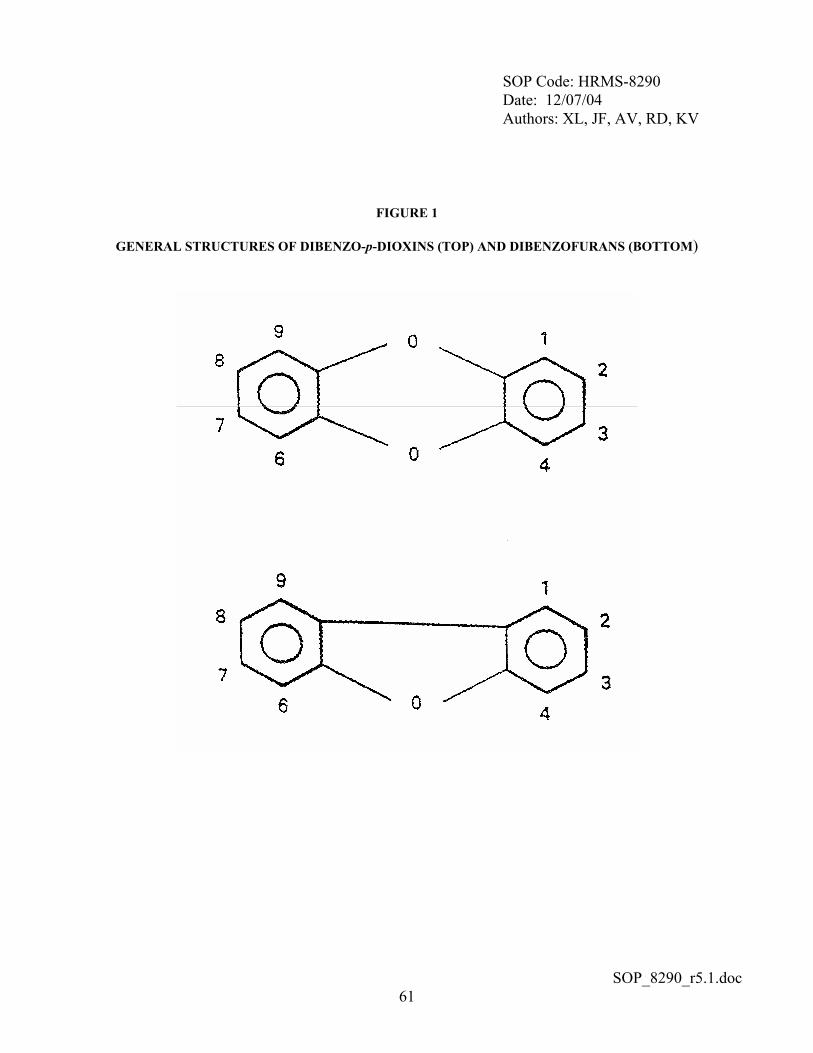
SOP Code: HRMS-8290 Date: 12/07/04 Authors: XL, JF, AV, RD, KV
SOP_8290_r5.1.doc 61
FIGURE 1
GENERAL STRUCTURES OF DIBENZO-p-DIOXINS (TOP) AND DIBENZOFURANS (BOTTOM)
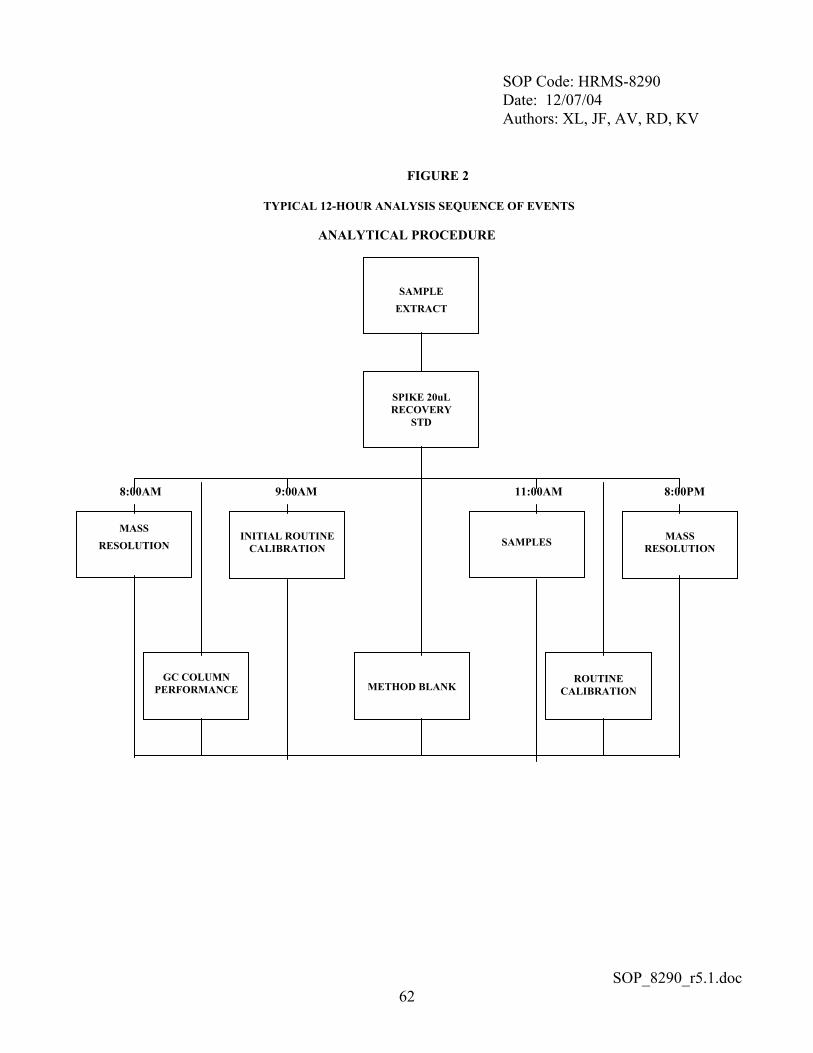
SOP Code: HRMS-8290 Date: 12/07/04 Authors: XL, JF, AV, RD, KV
SOP_8290_r5.1.doc 62
FIGURE 2
TYPICAL 12-HOUR ANALYSIS SEQUENCE OF EVENTS
ANALYTICAL PROCEDURE 8:00AM 9:00AM 11:00AM 8:00PM
SAMPLES
SAMPLE EXTRACT
SPIKE 20uL RECOVERY
STD
MASS RESOLUTION
INITIAL ROUTINE
CALIBRATION
MASS
RESOLUTION
GC COLUMN
PERFORMANCE
METHOD BLANK
ROUTINE
CALIBRATION
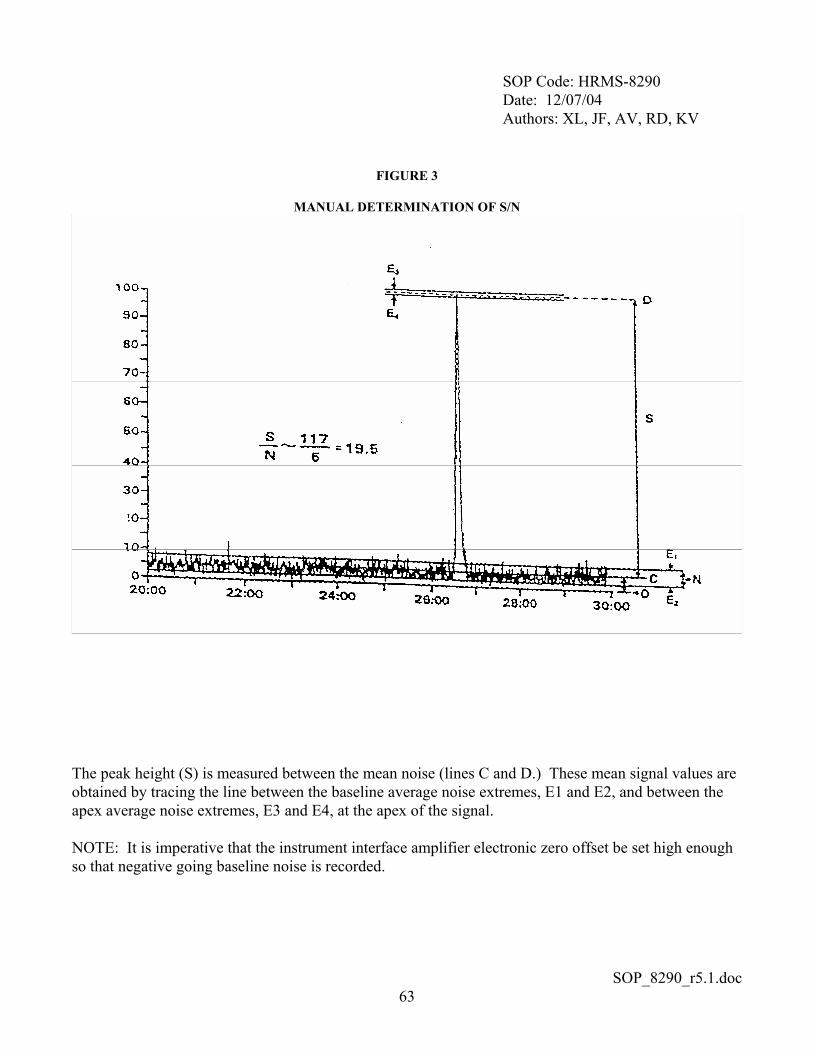
SOP Code: HRMS-8290 Date: 12/07/04 Authors: XL, JF, AV, RD, KV
SOP_8290_r5.1.doc 63
FIGURE 3
MANUAL DETERMINATION OF S/N
The peak height (S) is measured between the mean noise (lines C and D.) These mean signal values are obtained by tracing the line between the baseline average noise extremes, E1 and E2, and between the apex average noise extremes, E3 and E4, at the apex of the signal. NOTE: It is imperative that the instrument interface amplifier electronic zero offset be set high enough so that negative going baseline noise is recorded.
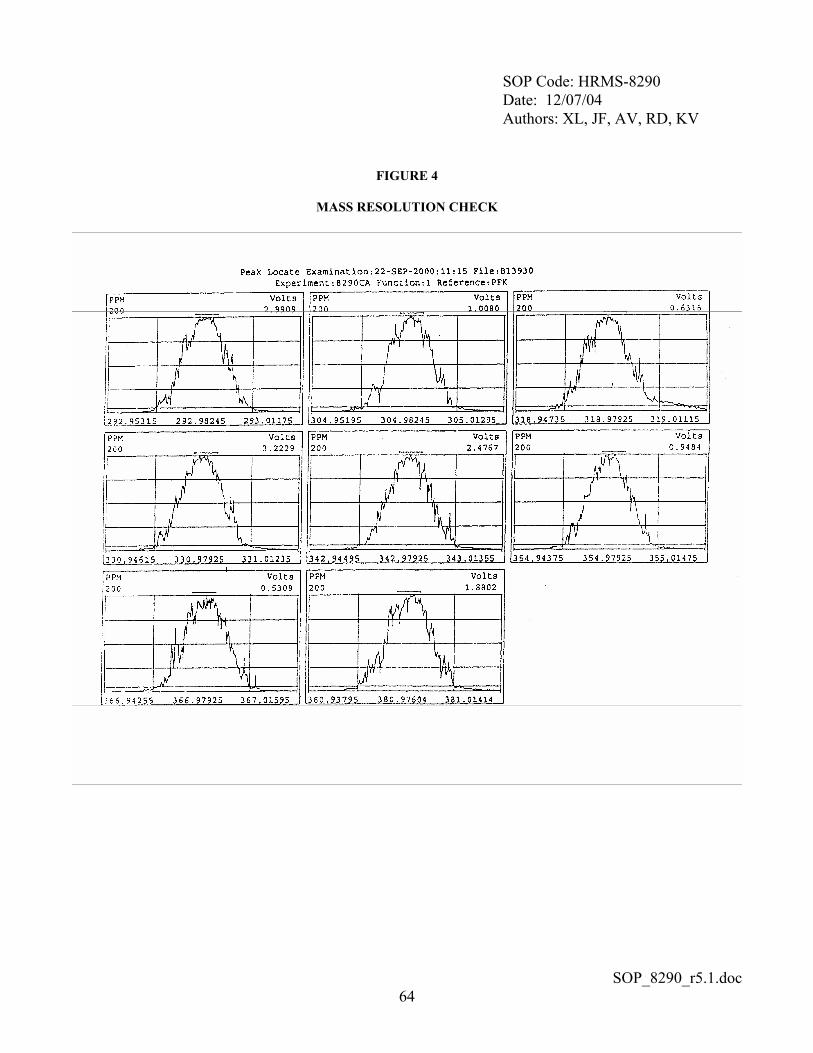
SOP Code: HRMS-8290 Date: 12/07/04 Authors: XL, JF, AV, RD, KV
SOP_8290_r5.1.doc 64
FIGURE 4
MASS RESOLUTION CHECK
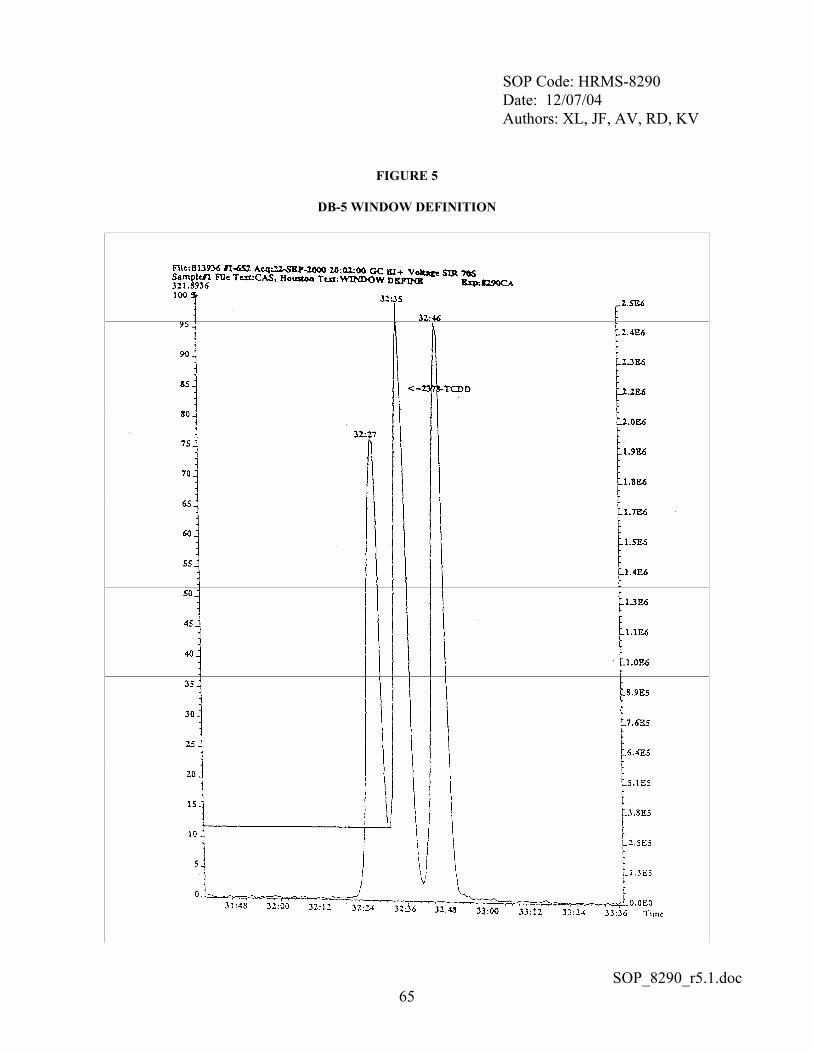
SOP Code: HRMS-8290 Date: 12/07/04 Authors: XL, JF, AV, RD, KV
SOP_8290_r5.1.doc 65
FIGURE 5
DB-5 WINDOW DEFINITION
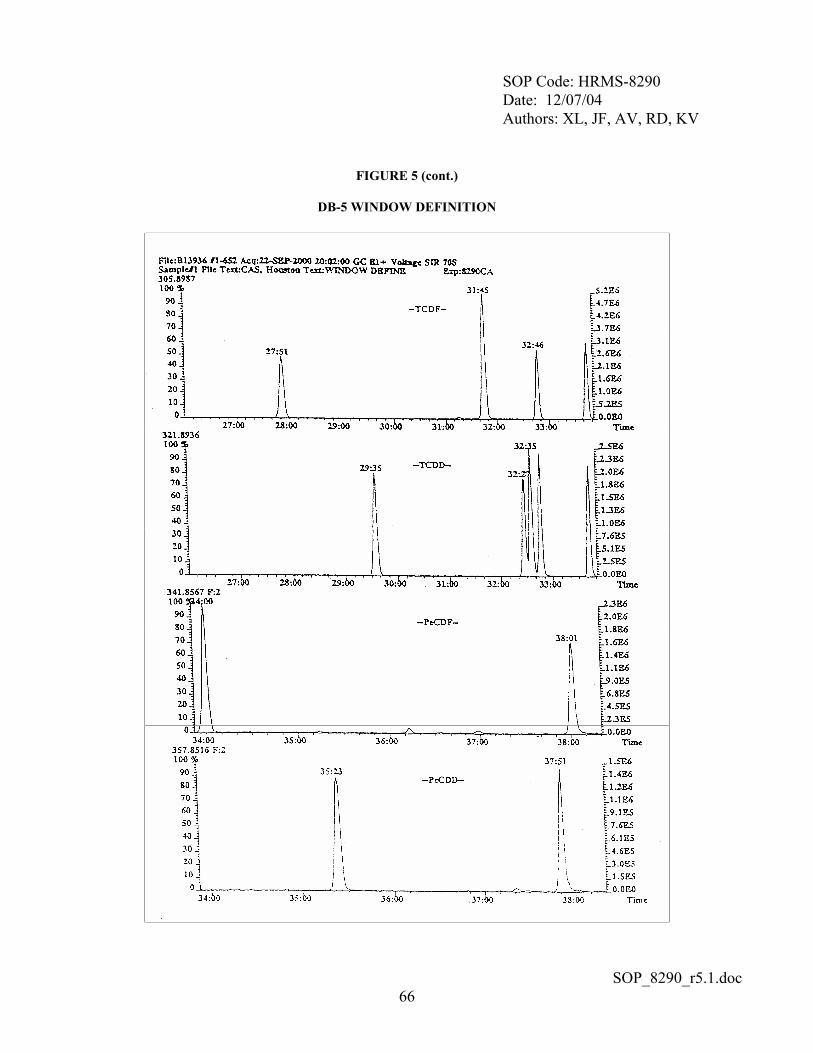
SOP Code: HRMS-8290 Date: 12/07/04 Authors: XL, JF, AV, RD, KV
SOP_8290_r5.1.doc 66
FIGURE 5 (cont.)
DB-5 WINDOW DEFINITION
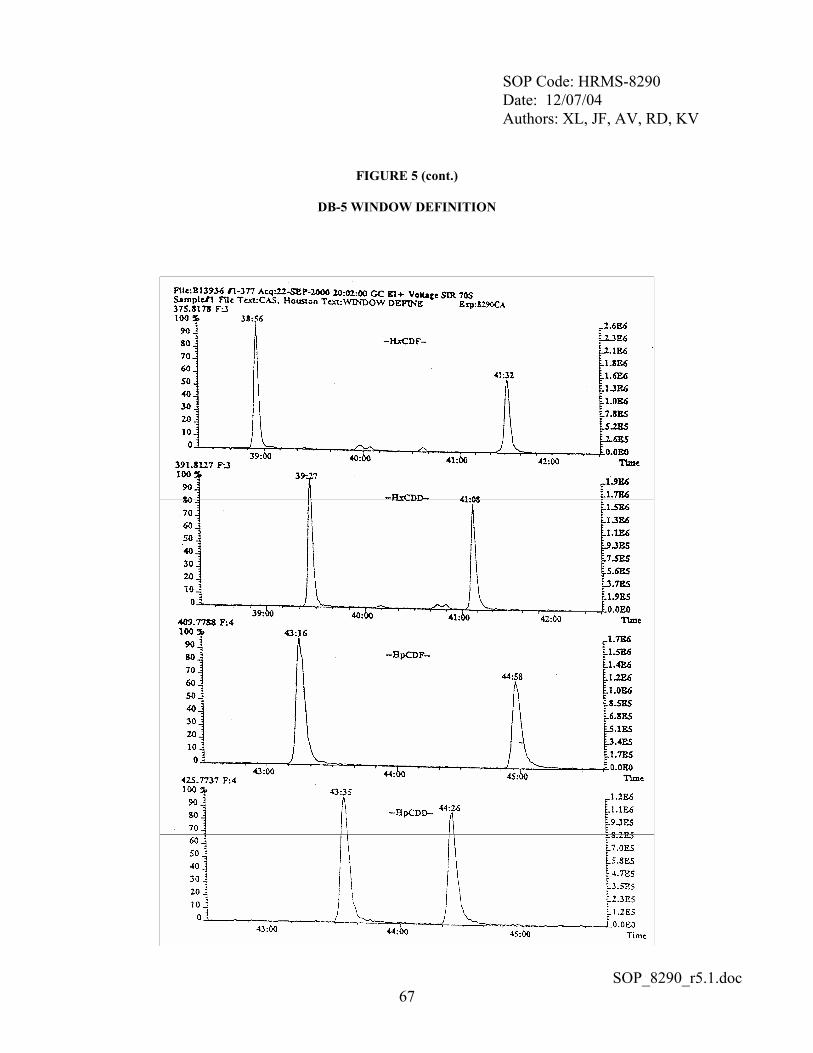
SOP Code: HRMS-8290 Date: 12/07/04 Authors: XL, JF, AV, RD, KV
SOP_8290_r5.1.doc 67
FIGURE 5 (cont.)
DB-5 WINDOW DEFINITION
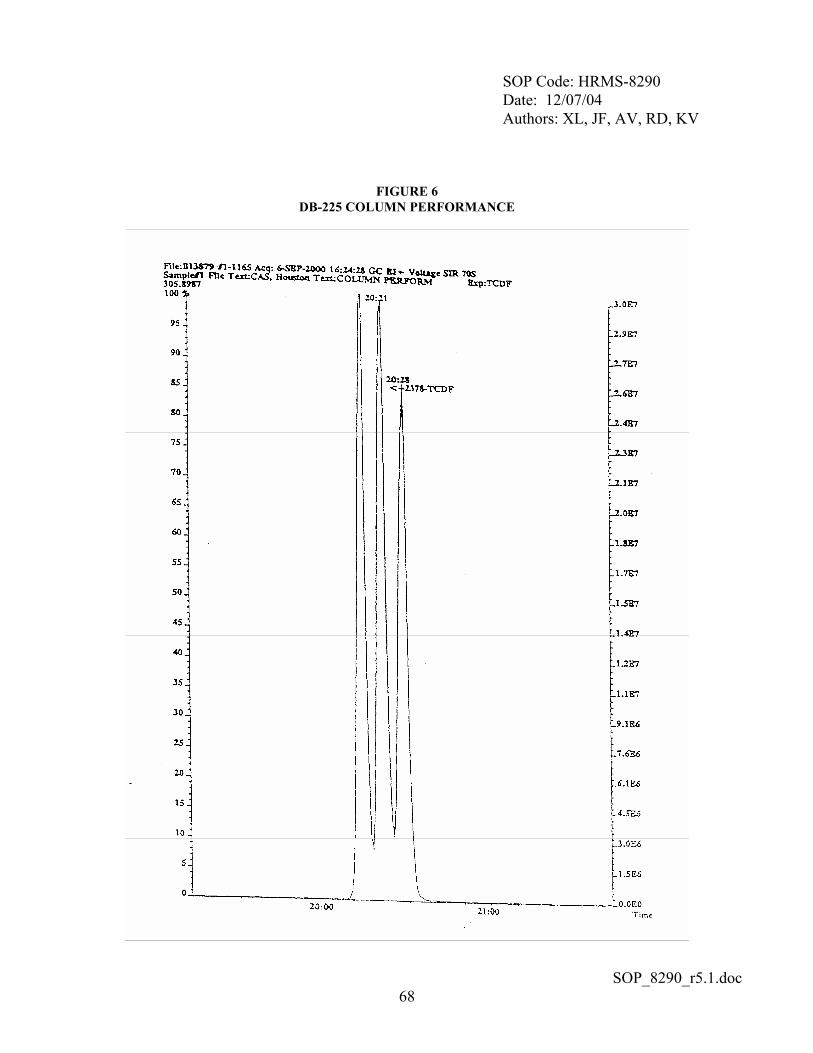
SOP Code: HRMS-8290 Date: 12/07/04 Authors: XL, JF, AV, RD, KV
SOP_8290_r5.1.doc 68
FIGURE 6
DB-225 COLUMN PERFORMANCE
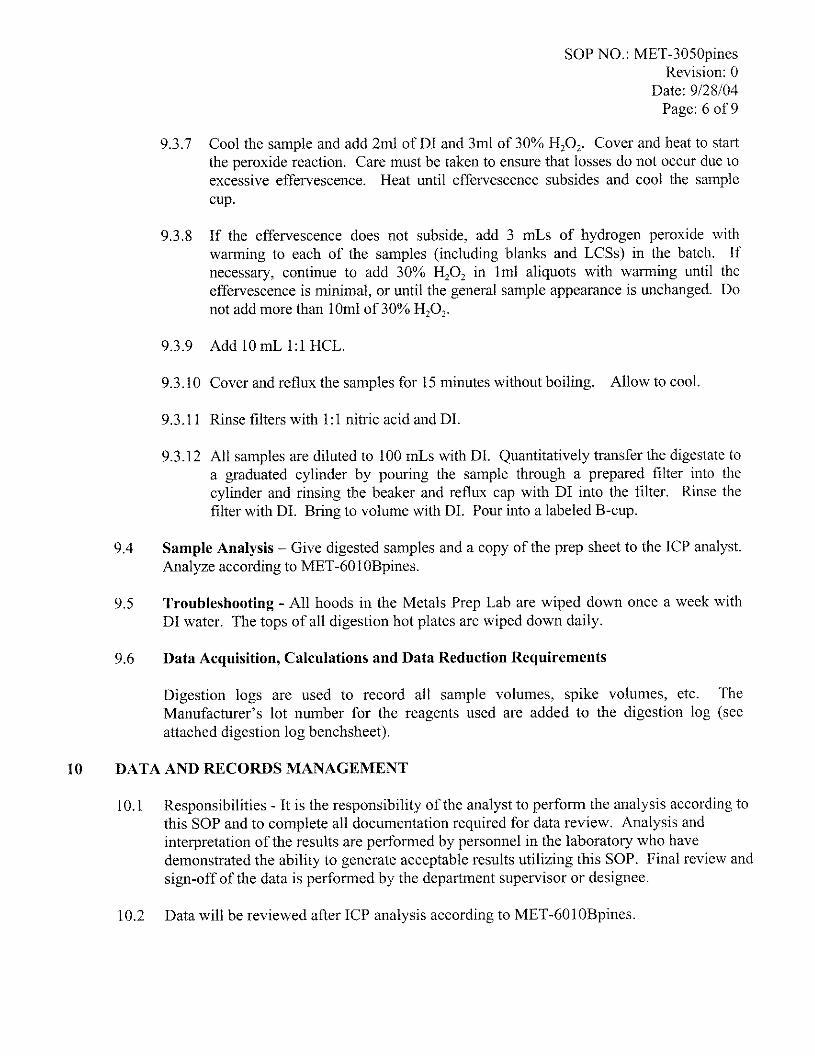
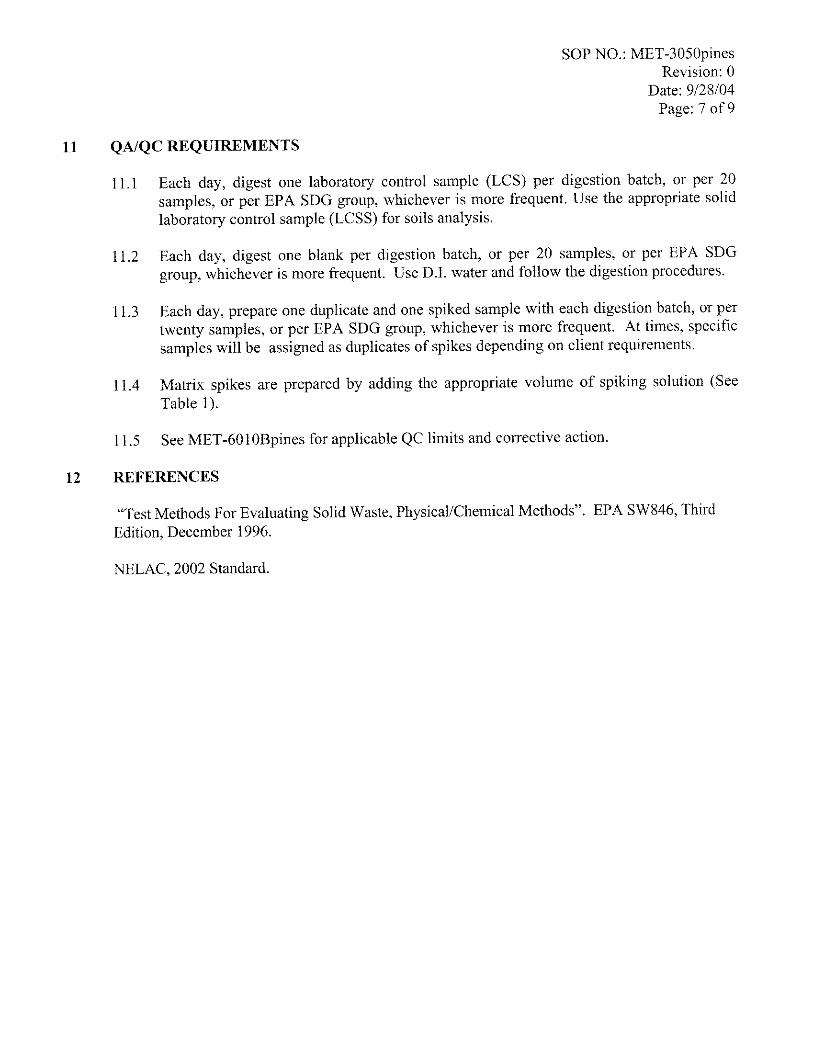
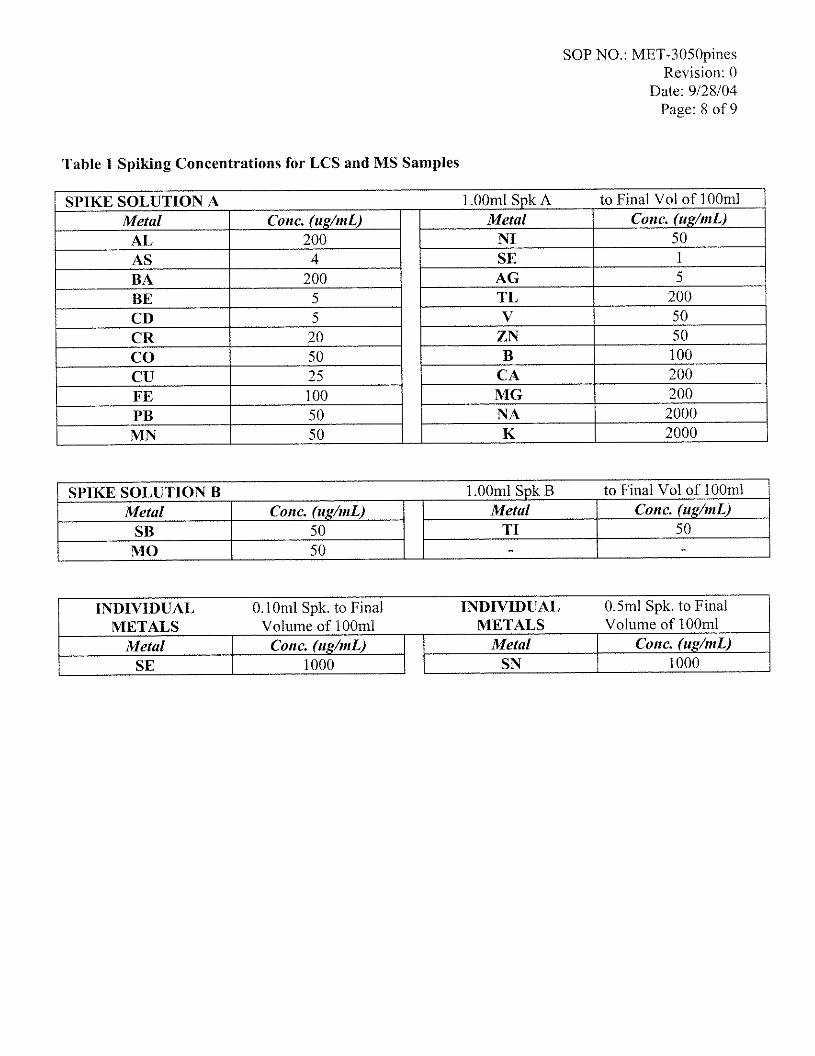
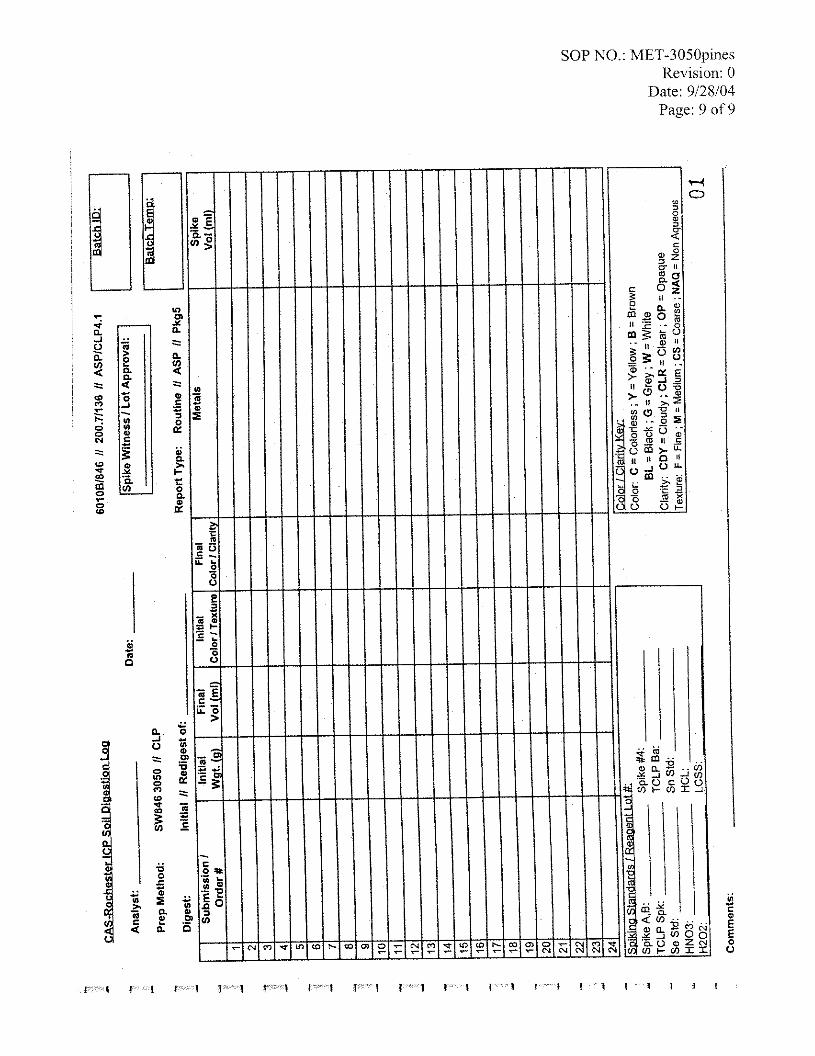
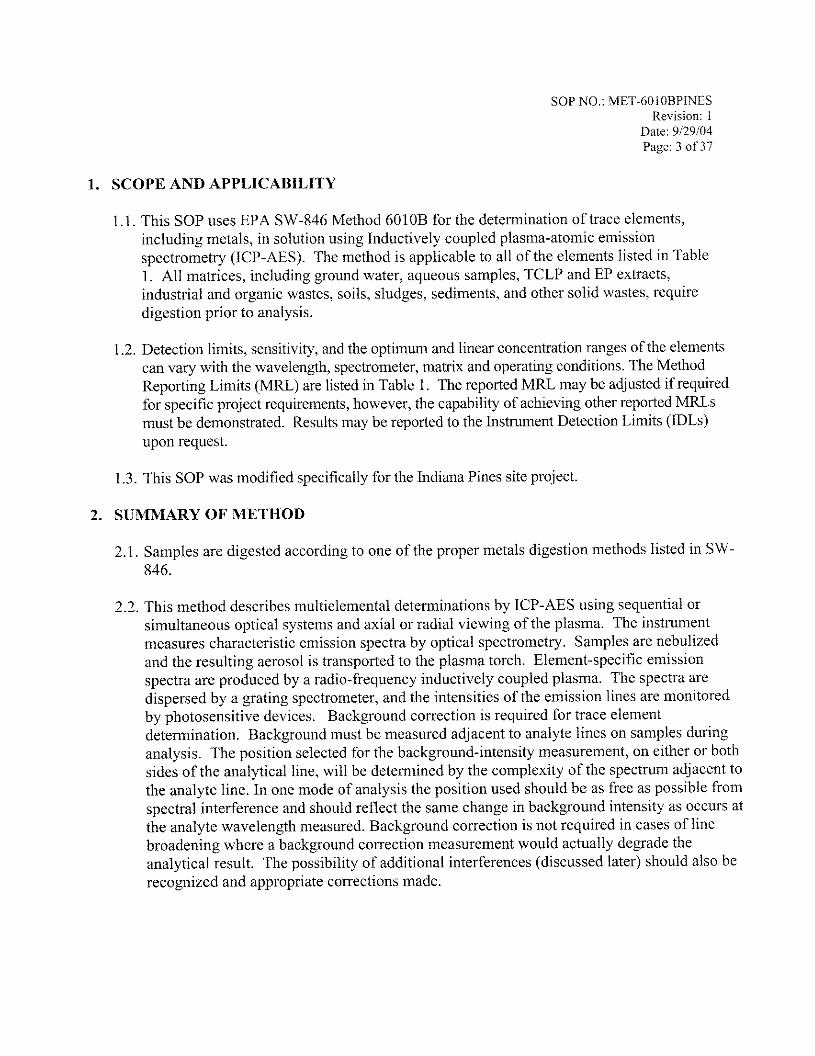
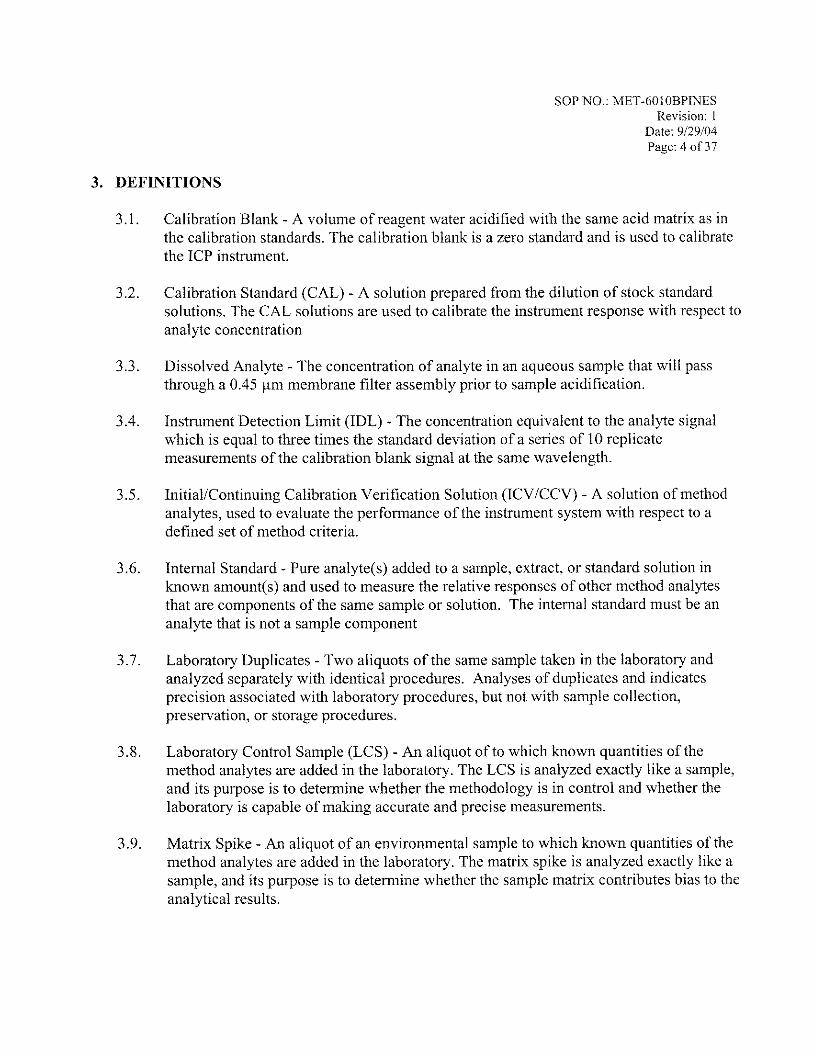
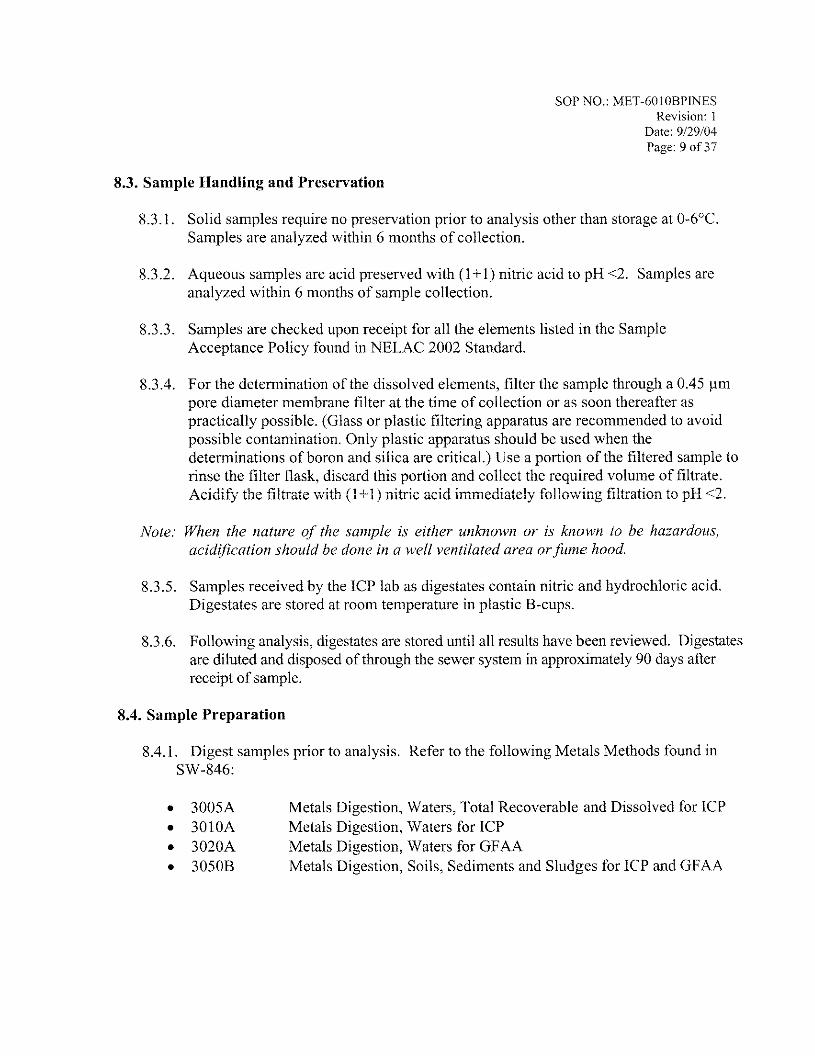
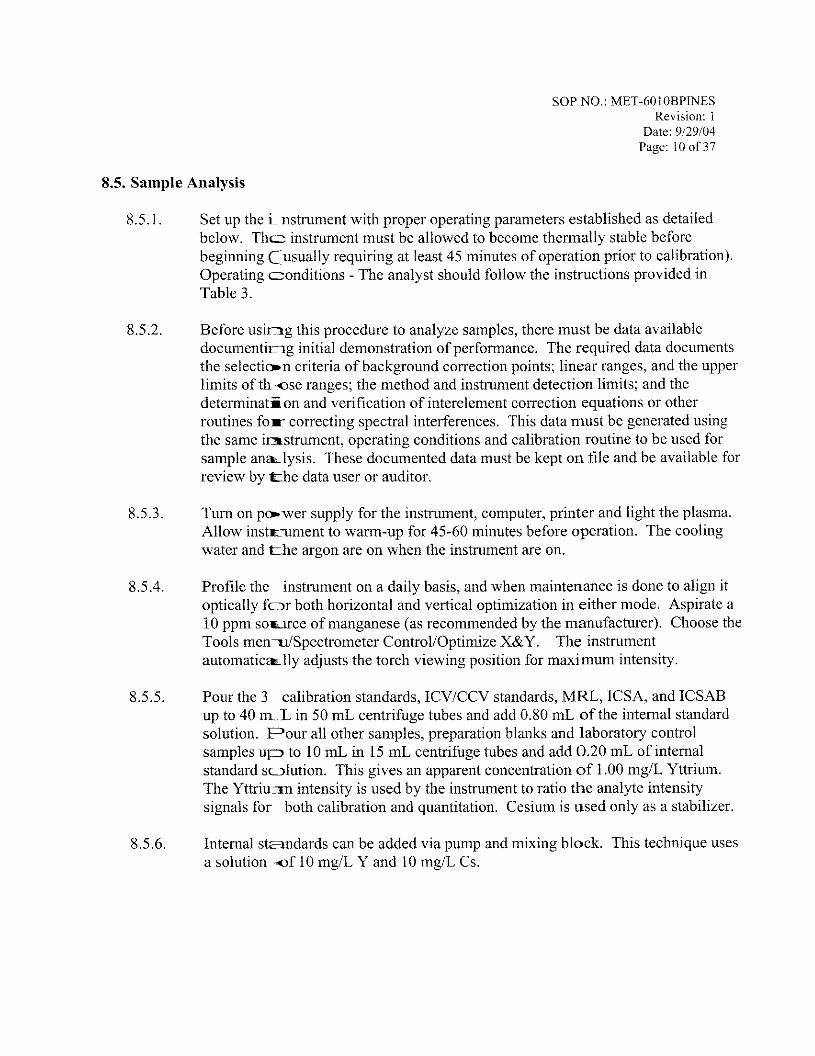
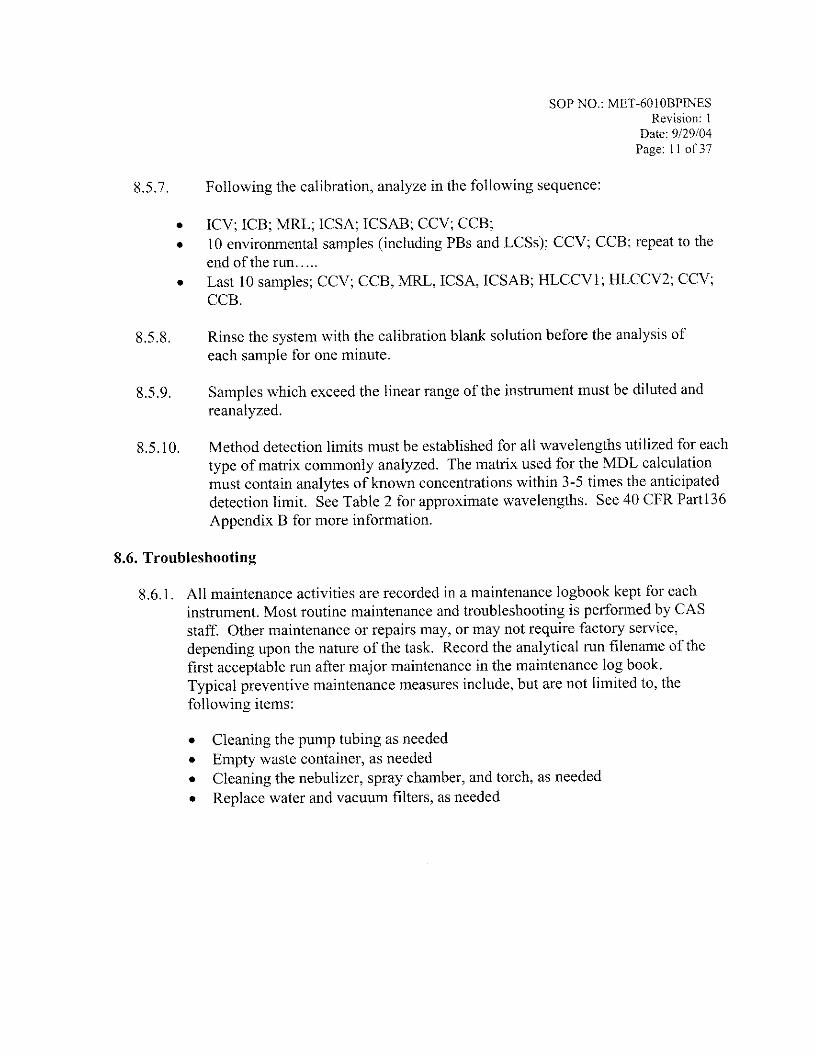
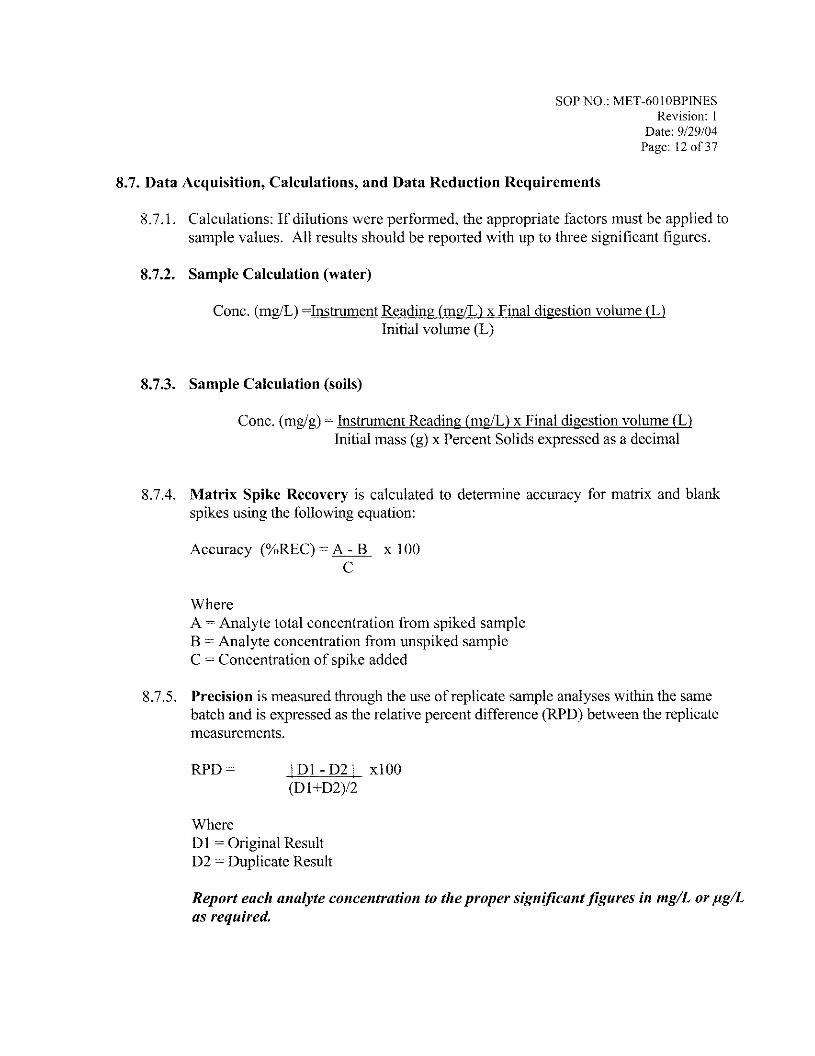
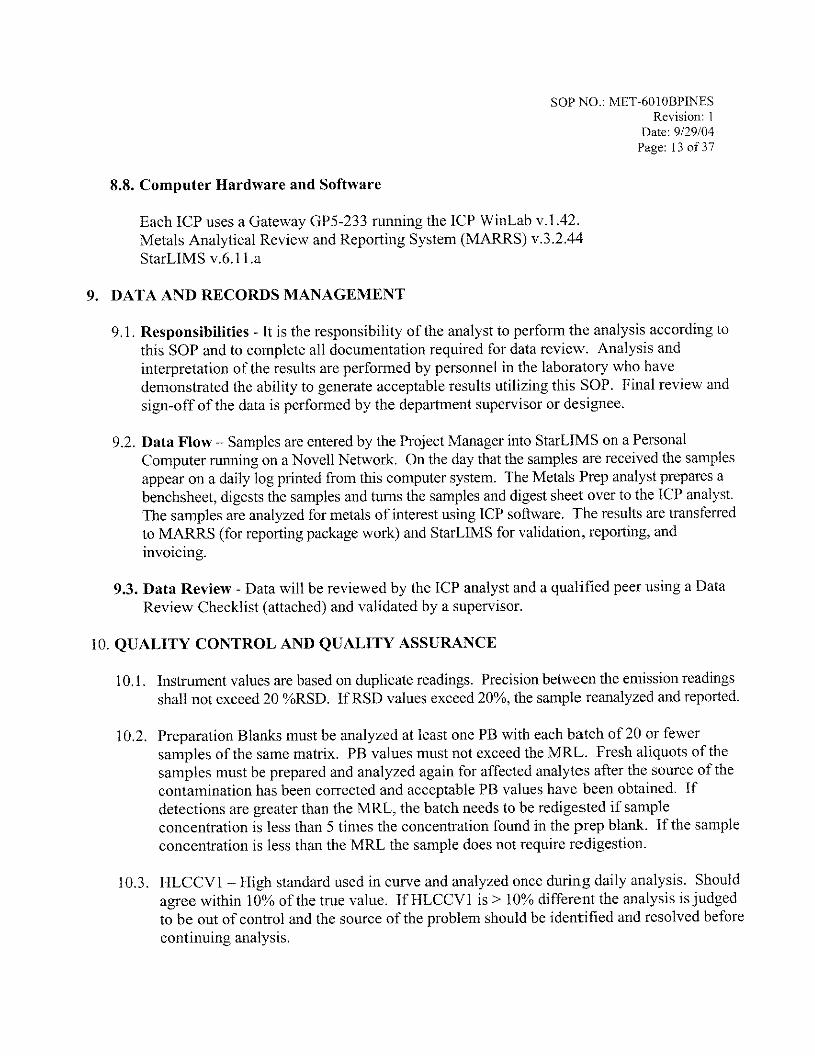
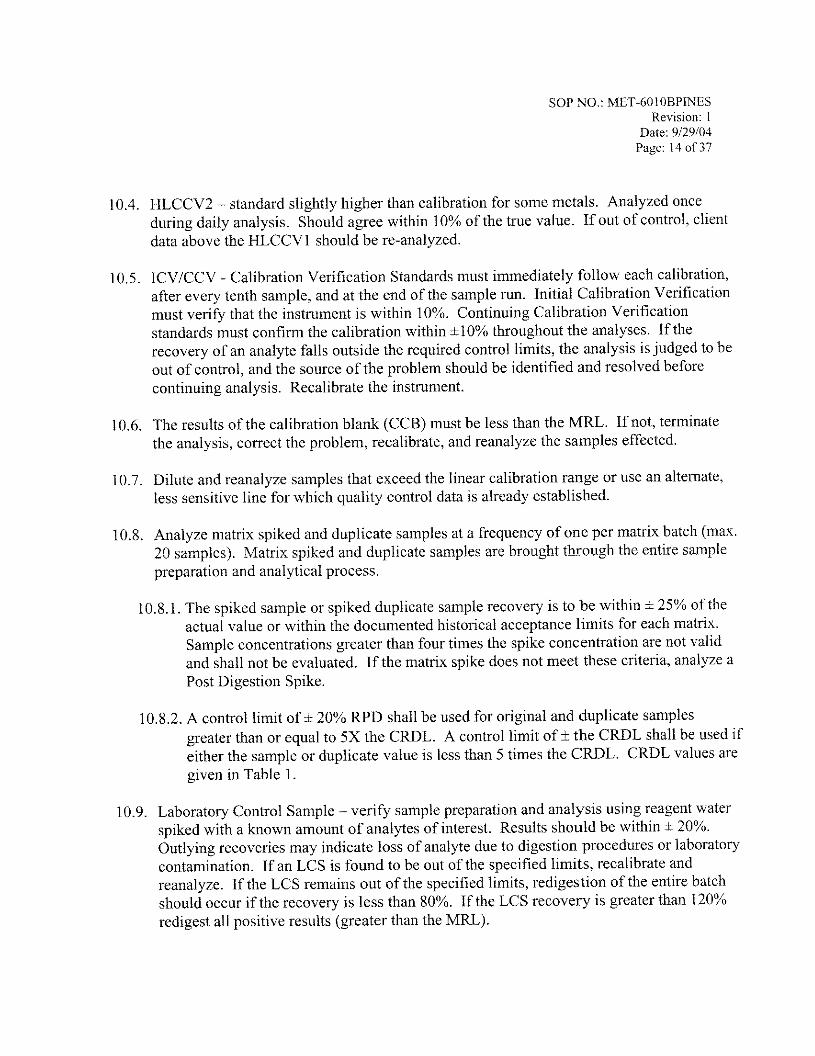
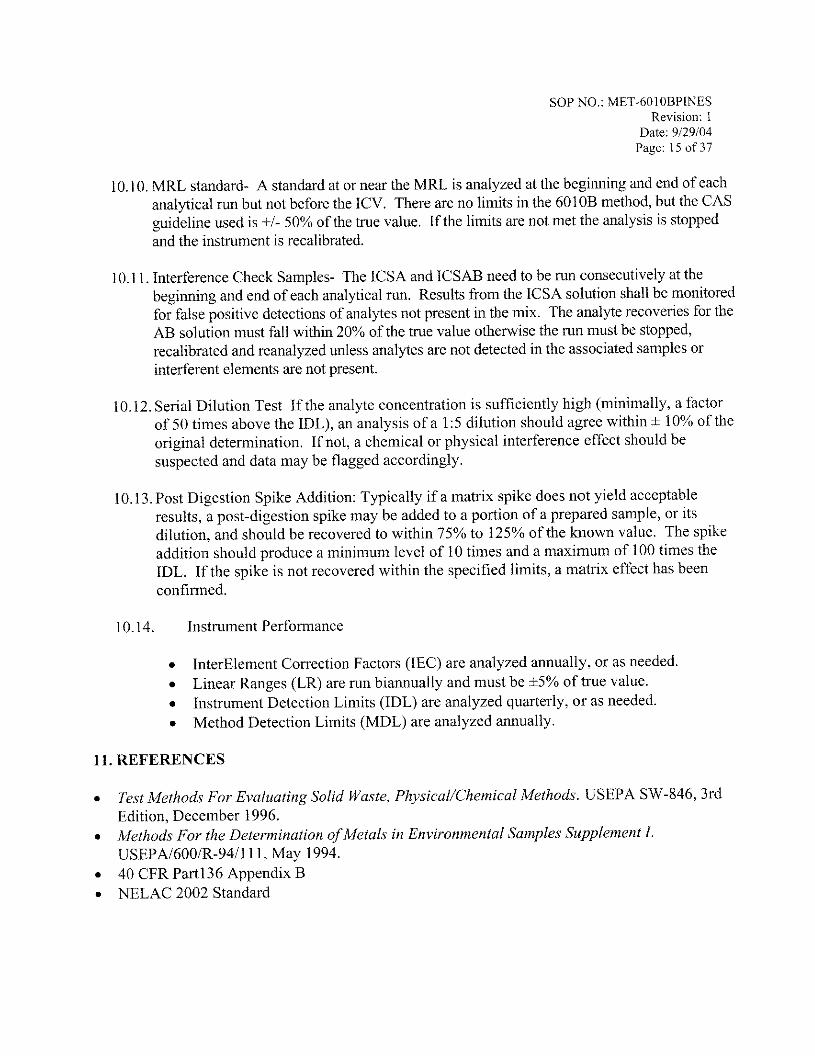
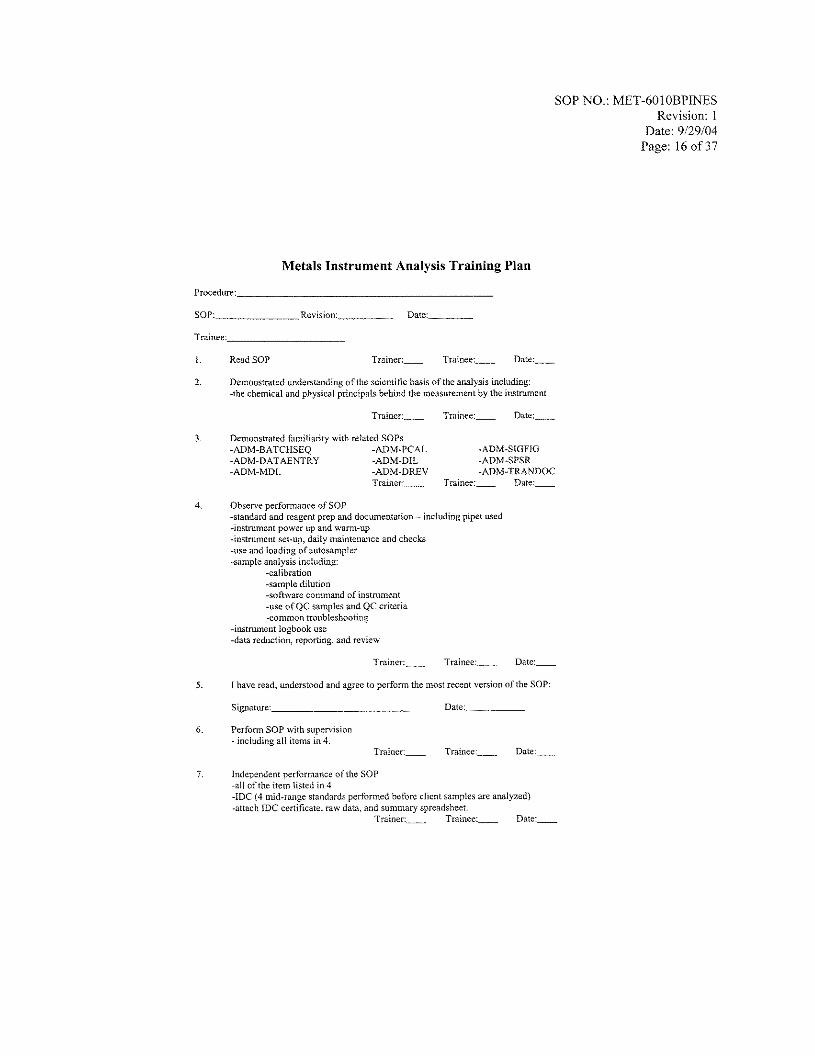
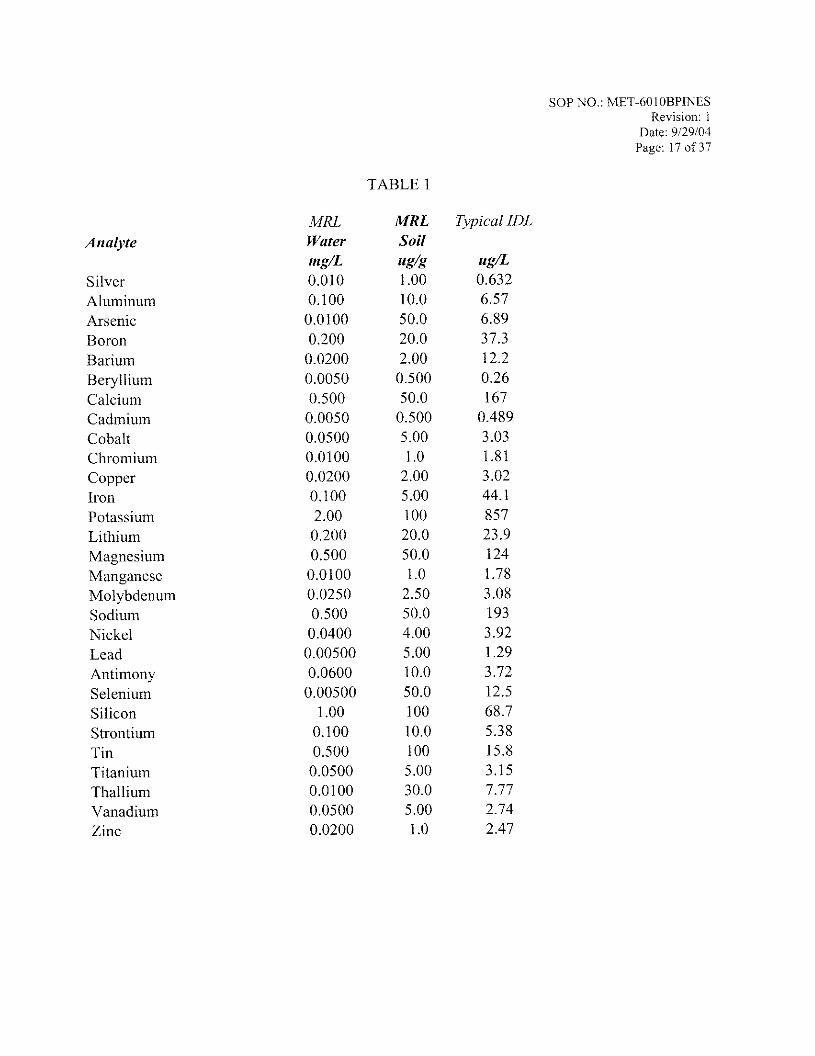
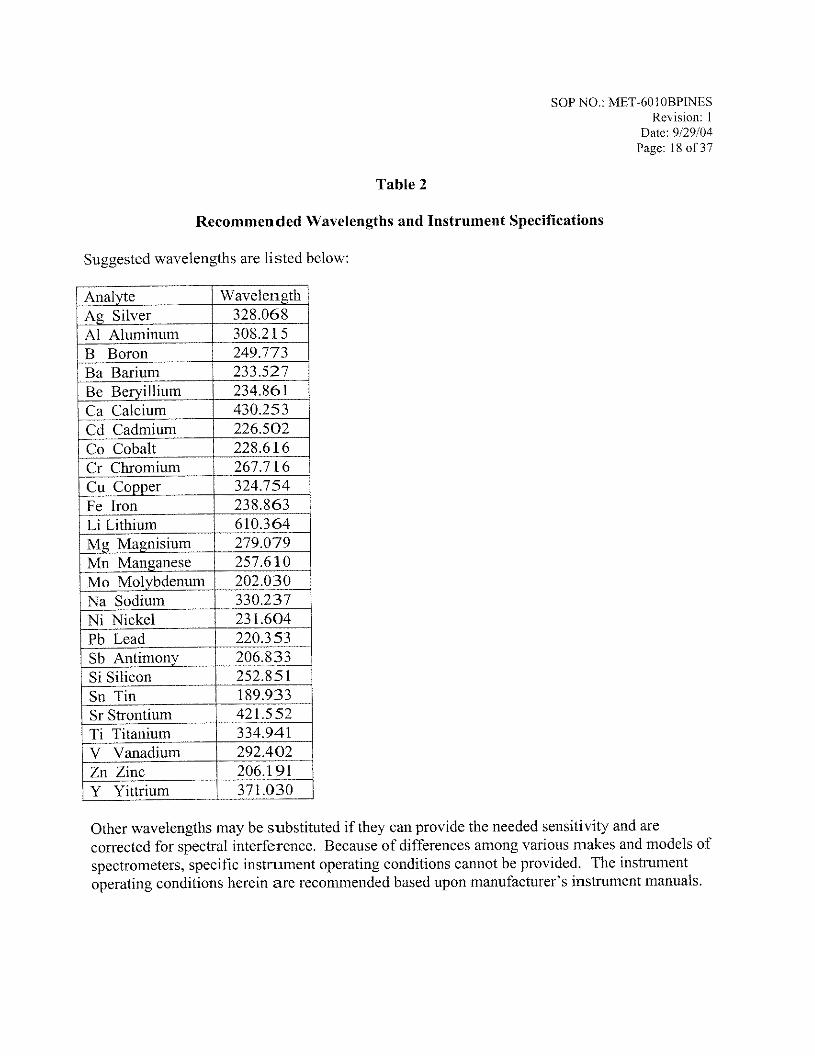
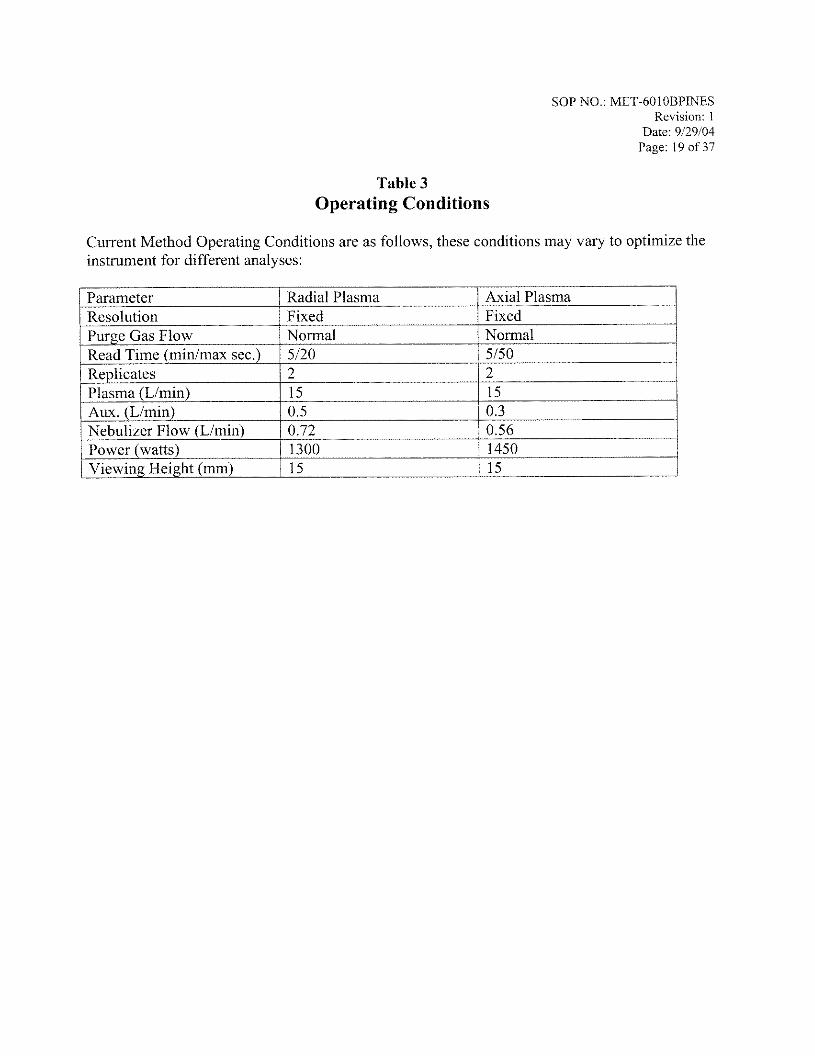
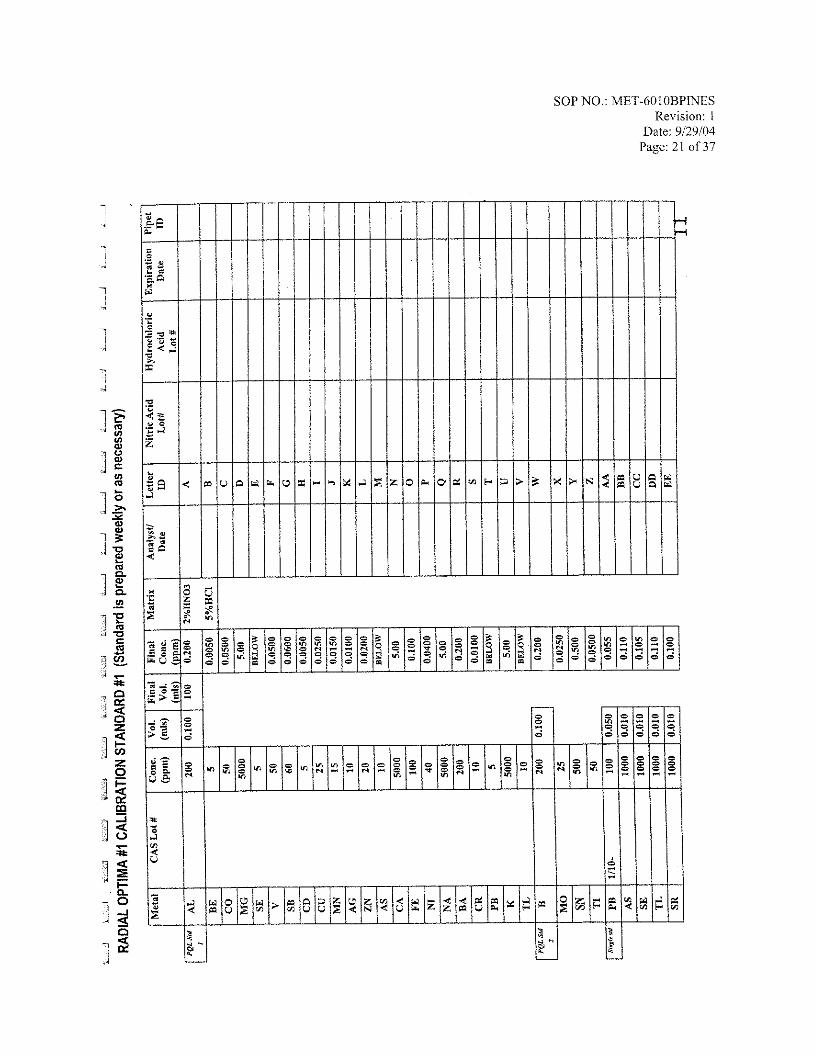
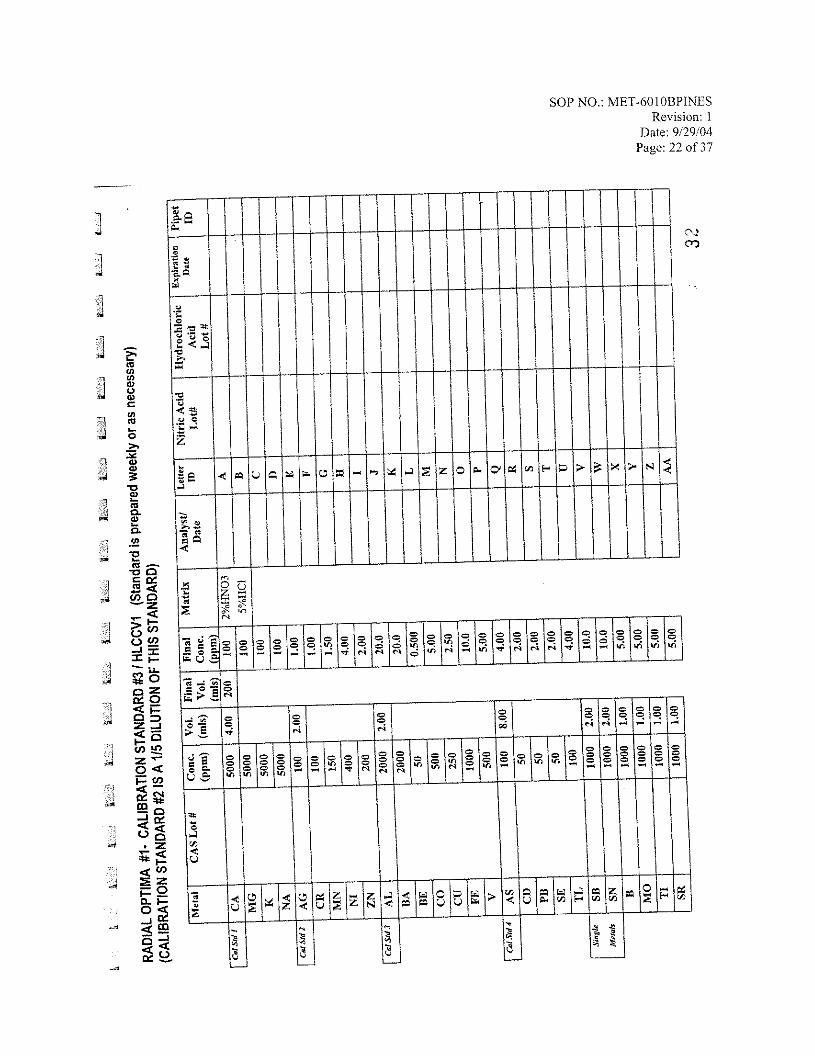
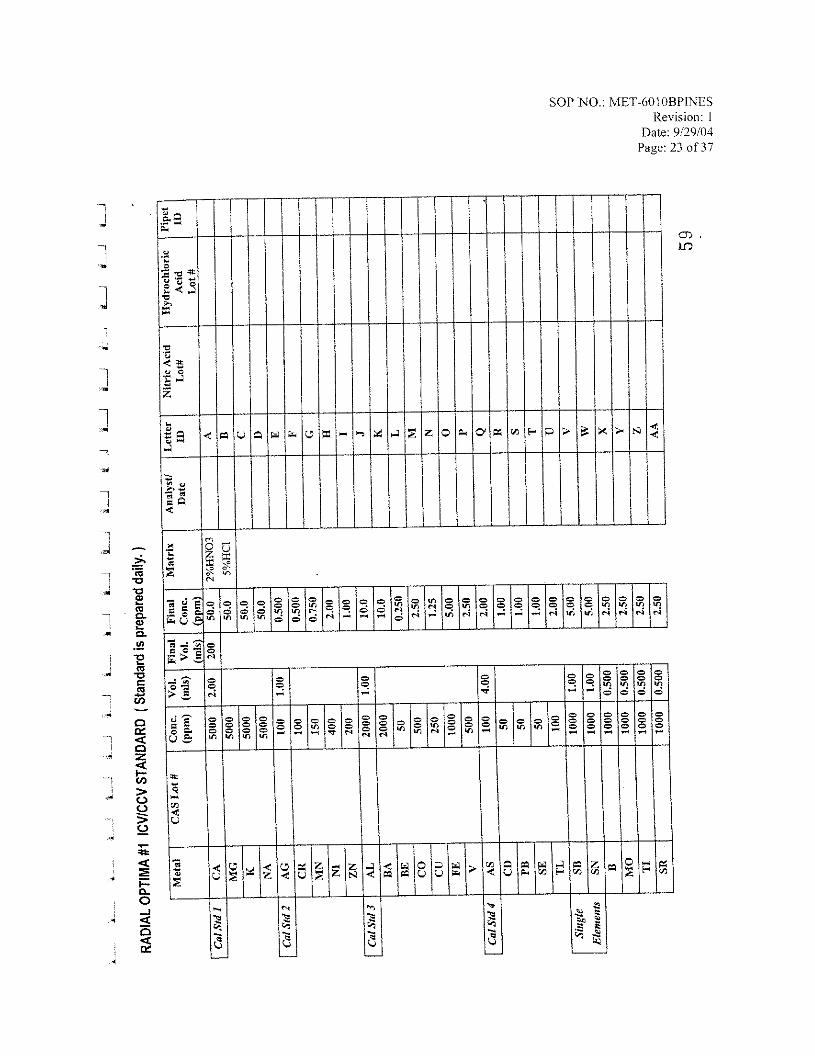
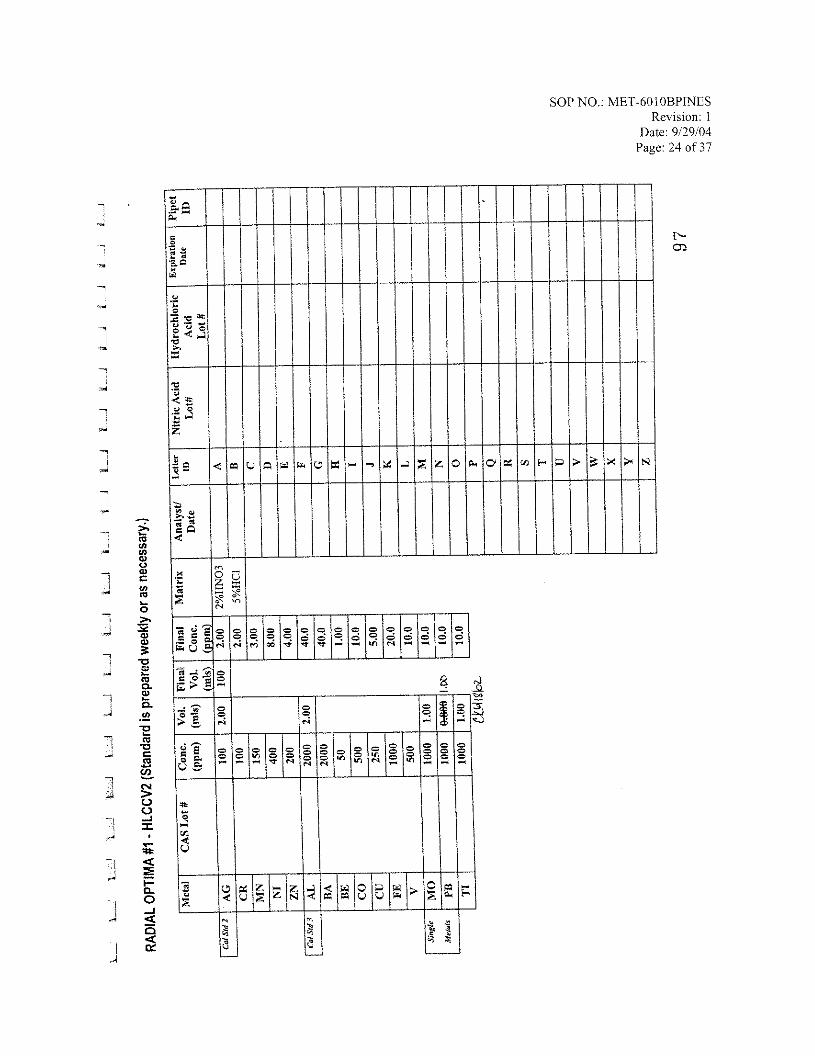
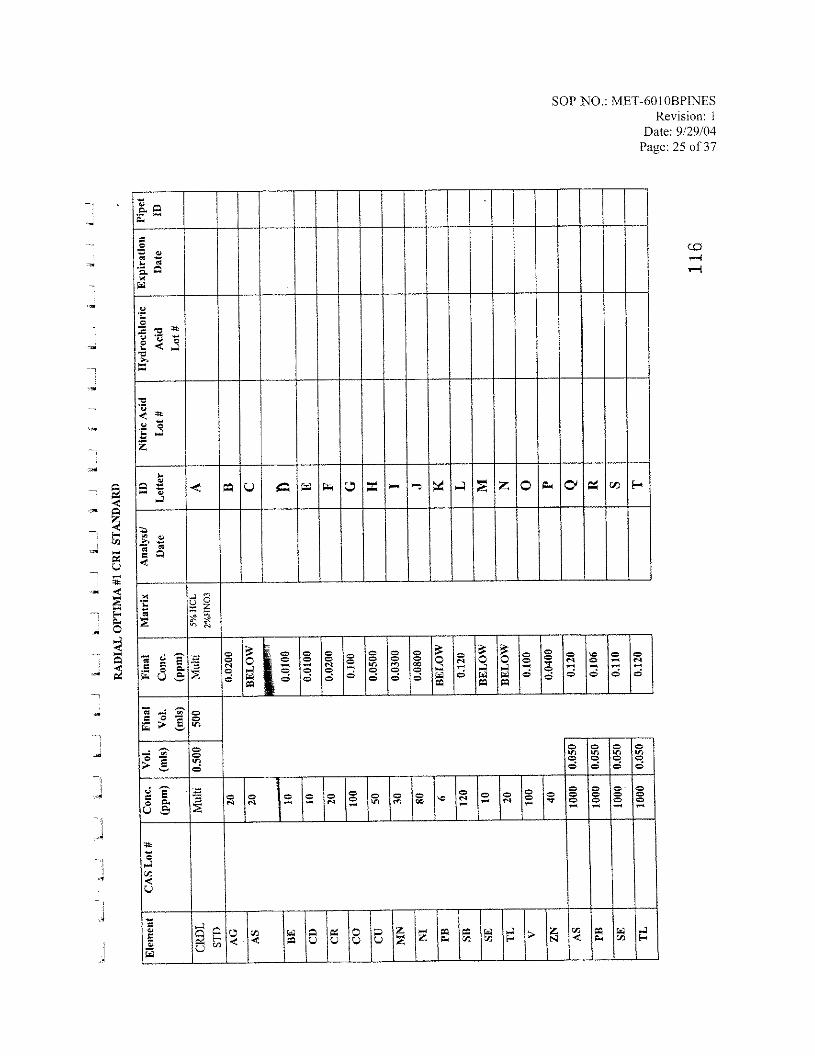
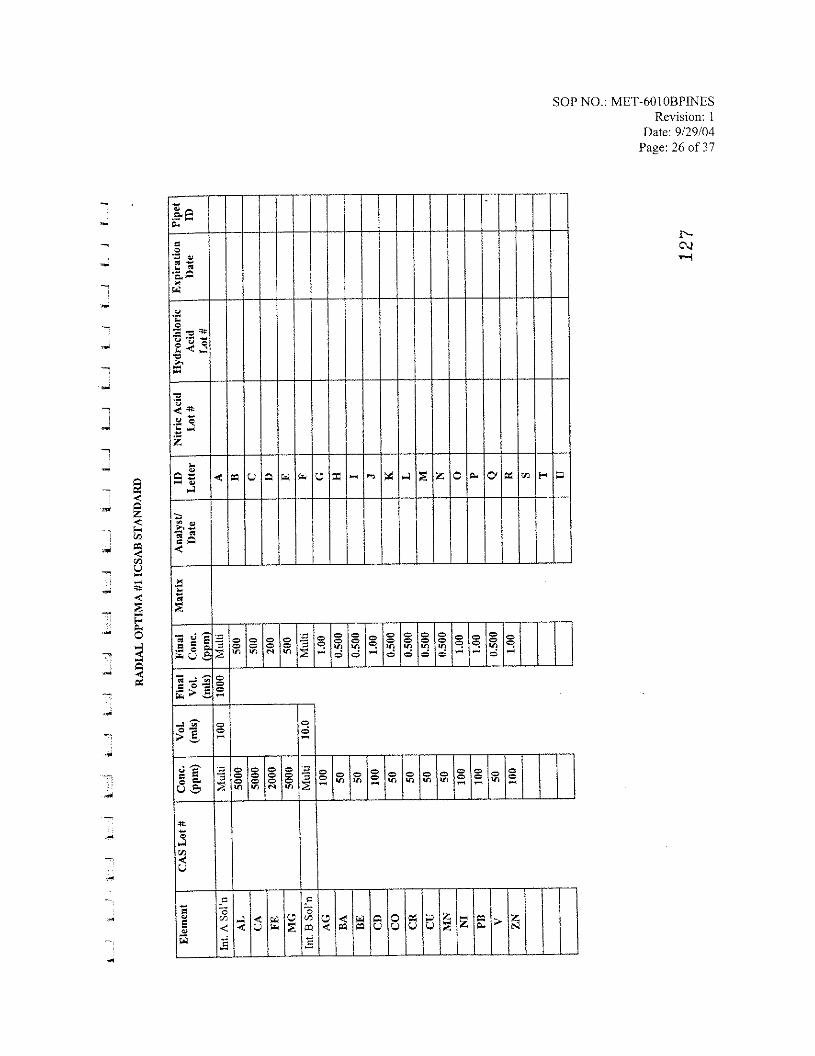
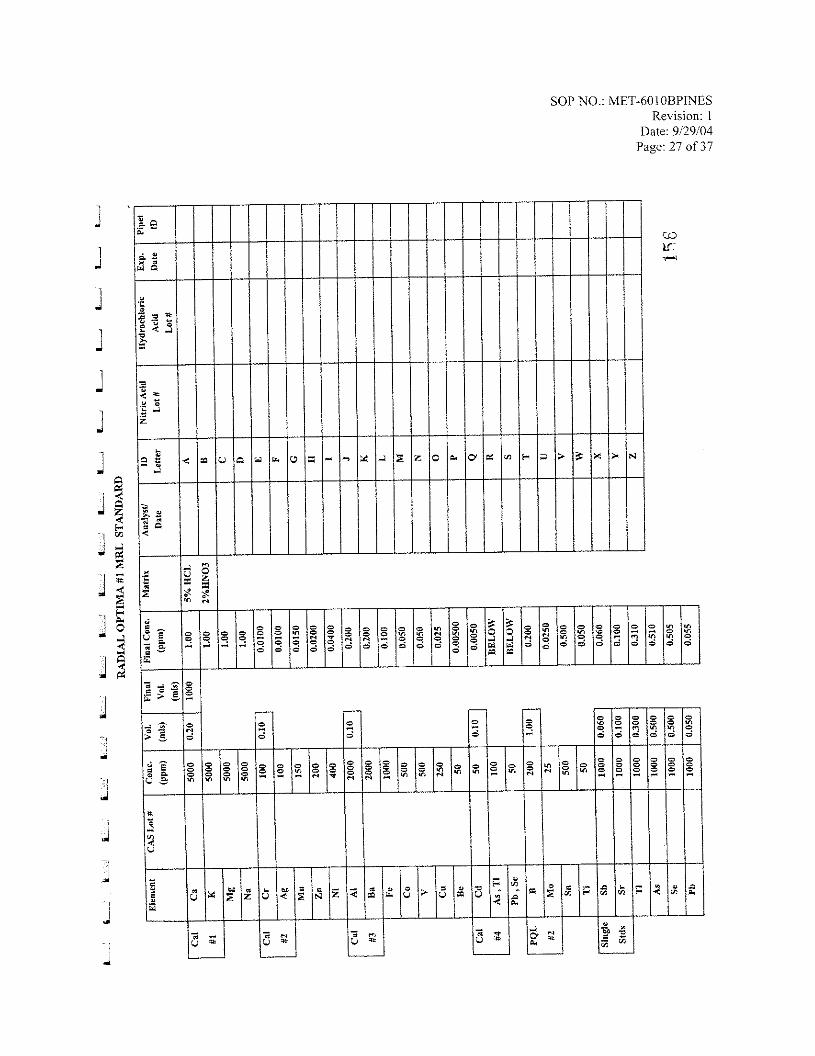
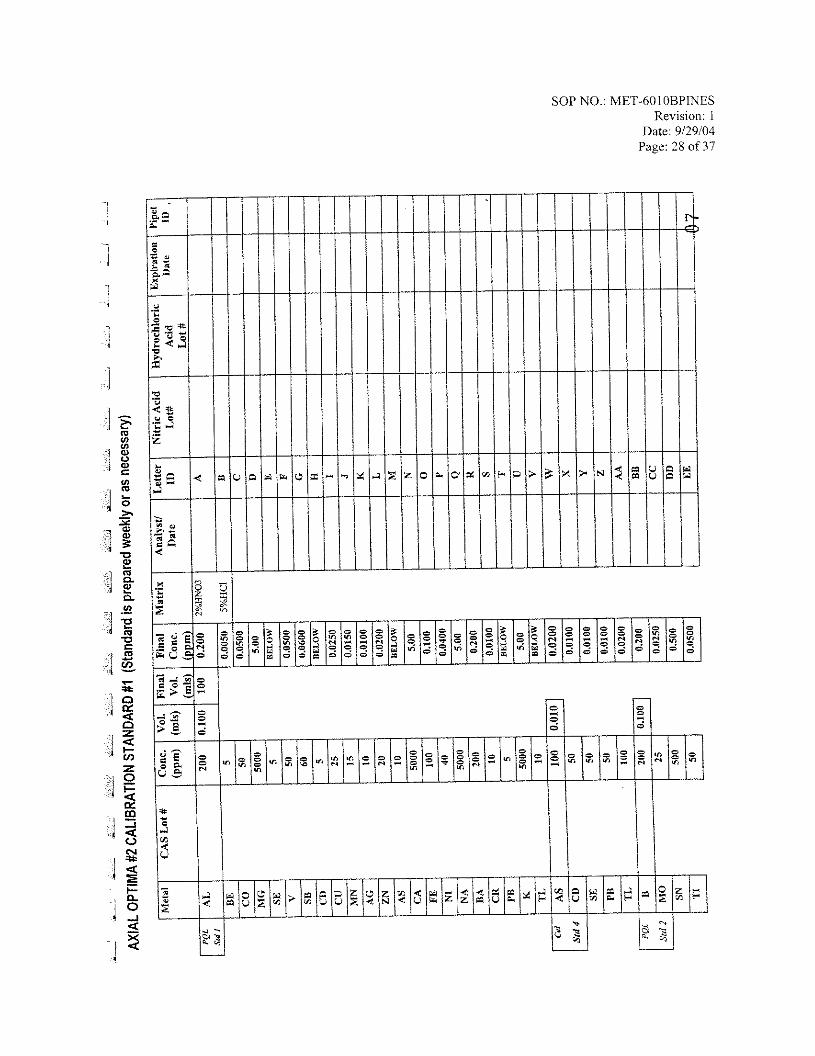
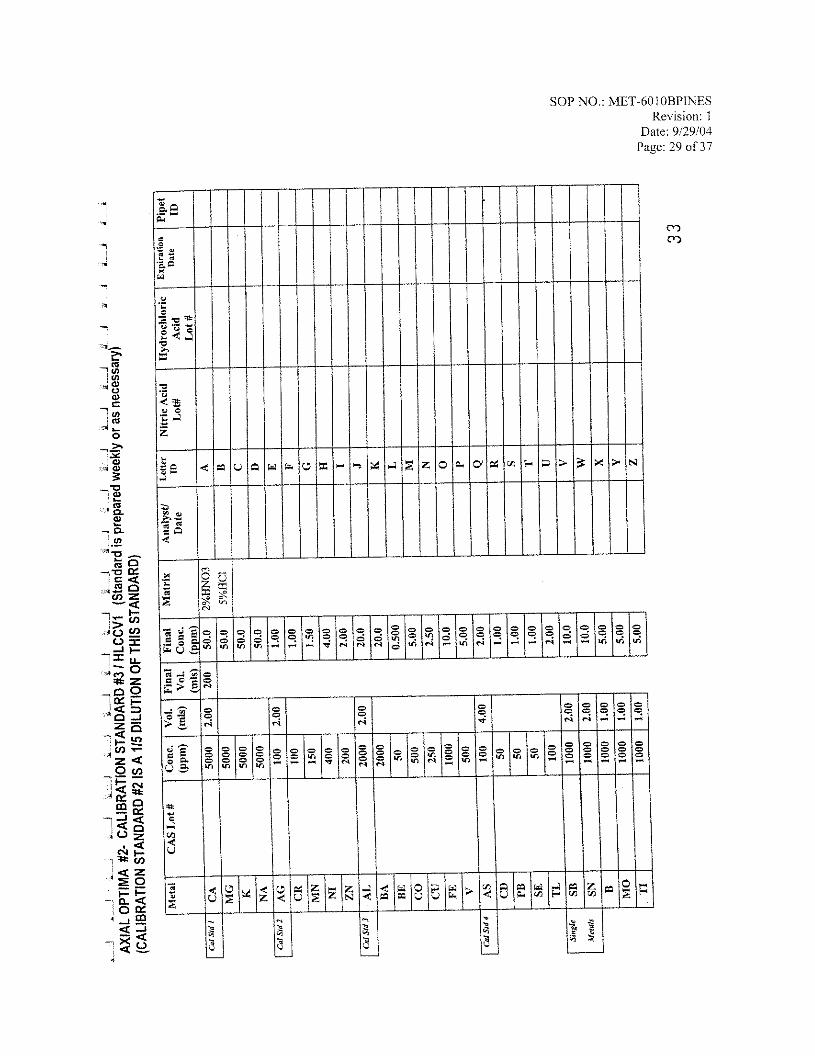
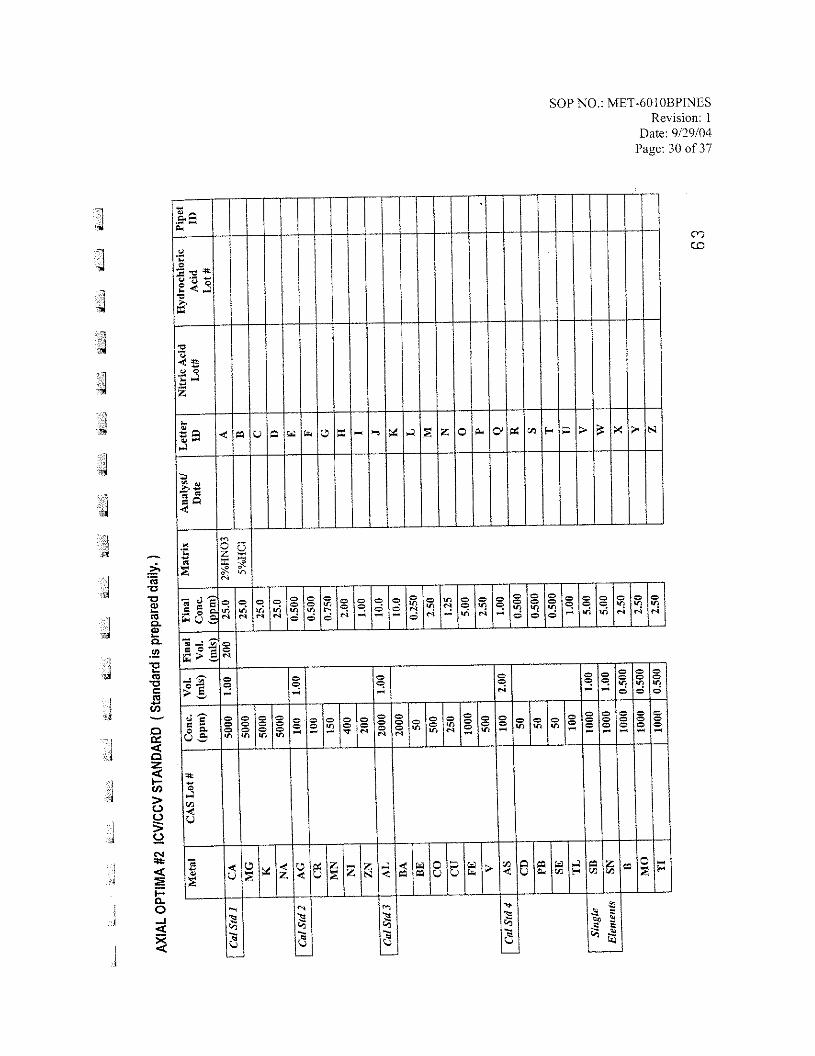
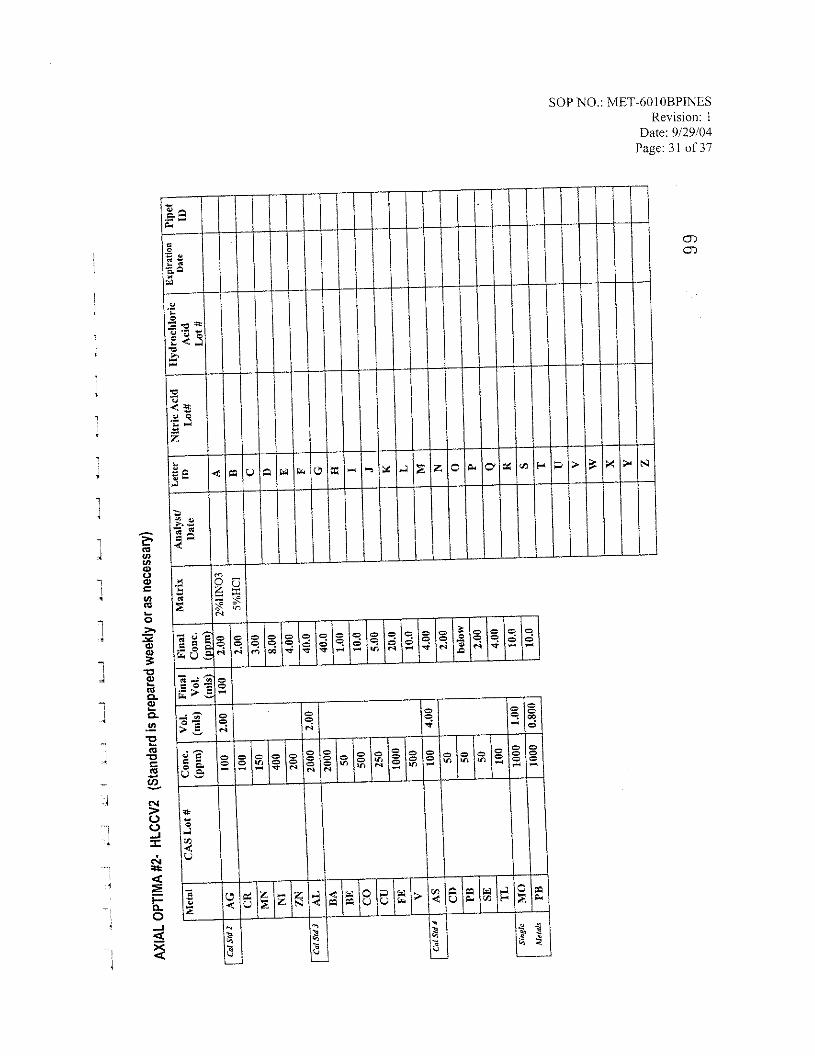
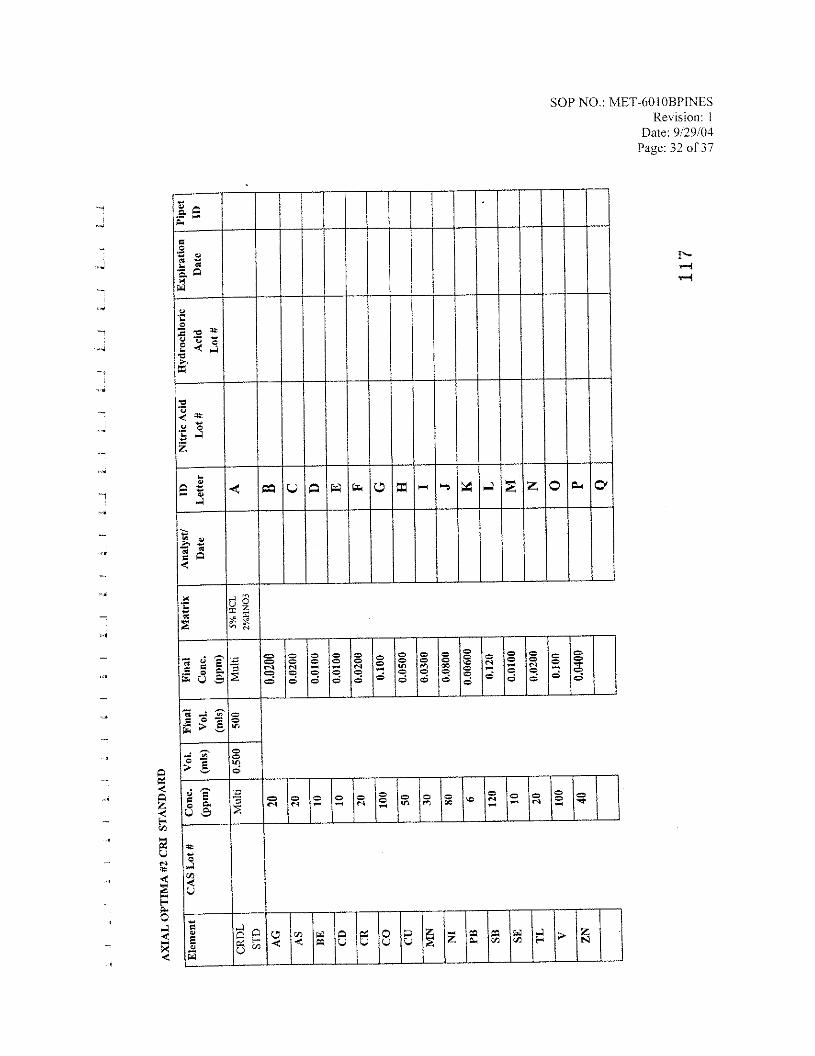
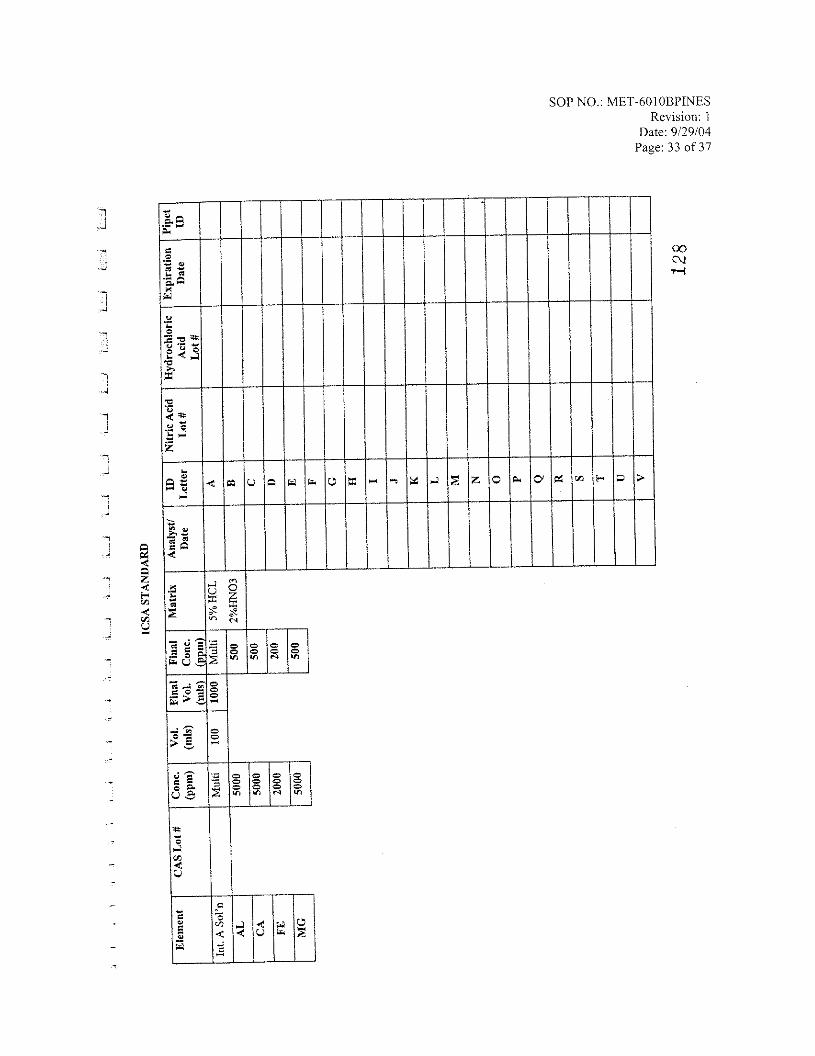
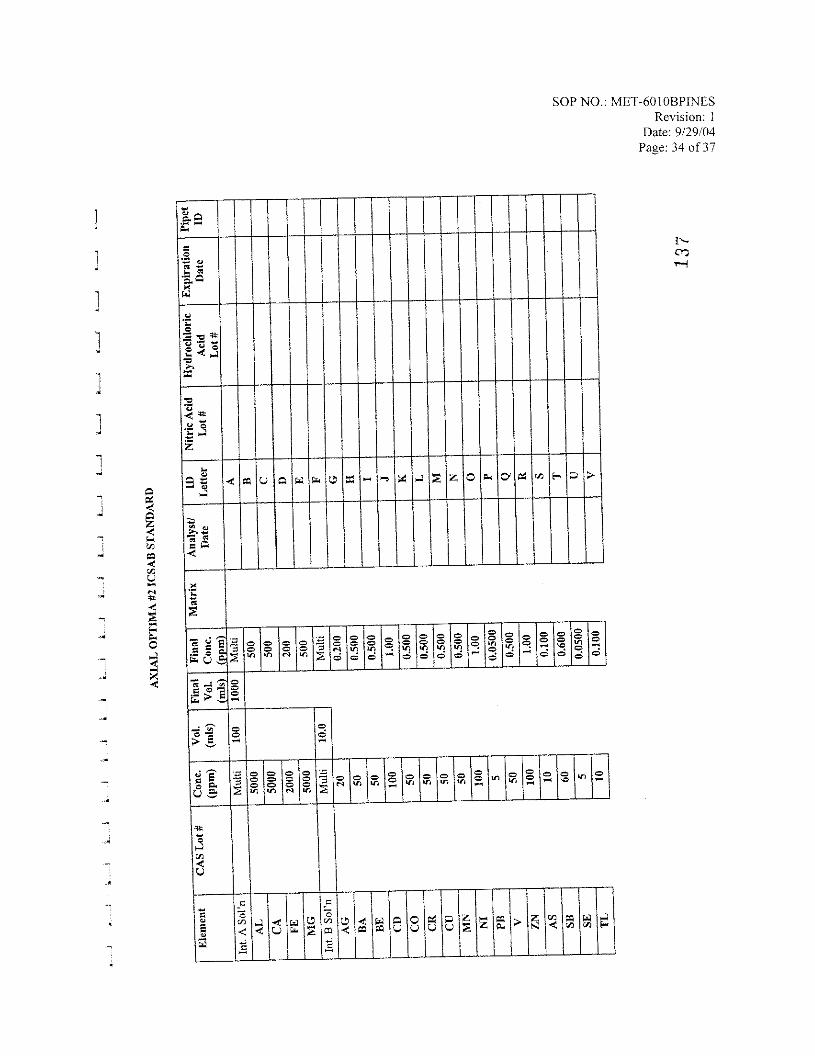
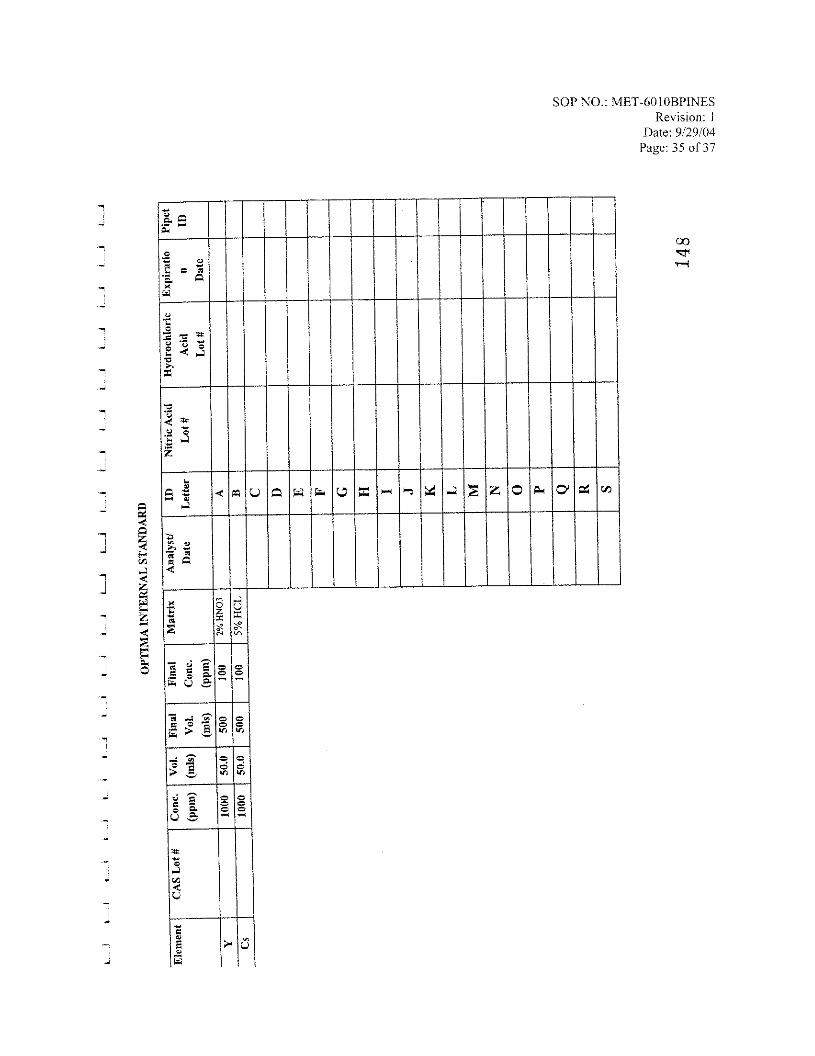
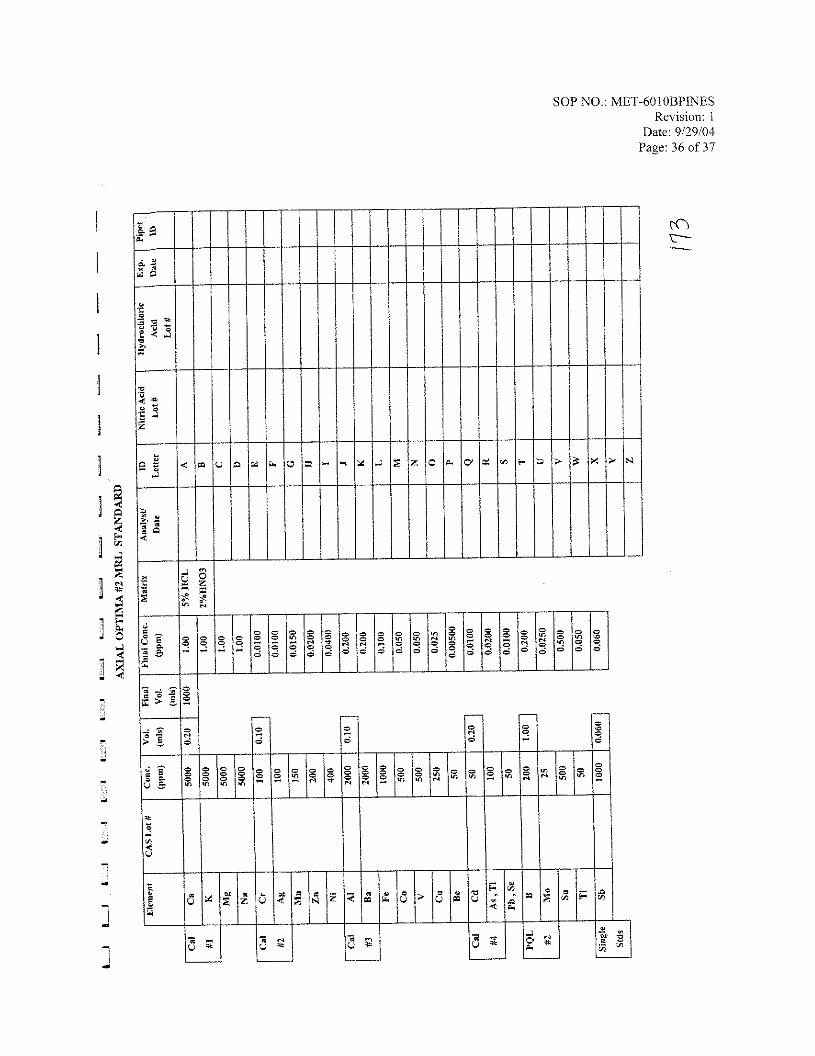
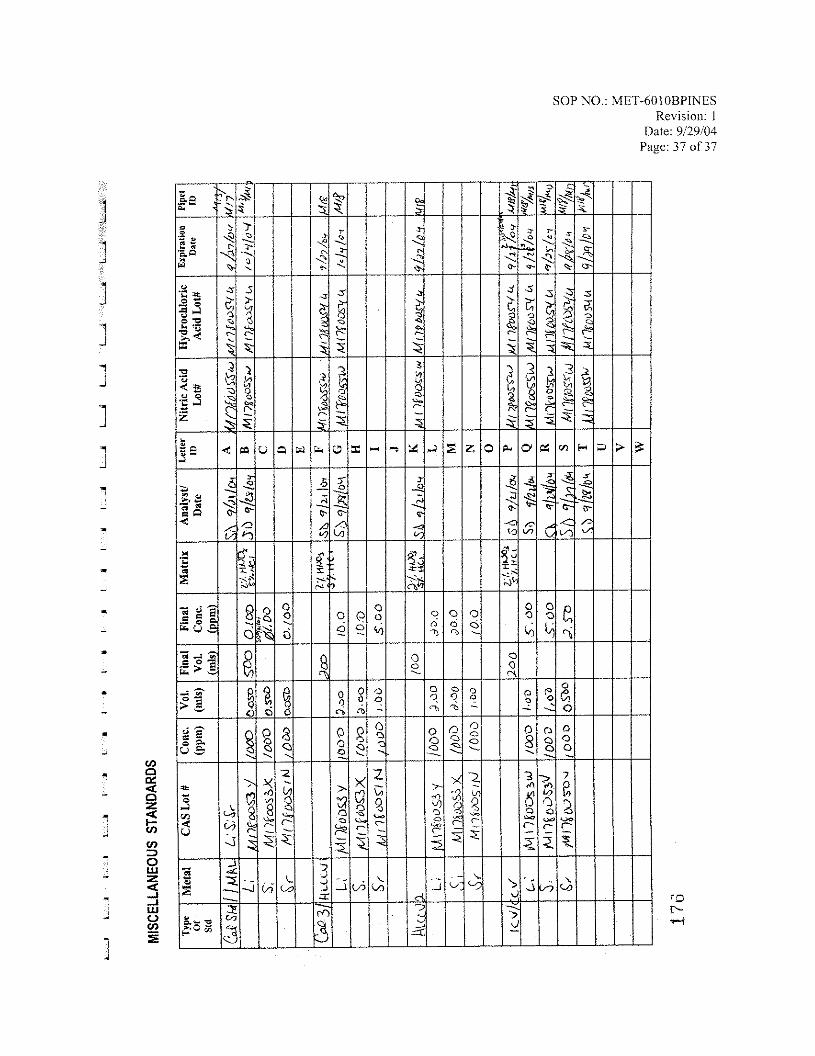
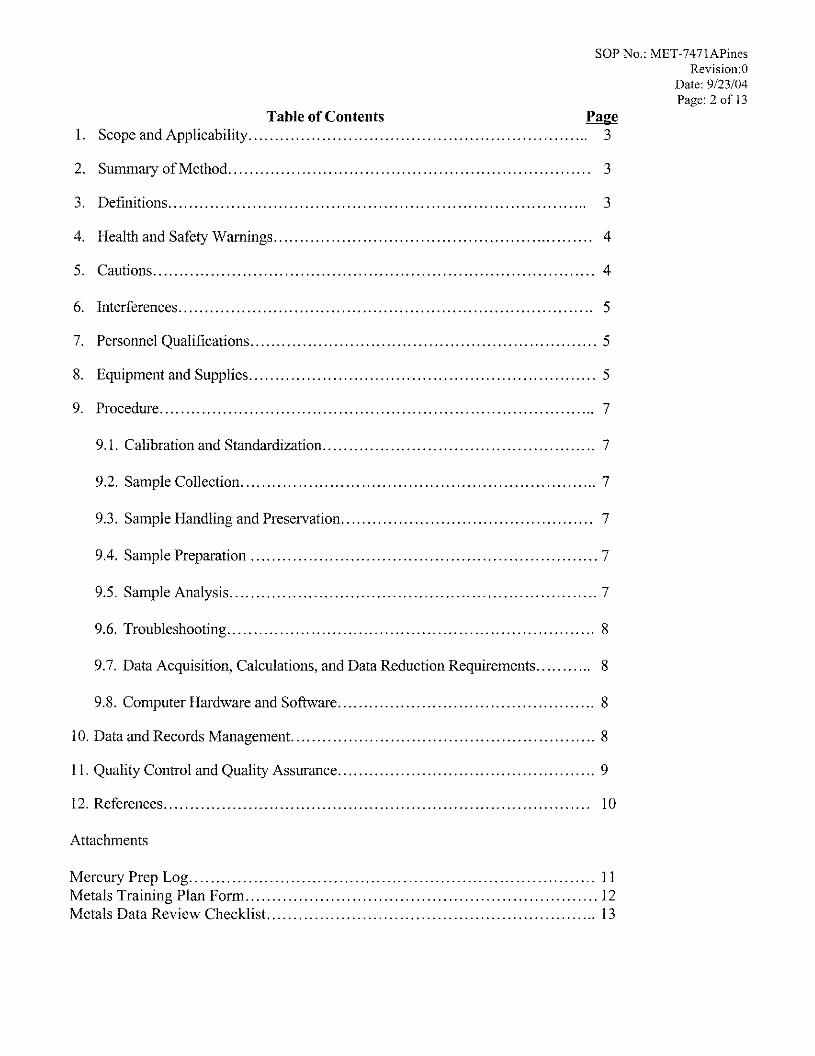
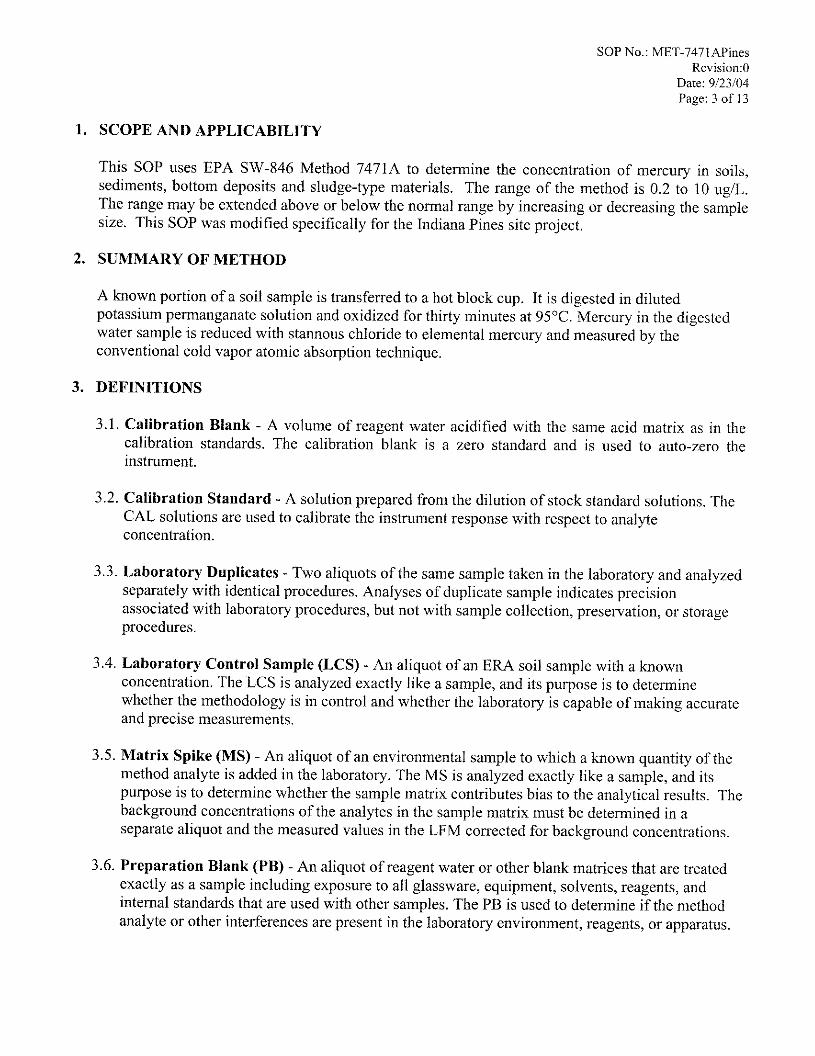
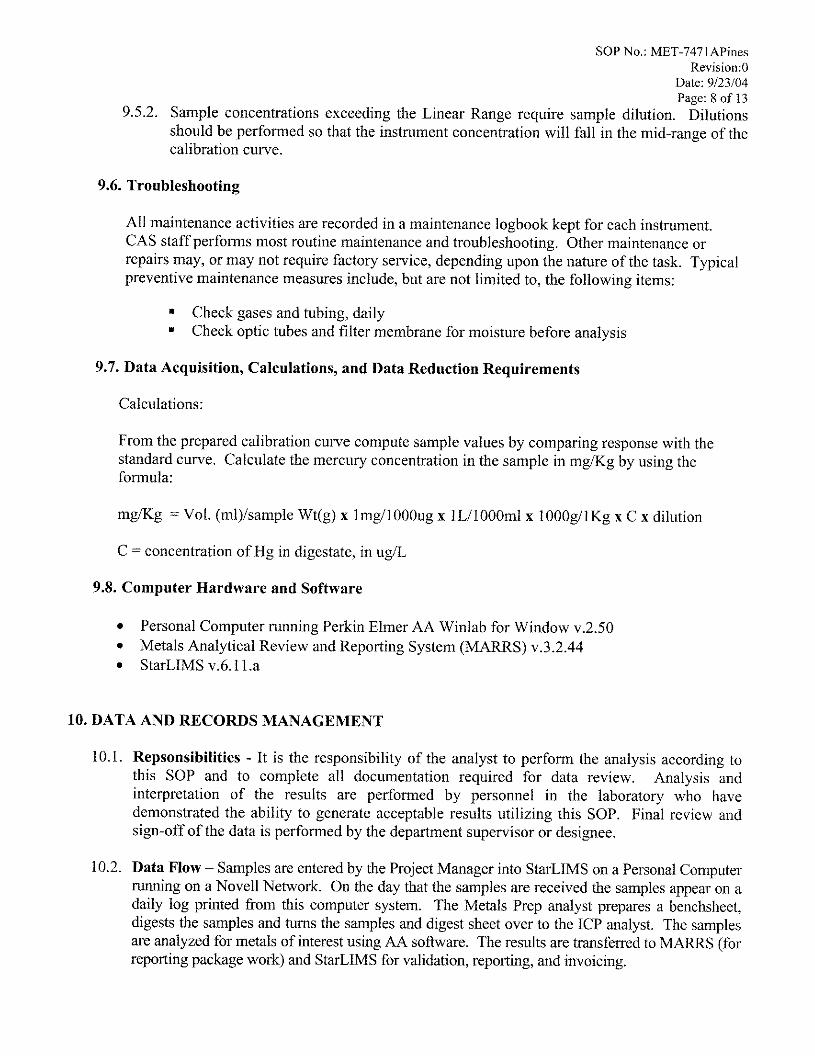
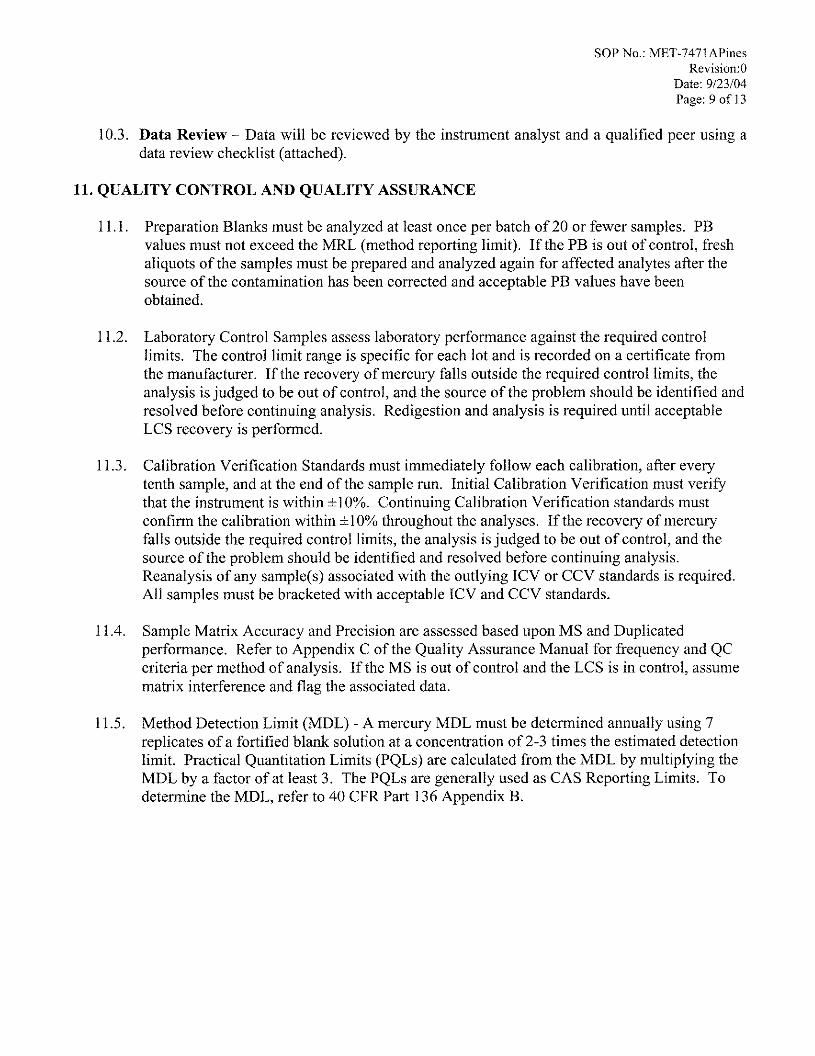
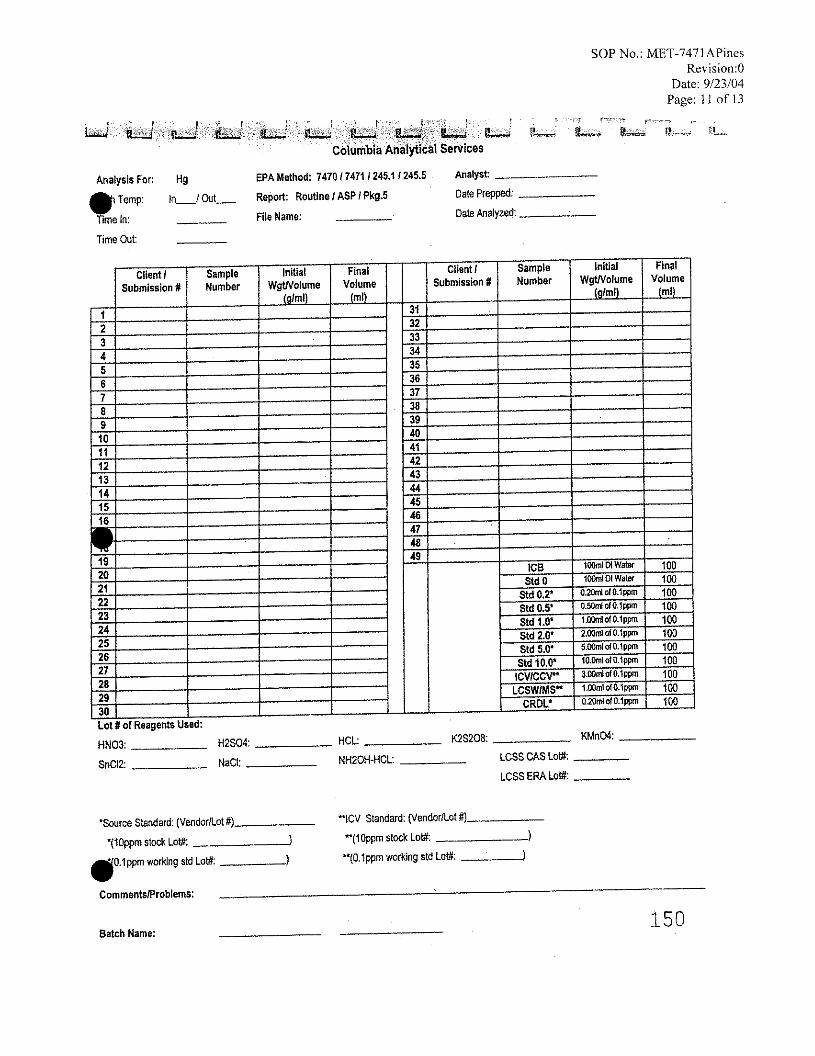
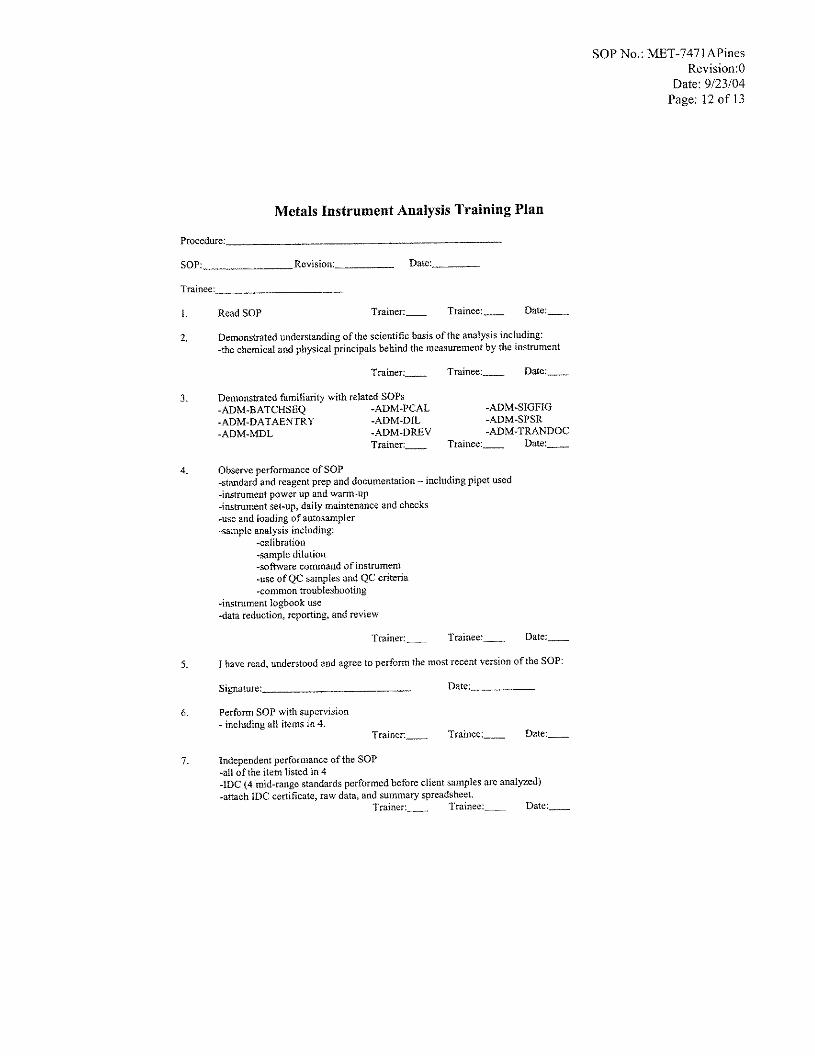
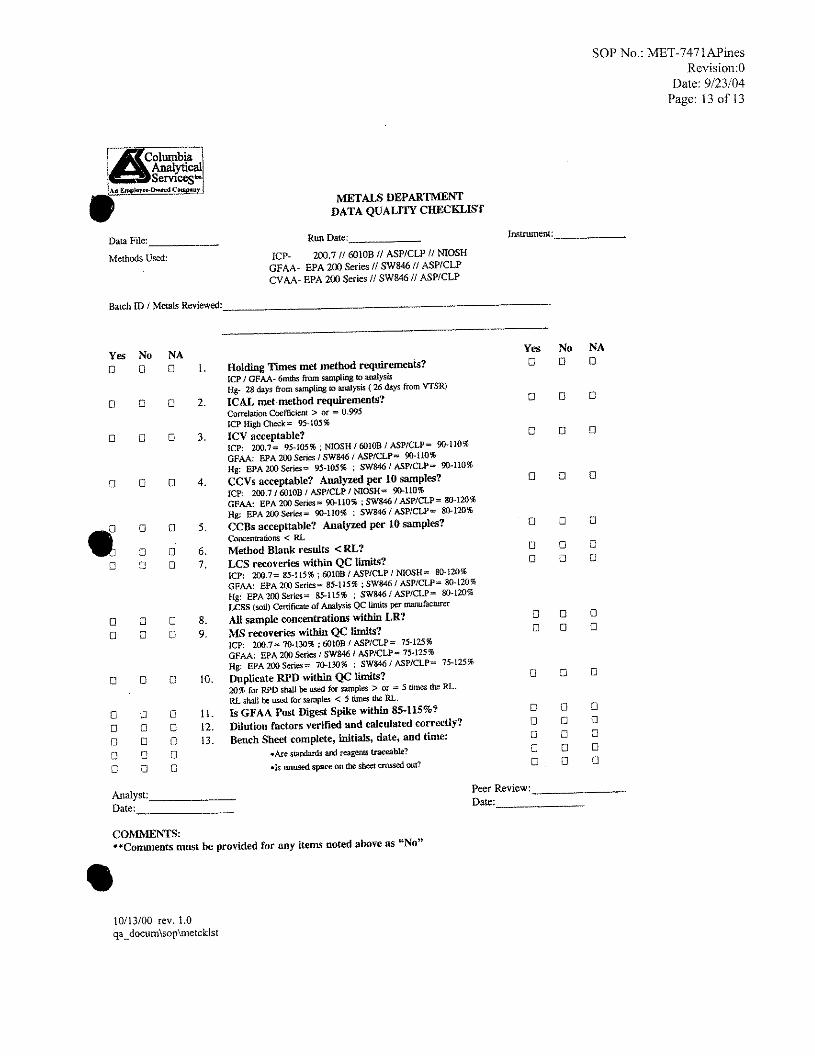
SOP NO.: MET-3050B Revision: 3
Date: 1/15/03 Page: 1 of 12
STANDARD OPERATING PROCEDURE
for
METALS DIGESTION, SOILS, SEDIMENTS, AND SLUDGE FOR ICP AND GFAA ANALYSIS
SOP No.: MET-3050B
Revision: 3
January 15, 2003
Approved by: ________________________________________________ _________________ Supervisor Date ________________________________________________ _________________ QA Coordinator Date ________________________________________________ _________________
Laboratory Manager Date
© Columbia Analytical Services, Inc., 2003
1 Mustard Street, Suite 250 Rochester, New York 14609
Annual review of this SOP has been performed DOCUMENT CONTROL and the SOP still reflects current practice.
Initials: ______ Date: __________ NUMBER: ________________ Initials: ______ Date: __________ Initials: ______ Date: __________ Initials: ______ Date: __________
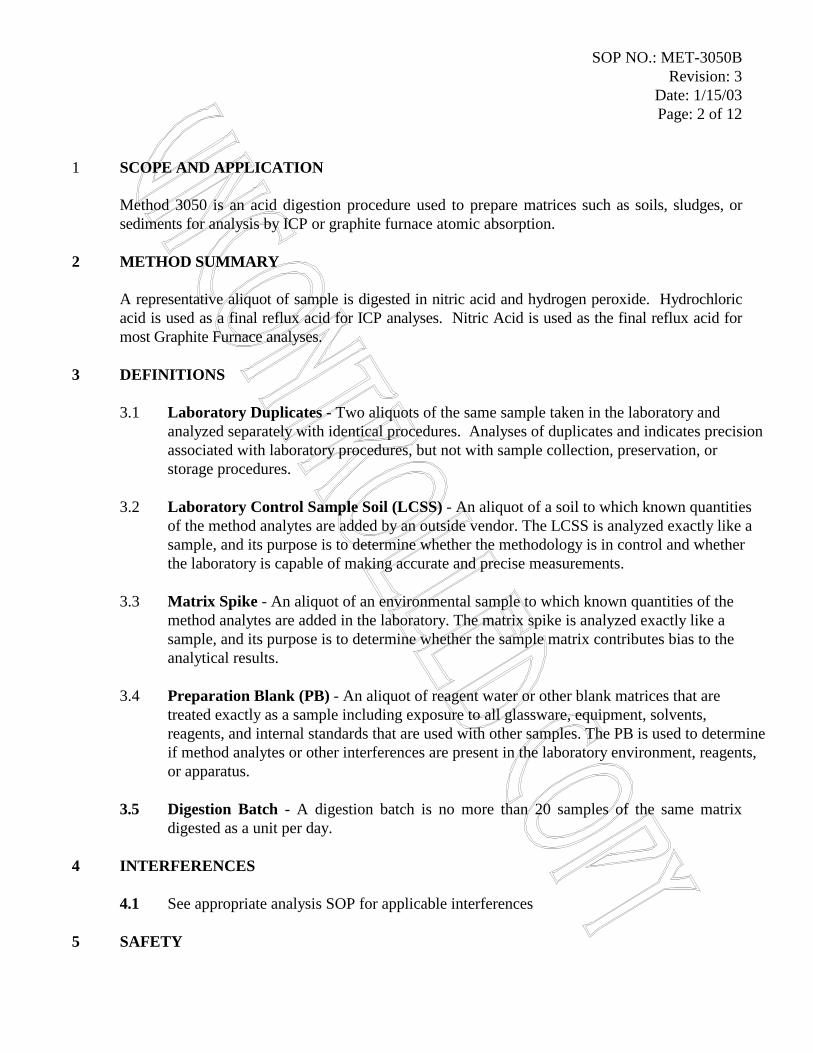
SOP NO.: MET-3050B Revision: 3
Date: 1/15/03 Page: 2 of 12
1 SCOPE AND APPLICATION
Method 3050 is an acid digestion procedure used to prepare matrices such as soils, sludges, or sediments for analysis by ICP or graphite furnace atomic absorption.
2 METHOD SUMMARY
A representative aliquot of sample is digested in nitric acid and hydrogen peroxide. Hydrochloric acid is used as a final reflux acid for ICP analyses. Nitric Acid is used as the final reflux acid for most Graphite Furnace analyses.
3 DEFINITIONS
3.1 Laboratory Duplicates - Two aliquots of the same sample taken in the laboratory and analyzed separately with identical procedures. Analyses of duplicates and indicates precision associated with laboratory procedures, but not with sample collection, preservation, or storage procedures.
3.2 Laboratory Control Sample Soil (LCSS) - An aliquot of a soil to which known quantities
of the method analytes are added by an outside vendor. The LCSS is analyzed exactly like a sample, and its purpose is to determine whether the methodology is in control and whether the laboratory is capable of making accurate and precise measurements.
3.3 Matrix Spike - An aliquot of an environmental sample to which known quantities of the
method analytes are added in the laboratory. The matrix spike is analyzed exactly like a sample, and its purpose is to determine whether the sample matrix contributes bias to the analytical results.
3.4 Preparation Blank (PB) - An aliquot of reagent water or other blank matrices that are
treated exactly as a sample including exposure to all glassware, equipment, solvents, reagents, and internal standards that are used with other samples. The PB is used to determine if method analytes or other interferences are present in the laboratory environment, reagents, or apparatus.
3.5 Digestion Batch - A digestion batch is no more than 20 samples of the same matrix
digested as a unit per day. 4 INTERFERENCES
4.1 See appropriate analysis SOP for applicable interferences 5 SAFETY
SOP NO.: MET-3050B Revision: 3
Date: 1/15/03 Page: 3 of 12
Nitric and Hydrochloric acids are extremely corrosive. Care should be taken while working with these chemicals. Personal protective equipment including safety glasses (with side shields), gloves, and lab coat shall be worn when handling samples or reagents.
6 SAMPLE COLLECTION, PRESERVATION AND STORAGE
For non-aqueous samples, glass or plastic sample containers are acceptable. Samples are analyzed within 6 months of sample collection. Additional sample handling policies and procedures are in SMO-GEN.
7 APPARATUS AND EQUIPMENT
7.1 250 and 100 mL beakers 7.2 Ribbed watch glasses 7.3 Hot plates 7.4 Graduated cylinders 7.5 Eppendorf Pipettors 7.6 Funnels 7.7 Mortar and pestle 7.8 Tongue depressors 7.9 Filter paper 7.10 Hot Block Digestor with ETR-3200 Controller by Environmental Express, LTD. 7.11 Graduated block digestor ribbed watch glasses 7.12 Block Digestor Filters. 7.13 CPI MOD Block Digestor
8 PREVENTIVE MAINTENANCE
8.1 All hoods in the Metals Prep Lab are wiped down once a week with DI water. The tops of all digestion hot plates are wiped down daily.
9 STANDARDS, REAGENTS, AND CONSUMABLE MATERIALS
9.1 Reagent water - ASTM Type II deionized water. Reagent water must be interference free.
9.2 Concentrated nitric acid (Baker Instra-Analyzed 69-70%): Acid should be demonstrated to be free of impurities at levels which would interfere with sample determinations. Store at room temperature in the dark. Expires per manufacturer’s indications or one year from receipt, whichever is sooner.
9.3 Concentrated hydrochloric acid (Baker Instra-Analyzed 36.5-38%): Acid should be
demonstrated to be free of impurities at levels which would interfere with sample determinations. Store at room temperature. Expires per manufacturer’s indications or one year from receipt, whichever is sooner.
SOP NO.: MET-3050B Revision: 3
Date: 1/15/03 Page: 4 of 12
9.4 Hydrogen peroxide (30%) - H2O2. Purchased commercially. Should be demonstrated to be
free of impurities at levels which would interfere with sample determinations. Store at room temperature. Expires upon manufacturer’s indications or 1 year from receipt, whichever is sooner.
9.5 ERA Soil Laboratory Control Sample (LCSS) - Concentrations and Performance
Acceptance Limits distributed through vendor. Store at room temperature. Expires upon manufacturer’s indications or 1 year from receipt, whichever is sooner.
9.6 Metals spiking solutions – Purchased commercially. See Table 1. Store at room
temperature. Stocks expires upon manufacturer’s indications or 1 year from receipt, whichever is sooner. Solutions prepared from stocks expire 6 months from preparation.
10 RESPONSIBILITIES
10.1 It is the responsibility of the analyst to perform the analysis according to this SOP and to complete all documentation required for data review. Analysis and interpretation of the results are performed by personnel in the laboratory who have demonstrated the ability to generate acceptable results utilizing this SOP. Final review and sign-off of the data is performed by the department supervisor or designee.
11 PROCEDURES
11.1 HOT PLATE 11.1.1 Mix the sample thoroughly to achieve homogeneity using a tongue depressor or the
mortar and pestle.
11.1.2 Weigh (to the nearest 0.01g) 1.00g to 1.50g of sample into a 250 or 100 mL beaker. For sludges and sediments that have a high moisture content, use more sample. The goal is to use about 1g of dry weight sample. At this point add the appropriate spiking solutions (see Table 1) directly onto the designated spike sample prior to addition of reagents.
11.1.3 Unless specified by project or state requirements, the addition of acid should be as
follows: Add 10ml of 1:1 HNO3, cover with a ribbed watch glass and reflux for 15 minutes. The sample temperature should be 90-95oC. Allow the sample to cool, then add 5ml of concentrated HNO3, cover and reflux for 30 minutes. Repeat the addition of 5ml of HNO3 and reflux to 5 mLs. Do not allow the sample to go to dryness. CAUTION: Do not boil. Antimony is easily lost by volatilization.
SOP NO.: MET-3050B Revision: 3
Date: 1/15/03 Page: 5 of 12
11.1.4 Cool the sample and add 2ml of DI and 3ml of 30% H2O2. Cover and heat to start the peroxide reaction. Care must be taken to ensure that losses do not occur due to excessive effervescence. Heat until effervescence subsides and cool the beaker.
11.1.5 If the effervescence does not subside, add 3 mLs of hydrogen peroxide with
warming to each of the samples (including blanks and LCSs) in the batch. If necessary, continue to add 30% H2O2 in 1ml aliquots with warming until the effervescence is minimal, or until the general sample appearance is unchanged. Do not add more than 10ml of 30% H2O2.
11.1.6 If the sample is being prepared for analysis by ICP, add 10 mL 1:1 HCL. If the
sample is being prepared for analysis by Graphite Furnace no HCl is added. 11.1.7 Cover and reflux the ICP samples for 15 minutes without boiling. Allow to cool.
11.1.8 Prepare filters by rinsing with 1:1 nitric acid and DI.
11.1.9 All samples are diluted to 100 mLs with DI. Quantitatively transfer the digestate to
a graduated cylinder by pouring the sample through a prepared filter into the cylinder and rinsing the beaker and watch glass with DI into the filter. Rinse the filter with DI. Bring to volume with DI.
11.2 HOT BLOCK DIGESTOR
11.2.1 Set the temperature on the Block Digestor to a temperature that brings the sample
temperature to 90-95°C without boiling. 11.2.2 The Hot Block is on a timer which can be set to turn on and off whenever necessary.
To set timer press the timer button and choose the days M-F (Monday through Friday). Then choose the hour and minutes to start and stop the Block Digestor.
11.2.3 Label graduated hot block digestor sample cups with appropriate sample IDs for
digestion.
11.2.4 Mix the sample thoroughly to achieve homogeneity using a tongue depressor or the mortar and pestle.
11.2.5 Weigh (to the nearest 0.01g) 1.00g to 1.50g of sample into labeled digestor sample
cup. For sludges and sediments that have a high moisture content, use more sample. The goal is to use about 1g of dry weight sample. At this point add the appropriate spiking solutions (see Table 1) directly onto the designated spike sample prior to addition of reagents.
SOP NO.: MET-3050B Revision: 3
Date: 1/15/03 Page: 6 of 12
11.2.6 Unless specified by project or state requirements, the addition of acid should be as follows: Add 10ml of 1:1 HNO3 and for ICP only add 1.5 mL of 1:1 HCl, cover with reflux cap and reflux for 15 minutes. The sample temperature should be 90-95oC. Allow the sample to cool, then add 5ml of concentrated HNO3, cover and reflux for 30 minutes. Repeat the addition of 5ml of HNO3 and reflux to 5 mLs. Do not allow the sample to go to dryness. CAUTION: Do not boil. Antimony is easily lost by volatilization.
11.2.7 Cool the sample and add 2ml of DI and 3ml of 30% H2O2. Cover and heat to start
the peroxide reaction. Care must be taken to ensure that losses do not occur due to excessive effervescence. Heat until effervescence subsides and cool the sample cup.
11.2.8 If the effervescence does not subside, add 3 mLs of hydrogen peroxide with
warming to each of the samples (including blanks and LCSs) in the batch. If necessary, continue to add 30% H2O2 in 1ml aliquots with warming until the effervescence is minimal, or until the general sample appearance is unchanged. Do not add more than 10ml of 30% H2O2.
11.2.9 If the sample is being prepared for analysis by ICP, add 10 mL 1:1 HCL. If the
sample is being prepared for analysis by Graphite Furnace no HCl is added. 11.2.10 Cover and reflux the ICP samples for 15 minutes without boiling. Allow to cool.
11.2.11 Prepare filters by rinsing with 1:1 nitric acid and DI.
11.2.12 All samples are diluted to 100 mLs with DI. Quantitatively transfer the digestate to
a graduated cylinder by pouring the sample through a prepared filter into the cylinder and rinsing the beaker and reflux cap with DI into the filter. Rinse the filter with DI. Bring to volume with DI. Pour into a labeled B-cup.
12 QA/QC REQUIREMENTS
12.1 Each day, digest one laboratory control sample (LCS) per digestion batch, or per 20 samples, or per EPA SDG group, whichever is more frequent. Use the appropriate solid laboratory control sample (LCSS) for soils analysis.
12.2 Each day, digest one blank per digestion batch, or per 20 samples, or per EPA SDG
group, whichever is more frequent. Use D.I. water and follow the digestion procedures. 12.3 Each day, prepare one duplicate and one spiked sample with each digestion batch, or per
twenty samples, or per EPA SDG group, whichever is more frequent. At times, specific samples will be assigned as duplicates of spikes depending on client requirements.
SOP NO.: MET-3050B Revision: 3
Date: 1/15/03 Page: 7 of 12
12.4 Matrix spikes are prepared by adding the appropriate volume of spiking solution (See Table 1).
12.5 See appropriate analysis SOP for applicable QC limits and corrective action.
13 DATA REDUCTION AND REPORTING
13.1 Digestion logs are used to record all sample volumes, spike volumes, etc. The Manufacturer’s lot number for the reagents used are added to the digestion log (see attached digestion log benchsheet).
13.2 Reporting and method performance is discussed in the appropriate analysis SOP. Data
review is discussed in ADM-DREV. 14 METHOD PERFORMANCE
Reporting limits are based upon an MDL study performed according to ADM-MDL and filed in the MDL binders in the QA office.
15 WASTE MANAGEMENT AND POLLUTION PREVENTION
15.1 Reagents are prepared upon an as-needed basis in small quantities. Minimum sample volumes are used during analysis.
15.2 Acidic waste is poured down the drain with copious amounts of water.
15.3 Samples with analyte concentrations exceeding TCLP regulatory limits are disposed of as
hazardous waste. Others are dumped down the drain with plenty of water. See SMO-SPLDIS.
16 CORRECTIVE ACTION FOR OUT OF CONTROL DATA
If data is produced that is out of control, the samples are to be re-analyzed with in-control QA whenever possible. See corrective actions in Section 12 of this SOP and in the applicable Figures in Section 12 of the Quality Assurance Manual.
17 CONTINGENCIES FOR HANDLING OUT OF CONTROL OR UNACCEPTABLE DATA
If data is produced that is out of control and is not to be re-analyzed due to sample volume restrictions, holding times, or QC controls can not be met, follow the procedures in Section 15 of the Quality Assurance Manual.
18 REFERENCES
SOP NO.: MET-3050B Revision: 3
Date: 1/15/03 Page: 8 of 12
“Test Methods For Evaluating Solid Waste, Physical/Chemical Methods”. EPA SW846, Third Edition, December 1996.
19 TRAINING OUTLINE
19.1 Read current SOP and applicable methodologies. Demonstrate a general understanding of the methodology and chemistry. Follow policies in ADM-TRANDOC.
19.2 Observe Sample Preparation.
19.3 Participate in the methodology, documentation, and data reduction with guidance.
19.4 Complete a Training Plan Form for the procedure.
19.5 Show Initial Demonstration of Capability (IDC) by independently preparing and digesting
four LCSs, or equivalent, according to the test method either concurrently or over a period of days. If recovery is within acceptable limits, complete IDC certification form, and Training Plan forms and file with QA. Continued capability shall be demonstrated annually using PE results, a single blind, or a new 4 replicate study.
20 METHOD MODIFICATIONS
None 21 INSTRUMENT-SPECIFIC ADDENDUM
Not Applicable
22 ATTACHMENTS
Table 1 Spike Concentrations Digestion Log Benchsheets SW846 Method 3050 Flow Chart
23 CHANGES FROM PREVIOUS REVISION
• Added Hot Block digestion procedures (11) and associated items to Apparatus and
Equipment (7) • Added sections 14, 16, 17, and 20 for NELAP compliance • Changed the amount of time to reflux sample from 10-15 minutes to just 15 minutes after the
first addition of acid (11).
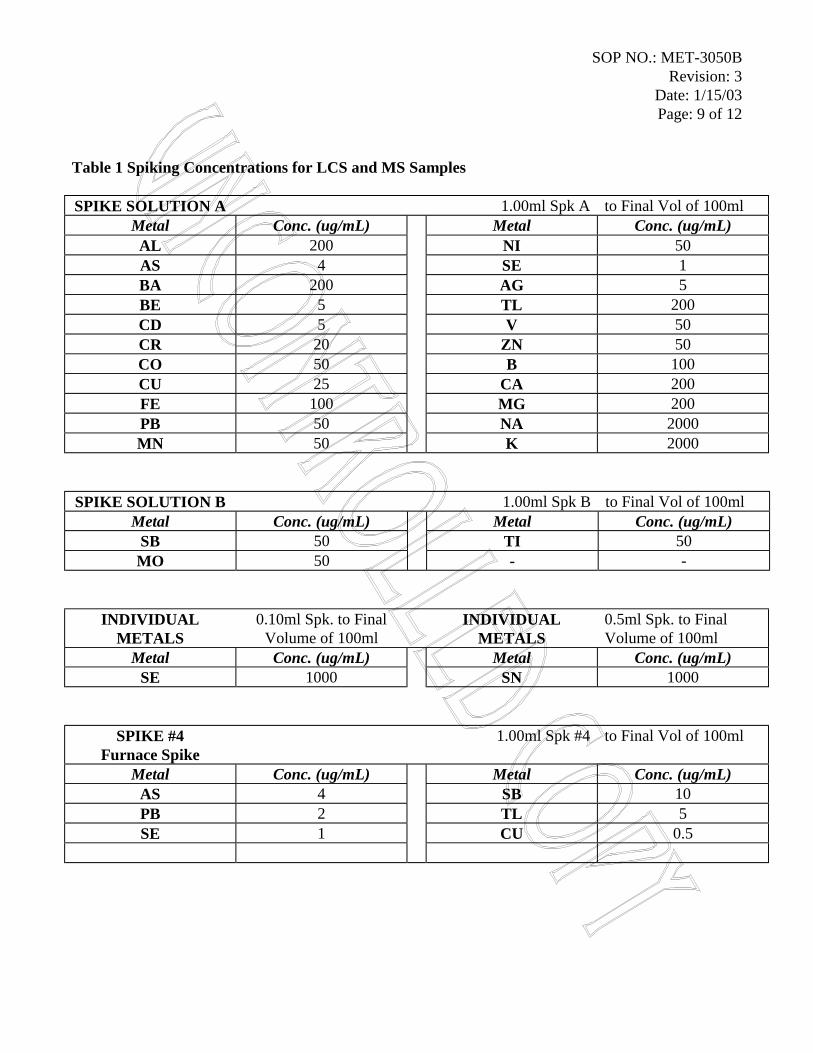
SOP NO.: MET-3050B Revision: 3
Date: 1/15/03 Page: 9 of 12
Table 1 Spiking Concentrations for LCS and MS Samples SPIKE SOLUTION A 1.00ml Spk A to Final Vol of 100ml
Metal Conc. (ug/mL) Metal Conc. (ug/mL) AL 200 NI 50 AS 4 SE 1 BA 200 AG 5 BE 5 TL 200 CD 5 V 50 CR 20 ZN 50 CO 50 B 100 CU 25 CA 200 FE 100 MG 200 PB 50 NA 2000 MN 50 K 2000
SPIKE SOLUTION B 1.00ml Spk B to Final Vol of 100ml Metal Conc. (ug/mL) Metal Conc. (ug/mL)
SB 50 TI 50 MO 50 - -
INDIVIDUAL METALS
0.10ml Spk. to Final Volume of 100ml
INDIVIDUAL METALS
0.5ml Spk. to Final Volume of 100ml
Metal Conc. (ug/mL) Metal Conc. (ug/mL) SE 1000 SN 1000
SPIKE #4 Furnace Spike
1.00ml Spk #4 to Final Vol of 100ml
Metal Conc. (ug/mL) Metal Conc. (ug/mL) AS 4 SB 10 PB 2 TL 5 SE 1 CU 0.5
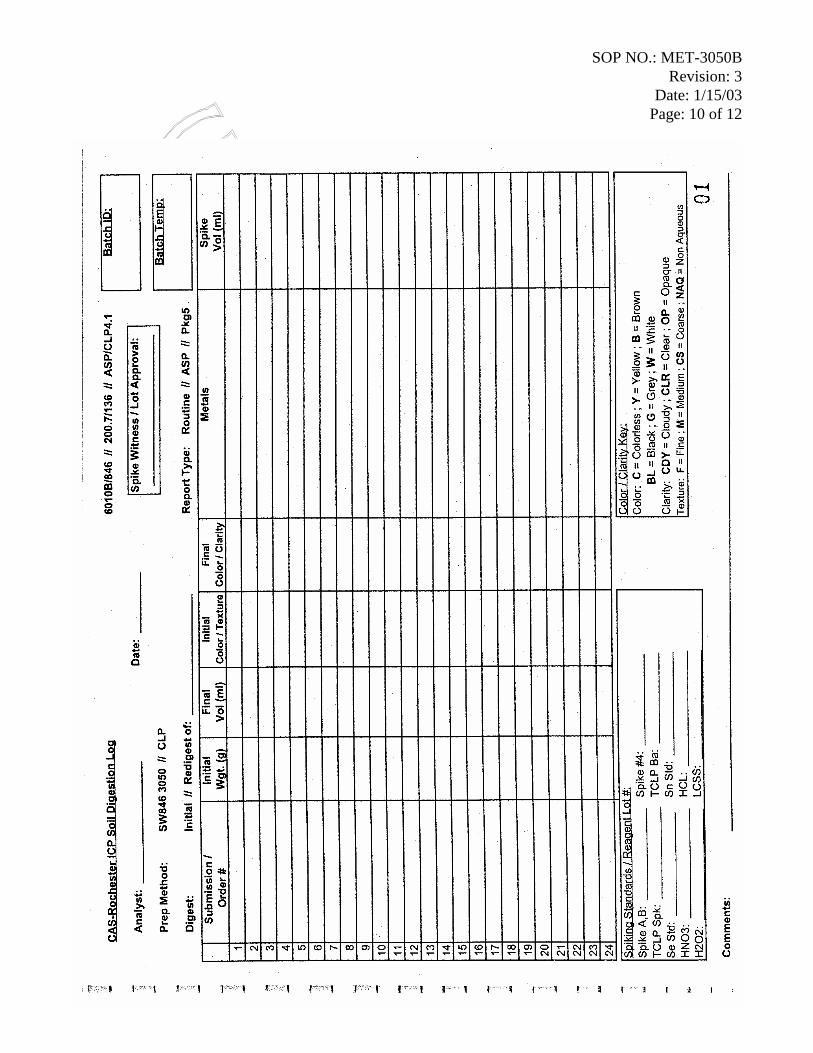
SOP NO.: MET-3050B Revision: 3
Date: 1/15/03 Page: 10 of 12
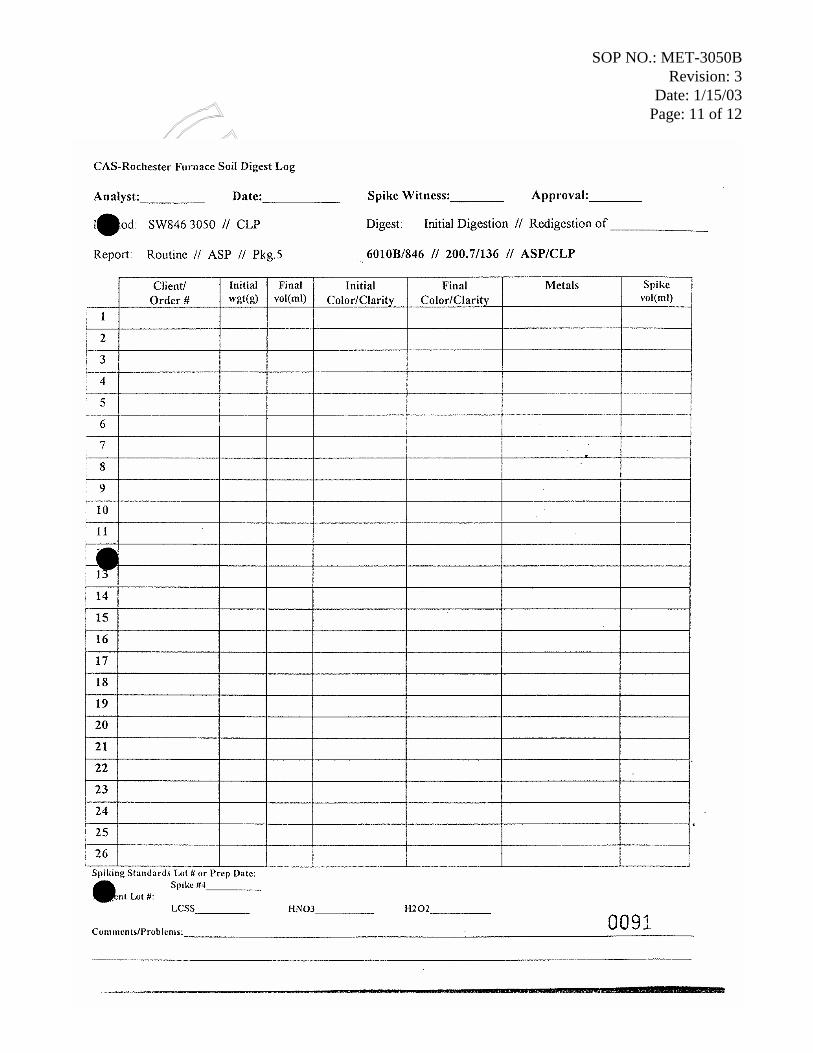
SOP NO.: MET-3050B Revision: 3
Date: 1/15/03 Page: 11 of 12
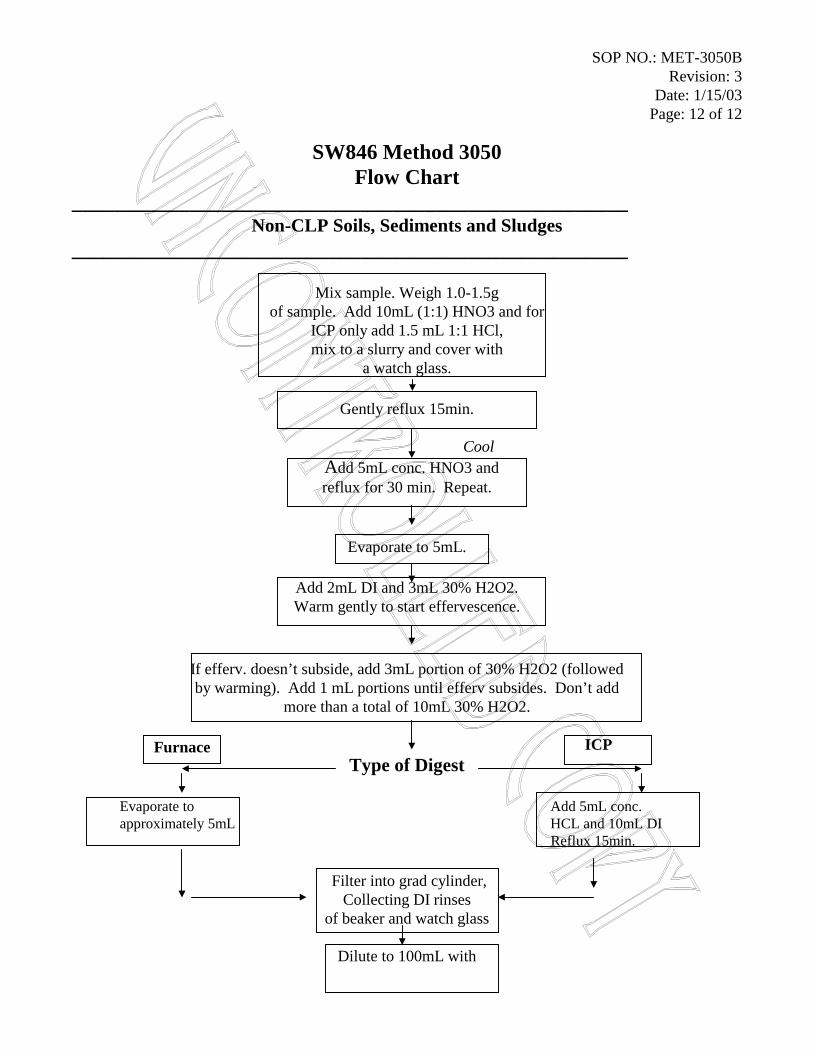
SOP NO.: MET-3050B Revision: 3
Date: 1/15/03 Page: 12 of 12
SW846 Method 3050 Flow Chart
____________________________________________________ Non-CLP Soils, Sediments and Sludges
____________________________________________________
Mix sample. Weigh 1.0-1.5g of sample. Add 10mL (1:1) HNO3 and for
ICP only add 1.5 mL 1:1 HCl, mix to a slurry and cover with
a watch glass.
Gently reflux 15min.
Cool Add 5mL conc. HNO3 and reflux for 30 min. Repeat.
Evaporate to 5mL.
Add 2mL DI and 3mL 30% H2O2. Warm gently to start effervescence.
If efferv. doesn’t subside, add 3mL portion of 30% H2O2 (followed by warming). Add 1 mL portions until efferv subsides. Don’t add
more than a total of 10mL 30% H2O2.
ICP Type of Digest
Evaporate to Add 5mL conc. approximately 5mL HCL and 10mL DI Reflux 15min.
Filter into grad cylinder, Collecting DI rinses
of beaker and watch glass
Dilute to 100mL with
Furnace

SOP NO.: MET-3050B Revision: 3
Date: 1/15/03 Page: 13 of 12
DI water.
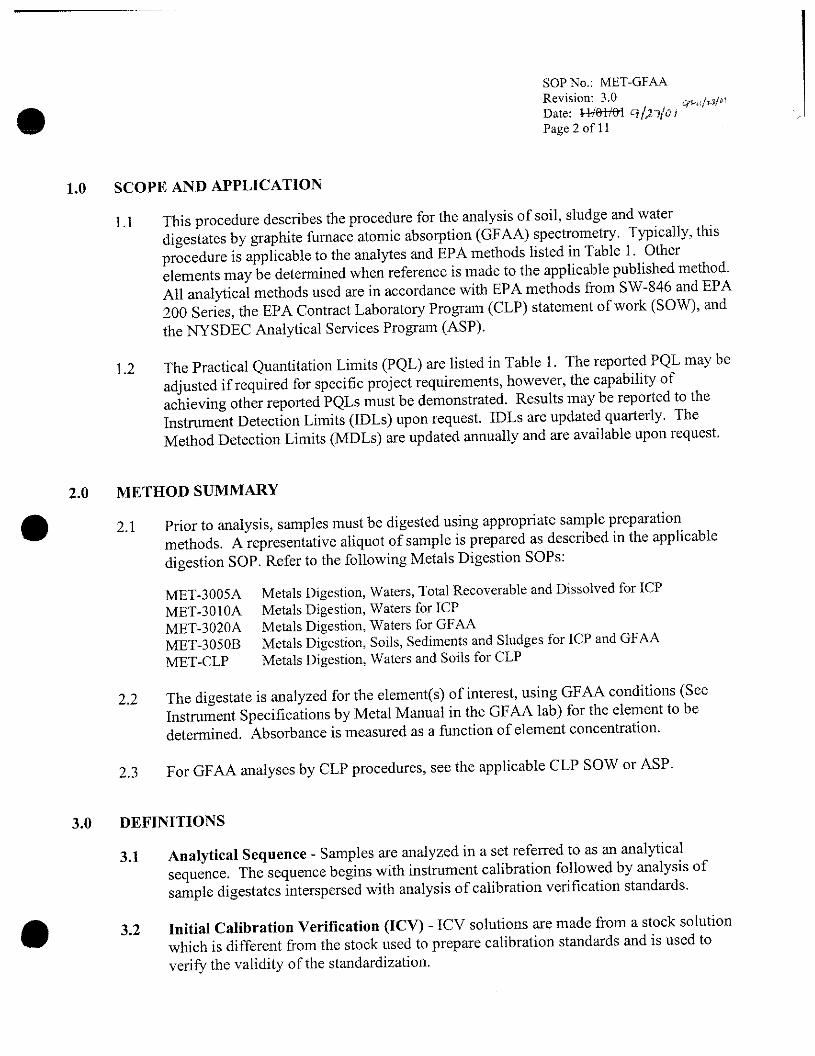
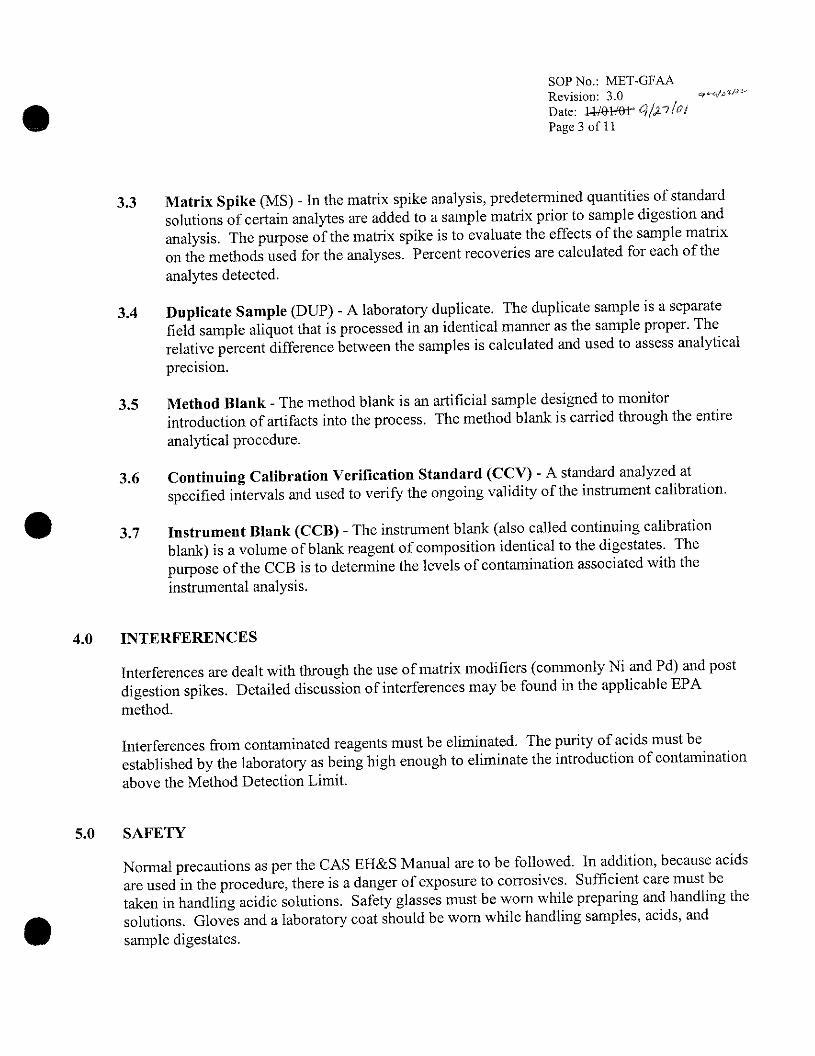
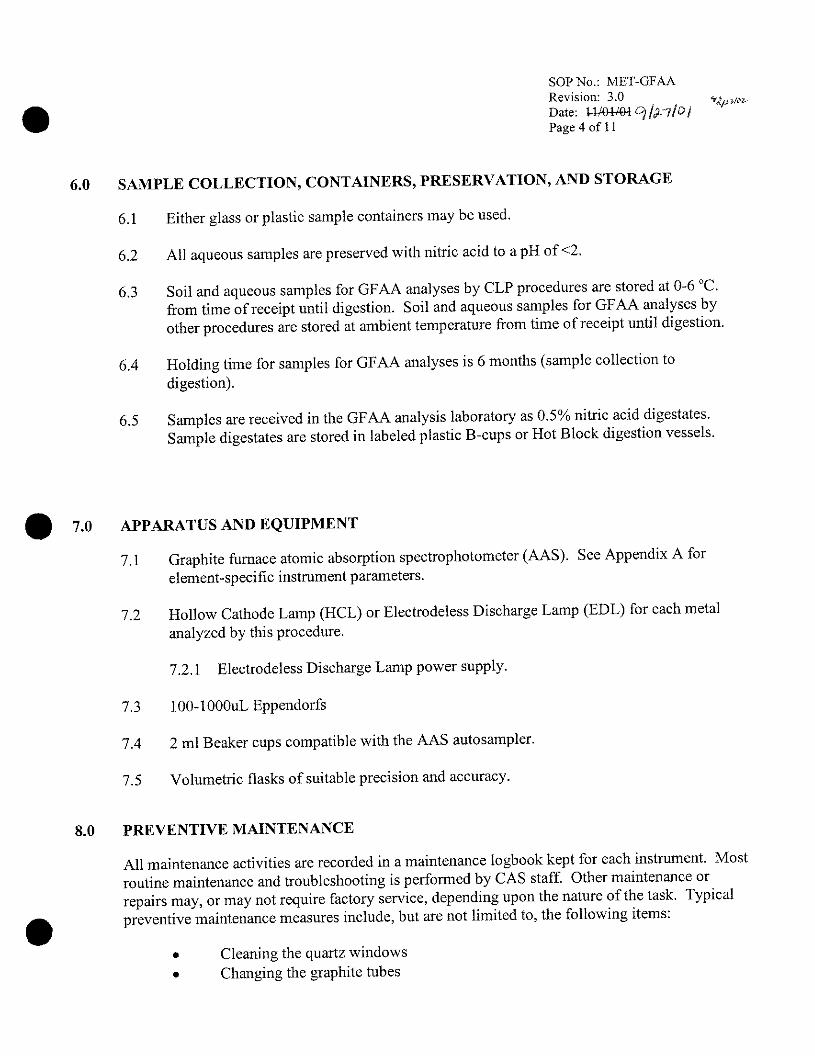
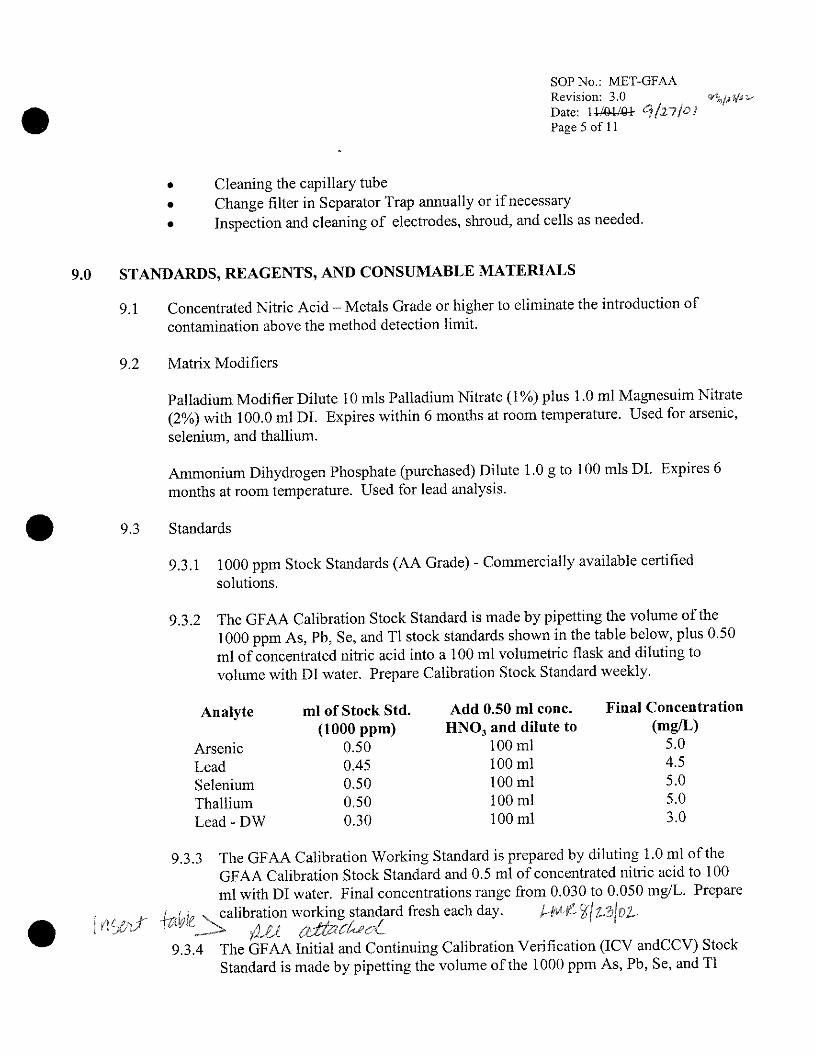
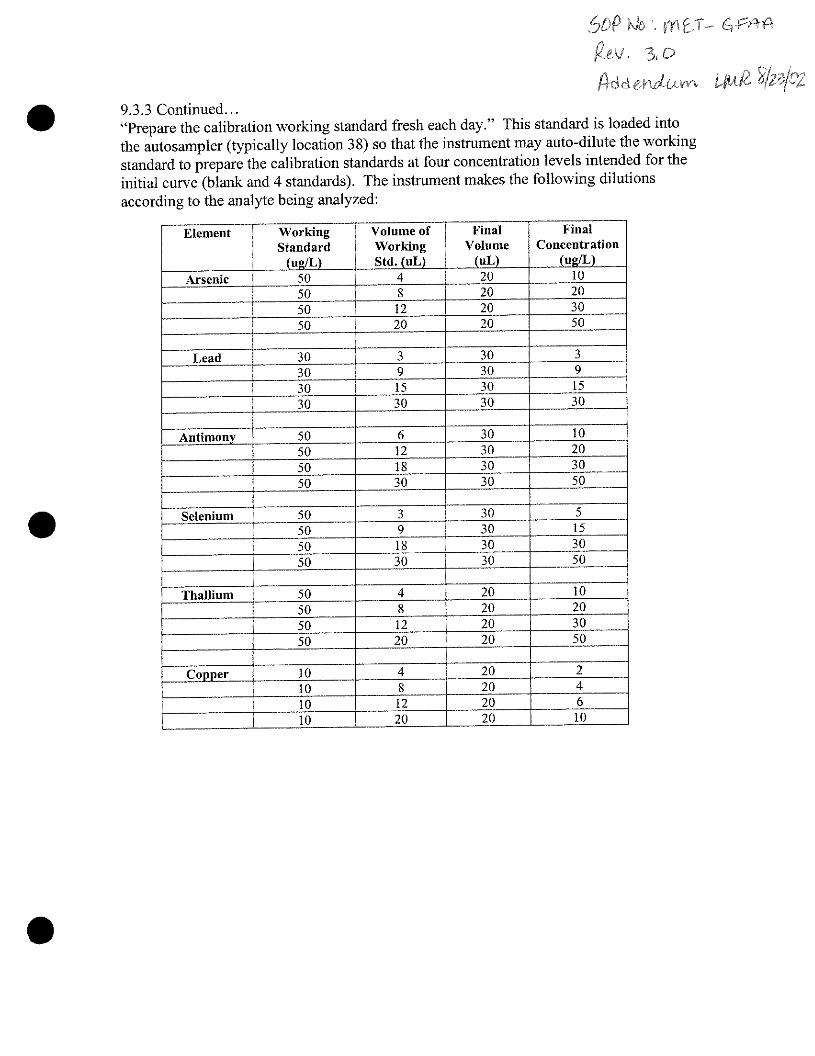
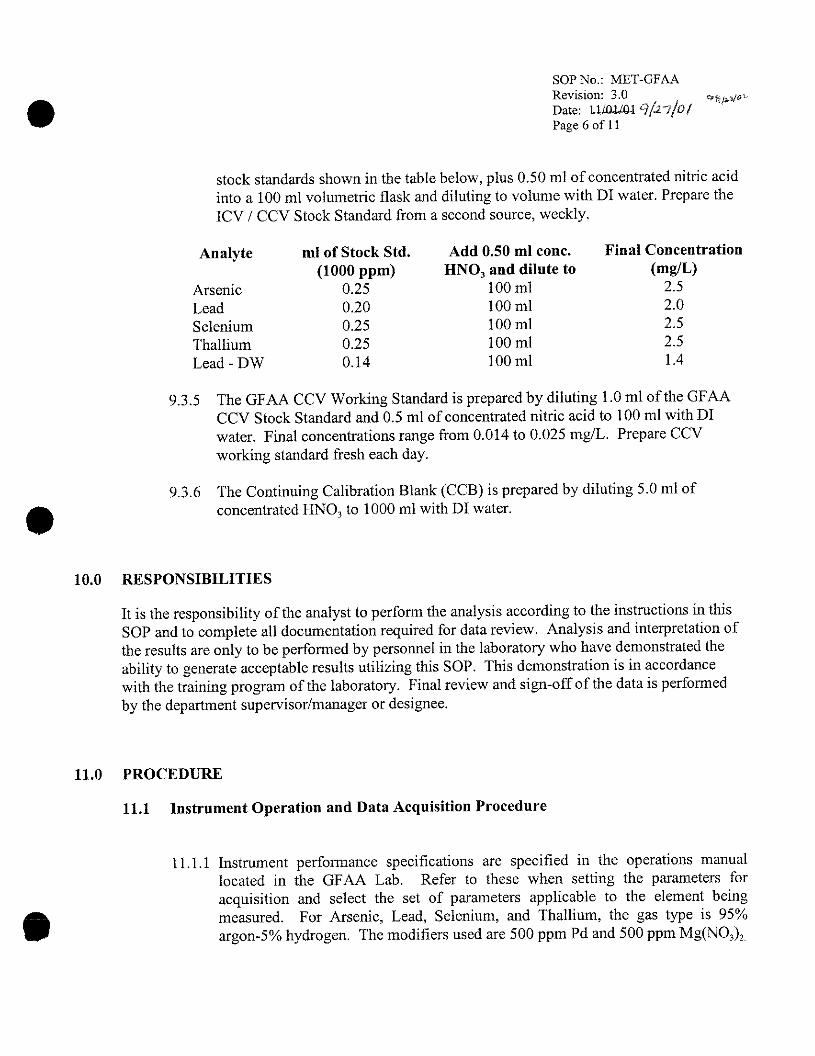
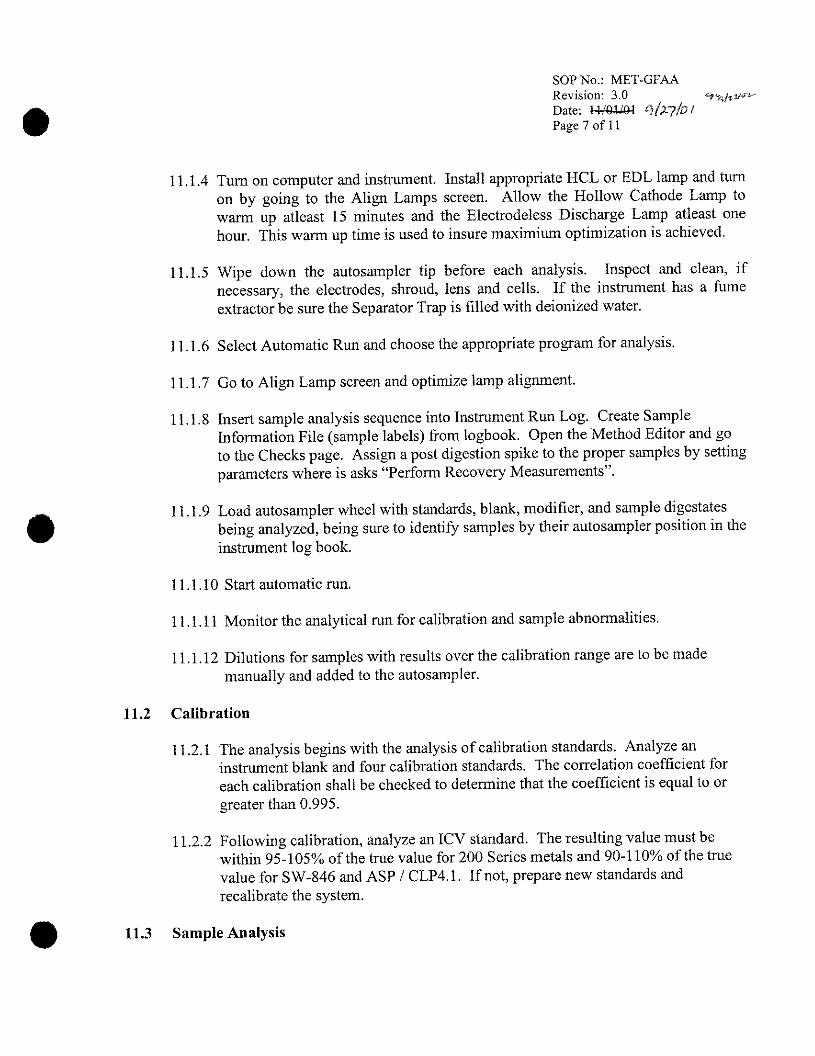
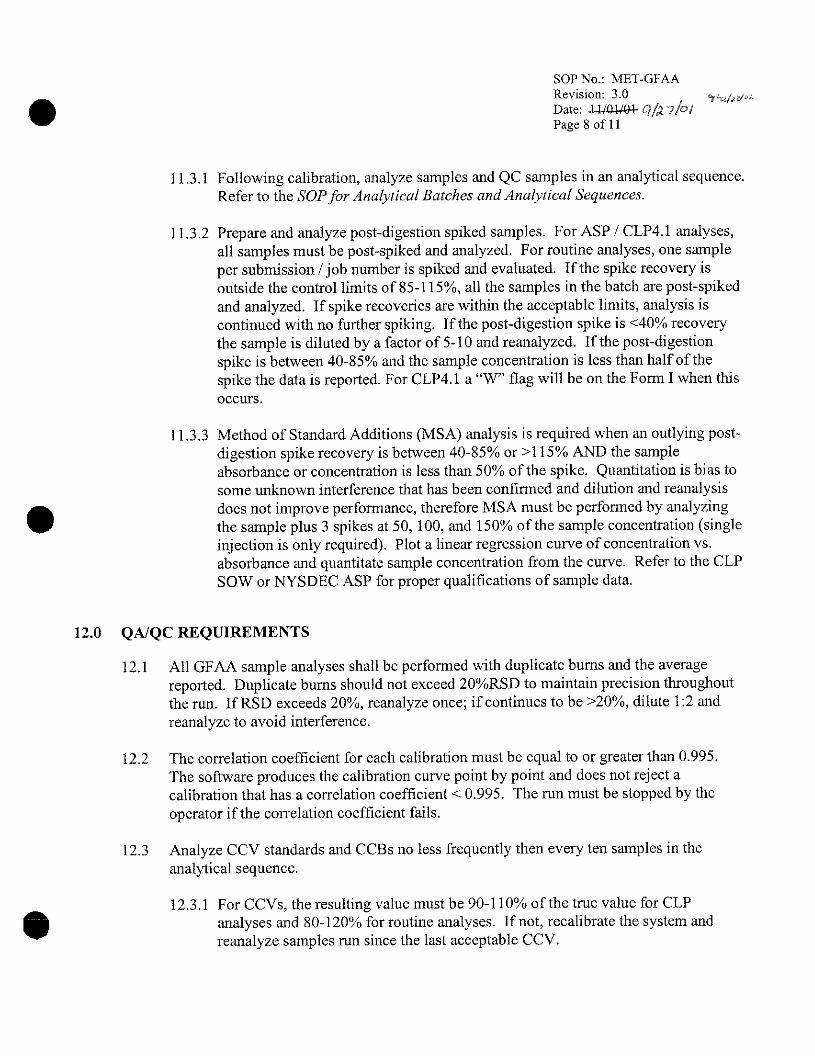
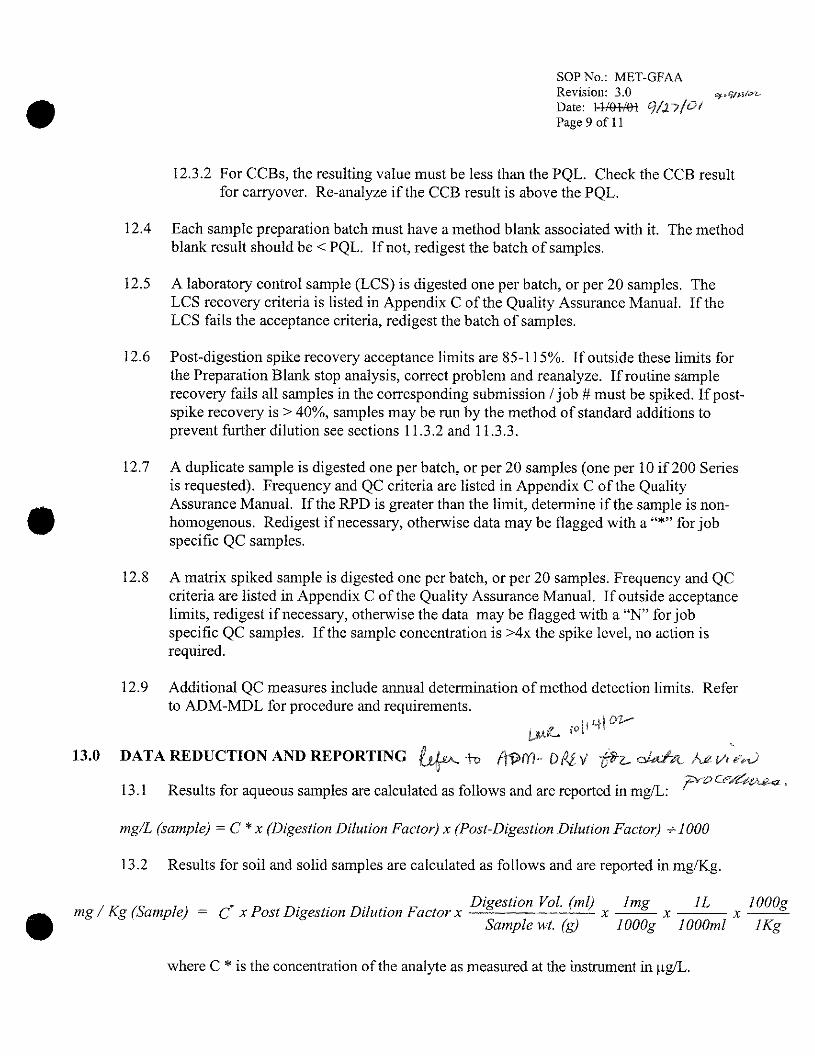
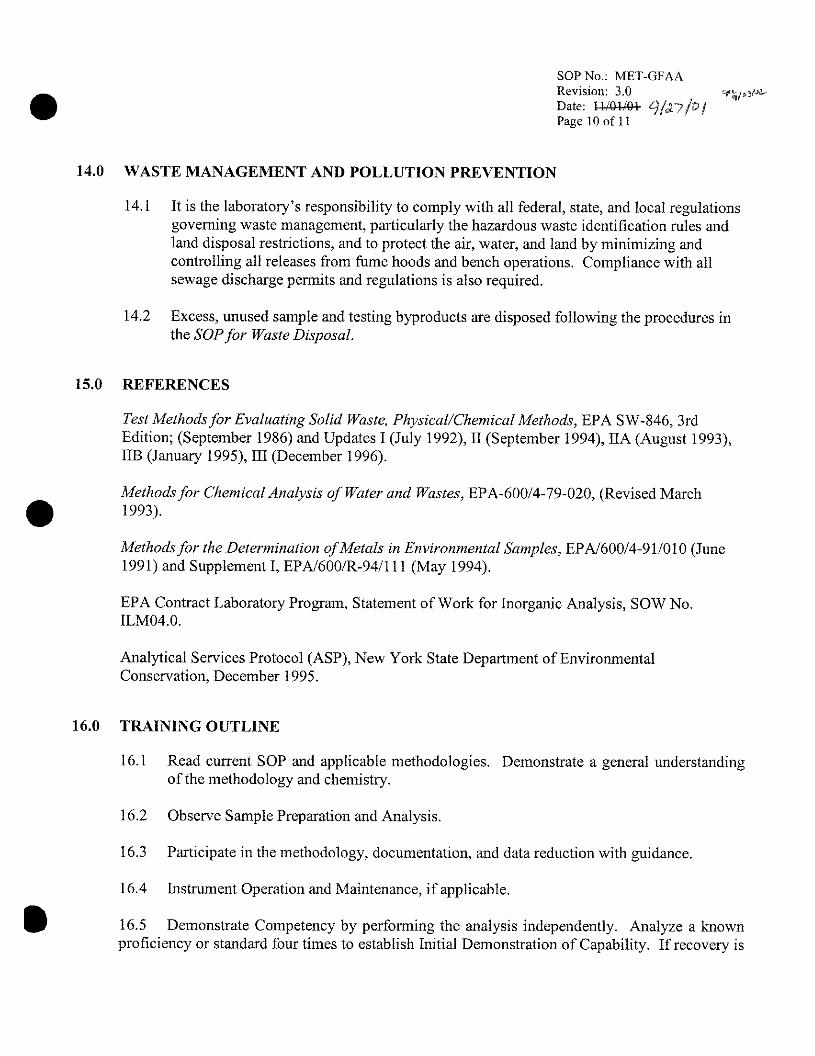
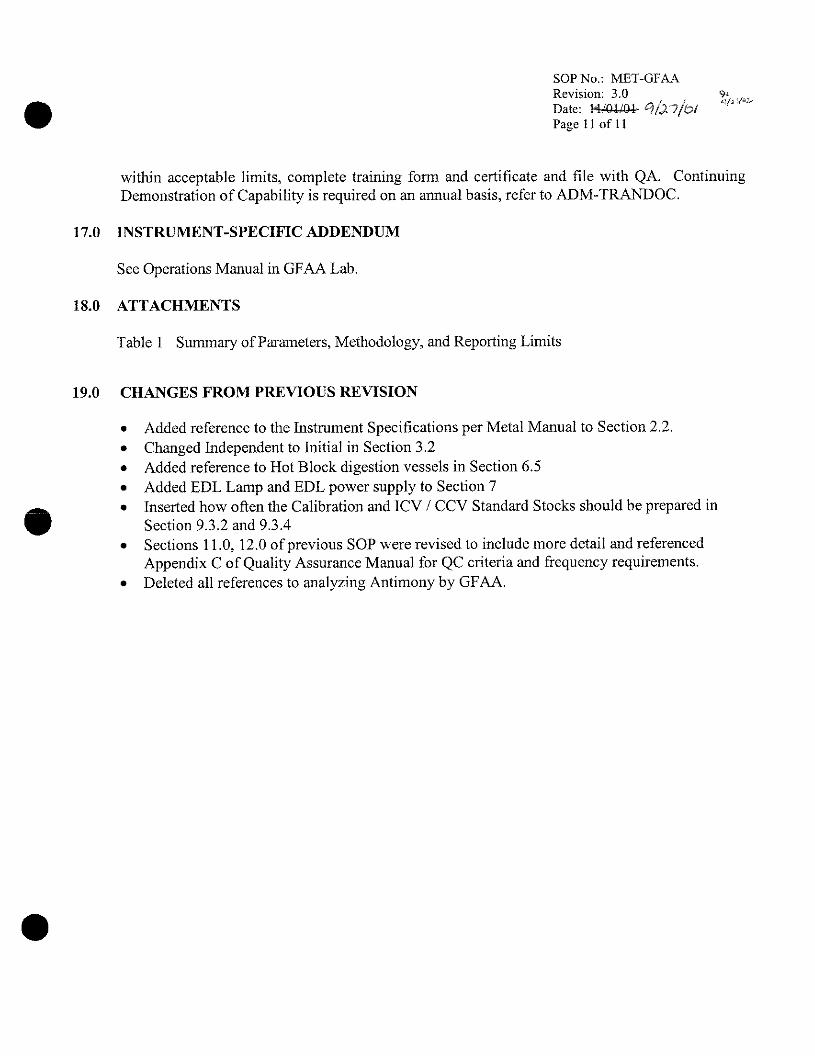
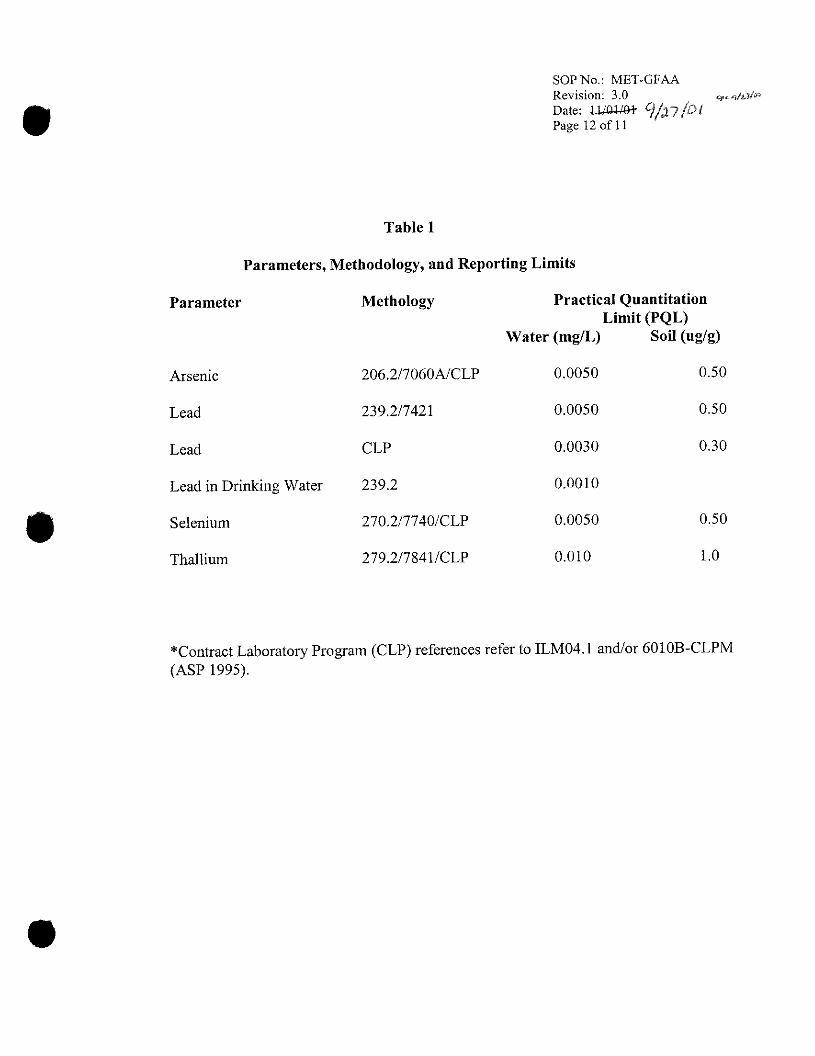
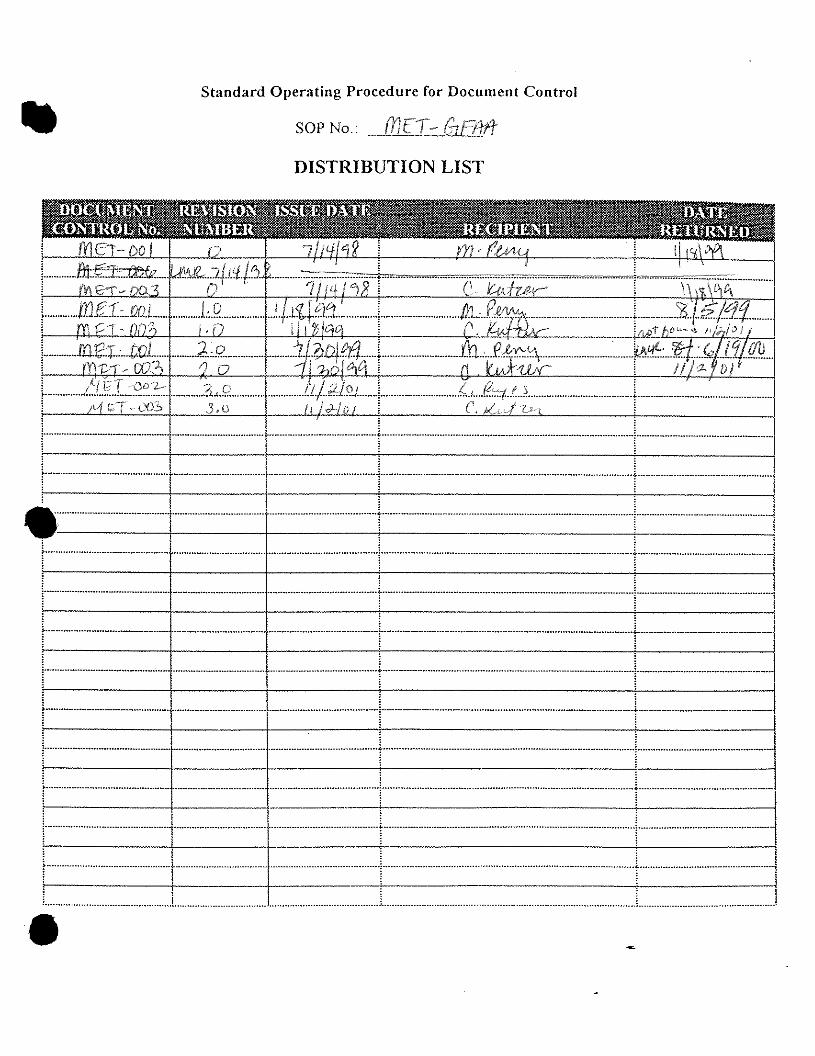
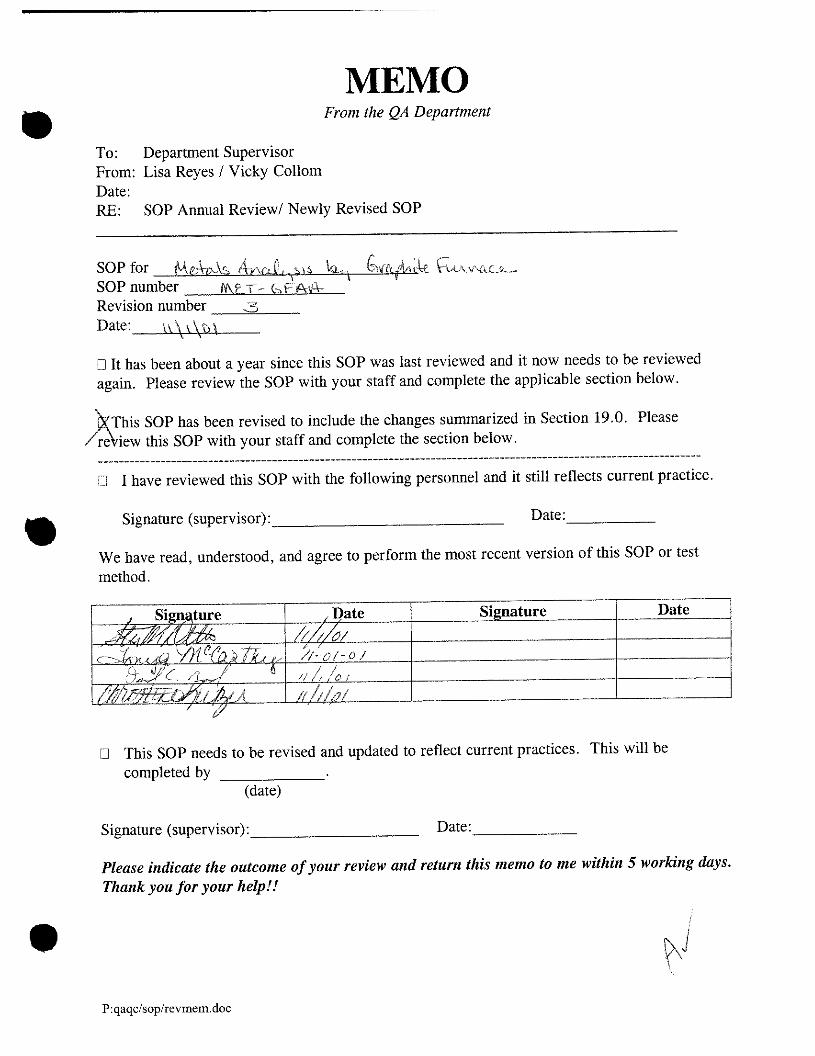
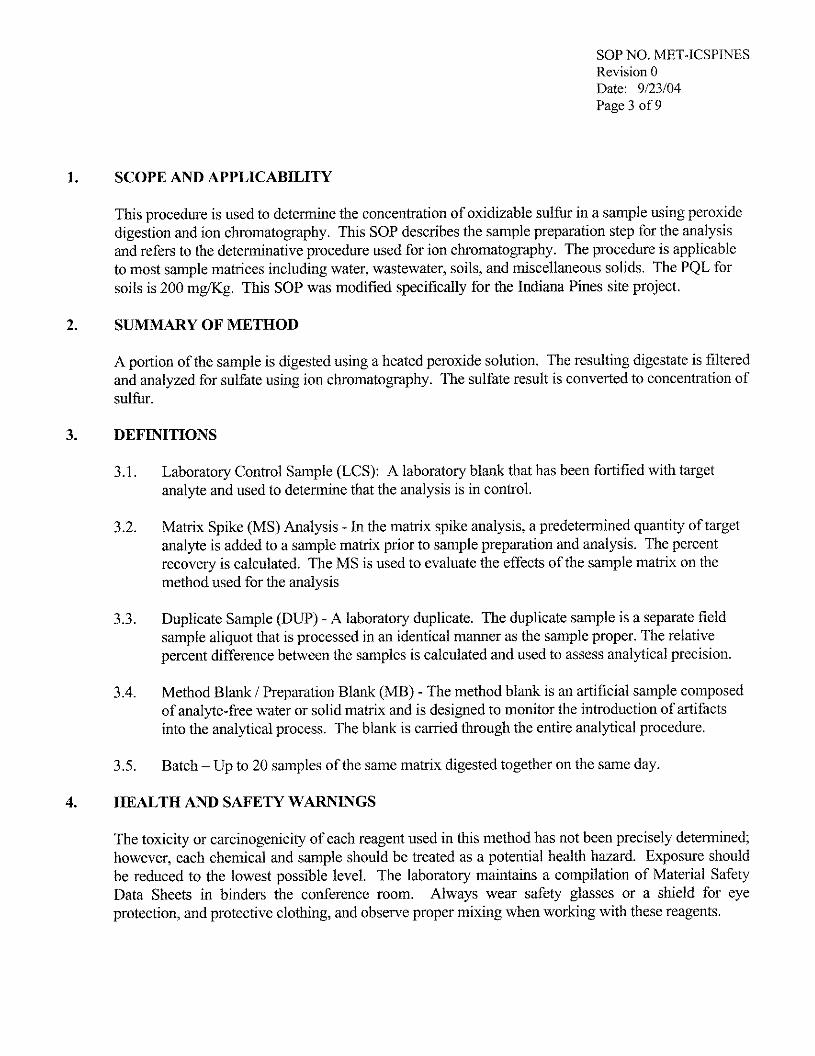
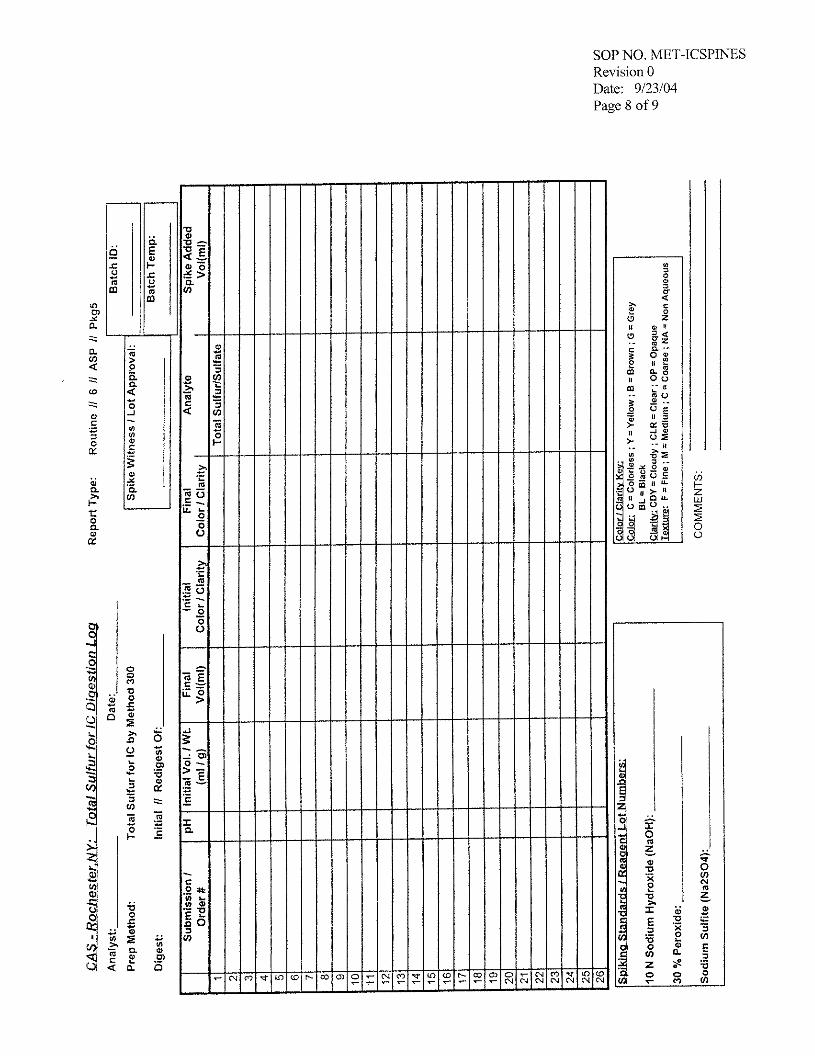
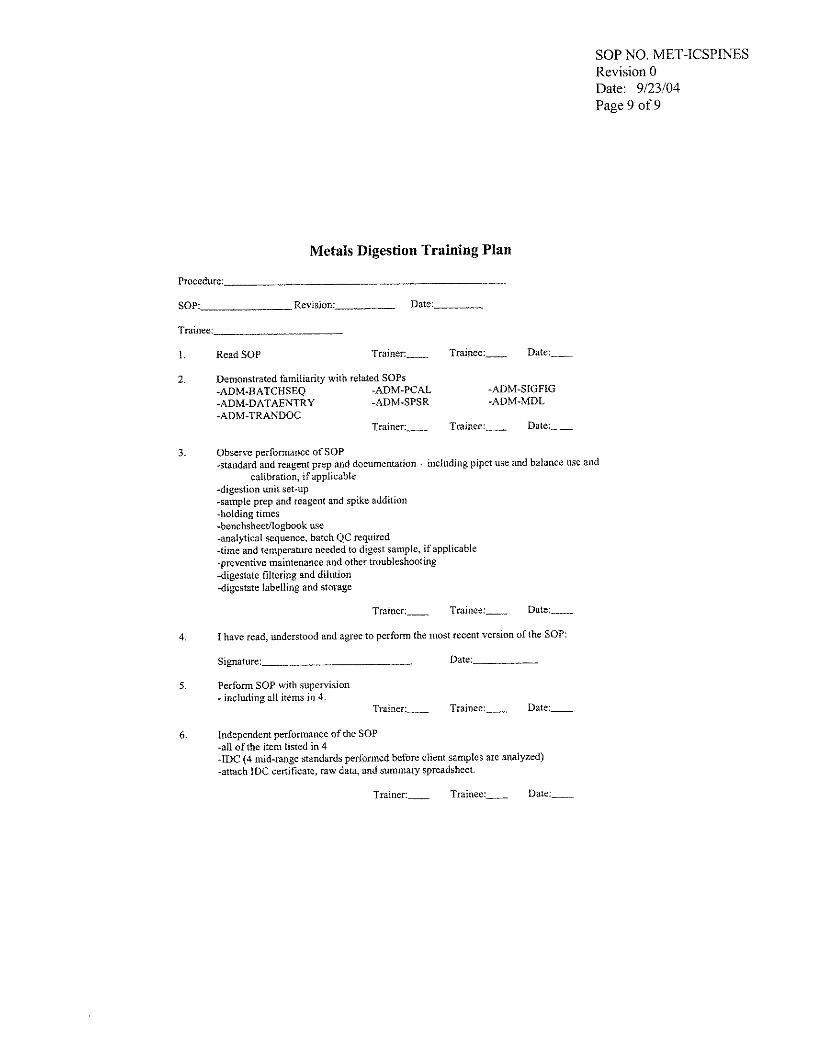
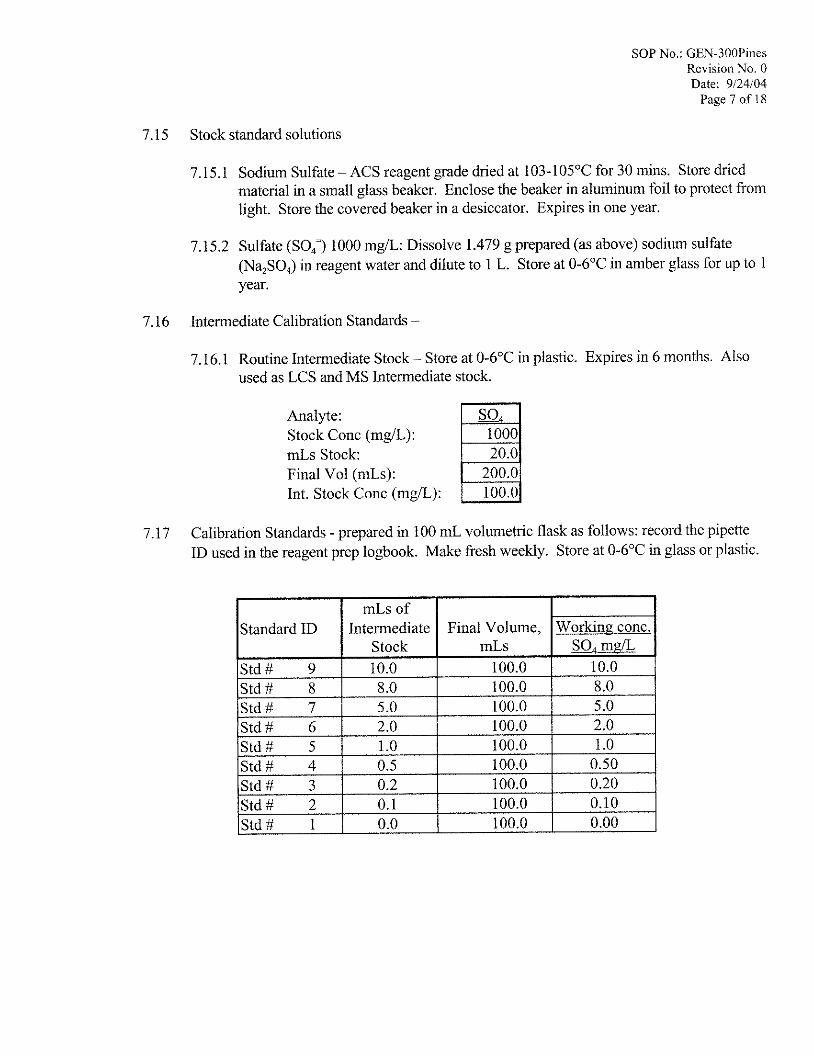
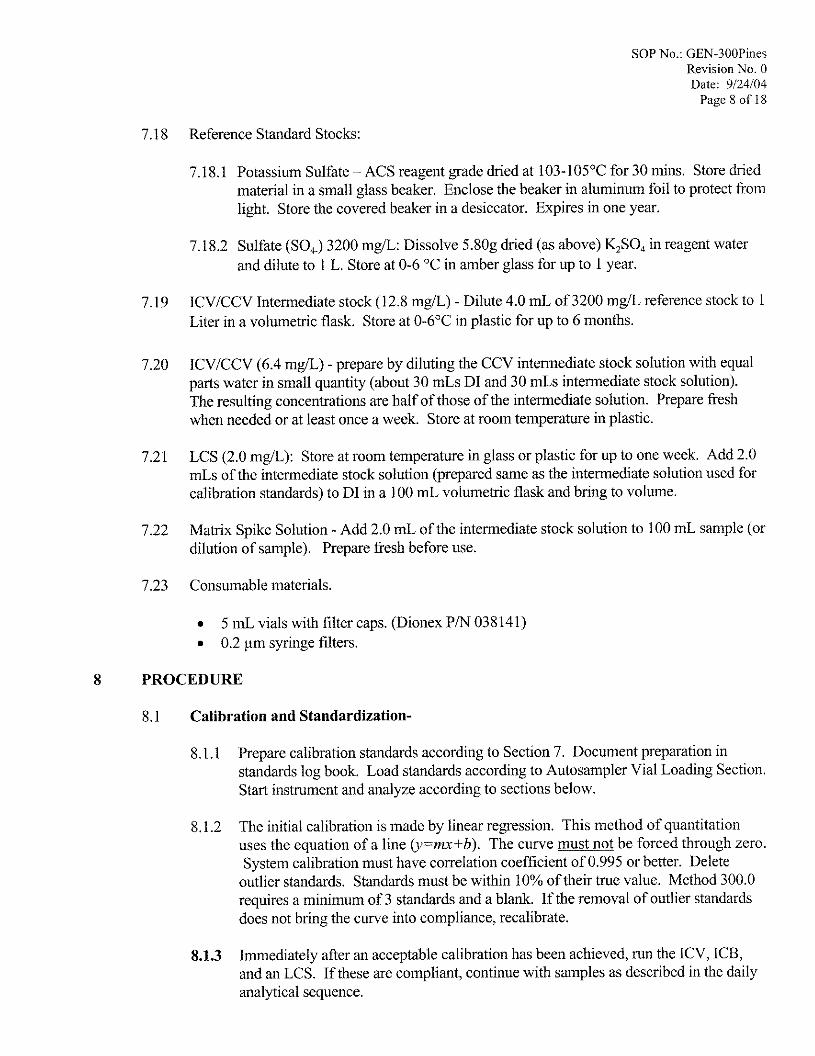
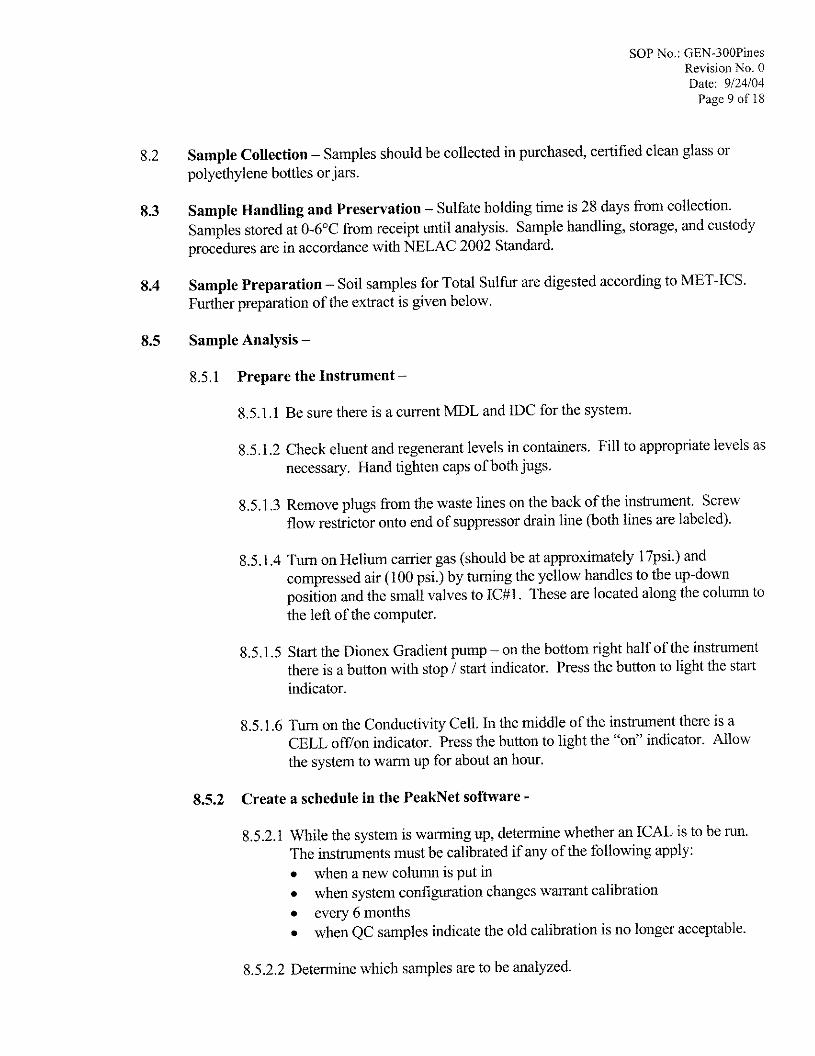
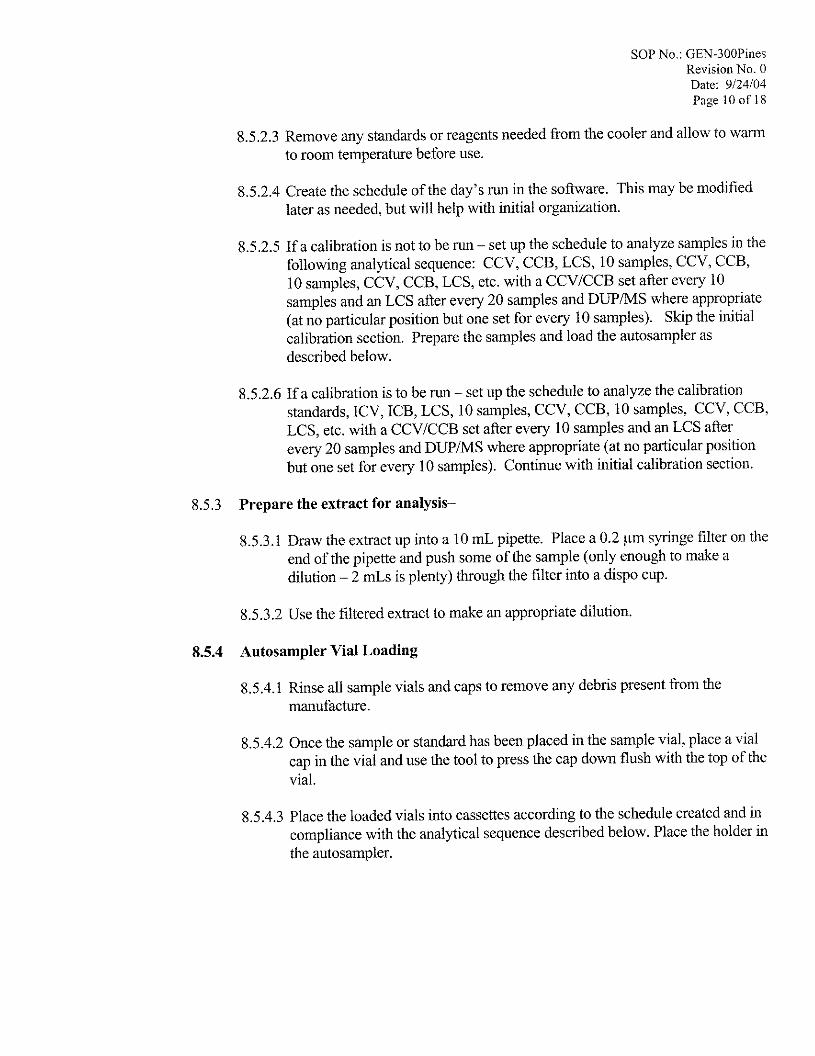
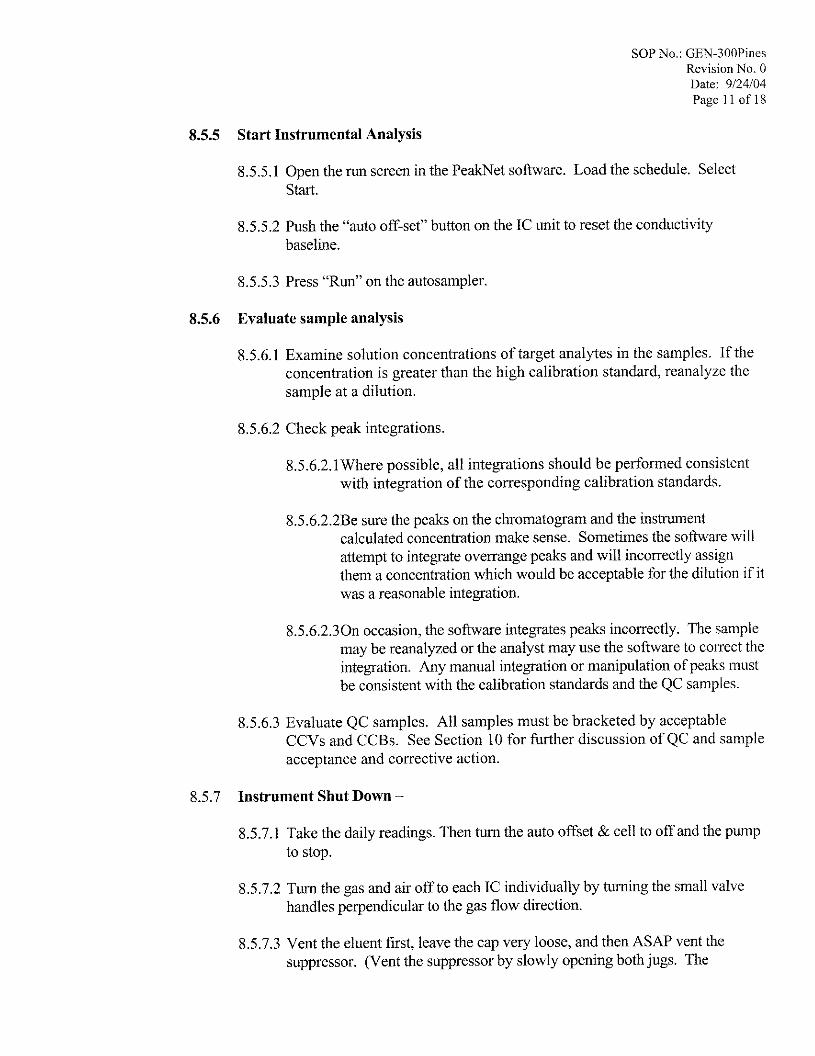
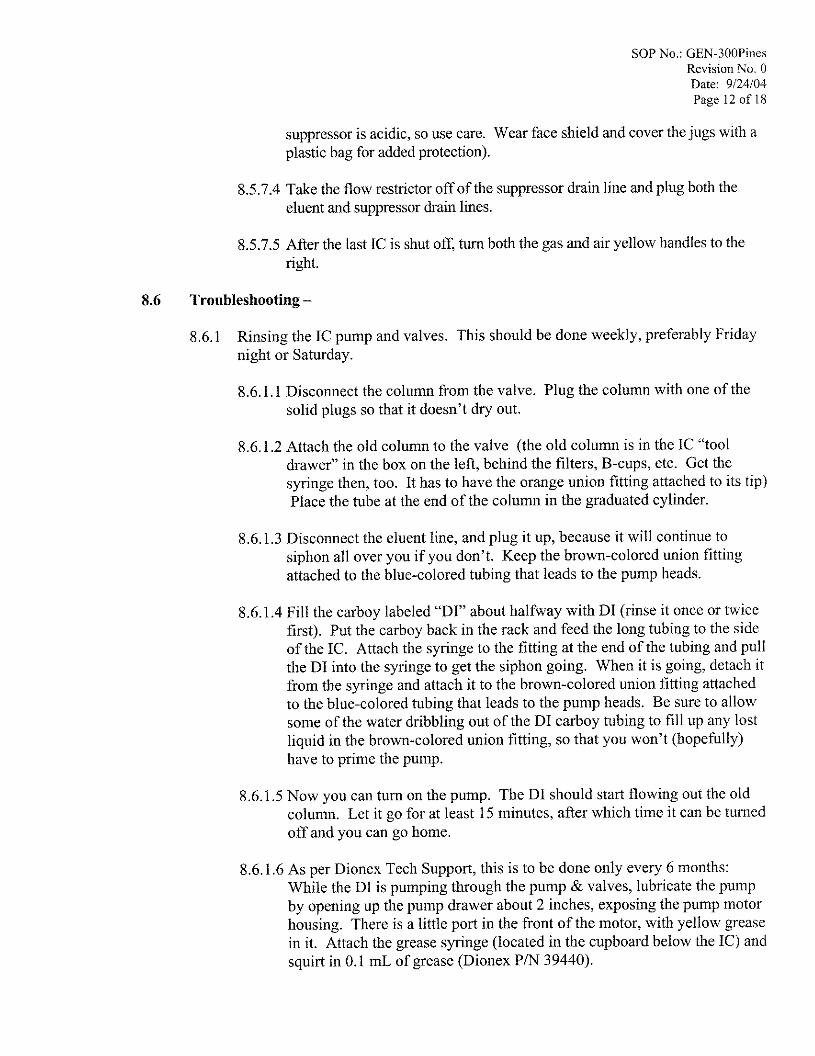
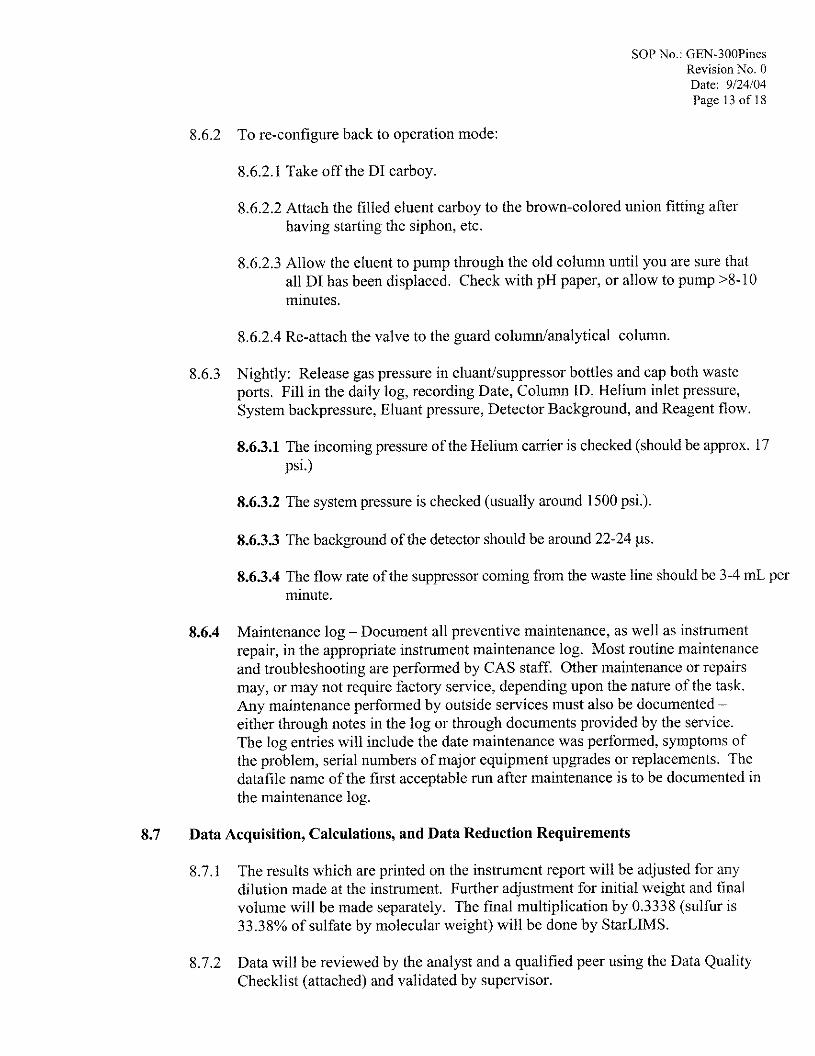
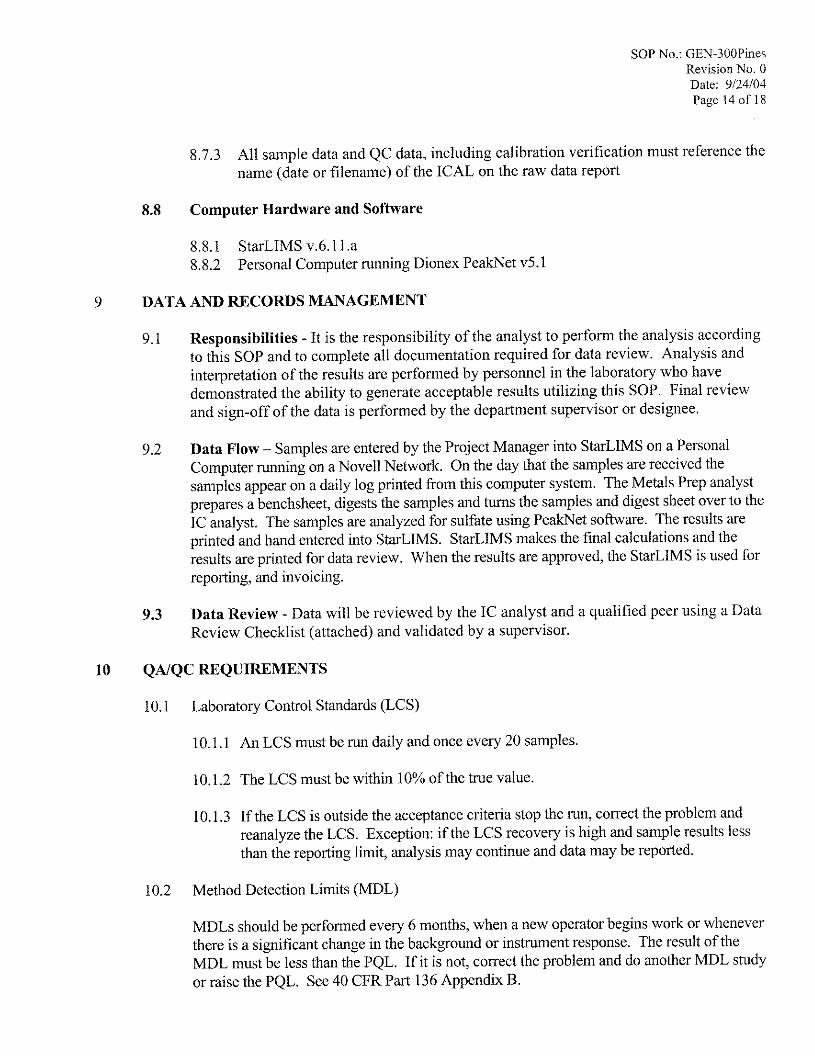
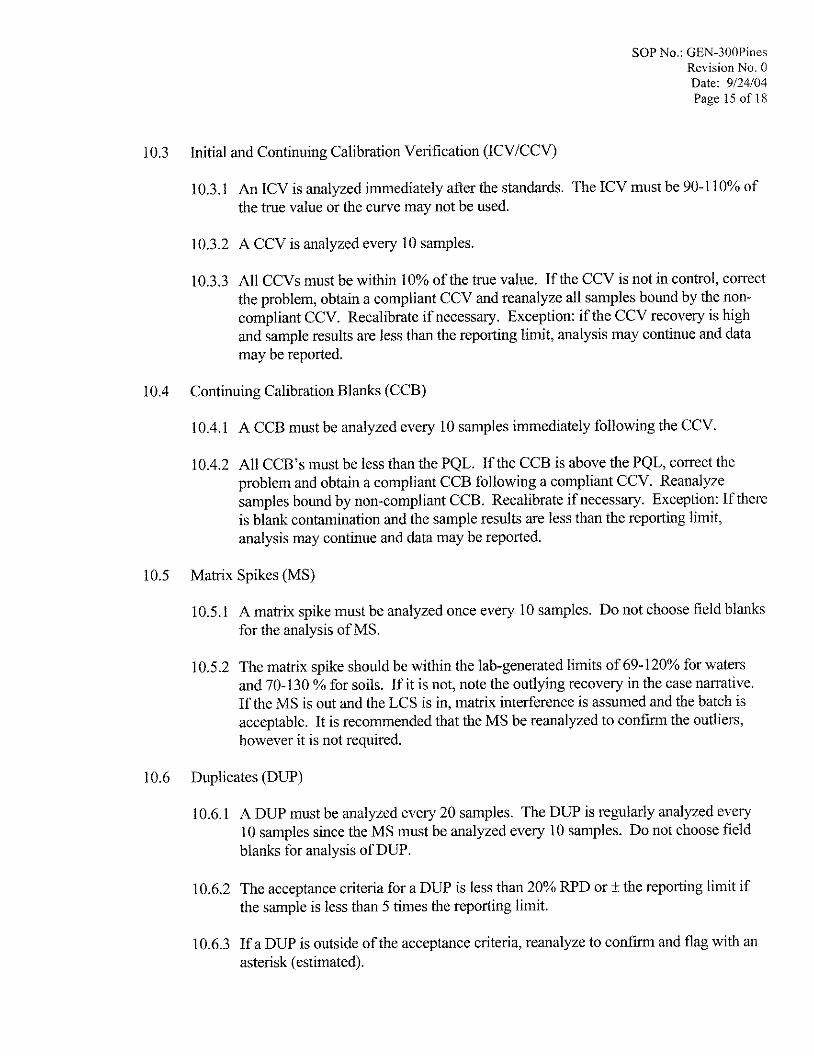
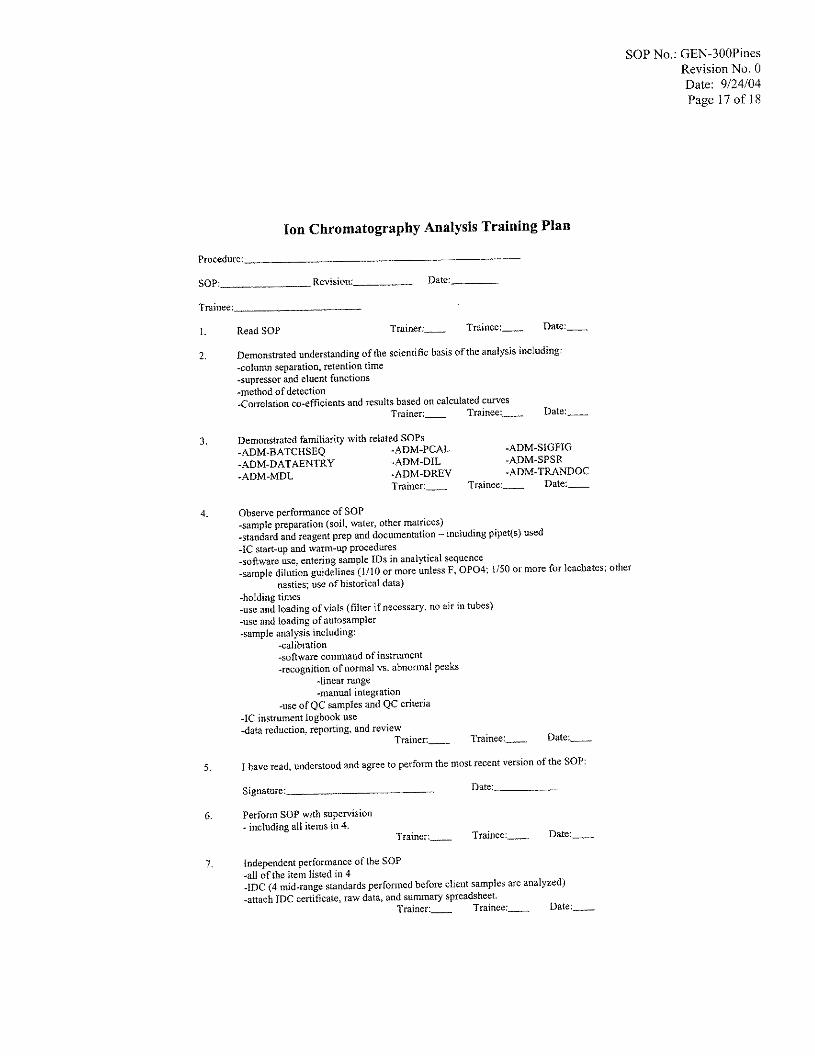
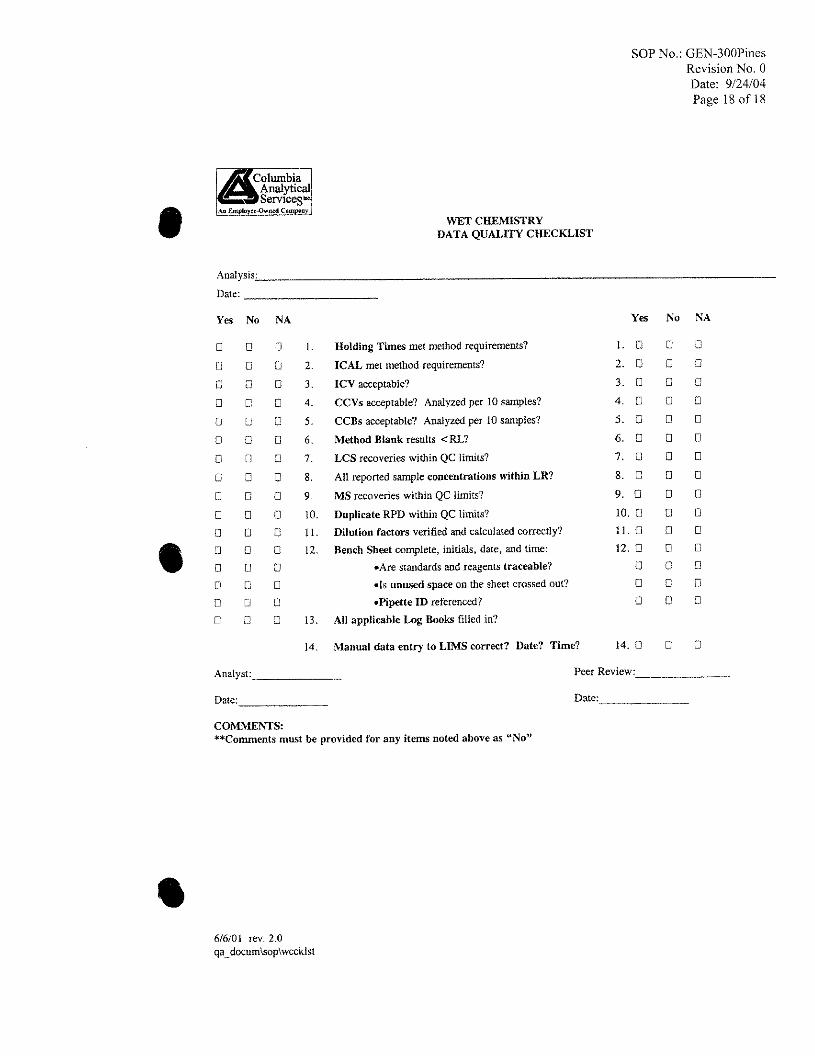
SOP Code: ADM - MDL Revision: 5 Date: August 1, 2003 Page 2 of 14
U N C O N T R O L L E DC O P Y
Standard Operating Procedure for The Determination of Method Detection Limits
1.0 PURPOSE
This standard operating procedure (SOP) documents the procedure for the determination of method detection limits (MDLs).
2.0 APPLICABILITY
The procedure described in this SOP is designed for applicability to a wide variety of sample types ranging from reagent (blank) water or wastewater containing the analyte to solids (such as soil) containing the analyte to the analyte in a gaseous matrix. The MDL for an analytical procedure will vary as a function of sample matrix. This SOP requires a complete, specific, and well-defined analytical procedure. It is essential that all sample-processing steps of the analytical procedure are included in the deter-mination of the MDL; that is, all the steps that a sample is processed through, from sample preparation to analytical completion, must be included in the MDL determination. The MDL obtained by this procedure is used to judge the significance of a single measurement of a future sample. This SOP for the determination of MDLs was designed for applicability to a broad variety of physical and chemical methods. To accomplish this, the procedure was made device or instrument-type independent.
3.0 DEFINITIONS
3.1 Method Detection Limit (MDL) The MDL is the minimum concentration of a substance or analyte that can be measured and reported with 99% confidence that the analyte concentration is greater than zero and is determined from analysis of a sample in a given matrix type containing the analyte. 3.1.1 The Calculated MDL (MDLC) is the MDL as calculated in Section 6.10 and will
typically contain two or more significant figures. 3.1.2 The Reported MDL (MDLR) is the MDL that is used for reporting purposes.
MDLs for organic analytes will be reported with two significant figures.1 MDLs for inorganic analytes will be reported with either one or two significant figures depending upon the number of significant figures in the analytes’ MRL.2
3.2 Analytical Procedure
The written, step-by-step description of the operation by which samples are processed in order to obtain the concentration of an analyte in a sample.
1 Organic analyte MDLs: see Section 6.3.2 in Reference 9.2. 2 Inorganic analyte MDLs: see Section 6.4.2 in Reference 9.2
SOP Code: ADM - MDL Revision: 5 Date: August 1, 2003 Page 3 of 14
U N C O N T R O L L E DC O P Y
3.3 Spike Level The spike level is the known concentration of analyte that is added to a matrix for the determination of the MDL.
3.4 Interferences
Interferences are defined as systematic errors in the measured analytical signal of an established procedure caused by the presence of known or unknown species (interferent) that hinder an accurate analysis of the target analyte(s).
3.5 Matrix3
3.5.1 When the matrix analyzed is aqueous (includes ground water, surface water,
waste water, drinking water, etc.), analyte-free reagent water is to be used. When the matrix analyzed is solid (includes soil, sand, tissue, or other solid materials), analyte-free soil, sand, tissue, or a suitable material is to be used. When the matrix analyzed is gaseous (i.e., air or emissions), an analyte-free, inert gas (such as zero-grade air or ultrapure helium or nitrogen) is to be used.
3.5.2 If the analysis is performed on a matrix for which there is not available an
appropriate or similar, analyte-free matrix (such as, metals analysis on soil samples), the MDL analysis will be done as prescribed by the SOP for the analysis except the sample (weight) will be omitted; that is, the analysis will be done on all the reagents but without addition of any sample.
4.0 DISCUSSION
The MDL is a property of the analytical procedure, sample matrix, and measurement system (e.g., an instrument if one is used in the analytical procedure). The MDL is a statistic. It is an estimate that includes both the systematic and random errors that are an inherent part of the analytical procedure. The MDL for a given analyte will be unique for the sample’s matrix and may be different than the MDLs shown in published methods. The MDL actually achieved in a given analysis will vary depending on instrument sensitivity and matrix effects. The relative uncertainty of an analytical measurement increases as the measured value approaches the MDL and at the MDL the uncertainty in the measured value may be 100% or greater.
3 For a list of matrices, see Section 3.3 in Reference 9.3
SOP Code: ADM - MDL Revision: 5 Date: August 1, 2003 Page 4 of 14
U N C O N T R O L L E DC O P Y
Regarding Method Proficiency, in Chapter One of the Third Edition of SW-846 (as updated) it states:
Procedures should be in place for demonstrating proficiency with each analytical method routinely used in the laboratory. These should include procedures for demonstrating the precision and bias of the method as performed by the laboratory and procedures for determining the method detection limit (MDL). All terminology, procedures and frequency of determinations associated with the laboratory’s establishment of the MDL and the reporting limit should be well-defined and well-documented. Documented precision, bias, and MDL information should be maintained for all methods performed in the laboratory.
This SOP is based upon the procedure described in 40 CFR Part 136, Appendix B (Reference 9.1).
5.0 RESPONSIBILITIES
It is the responsibility of the laboratory manager, working with the quality assurance program manager (QA PM) and department managers and supervisors, to schedule MDL determinations as they come due. It is the responsibility of the QA PM to track the status of MDLs. Completed MDL determinations are to be reviewed by the QA PM and approved by the laboratory manager and/or the QA PM before they are implemented. The QA PM is responsible for maintaining the MDL file described in Section 8.0.
6.0 PROCEDURE
6.1 General Requirements 6.1.1 MDLs are to be determined for each analyte and for each matrix. This SOP
describes procedures for determining MDLs for the generic matrices aqueous, solid, and gaseous. MDLs for specific matrix types may be adapted from the procedures in this SOP. See Section 3.5.1.
6.1.2 All sample processing steps in the analysis procedure shall be included in the
determination of the MDL. MDLs shall be generated for all preparatory and cleanup procedures routinely used on samples.
6.1.3 An MDL study is required for PCB Aroclors 1016 and 1260 only; i.e., it is not
necessary to perform an MDL study for all the PCB Aroclors, unless required by specific clients or accreditation programs.
6.1.4 An MDL study is not required for any analyte for which spiking solutions or
quality control samples are not available; e.g., temperature.
SOP Code: ADM - MDL Revision: 5 Date: August 1, 2003 Page 5 of 14
U N C O N T R O L L E DC O P Y
6.2 Frequency of MDL Determination 6.2.1 An MDL study shall be determined initially; i.e., when the procedure is first put
into production. An MDL study may also be done as part a procedure’s training requirements.
6.2.2 An MDL study shall be performed at the frequency specified in the applicable
method or as specified by an accrediting authority. For example, some state accrediting programs require annual MDL studies.
6.2.3 If an MDL study is not performed annually, an MDL verification check shall be
performed quarterly4 on every instrument used to perform a particular analysis. The MDL verification check sample is spiked at approximately two times the current MDL. The MDL verification check sample shall be acceptable if it produces a response that is at least three times above the instrument’s noise level. If the MDL verification check fails, additional MDL verification checks shall be performed at a higher level to set a higher MDL, or a new MDL study shall be performed.
6.2.4 A new MDL determination is to be performed “…each time there is a change in
the test method that affects how the test is performed, or when a change in instrumentation occurs that affects the sensitivity of the analysis.”5
6.3 Estimation of the MDL
Use one of the following guides to help estimate the MDL. 6.3.1 The concentration value that corresponds to an instrument signal-to-noise ratio in
the range of 2.5 to 5. 6.3.2 The concentration equivalent of three times the standard deviation of replicate
instrumental measurements of the analyte in reagent water. 6.3.3 That region of the calibration curve where there is a significant change in
sensitivity, i.e., a break in the slope of the calibration curve. 6.3.4 Instrumental limitations.
4 The quarterly MDL verification checking procedure is based on the procedure in Reference 9.7, Section D.1.4,
Clarification Box D-12. 5 See Reference 9.6, Section D.1.2.c) and Reference 9.7, Section D.1.4.c).
SOP Code: ADM - MDL Revision: 5 Date: August 1, 2003 Page 6 of 14
U N C O N T R O L L E DC O P Y
6.4 Aqueous Blank MDLs 6.4.1 Prepare reagent (blank) water that is as free of analyte as possible. Reagent or
interference free water is defined as a water sample in which analyte and interferent concentrations are not detected at or above the MDL of each analyte of interest.
6.4.2 Prepare a minimum of 7 (preferably 8 to 12) analyte-spiked reagent water
samples at a concentration that is 3 to 5 times the estimated MDL from Section 6.3.
6.4.3 Analyze the analyte-spiked reagent water samples prepared in Section 6.4.2 by
processing them through the entire analytical procedure. Make all computations according to the directions prescribed in the analytical procedure with the final results reported in the same units as used for water samples. Proceed to Section 6.10.
6.5 Aqueous Sample MDLs
6.5.1 Analyze the aqueous sample by processing it through the entire analytical
procedure. 6.5.2 Calculate the analyte concentration.
6.5.2.1 If the measured concentration of the analyte is in the recommended range of
3 to 5 times the estimated MDL from Section 6.3, proceed to Section 6.5.3. 6.5.2.2 If the measured concentration of the analyte is less than the
recommended 3 to 5 times the estimated MDL, add a known amount of analyte to bring the concentration of analyte between 3 to 5 times the estimated MDL and proceed to Section 6.5.3.
6.5.2.3 If the measured concentration of the analyte is greater than 5 times the
estimated MDL, either obtain another sample with a lower concentration of analyte in the same matrix, or the sample may be used as is for determining the MDL if the analyte concentration does not exceed 10 times the MDL of the analyte in reagent water. The variance of the analytical procedure changes as the analyte concentration increases from the MDL; hence the MDL determined under these circumstances may not truly reflect method variance at lower analyte concentrations. Proceed to Section 6.5.3.
6.5.3 Prepare and analyze a minimum of 7 (preferably 8 to 12) aliquots of the aqueous
sample by processing them through the entire analytical procedure. Make all computations according to the directions prescribed in the analytical procedure
SOP Code: ADM - MDL Revision: 5 Date: August 1, 2003 Page 7 of 14
U N C O N T R O L L E DC O P Y
with the final results reported in the same units as used for water samples. Proceed to Section 6.10.
6.6 Solid Blank MDLs
6.6.1 Prepare a solid material (e.g., soil, sand, tissue, Na2SO4, Teflon chips, or other
appropriate material) that is free of analyte. 6.6.2 Prepare a minimum of 7 (preferably 8 to 12) analyte-spiked solid samples at a
concentration that is 3 to 5 times the estimated MDL from Section 6.3. The same weight of analyte-spiked solid is substituted for the sample weight in the analytical procedure.
6.6.3 Analyze the analyte-spiked solid samples prepared in Section 6.6.2 by processing
them through the entire analytical procedure. Make all computations according to the directions prescribed in the analytical procedure with the final results reported in the same units as used for solid samples. Proceed to Section 6.10.
6.7 Solid Sample MDLs
6.7.1 Analyze the solid sample by processing it through the entire analytical procedure. 6.7.2 Calculate the analyte concentration.
6.7.2.1 If the measured concentration of the analyte is in the recommended range of
3 to 5 times the estimated MDL from Section 6.3, proceed to Section 6.7.3. 6.7.2.2 If the measured concentration of the analyte is less than the
recommended 3 to 5 times the estimated MDL, add a known amount of analyte to bring the concentration of analyte between 3 to 5 times the estimated MDL and proceed to Section 6.7.3.
6.7.2.3 If the measured concentration of the analyte is greater than 5 times the
estimated MDL, either obtain another sample with a lower concentration of analyte in the same matrix, or the sample may be used as is for determining the MDL if the analyte concentration does not exceed 10 times the MDL of the analyte in soil. The variance of the analytical procedure changes as the analyte concentration increases from the MDL; hence the MDL determined under these circumstances may not truly reflect method variance at lower analyte concentrations. Proceed to Section 6.7.3.
SOP Code: ADM - MDL Revision: 5 Date: August 1, 2003 Page 8 of 14
U N C O N T R O L L E DC O P Y
6.7.3 Prepare and analyze a minimum of 7 (preferably 8 to 12) aliquots of the soil sample by processing them through the entire analytical procedure. Make all computations according to the directions prescribed in the analytical procedure with the final results reported in the same units as used for solid samples. Proceed to Section 6.10.
6.8 Gaseous Blank MDLs
6.8.1 Using an appropriate sample container (e.g., Tedlar bag or SUMMA
passivated canister) and appropriate analyte-free inert gas (such as zero-grade air or ultrapure nitrogen), prepare a minimum of 7 (preferably 8 to 12) analyte-spiked inert gas samples at a concentration that is 3 to 5 times the estimated MDL from Section 6.3.
6.8.2 Analyze the analyte-spiked inert gas samples prepared in Section 6.8.1 by
processing them through the entire analytical procedure. Make all computations according to the directions in the analytical procedure with the final results reported in the same units as used for air samples. Proceed to Section 6.10.
6.9 Rejection of Replicate Sample Results
6.9.1 A replicate sample result may only be rejected if there is an assignable cause for
not using that result. Assignable causes include, but are not limited to, replicate sample preparation error, instrument malfunction, bad injection or purge, and internal standard(s) missing or response uncharacteristically high or low. The cause for rejecting the replicate sample result must be documented in the MDL data package.
6.9.2 For multi-analyte analyses, if a replicate sample result is rejected for an
assignable cause, results for all the analytes from that sample are to be rejected; that is, “picking and choosing” analyte results from a sample is not permitted.
6.10 Calculation of MDLC
6.10.1 Determine the standard deviation, s, of the replicate sample results. i
s = ∑ ( xi - x )2 n = 1 √ n - 1
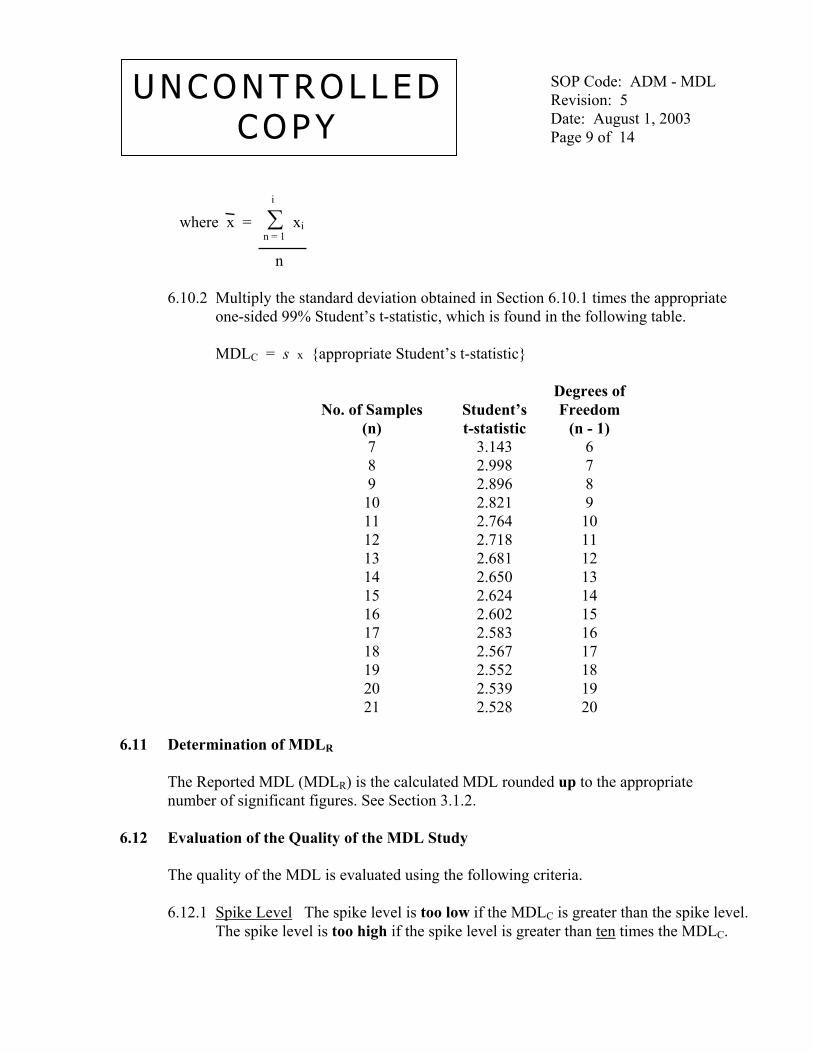
SOP Code: ADM - MDL Revision: 5 Date: August 1, 2003 Page 9 of 14
U N C O N T R O L L E DC O P Y
i
where x = ∑ xi n = 1 n 6.10.2 Multiply the standard deviation obtained in Section 6.10.1 times the appropriate
one-sided 99% Student’s t-statistic, which is found in the following table. MDLC = s x {appropriate Student’s t-statistic}
No. of Samples
(n)
Student’s t-statistic
Degrees of Freedom
(n - 1) 7 3.143 6 8 2.998 7 9 2.896 8 10 2.821 9 11 2.764 10 12 2.718 11 13 2.681 12 14 2.650 13 15 2.624 14 16 2.602 15 17 2.583 16 18 2.567 17 19 2.552 18 20 2.539 19 21 2.528 20
6.11 Determination of MDLR
The Reported MDL (MDLR) is the calculated MDL rounded up to the appropriate number of significant figures. See Section 3.1.2.
6.12 Evaluation of the Quality of the MDL Study
The quality of the MDL is evaluated using the following criteria. 6.12.1 Spike Level The spike level is too low if the MDLC is greater than the spike level.
The spike level is too high if the spike level is greater than ten times the MDLC.
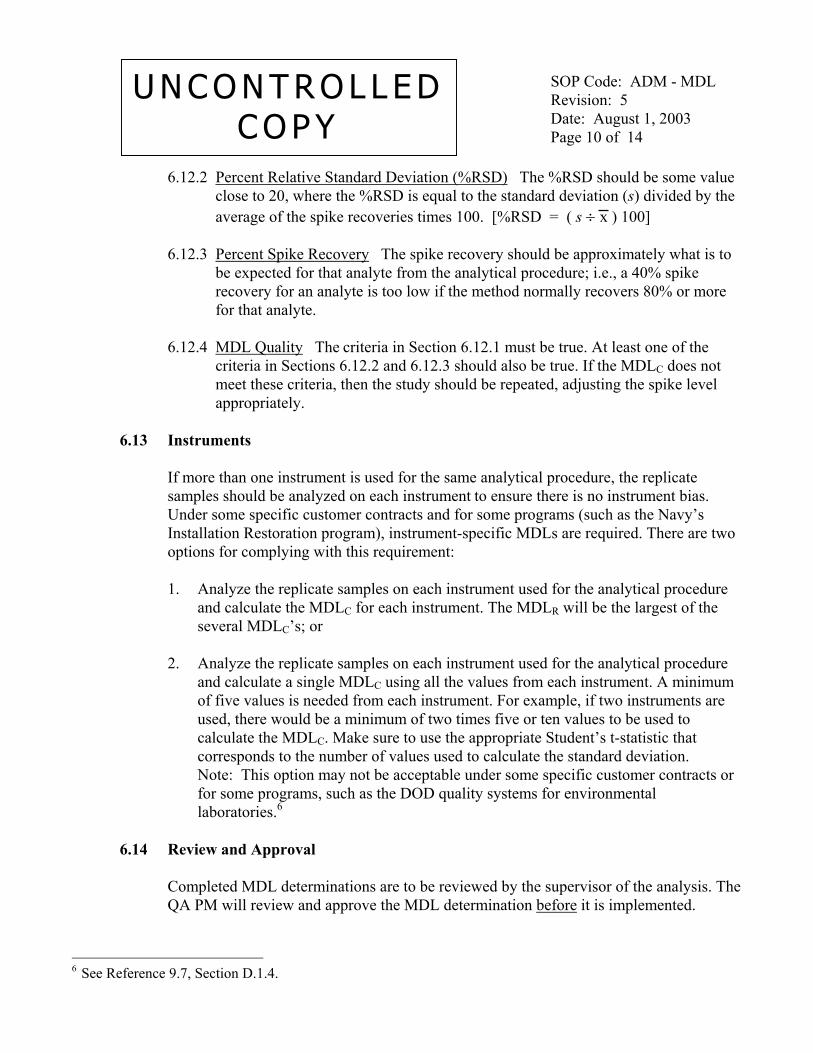
SOP Code: ADM - MDL Revision: 5 Date: August 1, 2003 Page 10 of 14
U N C O N T R O L L E DC O P Y
6.12.2 Percent Relative Standard Deviation (%RSD) The %RSD should be some value close to 20, where the %RSD is equal to the standard deviation (s) divided by the average of the spike recoveries times 100. [%RSD = ( s ÷ x ) 100]
6.12.3 Percent Spike Recovery The spike recovery should be approximately what is to
be expected for that analyte from the analytical procedure; i.e., a 40% spike recovery for an analyte is too low if the method normally recovers 80% or more for that analyte.
6.12.4 MDL Quality The criteria in Section 6.12.1 must be true. At least one of the
criteria in Sections 6.12.2 and 6.12.3 should also be true. If the MDLC does not meet these criteria, then the study should be repeated, adjusting the spike level appropriately.
6.13 Instruments
If more than one instrument is used for the same analytical procedure, the replicate samples should be analyzed on each instrument to ensure there is no instrument bias. Under some specific customer contracts and for some programs (such as the Navy’s Installation Restoration program), instrument-specific MDLs are required. There are two options for complying with this requirement: 1. Analyze the replicate samples on each instrument used for the analytical procedure
and calculate the MDLC for each instrument. The MDLR will be the largest of the several MDLC’s; or
2. Analyze the replicate samples on each instrument used for the analytical procedure
and calculate a single MDLC using all the values from each instrument. A minimum of five values is needed from each instrument. For example, if two instruments are used, there would be a minimum of two times five or ten values to be used to calculate the MDLC. Make sure to use the appropriate Student’s t-statistic that corresponds to the number of values used to calculate the standard deviation. Note: This option may not be acceptable under some specific customer contracts or for some programs, such as the DOD quality systems for environmental laboratories.6
6.14 Review and Approval
Completed MDL determinations are to be reviewed by the supervisor of the analysis. The QA PM will review and approve the MDL determination before it is implemented.
6 See Reference 9.7, Section D.1.4.
SOP Code: ADM - MDL Revision: 5 Date: August 1, 2003 Page 11 of 14
U N C O N T R O L L E DC O P Y
6.15 Department of Defense (DoD) Requirements6
6.15.1 An MDL verification check shall always be performed immediately following an
MDL study. DoD requires that the MDL check sample be spiked at approximately 2 times the current reported MDL.
6.15.2 If an annual MDL study is not performed, MDL verification checks shall be
performed quarterly. If the quarterly MDL verification check fails, additional MDL verification checks shall be performed at a higher level to set a higher MDL, or the MDL study shall be reconducted.
6.15.3 For DoD, the MDL verification check sample shall be acceptable if it produces a
response that lies at least 3 times above the instrument’s noise level.
7.0 QUALITY ASSURANCE/QUALITY CONTROL REQUIREMENTS
7.1 Replicate Samples No fewer then 7 replicate samples can be used; 8 to 12 replicate samples is preferred.
7.2 Analysis of the Replicate Samples
The replicate samples do not have to all be analyzed in the same analytical batch on the same day. In fact, it is preferred to spread out the replicate samples among several analytical batches analyzed on several days (to increase the contribution of the day-to-day variability). Furthermore, it is recommended that at least one MDL spike be routinely analyzed monthly and data accumulated and calculated at a later time.
7.3 MDL Quality
The MDL determination must meet the criteria in Section 6.12. If the MDLs from more than one instrument are combined as in Section 6.13, the combined MDL must meet the criteria in Section 6.12.
7.4 Matrices
MDLs shall be generated for all applicable matrices. See Section 6.1.1.
7.5 Preparatory and Clean-up Procedures
MDLs shall be generated for all preparatory and clean-up procedures routinely used on samples. See Section 6.1.2.
SOP Code: ADM - MDL Revision: 5 Date: August 1, 2003 Page 12 of 14
U N C O N T R O L L E DC O P Y
8.0 RECORDS
The data for the MDL determination is summarized in a table similar to the one shown in Figure 1. An Excel spread sheet similar to Figure 1 is available for this purpose. This summary and the reference to the location of the raw data are to be filed in a readily available file of MDLs. This file is to be located both in the department performing the analytical procedure and in a centralized location for MDLs from the entire laboratory. Also shown in Figure 1 are two examples illustrating how MDL data is to be summarized.
9.0 REFERENCES
9.1 40 CFR Part 136, Appendix B, Definition and Procedure for the Determination of the
Method Detection Limit--Revision 1.11. 9.2 SOP for Significant Figures, ADM-SIGFIG. 9.3 SOP for Sample Batches, ADM-BATCH. 9.4 Test Methods for Evaluating Solid Waste, Physical/Chemical Methods, SW-846, Third
Edition, September 1986 and as amended by Updates I, II, IIA, IIB, III, and IIIA. 9.5 Standard Methods for the Examination of Water and Wastewater, APHA/AWWA/WEF,
19th Edition, 1995, Method 1030E; 20th Edition, 1998, Method 1030C. 9.6 National Environmental Laboratory Accreditation Conference (NELAC), Quality Systems
Standard, Appendix D, Section D.1.2. 9.7 Department of Defense Quality Systems Manual for Environmental Laboratories, Final
Version 2, June 2002, Appendix D, Section D.1.4.
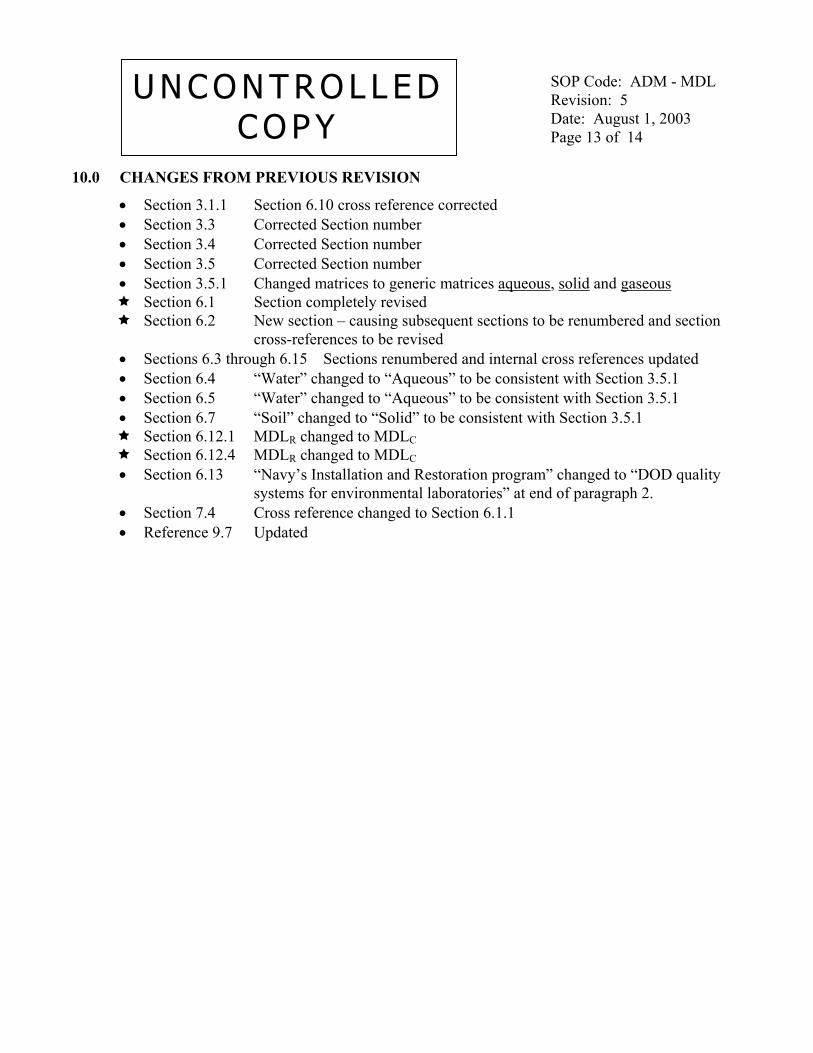
SOP Code: ADM - MDL Revision: 5 Date: August 1, 2003 Page 13 of 14
U N C O N T R O L L E DC O P Y
10.0 CHANGES FROM PREVIOUS REVISION
• Section 3.1.1 Section 6.10 cross reference corrected • Section 3.3 Corrected Section number • Section 3.4 Corrected Section number • Section 3.5 Corrected Section number • Section 3.5.1 Changed matrices to generic matrices aqueous, solid and gaseous
Section 6.1 Section completely revised Section 6.2 New section – causing subsequent sections to be renumbered and section
cross-references to be revised • Sections 6.3 through 6.15 Sections renumbered and internal cross references updated • Section 6.4 “Water” changed to “Aqueous” to be consistent with Section 3.5.1 • Section 6.5 “Water” changed to “Aqueous” to be consistent with Section 3.5.1 • Section 6.7 “Soil” changed to “Solid” to be consistent with Section 3.5.1
Section 6.12.1 MDLR changed to MDLC Section 6.12.4 MDLR changed to MDLC
• Section 6.13 “Navy’s Installation and Restoration program” changed to “DOD quality systems for environmental laboratories” at end of paragraph 2.
• Section 7.4 Cross reference changed to Section 6.1.1 • Reference 9.7 Updated
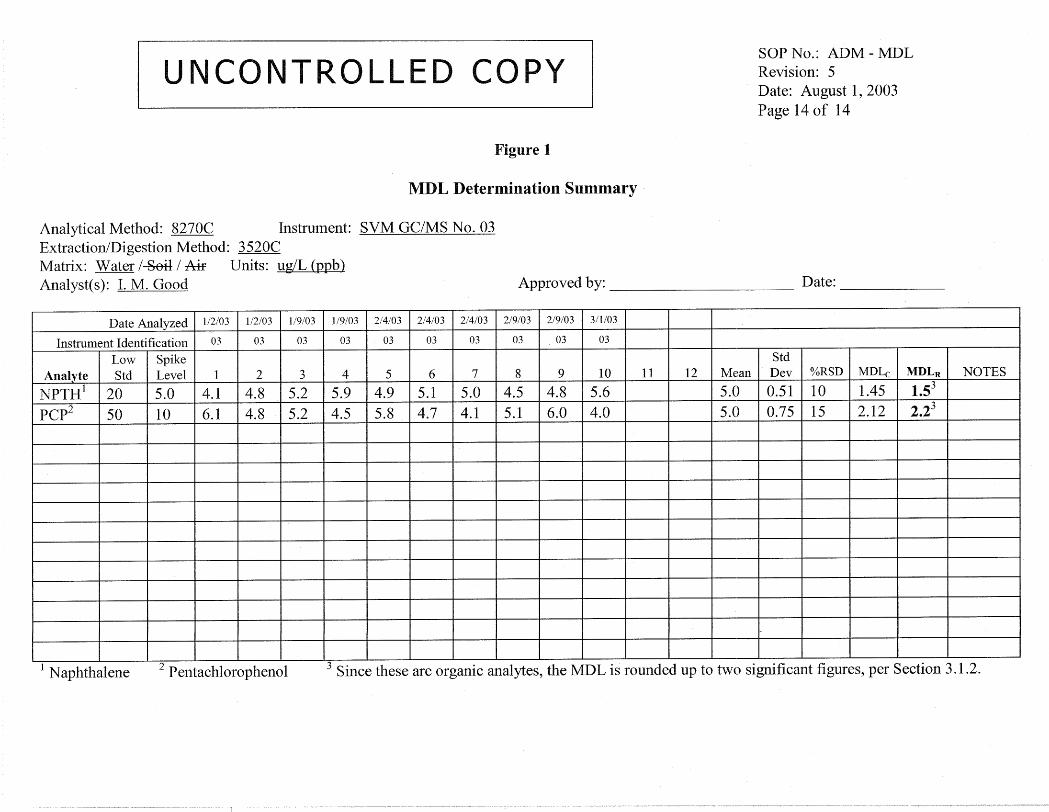
SOP No.: SMO-GEN Revision No. 2
Date: 12/8/04 Page 1 of 17
STANDARD OPERATING PROCEDURE
SAMPLE RECEIVING
SMO-GEN
Revision 2 December 8, 2004
Approved By: Supervisor Date QA Coordinator Date Laboratory Manager Date
©COLUMBIA ANALYTICAL SERVICES, INC. 2004 One Mustard St., Suite 250
Rochester, NY 14609
Annual review of this SOP has been performed DOCUMENT CONTROL and the SOP still reflects current practice.
Initials: ______ Date: __________ NUMBER: ________________ Initials: ______ Date: __________ Initials: ______ Date: __________ Initials: ______ Date: ________
SOP No.: SMO-GEN Revision No. 2
Date: 12/8/04 Page 2 of 17
1 SCOPE AND APPLICATION
This Sample Management SOP provides a key foundation to the SMO department. It explains the process of receiving samples and the steps that lead to the distribution of samples throughout the lab. By implementing an organized and thorough approach to the initial stages of the process, we can maintain an efficient and well-documented account of the samples status and condition.
2 METHOD SUMMARY
The process of receiving and distributing samples is outlined in this SOP. Upon receipt, a CR/PF is completed for each cooler. The sample information is logged into the LIMS database and then broken-down and distributed within the lab.
3 DEFINITIONS SMO Sample Management Office PM Project Manager CR/PF Cooler Receipt & Preservation Form QA/QC Quality Assurance / Quality Control LIMS Laboratory Information Management System COC Chain of Custody BREAKDOWN The act of removing samples form coolers, labeling the samples,
checking preservations, and distributing them to the correct destinations.
LOG-IN Entering the information from the COC, CRPF, and the specifics of the job into the LIMS
MATRIX The physical form of a sample. (water, oil, soil, solid, air) NELAC National Environmental Laboratory Accreditation Conference 4 INTERFERENCES
To avoid errors during log-in, detailed information shall be obtained from clients to complete chain of custody documentation.
5 SAFETY
5.1 The characteristics of incoming samples are often unknown. Treat all samples as potentially hazardous. SMO has first contact with samples and must be especially cautious.
5.2 All appropriate safety precautions for handling reagents and samples must be taken
when performing this procedure. This includes the use of personnel protective equipment, such as, safety glasses, lab coat and the correct gloves.
SOP No.: SMO-GEN Revision No. 2
Date: 12/8/04 Page 3 of 17
5.3 Sodium Hydroxide (NaOH) is a strong caustic and a severe health and contact hazard.
Use nitrile or latex gloves while handling pellets or preparing solutions.
5.4 Hydrochloric and Nitric Acid are used in this method. These acids are extremely corrosive and care must be taken while handling them. A face shield should be used while pouring acids. And safety glasses should be worn while working with the solutions. Lab coat and gloves should always be worn while working with these solutions.
5.5 Refer to the Safety Manual for further discussion of general safety procedures and
information. 6 SAMPLE CONTAINERS, COLLECTION, PRESERVATIONS, AND STORAGE
Sample preservation and storage are discussed as part of the procedure later in this SOP. 7 APPARATUS AND EQUIPMENT
• Infrared or digital thermometer – calibrated and maintained as per ADM-DALYCK. 8 PREVENTIVE MAINTENANCE
Not Applicable 9 STANDARDS, REAGENTS, AND CONSUMABLE MATERIALS
9.1 The following reagents are purchased commercially, stored at room temperature and expire upon manufacturer’s indications or 3 years from receipt if no other indication is given: Sulfuric Acid; Instranalyzed grade Nitric Acid; Instranalyzed grade Hydrochloric Acid; Instranalyzed grade Sodium Hydroxide; Lab grade
9.2 Consumable materials:
PH indicator Paper Potassium-Iodide Starch Paper for detection of residual chlorine
SOP No.: SMO-GEN Revision No. 2
Date: 12/8/04 Page 4 of 17
10 RESPONSIBILITIES
It is the responsibility of the analyst to receive samples according to this SOP and to complete all documentation required.
11 PROCEDURE
11.1 SAMPLE ACCEPTANCE POLICY
11.1.1 The laboratory’s sample acceptance policy outlines the circumstances under which samples shall be accepted or rejected. This information is made available to the sampler by an instruction sheet that accompanies each bottle set sent to the client (attached).
11.1.2 The samples received need to conform to the following acceptance criteria as
per NELAC:
• Proper, full, and complete documentation (COCs), which shall include sample identification, the location, date and time of collection, collector’s name, preservation type, sample type and any special remarks concerning the sample;
• Proper sample labeling to include unique identification and a labeling system for the samples with requirements concerning the durability of the labels (water resistant) and the use of indelible ink;
• Use of appropriate sample containers; • Adherence to specified holding times; • Adequate sample volume. Sufficient sample volume must be available
to perform the necessary tests; and • Procedures to be used when samples show signs of damage,
contamination, and inadequate preservation.
The above criteria are addressed in the rest of this section. In the event of an unacceptable sample, the Project Manager is notified and they will contact the client or recommend a proper course of action. Any data from samples which do not meet the acceptance policy must be written up in the case narrative in the report.
11.2 PROCEDURES FOR SAMPLE RECEIPT
11.2.1 The CAS Cooler Receipt and Preservation Form (CR/PF) (attached) is used
for the next steps to document the condition of the samples and coolers as per the Acceptance Policy.
SOP No.: SMO-GEN Revision No. 2
Date: 12/8/04 Page 5 of 17
11.2.2 Upon receipt, the coolers are examined for presence and condition of custody seals, locks, shipping bills, etc. The shipping labels are removed and placed on scrap paper and added to the receiving paper work.
11.2.3 The coolers are opened and examined for any existing hazards before
subsequent processing.
CAUTION: If samples exhibit any strong odors, or samples have been damaged, move cooler to the hood and continue processing per client.
11.2.4 Chain of Custody (COC) forms (attached) and any other documents are
located, removed and signed with date & time as received. Visually scan the COC for short holding time samples.
11.2.5 The temperature of the cooler is measured following the guidelines in this
SOP. The acceptance criteria for samples is 0-6°C. If a cooler exhibits a temperature greater than 6°C, or exhibits any other anomalies (deviations from the Acceptance Policy), the anomalies are noted on the CR/PF and the CR/PF is placed on top of the COC packet.
11.2.5.1Samples which are hand delivered immediately after collection
(delivered within 4 hours of sampling) may not have had time to cool. The samples are considered acceptable by NELAC if there is evidence that the chilling process has begun. Document the presence of ice on the CR/PF with a note about the 4-hour rule.
11.2.6 Once the coolers are initially examined and observations and temperature are
recorded, all of the COCs with corresponding CR/PF forms and shipping labels are submitted for review to the appropriate Project Manager. (The receiving paper work is comprised of at least 3 pages; the COC, a CR/PF, and a shipping label).
11.2.7 Rush requests and samples with short holding times are always given top
priority for initial processing. CAS follows EPA guidelines for preservation and holding time as outlined in our QA/QC manual Table 7-1. A list of short holding time parameters are attached to this SOP. An additional list of holding times may be found in SMO-BPS. If short holding time samples need to be distributed immediately (before log-in and labeling), distribute the samples with the attached form for Internal Tracking. Write all short holding time samples on the white board in Wetchem.
11.2.8 In the down time between receiving and actual breakdown of samples, the
coolers are stored in the SMO walk-in cooler, which also maintains a temperature of 0-6°C.
SOP No.: SMO-GEN Revision No. 2
Date: 12/8/04 Page 6 of 17
11.3 LOG-IN/LIMS
11.3.1 At log-in, the Project Manager enters the entire job into the LIMS system. The job is given a submission number, which consists of the lab location, year, and a unique sequential number. (R20-1508)
11.3.2 Each sample is given a unique order number during log-in. This number is
unique to a given location or sample site. A single sample site may consist of many bottles according to the analyses requested. The individual bottles within an order number are uniquely identified with the use of a bar code placed on the bottles during sample breakdown. See SMO-ICOC.
11.3.3 COC’ s are returned to SMO after the Project Manager has approved all
anomalies (See ADM-PCR) and entered the job into the LIMS database. At this point, the jobs are approved for breakdown.
11.4 SAMPLE BREAKDOWN
11.4.1 Sample containers are removed and organized according to chain of custody identification and analysis.
11.4.2 The following verifications are made as to the agreement of chain of custody
information as it applies to samples and containers received:
• Sample identification, time, date • Number of containers received • Matrix • Correct bottles for analysis requested. • Correct sample volume for analysis • Correct preservatives for analysis – according to the labels. The actual
preservation will be tested as below. Any discrepancies are reported to the Project Manager. Tests may be added or deleted so that LIMS matches the actual samples received. See the discrepancies section of this SOP (i.e. jobs can not have tests scheduled when the sample containers do not exist.)
11.4.3 Labels are printed from the LIMS database and placed on the sample
containers.
11.4.4 Barcodes are generated which are unique to each container for the purpose of sample tracking. VOA bags receive one barcode and each vial within the bag must be labeled with a different number (if not already done so when preparing the bottle set)
SOP No.: SMO-GEN Revision No. 2
Date: 12/8/04 Page 7 of 17
11.4.5 Preservations are checked on the appropriate samples and recorded on the job paperwork, the preservation check log, and preservative lot numbers are recorded on the front page of the paper work (the Analytical Request).
11.4.6 To check the preservation, place a small piece of pH test paper in a dispo-cup
and pour a small aliquot of the sample into a dispo-cup. Observe the color of the paper and compare to the colors on the paper dispenser to determine the pH. The preservation of samples should be as below:
HCl, HNO3, H2SO4 pH < 2 NaOH pH > 12 PCB 608 pH 5-9
If the sample was not sufficiently preserved, notify the Project Manager to determine whether more preservative should be added.
11.4.7 To check the chlorine residual, place a small piece of starch paper in a dispo-
cup and pour a small aliquot of the sample into a dispo-cup (this may be done on the same aliquot used to test pH). If the paper turns blue there is chlorine residual present in the sample. Note the discrepancy on the CR/PC and notify the Project Manager. The Project Manager may contact the client to determine if ascorbic acid should be added to eliminate the chlorine residual.
11.4.8 The CR/PC form is finished by the person who broke down the job.
11.4.9 All of the jobs are reviewed for completeness at the end of the day (or the
following morning), and the walk-in cooler temperatures are logged into a temperature logbook.
11.5 SAMPLE DISTRIBUTION
11.5.1 After a job is labeled, the samples are distributed to the appropriate
department. The samples are scanned into the appropriate storage areas as listed below.
11.5.2 CAS-Rochester currently maintains 3 walk-in coolers to refrigerate samples.
Extractables share a cooler with Metals, VOAs have a cooler, and WetChem shares the cooler with SMO. Metals are maintained at room temperature and are placed on a dedicated cart in the metals department. Mercury and TCLP samples are placed in the Metals/Extractables cooler. SMO is responsible for documenting the location of the Wetchem samples in the Wetchem/SMO cooler.
11.6 SAMPLE SECURITY AND STORAGE:
SOP No.: SMO-GEN Revision No. 2
Date: 12/8/04 Page 8 of 17
11.6.1 Bar-coding is used as a means of sample tracking. Custody is maintained according to SMO-ICOC.
11.6.2 The sample coolers are secured with locks, which can be accessed by technical
laboratory personnel, project managers, administrative support personnel and all senior staff members. All of the sample storage facilities are located in our building which is a secured area. Storage areas are kept clean and dry to avoid any damage or deterioration of samples while in storage.
11.6.3 Samples are held in refrigerators (if applicable) until analysis is completed and
reported to the Client. Routine samples are typically held for 30 days after mailing of report and CLP samples are stored for 90 days after report has been mailed.
11.6.4 Refrigeration is maintained at a temperature of 0-6° Celsius.
11.7 DISCREPANCIES
11.7.1 Any discrepancies or concerns such as non-matching identifications, missing samples, and tests not scheduled correctly are to be verbally communicated to the Project Manager. Any action taken is recorded on the COC and/or cooler receipt form, “as per” Project Manager. The Project Manager will make any contact to the client when they deem it necessary. If a Chain of Custody is not received, the Project Manager is informed and a CAS COC is filled out.
11.7.2 In the event of broken samples, a note is entered on the Chain of Custody and/or
the CR/PF accompanying the samples. Information pertaining to the sample is forwarded to the Project Manager for follow up purposes. Cleanup procedures are as follows: • Liquids: Broken glass is handled carefully using disposable gloves and
disposed of in the Glass Disposal Box. The liquid is disposed of in the SMO sink or under a hood if strong odors are evident. Any packing material is disposed of appropriately.
• Soils: The same documentation as liquids applies. Broken glass is
disposed of in the Glass Disposal Box and the soil is disposed of into the garbage.
11.8 RECEIVING SAMPLE COOLERS ON WEEKENDS OR AFTER HOURS
11.8.1 The date received is the date on which the Laboratory Personnel takes
possession of the samples. The client shall sign the COC as relinquished and the CAS employee shall sign in the adjacent box as received. If an employee outside of the SMO department receives the samples, the coolers or samples
SOP No.: SMO-GEN Revision No. 2
Date: 12/8/04 Page 9 of 17
are stored in a locked walk-in cooler and all paperwork is left on the lab bench in SMO for login the next working day.
11.8.2 If the samples are received by SMO staff but the samples cannot be processed
through the complete log-in procedure on the date received, the receiving procedure is performed as outlined in 11.1 and 11.2. Then SMO needs to check for short holding time samples. Short holding time tests are posted in breakdown. Most of the tests have holding times of 48 hours which means samples received on Saturday need to be run before Monday. Any cooler integrity issues shall be handled on the next business day, but the samples need to be tested so that holding times are maintained. To maintain an organized system, notes are indicated on the COC and on the white board in Wetchem as to which samples have been sent for analysis. Use the attached form for Internal Tracking of Short holding time samples.
11.9 SAMPLE SHIPPING TO SUBCONTRACT LABS
11.9.1 The sample is logged in and the test code for subcontracted analysis is assigned. 11.9.2 For CAS Network Labs: Subcontracted samples are shipped to the network lab
with a copy of the Internal Service Request form (ISR) and copy of the COC. The tests being subcontracted must be highlighted and the number of containers adjusted or a new COC is completed.
11.9.3 For other labs: A purchase order (PO) is filled out for work going to another
contract laboratory. TAT, deliverables, etc. should be clearly specified. A new Chain of Custody form is filled out with the pertinent information so the samples can be analyzed in a fashion that meets the client's needs.
11.9.4 Samples are prepared for shipping by packing in bubble wrap, and ice.
Temperature blanks, and the chain of custody are placed in shipping coolers. Custody seals are signed and dated and placed on the front of the cooler. The cooler is then sealed with packaging tape and shipped overnight through the courier system (confirm with Project Manager for am or pm delivery requirements).
11.10 THERMOMETER MEASUREMENTS
11.10.1 Unless unavailable, measure the cooler/sample temperature of an incoming cooler with the Infrared (IR) thermometer. Turn on the thermometer and point it at the temp blank or a sample (preferably clear glass or amber glass). Wipe the container with a dry paper towel. Hold the thermometer approximately 3-6 inches from the container and at least 3 inches above the counter. Temperature is rounded to the nearest whole number and recorded to the nearest whole
SOP No.: SMO-GEN Revision No. 2
Date: 12/8/04 Page 10 of 17
number on the cooler receipt form and COC. This method is preferred to the digital thermometer method.
11.10.2 If the IR thermometer is not available, a digital thermometer may be used. Place
the thermometer in the temperature blank or plunge it into the packing material or place it as deep into the cooler as is practical with the lid closed. Allow to equilibrate 5 minutes. After measurement, the temperature is recorded to the nearest whole number in the appropriate space on the cooler receipt form and COC.
12 QA/QC REQUIREMENTS
12.1 Not Applicable 13 DATA REDUCTION AND REPORTING
13.1 All samples, custody documents and discrepancy forms must be clearly completed with permanent ink and filed with the project folder.
14 WASTE MANAGEMENT AND POLLUTION PREVENTION
14.1 Not applicable. 15 REFERENCES
15.1 Test Methods for Solid and Hazardous Waste Physical and Chemical Analyses, USEPA SW846, December 1996.
15.2 NYSDEC Analytical Services Protocol, October 1995. 15.3 NELAC Standard, Chapter 5, July 2002.
16 TRAINING OUTLINE
• Read this SOP. • Follow policies in ADM-TRANDOC. • Observe performance of this SOP. Follow Breakdown Training Plan Form. • Perform this SOP with guidance. • Perform this SOP independently and have a trained analyst check the trainee’s work.
If work is acceptable, complete Training Plan Form and file with QA. 17 INSTRUMENT-SPECIFIC ADDENDUM
Not Applicable
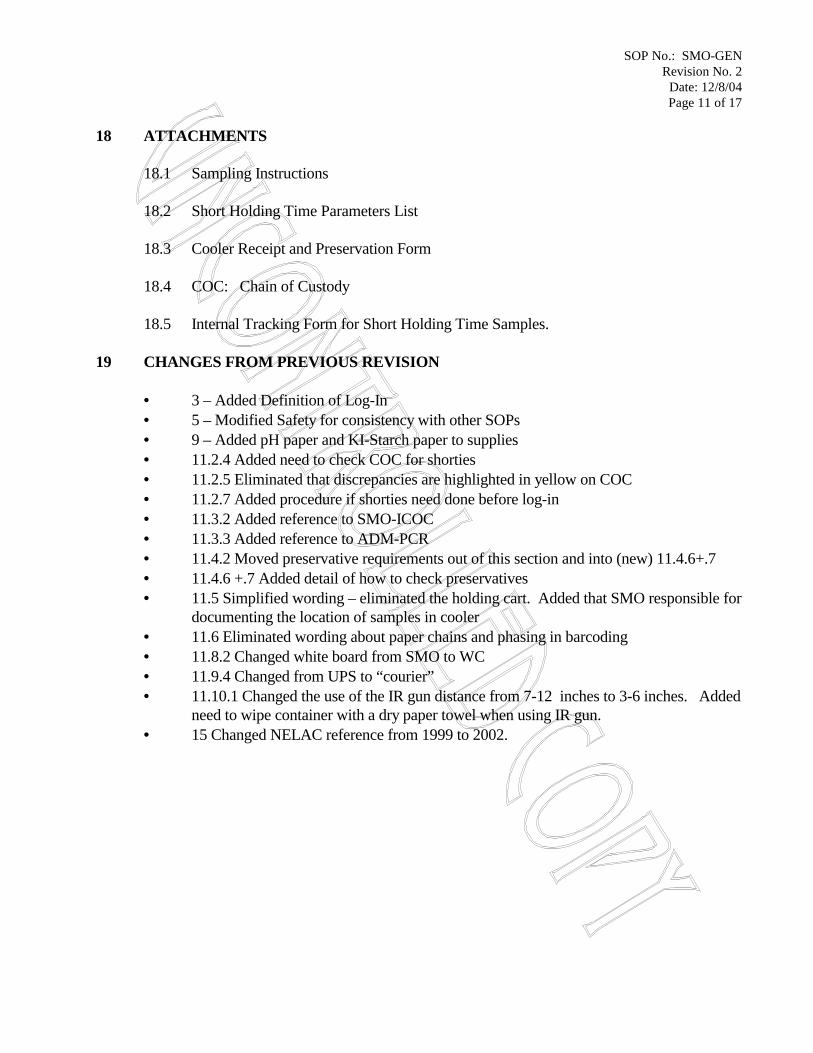
SOP No.: SMO-GEN Revision No. 2
Date: 12/8/04 Page 11 of 17
18 ATTACHMENTS
18.1 Sampling Instructions 18.2 Short Holding Time Parameters List 18.3 Cooler Receipt and Preservation Form 18.4 COC: Chain of Custody
18.5 Internal Tracking Form for Short Holding Time Samples.
19 CHANGES FROM PREVIOUS REVISION
• 3 – Added Definition of Log-In • 5 – Modified Safety for consistency with other SOPs • 9 – Added pH paper and KI-Starch paper to supplies • 11.2.4 Added need to check COC for shorties • 11.2.5 Eliminated that discrepancies are highlighted in yellow on COC • 11.2.7 Added procedure if shorties need done before log-in • 11.3.2 Added reference to SMO-ICOC • 11.3.3 Added reference to ADM-PCR • 11.4.2 Moved preservative requirements out of this section and into (new) 11.4.6+.7 • 11.4.6 +.7 Added detail of how to check preservatives • 11.5 Simplified wording – eliminated the holding cart. Added that SMO responsible for
documenting the location of samples in cooler • 11.6 Eliminated wording about paper chains and phasing in barcoding • 11.8.2 Changed white board from SMO to WC • 11.9.4 Changed from UPS to “courier” • 11.10.1 Changed the use of the IR gun distance from 7-12 inches to 3-6 inches. Added
need to wipe container with a dry paper towel when using IR gun. • 15 Changed NELAC reference from 1999 to 2002.
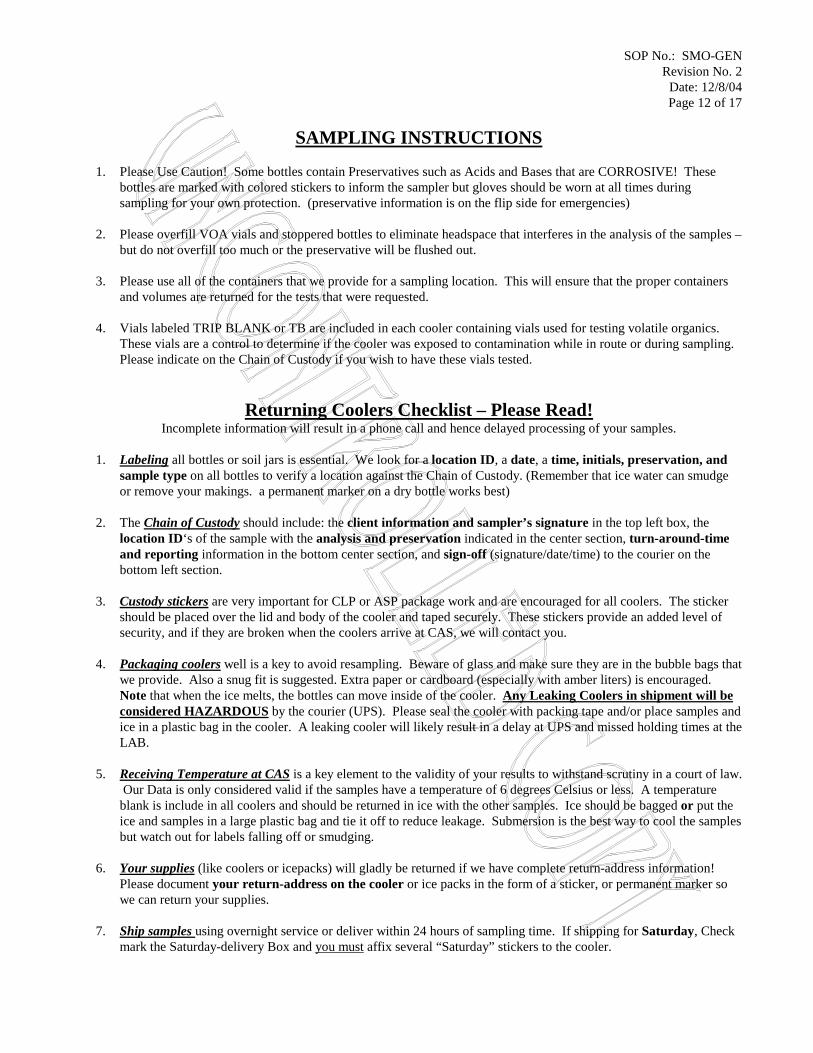
SOP No.: SMO-GEN Revision No. 2
Date: 12/8/04 Page 12 of 17
SAMPLING INSTRUCTIONS 1. Please Use Caution! Some bottles contain Preservatives such as Acids and Bases that are CORROSIVE! These
bottles are marked with colored stickers to inform the sampler but gloves should be worn at all times during sampling for your own protection. (preservative information is on the flip side for emergencies)
2. Please overfill VOA vials and stoppered bottles to eliminate headspace that interferes in the analysis of the samples –
but do not overfill too much or the preservative will be flushed out. 3. Please use all of the containers that we provide for a sampling location. This will ensure that the proper containers
and volumes are returned for the tests that were requested. 4. Vials labeled TRIP BLANK or TB are included in each cooler containing vials used for testing volatile organics.
These vials are a control to determine if the cooler was exposed to contamination while in route or during sampling. Please indicate on the Chain of Custody if you wish to have these vials tested.
Returning Coolers Checklist – Please Read! Incomplete information will result in a phone call and hence delayed processing of your samples.
1. Labeling all bottles or soil jars is essential. We look for a location ID, a date, a time, initials, preservation, and
sample type on all bottles to verify a location against the Chain of Custody. (Remember that ice water can smudge or remove your makings. a permanent marker on a dry bottle works best)
2. The Chain of Custody should include: the client information and sampler’s signature in the top left box, the
location ID‘s of the sample with the analysis and preservation indicated in the center section, turn-around-time and reporting information in the bottom center section, and sign-off (signature/date/time) to the courier on the bottom left section.
3. Custody stickers are very important for CLP or ASP package work and are encouraged for all coolers. The sticker
should be placed over the lid and body of the cooler and taped securely. These stickers provide an added level of security, and if they are broken when the coolers arrive at CAS, we will contact you.
4. Packaging coolers well is a key to avoid resampling. Beware of glass and make sure they are in the bubble bags that
we provide. Also a snug fit is suggested. Extra paper or cardboard (especially with amber liters) is encouraged. Note that when the ice melts, the bottles can move inside of the cooler. Any Leaking Coolers in shipment will be considered HAZARDOUS by the courier (UPS). Please seal the cooler with packing tape and/or place samples and ice in a plastic bag in the cooler. A leaking cooler will likely result in a delay at UPS and missed holding times at the LAB.
5. Receiving Temperature at CAS is a key element to the validity of your results to withstand scrutiny in a court of law.
Our Data is only considered valid if the samples have a temperature of 6 degrees Celsius or less. A temperature blank is include in all coolers and should be returned in ice with the other samples. Ice should be bagged or put the ice and samples in a large plastic bag and tie it off to reduce leakage. Submersion is the best way to cool the samples but watch out for labels falling off or smudging.
6. Your supplies (like coolers or icepacks) will gladly be returned if we have complete return-address information!
Please document your return-address on the cooler or ice packs in the form of a sticker, or permanent marker so we can return your supplies.
7. Ship samples using overnight service or deliver within 24 hours of sampling time. If shipping for Saturday, Check
mark the Saturday-delivery Box and you must affix several “Saturday” stickers to the cooler.
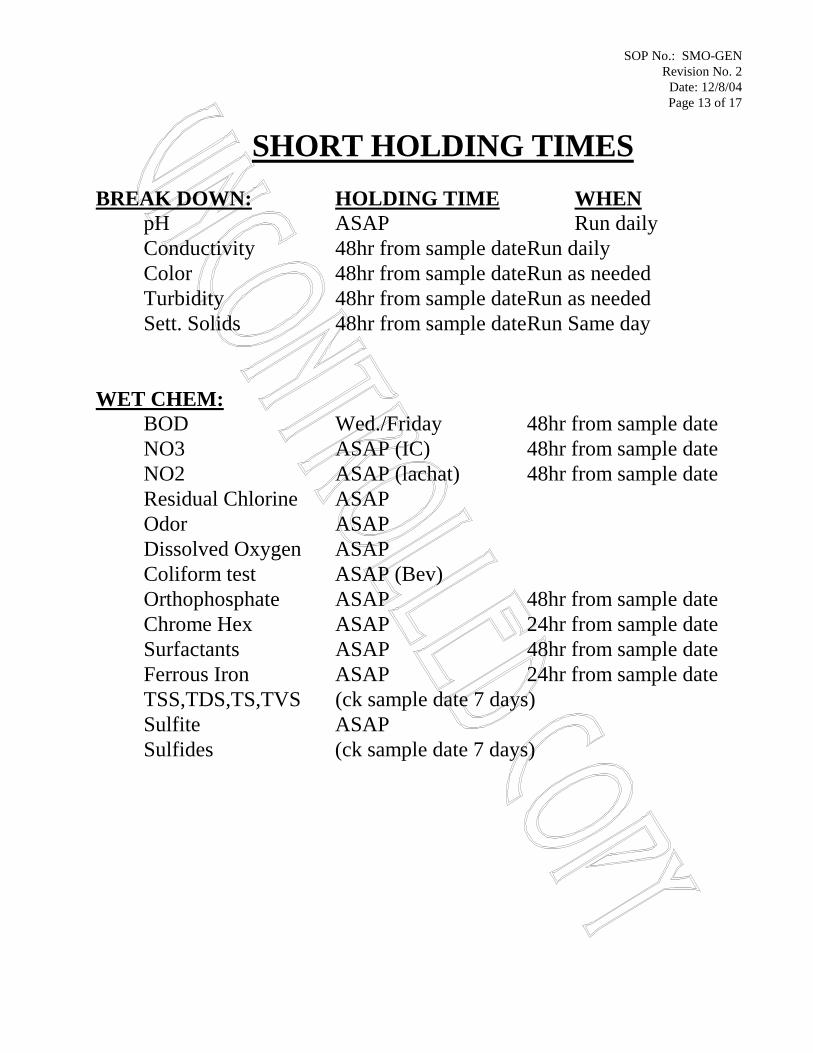
SOP No.: SMO-GEN Revision No. 2
Date: 12/8/04 Page 13 of 17
SHORT HOLDING TIMES BREAK DOWN: HOLDING TIME WHEN pH ASAP Run daily Conductivity 48hr from sample date Run daily Color 48hr from sample date Run as needed Turbidity 48hr from sample date Run as needed Sett. Solids 48hr from sample date Run Same day WET CHEM: BOD Wed./Friday 48hr from sample date NO3 ASAP (IC) 48hr from sample date NO2 ASAP (lachat) 48hr from sample date Residual Chlorine ASAP Odor ASAP Dissolved Oxygen ASAP Coliform test ASAP (Bev) Orthophosphate ASAP 48hr from sample date Chrome Hex ASAP 24hr from sample date Surfactants ASAP 48hr from sample date Ferrous Iron ASAP 24hr from sample date TSS,TDS,TS,TVS (ck sample date 7 days)
Sulfite ASAP Sulfides (ck sample date 7 days)
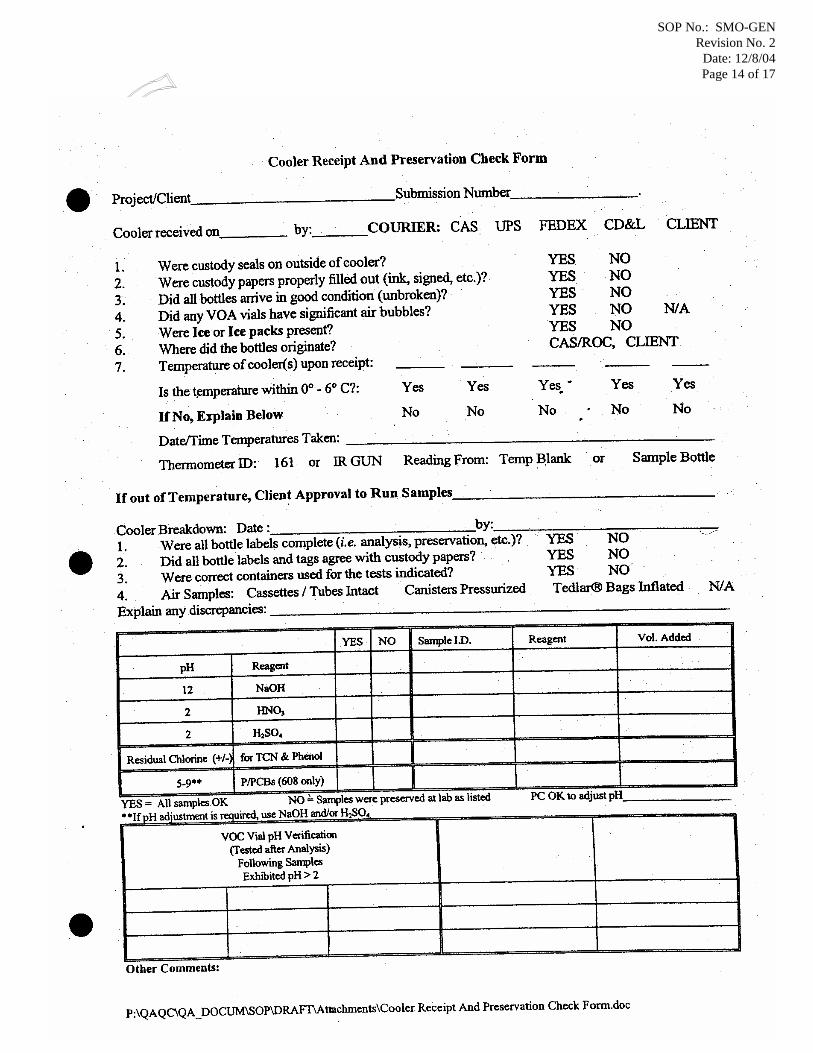
SOP No.: SMO-GEN Revision No. 2
Date: 12/8/04 Page 14 of 17
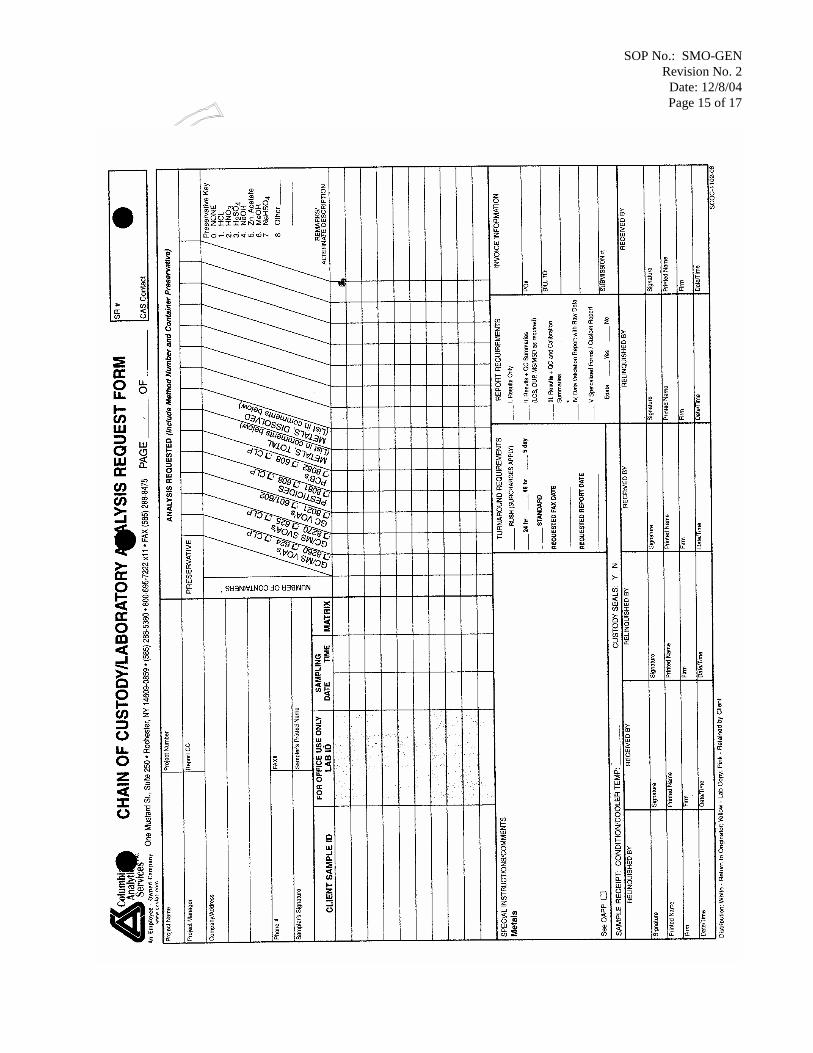
SOP No.: SMO-GEN Revision No. 2
Date: 12/8/04 Page 15 of 17
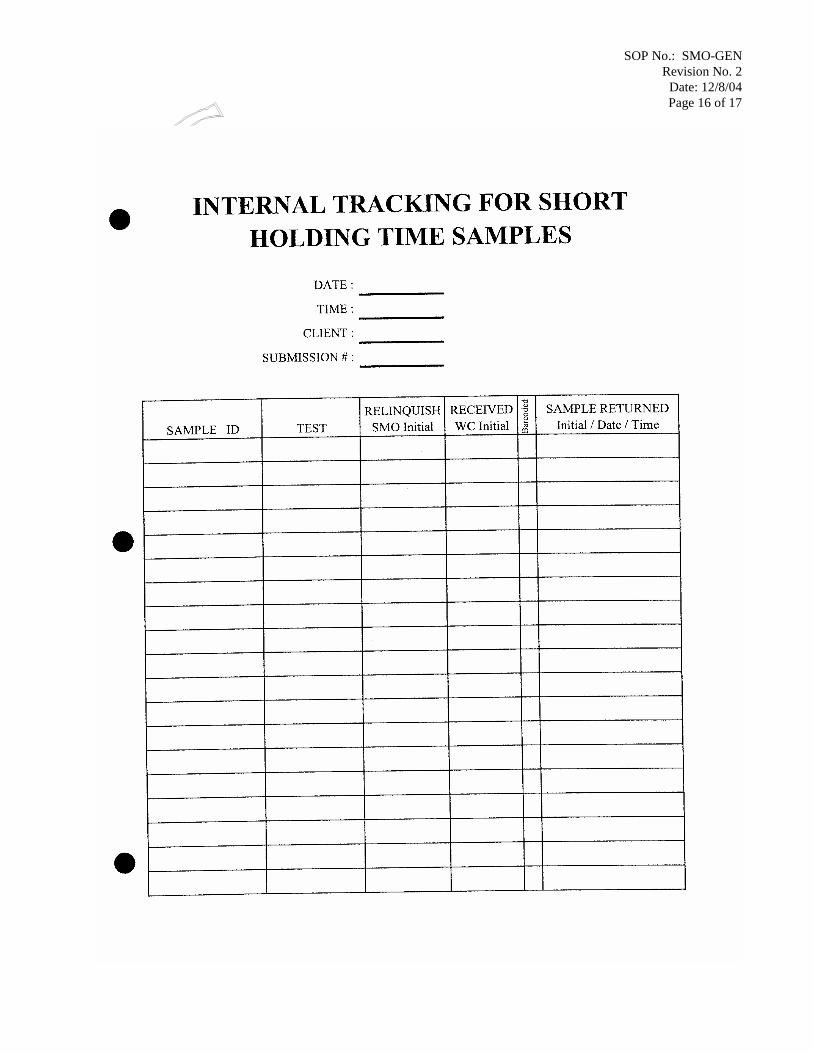
SOP No.: SMO-GEN Revision No. 2
Date: 12/8/04 Page 16 of 17
SOP No.: GEN-TOCLK/9060/TICLK Revision No. 2 Date: 1/17/05
Page 1 of 18
STANDARD OPERATING PROCEDURE
TOTAL ORGANIC CARBON or TOTAL INORGANIC CARBON IN SOILS
GEN-TOCLK/9060/TICLK
Revision 2
January 17, 2005 Approved By: Supervisor Date QA Coordinator Date Laboratory Manager Date
©COLUMBIA ANALYTICAL SERVICES, INC., 2005 One Mustard St., Suite 250
Rochester, NY 14609
Annual review of this SOP has been performed DOCUMENT CONTROL and the SOP still reflects current practice.
Initials: ______ Date: __________ NUMBER: ________________ Initials: ______ Date: __________ Initials: ______ Date: __________ Initials: ______ Date: __________
1. SCOPE AND APPLICATION
*See DoD Summary for DoD Specific Criteria
SOP No.: GEN-TOCLK/9060/TICLK Revision No. 2 Date: 1/17/05
Page 2 of 18
1.1. This procedure is applicable to the determination of Total Organic Carbon (TOC) in soils and sludges using the EPA document “Determination of Total Organic Carbon in Sediment” prepared by Lloyd Kahn (EPA 1988) or EPA SW846 9060. Total Inorganic Carbon (TIC) may be calculated by subtraction of TOC from Total Carbon(TC).
1.2. The current system will measure up to about 1500 ug/g C when the smallest sample
volume is used. When a range extender is used on the instrument, the range is extended to about 8000 ug/g C.
1.3. Normal operating parameters yield a Practical Quantitation Limit (PQL) of 300 mg/Kg.
Equivalent nomenclature for PQL includes Estimated Quantitation Limit (EQL) and Method Reporting Limit (MRL).
1.4. Data are reported in mg/kg on a dry weight basis.
2. METHOD SUMMARY
2.1. Treatment prior to analysis of carbon
2.1.1. For TOC - Inorganic Carbon from carbonates and bicarbonates is removed by
treatment with acid. 2.1.2. For TC - Inorganic Carbon from carbonates and bicarbonates is NOT removed by
treatment with acid. 2.1.3. For TIC - The samples are put through the process twice – once to measure Total
Carbon (TC), and once to measure Total Organic Carbon (TOC). The Total Inorganic Carbon (TIC) is calculated by difference.
2.2. The carbon compounds are decomposed into carbon dioxide and other gases by
pyrolysis at 800 °C in the presence of air. The interfering gases are removed by a sparger/scrubber system. The carbon dioxide that is formed is determined by direct nondispersive infrared detection that has been calibrated to directly display the mass of carbon dioxide detected. The resulting carbon mass in the form of carbon dioxide is the equivalent to the mass of carbon (TOC or TC) originally in the sample.
3. DEFINITIONS
3.1. Initial Calibration - analysis of analytical standards for a series of different specified
concentrations; used to define the linearity and dynamic range of the response of the system.
3.2. QA/QC Samples: Samples added to a sample preparation batch, or an analytical batch
to provide quality assurance checks on the analysis. 3.2.1. Matrix Spike (MS) - In the matrix spike analysis, a predetermined quantity of
*See DoD Summary for DoD Specific Criteria
SOP No.: GEN-TOCLK/9060/TICLK Revision No. 2 Date: 1/17/05
Page 3 of 18 standard solution is added to a sample matrix prior to sample analysis. The purpose of the matrix spike is to evaluate the effects of the sample matrix on the methods used for the analyses. Percent recoveries are calculated for the analyte detected.
3.2.2. Duplicate Sample (DUP) - A laboratory duplicate. The duplicate sample is a
separate field sample aliquot that is processed in an identical manner as the sample proper. The relative percent difference between the samples is calculated and used to assess analytical precision.
3.2.3. Laboratory Control Standard (LCS) - In the LCS or blank spike analysis,
predetermined quantities of standard solutions of certain analytes are added to a blank prior to sample analysis. Percent recoveries are calculated for the analyte detected and used to verify the linear range daily.
3.3. Relative Percent Difference (RPD) – The absolute value of the difference of two
values divided by the average of the same two values. Used to compare the precision of the analysis. The result is always a positive number.
3.4. Batch - Samples processed together as a unit, not to exceed 20 investigative samples. See
ADM-BATCH for further discussion. 3.5. Independent Calibration Verification (ICV) - ICV solutions are made from a stock
solution which is different from the stock used to prepare calibration standards and is used to verify the validity of the standardization.
3.6. Continuing Calibration Verification Standard (CCV) - A reference analyzed daily at
specified intervals and used to verify the ongoing validity of the instrument calibration.
3.7. Instrument Blank (ICB/CCB) - The instrument blank (also called initial or continuing calibration blank) is a volume of blank reagent of composition identical to the samples (DI in this test). The purpose of the CCB is to determine the levels of contamination associated with the instrumental analysis.
3.8. Method Detection Limit (MDL): a statistically derived value representing the lowest
level of target analyte that may be measured by the instrument with 99% confidence that the value is greater than zero
3.9. Method Reporting Limit (MRL): The minimum amount of a target analyte that can be
measured and reported quantitatively. The MRL is equivalent to Practical Quantitation Level (PQL) and Estimated Quantitation Level (EQL). Typically, the MRL is calculated as five times the MDL (although this is a rule of thumb and not intended to be a strict policy of establishing the MRL for a compound).
4. INTERFERENCES
Volatile organics in sediments may be lost in the decarbonation step resulting in low bias.
*See DoD Summary for DoD Specific Criteria
SOP No.: GEN-TOCLK/9060/TICLK Revision No. 2 Date: 1/17/05
Page 4 of 18 Minimize loss of organic compounds by bacterial decomposition and/or volatilization by maintaining the sample at 0-6 °C. Contamination by carryover can occur when high level samples immediately precede samples containing significantly lower levels of contamination. Pay close attention to samples which follow high level samples. Re-analyze if contamination is suspected.
5. SAFETY
• All appropriate safety precautions for handling reagents and samples must be taken when
performing this procedure. This includes the use of personnel protective equipment, such as, safety glasses, lab coat and the correct gloves.
• Chemicals, reagents and standards must be handled as described in the CAS safety policies,
approved methods and in MSDSs where available. Refer to the CAS Environmental, Health and Safety Manual and the appropriate MSDS prior to beginning this method.
• Nitric Acid is used in this method. This acid is extremely corrosive and care must be taken
while handling it. A face shield should be used while pouring acids. And safety glasses should be worn while working with the solutions. Lab coat and gloves should always be worn while working with these solutions.
• The use of pressurized gases is required for this procedure. Care should be taken when
moving cylinders. All gas cylinders must be secured to a wall or an immovable counter with a chain or a cylinder clamp at all times. Sources of flammable gases (e.g., pressurized hydrogen) should be clearly labeled.
• Refer to the Safety Manual for further discussion of general safety procedures and information.
Always wear chemical eye, skin, and clothes protection when handling samples or working with reagents.
6. SAMPLE CONTAINERS, COLLECTION, PRESERVATIONS, AND STORAGE
6.1. Samples are collected in purchased certified clean containers free of organic contaminants. Glass is preferable.
6.2. Because of the possibility of oxidation or bacterial decomposition of certain
components, the samples should be kept cool (0-6°C) and protected from sunlight and atmospheric oxygen from time of collection to analysis. Holding time for samples is 14 days.
6.3. Further sample handling, storage, and custody procedures are discussed in SMO-GEN.
7. APPARATUS AND EQUIPMENT
7.1. Model DC-190 Total Organic Carbon Analyzer with Boat Module. (Dohrmann)
*See DoD Summary for DoD Specific Criteria
SOP No.: GEN-TOCLK/9060/TICLK Revision No. 2 Date: 1/17/05
Page 5 of 18
7.2. Combustion boat: Platinum.
7.3. The linear range extender (Dohrmann part # 885-462) is used for high level samples. It consists of an expansion chamber attached to the 200 ml/min air line from the furnace/sparger and to a 400 ml/min line of air that acts to dilute the CO2 gas in the standards and samples by a factor of 1/3.
7.4. Volumetric pipets/glassware and/or adjustable micro-pipets.
7.5. Printer
7.6. Drying oven capable of maintaining 70 ± 2 °C.
7.7. Drying tins
7.8. Small glass test tubes
8. PREVENTIVE MAINTENANCE
8.1. For the most reliable performance of the instrument, the following schedule of routine
maintenance is suggested:
8.1.1. Daily:
• Condition the boat: Place fresh quartz wool plug and a few drops of HNO3 in the Pt boat. All boats should be “conditioned” prior to any runs in order to remove any CO2 that may have built up on the boat overnight. Place the boat in the hatch. Close the hatch (the sparger will bubble if the hatch is closed properly. Always watch for this every time the hatch is closed.) Advance the Pt Boat into the furnace. Allow it to bake for ~2-3 minutes, so that any carbonaceous material on the boat is removed. Retract the Pt Boat into the hatch block, allow to cool at least 30 seconds. Do this for all boats.
• Check the Cu/Sn scrubber. If dissolved or clogged, replace with fresh Cu
and/or Sn.
8.1.2. Weekly:
• Check gas cylinder – replace when necessary • Adjust IR “zero” if necessary • Leak check the carrier gases • Replace the sparger DI with UPDI acidified with phosphoric acid to pH <2
8.1.3. Every 2 Weeks or Earlier:
*See DoD Summary for DoD Specific Criteria
SOP No.: GEN-TOCLK/9060/TICLK Revision No. 2 Date: 1/17/05
Page 6 of 18 Check the Boat Module’s combustion tube. Replace the cobalt oxide catalyst if necessary. If the combustion tube becomes etched/”cloudy” looking, consider replacing it. The etching is produced by interfering gases in samples, and can cause a “slowdown” of movement of the carrier gas through the tube, resulting in “time out errors” during detection.
8.2. Maintenance log - All Preventive maintenance, as well as instrument repair, should be
documented in the appropriate instrument maintenance log. Most routine maintenance and troubleshooting are performed by CAS staff. Other maintenance or repairs may, or may not require factory service, depending upon the nature of the task. Any maintenance performed by outside services must also be documented – either through notes in the log or through documents provided by the service. The log entries will include the date maintenance was performed, symptoms of the problem, serial numbers of major equipment upgrades or replacements. The datafile name of the first acceptable run after maintenance is to be documented in the maintenance log.
9. STANDARDS, REAGENTS, AND CONSUMABLE MATERIALS
9.1. Reagent (laboratory deionized) water. If DI appears to be a source of contamination, use
DI that has been run through the Millipore system in the VOA lab. It is suggested to occasionally make reagents with this Millipore water and analyze the tap DI at the low level to determine if it has a value above 0.1 mg/L.
9.2. Phosphoric Acid: reagent grade, purchased commercially. Store at room temperature.
Expires upon manufacturer’s indications or 3 years from receipt if no other indication is given.
9.3. Cobalt oxide catalyst: Place about 2 inches of cobalt oxide in the combustion tube with
both ends bound by a tuft of quartz wool. Condition fresh cobalt oxide by placing a piece of tubing from the exit of the tube in dilute NaOH for at lease 1 hour with the air and furnace on.
9.4. Nitric Acid, concentrated: Purchased commercially. Store at room temperature. Expires
upon manufacturer’s indications or 3 years from receipt if no other indication is given.
9.5. 1+1 Nitric Acid (HNO3): Add a volume of DI to an equal volume of concentrated nitric acid. Store at room temperature. Expires in one year.
9.6. Sparger solution: Fill the sparger with UPDI from a squirt bottle. Acidify the water with
a couple drops of concentrated phosphoric acid to pH 2. 9.7. Gas Service: Compressed Air.
9.8. Standards Preparation General Information and Disclaimers
All of the preparation instructions are general guidelines. Other technical recipes may be used to achieve the same results. Example – a 20 ppb standard may be made by
*See DoD Summary for DoD Specific Criteria
SOP No.: GEN-TOCLK/9060/TICLK Revision No. 2 Date: 1/17/05
Page 7 of 18 adding 1 uL of 200 ppb to 10 mLs or may be made by adding 4 uL of 50 ppb to 10 mLs. The preparation depends upon the final volume needed and the initial concentration of the stock. Reasonable dilution technique is used. The initial calibration curves given are typical, but also subject to variation due to detection levels needed. The lowest concentration level shall be at the method reporting level. The remaining levels should define the working linear range of the analytical system. All Standards must be traceable using the CAS lot system (ADM-DATANTRY).
9.9. Organic Carbon stock solutions:
9.9.1. Standard Stock Solution (10,000 ppm C): Stock solution is prepared by adding
10.64 g of Potassium Biphthalate (KHP) (previously dried to a constant weight at 104°C) into a 500 mL volumetric flask. Dilute to volume with reagent water. Store in amber glass at room temperature for up to 1 year.
9.9.2. Reference Stock Solution (10,000 ppm C): Stock solution is prepared by adding
10.64 g of KHP (previously dried to a constant weight at 104°C and from a different manufacturer) into a 500 mL volumetric flask. Dilute to volume with reagent water. Store in amber glass at room temperature for up to 1 year.
9.10. Inorganic Carbon Stock Solution (10,000 mg/L inorganic C): Stock solution is
prepared by adding 8.824 g of Sodium Carbonate (previously dried to a constant weight at 104°C and from a different manufacturer) into a 100 mL volumetric flask. Dilute to volume with reagent water. Store in amber glass at room temperature for up to 1 year.
9.11. ICV/CCV: Add 50 uL of 10,000 mg/L Reference Stock to 100 mg of Ottawa Sand.
True Value = 5000 ug/g. 9.12. LCS for TC or TOC: Add 20 uL of 10,000 mg/L Standard Stock to 100 mg of Ottawa
Sand. True Value = 2000 ug/g 9.13. LCS for TIC – Add 20 uL of 10,000 mg/L Inorganic Carbon Stock to 100 mg of
Ottawa Sand. True Value = 2000 ug/g. 9.14. Matrix Spikes: Add 20 uL of 10,000 mg/L Standard Stock to a similar mass of sample
which was used for the sample analysis. TV = 2000 ug/g when 100 mg of sample is used. Prepare fresh before use.
9.15. ICB/CCB/Method Blanks – analyze 100mg of Ottawa Sand as a sample
9.16. Calibration Standards
***Note: When using an adjustable pipet, record the pipet ID of the pipet used.
*See DoD Summary for DoD Specific Criteria
SOP No.: GEN-TOCLK/9060/TICLK Revision No. 2 Date: 1/17/05
Page 8 of 18
9.16.1. Prepare Single Point Calibration Standard by adding 50 uL of 10,000 mg/L Organic Standard Stock to 100 mg Ottawa Sand.
9.16.2. Prepare a 1000 ppm working stock for the less concentrated check standards –
Dilute 1.0 mL of 10,000 ppm Standard Stock to 10 mLs with reagent water. Prepare fresh before use.
9.16.3. Prepare curve check standards as follows:
uL 10,000 ppm Standard Stock Weight (mg) Final Conc. (ug/g) 80 100 8000 50 100 5000 30 100 3000 100 uL 1000 ppm working stock 100 1000 50 uL 1000 ppm working stock 100 500 30 uL 1000 ppm working stock 100 300
** Note – These (above) curve check standards are to verify the instrument
response only. They are not used to calculate sample results 10. RESPONSIBILITIES
It is the responsibility of the analyst to perform the analysis according to this SOP and to complete all documentation required for data review. Analysis and interpretation of the results are performed by personnel in the laboratory who have demonstrated the ability to generate acceptable results utilizing this SOP. This demonstration is in accordance with the training program of the laboratory. Final review and sign-off of the data is performed by the department supervisor/manager or designee.
11. PROCEDURE
11.1. Be sure the analyst has a current Demonstration of Capability and the system has a current MDL.
11.2. Turn on the air gas flow and confirm 30 psi delivery pressure. Maintain this delivery
pressure. 11.3. Initial Power Up:
11.3.1. Turn on:
• The 70 °C oven • The Boat Module Furnace • The DC-190 Furnace and Carrier Gas. Confirm 200 mL/min readout.
Even though soils and the Boat Module do not need the DC-190 Furnace and carrier gas on, the instrument software does.
*See DoD Summary for DoD Specific Criteria • Allow time for all to come to correct temperature. The LED’s for each
SOP No.: GEN-TOCLK/9060/TICLK Revision No. 2 Date: 1/17/05
Page 9 of 18 will turn from red to green when ready.
11.3.2. Confirm that the desired analysis mode is properly selected. The TC and BOAT
LED’s on the DC-190 should be lit.
11.3.3. Condition the boat.
11.4. Initial Calibration
11.4.1. Prior to calibrating, reset the software to original conditions by pressing “Calibrate”, 7, 1. Press “Yes” when prompted. This will reset the calibration factor to 1.0. Be sure to then make sure that the sample size (50 uL) and concentration (10,000) of the calibration stock standard are entered correctly before starting a new calibration. Press “Boat” then “1” to change ug/g to mg/L. Press “3” to print.
11.4.2. Standard Analysis - A single point calibration technique is used because the
infrared detector response has been linearized. It is then verified with the other standards. The single-point calibration standard is run in duplicate, at least.
11.4.2.1. Weigh 100 mg of Ottawa Sand into the Pt Boat.
11.4.2.2. Add 1+1 HNO3 dropwise until no effervescence is visible.
11.4.2.3. Place the boat in the oven at 70-75 °C for 10-15 minutes.
11.4.2.4. Remove the boat from the oven, place it in the hatch. Add 50 uL of the
10,000 mg/L Standard Stock to the PT Boat. Close the hatch (the sparger will bubble if the hatch is closed properly. Always watch for this every time the hatch is closed.)
11.4.2.5. Press the START button on the DC-190. Enter the “sample ID.” The
“Wait” LED will light momentarily while the instrument checks the baseline.
11.4.2.6. When the “Inject” LED lights, advance the boat into the furnace at the rate
of about 2 inches per second. 11.4.2.7. The “Acquire” light will turn on. The analysis will take about 6-8 minutes
to finish, at which point the printer will print out the result, and the screen will ask “Continue Y/N?” Press the “Yes” button to do another.
11.4.2.8. Repeat the Standard Analysis steps for the replicate standard. If a third
replicate is desired, press “Yes” at the end of the analysis. (If an outlier needs to be removed from the calibration, see page 6-26 of the DC-190 Ops Manual. At least 2 replicates must be run for the initial calibration.) Press “No” to end the initial calibration.
*See DoD Summary for DoD Specific Criteria
SOP No.: GEN-TOCLK/9060/TICLK Revision No. 2 Date: 1/17/05 Page 10 of 18
11.4.3. Software Calibration
11.4.3.1. Press “Calibrate” to review the calibration menu. Verify that the sample
size and standard concentration are correct. 11.4.3.2. Press “5” to update the Calibration Factor. This will be calculated,
displayed on the menu, and printed out.
11.4.4. If necessary, set instrument blank - Perform the standard analysis steps except adding 50 uL of UPDI instead of standard. After 2 replicates of the blank, press “No”, “Calibrate” and “6” to update the system blank.
11.4.5. Change the concentration units from mg/L to ug/g by pressing “Boat” then “1”.
11.5. Run the curve check standards to verify linear range. The instrument calculated results of the curve check standards should be within 10% of the true value and 20% for the lowest curve check standard. If they are not, repeat the calibration
11.6. Run the ICV, ICB, and a LCS to verify the curve. See Section 12 for Limits and
Corrective Action.
11.7. Daily Sample Analysis and Continuing Calibration Verification
The calibration is confirmed with every run by the CCV, CCB, and LCS. Daily, every run is started with a CCV, CCB, and LCS and is closed with a CCV, CCB, as well as a CCV/CCB set every 10 samples and an LCS every 20. The instrument only needs to be recalibrated when these QC become unacceptable, or at least once a year.
11.7.1. Complete the initial power up steps
11.7.2. Condition Pt boat.
11.7.3. Sample preparation
11.7.3.1. Thoroughly mix sample and place a small aliquot (~2 g ) in a drying tin. 11.7.3.2. Allow to dry overnight in a hood at room temperature or dry at 70 ± 2ºC
for one hour.
11.7.3.3. Grind the sample with the bottom of a small glass test tube to break up aggregates.
11.7.3.4. Discard rocks.
11.7.3.5. Weigh 100 mg (or less depending on anticipated concentration) of sample
*See DoD Summary for DoD Specific Criteria
SOP No.: GEN-TOCLK/9060/TICLK Revision No. 2 Date: 1/17/05 Page 11 of 18
or Ottawa Sand into the Pt Boat.
11.7.3.6. For TOC - Add 1+1 HNO3 dropwise until no effervescence is visible. For TIC, separate aliquots of the sample will be analyzed – one with the acid added (TOC) and one with no acid added (TC). TIC will be the difference between the two results.
11.7.3.7. If acid has been added, place the boat in the oven at 70-75 °C for 10-15
minutes. Remove the boat from the oven.
11.7.4. Sample analysis
11.7.4.1. Spike at this time if needed.
11.7.4.2. The system is set up using the “Range Extender”. This setup creates back-pressure. The release of pressure when the sample hatch is opened can cause the carrier gas to back-flow through the mist-trap and into the sparger, thus forcing the sparge liquid into the combustion tube/cobalt oxide. To prevent this, the following procedure should be followed:
11.7.4.2.1. Before Opening the Hatch: remove one end of the line from the
sparger to the mist-trap.
11.7.4.2.2. Open the hatch and insert the boat. Close the hatch.
11.7.4.2.3. After Closing the Hatch: replace the end of the line from the sparger to the mist-trap. The sparger will bubble if the hatch is closed properly. Always watch for this every time the hatch is closed.
11.7.4.3. Press the START button on the DC-190. Enter the “sample ID” and the
mg of sample. The “Wait” LED will light momentarily while the instrument checks the baseline.
11.7.4.4. When the “Inject” LED lights, advance the boat into the furnace at the rate
of about 2 inches per second. 11.7.4.5. The “Acquire” light will turn on. The analysis will take about 6-8 minutes
to finish, at which point the printer will print out the result, and the screen will ask “Continue Y/N?” Press the “No” button to analyze another sample.
11.7.4.6. Samples analyzed by 9060 are to be analyzed in quadruplicate. Lloyd
Kahn samples are analyzed only once. Samples for TIC are analyzed once for TOC (with acid) and once for TC (without acid).
12. QA/QC REQUIREMENTS *See DoD Summary for DoD Specific Criteria
SOP No.: GEN-TOCLK/9060/TICLK Revision No. 2 Date: 1/17/05 Page 12 of 18
12.1. QC Samples and Acceptance Criteria 12.1.1. LCS for TOC - An LCS must be analyzed with each batch of 20 or fewer
samples. Results must be within the limits in Appendix C of the Quality Assurance Manual.
12.1.2. LCS for TIC - Analyze the inorganic carbon LCS per batch. Results should be
within 75-125% of the true value until enough points are available that calculated limits may be established.
12.1.3. ICV-Analze immediately after calibration. Result must be 85-115% of the true
value. If not, recalibrate unless there is an assignable cause for the ICV failure. Acceptable ICV must be achieved before sample analysis.
12.1.4. A CCV must be analyzed following every tenth injection and at the end of the
run. Recovery must be within 15% of the value (85-115%). 12.1.5. A CCB must be analyzed following every CCV. The result must be below the
PQL*. 12.1.6. Duplicates- One sample per 20 samples, must be analyzed in duplicate. If one or
both of sample or duplicate is < 5X RL, the control limit is ± RL. 12.1.7. Matrix Spikes- One spike sample must be analyzed per 20 samples. The matrix
spike recovery must within the limits in Appendix C of the Quality Assurance Manual.
12.1.8. Matrix Spike Duplicates – One sample for every 10 samples must be spiked and
analyzed in duplicate for 9060. The % recovery limits and corrective action are the same as the matrix spike and the RPD limits and corrective action are the same as the duplicate.
12.2. Corrective Action 12.2.1. CCV, CCB, LCS
12.2.1.1. Check for gas leaks, sufficient reagent, and other instrument problems. 12.2.1.2. Remake working standard and reanalyze. 12.2.1.3. Recalibrate if QC is still out of control. 12.2.1.4. When instrument is back in control, reanalyze samples bound by out of
control QC.
12.2.2. Duplicates
12.2.2.1. Check for gas leaks, sufficient reagent, and other instrument problems. 12.2.2.2. If the RPD of the duplicates is out of limits, repeat the sample and
*See DoD Summary for DoD Specific Criteria
SOP No.: GEN-TOCLK/9060/TICLK Revision No. 2 Date: 1/17/05 Page 13 of 18
duplicate unless there is assignable matrix interference, historical failures, or lack of volume. If an out of control duplicate is not repeated, note the reason on the data quality checklist. If, at the time when the problem is discovered, the sample exceeds twice the holding time, discuss with supervisor or Project Manager prior to repeating the samples. Report all of the replicates and explain in the checklist for the case narrative.
12.2.3. Matrix spike
12.2.3.1. Check for gas leaks, sufficient reagent, and other instrument problems 12.2.3.2. If there are no such problems and recovery of the MS fails on a sample,
the batch is considered acceptable as long as the LCS meets acceptance criteria. It is recommended that the MS/MSD be reprepared and reanalyzed to confirm the outliers, however it is not required due to probable matrix interferences.
13. DATA REDUCTION AND REPORTING
13.1. Calculations used by the DC-190 system
13.1.1. The equations used internally for determining a calibrated result:
Y = (Fx – b)/V Where: Y = Concentration (calibrated) of sample
x = Peak with background subtracted. Normally invisible to the user. The displayed value, y, may be made to equal x by setting F,b, and V to the appropriate values (1, 0, and 1, respectively)
F = “Calibration Factor”. This is the slope of the linear fit line. b = Intercept. This is an internal parameter which is invisible to the
user. SB = “System” Blank = b/V V = Sample volume (or mass)
The quantities F and SB are the ones displayed on the calibration menu and are the ones which can be edited directly.
13.1.2. The Calibration Factor and Blank are calculated by:
Fn = Fo(Cs/Ys) bn = bo(Fn/Fo)
Where: Cs = Concentration of the standard o = Old value n = New value s = Value of the standard
*See DoD Summary for DoD Specific Criteria
SOP No.: GEN-TOCLK/9060/TICLK Revision No. 2 Date: 1/17/05 Page 14 of 18
Both Fn and bn are re-calculated each time either the Calibration Factor or the System Blank are updated. It should be noted that if the old value bo is already 0, the new value bn and therefore SB will also be 0. This provides a means to have the system effectively do a one point calibration update when it calculates a new Calibration Factor. These equations may also be used to manually calculate the values and enter them on the “Calibration” menu directly.
13.2. The instrument calculates the ug/g C in the sample from the linearized response and the sample volume using the above equations. As long as the user enters the calibration correctly and the sample volume correctly, the instrument will print the final result with no further manipulation.
13.3. The result from the instrument is a dry weight result and is not to be further adjusted in
LIMS. 13.4. Data must be reviewed by the analyst and a peer (supervisor or qualified analyst) using
a Data Quality Checklist before the results are validated and reported to the client. Further data review policies and procedures are discussed in ADM-DREV.
13.5. TIC=TC-TIC. If TOC>TC, it is OK to report if TOC is within 10%RPD of TC.
14. METHOD PERFORMANCE
Reporting limits are based upon an MDL study performed according to ADM-MDL and filed in the MDL binders in the QA office. Demonstration of Capability is performed upon instrument set-up , whenever a new analyst begins independent analysis, and annually thereafter according to ADM-TRANDOC and section 19 below. The documentation of this method performance is retained by the Quality Assurance office
15. WASTE MANAGEMENT AND POLLUTION PREVENTION
• It is the laboratory’s practice to minimize the amount of solvents, acids and reagent used to perform this method wherever feasible. Standards are prepared in volumes consistent with methodology and only the amount needed for routine laboratory use is kept on site. The threat to the environment from solvent and reagents used in this method can be minimized when recycled or disposed of properly.
• The laboratory will comply with all Federal, State and local regulations governing waste
management, particularly the hazardous waste identification rules and land disposal restrictions as specified in the CAS EH&S Manual.
• Excess, unused sample and testing byproducts are disposed following the procedures in
SMO- SPLDIS. 16. CORRECTIVE ACTIONS FOR OUT OF CONTROL DATA *See DoD Summary for DoD Specific Criteria
SOP No.: GEN-TOCLK/9060/TICLK Revision No. 2 Date: 1/17/05 Page 15 of 18
If data is produced that is out of control, the samples are to be re-analyzed with in-control QA whenever possible. See corrective actions in Section 12 of this SOP and in the applicable Figures in Section 12 of the Quality Assurance Manual.
17. CONTINGENCIES FOR HANDLING OUT OF CONTROL OR UNACCEPTABLE
DATA
If data is produced that is out of control and is not to be re-analyzed due to sample volume restrictions, holding times, or QC controls can not be met, follow the procedures in Section 15 of the Quality Assurance Manual.
18. REFERENCES
18.1. “Total Organic Carbon in Soils” Lloyd Kahn EPA 1988. 18.2. Test Methods for Evaluating Solid Waste Physical/Chemical Methods, USEPA SW-
846.
18.3. OI Analytical, Model 1010 Wet Oxidation TOC Analyzer Operator’s Manual, Revision 9.1, June 2001
19. TRAINING OUTLINE
19.1. Read current SOP and applicable methodologies. Demonstrate a general understanding of the methodology and chemistry. Follow policies and procedures in ADM-TRANDOC.
19.2. Observe Sample Preparation and Analysis, including instrument operation and
maintenance. Follow Training Plan Form. 19.3. Participate in the methodology, documentation, and data reduction with guidance. 19.4. Demonstrate Competency by performing the analysis independently. Analyze a
known proficiency or standard four times for Initial Demonstration of Capability. If recovery is within acceptable limits, complete training plan form and IDC certificate. Turn paperwork in to QA for acceptance and filing.
19.5. Continuing Demonstration of Capability will be performed annually using an
internal unknown, a PE, or a new four replicate study. 20. METHOD MODIFICATIONS
Method 9060 is for waters and wastes but is useful for soils as described here. 21. INSTRUMENT-SPECIFIC ADDENDUM
*See DoD Summary for DoD Specific Criteria
SOP No.: GEN-TOCLK/9060/TICLK Revision No. 2 Date: 1/17/05 Page 16 of 18
The instrument manual is located next to the instrument. Refer to this manual for instrument setting or specifications not described in this SOP.
22. ATTACHMENTS
Benchsheet
23. CHANGES FROM PREVIOUS REVISION
• Eliminated most wording about High Level vs. Low Level since the range extender is always
used at this time. • Added TIC throughout • Changed references to TOC to Carbon, where applicable, to be inclusive for the addition of TIC
to this SOP • 2.1 – Added section about pre-treatment of sample • 4 – Added to be cautious of contamination by carry-over • 5 – Changed wording of Safety section for consistency with other SOPs • 8 – Expanded upon wording of Maintenance Log • 9 – Rearranged to put Reagents together and Standards together • 9- Eliminated 100 ug/g standard • 9 – Added Standards Prep General Info and Disclaimers • 12 – Modified wording of corrective actions for consistency • 14 – Added ADM-Trandoc for consistency with other SOPs • 15 – Modified for consistency with other SOPs • 18 – Added reference to TOC Analyzer Manual (used to verify method for TIC)
*See DoD Summary for DoD Specific Criteria
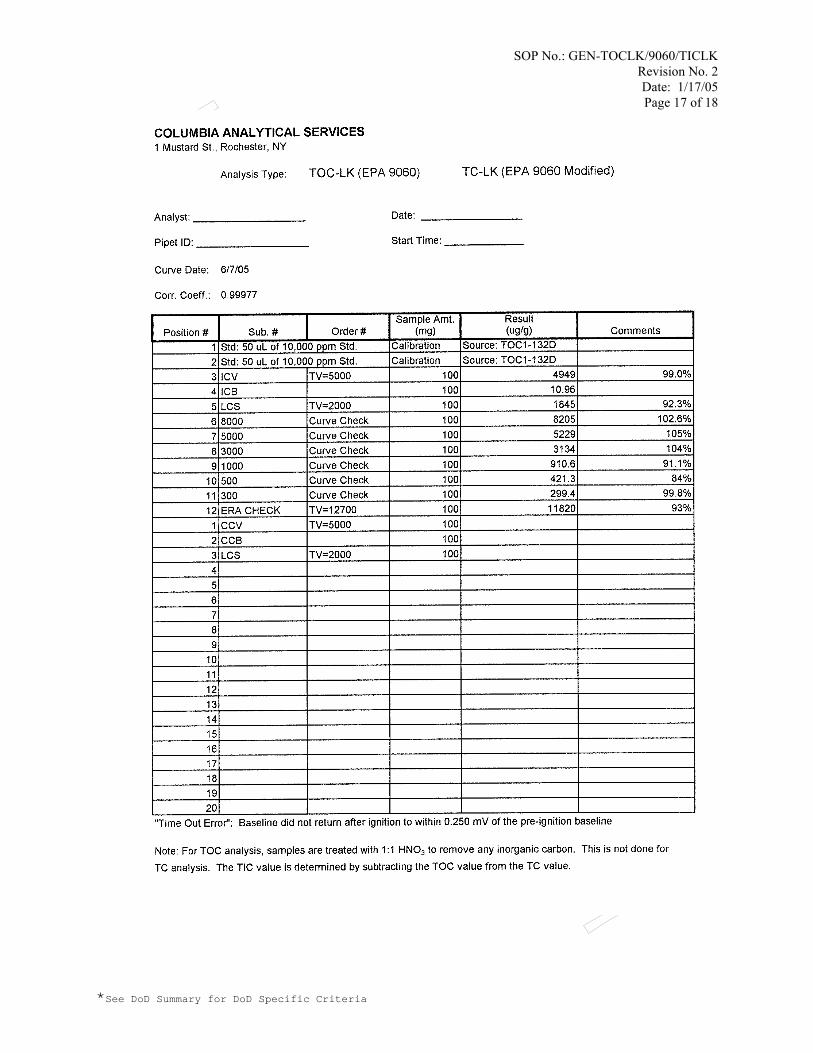
SOP No.: GEN-TOCLK/9060/TICLK Revision No. 2 Date: 1/17/05 Page 17 of 18
*See DoD Summary for DoD Specific Criteria
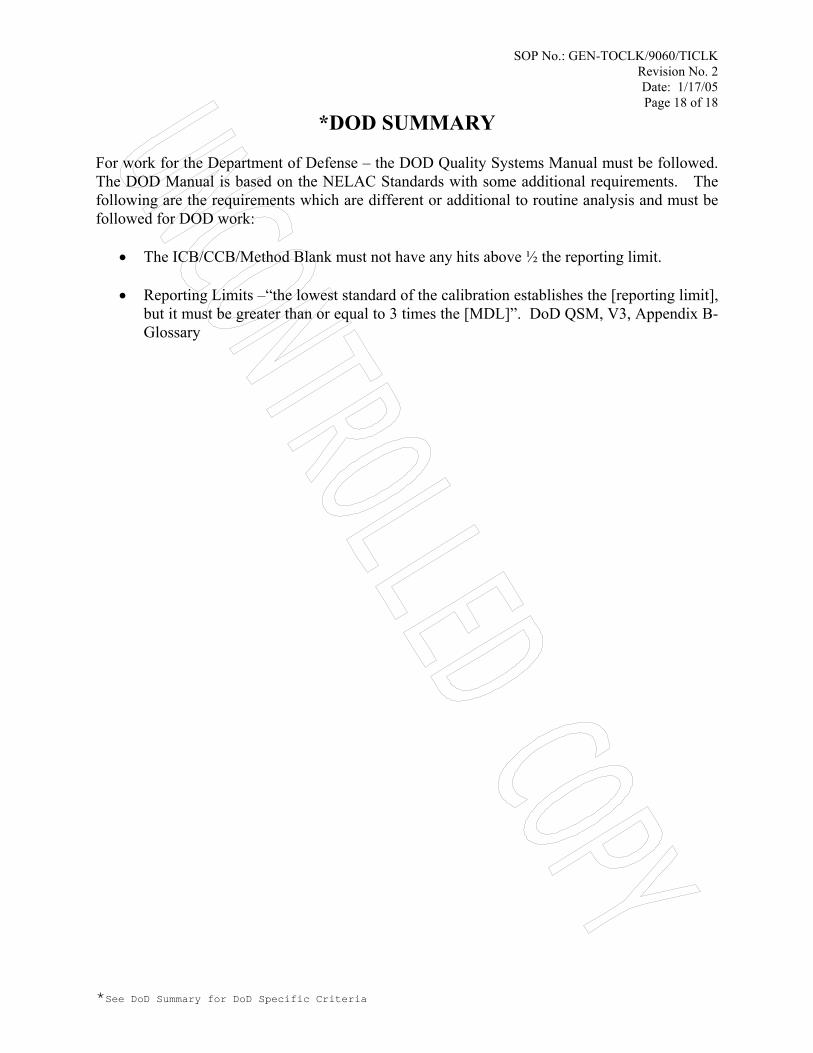
SOP No.: GEN-TOCLK/9060/TICLK Revision No. 2 Date: 1/17/05 Page 18 of 18
*See DoD Summary for DoD Specific Criteria
*DOD SUMMARY For work for the Department of Defense – the DOD Quality Systems Manual must be followed. The DOD Manual is based on the NELAC Standards with some additional requirements. The following are the requirements which are different or additional to routine analysis and must be followed for DOD work:
• The ICB/CCB/Method Blank must not have any hits above ½ the reporting limit.
• Reporting Limits –“the lowest standard of the calibration establishes the [reporting limit], but it must be greater than or equal to 3 times the [MDL]”. DoD QSM, V3, Appendix B-Glossary
AOC II – Docket No. V-W-’04-C-784 – Yard520 - AppC QAPP April 18, 2008
ATTACHMENT A-2
GENERAL ENGINEERING LABORATORIES, LLC STANDARD OPERATING PROCEDURES
GL-RAD-A-013, Rev. 10 The Determination of Gamma Isotopes
GL-SR-E-001, Rev. 17 Sample Receipt, Login and Storage
GL-RAD-A-045, Rev. 1 The Isotopic Determination of Plutonium, Uranium, Americium, Curium, and Thorium
GL-MA-E-014, Rev. 9 Determination of Metals by ICP-MS
The Determination of Gamma Isotopes SOP Effective Date: 2/4/92 GL-RAD-A-013-Rev 10 Revision 10 Effective March 2004 Page 1 of 12
VERIFY THE VALIDITY OF THIS SOP EACH DAY IN USE
STANDARD OPERATING PROCEDURE FOR
THE DETERMINATION OF
GAMMA ISOTOPES
(GL-RAD-A-013 REVISION 10)
APPLICABLE TO METHODS: EPA 600/4-80-032 Method 901.1 (Modified)
DOE EML HASL-300 (Modified)
PROPRIETARY INFORMATION
This document contains proprietary information that is the exclusive property of General Engineering Laboratories, LLC (GEL). No contents of this document may be reproduced or otherwise used for the benefit of others except by express written permission of GEL.
General Engineering Laboratories, LLC P.O. Box 30712 Charleston, SC 29417
This document is controlled when an original Set ID number is stamped on the front cover page (1). Uncontrolled documents do not bear an original Set ID number.
The Determination of Gamma Isotopes SOP Effective Date: 2/4/92 GL-RAD-A-013-Rev 10 Revision 10 Effective March 2004 Page 2 of 12
TABLE OF CONTENTS
1.0 THE DETERMINATION OF GAMMA ISOTOPES.....................................................................................3 2.0 METHOD OBJECTIVE, PURPOSE, CODE AND SUMMARY..................................................................3 3.0 METHOD APPLICABILITY.........................................................................................................................3 4.0 DEFINITIONS................................................................................................................................................3 5.0 METHOD VARIATIONS ..............................................................................................................................4 6.0 SAFETY PRECAUTIONS AND WARNINGS .............................................................................................4 7.0 INTERFERENCES .........................................................................................................................................5 8.0 APPARATUS, MATERIALS, REAGENTS, EQUIPMENT, AND INSTRUMENTATION .......................5 9.0 SAMPLE HANDLING AND PRESERVATION ..........................................................................................5 10.0 SAMPLE PREPARATION.............................................................................................................................6 11.0 PREPARATION OF STANDARD SOLUTIONS AND QUALITY CONTROL STANDARDS ................7 12.0 INSTRUMENT CALIBRATION AND PERFORMANCE ...........................................................................8 13.0 ANALYSIS AND INSTRUMENT OPERATION .........................................................................................8 14.0 EQUIPMENT AND INSTRUMENT MAINTENANCE ...............................................................................8 15.0 DATA RECORDING, CALCULATION, AND REDUCTION METHODS ................................................8 16.0 QUALITY CONTROL REQUIREMENTS .................................................................................................10 17.0 DATA REVIEW, APPROVAL, AND TRANSMITTAL ............................................................................11 18.0 RECORDS MANAGEMENT.......................................................................................................................12 19.0 LABORATORY WASTE HANDLING AND WASTE DISPOSAL ..........................................................12 20.0 REFERENCES..............................................................................................................................................12
General Engineering Laboratories, LLC P.O. Box 30712 Charleston, SC 29417
This document is controlled when an original Set ID number is stamped on the front cover page (1). Uncontrolled documents do not bear an original Set ID number.
The Determination of Gamma Isotopes SOP Effective Date: 2/4/92 GL-RAD-A-013-Rev 10 Revision 10 Effective March 2004 Page 3 of 12
1.0 THE DETERMINATION OF GAMMA ISOTOPES 2.0 METHOD OBJECTIVE, PURPOSE, CODE AND SUMMARY
2.1 This standard operating procedure provides the necessary instructions to conduct the analysis for Gamma Isotopes in water, soil, urine and miscellaneous matrices.
2.2 Water samples are counted in Marinelli beakers. Soil samples are sealed in aluminum cans, which are counted immediately if Ra-226 is not desired. If Ra-226 is desired, the sealed can is set aside to allow secular equilibrium between Rn-222 and Bi-214. Quantification is done by the abundance of the 609 KeV Bi-214 line.
2.3 This method has been modified from the source method EPA 600/4-80-032 “Prescribed Procedures for Measurement of Radioactivity in Drinking Water,” August 1980, Method 901.1, and the Department of Energy (DOE) EML Procedures Manual source method for Gamma PHA in soils and sediments, HASL-300. For all matrices, similar principles of radiochemical concentration and counting are used.
2.4 This method has been modified on the basis of GEL’s Performance Based Measurement System (PBMS).
3.0 METHOD APPLICABILITY 3.1 Minimum Detectable Activity (MDA): The MDA is based upon sample volume,
instrument background, instrument efficiency, count time and other statistical factors, as well as specific isotopic values such as abundance and half-life.
3.2 Method Precision: Typical relative percent difference (RPD) is less that 20%. 3.3 Method Bias (Accuracy): The method accuracy requirement for gamma, measured
by running a laboratory control sample (LCS) with each batch, is 25% of the true value.
3.4 Analysts go through a partnered training program with an already certified analyst for gamma spectroscopy. The analyst receives training on reviewing of standard analytical requirement such as RPD, method bias and technical review of gamma spectra. The analyst can then become qualified to perform the analysis by passing an unknown sample analysis and correctly identifying the isotope(s). Technical training records are maintained electronically by the Quality Systems staff.
4.0 DEFINITIONS 4.1 Clean Line: An energy line of an isotope with no known energy lines of other
isotopes within 2 KeV. (This excludes daughters that use the same line for quantification.)
4.2 Interfered Line: An energy line of an isotope with one or more energy lines of one or more different isotopes within 2 KeV.
4.3 Single and Double Escape Interference Lines: When high energy gamma lines above 1022 KeV have a large emission rate, it is possible to see single and double escape peaks caused by escape of the 511 KeV annihilation photon(s) from the detector.. 4.4 Summation Interference: When high gamma emission rates are seen, sample summation can occur. Prominent in geometries close to detection and in low energy range (i.e., 10,000 gps at 88 KeV, 15,000 gps at 210 KeV), a summation interference can be seen at 88+88=176 KeV, 210+210=420 KeV, 210+88=298KeV.
General Engineering Laboratories, LLC P.O. Box 30712 Charleston, SC 29417
This document is controlled when an original Set ID number is stamped on the front cover page (1). Uncontrolled documents do not bear an original Set ID number.
The Determination of Gamma Isotopes SOP Effective Date: 2/4/92 GL-RAD-A-013-Rev 10 Revision 10 Effective March 2004 Page 4 of 12
4.5 False Positive: An isotope that has failed one or more of several tests including half-life, abundance, and energy tolerance (± 2 KeV)
4.6 Abundance Test: The test where the software verifies the presence of 75% of the total abundance of a nuclide in the system library is present. The presence of
wer
4.7
greater than 75% of the total abundance will cause a nuclide to be identified. The abundance criteria may be reduced to less that 75% for nuclides with several loabundant photons. Energy Tolerance: The test where the software checks the energy line in the spectrum to see if it is within the energy tolerance setting. (The standard setting is 2
he
4.8
KeV.) If it is within this setting then the line is associated with that nuclide. Tenergy line can be associated with more than one nuclide. Half-Life Test: The test to determine if the half-life of the isotope is long enough not to have decayed away. The half-life of the sample is the time from sample date
e
4.9
to analysis date plus 1/2 the count time. A limit of no more than eight half-life is thstandard setting. Key Line: The line chosen by the builder of the library to be the prominent line of the isotope. This line is used in the MDA table for purposes of calculating activity,
4.10
error and MDA. For non-identified isotopes the key line energy is used as the basisof determining the region used to calculate the activity, error, and the MDA. Usually this line is the most abundant line on a line that is relatively free from interference. Abundance (Photon Intensity): The value, usually expressed in percent, givenphoton of specific energy which is emitted during the decay of a radionuclide. abundance rep
to a The
resents the probability of emission of a specific energy photon when a
4.11 radionuclide is decaying (gamma/disintegration). Counting Uncertainty: The error of the reported result due to the counting statistics of the instrument used for qualification. Back Scatter4.12 : The detection of a count that occurs when an event interacts with
5.0 METHOD VARIATIONS ily
calibrat WARNINGS
nnel performing this analytical procedure are trained in and follow the safe laboratory practices outlined in the Safety, Health and Chemical Hygiene Plan, GL-
dures
6.4 L-RAD-S-010 for Handling Biological Materials.
, and consult qualified senior personnel such as a Group or Team Leader.
counting materials, changes direction, and scatters back to the detector.
Modifications to the procedure are limited to GEL’s use of additional isotopes for the daion check and the inclusion of a more stringent calibration and resolution
periodicity. 6.0 SAFETY PRECAUTIONS AND6.1 Keep hands free from moving parts of canning device and Gamma shields. 6.2 Perso
LB-N-001. 6.3 Personnel handling radioactive materials are trained in and follow the proce
outlined in GL-RAD-S-004 for Radioactive Material Handling. Personnel handling biological materials are trained in and follow the procedures outlined in G
6.5 If there is any question regarding the safety of any laboratory practice, stop immediately
General Engineering Laboratories, LLC P.O. Box 30712 Charleston, SC 29417
This document is controlled when an original Set ID number is stamped on the front cover page (1). Uncontrolled documents do not bear an original Set ID number.
The Determination of Gamma Isotopes SOP Effective Date: 2/4/92 GL-RAD-A-013-Rev 10 Revision 10 Effective March 2004 Page 5 of 12
7.0 R7.1 other isotopes. If
l review of the peak search.
the standard used for calibration. This may
8.0 APPARATUS, MATERIALS, REAGENTS, EQUIPMENT, AND INSTRUMENTATION 8.1
s for soil and miscellaneous samples
l
8.2 inum can
d gamma standard in 2 L Marinelli beaker d gamma standard in 0.5 L Marinelli
gamma standard in Gelman Sciences PETRI dish
ilter
Am-241, Co-60,
d gamma standard of 1-47mm glass fiber nated
8.2.13 grams of H3BO3 per liter of water 8.3 Instrum
etector, with associated electronics and data
8.3.2 Top loader balance 9.0 PRESERVATION
g of sample should be collected, preferably in a plastic
9.2 f sample should be collected in a plastic container and v acid.
INTE FERENCES Some Gamma isotopes emit gamma lines that may overlap with the energies of the two isotopes are within 2 KeV, the peaks may not be resolvable and will give a positive bias to the result. This problem is minimizedby carefu
7.2 Soil samples may vary in density frombias the results due to self-absorption of lower energy (<100 K).
Ancillary Equipment 8.1.1 100 cc aluminum cans with lid8.1.2 Gelman Sciences PETRI dish for soil, filters and miscellaneous samples 8.1.3 2 L and 500 mL Marinelli beakers for water samples 8.1.4 Air displacement pipettes. 8.1.5 Can annealing too8.1.6 Graduated cylinder Reagents, Chemicals and Standards 8.2.1 NIST traceable mixed gamma standard in 100cc alum8.2.2 NIST traceable 2.0 liter mixe8.2.3 NIST traceable mixe8.2.4 NIST traceable mixed 8.2.5 Standard soil blank 8.2.6 NIST traceable mixed gamma standard of 13-47mm glass fiber f
composites in Gelman Sciences PETRI dish. 8.2.7 NIST traceable aqueous Mixed Gamma Standard: Contains
and Cs-137 as a minimum. 8.2.8 NIST traceable mixe8.2.9 NIST traceable mixed gamma standard frontloaded in BG-300 Impreg
Charcoal Sample Cartridge. 8.2.10 Nitric Acid, reagent grade. (16M) 8.2.11 Hydrofluoric acid, 48%. 8.2.12 Hydrochloric acid, reagent grade. (12M)
Boric acid, 5%. Dissolve 50 entation
8.3.1 High purity germanium dreduction software
SAMPLE HANDLING AND9.1 For soil samples, 500
container to avoid breakage. For water samples, 2 liters opreser ed to pH2 with Nitric
General Engineering Laboratories, LLC P.O. Box 30712 Charleston, SC 29417
This document is controlled when an original Set ID number is stamped on the front cover page (1). Uncontrolled documents do not bear an original Set ID number.
The Determination of Gamma Isotopes SOP Effective Date: 2/4/92 GL-RAD-A-013-Rev 10 Revision 10 Effective March 2004 Page 6 of 12
10.0 SAMPLE PREPARATION 10.1 Soil sample preparation.
10.1.1 Prepare the sample for
gamma counting in accordance with SOP GL-RAD-
r with sample prepared from step 10.1.1 using steps as a guideline:
analysis is required, the sample is placed in a 100cc
may decrease the accuracy of the
the team
is less
eight and date on sample container. ple
10.1.2.4
oncentrated nitric acid to each
lon lid. Reflux all samples for
10.1.2.4.4 to
ple. Cover samples and reflux for 120
10.1.2.4.5
rate to
10.1.2.4.7
ack on the hotplate long enough so that the
A-021 “Soil sample preparation for the determination of radionuclides”. 10.1.2 Fill the appropriate containe
the following10.1.2.1 If Ra-226
can for in-growth. NOTE: It is recommended that in-growth be allowed 7 days to quantify Ra-226. Longer intervals can be used at the request of the client. However, shorter in-growth periodsdata. If there is insufficient mass of sample to fill the 100cc can, contact
or group leader. 10.1.2.2 All homogenized samples shall be placed in the 100cc can.
Determine the net weight of the sample. If the net weightthan 55 grams or greater than 190 grams, contact the team or group leader to determine the appropriate counting container. Record sample w
10.1.2.3 If there is insufficient sample to fill the 100cc can, place samin the 10cc petri dish, cap and seal. Record sample weight and date on sample container. If there is insufficient sample to fill the 10cc petri dish, performthe following digestion process: 10.1.2.4.1 Weigh out an appropriate aliquot into a labeled teflon
beaker. Record this weight on the sample container.10.1.2.4.2 Add 10 mL of c
sample. 10.1.2.4.3 Place samples on medium heat (∼300 °F) and cover each sample with a tef30 minutes. Remove teflon lids and add 5 mL concentrated hydrochloric acid and 10 mL hydrofluoric acid each samminutes. Remove teflon lids and allow samples to evaporate to dryness.
10.1.2.4.6 Add 5 mL of concentrated nitric acid and evapodryness. Repeat Step 10.1.2.4.6.
10.1.2.4.8 Add 5 mL of concentrated nitric acid to the dry samples. Add 1 ml of 5% boric acid. Place the samples bdried sample dissolves into solution.
General Engineering Laboratories, LLC P.O. Box 30712 Charleston, SC 29417
This document is controlled when an original Set ID number is stamped on the front cover page (1). Uncontrolled documents do not bear an original Set ID number.
The Determination of Gamma Isotopes SOP Effective Date: 2/4/92 GL-RAD-A-013-Rev 10 Revision 10 Effective March 2004 Page 7 of 12
10.1.2.4.9 Transfer solution to a 500 mL marinelli beaker and ss the
10.2 Water sample preparation 10.2.1
Marinelli t. If applicaband expira
10.3.1 e and tare
10.3.2 Transfer r and record t
3 cid to the original sample container (typically 25 – 50
nds to remove sample residue from the sides of the
10.3.4 urine container and record the
10.3.5 ample.
ed,
lli The recorded volume on the que sheet should be (500 mL/850
10.4 Preparati10.4.1
f GL-RAD-A-026 has been performed, counting by referring to section 10.1.2
11.0 PREPARATION OF STANDARD SOLUTIONS AND QUALITY CONTROL STANDARDS 11.1
blank. 11.2 A duplicate should be run with each sample batch. Refer to the batch pull sheet
to determine the designated batch duplicate sample.
dilute to 500 mL. Record the original sample maand diluted volume on sample container. Recordoriginal sample mass on batch que sheet.
Mix and measure an appropriate volume into a 2 L or 500 mL beaker and record the volume on the batch Que Sheele, record the standard identification code, volume tion date on the batch Que sheet.
10.3 Urine Sample Preparation Place a 24-hour urine container (or other suitable container) on a balanc
the balance. the entire volume of the sample received to the tared containe
he volume of sample received. 10.3.3 Add 8 M HNO a
mL). Shake in the container and then heat in a microwave for approximately 30 secosample container. Add the nitric acid rinse to the 24-hour volume of the original sample plus acid. Cap and shake the 24-hour urine container to homogenize the sTransfer an aliquot (typically 500 mL) of this solution to a Marinelli Beaker.
10.3.6 Record the amount of the original sample, excluding the nitric acid addon the gamma spec que sheet. Example: 800 mL is received and 50 mL of 8 M HNO3 is added from the rinse of the sample container. 500 mL is transferred to the MarineBeaker. mL) x 800 mL = 470.6 mL. on of miscellaneous matrices Prepare the sample in accordance with SOP GL-RAD-A-026 “Preparation of Special Matrices for the Determination of Radionuclides.”
10.4.2 Once the appropriate section oprepare the sample for gammaabove.
A blank is performed with each batch. DI Water should be used to prepare the
General Engineering Laboratories, LLC P.O. Box 30712 Charleston, SC 29417
This document is controlled when an original Set ID number is stamped on the front cover page (1). Uncontrolled documents do not bear an original Set ID number.
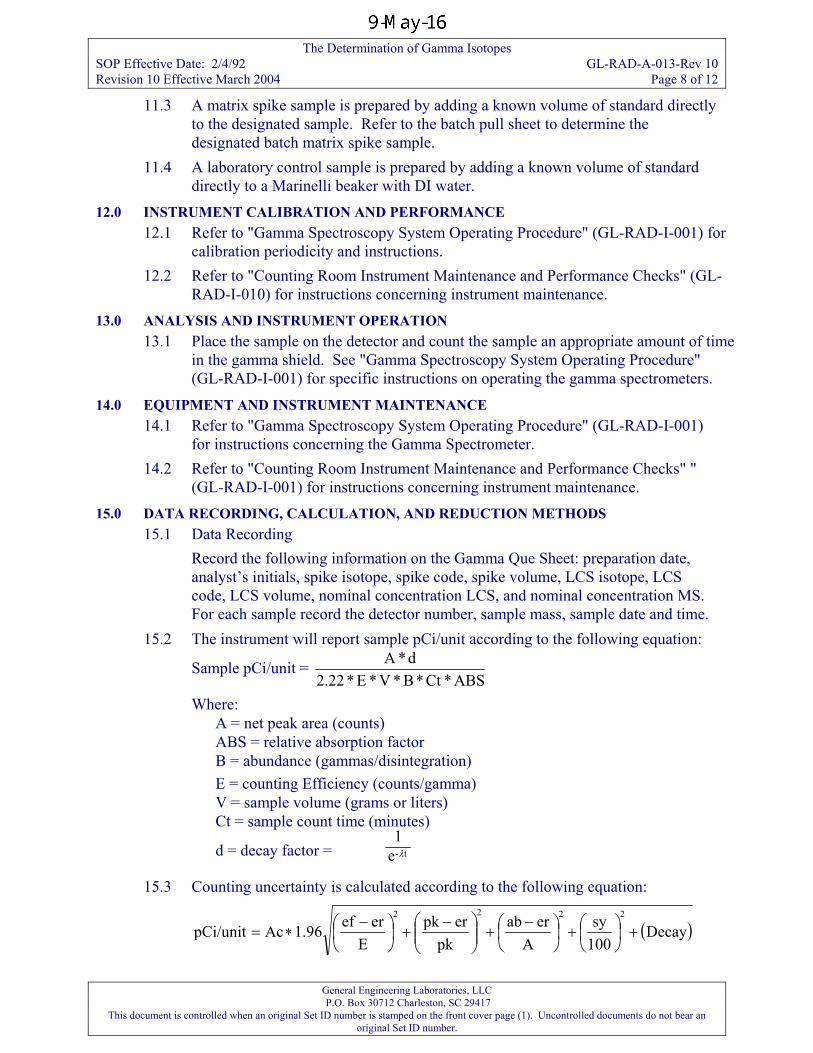
The Determination of Gamma Isotopes SOP Effective Date: 2/4/92 GL-RAD-A-013-Rev 10 Revision 10 Effective March 2004 Page 8 of 12
11.3 A matrix spike sample is prepared by adding a known volume of standto the d
ard directly esignated sample. Refer to the batch pull sheet to determine the
11.4 atory control sample is prepared by adding a known volume of standard
12.0 INSTR
12.2 Refer to "Counting Room Instrument Maintenance and Performance Checks" (GL-
13.0 ANALYSIS AND INSTRUMENT OPERATION ple an appropriate amount of time
s on operating the gamma spectrometers.
14.0 14.1 -RAD-I-001)
pectrometer.
15.0 DATA RECORDING, CALCULATION, AND REDUCTION METHODS
heet: preparation date,
and time.
ing equation:
designated batch matrix spike sample. A labordirectly to a Marinelli beaker with DI water. UMENT CALIBRATION AND PERFORMANCE
12.1 Refer to "Gamma Spectroscopy System Operating Procedure" (GL-RAD-I-001) forcalibration periodicity and instructions.
RAD-I-010) for instructions concerning instrument maintenance.
13.1 Place the sample on the detector and count the samin the gamma shield. See "Gamma Spectroscopy System Operating Procedure" (GL-RAD-I-001) for specific instruction
EQUIPMENT AND INSTRUMENT MAINTENANCE Refer to "Gamma Spectroscopy System Operating Procedure" (GLfor instructions concerning the Gamma S
14.2 Refer to "Counting Room Instrument Maintenance and Performance Checks" " (GL-RAD-I-001) for instructions concerning instrument maintenance.
15.1 Data Recording Record the following information on the Gamma Que Sanalyst’s initials, spike isotope, spike code, spike volume, LCS isotope, LCS code, LCS volume, nominal concentration LCS, and nominal concentration MS.For each sample record the detector number, sample mass, sample date
15.2 The instrument will report sample pCi/unit according to the follow
Sample pCi/unit = ABS*Ct *B*V*E*2.22
Where: A = net peak area (counts) ABS = relative absorption factor
d*A
V = sample volumsample count time (minutes)
B = abundance (gammas/disintegration) E = counting Efficiency (counts/gamma)
e (grams or liters) Ct =
d = decay factor = t-e λ 1
15.3 Counting uncertainty is calculated according to the following equation:
( )Decay100sy
Aerab
pkerpC
222
+
+
−
+
pkeref 2 − −
E1.96Aci/unit +
∗=
General Engineering Laboratories, LLC P.O. Box 30712 Charleston, SC 29417
This document is controlled when an original Set ID number is stamped on the front cover page (1). Uncontrolled documents do not bear an original Set ID number.
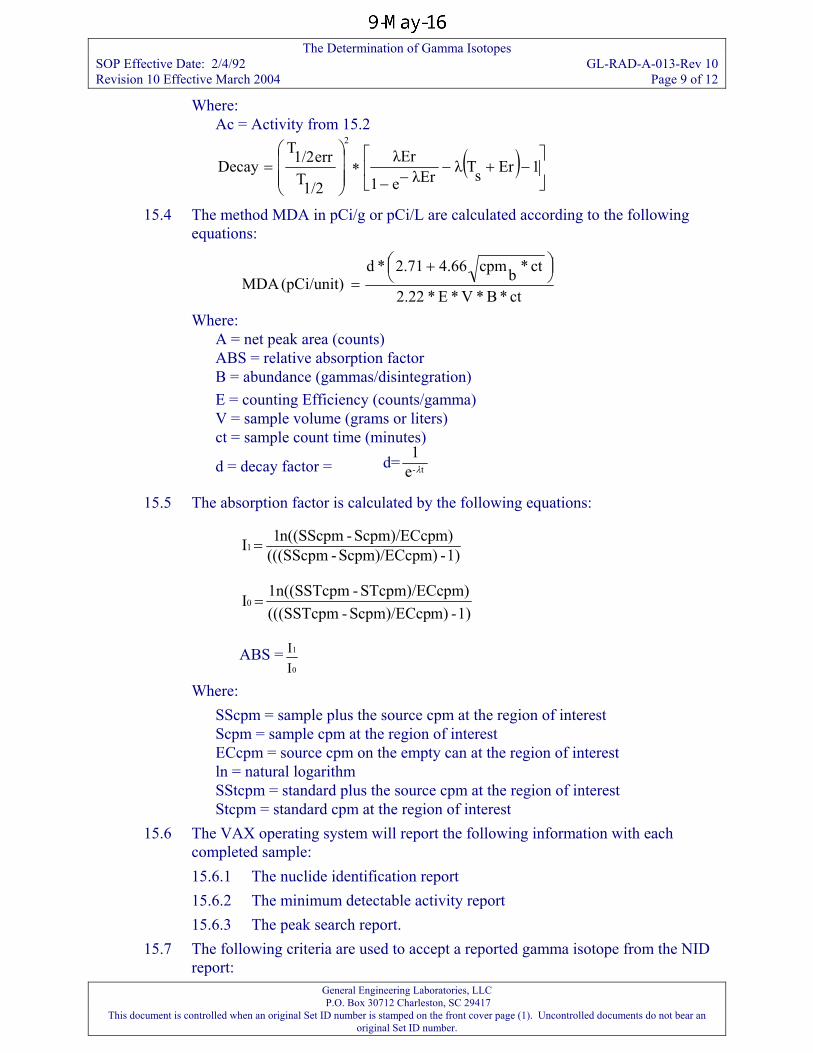
The Determination of Gamma Isotopes SOP Effective Date: 2/4/92 GL-RAD-A-013-Rev 10 Revision 10 Effective March 2004 Page 9 of 12
Where: Ac = Activity from 15.2
−−
sλEre11/2T
The method MDA in pCi/g or pCi/L are calculated according to the following
( )−+−∗
= 1ErTλλErerr1/2TDecay
2
15.4
equations:
ct*B*V*E*2.22b(pCi/unit)MDA =
ere: A = net peak area (counts)
ct*cpm4.662.71* +
Wh
ndance (gammas/disintegration)
d=
d
ABS = relative absorption factor B = abuE = counting Efficiency (counts/gamma)
sample volume (grams or liters) ct = sample count time (minutes) V =
d = decay factor = t-e1λ
15.5 The absorption factor is calculated by the following equations:
1 - m)Scpm)/ECcp - (((SScpm I1= )
m)Scpm)/ECcp - n((SScpm1
1) - m)Scpm)/ECcp - (((SSTcpmpm)c1n((SSTcp
ABS =
STcpm C - m I0 =)/E
0I
Where:
1
at the region of interest
pty can at the region of interest
plus the source cpm at the region of interest Stcpm = standard cpm at the region of interest
ting system will report the following information with each com15.15. ectable activity report 15.
15.7 The following criteria are used to accept a reported gamma isotope from the NID report:
I
SScpm = sample plus the source cpm = sample cpm at the region of interest
ECcpm = source cpm on the emScpm
ln = natural logarithmSStcpm = standard
15.6 The VAX operapleted sample:
6.1 The nuclide identification report 6.2 The minimum det6.3 The peak search report.
General Engineering Laboratories, LLC P.O. Box 30712 Charleston, SC 29417
This document is controlled when an original Set ID number is stamped on the front cover page (1). Uncontrolled documents do not bear an original Set ID number.
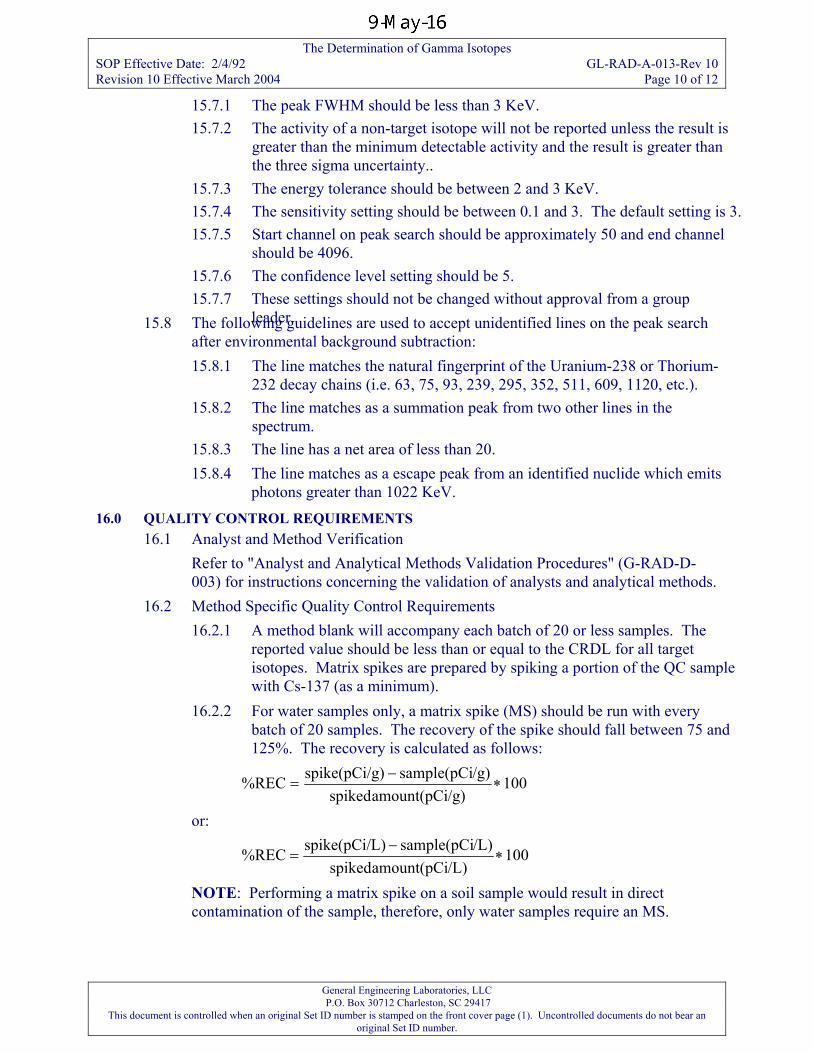
The Determination of Gamma Isotopes SOP Effective Date: 2/4/92 GL-RAD-A-013-Rev 10 Revision 10 Effective March 2004 Page 10 of 12
15.7.1 The peak FWHM should be less than 3 KeV. 15.7.2 The activity of a non-target isotope will not be reported unless the result is
ble activity and the result is greater than
uld be between 2 and 3 KeV. s 3.
Start channel on peak search should be approximately 50 and end channel
15.7.7 15.8 The following guidelines are used to accept unidentified lines on the peak search
15.8.2 as a summation peak from two other lines in the
15.8.4 matches as a escape peak from an identified nuclide which emits
16.0 QUALI16.1
Refer to
16.2 Method Specific Quality Control Requirements atch of 20 or less samples. The
red by spiking a portion of the QC sample ).
matrix spike (MS) should be run with every and
greater than the minimum detectathe three sigma uncertainty..
15.7.3 The energy tolerance sho15.7.4 The sensitivity setting should be between 0.1 and 3. The default setting i15.7.5
should be 4096. 15.7.6 The confidence level setting should be 5.
These settings should not be changed without approval from a group leader.
after environmental background subtraction: 15.8.1 The line matches the natural fingerprint of the Uranium-238 or Thorium-
232 decay chains (i.e. 63, 75, 93, 239, 295, 352, 511, 609, 1120, etc.). The line matchesspectrum.
15.8.3 The line has a net area of less than 20. The linephotons greater than 1022 KeV.
TY CONTROL REQUIREMENTS Analyst and Method Verification
"Analyst and Analytical Methods Validation Procedures" (G-RAD-D-003) for instructions concerning the validation of analysts and analytical methods.
16.2.1 A method blank will accompany each breported value should be less than or equal to the CRDL for all target isotopes. Matrix spikes are prepawith Cs-137 (as a minimum
16.2.2 For water samples only, abatch of 20 samples. The recovery of the spike should fall between 75125%. The recovery is calculated as follows:
/g)sample(pCig)spike(pCi/%REC ∗
−= 100
/g)amount(pCispiked
/L)sample(pCiL)spike(pCi/REC −=
or:
100/L)amount(pCispiked
% ∗
NOTE: contamin les require an MS.
Performing a matrix spike on a soil sample would result in direct ation of the sample, therefore, only water samp
General Engineering Laboratories, LLC P.O. Box 30712 Charleston, SC 29417
This document is controlled when an original Set ID number is stamped on the front cover page (1). Uncontrolled documents do not bear an original Set ID number.
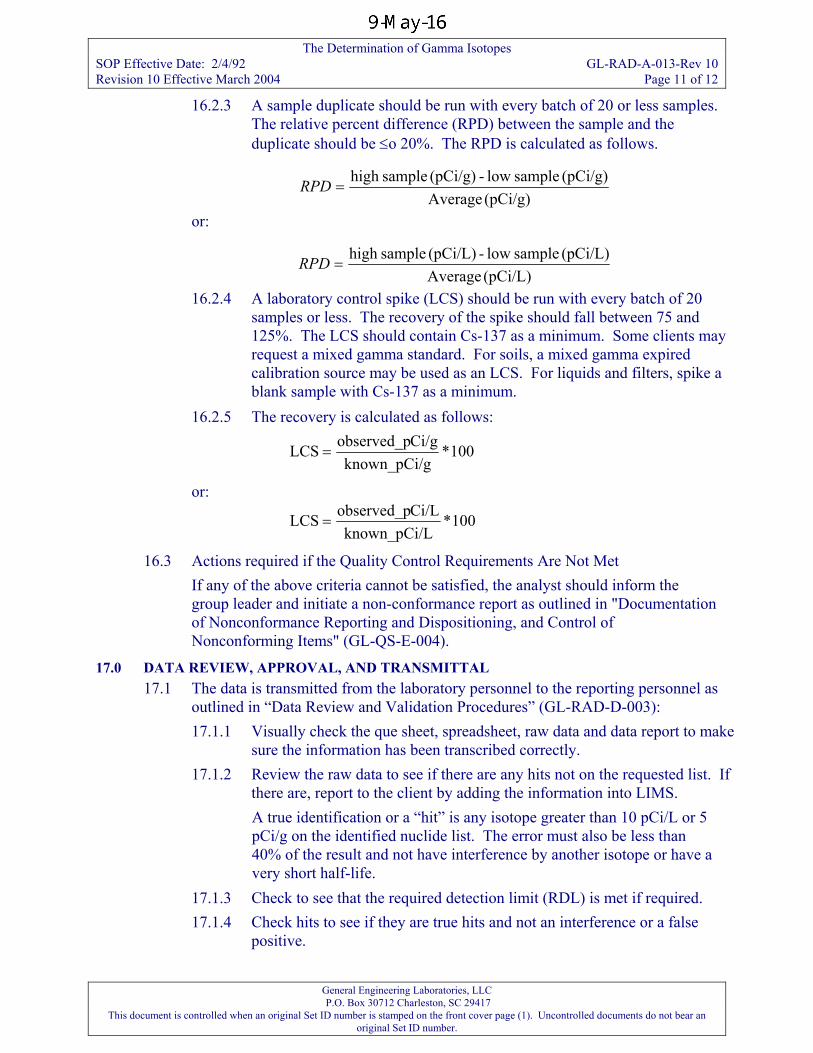
The Determination of Gamma Isotopes SOP Effective Date: 2/4/92 GL-RAD-A-013-Rev 10 Revision 10 Effective March 2004 Page 11 of 12
16.2.3 A sample duplicate should be run with every batch of 20 or less samples. ple and the The relative percent difference (RPD) between the sam
duplicate should be ≤o 20%. The RPD is calculated as follows.
(pCi/g) Average
(pCi/g) sample low - (pCi/g) samplehigh =RPD
o
r:
(pCi/L) sample low - (pCi/L) samplehigh =RPD
(pCi/L) Averageatory control spike (LCS) should be run with eve
les or less. The recovery of the spike should fall between 75 and 6.2.4 A labor ry1 batch of 20
samp25%. The LCS should contain Cs-137 as a minimum. Some clients may
request a m ma expired ilters, spike a
blank sam
1ixed gamma standard. For soils, a mixed gam
ion source may be used as an LCS. For liquids and fple with Cs-137 as a minimum.
calibrat
16.2.5 The recovery is calculated as follows:
010*gknown_pCi/
Ci/gobserved_pLCS =
Ci/Lobserved_p or:
100*
Lknown_pCi/LCS =
16.3 Actions required if ents Are Not Met
, the analyst should inform the er and initiate a non-conformance report as outlined in "Documentation
of NonconformNonconformi
17.0 17.1 el as
ta report to make nscribed correctly.
any hits not on the requested list. If
L or 5
er isotope or have a
17.1.3 ed. 17.1.4
the Quality Control Requiremve criteria cannot be satisfieIf any of the abo d
group leadance Reporting and Dispositioning, and Control of
ng Items" (GL-QS-E-004).
DATA REVIEW, APPROVAL, AND TRANSMITTAL The data is transmitted from the laboratory personnel to the reporting personnoutlined in “Data Review and Validation Procedures” (GL-RAD-D-003): 17.1.1 Visually check the que sheet, spreadsheet, raw data and da
sure the information has been tra17.1.2 Review the raw data to see if there are
there are, report to the client by adding the information into LIMS. A true identification or a “hit” is any isotope greater than 10 pCi/pCi/g on the identified nuclide list. The error must also be less than 40% of the result and not have interference by anothvery short half-life. Check to see that the required detection limit (RDL) is met if requirCheck hits to see if they are true hits and not an interference or a false positive.
General Engineering Laboratories, LLC P.O. Box 30712 Charleston, SC 29417
This document is controlled when an original Set ID number is stamped on the front cover page (1). Uncontrolled documents do not bear an original Set ID number.
The Determination of Gamma Isotopes SOP Effective Date: 2/4/92 GL-RAD-A-013-Rev 10 Revision 10 Effective March 2004 Page 12 of 12
General Engineering Laboratories, LLC P.O. Box 30712 Charleston, SC 29417
This document is controlled when an original Set ID number is stamped on the front cover page (1). Uncontrolled documents do not bear an original Set ID number.
Identifications are classified into two categories: false positives (interference), and true identification (hit). The false positives are
spectrum for the isotope. If none exist, then the identification ary
ill be
17.1.5 18.0 RECORDS MAN
18.1 Each ana un log accordin
18.2 All raw d ith the samp hival and review.
19.0 LABORATORY WASTE HANDLING AND WASTE DISPOSAL ple containers to storage as outlined in “Verifying the
19.2 in the Laboratory Waste
20.0 REFERactivity in Drinking
20.2 lications and Display User's
20.3 -Ed.25, 1982.
rejected by checking the abundance test results for the isotope and by checking last results for the half-life. The result is considered interference and rejected by checking to see if there are any clean lines in sampleis rejected. If the key line has a possible interference and secondlines do not confirm the activity calculation, the identification is rejected. Isotopes that pass these criteria are accepted as true identifications. The above tests and criteria are standard and wfollowed unless directed otherwise by contract, specification or instructions. Complete the batch checklist. AGEMENT lysis that is performed on the instrument is documented in the rg to “Run Logs” (GL-LB-E-009). ata printouts, calculation spreadsheets and batch checklists are filed wle data for arc
19.1 After analysis, return sammaintenance of sample integrity” (GL-LB-E-012). Radioactive waste is disposed of as outlinedManagement Plan (GL-LB-G-001). ENCES
20.1 USEPA. Prescribed Procedures for Measurement of RadioWater. Method 901.1, August 1980. Canberra Nuclear Genie System Spectroscopy, AppGuide. Vol. I and II, May 1991. EML procedures manual. HASL-300
Sample Receipt, Login and Storage SOP Effective 11/01/92 GL-SR-E-001 Rev 17 Revision 17 Effective June 2004 Page 1 of 15
VERIFY THE VALIDITY OF THIS SOP EACH DAY IN USE
STANDARD OPERATING PROCEDURE
FOR
SAMPLE RECEIPT, LOGIN AND STORAGE
(GL-SR-E-001 REVISION 17)
PROPRIETARY INFORMATION
This document contains proprietary information that is the exclusive property of General Engineering Laboratories, LLC (GEL). No contents of this document may be reproduced or otherwise used for the benefit of others except by express written permission of GEL.
GENERAL ENGINEERING LABORATORIES, LLC. 2040 Savage Road Charleston SC 29417
This document is controlled when an original Set ID number is stamped on the front cover page (1). Uncontrolled documents do not bear an original Set ID number
Sample Receipt, Login and Storage SOP Effective 11/01/92 GL-SR-E-001 Rev 17 Revision 17 Effective June 2004 Page 2 of 15
TABLE OF CONTENTS
1.0 STANDARD OPERATING PROCEDURE FOR SAMPLE RECEIPT, LOGIN AND STORAGE ............................................................................................................................ 3 2.0 PURPOSE............................................................................................................................. 3 3.0 DISCUSSION....................................................................................................................... 3 4.0 DEFINITIONS...................................................................................................................... 3 5.0 SAFETY, HEALTH AND ENVIRONMENTAL HAZARDS ............................................ 4 6.0 PROCEDURES..................................................................................................................... 4 7.0 RECORDS MANAGEMENT .............................................................................................. 9 8.0 REFERENCES ................................................................................................................... 10 APPENDIX 1: STORAGE AND PRESERVATION...................................................................11 APPENDIX 2: SAMPLE RECEIPT REVIEW SHEET...............................................................14 APPENDIX 3.................................................................................................................................15
GENERAL ENGINEERING LABORATORIES, LLC. 2040 Savage Road Charleston SC 29417
This document is controlled when an original Set ID number is stamped on the front cover page (1). Uncontrolled documents do not bear an original Set ID number
Sample Receipt, Login and Storage SOP Effective 11/01/92 GL-SR-E-001 Rev 17 Revision 17 Effective June 2004 Page 3 of 15
1.0 STANDARD OPERATING PROCEDURE FOR SAMPLE RECEIPT, LOGIN AND STORAGE 2.0 PURPOSE
To describe the routine operational procedures for the receipt, login and storage of samples received by General Engineering Laboratories, LLC (GEL).
3.0 DISCUSSION 3.1 Sample custody is a pre-planned mechanism for tracking a sample from the
collection of the sample in the field through the release of the finished analytical data to the client. At the collection site, the sample containers are filled with sample and the Chain of Custody form is initiated. The sample collector fills out the form, which includes the name of the client, the requested analysis parameters, sample location, the date and time of collection, sampling technique, preservatives used, and any comments or remarks that may be useful in the analytical work or data interpretation that will follow. Proper sample receipt, login and storage assure accurate chain of custody.
3.2 Custody is defined as: 3.2.1 Being in your physical possession, or 3.2.2 Being in your view, after being in your possession, or 3.2.3 Being locked up after being in your possession, or 3.2.4 Being in a designated secure area
3.3 Upon arrival at the laboratory, sampling personnel, delivery service and carriers relinquish the samples to the sample management group. Each sample container receives a unique sample identifier that is assigned electronically by LIMS (Laboratory Information Management System). LIMS tracks the status and location of each sample container, and serves as the database for analytical results.
4.0 DEFINITIONS 4.1 ALPHALIMS: Laboratory Information Management System. 4.2 Chain of Custody (COC): A written record of sample transfer and possession. 4.3 Custody Seal: Security seals that are attached to sample containers and/or bottles
that are used to detect unauthorized tampering. 4.4 Holding Time: The period of time between sample collection and preparation or
analysis. 4.5 Labeled Package: A package containing radioactive material labeled with a
Radioactive White-I, Radioactive Yellow-II or Radioactive Yellow-III label as specified in US Department of Transportation Regulations, 49 CFR 172.403 and 172.436-440.
4.6 Matrix: The physical appearance or make-up of a sample (groundwater, drinking water, wastewater, soil, sludge, etc.) as determined by the client or Project Manager.
4.7 Material Safety Data Sheet (MSDS): A document that may accompany samples of known chemical characteristics. (See our “Safety, Health and Chemical Hygiene Plan” for more information on MSDSs.)
4.8 Preservative: Additives that are introduced to a sample at the time of collection to help retard chemical and biological changes that may occur.
GENERAL ENGINEERING LABORATORIES, LLC. 2040 Savage Road Charleston SC 29417
This document is controlled when an original Set ID number is stamped on the front cover page (1). Uncontrolled documents do not bear an original Set ID number
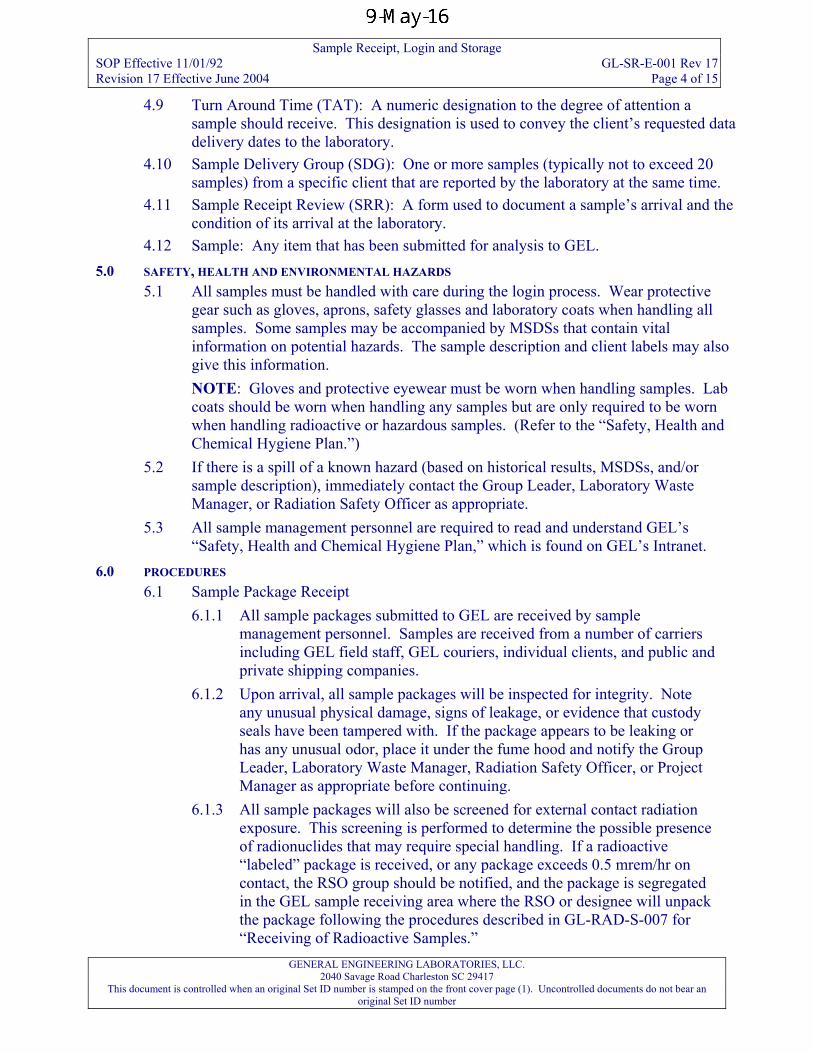
Sample Receipt, Login and Storage SOP Effective 11/01/92 GL-SR-E-001 Rev 17 Revision 17 Effective June 2004 Page 4 of 15
4.9 Turn Around Time (TAT): A numeric designation to the degree of attention a sample should receive. This designation is used to convey the client’s requested data delivery dates to the laboratory.
4.10 Sample Delivery Group (SDG): One or more samples (typically not to exceed 20 samples) from a specific client that are reported by the laboratory at the same time.
4.11 Sample Receipt Review (SRR): A form used to document a sample’s arrival and the condition of its arrival at the laboratory.
4.12 Sample: Any item that has been submitted for analysis to GEL. 5.0 SAFETY, HEALTH AND ENVIRONMENTAL HAZARDS
5.1 All samples must be handled with care during the login process. Wear protective gear such as gloves, aprons, safety glasses and laboratory coats when handling all samples. Some samples may be accompanied by MSDSs that contain vital information on potential hazards. The sample description and client labels may also give this information. NOTE: Gloves and protective eyewear must be worn when handling samples. Lab coats should be worn when handling any samples but are only required to be worn when handling radioactive or hazardous samples. (Refer to the “Safety, Health and Chemical Hygiene Plan.”)
5.2 If there is a spill of a known hazard (based on historical results, MSDSs, and/or sample description), immediately contact the Group Leader, Laboratory Waste Manager, or Radiation Safety Officer as appropriate.
5.3 All sample management personnel are required to read and understand GEL’s “Safety, Health and Chemical Hygiene Plan,” which is found on GEL’s Intranet.
6.0 PROCEDURES 6.1 Sample Package Receipt
6.1.1 All sample packages submitted to GEL are received by sample management personnel. Samples are received from a number of carriers including GEL field staff, GEL couriers, individual clients, and public and private shipping companies.
6.1.2 Upon arrival, all sample packages will be inspected for integrity. Note any unusual physical damage, signs of leakage, or evidence that custody seals have been tampered with. If the package appears to be leaking or has any unusual odor, place it under the fume hood and notify the Group Leader, Laboratory Waste Manager, Radiation Safety Officer, or Project Manager as appropriate before continuing.
6.1.3 All sample packages will also be screened for external contact radiation exposure. This screening is performed to determine the possible presence of radionuclides that may require special handling. If a radioactive “labeled” package is received, or any package exceeds 0.5 mrem/hr on contact, the RSO group should be notified, and the package is segregated in the GEL sample receiving area where the RSO or designee will unpack the package following the procedures described in GL-RAD-S-007 for “Receiving of Radioactive Samples.”
GENERAL ENGINEERING LABORATORIES, LLC. 2040 Savage Road Charleston SC 29417
This document is controlled when an original Set ID number is stamped on the front cover page (1). Uncontrolled documents do not bear an original Set ID number
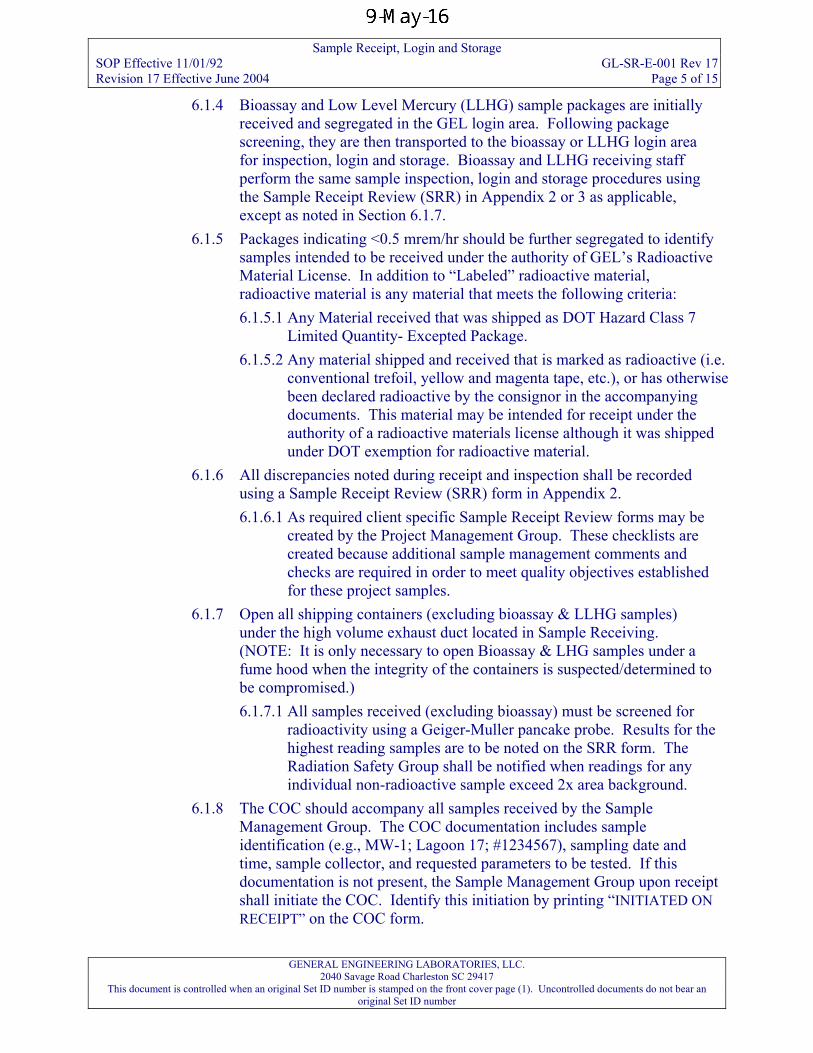
Sample Receipt, Login and Storage SOP Effective 11/01/92 GL-SR-E-001 Rev 17 Revision 17 Effective June 2004 Page 5 of 15
6.1.4 Bioassay and Low Level Mercury (LLHG) sample packages are initially received and segregated in the GEL login area. Following package screening, they are then transported to the bioassay or LLHG login area for inspection, login and storage. Bioassay and LLHG receiving staff perform the same sample inspection, login and storage procedures using the Sample Receipt Review (SRR) in Appendix 2 or 3 as applicable, except as noted in Section 6.1.7.
6.1.5 Packages indicating <0.5 mrem/hr should be further segregated to identify samples intended to be received under the authority of GEL’s Radioactive Material License. In addition to “Labeled” radioactive material, radioactive material is any material that meets the following criteria: 6.1.5.1 Any Material received that was shipped as DOT Hazard Class 7
Limited Quantity- Excepted Package. 6.1.5.2 Any material shipped and received that is marked as radioactive (i.e.
conventional trefoil, yellow and magenta tape, etc.), or has otherwise been declared radioactive by the consignor in the accompanying documents. This material may be intended for receipt under the authority of a radioactive materials license although it was shipped under DOT exemption for radioactive material.
6.1.6 All discrepancies noted during receipt and inspection shall be recorded using a Sample Receipt Review (SRR) form in Appendix 2. 6.1.6.1 As required client specific Sample Receipt Review forms may be
created by the Project Management Group. These checklists are created because additional sample management comments and checks are required in order to meet quality objectives established for these project samples.
6.1.7 Open all shipping containers (excluding bioassay & LLHG samples) under the high volume exhaust duct located in Sample Receiving. (NOTE: It is only necessary to open Bioassay & LHG samples under a fume hood when the integrity of the containers is suspected/determined to be compromised.) 6.1.7.1 All samples received (excluding bioassay) must be screened for
radioactivity using a Geiger-Muller pancake probe. Results for the highest reading samples are to be noted on the SRR form. The Radiation Safety Group shall be notified when readings for any individual non-radioactive sample exceed 2x area background.
6.1.8 The COC should accompany all samples received by the Sample Management Group. The COC documentation includes sample identification (e.g., MW-1; Lagoon 17; #1234567), sampling date and time, sample collector, and requested parameters to be tested. If this documentation is not present, the Sample Management Group upon receipt shall initiate the COC. Identify this initiation by printing “INITIATED ON RECEIPT” on the COC form.
GENERAL ENGINEERING LABORATORIES, LLC. 2040 Savage Road Charleston SC 29417
This document is controlled when an original Set ID number is stamped on the front cover page (1). Uncontrolled documents do not bear an original Set ID number
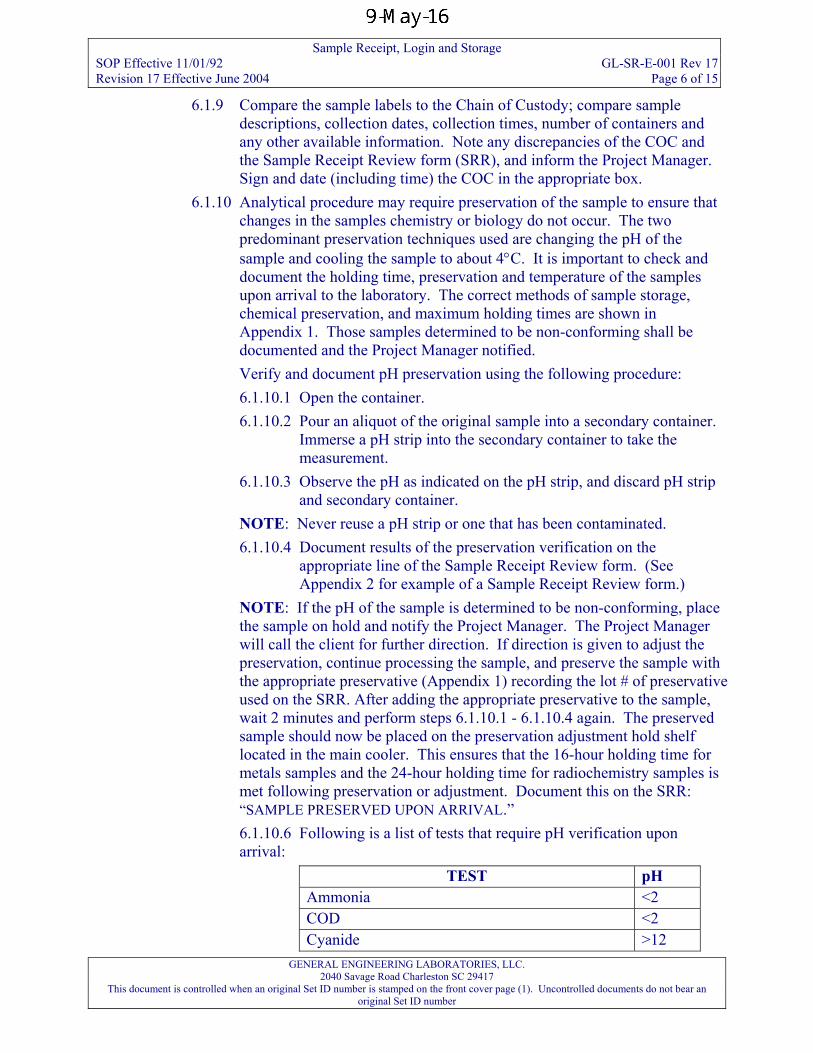
Sample Receipt, Login and Storage SOP Effective 11/01/92 GL-SR-E-001 Rev 17 Revision 17 Effective June 2004 Page 6 of 15
6.1.9 Compare the sample labels to the Chain of Custody; compare sample descriptions, collection dates, collection times, number of containers and any other available information. Note any discrepancies of the COC and the Sample Receipt Review form (SRR), and inform the Project Manager. Sign and date (including time) the COC in the appropriate box.
6.1.10 Analytical procedure may require preservation of the sample to ensure that changes in the samples chemistry or biology do not occur. The two predominant preservation techniques used are changing the pH of the sample and cooling the sample to about 4°C. It is important to check and document the holding time, preservation and temperature of the samples upon arrival to the laboratory. The correct methods of sample storage, chemical preservation, and maximum holding times are shown in Appendix 1. Those samples determined to be non-conforming shall be documented and the Project Manager notified. Verify and document pH preservation using the following procedure: 6.1.10.1 Open the container. 6.1.10.2 Pour an aliquot of the original sample into a secondary container.
Immerse a pH strip into the secondary container to take the measurement.
6.1.10.3 Observe the pH as indicated on the pH strip, and discard pH strip and secondary container.
NOTE: Never reuse a pH strip or one that has been contaminated. 6.1.10.4 Document results of the preservation verification on the
appropriate line of the Sample Receipt Review form. (See Appendix 2 for example of a Sample Receipt Review form.)
NOTE: If the pH of the sample is determined to be non-conforming, place the sample on hold and notify the Project Manager. The Project Manager will call the client for further direction. If direction is given to adjust the preservation, continue processing the sample, and preserve the sample with the appropriate preservative (Appendix 1) recording the lot # of preservative used on the SRR. After adding the appropriate preservative to the sample, wait 2 minutes and perform steps 6.1.10.1 - 6.1.10.4 again. The preserved sample should now be placed on the preservation adjustment hold shelf located in the main cooler. This ensures that the 16-hour holding time for metals samples and the 24-hour holding time for radiochemistry samples is met following preservation or adjustment. Document this on the SRR: “SAMPLE PRESERVED UPON ARRIVAL.” 6.1.10.6 Following is a list of tests that require pH verification upon arrival:
TEST pH Ammonia <2 COD <2 Cyanide >12
GENERAL ENGINEERING LABORATORIES, LLC. 2040 Savage Road Charleston SC 29417
This document is controlled when an original Set ID number is stamped on the front cover page (1). Uncontrolled documents do not bear an original Set ID number
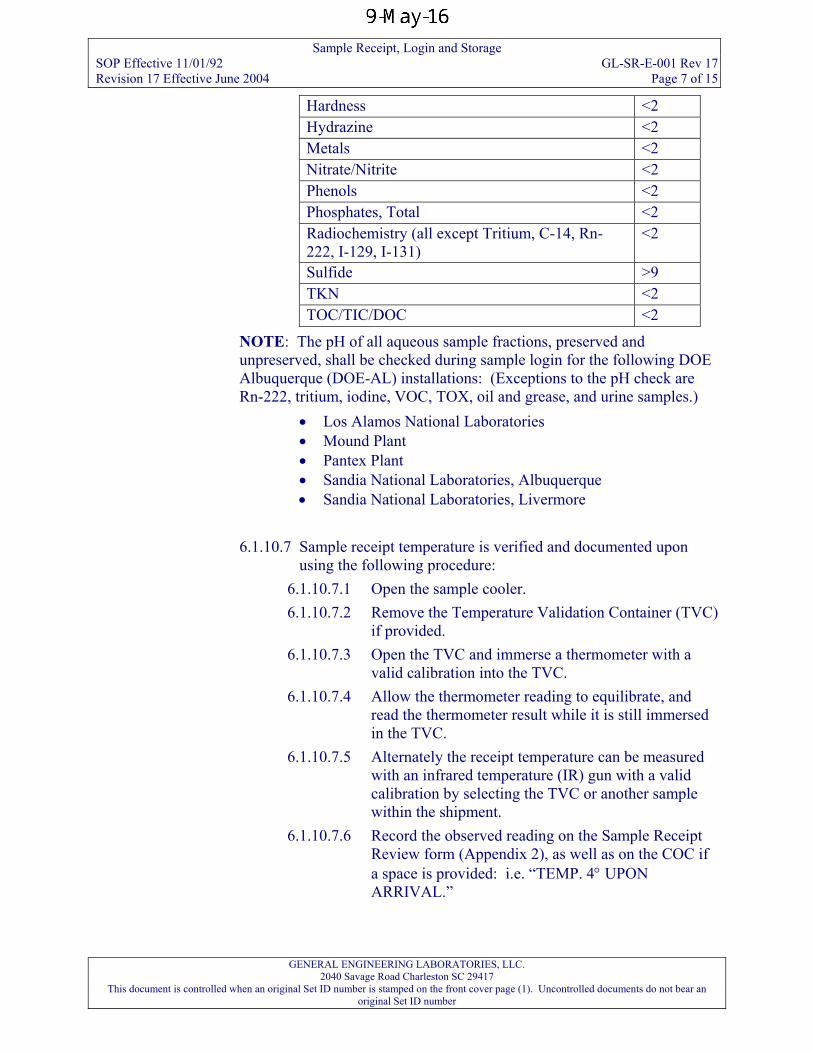
Sample Receipt, Login and Storage SOP Effective 11/01/92 GL-SR-E-001 Rev 17 Revision 17 Effective June 2004 Page 7 of 15
Hardness <2 Hydrazine <2 Metals <2 Nitrate/Nitrite <2 Phenols <2 Phosphates, Total <2 Radiochemistry (all except Tritium, C-14, Rn-222, I-129, I-131)
<2
Sulfide >9 TKN <2 TOC/TIC/DOC <2
NOTE: The pH of all aqueous sample fractions, preserved and unpreserved, shall be checked during sample login for the following DOE Albuquerque (DOE-AL) installations: (Exceptions to the pH check are Rn-222, tritium, iodine, VOC, TOX, oil and grease, and urine samples.)
• Los Alamos National Laboratories • Mound Plant • Pantex Plant • Sandia National Laboratories, Albuquerque • Sandia National Laboratories, Livermore
6.1.10.7
6.1.10.7.1 6.1.10.7.2
6.1.10.7.3
6.1.10.7.4
6.1.10.7.5
6.1.10.7.6
Sample receipt temperature is verified and documented upon using the following procedure:
Open the sample cooler. Remove the Temperature Validation Container (TVC) if provided. Open the TVC and immerse a thermometer with a valid calibration into the TVC. Allow the thermometer reading to equilibrate, and read the thermometer result while it is still immersed in the TVC. Alternately the receipt temperature can be measured with an infrared temperature (IR) gun with a valid calibration by selecting the TVC or another sample within the shipment. Record the observed reading on the Sample Receipt Review form (Appendix 2), as well as on the COC if a space is provided: i.e. “TEMP. 4° UPON ARRIVAL.”
GENERAL ENGINEERING LABORATORIES, LLC. 2040 Savage Road Charleston SC 29417
This document is controlled when an original Set ID number is stamped on the front cover page (1). Uncontrolled documents do not bear an original Set ID number
Sample Receipt, Login and Storage SOP Effective 11/01/92 GL-SR-E-001 Rev 17 Revision 17 Effective June 2004 Page 8 of 15
GENERAL ENGINEERING LABORATORIES, LLC. 2040 Savage Road Charleston SC 29417
This document is controlled when an original Set ID number is stamped on the front cover page (1). Uncontrolled documents do not bear an original Set ID number
6.1.10.7.7
6.1.10.7.8
6.1.10.7.9
6.1.10.7.10
6.1.10.8
6.1.11
6.1.12
6.1.13 6.1.14
Temperature verification results of 4° ± 2°C, are considered conforming for those samples listed in Appendix 1 for 4°. If the initial temperature verification results are determined to be non-conforming, select another sample container from the shipment for temperature verification and re-perform steps. Record the verification temperature on the SRR as well as on the COC if a space is provided. Label the temperature as a verification temperature (i.e., VT=7°C). If another container is not available within the shipment to verify the temperature, the secondary temperature verification is not performed and duly noted.
Project Managers may specify via client specific SRRs that aqueous organic analysis sample containers (excluding volatile 40-mL vials) be checked for the presence of chlorine residual at the time of sample receipt. If chlorine residual is present, document as such on the SRR and inform the Project Manager. The Project Manager may specify that samples with chlorine residual require the addition of Na2S2O3.
Deliver the completed COC and SRR to the appropriate Project manager. The Project Manager or Project Manager Assistant “logs” the data from the COC and SRR into ALPHALIMS. Once samples are logged into the system, unique bar code labels are generated for each sample container. The bar code labels are ready to be affixed to the appropriate containers. Sample bar code labels are color-coded as follows:
6.1.14.1 Yellow and magenta for radioactive samples. 6.1.14.2 Solid white for Federal Division non-radioactive samples 6.1.14.3 White and green for Industrial Division samples.
6.1.15 Compare the sample description on the printed GEL bar code label to the client sample bottle label before attaching labels to containers. You should not cover the client’s label or any other information provided by the client or sample collector.
6.1.16 If the sample is a solid submitted for volatiles analysis and a single container is provided, a designation is generated on the barcode label indicating, “Volatiles must aliquot sample first.” It is then stored in the appropriate volatile cooler until removed for volatiles testing. Once the volatiles lab takes its required aliquot the container will be marked with the analyst’s initials and the date completed. The sample container will
Sample Receipt, Login and Storage SOP Effective 11/01/92 GL-SR-E-001 Rev 17 Revision 17 Effective June 2004 Page 9 of 15
then be placed in the appropriate walk in cooler and released for other laboratory analyses. Note exception in Section 6.2.2.1.
6.2 Sample Storage and Security 6.2.1 Once the samples have been properly labeled, the samples are placed in
the appropriate storage areas. The storage areas are located within the laboratory area of the building. Access to the laboratory is limited to those with security clearance identification badges. Entrance into the laboratory is electronically monitored. All visitors to the building must sign in at the reception area where they will receive “Visitor” identification badges. Visitors must be escorted while they are in the laboratory. The samples are scanned into the electronic tracking system. Containers are loaded into the system by container type and size (i.e., 1000 mL – nalgene), preservative (i.e., H2S04), and storage area of destination.
6.2.2 Samples are placed in numerical order in the appropriate storage locations throughout the facility. 6.2.2.1 Samples requiring analysis of volatile organics shall be
segregated from other samples by placing them in either the radioactive or non-radioactive coolers, which are located in the Volatiles area and maintained at 4° ± 2°C.
NOTE: Samples requiring volatile analyses known to contain high concentrations of organic solvents or hydrocarbons should not be stored in the volatiles coolers. Place these samples in either the general use walk-in cooler. 6.2.2.2 Samples requiring radiochemical analyses only (except radon)
are stored, in numerical order, in ambient storage. Radioactive and Non Radioactive sample are segregated in these storage areas.
6.2.2.3 Samples required cold preservation (other than volatile organics samples) are stored, in numerical order, in general use walk-in coolers, which are maintained at 4° ± 2°C. Radioactive and non-radioactive samples are segregated in these storage areas.
6.2.3 The Sample Management Group monitors cooler temperature twice daily, every working day. Calibrated thermometers are located in each walk-in cooler and readings are taken once in the morning and once in the afternoon, no less than two hours apart. Contact the Group Leader if temperatures fall outside of acceptance ranges. Document all non-conformances and corrective actions in the temperature logs.
7.0 RECORDS MANAGEMENT 7.1 The Sample Receipt Review form is attached to the Chain of Custody and
forwarded to the Project Manager. 7.2 Cooler temperature logs are reviewed each month by Quality Systems. At the end
of the year, completed logs are forwarded to Quality Systems for archiving.
GENERAL ENGINEERING LABORATORIES, LLC. 2040 Savage Road Charleston SC 29417
This document is controlled when an original Set ID number is stamped on the front cover page (1). Uncontrolled documents do not bear an original Set ID number
Sample Receipt, Login and Storage SOP Effective 11/01/92 GL-SR-E-001 Rev 17 Revision 17 Effective June 2004 Page 10 of 15
8.0 REFERENCES 8.1 Example Standard Operating Procedures for Contract Laboratory Program (CLP),
National Enforcement Investigations Center (NEIC), Contract Evidence Audit Team (CEAT-TechLaw), EPA Contract 68-01-6838, 1986.
GENERAL ENGINEERING LABORATORIES, LLC. 2040 Savage Road Charleston SC 29417
This document is controlled when an original Set ID number is stamped on the front cover page (1). Uncontrolled documents do not bear an original Set ID number
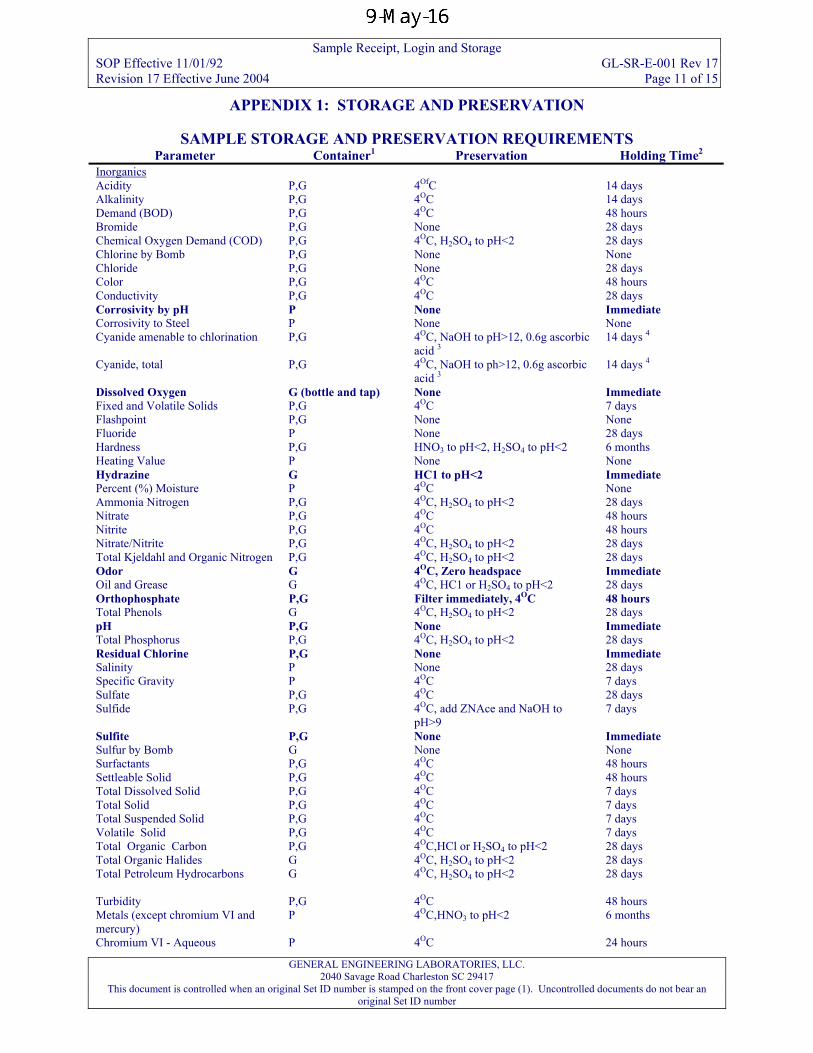
Sample Receipt, Login and Storage SOP Effective 11/01/92 GL-SR-E-001 Rev 17 Revision 17 Effective June 2004 Page 11 of 15
APPENDIX 1: STORAGE AND PRESERVATION
SAMPLE STORAGE AND PRESERVATION REQUIREMENTS Parameter Container1 Preservation Holding Time2
Inorganics Acidity P,G 4OfC 14 days Alkalinity P,G 4OC 14 days Demand (BOD) P,G 4OC 48 hours Bromide P,G None 28 days Chemical Oxygen Demand (COD) P,G 4OC, H2SO4 to pH<2 28 days Chlorine by Bomb P,G None None Chloride P,G None 28 days Color P,G 4OC 48 hours Conductivity P,G 4OC 28 days Corrosivity by pH P None Immediate Corrosivity to Steel P None None Cyanide amenable to chlorination P,G 4OC, NaOH to pH>12, 0.6g ascorbic
acid 3 14 days 4
Cyanide, total P,G 4OC, NaOH to ph>12, 0.6g ascorbic acid 3
14 days 4
Dissolved Oxygen G (bottle and tap) None Immediate Fixed and Volatile Solids P,G 4OC 7 days Flashpoint P,G None None Fluoride P None 28 days Hardness P,G HNO3 to pH<2, H2SO4 to pH<2 6 months Heating Value P None None Hydrazine G HC1 to pH<2 Immediate Percent (%) Moisture P 4OC None Ammonia Nitrogen P,G 4OC, H2SO4 to pH<2 28 days Nitrate P,G 4OC 48 hours Nitrite P,G 4OC 48 hours Nitrate/Nitrite P,G 4OC, H2SO4 to pH<2 28 days Total Kjeldahl and Organic Nitrogen P,G 4OC, H2SO4 to pH<2 28 days Odor G 4OC, Zero headspace Immediate Oil and Grease G 4OC, HC1 or H2SO4 to pH<2 28 days Orthophosphate P,G Filter immediately, 4OC 48 hours Total Phenols G 4OC, H2SO4 to pH<2 28 days pH P,G None Immediate Total Phosphorus P,G 4OC, H2SO4 to pH<2 28 days Residual Chlorine P,G None Immediate Salinity P None 28 days Specific Gravity P 4OC 7 days Sulfate P,G 4OC 28 days Sulfide P,G 4OC, add ZNAce and NaOH to
pH>9 7 days
Sulfite P,G None Immediate Sulfur by Bomb G None None Surfactants P,G 4OC 48 hours Settleable Solid P,G 4OC 48 hours Total Dissolved Solid P,G 4OC 7 days Total Solid P,G 4OC 7 days Total Suspended Solid P,G 4OC 7 days Volatile Solid P,G 4OC 7 days Total Organic Carbon P,G 4OC,HCl or H2SO4 to pH<2 28 days Total Organic Halides G 4OC, H2SO4 to pH<2 28 days Total Petroleum Hydrocarbons G 4OC, H2SO4 to pH<2 28 days Turbidity P,G 4OC 48 hours Metals (except chromium VI and mercury)
P 4OC,HNO3 to pH<2 6 months
Chromium VI - Aqueous P 4OC 24 hours
GENERAL ENGINEERING LABORATORIES, LLC. 2040 Savage Road Charleston SC 29417
This document is controlled when an original Set ID number is stamped on the front cover page (1). Uncontrolled documents do not bear an original Set ID number
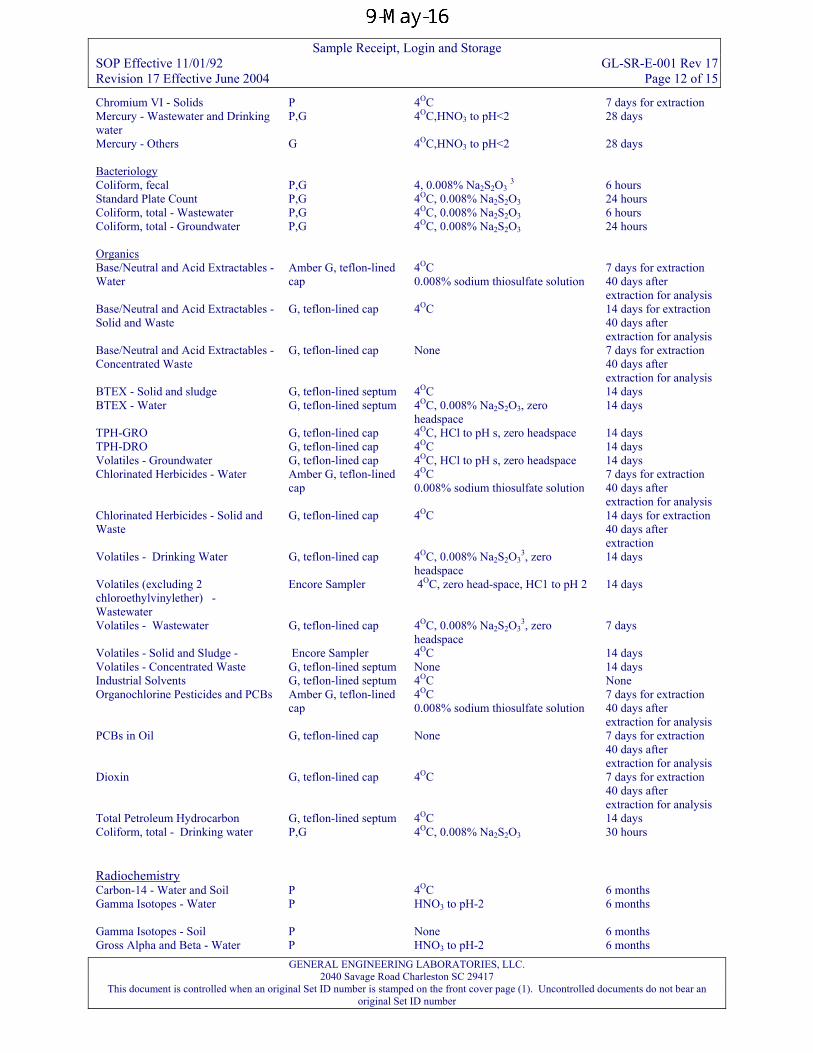
Sample Receipt, Login and Storage SOP Effective 11/01/92 GL-SR-E-001 Rev 17 Revision 17 Effective June 2004 Page 12 of 15
Chromium VI - Solids P 4OC 7 days for extraction Mercury - Wastewater and Drinking water
P,G 4OC,HNO3 to pH<2 28 days
Mercury - Others G 4OC,HNO3 to pH<2 28 days Bacteriology Coliform, fecal P,G 4, 0.008% Na2S2O3 3 6 hours Standard Plate Count P,G 4OC, 0.008% Na2S2O3 24 hours Coliform, total - Wastewater P,G 4OC, 0.008% Na2S2O3 6 hours Coliform, total - Groundwater P,G 4OC, 0.008% Na2S2O3 24 hours Organics Base/Neutral and Acid Extractables - Water
Amber G, teflon-lined cap
4OC 0.008% sodium thiosulfate solution
7 days for extraction 40 days after extraction for analysis
Base/Neutral and Acid Extractables - Solid and Waste
G, teflon-lined cap 4OC 14 days for extraction 40 days after extraction for analysis
Base/Neutral and Acid Extractables - Concentrated Waste
G, teflon-lined cap None 7 days for extraction 40 days after extraction for analysis
BTEX - Solid and sludge G, teflon-lined septum 4OC 14 days BTEX - Water G, teflon-lined septum 4OC, 0.008% Na2S2O3, zero
headspace 14 days
TPH-GRO G, teflon-lined cap 4OC, HCl to pH s, zero headspace 14 days TPH-DRO G, teflon-lined cap 4OC 14 days Volatiles - Groundwater G, teflon-lined cap 4OC, HCl to pH s, zero headspace 14 days Chlorinated Herbicides - Water Amber G, teflon-lined
cap 4OC 0.008% sodium thiosulfate solution
7 days for extraction 40 days after extraction for analysis
Chlorinated Herbicides - Solid and Waste
G, teflon-lined cap 4OC 14 days for extraction 40 days after extraction
Volatiles - Drinking Water G, teflon-lined cap 4OC, 0.008% Na2S2O33, zero
headspace 14 days
Volatiles (excluding 2 chloroethylvinylether) - Wastewater
Encore Sampler 4OC, zero head-space, HC1 to pH 2 14 days
Volatiles - Wastewater G, teflon-lined cap 4OC, 0.008% Na2S2O33, zero
headspace 7 days
Volatiles - Solid and Sludge - Encore Sampler 4OC 14 days Volatiles - Concentrated Waste G, teflon-lined septum None 14 days Industrial Solvents G, teflon-lined septum 4OC None Organochlorine Pesticides and PCBs Amber G, teflon-lined
cap 4OC 0.008% sodium thiosulfate solution
7 days for extraction 40 days after extraction for analysis
PCBs in Oil G, teflon-lined cap None 7 days for extraction 40 days after extraction for analysis
Dioxin G, teflon-lined cap 4OC 7 days for extraction 40 days after extraction for analysis
Total Petroleum Hydrocarbon G, teflon-lined septum 4OC 14 days Coliform, total - Drinking water P,G 4OC, 0.008% Na2S2O3 30 hours Radiochemistry Carbon-14 - Water and Soil P 4OC 6 months Gamma Isotopes - Water P HNO3 to pH-2 6 months Gamma Isotopes - Soil P None 6 months Gross Alpha and Beta - Water P HNO3 to pH-2 6 months
GENERAL ENGINEERING LABORATORIES, LLC. 2040 Savage Road Charleston SC 29417
This document is controlled when an original Set ID number is stamped on the front cover page (1). Uncontrolled documents do not bear an original Set ID number
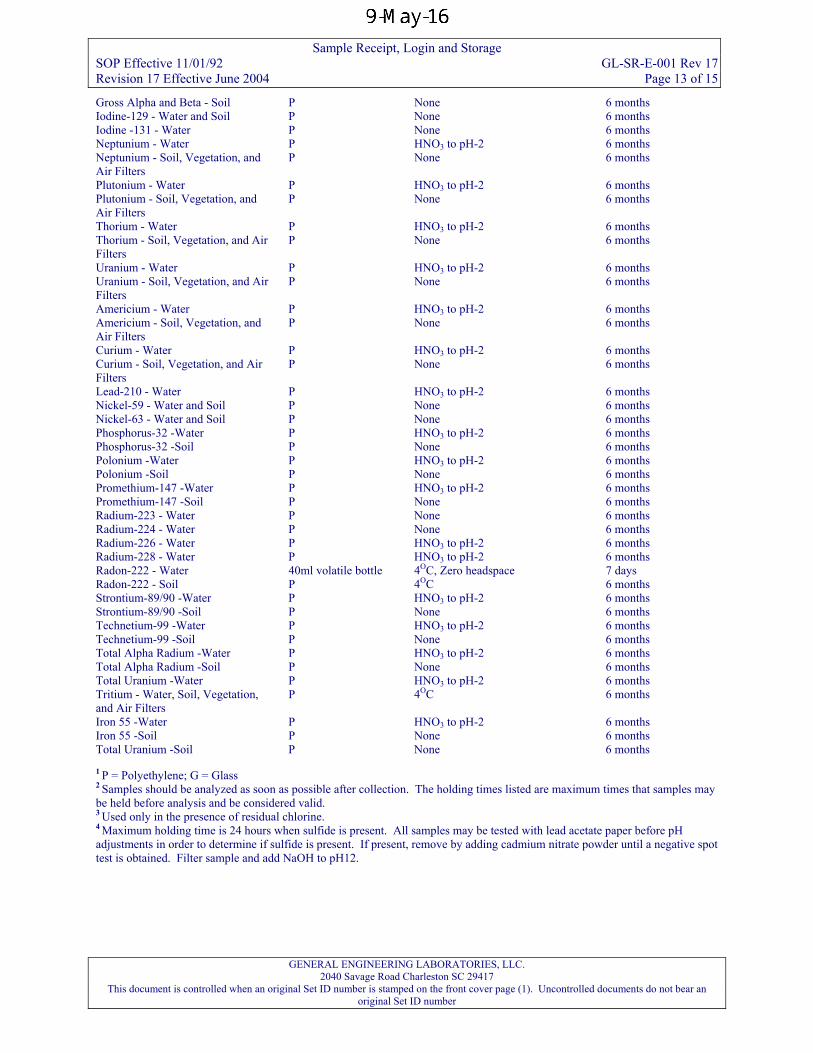
Sample Receipt, Login and Storage SOP Effective 11/01/92 GL-SR-E-001 Rev 17 Revision 17 Effective June 2004 Page 13 of 15
Gross Alpha and Beta - Soil P None 6 months Iodine-129 - Water and Soil P None 6 months Iodine -131 - Water P None 6 months Neptunium - Water P HNO3 to pH-2 6 months Neptunium - Soil, Vegetation, and Air Filters
P None 6 months
Plutonium - Water P HNO3 to pH-2 6 months Plutonium - Soil, Vegetation, and Air Filters
P None 6 months
Thorium - Water P HNO3 to pH-2 6 months Thorium - Soil, Vegetation, and Air Filters
P None 6 months
Uranium - Water P HNO3 to pH-2 6 months Uranium - Soil, Vegetation, and Air Filters
P None 6 months
Americium - Water P HNO3 to pH-2 6 months Americium - Soil, Vegetation, and Air Filters
P None 6 months
Curium - Water P HNO3 to pH-2 6 months Curium - Soil, Vegetation, and Air Filters
P None 6 months
Lead-210 - Water P HNO3 to pH-2 6 months Nickel-59 - Water and Soil P None 6 months Nickel-63 - Water and Soil P None 6 months Phosphorus-32 -Water P HNO3 to pH-2 6 months Phosphorus-32 -Soil P None 6 months Polonium -Water P HNO3 to pH-2 6 months Polonium -Soil P None 6 months Promethium-147 -Water P HNO3 to pH-2 6 months Promethium-147 -Soil P None 6 months Radium-223 - Water P None 6 months Radium-224 - Water P None 6 months Radium-226 - Water P HNO3 to pH-2 6 months Radium-228 - Water P HNO3 to pH-2 6 months Radon-222 - Water 40ml volatile bottle 4OC, Zero headspace 7 days Radon-222 - Soil P 4OC 6 months Strontium-89/90 -Water P HNO3 to pH-2 6 months Strontium-89/90 -Soil P None 6 months Technetium-99 -Water P HNO3 to pH-2 6 months Technetium-99 -Soil P None 6 months Total Alpha Radium -Water P HNO3 to pH-2 6 months Total Alpha Radium -Soil P None 6 months Total Uranium -Water P HNO3 to pH-2 6 months Tritium - Water, Soil, Vegetation, and Air Filters
P 4OC 6 months
Iron 55 -Water P HNO3 to pH-2 6 months Iron 55 -Soil P None 6 months Total Uranium -Soil P None 6 months
1 P = Polyethylene; G = Glass 2 Samples should be analyzed as soon as possible after collection. The holding times listed are maximum times that samples may be held before analysis and be considered valid. 3 Used only in the presence of residual chlorine. 4 Maximum holding time is 24 hours when sulfide is present. All samples may be tested with lead acetate paper before pH adjustments in order to determine if sulfide is present. If present, remove by adding cadmium nitrate powder until a negative spot test is obtained. Filter sample and add NaOH to pH12.
GENERAL ENGINEERING LABORATORIES, LLC. 2040 Savage Road Charleston SC 29417
This document is controlled when an original Set ID number is stamped on the front cover page (1). Uncontrolled documents do not bear an original Set ID number
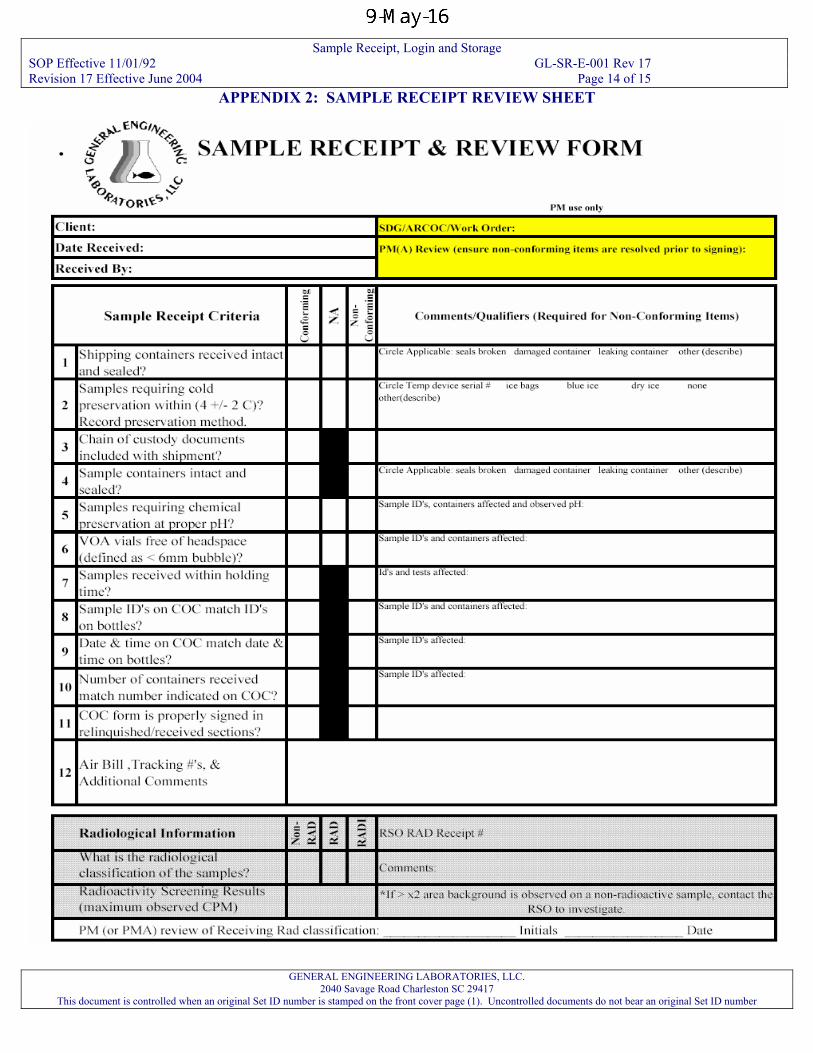
Sample Receipt, Login and Storage SOP Effective 11/01/92 GL-SR-E-001 Rev 17 Revision 17 Effective June 2004 Page 14 of 15
APPENDIX 2: SAMPLE RECEIPT REVIEW SHEET
GENERAL ENGINEERING LABORATORIES, LLC. 2040 Savage Road Charleston SC 29417
This document is controlled when an original Set ID number is stamped on the front cover page (1). Uncontrolled documents do not bear an original Set ID number
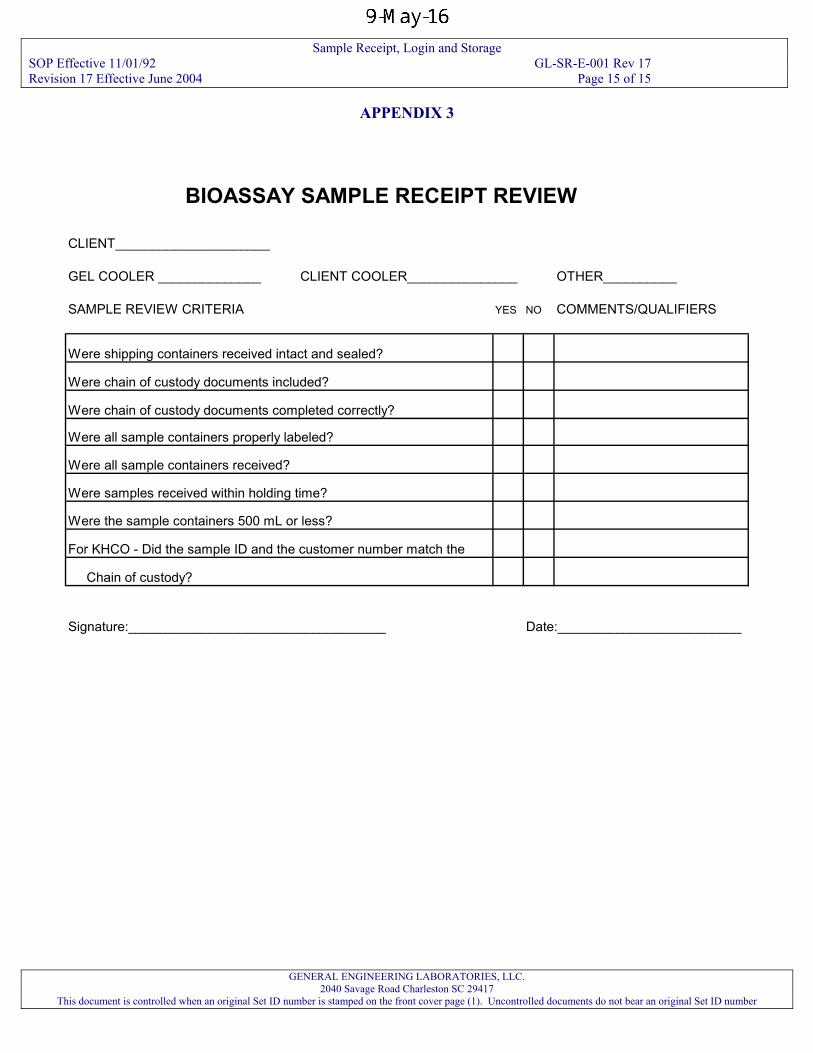
Sample Receipt, Login and Storage SOP Effective 11/01/92 GL-SR-E-001 Rev 17 Revision 17 Effective June 2004 Page 15 of 15
GENERAL ENGINEERING LABORATORIES, LLC. 2040 Savage Road Charleston SC 29417
This document is controlled when an original Set ID number is stamped on the front cover page (1). Uncontrolled documents do not bear an original Set ID number
APPENDIX 3
BIOASSAY SAMPLE RECEIPT REVIEW
CLIENT_____________________
GEL COOLER ______________ CLIENT COOLER_______________ OTHER__________
SAMPLE REVIEW CRITERIA YES NO COMMENTS/QUALIFIERS
Were shipping containers received intact and sealed?
Were chain of custody documents included?
Were chain of custody documents completed correctly?
Were all sample containers properly labeled?
Were all sample containers received?
Were samples received within holding time?
Were the sample containers 500 mL or less?
For KHCO - Did the sample ID and the customer number match the
Chain of custody?
Signature:___________________________________ Date:_________________________
The Determination of Plutonium, Uranium, Americium, Curium and Thorium SOP Effective August 25, 2002 GL-RAD-A-045 Rev 1 Revision 1 Effective May 2003 Page 1 of 14
VERIFY THE VALIDITY OF THIS SOP EACH DAY IN USE
STANDARD OPERATING PROCEDURE
FOR
THE ISOTOPIC DETERMINATION OF PLUTONIUM, URANIUM, AMERICIUM, CURIUM, AND THORIUM
Applicable to:
EML HASL-300 E-U-04 (Modified) EML HASL-300
(GL-RAD-A-045-REVISION 1)
PROPRIETARY INFORMATION
This document contains proprietary information that is the exclusive property of General Engineering Laboratories, LLC (GEL). No contents of this document may be reproduced or otherwise used for the benefit of others except by express written permission of GEL.
General Engineering Laboratories, LLC PO Box 30712 Charleston SC 29417
The Determination of Plutonium, Uranium, Americium, Curium and Thorium SOP Effective August 25, 2002 GL-RAD-A-045 Rev 1 Revision 1 Effective May 2003 Page 2 of 14
TABLE OF CONTENTS
1.0 STANDARD OPERATING PROCEDURE FOR THE DETERMINATION OF PLUTONIUM,
URANIUM, AMERICIUM, CURIUM, AND THORIUM............................................................... 3 2.0 METHOD OBJECTIVE AND APPLICABILITY............................................................................ 3 3.0 METHOD APPLICABLITY ............................................................................................................. 3 4.0 DEFINITIONS................................................................................................................................... 3 5.0 METHOD VARIATIONS ................................................................................................................. 3 6.0 SAFETY PRECAUTIONS AND WARNINGS................................................................................ 3 7.0 INTERFERENCES............................................................................................................................ 4 8.0 APPARATUS, MATERIALS, REAGENTS, EQUIPMENT, AND INSTRUMENTATION.......... 4 9.0 SAMPLE HANDLING AND PRESERVATION ............................................................................. 5 10.0 SAMPLE PREPARATION ............................................................................................................... 6 11.0 PREPARATION OF STANDARD SOLUTIONS AND QUALITY CONTROL STANDARDS ... 8 12.0 INSTRUMENT CALIBRATION AND PERFORMANCE.............................................................. 8 13.0 ANALYSIS AND INSTRUMENT OPERATION............................................................................ 9 14.0 EQUIPMENT AND INSTRUMENT MAINTENANCE .................................................................. 9 15.0 DATA RECORDING, CALCULATION, AND REDUCTION METHODS ................................... 9 16.0 QUALITY CONTROL REQUIREMENTS .................................................................................... 10 17.0 DATA REVIEW, APPROVAL, AND TRANSMITTAL ............................................................... 11 18.0 RECORDS MANAGEMENT ......................................................................................................... 11 19.0 LABORATORY WASTE HANDLING AND WASTE DISPOSAL ............................................. 11 20.0 REFERENCES................................................................................................................................. 11 APPENDIX 1.............................................................................................................................................. 12 APPENDIX 2.............................................................................................................................................. 13 APPENDIX 3.............................................................................................................................................. 14
General Engineering Laboratories, LLC PO Box 30712 Charleston SC 29417
The Determination of Plutonium, Uranium, Americium, Curium and Thorium SOP Effective August 25, 2002 GL-RAD-A-045 Rev 1 Revision 1 Effective May 2003 Page 3 of 14
1.0 STANDARD OPERATING PROCEDURE FOR THE DETERMINATION OF PLUTONIUM, URANIUM, AMERICIUM, CURIUM, AND THORIUM
2.0 METHOD OBJECTIVE AND APPLICABILITY 2.1 This standard operating procedure provides the necessary instructions to conduct the
analysis for isotopic plutonium, uranium, americium, and thorium in variety of matrices.
2.2 A sample is aliquoted and if necessary digested. Actinide elements are scavenged by co-precipitation with iron hydroxide. The precipitate is dissolved and separation of elements is accomplished through ion exchange resins and solid phase extraction. The elements are then prepared for the measurement of radioactive isotopes by co-precipitation with Neodymium fluoride. The Neodymium fluoride precipitate is trapped on a filter, mounted on a stainless steel disk and placed in a partially evacuated chamber for measurement of isotopic alpha emission.
2.3 This method has been modified on the basis of GEL’s Performance Based Measurement System (PBMS).
3.0 METHOD APPLICABLITY 3.1 Method Detection Limit: Typical minimum detectable activity (MDA) for
samples analyzed for plutonium, uranium, and thorium is 1 pCi/L or 1 pCi/g. 3.2 Method Precision: Typical relative percent difference (RPD) is 20%. 3.3 Method Bias (Accuracy): Acceptable criteria for method accuracy, measured by
running with each batch a laboratory control sample, is ±25% of true value. 3.4 Analysts are trained and certified to run this analysis after the analyst has
completed a batch with acceptable duplicate and laboratory control sample, as well as completed an unknown sample within ±25% of true value. Analyst training records are kept on hand in the Human Resources department.
4.0 DEFINITIONS 4.1 National Institute of Standards and Technology (NIST). For the purpose of this
method, the national scientific body responsible for the standardization and acceptability of analyte solutions.
4.2 Type II water: Deionized (DI) water. 4.3 ALPHA LIMS: Laboratory Information Management System. The database system
used to store and report data. 5.0 METHOD VARIATIONS
Some variation may be necessary due to special matrices encountered in the laboratory. These variations may be used with approval from a Group Leader or Team Leader. Variations to a method will be documented with the analytical raw data.
6.0 SAFETY PRECAUTIONS AND WARNINGS 6.1 Personnel performing this analytical procedure are trained in and follow the safe
laboratory practices outlined in the Safety, Health & Chemical Hygiene Plan, GL-LB-N-001.
6.2 Personnel handling Radioactive Materials are trained in and follow the procedures outlined in GL-RAD-S-004 for Radioactive Material Handling.
6.3 Personnel handling biological materials are trained in and follow the procedures outlined in GL-RAD-S-010 for Handling Biological Materials.
General Engineering Laboratories, LLC PO Box 30712 Charleston SC 29417
The Determination of Plutonium, Uranium, Americium, Curium and Thorium SOP Effective August 25, 2002 GL-RAD-A-045 Rev 1 Revision 1 Effective May 2003 Page 4 of 14
6.4 If there is any question regarding the safety of any laboratory practice, stop immediately, and consult senior qualified personnel such as a Group or Team Leader.
7.0 INTERFERENCES 7.1 Internal tracer standards may have ingrown daughters that may interfere with the
analysis. For example, Th-228 will be present in aged U-232 standard. This problem is overcome by using a self-cleaning U-232 tracer that utilizes barium sulfate to remove the Th-228.
7.2 Uranium and Thorium may not be run together if U-236 is used as a tracer due to the decay of U-236 to Th-232. The U-236 tracer does not currently utilize a barium sulfate clean-up to remove Th-232.
7.3 Short-lived radioactive progeny may ingrow on prepared filters. For example, the Ra-224 alpha peak will be present if the Th-228 parent is present. Counting samples as soon as possible after separation chemistry is completed minimizes this interference.
7.4 When present, Th-228 alpha energies interfere with the proper quantification of Pu-238. Steps are taken to ensure that the final plutonium counting sources are free from thorium interference.
7.5 Pu-236 decays to U-232 therefore Pu-236 may not be used as a tracer for this method. 8.0 APPARATUS, MATERIALS, REAGENTS, EQUIPMENT, AND INSTRUMENTATION
8.1 Ancillary Equipment 8.1.1 Ion exchange columns 8.1.2 Polypropylene centrifuge tube (50 mL) 8.1.3 Sample drying apparatus 8.1.4 Sample homogenizing apparatus 8.1.5 AG1X8 anion exchange resin, 100 – 200 mesh 8.1.6 Eichrom Technologies TRU Resin, 100 – 200 mesh 8.1.7 Silicon surface barrier detectors with associated electronics, vacuum
chambers, and data reduction capabilities 8.1.8 Vacuum pump and filtration apparatus (25 mm) 8.1.9 Gelman 25 mm filters with 0.1 µ pore size 8.1.10 Gelman polypropylene 25 mm support filter 8.1.11 Stainless steel disks, 29 mm 8.1.12 Stainless steel tweezers 8.1.13 Hotplate
8.2 Reagents, Chemicals, and Standards 8.2.1 Ammonium hydroxide concentrated (14 N). 8.2.2 Neodymium (500 mg/L) 8.2.3 Carbon Colorant. Place two 47mm cellulose nitrate filters in a beaker
and add 5mL concentrated H2SO4. Cover and heat on a hot plate until fumes of H2SO4 appear. Cool. Slurry the residue in DI water and dilute to 1L with DI water.
8.2.4 Sulfuric acid concentrated (18N)
General Engineering Laboratories, LLC PO Box 30712 Charleston SC 29417
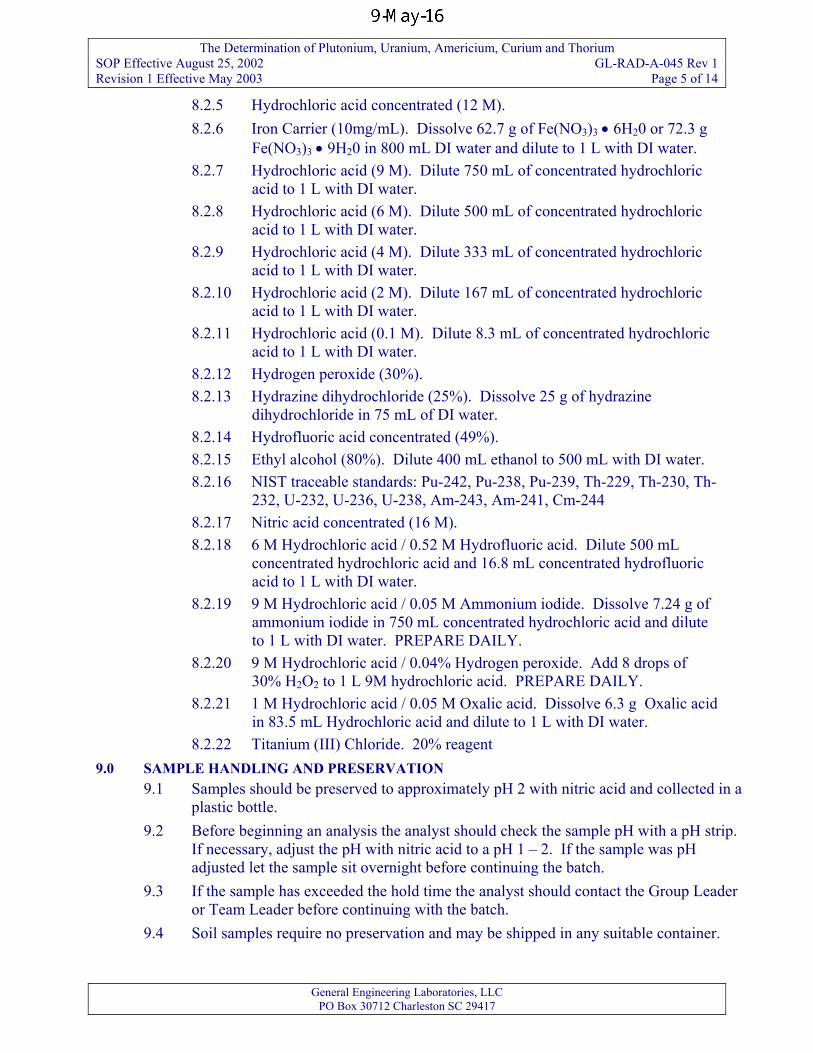
The Determination of Plutonium, Uranium, Americium, Curium and Thorium SOP Effective August 25, 2002 GL-RAD-A-045 Rev 1 Revision 1 Effective May 2003 Page 5 of 14
8.2.5 Hydrochloric acid concentrated (12 M). 8.2.6 Iron Carrier (10mg/mL). Dissolve 62.7 g of Fe(NO3)3 • 6H20 or 72.3 g
Fe(NO3)3 • 9H20 in 800 mL DI water and dilute to 1 L with DI water. 8.2.7 Hydrochloric acid (9 M). Dilute 750 mL of concentrated hydrochloric
acid to 1 L with DI water. 8.2.8 Hydrochloric acid (6 M). Dilute 500 mL of concentrated hydrochloric
acid to 1 L with DI water. 8.2.9 Hydrochloric acid (4 M). Dilute 333 mL of concentrated hydrochloric
acid to 1 L with DI water. 8.2.10 Hydrochloric acid (2 M). Dilute 167 mL of concentrated hydrochloric
acid to 1 L with DI water. 8.2.11 Hydrochloric acid (0.1 M). Dilute 8.3 mL of concentrated hydrochloric
acid to 1 L with DI water. 8.2.12 Hydrogen peroxide (30%). 8.2.13 Hydrazine dihydrochloride (25%). Dissolve 25 g of hydrazine
dihydrochloride in 75 mL of DI water. 8.2.14 Hydrofluoric acid concentrated (49%). 8.2.15 Ethyl alcohol (80%). Dilute 400 mL ethanol to 500 mL with DI water. 8.2.16 NIST traceable standards: Pu-242, Pu-238, Pu-239, Th-229, Th-230, Th-
232, U-232, U-236, U-238, Am-243, Am-241, Cm-244 8.2.17 Nitric acid concentrated (16 M). 8.2.18 6 M Hydrochloric acid / 0.52 M Hydrofluoric acid. Dilute 500 mL
concentrated hydrochloric acid and 16.8 mL concentrated hydrofluoric acid to 1 L with DI water.
8.2.19 9 M Hydrochloric acid / 0.05 M Ammonium iodide. Dissolve 7.24 g of ammonium iodide in 750 mL concentrated hydrochloric acid and dilute to 1 L with DI water. PREPARE DAILY.
8.2.20 9 M Hydrochloric acid / 0.04% Hydrogen peroxide. Add 8 drops of 30% H2O2 to 1 L 9M hydrochloric acid. PREPARE DAILY.
8.2.21 1 M Hydrochloric acid / 0.05 M Oxalic acid. Dissolve 6.3 g Oxalic acid in 83.5 mL Hydrochloric acid and dilute to 1 L with DI water.
8.2.22 Titanium (III) Chloride. 20% reagent 9.0 SAMPLE HANDLING AND PRESERVATION
9.1 Samples should be preserved to approximately pH 2 with nitric acid and collected in a plastic bottle.
9.2 Before beginning an analysis the analyst should check the sample pH with a pH strip. If necessary, adjust the pH with nitric acid to a pH 1 – 2. If the sample was pH adjusted let the sample sit overnight before continuing the batch.
9.3 If the sample has exceeded the hold time the analyst should contact the Group Leader or Team Leader before continuing with the batch.
9.4 Soil samples require no preservation and may be shipped in any suitable container.
General Engineering Laboratories, LLC PO Box 30712 Charleston SC 29417
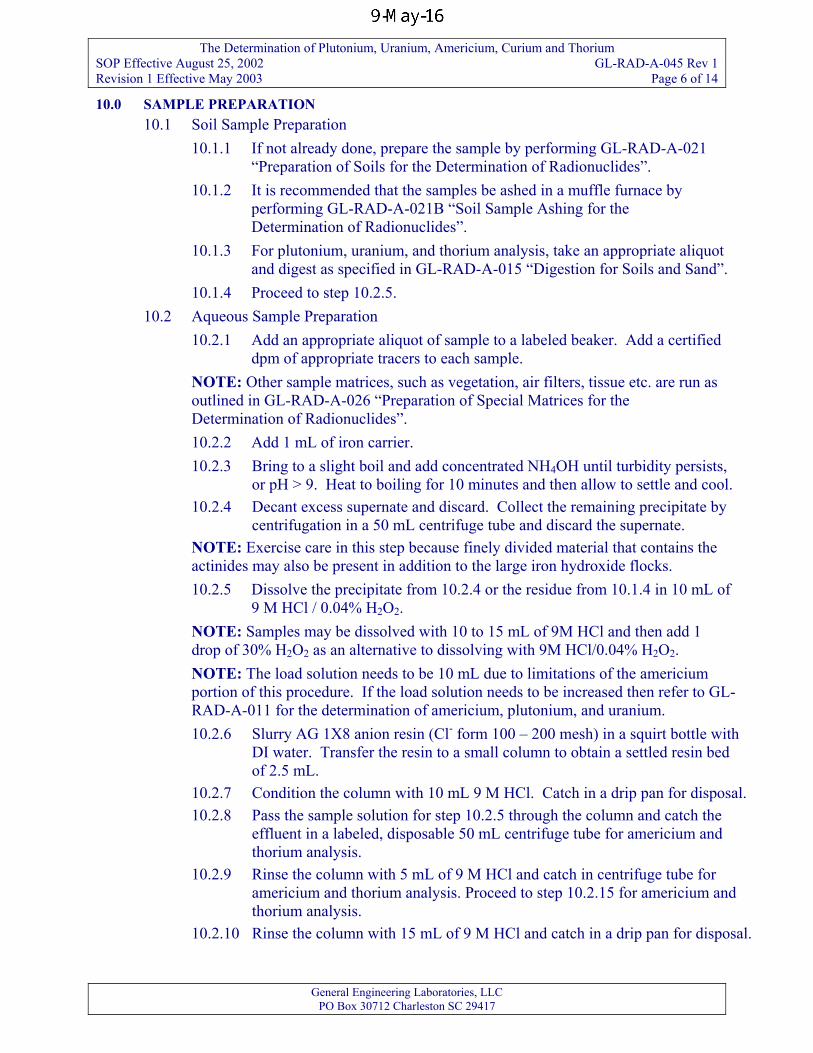
The Determination of Plutonium, Uranium, Americium, Curium and Thorium SOP Effective August 25, 2002 GL-RAD-A-045 Rev 1 Revision 1 Effective May 2003 Page 6 of 14
10.0 SAMPLE PREPARATION 10.1 Soil Sample Preparation
10.1.1 If not already done, prepare the sample by performing GL-RAD-A-021 “Preparation of Soils for the Determination of Radionuclides”.
10.1.2 It is recommended that the samples be ashed in a muffle furnace by performing GL-RAD-A-021B “Soil Sample Ashing for the Determination of Radionuclides”.
10.1.3 For plutonium, uranium, and thorium analysis, take an appropriate aliquot and digest as specified in GL-RAD-A-015 “Digestion for Soils and Sand”.
10.1.4 Proceed to step 10.2.5. 10.2 Aqueous Sample Preparation
10.2.1 Add an appropriate aliquot of sample to a labeled beaker. Add a certified dpm of appropriate tracers to each sample.
NOTE: Other sample matrices, such as vegetation, air filters, tissue etc. are run as outlined in GL-RAD-A-026 “Preparation of Special Matrices for the Determination of Radionuclides”. 10.2.2 Add 1 mL of iron carrier. 10.2.3 Bring to a slight boil and add concentrated NH4OH until turbidity persists,
or pH > 9. Heat to boiling for 10 minutes and then allow to settle and cool. 10.2.4 Decant excess supernate and discard. Collect the remaining precipitate by
centrifugation in a 50 mL centrifuge tube and discard the supernate. NOTE: Exercise care in this step because finely divided material that contains the actinides may also be present in addition to the large iron hydroxide flocks. 10.2.5 Dissolve the precipitate from 10.2.4 or the residue from 10.1.4 in 10 mL of
9 M HCl / 0.04% H2O2. NOTE: Samples may be dissolved with 10 to 15 mL of 9M HCl and then add 1 drop of 30% H2O2 as an alternative to dissolving with 9M HCl/0.04% H2O2. NOTE: The load solution needs to be 10 mL due to limitations of the americium portion of this procedure. If the load solution needs to be increased then refer to GL-RAD-A-011 for the determination of americium, plutonium, and uranium. 10.2.6 Slurry AG 1X8 anion resin (Cl- form 100 – 200 mesh) in a squirt bottle with
DI water. Transfer the resin to a small column to obtain a settled resin bed of 2.5 mL.
10.2.7 Condition the column with 10 mL 9 M HCl. Catch in a drip pan for disposal. 10.2.8 Pass the sample solution for step 10.2.5 through the column and catch the
effluent in a labeled, disposable 50 mL centrifuge tube for americium and thorium analysis.
10.2.9 Rinse the column with 5 mL of 9 M HCl and catch in centrifuge tube for americium and thorium analysis. Proceed to step 10.2.15 for americium and thorium analysis.
10.2.10 Rinse the column with 15 mL of 9 M HCl and catch in a drip pan for disposal.
General Engineering Laboratories, LLC PO Box 30712 Charleston SC 29417
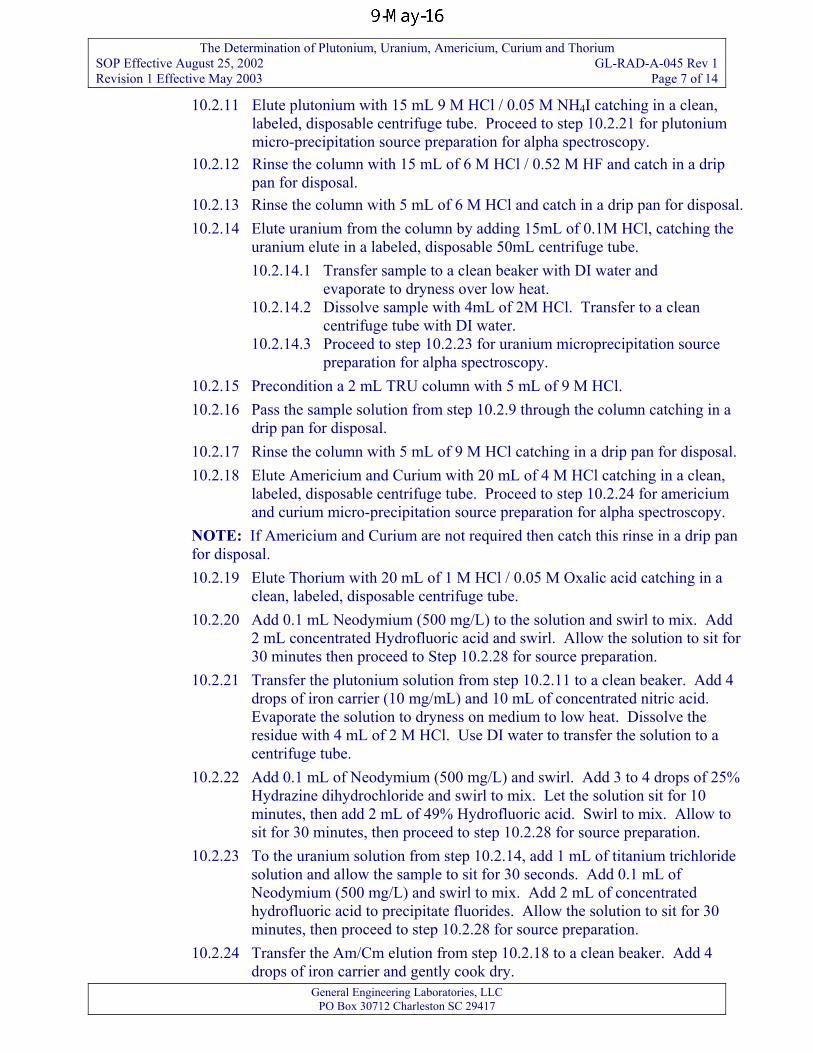
The Determination of Plutonium, Uranium, Americium, Curium and Thorium SOP Effective August 25, 2002 GL-RAD-A-045 Rev 1 Revision 1 Effective May 2003 Page 7 of 14
10.2.11 Elute plutonium with 15 mL 9 M HCl / 0.05 M NH4I catching in a clean, labeled, disposable centrifuge tube. Proceed to step 10.2.21 for plutonium micro-precipitation source preparation for alpha spectroscopy.
10.2.12 Rinse the column with 15 mL of 6 M HCl / 0.52 M HF and catch in a drip pan for disposal.
10.2.13 Rinse the column with 5 mL of 6 M HCl and catch in a drip pan for disposal. 10.2.14 Elute uranium from the column by adding 15mL of 0.1M HCl, catching the
uranium elute in a labeled, disposable 50mL centrifuge tube. 10.2.14.1 Transfer sample to a clean beaker with DI water and
evaporate to dryness over low heat. 10.2.14.2 Dissolve sample with 4mL of 2M HCl. Transfer to a clean
centrifuge tube with DI water. 10.2.14.3 Proceed to step 10.2.23 for uranium microprecipitation source
preparation for alpha spectroscopy. 10.2.15 Precondition a 2 mL TRU column with 5 mL of 9 M HCl. 10.2.16 Pass the sample solution from step 10.2.9 through the column catching in a
drip pan for disposal. 10.2.17 Rinse the column with 5 mL of 9 M HCl catching in a drip pan for disposal. 10.2.18 Elute Americium and Curium with 20 mL of 4 M HCl catching in a clean,
labeled, disposable centrifuge tube. Proceed to step 10.2.24 for americium and curium micro-precipitation source preparation for alpha spectroscopy.
NOTE: If Americium and Curium are not required then catch this rinse in a drip pan for disposal. 10.2.19 Elute Thorium with 20 mL of 1 M HCl / 0.05 M Oxalic acid catching in a
clean, labeled, disposable centrifuge tube. 10.2.20 Add 0.1 mL Neodymium (500 mg/L) to the solution and swirl to mix. Add
2 mL concentrated Hydrofluoric acid and swirl. Allow the solution to sit for 30 minutes then proceed to Step 10.2.28 for source preparation.
10.2.21 Transfer the plutonium solution from step 10.2.11 to a clean beaker. Add 4 drops of iron carrier (10 mg/mL) and 10 mL of concentrated nitric acid. Evaporate the solution to dryness on medium to low heat. Dissolve the residue with 4 mL of 2 M HCl. Use DI water to transfer the solution to a centrifuge tube.
10.2.22 Add 0.1 mL of Neodymium (500 mg/L) and swirl. Add 3 to 4 drops of 25% Hydrazine dihydrochloride and swirl to mix. Let the solution sit for 10 minutes, then add 2 mL of 49% Hydrofluoric acid. Swirl to mix. Allow to sit for 30 minutes, then proceed to step 10.2.28 for source preparation.
10.2.23 To the uranium solution from step 10.2.14, add 1 mL of titanium trichloride solution and allow the sample to sit for 30 seconds. Add 0.1 mL of Neodymium (500 mg/L) and swirl to mix. Add 2 mL of concentrated hydrofluoric acid to precipitate fluorides. Allow the solution to sit for 30 minutes, then proceed to step 10.2.28 for source preparation.
10.2.24 Transfer the Am/Cm elution from step 10.2.18 to a clean beaker. Add 4 drops of iron carrier and gently cook dry.
General Engineering Laboratories, LLC PO Box 30712 Charleston SC 29417
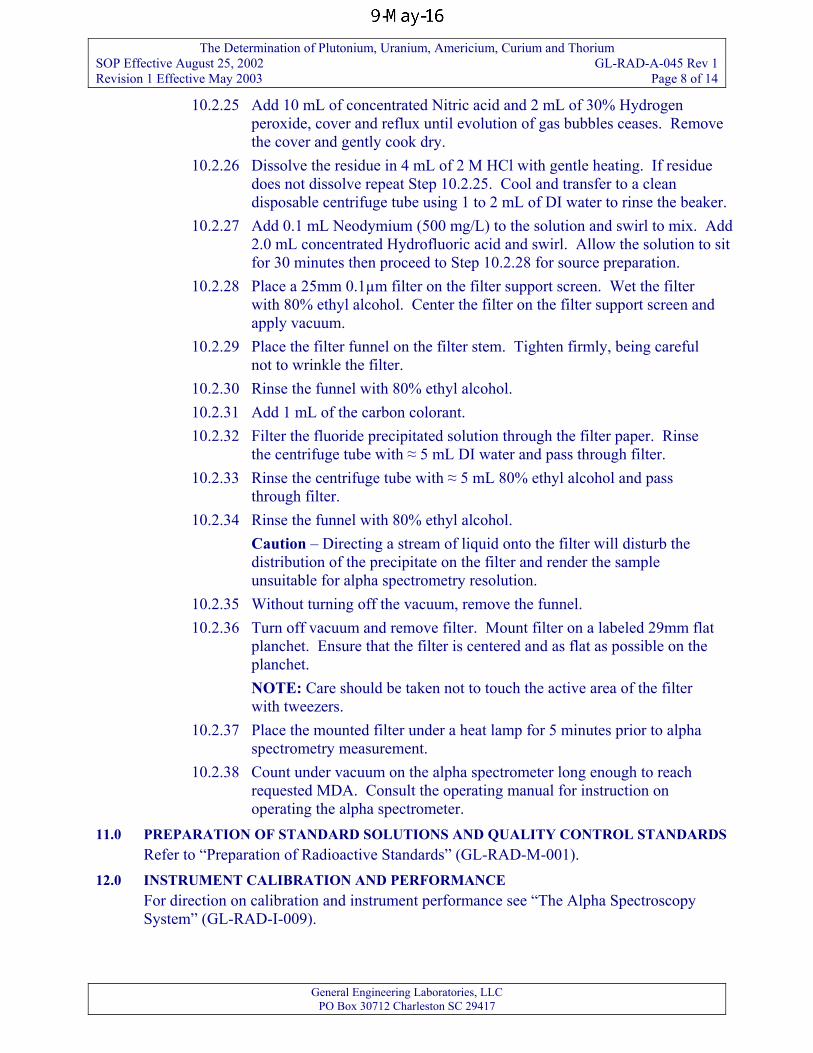
The Determination of Plutonium, Uranium, Americium, Curium and Thorium SOP Effective August 25, 2002 GL-RAD-A-045 Rev 1 Revision 1 Effective May 2003 Page 8 of 14
10.2.25 Add 10 mL of concentrated Nitric acid and 2 mL of 30% Hydrogen peroxide, cover and reflux until evolution of gas bubbles ceases. Remove the cover and gently cook dry.
10.2.26 Dissolve the residue in 4 mL of 2 M HCl with gentle heating. If residue does not dissolve repeat Step 10.2.25. Cool and transfer to a clean disposable centrifuge tube using 1 to 2 mL of DI water to rinse the beaker.
10.2.27 Add 0.1 mL Neodymium (500 mg/L) to the solution and swirl to mix. Add 2.0 mL concentrated Hydrofluoric acid and swirl. Allow the solution to sit for 30 minutes then proceed to Step 10.2.28 for source preparation.
10.2.28 Place a 25mm 0.1µm filter on the filter support screen. Wet the filter with 80% ethyl alcohol. Center the filter on the filter support screen and apply vacuum.
10.2.29 Place the filter funnel on the filter stem. Tighten firmly, being careful not to wrinkle the filter.
10.2.30 Rinse the funnel with 80% ethyl alcohol. 10.2.31 Add 1 mL of the carbon colorant. 10.2.32 Filter the fluoride precipitated solution through the filter paper. Rinse
the centrifuge tube with ≈ 5 mL DI water and pass through filter. 10.2.33 Rinse the centrifuge tube with ≈ 5 mL 80% ethyl alcohol and pass
through filter. 10.2.34 Rinse the funnel with 80% ethyl alcohol.
Caution – Directing a stream of liquid onto the filter will disturb the distribution of the precipitate on the filter and render the sample unsuitable for alpha spectrometry resolution.
10.2.35 Without turning off the vacuum, remove the funnel. 10.2.36 Turn off vacuum and remove filter. Mount filter on a labeled 29mm flat
planchet. Ensure that the filter is centered and as flat as possible on the planchet. NOTE: Care should be taken not to touch the active area of the filter with tweezers.
10.2.37 Place the mounted filter under a heat lamp for 5 minutes prior to alpha spectrometry measurement.
10.2.38 Count under vacuum on the alpha spectrometer long enough to reach requested MDA. Consult the operating manual for instruction on operating the alpha spectrometer.
11.0 PREPARATION OF STANDARD SOLUTIONS AND QUALITY CONTROL STANDARDS Refer to “Preparation of Radioactive Standards” (GL-RAD-M-001). 12.0 INSTRUMENT CALIBRATION AND PERFORMANCE
For direction on calibration and instrument performance see “The Alpha Spectroscopy System” (GL-RAD-I-009).
General Engineering Laboratories, LLC PO Box 30712 Charleston SC 29417
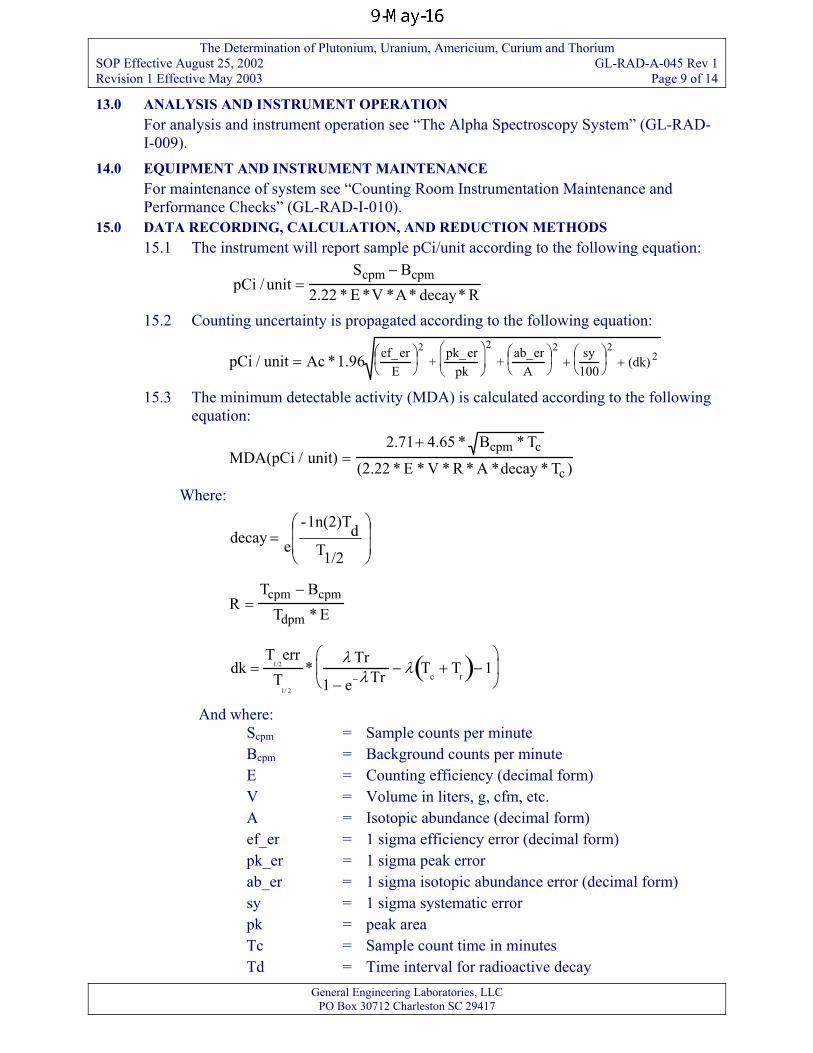
The Determination of Plutonium, Uranium, Americium, Curium and Thorium SOP Effective August 25, 2002 GL-RAD-A-045 Rev 1 Revision 1 Effective May 2003 Page 9 of 14
13.0 ANALYSIS AND INSTRUMENT OPERATION For analysis and instrument operation see “The Alpha Spectroscopy System” (GL-RAD-I-009).
14.0 EQUIPMENT AND INSTRUMENT MAINTENANCE For maintenance of system see “Counting Room Instrumentation Maintenance and Performance Checks” (GL-RAD-I-010).
15.0 DATA RECORDING, CALCULATION, AND REDUCTION METHODS 15.1 The instrument will report sample pCi/unit according to the following equation:
pCi / unitS B
2.22 * E *V *A* decay* Rcpm cpm
=−
15.2 Counting uncertainty is propagated according to the following equation:
pCi / unit Ac *1.96 ef_erE
+pk_er
pk+
ab_erA
sy100
(dk) 2=
+
+
2 2 2 2
15.3 The minimum detectable activity (MDA) is calculated according to the following equation:
MDA(pCi / unit)2.71 4.65 * B T
(2.22 * E * V * R * A *decay * T )cpm c
c=
+ *
Where:
=
1/2Td1n(2)T-
e decay
RT B
T * Ecpm cpm
dpm=
−
( )dkT err
T*
Tr
1 e Tr T T 11/2
1/ 2
c r=
−− + −
−
λλ λ
And where: Scpm = Sample counts per minute Bcpm = Background counts per minute E = Counting efficiency (decimal form) V = Volume in liters, g, cfm, etc. A = Isotopic abundance (decimal form) ef_er = 1 sigma efficiency error (decimal form) pk_er = 1 sigma peak error ab_er = 1 sigma isotopic abundance error (decimal form) sy = 1 sigma systematic error pk = peak area Tc = Sample count time in minutes Td = Time interval for radioactive decay
General Engineering Laboratories, LLC PO Box 30712 Charleston SC 29417
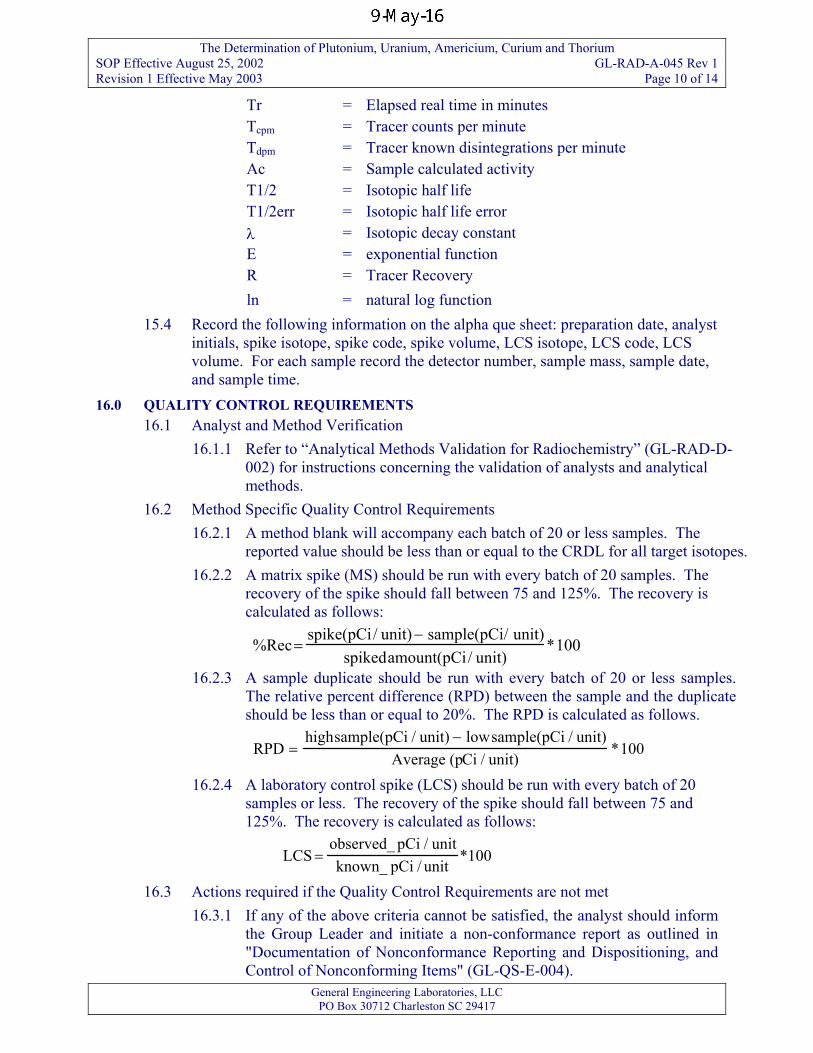
The Determination of Plutonium, Uranium, Americium, Curium and Thorium SOP Effective August 25, 2002 GL-RAD-A-045 Rev 1 Revision 1 Effective May 2003 Page 10 of 14
Tr = Elapsed real time in minutes Tcpm = Tracer counts per minute Tdpm = Tracer known disintegrations per minute Ac = Sample calculated activity T1/2 = Isotopic half life T1/2err = Isotopic half life error λ = Isotopic decay constant E = exponential function R = Tracer Recovery ln = natural log function
15.4 Record the following information on the alpha que sheet: preparation date, analyst initials, spike isotope, spike code, spike volume, LCS isotope, LCS code, LCS volume. For each sample record the detector number, sample mass, sample date, and sample time.
16.0 QUALITY CONTROL REQUIREMENTS 16.1 Analyst and Method Verification
16.1.1 Refer to “Analytical Methods Validation for Radiochemistry” (GL-RAD-D-002) for instructions concerning the validation of analysts and analytical methods.
16.2 Method Specific Quality Control Requirements 16.2.1 A method blank will accompany each batch of 20 or less samples. The
reported value should be less than or equal to the CRDL for all target isotopes. 16.2.2 A matrix spike (MS) should be run with every batch of 20 samples. The
recovery of the spike should fall between 75 and 125%. The recovery is calculated as follows:
%Rec
spike(pCi/ unit) sample(pCi/ unit)spikedamount(pCi/ unit)
=−
*100
16.2.3 A sample duplicate should be run with every batch of 20 or less samples. The relative percent difference (RPD) between the sample and the duplicate should be less than or equal to 20%. The RPD is calculated as follows.
RPD
highsample(pCi / unit) lowsample(pCi / unit)Average (pCi / unit)
*100=−
16.2.4 A laboratory control spike (LCS) should be run with every batch of 20
samples or less. The recovery of the spike should fall between 75 and 125%. The recovery is calculated as follows:
LCSobserved_ pCi / unitknown_ pCi / unit
*100=
16.3 Actions required if the Quality Control Requirements are not met 16.3.1 If any of the above criteria cannot be satisfied, the analyst should inform
the Group Leader and initiate a non-conformance report as outlined in "Documentation of Nonconformance Reporting and Dispositioning, and Control of Nonconforming Items" (GL-QS-E-004).
General Engineering Laboratories, LLC PO Box 30712 Charleston SC 29417
The Determination of Plutonium, Uranium, Americium, Curium and Thorium SOP Effective August 25, 2002 GL-RAD-A-045 Rev 1 Revision 1 Effective May 2003 Page 11 of 14
17.0 DATA REVIEW, APPROVAL, AND TRANSMITTAL Refer to “Data Review, Validation and Data Package Assembly” (GL-RAD-D-003) for instructions concerning the data review process, approval, and transmittal.
18.0 RECORDS MANAGEMENT 18.1 All raw data, calculation spreadsheets and batch checklists are filed with the sample
data and maintained as quality records in accordance with GL-QS-E-008 for Quality Records Management and Disposition.
18.2 Each analysis that is performed on the instrument is documented in the run log according to “Run Logs” (GL-LB-E-009).
18.3 All raw data printouts, calculation spreadsheets and batch checklists are filed with the sample data for archival and review.
19.0 LABORATORY WASTE HANDLING AND WASTE DISPOSAL Radioactive samples and material shall be handled and disposed of as outlined in the Laboratory Waste Management Plan (GL-LB-G-001).
20.0 REFERENCES 20.1 EPA Environmental Monitoring and Support Laboratory. Las Vegas. Radiochemical
Analytical Procedures for Analysis of Environmental Samples. March 1979. 20.2 EML Procedures Manual HASL-300, 1982. 20.3 DOE Methods Manual for Evaluating Environmental and Waste Management
Samples, 1997 Edition, RP800, “Sequential Separation of Americium and Plutonium by Extraction Chromatography”.
20.4 Analytical Chemistry. Rapid Determination of Th-230 in Mill Tailings by alpha spectroscopy. UNC Geotech, Grand Junction Projects Office. Steve Donivan, Mark Hollenbach, and Mary Costello. Vol. 59, No. 21, 1987.
20.5 Los Alamos Health and Environmental Chemistry: Analytical Techniques. LA-10300-M Vol. 1, September 1987.
General Engineering Laboratories, LLC PO Box 30712 Charleston SC 29417
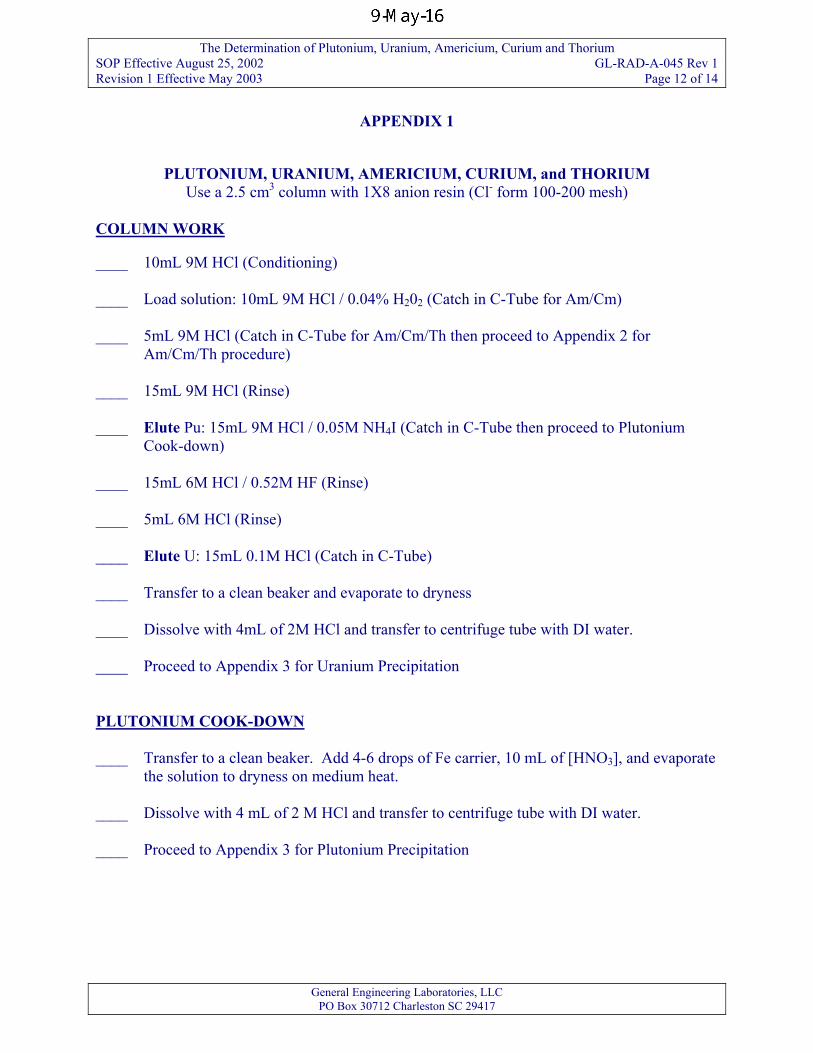
The Determination of Plutonium, Uranium, Americium, Curium and Thorium SOP Effective August 25, 2002 GL-RAD-A-045 Rev 1 Revision 1 Effective May 2003 Page 12 of 14
APPENDIX 1
PLUTONIUM, URANIUM, AMERICIUM, CURIUM, and THORIUM
Use a 2.5 cm3 column with 1X8 anion resin (Cl- form 100-200 mesh) COLUMN WORK ____ 10mL 9M HCl (Conditioning) ____ Load solution: 10mL 9M HCl / 0.04% H202 (Catch in C-Tube for Am/Cm) ____ 5mL 9M HCl (Catch in C-Tube for Am/Cm/Th then proceed to Appendix 2 for
Am/Cm/Th procedure) ____ 15mL 9M HCl (Rinse) ____ Elute Pu: 15mL 9M HCl / 0.05M NH4I (Catch in C-Tube then proceed to Plutonium
Cook-down) ____ 15mL 6M HCl / 0.52M HF (Rinse) ____ 5mL 6M HCl (Rinse) ____ Elute U: 15mL 0.1M HCl (Catch in C-Tube) ____ Transfer to a clean beaker and evaporate to dryness ____ Dissolve with 4mL of 2M HCl and transfer to centrifuge tube with DI water. ____ Proceed to Appendix 3 for Uranium Precipitation PLUTONIUM COOK-DOWN ____ Transfer to a clean beaker. Add 4-6 drops of Fe carrier, 10 mL of [HNO3], and evaporate
the solution to dryness on medium heat. ____ Dissolve with 4 mL of 2 M HCl and transfer to centrifuge tube with DI water. ____ Proceed to Appendix 3 for Plutonium Precipitation
General Engineering Laboratories, LLC PO Box 30712 Charleston SC 29417
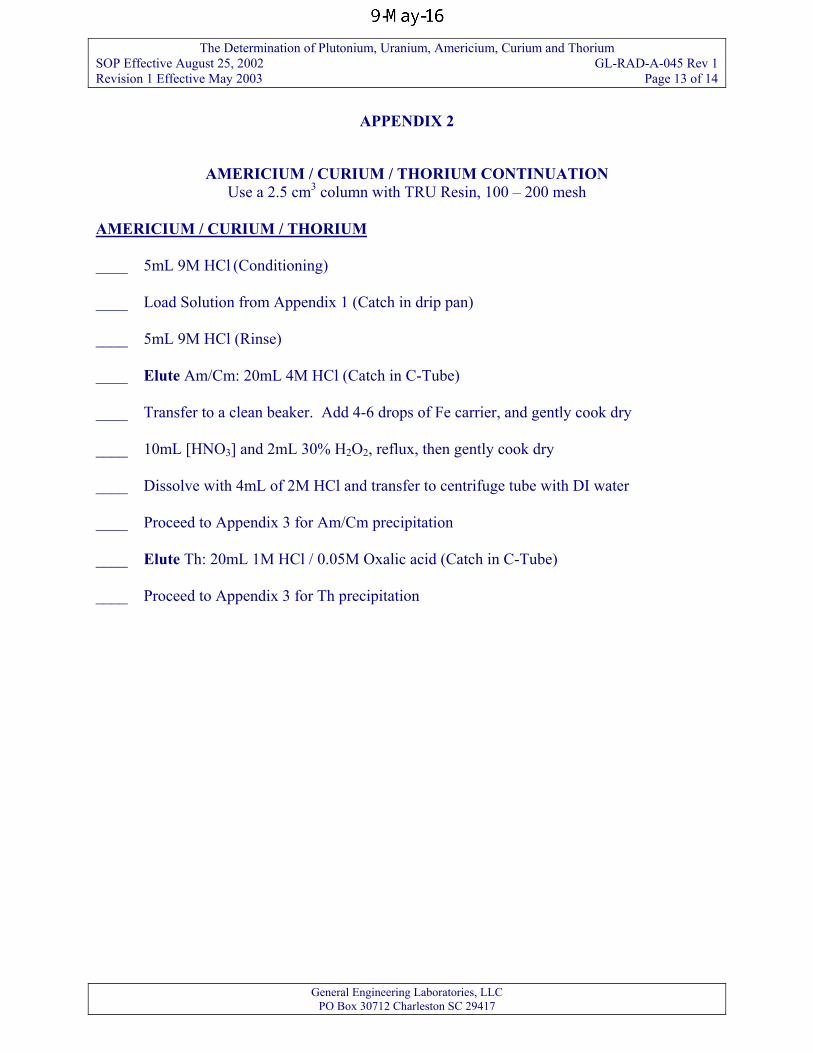
The Determination of Plutonium, Uranium, Americium, Curium and Thorium SOP Effective August 25, 2002 GL-RAD-A-045 Rev 1 Revision 1 Effective May 2003 Page 13 of 14
APPENDIX 2
AMERICIUM / CURIUM / THORIUM CONTINUATION
Use a 2.5 cm3 column with TRU Resin, 100 – 200 mesh
AMERICIUM / CURIUM / THORIUM ____ 5mL 9M HCl (Conditioning) ____ Load Solution from Appendix 1 (Catch in drip pan) ____ 5mL 9M HCl (Rinse) ____ Elute Am/Cm: 20mL 4M HCl (Catch in C-Tube) ____ Transfer to a clean beaker. Add 4-6 drops of Fe carrier, and gently cook dry ____ 10mL [HNO3] and 2mL 30% H2O2, reflux, then gently cook dry ____ Dissolve with 4mL of 2M HCl and transfer to centrifuge tube with DI water ____ Proceed to Appendix 3 for Am/Cm precipitation ____ Elute Th: 20mL 1M HCl / 0.05M Oxalic acid (Catch in C-Tube) ____ Proceed to Appendix 3 for Th precipitation
General Engineering Laboratories, LLC PO Box 30712 Charleston SC 29417
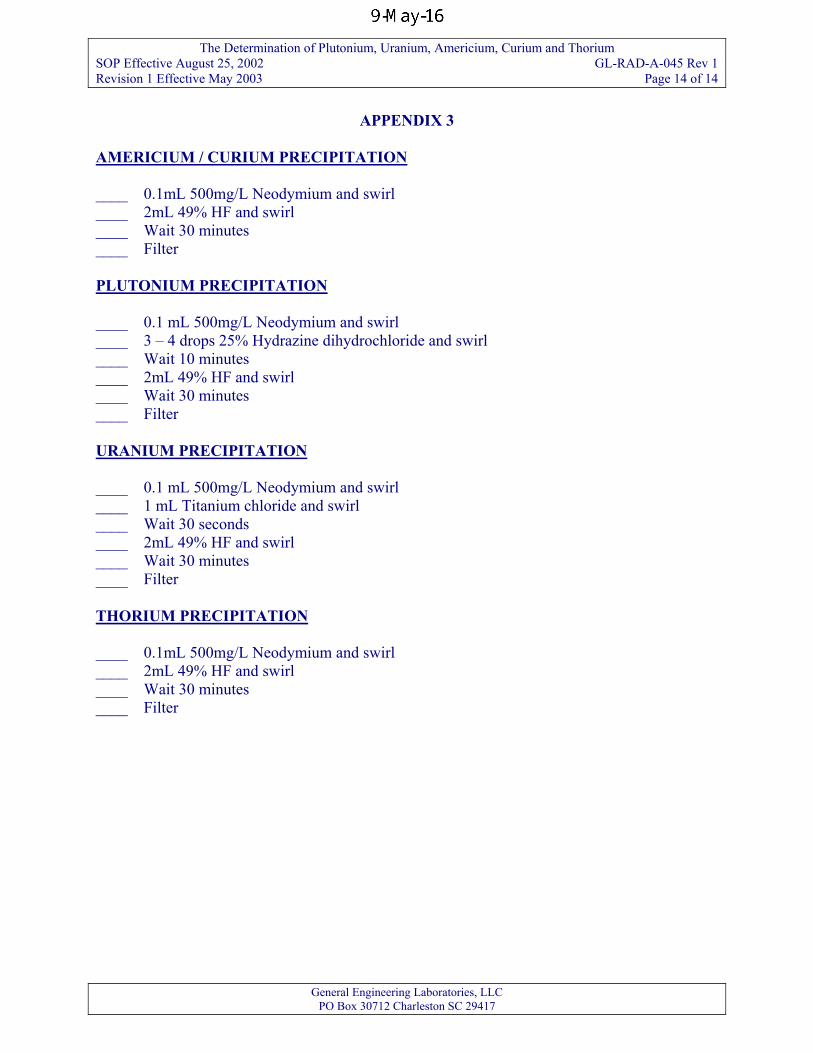
The Determination of Plutonium, Uranium, Americium, Curium and Thorium SOP Effective August 25, 2002 GL-RAD-A-045 Rev 1 Revision 1 Effective May 2003 Page 14 of 14
General Engineering Laboratories, LLC PO Box 30712 Charleston SC 29417
APPENDIX 3
AMERICIUM / CURIUM PRECIPITATION ____ 0.1mL 500mg/L Neodymium and swirl ____ 2mL 49% HF and swirl ____ Wait 30 minutes ____ Filter PLUTONIUM PRECIPITATION ____ 0.1 mL 500mg/L Neodymium and swirl ____ 3 – 4 drops 25% Hydrazine dihydrochloride and swirl ____ Wait 10 minutes ____ 2mL 49% HF and swirl ____ Wait 30 minutes ____ Filter URANIUM PRECIPITATION ____ 0.1 mL 500mg/L Neodymium and swirl ____ 1 mL Titanium chloride and swirl ____ Wait 30 seconds ____ 2mL 49% HF and swirl ____ Wait 30 minutes ____ Filter THORIUM PRECIPITATION ____ 0.1mL 500mg/L Neodymium and swirl ____ 2mL 49% HF and swirl ____ Wait 30 minutes ____ Filter
Determination of Metals by ICP-MS SOP Effective 11/95 GL-MA-E-014 REV 9 Revision 9 Effective June 2004 Page 1 of 24
VERIFY THE VALIDITY OF THIS SOP EACH DAY IN USE
STANDARD OPERATING PROCEDURE
FOR
DETERMINATION OF METALS BY ICP-MS
APPLICABLE TO METHODS: EPA Method 200.8
EPA SW-846 Method 6020
(GL-MA-E-014 REVISION 9)
PROPRIETARY INFORMATION
This document contains proprietary information that is the exclusive property of General Engineering Laboratories, LLC (GEL). No contents of this document may be reproduced or otherwise used for the benefit of others except by express written permission of GEL.
GENERAL ENGINEERING LABORATORIES, LLC P.O. Box 30712 Charleston SC 20417
This document is controlled when an original Set ID number has been stamped on the cover page (1). Uncontrolled documents do not bear an original Set ID number.
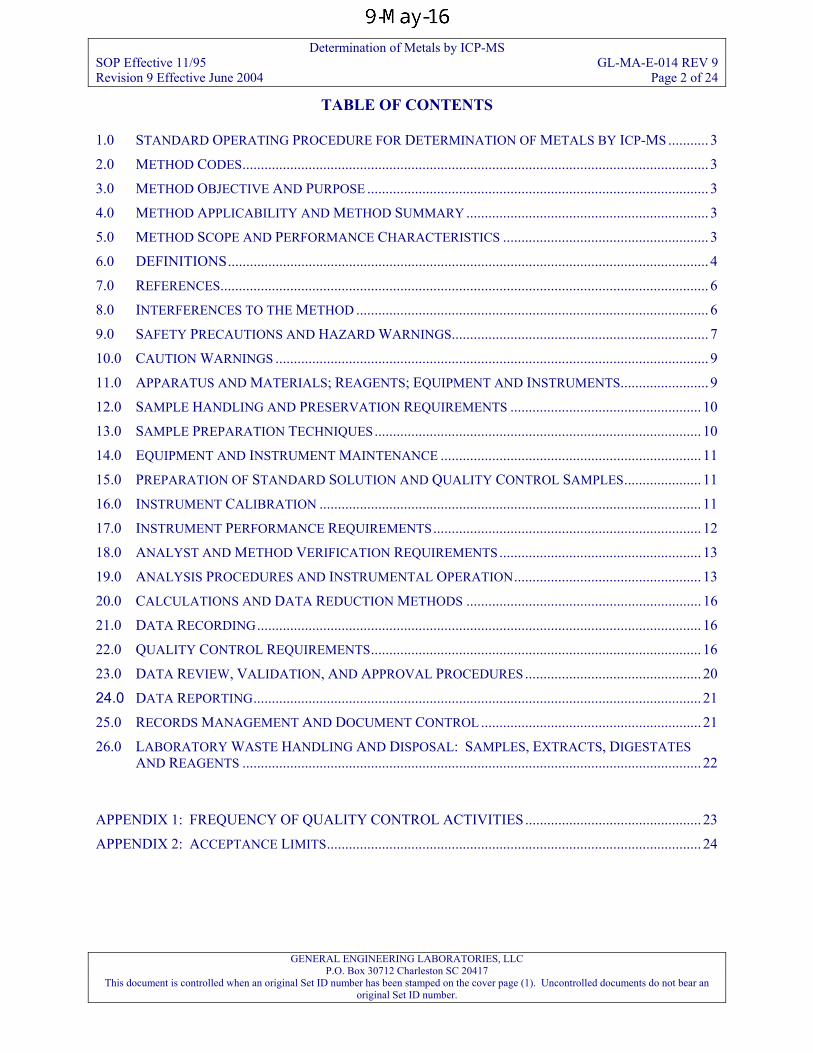
Determination of Metals by ICP-MS SOP Effective 11/95 GL-MA-E-014 REV 9 Revision 9 Effective June 2004 Page 2 of 24
TABLE OF CONTENTS
1.0 STANDARD OPERATING PROCEDURE FOR DETERMINATION OF METALS BY ICP-MS ........... 3
2.0 METHOD CODES............................................................................................................................... 3
3.0 METHOD OBJECTIVE AND PURPOSE ............................................................................................. 3
4.0 METHOD APPLICABILITY AND METHOD SUMMARY .................................................................. 3
5.0 METHOD SCOPE AND PERFORMANCE CHARACTERISTICS ........................................................ 3
6.0 DEFINITIONS................................................................................................................................... 4
7.0 REFERENCES..................................................................................................................................... 6
8.0 INTERFERENCES TO THE METHOD ................................................................................................ 6
9.0 SAFETY PRECAUTIONS AND HAZARD WARNINGS...................................................................... 7
10.0 CAUTION WARNINGS ...................................................................................................................... 9
11.0 APPARATUS AND MATERIALS; REAGENTS; EQUIPMENT AND INSTRUMENTS........................ 9
12.0 SAMPLE HANDLING AND PRESERVATION REQUIREMENTS .................................................... 10
13.0 SAMPLE PREPARATION TECHNIQUES......................................................................................... 10
14.0 EQUIPMENT AND INSTRUMENT MAINTENANCE ....................................................................... 11
15.0 PREPARATION OF STANDARD SOLUTION AND QUALITY CONTROL SAMPLES..................... 11
16.0 INSTRUMENT CALIBRATION ........................................................................................................ 11
17.0 INSTRUMENT PERFORMANCE REQUIREMENTS......................................................................... 12
18.0 ANALYST AND METHOD VERIFICATION REQUIREMENTS....................................................... 13
19.0 ANALYSIS PROCEDURES AND INSTRUMENTAL OPERATION................................................... 13
20.0 CALCULATIONS AND DATA REDUCTION METHODS ................................................................ 16
21.0 DATA RECORDING......................................................................................................................... 16
22.0 QUALITY CONTROL REQUIREMENTS.......................................................................................... 16
23.0 DATA REVIEW, VALIDATION, AND APPROVAL PROCEDURES ................................................ 20
24.0 DATA REPORTING.......................................................................................................................... 21
25.0 RECORDS MANAGEMENT AND DOCUMENT CONTROL ............................................................ 21
26.0 LABORATORY WASTE HANDLING AND DISPOSAL: SAMPLES, EXTRACTS, DIGESTATES AND REAGENTS ............................................................................................................................. 22
APPENDIX 1: FREQUENCY OF QUALITY CONTROL ACTIVITIES................................................ 23
APPENDIX 2: ACCEPTANCE LIMITS...................................................................................................... 24
GENERAL ENGINEERING LABORATORIES, LLC P.O. Box 30712 Charleston SC 20417
This document is controlled when an original Set ID number has been stamped on the cover page (1). Uncontrolled documents do not bear an original Set ID number.
Determination of Metals by ICP-MS SOP Effective 11/95 GL-MA-E-014 REV 9 Revision 9 Effective June 2004 Page 3 of 24
1.0 STANDARD OPERATING PROCEDURE FOR DETERMINATION OF METALS BY ICP-MS 2.0 METHOD CODES
2.1 EPA SW-846 Method 6020 2.2 EPA Method 200.8
3.0 METHOD OBJECTIVE AND PURPOSE This Standard Operating Procedure (SOP) describes the determination of metals using a Perkin Elmer ELAN ICP-MS Model 6100 Spectrometer or a Perkin Elmer ICP-MS Model 9000 Spectrometer. Prior to analysis, samples must be digested using appropriate sample preparation methods (such as Methods 3005, 3050, or 200.2, 3010) and other applicable requests.
4.0 METHOD APPLICABILITY AND METHOD SUMMARY 4.1 Analytes: Ag, Al, As, Ba, Be, Ca, Cd, Co, Cr, Cu, Fe, K, Li, Mg, Mn, Mo, Na, Ni,
Pb, Sb, Se, Sn, Tl, U, 235U, 238U, Isotopic U, V, and Zn. As well as client specific elements such as Os, Au, Pt, Pd, Cs, B, P, Sc, Ti, Ge, Sr, Zr, Hg and Th and others as needed.
4.2 Applicable Matrices: These methods are applicable to the determinations of any of the analytes listed above for various matrices including waters, oils, soils, sludges, Toxicity Characteristic Leaching Procedure (TCLP) extracts and other more unusual types of sample which are generally classified as a miscellaneous matrix.
4.3 General Method Summary: After the samples are prepared in accordance with the sample preparation SOP, they are analyzed by Inductively Coupled Plasma-Mass Spectrometry (ICP-MS) as follows: 4.3.1 The instrument is calibrated with a minimum of two calibration points for
each element to be analyzed. The points consist of a calibration blank solution to define the lower calibration point and at least one standard calibration solution at the analyte concentrations to define the higher calibration point(s).
4.3.2 Prepared client samples and numerous check standards and quality control samples, identified in Section 22.1 are then analyzed. The check standards and quality control samples are used to determine the quality and acceptability of the analytical data.
4.3.3 Continuing Calibration Verification standards (CCV) and Continuing Calibration Blanks (CCB) are analyzed a minimum of every 10 samples to ensure that the instrument is continuing to perform correctly.
4.4 Method Codes: Analyses must conform to SW-846 Method 6020, EPA Method 200.8, and/or customer contract specifications.
5.0 METHOD SCOPE AND PERFORMANCE CHARACTERISTICS 5.1 Calibration Range: The range of concentrations between the calibration blank,
typically 0, and that of the highest calibration standard for each analyte. Calibration standards vary according to method and equipment. A minimum of two, a blank and value standard, are required.
5.2 Linear Dynamic Range (LDR) studies are performed quarterly. For ICP-MS analyses, the upper limit of the linear range for each analyte must be determined by
GENERAL ENGINEERING LABORATORIES, LLC P.O. Box 30712 Charleston SC 20417
This document is controlled when an original Set ID number has been stamped on the cover page (1). Uncontrolled documents do not bear an original Set ID number.
Determination of Metals by ICP-MS SOP Effective 11/95 GL-MA-E-014 REV 9 Revision 9 Effective June 2004 Page 4 of 24
observing the signal responses from a minimum of three different concentration standards, one of which is close to the upper limit of the linear range. The linear calibration range that may be used for the analysis of samples should be judged by the analyst from the resulting data. The instrument is calibrated. The target LR should be prepared and analyzed. The results must fall within ±10% of the target value. This LR value is entered into the instrument’s software. Any hits below this value will be valid. Hits at or above this value will be flagged by the system and must be diluted to fall within the linear dynamic range.
5.3 Instrument Detection Limits (IDLs) in µg/L are determined by calculating the average of the standard deviation of the three runs on three non-consecutive days from the analysis of a reagent blank solution with seven consecutive measurements per day. Each measurement must be performed as though it were a separate analytical sample (i.e., each measurement must be followed by a rinse and/or any other procedure normally performed between the analysis of separate samples). IDLs must be determined at least every three months.
5.4 Method Detection Limit studies for each analyte are performed at least annually and are filed in the appropriate file in the Metals Lab. These studies are conducted and calculated in accordance with SW-846, Chapter 1, paragraph 5.0, and SOP GL-LB-E-001 for the Determination of Method Detection Limits. The relevant quantitation limits are established based on the most current MDL study.
5.5 Method Precision: To assure analytical precision of methods used, Laboratory Control Samples (LCS) are analyzed with each batch. LCS Duplicates are analyzed with each batch when requested.
5.6 Method Bias (Accuracy) is determined by calculating recoveries of LCS of a similar matrix.
6.0 DEFINITIONS 6.1
6.2
6.3
6.4
Calibration Standard (CAL) -- A solution prepared from the primary dilution standard solution or stock standard solutions and the internal standards surrogate analytes. The CAL solutions are used to calibrate the instrument response with respect to analyte concentration. Instrument Performance Check Solution (IPC) -- A solution of one of more method analytes, surrogates, internal standards, or other test substances used to evaluate the performance of the instrument system with respect to a defined set of criteria. Laboratory Control Standard (LCS) -- An aliquot of reagent water or other blank Matrix to which known quantities of the method analytes are added in the laboratory. The LCS is analyzed exactly like a sample, and its purpose is to determine whether the methodology is in control, and whether the laboratory is capable of making accurate and precise measurements. Spike (Matrix Spike or Post Spike) -- An aliquot of an environmental sample to which known quantities of the method analytes are added in the laboratory. The MS or PS is analyzed exactly like a sample, and its purpose is to determine whether the sample matrix contributes bias to the analytical results. The background concentrations of the analytes in the sample matrix must be
GENERAL ENGINEERING LABORATORIES, LLC P.O. Box 30712 Charleston SC 20417
This document is controlled when an original Set ID number has been stamped on the cover page (1). Uncontrolled documents do not bear an original Set ID number.
Determination of Metals by ICP-MS SOP Effective 11/95 GL-MA-E-014 REV 9 Revision 9 Effective June 2004 Page 5 of 24
determined in a separate aliquot and the measured values in the MS or PS corrected for background concentrations.
6.5
6.6
6.7
6.8
6.9
6.10
6.11
6.12
6.13
6.14
6.15
6.16
6.17
Method Blank(MB) -- An aliquot of reagent water or other blank matrix that is treated exactly as a sample including exposure to all glassware, equipment, solvents, reagents, internal standards, and surrogates that are used with other samples. The MB is used to determine if method analytes or other interferences are present in the laboratory environment, the reagents, or the apparatus. Linear Calibration Range (LCR) -- The concentration range over which the instrument response is linear. Method Detection Limit (MDL) -- The minimum concentration of an analyte that can be identified measured and reported with 99% confidence that the analyte concentration is greater than zero. Initial Calibration Verification (ICV) -- A solution of method analytes of known concentrations. The ICV is obtained from a source external to the laboratory and different from the source of calibration standards. It is used to check laboratory performance with externally prepared test materials. Stock Standard Solution -- A concentrated solution containing one or more method analytes prepared in the laboratory using certified reference materials or purchased from a reputable commercial source. Statistical Process Control (SPC) Limits-- Statistically derived limits which establish Acceptable Ranges for recoveries of analytes of interest, including LCS, MS, MSD, PS, PSD and internal standards. Continuing Calibration Verification (CCV) Standard -- An aliquot of reagent water or other blank matrix to which known quantities of the method analytes are added. The CCV is analyzed exactly like a sample, periodically throughout the run sequence. Its purpose is to determine whether the analytical sequence is in control during the sample analysis. It may be prepared from the same source as the calibration standards, and is usually of varied concentrations. Continuing Calibration Blank (CCB) -- An aliquot of reagent water or other blank matrix that is analyzed after each CCV. The CCB is used to determine whether the analytical sequence is in control during sample analysis. Initial Calibration Blank (ICB) -- An aliquot of reagent water or other blank matrix that is analyzed after each ICV. The ICB is used for determine whether there is carryover contamination. Analysis Date/Time – The date and military time (24-hour clock) of the introduction of the sample, Standard, or blank into the analysis system. Analytical Sample – Any solution of media introduced into an instrument on which an analysis is performed excluding instrument calibration, initial calibration verification (ICV), initial calibration blank (ICB), continuing calibration verification (CCV), and continuing calibration blank (CCB). Contract Required detection Limit – Minimum level of detection acceptable under the client project requirements or CLP Statement of Work. Control Limits – A range within which specified measurement results must fall to be compliant. Control limits may be mandatory, requiring corrective action if exceeded, or advisory, requiring that noncompliant data be flagged.
GENERAL ENGINEERING LABORATORIES, LLC P.O. Box 30712 Charleston SC 20417
This document is controlled when an original Set ID number has been stamped on the cover page (1). Uncontrolled documents do not bear an original Set ID number.
Determination of Metals by ICP-MS SOP Effective 11/95 GL-MA-E-014 REV 9 Revision 9 Effective June 2004 Page 6 of 24
6.18
6.19
6.20 6.21
6.22
6.23
6.24 7.0
7.1 7.2 7.3 7.4 7.5
Correlation Coefficient – A number ® which indicates the degree of dependence between two variable (concentration-absorbance). The more dependent they are, the closer the value to one. Determined on the basis of the least squares line. Duplicate – A second aliquot of a sample that is treated the same as the original sample in order to determine the precision of the method. Interferants – Substances which affect the analysis for the element of interest. Serial Dilution – The dilution of a sample by a known factor. When corrected by the dilution factor, the diluted sample should agree with the original undiluted sample within the specified limits. Serial dilution may reflect the influence of interferants. 10% Frequency – A frequency specification during an analytical sequence allowing for not more than 10 analytical samples between required calibration verification measurement, as specified by the EPA methodology or CLP Statement of Work. Internal Standard – Pure analyte(s) added to a sample, extract, or standard solution in known amounts and used to measure the relative responses of other 66 method analytes 66 AlphaLIMS -- The data system used at General Engineering Laboratories, LLC.
REFERENCES Perkin Elmer ELAN 9000 Hardware Guide Perkin Elmer ELAN 6100 Hardware Guide Perkin Elmer ELAN 9000 Software Guide Perkin Elmer ELAN 6000/6100 Software Guide Test Methods for Evaluating Solid Waste: Laboratory Manual Physical/Chemical Methods. Volume 1A, USEPA SW-846, Third Edition, Revision 2, September 1994: 7.5.1 Method 6020, "Inductively Coupled Plasma - Mass Spectrometry," Revision
0, September 1994 7.5.2 Method 3005A, "Acid Digestion of Waters for Total Recoverable or
Dissolved Metals for Analysis by FLAA or ICP Spectroscopy", Revision 1, July 1992
7.5.3 Method 3010A, "Acid Digestion of Aqueous Samples and Extracts for Total Metals for Analysis by ICP Spectroscopy", Revision 1, July 1992
7.5.4 Method 3050B, "Acid Digestion of Sediments, Sludges, and Soils", Revision 2, December 1996
7.6
8.0 NT8.1
8.1.1
USEPA Method 200.8, "Determination of Trace Elements in Waters and Wastes by Inductively Coupled Plasma - Mass Spectrometry", Revision 5.4, May 1994
I M ERFERENCES TO THE ETHODChemical interferences are minimal in ICP-MS Spectroscopy because the extremely high energy of the plasma breaks nearly all the chemical bonds. However, ICP-MS analysis is subject to the following three types of interferences:
Physical interferences are those physical properties of a sample solution that prevent their introduction to the plasma with an efficiency equal to that of the calibration standards. This type of interference can be corrected via the bias
GENERAL ENGINEERING LABORATORIES, LLC P.O. Box 30712 Charleston SC 20417
This document is controlled when an original Set ID number has been stamped on the cover page (1). Uncontrolled documents do not bear an original Set ID number.
Determination of Metals by ICP-MS SOP Effective 11/95 GL-MA-E-014 REV 9 Revision 9 Effective June 2004 Page 7 of 24
correction calculation in SW-846, Chapter 1, paragraph 5.0; through the use of an internal standard, in accordance with the instrument operating manual; or by diluting the sample in reagent blank solution until the percent recovery
8.1.2
signal btracting the
8.1.3 re
e system
sample prep procedures, appropriate corrections must
9.0 SAFET9.1 ROXIDE,
ROSIVE.
9.2 9.3 9.4 GH SKIN.
SURE MAY PRODUCE LIVER, KIDNEY, AND
9.5 9.6 RMFUL IF SWALLOWED, INHALED, OR
9.7 IXED WITH AN ACID. USE CAUTION WHEN HANDLING AND
9.8 LATION. PREVENT
9.9 CIFIED PERSONAL PROTECTIVE
9.10 R A HOOD TO PREVENT INHALATION WHEN MAKING STOCK
9.11
ly
falls with method guidelines. Isobaric elemental interferences are caused by isotopes of different elements that form singly or doubly charged ions of the same nominal mass-to-chargeratio and which cannot be resolved by the mass spectrometer. If analytical isotopes are selected which may have an isobaric interference then all data obtained under such conditions must be corrected by measuring the from another isotope of the interfering element and suappropriate signal ratio from the isotope of interest. Isobaric polyatomic ion interferences are caused by ions consisting of mothan one atom which have the same nominal mass-to-charge ratio as the isotope of interest, and which cannot be resolved by the mass spectrometer in use. These ions are commonly formed in the plasma or interfacfrom support gases or sample components. Most of the common interferences have been identified and are listed in Method 200.8, Table 2together with the method elements affected. Such interferences must be recognized, and when they cannot be avoided by the selection of alternative analytical isotopes orbe made to the data.
Y PRECAUTIONS AND HAZARD WARNINGS HYPOPHOSPHOROUS ACID (50%), PHOSPHORIC ACID, SODIUM HYDSULFURIC ACID, AND SULFAMIC ACID ARE HIGHLY COR
HYDROCHLORIC ACID IS A CORROSIVE AND A POISON.
POTASSIUM CYANIDE IS A CORROSIVE AND A CHEMICAL ASPHYXIANT.
PHENOL MAY BE FATAL IF SWALLOWED, INHALED, OR ABSORBED THROUCAUSES SEVERE BURNS; EXPONEUROLOGICAL DISORDERS.
CONTACT WITH OXIDIZERS MAY GENERATE EXPLOSIVE MIXTURES.
AMMONIUM SULFATE MAY BE HAABSORBED THROUGH THE SKIN.
POTASSIUM FERRICYANIDE EMITS TOXIC HYDROGEN CYANIDE GAS WHEN HEATED OR WHEN MWEAR GLOVES.
PYRIDINE IS FLAMMABLE AND A TOXIC UPON INHAINHALATION BY USING PYRIDINE UNDER A HOOD.
PREVENT SKIN AND EYE CONTACT BY USING SPEEQUIPMENT WHEN MAKING STOCK REAGENTS.
WORK UNDEREAGENTS.
Sample digestates are not extremely volatile or spontaneously combustible, but they are normally acidic and should be handled with care. Small spills may generally bewiped up with paper towels that can be disposed of in the trash. Larger spills may require the use of a mop, and the mop head may have to be disposed of as potential
GENERAL ENGINEERING LABORATORIES, LLC P.O. Box 30712 Charleston SC 20417
This document is controlled when an original Set ID number has been stamped on the cover page (1). Uncontrolled documents do not bear an original Set ID number.
Determination of Metals by ICP-MS SOP Effective 11/95 GL-MA-E-014 REV 9 Revision 9 Effective June 2004 Page 8 of 24
hazardous waste in accordance with the Laboratory Waste Management Plan (GL-LB-G-001). If the spilled digestates begin any obvious fuming or reacting, pour a generous amount of the acid neutralizer, which is located in each lab, onto the spill
9.11.2 en handling samples and an eyewash station is
9.11.3 ediately.
9.12 edure" (S-004), and
9.13 own any time electronic components may be exposed to personnel or
9.14 9.15
le. GEL
icals
tory. Individual sample ients are kept in Login.
9.16 9.16.1 Nitrile
ide, phenol, ammonium sulfate, and potassium ferricyanide in neat
9.17
9.18
before attempting to clean it up. 9.11.1 Gloves should be worn to avoid skin contact with digestate during clean-up.
Eye protection is required whlocated in each analysis lab. Do not persist in cleaning up a spill in the presence of strong fumes. Move out of the area, try to isolate the area and notify your supervisor imm
Radioactive samples - gloves, lab coat or apron required, in addition to eyeprotection. See "Radioactive Material Handling Proc"Radioactive Waste Handling Procedures" (S-005). These instruments use high voltage electricity and therefore, should be shut completely dany liquids. Wear eye protection with side shields while performing procedures in the lab.All chemicals and samples should be treated as a potential health hazard and exposure to these chemicals must be reduced to the lowest level possibmaintains a current awareness file of Occupational Safety and Health Administration (OSHA) regulations regarding the safe handling of the chemin the laboratory as well as a reference file of Material Safety Data Sheets (MSDS). These documents are maintained in the laboraMSDS forms provided by the clPersonal protective equipment
Gloves are required when handling the chemicals in this procedure.gloves are recommended for concentrated acids and bases, sodium hydroxform. 9.16.2 Work under a hood when using concentrated acids and bases, and Pyridine.
Prior to handling radioactive samples analysts must have had radiation safety training and understand their full responsibilities in radioactive sample handling. Some general guidelines follow: 9.17.1 Wear a lab coat when working with radioactive samples. 9.17.2 Prohibit admittance to immediate work area. 9.17.3 Protect counter tops with counter paper or work from radioactive sample
handling trays. 9.17.4 Post signs indicating radioactive samples are in the area. Take swipes of the counter tops upon completion of work. Deliver those
swipes to the nearest swipe count box. 9.17.5 Segregate radioactive wastes. Radioactive waste containers are obtained
from Waste Management. All samples, chemicals, extracts, and extraction residues must be transferred, delivered, and disposed of safely according to all related SOPs.
GENERAL ENGINEERING LABORATORIES, LLC P.O. Box 30712 Charleston SC 20417
This document is controlled when an original Set ID number has been stamped on the cover page (1). Uncontrolled documents do not bear an original Set ID number.
Determination of Metals by ICP-MS SOP Effective 11/95 GL-MA-E-014 REV 9 Revision 9 Effective June 2004 Page 9 of 24
9.18.1 Segregate solid wastes from liquid wastes in the satellite area containers. 9.18.2 Segregate oil wastes from water-soluble wastes in the satellite area
containers. 9.19
9.20
9.21
10.0 10.1
10.2 10.3 10.4 10.5
10.6
10.7
10.8
11.0 APPA LS11.1
Never leave gas cylinders unchained or untied, including when they are on the moving carts. In the event of an accident or medical emergency call for help immediately. When time and safety permit, an accident report form should be completed and turned in to the safety committee. Fire escape routes are posted in the lab and all personnel should be familiar with them. In addition, fire safety equipment such as fire extinguishers is located in the lab. Training is available on the proper operation of this equipment.
CAUTION WARNINGS Because they can be health hazards, the exhaust gases from the plasma and vacuum systems must be eliminated through the laboratory's ventilation duct, which is attached to the instrument's exhaust vent. If inadequate ventilation occurs, pump-fluid vapor, ozone, and other toxic products of combustion can accumulate in the laboratory and cause bodily harm. Hydrofluoric acid (HF) fumes, if inhaled, extensively burns lung tissue. Ensure that the exhaust system established at installation continues to operate effectively. Prepare sample and transfer acids using a hood to avoid fumes. Store and prepare sample away from the instrument to minimize corrosion. Clean up any spills quickly. The drain vessel contains the spray chamber's effluent, which can be toxic. Corrosion of the vessel and connecting tube can result in leaks that damage the instrument or cause bodily harm. 10.5.1 Use the capped plastic drain vessel that was provided with the instrument --
never use glass. 10.5.2 Place the drain vessel on the instrument table below the peristaltic pump
where the container is easy to check 10.5.3 Check the drain vessel frequently. Empty it before it is three-fourths full. 10.5.4 Check the tubing and vessel for deterioration. If the tubing becomes brittle
or cracked, replace it. Organic solvents cause more rapid deterioration than aqueous solutions.
The torch and interface remain hot after the plasma is turned off. Do not touch the torch box or interface cones for 10 minutes after the plasma has been shut off. High voltages and radio frequencies are potential hazards of the ICP-MS. Shut the instrument down completely before removing any of the outside panels (to clean air filters, replace a fuse, etc.). When changing the rotary pump oil remember, that the pump oil may be hot. The oil can cause a burn if allowed to contact the skin. RATUS AND MATERIAAncillary Equipment
; REAGENTS; EQUIPMENT AND INSTRUMENTS
GENERAL ENGINEERING LABORATORIES, LLC P.O. Box 30712 Charleston SC 20417
This document is controlled when an original Set ID number has been stamped on the cover page (1). Uncontrolled documents do not bear an original Set ID number.
Determination of Metals by ICP-MS SOP Effective 11/95 GL-MA-E-014 REV 9 Revision 9 Effective June 2004 Page 10 of 24
11.1.1 Replacement special glass parts for the ICP-MS such as quartz torch bodies, injector tips and spray chambers may be ordered from a qualified vendor through the GEL Purchasing Agent and Inorganic Group Leader.
11.1.2 Replacement ICP-MS interface parts such as sampling cones, skimmer cones and ion-optics can be purchased from a qualified vendor through the GEL Purchasing Agent and Inorganic Group Leader.
11.1.3 Consumable materials such as tubing are often attainable from various scientific product companies. The GEL Purchasing Agent can help to find the best prices. These items may also be ordered from the instrument manufacturer if necessary. All orders must be placed through the GEL Purchasing Agent.
11.2
11.3
12.0 12.1
12.2 13.0
13.1
13.2
Reagents, Chemicals, and Standards 11.2.1 Reagents: See Reagent Logbook 11.2.2 Standards: See GEL SOP “Laboratory Standards Documentation” (GL-LB-
E-007) and “Control of Laboratory Standards (GL-LB-E-015). 11.2.3 Other Chemicals: Additional compounds, surfactants, oils, cleaning agents,
etc., may be routinely ordered through the GEL Purchasing Agent. Instrumentation 11.3.1 Perkin Elmer ICPMS ELAN Model 6100 with IBM compatible PC, Monitor,
Printer. 11.3.2 Perkin Elmer ICP-MS ELAN Model 9000 with IBM compatible PC Monitor,
Printer. 11.3.3 CETAC Model ASX-500 Autosampler (PE 6100) CETAC Model ASX-510 Autosampler with accessory autodiluter (PE 9000) 11.3.4 Neslab CFT75 recirculating bath provides cooling to the ICP-MS (PE 6100/
PE 9000). SAMPLE HANDLING AND PRESERVATION REQUIREMENTS
Aqueous samples should be preserved with HNO3 to a pH of < 2 prior to receipt by the analyst. Solid samples should be kept at 4° ±2°C prior to digestion. See “Sample Receipt, Login, and Storage” (GL-SR-E-001).
SAMPLE PREPARATION TECHNIQUES All samples except drinking water with Turbidity < 1 NTU and samples specifically exempted by contract, are prepared in accordance with the following SOPs: 13.1.1 GL-MA-E-006, “Acid Digestion of Total Recoverable or Dissolved Metals
in Surface and Groundwater Samples for Analysis by ICP or ICP-MS." (USEPA SW-846 Method 3005A)
13.1.2 GL-MA-E-008, "Acid Digestion of Total Metals in Aqueous Samples and Extracts for Analysis by ICP or ICP-MS." (USEPA SW-846 Method 3010A)
13.1.3 GL-MA-E-009, "Acid Digestion of Sediments, Sludges and Soils." (USEPA SW-846 Method 3050B)
GENERAL ENGINEERING LABORATORIES, LLC
Additional filtration may be required to prevent clogging of sample introduction system.
P.O. Box 30712 Charleston SC 20417 This document is controlled when an original Set ID number has been stamped on the cover page (1). Uncontrolled documents do not bear an
original Set ID number.
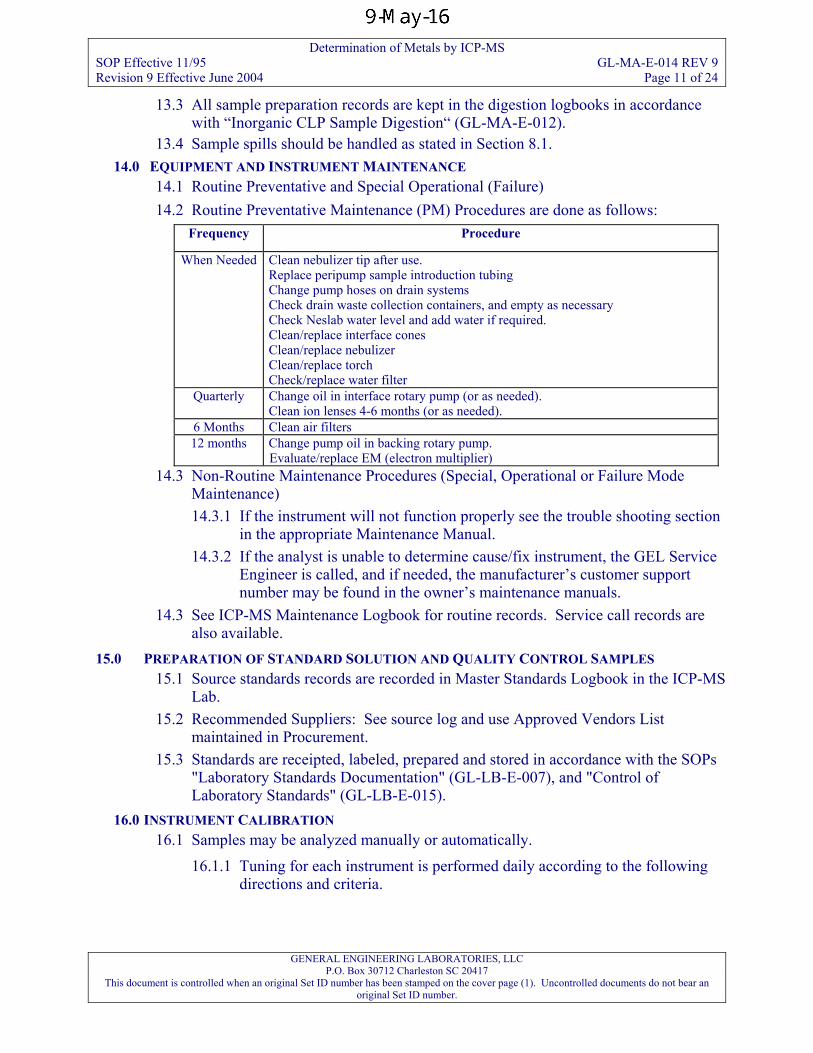
Determination of Metals by ICP-MS SOP Effective 11/95 GL-MA-E-014 REV 9 Revision 9 Effective June 2004 Page 11 of 24
13.3
13.4 14.0
14.1 14.2
All sample preparation records are kept in the digestion logbooks in accordance with “Inorganic CLP Sample Digestion“ (GL-MA-E-012). Sample spills should be handled as stated in Section 8.1.
EQUIPMENT AND INSTRUMENT MAINTENANCE Routine Preventative and Special Operational (Failure) Routine Preventative Maintenance (PM) Procedures are done as follows: Frequency Procedure
When Needed Clean nebulizer tip after use. Replace peripump sample introduction tubing Change pump hoses on drain systems Check drain waste collection containers, and empty as necessary Check Neslab water level and add water if required. Clean/replace interface cones Clean/replace nebulizer Clean/replace torch Check/replace water filter
Quarterly Change oil in interface rotary pump (or as needed). Clean ion lenses 4-6 months (or as needed).
6 Months Clean air filters 12 months Change pump oil in backing rotary pump.
Evaluate/replace EM (electron multiplier) 14.3 Non-Routine Maintenance Procedures (Special, Operational or Failure Mode
Maintenance) 14.3.1 If the instrument will not function properly see the trouble shooting section
in the appropriate Maintenance Manual. 14.3.2 If the analyst is unable to determine cause/fix instrument, the GEL Service
Engineer is called, and if needed, the manufacturer’s customer support number may be found in the owner’s maintenance manuals.
14.3
15.0
16.0 16.1
16.1.1
See ICP-MS Maintenance Logbook for routine records. Service call records are also available.
PREPARATION OF STANDARD SOLUTION AND QUALITY CONTROL SAMPLES 15.1 Source standards records are recorded in Master Standards Logbook in the ICP-MS
Lab. 15.2 Recommended Suppliers: See source log and use Approved Vendors List
maintained in Procurement. 15.3 Standards are receipted, labeled, prepared and stored in accordance with the SOPs
"Laboratory Standards Documentation" (GL-LB-E-007), and "Control of Laboratory Standards" (GL-LB-E-015).
INSTRUMENT CALIBRATION Samples may be analyzed manually or automatically.
Tuning for each instrument is performed daily according to the following directions and criteria.
GENERAL ENGINEERING LABORATORIES, LLC P.O. Box 30712 Charleston SC 20417
This document is controlled when an original Set ID number has been stamped on the cover page (1). Uncontrolled documents do not bear an original Set ID number.
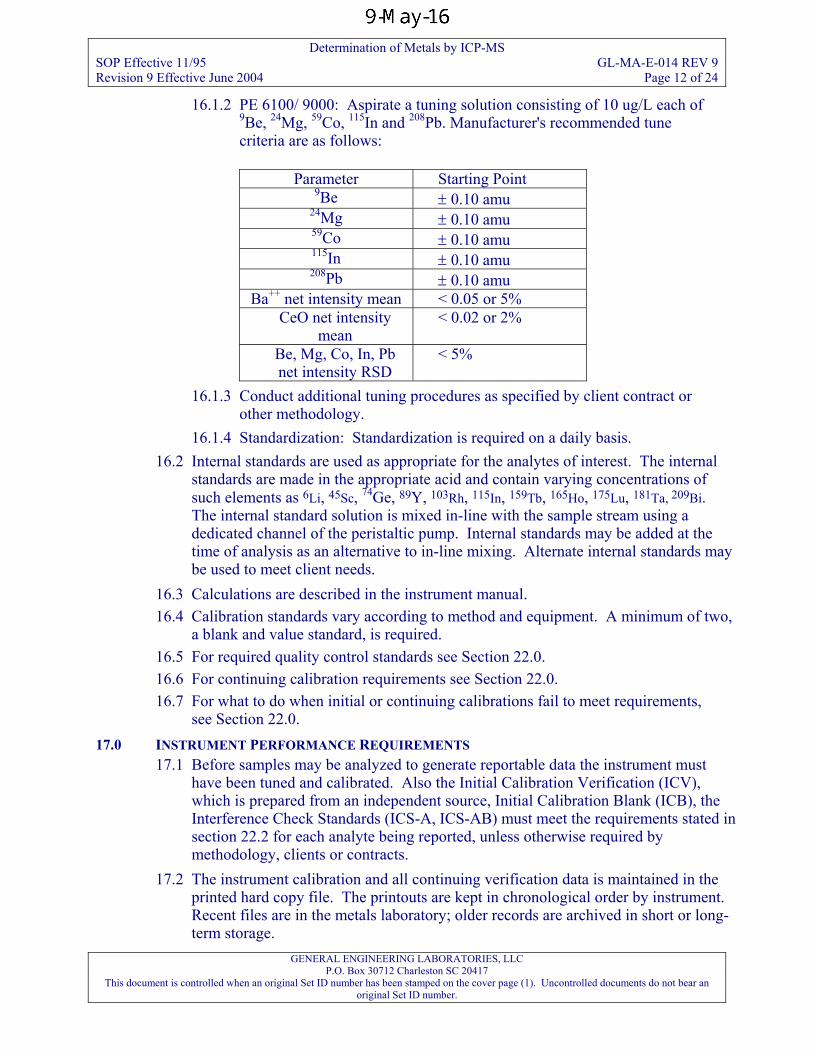
Determination of Metals by ICP-MS SOP Effective 11/95 GL-MA-E-014 REV 9 Revision 9 Effective June 2004 Page 12 of 24
16.1.2 PE 6100/ 9000: Aspirate a tuning solution consisting of 10 ug/L each of 9Be, 24Mg, 59Co, 115In and 208Pb. Manufacturer's recommended tune criteria are as follows:
Parameter Starting Point
9Be ± 0.10 amu 24Mg ± 0.10 amu 59Co ± 0.10 amu 115In ± 0.10 amu 208Pb ± 0.10 amu
Ba++ net intensity mean < 0.05 or 5% CeO net intensity
mean < 0.02 or 2%
Be, Mg, Co, In, Pb net intensity RSD
< 5%
16.1.3
16.1.4 16.2
16.3 16.4
16.5 16.6 16.7
17.0 17.1
17.2
Conduct additional tuning procedures as specified by client contract or other methodology. Standardization: Standardization is required on a daily basis.
Internal standards are used as appropriate for the analytes of interest. The internal standards are made in the appropriate acid and contain varying concentrations of such elements as 6Li, 45Sc, 74Ge, 89Y, 103Rh, 115In, 159Tb, 165Ho, 175Lu, 181Ta, 209Bi. The internal standard solution is mixed in-line with the sample stream using a dedicated channel of the peristaltic pump. Internal standards may be added at the time of analysis as an alternative to in-line mixing. Alternate internal standards may be used to meet client needs. Calculations are described in the instrument manual. Calibration standards vary according to method and equipment. A minimum of two, a blank and value standard, is required. For required quality control standards see Section 22.0. For continuing calibration requirements see Section 22.0. For what to do when initial or continuing calibrations fail to meet requirements, see Section 22.0.
INSTRUMENT PERFORMANCE REQUIREMENTS Before samples may be analyzed to generate reportable data the instrument must have been tuned and calibrated. Also the Initial Calibration Verification (ICV), which is prepared from an independent source, Initial Calibration Blank (ICB), the Interference Check Standards (ICS-A, ICS-AB) must meet the requirements stated in section 22.2 for each analyte being reported, unless otherwise required by methodology, clients or contracts. The instrument calibration and all continuing verification data is maintained in the printed hard copy file. The printouts are kept in chronological order by instrument. Recent files are in the metals laboratory; older records are archived in short or long-term storage.
GENERAL ENGINEERING LABORATORIES, LLC P.O. Box 30712 Charleston SC 20417
This document is controlled when an original Set ID number has been stamped on the cover page (1). Uncontrolled documents do not bear an original Set ID number.
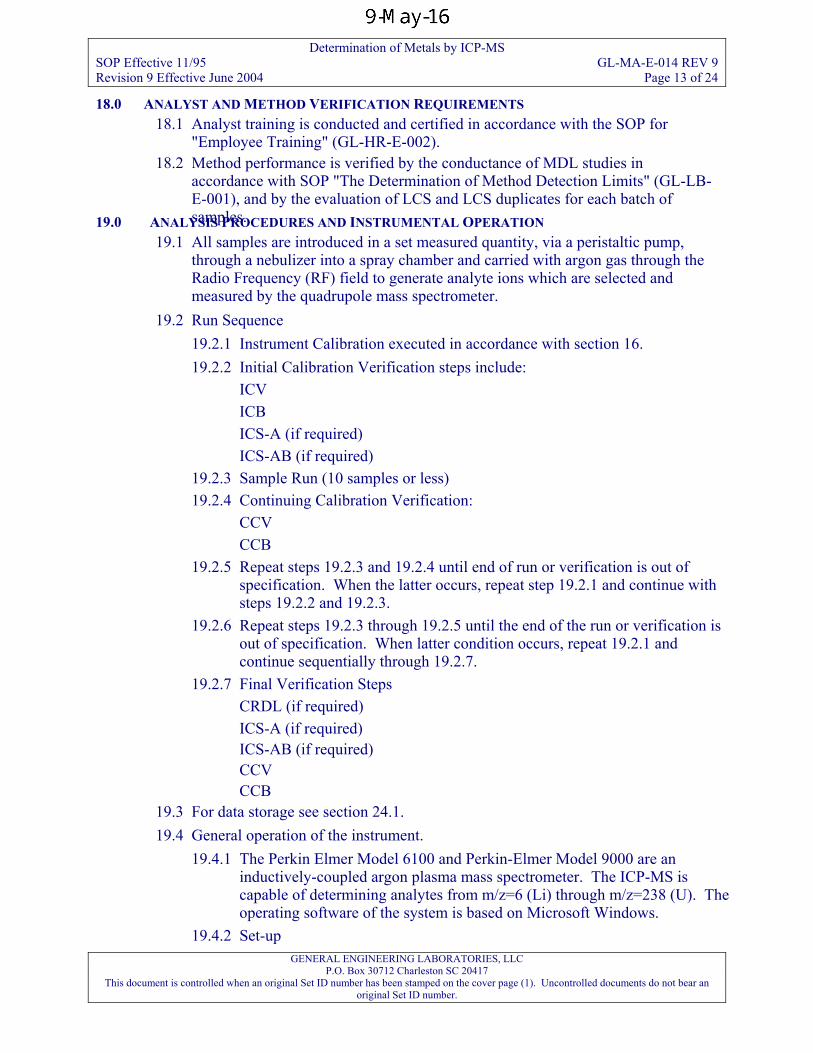
Determination of Metals by ICP-MS SOP Effective 11/95 GL-MA-E-014 REV 9 Revision 9 Effective June 2004 Page 13 of 24
18.0 18.1
18.2
19.0 ANAL EDURES AND INSTRUMENTAL OPERATION ia a peristaltic pump,
e
19.2 nt Calibration executed in accordance with section 16.
quired)
9.2.3 les or less) n:
19.2.3 and 19.2.4 until end of run or verification is out of ith
19.2.6 gh 19.2.5 until the end of the run or verification is
19.2.7
19.3 19.4
19.4.2 Set-up
ANALYST AND METHOD VERIFICATION REQUIREMENTS Analyst training is conducted and certified in accordance with the SOP for "Employee Training" (GL-HR-E-002). Method performance is verified by the conductance of MDL studies in accordance with SOP "The Determination of Method Detection Limits" (GL-LB-E-001), and by the evaluation of LCS and LCS duplicates for each batch of samples. YSIS PROC
19.1 All samples are introduced in a set measured quantity, vthrough a nebulizer into a spray chamber and carried with argon gas through thRadio Frequency (RF) field to generate analyte ions which are selected and measured by the quadrupole mass spectrometer. Run Sequence 19.2.1 Instrume19.2.2 Initial Calibration Verification steps include: ICV ICB ICS-A (if re ICS-AB (if required)1 Sample Run (10 samp19.2.4 Continuing Calibration Verificatio CCV CCB 19.2.5 Repeat steps
specification. When the latter occurs, repeat step 19.2.1 and continue wsteps 19.2.2 and 19.2.3. Repeat steps 19.2.3 throuout of specification. When latter condition occurs, repeat 19.2.1 and continue sequentially through 19.2.7. Final Verification Steps
CRDL (if required) ICS-A (if required) ICS-AB (if required) CCV CCB
For data storage see section 24.1. General operation of the instrument. 19.4.1 The Perkin Elmer Model 6100 and Perkin-Elmer Model 9000 are an
inductively-coupled argon plasma mass spectrometer. The ICP-MS is capable of determining analytes from m/z=6 (Li) through m/z=238 (U). The operating software of the system is based on Microsoft Windows.
GENERAL ENGINEERING LABORATORIES, LLC P.O. Box 30712 Charleston SC 20417
This document is controlled when an original Set ID number has been stamped on the cover page (1). Uncontrolled documents do not bear an original Set ID number.
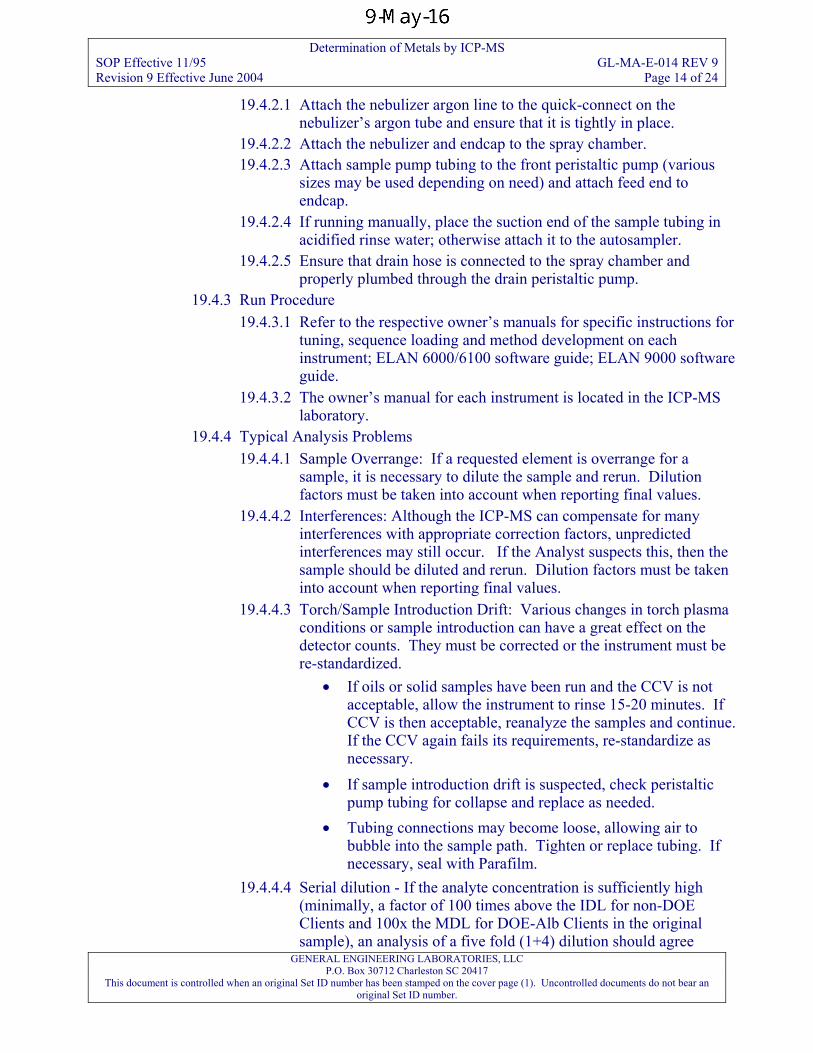
Determination of Metals by ICP-MS SOP Effective 11/95 GL-MA-E-014 REV 9 Revision 9 Effective June 2004 Page 14 of 24
19.4.2.1 Attach the nebulizer argon line to the quick-connect on the
19.4.2.2
19.4.2.4 g manually, place the suction end of the sample tubing in
19.4.2.5
19.4.3 Run Proc the respective owner’s manuals for specific instructions for
oftware
19.4.3.2 ner’s manual for each instrument is located in the ICP-MS
19.4.4 Typical Analysis Problems If a requested element is overrange for a
19.4.4.2
the
19.4.4.3 changes in torch plasma
e
olid samples have been run and the CCV is not f
.
• troduction drift is suspected, check peristaltic
• Tubing connections may become loose, allowing air to If
19.4.4.4 Serial dilution - If the analyte concentration is sufficiently high
nebulizer’s argon tube and ensure that it is tightly in place. Attach the nebulizer and endcap to the spray chamber.
19.4.2.3 Attach sample pump tubing to the front peristaltic pump (various sizes may be used depending on need) and attach feed end to endcap. If runninacidified rinse water; otherwise attach it to the autosampler. Ensure that drain hose is connected to the spray chamber andproperly plumbed through the drain peristaltic pump. edure
19.4.3.1 Refer totuning, sequence loading and method development on each instrument; ELAN 6000/6100 software guide; ELAN 9000 sguide. The owlaboratory.
19.4.4.1 Sample Overrange:sample, it is necessary to dilute the sample and rerun. Dilutionfactors must be taken into account when reporting final values. Interferences: Although the ICP-MS can compensate for many interferences with appropriate correction factors, unpredicted interferences may still occur. If the Analyst suspects this, thensample should be diluted and rerun. Dilution factors must be taken into account when reporting final values. Torch/Sample Introduction Drift: Various conditions or sample introduction can have a great effect on the detector counts. They must be corrected or the instrument must bre-standardized.
• If oils or sacceptable, allow the instrument to rinse 15-20 minutes. ICCV is then acceptable, reanalyze the samples and continueIf the CCV again fails its requirements, re-standardize as necessary. If sample inpump tubing for collapse and replace as needed.
bubble into the sample path. Tighten or replace tubing. necessary, seal with Parafilm.
(minimally, a factor of 100 times above the IDL for non-DOE Clients and 100x the MDL for DOE-Alb Clients in the originalsample), an analysis of a five fold (1+4) dilution should agree
GENERAL ENGINEERING LABORATORIES, LLC P.O. Box 30712 Charleston SC 20417
This document is controlled when an original Set ID number has been stamped on the cover page (1). Uncontrolled documents do not bear an original Set ID number.
Determination of Metals by ICP-MS SOP Effective 11/95 GL-MA-E-014 REV 9 Revision 9 Effective June 2004 Page 15 of 24
within 10% of the original determination. If not, a chemical orphysical interference effect should be suspected. and auxiliaries
19.5 Power switches main power switch. Refer to the respective
19.5.2 r system has 3 power cords all connected to a switchable power
puter switch is on the front of the CPU. . (Note: If
en
19.5.2.3 r switch is on the lower front of the printer. See printer
19.5.3 Argon ga om the storage tank. Under
19.5.4 system
19.5.4.2 ent provides specific ftware
19.5.4.3 should be steady and should not flicker. is best to set
. 19.5.5 Shutdow
only
19.5.1 Each instrument has onemaintenance manuals for the location (ELAN 6100 and ELAN 9000 Hardware Guide). This switch remains on except while servicing theinstrument. The computestrip: the computer main, the monitor and the printer power cords. The power to these is left on while the instrument is not in use for short times(e.g. overnight). 19.5.2.1 The main com19.5.2.2 The monitor switch is on the front of the monitor itself
the computer is left in use without an analyst present for an extended period of time, turn the monitor off to prevent screburn-in.). The printemanual for operating instructions. s is provided through a manifold fr
normal conditions a constant argon flow is available. Start-up 19.5.4.1 Before starting, ensure that the power is on and the vacuum
is switched on. The owner’s manual for each instruminstructions for ignition of the plasma (refer to 19.5.1 for somanuals). The plasma
19.5.4.4 Once ignition has occurred, levels may be adjusted; itlevels appropriate to the method by loading or editing an appropriate tune file and allow 15-30 minutes for warm-upn
19.5.5.1 When the plasma is off, the instrument is either in Standby or Shutdown mode. The ICP-MS should be completely shutdownin case of major maintenance, relocation of the instrument or when the lab is closed for an extended time.
19.5.5.2 Daily shutdown (if required) – refer to the respective owner’s manual shutdown procedures (see 19.5.1 for software manuals.)
19.6 Sample quantity requirements are approximately 5 mL for each run with the nebulizer. If out of specification or range, further sample may be necessary for reruns.
19.7 The autosampler can be used by attaching introduction tube to sample introduction system, and rinsing tubing to peristaltic pump and following autosampler table set-up and procedures.
GENERAL ENGINEERING LABORATORIES, LLC P.O. Box 30712 Charleston SC 20417
This document is controlled when an original Set ID number has been stamped on the cover page (1). Uncontrolled documents do not bear an original Set ID number.
Determination of Metals by ICP-MS SOP Effective 11/95 GL-MA-E-014 REV 9 Revision 9 Effective June 2004 Page 16 of 24
19.8 To define a Sequence, refer to the appropriate software manual (see 19.5.1). 20.0 CALCULATIONS AND DATA REDUCTION METHODS
20.1 Any dilutions, concentrations, or preparation factors must be taken into account prior to reporting data to a client.
Relative Percent Difference =
2Value 2 Sample Value 1 (Sample
Value 2 Sample - Value 1 Sample * 100+
Matrix Spike Recovery = PF * DF *ion Concentrat Nominal Spike
PF) * DF * Value Sample - PF * DF * Value (Spike * 100
Post Spike Recovery = ionConcentrat Nominal Spike
Value) Sample - Value (Spike * 100
LCS Recovery = PF*DF*ion ConcentratNominal
PF) * DF * Value (Sample * 100
Where: Sample Value = instrument reading for the Sample Spike Value = instrument reading for the Spiked Sample DF = Dilution Factor PF = Preparation Factor
20.2 Care must be taken that the correct units are being employed. 21.0 DATA RECORDING
21.1 ICP-MS data is generally stored to the hard disk drive of the ICP-MS computer system and printed at the instrument as each sample is analyzed.
21.2 ICP-MS samples are generally analyzed in three replicates (minimum of 2) and the reported value is the average of the replicates. The data for individual replicates is stored in the computer.
21.3 Data is processed locally by manual or programmable procedures to eliminate unused data, enter dilution factors and relevant conversion factors prior to uploading to the Laboratory Information Management System (LIMS).
22.0 QUALITY CONTROL REQUIREMENTS 22.1 Frequency of Quality Control Activities (also see Appendix 1)
22.1.1 Initial Calibration Verification (ICV) is performed immediately following each calibration and Continuing Calibration Verification (CCV) is performed after at least every 10 samples.
22.1.2 Initial Calibration Blank (ICB) is performed immediately following the ICV and Continuing Calibration Blanks (CCB) must run with each CCV.
22.1.3 An Interference Check Standard (ICS) is analyzed at the beginning of each analytical run and at least once every twelve hours (if required). Additional requirements may be specified by client contract or methodology.
GENERAL ENGINEERING LABORATORIES, LLC P.O. Box 30712 Charleston SC 20417
This document is controlled when an original Set ID number has been stamped on the cover page (1). Uncontrolled documents do not bear an original Set ID number.
Determination of Metals by ICP-MS SOP Effective 11/95 GL-MA-E-014 REV 9 Revision 9 Effective June 2004 Page 17 of 24
22.1.4 The PQL standard is analyzed after each calibration. This standard may also be labeled as a CRDL standard. For CLP work, the CRI is analyzed at the beginning and at the end of each analytical run, and at a minimum of two times per eight hours. For CLP analyses the CRI is analyzed at two times the CRDL or two times the IDL, whichever is greater.
22.1.5 A method blank is performed for each batch of 20 or fewer samples or per client requirement.
22.1.6 A matrix spike (MS) and a duplicate (DUP), or matrix spike and matrix spike duplicate (MSD) are analyzed for each batch of 20 or fewer samples or per client requirements.
22.1.7 A laboratory control sample (LCS) is analyzed with each batch of 20 or fewer samples. An LCS duplicate (LCS DUP) may be added if required by the client.
22.1.8 Serial dilutions or analytical spikes are analyzed to confirm the presence or absence of interferences when analyzing a new matrix type, the analyte concentrations are greater than 100 times the instrument detection limit, or an internal standard is not being used. The serial dilution is generally performed at a 5x of the test sample.
22.1.9 When performing CLP analyses, the serial dilution must be performed on a sample from each SDG of 20 samples or less.
22.1.10When performing CLP analyses, a post-spike must be performed on the original sample when the matrix spike recovery falls outside the control limits and the sample result does not exceed 4x the spike added. Spike the unspiked aliquot of the sample at 2x the indigenous level or 2x the CRDL, whichever is greater. Post-spike analysis is not required for Ag.
22.2 Acceptance Limits (also see Appendix 2) 22.2.1 ICV results must be between 90% and 110% of the true values for work
under EPA SW-846 Method 6020 or EPA Method 200.8. CCV results must be between 90% and 110% of the true values for work under EPA Method 200.8 or SW846 Method 6020. NOTE: The ICV is the second source standard and may be used as the CCV
as it also will show calibration verification. 22.2.2 ICB and CCB results must have an absolute value less than the Reporting
Limit (RL). If this is not the case, the reason for the out-of-control condition must be found and corrected, or any data reported must be 10 times greater than the absolute value for the element or less than the RL.
22.2.3 Interference Check Sample results must be monitored at the beginning of an analytical run or once every 12 hours, whichever is more frequent, for work under SW-846.
22.2.4 The intensities of all internal standards must be monitored for every analysis. When the intensity of any internal standard fails to fall between 30% and 120% of the intensity of that internal standard in the initial calibration then the sample must be diluted fivefold (1+4) and reanalyzed with the addition of appropriate amounts of internal standards. The intensity levels of the internal
GENERAL ENGINEERING LABORATORIES, LLC P.O. Box 30712 Charleston SC 20417
This document is controlled when an original Set ID number has been stamped on the cover page (1). Uncontrolled documents do not bear an original Set ID number.
Determination of Metals by ICP-MS SOP Effective 11/95 GL-MA-E-014 REV 9 Revision 9 Effective June 2004 Page 18 of 24
standards for the calibration blanks (ICB and CCB) and instrument check standards (ICV and CCV) must agree within +/- 20% of the intensity levethe internal standard of the original calibration solution. For work done under EPA Method 200.8, the internal standard responses of any one internalstandard must not devi
l of
ate more than 60% - 125% of the original response in
22.2.5 er
mination has been corrected
22.2.6 al Process Control, manufacturer’s
22.2.7 sence of
uggest the absence of interference for
22.2.8
hin the lue of the RL. Results less than the MDL or IDL are not
22.2.9 lts, imes the instrument detection
bsence of interference. 22.3
22.3.1
e
tip out
In inate the cause of the
22.3.2
the calibration blank. Method blank results must be lower than the PQL or less than 10% of the determined value of all samples in the batch. When performing work undEPA Method 200.8, if LRB (laboratory reagent blank) values are 10% or more of the analyte level determined for a sample or is 2.2 times the analyte MDL then fresh aliquots of the samples must be prepared and analyzed again for the affected analytes after the source of contaand acceptable LRB values have been obtained. LCS results, and LCS duplicate (if performed), must be within process control limits as established by Statisticcertification, or method requirements. Matrix spikes with recoveries between 70% and 130% suggest the abinterference for work under EPA Method 200.8. Matrix spikes with recoveries between 75% and 125% swork under SW-846 Method 6020. The relative percent difference (RPD) between a sample and a sample duplicate should be within ± 20% if the analyte concentration in the sample or duplicate is greater than 5 times the RL. If either the sample or duplicate concentration is less than 5 times the RL, the results should agree witabsolute vaevaluated. Serial dilution results that agree within 10% of the original analytical resuif the original results are greater than 100 tlimit, suggest the a
Out of Control situations ICV and/or CCV failure requires recalibration of the instrument and/or preparation of new standard solutions. Samples analyzed prior to or after calibration verifications that are not acceptable for required analytes must be reanalyzed. An ICV or CCV that has failed may be rerun once only if theris an attributable cause known to have affected the CCV only and not the previous samples. Examples of an acceptable cause may be a sample of solution during analysis, an incorrectly prepared CCV, or obvious carryover in the CCV from a very high sample immediately prior to the CCV. If a CCV is reanalyzed, the data must be lined through, initialed and dated, and the reason for the rerun must be documented on the raw data. addition, corrective action should be taken to eliminitial CCV failure to prevent future occurrence. ICB and CCB failure requires recalibration of the instrument and/or calibration blank solution to be remade. The CCB is acceptable if the level
GENERAL ENGINEERING LABORATORIES, LLC P.O. Box 30712 Charleston SC 20417
This document is controlled when an original Set ID number has been stamped on the cover page (1). Uncontrolled documents do not bear an original Set ID number.
Determination of Metals by ICP-MS SOP Effective 11/95 GL-MA-E-014 REV 9 Revision 9 Effective June 2004 Page 19 of 24
of analyte in the corresponding sample(s) is 10 times greater or less than thePQL for the failing element. ICS failure requires that the instrument be re-calibrated or the interferences be corrected, via recalculation, of Interelement Correction Factors so that thICS can be read within the required limits before samples ar
22.3.3 e
e analyzed. ICS r
22.3.4
ration of the instrument; and/or reanalysis of the affected samples, al
22.3.5 require
ration or
22.3.6 cators of
22.4 .2
ill then ill be kept on file. See
22.5 ith the requirements stated in Section 22.2 by the analyst during and/or after the analysis, but before the data is entered
nalyst at this point or by
failure at the end of an analysis period will require that the samples run fothe affected analyte(s) during that period to be reanalyzed. Internal Standard failure requires one or more of the following: five fold dilution of the sample; correction of the problem; termination of analysis; recalibdepending on whether the failure is due to the samples or the instrumentdrift. Method blank results higher than the PQL and greater than 10% of any sample value in that batch which has concentrations above the PQLthat batch be redigested and reanalyzed. If the method blank results are less than -2x PQL there may be significant interference, calibcontamination problems with the sample, instrument or calibration standards that must be resolved before the batch can be analyzed. Matrix spikes, duplicates and spike duplicates are used only as indimethod effectiveness on that sample and will not be used as acceptability criteria for the process, unless a special requirement of the client.
22.3.7 LCS and/or LCS duplicate results outside of established acceptance limits require the batch to be redigested and reanalyzed.
22.3.8 When analytical results suggest the presence of interference, one of the methods listed in section 19.4.4.2 should be employed.
22.3.9 The CRDL standard should be evaluated, but no action is required if the results fall outside of the 50%-150% advisory window.
Corrective actions taken for data not conforming to the requirements in Section 22are stated in Section 22.3. If these corrective actions can be taken by the analyst prior to the acceptance of the data, then no nonconformance documentation is required. However, if these corrective actions include redigestion of the batch or sample, if the data has already been accepted, or if the corrective action requires aninstrument service call, then a nonconformance and/or corrective action report should be completed. This report includes the date, person requesting the action, sample(s) or batch(s) effected and action requested, all provided by the requester. The person taking the action will provide any pertinent comments and their signature and date the action is completed. The disposition of the nonconformance wbe verified by the Quality Systems specialist. These reports w"Nonconformance Identification Control, Documentation, Reporting, and Dispositioning" (GL-QS-E-002).
Analytical data is evaluated for conformance w
into the LIMS. Data may be accepted or rejected by the athe data reviewer(s) as stated in Section 23.0.
GENERAL ENGINEERING LABORATORIES, LLC P.O. Box 30712 Charleston SC 20417
This document is controlled when an original Set ID number has been stamped on the cover page (1). Uncontrolled documents do not bear an original Set ID number.
Determination of Metals by ICP-MS SOP Effective 11/95 GL-MA-E-014 REV 9 Revision 9 Effective June 2004 Page 20 of 24
23.0 DATA 23.1
d
23.2 data report is generated which will be passed
23.3
evant uld be copied and delivered to the
acceptable s additional work or correction, it is returned to the analyst or
23.4 Listed Review23.4.1 enerated the data before
23.4.2
a
view check list. If
d/or by client ified person.
23.6 Specifi ollowing: 23.6.1
23.6.1.1 s in the batch are completed.
to
23.6.1.4 ccurate in the LIMS data report. et
or an explanation given. 23.6.2
23.6.2.1 plete and accurate in the LIMS Data Report.
REVIEW, VALIDATION, AND APPROVAL PROCEDURES After samples are analyzed, the data must go through the review process before it can be reported out of the lab. The analyst who performed the analyses will review the raw data prior to uploading it into LIMS. The upload process may be handleby the analyst or by a data entry clerk. After the upload is complete, a LIMS(along with the batch sheet, data review checklist, and the raw data) to another analyst for a peer review. Discrepancies found in this review will be resolved beforethe batch data is passed and update. When this peer review is completed and all of the data is found to be acceptable, thereviewer signs and dates the batch data report and updates the status of the batch to done. If the sample is for a Federal client, the batch data report and all relinformation (dependent upon client contract) shopackaging group. If the reviewer determines that the reviewed data is notand requirerepresentative with an appropriate explanation.
below are the data review responsibilities of the Analyst and Peer er: Analyst Review is performed by the analyst who gthe data is submitted for entry into the LIMS. Analyst completes and attaches the run data cover sheet to the printout. Peer Analyst Review is performed by an individual who did not perform the analysis but is familiar with the analytical method used and the reporting requirements. This person will review the complete data report after all datis entered and ensures that any data entry corrections are made before it is approved, and completes reviewer portion of the data rethe data does not meet the necessary quality requirements and needs further analysis, it is returned to the analyst or representative.
23.5 A Third Review is performed for Data Packages (CLP/CLP-Like) anrequirement. This review is by the Metals Team Validator or other qual
c items that are reviewed at each level include the fAnalyst Review: Before data is submitted for entry into LIMS.
All analyse23.6.1.2 Any corrections and comments on the data are properly initialed
and dated. 23.6.1.3 Proper standard identification numbers appear on the runlog
ensure traceability from the data to original source standards. All data is complete and a
23.6.1.5 Data acceptance limit criteria identified in Section 22.2 are m
Peer Analyst Review: Before data is submitted for further review or update:
All data is com
GENERAL ENGINEERING LABORATORIES, LLC P.O. Box 30712 Charleston SC 20417
This document is controlled when an original Set ID number has been stamped on the cover page (1). Uncontrolled documents do not bear an original Set ID number.
Determination of Metals by ICP-MS SOP Effective 11/95 GL-MA-E-014 REV 9 Revision 9 Effective June 2004 Page 21 of 24
23.6.2.2 Any exceptions or shortcomings have been sufficiently explainedor corrected.
23.6.2.4 e present in the
ons by LIMS are
23.7 f the lab, h the batching sheet and kept on file in the lab.
p Log Book, Prep data
24.0 DATA REPOR24.1 completed:
o nd. Change status from REVW to DONE and “Save.”
25.0 RECO25.1 Record
as follo25.1.1
lysis; the analyst identification; and the date and
al sequence,
25.1.2 ed
25.1.3 aintenance Logs are chronological representations of all
d
s
E" in the laboratory. This
25.1.5 "DONE", the
batch data report is stored with the Batch sheet.
23.6.2.3 Data is reported in the proper units or an explanation is given. Prep factor and dilution calculations by LIMS ardata report and LIMS calculations are correct.
23.6.2.5 LCS and Spike Recoveries and RPD calculaticorrect and the values are within control limits.
When the data review is completed and the data has been reported out oit is bound wit
23.8 The complete data review process requires the use of the Prereport, batch sheet, LIMS data report, raw instrument data, and runlog.
TING To report data after the review process has been24.1.1 Enter the ALPHALIMS program through an available terminal and select
DATA MENU, BATCH ITEMS, CHANGE BATCH STATUS. .24.1.2 Enter the Batch Number and “Submit.” 24.1.3 Use the down arrow key to move the cursor down the new status column t
the eRDS MANAGEMENT AND DOCUMENT CONTROL
s of the instrumental analysis, operation, and maintenance are maintained ws: Run logs are an accurate chronology of what the instrument did during a specified period of time. It details the standard name or sample number for each standardization or anatime of each analysis or standardization. This information is periodically retrieved from the instrument data files, printed in chronologicand maintained as documentation of the sequence of events and as a reference for the raw data. Extraction/Digestion Logs are maintained in accordance with the establishprocedures in the areas where these processes are performed. Instrument Mmaintenance activities involving the instrument operation. This record is kept in bound composition books and consists of the details of the action, who performed it, when it was performed, and when instrument was returneto operation.
25.1.4 Batch Sheets accompany the batch of samples through digestion and analysiand then accompanies the raw analytical data through data entry and data review until the batch status is changed to "DONrecord is maintained in the Metals group files. Batch Data Reports are generated to be used in the peer data review. After the batch is reviewed, corrected if necessary, and updated to
GENERAL ENGINEERING LABORATORIES, LLC P.O. Box 30712 Charleston SC 20417
This document is controlled when an original Set ID number has been stamped on the cover page (1). Uncontrolled documents do not bear an original Set ID number.
Determination of Metals by ICP-MS SOP Effective 11/95 GL-MA-E-014 REV 9 Revision 9 Effective June 2004 Page 22 of 24
25.1.6 Raw Instrument Data is generated as the analyses are performed and fromLIMS after the da
ta is entered and is attached to the batch sheet to is used in
26.0 LABODIGES ENTS
,
e stored in the lab for a specified period of time following nto a waste container that is picked
26.3 Radioa26.3.1 26.3.2 ollected in the radioactive waste carboy is dumped into the
nagement
26.3.3 Implements, vials, gloves, etc., are wrapped and labeled with radioactive tape and placed in the radioactive waste container in high bay area.
26.3.4 Expired Standard Solutions: See section 26.1.
the data review process and kept in the Metals group files. RATORY WASTE HANDLING AND DISPOSAL: SAMPLES, EXTRACTS, TATES AND REAG
26.1 Standard solutions that must be disposed are taken to the Waste Disposal coordinator for disposal in accordance with Laboratory Waste Management Plan(GL-LB-G-001).
26.2 Sample digestates aranalysis. At this time, they are composited iup by the Waste Management Technician for proper disposal.
ctive Waste: Samples returned to sample storage Drain waste cappropriate 55 gallon drum sitting outside the ICPMS laboratory when full. Ultimate disposal of liquid radioactive waste done by waste madepartment.
GENERAL ENGINEERING LABORATORIES, LLC P.O. Box 30712 Charleston SC 20417
This document is controlled when an original Set ID number has been stamped on the cover page (1). Uncontrolled documents do not bear an original Set ID number.
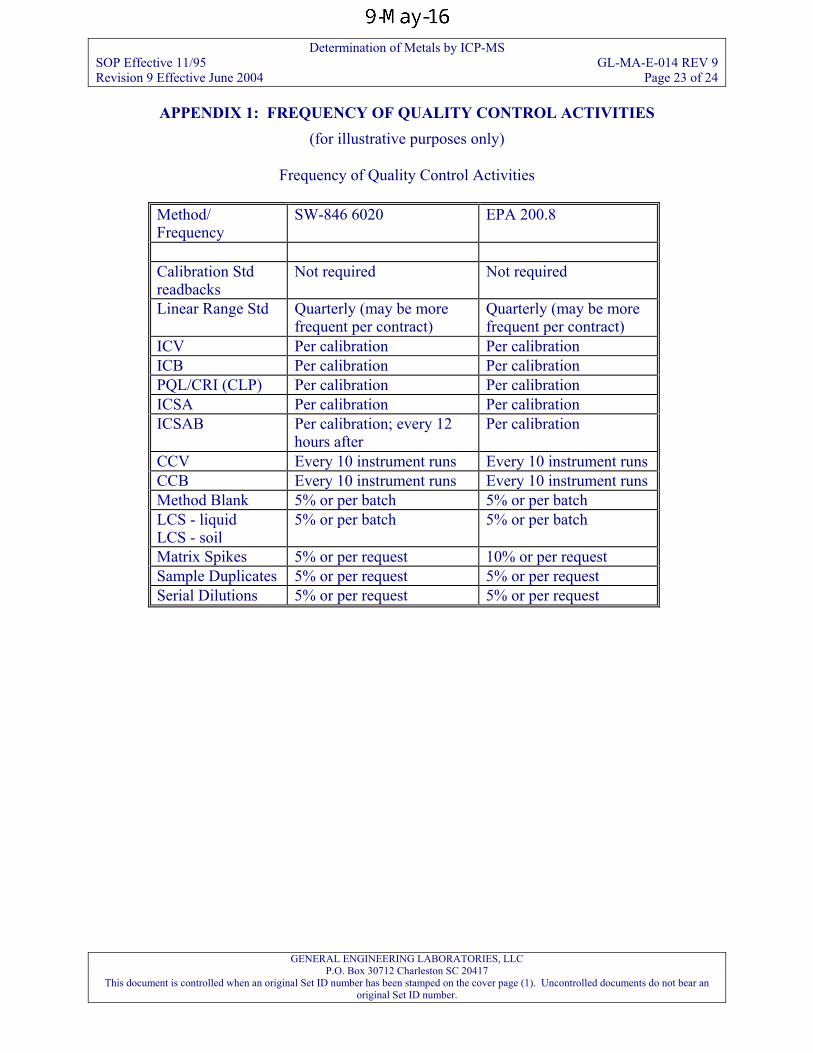
Determination of Metals by ICP-MS SOP Effective 11/95 GL-MA-E-014 REV 9 Revision 9 Effective June 2004 Page 23 of 24
APPENDIX 1: FREQUENCY OF QUALITY CONTROL ACTIVITIES (for illustrative purposes only)
Frequency of Quality Control Activities
Method/ Frequency
SW-846 6020
EPA 200.8
Calibration Std readbacks
Not required Not required
Linear Range Std Quarterly (may be more frequent per contract)
Quarterly (may be more frequent per contract)
ICV Per calibration Per calibration ICB Per calibration Per calibration PQL/CRI (CLP) Per calibration Per calibration ICSA Per calibration Per calibration ICSAB Per calibration; every 12
hours after Per calibration
CCV Every 10 instrument runs Every 10 instrument runs CCB Every 10 instrument runs Every 10 instrument runs Method Blank 5% or per batch 5% or per batch LCS - liquid LCS - soil
5% or per batch 5% or per batch
Matrix Spikes 5% or per request 10% or per request Sample Duplicates 5% or per request 5% or per request Serial Dilutions 5% or per request 5% or per request
GENERAL ENGINEERING LABORATORIES, LLC P.O. Box 30712 Charleston SC 20417
This document is controlled when an original Set ID number has been stamped on the cover page (1). Uncontrolled documents do not bear an original Set ID number.
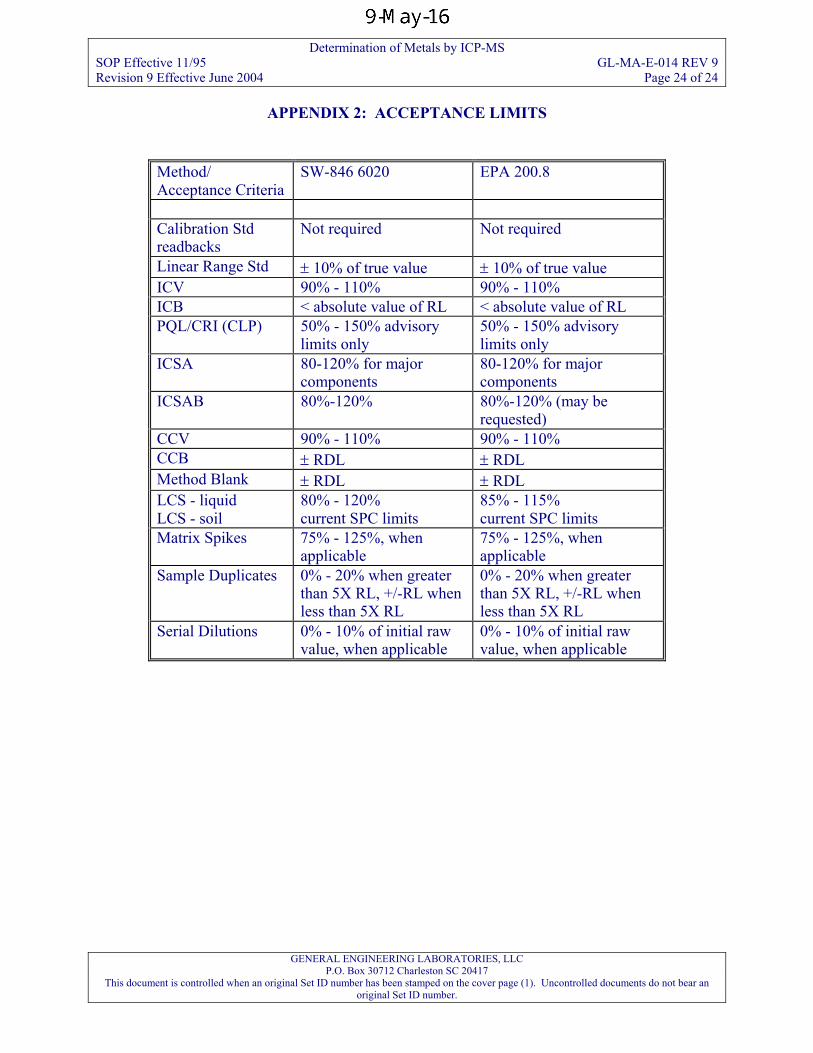
Determination of Metals by ICP-MS SOP Effective 11/95 GL-MA-E-014 REV 9 Revision 9 Effective June 2004 Page 24 of 24
GENERAL ENGINEERING LABORATORIES, LLC P.O. Box 30712 Charleston SC 20417
This document is controlled when an original Set ID number has been stamped on the cover page (1). Uncontrolled documents do not bear an original Set ID number.
APPENDIX 2: ACCEPTANCE LIMITS
Method/ Acceptance Criteria
SW-846 6020
EPA 200.8
Calibration Std readbacks
Not required Not required
Linear Range Std ± 10% of true value ± 10% of true value ICV 90% - 110% 90% - 110% ICB < absolute value of RL < absolute value of RL PQL/CRI (CLP) 50% - 150% advisory
limits only 50% - 150% advisory limits only
ICSA 80-120% for major components
80-120% for major components
ICSAB 80%-120% 80%-120% (may be requested)
CCV 90% - 110% 90% - 110% CCB ± RDL ± RDL Method Blank ± RDL ± RDL LCS - liquid LCS - soil
80% - 120% current SPC limits
85% - 115% current SPC limits
Matrix Spikes 75% - 125%, when applicable
75% - 125%, when applicable
Sample Duplicates 0% - 20% when greater than 5X RL, +/-RL when less than 5X RL
0% - 20% when greater than 5X RL, +/-RL when less than 5X RL
Serial Dilutions 0% - 10% of initial raw value, when applicable
0% - 10% of initial raw value, when applicable
AOC II – Docket No. V-W-’04-C-784 – Yard520 - AppC QAPP April 18, 2008
ATTACHMENT A-3
GEOTESTING EXPRESS, INC. STANDARD OPERATING PROCEDURES
04222, SOP Rev. 5 Grain Size Analysis
05057, SOP Rev. 1 Specific Gravity and Bulk Density
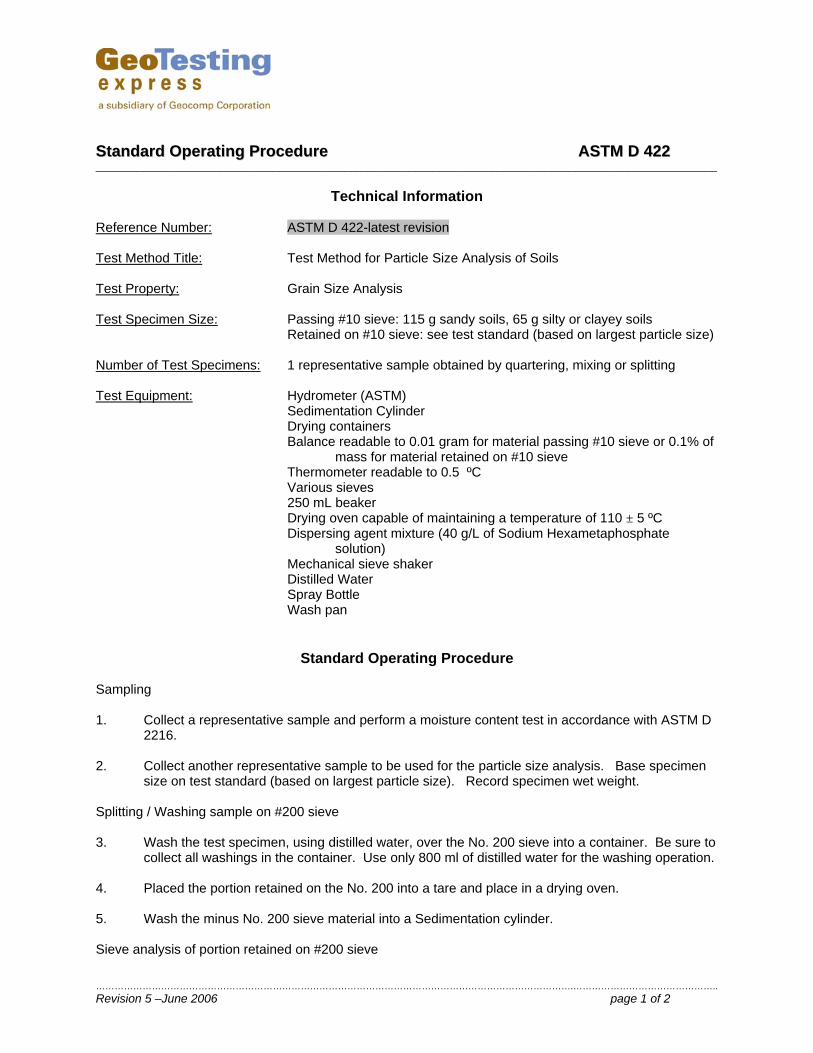
SSttaannddaarrdd OOppeerraattiinngg PPrroocceedduurree AASSTTMM DD 442222 _________________________________________________________________________________________________________
……………………………………………………………………………………………………………………………………….……………………………………….. Revision 5 –June 2006 page 1 of 2
Technical Information
Reference Number: ASTM D 422-latest revision Test Method Title: Test Method for Particle Size Analysis of Soils Test Property: Grain Size Analysis Test Specimen Size: Passing #10 sieve: 115 g sandy soils, 65 g silty or clayey soils
Retained on #10 sieve: see test standard (based on largest particle size) Number of Test Specimens: 1 representative sample obtained by quartering, mixing or splitting Test Equipment: Hydrometer (ASTM)
Sedimentation Cylinder Drying containers Balance readable to 0.01 gram for material passing #10 sieve or 0.1% of
mass for material retained on #10 sieve Thermometer readable to 0.5 ºC Various sieves 250 mL beaker Drying oven capable of maintaining a temperature of 110 ± 5 ºC Dispersing agent mixture (40 g/L of Sodium Hexametaphosphate
solution) Mechanical sieve shaker Distilled Water Spray Bottle Wash pan
Standard Operating Procedure Sampling 1. Collect a representative sample and perform a moisture content test in accordance with ASTM D
2216. 2. Collect another representative sample to be used for the particle size analysis. Base specimen
size on test standard (based on largest particle size). Record specimen wet weight. Splitting / Washing sample on #200 sieve 3. Wash the test specimen, using distilled water, over the No. 200 sieve into a container. Be sure to
collect all washings in the container. Use only 800 ml of distilled water for the washing operation. 4. Placed the portion retained on the No. 200 into a tare and place in a drying oven. 5. Wash the minus No. 200 sieve material into a Sedimentation cylinder.
Sieve analysis of portion retained on #200 sieve
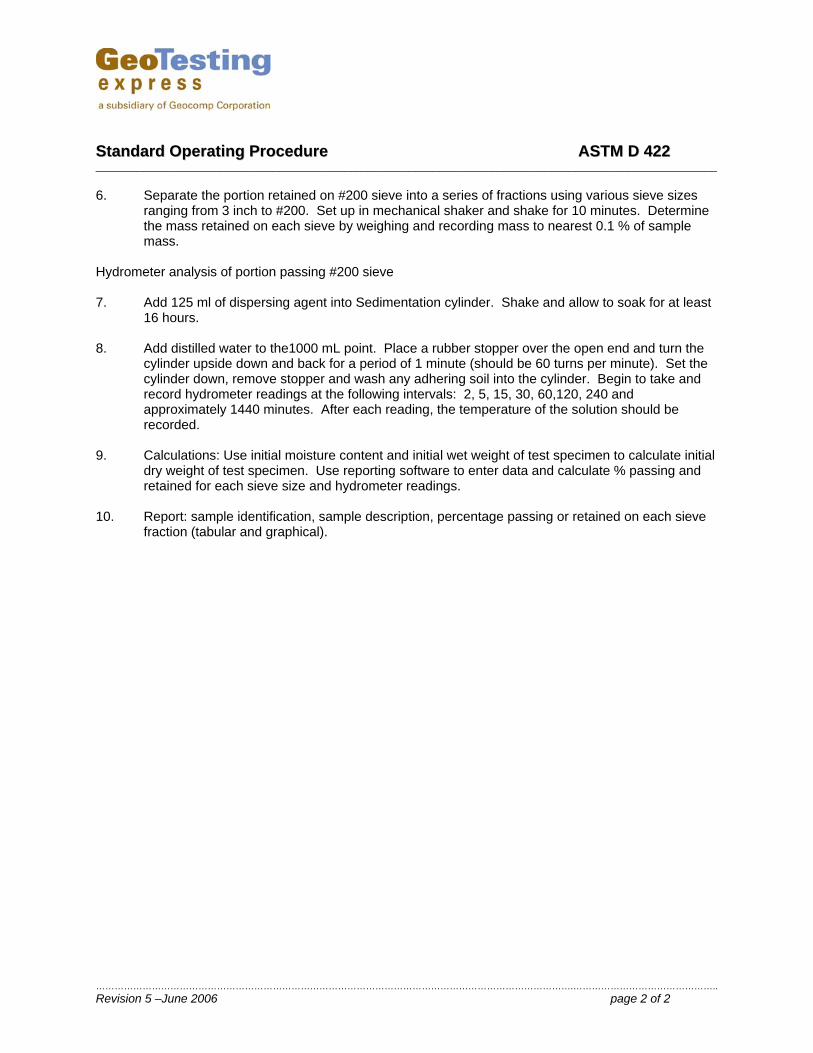
SSttaannddaarrdd OOppeerraattiinngg PPrroocceedduurree AASSTTMM DD 442222 _________________________________________________________________________________________________________
……………………………………………………………………………………………………………………………………….……………………………………….. Revision 5 –June 2006 page 2 of 2
6. Separate the portion retained on #200 sieve into a series of fractions using various sieve sizes
ranging from 3 inch to #200. Set up in mechanical shaker and shake for 10 minutes. Determine the mass retained on each sieve by weighing and recording mass to nearest 0.1 % of sample mass.
Hydrometer analysis of portion passing #200 sieve 7. Add 125 ml of dispersing agent into Sedimentation cylinder. Shake and allow to soak for at least
16 hours. 8. Add distilled water to the1000 mL point. Place a rubber stopper over the open end and turn the
cylinder upside down and back for a period of 1 minute (should be 60 turns per minute). Set the cylinder down, remove stopper and wash any adhering soil into the cylinder. Begin to take and record hydrometer readings at the following intervals: 2, 5, 15, 30, 60,120, 240 and approximately 1440 minutes. After each reading, the temperature of the solution should be recorded.
9. Calculations: Use initial moisture content and initial wet weight of test specimen to calculate initial
dry weight of test specimen. Use reporting software to enter data and calculate % passing and retained for each sieve size and hydrometer readings.
10. Report: sample identification, sample description, percentage passing or retained on each sieve
fraction (tabular and graphical).
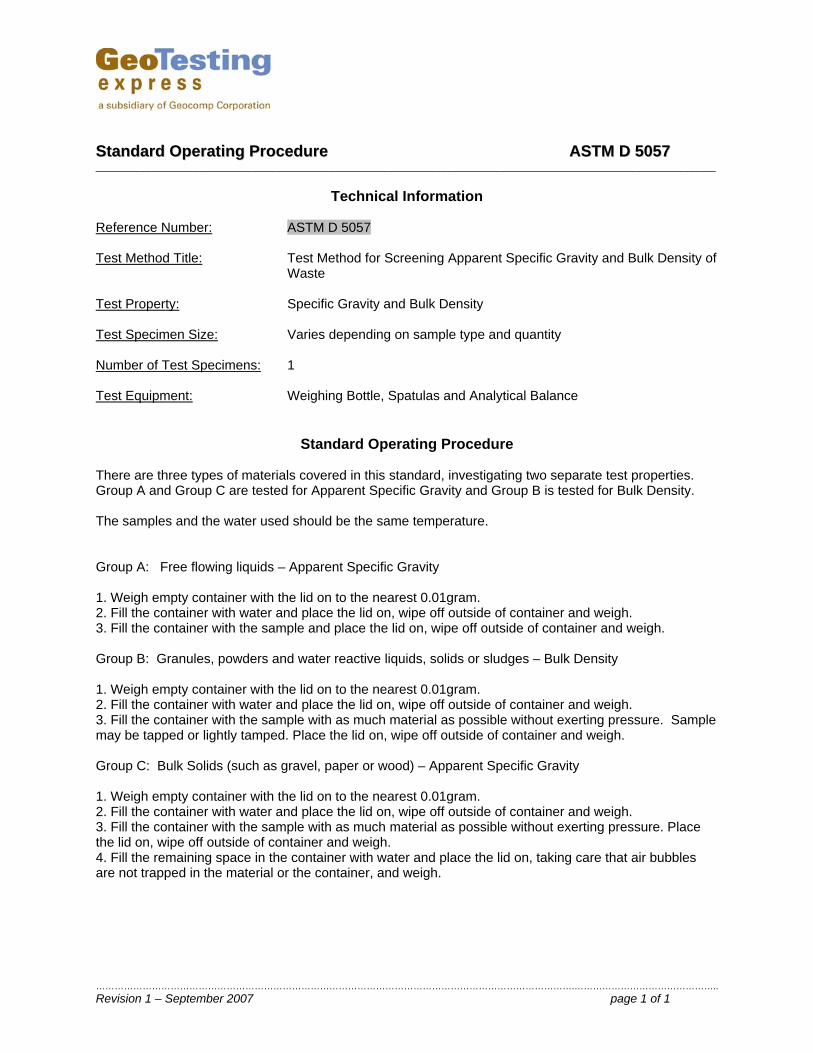
SSttaannddaarrdd OOppeerraattiinngg PPrroocceedduurree AASSTTMM DD 55005577 _________________________________________________________________________________________________________
……………………………………………………………………………………………………………………………………….……………………………………….. Revision 1 – September 2007 page 1 of 1
Technical Information
Reference Number: ASTM D 5057 Test Method Title: Test Method for Screening Apparent Specific Gravity and Bulk Density of
Waste Test Property: Specific Gravity and Bulk Density Test Specimen Size: Varies depending on sample type and quantity Number of Test Specimens: 1 Test Equipment: Weighing Bottle, Spatulas and Analytical Balance
Standard Operating Procedure
There are three types of materials covered in this standard, investigating two separate test properties. Group A and Group C are tested for Apparent Specific Gravity and Group B is tested for Bulk Density. The samples and the water used should be the same temperature. Group A: Free flowing liquids – Apparent Specific Gravity 1. Weigh empty container with the lid on to the nearest 0.01gram. 2. Fill the container with water and place the lid on, wipe off outside of container and weigh. 3. Fill the container with the sample and place the lid on, wipe off outside of container and weigh. Group B: Granules, powders and water reactive liquids, solids or sludges – Bulk Density 1. Weigh empty container with the lid on to the nearest 0.01gram. 2. Fill the container with water and place the lid on, wipe off outside of container and weigh. 3. Fill the container with the sample with as much material as possible without exerting pressure. Sample may be tapped or lightly tamped. Place the lid on, wipe off outside of container and weigh. Group C: Bulk Solids (such as gravel, paper or wood) – Apparent Specific Gravity 1. Weigh empty container with the lid on to the nearest 0.01gram. 2. Fill the container with water and place the lid on, wipe off outside of container and weigh. 3. Fill the container with the sample with as much material as possible without exerting pressure. Place the lid on, wipe off outside of container and weigh. 4. Fill the remaining space in the container with water and place the lid on, taking care that air bubbles are not trapped in the material or the container, and weigh.
AOC II – Docket No. V-W-’04-C-784 – Yard520 - AppC QAPP September 2, 2005
ATTACHMENT B
ENSR DATA VALIDATION PROTOCOLS
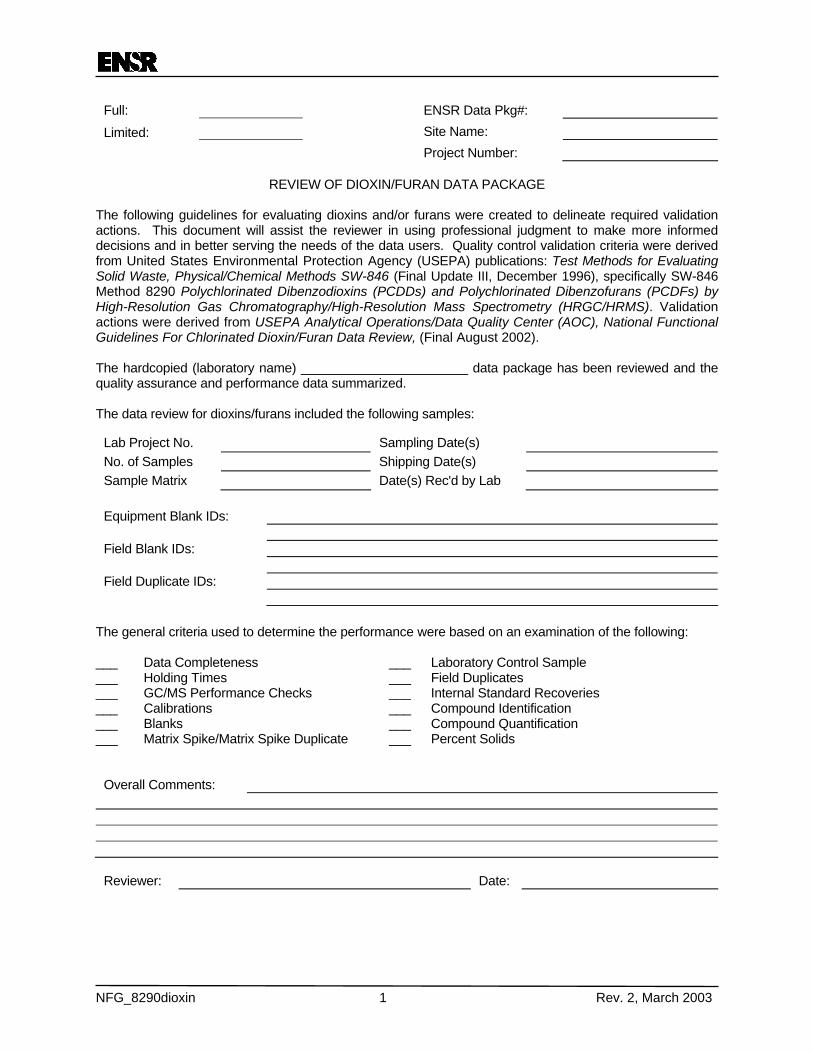
NFG_8290dioxin 1 Rev. 2, March 2003
Full: ENSR Data Pkg#:
Limited: Site Name: Project Number:
REVIEW OF DIOXIN/FURAN DATA PACKAGE The following guidelines for evaluating dioxins and/or furans were created to delineate required validation actions. This document will assist the reviewer in using professional judgment to make more informed decisions and in better serving the needs of the data users. Quality control validation criteria were derived from United States Environmental Protection Agency (USEPA) publications: Test Methods for Evaluating Solid Waste, Physical/Chemical Methods SW-846 (Final Update III, December 1996), specifically SW-846 Method 8290 Polychlorinated Dibenzodioxins (PCDDs) and Polychlorinated Dibenzofurans (PCDFs) by High-Resolution Gas Chromatography/High-Resolution Mass Spectrometry (HRGC/HRMS). Validation actions were derived from USEPA Analytical Operations/Data Quality Center (AOC), National Functional Guidelines For Chlorinated Dioxin/Furan Data Review, (Final August 2002). The hardcopied (laboratory name) _______________________ data package has been reviewed and the quality assurance and performance data summarized. The data review for dioxins/furans included the following samples:
Lab Project No. Sampling Date(s) No. of Samples Shipping Date(s) Sample Matrix Date(s) Rec'd by Lab
Equipment Blank IDs: Field Blank IDs: Field Duplicate IDs:
The general criteria used to determine the performance were based on an examination of the following: ___ Data Completeness ___ Laboratory Control Sample ___ Holding Times ___ Field Duplicates ___ GC/MS Performance Checks ___ Internal Standard Recoveries ___ Calibrations ___ Compound Identification ___ Blanks ___ Compound Quantification ___ Matrix Spike/Matrix Spike Duplicate ___ Percent Solids
Overall Comments:
Reviewer: Date:
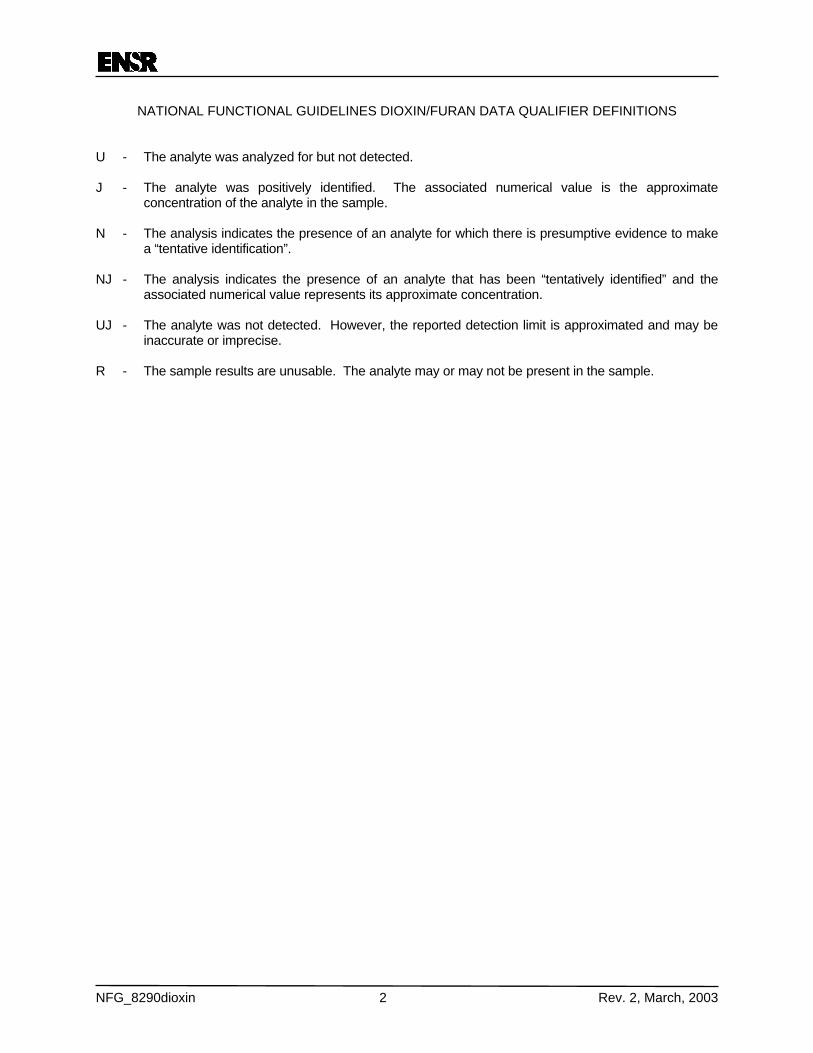
NFG_8290dioxin 2 Rev. 2, March, 2003
NATIONAL FUNCTIONAL GUIDELINES DIOXIN/FURAN DATA QUALIFIER DEFINITIONS U - The analyte was analyzed for but not detected. J - The analyte was positively identified. The associated numerical value is the approximate
concentration of the analyte in the sample. N - The analysis indicates the presence of an analyte for which there is presumptive evidence to make
a “tentative identification”. NJ - The analysis indicates the presence of an analyte that has been “tentatively identified” and the
associated numerical value represents its approximate concentration. UJ - The analyte was not detected. However, the reported detection limit is approximated and may be
inaccurate or imprecise. R - The sample results are unusable. The analyte may or may not be present in the sample.
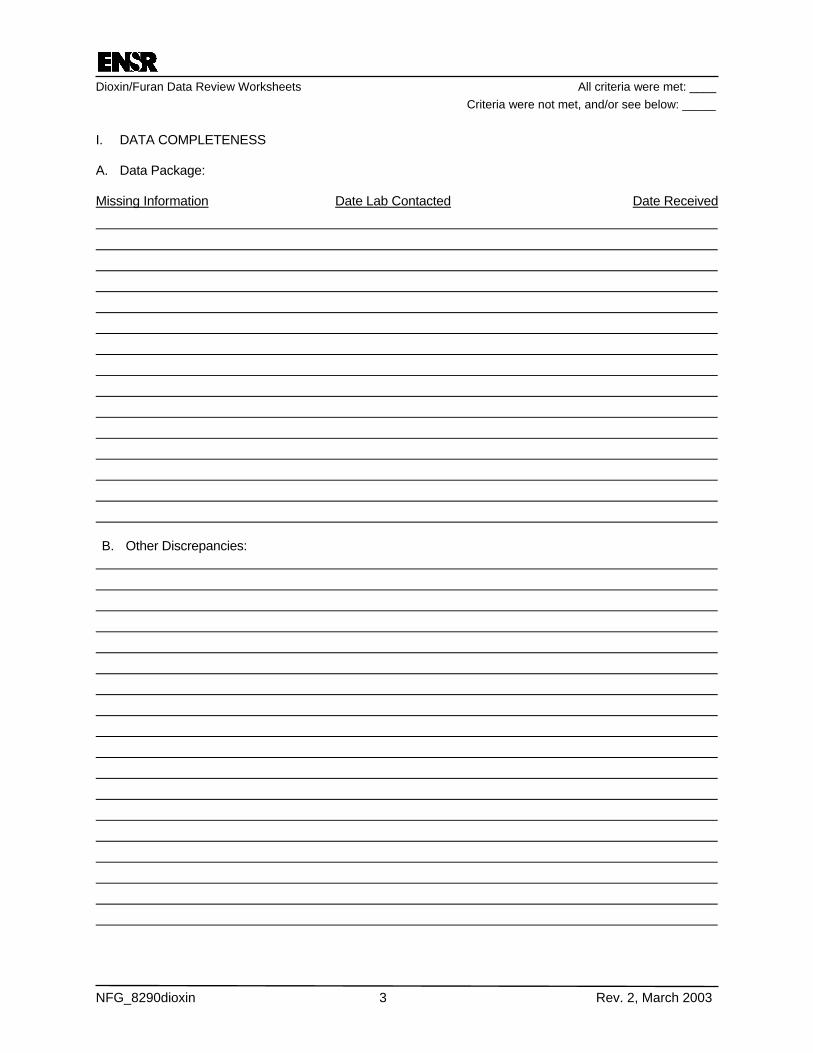
Dioxin/Furan Data Review Worksheets All criteria were met: ____ Criteria were not met, and/or see below: _____
NFG_8290dioxin 3 Rev. 2, March 2003
I. DATA COMPLETENESS A. Data Package: Missing Information Date Lab Contacted Date Received
B. Other Discrepancies:
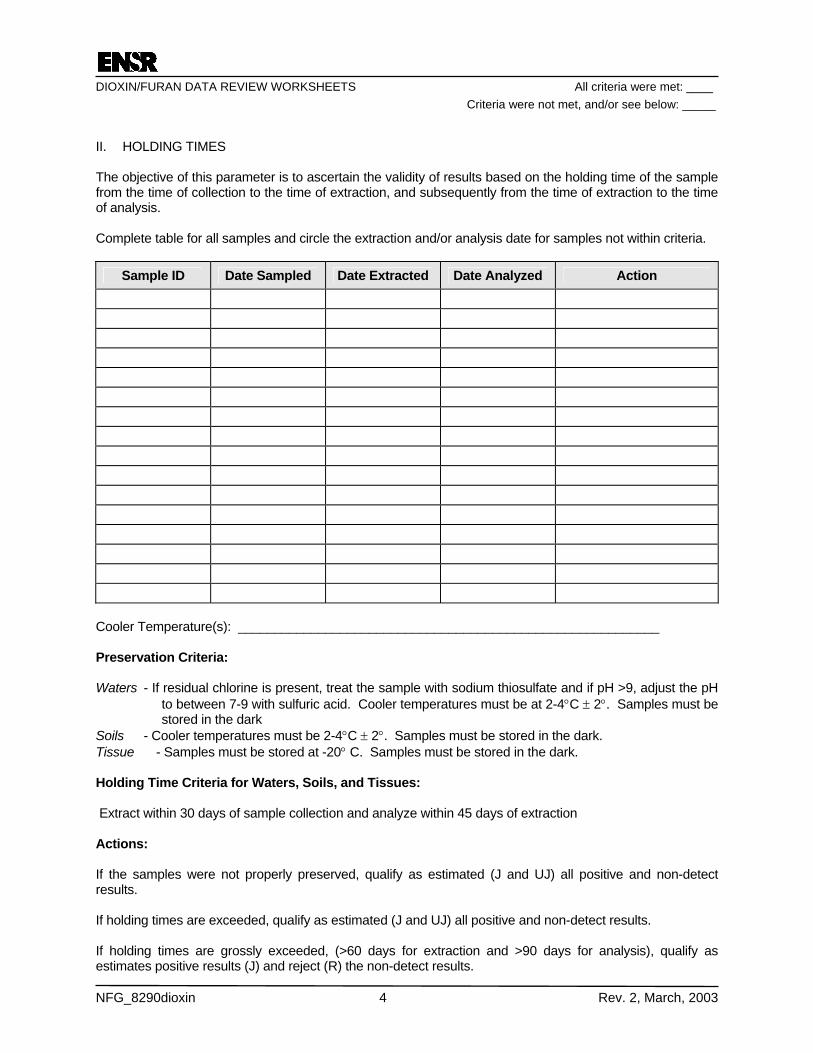
DIOXIN/FURAN DATA REVIEW WORKSHEETS All criteria were met: ____ Criteria were not met, and/or see below: _____
NFG_8290dioxin 4 Rev. 2, March, 2003
II. HOLDING TIMES The objective of this parameter is to ascertain the validity of results based on the holding time of the sample from the time of collection to the time of extraction, and subsequently from the time of extraction to the time of analysis. Complete table for all samples and circle the extraction and/or analysis date for samples not within criteria.
Sample ID Date Sampled Date Extracted Date Analyzed Action
Cooler Temperature(s): __________________________________________________________ Preservation Criteria: Waters - If residual chlorine is present, treat the sample with sodium thiosulfate and if pH >9, adjust the pH
to between 7-9 with sulfuric acid. Cooler temperatures must be at 2-4°C ± 2°. Samples must be stored in the dark
Soils - Cooler temperatures must be 2-4°C ± 2°. Samples must be stored in the dark. Tissue - Samples must be stored at -20° C. Samples must be stored in the dark. Holding Time Criteria for Waters, Soils, and Tissues: Extract within 30 days of sample collection and analyze within 45 days of extraction Actions: If the samples were not properly preserved, qualify as estimated (J and UJ) all positive and non-detect results. If holding times are exceeded, qualify as estimated (J and UJ) all positive and non-detect results. If holding times are grossly exceeded, (>60 days for extraction and >90 days for analysis), qualify as estimates positive results (J) and reject (R) the non-detect results.
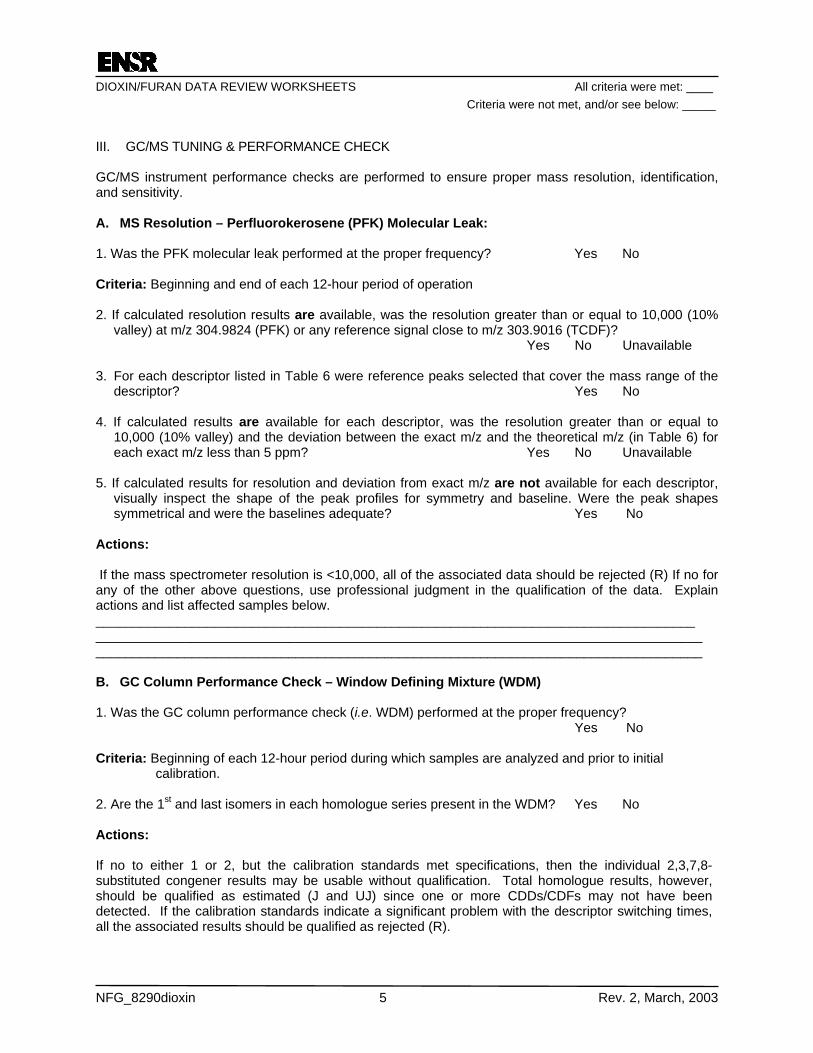
DIOXIN/FURAN DATA REVIEW WORKSHEETS All criteria were met: ____ Criteria were not met, and/or see below: _____
NFG_8290dioxin 5 Rev. 2, March, 2003
III. GC/MS TUNING & PERFORMANCE CHECK GC/MS instrument performance checks are performed to ensure proper mass resolution, identification, and sensitivity. A. MS Resolution – Perfluorokerosene (PFK) Molecular Leak: 1. Was the PFK molecular leak performed at the proper frequency? Yes No Criteria: Beginning and end of each 12-hour period of operation 2. If calculated resolution results are available, was the resolution greater than or equal to 10,000 (10%
valley) at m/z 304.9824 (PFK) or any reference signal close to m/z 303.9016 (TCDF)? Yes No Unavailable
3. For each descriptor listed in Table 6 were reference peaks selected that cover the mass range of the
descriptor? Yes No 4. If calculated results are available for each descriptor, was the resolution greater than or equal to
10,000 (10% valley) and the deviation between the exact m/z and the theoretical m/z (in Table 6) for each exact m/z less than 5 ppm? Yes No Unavailable
5. If calculated results for resolution and deviation from exact m/z are not available for each descriptor,
visually inspect the shape of the peak profiles for symmetry and baseline. Were the peak shapes symmetrical and were the baselines adequate? Yes No
Actions: If the mass spectrometer resolution is <10,000, all of the associated data should be rejected (R) If no for any of the other above questions, use professional judgment in the qualification of the data. Explain actions and list affected samples below. _________________________________________________________________________________ __________________________________________________________________________________ __________________________________________________________________________________ B. GC Column Performance Check – Window Defining Mixture (WDM) 1. Was the GC column performance check (i.e. WDM) performed at the proper frequency? Yes No Criteria: Beginning of each 12-hour period during which samples are analyzed and prior to initial
calibration. 2. Are the 1st and last isomers in each homologue series present in the WDM? Yes No Actions: If no to either 1 or 2, but the calibration standards met specifications, then the individual 2,3,7,8- substituted congener results may be usable without qualification. Total homologue results, however, should be qualified as estimated (J and UJ) since one or more CDDs/CDFs may not have been detected. If the calibration standards indicate a significant problem with the descriptor switching times, all the associated results should be qualified as rejected (R).
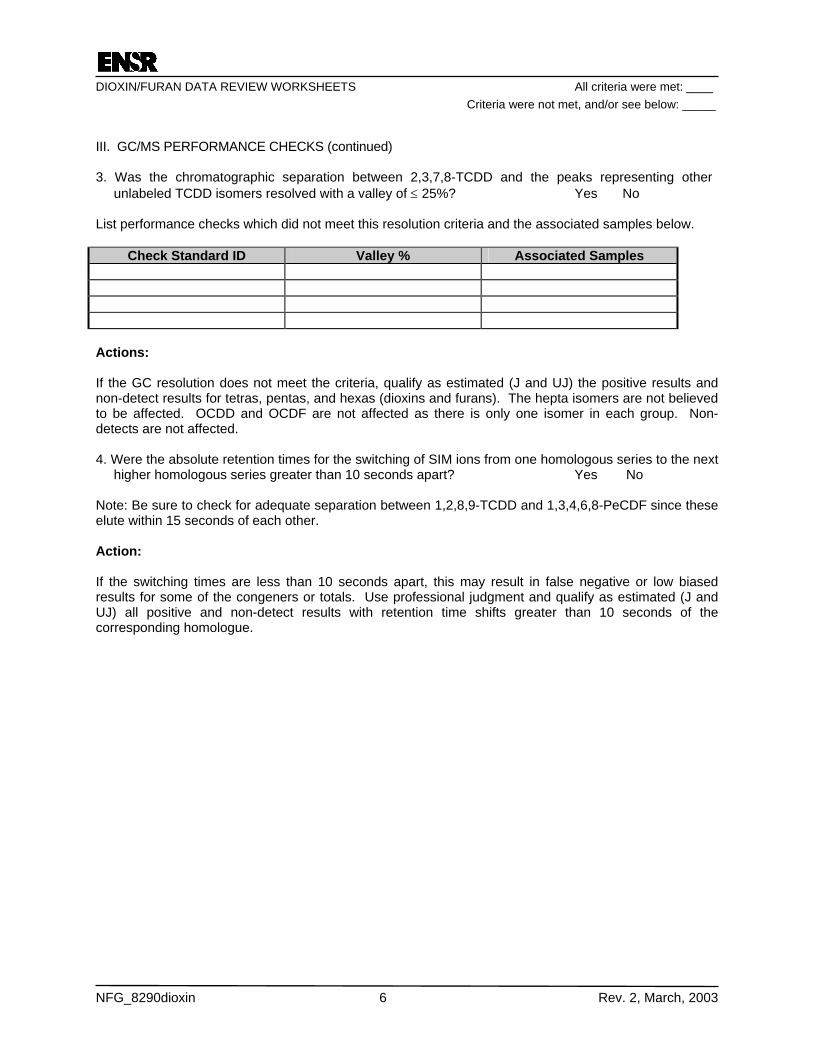
DIOXIN/FURAN DATA REVIEW WORKSHEETS All criteria were met: ____ Criteria were not met, and/or see below: _____
NFG_8290dioxin 6 Rev. 2, March, 2003
III. GC/MS PERFORMANCE CHECKS (continued) 3. Was the chromatographic separation between 2,3,7,8-TCDD and the peaks representing other
unlabeled TCDD isomers resolved with a valley of ≤ 25%? Yes No List performance checks which did not meet this resolution criteria and the associated samples below.
Check Standard ID Valley % Associated Samples
Actions: If the GC resolution does not meet the criteria, qualify as estimated (J and UJ) the positive results and non-detect results for tetras, pentas, and hexas (dioxins and furans). The hepta isomers are not believed to be affected. OCDD and OCDF are not affected as there is only one isomer in each group. Non-detects are not affected. 4. Were the absolute retention times for the switching of SIM ions from one homologous series to the next
higher homologous series greater than 10 seconds apart? Yes No Note: Be sure to check for adequate separation between 1,2,8,9-TCDD and 1,3,4,6,8-PeCDF since these elute within 15 seconds of each other. Action: If the switching times are less than 10 seconds apart, this may result in false negative or low biased results for some of the congeners or totals. Use professional judgment and qualify as estimated (J and UJ) all positive and non-detect results with retention time shifts greater than 10 seconds of the corresponding homologue.
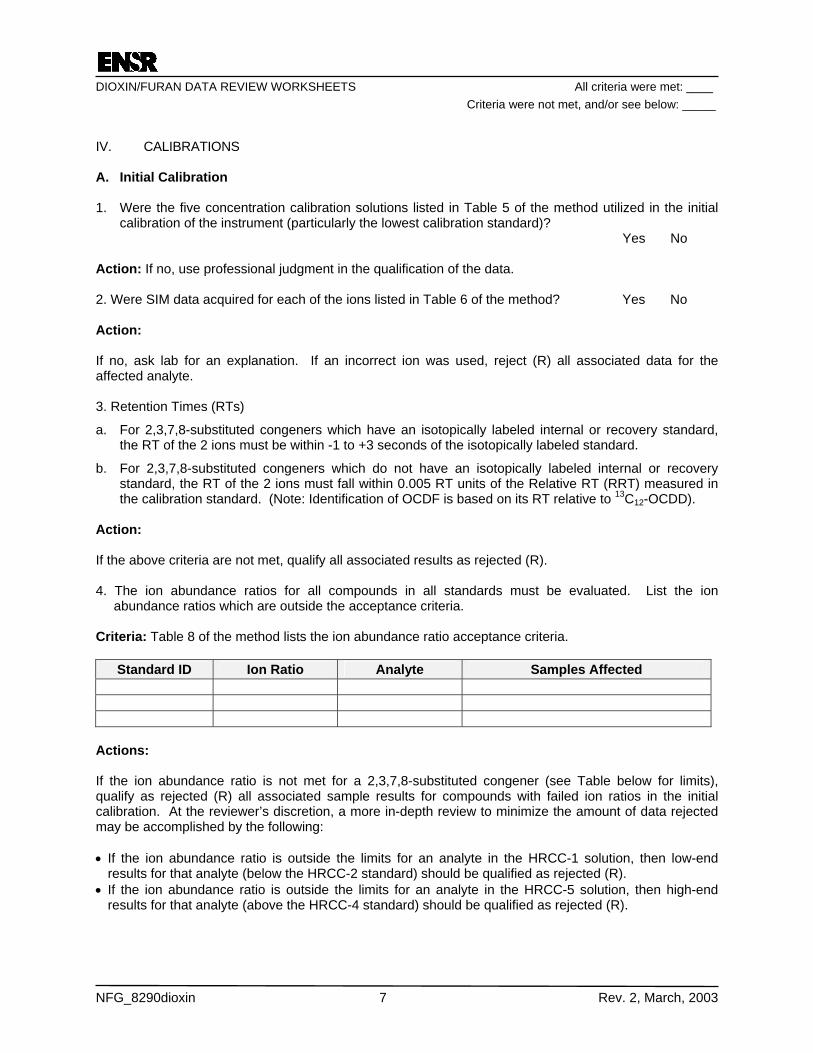
DIOXIN/FURAN DATA REVIEW WORKSHEETS All criteria were met: ____ Criteria were not met, and/or see below: _____
NFG_8290dioxin 7 Rev. 2, March, 2003
IV. CALIBRATIONS A. Initial Calibration 1. Were the five concentration calibration solutions listed in Table 5 of the method utilized in the initial
calibration of the instrument (particularly the lowest calibration standard)? Yes No
Action: If no, use professional judgment in the qualification of the data. 2. Were SIM data acquired for each of the ions listed in Table 6 of the method? Yes No Action: If no, ask lab for an explanation. If an incorrect ion was used, reject (R) all associated data for the affected analyte. 3. Retention Times (RTs)
a. For 2,3,7,8-substituted congeners which have an isotopically labeled internal or recovery standard, the RT of the 2 ions must be within -1 to +3 seconds of the isotopically labeled standard.
b. For 2,3,7,8-substituted congeners which do not have an isotopically labeled internal or recovery standard, the RT of the 2 ions must fall within 0.005 RT units of the Relative RT (RRT) measured in the calibration standard. (Note: Identification of OCDF is based on its RT relative to 13C12-OCDD).
Action: If the above criteria are not met, qualify all associated results as rejected (R). 4. The ion abundance ratios for all compounds in all standards must be evaluated. List the ion
abundance ratios which are outside the acceptance criteria. Criteria: Table 8 of the method lists the ion abundance ratio acceptance criteria.
Standard ID Ion Ratio Analyte Samples Affected
Actions: If the ion abundance ratio is not met for a 2,3,7,8-substituted congener (see Table below for limits), qualify as rejected (R) all associated sample results for compounds with failed ion ratios in the initial calibration. At the reviewer’s discretion, a more in-depth review to minimize the amount of data rejected may be accomplished by the following: • If the ion abundance ratio is outside the limits for an analyte in the HRCC-1 solution, then low-end
results for that analyte (below the HRCC-2 standard) should be qualified as rejected (R). • If the ion abundance ratio is outside the limits for an analyte in the HRCC-5 solution, then high-end
results for that analyte (above the HRCC-4 standard) should be qualified as rejected (R).
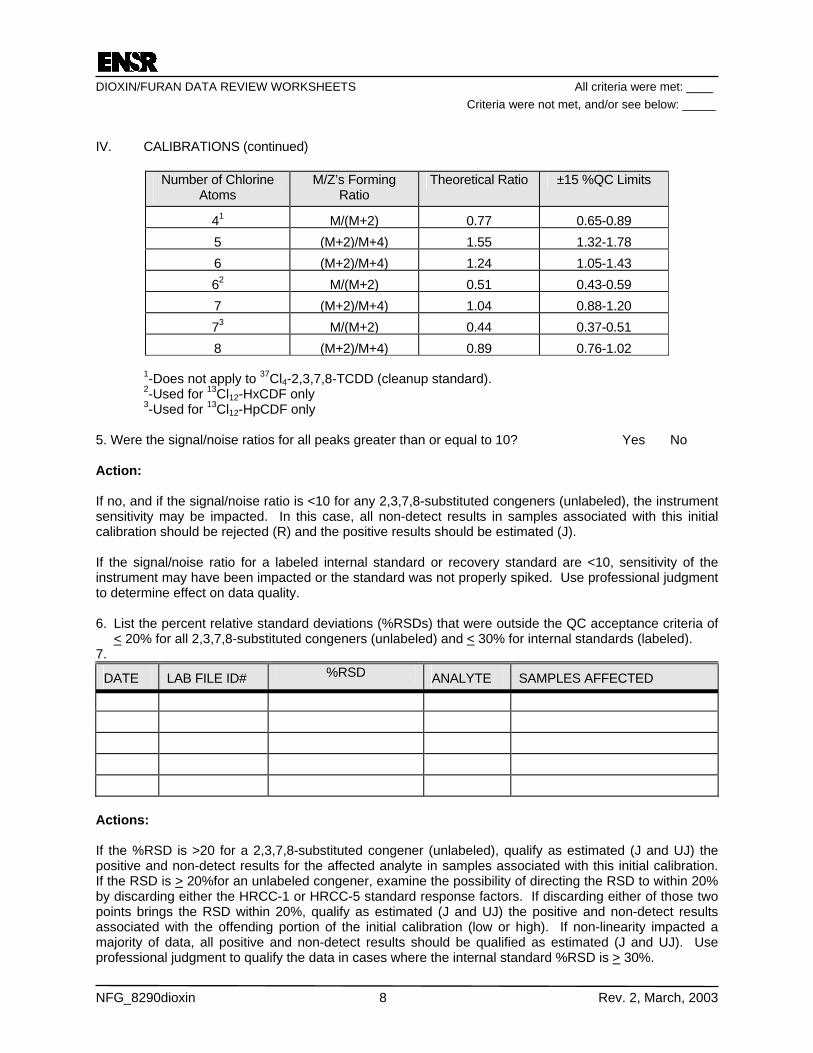
DIOXIN/FURAN DATA REVIEW WORKSHEETS All criteria were met: ____ Criteria were not met, and/or see below: _____
NFG_8290dioxin 8 Rev. 2, March, 2003
IV. CALIBRATIONS (continued)
Number of Chlorine Atoms
M/Z’s Forming Ratio
Theoretical Ratio ±15 %QC Limits
41 M/(M+2) 0.77 0.65-0.89 5 (M+2)/M+4) 1.55 1.32-1.78 6 (M+2)/M+4) 1.24 1.05-1.43 62 M/(M+2) 0.51 0.43-0.59 7 (M+2)/M+4) 1.04 0.88-1.20 73 M/(M+2) 0.44 0.37-0.51 8 (M+2)/M+4) 0.89 0.76-1.02
1-Does not apply to 37Cl4-2,3,7,8-TCDD (cleanup standard). 2-Used for 13Cl12-HxCDF only 3-Used for 13Cl12-HpCDF only
5. Were the signal/noise ratios for all peaks greater than or equal to 10? Yes No Action: If no, and if the signal/noise ratio is <10 for any 2,3,7,8-substituted congeners (unlabeled), the instrument sensitivity may be impacted. In this case, all non-detect results in samples associated with this initial calibration should be rejected (R) and the positive results should be estimated (J). If the signal/noise ratio for a labeled internal standard or recovery standard are <10, sensitivity of the instrument may have been impacted or the standard was not properly spiked. Use professional judgment to determine effect on data quality. 6. List the percent relative standard deviations (%RSDs) that were outside the QC acceptance criteria of
< 20% for all 2,3,7,8-substituted congeners (unlabeled) and < 30% for internal standards (labeled). 7.
DATE LAB FILE ID# %RSD ANALYTE SAMPLES AFFECTED
Actions: If the %RSD is >20 for a 2,3,7,8-substituted congener (unlabeled), qualify as estimated (J and UJ) the positive and non-detect results for the affected analyte in samples associated with this initial calibration. If the RSD is > 20%for an unlabeled congener, examine the possibility of directing the RSD to within 20% by discarding either the HRCC-1 or HRCC-5 standard response factors. If discarding either of those two points brings the RSD within 20%, qualify as estimated (J and UJ) the positive and non-detect results associated with the offending portion of the initial calibration (low or high). If non-linearity impacted a majority of data, all positive and non-detect results should be qualified as estimated (J and UJ). Use professional judgment to qualify the data in cases where the internal standard %RSD is > 30%.
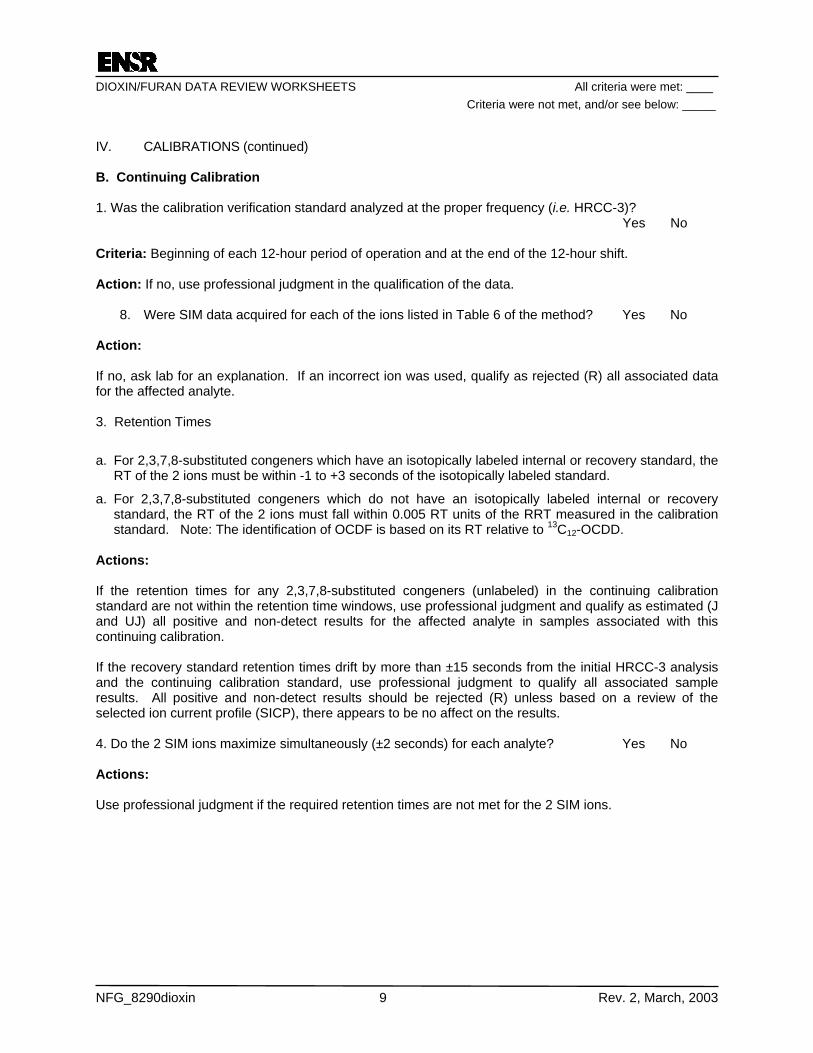
DIOXIN/FURAN DATA REVIEW WORKSHEETS All criteria were met: ____ Criteria were not met, and/or see below: _____
NFG_8290dioxin 9 Rev. 2, March, 2003
IV. CALIBRATIONS (continued) B. Continuing Calibration 1. Was the calibration verification standard analyzed at the proper frequency (i.e. HRCC-3)? Yes No Criteria: Beginning of each 12-hour period of operation and at the end of the 12-hour shift. Action: If no, use professional judgment in the qualification of the data.
8. Were SIM data acquired for each of the ions listed in Table 6 of the method? Yes No Action: If no, ask lab for an explanation. If an incorrect ion was used, qualify as rejected (R) all associated data for the affected analyte. 3. Retention Times
a. For 2,3,7,8-substituted congeners which have an isotopically labeled internal or recovery standard, the RT of the 2 ions must be within -1 to +3 seconds of the isotopically labeled standard.
a. For 2,3,7,8-substituted congeners which do not have an isotopically labeled internal or recovery standard, the RT of the 2 ions must fall within 0.005 RT units of the RRT measured in the calibration standard. Note: The identification of OCDF is based on its RT relative to 13C12-OCDD.
Actions: If the retention times for any 2,3,7,8-substituted congeners (unlabeled) in the continuing calibration standard are not within the retention time windows, use professional judgment and qualify as estimated (J and UJ) all positive and non-detect results for the affected analyte in samples associated with this continuing calibration. If the recovery standard retention times drift by more than ±15 seconds from the initial HRCC-3 analysis and the continuing calibration standard, use professional judgment to qualify all associated sample results. All positive and non-detect results should be rejected (R) unless based on a review of the selected ion current profile (SICP), there appears to be no affect on the results. 4. Do the 2 SIM ions maximize simultaneously (±2 seconds) for each analyte? Yes No Actions: Use professional judgment if the required retention times are not met for the 2 SIM ions.
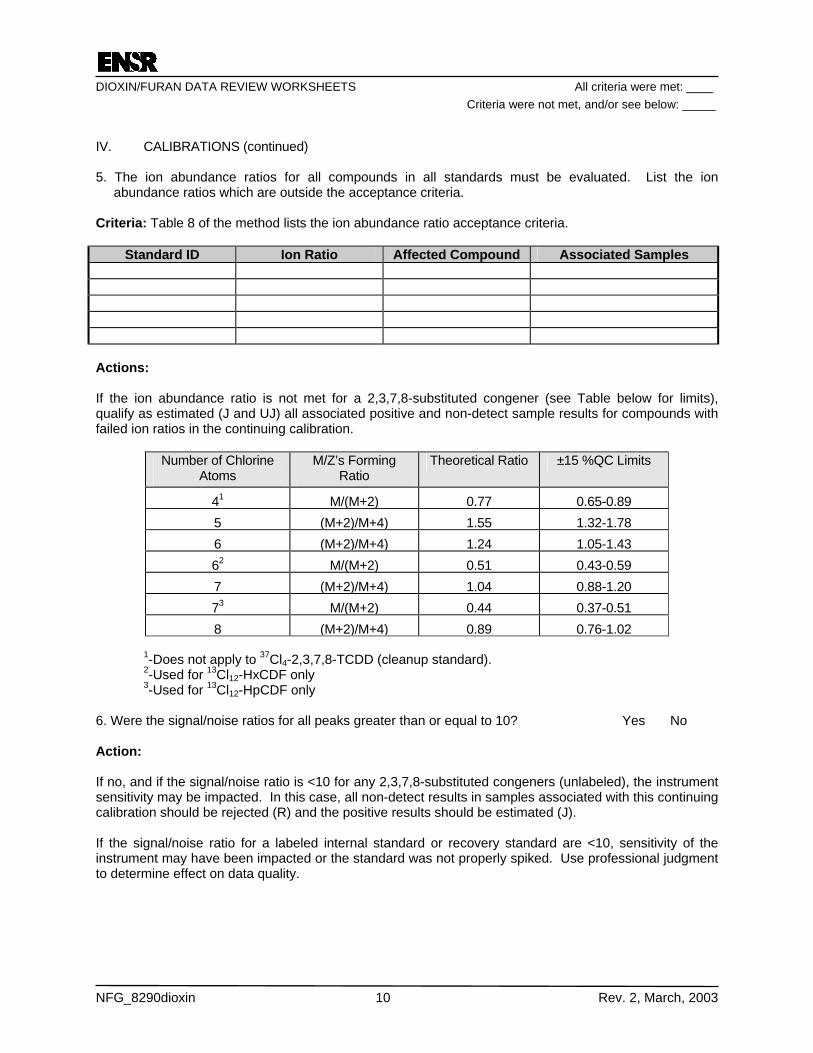
DIOXIN/FURAN DATA REVIEW WORKSHEETS All criteria were met: ____ Criteria were not met, and/or see below: _____
NFG_8290dioxin 10 Rev. 2, March, 2003
IV. CALIBRATIONS (continued) 5. The ion abundance ratios for all compounds in all standards must be evaluated. List the ion
abundance ratios which are outside the acceptance criteria. Criteria: Table 8 of the method lists the ion abundance ratio acceptance criteria.
Standard ID Ion Ratio Affected Compound Associated Samples
Actions: If the ion abundance ratio is not met for a 2,3,7,8-substituted congener (see Table below for limits), qualify as estimated (J and UJ) all associated positive and non-detect sample results for compounds with failed ion ratios in the continuing calibration.
Number of Chlorine Atoms
M/Z’s Forming Ratio
Theoretical Ratio ±15 %QC Limits
41 M/(M+2) 0.77 0.65-0.89 5 (M+2)/M+4) 1.55 1.32-1.78 6 (M+2)/M+4) 1.24 1.05-1.43 62 M/(M+2) 0.51 0.43-0.59 7 (M+2)/M+4) 1.04 0.88-1.20 73 M/(M+2) 0.44 0.37-0.51 8 (M+2)/M+4) 0.89 0.76-1.02
1-Does not apply to 37Cl4-2,3,7,8-TCDD (cleanup standard). 2-Used for 13Cl12-HxCDF only 3-Used for 13Cl12-HpCDF only
6. Were the signal/noise ratios for all peaks greater than or equal to 10? Yes No Action: If no, and if the signal/noise ratio is <10 for any 2,3,7,8-substituted congeners (unlabeled), the instrument sensitivity may be impacted. In this case, all non-detect results in samples associated with this continuing calibration should be rejected (R) and the positive results should be estimated (J). If the signal/noise ratio for a labeled internal standard or recovery standard are <10, sensitivity of the instrument may have been impacted or the standard was not properly spiked. Use professional judgment to determine effect on data quality.
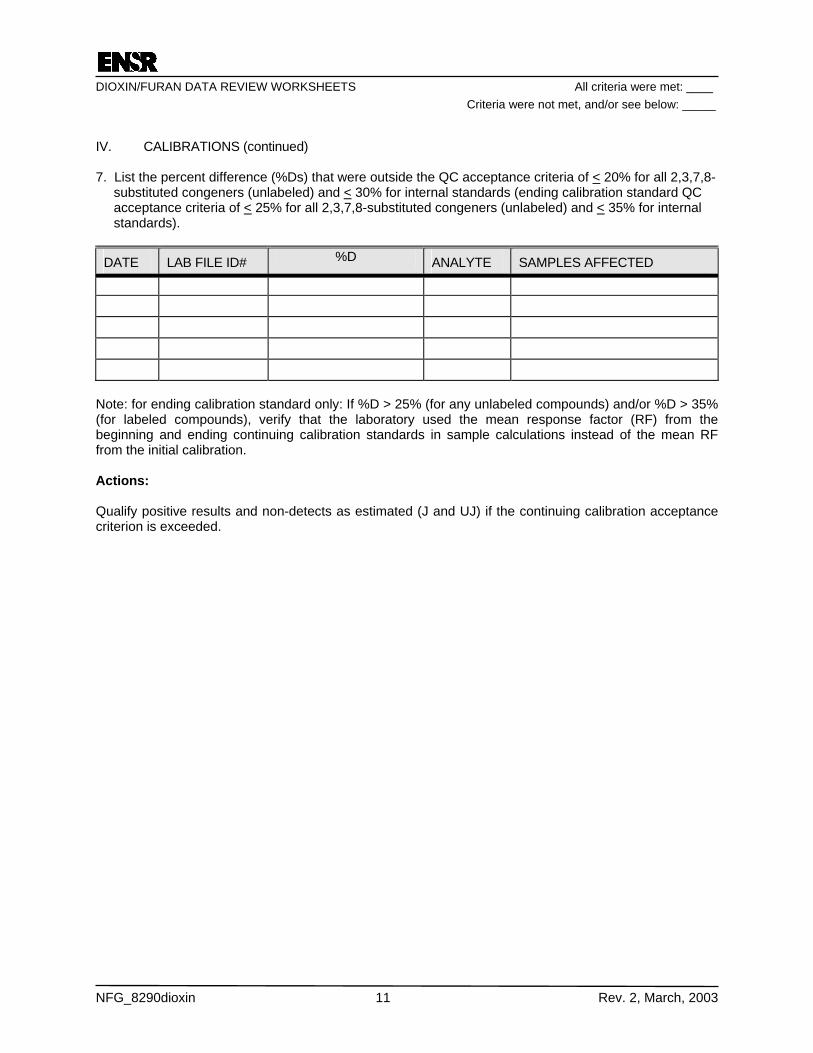
DIOXIN/FURAN DATA REVIEW WORKSHEETS All criteria were met: ____ Criteria were not met, and/or see below: _____
NFG_8290dioxin 11 Rev. 2, March, 2003
IV. CALIBRATIONS (continued) 7. List the percent difference (%Ds) that were outside the QC acceptance criteria of < 20% for all 2,3,7,8-
substituted congeners (unlabeled) and < 30% for internal standards (ending calibration standard QC acceptance criteria of < 25% for all 2,3,7,8-substituted congeners (unlabeled) and < 35% for internal standards).
DATE LAB FILE ID# %D ANALYTE SAMPLES AFFECTED
Note: for ending calibration standard only: If %D > 25% (for any unlabeled compounds) and/or %D > 35% (for labeled compounds), verify that the laboratory used the mean response factor (RF) from the beginning and ending continuing calibration standards in sample calculations instead of the mean RF from the initial calibration. Actions: Qualify positive results and non-detects as estimated (J and UJ) if the continuing calibration acceptance criterion is exceeded.
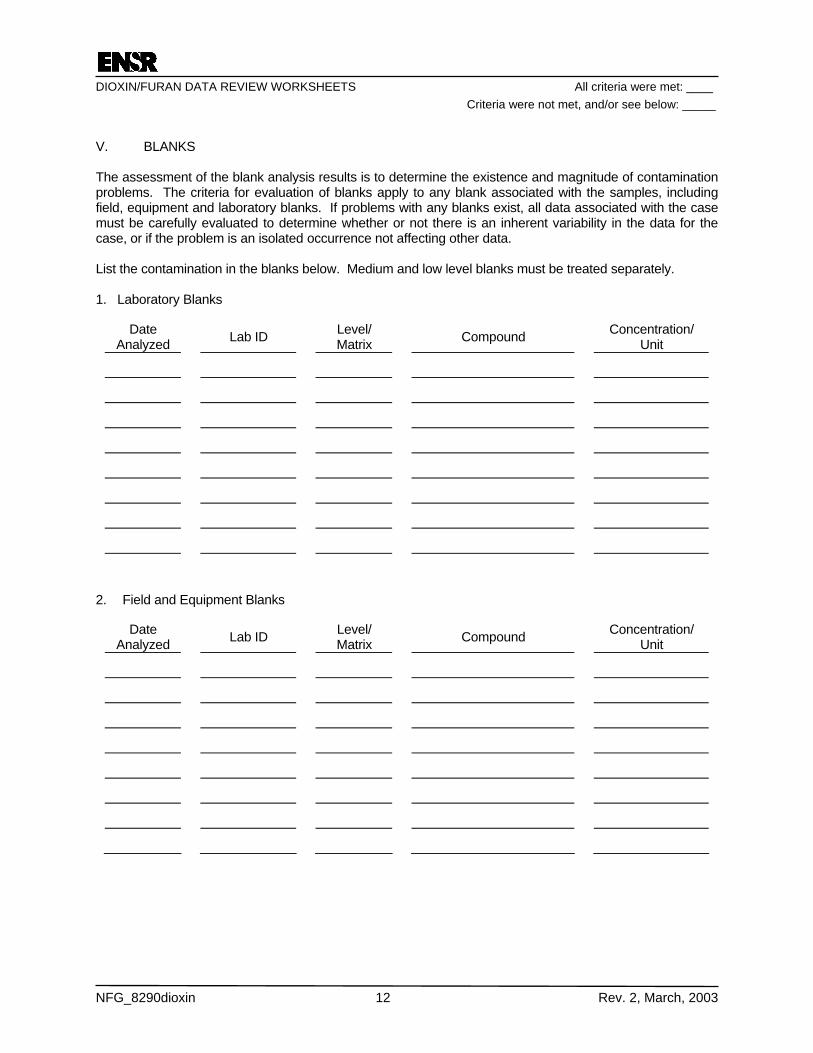
DIOXIN/FURAN DATA REVIEW WORKSHEETS All criteria were met: ____ Criteria were not met, and/or see below: _____
NFG_8290dioxin 12 Rev. 2, March, 2003
V. BLANKS The assessment of the blank analysis results is to determine the existence and magnitude of contamination problems. The criteria for evaluation of blanks apply to any blank associated with the samples, including field, equipment and laboratory blanks. If problems with any blanks exist, all data associated with the case must be carefully evaluated to determine whether or not there is an inherent variability in the data for the case, or if the problem is an isolated occurrence not affecting other data. List the contamination in the blanks below. Medium and low level blanks must be treated separately. 1. Laboratory Blanks
Date Analyzed Lab ID Level/
Matrix Compound Concentration/ Unit
2. Field and Equipment Blanks
Date Analyzed Lab ID Level/
Matrix Compound Concentration/ Unit
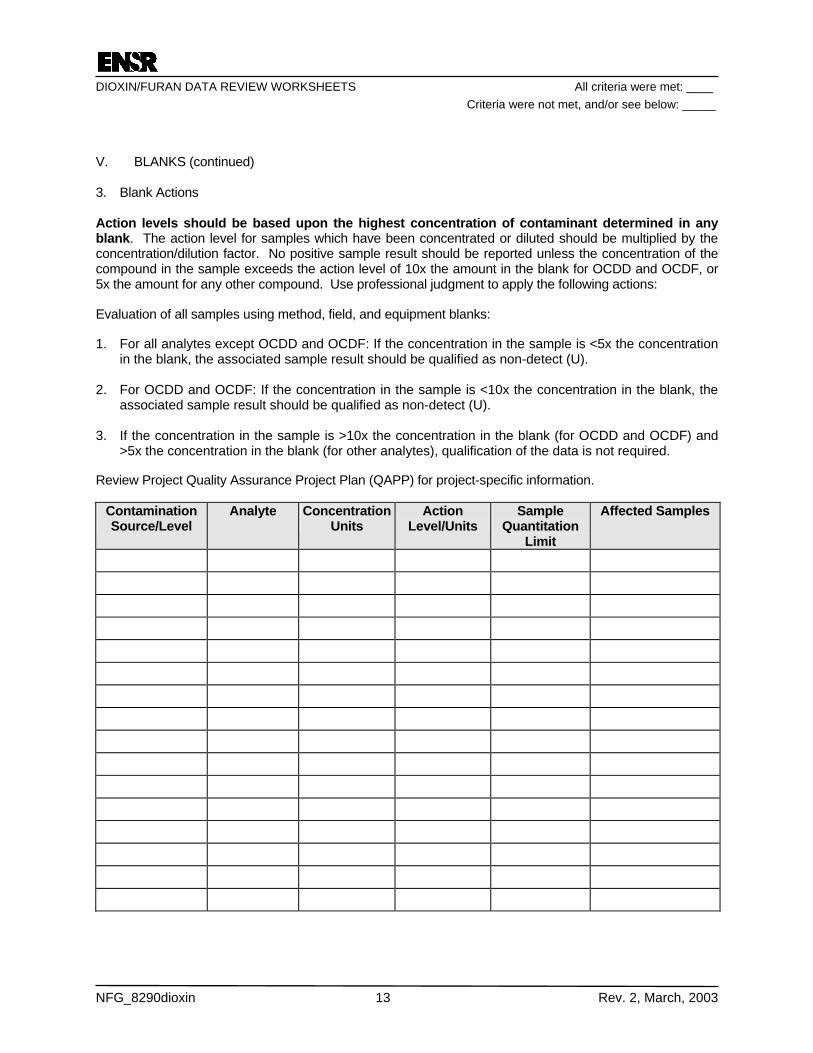
DIOXIN/FURAN DATA REVIEW WORKSHEETS All criteria were met: ____ Criteria were not met, and/or see below: _____
NFG_8290dioxin 13 Rev. 2, March, 2003
V. BLANKS (continued) 3. Blank Actions Action levels should be based upon the highest concentration of contaminant determined in any blank. The action level for samples which have been concentrated or diluted should be multiplied by the concentration/dilution factor. No positive sample result should be reported unless the concentration of the compound in the sample exceeds the action level of 10x the amount in the blank for OCDD and OCDF, or 5x the amount for any other compound. Use professional judgment to apply the following actions: Evaluation of all samples using method, field, and equipment blanks: 1. For all analytes except OCDD and OCDF: If the concentration in the sample is <5x the concentration
in the blank, the associated sample result should be qualified as non-detect (U). 2. For OCDD and OCDF: If the concentration in the sample is <10x the concentration in the blank, the
associated sample result should be qualified as non-detect (U). 3. If the concentration in the sample is >10x the concentration in the blank (for OCDD and OCDF) and
>5x the concentration in the blank (for other analytes), qualification of the data is not required. Review Project Quality Assurance Project Plan (QAPP) for project-specific information.
Contamination Source/Level
Analyte Concentration Units
Action Level/Units
Sample Quantitation
Limit
Affected Samples
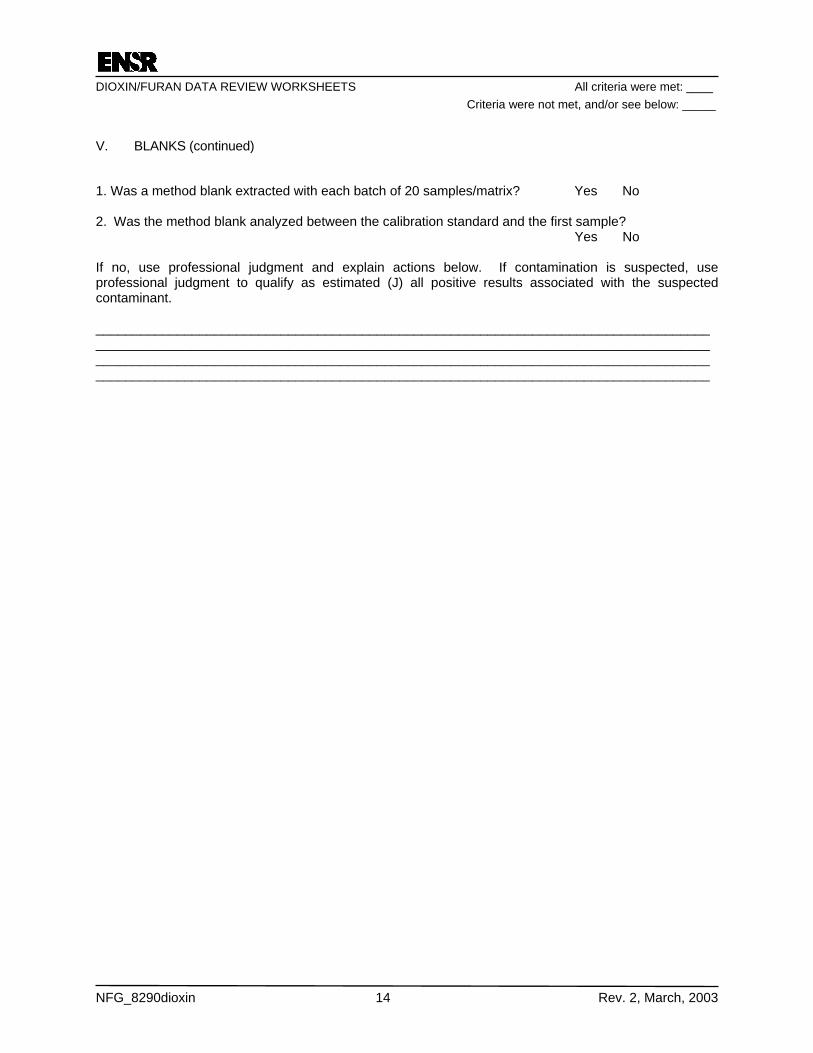
DIOXIN/FURAN DATA REVIEW WORKSHEETS All criteria were met: ____ Criteria were not met, and/or see below: _____
NFG_8290dioxin 14 Rev. 2, March, 2003
V. BLANKS (continued) 1. Was a method blank extracted with each batch of 20 samples/matrix? Yes No 2. Was the method blank analyzed between the calibration standard and the first sample? Yes No If no, use professional judgment and explain actions below. If contamination is suspected, use professional judgment to qualify as estimated (J) all positive results associated with the suspected contaminant. ___________________________________________________________________________________ ___________________________________________________________________________________ ___________________________________________________________________________________ ___________________________________________________________________________________
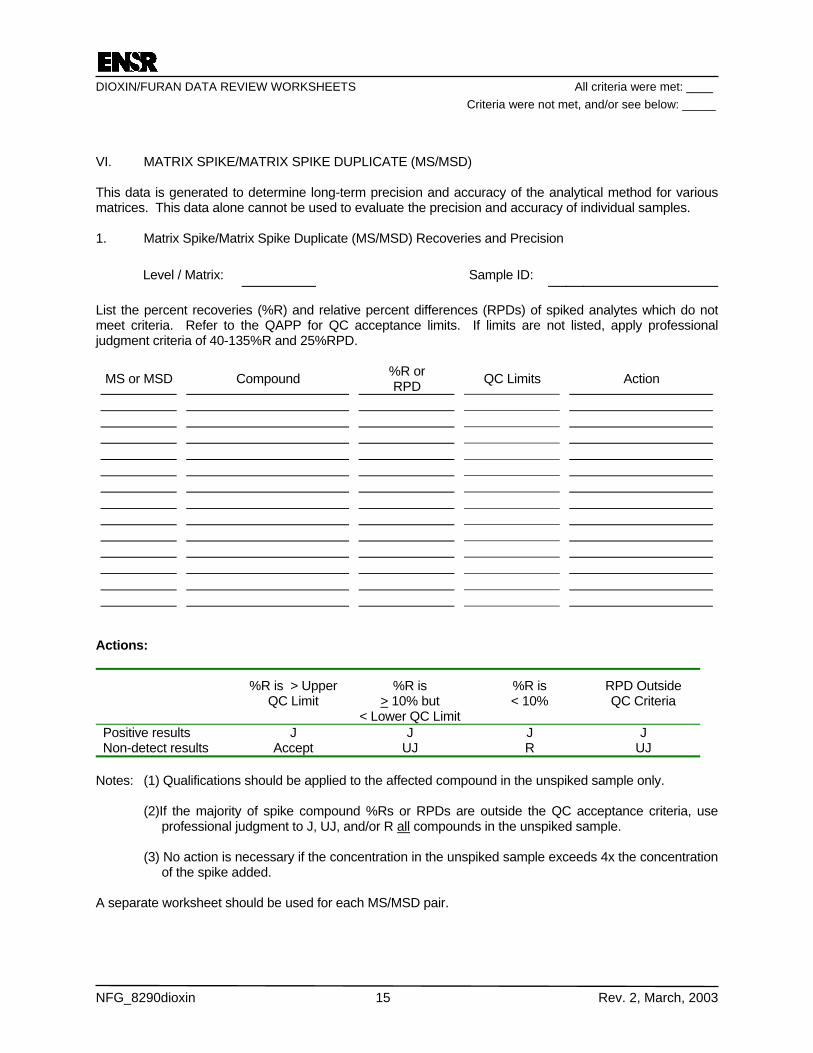
DIOXIN/FURAN DATA REVIEW WORKSHEETS All criteria were met: ____ Criteria were not met, and/or see below: _____
NFG_8290dioxin 15 Rev. 2, March, 2003
VI. MATRIX SPIKE/MATRIX SPIKE DUPLICATE (MS/MSD) This data is generated to determine long-term precision and accuracy of the analytical method for various matrices. This data alone cannot be used to evaluate the precision and accuracy of individual samples. 1. Matrix Spike/Matrix Spike Duplicate (MS/MSD) Recoveries and Precision Level / Matrix: Sample ID: List the percent recoveries (%R) and relative percent differences (RPDs) of spiked analytes which do not meet criteria. Refer to the QAPP for QC acceptance limits. If limits are not listed, apply professional judgment criteria of 40-135%R and 25%RPD.
MS or MSD Compound %R or RPD QC Limits Action
Actions:
%R is > Upper QC Limit
%R is > 10% but
< Lower QC Limit
%R is < 10%
RPD Outside QC Criteria
Positive results J J J J Non-detect results Accept UJ R UJ
Notes: (1) Qualifications should be applied to the affected compound in the unspiked sample only. (2)If the majority of spike compound %Rs or RPDs are outside the QC acceptance criteria, use
professional judgment to J, UJ, and/or R all compounds in the unspiked sample. (3) No action is necessary if the concentration in the unspiked sample exceeds 4x the concentration
of the spike added.
A separate worksheet should be used for each MS/MSD pair.
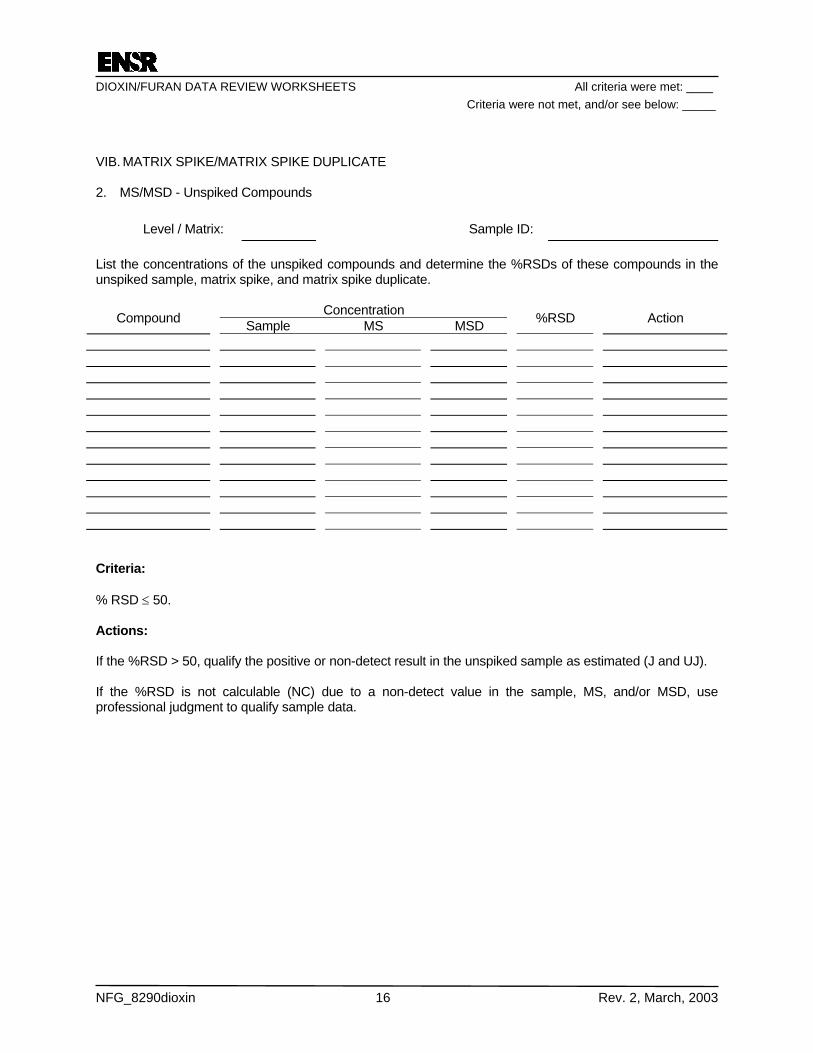
DIOXIN/FURAN DATA REVIEW WORKSHEETS All criteria were met: ____ Criteria were not met, and/or see below: _____
NFG_8290dioxin 16 Rev. 2, March, 2003
VIB. MATRIX SPIKE/MATRIX SPIKE DUPLICATE 2. MS/MSD - Unspiked Compounds Level / Matrix: Sample ID: List the concentrations of the unspiked compounds and determine the %RSDs of these compounds in the unspiked sample, matrix spike, and matrix spike duplicate.
Concentration Compound Sample MS MSD %RSD Action
Criteria: % RSD ≤ 50. Actions: If the %RSD > 50, qualify the positive or non-detect result in the unspiked sample as estimated (J and UJ). If the %RSD is not calculable (NC) due to a non-detect value in the sample, MS, and/or MSD, use professional judgment to qualify sample data.
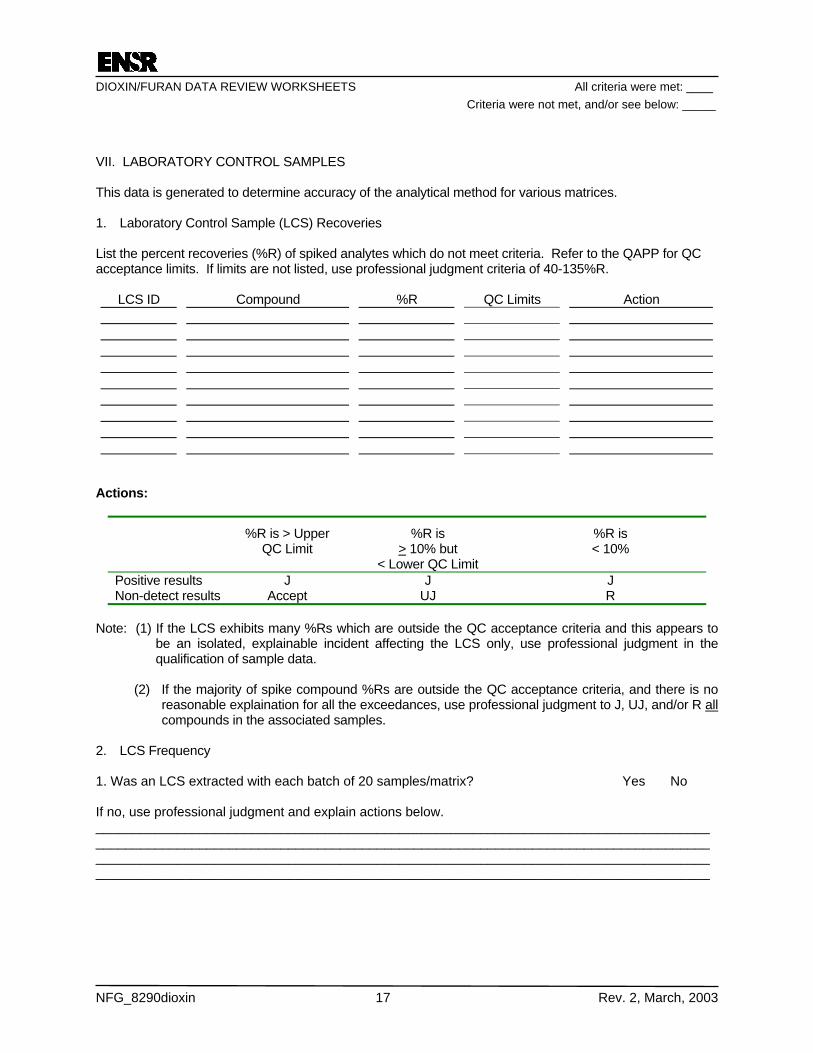
DIOXIN/FURAN DATA REVIEW WORKSHEETS All criteria were met: ____ Criteria were not met, and/or see below: _____
NFG_8290dioxin 17 Rev. 2, March, 2003
VII. LABORATORY CONTROL SAMPLES This data is generated to determine accuracy of the analytical method for various matrices. 1. Laboratory Control Sample (LCS) Recoveries List the percent recoveries (%R) of spiked analytes which do not meet criteria. Refer to the QAPP for QC acceptance limits. If limits are not listed, use professional judgment criteria of 40-135%R.
LCS ID Compound %R QC Limits Action
Actions:
%R is > Upper QC Limit
%R is > 10% but
< Lower QC Limit
%R is < 10%
Positive results J J J Non-detect results Accept UJ R
Note: (1) If the LCS exhibits many %Rs which are outside the QC acceptance criteria and this appears to
be an isolated, explainable incident affecting the LCS only, use professional judgment in the qualification of sample data.
(2) If the majority of spike compound %Rs are outside the QC acceptance criteria, and there is no
reasonable explaination for all the exceedances, use professional judgment to J, UJ, and/or R all compounds in the associated samples.
2. LCS Frequency 1. Was an LCS extracted with each batch of 20 samples/matrix? Yes No If no, use professional judgment and explain actions below. ___________________________________________________________________________________ ___________________________________________________________________________________ ___________________________________________________________________________________ ___________________________________________________________________________________
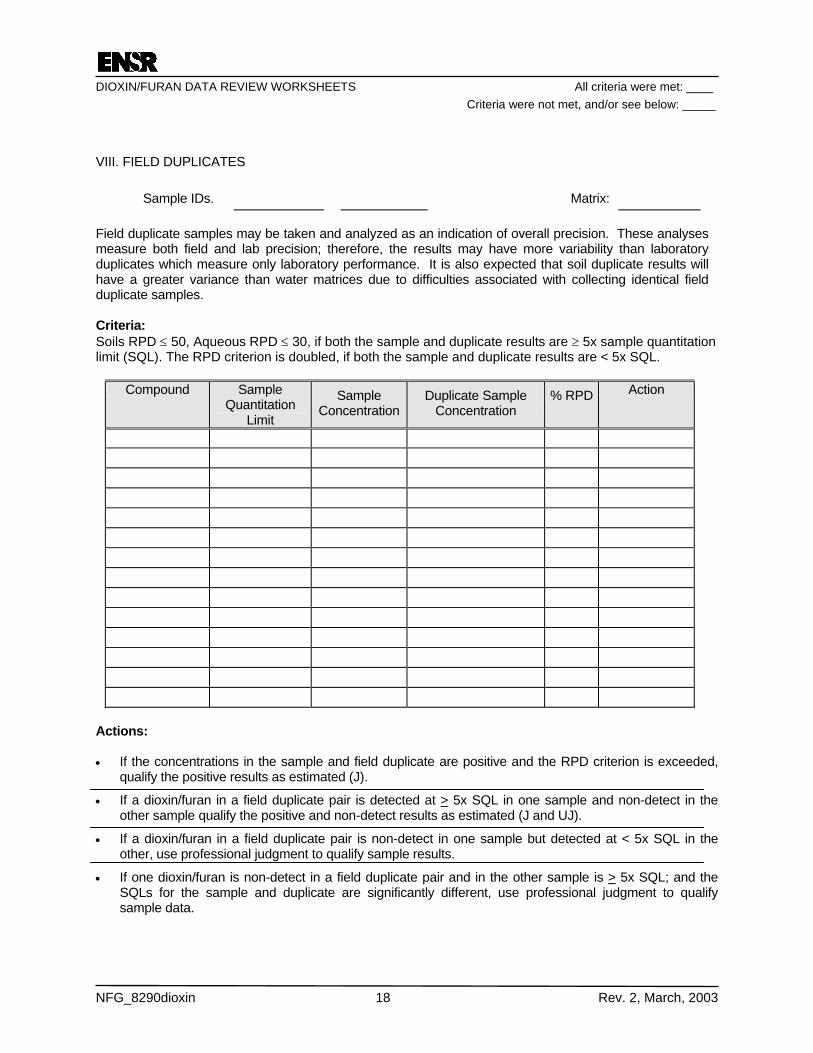
DIOXIN/FURAN DATA REVIEW WORKSHEETS All criteria were met: ____ Criteria were not met, and/or see below: _____
NFG_8290dioxin 18 Rev. 2, March, 2003
VIII. FIELD DUPLICATES Sample IDs. Matrix: Field duplicate samples may be taken and analyzed as an indication of overall precision. These analyses measure both field and lab precision; therefore, the results may have more variability than laboratory duplicates which measure only laboratory performance. It is also expected that soil duplicate results will have a greater variance than water matrices due to difficulties associated with collecting identical field duplicate samples. Criteria: Soils RPD ≤ 50, Aqueous RPD ≤ 30, if both the sample and duplicate results are ≥ 5x sample quantitation limit (SQL). The RPD criterion is doubled, if both the sample and duplicate results are < 5x SQL.
Compound Sample Quantitation
Limit
Sample Concentration
Duplicate Sample Concentration
% RPD Action
Actions: • If the concentrations in the sample and field duplicate are positive and the RPD criterion is exceeded,
qualify the positive results as estimated (J).
• If a dioxin/furan in a field duplicate pair is detected at > 5x SQL in one sample and non-detect in the other sample qualify the positive and non-detect results as estimated (J and UJ).
• If a dioxin/furan in a field duplicate pair is non-detect in one sample but detected at < 5x SQL in the other, use professional judgment to qualify sample results.
• If one dioxin/furan is non-detect in a field duplicate pair and in the other sample is > 5x SQL; and the SQLs for the sample and duplicate are significantly different, use professional judgment to qualify sample data.
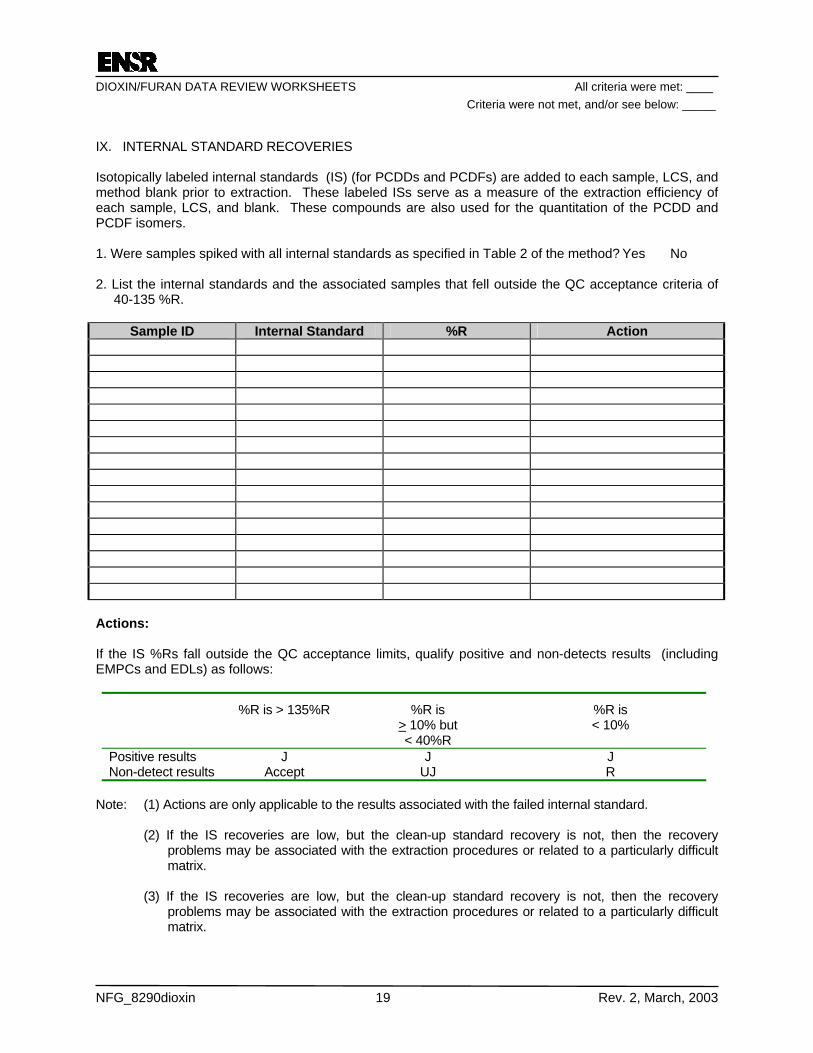
DIOXIN/FURAN DATA REVIEW WORKSHEETS All criteria were met: ____ Criteria were not met, and/or see below: _____
NFG_8290dioxin 19 Rev. 2, March, 2003
IX. INTERNAL STANDARD RECOVERIES Isotopically labeled internal standards (IS) (for PCDDs and PCDFs) are added to each sample, LCS, and method blank prior to extraction. These labeled ISs serve as a measure of the extraction efficiency of each sample, LCS, and blank. These compounds are also used for the quantitation of the PCDD and PCDF isomers. 1. Were samples spiked with all internal standards as specified in Table 2 of the method? Yes No 2. List the internal standards and the associated samples that fell outside the QC acceptance criteria of
40-135 %R.
Sample ID Internal Standard %R Action
Actions: If the IS %Rs fall outside the QC acceptance limits, qualify positive and non-detects results (including EMPCs and EDLs) as follows:
%R is > 135%R %R is > 10% but < 40%R
%R is < 10%
Positive results J J J Non-detect results Accept UJ R
Note: (1) Actions are only applicable to the results associated with the failed internal standard. (2) If the IS recoveries are low, but the clean-up standard recovery is not, then the recovery
problems may be associated with the extraction procedures or related to a particularly difficult matrix.
(3) If the IS recoveries are low, but the clean-up standard recovery is not, then the recovery
problems may be associated with the extraction procedures or related to a particularly difficult matrix.
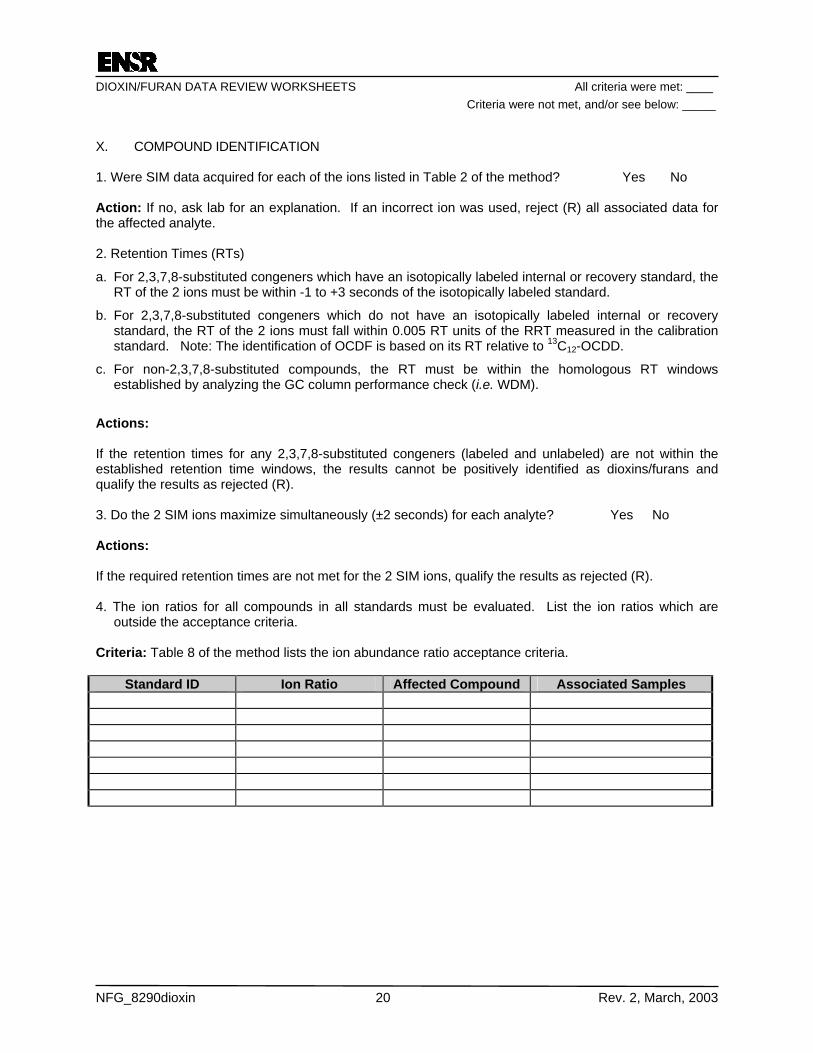
DIOXIN/FURAN DATA REVIEW WORKSHEETS All criteria were met: ____ Criteria were not met, and/or see below: _____
NFG_8290dioxin 20 Rev. 2, March, 2003
X. COMPOUND IDENTIFICATION 1. Were SIM data acquired for each of the ions listed in Table 2 of the method? Yes No Action: If no, ask lab for an explanation. If an incorrect ion was used, reject (R) all associated data for the affected analyte. 2. Retention Times (RTs)
a. For 2,3,7,8-substituted congeners which have an isotopically labeled internal or recovery standard, the RT of the 2 ions must be within -1 to +3 seconds of the isotopically labeled standard.
b. For 2,3,7,8-substituted congeners which do not have an isotopically labeled internal or recovery standard, the RT of the 2 ions must fall within 0.005 RT units of the RRT measured in the calibration standard. Note: The identification of OCDF is based on its RT relative to 13C12-OCDD.
c. For non-2,3,7,8-substituted compounds, the RT must be within the homologous RT windows established by analyzing the GC column performance check (i.e. WDM).
Actions: If the retention times for any 2,3,7,8-substituted congeners (labeled and unlabeled) are not within the established retention time windows, the results cannot be positively identified as dioxins/furans and qualify the results as rejected (R). 3. Do the 2 SIM ions maximize simultaneously (±2 seconds) for each analyte? Yes No Actions: If the required retention times are not met for the 2 SIM ions, qualify the results as rejected (R). 4. The ion ratios for all compounds in all standards must be evaluated. List the ion ratios which are
outside the acceptance criteria. Criteria: Table 8 of the method lists the ion abundance ratio acceptance criteria.
Standard ID Ion Ratio Affected Compound Associated Samples
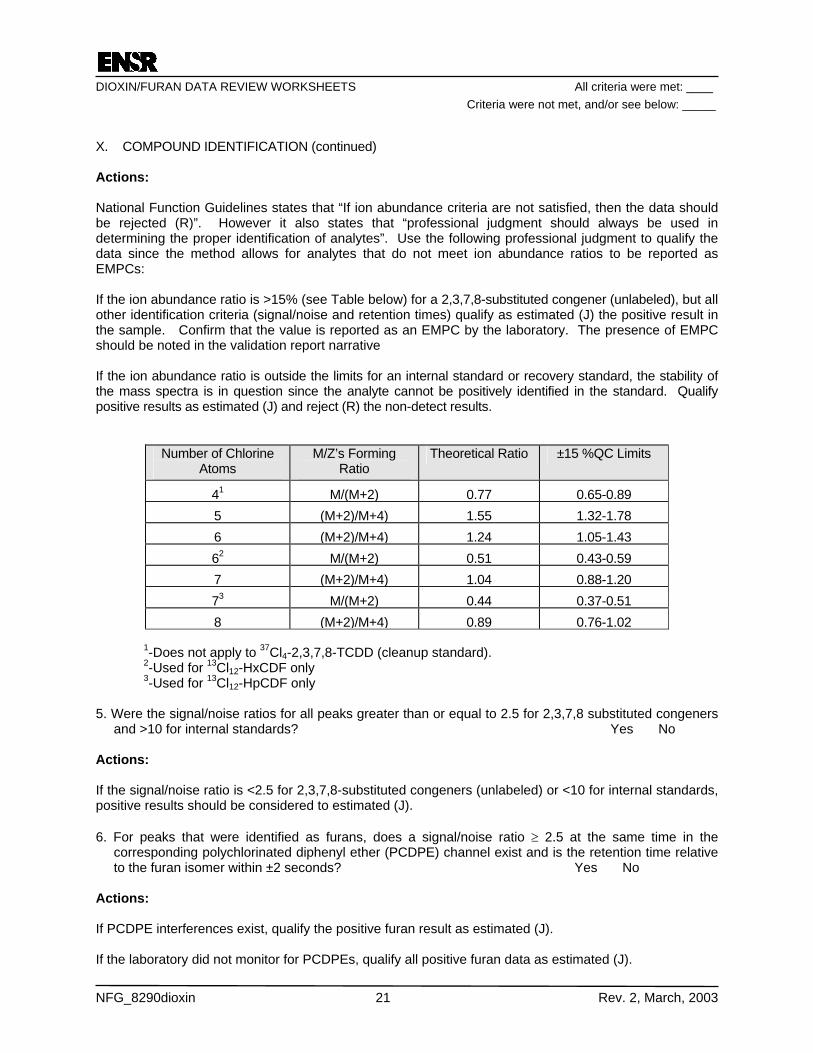
DIOXIN/FURAN DATA REVIEW WORKSHEETS All criteria were met: ____ Criteria were not met, and/or see below: _____
NFG_8290dioxin 21 Rev. 2, March, 2003
X. COMPOUND IDENTIFICATION (continued) Actions: National Function Guidelines states that “If ion abundance criteria are not satisfied, then the data should be rejected (R)”. However it also states that “professional judgment should always be used in determining the proper identification of analytes”. Use the following professional judgment to qualify the data since the method allows for analytes that do not meet ion abundance ratios to be reported as EMPCs: If the ion abundance ratio is >15% (see Table below) for a 2,3,7,8-substituted congener (unlabeled), but all other identification criteria (signal/noise and retention times) qualify as estimated (J) the positive result in the sample. Confirm that the value is reported as an EMPC by the laboratory. The presence of EMPC should be noted in the validation report narrative If the ion abundance ratio is outside the limits for an internal standard or recovery standard, the stability of the mass spectra is in question since the analyte cannot be positively identified in the standard. Qualify positive results as estimated (J) and reject (R) the non-detect results.
Number of Chlorine Atoms
M/Z’s Forming Ratio
Theoretical Ratio ±15 %QC Limits
41 M/(M+2) 0.77 0.65-0.89 5 (M+2)/M+4) 1.55 1.32-1.78 6 (M+2)/M+4) 1.24 1.05-1.43 62 M/(M+2) 0.51 0.43-0.59 7 (M+2)/M+4) 1.04 0.88-1.20 73 M/(M+2) 0.44 0.37-0.51 8 (M+2)/M+4) 0.89 0.76-1.02
1-Does not apply to 37Cl4-2,3,7,8-TCDD (cleanup standard). 2-Used for 13Cl12-HxCDF only 3-Used for 13Cl12-HpCDF only
5. Were the signal/noise ratios for all peaks greater than or equal to 2.5 for 2,3,7,8 substituted congeners
and >10 for internal standards? Yes No Actions: If the signal/noise ratio is <2.5 for 2,3,7,8-substituted congeners (unlabeled) or <10 for internal standards, positive results should be considered to estimated (J). 6. For peaks that were identified as furans, does a signal/noise ratio ≥ 2.5 at the same time in the
corresponding polychlorinated diphenyl ether (PCDPE) channel exist and is the retention time relative to the furan isomer within ±2 seconds? Yes No
Actions: If PCDPE interferences exist, qualify the positive furan result as estimated (J). If the laboratory did not monitor for PCDPEs, qualify all positive furan data as estimated (J).
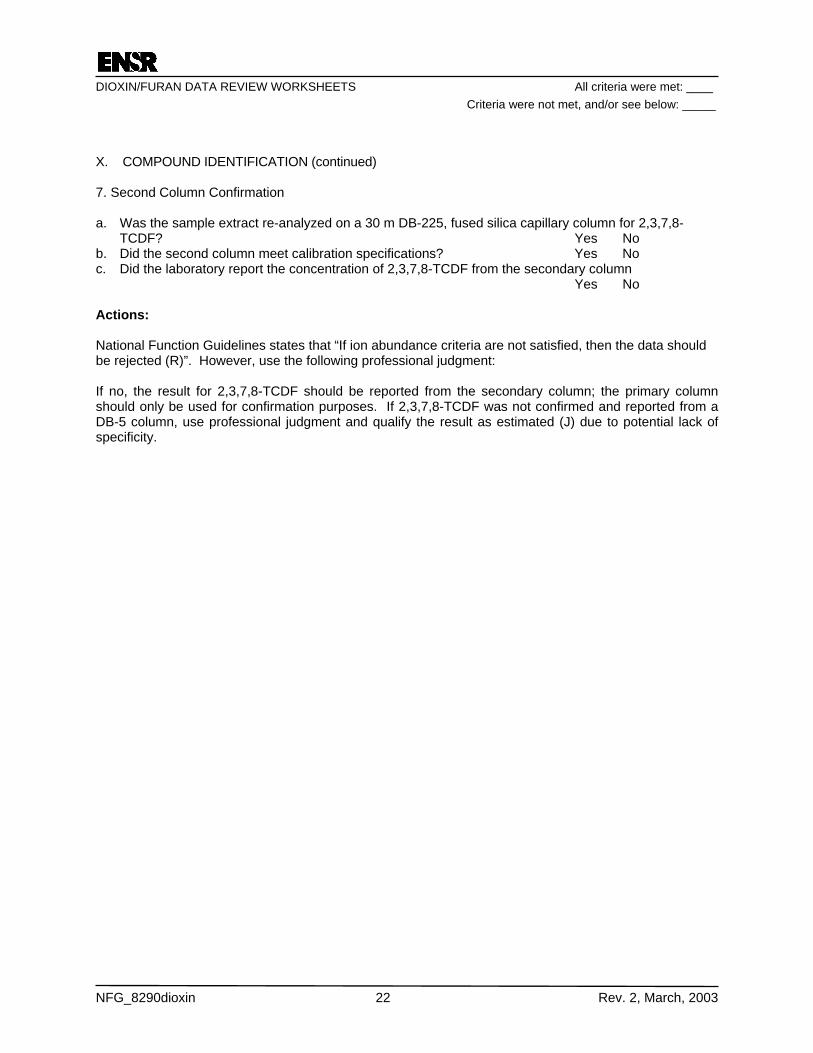
DIOXIN/FURAN DATA REVIEW WORKSHEETS All criteria were met: ____ Criteria were not met, and/or see below: _____
NFG_8290dioxin 22 Rev. 2, March, 2003
X. COMPOUND IDENTIFICATION (continued) 7. Second Column Confirmation a. Was the sample extract re-analyzed on a 30 m DB-225, fused silica capillary column for 2,3,7,8-
TCDF? Yes No b. Did the second column meet calibration specifications? Yes No c. Did the laboratory report the concentration of 2,3,7,8-TCDF from the secondary column
Yes No Actions:
National Function Guidelines states that “If ion abundance criteria are not satisfied, then the data should be rejected (R)”. However, use the following professional judgment: If no, the result for 2,3,7,8-TCDF should be reported from the secondary column; the primary column should only be used for confirmation purposes. If 2,3,7,8-TCDF was not confirmed and reported from a DB-5 column, use professional judgment and qualify the result as estimated (J) due to potential lack of specificity.
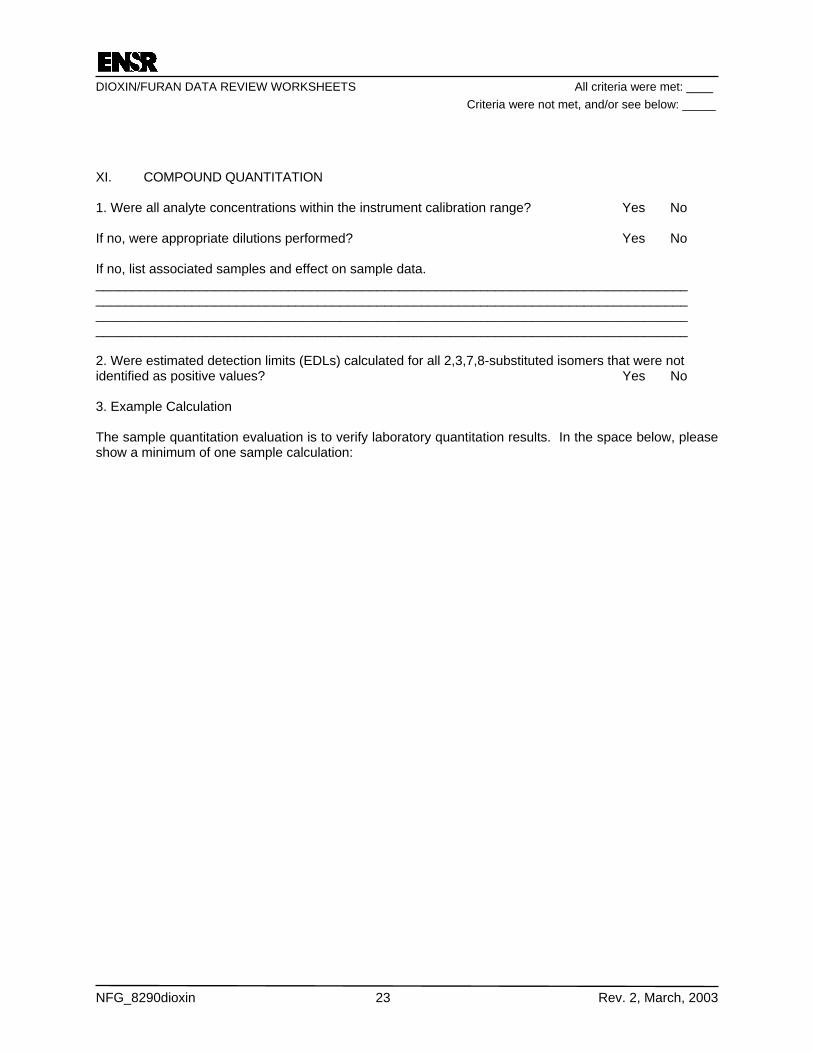
DIOXIN/FURAN DATA REVIEW WORKSHEETS All criteria were met: ____ Criteria were not met, and/or see below: _____
NFG_8290dioxin 23 Rev. 2, March, 2003
XI. COMPOUND QUANTITATION 1. Were all analyte concentrations within the instrument calibration range? Yes No If no, were appropriate dilutions performed? Yes No If no, list associated samples and effect on sample data. ________________________________________________________________________________ ________________________________________________________________________________ ________________________________________________________________________________ ________________________________________________________________________________ 2. Were estimated detection limits (EDLs) calculated for all 2,3,7,8-substituted isomers that were not identified as positive values? Yes No 3. Example Calculation The sample quantitation evaluation is to verify laboratory quantitation results. In the space below, please show a minimum of one sample calculation:
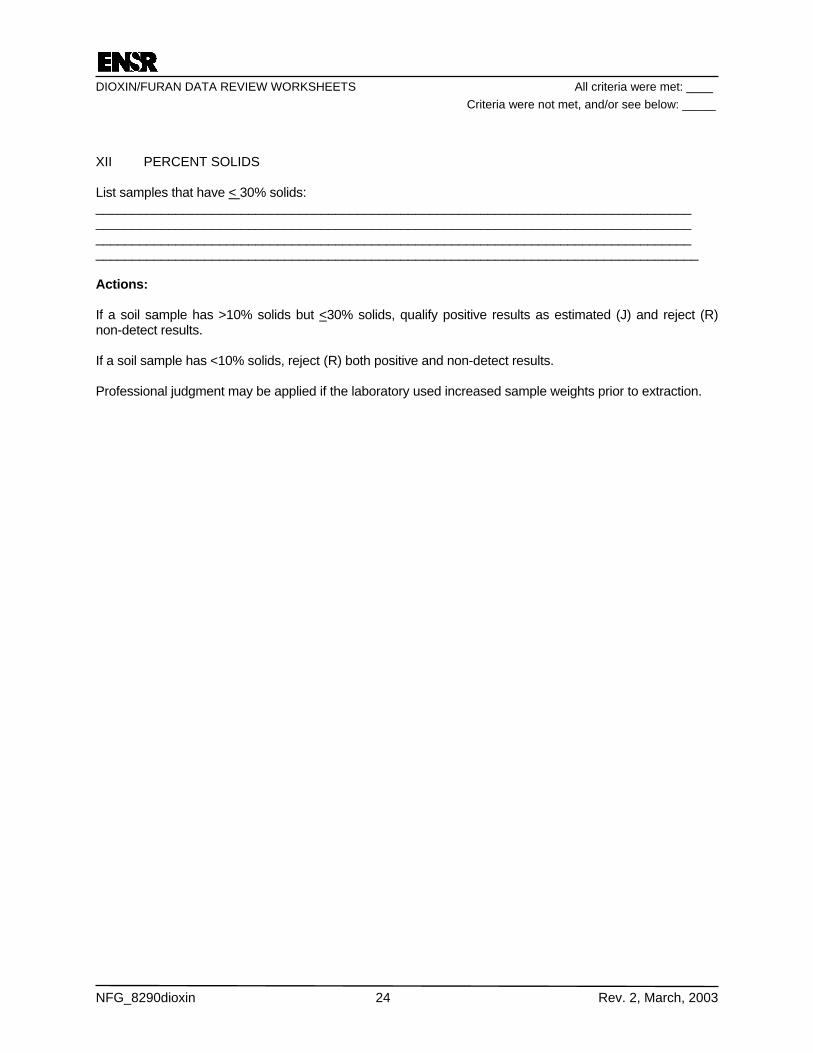
DIOXIN/FURAN DATA REVIEW WORKSHEETS All criteria were met: ____ Criteria were not met, and/or see below: _____
NFG_8290dioxin 24 Rev. 2, March, 2003
XII PERCENT SOLIDS List samples that have < 30% solids: __________________________________________________________________________________ __________________________________________________________________________________ __________________________________________________________________________________ ___________________________________________________________________________________ Actions: If a soil sample has >10% solids but <30% solids, qualify positive results as estimated (J) and reject (R) non-detect results. If a soil sample has <10% solids, reject (R) both positive and non-detect results. Professional judgment may be applied if the laboratory used increased sample weights prior to extraction.
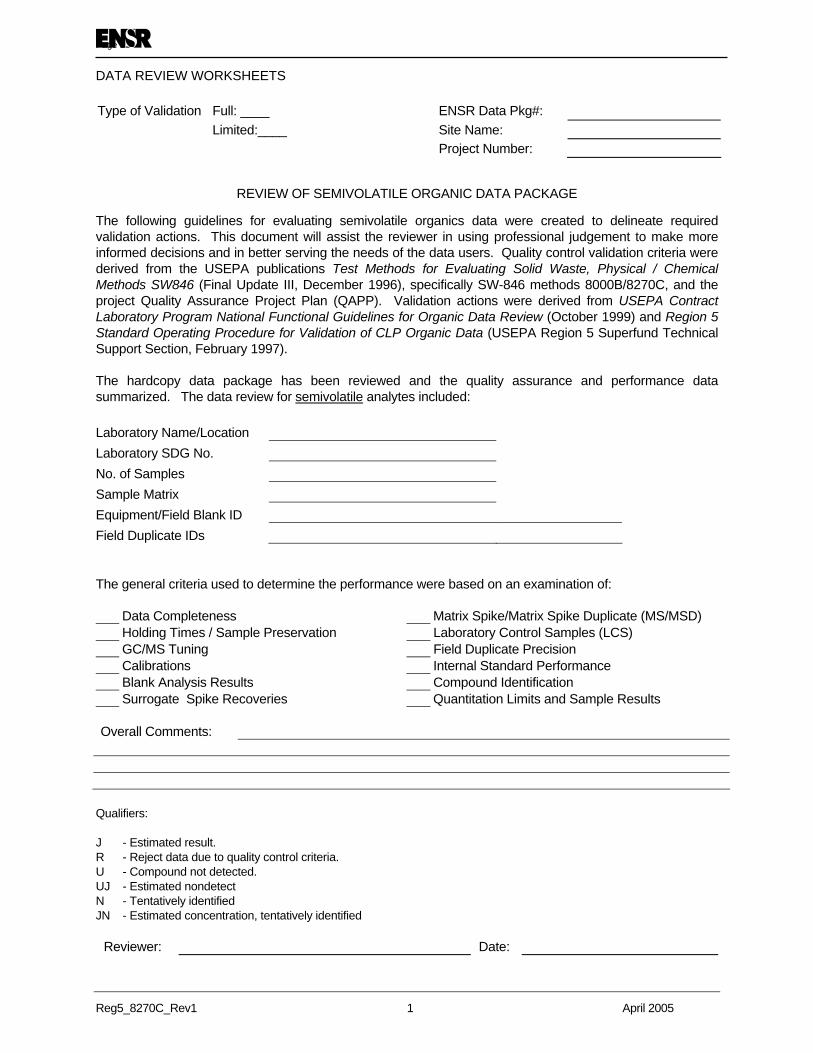
Page 1
DATA REVIEW WORKSHEETS
Reg5_8270C_Rev1 1 April 2005
Type of Validation Full: ____ ENSR Data Pkg#: Limited:____ Site Name: Project Number:
REVIEW OF SEMIVOLATILE ORGANIC DATA PACKAGE The following guidelines for evaluating semivolatile organics data were created to delineate required validation actions. This document will assist the reviewer in using professional judgement to make more informed decisions and in better serving the needs of the data users. Quality control validation criteria were derived from the USEPA publications Test Methods for Evaluating Solid Waste, Physical / Chemical Methods SW846 (Final Update III, December 1996), specifically SW-846 methods 8000B/8270C, and the project Quality Assurance Project Plan (QAPP). Validation actions were derived from USEPA Contract Laboratory Program National Functional Guidelines for Organic Data Review (October 1999) and Region 5 Standard Operating Procedure for Validation of CLP Organic Data (USEPA Region 5 Superfund Technical Support Section, February 1997). The hardcopy data package has been reviewed and the quality assurance and performance data summarized. The data review for semivolatile analytes included: Laboratory Name/Location Laboratory SDG No. No. of Samples Sample Matrix Equipment/Field Blank ID Field Duplicate IDs
The general criteria used to determine the performance were based on an examination of: Data Completeness Matrix Spike/Matrix Spike Duplicate (MS/MSD) Holding Times / Sample Preservation Laboratory Control Samples (LCS) GC/MS Tuning Field Duplicate Precision Calibrations Internal Standard Performance Blank Analysis Results Compound Identification Surrogate Spike Recoveries Quantitation Limits and Sample Results Overall Comments:
Qualifiers: J - Estimated result. R - Reject data due to quality control criteria. U - Compound not detected. UJ - Estimated nondetect N - Tentatively identified JN - Estimated concentration, tentatively identified
Reviewer: Date:
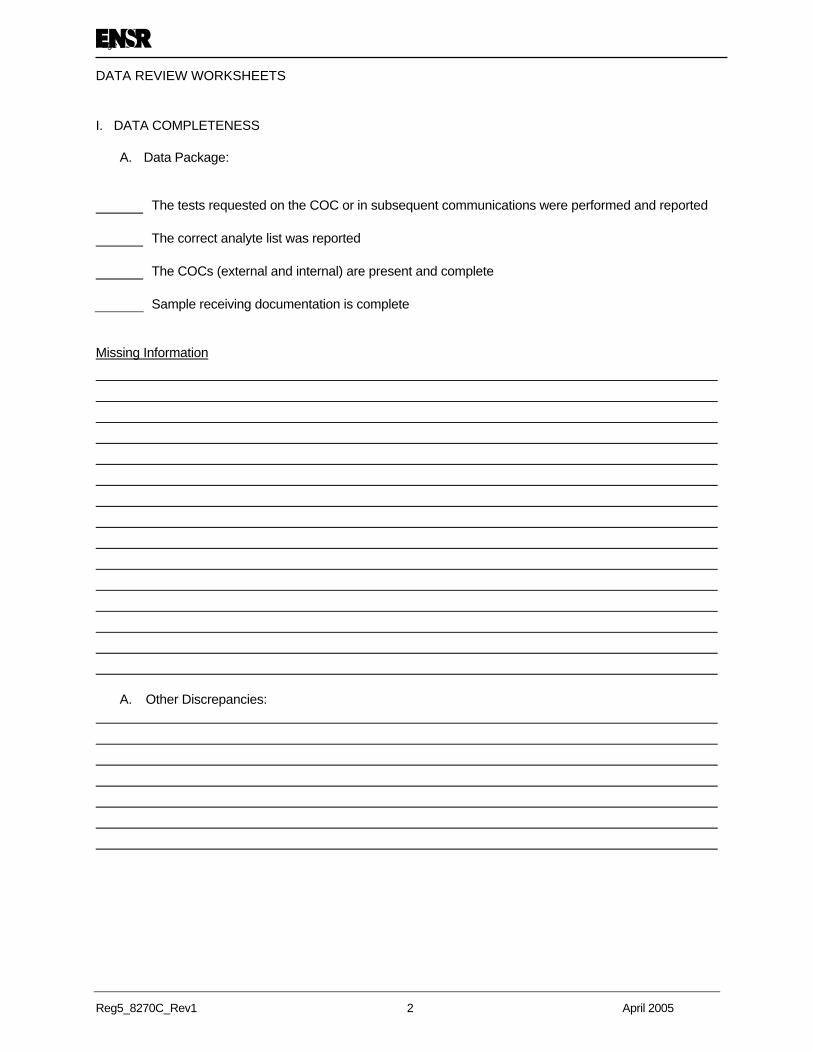
Page 2
DATA REVIEW WORKSHEETS
Reg5_8270C_Rev1 2 April 2005
I. DATA COMPLETENESS A. Data Package:
The tests requested on the COC or in subsequent communications were performed and reported
The correct analyte list was reported
The COCs (external and internal) are present and complete
Sample receiving documentation is complete
Missing Information
A. Other Discrepancies:
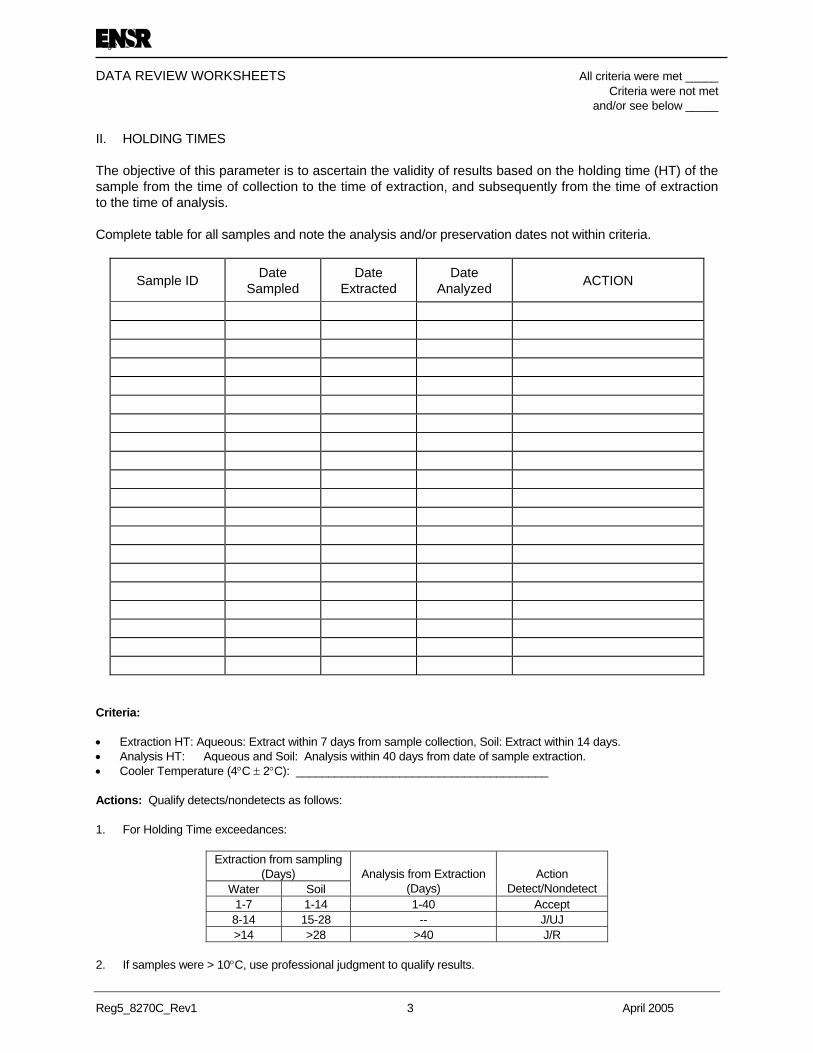
Page 3
DATA REVIEW WORKSHEETS All criteria were met _____ Criteria were not met and/or see below _____
Reg5_8270C_Rev1 3 April 2005
II. HOLDING TIMES The objective of this parameter is to ascertain the validity of results based on the holding time (HT) of the sample from the time of collection to the time of extraction, and subsequently from the time of extraction to the time of analysis. Complete table for all samples and note the analysis and/or preservation dates not within criteria.
Sample ID Date Sampled
Date Extracted
Date Analyzed ACTION
Criteria: • Extraction HT: Aqueous: Extract within 7 days from sample collection, Soil: Extract within 14 days. • Analysis HT: Aqueous and Soil: Analysis within 40 days from date of sample extraction. • Cooler Temperature (4°C ± 2°C): _______________________________________ Actions: Qualify detects/nondetects as follows: 1. For Holding Time exceedances:
Extraction from sampling (Days)
Water Soil Analysis from Extraction
(Days) Action
Detect/Nondetect 1-7 1-14 1-40 Accept 8-14 15-28 -- J/UJ >14 >28 >40 J/R
2. If samples were > 10°C, use professional judgment to qualify results.
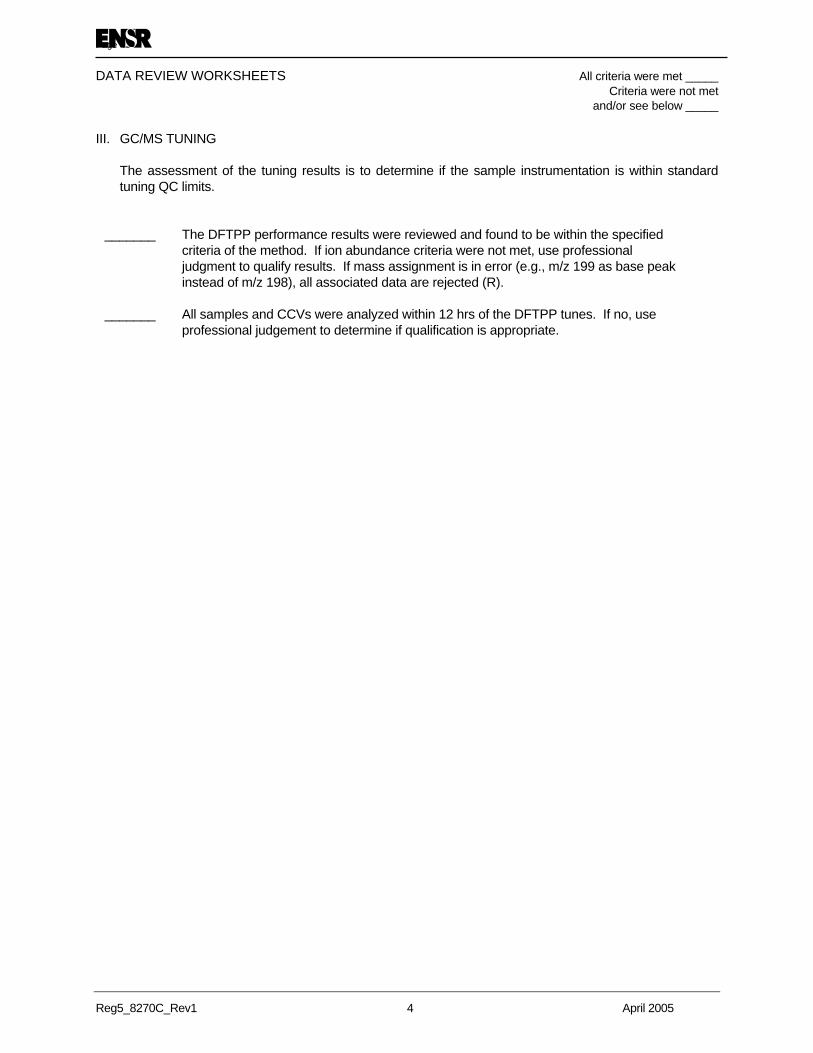
Page 4
DATA REVIEW WORKSHEETS All criteria were met _____ Criteria were not met and/or see below _____
Reg5_8270C_Rev1 4 April 2005
III. GC/MS TUNING The assessment of the tuning results is to determine if the sample instrumentation is within standard
tuning QC limits.
_______ The DFTPP performance results were reviewed and found to be within the specified criteria of the method. If ion abundance criteria were not met, use professional judgment to qualify results. If mass assignment is in error (e.g., m/z 199 as base peak instead of m/z 198), all associated data are rejected (R).
_______ All samples and CCVs were analyzed within 12 hrs of the DFTPP tunes. If no, use professional judgement to determine if qualification is appropriate.
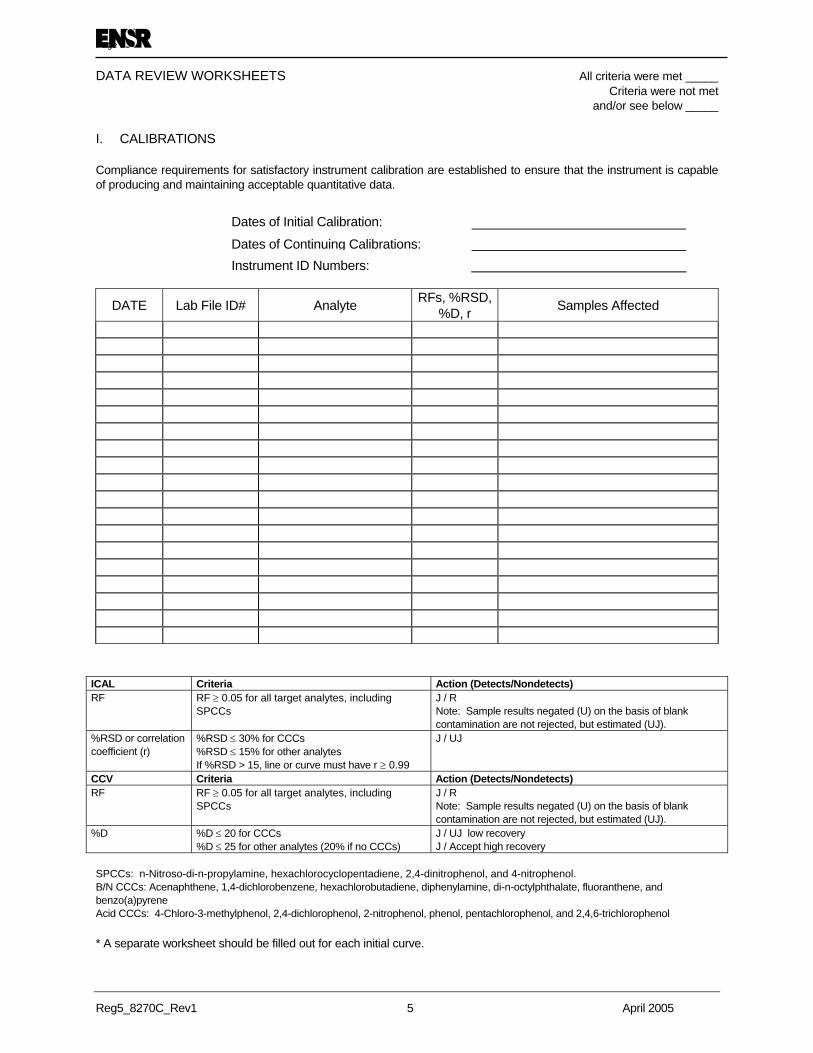
Page 5
DATA REVIEW WORKSHEETS All criteria were met _____ Criteria were not met and/or see below _____
Reg5_8270C_Rev1 5 April 2005
I. CALIBRATIONS
Compliance requirements for satisfactory instrument calibration are established to ensure that the instrument is capable of producing and maintaining acceptable quantitative data.
Dates of Initial Calibration:
Dates of Continuing Calibrations: Instrument ID Numbers:
DATE Lab File ID# Analyte RFs, %RSD, %D, r Samples Affected
ICAL Criteria Action (Detects/Nondetects) RF RF ≥ 0.05 for all target analytes, including
SPCCs
J / R Note: Sample results negated (U) on the basis of blank contamination are not rejected, but estimated (UJ).
%RSD or correlation coefficient (r)
%RSD ≤ 30% for CCCs %RSD ≤ 15% for other analytes If %RSD > 15, line or curve must have r ≥ 0.99
J / UJ
CCV Criteria Action (Detects/Nondetects) RF RF ≥ 0.05 for all target analytes, including
SPCCs
J / R Note: Sample results negated (U) on the basis of blank contamination are not rejected, but estimated (UJ).
%D
%D ≤ 20 for CCCs %D ≤ 25 for other analytes (20% if no CCCs)
J / UJ low recovery J / Accept high recovery
SPCCs: n-Nitroso-di-n-propylamine, hexachlorocyclopentadiene, 2,4-dinitrophenol, and 4-nitrophenol. B/N CCCs: Acenaphthene, 1,4-dichlorobenzene, hexachlorobutadiene, diphenylamine, di-n-octylphthalate, fluoranthene, and benzo(a)pyrene Acid CCCs: 4-Chloro-3-methylphenol, 2,4-dichlorophenol, 2-nitrophenol, phenol, pentachlorophenol, and 2,4,6-trichlorophenol * A separate worksheet should be filled out for each initial curve.
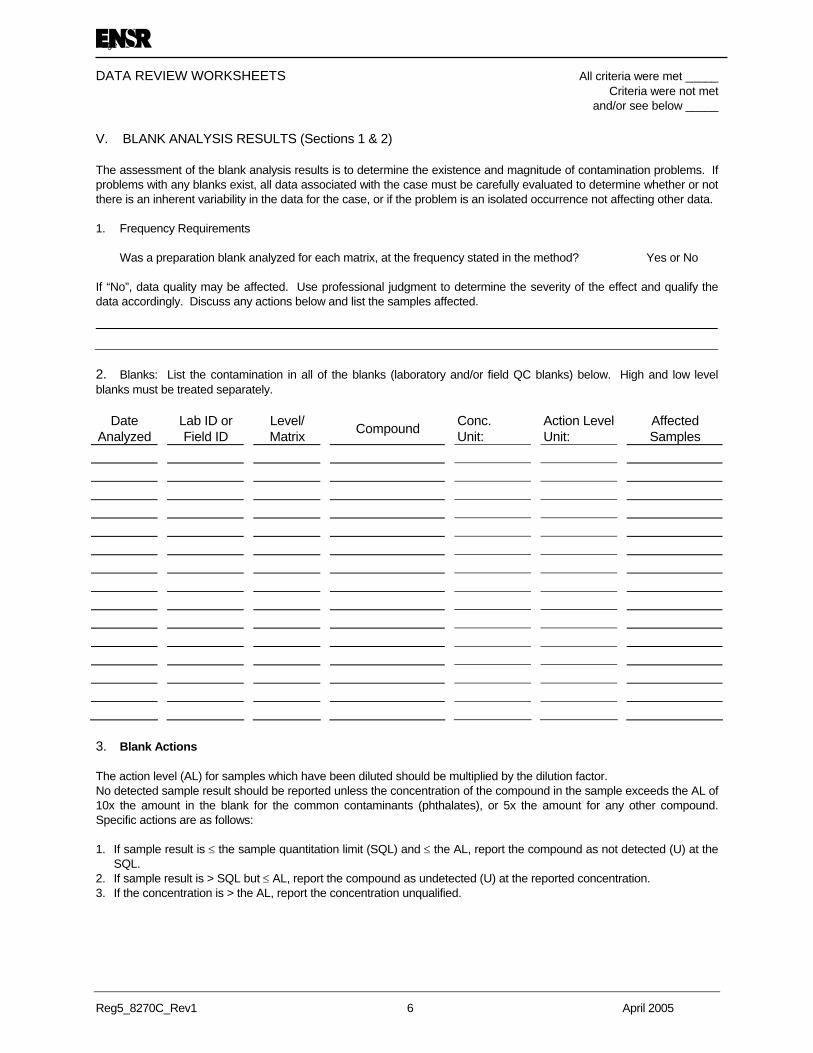
Page 6
DATA REVIEW WORKSHEETS All criteria were met _____ Criteria were not met and/or see below _____
Reg5_8270C_Rev1 6 April 2005
V. BLANK ANALYSIS RESULTS (Sections 1 & 2) The assessment of the blank analysis results is to determine the existence and magnitude of contamination problems. If problems with any blanks exist, all data associated with the case must be carefully evaluated to determine whether or not there is an inherent variability in the data for the case, or if the problem is an isolated occurrence not affecting other data. 1. Frequency Requirements Was a preparation blank analyzed for each matrix, at the frequency stated in the method? Yes or No If “No”, data quality may be affected. Use professional judgment to determine the severity of the effect and qualify the data accordingly. Discuss any actions below and list the samples affected.
2. Blanks: List the contamination in all of the blanks (laboratory and/or field QC blanks) below. High and low level blanks must be treated separately.
Date Analyzed Lab ID or
Field ID Level/ Matrix Compound Conc.
Unit: Action Level Unit:
Affected Samples
3. Blank Actions The action level (AL) for samples which have been diluted should be multiplied by the dilution factor. No detected sample result should be reported unless the concentration of the compound in the sample exceeds the AL of 10x the amount in the blank for the common contaminants (phthalates), or 5x the amount for any other compound. Specific actions are as follows: 1. If sample result is ≤ the sample quantitation limit (SQL) and ≤ the AL, report the compound as not detected (U) at the
SQL. 2. If sample result is > SQL but ≤ AL, report the compound as undetected (U) at the reported concentration. 3. If the concentration is > the AL, report the concentration unqualified.
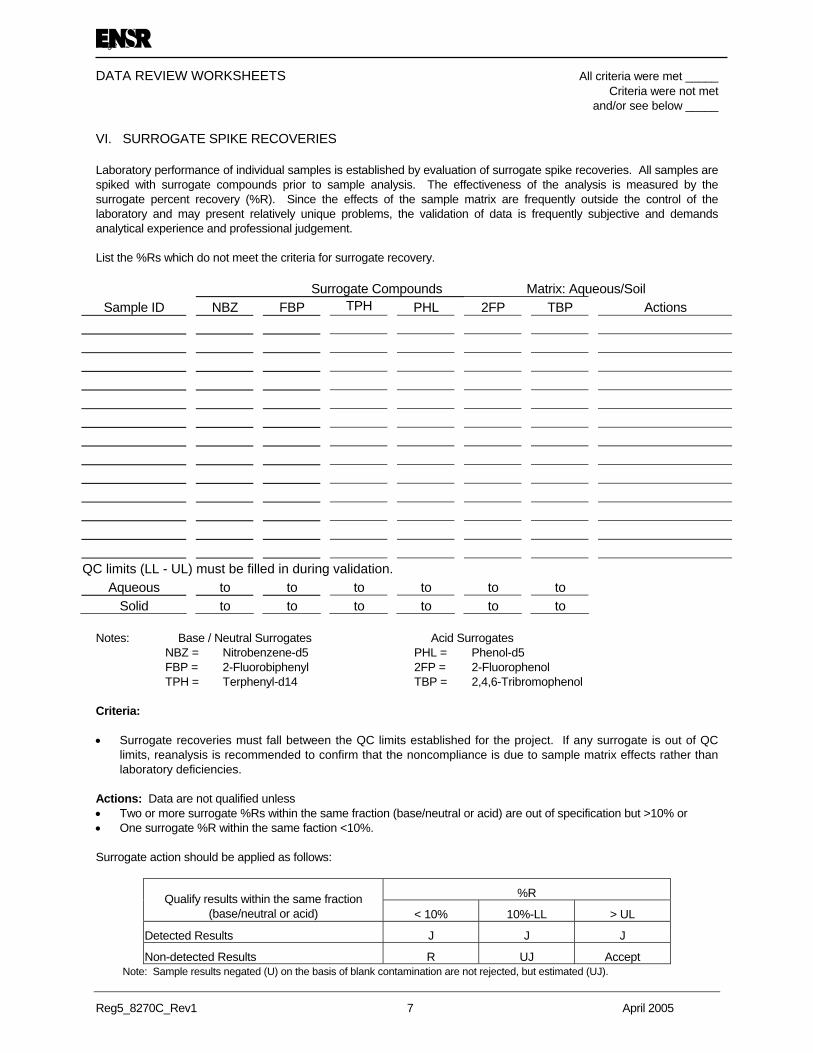
Page 7
DATA REVIEW WORKSHEETS All criteria were met _____ Criteria were not met and/or see below _____
Reg5_8270C_Rev1 7 April 2005
VI. SURROGATE SPIKE RECOVERIES Laboratory performance of individual samples is established by evaluation of surrogate spike recoveries. All samples are spiked with surrogate compounds prior to sample analysis. The effectiveness of the analysis is measured by the surrogate percent recovery (%R). Since the effects of the sample matrix are frequently outside the control of the laboratory and may present relatively unique problems, the validation of data is frequently subjective and demands analytical experience and professional judgement. List the %Rs which do not meet the criteria for surrogate recovery. Surrogate Compounds Matrix: Aqueous/Soil
Sample ID NBZ FBP TPH PHL 2FP TBP Actions
QC limits (LL - UL) must be filled in during validation. Aqueous to to to to to to
Solid to to to to to to Notes: Base / Neutral Surrogates Acid Surrogates
NBZ = Nitrobenzene-d5 PHL = Phenol-d5 FBP = 2-Fluorobiphenyl 2FP = 2-Fluorophenol TPH = Terphenyl-d14 TBP = 2,4,6-Tribromophenol
Criteria: • Surrogate recoveries must fall between the QC limits established for the project. If any surrogate is out of QC
limits, reanalysis is recommended to confirm that the noncompliance is due to sample matrix effects rather than laboratory deficiencies.
Actions: Data are not qualified unless • Two or more surrogate %Rs within the same fraction (base/neutral or acid) are out of specification but >10% or • One surrogate %R within the same faction <10%. Surrogate action should be applied as follows:
%R Qualify results within the same fraction (base/neutral or acid) < 10% 10%-LL > UL
Detected Results J J J
Non-detected Results R UJ Accept Note: Sample results negated (U) on the basis of blank contamination are not rejected, but estimated (UJ).
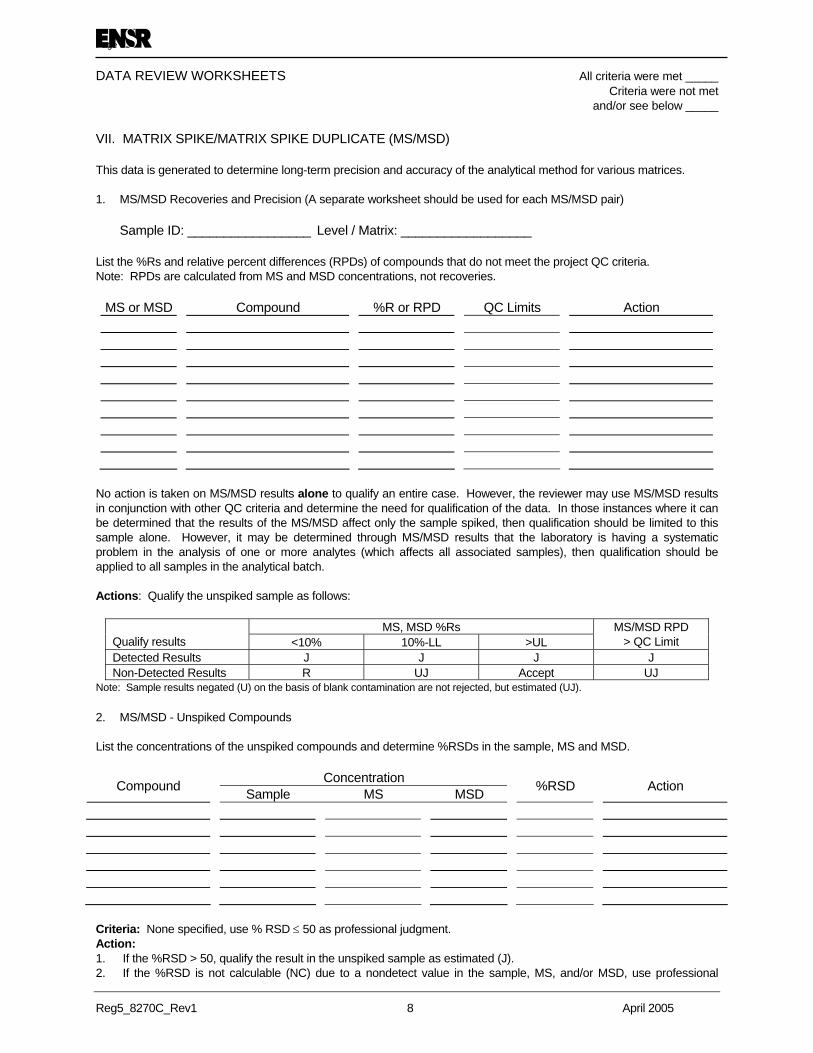
Page 8
DATA REVIEW WORKSHEETS All criteria were met _____ Criteria were not met and/or see below _____
Reg5_8270C_Rev1 8 April 2005
VII. MATRIX SPIKE/MATRIX SPIKE DUPLICATE (MS/MSD) This data is generated to determine long-term precision and accuracy of the analytical method for various matrices. 1. MS/MSD Recoveries and Precision (A separate worksheet should be used for each MS/MSD pair) Sample ID: _________________ Level / Matrix: __________________ List the %Rs and relative percent differences (RPDs) of compounds that do not meet the project QC criteria. Note: RPDs are calculated from MS and MSD concentrations, not recoveries.
MS or MSD Compound %R or RPD QC Limits Action
No action is taken on MS/MSD results alone to qualify an entire case. However, the reviewer may use MS/MSD results in conjunction with other QC criteria and determine the need for qualification of the data. In those instances where it can be determined that the results of the MS/MSD affect only the sample spiked, then qualification should be limited to this sample alone. However, it may be determined through MS/MSD results that the laboratory is having a systematic problem in the analysis of one or more analytes (which affects all associated samples), then qualification should be applied to all samples in the analytical batch. Actions: Qualify the unspiked sample as follows:
MS, MSD %Rs Qualify results <10% 10%-LL >UL
MS/MSD RPD > QC Limit
Detected Results J J J J Non-Detected Results R UJ Accept UJ
Note: Sample results negated (U) on the basis of blank contamination are not rejected, but estimated (UJ). 2. MS/MSD - Unspiked Compounds List the concentrations of the unspiked compounds and determine %RSDs in the sample, MS and MSD.
Concentration Compound Sample MS MSD %RSD Action
Criteria: None specified, use % RSD ≤ 50 as professional judgment. Action: 1. If the %RSD > 50, qualify the result in the unspiked sample as estimated (J). 2. If the %RSD is not calculable (NC) due to a nondetect value in the sample, MS, and/or MSD, use professional
Page 9
DATA REVIEW WORKSHEETS All criteria were met _____ Criteria were not met and/or see below _____
Reg5_8270C_Rev1 9 April 2005
judgment to qualify sample data.
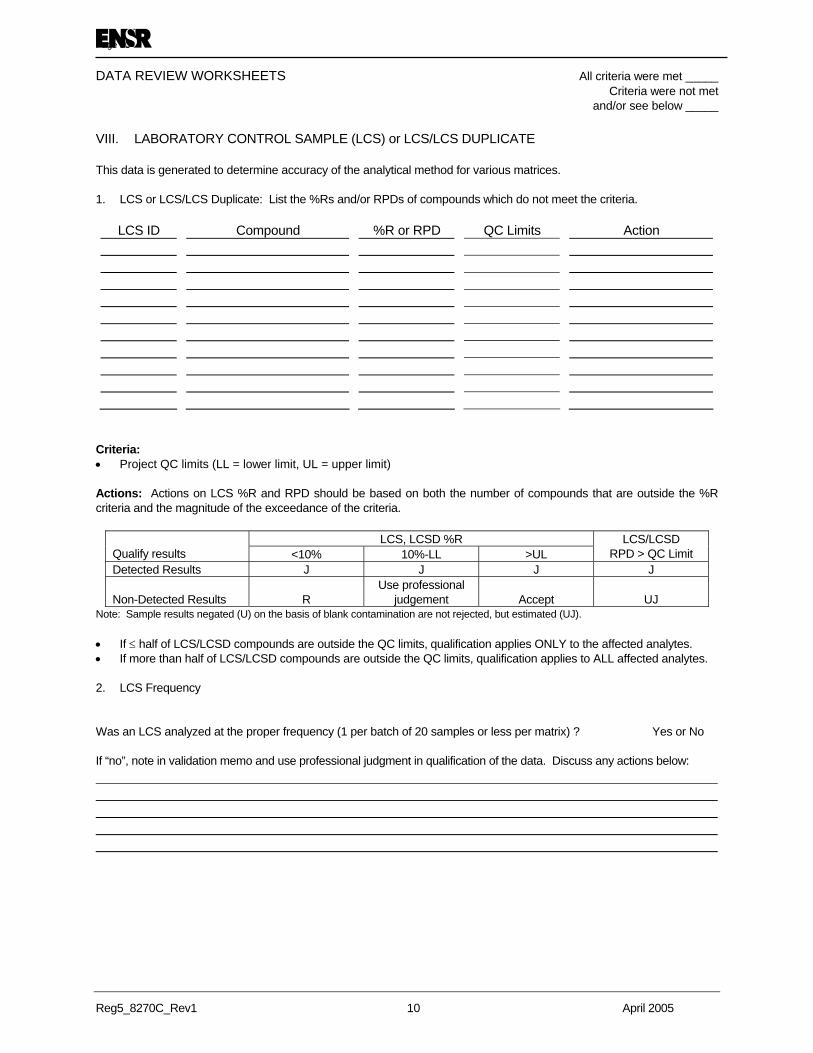
Page 10
DATA REVIEW WORKSHEETS All criteria were met _____ Criteria were not met and/or see below _____
Reg5_8270C_Rev1 10 April 2005
VIII. LABORATORY CONTROL SAMPLE (LCS) or LCS/LCS DUPLICATE This data is generated to determine accuracy of the analytical method for various matrices. 1. LCS or LCS/LCS Duplicate: List the %Rs and/or RPDs of compounds which do not meet the criteria.
LCS ID Compound %R or RPD QC Limits Action
Criteria: • Project QC limits (LL = lower limit, UL = upper limit) Actions: Actions on LCS %R and RPD should be based on both the number of compounds that are outside the %R criteria and the magnitude of the exceedance of the criteria.
LCS, LCSD %R Qualify results <10% 10%-LL >UL
LCS/LCSD RPD > QC Limit
Detected Results J J J J
Non-Detected Results R Use professional
judgement Accept UJ Note: Sample results negated (U) on the basis of blank contamination are not rejected, but estimated (UJ). • If ≤ half of LCS/LCSD compounds are outside the QC limits, qualification applies ONLY to the affected analytes. • If more than half of LCS/LCSD compounds are outside the QC limits, qualification applies to ALL affected analytes. 2. LCS Frequency Was an LCS analyzed at the proper frequency (1 per batch of 20 samples or less per matrix) ? Yes or No If “no”, note in validation memo and use professional judgment in qualification of the data. Discuss any actions below:
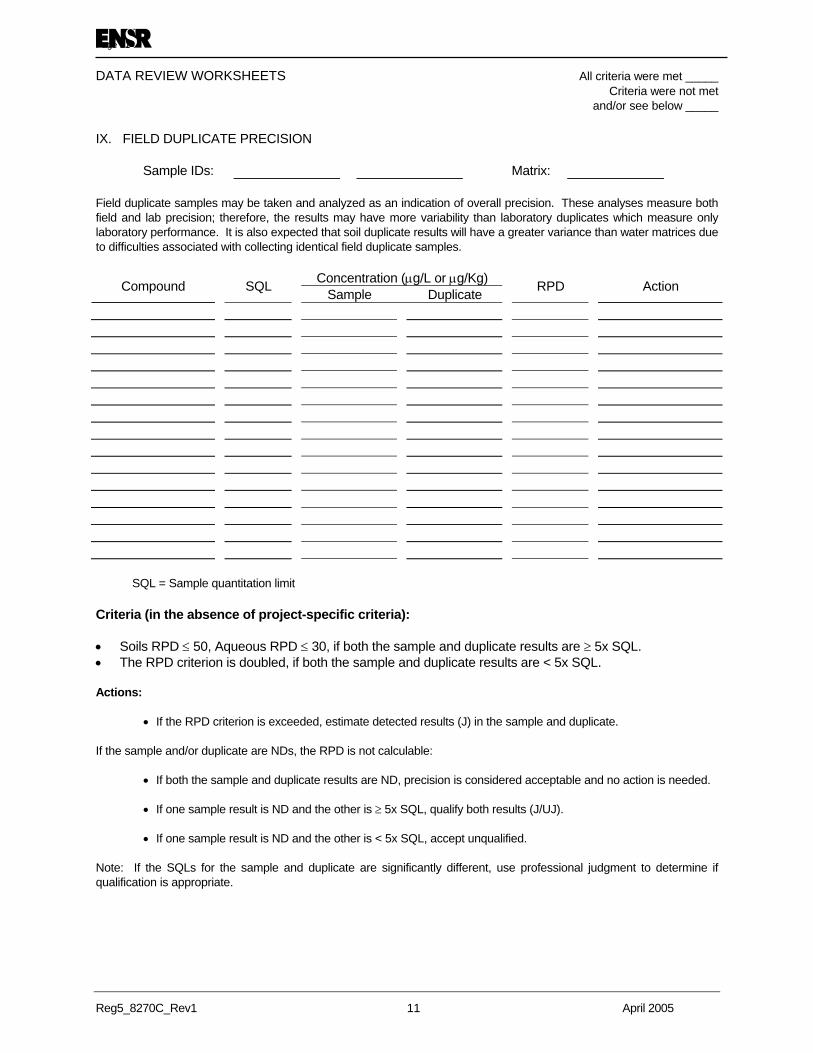
Page 11
DATA REVIEW WORKSHEETS All criteria were met _____ Criteria were not met and/or see below _____
Reg5_8270C_Rev1 11 April 2005
IX. FIELD DUPLICATE PRECISION Sample IDs: Matrix: Field duplicate samples may be taken and analyzed as an indication of overall precision. These analyses measure both field and lab precision; therefore, the results may have more variability than laboratory duplicates which measure only laboratory performance. It is also expected that soil duplicate results will have a greater variance than water matrices due to difficulties associated with collecting identical field duplicate samples.
Concentration (µg/L or µg/Kg) Compound SQL Sample Duplicate RPD Action
SQL = Sample quantitation limit Criteria (in the absence of project-specific criteria): • Soils RPD ≤ 50, Aqueous RPD ≤ 30, if both the sample and duplicate results are ≥ 5x SQL. • The RPD criterion is doubled, if both the sample and duplicate results are < 5x SQL. Actions:
• If the RPD criterion is exceeded, estimate detected results (J) in the sample and duplicate. If the sample and/or duplicate are NDs, the RPD is not calculable:
• If both the sample and duplicate results are ND, precision is considered acceptable and no action is needed.
• If one sample result is ND and the other is ≥ 5x SQL, qualify both results (J/UJ).
• If one sample result is ND and the other is < 5x SQL, accept unqualified. Note: If the SQLs for the sample and duplicate are significantly different, use professional judgment to determine if qualification is appropriate.
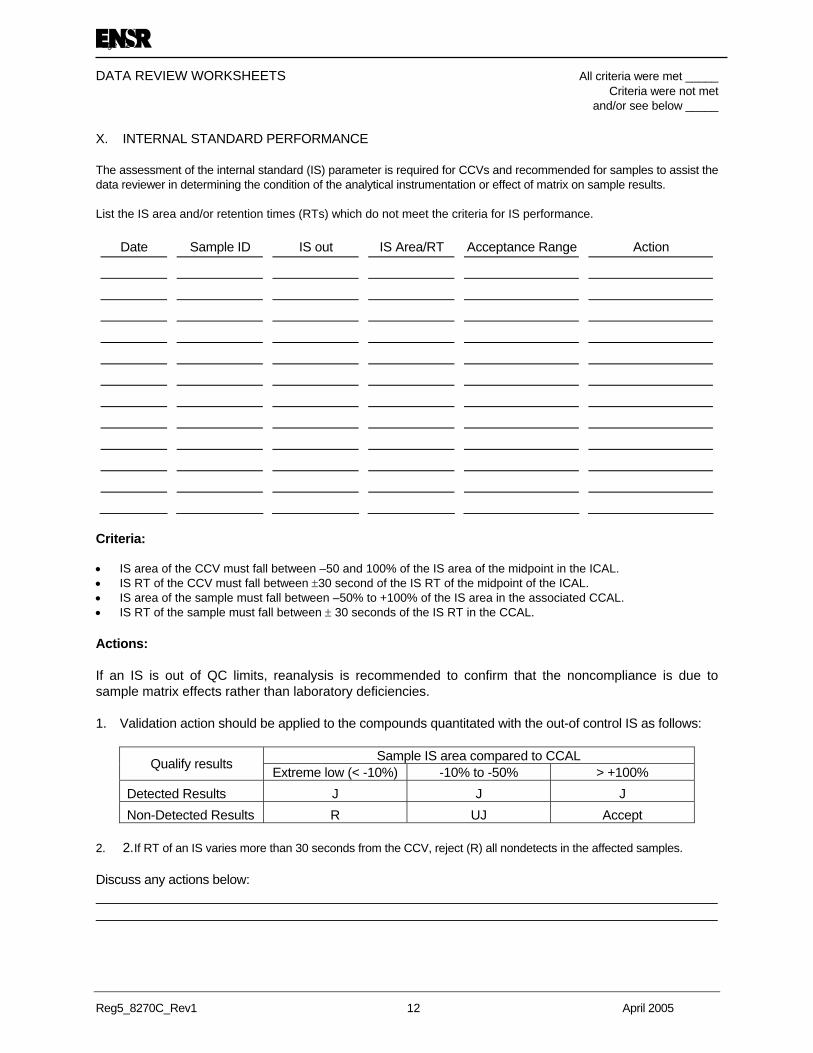
Page 12
DATA REVIEW WORKSHEETS All criteria were met _____ Criteria were not met and/or see below _____
Reg5_8270C_Rev1 12 April 2005
X. INTERNAL STANDARD PERFORMANCE The assessment of the internal standard (IS) parameter is required for CCVs and recommended for samples to assist the data reviewer in determining the condition of the analytical instrumentation or effect of matrix on sample results. List the IS area and/or retention times (RTs) which do not meet the criteria for IS performance.
Date Sample ID IS out IS Area/RT Acceptance Range Action
Criteria: • IS area of the CCV must fall between –50 and 100% of the IS area of the midpoint in the ICAL. • IS RT of the CCV must fall between ±30 second of the IS RT of the midpoint of the ICAL. • IS area of the sample must fall between –50% to +100% of the IS area in the associated CCAL. • IS RT of the sample must fall between ± 30 seconds of the IS RT in the CCAL. Actions: If an IS is out of QC limits, reanalysis is recommended to confirm that the noncompliance is due to sample matrix effects rather than laboratory deficiencies. 1. Validation action should be applied to the compounds quantitated with the out-of control IS as follows:
Sample IS area compared to CCAL Qualify results Extreme low (< -10%) -10% to -50% > +100% Detected Results J J J Non-Detected Results R UJ Accept
2. 2. If RT of an IS varies more than 30 seconds from the CCV, reject (R) all nondetects in the affected samples. Discuss any actions below:
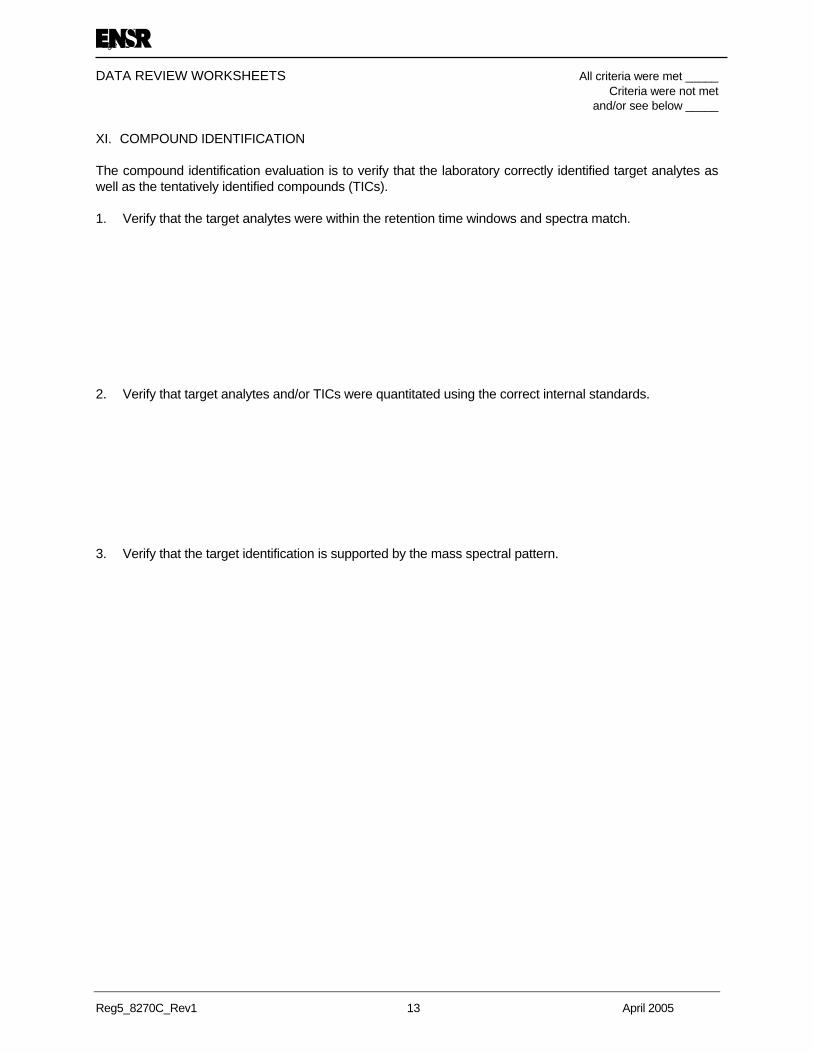
Page 13
DATA REVIEW WORKSHEETS All criteria were met _____ Criteria were not met and/or see below _____
Reg5_8270C_Rev1 13 April 2005
XI. COMPOUND IDENTIFICATION The compound identification evaluation is to verify that the laboratory correctly identified target analytes as well as the tentatively identified compounds (TICs). 1. Verify that the target analytes were within the retention time windows and spectra match. 2. Verify that target analytes and/or TICs were quantitated using the correct internal standards. 3. Verify that the target identification is supported by the mass spectral pattern.
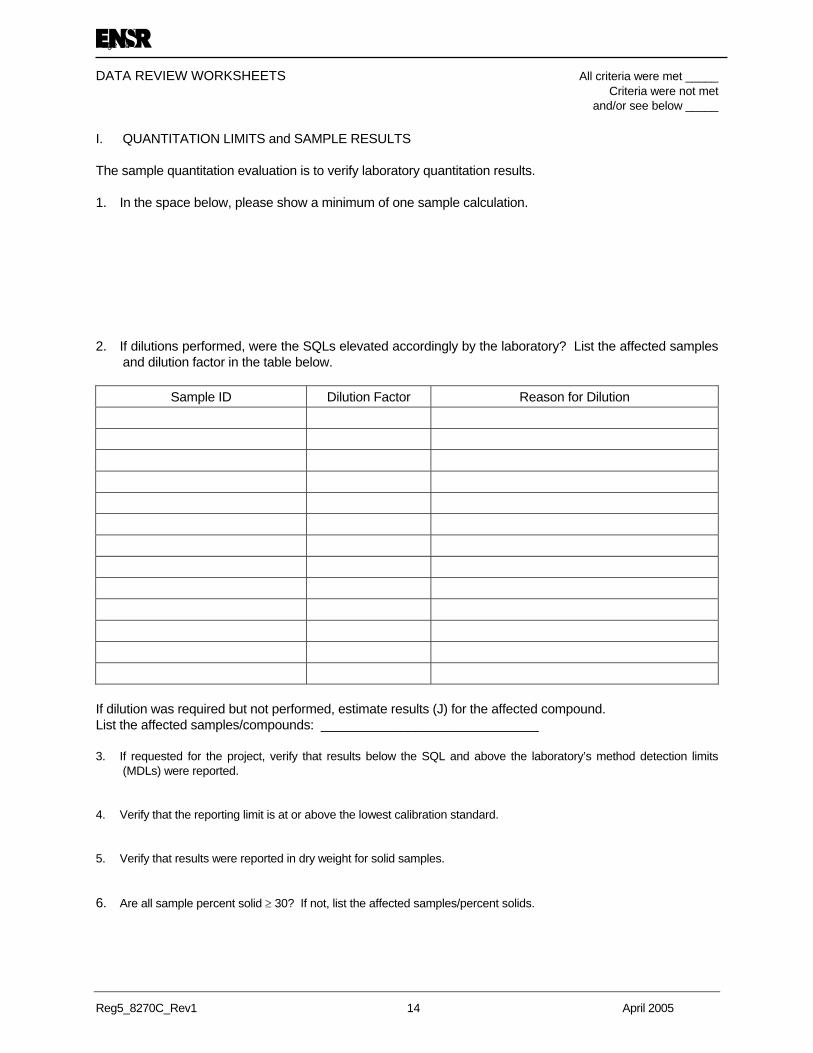
Page 14
DATA REVIEW WORKSHEETS All criteria were met _____ Criteria were not met and/or see below _____
Reg5_8270C_Rev1 14 April 2005
I. QUANTITATION LIMITS and SAMPLE RESULTS The sample quantitation evaluation is to verify laboratory quantitation results. 1. In the space below, please show a minimum of one sample calculation. 2. If dilutions performed, were the SQLs elevated accordingly by the laboratory? List the affected samples
and dilution factor in the table below.
Sample ID Dilution Factor Reason for Dilution
If dilution was required but not performed, estimate results (J) for the affected compound. List the affected samples/compounds: ______________________________ 3. If requested for the project, verify that results below the SQL and above the laboratory’s method detection limits
(MDLs) were reported. 4. Verify that the reporting limit is at or above the lowest calibration standard. 5. Verify that results were reported in dry weight for solid samples. 6. Are all sample percent solid ≥ 30? If not, list the affected samples/percent solids.
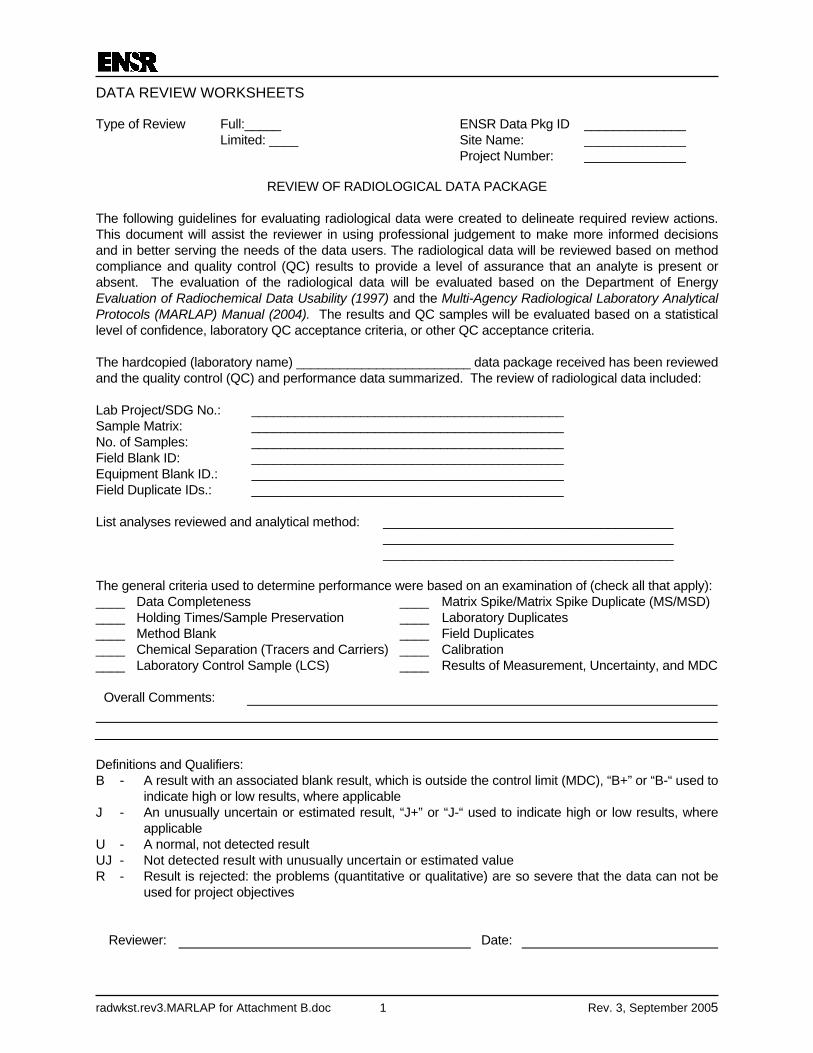
DATA REVIEW WORKSHEETS
radwkst.rev3.MARLAP for Attachment B.doc 1 Rev. 3, September 2005
Type of Review Full:_____ ENSR Data Pkg ID ______________ Limited: ____ Site Name: ______________ Project Number: ______________ REVIEW OF RADIOLOGICAL DATA PACKAGE The following guidelines for evaluating radiological data were created to delineate required review actions. This document will assist the reviewer in using professional judgement to make more informed decisions and in better serving the needs of the data users. The radiological data will be reviewed based on method compliance and quality control (QC) results to provide a level of assurance that an analyte is present or absent. The evaluation of the radiological data will be evaluated based on the Department of Energy Evaluation of Radiochemical Data Usability (1997) and the Multi-Agency Radiological Laboratory Analytical Protocols (MARLAP) Manual (2004). The results and QC samples will be evaluated based on a statistical level of confidence, laboratory QC acceptance criteria, or other QC acceptance criteria. The hardcopied (laboratory name) ________________________ data package received has been reviewed and the quality control (QC) and performance data summarized. The review of radiological data included: Lab Project/SDG No.: ___________________________________________ Sample Matrix: ___________________________________________ No. of Samples: ___________________________________________ Field Blank ID: ___________________________________________ Equipment Blank ID.: ___________________________________________ Field Duplicate IDs.: ___________________________________________ List analyses reviewed and analytical method: ________________________________________ ________________________________________ ________________________________________ The general criteria used to determine performance were based on an examination of (check all that apply): ____ Data Completeness ____ Matrix Spike/Matrix Spike Duplicate (MS/MSD) ____ Holding Times/Sample Preservation ____ Laboratory Duplicates ____ Method Blank ____ Field Duplicates ____ Chemical Separation (Tracers and Carriers) ____ Calibration ____ Laboratory Control Sample (LCS) ____ Results of Measurement, Uncertainty, and MDC
Overall Comments:
Definitions and Qualifiers: B - A result with an associated blank result, which is outside the control limit (MDC), “B+” or “B-“ used to
indicate high or low results, where applicable J - An unusually uncertain or estimated result, “J+” or “J-“ used to indicate high or low results, where
applicable U - A normal, not detected result UJ - Not detected result with unusually uncertain or estimated value R - Result is rejected: the problems (quantitative or qualitative) are so severe that the data can not be
used for project objectives
Reviewer:
Date:
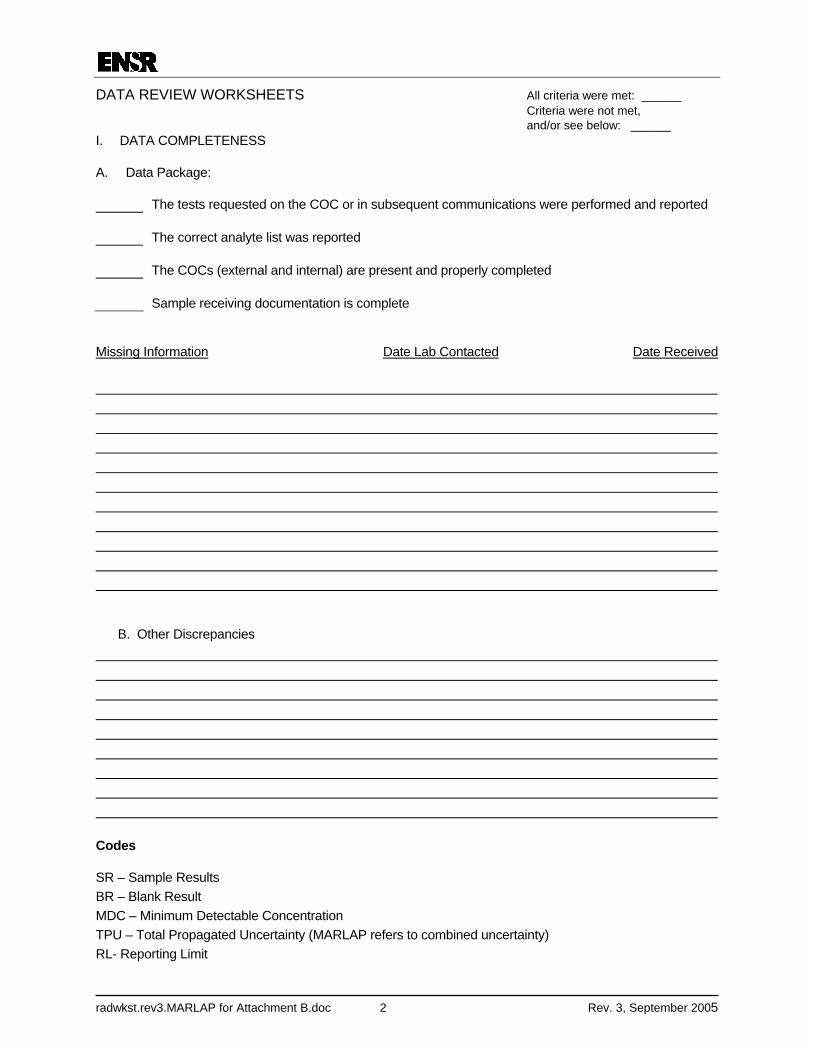
DATA REVIEW WORKSHEETS All criteria were met: ______ Criteria were not met, and/or see below: ______
radwkst.rev3.MARLAP for Attachment B.doc 2 Rev. 3, September 2005
I. DATA COMPLETENESS A. Data Package:
The tests requested on the COC or in subsequent communications were performed and reported
The correct analyte list was reported
The COCs (external and internal) are present and properly completed
Sample receiving documentation is complete
Missing Information Date Lab Contacted Date Received
B. Other Discrepancies
Codes SR – Sample Results BR – Blank Result MDC – Minimum Detectable Concentration TPU – Total Propagated Uncertainty (MARLAP refers to combined uncertainty) RL- Reporting Limit
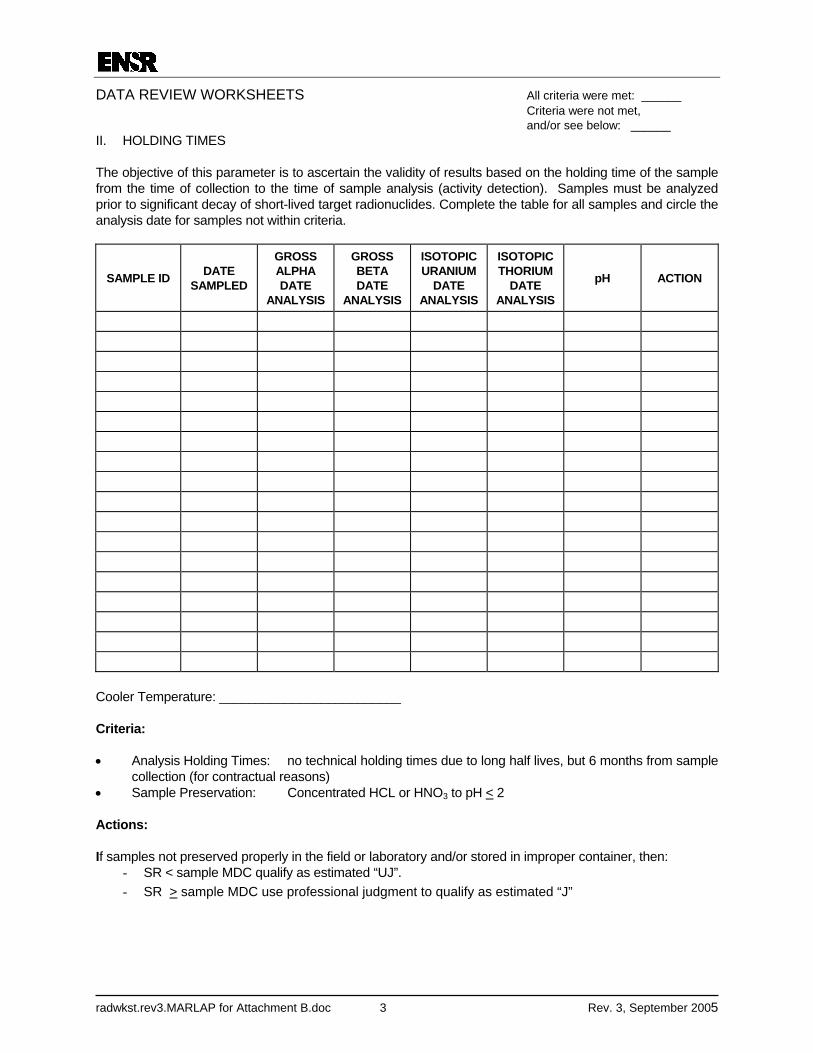
DATA REVIEW WORKSHEETS All criteria were met: ______ Criteria were not met, and/or see below: ______
radwkst.rev3.MARLAP for Attachment B.doc 3 Rev. 3, September 2005
II. HOLDING TIMES The objective of this parameter is to ascertain the validity of results based on the holding time of the sample from the time of collection to the time of sample analysis (activity detection). Samples must be analyzed prior to significant decay of short-lived target radionuclides. Complete the table for all samples and circle the analysis date for samples not within criteria.
SAMPLE ID DATE SAMPLED
GROSS ALPHA DATE
ANALYSIS
GROSS BETA DATE
ANALYSIS
ISOTOPIC URANIUM
DATE ANALYSIS
ISOTOPIC THORIUM
DATE ANALYSIS
pH
ACTION
Cooler Temperature: _________________________ Criteria: • Analysis Holding Times: no technical holding times due to long half lives, but 6 months from sample
collection (for contractual reasons) • Sample Preservation: Concentrated HCL or HNO3 to pH < 2 Actions: If samples not preserved properly in the field or laboratory and/or stored in improper container, then:
- SR < sample MDC qualify as estimated “UJ”. - SR > sample MDC use professional judgment to qualify as estimated “J”
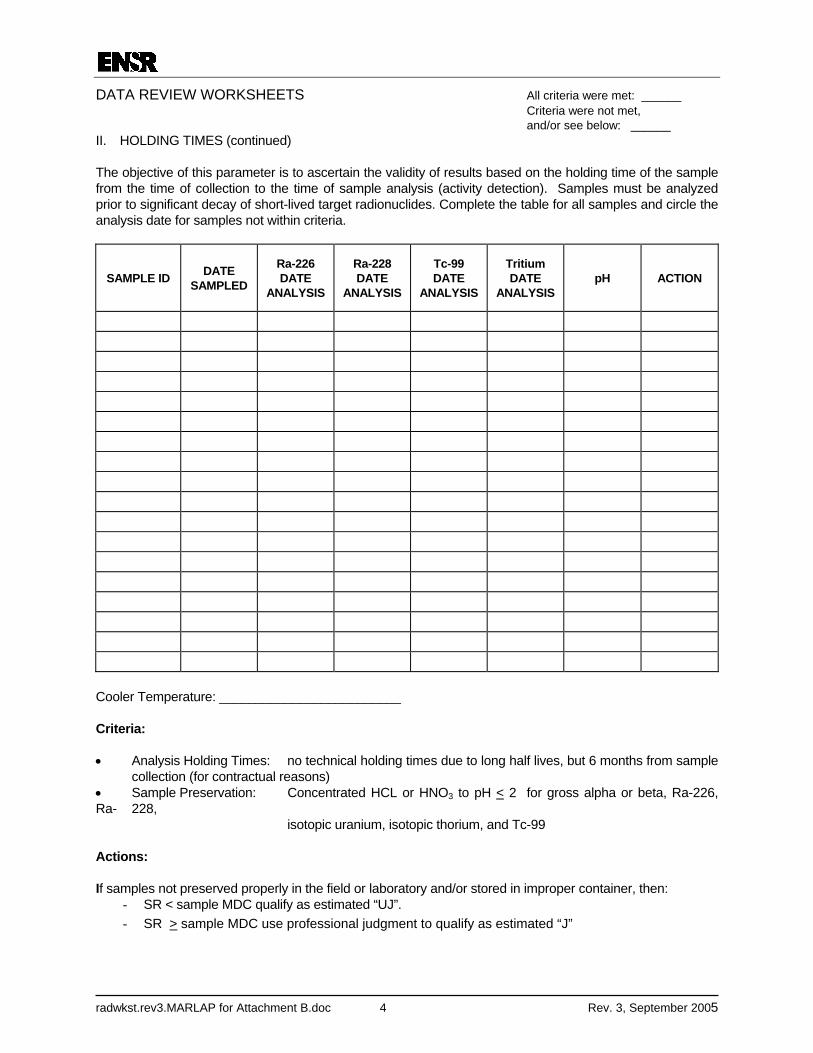
DATA REVIEW WORKSHEETS All criteria were met: ______ Criteria were not met, and/or see below: ______
radwkst.rev3.MARLAP for Attachment B.doc 4 Rev. 3, September 2005
II. HOLDING TIMES (continued) The objective of this parameter is to ascertain the validity of results based on the holding time of the sample from the time of collection to the time of sample analysis (activity detection). Samples must be analyzed prior to significant decay of short-lived target radionuclides. Complete the table for all samples and circle the analysis date for samples not within criteria.
SAMPLE ID DATE SAMPLED
Ra-226 DATE
ANALYSIS
Ra-228 DATE
ANALYSIS
Tc-99 DATE
ANALYSIS
Tritium DATE
ANALYSIS pH
ACTION
Cooler Temperature: _________________________ Criteria: • Analysis Holding Times: no technical holding times due to long half lives, but 6 months from sample
collection (for contractual reasons) • Sample Preservation: Concentrated HCL or HNO3 to pH < 2 for gross alpha or beta, Ra-226, Ra- 228, isotopic uranium, isotopic thorium, and Tc-99 Actions: If samples not preserved properly in the field or laboratory and/or stored in improper container, then:
- SR < sample MDC qualify as estimated “UJ”. - SR > sample MDC use professional judgment to qualify as estimated “J”
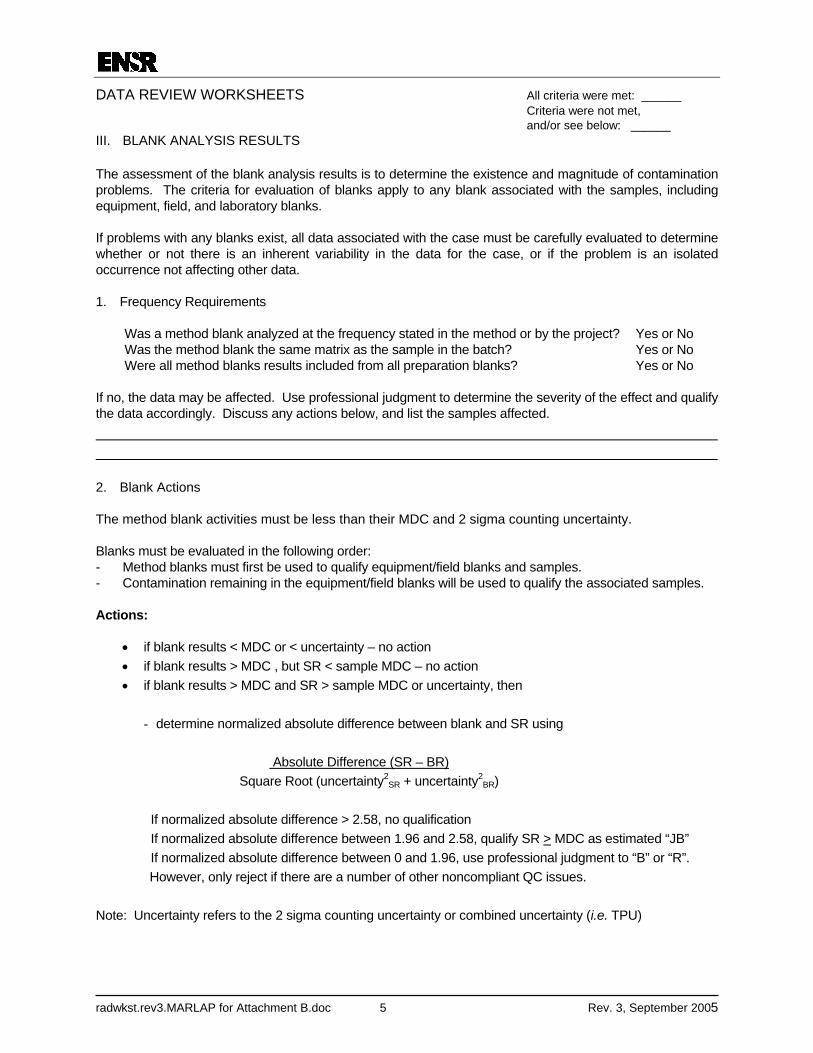
DATA REVIEW WORKSHEETS All criteria were met: ______ Criteria were not met, and/or see below: ______
radwkst.rev3.MARLAP for Attachment B.doc 5 Rev. 3, September 2005
III. BLANK ANALYSIS RESULTS The assessment of the blank analysis results is to determine the existence and magnitude of contamination problems. The criteria for evaluation of blanks apply to any blank associated with the samples, including equipment, field, and laboratory blanks. If problems with any blanks exist, all data associated with the case must be carefully evaluated to determine whether or not there is an inherent variability in the data for the case, or if the problem is an isolated occurrence not affecting other data. 1. Frequency Requirements Was a method blank analyzed at the frequency stated in the method or by the project?
Was the method blank the same matrix as the sample in the batch? Were all method blanks results included from all preparation blanks?
Yes or No Yes or No Yes or No
If no, the data may be affected. Use professional judgment to determine the severity of the effect and qualify the data accordingly. Discuss any actions below, and list the samples affected.
2. Blank Actions The method blank activities must be less than their MDC and 2 sigma counting uncertainty. Blanks must be evaluated in the following order: - Method blanks must first be used to qualify equipment/field blanks and samples. - Contamination remaining in the equipment/field blanks will be used to qualify the associated samples. Actions:
• if blank results < MDC or < uncertainty – no action • if blank results > MDC , but SR < sample MDC – no action • if blank results > MDC and SR > sample MDC or uncertainty, then
- determine normalized absolute difference between blank and SR using
Absolute Difference (SR – BR) Square Root (uncertainty2
SR + uncertainty2BR)
If normalized absolute difference > 2.58, no qualification If normalized absolute difference between 1.96 and 2.58, qualify SR > MDC as estimated “JB”
If normalized absolute difference between 0 and 1.96, use professional judgment to “B” or “R”. However, only reject if there are a number of other noncompliant QC issues.
Note: Uncertainty refers to the 2 sigma counting uncertainty or combined uncertainty (i.e. TPU)
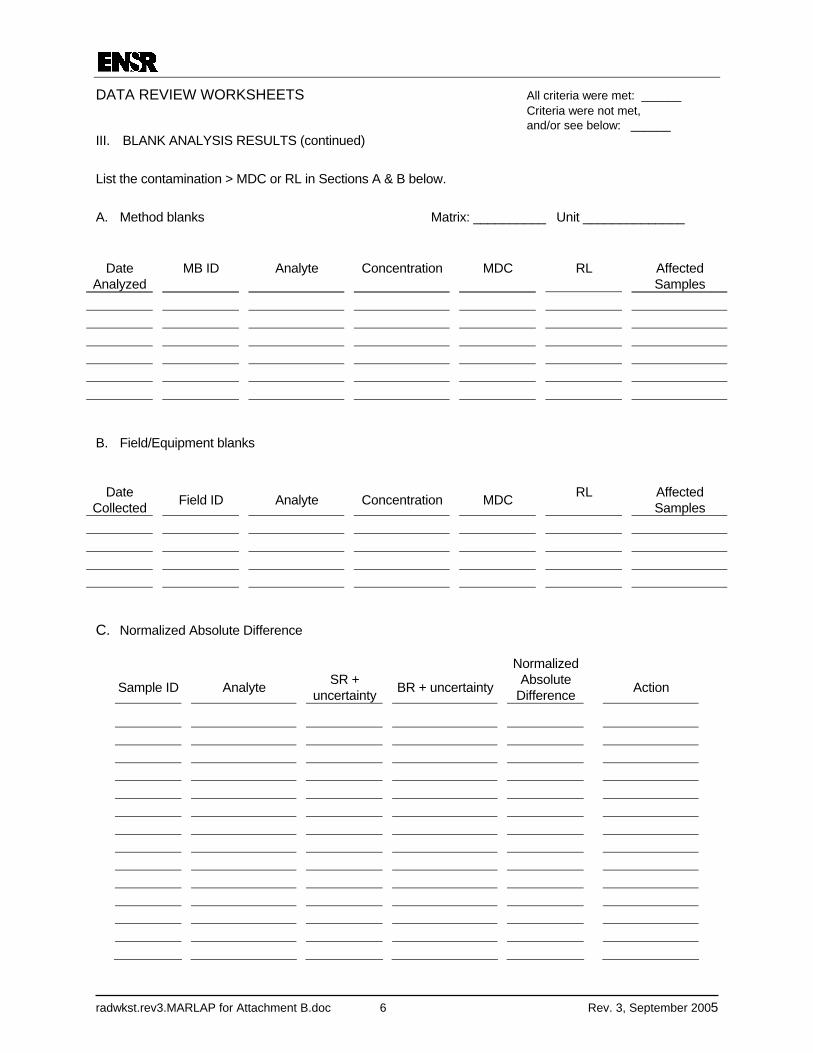
DATA REVIEW WORKSHEETS All criteria were met: ______ Criteria were not met, and/or see below: ______
radwkst.rev3.MARLAP for Attachment B.doc 6 Rev. 3, September 2005
III. BLANK ANALYSIS RESULTS (continued) List the contamination > MDC or RL in Sections A & B below. A. Method blanks Matrix: __________ Unit ______________
Date
Analyzed MB ID Analyte
Concentration
MDC RL
Affected Samples
B. Field/Equipment blanks
Date
Collected
Field ID
Analyte
Concentration
MDC RL
Affected Samples
C. Normalized Absolute Difference
Sample ID
Analyte
SR + uncertainty
BR + uncertainty
Normalized Absolute
Difference
Action
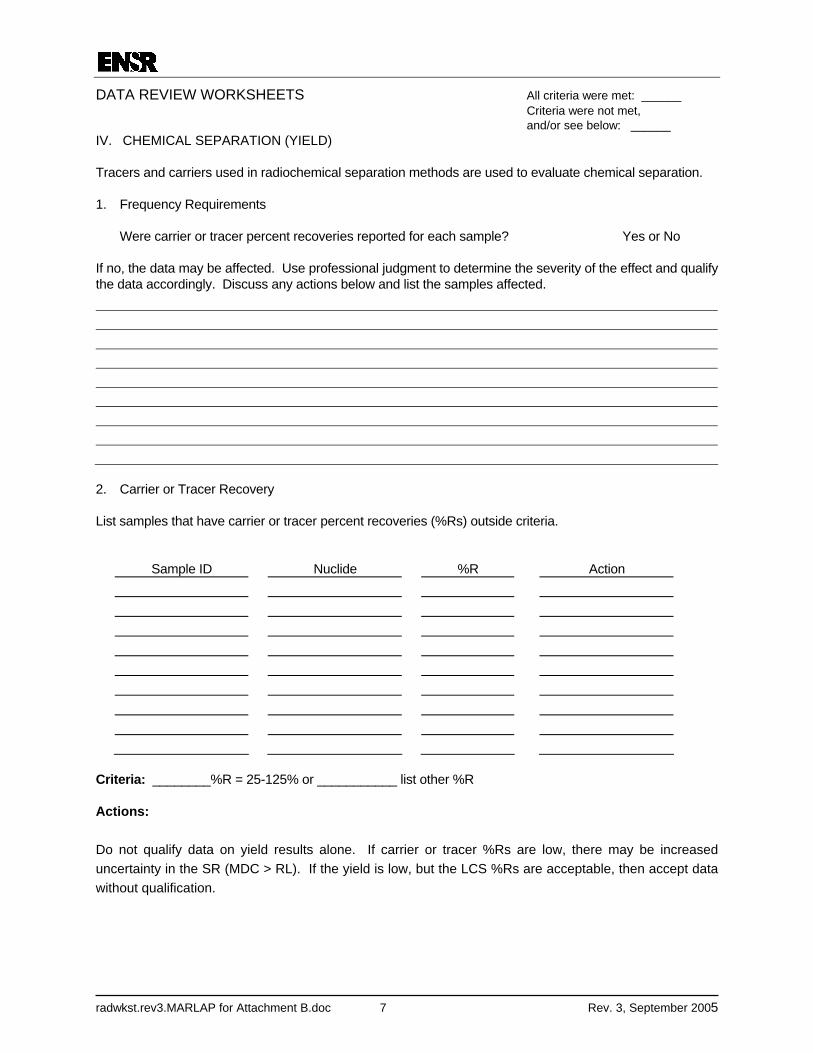
DATA REVIEW WORKSHEETS All criteria were met: ______ Criteria were not met, and/or see below: ______
radwkst.rev3.MARLAP for Attachment B.doc 7 Rev. 3, September 2005
IV. CHEMICAL SEPARATION (YIELD) Tracers and carriers used in radiochemical separation methods are used to evaluate chemical separation. 1. Frequency Requirements Were carrier or tracer percent recoveries reported for each sample? Yes or No If no, the data may be affected. Use professional judgment to determine the severity of the effect and qualify the data accordingly. Discuss any actions below and list the samples affected.
2. Carrier or Tracer Recovery List samples that have carrier or tracer percent recoveries (%Rs) outside criteria.
Sample ID
Nuclide
%R
Action
Criteria: ________%R = 25-125% or ___________ list other %R Actions: Do not qualify data on yield results alone. If carrier or tracer %Rs are low, there may be increased uncertainty in the SR (MDC > RL). If the yield is low, but the LCS %Rs are acceptable, then accept data without qualification.
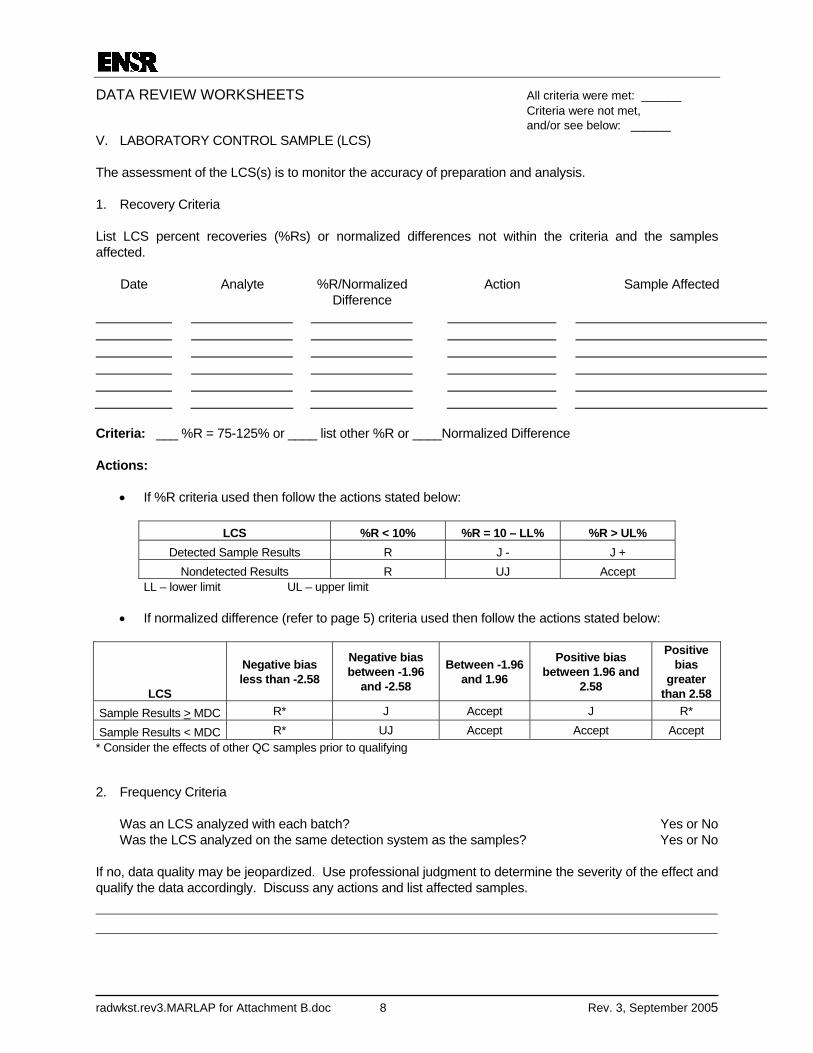
DATA REVIEW WORKSHEETS All criteria were met: ______ Criteria were not met, and/or see below: ______
radwkst.rev3.MARLAP for Attachment B.doc 8 Rev. 3, September 2005
V. LABORATORY CONTROL SAMPLE (LCS) The assessment of the LCS(s) is to monitor the accuracy of preparation and analysis. 1. Recovery Criteria List LCS percent recoveries (%Rs) or normalized differences not within the criteria and the samples affected.
Date Analyte %R/Normalized Difference
Action Sample Affected
Criteria: ___ %R = 75-125% or ____ list other %R or ____Normalized Difference Actions:
• If %R criteria used then follow the actions stated below:
LCS %R < 10% %R = 10 – LL% %R > UL% Detected Sample Results R J - J +
Nondetected Results R UJ Accept LL – lower limit UL – upper limit
• If normalized difference (refer to page 5) criteria used then follow the actions stated below:
LCS
Negative bias less than -2.58
Negative bias between -1.96
and -2.58
Between -1.96 and 1.96
Positive bias between 1.96 and
2.58
Positive bias
greater than 2.58
Sample Results > MDC R* J Accept J R*
Sample Results < MDC R* UJ Accept Accept Accept * Consider the effects of other QC samples prior to qualifying 2. Frequency Criteria Was an LCS analyzed with each batch? Yes or No Was the LCS analyzed on the same detection system as the samples? Yes or No If no, data quality may be jeopardized. Use professional judgment to determine the severity of the effect and qualify the data accordingly. Discuss any actions and list affected samples.
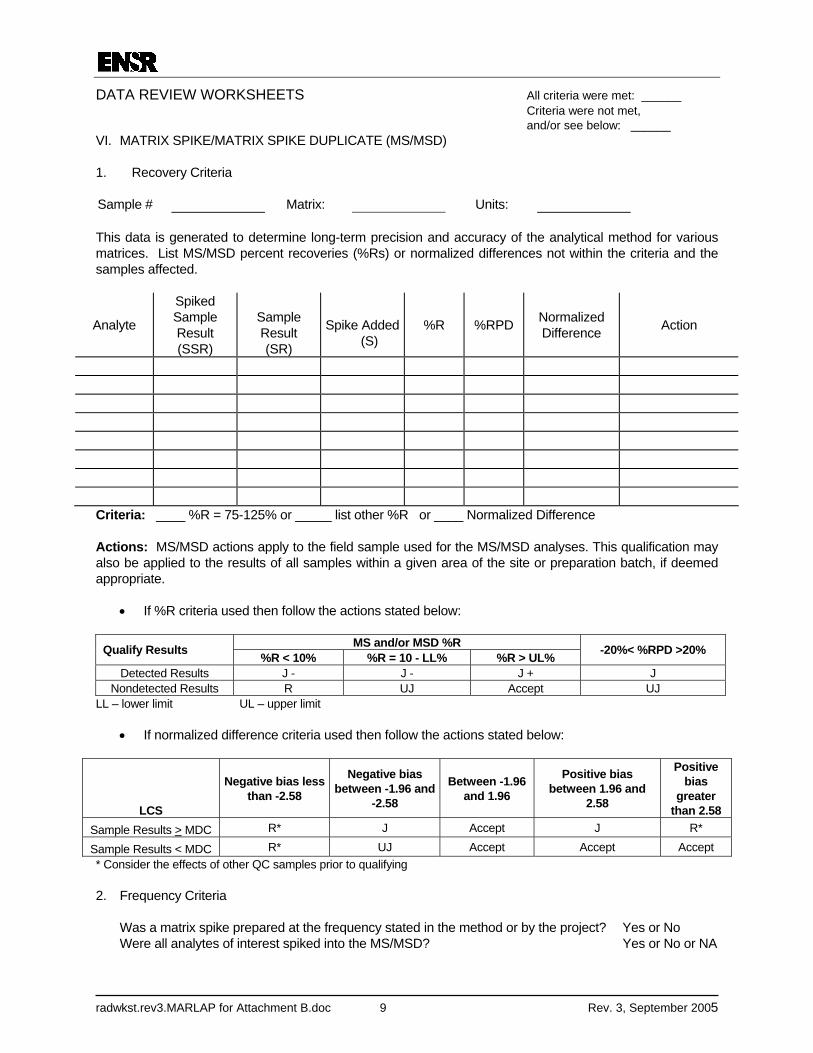
DATA REVIEW WORKSHEETS All criteria were met: ______ Criteria were not met, and/or see below: ______
radwkst.rev3.MARLAP for Attachment B.doc 9 Rev. 3, September 2005
VI. MATRIX SPIKE/MATRIX SPIKE DUPLICATE (MS/MSD) 1. Recovery Criteria Sample #
Matrix:
Units:
This data is generated to determine long-term precision and accuracy of the analytical method for various matrices. List MS/MSD percent recoveries (%Rs) or normalized differences not within the criteria and the samples affected.
Analyte
Spiked Sample Result (SSR)
Sample Result (SR)
Spike Added
(S) %R %RPD Normalized
Difference Action
Criteria: ____ %R = 75-125% or _____ list other %R or ____ Normalized Difference Actions: MS/MSD actions apply to the field sample used for the MS/MSD analyses. This qualification may also be applied to the results of all samples within a given area of the site or preparation batch, if deemed appropriate.
• If %R criteria used then follow the actions stated below:
MS and/or MSD %R Qualify Results %R < 10% %R = 10 - LL% %R > UL% -20%< %RPD >20%
Detected Results J - J - J + J Nondetected Results R UJ Accept UJ
LL – lower limit UL – upper limit
• If normalized difference criteria used then follow the actions stated below:
LCS
Negative bias less than -2.58
Negative bias between -1.96 and
-2.58
Between -1.96 and 1.96
Positive bias between 1.96 and
2.58
Positive bias
greater than 2.58
Sample Results > MDC R* J Accept J R*
Sample Results < MDC R* UJ Accept Accept Accept * Consider the effects of other QC samples prior to qualifying 2. Frequency Criteria Was a matrix spike prepared at the frequency stated in the method or by the project? Yes or No Were all analytes of interest spiked into the MS/MSD? Yes or No or NA
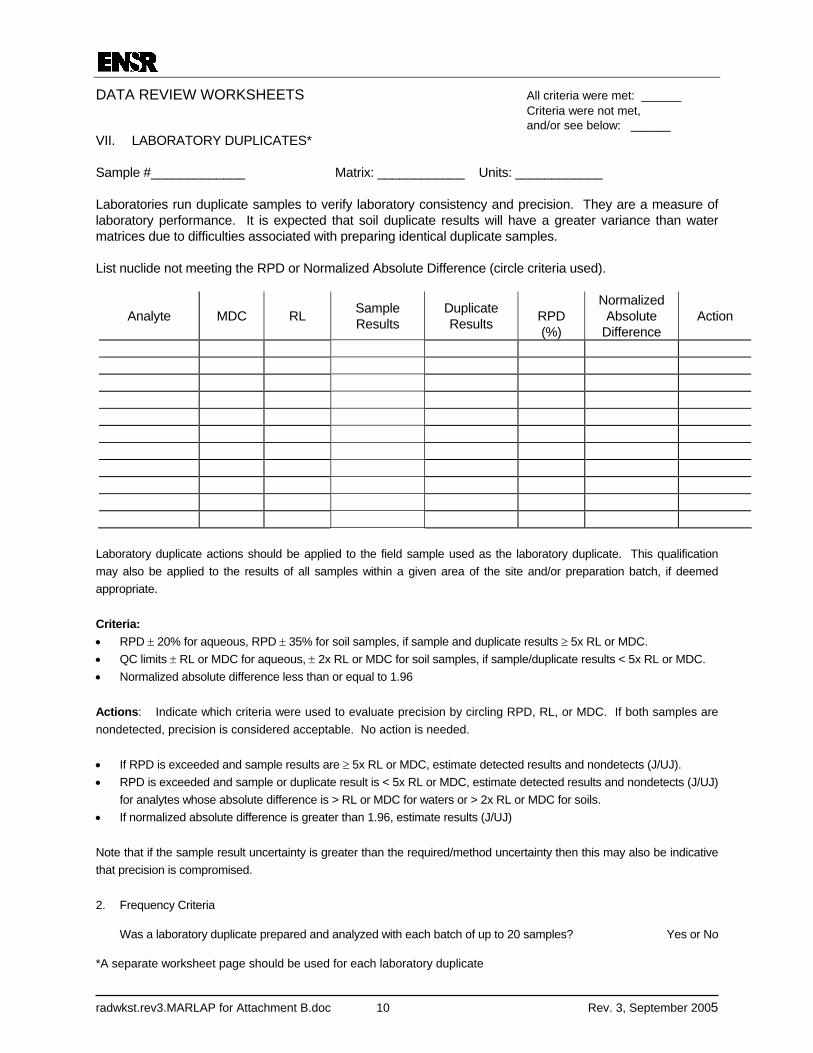
DATA REVIEW WORKSHEETS All criteria were met: ______ Criteria were not met, and/or see below: ______
radwkst.rev3.MARLAP for Attachment B.doc 10 Rev. 3, September 2005
VII. LABORATORY DUPLICATES* Sample #_____________ Matrix: ____________ Units: ____________ Laboratories run duplicate samples to verify laboratory consistency and precision. They are a measure of laboratory performance. It is expected that soil duplicate results will have a greater variance than water matrices due to difficulties associated with preparing identical duplicate samples. List nuclide not meeting the RPD or Normalized Absolute Difference (circle criteria used).
Analyte MDC
RL
Sample Results
Duplicate Results
RPD (%)
Normalized Absolute
Difference Action
Laboratory duplicate actions should be applied to the field sample used as the laboratory duplicate. This qualification may also be applied to the results of all samples within a given area of the site and/or preparation batch, if deemed appropriate. Criteria: • RPD ± 20% for aqueous, RPD ± 35% for soil samples, if sample and duplicate results ≥ 5x RL or MDC. • QC limits ± RL or MDC for aqueous, ± 2x RL or MDC for soil samples, if sample/duplicate results < 5x RL or MDC. • Normalized absolute difference less than or equal to 1.96 Actions: Indicate which criteria were used to evaluate precision by circling RPD, RL, or MDC. If both samples are nondetected, precision is considered acceptable. No action is needed. • If RPD is exceeded and sample results are ≥ 5x RL or MDC, estimate detected results and nondetects (J/UJ). • RPD is exceeded and sample or duplicate result is < 5x RL or MDC, estimate detected results and nondetects (J/UJ)
for analytes whose absolute difference is > RL or MDC for waters or > 2x RL or MDC for soils. • If normalized absolute difference is greater than 1.96, estimate results (J/UJ) Note that if the sample result uncertainty is greater than the required/method uncertainty then this may also be indicative that precision is compromised. 2. Frequency Criteria Was a laboratory duplicate prepared and analyzed with each batch of up to 20 samples? Yes or No *A separate worksheet page should be used for each laboratory duplicate
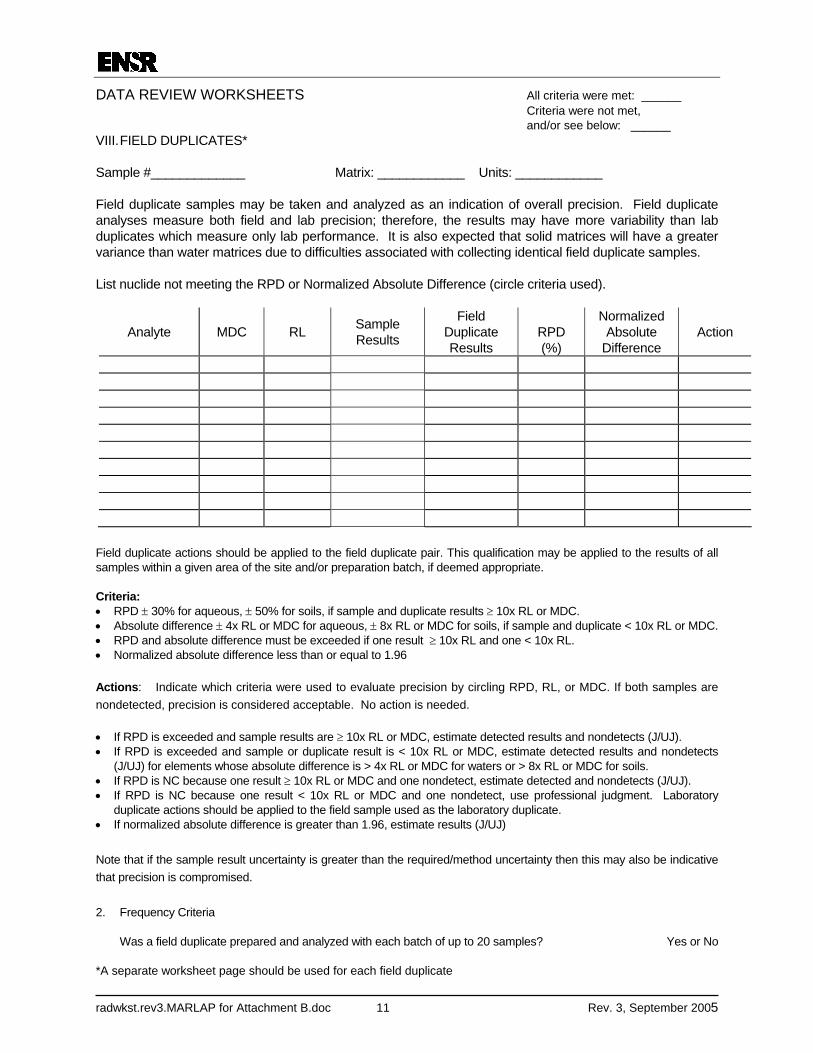
DATA REVIEW WORKSHEETS All criteria were met: ______ Criteria were not met, and/or see below: ______
radwkst.rev3.MARLAP for Attachment B.doc 11 Rev. 3, September 2005
VIII. FIELD DUPLICATES* Sample #_____________ Matrix: ____________ Units: ____________ Field duplicate samples may be taken and analyzed as an indication of overall precision. Field duplicate analyses measure both field and lab precision; therefore, the results may have more variability than lab duplicates which measure only lab performance. It is also expected that solid matrices will have a greater variance than water matrices due to difficulties associated with collecting identical field duplicate samples. List nuclide not meeting the RPD or Normalized Absolute Difference (circle criteria used).
Analyte MDC
RL
Sample Results
Field Duplicate Results
RPD (%)
Normalized Absolute
Difference Action
Field duplicate actions should be applied to the field duplicate pair. This qualification may be applied to the results of all samples within a given area of the site and/or preparation batch, if deemed appropriate. Criteria: • RPD ± 30% for aqueous, ± 50% for soils, if sample and duplicate results ≥ 10x RL or MDC. • Absolute difference ± 4x RL or MDC for aqueous, ± 8x RL or MDC for soils, if sample and duplicate < 10x RL or MDC. • RPD and absolute difference must be exceeded if one result ≥ 10x RL and one < 10x RL. • Normalized absolute difference less than or equal to 1.96 Actions: Indicate which criteria were used to evaluate precision by circling RPD, RL, or MDC. If both samples are nondetected, precision is considered acceptable. No action is needed. • If RPD is exceeded and sample results are ≥ 10x RL or MDC, estimate detected results and nondetects (J/UJ). • If RPD is exceeded and sample or duplicate result is < 10x RL or MDC, estimate detected results and nondetects
(J/UJ) for elements whose absolute difference is > 4x RL or MDC for waters or > 8x RL or MDC for soils. • If RPD is NC because one result ≥ 10x RL or MDC and one nondetect, estimate detected and nondetects (J/UJ). • If RPD is NC because one result < 10x RL or MDC and one nondetect, use professional judgment. Laboratory
duplicate actions should be applied to the field sample used as the laboratory duplicate. • If normalized absolute difference is greater than 1.96, estimate results (J/UJ) Note that if the sample result uncertainty is greater than the required/method uncertainty then this may also be indicative that precision is compromised. 2. Frequency Criteria Was a field duplicate prepared and analyzed with each batch of up to 20 samples? Yes or No *A separate worksheet page should be used for each field duplicate
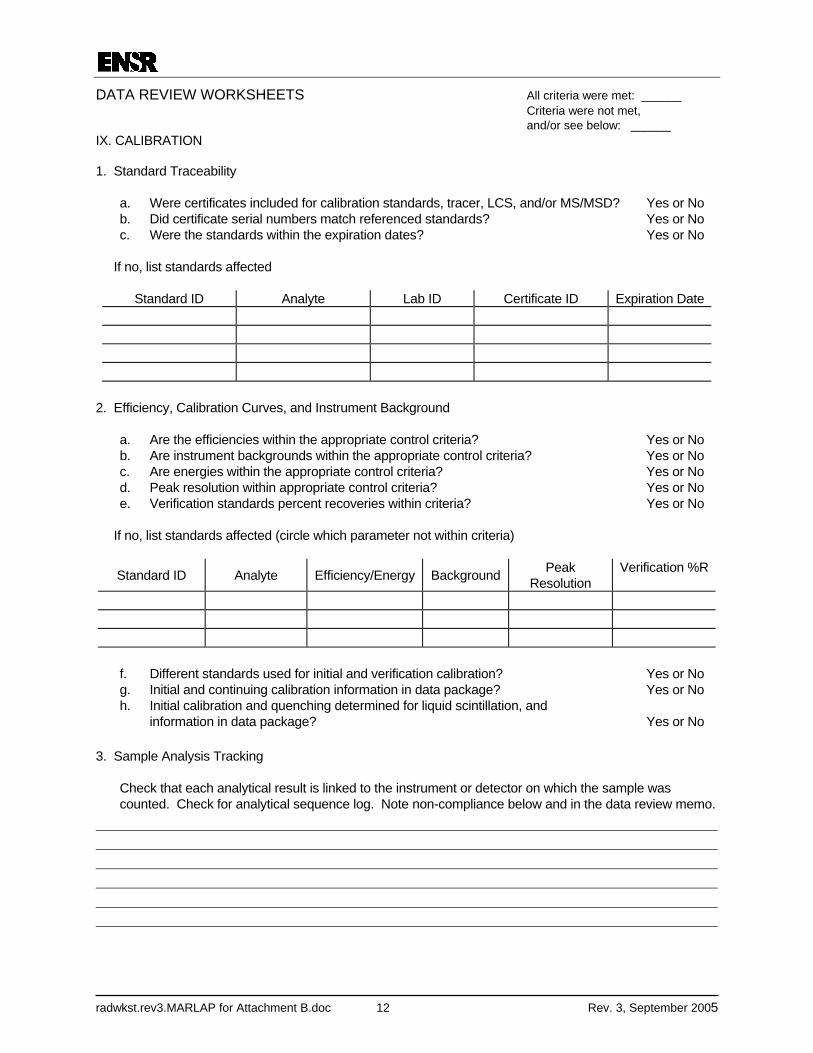
DATA REVIEW WORKSHEETS All criteria were met: ______ Criteria were not met, and/or see below: ______
radwkst.rev3.MARLAP for Attachment B.doc 12 Rev. 3, September 2005
IX. CALIBRATION 1. Standard Traceability
a. Were certificates included for calibration standards, tracer, LCS, and/or MS/MSD? Yes or No b. Did certificate serial numbers match referenced standards? Yes or No c. Were the standards within the expiration dates? Yes or No
If no, list standards affected
Standard ID Analyte Lab ID Certificate ID Expiration Date
2. Efficiency, Calibration Curves, and Instrument Background
a. Are the efficiencies within the appropriate control criteria? Yes or No b. Are instrument backgrounds within the appropriate control criteria? Yes or No c. Are energies within the appropriate control criteria? Yes or No d. Peak resolution within appropriate control criteria? Yes or No e. Verification standards percent recoveries within criteria? Yes or No
If no, list standards affected (circle which parameter not within criteria)
Standard ID Analyte Efficiency/Energy Background Peak Resolution
Verification %R
f. Different standards used for initial and verification calibration? Yes or No g. Initial and continuing calibration information in data package? Yes or No h. Initial calibration and quenching determined for liquid scintillation, and information in data package? Yes or No
3. Sample Analysis Tracking
Check that each analytical result is linked to the instrument or detector on which the sample was counted. Check for analytical sequence log. Note non-compliance below and in the data review memo.
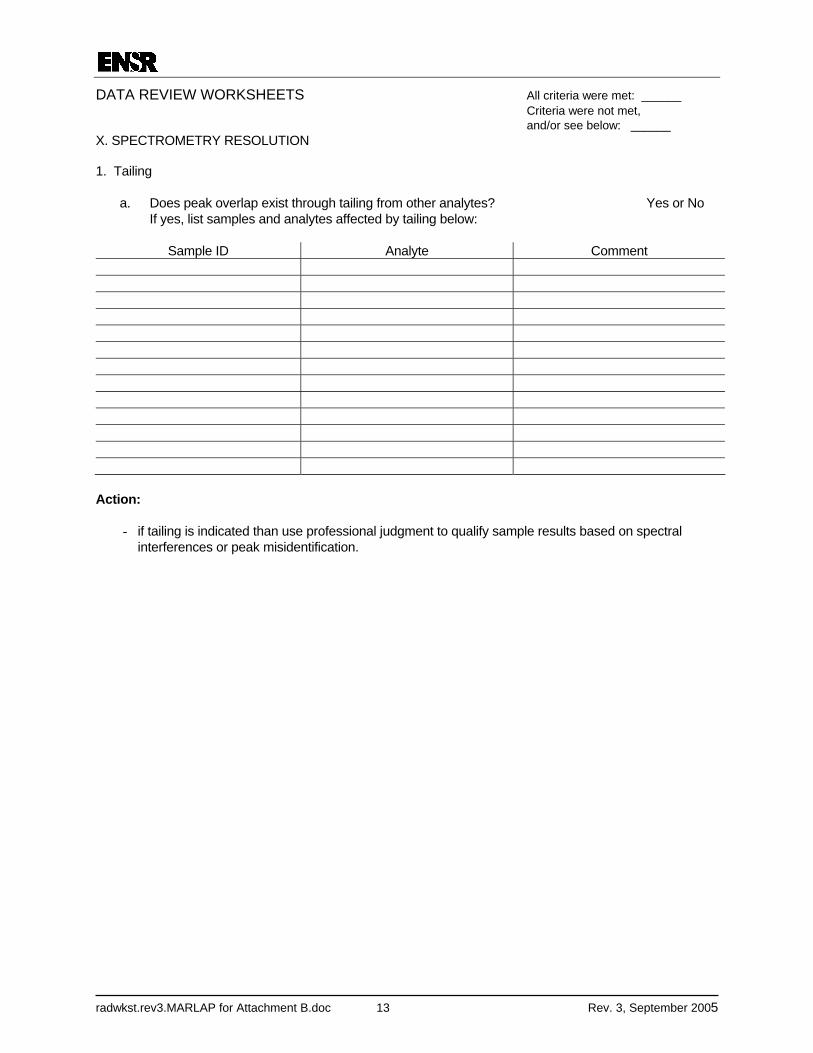
DATA REVIEW WORKSHEETS All criteria were met: ______ Criteria were not met, and/or see below: ______
radwkst.rev3.MARLAP for Attachment B.doc 13 Rev. 3, September 2005
X. SPECTROMETRY RESOLUTION 1. Tailing
a. Does peak overlap exist through tailing from other analytes? Yes or No If yes, list samples and analytes affected by tailing below:
Sample ID Analyte Comment
Action:
- if tailing is indicated than use professional judgment to qualify sample results based on spectral interferences or peak misidentification.
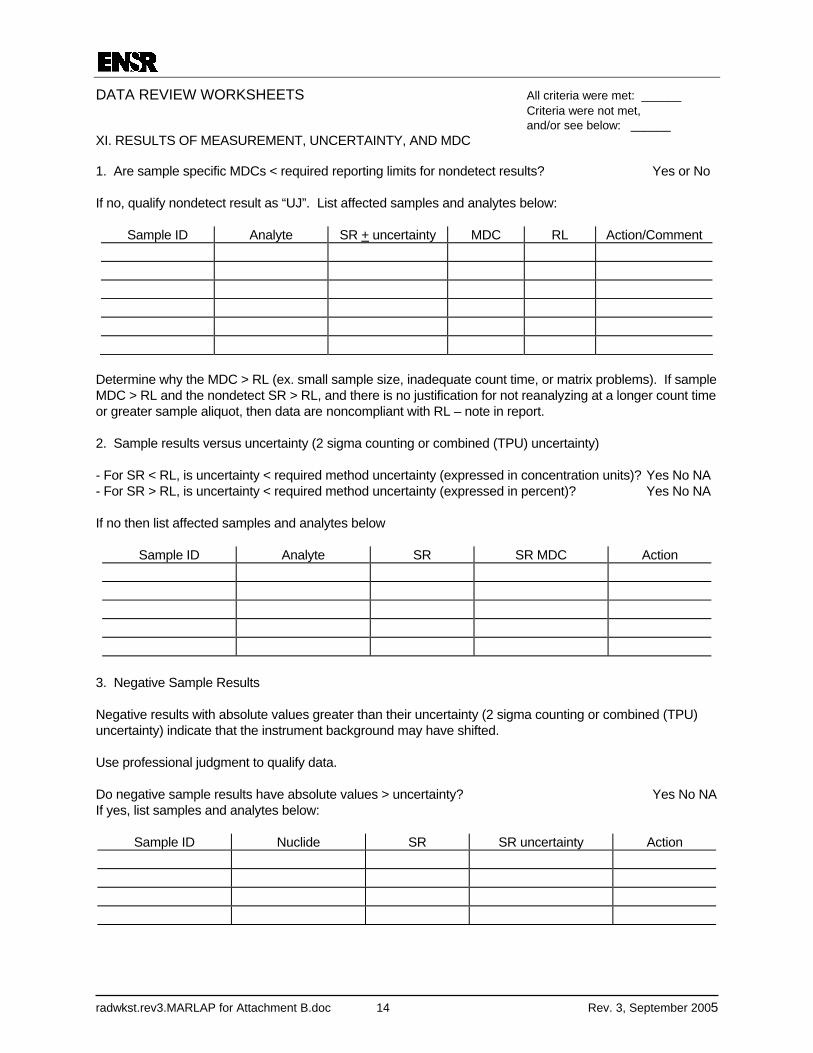
DATA REVIEW WORKSHEETS All criteria were met: ______ Criteria were not met, and/or see below: ______
radwkst.rev3.MARLAP for Attachment B.doc 14 Rev. 3, September 2005
XI. RESULTS OF MEASUREMENT, UNCERTAINTY, AND MDC 1. Are sample specific MDCs < required reporting limits for nondetect results? Yes or No
If no, qualify nondetect result as “UJ”. List affected samples and analytes below:
Sample ID Analyte SR + uncertainty MDC RL Action/Comment
Determine why the MDC > RL (ex. small sample size, inadequate count time, or matrix problems). If sample MDC > RL and the nondetect SR > RL, and there is no justification for not reanalyzing at a longer count time or greater sample aliquot, then data are noncompliant with RL – note in report. 2. Sample results versus uncertainty (2 sigma counting or combined (TPU) uncertainty) - For SR < RL, is uncertainty < required method uncertainty (expressed in concentration units)? Yes No NA - For SR > RL, is uncertainty < required method uncertainty (expressed in percent)? Yes No NA If no then list affected samples and analytes below
Sample ID Analyte SR SR MDC Action
3. Negative Sample Results Negative results with absolute values greater than their uncertainty (2 sigma counting or combined (TPU) uncertainty) indicate that the instrument background may have shifted. Use professional judgment to qualify data. Do negative sample results have absolute values > uncertainty? Yes No NA If yes, list samples and analytes below:
Sample ID Nuclide SR SR uncertainty Action
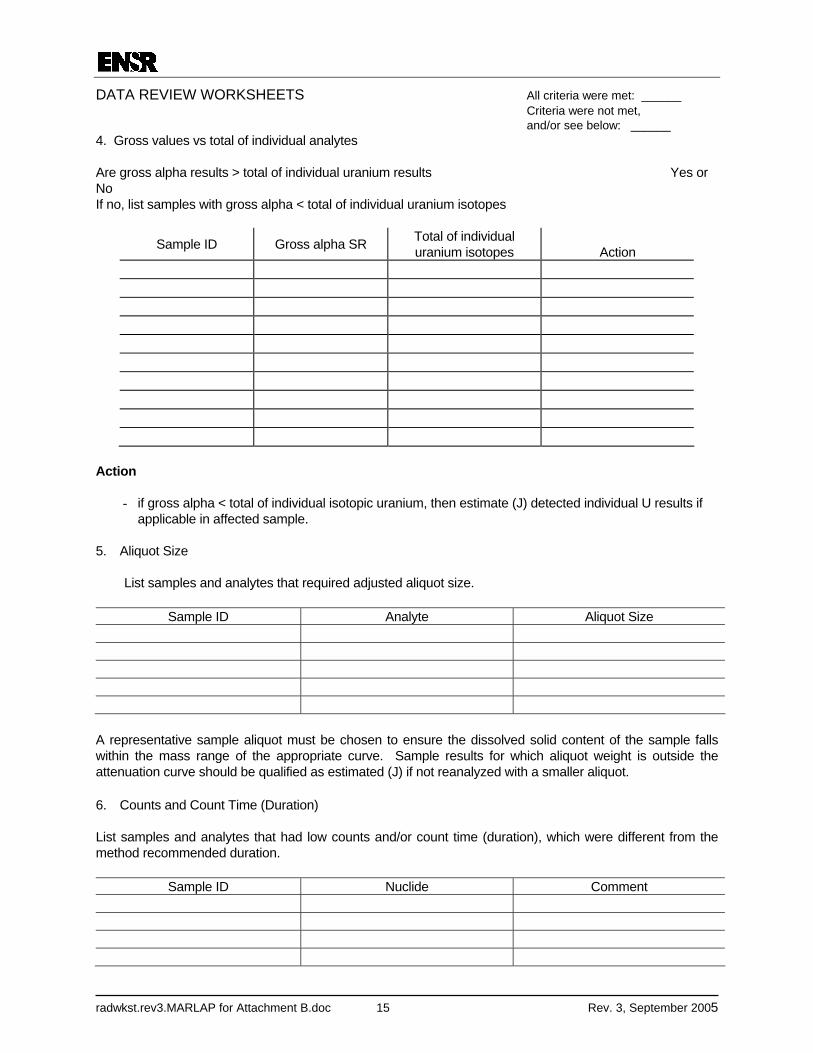
DATA REVIEW WORKSHEETS All criteria were met: ______ Criteria were not met, and/or see below: ______
radwkst.rev3.MARLAP for Attachment B.doc 15 Rev. 3, September 2005
4. Gross values vs total of individual analytes Are gross alpha results > total of individual uranium results Yes or No If no, list samples with gross alpha < total of individual uranium isotopes
Sample ID Gross alpha SR Total of individual uranium isotopes
Action
Action
- if gross alpha < total of individual isotopic uranium, then estimate (J) detected individual U results if applicable in affected sample.
5. Aliquot Size List samples and analytes that required adjusted aliquot size.
Sample ID Analyte Aliquot Size
A representative sample aliquot must be chosen to ensure the dissolved solid content of the sample falls within the mass range of the appropriate curve. Sample results for which aliquot weight is outside the attenuation curve should be qualified as estimated (J) if not reanalyzed with a smaller aliquot. 6. Counts and Count Time (Duration) List samples and analytes that had low counts and/or count time (duration), which were different from the method recommended duration.
Sample ID Nuclide Comment