Embed Size (px)
Citation preview


INTERNATIONAL JOURNAL OF MODERN ENGINEERING
THE LEADING JOURNAL OF ENGINEERING, APPLIED SCIENCE, AND TECHNOLOGY
Mark Rajai, Ph.D.
Editor-in-Chief California State University-Northridge College of Engineering and Computer Science Room: JD 4510 Northridge, CA 91330 Office: (818) 677-5003 Email: [email protected]
Contact us:
www.iajc.org www.ijme.us
www.tiij.org
www.ijeri.org
Print ISSN: 2157-8052 Online ISSN: 1930-6628
TO JOIN THE REVIEW BOARD:
• The International Journal of Engineering Research and Innovation (IJERI) For more information visit www.ijeri.org
• The Technology Interface International Journal (TIIJ).
For more information visit www.tiij.org
OTHER IAJC JOURNALS:
• Manuscripts should be sent electronically to the manuscript editor, Dr. Philip Weinsier, at [email protected].
For submission guidelines visit www.ijme.us/submissions
IJME SUBMISSIONS:
• Contact the chair of the International Review Board, Dr. Philip Weinsier, at [email protected]. For more information visit www.ijme.us/ijme_editorial.htm
• IJME was established in 2000 and is the first and official flagship journal of the International Association of Journal and Conferences (IAJC).
• IJME is a high-quality, independent journal steered by a distinguished board of directors and supported by an international review board representing many well-known universities, colleges and corporations in the U.S. and abroad.
• IJME has an impact factor of 3.00, placing it among
the top 100 engineering journals worldwide, and is the #1 visited engineering journal website (according to the National Science Digital Library).
ABOUT IJME:
INDEXING ORGANIZATIONS:
• IJME is currently indexed by 22 agencies. For a complete listing, please visit us at www.ijme.us.
——————————————————————————————————————————————————-
——————————————————————————————————————————————————– International Journal of Modern Engineering
International Journal of Modern Engineering
The INTERNATIONAL JOURNAL OF MODERN ENGINEERING (IJME) is
an independent, not-for-profit publication, which aims to provide the engineering
community with a resource and forum for scholarly expression and reflection.
IJME is published twice annually (fall and spring issues) and includes peer-
reviewed research articles, editorials, and commentary that contribute to our un-
derstanding of the issues, problems, and research associated with engineering and
related fields. The journal encourages the submission of manuscripts from private,
public, and academic sectors. The views expressed are those of the authors and do
not necessarily reflect the opinions of the IJME editors.
EDITORIAL OFFICE: Mark Rajai, Ph.D. Editor-in-Chief Office: (818) 677-2167 Email: [email protected] Dept. of Manufacturing Systems Engineering & Management California State University- Northridge 18111Nordhoff Street Northridge, CA 91330-8332
The International Journal of Modern Engineering Editors
Editor-in-Chief:
Mark Rajai
California State University-Northridge
Associate Editor:
Li Tan
Purdue University North Central
Production Editor:
Philip Weinsier
Bowling Green State University-Firelands
Subscription Editor:
Morteza Sadat-Hossieny
Northern Kentucky University
Executive Editor:
Paul Wilder
Vincennes University
Publisher:
Bowling Green State University-Firelands
Manuscript Editor:
Philip Weinsier
Bowling Green State University-Firelands
Copy Editor:
Li Tan
Purdue University North Central
Technical Editors:
Michelle Brodke
Bowling Green State University-Firelands
Paul Akangah
North Carolina A&T State University
Marilyn Dyrud
Oregon Institute of Technology
Web Administrator:
Saeed Namyar
Advanced Information Systems
Editor’s Note: IAJC / ATMAE Joint 2020 Conference ................................................................................................................ 4 Philip Weinsier, IJME Manuscript Editor Experimental Design Analysis of 3D Printing Processes in the Optimization of Material Mechanical Properties ................................................................................................................................................................ 5 Shaobiao Cai, Minnesota State University; Sairam Vangapally, Minnesota State University; Yongli Zhao, St. Cloud State University Mechanistic Implications of Mouthpiece Design Geometry and Powder Mixture Homogeneities on Successful Generation of Aerosolized Submicron Particles from Respiratory Drug Delivery Devices .................................... 12 Mohammed Ali, the University of Texas at Tyler Enhancing Downstream Performance of 5G Mobile Fronthaul................................................................................................ 20 ASM Delowar Hossain, City University of New York; Abdullah R. Hossain, City University of New York; Raiyan Hossain, New Jersey City University Multiscale Modeling of Aluminum Nickel-Coated Carbon Fiber Metal Matrix Composites .................................................... 28 Olanrewaju Aluko, University of Michigan-Flint; S. Gowtham, Michigan Technological University; Gregory Odegard, Michigan Technological University Instructions for Authors: Manuscript Submission Guidelines and Requirements ..................................................................... 36
——————————————————————————————————————————————–————
——————————————————————————————————————————————–————
International Journal of Modern Engineering | Volume 20, Number 1, Fall/Winter 2019
Table of Contents
Editorial Review Board Members
——————————————————————————————————————————————–————
State University of New York (NY) North Carolina A&T State University (NC) Michigan Tech (MI) Purdue University Northwest (IN) Zamfara AC Development (NIGERIA) Virginia State University (VA) Ohio University (OH) Guru Nanak Dev Engineering (INDIA) Bowling Green State University (OH) Penn State University (PA) Texas A&M University Kingsville (TX) Illinois State University (IL) Iowa State University (IA) Eastern Illinois University (IL) Indiana State University (IN) Ohio University (OH) Claflin University (SC) North Carolina A&T State University (NC) Alabama A&M University (AL) Ferris State University (MI) Appalachian State University (NC) Oregon Institute of Technology (OR) Elizabeth City State University (NC) Tennessee Technological University (TN) Millersville University (PA) University of Tennessee Chattanooga (TN) Zagazig University EGYPT) Western Illinois University (IL) Utah Valley University (UT) Abu Dhabi University (UAE) Purdue Polytechnic (IN) Penn State University (PA) Safety Engineer in Sonelgaz (ALGERIA) City University of New York (NY) Central Connecticut State University (CT) University of Louisiana Lafayette (LA) North Dakota State University (ND) Norfolk State University (VA) Western Illinois University (IL) North Carolina A&T University (NC) Indiana University Purdue (IN) Michigan Tech (MI) Eastern Illinois University (IL) Bowling Green State University (OH) Purdue Polytechnic (IN) North Dakota State University (ND) Abu Dhabi University (UAE) Purdue University Northwest (IN) Bowling Green State University (OH) Southeast Missouri State University (MO) Bowling Green State University (OH) Ohio University (OH) Penn State University Berks (PA) Central Michigan University (MI) Florida A&M University (FL) Penn State University (PA) ARUP Corporation University of Louisiana (LA) University of Southern Indiana (IN) Eastern Illinois University (IL) Cal State Poly Pomona (CA) Excelsior College (NY) Jackson State University (MS) Penn State Berks (PA) California State University Fresno (CA) Michigan Tech (MI) University of Central Missouri (MO) Purdue Fort Wayne (IN) Community College of Rhode Island (RI) Sardar Patel University (INDIA) Virginia State University (VA)
Mohammed Abdallah Paul Akangah Nasser Alaraje Ali Alavizadeh Lawal Anka Jahangir Ansari Kevin Berisso Pankaj Bhambri Michelle Brodke Shaobiao Cai Rajab Challoo Isaac Chang Shu-Hui (Susan) Chang Rigoberto Chinchilla Phil Cochrane Curtis Cohenour Emily Crawford Dongyang (Sunny)Deng Z.T. Deng Sagar Deshpande David Domermuth Marilyn Dyrud Mehran Elahi Ahmed Elsawy Cindy English Ignatius Fomunung Ahmed Gawad Kevin Hall Mohsen Hamidi Mamoon Hammad Gene Harding Bernd Haupt Youcef Himri Delowar Hossain Xiaobing Hou Shelton Houston Ying Huang Charles Hunt Dave Hunter Christian Bock-Hyeng Pete Hylton John Irwin Toqeer Israr Sudershan Jetley Rex Kanu Reza Karim Manish Kewalramani Tae-Hoon Kim Chris Kluse Doug Koch Resmi Krishnankuttyrema Zaki Kuruppalil Shiyoung Lee Soo-Yen (Samson) Lee Chao Li Dale Litwhiler Mani Manivannan G.H. Massiha Thomas McDonald David Melton Shokoufeh Mirzaei Sam Mryyan Jessica Murphy Rungun Nathan Arun Nambiar Aurenice Oliveira Troy Ollison Reynaldo Pablo Basile Panoutsopoulos Shahera Patel Thongchai Phairoh
Broadcom Corporation Warsaw University of Tech (POLAND) University of West Florida (FL) California State University-Fullerton (CA) Fastboot Mobile, LLC Brigham Young University (UT) DeSales University (PA) Baker College (MI) Michigan Technological University (MI) Zagros Oil and Gas Company (IRAN) St. Cloud State University (MN) Shahrood University of Technology (IRAN) North Carolina A&T State University (NC) Government Engineering College (INDIA) Wentworth Institute of Technology (MA) Southern Illinois University (IL) Ohio University (OH) Camarines Sur Polytechnic (PHILIPPINES) Missouri University of Science &Techn (MO) University of Houston Downtown (TX) University of South Florida Polytechnic (FL) Central Connecticut State University (CT) Texas A&M University (TX) Nanjing University of Science/Tech (CHINA) Thammasat University (THAILAND) Central Connecticut State University (CT) Purdue University (IN) University of Pittsburgh Johnstown (PA) Purdue University Northwest (IN) Chongqing University (CHINA) Sam Houston State University (TX) Ohio University (OH) Jackson State University (MS) Missouri Western State University (MO)
Huyu Qu Desire Rasolomampionona Michael Reynolds Nina Robson Marla Rogers Dale Rowe Karen Ruggles Anca Sala Alex Sergeyev Mehdi Shabaninejad Hiral Shah Mojtaba Shivaie Musibau Shofoluwe Amit Solanki Jiahui Song Carl Spezia Michelle Surerus Harold Terano Sanjay Tewari Vassilios Tzouanas Abraham Walton Haoyu Wang Jyhwen Wang Liangmo Wang Boonsap Witchayangkoon Shuju Wu Baijian “Justin” Yang Eunice Yang Xiaoli (Lucy) Yang Hao Yi Faruk Yildiz Yuqiu You Pao-Chiang Yuan Jinwen Zhu
——————————————————————————————————————————————————International Journal of Modern Engineering | Volume 20, Number 1, Fall/Winter 2019 3

ATMAE and IAJC join forces this year to offer their first-ever joint conference. Join us for this momentous event.
IAJC / ATMAE Joint 2020 Conference
Louisville, KY October 7-9, 2020
CALL FOR CONFERENCE PROPOSALS Conference Proposal Submission Deadlines:
● Abstract Proposal Submission Open February 3, 2020 ● Abstract Proposal Submission Closed March 16, 2020 ● Presenters Informed of Proposal Decision April 27, 2020 ● Invited Conference Paper Submission Open May 18, 2020 ● Invited Conference Paper Submission Closed July 27, 2020 ● Authors Informed of Conference Paper Decision September 1, 2020 ● Final Conference Paper Due October 12, 2020
The Association of Technology, Management and Applied Engineering (ATMAE) and the International Association of Journals and Conferences (IAJC) invite the submission of proposals for their first-ever joint conference. All abstract pro-posals must be submitted using Catalyst, ATMAE’s online abstract submission and peer review system. Have questions or need help? Contact ATMAE office [919.635.8335 or [email protected] ]
IAJC [email Philip Weinsier at [email protected] ] Get ready to submit your proposals, starting February 3rd. Submission guidelines and instructions will be available on both the IAJC and ATMAE websites soon.
Abstract
Mechanical properties, such as strength of materials, are among the most important material properties in engineer-ing, supporting applications such as mechanical systems and artificial bones in biomedical applications. With the applica-tion of additive manufacturing, such as 3D printing, com-plex structures can be achieved efficiently, greatly broaden-ing engineering design and fabrication capabilities. Howev-er, the mechanical properties of the 3D-printed part of a system need to be optimized. In this paper, the authors pre-sent insights into the effects of design structures and addi-tive manufacturing factors to the strength of commonly used PLA and stainless steel 316. Experimental design tech-niques were used to study parameters such as building tem-perature and layer thickness. The optimum factors of param-eters for achieving better strength of the PLA and stainless steel are identified. The design structures of stainless to the strength property of the parts were compared and analyzed. Recommendations for achieving better strength using addi-tive manufacturing are also made.
Introduction
Additive manufacturing (AM) is a method for creating a
product through layers. Typical examples include fused deposition, binder jetting, selective laser sintering, material jetting, and selective laser melting. These methods can han-dle almost any material, including polymer, metals/metal alloys, ceramics, and composites. According to Torres, Sandback, and Cai (2018):
AM allows parts to be designed with extremely complex geometries and at low cost compared to other manufacturing processes. AM also offers the ability to fabricate different parts using the same machine, making it appealing for low volume prod-uct production which would otherwise be prohibi-tively expensive. (p. 26)
Although AM is capable in handling myriad materials and
features, limitations do exist. One of the major concerns is the strength of the final part or system built. This is related to the mechanisms of the way that the material is fused or bonded. A typical example is the effect of temperature on the property of the built part. The final part may be very weak if temperature is not appropriately controlled. This may make the part useless. To broaden the practical applica-
tions of AM, further study on the fabrication factors that affect the properties of the materials is needed. As stated in earlier studies, as additive manufacturing becomes more prevalent, it is necessary to understand how the mechanical properties of the final products can be controlled (Torres et al., 2018; Kobryn, Moore, & Semiatin, 2000; Es-Said, Foy-os, Noorani, Mendelson, & Marloth, 2000; Ahn, Montero, Odell, Roundy, & Wright, 2002).
For additive manufacturing, the properties largely depend on the building method and the specific technology used. For instance, fused bonding with powder material and fila-ment can be different. Fusion of adjacent layers typically dominates the properties of material. Filament and deposi-tion orientation largely determine the anisotropic properties of the material. Many build parameters an affect the materi-al properties of the final product. These parameters include the number of contours within a layer, building orientation, raster angle, air gap, deposition speed, volume rate, temper-ature, etc. Material property change with AM build parame-ters, such as build orientation, raster angle and nozzle diam-eter has been reported (Torres et al., 2018).
Numerous researchers have conducted studies on 3D printing technologies and related factors (Bellini & Güçeri, 2003; Lee, Abdullah, & Kahn, 2005; Lee, Kim, Kim, & Ahn, 2007; Sood, Ohdar, & Mahapatra, 2012). Bellini and Güçeri used fused deposition modeling to study the me-chanical characterization of fabricated products. Lee et al. (2005) studied the properties of the product prototype by changing factors such as filament size, building path, and intervals. In addition, the material compressive strength was investigated by Lee et al. (2007) and Sood et al. (2012). Lee et al. (2007) further examined the strength in various direc-tions (anisotropic properties), while Sood, Ohdar, and Ma-hapatra (2010) studied various factors such as raster angle, orientation, thickness of layers, etc. Different building mate-rials such as thermoplastic ULTEM 9085 (Bagsik, 2011), bioextruded poly (Domingos, Chiellini, Gloria, Ambrosio, Bartolo, & Chiellini, 2012), ABS (Ziemian, Sharma, & Ziemian, 2012), lattice material (Park, Rosen, Choi, & Du-ty, 2014), Ti-6Al-4V (Carroll, Palmer, & Beese, 2015), pe-riodic lattice structure with selective laser melting AM method (Liang, Raymont, Yan, Hussein, & Young, 2011), foam/porous material (Gabbrielli, 2009), and porous metal structure (Furumoto, 2015) were studied using this technol-ogy as well. All of these studies presented valuable knowledge about the various factors for a specific AM tech-nique. Torres et al. (2018) explain that among the building
Experimental Design Analysis of 3D Printing Processes in the Optimization of Material
Mechanical Properties ——————————————————————————————————————————————–———–
Shaobiao Cai, Minnesota State University; Sairam Vangapally, Minnesota State University; Yongli Zhao, St. Cloud State University
——————————————————————————————————————————————————International Journal of Modern Engineering | Volume 20, Number 1, Fall/Winter 2019 5
——————————————————————————————————————————————–————
——————————————————————————————————————————————–————
6 International Journal of Modern Engineering | Volume 20, Number 1, Fall/Winter 2019
parameters, some of these parameters may play more signif-icant roles than the others in affecting the material proper-ties of the final product; and, it is expected that the individu-al parameters with the greatest effect can be obtained.
In this current study, the authors performed a comprehen-sive study of previous work as well as current work demon-strating that the different effects of the various factors in-volved and further showing that these factors can be opti-mized. As a comparison, both the fused deposition tech-nique for polylactic acid (PLA) and binder jetting for stain-less steel 316 are presented. Fused deposition uses extruding the molten material (melts) on a defined path; each previ-ously built layer cools readily and forms the foundation for a new layer. Binder jet additive manufacturing, however, uses a binding agent to join the powder particles. Further-more, each type of printer differs. Even within the same type, individual printers can be different. This current study used a well-established experimental design method aimed at providing reliable, tested direction/guidelines for obtain-ing preferable material properties when using additive man-ufacturing technology.
Design Experimentation
The design experimentation of PLA and stainless steel (SS316) are presented below. For this study, it was assumed that: the parameters were independent from other parame-ters not involved in the study and that the number of levels was sufficient; the machines could produce reliable sam-ples; and, the Taguchi experimental design technique used could deliver reliable results. This method is widely used in industry and academic fields to investigate the effects of multiple factors and multiple levels of each factor experi-mentally. With this method, full arrays of combinations may be avoided when the combinations are huge, and partial fractions of a limited number of trials may be used to pro-duce the most information. More details may be found in Torres et al. (2018).
Design with PLA
PLA has been studied recently (Torres et al., 2018). In this current study, three parameters—extruding temperature, deposition rate, and layer thickness—were used to investi-gate the factors affecting the properties of PLA, and three levels of each parameter were tested. Some of the data are presented here for comparison. These levels were defined as 1 (low level), 2 (medium level), and 3 (high level). The lev-els corresponding to each of the parameters were 200ºC (1), 225ºC (2), and 200ºC (3) for extruding temperature (T); 30 mm/s (1), 55 mm/s (2), and 80 mm/s (3) for deposition rate (D); and 0.05 mm (1), 0.13 mm (2), and 0.20 mm (3) for layer thickness (L). For notation, the sample made under T1D1L1 indicates that the operation parameters were at a lower temperature (200ºC), lower deposition rate (30 mm/s), and lower thickness (0.05 mm). For the tempera-
ture, the limits were not used in order to avoid potential unstable issues with the machine. Rather, the high limit used was 10ºC below the maximum, and the low limit was 20ºC higher than the minimum. As with the extruding tempera-ture, levels for the other two parameters were within the capability of the machine as well for the same reason.
For the experiment design, the Taguchi method was used. Based on this method, a partial of nine experimental trials were defined. These nine trials were expected to convey the same information as a full array of 27 trials without losing significance for the three-parameter three-level studies. Three samples were created for each parameter level in the study. The details of the combination array were presented in Torres et al. (2018). Ultimaker machine was used to make the PLA sample bars, and the binder jetting-based ExOne M-lab machine was used to make the stainless steel 316 samples. The PLA samples were first designed with Creo. The computer models were then converted to an STL file and then inputted into the Ultimaker machine in order to create the sample bar using configurations mentioned earlier with the standard Taguchi partial combination array. Three sample bars were created for each trial, and a total of 27 samples were used to examine the effect of the selected pa-rameters. The samples were tested using an MTS machine for tensile strength; details are presented in the Results and Discussions section. The MTS tester was calibrated by the professionals from the MTS Company under testing equip-ment standards.
Design with Stainless Steel 316
To study the mechanical strength of stainless steel 316 built with AM, binder jetting technology was used. This machine has the ability to build metal and metal alloy mate-rials. Stainless steel 316 was chosen for this study, given the many applications of stainless steel. Table 1 shows the com-ponents of this alloy. Layer thickness, sintering time, and sintering temperature were the three parameters selected for the study, and each parameter could vary from low to high levels (two levels). For the three-parameter, two-level ex-perimental design, a full factorial experimental approach was used. Table 2 lists the three process parameters at the corresponding two levels used to set up the machines. Table 1. Chemical composition of SS316 (wt%).
The full factorial design of experiments, three parameters and two levels each, yielded a total of 23 = 8 experimental combinations. Two samples were created for each parame-ter. Table 3 shows the design of the three parameters and two levels of the experiment. In the study, all eight possible combinations were tested. This experimental design was used to produce the parts for the study. The sample used in
C Mn P S Si Cr
0.08 max
2.00 max
0.045 max
0.03 max
0.75 max
16.00-18.00
——————————————————————————————————————————————–————
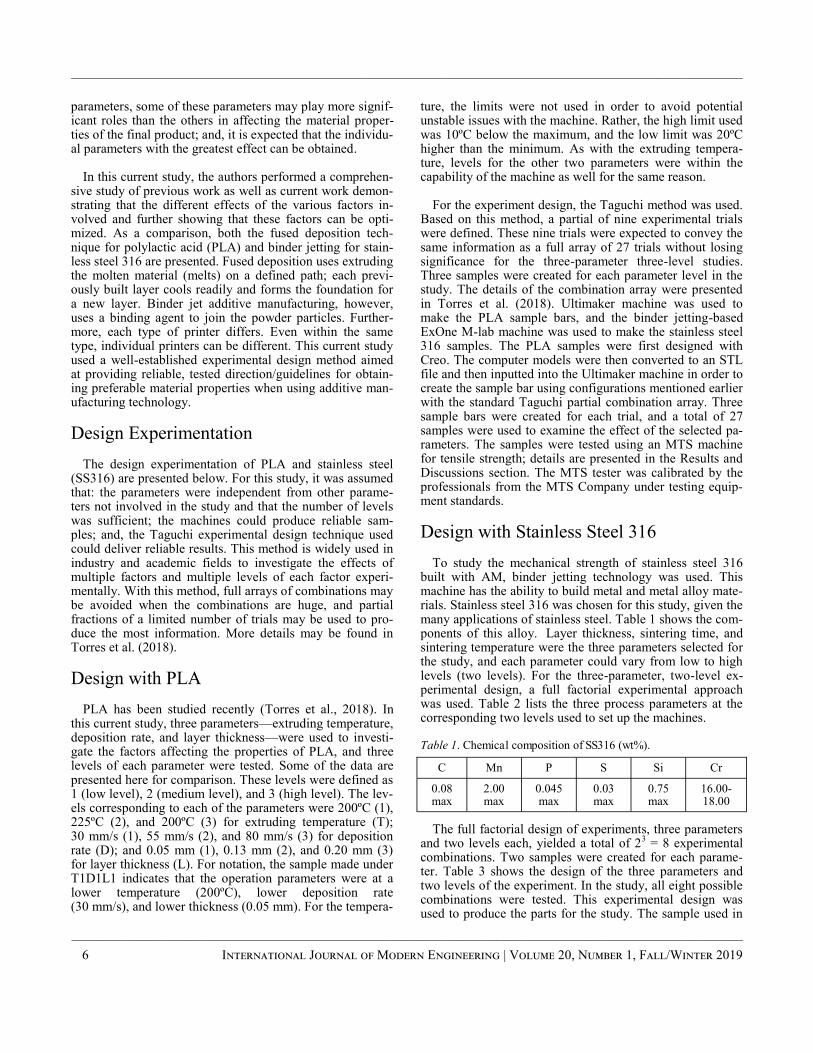
the study was a solid cylinder, 25 mm in length and 10 mm in diameter. To create the samples, the CAD model was designed in Creo Parametric 3.0. Then the CAD model was sliced into layers and the STL model was inputted into the ExOne M-lab machine for printing. The 3D printing process started by loading the stainless steel 316 powder into the bed. Along with the powder, the STL file, binding agent, and cleaning agent were loaded. The powder had an average particle size of 30 µm; the material was obtained from Ex-One and used with no further treatment. Figure 1 shows the samples created with the ExOne M-lab machine. Various structures (with/without lattice) were fabricated so that the structural effect could be studied. However, the focus of this current study was on the solid cylindrical structure without lattice; research on the structural analysis will occur in fu-ture studies. Compression testing on the samples followed ASTM E9 standards for metallic materials. An MTS 810 material testing machine with a 1KN load cell at a constant crosshead speed of 0.1 in/min was used, and the data were recorded for every 0.05 seconds. Table 2. Process parameters and levels.
Table 3. Full factorial experimental plan with low-level (0) and high level (1): A (low 50µm, high 100 µm); B (low 2 hours, high 4 hours); C (low 1120o C, high 1180o C).
Figure 1. Samples of various lattice structures made using binder jetting-based ExOne M-lab.
Results and Discussion
Parameter and Property Analysis of PLA
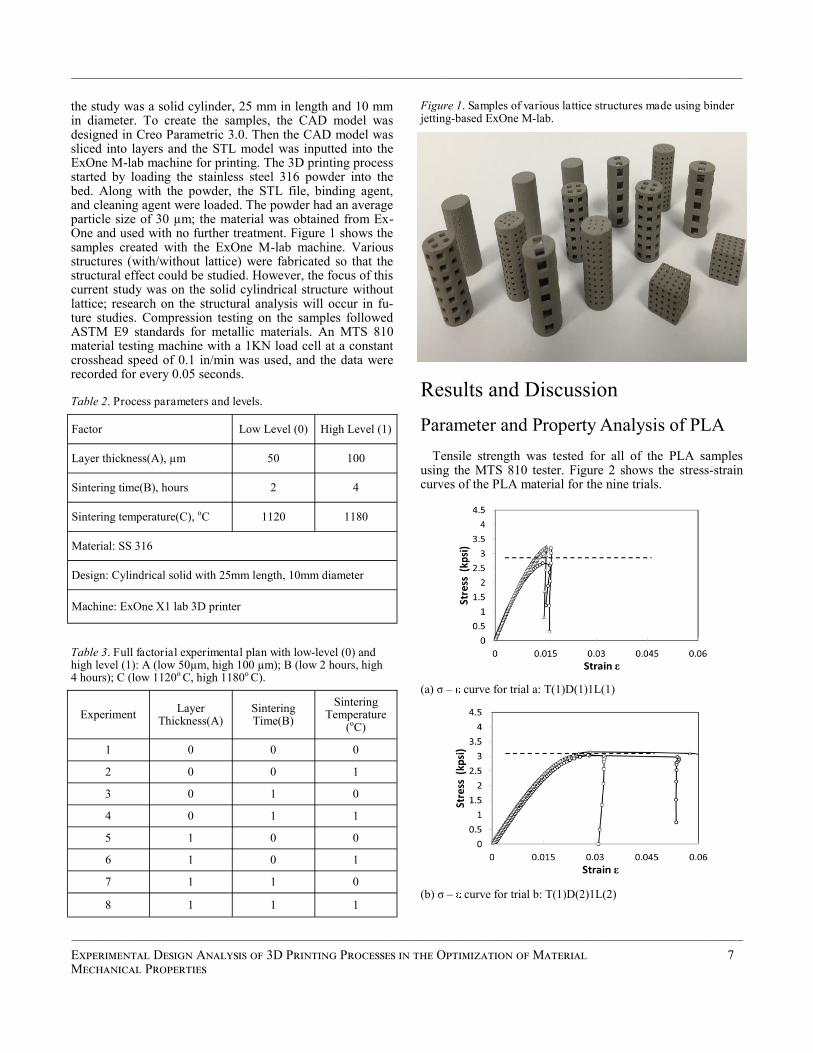
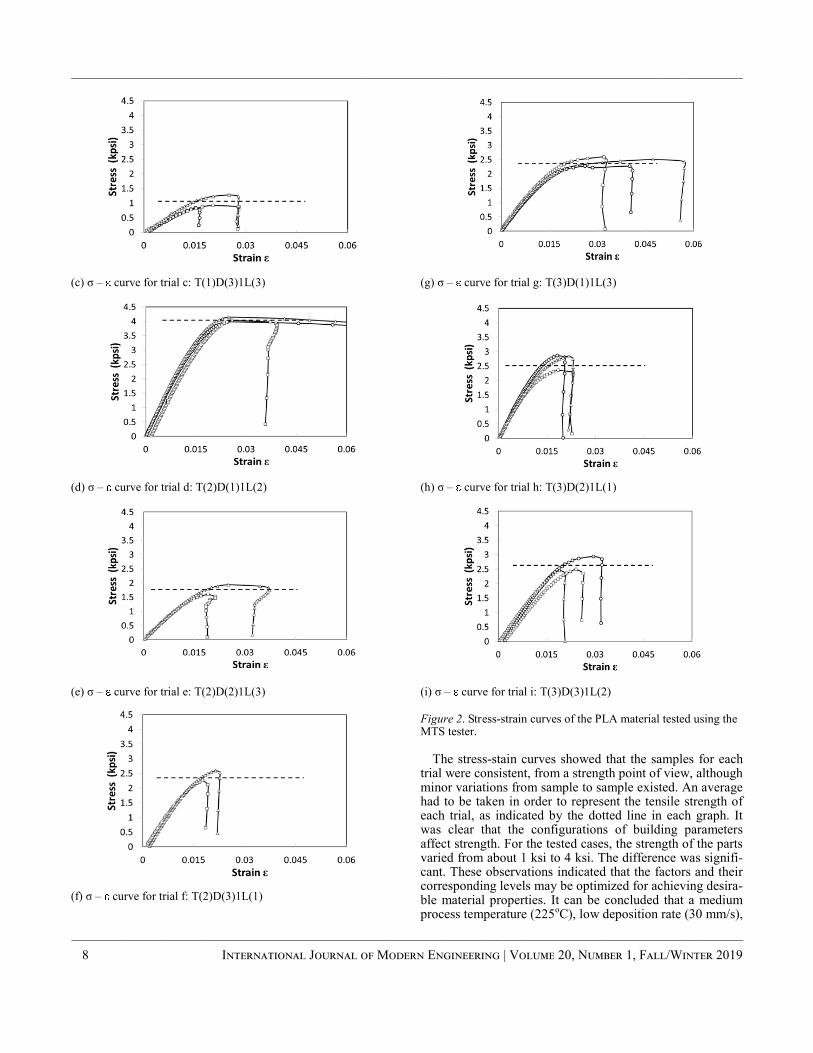
Tensile strength was tested for all of the PLA samples using the MTS 810 tester. Figure 2 shows the stress-strain curves of the PLA material for the nine trials.
(a) σ – curve for trial a: T(1)D(1)1L(1)
(b) σ – curve for trial b: T(1)D(2)1L(2)
——————————————————————————————————————————————————–
Experimental Design Analysis of 3D Printing Processes in the Optimization of Material 7 Mechanical Properties
Factor Low Level (0) High Level (1)
Layer thickness(A), µm 50 100
Sintering time(B), hours 2 4
Sintering temperature(C), oC 1120 1180
Material: SS 316
Design: Cylindrical solid with 25mm length, 10mm diameter
Machine: ExOne X1 lab 3D printer
Experiment Layer
Thickness(A) Sintering Time(B)
Sintering Temperature
(oC)
1 0 0 0
2 0 0 1
3 0 1 0
4 0 1 1
5 1 0 0
6 1 0 1
7 1 1 0
8 1 1 1
——————————————————————————————————————————————–————
——————————————————————————————————————————————–————
8 International Journal of Modern Engineering | Volume 20, Number 1, Fall/Winter 2019
(c) σ – curve for trial c: T(1)D(3)1L(3)
(d) σ – curve for trial d: T(2)D(1)1L(2)
(e) σ – curve for trial e: T(2)D(2)1L(3)
(f) σ – curve for trial f: T(2)D(3)1L(1)
(g) σ – curve for trial g: T(3)D(1)1L(3)
(h) σ – curve for trial h: T(3)D(2)1L(1)
(i) σ – curve for trial i: T(3)D(3)1L(2)
Figure 2. Stress-strain curves of the PLA material tested using the MTS tester.
The stress-stain curves showed that the samples for each
trial were consistent, from a strength point of view, although minor variations from sample to sample existed. An average had to be taken in order to represent the tensile strength of each trial, as indicated by the dotted line in each graph. It was clear that the configurations of building parameters affect strength. For the tested cases, the strength of the parts varied from about 1 ksi to 4 ksi. The difference was signifi-cant. These observations indicated that the factors and their corresponding levels may be optimized for achieving desira-ble material properties. It can be concluded that a medium process temperature (225oC), low deposition rate (30 mm/s),
——————————————————————————————————————————————–————
and medium layer thickness (0.13 mm) represent the opti-mized design configuration for producing the highest tensile strength for the PLA material using the specific 3D printing machine, Ultimaker 2. To generalize, this may apply to all fused deposition-based 3D printing processes with similar principles, though the exact temperature, deposition rate, and layer thickness may vary depending on the specific ma-chine.
Property and Processing Parameter Analysis of Stainless Steel 316
To study the effect of the design parameters on metal and metal alloy materials, stainless steel 316 was chosen, due to its broad applications. Compression testing on the samples was done according to ASTM E9 standards for metallic materials. The MTS 810 material testing system with a 1 KN load cell at a constant crosshead speed of 0.1 in/min was used and the data were recorded every 0.05 seconds. Table 4 shows the compressive strength and shrinkage of the experimental samples. The compressive strength ranged from 82.89 MPa to 1780.5 MPa; the radial shrinkage ranged from 0.06% to 3.72%; and, the longitudinal shrinkage ranged from 0% to 2.945%. These observations show that the process parameters, layer thickness, sintering time, and sintering temperature can significantly affect the compres-sive strength and shrinkage of the fabricated stainless steel 316 part, and optimal higher strength of the part can be achieved through control of the processing parameters. Table 4. Experimental results of compressive strength and shrinkage of the samples.
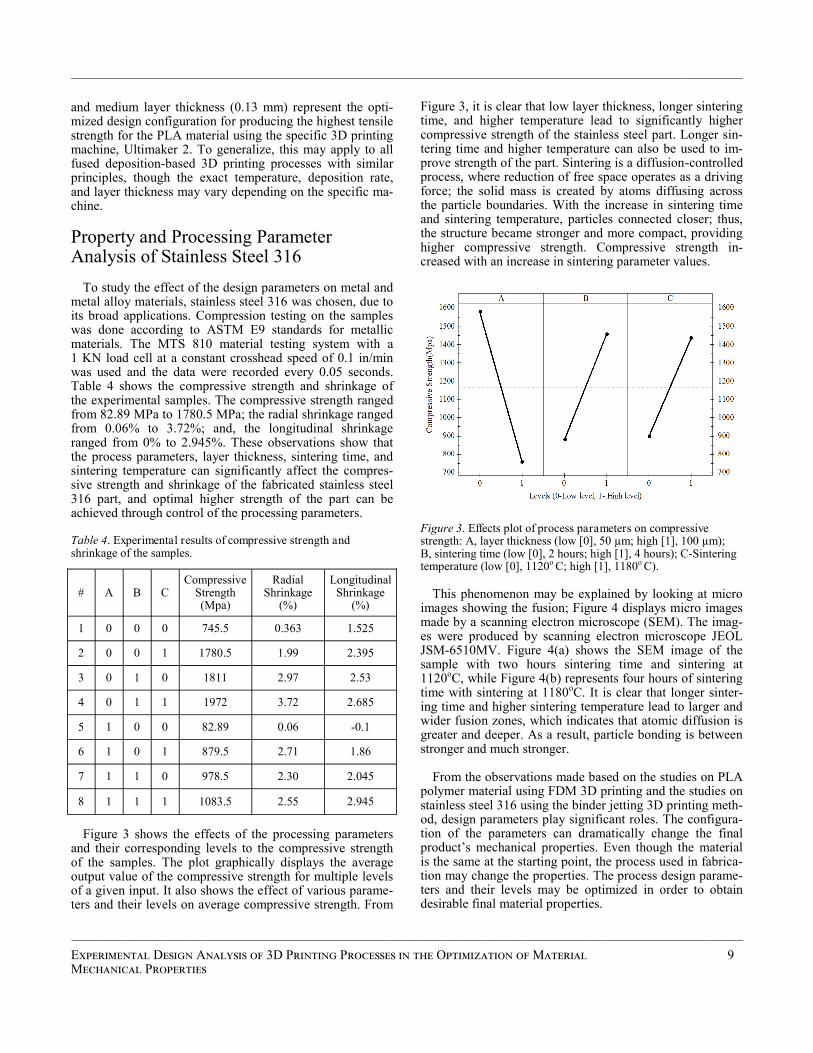
Figure 3 shows the effects of the processing parameters and their corresponding levels to the compressive strength of the samples. The plot graphically displays the average output value of the compressive strength for multiple levels of a given input. It also shows the effect of various parame-ters and their levels on average compressive strength. From
Figure 3, it is clear that low layer thickness, longer sintering time, and higher temperature lead to significantly higher compressive strength of the stainless steel part. Longer sin-tering time and higher temperature can also be used to im-prove strength of the part. Sintering is a diffusion-controlled process, where reduction of free space operates as a driving force; the solid mass is created by atoms diffusing across the particle boundaries. With the increase in sintering time and sintering temperature, particles connected closer; thus, the structure became stronger and more compact, providing higher compressive strength. Compressive strength in-creased with an increase in sintering parameter values.
Figure 3. Effects plot of process parameters on compressive strength: A, layer thickness (low [0], 50 µm; high [1], 100 µm); B, sintering time (low [0], 2 hours; high [1], 4 hours); C-Sintering temperature (low [0], 1120o C; high [1], 1180o C).
This phenomenon may be explained by looking at micro
images showing the fusion; Figure 4 displays micro images made by a scanning electron microscope (SEM). The imag-es were produced by scanning electron microscope JEOL JSM-6510MV. Figure 4(a) shows the SEM image of the sample with two hours sintering time and sintering at 1120oC, while Figure 4(b) represents four hours of sintering time with sintering at 1180oC. It is clear that longer sinter-ing time and higher sintering temperature lead to larger and wider fusion zones, which indicates that atomic diffusion is greater and deeper. As a result, particle bonding is between stronger and much stronger.
From the observations made based on the studies on PLA polymer material using FDM 3D printing and the studies on stainless steel 316 using the binder jetting 3D printing meth-od, design parameters play significant roles. The configura-tion of the parameters can dramatically change the final product’s mechanical properties. Even though the material is the same at the starting point, the process used in fabrica-tion may change the properties. The process design parame-ters and their levels may be optimized in order to obtain desirable final material properties.
# A B C Compressive
Strength (Mpa)
Radial Shrinkage
(%)
Longitudinal Shrinkage
(%)
1 0 0 0 745.5 0.363 1.525
2 0 0 1 1780.5 1.99 2.395
3 0 1 0 1811 2.97 2.53
4 0 1 1 1972 3.72 2.685
5 1 0 0 82.89 0.06 -0.1
6 1 0 1 879.5 2.71 1.86
7 1 1 0 978.5 2.30 2.045
8 1 1 1 1083.5 2.55 2.945
——————————————————————————————————————————————————–
Experimental Design Analysis of 3D Printing Processes in the Optimization of Material 9 Mechanical Properties
——————————————————————————————————————————————–————
——————————————————————————————————————————————–————
10 International Journal of Modern Engineering | Volume 20, Number 1, Fall/Winter 2019
(a) Two hours at 1120ºC
(b) Four hours at 1180ºC
Figure 4. SEM images of samples made at sintering time and temperature.
Conclusions
The studies on PLA polymer using the fused deposition method and stainless steel 316 with the binder jetting meth-od were presented. The process design parameters and their corresponding various levels were studied. Tensile strength for the PLA polymer material and compressive stress for stainless steel 316 were studied. It was found that the design parameters and their corresponding levels for obtaining de-sirable mechanical properties can be optimized for both cases. For the PLA material, medium process temperature, low deposition rate, and medium layer thickness represented the optimal design configuration for producing the highest tensile strength. For stainless steel 316, cylindrical samples were fabricated for each run of the experimental plan with different process parameters. Sintering time, sintering tem-perature, and layer thickness were analyzed for their effects on compressive strength. The optimal responses considered in the study were high compressive strength and low radial
and longitudinal shrinkage rates. The optimal parameters for high compressive strength were low layer thickness, longer sintering time, and higher sintering temperature, because the latter two lead to a larger, wider fusion zone. This indicates that atomic diffusion is greater and deeper, and the fusion zone forms a larger portion if the layer is thinner. The iden-tified optimal parameters might not be the same for different materials, but the study serves as a guide for adjusting print-ing parameters for different materials.
Although the technologies involved in AM 3D printing are different, the principles of adding layers are the same, and it is clear that the design parameters and their levels may significantly affect the properties of the final part. To design and fabricate a part with specific materials, its me-chanical properties may be optimized through appropriate control of the processing parameters and their levels. Future studies can be conducted on more parameters at more levels using structural design analysis to provide yet more insight into design materials and structures with this important manufacturing method.
References
Ahn, S. H., Montero, M., Odell, D., Roundy, S., & Wright,
P. K. (2002). Anisotropic material properties of fused deposition modeling ABS. Rapid Prototyping Journal, 8(4), 248-257.
Bagsik, A. (2011). Mechanical properties of fused deposi-tion modeling parts manufactured with ULTEM 9085. Proceedings of the 69th Annual Technical Conference of the Society of Plastics Engineers. Richardson, TX: Society of Plastics Engineers.
Bellini, A., & Güçeri, S. (2003). Mechanical characteriza-tion of parts fabricated using fused deposition model-ing. Rapid Prototyping Journal, 9(4), 252-264.
Carroll, B., Palmer, T., & Beese, A. (2015). Anisotropic tensile behavior of Ti-6Al-4V components fabricated with directed energy deposition additive manufacturing. Acta Materiala, 87, 309-320.
Domingos, M., Chiellini, F., Gloria, A., Ambrosio, L., Bartolo, P., & Chiellini, E. (2012). Effect of process parameters on the morphological and mechanical prop-erties of 3D bioextruded poly (1-caprolactone) scaf-folds. Rapid Prototyping Journal, 18(1), 56-67.
Es-Said, O., Foyos, J., Noorani R., Mendelson, M., & Mar-loth, R. (2000). Effect of layer orientation on mechani-cal properties of rapid prototyped samples. Materials and Manufacturing Processes, 15, 107-22.
Furumoto, T. (2015). Permeability and strength of a porous metal structure fabricated by additive manufacturing. Journal of Material Processing Technology, 219, 10-16.
Gabbrielli, R. (2009). Foam geometry and structural design of porous material. (Unpublished doctoral disserta-tion). University of Bath, Bath, Somerset, United King-dom.
——————————————————————————————————————————————–————
Kobryn, P. A., Moore, E. H., & Semiatin, S. L. (2000). The effect of laser power and traverse speed on microstruc-ture, porosity, and build height in laser-deposited Ti-6Al-4V, Scripta Materialia, 43(4), 299-305.
Lee, B. H., Abdullah, J., & Khan, Z. (2005). Optimization of rapid prototyping parameters for production of flexi-ble ABS object. Journal of Materials Processing Tech-nology, 169(1), 54-61.
Lee, C. S., Kim, S. G., Kim, H. J., & Ahn, S. H. (2007). Measurement of anisotropic compressive strength of rapid prototyping parts. Journal of Materials Processing Technology, 187/188, 627-630.
Liang, H., Raymont, D., Yan, C., Hussein, A., & Young, P. (2011, October). Design and additive manufacturing of cellular lattice structures. Proceedings of the 5th Inter-national Conference on Advanced Research in Virtual and Rapid Prototyping. Boca Raton, FL: CRC Press. doi: 10.1201/b11341-40
Park, S., Rosen, D., Choi, S., & Duty, C. (2014). Effective mechanical properties of lattice material fabricated by material extrusion additive manufacturing. Additive Manufacturing, 1-4, 12-23.
Sood, A. K., Ohdar, R. K., & Mahapatra, S. S. (2012). Ex-perimental investigation and empirical modelling of FDM process for compressive strength improvement. Journal of Advanced Research, 3, 81-90.
Sood, A. K., Ohdar, R. K., & Mahapatra, S. S. (2010). Para-metric appraisal of mechanical property of fused depo-sition modelling processed parts. Materials & Design, 31, 287-295.
Torres, P., Sandback, T., & Cai, S. (2018). Parametric anal-ysis of building parameters to maximize strength of material using additive manufacturing. International Refereed Journal of Engineering and Science, 7(1), 25-34.
Ziemian, C., Sharma, M., & Ziemian, S. (2012). Anisotropic mechanical properties of ABS parts fabricated by fused deposition modelling. In M. Gokcek (Ed.). Mechanical engineering (pp. 159-180). Retrieved from https://www.intechopen.com/books/mechanical-engineering
Biographies
SHAOBIAO CAI is an assistant professor in the De-partment of Mechanical and Civil Engineering at Minnesota State University, Mankato. His interests include materials, design, and manufacturing. His areas of expertise and re-search interests include interfacial contact mechanics and tribology, mechanical failure of materials, layered medium design, hydrophobic and hydrophilic micro/nano roughness modeling/fabrication and their various multidisciplinary applications, and the application of DFMA principles in the development of robust design solutions. He is a registered professional engineer in the state of Minnesota. He is a member of the American Society of Mechanical Engineers and the Society of Tribologists and Lubrication Engineers. Dr. Cai may be reached at [email protected]
SAIRAM VANGAPALLY is a graduate student in the Department of Mechanical and Civil Engineering at Minne-sota State University, Mankato. Mr. Vangapally may be reached at [email protected]
YONGLI ZHAO is a professor in the Department of Mechanical and Manufacturing Engineering at St. Cloud State University. Dr. Zhao may be reached at [email protected]
——————————————————————————————————————————————————–
Experimental Design Analysis of 3D Printing Processes in the Optimization of Material 11 Mechanical Properties
Abstract
In this paper, the author presents the mouthpiece design geometry and powder mixture homogeneity effects of three respiratory drug delivery devices (RDDDs) to the aerody-namic and electromechanical properties of generated inhala-ble submicron particles. These devices are commonly known as dry-powder inhalers (DPIs). Currently, DPI is considered as the preferred type of pulmonary drug admin-istration device with the greatest potential for other biomed-ical applications. The generation and inhalation of aeroso-lized submicron particles from the DPIs gained much atten-tion in the late 1980s, when the Montreal protocol was de-signed to discourage production of chlorofluorocarbon (CFC) propellant, a widely used aerosolization component in the popular metered dose inhaler.
Montreal protocol on controlling ozone depleted CFC
chemicals became a major drive for the design and manu-facturing technology of the DPI. The successful delivery of drugs deep into the lungs depends on various aerodynamic and electromechanical properties of generated particles from the devices. Effects of the mechanistic behaviors of the DPI design geometry, and integration between device performance and powder formulations are prime subjects for investigation. An electronic single-particle aerodynamic relaxation time analyzer, which functions on the laser Dop-pler velocimetry principal, was employed in order to meas-ure submicron particles’ charge and size in real time.
Results revealed that the generated aerosol particles from
all three DPIs were found to not only have different size distributions but also varied in their charge distributions. The net charge-to-mass ratio of DPI 1, 2, and 3 particles were 3.80 µC/g, 1.37 µC/g, and 1.45 µC/g, respectively. Count and mass distributions of the particles were reproduc-ible (p<0.05) for all DPIs. Variations in electrical, mechani-cal, and aerodynamic properties of the DPI aerosols can be explained by the combined effects of triboelectrification charging between carrier and active drug powders, delivery device geometries, polymeric material surfaces of delivery devices, and drug/carrier homogeneities.
Introduction
Dry-powder inhalers (DPIs) are a popular type of respira-
tory drug delivery device (RDDD), which generates an in-halable aerosolized particulate form of medications for the treatment of asthma and chronic obstructive pulmonary dis-ease. The generation and inhalation of aerosolized fine and ultrafine particles from the DPIs gained much attention in the late 1980s, when the Montreal protocol was designed to discourage production of CFC propellant, a widely used aerosolization component in the popular metered dose inhal-er (WMO, 2018). The Montreal protocol, on controlling ozone depleted CFC chemicals, became a major drive for the design and manufacturing of the DPI (de Boer et al., 2017). DPIs are breath-actuated devices, requiring inspirato-ry flow rates of 30-130 L/min to successfully generate an aerosolized bolus of drug/carrier powders (Labiris & Dolo-vich, 2003). The manufacturing technologies related to DPI drug dose preparation and releasing techniques and mouth-piece geometries have been constantly improved in order to fulfill the requirements of the biomedical device industry. The device features have consequential relationships with the emitted drug/carrier powder aerosol properties. The suc-cessful delivery of drugs deep into the lung depends on vari-ous aerodynamic and electromechanical properties of gener-ated particles. Precise quantification of these properties is not only convincing but also serve as a guide for better man-ufacturing techniques to satisfy the growing RDDD industry (BCC Research, 2018).
Mathematical Simulation on DPI Mouth-piece and Aerosol Generation
Numerical and computational fluid dynamics (CFD) mod-eling studies have quasi-successfully predicted the respira-tory aerosol flow and generation from the DPI mouthpiece inlets. Huynh et al. (2015) adopted the Boltzmann sigmoidal modified function (see Equation 1) to determine the rate of emptying of powder formulations from the DPIs. Addition-ally, they used a laser diffraction apparatus to determine the powder concentration of the aerosolized sample. The aero-solized sample defined as laser light intensity reduction (or obscuration) in the apparatus’s measurement cell is used as a function of aerosolization time.
Mechanistic Implications of Mouthpiece Design Geometry and Powder Mixture Homogeneities
on Successful Generation of Aerosolized Submicron Particles from Respiratory
Drug Delivery Devices ——————————————————————————————————————————————–———–
Mohammed Ali, the University of Texas at Tyler
——————————————————————————————————————————————–————
12 International Journal of Modern Engineering | Volume 20, Number 1, Fall/Winter 2019
——————————————————————————————————————————————–————
(1) where, %PO is the peak calculated obscuration value in percentage form; t50 is the time taken to reach half of %PO in seconds; and, tempty is the slope of the function, with a larger tempty value indicating a slower emptying behavior of the inhaler.
Results showed that the increase in powder residence time inside the inhaler increases the interaction among the dis-persed powder, air-stream, and device walls. This action potentially affected the powder-release behavior and subse-quent dispersion performance. In the assessment of DPI powder de-agglomeration behaviors, mathematical model-ing plays a key role in the interpretation of the powder re-lease from DPI systems (Huynh et al., 2015). Another study adopted the Reynolds-Averaged Navier-Stokes equation (or RANS equation) for idealized mouth geometry to under-stand aerosol flow and deposition from the DPI mouthpiec-es (Ilie, Matida, & Finlay, 2008). A good agreement was found when compared with experimentally measured data. The RANS is a time-averaged mass conservation equation of motion for the aerosolized form of turbulent fluid flow through DPI devices, which can be described by Equation 2:
(2) where, u, ū, and ú represent the instantaneous, mean, and fluctuating terms of aerosol flow velocity, respectively;is the mean pressure; is a vector representing external forces; µ is dynamic viscosity; and, xi and xj are position vectors.
The basic tool required for the derivation of the RANS equations from the instantaneous Navier–Stokes equations is the Reynolds decomposition of flow velocity (Anderson, 2009). Reynolds decomposition refers to the separation of the flow variable (like velocity u) into the mean (time-averaged) component (ū) and the fluctuating component (ú). Due to the fact that the mean operator is a Reynolds opera-tor, it has a set of properties. One of these properties is that the mean of the fluctuating quantity is equal to zero (ú =0). All of these studies concluded that the application of CFD in the design of mouthpieces as well as DPI is often diffi-cult, due to the highly complex nature of aerosol generation from drug-carrier powders. However, they do provide valu-able insight into certain aspects of device performance. Moreover, computing power becomes limited when it re-quires the implementation of numerical methods to the DPI design. Yet, the most useful application of CFD usually happens when concurrent CFD and experimental results are analyzed.
p
if
Design Implications to Particle Aerody-namic Size and Electrostatic Charge
Typically, DPI products consist of a drug formulation (the drug constituent part) and a container closure system. DPI drug formulation contains the drug substance and carrier excipients (e.g., lactose), which provides for uniformity and flow-ability of a blend during manufacturing. Carriers can also enhance the reproducibility of the metered, fine-particle dose by reducing agglomeration of the drug substance. A DPI container closure system consists of the device constit-uent part (DCP) and any protective secondary packaging (e.g., an overwrap). The materials used to fabricate the DCP may come in direct contact with either the formulation or the patient, thereby potentially affecting product safety and performance. For instance, drug particle-surface interac-tions, such as adhesion of drug onto mouthpiece surfaces, can affect the delivered dose drug/carrier homogeneities, aerodynamic particle size distribution, and the particles’ electrostatic charge distributions.
The DCP of an RDDD acts as the delivery system of the drug, its design, geometry, and dimensions. This can influ-ence device resistance, air flow, shear, and turbulence gen-erated within the DCP. The Food and Drug Administration recommends that RDDD manufacturers use experimental and modeling studies on their formulations, production pro-cesses, and DCP designs. This is recommended in order to identify the quality target product profile, critical quality attributes, and potential risks to the product, and then initi-ate product and process development to define a control strategy that eliminates or mitigates the risks (FDA, 2018). In DPI carrier-drug formulation, particular interactions within the formulation govern both the drug dissociation from carrier particles and the disaggregation of the drug into primary particles with a capacity to generate respirable (aerodynamic diameter or size, da, range from 0.5 µm to 10 µm) and penetrable deep into the lungs. Formulations must achieve two challenging characteristics: adhesion be-tween carrier and drug must be sufficient for the blend to be stable, yet weak enough to enable release of the drug from the carrier during patient inhalation.
Also, to be enabled as a consistent dose while metering
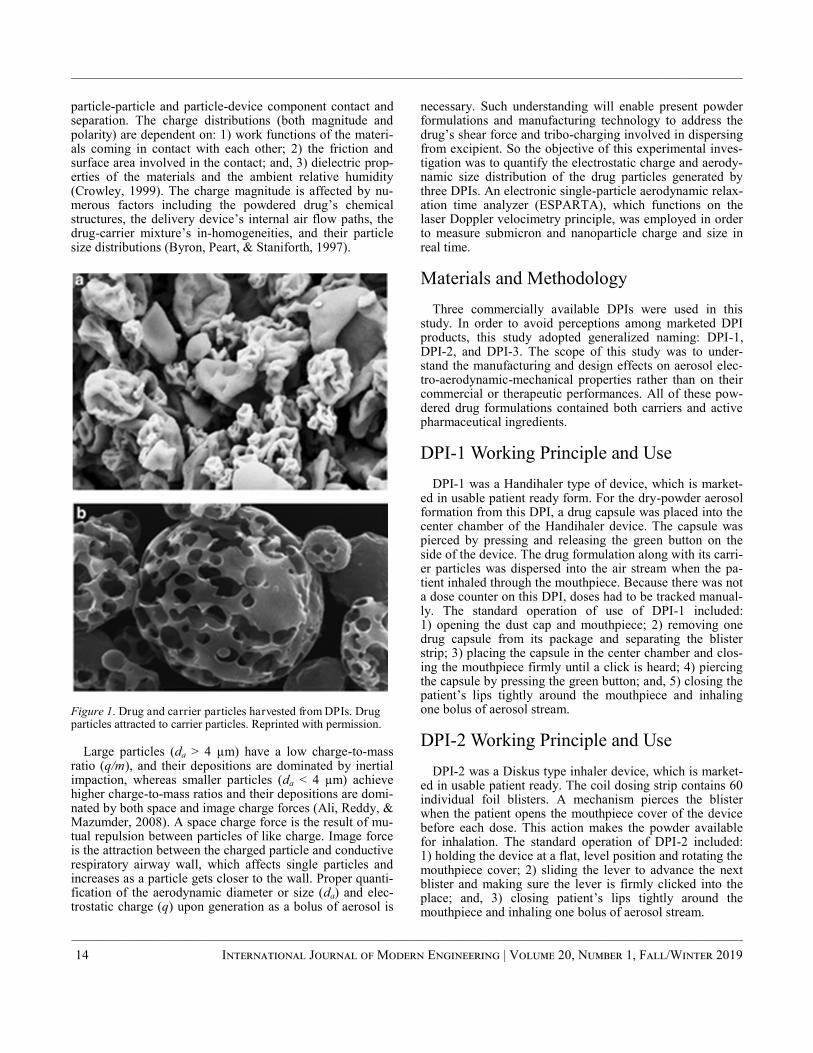
inside the DPI device, the drug-carrier powders must have flow properties. In addition, the powder should be capable of de-agglomerating while flowing in air-stream, and the inter-particulate interaction of inhalation powders needs to be understood in order to advance DPI formulation. Particle engineering technology demonstrated that highly irregular carrier particles with relatively large geometric diameters disperse readily, due to limited surface contact points with drug particles (see Figure 1). Reports from experimental studies found in the literature established that respiratory powdered drug particles aerosolized from DPIs may charge electrostatically (Ali, Mazumder, & Martonen, 2009). These particles acquire charge via electron and ion transfer during
50
%PO
1 expempty
y tt t
t
i i ij i ij
j j j i
u u uu f p u u
x x x x
——————————————————————————————————————————————————–
Mechanistic Implications of Mouthpiece Design Geometry and Powder Mixture Homogeneities on 13 Successful Generation of Aerosolized Submicron Particles from Respiratory Drug Delivery Devices
——————————————————————————————————————————————–————
——————————————————————————————————————————————–————
14 International Journal of Modern Engineering | Volume 20, Number 1, Fall/Winter 2019
particle-particle and particle-device component contact and separation. The charge distributions (both magnitude and polarity) are dependent on: 1) work functions of the materi-als coming in contact with each other; 2) the friction and surface area involved in the contact; and, 3) dielectric prop-erties of the materials and the ambient relative humidity (Crowley, 1999). The charge magnitude is affected by nu-merous factors including the powdered drug’s chemical structures, the delivery device’s internal air flow paths, the drug-carrier mixture’s in-homogeneities, and their particle size distributions (Byron, Peart, & Staniforth, 1997).
Figure 1. Drug and carrier particles harvested from DPIs. Drug particles attracted to carrier particles. Reprinted with permission.
Large particles (da > 4 µm) have a low charge-to-mass ratio (q/m), and their depositions are dominated by inertial impaction, whereas smaller particles (da < 4 µm) achieve higher charge-to-mass ratios and their depositions are domi-nated by both space and image charge forces (Ali, Reddy, & Mazumder, 2008). A space charge force is the result of mu-tual repulsion between particles of like charge. Image force is the attraction between the charged particle and conductive respiratory airway wall, which affects single particles and increases as a particle gets closer to the wall. Proper quanti-fication of the aerodynamic diameter or size (da) and elec-trostatic charge (q) upon generation as a bolus of aerosol is
necessary. Such understanding will enable present powder formulations and manufacturing technology to address the drug’s shear force and tribo-charging involved in dispersing from excipient. So the objective of this experimental inves-tigation was to quantify the electrostatic charge and aerody-namic size distribution of the drug particles generated by three DPIs. An electronic single-particle aerodynamic relax-ation time analyzer (ESPARTA), which functions on the laser Doppler velocimetry principle, was employed in order to measure submicron and nanoparticle charge and size in real time.
Materials and Methodology
Three commercially available DPIs were used in this study. In order to avoid perceptions among marketed DPI products, this study adopted generalized naming: DPI-1, DPI-2, and DPI-3. The scope of this study was to under-stand the manufacturing and design effects on aerosol elec-tro-aerodynamic-mechanical properties rather than on their commercial or therapeutic performances. All of these pow-dered drug formulations contained both carriers and active pharmaceutical ingredients.
DPI-1 Working Principle and Use
DPI-1 was a Handihaler type of device, which is market-ed in usable patient ready form. For the dry-powder aerosol formation from this DPI, a drug capsule was placed into the center chamber of the Handihaler device. The capsule was pierced by pressing and releasing the green button on the side of the device. The drug formulation along with its carri-er particles was dispersed into the air stream when the pa-tient inhaled through the mouthpiece. Because there was not a dose counter on this DPI, doses had to be tracked manual-ly. The standard operation of use of DPI-1 included: 1) opening the dust cap and mouthpiece; 2) removing one drug capsule from its package and separating the blister strip; 3) placing the capsule in the center chamber and clos-ing the mouthpiece firmly until a click is heard; 4) piercing the capsule by pressing the green button; and, 5) closing the patient’s lips tightly around the mouthpiece and inhaling one bolus of aerosol stream.
DPI-2 Working Principle and Use
DPI-2 was a Diskus type inhaler device, which is market-ed in usable patient ready. The coil dosing strip contains 60 individual foil blisters. A mechanism pierces the blister when the patient opens the mouthpiece cover of the device before each dose. This action makes the powder available for inhalation. The standard operation of DPI-2 included: 1) holding the device at a flat, level position and rotating the mouthpiece cover; 2) sliding the lever to advance the next blister and making sure the lever is firmly clicked into the place; and, 3) closing patient’s lips tightly around the mouthpiece and inhaling one bolus of aerosol stream.
——————————————————————————————————————————————–————
DPI-3 Working Principle and Use
DPI-3 was a Turbuhaler type device in usable patient
ready form. This kind of DPI contains a reservoir of 200 doses of drug-carrier powders. For each dose to be inhaled as a bolus of aerosol, it is necessary to twist the grip at the base of the device to rotate a disk contained of small cylin-ders. Those disks are filled with powder from the reservoir. The standard operation of DPI-3 included: 1) holding the inhaler in an upright position; 2) twisting the brown grip as far as it will go in one direction; 3) twisting the grip all the way back in the other direction; and, 4) inhale one bolus of aerosol stream. The cohesive nature of inhalation of aeroso-lized powders makes it necessary to impart significant ener-gy to the mouthpiece to efficiently disperse and de-agglomerate the powder so that sufficient aerosol will be generated and inhaled in order to achieve a therapeutic ad-vantage (Stein & Thiel, 2017).
Experimental Setup
The electronic single-particle aerodynamic relaxation
time analyzer (ESPARTA) was used to determine the DPI-generated particles in real time. In characterizing aeroso-lized submicron particles, the laser Doppler velocimetry (LDV) technique is a popular method. Optoelectronic meas-urements, including LDV, are non-intrusive and have fast response times and high data measurement accuracy. Fur-thermore, there has been a tremendous amount of interest and success in the real-time analysis of aerosols upon gener-ation. ESPARTA incorporates the methodology of the LDV principle, which measures simultaneously both aerodynamic diameter and electrostatic charge (magnitude and polarity) of DPI aerosol particles. Its application in the area of RDDDs was demonstrated elsewhere (Ali et al., 2009; Ma-zumder, Wilson, & Wankum, 1989). The suction pump of the ESPARTA-sampled aerosol occurred at the rate of 1 L/min (through aerosol inlet). The flow was directed down-wards through a sensing volume of concentrated beams of laser radiation.
During sampling, each particle traveled through converg-ing laser beams and experienced AC electrical excitation, which made it oscillate horizontally. A photomultiplier was used to measure the intensity of the scattered light generated by each particle as it passed through the sensing volume. The electronic signal and data processor analyzed the phase lag of the particle’s motion with respect to the AC electrical field driving the particle. The aerodynamic size was derived from the phase lag value. The direction and amplitude of the electrical migration velocity of the particle with respect to the electrical field provided the polarity and magnitude of its electrostatic charge. Figure 2 illustrates the schematic effects of the experimental setup. ESPARTA operates in two modes, as per its design and working principle. In mode 1, it measures the aerodynamic size of each particle and whether the particle is charged or uncharged. Acquired aer-
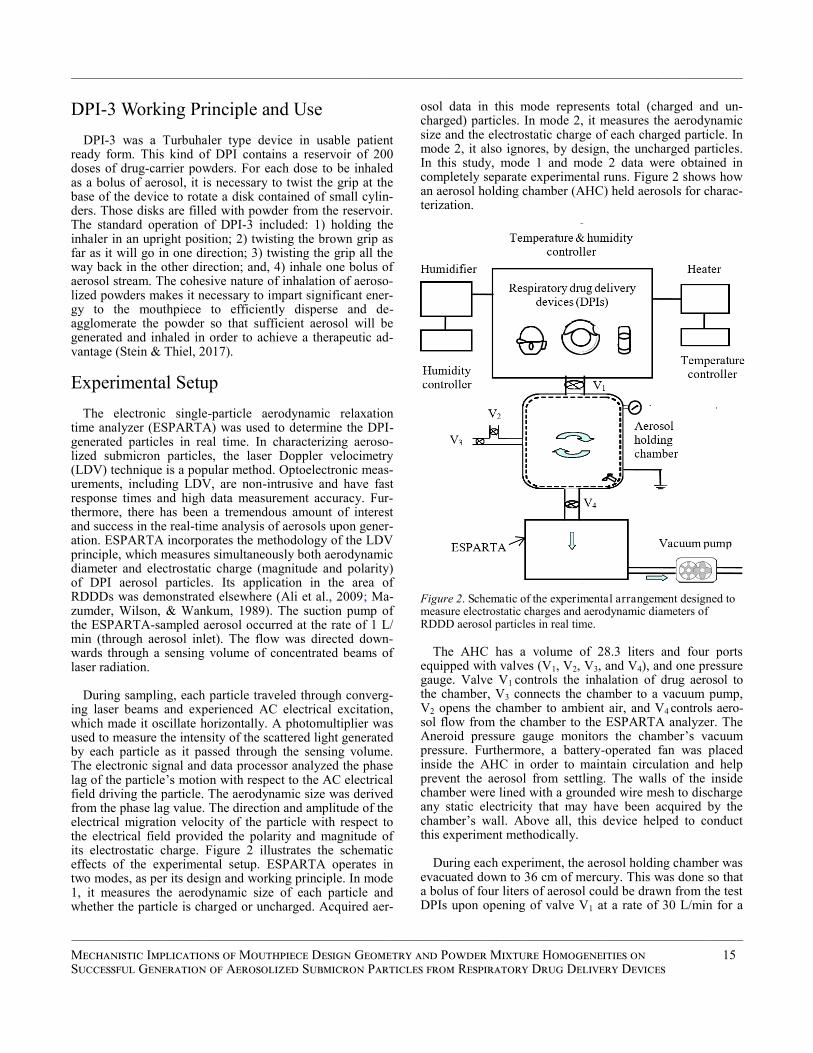
osol data in this mode represents total (charged and un-charged) particles. In mode 2, it measures the aerodynamic size and the electrostatic charge of each charged particle. In mode 2, it also ignores, by design, the uncharged particles. In this study, mode 1 and mode 2 data were obtained in completely separate experimental runs. Figure 2 shows how an aerosol holding chamber (AHC) held aerosols for charac-terization.
Figure 2. Schematic of the experimental arrangement designed to measure electrostatic charges and aerodynamic diameters of RDDD aerosol particles in real time.
The AHC has a volume of 28.3 liters and four ports
equipped with valves (V1, V2, V3, and V4), and one pressure gauge. Valve V1 controls the inhalation of drug aerosol to the chamber, V3 connects the chamber to a vacuum pump, V2 opens the chamber to ambient air, and V4 controls aero-sol flow from the chamber to the ESPARTA analyzer. The Aneroid pressure gauge monitors the chamber’s vacuum pressure. Furthermore, a battery-operated fan was placed inside the AHC in order to maintain circulation and help prevent the aerosol from settling. The walls of the inside chamber were lined with a grounded wire mesh to discharge any static electricity that may have been acquired by the chamber’s wall. Above all, this device helped to conduct this experiment methodically.
During each experiment, the aerosol holding chamber was evacuated down to 36 cm of mercury. This was done so that a bolus of four liters of aerosol could be drawn from the test DPIs upon opening of valve V1 at a rate of 30 L/min for a
——————————————————————————————————————————————————–
Mechanistic Implications of Mouthpiece Design Geometry and Powder Mixture Homogeneities on 15 Successful Generation of Aerosolized Submicron Particles from Respiratory Drug Delivery Devices
——————————————————————————————————————————————–————
——————————————————————————————————————————————–————
16 International Journal of Modern Engineering | Volume 20, Number 1, Fall/Winter 2019
period of eight seconds (30 L/min x 8 s = 4.0 L). The con-cept of 4L inhalation is a recommendation by the FDA (2018). The flow rate was determined using an Extech heavy duty hot wire thermo-anemometer (Extech Instru-ments, n.d.). To characterize DPI aerosols, RDDD scientists agreed that bolus inhalations be employed in order to com-ply with standard operating conditions. For that reason, the author of this current study adopted this methodology. A humidity-controlled chamber was used to preserve a con-stant relative humidity (RH) in the AHC. The inhalation experiments with all DPIs were conducted by holding them in the top opening of valve V1. Hence, the inhalation of bo-lus aerosol through V1, while the DPI was placed inside the humidity-and temperature-controlled chamber along with sampling from the AHC, was done purposely to simulate the temperature and humidity inside a patient’s mouth. The constant temperature and humidity were maintained by an Electro-tech Systems 5100-240 controller (Electro-tech Sys-tems, n.d.) at 37oC and 95%, respectively.
Evacuation of the AHC and inhalation of a total of 4L of drug/carrier powder aerosols was done in order to comply with DPI drug administration to a COPD adult patient. The AHC was cleaned before each run of the experiment. The DPI devices were made ready for inhalation as per standard operating procedures described in the Materials and Meth-odology section. The DPI mouthpieces were placed at inlet valve V1 just before opening it. Once the AHC was filled, valves V1, V2, and V3 were closed and the circulation fan started. Valve V4 was then opened for sampling by the ES-PARTA for a period of five minutes. Thus, it was unlikely that variation in the quantity of the drug/carrier powder in each dose of the individual DPI affected the measurements. Also, comparisons of the portion of charged particles in each bolus were not affected. The repetitive procedure was continued for five consecutive runs. Aerodynamic size and electrostatic charge distribution were measured in each case.
Results and Discussion
The cost in 2015 for the respiratory drug manufacturing industry to market medications for such ailments as asthma and COPD was $9.9 billion. This final cost analysis in-cludes the countries of Italy, Spain, France, Germany, the United States, the United Kingdom, Japan, and Australia. In 2025, the estimated cost from those same countries is ex-pected to increase by $14.1 billion, bringing the estimated total for 2025 to $24 billion. This represents a compound annual growth rate of 3.7%, according to the research and consulting firm Global Data (2017). As a result, there is a growing demand for dry-powder inhalation formulations that allow for composite-particle technology to have the development of more efficient formulations and challenging molecules. Spray drying is an enabling technology for com-posite-particle preparation (Santos et al., 2018). It is also ideal for generating engineered particles with improved electromechanical and aerodynamic performance. During
spray drying, a solution of the drug substance and suitable carrier excipients are subjected to mild flash drying, which allows for careful control of particle properties (particle size, bulk density, degree of crystallinity, etc.) (Winters & Costa, 2016).
Storage location and moisture affect the flow and de-agglomeration of DPI drug/carrier powder mixtures. Alt-hough there is no clear evidence about the DPI cleaning practice, each manufacturing company has recommenda-tions for periodic cleaning, and suggests wiping the mouth-piece of the DPI with a clean dry cloth. In this study the author adopted these procedures. Tables 1 and 2 summarize the aerodynamic size, count median aerodynamic diameter (CMAD), mass median aerodynamic diameter (MMAD), and electrostatic charge results of three DPIs. Table 1. Summary of the three dry-powder inhaler (DPI) aerosols aerodynamic size properties (mean ± SD).
Table 2. Summary of the three dry-powder inhaler (DPI) aerosols electrostatic charge properties (mean ± SD).
It is necessary to mention here that the data presented in these tables represent the normalized data (mean ± SD) from five runs of sampled aerosol particle counts (Bruna, Fourment, & Stradella, 2000; Srinivasan et al., 2018). Ac-cording to the ESPARTA working principle, the uncharged particle counts are the difference between total particles and charged particles. It was observed that the aerosol particles generated from all three DPIs were found to not only have different size distributions, but also varied in their charge distributions. The net charge-to-mass ratio of DPI 1, 2, and 3 particles were 3.80 µC/g, 1.37 µC/g, and 1.45 µC/g, re-spectively.
DPI CMAD (µm) (mean ± SD)
MMAD (µm) (mean ± SD)
DPI 1 3.61 ± 0.07 4.99 ± 0.03
DPI 2 3.61 ± 0.19 5.29 ± 0.15
DPI 3 2.86 ± 0.02 3.65 ± 0.10
CMAD: Count median aerodynamic diameter, MMAD: Mass median aerodynamic diameter
DPI Charged Particle
%
+ ve Counts vs
- ve Counts
Charge/mass + ve and
- ve (µC/g)
Net Charge/ mass ratio
(µC/g)
DPI 1
62 ± 4 1783 ± 20 1899 ± 24
+ 5.30 ± 14 - 6.61 ± 16
+ 3.80 ± 06
DPI 2
67 ± 5 1626 ± 29 2313 ± 31
+ 4.77 ± 13 - 6.30 ± 17
+ 1.37 ± 03
DPI 3
28 ± 2 475 ± 9
618 ± 12 + 5.41 ± 11 - 6.63 ± 12
+ 1.45 ± 04
——————————————————————————————————————————————–————
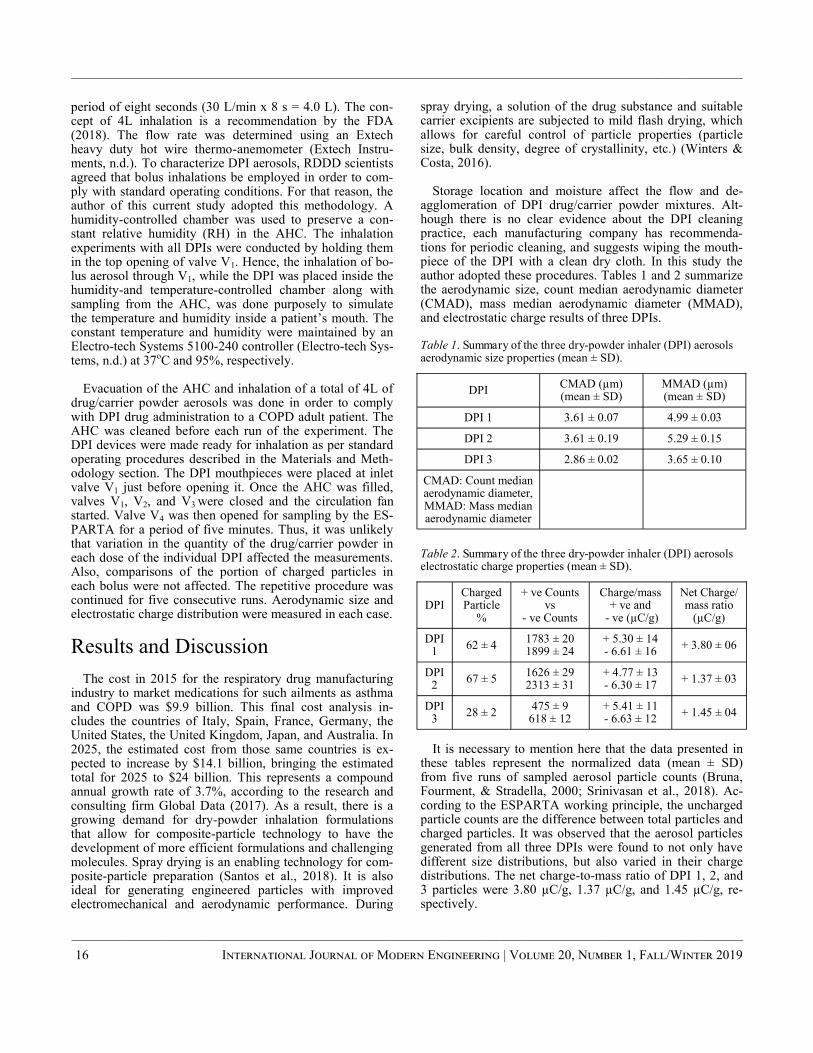
Figure 3 shows the graphical representations of the CMAD and MMAD for all three DPIs. Count and mass distributions were reproducible (p<0.05) for each of them. According to the guide for aerosol delivery devices pub-lished by the American Association of Respiratory Care (2013), particles in the size range of 1-5 µm are able to reach the lung periphery. In this respect, data in Tables 1 and 2 along with Figure 3 tell us that all three DPIs were producing acceptable levels, according to the respiratory drug industry, and therapeutically capable size range drug/carrier mixture of particles (American Association of Res-piratory Care, 2013).
Figure 3. Count median aerodynamic diameter (CMAD) and mass median aerodynamic diameter (MMAD) of three DPIs.
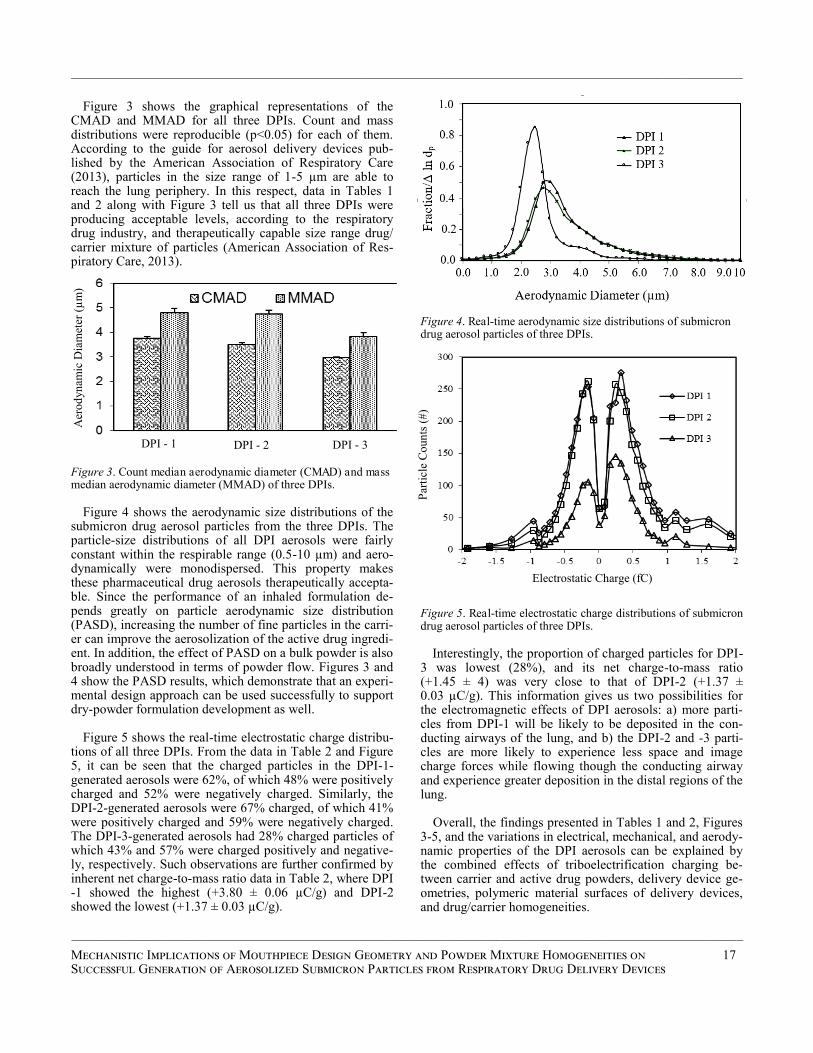
Figure 4 shows the aerodynamic size distributions of the
submicron drug aerosol particles from the three DPIs. The particle-size distributions of all DPI aerosols were fairly constant within the respirable range (0.5-10 µm) and aero-dynamically were monodispersed. This property makes these pharmaceutical drug aerosols therapeutically accepta-ble. Since the performance of an inhaled formulation de-pends greatly on particle aerodynamic size distribution (PASD), increasing the number of fine particles in the carri-er can improve the aerosolization of the active drug ingredi-ent. In addition, the effect of PASD on a bulk powder is also broadly understood in terms of powder flow. Figures 3 and 4 show the PASD results, which demonstrate that an experi-mental design approach can be used successfully to support dry-powder formulation development as well.
Figure 5 shows the real-time electrostatic charge distribu-tions of all three DPIs. From the data in Table 2 and Figure 5, it can be seen that the charged particles in the DPI-1-generated aerosols were 62%, of which 48% were positively charged and 52% were negatively charged. Similarly, the DPI-2-generated aerosols were 67% charged, of which 41% were positively charged and 59% were negatively charged. The DPI-3-generated aerosols had 28% charged particles of which 43% and 57% were charged positively and negative-ly, respectively. Such observations are further confirmed by inherent net charge-to-mass ratio data in Table 2, where DPI-1 showed the highest (+3.80 ± 0.06 µC/g) and DPI-2 showed the lowest (+1.37 ± 0.03 µC/g).
Figure 4. Real-time aerodynamic size distributions of submicron drug aerosol particles of three DPIs.
Figure 5. Real-time electrostatic charge distributions of submicron drug aerosol particles of three DPIs.
Interestingly, the proportion of charged particles for DPI-
3 was lowest (28%), and its net charge-to-mass ratio (+1.45 ± 4) was very close to that of DPI-2 (+1.37 ± 0.03 µC/g). This information gives us two possibilities for the electromagnetic effects of DPI aerosols: a) more parti-cles from DPI-1 will be likely to be deposited in the con-ducting airways of the lung, and b) the DPI-2 and -3 parti-cles are more likely to experience less space and image charge forces while flowing though the conducting airway and experience greater deposition in the distal regions of the lung.
Overall, the findings presented in Tables 1 and 2, Figures 3-5, and the variations in electrical, mechanical, and aerody-namic properties of the DPI aerosols can be explained by the combined effects of triboelectrification charging be-tween carrier and active drug powders, delivery device ge-ometries, polymeric material surfaces of delivery devices, and drug/carrier homogeneities.
Aer
od
yn
amic
Dia
met
er (
µm
)
DPI - 1 DPI - 2 DPI - 3
Par
ticl
e C
oun
ts (
#)
Electrostatic Charge (fC)
——————————————————————————————————————————————————–
Mechanistic Implications of Mouthpiece Design Geometry and Powder Mixture Homogeneities on 17 Successful Generation of Aerosolized Submicron Particles from Respiratory Drug Delivery Devices
——————————————————————————————————————————————–————
——————————————————————————————————————————————–————
18 International Journal of Modern Engineering | Volume 20, Number 1, Fall/Winter 2019
For carrier formulations, the particle-size distribution of the drug powders and the percentage of fine lactose in a formulation are the main parameters that influence aerody-namic performance. In addition, the formulation has a sig-nificant impact on blending and capsule-filling yields. Spe-cifically, formulations that enable improved fine-particle fractions are detrimental to the process yield, leading to significant product loss in the blending and capsule-filling steps. As a result, there is a need to balance the desired aer-odynamic performance with the manufacturability proper-ties of any given DPI formulation. Specifically for carrier formulations, whenever possible, the fine lactose percentage should be minimized to <10% and low fill weights of <10 mg should be avoided in order to achieve the best bal-ance between manufacturability and aerodynamic perfor-mance (Winters & Costa, 2016).
Polymeric materials for manufacturing RDDDs have been promising for some time. However, selecting the best mate-rial for the parts and devices is needed in order to make new products functional and safe. In this study, it was found that the material provides a considerable impact on device per-formance. Moreover, when the device being developed has unique requirements, developers must consider what materi-al will have the necessary mechanical, electrical, and bio-logical properties that will allow its use at the lowest possi-ble cost. Czuba (2015) suggested a group of such polymers, including polyether ether ketone, polyethylene and cyclic olefin copolymers, bioresorbables, and fluoropolymers.
At this point, it is necessary to recognize certain limita-tions in this study. For example, this current study only ad-dressed the therapeutically useful fraction of RDDD-emitted aerosol particle sizes in the range of 0.5 to 10 µm. Addition-ally, this study purposely avoided considering the electro-aerodynamic behavior of particles smaller than 0.5 µm, be-cause ESPARTA was not able to detect sizes below this range. The maximum counting limit of this instrument was 200 particles per second. Also, it was assumed that aerody-namic properties such as diffusion, aggregation, and sedi-mentation of aerosols in the sampling chamber were un-changed during five minutes of sampling period, and that they were dynamic in the chamber.
Like other real-time single-particle counting instruments,
ESPARTA also suffers coincidence effects, which occur when more than one particle is present in the instrument’s measuring volume. This can distort sizing information and lead to underreporting of particle concentration. It is one of the reasons the ESPARTA samples aerosol at a rate of 1.0 L/min by design. Furthermore, it was beyond the meth-odology of this study, whether the assessment was done only for the non-active drug carrier with active drug pow-ders for the tested DPIs or not. However, the fundamental assumption of a DPI-emitted powder in the inhaled air is that each aerosol particle may contain both drug and carrier.
Conclusions
This study presented a new method of real-time and sim-ultaneous measurement of the aerodynamic size and electro-static charge of the respiratory drug DPI- emitted bolus aer-osol particles. Aerosols generated by all three devices tested (number of runs, n = 5) exhibited net electro-positively charged particles. These DPIs were not only capable of pro-ducing particles of different size distributions but also var-ied charge distributions. Therefore, the author believes that the findings have practical values and biomedical device manufacturing implications, and suggests that the develop-ers of RDDDs consider electrodynamic effects, while de-signing improved products. Limitations of this study includ-ed: 1) the particle size range only included those between 0.5 and 10 µm; 2) ESPARTA’s maximum particle counts were 200 per second at a rate of 1.0 L/min by design; and, 3) the fundamental assumption was that the DPI-emitted powders contained both drug and carrier.
Acknowledgements
This work was supported in part by the Academic Part-nerships Healthcare grant of the Soules College of Business at the University of Texas at Tyler. The author would like to thank Dr. Malay K. Mazumder, Emeritus Professor of the University of Arkansas at Little Rock, for allowing the use of the ESPARTA instrument.
References Ali, M., Mazumder, M. K., & Martonen, T. B. (2009).
Measurements of electrodynamic effects on the deposi-tion of MDI and DPI aerosols in a replica cast of human oral-pharyngeal-laryngeal airways. Journal of Aerosol Medicine and Pulmonary Drug Delivery, 22(1), 35-44.
Ali, M., Reddy, R. N., & Mazumder, M. K. (2008). Electro-static charge effect on respirable aerosol particle depo-sition in a cadaver based throat cast replica. Journal of Electrostatics, 66, 401-406.
American Association of Respiratory Care. (2013). A guide to aerosol delivery devices for respiratory therapists, 3rd ed. Irving, TX: AARC.
Anderson, J. D. (2009). Governing equations of fluid dy-namics. In J. D. Anderson & G. E. Degrez (Eds.), Com-putational fluid dynamics, 3rd ed. (pp. 15-51). Heidel-berg, Germany: Springer.
BCC Research. (2018). Pulmonary drug delivery systems: Technologies and global markets. Wellesly, MA: Busi-ness Communication Company Research Publishing. Retrieved from https://www.bccresearch.com
Bruna, P., Fourment, O., & Stradella, G. (2000). Inhaler apparatus for dispensing accurate and reproducible dos-es of powder. US Patent No. 6,056,169. Washington, DC: US Patent and Trademark Office.
——————————————————————————————————————————————–————
Byron, P. R., Peart, J., & Staniforth, J. N. (1997). Aerosol electrostatics I: Properties of fine powders before and after aerosolization by dry powder inhalers. Pharmaceu-tical Research, 14, 698-705.
Crowley, J. M. (1999). Fundamentals of applied electrostat-ics. San Francisco, CA: Laplace Press.
Czuba, L. (2015). An introduction to emerging polymers for medical devices. Medical Device Online. Retrieved from www.meddeviceonline.com/doc/an-introduction-to-emerging-polymers-for-medical-devices-0001
de Boer, A. H., Hagedoorn, P., Hoppentocht, M., Buttini, F., Grasmeijer, F., & Frijlink, H. W. (2017). Dry powder inhalation: Past, present and future. Expert Opinion on Drug Delivery, 14, 499-512.
Electro-tech Systems. (n.d.). 5100-240 Humidity Controller. Retrieved from https://www.electrotechsystems.com/products/environmental-control/control-systems/5100-240-humidity-controller/
Extech Instruments. (n.d.). Heavy Duty Hot Wire Thermo-Anemometer. Retrieved from http://www.extech.com/products/407123
FDA CDER. (2018). Guidance for industry: MDI and DPI products—quality considerations. Silver Springs, MD: US Department of Health and Human Services.
Global Data. (2017, June 8). COPD market set to hit $14.1 billion by 2025, with AstraZeneca and GSK making strides. Retrieved from www.globaldata.com/copd-market-set-hit-14-1-billion-2025-astrazeneca-gsk-making-strides
Huynh, B. K., Chen, Y., Fletcher, D. F., Young, P., Zhu, B., & Traini, D. (2015). An investigation into the powder release behavior from capsule based dry powder inhal-ers. Journal of Aerosol Science and Technology, 49(10), 902-911.
Ilie, M., Matida, E. A., & Finlay, W. H. (2008). Asymmet-rical aerosol deposition in an idealized mouth with a DPI mouthpiece inlet. Journal of Aerosol Science and Technology, 42(1), 10-17.
Labiris, N. R., & Dolovich, M. B. (2003). Pulmonary drug delivery. Part II: The role of inhalant delivery devices and drug formulations in therapeutic effectiveness of aerosolized medications. British Journal of Clinical Pharmacology, 56(6), 600-612.
Mazumder, M. K., Wilson, J. D., & Wankum, D. L. (1989). Dual laser Doppler system for real-time simultaneous characterization of aerosols by size and concentration. In J. D. Crapo (Ed.), Lung dosimetry (pp. 211-234). San Diego, CA: Academic Press.
Santos, D., Maurício, C., Sencadas, V., Santos, J. D., Fernandes, M. H., & Gomes, P. S. (2018). Spray dry-ing: An overview. In R. Pignatello (ed.), Biomaterials—Physics and chemistry (pp. 10-35). London, UK: Intech Open Publisher.
Srinivasan, S. S., Kantareddy, S., Nkwate, E. A., Meka, P., Chang, I., Hanumara, N. C., & Ramadi, K. B. (2018). Design of a precision medication dispenser: Preventing overdose by increasing accuracy and precision of dos-
age. IEEE Journal of Translational Engineering in Health and Medicine, 6, 2800406.
Stein, S., & Thiel, C. G. (2017). The history of therapeutic aerosols: A chronological review. Journal of Aerosol Medicine and Pulmonary Drug Delivery, 30(1), 20-41.
Winters, C., & Costa, E. (2016). Dry powder inhalation formulation: balancing performance and manufactura-bility. American Pharmaceutical Review, 9, 1-4.
World Meteorological Organization (WMO), UN Environ-ment Programme, US Department of Commerce, NO-AA, European Commission. (2018). Executive sum-mary: Scientific assessment of ozone depletion: 2018. (Report No. 58). Geneva, Switzerland: WMO.
Biography
MOHAMMED ALI is an Associate Professor of In-dustrial Technology and Industrial Management at The Uni-versity of Texas at Tyler. He earned his BS degree (Mechanical Engineering, 1992) from Chittagong Universi-ty of Engineering and Technology, Bangladesh; ME (Industrial and Production Engineering, 1993) from Bangla-desh University of Engineering and Technology, Dhaka; MBA (Management of Technology, 1995) from Asian Insti-tute of Technology, Bangkok, Thailand; MS (Computer Science, 2001) from Oklahoma City University; and, PhD (Applied Science – Manufacturing of Drug Delivery Devic-es, 2008) from the University of Arkansas at Little Rock. His research interests include additive bio-manufacturing, learning pedagogy in technology and applied engineering curriculum, smart-manufacturing of drug delivery devices, modeling and bio-simulation of submicron- and nano-particle flow and deposition in the lung airways. Dr. Ali may be reached at [email protected]
——————————————————————————————————————————————————–
Mechanistic Implications of Mouthpiece Design Geometry and Powder Mixture Homogeneities on 19 Successful Generation of Aerosolized Submicron Particles from Respiratory Drug Delivery Devices
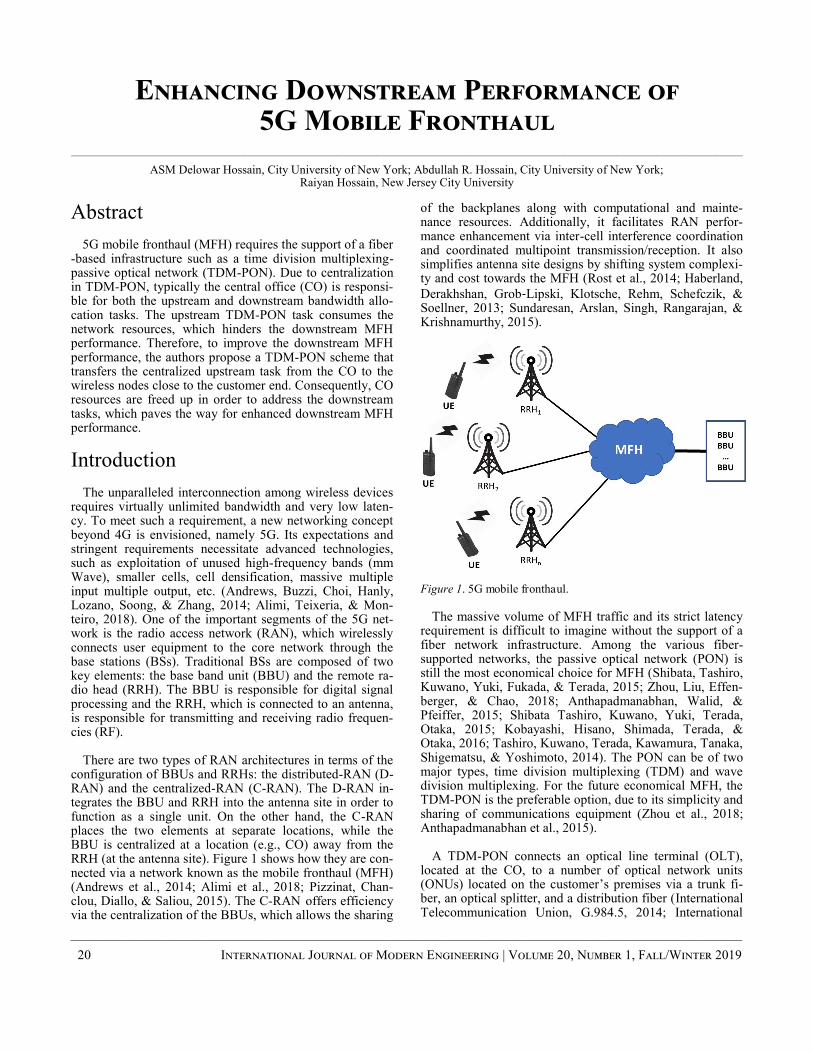
Abstract
5G mobile fronthaul (MFH) requires the support of a fiber-based infrastructure such as a time division multiplexing-passive optical network (TDM-PON). Due to centralization in TDM-PON, typically the central office (CO) is responsi-ble for both the upstream and downstream bandwidth allo-cation tasks. The upstream TDM-PON task consumes the network resources, which hinders the downstream MFH performance. Therefore, to improve the downstream MFH performance, the authors propose a TDM-PON scheme that transfers the centralized upstream task from the CO to the wireless nodes close to the customer end. Consequently, CO resources are freed up in order to address the downstream tasks, which paves the way for enhanced downstream MFH performance.
Introduction
The unparalleled interconnection among wireless devices requires virtually unlimited bandwidth and very low laten-cy. To meet such a requirement, a new networking concept beyond 4G is envisioned, namely 5G. Its expectations and stringent requirements necessitate advanced technologies, such as exploitation of unused high-frequency bands (mm Wave), smaller cells, cell densification, massive multiple input multiple output, etc. (Andrews, Buzzi, Choi, Hanly, Lozano, Soong, & Zhang, 2014; Alimi, Teixeria, & Mon-teiro, 2018). One of the important segments of the 5G net-work is the radio access network (RAN), which wirelessly connects user equipment to the core network through the base stations (BSs). Traditional BSs are composed of two key elements: the base band unit (BBU) and the remote ra-dio head (RRH). The BBU is responsible for digital signal processing and the RRH, which is connected to an antenna, is responsible for transmitting and receiving radio frequen-cies (RF).
There are two types of RAN architectures in terms of the configuration of BBUs and RRHs: the distributed-RAN (D-RAN) and the centralized-RAN (C-RAN). The D-RAN in-tegrates the BBU and RRH into the antenna site in order to function as a single unit. On the other hand, the C-RAN places the two elements at separate locations, while the BBU is centralized at a location (e.g., CO) away from the RRH (at the antenna site). Figure 1 shows how they are con-nected via a network known as the mobile fronthaul (MFH) (Andrews et al., 2014; Alimi et al., 2018; Pizzinat, Chan-clou, Diallo, & Saliou, 2015). The C-RAN offers efficiency via the centralization of the BBUs, which allows the sharing
of the backplanes along with computational and mainte-nance resources. Additionally, it facilitates RAN perfor-mance enhancement via inter-cell interference coordination and coordinated multipoint transmission/reception. It also simplifies antenna site designs by shifting system complexi-ty and cost towards the MFH (Rost et al., 2014; Haberland,
Derakhshan, Grob‐Lipski, Klotsche, Rehm, Schefczik, & Soellner, 2013; Sundaresan, Arslan, Singh, Rangarajan, & Krishnamurthy, 2015).
Figure 1. 5G mobile fronthaul.
The massive volume of MFH traffic and its strict latency
requirement is difficult to imagine without the support of a fiber network infrastructure. Among the various fiber-supported networks, the passive optical network (PON) is still the most economical choice for MFH (Shibata, Tashiro, Kuwano, Yuki, Fukada, & Terada, 2015; Zhou, Liu, Effen-berger, & Chao, 2018; Anthapadmanabhan, Walid, & Pfeiffer, 2015; Shibata Tashiro, Kuwano, Yuki, Terada, Otaka, 2015; Kobayashi, Hisano, Shimada, Terada, & Otaka, 2016; Tashiro, Kuwano, Terada, Kawamura, Tanaka, Shigematsu, & Yoshimoto, 2014). The PON can be of two major types, time division multiplexing (TDM) and wave division multiplexing. For the future economical MFH, the TDM-PON is the preferable option, due to its simplicity and sharing of communications equipment (Zhou et al., 2018; Anthapadmanabhan et al., 2015).
A TDM-PON connects an optical line terminal (OLT), located at the CO, to a number of optical network units (ONUs) located on the customer’s premises via a trunk fi-ber, an optical splitter, and a distribution fiber (International Telecommunication Union, G.984.5, 2014; International
Enhancing Downstream Performance of 5G Mobile Fronthaul
——————————————————————————————————————————————–———— ASM Delowar Hossain, City University of New York; Abdullah R. Hossain, City University of New York;
Raiyan Hossain, New Jersey City University
——————————————————————————————————————————————–————
20 International Journal of Modern Engineering | Volume 20, Number 1, Fall/Winter 2019
——————————————————————————————————————————————–————
sorted according to the destination ONU addresses and then admitted into the corresponding queues (see Figure 3). The OLT polls the downstream queues cyclically to assess the transmission need; subsequently, it divides available down-stream bandwidth among the queues and allocates transmis-sion timeslots in which frames are broadcast downstream. Upon reception of the broadcasted frame, an ONU accepts the frame after matching the ONU’s medium access control (MAC) address to the received frame’s destination MAC address.
Figure 3. OLT’s downstream configuration.
In a typical centralized TDM-PON architecture, the OLT
bears the burden of performing the additional function of arbitrating shared upstream bandwidth among the ONUs, which impacts downstream operation. To implement such a scheme requires exchange of control messages between the OLT and ONUs; namely, REPORT (request) and GATE (grant) messages. These control messages are guided by the multi-point control protocol, as defined by the IEEE 802.3ah task force (IEEE, 2012). An ONU sends a RE-PORT message to the OLT requesting transmission band-width. The OLT uses the received REPORT to perform the bandwidth allocation computation. Then the OLT sends a GATE message to the ONU granting a transmission time slot (indicating the start time and the duration) in which the ONU transmits upstream traffic. Each ONU follows this process sequentially, requiring a short guard time between two successive transmissions. A cycle ends after every ONU completes the above process once (Kramer, Mukher-jee, & Pesavento (2002). The cyclic OLT upstream task consumes network resources that impact downstream PON performance.
One of the elements that influences the downstream cyclic overhead is the upstream cycle length. The upstream cycle length varies in order to accommodate a variable traffic load; however, it is also restricted by a certain minimum and maximum duration. The cycle length can reach the maxi-mum limit at a higher upstream load that should not exceed an MFH latency requirement of about 300 µs (Yoshimoto, 2014). On the other hand, the cycle length gets shorter in lower upstream loads. However, the minimum cycle length cannot be shorter than the RTT between an ONU and OLT, as the cycle length is the time between two consecutive GATEs to a specific ONU, which is equivalent to at least
Telecommunication Union, G.987.3, 2014). Figure 2 shows how it employs two wavelengths for transmission, one for traffic from OLT to ONUs (downstream), and another for traffic from ONUs to OLT (upstream). For the downstream direction, the OLT broadcasts to ONUs via the long trunk fiber with a passive power splitter that connects the ONUs through the distribution fiber (point-to-multipoint). For the upstream direction (multipoint-to-point), a number of ONUs have to share the trunk fiber towards the OLT, which re-quires some form of arbitration scheme. Since the OLT pro-cesses the centralized intelligence of the network, it bears the burden of this task. There are a number of studies pre-sented in the literature dealing with the upstream dynamic bandwidth allocation (DBA) schemes for the TDM-PON, especially within the context of MFH (Kobayashi et al., 2016; Tashiro et al., 2014). Those DBAs are generally cen-tralized at the OLT (co-located with the BBUs), which is located far away from the ONUs/RRHs. Such a DBA neces-sitates the exchange of control messages between the ONU and the OLT; this process suffers from a long roundtrip time (RTT) and consumes much-needed network bandwidth (in both directions) and OLT processing time. Consequently, it hinders overall network performance, specifically in the downstream direction.
Figure 2. PON-supported 5G mobile fronthaul.
To overcome such a hindrance, the authors of this current
study present a DBA that shifts the task towards the ONUs/RRHs from the distant OLT; that is, it relieves the OLT from the burden of continuous exchanges of control mes-sages, which translates into added PON resources (in addi-tion to eliminating the upstream RTT). The result was an enhanced downstream performance that offered lower laten-cy, smaller queue sizes, and reduced packet loss.
TDM-PON Downstream Operation
The OLT houses N queues, where each queue corre-sponds to an ONU. The arriving traffic into the OLT is first
——————————————————————————————————————————————————–
Enhancing Downstream Performance of 5G Mobile Fronthaul 21
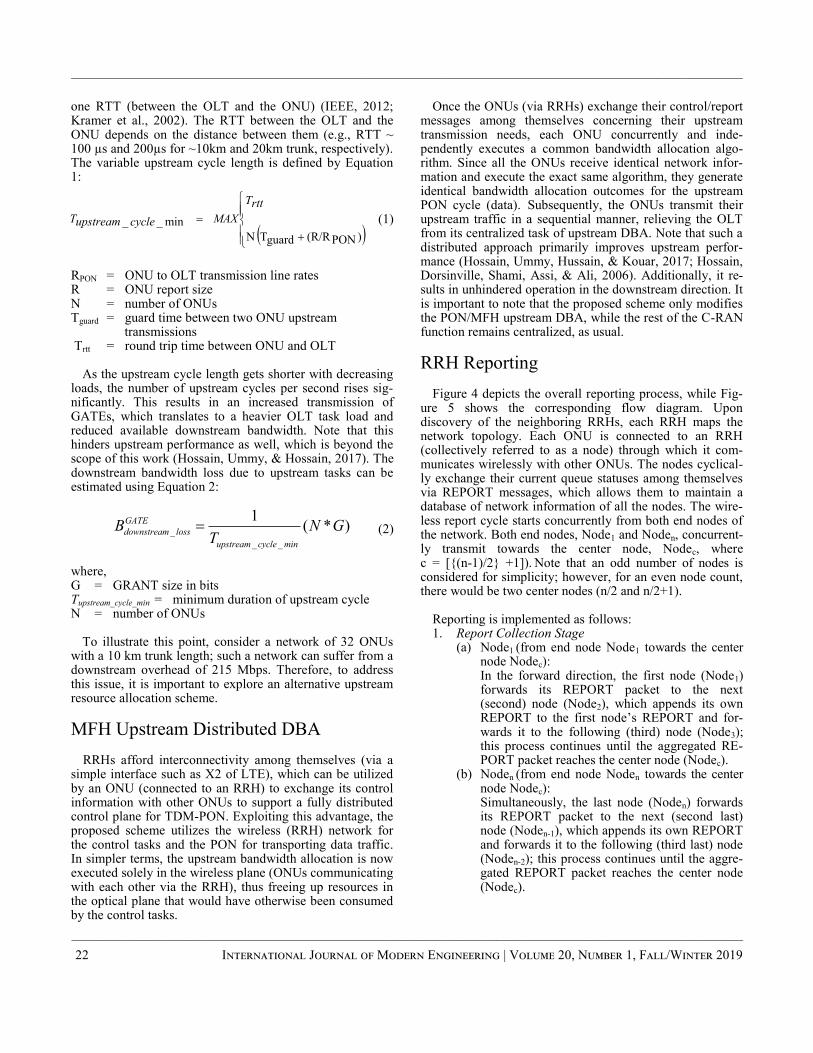
——————————————————————————————————————————————–————
——————————————————————————————————————————————–————
22 International Journal of Modern Engineering | Volume 20, Number 1, Fall/Winter 2019
one RTT (between the OLT and the ONU) (IEEE, 2012; Kramer et al., 2002). The RTT between the OLT and the ONU depends on the distance between them (e.g., RTT ~ 100 µs and 200µs for ~10km and 20km trunk, respectively). The variable upstream cycle length is defined by Equation 1:
(1) RPON = ONU to OLT transmission line rates R = ONU report size N = number of ONUs Tguard = guard time between two ONU upstream
transmissions Trtt = round trip time between ONU and OLT
As the upstream cycle length gets shorter with decreasing loads, the number of upstream cycles per second rises sig-nificantly. This results in an increased transmission of GATEs, which translates to a heavier OLT task load and reduced available downstream bandwidth. Note that this hinders upstream performance as well, which is beyond the scope of this work (Hossain, Ummy, & Hossain, 2017). The downstream bandwidth loss due to upstream tasks can be estimated using Equation 2:
(2) where, G = GRANT size in bits Tupstream_cycle_min = minimum duration of upstream cycle N = number of ONUs
To illustrate this point, consider a network of 32 ONUs with a 10 km trunk length; such a network can suffer from a downstream overhead of 215 Mbps. Therefore, to address this issue, it is important to explore an alternative upstream resource allocation scheme.
MFH Upstream Distributed DBA
RRHs afford interconnectivity among themselves (via a simple interface such as X2 of LTE), which can be utilized by an ONU (connected to an RRH) to exchange its control information with other ONUs to support a fully distributed control plane for TDM-PON. Exploiting this advantage, the proposed scheme utilizes the wireless (RRH) network for the control tasks and the PON for transporting data traffic. In simpler terms, the upstream bandwidth allocation is now executed solely in the wireless plane (ONUs communicating with each other via the RRH), thus freeing up resources in the optical plane that would have otherwise been consumed by the control tasks.
Once the ONUs (via RRHs) exchange their control/report messages among themselves concerning their upstream transmission needs, each ONU concurrently and inde-pendently executes a common bandwidth allocation algo-rithm. Since all the ONUs receive identical network infor-mation and execute the exact same algorithm, they generate identical bandwidth allocation outcomes for the upstream PON cycle (data). Subsequently, the ONUs transmit their upstream traffic in a sequential manner, relieving the OLT from its centralized task of upstream DBA. Note that such a distributed approach primarily improves upstream perfor-mance (Hossain, Ummy, Hussain, & Kouar, 2017; Hossain, Dorsinville, Shami, Assi, & Ali, 2006). Additionally, it re-sults in unhindered operation in the downstream direction. It is important to note that the proposed scheme only modifies the PON/MFH upstream DBA, while the rest of the C-RAN function remains centralized, as usual.
RRH Reporting
Figure 4 depicts the overall reporting process, while Fig-ure 5 shows the corresponding flow diagram. Upon discovery of the neighboring RRHs, each RRH maps the network topology. Each ONU is connected to an RRH (collectively referred to as a node) through which it com-municates wirelessly with other ONUs. The nodes cyclical-ly exchange their current queue statuses among themselves via REPORT messages, which allows them to maintain a database of network information of all the nodes. The wire-less report cycle starts concurrently from both end nodes of the network. Both end nodes, Node1 and Noden, concurrent-ly transmit towards the center node, Nodec, where c = [{(n-1)/2} +1]). Note that an odd number of nodes is considered for simplicity; however, for an even node count, there would be two center nodes (n/2 and n/2+1).
Reporting is implemented as follows: 1. Report Collection Stage
(a) Node1 (from end node Node1 towards the center node Nodec): In the forward direction, the first node (Node1) forwards its REPORT packet to the next (second) node (Node2), which appends its own REPORT to the first node’s REPORT and for-wards it to the following (third) node (Node3); this process continues until the aggregated RE-PORT packet reaches the center node (Nodec).
(b) Noden (from end node Noden towards the center node Nodec): Simultaneously, the last node (Noden) forwards its REPORT packet to the next (second last) node (Noden-1), which appends its own REPORT and forwards it to the following (third last) node (Noden-2); this process continues until the aggre-gated REPORT packet reaches the center node (Nodec).
)PON(R/RguardT N
min__
rttT
MAXcycleupstreamT
_
_ _
1( * )GATE
downstream loss
upstream cycle min
B N GT
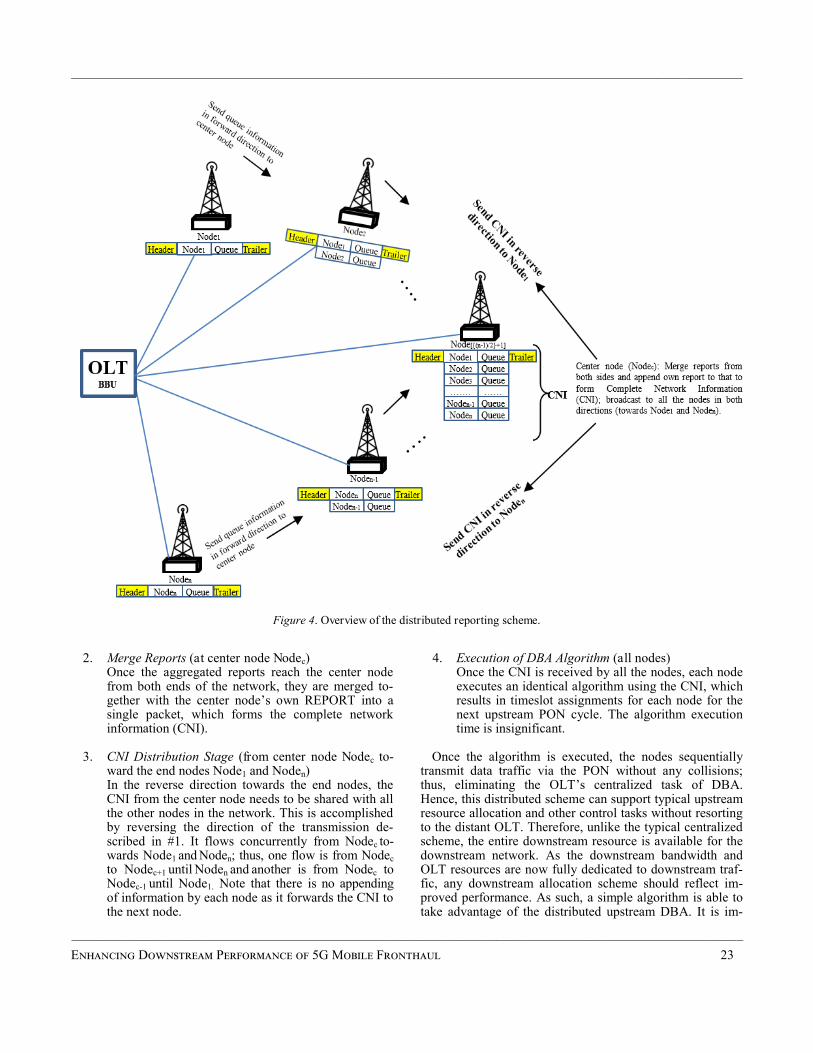
——————————————————————————————————————————————–————
2. Merge Reports (at center node Nodec) Once the aggregated reports reach the center node from both ends of the network, they are merged to-gether with the center node’s own REPORT into a single packet, which forms the complete network information (CNI).
3. CNI Distribution Stage (from center node Nodec to-
ward the end nodes Node1 and Noden) In the reverse direction towards the end nodes, the CNI from the center node needs to be shared with all the other nodes in the network. This is accomplished by reversing the direction of the transmission de-scribed in #1. It flows concurrently from Nodec to-wards Node1 and Noden; thus, one flow is from Nodec
to Nodec+1 until Noden and another is from Nodec to Nodec-1 until Node1. Note that there is no appending of information by each node as it forwards the CNI to the next node.
4. Execution of DBA Algorithm (all nodes) Once the CNI is received by all the nodes, each node executes an identical algorithm using the CNI, which results in timeslot assignments for each node for the next upstream PON cycle. The algorithm execution time is insignificant.
Once the algorithm is executed, the nodes sequentially
transmit data traffic via the PON without any collisions; thus, eliminating the OLT’s centralized task of DBA. Hence, this distributed scheme can support typical upstream resource allocation and other control tasks without resorting to the distant OLT. Therefore, unlike the typical centralized scheme, the entire downstream resource is available for the downstream network. As the downstream bandwidth and OLT resources are now fully dedicated to downstream traf-fic, any downstream allocation scheme should reflect im-proved performance. As such, a simple algorithm is able to take advantage of the distributed upstream DBA. It is im-
Figure 4. Overview of the distributed reporting scheme.
——————————————————————————————————————————————————–
Enhancing Downstream Performance of 5G Mobile Fronthaul 23
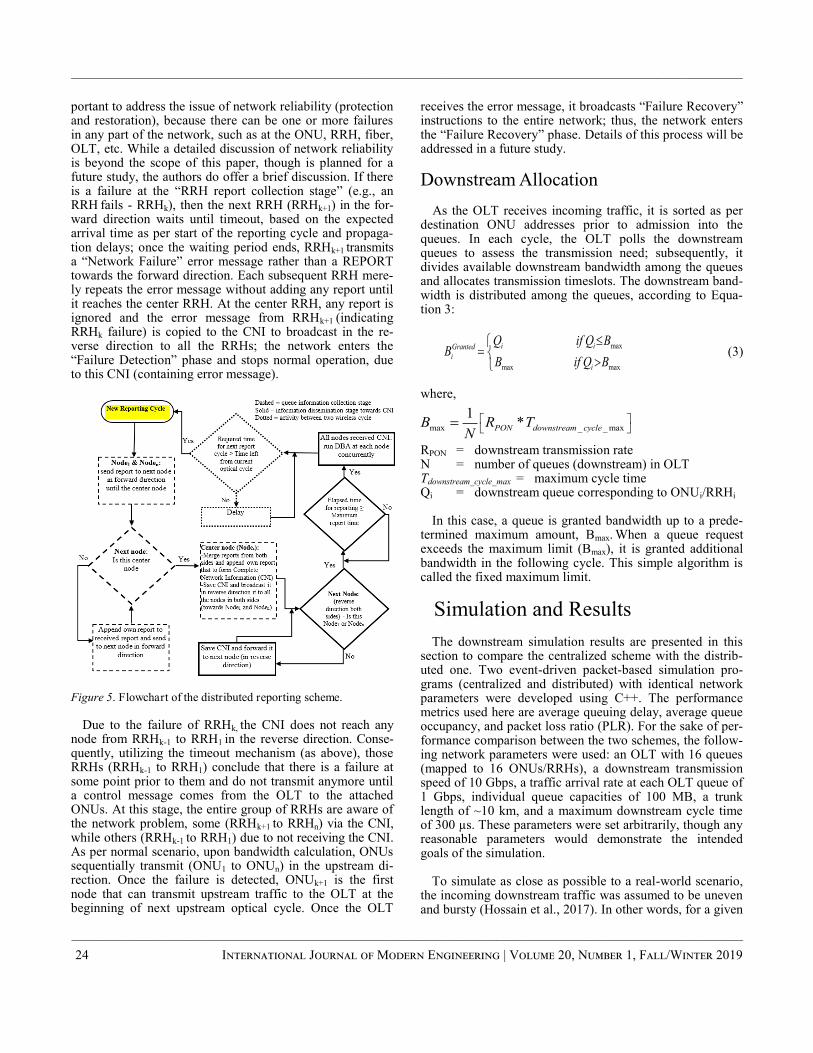
——————————————————————————————————————————————–————
——————————————————————————————————————————————–————
24 International Journal of Modern Engineering | Volume 20, Number 1, Fall/Winter 2019
portant to address the issue of network reliability (protection and restoration), because there can be one or more failures in any part of the network, such as at the ONU, RRH, fiber, OLT, etc. While a detailed discussion of network reliability is beyond the scope of this paper, though is planned for a future study, the authors do offer a brief discussion. If there is a failure at the “RRH report collection stage” (e.g., an RRH fails - RRHk), then the next RRH (RRHk+1) in the for-ward direction waits until timeout, based on the expected arrival time as per start of the reporting cycle and propaga-tion delays; once the waiting period ends, RRHk+1 transmits a “Network Failure” error message rather than a REPORT towards the forward direction. Each subsequent RRH mere-ly repeats the error message without adding any report until it reaches the center RRH. At the center RRH, any report is ignored and the error message from RRHk+1 (indicating RRHk failure) is copied to the CNI to broadcast in the re-verse direction to all the RRHs; the network enters the “Failure Detection” phase and stops normal operation, due to this CNI (containing error message).
Figure 5. Flowchart of the distributed reporting scheme.
Due to the failure of RRHk, the CNI does not reach any
node from RRHk-1 to RRH1 in the reverse direction. Conse-quently, utilizing the timeout mechanism (as above), those RRHs (RRHk-1 to RRH1) conclude that there is a failure at some point prior to them and do not transmit anymore until a control message comes from the OLT to the attached ONUs. At this stage, the entire group of RRHs are aware of the network problem, some (RRHk+1 to RRHn) via the CNI, while others (RRHk-1 to RRH1) due to not receiving the CNI. As per normal scenario, upon bandwidth calculation, ONUs sequentially transmit (ONU1 to ONUn) in the upstream di-rection. Once the failure is detected, ONUk+1 is the first node that can transmit upstream traffic to the OLT at the beginning of next upstream optical cycle. Once the OLT
receives the error message, it broadcasts “Failure Recovery” instructions to the entire network; thus, the network enters the “Failure Recovery” phase. Details of this process will be addressed in a future study.
Downstream Allocation
As the OLT receives incoming traffic, it is sorted as per destination ONU addresses prior to admission into the queues. In each cycle, the OLT polls the downstream queues to assess the transmission need; subsequently, it divides available downstream bandwidth among the queues and allocates transmission timeslots. The downstream band-width is distributed among the queues, according to Equa-tion 3:
(3) where, RPON = downstream transmission rate N = number of queues (downstream) in OLT Tdownstream_cycle_max = maximum cycle time Qi = downstream queue corresponding to ONUi/RRHi
In this case, a queue is granted bandwidth up to a prede-termined maximum amount, Bmax. When a queue request exceeds the maximum limit (Bmax), it is granted additional bandwidth in the following cycle. This simple algorithm is called the fixed maximum limit.
Simulation and Results The downstream simulation results are presented in this
section to compare the centralized scheme with the distrib-uted one. Two event-driven packet-based simulation pro-grams (centralized and distributed) with identical network parameters were developed using C++. The performance metrics used here are average queuing delay, average queue occupancy, and packet loss ratio (PLR). For the sake of per-formance comparison between the two schemes, the follow-ing network parameters were used: an OLT with 16 queues (mapped to 16 ONUs/RRHs), a downstream transmission speed of 10 Gbps, a traffic arrival rate at each OLT queue of 1 Gbps, individual queue capacities of 100 MB, a trunk length of ~10 km, and a maximum downstream cycle time of 300 µs. These parameters were set arbitrarily, though any reasonable parameters would demonstrate the intended goals of the simulation.
To simulate as close as possible to a real-world scenario, the incoming downstream traffic was assumed to be uneven and bursty (Hossain et al., 2017). In other words, for a given
maxmax
max
BQifB
BQifQB
i
iiGranted
i
max _ _ max
1*PON downstream cycleB R T
N
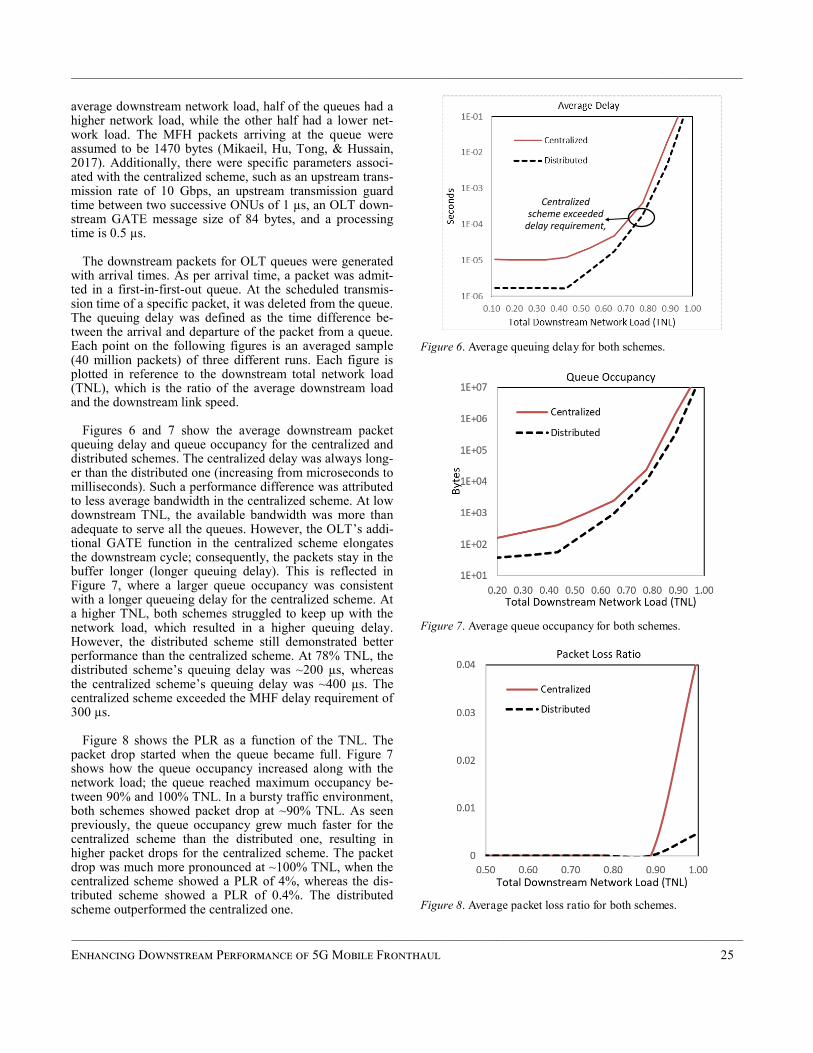
——————————————————————————————————————————————–————
average downstream network load, half of the queues had a higher network load, while the other half had a lower net-work load. The MFH packets arriving at the queue were assumed to be 1470 bytes (Mikaeil, Hu, Tong, & Hussain, 2017). Additionally, there were specific parameters associ-ated with the centralized scheme, such as an upstream trans-mission rate of 10 Gbps, an upstream transmission guard time between two successive ONUs of 1 µs, an OLT down-stream GATE message size of 84 bytes, and a processing time is 0.5 µs.
The downstream packets for OLT queues were generated
with arrival times. As per arrival time, a packet was admit-ted in a first-in-first-out queue. At the scheduled transmis-sion time of a specific packet, it was deleted from the queue. The queuing delay was defined as the time difference be-tween the arrival and departure of the packet from a queue. Each point on the following figures is an averaged sample (40 million packets) of three different runs. Each figure is plotted in reference to the downstream total network load (TNL), which is the ratio of the average downstream load and the downstream link speed.
Figures 6 and 7 show the average downstream packet queuing delay and queue occupancy for the centralized and distributed schemes. The centralized delay was always long-er than the distributed one (increasing from microseconds to milliseconds). Such a performance difference was attributed to less average bandwidth in the centralized scheme. At low downstream TNL, the available bandwidth was more than adequate to serve all the queues. However, the OLT’s addi-tional GATE function in the centralized scheme elongates the downstream cycle; consequently, the packets stay in the buffer longer (longer queuing delay). This is reflected in Figure 7, where a larger queue occupancy was consistent with a longer queueing delay for the centralized scheme. At a higher TNL, both schemes struggled to keep up with the network load, which resulted in a higher queuing delay. However, the distributed scheme still demonstrated better performance than the centralized scheme. At 78% TNL, the distributed scheme’s queuing delay was ~200 µs, whereas the centralized scheme’s queuing delay was ~400 µs. The centralized scheme exceeded the MHF delay requirement of 300 µs.
Figure 8 shows the PLR as a function of the TNL. The packet drop started when the queue became full. Figure 7 shows how the queue occupancy increased along with the network load; the queue reached maximum occupancy be-tween 90% and 100% TNL. In a bursty traffic environment, both schemes showed packet drop at ~90% TNL. As seen previously, the queue occupancy grew much faster for the centralized scheme than the distributed one, resulting in higher packet drops for the centralized scheme. The packet drop was much more pronounced at ~100% TNL, when the centralized scheme showed a PLR of 4%, whereas the dis-tributed scheme showed a PLR of 0.4%. The distributed scheme outperformed the centralized one.
Figure 6. Average queuing delay for both schemes.
Figure 7. Average queue occupancy for both schemes.
Figure 8. Average packet loss ratio for both schemes.
Centralized scheme exceeded
delay requirement,
——————————————————————————————————————————————————–
Enhancing Downstream Performance of 5G Mobile Fronthaul 25
——————————————————————————————————————————————–————
——————————————————————————————————————————————–————
26 International Journal of Modern Engineering | Volume 20, Number 1, Fall/Winter 2019
Conclusions
This study exploited the wireless connectivity in TDM-PON-based 5G MFH to exchange network information in order to support a fully distributed control plane, where the OLT was relieved from upstream resource allocation tasks. Specifically, the proposed distributed scheme, which ex-ploited the wireless exchange of bandwidth information between the nodes via the RRH to alleviate the burden from the optical plane (by excluding the OLT from bandwidth allocation decisions for upstream traffic), resulted in signifi-cantly lower latency, smaller queue sizes, and reduced pack-et loss at all traffic loads. Potential future recommended areas of study can include a quality-of-service analysis of various traffic types and network protection and restoration in the event of various failures for both the optical and wire-less planes.
References Alimi, I. A., Teixeria, A. L., & Monteiro, P. P. (2018). To-
ward an efficient C-RAN optical fronthaul for the fu-ture networks: A tutorial on technologies, requirements, challenges, and solutions. IEEE Communications Sur-veys & Tutorials, 20(1), 708-769.
Andrews, J., Buzzi, S., Choi, W., Hanly S. V., Lozano, A., Soong, A. C. K., & Zhang, J. C. (2014). What will 5G be? IEEE Journal on Selected Areas of Communica-tions, 32(6), 1065-1082.
Anthapadmanabhan, N. P., Walid, A., & Pfeiffer, T. (2015, June). Mobile fronthaul over latency-optimized time division multiplexed passive optical networks. Paper presented at the 2015 IEEE International Conference on Communication Workshop. Retrieved from https://ieeexplore.ieee.org/document/7247156
Haberland, B., Derakhshan, F., Grob‐Lipski, H., Klotsche, R., Rehm, W., Schefczik, P., & Soellner, M. (2013). Radio base stations in the cloud. Bell Labs Technical Journal, 18(1), 129-152.
Hossain A. D., Dorsinville, R., Shami, A., Assi, C., & Ali, M. A. (2006). A novel ring-based local access PON architecture for supporting private networking capabil-ity. Journal of Optical Networking, 5(1), 26-39.
Hossain, A. D., Ummy, M. A., & Hossain, A. (2017). Im-proving FiWi access network downstream perfor-mance: A distributed approach. International Journal of Modern Engineering, 17(2), 20-25.
Hossain, A. D., Ummy, M., Hussain, A., & Kouar, M. (2017). Revisiting FiWi: On the merits of a distributed upstream resource allocation scheme. Journal of Optical Communication and Networking, 7(9), 773-781.
IEEE Standards Association. (2012, December 28). IEEE 802.3-2012 - IEEE Standard for Ethernet. Retrieved from https://standards.ieee.org/standard/802_3-2012.html
International Telecommunication Union. (2014). G.984.5 Series G: Transmission systems and media digital sys-
tems and networks. Retrieved from https://www.itu.int/rec/T-REC-G.984.5-201405-I/en
International Telecommunication Union. (2014). G.987.3 Series G: Transmission systems and media digital sys-tems and networks. Retrieved from https://www.itu.int/rec/T-REC-G.987.3-201401-I/en
Kobayashi, T., Hisano, D., Shimada, J., Terada, J., & Otaka, A. (2016, March). Bandwidth allocation scheme based on simple statistical traffic analysis for TDM-PON based mobile fronthaul. Paper presented at the 2016 Optical Fiber Communications Conference and Exhibi-tion. Retrieved from https://ieeexplore.ieee.org/document/7537760
Kramer, G., Mukherjee, B., & Pesavento, G. (2002). IPACT: A dynamic protocol for an Ethernet PON (EPON). IEEE Communications Magazine, 40(2), 74-80.
Mikaeil, A., Hu, W., Tong, Y., & Hussain, S. B. (2017). Performance evaluation of XG-PON based mobile front-haul transport in cloud-RAN architecture. Journal of Optical Communications and Networking, 9(11), 984-994.
Pizzinat, A., Chanclou, P., Diallo, T., & Saliou, F. (2015). Things you should know about fronthaul. Journal of Lightwave Technology, 33(5), 1077-1083.
Rost, P., Bernardos, C. J., Domenico, A. D., Girolamo, M. D., Lalam, M., Maeder, A.,…Wübben, D. (2014). Cloud technologies for flexible 5G radio access net-works. IEEE Communications Magazine, 52(5), 68-76.
Shibata, N., Tashiro, T., Kuwano, S., Yuki, N., Terada, J., & Otaka, A. (2015, March). Mobile front-haul employing Ethernet-based TDM-PON system for small cells. Pa-per presented at the 2015 Optical Fiber Communica-tions Conference and Exhibition. Retrieved from https://ieeexplore.ieee.org/document/7121508
Shibata, N., Tashiro, T., Kuwano, S., Yuki, N., Fukada, Y., & Terada, J. (2015). Performance evaluation of mobile front-haul employing Ethernet-based TDM-PON with IQ data compression. Journal of Optical Communica-tions and Networking, 7(11), B16-B22.
Sundaresan, K., Arslan, M. Y., Singh, S., Rangarajan, S., & Krishnamurthy, S. V. (2015). FluidNet: A flexible cloud-based radio access network for small cells. IEEE/ACM Transactions on Networking, 24(2), 99-110.
Tashiro, T., Kuwano, S., Terada, J., Kawamura, T., Tanaka, N., Shigematsu, S., & Yoshimoto, N. (2014, March). A novel DBA scheme for TDM-PON based mobile fron-thaul. Paper presented at the 2014 Optical Fiber Com-munications Conference and Exhibition. Retrieved from https://ieeexplore.ieee.org/document/6886953
Yoshimoto, N. (2014, June). Operator perspective on next-generation optical access for future radio access. Pa-per presented at the 2014 IEEE International Confer-ence on Communications Workshops. Retrieved from https://ieeexplore.ieee.org/document/6881226
Zhou, S., Liu, X., Effenberger, F., & Chao, J. (2018). Low-latency high-efficiency mobile fronthaul with TDM-PON (mobile-PON). Journal of Optical Communica-tions and Networking, 10(1), A20-A26.
——————————————————————————————————————————————–————
Biographies
ASM DELOWAR HOSSAIN is an associate professor of electrical engineering Technology at the City University of New York. He earned his BS, MS, and PhD (2007) de-grees in electrical engineering from the City University of New York. Dr. Hossain’s research interests include wireless and optical access networks. Dr. Hossain may be reached at [email protected]
ABDULLAH RIDWAN HOSSAIN is a graduate stu-dent at the City University of New York. He earned his BS (Electrical Engineering, 2017) degree from the City Univer-sity of New York. Mr. Hossain’s research interests include fiber optics communications. Mr. Hossain may be reached at [email protected]
RAIYAN HOSSAIN is a senior (Computer Science) at the New Jersey City University. She may be reached at [email protected]
——————————————————————————————————————————————————–
Enhancing Downstream Performance of 5G Mobile Fronthaul 27
Abstract
In this paper, the authors present a multiscale computa-tional analysis of nickel-coated carbon fiber-reinforced alu-minum metal matrix composite. The methodology involved different scale lengths ranging from nano to macro scales. In this hierarchical multiscale modeling technique, the out-puts of each lower scale were fed into the next higher scale as input data. Molecular dynamics (MD) modeling was per-formed at the nano and micro scales, and polycrystalline materials modeling was done at the meso scale. A microme-chanical model was utilized at the macro-length scale, and the results from these simulations provided the relationship between the microstructures of the constituents and the composite performance. The computational model provided the opportunity to quickly assess the ratios of the constitu-ents in terms of volume fraction in the aluminum matrix composite products that are required for specific engineer-ing performance.
Introduction
The need for the development of new materials to provide
solutions to present day challenges of using traditional ma-terials for different applications is increasing, due to the engineering requirements from high technology. In the quest for high-performance and lightweight structural mate-rials for automotive and aerospace applications, researchers have innovated different material systems made up of more than one constituent. Metal matrix composite (MMC) is one of such material system from which engineers have com-bined different constituent materials to form a new product to overcome the limitations of each individual constituent. As such, the use of composite materials for engineering applications provides the flexibility for engineers to vary the ratio of the materials that constitute the composite in order to meet different requirements and performance standards. Hence, this current research study focused on aluminum matrix composites, due to their lightweight and outstanding specific properties at room or elevated temperatures (Lee, Sue, & Lin, 2010), which render them usable in the automo-bile and aerospace industries (Sozhamannan, Prabu, & Ven-katagalapathy, 2012).
Other researchers (Kumar, Chittappa, & Vannan, 2018; Sharma, Khanduja, & Sharma, 2014; Surappa, 2003) have performed research studies on the mechanical performance
of aluminum matrix composites. According to Abraham, Pai, Satyanarayana, & Vaidyan (1992), aluminum (Al) and carbon do undergo a chemical reaction at the interface to form brittle aluminum carbide (Al4C3). Gupta, Nguyen, and Rohatgi (2011) performed a cooling analysis through nickel-coated carbon fibers in the solidification processing of alu-minum matrix composites and found that thermal stresses can cause failure of the nickel coating. Hua et al. (2012) performed electroplating technique to test coat carbon fibers with nickel. Their results indicated that nickel-coated fibers exhibited good bonding strength, the wettability of alumi-num was improved, and the fibers exhibited excellent re-sistance to oxidation at high temperatures.
A concerted effort was made (Kumar, Rao, & Selvaraj, 2011) to strengthen some mechanical and wear behavior of Al—MMCs, and the prediction of the mechanical and tribo-logical behaviors of aluminum MMCs. High-resolution electron microscopy and X-ray photoelectron spectroscopy were utilized (Diwanji & Hall, 1992) to analyze the car-bon/aluminum matrix interface, and showed that carbide formation is a conventional two-step process of nucleation and growth. Other authors (Lacin & Marhic, 2000) used a transmission electron microscope to fully characterize the microstructure of the high modulus PAN-based fiber and the pyrolytic carbon coating (Cp). Nickel-coated carbon fibers were mixed, consolidated, and heated with AA6061 aluminum powders at temperatures ranging from 650°C to 950°C, in order to study the reactivity, the nickel (Ni) diffu-sion, and the resulting interfaces. Alfos et al. (2015) evalu-ated the effects of Young’s modulus on Al4C3 formation in the carbon nanotube (CNT)–Al interface for Al matri composites using finite element analysis (FEA) mod-els that incorporate different CNT volume fractions and interfacial Al4C3 layers of various thicknesses.
Similarly, Choi, Yoon, and Lee (2016) investigated the mechanical behavior of CNT-reinforced aluminum compo-site under a tensil loading condition using molecular dy-namic (MD) simulations. In addition, Nasiri, Wang, Yang, Li, and Zaiser (2019) utilized a multiscale approach to analyze nickel-coated carbon nanotubes in aluminum ma-trix composites. With the increased emphasis on reducing the cost and time to market of new materials, the need for multiscale analysis to capture the effect of the nanostruc-tured additive on the composite matrix is increasingly im-portant. This multiscale modeling approach revolutionizes the ability to create new materials and tailor their specific
Multiscale Modeling of Aluminum Nickel-Coated Carbon Fiber Metal
Matrix Composites
——————————————————————————————————————————————–———— Olanrewaju Aluko, University of Michigan-Flint; S. Gowtham, Michigan Technological University;
Gregory Odegard, Michigan Technological University
——————————————————————————————————————————————–————
28 International Journal of Modern Engineering | Volume 20, Number 1, Fall/Winter 2019
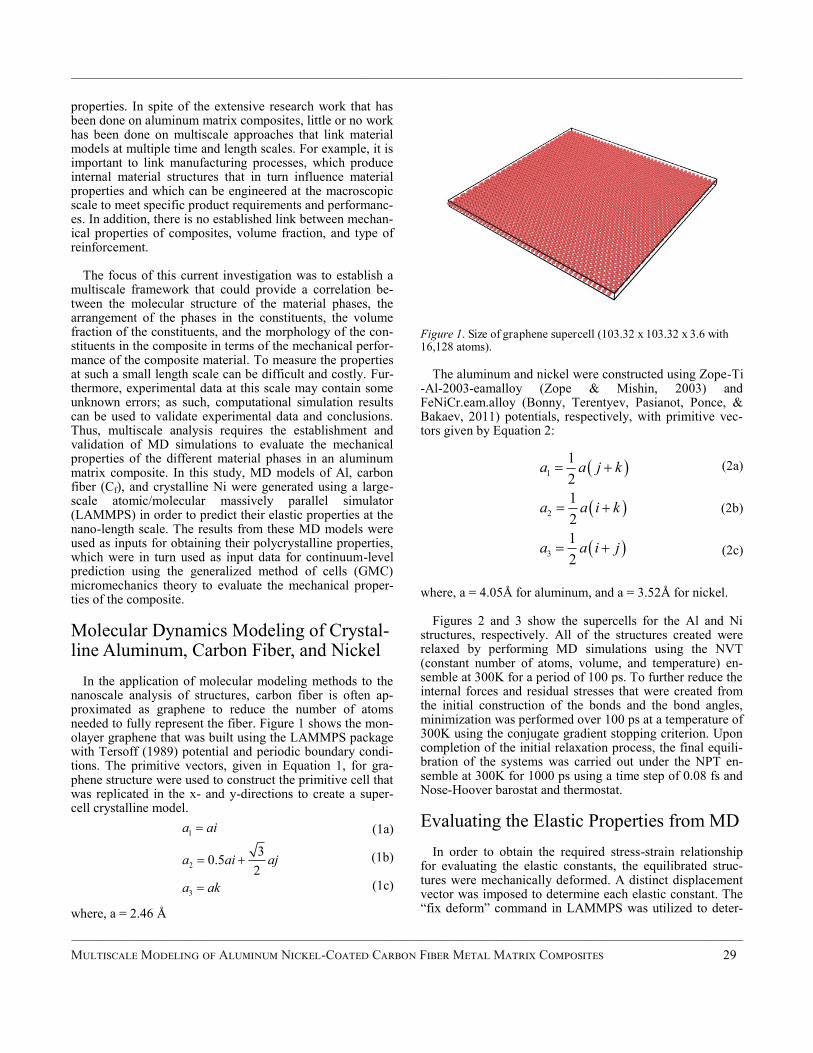
——————————————————————————————————————————————–————
properties. In spite of the extensive research work that has been done on aluminum matrix composites, little or no work has been done on multiscale approaches that link material models at multiple time and length scales. For example, it is important to link manufacturing processes, which produce internal material structures that in turn influence material properties and which can be engineered at the macroscopic scale to meet specific product requirements and performanc-es. In addition, there is no established link between mechan-ical properties of composites, volume fraction, and type of reinforcement.
The focus of this current investigation was to establish a multiscale framework that could provide a correlation be-tween the molecular structure of the material phases, the arrangement of the phases in the constituents, the volume fraction of the constituents, and the morphology of the con-stituents in the composite in terms of the mechanical perfor-mance of the composite material. To measure the properties at such a small length scale can be difficult and costly. Fur-thermore, experimental data at this scale may contain some unknown errors; as such, computational simulation results can be used to validate experimental data and conclusions. Thus, multiscale analysis requires the establishment and validation of MD simulations to evaluate the mechanical properties of the different material phases in an aluminum matrix composite. In this study, MD models of Al, carbon fiber (Cf), and crystalline Ni were generated using a large-scale atomic/molecular massively parallel simulator (LAMMPS) in order to predict their elastic properties at the nano-length scale. The results from these MD models were used as inputs for obtaining their polycrystalline properties, which were in turn used as input data for continuum-level prediction using the generalized method of cells (GMC) micromechanics theory to evaluate the mechanical proper-ties of the composite.
Molecular Dynamics Modeling of Crystal-line Aluminum, Carbon Fiber, and Nickel
In the application of molecular modeling methods to the
nanoscale analysis of structures, carbon fiber is often ap-proximated as graphene to reduce the number of atoms needed to fully represent the fiber. Figure 1 shows the mon-olayer graphene that was built using the LAMMPS package with Tersoff (1989) potential and periodic boundary condi-tions. The primitive vectors, given in Equation 1, for gra-phene structure were used to construct the primitive cell that was replicated in the x- and y-directions to create a super-cell crystalline model.
(1a)
(1b)
(1c) where, a = 2.46 Å
Figure 1. Size of graphene supercell (103.32 x 103.32 x 3.6 with 16,128 atoms).
The aluminum and nickel were constructed using Zope-Ti
-Al-2003-eamalloy (Zope & Mishin, 2003) and FeNiCr.eam.alloy (Bonny, Terentyev, Pasianot, Ponce, & Bakaev, 2011) potentials, respectively, with primitive vec-tors given by Equation 2:
(2a)
(2b)
(2c) where, a = 4.05Å for aluminum, and a = 3.52Å for nickel.
Figures 2 and 3 show the supercells for the Al and Ni structures, respectively. All of the structures created were relaxed by performing MD simulations using the NVT (constant number of atoms, volume, and temperature) en-semble at 300K for a period of 100 ps. To further reduce the internal forces and residual stresses that were created from the initial construction of the bonds and the bond angles, minimization was performed over 100 ps at a temperature of 300K using the conjugate gradient stopping criterion. Upon completion of the initial relaxation process, the final equili-bration of the systems was carried out under the NPT en-semble at 300K for 1000 ps using a time step of 0.08 fs and Nose-Hoover barostat and thermostat.
Evaluating the Elastic Properties from MD
In order to obtain the required stress-strain relationship for evaluating the elastic constants, the equilibrated struc-tures were mechanically deformed. A distinct displacement vector was imposed to determine each elastic constant. The “fix deform” command in LAMMPS was utilized to deter-
——————————————————————————————————————————————————–
Multiscale Modeling of Aluminum Nickel-Coated Carbon Fiber Metal Matrix Composites 29
1
2
3
30.5
2
a ai
a ai aj
a ak
1
2
3
1
2
1
2
1
2
a a j k
a a i k
a a i j
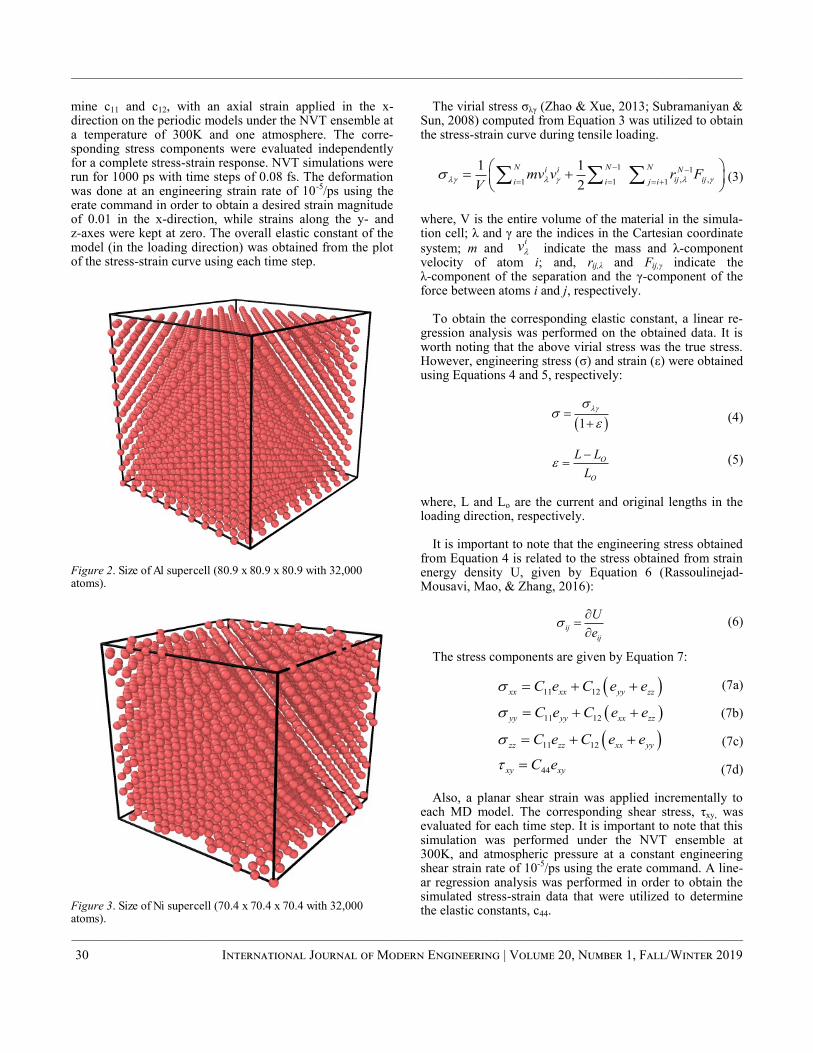
——————————————————————————————————————————————–————
——————————————————————————————————————————————–————
30 International Journal of Modern Engineering | Volume 20, Number 1, Fall/Winter 2019
mine c11 and c12, with an axial strain applied in the x-direction on the periodic models under the NVT ensemble at a temperature of 300K and one atmosphere. The corre-sponding stress components were evaluated independently for a complete stress-strain response. NVT simulations were run for 1000 ps with time steps of 0.08 fs. The deformation was done at an engineering strain rate of 10-5/ps using the erate command in order to obtain a desired strain magnitude of 0.01 in the x-direction, while strains along the y- and z-axes were kept at zero. The overall elastic constant of the model (in the loading direction) was obtained from the plot of the stress-strain curve using each time step.
Figure 2. Size of Al supercell (80.9 x 80.9 x 80.9 with 32,000 atoms).
Figure 3. Size of Ni supercell (70.4 x 70.4 x 70.4 with 32,000 atoms).
The virial stress σλγ (Zhao & Xue, 2013; Subramaniyan & Sun, 2008) computed from Equation 3 was utilized to obtain the stress-strain curve during tensile loading.
(3) where, V is the entire volume of the material in the simula-tion cell; λ and γ are the indices in the Cartesian coordinate
system; m and indicate the mass and λ-component velocity of atom i; and, rij,λ and Fij,γ indicate the λ-component of the separation and the γ-component of the force between atoms i and j, respectively.
To obtain the corresponding elastic constant, a linear re-gression analysis was performed on the obtained data. It is worth noting that the above virial stress was the true stress. However, engineering stress (σ) and strain (ε) were obtained using Equations 4 and 5, respectively:
(4)
(5) where, L and Lo are the current and original lengths in the loading direction, respectively.
It is important to note that the engineering stress obtained from Equation 4 is related to the stress obtained from strain energy density U, given by Equation 6 (Rassoulinejad-Mousavi, Mao, & Zhang, 2016):
(6)
The stress components are given by Equation 7:
(7a)
(7b)
(7c)
(7d)
Also, a planar shear strain was applied incrementally to each MD model. The corresponding shear stress, τxy, was evaluated for each time step. It is important to note that this simulation was performed under the NVT ensemble at 300K, and atmospheric pressure at a constant engineering shear strain rate of 10-5/ps using the erate command. A line-ar regression analysis was performed in order to obtain the simulated stress-strain data that were utilized to determine the elastic constants, c44.
iv
1 1
, ,1 1 1
1 1
2
N N Ni i N
ij iji i j imv v r F
V
1
O
O
L L
L
ij
ij
U
e
11 12
11 12
11 12
44
xx xx yy zz
yy yy xx zz
zz zz xx yy
xy xy
C e C e e
C e C e e
C e C e e
C e
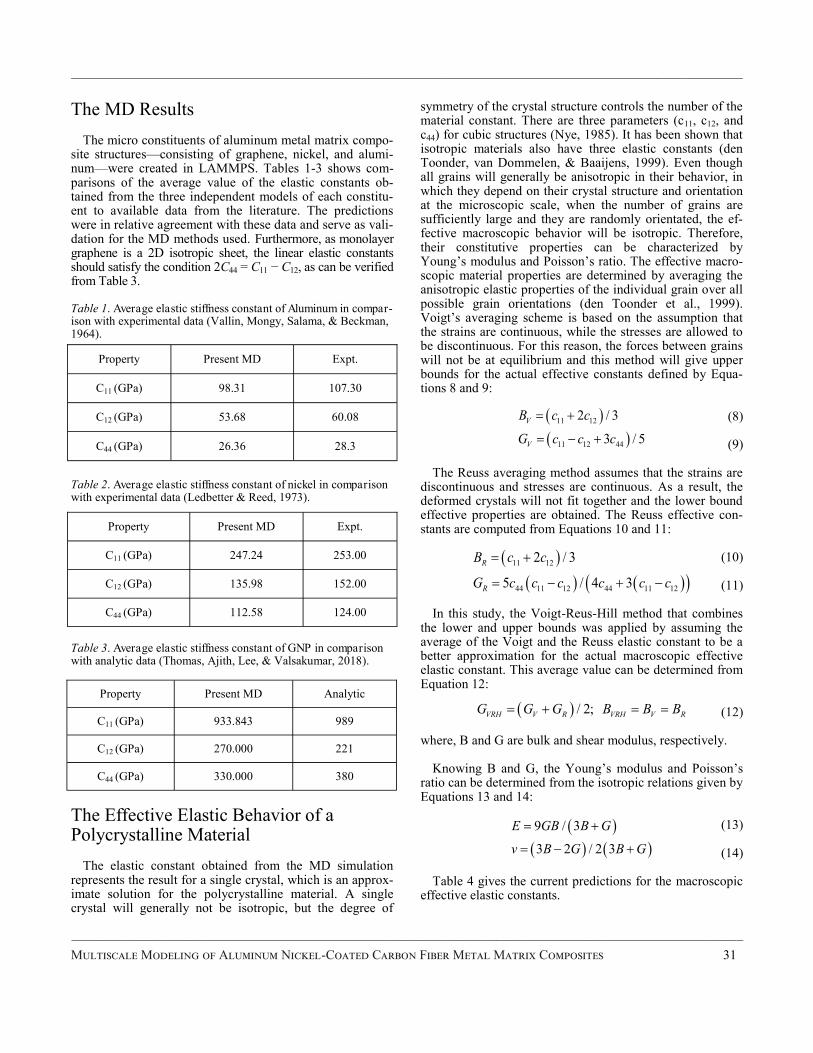
——————————————————————————————————————————————–————
The MD Results
The micro constituents of aluminum metal matrix compo-site structures—consisting of graphene, nickel, and alumi-num—were created in LAMMPS. Tables 1-3 shows com-parisons of the average value of the elastic constants ob-tained from the three independent models of each constitu-ent to available data from the literature. The predictions were in relative agreement with these data and serve as vali-dation for the MD methods used. Furthermore, as monolayer graphene is a 2D isotropic sheet, the linear elastic constants should satisfy the condition 2C44 = C11 − C12, as can be verified from Table 3. Table 1. Average elastic stiffness constant of Aluminum in compar-ison with experimental data (Vallin, Mongy, Salama, & Beckman, 1964).
Table 2. Average elastic stiffness constant of nickel in comparison with experimental data (Ledbetter & Reed, 1973).
Table 3. Average elastic stiffness constant of GNP in comparison with analytic data (Thomas, Ajith, Lee, & Valsakumar, 2018).
The Effective Elastic Behavior of a Polycrystalline Material
The elastic constant obtained from the MD simulation represents the result for a single crystal, which is an approx-imate solution for the polycrystalline material. A single crystal will generally not be isotropic, but the degree of
symmetry of the crystal structure controls the number of the material constant. There are three parameters (c11, c12, and c44) for cubic structures (Nye, 1985). It has been shown that isotropic materials also have three elastic constants (den Toonder, van Dommelen, & Baaijens, 1999). Even though all grains will generally be anisotropic in their behavior, in which they depend on their crystal structure and orientation at the microscopic scale, when the number of grains are sufficiently large and they are randomly orientated, the ef-fective macroscopic behavior will be isotropic. Therefore, their constitutive properties can be characterized by Young’s modulus and Poisson’s ratio. The effective macro-scopic material properties are determined by averaging the anisotropic elastic properties of the individual grain over all possible grain orientations (den Toonder et al., 1999). Voigt’s averaging scheme is based on the assumption that the strains are continuous, while the stresses are allowed to be discontinuous. For this reason, the forces between grains will not be at equilibrium and this method will give upper bounds for the actual effective constants defined by Equa-tions 8 and 9:
(8)
(9)
The Reuss averaging method assumes that the strains are discontinuous and stresses are continuous. As a result, the deformed crystals will not fit together and the lower bound effective properties are obtained. The Reuss effective con-stants are computed from Equations 10 and 11:
(10)
(11)
In this study, the Voigt-Reus-Hill method that combines the lower and upper bounds was applied by assuming the average of the Voigt and the Reuss elastic constant to be a better approximation for the actual macroscopic effective elastic constant. This average value can be determined from Equation 12:
(12) where, B and G are bulk and shear modulus, respectively.
Knowing B and G, the Young’s modulus and Poisson’s ratio can be determined from the isotropic relations given by Equations 13 and 14:
(13)
(14)
Table 4 gives the current predictions for the macroscopic effective elastic constants.
Property Present MD Expt.
C11 (GPa) 98.31 107.30
C12 (GPa) 53.68 60.08
C44 (GPa) 26.36 28.3
Property Present MD Expt.
C11 (GPa) 247.24 253.00
C12 (GPa) 135.98 152.00
C44 (GPa) 112.58 124.00
Property Present MD Analytic
C11 (GPa) 933.843 989
C12 (GPa) 270.000 221
C44 (GPa) 330.000 380
11 12
11 12 44
2 / 3
3 / 5
V
V
B c c
G c c c
11 12
44 11 12 44 11 12
2 / 3
5 / 4 3
R
R
B c c
G c c c c c c
/ 2; VRH V R VRH V RG G G B B B
9 / 3
3 2 / 2 3
E GB B G
v B G B G
——————————————————————————————————————————————————–
Multiscale Modeling of Aluminum Nickel-Coated Carbon Fiber Metal Matrix Composites 31
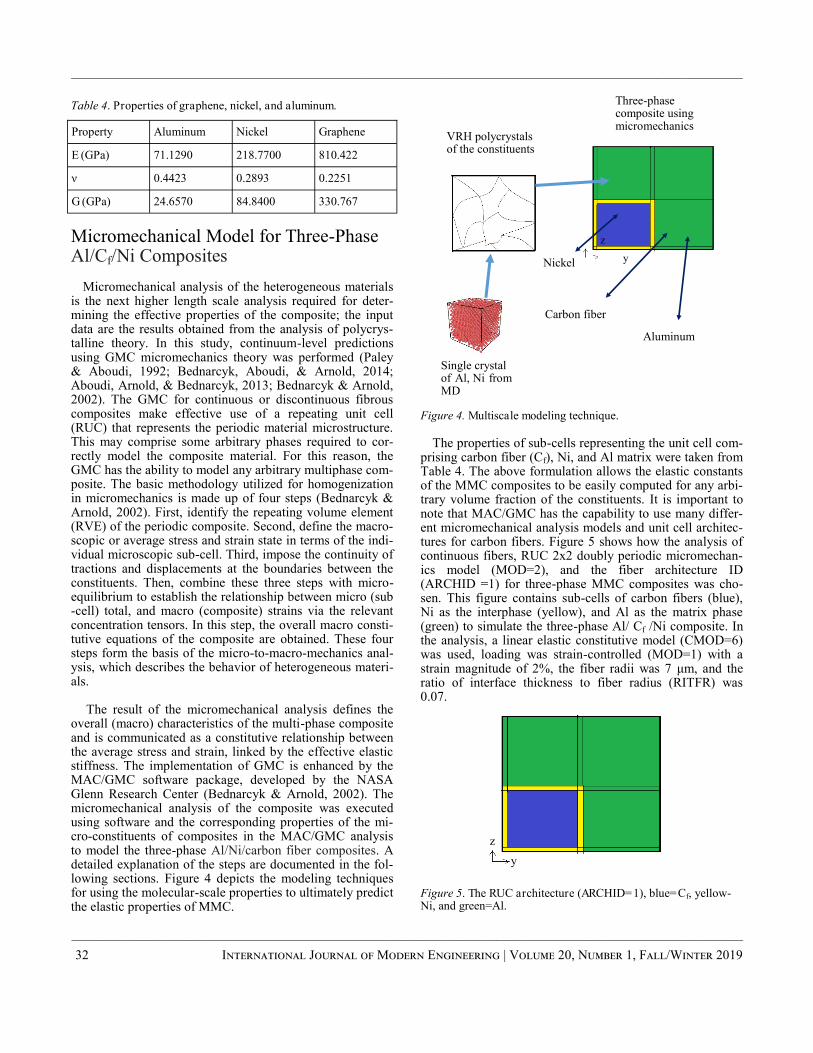
——————————————————————————————————————————————–————
——————————————————————————————————————————————–————
32 International Journal of Modern Engineering | Volume 20, Number 1, Fall/Winter 2019
Table 4. Properties of graphene, nickel, and aluminum.
Micromechanical Model for Three-Phase Al/Cf/Ni Composites
Micromechanical analysis of the heterogeneous materials is the next higher length scale analysis required for deter-mining the effective properties of the composite; the input data are the results obtained from the analysis of polycrys-talline theory. In this study, continuum-level predictions using GMC micromechanics theory was performed (Paley & Aboudi, 1992; Bednarcyk, Aboudi, & Arnold, 2014; Aboudi, Arnold, & Bednarcyk, 2013; Bednarcyk & Arnold, 2002). The GMC for continuous or discontinuous fibrous composites make effective use of a repeating unit cell (RUC) that represents the periodic material microstructure. This may comprise some arbitrary phases required to cor-rectly model the composite material. For this reason, the GMC has the ability to model any arbitrary multiphase com-posite. The basic methodology utilized for homogenization in micromechanics is made up of four steps (Bednarcyk & Arnold, 2002). First, identify the repeating volume element (RVE) of the periodic composite. Second, define the macro-scopic or average stress and strain state in terms of the indi-vidual microscopic sub-cell. Third, impose the continuity of tractions and displacements at the boundaries between the constituents. Then, combine these three steps with micro-equilibrium to establish the relationship between micro (sub-cell) total, and macro (composite) strains via the relevant concentration tensors. In this step, the overall macro consti-tutive equations of the composite are obtained. These four steps form the basis of the micro-to-macro-mechanics anal-ysis, which describes the behavior of heterogeneous materi-als.
The result of the micromechanical analysis defines the overall (macro) characteristics of the multi-phase composite and is communicated as a constitutive relationship between the average stress and strain, linked by the effective elastic stiffness. The implementation of GMC is enhanced by the MAC/GMC software package, developed by the NASA Glenn Research Center (Bednarcyk & Arnold, 2002). The micromechanical analysis of the composite was executed using software and the corresponding properties of the mi-cro-constituents of composites in the MAC/GMC analysis to model the three-phase Al/Ni/carbon fiber composites. A detailed explanation of the steps are documented in the fol-lowing sections. Figure 4 depicts the modeling techniques for using the molecular-scale properties to ultimately predict the elastic properties of MMC.
Figure 4. Multiscale modeling technique.
The properties of sub-cells representing the unit cell com-
prising carbon fiber (Cf), Ni, and Al matrix were taken from Table 4. The above formulation allows the elastic constants of the MMC composites to be easily computed for any arbi-trary volume fraction of the constituents. It is important to note that MAC/GMC has the capability to use many differ-ent micromechanical analysis models and unit cell architec-tures for carbon fibers. Figure 5 shows how the analysis of continuous fibers, RUC 2x2 doubly periodic micromechan-ics model (MOD=2), and the fiber architecture ID (ARCHID =1) for three-phase MMC composites was cho-sen. This figure contains sub-cells of carbon fibers (blue), Ni as the interphase (yellow), and Al as the matrix phase (green) to simulate the three-phase Al/ Cf /Ni composite. In the analysis, a linear elastic constitutive model (CMOD=6) was used, loading was strain-controlled (MOD=1) with a strain magnitude of 2%, the fiber radii was 7 μm, and the ratio of interface thickness to fiber radius (RITFR) was 0.07.
Figure 5. The RUC architecture (ARCHID=1), blue=Cf, yellow-Ni, and green=Al.
Property Aluminum Nickel Graphene
E (GPa) 71.1290 218.7700 810.422
ν 0.4423 0.2893 0.2251
G (GPa) 24.6570 84.8400 330.767
VRH polycrystals of the constituents
Carbon fiber
Three-phase composite using micromechanics
Aluminum
Single crystal of Al, Ni from MD
Nickel y
z
z
y

——————————————————————————————————————————————–————
Figure 6 shows how the analysis of short fibers, RUC triply periodic micromechanics model (MOD=3), and the fiber architecture ID (ARCHID =2) for the three-phase MMC composites was also chosen.
Figure 6. The RUC architecture (ARCHID=2), blue=Cf, yellow-Ni, and green=Al.
To establish the validity of the present methodology, the
available experimental data of aluminum nickel-coated short carbon fiber metal matrix composites in the literature (Kumar et al., 2018) was utilized. In their experimental in-vestigation, the authors used nickel-coated fibers with an average diameter of 7μm and a length of about 1.0-1.5 mm.
Results and Discussion
The three-phase MMC making up the Al structures, car-bon fibers (Cf), and Ni were modeled using micromechanics theory. The elastic moduli, shear moduli, and Poisson’s ratios for each model were obtained from macroscopic theo-ry of polycrystalline materials. Tables 5 and 6 document the predicted effective properties of the three-phase Al/Cf/Ni composites using MAC/GMC software for continuous and short fibers, respectively. Table 5 shows how the computa-tional results of continuous fibers at different volume frac-tions of carbon fibers (Vf) can be used to optimize the per-formance of the MMC composites. The results generally showed that the structural properties of the MMCs depend-ed on their microstructural constituents. It was clearly demonstrated that the composite was transversely isotropic with stiffness greater in the fiber direction.
Table 5 shows that the range of E1 for the composites was 71.89-261.88 GPa, while that for E2 was 71.35-137.16 GPa. The E1 and E2 data are also presented visually on the graph in Figure 7. However, the numerical results were normal-ized by 71.89 GPa for E1 and 71.35 for E2 in order to com-pare the two. Figure 7 shows that E linearly increases with increased carbon fibers in both longitudinal and transverse directions. Table 6 documents the effective properties of aluminum nickel-coated short carbon fiber metal matrix composites. As noted previously, the fiber’s average diame-ter of 7 μm and length of 1.2 mm were used to compare the results with the experimental data found in the literature (Kumar et al., 2018).
Table 5. The effective properties for the three-phase composites Al/Cf/Ni for continuous fibers.
Table 6. The effective properties for the three-phase Al/Cf/Ni composites for short fibers.
These data showed that the Young’s modulus of alumi-num nickel-coated carbon fiber metal matrix composite ranged from 73 to 90 GPa for a weight fraction in the range 0-0.08 (0-0.1231 vol. fraction) of carbon fiber. In this cur-rent study, a volume fraction of carbon fiber ranging from 0 to 0.25 (see again Table 6) was compared with experi-mental data results (see Table 7). The value of E was in agreement with the experimental data. However, the subtle difference between the two data might be due to the length
y
z
Vf 0.0 0.05 0.10 0.15 0.20 0.25
E1
(GPa) 71.89 109.25 147.40 185.57 223.73 261.88
E2
(GPa) 71.35 81.80 92.77 105.26 119.93 137.16
E3
(GPa) 71.35 81.80 92.77 105.27 119.93 137.16
G12
(GPa) 24.68 26.27 28.31 30.73 33.58 36.91
G13
(GPa) 24.68 26.27 28.31 30.73 33.58 36.91
G23
(GPa) 24.68 25.99 27.48 29.15 31.04 33.19
v12 0.442 0.430 0.418 0.405 0.393 0.381
v13 0.442 0.430 0.418 0.405 0.393 0.381
v23 0.445 0.538 0.578 0.592 0.591 0.580
Vf 0.0 0.05 0.10 0.15 0.20 0.25
E1
(GPa) 71.13 75.78 81.32 87.35 93.70 100.26
E2
(GPa) 71.13 75.59 80.81 86.45 92.38 98.50
E3
(GPa) 71.13 75.59 80.81 86.45 92.38 98.50
G12
(GPa) 24.66 25.94 27.42 29.08 30.94 33.02
G13
(GPa) 24.67 25.94 27.42 29.08 30.94 33.02
G23
(GPa) 24.67 25.94 27.29 28.80 30.45 32.22
v12 0.442 0.441 0.439 0.437 0.435 0.433
v13 0.442 0.441 0.439 0.437 0.435 0.433
v23 0.442 0.441 0.440 0.439 0.4378 0.4362
——————————————————————————————————————————————————–
Multiscale Modeling of Aluminum Nickel-Coated Carbon Fiber Metal Matrix Composites 33
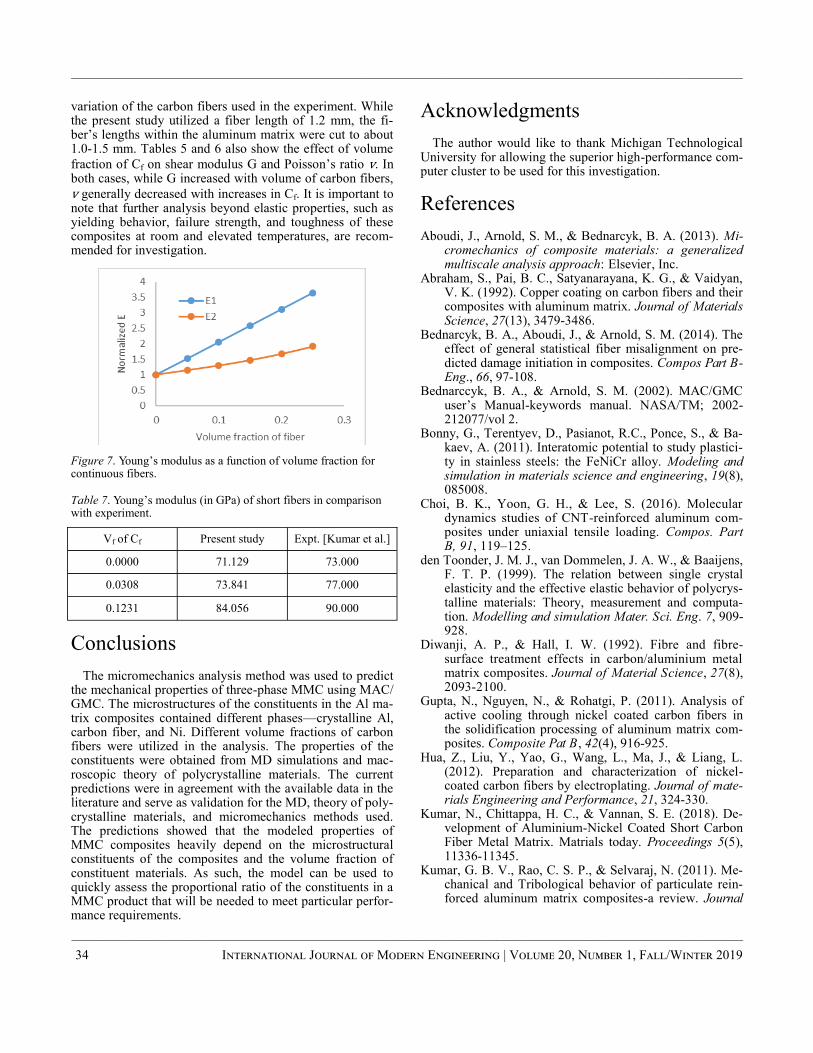
——————————————————————————————————————————————–————
——————————————————————————————————————————————–————
34 International Journal of Modern Engineering | Volume 20, Number 1, Fall/Winter 2019
variation of the carbon fibers used in the experiment. While the present study utilized a fiber length of 1.2 mm, the fi-ber’s lengths within the aluminum matrix were cut to about 1.0-1.5 mm. Tables 5 and 6 also show the effect of volume
fraction of Cf on shear modulus G and Poisson’s ratio v. In both cases, while G increased with volume of carbon fibers,
v generally decreased with increases in Cf. It is important to note that further analysis beyond elastic properties, such as yielding behavior, failure strength, and toughness of these composites at room and elevated temperatures, are recom-mended for investigation.
Figure 7. Young’s modulus as a function of volume fraction for continuous fibers.
Table 7. Young’s modulus (in GPa) of short fibers in comparison with experiment.
Conclusions
The micromechanics analysis method was used to predict the mechanical properties of three-phase MMC using MAC/GMC. The microstructures of the constituents in the Al ma-trix composites contained different phases—crystalline Al, carbon fiber, and Ni. Different volume fractions of carbon fibers were utilized in the analysis. The properties of the constituents were obtained from MD simulations and mac-roscopic theory of polycrystalline materials. The current predictions were in agreement with the available data in the literature and serve as validation for the MD, theory of poly-crystalline materials, and micromechanics methods used. The predictions showed that the modeled properties of MMC composites heavily depend on the microstructural constituents of the composites and the volume fraction of constituent materials. As such, the model can be used to quickly assess the proportional ratio of the constituents in a MMC product that will be needed to meet particular perfor-mance requirements.
Acknowledgments
The author would like to thank Michigan Technological University for allowing the superior high-performance com-puter cluster to be used for this investigation.
References Aboudi, J., Arnold, S. M., & Bednarcyk, B. A. (2013). Mi-
cromechanics of composite materials: a generalized multiscale analysis approach: Elsevier, Inc.
Abraham, S., Pai, B. C., Satyanarayana, K. G., & Vaidyan, V. K. (1992). Copper coating on carbon fibers and their composites with aluminum matrix. Journal of Materials Science, 27(13), 3479-3486.
Bednarcyk, B. A., Aboudi, J., & Arnold, S. M. (2014). The effect of general statistical fiber misalignment on pre-dicted damage initiation in composites. Compos Part B-Eng., 66, 97-108.
Bednarccyk, B. A., & Arnold, S. M. (2002). MAC/GMC user’s Manual-keywords manual. NASA/TM; 2002-212077/vol 2.
Bonny, G., Terentyev, D., Pasianot, R.C., Ponce, S., & Ba-kaev, A. (2011). Interatomic potential to study plastici-ty in stainless steels: the FeNiCr alloy. Modeling and simulation in materials science and engineering, 19(8), 085008.
Choi, B. K., Yoon, G. H., & Lee, S. (2016). Molecular dynamics studies of CNT-reinforced aluminum com-posites under uniaxial tensile loading. Compos. Part B, 91, 119–125.
den Toonder, J. M. J., van Dommelen, J. A. W., & Baaijens, F. T. P. (1999). The relation between single crystal elasticity and the effective elastic behavior of polycrys-talline materials: Theory, measurement and computa-tion. Modelling and simulation Mater. Sci. Eng. 7, 909-928.
Diwanji, A. P., & Hall, I. W. (1992). Fibre and fibre-surface treatment effects in carbon/aluminium metal matrix composites. Journal of Material Science, 27(8), 2093-2100.
Gupta, N., Nguyen, N., & Rohatgi, P. (2011). Analysis of active cooling through nickel coated carbon fibers in the solidification processing of aluminum matrix com-posites. Composite Pat B, 42(4), 916-925.
Hua, Z., Liu, Y., Yao, G., Wang, L., Ma, J., & Liang, L. (2012). Preparation and characterization of nickel-coated carbon fibers by electroplating. Journal of mate-rials Engineering and Performance, 21, 324-330.
Kumar, N., Chittappa, H. C., & Vannan, S. E. (2018). De-velopment of Aluminium-Nickel Coated Short Carbon Fiber Metal Matrix. Matrials today. Proceedings 5(5), 11336-11345.
Kumar, G. B. V., Rao, C. S. P., & Selvaraj, N. (2011). Me-chanical and Tribological behavior of particulate rein-forced aluminum matrix composites-a review. Journal
Vf of Cf Present study Expt. [Kumar et al.]
0.0000 71.129 73.000
0.0308 73.841 77.000
0.1231 84.056 90.000
——————————————————————————————————————————————–————
of minerals and materials Characterization & Engi-neering, 10(1), 59-91.
Lacin, M., & Marhic, C. (2000). TEM study of carbon fibre reinforced aluminium matrix composites: influence of brittle phases and interface on mechanical properties. Journal of the European Ceramic Society, 20(10), 1493-1503.
Ledbetter, H. M., & Reed, R. P. (1973). Elastic Properties
of Metals and Alloys, I. Iron, Nickel, and Iron‐Nickel Alloys. Journal of Physical and Chemical Reference Data 2, 531: https://doi.org/10.1063/1.325312.
Lee, W. S., Sue, W. C., & Lin, C. F. (2010). The effects of temperature and strain rate on the properties of carbon-fiber-reinforced 7075 aluminum alloy metal-matrix composite. Composite Science and technology, 60(10), 1975-1983.
Nye, J. F. (1985). Physical properties of crystals. Oxford: Clarendon.
Nasiri, S., Wang, K., Yang, M., Li, Q., & Zaiser, M. (2019). Nickel coated carbon nanotubes in aluminum matrix composites: a multiscale simulation study. Eur. Phys. J. B, 92(186). https://doi.org/10.1140/epjb/e2019-100243-.
Paley, M., & Aboudi, J. (1992). Micromechanical analysis of composites by the generalized cells model. Mech. Mater., 14, 127-139.
Rassoulinejad-Mousavi, S. M., Mao, Y., & Zhang, Y. (2016). Evaluation of copper, aluminum, and nickel interatomic potentials on predicting the elastic proper-ties. Journal of Applied Physics 119, 244304.
Sharma, P., Khanduja, D., & Sharma, S. (2014). Tribologi-cal and mechanical behavior of particulate aluminum matrix composites. J. Reinf Plast Compos, 33(23), 2192-202.
Sozhamannan, G. G., Prabu, S. B., & Venkatagalapathy, V. S. K. (2012). Effect of processing parameters on metal matrix composites: stir casting process. Journal of Sur-face Engineered Materials and Advanced Technology, 2(1), 11-15.
Subramaniyan, A. K., & Sun, C. T. (2008). Continuum In-terpretation of Virial Stress in Molecular Simulations. International Journal of Solids and Structures, 45, 4340-4346.
Surappa, M. K. (2003). Aluminium matrix composites: Challenges and opportunities. Sadhana, 28(1-2), 319-334.
Tersoff, J. (1989). Modelling solid-state chemistry: Intera-tomic potentials for multicomponents systems. Phys. Rev., 39(8), 5566R.
Thomas, S., Ajith, K. M., Lee, S. U., & Valsakumar, M. C. (2018). Assessment of the mechanical properties of monolayer graphene using the energy and strain-fluctuation methods. RSC Advances, 8, 27283.
Vallin, J., Mongy, M., Salama, K., & Beckman, O. (1964). Elastic constant of aluminum. Journal of Applied Phys-ics, 35(2), 1825.
Zhao, S., & Xue, J. (2013). Mechanical properties of hybrid graphene and hexagonal boron nitride sheets as re-
vealed by molecular dynamic simulations. Journal of Physics D: Applied Physics, 46(13).
Zope, R. R., & Mishin, Y. (2003). Interatomic potential for atomistic simulations of the Ti-Al system. Physical Review B, 68(2), 024102.
Biographies
OLANREWAJU ALUKO is an associate professor of mechanical engineering at the University of Michigan-Flint. He earned his BS and MS degrees from the University of Ilorin in 1989 and 1995, respectively, and PhD in Mechani-cal Engineering in 2007 from Howard University. Dr. Alu-ko’s research interests include multiscale analysis of com-posite materials and structures. Dr. Aluko may be reached at [email protected]
S. GOWTHAM is a research associate professor of physics and electrical engineering and Director of Research Computing at Michigan Technological University. He earned his PhD in Physics from Michigan Technological University in 2007. His research interests include parallel computing and visualization, and interaction of biological matter with nanomaterials. Dr. Gowtham may be reached at [email protected]
GREGORY M. ODEGARD is a professor of mechani-cal engineering at Michigan Technological University. He earned his PhD in Mechanical Engineering from the Univer-sity of Denver in 2000. His research interests include com-putational mechanics and computational materials science. Dr. Odegard may be reached at [email protected]
——————————————————————————————————————————————————–
Multiscale Modeling of Aluminum Nickel-Coated Carbon Fiber Metal Matrix Composites 35
Instructions for Authors: Manuscript Formatting Requirements
The INTERNATIONAL JOURNAL OF MODERN ENGINEERING is an online/print publication designed for Engineering, Engineering Technology, and Industrial Tech-nology professionals. All submissions to this journal, sub-mission of manuscripts, peer-reviews of submitted docu-ments, requested editing changes, notification of acceptance or rejection, and final publication of accepted manuscripts will be handled electronically. The only exception is the submission of separate high-quality image files that are too large to send electronically.
All manuscript submissions must be prepared in Microsoft Word (.doc or .docx) and contain all figures, im-ages and/or pictures embedded where you want them and appropriately captioned. Also included here is a summary of the formatting instructions. You should, however, review the sample Word document on our website (http://ijme.us/formatting_guidelines/) for details on how to correctly for-mat your manuscript. The editorial staff reserves the right to edit and reformat any submitted document in order to meet publication standards of the journal.
The references included in the References section of your manuscript must follow APA-formatting guidelines. In order to help you, the sample Word document also includes numerous examples of how to format a variety of scenarios. Keep in mind that an incorrectly formatted manuscript will be returned to you, a delay that may cause it (if accepted) to be moved to a subsequent issue of the journal. 1. Word Document Page Setup: Two columns with ¼"
spacing between columns; top of page = ¾"; bottom of page = 1" (from the top of the footer to bottom of page); left margin = ¾"; right margin = ¾".
2. Paper Title: Centered at the top of the fir st page
with a 22-point Times New Roman (Bold), small-caps font.
3. Page Breaks: Do not use page breaks. 4. Figures, Tables, and Equations: All figures, tables,
and equations must be placed immediately after the first paragraph in which they are introduced. And, each must be introduced. For example: “Figure 1 shows the opera-tion of supercapacitors.” “The speed of light can be determined using Equation 4:”
5. More on Tables and Figures: Center table captions above each table; center figure captions below each figure. Use 9-point Times New Roman (TNR) font. Italicize the words for table and figure, as well as their respective numbers; the remaining information in the caption is not italicized and followed by a period—e.g., “Table 1. Number of research universities in the state.” or “Figure 5. Cross-sectional aerial map of the forested area.”
6. Figures with Multiple Images: If any given figure
includes multiple images, do NOT group them; they must be placed individually and have individual minor captions using, “(a)” “(b)” etc. Again, use 9-point TNR.
7. Equations: Each equation must be numbered,
placed in numerical order within the document, and introduced—as noted in item #4.
8. Tables, Graphs, and Flowcharts: All tables, graphs,
and flowcharts must be created directly in Word; tables must be enclosed on all sides. The use of color and/or highlighting is acceptable and encouraged, if it provides clarity for the reader.
9. Textboxes: Do not use text boxes anywhere in the
document. For example, table/figure captions must be regular text and not attached in any way to their tables or images.
10. Body Fonts: Use 10-point TNR for body text through-
out (1/8" paragraph indention); indent all new para-graphs as per the images shown below; do not use tabs anywhere in the document; 9-point TNR for author names/affiliations under the paper title; 16-point TNR for major section titles; 14-point TNR for minor section titles.
11. Personal Pronouns: Do not use personal pronouns
(e.g., “we” “our” etc.). 12. Section Numbering: Do not use section number ing
of any kind. 13. Headers and Footers: Do not use either .
——————————————————————————————————————————————–———— 36 Instructions for Authors: Manuscript Submission Guidelines and Requirements
14. References in the Abstract: Do NOT include any references in the Abstract.
15. In-Text Referencing: For the fir st occur rence of a
given reference, list all authors—last names only—up to seven (7); if more than seven, use “et al.” after the seventh author. For a second citation of the same refer-ence—assuming that it has three or more authors—add “et al.” after the third author. Again, see the sample Word document and the formatting guide for references for specifics.
16. More on In-Text References: If you include a refer -
ence on any table, figure, or equation that was not cre-ated or originally published by one or more authors on your manuscript, you may not republish it without the expressed, written consent of the publishing author(s). The same holds true for name-brand products.
17. End-of-Document References Section: List all refer -
ences in alphabetical order using the last name of the first author—last name first, followed by a comma and the author’s initials. Do not use retrieval dates for web-sites.
18. Author Biographies: Include biographies and cur -
rent email addresses for each author at the end of the document.
19. Page Limit: Manuscr ipts should not be more than
15 pages (single-spaced, 2-column format, 10-point TNR font).
20. Page Numbering: Do not use page numbers. 21. Publication Charges: Manuscr ipts accepted for pub-
lication are subject to mandatory publication charges. 22. Copyright Agreement: A copyr ight transfer agree-
ment form must be signed by all authors on a given manuscript and submitted by the corresponding author before that manuscript will be published. Two versions of the form will be sent with your manuscript’s ac-ceptance email. Only one form is required. Do not submit both forms! The form named “paper” must be hand-signed by each author. The other form, “electronic,” does not require hand signatures and may be filled out by the corre-sponding author, as long as he/she receives written per-mission from all authors to have him/her sign on their behalf.
23. Submissions: All manuscr ipts and required files and forms must be submitted electronically to Dr. Philip D. Weinsier, manuscript editor, at [email protected].
24. Published Deadlines: Manuscr ipts may be submit-
ted at any time during the year, irrespective of pub-lished deadlines, and the editor will automatically have your manuscript reviewed for the next-available issue of the journal. Published deadlines are intended as “target” dates for submitting new manuscripts as well as revised documents. Assuming that all other submis-sion conditions have been met, and that there is space available in the associated issue, your manuscript will be published in that issue if the submission process—including payment of publication fees—has been com-pleted by the posted deadline for that issue.
Missing a deadline generally only means that your manuscript may be held for a subsequent issue of the journal. However, conditions exist under which a given manuscript may be rejected. Always check with the editor to be sure. Also, if you do not complete the sub-mission process (including all required revisions) with-in 12 months of the original submission of your manu-script, your manuscript may be rejected or it may have to begin the entire review process anew.
——————————————————————————————————————————————————
Instructions for Authors: Manuscript Submission Guidelines and Requirements 37
INTERNATIONAL JOURNAL OF ENGINEERING RESEARCH AND INNOVATION
CUTTING EDGE JOURNAL OF RESEARCH AND INNOVATION IN ENGINEERING
Mark Rajai, Ph.D.
Editor-in-Chief California State University-Northridge College of Engineering and Computer Science Room: JD 4510 Northridge, CA 91330 Office: (818) 677-5003 Email: [email protected]
Contact us:
www.iajc.org www.ijeri.org
www.ijme.us www.tiij.org
Print ISSN: 2152-4157 Online ISSN: 2152-4165
• Manuscripts should be sent electronically to the manuscript editor, Dr. Philip Weinsier, at [email protected].
For submission guidelines visit www.ijeri.org/submissions
IJERI SUBMISSIONS:
• The International Journal of Modern Engineering (IJME) For more information visit www.ijme.us
• The Technology Interface International Journal (TIIJ)
For more information visit www.tiij.org
OTHER IAJC JOURNALS:
• Contact the chair of the International Review Board, Dr. Philip Weinsier, at [email protected].
For more information visit www.ijeri.org/editorial
a TO JOIN THE REVIEW BOARD:
• IJERI is the second official journal of the International Association of Journals and Conferences (IAJC).
• IJERI is a high-quality, independent journal steered by a distinguished board of directors and supported by an international review board representing many well-known universities, colleges, and corporations in the U.S. and abroad.
• IJERI has an impact factor of 1.58, placing it among
an elite group of most-cited engineering journals worldwide.
ABOUT IJERI:
INDEXING ORGANIZATIONS:
• IJERI is currently indexed by 16 agencies. For a complete listing, please visit us at www.ijeri.org.
THE LEADING JOURNAL OF ENGINEERING, APPLIED
SCIENCE AND TECHNOLOGY
IJME IS THE OFFICAL AND FLAGSHIP JOURNAL OF THE
INTERNATIONAL ASSOCATION OF JOURNALS AND CONFERENCE (IAJC) www.iajc.org
The International Journal of Modern Engineering (IJME) is a highly-selective, peer-reviewed journal covering topics that appeal to a broad readership of various branches of engineering and related technologies.
IJME is steered by the IAJC distinguished board of directors and is supported by an international review board consisting of prominent individuals representing many well-known universities, colleges,
and corporations in the United States and abroad.
IJME Contact Information General questions or inquiries about sponsorship of the journal should be directed to:
Mark Rajai, Ph.D.
Editor-in-Chief
Office: (818) 677-5003
Email: [email protected]
Department of Manufacturing Systems Engineering & Management
California State University-Northridge
18111 Nordhoff St.
Northridge, CA 91330
The latest impact factor (IF) calculation (Google Scholar method) for IJME of 3.0 moves
it even higher in its march towards the top 10 engineering journals.


