Embed Size (px)
Citation preview
What Affects Nonprofit Survival?
Wolfgang Bielefeld This article describes mortality patterns for nonprofit organi- zations in a major U.S. metropolitan area between 1980 and 1988. Twenty percent of the nonprofits in a paneZ ceased oper- ations during this period. Mortality rates were found to vary widely. In some instances, high mortality was found in parts of the sector that were growing rapidly. Overall, nonprofits that ceased to operate were younger and smallet; used fewer strategies to attract funders, and had less diversvied income streams than survivors. These patterns also varied substan- tially. The results point to the drawbacks of using limited or commonsense information and the necessity of theory-based research.
HILE there has been an increase in scholarly interest and writing on the subject of organizational decline (for exam- W ple, Cameron, Sutton, and Whetten, 1988), little of this
focus has dealt systematically with nonprofit organizations (Cameron, Kim, and Whetten, 1987; Singh, House, and Tucker, 1986; Selle and Oymy-r, 1992 are exceptions). This lack of attention is unfortunate because the nonprofit sector has recently faced a series of financial constraints brought on by cutbacks in public expenditures during the Reagan administration, continued low levels of public expenditures during the Bush adrmnistration, and recessions in the early 1980s and 1990s. In addition, the sector’s mission and accountability have increasingly been scrutinized by the public, government, and busi- ness (Estes, Binney, and Bergthold, 1989; Goss, 1993), and major institutional funders have, in some cases, reevaluated and changed their funding priorities (Millar and Moore, 1991; Millar, 1991).
Note: The research described in this article was supported by grants from the National Science Foundation; the Program on Non-profit Organizations at Yale University; the Center for Urban and Regional Affairs, the Conflict and Change Center, and the Graduate School at the University of Minnesota; and the North- west Area Foundation. An earlier version of this article was presented at the 1993 INDEPENDENT SECTOR Spring Research Forum, Mar. 18-19, San Antonio, Tex.
20 BIELEFELD
This study is one of thefew
conducted in the United States
that has followed a broad-based
popuZation of nonprofit
organizations over an extended
period
Data gathered as part of a panel study of the nonprofit sector in MinneapoldSt. Paul, Minnesota, between 1980 and 1988 provide an opportunity to examine nonprofit mortality. This study is one of the few conducted in the United States that has followed a broad- based population of nonprofit organizations over an extended period. This analysis will delineate the numbers and types of orga- nizations that were present in 1980 and follow the fates of these organizations until 1988. Throughout, comparisons will be made between the first and second parts of this period to provide an indi- cation of how mortality in the panel may have changed over time. This information will also be put into perspective by considering how the sector as a whole changed.
Although these patterns are interesting, understanding the rea- sons for them is important. The data also provide information on the characteristics of the nonprofits that ceased operations. To identify factors that may have contributed to these nonprofits’ demise, this analysis will compare these organizations to those that survived. This analysis will also examine the degree to which organization the- ory can help us understand the findings. Selle and Oymyr (19921, for instance, studied nongovernmental organizations in a Norwegian province in 1941,1980, and 1988. Drawing on population ecology theory, they found some support for the “liability of nemess’’ and “liability of smallness” arguments, which hold that age and size affect organizational mortality (Stinchcombe, 1965; Freeman, Carrol, and Hannan, 1983; Aldrich and Marsden, 1988). These patterns are well documented in the research literature, and we would expect to find them reflected in the TMn Cities data too.
While population ecology theory has generated several interest- ing and suggestive findings about macro-level changes in organiza- tional populations (for example, Singh and Lumsden, 19901, this theory has also been subject to criticism (Young, 1988,1989; Zucker, 1989), particularly in terms of limitations in the variables consid- ered and the definition and measurement of key concepts. This crit- icism may have contributed both to Selle and Oymyr’s (1992, p. 176) findings that some types of organizations display patterns that are at odds with population ecology theory and to their conclusion that population ecology may be too general. In light of this controversy, restricting an analysis to considerations of only population ecology variables such as age, size, or specialism seems premature. The analysis will examine several expectations derived from population ecology theory, then will look beyond these expectations for a more complete explanation.
Resource dependence theory has also been used to study orga- nizational change. It emphasizes organizational adaptation to en- vironmental contingencies through environmental scanning and strategic action (Pfeffer and Salancik, 1978). Resource dependence theory is concerned with critical resource flows and would argue that, to succeed, organizations need to take actions to avoid the
WHAT AFFECTS NONPROFIT SURVIVAL? 21
dependencies and vulnerabilities inherent in an overreliance on par- ticular or limited resource suppliers. An important consideration, therefore, is whether an organization possesses the ability to for- mulate and successfully carry out resource-acquisition strategies. This analysis will examine the degree to which nonprofits adopted strategies to attract funders. The above points lead to the expecta- tion that the organizations that engaged in more of these strategies were more likely to acquire funders and were, consequently, more likely to survive.
In addition. an organization’s fate is controlled by an external actor to the extent that the organization depends on that actor for a large proportion of its inputs or outputs (Pfeffer and Salancik, 1978, p. 271). This leads to the expectation that diversification, although it may involve increased management effort (Bielefeld; 1992), will decrease a nonprofit’s dependence on any given environmental actor. An organization with numerous suppliers, therefore, is less likely to be vulnerable or controlled than one with fewer suppliers. The diver- sity of funder types will be considered in this analysis. The above ideas lead to the expectation that nonprofits with greater diversity of funder types would be more likely to survive.
Data and Methods The nonprofits in the study were chosen at random from a list of all private nonreligious charities headquartered in the MinneapolidSt. Paul, Minnesota, metropolitan area in 1979 (Galaskiewicz, 1985). The list was generated by scanning the Internal Revenue Service’s (IRs’s) Cumulative List of Organizations (October 1979), which lists all 501(c)(3) nonprofits in the United States. A total of 1,625 eligi- ble nonprofits were found. This list was stratified into ten functional categories before sampling: healthelfare, educational, legal, hous- indurban development, mass media, recreational, cultural, civic, environmental, and miscellaneous. A sample of 325 (20 percent) was drawn from the study population, and 228 of these were interviewed during 1980. Personal interviews were held with chief operating offi- cers or their designates, and information was obtained on a wide variety of organizational structures and processes.
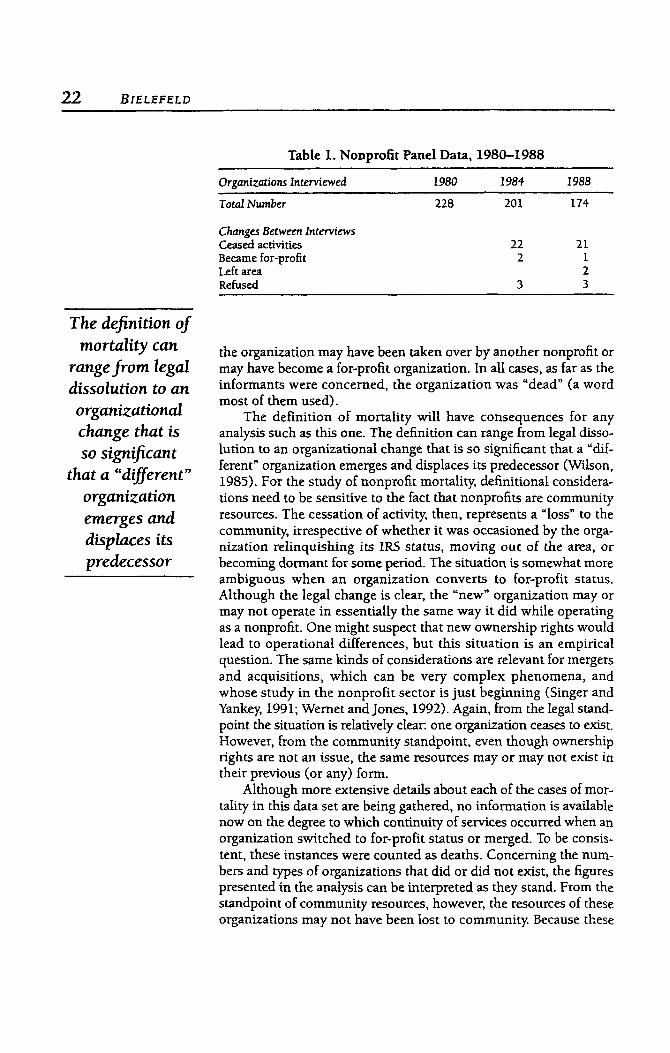
Surviving nonprofits were reinterviewed in 1984 and 1988; data were obtained on most of the same factors used in 1980 and on what had transpired in these organizations between interviews. Table 1 shows the number of nonprofits that were interviewed each time and the number that dropped out of the panel during each period.
Mortality of an organization was deemed to have occurred when a knowledgeable informant (usually the former top adminis- trator or a former board member) verified that one of several con- ditions had been met. The organization may have ceased to operate, defined in this study as no program or board activity during the pre- vious year and no activity expected during the following year. Or
The nonprofits in the study were
chosen at randomfrom a
list of all private nonreZigious
charities headquartered
in the Minneapolis1 St. Paul area
22 B I E L E F E L D
The definition of mortaZity can
range from ZegaZ dissoZution to an organizutional change that is so signijicant
that a “different” organization emerges and dispZaces its predecessor
Table 1. Nonprofit Panel Data, 1980-1988
Organizations Interviewed 1980 1984 1988 -~
Total Number
Changes Between Interviews Ceased activities Became for-profit Left area Refused
228 201 174
22 21 2 1
2 3 3
the organization may have been taken over by another nonprofit or may have become a for-profit organization. In all cases, as far as the informants were concerned, the organization was “dead” (a word most of them used).
The definition of mortality will have consequences for any analysis such as this one. The definition can range from legal disso- lution to an organizational change that is so significant that a “dif- ferent” organization emerges and displaces its predecessor (Wilson, 1985). For the study of nonprofit mortality, definitional considera- tions need to be sensitive to the fact that nonprofits are community resources. The cessation of activity, then, represents a “loss” to the community, irrespective of whether it was occasioned by the orga- nization relinquishing its IRS status, moving out of the area, or becoming dormant for some period. The situation is somewhat more ambiguous when an organization converts to for-profit status. Although the legal change is clear, the “new” organization may or may not operate in essentially the same way it did while operating as a nonprofit. One might suspect that new ownership rights would lead to operational differences, but this situation is an empirical question. The same kinds of considerations are relevant for mergers and acquisitions, which can be very complex phenomena, and whose study in the nonprofit sector is just beginning (Singer and Yankey, 1991; Wernet and Jones, 1992). Again, from the legal stand- point the situation is relatively clear: one organization ceases to exist. However, from the community standpoint, even though ownership rights are not an issue, the same resources may or may not exist in their previous (or any) form.
Although more extensive details about each of the cases of mor- tality in this data set are being gathered, no information is available now on the degree to which continuity of services occurred when an organization switched to for-profit status or merged. To be consis- tent, these instances were counted as deaths. Concerning the num- bers and types of organizations that did or did not exist, the figures presented in the analysis can be interpreted as they stand. From the standpoint of community resources, however, the resources of these organizations may not have been lost to community Because these
WHAT AFFECTS NONPROFIT SURVIVAL? 23
organizations were generally small, however, this distinction is not likely to have a major impact on the overall conclusions.
Finally, this research study also sought to assess the degree to which the nonprofit sector as a whole changed between 1980 and 1988. Because the panel inevitably became less representative of the population over time, new random samples of the nonprofit sector were drawn in 1984 and 1988. The procedure was similar to that outlined above. A mailed questionnaire was used to gather basic information from the nonprofits in these new cross sections. This information will be used to put the panel findings in perspective.
Findings The results of the analysis are presented in this section. First, the changes in the nonprofit sector as a whole between 1980 and 1988 are considered, followed by the more detailed assessment of the impacts that age, size, strategies, and funding diversity had on the panel organizations.
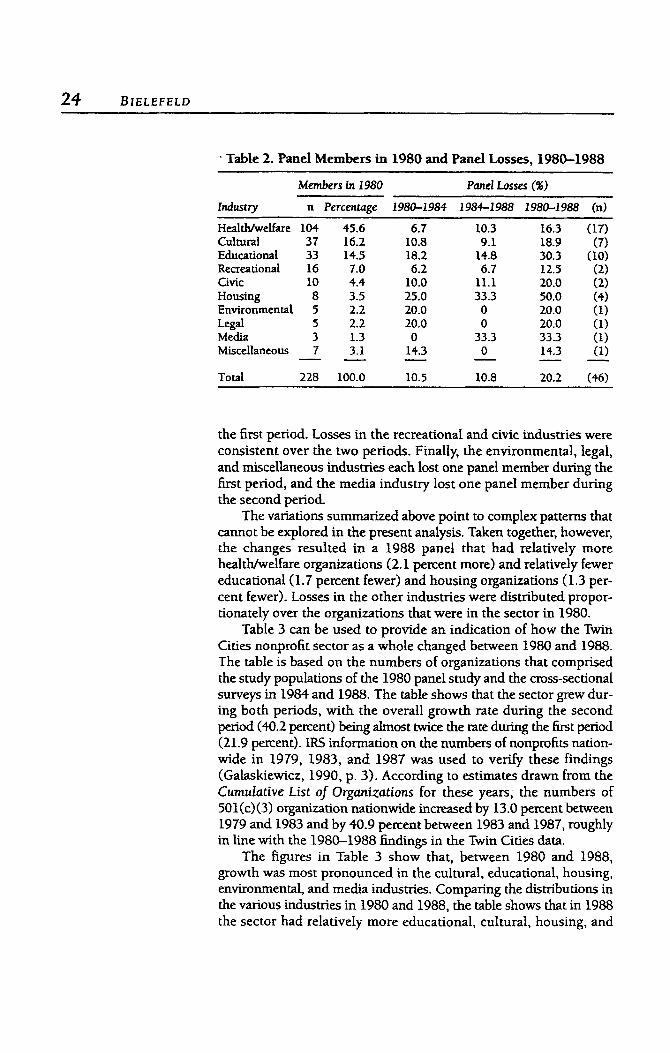
Overall Sector Changes Table 2 shows the number of panel nonprofits in the various indus- tries in 1980 and summarizes the panel losses between 1980 and 1988. An examination of the numbers of nonprofits in the panel in 1980 clearly shows that the sizes of nonprofit industries vary widely Industries where a relatively large number of organizations can be found are healtldwelfare, educational, and cultural industries, which together account for about 76 percent of the panel. The remaining panel members are distributed over the other seven industries. The numbers are especially small in the environmental, legal, and media industries. An important ramification is that percent changes in these industries over time will be volatile and should, consequently, be interpreted with caution.
Table 2 shows that, overall, 20.2 percent (n = 46) of the panel nonprofits ceased to operate between 1980 and 1988. The figures for the various industries show that considerable variation in mortality rates occurred. The housing industry suffered the highest degree of loss, with 50 percent of the panel nonprofits ceasing to operate over the course of the study In addition, the educational industry panel nonprofits lost 30 percent of their members. Panel losses were rela- tively light in the recreational industry (-12.5 percent) and the healtuwelfare industry (-1 6.3 percent).
Overall, the panel losses were distributed equally between the two periods, with twenty-four occurring during the first period and twenty-two occurring during the second. However, there was again industry-level variation in the distribution of losses between the periods. In the healtuwelfare industry, for example, more losses occurred during the second period. This pattern was reversed in the cultural and educational industries, where losses were high during
An examination of the numbers of nonprofts in
the panel in 1980 clearly shows that the sizes of nonprofit indw tries
vary widely
24 BIELEFELD
. Table 2. Panel Members in 1980 and Panel Losses, 1980-1988
Members in 1980 Panel Losses (4;) Industry n Percentage 1980-1984 1984-1988 1980-1988 (n)
Healthhelfare 104 45.6 6.7 10.3 16.3 (17) Cultural 37 16.2 10.8 9.1 18.9 (7) Educational 33 14.5 18.2 14.8 30.3 (10) Recreational 16 7.0 6.2 6.7 12.5 (2) Civic 10 4.4 10.0 11.1 20.0 (2) Housing 8 3.5 25.0 33.3 50.0 (4) Environmental 5 2.2 20.0 0 20.0 (1) Legal 5 2.2 20.0 0 20.0 (1) Media 3 1.3 0 33.3 33.3 (1)
14.3 (1) 14.3 Miscellaneous 7 3.1
Total 228 100.0 10.5 10.8 20.2 (46)
- - 0 - - - -
the first period. Losses in the recreational and civic industries were consistent over the two periods. Finally, the environmental, legal, and miscellaneous industries each lost one panel member during the first period, and the media industry lost one pane1 member during the second period.
The variations summarized above point to complex patterns that cannot be explored in the present analysis. Taken together, however, the changes resulted in a 1988 panel that had relatively more health/welfare organizations (2.1 percent more) and relatively fewer educational ( 1.7 percent fewer) and housing organizations ( 1.3 per- cent fewer). Losses in the other industries were distributed propor- tionately over the organizations that were in the sector in 1980.
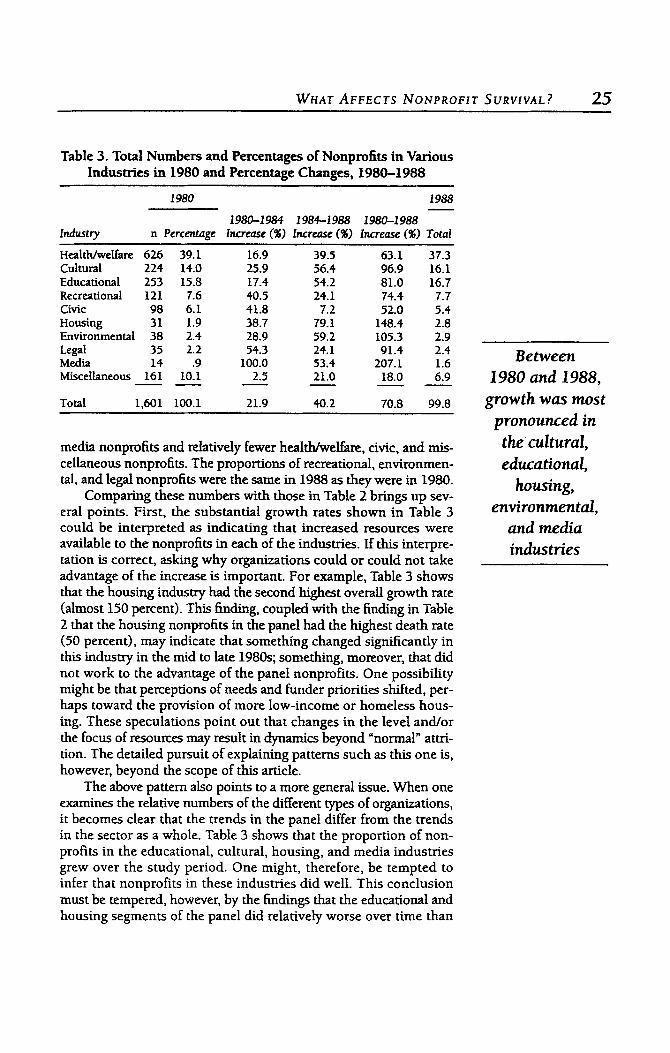
Table 3 can be used to provide an indication of how the Twin Cities nonprofit sector as a whole changed between 1980 and 1988. The table is based OR the numbers of organizations that comprised the study populations of the 1980 panel study and the cross-sectional surveys in 1984 and 1988. The table shows that the sector grew dur- ing both periods, with the overall growth rate during the second period (40.2 percent) being almost twice the rate during the first period (21.9 percent). IRS information on the numbers of nonprofits nation- wide in 1979, 1983, and 1987 was used to verify these findings (Galaskiewiu, 1990, p. 3). According to estimates drawn from the Cumulative List of Organizations for these years, the numbers of 501(c)(3) organization nationwide increased by 13.0 percent between 1979 and 1983 and by 40.9 percent between 1983 and 1987, roughly in line with the 1980-1988 findings in the Twin Cities data.
The figures in Table 3 show that, between 1980 and 1988, growth was most pronounced in the cultural, educational, housing, environmental, and media industries. Comparing the distributions in the various industries in 1980 and 1988, the table shows that in 1988 the sector had relatively more educational, cultural, housing, and
W m r A F F E C T S N O N P R O F I T SURVIVAL? 25
Table 3. Total Numbers and Percentages of Nonprofits in Various Industries in 1980 and Percentage Changes, 1980-1988
1988
Industry n Percentage Increase (%) Increase (%) Increase (%) Total
Health/welfare 626 39.1 16.9 39.5 63.1 37.3 Cultural 224 14.0 25.9 56.4 96.9 16.1 Educational 253 15.8 17.4 54.2 81.0 16.7 Recreational 121 7.6 40.5 24.1 74.4 7.7 Civic 98 6.1 41.8 7.2 52.0 5.4 Housing 31 1.9 38.7 79.1 148.4 2.8 Environmental 38 2.4 28.9 59.2 105.3 2.9 Legal 35 2.2 54.3 24.1 91.4 2.4 Media 14 .9 100.0 53.4 207.1 1.6
18.0 6.9 Miscellaneous 161 10.1
Total 1,601 100.1 21.9 40.2 70.8 99.8
- 1980
1980-1 984 1 984-1 988 1980-1 988
- - 21.0 - 2.5 - --
media nonprofits and relatively fewer healthhelfare, civic, and mis- cellaneous nonprofits. The proportions of recreational, environmen- tal, and legal nonprofits were the same in 1988 as they were in 1980.
Comparing these numbers with those in Table 2 brings up sev- eral points. First, the substantial growth rates shown in Table 3 could be interpreted as indicating that increased resources were available to the nonprofits in each of the industries. If this interpre- tation is correct, asking why organizations could or could not take advantage of the increase is important. For example, Table 3 shows that the housing industry had the second highest overall growth rate (almost 150 percent). This finding, coupled with the finding in Table 2 that the housing nonprofits in the panel had the highest death rate (50 percent), may indicate that something changed significantly in this industry in the mid to late 1980s; something, moreover, that did not work to the advantage of the panel nonprofits. One possibility might be that perceptions of needs and funder priorities shifted, per- haps toward the provision of more low-income or homeless hous- ing. These speculations point out that changes in the level and/or the focus of resources may result in dynamics beyond “normal” attri- tion. The detailed pursuit of explaining patterns such as this one is, however, beyond the scope of this article.
The above pattern also points to a more general issue. When one examines the relative numbers of the different types of organizations, it becomes clear that the trends in the panel differ from the trends in the sector as a whole. Table 3 shows that the proportion of non- profits in the educational, cultural, housing, and media industries grew over the study period. One might, therefore, be tempted to infer that nonprofits in these industries did well. This conclusion must be tempered, however, by the findings that the educational and housing segments of the panel did relatively worse over time than
Between 1980 and 1988,
growth was most pronounced in the cultural, educational,
housing, environmentaz,
and media industries
26 BIELEFELD
the other segments. In fact, the segment of the panel that did rela- tively the best, healthelfare, was in one of the industries that did relatively the worst in the sector as a whole. Comparisons such as these, and the differences they point out, have implications for the study of change and the debates over whether the focus should be on the fate of individual organizations or on more aggregate dynam- ics. We will return to this issue in the final section of this article.
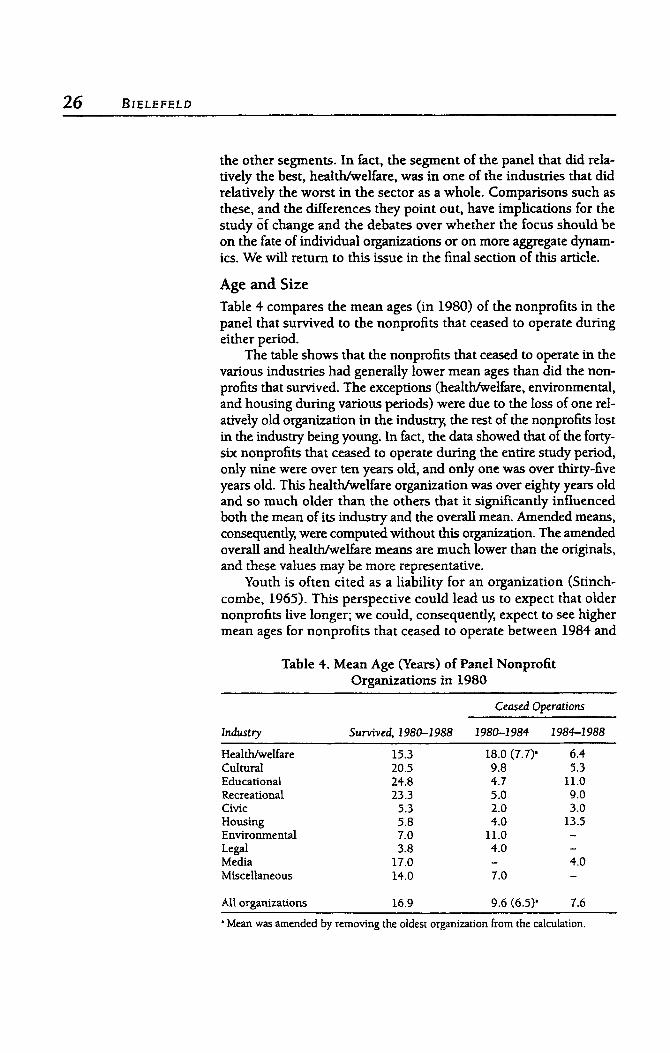
Age and Size Table 4 compares the mean ages (in 1980) of the nonprofits in the panel that survived to the nonprofits that ceased to operate during either period.
The table shows that the nonprofits that ceased to operate in the various industries had generally lower mean ages than did the non- profits that survived. The exceptions (healthltvelfare, environmental, and housing during various periods) were due to the loss of one rel- atively old organization in the industry the rest of the nonprofits lost in the industry being young. In fact, the data showed that of the forty- six nonprofits that ceased to operate during the entire study period, only nine were over ten years old, and only one was over thirty-five years old. This healthhivelfare organization was over eighty years old and so much older than the others that it significantly influenced both the mean of its industry and the overall mean. Amended means, consequently were computed without this organization. The amended overall and healwwelfare means are much lower than the originals, and these values may be more representative.
Youth is often cited as a liability for an organization (Stinch- combe, 1965). This perspective could lead us to expect that older nonprofits live longer; we could, consequently expect to see higher mean ages for nonprofits that ceased to operate between 1984 and
Table 4. Mean Age (Years) of Panel Nonprofit Organizations in 1980
Ceased Operations
Industry Survived, 1980-1 988 1980-1 984 1984-1 988
Heal thlwelfare Cultural Educational Recreational Civic Housing Environmental Legal Media Miscellaneous
15.3 20.5 24.8 23.3 5.3 5.8 7.0 3.8
17.0 14.0
18.0 (7.7)’ 6.4 9.8 5.3 4.7 11.0 5.0 9.0 2.0 3.0 4.0 13.5
11.0 - 4.0 - - 4.0 7.0 -
All organizations 16.9 9.6 (6.5)’ 7.6
’ Mean was amended by removing the oldest organization from the calculation.
WHAT A F F E C T S N O N P R O F I T S U R V I V A L ? 27
1988 than for those that ceased to operate between 1980 and 1984. This pattern is found in the educational, recreational, housing, and civic industries, but not in the healtwwelfare industry (even with the oldest organization being removed from the 1980-1988 calcula- tions) and the cultural industry
The remainder of this analysis will focus on the healthelfare, cultural, educational, and housing industries. These industries were chosen because the healthlwelfare, cultural, and educational indus- tries had the largest numbers of organizations in them, and the hous- ing industry had the highest rate of loss. Small numbers in the other industries make conclusions tentative. In fact, even in the focus in- dustries, small numbers are a problem at times.
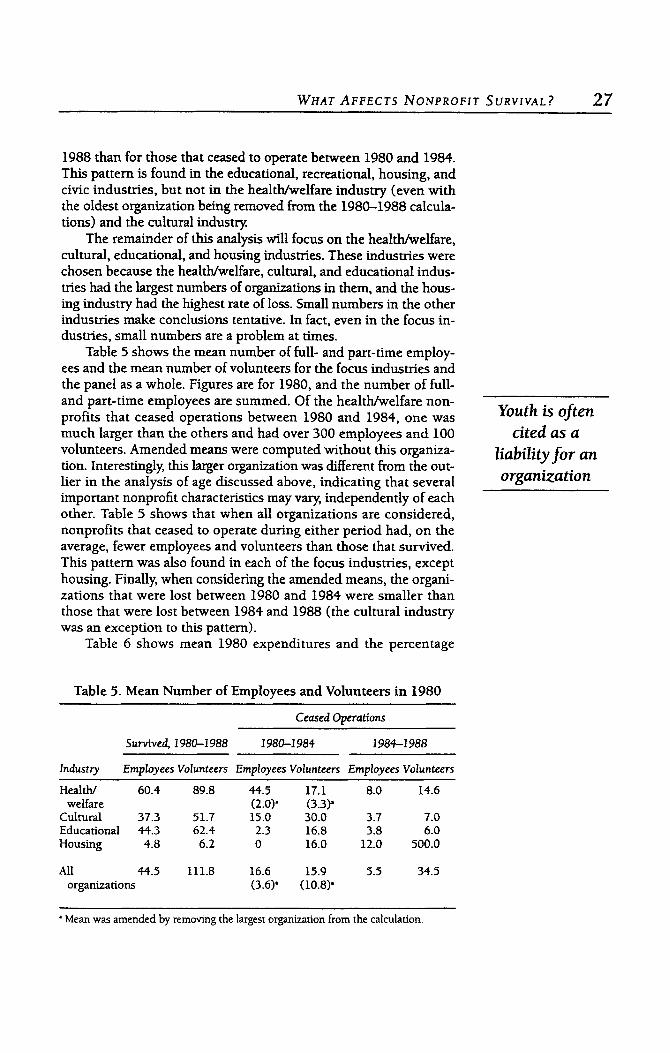
Table 5 shows the mean number of full- and part-time employ- ees and the mean number of volunteers for the focus industries and the panel as a whole. Figures are for 1980, and the number of full- and part-time employees are summed. Of the healtwwelfare non- profits that ceased operations between 1980 and 1984, one was much larger than the others and had over 300 employees and 100 volunteers. Amended means were computed without this organiza- tion. Interestingly, this larger organization was different from the out- lier in the analysis of age discussed above, indicating that several important nonprofit characteristics may vary, independently of each other. Table 5 shows that when all organizations are considered, nonprofits that ceased to operate during either period had, on the average, fewer employees and volunteers than those that survived. This pattern was also found in each of the focus industries, except housing. Finally, when considering the amended means, the organi- zations that were lost between 1980 and 1984 were smaller than those that were lost between 1984 and 1988 (the cultural industry was an exception to this pattern).
Table 6 shows mean 1980 expenditures and the percentage
Youth is often cited as a
liability for an organization
Table 5. Mean Number of Employees and Volunteers in 1980
Survived, 1980-1988
Industry Employees Volunteers
Health/ 60.4 89.8
Cultural 37.3 51.7 Educational 44.3 62.4 Housing 4.8 6.2
welfare
Ceased Operations
7 980-1984 19861 988
Employees Volunteers Employees Volunteers
44.5 17.1 8.0 14.6
15.0 30.0 3.7 7.0 2.3 16.8 3.8 6.0 0 16.0 12.0 500.0
(2.0)' (3.3)'
All 44.5 111.8 16.6 15.9 5.5 34.5 organizations (3.6)' (10.8)'
a Mean was amended by removing the largest organization from the calculation
28 BIELEFELD
1980 expenditures were srnaZZer
for nonprofits that ceased to operate than
for those that survived over the course of
the study
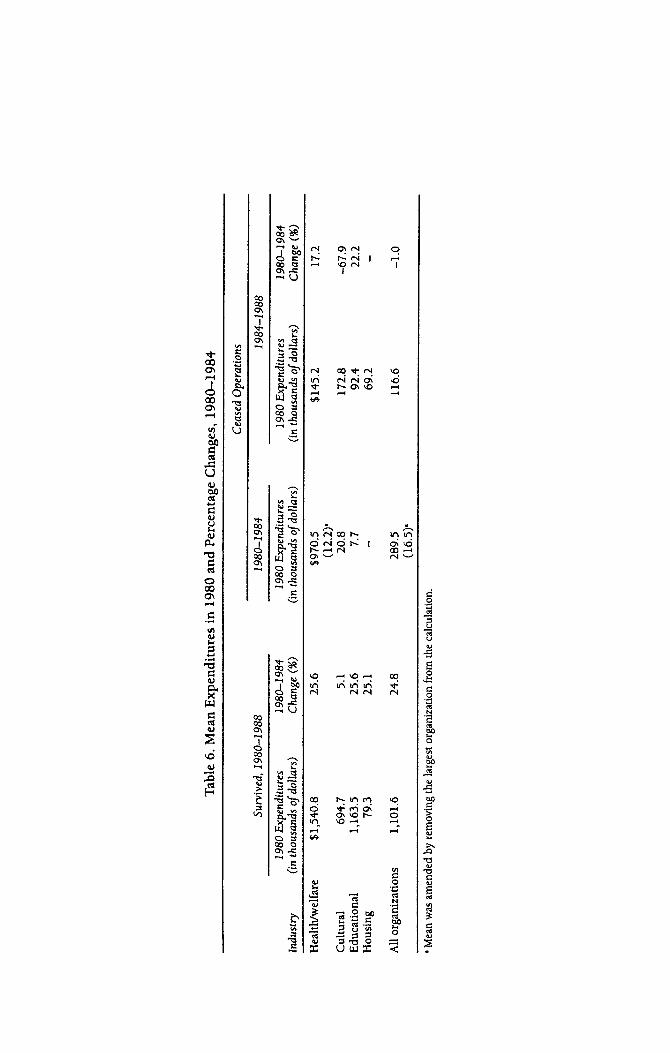
change in mean expenditures between 1980 and 1984 for the focus industries and the panel as a whole. Expenditure change was com- puted by subtracting 1980 expenditures from deflated 1984 ex- penditures. Because expenditure change was based in part on 1984 expenditures, it could not be computed for the nonprofits that ceased operation between 1980 and 1984 (we had no data from these nonprofits for 1984). Amended means were again computed without the large healtldwelfare nonprofit mentioned above, which had over $5 million in 1980 expenditures.
Table 6 clearly shows that 1980 expenditures were smaller for nonprofits that ceased to operate than for those that survived over the course of the study The table also shows that the 1980 expen- ditures of organizations that ceased to operate between 1980 and 1984 were smaller than the expenditures of those that ceased to operate between 1984 and 1988 (especially when considering the amended means). This information indicates that nonprofits that ceased operations during the second period tended to be larger. We could speculate that these larger organizations were able to cope with adversity or constraint longer, perhaps having more resources available to them. That they may have been experiencing problems could be inferred from data indicating a change in expenditures from 1980 to 1984. In those industries where the expenditures of the non- profits that ceased to operate increased, they did so to a lesser degree than the expenditures of those that survived. In the educational industry, moreover, the expenditures of the nonprofits that ceased to operate actually decreased. This pattern can be assumed to have con- tinued into the 1984-1988 period. The nonprofits that ceased to operate between 1980 and 1984 were smaller in terms of personnel as well as expenditures. So, in addition to a low level of financial reserves, these nonprofits may also have lacked the manpower and expertise to weather turbulence or constraint.
Strategies and Funding Diversity Because data on these factors were first obtained in 1984, only the set of organizations that ceased to operate between 1984 and 1988 will be included in this part of the analysis. During the 1984 inter- views, respondents were given a list of strategies and asked to indi- cate which of them the organization had engaged in since 1980. These strategies-new revenue, legitimation, and retrenchment- were drawn from the literature on organizational change and repre- sented three broad responses that organizations can have to their financial environments (Bielefeld, 1992). New revenue strategies are those designed to generate income through direct-marketing-type activities, such as starting new services, approaching new funders, assessing needs, or strategic planning. Legitimation strategies take a different approach to funders. They are designed to favorably influ- ence the perceptions of larger groups of funders through enhancing the prestige or reputation of the organization, including activities
Tab
le 6.
Mea
n E
xpen
ditu
res i
n 19
80 a
nd P
erce
ntag
e C
hang
es, 1
980-
1984
Cea
sed
Ope
ratio
ns
Surv
ived
, 198
0-1
988
1980
-1 9
84
1984
-1 9
88
1980
Exp
endi
ture
s 19
80-1
984
19
80 E
xpen
ditu
res
1980
Exp
endi
ture
s 19
80-1
984
C
hang
e (%
) (in
thou
sand
s of
dolla
rs)
lndu
stry
(in th
ousa
nds o
f do
llars
) C
hang
e (%
) (in
thou
sand
s ojd
olla
rs)
Hea
lthlw
elfa
re
$1,540.8
25.6
Cul
tura
l 694.7
Educ
atio
nal
1,163.5
Hou
sing
79.3
5.1
25.6
25.1
$970.5
( 12.2)'
20.8
7.7
-
$145.2
172.8
92.4
69.2
17.2
-67.9
22.2
All
orga
niza
tions
1,101.6
24.8
289.5
116.6
-1.0
(16.5)'
Mea
n w
as am
ende
d by
rem
ovin
g the
larg
est o
rgan
izatio
n fro
m th
e ca
lcula
tion.
30 BIELEFELD
such as getting endorsements, lobbying, or contributing to local causes. Retrenchment strategies, on the other hand, have an inter- nal focus and are designed to save money through activities such as increasing workload, reducing staff, using more volunteers, or rais- ing fees.
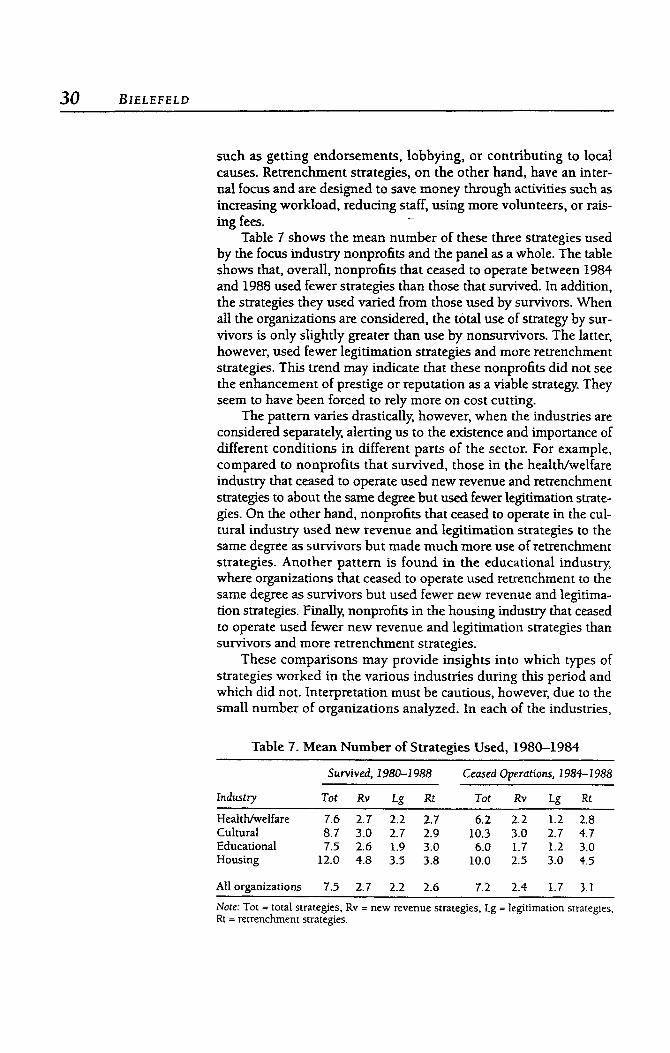
Table 7 shows the mean number of these three strategies used by the focus industry nonprofits and the panel as a whole. The table shows that, overall, nonprofits that ceased to operate between 1984 and 1988 used fewer strategies than those that survived. In addition, the strategies they used varied from those used by survivors. When all the organizations are considered, the total use of strategy by sur- vivors is only slightly greater than use by nonsurvivors. The latter, however, used fewer legitimation strategies and more retrenchment strategies. This trend may indicate that these nonprofits did not see the enhancement of prestige or reputation as a viable strategy. They seem to have been forced to rely more on cost cutting.
The pattern varies drastically, however, when the industries are considered separately, alerting us to the existence and importance of different conditions in different parts of the sector. For example, compared to nonprofits that survived, those in the healtldwelfare industry that ceased to operate used new revenue and retrenchment strategies to about the same degree but used fewer legitimation strate- gies. On the other hand, nonprofits that ceased to operate in the cul- tural industry used new revenue and legitimation strategies to the same degree as survivors but made much more use of retrenchment strategies. Another pattern is found in the educational industry, where organizations that ceased to operate used retrenchment to the same degree as survivors but used fewer new revenue and legitima- tion strategies. Finally, nonprofits in the housing industry that ceased to operate used fewer new revenue and legitimation strategies than survivors and more retrenchment strategies.
These comparisons may provide insights into which types of strategies worked in the various industries during this period and which did not. Interpretation must be cautious, however, due to the small number of organizations analyzed. In each of the industries,
-
Table 7. Mean Number of Strategies Used, 1980-1984
Survived, 1980-1988 Ceased Operations, 1984-1 988
Industry Tot Rv tg Rt Tor Rv Lg Rt
Healthelfare 7.6 2.7 2.2 2.7 6.2 2.2 1.2 2.8 Cultural 8.7 3.0 2.7 2.9 10.3 3.0 2.7 4.7 Educational 7.5 2.6 1.9 3.0 6.0 1.7 1.2 3.0 Housing 12.0 4.8 3.5 3.8 10.0 2.5 3.0 4.5
Allorganizations 7.5 2.7 2.2 2.6 7.2 2.4 1.7 3.1
Note: Tot = total strategies, Rv = new revenue strategies, Lg = legitimation strategies, Rt = retrenchment strategies.
WHAT AFFECTS NONPROFIT SURVIVAL? 31
moreover, the data showed that one nonprofit used a relatively large number of strategies, while the others used far fewer. Perhaps the most useful pattern to emerge from these data is that the nonprofits that ceased to operate used some degree of strategy to attract fund- ers. The degree of use, however, was usually less than the strategy use of survivors, and it was clearly not able to stop the organizations’ decline (as implied by the expenditure data). This information may indicate that the strategies used were unsuccessful. These factors lead to the finding that the only type of strategy used more often by the nonsurvivors was retrenchment.
Finally, the degree to which each nonprofit received income from a variety of funding sources is considered. During the 1980 and 1984 interviews, respondents were given a list of fifteen funder types and asked to indicate the amount of money the organization received from each type in fiscal years 1980 and 1984, respectively These funder types were grouped into three categories, indicating monies received from private sources (foundations, individuals, federated funders, special benefits, corporations, and trusts), government sources (fed- eral, state, county, and municipal), and self-generated sources (dues, interest, sale of assets, and service revenue). These data were recoded to indicate which funder types each nonprofit received money from during each fiscal year.
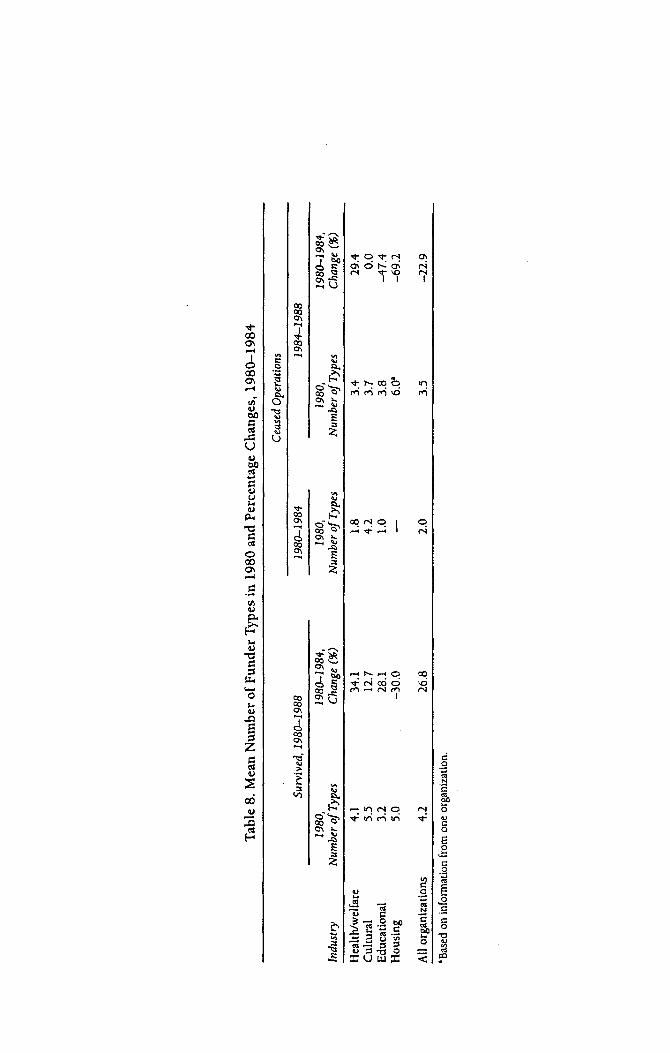
Table 8 shows the mean number of funder types reported in 1980 by the nonprofits in each of the focus industries and by the panel as a whole. It also shows the percentage of change in the mean number of funder types between 1980 and 1984. Considering the entire panel, organizations that survived had a broader funder base than those that ceased operations. Surviving nonprofits received income, on average, from 4.2 funder types in 1980. Nonprofits that ceased to operate between 1980 and 1984, on the other hand, reported an average of only 2.0 funder types. Nonprofits that ceased to operate between 1984 and 1988 reported receiving income from an average of 3.5 funder types. A possibly more telling finding is that survivors increased their funding diversity between 1980 and 1984 and were funded by almost 27 percent more funder types in 1984. Organizations that ceased to operate between 1984 and 1988, on the other hand, lost almost 23 percent of their funder types between 1980 and 1984. These general findings are consistent with the expectation, drawn from resource dependence theory, that funding diversity will enhance survival prospects.
In considering the focus industries, some noteworthy patterns are found. Among the organizations that ceased to operate between 1980 and 1984, the nonprofits in the cultural industry had far more funder types than did nonprofits in the other industries, but did not have as many as did the survivors in the cultural industry. Among the organizations that ceased to operate between 1984 and 1988, the percentage of change in funder types between 1980 and 1984 varied greatly. In healthlwelfare, for example, the funding base broadened
The nonprofits that ceased to operate used some degree of strategy to
at tract fund ers, however, usuaIZy
Zess than the strategy use of survivors
Tab
le 8
. Mea
n N
umbe
r of
Fun
der
Typ
es in
198
0 an
d Pe
rcen
tage
Cha
nges
, 198
0-19
84
Ceas
ed O
pera
tions
Surv
ived
, 198
0-1
988
1980
-1 9
84
1984
-1 9
88
1980
, 19
80-1
984,
19
80,
1980
, 19
80-1
984
, In
dustr
y N
umbe
r of
Type
s Ch
ange
(%)
Num
ber of
Type
s N
umbe
r of
Type
s Ch
ange
(%)
Hea
lt Ww
elfa
re
4.1
34.1
1.
8 3.
4 29
.4
Cul
tura
l 5.
5 12
.7
4.2
3.7
0.0
Educ
atio
nal
3.2
28.1
1 .o
3.
8 -4
7.4
Hou
sing
5 .
O -3
0.0
-
6.0'
-6
9.2
All
orga
niza
tions
4.
2 26
.8
2.0
3.5
-22.
9 'B
ased
on
info
rmat
ion
from
one
org
aniz
atio
n.
WHAT AFFECTS NONPROFIT SURVIVAL? 33
(29.4 percent), but not to the degree to which the survivors’ fund- ing base broadened (34.1 percent). In the cultural industry, on the other hand, no change occurred in the mean number of funder types during this period, whereas survivors’ mean number increased by 12.7 percent. The situation was more dramatic in the educattonal industry, where the number of funder types dropped by 47.4 percent for nonprofits that ceased to operate and increased by 28.1 percent for those that survived. The loss in funder types was greatest in the housing industry (-69.2 percent), but data from only one organiza- tion were available. Interestingly, the survivors in this industry lost 30 percent of their funder types, againindicating that this industry experienced some significant changes between 1980 and 1984.
Conclusion Previous work has shown that the nonprofits in the Twin Cities panel study had various patterns of growth and shrinkage over time (Galaskiewicz and Bielefeld, 1990). However, previous work has sel- dom systematically examined nonprofits that cease to operate. This analysis has sought to generate baseline data describing nonprofit mortality patterns and to investigate some of the factors that may have contributed to these patterns.
The data showed that about 10 percent of the panel organi- zations were lost in each four-year period. During the same two periods, the nonprofit sector as a whole grew by 20 percent and 40 percent, respectively. The growth rate between 1980 and 1984 was, in fact, higher than the nationwide rate. This fact would seem to indicate that nonprofits in the Twin Cities fared well. When the panel and overall sector results were compared, however, it became clear that the trends in the two data sets were different. The seg- ments of the panel that fared the worst (educational and housing) were in industries whose growth was among the highest. The situa- tion was the opposite for the segment of the panel that fared the best (healtwwelfare).
These patterns underscore that organizational change is a com- plex phenomenon, that it proceeds on several levels, and that how we approach it can influence our findings and conclusions. It is espe- cially hazardous for researchers or practitioners to extrapolate out- side the level of analysis of any given piece of information. Examining the micro-level panel findings, as resource dependence theory would have us do, can tell us about factors that influence the fate of partic- ular organizations. To infer, however, that industqwide patterns are similar to panel patterns would be a mistake. Alternatively, examin- ing the macrolevel birth and death rates, as population ecology the- ory would have us do, can tell us how the industry as a whole has fared. With this examination, however, we will know little about the patterns we are likely to find for individual organizations. Clearly, we
34 BIE LEFE L D
will need to consider both levels of examination, because focusing on one will at best give us partial information and at worst lead us to erroneous conclusions. We would be unwise to restrict ourselves to only one of the various theories of organizational change.
The analysis next compared panel nonprofits that sGrvived to those that did not survive. The data showed that the latter were younger, had fewer employees and volunteers, and had lower expen- ditures (which increased only slightly or declined over time). The picture that emerges is of young organizations with few and shrink- ing resources. This is familiar in population ecology research and indicates that younger and smaller organizations are more likely to die. For each variable, however, exceptions to the expected pattern existed. Although these exceptions may have been due to the rela- tively short time span and small number of organizations studied, they may also caution us about the applicability of population ecol- ogy dynamics to diverse sets of organizations, and, again, about rely- ing on commonsense expectations.
Finally, resource dependence theory was used to generate expectations about the relationship between nonsurviving non- profits and their funders. The nonprofits that ceased to operate were found to have utilized fewer strategies aimed at funders and more strategies focusing on retrenchment. This trend is consistent with the idea that these organizations were unable to take appropriate strategic action to secure continued funding due to lack of resources, knowledge, or personnel. In addition, nonprofits that ceased to operate were funded by fewer funder types. While this fact may indicate that they had fewer funders of any type, it also is consis- tent with the idea that diversity of funder type enhances survival, in the same way that a diversified stock portfolio enhances long- term returns. It supports the argument that different types of fund- ers respond to different criteria in their funding decisions, and that one type may well continue funding a certain area of nonprofit activity when another type decides to shift its priorities.
This analysis has clearly only begun the task of providing a com- prehensive understanding of nonprofit mortality To complete the picture, future work should explore the conditions under which the various factors that were identified in his analysis and suggested by additional theoretical speculations are, singIy or in combination, most important.
WOLFGANG B r U r F E L D is assistant professor of sociology and political economy in the School of Social Sciences at the Universily of Texas, DUllUS.
WHAT AFFECTS NONPROFIT SURVIVAL? 35
References Aldrich, H. E., and Marsden, E V “Environments and Organizations.”
In N. J. Smelser (ed.), Handbook ofSociology. Newbury Park, Calif.:
Bielefeld, W “Funding Uncertainty and Nonprofit Strategies in the 1980s.” Nonprofit Management and Leadership, 1992,2,381402.
Cameron, K. S., Kim, M. U., and Whetten, D. A. “Organizational Effects of Decline and Turbulence.” Administrative Science Quar- terly, 1987,32, 222-240.
Cameron, K. S., Sutton, R. I., and Whetten, D. A. Readings in Orga- nizational Decline. New York Ballinger, 1988.
Estes, C. L., Binney E. A., and Bergthold, L A. “How the Legitimacy of the Sector Has Eroded.” In V. A. Hodgkinson, R. W. Lyman, and Associates, The Future of the Nonprofit Sector: Challenges, Changes, and Policy Considerations. San Francisco: Jossey-Bass, 1989.
Freeman, J., Carrol, G. R., and Hannan, M. T. “The Liability of New- ness: Age Dependency in Organizational Death Rates.” American Sociological Review, 1983,48,692-710.
Galaskiewicz, J. Social Organization of an Urban Grants Economy. San Diego, Calif.: Academic Press, 1985.
Galaskiewicz, J. Corporate-Nonprofit Linkages in Minneapolis-St. Paul: Findings from a Longitudinal Study 1980-1 988. Unpublished report, University of Minnesota, Minneapolis, 1990.
Galaskiewicz, J., and Bielefeld, W. “Growth, Decline, and Organi- zational Strategies: A Panel Study of Nonprofit Organizations, 1980-1988.” In The Nonprofit Sector (NGO’S) in the United States and Abroad: Cross-Cultural Perspectives. Washington, D.C.: INDE-
Goss, K. A. “A Crisis of Credibility for America’s Nonprofits.” Chron- icle ofPhilanthropy, June 15, 1993, pp. 1,38-41.
Millar, B. “United Way Emphasizes Donor Choice.” Chronicle of Philanthropy, Feb. 12, 1991, pp. 23-25.
Millar, B., and Moore, J. “Corporate Gifts Harder to Obtain.” Chron- icle ofPhilanthropy, July 2, 1991, pp. I, 12-14.
Pfeffer, J., and Salancik, G. R. The External Control of Organiza- tions: A Resource Dependence Perspective. New York: Harper- Collins, 1978.
Selle, l?, and Oymyr, B. “Explaining Changes in the Population of Voluntary Organizations: The Roles of Aggregate and Individual Level Data.” Nonprofit and Voluntary Sector Quarterly, 1992, 21,
Singer, M. I., and Yankey, J. A. “Organizational Metamorphosis: A Study of Eighteen Nonprofit Mergers, Acquisitions, and Consoli- dations.” Nonprofit Management and Leadership, 1991, 1 ,
Singh, J. V., House, R. J., and Tucker, D. J. “Organizational Change and Organizational Mortality. ” Administrative Science Quarterly,
Sage, 1988. -
PENDENT SECTOR, 1990.
147-179.
3 57-369.
L986,31, 171-193.
36 BIELEFELD
Singh, J. V., and Lumsden, C. J. “Theory and Research in Organiza- tional Ecology.” Annual Review of Sociology, 1990,16, 161-195.
Stinchcombe, A. L. “Social Structure and Organizations.” In J. G. March (ed.), Handbook of Organizations. Skokie, Ill.: Rand Mc- Nally, 1965.
Wernet, S. €?, and Jones, S . A. “Merger and Acquisition Activity Be- tween Nonprofit Social Service Organizations: A Case Study.” Nonprofit and Voluntary Sector Quarterly, 1992,21, 367-380.
Wilson, E. K. “What Counts in the Death or Transformation of an Organization?” SociaZ Forces, 1985, 64, 259-280.
Young, R. C. “Is Population Ecology a Useful Paradigm for the Study of Organizations?” American journal of SocioIogy, 1988,94,1-24.
Young, R. C. “Reply to Freeman and Hannan and Brittain and Wholey ” American]oumaZ of Sociology, 1989,95, 445-446.
Zucker, L. G. “Combining Institutional Theory and Population Ecology: No Legitimacy, No History.” American Sociological Re- view, 1989,54,542-545.


