Embed Size (px)
Citation preview

1
WATER SCARCITY AND THE IMPACT OF IMPROVED IRRIGATION
MANAGEMENT: A COMPUTABLE GENERAL EQUILIBRIUM ANALYSIS
Alvaro Calzadilla a,b,*, Katrin Rehdanz a,c,d and Richard S.J. Tol e,f,g,h
a Research unit Sustainability and Global Change, Hamburg University and Centre for Marine and Atmospheric Science, Hamburg, Germany b International Max Planck Research School on Earth System Modelling, Hamburg, Germany c Christian-Albrechts-University of Kiel, Department of Economics, Kiel, Germany d Kiel Institute for the World Economy, Kiel, Germany e Economic and Social Research Institute, Dublin, Ireland f Institute for Environmental Studies, Vrije Universiteit, Amsterdam, The Netherlands g Department of Spatial Economics, Vrije Universiteit, Amsterdam, The Netherlands h Engineering and Public Policy, Carnegie Mellon University, Pittsburgh, PA, USA
Working Paper FNU-160
February, 2009
(Revised version)
Abstract
We use the new version of the GTAP-W model to analyze the economy-wide impacts of enhanced irrigation efficiency. The new production structure of the model, which introduces a differentiation between rainfed and irrigated crops, allows a better understanding of the use of water resources in agricultural sectors. The results indicate that a water policy directed to improvements in irrigation efficiency in water-stressed regions is not beneficial for all. For water-stressed regions the effects on welfare and demand for water are mostly positive. For non-water scarce regions the results are more mixed and mostly negative. Global water savings are achieved. Not only regions where irrigation efficiency changes are able to save water, but also other regions are pushed to reduce irrigation water use.
Keywords: Computable General Equilibrium, Irrigation, Water Policy, Water Scarcity, Irrigation Efficiency
JEL Classification: D58, Q17, Q25
* Corresponding author: Research unit Sustainability and Global Change, Hamburg University and Centre for Marine and Atmospheric Science, Bundesstrasse 55 (Pavillion Room 10), 20146 Hamburg, Germany. Tel.: 49 40 42838 4375; fax: 49 40 42838 7009. E-mail address: [email protected]
2
1 Introduction
Aristotle wondered why useless diamonds are expensive, while essential drinking water is
free. Any economist since Jevons knows that this is because diamonds are scarce, while water
is abundant – at least, when Aristotle lived. Nowadays, water is scarce and therefore should
command a price. However, both water management and economics have been slow to adapt
to this new reality. This article contributes directly to the latter and indirectly to the former.
Several factors contribute to water scarcity. Average annual precipitation may be low,
or it may be highly variable. Moreover, population growth and an increasing consumption of
water per capita have resulted in a rapid increase in the demand for water. This tendency is
likely to continue as water consumption for most uses is projected to increase by at least 50%
by 2025 compared to 1995 level (Rosegrant et al. 2002). Since the annually renewable fresh
water available in a particular location is typically constant, water scarcity is increasingly
constraining food production.
As the supply of water is limited, attempts have been made to economize on the
consumption of water, especially in regions where the supply is critical (Seckler et al. 1998;
Dinar and Yaron 1992). Since the agricultural sector accounts for about 70 percent of
renewable fresh water use worldwide one way to address the problem is to reduce the
inefficiencies in irrigation. Irrigated agriculture uses about 18 percent of the total arable land
and produces about 33 percent of total agricultural output (Johansson et al. 2002). However,
expanding irrigated areas might not be sufficient to ensure future food-security and meet the
increasing demand for water in populous but water-scarce regions (Kamara and Sally 2004).
Furthermore, in many regions water is free or subsidized (Rosegrant et al. 2002) and
for many countries the average irrigation efficiency is low (Seckler et al. 1998). The current
level and structure of water charges mostly do not encourage farmers to use water more
efficiently. An increase in water price, for instance by a tax, would lead to the adoption of
improved irrigation technology and water savings (e.g. Dinar and Yaron 1992; Tsur et al.
2004; Easter and Liu 2005). The water saved could be used in other sectors, for which the
value is much higher. More efficient use would enhance sustainable irrigation with lower
environmental impacts including soil degradation (erosion, salination, etc.). However, there
are many components of water pricing which make it difficult to determine the marginal
value of water (see e.g. Johansson et al. 2002). Furthermore, in their study for northern
China, Yang et al. (2003) point out that pricing alone is not enough to encourage water
conservation. Water rights need to be clearly defined and legally enforceable, responsibilities
for water operators and users identified. Wichelns (2003) discusses the importance of non-
3
water inputs and farm-level constrains for water use and agricultural productivity. He
investigates policies that modify farm-level input and output prices directly, international
trade policies, policies that revise regulations on land tenure and sources of investment funds.
An alternative, although limited, strategy to meet the increasing demand for water is
the use of non-conventional water resources including desalination of seawater, purification
of highly brackish groundwater, harvesting of rainwater, as well as the use of marginal-
quality water resources (Ettouney et al. 2002; Zhou and Tol 2005; Qadir et al. 2007).
Continued progress in desalination technology has lead to considerably lower costs for water
produced. However, costs are still too high for agricultural use. Marginal-quality water
contains one or more impurities at levels that might be harmful to human and animal health.
Most of the existing literature related to irrigation water use investigates irrigation
management, water productivity and water use efficiency. One strand of literature compares
the performance of irrigation systems and irrigation strategies in general (e.g. Pereira 1999;
Pereira et al. 2002). Others have a clear regional focus and concentrate on specific crop types.
To provide a few examples from this extensive literature; Deng et al. (2006) investigate
improvements in agricultural water use efficiency in arid and semiarid areas of China.
Bluemling et al. (2007) study wheat-maize cropping pattern in the North China plain. Mailhol
et al. (2004) analyze strategies for durum wheat production in Tunisia. Lilienfeld and Asmild
(2007) estimate excess water use in irrigated agriculture in western Kansas.
As the above examples indicate, water problems related to irrigation management are
typically studied at the farm-level, the river-catchment-level or the country-level. About 70
percent of all water is used for agriculture, and agricultural products are traded
internationally. A full understanding of water use and the effect of improved irrigation
management is impossible without understanding the international market for food and
related products, such as textiles. We use the new version of the GTAP-W model, based on
GTAP 6, to analyze the economy-wide impacts of enhanced irrigation efficiency. The new
production structure of the model introduces water as an explicit factor of production and
accounts for substitution possibilities between water and other primary factors. The new
GTAP-W model differentiates between rainfed and irrigated crops, which allows a better
understanding of the use of water resources in agricultural sectors. Efforts towards improving
irrigation management, e.g. through more efficient irrigation methods, benefit societies by
saving large amounts of water. These would be available for other uses. The aim of our
article is to analyze if improvements in irrigation management would be economically
beneficial for the world as a whole as well as for individual countries and whether and to

4
what extent water savings could be achieved. Because the regional and sectoral resolutions
are crude, the model cannot be used directly for advice on national let alone local water
policy.
The remainder of the article is organized as follows: the next section briefly reviews
the literature on economic models of water use. Section 3 presents the new GTAP-W model
and the data on water resources and water use. Section 4 lays down the three simulation
scenarios with no constraints on water availability. Section 5 discusses the results and section
6 concludes.
2 Economic models of water use
Economic models of water use have generally been applied to look at the direct effects of
water policies, such as water pricing or quantity regulations, on the allocation of water
resources. In order to obtain insights from alternative water policy scenarios on the allocation
of water resources, partial and general equilibrium models have been used. While partial
equilibrium analysis focus on the sector affected by a policy measure assuming that the rest
of the economy is not affected, general equilibrium models consider other sectors or regions
as well to determine the economy-wide effect; partial equilibrium models tend to have more
detail. Most of the studies using either of the two approaches analyze pricing of irrigation
water only (for an overview of this literature see Johannson et al. 2002). Rosegrant et al.
(2002) use the IMPACT model to estimate demand and supply of food and water to 2025.
Fraiture et al. (2004) extend this to include virtual water trade, using cereals as an indicator.
Their results suggest that the role of virtual water trade is modest. While the IMPACT model
covers a wide range of agricultural products and regions, other sectors are excluded; it is a
partial equilibrium model.
Studies of water use using general equilibrium approaches are generally based on data
for a single country or region assuming no effects for the rest of the world of the
implemented policy. Therefore, none of these studies is able to look at the global impact of
improvements in irrigation management. Decaluwé et al. (1999) analyze the effect of water
pricing policies on demand and supply of water in Morocco. Diao and Roe (2003) use an
intertemporal computable general equilibrium (CGE) model for Morocco focusing on water
and trade policies. Diao et al. (2008) extend a general equilibrium-water model to analyze
groundwater resources and rural-urban water transfer in Morrocco. Seung et al. (2000) use a
dynamic CGE model to estimate the welfare gains of reallocating water from agriculture to
recreational use for the Stillwater National Wildlife Refuge in Nevada. Letsoalo et al. (2007)

5
and van Heerden et al. (forthcoming) study the effects of water charges on water use,
economic growth, and the real income of rich and poor households in South Africa. For the
Arkansas River Basin, Goodman (2000) shows that temporary water transfers are less costly
than building new dams. Strzepek et al. (2008) estimate the economic benefits of the High
Aswan Dam. Gómez et al. (2004) analyze the welfare gains by improved allocation of water
rights for the Balearic Islands. Feng et al. (2007) use a two-region recursive dynamic general
equilibrium approach based on the GREEN model (Lee et al. 1994) to assess the economic
implications of the increased capacity of water supply through the Chinese South-to-North
Water Transfer (SNWT) project. All of these CGE studies have a limited geographical scope.
Berrittella et al. (2007) are an exception. They use a global CGE model including
water resources (GTAP-W, version 1) to analyze the economic impact of restricted water
supply for water-short regions. They contrast a market solution, where water owners can
capitalize their water rent, to a non-market solution, where supply restrictions imply
productivity losses. They show that water supply constraints could actually improve
allocative efficiency, as agricultural markets are heavily distorted. The welfare gain from
curbing inefficient production may more than offset the welfare losses due to the resource
constraint. Berrittella et al. (forthcoming, a) use the same model to investigate the economic
implications of water pricing policies. They find that water taxes reduce water use, and lead
to shifts in production, consumption and international trade patterns. Countries that do not
levy water taxes are nonetheless affected by other countries’ taxes. Like Feng et al. (2007),
Berrittella et al. (2006) analyze the economic effects of the Chinese SNWT project. Their
analysis offers less regional detail but focuses in particular on the international implications
of the project. Berrittella et al. (forthcoming, b) extend the previous papers by looking at the
impact of trade liberalization on water use.
In this article we use the new version of the GTAP-W model to analyze the economy-
wide impacts of enhanced irrigation management through higher levels of irrigation
efficiency. The crucial distinction between version 2 of GTAP-W, used here, and version 1,
used by Berrittella et al., is that version 2 distinguishes rainfed and irrigated agriculture while
version 1 did not make this distinction.

6
3 The new GTAP-W model
In order to assess the systemic general equilibrium effects of improved irrigation
management, we use a multi-region world CGE model, called GTAP-W. The model is a
further refinement of the GTAP model1 (Hertel, 1997), and is based on the version modified
by Burniaux and Truong2 (2002) as well as on the previous GTAP-W model introduced by
Berrittella et al. (2007).
The new GTAP-W model is based on the GTAP version 6 database, which represents
the global economy in 2001. The model has 16 regions and 22 sectors, 7 of which are in
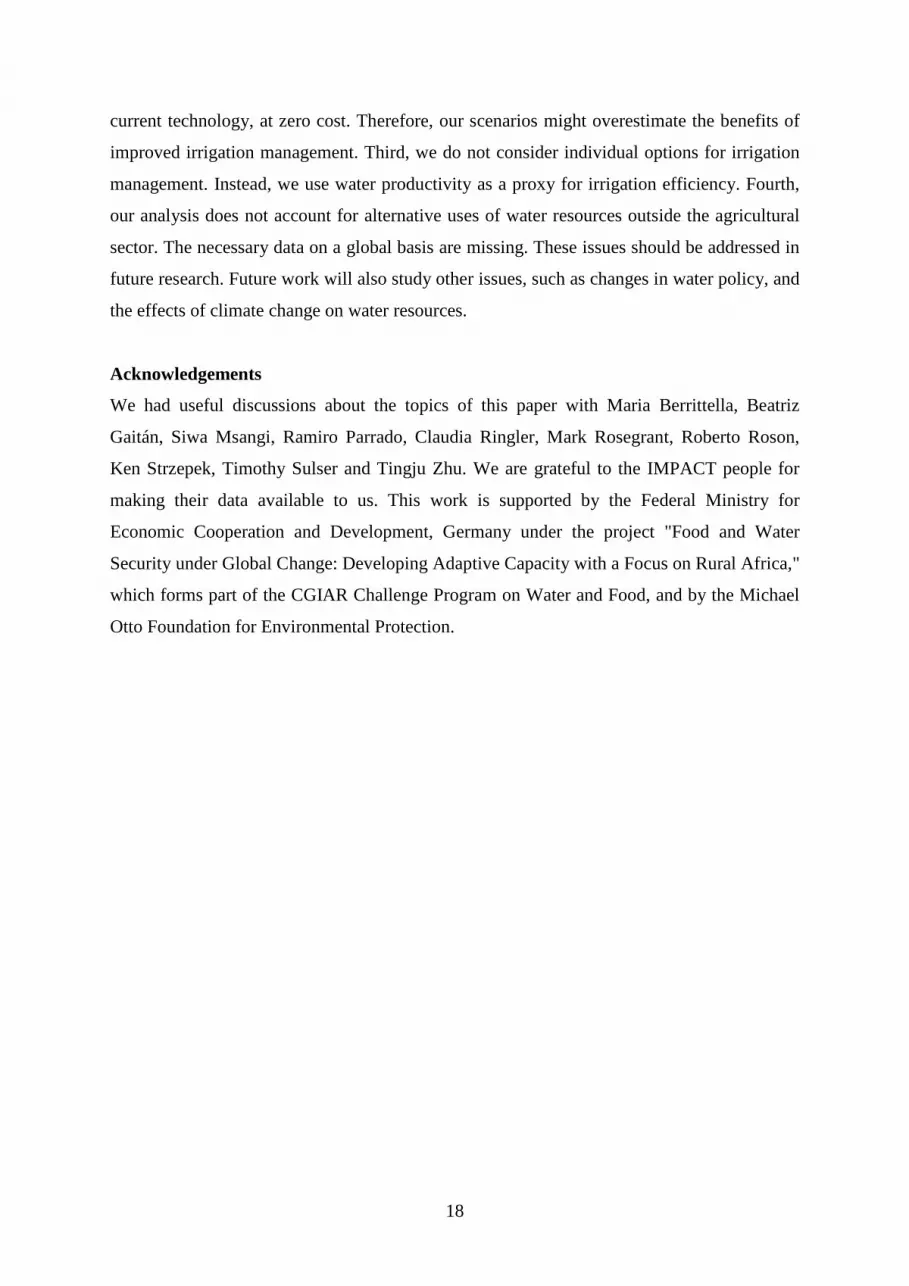
agriculture.3 However, the most significant change and principal characteristic of version 2 of
the GTAP-W model is the new production structure, in which the original land endowment in
the value-added nest has been split into pasture land and land for rainfed and for irrigated
agriculture. Pasture land is basically the land used in the production of animals and animal
products. The last two types of land differ as rainfall is free but irrigation development is
costly. As a result, land equipped for irrigation is generally more valuable as yields per
hectare are higher. To account for this difference, we split irrigated agriculture further into
the value for land and the value for irrigation. The value of irrigation includes the equipment
but also the water necessary for agricultural production. In the short-run irrigation equipment
is fixed, and yields in irrigated agriculture depend mainly on water availability. The tree
diagram in figure 1 represents the new production structure.
Figure 1 about here
Land as a factor of production in national accounts represents “the ground, including
the soil covering and any associated surface waters, over which ownership rights are
enforced” (United Nations 1993). To accomplish this, we split for each region and each crop
the value of land included in the GTAP social accounting matrix into the value of rainfed
1 The GTAP model is a standard CGE static model distributed with the GTAP database of the world economy
(www.gtap.org). For detailed information see Hertel (1997) and the technical references and papers available on
the GTAP website. 2 Burniaux and Truong (2002) developed a special variant of the model, called GTAP-E. The model is best
suited for the analysis of energy markets and environmental policies. There are two main changes in the basic
structure. First, energy factors are separated from the set of intermediate inputs and inserted in a nested level of
substitution with capital. This allows for more substitution possibilities. Second, database and model are
extended to account for CO2 emissions related to energy consumption. 3 See Annex I for the regional, sectoral and factoral aggregation used in GTAP-W.
7
land and the value of irrigated land using its proportionate contribution to total production
(see Annex II, table A1).4 The value of pasture land is derived from the value of land in the
livestock breeding sector.
In the next step, we split the value of irrigated land into the value of land and the
value of irrigation using the ratio of irrigated yield to rainfed yield. These ratios are based on
IMPACT data (see Annex II, table A2).5 The numbers indicate how relatively more valuable
irrigated agriculture is compared to rainfed agriculture. The magnitude of additional yield
differs not only with respect to the region but also to the sector. On average, producing rice
using irrigation is relatively more productive than using irrigation for growing oil seeds, for
example. Regions like South America seems to grow on average relatively more using
irrigation instead of rainfed agriculture compared to countries in North Africa or Sub-Saharan
Africa.
The procedure we described above to introduce the four new endowments (pasture
land, rainfed land, irrigated land and irrigation) allows us to avoid problems related to model
calibration. In fact, since the original database is only split and not altered, the original
regions’ social accounting matrices are balanced and can be used by the GTAP-W model to
assign values to the share parameters of the mathematical equations. For detailed information
about the social accounting matrix representation of the GTAP database see McDonald et al.
(2005).
The GTAP-W model accounts only for water resources used in the agricultural sector,
which consumes about 70 percent of the total freshwater resources. Domestic, industrial and
environmental water uses are not considered by the model, because the necessary data are
missing at a global scale. Therefore, the model does not account for alternative uses of water
outside the agricultural sector. Even when water used in municipal and industrial sectors is
typically considered to have a higher value than in agriculture.
As in all CGE models, the GTAP-W model makes use of the Walrasian perfect
competition paradigm to simulate adjustment processes. Industries are modelled through a 4 Let us assume that 60 percent of total rice production in region r is produced on irrigated farms and that the
returns to land in rice production are 100 million USD. Thus, we have for region r that irrigated land rents in
rice production are 60 million USD and rainfed land rents in rice production are 40 million USD. 5 Let us assume that the ratio of irrigated yield to rainfed yield in rice production in region r is 1.5 and that
irrigated land rents in rice production in region r are 60 million USD. Thus, we have for irrigated agriculture in
region r that irrigation rents are 20 million USD and land rents are 40 million USD.

8
representative firm, which maximizes profits in perfectly competitive markets. The
production functions are specified via a series of nested constant elasticity of substitution
functions (CES) (figure 1). Domestic and foreign inputs are not perfect substitutes, according
to the so-called ‘‘Armington assumption’’, which accounts for product heterogeneity.
A representative consumer in each region receives income, defined as the service
value of national primary factors (natural resources, pasture land, rainfed land, irrigated land,
irrigation, labour and capital). Capital and labour are perfectly mobile domestically, but
immobile internationally. Pasture land, rainfed land, irrigated land, irrigation and natural
resources are imperfectly mobile. While perfectly mobile factors earn the same market return
regardless of where they are employed, market returns for imperfectly mobile factors may
differ across sectors. The national income is allocated between aggregate household
consumption, public consumption and savings. The expenditure shares are generally fixed,
which amounts to saying that the top level utility function has a Cobb-Douglas specification.
Private consumption is split in a series of alternative composite Armington aggregates. The
functional specification used at this level is the constant difference in elasticities (CDE) form:
a non-homothetic function, which is used to account for possible differences in income
elasticities for the various consumption goods. A money metric measure of economic
welfare, the equivalent variation, can be computed from the model output.
In the GTAP model and its variants, two industries are not related to any region.
International transport is a world industry, which produces the transportation services
associated with the movement of goods between origin and destination regions. Transport
services are produced by means of factors submitted by all countries, in variable proportions.
In a similar way, a hypothetical world bank collects savings from all regions and allocates
investments so as to achieve equality of expected future rates of return (macroeconomic
closure).
In the original GTAP-E model, land is combined with natural resources, labour and
the capital-energy composite in a value-added nest. In our modelling framework, we
incorporate the possibility of substitution between land and irrigation in irrigated agricultural
production by using a nested constant elasticity of substitution function (figure 1). The
procedure how the elasticity of factor substitution between land and irrigation (σLW) was

9
obtained is explained in more detail in Annex III.6 Next, the irrigated land-water composite is
combined with pasture land, rainfed land, natural resources, labour and the capital-energy
composite in a value-added nest through a CES structure. The original elasticity of
substitution between primary factors (σVAE) is used for the new set of endowments.
In the benchmark equilibrium, water used for irrigation is supposed to be identical to
the volume of water used for irrigated agriculture in the IMPACT model. An initial sector
and region specific shadow price for irrigation water can be obtained by combining the SAM
information about payments to factors and the volume of water used in irrigation from
IMPACT. In this article enhanced irrigation management including more efficient irrigation
water use is introduce in the model through higher levels of productivity in irrigated
production.
4 Design of simulation scenarios
Performance and productivity of irrigated agriculture is commonly measured by the term
irrigation efficiency. For a detailed description and evolution of the irrigation efficiency
terminology see Burt et al. (1997) and Jensen (2007), respectively. In a finite space and time,
FAO (2001) defines irrigation efficiency as the percentage of the irrigation water consumed
by crops to the water diverted from the source of supply. It distinguishes between conveyance
efficiency, which represents the efficiency of water transport in canals, and the field
application efficiency, which represents the efficiency of water application in the field.
In this article, the term irrigation efficiency indicates the ratio between the volume of
irrigation water beneficially used by the crop to the volume of irrigation water applied to the
crop. In this sense, no distinction is made between conveyance and field application
efficiency. Therefore any improvement in irrigation efficiency refers to an improvement in
the overall irrigation efficiency.
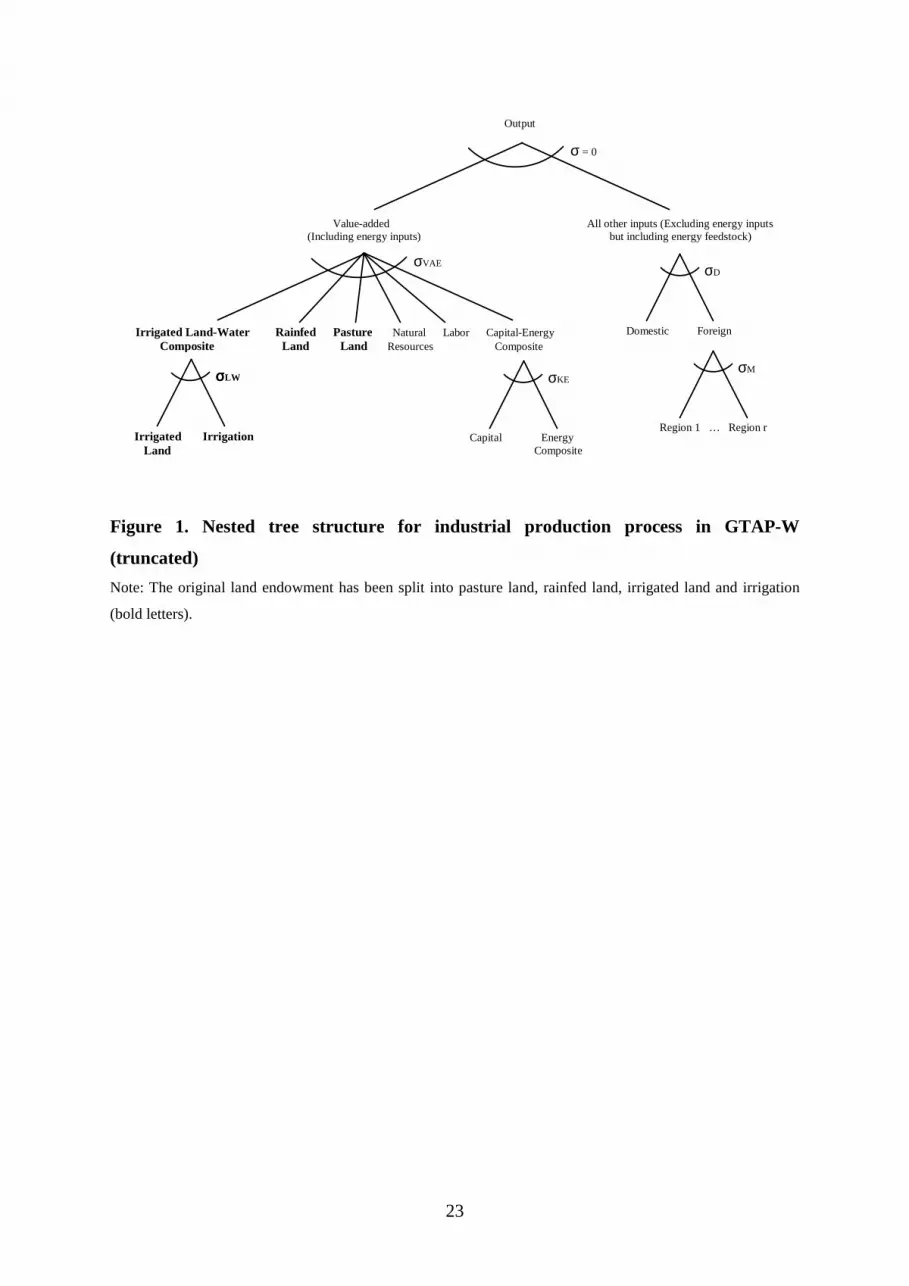
Figure 2 shows a global map of average irrigation efficiency by country. It is based on
the volume of beneficial and non-beneficial irrigation water use provided by the IMPACT
baseline dataset. The reported irrigation efficiency clearly indicates that irrigation
management in most developing regions is performing poorly, the only exception is water-
scarce North Africa, where levels are comparable to those of developed regions. Irrigation
6 A sensitivity analysis was performed and revealed that the model results are not sensitive to changes in the
value of the elasticity of substitution between land and irrigation.

10
efficiency in Canada and Western Europe is low. However, in those two regions irrigated
production is not important relative to total production levels.
Figure 2 about here
Certainly, there are differences in performance within regions. Rosegrant et al. (2002)
point out that irrigation efficiency ranges between 25 to 40 percent in the Philippines,
Thailand, India, Pakistan and Mexico; between 40 to 45 percent in Malaysia and Morocco;
and between 50 to 60 percent in Taiwan, Israel and Japan. In our analysis, based on regional
averages, these individual effects are averaged out but marked differences between the
regions still exist.
Global projections of agriculture-water supply and demand, made by IWMI, FAO and
IFPRI reported in World Bank (2003), show that the demand for improved water-use
efficiency and hence efforts towards improving irrigation efficiency, would mostly take place
in water-scarce areas. Following that proposition, we evaluate the effects on global
production and income of enhanced irrigation efficiency through three different scenarios.
The scenarios are designed so as to show a gradual convergence to higher levels of irrigation
efficiency. The first two scenarios assume that an improvement in irrigation efficiency is
more likely in water-scarce regions. In the first scenario irrigation efficiency in water-stressed
developing regions improves. We consider a region as water-stressed region if at least for one
country within the region water availability is lower than 1,500 cubic meters per person per
year.7 These regions include South Asia (SAS), Southeast Asia (SEA), North Africa (NAF),
the Middle East (MDE), Sub-Saharan Africa (SSA) as well as the Rest of the World (ROW).
The second scenario improves irrigation efficiency in all water-scarce regions independent of
the level of economic development. In addition to the previous scenario Western Europe
(WEU), Eastern Europe (EEU) as well as Japan and South Korea (JPK) are added to the list
of water-short regions. For the first two scenarios, irrigation efficiency is improved for all
irrigated crops in each region to a level of 73 percent. Comparing with figure 2 above, this is
the weighted average level of Australia and New Zealand (ANZ), which is close to the
maximum achievable efficiency of 75 percent (World Bank 2003). In the third scenario, we
improve irrigation efficiency in all 16 regions up to 73 percent.
Our scenarios do not add costs, that is, we assume that higher levels of efficiency are
possible with the current technology. Jensen (2007) points out that better irrigation
7 The water-stressed countries were identified using the current AQUASTAT database.

11
scheduling practices, controlling timing of irrigation and amounts applied, can improve
irrigation efficiency and productivity of water with little additional cost.
5 Results
Figure 3 shows irrigated production as share of total agricultural production in the GTAP-W
baseline data. Irrigated rice production accounts for 73 percent of the total rice production;
the major producers are Japan and South Korea, China, South Asia and Southeast Asia.
Around 47 percent of wheat and sugar cane is produced using irrigation. However, the
volume of irrigation water used in sugar cane production is less than one-third of what is used
in wheat production. In irrigated agriculture major producers of wheat are South Asia, China,
North Africa and the USA and for sugar cane South Asia and Western Europe. The share of
irrigated production in total production of the other four crops in GTAP-W (cereal grains, oil
seeds, vegetables and fruits as well as other agricultural products) varies from 31 to 37
percent. Major producers of cereal grains are the USA and China; for oil seeds are the USA,
South Asia and China; for vegetables and fruits are China, the Middle East and Japan and
South Korea; and for other agricultural products are the USA and South Asia.
Figure 3 about here
The irrigated production of rice and wheat consumes half of the irrigation water used
globally, and together with cereal grains and other agricultural products the irrigation water
consumption rises to 80 percent. There are three major irrigation water users (South Asia,
China and USA). These regions use over 70 percent of the global irrigation water used, just
South Asia uses more than one-third.
Table 1 reports the percentage changes in the use of two production factors, irrigated
land and irrigation (compare irrigated land-water composite in figure 1) for four of our seven
agricultural sectors (rice, wheat, cereal grains as well as vegetables and fruits).8 These two
factors indicate changes in irrigated production. In table 2, the percentage changes in total
agricultural production are displayed. Not only regions where irrigation water efficiency
changes alter their levels of irrigated and total production in the different sectors, but other
regions are affected as well through shifts in competitiveness and international trade. The
effects are different for the different scenarios we implemented, as discussed below.
8 Results for the other three agricultural sectors including oil seeds, sugar cane and sugar beet as well as other
agricultural products are excluded for clarity but can be obtained from the authors on request.

12
Turning to rice production first, the four major rice producers (Japan and South
Korea, South Asia, Southeast Asia and China) are affected differently. In Southeast Asia, for
example, where irrigation efficiency was lowest, production increases more compared to the
other three regions. In general, higher levels of irrigation efficiency lead to increases in
irrigated rice production as well as total rice production. However, total rice production
within a region increases less if more regions have higher levels of irrigation efficiency
(scenarios 2 and 3). Although irrigated production increases, demand for irrigation water
decreases in most regions (table 3). After all, the demand for food increases only slightly. An
exception is the Middle East where total rice production decreases while irrigated production
and water demand increase. The relatively high level of irrigation efficiency leaves little
room for further improvements and water savings.
Tables 1 to 3 about here
There are seven major wheat-producing regions in the world (South Asia, China,
North Africa, USA, Western Europe, Eastern Europe and the former Soviet Union). Within
these regions the first four regions are the major producers of irrigated wheat. Comparing the
results of table 1 for the different scenarios, higher levels of irrigation efficiency generally
lead to increases in irrigated wheat production in these regions. As discussed above, the
increase is less pronounced when more regions achieve higher levels of irrigation efficiency
(scenarios 2 and 3). Irrigation water demand is affected differently in the different regions. In
scenario 3, water demand increases in water-scarce South Asia as well as in the USA and
China. In Western and Eastern Europe as well as North Africa higher levels of irrigation
efficiency is mostly followed by a decrease in the demand for water. Total wheat production
does not necessarily follow the trend of irrigated production. Only in two of the seven regions
(South Asia, Eastern Europe and partly China) total production increases with higher levels
of irrigation efficiency.
Turning to the rest of the regions, improved irrigation efficiency leads to more
irrigated and total wheat production in water-scarce regions. In most of these regions (Japan
and South Korea, Southeast Asia, Sub-Saharan Africa and Rest of the World) excluding the
Middle East this is followed by an increasing demand for irrigation water. However,
production levels are relatively low.
For cereal grains the picture is similar. Major producers (USA, Eastern Europe,
former Soviet Union, South America, China and Sub-Saharan Africa) increase their irrigated
production with higher levels of irrigation efficiency like all other regions too. In the
developing regions as well as the former Soviet Union irrigation water demand is increasing

13
with higher levels of irrigation efficiency while water demand is decreasing in the USA and
Eastern Europe. Total agricultural production increases only in three of the six regions
(Eastern Europe, South America and China).
The number of regions that are major vegetable and fruit producers is relatively large
(USA, Western Europe, Japan and South Korea, former Soviet Union, Middle East, South
Asia, Southeast Asia and China). However, only for China, the Middle East as well as Japan
and South Korea irrigated production amounts to a significant share of total production.
Comparable to irrigated rice production, irrigated production of vegetable and fruit increases
with higher levels of irrigation efficiency. Irrigated production in some regions increases
even further when more regions reach higher efficiency levels (an exception is Western
Europe). For most of these regions irrigation water demand decreases; exceptions are
Western Europe and the former Soviet Union. Comparing results of scenarios 2 and 3, water
demand decreases more the lower the number of regions obtaining higher levels of irrigation
efficiency. Turning to changes in total production the picture is more mixed. Production
levels in the USA, Western Europe and the Middle East decrease and increase in the other
regions of major producers.
One reason to increase the efficiency in irrigation is to save water. Figure 4 compares
how much water used in irrigated agriculture could be saved by the different scenarios. The
initial water saving shows the reduction in the irrigation water requirements under the
improved irrigation efficiency, without considering any adjustment process in food and other
markets. The final water saving also considers the additional irrigation water used as a
consequence of the increase in irrigated production. At the global level, the final water
savings increase as more regions achieve higher levels of irrigation efficiency. At regional
level, the tendency is similar except for only slight decreases in Sub-Saharan Africa as well
as in Australia and New Zealand. The results show that not only regions where irrigation
efficiency changes save water, but also other regions are pushed to reduce irrigation water
use. This is evident for the USA and China in scenarios 1 and 2, where total irrigated
production decreases. Only in North Africa the final water savings exceed the initial water
savings; and the additional irrigation water saved increases more the higher the number of
regions improving the irrigation efficiency.
Our estimates of water savings are directly based on the reduction in the irrigation
water requirements for crop production. However, if improvements in irrigation efficiency
will save water that can be used for other proposes depend on what happen to the drainage

14
water and the return flow of water (Molden and de Fraiture 2002; Jensen 2007). These
features are not considered here.
Figure 4 about here
Higher levels of irrigation efficiency lead to a decrease in the production costs of
irrigated agriculture. As the production costs of rainfed agriculture remain the same, the
result is a shift in production from rainfed to irrigated agriculture. Table 4 reports the
percentage changes in rainfed, irrigated and total agricultural production as well as the
changes in world market prices. For all agricultural products, the increases in irrigated
production and the decreases in rainfed production are more pronounced when more regions
reach higher efficiency levels (scenario 2 and 3). In scenario 3, total agricultural production
rises by 0.7 percent. This consists of an increase in irrigated production of 24.6 percent and a
decline in rainfed production of 15 percent. For individual agricultural products, the shift
from rainfed to irrigated production varies widely.
The world market prices for all agricultural products decrease as a consequence of the
lower production costs of irrigated agriculture. The world market prices fall more as more
regions improve irrigation efficiency. Lower market prices stimulate consumption and total
production of all agricultural products increases. In scenario 3, rice has the greatest reduction
in prices (13.8 percent) which is accompanied by an increase in total production (1.7
percent). The reduction in the world market price is the smallest for cereals (3.4 percent);
total production rises by 0.4 percent.
Table 4 about here
Changes in production induce changes in welfare. At the global level, welfare
increases as more regions implement strategies to improve irrigation. However, at the
regional level, the effects might be less positive for some. Figure 5 compares the changes in
welfare for our three different scenarios for the 16 regions. Discussing the bottom panel first,
changes in welfare in water-scarce developing regions are mostly positive but the magnitude
varies considerably. For water-stressed regions, changes are most pronounced for South Asia
followed by Southeast Asia, the Middle East, North Africa and Sub-Saharan Africa.
Differences between scenario results 1 and 2 are negligible while the third scenario leads to
additional welfare gains. An exception is Sub-Saharan Africa where welfare changes are
negative. The gains for food consumers are smaller than the losses incurred by food
producers. For non-water stressed developing regions, there are mostly welfare gains, which
are marked for China in scenario 3. South America is the exception. As other regions are able
to grow more food, South America loses parts of a valuable export.

15
Figure 5 about here
The upper panel of figure 5 indicates that water-stressed developed regions benefit
from higher levels of irrigation efficiency, and even more so as efficiency improvement
occurs in more regions. This is also true for the non-water stressed former Soviet Union. For
food-exporters (USA, Canada, Australia and New Zealand) an opposite effect occurs; the
larger the number of regions implementing more efficient irrigation management the greater
the loss. This is reversed for the USA in scenario 3, in which the USA itself also benefits
from improved irrigation efficiency.
Figure 6 shows, for scenario 3, changes in welfare as a function of the additional
irrigation water used in irrigated production, that is, the difference between the initial water
savings and the actual water savings (cf. figure 4). There is a clear positive relationship for
the major users (Central America, Southeast Asia, China and South Asia). Japan and South
Korea are outliers. They show high levels of welfare improvements for small increases in
water demand for irrigated agriculture. This is due to a combination of water scarcity and a
strong preference for locally produced rice. Welfare gains in Japan and South Korea are
mostly associated with improvements in its terms of trade and irrigation efficiency. Japan and
South Korea are in line with the rest of the world when changes in welfare are plotted as a
function of changes in total agricultural production (figure 7). Changes in welfare are not
always associated with higher levels of irrigated production: Western Europe, the Middle
East and the former Soviet Union experience welfare increases with an absolute reduction in
domestic agricultural production. Figure 6 also shows welfare losses for food-exporting
regions that lose their competitive advantage as other regions increase their irrigation
efficiency.
Figure 6 and 7 about here
Changes in agricultural production modify international trade patterns and generate
changes in international flows of virtual water. Virtual water is defined as the volume of
water used to produce a commodity (Allan 1992 and 1993). We use the production-site
definition, that is, we measure it at the place where the product was actually produced. The
virtual water content of a product can also be defined as the volume of water that would have
been required to produce the product at the place where the product is consumed
(consumption-site definition). The virtual water used in the agricultural sector has two
components: effective rainfall (green water) and irrigation water (blue water). Table 5 shows
the international flows of irrigation water used associated to the additional agricultural
production (blue virtual water). At the global level, depending on the scenario, between 30 to
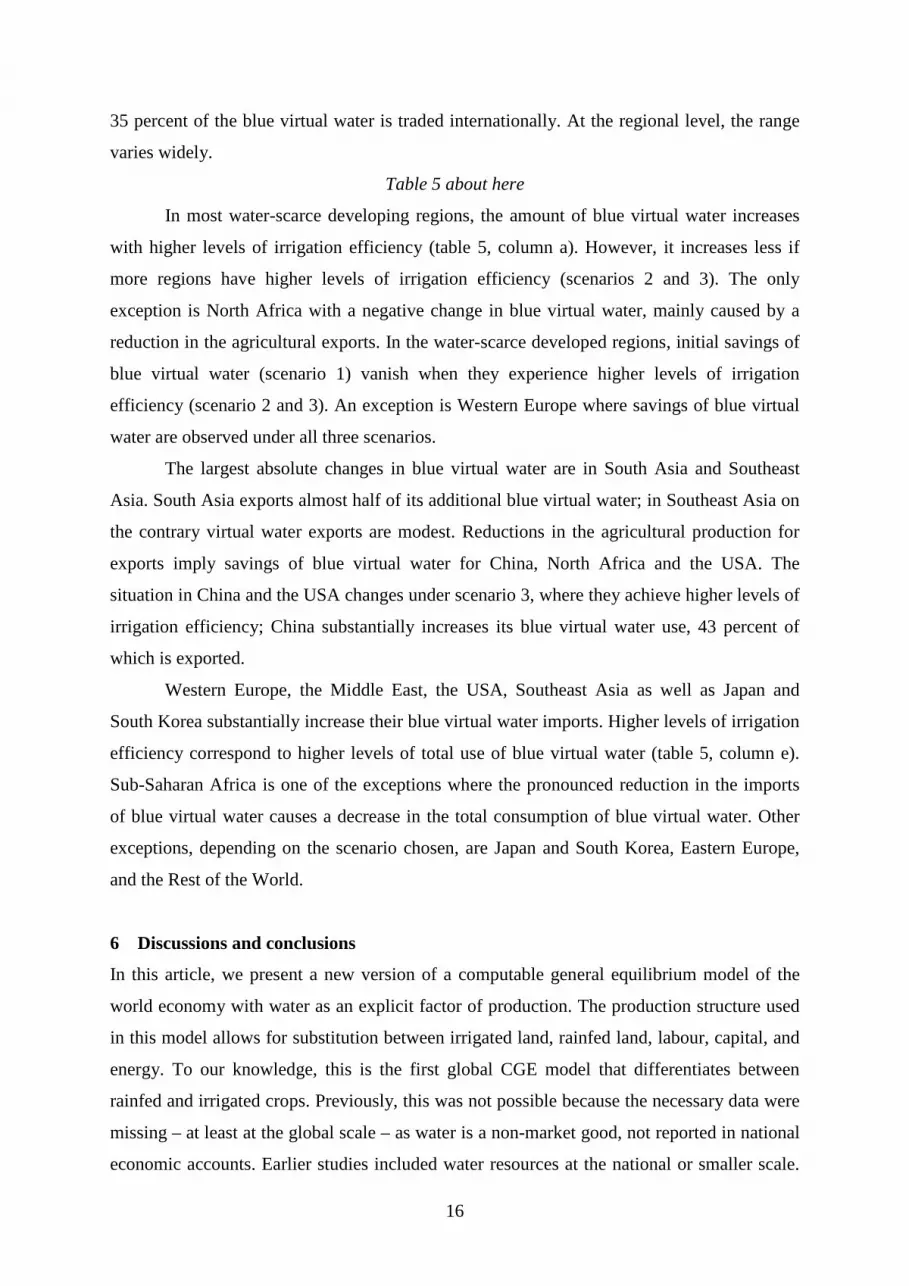
16
35 percent of the blue virtual water is traded internationally. At the regional level, the range
varies widely.
Table 5 about here
In most water-scarce developing regions, the amount of blue virtual water increases
with higher levels of irrigation efficiency (table 5, column a). However, it increases less if
more regions have higher levels of irrigation efficiency (scenarios 2 and 3). The only
exception is North Africa with a negative change in blue virtual water, mainly caused by a
reduction in the agricultural exports. In the water-scarce developed regions, initial savings of
blue virtual water (scenario 1) vanish when they experience higher levels of irrigation
efficiency (scenario 2 and 3). An exception is Western Europe where savings of blue virtual
water are observed under all three scenarios.
The largest absolute changes in blue virtual water are in South Asia and Southeast
Asia. South Asia exports almost half of its additional blue virtual water; in Southeast Asia on
the contrary virtual water exports are modest. Reductions in the agricultural production for
exports imply savings of blue virtual water for China, North Africa and the USA. The
situation in China and the USA changes under scenario 3, where they achieve higher levels of
irrigation efficiency; China substantially increases its blue virtual water use, 43 percent of
which is exported.
Western Europe, the Middle East, the USA, Southeast Asia as well as Japan and
South Korea substantially increase their blue virtual water imports. Higher levels of irrigation
efficiency correspond to higher levels of total use of blue virtual water (table 5, column e).
Sub-Saharan Africa is one of the exceptions where the pronounced reduction in the imports
of blue virtual water causes a decrease in the total consumption of blue virtual water. Other
exceptions, depending on the scenario chosen, are Japan and South Korea, Eastern Europe,
and the Rest of the World.
6 Discussions and conclusions
In this article, we present a new version of a computable general equilibrium model of the
world economy with water as an explicit factor of production. The production structure used
in this model allows for substitution between irrigated land, rainfed land, labour, capital, and
energy. To our knowledge, this is the first global CGE model that differentiates between
rainfed and irrigated crops. Previously, this was not possible because the necessary data were
missing – at least at the global scale – as water is a non-market good, not reported in national
economic accounts. Earlier studies included water resources at the national or smaller scale.

17
These studies necessarily miss the international dimension,9 which is important as water is
implicitly traded in international markets, mainly for agricultural products. In earlier studies
by ourselves, we had been unable to separate rainfed and irrigated agriculture.
Efforts towards improving irrigation management, e.g. through more efficient
irrigation methods, benefit societies by saving large amounts of water. These would be
available for other uses. In this article, we analyze if such a water policy would be
economically beneficial for the world as a whole as well as for individual countries and
whether and to what extent water savings could be achieved. We find that higher levels of
irrigation efficiency have, depending on the scenario and the region, a significant effect on
crop production, water use and welfare. Water use for some crops and some regions goes up,
and it goes down for other crops and regions. This leads to mixed pattern in total water use
for some regions.
At the global level, water savings are achieved and the magnitude increases when
more regions have higher levels of irrigation efficiency. The same tendency is observed at the
regional level, except for only slight decreases in Sub-Saharan Africa as well as in Australia
and New Zealand. The results show that not only regions where irrigation efficiency changes
are able to save water, but also other regions are pushed to reduce irrigation water use.
We find that welfare tends to increases with the additional irrigation water used in
irrigated production. The same positive relationship is observed when changes in welfare are
associated with changes in total agricultural production. However, increased water efficiency
also affects competitiveness, and hurts rainfed agriculture, so that there are welfare losses as
well. Such losses are more than offset, however, by the gains from increased irrigated
production and lower food prices.
Several limitations apply to the above results. First, in our analysis water-scarce
regions are defined based on country averages. We do not take into account that water might
be scarce within countries due to limited availability in water basins. China is an example of
such a country. Although on average water is not short, water supply is a problem in Northern
China. In fact, we implicitly assume a perfect water market in each region. Second, in our
analysis increases in irrigation efficiency are not accompanied by, for example, changes in
water prices. We implicitly assume that higher levels of efficiency are possible with the
9 Although, in a single country CGE, there is either an explicit “Rest of the World” region or the rest of the
world is implicitly included in the closure rules.
18
current technology, at zero cost. Therefore, our scenarios might overestimate the benefits of
improved irrigation management. Third, we do not consider individual options for irrigation
management. Instead, we use water productivity as a proxy for irrigation efficiency. Fourth,
our analysis does not account for alternative uses of water resources outside the agricultural
sector. The necessary data on a global basis are missing. These issues should be addressed in
future research. Future work will also study other issues, such as changes in water policy, and
the effects of climate change on water resources.
Acknowledgements
We had useful discussions about the topics of this paper with Maria Berrittella, Beatriz
Gaitán, Siwa Msangi, Ramiro Parrado, Claudia Ringler, Mark Rosegrant, Roberto Roson,
Ken Strzepek, Timothy Sulser and Tingju Zhu. We are grateful to the IMPACT people for
making their data available to us. This work is supported by the Federal Ministry for
Economic Cooperation and Development, Germany under the project "Food and Water
Security under Global Change: Developing Adaptive Capacity with a Focus on Rural Africa,"
which forms part of the CGIAR Challenge Program on Water and Food, and by the Michael
Otto Foundation for Environmental Protection.

19
References
Allan, J.A. 1992. “Fortunately there are substitutes for water otherwise our hydro-political
futures would be impossible.” In: Proceedings of the Conference on Priorities for Water
Resources Allocation and Management: Natural Resources and Engineering Advisers
Conference, Southampton, July 1992, pp. 13-26.
Allan, J.A. 1993. “Overall perspectives on countries and regions.” In: Rogers, P., Lydon, P.
eds. Water in the Arab World: Perspectives and Prognoses. Cambridge, MA, pp. 65-100.
Berrittella, M., A.Y. Hoekstra, K. Rehdanz, R. Roson, and R.S.J. Tol. 2007. “The Economic
Impact of Restricted Water Supply: A Computable General Equilibrium Analysis.” Water
Research 41: 1799-1813.
Berrittella, M., K. Rehdanz, R. Roson, and R.S.J. Tol. Forthcoming, a. “The Economic
Impact of Water Pricing: A Computable General Equilibrium Analysis.” Water Policy, in
press.
Berrittella, M., K. Rehdanz, and R.S.J. Tol. 2006. “The Economic Impact of the South-North
Water Transfer Project in China: A Computable General Equilibrium Analysis.” Research
unit Sustainability and Global Change FNU-117, Hamburg University and Centre for
Marine and Atmospheric Science, Hamburg.
Berrittella, M., K. Rehdanz, R.S.J. Tol, and Y. Zhang. Forthcoming, b. “The Impact of Trade
Liberalisation on Water Use: A Computable General Equilibrium Analysis.” Journal of
Economic Integration, in press.
Bluemling, B., H. Yang, and C. Pahl-Wostl. 2007. “Making water productivity operational-A
concept of agricultural water productivity exemplified at a wheat-maize cropping pattern
in the North China plain.” Agricultural Water Management 91: 11-23.
Burniaux, J.M., and T.P. Truong. 2002. “GTAP-E: An Energy Environmental Version of the
GTAP Model.” GTAP Technical Paper no. 16.
Burt, C.M., A.J. Clemmens, T.S. Strelkoff, K.H. Solomon, R.D. Bliesner, R.A. Hardy, T.A.
Howell, and D.E. Eisenhauer. 1997. “Irrigation performance measures: Efficiency and
uniformity.” Journal of Irrigation and Drainage Engineering 123: 423-442.
Decaluwé, B., A. Patry, and L. Savard. 1999. “When water is no longer heaven sent:
Comparative pricing analysis in a AGE model.” Working Paper 9908, CRÉFA 99-05,
Départment d’économique, Université Laval.
Deng, X., L. Shan, L. Zhang, and N.C. Turner. 2006. “Improving agricultural water use
efficiency in arid and semiarid areas of China.” Agricultural Water Management 80: 23-
40.

20
Diao, X., and T. Roe. 2003. “Can a water market avert the “double-whammy” of trade reform
and lead to a “win-win” outcome?” Journal of Environmental Economics and
Management 45: 708-723.
Diao, X., A. Dinar, T. Roe, and Y. Tsur. 2008. “A general equilibrium analysis of
conjunctive ground and surface water use with an application to Morocco.” Agricultural
Economics, Vol. 38, No. 2, March 2008, pp. 117-135.
Dinar, A., and D. Yaron. 1992. “Adoption and Abandonment of Irrigation Technologies.”
Agricultural Economics, Vol. 6, Issue 4, April 1992, pp. 315-332.
Easter, K.W., and Y. Liu. 2005. “Cost Recovery and Water Pricing for Irrigation and
Drainage Projects.” Agriculture and Rural Development Discussion Paper 26. The World
Bank, Washington, D.C.
Ettouney, H.M., H.T. El-Dessouky, R.S. Faibish, and P.J. Gowin. 2002. “Evaluating the
Economics of Desalination.” Chemical Engineering Progress, December 2002, pp. 32-39.
FAO. 2001. Handbook on pressurized irrigation techniques. Rome, FAO.
Feng, S., L.X. Li, Z.G. Duan, and J.L. Zhang. 2007. “Assessing the impacts of South-to-
North Water Transfer Project with decision support systems.” Decision Support Systems
42 (4): 1989-2003.
Fraiture, C. de, X. Cai, U. Amarasinghe, M. Rosegrant, and D. Molden. 2004. “Does
international cereal trade save water? The impact of virtual water trade on global water
use.” Comprehensive Assessment Research Report 4, Colombo, Sri Lanka.
Gómez, C.M., D. Tirado, and J. Rey-Maquieira. 2004. “Water exchange versus water work:
Insights from a computable general equilibrium model for the Balearic Islands.” Water
Resources Research 42 W10502 10.1029/2004WR003235.
Goodman, D.J. 2000. “More reservoir or transfer? A computable general equilibrium analysis
of projected water shortages in the Arkansas River Basin.” Journal of Agricultural and
Resource Economics 25 (2): 698-713.
van Heerden, J.H., J.N. Blignaut, and M. Horridge. Forthcoming. “Integrated water and
economic modelling of the impacts of water market instruments on the South African
economy.” Ecological Economics, in press.
Hertel, T.W. 1997. Global Trade Analysis: Modeling and Applications. Cambridge
University Press, Cambridge.
Jensen, M.E. 2007. “Beyond efficiency.” Irrigation Science 25 (3): 233-245.
Johansson, R.C., Y. Tsur, T.L. Roe, R. Doukkali, and A. Dinar. 2002. “Pricing irrigation
water: a review of theory and practice.” Water Policy 4 (2): 173-199.

21
Kamara, A. B., and H. Sally. 2004. “Water management options for food security in South
Africa: scenarios, simulations and policy implications.” Development Southern Africa 21
(2): 365-384.
Lee, H., J. Oliveira-Martins, and D. van der Mensbrugghe. 1994. “The OECD GREEN
Model: An updated overview.” Working Paper No. 97, OECD, Paris.
Letsoalo, A., J. Blignaut, T. de Wet, M. de Wit, S. Hess, R.S.J. Tol, and J. van Heerden.
2007. “Triple Dividends of Water Consumption Charges in South Africa.” Water
Resources Research, 43, W05412.
Lilienfeld, A., and M. Asmild. 2007. “Estimation of excess water use in irrigated agriculture:
A Data Envelopment Analysis approach.” Agricultural Water Management 94 (1-3): 73-
82.
Mailhol, J.C., A. Zairi, A. Slatni, B. Ben Nouma, and H. El Amani. 2004. “Analysis of
irrigation systems and irrigation strategies for durum wheat in Tunisia.” Agricultural
Water Management 70 (1): 19-37.
Molden, D., and C. de Fraiture. 2000. “Major Paths to Increasing the Productivity of
Irrigation Water.” In IWMI. World Water Supply and Demand: 1995 to 2025.
International Water Management Institute, Colombo, Sri Lanka. pp. 23-32.
McDonald, S., S. Robinson, and K. Thierfelder. 2005. “A SAM Based Global CGE Model
using GTAP Data.” Sheffield Economics Research Paper 2005:001. The University of
Sheffield.
Pereira, L.S. 1999. “Higher performance through combined improvements in irrigation
methods and scheduling: a discussion.” Agricultural Water Management 40 (2-3): 153-
169.
Pereira, L.S., T. Oweis, and A. Zairi. 2002. “Irrigation management under water scarcity.”
Agricultural Water Management 57 (3): 175-206.
Qadir, M., B.R. Sharma, A. Bruggeman, R. Choukr-Allah, and F. Karajeh. 2007. “Non-
conventional water resources and opportunities for water augmentation to achieve food
security in water scarce countries.” Agricultural Water Management 87 (1): 2-22.
Rosegrant, M.W., X. Cai, and S.A. Cline. 2002. World Water and Food to 2025: Dealing
With Scarcity. International Food Policy Research Institute. Washington, DC.
Seckler, D., D. Molden, and R. Barker. 1998. “World Water Demand and Supply, 1990 to
2025: Scenarios and Issues.” International Water Management Report, Research Report
19.

22
Seung, C.K., T.R. Harris, J.E. Eglin, and N.R. Netusil. 2000. “Impacts of water reallocation:
A combined computable general equilibrium and recreation demand model approach.”
The Annals of Regional Science 34: 473-487.
Strzepek, K.M., G.W. Yohe, R.S.J. Tol and M. Rosegrant. 2008. “The Value of the High
Aswan Dam to the Egyptian Economy.” Ecological Economics 66:117-126.
Tsur, Y., A. Dinar, R. Doukkali, and T. Roe. 2004. “Irrigation water pricing: policy
implications based on international comparison.” Environmental and Development
Economics 9: 735-755.
United Nations. 1993. The System of National Accounts (SNA93). United Nations, New York.
Wichelns, D. 2003. “Enhancing water policy discussions by including analysis of non-water
inputs and farm-level constraints.” Agricultural Water Management 62 (2): 93-103.
World Bank, 2003. Prospects for irrigated agriculture. Whether irrigated area and irrigation
water must increase to meet food needs in the future: Validation of global irrigation-
water-demand projections by FAO, IFPRI, and IWMI. Report No. 26029. Agriculture and
rural development department, the World Bank, Washington, D.C.
Yang, H., X. Zhang, and A.J.B. Zehnder. 2003. “Water scarcity, pricing mechanism and
institutional reform in northern China irrigated agriculture.” Agricultural Water
Management 61 (2): 143-161.
Zhou, Y., and R.S.J. Tol. 2005. “Evaluating the costs of desalination and water transport.”
Water Resource Research 41(3) W03003 10.1029/2004WR003749.
23
Capital Energy Composite
σKE
Irrigated Land-Water Rainfed Pasture Natural Labor Capital-Energy Composite Land Land Resources Composite
Region 1 … Region r
σM
Domestic Foreign
σD
Irrigated Irrigation Land
σσσσLW
σVAE
σ = 0
Value-added (Including energy inputs)
All other inputs (Excluding energy inputs but including energy feedstock)
Output
Figure 1. Nested tree structure for industrial production process in GTAP-W
(truncated)
Note: The original land endowment has been split into pasture land, rainfed land, irrigated land and irrigation
(bold letters).

24
Irrigation efficiency(Percentage)
40 - 4647 - 5354 - 5960 - 6667 - 73
Figure 2. Average irrigation efficiency, 2001 baseline data

25
0
10
20
30
40
50
60
70
80
Rice (321 km³)
Wheat (296 Km³)
OthAgr (222 km³)
CerCrops(221 Km³)
SugCan (89 km³)
VegFruits(82 km³)
OilSeeds(79 km³)
Per
cent
SAS* (458 km³)
CHI (278 km³)
USA (190 km³)
MDE* (62 km³)
SEA* (56 km³)
SAM (47 km³)
FSU (47 km³)
CAM (46 km³)
NAF* (42 km³)
SSA* (37 km³)
ANZ (15 km³)
EEU* (14 km³)
WEU* (10 km³)
ROW* (5 km³)
JPK* (3 Km³)
CAN (1 km³)
Figure 3. Share of irrigated production in total production by crop and region, 2001
baseline data
Note: Irrigation water used in km3 by crop and region is shown in parenthesis. Water-stressed regions are
indicated by an asterisk (*).

26
0
2
4
6
8
10
12
USA CAN WEU* JPK* ANZ EEU* FSU
Wat
er s
avin
gs (
km 3 )
Initial water saving Final water saving
0
20
40
60
80
100
120
140
MDE* CAM SAM SAS* SEA* CHI NAF* SSA* ROW*
Wat
er s
avin
gs (
km 3 )
Initial water saving Final water saving
Figure 4. Initial and final water savings by scenario, 2001
Note: Developed regions (top panel) and developing regions (bottom panel). Water-stressed regions are
indicated by an asterisk (*). The three bars refer to the three scenarios respectively.

27
-1,000
-500
0
500
1,000
1,500
2,000
2,500
3,000
3,500
USA CAN WEU* JPK* ANZ EEU* FSU
Cha
nge
in w
elfa
re (
mill
ion
US
D)
S1: Water-stressed (developing regions) S2: Water-stressed (all regions) S3: All regions
-1,000
0
1,000
2,000
3,000
4,000
5,000
6,000
MDE* CAM SAM SAS* SEA* CHI NAF* SSA* ROW*
Cha
nge
in w
elfa
re (
mill
ion
US
D)
S1: Water-stressed (developing regions) S2: Water-stressed (all regions) S3: All regions
Figure 5. Changes in regional welfare by scenario (million USD)
Note: Developed regions (top panel) and developing regions (bottom panel). Water-stressed regions are
indicated by an asterisk (*).

28
ANZUSA
MDE*
NAF*CAM
SEA*
JPK* CHI
SAS*
WEU*FSU
ROW*EEU*
SSA*SAMCAN
-1,000
0
1,000
2,000
3,000
4,000
5,000
6,000
-10 0 10 20 30 40 50 60 70 80 90
Additional irrigation water used (km3)
Cha
nge
in w
elfa
re (
mill
ion
US
D)
Figure 6. Changes in welfare as a function of the additional irrigation water used,
scenario 3
Note: Water-stressed regions are indicated by an asterisk (*).

29
ANZUSA
MDE*NAF* CAM
SEA*
JPK* CHI
SAS*
WEU* FSU
ROW*EEU*
SSA*SAMCAN
-1,000
0
1,000
2,000
3,000
4,000
5,000
6,000
-4,000 -2,000 0 2,000 4,000 6,000 8,000
Change in total agricultural production (million USD)
Cha
nge
in w
elfa
re (
mill
ion
US
D)
Figure 7. Changes in welfare as a function of the additional agricultural production,
scenario 3 (million USD)
Note: Water-stressed regions are indicated by an asterisk (*).

30
Table 1. Percentage change in irrigated land-water composite as an indicator for changes in irrigated production, results for scenarios 1
to 3 for four agricultural sectors
Rice (%) Wheat (%) Cereal grains (%) Vegetables and fruits (%) Region Scen. 1 Scen. 2 Scen. 3 Scen. 1 Scen. 2 Scen. 3 Scen. 1 Scen. 2 Scen. 3 Scen. 1 Scen. 2 Scen. 3 USA -5.70 -6.97 -7.57 -1.57 -2.13 3.19 0.63 0.86 4.96 0.55 0.35 3.78CAN 0.00 0.00 0.00 -2.56 -3.45 25.54 1.11 1.50 34.67 -0.01 -0.06 33.20WEU* -22.87 4.13 2.36 -0.52 31.91 31.30 0.83 33.17 33.86 0.67 33.76 33.67JPK* -0.62 22.99 23.05 -0.12 42.78 42.00 0.67 31.75 28.97 0.64 25.93 26.43ANZ -6.10 -7.51 -8.11 -1.86 -1.98 -1.32 1.35 2.02 1.38 0.50 0.47 0.89EEU* -1.04 18.89 17.67 -0.17 21.69 21.61 0.06 21.45 21.53 0.10 21.90 21.93FSU -0.05 0.01 26.51 -0.17 -0.28 26.42 0.08 0.11 27.08 0.21 0.23 25.96MDE* 7.97 8.16 8.57 6.63 6.03 4.66 8.80 8.76 8.26 10.01 10.02 10.18CAM -1.21 -1.33 54.40 -0.43 -0.65 54.57 0.39 0.59 42.76 0.09 -0.08 48.62SAM -0.79 -0.59 73.99 -0.72 -0.64 76.81 0.38 0.55 76.81 0.45 0.2978.26SAS* 30.54 30.47 30.55 36.36 36.25 36.15 34.59 34.71 34.93 36.08 36.11 36.20SEA* 53.32 52.37 52.91 68.47 69.19 69.06 53.70 54.63 53.92 53.00 53.56 53.86CHI 0.14 0.20 29.92 0.17 0.24 29.28 -0.03 0.07 30.15 0.22 0.30 34.35NAF* -5.78 -8.35 -13.23 4.81 4.64 4.54 4.82 4.97 5.00 4.83 4.85 5.07SSA* 61.45 63.37 63.07 57.50 58.33 56.00 61.68 63.80 63.37 63.02 64.07 63.15ROW* 76.82 76.86 71.33 98.25 95.31 94.05 77.03 72.35 72.63 71.47 69.38 73.69Note: Water-stressed regions are indicated by an asterisk (*).

31
Table 2. Percentage change in total agricultural production, results for scenarios 1 to 3 for four agricultural sectors
Rice (%) Wheat (%) Cereal grains (%) Vegetables and fruits (%) Region Scen. 1 Scen. 2 Scen. 3 Scen. 1 Scen. 2 Scen. 3 Scen. 1 Scen. 2 Scen. 3 Scen. 1 Scen. 2 Scen. 3 USA -7.62 -9.38 -12.97 -2.83 -3.79 -1.18 -0.26 -0.30 -0.51 -0.36-0.91 -2.17CAN -13.89 -14.27 -16.73 -4.64 -6.30 -9.56 -0.30 -0.48 -1.36 -1.65 -2.33 -2.07WEU* -28.14 -25.86 -28.34 -1.95 -1.26 -3.03 -0.33 -0.19 -0.81 -0.53 0.69 -0.67JPK* -1.50 1.80 1.10 -0.92 18.97 17.35 0.00 10.88 7.38 -0.08 2.38 2.11ANZ -8.53 -10.75 -12.44 -3.56 -4.31 -4.59 0.21 0.37 -1.47 -0.83 -1.51 -2.13EEU* -1.44 -1.16 -2.65 -0.39 1.09 0.76 -0.13 0.27 0.11 -0.08 0.74 0.52FSU -0.38 -0.42 0.04 -0.54 -0.77 -0.30 -0.25 -0.33 -0.13 -0.08 -0.17 0.53MDE* -0.10 -0.12 -0.13 -2.12 -3.02 -5.00 -0.10 -0.38 -1.40 0.47 0.24 -0.05CAM -1.89 -2.24 6.03 -0.99 -1.47 14.11 -0.03 -0.01 3.26 -0.37 -0.79 6.17SAM -1.62 -1.68 0.52 -1.47 -1.67 -0.30 -0.22 -0.32 0.07 -0.12 -0.58 1.40SAS* 3.71 3.53 3.30 7.16 6.92 6.47 1.37 1.37 1.29 2.61 2.53 2.34SEA* 6.08 4.79 4.75 14.56 14.54 13.93 5.63 5.82 4.84 2.79 2.71 2.53CHI -0.23 -0.35 1.41 -0.21 -0.31 2.16 -0.45 -0.52 2.74 -0.17 -0.28 0.75NAF* -11.77 -14.90 -20.78 0.17 -0.27 -0.88 0.33 0.26 -0.21 0.12 -0.10 -0.35SSA* -0.22 -0.35 -0.44 1.98 0.99 -0.68 0.07 0.06 -0.08 -0.09 -0.88-1.40ROW* 5.92 5.61 2.13 20.56 19.50 18.07 0.71 0.68 0.03 3.14 2.66 2.07Note: Water-stressed regions are indicated by an asterisk (*).

32
Table 3. Percentage change in water demand in irrigated agriculture, results for scenarios 1 to 3 for four agricultural sectors
Rice (%) Wheat (%) Cereal grains (%) Vegetables and fruits (%) Region Scen. 1 Scen. 2 Scen. 3 Scen. 1 Scen. 2 Scen. 3 Scen. 1 Scen. 2 Scen. 3 Scen. 1 Scen. 2 Scen. 3 USA -5.68 -6.94 -8.70 -1.55 -2.10 0.64 0.65 0.89 -0.92 0.57 0.38 -2.03CAN 0.00 0.00 0.00 -2.56 -3.45 -5.43 1.11 1.50 1.45 -0.02 -0.06 0.34WEU* -22.86 -21.51 -22.84 -0.50 -0.48 -0.94 0.86 0.47 0.98 0.69 0.91 0.84JPK* -0.63 -1.45 -1.43 -0.13 9.83 9.20 0.66 9.51 7.18 0.63 -0.38 -0.01ANZ -6.11 -7.53 -8.16 -1.88 -2.00 -1.38 1.34 2.00 1.32 0.49 0.45 0.83EEU* -1.04 -2.30 -3.31 -0.17 -0.01 -0.07 0.06 -0.21 -0.14 0.10 0.17 0.19FSU -0.06 0.00 -2.91 -0.18 -0.29 -0.22 0.07 0.09 0.38 0.20 0.21 1.34MDE* 1.60 1.78 2.15 -0.50 -1.07 -2.36 0.86 0.82 0.34 -0.23 -0.23 -0.10CAM -1.23 -1.34 -7.25 -0.45 -0.66 8.10 0.37 0.58 -0.57 0.07 -0.09-0.84SAM -0.78 -0.59 -2.12 -0.71 -0.64 -0.09 0.38 0.54 0.65 0.46 0.29 0.67SAS* -0.18 -0.24 -0.18 2.78 2.70 2.61 -1.60 -1.51 -1.36 -1.23 -1.21 -1.15SEA* -2.07 -2.65 -2.33 -0.15 0.31 0.20 2.98 3.64 3.12 -1.19 -0.80 -0.65CHI 0.12 0.17 -3.28 0.15 0.22 2.17 -0.05 0.05 3.51 0.21 0.27 -0.86NAF* -9.67 -12.13 -16.81 0.10 -0.06 -0.15 0.30 0.45 0.47 0.03 0.05 0.25SSA* -1.91 -0.62 -0.92 6.42 7.13 5.42 -0.56 0.88 0.48 -2.15 -1.39 -2.07ROW* -1.14 -0.04 -3.40 10.64 9.90 9.11 -0.67 -2.89 -2.72 -4.56 -4.92 -1.96Note: Water-stressed regions are indicated by an asterisk (*).

33
Table 4. Percentage change in global total, irrigated and rainfed agricultural production and world market prices by scenario
Scenario 1 Scenario 2 Scenario 3 Agricultural Agricultural production Agricultural production Agricultural production
products Total Irrigated Rainfed Price Total Irrigated Rainfed Price Total Irrigated Rainfed Price Rice 1.07 14.74 -36.08 -6.78 1.55 17.49 -41.75 -10.03 1.71 19.69 -47.16 -13.79 Wheat 0.45 13.22 -11.03 -2.95 0.73 17.22 -14.09 -3.60 0.87 24.58 -20.45 -5.16 Cereal grains 0.07 4.35 -2.29 -0.95 0.13 7.34 -3.84 -1.34 0.38 21.94 -11.49 -3.44 Vegetable and fruits 0.25 7.38 -3.59 -1.41 0.41 15.46 -7.68 -2.44 0.70 29.01 -14.52 -4.47 Oil seeds 0.58 15.96 -6.36 -2.57 0.62 16.90 -6.73 -2.78 1.00 27.97 -11.18 -4.19 Sugar cane and beet 0.76 21.52 -17.59 -6.26 0.80 26.69 -22.09 -6.87 0.90 37.49 -31.45 -8.25 Other agri. products 0.27 8.83 -4.78 -1.91 0.39 12.72 -6.87 -2.47 0.48 21.43 -11.86 -3.99 TOTAL 0.35 10.02 -6.02 0.52 14.86 -8.93 0.71 24.58 -15.00

34
Table 5. Changes in blue virtual water flows related to the additional agricultural production by scenario, in cubic kilometres (km3)
Scenario 1 Scenario 2 Scenario 3 Virtual Destination Market Virtual Destination Market Virtual Destination Market
Region Water Domestic Exports Imports Net Water Domestic Exports Imports Net Water Domestic Exports Imports Net
(a=b+c) (b) (c) (d) (e=b+d-c) (a=b+c) (b) (c) (d) (e=b+d-c) (a=b+c) (b) (c) (d) (e=b+d-c)
USA -1.38 -0.34 -1.05 0.44 1.16 -1.68 -0.39 -1.29 0.43 1.33 -0.46 -0.13 -0.33 0.71 0.91 CAN 0.00 0.00 0.00 0.03 0.03 0.00 0.00 0.00 0.02 0.03 0.00 0.00 0.00 0.07 0.07 WEU* -0.19 -0.11 -0.07 1.48 1.44 -0.09 -0.05 -0.03 1.37 1.35 -0.12 -0.08 -0.05 2.57 2.54 JPK* -0.04 -0.01 -0.03 0.41 0.42 0.06 0.06 0.00 -0.34 -0.29 0.04 0.04 0.00 1.13 1.17 ANZ -0.06 -0.02 -0.04 0.03 0.05 -0.08 -0.02 -0.05 0.02 0.05 -0.08 -0.01 -0.07 0.04 0.10 EEU* -0.01 0.00 0.00 0.17 0.17 0.08 0.04 0.04 0.07 0.08 0.05 0.03 0.02 -0.24 -0.23 FSU -0.05 -0.03 -0.02 0.19 0.18 -0.07 -0.04 -0.03 0.20 0.19 0.03 0.04 0.00 0.31 0.35 MDE* 0.04 0.03 0.01 1.41 1.43 0.02 0.03 -0.01 1.36 1.40 -0.07 -0.06 -0.01 1.41 1.37 CAM -0.06 -0.03 -0.03 0.06 0.06 -0.08 -0.03 -0.05 0.07 0.09 1.29 0.87 0.42 -0.14 0.31 SAM -0.15 -0.03 -0.12 0.07 0.16 -0.16 -0.03 -0.13 0.07 0.18 0.11 0.08 0.03 0.06 0.11 SAS* 16.41 8.70 7.72 -0.08 0.90 15.89 8.62 7.27 -0.08 1.27 14.85 8.43 6.42 0.39 2.41 SEA* 2.21 1.81 0.40 0.83 2.24 1.95 1.57 0.37 0.66 1.86 1.84 1.54 0.30 1.44 2.68 CHI -1.38 -0.63 -0.74 0.10 0.21 -1.97 -0.81 -1.16 0.10 0.46 7.28 4.14 3.14 0.29 1.30 NAF* -0.97 -0.04 -0.93 0.16 1.06 -1.27 -0.08 -1.19 0.16 1.28 -1.79 -0.13 -1.66 0.37 1.90 SSA* 0.04 0.03 0.01 -0.12 -0.09 0.02 0.02 0.00 -0.31 -0.29 0.00 0.00 0.00 -0.20 -0.20 ROW* 0.04 0.03 0.01 -0.08 -0.06 0.04 0.03 0.01 -0.08 -0.06 0.03 0.02 0.01 -0.01 0.01 TOTAL 14.45 9.36 5.10 5.10 9.36 12.66 8.92 3.73 3.73 8.92 23.00 14.79 8.21 8.21 14.79
Note: Water-stressed regions are indicated by an asterisk (*).

35
Annex I: Aggregations in GTAP-W
A. Regional Aggregation B. Sectoral Aggregation
1. USA - United States 1. Rice - Rice
2. CAN - Canada 2. Wheat - Wheat
3. WEU - Western Europe 3. CerCrops - Cereal grains (maize, millet,
4. JPK - Japan and South Korea sorghum and other grains)
5. ANZ - Australia and New Zealand 4. VegFruits - Vegetable, fruits, nuts
6. EEU - Eastern Europe 5. OilSeeds - Oil seeds
7. FSU - Former Soviet Union 6. Sug_Can - Sugar cane, sugar beet
8. MDE - Middle East 7. Oth_Agr - Other agricultural products
9. CAM - Central America 8. Animals - Animals
10. SAM - South America 9. Meat - Meat
11. SAS - South Asia 10. Food_Prod - Food products
12. SEA - Southeast Asia 11. Forestry - Forestry
13. CHI - China 12. Fishing - Fishing
14. NAF - North Africa 13. Coal - Coal
15. SSA - Sub-Saharan Africa 14. Oil - Oil
16. ROW - Rest of the World 15. Gas - Gas
16. Oil_Pcts - Oil products
C. Endowments 17. Electricity - Electricity
Wtr - Irrigation 18. Water - Water
Lnd - Irrigated land 19. En_Int_Ind - Energy intensive industries
RfLand - Rainfed land 20. Oth_Ind - Other industry and services
PsLand - Pasture land 21. Mserv - Market services
Lab - Labour 22. NMServ - Non-market services
Capital - Capital
NatlRes - Natural resources

36
Annex II:
Table A1. Share of irrigated production in total production by region and crop
(percentages)
Region Rice Wheat CerCrops VegFruits OilSeeds Sug_Can Oth_Agr Total USA 51.01 78.93 70.25 34.20 68.45 48.00 100.00 67.73 CAN 0.00 1.92 10.36 34.72 3.33 44.08 0.00 8.50 WEU 48.77 19.56 16.28 35.32 5.69 40.28 5.03 24.10 JPK 93.71 79.66 65.26 66.26 32.10 56.64 81.50 75.48 ANZ 48.10 12.82 17.94 33.66 11.66 48.34 9.30 28.93 CEE 48.50 30.30 18.81 19.01 5.82 28.97 0.00 17.75 FSU 49.40 20.76 9.67 28.31 6.18 40.22 24.57 24.13 MDE 55.82 45.36 29.59 51.77 47.07 49.60 44.45 46.82 CAM 46.82 55.43 49.03 47.34 56.54 41.98 43.73 44.54 SAM 63.32 9.71 12.39 20.53 0.66 27.80 17.57 22.11 SAS 70.32 75.46 31.05 33.55 31.53 62.55 41.47 53.27 SEA 48.59 49.43 30.67 25.16 45.26 51.96 24.62 36.64 CHI 100.00 85.91 73.32 26.99 46.83 41.74 82.65 59.59 NAF 82.09 63.92 76.49 56.02 46.76 49.65 65.34 60.68 SSA 20.80 28.95 4.75 4.20 5.92 42.06 1.07 8.97 SIS 49.46 49.75 10.78 25.41 56.09 39.33 22.38 33.52 Total 73.16 48.42 42.30 28.13 37.06 43.97 47.53 42.16 Source: Own calculations based on IMPACT baseline data.

37
Table A2. Ratio of irrigated yield to rainfed yield by region and crop
Region Rice Wheat CerCrops VegFruits OilSeeds Sug_Can Oth_Agr USA 1.42 1.42 1.42 1.41 1.35 1.42 1.31* CAN -- 1.36 1.38 1.39 1.30 1.41 1.31* WEU 1.42 1.36 1.36 1.39 1.30 1.39 1.26 JPK 1.39 1.37 1.36 1.42 1.35 1.43 1.33 ANZ 1.41 1.39 1.38 1.39 1.32 1.43 1.33 CEE 1.41 1.37 1.36 1.36 1.32 1.38 1.31* FSU 1.42 1.38 1.38 1.40 1.33 1.40 1.32 MDE 1.33 1.36 1.36 1.38 1.37 1.36 1.29 CAM 1.43 1.41 1.40 1.40 1.33 1.39 1.30 SAM 1.44 1.54 1.36 1.36 1.33 1.47 1.30 SAS 1.43 1.41 1.38 1.40 1.39 1.41 1.32 SEA 1.42 1.40 1.35 1.36 1.34 1.41 1.31 CHI 1.40* 1.42 1.42 1.38 1.40 1.44 1.32 NAF 1.33 1.37 1.33 1.34 1.33 1.34 1.31 SSA 1.37 1.36 1.34 1.36 1.34 1.34 1.32 SIS 1.39 1.41 1.34 1.34 1.33 1.39 1.31 Source: Own calculations based on IMPACT baseline data.
* World average.

38
Annex III: The substitution elasticity of water
Let us assume that there is a production
( , )A f X W= (1)
where A is output, W is water input, and X is all other input. The cost of production
C pX tW= + (2)
where t is the price of water and p is the composite price of other inputs. Production
efficiency implies
X
W
A p
A t= (3)
Let us assume that (1) is CES
( ) 1
A X Wρ ρ ρ−
− −= + (1’)
This implies
1
1X
W
A W p
A X t
ρ
ρ
+
+= = (3’)
From Rosegrant et al. (2002), we know the price elasticity of water use, η. Thus, we have
1 11 11 2
1 21 1
1 2
(1 )(1 )
(1 )
W p W pW W
X t X t
W W
ρ ρρ ρ
ρ ρ δδ
ηδ
+ ++ +
+ += ∧ = ⇒ = ++
= + (4)
That is, the price elasticity η implies the substitution elasticity ρ, for any price change δ:
ln(1 )1
ln(1 )
δρηδ
+= −+
(5)

39
Working Papers
Research Unit Sustainability and Global Change
Hamburg University and Centre for Marine and Atmospheric Science
Calzadilla, A, K. Rehdanz and R.S.J. Tol (2008), Water Scarcity and the Impact of Improved Irrigation Management: A CGE Analysis, FNU-160 (submitted)
Schleupner, C. and U.A. Schneider (2008), A cost-effective spatial wetland site-selection model for European biotope restoration, FNU-159 (submitted)
Schleupner, C. and U.A. Schneider (2008), Evaluation of European wetland restoration potentials by considering economic costs under different policy options, FNU-158 (submitted)
Bigano, A., J.M. Hamilton and R.S.J. Tol (2008), Climate Change and Tourism in the Mediterranean, FNU-157 (submitted).
Schneider U.A., J. Balkovic, S. De Cara, O. Franklin, S. Fritz, P. Havlik, I. Huck, K. Jantke, A.M.I. Kallio, F. Kraxner, A. Moiseyev, M. Obersteiner, C.I. Ramos, C. Schleupner, E. Schmid, D. Schwab, R. Skalsky (2008), The European Forest and Agricultural Sector Optimization Model – EUFASOM, FNU-156.
Schneider, U.A. and P. Kumar (2008), Greenhouse Gas Emission Mitigation through Agriculture, FNU-155.
Tol, R.S.J. and S. Wagner (2008), Climate Change and Violent Conflict in Europe over the Last Millennium. FNU-154 (submitted).
Schleupner, C. (2007), Regional Spatial Planning Assessments for Adaptation to accelerated sea level rise – an application to Martinique’s coastal zone. FNU-153 (submitted).
Schleupner, C. (2007). Evaluating the Regional Coastal Impact Potential to Erosion and Inundation caused by Extreme Weather Events and Tsunamis. FNU-152 (submitted).
Rehdanz, K. (2007), Species diversity and human well-being: A spatial econometric approach, FNU-151 (submitted).
Osmani, D. and R.S.J. Tol (2007), A short note on joint welfare maximization assumption, FNU-150 (submitted).
Osmani, D. and R.S.J. Tol (2007), Towards Farsightedly Stable International Environmental Agreements: Part Two, FNU-149 (submitted).
Ruane, F.P. and R.S.J. Tol (2007), Academic Quality, Power and Stability: An Application to Economics in the Republic of Ireland, FNU-148 (submitted).
Tol, R.S.J. (2007), A Rational, Successive g-Index Applied to Economics Departments in Ireland, FNU-147 (forthcoming, Journal of Informetrics).
Tol, R.S.J. (2007), Of the h-Index and its Alternatives: An Application to the 100 Most Prolific Economists, FNU-146 (forthcoming, Scientometrics).
Yohe, G.W. and R.S.J. Tol (2007), Precaution and a Dismal Theorem: Implications for Climate Policy and Climate Research, FNU-145 (submitted).
Tol, R.S.J. (2007), The Social Cost of Carbon: Trends, Outliers and Catastrophes, FNU-144 (submitted, economics).
Tol, R.S.J. (2007), The Matthew Effect Defined and Tested for the 100 Most Prolific Economists, FNU-143 (submitted, Journal of the American Society for Information Science and Technology).
Berrittella, M., K. Rehdanz, R.S.J. Tol and J. Zhang (2007), The Impact of Trade Liberalisation on Water Use: A Computable General Equilibrium Analysis, FNU-142 (forthcoming, Journal of Economic Integration).
Lyons, S., K. Mayor and R.S.J. Tol (2007), Convergence of Consumption Patterns during Macroeconomic Transition: A Model of Demand in Ireland and the OECD, FNU-141 (submitted).
Osmani, D. and R.S.J. Tol (2007), Towards Farsightedly Stable International Environmental Agreements, FNU-140 (submitted).
Rehdanz, K. and S. Stöwhase (2007), Cost Liability and Residential Space Heating Expenditures of Welfare Recipients in Germany, FNU-139 (submitted).
Schleupner, C. and P.M. Link (2007), Potential impacts on bird habitats in Eiderstedt (Schleswig-Holstein) caused by agricultural land use changes, FNU-138 (Applied Geography, doi: 10.1016/j.apgeog.2008.04.001).
Link, P.M. and C. Schleupner (2007), Agricultural land use changes in Eiderstedt: historic developments and future plans, FNU-137 (Coastline Reports, 9, 197-206).
Anthoff, D., R.J. Nicholls and R.S.J. Tol (2007), Global Sea Level Rise and Equity Weighting, FNU-136 (submitted).
Schleupner, C. (2007), Wetland Distribution Modelling for Optimal Land Use Options in Europe, FNU-135 (submitted).
Mayor, K. and R.S.J. Tol (2007), The Impact of the EU-US Open Skies Agreement on International Travel and Carbon Dioxide Emissions, FNU-134 (Journal of Air Transport Management, 14, 1-7).
Schneider, U.A., M. Obersteiner, and E. Schmid (2007), Agricultural adaptation to climate policies and technical change, FNU-133 (submitted).
Lychnaras, V. and U.A. Schneider (2007), Dynamic Economic Analysis of Perennial Energy Crops - Effects of the CAP Reform on Biomass Supply in Greece, FNU-132 (submitted).
Mayor, K. and R.S.J. Tol (2007), The Impact of the UK Aviation Tax on Carbon Dioxide Emissions and Visitor Numbers, FNU-131 (Transport Policy, 14 (6), 407-513).
Ruane, F. and R.S.J. Tol (2007), Refined (Successive) h-indices: An Application to Economics in the Republic of Ireland, FNU-130 (forthcoming, Scientometrics).
Yohe, G.W., R.S.J. Tol and D. Murphy (2007), On Setting Near-Term Climate Policy as the Dust Begins the Settle: The Legacy of the Stern Review, FNU-129 (Energy & Environment, 18 (5), 621-633).

40
Maddison, D.J. and K. Rehdanz (2007), Happiness over Space and Time, FNU-128 (submitted).
Anthoff, D. and R.S.J. Tol (2007), On International Equity Weights and National Decision Making on Climate Change, FNU-127 (submitted).
de Bruin, K.C., R.B. Dellink and R.S.J. Tol (2007), AD-DICE: An Implementation of Adaptation in the DICE Model, FNU-126 (submitted, Climatic Change).
Tol, R.S.J. and G.W. Yohe (2007), The Stern Review: A Deconstruction, FNU-125 (submitted).
Keller, K., L.I. Miltich, A. Robinson and R.S.J. Tol (2007), How Overconfident Are Current Projections of Anthropogenic Carbon Dioxide Emissions?, FNU-124 (submitted, Energy Journal).
Cowie, A., U.A. Schneider and L. Montanarella (2006), Potential synergies between existing multilateral environmental agreements in the implementation of Land Use, Land Use Change and Forestry activities, FNU-123 (submitted)
Kuik, O.J., B. Buchner, M. Catenacci, A. Goria, E. Karakaya and R.S.J. Tol (2006), Methodological Aspects of Recent Climate Change Damage Cost Studies, FNU-122 (forthcoming, Climate Policy)
Anthoff, D., C. Hepburn and R.S.J. Tol (2006), Equity Weighting and the Marginal Damage Costs of Climate Change, FNU-121 (submitted, Ecological Economics)
Tol, R.S.J. (2006), The Impact of a Carbon Tax on International Tourism, FNU-120 (Transportation Research D: Transport and the Environment, 12 (2), 129-142).
Rehdanz, K. and D.J. Maddison (2006), Local Environmental Quality and Life Satisfaction in Germany, FNU-119 (forthcoming, Ecological Economics)
Tanaka, K., R.S.J. Tol, D. Rokityanskiy, B.C. O’Neill and M. Obersteiner (2006), Evaluating Global Warming Potentials as Historical Temperature Proxies: An Application of ACC2 Inverse Calculation, FNU-118 (submitted, Climatic Change)
Berrittella, M., K. Rehdanz and R.S.J. Tol (2006), The Economic Impact of the South-North Water Transfer Project in China: A Computable General Equilibrium Analysis, FNU-117 (submitted, China Economic Review)
Tol, R.S.J. (2006), Why Worry about Climate Change? A Research Agenda, FNU-116 (forthcoming, Environmental Values)
Hamilton, J.M. and R.S.J. Tol (2006), The Impact of Climate Change on Tourism in Germany, the UK and Ireland: A Simulation Study, FNU-115 (Regional Environmental Change, 7 (3), 161-172)
Schwoon, M., F. Alkemade, K. Frenken and M.P. Hekkert (2006), Flexible transition strategies towards future well-to-wheel chains: an evolutionary modelling approach, FNU-114 (submitted).
Ronneberger, K., L. Criscuolo, W. Knorr and R.S.J. Tol (2006), KLUM@LPJ: Integrating dynamic land-use decisions into a dynamic global vegetation and crop growth model to assess the impacts of a changing climate. A feasibility study for Europe, FNU-113 (submitted)
Schwoon, M. (2006), Learning-by-doing, Learning Spillovers and the Diffusion of Fuel Cell Vehicles, FNU-112 (submitted).
Strzepek, K.M., G.W. Yohe, R.S.J. Tol and M. Rosegrant (2006), The Value of the High Aswan Dam to the Egyptian Economy, FNU-111 (forthcoming, Ecological Economics).
Schwoon, M. (2006), A Tool to Optimize the Initial Distribution of Hydrogen Filling Stations, FNU-110 (Transportation Research D: Transport and the Environment, 12 (2), 70-82).
Tol, R.S.J., K.L. Ebi and G.W. Yohe (2006), Infectious Disease, Development, and Climate Change: A Scenario Analysis, FNU-109 (forthcoming, Environment and Development Economics).
Lau, M.A. (2006), An analysis of the travel motivation of tourists from the People’s Republic of China, FNU-108 (submitted).
Lau, M.A. and R.S.J. Tol (2006), The Chinese are coming – An analysis of the preferences of Chinese holiday makers at home and abroad, FNU-107 (submitted).
Röckmann, C., R.S.J. Tol, U.A. Schneider, and M.A. St.John (2006), Rebuilding the Eastern Baltic cod stock under environmental change - Part II: The economic viability of a marine protected area. FNU-106 (forthcoming, Natural Resources Modelling)
Ronneberger, K., M. Berrittella, F. Bosello and R.S.J. Tol (2006), KLUM@GTAP: Introducing biophysical aspects of land-use decisions into a general equilibrium model. A coupling experiment, FNU-105 (submitted).
Link, P.M. and Tol, R.S.J. (2006), Economic impacts on key Barents Sea fisheries arising from changes in the strength of the Atlantic thermohaline circulation, FNU-104 (submitted).
Link, P.M. and Tol, R.S.J. (2006), Estimation of the economic impact of temperature changes induced by a shutdown of the thermohaline circulation: an application of FUND, FNU-103 (submitted, Climatic Change).
Tol, R.S.J. (2006), Integrated Assessment Modelling, FNU-102 (submitted).
Tol, R.S.J. (2006), Carbon Dioxide Emission Scenarios for the USA, FNU-101 (Energy Policy, 35, 5310-5326).
Tol, R.S.J., S.W. Pacala and R.H. Socolow (2006), Understanding Long-Term Energy Use and Carbon Dioxide Emissions in the USA, FNU-100 (submitted).
Sesabo, J.K, H. Lang and R.S.J. Tol (2006), Perceived Attitude and Marine Protected Areas (MPAs) establishment: Why households’ characteristics matters in Coastal resources conservation initiatives in Tanzania, FNU-99 (submitted).
Tol, R.S.J. (2006), The Polluter Pays Principle and Cost-Benefit Analysis of Climate Change: An Application of FUND, FNU-98 (submitted)
Tol, R.S.J. and G.W. Yohe (2006), The Weakest Link Hypothesis for Adaptive Capacity: An Empirical Test, FNU-97 (Global Environmental Change, 17, 218-227)
Berrittella, M., K. Rehdanz, R.Roson and R.S.J. Tol (2005), The Economic Impact of Water Pricing: A Computable General Equilibrium Analysis, FNU-96 (forthcoming, Water Policy)
Sesabo, J.K. and R. S. J. Tol (2005), Technical Efficiency and Small-scale Fishing Households in Tanzanian coastal Villages: An Empirical Analysis, FNU-95 (submitted)
41
Lau, M.A. (2005), Adaptation to Sea-level Rise in the People’s Republic of China – Assessing the Institutional Dimension of Alternative Organisational Frameworks, FNU-94 (submitted)
Berrittella, M., A.Y. Hoekstra, K. Rehdanz, R. Roson and R.S.J. Tol (2005), The Economic Impact of Restricted Water Supply: A Computable General Equilibrium Analysis, FNU-93 (Water Research, 42, 1799-1813)
Tol, R.S.J. (2005), Europe’s Long Term Climate Target: A Critical Evaluation, FNU-92 (Energy Policy, 35 (1), 424-434)
Hamilton, J.M. (2005), Coastal Landscape and the Hedonic Price of Accommodation, FNU-91 (Ecological Economics, 62 (3-4), 594-602)
Hamilton, J.M., D.J. Maddison and R.S.J. Tol (2005), Climate Preferences and Destination Choice: A Segmentation Approach, FNU-90 (submitted)
Zhou, Y. and R.S.J. Tol (2005), Valuing the Health Impacts from Particulate Air Pollution in Tianjin, FNU-89 (submitted)
Röckmann, C. (2005), International Cooperation for Sustainable Fisheries in the Baltic Sea, FNU-88 (forthcoming, in Ehlers,P./Lagoni,R. (Eds.): International Maritime Organisations and their Contribution towards a Sustainable Marine Development.)
Ceronsky, M., D. Anthoff, C. Hepburn and R.S.J. Tol (2005), Checking the price tag on catastrophe: The social cost of carbon under non-linear climate response FNU-87 (submitted, Climatic Change)
Zandersen, M. and R.S.J. Tol (2005), A Meta-analysis of Forest Recreation Values in Europe, FNU-86 (submitted, Journal of Forest Economics)
Heinzow, T., R.S.J. Tol and B. Brümmer (2005), Offshore-Windstromerzeugung in der Nordsee -eine ökonomische und ökologische Sackgasse? FNU-85 (Energiewirtschaftliche Tagesfragen, 56 (3), 68-73)
Röckmann, C., U.A. Schneider, M.A. St.John, and R.S.J. Tol (2005), Rebuilding the Eastern Baltic cod stock under environmental change - a preliminary approach using stock, environmental, and management constraints, FNU-84 (Natural Resources Modelling, 20 (2), 223-262)
Tol, R.S.J. and G.W. Yohe (2005), Infinite uncertainty, forgotten feedbacks, and cost-benefit analysis of climate policy, FNU-83 (Climatic Change, 83, 429-442)
Osmani, D. and R.S.J. Tol (2005), The case of two self-enforcing international agreements for environmental protection, FNU-82 (submitted)
Schneider, U.A. and B.A. McCarl, (2005), Appraising Agricultural Greenhouse Gas Mitigation Potentials: Effects of Alternative Assumptions, FNU-81 (submitted)
Zandersen, M., M. Termansen, and F.S. Jensen, (2005), Valuing new forest sites over time: the case of afforestation and recreation in Denmark, FNU-80 (submitted)
Guillerminet, M.-L. and R.S.J. Tol (2005), Decision making under catastrophic risk and learning: the case of the possible collapse of the West Antarctic Ice Sheet, FNU-79 (submitted, Climatic Change)
Nicholls, R.J., R.S.J. Tol and A.T. Vafeidis (2005), Global estimates of the impact of a collapse of the West Antarctic Ice Sheet: An application of FUND, FNU-78 (forthcoming, Climatic Change)
Lonsdale, K., T.E. Downing, R.J. Nicholls, D. Parker, A.T. Vafeidis, R. Dawson and J.W. Hall (2005), Plausible responses to the threat of rapid sea-level rise for the Thames Estuary, FNU-77 (submitted, Climatic Change)
Poumadère, M., C. Mays, G. Pfeifle with A.T. Vafeidis (2005), Worst Case Scenario and Stakeholder Group Decision: A 5-6 Meter Sea Level Rise in the Rhone Delta, France, FNU-76 (submitted, Climatic Change)
Olsthoorn, A.A., P.E. van der Werff, L.M. Bouwer and D. Huitema (2005), Neo-Atlantis: Dutch Responses to Five Meter Sea Level Rise, FNU-75 (forthcoming, Climatic Change)
Toth, F.L. and E. Hizsnyik (2005), Managing the inconceivable: Participatory assessments of impacts and responses to extreme climate change, FNU-74 (submitted, Climatic Change)
Kasperson, R.E. M.T. Bohn and R. Goble (2005), Assessing the risks of a future rapid large sea level rise: A review, FNU-73 (submitted, Climatic Change)
Schleupner, C. (2005), Evaluation of coastal squeeze and beach reduction and its consequences for the Caribbean island Martinique, FNU-72 (submitted)
Schleupner, C. (2005), Spatial Analysis As Tool for Sensitivity Assessment of Sea Level Rise Impacts on Martinique, FNU-71 (submitted)
Sesabo, J.K. and R.S.J. Tol (2005), Factors affecting Income Strategies among households in Tanzanian Coastal Villages: Implication for Development-Conservation Initiatives, FNU-70 (submitted)
Fisher, B.S., G. Jakeman, H.M. Pant, M. Schwoon. and R.S.J. Tol (2005), CHIMP: A Simple Population Model for Use in Integrated Assessment of Global Environmental Change, FNU-69 (Integrated Assessment Journal, 6 (3), 1-33)
Rehdanz, K. and R.S.J. Tol (2005), A No Cap But Trade Proposal for Greenhouse Gas Emission Reduction Targets for Brazil, China and India, FNU-68 (submitted, Climate Policy)
Zhou, Y. and R.S.J. Tol (2005), Water Use in China’s Domestic, Industrial and Agricultural Sectors: An Empirical Analysis, FNU-67 (Water Science and Technoloy: Water Supply, 5 (6), 85-93)
Rehdanz, K. (2005), Determinants of Residential Space Heating Expenditures in Germany, FNU-66 (Energy Economics 29)
Ronneberger, K., R.S.J. Tol and U.A. Schneider (2005), KLUM: A Simple Model of Global Agricultural Land Use as a Coupling Tool of Economy and Vegetation, FNU-65 (submitted, Climatic Change)
Tol, R.S.J. (2005), The Benefits of Greenhouse Gas Emission Reduction: An Application of FUND, FNU-64 (submitted, Global Environmental Change)
Röckmann, C., M.A. St.John, U.A. Schneider, F.W. Köster, F.W. and R.S.J. Tol (2006), Testing the implications of a permanent or seasonal marine reserve on the population dynamics of Eastern Baltic cod under varying environmental conditions, FNU-63-revised (Fisheries Research, 85, 1-13)
Letsoalo, A., J. Blignaut, T. de Wet, M. de Wit, S. Hess, R.S.J. Tol and J. van Heerden (2005), Triple Dividends of Water Consumption Charges in South Africa, FNU-62 (Water Resources Research, 43, W05412)

42
Zandersen, M., Termansen, M., Jensen,F.S. (2005), Benefit Transfer over Time of Ecosystem Values: the Case of Forest Recreation, FNU-61 (submitted)
Rehdanz, K., Jung, M., Tol, R.S.J. and Wetzel, P. (2005), Ocean Carbon Sinks and International Climate Policy, FNU-60 (Energy Policy, 34, 3516-3526)
Schwoon, M. (2005), Simulating the Adoption of Fuel Cell Vehicles, FNU-59 (submitted)
Bigano, A., J.M. Hamilton and R.S.J. Tol (2005), The Impact of Climate Change on Domestic and International Tourism: A Simulation Study, FNU-58 (submitted, Integrated Assessment Journal)
Bosello, F., R. Roson and R.S.J. Tol (2004), Economy-wide estimates of the implications of climate change: Human health, FNU-57 (Ecological Economics, 58, 579-591)
Hamilton, J.M. and M.A. Lau (2004) The role of climate information in tourist destination choice decision-making, FNU-56 (forthcoming, Gössling, S. and C.M. Hall (eds.), Tourism and Global Environmental Change. London: Routledge)
Bigano, A., J.M. Hamilton and R.S.J. Tol (2004), The impact of climate on holiday destination choice, FNU-55 (Climatic Change, 76 (3-4), 389-406)
Bigano, A., J.M. Hamilton, M. Lau, R.S.J. Tol and Y. Zhou (2004), A global database of domestic and international tourist numbers at national and subnational level, FNU-54 (International Journal of Tourism Research, 9, 147-174)
Susandi, A. and R.S.J. Tol (2004), Impact of international emission reduction on energy and forestry sector of Indonesia, FNU-53 (submitted)
Hamilton, J.M. and R.S.J. Tol (2004), The Impact of Climate Change on Tourism and Recreation, FNU-52 (forthcoming, Schlesinger et al. (eds.), Cambridge University Press)
Schneider, U.A. (2004), Land Use Decision Modelling with Soil Status Dependent Emission Rates, FNU-51 (submitted)
Link, P.M., U.A. Schneider and R.S.J. Tol (2004), Economic impacts of changes in fish population dynamics: the role of the fishermen’s harvesting strategies, FNU-50 (submitted)
Berritella, M., A. Bigano, R. Roson and R.S.J. Tol (2004), A General Equilibrium Analysis of Climate Change Impacts on Tourism, FNU-49 (Tourism Management, 27 (5), 913-924)
Tol, R.S.J. (2004), The Double Trade-Off between Adaptation and Mitigation for Sea Level Rise: An Application of FUND, FNU-48 (Mitigation and Adaptation Strategies for Global Change, 12 (5), 741-753)
Erdil, E. and Yetkiner, I.H. (2004), A Panel Data Approach for Income-Health Causality, FNU-47
Tol, R.S.J. (2004), Multi-Gas Emission Reduction for Climate Change Policy: An Application of FUND, FNU-46 (Energy Journal (Multi-Greenhouse Gas Mitigation and Climate Policy Special Issue), 235-250)
Tol, R.S.J. (2004), Exchange Rates and Climate Change: An Application of FUND, FNU-45 (Climatic Change, 75, 59-80)
Gaitan, B., Tol, R.S.J, and Yetkiner, I. Hakan (2004), The Hotelling’s Rule Revisited in a Dynamic General Equilibrium Model, FNU-44 (submitted)
Rehdanz, K. and Tol, R.S.J (2004), On Multi-Period Allocation of Tradable Emission Permits, FNU-43 (submitted)
Link, P.M. and Tol, R.S.J. (2004), Possible Economic Impacts of a Shutdown of the Thermohaline Circulation: An Application of FUND, FNU-42 (Portuguese Economic Journal, 3, 99-114)
Zhou, Y. and Tol, R.S.J. (2004), Evaluating the costs of desalination and water transport, FNU-41 (Water Resources Research, 41 (3), W03003)
Lau, M. (2004), Küstenzonenmanagement in der Volksrepublik China und Anpassungsstrategien an den Meeresspiegelanstieg,FNU-40 (Coastline Reports (1), 213-224.)
Rehdanz, K. and D.J. Maddison (2004), The Amenity Value of Climate to German Households, FNU-39 (submitted)
Bosello, F., Lazzarin, M., Roson, R. and Tol, R.S.J. (2004), Economy-wide Estimates of the Implications of Climate Change: Sea Level Rise, FNU-38 (Environmental and Resource Economics, 37, 549-571)
Schwoon, M. and Tol, R.S.J. (2004), Optimal CO2-abatement with socio-economic inertia and induced technological change, FNU-37
(Energy Journal, 27 (4), 25-60)
Hamilton, J.M., Maddison, D.J. and Tol, R.S.J. (2004), The Effects of Climate Change on International Tourism, FNU-36 (Climate Research, 29, 255-268)
Hansen, O. and R.S.J. Tol (2003), A Refined Inglehart Index of Materialism and Postmaterialism, FNU-35 (submitted)
Heinzow, T. and R.S.J. Tol (2003), Prediction of Crop Yields across four Climate Zones in Germany: An Artificial Neural Network Approach, FNU-34 (submitted, Climate Research)
Tol, R.S.J. (2003), Adaptation and Mitigation: Trade-offs in Substance and Methods, FNU-33 (Environmental Science and Policy, 8 (6), 572-578)
Tol, R.S.J. and T. Heinzow (2003), Estimates of the External and Sustainability Costs of Climate Change, FNU-32 (submitted)
Hamilton, J.M., Maddison, D.J. and Tol, R.S.J. (2003), Climate change and international tourism: a simulation study, FNU-31 (Global Environmental Change, 15 (3), 253-266)
Link, P.M. and R.S.J. Tol (2003), Economic impacts of changes in population dynamics of fish on the fisheries in the Barents Sea, FNU-30 (ICES Journal of Marine Science, 63 (4), 611-625)
Link, P.M. (2003), Auswirkungen populationsdynamischer Veränderungen in Fischbeständen auf die Fischereiwirtschaft in der Barentssee, FNU-29 (Essener Geographische Arbeiten, 35, 179-202)
Lau, M. (2003), Coastal Zone Management in the People’s Republic of China – An Assessment of Structural Impacts on Decision-making Processes, FNU-28 (Ocean & Coastal Management, No. 48 (2005), pp. 115-159.)
Lau, M. (2003), Coastal Zone Management in the People’s Republic of China – A Unique Approach?, FNU-27 (China Environment Series, Issue 6, pp. 120-124; http://www.wilsoncenter.org/topics/pubs/7-commentaries.pdf )

43
Roson, R. and R.S.J. Tol (2003), An Integrated Assessment Model of Economy-Energy-Climate – The Model Wiagem: A Comment, FNU-26 (Integrated Assessment, 6 (1), 75-82)
Yetkiner, I.H. (2003), Is There An Indispensable Role For Government During Recovery From An Earthquake? A Theoretical Elaboration, FNU-25
Yetkiner, I.H. (2003), A Short Note On The Solution Procedure Of Barro And Sala-i-Martin for Restoring Constancy Conditions, FNU-24
Schneider, U.A. and B.A. McCarl (2003), Measuring Abatement Potentials When Multiple Change is Present: The Case of Greenhouse Gas Mitigation in U.S. Agriculture and Forestry, FNU-23 (submitted)
Zhou, Y. and Tol, R.S.J. (2003), The Implications of Desalination to Water Resources in China - an Economic Perspective, FNU-22 (Desalination, 163 (4), 225-240)
Yetkiner, I.H., de Vaal, A., and van Zon, A. (2003), The Cyclical Advancement of Drastic Technologies, FNU-21
Rehdanz, K. and Maddison, D. (2003) Climate and Happiness, FNU-20 (Ecological Economics, 52 111-125)
Tol, R.S.J., (2003), The Marginal Costs of Carbon Dioxide Emissions: An Assessment of the Uncertainties, FNU-19 (Energy Policy, 33 (16), 2064-2074).
Lee, H.C., B.A. McCarl, U.A. Schneider, and C.C. Chen (2003), Leakage and Comparative Advantage Implications of Agricultural Participation in Greenhouse Gas Emission Mitigation, FNU-18 (submitted).
Schneider, U.A. and B.A. McCarl (2003), Implications of a Carbon Based Energy Tax for U.S. Agriculture, FNU-17 (submitted).
Tol, R.S.J. (2002), Climate, Development, and Malaria: An Application of FUND, FNU-16 (forthcoming, Climatic Change).
Hamilton, J.M. (2003), Climate and the Destination Choice of German Tourists, FNU-15 (revised and submitted).
Tol, R.S.J. (2002), Technology Protocols for Climate Change: An Application of FUND, FNU-14 (Climate Policy, 4, 269-287).
Rehdanz, K (2002), Hedonic Pricing of Climate Change Impacts to Households in Great Britain, FNU-13 (Climatic Change 74).
Tol, R.S.J. (2002), Emission Abatement Versus Development As Strategies To Reduce Vulnerability To Climate Change: An Application Of FUND, FNU-12 (Environment and Development Economics, 10, 615-629).
Rehdanz, K. and Tol, R.S.J. (2002), On National and International Trade in Greenhouse Gas Emission Permits, FNU-11 (Ecological Economics, 54, 397-416).
Fankhauser, S. and Tol, R.S.J. (2001), On Climate Change and Growth, FNU-10 (Resource and Energy Economics, 27, 1-17).
Tol, R.S.J.and Verheyen, R. (2001), Liability and Compensation for Climate Change Damages – A Legal and Economic Assessment, FNU-9 (Energy Policy, 32 (9), 1109-1130).
Yohe, G. and R.S.J. Tol (2001), Indicators for Social and Economic Coping Capacity – Moving Toward a Working Definition of Adaptive Capacity, FNU-8 (Global Environmental Change, 12 (1), 25-40).
Kemfert, C., W. Lise and R.S.J. Tol (2001), Games of Climate Change with International Trade, FNU-7 (Environmental and Resource Economics, 28, 209-232).
Tol, R.S.J., W. Lise, B. Morel and B.C.C. van der Zwaan (2001), Technology Development and Diffusion and Incentives to Abate Greenhouse Gas Emissions, FNU-6 (submitted).
Kemfert, C. and R.S.J. Tol (2001), Equity, International Trade and Climate Policy, FNU-5 (International Environmental Agreements, 2, 23-48).
Tol, R.S.J., Downing T.E., Fankhauser S., Richels R.G. and Smith J.B. (2001), Progress in Estimating the Marginal Costs of Greenhouse Gas Emissions, FNU-4. (Pollution Atmosphérique – Numéro Spécial: Combien Vaut l’Air Propre?, 155-179).
Tol, R.S.J. (2000), How Large is the Uncertainty about Climate Change?, FNU-3 (Climatic Change, 56 (3), 265-289).
Tol, R.S.J., S. Fankhauser, R.G. Richels and J.B. Smith (2000), How Much Damage Will Climate Change Do? Recent Estimates, FNU-2 (World Economics, 1 (4), 179-206)
Lise, W. and R.S.J. Tol (2000), Impact of Climate on Tourism Demand, FNU-1 (Climatic Change, 55 (4), 429-449).


