Embed Size (px)
Citation preview

Macromolecules 1992,25, 6007-6017 6007
Cononsolvency of Poly(N4sopropylacrylamide) in Mixed Water-Methanol Solutions: A Look at Spin-Labeled Polymers
Frangoise M. Winnik' Xerox Research Centre of Canada, 2660 Speakman Drive, Mississauga, Ontario, Canada W K 2Ll M. Francesca Ottaviani Dipartimento di Chimica, Uniuersitd di Firenze, 50121 Firenze, Italy
Stefan H. Bossmann, M. Garcia-Garibay, and Nicholas J. Turro Department of Chemistry, Hauemeyer Hall, Columbia University, New York, New York 10027 Received April 3, 1992; Revised Manuscript Received July 8, 1992
ABSTRACT A spin label was attached to poly(N4sopropylacrylamide) (PNIPAM) to allow EPR spectroscopy to be used as a probe of the interactions between the solvent and this polymer in water, methanol, and watermethanol mixtures. Labeled polymers were prepared by reaction of a copolymer of N-isopropylacryl- amide and N-(acry1oxy)succinimide with 4-amino-2,2,6,6-tetramethylpiperidine 1-oxide. The label contents of the polymers (M, 2.9 X lo6) were 1 X 10" and 1.6 X lo4 mol g*. EPR spectra of solutions of the labeled polymers (3 g L-9 were recorded (a) at constant temperature as a function of solvent composition and (b) for several water-methanol mixtures as a function of temperature (-10 to +35 O C ) . The spectra were analyzed in terms of the isotropic hyperfine coupling constant and the correlation time for the reorientation motion. The temperature and composition dependence of the parameters was determined by fitting the line shapes of the experimental spectra to simulated spectra. The results support a model involving preferential adsorption of methanol to the polymer chains in mixed methanol-water solutions, as the main contributor to the cononsolvency phenomenon.
Introduction
Aqueous solutions of poly(N4sopropylacrylamide) (PNIPAM) exhibit unusual properties. Most fascinating are the effects triggered by changes in the solution temperature or by the addition of water-miscible solvents. Decreasing the solution temperature enhances the solu- bility of the polymer in water, and increasing ita temper- ature induces precipitation. Above a cricial temperature (31 OC)I a clear PNIPAM solution becomes suddenly milky in appearance. The process is reversible: cooling the suspension below 31 "C results in instantaneous redis- solution of the polymer. Disconcerting is the behavior of PNIPAM in certain solvent mixtures. The polymer is extremely soluble in pure methanol and in pure (cold) water, but it is not soluble in certain mixtures of the two solvents.2 The effect is so extreme that it can be used as a simple and effective purification technique.3 The origin of both phenomena can be traced, it seems, to subtle aspects of the interactions between the polymer and water. The phase separation of aqueous PNIPAM solutions at the lower critical solution temperature (LCST) results from changes in the balance between hydrogen bonding and hydrophobic interactions. Hydrogen bonding between the polymer and water lowers the free energy of mixing. It triggers the formation of a layer of highly organized water molecules around the polymer, resulting in a decrease in the entropy of the system. When the temperature is raised, the association of hydrophobe solutes releases bound water, and the increase of entropy drives phase separation.
The phenomenon of cononsolvency in mixed aqueous solutions of PNIPAM can be ascribed to temperature- induced changes in the relative interactions between water, methanol, and the polymer. In a recent publication Schild, Muthukumar, and D. Tirrell applied the Flory-Huggins ternary solution theory to the cononsolvency phenome- none4 In their conclusion these authors suggest however
0024-9297/92/2226-607$03.00/0
that the phenomenon may not in fact result from polymer- induced perturbations of the water-methanol xl2 inter- action parameter, but rather from changes in local contach between the polymer and the solvents.
Intrigued by this remark, we set about to design experiments capable of detecting changes in local inter- actions between the polymer and the solvent. Electronic paramagnetic resonance (EPR) spectroscopy can provide dynamic information on a polymer in various environ- menta. It reflects more directly the environmental dif- ferences than do static data obtained for example from steady-state fluorescence spectroscopy. Therefore, spin- labeled polymers have been employed to monitor changes in the local segmental motion of polymer chains associated with phenomena such as aggregation and adsorption.5 The dynamics of polymers in organic solvents have been investigated in great detail over the last 2 decades.6 Recently a number of reports have dealt with aqueous polymer solutions as well, in view of a renewed interest in the use of these polymers as components of industrially important fluids, such as water-borne coating materials or drug delivery materials. Examples of water-soluble spin-labeled polymers include both polyelectrolytes, such as poly(acry1ic acid),'?* poly(methacry1ic acid)? and qua- ternized lauryl poly(ethy1ene imine): and neutral poly- mers, such as poly(viny1 alcohol),1° poly(N-vinylpyrroli- done-alt -maleic anhydride) ,I1 and poly (methacrylamide) .I2
We report here the synthesis of nitroxide-labeled poly- (N-isopropylacrylamides) and a spectroscopic study of their solutions in water, in methanol, and in mixtures of water and methanol. The polymers were labeled randomly with small amounts of 4-amino-2,2,6,6-tetramethylpi- peridine 1-oxide (4-amino-TEMPO) attached to the poly- mer chains via an amide linkage. EPR spectra of the labeled polymers were monitored in water and in methanol at several temperatures and as a function of solvent
0 1992 American Chemical Society

6008 Winnik et al. Macromolecules, Vol. 25, No. 22, 1992
reported by Schneider and Freed.15 Best fits were obtained by setting parameters such as (1) the input magnetic parameters for the g and A tensor components evaluated by computing the spectra in the slowest motion; (2) the model for the rotational diffusional motion (Brownian motion, free motion, or jump motion), and (3) the principal components of the diffusion tensor, including the diffusion tilt angle with respect to the magnetic frame. For them parameters, the following values were employed. MeOH. g,, = 2.0087, g,, = 2.0064, g,, = 2.0038; A,, = 6 G, A,, = 7.5 G, A,, = 34.5 G; N = 15 (N = Dll/DL); tilt angle = No, z' = x axis. Water: g,, = 2.0087, g,, = 2.0064, g,, 2.0038; A,, = 6.5 G, A,, = 7.5 G, A,, = 36.5 G; N = 4 (N = Dll/Dl); tilt angle (component A) = 90"; tilt angle (component B) = 30°, z' = y axis; tilt angle (component C) = Oo, z' = y axis. In cases where more than one signal contributed to the EPR spectra, each signal was computed separately and added in a ratio appropriate to simulate the experimental spectrum. A substraction-addition procedure was performed in order to identify the spectrum line shapes. The accuracies in the determination of rotational correlation times were *lo% and in the determination of hyperfine coupling constants f0.05 G.
Preparation of Samples for Analysis. Solutions of the labeled polymer for EPR analysis were prepared by dissolving the polymer (4 g L-l) in either water or methanol. Adequate time (ca. 24 ha t 25 "C) was allowed to ensure complete dissolution of the polymer in water. Solutionsemployed in the mixed-solvent experiments were prepared by mixing aliquots of each solution in the appropriate volume ratio, except in the case of the 64% viv and 65% v/v solutions which were prepared by weighing the two solutions prior to mixing. The total sample volume was 0.2 mL. Unless otherwise specified (see aging effects) the mixed solutions were equilibrated for 12 h at 25 "C. They were then cooled to 0 or -15 "C for complete dissolution. Solutions of TEMPO (probe) and PNIPAM in water or methanol were prepared by dissolving the polymer (4 g L-l) in a solution of the TEMPO (5 x mol L-l) in water or methanol. Solutions employed in the mixed-solvent experiments were prepared as described in the case of the labeled polymer solutions. Solutions in methanol and tetrahydrofuran were degassed by a 20-min purge with argon. For NMR analysis the polymer concentrations were approximately 10-15 g L-l. For measurements of NMR spectra of PNIPAM in the presence of TEMPO, TEMPO (1 % by weight) was added to PNIPAM solutions.
Results Synthesis and Characterization of the Polymers.
Attachment of the label to the PNIPAM backbone was achieved by reacting a copolymer of N-isopropylacrylamide and N-(acry1oxy)succinimide (PNIPAM-NASI), f i i t with 4-amino-2,2,6,6-tetramethylpiperidine 1-oxide and then with N-isopropylamine, to quench any unreacted (acryl- oxy)succinimido moieties (Figure 1). The labeled polymer was purified by repeated precipitations to ensure removal of all unreacted 4-amino-TEMPO. The purity of the polymer was ascertained by GPC analysis, which indicated the absence of low molecular weight impurities and that the chemical transformation did not alter the (broad) molecular weight distribution of the polymer. The absence of 4-amino-TEMPO was confirmed also by the EPR analysis described next. The amount of label attached to the polymer was determined by UV analysis of solutions of the polymer in methanol, using 4-amino-TEMPO as a reference compound. The TEMPO contents of the polymers were calculated to be 1 X mol g-l of polymer for PNIPAM-T/880 and 1.6 X lo* mol gl of polymer for PNIPAM-T/5500.'8 Such low amounts of label were intended to avoid spin-apin interactions along the polymer chain. The digit in the polymer designation refers to the average number of NIPAM units per label. Viscosity- averaged molecular weights were calculated from the intrinsic viscosity, [VI, of the polymer in THF solution, using the viscometric relationship: 173 = 9.59 X 10⁻³Mv0.66 cm3 g-l.17 The physical properties of PNIPAM-T/880,
composition in methanol-water mixtures. Control ex- periments were performed with an EPR probe, 2,2,6,6- tetramethylpiperidine 1-oxide (TEMPO), dissolved in solutions of unlabeled polymers. Reported also are the 13C NMR spectra of the labeled polymers in the bulk and in aqueous solutions below and above the LCST. From results of the two techniques emerges a coherent descrip- tion of the polymer-solvent interaction in the PNIPAM- methanol-water ternary system.
Experimental Section Materials. All commercial chemicals were purchased from
Aldrich Chemical Co., unless otherwise noted. N-Isopropylacryl- amide was purchased from Eastman Kodak Chemicals. The EPR probes 2,2,6,6-tetramethylpiperidine 1-oxide (TEMPO) and 4-amino-2,2,6,6-tetramethylpiperidine 1-oxide (4-amino-TEM- PO) were used without purification. For the syntheses, reagent- grade solvents were used without further purification, except for tetrahydrofuran (THF), which was dried by distillation from sodium-benzophenone. The reactive polymer, N-isopropylacryl- amidelN4acryloxy)succinimide copolymer (PNIPAM-NASI), was prepared by free-radical copolymerization of N-isopropyl- acrylamide and N-(acry1oxy)succinimide in tert-butyl alcohol, as described previously.13 Water was deionized with a Millipore Milli-Q water purification system. Spectroscopic-grade solvents were used for all spectroscopic measurements.
Preparation of TEMPO-Labeled Poly (N-isopropylacryl- amides). PNLPAM-T/IO. A solution of PNIPAM-NASI (1.0 g) and 4-amino-2,2,6,6-tetramethylpiperidine 1-oxide (6.0 mg, 3.5 X mol, 4-amino-TEMPO) in dry THF was stirred at room temperature in the dark and under nitrogen for 17 h. Isopropylamine (0.1 mL) was added to the reaction mixture to quench the unreacted N-oxysuccinimido groups. The mixture was stirred for 3 h after the addition. The polymer was isolated by precipitation into hexane (300 mL). It was purified by two precipitations of THF solutions (10 mL) into hexane (500 mL). It was dried in vacuo for 24 h at 40 "C (660 mg): IR (KBr) 3440, 2923, 1728, 1652, 1543, 698 cm-'; UV (methanol) A, 259 nm; TEMPO content, 9.8 X lo+ mol gl or 1 TEMPO per 880 NIPAM units.
PNIPAM-T/5500. A polymer sample containii fewer TEM- PO groups was prepared under identical conditions, starting with PNIPAM-NASI (1.5 g) and 4-amino-TEMPO (4.0 mg, 2.3 X mol). The TEMPO content determined from UV data was 1.6 X lo+ mol g-l or 1 TEMPO per 5500 NIPAM units.
Instrumentation. UV spectra were recorded with a Varian UV-vis-near-IR Cary-5 spectrophotometer. Solution viscosities were measured at 30 "C with a Viscotek Model 100 differential viscometer (THF, temperature 30 "C, polymer concentration ca. 75 ppm). Gel permeation chromatography (GPC) measurements were performed with a Waters WISP 700 system equipped with a Waters RI 410 refractive index detector. Four Ultrastyragel columns (10 000, 5000,500, and 100 A) were used. The eluent (THF) was used at a flow rate of 0.8 mL mix1. Polystyrene standards were used to determine molecular weights and mo- lecular weight distributions. Cloud points were determined by spectrophotometric detection of changes in turbidity of solutions (1 g L-1) heated at a constant rate (0.2 "C min-l) in amagnetically stirred UV cell, as described pre~iously.'~ 13C CPMAS NMR spectra were recorded at a field of 62.8 MHz with a Bruker AF 260 spectrometer equipped with a solid-state probe manufactured by Doty Scientific, using decoupling radio-frequency fields with YBIH of ca. 40 kHz. The Hartmann-Hahncondition was adjusted in order to obtain best resolution. Chemical shifta were calibrated with a sample of p-di-tert-butylbenzene [G(CH& = 31 ppm]. Contact times for cross-polarization were optimized for maximum signal between 100 and 2000 ms, and recycle delays were 2-4 8. Samples of solid and dissolved polymer were placed in a 7-mm- i.d. sapphire rotor with 0-ring-sealed Macor caps. The samples were spun at the magic angle a t 2-3 kHz. EPR spectra were recorded with a Bruker ESP 300 spectrometer with an ESP 1600 data analysis software. Temperature control was achieved with a Bruker ER 4111T variable-temperature accessory.
Analysis of the EPR Spectra In the caw of labeled polymers the analysis of the signals was performed by using the procedure
Macromolecules, Vol. 25, No. 22, 1992 Cononsolvency of PNIPAM 6009
A- y 2
CH - NH -C-CH
PNIPAM-NASI
2) H2N -CH -CH3 I CH3
CH - NH - c - ~ H /
PNIPAM-TI880
(m =WO) Figure 1. Synthetic sc-.3me for the preparation of TEMPO- labeled poly(N4sopropylacrylamide) and structure of the poly- mers used in this study.
Table I Physical Properties of the Polymers
LCST [Tla ("C at
polymer (cm3g1) MVb M, M, 1 gL-1)
PNIPAM 72 f 1 0.92 X 10' 55000 120000 32.5 PNIPAM-NASI 1 4 1 f 3 2 .6X 10' 87000 340000 32.4 PNIPAM-T/880 151 f 3 2.9 X 10' 90 OOO 340000 32.2 PNIPAM-T/5500 148 f 3 2.9 X 10' 89 000 340 000 32.2
0 From THF solutions. From [TI = 9.59 X 10⁻³Mv0.66.17
PNIPAM-NASI, and a sample of PNIPAM used in control experiments are presented in Table I. Note that at the light level of labeling used here the attachment of TEMPO or PNIPAM does not affect the LCST of the aqueous polymer solution.
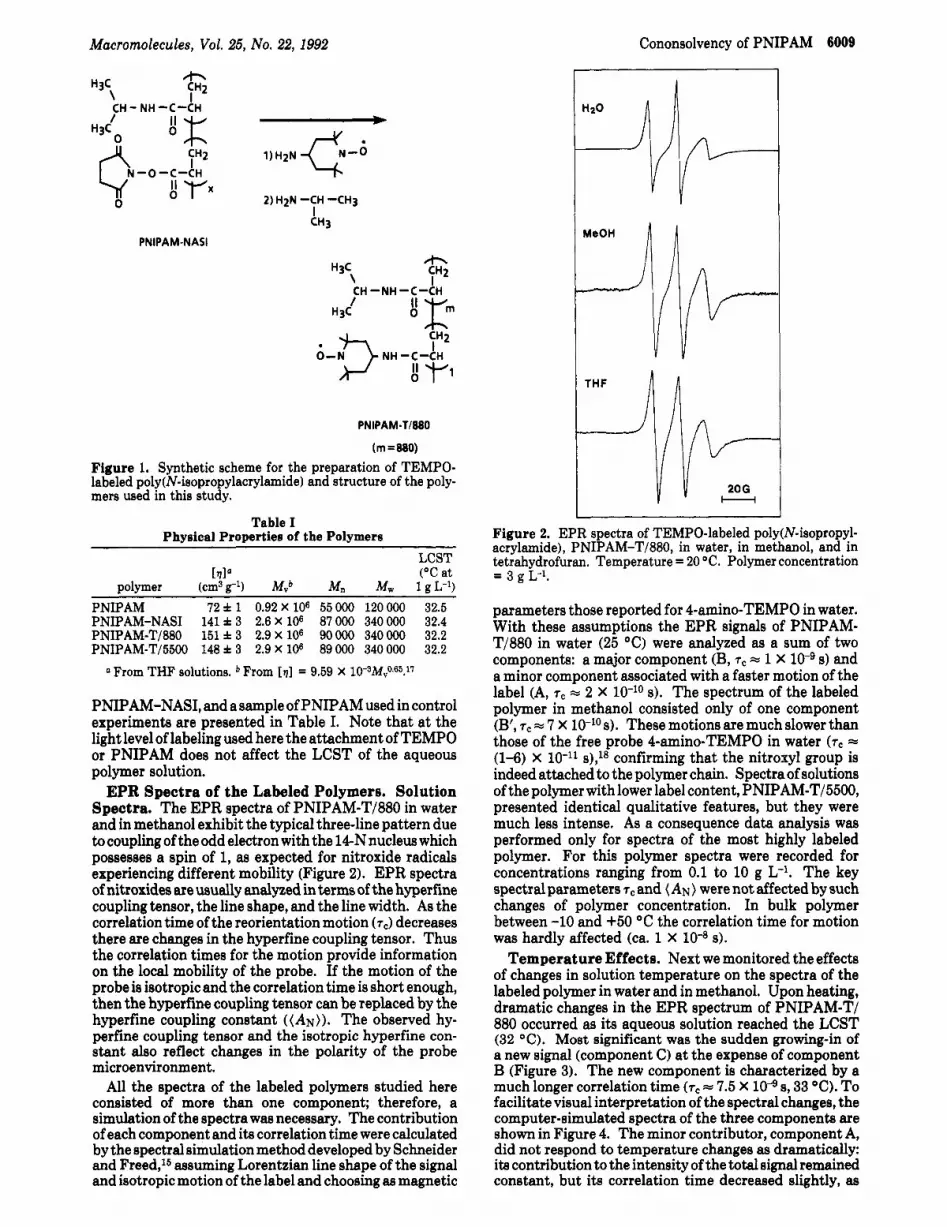
EPR Spectra of the Labeled Polymers. Solution Spectra. The EPR spectra of PNIPAM-T/880 in water and in methanol exhibit the typical three-line pattern due to coupling of the odd electron with the 14-N nucleus which possesses a spin of 1, as expected for nitroxide radicals experiencing different mobility (Figure 2). EPR spectra of nitroxides are usually analyzed in terms of the hyperfine coupling tensor, the line shape, and the line width. As the correlation time of the reorientation motion (7J decreases there are changes in the hyperfine coupling tensor. Thus the correlation times for the motion provide information on the local mobility of the probe. If the motion of the probe is isotropic and the correlation time is short enough, then the hyperfine coupling tensor can be replaced by the hyperfine coupling constant ((AN)). The observed hy- perfine coupling tensor and the isotropic hyperfine con- stant also reflect changes in the polarity of the probe microenvironment.
All the spectra of the labeled polymers studied here consisted of more than one component; therefore, a simulation of the spectra was necessary. The contribution of each component and its correlation time were calculated by the spectral simulation method developed by Schneider and Freed,l6 assuming Lorentzian line shape of the signal and isotropic motion of the label and choosing as magnetic
MeOH 1
THF n n
Figure 2. EPR spectra of TEMPO-labeled poly(N-isopropyl- acrylamide), PNIPAM-T/880, in water, in methanol, and in tetrahydrofuran. Temperature = 20 "C. Polymer concentration = 3 g L-1.
parameters those reported for 4-amino-TEMPO in water. With these assumptions the EPR signals of PNIPAM- T/880 in water (25 "C) were analyzed as a sum of two components: a major component (B, T~ = 1 X 10⁻⁹ s) and a minor component associated with a faster motion of the label (A, T~ = 2 X 10-lo s). The spectrum of the labeled polymer in methanol consisted only of one component (B', 7c = 7 X s). These motions are much slower than those of the free probe 4-amino-TEMPO in water (zc = (1-6) X lo-" s),18 confirming that the nitroxyl group is indeed attached to the polymer chain. Spectra of solutions of the polymer with lower label content, PNIPAM-T/BBOO, presented identical qualitative features, but they were much less intense. As a consequence data analysis was performed only for spectra of the most highly labeled polymer. For this polymer spectra were recorded for concentrations ranging from 0.1 to 10 g L-l. The key spectral parameters rC and (AN) were not affected by such changes of polymer concentration. In bulk polymer between -10 and +50 "C the correlation time for motion was hardly affected (ca. 1 X 10⁻⁸ 8).
Temperature Effects. Next we monitored the effects of changes in solution temperature on the spectra of the labeled polymer in water and in methanol. Upon heating, dramatic changes in the EPR spectrum of PNIPAM-T/ 880 occurred as ita aqueous solution reached the LCST (32 "C). Most significant was the sudden growing-in of a new signal (component C) a t the expense of component B (Figure 3). The new component is characterized by a much longer correlation time ( T ~ = 7.5 X loe9 s, 33 "C). To facilitate visual interpretation of the spectral changes, the computer-simulated spectra of the three components are shown in Figure 4. The minor contributor, component A, did not respond to temperature changes as dramatically: its contribution to the intensity of the total signal remained constant, but its correlation time decreased slightly, as

6010 Winnik et al. Macromolecules, Vol. 26, No. 22, 1992
Table I1 Spectral Characteristics. of PNIPAM-T/BBO* in Water and
in Methanol n Temperature:
35 "C
33 "C
31 "C
30°C
Figure 3. Experimental EPR spectra of TEMPO-labeled poly- (N-isopropylacrylamide), PNIPAM-T/880, in water at several temperatures. Polymer concentration = 3 g L-1.
Signal C
- Figure 4. Simulated EPR signah of the three components A-C employed in the analysis of the EPR spectra of TEMPO-labeled poly(N4aopropylacrylamide).
observed also for radicals in solution undergoing phase changes (Table II).l9 The heating-induced effects were reversible: upon cooling, component B appeared and increased at the expense of C, as the temperature dropped below the LCST. Note that some time-dependent effects were observed during the heating scan, as described in a separate section. Solutions of the polymer in methanol were subjected to the same temperature treatment: Their spectra were not affected significantly over a 20 "C temperature range (from 20 to 40 "C).
Solvent Effects. At room temperature both methanol and water are solvents in PNIPAM; yet the phase diagram shows that certain solvent proportions result in immis-
water methanol solvent 25 O C 35 O C 25 O C 35 O C
~ ~~~ ~
2 x 10⁻¹. 12 17.0
7 x 10⁻¹⁰ 100 16.4
5 x 10⁻¹⁰
8.4 X lO"3 88
a T~ = rotational correlation time; (AN) = hyperfine coupling constant. b Polymer concentration = 3 g L-1.
cibility. This effect, termed "cononsolvency"? has been reported also, in varying degrees, in aqueous solutions of PNIPAM with THF, dioxane, acetone, and DMSO? as well as with alcohols such as ethanol, propanol, n-butanol, and glycerol.20 The phenomenon has been monitored experimentally by t u r b i d i m e t ~ y , ~ * ~ * ~ ~ calorimetry,4*20 and fluorescence spectroscopy.21 Data from different labo- ratories concur to establish the following phase diagram for the PNIPAM-water-methanol ternary system: (i) for methanol molar fractions ( X M ) lower than 0.05, the LCST is hardly affected; (ii) for 0.05 < XM < 0.35, the LCST decreases from 31 O C to reach a minimum value of -7.5 OC; (iii) for 0.35 < XM < 0.45, the LCST increases sharply to reach a value of 14.5 "C; (iv) for XM > 0.45 (64.4% v/v), it is not possible anymore to detect an LCST. Solutions in this concentration range can be heated to 100 OC without showing any turbidity. EPR spectra of solutions of the TEMPO-labeled polymers were measured for a series of solutions of increasing methanol content, first at constant temperature, and then spectra were examined as a function of temperature for a number of solutions of set composition.
Solutions of PNIPAM-T/880 were prepared in a series of water-methanol mixtures, and their EPR spectra were recorded at 20 "C (Figure 5). The spectra were analyzed in terms of the three components A-C already described to interpret the spectra of solutions in 100% water. Note that this data treatment could not be applied for solutions containing more than 40% v/v MeOH for the following reason: The LCST of PNIPAM in a solvent of this composition is ca. -7 "C. At this temperature the motion of the label described by component B is slowed down significantly. As a result the errors in the fitting routine become prohibitively large.
(i) The minor contributor, component A, was nearly unaffected by changes in solution composition: its cor- relation time and ita contribution to the overall spectrum remained constant, but a significant decrease in ita hyperfine coupling constant took place with increasing MeOH content, from 17.0 G in water to 16.0 G in 45% v/v MeOH. This decrease in (AN) is diagnostic of a decrease in the polarity of the environment of the nitroxide group.
(ii) Component B, the major contributor to the EPR signal of the polymer in 100 % water, exhibited a similar decrease in (AN) with increasing MeOH content, from 0% to 28% MeOH. This component all but vanishes (e.g., its contribution to the total signal accounts for less than 3%) in EPR spectra of solutions of methanol content higher than 28% ? the composition corresponding to the phase transition at 20 "C, as determined by cloud-point measurements.
(iii) Component C was the main contributor of the spectra of polymer in H20-MeOH mixtures corresponding to phase separation. It presented the features already

Macromolecules, Vol. 25, No. 22, 1992 Cononsolvenw of PNIPAM 6011
25 % -4- + + 35 %
e4 %
Figure 5. EPR spectra of TEMPO-labeled poly(N-isopropyl- acrylamide), PNIPAM-TIEBO, in water-methanol mixtures (% vlv). Temperature = 20 ' C .
observed in spectra from phase-separated aqueous solu- tions. In solutions of methanolvolume content lower than 50%, it was possible to identify by analysis of the EPR spectra the transition temperature corresponding to the LCST, even though both components B and C were affected at that temperature. The component B (faster motion) could be isolated. It was of interest to monitor carefully systems of compositions near the second tran- sition of the phase diagram, that is, solutions containing from 60 to 65% v/v methanol. Spectral analysis became very difficult to perform in this composition range, and only qualitative data can be reported The two compo- nents B and C gradually merge to a single component identical to that observed in the spectrum of the polymer in pure methanol. In spectra recorded with solutions of methanol content higher than 40% this analysis was no longer possible, because componentsB and C become more and more similar as the methanol content of the solvent increases. Therefore, in this concentration domain the LCST was detected by the occurrence of the component C.
The extreme sensitivity to temperature and to solvent composition of the relative Contributions of components B and C to the overall EPR signal is best appreciated in a plot (Figure 6) of the fractions F of each component of the EPR signal as a function of temperature for solutions of PNIPAM-T/880 in water and in MeOH-H20 10% v/v and 25% viv. The inflection points in the curves of the fraction of components B or C are nearly identical to the
i
I
TEMPERATURE ( 'C)
Figure 6. Fraction (F) of the three components A-C of the EPR signal of PNIPAM-TI880 as a function of temperature in water- methanol mixtures: (a) MeOH-H20, 25% vlv; (b) MeOH-H20, 10% vlv; (c) MeOH-H20, 0%. Polymer concentration = 3 g L-'. The hatched areas correspond to the temperature rangeofphase separation determined by cloud-point measurement.
cloud points of PNIPAM in water or in the water-methanol mixtures. The small differences in the values of the transition temperatures recorded by the two techniques result from (1) inherent errors in the temperaturedetection within the EPR sample holder and (2) uncertainties in the data analysis.
In summary, two features of the overall EPR signals of the labeled polymer are extremely sensitive to solvent composition. These are (a) the hyperfine coupling con- stant, (AN). and (b) the relative contributions of com- ponents Band C. The two parameters were used to build "phase diagrams" of the PNIPAM-T/EE&MeOH-H20 ternary system (Figure 7). Here we plot as a function of solvent composition (a) (top) the changes in (AN) and (b) (bottom) the changes in the temperature of appearance of component C. The correspondence between each set ofdatapointsandthe phase transitiondiagramdetermined from cloud-point measurements is quite remarkable. It gives weight to the underlying assumption that the changes in polymer-solvent interactions detected on a molecular scale by EPR measurements truly reflect the macroscopic phenomena. Aging Effects. All the data presented in the text and
the figures were collected from samples equilihrated a t 25 "C for 12 h, as described in the Experimental Section. To assess the reproducibility of the results, a spectrum for every composition was recorded also a t several time intervals after sample preparation by the following pro- tocol. Aqueous and methanolic solutions were mixed in anappropriateratiotoatotalvolumeof 1 mL. Thesample was placed immediately in the spectrometer cell holder preset a t a temperature 1 "C below the cloud point of the mixture. After 30 min a spectrum was recorded. Then the temperature was increased by 1 O C , and the sample
6012 Winnik et al. Macromolecules, Vol. 25, No. 22, 1992
r i 17.2 o cloud point
' (AN) 116.8
(AN)
16.4
0
16.0 5 -10
Y - - W
c I a r 4:
o cloud point EPR i
I
10 1 " i i I -10 v I I 0 20 40 60 80 100
% MeOH ( V / V )
Figure 7. Phase diagrams of the PNIPAM-T/880-methanol- water ternary system determined by measurements of EPR spectra: (top) from measurements of the hyperfine coupling constant (AN) of the EPR signal of component A (temperature = 20 OC); (bottom) from the determination of the temperature of the appearance of component C (see text). Polymer concen- tration = 3 g L-l. Also shown (open circles) are the phase transition temperatures from cloud-point measurements (data from ref 2).
was equilibrated again for 30 min before measuring the next spectrum. An identical procedure was performed 1 "C above the cloud point. In all cases we observed that the temperature of onset of signal C was higher by about 0.5-1.0 "C, compared to the transition temperature evaluated by cloud-point measurements or from EPR spectra measured on equilibrated samples. For some compositions spectra were measured also several days after sample preparation. These spectra were identical to those measured after 12 h. Aging effects were observed only in solutions of composition ranging from 10 to 35 % methanol. None were detected in pure water or pure methanol.
EPR Spectra of a Probe in Solutions of PNIPAM. It was important to confirm the validity of the approach through a series of control experimentswith an EPR probe not attached to the polymer and therefore free to diffuse in solution. In water and in methanol 2,2,6,6-tetra- methylpiperidine 1-oxide (TEMPO) shows the usual three- line spectrum, with rotational correlation times typical of fast rotating probes. The motion of the probe is not affected by added PNIPAM under conditions of complete solubility of the polymer, namely, pure methanol or pure water below the LCST. The correlation time for the motion of TEMPO in water and methanol had a value of (3-5) X 10-l1 s in the presence and absence of PNIPAM. In phase-separated systems a slight increase in the rotational correlation times was observed, concomitant, in the case of samples in pure water, with a slight decrease in the hyperfine coupling constant above the LCST ( ( A ~ ) 2 0 o c - (AN)32 o c = ca. 0.15 GI. It was noted that as the temperature was increased further to 45 "C (AN) recovered its value in polymer solution below the LCST. The temperature sensitivity of (AN) in aqueous PNIPAM reflects changes in the polarity of the environment sensed by the probe. It can be attributed to a distribution of locations of the probe in bulk water and within the
17'2h 0 D PNIPAM TEMPO' C NIPAM - +TEMPO T / 880 1 16.8
4
A
16.0 1 1 I I I
0 20 40 60 80 100
% MeOH ( V / V )
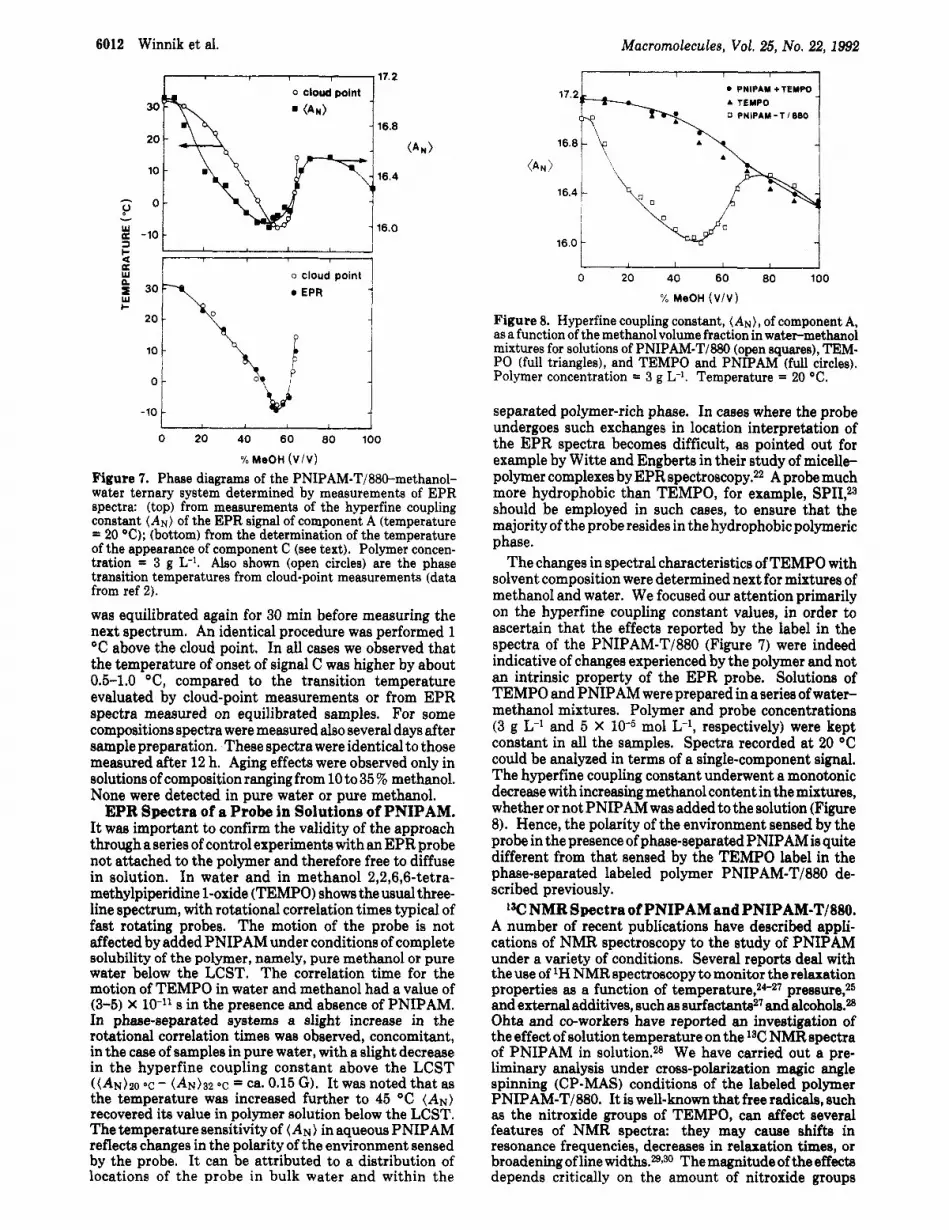
Figure 8. Hyperfine coupling constant, (AN) , of component A, as a function of the methanol volume fraction in water-methanol mixtures for solutions of PNIPAM-T/880 (open squares), TEM- PO (full triangles), and TEMPO and PNIPAM (full circles). Polymer concentration = 3 g L-l. Temperature = 20 "C.
separated polymer-rich phase. In cases where the probe undergoes such exchanges in location interpretation of the EPR spectra becomes difficult, as pointed out for example by Witte and Engberts in their study of micelle- polymer complexes by EPR spectroscopy.22 A probe much more hydrophobic than TEMPO, for example, SPII?3 should be employed in such cases, to ensure that the majority of the probe resides in the hydrophobic polymeric phase.
The changes in spectral characteristics of TEMPO with solvent composition were determined next for mixtures of methanol and water. We focused our attention primarily on the hyperfine coupling constant values, in order to ascertain that the effects reported by the label in the spectra of the PNIPAM-T/880 (Figure 7) were indeed indicative of changes experienced by the polymer and not an intrinsic property of the EPR probe. Solutions of TEMPO and PNIPAM were prepared in a series of water- methanol mixtures. Polymer and probe concentrations (3 g L-* and 5 X mol L-I, respectively) were kept constant in all the samples. Spectra recorded at 20 "C could be analyzed in terms of a single-component signal. The hyperfine coupling constant underwent a monotonic decrease with increasing methanol content in the mixtures, whether or not PNIPAM was added to the solution (Figure 8). Hence, the polarity of the environment sensed by the probe in the presence of phase-separated PNIPAM is quite different from that sensed by the TEMPO label in the phase-separated labeled polymer PNIPAM-T/BM de- scribed previously.
NMR Spectra of PNIPAM and PNIPAM-T/880. A number of recent publications have described appIi- cations of NMR spectroscopy to the study of PNIPAM under a variety of conditions. Several reports deal with the use of lH NMR spectroscopy to monitor the relaxation properties as a function of temperature,24-27 pressure,25 and external additives, such as surfactants27 and alcohols.28 Ohta and co-workers have reported an investigation of the effect of solution temperature on the lsC "spectra of PNIPAM in solution.28 We have carried out a pre- liminary analysis under cross-polarization magic angle spinning (CP-MAS) conditions of the labeled polymer PNIPAM-T/880. It is well-known that free radicals, such as the nitroxide groups of TEMPO, can affect several features of NMR spectra: they may cause shifta in resonance frequencies, decreases in relaxation times, or broadening of line widths.29930 The magnitude of the effects depends critically on the amount of nitroxide groups

Macromolecules, Vol. 25, No. 22, 1992
( a ) PNIPAM (b) PNlPAM-T/SSO
solid phase dd in water (31 'C) --.---Ad in water (25%) dd
200 150 100 5 0 0 200 150 100 5 0 0 PPM PPM
Figure 9. 13C CP-MAS NMR spectra of (a) PNIPAM and (b) PNIPAM-T/880 in aqueous solutions at 25 O C (bottom), in phase- separated solutions at 31 OC (middle), and in the solid phase (top).
Cononsolvency of PNIPAM 6013
attached to the polymer chain and also on the chain conformation and on the mobility of the polymer.
Spectra of PNIPAM-T/880 and of PNIPAM were recorded under identical conditions in the solid phase and in solutions in water below the LCST and above the LCST (Figure 9).31 The spectra of PNIPAM (Figure 9a) were consistent with those reported by Ohta et They exhibit a signal at 160 ppm, assigned to the carbon of the carbonyl group of the pendent isopropylamide groups, and two signals at 42 and 25 ppm attributed to the isopropyl methine and methyl carbons, respectively. The signals due to the backbone methine and methylene carbons are unresolved, contributing as weak shoulders to the signal centered at 42 ppm. The signal due to the carbonyl carbon is absent in the spectrum of the polymer in solution (Figure 9a, bottom) or in the precipitated phase (Figure 9a, middle). The signals due to the main-chain carbons are also much weaker under these conditions. In contrast, note that the signal due to the side-chain methyl groups is rather insensitive to the physical state of the polymer. The relative insensitivity to the physical state of the polymer of the signal due to the methyl carbons reflects the fact that the dynamics of the methyl groups are dominated by their internal rotation, which is not coupled strongly to the dynamics of the polymer chain.
A comparison of the spectra of PNIPAM-T/880 (Figure 9b) to those of PNIPAM reveals several important differences. Most noticeable are the changes in the spectra of the polymers in the phase-separated polymer (middle frames in Figure 9a,b). The signal due to the methyl carbons is much weaker and broader in the spectrum of PNIPAM-T/880, revealing a strong interaction between the nitroxide groups and the methyl groups. Signals due to the main-chain carbons and the isopropyl methine carbon are also much broader. These differences are much weaker in polymer solutions below their LCST (bottom frames in Figure 9a,b) and nearly nonexistent in the solid polymer (top frames in Figure 9a,b). These results reveal the absence of specific interactions between the nitroxide group of the label and the carbon nuclei of the polymer in the solid phase and in solution. In the phase-separated polymer the situation is quite different. Strong interac- tions take place, even at the very low level of nitroxide incorporation along the polymer chain.
Discussion Implications of the Analysis of the EPR Spectra in
Terms of Three Spectral Components. All the EPR spectra recorded over a variety of experimental conditions can be simulated in terms of a superposition of up to three components, termed A-C, distinguishable primarily by their different rotational correlation times. These com- ponents are assumed to correspond to the motions of the
Scheme I
dissolved precipitated (above the LCST)
label in structurally different regions of the polymer. The overall behavior of the system can be interpreted once the identity of these three components has heen clarified. Only two components, A and B, are required to simulate the spectra of solutions of the polymer in water and in methanol-water mixtures in temperature domains which do not include the LCST. In methanol only one component related to component B (B', Scheme I) is present. At the phase transition, the contribution of component B de- creases dramatically, indicating the connection of this component of the EPR spectrum to the motions of the polymer in solution. The corresponding increase in the contribution of component C clearly shows that this component is connected with structures in the phase- separated polymer.
A very close relationship between components A and B is apparent by visual inspection of the spectra. Detailed simulations, however, reveal subtle but experimentally significant differences regarding their relative contribu- tions and their motion parameters. Component A is characterized by rotational motions with a correlation time of ca. 0.2 X s as compared with ca. lo+ s for component B and ca. 4 X s for C. While these differences are small in absolute terms, EPR techniques are very sensitive to differences within these time scales, as can be appre- ciated by comparing the spectra in Figure 3 and the simulated spectra of Figure 4.
An interpretation of the physical significance of each spectral ' component should take into account (1) the structural similarity of A and B, (2) the preservation of A across the phase transition, and (3) the appearance of C at the expense of B at the LCST. Component A is involved in slow exchange equilibria with component B below the LCST and with component C above the LCST. This is suggested by the fact that the rotational correlation time of component A is insensitive to changes occurring across the LCST even though its hyperfine coupling constant is sensitive to the composition of the system (vide infra). The contribution of component A to the total spectrum remains almost constant both along variations in the solvent composition and across the LCST, suggesting that the structure reported by component A may be related to molecularly-determined properties. The correlation times for the two equilibria A F! B and A C have to be slower than the time scales probed by the rotation of the nitroxide labels and have to be related to polymer motions not affected by changes occurring during the precipitation phenomena. The differences in the structures sensed by A and those sensed by B and C may originate from a syn- anti isomerism of the primary amide bond (Chart I).S2*33 The isomeric state of the amide group may affect the local conformation of the chain and place the label in regions of different solvent content and mobility. Support of this view may be obtained from a detailed analysis of the differences between A and B. Best fits of the spectra suggest that the difference in the preferential axis of rotation (component A tilt angle, 90°; component B tilt angle, 30') of the two components can be ascribed mainly to differences in the rates of rotation along the third axis. This observation indicates a different disposition of the

6014 Winnik et al. Macromolecules, Vol. 25, No. 22, 1992
a U v = 58.0
56.0.
54.0.
17.2 -
17.0 -
16.8 -
16.6 -
-10 0 10 20 30 40
TEMPERATURE ("C)
'
Figure 10. Changes in the hyperfine coupling constant (AN) of component A aa a function of the phase transition temperature determined by turbidimetry (TLCST) for solutions of PNIPAM- T/880 in water-methanol mixtures. Polymer concentration = 3 g L-1.
Chart I
I 0
Anti isomer Syn isomer
label with respect to the polymer chain, which can be accounted for by different amide bond conformations.
It is interesting to note that no qualitative differences were observed for components A and B, as far as their hyperfine coupling values, (AN), either as a function of solvent composition or, for a given mixture, across the LCST. However, at a constant temperature (20 OC) the variations in the (AN) values of componefit A as a function of solvent composition follow accurately the profile of the phase diagram of the ternary mixture established from cloud-point measurements (Figure 7). This coincidence between the EPR data and the cloud-point values deter- mined by turbidity is emphasized by the linearity of the changes in (AN) versus LCST temperature (Figure 10). The only point that does not satisfy a linear relationship corresponds to the value measured in a solution of methanol volume fraction of 64% v/v, where small deviations from the nominal solvent composition result in large deviations in the value of the LCST.2 In the precipitated phase component C exhibits a similar be- havior: the parallel component, All, of its signal follows the same trend with solvent composition as determined by analysis of the anisotropic hyperfine A tensor of component C above the LCST (Figure 11). It should be streeeed here that the (AN) values measured for component A are extremely different from those measured for unbound TEMPO in the control experiments with and without PNIPAM at the same solvent concentrations (Figure 8). The correspondence of the variations in (AN) and All from componenta A and C with respect to changes
60.0 62.0[
b
a
a a
b * a
52.0 I 1 0 10 20 30 40 50 60
% MeOH ( V / V )
Figure 11. Changes in the anisotropic hyperfine A tensor, A,,, of component C as a function of the methanol volume fraction for solutions of PNIPAM-T/880. Polymer concentration = 3 g L-1.
in solvent composition supports a model where all parts of the polymer chains experience the same changes in polarity, at least in the distance and time domains sensed by the label.
Phase Transition Phenomenon in Mixed Solvents. Taken together the facts discussed to this point have important implications on the local solvent composition in the vicinity of the polymer chains in solution and in the phase which separates from solution above the LCST. To the extent that (AN) depends on the local polarity, and this in turn on the local solvent composition, it appears that the solvent composition felt by the probe, presumably very close to the first solvation layer, remains constant both below and above the LCST. This is in contrast to most common views of the LCST phenomenon including some theoretical predictions which suggest drastic changes in the composition at the interface.34
A detailed analysis of temperature studies at three solvent concentrations of 0, 10, and 25% MeOH (Table I11 and Figure 6) provides further evidence for this description of the phase transition behavior. Figure 6 represents the interconversion of B and C as the phase transition occurs. The phase transition temperatures, given by the inflection points of the curves for B and C, become increasingly more diffuse with increasing methanol concentration. This observation suggests a direct con- nection between our microscopic observations based on the motion of the label and the calorimetric measurements (microcalorimetric endotherms) carried out by Tirrek4 Furthermore, dynamic aspects of the system are revealed by analysis of the correlation times for component C, which decrease with increasing temperature. These changes may correlate with the collapse of the polymer chains which may occur by stepwise extrusion of solvent away from regions close to the interface sensed by the probe. However, not all the solvent is extruded, as indicated by the conservation of the component A across the phase transition and confirmed by the NMR results. The broadening of the signals from TEMPO-labeled polymer observed in the precipitated phase together with the lack of broadening of the signals in the solid sample point to the fact that the overall mobility of the polymer in the precipitated phase is much higher than that in the pure nondissolved solid. Similar differences between the phase- separated polymer and the nondissolved solid were ob- served from the standpoint of EPR where the spectra of component C could be determined in both cases.36

Macromolecules, Vol. 25, No. 22, 1992 Cononsolvency of PNIPAM 6015
Table I11 EPR Parameters of the TEMPO Label in Water-Methanol Solutions of PNIPAM-TI880
temp component Ao component Ba component Co solvent ("0 % 7, (logs) a (G)b % ( l O 9 s ) b a (GY '%I vc (109 8 ) (GY
30 12 0.2 17.0 88 1.0 16.9 12 0.2 17.0 35 1.0 16.9 53 7.5 61.5 31
33 12 0.2 17.0 2 e e 86 7.3 62.3 35 12 0.2 17.0 88 8.4 65.3
27 12 0.2 17.0 58 2.0 16.8 30 5.0 48.0 28 12 0.2 17.0 18 2.0 16.8 70 7.4 60.0 30 12 0.2 17.0 3 e e 85 7.7 61.0 32 12 0.2 17.0 88 8.1 62.0
16 12 0.6 16.4 73 4.0 44.od 15 5.8 51.0 17 12 0.6 16.4 38 3.0 e 50 6.8 55.3 19 12 0.4 16.4 13 3.0 e 75 7.4 58.0 21 12 0.4 16.4 3 e e 85 7.6 58.5 23 12 0.4 16.4 sa 7.6 58.5
H20
10% MeOH 26 12 0.2 17.0 88 2.0 16.9
25% MeOH 15 12 0.6 16.4 88 4.0 44.0d
0 See text for the definitions of Components A X . 7c = rotational correlation time. Isotropic coupling constant. A = parallel coupling constant. e Value cannot be measured.
Insights into the dynamic nature of the system can be gained also from the I3C NMR results, in particular from a comparison between the TEMPO-labeled and unlabeled materials (Figure 9). While the low degree of free-radical labeling has no effect on the spectrum of the undissolved polymer, TEMPO is able to cause much paramagnetic line broadening in spectra of the polymer solutions heated above their LCST. That a large number of nuclei can be relaxed by the free radicals within the time scale of the NMR measurement gives some indication of the average mobility of the phase-separated polymer. The small effect in the dissolved phase suggests a more open or extended conformation where fewer nuclei of the polymer become accessible to the relatively dilute TEMPO radical.
The picture emerging from our results of the spectros- copy of the polymer in mixed water-methanol solutions favors a model involving preferential adsorption of meth- anol in the vicinity of the polymer chain in solution below the LCST. Strong evidence for this situation is given by a comparison of the values of the hyperfine coupling constants of TEMPO attached to the polymer to those of reference systems, as shown in Figure 8.36 A second conclusion of this study concerns the solvent-polymer interactions at the LCST: all facts point to the comer- vation of the solvent composition at the polymer-solvent interface, at least for the solvent layers closest to the polymer chain, as the polymer solution undergoes phase separation. One aspect of the label experiments raises an interesting point: we observe that for methanol-water mixtures containing between 30 and 60% MeOH (v/v) the polarity reported by the label, as measured by the hyperfine coupling constant of the component A ((AN) = 16.0-16.2 G Figure 71, is lower than that reported by the labeled polymer in pure methanol ((AN) = 16.4 G ) . It is in fact closer to the polarity reported by TEMPO in N-isopropylacrylamide ((AN) = 16.1 G). This may in- dicate the existence, within the precipitated phase, of microdomains consisting mostly of aggregated collapsed polymer chains from which the solvent has been "exclud- ed".
The most striking implication of the EPR results is the preservation of the solvent composition sensed by the free radicals attached to the polymer chain. This suggests that at the LCST the changes in the solvent composition around the polymer occur mostly at outer layers and that the polymer chains are involved in ternary complexes with methanol and water. The possible formation of ternary complexes argues against theoretical treatments based on
Polymmrr BoundSolwnt ', I
1 Polymer Chain in Solution I I
l> LCST \
\ \
SoIvint ' Gradient ,/'Bulk .. - - - - 0 Solveni
'. Collapsed and Aggregated Polymer Chains
Figure 12. Pictorial representation of a model proposed to describe the polymer-solvent interactions in mixed solvents for poly(N4sopropylacrylamide) in solution (top) and in the phase separated above the LCST (bottom).
the Flory-Huggins a p p r o x i m a t i ~ n ~ ~ ~ ~ where pairwise in- teractions between the components are considered. Not only would the pairwise interaction between components be understandably limited but it would also affect the common assumption of a constant interaction parameter between any two components (Figure 12).
Energetic and entropic changes occur in the mixed- solvent polymer solutions as a function of solvent com- position. They can be interpreted in terms of changes in hydrogen bonding between the three components and in water structure. Addition of methanol to the polymer in aqueous solution results in an increase in the entropic term and a decrease in the enthalpic term of the free energy of the system. Qualitatively, these changes result from perturbations to the structure of PNIPAM-bound water caused by the addition of methanol which displaces polymer-bound water. Our results suggest that several solvent layers may be involved in the dissolution and

6016 Winnik et al.
precipitation of the polymer and that drastic changes may occur mainly at the outer layers. EPR results also show that at high methanol contents, close to the limit of the cononsolvency region, there is a clear merging of the spectral characteristics of the components B and C (Figure 5 ) and hence of the A-C and A-B pairs, resulting in a single-component signal in pure methanol. As the cor- relation times for rotational motion become closer and closer it is possible to postulate that the dynamics of the system also become closer for the precipitated and dissolved polymer phases. This indicates that the struc- ture of the two phases is becoming increasingly similar until a critical point is reached.
As the energetic differences between the precipitated and dissolved structures disappear, the LCST phenomenon cannot be detected anymore. Microcalorimetric endo- therms reported by D. Tirrell demonstrate this in a direct manner. D. Tirrell proposed that the point of disappear- ance of the LCST should depend on the molar mass of the polymer. This conclusion together with the conservation of the composition of the closest solvent layers revealed by our results suggests a complex-type structure with equilibrium values determined by the solvent composition in the bulk. A sharp critical point should be found for monodisperse PNIPAM. If we scan the behavior of (AN) in Figure 8 as a function of solvent composition starting from pure methanol solutions, we can see how the polarity felt by the covalently bound label is essentially the same as that of the model systems until a “critical composition” is reached. When the amount of methanol reaches a value of ca. 64.4 5% by volume, the amount of water bound to the polymer at equilibrium is sufficient to introduce an energetic term capable of modifying the free energy of the system from the point of view of the precipitated and dissolved phases. After that point, increasing the water content in the bulk reduces the amount of water bound to the polymer probably due to an increase in the order of the solvent structure at the interface. However, the order-disorder transition occurring inside the LCST region as the temperature is increased and the polymer precip- itates does not occur by changing the composition of the interface. This transition appears to come by reduction of the order at the outer layers of the system.
Macromolecules, Vol. 25, No. 22, 1992
M.G.-G., and N.J.T. thank the National Science Foun- dation and the Air Force Office of Scientific Research for their generous support of this research.
Raferences and Notes (1) Heskins, M.; Guillet, J. E. J. Macromol. Sci., Chem. 1968, A2,
(2) Winnik, F. M.;Ringsdorf, H.; Venzmer, J. Macromolecules 1990,
(3) Schild, H. G.; Tirrell, D. A. J. Phys. Chem. 1990, 94,4352. (4) Schild, H. G.; Muthukumar, M.; Tirrell, D. Macromolecules
1991, 24, 948. (5) For reviews, see, for example: (a) Miller, W. G. In Spin Labeling
ZZ: Theory and Applications; Berliner, L. J., Ed.; Academic Press: New York, 1979; Chapter 4. (b) TBrmaii, P.; Lindberg, J. J. In Structural Studies of Macromolecules by Spectroscopic Methods; Ivin, K. J., Ed.; John Wiley and Sons: London, U.K., 1976; Chapter 14. (c) Wasserman, A. M.; Kovarskii, A. L. Spin Labels and Probes in Physical Chemistry of Polymers; Nauka: Moscow, 1990.
(6) See for example: Pilaf, J.; Labsky, J. J. Phys. Chem. 1986,90, 6038 and references therein.
(7) Pilaf, J.; Labsky, J. Macromolecules 1991, 24, 4188. (8) Wielema, T. A.; Engberts, J. B. F. N. Bur. Polym. J. 1988,24,
(9) Sisido, M.; Akiyama, K.; Imanishi, Y.; Klotz, I. M. Macromol-
(10) Tenhu, K. H.; Sundholm, F. Br. Polym. J. 1990,23, 129. (11) Azori, M.; GyBr, M.; Tudb, F. New Polym. Mater. 1991,3,73. (12) Labsky, J.; Pilaf, J.; Kglal, J. Macromolecules 1977,10,1153. (13) Winnik, F. M. Macromolecules 1990, 23, 233. (14) Winnik, F. M. Macromolecules 1987,20, 2745. (15) Schneider, D. J.; Freed, J. H. In Biological Magnetic Resonance;
Berliner, L. J.; Teuben, J., Eds.; Plenum Press: New York,
(16) By comparison of the intensity of the EPRsignal of thenitroxide label in samples of the polymer solution (MeOH or THF, 20 OC) to that of the EPR signal of a probe (4-amino-TEMPO) in the same solvent, the label content per NIPAM unit was estimated at 19300 i 80).
1441.
23, 2615.
647.
ecules 1984,17, 198.
1989; Vol. 8, pp 1-76.
(17) Fujishige, S. Polym. J. 1987, 19, 297. (18) See, for example: Reference 5a, p 173. (19) Martini, G.; Ottaviani, M. F.; Romanelli, M. F. J. Colloid
Interface Sci. 1983, 94, 107. Martini, G.; Ottaviani, M. F.; Romanelli, M.; Kevan, L. Colloids Surf. 1989,41, 149.
(20) Otake, K.; Inomata, H.; Konno, M.; Saito, S. Macromolecules 1990,23, 283.
(21) For apreliminaryaccount,see: Winnik, F. M. Inphotochemical Processes in Organized Molecular Sys t em; Honda, K., Ed.; North-Holland and Elsevier Science Publishers B. V.: Am- sterdam, The Netherlands, 1991; pp 257-275.
(22) Witte, F. M.; Engberts, J. B. F. N. J. Org. Chem. 1988,53,3085. (23) Seo, T.; Take, S.; Akimoto, T.; Hamada, K.; Iijima, T. Mac-
romolecules 1991,24, 4801. (24) Ohta, H.; Ando, I.; Fujishige, S.; Kubota, K. J. Polym. Sci.,
Polym. Phys. 1991, 29, 963. (25) Tokuhiro, T.; Amiya, T.; Mamada, A.; Tanaka, T. Macromol-
ecules 1991, 24, 2936. (26) Badiger, M. V.; Rajamohanan, P. R.; Kulkarni, M. G.; Ganapthy,
S.; Mashelkar, R. A. Macromolecules 1991,24, 106. (27) Fujishige, S.; Dong Hong, L.; Kubota, K.; Ando, I.; Ohta, H.
Bulletin of the Research Institute for Polymer and Textiles No. 167, Tsukuba, Japan, 1991.
(28) Ohta. H.: Ando, I.: Fuiishine. S.: Kubota. K. J. Mol. Struct.
Conclusion We conclude from the combined EPR and 13C NMR
results that the details of the mechanism for the LCST should involve consideration of a ternary complex between the polymer chain and the two solvents, with structural changes occurring mainly at the outer solvent layers of a highly ordered structure present already in the dissolved phase. The excellent correlation between macroscopic determinations of the LCST and microscopic EPR pa- rameters argues strongly against a mechanism involving solely preferential solvation around the nitroxide group. The occurrence of preferential solvent adsorption may be detected by other spectroscopic techniques. 15N NMR spectroscopy is a very promising tool in this respect, since l5N chemical shifts are sensitive to solvent polarity and to protonation. It can reveal subtle changes in solvent composition, in hydrogen bonding, and in the conformation of the amide bond in the polymer.% Studies of 15N-labeled polymers are currently under progress in our laboratories.
Acknowledgment. We thank D. R. Veregin (Xerox Research Centre of Canada) and Professor H. Morawetz (Polytechnic University, Brooklyn, NY) for their helpful and constructive commenb on the manuscript. S.H.B.,
. . . . ” - . . 1991,’245, 391.
G. A.. Ed.: Academic Press: London. 1979 DD 1-123. (29) Orrel, K. G. In Annual Reports of NMR Spectroscopy; Webb,
(30) Syoseva, N. A.; Karmilov, A. Y.; Buchachenko, A. L. Chem. Phys. 1976,15, 313.
(31) Control experiments carried out with PNIPAM solutions containing large amounts of dissolved TEMPO confirmed that the spectroscopy of PNIPAM in solution below and above the LCST is not affected by an external probe, free to diffuse in solution.
(32) Kollman, P. A.; Allen, L. C. Chem. Rev. 1972, 72, 283. (33) Kamlet,M. J.;Abboud,R. W.;Taft,R. W.InProgressinPhysica1
Organic Chemistry; Taft, R. W., Ed.; Wiley: New York, 1991; Vol. 13, p 82.
(34) Flory, P. J. Polym. Sci. 1955,15,231. Altena, F. W.; Smolders, C. A. Macromolecules 1982,25,1491. McHugh, A. J.; Yilmuz, L. J. Appl. Polym. Sci. 1986,31,997. Zeman, L.; Patterson, D. Macromolecules 1972,5,513. Robard, A.;Patterson,D.;Delmaa,

Macromolecules, Vol. 25, No. 22, 1992 Cononsolvency of PNIPAM 6017
G. Macromolecules 1977,10,706. Shultz, A. R.; Hirotsu, S. J. Phys. Chem. Jpn. 1987,56,233.
(35) A c c o r d ~ ~ o ~ E P R f i n d ~ , e v e n t h e n o n ~ S o l v ~ P N ~ ~ - T/880 contains a certain amount of solvent (probably bound water), since the radical retains its mobility even at low temperatures.
(36) Amiya,T.;Hirokawa,Y.; Hirose, Y.;Li,Y.;Tanaka,T. J. Chem. Phys. 1987,86,2375. Franks, F.; Ives, D. J. G. Q. Rev. Chem. SOC. 1966,20,1. Franks, F. In Physico-chemical Processes in Mixed Aqueous Solvents; Franks, F., Ed.; Heinemann: London, 1967. Elisaaf, J.; Silberberg, A. J. Polym. Sci. 1959, 41, 33.
Priel, Z.; Silberberg, A. J. Polym. Sci., Polym. Phys. Ed. 1970, 8, 705.
(37) A detailed explanation of the Flory-Huggins ternary solution theory is presented in ref 4.
(38) Witanowski, M.; &faniak, L.; Webb, G. A. Annual Report on NMR Spectroscopy; Webb, G. A., Ed.; AcademicPress: London, 1986; p 18.
Registry No. PNIPAM-NASI (copolymer), 71137-65-0; HzO, 7732-18-5; CHsOH, 67-56-1.


