Embed Size (px)
Citation preview

The combination of sol–gel chemistry and epitaxial growth provides direct access to the integration of piezoelectric macroporous quartz, epitaxially grown on (100)-silicon substrates. A. Carretero-Genevrier and co-workers demonstrate on page 5494 that the interplay between temperature, humidity, catalyst content, and epitaxial growth plays a key role for the bottom-up fabrication of macroporous quartz on silicon substrates.
QUARTZ FILMS
ADFM-24-35-frontispiece.indd 1 8/26/14 9:57 AM

FULL P
APER
© 2014 WILEY-VCH Verlag GmbH & Co. KGaA, Weinheim 1wileyonlinelibrary.com
via resonance frequency shifts, which ena-bles the quartz crystal microbalance to detect molecular deposition and the study of biological systems by micro-electro-mechanical systems. In the latter case, the micromorphology of the fi lm is of high importance as macroperforations of the correct size distribution can enhance cell attachment and spread. [ 1 ]
Due to the previous absence of methods for epitaxial growth of quartz on silicon, [ 2 ] quartz-based sensors are currently pro-duced using bulk micromachining, with a minimum obtainable thickness of 10 µm. [ 3 ] Reducing the thickness of quartz crystals used for mass sensing is very appealing to increase resonance fre-quency and improve measurement sensi-tivity. [ 3 ] Quartz patterning can be achieved through wet etching, but precision and miniaturization are limited using this technique. Dry etching via reactive ion etching is another approach with impres-sive control over morphology, [ 4 ] however this technique is relatively expensive and usually requires multiple steps to deposit
an effective mask. The incorporation of functional oxide nano-structures as active materials in electronics critically depends on the ability to integrate crystalline oxides onto silicon sub-strates. The diffi culty of assimilating such materials into a device arises from the differences in their crystal structures and chemical reactivity. [ 4 ] Thus material scientists and engineers have long awaited a method where amorphous structured silica could be converted to epitaxial quartz.
Water-Induced Phase Separation Forming Macrostructured Epitaxial Quartz Films on Silicon
Glenna L. Drisko , Adrian Carretero-Genevrier , * Martí Gich , Jaume Gàzquez , Djawhar Ferrah , David Grosso , Cédric Boissière , Juan Rodriguez-Carvajal , and Clément Sanchez *
Quartz has been widely used as a bulk material in optics, the microelectronic industry, and sensors. The nanostructuring and direct integration of oriented quartz crystals onto a semiconductor platform has proven to be challenging. However, here, a new approach is presented to integrate epitaxial quartz fi lms with macroperforations within the range of 500 nm and 1 µm using chemical solution deposition. This method constitutes an appealing approach to develop piezoelectric mass sensors with enhanced resonance frequencies due to the thickness reduction. Perforated quartz fi lms on (100)-silicon are pre-pared from amorphous silica fi lms deposited via dip-coating and doped with metal cations that catalyze quartz crystallization. The metal cations are also active in the formation of the macroperforations, which arise due to a phase separation mechanism. Cationic surfactant–anion–metal cation assemblies stabilize droplets of water, creating an indentation in the hydrophilic silica matrix which remains after solvent evaporation. Many cations induce phase separation, including Li + , Na + , Sr 2+ , Mn 2+ , Fe 2+ /Fe 3+ , Ca 2+ , Ce 3+ and La 3+ but only the Sr 2+ and Ca 2+ cations in this series induce the epitaxial growth of α-quartz fi lms under the conditions studied. The combination of sol–gel chemistry and epitaxial growth opens new opportunities for the integration of patterned quartz on silicon.
Dr. G. L. Drisko, Dr. A. Carretero-Genevrier, Prof. D. Grosso, Dr. C. Boissière, Prof. C. Sanchez Laboratoire de Chimie de la Matière Condensée de Paris Université Pierre et Marie Curie-Paris 6, CNRS, 4 place Jussieu 75252 , Paris CEDEX 05 , France E-mail: [email protected]; [email protected] Dr. A. Carretero-Genevrier, Dr. D. Ferrah Institut des Nanotechnologies de Lyon (INL) CNRS- Ecole Centrale de Lyon 36 avenue Guy de Collongue 69134 , Ecully , France
Dr. M. Gich, Dr. J. Gàzquez Institut de Ciència de Materials de Barcelona ICMAB Consejo Superior de Investigaciones Científi cas CSICCampus UAB, 08193 , Bellaterra , Catalonia , Spain Prof. J. Rodriguez-Carvajal Institut Laue-Langevin 6 rue Jules Horowitz, BP 156, 38042 , Grenoble Cedex 9 , France
DOI: 10.1002/adfm.201401066
1. Introduction
Quartz has many advantages over its amorphous counterpart, including UV transparency, lower solubility in aqueous solu-tions, increased hardness and piezoelectricity. Thus crystalline silica is used in optics, biomedicine, abrasion and electronics. The high quality factor of quartz for piezoelectricity lends itself to highly sensitive measurements of mass changes monitored
Adv. Funct. Mater. 2014, DOI: 10.1002/adfm.201401066
www.afm-journal.dewww.MaterialsViews.com

FULL
PAPER
2 wileyonlinelibrary.com © 2014 WILEY-VCH Verlag GmbH & Co. KGaA, Weinheim
We recently published the fi rst report of the conversion of amorphous silica thin fi lms to epitaxial polycrystalline α-quartz, while maintaining pore architectures. [ 5 ] Here we elaborate the synthesis methods for the macrostructured silica fi lms and explore crystallization over a range of conditions. Macroperfo-rations of adjustable size and surface coverage are generated via a nucleation and growth phase separation, mediated by the salt, surfactant and counterion present in solution. This phase separation technique differs from both breath fi gures and templating salt crystals [ 6 ] or organic moieties. [ 7,8 ] The interplay between the kinetics of the sol-gel transition and rate of water intake into the fi lm determine the size of the macroperfora-tions, allowing for the preparation of epitaxial quartz fi lms with controllable morphology.
2. Results and Discussion
Macropores were produced in silica fi lms via a salt-surfactant mediated nucleation and growth mechanism. The Si sub-strate is coated by an amorphous silica fi lm with an opales-cent appearance which scatters the light from a green laser to produce a diffraction pattern ( Figure 1 a), indicating the pres-ence of some degree of order and a periodicity comparable with the light wavelength (λ = 532 nm). The fi lms have hier-archical pore structure, as CTA + organizes into micelles that generate mesopores (3.2 nm, Figure S1), and additionally to assist the phase separation process, which forms macropores. Many salts generated macroperforated fi lms, including mono-valent (LiBr and NaBr), divalent (Sr(NO 3 ) 2 , SrCl 2 , Ca(NO 3 ) 2 , MnCl 2 , FeCl 2 ) and trivalent (CeCl 3 , and La(NO 3 ) 2 ) cations (Figure S2). Organic salts, such as N(CH 3 ) 4 Br, and any salt insoluble in the ethanolic solvent were unsuitable candidates, as ethanol was the primary solvent. Nonionic surfactants (Brij 56, Pluronic F127 and polyethylene-block-polybutadiene) did not produce such macropore structures, thus CTAB was used as the surfactant. Therefore the dissociation of the salt in solution and the ionic nature of the surfactant are key ele-ments of the phase separation mechanism. We present the relevant results that ilucidate the macropore formation mech-anism in the following sections: 1. Ultimate cation location,
2. The role of processing parameters, and 3. The role of solu-tion chemistry.
2.1. Ultimate Cation Location
FEG-SEM analysis of fi lms calcined at 500 °C (Figure 1 c–h) showed that the salt was predominantly lining the macroper-forations (Figure 1 c, e, g, h, Figure S3–5). Three cations were imaged, monovalent Na + , divalent Ca 2+ and trivalent Ce 3+ , which were chosen based on their excitation energies being signifi cantly different than those of Si and O, and on having excitation energies less than 5 keV. Excitation at 5 keV was the maximum intensity possible as this led the SEM electron beam to penetrate a maximum of 287 nm and the fi lm itself was 245 nm thick. Imaging a cross-section of a fi lm prepared with Sr 2+ with high resolution STEM, it is possible to see that a fraction of metal salt was additionally present in the silica walls, perhaps due to association with CTAB (Figure S6g).
2.2. The Role of Processing Parameters: Drying Conditions and Film Thickness
Experiments studying the infl uence of different fi lm prepa-ration parameters were conducted to understand the phase separation mechanism and determine how macropore size, % coverage and density could be controlled ( Figure 2 , Figure S7). First, parameters that affect evaporation were explored, such as ethanol content (data not shown), temperature, and rela-tive humidity. As ethanol content increases, so does the rate of evaporation, but the fi lm thickness also changes, confusing the conclusions. In this series, perforation size decreased with increasing ethanol content, which either means that perfora-tion size increases with fi lm thickness (discussed again below) or that it increases with decreased evaporation rate. Humidity does impact pore size (see next paragraph), but as humidity affects the evaporation rate, the silica condensation kinetics and the quantity of water in the fi lm, this is also an ambiguous result. Regarding the infl uence of evaporation temperature, there was no signifi cant change in % coverage (Figure 2 a),
but a 40% decrease in pore diameter was observed between 24 °C and 36 °C due to an increase in the nucleation rate of the perfora-tions (plotted in Figure S7). As the humidity and ethanol results contradict each other in terms of evaporation rate, and as temperature affects nucleation rate more than perforation size, the formation of macropores is not prin-cipally an evaporation induced process.
Relative humidity (RH) has a strong effect on pore structures. Under dry conditions, the phase separation did not occur. Humidity is thus needed to generate the macropore struc-ture, and its increase favors larger perfora-tions (Figure 2 b). Above 55% RH, the fi lm absorbs so much water that it does not dry and droplets visible to the naked eye form on the substrate, destroying its homogeneity.
Adv. Funct. Mater. 2014, DOI: 10.1002/adfm.201401066
www.afm-journal.dewww.MaterialsViews.com
Figure 1. (a) Optical image of a dip-coated macroporous fi lm prepared using 1 mmol Sr(NO 3 ) 2 , 25 °C, 40% RH, 2 mm s −1 , with a CTAB/Si ratio of 0.14. Inset showing the diffraction pattern of grazing incident light from a green laser λ = 532 nm. (b) SEM low-magnifi cation image of the same fi lm. Film produced using 2.6 mmol CeCl 3 , 25 °C, 40% RH, 3 mm s −1 imaged using (c, g) FEG-SEM back scatter detector, (d, f) secondary electron detector, (e, h) elemental analysis of Ce (Mα = 0.88 keV), where (c-e) are images taken from the top view of the sample, and (f-h) are cross-sectional viewings of the fi lm.

FULL P
APER
3wileyonlinelibrary.com© 2014 WILEY-VCH Verlag GmbH & Co. KGaA, Weinheim
It is tempting to attribute these macroperforations to a breath fi gure, but there are key differences. Firstly, the morphology of the macropores is different than that formed by breath fi gures. Breath fi gures produce indentations of between 300 nm-10 µm, larger than those formed in fi lms produced through this phase separation process (75 nm–2 µm). More importantly, the inter-actions between the water and the fi lm are different. Breath fi gures are due to indentations formed from the condensation of water droplets on the surface of a hydrophobic fi lm during evaporative cooling in a highly humid environment. [ 9 ] In the current report, fi lms are hydrophilic, quickly drawing water from the atmosphere into the poorly condensed silica/CTAB/salt structure of the fi lm (phase separation is taking place typi-cally 1–2 minutes after the fi lm deposition, see video in Supple-mentary Information). The silica network is still fl exible at this time and can accommodate the formation and growth of water droplets. The % coverage of pores globally increases from 0 to
55% RH but evolves little in the 30–55% RH range. In addition, the higher RHs fi nally produce lower perforations densities per surface area (Figure S7b). Thus, an increasing RH concurrently favors the absorption of water, and diminishes silica condensa-tion kinetics, giving enough time for small droplets to coalesce, minimizing their surface energy, without increasing signifi -cantly the % coverage.
Withdrawal rate greatly affects the perforation size (Figure 2 c) as fi lm thickness alters with withdrawal speed (Figure S8). [ 10 ] Whenever a liquid fi lm is deposited in the Landau-Levich regime (that is dip-coating speeds ≥0.5 mm s −1 ), thicker fi lms generate larger macropores. Thicker fi lms evaporate more slowly and thus they have more time to absorb a signifi cant amount of water, which mechanically favors the growth of water domains. This is confi rmed by the study of pore density (Figure S7c), which decreases for thicker fi lms suggesting once again that with longer drying times droplet coalescence occurs.
Adv. Funct. Mater. 2014, DOI: 10.1002/adfm.201401066
www.afm-journal.dewww.MaterialsViews.com
Figure 2. Size of macropores in fi lms. (a) Change in temperature (1 mmol Sr 2+ , 4 mm s −1 withdrawal rate, 40% RH). (b) Change in relative humidity (1 mmol Sr 2+ , 24 °C, 1 mm s −1 withdrawal rate). (c) Change in withdrawal rate (1 mmol Sr 2+ , 25 °C, 40% RH). (d) Change in strontium quantity (24 °C, 1 mm s-1 withdrawal rate, 30% RH). (e) Change in CTAB concentration (25 °C, 1 mm s −1 withdrawal rate, 40% RH). Colored circles relate to the axis bearing perforation diameter, the grey diamonds relate to the % coverage.
FULL
PAPER
4 wileyonlinelibrary.com © 2014 WILEY-VCH Verlag GmbH & Co. KGaA, Weinheim
Thus all of the processing parameters that affect the crosslinking kinetics of the silica network (drying temperature, RH and fi lm thickness) affect both the droplet domain size, perforation coverage fraction and perforation density per surface area of fi lm.
2.3. The Role of Solution Chemistry: Salt Concentration, Salt Nature, Anions, and Surfactant
Among chemical parameters, salt content is very important. It has a linear affect on both the % coverage and the perforation diameter (Figure 2 d). Surprisingly, the amount of salt does not affect the perforation density (Figure S7) for a given processing parameter set. If compared with the infl uence of processing parameters which affect the condensation kinetics of the silica network (and the number of perforations per surface unit of fi lm), it is very likely that salt does not signifi cantly affect the condensation kinetics of the silica network, but simply controls the kinetics of water absorption. Saltier fi lms produce larger macropores over the same duration of time. To unambiguously prove this point would require specifi cally designed in situ monitoring of water droplet nucleation and growth. Finally, as Sr 2+ salts are poorly soluble in ethanol, we could not explore the effect of higher salt concentrations. In fact, aging the solu-tion led to the recrystallization of Sr(NO 3 ) 2 (precipitate verifi ed using XRD). At 25 °C, a solution containing Sr(NO 3 ) 2 had det-rimental precipitation within 30 min (followed by DLS meas-urements and monitoring fi lm quality). Precipitation occurred more quickly for concentrated solutions. The solution temper-ature also has a large impact on the stability of the solution, with solutions at 30 °C being much more stable than solutions at 18 °C. SrCl 2 is more soluble in ethanol than Sr(NO 3 ) 2 , pro-viding greater solution longevity (up to 24 h). Solutions of LiBr induced good quality phase separation even after 3 months of aging due to the high solubility of the LiBr in ethanol.
Macroperforated fi lms were prepared using a suite of cations at 25 °C (Figure S2). Very little change was apparent in perfo-ration size, % coverage or morphology. What differences are present can be attributed to the cation solubility and the coun-terions present in solution. However, dip coating conditions need to be slightly modifi ed for each salt. For example, fi lms containing Ca(NO 3 ) 2 (solubility 121 g/100 g H 2 O at 20 °C) did not dry at 22 °C and 40% relative humidity due to the hygrosco-picity of the fi lm, whereas these were ideal conditions for fi lms prepared using Sr(NO 3 ) 2 (solubility 66 g/100 g H 2 O at 20 °C). Thus conditions must be tuned for each cation, but the struc-tural evolution trends described above are the same for all inor-ganic salts tested.
A cornerstone to this phase separation mechanism is the counterion. It seems that the anion is perhaps facilitating an interaction between the cationic surfactant and the cationic metal making a [S + A − M x+ ] complex. Several anions are present in solution: Br − originating from CTAB; the counterion from the acid (HCl, HBr, HNO 3 ); and the counterion from the salt (Sr(NO 3 ) 2 , SrCl 2 , etc.). Here it is useful to recall the molar ratios of reagents included in a standard solution: 1 Si: 0.14 CTAB: 6.6 H 2 O: 25 EtOH: 1 HCl: 0.06 SrCl 2 yielding anion atomic ratios of 0.14 ACTAB
− : 1 AHCl− : 0.12 ASrCl
−2. Thus the largest source of anions
comes from the acid by a factor of more than 6. Three different sources of acid were tested, HCl, HBr, HNO 3 (Figure S9). HNO 3 did not produce phase separation, HCl yielded relatively small perforations and HBr led to large perforations. Although it is alluring to ascribe macroperforation size to salt insolubility, to remain consistent with previously reported mechanisms, [ 11 ] perforation size does not correlate with solubility in the case of Sr 2+ salts as the chloride is less soluble than the nitrate salt. The order of solubility in water at 25 °C is SrCl 2 (35.4 g 100 mL −1 ) < Sr(NO 3 ) 2 (44.5 g 100 mL −1 ) < SrBr 2 (51.7 g 100 mL −1 ). [ 12 ] It seems likely that the surface stabilization of the water droplet by an ionic complex formed by ions present in solution can account for the difference in perforation size. Supporting this statement, the destruction of a thin soft matter fi lm lining the perforations in the as-made fi lms is observed using a scan-ning electron microscope (Figure S10). The degree of surface stabilization by CTAC ([C 16 H 33 N(CH 3 ) 3 + Cl − ]) is not the same as that of CTAB ([C 16 H 33 N(CH 3 ) 3 + Br - ]). [ 13 ] Electrostatic repul-sion between adjacent polar head groups associated with bro-mide is much lower than those associated with chloride due to the counterion binding strength . [ 13 ] The observed packing and capacity to assemble of [CTA + Br − M x+ ] is completely different than [CTA + Cl − M x+ ] in that they assemble into different phases and require different conditions in order to assemble. Nitrate is a poor coordinating ligand and cannot simultaneously coor-dinate a CTA + molecule and a Sr 2+ atom in the [S + A − M x+ ] com-plex, which therefore prevents the formation of macrodomains. Strontium nitrate salt crystals can be observed in the fi lm pro-duced from HNO 3 (Figure S9c,d). The presence of deposited salt on the walls and fl oor of the perforation is due to both the formation of the [S + A − M x+ ] complex and the drying of the salty water droplet.
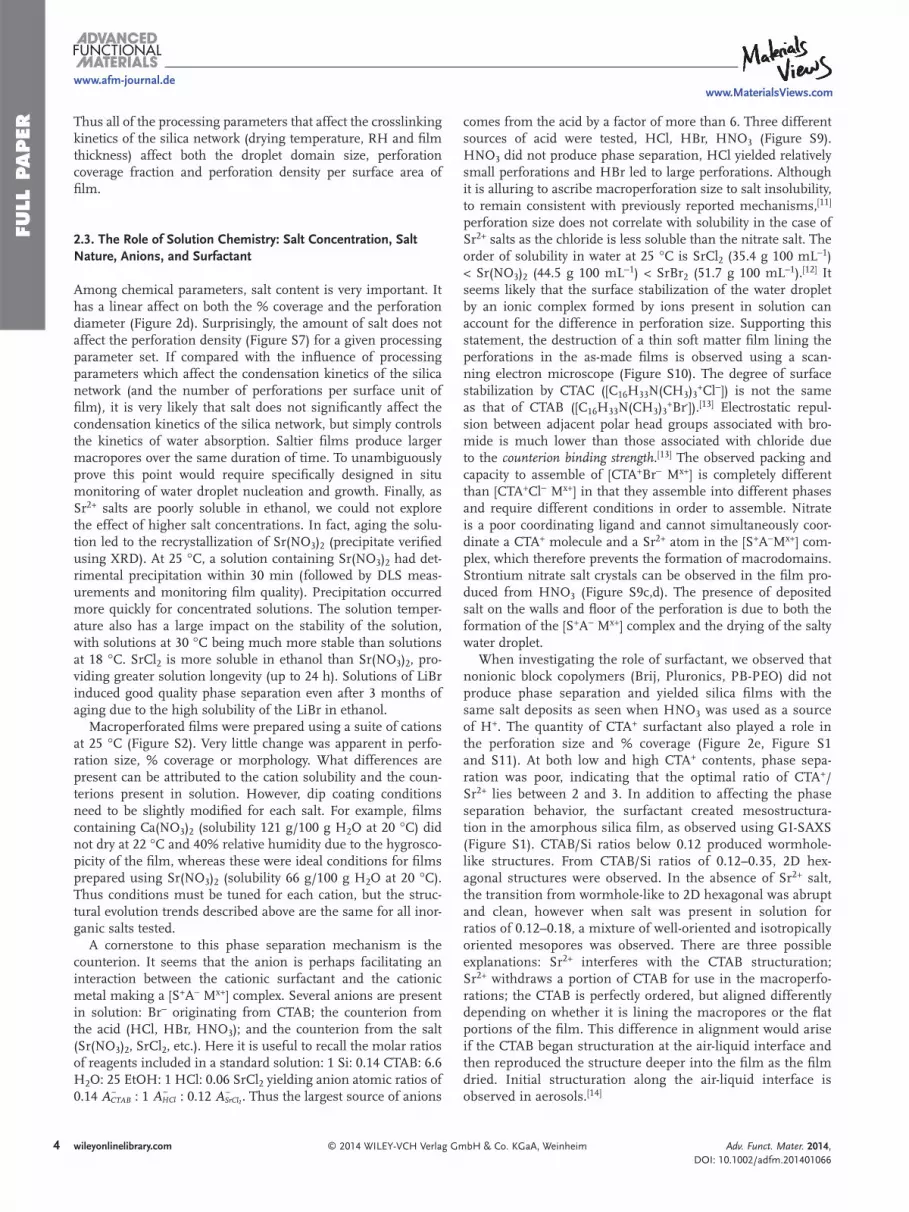
When investigating the role of surfactant, we observed that nonionic block copolymers (Brij, Pluronics, PB-PEO) did not produce phase separation and yielded silica fi lms with the same salt deposits as seen when HNO 3 was used as a source of H + . The quantity of CTA + surfactant also played a role in the perforation size and % coverage (Figure 2 e, Figure S1 and S11). At both low and high CTA + contents, phase sepa-ration was poor, indicating that the optimal ratio of CTA + /Sr 2+ lies between 2 and 3. In addition to affecting the phase separation behavior, the surfactant created mesostructura-tion in the amorphous silica fi lm, as observed using GI-SAXS (Figure S1). CTAB/Si ratios below 0.12 produced wormhole-like structures. From CTAB/Si ratios of 0.12–0.35, 2D hex-agonal structures were observed. In the absence of Sr 2+ salt, the transition from wormhole-like to 2D hexagonal was abrupt and clean, however when salt was present in solution for ratios of 0.12–0.18, a mixture of well-oriented and isotropically oriented mesopores was observed. There are three possible explanations: Sr 2+ interferes with the CTAB structuration; Sr 2+ withdraws a portion of CTAB for use in the macroperfo-rations; the CTAB is perfectly ordered, but aligned differently depending on whether it is lining the macropores or the fl at portions of the fi lm. This difference in alignment would arise if the CTAB began structuration at the air-liquid interface and then reproduced the structure deeper into the fi lm as the fi lm dried. Initial structuration along the air-liquid interface is observed in aerosols. [ 14 ]
Adv. Funct. Mater. 2014, DOI: 10.1002/adfm.201401066
www.afm-journal.dewww.MaterialsViews.com

FULL P
APER
5wileyonlinelibrary.com© 2014 WILEY-VCH Verlag GmbH & Co. KGaA, Weinheim
Mechanism: The observations reported in the preceding sec-tions indicate that the production of macro-perforations occurs through the nucleation and growth of water droplets within the CTAB/silica hybrid network mediated by the salt and the sur-factant ( Figure 3 ). To summarize the results:
• The phase separation proceeded for mono-, di- and trivalent cationic salts, where the salts were predominantly deposited on the walls of the perforations, along with a surfactant mem-brane.
• The surfactant must be itself ionic to produce a phase separa-tion.
• Anions capable of coordinating at least two cations simulta-neously were necessary for the phase separation to occur (e.g. Cl − and Br − ).
• A certain quantity of surfactant, salt and relative humidity are needed. Increases in salt and humidity linearly increase per-foration size. Increases in surfactant concentration increase perforation size up to a point, after which more CTAB de-creases perforation size.
• Processing parameters that slow SiO 2 condensation kinetics (drying temperature, RH and fi lm thickness) affect perfora-tion size, coverage fraction and perforation density per sur-face area.
Combining these observations the following mechanism is proposed: In the initial phases of drying CTA + micelles organize with Sr 2+ associated with the polar head groups through an ionic complex of the type [S + A − M x+ ], where S + is CTA + , A − is the counterion (Br − or Cl − ) and M x+ is the cationic salt ( e.g. Na + , Sr 2+ , Ce 3+ ). [ 15 ] M x+ and H 2 O are distributed through the loosely
condensed SiO 2 matrix. Just after deposition, the uncondensed fi lm begins to pump water from the atmosphere. A surfactant bilayer (previously evidenced in the preparation of metallic nanoparticles in aqueous media, [ 16–18 ] and silica surfaces in water [ 19 ] is likely to ensure the stabilization of the water/silica interface. A [CTA + A − M x+ ] membrane self-assembles at the droplet interface to minimize the interfacial energy. However, when a large excess (greater than 3) of CTAB to cationic salt exists, salt is predominately stabilized by the micelles within the silica walls, and thus water pumping is minimized. The amount of salt present in solution controls the hygroscopicity of the fi lm, thus the kinetics of water absorption. Once a certain amount of water is absorbed, a phase separation occurs via nucleation, mediated by [S + A − M x+ ] species, and growth of water droplets. The growth of water domains is limited by the condensation of the silica network, thus the fi nal macrostruc-ture of the fi lm is not the result of a thermodynamically stable system, but rather from quenching the phase separation of a phase A (water and salt-rich) and a phase B (made of salt and mesostructured silica). Normally on the time frame of the fi lm evolution, spherical droplets are frozen in the silica network. However, if TEOS is added to the solution shortly before fi lm deposition is performed, TEOS is not hydrolyzed and condensa-tion is delayed. In this case spinodal decomposition occurs to form non-spherical structures (Figure S12).
2.4. Crystallization of the Silica Films
Among the different cations screened in this work (i.e. Li + , Na + , Sr 2+ , Mn 2+ , Fe 2+ /Fe 3+ , Ca 2+ , Ce 3+ and La 3+ ), only Sr 2+ and
Ca 2+ offer the potential to thermally induce the epitaxial growth of macroperforated (100) α-quartz fi lms on (100) silicon substrates under the conditions studied (see Table 1 ). Signifi cantly, we observe that whereas the Ca 2+ catalyst acts as a melting agent in a wide range of concentrations, in the case of strontium doped silica fi lms, the crystalliza-tion process only takes place under a precise Sr 2+ salt concentration within the initial pre-cursor solution (see Table 1 ). Figure 4 shows a detailed study of crystallization of macropo-rous silica fi lms at 1000 °C for different Sr 2+ contents. Noteworthy, only samples with a concentration of 1 mmol of Sr 2+ (Sr/Si molar ratio of 0.06) within the amorphous silica matrix have the right quantity and homoge-neous dispersion of salt to permit further crystallization into a (100) epitaxial quartz fi lm (Figure 4 d and e). At this Sr 2+ concen-tration, the density, distribution and average diameter of macroperforations within the silica fi lm provides the conditions needed to ensure ultimate epitaxial crystallization. Below this critical concentration (<1 mmol Sr 2+ ), related to an insuffi cient homogeneity of Sr 2+ cations within the silica network, fi lm devitrifi cation is impaired and thus so is the
Adv. Funct. Mater. 2014, DOI: 10.1002/adfm.201401066
www.afm-journal.dewww.MaterialsViews.com
Figure 3. The phase separation mechanism when Br- is used as the counterion: (a) dip-coating deposition of a wet thin fi lm, solvent evaporation and onset of silica condensation; (b) intake of water in the later stages of drying where a hierarchical porosity is produced during a salt-surfactant mediated nucleation and growth mechanism, where droplets are stabilized by a bilayer of CTAB; c) dry fi lm where M x+ (Li + , Na + , Sr 2+ , Mn 2+ , Fe 2+ /Fe 3+ , Ca 2+ , La 3+ , Ce 3+ ) has been deposited on the walls of the perforations.

FULL
PAPER
6 wileyonlinelibrary.com © 2014 WILEY-VCH Verlag GmbH & Co. KGaA, Weinheim
subsequent nucleation of quartz crystallites along the silica/silicon interface (see Figure 4 f–i). As an example, when 0.5 mmol Sr 2+ was used (Sr/Si molar ratio of 0.03), a polycrystal-line quartz diffraction pattern is observed (Figure 4 a), indi-cating an inhomogeneous and random nucleation of quartz crystals at the interface. Below 0.5 mmol, crystallization was not observed. Conversely, at a Sr/Si molar ratio of 0.12, an excess of catalyst prevents both controlled devitrifi cation and controlled kinetics of nucleation and growth at the interface of SiO 2 /Si. Under the right crystallization conditions (i.e. Sr/Si molar ratio of 0.06) a strontium-rich phase sinters during the devitrifi cation and crystallization process to be fi nally expulsed from the crystalline quartz matrix in the form of spherical nanoparticles. This process will be further developed in the following sections.
2.5. Strontium Solid Dewetting Process
In the case of Sr 2+ doped silica fi lms heated to 900–1000 °C (Figure 4 d,e and Figure S6), we observed that strontium dewets or agglomerates at the surface of the quartz fi lm to fi nally form SrO nanoparticles ( Figure 5 ). SrO then reacted with CO 2 and H 2 O from the ambient air after cooling to form SrCO 3 (Figure S13). This type of behavior has been reported for La 0.3 Sr 0.7 CoO x (LSCO) perovskite membranes during oxygen permeation experiments. [ 19 ] In this case, a 10–15 nm surface SrO layer was formed by reduction of the La 0.3 Sr 0.7 CoO x phase at 900 ºC. After cooling and exposure to the atmosphere, CO 2 reacted with SrO to form SrCO 3 , which was identifi ed by XPS.
Evidence for this is also supported by the XPS Sr 3d spec-tral region. For quartz fi lms, a Sr 3d doublet (Figure S13)
showed a shift to higher binding energy, consistent with that expected for a carbonate oxygen. [ 20 ] Furthermore, elemental maps of the Sr M-edge around 135 eV and O K-edge around 530 eV, acquired from annular dark fi eld (ADF) Z-contrast image of a macropo-rous α-quartz layer, allowed us to identify the presence of strontium and oxygen in the carbonaceous amorphous nanoparticles (Figure S13). These observations indicate that the macroporous quartz fi lm has under-gone substantial SrO dewetting during the crystallization process to form carbonate spe-cies due to the ambient atmosphere. This dewetting process is likely driven by surface energy minimization and occurs via surface diffusion below 800 °C, at which temperature the mobility of the Sr 2+ atoms is suffi ciently high. [ 21 ] Figure 5 and Figure S6 show the physical state at different stages of silica crys-tallization and Sr 2+ dewetting. This process
Adv. Funct. Mater. 2014, DOI: 10.1002/adfm.201401066
www.afm-journal.dewww.MaterialsViews.com
Table 1. Preparation of salt solutions and potential to crystallize prepared fi lms.
Salt Molarity [mol L −1 ]
Quantity used [g]
Approximate solution density [g mL −1 ]
Phase of heat-treated fi lms, 1000 °C
Ca(NO 3 ) 2 • 4 H 2 O 1.00 5.88 1.12 (100)-α-Quartz
Ca(NO 3 ) 2 • 4 H 2 O 3.00 17.74 1.33 (100)-α-Quartz
CeCl 3 • 7 H 2 O 1.00 9.38 1.22 Amorphous SiO 2
CeCl 3 • 7 H 2 O 2.66 24.78 1.55 Amorphous SiO 2
FeCl 2 • 4 H 2 O 1.02 5.05 1.18 Amorphous SiO 2
La(NO 3 ) 3 • 6 H 2 O 1.00 10.83 1.23 Amorphous SiO 2
LiBr 1.00 2.18 1.05 Amorphous SiO 2
MnCl 2 1.02 3.20 1.14 Amorphous SiO 2
NaBr 3.01 7.75 1.22 Amorphous SiO 2
SrCl 2 • 6 H 2 O 1.01 6.70 1.14 (100)-α-Quartz
Sr(NO 3 ) 2 0.25 1.34 1.03 Amorphous SiO 2
Sr(NO 3 ) 2 0.50 2.65 1.08 Non-oriented α-Quartz
Sr(NO 3 ) 2 1.01 5.32 1.15 (100)-α-Quartz
Sr(NO 3 ) 2 2.00 10.58 1.31 Amorphous SiO 2
Figure 4. Thermal treatment at 1000 °C of macroporous silica fi lms prepared using different contents of Sr 2+ relative to 16.3 mmol Si. (a) XRD pattern of samples with 0.25 (green), 0.5 (blue), 1 (red), and 2 (pink) mmol of Sr 2+ . FEG-SEM images of (b, c) 2 mmol of Sr 2+ , (d, e) 1 mmol of Sr 2+ , (f, g) 0.5 mmol of Sr 2+ , (h, g) 0.25 mmol of Sr 2+ relative to 16.3 mmol Si.

FULL P
APER
7wileyonlinelibrary.com© 2014 WILEY-VCH Verlag GmbH & Co. KGaA, Weinheim
drives the assembly of sintered SrCO 3 nanoparticles at 1000 °C around and at the center of macroperforations (see Figure S6 and Figure S14), which could be useful for electronic and pho-tonic devices and for catalyzing the growth of nanotubes and nanowires. [ 22,23 ] In previous studies, we already observed the formation of euhedral macrodomains that break the continuity of quartz fi lms and relax internal stresses within the fi lm at high temperatures. [ 5 ] This break results from the difference of thermal expansion coeffi cients and the relatively high mis-match between the quartz fi lm and the silicon substrate along the α-quartz [010] crystallographic direction at high tempera-tures (see Figure 6 a–c). The present work investigates the evo-lution of the amorphous SrCO 3 nanoparticles as they sinter and dewet during thermal treatment. Our results show that sintered amorphous SrCO 3 nanoparticles, formed during devitrifi cation and the crystallization process, are expulsed from the interior of the silica matrix towards the quartz macrodomain grain bound-aries (Figure 5 , step 4). SrCO 3 loses its spherical morphology upon insertion into the quartz grain boundaries to minimize the surface energy of the whole system. As a result, new perfo-rations in the quartz fi lm, within the range of 50 nm, are gener-ated from the space previously occupied by those nanoparticles (Figure 5 , step 4).
Proof of SrCO 3 migration during macrodomain forma-tion is displayed in Figure 6 f and Figure S-6, where AFM and FEG-SEM images show the existence of stable SrCO 3 particles (brighter spots) along the fi lm. Conversely, within euhedral
macrodomains, SrCO 3 has migrated to the domain boundaries, leaving behind the par-ticle fi ngerprint (see AFM profi le analysis in Figure 6 d).
The converse piezoelectric effect of the macroporous quartz fi lms has been studied by piezo-response force microscopy (PFM). Figure 7 a shows the topographic AFM image of a crystallized macropore and the corre-sponding PFM amplitude is displayed in Figure 7 b. The PFM response preserves the features of the topographic image, namely the boundaries between the crystals sur-rounding the macropore and the perimeter of the macropores, but interestingly there are no signifi cant differences between PFM response within and outside the macropore. Thus the piezoelectric functionality of the material is completely preserved.
3. Conclusion
The sol-gel wet deposition approach provides direct access to the integration of piezoelec-tric macroporous quartz, epitaxially grown on (100)-silicon substrates.
This synthesis method uses a phase sepa-ration mechanism and surfactant templating to generate silica fi lms with hierarchical porosity consisting of 3.2 nm mesopores and macropores of between 75 nm – 2 µm.
The formation of macroperforations is mediated by the metal salt, counterion, cationic surfactant, the drying time and rela-tive humidity. The hygroscopic phase separation presented here is general for inorganic salts of different nature, being produced using monovalent, divalent and trivalent cations. The phase separation occurred through a nucleation and growth process, controlled both by processing parameters and the chemical composition of the fi lm. In spite of the good con-trol over the fi nal macroperforations, a detailed investigation of the formation mechanism requires further in situ analysis to gather specifi c kinetics data.
The surfactant plays two roles in the fi lm: it generates mesoporosity and it stabilizes water droplets by minimizing the interfacial energy. GI-SAXS studies may suggest that CTAB micelle organization starts at the silica interface and then propagates further into the fi lm, a subject to be further investigated.
The thermally activated crystallization of the macroporous silica fi lm and the native silica surface is induced by hetero-geneous catalysis of Sr 2+ or Ca 2+ cations present in the ini-tial precursor solution. A precise concentration and a homo-geneous distribution of cations within the silica phase are required. Thus, the interplay between temperature, humidity, catalyst content, and epitaxial growth plays a key role for the bottom-up fabrication of macroporus quartz on silicon sub-strates. The macroporous structuring of quartz fi lms is in no way detrimental to the piezoelectric properties of the fi lm,
Adv. Funct. Mater. 2014, DOI: 10.1002/adfm.201401066
www.afm-journal.dewww.MaterialsViews.com
Figure 5. Scheme at different stages of quartz crystallization and Sr 2+ dewetting. 1) Cross-section of the original mesoporous fi lm showing homogeneous Sr 2+ distribution within the meso- and macroporous range porous amorphous silica matrix. 2) Nucleation above 800 ºC of α-quartz crystals at the silicon-silica interface during the devitrifi cation of the original amor-phous mesoporous fi lm. At this stage Sr 2+ sinters and forms spherical nanoparticles of SrCO 3 . 3) Oriented columnar quartz crystallite growth within the original (100) silicon substrate, where crystallization is limited by the oxygen diffusion. The catalytic agent (Sr 2+ , red spheres) used for the devitrifi cation of silica fi lms is trapped within quartz matrix in the form of spherical nano-particles. 4) Formation mechanism of macrodomains at high temperature (1000 °C) where SrCO 3 nanoparticles migrate to the crystal boundaries of the macrodomains.

FULL
PAPER
8 wileyonlinelibrary.com © 2014 WILEY-VCH Verlag GmbH & Co. KGaA, Weinheim
which are preserved both within the pores and the walls, thus the combination of these two functional properties in the material can be exploited for new developments in biological sensors.
Finally, this work will serve as a starting point for forth-coming studies involving the validation and generalization of sol-gel assisted by a novel phase separa-tion mechanism for the generation of epi-taxial quartz macrostructured systems and, more importantly, to improve technological developments based on the fabrication of new high frequency resonators and high sensitivity sensors relevant in different fi elds of application, opening a wide range of applications.
4. Experimental Section Materials : Ethanol and 37% HCl, 48% HBr,
and 69% HNO 3 were purchased from AnalaR NORMAPUR. Tetraethyl orthosilicate (TEOS), cetyltrimethylammonium bromide (CTAB), manganese chloride, strontium nitrate and
strontium chloride hexahydrate were obtained from Aldrich. Calcium nitrate, cerium chloride, ferrous chloride tetrahydrate, lanthanum nitrate and lithium bromide originated from Fluka. CZ silicon wafers doped with boron with a <100> orientation were from SHE Europe Ltd. Water was purifi ed using a MilliQ fi lter.
To prepare salt solutions of specifi ed molarity, the appropriate amount of salt was weighed into a 25 mL volumetric fl ask (see Table 1 ). The salt was then dissolved in purifi ed water, up to the 25 mL mark at 20 °C.
Film Synthesis : In a standard synthesis, CTAB (0.84 g, 2.3 mmol) was dissolved in ethanol (18.9 g, 410 mmol) and 37% HCl (1.6 g, 16.24 mmol H + , 55.94 mmol H 2 O). TEOS (3.4 g, 16.32 mmol) was added dropwise and the solution was aged overnight. A 1 M SrCl 2 solution (1.14 g, 1 mmol Sr 2+ , 52.07 mmol H 2 O) was added just before dipping fi lms, yielding a molar ratio of 1 Si: 0.14 CTAB: 6.6 H 2 O: 25 EtOH: 1 HCl: 0.06 SrCl 2 . The solution was not kept for more than a few hours. Any deviation from this standard synthesis is explicitly noted in the text, otherwise it should be assumed that fi lms were prepared using a solution of this composition.
For one set of experiments, either HNO 3 or HBr were substituted for HCl. In this case, the molar ratio of reagents was 1 Si: 0.14 CTAB: 6.6 H 2 O: 25 EtOH: 1 HBr or 1 HNO 3 : 0.06 SrCl 2 .
Silicon substrates were rinsed with acetone and water, then soaked in 3M HNO 3 to oxidize the surface of the wafers, then re-rinsed with water, ethanol and wiped with an acetone-soaked tissue prior to use. The fi lms were dip-coated with the solution at 4 mm s −1 , 24 °C and 40% RH. The fi lms were then calcined for 5–10 min at 500 °C to remove surfactant. To crystallize, the fi lms were heated at a rate of 3 °C min −1 to 900 °C, kept at the maximum temperature for 5 h, and then cooled to room temperature at a rate of 3 °C min −1 . Any modifi cations to this procedure are clearly noted in the text.
X-ray Diffraction (XRD) : The crystalline texture of fi lms was studied with a Bruker D8 diffractometer: 3 s acquisition every 0.02° in Bragg-Brentano geometry. Epitaxial relationship was analyzed through X-ray diffraction measurements by using a Bruker AXS GADDS equipped with a 2D X-ray detector. Diffraction patterns were measured with X-ray radiation of wavelength 0.154056 nm.
Adv. Funct. Mater. 2014, DOI: 10.1002/adfm.201401066
www.afm-journal.dewww.MaterialsViews.com
Figure 6. (a) AFM image showing a large scan area of macroporous quartz fi lms prepared at 1000 °C for 5 h. (b,c) Higher magnifi cation AFM and FEG-SEM images illustrating the forma-tion of a thinner euhedral macrodomain (1000 °C over 5 h). (d) Profi le analysis of the AFM image in b, revealing that the SrCO 3 leaves behind a particle fi ngerprint upon migration to the grain boundary. (e) Pole fi gure of macroporous quartz fi lms showing that [210]Q//[100]S is the direction of macroporous quartz growth. (f) Low magnifi cation high angle annular dark fi eld (HAADF) Z-contrast image of a macroporous quartz fi lm grown on the Si substrate assisted by the Sr 2+ catalyst at 1000 °C, 5 hours. The contrast in the HAADF images is proportional to Z 2 in a fi rst approximation (Z being the atomic number) so that heavier Sr-rich nanoparticles at the surface appear much brighter. Inset fi gures show the corresponding FFT of both the quartz fi lm and the silicon substrate, and the Sr M-edge EEL spectrum acquired from a Sr-rich nanoparticle.
Figure 7. Piezoelectric response of macroperforated epitaxial quartz fi lms. (a) AFM image of the topography and (b) PFM amplitude recorded simultaneously under a tip-substrate AC voltage of 17.5 V. The inset shows the proportional relationship between applied voltage and tip defl ection.

FULL P
APER
9wileyonlinelibrary.com© 2014 WILEY-VCH Verlag GmbH & Co. KGaA, WeinheimAdv. Funct. Mater. 2014, DOI: 10.1002/adfm.201401066
www.afm-journal.dewww.MaterialsViews.com
Grazing Incidence Small Angle X-ray Scattering (GI-SAXS) : A Rigaku S-max 3000 equipped with a microfocus source l ¼ 0.154 nm and a 2D Gabriel type detector was placed at 1480 mm from the sample (all under vacuum), at an incident angle of 0.2°. The direct and specular refl ected beams were masked by a vertical beam-stop. Diffraction patterns were analyzed using Igor software 13.
Field Emission Gun Scanning Electron Microscope (FEG-SEM) : The microstructure of the fi lms was studied using FEG-SEM model Su-70 Hitachi, equipped with an EDX detector X-max 50 mm 2 Oxford instruments.
Transmission Electron Microscope (TEM) : The microstructure of the fi lms was studied using a FEI Technai G2 F20 operated at 200 kV, in both TEM and STEM mode, and equipped with a Gatan Imaging Filter (GIF) Quantum SE 963 spectrometer. Specimens for TEM were prepared by conventional methods, by grinding, dimpling and Ar ion milling.
X-ray Photoelectron Spectroscopy (XPS) : XPS measurements were carried out in a Vacuum Science Workshop (VSW) chamber (base pressure < 10 −9 ), equipped with a monochromatic X-ray source AlKα (1486.6 eV). The angle between the X-ray source and the photoelectron detector is set at the “magic angle”, i.e. 54.7°. All the spectra were recorded in the direction normal to the sample surface.
Atomic Force Microscopy (AFM) : AFM imaging experiments were performed on a multimode-V microscope controlled by Nanoscope-V electronics and the Nanoscope 8 software (Bruker AXS Corporation, Santa Barbara, CA). V-shaped Si 3 N 4 cantilevers (SNL, Bruker AXS Corporation, Santa Barbara, CA), with a nominal spring constant of 0.35 N/m, a nominal resonant frequency of 65 kHz and a nominal tip radius of 3 nm, were operated under air.
Piezoresponse Force Microscopy (PFM) : Piezoresponse force microscopy measurements were performed on an Agilent 5500LS instrument using a conducting tip of Si coated with boron-doped diamond with a spring constant of 0.2 N/m. The tip was brought into feedback position in the contact mode with a constant force of 25 nN which was maintained between the tip and the sample surface. An AC voltage V AC = 7.5 V was applied between the tip and the substrate backside and a frequency sweep was recorded to determine the frequency of the contact resonance peak (145 kHz) and its quality factor (Q = 49). The tip oscillation amplitude driven by the oscillating surface displacement of the fi lm was recorded with a lock-in amplifi er while applying between the tip and the substrate backside a V AC of 17.5 V at 145 kHz. The photodetector response was calibrated with a force-displacement curve to obtain the response in units of distance. The tip amplitudes presented in Figure 7 (b) was corrected by subtracting the zero volt amplitude and dividing by Q.
Supporting Information Supporting Information is available from the Wiley Online Library or from the author.
Acknowledgements G. L. Drisko and A. Carretero-Genevrier contributed equally to this work. ACG and GLD acknowledge the Collège de France foundation for material and a part of their fi nancial support and IMPC for use FEG-SEM facilities. ACG acknowledges Collège de France and LCMCP for his Visiting Scientist position and INL-CNRS for his detachment. This study was made possible by grant, Marie Curie Reintegration
Grant (PCIG09-GA-2011–294168) to M.G. We thank David Montero and Mohamed Selmane for technical support. Andrés Gomez is acknowledged for his technical assistance in the PFM measurements. Geneviève Grenet is acknowledged for her technical assistance in XPS measurements at INL-CNRS. This research was partially funded by the RyC-2012–11709 contract of J. G. The TEM microscopy work was conducted in the Catalan Institute of Nanoscience and Nanotechnology (ICN2). Authors acknowledge the ICN2 Electron Microscopy Division for offering access to their instruments and expertise.
Received: April 3, 2014 Revised: May 10, 2014
Published online:
[1] L. Li , C. Chen , J. Li , A. Zhang , X. Liu , B. Xu , S. Gao , G. Jin , Z. Ma , J. Mater. Chem. 2009 , 19 , 2789 .
[2] C. J. Brinker , P. G. Clem , Science 2013 , 340 , 818 . [3] S. Tadigadapa , K. Mateti , Meas. Sci. Technol. 2009 , 20 , 092001 . [4] K. Mohamed , M. M. Alkaisi , Nanotechnology 2013 , 24 , 015302 . [5] A. Carretero-Genevrier , M. Gich , L. Picas , J. Gazquez , G. L. Drisko ,
C. Boissiere , D. Grosso , J. Rodriguez-Carvajal , C. Sanchez , Science 2013 , 340 , 827 .
[6] L. Malfatti , P. Falcaro , D. Marongiu , M. F. Casula , H. Amenitsch , P. Innocenzi , Chem. Mater. 2009 , 21 , 4846 .
[7] L. Malfatti , M. G. Bellino , P. Innocenzi , G. J. A. A. Soler-Illia , Chem. Mater. 2009 , 21 , 2763 .
[8] L. Han , P. Xiong , J. Bai , S. Che , J. Am. Chem. Soc. 2011 , 133 , 6106 .
[9] L. Heng , B. Wang , M. Li , Y. Zhang , L. Jiang , Materials 2013 , 6 , 460 .
[10] M. Faustini , B. Louis , P. A. Albouy , M. Kuemmel , D. Grosso , J. Phys. Chem. C 2010 , 114 , 7637 .
[11] X. Jiang , T. L. Ward , F. van Swol , C. Brinker , J. Ind. Eng. Chem. Res. 2010 , 49 , 5631 .
[12] CRC Handbook of Chemistry and Physics , 85th Ed (Ed: D. R. Lide ), CRC Press , Boca Raton, FL 2005 .
[13] T. A. Bleasdale , G. J. T. Tiddy , E. Wyn-Jones , J. Phys. Chem. C 1991 , 95 , 5385 .
[14] C. Boissiere , D. Grosso , A. Chaumonnot , L. Nicole , C. Sanchez , Adv. Mater. 2011 , 23 , 599 .
[15] Q. Huo , D. I. Margolese , U. Ciesla , D. G. Demuth , P. Feng , T. E. Gier , P. Sieger , A. Firouzi , B. F. Chemelka , F. Schüth , G. D. Stucky , Chem. Mater. 1994 , 6 , 1176 .
[16] S. H. Wu , D. H. Chen , J. Colloid Interface Sci. 2004 , 273 , 165 . [17] Z. M. Sui , X. Chen , L. Y. Wang , L. M. Xu , W. C. Zhuang , Y. C. Chai ,
C. Yang , J. Phys. E-Low Dimensional Systems Nanostructures 2006 , 33 , 308 . [18] J. Casas , M. Venkataramasubramani , Y. Wang , L. Tang , Biosens. Bio-
electron. 2013 , 49 , 525 . [19] R. H. E. van Doorn , H. J. M. Bouwmeester , A. Burggraaf , J. Solid-
State Ionics 1998 , 111 , 263 . [20] J. F. Moulder , W. F. Stickle , P. E. Sobol , K. D. Bomben , Perkin Elmer Cor-
poration , Physical Electronics Division , Eden Prairie, Minnesota 1992 . [21] C. V. Thompson , Annu. Rev. Mater. Res. 2012 , 42 , 399 . [22] A. Carretero-Genevrier , T. Puig , X. Obradors , N. Mestres , Chem.
Soc. Rev. 2014 , 43 , 2042 . [23] A. Carretero-Genevrier , J. Oro-Sole , J. Gazquez , C. Magén ,
L. Miranda , T. Puig , X. Obradors , E. Ferain , C. Sanchez , J. Rodriguez-Carvajal , N. Mestres , Chem. Mater. 2014 , 26 , 1019 .

Copyright WILEY‐VCH Verlag GmbH & Co. KGaA, 69469 Weinheim, Germany, 2014.
Supporting Information
for Adv. Funct. Mater., DOI: 10.1002/adfm.201401066
Water-Induced Phase Separation Forming Macrostructured Epitaxial Quartz Films on Silicon Glenna L. Drisko, Adrian Carretero-Genevrier,* Martí Gich, Jaume Gàzquez, Djawhar Ferrah, David Grosso, Cédric Boissière, Juan Rodriguez-Carvajal, and Clément Sanchez*

Supplementary information
Water-Induced Phase Separation forming
Macrostructured Epitaxial Quartz Films on Silicon
Glenna L. Drisko, Adrian Carretero-Genevrier, Martí Gich, Jaume Gàzquez, Djawhar Ferrah,
David Grosso, Cédric Boissière, Juan Rodriguez-Carvajal, and Clément Sanchez
Figure S1. (a) Low and (b) high magnification TEM images showing evidence of a hierarchical meso- macroporous material. The high magnification image is taken around a macropore produced during the phase separation process and reveals fringes that by Fast Fourier Transform (inset in (b)) can be ascribed to a structure with 3.2 nm periodicity in good agreement with the ordered mesoporous silica structures obtained by CTAB. GI-SAXS patterns of (c) 1 mol Si: 0.15 mol CTAB: 0.06 mol Sr2+ and (d) 1 mol Si: 0.15 mol CTAB: 0.00 mol Sr2+ for films prepared at 25 °C and 35 % relative humidity, with a withdrawal rate of 2 mm s-1. Either isotropic orientation or disordered mesostructure appear upon addition of Sr2+ salt.

Figure S2. SEM images of films prepared using a suite of cations: (a) SrCl2, (b) Ca(NO3)2, (c) CeCl3, (d) FeCl2, (e) La(NO3)3, (f) MnCl2. Films were prepared at 25 °C and 40 % relative humidity with a withdrawal rate of 3 mm s-1, with a cation/Si molar ratio of 0.06. The scale is identical for all images. (b) (c)
(e)

Figure S3. FEG-SEM (a) back scatter and (b) secondary electron image of a film produced using 3 mmol CaCl2, 25 °C, 30% RH, CTAB/Si=0.14, 2 mm s-1. Elemental analysis indicating the distribution of (c) Ca (Kα = 3.69 keV), (d) Si (Kα = 1.74 keV) and (e) O (Kα = 0.52 keV).

Figure S4. FEG-SEM (a, e) back scatter and (b, d) secondary electron image of a film produced using 2.6 mmol CeCl3, 25 °C, 30% RH, CTAB/Si=0.14, 3 mm s-1. Elemental analysis indicating the distribution of (c, f) Ce (Mα = 0.88 keV), (g) Si (Kα = 1.74 keV) and (h) O (Kα = 0.52 keV).
(a) (b) (c)
(d) (f)

Figure S5. FEG-SEM (a) back scatter and (b) secondary electron image of a film produced using 3 mmol NaCl, 25 °C, 30% RH, CTAB/Si=0.14, 2 mm s-1. Elemental analysis indicating the distribution of (c) Na (Kα = 1.04 keV), (d) Si (Kα = 1.74 keV) and (e) O (Kα = 0.52 keV).

Figure S6. Quartz crystallization and self-assembly of sintered SrCO3nanoparticles. FEG-SEM images showing the crystallization process of macroporous quartz films and the sintering of spherical SrCO3nanoparticles at different temperatures (a). Room temperature, (b) 900 °C and (c) 1000 °C. (d) Schematic of a hierarchical macroporous/mesoporous film at room temperature showing the homogeneous Sr2+ distribution within the amorphous silica matrix. (e) Sintering of amorphous SrO
spheres of 20-60 nm in diameter and crystallization of α-quartz film at 900 °C . (f) At 1000 °C Sr2+ sinters and forms 100 nm-diameter SrO spherical nanoparticles that are found at both the center and the edge of quartz macroperforations.(g) Low magnification high angle annular dark field (HAADF) Z-contrast cross-sectional image of a macroporous quartz film grown on a Si substrate assisted by Sr2+ catalyst at 900 °C, 5 hours. Notice that strontium which is homogeneously distributed within the quartz matrix, dewets and agglomerates to form spherical amorphous 50 nm-diameter nanopaticles when heated to 900 °C, 5 hours. During this process SrO diffuses through the matrix forming bigger nanoparticles, and leaving behind the particle fingerprint. (h) Low magnification HAADF Z-contrast cross-sectional image of a macroporous quartz film grown on Si substrate assisted by Sr2+ catalyst at 1000 °C during 5 hours. At this stage, the process of sintering drives the assembly of 100 nm-diameter SrO amorphous nanoparticles around and at the center of quartz macroperforations. At the same time the matrix of macroporous quartz film is totally re-crystallized and reconstructed. The SrO is transformed into SrCO3 upon cooling.

Figure S7. Evolution of the mean number of perforations per square millimeter, as a function of processing parameters or solution composition. (a) Change in temperature (1 mmol Sr2+, 4 mm s-
1 withdrawal rate, 40% RH). (b) Change in relative humidity (1 mmol Sr2+, 24 °C, 1 mm s-1
withdrawal rate). (c) Change in withdrawal rate (1 mmol Sr2+, 25 °C, 40% RH). (d) Change in strontium quantity (24 °C, 1 mm s-1 withdrawal rate, 30% RH). (e) Change in CTAB concentration (25 °C, 1 mm s-1 withdrawal rate, 40% RH).
(c)
(a)
(d)
(b)
(e)

Figure S8. Ellipsometric measurement of film thickness with varying withdrawal rate. Films were prepared from a solution containing a molar ratio of 1 Si: 0.14 CTAB: 6.6 H2O: 25 EtOH: 1 HCl at 25 °C and 50 % relative humidity.

Figure S9. SEM images of films prepared using (a) HCl, (b) HBr and (c, d) HNO3 as a proton source. Films were prepared at 25 °C and 40 % relative humidity with a withdrawal rate of 1 mm s-1, CTAB/Si=0.14, and using 1 mmol of Sr(NO3)2.
(a)

Figure S10. SEM images of films (a, b) before and (c, d) after calcination where (a and c) are initial exposure to the electron beam and (b and d) are films aged under the beam for 1 min. In the case of non-calcined films, an organic deposit (indicated with a white arrow) is seen to disappear with exposure to the electron beam (5 kV) and the calcined film does not evolve in the same way. Films were prepared at 26 °C and 38 % relative humidity with a withdrawal rate of 2 mm s-1, using 1.2 mmol of SrCl2 to 16.3 mmol Si(OEt)4. The scale is the same for all images.
Figure S11. SEM images of films prepared using (a) 0.08, (b) 0.10, (c) 0.12, (d) 0.14, (e) 0.18 and (f) 0.35 mol CTAB relative to 1 mol Si. Films were prepared at 25 °C and 40 % relative humidity with a withdrawal rate of 1 mm s-1, using Sr/Si=0.06 molar ratio and Sr(NO3)2 salt.

Figure S12. Spinodal decomposition in a film produced from a solution with the following molar ratio of reagents: 1 Si: 0.14 CTAB: 6.6 H2O: 1 HCl: 0.06 SrCl2. The film was prepared without pre-hydrolyzing silica at 25 °C and 40 % relative humidity with a withdrawal rate of 1 mm s-1.

Figure S13. XPS analysis of Sr 3d spectral region of macroporous films before and after quartz crystallization. XPS analysis shows the presence of strontium at the surface of the film only after crystallization due to the strontium sintering and dewetting at the quartz surface. (a) XPS Sr 3d spectral region in quartz surface showed a shift to higher binding energy consistent with the formation of carbonate oxygen and also Sr(OH)2·8H2O 1 (b) Elemental maps for Sr M-edge around 135 eV and O K-edge around 530 eV acquired from annular dark field (ADF) Z-contrast image of a macroporous α-quartz layer permit the identification of the presence of strontium and oxygen in carbonaceous amorphous nanoparticles.

Figure S14. (a) Low magnification HAADF Z-contrast cross-sectional image of a macroporous quartz film grown on a Si substrate assisted by Sr2+ catalyst. The SrCO3 nanoparticles at the surface appear much brighter and the position of some of these are indicated with red arrow. (b) FEG-SEM 40º-tilted image showing the regular structure over a large area in a macroporous quartz thin film with assembled amorphous strontium located at the center of each macroperforation.

(1) R.P. Vasquez. Journal of electron spectroscopy and related phenomena, 1991, 56, 217.
Video images showing phase separation process in real time


