Embed Size (px)
Citation preview
Chapter 1Warranty Servicing with Imperfect Repair forProducts Sold with a Two-DimensionalWarranty
Bermawi P. Iskandar and Nat Jack
Abstract In this paper, a new servicing strategy with imperfect repair is defined andstudied for the manufacturer of a product sold with a two-dimensional warranty.The strategy is based on a specified region of the warranty defined in terms of ageand usage, with the first failure in the region rectified by an imperfect repair andall other failures being minimally repaired. Product failures are modeled using anaccelerated failure time (AFT) model that allows for the effect of usage rate on itemdegradation.
1.1 Introduction
Manufacturers who sell products with warranties incur the additional costs of ser-vicing any claims made by their customers. These warranty costs depend on fac-tors such as product reliability, warranty terms, usage intensity, operating environ-ment, and servicing logistics. They can vary between 2 to 10% of product saleprice depending on the product and manufacturer and details can be found in theweekly newsletter “Warranty Week” (http://www.warrantyweek.com/). The annualwarranty costs for large companies (such as automobile and computer manufactur-ers) sometimes run into billions of dollars. Consequently, methods for reducing war-ranty costs are of great interest to manufacturers. Three possible ways of achievinga reduction in costs are to improve product reliability, use preventive maintenance,and use an effective warranty servicing strategy (Yun et al. [35]).
Bermawi P. Iskandar (B)Bandung Institute of Technology, Department of Industrial Engineering, Jalan Ganesa 10, Ban-dung, Indonesia 40132e-mail: [email protected]
Nat JackUniversity of Abertay Dundee, Dundee Business School, Dundee DD1 1HG, UKe-mail: [email protected]
1
2 Bermawi P. Iskandar and Nat Jack
In the case of a repairable product, a manufacturer has the choice of repairing orreplacing the failed item (component, module, assembly or product) by a new one.Murthy and Jack [27] review the different repair-replace strategies that have beenproposed for products sold with one-dimensional warranties. If the replacement costis very high compared to the cost of a repair, then a servicing strategy involvingreplacement is not economical. As a result, a servicing strategy with imperfect repair(which improves the reliability of the repaired item) instead of a replacement ismore economical. Yun et al. [35] have studied several servicing strategies involvingimperfect repair for items sold with a one dimensional warranty.
With a two-dimensional warranty, the effect of age and usage on product degrada-tion and failure needs to be modeled. The usage can be the output (copies producedfor a photocopier), distance traveled (kilometers for an automobile), or the numberof times or hours the product has been used (takeoffs and landings or the total hoursflown for an aircraft). Three different approaches have been proposed to model fail-ures involving age and usage. These are discussed in the next section where wealso review the literature on servicing strategies involving options such as minimalrepair, imperfect repair, and replacement for products sold with two-dimensionalwarranties. We then study a servicing strategy with an imperfect repair using a newmodel formulation which is more appropriate for these types of warranty.
The outline of the paper is as follows. In Section 2 we give the details of themodel formulation. The strategy with imperfect repair depends on the usage rateand is characterized by three parameters. Section 3 deals with the analysis of themodel to optimally select the three parameter values which depend on the usagerate. Two of the parameter values define a two-dimensional region where imperfectrepair is carried out and the third value defines the degree of imperfect repair thatshould be used. Section 4 looks at the case where the item has a Weibull failuredistribution and we illustrate with a numerical example. Finally, we conclude witha brief discussion of topics for future research in Section 5.
1.2 Model Formulation
The following notation is used to model the new servicing strategy with imperfectrepair.
Notation
W,U Parameters of the 2-dimensional warranty policyx Item ageu Total item usageY Usage rate (random variable)y0 Nominal usage rate used in product design
1 Imperfect Repair for Products Sold with a Two-Dimensional Warranty 3
F0(x;α0) Failure distribution function with nominal design usage rate y0 andscale parameter α0
F(x;α(y)) Conditional failure distribution function given that the usage rate isY = y
f (x;α(y)) Density function associated with F(x;α(y))F(x;α(y)) Survivor function associated with F(x;α(y))h(x;α(y)) Hazard rate associated with F(x;α(y))H(x;α(y)) Cumulative hazard function associated with F(x;α(y))α(y) Scale parameter with usage rate y (≡ (y0/y)γ α0)γ Parameter of the accelerated failure time (AFT) model (≥ 1)Ky,Ly Parameters of the warranty servicing strategy under usage rate yWy Age of the item at the expiry of the warranty under usage rate yλ (·) Base failure intensity functionλy(·) Failure intensity function under usage rate yδy(·) Proportional hazard rate reduction for an imperfect repair under us-
age rate y (0≤ δy ≤ 1)Cm Cost of a minimal repairC0 Cost of an imperfect repair that achieves a 100% reduction in the
hazard rateCi(δy) Cost of an imperfect repair under usage rate yJ(Ky,Ly,δy) Expected warranty servicing cost under usage rate y
1.2.1 Approaches to Modeling Failures
Three approaches can be used to modeling failures for products sold with two-dimensional warranties.
Approach 1
The time to first failure is modeled by a bivariate distribution function F(x,u). Iffailed items are replaced by new ones and replacement times are negligible, thenfailures over the warranty region occur according to a two-dimensional renewal pro-cess (Hunter [11]). The modeling of failures with repair instead of replacement isstill an active area of research (see Baik et al. [2], [3] and Murthy et al. [30]). Murthyet al. [29], Kim and Rao [20], Yang and Nachlas [33], Pal and Murthy [32], and Jungand Bai [19] have used this approach for the cost analysis of two-dimensional war-ranty policies.
4 Bermawi P. Iskandar and Nat Jack
Approach 2
The two measurement scales (age and usage) are combined to provide a single com-posite scale z (z = ax + bu is an illustrative example) and failures are modeled as acounting process using this composite scale. Kordonsky and Gertsbakh [21], [22],[23] discuss this method in a reliability context and Gertsbakh and Kordonsky [10]use it in a warranty context. For a more detailed discussion of the method and vari-ous related issues, see Duschesne and Lawless [9].
Approach 3
The usage rate Y is assumed to vary from customer to customer but is constant fora given customer. The random variable Y has density function g(u), 0 ≤ u < ∞.Conditional on Y = y, the total usage u at age x is given by
u = yx. (1.1)
For a given usage rate y, the conditional hazard (failure rate) function for the timeto first failure is given by h(x;y)≥ 0 which is a non-decreasing function of the itemage x and y. Failures over time are modeled by a counting process. If failed itemsare replaced by new ones, then this counting process is a renewal process associ-ated with the conditional distribution F(x;y) which can be derived from h(x;y). Iffailed items are repaired then the counting process is characterized by a conditionalintensity function λy(x) which is a non-decreasing function of x and y. If all re-pairs are ’minimal’ (Barlow and Hunter [4]) and repair times are negligible, thenλy(x) = h(x;y).
Murthy and Wilson [28], Iskandar et al. [14], Moskowitz and Chun [26], andChun and Tang [7] assume λy(x) to be a linear function of age and usage to buildmodels for warranty cost analysis.
Lawless et al. [25] use a different method, utilizing concepts from the acceler-ated failure time and proportional hazards models (see Lawless [24] and Blischkeand Murthy [5]) to model the effect of usage rate on reliability. A variation of thismethod is used in this paper.
1.2.2 Modeling First Failure
We consider a product consisting of several interconnected components whose reli-ability is a function of the component reliabilities. During its design, decisions aremade about the component reliabilities in order to ensure that the product has thedesired reliability at some nominal usage rate y0. When the actual usage rate is dif-ferent from this nominal value, some of the component reliabilities can be affectedand this in turn affects the product reliability. As the usage rate increases above
1 Imperfect Repair for Products Sold with a Two-Dimensional Warranty 5
the nominal value, the rate of degradation increases and this, in turn, acceleratesthe time to failure. Consequently, the product reliability decreases [increases] as theusage rate increases [decreases].
The effect of usage rate on degradation can be modeled using an acceleratedfailure time (AFT) model (see Nelson [31], Blischke and Murthy [5]). With theAFT formulation, if T0 [Ty] denotes the time to first failure under usage rate y0 [y],then we have
Ty
T0=
(y0
y
)γ. (1.2)
If F0(x,α0) is the distribution function for T0 where α0 is the scale parameter, thenthe distribution function for Ty is the same as that for T0 but with scale parametergiven by
α(y) =(
y0
y
)γα0, (1.3)
with γ ≥ 1. Hence, we have
F(x,α(y)) = F0(y/y0γ x;α0). (1.4)
The hazard and the cumulative hazard functions associated with F(x,α(y)) aregiven by
h(x,α(y)) = f (x;α(y))/F(x;α(y)), (1.5)
andH(x,α(y)) =
∫ x
0h(x′;α(y))dx′, (1.6)
where f (x;α(y)) is the associated density function.
1.2.3 Modeling Subsequent Failures
Subsequent failures depend on the type of action taken to rectify a failed item. For arepairable product, the subsequent failures depend on the type of repair carried out.If this is a minimal repair, the reliability of the product after repair is the same asthat just before failure. An imperfect repair (see Doyen and Gaudoin [8]) improvesthe reliability of the product, but it is still inferior to that of a new item.
If the failed product is always minimally repaired and repair times are negligible(relative to the mean time between failures) and so can be ignored, then failures overtime occur according to a non-homogeneous Poisson process (NHPP). The failureintensity function has the same form as the hazard rate for time to first failure so, ifthe product has usage rate y, the intensity function is
λy(x) = h(x;α(y)), (1.7)
6 Bermawi P. Iskandar and Nat Jack
where h(x;α(y)) is the hazard function given by (1.5). The hazard rate for the prod-uct lifetime after a minimal repair is the same as that before failure.
In contrast, an imperfect repair improves the product’s reliability and the hazardrate after a repair is smaller. We model this as follows. For a given usage rate y, if afailure occurring at age x is rectified by an imperfect repair, then the hazard rate forthe product lifetime after a repair, h(x+;α(y)) is given by
h(x+;α(y)) = h(x−;α(y))−δy
h(x−;α(y))−h(0;α(y))
, (1.8)
where h(x−;α(y)) is the hazard rate just before failure. Imperfect repair times arealso assumed to be negligible and so can be ignored.
1.2.4 Warranty Policy and Coverage
The product is sold with a two-dimensional warranty with warranty region Ω , therectangle [0,W )× [0,U), where W is the time limit and U the usage limit. Thewarranty ceases at the first instance when the age of the item reaches W or its usagereaches U , whichever occurs first. If the usage rate y is at most U/W , then thewarranty expires at age W and an estimate of the total usage is yW . When y is greaterthan U/W , the warranty expires at age U/y when the usage limit U is reached. IfWy denotes the warranty expiry time when the usage rate is y then
Wy =
W, if y≤U/W,U/y, if y > U/W.
(1.9)
All failures are rectified by the manufacturer at no cost to the customer until timeWy.
1.2.5 Warranty Servicing Strategies
For one-dimensional warranties with time limit W , Jack and van der Duyn Schouten[16] made the conjecture that the optimal servicing strategy is characterized by threedistinct intervals, [0,K), [K,L), and [L,W ). During the first and last intervals, min-imal repairs are carried out and, during the middle interval, either minimal repairor replacement by a new item is used, depending on the age of the item at failure.This conjecture was proved to be true by Jiang et al. [18]. Unfortunately, the op-timal strategy is difficult to implement, and Jack and Murthy [15] proposed a nearoptimal strategy involving the same three intervals but with only the first failure inthe middle interval resulting in a replacement and all other failures being minimallyrepaired. If the cost of an item replacement is very high compared to the cost of aminimal repair, then replacement in the middle interval is not appropriate. In thiscase, performing a ’better than minimal’ repair in this interval can be a better op-
1 Imperfect Repair for Products Sold with a Two-Dimensional Warranty 7
tion. Two servicing strategies involving imperfect repair for products sold with aone dimensional warranty have been studied by Yun et al. [35].
There is a limited literature on repair-replacement strategies for products soldwith two-dimensional warranties. Iskandar and Murthy [12] and Iskandar et al. [13]study two different servicing strategies using Approach 3 to model failures. In eachcase, the optimal strategy is characterized by three disjoint sub-regions Ω1,Ω2, andΩ3. Chukova and Johnston [6] consider strategies involving a choice between min-imal and complete repair. Yun and Kang [34] extend one of the imperfect repairstrategies studied by Yun et al. [35] to the case of a two dimensional warranty. Jacket al. [17] study a repair-replacement strategy where the middle sub-region Ω2 (inwhich the first failure to occur results in replacement) is defined in term of age andusage, and is not restricted to the shape considered by Iskandar et al. [13] and Yunand Kang [34]. In this paper, we discuss a servicing strategy involving imperfectrepair where the middle region is similar to that defined in Jack et al. [17].
1.2.6 A New Servicing Strategy for 2-D Warranties
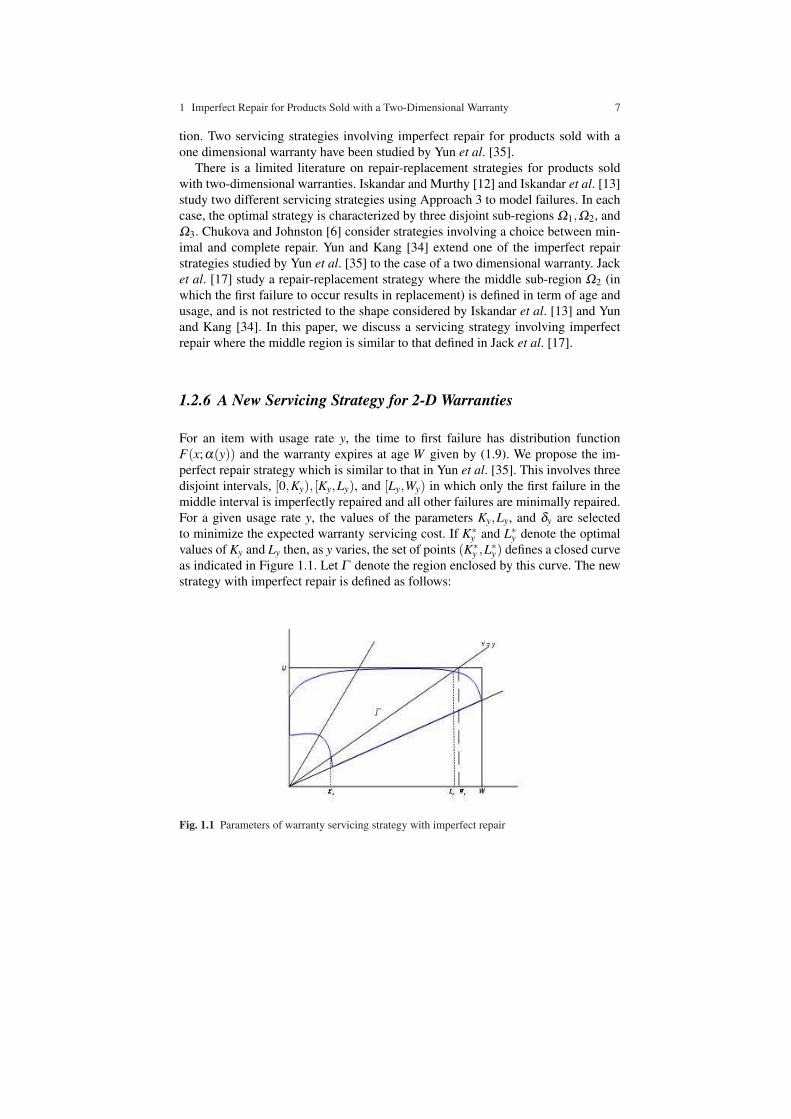
For an item with usage rate y, the time to first failure has distribution functionF(x;α(y)) and the warranty expires at age W given by (1.9). We propose the im-perfect repair strategy which is similar to that in Yun et al. [35]. This involves threedisjoint intervals, [0,Ky), [Ky,Ly), and [Ly,Wy) in which only the first failure in themiddle interval is imperfectly repaired and all other failures are minimally repaired.For a given usage rate y, the values of the parameters Ky,Ly, and δy are selectedto minimize the expected warranty servicing cost. If K∗
y and L∗y denote the optimalvalues of Ky and Ly then, as y varies, the set of points (K∗
y ,L∗y) defines a closed curveas indicated in Figure 1.1. Let Γ denote the region enclosed by this curve. The newstrategy with imperfect repair is defined as follows:
Fig. 1.1 Parameters of warranty servicing strategy with imperfect repair
8 Bermawi P. Iskandar and Nat Jack
For an item sold with a two-dimensional warranty, perform an imperfect repairat the first failure in the region Γ and repair all other failures through minimalrepair.
The region Γ depends on the type of model used for item failures and on the costof each minimal repair and imperfect repair. As in Yun et al. [6], we assume thatCi(δy) = Cm +Dδ p
y with p > 1 and D = C0−Cm, so the cost of an imperfect repairlies between Cm (when δy = 0) and C0 (when δy = 1).
1.3 Model Analysis and Optimization
1.3.1 Expected Warranty Servicing Cost
If the item has usage rate y, then the warranty expires after time Wy. An expres-sion for J(Ky,Ly,δy), the expected warranty servicing cost under the new servicingstrategy with imperfect repair, is obtained as follows:
Minimal repairs are carried out during the interval [0,Ky), so the expected repaircost for this period is
Cm
∫ Ky
0h(t;α(y))dt = CmH(Ky;α(y)). (1.10)
The expected cost for the remaining interval [Ky,Wy) depends on whether the firstfailure after Ky occurs in [Ky,Ly) or not. If X denotes the time at which the firstfailure occurs after Ky and X lies the interval [Ky,Ly), then this failure is imperfectlyrepaired and failures over the interval [x,Wy) occur according to an NHPP withintensity function
λy(t) = h(t;α(y))−δy (h(x;α(y))−h(0;α(y))) . (1.11)
The expected repair cost for the remainder of the warranty period, conditional onX = x, is
Ci(δy)+Cm
∫ Wy
x[h(t;α(y))−δy (h(x;α(y))−h(0;α(y)))]dt
= Ci(δy)+Cm [H(Wy;α(y))−H(x,α(y))−δy(Wy− x)(h(x;α(y))−h(0;α(y)))] .(1.12)
If X lies beyond Ly, then this failure and all remaining failures over the remainderof the warranty period are minimally repaired. The conditional expected repair costfor the interval [Ly,Wy) is
1 Imperfect Repair for Products Sold with a Two-Dimensional Warranty 9
Cm
∫ Wy
Ly
h(t;α(y))dt = Cm [H(Wy;α(y))−H(Ly,α(y))] . (1.13)
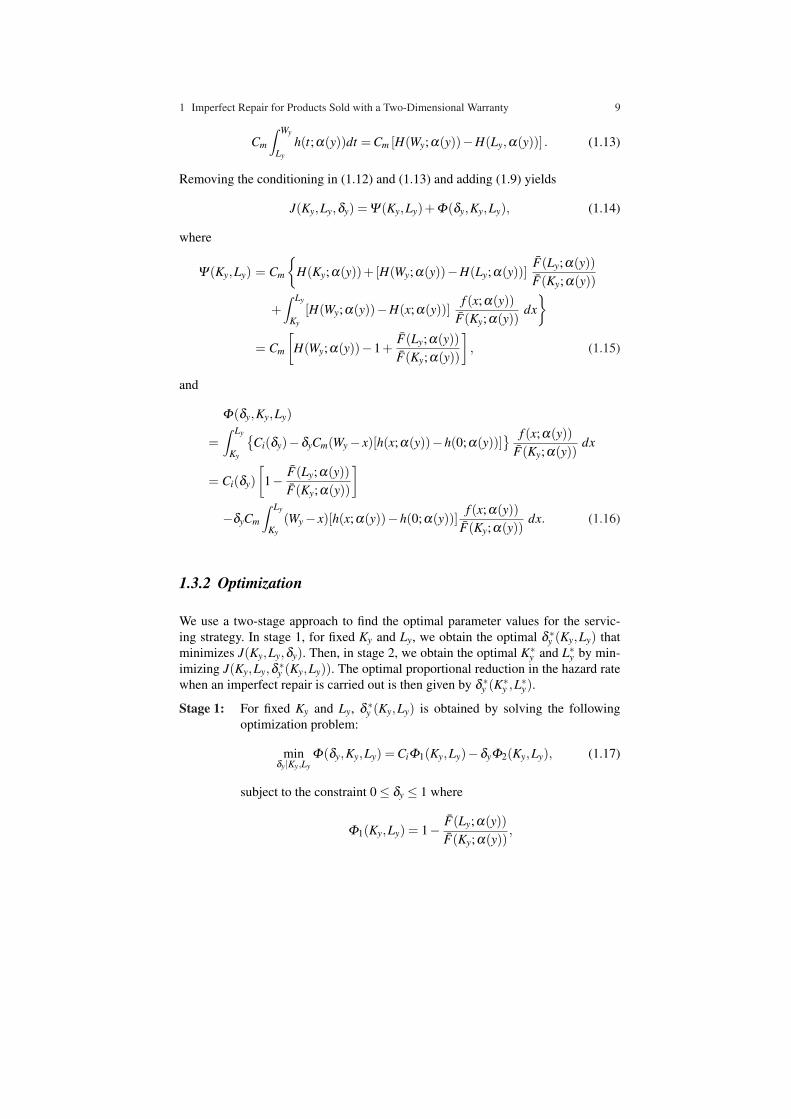
Removing the conditioning in (1.12) and (1.13) and adding (1.9) yields
J(Ky,Ly,δy) = Ψ(Ky,Ly)+Φ(δy,Ky,Ly), (1.14)
where
Ψ(Ky,Ly) = Cm
H(Ky;α(y))+ [H(Wy;α(y))−H(Ly;α(y))]
F(Ly;α(y))F(Ky;α(y))
+∫ Ly
Ky
[H(Wy;α(y))−H(x;α(y))]f (x;α(y))
F(Ky;α(y))dx
= Cm
[H(Wy;α(y))−1+
F(Ly;α(y))F(Ky;α(y))
], (1.15)
and
Φ(δy,Ky,Ly)
=∫ Ly
Ky
Ci(δy)−δyCm(Wy− x)[h(x;α(y))−h(0;α(y))]
f (x;α(y))F(Ky;α(y))
dx
= Ci(δy)[
1− F(Ly;α(y))F(Ky;α(y))
]
−δyCm
∫ Ly
Ky
(Wy− x)[h(x;α(y))−h(0;α(y))]f (x;α(y))
F(Ky;α(y))dx. (1.16)
1.3.2 Optimization
We use a two-stage approach to find the optimal parameter values for the servic-ing strategy. In stage 1, for fixed Ky and Ly, we obtain the optimal δ ∗y (Ky,Ly) thatminimizes J(Ky,Ly,δy). Then, in stage 2, we obtain the optimal K∗
y and L∗y by min-imizing J(Ky,Ly,δ ∗y (Ky,Ly)). The optimal proportional reduction in the hazard ratewhen an imperfect repair is carried out is then given by δ ∗y (K∗
y ,L∗y).
Stage 1: For fixed Ky and Ly, δ ∗y (Ky,Ly) is obtained by solving the followingoptimization problem:
minδy|Ky,Ly
Φ(δy,Ky,Ly) = CiΦ1(Ky,Ly)−δyΦ2(Ky,Ly), (1.17)
subject to the constraint 0≤ δy ≤ 1 where
Φ1(Ky,Ly) = 1− F(Ly;α(y))F(Ky;α(y))
,
10 Bermawi P. Iskandar and Nat Jack
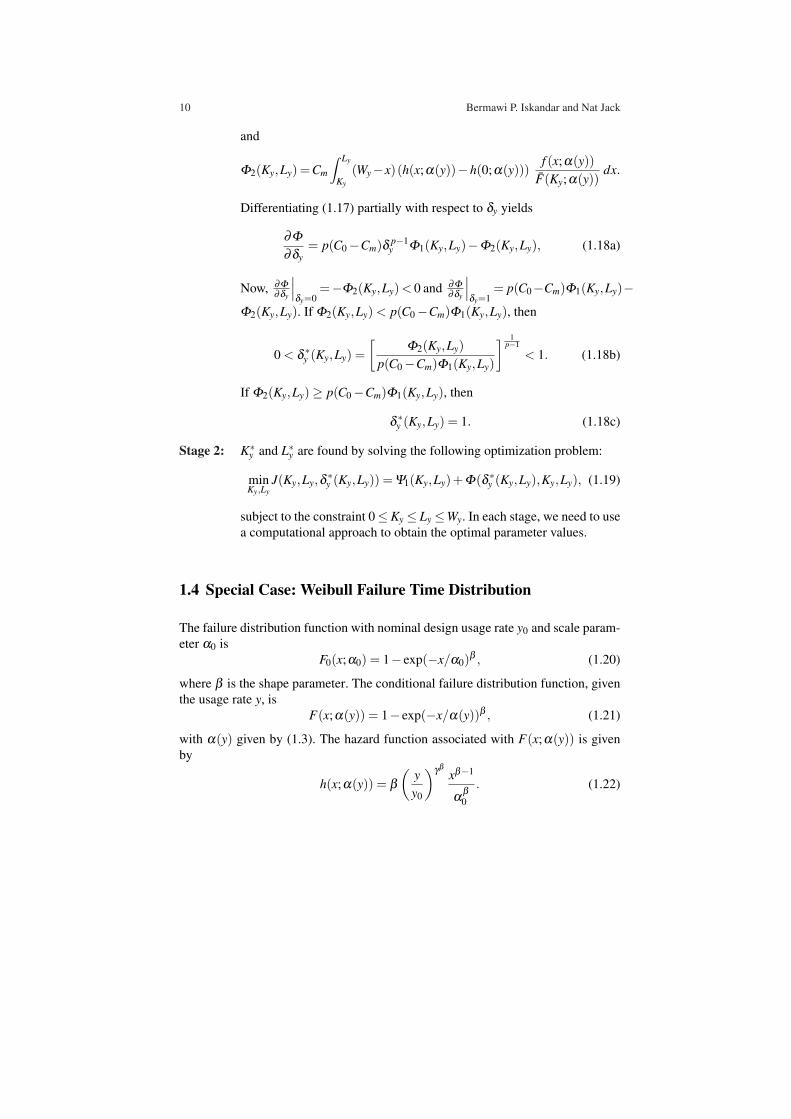
and
Φ2(Ky,Ly) =Cm
∫ Ly
Ky
(Wy−x)(h(x;α(y))−h(0;α(y)))f (x;α(y))
F(Ky;α(y))dx.
Differentiating (1.17) partially with respect to δy yields
∂Φ∂δy
= p(C0−Cm)δ p−1y Φ1(Ky,Ly)−Φ2(Ky,Ly), (1.18a)
Now, ∂Φ∂δy
∣∣∣δy=0
=−Φ2(Ky,Ly)< 0 and ∂Φ∂δy
∣∣∣δy=1
= p(C0−Cm)Φ1(Ky,Ly)−Φ2(Ky,Ly). If Φ2(Ky,Ly) < p(C0−Cm)Φ1(Ky,Ly), then
0 < δ ∗y (Ky,Ly) =[
Φ2(Ky,Ly)p(C0−Cm)Φ1(Ky,Ly)
] 1p−1
< 1. (1.18b)
If Φ2(Ky,Ly)≥ p(C0−Cm)Φ1(Ky,Ly), then
δ ∗y (Ky,Ly) = 1. (1.18c)
Stage 2: K∗y and L∗y are found by solving the following optimization problem:
minKy,Ly
J(Ky,Ly,δ ∗y (Ky,Ly)) = Ψ1(Ky,Ly)+Φ(δ ∗y (Ky,Ly),Ky,Ly), (1.19)
subject to the constraint 0≤Ky ≤ Ly ≤Wy. In each stage, we need to usea computational approach to obtain the optimal parameter values.
1.4 Special Case: Weibull Failure Time Distribution
The failure distribution function with nominal design usage rate y0 and scale param-eter α0 is
F0(x;α0) = 1− exp(−x/α0)β , (1.20)
where β is the shape parameter. The conditional failure distribution function, giventhe usage rate y, is
F(x;α(y)) = 1− exp(−x/α(y))β , (1.21)
with α(y) given by (1.3). The hazard function associated with F(x;α(y)) is givenby
h(x;α(y)) = β(
yy0
)γβxβ−1
αβ0
. (1.22)
1 Imperfect Repair for Products Sold with a Two-Dimensional Warranty 11
1.4.1 Numerical Example
Let the parameter values be as follows:
Warranty Policy W = 2 (years) and U = 2(×104 Km), so U/W = 1Design Reliability (×104 Km per year), α0 = 1 (year) and β = 2AFT Model γ = 2
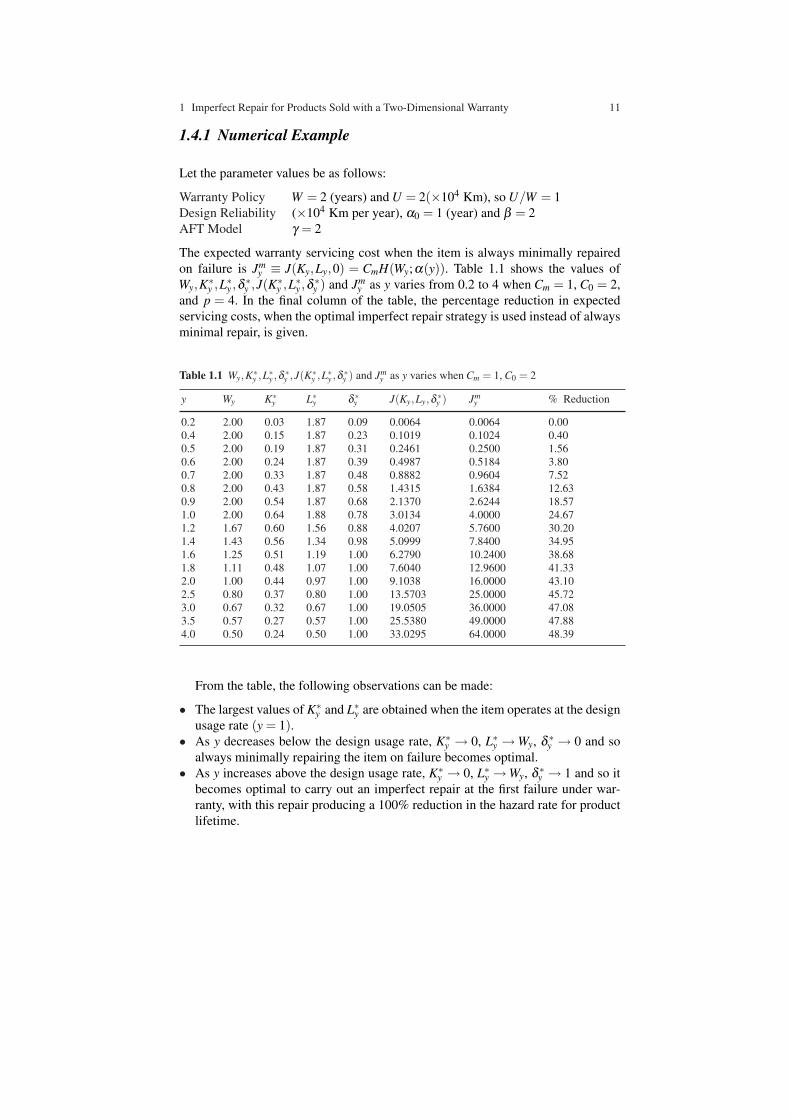
The expected warranty servicing cost when the item is always minimally repairedon failure is Jm
y ≡ J(Ky,Ly,0) = CmH(Wy;α(y)). Table 1.1 shows the values ofWy,K∗
y ,L∗y ,δ ∗y ,J(K∗y ,L∗y ,δ ∗y ) and Jm
y as y varies from 0.2 to 4 when Cm = 1, C0 = 2,and p = 4. In the final column of the table, the percentage reduction in expectedservicing costs, when the optimal imperfect repair strategy is used instead of alwaysminimal repair, is given.
Table 1.1 Wy,K∗y ,L∗y ,δ ∗y ,J(K∗
y ,L∗y ,δ ∗y ) and Jmy as y varies when Cm = 1, C0 = 2
y Wy K∗y L∗y δ ∗y J(Ky,Ly,δ ∗y ) Jm
y % Reduction
0.2 2.00 0.03 1.87 0.09 0.0064 0.0064 0.000.4 2.00 0.15 1.87 0.23 0.1019 0.1024 0.400.5 2.00 0.19 1.87 0.31 0.2461 0.2500 1.560.6 2.00 0.24 1.87 0.39 0.4987 0.5184 3.800.7 2.00 0.33 1.87 0.48 0.8882 0.9604 7.520.8 2.00 0.43 1.87 0.58 1.4315 1.6384 12.630.9 2.00 0.54 1.87 0.68 2.1370 2.6244 18.571.0 2.00 0.64 1.88 0.78 3.0134 4.0000 24.671.2 1.67 0.60 1.56 0.88 4.0207 5.7600 30.201.4 1.43 0.56 1.34 0.98 5.0999 7.8400 34.951.6 1.25 0.51 1.19 1.00 6.2790 10.2400 38.681.8 1.11 0.48 1.07 1.00 7.6040 12.9600 41.332.0 1.00 0.44 0.97 1.00 9.1038 16.0000 43.102.5 0.80 0.37 0.80 1.00 13.5703 25.0000 45.723.0 0.67 0.32 0.67 1.00 19.0505 36.0000 47.083.5 0.57 0.27 0.57 1.00 25.5380 49.0000 47.884.0 0.50 0.24 0.50 1.00 33.0295 64.0000 48.39
From the table, the following observations can be made:
• The largest values of K∗y and L∗y are obtained when the item operates at the design
usage rate (y = 1).• As y decreases below the design usage rate, K∗
y → 0, L∗y →Wy, δ ∗y → 0 and soalways minimally repairing the item on failure becomes optimal.
• As y increases above the design usage rate, K∗y → 0, L∗y →Wy, δ ∗y → 1 and so it
becomes optimal to carry out an imperfect repair at the first failure under war-ranty, with this repair producing a 100% reduction in the hazard rate for productlifetime.
12 Bermawi P. Iskandar and Nat Jack
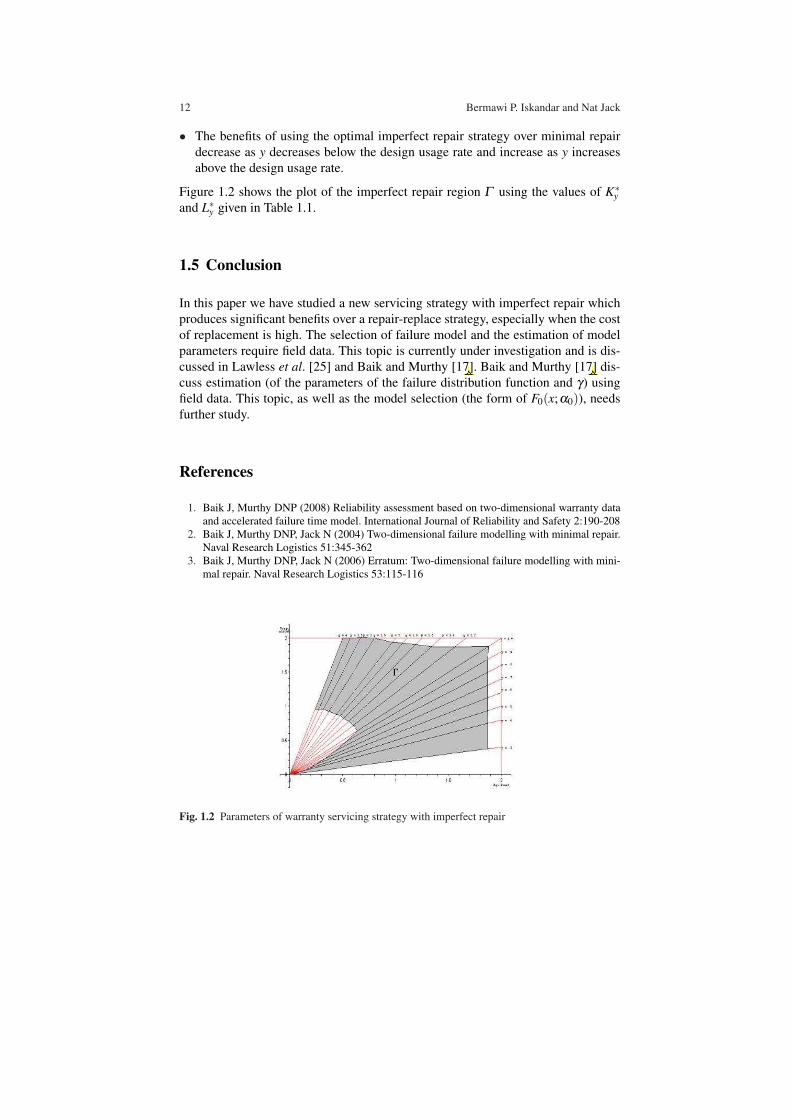
• The benefits of using the optimal imperfect repair strategy over minimal repairdecrease as y decreases below the design usage rate and increase as y increasesabove the design usage rate.
Figure 1.2 shows the plot of the imperfect repair region Γ using the values of K∗y
and L∗y given in Table 1.1.
1.5 Conclusion
In this paper we have studied a new servicing strategy with imperfect repair whichproduces significant benefits over a repair-replace strategy, especially when the costof replacement is high. The selection of failure model and the estimation of modelparameters require field data. This topic is currently under investigation and is dis-cussed in Lawless et al. [25] and Baik and Murthy [17]. Baik and Murthy [17] dis-cuss estimation (of the parameters of the failure distribution function and γ) usingfield data. This topic, as well as the model selection (the form of F0(x;α0)), needsfurther study.
References
1. Baik J, Murthy DNP (2008) Reliability assessment based on two-dimensional warranty dataand accelerated failure time model. International Journal of Reliability and Safety 2:190-208
2. Baik J, Murthy DNP, Jack N (2004) Two-dimensional failure modelling with minimal repair.Naval Research Logistics 51:345-362
3. Baik J, Murthy DNP, Jack N (2006) Erratum: Two-dimensional failure modelling with mini-mal repair. Naval Research Logistics 53:115-116
Fig. 1.2 Parameters of warranty servicing strategy with imperfect repair
1 Imperfect Repair for Products Sold with a Two-Dimensional Warranty 13
4. Barlow RE, Hunter L (1960) Optimal preventive maintenance policies. Operations Research8:90-100
5. Blischke WR, Murthy DNP (2000) Reliability: modeling, prediction, and optimisation. Wiley,New York
6. Chukova S, Johnston MR (2006) Two-dimensional warranty repair strategy based on minimaland complete repairs. Mathematical and Computer Modelling 44:1133-1143
7. Chun YH, Tang K (1999) Cost analysis of two-attribute policies based on the product usagerate. IEEE Transactions on Engineering Management 46:201-209
8. Doyen L, Gaudoin O (2004) Classes of imperfect repair models based on reduction of failureintensity or virtual age. Reliability Engineering and System Safety 84:45-56
9. Duchesne T, Lawless JF (2000) Alternative time scales and failure time models. LifetimeData Analysis 6:157-179
10. Gertsbakh IB, Kordonsky KB (1998) Parallel time scales and two-dimensional manufacturerand individual customer warranties. IIE Transactions 30:1181-1189
11. Hunter JJ (1974) Renewal theory in two dimensions: basic results. Advances in Applied Prob-ability 6:376-391
12. Iskandar BP, Murthy DNP (2003) Repair-replace strategies for two-dimensional warrantypolicies. Mathematical and Computer Modelling 38:1233-1241
13. Iskandar BP, Murthy DNP, Jack N (2005) A new repair-replace strategy for items sold with atwo-dimensional warranty. Computers and Operations Research 32:669-682
14. Iskandar BP, Wilson RJ, Murthy DNP (1994) Two-dimensional combination warranty poli-cies. RAIRO Operational Research 28:57-75.
15. Jack N, Murthy DNP (2001) A servicing strategy for items sold under warranty. Journal ofthe Operational Research Society 52:1284-1288
16. Jack N, Van der Duyn Schouten F (2000) Optimal repair-replace strategies for a warrantedproduct. International Journal of Production Economics 67:95-100
17. Jack, N, Iskandar BP, Murthy DNP (2008) A new repair-replace strategy based on usagerate for items sold with a two-dimensional warranty. Submitted for publication in ReliabilityEngineering and Systems Safety
18. Jiang X, Jardine AKS, Lugitigheid D (2006) On a conjecture of optimal repair-replacementstrategies for warranted products. Mathematical and Computer Modelling 44:963-972
19. Jung M, Bai DS (2007) Analysis of field data under two-dimensional warranty. ReliabilityEngineering and System Safety 92:135-143
20. Kim HG, Rao BM (2000) Expected warranty cost of two-attribute free-replacement war-ranties based on a bivariate exponential distribution. Computers and Industrial Engineering38:425-434
21. Kordonsky KB, Gertsbakh I (1993) Choice of the best time scale for system reliability anal-ysis. European Journal of Operational Research 65:235-246
22. Kordonsky KB, Gertsbakh I (1995) System state monitoring and lifetime scales - I. ReliabilityEngineering and System Safety 47:1-14
23. Kordonsky KB, Gertsbakh I (1995) System state monitoring and lifetime scales - II. Reliabil-ity Engineering and System Safety 49:145-154
24. Lawless J (1982) Statistical models and methods for lifetime data. Wiley, New York25. Lawless J, Hu J, Cao J (1995) Methods for estimation of failure distributions and rates from
automobile warranty data. Lifetime Data Analysis 1:227-24026. Moskowitz H, Chun YH (1994) A Poisson regression model for two-attribute warranty policy.
Naval Research Logistics 41:355-37627. Murthy DNP, Jack N (2007) Warranty servicing. In: Ruggeri F, Faltin F, Kenett R (eds) En-
cyclopedia of Statistics in Quality and Reliability, John Wiley and Sons, Chichester28. Murthy DNP, Wilson RJ (1991) Modelling two-dimensional warranties. Proceedings of the
Fifth International Symposium on Applied Stochastic Models and Data Analysis, Granada,Spain 481-492
29. Murthy DNP, Iskandar BP, Wilson RJ (1995) Two-dimensional failure free warranties: two-dimensional point process models. Operations Research 43:356-366
14 Bermawi P. Iskandar and Nat Jack
30. Murthy DNP, Baik J, Wilson RJ, Bulmer M (2006) Two-dimensional failure modelling.Springer Handbook of Engineering Statistics 97-112
31. Nelson W (1982) Applied life data analysis. Wiley, New York32. Pal S, Murthy GSR (2003) An application of Gumbel’s bivariate exponential distribution in
estimation of warranty cost of motor cycles. International Journal of Quality and ReliabilityManagement 20:488-502
33. Yang SC, Nachlas JA (2001) Bivariate reliability and availability modelling. IEEE Transac-tions on Reliability 50:26-35
34. Yun W-Y, and Kang, KM (2007) Imperfect repair policies under two-dimensional warranty.Journal of Risk and Reliability 221:239-247
35. Yun W-Y, Murthy DNP, and Jack N (2008) Warranty servicing with imperfect repair. Interna-tional Journal of Production Economics 111:159-169


