Embed Size (px)
Citation preview

Wachusett Regional High School
Honors Science Project Manual
1
The Science Project Introduction, Expectations & Ethics One requirement of all honors level science courses at WRHS is a yearlong science project. In this project you will complete an original science experiment (outside of class) and then present it to the class. The Scientific Method will be used to guide your original work. The experimentation portion of this project is essential and your innate curiosity and ingenuity will allow you to produce high quality, creative, independent work.
It is expected that all work is the student’s original work. If for any reason, there is suspicion that a student fabricated data or plagiarized material the student’s work will be reviewed by a Science Academic Integrity Review Committee made up of teachers and administrators. If the student is found to have misrepresented his/her work he/she will receive a grade of zero, lose honors credit, and parents and administration will be notified. Upon submission of Research Paper students will formally acknowledge that all work is their own, and no data is falsified.
All students in Honors Freshman Physics, Honors Biology, and Honors Chemistry are expected to carry out an inquiry-based, hypothesis-driven research project answering an original, novel question. All projects are due in completion at the start of class on the Monday before April Vacation. Projects will be accepted early at the discretion of the teacher. NO LATE PROJECTS WILL BE ACCEPTED All aspects of the project need to be handed in on time, or the grade for the project is a zero, and the student loses Honors credit. Note that the project grade is 50% of the term 4 class grade. The ‘project’ includes:
• Project Notebook to include all literature search notes, quantitative and qualitative data, data analysis, etc (A more complete list is given in this manual)
• Printed out Internet sources
• Pictures of student working on data collection
• 2 copies of the Abstract
• 2 copies of the Research Paper
• Project Display Board
• A submitted electronic copy for checking plagiarism This project aligns with the mission of the high school and addresses several of the expectations for student learning. WRHS Mission Statement Wachusett Regional High School is committed to an educational process that fosters independence and responsibility in our students. By offering diverse, challenging academic programs and rich co-curricular activities, Wachusett Regional High School strives to provide students with the skills and knowledge to achieve their potential as life-long learners. Core Values
• Critical Thinking/Problem Solving • Creativity/Innovation • Citizenship/Responsibility • Communication • Collaboration
Student Learning Expectations Students will . . .
• exercise responsible citizenship • communicate effectively • think critically and solve problems • think creatively • collaborate and learn actively • use technology effectively
Required Project Type Science Projects generally fall under two categories:
1. Informational (or display)-this type is of the elementary/jr. high variety: not all that much different from a simple research report. For example, “The Solar System”, or “The Mechanical Advantage of a Class 3 Lever System”. These types of reports are NOT acceptable!
2. Hypothesis-driven, inquiry-based, research project - this is the type of report where you state a problem from documented
observations, propose a hypothesis, gather evidence through carefully-organized, thoughtfully-designed, well-documented experiments (that are intended to gather quantitative as well as qualitative data), analyze and report results logically, using acceptable mathematical and statistical techniques, draw conclusions, and propose follow-up experiments. For example, “The Effect of Ultrasonic Waves Towards the Disruption of Air Flow and Turbulence On the Exterior of an Aerodynamic Surface” or “The Effect of Simulated Acid Rain on Lettuce Plants.”
You will need many people, equipment, documents, and qualities and skills to successfully complete this yearlong project. Many of them (but not all) are listed below. It is vitally important that you seek out the type of help that will get you to the next step of your project. If you are stalled for more than a week on any section and/or exhausted the items in the toolbox see your teacher immediately. Document the experience in your journal!
2
Where can you get help? Faculty Starting a dialog with your classroom teacher is a good first step. Next, consider meeting the media specialist at the onset of your research. Many teachers & staff have hidden hobbies and talents that will help you navigate your project. It is important for you to get networked with the experts in your field to find a solution or direction. Ask your teacher whom you should contact. E.U.R.E.K.A. Eureka (Encouraging Underclassmen to Research and Experiment to Know All) is a mentoring program that started in the 2004-2005 school year. Every morning before school freshman and sophomores can get help from Juniors and Seniors in room D115. The upperclassmen have extensive experience in doing all types of projects. They have learned well from their mistakes and will help you to avoid common pitfalls. They give advice on project ideas and experimental designs. They help with science fair forms, statistical analyses, and troubleshooting. They will teach you how to use the Vernier Probes and show you how to transfer necessary programs. If asked they are usually willing to help with homework or test review. They will give feedback on project presentation, and help edit your final paper. Be sure you take advantage of this program. Volunteer Teachers & Graduate Students A few generous retired teachers and several graduate students form UMass volunteer their time and talent specifically to help with yearlong honor projects. They have a wealth of knowledge and expertise. They can be found in the project room a few days a week to help you with technique and protocol. They will help with other aspects of your project if you ask. Science Seminar Science Seminar is a program that was established in 1959 to add another dimension to the learning of science at our high school. The faculty of Science Seminar are working scientists in the greater Wachusett/Worcester area. Meetings are held EVERY TUESDAY evening from 7:00-9:00. During the first hour a speaker talks to Seminar students about research in which they are actively engaged. These speakers cover all areas of science. During the second hour the faculty work with the students on their projects. These advisors do not actually help with experimentation, but they help students to become focused and to define a problem such that the goals are attainable. They help maintain a timetable, encourage collection of data, and offer insights as to possible analysis of data and conclusions based on results.
During the second week of school the faculty of Science Seminar will visit freshman classes to answer any questions about Seminar. Students will be given the opportunity to sign up and take the Science Seminar Entrance Exam. About 15-20 new students are accepted into seminar each year. The faculty of Science Seminar hope students will see the Seminar as an opportunity to discover what science is and what scientists do. Science is not only sets of subject matter, but also a set of attitudes and approaches. Its demands in effort and self-discipline match its satisfactions in discovery and understanding. Seniors may participate in Seminar without working on a current project, if they have been active members during the first three years of high school. Easybib.com WRHS recommended bibliography maker. Enter in the proper information and “Easybib” does the work. http://easybib.com/ Databases These databases are purchased for use by Wachusett School District. You will need a user name and password for many of them. Most of them use wachusett1 for both the UN and PW, so try that first. Log on information can be found in the media center. http://www.wrsd.net/wrhs/databases.cfm Turn It In.com Honors teachers will be utilizing “Turn It In”. You will submit parts of your project to this on-line database as the year progresses culminating in the submission of your full report and abstract. This service will provide you with feedback on how well you write each section with proper paraphrasing and citations. Your teacher can add comments to allow you to appropriately edit your work. Your final paper will be kept by this service and will be forever attributed to you. No other student will be able to use your work without citing your paper as a source. Many colleges use this or something like this, so you will have the opportunity to get used to it.
You will need to have an account (no charge) and you will need information from your teachers in order to set that up. https://turnitin.com/static/index.php
Materials and Equipment The school may have some equipment you could use for your project. You will need teacher approval, a special permission form signed by
your parents, and at least 1 training session before you pick up equipment. Plan accordingly. Re-read the previous paragraph- You cannot come by at the end of the day to grab equipment and catch the bus. We are very short of electronic balances. You will need to sign them out for a few days and then return them for other students to use.
Depending on requests for certain popular probes, they might also need to be shared. All equipment will need to be returned by April 1st at the very latest, unless you are given special permission. Chemicals, glassware, and testing equipment are available. Sensitive balances are available to ten thousandths of a gram. Thermometers, pH meters,
strobe lights, de-gaussers, and water quality test kits can be used. We have access to several Vernier probes that have download capabilities directly to your home computer, approved TI calculator, or school’s computers. Wachusett Regional maintains a license for LoggerPro (a graphical analysis software). Installation of this program on your home computers is part of our site license and your teacher will show you how to do that. A complete list of probes is available from your classroom teacher.
Biological specimens can be ordered through the school. Orders need to be submitted according to the timetable of your teacher (before Thanksgiving). Note: Supplies not ordered by Thanksgiving, become the responsibility of the student.
The Regional Science Resource Center of the UMass Medical School on Maple Avenue in Shrewsbury has a program that allows students to work on biological science projects. You may work there but you need a reference from your science teacher. Please be aware that this facility is not open during school vacation weeks or on weekends. You must have transportation to and from the facility.
3
Scaffolding Honors Freshman Physics - Physical Science-related project
• A minimum of 1 Independent Variable (3 levels minimum, one of which is a control, if possible) and 1 Dependent Variable
• A minimum of 10 data points for every level of the IV
• A minimum of 10 summarized research sources Honors Biology - Life Science-related project
• Must use a ‘living system’. Note- students cannot use any bacteria either at school or at home. If this is the chosen living system, student must find the appropriate Bio-level lab to work in with a mentor approved by the Wachusett Science Department Head. Students cannot use any living system that contains a vertebrae (MA state law).
• Students must meet the minimum requirements above (Freshman projects)
• The entire experiment must be completed in full again to show repeatability of results (at least 2 complete trials.
• Biology students must have a minimum of three experimental groups and a control, with ten data points for each group (including the control group). This will often require that students start with more than ten individual organisms for each group as they must expect that some will die during experimentation.
• A minimum of 20 summarized research sources Honors Chemistry
• Students doing a project while enrolled in chemistry can choose from the Physical or Life Sciences as well as Computer Science or Engineering. They can continue a project from a previous year, but only with approval from their teacher.
• A minimum of 2 Independent Variables (with a minimum of 3 levels each, with each level having a minimum of 10 data points)* and a control.
• More than one Dependent Variable is encouraged*
• Students must complete a well-documented preliminary trial to assess viability of idea to be turned in prior to February break on a date specified by the teacher.
• The entire experiment must be completed in full again to show reproducibility of results (at least 2 complete trials)
• A minimum of 20 summarized research sources only xxx of which can be Internet sources.
• An extension is highly recommended *Note- Computer Science and Engineering projects have different criteria. If a student chooses an engineering project, understand that early approval is required, as the process can be considerably longer. Students will have a clearly defined engineering goal (instead of a hypothesis) and will design, build, test, and rebuild prototypes, collecting qualitative and quantitative data on the success of those prototypes. A computer project also requires a goal, the computer programming to achieve that goal, and data to determine its effectiveness or accuracy.
4
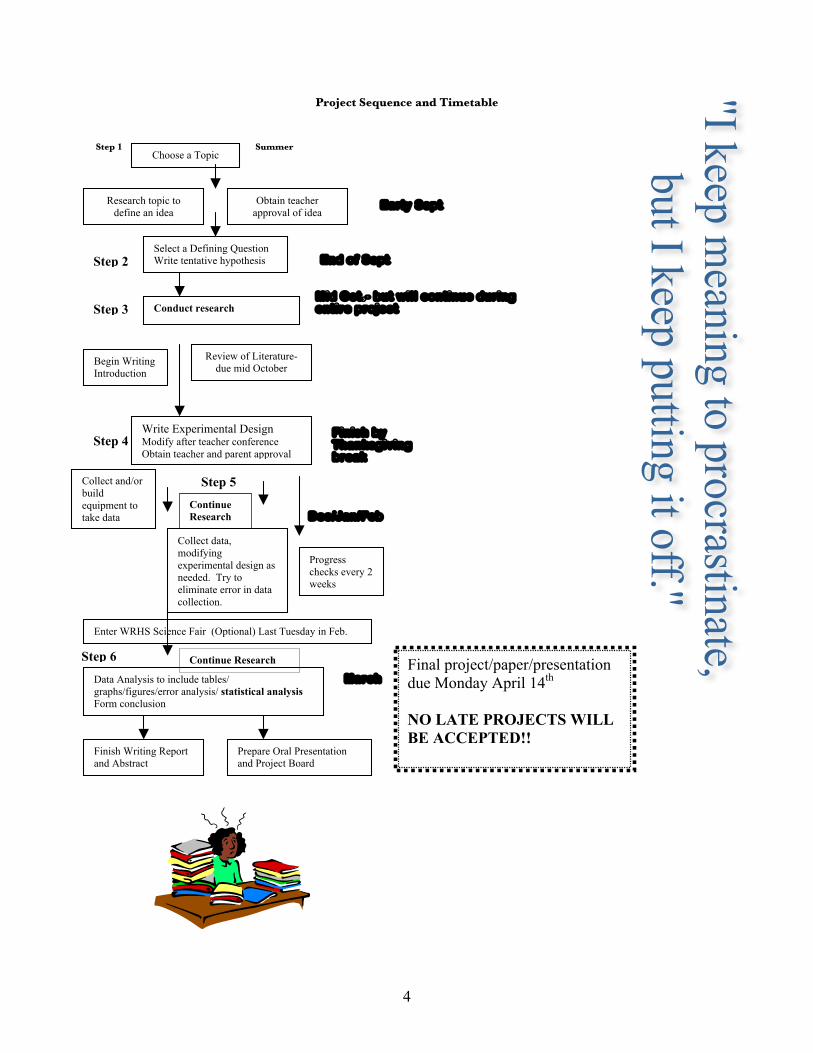
Project Sequence and Timetable Step 1 Summer
Choose a Topic
Research topic to define an idea
Obtain teacher approval of idea
Select a Defining Question Write tentative hypothesis End of Sept .
Conduct research
Begin Writing Introduction
Mid Oct.- but will continue during entire project
Review of Literature-due mid October
Write Experimental Design Modify after teacher conference Obtain teacher and parent approval
Collect and/or build equipment to take data
Collect data, modifying experimental design as needed. Try to eliminate error in data collection.
Finish by Thanksgiving break
Dec/Jan/Feb
Enter WRHS Science Fair (Optional) Last Tuesday in Feb.
Data Analysis to include tables/ graphs/figures/error analysis/ statistical analysis Form conclusion
March
Finish Writing Report and Abstract
Prepare Oral Presentation and Project Board
Step 2
Step 3
Step 4
Step 5
Step 6
Progress checks every 2 weeks
Early Sept .
Continue Research
Continue Research Final project/paper/presentation due Monday April 14th NO LATE PROJECTS WILL BE ACCEPTED!!
! 5!!
The Notebook All researchers regardless of the field of research, have one very important thing in common- the need for a detailed, dated record of all the events, thoughts, initial to final experimental designs, data collection and tables, computations, and any other item that relates to the project from start to finish. Like a diary, it should be carefully dated for each entry as a source of documentation pertaining to every aspect of your research. All data and work that you do at home on your project will be in this notebook. The notebook will also contain all of your research, and, if possible the class activities that were specifically designed to help you with some aspect of your project. ABSOLUTE RULES OF THE NOTEBOOK NOTHING MAY EVER BE REMOVED.
Pages, comments, graphs, doodling must all be visible in your notebook. No cross outs, scribble outs, or white-out may be used. Simply put a line through errors and explain.
LEAVE THE FIRST 3 PAGES BLANK. The first page will contain your title & identifying information. The next 2 will be available for a Table of Contents.
ALWAYS MAKE YOUR ENTRIES IN INK Never use pencil. ALL PAGES MUST BE NUMBERED.
Numbering must be done before any data is entered. Numbers should appear in the upper corner along the outside edge of the pages. Consider your handwriting pressure and ink when choosing to write on 1 or 2 sides of the page.
EACH SECTION MUST BE TITLED AND LABLED. You will install tabs on each of these pages before turning it in. EACH NEW ENTRY BEGINS ON A NEW PAGE. ALL ENTRIES ARE TO BE DATED. USE ADDED STRUCTURE FOR RESEARCH SECTION
Photograph the progress of your project in various stages. Include yourself and a sheet of paper indicating the date. The burden of proof that the project was completed is on the student. To avoid any questions as to the validity of your experiment you should document everything.
Everything in your project notebook should be hand-written!
! 6!!
Notebook Sections
∗ Title Page ∗ A table of contents (so leave a couple pages blank for this) ∗ Brainstorming
A list of potential science project topics Work toward defining a particular project Defining Question
∗ Hypothesis Tentative Hypothesis Working Hypothesis Formal Project Title
∗ Experimental Design Design form (to be discussed later) Materials list Apparatus (several pictures of working experiment) Original Procedure Procedure changes and comments
∗ Data Qualitative experimental observation Quantitative data
Includes equipment readouts, raw data & summary tables Computer generated items may be taped into the notebook with proper date and signature
∗ Results Calculations Rough graphs and discussion of trends. Statistics Notes and thoughts on data analysis Synthesize the calculations, graphs, and statistics looking for meaningful trends. Include thoughts on deviations and percent error
∗ Conclusion How did the test results compare to your hypothesis? What were the major trends seen in you experiment? How do the results compare to all the research you had done & discussed previously? How will this new information be useful to others beyond this class? If you had another few months and granted funds, what would you research & test next to further mankind’s knowledge?
∗ Research (in the back third of the notebook) List a proper citation and date each new reading on a separate page. Include a summary of readings (and print internet source with highlighted sections if applicable.) Express your thoughts on how this material impacts or will be used to answer your question.
∗ Journal Daily observations (at minimum weekly)
The amount and frequency will depend on what part of the process is being covered. You need to say exactly what you did, not just “that you did”
Include what you talked about in class, what you did outside of class, discussion you had with friends, family and other people. Include your thought on how those conversations, readings, purchasing, building, experimenting, graphing, etc are helping you on your quest.
The more notes you take the better (you will not remember). Include pictures! See note above.
Note: Record EVERYTHING! No detail is too insignificant!
7
As you work on defining a project and as you work toward finalization of the project keep these guidelines in mind. GUIDELINES FOR JUDGING OF EXHIBITS AND SCIENTIFIC PAPERS Evidence of knowledge gained • Is there evidence that the student has acquired scientific knowledge or scientific skills by
doing this project? • Does the student recognize the scope and limitations of the problem selected? • Does the project add to scientific knowledge? Evidence of the scientific approach • Has the scientific approach been taken with the problem? • Has the student solved a problem using known scientific facts or principles as a basis for
new conclusions? Evidence of primary experimental research • Have data been gathered from experiments done by the student, instead of from the
results of others? • Has the student devised methods of carrying out work unique to the project, such as
designing a special piece of apparatus or deciding on specific materials needed? Does it do what it was intended to do?
• Can the work be the basis for further experimentation? Evidence of individual work • Has the material as a whole been gathered from various sources and reorganized
according to the student's own thinking and research? • Has the student set up a systematic plan of work and secured measurements? Evidence of thoroughness • Is the student aware of the empirical method--of the necessity of repeating trials and the
importance of controlling variables in experiments in order to reach valid conclusions? • Has the analysis of the problem been orderly?
8
• Has the original plan been carried successfully through to completion? Validity of information • Are known facts and principles stated correctly and used accurately? • Have results of experiments been given accurately and used accurately? • Are the data complete, or at least based upon random [rather than selected] samples? Validity of conclusions • Has the student started with known facts and evolved new experiments and drawn
relevant conclusions? • Are the conclusions consistent with the data? Quality of written presentation • Does the Research Paper follow the guidelines? • Has the student searched the literature concerning the project? • Has the student made use of accumulated research, including bibliography, interviews,
and correspondence? • Considering age and experience, does the project make use of the student’s abilities? • Does the Abstract state the purpose, procedure, and conclusion in a concise manner,
adequately summarizing the project on paper? Quality of visual presentation • Is the display board attractive and does it adequately represent the theme of the project? • Have the data been presented in the most explicit way for the particular type of
information involved? Adapted from http://www.iit.edu/`smile/judgings.html 1 Dec 2004
9
Step 1
Choosing a Topic The first step could, quite possibly be the most difficult step…choosing a topic. Hopefully you have worked on this over the summer and have started school with a major area of interest chosen and researched. Bear in mind that it is not the choice of topic that is important, but the manner in which the project is handled. Often times it is the simplest of projects that presents the greatest challenge to an imaginative and intelligent student. Some questions to consider: A) Have you seen something recently that interested you on the Discovery Channel or The Learning
Channel? B) As you looked at scientific journals and periodicals at your local library, which articles did you find
interesting? C) Was there a topic in 7th or 8th grade science that you particularly enjoyed? D) Is there an activity, sport, or hobby that you participate in that lends itself to a scientific study? Also consider the feasibility of your project:
1. Is there a considerable amount of information pertaining to the selected topic? Check out local libraries (public, school, and college). Find out if there might be local college support. Do you have any connections at local colleges whose facilities and resources you might tap? How about local research firms?
2. Can the project be completed in the time allowed? 3. Do you have enough room at home in which to work on this project. Is this OK
with your parents? 4. Is the cost of completing the project a detriment? 5. Do you need any special equipment not available from school? 6. Is the design of the experiment adequate? Are the effects measurable in an
objective way? You need to choose a defining question and from this you will build a hypothesis. [Hypothesis- an educated guess; a reasonable explanation of an observation or experimental result that is not fully accepted as factual until tested over and over again by experiment.] This is a difficult part. To do this, you must read extensively, research your ideas, and come up with some questions that you can use as a basis for your hypothesis. At this point your project proposal can be modified or even refused by your instructor if it is impractical, unsafe, too simple, or too complex. All project proposals must be approved at this point before you will be allowed to proceed. Massachusetts’s statutes restrict the use of live vertebrates and humans for experimental purposes in public schools. See your instructor for clarification if applicable. Some examples of freshmen projects from previous years: The Efficiency of Waterwheel Designs The Effect of Wing Design on Lift and Drag A Study of Waxes on a Snowboard The Effect of Octave Change on Amplitude
Make sure you give some serious consideration to the choice of your project. You will be working on this over an extended period of time. If it is to be stimulating and rewarding it needs to be something that genuinely interests you.
You may not, under any circumstances, ingest anything, or ask anyone else to ingest anything!!!!! (No taste tests) You may not use any hazardous materials, illegal or controlled substances, pathogenic agents, animal or human tissue, or poisonous plants. Over-the counter medications, vitamins, antibiotics need special approval. No magnets, no product testing All project involving lasers, electricity andpower equipment must get special approval from teacher.
10
Step 2
Defining Question and Hypothesis(es): Now that you have chosen a topic and have a basic idea of what you are going to do, you need to come up with a defining question and a tentative hypothesis. These identify the problem you are about to study. The defining question should be to the point and understandable to everyone. The hypothesis will put you defining question into more scientific terms and clearly identify the independent and dependent variables. As an example: Defining Question: Is it possible to decrease sound intensity levels by insulating a room with thicker materials? Hypothesis: As the thickness of an insulating material increases, sounds are absorbed, and sound intensity levels decrease. Once you have completed some research (see below) you may decide to alter your hypothesis into a new working hypothesis. These should be written in your notebook. Your research on sound, waves, and the transfer of sound energy may lead you to find that it is not the thickness of the insulating material, but its density that causes a material to absorb the sound and dampen the transferred energy. You would then alter your tentative hypothesis into a working hypothesis to reflect this. Make sure you cite references from your research to support this hypothesis. The working hypothesis needs to
• be consistent with previous research. • state clearly and concisely the expected relationship between the IV and DV. • be easy to understand. • be testable, allowing for quantitative data to be gathered and analyzed in a
reasonable amount of time. Sample hypothesis: If radishes are watered with simulated acid rain, then their germination levels will be reduced. Thick insulating materials are more effective at reducing relative sound intensity levels than thin
insulating materials. If high concentrations of fluorocarbons are present in a ski wax, then the ski will have a lower
coefficient of friction. The ingesting of nicotine lowers fruit fly hatch rates. NOTE
If you are doing an engineering or a computer project you will use a statement of purpose in the place of a hypothesis. For example, “The purpose of this computer project is to write an algorithm to find the most efficient bus route through the town of Sterling.”
Step 3
Another note: Step 2 and Step 3 REALLY need to be completed simultaneously!
11
Step 3
Research Notes –Researching the Topic The next step, after choosing a project idea, consists of an extensive research of the materials already written that directly
or indirectly relate to your topic. Since you are NOT (now) an expert in the field that you are investigating, you must turn to reliable, relevant, and recent (the three “r’s” of research) literature that relate to your topic. The purpose of this is not only to document your own written report, but also to educate yourself in this area so that you have the necessary background to organize and carry out your project. Use the Worcester Public Library as well as the libraries at WPI, Clark U., Worcester State College, and Assumption College. Ask for help finding information on your topic from the librarians (it is, after all, their job). Specific consumer product companies can be called. The yellow pages list governmental agencies that can help. Consider calling people who work in greenhouses, florists, engineering firms, labs, medical facilities, nature centers and schools. The Internet is a valuable source if used correctly. Only recognized sources like universities or known experts are valid (look for .edu). USE WIKIPEDIA ONLY TO GAIN BACKGROUND KNOWLEDGE AND FIND KEY WORDS TO USE AS A ‘SEARCH’.
Encyclopedias can also be used as quick background information, but you will not find the type of in-depth information you need. Do not include them in your list of references unless they are good scientific encyclopedias such as The McGraw-Hill Encyclopedia of Science and Engineering. In the appendix of this manual you will find a listing of reliable periodicals for research.
Good literary research and documentation is necessary for a good project. It will provide a justification for your hypothesis and help you to learn enough about your subject to design an experiment.
The Wachusett Media Center has MAS-full text elite (magazine article summaries) and Internet search engines. The links and passwords can be found in the appendix of this manual.
Any statements, previously-collected data, findings, historical background or formulas used in compiling your written report MUST BE PROPERLY DOCUMENTED when you write your report if they are being quoted, or otherwise used in the context of your presentation. (The penalty for plagiarism in most colleges and universities is IMMEDIATE and UNCONDITIONAL EXPLUSION!) Therefore, any previously written statements (taken from a published text, journal, historical records, etc.) in your report that you are using must be properly credited to the source from which they came. (See appendix)
The following format should be used for your RESEARCH NOTES (this is what you put in your notebook) You need to have 5-10 different literature sources for freshmen projects, more for sophomore and junior projects. All of your sources cannot be from the Internet. All Internet sources must be printed out, highlighted and handed in.
1. Reference (there are examples in the appendix of this pamphlet) For your own convenience, include at the beginning of the entry the location where the source can be found, such as the Holden Library or at your house or in room D115 at WRHS, and the time visited. Use the margins to enter the page of the reference from which the notes were taken. Also include the call number (number used by library to catalog books).
2. Summary- Summarize the article to include the major topic, keywords and phrases and to record major points,
and definitions of any new vocabulary. Summarize all information that has a connection to your topic. If you use the author’s own words use quotation marks, and indicate page number. If the author refers to other references that you think might be helpful, list them. You will go back to these notes to brush up on information at several times during your project. Write down all pertinent information. You think you will remember, but you will not. It will be much easier to find it in your notebook than to find the book or periodical again.
3. Applications-A brief summary of how this reference applies to your topic. In other words, explain why were
you interested in this particular article and how you will use this information in your project. For example, does it give you background information about some aspect of your topic? Will it help you with your experimental design? Will it help you to analyze your results?
VERY Important Note: Just because you have handed in your marbled notebook so that your teacher can take a look at your RESEARCH NOTES, THAT PART OF YOUR PROJECT IS NOT FINISHED!!!!!! Even after you hand in the Literature Review in October, you are not done with research. Your research should continue all through your project. As you start experimenting you will find that you ask more questions than you answer. Continue to research. Find the answers to your questions and make your project better! When you get ready to write the “Review of Literature” part of your final paper, you will use the information from your marbled notebook. *You must also hand–in all the web pages you have printed out with the sections you used highlighted.
12
Literature Review: Using your “Research Notes” you will write a summary of all you have learned about your topic. This should include information that you will use to justify your hypothesis, information that you need to design an experiment to test your hypothesis; summaries of previous studies that relate to your project, and information that you might use as you analyze your data.
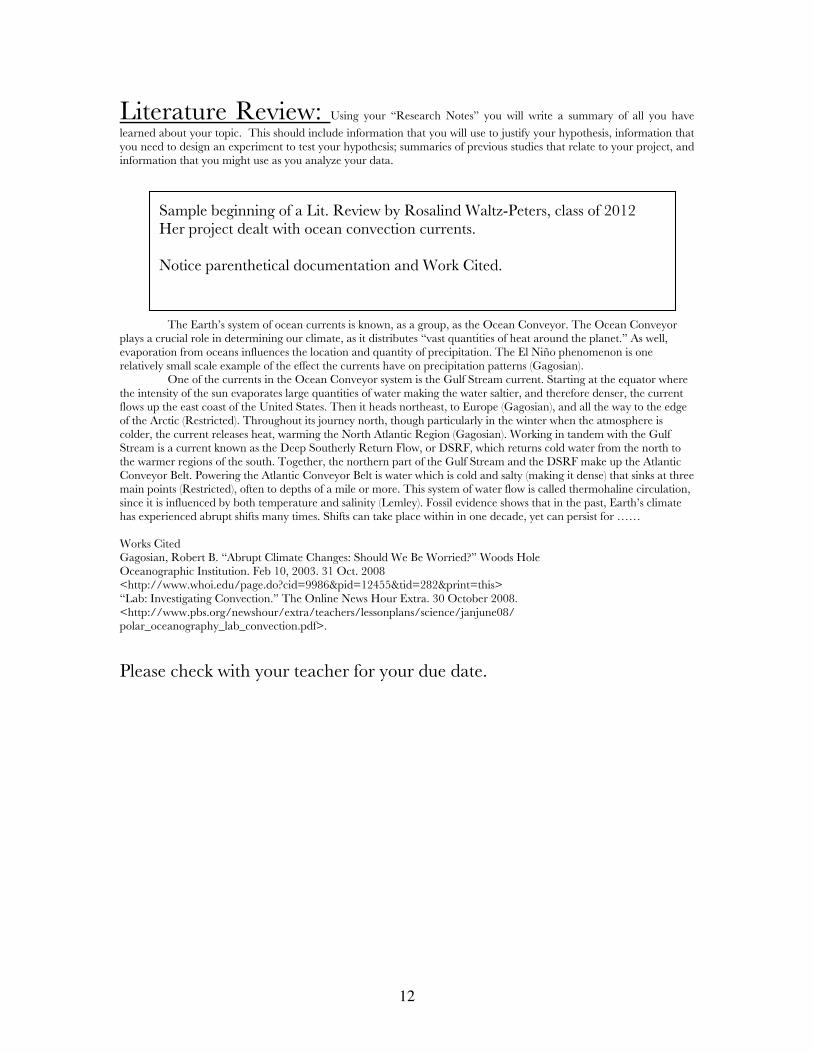
The Earth’s system of ocean currents is known, as a group, as the Ocean Conveyor. The Ocean Conveyor plays a crucial role in determining our climate, as it distributes “vast quantities of heat around the planet.” As well, evaporation from oceans influences the location and quantity of precipitation. The El Niño phenomenon is one relatively small scale example of the effect the currents have on precipitation patterns (Gagosian).
One of the currents in the Ocean Conveyor system is the Gulf Stream current. Starting at the equator where the intensity of the sun evaporates large quantities of water making the water saltier, and therefore denser, the current flows up the east coast of the United States. Then it heads northeast, to Europe (Gagosian), and all the way to the edge of the Arctic (Restricted). Throughout its journey north, though particularly in the winter when the atmosphere is colder, the current releases heat, warming the North Atlantic Region (Gagosian). Working in tandem with the Gulf Stream is a current known as the Deep Southerly Return Flow, or DSRF, which returns cold water from the north to the warmer regions of the south. Together, the northern part of the Gulf Stream and the DSRF make up the Atlantic Conveyor Belt. Powering the Atlantic Conveyor Belt is water which is cold and salty (making it dense) that sinks at three main points (Restricted), often to depths of a mile or more. This system of water flow is called thermohaline circulation, since it is influenced by both temperature and salinity (Lemley). Fossil evidence shows that in the past, Earth’s climate has experienced abrupt shifts many times. Shifts can take place within in one decade, yet can persist for …… Works Cited Gagosian, Robert B. “Abrupt Climate Changes: Should We Be Worried?” Woods Hole Oceanographic Institution. Feb 10, 2003. 31 Oct. 2008 <http://www.whoi.edu/page.do?cid=9986&pid=12455&tid=282&print=this> “Lab: Investigating Convection.” The Online News Hour Extra. 30 October 2008. <http://www.pbs.org/newshour/extra/teachers/lessonplans/science/janjune08/ polar_oceanography_lab_convection.pdf>.
Please check with your teacher for your due date.
Sample beginning of a Lit. Review by Rosalind Waltz-Peters, class of 2012 Her project dealt with ocean convection currents. Notice parenthetical documentation and Work Cited.
13
Step 4
Experimental Design: The next step of your project is to design a controlled experiment to test your hypothesis. In order to do this you need to define your independent and dependent variables, and the constants (or controlled variables). In this project YOU are the designer of all experiments. It is your job to decide what data to collect, collect the data, analyze the data, interpret your results, and offer those results as “evidence” in your conclusions. It is your job to deal with apparatus design, numerical precision and accuracy, error margins due to equipment, statistical analysis of data, etc. (You will learn how to do all of this during the course of this year!) As you work on this remember to have as many “constants” as possible, and look for ways to eliminate error.
1. Defining Question and Hypothesis This question should clearly and interestingly encapsulate your entire project. For example, “Is there a golf ball that travels further on a hot day?” Or, “Do the materials used to coat airplane wings change the flight of the plane?”
2. Independent variable This is the variable that you control and that you change. For instance, if your project is “The Effect of Fertilizer on Plant Growth”, the independent variable is the fertilizer. Next, decide on the levels of the independent variable. For example, you may decide to use 1/2 the suggested amount of fertilizer, the correct amount of fertilizer, and twice the suggested amount of fertilizer. You need to decide the number of levels as well as the value of each level. Too few levels will not give you enough data to establish a pattern in the data. Too many levels may give more data than is necessary. Hopefully, some of your background research will help you with this. You also need to decide when the independent variable will be applied. For example, will you apply the fertilizer every time you water from the planting of the seed until the end of the experiment? Or will you let the plants grow to a particular height first before you apply the fertilizer? Or maybe you will apply the fertilizer for a while, and then stop to see how long the affect of the fertilizer continues.
Control Group (Identify this within the IV) In order to determine what affect the independent variable had on the dependent variable a comparison group or control is necessary. In the above experiment, the set of plants to be grown with no fertilizer could be the control group. Or, you may decide to use the group of plants receiving the recommended amount of fertilizer as the control group.
3. Dependent variable Now identify what you are going to measure. In the case of the fertilizer experiment, the student could decide to measure growth, number of leaves, number of flowers, coloration, time to germination, etc. For this example we will measure growth. You may decide to have more than one dependent variable to make your project more interesting.
4. Constants (Controlled Variables) The next step is to try to keep all other factors that might affect the dependent variable constant. Growth could be affected by amount of sunshine, temperature of the environment, amount of oxygen, amount of water, type and amount of planting soil, how often measurements are taken, equipment used for measurement, etc. It is not enough to simply list these; you must also assign a value to each constant. In setting that value you must be very careful that the value will not interfere with the affect of the independent variable. For example if you set the amount of water too high or too low, no growth will occur. To make good choices for constants you will have to learn as much as possible about the topic of your experiment. For example, you would need to know the proper depth to plant the seeds and the amount of sunshine required for the particular plant you have chosen.
14
5. Number of trials You will need to decide the number of trials you will have for each level of your independent variable. For example, you would not grow just one plant for each level of fertilizer. For living organisms, do as many trials as time, money and space will allow. You might settle on ten plants in each of the experimental and control groups. In order to complete meaningful statistical analysis you should have a minimum of 5 (10 is better) repeated trials.
6. Procedure Remember that data comes in two forms: qualitative (sensory-based observations that you describe in a “subjective” way), and quantitative (measurements, carefully and accurately made using instruments that generate numerical data). Rating scales can be used to make more qualitative data like health of plants or color of plants more quantitative. Numerical data (and lots of it) is almost always more convincing than the more subjective descriptions that tend to be vulnerable to our own human sensory deficiencies and biases. This does not at all mean that you should not use your powers of observation to report occurrences that come about during (or as a result of) your experiment. Such observations (often very subtle in nature) are what tend to separate the scientist from the non-scientist, and greatly add to the depth of your report. After identifying all of these it is time to write a formal procedure. Think very carefully about each step, assuming that the reader has no idea how to do this experiment, but with your procedure could duplicate your work. The procedure should be written as a list of steps (just like a recipe in a cookbook), preceded by a materials and equipment list. Have your procedure checked by a classmate and a parent to make sure all steps and materials are included. Your teacher will meet with you for an Experimental Design Conference or a Pre-proposal conference to offer suggestions and to give approval. NO GATHERING OF DATA CAN OCCUR UNTIL YOUR EXPERIMENTAL DESIGN IS APPROVED AND YOUR PARENTS HAVE SIGNED THE PROJECT PERMISSION FORM. You must submit the five experimental design parameters stated above, a materials and equipment list, and a formal procedure, using the Experimental Design Format below. Put this in your notebook! Important note to Science Seminar Students: Science Fair Forms MUST be completed at this time!
Preliminary experimentation is required and will help you take some of the bugs out of your procedure. How many times do we hear “all my plants died”? Perhaps you can’t use that exact procedure or concentration or quantity of chemicals. Start experimentation as soon as you possibly can. If you were to ask a former honors student “What would you do differently?” Always the response would be “I would have started sooner.”
15
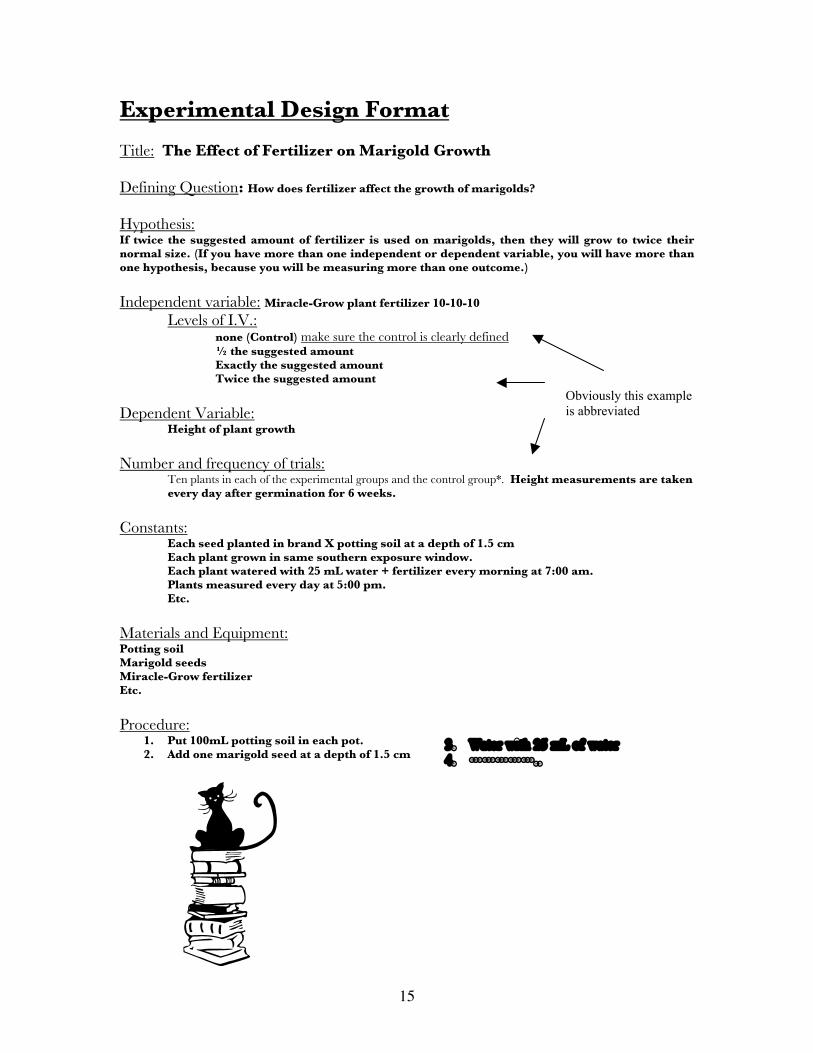
Experimental Design Format Title: The Effect of Fertilizer on Marigold Growth Defining Question: How does fertilizer affect the growth of marigolds?
Hypothesis: If twice the suggested amount of fertilizer is used on marigolds, then they will grow to twice their normal size. (If you have more than one independent or dependent variable, you will have more than one hypothesis, because you will be measuring more than one outcome.) Independent variable: Miracle-Grow plant fertilizer 10-10-10
Levels of I.V.: none (Control) make sure the control is clearly defined
½ the suggested amount Exactly the suggested amount Twice the suggested amount
Dependent Variable:
Height of plant growth Number and frequency of trials:
Ten plants in each of the experimental groups and the control group*. Height measurements are taken every day after germination for 6 weeks.
Constants:
Each seed planted in brand X potting soil at a depth of 1.5 cm Each plant grown in same southern exposure window. Each plant watered with 25 mL water + fertilizer every morning at 7:00 am. Plants measured every day at 5:00 pm. Etc.
Materials and Equipment: Potting soil Marigold seeds Miracle-Grow fertilizer Etc. Procedure:
1. Put 100mL potting soil in each pot. 2. Add one marigold seed at a depth of 1.5 cm
�� ����� ��������������� �� �������
Obviously this example is abbreviated
16
Step 5
Experimentation: You are now ready to take some data! Once your experimental design has approval from both your teacher and your parents it is time to start gathering equipment and take some data. You may want to label this data as “preliminary” in your notebook. Many of you will get a new or better idea as you start to physically work on the project. Update your teacher if you make any major changes to your experimental design. Set up a timetable for yourself so that you don’t procrastinate this part of the project. It is very easy to say, “I will start this weekend…..well, next weekend.” Document EVERYTHING you do. The burden of proof is on your shoulders. One way of proving your work as original is to take pictures. Have someone take pictures of you setting up equipment and taking data. Include in the picture a piece of paper that clearly identifies the date. Be attentive to all safety concerns expressed by your teacher. Do not use any equipment that is unfamiliar to you. Ask for help whenever you need it. Record all data (both qualitative and quantitative) in your notebook. All details could be significant. You think you will remember the details and idiosyncrasies of your work, but you will not. Organize your data into tables. Make sure to include units. You should also make note of the precision of the measuring device. Note any problems you have taking data. Look for sources of error. Have you calibrated your measuring instruments? Are your measuring devices precise enough? Is there a better way to get more accurate data? What variables are you unable to control and what can you do to try to minimize their affect? Is your data repeatable? If so, take multiple sets of data on different days. Is your experiment reliable? Do you find similar patterns in the data? If you do not, this would indicate that your experiment has some inherent error that you need to find and minimize.
*VERY IMPORTANT NOTE: In order to get data that can be dealt with to show significance you need to have 10 or more data points for each level of your IV. If you are measuring the force required to start a wheel rotating, you need to measure that at least 10 times for each change of the wheel.
Stop Procrastinating!!
All Measurements should be in Metric Units!!!!!!!!!!
17
Step 6
Analyzing Experimental Data ***Note: This section attempts to simplify statistical analysis to the early high school level. Statistical analysis is very complex, and you should try to add to your knowledge of “stats” as you continue scientific research. This section is introductory only. If you are at the point in your independent yearlong project where you have lots of data and now need to figure out what to do with it, this section will help you with that. You have conducted an experiment to test your hypothesis. You now need to determine the answer to..”Is there a significant difference between…?” Or…”Is there a significant relationship between…?” Or… “Did….significantly change …..?” This section will give you possibilities of ways to use descriptive statistics to determine significance. Some will not be appropriate for your type of data. What does significance really mean? When a statistic is significant, it means that the cause and effect that you have observed did not happen by chance. The difference or relationship you observed is reliable. It doesn’t mean that your finding is important. It makes no statement as to the strength of the relationship. Is does not indicated that the difference is large. It just means that the effect, or difference, or relationship is real. By this point you should be able to describe the difference between quantitative and qualitative data. You have become quite adept at graphing and analyzing graphs of quantitative data. Remember, though, that quantitative data could be continuous (the height of a plant) or discrete (the number of leaves). Let’s talk for a minute about qualitative data. Qualitative data can be classified into categories. When your qualitative data can be named or placed into discrete categories with no rank order they are classified as nominal data. Examples of nominal data would be gender (male, female) or the color of eyes (brown, blue). Sometimes qualitative data can be placed into categories that can be rank ordered. This data is classified as ordinal data. An example would be the darkness of the green of a leaf rated on a scale of 1 to 5. When analyzing your data, you need to consider such things as a measure of central tendency (mean, mode and median), variation (range or frequency distribution), standard deviation, and significance of variation.
Percent change: You might want to start looking at your data and deciding whether your change of the independent variable affected the dependent variable by calculating % change. If you’ve change the independent variable by 200% and your dependent variable only changed by 2%, you could conclude that there was no data to support that the dependent variable was affected by the independent variable. However, if you changed the independent variable by 25% and the dependent variable changed by 15%, there is a significant cause and effect there.
Accuracy and Precision: Remember that accuracy has to do with how close your values are to an accepted value or known quantity. Most of you will not have an experiment that can use accuracy. Precision should be discussed thoroughly. You need to take a close look at the range of values you obtained under a particular trial and analyze. That will be covered below when we deal with variation. You need to also discuss precision in terms of the precision of the measuring instruments you used. How did you determine what to use and why was it appropriate? It is interesting to look at the precision of the measuring instruments you used compared to what you were measuring. For example, It would not be good to use a metric ruler precise to ± 0.5 mm if you were measuring the width of a strand of hair since error in the measuring instrument would be larger than what you were measuring. If you were measuring the length of the tabletop it would be great.
18
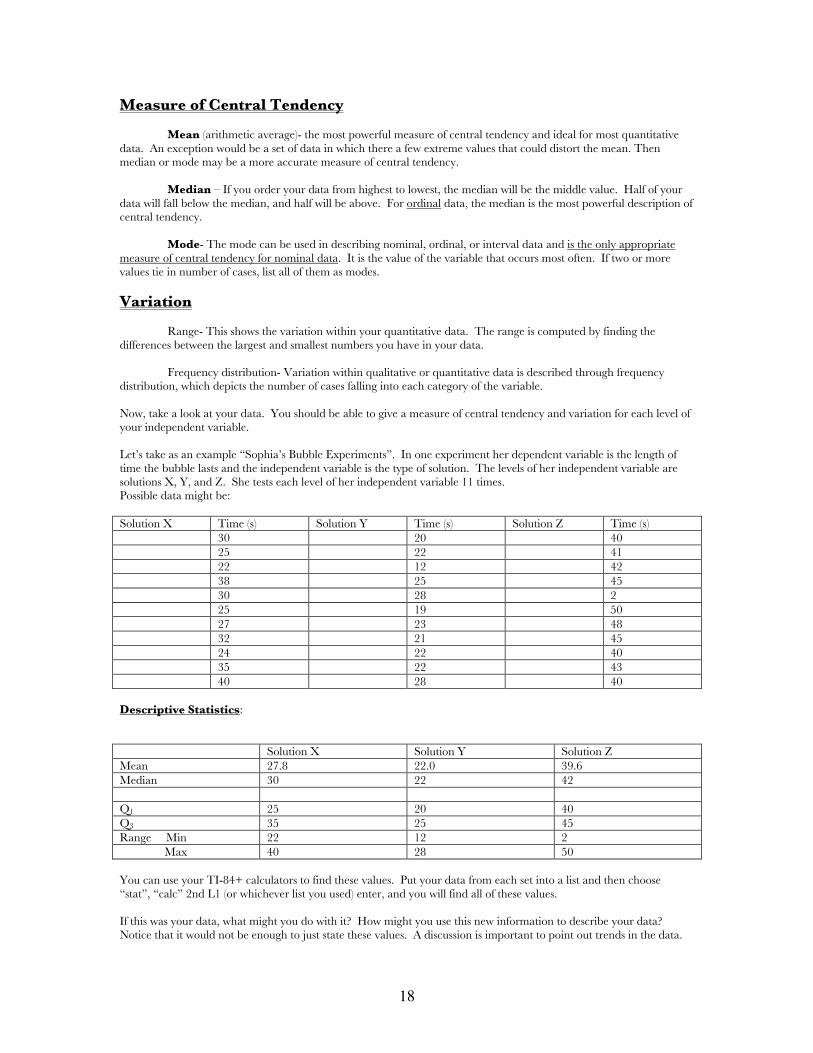
Measure of Central Tendency Mean (arithmetic average)- the most powerful measure of central tendency and ideal for most quantitative data. An exception would be a set of data in which there a few extreme values that could distort the mean. Then median or mode may be a more accurate measure of central tendency. Median – If you order your data from highest to lowest, the median will be the middle value. Half of your data will fall below the median, and half will be above. For ordinal data, the median is the most powerful description of central tendency. Mode- The mode can be used in describing nominal, ordinal, or interval data and is the only appropriate measure of central tendency for nominal data. It is the value of the variable that occurs most often. If two or more values tie in number of cases, list all of them as modes. Variation Range- This shows the variation within your quantitative data. The range is computed by finding the differences between the largest and smallest numbers you have in your data. Frequency distribution- Variation within qualitative or quantitative data is described through frequency distribution, which depicts the number of cases falling into each category of the variable. Now, take a look at your data. You should be able to give a measure of central tendency and variation for each level of your independent variable. Let’s take as an example “Sophia’s Bubble Experiments”. In one experiment her dependent variable is the length of time the bubble lasts and the independent variable is the type of solution. The levels of her independent variable are solutions X, Y, and Z. She tests each level of her independent variable 11 times. Possible data might be: Solution X Time (s) Solution Y Time (s) Solution Z Time (s) 30 20 40 25 22 41 22 12 42 38 25 45 30 28 2 25 19 50 27 23 48 32 21 45 24 22 40 35 22 43 40 28 40 Descriptive Statistics: Solution X Solution Y Solution Z Mean 27.8 22.0 39.6 Median 30 22 42 Q1 25 20 40 Q3 35 25 45 Range Min 22 12 2 Max 40 28 50 You can use your TI-84+ calculators to find these values. Put your data from each set into a list and then choose “stat”, “calc” 2nd L1 (or whichever list you used) enter, and you will find all of these values. If this was your data, what might you do with it? How might you use this new information to describe your data? Notice that it would not be enough to just state these values. A discussion is important to point out trends in the data.
19
Start by making some statements that compare the measures of central tendency assuming that solution X was the control. As you apply this to your own project and use this new information in writing your report you will compare the means, describe the variation and use them as support for your hypothesis. If your data is more qualitative, then you will need to state whether it is nominal or ordinal and then follow through with measures of central tendency and variance to support your hypothesis. Now you need to further your analysis of collected data and expand the possibilities for displaying the dispersion or variation within sets of quantitative data. You can make a box-and-whiskers plot using this data to show differences in data sets. Q1, the median, and Q3 make the box, with min and max making the whiskers.
Standard Deviation- The standard deviation is a statistic that tells you how tightly all the data is clustered around the mean. When the data is tightly bunched together and the bell-shaped curve is steep, the standard deviation is small. When the examples are spread apart and the bell curve is relatively flat, that tells you have a relatively large standard deviation. You will not get frequency distribution curves that look like this simply because you do not have enough data. You would need a whole “population” to get data that would fall like this. However, you can understand that this is how it would be with the shape of the curve being an indicator of deviation if you could get that much data. If you have a least 10 values for each level of your independent variable, you can calculate standard deviation, using your calculator, Excel, or LoggerPro.
After completing all of this we can use these values to run the Student t-test to test for the significance of the difference between your data sets.
Whenever a significance test is performed, it compares a test value you calculate to some critical value for the statistic. The critical value is the error rate you are willing to accept. In most physical science studies we use a critical (alpha) value of 0.01. Meaning that we want to be 99% sure of a significant difference (meaning that the difference you see in the experimental groups is not due to pure chance). In the life sciences 0.05 is used more often. When you use your calculator to run the Student t-test you will end up with a “p” value. If this value is ‹ 0.01, you can conclude that you have shown a significant change.
Graphs are an important part of your discussion of results.
You must have a graph showing the effect of the independent variable on the dependent variable. We’ve discussed this a multiple of times in class, and made several of these types of graphs, so you should be able to do this just fine. Remember to make some rough sketches in your marbled notebook as you take data. You may notice a trend you hadn’t expected and that trend could lead you in an interesting direction.
20
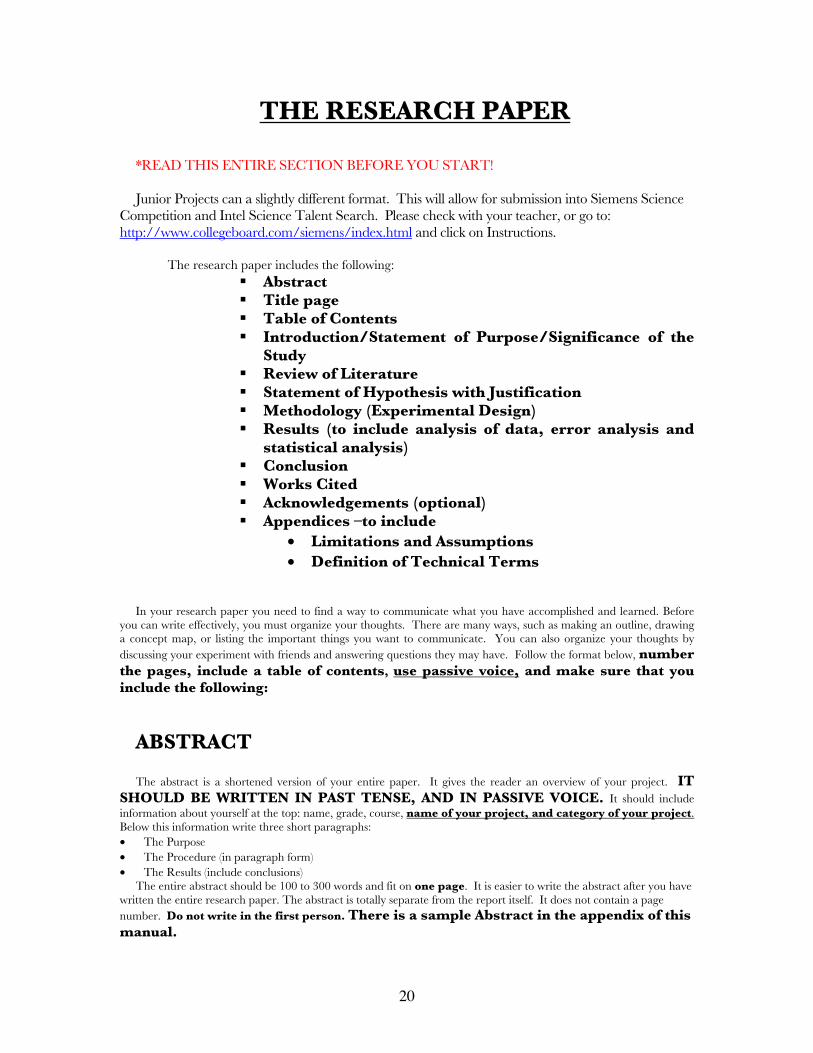
THE RESEARCH PAPER
*READ THIS ENTIRE SECTION BEFORE YOU START! Junior Projects can a slightly different format. This will allow for submission into Siemens Science
Competition and Intel Science Talent Search. Please check with your teacher, or go to: http://www.collegeboard.com/siemens/index.html and click on Instructions.
The research paper includes the following:
Abstract Title page Table of Contents Introduction/Statement of Purpose/Significance of the
Study Review of Literature Statement of Hypothesis with Justification Methodology (Experimental Design) Results (to include analysis of data, error analysis and
statistical analysis) Conclusion Works Cited Acknowledgements (optional) Appendices –to include
• Limitations and Assumptions • Definition of Technical Terms
In your research paper you need to find a way to communicate what you have accomplished and learned. Before you can write effectively, you must organize your thoughts. There are many ways, such as making an outline, drawing a concept map, or listing the important things you want to communicate. You can also organize your thoughts by discussing your experiment with friends and answering questions they may have. Follow the format below, number the pages, include a table of contents, use passive voice, and make sure that you include the following:
ABSTRACT The abstract is a shortened version of your entire paper. It gives the reader an overview of your project. IT
SHOULD BE WRITTEN IN PAST TENSE, AND IN PASSIVE VOICE. It should include information about yourself at the top: name, grade, course, name of your project, and category of your project. Below this information write three short paragraphs: • The Purpose • The Procedure (in paragraph form) • The Results (include conclusions)
The entire abstract should be 100 to 300 words and fit on one page. It is easier to write the abstract after you have written the entire research paper. The abstract is totally separate from the report itself. It does not contain a page number. Do not write in the first person. There is a sample Abstract in the appendix of this manual.
21
Follow these instructions carefully when writing your paper:
• TITLE PAGE (of your choice) • TABLE OF CONTENTS
The table of contents is not a numbered page. It is an outline that indicates the location of each section of your report. List only the number of the first page of any section.
I. INTRODUCTION AND STATEMENT OF PURPOSE
This section can be completed before experimentation is complete. You need to provide the reader with sufficient information to understand your project. This is a mini essay about your project in terms of background to get the reader acquainted with the general area studied and how this project fits into our world. Why is this topic of interest? Discuss the problem or question that the project idea was based upon. What was the intent of the experiment, what were the expectations? Remember to avoid writing in the first person.
II. REVIEW OF LITERATURE
This is not a summary of each article you have read. Instead, using paragraph form, justify the project based on the information you have gathered from the library, Internet sources, and interviews. Be sure to use parenthetical documentation. Define terms and discuss backgrounds necessary to allow the reader a deeper understanding of concepts important to your project. For example, if a project deals with the effects of sound waves on the strength of a toothpick bridge it would be necessary to include information and definitions of mechanical waves and bridge designs. It is also important to give some explanation of the equipment used to make measurements. This section could quite possibly be several pages long. Use information from the Literature Review that was completed in your notebook for this section. All paraphrasing must be documented.
III. STATEMENT OF HYPOTHESIS
A formal statement of the hypothesis is included and justification for this hypothesis should be shown based on pertinent information gained from the background research.
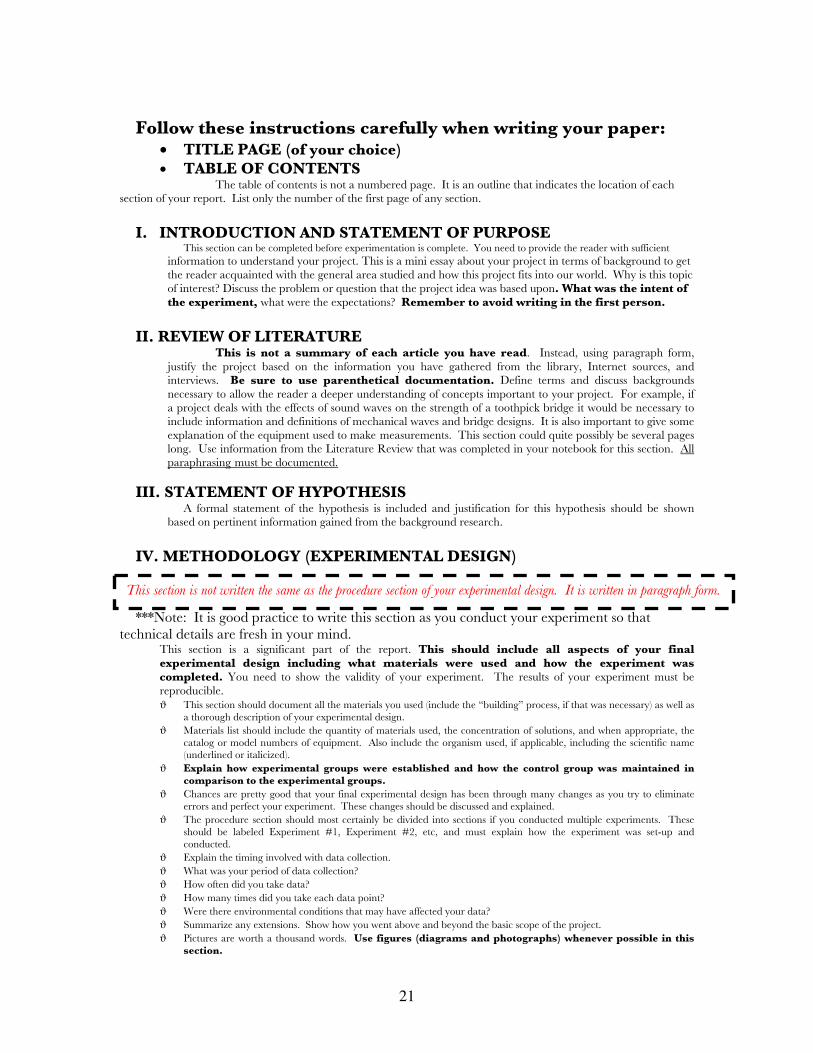
IV. METHODOLOGY (EXPERIMENTAL DESIGN)
***Note: It is good practice to write this section as you conduct your experiment so that technical details are fresh in your mind.
This section is a significant part of the report. This should include all aspects of your final experimental design including what materials were used and how the experiment was completed. You need to show the validity of your experiment. The results of your experiment must be reproducible. ϑ This section should document all the materials you used (include the “building” process, if that was necessary) as well as
a thorough description of your experimental design. ϑ Materials list should include the quantity of materials used, the concentration of solutions, and when appropriate, the
catalog or model numbers of equipment. Also include the organism used, if applicable, including the scientific name (underlined or italicized).
ϑ Explain how experimental groups were established and how the control group was maintained in comparison to the experimental groups.
ϑ Chances are pretty good that your final experimental design has been through many changes as you try to eliminate errors and perfect your experiment. These changes should be discussed and explained.
ϑ The procedure section should most certainly be divided into sections if you conducted multiple experiments. These should be labeled Experiment #1, Experiment #2, etc, and must explain how the experiment was set-up and conducted.
ϑ Explain the timing involved with data collection. ϑ What was your period of data collection? ϑ How often did you take data? ϑ How many times did you take each data point? ϑ Were there environmental conditions that may have affected your data? ϑ Summarize any extensions. Show how you went above and beyond the basic scope of the project. ϑ Pictures are worth a thousand words. Use figures (diagrams and photographs) whenever possible in this
section.
This section is not written the same as the procedure section of your experimental design. It is written in paragraph form.
22
V. RESULTS • This section summarizes the data collected (both quantitative and qualitative) and the statistical treatment of
that data. It is the most important part of your paper. This section contains all findings of the experiment with statistical treatment of the data and an error analysis.
• Briefly state the main results or findings. • Report the data in sufficient detail to validate your conclusions, but do not report all of your
raw data. Point out the important features and make connections wherever possible. If you have a deep desire to include your raw data it should be placed in the appendix.
• Use summary data to make graphs comparing each of the groups in the experiment, or showing the effect of one variable on another. Use tables, graphs, figures and photographs. . Do not be redundant. Do not present the same results in multiple formats. Choose the best format to make your point.
• Always tell the reader what to look for in tables and graphs and place this text in the report next to the explanation for the convenience of the reader. If you have studied more than one variable, include for each experiment a short discussion of results. Label each experiment the same as you have labeled them in the Methods section of this paper.
• Prepare your tables or figures before writing the text so that you can clarify your thinking. You may find gaps in your data and decide to do more experimental work.
• This section also includes an explanation of any mathematical manipulation of the measurements that led to numerical answers.
Descriptive statistics such as measure of central tendency (mean, median, and mode), variance (range and standard deviation) and frequency distribution would be very helpful. Each teacher will determine the degree of statistical treatment required.
If your data is appropriate, calculate standard deviation, and explain its significance. Calculate percent change in the range of the independent variable and compare it to the % change in the dependent variable. Use those comparisons to discuss the significance of your results. More statistical treatment of data will be required in 2nd and 3rd year projects.
An error analysis must be included in this section.
Discuss sources of error and attempts to minimize error. Discuss the calibration and precision of all measuring devices.
VI. CONCLUSION • In the conclusion tie together the work completed (the evidence presented) and make a case that the hypothesis
presented is a valid statement as suggested from research and experimentation. • Evaluate and interpret the implications of the results. • Does the data support or contradict the hypothesis? • If the results contradict the hypothesis, this should, of course, be discussed. This does not mean that you have
failed, but that your hypothesis may be wrong, incomplete, or that your experiment may have gross error due to faulty design or technique.
• Quote results often, but remember your project is just ONE experiment. No matter how painstakingly and carefully you carried out this experiment, it does not PROVE anything. It merely suggests that your hypothesis MAY be valid.
• Re-state any limitations that affected the results; discuss the factors over which you had no control; explain their possible effect on the data.
• Compare findings with other researchers. • Offer possible explanations of findings. • Include the following: How could this project be applied to the real world (problems, events, technologies, etc)?
How could this project be improved? What other independent variables could be tested? What recommendations can be offered for further study and for improving the experiment?
VII. WORK CITED
All sources must be properly documented whether taken from books, periodicals, newspapers, electronically oriented, or personal communications (see appendix for examples).
VIII. Acknowledgements- Give credit to everyone that helped you. This section can be written in first person.
23
IX. Appendix-Use the appendix for any “extra” materials. If you would like to include more extensive data tables, put them here. If you have more graphs than fit comfortably in the report, put them here as well.
• LIMITATIONS AND ASSUMPTIONS No project is perfect. Be honest in assessing those things that had to be assumed or carried out for
practical reasons like time constraints or financial limitations. An assumption in research is an important fact that is accepted to be true, without proof, upon which
the validity of the study depends. A limitation is an aspect of a scientific study that the researcher knows may negatively affect the results, but over which he/she has no control. It is assumed that the metals were pure and a limitation of the study is that not every kind of metal was available.
• DEFINITIONS OF TECHNICAL TERMS
An alphabetical list of all terms and concept used elsewhere in your paper. Define each.
ORAL PRESENTATION The following outline should help you prepare for your oral presentation.
o Please limit your presentation to about 5 minutes. Your presentation must NOT exceed 10 minutes.
o You should be well rehearsed and NOT need to look at your report or the display board for information. You should be “infinitely” familiar with your project at this point!
o You may have note cards. o The following 8 items MUST be included. o It will take some work on your part to organize a presentation to include everything and stay
within the necessary time frame. o Avoid using uhmmmm…. And yeah,…..like…….whul. o Practice your presentation with your parents, or tape it and listen to it. You will be amazed
how much better you will get as you practice. 1. State the project title and purpose. Note: Translate your defining question into the purpose. 2. Tell how you became interested in the topic. 3. Review pertinent background information. Include here definitions of terms the class may not
already know, as well as any assumptions you have made due to knowledge gained before experimentation.
4. State the research hypothesis. Discuss the hypothesis in terms of research that would substantiate it.
5. Describe your experimental design. 6. Explain your data and how the data was analyzed. 7. Summarize your findings, including support for the research hypothesis. 8. Suggest improvements, topics for further study, and potential applications.
uhmmmm
24
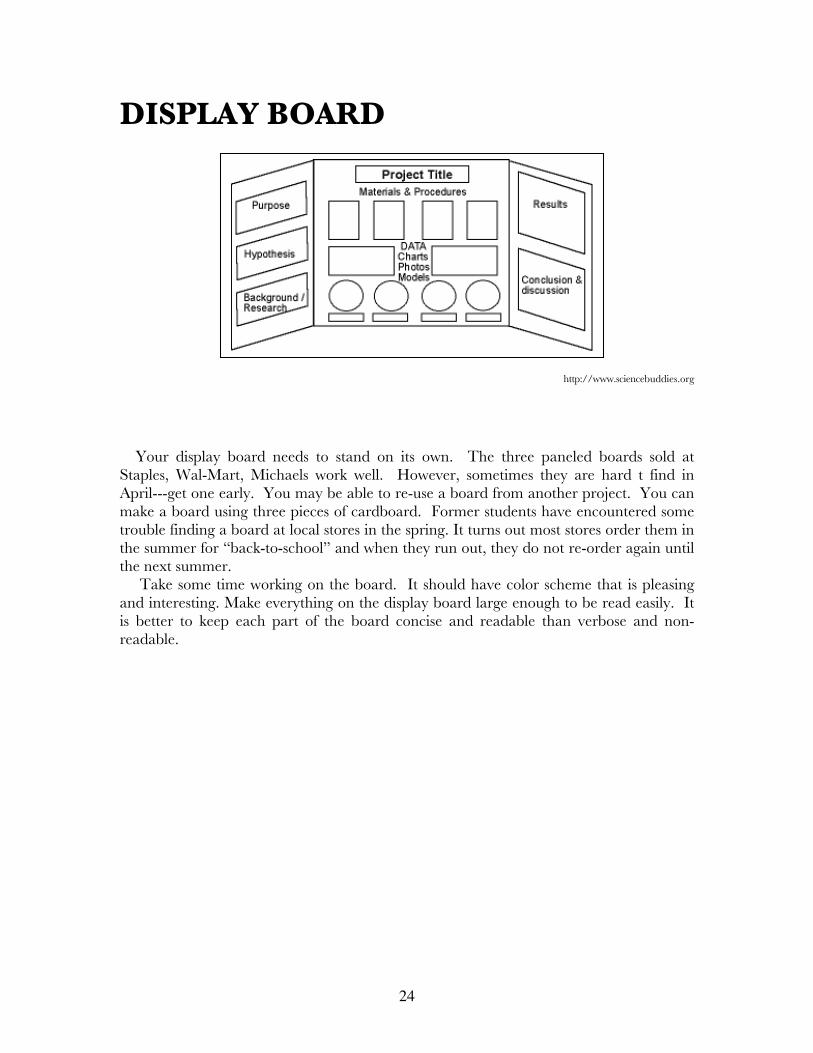
DISPLAY BOARD
http://www.sciencebuddies.org
Your display board needs to stand on its own. The three paneled boards sold at
Staples, Wal-Mart, Michaels work well. However, sometimes they are hard t find in April---get one early. You may be able to re-use a board from another project. You can make a board using three pieces of cardboard. Former students have encountered some trouble finding a board at local stores in the spring. It turns out most stores order them in the summer for “back-to-school” and when they run out, they do not re-order again until the next summer.
Take some time working on the board. It should have color scheme that is pleasing and interesting. Make everything on the display board large enough to be read easily. It is better to keep each part of the board concise and readable than verbose and non-readable.
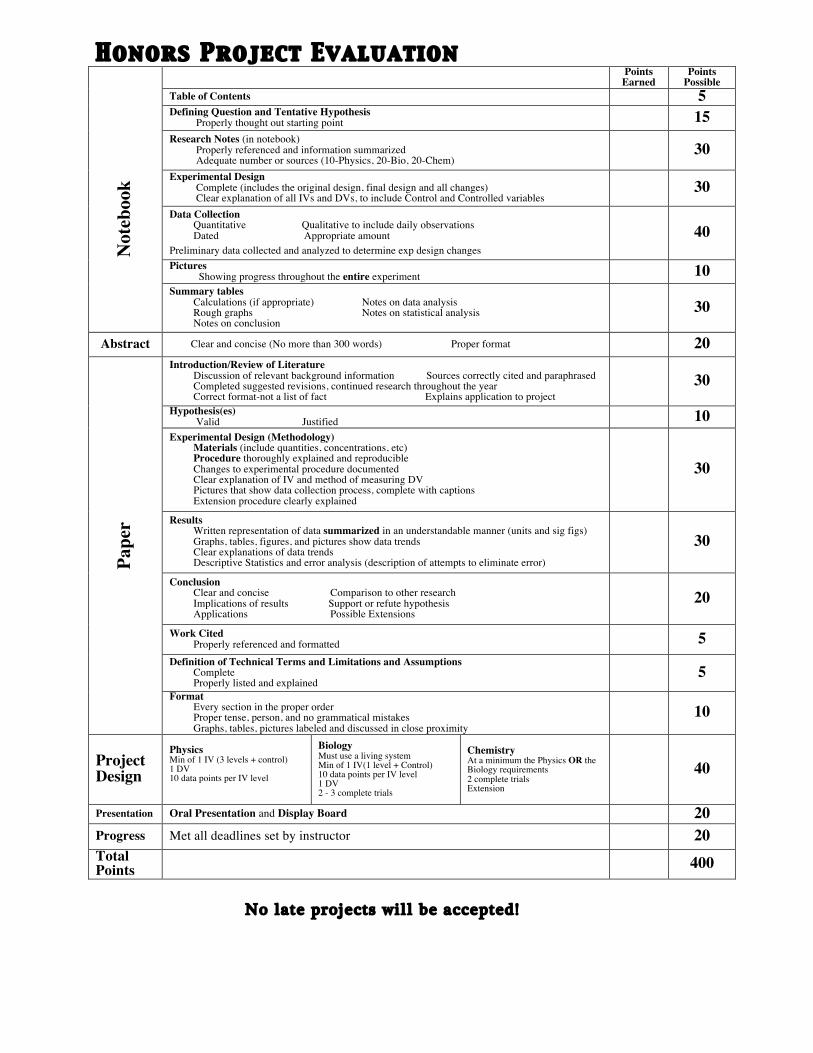
Honors Project Evaluation Points
Earned Points
Possible Table of Contents 5
Not
eboo
k Defining Question and Tentative Hypothesis Properly thought out starting point 15 Research Notes (in notebook) Properly referenced and information summarized Adequate number or sources (10-Physics, 20-Bio, 20-Chem)
30 Experimental Design Complete (includes the original design, final design and all changes) Clear explanation of all IVs and DVs, to include Control and Controlled variables
30 Data Collection Quantitative Qualitative to include daily observations Dated Appropriate amount
Preliminary data collected and analyzed to determine exp design changes
40
Pictures Showing progress throughout the entire experiment 10 Summary tables Calculations (if appropriate) Notes on data analysis Rough graphs Notes on statistical analysis Notes on conclusion
30
Abstract Clear and concise (No more than 300 words) Proper format 20
Pape
r
Introduction/Review of Literature Discussion of relevant background information Sources correctly cited and paraphrased Completed suggested revisions, continued research throughout the year Correct format-not a list of fact Explains application to project
30
Hypothesis(es) Valid Justified 10
Experimental Design (Methodology) Materials (include quantities, concentrations, etc) Procedure thoroughly explained and reproducible Changes to experimental procedure documented Clear explanation of IV and method of measuring DV Pictures that show data collection process, complete with captions Extension procedure clearly explained
30
Results Written representation of data summarized in an understandable manner (units and sig figs) Graphs, tables, figures, and pictures show data trends Clear explanations of data trends Descriptive Statistics and error analysis (description of attempts to eliminate error)
30
Conclusion Clear and concise Comparison to other research Implications of results Support or refute hypothesis Applications Possible Extensions
20
Work Cited Properly referenced and formatted 5 Definition of Technical Terms and Limitations and Assumptions Complete Properly listed and explained 5 Format Every section in the proper order Proper tense, person, and no grammatical mistakes Graphs, tables, pictures labeled and discussed in close proximity
10
Project Design
Physics Min of 1 IV (3 levels + control) 1 DV 10 data points per IV level
Biology Must use a living system Min of 1 IV(1 level + Control) 10 data points per IV level 1 DV 2 - 3 complete trials
Chemistry At a minimum the Physics OR the Biology requirements 2 complete trials Extension
40
Presentation Oral Presentation and Display Board 20 Progress Met all deadlines set by instructor 20 Total Points
400
No late projects will be accepted!
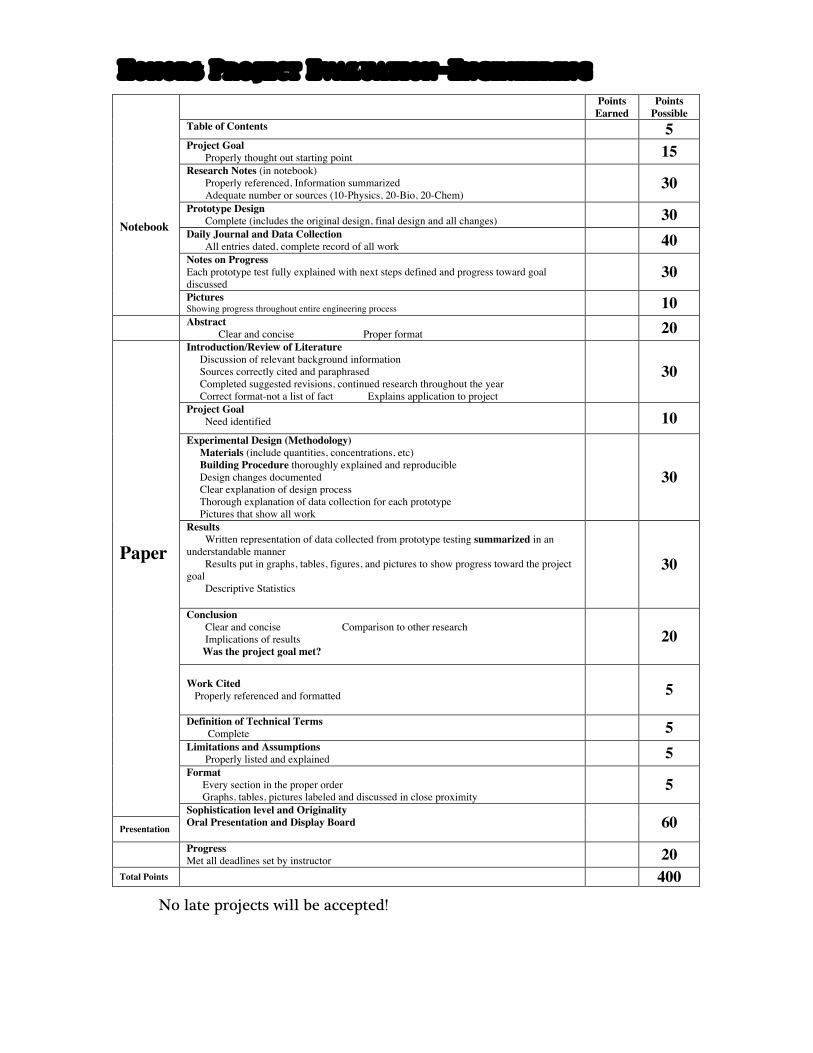
Honors Project Evaluation-Engineering
Points Earned
Points Possible
Table of Contents 5 Project Goal Properly thought out starting point 15 Research Notes (in notebook) Properly referenced, Information summarized Adequate number or sources (10-Physics, 20-Bio, 20-Chem)
30 Prototype Design Complete (includes the original design, final design and all changes) 30 Daily Journal and Data Collection All entries dated, complete record of all work 40 Notes on Progress Each prototype test fully explained with next steps defined and progress toward goal discussed
30
Notebook
Pictures Showing progress throughout entire engineering process 10
Abstract Clear and concise Proper format 20 Introduction/Review of Literature Discussion of relevant background information Sources correctly cited and paraphrased Completed suggested revisions, continued research throughout the year Correct format-not a list of fact Explains application to project
30
Project Goal Need identified 10 Experimental Design (Methodology) Materials (include quantities, concentrations, etc) Building Procedure thoroughly explained and reproducible Design changes documented Clear explanation of design process Thorough explanation of data collection for each prototype Pictures that show all work
30
Results Written representation of data collected from prototype testing summarized in an understandable manner Results put in graphs, tables, figures, and pictures to show progress toward the project goal Descriptive Statistics
30
Conclusion Clear and concise Comparison to other research Implications of results Was the project goal met?
20
Work Cited Properly referenced and formatted 5
Definition of Technical Terms Complete 5
Paper
Limitations and Assumptions Properly listed and explained 5 Format Every section in the proper order Graphs, tables, pictures labeled and discussed in close proximity
5
Presentation
Sophistication level and Originality Oral Presentation and Display Board 60
Progress Met all deadlines set by instructor 20
Total Points 400
No late projects will be accepted!
i
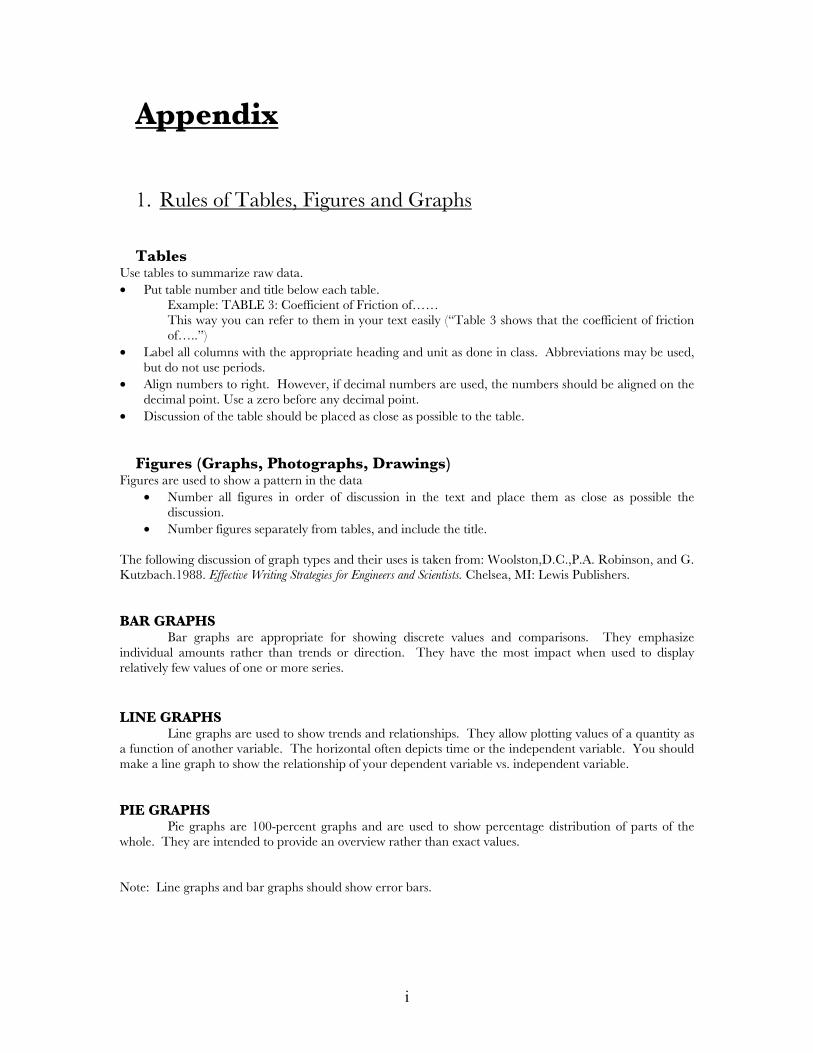
Appendix 1. Rules of Tables, Figures and Graphs Tables
Use tables to summarize raw data. • Put table number and title below each table.
Example: TABLE 3: Coefficient of Friction of…… This way you can refer to them in your text easily (“Table 3 shows that the coefficient of friction of…..”)
• Label all columns with the appropriate heading and unit as done in class. Abbreviations may be used, but do not use periods.
• Align numbers to right. However, if decimal numbers are used, the numbers should be aligned on the decimal point. Use a zero before any decimal point.
• Discussion of the table should be placed as close as possible to the table. Figures (Graphs, Photographs, Drawings)
Figures are used to show a pattern in the data • Number all figures in order of discussion in the text and place them as close as possible the
discussion. • Number figures separately from tables, and include the title.
The following discussion of graph types and their uses is taken from: Woolston,D.C.,P.A. Robinson, and G. Kutzbach.1988. Effective Writing Strategies for Engineers and Scientists. Chelsea, MI: Lewis Publishers. BAR GRAPHS Bar graphs are appropriate for showing discrete values and comparisons. They emphasize individual amounts rather than trends or direction. They have the most impact when used to display relatively few values of one or more series. LINE GRAPHS Line graphs are used to show trends and relationships. They allow plotting values of a quantity as a function of another variable. The horizontal often depicts time or the independent variable. You should make a line graph to show the relationship of your dependent variable vs. independent variable. PIE GRAPHS Pie graphs are 100-percent graphs and are used to show percentage distribution of parts of the whole. They are intended to provide an overview rather than exact values. Note: Line graphs and bar graphs should show error bars.
ii
2. Writing Suggestions
START EARLY
This paper is not something you can write in an evening. Papers are rarely written well on the first draft. This paper can easily be written in discrete sections. As you work on each section, reread it yourself a couple days later and make appropriate changes. Ask someone else to read it. Choose people who know about your research as well as people that have no knowledge base about your topic. Be open to their suggestions. Ask for help with spelling and grammatical errors. You will probably look right by them, because you know what you meant to say. TENSES
You have probably noticed in other classes that one of the hardest things about writing is putting everything into the proper tense. Here is a guideline for this paper.
• The Abstract – PAST tense. • Introduction- PRESENT and PAST tenses are acceptable, but choose one and
use that for the entire introduction. • Literature Review- PAST tense or PRESENT PERFECT tense (researchers
have shown). • Experimental Design- PAST tense. • Results – PAST tense • Conclusion- PRESENT tense.
Your paper should not “ramble”. Length is limited to about 20 pages. Do not include large data tables and graph after graph after graph. Figure out how to present your research in a clear, concise manner.
iii
SAMPLE ABSTRACT COMPARING OPERANT CONDITIONING IN HUMANS AND
ANIMALS
John Smith Behavioral Science Grade 9 Biology Mr. Smith The purpose of this project was to study the possibility that the mice would respond to conditioning through environmental manipulations in a maze. After an operant response is emitted followed by stimulus, the probability that the response will occur again is increased. There are several examples of operant conditioning in humans as well as animals. Just as a human can find its way to the refrigerator in a house, a mouse can find its way to food in a maze. Just as a baby might find it’s way to a cabinet where its food is kept. A large maze was built for two laboratory mice. The first day the mice ran around the maze to become familiar with it. One mouse was trained to enter the square room for food, and the other was trained to enter the rectangular room for food. A daily log was kept of the progress of each mouse. One mouse was quicker to respond than the other. However, both responded to the environmental conditioning as expected, and this experiment was successful. This study of operant conditioning has been shown in this situation because the mice responded to a reinforcing stimulus by decreasing the time to arrive at the room in the maze as well as reoccurrence of the response. In order to survive, animals as well as humans must be able to learn. This learning enables them to make predictions about the future events and to use the environment to meet its needs. Adapted from http://www.scifair.com
iv
Statistical Analysis The best way to complete the calculations for Measures of Central Tendency, Deviations, and Statistical
Significance is to use Excel or LoggerPro. Tutorials are available on the Internet and depend on the version of Excel you have.
Graphs can be made using Excel or LoggerPro. Again, watch the tutorials for Excel and there are built-in tutorials in LoggerPro. Open the program, under Open, cursor down to Tutorials.
Student’s t-test can be performed using Excel as well.
Research Using WRSD Electronic Databases
v
Wachusett Regional High School Library Media Center Research Databases: www.wrsd.net/wrhs -Library Media Center -Research Databases Remote login & password: wachusett1 - wachusett1
• ABC-CLIO Databases, e-books • CQ Researcher • eLibrary • Encyclopedia Britannica Online • Facts-on-File • Health Reference Center • Literary Reference Center • Salem Press History Databases • Salem Press Science Databases • Science Reference Center • SIRS Researcher
JSTOR only: Set up your own login/password: tiny.cc/hcagy For current newspapers remote & mobile devices: [email protected] wachusett1
• The Boston Globe • The New York Times • The Wall Street Journal • The Holden Landmark
Note: Usernames and Passwords as well a particular databases are always changing. Check with your science teacher, English teacher, or Media Center Specialists for updates.
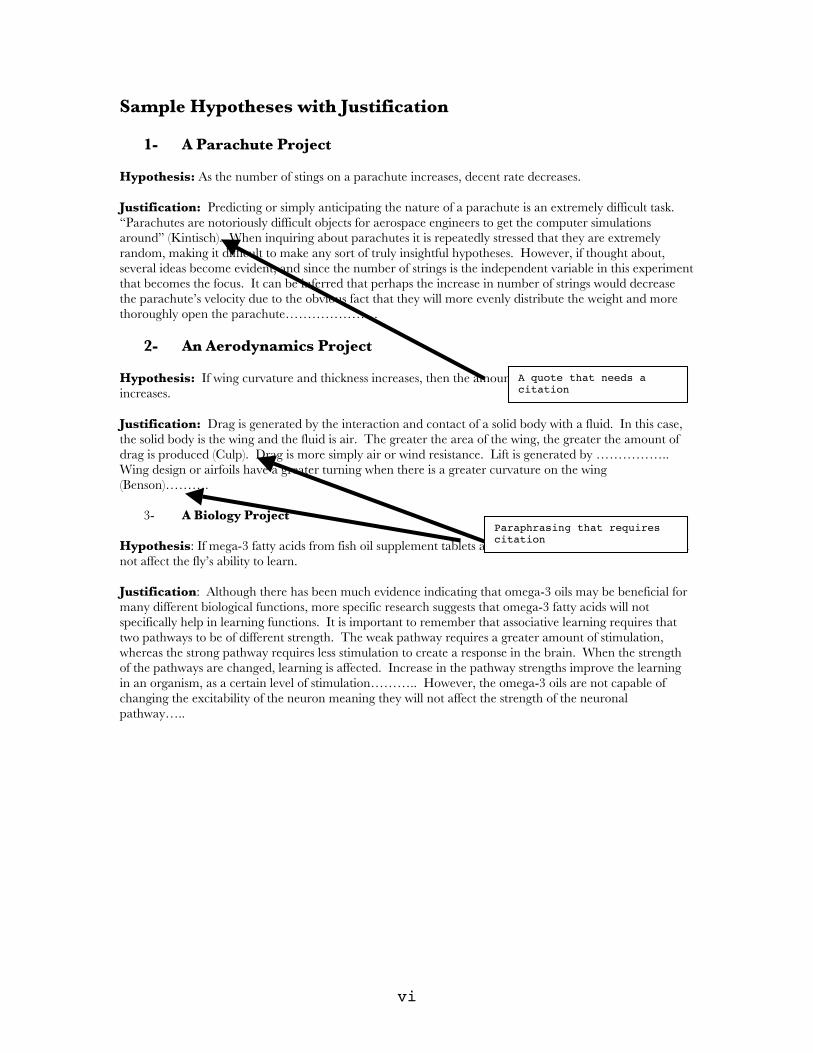
vi
Sample Hypotheses with Justification
1- A Parachute Project Hypothesis: As the number of stings on a parachute increases, decent rate decreases. Justification: Predicting or simply anticipating the nature of a parachute is an extremely difficult task. “Parachutes are notoriously difficult objects for aerospace engineers to get the computer simulations around” (Kintisch). When inquiring about parachutes it is repeatedly stressed that they are extremely random, making it difficult to make any sort of truly insightful hypotheses. However, if thought about, several ideas become evident, and since the number of strings is the independent variable in this experiment that becomes the focus. It can be inferred that perhaps the increase in number of strings would decrease the parachute’s velocity due to the obvious fact that they will more evenly distribute the weight and more thoroughly open the parachute…………………
2- An Aerodynamics Project Hypothesis: If wing curvature and thickness increases, then the amount of lift and drag produced increases. Justification: Drag is generated by the interaction and contact of a solid body with a fluid. In this case, the solid body is the wing and the fluid is air. The greater the area of the wing, the greater the amount of drag is produced (Culp). Drag is more simply air or wind resistance. Lift is generated by …………….. Wing design or airfoils have a greater turning when there is a greater curvature on the wing (Benson)……….
3- A Biology Project Hypothesis: If mega-3 fatty acids from fish oil supplement tablets are added to drosophila’s diet, then it will not affect the fly’s ability to learn. Justification: Although there has been much evidence indicating that omega-3 oils may be beneficial for many different biological functions, more specific research suggests that omega-3 fatty acids will not specifically help in learning functions. It is important to remember that associative learning requires that two pathways to be of different strength. The weak pathway requires a greater amount of stimulation, whereas the strong pathway requires less stimulation to create a response in the brain. When the strength of the pathways are changed, learning is affected. Increase in the pathway strengths improve the learning in an organism, as a certain level of stimulation……….. However, the omega-3 oils are not capable of changing the excitability of the neuron meaning they will not affect the strength of the neuronal pathway…..
A quote that needs a citation
Paraphrasing that requires citation
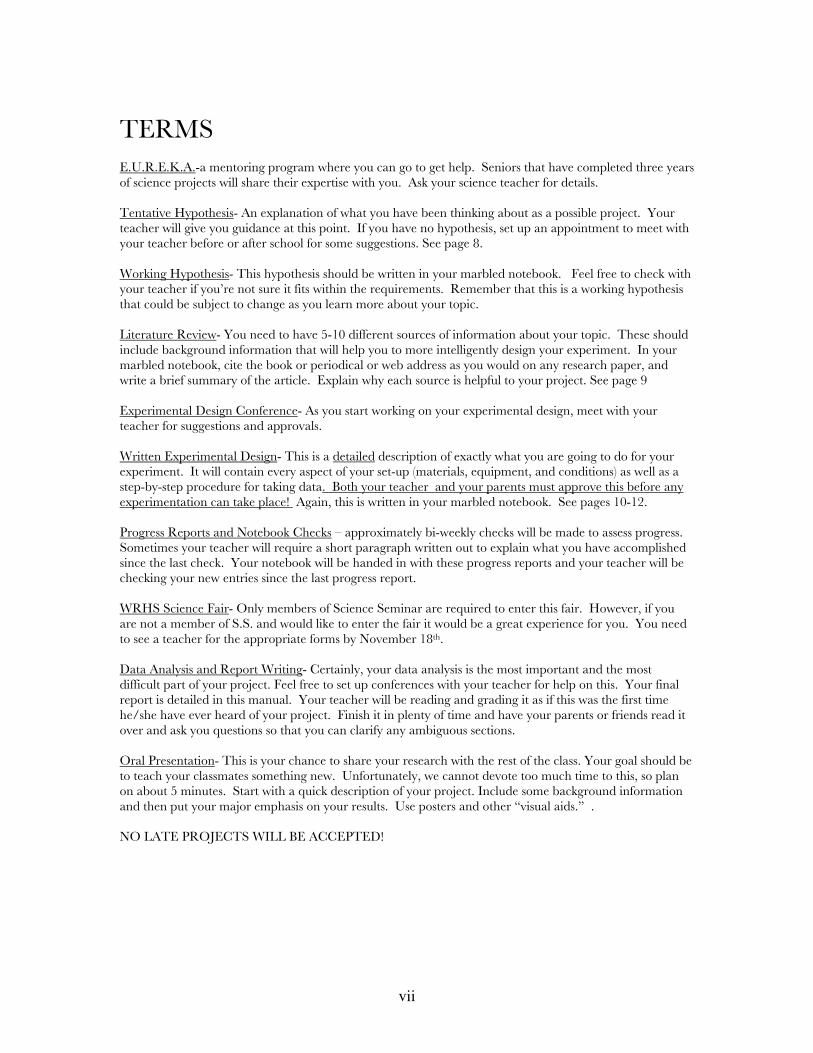
vii
TERMS E.U.R.E.K.A.-a mentoring program where you can go to get help. Seniors that have completed three years of science projects will share their expertise with you. Ask your science teacher for details. Tentative Hypothesis- An explanation of what you have been thinking about as a possible project. Your teacher will give you guidance at this point. If you have no hypothesis, set up an appointment to meet with your teacher before or after school for some suggestions. See page 8. Working Hypothesis- This hypothesis should be written in your marbled notebook. Feel free to check with your teacher if you’re not sure it fits within the requirements. Remember that this is a working hypothesis that could be subject to change as you learn more about your topic. Literature Review- You need to have 5-10 different sources of information about your topic. These should include background information that will help you to more intelligently design your experiment. In your marbled notebook, cite the book or periodical or web address as you would on any research paper, and write a brief summary of the article. Explain why each source is helpful to your project. See page 9 Experimental Design Conference- As you start working on your experimental design, meet with your teacher for suggestions and approvals. Written Experimental Design- This is a detailed description of exactly what you are going to do for your experiment. It will contain every aspect of your set-up (materials, equipment, and conditions) as well as a step-by-step procedure for taking data. Both your teacher and your parents must approve this before any experimentation can take place! Again, this is written in your marbled notebook. See pages 10-12. Progress Reports and Notebook Checks – approximately bi-weekly checks will be made to assess progress. Sometimes your teacher will require a short paragraph written out to explain what you have accomplished since the last check. Your notebook will be handed in with these progress reports and your teacher will be checking your new entries since the last progress report. WRHS Science Fair- Only members of Science Seminar are required to enter this fair. However, if you are not a member of S.S. and would like to enter the fair it would be a great experience for you. You need to see a teacher for the appropriate forms by November 18th. Data Analysis and Report Writing- Certainly, your data analysis is the most important and the most difficult part of your project. Feel free to set up conferences with your teacher for help on this. Your final report is detailed in this manual. Your teacher will be reading and grading it as if this was the first time he/she have ever heard of your project. Finish it in plenty of time and have your parents or friends read it over and ask you questions so that you can clarify any ambiguous sections. Oral Presentation- This is your chance to share your research with the rest of the class. Your goal should be to teach your classmates something new. Unfortunately, we cannot devote too much time to this, so plan on about 5 minutes. Start with a quick description of your project. Include some background information and then put your major emphasis on your results. Use posters and other “visual aids.” . NO LATE PROJECTS WILL BE ACCEPTED!
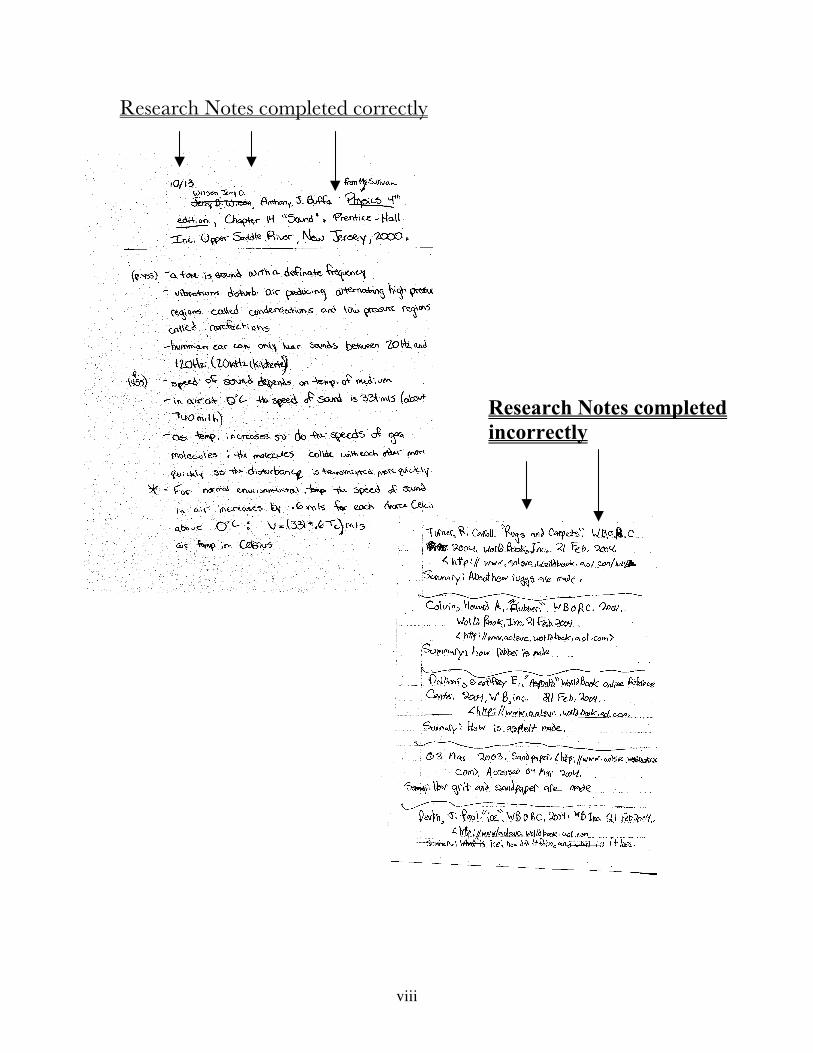
viii
Research Notes completed correctly
Research Notes completed incorrectly
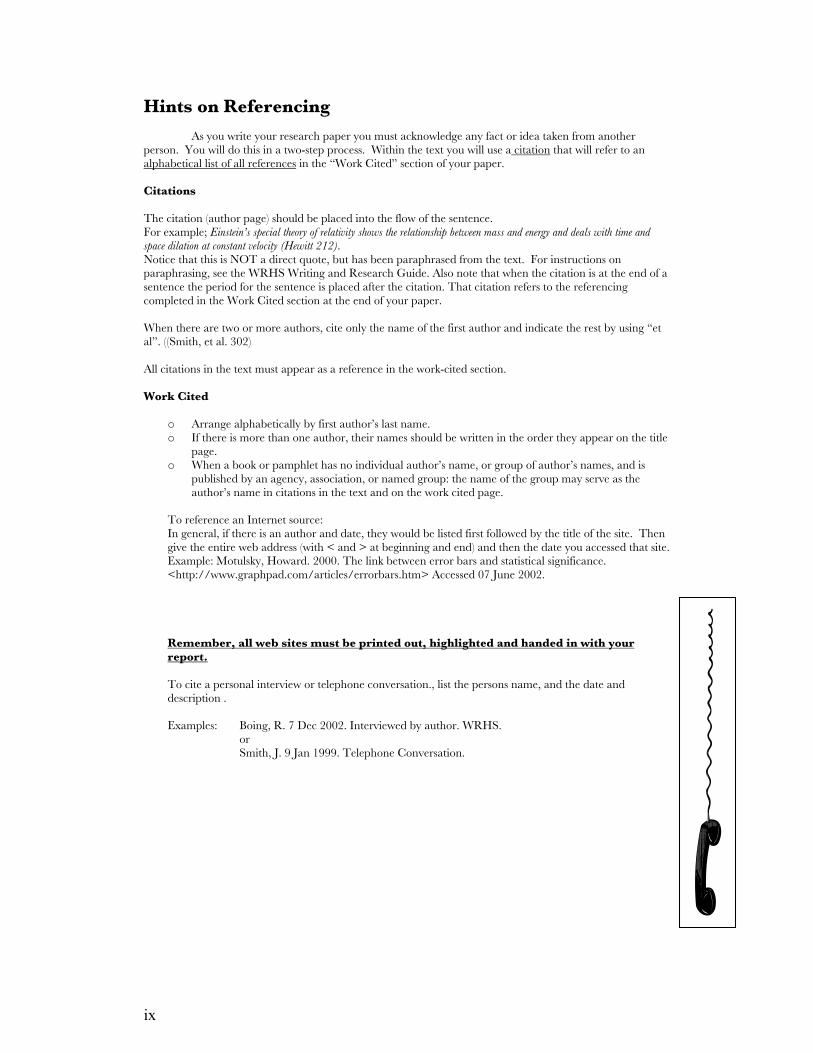
ix
Hints on Referencing As you write your research paper you must acknowledge any fact or idea taken from another person. You will do this in a two-step process. Within the text you will use a citation that will refer to an alphabetical list of all references in the “Work Cited” section of your paper. Citations The citation (author page) should be placed into the flow of the sentence. For example; Einstein’s special theory of relativity shows the relationship between mass and energy and deals with time and space dilation at constant velocity (Hewitt 212). Notice that this is NOT a direct quote, but has been paraphrased from the text. For instructions on paraphrasing, see the WRHS Writing and Research Guide. Also note that when the citation is at the end of a sentence the period for the sentence is placed after the citation. That citation refers to the referencing completed in the Work Cited section at the end of your paper. When there are two or more authors, cite only the name of the first author and indicate the rest by using “et al”. ((Smith, et al. 302) All citations in the text must appear as a reference in the work-cited section. Work Cited
o Arrange alphabetically by first author’s last name. o If there is more than one author, their names should be written in the order they appear on the title
page. o When a book or pamphlet has no individual author’s name, or group of author’s names, and is
published by an agency, association, or named group: the name of the group may serve as the author’s name in citations in the text and on the work cited page.
To reference an Internet source: In general, if there is an author and date, they would be listed first followed by the title of the site. Then give the entire web address (with < and > at beginning and end) and then the date you accessed that site. Example: Motulsky, Howard. 2000. The link between error bars and statistical significance. <http://www.graphpad.com/articles/errorbars.htm> Accessed 07 June 2002. Remember, all web sites must be printed out, highlighted and handed in with your report. To cite a personal interview or telephone conversation., list the persons name, and the date and description . Examples: Boing, R. 7 Dec 2002. Interviewed by author. WRHS. or
Smith, J. 9 Jan 1999. Telephone Conversation.
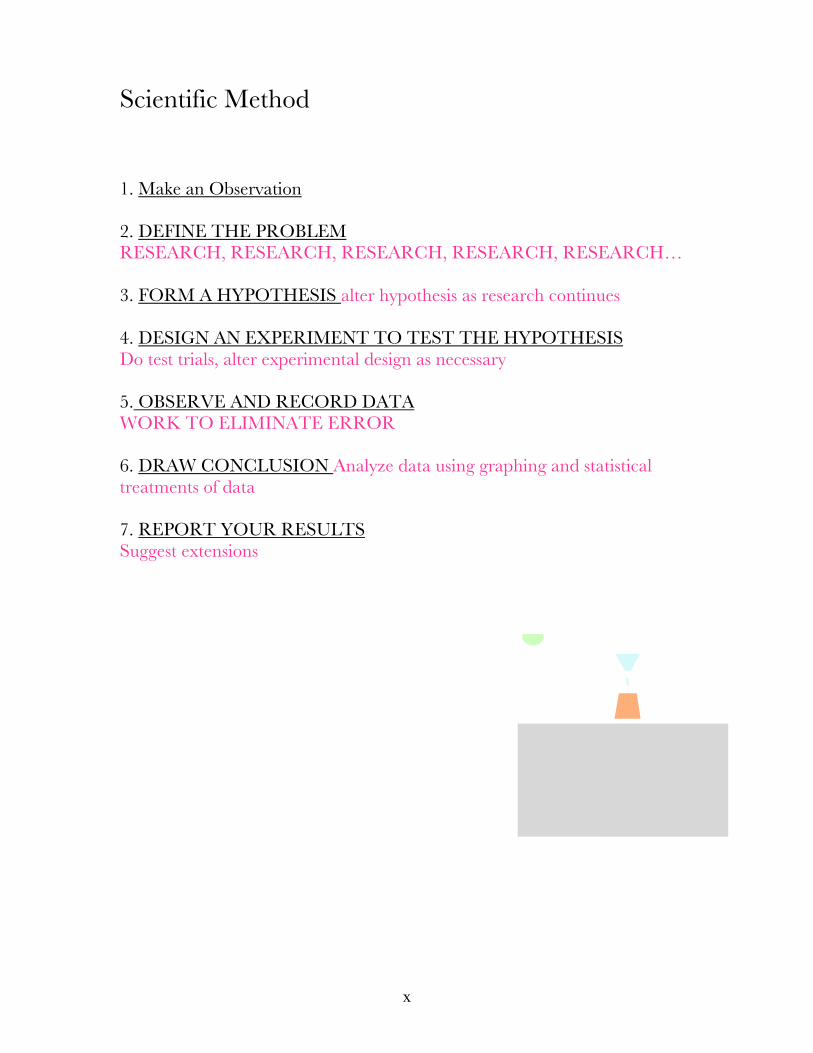
x
Scientific Method 1. Make an Observation 2. DEFINE THE PROBLEM RESEARCH, RESEARCH, RESEARCH, RESEARCH, RESEARCH… 3. FORM A HYPOTHESIS alter hypothesis as research continues 4. DESIGN AN EXPERIMENT TO TEST THE HYPOTHESIS Do test trials, alter experimental design as necessary 5. OBSERVE AND RECORD DATA WORK TO ELIMINATE ERROR 6. DRAW CONCLUSION Analyze data using graphing and statistical treatments of data 7. REPORT YOUR RESULTS Suggest extensions


