Embed Size (px)
Citation preview
A R G U S R E S E A R C H C O M P A N Y • 6 1 B R O A D W A Y • N E W Y O R K, N.Y. 1 0 0 0 6
W E E K L Y S T A F F R E P O R T
Withfivemonthsremainingin2021,economicfundamentalsgenerallyarepositive,creatinganenvironmentforfurtherstock-marketgainsintoyear-end.Theeconomyandpublichealthhavestagedaremarkablecomebackfromthedepthsofthepandemic-in-ducedeconomicshutdown.Thecalendarsecond-quarterearningsseasonhasblownawayalready-highexpectations,reflectingacombinationofmaximumrecoverymomentumandcomparisonsagainstayear-earlierperiodwhenthenationwasineconomicshutdown. Ongoingmonetarystimulus,viaQEandultra-lowshort-termrates,continues.TheFedlikelywouldtaperitsmassiveQEprogramlongbeforeitactuallyraisedthefedfundsrate.Bysignalingthatitintendstostaythecourseonaccommodativemonetarypolicy,andbypositingthatanyinflationspikewastransitory,theFedhasdispelledinflationfearsandallowedbullstoinvestwithconfidence. ThebiggestcurrentconcernsaretheresurgenceinCOVID-19inunder-vaccinatedareas,andelevatedvaluationsnotonlyinthestockmarketbutinmostassetclasses.Aslongastheeconomycankeepexpandingandearningskeepgrowing,valuationconcernsshouldmoderateovertime.
The Economy, Interest Rates and EarningsTheadvancereportof2Q21GDPshowedgrowthof6.5%,edgingupfrom6.3%forthefirstquarter.TheU.S.economyinthefirsthalfof2021carriedstrengthforwardfromthesecondhalfof2020,whichfeatured4.2%growthinthefourthquarterand30%inabounce-backthirdquarter. During2Q21,keyGDPdrivers includedpersonalconsumptionexpenditures(PCE),non-residentialfixedinvestment,exports,andstateandlocalgovernmentspending.TheselattertwocategorieshavebothcomebackfrommultiplequartersinwhichtheircontributiontoGDPgrowthwasbelowthelong-termtrend.Growthdriverswereoffsetpartlybydecreasesinprivateinventoryinvestment,residentialfixedinvestment,andfederalgovernmentspending.Theselattertwocategoriesweremainstaysintheeconomy’sdarkesthoursduringtheworstofthepandemic. Upuntil2Q21,U.S.grossdomesticproductonanannualizedbasisremainedbelowthepre-pandemicpeak.Whileweoriginallytargeteda“round-triprecovery”intheeconomytothesecondhalf,inspring2021wemovedupourtargetbasedonsignsofacceleratingmomentumasvaccinationssurged.Infact,current-dollarGDPin2Q21reached$22.72trillion,up13%year-over-yearandabovethepriorall-timehighreachedin4Q19.
(continued on next page)
August 9, 2021Vol. 88, No. 10
IN THIS ISSUE
SECTION 1Economic & Market CommentaryTechnical Trends Commentary
SECTION 2Focus StocksChanges in RatingsGrowth & Value StocksUtilityScopeStocks to Avoid
SECTION 3Economic CalendarSpecial Situations & ScreensMaster List ChangesRecent Argus BUY Upgrades
Trying to Get to Normal: Our Monthly Survey of the Economy, Interest Rates, and Markets
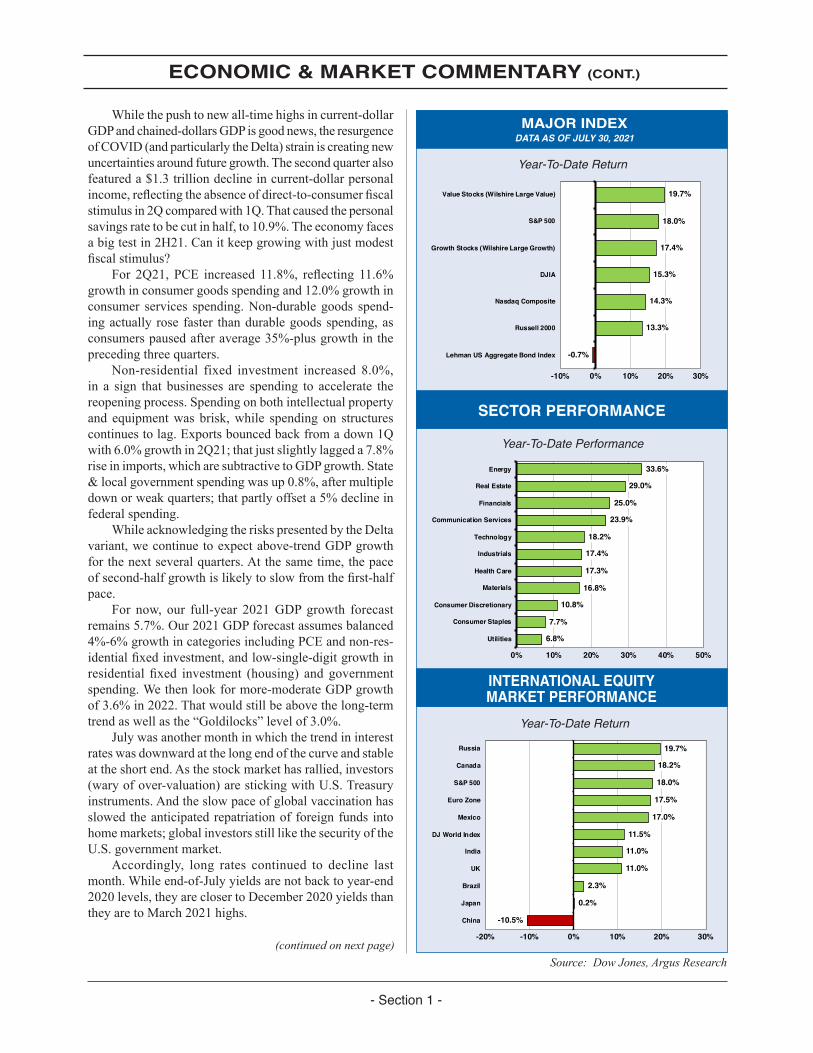
Whilethepushtonewall-timehighsincurrent-dollarGDPandchained-dollarsGDPisgoodnews,theresurgenceofCOVID(andparticularlytheDelta)strainiscreatingnewuncertaintiesaroundfuturegrowth.Thesecondquarteralsofeatureda$1.3trilliondeclineincurrent-dollarpersonalincome,reflectingtheabsenceofdirect-to-consumerfiscalstimulusin2Qcomparedwith1Q.Thatcausedthepersonalsavingsratetobecutinhalf,to10.9%.Theeconomyfacesabigtestin2H21.Canitkeepgrowingwithjustmodestfiscalstimulus? For 2Q21, PCE increased 11.8%, reflecting 11.6%growthinconsumergoodsspendingand12.0%growthinconsumer services spending.Non-durable goods spend-ingactually rose faster thandurablegoodsspending,asconsumerspausedafteraverage35%-plusgrowthintheprecedingthreequarters. Non-residential fixed investment increased 8.0%,in a sign that businesses are spending to accelerate thereopeningprocess.Spendingonbothintellectualpropertyand equipmentwas brisk,while spendingon structurescontinuestolag.Exportsbouncedbackfromadown1Qwith6.0%growthin2Q21;thatjustslightlylaggeda7.8%riseinimports,whicharesubtractivetoGDPgrowth.State&localgovernmentspendingwasup0.8%,aftermultipledownorweakquarters;thatpartlyoffseta5%declineinfederalspending. WhileacknowledgingtheriskspresentedbytheDeltavariant,wecontinuetoexpectabove-trendGDPgrowthforthenextseveralquarters.Atthesametime,thepaceofsecond-halfgrowthislikelytoslowfromthefirst-halfpace. For now, our full-year 2021GDPgrowth forecastremains5.7%.Our2021GDPforecastassumesbalanced4%-6%growthincategoriesincludingPCEandnon-res-identialfixedinvestment,andlow-single-digitgrowthinresidential fixed investment (housing) and governmentspending.Wethenlookformore-moderateGDPgrowthof3.6%in2022.Thatwouldstillbeabovethelong-termtrendaswellasthe“Goldilocks”levelof3.0%. Julywasanothermonthinwhichthetrendininterestrateswasdownwardatthelongendofthecurveandstableattheshortend.Asthestockmarkethasrallied,investors(waryofover-valuation)arestickingwithU.S.Treasuryinstruments.Andtheslowpaceofglobalvaccinationhasslowedtheanticipatedrepatriationofforeignfunds intohomemarkets;globalinvestorsstilllikethesecurityoftheU.S.governmentmarket. Accordingly, long rates continued to decline lastmonth.Whileend-of-Julyyieldsarenotbacktoyear-end2020levels,theyareclosertoDecember2020yieldsthantheyaretoMarch2021highs.
ECONOMIC & MARKET COMMENTARY (CONT.)
MAJOR INDEXDATA AS OF JULY 30, 2021
SECTOR PERFORMANCE
INTERNATIONAL EQUITY MARKET PERFORMANCE
Source: Dow Jones, Argus Research
- Section 1 -
Year-To-Date Return
Year-To-Date Return
Year-To-Date Performance
(continued on next page)
19.7%
18.0%
17.4%
15.3%
14.3%
13.3%
-0.7%
-10% 0% 10% 20% 30%
Value Stocks (Wilshire Large Value)
S&P 500
Growth Stocks (Wilshire Large Growth)
DJIA
Nasdaq Composite
Russell 2000
Lehman US Aggregate Bond Index
33.6%
29.0%
25.0%
23.9%
18.2%
17.4%
17.3%
16.8%
10.8%
7.7%
6.8%
0% 10% 20% 30% 40% 50%
Energy
Real Estate
Financials
Communication Services
Technology
Industrials
Health Care
Materials
Consumer Discretionary
Consumer Staples
Utilities
19.7%
18.2%
18.0%
17.5%
17.0%
11.5%
11.0%
11.0%
2.3%
0.2%
-10.5%
-20% -10% 0% 10% 20% 30%
Russia
Canada
S&P 500
Euro Zone
Mexico
DJ World Index
India
UK
Brazil
Japan
China
ECONOMIC & MARKET COMMENTARY (CONT.)
Asareminder,the10-yearTreasuryyieldrosesharplyfrom0.9%attheendof2020to1.75%bytheendofthefirstquarterof2021.Thelongyieldgenerallyhasbeentrendinglowereversince,however.The10-yearyieldendedJulyat1.24%afterendingJuneat1.48%. TheFederalReserve’spolicy-settingarm,theFederalOpenMarketCommittee (FOMC),met inmid-Julyandhelditsbenchmarkinterestrate(thefedfundsrate)nearzero.Thatwasasexpected.InvestorswerewaitingtoseeiftherewereanychangesintheFed’sstanceorevennuancesincurrentaccommodativepolicy. UnlikeinJune,whentheFedseemedtobemullingapotentialdownshiftinquantitativeeasing,theJulysessiondidnotgiveinvestorsmuchtochewon.Inaunanimouslyapproved statement, the FOMC said that the economycontinuestostrengthen.ChairmanJeromePowellsaidtheFedisnotclosetoconsideringaratehike.TheFedwantstosee“substantialfurtherprogress”onemploymentandwould countenancehigher inflationbefore beginning totightenpolicy.InitialtighteninginpolicymostlikelywouldbeareductioninQEratherthananoutrightratecut. Weconcurthatrecentelevatedinflationnumberscon-tainedsomedistortionsthatmaybeoverstatingthelong-termpricetrend.Butinflationinherentlyisunpredictable,andtheFedmayneedtoamenditsagendainresponsetoreal-timeinflationdataacross2021and2022. Assumingtheeconomyistrulyexpandingagain,the10-yearcannotstaydownforever.Welookforthe10-yearyieldtobreakabove2.0%eventually,perhapsassoonasyear-end2021--thoughmorelikelyatsomepointin2022. Second-quarterearningsseasonhasbeenanunmitigat-edsuccess.ThefinalweekofJuly,whichwasthebusiestsingleweek of the earnings season,was even strongerthan thefirst twoweeks.Withabout60%ofcompanieshavingreported,S&P500earningsfromcontinuingoper-ationsfor2Q21areupmorethan70%year-over-year,onamarket-cap-weighted percentage-change basis.WhileBloombergandFactSethavecalculatedslightlydifferentpercentagechanges,bothconcurthat2Q21earningsgrowthisthestrongestsincetherecoveryquarterof4Q09follow-ingtheGreatRecessionof2008-2009. Earnings are being pushed up by amultitude offactors, reflecting thecombinationofpositiveeconomicfundamentals,vaccine-andreopening-inducedoptimism,fiscalandmonetarystimulus,andmore.Earningsin1H21alsobenefitedfromrecoveryinsectorssuchasEnergyandIndustrials,whichweresubtractiveto2020earningsbutarecontributingstronglyin2021. Weprioritizeperformanceonayear-over-yearbasisoverperformanceagainstconsensusestimates,giventhatthelattercanbesteeredbycompanyexecutives.Butthenumberofcompaniestoppingconsensushasbeenremark-able,andperhapshistorical,inthe2Q21earningsseasontodate.Approximately88%ofcompanieshavepostedsec-ond-quarterEPSthatexceededpre-reportingexpectations.Andthescaleoftheearningsbeatisnotable.Companies
haveoutperformedexpectationsnotbyafewpercentagepoints,butbyover20%comparedwithconsensusestimates. About85%ofcompanieshaveexceededconsensusrevenue expectations.With the “scarcityof everything”spurred by high demand in an accelerating recovery,companieshavepricingpower.Higherpriceareenablingcompanies tooffsethigher inputcosts,whichotherwisewouldbenegativelyimpactingmargins. Afterfirst-halfEPSgrowthexceeded50%,welookformore-moderatebutstillabove-trendEPSgrowthof18%inthesecondhalfof2021.Companieswillbeconfront-ingmore-challengingcompsbeginningwiththird-quarter2021earnings,tobereportedinmid-October.Currently,consensusexpectationsareforthird-quartergrowthinthemid-20%range,andfourth-quartergrowthinthehigh-teenspercentagerange. InMay2021,andforathirdtimethisyear,weraisedour2021estimateofS&P500earningsfromcontinuingoperationsto$182pershare,fromaprior$177.Wealsoraisedour2022estimateofS&P500earningsfromcon-tinuingoperationsto$205pershare,fromaprior$201.Wearelikelytoraiseourforecastsonceagainafter2Q21EPSresultsarefinalized.
Domestic and Global MarketsLatein2020,thestockmarketbeganitsrotationawayfromgrowth-centricsectorsthathadlongledthemarket,andtowardcyclical,interest-ratesensitive,andinflation-benefi-ciarysectors.Theshiftwaspredicatedontheviewthattherecoveringeconomywouldfavorcyclicalsectors,includingIndustrialandRealEstate;thatrisingdemandwouldpushup interest rates,benefitingFinancialServices; and thatrisingpriceswouldfavor“wealthintheground”sectorsincludingEnergyandBasicMaterials. Fortheyear-to-date,thatthesishascertainlyplayedout.Fiveofthesixtopsectorsin2021remaincyclical,havebene-fitedfromrisingrates,orareperceivedashigherinflationplays. In the secondquarter, and particularly in late JunethroughJuly,themarketstagedapartialre-rotationbacktogrowth.Onthatbasis,asoftheendofJuly,growthhasclosedthegapwithvalue.AndtheNasdaqhasnearlypulledevenwiththeblue-chipDJIA. Julywasagoodmonth for stocks,andvirtuallyallindicesandinvestingstylesimprovedmonth-over-month.WilshireLarge-CapValue,up17.7%asoftheendofJune,is nowon topwith a 19.7%gain.WilshireLarge-CapGrowthcontinuestoclosethegapwithValue,whichitnowlagsbylessthan200bpsyear-to-date.ThisistheclosestithasbeentotheWilshireValueallyear. NextistheS&P500,up18.0%foryear.TheS&P500overtooktheDJIAbeforemidyearandhassincewideneditsadvantage.TheDowisup15.3%year-to-date.It’sunusualtosaythis lateinthesummer,but theNasdaqisdeeplylagging theblue-chip indexes.TheNasdaq isup14.3%year-to-date,whichputsitbehindnotonlytheS&P500butalsotheDJIA.
- Section 1 -
Themarketappearstohavelostitsattractiontosmall-caps,perhapsonfearsthatanycorporatetaxhikewouldhitthiscategoryharder.Thesmall-capRussell2000isup13.3%,havingshedalmost400bpsofgaininthepastfewmonths. TheBarclayBloombergU.S.Bondindex,whichdeliv-ered7.2%totalreturnin2020,isdown0.7%fortheyear.Thatisanimprovementafterbeingdown3.0%asoftheendofMarch.Ifratesatthelongerendofthecurveresumetheir rise, fixed-income total return is likely toweakenfurther.Giventherecentdeclineinlongyields,wedonotlookformassiveunderperformanceinbondsthisyear. Sevenmonthsintothetradingyear,everysectorintheS&P500ispositive.TherotationalwinnersinEnergy,BasicMaterials,FinancialServices,andRealEstateremaininfront.Butgrowthsectorshavealsoparticipatedintherallyandhavebeensomeofthestrongestmarketperformersoflate. Someof the year-to-datewinners have given backin the past twomonths.These includeBasicMaterials,Industrials, and Financial Services. Fortunately, thesesectorshadexcessgainstospare.EventhoughitstumbledinJuly,Energyremainsthemarketleaderwitha34%gainyear-to-date,eventhoughthatisdownfromthemid-40%range.FinancialServices andRealEstate arenextwithupper-20%gains.Bothsectorshavebeensubjecttosomeprofit-taking,yetbotharehangingontoleadershipspots. Growthsectorshaveralliedandareclosinginontheleaders.CommunicationsServiceisupinmid-20%rangewhileTechnologyisinthehighteens.Otherdouble-digitwinnersincludeHealthcare,Industrials,BasicMaterials,andConsumerDiscretionary. Inourview,year-end2020rotationthathascarriedinto2021ishealthy.InvestorsrotatedoutofsectorssuchasTechnologythatlookedover-extendedatyear-end2020,andintoareassuchasEnergy,FinancialServices,andRealEstatewheretheysawvalue. Wenowseesignsofare-rotationintotheoldgrowthfavorites.Buttheoriginalrotationintocyclical,ratesensi-tiveandwealthinthegroundsectorsisnotover.MuchastheoriginalrotationtooksomeoftheheatoffTechnologyandallowedinvestorstoloveTechstocksanew,wecouldseerecentsoftnessasearly-2021rotationfavoritesgivewaytoarenewedaffectionforthesemulti-yearunderperformersasreopeningcontinuestodrivegrowth. ThetrendinU.S.long-terminterestrateshasshowncorrelationwithsectorrotationintheU.S.equitymarket.Cyclical reopening stocks, inflation beneficiaries, andFinancialServicesstocksallralliedinthespringmonthsasratesmovedhigher.Asnoted,rateshavebeenmovingdowninrecentmonths,andthatisallowinggrowthstockstorotatebackontofavor. In July,Technology sectorweighting rosemonth-over-monthforthefirsttimesincelatewinter.Techstocksreached27.8%ofS&P500sectorweight,up40bpsmonth-over-month.Healthcarealsoexpandedmonth-over-monthby40bps,toa13.4%weighting.Electiveproceduresthatweredeferredduringthepandemichaveresumed;atthe
sametime,companiescontinuetobattleCOVID-19’snewvariants.CommunicationServicesalsoedgedhigher,ledbymediaandinternetstocks. Thesegainscameattheexpenseofearly-yearwin-ners,whereinvestorsshowedwillingnesstotakeprofits.FinancialServicesweightingslidlowerby40bpsto10.9%,as falling interest rates reduced the net interestmarginavailable to banks.ConsumerDiscretionary also shedmarketweight.Whilethisisconsideredagrowthsector,areasincludinghospitality,leisure,restaurants,andretailhaveledthemarketonreopening.AcombinationofDeltaconcernandstrongperformanceappearstohavepromptedsomeprofit-takinginthoseareas. OtherreopeningbeneficiariessuchasEnergyandIn-dustrialalsobackeddownslightlyinJuly.Despitemodestpullbacksinthereopeningtrade,mostofthesesectorsarebiggerthantheywereayearago.Wecontinuetobelievethatthebalancedadvanceinthemarket,inwhichgrowthsectorstag-teamreopeningsectors,hasprovidedhealthybalancethatisastrongsupportfortheoverallstockmarketatcurrentlevels. AsvaccinesproliferateintheU.S.andahandfulofdeveloped nations, the pandemic continues to presentchallengesintheworldatlarge.ManymajorinternationalmarketsweakenedinJuly,however.Ourcompositeof11globalboursesonaveragewasup10.9%attheendofJuly,versusup12.2%atmidyear. Japanisbarelypositiveyear-to-date,withtheOlym-picsprovidingnotailwind.Chinaisdown11%inapartlyself-inflicteddecline,asthegovernmenttakesaimattopTechstocks. Thebest-performingthemeamongourglobalindicesis theAmericas,whereCanadaandMexicocontinue tobuildonearly-yearstrength.Europeand theUKtookastepback,asdidtheBRICs.
ConclusionThe highly infectiousDelta variant ofCOVID-19 hascausedasurgeofinfectionsandhigherhospitalizations.Butbecause it ismainlyhittingahealthierandyoungerpopulation,themortalityrateisnotasfearsomeasinthefirstwavesofthepandemic.Outbreaksalsoarelocalizedtomainlyunvaccinatedstatesandregions.Peopleintheseareasarestartingtogetvaccinatedingreaternumbers. ExitingJuly,theS&P500hadbankeda17%gainsofarin2021.Whenstocksaredoingthiswellthisfaralongintheyear,theytendtofinishwithbetter-than-averageupside.Inthisenvironment,mostinvestorswillholdthroughthetypicallyslowAugust-Septemberperiodandthenlookforadditionalfireworksinthefinalthreemonthsoftheyear.Withsomanyinvestorsinthegreensofarin2021,andwithbearsatsomepointneedingtocapitulateandbuytheyear’swinners,furthergainscanbecomeaself-fulfillingprophecy.
JimKelleher,CFA,DirectorofResearch
ECONOMIC & MARKET COMMENTARY (CONT.)
TECHNICAL TRENDS COMMENTARY
- Section 1 -
Julyendedwithaboutofselling,butbullsconsidereditoverdueprofit-takingafteranothersuccessfulmonth.EvenwithFriday’swashout,theS&P500rose2.3%inJuly.Thatmarkedsixstraightmonthsofappreciationforthebluechipindex(onlyJanuaryhasbeennegativein2021)andwasthebestmarketmonthsinceApril. InJuly,stocksweredoingwhattheyaresupposedtodo.Since1980,theS&P500hasaveragedagainof1.1%inJuly,whichmakesitbyfarthebestsummermonth.Oddly,Julyhasbeendownnearlyasmanytimesasithasbeenupsince1980.ButJulyhashadsomebigwinners,including2010(up7.5%)and2013(up4.9%). As far as investors are concerned, the only troublewithJulyisthatitisfollowedbyAugustandSeptember.Since1980,Augusthasaveragedalackluster0.05%gain.
September has the distinction of being the onlymonthamongthe12toaverageanegativereturnsince1980.Overthepast41years,theS&P500hasdeclinedonaverageby0.69%inSeptember. The silver lining for stocks, assuming theymake itthrough theAugust-September stretchwithmost of theyear-to-dategainsintact,istheOctober-Decemberperiod.DespiteOctober’sfearsomereputation, this three-monthstretchtypicallyisthemarket’sbestallyear. Since1980,theS&P500hasaveragedagainof4.4%intheOctober-Decemberperiod.IftheU.S.stockmarketcanaddanother4%tothe17%advanceyeartodate,that20%-plusgainfor theyearwouldmore thandouble theaverage10.5%returnsince1980.
JimKelleher,CFA,DirectorofResearch
FOCUS LIST
Focus List Stocks
TICKER
PRICEAS OF
8/4/21
Basic Materials
LyondellBasell Industries NV LYB $100.20
Communication Services
Activision Blizzard Inc ATVI 79.83Pinterest Inc PINS 60.01T-Mobile US Inc TMUS 144.50
Consumer Discretionary
D.R. Horton Inc. DHI 97.55EBay Inc. EBAY 68.01Lululemon Athletica inc. LULU 407.51Restaurant Brands Intl In QSR 66.44
Consumer Staples
Coca-Cola Co KO 56.92Monster Beverage Corp. MNST 93.04
Energy
Enbridge Inc ENB 39.47
Financial
Discover Financial Services DFS 126.01Lazard Ltd. LAZ 47.20Raymond James Financial, Inc. RJF 129.52U.S. Bancorp. USB 55.89
Healthcare
Anthem Inc ANTM 395.29HCA Healthcare Inc HCA 253.51Mckesson Corporation MCK 206.42Silk Road Medical Inc SILK 52.49Zoetis Inc ZTS 204.10
Industrials
General Dynamics Corp. GD 197.32Trane Technologies plc TT 206.56Vontier Corp VNT 32.52
Real Estate
Weyerhaeuser Co. WY 34.54
Technology
Dell Technologies Inc DELL 98.43International Business Machine IBM 144.07KLA Corp. KLAC 346.89Qorvo Inc QRVO 195.18Sanmina Corp SANM 38.17
Utility
American Electric Power Co Inc AEP 89.09
Focus List Stocks in this Report
PRICEAS OF
TICKER 8/4/21
American Electric Power Co Inc AEP $89.09
Anthem Inc ANTM 395.29
General Dynamics Corp. GD 197.32
HCA Healthcare Inc HCA 253.51
KLA Corp. KLAC 346.89
Lazard Ltd. LAZ 47.20
LyondellBasell Industries NV LYB 100.20
Raymond James Financial, Inc. RJF 129.52
Restaurant Brands Intl In QSR 66.44
Sanmina Corp SANM 38.17
Weyerhaeuser Co. WY 34.54
American Electric Power Co Inc (AEP)Publication Date: 7/29/21Current Rating: BUY
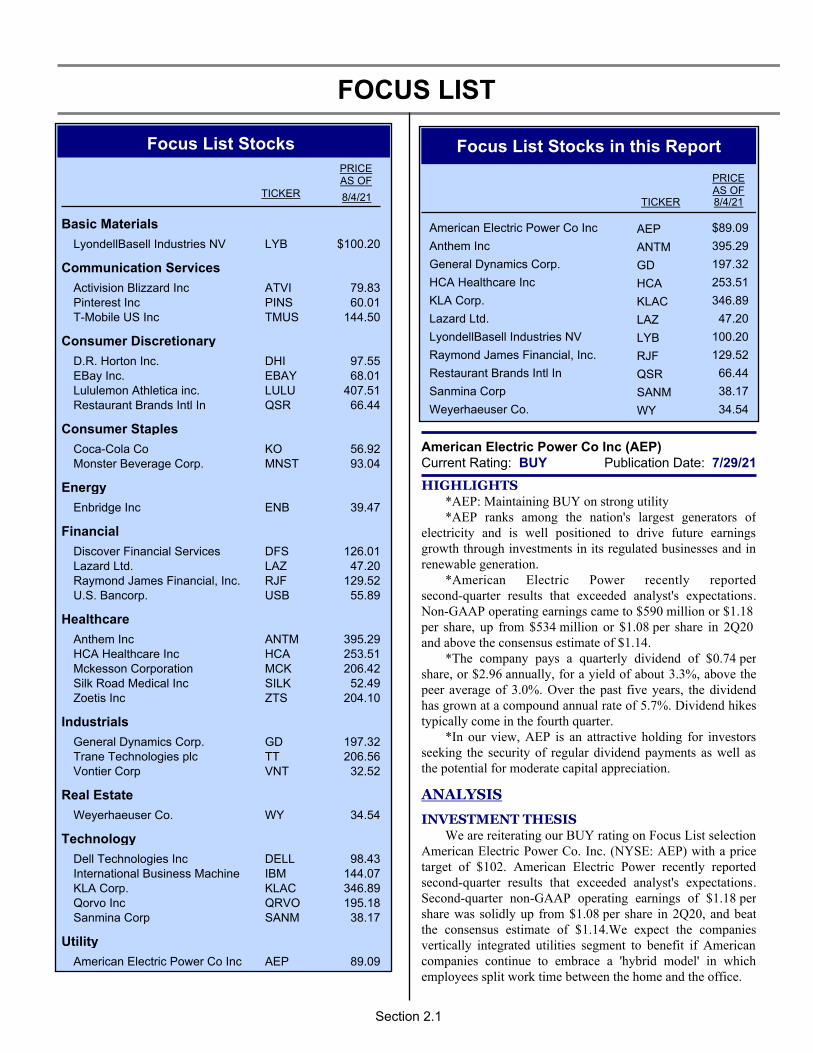
HIGHLIGHTS*AEP: Maintaining BUY on strong utility*AEP ranks among the nation's largest generators of
electricity and is well positioned to drive future earnings growth through investments in its regulated businesses and in renewable generation.
*American Electric Power recently reported second-quarter results that exceeded analyst's expectations. Non-GAAP operating earnings came to $590 million or $1.18 per share, up from $534 million or $1.08 per share in 2Q20 and above the consensus estimate of $1.14.
*The company pays a quarterly dividend of $0.74 per share, or $2.96 annually, for a yield of about 3.3%, above the peer average of 3.0%. Over the past five years, the dividend has grown at a compound annual rate of 5.7%. Dividend hikes typically come in the fourth quarter.
*In our view, AEP is an attractive holding for investors seeking the security of regular dividend payments as well as the potential for moderate capital appreciation.
ANALYSIS
INVESTMENT THESISWe are reiterating our BUY rating on Focus List selection
American Electric Power Co. Inc. (NYSE: AEP) with a price target of $102. American Electric Power recently reported second-quarter results that exceeded analyst's expectations. Second-quarter non-GAAP operating earnings of $1.18 per share was solidly up from $1.08 per share in 2Q20, and beat the consensus estimate of $1.14.We expect the companies vertically integrated utilities segment to benefit if American companies continue to embrace a 'hybrid model' in which employees split work time between the home and the office.
Section 2.1
FOCUS LISTThe company is well positioned to drive future earnings
growth through investments in its regulated businesses, with planned transmission investments funded through equity and debt offerings. AEP is also benefiting from recently implemented cost-reduction programs, which, along with favorable rate case decisions, should contribute to stable earnings growth over the next few years. We also like the company's consistent record of dividend growth, with a 5.7% compound annual increase over the last five years. The current yield is about 3.3%, above the peer average of 3.0%.
We also like AEP over the long term, as the company ranks among the nation's largest generators of electricity, with substantial exposure to states with strong population growth, like Texas.
RECENT DEVELOPMENTSAEP shares have underperformed the S&P 500 over the
past three months, with a gain of 2% compared to a gain of 5% for the S&P. Over the past year, the shares have also underperformed, climbing 7% compared to a gain of 36% for the S&P. The shares have underperformed the Utility Sector ETF (IDU) over the last year, but have outperformed over the past 5- and 10-year periods. The stock's beta is 0.26.
American Electric Power recently reported second-quarter results that exceeded analyst's expectations. The company reported second-quarter non-GAAP operating earnings of $590 million or $1.18 per share, up from $534 million or $1.08 per share in 2Q20. Non-GAAP EPS beat the consensus estimate of $1.14. Positive drivers included better rates, higher transmission revenue, and new investment growth. These positives were partially offset by an increase in O&M expense, an increase in depreciation, and unfavorable weather. GAAP EPS increased to $1.16 from $1.05 per share in the prior-year period on roughly the same drivers. Revenue came to $3.8 billion, up 10% from the prior-year-period.
On the 2Q conference call, management reaffirmed its 2021 adjusted EPS guidance of $4.55-$4.75. It also reaffirmed its long-term EPS growth forecast of 5%-7% from a 2019 base.
EARNINGS & GROWTH ANALYSISKey 2Q operating metrics for American Electric Power
are summarized below.
In the Vertically Integrated Utilities segment, total second-quarter KWH sales increased 2.3% year-over-year to 25.8 billion, reflecting a 6.5% decline in residential sales, a 10.1% increase in commercial, an 11.8% increase in industrial, and a 8.9% decrease in wholesale. Segment operating earnings fell 10.9% to $228 million, or $0.45 per share, due to higher O&M, higher depreciation and amortization, and higher taxes. The higher O&M was the result of a true-up during the quarter.
In the Transmission & Distribution segment, operating revenue increased 6.6% to $1.10 billion. Operating EPS increased to $0.31 from $0.29. The results reflected an increase in O&M that was more than offset by lower depreciation and amortization.
Second-quarter earnings in the AEP Transmission Holdco segment rose to $0.34 per share from $0.19 a year earlier due to increased transmission investment.
As the company scales back its nonregulated business, earnings and dividend growth should become more predictable. The company will also be able to use proceeds from the sale of nonregulated assets to strengthen its regulated business and expand its generation of renewable energy. Asset sales have slowed recently, as the generation and marketing segment has retired coal assets and brought renewable assets online. Total MWhs generated in the segment has declined 22% since 2018, as coal generation has been cut in half and renewable generation has increased.
Management has projected capital spending of $37.0 billion through 2025, with substantially all of it earmarked for regulated businesses or contracted renewables.
Turning to our estimates, we are maintaining our 2021 adjusted EPS estimate of $4.74. We are also maintaining our 2022 estimate of $5.05. Our long-term earnings growth rate estimate is 6%.
FINANCIAL STRENGTH & DIVIDENDOur financial strength rating on American Electric Power
is Medium, the middle rank on our five-point scale. The company achieves average to above-average scores on our three main financial strength criteria - debt-to-capital, interest coverage, and profitability. Moody's and S&P rate the company's debt at Baa2 and BBB+, respectively.
At the end of 2Q21, the company had $313 million in cash, down from $393 million at the end of 2020. Total debt stood at $30.7 billion, up from $29.0 billion at the end of 2020. The debt/capital ratio was 59%, above the peer average of 54%. During 2020, EBITDA covered interest expense by a factor of 5.4, above the peer average of 5.1.
The company pays a quarterly dividend of $0.74, or $2.96 annually, for a yield of about 3.4%, above the peer average of 3.0%. Management expects to grow the dividend at a 5%-7% annual rate going forward - the same pace as projected EPS growth. Over the past five years, the dividend has grown at a compound annual rate of 5.7%. Our 2021 dividend estimate is $3.00 and our 2022 estimate is $3.16.
MANAGEMENT & RISKSNicholas Akins is the chairman, president and CEO of
Section 2.2
FOCUS LISTAmerican Electric Power. He is the sixth CEO in the company's 114-year history. He joined AEP in 2000 after his former company, Central and South West Corp., was acquired by AEP. Julie Sloat is the CFO and Lisa Barton is the COO.
Key risks for electric utility stocks include commodity price fluctuations, adverse weather conditions, regulatory issues (especially construction cost recovery), and environmental and safety liabilities. Lastly, the capital-intensive nature of the industry creates ongoing liquidity risk.
COMPANY DESCRIPTIONAmerican Electric Power is a major U.S. electric utility,
delivering electricity to more than 5.5 million customers in 11 states. AEP ranks among the nation's largest generators of electricity. It owns 22,000 megawatts of generating capacity, with an estimated 45% of generating capacity from coal; 24% from nuclear; 18% from natural gas; and 13% from renewables. The company is expanding its use of renewable energy. AEP also owns the nation's largest electricity transmission system, a network of over 40,000 miles.
VALUATIONWe think that AEP shares remain attractively valued at
current prices near $89, above the midpoint of the 52-week range of $75-$94.
The shares trade at 18.8-times our 2021 EPS estimate, below the midpoint of the five-year historical range of 17.0-21.3 and below the peer average of 20.5. AEP also trades at a price/book multiple of 2.1, below the peer average of 2.3. We view AEP as an attractive holding for investors seeking regular dividend payments as well as the potential for moderate capital appreciation. Our target price is $102.
On July 28, BUY-rated AEP traded at $88.99, down $0.40. (Angus Kelleher-Ferguson, 7/28/21)
Anthem Inc (ANTM)Publication Date: 8/4/21Current Rating: BUY
HIGHLIGHTS*ANTM: Raising EPS estimates on continued
outperformance*Anthem continues to benefit from rising enrollments in
its Government segment, rate increases, and the 2019 launch of its in-house pharmacy benefit manager, IngenioRx.
*Management now expects 2021 adjusted EPS of more than $25.50, raised from its earlier guidance of more than $25.10 and representing growth of at least 13%.
*We are boosting our 2021 adjusted EPS estimate to $25.70 from $25.20 and our 2022 estimate to $28.50 from $28.45.
*We believe that ANTM is attractively valued at 15-times our 2021 EPS estimate, below the peer average of 17.
ANALYSIS
INVESTMENT THESISWe are maintaining our BUY rating on Focus List
selection Anthem Inc. (NYSE: ANTM), a leading health insurer. As an independent licensee of the Blue Cross and Blue Shield Association, this well-managed company provides affiliated health and specialty insurance plans for government and commercial clients. While the company continues to face pressure in its Commercial & Specialty business, it has outperformed throughout the pandemic, benefiting from growth in Medicare and Medicaid, rising enrollments in its Government segment, and the launch of its in-house pharmacy benefit manager, IngenioRX. The company has also pursued a number of acquisitions that we believe will bolster its competitive position. As such, with the stock trading at 15-times our 2021 EPS estimate, below the peer average of 17, we view ANTM as attractively valued. Our target price is $435.
RECENT DEVELOPMENTSOver the last three months, ANTM shares have
underperformed, gaining 3% compared to a 5% gain for the S&P 500. However, they have outperformed over the past year, rising 46% compared to a 34% gain for the index. They have also outperformed over the past five years, with a gain of 208% versus a 102% advance for the S&P 500. The beta on ANTM is 1.05, near the average of 1.01 for a peer group that includes CVS, HUM, and UNH.
Anthem has relied in part on acquisitions to drive growth. On June 30, 2021, it completed its acquisition of MMM Holdings, LLC and affiliated companies from InnovaCare Health L.P. With more than 275,000 Medicare Advantage members and over 314,000 Medicaid members, MMM operates Puerto Rico's largest Medicare Advantage plan and is one of the fastest-growing vertically integrated healthcare organizations in the U.S. Financial terms of the transaction were not disclosed. On April 29, Anthem completed its acquisition of myNEXUS Inc., a home-based nursing management company. The company deploys a user-friendly platform that allows healthcare providers to automate the home visit authorization process, speed time to care, and increase provider effectiveness. The platform delivers integrated clinical support services for approximately 1.7 million Medicare Advantage members in 20 states. Financial terms were not disclosed.
The company has also benefited from collaborations with other organizations. On May 19, Anthem announced that through its collaboration with health information company Epic, it would facilitate the secure, bi-directional exchange of health information between healthcare providers and its own affiliated health plans. The increased exchange of health data will also help to streamline administrative processes, such as prior authorizations; enhance care management; and notify
Section 2.3
FOCUS LISTproviders of significant health events.
Anthem has responded to the COVID-19 pandemic by creating digital tools for its members. These include C19 Explorer, which provides dashboards on infection rates and community risk scores to aid in reopening plans; C19 Navigator, which provides Anthem's employer customers with clinical insights and predictions; and Biometric Passport, which allows employers to assess the safety of employees re-entering the workplace without compromising health data privacy. It also includes tools for individuals such as Sydney Care, which provides real-time access to health information, telehealth services, and information on testing locations; ianacare, which allows users to coordinate practical help such as dropping off groceries and picking up medications; and PsychHub, which provides a range of mental health resources for people coping with pandemic-related stress. In addition, the portal includes access to Aunt Bertha, a social care network that helps connect individuals and families to more than 35,000 reduced-cost social services such as food delivery and help with paying bills.
ANTM reported 2Q21 results on July 21 that topped analyst expectations for both earnings and revenue. This was the sixth consecutive quarter of better-than-expected EPS. Adjusted EPS fell to $7.03 from $9.20 in 2Q20, but came in $0.69 ahead of consensus. Total operating revenue rose 14% to $33.3 billion, beating the consensus by $86 million. The increase reflected higher premium revenue due to growth in Medicare and Medicaid, as well as pharmacy product revenue from IngenioRX and rate increases to cover the overall cost trend, but was partially offset by the repeal of the health insurance tax. Medical enrollment totaled 44.3 million members, up 4.5% from 2Q20, driven by growth in the Government segment. The benefit expense ratio rose 890 basis points to 86.8%, reflecting an increase in both non-COVID and COVID-related healthcare costs. The companywide operating margin fell 520 basis points to 6.3%.
Along with the 2Q21 results, management updated its outlook for 2021. It now expects adjusted 2021 EPS of more than $25.50, raised from its earlier guidance of more than $25.10 and representing growth of at least 13%. Management also expects operating revenue of roughly $137 billion, raised from its earlier estimate of $135 billion and representing about 13% growth, and total end-of-year medical enrollment of 44.8-45.3 million, raised from a prior estimate of 44.1-44.7 million.
EARNINGS & GROWTH ANALYSISAnthem provides health insurance for both government
and commercial clients in the following customer groups: National Accounts, Local Groups, Individuals, Medicare Programs, Medicaid, Federal Employee Programs, BlueCard, and Specialty Products.
The company has a record of consistent growth. In 2Q, total revenue rose 16% to $33.9 billion, consisting primarily of operating revenue, as well as contributions from investment income and gains on financial instruments. Premiums, which accounted for roughly 86% of operating revenue, rose 14% to $28.5 billion. Product revenue, which accounted for 9% of operating revenue, rose 20% to $3.0 billion. Administrative fees and other revenue, which accounted for 5%, rose 10% to $1.7 billion. By segment, operating revenue grew 18% to $6.2 billion at IngenioRx, 16% to $20.1 billion in the Government Business, and 9% to $9.6 billion in the Commercial & Specialty business. The operating margin rose 70 basis points to 6.5% at IngenioRx, but fell 730 basis points to 8.3% in the Commercial & Specialty business and 510 basis points to 4.3% in the Government segment.
We are raising our 2021 adjusted EPS estimate to $25.70 from $25.20, reflecting the company's updated guidance, better-than-expected 2Q21 earnings, and continued gains in medical enrollment. Our revised estimate implies full-year earnings growth of 14%. We are also raising our 2022 EPS estimate to $28.50 from $28.45 to reflect the higher EPS base in 2021. Our revised estimate implies growth of 11%.
FINANCIAL STRENGTH & DIVIDENDOur financial strength rating on ANTM is Medium, the
midpoint of our five-point scale. The company receives average marks on our three main financial strength criteria: fixed-cost coverage, debt levels, and profitability.
As of June 30, 2021, Anthem had cash and equivalents of $5.3 billion, down from $5.7 billion at the end of 2020. Total debt rose to $24.2 billion from $20.0 billion, and accounted for 41% of total capital, up from 38% but below the peer average of 47%. We view average levels as 50%-55%. Operating income covered interest expense by a factor of 10.2, down from 16.7 in 2Q20; our view of an average interest coverage ratio is 10-12. The 2Q adjusted profit margin was 5.2%, down from 8.1% in 2Q20. Second-quarter operating cash flow was $1.7 billion, down from $5.5 billion in the prior-year period. Moody's rates the company's debt as Baa2/stable and S&P rates it as A/stable.
Anthem has a share buyback program. During the second quarter, it repurchased 1.3 million shares for $480 million. As of June 30, 2021, it had $5.2 billion remaining on its buyback authorization.
The company pays a dividend. It raised its quarterly payout by 19% in January 2021 to $1.13 per share, or $4.52 annually, for a yield of about 1.2%. Our dividend estimates are $4.52 for 2021 and $5.20 for 2022.
MANAGEMENT & RISKSGail K. Boudreaux has served as the president and CEO
of Anthem since November 2017. She previously served as the
Section 2.4
FOCUS LISTCEO of United Healthcare, a division of UnitedHealth Group, where she increased membership by more than 8 million members in six years. John E. Gallina has served as executive VP and CFO since June 2016. He joined the company in 1994. Prior to becoming CFO, Mr. Gallina served as the senior VP and CFO of the Commercial and Specialty Business Division. Elizabeth E. Tallett is Anthem's chair and has been a member of the board since 2013.
Investors in ANTM shares face risks. The company must accurately predict healthcare costs in order to set appropriate premiums. Its business could also be impacted by changes in funding for Medicare and Medicaid programs, and by other factors that could reduce enrollment. In addition, Anthem faces a range of regulatory, compliance, and legal risks, including ongoing lawsuits. The company also faces risks related to COVID-19.
COMPANY DESCRIPTIONBased in Indianapolis, Anthem is one of the largest health
insurance companies in the U.S. As an independent licensee of the Blue Cross and Blue Shield Association, the company serves members in California, Colorado, Connecticut, Georgia, Indiana, Kentucky, Maine, Missouri, Nevada, New Hampshire, New York, Ohio, Virginia, and Wisconsin, as well as specialty plan members in other states. The company also provides services to the federal government in connection with the Federal Employee Program. The company is a component of the S&P 500 and has 83,400 employees.
INDUSTRYOur rating on the Healthcare sector is Over-Weight.
Consumers are now more willing to spend on lifestyle enhancements along with necessary spending on life-saving treatments. In addition, the survival of the Affordable Care Act has kept the ranks of insured U.S. citizens above the historical average, further increasing consumer spending on healthcare services and products. Meanwhile, companies with experience in diagnostic testing, vaccines, and antiviral medicines, as well as suppliers of protective equipment and other hospital products, should benefit from efforts to contain the coronavirus pandemic.
The sector accounts for 13.0% of the S&P 500, and includes companies in the pharmaceuticals, medical devices, healthcare services, and insurance industries. The sector is underperforming the market thus far in 2021, with a gain of 12.9%. It underperformed in 2020, with a gain of 11.4%, and in 2019, with a gain of 18.7%.
VALUATIONAt current prices near $394, ANTM shares are trading
near the high end of their 52-week range of $244-$406. From a technical standpoint, the stock has performed particularly well since its October 2020 golden cross, when its 50-day moving average rose above its 200-day, rising 45% since that time.
To value the stock on a fundamental basis, we use peer and historical multiple comparisons, as well as a discounted cash flow model. The shares are trading at 15-times our 2021 EPS estimate, in line with the five-year historical average but below the industry average of 17. Given the company's continued outperformance during the pandemic, rising enrollments, new in-house PBM, and regular dividend hikes, we believe that ANTM shares warrant a premium valuation. Our target price of $435 implies a multiple of 17-times our 2021 EPS estimate, in line with the peer average, and a potential gain, including the dividend, of 12% from current levels.
On August 3, BUY-rated ANTM closed at $395.29, up $5.00. (Jasper Hellweg, 8/3/21)
General Dynamics Corp. (GD)Publication Date: 7/30/21Current Rating: BUY
HIGHLIGHTS*GD: Attractive yield and improved growth prospects*General Dynamics recently posted 2Q EPS that topped
consensus expectations, and management raised guidance, as we had expected.
*Management has signaled confidence in the near-term outlook with an 8% dividend increase. The shares yield about 2.5%.
*From a technical standpoint, the shares have reversed a long-term bearish pattern of lower highs and lower lows and are now in a bullish pattern of higher highs and higher lows that dates to October 2020.
*Our 12-month target price is $225.
ANALYSIS
INVESTMENT THESISOur rating on General Dynamics Corp. (NYSE: GD) is
BUY. We are encouraged by the recent progress in the Aerospace segment, as order rates are improving. Over the long term, GD management is focused on driving growth through modest sales increases, margin improvement, and share buybacks. The company also aggressively returns cash to shareholders through increased dividends (most recently with a hike of 8%). From a technical standpoint, the shares have reversed a long-term bearish pattern of lower highs and lower lows and are now in a bullish pattern of higher highs and higher lows that dates to October 2020. Compared to the peer group, GD's multiples are generally below industry averages, which we think offers value. Blending our valuation approaches, we arrive at a price target of $225, or 18-times projected 2022 earnings, closer to the industry average.
RECENT DEVELOPMENTSGD shares have performed in line with market over the
last quarter, gaining 6%. They have underperformed over the past year, with a gain of 32% compared to a gain of 36% for the S&P 500 index. GD has underperformed both the market
Section 2.5
FOCUS LISTand the industry ETF IYJ over the past five-year period. The beta on GD is 1.13.
General Dynamics recently posted 2Q EPS that rose 20% from the prior year and topped consensus expectations. On July 28, the company reported 2Q revenue of $9.2 billion, flat year-over-year. The consolidated operating margin widened by 140 basis points from the prior year to 10.4%. EPS from continuing operations came to $2.61; the consensus was $2.54. For the first half, the company has earned $5.09 per share.
General Dynamics typically provides guidance at the beginning of the year and then updates it at midyear. At the beginning of the year, the company projected 2021 EPS of $11.00-$11.05, essentially flat with 2020. At midyear, the company raised its projected 2021 EPS to $11.50.
EARNINGS & GROWTH ANALYSISGD has four primary business segments: Aerospace (19%
of 2Q revenue), which includes the Gulfstream jet business; Combat Systems (21%), which builds tanks and other land combat equipment; Marine Systems (28%), which builds nuclear-powered submarines and combat-logistics ships; and Technologies (34%), which provides IT services to the Department of Defense and intelligence agencies as well as communications and surveillance services.
All segments posted revenue growth in 2Q, except for Aerospace which fell 18%. Marine Systems (+3%) grew as the U.S. Navy expanded its fleet; Combat Systems rose 8%, with growth in both domestic and international markets; and Technologies grew 3% as new programs ramped up.
The Aerospace segment, which includes Gulfstream business jets, is the one that analysts have been watching closely. Over the past two years, Gulfstream has been transitioning to new aircraft (from the G550 to the G600, the G650 and next year the G700), and, after a manufacturing problem with a supplier, demand was finally starting to build in 4Q19. Then the pandemic struck, reducing deliveries for 2020. But the business now seems poised to return to more consistent growth. The book-to-bill ratio for Gulfstream rose to 2.1 in 2Q21, up from 1.34 in 1Q21, 0.96 in 4Q20, 0.9 in 3Q20, 0.5 in 2Q20, and 1.1 in 1Q20. Management now expects 120 Gulfstream deliveries in 2021, up from its prior forecast of 112-117; first-half deliveries totaled 49.
The total backlog for GD at the end of 2Q was flat with the prior quarter at $89 billion, and the estimated potential contract value (representing management's estimate of the value of unfunded indefinite-delivery, indefinite-quantity (IDIQ) contracts and unexercised options) was $41 billion. At the end of the period, the total potential contract value -- the sum of all backlog components -- was a healthy $130 billion, but down 1.5% year-over-year. Marine Systems is the segment with the largest backlog, including contracts for the
Virginia-class attack submarine and the future Columbia-class ballistic-missile submarine.
On the expense side, the pro forma operating margin was 10.4% in 2Q21, up 140 basis points from the prior year. Margins widened in all four business segments.
Turning to our estimates, based on the improvement in the book-to-bill ratio in Aerospace and growth in the other businesses, we are raising our 2021 adjusted EPS forecast to $11.50 from $11.20. Our estimate is in line with management's guidance, and implies year-over-year growth of 5%. We expect results to improve in 2022, as the new Gulfstream 700 is delivered, and are raising our 2022 EPS forecast to $12.50 from $12.30. Our five-year earnings growth rate forecast is 8%.
FINANCIAL STRENGTH & DIVIDENDOur financial strength rating on General Dynamics is
Medium, the midpoint on our five-point scale. The company receives average scores on our main financial strength criteria: leverage, fixed-cost coverage, cash flow generation, and profitability.
GD had cash and cash equivalents of $3 billion and total debt of $14.3 billion at the end of the quarter. The total debt/capital ratio was 48%. Operating earnings covered interest expense by a factor of 9 last year. In 2020, the cash conversion ratio was a 91%, indicating relatively high-quality earnings.
GD pays a dividend, which it usually raises in 1Q. As expected, it raised the payout by 8% in 1Q21, to $1.19, or $4.76 for the year. We think the dividend is secure and likely to grow, as it has for 24 consecutive years. Our dividend estimates are $4.76 for 2021 and $5.14 for 2022.
GD also uses excess cash to buy back stock.
MANAGEMENT & RISKSPhebe Novakovic has been the chairman and CEO of
General Dynamics since 2013. Ms. Novakovic was formerly the COO. She has also held management roles in GD's Marine Services business and in the planning and development division. Jason Aiken is the CFO.
Investors in GD shares face numerous risks. General Dynamics is a key supplier to the U.S. military (approximately two thirds of sales) and thus vulnerable to debates over, and potential cuts in, domestic and international defense spending. The company is subject to a number of procurement laws and regulations, and evolving U.S. government procurement policies and increased emphasis on cost over performance could adversely affect General Dynamics' business. The Defense industry is competitive, with other deep-pocketed players.
Section 2.6
FOCUS LIST
The shares have been as impacted by the political changes in Washington, D.C. The conventional wisdom is that Defense stocks perform better under Republican administrations.
GD mitigates risks related to U.S. government spending through its strong position in the business jet space and its international business, which accounts for about 20% of revenue. That said, the business jet market is affected by global economic and stock market trends, which are outside of management's control.
COMPANY DESCRIPTIONGeneral Dynamics is a defense contractor with leading
market positions in business aviation and aircraft services, land and amphibious combat systems, mission-critical information systems and technologies, and shipbuilding and marine systems. The company is headquartered in Falls Church, Virginia. GD shares are a component of the S&P 500. The company has 100,000 employees.
VALUATIONWe think that GD shares are attractively valued at current
prices near $197, near the high end of their 52-week range of $129-$199. From a technical standpoint, the shares have recently reversed a long-term bearish pattern of lower highs and lower lows and are now in a bullish pattern of higher highs and higher lows that dates to October 2020.
To value the stock on a fundamental basis, we use peer and historical multiple comparisons, as well as a dividend discount model. GD shares are trading at 16-times projected 2022 earnings, near the midpoint of the historical range of 10-20. On a price/sales basis, the shares are trading at the low end of their five-year range of 1.0-2.2. The dividend yield of about 2.5% is above the S&P 500 yield, signaling value. Compared to the peer group, GD's multiples are generally below industry averages. Blending our valuation approaches, we arrive at our price target of $225, or 18-times projected 2022 earnings, closer to the industry average.
On July 29, BUY-rated GD closed at $198.14, up $2.63. (John Eade, 7/29/21)
HCA Healthcare Inc (HCA)Publication Date: 8/2/21Current Rating: BUY
HIGHLIGHTS*HCA: Raising target to $275*HCA recently reported 2Q21 revenue and earnings that
exceeded consensus expectations - the third straight quarter of better-than-expected results.
*Management noted that coronavirus patients fell from an average of 10% of total admissions in the first quarter of 2021 to about 3% in the second quarter.
*HCA has raised its 2021 guidance. It now expects full-year diluted EPS of $16.30-$17.10, up from its earlier
estimate of $13.30-$14.30 and implying growth of 40%-47%.*We believe that the stock is undervalued at 15-times our
2021 EPS estimate, below the peer average of 17.
ANALYSIS
INVESTMENT THESISWe are maintaining our BUY rating on HCA Healthcare
Inc. (NYSE: HCA), one of the largest hospital companies in the U.S. The company has improved efficiency and lowered costs during the pandemic, which has resulted in higher profit margins. It is also benefiting from vaccine distribution, with COVID-19 patients declining as a percentage of total admissions and renewed growth in outpatient surgeries. Reflecting these positives, management has raised its 2021 guidance.
Given the continued aging of the U.S. population, we like HCA's reach within the healthcare services market and believe that it is well positioned for long-term growth. As such, with the stock trading at 15-times our 2021 estimate, we view HCA as attractively valued. Our revised target price of $275 (raised from $240) implies a projected 2021 P/E of 17, in line with the peer average, and a potential return, including the dividend, of about 11% from current levels.
RECENT DEVELOPMENTSHCA shares have outperformed the market over the past
quarter, rising 22% compared to a gain of 5% for the S&P 500. The shares have also outperformed over the past year, rising 94% compared to a 36% increase for the index. Over the past five years, HCA's 222% return exceeds the 102% increase for the S&P. The beta on HCA is 1.05.
Like many companies, HCA has been affected by the pandemic, although the impact has moderated over the past several months. During the second quarter, COVID-19 patients represented roughly 3% of admissions, down from 10% in the first quarter. (Management has noted that coronavirus patients typically have greater-than-average acuity and a longer length of stay, resulting in above-average revenue per admission.)
HCA has grown in part through acquisitions. On July 1, 2021, the company completed its $400 million purchase of a majority stake in Brookdale Health Care Services from Brookdale Senior Living Inc. HCA now has an 80% stake in Brookdale Health Care Services. HCA is also divesting certain assets. On May 13, it announced plans to sell the Redmond Regional Medical Center, a hospital in north Georgia, to AdventHealth for $635 million. On May 3, it also announced that it would sell four hospitals in Georgia to Piedmont Healthcare for $950 million. These hospitals are not located in HCA's core geographic markets. The sales will give the company greater financial flexibility and provide resources that can be used for new acquisitions. Both transactions are expected to close in 3Q21.
Section 2.7
FOCUS LISTHCA recently reported 2Q21 revenue and earnings that
exceeded consensus expectations - the third straight quarter of better-than-expected results. On July 20, HCA reported 2Q21 diluted EPS of $4.37, up from $3.23 in 2Q20 and $1.21 above consensus. Revenue rose 30% to $14.4 billion, beating the consensus by $823 million, while adjusted EBITDA rose 21% to $3.2 billion. The adjusted EBITDA margin was 22.3%, down from 24.1% in the prior-year period. The profit margin rose to 10.0% from 9.8%. The diluted share count fell nearly 3% from the prior year to 333 million.
Along with the 2Q results, management updated its 2021 guidance. It now expects revenue of $57.0-$58.0 billion, raised from its earlier estimate of $54.0-$55.5 billion and representing growth of 11%-13%; adjusted EBITDA of $12.1-$12.5 billion, raised from $10.85-$11.35 billion and representing growth of 21%-25%; and diluted EPS of $16.30-$17.10, raised from $13.30-$14.30 and representing growth of 40%-47%.
EARNINGS & GROWTH ANALYSISHCA posted growth across all operating metrics in 2Q. On
a reported basis, admissions rose 18%, equivalent admissions rose 27%, revenue per equivalent admission rose 3%, inpatient revenue per admission increased 3%, inpatient surgeries rose 15%, outpatient surgeries rose 53%, and emergency room visits rose 40%. On a same-facility basis, admissions rose 18%, equivalent admissions rose 27%, revenue per equivalent admission rose 3%, inpatient revenue per admission increased 2%, inpatient surgeries rose 15%, outpatient surgeries rose 53%, and emergency room visits rose 41%.
Turning to our estimates, based on the company's strong 2Q results and management's revised guidance, we are raising our 2021 EPS estimate to $16.30 from $14.00, implying growth of 43% for the year. We are also raising our 2022 EPS estimate to $17.25 from $15.20. The revision reflects the higher projected earnings base in 2021 and implies growth of 6% from our 2021 estimate.
FINANCIAL STRENGTH & DIVIDENDOur financial strength rating on HCA Healthcare is
Medium, the midpoint on our five-point scale. At the end of 2Q21, HCA had cash and equivalents of $1.1 billion, down from $1.8 billion at the end of 2020. Total debt was $34.3 billion, up from $32.7 billion. Debt rose to 95% of total capital from 92%, remaining well above the peer average of 64%. Second-quarter income before taxes of $2.1 billion was up 36% and covered interest expense by a factor of 5.5, up from 4.0 in 2Q20. Operating cash flow fell to $2.2 billion from $8.7 billion in 2Q20, although we note that the 2Q20 results included $822 million of government stimulus income and $5.0 billion of contract liabilities-deferred revenue. Moody's withdrew its rating on the company's debt on June 24, 2021. Standard & Poor's rates the debt as BB+/positive, raised from BB+/stable on July 29, 2021.
HCA pays a dividend, which it reinstated in 4Q20 after suspending payments in 2Q20 due to the pandemic. The quarterly dividend of $0.48 per share, or $1.92 annually, yields about 0.8%. Our dividend estimates are $1.92 for 2021 and $2.10 for 2022.
The company has a stock repurchase program, which it reinstated with its 4Q20 results after suspending buybacks in March 2020. During the second quarter of 2021, HCA repurchased 11.261 million shares of common stock for roughly $2.3 billion. As of June 30, 2021, it had $5.0 billion remaining on its repurchase authorization.
MANAGEMENT & RISKSSamuel N. Hazen became HCA's CEO on January 1, 2019
following the retirement of former chairman and CEO R. Milton Johnson. Mr. Hazen previously served as HCA's president and COO, and has worked at the company for almost 37 years.
Thomas F Frist III is the company's chairman. Mr. Frist is the son of HCA founder Thomas Frist, Jr. and has served on the board since 2006.
HCA investors face risks related to the company's high leverage, with a debt/cap ratio above 90%. They also face risks related to intense competition, currency headwinds, and regulatory changes in the healthcare industry. The company also faces risks related to the COVID-19 pandemic, including volumes declines, and potential liquidity issues.
COMPANY DESCRIPTIONHCA Healthcare (formerly HCA Holdings) is one of the
largest hospital companies in the U.S. The company operates 187 hospitals and 122 freestanding surgery centers and provides extensive outpatient and ancillary services. It operates hospitals in 21 U.S. states, as well as in the UK; its largest presence is in Florida and Texas. HCA is a component of the S&P 500.
VALUATIONHCA shares have performed particularly well since the
coronavirus selloff in March 2020, more than quadrupling since that time. The shares also achieved a golden cross in September 2020, as the 50-day moving average rose above the 200-day. Since then, the stock has gained more than 80%.
HCA shares appear attractively valued at 15-times our 2021 EPS estimate, below the peer average of 17. We think that higher multiples are warranted given the company's strong 2Q results, renewed dividend payments and stock repurchases, and positive 2021 outlook. Our revised target price is $275.
On July 30, BUY-rated HCA closed at $248.20, up $0.30. (Jasper Hellweg, 7/30/21)
Section 2.8
FOCUS LIST
KLA Corp. (KLAC)Publication Date: 8/2/21Current Rating: BUY
HIGHLIGHTS*KLAC: Solid quarterly performance, further growth
ahead*KLA Corp. topped fiscal 4Q21 consensus expectations
and reported strong double-digit year-over-year growth in sales and non-GAAP EPS.
*KLA saw continued strength in foundry and logic demand in the quarter. Memory demand also continues to improve as data storage customers meet rising end-user demand.
*KLA has announced a 17% increase in its quarterly dividend, to $1.05 per common share from a prior $0.90. KLA's board has also authorized a new $2 billion share-repurchase program.
*With demand strengthening and now exceeding pre-pandemic production levels in many markets, KLAC shares appear attractive at current levels.
ANALYSIS
INVESTMENT THESISBUY-rated KLA Corp. (NGS: KLAC), formerly
KLA-Tencor, rallied by 9% in a declining market on 7/30/21 after besting consensus expectations and reported strong year-over-year growth in fiscal 4Q21 sales and non-GAAP EPS. Non-GAAP EPS rose more than 60% annually while exceeding consensus expectations by $0.43.
The company has meaningfully stepped up its shareholder return program. KLA has announced a 17% increase in its quarterly dividend, to $1.05 per common share from a prior $0.90. KLA's board has also authorized a new $2 billion share-repurchase program. Despite the dynamic environment and growth investing, the company has consistently returned value to shareholders.
KLA saw continued strength in foundry and logic demand in the quarter. Memory demand also continues to improve as data storage customers meet rising end-user demand. The company continues to build on its industry leading market share in process control and metrology.
KLA's newer products continue to drive momentum in the market place. Service revenue is rising as a percentage of sales, reflecting past growth in the installed base, and the EPC business is addressing fast-growing new markets in the electronics value chain.
KLA provided above-consensus guidance for fiscal 1Q22. Semiconductor capital equipment stocks are relatively outperforming in response to urgent need for new semiconductor fab capacity amid worldwide semiconductor shortages. The group is also rallying on prospects for ongoing
infrastructure investment and potentially more favorable trade relations.
With demand strengthening and now exceeding pre-pandemic production levels in many markets, KLAC shares appear attractive at current levels. For the long-term investor, KLAC appears particularly attractive based on our discounted free cash flow model. We are reiterating our BUY rating on KLAC and 12-month target price of $390, raised from $360.
RECENT DEVELOPMENTSKLAC is up 35% in 2021, and peers are up 35%. KLAC
appreciated 45% in 2020, while the WFE peer-group advanced 49%. KLAC rose 99% in 2019, slightly below the 100% WFE peer-group gain and ahead of the 54% gain for Argus-covered semiconductor companies. KLAC shares declined 15% in 2018, compared to a 25% decline for the peer group of Argus-covered semiconductor capital equipment companies; the peer group includes Applied Materials and Lam Research. KLAC rose 37% in 2018, trailing gains of 56% for the peer group, while tracking the 38% gain in the Philadelphia Semiconductor index. KLAC advanced 13% in 2016.
For fiscal 4Q21 (calendar 2Q21), KLA Corp. posted revenue of $1.92 billion, which was up 32% annually and 7% sequentially; the Orbotech acquisition is now fully anniversaried. Revenue was toward the high end of management's wide guidance range of $1.76-$1.96 billion and above the consensus forecast of $1.87 billion. Non-GAAP EPS of $4.43 rose 63% year-over-year and $0.58 sequentially. Non-GAAP EPS exceeded the high end of management's wide $3.47-$4.35 guidance range and the $4.00 consensus call.
CEO Rick Wallace noted that the June 2021 quarter continued recent momentum and strength for KLA. The company more than met its top- and bottom-line goals and 'progressed against its long-term strategic objectives.' KLA is seeing increased customer demand across each of its major product groups.
Highlights in the quarter included continued strength and breadth in foundry & logic, and continuing improvement in memory demand; growing market share in process control; and a rising contribution from services revenue. Secular demand trends continue to shape multiple markets, fueled by the accelerating digitization of end markets and industries.
KLA is also seeing a heightened focus on the strategic nature of customers' investments as they seek to maximize leading-edge development, optimize facilities utilization and respond to regional trends. Process control intensity is building, and KLA is retaining its market leadership in the areas of metrology and inspection where its market share is four-times that of its nearest competitor.
Section 2.9
FOCUS LISTIncreasingly, semiconductor capital equipment companies
are seeking to harness the power of AI to make metrology and inspection more efficient. While rival introduced AI-based metrology solutions in spring 2021, KLA introduced metrology & inspection systems utilizing AI more than a year ago. In July 2020, KLA introduced its eSL10 e-beam patterned-wafer defect inspection system that employs deep leaning algorithms. According to recent industry data from Gartner, the total optical inspection market in 2020 grew at double the rate of the overall WFE market, and KLA believes it gained several points of market share.
Key drivers in the current environment include data center, 5G infrastructure and smartphone growth, and client (PC) products to support remote work & learn, virtual collaboration, entertainment & gaming, and other aspects of the remote and/or hybrid lifestyle. These digital transformations in turn are accelerating next generation technologies including high performance computing, AI and accelerated migration to the cloud.
KLA now has four reportable segments. Semiconductor process controls (SPC) revenue of $1.58 billion (83% of total) increased 37% annually and 5% sequentially. KLA is now reporting foundry & logic as one category, to mute any 'noise' related to brief shifts in customer demand; this also aligns with peer-group reporting.
Within SPC, Foundry & Logic shipments (68% of total) rose 55% annually. Memory revenue (32% of SPC total) was up 9% year-over-year and 8% sequentially. Given a multitude of end-use demand drivers, the memory business can quickly pivot from fast growth to inventory digestion at customers with a few quarters. Within memory, according to CFO Bren Higgins, the split remains approximately 55% NAND and 45% DRAM.
On a product basis for 4Q21, the core business of wafer inspection (38% of revenue) was up 51% annually and 3% quarter-over-quarter. Patterning revenue (22% of total) increased 39% annually and 7% sequentially.
Services (23% of total) grew 16% year-over-year and 4% quarter-over-quarter. Among the other reportable segments, Specialty Semiconductor Processes revenue (4% of total) dipped 1% year-over-year. PCB, display and content inspection (10% of total) surged 26% annually and a more than seasonally strong 30% sequentially.
On a regional basis, traditional WFE top customer Korea (13% of revenue) dipped 18% after growing 87% annually in 3Q21; 4Q21 featured seasonal weakness after the Samsung and LG seasonal smartphone launches. Another traditional giant, Taiwan (28% of total), grew 42%, reflecting strength at TSMC. New powerhouse China (32% of revenue) delivered 62% growth, after two straight weak quarters. The U.S., at
11% of the total, was up 32% annually. The U.S. has been among the fastest-growing end markets for KLA over the past year. We believe cloud data center recovery and the new iPhone cycle are driving domestic growth.
China has been the strongest regional market for WFE companies in recent years. In December 2020, the U.S. Justice Department added China's chip production giant Semiconductor Manufacturing International Corp. (SMIC) to the entities list. Anticipation of that designation likely drove a pull-forward in semiconductor capital equipment sales to SMIC and other Chinese companies. Among the three semiconductor capital equipment companies in Argus coverage, KLA has the least Chinese exposure.
For calendar 2021, KLA now expects industry growth in the mid-to-high 30% range, up from the earlier mid-to-high 20% forecast, off a $61 billion base for calendar 2020. Amid strength across all major SPC end markets, KLA expects the best demand growth to come from memory.
Based on KLA's backlog and sales funnel visibility, KLA sees 'sustainable' demand across the calendar year. With demand strengthening and KLA back to pre-pandemic production levels in many markets, KLAC shares appear attractive at current levels. For the long-term investor, KLAC appears particularly attractive based on our discounted free cash flow model.
EARNINGS & GROWTH ANALYSISFor fiscal 4Q21 (calendar 2Q21), KLA Corp. posted
revenue of $1.92 billion, which was up 32% annually and 7% sequentially; the Orbotech acquisition is now fully anniversaried. Revenue was toward the high end of management's wide guidance range of $1.76-$1.96 billion and above the consensus forecast of $1.87 billion.
The non-GAAP gross margin tightened sequentially to 62.0% in 4Q21 from 62.9% in 3Q21 but edged up from 60.3% a year earlier. The non-GAAP operating margin was sequentially lower at 40.2% in 4Q21 from 40.8% in 3Q21 but was up meaningfully from 35.5% a year earlier.
Non-GAAP EPS of $4.43 rose 63% year-over-year and $0.58 sequentially. Non-GAAP EPS exceeded the high end of management's wide $3.47-$4.35 guidance range and the $4.00 consensus call.
For all of the June 2021 fiscal year, revenue of $6.9 billion increased 24%, from $5.81 billion for FY20. Non-GAAP EPS of $14.56 rose 41% from $10.35 in FY20.
For fiscal 1Q22, KLA projected revenue of $1.92-$2.12 billion, which at the $2.02 billion midpoint would be up 31% annually and 5% sequentially. KLA also projected non-GAAP EPS of $4.01-$4.89; at the $4.45 midpoint, EPS would be up
Section 2.10
FOCUS LISTmore than 45% annually. Midpoint guidance for 4Q21 topped the $1.91 billion revenue consensus and the $4.14 non-GAAP EPS consensus.
We are boosting our fiscal 2022 non-GAAP EPS forecast to $17.64 per diluted share from $16.16. We are implementing a FY23 non-GAAP EPS projection of $19.09. Our five-year earnings growth rate forecast is 11%.
FINANCIAL STRENGTH & DIVIDENDOur financial strength rating for KLAC is Medium-High.
The company has strengthened its shareholder return policies and is an active repurchaser of its stock.
Cash & investments were $2.50 billion at the end of fiscal 2021. Cash was $1.63 billion at the end of FY20, $1.74 billion at the end of FY19 (following the Orbotech deal), $3.06 billion at the end of FY18, $3.02 billion at the end of FY17, and $2.49 billion at the end of FY16.
Debt was $3.44 billion at the close of fiscal 2021. Debt was $3.44 billion at the close of FY20, $3.42 billion at the close of FY19, $2.77 billion at the end of FY18, $2.68 billion at the end of FY17, and $3.06 billion at the end of FY16.
Cash flow from operations was $2.19 billion in FY21. Cash flow from operations was $1.78 billion in FY20, $1.15 billion in FY19, $1.23 billion in FY18, $1.08 billion in FY17, and $760 million in FY16.
In July 2021, KLA raised its quarterly dividend by 17%, to $1.05 per share. In August 2020, KLA in 2020 raised its quarterly dividend by $0.05, to $0.90 per share. In September 2019, KLA raised its quarterly dividend by 13%, to $0.85 per share; and in June 2018, it raised its quarterly dividend by 27% to $0.75 per share. Those increases follow a 9.3% hike to $0.59 per share in September 2017. In late December 2014, KLAC declared a special cash dividend of $16.50 per share. Excluding the special dividend, KLA has grown its dividend at a 15% compound annual rate since 2007.
Our dividend estimates are $3.80 for FY22 and $4.00 for FY23.
MANAGEMENT & RISKSCEO Rick Wallace has been with KLAC for 29 years,
starting as an applications engineer in 1998 and subsequently serving in several management positions. Bren Higgins has been CFO since 2013. He joined KLAC in 1999 and was previously division controller and VP of Corporate Finance. Ahmad Khan is EVP of Global Products; as head of process controls, he may be in line to be the next CEO.
A main risk for KLA Corp., as for other semiconductor capital equipment companies, is the possibility of a general economic downturn and a corresponding dip in semiconductor
production related to the COVID-19 pandemic. We believe that KLAC has the financial strength, market leadership, and growth characteristics to weather this storm and emerge a stronger player. We also believe the pandemic could drive a permanent increase in the percentage of hours worked away from the office. That should drive long-term demand for semiconductors that power connected devices used in remote applications and in the home. Finally, KLA's process controls business has proved more stable than other WFE niches during prior economic downturns.
The now completed acquisition of Orbotech carries numerous risks, including potential misalignment in corporate culture, and participation in weak-return industries. However, we believe that the deal makes strategic sense as it positions KLA-Tencor in adjacent industries within the electronics supply chain, with limited to no overlap in geography, customers, or product categories. We also believe the acquisition was reasonably priced.
KLAC is subject to the usual risks of cyclicality in the semiconductor-equipment industry. As revenues slow, margins also typically suffer, leading to sharp declines in earnings. Industry downturns may be precipitated by economic recessions, and may also be affected by changes in demand for consumer products (mobile phones, tablets, and PCs), as well as for data center communications systems, and industrial uses.
Similarly, the company must be ready with new products when the next cyclical upturn arrives - if new semiconductor equipment arrives too soon before the upturn, it may be viewed as out-of-date when semiconductor sales accelerate; if it arrives too late, it may result in the loss of equipment sales to competitors.
The company also faces customer-concentration risk, as it relies on a small number of large customers with significant bargaining power. KLAC also faces risks from regulation and unfavorable currency translation, as well as from the debt incurred to support capital expenditures and acquisitions. Like its peers, it also faces the challenge of attracting top technical talent.
COMPANY DESCRIPTIONKLA Corp. is a leading supplier of process-control and
yield-management solutions for the semiconductor and related nanoelectronics industries. The company's tools help integrated circuit manufacturers manage yield throughout the semiconductor manufacturing process. KLA provides chip and wafer manufacturing products, including defect inspection and review, metrology solutions, lithography software, and other offerings. In addition, KLA provides power device, LED, micromechanical systems, and other products for the display market. KLA Corp. was formerly known as KLA-Tencor Corp. and changed its name in July 2019.
Section 2.11
FOCUS LIST
VALUATIONKLAC shares trade at 19.7-times our FY22 non-GAAP
EPS forecast and at 18.1-times our FY23 projection; the two-year average forward P/E of 18.9 is above the five-year (FY16-FY20) trailing multiple of 14.6. The shares, which have historically traded at a 25% discount to the market multiple, currently trade at a two-year forward relative P/E of 0.85, or at a 15% discount to the market multiple. Other historical comparables signal undervaluation; our price-based historical comparable valuation points to a value in the mid-$260s, in a stable to rising trend though below current prices.
KLAC trades at a modest premium to peers on price/sales, and in line with peers on absolute and relative P/E and EV/EBITDA; KLAC has historically commanded premiums to its peer group. Peer indicated value is around $335, in a rising trend and close to current prices. Our discounted free cash flow analysis values the stock above $550, in a rising trend and well above current prices.
Our blended valuation estimate exceeds $440, in a rising trend. Appreciation to our 12-month target price of $390 (raised from $360), along with the 1.0% annual yield, implies a risk-adjusted return in excess of our total forecast return for the broad market and is thus consistent with a BUY rating.
On July 30, BUY-rated KLAC closed at $348.16, up $28.73. (Jim Kelleher, CFA, 7/30/21)
Lazard Ltd. (LAZ)Publication Date: 8/2/21Current Rating: BUY
HIGHLIGHTS*LAZ: Raising target to $54 following 1Q results*On July 30, Lazard reported adjusted 2Q21 earnings of
$1.28 per share, up from $0.66 a year earlier and well above the consensus of $0.88.
*Revenue rose 51%, with a 61% increase in financial advisory revenue and a 40% gain in asset management fees.
*Business confidence continues to improve, and we expect ongoing good demand for Lazard's experience in capital structure, capital raising, debt negotiations and restructuring.
*Our target price of $54 implies a multiple of 12-times our upwardly revised EPS estimate for 2021.
ANALYSIS
INVESTMENT THESISWe are reiterating our BUY rating on Lazard Ltd. (NYSE:
LAZ) with a target price of $54 following the company's 2Q earnings report. Revenues were up sharply, driven by strong growth in both financial advisory and asset management fees.
Business confidence has improved markedly in recent quarters, and we continue to see good demand for Lazard's experience in capital structure, capital raising, debt
negotiations and restructuring.
In our view, Lazard remains a compelling secular growth story with a clean balance sheet and a focused business model.
We see room for P/E multiple expansion as operating margins and market share increase. Our target price of $54 implies a multiple of 12-times our revised 2021 EPS estimate. The dividend also yields a generous 4.1%.
RECENT DEVELOPMENTSLAZ shares are up 60% over the past year, compared to a
35% advance for the broad market.
On July 30, Lazard reported adjusted 2Q21 earnings of $1.28 per share, up from $0.66 a year earlier and well above the consensus of $0.88. Revenue rose 51% to $821 million, with a 61% increase in financial advisory revenue and a 40% gain in asset management fees. Adjusted net income was up 94% to $146 million.
Increased M&A and restructuring activity helped the financial advisory segment, while a 32% rise in average AUM (to $276 billion) benefited the asset management segment.
EARNINGS & GROWTH ANALYSISBusiness confidence continues to improve along with
vaccinations and the re-opening of world economies. Accordingly, we continue to see good demand for Lazard's experience in capital structure, capital raising, debt negotiations and restructuring - as companies work to strengthen their financial and operational efficiency. Management continues to note that confidence in the future and low interest rates is resulting in constructive M&A discussions. We believe that Lazard's broad and deep coverage - by geography and industry - distinguishes it from boutiques, while its focus on advisory distinguishes it from large banks. We now look for a 17% rise in revenues in 2021, up from a previous 9% following a very strong 2Q.
In the asset management business, average AUM declined 4% in 2020, hurt by a sharp fall in the second quarter during the height of the coronavirus pandemic. However, a healthy rebound in asset values since then has boosted management fees, and we expect new strategies and product extensions to further aid the segment.
Compensation was 59.5% of revenue in 2020, up from 57.5% a year earlier. The company expects to achieve a compensation ratio in the mid- to high 50s on both an awarded and an adjusted basis. Noncompensation expense was only 17.1% of revenue in 2020, down from 19.6% a year earlier, aided by lower business development and travel costs; the company's goal is to keep this ratio between 16% and 20%.
Given continued improvement in AUM and the M&A
Section 2.12
FOCUS LISTenvironment, which resulted in very strong 2Q results, we are raising our 2021 EPS estimate to $4.37 from $3.85, and our 2022 forecast to $4.48 from $4.31.
FINANCIAL STRENGTH & DIVIDENDOur financial strength rating on Lazard is High. The
company has a low long-term debt/cap ratio and high liquidity. Lazard acts mainly as an advisor; it does not provide financing for transactions or otherwise commit its own capital in order to complete transactions.
Lazard last raised its quarterly dividend by 7% in April 2019 to $0.47 per share, or $1.88 annually, for a yield of about 4.1%. We expect the dividend to remain at $1.88 for the foreseeable future. Lazard expects to gradually increase the dividend over time. The company also declared a special $0.50 per share common stock dividend in January 2019. Special dividends have included: $1.30 per share in January 2018, $1.20 per share in both January 2017 and February 2016; and $1.00 per share in February 2015. Special dividends have provided a healthy boost to total returns.
During 2020, Lazard repurchased 2.9 million shares of common shares for an average price of $32.70 per share. In April 2021, directors authorized additional share repurchases of up to $300 million, bringing total share repurchase authorization to $439 million. In 2Q21, Lazard repurchased $111 million of common shares, leaving $366 million under the repurchase authorization at June 30. Historically, share buybacks have primarily offset dilution from share issuance, although management has noted more recently that buybacks are likely to be more of a focus.
MANAGEMENT & RISKSLazard is led by Chairman and CEO Kenneth M. Jacobs,
who has been in those roles since 2009.
While Lazard has diversified its revenue in recent years, revenue is still highly dependent on fees earned from advising clients on financial transactions and fees earned on assets under management. Lazard also earns fees if its investment funds exceed return hurdles, but these typically account for only 5%-10% of asset management revenues. Thus, Lazard's revenues can be volatile and tough to predict from quarter to quarter.
Advisory revenues are dependent on levels of CEO confidence as well as on stock valuations and conditions in the financing markets. Large companies remain flush with cash, financing markets are functioning well, and interest rates remain at historically low levels.
With regard to risks related to financial regulatory reform, we note that Lazard does not have a proprietary trading desk or commit its own capital to private equity or real estate funds. As a result, the Volcker Rule has no direct impact on the
company.
COMPANY DESCRIPTIONLazard Ltd., one of the world's leading financial advisory
and asset management firms, provides advice on mergers and acquisitions, strategic matters, restructuring and capital structure, capital raising and corporate finance, as well as asset management services to corporations, partnerships, institutions, governments, and individuals.
VALUATIONLazard derived about 57% of its revenues from corporate
advisory in 2Q, above the recent trend on a very strong quarter for M&A activity. The balance was derived from institutional asset management. Lazard has been able to consistently grow assets over time, although fee rates have been under pressure for many years due to competition and as more assets are invested in passive index strategies.
Our target price is $54, implying a multiple of 12.4-times our revised EPS estimate for 2021. We expect Lazard to continue to benefit from its leading market position in financial advisory and look for growth to continue in asset management.
On July 30, BUY-rated LAZ closed at $47.20, up $1.41. (Stephen Biggar, 7/30/21)
LyondellBasell Industries NV (LYB)Publication Date: 8/3/21Current Rating: BUY
HIGHLIGHTS*LYB: Reiterating $133 target*On July 30, LyondellBasell reported adjusted 2Q21 net
income of $2.059 billion or $6.13 per diluted share, up from $314 million or $0.68 per share in the prior-year period.
*The higher earnings reflected increased demand and constrained industry supply, which enabled price increases and drove margin improvement in most product lines.
*We are raising our 2021 EPS estimate to $19.21 from $14.45 based on the company's 2Q21 results and our expectations for higher pricing and increased volume as the pandemic recedes. The consensus forecast is $18.45.
*In May 2021, Lyondell raised its quarterly dividend by 8% to $1.13 per share or $4.52 annually. The current yield is about 4.6%. The company is working to become a 'top-decile' dividend payer in the Specialty Chemical sector.
ANALYSIS
INVESTMENT THESISWe are reaffirming our BUY rating on LyondellBasell
Industries N.V. (NYSE: LYB) with a price target of $133. We expect demand for LYB's products to accelerate in the near term amid low customer inventories. We also look for continued strong North American polyethylene margins due to high order backlogs, along with margin growth in the Refining
Section 2.13
FOCUS LISTand Oxyfuels business due to higher demand for gasoline and jet fuel. Margins should also benefit from moderating feedstock costs.
We believe that LYB stock is favorably valued at current levels. The shares also carry an attractive dividend, supported by strong cash flow, which we believe is sustainable. The current yield is about 4.6%.
RECENT DEVELOPMENTSOn July 30, LyondellBasell reported adjusted 2Q21 net
income of $2.059 billion or $6.13 per diluted share, up from $314 million or $0.68 per share in the prior-year period. Adjusted EPS topped our estimate of $4.48 and the consensus forecast of $5.43. The higher earnings reflected increased demand and constrained industry supply, which enabled price increases and drove margin improvement in most product lines.
Second-quarter revenue rose 109% from the prior year to $11.561 billion, above the StreetAccount consensus of $10.960 billion.
LyondellBasell has six operating segments: Olefins & Polyolefins Americas; Olefins & Polyolefins Europe, Asia and International (EAI); Intermediates & Derivatives; Advanced Polymer Solutions; Refining; and Technology.
Second-quarter revenue rose from the prior year in all six segments. Revenue rose 160% in Olefins and Polyolefins Americas, 123% in Intermediates & Derivatives, 112% in Refining, and 103% in Olefins and Polyolefins EAI. Revenue rose 90% in Advanced Polymer Solutions business and 3% in the Technology segment.
Operating income rose in Intermediates & Derivatives (+1,954%), Olefins & Polyolefins Americas (+1,204%), and Olefins & Polyolefins EAI (+580%). Advanced Polymer Solutions reported operating income of $101 million after a loss of $83 million in 2Q20.
On the negative side, the Refinery segment posted an operating loss of $95 million compared to an operating profit of $116 million in 2Q20. In the Technology segment, operating earnings fell to $82 million from $104 million a year earlier.
EARNINGS & GROWTH ANALYSISLyondell does not provide formal guidance; however, on
the 2Q21 conference call, management said that it had no significant planned maintenance programs for the remainder of 2021. It also expects the company to operate at nearly full capacity amid strong demand and low customer inventories.
We are raising our 2021 EPS estimate to $19.21 from $14.45 based on the company's 2Q21 results and our
expectations for higher pricing and increased volume as the pandemic recedes. The consensus forecast is $18.45.
We are also boosting our 2022 EPS estimate to $15.18 from $12.75, which assumes a modest improvement in pricing and volume next year, offset in part by slower GDP growth. The 2022 consensus is $14.80.
FINANCIAL STRENGTH & DIVIDENDWe rate LYB's financial strength as Medium, the midpoint
on our five-point scale. The company's debt is rated Baa2/stable by Moody's and BBB/stable by S&P.
At the end of 2Q21, the total debt/total capitalization ratio was 59.3%, compared to 67.4% at the end of 2Q20. The ratio is slightly above the peer average and has averaged 57.9% over the past five years.
Total debt was $15.537 billion at the end of 2Q21, up from $15.496 billion at the end of 2Q20. Nearly all of this debt was long term. LYB had cash and equivalents of $1.4 billion at the end of 2Q21, down from $2.6 billion at the end of 2Q20.
On May 31, 2021, Lyondell raised its quarterly dividend by 8% to $1.13 per share or $4.52 annually. The current yield is about 4.6%. Our revised dividend estimates are $4.44 (raised from $4.24) for 2021 and $4.52 (raised from $4.28) for 2022. The company is working to become a 'top-decile' dividend payer in the Specialty Chemical sector.
In May 2019, the company authorized the repurchase of up to 10% of LYB common stock over an 18-month period. It repurchased 42.7 million shares in 2019. This compares to 19.2 million shares in 2018, 10.0 million in 2017, and 36.6 million in 2016. The company did not repurchase any shares in 2020, but we expect the program to be resumed later in 2021.
MANAGEMENT & RISKSBhavesh V. 'Bob' Patel became the company's CEO in
January 2015 following the retirement of James L. Gallogly.
Mr. Patel had served as executive vice president, Olefins & Polyolefins Europe, Asia & International, and as executive vice president, Technology, since October 2013. He joined the company in March 2010 as senior vice president, O&P Americas, where he restructured the business to take advantage of the shale gas expansion in the U.S. He previously held executive positions at Chevron Corp. and Chevron Phillips Chemical Co.
Lyondell's growth is dependent on the overall health of the global economy. In addition, the company faces a range of risks associated with commodity and capacity utilization.
COMPANY DESCRIPTIONLyondellBasell Industries manufactures chemicals and
polymers, refines crude oil, produces gasoline blending
Section 2.14
FOCUS LISTcomponents, and develops and licenses technologies for the production of polymers.
Lyondell Petrochemical Corp. began business in 1985 and merged with Basell Polyolefins to become LyondellBasell Industries in December 2007. LyondellBasell filed for Chapter 11 bankruptcy protection in 2009 and emerged from bankruptcy in 2010.
In 2020, the company generated 26% of sales from Olefins & Polyolefins Americas, 30% from Olefins & Polyolefins EAI, 23% from Intermediates & Derivatives, 13% from Refining, 7% from Advanced Polymer Solutions, and 1% from Technology.
INDUSTRYOur rating on the Basic Materials sector is
Market-Weight. The Materials sector is generally benefiting from rising commodity prices, reflecting both recovering global economies as well as a two-year low in the U.S. dollar (most commodity prices move inversely to the dollar). With the Fed having hyperinflated its own balance sheet, dollar weakness and commodity strength could be a persistent feature in the year ahead.
The sector accounts for 2.6% of the S&P 500, and includes industries such as chemicals, paper, metals and mining. Over the past five years, the weighting has ranged from 2% to 4%. We think investors should consider allocating 2%-3% of their diversified portfolios to stocks in this sector. The sector is underperforming thus far in 2021, with a gain of 14.2%. It outperformed in 2020, with a gain of 18.1%, and underperformed in 2019, with a gain of 21.9%.
The P/E ratio on projected 2022 EPS is 18, below the market multiple. The sector's debt ratios appear sound, as many in the group have deleveraged in recent years. Yields of 1.3% are in line with the market average. The Street consensus calls for earnings growth of 81.2% in 2021 and a decline of 2.0% in 2022. Earnings fell 7.0% in 2020 and 21.0% in 2019 after rising 25.6% in 2018.
VALUATIONLYB shares have traded between $61.61 and $118.02
over the past 52 weeks and are currently above the midpoint of this range. To value the stock on a fundamental basis, we use peer group and historical multiple comparisons, as well as a dividend discount model.
The shares are trading at 5.2-times our 2021 EPS estimate and at 6.5-times our 2022 forecast, compared to an 11-year annual average range of 7-13. On other valuation metrics, the shares are trading below the midpoint of the historical range for price/book (3.2 versus a range of 3.0-4.8) and price/sales (0.9 versus a range of 0.7-1.2). They are trading at a price/cash flow multiple of 8.2, versus a range of 5.9-10.0, and at a
price/EBITDA multiple of 5.6, versus a range of 4.4-7.2.
We believe that LYB is favorably valued based on its size, geographic reach, and broad product portfolio, and that the dividend is safe and sustainable under current market conditions. We are maintaining our BUY rating with a price target of $133.
On August 3 at midday, BUY-rated LYB traded at $99.31, up $0.41. (Bill Selesky, 8/3/21)
Raymond James Financial, Inc. (RJF)Publication Date: 8/3/21Current Rating: BUY
HIGHLIGHTS*RJF: Reaffirming BUY and target of $145*RJF shares have outperformed over the past year, rising
81% compared to gains of 36% for the S&P 500 and 67% for the IAI broker-dealer and securities ETF.
*On July 28, Raymond James reported record fiscal 3Q21 EPS of $2.74, up from $1.67 a year earlier, reflecting strong growth in assets under management and investment banking activity.
*We are raising our FY21 EPS estimate to $9.80 from $9.69 and our FY22 estimate to $10.77 from $10.49.
*Our target price of $145 implies a multiple of 15-times our FY21 EPS estimate, as RJF continues to expand through organic growth and strategic acquisitions.
ANALYSIS
INVESTMENT THESISWe are maintaining our BUY rating on Focus List
selection Raymond James Financial Inc. (NYSE: RJF) with a target price of $145. Looking ahead, we expect revenues to increase in the Private Client Group and Asset Management as net inflows continue to grow. We also look for declining loss provisions and stabilization of the net interest margin. We expect the company to remain in expansion mode as it brings additional advisers to its platform and makes strategic acquisitions that fit within its long-term plan.
RJF reported record quarterly net revenues of $2.47 billion in fiscal 3Q21, driven by higher asset management fees and higher brokerage and investment banking revenues, offset in part by the impact of lower interest rates and account service fees.
RECENT DEVELOPMENTSRJF shares have outperformed over the past year, rising
81% compared to gains of 36% for the S&P 500 and 67% for the IAI broker-dealer and securities ETF.
On July 28, Raymond James reported record fiscal 3Q21 EPS of $2.74, up from $1.67 a year earlier, reflecting strong growth in assets under management and investment banking activity. Operating expenses rose 11%, primarily due to higher
Section 2.15
FOCUS LISTcompensation costs. The adviser count rose to a record 8,413, up 258 from 2Q21.
The 3Q return on equity was 15.9% and the return on tangible common equity was 22.2%.
In May 2021, RJF announced the acquisition of private equity advisor Cebile Capital. Cebile Capital is a private fund placement agent and secondary market adviser to middle-market and private capital firms.
On December 24, 2020, the company completed the acquisition of 401(k) provider NWPS Holdings Inc. The acquisition expands RJF's retirement service offerings.
On December 17 2020, the company announced the acquisition of Financo, a boutique investment bank that advises on middle-market consumer transactions. The acquisition will enable RJF to expand its presence in retail and consumer investment banking.
EARNINGS & GROWTH ANALYSISRJF organizes its businesses into four segments: Private
Client Group, Capital Markets, Asset Management, and Raymond James Bank. We look at recent trends and outlooks for these segments below.
Private Client Group posted fiscal 3Q21 net revenues of $1.7 billion (69% of net revenue), up 36% from the prior year, driven by higher asset management fees and brokerage revenue. However, fees from third-party banks fell due to lower interest rates.
Capital Markets net revenue rose 38% to $446 million (18% of net revenue), driven by increased fixed-income brokerage revenue, growth in equity and debt underwriting, and increased M&A activity.
Asset Management net revenue rose 38% to $225 million (9% of net revenue); assets under management rose 31% to $191 billion on rising equity values and net inflows.
At Raymond James Bank, net revenue fell 5% to $169 million (7% of net revenue). The net interest margin declined two basis points sequentially to 1.92%, reflecting lower yields in the investment portfolio. Net charge-offs were $4 million in fiscal 3Q and nonperforming assets were unchanged at 0.12% of total assets. The allowance for loan losses fell to 1.34% of loans, reflecting improving macroeconomic conditions.
We are raising our FY21 EPS estimate to $9.80 from $9.69 and our FY22 estimate to $10.77 from $10.49.
FINANCIAL STRENGTH & DIVIDENDOur financial strength rating on Raymond James Financial
Inc. is Medium-High. The company scores well above average
on our three main measures of financial strength: leverage based on debt/cap, profitability, and interest coverage.
In fiscal 3Q, total assets rose 28% to $57 billion, while tangible book value rose 10% to $51.55 per share. The Tier 1 capital ratio declined to 24.3% from 24.8% in the prior-year quarter.
The company has a new $750 million share repurchase program. It repurchased $48 million of its stock in fiscal 3Q.
RJF recently raised its quarterly dividend to $0.39 per share from $0.36. The current annualized payout of $1.56 yields about 1.2%. Our dividend estimates are $1.56 for FY21 and $1.60 for FY22.
MANAGEMENT & RISKSPaul Reilly is the company's chairman and CEO. He has
served as CEO since 2010 and been a member of the board since 2006. Paul Shoukry is the CFO.
Investors in RJF shares face numerous risks.
The company's performance is affected by market volatility and the level of adviser retention. The company has relatively high fixed costs, and would suffer significant margin erosion if asset values decline and advisers leave the firm.
RJF also faces intense competition from other financial firms, which is likely to increase in the near term. In order to maintain its competitive position, the company needs to invest heavily in new technology and in recruiting and retaining advisers. We note that many advisers are approaching retirement, which could make it more difficult for the company to maintain a stable asset base. In addition, RJF must continue to grow its businesses organically or through acquisitions. The financial services industry is also subject to legal and regulatory developments that could raise the overall cost of doing business.
COMPANY DESCRIPTIONRaymond James Financial Inc. is a diversified financial
services company. The company's businesses provide capital markets, asset management, private client, banking and other services to individuals, corporations and municipalities. The company was founded in 1962 and went public in 1983. RJF has over 8,300 advisors in the U.S. and total client assets of $1.02 trillion.
VALUATIONAt current prices near $131, RJF shares are trading near
the high end of their 52-week range of $69-$136. The shares are trading at 13.4-times our revised FY21 EPS estimate, above the midpoint of the historical average range of 12-14, though we believe that a higher multiple is warranted based on the company's growth prospects. Our target price of $145 implies a multiple of 15-times our FY21 EPS estimate as RJF
Section 2.16
FOCUS LISTexpands through organic growth and acquisitions. We think that investors will continue to focus on the company's growth in assets under management, strategic acquisitions, and efforts to expand the number of advisers, though low interest rates, potentially higher loan loss provisions, and NIM compression could be headwinds in the near term.
On August 2, BUY-rated RJF closed at $130.37, up $0.89. (Kevin Heal and Caleigh McGough, 8/2/21)
Restaurant Brands Intl In (QSR)Publication Date: 8/3/21Current Rating: BUY
HIGHLIGHTS*QSR: Posts better-than-expected 2Q results*QSR owns three major restaurant chains - Burger King,
Tim Horton's, and Popeye's Louisiana Kitchen - and has more than 26,000 restaurants worldwide.
*We expect the company's emphasis on drive-through purchases to boost revenue going forward. We also have a positive view of its master franchise joint venture agreements at Burger King, and of the upgraded Burger King restaurants.
*We are raising our 2021 EPS estimate to $2.86 from $2.84 and our 2022 estimate to $3.18 from $3.15.
*Our target price of $80, combined with the dividend, implies a total potential return of 22% from current levels.
ANALYSIS
INVESTMENT THESISINVESTMENT THESIS
We are maintaining our BUY rating and $80 price target on Restaurant Brands International Inc. (NYSE: QSR). The company owns three major restaurant chains - Burger King, Tim Horton's, and Popeye's Louisiana Kitchen - and has more than 26,000 restaurants worldwide. We expect the company's emphasis on drive-through purchases to boost revenue going forward. We also look for continued strong growth in sales and unit volume at Popeye's, helped by its popular chicken sandwich. In addition, we have a positive view of QSR's master franchise joint venture agreements at Burger King, in which franchises are sold to the most successful and financially solid franchisees, and of the upgraded Burger King restaurants. Our target price of $80, combined with the dividend, implies a total potential return of 22% from current levels.
RECENT DEVELOPMENTSOn July 30, the company reported adjusted 2Q21 EPS of
$0.77, above the consensus estimate of $0.61 and up from $0.38 in the prior-year period. The improvement reflected higher same-store sales at Burger King and Tim Horton's, offset in part by weakness at Popeye's. Overall EBITDA rose by 61% to $577 million, with an EBITDA margin of 40%, thanks to increases in all three divisions. The consensus estimate had called for EBITDA of $530 million.
Overall revenue rose by $390 million to $1.44 billion, above the consensus estimate of $1.37 billion. The improvement reflected an increase in deliveries, drive-thru purchases, and takeout orders. We note that digital sales across all brands were strong.
Following a 13.4% decrease in the prior-year period, same-store sales at Burger King rose 18.2%, 70 basis points below the consensus estimate. Tim Horton's same-store sales rose 27.6%, an improvement from a 29.3% decline a year earlier. The consensus estimate had called for a 28.6% increase. Comp sales at Popeye's fell 30 basis points, down from 24.8% higher in 2Q20 and below the consensus forecast of 3.6% growth.
As discussed in a previous note, in 2020, revenue fell 11% to just under $5.0 billion, while EPS fell to $1.97 from $2.73 in 2019.
EARNINGS & GROWTH ANALYSISWe expect same-store sales at Tim Horton's, which has
reported lower comps in eight of the past ten quarters, to continue to improve as management applies the operational strategies that have worked well at Popeye's and Burger King. Sales at Burger King have been strong, rising nearly 38% in 2Q21, and we expect continued growth over the remainder of 2021 and in 2022. At Burger King, we expect results to improve as the chain focuses on drive-thru orders and expands its value menu. Based on these factors, we are raising our 2021 EPS estimate to $2.86 from $2.84 and our 2022 estimate to $3.18 from $3.15.
FINANCIAL STRENGTH & DIVIDENDOur financial strength rating on QSR is now Medium. The
company's EBITDA margin rose to 40% in 2Q21 from 34% a year earlier, as the cost of sales held steady amid higher revenue. Operating income covered interest expense by a factor of 3.9, up from 1.9 in 2Q20. Cash and cash equivalents totaled $1.8 billion at the end of 2Q, up 12.8% from 4Q20. The long-term debt/capital ratio at the end of the second quarter was 87.8%, down from 89.6% at the end of 2020.
In April 2021, the company raised its quarterly dividend by 2% to $0.53 per share, or $2.12 annually, for a yield of about 3.1%. Our dividend estimates are $2.12 for 2021 and $2.16 for 2022.
MANAGEMENT & RISKSIn January 2019, Jose Gil became the company's new
CEO. Josh Kobza is the CFO.
The restaurant industry is highly competitive and Restaurant Brands competes with many well-established food service companies on the basis of product choice, quality, affordability, service and location. In addition, any negative publicity regarding the company's products, or any ingredient
Section 2.17
FOCUS LISTused in its products, could significantly hurt sales. Unfavorable foreign currency movements may also have a significant impact on earnings.
COMPANY DESCRIPTIONRestaurant Brands International Inc. was created in 2014
when 3G Capital, a Brazilian private equity firm, backed Burger King's $11.4 billion acquisition of Tim Horton's. 3G Capital owns more than 41% of Restaurant Brands International's common stock.
QSR consists of Burger King (the world's second-largest quick-service restaurant chain), Tim Horton's (Canada's second-largest chain), and Popeye's Louisiana Kitchen, which it acquired in March 2017. The company has more than 26,000 restaurants worldwide. Franchisees own 99% of these restaurants. About 44% of revenue comes from international markets
VALUATIONQSR shares are trading near the high end of their 52-week
range of $48-$71, and at 21.0-times our revised 2022 EPS estimate, below the peer average. However, we believe that they merit a higher multiple based on prospects for mid-single-digit unit expansion and a strong earnings recovery as the pandemic recedes. Our target price of $80, combined with the 3.1% dividend yield, implies a total potential return of 22% from current levels.
On August 3 at midday, BUY-rated QSR traded at $66.52, down $0.40. (John Staszak, CFA, 8/3/21)
Sanmina Corp (SANM)Publication Date: 8/4/21Current Rating: BUY
HIGHLIGHTS*SANM: Margin pressures from parts scarcity; reiterating
BUY*Sanmina posted fiscal 3Q21 revenue that fell short of
consensus, as materials shortages reduced sales by more than $150 million.
*While non-GAAP gross margin was impacted by higher costs for materials and logistics, Sanmina was able to hold non-GAAP operating margin flat sequentially by taking proactive steps.
*Gross and operating margin improved on a year-over-year basis on a similar level of revenue, even though supply challenges are currently much more intense than they were a year ago.
*Although component shortages could have an uncertain impact on near-term results, we believe that Sanmina can sustain profitable growth in what we anticipate will be a normalized operating environment going forward.
ANALYSIS
INVESTMENT THESIS
BUY-rated, Focus List selection Sanmina Corp. (NGS: SANM) was unchanged in a rising market on 8/3/21 after the company posted fiscal 3Q21 (calendar 2Q21) earnings that lagged analysts' expectations. Non-GAAP EPS still rose in mid-teens annually. Revenue was below consensus in 3Q21, and came in flat with year-earlier levels.
Sanmina missed Street revenue expectations due to 'materials shortages' and COVID impacts that further impeded the supply chain. CFO Kurt Adzema noted that the Sanmina team managed through the increasing prevalence of supply chain constraints. Demand was stronger than Sanmina's ability to fill all orders, and revenue of $1.66 billion was below internal expectations at the beginning of the quarter.
Non-GAAP gross margin was impacted by higher costs for materials and logistics, but Sanmina was able to hold non-GAAP operating margin flat sequentially by taking proactive steps. Gross and operating margin improved on a year-over-year basis on a similar level of revenue, even though supply challenges are currently much more intense than they were a year ago.
Sanmina has deliberately shifted its end-market business mix toward mission-critical and high-complexity solutions, where contractual relationships tend to run longer, enabling greater linearity and manufacturing efficiency. On a go-forward basis, we look for a 60/40 end-market split in which 60% of revenue is generated from high-value-added industrial, medical, A/D and automotive solutions; and 40% from slightly lower-margin but high-volume communications networks and cloud infrastructure engagements.
Although component shortages could have an uncertain impact on near-term results, we believe that Sanmina can sustain growth in what we anticipate will be a normalized operating environment going forward. On that basis, we believe that a BUY rating is now appropriate. Our 12-month target price is $50.
RECENT DEVELOPMENTSSANM is up 20% year-to-date in 2021, better than the
17% peer-group gain. SANM declined 7% in 2020, while the peer group of electronic manufacturing services (EMS) companies rose 9%. SANM increased 42% in 2019, while peers also advanced 42%. SANM declined 28% in 2018, in line with the 27% decline for the peer group. SANM shares declined 10% in 2017, lagging the 4% gain for peers.
For fiscal 3Q21 (calendar 2Q21), Sanmina reported revenue of $1.66 billion, which was unchanged year-over-year and down 2% sequentially. Revenue was at the low end of management's $1.66-$1.78 billion guidance range and below the $1.72 billion consensus estimate. Non-GAAP earnings of $0.99 per diluted share were up 15% from 3Q20, while declining $0.02 sequentially. Non-GAAP EPS came in above
Section 2.18
FOCUS LISTthe top of management's $0.84-$0.94 guidance range and $0.08 above the consensus estimate of $0.91.
Sanmina missed Street revenue expectations due to 'materials shortages' and COVID impacts that further impeded the supply chain. CFO Adzema noted that while demand was strong, management believes that 3Q21 revenue was adversely impacted by more than $150 million due to supply chain constraints.
Sanmina in the preceding quarter (fiscal 2Q21, or calendar 1Q21) generated a triple-digit profit gain from single-digit top-line growth. Supply constraints worsened as 3Q21 progressed, however. The company's margin performance was all the more impressive given materials and logistics costs challenges and parts scarcity overall.
Non-GAAP gross margin of 8.4% in fiscal 3Q21 was impacted by higher costs for materials and logistics, and tightened sequentially from 8.6% in 2Q21. But Sanmina was able to hold non-GAAP operating margin flat sequentially at 5.0% by taking proactive steps. On a year-over-year basis, gross margin improved from 8.2% and operating margin improved from 4.6% on a similar levels of revenue even through supply challenges are currently much more intense than they were a year ago.
CEO Jure Sola has previously stated that Sanmina has 'learned a lot this year' about how to optimize operations for profitability. Sanmina has also 'tuned' the company for the future. Sanmina also continues to benefit from an improving mix along with a higher revenue contribution from its Components, Products & Services (CPS) segment.
CPS includes high-value-added vertical capabilities that provide margins well above those of traditional contract manufacturing services, and, as such, drives profit growth for the overall company CPS business often delivers gross margins as much as twice the level of the Integrated Manufacturing Solutions (IMS) business, representing the traditional electronic manufacturing services or contract manufacturing business.
For fiscal 3Q21, Sanmina's Components, Products, and Services (CPS) segment posted revenue of $345 million (21% of revenue), which was up 2% annually and down 4% sequentially. CPS includes interconnect systems, precision mechanical systems, the global services and logistics business, SCI (aerospace & defense), and Viking (memory & storage).
In years past, this business has frustrated investors with below-potential gross margin performance. CPS GMs were in the 7%-9% range for most of FY16-FY18 and improved slightly in FY19. CPS gross margins improved further late in FY20, before reaching 12.4% in 1Q21 and 14.2% in 2Q21 - the highest level in our quarterly model dating back to FY11.
In fiscal 3Q21, CPS growth margin moderated to 11.2%, down 300 bps partly on supply chain challenges. Other factors included less favorable mix, lower revenue, and costs associated with ramping several defense-related programs.
On the upside, growth in defense-related is positive for margins for the long term. Much of Sanmina's A/D business is leveraged to stable, multi-year programs with the U.S. Department of Defense, or commercial aircraft where the entire domestic industry hinges on developments at Boeing. The improvement at the aerospace giant is beneficial to Sanmina's A/E prospects going forward. CFO Adzema forecast CPS gross margins to return to more normalized levels in fiscal 3Q21 to subsequently improve thereafter.
Also for 3Q21, Integrated Manufacturing Solutions (IMS), representing the traditional electronic manufacturing services business, posted revenue of $1.35 billion (80% of revenue). IMS sales were flat year-over-year while declining 2% sequentially. The IMS gross margin broadened sequentially to 7.6% in 3Q21 from 6.9% in 2Q21 and was wider by 60 basis points year-over-year.
Sales in IMS were even more impacted by supply constraints than sales in CPS. In this challenging environment, Sanmina was able to bolster IMS gross margins due to favorable mix and one-time release of a $2.2 million customer inventory reserve.
Sanmina formerly reported three broad end markets of Communications, Cloud Solutions, and Industrial, Medical, Defense & Automotive. The company has now combined Communications Networks & Cloud Infrastructure (CN&CI) into a single unit, while maintaining Industrial, Medical, Defense & Automotive as is.
On an end-market basis for 3Q21, CN&CI revenue (42% of total) was down 2% annually and 3% sequentially. Communications continues to experience broad-based demand strength spanning IP, optical, and wireless, including 5G; optical and other areas were impacted by component shortages, however.
Within Communications, Sanmina remains well positioned in IP routing and advanced optical and is gathering momentum in wireless. Management believes 5G will be a near-term driver and a long-tail opportunity in late 2021 and 2022.
The cloud business is now primarily focused on high-end computing and data center storage solutions. We believe that Sanmina is able to bring ODM expertise to high-end computing and data center storage. The cloud business also includes remnants of Sanmina's legacy enterprise exposure, though niches such as retail point-of-sale have largely run off.
Section 2.19
FOCUS LISTAnother legacy area, set-top boxes, are less in demand in the streaming era. According to the CEO, these businesses are now less than 2% of revenue and persist only within broader customer relationships.
Semiconductor scarcity has had a major impact on Sanmina's high-end communications and cloud solutions. Sanmina is now asking its customers to plan at least four quarters in advance, and is asking for more guaranteed purchase orders and purchase commitments. The company sees already extended lead times lengthening further, and - based on discussions with suppliers, vendors, distributors and customers - expects semiconductor and parts shortages to persist past year-end 2021 well into 2022.
Fiscal 3Q21 revenue for Industrial, Medical, Defense & Automotive (58% of revenue) was up 2% annually and down 2% sequentially. This is Sanmina's focus business, and long-term demand is expected to benefit from secular transitions to an outsourced model by industrial customers.
Within IMD&A, aerospace-defense has remained an important vertical for Sanmina, where it supports advanced communications, satellites, military and commercial aircraft, and related areas. Sanmina has also built out its business in industrial, medical and automotive end-markets. Automotive continues to recover from 2020 weakness, while industrial demand is solid, notwithstanding supply-chain issues that have and will continue to impact production.
Looking out across calendar 2021, the company sees broadly stable end markets and a 60/40 split between IMD&A and CN&CI. Management believes that Sanmina is well established in the 'right markets,' which include mission-critical, high-complexity, and in some cases heavily regulated, markets.
Sanmina looks for its C&CS business to grow sequentially in fiscal 4Q21, while its IMD&A business is forecast to be flat to up sequentially.
Given prospects for more normalized gross profits, particularly in the components & services business, and continued rich mix, we look for strong sequential profits momentum in fiscal 4Q21
SANM has risen from our upgrade price of $34 in February 2021, while continuing to offer good value at current levels. Although component shortages could have an uncertain impact on near-term results, we believe that Sanmina can sustain growth even with the current environment as well as in what we anticipate will be a normalized operating environment at some point in fiscal 2Q22.
EARNINGS & GROWTH ANALYSISFor fiscal 3Q21 (calendar 2Q21), Sanmina reported
revenue of $1.66 billion, which was unchanged year-over-year
and down 2% sequentially. Revenue was at the low end of management's $1.66-$1.78 billion range guidance range and below the $1.72 billion consensus estimate.
The non-GAAP gross margin was 8.5% for 3Q21, vs. 8.6% for 2Q21 and 7.0% a year earlier. The non-GAAP operating margin was 5.0% in 3Q21, versus 5.0% in 2Q21 and 4.6% a year earlier.
Non-GAAP earnings of $0.99 per diluted share were up 15% from 3Q20, while declining $0.02 sequentially. Non-GAAP EPS came in above the top of management's $0.84-$0.94 guidance range and $0.08 above the consensus estimate of $0.91.
For all of fiscal 2020, revenue of $6.96 billion declined 15% year-over-year. Non-GAAP earnings of $3.06 per diluted share fell 10%.
For fiscal 4Q21, Sanmina guided for revenue in the $1.65-$1.75 billion range, which at the $1.70 billion midpoint would be down 9% annually. The company also forecast non-GAAP EPS of $0.93-$1.03, which at the $0.98 midpoint would be down 11% year-over-year. We expect 4Q21 to be Sanmina's most difficult quarter from a supply chain perspective.
We are reiterating our FY21 non-GAAP earnings forecast of $4.02 per diluted share. We are trimming our FY22 forecast to $4.26 per diluted share from $4.36. Our estimates are predicated on Sanmina sustaining gross margins at or near current levels in an increasingly challenging environment. We regard our estimates as fluid and subject to revision.
FINANCIAL STRENGTH & DIVIDENDOur financial strength rating for SANM is Medium-High.
Sanmina had cash of $575 million at the end of 3Q21. Cash was $495 million at the end of FY20, $455 million at the end of FY19, $420 million at the end of FY18, $419 million at the end of FY17, and $398 million at the end of FY16. The decline in cash from peak levels has been driven mainly by debt repayments and, to a lesser extent, share repurchases.
Debt was $339 million at the end of 3Q21. Debt was $347 million at the end of FY20, $385 million at the end of FY19, $607 million at the end of 2018, $494 million at the end of FY17, and $462 million at the end of FY16. As we have said repeatedly, no company deserves more kudos than Sanmina for its long-term debt reduction. Sanmina's debt peaked at $2.2 billion in fiscal 2002 right after buying SCI and was $1.2 billion a decade ago.
Sanmina moved decisively under renewed management to backstop its financial position as the pandemic got underway early in calendar 2020. At the time, Sanmina drew down $650
Section 2.20
FOCUS LISTmillion of its $700 million revolving credit facility. At present, the credit facility is undrawn and has not been used.
Sanmina is among a small set of companies that maintained share buybacks in FY20, repurchasing $166 million of its stock. As of the end of FY20, the company had $135 million left on its repurchase authorization. It has repurchased more than $800 million of its stock since FY14. We expect the company to continue buying back stock opportunistically, with repurchases funded by rising cash flows.
We do not expect Sanmina to pay a dividend in FY21 or FY22.
MANAGEMENT & RISKSCo-founder and Chairman Jure Sola has resumed the CEO
role in mid-August 2020, after Hartmut Liebel stepped down as CEO after less than a year on the job. Mr. Kurt Adzema has been CFO since October 2019.
Sanmina has experienced unusual turbulence in the C-suite. Both former CEO Bob Eulau and Hartmut Liebel lasted just 11 months on the job. Founder and Chairman Jure Sola, who ran the company from inception, stepped down in fall 2017, but has since twice taken over for short-tenure CEOs.
The uncommonly busy pace of executive changes was unfortunate but mainly a matter of circumstance. We believe operational metrics rather than management change is likely to drive the stock price. The presence Jure Sola is likely reassuring to customers, vendors, employees and investors.
Sanmina operates in a low-margin business with high operating leverage; the steep hit to EPS relative to the change in revenue outlook was to be expected. Still, we will be monitoring Sanmina carefully for signs of additional revenue weakness, which might indicate a deeper industry decline in demand for communications and optical products. The company now derives about half of revenue from nontechnology markets, which is highly positive for the long term.
COMPANY DESCRIPTIONSanmina is an electronics manufacturing services (EMS)
company formed from the combination of Sanmina and SCI Corp. in 2001. Key markets include communications, enterprise networking & storage, automotive, industrial, medical, consumer, defense & aerospace, and multimedia. In addition to providing traditional EMS services such as printed circuit board assembly and final product assembly & test, Sanmina also participates in higher-margin vertical businesses, including printed circuit board fabrication and enclosures.
VALUATIONSANM shares are trading at 9.5-times our FY21
non-GAAP EPS estimate and at 8.9-times our FY22 estimate. The two-year forward average P/E of 9.2 is now below the five-year (FY16-FY20) average of 10.4. And the two-year forward relative P/E of 0.39 is well below the five-year average of 0.56. Our historical comparable valuation analysis points to a value in the low $40s, in a rising trend and just above current prices.
Peer group analysis indicates a value in the low- to mid-$40s, in a rising trend and above current prices. Our discounted free cash flow model suggests a value in the high $60s, now in a rising trend. Our blended fair value estimate in the mid-$50s is in a rising trend and now above the stock price.
Appreciation to our blended fair value estimate, on a risk-adjusted basis, is greater than our total-return forecast for the broad market and thus consistent with a near-term BUY rating. We are reiterating our BUY rating and $50 target price.
On August 3, BUY-rated SANM closed at $38.17, up $0.07. (Jim Kelleher, CFA, 8/3/21)
Weyerhaeuser Co. (WY)Publication Date: 8/4/21Current Rating: BUY
HIGHLIGHTS*WY: Reiterating BUY and maintaining target of $51*We expect Weyerhaeuser to benefit from historically
elevated lumber prices in 2021 and 2022, driven by a robust housing sector and the Biden infrastructure plan.
*In 2Q21, adjusted earnings came to $1.02 billion or $1.37 per share, up from $72 million or $0.10 per share in 2Q20. Adjusted EPS of $1.37 exceeded our estimate of $1.26 per share.
*WY recently reinstated its base dividend at a quarterly rate of $0.17 per share, or $0.68 annually, for a yield of about 2.0%. In addition to the base quarterly dividend, the company plans to begin paying an annual variable supplemental dividend in 1Q22.
*We project that the variable dividend will be greater than the annualized base dividend due to the cash windfall from high lumber prices. As such, our 2022 dividend estimate is $3.05 (lowered from $3.45) compared to our 2021 estimate of $0.68.
ANALYSIS
INVESTMENT THESISWe are reaffirming our BUY rating on Weyerhaeuser Co.
(NYSE: WY) and maintaining our target price of $51. Weyerhaeuser recently posted record second-quarter earnings, driven by high lumber prices that peaked in the middle of the quarter at about $1,500/MBF (data from the Random Lengths framing lumber composite.) Since mid-May, lumber prices have corrected aggressively, falling to roughly $500/MBF for the week ended 07/30/21. Oriented Strand Board (OSB) prices
Section 2.21
FOCUS LISTmaintained record levels for longer, peaking closer to the end of the quarter. OSB pricing is a key business driver, making up 30% of WY's 2Q21 consolidated EBITDA versus 51% for lumber. Even with prices for both lumber and OSB moving lower as the second quarter ended, adjusted earnings came to $1.02 billion or $1.37 per share, up from $72 million or $0.10 per share in 2Q20. Adjusted EPS of $1.37 exceeded our estimate of $1.26 per share. Even with the strong 2Q21 results, we are nudging our earnings forecast lower to reflect the current lumber pricing environment. We now project 2021 adjusted EPS of $4.01, down from $4.69 per share.
Though we are nudging our earnings estimates lower, we still have a very positive view on Weyerhaeuser's variable supplemental dividend policy. WY recently reinstated its base dividend at a quarterly rate of $0.17 per share, or $0.68 annually, for a yield of about 2.0%. In addition to the base quarterly dividend, the company plans to begin paying an annual variable supplemental dividend in 1Q22. The payout will be based on funds available for distribution (FAD) in the preceeding fiscal year. We project that the variable dividend will be significant as a result of high FAD in FY2021. Our 2022 dividend estimate is $3.05 (lowered from $3.45) compared to our 2021 estimate of $0.68.
RECENT DEVELOPMENTSWY shares have underperformed the S&P 500 over the
past three months, falling 11% compared to a 5% gain for the index. Over the past year, the shares have also underperformed, rising 24%, compared to a 34% gain for the S&P. The beta on WY shares is 1.87.
Weyerhaeuser recently posted record second-quarter earnings, driven by high lumber prices that peaked in May at about $1,500/MBF (data from the Random Lengths framing lumber composite). Even with prices for both lumber and OSB heading lower as the second quarter ended, adjusted earnings came to $1.02 billion or $1.37 per share, up from $72 million or $0.10 per share in 2Q20. Adjusted quarterly EPS of $1.37 exceeded our estimate of $1.26 per share. The adjusted EBITDA margin widened to 50.0% from 23.7% in the year-ago period. First-quarter net sales of $3.14 billion increased 92.8% from 2Q20, while the cost of sales increased only 23.4%.
Since mid-May, lumber prices have corrected aggressively, falling to roughly $500/MBF for the week ended 07/30/21. Oriented Strand Board (OSB) prices maintained record territory for longer, peaking closer to the end of 2Q21. OSB pricing is a secondary business driver, making up 30% of WY's 2Q21 EBITDA versus 51% for lumber. For 3Q21, OSB has the potential to capture a greater share of EBITDA due to longer order files and prices that stayed high for longer.
During the second quarter of 2021, lumber demand metrics ran very strong before weakening in the back half of
the quarter. New housing starts remained strong on a year-over-year basis, with the average monthly SAAR up 44% versus the average monthly SAAR in 2Q20. On a sequential basis, the new housing starts moderated 2% versus 1Q21. In DIY markets, sticker shock at high lumber prices had a negative impact on demand. Many of the big-box lumber stores slowed purchases as a result.
Looking beyond residential construction trends, the Biden infrastructure plan has the potential to unlock additional lumber/panel demand from other areas of constructing spending (residential construction spending only accounts for about half of total construction spending, according to the U.S. Census.) The current infrastructure proposal calls for a $1.0 trillion, 10-year spending plan that should create incremental annual construction spending of $100 billion (using back of the napkin math.) We note that this $100 billion per year figure is inherently low, as government spending doesn't translate on a one-to-one basis to actual spending in the economy. Instead, government bills generally earmark spending for subsidies or voucher programs that amplify each dollar spent. To put the incremental spending in perspective, total construction spending has averaged about $1.5 trillion per year in recent years.
EARNINGS & GROWTH ANALYSISWeyerhaeuser reports result for three operating segments:
Timberlands (24% of 2020 revenue and 26% of 2020 adjusted EBITDA), Real Estate, Energy & Natural Resources (3% and 10%), and Wood Products (72% and 64%). Segment results are presented below and performance is compared sequentially to 1Q21.
The Timberlands segment reported 2Q21 adjusted EBITDA of $180 million, up 5% from $172 million in 1Q21 as the western region saw 5.4% higher sales realizations and 4.5% higher volumes; the south saw 9.7% higher sales volumes and 1.8% higher sales realizations.; and the north saw 19.2% higher year-over-year realizations. These positives were offset by northern region volumes that were 55.9% sequentially lower due to seasonality, and forestry and road expenses that were higher. Management expects lower EBITDA in the third quarter versus the second quarter due to lower sales realizations.
In Real Estate, Energy & Natural Resources (ENR), adjusted EBITDA fell to $91 million from $96 million in 1Q21 due to slightly lower acres sold and lower price per acre. Management expects similar EBITDA in 3Q21 versus 3Q20, but significantly higher earnings due to the mix of properties sold.
In the Wood Products segment, 2Q21 adjusted EBITDA increased 55.9% to $1,386 million due to lumber prices peaking in May and OSB peaking in June. In 1Q21, third-party sales realizations averaged $1,077/MBF for lumber (up 25%
Section 2.22
FOCUS LISTquarter-over-quarter) and $911/M for OSB (up 48%). For 3Q21, management expects significantly lower EBITDA compared to 2Q21 due to lower lumber and OSB pricing this quarter. During the conference call on July 30, management stated that so far in the third quarter average lumber realizations were running at $652/MBF and that OSB realizations were running at $1,065. At these realization levels, OSB is the lead business driver, accounting for approximately 50% of consolidated EBITDA versus 25% for lumber. Looking beyond spot prices, futures prices for random length lumber (as provided by the CME) point to higher price levels than current benchmark pricing. As of this writing, the September futures contract settles at $610, and the November contract is at $630. Factoring in our positive assumptions regarding the Biden infrastructure bill and still-strong residential construction trends, partially offset by weak DIY lumber demand, we forecast lumber realizations of $650/MBF in 3Q21 and $615/MBF in 4Q21. For OSB, our assumptions are $950/M in 3Q21 and $850/M in 4Q21. As such, our full-year EBITDA estimate for this segment is $4.06 billion (lowered from $4.87 billion), compared to $1.53 billion in 2020 and $0.27 billion in 2019.
We are lowering our 2021 adjusted EPS estimate to $4.01 from $4.69 and lowering our 2022 estimate to $2.20 from $2.37. We regard both estimates as subject to change based on lumber and OSB pricing, which has been extremely volatile during the past year. Our long-term earnings growth rate forecast is 5%.
FINANCIAL STRENGTH & DIVIDENDOur financial strength rating for Weyerhaeuser is
Medium-High, raised from Medium due to the company's rising cash levels and debt retirements. We also applaud management's quick efforts to cut the dividend at the start of the pandemic, followed by reinstating it a more sustainable level.
At the end of 2Q21, the company had $5.250 billion in total debt, down versus $5.475 billion at the end of 2020 and $6.150 billion at the end of 2019. Cash and cash equivalents came to $1,777 million, up from $495 million at the end of 2020 and $139 million at the end of 2019. The debt/total capital ratio was 34%, roughly in line with the peer median. For 2020, adjusted EBITDA covered interest expense by a factor of 5.0, below the peer median of 6.5.
WY recently reinstated its base dividend at a quarterly rate of $0.17 per share, or $0.68 annually, for a yield of about 2.0%. In addition to the base quarterly dividend, the company plans to begin paying an annual variable supplemental dividend in 1Q22. The payout will be based on funds available for distribution (FAD) in the preceeding fiscal year. We project that the variable dividend will be significant as a result of high FAD in FY21. Our 2022 dividend estimate is $3.05 (lowered from $3.45) compared to our 2021 estimate of $0.68.
MANAGEMENT & RISKSDevin Stockfish, former senior vice president of the
Timberlands segment, has served as CEO since January 2019. The CFO is Nancy Loewe, who recently assumed the position from Russell Hagen. Former Plum Creek CEO Rick Holly is chairman of the board.
Investors in Weyerhaeuser face a range of risks. In addition to industry-wide issues of competition, operational efficiency, environmental compliance and potential litigation, the firm has significant debt. The volatility of wood prices can also be substantial.
The company is also exposed to housing, which is historically highly cyclical. Wildfires in British Columbia are a more recent risk that threatens to halt logging efforts in parts of Canada. Weyerhaeuser's business may also be hurt by trade disputes with China.
COMPANY DESCRIPTIONWeyerhaeuser grows and harvests trees and manufactures
forest products in North America. The company owns almost 11 million acres of timberlands in the U.S., and controls more than 14 million acres in Canada. Its vast U.S. land ownership makes Weyerhaeuser the largest non-governmental landowner in the U.S.
The company has nearly 9,400 employees, about 75% of them work in the Wood Products segment; 15% work in the Timberlands segment; 10% work in Corporate; and a small portion work in the Real Estate & ENR segment. In 2010, the company classified itself as a REIT for tax purposes, though investors can view this company through the lens of a vertically integrated commodities company.
VALUATIONWe think that WY shares are undervalued at current prices
near $34, at the midpoint of their 52-week range of $27-$42. We note that the stock previously reached its five-year high of $38 in June 2018, the same month that southern yellow pine lumber prices touched their previous all-time-high of $576/MBF. More recently, southern yellow pine prices have averaged roughly $900/MBF during the 2021 YTD.
WY shares trade at 8.4-times our 2021 EPS estimate, below the average for wood products producers and timber REITs of 12.6. A more appropriate comparison in the current environment may be price/sales. WY trades at a price/sales multiple of 3.1, compared to 5.4 for timber REIT peers; and a price to book of 2.7, compared to 3.4 for timber REITs. We feel that it should trade at a premium to peers based on the company's dominant market share and growth profile. Our target price of $51 implies a price/sales ratio of 3.9, still below the peer average.
On August 3, BUY-rated WY closed at $34.54, up $0.32. (Angus Kelleher-Ferguson, 8/3/21)
Section 2.23

FOCUS LIST
Section 2.24
CHANGE IN RATING / INITIATION OF COVERAGE
Change in Rating / Initiation of Coverage in this Report
PRICEAS OF
TICKER 8/4/21
Chubb Limited CB $172.62
Raytheon Teches Corporatio RTX 87.97
Teladoc Health Inc TDOC 151.41
Chubb Limited (CB)Publication Date: 7/30/21Current Rating: BUY
HIGHLIGHTS*CB: Upgrading to BUY with $185 target*A provider of P&C and health/life insurance, as well as
reinsurance, Chubb benefits from a strong brand, an experienced management team, and a healthy balance sheet.
*The company posted record operating earnings and underwriting results in 2Q21, with P&C premiums rising 15%.
*We are raising our 2021 EPS estimate to $11.88 from $10.46 and our 2022 estimate to $12.00 from $10.57. Our long-term earnings growth rate estimate is 7%, raised from 6%.
*CB shares appear attractively valued at 14-times our 2021 EPS estimate, below both the peer median and the five-year historical average.
ANALYSIS
INVESTMENT THESISWe are raising our rating on Chubb Ltd. (NYSE: CB) to
BUY from HOLD. A provider P&C and health/life insurance, as well as reinsurance, Chubb benefits from a strong brand, an experienced management team, and a healthy balance sheet. The company posted record operating earnings and underwriting results in 2Q21, with P&C premiums rising 15%. The P&C combined ratio also improved to 85.5. The shares have underperformed the market in recent periods, and in our view provide investors with a favorable entry point. Our target price is $185.
RECENT DEVELOPMENTSCB has underperformed the S&P 500 year-to-date, rising
8% compared to a 17% gain for the index. Over the past year, the shares have risen 26%, compared to a gain of 36% for the index. The shares have also underperformed over the past five years, gaining 33% compared to a 103% advance for the index. The beta on CB shares is 0.71.
On July 27, Chubb reported record 2Q21 core operating income of $1.62 billion or $3.52 per share, up from a loss of 254 million or $0.56 per share in 2Q20. Revenue rose 6% to $9.55 billion.
Net premiums written rose to $9.5 billion, up 14.2% in constant dollars. Net premiums earned rose 58.4% from the prior year to $8.8 billion, primarily due to growth in commercial P&C and consumer lines. Pretax net investment income rose 7% to a record $884 million, helped by gains in equities. Book value fell 3.8% to $136.90 per share.
Chubb's six business segments are Commercial P&C Insurance, Personal P&C, Agricultural Insurance (all North America), Overseas General Insurance, Global Reinsurance, and Life Insurance.
In 2Q, Commercial P&C net premiums written rose 20% to $6.4 billion. The segment combined ratio fell to 85.5 from 112.3 a year earlier, reflecting lower catastrophe losses and improving margins. The segment combined ratio excluding catastrophe losses decreased to 85.4 from 87.4. (A combined ratio of less than 100 indicates that premiums received exceeded claims paid and operating expenses.)
In Personal P&C, net premiums written rose 2.6% to $1.36 billion, and the combined ratio fell to 80.7 from 88.8 on lower catastrophe losses in the United States.
In the remaining segments, Agricultural Insurance net premiums written rose 11% to $512 million and the combined ratio improved to 88.1 from 91.8. Overseas General premiums rose 24% to $2.5 billion, and the combined ratio improved to 83.8 from 107.1. Reinsurance net premiums rose 32.4% to $274 million; however, the combined ratio rose to 86.6 from 76.6 on increased cyber-security claims. (We note that the segment combined ratios cited above exclude catastrophe losses.)
Lastly, Life Insurance premiums written fell 0.7% to $615 million, while segment income rose 16.1% to $102 million.
EARNINGS & GROWTH ANALYSISWe expect Chubb to benefit from improved economic
conditions in 2021 as the economy rebounds from the pandemic. Management noted that retention rates remain strong, and that premiums continue to rise both in the U.S. and in international markets. We are encouraged by the strong growth in the P&C segment and expect further growth in the Reinsurance business.
We are raising our 2021 EPS estimate to $11.88 from $10.46 and our 2022 estimate to $12.00 from $10.57. Our long-term earnings growth rate estimate is 7%, raised from 6%.
FINANCIAL STRENGTH & DIVIDENDOur financial strength rating on Chubb is Medium-High,
the second-highest rank on our five-point scale, raised from Medium. At the end of 2Q21, cash totaled $1.8 billion, up 5.5% from the end of 2020. Total long-term debt at the end of
Section 2.25
CHANGE IN RATING / INITIATION OF COVERAGEthe quarter was $14.9 billion and the debt/equity ratio was 20%. The 2Q21 operating margin was 12%. Core ROE was 11.5%.
The company's senior debt has ratings of AA from S&P, A3 from Moody's, and A+ from Fitch, all with stable outlooks. In September 2020, the company issued $1 billion of 1.375% 10-year debt. The proceeds will be used to prefund $1 billion of 2.875% debt that will mature in November 2022.
In May 2021, Chubb raised its quarterly dividend by 2.6% to $0.80 per share, or $3.20 annually, for a yield of about 1.9%. Over the past five years (since the ACE merger), CB has raised its dividend by an average of 3.0% annually. We are raising our dividend estimates to $3.18 (from $3.12) for 2021 and to $3.29 (from $3.20) for 2022.
On July 19, 2021, Chubb announced a new $5 billion share buyback plan, which at the time represented 6.8% of CB market value. The new plan follows the previous buyback authorization of $2.5 billion and will run through June 2022.
MANAGEMENT & RISKSFollowing the January 2016 merger with ACE, the new
company took the name Chubb Ltd. and four Chubb directors were added to the board. Evan Greenberg, previously the CEO of ACE, is chairman and CEO of Chubb. We have a positive view of Mr. Greenberg's management and note that ACE grew through acquisitions. We also like the fact that a number of veteran Chubb managers remain in key positions.
Risks faced by Chubb investors include the possibility that the company's underwriters may misprice its policies and suffer losses as claims exceed premiums written. The company may also be hurt by weak returns on its investment portfolio. In addition, Chubb faces challenges related to its post-merger integration. Like other insurers, the company is also exposed to substantial risk from weather-related losses and natural catastrophes.
COMPANY DESCRIPTIONBased in Switzerland, Chubb Ltd. is a global specialty
insurer and reinsurer formed through ACE Ltd.'s acquisition of Chubb Corp. in January 2016. The merged firm, which retained the Chubb name, is one of the world's largest property and casualty insurance companies. With a market cap of approximately $75 billion, CB shares are generally regarded as large-cap value.
INDUSTRYOur rating on the Financial Services sector is
Over-Weight. With market optimism rising on positive vaccine developments and the new administration in Washington, interest rates have started to move higher at the long end of the yield curve. We expect banks to benefit from wider net interest margins and lower loan-loss provisions as the economy normalizes, and insurance companies to generate higher
income in their investment portfolios.
The sector accounts for 11.2% of the S&P 500, down from 16.3% following the exclusion of REIT stocks. Over the past five years, the weighting has ranged from 9% to 17%. We think the sector should account for 12%-13% of diversified portfolios. The Financial sector is outperforming the market thus far in 2021, with a gain of 25.2%. It underperformed in 2020, with a loss of 4.1%, and slightly outperformed in 2019, with a gain of 29.2%.
The projected P/E ratio on 2022 earnings is 14, below the market multiple of 20. As for earnings expectations, analysts now expect earnings to rise 36.7% in 2021 and fall 2.6% in 2022 after falling 24.8% in 2020 and rising 39.0% in 2019. Yields are in line with the market average. Dividends and share repurchases also remain subject to regulatory approval for large banks deemed too-big-to-fail.
VALUATIONCB shares are trading toward the high end of their
52-week range of $112-$179. We believe that the shares are attractively valued at 14-times our 2021 EPS estimate, below both the peer median and the five-year historical average. Chubb's failed takeover of Hartford Insurance has put the focus on organic growth and capital returns to shareholders. Based on the company's record 2Q earnings, improved P&C pricing, low combined ratios, and double-digit ROE, we believe that a BUY rating is appropriate. Our target price is $185.
On July 29, BUY-rated CB closed at $167.43, up $1.41. (Kevin Heal, 7/29/21)
Raytheon Teches Corporatio (RTX)Publication Date: 7/29/21Current Rating: BUY
HIGHLIGHTS*RTX: Raising rating to BUY*RTX shares have outperformed the market over the past
three months, gaining 9% while the S&P 500 has advanced 6%.
*The company recently reported 2Q results that indicated EPS growth of 164%, and management raised guidance.
*Importantly, management is now providing more transparency on historical results and its multi-year outlook.
*Given the greater transparency on the earnings outlook, we think the shares are now undervalued and are setting a 12-month target price of $100.
ANALYSIS
INVESTMENT THESISOur rating on Raytheon Technologies Corp. (NYSE:
RTX) is now BUY. Raytheon Technologies is the result of a merger between United Technologies and Raytheon Corp., and also factors in the old UTX's divestiture of its elevator and air
Section 2.26
CHANGE IN RATING / INITIATION OF COVERAGEconditioner businesses, and its acquisition of Collins Aerospace. That's a lot of moving parts, and it has taken management a while to bring the pieces in line. But we think that job is now finished, and have more confidence in the company's results and outlook. RTX's business mix appears favorable compared to that of most defense industry peers. Technical trends have turned positive, and the company has recently raised its dividend by 7%. Compared to the peer group, RTX shares are trading in line with or below peer averages on metrics such as P/E and price/sales. Given the greater transparency on the earnings outlook, we think the shares are now undervalued and are setting a 12-month target price of $100.
RECENT DEVELOPMENTSRaytheon Technologies was formed through the merger of
United Technologies and Raytheon Corp. on April 3, 2020. On that date, United Technologies spun off its Carrier and Otis subsidiaries.
RTX shares have outperformed the market over the past three months, gaining 9% while the S&P 500 has advanced 6%. Over the past year, the shares are up 42%, compared to a 38% gain for the S&P 500 and a 44% recovery for the industry ETF.
Raytheon Technologies reported 2Q21 results on July 27, 2021. The company reported adjusted sales of $15.9 billion, up 10% on an organic basis. The net margin widened 580 basis points to 9.9%. EPS jumped 164% to $1.03, above the consensus forecast of $0.92. For the first half, the company has earned $1.93 per share.
The backlog at the end of the third quarter was $152 billion, of which $86 billion was from commercial aerospace and $66 billion was from defense. The backlog was up 3% quarter-to-quarter at the end of 2Q.
Along with the results, management provided an updated outlook for 2021. The company expects sales of $64.4 - $65.4 billion (up $500 million at the low end), adjusted EPS of $3.85 - $4.00 (up 35 cents at the low end and 30 cents at the high end) and free cash flow of $4.5 - $5.0 billion, up from $4.5 billion. Management raised guidance based on increased confidence from overall solid execution and significant program wins during the second quarter.
The company continues to refine its portfolio of businesses. In 1Q, it sold cybersecurity firm Forcepoint for gross proceeds of $1.1 billion.
The company held an analyst/investor day on May 18, 2021. Management set financial targets of 6%-7% revenue growth per year through 2025; 550-650 basis points margin expansion in that time frame from an adjusted pro forma rate of 7.9% in 2020; free cash flow of $10 billion by 2025, up
from $2.3 billion in 2020; and the return of $20 billion to shareholders by 2025.
EARNINGS & GROWTH ANALYSISRaytheon Technologies has four primary business
segments: Pratt & Whitney (26% of pro forma 2Q sales); Collins Aerospace (28%); Raytheon Intelligence & Space (23%) and Raytheon Missiles & Defense (24%). Recent trends and outlooks are discussed below.
The legacy UTX segments - Pratt & Whitney and Collins Aerospace - returned to growth, as expected, and reported 2Q year-over-year sales gains of 19% and 6%. Collins and Pratt & Whitney both benefited from growth in the commercial OEM and aftermarket segments. RIS grew 12% year-over-year, on higher volume in sensing, cyber, training and services. RMD grew 15% on higher Patriot missile volume. Management expects low to mid-single-digit growth for the two former Raytheon segments in 2021, as well as for Pratt & Whitney; Collins sales are expected to be down in the low-to-middle single digits.
On the expense side, the net margin widened 580 basis points to 9.9%. Margins widened in all four segments. To improve margins in 2021, the company is implementing $2 billion of immediate cost and $4 billion of immediate cash actions, including cuts to capex, office space, and headcount; about 21,000 positions have been eliminated. During 2Q, the company achieved $185 million in merger synergies, raising the total to $385 million for the first half of the year.
Turning to our estimates, and taking into account the expected improvement in both sales and margins, we are raising our 2021 EPS estimate to $3.95 from $3.70. Our estimate is near the high end of management's guidance range. We look for growth to continue in 2022 and are boosting our EPS estimate to $5.00 from $4.30. Our five-year earnings growth rate forecast is 9%.
FINANCIAL STRENGTH & DIVIDENDOur financial strength rating on RTX is Medium, the
midpoint on our five-point scale. The company receives average scores on our key financial strength criteria of debt levels, fixed-cost coverage, profitability, earnings quality and cash flow generation.
The company had $8 billion in cash on the balance sheet at the end of 2Q21. Total debt was $31 billion, and the debt-to-total capitalization ratio was 29%.
The company has a share buyback plan, and is planning to buy back $2.0 billion of its stock in 2021 - up from its previous forecast of $1.5 billion.
RTX pays a dividend. In April, the company raised the quarterly payout 7% to $0.51, or $2.04 annually, for a yield of
Section 2.27
CHANGE IN RATING / INITIATION OF COVERAGEabout 2.4%. Our dividend estimates are $2.01 for 2021 and $2.16 for 2022.
MANAGEMENT & RISKSGregory Hayes has been the company's president and
CEO since 2014. Mr. Hayes, the former CFO, has been with the company since 1999. Neil Mitchill, Jr. is the new CFO. Thomas Kennedy, the former CEO of Raytheon Co., is the executive chairman.
The RTX board is committed to effective cash deployment, with priorities that include dividend payments, share buybacks, debt repayment, and M&A.
CEO Hayes has also expressed a willingness to make a major acquisition, or to divest business lines from the current product portfolio. His latest decisions - to buy Raytheon and Rockwell Collins, and to divest the Carrier and Otis divisions - show that he's true to his word.
Investors in RTX shares face risks. Raytheon Technologies is a key supplier to the U.S. military and thus vulnerable to debates over and potential cuts in domestic and international defense spending. The company is subject to a number of procurement laws and regulations, and evolving U.S. government procurement policies and increased emphasis on cost over performance could adversely affect Raytheon's business. The Defense industry is competitive, with other deep-pocketed players.
Raytheon Technologies generates substantial revenue from overseas, and its results are typically linked to global economic trends.
RTX is also sensitive to trends in the dollar. At current levels, we think the greenback is fairly valued and likely to drift sideways to lower over the next few quarters. A stable or falling dollar would be a positive development for the Industrial sector and Raytheon Technologies.
COMPANY DESCRIPTIONRaytheon Technologies, based in Massachusetts, is an
industrial conglomerate with a focus on the Aerospace & Defense business. The shares are a component of the Dow Jones Industrial Average and the S&P 500. The company has 181,000 employees.
VALUATIONWe think that RTX shares are attractively valued at
current prices near $87, near the high end of the 52-week range of $51-$90. From a technical standpoint, the shares have reversed a long-term neutral pattern and are now in a bullish pattern of higher highs and higher lows.
To value the stock on a fundamental basis, we use peer and historical multiple comparisons, as well as a dividend discount model. RTX shares are trading at 18-times projected
2022 earnings, near the high end of the historical range of 12-20. The dividend yield of about 2.4% is above the market average, signaling value. Compared to the peer group, RTX shares are trading in line with or below peer averages on metrics such as P/E and price/sales. Given the greater transparency on the earnings outlook, we think the shares are now undervalued and are setting a 12-month target price of $100.
On July 28, BUY-rated RTX closed at $87.20, down $1.02. (John Eade, 7/28/21)
Teladoc Health Inc (TDOC)Publication Date: 8/2/21Current Rating: HOLD
HIGHLIGHTS*TDOC: Downgrading to HOLD from BUY *Teladoc continues to post operating losses as its costs for
marketing, sales, and technology are rising faster than revenue.*Teladoc is also facing an expanding range of competitors
in the telehealth space.*The company saw strong membership growth in 2020,
driven by increased demand for virtual healthcare during the pandemic; however, this growth is now slowing as patients return to physicians' offices.
*We are widening our 2021 GAAP loss estimate to $1.20 per share from $0.60. We are also lowering our 2022 estimate to a loss of $1.00 per share from earnings of $0.40 per share.
ANALYSIS
INVESTMENT THESISWe are lowering our rating on Teladoc Health Inc.
(NYSE: TDOC) to HOLD from BUY amid continued operating losses. The company is showing strong revenue growth, but its costs for marketing, sales, and technology are rising faster than revenue. Teladoc is also facing an expanding range of competitors in the telehealth space. Given the company's current spending on technology and expanded service offerings, we expect TDOC to post continued operating losses over the next 18-24 months, and are widening our loss estimate for 2021. We also expect a loss in 2022 after previously projecting a modest profit next year.
RECENT DEVELOPMENTSOn July 27, Teladoc reported a 2Q21 GAAP net loss of
$133.8 million or $0.86 per share, wider than the loss of $25.7 million or $0.34 per share a year earlier. Revenue was $503.1 million, up 109% from the prior year. Excluding contributions from InTouch Health (acquired in July 2020) and Livongo (acquired in October), revenue rose 41%.
While the company saw strong membership growth in 2020, driven by increased demand for virtual healthcare during the pandemic, this growth is now slowing as patients return to physicians' offices. At the same time, Teladoc is increasing spending on technology and expanded service offerings,
Section 2.28
CHANGE IN RATING / INITIATION OF COVERAGEincluding specialty areas such as diabetes management, hypertension monitoring, and behavioral health. Teladoc is also facing increased competition in the telehealth space. Its competitors include Amazon and Walmart, smaller companies such as Amwell, and a range of start-ups.
To be sure, certain operating metrics are improving. The 2Q adjusted gross margin was 68.1%, up 580 basis points. Utilization, which measures engagement activity by members seeking care, was 21.5%, up from 16.0% a year earlier. Revenue per member per month (PMPM) rose to $2.47 from $1.02. The rising PMPM shows that members are seeking multiple services, including behavioral health services and the treatment of chronic conditions.
EARNINGS & GROWTH ANALYSISThe company has updated its guidance for 2021. It now
expects revenue of $2.0-$2.025 billion, up from a prior view of $1.97-$2.02 billion. But it continues to project adjusted EBITDA of $255-$275 million. In other words, with operating costs rising, the expected higher revenue is not translating into higher earnings.
Based on the company's 2Q21 results and updated guidance, we are widening our 2021 GAAP loss estimate to $1.20 per share from $0.60. We are also lowering our 2022 estimate to a loss of $1.00 per share from earnings of $0.40 per share.
FINANCIAL STRENGTH & DIVIDENDOur financial strength rating on Teladoc is Medium-Low.
We typically measure a company's financial strength by reviewing its debt levels, cash position, cash-generation ability, fixed-cost coverage, and level of profitability.
Teladoc ended 2Q21 with cash of $783.7 million, up from $733.3 million at the end of 4Q20. It had $1.4 billion in convertible senior notes at the end of the quarter. Cash flow from operations rose to $34.2 million in the first six months of 2021 from $29.3 million in the same period a year earlier.
The company does not pay a dividend and is unlikely to initiate one in the medium term.
RISKSTDOC faces risks from competitors in the telehealth
space, which may lead to lower pricing and membership churn. The company also faces risks related to the integration of acquired businesses, including InTouch Health and Livongo.
COMPANY DESCRIPTIONTeladoc Health Inc., based in Purchase, New York,
provides virtual healthcare services in the United States and internationally. Teladoc provides members with a full spectrum of virtual care services through a single consumer-centric access point. Since its IPO in 2015, the company has increased its membership, product offerings, and
the utilization of its services.
INDUSTRYOur rating on the Healthcare sector is Over-Weight.
Consumers are now more willing to spend on lifestyle enhancements along with necessary spending on life-saving treatments. In addition, the survival of the Affordable Care Act has kept the ranks of insured U.S. citizens above the historical average, further increasing consumer spending on healthcare services and products. Meanwhile, companies with experience in diagnostic testing, vaccines, and antiviral medicines, as well as suppliers of protective equipment and other hospital products, should benefit from efforts to contain the coronavirus pandemic.
The sector accounts for 13.0% of the S&P 500, and includes companies in the pharmaceuticals, medical devices, healthcare services, and insurance industries. The sector is underperforming the market thus far in 2021, with a gain of 12.9%. It underperformed in 2020, with a gain of 11.4%, and in 2019, with a gain of 18.7%.
VALUATIONTDOC stock has underperformed thus far in 2021, with a
decline of 22%. Given its current spending requirements and increased competition in the telehealth space, we expect Teladoc to post continued operating losses over the next 18-24 months. We see limited upside for the shares in the near term, and are lowering our rating to HOLD.
On July 30, HOLD-rated TDOC closed at $148.45, down $7.58. (David Toung, 7/30/21)
Section 2.29
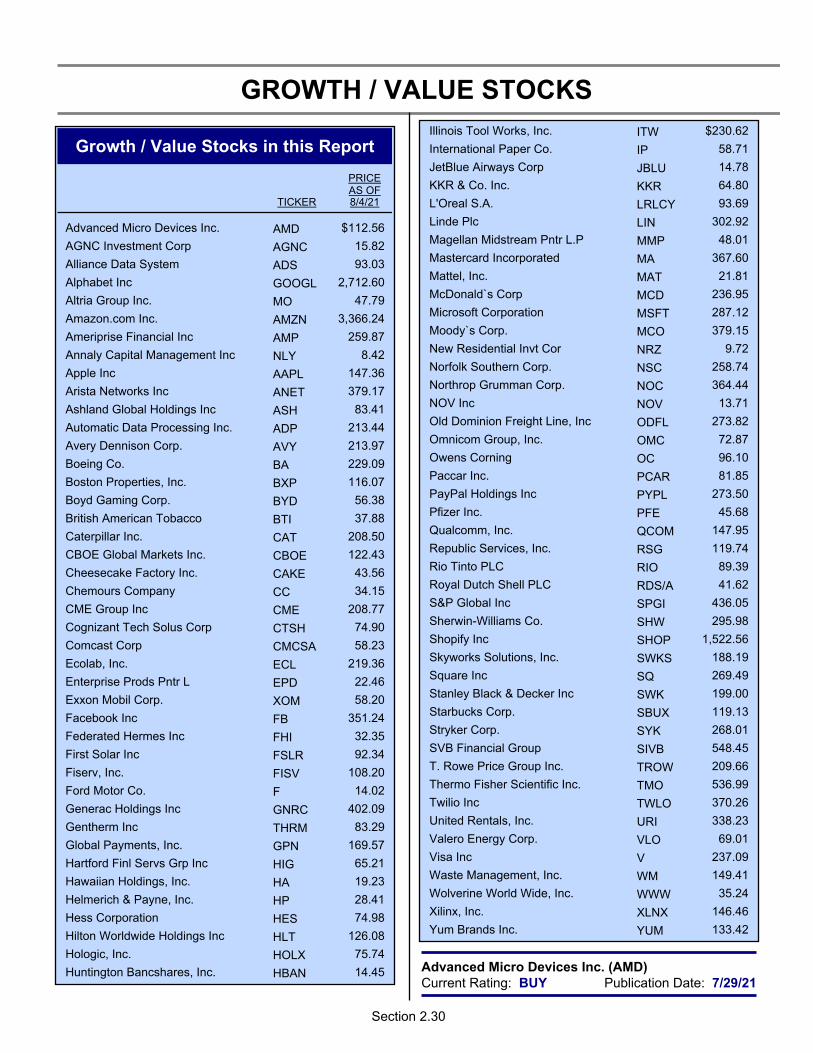
GROWTH / VALUE STOCKS
Growth / Value Stocks in this Report
PRICEAS OF
TICKER 8/4/21
Advanced Micro Devices Inc. AMD $112.56
AGNC Investment Corp AGNC 15.82
Alliance Data System ADS 93.03
Alphabet Inc GOOGL 2,712.60
Altria Group Inc. MO 47.79
Amazon.com Inc. AMZN 3,366.24
Ameriprise Financial Inc AMP 259.87
Annaly Capital Management Inc NLY 8.42
Apple Inc AAPL 147.36
Arista Networks Inc ANET 379.17
Ashland Global Holdings Inc ASH 83.41
Automatic Data Processing Inc. ADP 213.44
Avery Dennison Corp. AVY 213.97
Boeing Co. BA 229.09
Boston Properties, Inc. BXP 116.07
Boyd Gaming Corp. BYD 56.38
British American Tobacco BTI 37.88
Caterpillar Inc. CAT 208.50
CBOE Global Markets Inc. CBOE 122.43
Cheesecake Factory Inc. CAKE 43.56
Chemours Company CC 34.15
CME Group Inc CME 208.77
Cognizant Tech Solus Corp CTSH 74.90
Comcast Corp CMCSA 58.23
Ecolab, Inc. ECL 219.36
Enterprise Prods Pntr L EPD 22.46
Exxon Mobil Corp. XOM 58.20
Facebook Inc FB 351.24
Federated Hermes Inc FHI 32.35
First Solar Inc FSLR 92.34
Fiserv, Inc. FISV 108.20
Ford Motor Co. F 14.02
Generac Holdings Inc GNRC 402.09
Gentherm Inc THRM 83.29
Global Payments, Inc. GPN 169.57
Hartford Finl Servs Grp Inc HIG 65.21
Hawaiian Holdings, Inc. HA 19.23
Helmerich & Payne, Inc. HP 28.41
Hess Corporation HES 74.98
Hilton Worldwide Holdings Inc HLT 126.08
Hologic, Inc. HOLX 75.74
Huntington Bancshares, Inc. HBAN 14.45
Illinois Tool Works, Inc. ITW $230.62
International Paper Co. IP 58.71
JetBlue Airways Corp JBLU 14.78
KKR & Co. Inc. KKR 64.80
L'Oreal S.A. LRLCY 93.69
Linde Plc LIN 302.92
Magellan Midstream Pntr L.P MMP 48.01
Mastercard Incorporated MA 367.60
Mattel, Inc. MAT 21.81
McDonald`s Corp MCD 236.95
Microsoft Corporation MSFT 287.12
Moody`s Corp. MCO 379.15
New Residential Invt Cor NRZ 9.72
Norfolk Southern Corp. NSC 258.74
Northrop Grumman Corp. NOC 364.44
NOV Inc NOV 13.71
Old Dominion Freight Line, Inc ODFL 273.82
Omnicom Group, Inc. OMC 72.87
Owens Corning OC 96.10
Paccar Inc. PCAR 81.85
PayPal Holdings Inc PYPL 273.50
Pfizer Inc. PFE 45.68
Qualcomm, Inc. QCOM 147.95
Republic Services, Inc. RSG 119.74
Rio Tinto PLC RIO 89.39
Royal Dutch Shell PLC RDS/A 41.62
S&P Global Inc SPGI 436.05
Sherwin-Williams Co. SHW 295.98
Shopify Inc SHOP 1,522.56
Skyworks Solutions, Inc. SWKS 188.19
Square Inc SQ 269.49
Stanley Black & Decker Inc SWK 199.00
Starbucks Corp. SBUX 119.13
Stryker Corp. SYK 268.01
SVB Financial Group SIVB 548.45
T. Rowe Price Group Inc. TROW 209.66
Thermo Fisher Scientific Inc. TMO 536.99
Twilio Inc TWLO 370.26
United Rentals, Inc. URI 338.23
Valero Energy Corp. VLO 69.01
Visa Inc V 237.09
Waste Management, Inc. WM 149.41
Wolverine World Wide, Inc. WWW 35.24
Xilinx, Inc. XLNX 146.46
Yum Brands Inc. YUM 133.42
Advanced Micro Devices Inc. (AMD)Publication Date: 7/29/21Current Rating: BUY
Section 2.30
GROWTH / VALUE STOCKS
HIGHLIGHTS*AMD: Accelerating momentum and raised guidance;
reiterating BUY*Advanced Micro Devices posted well-above-consensus
results for 2Q21, featuring high-double-digit revenue growth and triple-digit EPS growth.
*We view the proposed Xilinx acquisition as positive, although Chinese regulators could block the deal through inaction.
*AMD raised its full-year revenue-growth guidance to 60%, from a prior 50% (April) and an initial 37% (January).
*Current prices in our view do not fully discount AMD's revenue growth and margin expansion potential, along with ongoing market share gains at Intel's expense.
ANALYSIS
INVESTMENT THESISBUY-rated Advanced Micro Devices Inc. (NGS: AMD)
rallied 5% in a mixed market on 7/28/21 after posting well-above-consensus results for 2Q21. AMD's performance across notebook and desktop PCs and in gaming was predictably strong, and the company appears to be continuing to gain server processor share at Intel's expense. At a time when Intel's data center business is struggling with top-line and profitability issues, AMD's data center revenue continues to grow sharply. The company raised its full-year revenue growth guidance to 60%, from a prior 50%.
Giant competitor Intel's Data Center revenue is on track for an annual decline in 2021, even as new Intel CEO Pat Gelsinger races to shore up the business. That is positioning AMD's EPYC processors for strong market-share gains and continued double-digit growth. Data center sales worldwide show signs of entering a digestive phase. Still, AMD has been able to grow its EE&SC revenue, which includes both gaming-console products and server processors, sharply from the 2020 level.
In October 2020, AMD agreed to acquire programmable logic device (PLD) maker Xilinx in an all-stock transaction valued at $35 billion; the deal has now been approved by shareholders from each company. Given its all-stock nature, which enables AMD to avoid taking on crushing debt, the deal is expected to be immediately accretive to margins, cash flow and EPS.
By acquiring Xilinx, which AMD called the No. 1 provider of adaptive computing solutions, AMD increases its total available market to $110 billion. We believe Xilinx adds high-growth complementary assets that will accelerate AMD's growth in the cloud data center and in high-value-added nontechnology markets. Gaining Chinese regulatory approval could be a real hurdle, however.
AMD provided above-consensus guidance for 3Q21,
signaling that its momentum will continue across 2H21. AMD is growing sales and profits much faster than the market and its top competitor. The Xilinx acquisition, in our view, represents yet another growth platform.
Although AMD has outperformed peers and the market in the coronavirus downturn, the stock has underperformed year-to-date amid market rotation. Current prices in our view do not fully discount AMD's revenue growth and margin expansion potential, along with ongoing market share gains at Intel's expense. We are reiterating our BUY rating and our 12-month target price of $120 (raised from $106).
RECENT DEVELOPMENTSAMD is approximately flat year-to-date in 2021, versus a
12% gain for peers. AMD rose an even 100% in 2020, while the Argus semiconductor peer group advanced 49%. AMD rose 148% in 2019; peers were up 54%. AMD rose 80% in 2018, compared with a 4% decline for peers. In 2017, AMD declined 9% following a spectacular 2016 in which the stock more than tripled.
For 2Q21, Advanced Micro Devices reported revenue of $3.85 billion, which was up 99% year-over-year and 12% sequentially. Management had guided for sales of $3.5-$3.7 billion, and the Street consensus called for revenue of $3.62 billion. Non-GAAP profit totaled $0.64 per diluted share, up 248% from $0.18 a year earlier and $0.12 sequentially from $0.52 for 1Q21. The Street had projected non-GAAP EPS of $0.54; management does not provide explicit EPS guidance.
Fueled by strong across the board growth in Ryzen CPUs, Radeon GPUs, EPYC server processors and semi-custom solutions for leading gaming consoles, AMD crushed revenue expectations. Higher volume leverage and favorable mix led to four percentage points of gross margin gain, while non-GAAP operating margin doubled to 24% year-over-year.
CEO Lisa Su was not exaggerating when she said that AMD 'is growing significantly faster than the market,' while experiencing strong demand across all businesses and product categories. AMD also generated record free cash flow for any quarter in 2Q21.
A year earlier, economic lockdowns were driving people indoors and spurring home PC demand. Even against this dynamic quarterly comparison, AMD drove record revenue for any quarter.
For 2Q21, Computing & Graphics (C&G) revenue of $2.24 billion (58% of total) rose 65% annually and 7% sequentially. C&G operating profit rose 65% year-over-year to a record $526 million. The C&G operating margin was 23.4% for 2Q21, vs. 23.1% for 1Q21 and 14.6% a year earlier. C&G margin in 2Q21 surpassed the prior peak level of 23.1% attained in 1Q21.
Section 2.31
GROWTH / VALUE STOCKS
C&G revenue growth was driven both by Ryzen and Radeon sales. Client computing had another quarter of record processor revenue. Sales into both notebook and desktop increased at high-double-digit rates, and the AMD believes it gained revenue share in PC CPUs for a fifth straight quarter.
Robust demand for AMD's highest-end Ryzen desktop processors led to a richer product mix in the quarter; Ryzen 9 processor unit shipments more than doubled year-over-year. Notebook units and ASPs increased both annually and sequentially. AMD delivered a seventh straight quarter of mobile CPU record revenue, led by Ryzen 5000 mobile processors.
Enterprise is coming back, and AMD's Ryzen PRO mobile processors also doubled year-over-year. AMD has won multiple high-volume deployments with Fortune 500 companies in finance, automotive, and pharmaceuticals, among other areas. Graphics revenue doubled annually, reflecting demand for Radeon 6000 series. Graphics card demand in the distribution channel remains robust.
AMD is also seeing early adoption of its data center GPUs. Radeon 6000 M series GPUs launched, and AMD also is the first AMD Advantage notebooks that combine Ryzen CPUs, Radeon GPUs, and AMD software. Asus, Lenovo, HP and others are bringing AMD Advantage to notebooks to market in time for the holiday season.
Also for 2Q21, EE&SC (Enterprise, Embedded and Semi-Custom) segment revenue of $1.60 billion (42% of total) was up 183% from $565 million a year earlier, in one of the final quarters before the launch of the new PlayStation and Xbox gaming consoles. Revenue also rose 19% sequentially.
EE&SC segment profit of $398 million was up more than 10-fold from prior-year profit of $33 million, and was the highest ever in our AMD quarterly model going back to 2013. EE&SC profit also improved from $277 million in 1Q21 and $243 million in 4Q20, the two prior record levels. EE&SC segment margin reached 24.6% for 2Q21, compared with 20.6% for 1Q21 and 5.8% a year earlier.
Growth was consistent across both EPYC server processors and semi-custom solutions, particularly for gaming consoles including Microsoft Xbox and Sony PS5. Console demand remains strong, noted the CEO, and in this first year of new devices AMD expects gaming console demand to remain strong throughout the year. AMD announced a new semi-custom win earlier this year when Valve chose AMD to power their Steam handheld game console, which is planned for a December launch.
The embedded part of EE&SC is expanding presence across key verticals such as automotive, networking, and
storage. AMD is ramping production off Ryzen embedded CPUs and Radeon RDNA 2 GPUs for in-dash infotainment systems in Tesla models, including Model S and X vehicles.
The single area of most intense interest for AMD investors is the EPYC server processor business within EE&SC. Whereas AMD has always had some share in PC CPUs, Intel has enjoyed near-hegemony in server CPUs. EPYC is coming on very hard at a crucial time for the server CPU world, as the customer base accelerates its transition from on-premises and server closet, to an AI cloud and edge-based end market.
CEO Su noted that in 2Q21 AMD delivered its fifth straight quarter of record server processor revenue. Sales grew by a 'significant' double-digit percentage sequentially, with both higher unit shipments and higher ASPs driving very strong demand across the server portfolio. Second-generation EPYC saw doubled-digit sequential growth, while third-gen EPYC sales more than doubled quarter over quarter.
Third-generation EPYC is exclusively powering the 'Tau' product line from VMware, aimed at scale-out workloads. In enterprise, more than 100 third-gen EPYC platforms are now in production from Dell, HP, Lenovo, Cisco, and others. The CEO cited 'rapid expansion' in AMD-powered solutions from ecosystem partners targeting Hyperconverged and virtual infrastructure. AMD secured multiple HPC wins in the quarter. Overall data center revenue nearly doubled year over year, the CEO noted.
Touching on the planned Xilinx acquisition, the CEO noted additional milestones reached in the quarter, including regulatory approval in EU and the UK.
Xilinx brings a revenue base that we calculate at $3.1 billion for the March 2021 fiscal year, compared to AMD's roughly $15 billion revenue base ($10 billion just one year ago!). Importantly, Xilinx is expected to derive about 55% of FY21 revenue from nontechnology end markets, including aerospace & defense, industrial, automotive, broadcast, and consumer. These now all become growth venues for AMD's sales and go-to-market teams.
On balance, we regard the XLNX deal as a logical next step in AMD's journey, one that adds high-growth complementary assets that will accelerate AMD's growth in the cloud data center and high-value-added non-technology markets. The big unknown is whether the deal can win Chinese regulatory approval. A new U.S-China trade deal might help in this matter, but that does not seem to be on Washington's radar.
AMD began 2021 guiding for 37% annual revenue growth, which was later raised to 50%. AMD is now forecasting full-year 2021 revenue growth of 60%; Intel, by
Section 2.32
GROWTH / VALUE STOCKScontrast, recently raised its outlook from small revenue decline for the year to single-digit growth. AMD is hitting on all cylinders, even if its year-to-date stock performance does not reflect the acceleration in the business.
Although AMD has outperformed peers and the market in the coronavirus downturn, the stock has underperformed year-to-date amid market rotation. Current prices in our view do not fully discount AMD's revenue growth and margin expansion potential, along with ongoing market share gains at Intel's expense.
EARNINGS & GROWTH ANALYSISFor 2Q21, Advanced Micro Devices reported revenue of
$3.85 billion, which was up 99% year-over-year and 12% sequentially. Management had guided for sales of $3.5-$3.7 billion, and the Street consensus called for revenue of $3.62 billion.
The non-GAAP gross margin was 47.6% for 2Q21, compared to 46.1% for 1Q21 and 44.0% a year earlier. Reflecting better overhead absorption on higher revenue, the non-GAAP operating margin expanded to 24.0% in 2Q21 from 22.1% in 1Q21 and 12.1% a year earlier.
Non-GAAP profit totaled $0.64 per diluted share, up 248% from $0.18 a year earlier and $0.12 sequentially from $0.52 for 1Q21. The Street had projected non-GAAP EPS of $0.54; management does not provide explicit EPS guidance.
For all of 2020, revenue of $9.76 billion rose 45% from $6.73 billion in 2019. Non-GAAP EPS rose to $1.29 from $0.64 in 2019.
For 3Q21, AMD guided for revenue of $4.0-$4.2 billion, which at the midpoint represents an increase of about 46% annually. Adjusted gross margin was forecast at about 48% for 3Q21. Non-GAAP operating costs are forecast at about $1.0 billion, all other costs (including interest expense and taxes) are forecast at $150 million, and share count should be about 1.23 billion. In all, this points to non-GAAP EPS of $0.60-$0.66, which would be up more than 55% from $0.41 in the prior year.
AMD is forecasting full-year sales growth of about 60%, up from prior guidance of at least 50%, and initial sales-growth guidance of 37% for the full year. Management is also guiding for non-GAAP operating costs equal to 25% of revenue (down from earlier guidance of 26%) and a 15% full-year tax rate. On that basis, EPS growth for 2021 should exceed top-line growth.
We are raising our 2021 non-GAAP earnings forecast to $2.51 per diluted share from $2.27. We are also raising our 2022 non-GAAP EPS forecast to $2.80 per diluted share, from a preliminary $2.43. We regard our estimates as fluid and
subject to revision. Our estimates do not include any contribution from the Xilinx acquisition, which remains scheduled to close before the end of calendar 2021.
FINANCIAL STRENGTH & DIVIDENDOur financial strength rating on AMD is Medium-High.
AMD has successfully restructured its debt, which is helping the company to reduce interest costs. The company has swung to a net cash position from a net debt position, and has stepped up shareholder returns.
Cash was $3.79 billion at the end of 2Q21. Cash was $2.29 billion at the end of 2020, $1.50 billion at the end of 2019, $1.08 billion at year-end 2018, $1.19 billion at year-end 2017, and $1.26 billion at the end of 2016.
Debt was $313 million as of the end of 2Q21. Debt was $330 million as of the end of 2020, $685 million at the end of 2019, $1.25 billion at year-end 2018, $1.40 billion at year-end 2017, and $1.44 billion at the end of 2016.
Net cash was $3.48 billion at the end of 2Q21. That is up meaningfully from net cash of $1.96 billion at the end of 2020. Net cash was $818 million at the end of 2019. Prior to mid-2019, AMD was in a net debt position for multiple years. Net debt was $172 million at year-end 2018, $210 million at year-end 2017, and $171 million at the end of 2016.
Cash flow from operations was $1.85 billion in the first half of 2021, vs. $178 million in the first half of 2020. Cash flow from operations was $1.07 billion in 2020, $493 million in 2019, $34 million in 2018, and $68 million in 2017.
We do not expect AMD to pay a dividend in 2021 or 2022. Share repurchases are used primarily to offset dilution from stock-based compensation.
MANAGEMENT & RISKSLisa Su became CEO in October 2014. The CFO is
Devinder Kumar, who has been in that role since 2013. In August 2018, AMD named Saeied Moshkelani as SVP and GM of its Client Compute Group, replacing Jim Anderson.
We believe that the company's IP monetization strategy, as well as success in EE&SC, could give CEO Su a longer leash than was given to prior CEOs. The pandemic has turned around what had been structural decline in PCs, and AMD appears positioned for market share gains at the expense of Intel, which is wrestling with production issues.
The acquisition of Xilinx for $35 billion carries multiple risks, including potential issues with cultural integration, a misreading of end-market outlooks, and potential end-market cannibalization. We believe these risks are worth the TAM opportunities afforded by XLNX. The all-stock nature of the deal also eliminates the potential for a cumbersome debt
Section 2.33
GROWTH / VALUE STOCKSburden. AMD will dilute its share base by one-third, but is acquiring growing and higher-margin assets that should not be dilutive to EPS.
A main risk for AMD as for other semiconductor companies, is the possibility of a general economic downturn and a corresponding dip in technology hardware sales due to the pandemic. We believe that AMD has the financial strength, market leadership, and growth characteristics to weather this storm and emerge a stronger player. We also believe the percentage of hours worked away from the office will continue to increase. That should drive long-term demand for personal PCs served by AMD CPUs, for data center CPUs to manage fast-growing data traffic, and for GPUs for gaming applications.
AMD has been betting heavily on nontraditional businesses, including embedded, micro-server, and semi-custom (gaming console). Simultaneously, AMD is supporting both stand-alone CPU and GPU lines as well as its APU line that combines compute and graphics processing on a single die. The new CEO must consider exiting some businesses. Spinning off the ATMP Asian operations into the NFME JV is part of that plan.
COMPANY DESCRIPTIONAdvanced Micro Devices is the number-two player in
x86-based microprocessors, behind Intel, and -- with the 2008 acquisition of ATI -- a top player in graphic processors. In 2009, Advanced Micro Devices spun off its foundry operations into a joint venture called Global Foundries. In mid-2014, AMD underwent an internal reorganization, aligning businesses along functional lines and creating a single internal infrastructure.
VALUATIONAMD shares are trading at a P/E of 34.6 on a two-year
forward average basis, compared to a multiple of 73.7-times for 2017-2020 (recent profitable years). The two-year-forward relative P/E of 1.51 is below the historical average of 2.47. Despite a rising stock price, multiples are declining because inputs (earnings, sales, etc.) are rising faster. Historical comparable valuation for AMD indicates value in the low-$120s, in a clearly rising trend and above current prices.
Peer group analysis suggests that AMD deserves to trade at a premium to peers on absolute and relative P/E; our peer-indicated value is in the low $110s, now rising and above current prices. Our discounted free cash flow model renders a fair value in the $200s, in a rising trend. Blending these approaches, we arrive at a value above $180, in a clearly rising trend and above current prices.
We are encouraged by the progress of EPYC in cloud and enterprise data center, the success of Ryzen CPUs for desktop and notebook PCs, and the outlook for AMD's Radeon GPUs
in the new gaming cycle. We regard the XLNX deal as a logical next step in AMD's journey, one that adds high-growth complementary assets that will accelerate AMD's growth in the cloud data center and high-value-added nontechnology markets.
AMD has outperformed peers and the market during most of the coronavirus downturn, but has underperformed so far this year. Current prices in our view do not fully discount AMD's revenue growth and margin expansion potential, and the Xilinx acquisition represents yet another growth platform for the company. We are reiterating our BUY rating to a 12-month target price of $120 (raised from $106).
On July 28, BUY-rated AMD closed at $97.93, up $6.90. (Jim Kelleher, CFA, 7/28/21)
AGNC Investment Corp (AGNC)Publication Date: 7/28/21Current Rating: BUY
HIGHLIGHTS*AGNC: Reiterating BUY on high-yield REIT *AGNC Investment is a publicly traded REIT that invests
primarily in U.S. agency-backed residential mortgage securities.
*On July 26, the company reported 2Q21 EPS of $0.76, up 31% from the prior year and above the consensus forecast of $0.64.
*AGNC pays an annualized dividend of $1.44 per share, for a yield of about 8.9%.
*Our target price of $18, combined with the dividend yield, implies a total potential return of 20% from current levels.
ANALYSIS
INVESTMENT THESISWe are reiterating our BUY rating on AGNC Investment
Corp. (NGS: AGNC) and our target price of $18. AGNC invests in U.S. agency mortgage securities on a leveraged basis, funding the assets through repurchase agreements (repos). As of June 30, AGNC's investment portfolio was $87.5 billion, including $58.1 billion in agency MBS, $27.4 billion in TBA securities, and $2.0 billion in nonagency and credit risk transfer securities. Lower coupon TBA securities have risen due to favorable rates in the TBA roll market. Management intends to take advantage of this favorable financing in the near term.
The company generates income from the interest earned on securities less hedging and borrowing costs, and from net realized gains and losses on its investment portfolio. The company's leverage was 7.9-times as of March 31, down from 8.0-times at the end of 1Q and in line with management's target range.
We believe that continued additional Federal Reserve
Section 2.34
GROWTH / VALUE STOCKSMBS purchases of $40 billion per month (not including the reinvestment of mortgage prepayments) will ensure liquidity and less volatility in the MBS markets for the foreseeable future. Fed intervention in the repo markets and extended MBS purchases should allow market participants to continue to operate in markets that had seized up in March-April 2020. Management discussed prospects for Fed tapering on the 2Q earnings call. It believes that any tapering will be slow and deliberate, and will likely apply only to the monthly $40 billion, with no tapering of prepayments.
AGNC pays an annualized dividend of $1.44 per share ($0.12 per month) for a yield of about 8.9%. The high yield is generated via leverage in the repo and term funding markets. Tangible book value was $16.39 per share at the end of 2Q21, down from $17.72 at the end of 1Q on higher prepayment speeds. We believe that the stock remains attractive at current levels.
RECENT DEVELOPMENTSAGNC shares have underperformed the broad market over
the past year, rising 20% while the S&P 500 has risen 37%. However, we note that the main driver of the stock is the dividend yield, currently at 8.9%. AGNC has a beta of 1.02. The stock has 60% institutional ownership and represents 11.3% of Mortgage REIT ETF REM.
On July 26, the company reported 2Q21 EPS of $0.76, up 31% from the prior year and above the consensus forecast of $0.64.
AGNC reported a 2Q conditional prepayment rate (CPR) of 25.7%, compared to 24.6% in the prior quarter. It saw high prepayment rates in the 3.0%-4.5% coupon cohorts as mortgage rates remained near 3%, allowing the refinancing boom to continue. The CPR is the percentage of a mortgage security or pool that is expected to be prepaid in a year, and the higher the CPR, the lower the return on the investment. Conversely, a lower CPR boosts returns and benefits earnings. Looking ahead, we expect a lower-than-average CPR for the AGNC portfolio due to the company's continued purchases of prepayment-protected securities.
The company pay a monthly dividend of $0.12, or $1.44 annually, for a yield of about 8.9%. During the conference call, management reiterated its focus on the economic return on tangible common equity. For the quarter, the negative 5.5% return was comprised of $0.36 per share in dividends and a $1.33 decrease in tangible net value. Management said that it would be prudent about the timing of the next dividend increase. We project an increase in the dividend by 1Q22.
EARNINGS & GROWTH ANALYSISAGNC invests in agency mortgage-backed securities by
using collateralized borrowings structured as repurchase agreements. Income is generated through interest earned on the
company's investment assets, net of associated borrowing and hedging costs, and net realized gains and losses on its investment activities. The company has an $87.5 billion investment portfolio that includes $58.1 billion in agency MBS, $27.4 billion in net TBA mortgage positions, and $2.0 billion of credit risk transfers and nonagency securities.
The company funds its mortgage-backed securities via the repo market, allowing it to leverage its MBS portfolio in order to pay the dividend. (Its leverage ratio was 7.9 as of June 30). AGNC sees growth in times of economic stability, when U.S. interest rates and MBS rate spreads are steady, as it takes advantage of the spread between the yield of the acquired securities and its hedging costs. We note that AGNC and other REITs are required to pay out 90% of their income to shareholders.
AGNC adjusted its investment portfolio in 2Q to take advantage of favorable TBA financing.
Based on the company's recent results and investment trends, we are raising our 2021 EPS forecast to $2.91 from $2.83 and maintaining our 2022 estimate of $2.81.
FINANCIAL STRENGTH & DIVIDENDOur financial strength rating on AGNC is Medium. The
company scores well above average on our three main measures of financial strength: leverage based on debt/cap, profitability, and interest coverage.
The company pays a monthly dividend of $0.12 per share, or $1.44 annually, for a yield of about 8.9%. We are lowering our 2021 dividend estimate to $1.44 from $1.80 and maintaining our 2022 estimate of $1.92.
MANAGEMENT & RISKSThe company was founded in 2008 and is based in
Bethesda, Maryland. It is internally managed, in contrast with other MBS REITS that are managed by an outside affiliate. Peter Federico serves as the CEO and chief investment officer, having recently taken over for Gary Kain, who has become executive chairman. Mr. Kain previously headed the Freddie Mac investment portfolio.
Investors in AGNC shares face numerous risks. On a macro level, the company is dependent on a stable housing environment. Investments in agency MBSs are very interest rate-sensitive, especially in a declining rate environment. As mortgage prepayments increase, the value of the securities falls. Liquidity risks are also significant, as AGNC must be able to fund its securities through repurchase agreements. AGNC currently maintains 47 repo counterparties and has a captive broker-dealer, Bethesda Securities, with direct access to the Fixed Income Clearing Corp. (FICC) that funds approximately 44% of its portfolio. Federal Reserve actions in the repo market have diminished fears that the market could
Section 2.35
GROWTH / VALUE STOCKSagain seize up, though rising prepayments could negatively impact the portfolio. The company also faces regulatory risks at both the national and state level.
COMPANY DESCRIPTIONAGNC Investment Corp. is a publicly traded REIT
focused on residential housing. The company's investment portfolio consists of agency mortgage-backed securities (MBS), managed on a leveraged basis. The company uses an actively managed portfolio and hedging strategies with the goal of preserving net asset value in different interest rate scenarios.
VALUATIONWe think that AGNC shares remain attractively valued
based on the appeal of the 8.9% dividend yield in a low rate environment. On the fundamentals, the stock is trading near its tangible net book value of $16.39 per share, which we believe reflects management's ability to strategically invest and hedge the investment portfolio. Interest rates on the short end of the curve have been relatively stable amid the recent rally in the 10-year Treasury. The flattening of the yield curve has caused some spread compression between MBS rates and funding costs, though funding costs remain at all-time lows.
We believe that Federal Reserve programs will continue to ensure liquidity and reduce volatility in the MBS markets. Fed intervention in the repo markets and MBS purchases should allow market participants to continue to operate in markets that had seized up in March 2020. We don't expect any Fed tapering of these purchases in the near term. Our target price of $18, combined with the dividend yield, implies a potential total return of 20% from current levels.
On July 28 at midday, BUY-rated AGNC traded at $16.10, down $0.08. (Kevin Heal, 7/28/21)
Alliance Data System (ADS)Publication Date: 7/30/21Current Rating: BUY
HIGHLIGHTS*ADS: Maintaining BUY following 2Q results*We expect Alliance to post stronger results as the impact
of the pandemic diminishes and business conditions improve for its retail and travel industry clients.
*Alliance reported 2Q21 results on July 29. Revenue rose 3% to $1.01 billion. Diluted EPS rose to $5.47 from $0.81 in 2Q20 and topped the consensus of $3.83.
*We are raising our 2021 EPS estimate to $17.10 from $14.53 and our 2022 estimate to $14.70 from $13.40.
*On the fundamentals, ADS is trading at 6-times our 2021 core EPS estimate, below the five-year historical average of 13 and the industry average of 10.
ANALYSIS
INVESTMENT THESIS
We are maintaining our BUY rating on Alliance Data Systems Corp. (NYSE: ADS) and our target price of $135. The company provides private-label credit cards and marketing services, and many of its clients are airlines, cruise line operators, department stores and other retailers that have been hit hard by the pandemic. However, we expect Alliance to post stronger results as the impact of the pandemic diminishes and business conditions improve for its retail and travel industry clients. We also expect the company to benefit from its recent acquisition of Lon Inc., which provides an omnichannel solution for retailers and a 'buy-now-pay-later' option for consumers at the point of sale. Our target of $135, combined with the dividend, implies a potential total return of 36% from current levels.
RECENT DEVELOPMENTSADS shares have underperformed over the past three
months, falling 18% compared to single-digit declines for both the S&P 400 and the industry. Over the past year, the shares have gained 117%, compared to a 45% gain for both the index and the industry. The shares have underperformed both the market and the industry over the past five years. The beta on ADS is 2.6.
Alliance reported 2Q21 results on July 29. Revenue rose 3% to $1.01 billion. Diluted EPS rose to $5.47 from $0.81 in 2Q20 and topped the consensus of $3.83. The EBITDA margin rose to 50% from 23% in the prior-year period.
In 2020, the company earned $9.39 per share.
On May 12, ADS announced plans to spin off its LoyaltyOne segment, including its Canadian AIR MILES Rewards Program and Netherlands-based BrandLoyalty business. The spinoff is expected to be tax-free to shareholders, and to result in two independent, U.S.-based, publicly traded companies: Alliance Data and the still unnamed 'Spinco.' Alliance Data stockholders will own shares of both companies, with Alliance retaining a minority stake in Spinco. At the time of the spinoff, Spinco will also complete a debt financing and distribute the net proceeds to Alliance Data as a dividend. Alliance Data will use the net proceeds to retire a portion of its corporate debt. It expects the spinoff to be completed by the end of the year.
Charles Horn, currently executive vice president at Alliance Data, will become the CEO of Spinco. Blair Cameron and Claudia Mennen will continue to lead the AIR MILES and BrandLoyalty businesses, respectively. The remainder of the Spinco leadership team and board will be announced over the next several months.
In December 2020, ADS acquired Lon Inc., a digital payments company operating under the name Bread. The company offers an omnichannel solution for retailers and platform capabilities for bank partners. It also provides a
Section 2.36
GROWTH / VALUE STOCKS'buy-now-pay-later' option for consumers at the point of sale. Alliance Data paid $450 million for Lon in cash and common stock, with a portion of the cash payment deferred for a period of one year. On April 28, ADS announced that Bread would provide turnkey point-of-sale lending products to businesses using merchant acquiring services from Fiserv.
EARNINGS & GROWTH ANALYSISADS has two primary businesses. Card Services (85% of
2Q21 revenue) competes with financial institutions that develop credit card programs with large revolving balances. The LoyaltyOne segment (15%) administers rewards programs and provides related marketing services; it competes with other loyalty programs for clients' marketing and advertising dollars. First-quarter results by business segment are summarized below.
In 2Q21, Card Services revenue rose 4% from the prior year to $861 million. Pretax earnings rose to $405 million from $70 million a year earlier, helped by pandemic-related consumer relief programs offered by ADS in 2Q20. EBT rose by $334 million to $404 million, with help from a lower loan loss provision. The net principal loss rate was 5.1%, an improvement of 250 basis points from 2Q20, and the delinquency rate improved by 100 basis points to 3.3%, well below the historical average of 6%. Adjusted segment EBITDA rose to $501 million from $229 million in 2Q20.
In the LoyaltyOne segment, revenue was flat with the prior year at $151 million, with an 11% increase in AIR MILES revenue and a 9% decline in BrandLoyalty revenue. Pretax earnings rose to $24.5 million from $24.0 million. EBT in the LoyaltyOne segment rose 2% to $24 million due to lower amortization expense. Adjusted segment EBITDA fell to $36 million from $44 million.
Along with the 2Q21 results, the company provided 2021 guidance. It expects average receivables to be down in the mid-single digits, revenue to be down in the low single digits, and expenses (excluding loan losses) to be flat. It expects a net loss rate in the low 5% range, down from 6.6% in 2020.
We are raising our 2021 EPS estimate to $17.10 from $14.53 and our 2022 estimate to $14.70 from $13.40.
FINANCIAL STRENGTH & DIVIDENDOur financial strength rating on Alliance Data Systems is
Medium-Low, the second-lowest point on our five-point scale. The company receives below-average scores on our primary financial strength criteria of debt levels, fixed-cost coverage, cash flow generation, and profitability. Neither Moody's nor Standard & Poor's rate the company's debt.
Alliance had cash and equivalents of $3 billion as of June 30, 2021. Total debt was $7.6 billion, and accounted for 79% of total capital, down from 93% a year earlier. Second-quarter
EBITDA of $490 million was in line with the prior year. The adjusted EBITDA margin was 50%, up from 27% in the prior-year period.
The company pays a dividend. It reduced its quarterly payment by two thirds to $0.21 per share in 1Q20. The current annualized dividend of $0.84 yields about 0.8%. Our 2021 dividend estimate is $0.88 and our 2022 estimate is $1.03.
The company has historically had a stock repurchase plan. However, it suspended buybacks in 1Q20 due to pandemic-related uncertainty.
MANAGEMENT & RISKSRalph Andretta is Alliance's president and CEO, having
succeeded Melisa Miller in February 2020, five months after she started in the role. Prior to joining Alliance, Mr. Andretta served as managing director and head of U.S. Cards for Citi. Roger H. Ballou is the company's chairman. Perry Beberman became the company's new CFO in July 2021, succeeding Tim King.
Investors in Alliance Data face risks. The company is highly leveraged, and susceptible to rising interest rates. It is also vulnerable to high credit card delinquencies. Additionally, the company faces considerable risks related to the coronavirus pandemic. Because of the virus, some of the company's clients, which include department stores, cruise line operators, and large mall-based retailers, have decided to temporarily or even permanently shut down. The company's AIR MILES program has also suffered from the reduction in airline travel.
COMPANY DESCRIPTIONAlliance Data Systems provides data-driven marketing
and loyalty solutions to large, consumer-based businesses in a number of industries. It generates the largest portion of its revenue and earnings from its Card Services business, which offers private-label and co-branded credit card accounts to retailers. It also offers major Canadian and Dutch rewards programs through its LoyaltyOne segment. The company has about 8,000 full-time employees. ADS is a component of the S&P MidCap 400.
VALUATIONAt current prices near $97, ADS shares are trading above
the midpoint of their 52-week range of $40-$128. The shares have risen strongly from their pandemic lows in March 2020, but are still well below their all-time highs in early 2018. On the fundamentals, ADS is trading at 6-times our 2021 core EPS estimate, below the five-year historical average of 13 and the industry average of 10. ADS is also trading at a price/sales multiple of 1.1, below the peer average of 2.3 and the five-year average of 1.4. We believe that ADS is favorably valued at current levels, and expect sales and earnings to improve as the pandemic recedes. As such, we are maintaining our BUY rating. Our target price is $135.
Section 2.37
GROWTH / VALUE STOCKSOn July 30 at midday, BUY-rated ADS traded at $93.63,
down $3.74. (David Coleman, 7/30/21)
Alphabet Inc (GOOGL)Publication Date: 7/29/21Current Rating: BUY
HIGHLIGHTS*GOOGL: Raising target to $3100*Alphabet reported remarkably strong 2Q21 results, with
169% EPS growth on 61% revenue growth.*Advertising revenue showed strong momentum in the
quarter, rising 69% to $50.44 billion, and was even up 55% from the pre-pandemic 2Q19.
*But the stellar quarterly results will not lessen the increasing regulatory pressure on Alphabet, which is facing mounting antitrust lawsuits in the U.S. and abroad as well as potential action by Congress.
*We are raising our 2021 GAAP EPS estimate to $101.06 from $86.11 and our 2022 forecast to $101.18 from $97.42.
ANALYSIS
INVESTMENT THESISWe are maintaining our BUY rating on Alphabet Inc.
(NGS: GOOGL) and raising our target price to $3100 from $2800.
We see Alphabet as one of the tech industry's leaders, along with Facebook, Apple, Amazon, and Microsoft. These companies have come to dominate new developments in mobile, public cloud, and big data analytics, as well as emerging areas such as artificial intelligence and virtual/augmented reality. While Alphabet has often been criticized as a Johnny one note for its dependence on digital advertising, the powerful ramp-up in digital advertising as economies have reopened, combined with Google's dominant position, has certainly been a financial plus that shows little sign of weakening.
Alphabet is beset by antitrust investigations and lawsuits both in the U.S. and internationally, particularly in Europe. While the U.S. Department of Justice antitrust complaint against the company is perhaps the most serious threat to Alphabet, all of the investigations/cases in the aggregate could potentially slow the company's growth, if not force a breakup or other onerous regulation. At a minimum, we think that regulators will carefully scrutinize further acquisitions by Alphabet. We think that the current antitrust cases are serious, though it will probably take years for them to play out, and they may be difficult to prove in court. New legislation, while a threat, may also face difficulty in a divided U.S. Congress. The company faces headline risks over these lawsuits and investor uncertainty over regulatory outcomes may create an overhang for GOOGL shares. Of course, the company faces possible sanctions if the outcomes are unfavorable.
Alphabet's recovery from the 2Q20 COVID-19-induced advertising slump has been remarkable. We see continued momentum in the coming quarters as e-commerce and digital advertising have burgeoned with economic recovery.
GOOGL shares appear attractively valued given the company's rapidly expanding businesses.
RECENT DEVELOPMENTSAlphabet reported 2Q results on July 27. Revenue topped
the consensus by $4.9 billion and GAAP EPS beat the consensus by $7.91. Alphabet provides no actual guidance, so large variances from consensus usually do not surprise - though the large variance in 2Q underscores the company's strength as it emerges from the pandemic. GOOGL shares rose more than 3% on July 28.
Excluding traffic acquisition costs (TAC), consolidated net revenue increased 61% to $50.95 billion. Obviously, the company had a very easy comparison with 2Q20. However, 2Q21 revenue was also up 61% from the more normal 2Q19 and up 12%, i.e., by more than $5.3 billion, sequentially. Other than the easy year-over-year comparison, management attributed the revenue growth to 'elevated consumer activity online and broad-based increases in advertiser spending.' Google Advertising revenue grew 69% from the prior year to $50.44 billion, with 68% growth from Google Search & Other, as YouTube reported another stellar quarter of 60% growth, to $7 billion. Google Cloud revenue reported robust 54% growth to $4.6 billion. Google Other (Google Play, hardware and other non-advertising businesses) reported 29% revenue growth in a seasonally slow quarter, to $6.6 billion. Management expects the comparisons to get tougher in 2H as the company moves further away from the pandemic trough.
Traffic acquisition costs (TAC) as a percentage of advertising revenue narrowed by 70 basis points from the prior year to 21.7% and were stable sequentially.
The cost of revenue rose 41% from the prior year. Other cost of revenue, excluding TAC, also rose 29%, driven by content acquisition costs for YouTube TV ad-supported and subscription content. Second-quarter operating income more than tripled to $19.4 billion, and the operating margin expanded by more than more than 14 percentage points to 31.3%. However, compared to the more normal 2Q19, the operating margin was 6.5 percentage points lower in 2Q21. We expect management to continue to invest in the key growth areas of Search, Machine Learning, and Google Cloud. GAAP diluted EPS rose 169% from the prior year to $26.27 and was stable sequentially.
The much maligned 'Other Bets' segment, i.e., Google Fiber, Waymo, and Verily Life Science (along with other smaller start-ups) reported a $1.4 billion operating loss, wider than its losses of $1.1 billion in both 2Q20 and 1Q21.
Section 2.38
GROWTH / VALUE STOCKSHowever, Google Cloud shaved its segment operating loss to $591 million from $1.4 billion in 2Q20, continuing an improving trend.
Alphabet reorganized its financial reporting in 4Q20. The company now has three segments: Google Services, Google Cloud, and Other Bets. Google Services encompasses the old Google division components of Search, YouTube, and Google Other. Google Other continues to include revenue from the Google Play application store, Google hardware, and YouTube subscriptions, and will also include the recent Fitbit acquisition. The Google Cloud division includes revenue from Google Cloud Platform and Google Workspace, Alphabet's cloud-native communication and collaboration solution. Other Bets continues to comprise the company's nascent business ideas.
On June 11, the U.S. House of Representatives Antitrust Subcommittee of the Judiciary Committee introduced several different but related bills addressing antitrust concerns related to large tech company platforms. Given the multiple investigations and rounds of executive testimony before Congress over the last few years, the obvious targets are Alphabet/Google, Amazon, Facebook, and Apple. The proposed legislation is a rather mixed bag of bipartisan bills, each sponsored by both a Democrat and Republican House member. The bills are:
- The 'American Innovation and Choice Online Act,' aimed at prohibiting 'discriminatory conduct by dominant online platforms.'
- The 'Platform Competition and Opportunity Act,' which seeks to prohibit acquisitions that could 'expand or entrench market power.'
- The 'Ending Platform Monopolies Act,' which looks to eliminate 'the ability of dominant platforms' to leverage control over business lines to their own benefit and disadvantage competitors.
- The 'Augmenting Compatibility and Competition by Enabling Service Switching Act,' which promotes interoperability and data portability in order to lower barriers to entry, facilitate customer switching, and enhance competition.
- The 'Merger Filing Fee Modernization Act,' which raises merger filing fees in order to increase regulatory resources.
The bills look to either break up or competitively constrain large tech company platforms. The last two might face the least industry opposition and perhaps have the greatest chance of passage. While the bills face many hurdles, not least the knife's edge balance between the parties in the U.S. Senate, we see them as the logical outcome of Congressional and
regulatory investigations - including the multiple antitrust lawsuits filed by government entities in 2020 against Alphabet/Google and Facebook. Press reports indicate that big tech is revving up well-financed lobbying efforts to fight the legislation. While it is unclear what kind of bill might emerge from the Congressional sausage grinder, the proposed legislation reflects the sharp change in public and political attitudes toward Alphabet/Google and big tech in general over the last several years - from an industry viewed as a shining example of American innovation to a threatening presence on the American industrial landscape. We reiterate our opinion that antitrust regulation, both in the U.S. and internationally, remains a primary threat to Alphabet/Google.
On June 22, the European Commission opened a formal investigation into whether Google favors its own online display advertising services 'to the detriment of competing providers of advertising technology services, advertisers and online publishers.' The Commission's investigation will encompass a number of business practices, including possible pressure to purchase Google's advertising services or Ad Manager to the exclusion of competing services, the potential 'favoring' of Google Ad Exchange, and restrictions on identity tracking by third-party advertisers or adtech competitors.
Google's end-to-end participation in the online advertising technology market is a salient antitrust concern given the company's dominant market share in digital advertising. It is also the subject of one of the antitrust cases filed in the U.S. in December 2020. Further, Google has been subject to antitrust actions and fines in the EU related to alleged anticompetitive behavior for a number of years, and has had to modify practices as well as pay multiple massive fines totaling $9 billion. While the EU may have a solid case with respect to Google's adtech business, the allegations surrounding identity tracking appear inconsistent with the EU's own directives on user privacy.
Although the European Commission formally opened its investigation of Google adtech on June 7, Alphabet/Google recently settled a case brought by the French Competition Authority with similar allegations, i.e., that Google discriminated against third-party adtech platforms in favor of its own platforms, increasing the cost of advertising to web publishers. Alphabet/Google agreed to pay $270 million to the French Authority and to implement a number of new business practices. The new practices include allowing third-party adtech platforms to access the same bid information that Google itself uses to optimize advertising auction bids, and other technical fixes to make the bidding process more transparent and flexible for publishers and third-party adtech platforms. Google has also agreed to an independent monitor of its efforts to implement these commitments. In a blog post, Google noted that it will be testing some of the
new business practices in anticipation of a global rollout. A wider rollout of the new practices might help to stave off
Section 2.39
GROWTH / VALUE STOCKSsimilar antitrust investigations in the U.S., the EU as a whole, and other countries.
EARNINGS & GROWTH ANALYSISWe are raising our 2021 GAAP EPS estimate to $101.06
from $86.11 and our 2022 forecast to $101.18 from $97.42. Alphabet does not issue guidance. Our estimates imply 36% EPS growth on average over the next two years. Our long-term earnings growth rate forecast is 17%.
Search advertising, whether on Google sites or through its third-party Google Network (on desktop or mobile), remains the crucial revenue driver, even as other businesses, like YouTube, Google Play and Google Cloud (the so-called 'second wave') have ramped up to multi-billion dollar businesses in their own right. Management often notes that it manages for the long term and that quarterly results can be lumpy; however, it has only grudgingly released key performance indicators that might illustrate the health of its important advertising and nonadvertising businesses: YouTube, Google Cloud Platform, and hardware. The lack of relevant information leads to higher investor uncertainty and risk, and could be a negative for GOOGL shares. Alphabet's decision to begin reporting Google Cloud as a separate division in 4Q20 was a small step in the right direction.
Aside from advertising, Google is looking to apply its deep research into artificial intelligence across the company's platforms and applications. Its three primary 'bets' for the immediate future are YouTube, the Google Cloud Platform (GCP), and hardware. YouTube has taken a number of steps to move forward from issues surrounding the appearance of noxious content on the service. As usual, Google has responded with technical solutions, using AI to prevent advertising from being matched with inappropriate content and changing its platform rules around childrens' content. CEO Sundar Pichai has made a point of noting that YouTube's 'violative view rate,' i.e., views of content that violate YouTube's policies, was between 16 and 18 views per 10,000, down 70% over the last three years. This comment came after Mr. Pichai received a raft of criticism from U.S. Congress members over the company's alleged role in making pernicious content available to children.
With GCP, Google has provided a steady stream of improvements, as it does with most of its products, and is working to differentiate its services through AI. It has also moved to provide discounts, competing on price against Amazon, and has beefed up its sales staff. In addition, it has made strategic acquisitions in the space.
Google is generally thought to be in fourth place in the hyper-scale public cloud market, well behind Amazon Web Services, Alibaba Cloud, and Microsoft Azure. It is also partnering with multinational giants, as in its deals with SAP, Salesforce, and Cisco to integrate business software systems
into GCP. Management clearly views GCP as critical to the company's future, and in 2018 hired new leadership for the business, replacing Diane Green with former Oracle executive Thomas Kurian. Mr. Kurian has been working to build up GCP's sales efforts by ramping up the sales force. The plan is for GCP's sales team to triple in size over the next few years. Google has often been an also-ran in hardware, particularly compared to Apple, with its iPhone/iPad juggernaut, and even Amazon with its Kindle and Echo voice-activated home assistant. Google has been plugging away with new lines of mobile and in-home devices and will do so again this coming holiday season, but has not yet come up with a must-have device. Perhaps the Fitbit acquisition will change the trajectory in Google hardware.
Google's YouTube announced its new streaming television channel service, called 'YouTubeTV,' on February 28, 2017. It had previously been referred to as 'Unplugged.' The service, technically a virtual multichannel video program distribution service ('VMVPD'), became another formidable competitor in the over-the-top (OTT) streaming video market. This market already includes Hulu Live TV, Dish's Sling, and AT&T TVNow, as well as a host of other OTT services like Netflix, Amazon Prime Video, and Disney+. We say 'formidable' because YouTube users already spend over a billion hours a day watching its short-form content offerings; it thus has a huge potential customer base. According the Wall Street Journal, YouTube accounts for 73% of online video traffic. YouTube TV got a leg up with its debut on both the Roku and Apple TV streaming devices. The company has also partnered with Verizon, the largest wireless provider in the U.S. and a possibly growing player in the 5G connected home market. YouTubeTV initially charges a $65 per month subscription fee for an initial lineup of 40 channels, including the major broadcast networks (CBS, NBC, ABC, and FOX) as well as an assortment of cable channels like the ESPN and FOX sports channels and nearly all of NBC/Universal's and FOX's other cable channels. YouTube TV subscribers have access to the content on YouTube's cheaper $11.99 per month content subscription service, YouTube Premium.
In December 2020, Alphabet/Google was hit with two consecutive federal antitrust lawsuits, initiated by state attorneys general, following the DOJ's antitrust suit in October 2020. On December 16, 2020, ten state attorneys general, led by the State of Texas, filed suit alleging that Google created a monopoly in the digital ad market through its 2008 acquisition of DoubleClick (this business evolved into the AdX ad exchange digital advertising auction market). As Google controls both the market as well both sides of the auction, this charge may not be hard to prove - though proving harm to consumers, advertisers, and publishers may be more difficult. The complaint further alleges that Google conspired with its biggest digital advertising competitor, Facebook, to manipulate the auction process in Facebook's favor in exchange for Facebook stepping back from direct competition
Section 2.40
GROWTH / VALUE STOCKSwith Google. The complaint also alleges other anticompetitive actions by Google. The obvious remedy would be the breakup of Alphabet/Google, essentially undoing the 12-year-old DoubleClick acquisition, as well as fines for any illegal conduct.
On December 17, 2020, 38 states, led by Colorado, filed another federal antitrust complaint against Alphabet/Google. The Colorado suit harkens back to the October DOJ complaint, again accusing Google of unlawful monopolization of the internet search business through anticompetitive practices.
On July 7, 2021, 12 states and the District of Columbia, led by Utah, filed another federal antitrust complaint against Alphabet/Google. The Utah suit alleges that Google's operation of the Android mobile operating system and the Google Play application store violate federal and state antitrust laws and consumer protection laws.
While the state suits and the DOJ suit will likely take years to litigate, we think the Texas case may have the most chance of success due to Google's fairly obvious (at least to us) domination of the digital advertising marketplace. The search-related DOJ and Colorado cases may be more difficult to prove, especially when it comes to allegations of consumer harm and the stifling of innovation. Alphabet/Google has been one of the tech industry's most innovative companies. Yes, some of those innovations have benefited the company, and, at times, have cut traffic to internet website publishers. For example, Google Search has evolved into a service that provides users with direct answers to questions rather than just a list of potentially useful websites. It will be hard to argue that a direct answer is not more relevant to the user even if it might be harmful to a middleman website publisher. The case for 'consumer harm' also appears weak as users continue to choose Google for billions of queries rather than switch to other alternatives. Whatever the outcome of these lawsuits, Alphabet/Google will face the risk of negative headlines
and the more substantive risk of management distraction - as we believe occurred in the 1990s with Microsoft. While Microsoft eventually won its multiyear antitrust litigation with the U.S. government, its management also lost focus, putting the company into a decade-plus tailspin. The company also faces continuing headline risk as the cases play out, and as bits of evidence, perhaps one-sided, leak from the prosecutors' offices to create embarrassing news stories. This occurred in April, when evidence surfaced of an alleged scheme to fix advertising auctions in Google's favor.
On January 14, 2021, Alphabet's Google division completed its acquisition of wearable fitness tracker maker Fitbit (FIT) for $2.1 billion in cash ($7.35 per share). Google has pledged to not use Fitbit data for advertising, and to segregate Fitbit data from other user data. Further, Google has committed to keeping Fitbit, with a global user base of 28
million, 'platform-agnostic,' i.e., available on both Android (Google) and iOS (Apple) devices. These commitments are on a global basis, but were forged through negotiation with the European Commission, which approved the deal on December 17, 2020. The stance of the U.S. Department of Justice on the merger is unclear. The DOJ allowed its merger review period to expire, but also said that its investigation into the merger 'remains ongoing.' The merger remains under review by Australian regulatory authorities.
With the acquisition, Google management is doubling down on its commitment to wearables. Google's track record in devices has been pretty feeble - even putting aside the Google Glass disaster several years ago. The company has developed products like the Pixel smartphone and expanded into in-home devices, smart speakers and wearables, though with relatively little success. For its part, Fitbit has a reasonably solid 24% share (according to Canalys) of the North American smartwatch market and a 10% global share, well behind Apple's 46% (according to Strategy Analytics). The popularity of the Android operating system with third-party watch/wearables makers might give Google a boost as it expands its wearable line. We remain skeptical about the ability of Alphabet/Google - despite its power as an online information/advertising aggregator - to compete successfully in a very different business where Apple is dominant.
FINANCIAL STRENGTH & DIVIDENDOur financial strength rating on Alphabet is High, our
highest rating. The company's credit ratings are in the high A's, high-quality investment grade, with stable outlooks.
The company does not pay a dividend. Alphabet repurchased $24.2 billion of its stock in 1H21 after buying back $18.4 billion in 2020 and $31.1 billion in 2019. The share count has fallen about 1% in the last 12 months. Google is well able to continue large share repurchases and, with both $136 billion in cash on the balance sheet and $64 billion in trailing 12-month free cash flow, certainly has the liquidity to do so.
RISKSLike all advertising-dependent companies, Alphabet could
be severely hurt by another slowdown in ad spending; however, 2Q21's performance demonstrates that online advertising is ramping higher.
Like Microsoft and Intel before it, Alphabet has run into serious antitrust issues. The European Commission has issued adverse rulings and levied record-breaking fines with perhaps more to come. The U.S Department of Justice and many U.S. states have filed complaints against Alphabet's Google division. Most recently, the U.S. Congress has begun introducing legislation aimed at severely curtailing Google's business if not breaking Alphabet up completely. While these issues may take years to play out, Alphabet could one day be
Section 2.41
GROWTH / VALUE STOCKSsubject to onerous regulation and perhaps even to a forced breakup, as well as to additional fines. Even its current efforts to abide by recent EC rulings could provide openings for competitors to take market share.
Alphabet's internet advertising-based businesses are highly competitive and subject to rapid and disruptive technological change. Alphabet must keep up with, if not lead, such changes to remain relevant. Management recognizes that cultural norms around user privacy are evolving. Such norms could develop in a direction that limits Google's use of user data to make the advertising it sells more targeted, more relevant to the user, and thus more valuable to advertisers. The rapid adoption of mobile connectivity is a strong secular trend and Google competitor Facebook has developed a mobile advertising platform to challenge Google's hegemony in digital advertising. Another deep-pocketed tech competitor, Amazon, has also decided to move into the advertising business, which threatens Alphabet/Google's industry position. Mobile search, particularly important to Alphabet/Google, remains a vibrant business. While mobile search queries are accelerating, mobile advertising typically carries a lower rate. Alphabet must find ways to profitably capitalize on emerging platforms in order to sustain its growth.
The Snowden revelations of National Security Administration spying on personal e-mails and communications collected from internet service providers, including Alphabet, was just the beginning of concerns about tech firms' use of personal data. The Cambridge Analytica and Russian troll scandals surrounding Facebook and Google's own data security issues could lead to greater regulation of all internet-related tech firms, as many nations are considering legislation that would restrict the use of personal data and ensure that this data remains stored within national boundaries. In particular, China passed a law in July 2017 mandating that all data from Chinese users be kept within its national boundaries. As illogical as this idea sounds given the global nature of the worldwide web, the threat of such laws to Alphabet's business is real. For example, Alphabet's capex and opex costs would increase substantially if it were required to maintain a data center in each country in which it operates rather than using its current regional data center model. We also note that Europe's General Data Protection Regulation (GDPR), which took effect on May 25, 2018, raises additional legal and compliance risks.
Alphabet's growth could slow if it is unable to acquire the technologies, talent, and customers that management believes are necessary to sustain long-term performance. Other risks relate to the integration of acquisitions and the retention of key personnel in the highly competitive internet technology sector. The company lost Regina Dugan, the head of Google's Advanced Technologies and Products Group, to Facebook, in April 2016 - another in a long line of senior executives who have moved on to other companies. These include Chief
Business Officer Nikesh Aurora, who resigned in July 2014 to become COO of Japanese telecom SoftBank; Sheryl Sandberg, now the COO of Facebook; and Marissa Mayer, who became CEO of Yahoo. We think the reorganization into Alphabet was, in part, designed to stem the brain drain to other companies by giving business unit leaders more responsibility and freedom.
If Alphabet's financial results fall short of expectations in any given period, shareholders could quickly lose a significant portion of their investment. Indeed, momentum investors typically abandon a stock that is in decline, exacerbating the pullback. Investors should recognize that Alphabet's operating expenditures are driven by management's desire to capitalize on long-term growth opportunities - not by Wall Street's financial models or focus on quarterly results. Moreover, analysts have sometimes overestimated Alphabet's bottom line. Another risk for Alphabet is the growing complexity of managing global operations, with foreign exchange risk and hedging becoming a greater factor in the company's results.
Management does not provide forecasts and instead discusses the business only in general terms. This leads to large variances - positive or negative - between consensus estimates and actual results. In addition, while the first and fourth quarters are seasonally strong, the second and third quarters are seasonally slower - and the investment community may underestimate or overestimate these seasonal effects. Large negative variances to consensus may hurt GOOGL shares.
Finally, management may not be able to efficiently guide the company's rapid growth. Competitive pressures are also likely to increase as Alphabet's rivals - Apple, Facebook, Amazon, Yahoo, and Microsoft - continue their attempts to capture market share in the online advertising space, enterprise cloud computing, streaming internet video, and other competitive markets.
COMPANY DESCRIPTIONAlphabet, formerly called Google, maintains the largest
online index of websites accessible through automated search technology and generates revenue through online advertising, cloud services, and hardware. Google is now an operating segment of Alphabet. The company was founded in 1998 by Sergey Brin and Larry Page and went public in 2004.
Google's AdWords is an auction-based program that lets businesses display ads along with particular search results. Google's AdSense program enables websites in the company's network to serve targeted ads, based on search terms or web content, from AdWords advertisers. Most of the revenue generated through AdSense is shared with network partners. Alphabet also owns YouTube.com, the web-based video site, and has expanded into mobile telephony with its Android smartphone operating system. About 54% of Alphabet's
Section 2.42
GROWTH / VALUE STOCKSrevenue is generated outside the United States.
On April 3, 2014, Alphabet's new nonvoting class C shares began trading under the ticker 'GOOG.' Alphabet's publicly held class A shares switched to the ticker 'GOOGL.' The effect of the new class C share issuance was a noneconomic 2-for-1 stock split.
VALUATIONAlphabet shares are up 50% year-to-date, better than the
17% capital gain for the S&P 500, the 46% return for the S&P Interactive Media Industry Index, and the 12% gain for the NYSE Fang+ Index. We believe that the shares remain attractively valued given the company's rapidly expanding businesses. Alphabet's trailing EV/EBITDA multiple of 22.5 is just below the peer median of 22.8. The forward EV/EBITDA multiple of 16.3 is 4% below the peer average, compared to an average discount of 12% over the past two years. We are maintaining our BUY rating on GOOGL and raising our target price to $3,100.
On July 28, BUY-rated GOOGL closed at $2721.88, up $83.88. (Joseph Bonner, CFA, 7/28/21)
Altria Group Inc. (MO)Publication Date: 8/3/21Current Rating: HOLD
HIGHLIGHTS*MO: Maintaining HOLD amid regulatory challenges*Altria has seen a sharp decline in the value of its
investment in e-cigarette maker JUUL, and is facing increased legislative and regulatory risks.
*In particular, the FDA recently said that it planned to ban menthol cigarettes, and was considering rules that would reduce cigarette nicotine to nonaddictive levels. The Biden administration may also raise excise taxes on cigarettes.
*Altria is also facing charges of patent infringement. The International Trade Commission recently ruled that its heated tobacco products infringed on two patents held by British American Tobacco and recommended a ban on the sale of these devices in the United States.
*We are maintaining our 2021 adjusted EPS estimate of $4.55, just below the low end of management's guidance range. Our estimate implies growth of 4% this year. We are also maintaining our 2022 adjusted EPS estimate of $4.74.
ANALYSIS
INVESTMENT THESISWe are maintaining our HOLD rating on Altria Group Inc.
(NYSE: MO). The company manufactures and sells cigarettes, smokeless tobacco products, and alcoholic beverages in the United States and abroad. Altria has been growing through investments in companies with products that diversify its portfolio, including the purchase of a 45% stake in Cronos Group, a Canadian cannabinoid producer, and a 35% stake in popular e-cigarette maker JUUL Labs. The company also pays
a solid dividend with a yield of about 7%. However, Altria has seen a sharp decline in the value of its JUUL investment, and is facing increased legislative and regulatory risks. In particular, the FDA recently said that it planned to ban menthol cigarettes, and was considering rules that would reduce cigarette nicotine to nonaddictive levels. In addition, the Biden administration may raise excise taxes on cigarettes. Altria is also facing charges of patent infringement. The International Trade Commission recently ruled that its heated tobacco products infringed on two patents held by British American Tobacco and recommended a ban on the sale of these devices in the United States. Such a ban, if imposed, would hurt Altria's ability to compete in the heated tobacco market. Based on these challenges, we believe that a HOLD rating remains appropriate.
RECENT DEVELOPMENTSMO shares have advanced 3% over the past three months,
in line with the Consumer Goods industry ETF IYK but below the 5% gain for the S&P 500. Over the past year, the shares have underperformed, rising 15%, while the S&P 500 has gained 36% and the industry ETF has risen 33%. Over the past five years, the shares have fallen 29%, compared to gains of 103% for the index and 59% for the industry.
Altria recently reported 2Q21 results that topped expectations. Revenue rose 9% to $6.9 billion and topped the consensus of $5.4 billion. Net of excise taxes, revenues were $5.6 billion, up 11%. Adjusted diluted EPS rose to $1.23 from $1.09 a year earlier and beat the consensus forecast of $1.18. The gross margin rose 90 basis points to 54%. Operating income of $3.3 billion rose 14.1% and the operating margin rose 210 basis points to 47%. Net earnings were $2.15 billion, up from $1.94 billion in 2Q20.
In May 2021, an International Trade Commission judge found that the IQOS systems sold by Altria infringed on two patents held by British American Tobacco. The judge recommended a ban on the sale of the Marlboro Heatsticks IQOS device, and the component parts of this device, in the U.S. The order is subject to review in federal court. Due to uncertainty surrounding this ruling, PM USA has delayed the planned expansion of IQOS and Marlboro HeatSticks into new markets in the United States.
In recent months, the U.S. government has announced several proposals that would hurt the cigarette industry, including a ban on the use of menthol in cigarettes and a reduction in cigarette nicotine to nonaddictive levels. Separately, the Biden administration is considering higher excise taxes. If implemented, these proposals would hurt the earnings of cigarette companies, particularly Altria, which sells its products primarily in the U.S.
During the first quarter of 2021, Altria recorded an unrealized pretax loss of $200 million to reflect a decrease in
Section 2.43
GROWTH / VALUE STOCKSthe fair value of its investment in JUUL. JUUL's revenue outlook has weakened due to heightened competition in the U.S. vapor category, and its market share has fallen to 33%. In 2020, Altria took $2.6 billion in impairment charges related to its JUUL investment. In addition, the FTC has charged Altria with violating federal antitrust laws through its purchase of a 35% stake in JUUL.
In 2020, the company took charges of $763 million for its investment in Anheuser-Busch (ABI) due to the negative impact of the pandemic. Altria believes that this fair value decline is temporary. It also took an impairment charge for its investment in Cronos. The fair value of these investments remains below their carrying value.
In August 2019, Altria acquired 80% of certain Burger Sohne Holding AG companies that commercialize oral nicotine pouches. It acquired the remainder of this business for $250 million in 1Q21, and plans to expand sales of the pouches in the U.S.
In July 2021, Altria agreed to sell its St. Michelle Wine Estates business in a $1.2 billion all cash transaction, which is expected to close in the second half of the year. Altria expects to use the proceeds for share repurchases.
Along with the 2Q results, management narrowed its 2021 adjusted diluted EPS guidance to $4.56-$4.62 from $4.49-$4.62, implying 4.5%-6% growth this year. Management said that the guidance included planned investments in smoke-free products and related research.
EARNINGS & GROWTH ANALYSISAltria has three segments, Smokeable Products (87% of
2Q21 revenue), Oral Tobacco (10%), and Wine (3%). Second-quarter business trends for these segments are discussed below:
The Smokeable products segment posted 2Q revenue net of excise taxes of $4.8 billion, up 10% from the prior year. The results reflected higher pricing and higher shipment volume, partially offset by higher promotional activity. Adjusted operating income was $2.8 billion, up 11% from the prior year, and the adjusted operating margin was 58.4%, up 60 basis points. When adjusted for trade inventory movements, second-quarter volume fell 4.5%. The company's total retail market share of 49% was unchanged from the prior year; Marlboro's retail market share of 43.2% was up slightly from 42.7%.
In the Oral Tobacco category, revenue net of excise taxes rose 5.1% to $658 million. The results reflected higher pricing, partly offset by increased promotional activity related to On! oral nicotine pouches. Adjusted operating income was $472 million, up 3.5%, and the adjusted operating margin was 71.7%, down 110 basis points. The company's retail market
share in this segment was 47.8%, down 220 basis points from the prior year.
In the Wine segment, revenue net of excise taxes rose 28.6% to $162 million, helped by higher shipment volume. Adjusted operating income was $27 million, up 80% from the prior year, and the adjusted operating margin was 16.7%, up 480 basis points.
Turning to expenses, the 2Q operating margin rose 210 basis points to 47%. Marketing, administrative, and research costs were $469 million, up 10% from the prior year; these costs were 7% of sales. In an effort to boost profitability, Altria management has implemented programs to lower costs, including facility consolidation.
We are maintaining our 2021 adjusted EPS estimate of $4.55, just below the low end of management's guidance range. Our estimate implies growth of 4% this year. We are also maintaining our 2022 adjusted EPS estimate of $4.74.
FINANCIAL STRENGTH & DIVIDENDOur financial strength rating on Altria is Medium, the
middle rank on our five-point scale. The company receives average scores on our four main financial strength criteria of debt levels, fixed-cost coverage, profitability, and cash flow generation. Altria's long-term debt is rated A3/stable by Moody's. Standard & Poor's rating is BBB/stable and Fitch's rating is BBB/stable.
The company had $1.9 billion in cash and equivalents at the end of the second quarter, down from $4.9 billion at the end of 4Q20. During the quarter, Altria repaid $1.5 billion of its senior notes. Total long-term debt at the end of the quarter was $28.2 billion, representing 90% of total capitalization, down from 95% a year earlier.
Altria pays a dividend. In July 2020, it raised its quarterly payout by 2% to $0.86 per share. The annualized dividend of $3.44 yields about 7%. The company expects a payout ratio of approximately 80% of adjusted EPS in 2020-2022. Our dividend estimates are $3.60 for 2021 and $3.88 for 2022.
Altria buys back stock. In 2Q21, it repurchased 6.6 million shares for $325 million. At the end of the quarter, Altria had $1.35 billion remaining on its $2 billion share repurchase program, which it expects to complete by June 30, 2022.
MANAGEMENT & RISKSCEO Billy Gifford joined Altria in 1994. He previously
served as the company's CFO and vice chairman, and in other leadership positions. Prior to joining Altria, Mr. Gifford worked at the public accounting firm Coopers & Lybrand. VP and CFO Sal Mancuso joined Altria in 1990 and previously held a number of senior roles in finance and accounting.
Section 2.44
GROWTH / VALUE STOCKS
Investors in MO face numerous risks, including the impact of increased excise taxes and weak consumer spending due to the pandemic. The U.S. cigarette industry has seen sales decline by about 2% annually over the past several years due to health concerns, higher taxes, and weaker consumer spending. As a result, Altria has focused on growing its smokeless tobacco, e-cigarette, and beverage offerings; however, the company is likely to face additional restrictions on e-cigarettes in the wake of deaths associated with these products. FDA regulatory authority over tobacco products could also have a significant impact on the company and the industry.
Tobacco companies continue to face substantial legal risks and potential monetary liabilities in the U.S., though they have recently been successful in appealing and reducing damages awarded by the courts. In addition, given the lengthy nature of the appeals process, any damages awarded are likely to be paid many years after the original verdict. Ultimately, we do not believe that the states or the federal government want to drive the tobacco companies out of business and lose this rich source of tax revenue. That said, we expect Altria to face continued legal and regulatory pressure, both in the traditional cigarette and e-cigarette markets.
Altria has been investing in alternative products, notably through a licensing and distribution agreement with Phillip Morris for its IQOS heated tobacco product, and its equity stakes in Cronos Group and JUUL. Although cannabis is illegal at the federal level in the U.S., Altria management believes that the acquisitions will position the company well if cannabis is eventually legalized. On April 1, 2020, the U.S. Federal Trade Commission filed an administrative complaint against Altria and JUUL to challenge Altria's minority investment in JUUL. Altria intends to defend the transaction. In July 2020, the U.S. FDA authorized IQOS and HeatSticks to be marketed as Modified Risk Tobacco Products with a 'reduced exposure' claim rather than a 'risk modification' claim.
The company recently revised the terms governing its 35% stake in JUUL. The agreement stipulates the services that Altria will provide to JUUL, and conditions for the inclusion of additional JUUL board seats to be held by Altria representatives. Altria will also be released from its noncompete agreement if JUUL is prohibited from selling in the U.S. for more than a year or if the carrying value of the JUUL investment falls to less than 10% of the initial carrying value of $12.8 billion - or $1.28 billion. The current carrying value of the investment after impairments is $1.5 billion.
COMPANY DESCRIPTIONAltria Group, founded in 1919, manufactures and sells
cigarettes, smokeless tobacco products, and alcoholic beverages in the United States and abroad. Its cigarette brands include Marlboro, Virginia Slims, Parliament, Benson &
Hedges, Basic, Merit, Chesterfield and L&M. The company acquired the U.S. Smokeless Tobacco Company in 2009, adding the Copenhagen, Skoal, Red Seal, and Husky brands to its portfolio. The company also spun off its international operations as Philip Morris International in 2008. Altria retains the Philip Morris USA segment, which focuses on the U.S. market and includes various cigar, pipe tobacco, e-cigarette, wine, and beer brands. The company also manages a portfolio of leveraged leases in land transportation, aircraft, electric power, real estate, and manufacturing. Altria has 7,300 employees.
INDUSTRYOur rating on the Consumer Staples sector is
Market-Weight, raised from Under-Weight. With consumers now venturing out of their homes, we see markets reopening for processed food and beverage companies in ballparks, restaurants, taverns, swim clubs, and other gathering spots.
The sector now accounts for 5.8% of the S&P 500, toward the low end of the five-year range. We think investors should consider allocating about 6% of their diversified portfolios to this group. The sector includes industries such as food, beverages, household products and grocery stores. The sector is underperforming thus far in 2021, with a gain of 3.7%. It also underperformed in 2020, with a gain of 7.6%, and in 2019, with a gain of 24.0%.
According to our models, the projected P/E ratio on 2022 earnings is 19, below the market multiple. Sector earnings are expected to rise 4.1% in 2021 and 10.5% in 2022. Earnings rose 5.2% in 2020 and 3.9% in 2019. The sector's debt ratios are reasonable, with an average debt-to-cap ratio of 45%. Yields of 1.3% on average are in line with the S&P 500.
VALUATIONWe believe that MO shares are fairly valued at current
prices near $48, above the midpoint of their 52-week range of $35-$53. On a technical basis, the shares are in a bearish pattern of lower highs and lower lows that dates to June 2017. On a fundamental basis, MO is trading at 11-times our 2021 EPS estimate, near the low end of the five-year annual average range of 9-23. The dividend yields about 7%. The company has strong brands and prospects for growth in cannabis and smokeless products, and should also benefit from its investment in Anheuser-Busch. However, we are concerned about potential new cigarette regulations, patent infringement litigation, and prospects for higher excise taxes on products that comprise most of Altria's revenue. Based on these challenges, we are maintaining our rating of HOLD.
On August 3 at midday, HOLD-rated MO traded at $47.85, up $0.12. (Kristina Ruggeri, 8/3/21)
Amazon.com Inc. (AMZN)Publication Date: 8/2/21Current Rating: BUY
Section 2.45
GROWTH / VALUE STOCKS
HIGHLIGHTS*AMZN: Cautions slams stock; reiterating BUY*After multiple quarters of blow-out growth, Amazon
could see its online retail business moderate as consumers venture out and resume in-person retail shopping.
*We believe there is no turning back for Prime members, who may be in for a shock when they face the limited inventory and uneven sizes in physical retail stores.
*Beyond retail, in 2Q21 Amazon welcomed new CEO Andy Jassy, conducted its annual Prime Day, announced a deal to acquire MGM content assets, and learned that it was still in the bidding for a massive Department of Defense Cloud contract.
*We believe that AMZN warrants long-term accumulation in most equity accounts.
ANALYSIS
INVESTMENT THESISBUY-rated Amazon.com (NGS: AMZN) fell by 7%, or
around $250, in a down market on 7/30/21 following above-consensus profits but below-consensus revenue for 2Q21. Amazon delivered a third consecutive $100 billion-plus revenue quarter, but sales were several billion dollars below consensus. Amazon continued to generate strong operating income, leading to record EPS for the quarter. But its third-quarter revenue guidance was also below consensus.
After multiple quarters of blow-out growth, Amazon could see its online retail business moderate as consumers venture out and resume in-person retail shopping. We believe the Prime habit is tough to shake; but the company could see a slowing from peak demand for home essentials, including everything from cleaning supplies to canned soup. Prime Day may also have lagged internal expectations.
New CEO Andy Jassy is immediately being put to the test by the sales shortfall. Founder Jeff Bezos has transitioned to the role of executive chairman. CEO Jassy is one of the founding architects of Amazon Web Services, and, as such, has deep experience with what is by far Amazon's most profitable business. A potential downside could emerge if Congressional action forces Amazon to divest its AWS business, but that is at best a distant threat.
Amazon has plenty on its plate. In May, Amazon agreed to acquire MGM for $8.45 billion. The deal will provide Amazon Video with MGM's extensive library of films and TV shows, along with its theatrical film and TV production businesses. We see the deal as a sensible means of acquiring valuable content, though it is not without risks. AWS also looks set to benefit from the U.S. defense department's cancellation of the $10 billion JEDI cloud contract that had been awarded to Microsoft Azure. We expect multiple CSPs, including AWS, to be included in the new cloud computing project, which is now known as Joint Warfighter Cloud
Capability.
In contrast with most recent years, AMZN is a market and peer laggard year-to-date, with the post-2Q21 selloff wiping out most 2021 gains. We believe that this lagging performance provides an opportunity to establish or dollar-average positions in AMZN stock. In our view, AMZN warrants long-term accumulation in most equity accounts given the company's indisputable franchise leadership in online retail, ability to leverage its vendor relationships in the retail space, thriving connected-home platform, and market dominance in cloud IaaS. We are reiterating our BUY rating with a 12-month target price of $4,000.
RECENT DEVELOPMENTSAMZN is up 3% year-to-date in 2021, while immediate
peers are up 20% and the S&P 500 is up 16%. AMZN rose 76% in 2020, while the peer group of Argus-covered internet, social media & cloud company stocks advanced 89%. AMZN rose 23% in 2019, while the peer group advanced 51%. AMZN rose 28% in 2018, while peers dipped by 3%. AMZN shares rose 60% in 2017, compared to a 39% gain for peers and a 19% gain for the S&P 500.
For 2Q21, Amazon posted revenue of $113.1 billion, which was up 27% year-over-year and 4% sequentially. Revenue was in the middle of management's $110-$116 billion guidance range but below the $115 billion consensus call. GAAP earnings of $15.12 per diluted share were up 47% from 2Q20, and above the consensus forecast of $12.30.
Amazon had a typically busy quarter even if sales failed to meet consensus expectations. The company welcomed new CEO Andy Jassy, conducted its annual Prime Day, announced a deal to acquire MGM content assets, and learned that it was still in the bidding for a massive Department of Defense Cloud contract.
Amazon is first and foremost a retailer, and its revenue results and guidance suggest that the online retail tailwinds from the pandemic may be lessening. Of course, 25%-plus growth would be solid for any company, and is even more so for a company generating $100 billion in revenue. But Amazon has been priced for its extraordinary run in the pandemic era, and any slowing in that pace catches investors' attention.
CFO Brian Olsavsky could point to multiple positives in the quarter, including the biggest Prime Day ever for the small and mid-sized businesses that comprise Amazon's third-party merchants. The CFO noted that third-party revenue continues to grow significantly faster than Amazon online store revenues.
According to the CFO, the shift of Prime Day into 2Q21 added 400 bps to sales growth. As the quarter progressed,
Section 2.46
GROWTH / VALUE STOCKSpeople were at home less in prime geographies including North America and much of Europe. While Prime members continue to spend more with Amazon, growth in this spending moderated compared to the pace of growth during the peak of the pandemic.
Sales growth in the main pandemic quarters was in the 35%-40% range, after Amazon added hundreds of thousands of employees and more warehouse capacity. Amazon may see a return to growth rates in the pre-pandemic period, which were in the 20%-25% range. In fact, against the tough upcoming comparisons, Amazon could shift down to mid- to upper-teens growth, which is what the company is forecasting for 3Q21.
For 2Q21, total retail sales of $98.3 billion increased 26% annually and 3% sequentially. Total retail operating profit of $3.51 billion rose 41% from a year earlier, while declining from peak levels of $4.7 billion in 1Q21. The total retail operating margin rose to 3.6% from 3.2% a year earlier.
North American retail revenue of $67.6 billion (60% of total revenue) was up 22% year-over-year and 5% sequentially. North American (NA) retail generated an operating profit of $3.15 billion. The NA retail operating margin of 4.7% expanded from 3.9% a year earlier.
International retail revenue of $30.7 billion (27% of total) increased 36% annually and was flat sequentially. The International segment margin tightened sequentially to 1.2% from 4.1% in 1Q21 and was down from a 1.5% in 2Q20 a year earlier. International retail has now been profitable from 2Q20 through 2Q21; prior to this, international had not been profitable since 2016.
AWS revenue of $14.8 billion (13% of total) increased 37% year-over-year and 10% sequentially. Record AWS operating profit of $4.19 billion increased 25% year-over-year and generated a 28.2% operating margin, down from 31.1% a year earlier.
AWS remains the key operating profit driver at Amazon, accounting for more than half of operating profit. The long-standing concern that growing cloud competition would drive down AWS margins has been superseded by the reality that the pandemic has made the cloud data center more important than ever.
Online sales, representing wholly owned products retailed by Amazon, were $53.1 billion in 2Q21, representing 47% of revenue; this category grew 16% year-over-year. Within retail, the best growth continues to come from third-party merchants, which represented $25.1 billion of revenue (22% of total), while growing 38% year-over-year.
Sales at physical stores (4% of total) were up 11%
year-over-year in 2Q21, as Whole Foods stores and Amazon retail stores generated more foot traffic. This formerly slow-growing category could see an upward shift as consumers become accustomed to their kitchens once again, while also purchasing ready-to-eat meals for home consumption.
Amazon is first and foremost a retailer, and all goods retail grew 21% in 2Q21. In most quarters, however, nonretail businesses grow faster than merchandising operations. In 2Q21, non-goods services - including subscription services, AWS, advertising & other - generated revenue of $30.6 billion and grew 46% year-over-year. Subscription services (7% of total) grew 32%.
Amazon shares rallied around the time of the CEO transition, but that may not have been the key driver. On 7/6/21, the Pentagon announced that it was canceling its planned $10 billion Joint Enterprise Defense Initiative (JEDI) cloud computing program, which the Trump administration granted as a nearly sole-source contract to Microsoft.
JEDI has been mired in controversy and lawsuits since the contract award. Contracts of this size are almost always multivendor in nature, and AWS - already an established government cloud vendor - had been expected to play a major role in JEDI. Amazon filed suit to stop the original JEDI contract, alleging that President Trump interfered with the award process based on his personal animosity toward Mr. Bezos, the owner of the Washington Post. The Pentagon's official reason for canceling the deal is to avoid multiple years of litigation that would delay needed upgrades in cloud capability and defense security.
Unlike JEDI, the Joint Warfighter Cloud Capability program lacks a Star Wars-inspired acronym. The dollar value and contract length of the JWCC program, along with its participants, have yet to be determined. AWS is likely to be well positioned within the successor program given its leading role in cloud services.
In May 2021, Amazon agreed to acquire MGM for $8.45 billion. The deal will provide Amazon Video with MGM's extensive library of films and TV shows, along with its theatrical film and TV production businesses. MGM's massive film and rights library includes the Rocky and James Bond theatrical film franchises along with current popular TV shows like the Handmaid's Tale and Fargo.
Prime Video competes in the video content streaming market, once the purview of Netflix but now a crowded and brutally competitive place. With this acquisition, Amazon appears to be taking its cue not so much from Netflix, which is mainly focused on original content, but from Disney, whose acquired properties provide some of the most popular content on Disney+. Prime has 200 million members, which is a huge advantage in online retailing - but also a lot of hungry mouths
Section 2.47
GROWTH / VALUE STOCKSto feed when it comes to video content.
We see the deal as a sensible means of acquiring valuable content, though it is not without risks. Netflix's original content is hugely popular, and Disney has a captive audience (children) for its legacy fare. Prime Video could discover that there is a limited appetite for material deemed to be dated.
We expect Prime-MGM to not only re-release content straight from the vault, but also to develop new chapters in acquired franchises. Apparently, one sticking point on the deal was future James Bond properties. We see Bond as ripe for at least a stepped-up pace of theatrical releases.
MGM is not the only content deal that Amazon has struck in calendar 2021. Prime Video will begin to draw more viewers this fall with its exclusive streaming rights to the NFL's Thursday Night Football. Given Prime's 200 million-plus members, the deal could provide a major boost both for the NFL and for Prime.
Amazon guided revenue growth for 3Q21 in line with its new targets. The company may be acting overly cautious. We believe there is no turning back for Prime members, who may be in for a kind of shock when they face the limited inventory and uneven sizes in physical retail stores.
In our view, AMZN warrants long-term accumulation in most equity accounts given the company's indisputable franchise leadership in online retail, ability to leverage its vendor relationships in the retail space, thriving connected-home platform, and market dominance in cloud IaaS.
EARNINGS & GROWTH ANALYSISFor 2Q21, Amazon posted revenue of $113.1 billion,
which was up 27% year-over-year and 4% sequentially. Revenue was in the middle of management's $110-$116 billion guidance range but below the $115 billion consensus call.
The GAAP gross margin broadened to 43.2% in 2Q21 from 42.5% in 1Q21 and also rose from 40.8% a year earlier. The GAAP operating margin was 6.8% in 2Q21 vs. 8.2% in 1Q21 and 6.6% a year earlier.
GAAP earnings of $15.12 per diluted share were up 47% from 2Q20, and above the consensus forecast of $12.30.
For all of 2020, revenue of $386.1 billion rose 38% from $280.5 billion in 2019. GAAP EPS totaled $41.75 per diluted share and increased 81% from $23.02 in 2019.
Amazon projected 3Q21 sales of $106-$112 billion; the $109 billion midpoint implies 13% annual growth and was about $5 billion below the 3Q21 consensus forecast. It also forecast operating income of $2.5-$6.0 billion. The $4.25
billion midpoint compares with $6.2 billion a year earlier. Amazon has repeatedly beaten its own profit guidance, while demonstrating indifference to pleasing Wall Street or providing accurate guidance.
We are nudging up our GAAP diluted EPS projection for 2021 to $63.50 from $60.99; our new estimate implies 52% growth from 2020. We are trimming our 2022 EPS forecast to $70.08 from $71.61; our new estimate implies 10% growth. We consider our estimates to be fluid. Our five-year earnings growth rate projection remains 14%.
FINANCIAL STRENGTH & DIVIDENDOur financial strength rating on Amazon is Medium-High,
the second-highest rating on our five-point scale.
Cash & marketable securities were $89.9 billion at the end of 2Q21. Cash & marketable securities were $84.4 billion at year-end 2020, $55.0 billion at the end of 2019, $41.3 billion at the end of 2018, $31.0 billion at the end of 2017, and $25.98 billion at the end of 2016.
Total debt was $50.3 billion at the end of 2Q21. Total debt was $31.8 billion at year-end 2020, $23.4 billion at the end of 2019, $23.5 billion at the end of 2018, and $24.7 billion at the end of 2017, up from $7.68 billion at the end of 2Q17 to pay for the acquisition of Whole Foods. Total debt was $7.69 billion at the end of 2016.
Net cash was $52.6 billion at year-end 2020. Net cash was $31.6 billion at the end of 2019, $17.6 billion at year-end 2018, and $6.3 billion at year-end 2017.
Amazon generates significant cash in a fast-accelerating trend. Cash flow from operations was $66.1 billion in 2020. Cash flow from operations was $38.5 billion in 2019, $30.7 billion in 2018, $18.4 billion in 2017, $17.27 billion in 2016, and $11.92 billion in 2015.
Amazon's free cash flow was $35.0 billion in 2020. Free cash flow reached $21.7 billion in 2019, up from $17.6 billion in 2018, $6.4 billion in 2017, and $12.7 billion in 2016. Amazon has set a long-term goal of optimizing free cash flow.
The credit agencies rate Amazon's debt as investment grade. There is a substantial difference in agency ratings between the Baa1 at Moody's and the very strong AA- at S&P. Both agencies have stable outlooks.
Amazon does not pay and is unlikely to implement a dividend. The company repurchases shares mainly to contain dilution.
MANAGEMENT & RISKSIn July 2021, Founder Jeff Bezos transitioned to executive
chairman and former AWS leader Andy Jassy became the
Section 2.48
GROWTH / VALUE STOCKScompany's new CEO. Brian Olsavsky is the CFO, and Jeffrey Wilke is the chief executive officer of the Worldwide Consumer business. In March 2021, Adam Selipsky was named the new CEO of Amazon Web Services.
Prior to leading AWS, Mr. Jassy was instrumental in developing the business. He played a key role in the development of cloud computing, infrastructure-as-a-service, and other elements of the cloud that we now take for granted. We believe he is the logical successor to Mr. Bezos.
Amazon, as a provider of online goods and services, may be better positioned than brick & mortar rivals during the crisis, but is not immune to challenges including lower consumer spending in a potential recessionary environment. We believe that Amazon has the strength to sustain growth during this difficult time, and its plans to add employees signal management's confidence in its long-term operating model and strategy.
The addition of Whole Foods positions Amazon in a low-margin business. Amazon has extensive experience in operating efficiently in the low-margin online retail industry. We expect the company to pursue margin expansion at WFM not from conservative pricing (AMZN is already aggressively pricing WFM goods) but through increased efficiency and leverage from customer growth.
We give management high marks for continually making Amazon's 'store' cheaper, easier and more secure for shoppers. We think the security and convenience of Amazon's site has given many former critics of e-commerce the confidence to shop online. In addition, innovations like Amazon Prime, Amazon Web Services, and Kindle have made Amazon an internet powerhouse.
Amazon is likely to face fierce competition over the next several years as more companies expand online sales and match Amazon's prices offline. Amazon has been able to stay in front of physical and online retail rivals with innovations such as Prime, along with expanded third-party sales.
The company could be hurt in the event of a significant security breach, theft of client information, or outages at its Amazon Web Services unit. This is a risk for all e-commerce businesses, but may be heightened in the case of a well-known consumer company like Amazon.
COMPANY DESCRIPTIONAmazon.com is the leading U.S. e-commerce retailer and
among the top e-commerce sites globally. Amazon.com also provides Amazon Web Services (AWS), which is the global leader in cloud-based Infrastructure-as-a-Service (IaaS) platforms. The company's Prime membership platform is a key online retail differentiator, providing customers with free shipping (after an annual fee) along with exclusive media
content (music, video, audible books, etc.). The company's Kindle reader and Alexa-based Echo and Dot digital voice assistants are category leaders. Amazon acquired Whole Foods Market in August 2017.
VALUATIONWhile the growth engine at Amazon is unmatched, the
stock has been difficult to time from a valuation perspective. The margin and profit outlook is now expanding so rapidly, however, that forward-looking (DFCF) valuations and even price-based comparable valuations are increasingly attractive.
On a historical comparables basis, AMZN trades at an average two-year forward P/E of 50.3-times GAAP EPS, or about half the trailing five-year multiple (2016-2020) of 102.4. The two-year forward relative P/E of 2.2, though more than double the market P/E, is less than half the historical relative P/E of 5.5. Our historical comparables valuation is in the $4,600 range, in a steady pattern.
AMZN trades at an enterprise value/EBITDA multiple of 21.7 for 2021-2022, at a 200-bps discount to its trailing five-year (2016-2020) multiple of 23.7. We believe that AMZN merits a significant premium to historical EV/EBITDA given the company's overall growth in high-end offerings such as Prime and Prime Video, superior growth in AWS, new Alexa-based products and partnerships, digital advertising and subscription services, and volume leverage. On peer analysis, AMZN appears fairly valued near current prices.
Using our two- and three-stage discounted free cash flow model, we calculate a value in the $4,600 range. Based on our historical comparables analysis, peer indicated value and discounted free cash flow valuation, our blended valuation model exceeds $4,800, in a stable to rising trend.
Appreciation to our 12-month target price of $4,000 implies a risk-adjusted return that is greater than our forecast for the broad market and thus consistent with a BUY rating.
Given the company's indisputable franchise leadership, ability to leverage its vendor relationships in the retail space, and market dominance and superior growth in infrastructure-as-a-service, we believe that AMZN warrants long-term accumulation in most equity accounts.
On July 30, BUY-rated AMZN closed at $3327.59, down $272.33. (Jim Kelleher, CFA, 7/30/21)
Ameriprise Financial Inc (AMP)Publication Date: 7/29/21Current Rating: BUY
HIGHLIGHTS*AMP: Maintaining BUY and target price of $280*AMP shares have risen 61% over the past year,
compared to a 38% increase for the broad market and a 66%
Section 2.49
GROWTH / VALUE STOCKSincrease for the IAI (Broker Dealer & Securities Exchange ETF).
*On July 26, AMP reported 2Q21 adjusted earnings of $5.27 per share, up from $3.78 a year earlier. Adjusted net revenue rose 22% to $3.4 billion and average adviser productivity rose 14% to $731,000.
*On April 13, AMP announced plans to acquire the EMEA asset management operations from Bank of Montreal for $845 million. The acquisition will add $124 billion in assets, bringing total AUM to $1.2 trillion.
*We believe that AMP shares are favorably valued at 12-times our revised 2021 EPS estimate, below the peer average of 14.
ANALYSIS
INVESTMENT THESISWe are reiterating our BUY rating on Ameriprise
Financial Inc. (NYSE: AMP) and our target price of $280. Ameriprise has generated solid revenue in recent quarters, driven by growth in assets under management in the Advice & Wealth Management segment. The company posted 2Q adjusted operating earnings (excluding unlocking) of $5.27 per share, helped by an increase in the number of advisers and higher fund assets, which offset the impact of lower interest rates. (AMP reports adjusted earnings excluding unlocking to highlight the underlying performance of the business. Unlocking refers to the recognition of deferred acquisition costs (DAC). Life insurers carry DAC on their books and amortize the expense over a set schedule.)
We expect long-term growth at Ameriprise to be driven by the addition of experienced financial advisers, an increase in fee-based accounts, higher revenues from asset manager Columbia Threadneedle, and the recent acquisition of Bank of Montreal's EMEA asset management unit.
RECENT DEVELOPMENTSAMP shares have risen 61% over the past year, compared
to a 38% increase for the broad market and a 66% increase for the IAI (Broker Dealer & Securities Exchange ETF). We note that the stock has a high beta of 1.68.
On July 26, AMP reported 2Q21 adjusted earnings of $5.27 per share, up from $3.78 a year earlier. Adjusted net revenue rose 22% to $3.4 billion and average adviser productivity rose 14% to $731,000. Total advisers rose to 10,047, with 42 experienced advisers joining the firm in 2Q.
On April, 13 AMP announced plans to acquire the EMEA asset management operations of the Bank of Montreal for $845 million. The acquisition will add $124 billion in assets, bringing total AUM to $1.2 trillion. The deal is expected to close in 4Q21. Ameriprise expects the acquisition to be accretive in 2023, with an internal rate of return of 20%.
EARNINGS & GROWTH ANALYSIS
Ameriprise organizes its business into four segments. We look at recent trends and forecasts for these segments below.
In Advice & Wealth Management, earnings rose 56% to $423 million (49% of operating earnings), driven by higher transactional activity, market appreciation, and disciplined expense management.
Asset Management earnings rose 79% to $253 million (29% of operating earnings) on net inflows of $6.7 billion.
The Retirement & Protection segment saw earnings fall 18% to $182 million (21% of operating earnings), reflecting higher distribution expenses associated with increased sales.
In the Corporate & Other segment, the 2Q operating loss was $77 million.
We expect growth at Ameriprise to be driven by increased revenue in the Advice & Wealth Management and Asset Management segments, but look for net interest income to face pressure from low interest rates. We also see the company's opening of its own retail bank, now with over $8 billion in assets, as a driver of future growth.
We are lowering our 2021 EPS estimate to $21.15 from $21.20 and maintaining our 2022 estimate of $21.93.
FINANCIAL STRENGTH & DIVIDENDOur financial strength rating on AMP is Medium, the
midpoint on our five-point scale. Moody's rates Ameriprise's debt at A3/stable, while S&P rates it as A/stable.
Total long-term debt was $2.8 billion at the end of 2Q21, unchanged from 2Q20. In April 2020, the company issued $500 million in long-term debt, taking advantage of historically low rates. Long-term debt was 33.3% of capital at the end of 2Q21.
Ameriprise recently raised its quarterly dividend by 9% to $1.13, or $4.52 annually, for a yield of about 1.8%. Our 2021 dividend estimate is $4.43 and our 2022 estimate is $4.79.
AMP repurchased $450 million of its stock in 2Q and has $1.5 billion remaining on its current repurchase authorization, which runs through September 2022.
MANAGEMENT & RISKSAMP is led by Chairman and CEO James Cracchiolo.
Walter Berman is the CFO.
The company faces a range of business and economic risks, including changes in interest rates and credit quality, regulatory complexity, and market volatility.
COMPANY DESCRIPTIONBased in Minneapolis, Ameriprise Financial, through its
Section 2.50
GROWTH / VALUE STOCKSsubsidiaries, provides financial products and services to individual and institutional clients in the U.S. and internationally. It has four business segments: Advice & Wealth Management, Asset Management, Annuities & Protection, and Corporate & Other.
VALUATIONAmeriprise shares are trading near the high end of its one
year range of $145-$265. We believe that AMP shares are favorably valued at 12-times our revised 2021 EPS estimate, below the peer average of 14. We expect future growth to be driven by the addition of experienced financial advisers, an increase in fee-based accounts, improving revenues from asset manager Columbia Threadneedle, and incremental revenue from the Bank of Montreal asset management purchase. Our target price is $280.
On July 28, BUY-rated AMP closed at $252.06, up $2.51. (Kevin Heal and Taylor Conrad, 7/28/21)
Annaly Capital Management Inc (NLY)Publication Date: 7/30/21Current Rating: BUY
HIGHLIGHTS*NLY: Reiterating BUY and price target of $10*Annaly Capital Management is a publicly traded REIT
that invests primarily in U.S. agency-backed residential mortgage securities.
*The company generates income from the interest earned on securities less hedging and borrowing costs, and from net realized gains and losses on its investment portfolio.
*NLY currently pays an annualized dividend of $0.88 per share, for a yield of about 10.4%.
*Our price target of $10, along with the dividend, implies a potential total return of 26% from current levels.
ANALYSIS
INVESTMENT THESISWe are reiterating our BUY rating on mortgage REIT
Annaly Capital Management Inc. (NYSE: NLY) with a target price of $10. NLY invests in U.S. agency mortgage securities on a leveraged basis, funding the assets through repurchase agreements (repos). As of June 30, NLY's investment portfolio was $92.9 billion, down from $100.4 billion at the end of 1Q21. The company generates income from the interest earned on securities less hedging and borrowing costs, and from net realized gains and losses on its investment portfolio. The company's leverage as of June 30, 2021 was 5.8-times, down from 6.1-times as of March 31, 2021.
We believe that Federal Reserve programs will ensure liquidity and reduce volatility in the MBS markets for the foreseeable future. Fed intervention in the repo markets and MBS purchases of at least $40 billion per month should allow market participants to continue to operate in markets that had seized up during the pandemic.
We are encouraged by the sale of the company's $2.3 billion commercial mortgage portfolio. The sale will allow NLY to deploy the capital into securities with less credit risk.
NLY pays an annualized dividend of $0.88 per share for a yield of about 10.4%. The high yield is generated via leverage in the repo and term funding markets. Our price target of $10, along with the dividend, implies a potential total return of 26% from current levels.
RECENT DEVELOPMENTSYear-to-date, NLY shares have underperformed the broad
market, rising 2% versus an 18% gain for the S&P 500. We note that the main driver of the stock is the dividend yield, currently at 10.4%. NLY has a beta of 1.3. The company accounts for about 16% of the Mortgage Real Estate ETF REM.
On July 28, the company reported core 2Q21 EPS of $0.30, above the consensus estimate of $0.27. Book value fell to $8.37 per share at the end of 2Q21 from $8.95 at the end of 1Q21. Economic return, which is the change in book value and dividends, resulted in a loss of 4%.
NLY reported a 2Q conditional prepayment rate (CPR) of 26.8%, lower than the overall market CPR of 29.3%, and projects an 11.8% long-term CPR for its existing portfolio. CPR is the percentage of a mortgage security or pool that is expected to be prepaid in a year, and the higher the CPR, the lower the return on the investment. Conversely, a lower CPR boosts returns and benefits earnings. We expect a lower-than-average CPR for the NLY portfolio due to the company's purchases of prepayment-protected securities.
In 2Q, the company priced three securitizations for a total of $1.1 billion, consisting of prime jumbo (large loans) and non-QM mortgages that were not agency-eligible.
On March 25, 2021, Annaly agreed to sell the Annaly Commercial Real Estate business to Slate Asset Management for $2.33 billion. The transaction will allow NLY to focus on the residential mortgage finance market. The assets are expected to be transferred by the end of 3Q21.
On July 1, 2020, the company completed the acquisition of its external manager Annaly Management Company. This finalized the transition from an externally managed REIT to an internally managed REIT, which should better align the interests of management and shareholders.
EARNINGS & GROWTH ANALYSISNLY invests mainly in agency mortgage-backed securities
collateralized by residential mortgages. Its $92.9 billion investment portfolio includes $84.5 billion in agency securities, composed of specified pools, TBAs, mortgage
Section 2.51
GROWTH / VALUE STOCKSservicing rights, and Agency CMBS. During the second quarter, NLY took advantage of tight mortgage spreads, selling lower-coupon securities and buying higher-coupon securities. Income is generated through the spread between the yield on its investments and the cost of borrowing and hedging activities.
Annaly continues to expand its platform for mortgage servicing rights (MSRs). MSRs are the rights to 'service' an existing mortgage, including collecting payments and taxes. The originator of the loan pays a fee to the holder of the MSR. MSRs become more valuable in a steady or rising rate environment and act as a hedge against a decline in the value of the securities portfolio.
The company also has two other smaller business segments. Annaly Residential Credit Group, with $4.2 billion in assets, invests in non-agency residential mortgage assets. It added $1.0 billion in assets during the second quarter as liquidity improved and asset securitizations increased. Annaly Middle Market Lending Group, with assets of $2.1 billion, finances private equity-backed middle-market businesses. The unit closed six deals in 2Q21 and six other deals were repaid. These two 'riskier' businesses are the primary reason that NLY has a higher yield than many peers.
NLY's investment portfolio declined 7.5% in 2Q21. The portfolio rotated out of lower-coupon securities into higher-coupon securities, and the company chose not to reinvest principal paydowns. The company funds its mortgage-backed securities via the repo market, allowing it to leverage its MBS portfolio in order to pay its dividend. (Its leverage ratio was slightly lower, at 5.8-times, in 2Q21). NLY sees growth in times of economic stability, when U.S. interest rates and MBS rate spreads are steady, as it takes advantage of the spread between the yield of the acquired securities and its hedging costs. We note that NLY and other REITs are required to pay out 90% of their income to shareholders.
Based on the company's recent results and investment trends, we are maintaining our 2021 EPS estimate of $1.22 and our 2022 EPS estimate of $1.25.
FINANCIAL STRENGTH & DIVIDENDOur financial strength rating on NLY is Medium. The
company scores well above average on our three main measures of financial strength: leverage based on debt/cap, profitability, and interest coverage.
The company pays a quarterly dividend of $0.22 per share, or $0.88 annually, for a yield of about 10.4%. Our dividend estimates are $0.88 for both 2021 and 2022.
Annaly has a stock buyback program. The current program runs through the end of 2021. The company did not repurchase any stock in 2Q21. NLY also raised $420 million
through its 'at-the-market' sales program.
MANAGEMENT & RISKSFounded in 1996 and based in New York, Annaly is
managed by Annaly Management Company LLC. David Finkelstein became the company's CEO and chief investment officer in March 2020. Prior to joining Annaly in 2013, Mr. Finkelstein served as an officer in the markets group of the Federal Reserve Bank of New York. Serena Wolfe is the CFO.
Investors in NLY shares face numerous risks. On a macro level, the company is dependent on a stable housing environment. Investments in agency MBSs are very interest rate-sensitive, especially in a declining rate environment. As mortgage prepayments increase, the value of the securities falls. Liquidity risks are also significant, as NLY must be able to fund its securities through repurchase agreements. Recent Federal Reserve actions in the repo market have diminished fears that the market could again seize up, though rising prepayments could negatively impact the portfolio. The company also faces regulatory risks at both the national and state level. Additionally, NLY is subject to risks related to the pandemic.
COMPANY DESCRIPTIONAnnaly Capital Management is a leading diversified
capital manager. It is a publicly traded REIT that invests in and finances residential and commercial assets. The company has three different types of businesses: Agency, Middle Market Lending, and Residential Credit. The company's primary investment portfolio consists of agency mortgage-backed securities (MBS), managed on a leveraged basis. The company uses an actively managed portfolio and hedging strategies with the goal of preserving net asset value in different interest rate scenarios.
VALUATIONWe think that NLY shares are attractively valued at recent
prices near $8.50, near the midpoint of their 52-week range of $6.98-$9.54. On the fundamentals, the stock is currently trading above its June 30 book value of $8.37 per share; however, we expect further growth in book value based on our expectations for increased hedging activities, lower CPR rates, and the expansion of the MSR platform. We expect NLY to trade at a higher yield than competitors due the credit risk in the company's two smaller segments.
Long-term bonds have recently rallied, causing the yield curve to flatten and in turn compressing margins for mortgage investors. We believe that NLY exercised good judgement in response to this margin compression by lowering the size of the investment portfolio and electing not to reinvest prepayments. Fed intervention in the repo markets and increased MBS purchases should also allow market participants to continue to operate in markets that had seized up at the beginning of the pandemic. In addition, we expect that any future Fed 'tapering' will be orderly and signaled well
Section 2.52
GROWTH / VALUE STOCKSin advance. Our price target of $10, combined with the dividend, implies a potential total return of 26% from current levels.
On July 29, BUY-rated NLY closed at $8.62, up $0.20. (Kevin Heal, 7/29/21)
Apple Inc (AAPL)Publication Date: 7/28/21Current Rating: BUY
HIGHLIGHTS*AAPL: Continued broad-based momentum; reiterating
BUY *Apple meaningfully topped fiscal 3Q21 consensus
expectations, including beating the revenue consensus by more than $8 billion.
*Apple posted June-quarter sales records in multiple product categories and regions, while posting all-time high revenue in services.
*We look for the coming second-generation 5G iPhone launch, tentatively called iPhone 13, to feature new M2 chips replacing 'Bionic' (A series) chips as iPhone's central processor.
*We regard year-to-date underperformance vs. peers as an opportunity to establish or dollar-average into positions in AAPL.
ANALYSIS
INVESTMENT THESISBUY-rated Apple Inc. (NGS: AAPL) dipped 2% on
7/28/21 despite posting fiscal 3Q21 (calendar 2Q21) revenue and EPS that far exceeded consensus expectations. The results reflected broad-based strength across multiple product and service categories, and ongoing strong demand for iPhone. Services revenue also sharply exceeded expectations.
In a quarter in which iPhone revenue has averaged a 20% sequential drop, iPhone in fiscal 3Q21 topped revenue expectations by about $4 billion while growing 50% annually. Following revenue of $90 billion and 62% annual growth in 2Q21, Apple's total 3Q21 revenue of $81.4 billion was up 37% annually and down a less-than-seasonally normal 9% on a sequential basis.
Apple as usual has had a highly productive FY21 to date. At its WWDC event in June, Apple presented upgraded operating systems for iPhone, iPad, Mac and Apple Watch while introducing new features for Air Pods, iCloud updates, and Apple Home. That follows an eventful calendar 2020, in which it launched 5G iPhones, new Macs with M1 chips, watches, iPods, service bundles, and other products.
Looking ahead to September, we look for the coming second-generation 5G iPhone launch, tentatively called iPhone 13, to feature new M2 chips replacing 'Bionic' (A series) chips as iPhone's central processor. More broadly, we expect Apple
to build on its franchise leadership in smartphones, compute products (Mac and iPad), and consumer goods (Air Pods, Watch, Home), while continuing to grow its services ecosystem of App Store, iCloud, Apple Pay, Apple TV+, and multiple other offerings.
After more than a decade of outperformance, AAPL has had a quiet and market-lagging start to the calendar year. In our view, the relative underperformance reflects sector rotation, not any misfires in Apple's leadership franchises. We therefore regard the underperformance as an opportunity to establish or dollar-average into positions in AAPL. We are reiterating our BUY rating and 12-month target price of $165.
.RECENT DEVELOPMENTS
AAPL is up 12% year-to-date in 2021, versus a 16% gain for peers. AAPL rose 81% in 2020, compared to a 9% advance for the peer group of computing, storage, and information-processing companies in Argus coverage. AAPL rose 86% in 2019, while the peer group was up 39%. AAPL declined 7% in 2018; the peer group was down 15%. AAPL rose 46% in 2017; the peer group was up 18%.
For fiscal 3Q21 (calendar 2Q21), Apple posted revenue of $81.4 billion, which was up 37% year-over-year. Revenue far exceeded the consensus forecast of $73.3 billion. GAAP earnings totaled $1.30 per diluted share, up 100% from $0.65 a year earlier. GAAP EPS was $0.34 above the consensus call of $1.01. Management provided no explicit top- or bottom-line guidance for fiscal 3Q21.
CEO Tim Cook noted that Apple revenue set a new record for June-ending quarters (fiscal 3Q), translating 'unmatched innovation' into powerful products for Apple users. With almost all retail stores now open worldwide, Apple's retail sales set a June record as well. The CEO cautioned that progress made does not guarantee anything, perhaps being mindful of resurgent infections in the U.S.
Apple believes the world is in the early innings of 5G. While iPhone remains the star of the show, iPad had its best June quarter in 'nearly a decade.' Mac also set a June-quarter record, as did Wearables Home & Accessories. Services set an all-time revenue record for any quarter, with Apple TV+ turning into what we regard as a surprise success in a crowded field. The service generated 35 Emmy nominations, 20 of which belong to 'Ted Lasso.'
In calendar 2020, the Apple App economy generated $643 billion in revenue. As announced at WWDC 2021, new updates are coming to iOS, iPadOS, macOS, and WatchOS in autumn 2021. Also at WWDC, new iPads with M1 chips were introduced. We expect the coming second-generation 5G iPhone launch, tentatively called iPhone 13, to feature new M2 chips replacing 'Bionic' (A series) chips as iPhone's central
Section 2.53
GROWTH / VALUE STOCKSprocessor. Reportedly, these chips in 5 nm process are being developed at merchant fabs operated by Taiwan Semiconductor.
We are often asked if Apple is a products company or a services company. We respond that Apple is an eco-system company, and that products and services are intertwined in a fruitful symbiotic relationship. For fiscal 3Q21 (calendar 2Q21), product revenue growth of 37% and services revenue growth of 33% were nicely balanced.
On a regional basis, fears of a weak showing in Greater China revenue proved unfounded; revenue from the region rose 58% annually. All other regions posted revenue growth in the 29%-34% range, including the Americas - at 44% of sales, the largest region.
For fiscal 3Q21, iPhone generated revenue of $39.6 billion (49% of total), a record for any June quarter and up 50% year-over-year; notably, iPhone sales were about $4 billion above consensus. Since 2016, the 2Q-to-3Q sequential trend in iPhone has been an average 20% decline.
But for the preceding two years of FY19 and FY20, the decline has been a more moderate 12%, and just 9% in FY20. Investors who saw that coming correctly modeled a more moderate sequential decline. Even so, fiscal 3Q21 iPhone revenue declined 17% from 2Q21, the first full quarter of 5G iPhones. CFO Luca Maestri noted that iPhone grew in double digits in every region. We believe iPhone is strongest in the U.S., where it has chased away many other premium and mid-tier Android smartphones.
The next largest revenue category, Services, posted all-time record revenue of $17.49 billion (21% of total); Services revenue was up 33% annually and 3% sequentially. A key driver for services is the base of installed Apple devices, which once again hit a new all-time record.
New service offerings continue to scale across users, content, and features, and Apple is having particular success stepping into the digital transaction world; paid accounts increased by double digits annually. According to the CFO, Apple has more than 700 million paid subscriptions across all its platforms, which is four-times the number of paid subscriptions four years ago.
Wearables, Home & Accessories (WH&A) surprisingly moved into the number 3 revenue category in fiscal 3Q21, ahead of Mac and iPad. WH&A revenue of $8.78 billion. Growth was aided by new products including Apple TV 4K and Air Tags.
The Apple Watch user base continues to grow, with 75% of buyers new to the product, according to the CFO. The upcoming Watch OS8 includes new features that integrate with
Health, as this category broadens from workouts to monitoring the overall health of an aging population.
In the compute space, Mac revenue (10% of total) was up 16% annually and down 10% sequentially. We believe the M1 chip has and will reinvigorate Mac sales going forward, particularly with the new macOS dubbed 'Monterey.' Like other products that are semiconductor-dependent, Mac faced supply constraints, yet still set a June-quarter revenue record.
iPad revenue (9% of total) was up 12% annually and down a less than seasonal 6% sequentially. We believe putting the M1 chip in the new iPad Pro has stimulated interest in this product in time for the resurgence in enterprise IT spending. The CFO offered the example of MassMutual, which is offering M1-equipped iPad Pros to all employees while equipping conference rooms with iPad Minis 'in anticipation of a return to work.'
With new OS updates coming, we believe iPad and Mac are set up for accelerating momentum in fiscal 4Q21 (calendar 3Q21), followed by strong holiday-quarter performance in fiscal 1Q22. The next generation of iPhone will be powered by iOS 15, which offers a refinement that will enable FaceTime to behave more like a multiuser video experience akin to Zoom, among other new features.
In April 2021, historically the month in which Apple announces its dividend
hike and new share repurchase authorization, Apple took the notion of shareholder return to a new level in keeping with the company's exceptional position on the national and global stage. In addition to a 7% increase in its quarterly dividend and a $90 billion increase in its share repurchase authorization, Apple committed to $430 billion in U.S investments over a five-year period while adding 20,000 new U.S. jobs.
Apple supports 2.7 million jobs in the U.S. through direct employment, spending with U.S. suppliers and manufacturers, multiple Apple TV production sites in 20 states, and developer jobs in the iOS App economy. Apple is also the largest taxpayer in the U.S., having paid $45 billion in domestic corporate income tax in the past five years.
After more than a decade of outperformance, AAPL has had a quiet and market-lagging start to the calendar year. In our view, the relative underperformance reflects sector rotation, not any misfires in Apple's leadership franchises. We therefore regard the underperformance as an opportunity to establish or dollar-average into positions in Apple, the world's premier consumer products company.
EARNINGS & GROWTH ANALYSISFor fiscal 3Q21 (calendar 2Q21), Apple posted revenue of
$81.4 billion, which was up 37% year-over-year. Revenue far exceeded the consensus forecast of $73.3 billion.
Section 2.54
GROWTH / VALUE STOCKS
The GAAP gross margin expanded sequentially to 43.3% in 3Q21 from 42.5% in 2Q21 and was also up from 38.0% a year earlier. The GAAP operating margin tightened sequentially to 29.6% in 3Q21 from 30.7% in 2Q21 but expanded from 21.9% in the prior-year quarter.
GAAP earnings totaled $1.30 per diluted share, up 100% from $0.65 a year earlier. GAAP EPS was $0.34 above the consensus call of $1.01. Management provided no explicit top- or bottom-line guidance for fiscal 3Q21.
For all of FY20, Apple posted revenue of $274.5 billion, up 6% from $260.1 billion in FY19. GAAP EPS totaled $13.05 (on a presplit basis), up 10% from the $11.84 earned in FY19.
Given the strong nine-month performance in fiscal 2021, we are raising our FY21 GAAP earnings estimate to $5.71 per diluted share from $5.16. We are also boosting our FY22 non-GAAP EPS forecast to $6.14 per share from $5.52. We regard our EPS estimates as fluid and subject to change. With no significant adjustments, events or charges in any period, our GAAP and non-GAAP earnings estimates are identical. Our long-term EPS growth rate forecast for AAPL is 13%.
FINANCIAL STRENGTH & DIVIDENDOur financial strength rating on Apple is High, the top of
our five-point scale. In the wake of the recent cut in the corporate tax rate and relaxed restrictions on repatriating overseas cash, Apple has stepped up its shareholder return program with higher buybacks and an April 2019 dividend hike. It has also accelerated debt retirement.
Cash & short- and long-term investments were $193.6 billion at the end of fiscal 3Q21. Cash was $191.8 billion at the end of FY20, $205.9 billion at the end of FY19, $237.1 billion at the end of FY18, $277.0 billion at the end of FY17, and $237.6 billion at the end of FY16.
Debt was $121.8 billion at the end of fiscal 3Q21. Debt was $112.4 billion at the end of FY20, $108.1 billion at the end of FY19, $114.5 billion at the close of FY18, $115.7 billion at the end of FY17, and $87.0 billion at the end of FY16. In recent years, Apple has levered up in anticipation of more aggressive capital allocation.
For the first nine months of fiscal 2021, Cash flow from operations was $83.8 billion vs. $60.1 billion in the year-earlier nine-month period. Cash flow from operations was $80.7 billion in FY20. Cash flow from operations was $69.4 billion in FY19, $77.9 billion in FY18, and $69.4 billion in FY17.
Apple added $90 billion to its buyback authorization in April 2021 and $50 billion in April 2020. In April 2019,
Apple authorized a $75 billion buyback. In April 2018, it announced a new $100 billion share repurchase authorization.
In April 2021, Apple raised its quarterly dividend by 7% to a split-adjusted $0.22 per share. It also raised its dividend by 6.5% in April 2020, by 5% in April 2019, by 16% in April 2018, and by 10.5% in April 2017. Apple declared its first quarterly dividend in April 2012.
We expect a new buyback authorization and dividend hike to continue to drive investor interest in the stock. On a split-adjusted basis, our dividend forecasts are $0.84 for FY21 and $0.92 for FY22.
MANAGEMENT & RISKSTimothy Cook has served as CEO since industry legend
Steve Jobs passed away in 2011. Former Apple controller and former Xerox CFO Luca Maestri became CFO in September 2013. Jeff Williams is COO. Longtime head of worldwide marketing Phil Schiller retired from that role and has become an Apple fellow. Another long-term Apple executive, Greg Joswiak, is the head of marketing.
Other top executives, including design leader Jony Ive and SVP of retail Angela Ahrendts, have left the company in the past year and a half. However, Apple has a deep bench of executive, engineering and marketing talent. We think that it will continue to attract high-quality talent, both from an engineering perspective as well as in the corporate leadership ranks.
Apple is in its familiar cadence of introducing new phones in the fall, just ahead of holiday spending, though that schedule was slightly delayed last year. The upcoming 5G cycle promises to be major. Apple is a product perfecter, not a product originator, and will eventually find a ready appetite for its iPhones whenever they are ready.
Apple sells phones around the globe; smartphones are now ubiquitous and in need of constant upgrades; and consumers are anxious to remain within the Apple ecosystem. For these reasons, we expect Apple's long-cycle demand to smooth any near-term demand bumps. Tariffs also represent a difficult-to-quantify risk, but all parties have a long-term interest in facilitating global trade flows.
Investors have criticized Apple for its closed ecosystem. That system, however, has the effect of prompting consumers to buy iPads and Macs for system compatibility. Even more compelling for brand loyalty are Apple's services, including iTunes, App Store, and iCloud, as consumers do not want the cost and complexity of pulling their media libraries out of the comfortable arms of Mother Apple.
The shares are always at risk from the perception that growth could slow as the law of large numbers catches up with
Section 2.55
GROWTH / VALUE STOCKSApple. The company has mitigated that risk, in our view, with very aggressive shareholder return policies, which will likely remain paramount. Despite the company's growing largesse, we expect institutional investors to continue to demand more aggressive dividend growth and a larger share repurchase plan.
COMPANY DESCRIPTIONApple manufactures smartphones, tablets, PCs, software
and peripherals for a worldwide customer base. Its products include Mac desktop and mobile PCs, iPhone, iPad, Apple Watch, and various consumer products, including AirPods, Beats headphones and Apple TV. Apple services include App Store, iTunes, iCloud, Apple TV+, Apple Arcade, Apple Music, Apple Pay, and more.
VALUATIONOn a split adjusted basis, AAPL trades at 26.1-times our
FY21 EPS forecast and at 24.3-times our FY22 forecast; the two-year average P/E of 25.2 remains well above the five-year (FY16-FY20) trailing multiple of 15.8. Apple is trading at a premium to historical relative multiples. Over the past five years, AAPL has traded at an average 17% discount to the market multiple, or at a relative P/E of 0.83. The stock now trades at 105% of the market multiple on a two-year-average forward basis, or at a relative P/E of 1.05. On all comparable historicals, we calculate a split-adjusted value in the mid-$80s, in a rising trend though below current prices.
AAPL trades at premiums to the technology hardware peer group on P/E, relative P/E, EV/EBITDA and PEGY. While peer indicated value of about $100 is below current prices, we believe that AAPL warrants a significant premium to peers given the company's ability to expand globally and to generate healthy demand for its products in every kind of economy. Apple also trades on GAAP results while peers trade on non-GAAP results.
Our more forward-looking two- and three-stage discounted free cash flow model renders a value around $245 per share, in a rising trend and well above current levels. Our blended fundamental valuation model points to a price of $215, in a rising trend and well above current prices.
Appreciation to our split-adjusted 12-month target price of $165, along with the dividend yield of about 0.5%, implies a risk-adjusted total return in excess of our forecast for the broad market and is thus consistent with a BUY rating.
On July 28 at midday, BUY-rated AAPL traded at $144.74, down $2.03. (Jim Kelleher, CFA, 7/28/21)
Arista Networks Inc (ANET)Publication Date: 8/4/21Current Rating: BUY
HIGHLIGHTS*ANET: Continued growth, raising target price to $440*Arista Networks beat consensus estimates for 2Q21 sales
and non-GAAP EPS, but sold off slightly on concerns about prolonged supply chain challenges.
*Since wrapping 2020 on a high note, Arista continued to see improvement in underlying business trends in 1H21.
*Although supply-chain challenges have worsened, Arista is modeling double-digit top-line growth for 3Q21, and provided line-item guidance consistent with double-digit profits growth.
*We regard ANET share price weakness as an opportunity to establish or add to positions in what we regard as a premier long-term holding in the cloud networking space.
ANALYSIS
INVESTMENT THESISBUY-rated Arista Networks Inc. (NYSE: ANET) slipped
3% in a mixed market on 8/3/21 after the cloud networking company beat consensus estimates for 2Q21 sales and non-GAAP EPS. Both revenue and non-GAAP EPS increased at a double-digit percentage clip in 2Q21. Both product and services revenue rose in solid double digits in the second quarter. Weakness in the stock likely flowed from management's caution related to supply chain challenges.
Arista in 4Q20 grew sales and profits for the first time since 3Q19. Since wrapping 2020 on a high note, Arista continues to see improvement in underlying business trends. Revenues from cloud and focus enterprise verticals such as financial services continue to recover.
Arista is helping customers migrate from legacy architectures to cloud networks. During 2Q21, Arista surpassed 50 million cloud networking products shipped cumulatively. Arista's technology has proven disruptive in the marketplace for large enterprise and cloud service provider solutions.
In recent years, Arista has supplemented its focus on cloud, carrier and large-enterprise customers with products for the campus and mainstream switching market segments. That market stalled early in the pandemic as branch offices sat idle and companies held off on new investments. As workers partly return to offices, the campus is now evolving to a distributed workplace environment. Arista has expanded its cognitive campus portfolio with new platforms, including the 750 series modular chassis and the 720 series fixed port switch.
After mostly negative top- and bottom-line annual comparisons in 2020, Arista has shown first-half strength and appears positioned for sustained annual revenue and EPS growth in 2021 and beyond. The company is financially strong; debt is less than 5% of cash, which is growing rapidly.
Despite the recent share price recovery, ANET lagged peers in 2019 and 2020. We regard ANET share price weakness as an opportunity to establish or add to positions in
Section 2.56
GROWTH / VALUE STOCKSwhat we regard as a premier long-term holding in the cloud networking space. We are reiterating our BUY rating and raising our 12-month target price to $440 from $360.
RECENT DEVELOPMENTSArista is up 28% year-to-date in 2021, while immediate
peers are up 20%. ANET advanced 43% in 2020, versus an 89% gain for the peer group of cloud, social, mobile and internet service companies in Argus coverage. ANET declined 4% in 2019 while peers were up 51%. ANET declined 11% in 2018 versus a 3% decline for the peer group. ANET shares advanced 143% in 2017, compared to a 39% gain for peers; and rose 24% in 2016, compared to a 9% gain for peers.
For 1Q21, Arista reported revenue of $707 million, which was up 31% year-over-year and 6% sequentially. Revenue came in above the high end of management's guidance range of $675-$695 million, and also topped the $685 million consensus forecast. Non-GAAP earnings of $2.72 per diluted share were up 25% annually and up $0.22 sequentially from 1Q21. Non-GAAP EPS beat the consensus call of $2.55 by $0.17. Management does not furnish formal non-GAAP EPS guidance; line-item guidance had pointed to EPS in the $2.60-$2.70 range.
Arista meaningfully underperformed peers in 2019 and 2020 as it navigated challenging end-markets. The company's formerly fast-growing Cloud Titans vertical slowed in 2019, partly reflecting inventory digestion after multiple years of rapid growth. And large enterprise ground to a halt in 2020 as the pandemic shut offices.
The company has modestly outperformed peers in 2021 as key end markets recover. Cloud Titan is back in growth mode, and important enterprise verticals such as financial services are recovering. Along the way, Arista has penetrated the campus opportunity, which in the post-pandemic era is evolving into a distributed workspace.
Jayshree Ullal has served as president and CEO of Arista since October 2008, meaning she has been through multiple economic cycles as well as good and bad times. Even as Arista is seeing improving end markets in various verticals, the company is also navigating supply-chain shortages and 'escalating cost of components, freight, and expedite logistics,' according to the CEO.
As a relatively smaller provider in the networking space, and also as a 'box builder' dependent on multiple vendors for a completed solution, Arista may be facing heightened difficulties in sourcing some parts. Chief Platform Officer John McCool discussed the environment as well as Arista's manufacturing execution.
CPO McCool called out numerous factors impacting the environment, including COVID as well as spike in demand for
electronics products related to global reopening. Component lead times are 'the highest we've seen,' having roughly doubled from the pre-pandemic period. Semiconductor lead times have spiked to a range of 40-60 weeks.
Supplier factories are running full out, limiting any prospect for a lessening in demand imbalance in the near term. Arista expects supply chain impediments - including extended lead times and escalating project costs related to rising parts and logistics costs - to remain in place through 2021 and 2022.
In this environment, Arista's mitigating actions include improving manufacturing procedures to maximize capacity and material utilization. The company is increasing purchase commitments for 2022, and is working closely with strategic supply partners as they plan their capacity expansion programs. Arista looks forward to supply chain improvements in the second half of 2022, a sobering timeline for investors hoping these issues will be resolved by year-end 2021.
The company's proactive response early in the supply-chain crisis has enabled Arista to mainly meet customer demand, resulting in double-digit sales and profit growth. Assessing the various market verticals served, the CEO noted that enterprise customer momentum has never been stronger. The CEO called out numerous wins for EOS-based solutions, including one in the data center in the Data Analysis Switching and routing (DANS) niche.
The customer also used Arista's Cognitive Campus, while driving automation across retail sites with CloudVision and open APIs. Other customers in the enterprise space, including a major U.S. financial firm and an international media company, migrated from legacy to EOS-based solutions and a cohesive client-to-cloud strategy.
The CEO cited industry data that Arista is the market share leader in 100G Ethernet ports, for a fifth consecutive year. Even amid the industry supply crunch, Arista regards 2021 as 'the first year of inflection for higher speeds,' ranging from 100G to 200G and now 400G. Arista shipped more than 2.5 million high-performance ports in the 2021 first half, and has surpassed 50 million cloud networking ports shipped cumulatively since the company's inception.
Beginning in 1Q21, the company started providing revenue ranges rather than revenue specifics for its major customer classes and for its product-line sales. In 2Q21, cloud titans were the largest vertical, followed closely by large enterprise. The financial services vertical and specialty cloud providers are similar in size. In any given quarter, cloud titans and large enterprise will each represent 35%-39% of revenue, while specialty cloud providers will contribute 25%-30%.
In terms of sales by product category, 60%-65% of sales are to the core data center, 10%-15% for adjacent campus
Section 2.57
GROWTH / VALUE STOCKSswitching and routing, and 20%-25% for software and services. A-Care service, EOS renewals, and subscription software contribute about 20% of revenue.
In the core cloud and data center markets, Arista looks to build on its flagship Arista EOS with its leaf & spine topology (differentiated from traditional spanning tree architectures). Arista believes it is winning in 100 Gbps and in 400 Gbps. Currently, the CEO sees the 100-gig opportunity as being 10-times larger than the 400-gig market, which is just getting started. In the cloud titan space, Arista is gaining increased momentum in 100-, 200- and 400-gig. The availability of ZR optics, MACsec encryption, and software monitoring of optical links are all driving cloud titan demand for these solutions.
In April 2021, Arista announced its CloudVision 2021 offering, a further expansion of Arista's software-driven solution for modern enterprises. CloudVision 2021 provides new network automation capabilities designed to improve network agility and streamline enterprise business processes and outcomes, according to the company.
CloudVision 2021 is designed to provide operators with a single, unified observation point for end-to-end networks via a suite of automation, telemetry, and analytics. Operating as a multi-domain management plane, CloudVision enables operational consistency across data center, campus wired and wireless, and public cloud use cases. And it is available as an on-premises implementation or via SaaS-based delivery.
CloudVision was in customer trials throughout 1Q21, and became generally available in 2Q21. CloudVision 2021 delivers new automation capabilities designed to improve network agility
Although customer demand and visibility have continued to improve, industry supply-chain challenges have worsened and are impacting Arista's ability to fulfill orders. Still, the company is modeling double-digit topline growth for 3Q21, and provided line-item guidance consistent with double-digit profits growth.
For 3Q21, Arista is modeling revenue of $725-$745 million, which at the $735 million midpoint would be up 21% year-over-year and up in single digits sequentially. Based on other elements of line-item guidance, we believe Arista can earn about $3.00 in 3Q21, which would be up in high-teen percentages annually.
After mostly negative top- and bottom-line annual comparisons in 2020, Arista has shown first-half strength and appears positioned for sustained annual revenue and EPS growth in 2021 and beyond. Despite year-to-date share-price recovery, ANET lagged peers in 2019 and 2020. We
regard ANET share price weakness as an opportunity to
establish or add to positions in what we regard as a premier long-term holding in the cloud networking space.
EARNINGS & GROWTH ANALYSISFor 1Q21, Arista reported revenue of $707 million, which
was up 31% year-over-year and 6% sequentially. Revenue came in above the high end of management's guidance range of $675-$695 million, and also topped the $685 million consensus forecast.
Despite rising procurement and logistics costs, the non-GAAP gross margin widened sequentially to 65.2% in 2Q21 from 64.7% in 1Q21 and 64.7% a year earlier. The non-GAAP operating margin also widened, to 38.4% in 2Q21 from 37.6% in 1Q21 while tightening from 39.2% a year earlier.
Non-GAAP earnings of $2.72 per diluted share were up 25% annually and up $0.22 sequentially from 1Q21. Non-GAAP EPS beat the consensus call of $2.55 by $0.17. Management does not furnish formal non-GAAP EPS guidance; line-item guidance had pointed to EPS in the $2.60-$2.70 range.
For all of 2020, revenue of $2.32 billion dipped 4% from $2.41 billion in 2019. Arista generated non-GAAP earnings of $9.25 per diluted share in 2020, down 5% from $9.74 per share in 2019.
For 3Q21, Arista is modeling revenue of $725-$745 million, which at the $735 million midpoint would be up 21% year-over-year and up in single digits sequentially. Based on other elements of line-item guidance, we believe Arista can earn about $3.00 in 3Q21, which would be up in high-teen percentages annually.
We are raising our non-GAAP diluted EPS projection for 2021 to $11.02 from $10.87. We are also raising our 2022 projection to $12.20 from $11.71. We regard our estimates as fluid and subject to revision. Our five-year EPS growth rate forecast is 14%.
FINANCIAL STRENGTH & DIVIDENDOur financial strength rating on Arista is High. The
company's rapid sales growth, which is increasingly software-driven, throws off substantial cash. Debt is less than 10% of cash.
Cash & investments were $3.28 billion at the end of 2Q21. Cash & investments were $2.87 billion at the end of 2020, $2.72 billion at the end of 2019, $1.96 billion at the end of 2018, $1.54 billion at the end of 2017, and $868 million at the end of 2016.
Total debt was $334 million at the end of 2Q21. Total debt was $349 million at the end of 2020, $135 million at the
Section 2.58
GROWTH / VALUE STOCKSend of 2019, $66 million at the end of 2018, $54 million at the end of 2017, and $55 million at the end of 2016.
The debt/total capital ratio was 10.5% at the end of 2020, up from 4.3% at the end of 2019, 3.2% at the end of 2018, 3.4% at the end of 2017, and 4.6% at year-end 2016. Those debt/cap ratios are well below the communications equipment industry average of 17.6%.
Cash flow from operations was $735 million in 2020. Cash flow from operations was $963 million in 2019, $503 million in 2018 (reduced by the $400 million payment made to Cisco) and $632 million in 2017.
In May 2019, Arista announced a $1 billion share repurchase program. The company repurchased little stock in 2020 due to the pandemic, and is resuming buybacks cautiously. Purchases will be made opportunistically and will be funded from working capital.
The company has never paid a dividend, and we do not expect it to implement one over the next two years.
MANAGEMENT & RISKSJayshree Ullal has served as president and CEO of Arista
since October 2008, and was previously senior vice president of data center, switching and services at Cisco. Ita Brennan is the CFO. Manny Rivelo is chief sales officer. In March 2019 Anshul Sadana was promoted to COO. John McCool is chief platform and customer officer. The CTO is Kenneth Duda, one of the co-founders.
Andreas Bechtolsheim, an Arista founder, has served as the company's chairman since 2004 and as its chief development officer since 2008. Mr. Bechtolsheim was previously the co-founder of Sun Microsystems, a maker of computers and computer software, which was acquired by Oracle in 2010. He also co-founded Granite Systems, a producer of Gigabit Ethernet switches, which was purchased by Cisco in 1996, and served in various executive positions at Cisco following the buyout.
A main risk for Arista, as for other networking gear companies, is the possibility of a general economic downturn and a corresponding dip in demand for networking gear, inventory congestion, and a cyclical slowdown in orders. Those risks have been amplified by the pandemic. We believe that Arista has the financial strength, market leadership, and growth characteristics to weather this storm and emerge a stronger player.
The pause in spending by leading cloud customers is cause for concern and bears monitoring. We see no evidence of competitive share loss, however, and believe the digestion phase among leading customers is part of the business cycle in a fast-formulating cloud data center environment.
Arista was long involved in patent litigation with Cisco Systems, but in August 2018 the two sides signed a binding term sheet to end the litigation. By paying $400 million to Cisco, Arista effectively acknowledged some infringement. Still, we expect Arista to benefit from the resolution of this multiyear litigation against a cash-rich giant.
Arista investors face customer concentration risk, as several large customers account for a significant portion of the company's revenue, as well as risks from intense competition and changes in technology that could reduce demand for the company's products. Arista may also be hurt by supply shortages and adverse currency movements.
COMPANY DESCRIPTIONArista Networks is a leading supplier of cloud networking
solutions for internet companies, cloud service providers, and next-generation data centers. It generates the largest portion of its revenue from switching products that incorporate its Extensible Operating System (EOS) software.
VALUATIONANET shares trade at 34.2-times our 2021 non-GAAP
EPS estimate and at 30.9-times our 2022 forecast. The average two-year forward P/E of 32.5 is now above the five-year historical P/E (2016-2020) of 27.3. On a two-year-forward basis, ANET trades at a relative P/E of 1.46, below its historical relative P/E of 1.50. Historical comparables indicate a value in the low $300s, in a rising trend.
Compared to a diverse peer group that includes equipment vendors as well as cloud service providers, ANET trades at premiums that we believe are well deserved given its disruptive business model. Our peer-indicated value is in the high $270s, below current prices but in a slightly rising trend.
Our more forward-looking discounted free cash flow model values ANET in the low $500s, in a rising trend. Our blended fair value estimate is in the low- to mid-$400s is in a clearly rising trend. Appreciation to our 12-month target price of $440 (raised from $360) implies a potential risk-adjusted return in excess of our forecast market return and is thus consistent with a BUY rating.
On August 3, BUY-rated ANET closed at $379.17, up $1.99. (Jim Kelleher, CFA, 8/3/21)
Ashland Global Holdings Inc (ASH)Publication Date: 8/2/21Current Rating: BUY
HIGHLIGHTS*ASH: Reaffirming BUY following 3Q21 results*On July 27 after the close, Ashland reported an adjusted
fiscal 3Q21 net profit from continuing operations (for the period ended June 30, 2021) of $75 million or $1.22 per diluted share, up from $52 million or $0.84 per share in the
Section 2.59
GROWTH / VALUE STOCKSprior-year quarter.
*The higher year-on-year earnings were driven by positive sales gains in nearly all operating business segments, supplemented by lower research & development (R&D) costs.
*We are reducing our 2021 EPS estimate to $4.85 from $5.13 to partly reflect third-quarter results, which missed our quarterly estimate and our assumption that supply-chain challenges and high raw material costs will negatively impact results over the short-term.
*At the same time, we are maintaining our above-consensus 2022 EPS estimate of $5.82 per share, which assumes further growth in margins and earnings next year as the company resolves issues mentioned above.
ANALYSIS
INVESTMENT THESISWe are reiterating our BUY rating on Ashland Global
Holdings Inc. (NYSE: ASH) with a price target of $99 per share. We continue to view Ashland as one of the top specialty chemicals companies in our coverage universe and, despite uneven demand due to COVID-19, we believe that Ashland's wide range of consumer and industrial products will enable it to thrive even in challenging economic conditions.
RECENT DEVELOPMENTSOn July 27 after the close, Ashland reported an adjusted
fiscal 3Q21 net profit from continuing operations (for the period ended June 30, 2021) of $75 million or $1.22 per diluted share, up from $52 million or $0.84 per share in the prior-year quarter. EPS missed our forecast and the consensus estimate of $1.27.
The higher earnings were driven by positive sales gains in nearly all operating business segments, supplemented by lower research & development (R&D) costs. Third-quarter 2021 revenue totaled $637 million, up 11% from the prior year.
Ashland now reports results for three segments: Consumer Specialties (56% of 2020 sales), Industrial Specialties (38% of sales), and Intermediates & Solvents (6% of sales).
Consumer Specialties reported 3Q21 sales of $340 million, down 1% from the prior year. Pharma-related sales were modestly lower than the strong prior-year period, while nutraceutical sales rose. Sales in the personal care and household categories fell due to the discontinuation of low-margin products and reduced demand for styling, grooming and oral care products during the pandemic. Currency translation boosted sales by 3%. Adjusted segment income fell 2% to $55 million.
Industrial Specialties posted 3Q21 sales of $263 million, up 28% versus a year ago, as continued strong demand for architectural coatings and adhesive applications was partially offset by weak sales to energy industry customers in the U.S. and lower construction additive sales following a strike at the
company's plant in Belgium. Currency translation again provided a 4% benefit. Segment operating income was comparable to the prior-year at $30 million, as cost reduction efforts were more than offset by increased manufacturing and shipping costs, along with higher raw material costs.
The Intermediates & Solvents division reported fiscal 3Q sales of $49 million, up 32% compared to the prior-year quarter. The segment posted an operating profit of $11 million, up from $7 million a year earlier. The gain was attributable to higher pricing on the sale of derivatives to high-value industries and intercompany sales.
On January 19, 2021, Ashland agreed to acquire the personal care business of Schulke & Mayr for $263 million in cash. Schulke & Mayr's personal care line consists mostly of cosmetics-grade antimicrobial agents that kill bacteria, yeast, and mold. The transaction closed on April 30.
EARNINGS & GROWTH ANALYSISAshland is not currently providing detailed financial
guidance, but indicated that overall demand was very strong and was expected to remain that way for the remainder of the year. On the negative side, supply-chain disruptions and higher raw material costs were posing a short-term problem.
We are reducing our 2021 EPS estimate to $4.85 from $5.13 to partly reflect third-quarter results, which missed our quarterly estimate and our assumption that supply-chain challenges and high raw material costs will negatively impact results over the short-term. The current consensus is $4.57.
At the same time, we are maintaining our above-consensus 2022 EPS estimate of $5.82 per share, which assumes further growth in margins and earnings next year as the company resolves issues mentioned above and also as it exits low-margin businesses and pursues accretive, bolt-on acquisitions. The FY22 consensus is $5.47.
FINANCIAL STRENGTH & DIVIDENDWe rate Ashland's financial strength as Medium, the
midpoint on our five-point scale. The company's debt is rated BB+/stable by Standard & Poor's.
The total debt/total capitalization ratio was 36.3% at the end of 3Q21, down from the 41.6% at the end of 3Q20. The debt/cap ratio is in line with the average for other specialty chemicals companies and has averaged 45.2% over the past five years.
Total debt was $1.821 billion at the end of 3Q21, down from $2.142 billion a year earlier. The company has minimal short-term borrowings. It has $500 million remaining on its current buyback authorization but did not repurchase any shares in 3Q21.
Section 2.60
GROWTH / VALUE STOCKSAshland had cash and cash equivalents of $262 million at
the end of 3Q21, compared to $416 million at the end of 3Q20. Cash from operating activities increased to $233 million in 3Q21 from $140 million in the prior-year quarter.
On May 21, the company raised its quarterly dividend 9% to $0.30 per share, or $1.20 annually. The current yield is 1.4%. Our revised dividend estimates are $1.18 for FY21 and $1.20 for FY22.
MANAGEMENT & RISKSGuillermo Novo became the company's new chairman and
CEO on December 31, 2019, succeeding William A. Wulfsohn. Following Mr. Wulfsohn's departure, the board consists of 10 members, including nine independent directors.
Ashland's volume and pricing are highly dependent on the health of the global economy. In addition, the company faces risks associated with foreign exchange rates, changes in commodity and energy costs, environmental issues, and litigation.
COMPANY DESCRIPTIONFounded in 1924, Ashland Global Holdings Inc. is a
global specialty chemicals company serving a wide range of consumer and industrial markets, including adhesives, architectural coatings, automotive, construction, energy, food and beverage, personal care and pharmaceutical.
VALUATIONAshland shares have traded between $66.95 and $95.96
over the past 12 months and are currently toward the high end of the range. To value ASH on a fundamental basis, we use peer group and historical multiple comparisons, as well as a dividend discount model.
The shares trade at 17.5-times our FY21 operating EPS estimate and at 14.6-times our FY22 estimate, compared to a 26-year historical average range of 16-46.
They also trade at a price/sales multiple of 2.2, above the historical range of 0.6-0.9. The price/cash flow multiple of 9.5 is below the midpoint of the historical average range of 7.0-13.6, and the enterprise value/EBITDA multiple of 11.2 is toward the high end of the range of 6.3-12.0. We are reiterating our BUY rating on Ashland with a target price of $99.
On July 30, BUY-rated ASH traded at $85.07, up $0.16. (Bill Selesky, 7/30/21)
Automatic Data Processing Inc. (ADP)Publication Date: 7/29/21Current Rating: BUY
HIGHLIGHTS*ADP: Boosting target to $225 *On July 28, ADP reported that fiscal 4Q21 revenue rose
11% year-over-year to $3.7 billion. Adjusted diluted EPS from continuing operations rose 5% to $1.20.
*Management now expects FY22 revenue growth of 6%-7% and adjusted EPS growth of 9%-11%.
*We are raising our FY22 EPS estimate to $6.52 from $6.50 and initiating an FY23 estimate of $7.15. Our long-term earnings growth rate forecast is 9%.
*Valuations are reasonable for ADP shares, and the company has rewarded investors over time with consistent results and market-beating returns. We think that ADP shares are suitable as a core portfolio holding in diversified accounts.
ANALYSIS
INVESTMENT THESISWe are maintaining our BUY rating on Automatic Data
Processing Inc. (NGS: ADP) with a revised 12 month target price of $225, raised from $205. ADP has a clean balance sheet and an experienced management team - two factors that we think are important during the pandemic. ADP also has an impressive record of growing its dividend, which currently yields about 1.8%, and has raised its payout for 44 straight years. Valuations are reasonable for ADP, and the company has rewarded investors over time with consistent results and market-beating returns. We think that ADP shares are suitable as a core portfolio holding in diversified accounts.
RECENT DEVELOPMENTSADP shares have outperformed the broad market over the
past three months, gaining 11% compared to a 6% advance for the S&P 500. The shares have outperformed the market over the past year and over the past five years. ADP is often classified as an Industrial company (staffing and employment services), and the shares have outperformed the industry ETF IYJ over the past five years. The beta on ADP is 0.73.
ADP recently reported results that topped expectations. On July 28, the company reported that fiscal 4Q21 revenue rose 11% year-over-year to $3.7 billion (also up 9% on an organic constant-currency basis). Adjusted EBIT fell 2% and the adjusted EBIT margin declined by 120 basis points to 18.1%. Adjusted diluted EPS from continuing operations rose 5% to $1.20.
For the full year, the company reported revenue of $15 billion, up 2% on an organic basis. Full-year adjusted EPS rose 2% to $6.02.
Along with the 4Q report, management issued guidance for FY22. It expects revenue growth of 6%-7%, and a 50- to 75-basis-point increase in the adjusted EBIT margin. It expects adjusted EPS to be up 9%-11%. In the Employer Services segment, the company expects revenue growth of 4%-6%, and in the PEO Services Segment, it expects growth of 9%-11%. It projects interest on funds held for clients of $405-$415 million; this is based on anticipated growth in client fund balances of 8%-10% from $27.4 billion in fiscal 2021, and a
Section 2.61
GROWTH / VALUE STOCKS10-basis-point decline in the average yield to 1.4%.
EARNINGS & GROWTH ANALYSISADP organizes its businesses into three units: Employer
Services (68% of 2021 sales), Professional Employer Organization Services (32%), and Interest Held for Clients (0.2%). We review recent trends and outlooks by business segment below.
In Employer Services, fourth-quarter revenue rose 10% on a reported basis and 8% on a constant-currency basis. The segment margin declined 90 basis points from the prior year. Management expects new business bookings to increase 10%-15% in FY22. It looks for segment revenue growth of 4%-6% and 50-75 basis points of margin expansion.
In the Professional Employer Organization segment or PEO, fourth-quarter revenue rose 12%. This remains a volume business for ADP: the average number of worksite employees paid rose 12% in the fourth quarter and 7% for the fiscal year. In FY22, management expects average worksite employees paid to grow 9%-11%, and looks for revenue growth of 9%-11%. It expects the segment margin to increase 25-75 basis points.
ADP also generates earnings from interest on funds held for clients. Interest on these funds fell 10% year-over-year, to $103 million, in the fourth quarter (and 23% for the full year, to $422 million). Average client fund balances increased 22% in 4Q to $33.2 billion.
Turning to our estimates, based on recent trends in sales, orders and margins, we are raising our FY22 EPS estimate to $6.52 from $6.50. We are initiating an FY23 estimate of $7.15. Our long-term EPS growth rate forecast is 9%.
FINANCIAL STRENGTH & DIVIDENDWe rate the financial strength of ADP as High, the top of
our five-point scale. ADP scores well above average on our main financial strength criteria: debt levels, fixed-cost coverage, profitability, cash flow generation, and earnings quality. The company is rated Aa3/stable, up from Aa3/negative, by Moody's and AA-/stable, down from AA/stable, by S&P.
ADP pays a dividend and has increased its payout for 45 straight years. In November 2020, it raised its quarterly payout to $0.93 per share, or $3.72 annually. The yield is about 1.8%. Our dividend estimates are $3.80 for FY22 and $3.88 for FY23.
ADP also has a share buyback program.
MANAGEMENT & RISKSCarlos A. Rodriguez has been the company's CEO since
2011. Mr. Rodriguez was previously president and COO of ADP, and has also served as president of several key ADP
businesses, including National Accounts Services, Employer Services International, and Small Business operations. He joined the firm in 1999. Kathleen Winters is the CFO. The nonexecutive chairman is John P. Jones.
Risks to earnings include:
-- The impact of COVID-19.
-- Historically low interest rates, which have reduced the company's interest income.
-- Exposure to the European economy. ADP's European operations typically account for 10%-11% of total sales.
-- Exposure to changes in government regulations. If the company's time allotment for paying taxes or the total percentage of taxes withheld declines, ADP's interest income could be at risk. Furthermore, ADP's low borrowing rates would likely rise if its credit ratings decline.
-- The overall health of the economy. A reduction in employment and decreased spending on payroll processes and services could slow the company's growth.
COMPANY DESCRIPTIONAutomatic Data Processing, based in Roseland, New
Jersey, is a leading cloud-based business services company. The firm is focused on Human Capital Management (HCM) and has two primary segments: Employer Services, which provides payroll services to companies; and Professional Employer Organization Services, which provides employment administration outsourcing solutions such as benefit management, human resources, retirement, and compliance programs. The shares are a component of the S&P 500. The company has 58,000 employees.
VALUATIONWe believe that ADP shares remain attractively valued at
current prices near $206, near the high end of their 52-week range of $127-$208. The shares have moved higher, with several sharp swings, since their pandemic lows in March 2020.
Our fundamental valuation model incorporates historical multiple and peer comparison analysis. The current P/E on projected FY22 earnings is 32, above the five-year average of 28, and the price/sales ratio is 5.9, above the five-year average of 4.4. We are reiterating our BUY rating on ADP with a target price of $225.
On July 29 at midday, BUY-rated ADP traded at $208.84, up $1.96. (David Coleman, 7/29/21)
Avery Dennison Corp. (AVY)Publication Date: 7/29/21Current Rating: BUY
Section 2.62
GROWTH / VALUE STOCKS
HIGHLIGHTS*AVY: Maintaining BUY with $245 target*We expect earnings at Avery Dennison to benefit from
volume recovery, restructuring savings, and productivity improvements.
*We note that AVY businesses have historically rebounded quickly in the year following a recession, and that the company has taken steps to control costs and conserve cash during the pandemic.
*Management has raised its 2021 adjusted EPS guidance to $8.65-$8.95, up from its prior forecast of $8.40-$8.80 and well above the $7.10 earned in 2020. It expects organic sales growth of 13%-15%, up from its previous forecast of 8%-10%.
*We are raising our 2021 EPS estimate to $8.95 from $8.76 and our 2022 forecast to $9.40 from $8.89.
ANALYSIS
INVESTMENT THESISWe are maintaining our BUY rating on Avery Dennison
Corp. (NYSE: AVY) with a target price of $245. The company, a provider of packaging products and services that began operations in 1935, generates revenue through sales of adhesive materials, logo branding solutions, and inventory tracking solutions (RFID security tags). Its products are used in a variety of industries, including retail, automotive, industrial, and healthcare. We expect volume recovery, restructuring savings, and productivity improvements to benefit earnings in the coming quarters, and believe that a BUY remains appropriate.
RECENT DEVELOPMENTSOn July 28, Avery Dennison reported an adjusted 2Q21
net profit from continuing operations of $188 million or $2.25 per diluted share, up from $106.5 million or $1.27 per share in the prior-year quarter. EPS topped the consensus estimate of $2.06. Second-quarter revenue was $2.10 billion, up from $1.53 billion a year earlier and above consensus. The adjusted operating margin rose 210 basis points to 12.8%. In 2020, revenue came to $6.97 billion, down from $7.02 billion in 2019. Adjusted EPS rose to $7.10 from $6.68 in 2019.
Avery Dennison reports results for three operating segments: Label & Graphic Materials (LGM), Retail Branding & Information Solutions (RBIS), and Industrial & Healthcare Materials (IHM). LGM accounted for 67% of 2Q21 sales, RBIS for 25%, and IHM for 9%.
The LGM segment posted 2Q net sales of $1.40 billion, up 16% from the prior year on an organic basis and 11% from 2Q19. The segment operating margin fell 30 basis points to 14.5%, reflecting the net impact of pricing adjustments, and higher raw material and employee-related costs, partially offset by higher volume and an improved product mix. Typical products in this segment are label and packaging materials and reflective adhesives for road signs and emergency response vehicles.
The RBIS division reported net 2Q sales of $529 million, up 72% from the prior year on an organic basis and up 14% from 2Q19. The adjusted operating margin rose 1240 basis points to 13.1% as higher volume and increased productivity more than offset higher employee-related costs and spending on growth projects. The segment provides customers with sustainable packaging and logo embellishing services, along with RFID security tags for tracking inventory.
The IHM segment reported net 2Q sales of $197 million, up 33% on an organic basis and up 6% from 2Q19. The adjusted operating margin rose 490 basis points to 11.7%. The IHM segment sells healthcare-related tapes and industrial-related tapes and fasteners.
On July 28, AVY announced plans to acquire Vestcom, a provider of 'shelf-edge media solutions for retailers' for $1.45 billion. The company's solutions synthesize store-level data and provide 'item-specific, price-integrated messaging at the shopper's point of decision,' thus helping to boost sales and increase customer loyalty. The acquisition is expected to close in the third quarter of 2021.
The company deployed $31 million for acquisitions and equity investments in the first quarter, including two strategic acquisitions: JDC Solutions in the IHM segment and ZippyYum LLC in the RBIS segment.
EARNINGS & GROWTH ANALYSISManagement has raised its 2021 adjusted EPS guidance to
$8.65-$8.95, up from its prior forecast of $8.40-$8.80 and well above the $7.10 earned in 2020. It expects organic sales growth of 13%-15%, up from its previous forecast of 8%-10%.
We note that AVY's businesses have historically rebounded quickly in the year following a recession. The company has also taken steps to control costs and conserve cash during the pandemic. Management projects free cash flow of at least $700 million in 2021. Cash flow in 2020 was $547.5 million.
We are raising our 2021 EPS estimate to $8.95 from $8.76 and our 2022 forecast to $9.40 from $8.89.
FINANCIAL STRENGTH & DIVIDENDOur financial strength rating on AVY is Medium-High,
the second-highest rank on our five-point scale. The company's debt is rated Baa2/stable by Moody's and BBB/stable by Standard & Poor's.
At the end of 2020, the total debt/capitalization ratio was 57.5%, down from 71% a year earlier. The total debt/cap ratio is above the peer average of 53%.
Debt totaled $2.05 billion at the end of 2Q21, compared
Section 2.63
GROWTH / VALUE STOCKSto $2.29 billion at the end of 2Q20. We believe that the debt load is manageable.
Cash and cash equivalents were $345 million at the end of 2Q, up from $252 million at the end of 2020 and $263 million a year earlier. Cash from operations rose to $270 million in 2Q21 from $124 million in 2Q20. Free cash flow was $206 million, compared to $144 million in 2Q20.
In December 2020, the company raised its quarterly dividend by 7% to $0.62. It then raised the payout by an additional 10% to $0.68, or $2.72 annually, for a yield of about 1.3%. Our dividend estimates are $2.66 for 2021 and $2.78 for 2022.
The company repurchased $56 million of its stock in 1Q21 and $39 million in 2Q21. Net of dilution from long-term incentive awards, the share count has fallen by 0.1 million shares over the last year. In 2Q, the company returned $203 million in cash to shareholders through a combination of share repurchases and dividends.
MANAGEMENT & RISKSMitch Butier has been the chairman and CEO of Avery
Dennison since 2014 and Greg Lovins has served as CFO since 2017. Both have worked at the company for most of their careers.
Investors in AVY shares face risks. The company is growing organically as well as through M&A, introducing integration risks. It may also see limited benefits from its cost-saving initiatives, which it has used to boost earnings in the past. AVY relies on product innovation to drive revenue and earnings. If it becomes unable to develop and market new products, results could suffer. It also faces risks from rising raw materials costs.
With approximately 77% of revenue generated outside the U.S., AVY's results are typically linked to global economic trends. The company also faces significant exchange rate risk.
COMPANY DESCRIPTIONAvery Dennison Co. generates revenue through the sale of
adhesive materials, logo branding solutions, and inventory tracking solutions (RFID security tags). The company's products are used in a range of industries, including retail, automotive, industrial, and healthcare. The company has 32,000 employees and operates in more than 50 countries.
VALUATIONAvery Dennison shares have traded between $112 and
$226 over the past 12 months and are currently near the top of that range. The shares have been in a bullish pattern of higher highs and higher lows for more than a year.
To value AVY on a fundamental basis, we use peer group and historical multiple comparisons, as well as a dividend
discount model. The shares currently trade at 24-times our 2021 operating EPS estimate and at 23-times our 2022 estimate, compared to a five-year historical average of 21. They also trade at a trailing price/book multiple of 11.3, above the five-year average of 10, and at a price/sales multiple of 2.3, above the five-year average of 1.4. The price/cash flow multiple of 17 is above the five-year average of 15, and the enterprise value/EBITDA multiple of 15.4 is above the five-year average of 12.4. The stock is also trading above the peer average for most valuation metrics. However, we believe that AVY merits a premium based on the company's strong growth prospects. Our target price is $245.
On July 28, BUY-rated AVY closed at $209.99, up $4.94. (David Coleman, 7/28/21)
Boeing Co. (BA)Publication Date: 7/29/21Current Rating: BUY
HIGHLIGHTS*BA: Deep value idea*BA shares have underperformed over the past quarter,
falling 2% compared to a 5% advance for the S&P 500.*The shares remain more than 45% below their all-time
high as the company weathers the coronavirus crisis and continues to respond to two fatal airplane accidents involving the 737 Max.
*Investors have responded to numerous developments, both positive and negative.
*Despite the recent run from 52-week lows, we still see value in the depressed shares, and are maintaining our 12-month target price of $275.
ANALYSIS
INVESTMENT THESISOur rating on Boeing Co. (NYSE: BA) is BUY. Boeing is
among the largest aerospace and defense companies in our coverage universe, and we think it has superior long-term prospects due to its significant backlog and strong presence in the growing commercial aerospace industry. Further, its profitable Defense segment is a top 5 defense contractor. The company faces numerous near-term challenges, including the spread of COVID-19, which has curtailed air traffic, and cash flow issues. The company has cleared a major hurdle, though, as the U.S. Federal Aviation Authority has rescinded its grounding of Boeing's MAX 737 jet, which had been the company's prime revenue and earnings driver prior to two fatal crashes in 2018-2019. A new CEO has come on board and is leading a turnaround. The shares are down almost 45% from their all-time high of $440, set in February 2019. Looking ahead, once the 737 MAX is fully back in the air and Boeing is accelerating production, we see earnings power of $15-$20 per share. It looks like that will be 2023 at the earliest. We still see value in the depressed shares, and are maintaining our 12-month target price of $275.
Section 2.64
GROWTH / VALUE STOCKS
RECENT DEVELOPMENTSBA shares have underperformed over the past quarter,
falling 2% compared to a 5% advance for the S&P 500. Over the past 12 months, the shares have performed in line with the market, gaining 36%. BA shares have also underperformed the industrial sector ETF IYJ over the past year as well as over the past five years. The beta on BA is 1.60.
The shares remain more than 45% below their all-time high as the company weathers the coronavirus crisis, continues to respond to the two fatal airplane accidents involving the Boeing 737 Max (the March 2019 crash of Ethiopian Airlines Flight 302 followed the crash of a Lion Air jet out of Indonesia in October 2018); and recently has pushed back delivery of its 777X twin-engine jet from 2021 to 2023 due to an updated assessment of global certification requirements, the company's latest assessment of COVID-19 impacts on market demand, and discussions with its customers with respect to aircraft delivery timing.
The U.S. Federal Aviation Administration during 4Q20 rescinded the order that halted commercial operations of the 737 MAX, allowing the airlines that are under the FAA's jurisdiction to take the steps necessary to resume service and allowing Boeing to begin making deliveries. European regulators have also cleared the way for the 737 MAX to return to service. The company restarted 737 MAX aircraft production at low rates in 2Q20 and expects to gradually increase the production rate to 31 planes per month in 2022, with further gradual increases in line with market demand.
Since the FAA's approval to return to operations, Boeing has delivered more than 130 737 MAX aircraft, and 30 airlines have returned their fleets to service. Management expects about half of the 450 aircraft that were in storage at the end of 2020 to be delivered by the end 2021 (the number in storage was down to 320 at the end of 2Q) and the majority of the remaining jets in 2022. Boeing has secured new orders for more than 280 of the jets from carriers such as Southwest Airlines, United Airlines and Alaska Airlines.
Boeing recently reported 2Q results that included a 44% gain in revenue and a surprise profit for the period. On July 28, Boeing posted consolidated 2Q revenue of $17.0 billion. The non-GAAP core operating profit for the period was $0.40 per share. For the first half of the year, the company has reported a core operating loss of $1.12 per share.
The onset and spread of the coronavirus continued to have an impact on 2Q results. The pandemic is affecting every aspect of Boeing's business, including airline customer demand, production continuity, and supply chain stability. In May, domestic passenger operations reached approximately 90% of last year's levels, and European traffic was near full recovery as well. As the pandemic continues to affect airline passenger traffic, Boeing sees a significant impact on demand
for new commercial airplanes and services, with airlines delaying purchases of new jets, slowing delivery schedules, and deferring elective maintenance. To align the business with the new market reality, Boeing is taking cost-reducing steps that include reducing commercial airplane production and employment levels and consolidating facilities. Boeing anticipates that air passenger traffic will not return to pre-COVID levels until 2023-2024, and that the long-term growth trend of 4%-5% will not resume for another few years after that.
The company is not providing specific EPS guidance for 2021 but management has forecast that revenue is expected to improve versus 2020, as well as its profitability and cash flow generation. Management expects higher 787 and 737 deliveries this year, modest growth in the Defense business and a stable performance in Global Services. Management expects the company to turn cash flow positive in 2022.
EARNINGS & GROWTH ANALYSISBoeing organizes its operations into two manufacturing
businesses: Commercial Airplanes (35% of 2Q revenue), which includes key products such as the single-aisle 737 MAX, the 787 Dreamliner series, and the 777X, which is the largest twin-engine jet in the world, with first deliveries now scheduled for 2023; and Defense, Space and Security (41%), which manufactures products such as the F-18 Hornet, the AH-64 Apache helicopter, P-8 Poseidon aircraft, and the KC-46 Tanker. Boeing also has a Capital segment, which provides aircraft financing, and a Global Services business (24%), which 'captures value over the life cycle' of the company's products.
In the Commercial Airplanes segment, the company reported that 2Q revenues rose 250% year-over-year to 46 billion. The company delivered 79 commercial airplanes (including 47 737 MAX) in the quarter, up from 20 in 2Q20. The operating margin, typically in the 10%-12% range, was negative for the eighth quarter in a row. The company is also incurring abnormal production costs related to the 737 MAX, and those costs are estimated at $5.0 billion for 2020-2021. In 2Q, these costs totaled $515 million and the cumulative expense to date is $4.2 billion. The backlog totals more than 4,100 aircraft, valued at $285 billion, in line with the backlog totals at the end of recent quarters.
The Defense, Space and Security segment reported a 4% revenue increase year-over-year in the quarter. The 2Q operating margin widened 530 basis points to 13.9%. The segment backlog was $591 billion, down 3% compared to the prior quarter.
The Global Services segment reported a 17% gain in 2Q revenue, driven by higher commercial services volume. The segment generated an operating profit margin of 13.1% for the quarter.
Section 2.65
GROWTH / VALUE STOCKS
At Boeing Capital, the net portfolio balance was $1.9 billion at the end of 2Q, flat compared to the beginning of the quarter. Boeing Capital reported 2Q revenue of $78 million, compared to $69 million in the year-earlier quarter, and an operating profit of $36 million.
Boeing's earnings are destined to be volatile and murky for the next several quarters, as analysts incorporate ever-changing charges, the uncertainty surrounding the full return of the 737 Max, and the impact of the coronavirus. Our full-year 2021 adjusted estimate is now a profit of $0.20 per share; we note the consensus ranges from a loss of $4.00 per share to profit of $1.10. We are also maintaining our preliminary 2022 adjusted EPS estimate of $6.00. Our five-year earnings growth rate forecast is 12%.
FINANCIAL STRENGTH & DIVIDENDOur financial strength rating on Boeing is Medium.
Boeing had cash and marketable securities of $21.3 billion at the end of 2Q21, and debt of $63.5 billion.
Boeing has a share repurchase program, which it has suspended.
The company has also suspended its dividend. Our dividend estimates are zero for both 2021 and 2022.
MANAGEMENT & RISKSDavid Calhoun is Boeing's new CEO and president. Brian
West will be the new CEO effective August 27, 2021. Lawrence A. Kellner is the Chairman of the Board.
Boeing has been attempting to resolve several issues in order to move forward and resume its growth trajectory, which had been impressive for most of the past decade.
The first was fixing the 737 MAX, which now appears complete.
The second was getting the plane recertified. This box also now appears checked, though not in all countries.
The third is convincing Congress, Wall Street and air travelers that the company has learned from its mistakes, is reforming its culture, and is focused on the safety of its planes. Boeing's former CEO, Dennis Muilenburg, was stripped of his chairman title last year by the Boeing board and removed as CEO in January 2020. The new CEO, David Calhoun, is a former Boeing board member and former head of General Electric's Transportation and Aircraft Engines division. In his conference calls with Wall Street analysts, he has come across as open and transparent.
Boeing will also have to convince its customers to
maintain and increase their orders - which may be difficult in the age of the coronavirus. The main competition for the 737 MAX is the Airbus A320, which also scores high in fuel efficiency. Both of these planes are important cogs in air travel today, providing service on short- and medium-haul routes. The industry had been healthy. Global passenger traffic had been growing at a 4.5% rate, above the global GDP growth rate of about 3.0%. While the outlook has been reduced for the next few years, we do expect faster-than-GDP growth to return over the long term. The COVID-19 vaccines help here.
The company's assessment of the liability for the estimated potential concessions and other considerations to customers for disruptions related to the 737 MAX grounding and associated delivery delays is $9.3 billion. To date, it has made approximately $5.3 billion of payments to customers in cash and other forms of compensation. The company has settlement agreements covering approximately $2.5 billion of the remaining liability balance of $4.0 billion.
The company is also vulnerable to a cyclical downturn in the commercial aviation market, though the geographic diversification of its product portfolio provides some stability. Much of the company's backlog consists of orders from rapidly growing international customers.
Fixed costs are high in the airline manufacturing industry, and from time to time the company takes charges if it determines that investments are not generating the expected return or that more investment is needed.
Like most military contractors, Boeing also faces risks related to the cancellation or curtailment of new and existing Defense Department contracts. However, Boeing has seen solid support for its Defense, Space and Security programs, and management continues to anticipate modest defense spending growth over the next five years.
Boeing also faces risks associated with its pension obligations.
COMPANY DESCRIPTIONBoeing manufactures commercial jetliners and military
aircraft as well as rotorcraft, electronic and defense systems, missiles, satellites, launch vehicles, and advanced information and communication systems. The company was founded in 1916 and is based in Chicago. The shares are a component of the Dow Jones Industrial Average and the S&P 500. The company has more than 141,000 employees.
VALUATIONWe think that BA shares are attractively valued at current
prices near $232, above the midpoint of the 52-week range of $141-$278. The shares are down more than 45% from their all-time high of $440, set in February 2019.
Section 2.66
GROWTH / VALUE STOCKSTo value the stock on a fundamental basis, we use peer
and historical multiple comparisons, along with a dividend discount model. The models are now somewhat distorted, given Boeing's eliminated dividend, recent losses and depressed forward earnings estimates. Once the 737 MAX is fully back in the air and Boeing is accelerating production, we see earnings power of $15-$20 per share. It looks like that will be 2023 at the earliest. Despite the recent run from the 52-week lows, we still see value in the depressed shares, and are maintaining our 12-month target price of $275.
On July 29 at midday, BUY-rated BA traded at $234.33, up $2.76. (John Eade, 7/29/21)
Boston Properties, Inc. (BXP)Publication Date: 8/2/21Current Rating: BUY
HIGHLIGHTS*BXP: Reiterating BUY and raising target to $132*While the pandemic has decreased demand for office
space, we think that concerns about permanently weak demand are overblown, and expect a gradual recovery for office REITs such as BXP.
*We have a favorable view of BXP's focus on growth areas such as life science buildings and co-working spaces. At the end of the quarter, roughly 26% of the company's annualized rent came from technology, media, and life science companies.
*BXP recently reported results that exceeded consensus estimates. Second-quarter FFO rose to $267 million or $1.72 per share from $237 million or $1.52 per share in 2Q20. FFO per share exceeded the consensus estimate of $1.61 and the guidance midpoint of $1.60.
*We are raising our 2021 FFO estimate to $6.77 per share from $6.58 based on the stronger-than-expected 2Q results. We are also boosting our 2022 estimate to $7.38 from $7.10.
ANALYSIS
INVESTMENT THESISWe are reiterating our BUY rating on Boston Properties
Inc. (NYSE: BXP), an office REIT, and raising our target price to $132 from $120. The company's $2.7 billion development pipeline is weighted toward coastal markets outside of New York. We see this as a competitive advantage relative to peers, such as New York-focused SL Green, whose rents are being pressured by years of rising supply. We also have a favorable view of the company's focus on growth areas such as life science buildings and co-working spaces. At the end of the quarter, roughly 26% of the company's annualized rent came from technology, media, and life science companies.
Coming into the pandemic, BXP had impressive NOI growth of 6.7% in 2019, with strong results in Boston and San Francisco. Going forward, we expect BXP to continue to benefit from its diverse tenant base and from the prime location of its office space.
RECENT DEVELOPMENTSBXP shares have outperformed the S&P 500 over the last
three months, rising 7% versus a 5% gain for the index. Over the past year, however, the shares have underperformed, with a gain 30%, compared to a 36% advance for the S&P. The beta on BXP is 1.25, in line with peers.
BXP recently reported results that exceeded consensus estimates. For 2Q21, FFO came to $267 million or $1.72 per share, up from $237 million or $1.52 per share in 2Q20. FFO per share exceeded the consensus estimate of $1.61 and the guidance midpoint of $1.60. Same-property cash NOI rose 10% to $412 million, and the NOI margin rose 74 basis points to 60.1% - the first year-over-year growth since the start of the pandemic. Positive drivers included 9% revenue growth and more modest 4% growth in operating expenses, along with higher-than-expected termination income and parking/hotel ancillary revenue.
The company continues to grow through acquisitions. It recently agreed to acquire Safeco Plaza in Seattle for $465 million, with BXP assuming a 51% ownership stake. The acquisition of the 50-story, 800,000-square-foot class A office building marks BXP's entry into the Seattle market. The company also recently acquired 360 Park Avenue South in New York for about $300 million. The property has 450,000 square feet of space. Boston Properties will also acquire a cluster of life science buildings in Rockville, Maryland and two buildings in Waltham, Massachusetts. All of the transactions are expected to close in 2021.
On the disposition front, the company agreed to sell three assets in Lexington, Massachusetts for $192 million. It expects the transaction to close in September 2021.
In another transaction, Boston Properties recently entered into a co-investment program with Singapore-based investment firm GIC and the Canadian Pension Plan (CPP.) The three entities are targeting $1.0 billion in aggregate equity, with $500 million from GIC, and $250 million apiece from BXP and CPP. From BXP's perspective, the two-year program will unlock additional capital to fund future acquisitions. Additionally, GIC has a long track record of investing in U.S. infrastructure - including digital and green infrastructure. This infrastructure expertise is expected to complement BXP's experience in commercial development.
For 3Q21, the company projects FFO of $1.68-$1.70 per share. The midpoint of $1.69 per share implies annualized FFO of $6.76 per share. We are slightly more optimistic about portfolio performance in our FFO forecast, and note that the company exceeded its 2Q21 guidance midpoint by $0.12 per share.
EARNINGS & GROWTH ANALYSIS
Section 2.67
GROWTH / VALUE STOCKSOperating trends and forecasts for the company's primary
business lines are as follows:
-- Occupancy. For the company's in-service portfolio, the 2Q21 occupancy rate rose 10 basis points sequentially to 88.6%. Management is working to raise occupancy to the low 90s by the end of next year, driven by recent acquisitions that are 100% leased combined with modest rollover into 2022.
-- Leasing Activity/Leasing Expirations. In 2Q21, BXP signed leases totaling 1.2 million square feet with an average term of 7.5 years. New leases accounted for 60% of total signings and lease renewals for 40%. Lease expirations represent 2.4% and 6.3% of in-service square footage in 2021 and 2022, respectively, at annualized revenue of roughly $60 per square foot.
-- Construction/Development. The company had nine East Coast projects and one West Coast project underway at the end of 2Q21. Four of the projects are life science buildings and five are office. The remaining project is classified as 'other.'
We are raising our 2021 FFO estimate to $6.77 per share from $6.58 based on the stronger-than-expected 2Q results. We are also boosting our 2022 estimate to $7.38 from $7.10. Our estimates reflect management's outlook and our expectations for an accelerating recovery in 4Q21. Our long-term growth rate forecast is 5%.
FINANCIAL STRENGTH & DIVIDENDWe are raising our financial strength rating on Boston
Properties to Medium, the midpoint on our five-point scale, from Medium-Low. At the end of the quarter, cash totaled $557 million, down from $1.7 billion at the end of 2020 and $645 million at the end of 2019. Debt totaled $12.5 billion, flat with the end of 2020. BXP has repaid outstanding borrowings on its $2.0 billion revolving credit line. At the end of the quarter, the total debt/capital ratio was 39%, below the peer average of 47%. Over the past year, cash and debt have been used to fund joint ventures, construction, and building improvements. Trailing 12-month EBITDA covered interest expense by a factor of 3.9, below the peer average of 5.3.
BXP pays a quarterly dividend of $0.98 per share, or $3.92 annually, for a yield of about 3.3%, below the peer average of 4.0%. Over the past five years, the company has raised its dividend at an average annual rate of 8.6%. Our dividend estimates are $3.92 for both 2021 and 2022.
MANAGEMENT & RISKSOwen Thomas has been the company's CEO since 2013
and has more than 25 years of real estate experience. Joel Klein has been chairman since 2019 and has almost 40 years of industry experience.
Investors in BXP face several risks. Tenants may fail to pay rent or decide not to renew leases, which would stress the company's short-term liquidity. In addition, high vacancy rates can provide tenants with leverage when negotiating renewals, resulting in lease roll-downs. The company also faces asset concentration risk from its locations in New York and Washington, and could be hurt by regional slowdowns.
Some notable tenants at the end of 2020 were Salesforce (with 2% of square footage), Arnold & Porter (one of BXP's many law firm tenants), the U.S. government, a handful of large-cap tech companies, and WeWork. Some of these tenants have been cutting back on office space.
COMPANY DESCRIPTIONBoston Properties Inc. is a real estate investment trust
(REIT). The company is one of the largest owners and developers of Class A office properties in the U.S., and focuses on Boston, Los Angeles, New York, San Francisco, and Washington, D.C. BXP's portfolio consists of 196 properties with 52 million square feet. The shares are included in the S&P 500.
INDUSTRYOur rating on the Real Estate sector is Market-Weight.
While REIT shares have recently faced pressure from rising interest rates, we see longer-term benefits from the reopening of offices, increased physical retail activity, and benefits to niche REIT plays in medical facilities, apartments, data centers, and other areas.
Real Estate previously accounted for about 20% of the Financial sector; the Real Estate sector accounts for about 2.6% of the S&P 500. We recommend that investors allocate 2%-3% of diversified portfolios to this group. The sector is outperforming the market thus far in 2021, with a gain of 22.7%. It underperformed in 2020, with a loss of 5.2%, and in 2019, with a gain of 24.9%.
VALUATIONBXP shares are trading at a projected 2021 price/FFO
multiple of 17, near the midpoint of the five-year range of 10-23 and near the peer average of 16. The dividend yield is about 3.3%, below the peer average of 4.0% for comparable office and life science REITs. We believe that the stock warrants a premium valuation as Boston Properties typically grows rent and NOI faster than peers. The company also has access to cheaper capital than peers, as evidenced by its lower WACC, and by partnerships not available to peers, such as the recently announced co-investment program with GIC and CPP. We are maintaining our BUY rating and raising our target price to $132.
On July 30, BUY-rated BXP closed at $117.38, down $1.03. (Angus Kelleher-Ferguson, 7/30/21)
Boyd Gaming Corp. (BYD)
Section 2.68
GROWTH / VALUE STOCKS
Publication Date: 7/29/21Current Rating: BUY
HIGHLIGHTS*BYD: Maintaining BUY and $79 target*Boyd Gaming is benefiting from efforts to cut costs
(through executive pay cuts, employee furloughs, and the elimination of nonessential spending) as well as from recent acquisitions.
*We see the company's partnership with FanDuel and the expansion of its online betting platform as future growth drivers.
*Based on expected benefits from cost-cutting, casino reopenings, and much stronger-than-expected 2Q21 earnings, we are raising our 2021 EPS estimate to $3.00 from $2.30 and our 2022 estimate to $3.80 from $2.89.
*BYD shares are trading at 15-times our revised 2022 EPS estimate, near the midpoint of their three-year range of 4-27. We believe that a higher multiple is warranted based on our expectations for a full recovery next year.
ANALYSIS
INVESTMENT THESISWe are maintaining our BUY rating and $79 price target
on Boyd Gaming Corp. (NYSE: BYD). Boyd Gaming is benefiting from efforts to cut costs (through executive pay cuts, employee furloughs, and the elimination of nonessential spending) as well as from recent acquisitions. We also see the company's partnership with FanDuel and the expansion of its online betting platform as future growth drivers. Over the long term, we expect Boyd's operating margin to increase as a result of favorable operating leverage at the company's Las Vegas properties and at some regional casinos.
RECENT DEVELOPMENTSOn July 27, Boyd reported 2Q21 net revenue of $894
million, up from $210 million in the prior-year period. The increase reflected the impact of casino reopenings, strong results in June, and pent-up demand. Revenue also rose 6% from the pre-pandemic 2Q19.
By business segment, Las Vegas Locals posted 2Q revenue of $236 million, up from $49 million a year earlier. The consensus estimate had called for revenue of $184 million. Adjusted EBITDAR of $134 million rose by $131 million from the prior year, and the EBITDAR margin rose to 57% from 6%. Downtown Las Vegas revenue rose by more than $34 million to $39 million. Adjusted segment EBITDAR rose to $15.4 million, up from a loss of $7.2 million a year earlier, driven by increased travel to Las Vegas. In the Midwest and South segment, revenue rose by $462 million to $619 billion and topped the consensus of $569 million. Adjusted EBITDAR rose to $260 million from $33 million, and the EBITDAR margin rose to 46% from 13.5%. The consensus estimate had called for adjusted EBITDAR of $175 million.
In all, Boyd posted second-quarter adjusted EBITDAR of $409 million, $142 million above consensus and up $381 million from the prior year. Interest expense fell to $55 million from $59 million. Adjusted earnings rose to $1.54 per share from a loss of $0.98 per share in 2Q20, and topped the consensus by $0.60. The share count rose by approximately 800,000 to just over 114 million shares.
BYD shares have gained 85% since our upgrade to BUY on 10/30/20. Based on prospects for higher margins and recovery in the company's regional and Las Vegas markets, we think the shares can move higher.
In 2020, revenue fell 35% to $2.2 billion. The company posted a loss of $0.16 per share, down from EPS of $1.78 in 2019.
EARNINGS & GROWTH ANALYSISTo manage expenses, Boyd has substantially reduced
executive pay and furloughed many employees.
Looking ahead, management said that it expects to be able to hire all the help it needs and that wages remain muted.
Based on expected benefits from cost-cutting, casino reopenings, and much stronger-than-expected 2Q21 earnings, we are raising our 2021 EPS estimate to $3.00 from $2.30 and our 2022 estimate to $3.80 from $2.89.
Over the long term, we expect Boyd's operating margin to increase as a result of favorable operating leverage at the company's Las Vegas properties and at some regional casinos. Reflecting the company's extensive development pipeline, our long-term earnings growth rate estimate is 18%.
FINANCIAL STRENGTH & DIVIDENDOur financial strength rating on Boyd Gaming is Low. At
the end of 2Q21, the company had $335 million in cash and total debt of $3.39 billion.
In March 2020, the company suspended both share buybacks and dividend payments. We expect the dividend to be restored later in 2021 at an annualized rate of $0.24. For 2022, we project an annual dividend of $0.28.
MANAGEMENT & RISKSKeith E. Smith has served as the CEO of Boyd Gaming
since January 2008 and as the company's president since March 2005.
Boyd faces the risk that states near the company's existing operations could legalize or expand gambling activity, leading to increased competition. The company also faces risks from terrorism or outbreaks of disease, such as the coronavirus, which could cause tourists to cancel travel plans or force the company to close casinos. Severe weather, especially Gulf Coast hurricanes, could also force the company to temporarily
Section 2.69
GROWTH / VALUE STOCKSclose casinos.
COMPANY DESCRIPTIONBoyd Gaming, based in Las Vegas, owns and operates 29
gaming properties, up from 16 in 2011. The company's properties are located in Nevada, Iowa, Mississippi, Indiana, Illinois, Kansas, Missouri, Ohio, Pennsylvania and Louisiana. With a market cap of $6.6 billion, BYD is generally considered a mid-cap growth stock.
VALUATIONBYD shares are trading at 15-times our revised 2022 EPS
estimate, near the midpoint of their three-year range of 4-27. We believe that a higher multiple is warranted based on our expectations for a full recovery next year. Our target price of $79 implies a projected 2022 P/E of 21, and a potential return of 35% from current levels.
On July 29 at midday, BUY-rated BYD traded at $58.54, up $0.04. (John Staszak, CFA, 7/29/21)
British American Tobacco (BTI)Publication Date: 8/2/21Current Rating: BUY
HIGHLIGHTS*BTI: High dividend yield; maintaining target of $50*We believe that BTI shares offer value and like the high
dividend yield of about 8%.*Management has reiterated its 2021 outlook. It projects
constant-currency revenue growth of more than 5% and mid-single-digit growth in constant-currency adjusted EPS.
*We are reiterating our 2021 earnings estimate of $4.55 per ADR and our 2022 estimate of $4.85 per ADR.
*BTI shares appear favorably valued at 8.4-times projected 2021 EPS, toward the low end of the five-year historical range and below the peer average.
ANALYSIS
INVESTMENT THESISOur rating on British American Tobacco plc (NYSE: BTI)
is BUY. A leading global tobacco supplier, British American has a record of consistent growth, with gains in revenue, net income, and adjusted EPS over the last several years. The company continues to benefit from acquisitions, including Reynolds American, which has expanded its presence in high-growth emerging markets and in the U.S., and Dryft Sciences, which has expanded its presence in the U.S. Modern Oral segment. In 1H21, BTI saw growth in its New Categories business, with all three products posting higher revenue and market share gains.
However, British American faces a range of legal and regulatory risks, including smoking bans, restrictions on package advertising, FDA regulation of both smokeless and smokeable products, and risks related to allegations of bribery in its African operations. It also faces competition from
established cigarette companies and manufacturers of smokeless products, as well as pressure from rising taxes and sales of counterfeit cigarettes.
Despite these challenges, we believe that BTI shares offer value and like the high dividend yield of about 8%. Our target price is $50.
RECENT DEVELOPMENTSBTI shares have risen 1.4% over the past three months,
compared to gains of 1% for the EFA ETF and 3% for the IYK consumer goods industry ETF. The shares have underperformed over the past year, rising 8% compared to a gain of 25% for EFA and 32% for the industry. The shares have also underperformed over the past five years, falling 40% compared to gains of 37% for EFA and 57% for the industry. The beta on BTI is 0.71.
The company reports earnings twice a year and presents its results in British pounds. British American Tobacco also provides a trading update ahead of its results. For the convenience of U.S. ADR investors, we provide dollar-based EPS and dividend estimates. Each ADR represents one share of common stock.
BTI recently reported results for 1H21. Revenue came to GBP 12.2 billion, down 0.8% from the prior year but GBP 40 million above consensus expectations. Adjusted currency-neutral operating profit rose 8.1% to GBP 5.2 million, though the adjusted operating margin fell 70 basis points to 43% due to investment in New Category products. First-half adjusted diluted EPS fell 2.3% to 154.2 pence. In U.S. dollars, at the average 1H exchange rate of 1 GBP/$1.389, earnings came to $2.14 per ADR. Free cash flow of GBP 1.2 billion reflected operating cash flow conversion of 67%, below management's 90% target.
In 1H21, purchasers of the company's noncombustible products rose by 2.6 million to 16.1 million. Management expects to raise this number to 50 million by 2030. It also projects GBP 5 billion in New Category revenue by 2025.
The company relies in part on new products to generate growth. In October 2020, BTI acquired Dryft Sciences, which expanded its U.S. Modern Oral segment from 4 to 28 products. The new nicotine pouch portfolio will include a wider range of pouch strengths and flavors, and will be rebranded under BTI's modern oral nicotine brand, Velo.
The company is strengthening its position in e-commerce, with a focus on subscription-based sales, and looks for GBP 100 million in e-commerce sales in the near term. Management has noted that margins on subscription sales are 3-times higher than those on traditional retail sales.
BTI intends to build a 'simpler, stronger, more agile
Section 2.70
GROWTH / VALUE STOCKSorganization' through its Project Quantum cost-savings program. In 1H21, the program generated savings of GBP 256 million, bringing total savings to GBP 856 million. Management now expects GBP 1.5 billion in savings by 2022, up from its prior forecast of GBP 1.0 billion.
Management has reiterated its 2021 outlook. It projects constant-currency revenue growth of more than 5% and mid-single-digit growth in constant-currency adjusted EPS.EARNINGS & GROWTH ANALYSIS
The company has three main product segments: Combustibles (86% of 1H21 revenue), New Categories (7%), and Traditional Oral (5%). It also has four geographic segments: the U.S. (46% of first-half revenue); Americas and Sub-Saharan Africa (AmSSA) (15%); Europe and North Africa (ENA) (22%); and Asia-Pacific and Middle East (APME) (17%). In addition, the company has a 'strategic portfolio' consisting of its 'global drive brands' (Kent, Dunhill, Lucky Strike, Pall Mall and Rothmans); three U.S. brands (Camel, Newport and Natural American Spirit); and reduced-risk products.
On a currency-neutral basis, BTI saw revenue growth in all segments in 1H21. First-half business trends for these segments are discussed below. (Note that all revenue numbers are on a currency-neutral basis.)
In the Combustibles segment, revenue fell 3% to GBP 10.5 billion; however, market share rose 10 basis points, driven by higher volume and improved performance in the U.S. Management expects overall industry volume for combustible products to decline 1.5% this year, but looks for stronger results at BTI.
In the New Categories segment, the company's brands are the Vuse line of vapor products, Velo modern oral products, and GLO Hyper heated tobacco. First-half segment revenue rose 50%, led by 59% growth in vapor products and 63% growth in modern oral products. Management said that the Vuse vape brand had a 30% market share in the U.S. and was closing the gap with the number-one brand. Vuse was also the market leader in 20 U.S. states, up from 15 at the end of 2020. Management noted that modern oral products had doubled their market share in 32 states since their rollout in November 2020.
Management keeps a close watch on expenses. In 2020, the adjusted operating margin narrowed by 70 basis points to 43%, reflecting investments in the New Categories segment, offset by savings from the Project Quantum program. The program has enabled BTI to spend more on New Categories marketing without substantially increasing total expenses.
Turning to our estimates, based on recent sales trends and management's outlook, we are reiterating our 2021 earnings
estimate of $4.55 per ADR. Our estimate implies growth of 7% this year. We are also maintaining our 2022 earnings estimate of $4.85 per ADR.
FINANCIAL STRENGTH & DIVIDENDOur financial strength rating on BTI is Medium, the
midpoint on our five-point scale. The company is rated Baa2/stable by Moody's, down from A3 following the Reynolds acquisition, and BBB+/stable by S&P. Fitch rates the company at BBB/stable.
The company scores above average on profitability, but below average on debt/cap. The operating margin of 43% is above the 10-year average of 32.6% and the peer average of 29.9%. The debt/cap ratio was 70% at the end of 1H21, above the 10-year historical average of 60.7%.
The company had GBP 3 billion in cash and cash equivalents at the end of 1H21, compared to GBP 4.8 billion a year earlier. Total long-term debt was GBP 45 billion, down 10% from the prior year. BTI plans to continue to reduce debt and is targeting an adjusted net debt to EBITDA ratio of 3.0 by the end of 2021.
British American Tobacco pays a dividend. The current yield is about 8%. Management raised the payout by 4% in February 2021. We think the dividend is secure and likely to grow. Management has said that it is committed to a 65% annual dividend payout ratio. Our dividend estimates are 215p ($2.69) for 2021 and 222p ($2.85) for 2022.
The company has suspended its share buyback program due to its investment in Reynolds American.
MANAGEMENT & RISKSJack Bowles, formerly the company's COO, took over as
CEO from Nicandro Durante on April 1, 2019. The finance director is Tadeu Marroco. He has been with the company since 2003 and became the finance director in August 2019.
British American has expanded its business through a range of investments, including the acquisition of the remainder of Reynolds American. In 2015, it spent $4.7 billion to maintain a 42% stake in an enlarged Reynolds American, paid 1.7 billion pounds to acquire the shares of Brazilian tobacco company Souza Cruz S.A. that it did not already own, and acquired Croatian tobacco company TDR for 550 million euros. It has also purchased CHIC, a Polish e-cigarette business, and TwispPropriety, a South African e-cigarette/nicotine vapor company.
The company faces a range of legal and regulatory risks, including smoking bans, restrictions on package advertising, and risks related to allegations of bribery in its African operations. It also faces competitive challenges, both from established cigarette companies and manufacturers of
Section 2.71
GROWTH / VALUE STOCKSsmokeless products, as well as pressure from rising taxes and sales of counterfeit cigarettes.
The stock has recently faced pressure from stronger FDA regulation of both smokeless and smokeable products, including efforts to reduce nicotine content to nonaddictive levels.
COMPANY DESCRIPTIONLondon-based British American Tobacco plc is the
holding company for a group of companies that manufacture, market and sell cigarettes and other tobacco products, as well as smokeless products. The company sells its products in 180 countries and has approximately 64,000 employees, not including employees at tobacco farms. Its major brands include Newport, Dunhill, Kent, Lucky Strike, Pall Mall, Vuse, Rothmans, Vogue, Viceroy, Kool, Peter Stuyvesant, Benson & Hedges, John Player Gold Leaf, State Express 555, and Shuang Xi.
VALUATIONWe believe that BTI shares remain undervalued at current
prices near $38, near the top of their 52-week range of $31 to $41. From a technical standpoint, the shares are in a bearish pattern of lower highs and lower lows that dates to May 2017.
On a fundamental basis, the shares are trading at 8.4-times our 2021 EPS forecast, compared to a five-year range of 8-19 and an average of 10.9 for peers. They are also trading at a price/sales multiple of 2.4, near the low end of the historical range of 2.2-7.1 and below the peer average of 3.8. We think the shares offer value along with a high dividend yield. We are reaffirming our BUY rating with a target price of $50.
On July 30, BUY-rated BTI closed at $37.45, down $0.72. (Kristina Ruggeri, 7/30/21)
Caterpillar Inc. (CAT)Publication Date: 8/2/21Current Rating: BUY
HIGHLIGHTS*CAT: Recent weakness offers buying opportunity*CAT shares have underperformed the market over the
past quarter, falling 9% while the S&P 500 has risen 5%.*The company recently reported 2Q EPS that topped
estimates, and we are raising our forecasts.*The company has a strong balance sheet and a
long-standing commitment to the dividend, which it recently boosted 8%.
*Our target price is $250.
ANALYSIS
INVESTMENT THESISOur rating on Caterpillar Inc. (NYSE: CAT) is BUY. In
this pandemic, we think that companies with strong balance sheets and experienced management teams - as CAT has -- are
in the best position to survive and thrive. Financial strength will carry a company through the crisis, and talented management will lead it to the other side. Demand plummeted for CAT early during the coronavirus crisis, but is starting to come back. Meantime, management has taken steps to reduce costs and bolster a balance sheet that was already strong. Management's focus on margins should, in our view, position the company for more consistent results on the other side of the pandemic. The shares offer value, with a dividend yield of 2.1% that is attractive in a low interest rate environment. Management's recent 8% increase in the dividend signals confidence in the near-term outlook. Our target price is $250.
RECENT DEVELOPMENTSCAT shares have underperformed the market over the past
quarter, falling 9% while the S&P 500 has risen 5%. Over the past year, the shares have outperformed, rising 45% versus the broad market's 36% gain. The shares have outperformed the industry ETF IYJ over the past 12 months and over the past five years. The beta on the CAT shares is about 0.90.
The company recently reported 2Q adjusted EPS of $2.60, up 105% year-over-year on a pro forma basis and above the consensus estimate of $2.38. Sales rose 29% from the prior year, to $12.9 billion. The adjusted operating margin widened by 380 basis points to 14.1%. For the first half, the company has earned $5.47 per share.
Due to the pandemic, Caterpillar is not currently providing detailed financial guidance for the full year, though it does expect 2021 to be a 'better year than 2020.' Management is expecting wider margins and higher free cash flow than the average of the 2010-2016 period.
EARNINGS & GROWTH ANALYSISCaterpillar has three primary segments. Construction
Industries (approximately 43% of 2Q sales), Resource Industries (20%) and Energy & Transportation (38%). Recent results and segment outlooks are summarized below. Comparisons are year-over-year.
In Construction Industries, sales rose 40%. The increase was due to higher sales volume driven by higher end-user demand for equipment and aftermarket parts, and the impact from changes in dealer inventories. Sales rose in all regions. The segment operating margin widened by 530 basis points to 18.1%. Management commented during the 2Q conference call that increased residential demand in North America is a favorable tailwind, but China demand has slowed.
In Resource Industries, sales rose 41% due to volume gains driven by the impacts of changes in dealer inventories, and higher end-user demand for equipment and aftermarket parts. The segment operating margin widened by 570 basis points to 14.0%. This segment is driven by trends in the mining sector, which are on the upswing as commodity prices
Section 2.72
GROWTH / VALUE STOCKSrise.
In the Energy & Transportation segment, sales rose 20% year-over-year, while operating profit increased 17%. Sales improved in all subsegments - Oil & Gas, Industrial, Power Generation and Transportation. The operating margin narrowed by 30 basis points to 14.7%. Stable oil prices will help this segment recover more quickly. Data center activity is also providing support for the Power Generation group.
Management keeps a close eye on costs. The operating margin in 2Q widened by 380 basis points year-over-year to 14.1%, but we note it narrowed sequentially to 15.3% due to higher input costs. CAT's operating margin over the past ten years has ranged from 8% to 15.4%. CAT should hit the upper end of the range in 2021.
Turning to our estimates, based on the trends in sales and margins heading into 2H20, we are boosting our adjusted 2021 EPS forecast from $10.10 to $10.25. Our estimate implies growth of 56% for the year. We are anticipating another year of growth in 2022 and are raising our preliminary adjusted EPS forecast of $12.75 to $12.85. Our five-year earnings growth rate forecast is 9%.
FINANCIAL STRENGTH & DIVIDENDWe rate Caterpillar's financial strength as Medium-High.
The company receives above-average scores on our key financial tests of leverage, fixed-cost coverage, cash flow generation, and profitability.
Caterpillar has taken actions to improve its strong financial position by increasing liquidity. On a consolidated basis, Caterpillar ended 2Q21 with $10.8 billion of cash.
CAT's debt/capitalization ratio, excluding the Financial Products division, was 57% at the end of the latest quarter.
CAT pays a dividend. In June, the company raised its quarterly payout by 8% to $1.11, or $4.44 annually, for a yield of about 2.1%. The company has paid dividends since 1933. Our dividend estimates are $4.36 for 2021 and $4.70 for 2022.
Caterpillar also has a share repurchase plan.
MANAGEMENT & RISKSThe Chairman and CEO is Jim Umpleby, formerly a
Caterpillar group president with responsibility for Energy & Transportation. Mr. Umpleby has worked for Caterpillar for more than 35 years. The CFO is Andrew R.J. Bonfield. Mr. Bonfield joined Caterpillar on September 1, 2018 and brings more than three decades of financial expertise to the role, most recently serving as Group CFO and board member of National Grid plc, a British multinational electricity and gas utility company.
Caterpillar has a history of providing transparent results to investors.
Caterpillar management met with investors in May 2019. Key takeaways included:
-- The company plans to return substantially all Machine, Energy & Transportation (ME&T) free cash flow to shareholders through continued dividend growth and more consistent share repurchases.
-- Caterpillar expects to deliver higher adjusted operating margins through the cycle of three to six percentage points above historical performance; in other words, the target operating margin peak is now about 17%.
-- To achieve this margin improvement, the company intends to double ME&T services sales to about $28 billion by 2026, from a 2016 baseline of about $14 billion.
The company faces a range of operational and financial risks, and its performance could be hurt by rising interest rates, unfavorable exchange-rate movements, declining commodity prices, and weakness in the construction and mining industries. The pandemic is posing a severe risk to the company's profitability, but not its financial strength.
Caterpillar generates more than 50% of its revenue overseas and its results are typically linked to global economic trends. Caterpillar's results are also sensitive to trends in the dollar. A stable or falling dollar would be a positive development for the Industrial sector and Caterpillar.
The company also has an underfunded pension plan.
COMPANY DESCRIPTIONCaterpillar is the world's leading manufacturer of
construction and mining equipment, diesel and natural gas engines, industrial gas turbines, and diesel-electric locomotives. The company was founded in 1925. It is a component of the Dow Jones Industrial Average and the S&P 500 Index. The company has approximately 97,000 employees.
VALUATIONWe think that CAT shares are attractively valued at
current prices near $205. The shares have traded between $130 and $247 over the past 52 weeks. From a technical standpoint, since the pandemic lows of March 2020, the shares had been in a bullish pattern of higher highs and higher lows, though the trend turned neutral in June.
On the fundamentals, CAT shares are trading at 16-times our 2022 EPS forecast, compared to a 15-year annual average range of 9-25, though we note that for highly cyclical companies, it is often better to buy at high valuations, which
Section 2.73
GROWTH / VALUE STOCKSimply low earnings that can rebound. On other metrics, the shares are trading at a trailing price/book multiple of 7.0, at the high end of the historical range of 2.5-8.5; and at a price/sales multiple of 2.7, near the high end of the range of 1.0-3.5. Compared to the peer group, the shares offer a higher yield and a lower P/E. Our dividend discount model points to a fair value above $250. We are maintaining our BUY rating on this well-managed company and our target price of $250.
On July 30, BUY-rated CAT closed at $206.75, down $5.81. (John Eade, 7/30/21)
CBOE Global Markets Inc. (CBOE)Publication Date: 8/4/21Current Rating: BUY
HIGHLIGHTS*CBOE: Raising target to $133 *On July 30, the company reported 2Q21 adjusted EPS of
$1.38, up from $1.31 a year earlier and above the consensus of $1.35. Net revenues rose 18% to $351 million.
*Management has raised its 2021 nontransaction revenue growth target to 15%-16% from 11%-12%, and its organic revenue growth target to 12%-13% from 10%-11%.
*We are boosting our 2021 EPS estimate to $5.68 from $5.57 and our 2022 estimate to $5.72 from $5.62.
*On valuation, CBOE shares remain attractive at 21-times our 2021 EPS estimate, at the low end of the historical average range.
ANALYSIS
INVESTMENT THESISWe are maintaining our BUY rating on options exchange
operator Cboe Global Markets Inc. (BATS: CBOE) and raising our price target to $133 from $120. We expect CBOE to benefit from increased market volatility and from its ability to provide greater price transparency in options trading. We also have a favorable view of the recent acquisitions of Hanweck and FT Options, which have enabled CBOE to deliver portfolio tools and risk analytics to its user base and have been accretive to earnings. CBOE's recent acquisition of BIDS Trading will also allow it to expand in off-exchange equity block transactions, a growing market segment. In addition, the company continues its expansion outside the U.S., with the integration of EuroCCP, the acquisition of Canadian trading platform MATCHNow, and the recent acquisition of Chi-X Asia Pacific. On valuation, CBOE shares remain attractive at 21-times our 2021 EPS estimate, at the low end of the historical average range. Our revised target price of $133 assumes a higher multiple of 23, closer to the historical average and in line with the multiples of other exchange operators.
RECENT DEVELOPMENTSOver the past three months, CBOE has outperformed the
S&P 500, rising 17% versus a 5% gain for the index. Over the past year, the shares have risen 40%, compared to a gain of
35% for the index. We note that 17% of CBOE shares are held in ETFs, with CBOE representing 4.6% of the U.S. Broker-Dealers ETF IAI. The stock has a low beta of 0.65.
On July 30, the company reported 2Q21 adjusted EPS of $1.38, up from $1.31 a year earlier and above the consensus of $1.35. Net revenues rose 18% to $351 million, reflecting higher recurring nontransaction revenue. Adjusted operating expenses rose 34%, primarily due to higher technology costs and costs related to acquisitions.
In July 2021, CBOE completed its acquisition of Chi-X Asia Pacific. The acquisition expands the company's presence in the Asia Pacific region.
On January 4, CBOE completed its purchase of BIDS Trading, the largest volume block-trading platform in the U.S. The platform expands CBOE's presence in the off-exchange segment of the U.S. equities market.
On August 9, 2020, CBOE launched Mini Cboe Volatility Index (Mini VIX) futures. Mini VIX provides a way for smaller investors to hedge against market volatility.
The company continues its focus on retail investors. In particular, it is working to educate retail-oriented investment firms about the value of including volatility-based options in diversified portfolios. Recent developments include the use of virtual forums and webinars. Management notes that activity is increasing, and that more retail investors are beginning to use options to hedge their portfolios.
In July 2020, the company acquired European equity clearing house EuroCCP. EuroCCP has enabled CBOE to expand its presence in the European derivatives market. It plans to launch European stock indices in September 2021.
CBOE also recently acquired data analytics companies Hanweck and FT Options, adding to recurring revenue. Hanweck provides capital efficiency tools and portfolio margin capabilities, while FT Options provides CBOE clients with portfolio risk management tools. The company also completed its acquisition of Trade Alert, adding to its suite of information services, and MATCHNow, a leading Canadian trading platform.
EARNINGS & GROWTH ANALYSISCBOE organizes its businesses into five segments:
Options, North American Equities, European Equities, Futures, and Global FX. We review recent results in these segments below.
In the Options segment, 2Q net revenue rose 19% to $179 million (51% of overall net revenue). The increase was driven by higher transaction and clearing fees. Total market share fell 4.8 percentage points to 30.4%, reflecting lower volume in
Section 2.74
GROWTH / VALUE STOCKSindex options.
In North American Equities, net revenues fell 2% to $89.2 million (25% of revenue), primarily due to a decrease in transaction and clearing fees. U.S. equity market share fell to 14.3% from 16.1% due to higher off-exchange volumes.
European Equities net revenue rose 97% to $41.6 million (12% of net revenue), reflecting the addition of EuroCCP, which contributed $11.7 million in additional revenue, as well as higher access and capacity fees.
Futures net revenue rose 31% to $27.4 million (8% of net revenue), primarily due to an increase in net transaction fees.
Global FX net revenue rose 1% to $13.8 million (4% of net revenue), driven by higher net transaction and clearing fees.
In 2021, management projects adjusted operating expenses of $531-$539 million, reflecting higher compensation costs (including incentive-based compensation), merger and acquisition costs, and strategic growth initiatives. It projects an effective tax rate of 27.5%-29.5%, and depreciation and amortization expense of $34-38 million. Management has raised its nontransaction revenue growth target to 15%-16% from 11%-12%, and its organic revenue growth target to 12%-13% from 10%-11%.
We are raising our 2021 EPS estimate to $5.68 from $5.57 and our 2022 EPS estimate to $5.72 from $5.62.
FINANCIAL STRENGTH & DIVIDENDOur financial strength rating on CBOE is Medium-High.
The company scores well above average on our three main measures of financial strength: leverage based on debt/cap, profitability, and interest coverage. Total debt at June 30, 2021 was $875 million. CBOE continues to benefit from run-rate synergies from the BATS merger and is on track to reach its annual target of $80 million in 2021.
In 2Q21, the company returned $79 million to shareholders via share buybacks and has approximately $270 million remaining on its current authorization.
CBOE pays a quarterly dividend of $0.42 per share, or $1.68 annually, for a yield of about 1.4%. Our dividend estimates are $1.78 for 2021 and $1.92 for 2022.
MANAGEMENT & RISKSEdward T. Tilly has been the company's CEO since 2013
and chairman since 2017. Chris Isaacson is the chief operating officer.
The company provides investors with operating expense and tax rate guidance, but does not provide EPS guidance.
Investors in CBOE shares face numerous risks.
The company's performance is affected by market volatility and by the level of equity and options activity. In addition, the company has relatively high fixed costs, and would suffer significant margin erosion if volatility declined sharply and stayed low for an extended period.
CBOE also faces intense competition from other exchanges, which is likely to increase in the near term. The proposed Members Exchange and IEX are two examples of competing platforms. In order to maintain its competitive position, the company needs to invest heavily in new technology and in its workforce. It must also protect its intellectual property.
The derivatives and options trading industry is subject to legal and regulatory developments that could hurt trading and clearing volumes and raise the overall cost of doing business. The clearing business faces counterparty risk as well as scrutiny from regulators who believe that clearing houses may be a systemically risky part of the financial system.
COMPANY DESCRIPTIONCboe Global Markets is one of the largest global exchange
operators. The company offers trading across a wide range of asset classes, including options, futures, U.S. and European equities, exchange-traded products (ETPs), global FX, and products on the VIX index. Cboe maintains the largest options exchange in the U.S. and the largest stock exchange in Europe. The company is headquartered in Chicago, with offices in Kansas City, New York, London, San Francisco, Singapore, Hong Kong and Ecuador.
INDUSTRYOur rating on the Financial Services sector is
Over-Weight. With market optimism rising on positive vaccine developments and the new administration in Washington, interest rates have started to move higher at the long end of the yield curve. We expect banks to benefit from wider net interest margins and lower loan-loss provisions as the economy normalizes, and insurance companies to generate higher income in their investment portfolios.
The sector accounts for 11.2% of the S&P 500, down from 16.3% following the exclusion of REIT stocks. Over the past five years, the weighting has ranged from 9% to 17%. We think the sector should account for 12%-13% of diversified portfolios. The Financial sector is outperforming the market thus far in 2021, with a gain of 25.2%. It underperformed in 2020, with a loss of 4.1%, and slightly outperformed in 2019, with a gain of 29.2%.
The projected P/E ratio on 2022 earnings is 14, below the market multiple of 20. As for earnings expectations, analysts
Section 2.75
GROWTH / VALUE STOCKSnow expect earnings to rise 36.7% in 2021 and fall 2.6% in 2022 after falling 24.8% in 2020 and rising 39.0% in 2019. Yields are in line with the market average. Dividends and share repurchases also remain subject to regulatory approval for large banks deemed too-big-to-fail.
VALUATIONCBOE is trading near the high end of its 52-week range of
$78-$122. We believe that CBOE has strong prospects in its core businesses and expect further growth in nontransactional services. We also expect the company to benefit from continued option and equity market volatility, and note that recent acquisitions will allow CBOE to provide a more comprehensive global suite of services to clients. CBOE shares appear attractive at 21-times our 2021 EPS estimate, at the low end of the historical average range. Our revised target price of $133 assumes a higher multiple of 23, closer to the historical and peer group average.
On August 3, BUY-rated CBOE closed at $122.43, up $1.75. (Kevin Heal and Caleigh McGough, 8/3/21)
Cheesecake Factory Inc. (CAKE)Publication Date: 7/30/21Current Rating: BUY
HIGHLIGHTS*CAKE: Reaffirming BUY following second-quarter
results*Cheesecake Factory recently reported 2Q net sales of
$769 million, up 160% from the prior year and above the consensus of $743 million. Adjusted EPS rose to $0.80, up from a loss of $0.90 per share in 2Q20 and above the consensus EPS estimate of $0.72.
*We expect vaccine distribution to continue to boost comp sales at Cheesecake Factory, and note that comps thus far in 3Q are running 10% above 2019 levels.
*Off-premise sales represented approximately 27% of Cheesecake Factory restaurant sales in 2Q21, and management believes that they could remain an important sales driver after the pandemic.
*We are raising our 2021 EPS estimate to $2.35 from $2.00 and our 2022 estimate to $3.25 from $2.95.
ANALYSIS
INVESTMENT THESISWe are maintaining our BUY rating on Cheesecake
Factory Inc. (NGS: CAKE). We expect the distribution of COVID-19 vaccines to continue to boost comp sales and note that comps thus far in the third quarter are running 10% above 2019 levels. We also expect revenue to benefit from the company's increased focus on mobile ordering, carryout, and deliveries. These off-premise sales represented approximately 27% of Cheesecake Factory restaurant sales in 2Q21, and management believes that they could remain an important sales driver after the pandemic. The company should also benefit from a new rewards program launching next year and from a
website upgrade, which management believes will increase the size of online orders.
On valuation, the stock has risen above pre-pandemic levels, though it still appears favorably valued relative to peers. The shares are trading at 20-times our 2021 EPS estimate, compared to a five-year historical average range of 18-21 and below the average multiple of 29 for peers PZZA, EAT, and CBRL. We think that the shares should trade more in line with the peer group. Our revised target price is $65, reduced from $76.
RECENT DEVELOPMENTSCAKE shares have underperformed over the past quarter,
falling 16% compared to a 5% gain for the S&P 500 and a 2% advance for the industry (ETF IYC). Over the past year, the shares have outperformed, rising 97% compared to gains of 36% for both the index and the industry. They have underperformed over the past five years, falling 6% compared to a gain of 103% for the index and 112% for the industry. The beta on CAKE is 1.78.
Cheesecake Factory recently reported 2Q net sales that topped analyst expectations. Revenue of $769 million was up 160% from the prior year and above the consensus of $743 million. (Relative to the pre-pandemic 2Q19, sales improved 28%.) Adjusted net income rose to $43.9 million, up from a loss of $46 million. Adjusted EPS rose to $0.80, up from a loss of $0.90 per share in 2Q20 and above the consensus EPS estimate of $0.72. (Earnings declined 2% from the pre-pandemic 2Q19.) Cash flow from operating activities was $109 million.
Cheesecake Factory is targeting the launch of a rewards program next year. The company is also revamping its website with the goal of increasing conversion rates and the size of online orders. Management expects these initiatives to lower gross margins by about 20 basis points in the second half of 2021.
During the second quarter, the company opened four new restaurants. It plans to open approximately 14 new U.S. restaurants this year, along with three international Cheesecake Factory locations under licensing agreements. As of the end of June, nearly all of the company's restaurants were open, with at least some indoor dining. As noted above, off-premise revenue represented approximately 27% of 2Q revenue at Cheesecake Factory restaurants and, in management's view, could remain an important sales driver after the pandemic. To help boost sales and earnings, the company is also testing new AI-based technology at its Flower Child restaurants. Management expects the new technology to enable faster ordering, reduce the time customers spend at restaurants, and increase table turnover.
CAKE has a growth-by-acquisition strategy. In October
Section 2.76
GROWTH / VALUE STOCKS2019, it acquired Fox Restaurant Concepts (FRC). After investing $88 million in FRC's Flower Foods and North Italia brands, the company invested an additional $308 million at closing and will invest $45 million over the next four years, for a total of approximately $440 million. The acquisition is expected to be accretive to 2021 earnings.
Management said that it expects cost of sales inflation of 3% in the second half of the year and labor expense deleveraging of up to 25 basis points. The company has raised menu prices by 3%, which management believes is sufficient to cover the impact of inflation this year. Management also said that staffing levels currently exceed those of 2019 and are nearly sufficient to support current sales.
EARNINGS & GROWTH ANALYSISThe company owns 300 restaurants in the U.S. and has
license agreements for 28 restaurants abroad. The company has four segments: Cheesecake Factory restaurants (79% of 2Q sales), North Italia (6%), Other FRC (6%), Other (9%). Second-quarter results by segment are summarized below:
All segments saw year-over-year revenue improvement. At Cheesecake Factory restaurants, revenue rose more than 150% to $607 million. Comparable restaurant sales rose 150% from the prior year, and were up 8% from 2Q19. The segment operating margin was 14%, up from a loss in 2Q20. Preopening costs were down 24% from the prior year.
At North Italia, revenue rose more than 200% to $44 million. Comparable restaurant sales were up 182% from the prior year and 10% from 2Q19. The segment operating margin was 7%, compared to a loss in 2Q20. Preopening costs were up nearly 250% from 2Q20.
In the Other FRC segment, sales rose nearly 300% from the prior year to $47 million, and income rose to $7.3 million following a loss of $5 million a year earlier. Preopening costs rose 68%. In the Other segment, revenue rose nearly 150% to $71 million (up 39% from 2Q19), but the net operating loss widened to $52 million from $47 million. Preopening costs fell 22%.
On the expense side, the cost of sales was 22% of revenue, down 240 basis points from the prior year, driven by sales mix and pricing leverage. Labor costs were 35.7% of revenue, down 580 basis points. Other operating costs were 25.9% of sales, down 1,520 basis points from 2Q20 due to sales leverage. G&A expense was 6.3% of revenue, down 580 basis points.
Turning to our estimates, based on the better-than-expected 2Q results and strong comp sales thus far in 3Q, we are raising our 2021 EPS estimate to $2.35 from $2.00. For 2022, we are raising our EPS estimate to $3.25 from $2.95, implying 38% growth from our 2021 estimate and
well above the $2.61 earned in 2019. Our estimates assume continued recovery in demand, no additional pandemic-related closures, and higher pricing, partly offset by a modest increase in labor and other input costs.
FINANCIAL STRENGTH & DIVIDENDOur financial strength rating on Cheesecake Factory is
Medium-Low. The company has below-average scores on our main financial strength criteria of debt levels, fixed-cost coverage, profitability, cash flow generation, and earnings quality.
The company's cash and cash equivalents were $162 million at the end of 2Q21, up from $154 million at the end of 2020. Including the $240 million available on the company's revolver, total liquidity was $402 million. After the issuance of $345 million in convertible senior notes in 2Q21, long-term debt was $475 million, up from $280 million at the end of 2020. The company did not provide any information on long-term lease liabilities in its 2Q earnings report, but 1Q21 lease liabilities were $1.2 billion. Total long-term debt and lease liabilities were about 84% of total equity at the end of 1Q21. Cash flow from operating activities was $109 million in 2Q.
In 2Q21, CAKE completed a 3.125 million share common stock offering. The proceeds from this offering and from the above-mentioned convertible senior notes were used to repurchase most of the company's outstanding convertible preferred stock. The preferred shares that were not repurchased were converted into approximately 2.4 million shares of common stock. Management believes that these transactions simplify CAKE's capital structure.
Management said on the 2Q call that it expects to reinstate dividends and share buybacks in 2022. Our current dividend estimates are zero for 2021 and 2022.
MANAGEMENT & RISKSDavid Overton has served as the company's chairman and
CEO since 1992. Mr. Overton co-founded the company with his parents, opening the first Cheesecake Factory restaurant in 1978. Matthew Clark has served as EVP and CFO since 2017. Prior to becoming CFO, Mr. Clark served as SVP, Finance and Strategy.
Investors in the CAKE shares face risks. The pandemic has reduced restaurant traffic, which may not return to previous levels in the near term. Higher food and beverage costs are also a risk for restaurant companies. Dairy costs, in particular, affect Cheesecake Factory, as cream cheese is the primary ingredient in the company's namesake product. In addition, increased labor turnover, as well as higher wage and benefit costs, may reduce earnings.
COMPANY DESCRIPTIONBased in Calabasas, California, Cheesecake Factory
Section 2.77
GROWTH / VALUE STOCKSoperates a chain of upscale casual dining restaurants. In addition, it operates a bakery that produces cheesecake and other baked products for the company's restaurants and other foodservice operators, retailers and distributors. The company has 46,250 employees.
INDUSTRYOur rating on the Consumer Discretionary sector is
Under-Weight, reduced from Market-Weight. We believe that recovery in leisure and service industries such as hotels, casinos, restaurants, and airlines has been largely priced into stocks. Meanwhile, sector giants AMZN and TSLA have cycled out of investor favor amid broad sector rotation.
The sector accounts for 12.3% of the S&P 500, compared to 13% following the reassignment of media & entertainment companies to the newly formed Communication Services sector. The reassignment removed companies in areas including theatrical filmed entertainment, publishing, advertising, broadcasting, and cable & satellite communications. We believe that the net impact of the change will be a moderate reduction in Consumer Discretionary EPS growth and a slight boost in the weighted dividend yield.
We think investors should consider allocating 11%-12% of their diversified portfolios to the group. The sector is underperforming thus far in 2021, with a gain of 11.6%. It outperformed in 2020, with a gain of 32.1%, but underperformed in 2019, with a gain of 26.2%.
Consumer Discretionary earnings are expected to increase 40.2% in 2021 and 34.4% in 2022. This follows declines of 28.3% in 2020 and 0.9% in 2019. On valuation, the 2022 projected P/E ratio is 27, above the market multiple of 20. The sector's debt ratios are high, with an average debt-to-cap ratio of 52%. Yields are below average at 0.5%.
VALUATIONCAKE shares appear undervalued at current prices near
$48, above the midpoint of their 52-week range of $22-$66. From a technical standpoint, prior to the pandemic, the shares had been in a generally bearish trend of lower highs and lower lows since April 2017. However, they have now risen above pre-pandemic levels. The shares are trading at 20-times our 2021 EPS estimate, compared to a five-year historical average range of 18-21 and below the average multiple of 29 for peers PZZA, EAT, and CBRL. We think that the shares should trade more in line with the peer group. Our revised target price is $65.
On July 30 at midday, BUY-rated CAKE traded at $45.89, down $1.85. (Kristina Ruggeri, 7/30/21)
Chemours Company (CC)Publication Date: 8/3/21Current Rating: BUY
HIGHLIGHTS
*CC: Maintaining BUY*Chemours has done a good job of navigating through the
pandemic, and we expect it to benefit from its broad global footprint and improving industry conditions.
*On July 29, Chemours posted 2Q21 adjusted net income of $205 million or $1.20 per diluted share, up from $1.02 a year earlier and above the consensus of $0.89.
*Based on recent volume and margin trends, we are raising our 2021 EPS estimate to $3.56 from $3.03 and our 2022 estimate to $4.00 from $3.75.
*Our target price of $40, combined with the dividend, implies a potential total return of 23% from current levels.
ANALYSIS
INVESTMENT THESISWe are maintaining our BUY rating on The Chemours
Company (NYSE: CC), a specialty chemical producer spun off from DuPont. We view Chemours as a well-run company with a strong track record in its industry, and expect its products and services to be in high demand on the other side of the pandemic. Chemours has done a good job of navigating through the downturn, and we expect it to benefit from its broad global footprint and improving industry conditions. The balance sheet is not very strong, though. On the fundamentals, CC shares are trading at 9-times our 2021 EPS forecast, in the upper half of the historical range of 3-14. The price/sales multiple of 1.0 is near the high end of the historical range of 0.3-1.1. In our view, these valuations are attractive given the current economic backdrop despite the company's weak balance sheet. We are maintaining our BUY rating and target price of $40, implying a potential total return of 23% including the dividend.
RECENT DEVELOPMENTSCC shares have outperformed the S&P 500 over the past
three months, rising 11% compared to a gain of 5% for the index. They have also outperformed over the past year, rising 80% compared to a gain of 34% for the index. Over the past five years, the stock has risen 265%, compared to a 101% gain for the S&P 500. The beta on CC is 2.1.
The company recently posted 2Q21 results that topped consensus estimates. On July 29, Chemours posted 2Q21 adjusted EBITDA of $366 million, up 120% year-over-year. Second-quarter adjusted net income was $205 million or $1.20 per diluted share, up from $1.02 a year earlier and above the consensus of $0.89. Net sales rose 51% to $1.7 billion.
In 2020, net sales came to $4.97 billion and adjusted EPS fell to $1.98 from $2.51 in 2019.
EARNINGS & GROWTH ANALYSISIn 4Q20, the company split its Fluoroproducts segment
into Thermal and Specialized Solutions (TSS) and Advanced Performance Materials (APM). It now has four business segments: Thermal and Specialized Solutions (50% of sales);
Section 2.78
GROWTH / VALUE STOCKSTitanium Technologies (21%), Advance Performance Materials (23%), and Chemical Solutions (5%).
By segment, TSS posted 2Q21 sales of $340 million, up 4.7% year-over year. Segment adjusted EBITDA rose 113% and the adjusted EBITDA margin of 34% rose 1000 basis points, reflecting a recovery in key markets and an improved product mix. Volume rose 48% from the prior year.
In Titanium Technologies, 2Q net sales rose to $859 million from $488 million in the prior-year quarter. Volume rose 15%, reflecting solid demand in all regions and end markets. Segment adjusted EBITDA rose 133% from the prior year and the adjusted EBITDA margin of 25% rose 600 basis points.
In Advanced Performance Materials, sales rose to $362 million from $292 million a year earlier. Segment adjusted EBITDA rose 76% to $74 million and the adjusted EBITDA margin rose by 600 basis points.
In the Chemical Solutions segment, 2Q sales rose 15%. Adjusted EBITDA of $19 million was flat with the prior year.
The company expects 2021 adjusted EBITDA of $1.10-$1.25 billion, up from $879 million in 2020. It also projects 2021 EPS of $2.84-$3.56, up from $1.98 in 2020. It expects free cash flow of $450 million.
Turning to our estimates, based on recent volume and margin trends, we are raising our 2021 EPS estimate to $3.56 from $3.03 and our 2022 estimate to $4.00 from $3.75.
FINANCIAL STRENGTH & DIVIDENDWe rate the company's financial strength as Medium-Low,
the second-lowest rank on our five-point scale. The company's debt is rated Ba3/negative by Moody's and B+/positive by S&P.
Long-term debt was $4.2 billion at the end of 2Q21 and accounted for 83% of total capitalization. Second-quarter cash flow from operating activities of $256 million covered interest expense of $47 million by a factor of 5.4. Cash and cash equivalents were $1.1 billion, up from $1.0 billion a year earlier. Free cash flow was $189 million, compared to $50 million in 2Q20. The company recently issued $800 million in notes due 2028 to replace outstanding notes due 2023.
The company pays a quarterly dividend of $0.25 per share, or $1.00 annually, for a yield of about 3%. Our dividend estimates are $1.00 for both 2021 and 2022.
The company has a share buyback program, but did not repurchase any shares in 2020.
MANAGEMENT & RISKS
Mark Newman became the company's president and CEO on July 1, 2021, following the retirement of Mark P. Vergnano. Mr. Vergnano is now nonexecutive chairman.
Investors in CC shares face risks. Chemours' growth is dependent on the health of the global economy. In addition, the company faces a range of risks associated with commodity and energy costs, foreign exchange rates, environmental issues, litigation, and capacity utilization.
Illegal imports of stationary refrigerants into the EU pose a risk for the company's Fluoroproducts business.
As a former DuPont subsidiary, Chemours is obligated to indemnify DuPont for any judgments against its former parent in a range of product liability, intellectual property, commercial, antitrust, and environmental lawsuits.
DuPont, Corteva, and Chemours face legal liabilities from the past production of hazardous PFAS chemicals. The companies have now agreed to establish a cost-sharing arrangement and an escrow account to manage potential legacy PFAS liabilities arising from conduct prior to July 1, 2015. The new agreement replaces the February 2017 PFOA Settlement and subsequent amendment to the Chemours Separation Agreement. DuPont, Corteva and Chemours have also agreed to resolve ongoing matters in the multidistrict PFOA litigation in Ohio.
COMPANY DESCRIPTIONChemours, a July 2015 spinoff from DuPont, is a global
leader in titanium technologies, fluoroproducts, and chemical solutions. Its products are used in a wide range of industrial businesses, including plastics, coatings, refrigeration and air conditioning, mining, and oil refining. Its major brands include Teflon, Ti-Pure, Krytox, Viton, Opteon and Nafion. Chemours has approximately 6,500 employees and 30 manufacturing plants, and serves approximately 3,300 industrial customers. The company is based in Wilmington, Delaware.
VALUATIONCC shares have traded between $4 and $39 since the
company's July 2015 spinoff from DuPont. They are currently in the upper half of their 52-week range of $19-$39. From a technical standpoint, the shares reversed a long-term bearish pattern of lower highs and lower lows after the pandemic selloff in March 2020. They recovered in a pattern of higher highs and higher lows until mid-June 2021, but have traded mostly lower since that time.
On the fundamentals, CC shares are trading at 9-times our 2021 EPS forecast, in the upper half of the historical range of 3-14. The price/sales multiple of 1.0 is near the high end of the historical range of 0.3-1.1. In our view, these valuations are attractive given the current economic backdrop despite the company's weak balance sheet. We are maintaining our BUY
Section 2.79
GROWTH / VALUE STOCKSrating and target price of $40, implying a potential total return of 23% including the dividend.
On August 2, BUY-rated CC closed at $33.51, up $0.26. (David Coleman, 8/2/21)
CME Group Inc (CME)Publication Date: 7/30/21Current Rating: HOLD
HIGHLIGHTS*CME: Reiterating HOLD on valuation*On July 28, CME reported adjusted 2Q21 earnings of
$1.64 per share, up from $1.63 in 2Q20. Revenue was flat with 2Q20, at $1.18 billion.
*Looking ahead, we expect volume in interest rate contracts to decline amid low short-term interest rates. We also expect lower energy contract volume due to range-bound oil prices, which have reduced the need for hedging.
*CME is trading at 30-times our 2021 EPS estimate, topping the high end of the historical range of 12-28 and above the peer average.
*Based on the current valuation and the lack of a clear catalyst, we see limited near-term upside for CME and believe that a HOLD rating remains appropriate.
ANALYSIS
INVESTMENT THESISWe are reiterating our HOLD rating on CME Group Inc.
(NGS: CME). We expect volume in interest rate contracts to decline amid low short-term interest rates, and look for lower energy contract volume due to range-bound oil prices, which have reduced the need for hedging. On the positive side, we expect higher volume for agricultural contracts, newly launched cryptocurrency contracts and the introduction of micro-contracts geared toward retail investors along with continued strong cost controls.
CME shares have risen strongly from their pandemic lows in March 2020 and are currently trading at 30-times our 2021 EPS estimate, topping the high end of the historical range of 12-28 and above the peer average. Based on the current valuation and the lack of a clear catalyst, we see limited near-term upside for CME and believe that a HOLD rating remains appropriate.
RECENT DEVELOPMENTSCME shares have outperformed thus far in 2021, rising
18% compared to a gain of 17% for the S&P 500. Over the past year, the shares have risen 29%, compared to a 37% advance for the index. The shares have outperformed over the past five years, gaining 110% compared to 103% for the index. The beta on the shares is a low 0.44.
On July 28, CME reported adjusted 2Q21 earnings of $1.64 per share, up from $1.63 in 2Q20. Revenue was flat with 2Q20, at $1.18 billion. Second-quarter expenses fell 7% to
$505 million, primarily due to a decrease in professional fees and outside services.
In 2Q21, CME introduced a new suite of micro-contracts that allow retail market users to customize their trading and hedging. CME also introduced new ESG-focused futures contracts that help manage climate-related risk. In 1Q21, the company migrated U.S. Treasury broker BrokerTec to the CME Globex platform. CME also began trading Global Emission Offset futures and Mini-Bitcoin futures.
The company launched Nasdaq Veles California Water Index futures in the fourth quarter of 2020, and options on its Micro E-mini S&P 500 and Micro E-mini Nasdaq-100 futures contracts in 3Q. To provide clients with better trading information, it also launched the FX Options Volatility Converter tool on September 9 and the TreasuryWatch Tool on October 6.
The company took several steps in 2020 to maintain safe operations during the pandemic. It closed trading floors, transitioned clients to electronic trading, and allowed most employees to work remotely. In August, CME reopened its Eurodollar Options pit with limited access.
EARNINGS & GROWTH ANALYSISRevenue growth for CME is mainly driven by increases in
average daily contract volume (ADV), a measure of the average number of contracts traded and/or cleared in a day, and by growth in the rate per contract (RPC), the average transaction and clearing fee generated from a contract.
In 2Q21, average daily contract volume rose to 18.4 million, up 5% from 1Q20, with increases in all contracts except energy and equity. Interest rate ADV rose 25% to 8.6 million contracts, and equity index ADV fell 12% to 4.9 million contracts. In commodities, energy ADV fell 24% to 1.96 million contracts; metals ADV rose 9% to 568,000 contracts; and agricultural ADV rose 24% to 1.63 million contracts. Foreign exchange ADV rose 6% to 769,000 contracts. The average rate per contract fell to $0.695 from $0.731.
The company has maintained strong control over compensation costs, which have totaled 18%-23% of revenue in recent quarters.
Management projects an effective tax rate of 23.2%-24.2% in 2021.
We are lowering our 2021 EPS estimate to $7.07 from $7.55 and our 2022 estimate to $7.52 from $8.05. Our long-term EPS growth rate forecast is 7%.
FINANCIAL STRENGTH & DIVIDENDOur financial strength rating on CME Group is High, the
Section 2.80
GROWTH / VALUE STOCKShighest point on our five-point scale. The company scores above average on key financial strength criteria, including debt levels, interest coverage, and profitability.
CME had $1.1 billion in cash and cash equivalents and $3.4 billion in long-term debt as of June 30, 2020. The company reported total assets of $179 billion as of June 30.
CME pays a regular quarterly dividend of $0.90 per share, or $3.60 annually, for a yield of about 1.7%. The company has a strong record of dividend growth and raised its payout by 6% in 1Q21. In December 2020, it also declared a $2.50 annual variable dividend payable in January - bringing the combined regular-plus-variable yield to about 3.0%. Since implementing its variable dividend policy in 2012, the company has returned $15.6 billion to shareholders in the form of dividends. Our regular dividend estimates are $3.60 for 2021 and $3.80 for 2021.
MANAGEMENT & RISKSTerry Duffy became the company's chairman and CEO at
the end of 2016. Mr. Duffy had been president of CME Group since 2012. Bryan Durkin, previously chief commercial officer, currently serves as president. John Pietrowicz has been the CFO since 2015.
Management's growth strategy focuses on new product development, new customer acquisition, and global expansion. In our view, management has done a good job of launching new products that respond to regulatory changes. It also provides helpful financial guidance to the investment community.
Price competition is a key risk for CME. Key exchange competitors include Intercontinental Exchange, Hong Kong Exchanges and Clearing, and the Eurex Group. The company's clearing operations also face increasingly stiff competition due to the implementation of Dodd-Frank. Many exchanges, such as ICE, have their own clearing houses. Other clearing houses include Depository Trust & Clearing Corp.
New regulations also pose risks for CME. The company is subject to regulation by the CFTC in the U.S. as well as by overseas regulators. Other risks include market weakness in Europe, cybersecurity threats, and legal and counterparty risks.
COMPANY DESCRIPTIONCME Group is a futures and derivatives exchange and
clearing company. It operates exchanges such as the Chicago Mercantile Exchange (CME), the Chicago Board of Trade (CBOT), the New York Mercantile Exchange (NYMEX), the Commodity Exchange (COMEX) and the Kansas City Board of Trade (KCBT). In addition, CME offers a range of market data and information services. CME shares are a component of the S&P 500.
VALUATION
CME shares have risen strongly from their pandemic lows in March 2020. They have traded in a range of $146-$222 over the past 52 weeks, and are currently near the high end of the range. The stock is also trading at 30-times our 2021 EPS estimate, topping the high end of the historical range of 12-28 and above the peer average. Based on the current valuation and the lack of a clear catalyst, we believe that a HOLD rating is appropriate. We will look for a significant nonfundamental pullback or a new catalyst as an opportunity to revisit our rating.
On July 30 at midday, HOLD-rated CME traded at $213.28, down $1.42. (Kevin Heal & Taylor Conrad, 7/30/21)
Cognizant Tech Solus Corp (CTSH)Publication Date: 7/30/21Current Rating: HOLD
HIGHLIGHTS*CTSH: Improving trends, higher guidance; reiterating
HOLD *Cognizant Technology topped consensus expectations
for revenue and adjusted EPS for 2Q21.*Both sales and EPS for 2Q21 grew in double digits
against the pandemic quarter of 2Q20.*During the quarter, bookings grew 12%, and book-to-bill
is now 1.2 on a trailing 12-month basis. Both qualified pipeline and win rates are up year-to-date, positioning the company for ongoing strength through calendar 2021.
*We would get closer to considering an upgrade should Cognizant show signs of sustained top- and bottom-line acceleration.
ANALYSIS
INVESTMENT THESISHOLD-rated Cognizant Technology Solutions Corp.
(NGS: CTSH) rose 6% in an up market on 7/29/21 after the company topped consensus expectations for revenue and adjusted EPS for 2Q21. Investors appear to have moved past concerns about business continuity given the COVID-19 outbreak in India, home to two-thirds of Cognizant employees; the disease may have peaked in India.
Despite the humanitarian crisis in India, as well as global labor challenges, Cognizant executed well in 2Q21 and delivered significant upside to its revenue guidance, according to CEO Brian Humphries. Cognizant has implemented its 'Operation C3' vaccination drive across 11 major Indian cities where Cognizant has operations.
During the quarter, bookings grew 12%, and book-to-bill is now 1.2 on a trailing 12-month basis. Both qualified pipeline and win rates are up year to date, positioning the company for ongoing strength through calendar 2021.
The company reported annual revenue growth both in financial services and healthcare, the two biggest end markets
Section 2.81
GROWTH / VALUE STOCKSfor the company. Both end markets have been challenging at times, but are now benefiting from strengthening demand growth along with the benefits of niche acquisitions. Cognizant raised its full-year sales and EPS guidance, putting it ahead of the pre-reporting consensus.
Cognizant continues to prioritize capital return, with a goal of allocating all free cash flow to shareholder return and M&A. In February, the company announced a 9% hike in its quarterly dividend. Cognizant is repurchasing stock and has accelerated its pace of niche acquisitions. We take a positive view of M&A investments that contribute to vertical and regional diversity.
Cognizant may face modest growth trends overall which limits its operating leverage. On the upside, India-specific risks may have crested. In our view, Cognizant could face a few more slow-growth quarters. We would get closer to considering an upgrade should Cognizant show signs of sustained top- and bottom-line acceleration. For now, a near-term HOLD rating appears appropriate.
RECENT DEVELOPMENTSCTSH is down 10% year-to-date in 2021, while peers are
up 16%. CTSH was up 32% in 2020, while the Argus computing, information processing & storage peer group rose 9%. CTSH declined 2% in 2019, while the peer group was up 39%. CTSH declined 11% in 2018, versus a 15% peer-group decline. CTSH advanced 27% in 2017, versus an 18% gain for the peer group, which was revised beginning in 2017 to include the remaining storage companies in coverage following multiple acquisitions of publicly traded storage companies. CTSH shares declined 7% in 2016, compared to a 12% gain for peers.
For 2Q21, Cognizant reported revenue of $4.59 billion, which was up 15% in GAAP and 12% in constant currency year-over-year. Revenue for 2Q21 was above the high end of management's $4.42-$4.46 billion guidance range, and also above the $4.45 billion consensus forecast. Non-GAAP earnings of $0.99 per diluted share for 2Q21 were up 20% year-over-year, while increasing $0.02 sequentially. Adjusted EPS topped the $0.96 consensus forecast.
Despite the humanitarian crisis in India, as well as global labor challenges, Cognizant executed well in 2Q21 and delivered significant upside to its revenue guidance, according to CEO Brian Humphries. Cognizant has implemented its 'Operation C3' vaccination drive across 11 major Indian cities where Cognizant has operations.
During the quarter, bookings grew 12%, and book-to-bill is now 1.2 on a trailing 12-month basis. Both qualified pipeline and win rates are up year-to-date, positioning the company for ongoing strength through calendar 2021.
The company reported annual revenue growth both in financial services and healthcare, the two biggest end markets for the company. Both end markets have been challenging at times, but are now benefiting from strengthening demand growth along with the benefits of niche acquisitions. Some of the best growth came outside those large segments. On a regional basis, the best growth was outside the U.S.
In terms of customer verticals for 2Q21, Financial Services revenue of $1.50 billion (33% of total) was up 7.6% in GAAP and 4.8% in constant currency. Both banking and insurance grew year-over-year and sequentially. In banking, the biggest part of the segment, Cognizant has sharpened its focus on 'the highest potential client relationships' over the past year and a half, and that is now paying dividends.
Client engagement is improving with regional banks, although erosion in business with major banks remains a problem. Overall, we expect the financial services vertical to remain below company average performance for the next several quarters before gradually improving.
Healthcare (29% of total) posted revenue growth of 15% in GAAP and 13% in constant currency. Both the payer (insurance) and life sciences verticals posted double-digit annual growth, and the provider business is seeing improving trends. Cognizant healthcare has refreshed its product strategy and better aligned investments with market priorities. An 'intensified pivot to digital' has resonated with clients and prospects, leading to double-digit growth in segment software sales. The CEO called out a new relationship with Viatris, formed from the merger of Upjohn and Mylan.
Cognizant posted strong growth in Communications, Media, and Technology (15% of total), where revenue was up 21% on a GAAP basis and 18% on a constant-currency basis. This industry vertical now includes some of Cognizant's largest clients, who are embracing digital solutions.
Products & Resources revenue (23% of total) like CMT was up 21% on a GAAP basis and 18% on a constant-currency basis. Key customer verticals supporting this growth include manufacturing, logistics, energy, and utilities. Industries suppressed during the pandemic, including retail, consumer goods and travel, continue their multi-quarter sequential growth and are 'now close to pre-pandemic levels,' according to the CEO.
Beyond these verticals, Cognizant has focused in recent years on 'targeted digital battlegrounds,' including IoT, digital engineering, and cloud. The IoT business has scaled rapidly and revenues are expected to exceed $600 million in 2021, about double its size in 2019. Digital engineering is now at a $1.2 billion annual revenue run rate, making it one of the largest digital engineering businesses in the world.
Section 2.82
GROWTH / VALUE STOCKSCognizant has targeted seven acquisitions over the past 18
months in order to expand its cloud business. Cognizant now has three cloud-focused businesses; one each for Microsoft, AWS, and most recently for Google Cloud.
Within the company's polity of utilizing all of its free cash flow, half is being allocated to M&A. We expect Cognizant to be an active acquirer, with a focus on expanding capabilities in key digital focus areas of software engineering, data and AI, cloud, and IoT.
While the outlook is improving, Cognizant may face modest growth trends overall which limits its operating leverage. We would get closer to considering an upgrade should Cognizant show signs of sustained top- and bottom-line acceleration.
EARNINGS & GROWTH ANALYSISFor 2Q21, Cognizant reported revenue of $4.59 billion,
which was up 15% in GAAP and 12% in constant currency year-over-year. Revenue for 2Q21 was above the high end of management's $4.42-$4.46 billion guidance range, and also above the $4.45 billion consensus forecast.
The GAAP gross margin broadened sequentially to 37.6% in 2Q21 from 37.2% in 1Q21 and was up from 34.6% a year earlier. The non-GAAP operating margin was sequentially steady at 15.2% in 2Q21 while rising from 14.1% a year earlier.
Non-GAAP earnings of $0.99 per diluted share for 2Q21 were up 20% year-over-year, while increasing $0.02 sequentially. Adjusted EPS topped the $0.96 consensus forecast.
For all of 2020, revenue of $16.65 billion fell 1% from $16.78 billion in 2019. Non-GAAP earnings came to $3.38 per diluted share, down 15% from $3.99 per diluted share in 2019.
For 3Q21, revenue is forecast at $4.69-$4.74 billion, which would be up 10%-11% in constant currency and about 160 bps higher than that in GAAP.
For all of 2021, the company bumped up its revenue forecast to $18.4-$18.5 billion, from $17.8-$18.1 billion, for growth of 9%-10% in constant currency and about 120 bps higher than that in GAAP (10.2%-11.2%). Adjusted operating margin is forecast at 15.4%, tightened from earlier guidance of 15.2%-15.7%. Full-year 2021 adjusted EPS is now forecast at $4.00-$4.06, up slightly from $3.90-$4.02.
We are nudging up our non-GAAP forecast for 2021 to $4.01 per diluted share, from $3.96. We have increased our non-GAAP EPS projection for 2022 to $4.38 per diluted share, from a preliminary $4.31. We regard our estimates as fluid and subject to change depending on evolving economic
conditions related to the COVID-19 pandemic, with a particular focus on India. Our long-term EPS growth rate forecast is 9%.
FINANCIAL STRENGTH & DIVIDENDOur financial strength ranking on Cognizant is
Medium-High. Cognizant has used its strong cash flow to reduce debt and is also repurchasing shares.
In response to the COVID-19 pandemic, Cognizant took actions to increase liquidity and financial flexibility. In March 2020, Cognizant drew down $1.74 billion on its revolving credit facility. The revolver, which was drawn for over three quarters and thus classified as long-term debt, has since been paid down.
Cognizant has reduced its cash to fund niche acquisitions, repurchase debt, and fund its capital allocation program. Cash & short-term investments were $1.85 billion at the end of 2Q21. Cognizant had cash & equivalents and investments of $2.72 billion at the end of 2020, $3.42 billion at the end of 2019, $4.65 billion at the end of 2018, $5.06 billion at the end of 2017, and $5.17 billion at the end of 2016.
Debt was $683 million at the end of 2Q21. Debt was $701 million at the end of 2020, $773 million at the end of 2019, $487 million at the end of 2018, $873 million at year-end 2017, and $878 million at the end of 2016.
Net cash was $2.03 billion at the close of 2020. Net cash was $2.65 billion at the close of 2019, $4.02 billion at the close of 2018, $4.18 billion at the end of 2017, and $4.29 billion at the end of 2016.
Cognizant in 3Q20 reversed its indefinite reinvestment assertion on Indian earnings in order to improve cash flow utilization. While the adjustment led to a one-time GAAP tax payment, it also triggered a $2 billion net cash transfer from India and will enable the company to more efficiently utilize its free cash flows on a global basis. The company intends to utilize free cash flows for share buybacks, dividends, repayment of credit facilities, and M&A.
In February 2021, Cognizant updated its capital allocation policy. The company now intends to deploy 100% of annual free cash flow through a balanced program. Under the program, 50% of free cash flow will be allocated toward M&A in areas aligned with strategic priorities. The remaining 50% will be allocated to buybacks and dividends, targeting a consistent dividend-payout ratio of about 25% along with repurchases to offset dilution.
Also in February 2021, Cognizant announced a 9% increase in its quarterly dividend, to $0.24 per common share. In February 2020, Cognizant announced a 10% increase in its quarterly dividend, to $0.22 per common share. The company
Section 2.83
GROWTH / VALUE STOCKSdid not announce a dividend hike in February 2019. In February 2018, Cognizant announced a 33% increase in its quarterly dividend, to $0.20 per common share. Our dividend estimates are $0.94 for 2021 and $0.99 for 2022.
MANAGEMENT & RISKSBrian Humphries became CEO in April 2019. Longtime
CEO and co-founder Francisco D'Souza, who became vice chairman in June 2018, stepped down from the board in March 2020.
Jan Siegmund became CFO in September 2020, succeeding Karen McLoughlin. Malcom Frank is EVP of strategy & marketing.
CEO Humphries was formerly CEO of Vodafone Business. New CFO Siegmund comes to the company from ADP, were he served as CFO from 2012 to 2019. The executive transitions have been smooth, in our view.
A main risk for Cognizant, as for other consulting and outsourcing companies, is the possibility of a general economic downturn and a corresponding dip in demand for professional services related to the COVID-19 pandemic. We believe that Cognizant has the financial strength, market leadership, and growth characteristics to weather this storm and emerge a stronger player. Further, the companies in Cognizant's blue-chip client base will need consulting and outsourcing help as they navigate a challenging environment during and after the pandemic. Additionally, Cognizant's digital solutions facilitate secular trends, such as social media, remote workspaces, and growth in streaming traffic, that have been accelerated during the pandemic.
In February 2019, Cognizant completed an internal corruption investigation related to Indian operations. Cognizant paid $28 million to DoJ and the SEC. DoJ also issued a declaration letter declining to take any additional action against the company.
Additional risks associated with an investment in Cognizant include the company's aggressive growth strategy, based on both organic business development and acquisitions. We think the company offsets these risks with a demonstrated ability to integrate acquired assets without sacrificing margins.
Large contracts carry implementation risks along with the potential for margin pressure from high initial costs. We believe these risks are offset by the addition of lucrative long-term contracts and customer relationships.
COMPANY DESCRIPTIONCognizant Technology Solutions Corp., based in Teaneck,
New Jersey, provides information technology outsourcing, consulting, and business process outsourcing services worldwide. The company operates in four operating segments:
F i n a n c i a l S e r v i c e s , H e a l t h c a r e , Manufacturing/Retail/Logistics, and Other. Total 2020 revenue was $16.65 billion, down slightly from 2019.
VALUATIONCTSH shares trade at 17.4-times our 2021 non-GAAP
forecast and at 16.0-times our 2022 projection. The two-year average forward P/E multiple of 16.7 is now below the historical (trailing five-year) average multiple of 18.1; higher P/Es were accorded when EPS was growing rapidly. In a rising market, CTSH trades at an average of 0.73-times the forward market multiple, below the trailing five-year relative P/E of 0.86. Our comparable historical valuation model, along with peer-group comparisons, renders a fair value in the high-$70s, just above the current price and in a stable to slightly rising trend.
Peer indicated value is close to the current share price and is in a declining trend. Our more forward looking two- and three-stage discounted free cash flow model renders a value in the $90s, now rising after having moved down sharply from peak levels. Our blended value is in the low $80s, now above current levels.
After years of middling performance, CTSH outperformed peers in 2020. At the same time, the company in our view faces near-term challenges related to vertical concentration in at-risk sectors. Investors may remain concerned about modest growth trends overall and limited operating leverage, along with India-specific risks. In our view, Cognizant could face a few more slow-growth quarters.
We would get closer to considering an upgrade should Cognizant show signs of sustained top- and bottom-line acceleration. For now, a near-term HOLD rating appears appropriate.
On July 29, HOLD-rated CTSH closed at $73.92, up $4.13. (Jim Kelleher, CFA, 7/29/21)
Comcast Corp (CMCSA)Publication Date: 8/3/21Current Rating: BUY
HIGHLIGHTS*CMCSA: Maintaining BUY and $67 target*Comcast's Cable division again showed resilience in
2Q21. The company's theme park, advertising, and theatrical businesses also continued to recover from their pandemic trough.
*Comcast continues to lose video subscribers, while gaining large numbers of high-speed internet subscribers.
*Management has warned of elevated costs related to the return of delayed sporting events and preopening costs for NBCU's new Beijing Theme Park, though both of these investments are long-term positives for the company.
*We are raising our 2021 EPS estimate to $3.06 from
Section 2.84
GROWTH / VALUE STOCKS$2.99 and our 2022 forecast to $3.36 from $3.27.
ANALYSIS
INVESTMENT THESISWe are maintaining our BUY rating on Comcast Corp.
(NGS: CMCSA) with a target price of $67. The company's Cable division continues to provide vital connectivity for its large subscriber base, and as economies reopen, the theme park, advertising, and theatrical businesses are also rebounding smartly. Comcast's data and communications networks have never been in greater demand as usage spikes with the stay-at-home/work-from-home phenomenon. Management has warned of elevated costs related to the return of delayed sporting events and preopening costs for NBCU's new Beijing theme park, though both are long-term positives for the company. Comcast's solid balance sheet and cash flows remain key differentiating assets for this industry leader.
RECENT DEVELOPMENTSComcast reported 2Q21 results on July 29, beating the
consensus by $0.18 on the bottom line and by $1.4 billion on the top line. The company lost 399,000 video customers in the quarter, compared to losses of 491,000 in 1Q21, 477,000 in 2Q20, and 224,000 in 2Q19. At the same time, it gained 354,000 high-speed internet customers in 2Q21, down from 461,000 net adds in 1Q21 though up from 323,000 in the pandemic-affected 2Q20 and 209,000 in 2Q19.
Second-quarter revenue rose 20% year-over-year to $22.55 billion. The Cable division posted 11% revenue growth, driven as usual by the broadband business. The wireless, business services, advertising, and video businesses also made solid contributions. Voice revenues were modestly lower. Management anticipates a strong 2021 for broadband, but would prefer that investors benchmark broadband customer growth against 2019's 1.4 million net adds rather than 2020's outsized 1.97 million. A key question for investors is how much HSI subscriber demand may have been pulled forward into 2020 from 2021. The 2Q subscriber results may keep this question alive.
NBC/Universal made a strong year-over-year recovery in 2Q21, with 39% revenue growth, as the reopening of the company's theme parks added almost $1 billion to segment revenue. The division's largest business, media, reported strong 26% growth with the studio business also contributing. The Sky division reported 15% constant-currency revenue growth, also rebounding from 2Q20.
The company's favorite metric, consolidated adjusted EBITDA, rose 12.6% to $8.93 billion, though the EBITDA margin narrowed by 220 basis points to 31%. Management noted that Peacock, the company's new video streaming service, posted an EBITDA loss of $363 million as costs rose due to content additions and geographic expansion. Adjusted EPS rose 22% to $0.84. GAAP EPS came to $0.80, up from
$0.65 in 2Q20. GAAP EPS excluded an $0.11 benefit from tax adjustments and a negative $0.12 swing in investment losses, among other smaller items, in 2Q21.
The Tokyo Olympics are currently underway with wall-to-wall coverage on multiple NBCU cable channels, the Peacock streaming video service, and, of course, online. Press reports indicate that viewership is down from the 2016 Rio Olympics five years ago, though the Hollywood Reporter pointed out that the decline is only slightly greater than the overall decline in linear television viewing over the last five years. Whether viewing may pick up with the broadcast of track and field in the second week is unknown, though on the 2Q call, management said that the Tokyo games would be profitable.
EARNINGS & GROWTH ANALYSISWe are raising our 2021 EPS estimate to $3.06 from
$2.99 and our 2022 forecast to $3.36 from $3.27. Our estimates imply 14% average EPS growth over the next two years. Our long-term earnings growth rate forecast is 8%.
While COVID-19 materially impacted Comcast in 2020 and early 2021, the company is now emerging from the pandemic as theme parks and theaters reopen, media production returns to normal levels, and advertising recovers with the return of live sports broadcasts.
CEO Brian Roberts has made innovation a top priority, particularly with regard to Comcast's top strategic priority, broadband service, as it continually works to improve speed, range, and connectivity. Along with innovation, Comcast's Sky acquisition is a strategic effort to build scale by extending into new markets in the UK and Europe. Later this year, Sky will introduce Comcast's Peacock streaming video service to the Sky European market base by adding Peacock as a free service for subscribers.
In 2Q21, the company's core Cable Communications division reported 14.5% adjusted EBITDA growth, to 7.1 billion, and 9% growth in adjusted EBITDA per customer relationship, to $70.07. As we might expect, management continues to focus on broadband - the primary growth engine for Comcast's cable business - with an emphasis on speed. CEO Roberts sees a 'capital-efficient path to 10-gig speed in the coming years.' Comcast has consistently increased its internet speeds, with 1 gigabyte per second speeds available to almost all customers. We see Comcast as a clear leader in the broadband speed race and believe that DOCSIS 3.1 will ensure its dominance for some time - especially as challengers like Google Fiber have scaled back their operations. In 2Q21, broadband revenue rose 14% to $5.7 billion. While broadband is the Cable division's primary revenue driver, Business Services, Wireless (Xfinity Mobile) and Advertising are all making solid contributions. Xfinity Mobile ended 2Q21 with 3.4 million customer lines, including 280,000 net adds in 2Q,
Section 2.85
GROWTH / VALUE STOCKSits largest net-add quarter since its launch in mid-2017. Comcast is sticking with its mobile virtual network operator plan and expanding its partnership with Verizon, offering new 5G wireless service along with other offers that may help it acquire wireless subscribers more profitably.
Second-quarter adjusted EBITDA in the NBCU segment rose 12.5% to $1.55 billion as NBCU emerged from the pandemic trough. Theme parks reported 221 million in adjusted EBITDA, compared to a loss of $393 million in 2Q20, even after incurring $150 million in preopening costs for the new Beijing theme park. Management expects another $250 million headwind from preopening costs in 3Q, but looks for the Beijing park to open within the next two months. As movie theaters come back on line with capacity restrictions, the theatrical business is likely to see a slow recovery in 2021. NBCU released 'Fast 9,' the latest installment in the Fast and Furious franchise in June. It has thus far garnered a respectable $600 million at the theatrical box office. In 2022, on the expiration of its HBO contract, NBCU will begin streaming all of its new movies on Peacock in the Pay-TV 1 window (typically 120 days after theatrical release) for four months. After that first four-month window, Amazon Prime and Netflix will share broadcast rights for the next 10 months, after which the movies will return to Peacock.
Comcast's newest division, Sky, posted a constant-currency adjusted EBITDA decline of 32%, to $560 million, in 2Q - reflecting higher costs related to the resumption of sports programming after sports events were canceled last year.
NBCU's Peacock streaming video application launched nationally in the U.S. on July 15, 2020. The launch was originally timed to coincide with NBCU's broadcast of the 2020 Tokyo Summer Olympics. However, the Tokyo games were delayed until this summer. Peacock may have lost a prime promotional vehicle last year, but it looks like the Olympics may have helped Peacock to add subscribers in 2Q. Management claims that Peacock had 54 million sign-ups and more than 20 million subscribers as of July 29, up from 42 million sign-ups and 11 million net adds in April.
We view the Peacock service as the company's most important recent strategic move. NBCU has differentiated itself from some other video streaming rivals in two ways: first, with an ad-supported 'free' base tier service, and second, by including live sports content (leveraging NBCU's Olympics coverage this year, and, for higher tiers, its Premier League rights). Peacock Free or advertising-supported video-on-demand (AVOD) service includes access to two-thirds of the programming catalog, with access to current-season and library NBCU television and movie content and Olympics coverage, though with only 'select episodes' of Peacock original content. The next tier up, Peacock Premium, is also ad-supported and will be bundled at no cost for
Comcast and Cox subscribers, and perhaps for subscribers of other cable services in the future. Noncable subscribers are charged $5 per month. Peacock Premium includes all 20,000 hours of content (essentially all the content available on Peacock Free plus all Peacock originals), early access to NBC late-night talk shows, and additional sports programming. Finally, the highest tier is a $10 per month ad-free service.
On March 18, the NFL announced new 10-year license deals beginning with the 2023 season with Comcast NBCU, along with other traditional media partners Viacom/CBS, Disney/ESPN/ABC, and FOX, as well as with Amazon Prime Video for digital-only rights. Comcast NBCU was rumored to have paid $2 billion per year for the new NFL rights, with the fees essentially doubling with the new contract. However, the rights will also be expanded, with NBCU's NFL games destined to be either simulcast or exclusive to the Peacock premium tier. The new rights will also include highlights and other content. Although NFL ratings slipped about 7% in the 2020-2021 season, NFL games are still the most popular sporting events in the U.S. which could boost Peacock subscriber acquisitions. Apart from football's popularity, the rights will help to differentiate Peacock from Netflix, which does not broadcast sports content of any sort. Given the importance of sports programming to the Comcast traditional linear television businesses and the differentiation it provides for the emerging Peacock service, the NFL deal was a must-sign for the company even with the exorbitant fee.
FINANCIAL STRENGTH & DIVIDENDOur financial strength rating on Comcast is Medium, the
midpoint on our five-point scale. Total debt/capitalization was 51% at the end of 2Q21. Comcast ballooned its debt by $47.2 billion in 2018 to $111.7 billion, mostly due to the Sky acquisition. The company has been retiring debt and had $98.6 million in total debt at the end of 2Q, of which $3.4 billion was current. The company has $12.4 billion in cash and equivalents. Adjusted EBITDA covered interest expense by a factor of 8.2 in 2Q21, up from 6.7 in 2020 and 7.5 in 2019, though down from 8.5 in 2018 and 9.1 in 2017. Trailing 12-month free cash flow rose 1% to $14 billion in 2Q21. The credit agencies give Comcast ratings on the lowest A rung, safely within investment grade, with stable outlooks.
Comcast's quarterly dividend is $0.25 per share, or $1.00 annually, for a yield of about 1.7%. Comcast has raised its dividend at a compound annual rate of 13% over the last five years. Our 2021 dividend estimate is $1.00 and our 2022 forecast is $1.08.
Comcast made only minimal share repurchases in 2020 as it focused on debt reduction. The company resumed buybacks in May 2021, repurchasing 8.8 million shares for $1.2 billion. Management expects to increase buybacks back to their historical $5 billion annual pace. Of course, actual buybacks remain at management's discretion.
Section 2.86
GROWTH / VALUE STOCKS
MANAGEMENT & RISKSThe effects of the COVID-19 pandemic have become a
serious risk for Comcast. We have noted the impact on NBCU's parks, which, even with most reopened, are still operating at limited capacity. The company is also grappling with the impact of the closure of theaters on the theatrical film business, though the core advertising market has bounced back. The mitigation of these risks will depend on uncertain epidemiological outcomes and how long a 'new normal' of social-distancing restrictions may affect attendance at theme parks and movie theaters.
While Comcast reoriented its business toward internet connectivity years ago, the company continues to fight the trend of 'cord cutting,' i.e., millennials cancelling or never signing up for Comcast's cable video subscriptions and instead opting for over-the-top streaming video. COVID-19 appears to have intensified the cord-cutting trend. The millennial generation (those born between 1980 and 2000), is a key demographic whose purchasing power is growing. 'Cord cutting' is simply a reflection of what we see as the secular trend of video consumption in the U.S. - moving first to the internet then to the mobile internet as the expansion of broadband bandwidth has accelerated. Comcast has moved proactively to address the cord-cutter phenomenon by offering more affordable 'skinny bundles' with smaller numbers of channels, and by offering new lower-cost subscriber equipment designed for internet-delivered video. The practice of cord cutting will likely accelerate if more consumers begin to see OTT as a viable alternative to cable video rather than its complement. We think that this would compound the negative impact of subscriber losses on Comcast, even if it sells more broadband subscriptions.
The threat from internet streaming video reflects the growth of over-the-top or OTT video content services. Netflix has become a deadly threat through its aggregation of content and viewers. It is joined by a host of other services, including Dish's Sling TV, HBO, CBS, YouTube, and Facebook Video. These services have been joined by some of the largest Hollywood producers and tech companies, with the launches of Apple TV and Disney Plus in November 2019, AT&T/WarnerMedia's HBO Max in May 2020, and Comcast/NBCU's own Peacock service in July.
Comcast's acquisition of Sky carries significant integration risk. While Sky is in a similar Pay-TV distribution business, it is focused on Europe and thus operates in a considerably different market environment. The secular growth of digital streaming video in Europe could impact Sky's business prospects to an even greater extent than the impact on Comcast in the U.S. Comcast's price for Sky was bid up in an auction process and returns from Sky may not justify the purchase price.
While Comcast has done a good job integrating NBCU and has successfully turned around some underperforming assets, NBCU's revenue streams can be much more variable than Comcast's core cable business, as has been amply demonstrated in the COVID-19-impacted 2020. As such, disappointing results at NBCU could weigh on the share price. In addition, even if things go well, Comcast could be subject to a 'conglomerate discount.' NBCU is, of course, subject to the usual risks of content producer/distributors, i.e., having to guess what a fickle public will want to watch. In addition, we are seeing advertising dollars flow away from cable networks, a core NBCU segment, and toward online channels. Weak ratings and audience erosion have also plagued cable and broadcast networks industrywide.
Investors in Comcast face numerous other risks. The company is seeing increased competition in cross-selling from rejuvenated providers, such as the telecoms and their satellite broadcast allies. The larger telcos have rolled out competitive video, high-speed internet and digital phone offerings, with wireless sometimes also thrown in, and will inevitably woo some Comcast subscribers away with special promotions. The fiercest competitors for Comcast are the direct broadcast satellite (DBS) video services, AT&T's DirecTV and Dish. Comcast has expanded its own service bundle to quad-play with the addition of its own Xfinity Mobile wireless service.
Increasing marketing and promotional costs in this highly competitive environment are also likely to hurt margins. Programming costs are Comcast's largest single expense item, and faster growth in expenses than revenue would erode the company's profitability. So-called 'must-have' content providers typically have a negotiating advantage, though this advantage is partly mitigated by Comcast's sheer size. Broadcast networks are viewing cable retransmission fees as a new profit center. Carriage renewal negotiations between content providers and cable companies have become extremely contentious and have resulted in occasional channel blackouts, though in the end the cablers often have to pay up. All these factors could increase Comcast's cost of doing business. Advertising is about 12% of total revenue. Though this is much less than at most of Comcast's integrated media peers, this cyclically sensitive and high-margin segment suffers in economic downturns.
Comcast, like many other companies in the media sector, has two classes of stock, with super-voting shares in the hands of the controlling Roberts family. This system has been attacked by activists as being unresponsive to minority shareholder concerns.
COMPANY DESCRIPTIONComcast Corp. is a leading cable and telecommunications
company in the U.S., providing television, high-speed internet and telephone services over its networks. The company owns NBC/Universal, a media conglomerate that includes cable and
Section 2.87
GROWTH / VALUE STOCKSbroadcast channels, local television stations, a movie studio, and theme parks.
VALUATIONOur valuation methodology for CMCSA is multistage,
including peer analysis and a multiple-analysis matrix applied to our proprietary forecasts. Comcast shares have risen 14% on a total-return basis year-to-date, compared to an 18% increase for the S&P 500 and a 28.5% gain for the S&P Media & Entertainment Industry Group index. The shares have traded between $41 and $60 over the last year, and are currently near the high end of this range.
The stock is trading above the high end of its trailing five-year average range for enterprise value/EBITDA (11.5 versus a range of 8.5-10.0) and above the peer average of 9.5. Comcast's forward enterprise value/EBITDA multiple of 9.8 is 5% above the peer average, compared to an average premium of 1% over the past two years. We note that Comcast is the industry leader and may warrant higher multiples. We are maintaining our BUY rating and target price of $67.
On August 2, BUY-rated CMCSA closed at $58.47, down $0.36. (Joseph Bonner, CFA, 8/2/21)
Ecolab, Inc. (ECL)Publication Date: 7/28/21Current Rating: BUY
HIGHLIGHTS*ECL: Maintaining BUY and $250 target*We expect Ecolab's water treatment, sanitation, and
healthcare cleaning services to be in strong demand on the other side of the pandemic.
*Based on new business wins, product and service innovation, and investments in new hygiene and digital technologies, management expects 2021 earnings from continuing operations to exceed the company's 2019 results.
*Ecolab has an impressive history of dividend payments and growth.
*We view ECL shares as a suitable core holding in a diversified portfolio.
ANALYSIS
INVESTMENT THESISWe are maintaining our BUY rating on Ecolab Inc.
(NYSE: ECL), a leader in water, hygiene, and energy technologies, with a target price of $250. In our view, the company has prospects for above-average revenue and earnings growth over the long term. On the other side of the pandemic, we expect Ecolab's water treatment, sanitation and healthcare cleaning services to be in strong demand. The company continues to tweak its portfolio of businesses to optimize growth, and management has divested a lower-margin segment, which should boost profitability in 2021-2022. Ecolab has a clean balance sheet and an impressive history of dividend payments and growth. The
shares are a suitable core holding from the Materials group in a diversified portfolio. Nonfundamental selloffs often represent good buying opportunities for this diversified company.
RECENT DEVELOPMENTSECL shares have underperformed over the past quarter,
rising 1% compared to an advance of 6% for the S&P 500 and 1% for the industry ETF IYM. Over the past year, the shares have also underperformed, rising 5% compared to the S&P 500's 38% gain. Compared to the industry ETF IYM, the shares have underperformed over the past year, but have outperformed over the past five years. The beta on ECL is 0.99.
On July 27, Ecolab reported above-consensus 2Q21 earnings. Adjusted EPS came to $1.22, up from $0.65 in 2Q20 but below the $1.42 earned in pre-pandemic 2Q19. Adjusted EPS topped the consensus forecast of $1.18. The higher earnings reflected volume increases, price hikes, and lower bad debt expense, which more than offset increased variable compensation costs and the lingering impact of the winter freeze in Texas. Second-quarter reported sales rose 18%. Sales rose 13% on a currency-neutral basis after adjusting for the impact of acquisitions.
EARNINGS & GROWTH ANALYSISSecond-quarter operating income rose 113%, or 53% on a
currency-neutral basis, including restructuring costs and pay-protection costs for certain employees impacted by the pandemic. On the 2Q earnings call, CEO Christophe Beck said that the company expected the U.S. recovery to continue in 2021, with the rest of the world to follow. He noted that coronavirus variants and rising inflation would present 'near-term challenges,' but said that the company was addressing these with price hikes, new business wins, and efficiency improvements. Mr. Beck also said that Ecolab expected full-year 2021 EPS from continuing operations to exceed 2019 levels, excluding the estimated $0.15 per share impact of the freeze in Texas.
Based on current revenue and margin trends, we are lowering our 2021 adjusted EPS forecast to $5.07 from $5.11 and our 2022 forecast to $6.15 from $6.18. Our five-year earnings growth rate forecast is 10%.
FINANCIAL STRENGTH & DIVIDENDWe rate Ecolab's financial strength as Medium, the
midpoint on our five-point scale. The company achieves average scores on our four main financial strength criteria of debt levels, fixed-cost coverage, cash flow generation, and profitability. The company's debt is rated Baa1/positive by Moody's and A-/stable by S&P.
The company's total debt/total capitalization ratio was 51% at the end of 2Q21. Cash and equivalents were $1.40 billion. Second-quarter operating income covered interest
Section 2.88
GROWTH / VALUE STOCKSexpense by a factor of 10.
The company has extended its $2 billion revolving credit facility.
Ecolab has paid a cash dividend for 88 consecutive years. In December 2020, the board increased the quarterly dividend by 2% to $0.48, or $1.92 annually. We think the dividend is secure and likely to grow. Our dividend estimates are $1.92 for 2021 and $2.00 for 2022.
The company has a share buyback program.
MANAGEMENT & RISKSDouglas M. Baker, Jr. is Ecolab's chairman. Mr. Baker
previously held executive positions in marketing, sales, and general management both in the U.S. and Europe. Christophe Beck became the company's CEO in January 2021. He was formerly president and chief operating officer. CFO Daniel J. Schmechel joined Ecolab in 1995, and previously held finance positions at Exxon and Amoco.
Investors in ECL shares face risks, including the risk that management will not be able to profitably integrate acquired companies.
The company's businesses are cyclical, and may rise and fall with global economic trends.
Ecolab generates approximately 40% of revenue overseas and its results are sensitive to trends in the dollar. Looking ahead, we think the greenback is fairly valued and likely in a trading range in 2021. A stable or falling dollar would be a positive development for the Industrial sector and Ecolab.
COMPANY DESCRIPTIONEcolab is a provider of water, hygiene, and energy
technology and services. The company delivers comprehensive solutions to promote safe food, maintain clean environments, optimize water and energy use, and improve operational efficiency for customers in the food, healthcare, energy, hospitality, and industrial sectors. Ecolab has 44,000 employees worldwide. The shares are a component of the S&P 500.
VALUATIONWe think that ECL shares are attractively valued at
current prices near $221. The shares have traded between $181 and $230 over the past 52 weeks and are currently near the high end of the range. From a technical standpoint, prior to the pandemic, the shares had been in a bullish pattern of higher highs and higher lows that dated from February 2016. The shares rose from their pandemic lows in March 2020 through early June, but have fluctuated in a narrower range since that time.
On the fundamentals, the shares are trading at 44-times
our 2021 EPS forecast, compared to a five-year average of 36. They are also trading at a trailing price/book multiple of 9.0, above the five-year historical average of 6.6; and at a price/sales multiple of 5.2, above the five-year historical average of 3.6. Our price target is $250.
On July 28 at midday, BUY-rated ECL traded at $218.37, down $2.43. (David Coleman, 7/28/21)
Enterprise Prods Pntr L (EPD)Publication Date: 8/2/21Current Rating: BUY
HIGHLIGHTS*EPD: Reaffirming BUY following 2Q21 results*On July 28, EPD reported adjusted 2Q21 net income
attributable to limited partners of $1.112 billion or $0.51 per diluted unit, up from $1.034 billion or $0.45 per unit a year earlier.
*The higher earnings reflected higher NGL production and natural gas pipeline volume, which more than offset lower marine terminal volume. Revenue rose 64% to $9.450 billion.
*We are raising our 2021 EPS estimate to $2.20 from $2.18 based on the better-than-expected second-quarter results. The current consensus is $2.20.
*We are maintaining our 2022 EPS estimate of $2.36, which assumes slightly higher commodity prices, higher volume, and margin growth next year. The 2022 consensus is $2.21.
ANALYSIS
INVESTMENT THESISWe are reaffirming our BUY rating on Enterprise
Products Partners LP (NYSE: EPD) with a price target of $26. The company posted solid 2Q21 results and should continue to benefit from higher volume as the economy recovers. EPD also has a strong balance sheet with below-industry-average leverage, and a well-regarded management team.
On valuation, EPD appears attractive based on historical P/E and our discounted cash flow analysis. Enterprise has also raised its distribution for 22 straight years. The dividend yields about 7.9% and appears sustainable under current market conditions.
RECENT DEVELOPMENTSOn July 28, EPD reported adjusted 2Q21 net income
attributable to limited partners of $1.112 billion or $0.51 per diluted unit, up from $1.034 billion or $0.45 per unit in the prior-year quarter. EPS beat our quarterly estimate of $0.49 and the consensus estimate of $0.48.
The higher earnings reflected higher NGL production and natural gas pipeline volume, which more than offset lower marine terminal volume. Adjusted EBITDA rose 2% to $2.008 billion, and revenue rose 64% to $9.450 billion. The consensus estimate was $6.60 billion.
Section 2.89
GROWTH / VALUE STOCKS
On an adjusted basis, Enterprise reported 2Q21 distributable cash flow of $1.599 billion, up 2% from the prior year. Distributable cash flow covered the distribution by a factor of 1.6. The company reported a gross operating margin of $2.061 billion in 2Q21, up 3% from 2Q20.
Our preferred metrics for evaluating EPD are adjusted EBITDA, distributable cash flow, and gross operating margin. Net income has little impact on our analysis as we prefer to evaluate the company's performance on a cash flow basis, which excludes noncash charges, namely, depreciation expense.
EARNINGS & GROWTH ANALYSISEnterprise Products did not provide 2021 earnings
guidance, but did project capital spending on already approved projects of $1.7 billion in 2021 and $800 million in 2022. These estimates do not include spending on the proposed deepwater Seaport Oil Terminal, which must still obtain regulatory approval.
We are raising our 2021 EPS estimate to $2.20 from $2.18 based on the better-than-expected second-quarter results. The current consensus is $2.20.
We are maintaining our 2022 EPS estimate of $2.36, which assumes slightly higher commodity prices, higher volume, and margin growth next year. The 2022 consensus is $2.21.
With respect to long-term growth, we note that EPD has a leading position across the natural gas and NGL value chain in some of the largest-producing basins in the U.S. It also has about $3.9 billion in growth projects that are expected to enter service over the next several years, and, despite the impact of the pandemic, will continue to invest in natural gas, NGL, and crude oil infrastructure to support shale play development. The growth in hydrocarbon production from shale basins and unconventional drilling has resulted in structural cost advantages for petrochemical production in the U.S. and has increased NGL demand from the petrochemical industry. This should boost earnings visibility and support growth in the distribution. EPD has the highest distributable cash flow coverage ratio in our MLP coverage universe.
FINANCIAL STRENGTH & DIVIDENDWe rate EPD's financial strength as Medium-High, the
second-highest rating on our five-point scale. The company's debt is rated BBB+/stable by Standard & Poor's.
At the end of 2Q21, EPD's total debt/capitalization ratio was 52.3%, down from 53.6% a year earlier. The debt/cap ratio is in line with the peer average and has averaged 52.3% over the past five years.
Enterprise Products has eliminated the incentive distribution rights previously held by the general partner, and is transitioning the company to mainly fee-based businesses that are supported by long-term contracts. This allows the company to have one of the lowest costs of capital in its MLP peer group.
Total debt totaled $28.8 billion at the end of 2Q21, down from $29.9 billion at the end of 2Q20. The company has minimal short-term borrowings.
EPD had cash and cash equivalents of $1.2 billion at the end of 2Q21, compared to $1.3 billion at the end of 2Q20. Cash from operating activities rose to $1.994 billion in 2Q21 from $1.182 billion in the prior-year quarter.
On January 7, 2021, EPD announced its 22nd consecutive year of distribution increases, to $0.45 per unit, or $1.80 annually, up 1% from the prior-year quarter. The annualized payout yields about 7.9%. Reflecting volatile energy market conditions, management plans to keep the distribution unchanged in the near term. Our distribution estimates are $1.80 for both 2021 and 2022.
Enterprise Products initiated a $2.0 billion share repurchase program in January 2019. It repurchased 6.4 million common units in the open market in 1Q20 for approximately $140 million, but did not repurchase any units in 2Q20. It repurchased 2 million units in 3Q and 26 million units in 4Q. It has not repurchased any units thus far in 2021.
MANAGEMENT & RISKSJim Teague, formerly the company's COO, became CEO
on December 31, 2015, succeeding Michael Creel. We think that EPD management has performed well over the last several years through a combination of accretive acquisitions and internal growth. Its efforts have led to increased earnings and cash flow. We are also impressed that management purchases outside energy assets only after thorough due diligence.
MLPs face substantial funding risk as they are required to pay out a significant portion of cash flow to unitholders and are thus dependent on external funding. Investment in pipelines also involves risks related to fires, explosions and environmental issues. All of the company's pipelines are regulated by the Federal Energy Regulatory Commission (FERC). The normal tax risks of investing in MLPs apply to this investment. Unitholders are responsible for payment of taxes on their pro rata share of company earnings, whether or not any cash distribution is made. Unitholders have no control over the general partner or the election of officers of the general partner. In addition, investors' holdings could be diluted by the issuance of additional partnership units. The controlling unitholder of the partnership could also reduce the price by disposing of a large number of units.
Section 2.90
GROWTH / VALUE STOCKS
COMPANY DESCRIPTIONEnterprise Products Partners L.P. is a North American
provider of midstream energy services to producers and consumers of natural gas, NGLs, crude oil, refined products and petrochemicals. The partnership's assets include over 50,000 miles of natural gas, NGL, refined products, and petrochemical pipelines; 260 million barrels of storage capacity for NGLs, refined products and crude oil; and 14 billion cubic feet of natural gas storage capacity. The company completed its IPO in July 1998.
INDUSTRYWe use a matrix approach to assess an MLP's ability to
grow distributions to limited partners over the long term, and view distribution growth as the most important metric when valuing MLPs. One component of our matrix focuses on an MLP's asset footprint. We prefer to see assets located near high-growth unconventional and liquids-rich basins such as the Bakken shale in North Dakota, the Permian and Eagle Ford basins in Texas, the Marcellus shale in Pennsylvania, and the Haynesville shale in Louisiana. A second aspect of our matrix assesses the company's business model and its exposure to a range of markets, including natural gas liquids, crude oil transport/storage, gas gathering/processing, refined products, gas transportation/storage, and propane. A third component of the matrix considers the structure of the entity. Fourth, because MLPs depend heavily on external financing, we look at debt-to-EBITDA ratios and distribution coverage (distributable cash flow/declared distribution). We also monitor the actions of the ratings agencies in determining a company's creditworthiness.
Tax law allows MLPs to minimize federal income tax by distributing a large percentage of their cash flow to investors. The partnerships can retain funds for capital expenditures needed not only to sustain existing operations, but to grow as well. Growth comes from internal development and from acquisitions financed by combinations of cash, debt, and the sale of additional units. The funds not used for sustaining capital expenditures are known as distributable cash flow, which is one of the key metrics for evaluating the company's performance.
The distribution has further appeal to retail investors, because a significant portion qualifies as a return of capital. In the past, this has been approximately 95% of the distribution. As a result, many investors effectively realize a much higher yield. By distributing essentially all cash flow in excess of sustaining capital spending, the partnership avoids federal income tax and the double-taxation burden of the typical corporation. Individual investors should be aware that they will be required to report their earnings using a K-1. This may require special tax preparation; and it may require them to file for an extension on their tax returns, as K-1s are often sent to filers close to April 15.
VALUATIONEPD units have traded between $14.90 and $25.69 over
the past 52 weeks and are currently near the high end of the range. They trade at 10.3-times our 2021 EPS estimate and at 9.6-times our 2022 forecast, compared to a ten-year historical average range of 15-21. Our multistage dividend discount model yields a fair value of $26 per share, which is our current target price.
On July 30, BUY-rated EPD closed at $22.57, down $0.29. (Bill Selesky, 7/30/21)
Exxon Mobil Corp. (XOM)Publication Date: 8/3/21Current Rating: HOLD
HIGHLIGHTS*XOM: Reaffirming HOLD following 2Q21 results*On July 30, ExxonMobil reported a 2Q21 adjusted net
profit of $4.702 billion or $1.10 per share, compared to an adjusted net loss of $3.002 billion or $0.70 per share in 2Q20.
*The swing to profitability reflected strong crude oil and natural gas demand, higher commodity prices, and lower structural costs. Revenue rose 108% to $67.742 billion. The consensus estimate was $63.731 billion.
*We are raising our 2021 EPS estimate to $4.12 from $3.30 to reflect the recent recovery in crude oil prices. Based on expectations for continued global economic recovery, we also look for higher volumes and margins in the near term.
*We are also raising our 2022 EPS estimate to $4.80 from $4.05 based on our expectations for continued growth in commodity prices next year. The 2022 consensus is $4.76.
ANALYSIS
INVESTMENT THESISWe are maintaining our HOLD rating on ExxonMobil
Corp. (NYSE: XOM). The company topped our EPS estimate and the consensus forecast in 2Q21, helped by higher margins in the Chemical segment and higher pricing in the Upstream business. Management expects cash flow to cover capital spending and dividend payments this year as long as Brent crude prices remain above $50 per barrel. With Brent currently near $73 per barrel, we believe that the dividend is secure. That said, energy prices remain volatile and any sharp drop could have a substantial negative impact on XOM. The company also recently took a $16.8 billion write-down on XTO Energy, a U.S. shale oil and gas producer that it purchased for $30 billion in 2010. We believe that XOM is fairly valued at current levels and see a greater likelihood of outperformance elsewhere in our Energy sector coverage universe.
RECENT DEVELOPMENTSOn July 30, ExxonMobil reported a 2Q21 adjusted net
profit of $4.702 billion or $1.10 per share, compared to an adjusted net loss of $3.002 billion or $0.70 per share a year earlier. EPS beat our estimate of $0.81 and the consensus
Section 2.91
GROWTH / VALUE STOCKSestimate of $1.01.
The swing to profitability reflected strong crude oil and natural gas demand, higher commodity prices, and lower structural costs. Revenue rose 108% to $67.742 billion. The consensus estimate was $63.731 billion.
In the consolidated Upstream segment, the company reported an adjusted 2Q21 operating profit of $3.185 billion, compared to an adjusted operating loss of $1.651 billion a year earlier. On an oil-equivalent basis, production declined 2% from the prior year to 3.6 million barrels per day, reflecting increased maintenance activity. On a sequential basis, average realized crude oil prices rose 13%, while realized natural gas prices rose 1%.
The U.S. Upstream business posted a profit of $663 million, compared to a loss of $1.197 billion a year earlier. Non-U.S. Upstream earnings rose to $2.522 billion from a loss of $454 million.
The consolidated Downstream segment posted an operating loss of $227 million, compared to an operating profit of $976 million in 2Q20. The swing to a loss reflected increased maintenance activity and relatively weak fuel margins.
The Chemicals segment posted an operating profit of $2.320 billion, up from $467 million a year earlier. The results reflected higher pricing, margin growth, and strength in base operations.
Capital and exploration expense fell to $3.803 billion in 2Q21 from $5.327 billion in 2Q20. Management now expects full-year capital spending to be at the low end of its previously announced guidance range of $16-$19 billion. Capital expenditures were about $7 billion in the first half of the year. The company's priorities for capital allocation are investing in promising projects, strengthening the balance sheet, and paying a sustainable dividend.
EARNINGS & GROWTH ANALYSISWe are raising our 2021 EPS estimate to $4.12 from
$3.30 to reflect the recent recovery in crude oil prices. Based on expectations for continued global economic recovery, we also look for higher volumes and margins in the near term. The consensus forecast is $4.10.
We are also raising our 2022 EPS estimate to $4.80 from $4.05 based on our expectations for continued growth in commodity prices next year. The 2022 consensus is $4.76.
FINANCIAL STRENGTH & DIVIDENDOur financial strength rating on Exxon is Medium-High.
Moody's credit rating is Aa2/stable while Standard & Poor's is AA-/negative. Both ratings are considered investment grade.
At the end of 2Q21, XOM's total debt/capitalization ratio was 27.4%, up slightly from 27.1% a year earlier but below the peer average. In 2Q20, the company issued $15 billion in term debt to provide additional liquidity.
Total debt was $62.28 billion at the end of 2Q21, down from $69.52 billion at the end of 2Q20. The company has an $11.3 billion revolving credit facility, which remains undrawn.
ExxonMobil had cash and cash equivalents of $3.5 billion at the end of 2Q21, down from $12.6 billion a year earlier. Cash from operating activities totaled $18.91 billion in 2Q, up substantially from $1.50 billion a year earlier.
In 2020, the company repurchased $305 million of its stock to offset the impact of stock-based compensation. It suspended buybacks in 1Q21 due to market uncertainty, but intends to resume repurchases as business conditions improve.
In May 2019, the company raised its quarterly dividend by 6% to $0.87 per share or $3.48 annually. The shares currently yield about 5.9%. Our dividend forecasts are $3.48 for both 2021 and 2022. Based on recent company actions, we no longer believe the dividend is in danger of being cut or eliminated.
RISKSLike its peers, Exxon operates in a commodity business in
which it has little control over the price of the products it sells. Exxon Mobil also operates in some countries with a history of official corruption and in others that are prone to political upheavals. At the same time, its broad presence reduces the impact of risks in individual countries.
COMPANY DESCRIPTIONExxon Mobil is the world's largest nongovernment-owned
energy company. It is also one of the world's largest publicly traded companies in terms of market capitalization. XOM operates globally along the entire hydrocarbon value chain, from energy exploration to end-user product sales and marketing. The company is the largest refiner and marketer of refined products and its chemical business is one of the world's largest. The company is the result of the 1999 merger of Exxon and Mobil.
VALUATIONXOM shares have traded between $31.11 and $64.93 over
the past 52 weeks and are currently in the upper half of that range. To value the stock on a fundamental basis, we use peer group and historical multiple comparisons, as well as a dividend discount model.
The shares trade at 14-times our 2021 EPS estimate, compared to a ten-year historical average range of 16-22. They also trade at a trailing price/book multiple of 1.6, below the low end of the historical average range of 1.7-2.2; at a
Section 2.92
GROWTH / VALUE STOCKSprice/sales multiple of 1.2, at the midpoint of the historical range of 1.0-1.4; and at a price/cash flow multiple of 9.0, below the midpoint of the range of 8.0-12.4. The enterprise value/EBITDA multiple is 13.8, above the high end of the historical range of 7.6-11.3.
On August 3 at midday, HOLD-rated XOM traded at $58.20, up $0.62. (Bill Selesky, 8/3/21)
Facebook Inc (FB)Publication Date: 8/2/21Current Rating: BUY
HIGHLIGHTS*FB: Maintaining BUY after 2Q21 results *Facebook posted strong second-quarter results, as GAAP
EPS more than doubled from the prior year and revenue rose 56%.
*However, management again projected slower revenue growth in 2H21 due to tougher comparisons and the impact on advertising of Apple's iOS 14.5 update.
*Facebook continues to face a daunting range of antitrust and other regulatory issues in the U.S. and abroad.
*We are raising our 2021 GAAP EPS estimate to $14.61 from $13.30 and our 2022 forecast to $15.05 from $14.67.
ANALYSIS
INVESTMENT THESISWe are maintaining our BUY rating on Facebook Inc.
(NGM: FB) with a target price of $410. Continued strength in e-commerce advertising is driving Facebook's stellar results, though 2Q also benefited from an easy prior-year comparison. However, antitrust and regulatory issues continue to hound the company, which cannot seem to keep out of the headlines. In addition, management remains concerned about changes to Apple's iOS 14.5 mobile operating system, which may cut into advertising revenue, and about the more difficult year-over-year comparisons coming in 2H. Still, we expect these negatives to be offset by the impact of the economic recovery and the trend toward strong digital advertising.
Both user additions and average revenue per user remained robust in 2Q, leading to strong revenue growth. A primary revenue source is direct-response advertising, the type of advertising used in e-commerce. The acceleration in e-commerce brought about by stay-at-home restrictions during the early months of the pandemic may represent a secular shift, which would be a strong positive for Facebook. We also applaud management's execution surrounding the development of newer services, including Instagram, Messenger, and WhatsApp, as the flagship Facebook site has matured. We continue to believe that Facebook's most perilous near-term risks arise from regulatory investigations and headlines highlighting the spread of misinformation on its sites.
RECENT DEVELOPMENTSFacebook posted 2Q results after the close on July 28. The
company beat the consensus revenue estimate by $1.2 billion and the consensus EPS forecast by $0.59.
Second-quarter revenue rose a remarkable 56% year-over-year to $29.1 billion, the best revenue growth rate in five years. Like many companies reporting 2Q results, Facebook lapped a very easy comparison with 2Q20. As usual, advertising drove the growth in revenue, with a 47% increase in the average price per ad and a 6% increase in number of ads delivered. Positive foreign exchange movements added $982 million or five percentage points to revenue growth. Management expects advertising and revenue growth to continue to be driven by price increases in 2H21, but expects revenue growth to 'decelerate significantly' as year-over-year comparisons become more difficult. Management also noted the growing negative impact on Facebook's advertising business of Apple's decision to adopt 'opt-in' data tracking in its iOS 14.5 operating system.
Total 2Q costs rose 31%, while operating income more than doubled to $12.4 billion and the operating margin expanded by eleven percentage points to 43%. GAAP diluted EPS also more than doubled to $3.61 from $1.80 in 2Q20. FB shares have fallen 4% since the 2Q report.
Facebook reported that it added 42 million new monthly active users (MAUs) in 2Q21, up 7% from the prior year. This was below the 98 million added in the COVID-affected 2Q20, but a little better than the 39 million adds in 2Q19 and the 38 million in 2Q18. The company ended 2Q21 with 2.9 billion monthly active users. The company's latest key performance metric, Family Monthly Active People, i.e., users who have visited one of the company's family of products, Facebook, Instagram, Messenger, and/or WhatsApp, added 60 million users in 2Q, with the user base up 12% from the prior year, and ended 2Q21 with 3.51 billion users. Facebook's key growth drivers are increasing membership, member engagement, advertising loads (the number of ads it places), and ad prices. Management expect ad prices to be the key growth driver for the remainder of 2021.
Second-quarter average revenue per user (ARPU) rose 44% year-over-year to $10.12, the fastest growth rate since 1Q14. The new metric, family average revenue per person, rose 37% to $8.36.
On June 28, a U.S. District Court judge dismissed the antitrust complaints filed against Facebook by the FTC and state attorneys general in December 2020. Facebook had filed motions to dismiss the cases on March 10. The dismissals were based on the failure of the FTC and the states to 'plausibly establish... that Facebook has monopoly power in the market for Personal Social Network (PSN) services.' Judge James Boasberg also ruled that the FTC could not challenge Facebook's practice of refusing to grant interoperability to competing applications. The judge dismissed the states' case
Section 2.93
GROWTH / VALUE STOCKSon the grounds that states are unable to challenge acquisitions (Instagram and WhatsApp) after the fact, but expressly ruled that the FTC does have this power. While we see the dismissals as a win for Facebook, as with so much litigation, these cases are not dead. The FTC plans to amend its complaint and refile the lawsuit by August 19. The state attorneys general are appealing the judge's decision.
While the antitrust cases brought by the FTC and state attorneys general are a serious threat, they are only one vector in a multipronged regulatory onslaught on Facebook. On June 11, the U.S. House of Representatives Antitrust Subcommittee of the Judiciary Committee introduced several different but related bills addressing antitrust concerns related to large tech company platforms. Given the multiple investigations and rounds of executive testimony before Congress over the last few years, the obvious targets are Alphabet/Google, Amazon, Facebook, and Apple. The proposed legislation is a rather mixed bag of bipartisan bills, each sponsored by both a Democrat and Republican House member. The bills are:
- The 'American Innovation and Choice Online Act,' aimed at prohibiting 'discriminatory conduct by dominant online platforms.'
- The 'Platform Competition and Opportunity Act,' which seeks to prohibit acquisitions that could 'expand or entrench market power.'
- The 'Ending Platform Monopolies Act,' which looks to eliminate 'the ability of dominant platforms' to leverage control over business lines to their own benefit and disadvantage competitors.
- The 'Augmenting Compatibility and Competition by Enabling Service Switching Act,' which promotes interoperability and data portability in order to lower barriers to entry, facilitate customer switching, and enhance competition.
- The 'Merger Filing Fee Modernization Act,' which raises merger filing fees in order to increase regulatory resources.
The bills look to either break up or competitively constrain large tech company platforms. The last two might face the least industry opposition and perhaps have the greatest chance of passage. While the bills face many hurdles, not least the knife's edge balance between the parties in the U.S. Senate, we see them as the logical outcome of Congressional and regulatory investigations - including the multiple antitrust lawsuits filed by government entities in 2020 against Alphabet/Google and Facebook. Press reports indicate that big tech is revving up well-financed lobbying efforts to fight the legislation. While it is unclear what kind of bill might emerge from the Congressional sausage grinder, the proposed legislation reflects the sharp change in public and political
attitudes toward Facebook and big tech in general over the last several years - from an industry viewed as a shining example of American innovation to a threatening presence on the American industrial landscape. We reiterate our opinion that antitrust regulation, both in the U.S. and internationally, remains a threat to Facebook.
On the regulatory front, President Biden has also castigated Facebook for disseminating misinformation related to COVID-19 vaccines. Mr. Biden's comments are reminiscent of earlier criticism of the company's role in spreading misinformation during the 2016 and 2020 presidential election cycles. While we are by no means absolutist in this regard, we should remember that Facebook is at its core a communications platform, and that this platform can be used for good or evil depending on the user. In our view, Facebook would like nothing better than clear and consistent regulation as to what is and is not misinformation so that it can get out of the business of judging content on its own. Mr. Biden has also ordered government agencies like the FTC to draft new rules reining in the power of Facebook and other big-tech companies.
Apart from regulatory issues, Facebook faces a serious near-term competitive threat from Apple's unilateral decision to require users of Facebook on iOS, i.e., on Apple iPhones and other devices, to opt in to data use by advertisers, rather than maintaining the opt-out default. The new standard took effect with the release of the iOS 14.5 software update on April 16. Apple's stated reason for this action was to bolster user privacy, though it could also seriously damage Facebook. Making the default 'opt-in' will inevitably lead some fraction, perhaps even a large percentage, of iOS users to prohibit data usage by Facebook. This would weaken Facebook's ability to target ads to individual users, thus making its advertising less relevant and less valuable to advertisers. Facebook management has complained bitterly of this change and has taken steps to mitigate its impact on Facebook advertisers. These include the development of its own 'aggregated events measurement' application program interface as well as other efforts to help advertisers deal with Apple's new API. While the i
OS 14.5 update had only a minimal impact on 2Q results, management has warned that the impact may intensify and slow revenue growth in 3Q21 and 4Q21. This could in turn become an overhang for FB shares.
EARNINGS & GROWTH ANALYSISWe are raising our 2021 GAAP EPS estimate to $14.61
from $13.30 and our 2022 forecast to $15.05 from $14.67. Our estimates imply 24% average annual earnings growth over the next two years, above our long-term earnings growth rate forecast of 21%.
Facebook's 2Q results continue to indicate strong momentum in digital advertising even as some hard-hit
Section 2.94
GROWTH / VALUE STOCKSindustry verticals, like travel, entertainment, and lodging, are only beginning to recover. The second quarter also provided new evidence of a secular shift toward digital advertising, which continues to grow strongly even as economies open up. This shift directly benefits Facebook as it is overindexed in retail product categories and underindexed in services like travel. While management again warned about the impact of the new iOS 14.5 'opt-in' policy in 2H21, a strong economy and recovery in some weaker industry verticals should help to offset this impact.
On the 2Q call, Mr. Zuckerberg discussed Facebook's key investment focus areas. He built on past remarks related to the development of AR/VR (augmented reality/virtual reality) by introducing the concept of the 'metaverse,' i.e., a digital virtual environment that is 'an embodied internet that you're inside of rather than just looking at.' (Mr. Zuckerberg is actually the second person to introduce the word 'metaverse' into an earnings call - Microsoft CEO Satya Nadella did so the day before but was less grandiose in his comments. Still, 'metaverse' may become the new technology 'it word' for 2021.) One might dismiss the metaverse as so much claptrap if Mr. Zuckerberg were not the head of the world's largest social media network. However, he remains convinced that AR/VR will become the 'next computing platform,' even as industry critics have derided it as an overhyped technology that never seems to catch on. Facebook acquired Oculus in 2014 and Mr. Zuckerberg has been talking about the transformational nature of AR/VR since at least that time. Facebook has been testing new neural interfaces for AR and for a new avatar system.
Another major investment area is commerce and business messaging. Facebook already has an e-commerce platform in Marketplace, with 1 billion unique visitors per month; in 2020, it also launched Shops, which now has 1 million monthly active shops and 250 million monthly active visitors. The company is focused on building native commerce tools across its applications as well as integrated infrastructure to support payments and customer service. The WhatsApp Business application programming interface is already sending 100 million messages per day. Facebook's agreement to acquire omnichannel customer relations management start-up Kustomer for $1 billion is in line with this focus on e-commerce communications.
The company's third investment focus centers on 'creators,' i.e., internet personalities who create content, often short videos that help drive user engagement. Facebook recently announced a program to pay content creators $1 billion through 2022 while also keeping creator tools free through 2023. Facebook's efforts to attract creators should help it compete with Google's more established YouTube digital video platform and with wildly successful social media upstart TikTok. Facebook's recently announced move into audio and written content are also in line with this focus.
The company has also introduced Facebook Rooms, and expanded the number of users who can participate in a call on the WhatsApp's video calling service. Both of these new products are aimed at the skyrocketing use of video calling, originally due to stay-at-home restrictions but fast becoming a new consumer paradigm. As it has often done in the past, Facebook saw an opportunity with the popularity of Zoom Video Communications and essentially copied the idea. Facebook can also boast that WhatsApp is actually end-to-end encrypted, something that Zoom only recently achieved.
Under Mr. Zuckerberg, Facebook has three operating priorities: capitalizing on the shift of computing/internet to mobile devices, growing the number of marketers that use Facebook's advertising products, and making its advertising more relevant and effective. The underlying goal is to increase member engagement with the site. This is why Facebook's push into video and now into audio has become almost as critical as its shift to a mobile communications platform. Mr. Zuckerberg believes that video will be key to fueling Facebook's next growth stage, and is one of the company's primary investment areas. Management first identified member-generated short-form video as a means of boosting engagement. It has also begun to move into long-form professionally produced video with the 'Watch' tab. For advertisers, the company has invested heavily in ad-technology to measure reach, engagement, and sales conversion. An unintended consequence has been the use of Facebook Live video to record some grisly scenes of violence. Facebook has worked to remedy this issue. While Facebook often relies on human checkers to flag objectionable content, the company is also applying AI technology across its product portfolio, including News Feed, search, advertising, security, and spam filtering.
FINANCIAL STRENGTH & DIVIDENDWe rate Facebook's financial strength as High, the highest
rating on our five-point scale. The company had cash, equivalents and marketable securities of $64.1 billion at the end of 2Q21, and no debt. It generated $31.5 billion in trailing 12-month free cash flow in 2Q21, up 72% year-over-year.
Facebook does not plan to pay a dividend in the near term. The company repurchased $11 billion of its Class A stock in 1H21, after buying back $6.3 billion in 2020, $4.2 billion in 2019, $12.9 billion in 2018, and $2.0 billion in 2017. The share count has fallen by 2 million shares or 0.1% over the last year.
MANAGEMENT & RISKSThe FTC lawsuit has at a minimum increased headline
risk for Facebook, and will likely take substantial time to move through the courts. However, as we have noted, a breakup of the company may not necessarily be a negative for FB shareholders, even if it is initially perceived as such. Management distraction is another risk arising from the FTC
Section 2.95
GROWTH / VALUE STOCKSsuit, which could also weigh on possible future M&A by Facebook.
Like all advertising-dependent companies, Facebook could be severely hurt by a decline in advertising, though this spending now appears to be recovering from pandemic effects. Facebook may also be more resilient than other ad-reliant companies due the secular trend of advertisers moving to digital from other channels and since much of its revenue comes from direct-response advertising by e-commerce sites.
While user growth has migrated toward developing markets, the U.S., Facebook's home market, is still its most lucrative. As such, a meaningful defection of U.S. users (other than to Facebook's own sister applications Instagram and WhatsApp) could materially impact the company's performance and business model. The third quarter of 2020 saw the first-ever decline in U.S. and Canadian Facebook users, which fell by 1 million to 255 million; however, growth resumed in 4Q, with users rising to 258 million. Users rose further to 259 million in 1Q21 and were flat sequentially in 2Q. A significant loss of advertisers would also be a material problem.
The Cambridge Analytica and follow-on scandals highlighted the risks inherent in Facebook as the repository of a vast amount of personal information on its users, which it uses to make its targeted advertising more valuable to marketers. If large numbers of users refuse to allow Facebook to use their personal data, the company's advertising could become less valuable. As noted above, this risk has increased with Apple's recent launch of its iOS 14.5 mobile device software update.
Facebook is vulnerable to extreme regulatory backlash in the U.S. and around the world related to antitrust; the spread of misinformation, including election interference; the spread of unlawful content in private groups and encrypted communications, e.g., child pornography, hate speech; and the misuse of members' private information. We say 'extreme regulatory backlash' since some politicians have begun to raise the issue not just of huge fines but also of a break-up of the company given its social media market power. Facebook may also be subject to attacks from individuals or organizations attempting to steal member information.
Facebook is almost entirely dependent on advertising revenue, which has grown to more than 98% of total revenue. The secular trend of advertisers devoting more and more of their advertising dollars to internet-based advertising has generally softened the impact of cyclical swings in the online advertising market; however, with COVID-19, all bets are off. The flagship Facebook platform is at saturation in the U.S., meaning that growth in that platform will likely slow over time. Facebook's emerging platforms, Instagram, Messenger, and WhatsApp have been building their respective user bases
nicely and are in the early stages of monetization. But it remains unclear whether returns from these emerging platforms will be able to offset any slowdown in flagship Facebook.
Mobile is a critical growth engine for Facebook and the company derives 94% of its advertising revenue from mobile applications. Management has also warned that it is willing to sacrifice short-term margin expansion for long-term membership growth and increased member engagement.
Competition in the internet space is intense and Facebook is up against a number of larger companies with greater resources, including Google, Microsoft, and Apple. The company also competes with smaller virally popular social media startups like TikTok, Twitter, and Snapchat. As Facebook expands internationally, it must manage its entry into new markets, where it may have limited understanding of the local culture. It also faces pressure from 'national champion' competitors, especially in China, from which it is currently banned. Government regulation and the possible censorship of site content could also become much more burdensome in the coming years, both in the U.S. and in international markets. The Snowden revelations involving the use of American internet company data by the NSA could make Facebook's penetration of foreign markets much more difficult, and result in restrictions or outright bans by foreign governments.
Facebook has expanded its role from simple interpersonal communications, i.e., timeline posts, to become a broad-based news media outlet. However, this expansion has been fraught with allegations of bias. It has also raised concerns about the company's role in disseminating fake news, in which bad actors game Facebook's news algorithms to plant false news stories or propaganda. Management is now in an 'arms race' with individuals and nation states trying to use its service to distribute fake news to influence elections or to just generally sow societal discord. Foreign governments' continuing attempts to use the company's advertising systems to influence public opinion during the 2020 presidential election have brought this issue into a harsher light.
Like any fast-growing tech company, Facebook must successfully manage its explosive growth trajectory. It must also ensure 24/7 system reliability in the face of increasingly toxic computer network attacks from sources who would like nothing more than the headlines from a successful attack on a high-profile target like Facebook.
More than most internet start-ups, Facebook is identified with its founder, chairman and CEO Mark Zuckerberg, and his possible loss would undoubtedly be a major blow to the company.
COMPANY DESCRIPTION
Section 2.96
GROWTH / VALUE STOCKSFacebook operates the world's largest family of social
networking websites, including the flagship Facebook site, Instagram, Facebook Messenger, and WhatsApp. The sites enable users to communicate with friends and family by posting to the site; commenting on others' posts; sharing photographs, website links, and videos; messaging and playing games. Facebook also partners with application developers to add functionality to the sites, and allows users to pay for virtual goods and services through its Payments function. Facebook derives about 55% of its revenue from outside the U.S. and Canada. Facebook went public on May 18, 2012.
VALUATIONFacebook shares are up 31% year-to-date, compared to an
18% gain for the S&P 500, a 46% gain for the S&P 500 Interactive Media & Services Industry Index, and a 14% gain for the NYSE FANG+ Index. Facebook's trailing EV/EBITDA multiple of 18 is below the peer median of 21.5. The forward enterprise value/EBITDA multiple of 13.1 is 41% below the peer average, compared to an average discount of 38% over the past two years. We are maintaining our BUY rating on Facebook with a target price of $410.
On July 30, BUY-rated FB closed at $356.30, down $2.02. (Joseph Bonner, CFA, 7/30/21)
Federated Hermes Inc (FHI)Publication Date: 8/2/21Current Rating: HOLD
HIGHLIGHTS*FHI: Fee rates turn lower in 2Q, money market fee
waivers weigh*On July 29, the company reported adjusted 2Q21
earnings of $0.70 per share, down from $0.80 a year earlier but above the $0.66 consensus.
*Average managed assets rose 3% sequentially in 2Q with modest growth in both long-term and money market assets.
*High redemption rates in the company's long-term assets have been an issue in recent quarters and reflect a shift toward index funds - a segment in which FHI does not compete.
*We see limited multiple expansion prospects given current industry trends. However, we note that the stock carries an attractive dividend yield of about 3.3%, which we view as secure.
ANALYSIS
INVESTMENT THESISWe are maintaining our HOLD rating on Federated
Hermes Inc. (NYSE: FHI) following 3Q earnings. Although the company is a well-managed fund provider, and received a short-term boost in assets from the acquisition of Hermes, it continues to face pressure on long-term AUM, with outflows of long-term asset products nearly exceeding new sales in 2020. In particular, the company has been hurt by the shift toward index funds, as it does not compete in this segment.
We were encouraged by the initial improvement in average fee rates following the inclusion of Hermes, as well as cross-selling opportunities of Hermes products in the U.S., but fee rates have turned lower and we expect them to remain under pressure in a hyper-competitive environment for money managers.
Despite near-term headwinds, our long-term rating remains BUY based on the company's healthy balance sheet and margins, strong products, and favorable dividend yield.
RECENT DEVELOPMENTSRECENT DEVELOPMENTS
Over the past year, the FHI shares are up 35%, versus a 34% rise for the broader market.
On July 29, the company reported 2Q21 earnings of $0.70 per share, down from $0.80 a year earlier but above the $0.66 consensus.
Revenue decreased 14% to $311 million, hurt by an increase in voluntary fee waivers related to certain money market funds in order for those funds to maintain positive or zero net yields. Overall average managed assets were up 0.4% in the second quarter year-over-year, to $640 billion.
Total operating costs were down 13%, as higher compensation was offset by lower distribution, advertising and travel costs, leading to a 31% fall in net income to $55.9 million.
In 2Q, the company had sales of $17.4 billion for long-term asset products, while redemptions totaled $15.3 billion, leading to $2.1 billion of net inflows. Market gains added $7.7 billion to long-term assets.
In July 2018, Federated Investors acquired a 60% interest in Hermes Fund Managers Limited, which managed $47.2 billion across strategies in equities, credit and private markets. Hermes also has sizeable assets tied to ESG investing. The purchase price was 246 million euros. In January 2020, the company changed its name to Federated Hermes Inc., and its NYSE ticker symbol from FII to FHI.
EARNINGS & GROWTH ANALYSISEquities were 16% of average managed assets in 2Q, but
they accounted for 55% of 2Q revenue due to the higher margins on equity products. Money market assets, which historically have accounted for a mid-60 percent of total assets, jumped in 2Q20 and remained around 69% in 2Q, as investors continued to maintain high levels of cash. We expect a decline in money market funds in more of a risk-on market environment in 2021. Money market assets also carry lower margins and have weighed on the take rate (revenues divided by average assets).
Section 2.97
GROWTH / VALUE STOCKS
We see an 11% decline in revenues in 2021 on the lower money market balances. Of some concern, redemptions of average long-term assets nearly outpaced sales in 2020.
Operating expenses have been better managed in recent quarters, helped by lower distribution and travel costs. During 2Q, fee waivers of $117.8 million allowed money market funds to maintain positive or zero net yields.
We are lowering our 2021 EPS estimate to $2.94 from $3.15 on continued higher fee-waiver expenses, while also lowering our 2022 forecast to $2.95 from $3.23.
Over the long term, we expect strong investment results -- about two-thirds of the company's funds have been in the top half of their peer group range over the last three years -- to lead to fund inflows and higher performance fees. Our long-term earnings growth rate forecast remains 5%.
FINANCIAL STRENGTH & DIVIDENDOur financial strength rating on Federated Hermes is
Medium, the midpoint on our five-point scale. The company achieves average scores on our three main measures of financial strength: leverage based on debt/cap, profitability, and interest coverage.
The company had $424 million in cash and marketable securities at June 30, 2021. Long-term debt totaled $65 million, compared to shareholders' equity of $1.55 billion, for a debt/cap ratio of only 4%. The company's operating margins have been running in the high 20% range. Top performers in the industry typically generate margins in the high 30s to low 40s. The company's relatively high proportion of money market assets accounts for the below-peer-average operating margin.
In April 2021, the board authorized a 4 million common stock repurchase plan. Management has used buybacks mainly to offset dilution from various sources. The company repurchased 1.5 million common shares for $45 million in 1Q21, but skipped repurchases in 2Q21.
The company last raised its quarterly dividend by 8% to $0.27 per share, or $1.08 annually, in 2Q18, for a current yield of about 3.3%. The dividend payout ratio on 2020 earnings was 33%, and we expect it to remain below 40% in both 2021 and 2022. We look for dividends to remain at $1.08 per share in 2021 and 2022. The company also occasionally pays a special dividend. It made a special $1.00 per share payment in November 2020.
MANAGEMENT & RISKSJ. Christopher Donahue, the son of co-founder and board
chairman John Donahue, has served as CEO of Federated since 1998. Thomas Donahue is the CFO, and previously
worked in venture capital. The Donahue family owns all of the company's voting stock, and is likely to do so for the foreseeable future.
Federated Hermes is best known for its money-market funds, which have been pressured by persistently low interest rates in the wake of the 2007-2009 financial crisis. To ensure that its investors had a better chance of breaking even, the company waived fees on several funds for many years; without this, low short-term bond yields may have forced some funds into negative-return territory. This is a common practice, as funds try to avoid 'breaking the buck,' a situation in which their NAV falls below $1.00. While this pressure has eased with rising interest rates, trimming fees has in the past meaningfully impacted FHI's bottom line.
COMPANY DESCRIPTIONFederated Hermes, based in Pittsburgh, is an asset
management holding company with about $646 billion in AUM as of June 30, 2021. It offers equity, fixed-income and money-market funds. The company's clients include high-net-worth individuals, registered investment advisors, pension funds, charities, and government organizations. Federated Hermes takes a relatively conservative, long-term approach to investing.
VALUATIONWe expect revenue growth trends to remain sluggish, as
redemptions have nearly outpaced sales in recent quarters, and as money market assets decline in a more risk-on environment. While the shares are trading below their historical valuation at about 11-times our 2021 EPS estimate, we see limited prospects for P/E multiple expansion given current revenue headwinds, and note an expected slight earnings decline in 2021.
In valuing the shares, we blend the results of our discounted cash flow, dividend discount, and peer multiple comparison models. Using the 2021 dividend and a 5% growth rate, our dividend discount model points to a fair value of $25 per share, while our DCF model indicates a price of $30. Our comparable analysis implies a value of $31 per share. Blending these approaches, we calculate a fair value for FHI of $29 per share, near current levels. As such, our rating remains HOLD.
On July 30, HOLD-rated FHI closed at $32.44, down $0.68. (Stephen Biggar and Caleigh McGough, 7/30/21)
First Solar Inc (FSLR)Publication Date: 8/2/21Current Rating: BUY
HIGHLIGHTS*FSLR: Reaffirming BUY following 2Q21 results*On July 29, First Solar reported adjusted fiscal 2Q21
earnings from continuing operations of $82.5 million or $0.77 per diluted share, up from $36.9 million or $0.35 per share in
Section 2.98
GROWTH / VALUE STOCKSthe prior-year quarter.
*The higher earnings reflected an increase in Modules segment revenue and revenue related to a settlement for a legacy systems project.
*On the 2Q21 conference call, First Solar adjusted its 2021 guidance due to elevated freight costs and supply-chain disruptions caused by the pandemic. We believe that these changes reflect industrywide rather than company-specific issues.
*We are lowering our 2021 EPS estimate to $4.30, at the midpoint of management's revised guidance range, from $4.40. The current consensus is $4.32.
ANALYSIS
INVESTMENT THESISWe are reaffirming our BUY rating on First Solar Inc.
(NGS: FSLR), a leading solar energy company, with a price target of $104. We believe that First Solar is well positioned for future growth based on its solid balance sheet and focus on cadmium telluride technology, which should provide a meaningful cost advantage relative to more commoditized technologies like polysilicon. The company posted strong 2Q21 results, though it lowered its full-year EPS guidance, citing elevated freight costs and supply-chain disruptions caused by the pandemic. We believe that these are industrywide rather than company-specific issues. We also expect them to be temporary in nature and expect First Solar to benefit over time from the growing interest in renewable energy.
We caution that FSLR shares have a history of volatility, and that any sales or earnings disappointment could result in a sharp selloff. As such, we view FSLR as appropriate only for risk-tolerant investors as part of a diversified portfolio.
RECENT DEVELOPMENTSOn July 29, First Solar reported adjusted fiscal 2Q21
earnings from continuing operations of $82.5 million or $0.77 per diluted share, up from $36.9 million or $0.35 per share in the prior-year quarter. EPS topped our estimate of $0.57 and the consensus of $0.60.
The higher earnings reflected an increase in Modules segment revenue and revenue related to a settlement for a legacy systems project.
Net sales fell 2% to $629.2 million, reflecting a difficult comparison with 2Q20, when revenue benefited from the sale of the American Kings project.
In the Modules segment (about 86% of 2Q21 sales), revenue rose 46% to $543.0 million, driven by an increase in modules sold to third parties. In the Systems business (about 14% of 2Q sales), sales fell 68% from the prior year to $86.2 million.
On a companywide basis, the 2Q21 gross margin was 27.7%, up 630 basis points from the prior year due to higher project sales and improved throughput at the company's manufacturing facilities. These positives were partly offset by higher manufacturing costs related to the pandemic.
The company reported 2Q21 module production of 2.0 GW, which now includes production at a second Series 6 factory in Malaysia. Nameplate capacity rose to 7.9 GW. In 2020, module production totaled 6.1 GW, including 5.9 GW of Series 6 modules, up from 5.7 GW in 2019.
First Solar generates revenue by manufacturing and shipping photovoltaic (PV) modules and PV solar power systems and by providing operational and maintenance services to system owners.
EARNINGS & GROWTH ANALYSISOn the 2Q21 conference call, First Solar adjusted its 2021
guidance due to elevated freight costs and supply-chain disruptions caused by the pandemic. We believe that these changes reflect industrywide rather than company-specific issues.
The company now expects net sales of $2.875-$3.10 billion (up from a prior $2.85-$3.00 billion), a gross margin of $695-$760 million (down from $710-$775 million), and diluted EPS of $4.00-$4.60 (down from $4.05-$4.75). It also projects capital spending of $825-$875 million, up from a prior forecast of $425-$475 million.
We are lowering our 2021 EPS estimate to $4.30, at the midpoint of the revised guidance range, from $4.40. The current consensus is $4.32.
We are also lowering our 2022 EPS estimate to $3.40 from $4.84 based on our expectations for continued pandemic-related pressures at the company's manufacturing plants in Malaysia and Vietnam. The 2022 consensus is $3.24.
FINANCIAL STRENGTH & DIVIDENDOur financial strength rating on First Solar is Medium, the
middle rank on our five-point scale. The company receives average scores on our key financial strength criteria of debt levels, fixed-cost coverage, profitability, cash flow generation, and earnings quality. The company is not rated by any of the rating agencies.
Cash and cash equivalents totaled $2.1 billion at the end of 2Q21, compared to $1.23 billion at the end of 4Q20. The debt/cap ratio was 7.5% at the end of the quarter, compared to 11.5% at the end of 2Q20 and below the peer average.
Total debt was $468.30 million at the end of 2Q21, consisting of $451.84 million in long-term borrowings and $16.46 million in short-term obligations. This compares to
Section 2.99
GROWTH / VALUE STOCKStotal debt of $676.09 million at the end of 2Q20.
First Solar does not pay a dividend and is unlikely to implement one in the near term. It also does not have a share repurchase program. As of June 30, 2021, FSLR had no off-balance sheet debt or similar obligations, other than financial assurance-related instruments, which are not classified as debt. The company does not guarantee any third-party debt.
MANAGEMENT & RISKSMark Widmar became the company's CEO in 2016 and
previously served as CFO. Alex Bradley has been CFO since 2016. Michael J. Ahearn is the chairman. He served as CEO in 2000-2009 and again in 2011-2012.
We believe that the company has the large project personnel, experience, and track record to lead in the solar utility market on a global basis, much as it dominates in the U.S.
Investors in FSLR shares face risks. The reduction, elimination, or expiration of government subsidies, economic incentives, tax incentives, renewable energy targets, and other support for on-grid solar electricity applications, or other adverse public policies, such as tariffs or other trade remedies imposed on solar cells and modules, could negatively impact demand and/or price levels for solar modules and systems.
At this stage, we believe that a primary risk to an investment in FSLR remains a resetting of industry valuations, as energy prices remain volatile, industry competition remains fierce, and strained government budgets, coupled with a changing political climate, create increased risk for subsidies. Pricing in some markets has become fiercer, affecting both Purchase Power Agreements (PPAs) and First Solar's modules; the company must maintain a balance so that the return on capital will be commensurate with the underlying risks.
If the market for utility scale solar power generation does not expand significantly over the next few years due to cost factors or technological or political developments, First Solar would likely experience slower-than-anticipated growth. The company also faces interest rate and currency risks.
First Solar's foray into the ownership of solar projects increases the company's financial risks and may significantly extend the time for a return on investment from such projects. This is a factor for investors to watch if it becomes a significant portion of the business.
COMPANY DESCRIPTIONFirst Solar designs, develops, manufactures and markets a
line of thin-film semiconductor photovoltaic (PV) cells and modules that convert sunlight into electricity. The company's products, based on cadmium telluride technology, are used to
provide environmentally friendly electric power. The company also sells PV solar systems, and provides operations and maintenance services. The company has 6,600 employees.
VALUATIONWe believe that FSLR shares are attractively valued at
current prices near $86. The shares have traded between $59.29 and $112.50 over the last 52 weeks and are near the midpoint of that range. From a fundamental standpoint, FSLR trades at 20-times our 2021 EPS forecast, near the low end of the historical range of 17-42 and below the peer average of 21. It is also trading at 25-times our 2022 EPS estimate.
The price/sales multiple is 3.1, below the industry average of 3.9 but above the midpoint of the five-year range of 1.7-3.4. We are maintaining our BUY rating with a target price of $104, reflecting the company's strong contracted backlog. We also believe that FSLR could be an attractive acquisition target for an integrated oil company looking to bolster its renewable operations.
On August 2 at midday, BUY-rated FSLR traded at $88.01, up $1.97 (Bill Selesky, 8/2/21)
Fiserv, Inc. (FISV)Publication Date: 8/2/21Current Rating: BUY
HIGHLIGHTS*FISV: Maintaining BUY and $140 target*On July 27, Fiserv reported 2Q21 adjusted EPS that rose
47% from the prior year.*Management expects 24%-27% adjusted EPS growth in
2021.*Compared to a group of peers (ADP, FIS, GPN, PAYX),
FISV shares are trading at discount valuations.*However, we believe that higher multiples are warranted
given the company's record of consistent double-digit EPS growth.
ANALYSIS
INVESTMENT THESISOur rating on Fiserv Inc. (NGS: FISV) is BUY with a
target price of $140. We believe that Fiserv, a financial services firm, benefits from a highly scalable business model. Over the last several years, it has consistently turned single-digit revenue growth into double-digit EPS growth with help from strong margins and share buybacks. While 2020 was a challenging year, management projects EPS growth of 24%-27% and revenue growth of 10%-12% in 2021. Fiserv should also benefit from secular tailwinds, including strong technology spending by its bank and credit customers. These customers often focus their spending on areas that are central to Fiserv's value proposition, which includes increasing the efficiency of mobile payments processing. Innovation in this area has been a strong point for Fiserv, with products such as Mobiliti for mobile banking; DNA for account processing;
Section 2.100
GROWTH / VALUE STOCKSZelle, a peer-to-peer payment solution; and, more recently, CheckFree Next for bill payments. With the acquisition of First Data, Fiserv's portfolio now includes Clover, a cloud-based point-of-sale platform similar to Square.
Compared to a group of peers (ADP, FIS, GPN, PAYX), Fiserv shares are trading at discount valuations; however, we believe that they merit higher multiples given the company's consistent double-digit EPS growth, record of product innovation, and scalable business model. Our target price of $140 implies a multiple of 22-times our 2022 EPS estimate, and a potential return of 22% from current levels.
RECENT DEVELOPMENTSOn July 27, the company reported second-quarter adjusted
EPS that rose 47% from the prior year to $1.37 - above the consensus forecast of $1.28. Adjusted revenue rose 20% to $3.86 billion, while internal (i.e., organic) revenue rose 4%. The adjusted operating margin increased 510 basis points to 33.9%.
The company has raised its 2021 guidance. It now expects adjusted EPS of $5.50-$5.60 (implying 24%-27% growth), up from a prior $5.35-$5.50; internal revenue growth of 10%-12%, up from 9%-12%; and adjusted operating margin expansion of 250 basis points.
During the first quarter, the company completed the acquisition of Ondot and announced an agreement to acquire Pineapple Payments.
EARNINGS & GROWTH ANALYSISThe company organizes its business into three segments:
Acceptance (43% of sales), which provides e-commerce and mobile commerce point-of-sale solutions to businesses, and credit card and loan account processing, among other services; Fintech (20%), which provides account processing products and services to financial institutions; and Payments (37%), which provides products and services used to process electronic transactions.
In the Acceptance segment, second-quarter adjusted revenue came to $1.666 billion, up from $1.223 billion in the prior-year quarter. In Fintech, adjusted revenue rose to $754 million from $714 million, and in Payments, adjusted revenue rose to $1.427 billion from $1.329 billion.
Management keeps a close eye on costs. Margins widened in all three segments in 2Q; the overall adjusted operating margin also widened by 510 basis points to 33.9%.
Turning to our estimates, we are raising our 2021 EPS forecast to $5.57, in the upper half of management's guidance range, from $5.45. We are also boosting our 2022 estimate to $6.40 from $6.30.
FINANCIAL STRENGTH & DIVIDEND
Our financial strength rating on Fiserv is Medium, the midpoint on our five-point scale. At June 30, Fiserv had cash and equivalents of $831 million, down from $906 million as of December 31, 2020. Total debt was $20.8 billion at June 30 and the debt-to-adjusted EBITDA ratio was 3.2. Second-quarter free cash flow was $801 million, up from $789 million a year earlier. Operating cash flow rose 5% to $2.01 billion in the first half of 2021. Moody's rates the company's debt as Baa2/stable and S&P rates it as BBB/stable.
Fiserv has a stock repurchase program. The company repurchased 5.0 million shares of stock for $588 million in 2Q and 10.2 million shares for $1.2 billion in the first half of the year. In 2020, it repurchased 16.1 million shares for $1.64 billion.
The company does not pay a dividend.
MANAGEMENT & RISKSFrank Bisignano is the president and CEO of Fiserv,
having succeeded former CEO Jeffrey Yabuki on July 1, 2020. Mr. Bisignano was previously the company's president and had served as CEO of First Data. He has also been the CEO of JP Morgan Chase's Mortgage Banking business. Robert Hau has been Fiserv's CFO and treasurer since March 2016. He was previously the CFO of TE Connectivity Ltd., a $12 billion global product technology company.
Fiserv faces the risk that its bank and credit union customers may cut technology budgets, which would likely hurt revenue. The account processing industry is also highly competitive, and competitors may provide more innovative solutions than Fiserv, resulting in customer migration. The company also faces risks from cryptocurrencies, which may offer alternative systems for banking, bill payments, and more. Fiserv's large installed base and leading industry position help to mitigate these risks. The company also faces risks related to the coronavirus pandemic, as weaker economic conditions could reduce certain payment activity and raise credit risk. At the same time, the pandemic has created opportunities for Fiserv, as many consumers have actively sought out contactless payment methods to reduce the risk of infection.
COMPANY DESCRIPTIONFiserv is a leading provider of information management
and e-commerce systems for the financial services industry. Services include account processing and management, online bill payment and presentment, mobile banking, and debit card transaction processing. Fiserv is a member of the S&P 500 Index.
VALUATIONWe think that FISV shares are attractively valued at recent
prices near $115. The shares have traded between $92 and $127 over the past year and are currently above the midpoint of the range. Prior to the pandemic, the shares had been in a bullish pattern of higher highs and higher lows. The shares
Section 2.101
GROWTH / VALUE STOCKSreached a near-term high above $125 in late April 2021 and then fell until late June. They have risen modestly since that time.
On the fundamentals, the projected 2021 P/E multiple of 21 is toward the high end of the historical range of 14-24, and the price/sales ratio of 5 is above the midpoint of the historical range of 2-7. Compared to a group of peers (ADP, FIS, GPN, PAYX), Fiserv shares are trading at discount valuations; however, we believe that higher multiples are warranted given the company's record of consistent double-digit EPS growth. Our target price of $140 implies a multiple of 25-times our 2021 EPS estimate and 22-times our 2022 estimate, and a potential return of 22% from current levels.
On August 2 at midday, BUY-rated FISV traded at $112.48, down $2.63. (David Coleman, 8/2/21)
Ford Motor Co. (F)Publication Date: 8/2/21Current Rating: BUY
HIGHLIGHTS*F: Reaffirming BUY following 2Q21 financial results*On July 28, Ford reported a 2Q21 adjusted net profit of
$511 million or $0.13 per share, up from an adjusted net loss of $1.408 billion or $0.35 per share in 2Q20.
*The swing to a better-than-expected operating profit in 2Q21 largely reflected strong revenue growth in North America, South America and Europe, which partly offset ongoing semiconductor supply shortages.
*Based on better-than-expected 2Q21 results and current operating trends, Ford is raising its full-year adjusted EBIT by about $3.5 billion, to between $9 billion and $10 billion (previously $5.5-$6.5 billion).
*Overall, volume is expected to increase by about 30% sequentially from the first to the second half of the year, driving an improvement in market factors net of production costs.
ANALYSIS
INVESTMENT THESISWe are reiterating our BUY rating on Ford Motor Co.
(NYSE: F) with a price target of $18. Despite the company's forecast for reduced production in 2021 due to the semiconductor shortage, we remain bullish on Ford shares. Our upgrade in February 2021 reflected our view that Ford would benefit from robust consumer spending, driven by increased vaccine distribution, stimulus payments, low borrowing costs, and high savings rates. The company has strengthened its balance sheet and set clear financial targets. It is also seeing strong consumer interest in its cars and trucks, including new electric vehicles.
RECENT DEVELOPMENTSOn July 28, Ford reported a 2Q21 adjusted net profit of
$511 million or $0.13 per share, up from an adjusted net loss
of $1.408 billion or $0.35 per share in 2Q20. The results exceeded our EPS loss estimate of $0.23 per share and the consensus loss estimate of $0.03.
The swing to a better-than-expected operating profit in 2Q21 largely reflected strong revenue growth in North America, South America and Europe, which partly offset ongoing semiconductor supply shortages. For the second quarter, sales grew 38% to $26.752 billion.
In North America, Ford reported second-quarter EBIT of $0.2 billion, up from a loss of $0.9 billion a year earlier, reflecting strong customer demand for new products and higher industrywide net pricing, compared to the global pandemic experienced in the year-ago quarter. Additionally, lower incentive spending and favorable product mix helped quarterly performance. Overall North American sales rose 37% to $15.0 billion.
In Europe, Ford reported a 2Q21 EBIT loss of $0.3 billion, narrower than the EBIT loss of $0.7 billion in the year-ago quarter. The smaller EBIT loss reflected an improved product mix of utility vehicles, commercial vehicles and ongoing cost reduction initiatives. Segment revenue rose 55% in 2Q21.The company continues to reduce its Western European headcount, and has eliminated a total of 11,000 jobs.
In the South American division, Ford posted an EBIT loss of $0.1 billion, compared to an EBIT loss of $0.2 billion a year ago. The division is transitioning to a leaner, asset-light business model focused on vehicles such as the Ranger pickup, the Transit van and the Bronco Sport. Segment revenue for the quarter was $0.5 billion, up from $0.2 billion in the prior-year quarter.
The company's new International Markets Group (IMG), which consolidates the Asia Pacific, Middle East & Africa, and Russia divisions, reported EBIT of $0.2 billion in 2Q21, compared to an EBIT loss of $0.1 billion in 2Q20.
The China division reported an EBIT loss of $0.1 billion in 2Q21, comparable to the same quarter a year ago. It was the fifth consecutive quarter of year-over-year EBIT improvement, driven by strength of localized Lincoln, improved mix of Ford utility vehicles and commercial vehicles. Commercial vehicles accounted for 52% of Ford's sales in China.
Ford Motor Credit reported 2Q21 EBIT of $1.6 billion, up from $0.5 billion in the year-ago period. The improvement was largely driven by strong auction values. The portfolio continues to perform well, with LTR (loss-to-receivables) remaining low and below prior-year levels.
The company's Mobility segment reported a pro forma EBIT loss of $0.2 million, narrower than the EBIT loss of $0.3 million in 2Q20.
Section 2.102
GROWTH / VALUE STOCKS
As noted in our previous note, on May 20, 2021, Ford and South Korean battery maker SK Innovation, announced that they had signed an MoU(memorandum of understanding) to create a joint venture to be called 'BlueOvalSK' to produce approximately 60 gigawatt-hours (GWh) annually in traction battery cells and array modules, starting mid-decade, with the potential to expand.
Ford's global BEV plan calls for at least 240 gigawatt hours (GWh) of battery cell capacity by 2030 - roughly 10 plants' worth of capacity. Approximately 140 GWh will be required in North America, with the balance dedicated to other key regions, including Europe and China. The creation of the JV is subject to definitive agreements, regulatory approvals and other conditions. Next-gen cells and arrays will be used to power several future Ford battery electric vehicles. We see this as a positive development in the company's transition to an all-electric fleet over the next few decades.
EARNINGS & GROWTH ANALYSISBased on better-than-expected 2Q21 results and current
operating trends, Ford is raising its full-year adjusted EBIT by about $3.5 billion, to between $9 billion and $10 billion (previously $5.5-$6.5 billion).Overall, volume is expected to increase by about 30% sequentially from the first to the second half of the year, driving an improvement in market factors net of production costs.
However, the volume benefit is anticipated to be offset by higher commodity costs, investments in the Ford+ plan and lower earnings by Ford Credit, among other factors, with second-half adjusted EBIT lower than in the first half. Also, Ford has lifted its target for full-year adjusted free cash flow to between $4 billion and $5 billion (from $0.5-1.5 billion), supported by expected favorable second-half working capital as vehicle production increases with anticipated improvement in availability of semiconductors.
We are increasing our 2021 EPS estimate to $1.59 from $1.23 to reflect both company guidance and our expectations for continued growth in pricing and margins this year, despite the ongoing impact of the semiconductor shortage. The consensus forecast is $1.41.
At the same time, we are raising our 2022 EPS estimate to $2.06 from $1.79 per share to reflect our assumption for an easing of the chip shortage and continued improvement in pricing, volume and margins next year. The current consensus estimate is $1.84.
FINANCIAL STRENGTH & DIVIDENDOur financial strength rating on Ford is Medium. Standard
& Poor's rates the company's credit as BB+/negative, while Fitch rates it as BB+/stable. Moody's has a rating of Ba2/stable.
At the end of 2Q21, Ford's total debt/capitalization ratio was 80.9%, down from 85.1% at the end of 2Q20. This ratio includes debt from Ford Credit. The five-year average debt/cap ratio is 83.1%.
Debt totaled $146.92 billion at the end of 2Q21, including short-term borrowings of $46.01 billion and long-term borrowings of $100.91 billion. This compares to $176.48 billion in 1Q20.
Ford suspended its dividend on March 19, 2020 during the initial phase of the pandemic. We do not expect it to resume dividend payments this year or next. Ford paid out approximately $2.4 billion in dividends in 2019.
Ford ended 2Q21 with $25.1 billion in cash and cash equivalents, down from $39.0 billion a year earlier. At the end of the second quarter, the company had $41 billion in liquidity.
MANAGEMENT & RISKSLike its competitors, Ford faces risks from general
economic weakness, as well as from changes in consumer preferences and spending patterns. The company is also at risk from higher costs for components and raw materials, as well as from supply disruptions. Ford also operates in a highly competitive industry that continues to show signs of excess manufacturing capacity.
Jim Farley became Ford's new president and CEO on October 1, 2020, following the retirement of Jim Hackett. Mr. Farley has also joined the board of directors.
COMPANY DESCRIPTIONFord Motor Co., based in Dearborn, Michigan,
manufactures and sells automobiles on six continents. With about 175,000 employees and 65 plants worldwide, the company's automotive brands include Ford and Lincoln. The company also provides financial services through Ford Motor Credit.
VALUATIONFord shares have traded between $6.41 and $16.45 over
the past 52 weeks and are currently above the midpoint of that range. They are trading at 8.8-times our 2021 EPS forecast and at 6.8-times our 2022 forecast, compared to a 14-year annual average range of 7-13.
They are also trading at a trailing price/book multiple of 1.7, below the midpoint of the historical range of 1.3-2.2; at a price/sales multiple of 0.4, at the high end of the range of 0.2-0.4; and at a price/cash flow multiple of 2.7, near the low end of the range of 2.6-4.2. The price/EBITDA multiple is 6.7, above the midpoint of the range of 3.0-11.7.
We view Ford shares as attractively valued at current levels based on our expectations for increased consumer
Section 2.103
GROWTH / VALUE STOCKSspending and accelerating vehicle sales in 2021. Our target price is $18.
On July 30, BUY-rated F closed at $13.95, down $0.44. (Bill Selesky, 7/30/21)
Generac Holdings Inc (GNRC)Publication Date: 7/29/21Current Rating: BUY
HIGHLIGHTS*GNRC: Raising target price*GNRC shares have outperformed the market over the
past quarter, rising 25% compared to a gain of 5% for the S&P 500.
*The GNRC shares fell 5% on 7/28/2021 after the company reported 2Q adjusted diluted EPS that rose 70% year-over-year and topped expectations.
*Management expressed caution over rising costs.*We think earnings are poised to grow at an accelerated
rate and view the sell-off as a buying opportunity.
ANALYSIS
INVESTMENT THESISOur rating on Generac Holdings Inc. (NYSE: GNRC) is
BUY. This well-managed company has a long record of market outperformance and earnings growth. Generac designs, manufactures, and sells power generation equipment, energy storage systems, and other power products for the residential and light commercial and industrial markets. We think that the company is well positioned to address the impact of climate change and energy market disruption, 5G deployment, and increased automation in manufacturing. The company has a strong balance sheet and an experienced management team - two factors that we think are important during the pandemic. On a technical basis, the shares have been in a long-term bullish pattern of higher highs and higher lows dating back to 2015. Compared to a group of peers that serve similar markets (FAST, ECL, WMX, OC), the shares are trading at premium multiples, which we think is reasonable given the company's strong balance sheet, experienced management team, and record of growth. We expect the positive sales, earnings and stock price momentum to continue for this well-positioned company. Our new target price is $475.
RECENT DEVELOPMENTSGNRC shares have outperformed the market over the past
quarter, rising 25% compared to a gain of 5% for the S&P 500. Over the past year, the shares have also outperformed, advancing 201% while the S&P 500 has risen 36%. Over the past five years, GNRC's returns have topped the index as well as the industry ETF IYJ. The beta on GNRC is 0.91.
The GNRC shares fell 5% on 7/28/2021 after the company reported 2Q adjusted diluted EPS that rose 70% year-over-year and topped expectations. Core revenue rose 68% to $920 million - in line with the 67% growth recorded in
the prior quarter. The adjusted EBITDA margin widened by 120 basis points to 23.7%. Adjusted EPS came to $2.39, topping the consensus forecast of $2.31. For the first half of the year, the company has earned $4.77 per share.
The coronavirus pandemic has had an impact on results. Management has noted that the pandemic has caused more people to stay at home, lifting demand for home generators to an all-time high. At the same time, demand for commercial and industrial products has fallen sharply. In 2Q20, management initiated a number of restructuring actions in this part of the business to better align its cost structure with customer demand.
Along with the 2Q results, management adjusted its outlook for 2021. It now expects sales growth of 47%-50%, up from its previous forecast of 40%-45%. This guidance assumes power outages in line with the long-term baseline average, the continuation of the recent 'home as sanctuary' trend, and increasing demand for PWRcell solar and battery energy storage systems. But costs are coming in higher as well, and the company now projects an adjusted EBITDA margin of 24.5%-25.0%, which would be an increase from the 23.5% recorded in 2020, but is down from its prior forecast range of 24.5%-25.5%.
The company has a history of growth through acquisitions. In June, the company closed on the acquisition of Deep Sea Electronics Limited, an advanced controls designer and manufacturer headquartered in Hunmanby, United Kingdom. In July, the company closed on the acquisition of Chilicon Power, LLC. Based in California, Chilicon is a designer and provider of grid-interactive microinverter and monitoring solutions for the solar market. Since 2011, management has executed 19 deals.
EARNINGS & GROWTH ANALYSISGenerac products include generators for residential and
commercial & industrial uses; transfer switches, which transfer power from a utility source to a generator; pressure washers; water pumps; and professional-grade power products for the rental and contractor markets. The company has two product classes: Residential Products (65% of 2Q sales) and Commercial & Industrial Products (28%). The company also is organized geographically, with Domestic accounting for 85% of 2Q sales and International accounting for 15%. Recent business trends are summarized below.
Domestic segment sales rose 68% year-over-year in 2Q, with core sales growth driven by broad-based strength across both residential and C&I products highlighted by very strong growth with home standby generators, PWRcell energy storage systems, telecom national account customers and C&I mobile products. Adjusted segment EBITDA was 26.0% of net sales, down from 26.3% in the prior-year period. This margin decline was driven by higher input and logistics costs.
Section 2.104
GROWTH / VALUE STOCKS
International sales, which consist primarily of C&I products, increased 45% on a core basis. Adjusted segment EBITDA was 10.1% of net sales, up from 2.2% a year earlier. The margin improvement was primarily due to improved operating leverage on the higher sales volumes.
Turning to our estimates, and based on expected sales and margin trends, we are maintaining our 2021 adjusted EPS estimate of $10.00. Our estimate implies growth of 35% for the year. We expect continued growth in 2022 and are raising our adjusted EPS estimate to $11.25 from $11.10.
FINANCIAL STRENGTH & DIVIDENDOur financial strength rating on Generac Holdings Inc. is
Medium-High, the second-highest rank on our five-point scale. The company typically scores above average on our key financial strength criteria of debt levels, fixed-cost coverage, cash flow generation and profitability.
Generac ended the first quarter with cash of $390 million. Debt was $865 million at quarter-end, and the debt/cap ratio was 36%. For all of 2020, the company had a healthy EBITDA margin of 23.5%. Free cash flow for 2020 was a record $427 million, up from $251 million in 2019. The company is targeting a cash conversion ratio in 2021 of 90%.
The company does not pay a dividend and we do not expect it to pay one in the near term.
MANAGEMENT & RISKSAaron P. Jagdfeld has been the company's CEO since
2008 and chairman since 2016. He has been with the company since 1993. York A. Ragen is the CFO; he joined Generac in 2008.
Generac is well positioned to take advantage of mega trends such as climate change, population growth, 5G deployment, the rise of battery technology, energy market disruption, and increased automation in manufacturing, among others. The company's financial targets include 9%-10% core sales growth (from a 2019 base) through 2022, an adjusted EBITDA margin of 21%, and a free cash flow to net income conversion ratio of at least 85%.
GNRC investors face risks related to the cyclicality of the company's businesses and end markets; intense competition; regulatory issues; and economic, political and other risks associated with its foreign operations. The company's top suppliers include Siemens, Stanley Black & Decker, and Eaton. Its top customers include Amazon, Walmart, and Siemens. We note that goodwill and intangibles represent a high 26% of total assets.
COMPANY DESCRIPTIONGenerac Holdings Inc., based in Wisconsin, designs,
manufactures, and sells power generation equipment, energy
storage systems, and other power products for the residential, and light commercial and industrial markets. The company has approximately 6,400 employees. The shares are a component of the S&P 500 index.
VALUATIONWe think that GNRC shares are attractively valued at
recent prices near $420, near the high end of the 52-week range of $135-$457, though down 8% from their highs. On a technical basis, the shares have been in a long-term bullish pattern of higher highs and higher lows since December 2015.
On a fundamental basis, the shares are trading at 37-times our 2022 EPS estimate, above the midpoint of the historical range of 20-40. They are trading at 10-times sales, at the high end of the historical range of 3.5-10.0. Compared to a group of peers that serve similar markets (FAST, ECL, WMX, OC), the shares are trading at premium multiples, which we think is reasonable given the company's strong balance sheet, experienced management team, and record of growth. We expect the positive sales, earnings, and stock price momentum to continue for this well-positioned company, and are raising our target price to $475.
On July 28, BUY-rated GNRC closed at $431.04, down $7.88. (John Eade, 7/28/21)
Gentherm Inc (THRM)Publication Date: 7/30/21Current Rating: BUY
HIGHLIGHTS*THRM: Raising target to $96*Gentherm appears well positioned in its key markets,
which should drive revenue growth and margin expansion as the U.S. economy reopens.
*The company reported 2Q adjusted earnings that far exceeded consensus expectations.
*THRM shares have outperformed over the last three months, rising 12% compared to a loss of 1% for the S&P 600.
*Based on current revenue trends and management's guidance, we are maintaining our 2021 adjusted EPS estimate of $3.68. We look for growth to continue in 2022 and are maintaining our EPS estimate of $4.00.
ANALYSIS
INVESTMENT THESISWe are maintaining our BUY rating on Gentherm Inc.
(NGM: THRM). Gentherm is a small-cap company that develops heating and cooling products for the auto industry and other markets based on its proprietary thermoelectric technologies. The company is also applying its technologies in new areas, such as its medical business. Gentherm has updated its 2021 guidance and appears well positioned in its key markets, which should drive revenue growth and margin expansion as the U.S. economy reopens. The company also has a strong balance sheet. Our revised target price is $96,
Section 2.105
GROWTH / VALUE STOCKSraised from $85.
RECENT DEVELOPMENTSTHRM shares have outperformed over the last three
months, rising 12% compared to a loss of 1% for the S&P 600 and a 3% gain for the Consumer Goods ETF IYK. The shares have outperformed over the past year, advancing 102% versus an increase of 55% for the index and 35% for IYK. The shares have risen 142% over the past five years, compared to gains of 94% for the index and 77% for IYK. The beta on THRM is 1.5.
The company reported 2Q adjusted earnings that far exceeded consensus expectations. On July 29, Gentherm reported 2Q21 revenue of $266 million ($255 million excluding the impact of currency translation), up 87% from the prior year. Adjusted EPS rose to $0.85 from a loss of $0.30 a year earlier and beat the consensus EPS estimate of $0.67.
In 2020, the company earned $2.29 per share, down from $2.68 in 2019. Full-year revenue was $913 million and adjusted EBITDA was $139 million.
Along with the 2Q results, management updated its 2021 guidance. It expects product revenue of $1.11-$1.17 billion, up from its prior forecast of $1.05-$1.13 billion. It looks for an adjusted EBITDA margin of 17%-18%, narrowed at the high end from its previous guidance of 17%-19%; an effective tax rate of 20%-22%, down from a prior 22%-24%; and capital expenditures of $50-$60 million.
EARNINGS & GROWTH ANALYSISGentherm has two business segments: Automotive (96%
of sales) and Medical (4%). Recent trends and outlooks for these businesses are discussed below.
Second-quarter revenue rose 105% in the Automotive segment, but fell 6.6% in the Medical business, primarily due to the negative impact of the pandemic on elective surgical procedures. The company also saw lower sales of Blanketrol temperature-management products, which have been used to care for hospitalized coronavirus patients.
The company has received FDA emergency use authorization for its Hemotherm Model 400CE Dual Reservoir Cooler-Heater, a blood oxygenator/heat exchanger that is used to cool or warm blood during long-term respiratory/cardiopulmonary support.
Management continues to focus on margins. The EBITDA margin widened to 16% in 2Q from 1.3% a year earlier.
Based on current revenue trends and management's guidance, we are maintaining our 2021 adjusted EPS estimate of $3.68. We look for growth to continue in 2022 and are maintaining our EPS estimate of $4.00.
FINANCIAL STRENGTH & DIVIDENDOur financial strength rating on Gentherm is
Medium-High, the second-highest rating on our five-point scale. The company receives above-average scores on our main financial strength criteria of debt levels, fixed-cost coverage, cash flow generation, and profitability. The company's debt is not rated by any of the major rating agencies.
Gentherm had cash and cash equivalents of $187 million at the end of 2Q21. Debt was $76 million and the debt/cap ratio was 10.5%. Adjusted EBITDA covered interest expense by a factor of 69 in the second quarter.
The company suspended its stock buyback program in March 2020 to preserve liquidity, but authorized a new $150 million buyback on December 11. The prior stock repurchase program had a remaining authorization of $74.2 million. Gentherm repurchased $148 million of its stock in 2018, $63 million in 2019, and $9 million in 2020.
The company does not pay a dividend.
MANAGEMENT & RISKSPhillip Eyler is the president and CEO of Gentherm. Mr.
Eyler previously worked at Harman, a subsidiary of Samsung. Francois Castaing is the company's chairman. Matteo Anversa is the CFO and treasurer. He was previously the CFO of Myers Industries.
Investors in THRM shares face risks related to the pandemic, supply-chain issues, tax matters, and trade policies. The company may also face pressure from weak consumer spending and new regulatory requirements.
COMPANY DESCRIPTIONGentherm develops heating and cooling products for the
auto industry and other markets based on its proprietary thermoelectric technologies. The company's principal product is its Climate Control Seat (CCS) system, which permits drivers and passengers to control the heating and cooling of their seats. The CCS system uses no CFCs or other environmentally sensitive coolants. Gentherm has about 11,000 employees at facilities in the U.S., Germany, Mexico, China, Canada, Japan, England, Korea, Malta, Hungary, Ukraine and Vietnam. Gentherm was founded in 1968 and is headquartered in Northville, Michigan. The shares are a component of the S&P 600 Small-Cap Index.
VALUATIONWe think that THRM shares are attractively valued at
recent prices near $81, toward the high end of their 52-week range of $38-$84. The shares recovered strongly from their pandemic lows in March 2020. They traded lower from early March 2021 through mid-July, but rallied following the release of 2Q21 results.
Section 2.106
GROWTH / VALUE STOCKSOn the fundamentals, THRM shares are trading at
22-times our 2021 EPS estimate, above the midpoint of the historical range of 12-27 and in line with the five-year average. The price/sales multiple of 2.4 is above the five-year average of 1.5, and the price/cash flow multiple of 18.5 is above the five-year average of 17. Our revised 12-month target price is $96.
On July 30 at midday, BUY-rated THRM traded at $81.34, down $0.14. (David Coleman, 7/30/21)
Global Payments, Inc. (GPN)Publication Date: 8/4/21Current Rating: BUY
HIGHLIGHTS*GPN: Encouraged by raised EPS guidance along with 2Q
results*On August 3, Global Payments reported adjusted 2Q21
EPS of $2.04, up from $1.31 a year earlier and above the consensus estimate of $1.89. Adjusted revenues increased 28% to $1.94 billion.
*Management raised its 2021 financial guidance to include adjusted net revenue growth of 13%-14% (up from a prior 12%-13%), and adjusted EPS of $8.07-$8.20 (up from a prior $7.87-$8.07).
*The company said annual run-rate expense synergies from the TSYS merger of $400 million were achieved, in addition to annual revenue synergies of $150 million.
*Our target price remains $233, a high-20s multiple on our 2021 EPS forecast that we believe is justified by margins moving into the low 40% range following merger synergies.
ANALYSIS
INVESTMENT THESISWe are maintaining our BUY rating on Global Payments
Inc. (NYSE: GPN), a provider of payments technology and software solutions, and target price of $233, following 2Q results. We believe that the company is well positioned to take advantage of the changing payments landscape, which increasingly favors the use of electronic payments over cash and checks, and note that it is helping brick-and-mortar merchants to move more of their transactions online during the pandemic. GPN also benefits from its broad global reach, as it partners with more than 1,300 financial institutions and supports more than 140 different types of payments.
In August 2020, Global Payments and Amazon Web Services (AWS) announced a multiyear collaboration to provide a cloud-based issuer processing platform for financial institutions worldwide. The collaboration aims to deliver secure solutions for the payment industry at scale. We also believe that the company's new partnership with Google will help to boost revenue and lower operating costs in GPN's Digital Merchant Solutions business.
RECENT DEVELOPMENTS
Over the past year, GPN shares are down 4%, versus a 35% advance for the broad market.
On August 3, Global Payments reported adjusted 2Q21 EPS of $2.04, up from $1.31 a year earlier and above the consensus estimate of $1.89. Adjusted revenues increased 28% to $1.94 billion.
Second-quarter adjusted operating income rose 44% from the prior year, and the adjusted operating margin rose 480 basis points to 41.8%.
In May 2021, GPN agreed to acquire Zego, which provides resident experience management software and digital commerce solutions to property managers mainly in the U.S., from Vista Equity Partners, for $925 million in cash.
In 4Q20, the company announced a partnership with Google intended to boost revenue and lower costs in its Digital Merchant Solutions business.
In 2Q20, GPN expanded its relationship with CaixaBank, one of Europe's largest banks, by agreeing to increase its ownership in their JV and further expand the partnership through 2040. The company has also entered into a new multiyear relationship with Amazon Web Services, which will be a preferred cloud provider for its issuer business. It expects the AWS collaboration to substantially expand its business opportunities, which may include additional business with Amazon.
In September 2019, the company acquired Total System Services Inc. (TSYS) for $24.5 billion in common stock. TSYS shareholders received 0.8101 GPN shares for each TSYS share.
In May 2020, Global Payments scored a significant win when Truist Financial, the sixth-largest commercial bank in the U.S. (formed from the merger of BB&T and SunTrust), selected the company to process its consumer, commercial, and small business credit card portfolios. Revenue contributions are expected to begin in early 2022.
EARNINGS & GROWTH ANALYSISGlobal Payments is a pure-play payments technology
company. It reports results for three segments: Merchant Solutions (66% of 2Q21 revenue), Issuer Solutions (23%), and Business and Consumer Solutions (11%). Merchant Solutions provides customers with payments technology and related software. The Issuer Solutions segment provides solutions that enable financial service providers to manage their card portfolios. The Business and Consumer Solutions segment provides general purpose reloadable prepaid debit and payroll cards, demand deposit accounts, and other financial services to U.S. consumers, including underbanked consumers, and businesses through its Netspend brand.
Section 2.107
GROWTH / VALUE STOCKS
We expect Global Payments to take advantage of secular changes in the payments landscape, which include the increasing use of electronic payments over cash and checks.
While consumer spending declined sharply in March and April 2020 due to the pandemic and related business shutdowns, GPN has seen a spending recovery since. However, the commercial card business continues to be hurt by reduced travel spending by businesses and government agencies.
We look for revenue to grow 14% in 2021, up from our prior 13% forecast. Along with 2Q21 earnings, management raised expectations for 2021 for adjusted net revenue to be in the range of $7.70 billion to $7.73 billion, or growth of 13%-14%, and for adjusted EPS to be in a range of $8.07 to $8.20 (up from a prior $7.87-$8.07), or growth of 26%-28%. In addition, the company said it had achieved its estimate of annual run-rate expense synergies from the TSYS merger of $400 million and annual revenue synergies of at least $150 million.
We are leaving our 2021 EPS forecast at $8.04, while raising our 2022 EPS forecast to $9.35 from $9.21 on expected better global spending volumes.
FINANCIAL STRENGTH & DIVIDENDOur financial strength rating on Global Payments is
Medium-High, the second-highest point on our five-point scale, reflecting the company's strong operating margins, favorable cash position, and manageable debt levels.
At the end of 2Q21, the company had $1.80 billion in cash and $10.2 billion in long-term liabilities. In August 2019, GPN issued $3 billion in senior unsecured notes with maturities extending through 2049. Proceeds were used to help fund the TSYS acquisition.
In August 2021, GPN's directors approved an increase in the company's share repurchase authorization to $1.5 billion.
The company raised its quarterly dividend to $0.25 per share from $0.195 per share effective 3Q21. We now look for dividends of $0.89 in 2021 and $1.00 per share in 2022.
MANAGEMENT & RISKSJeff Sloane became the CEO of GPN in October 2013
after previously serving as the company's president. Cameron Bready has been the president and COO since September 2019, and previously served as CFO. Paul Todd is the current CFO. Management has historically provided meaningful guidance to investors, including revenue and EPS guidance.
As a financial services company, Global Payments is broadly exposed to global economic conditions and their
impact on consumer card spending, and faces risks related to the severity and duration of the coronavirus pandemic. The company also faces integration risk related to its acquisition of TSYS.
COMPANY DESCRIPTIONGlobal Payments is a financial services company that
offers payments and software solutions. GPN has partnered with more than 1,300 financial institutions in 100 countries and supports more than 140 different types of payments. GPN is based in Georgia and has nearly 24,000 employees worldwide.
VALUATIONGPN shares have traded between $153 and $221 over the
past year and are currently near the lowering end of that range. GPN has historically traded at a forward P/E in the low to mid-20s. Given expanded operating margins (currently in the mid-40s) following the TSYS merger integration, and sustainable mid- to high-teens earnings growth, we believe that a P/E in the high 20s is warranted. Our revised target price of $233 implies a multiple of 29-times our 2021 EPS estimate.
On August 3, BUY-rated GPN closed at $169.57, down $2.22. (Stephen Biggar, 8/3/21)
Hartford Finl Servs Grp Inc (HIG)Publication Date: 8/3/21Current Rating: BUY
HIGHLIGHTS*HIG: Reiterating BUY and target price of $75*HIG shares have underperformed the S&P 500 over the
past three months, falling 7% compared to a 6% increase for the index.
*On July 28, Hartford reported 2Q21 core earnings of $836 million or $2.33 per share, up 91% from 2Q20 and above the consensus forecast of $1.33.
*We are raising our 2021 EPS estimate to $6.21 from $5.21 and our 2022 estimate to $7.33 from $6.28.
*We believe that HIG is favorably valued at 10-times our 2021 EPS estimate, below the midpoint of the five-year range of 4-18 and below the peer median of 12.
ANALYSIS
INVESTMENT THESISWe are reiterating our BUY rating on Hartford Financial
Services Group Inc. (NYSE: HIG) with a target price of $75. We had noted the potential for a buyout in previous reports given Hartford's relatively small size. Apart from any possible acquisition, we expect Hartford to generate above-peer-average ROE over the next few years as management raises prices and reduces operating expenses.
HIG trades at 10-times our 2021 EPS estimate, below the midpoint of the five-year range of 4-18 and below the peer median of 12. Although the company faces risks from rising
Section 2.108
GROWTH / VALUE STOCKScatastrophe losses and the impact of the pandemic, we believe that previous Chubb buyout offers have provided a floor for the stock. Our target price of $75 implies a projected 2021 P/E of 12, and a potential total return, including the dividend, of 19% from current levels.
RECENT DEVELOPMENTSHIG shares have underperformed the S&P 500 over the
past three months, falling 7% compared to a 6% increase for the index. Over the past year, the shares have risen 55%, while the S&P has risen 37%. The shares have underperformed over the past five years, rising 57% compared to a gain of 102% for the index. The beta on HIG is 1.07.
On July 28, Hartford reported 2Q21 core earnings of $836 million or $2.33 per share, up 91% from 2Q20 and above the consensus forecast of $1.33. The results included higher pretax net investment income of $581 million, up from $339 million in 2Q20; and pretax COVID-related P&C losses of $3 million, compared to losses of $213 million a year earlier. On a GAAP basis, 2Q21 net income rose 94% to $900 million or $2.51 per share.
Second-quarter revenue rose 10% to $5.6 billion. Book value at the end of 2Q21 was $50.62 per share, up 9% from the prior year, reflecting higher net income partly offset by the impact of share repurchases and dividend payments. The net margin rose to 10.7% in 2Q21 from 6.7% a year earlier.
The company launched its Hartford Next restructuring and cost-reduction plan in 2020. The plan generated $195 million in pretax expense savings in the first half of 2021. Management currently expects pretax savings from the plan of $540 million in 2022 and $625 million in 2023.
EARNINGS & GROWTH ANALYSISHartford has taken steps in recent years to strengthen its
balance sheet, reduce risk, and improve returns in its business. These steps have included asset sales and restructuring.
Hartford organizes its operations into five segments: Commercial Lines, Personal Lines, P&C Other Operations (which are all part of the P&C business), Group Benefits, and Hartford Funds, its mutual fund business. We summarize 2Q business trends and outlooks for these segments below.
Commercial Lines. This segment, which normally accounts for most of Hartford's operating earnings, reported core earnings of $560 million in 2Q, up from a loss of $57 million a year earlier. Written premiums rose 15% to $2.5 billion. The underlying combined ratio improved 13.5 points to 89.4 due to reduced COVID-related losses.
Personal Lines. This segment, which includes car and home insurance, saw core earnings fall 69% to $113 million in 2Q21 due to less favorable prior-year development. Written
premiums rose 3% to $760 million. The underlying combined ratio rose 7.5 points from the prior year to 88.2.
Group Benefits. This segment reported 2Q21 revenue of $149 million, up from $102 million a year earlier, reflecting higher net investment income and lower excess mortality. Earned premiums rose 2% to $1.38 billion.
Hartford Funds. This segment reported 2Q core earnings of $51 million, up 55% from 2Q20, largely driven by higher daily average AUM. We expect a low single-digit increase in core earnings in this group over the next 12 months.
To generate our EPS estimates for the insurance industry, we focus on returns on equity. In 2Q21, Hartford's core ROE for the trailing four quarters was 13.1%, above the peer median of 10%. Management's goals include sustaining core ROE well above the company's cost of capital.
Reflecting the company's 2Q earnings, we are raising our 2021 EPS estimate to $6.21 from $5.21. We are also boosting our 2022 estimate to $7.33 from $6.28. Our long-term EPS growth rate forecast is 8%, raised from 6%.
FINANCIAL STRENGTH & DIVIDENDOur financial strength rating on Hartford is Medium-High.
The company achieves average to above-average scores on our three main measures of financial strength: leverage based on debt/capital, interest coverage, and profitability. The debt/capital ratio was 33% at the end of 2Q21, above the peer average.
In April 2021, Hartford raised its quarterly dividend by 7.7% to $0.35 per share, or $1.40 annually, for a yield of about 2.1%. Over the past five years, the company has raised the dividend at a compound annual rate of 11%. Our dividend estimates are $1.40 (raised from $1.38) for 2021 and $1.51 (raised from $1.48) for 2022.
In 2Q21, the company returned $694 million to shareholders including $568 million in share repurchases and $126 million in dividends. In 1Q, it raised its buyback authorization to $2.5 billion from $1.5 billion. The authorization runs through December 31, 2022.
MANAGEMENT & RISKSChristopher Swift has been Hartford's chairman and CEO
since 2014, after previously serving as CFO. Doug Elliot has served as president since 2014. Beth Costello is executive vice president and CFO, and has been with the company since 2004.
Hartford faces macroeconomic risks related to the impact of slow economic growth and volatile equity markets on the company's balance sheet, capital levels, interest rates, credit ratings, revenues and income.
Section 2.109
GROWTH / VALUE STOCKS
COMPANY DESCRIPTIONHartford Financial Services Group Inc., is a leading
property and casualty insurance company. The company distributes its insurance products and other financial services through independent agencies. The shares are a component of the S&P 500.
VALUATIONWe view HIG shares as attractively valued at current
prices near $64, near the high end of their 52-week range of $34-$70. The price/book multiple of 1.2 is above the midpoint of the five-year historical range of 0.4-1.6 and above the peer median of 1.1. On P/E, the stock trades at 10-times our 2021 EPS estimate, below the midpoint of the five-year range of 4-18 and below the peer median of 12. Although the company faces risks from rising catastrophe losses and the impact of the pandemic, we believe that the previous Chubb buyout offers have provided a floor for the stock. Our target price of $75 implies a projected 2021 P/E of 12, and a potential total return, including the dividend, of 19% from current levels.
On August 2, BUY-rated HIG closed at $64.42, up $0.80. (Kevin Heal and Nick Eade, 8/2/21)
Hawaiian Holdings, Inc. (HA)Publication Date: 7/30/21Current Rating: HOLD
HIGHLIGHTS*HA: Maintaining HOLD following second-quarter
results*On July 27, HA reported a 2Q21 adjusted loss of $73.8
million or $1.44 per share, narrower than the loss of $3.81 per share a year earlier. The consensus estimate had called for a loss of $1.85 per share.
*Given the decline in air travel during the pandemic and the uncertain impact of the Delta variant, we expect continued losses in 2021. We also expect a modest loss in 2022.
*We are narrowing our 2021 loss estimate to $6.57 per share from $7.15, and are lowering our 2022 estimate to a loss of $0.19 per share from earnings of $1.55 per share.
*Hawaiian is pursuing a range of environmental, social, and governance initiatives. It has committed to achieving net-zero carbon emissions by 2050 through fleet investments, carbon offsets, and the development of more environmentally friendly aviation fuel.
ANALYSIS
INVESTMENT THESISWe are maintaining our HOLD rating on Hawaiian
Holdings Inc. (NGS: HA). While the pandemic continues to have a significant impact on Hawaiian, we expect the company to benefit as the state of Hawaii gradually reopens to tourism. We note that Hawaiian is also adding new routes, and has reported increased bookings for the third quarter of 2021. However, we are concerned about the impact of the Delta variant on ticket sales and look for the company to post
continued losses into 2022.
RECENT DEVELOPMENTSOn July 27, HA reported a 2Q21 adjusted loss of $73.8
million or $1.44 per share, narrower than the loss of $3.81 per share a year earlier. The consensus estimate had called for a loss of $1.85 per share. Passenger revenue rose to $356 million from just $30 million in 2Q20, and 'other revenue' rose 80% to $411 million. Total revenue rose to $410 million from $60 million and topped the consensus of $399 million. Revenue passenger miles, a measure of traffic, rose to 2.7 billion miles from 95 million. Available seat miles rose to 3.5 billion from 410 million. Operating revenue per available seat mile (RASM) fell 21.8% to $0.1145. Total operating expenses fell slightly to $549 million. Aircraft fuel costs, including taxes and delivery, rose to $83.8 million from $7.0 million. Costs per available seat mile (CASM), excluding fuel and nonrecurring items, fell to $0.11 per share from $0.683. Interest expense rose to $30.3 million from $8.2 million.
In March and April 2021, the company launched four new North America routes.
- Daily service between Maui and Long Beach.
- Twice weekly service between Honolulu and Orlando.
- Five flights per week between Honolulu and Ontario, California.
- Twice weekly service between Honolulu and Austin, Texas.
Hawaiian continues to rebuild its network with growth in both North American and inter-island flights, but noted that the pace of recovery in international demand remains uncertain. It looks for higher operating expenses as it expands its flight schedule and prepares for an increase in international travel. Management also expects higher fuel costs and higher airport rates.
In 3Q21, management expects available seat miles to be down 20%-23%. It also expects revenue to be down 28%-33% and operating expenses to decline 10%-14%. It projects adjusted EBITDA of negative $20 million to positive $20 million, and average fuel costs of $2.04 per gallon.
Hawaiian is pursuing a range of environmental, social, and governance initiatives (ESG). It has committed to achieving net-zero carbon emissions by 2050 through fleet investments, carbon offsets, and the development of more environmentally friendly aviation fuel. In 2021, it has also pledged to offset emissions from international flights that exceed 2019 levels, in accordance with a carbon offset program developed by the International Civil Aviation Organization.
Section 2.110
GROWTH / VALUE STOCKS
The company has delayed deliveries of ten Boeing 787-9 aircraft. It now expects to take delivery of these planes from 2022 to 2026, with the first to be delivered in September 2022.
EARNINGS & GROWTH ANALYSISGiven the decline in air travel during the pandemic and
the uncertain impact of the Delta variant, we expect continued losses in 2021. We also expect a modest loss in 2022. We are narrowing our 2021 loss estimate to $6.57 per share from $7.15, and are lowering our 2022 estimate to a loss of $0.19 per share from earnings of $1.55 per share.
FINANCIAL STRENGTH & DIVIDENDOur financial strength rating on Hawaiian Holdings is
Medium-Low. The company scores below average on our three main financial strength criteria of debt levels, interest coverage and profitability. The company's debt is rated B1/negative by Moody's; CCC+/positive by S&P; and B-/negative by Fitch, down from B+/positive.
As of June 30, 2021 the company had unrestricted cash, cash equivalents and short-term investments of $2.2 billion (up $304 million from March 2021), outstanding debt and finance lease obligations of $2.2 billion (up $22 million from March), and air traffic liability of $823 million (up $136 million from March).
The company is participating in the Treasury Department's Payroll Support Program. In April, as part of this program, the Treasury agreed to pay Hawaiian $179.7 million, in a series of installments, to support the continuation of employee salaries, wages and benefits. The first installment of $89.8 million was disbursed on April 23. As part of the program, HA has agreed to refrain from involuntary furloughs or salary or benefit cuts and to limit executive compensation. The company must also suspend dividend payments and stock repurchases through September 30, 2022. In addition, it must continue to provide air service through March 1, 2022 to markets served prior to March 1, 2020.
In March 2021, the company completed an at-the-market equity offering of 5.0 million shares of common stock, raising net proceeds of $109 million.
In February 2021, the company repaid $235 million of borrowings under its revolving credit facility.
The company does not pay a dividend.
MANAGEMENT & RISKSPeter Ingram is the president and CEO of Hawaiian
Holdings and its subsidiary, Hawaiian Airlines. He previously served as CFO.
Airline financials, labor negotiations, ticket prices, and fuel costs all represent potential catalysts for share price
movement. In addition, the risk of a major terrorist attack or health scare that reduces airline travel is ever-present.
The company faces stiff competition from other low-cost airlines and from legacy carriers that have cut ticket prices over the past several years.
In times of high oil prices, fuel costs represent more than a third of an airline's costs. Hawaiian Holdings' earnings and share price could suffer if oil prices increase significantly.
COMPANY DESCRIPTIONHawaiian Holdings, through its subsidiary Hawaiian
Airlines, is a leading carrier for inter-island flights, which account for about a quarter of revenue. The airline also has the largest share of flights between Hawaii and the West Coast, which account for half of revenue.
VALUATIONHA shares appear fairly valued at current prices near $21,
near the midpoint of their 52-week range of $12-$31. On the fundamentals, valuation based on P/E is meaningless given our loss estimates for 2021 and 2022. The price/sales multiple of 1.2 is below the peer average and below the midpoint of the five-year historical range. The price/book ratio is 1.7, again below the peer average and the five-year average of 2.0. Given the ongoing impact of the pandemic on air travel, we are maintaining our HOLD rating.
On July 29, HOLD-rated HA closed at $20.25, down $0.06. (David Coleman, 7/29/21)
Helmerich & Payne, Inc. (HP)Publication Date: 8/2/21Current Rating: HOLD
HIGHLIGHTS*HP: Maintaining HOLD following fiscal 3Q21 results*While oil prices have recovered from their 2020 lows,
we believe the impact of the pandemic on upstream capital spending will be longer lasting.
*We expect oil and gas drilling expenditures to improve modestly in 2021, but do not expect them to return to pre-pandemic levels.
*On July 28, Helmerich & Payne reported an adjusted fiscal 3Q21 net loss of $56.7 million or $0.57 per share, wider than the adjusted net loss of $46.0 million or $0.37 per share in the prior-year quarter.
*We are narrowing our FY21 loss estimate to $2.40 per share from $2.43 based on our expectations for modestly higher rig demand in 4Q. The consensus calls for a loss of $2.38 per share.
ANALYSIS
INVESTMENT THESISWe are maintaining our HOLD rating on contract drilling
company Helmerich & Payne Inc. (NYSE: HP). While oil
Section 2.111
GROWTH / VALUE STOCKSprices have recovered from their 2020 lows, we believe the impact of the pandemic on upstream capital spending will be longer lasting. We expect oil and gas drilling expenditures to improve modestly in 2021, but do not expect them to return to pre-pandemic levels.
In this environment, we expect E&P companies to spend conservatively, protecting their cash flow until they believe that WTI oil prices above $70 per barrel are sustainable. As such, we expect Helmerich & Payne to face continued earnings pressure in the coming quarters.
RECENT DEVELOPMENTSOn July 28, Helmerich & Payne reported an adjusted
fiscal 3Q21 net loss (for the period ended June 30, 2021) of $56.7 million or $0.57 per share, wider than the adjusted net loss of $46.0 million or $0.37 per share in the prior-year quarter. The loss was also wider than our loss estimate of $0.54 per share and the consensus loss estimate of $0.56. Operating revenue rose 5% from the prior year to $332.2 million, above the consensus of $326.5 million.
Helmerich & Payne reports results for three segments: North America Solutions, International Solutions, and Offshore Gulf of Mexico. Fiscal 3Q21 results for these segments are provided below.
The North America Solutions segment posted an operating loss of $43.7 million, compared to an operating loss of $25.2 million in 3Q20. At the end of the quarter, HP had 121 rigs in active service, up from 68 rigs in 3Q20.
The International Solutions segment posted an operating loss of $3.54 million, compared to an operating loss of $9.54 million in 3Q20. The narrower loss reflected higher margins and revenue reimbursements of $1.1 million. Segment results included a $0.6 million foreign currency loss related to South American operations.
The Offshore Gulf of Mexico segment posted 3Q operating income of $5.71 million, up from $3.01 million a year earlier, reflecting increased drilling activity.
EARNINGS & GROWTH ANALYSISHelmerich & Payne did not provide formal guidance for
FY21. However, on the 3Q21 conference call, CEO John Lindsay said that the company had recently seen some moderation in drilling activity, but expected activity and pricing to increase in 4Q.
We are narrowing our FY21 loss estimate to $2.40 per share from $2.43 based on our expectations for modestly higher rig demand in 4Q. The consensus calls for a loss of $2.38 per share.
We are maintaining our FY22 loss estimate of $1.31 per
share, despite improving rig demand, as we expect crude oil prices to trend lower in the coming quarters following the recent OPEC/OPEC+ supply agreement. The 2022 consensus loss estimate is $1.23 per share.
FINANCIAL STRENGTH & DIVIDENDWe rate HP's financial strength as Medium-High, the
second-highest rating on our five-point scale. The company's debt is rated BBB+/stable by Standard & Poor's and Baa1/stable by Moody's.
At the end of fiscal 3Q21, HP's total debt/capitalization ratio was 13.8%, up from 13.5% a year earlier. The total debt/cap ratio remains well below the peer average and has averaged 10.8% over the past five years.
Helmerich & Payne had total debt of $481.0 million at the end of 3Q21, compared to $527.8 million at the end of 2Q20. The company has access to $750 million in liquidity under its revolving credit facility.
The company ended the quarter with $371 million in cash and short-term investments (versus $426 million a year earlier) and no borrowings on its credit facility. Net cash provided by operating activities was $90 million in 3Q21, compared to $446 million a year earlier.
The company cut its annualized dividend from $2.84 to $1.00 per share in March 2020. The current yield is about 3.3%. Our dividend estimates are $1.00 for both FY21 and FY22.
MANAGEMENT & RISKSJohn W. Lindsay became chief executive officer of
Helmerich & Payne in March 2014, succeeding Hans Helmerich. Mr. Lindsay joined the company in 1987 as a drilling engineer.
The oil services, drilling and equipment industry is one of the most volatile and unpredictable industries in the S&P 500. The main investment risk is the overall health of the global economy, though the industry also faces significant geopolitical risk.
COMPANY DESCRIPTIONFounded in 1920, Helmerich & Payne, Inc. designs,
manufactures and operates high-performance drilling rigs. H&P also develops and implements advanced automation, directional drilling, and survey management technologies. At March 31, 2021, H&P's fleet included 242 land rigs in the U.S., 32 international land rigs, and seven offshore platform rigs.
VALUATIONHP shares have traded between $12.87 and $36.26 over
the past 52 weeks and are currently above the midpoint of that range. P/E multiples are not useful for valuation purposes
Section 2.112
GROWTH / VALUE STOCKSgiven our loss estimates for FY21 and FY22. The shares are trading at a trailing price/book multiple of 1.0, at the low end of the historical average range of 1.0-1.9; at a price/sales multiple of 2.9, above the midpoint of the range of 1.8-3.5; and at a price/cash flow multiple of 17.1, above the high end of the range of 5.6-12.5. We believe that the stock is fully valued given the company's current challenges and are maintaining our HOLD rating.
On July 30, HOLD-rated HP closed at $28.67, down $0.46. (Bill Selesky, 7/30/21)
Hess Corporation (HES)Publication Date: 7/30/21Current Rating: HOLD
HIGHLIGHTS*HES: Maintaining HOLD following 2Q21 results*On July 28, Hess reported an adjusted 2Q21 net profit of
$74 million or $0.24 per share, compared to an adjusted net loss of $320 million or $1.05 per share in the year-earlier quarter.
*The swing to a profit was driven mainly by higher realized selling prices. Second-quarter revenue rose 90% to $1.598 billion, and topped the StreetAccount consensus of $1.508 billion.
*We are raising our 2021 EPS estimate to $1.95 from $1.00 to reflect the better-than-expected 2Q results and the recent rebound in crude oil prices, which are currently above $73 per barrel. The consensus calls for a profit of $1.96 per share.
*We are also raising our 2022 EPS estimate to $4.23 from $2.39 based on our expectations for further growth in crude oil pricing next year. The 2022 consensus estimate is $4.26.
ANALYSIS
INVESTMENT THESISWe are maintaining our HOLD rating on Hess Corp.
(NYSE: HES), reflecting concerns about the company's history of operating losses and high debt. Despite the recent rebound in energy markets, we prefer E&P companies with strong balance sheets and low leverage. At the end of 2Q21, the company's debt/cap ratio was nearly 58%. We believe that less debt would be preferable in the current volatile energy environment.
RECENT DEVELOPMENTSOn July 28, Hess reported an adjusted 2Q21 net profit of
$74 million or $0.24 per share, compared to an adjusted net loss of $320 million or $1.05 per share in the year-earlier quarter. EPS beat our estimate of $0.04 and the consensus estimate of $0.12.
The swing to a profit was driven mainly by higher realized selling prices. Second-quarter revenue rose 90% to $1.598 billion, and topped the StreetAccount consensus of $1.508 billion.
Total net oil and gas production from continuing operations (including Libya) averaged 328,000 barrels of oil equivalent per day (boe/d) in 2Q21, down 2% from 2Q20. The decline reflected the disposition of the Shenzi Oil Field.
Total crude oil production fell 9% year-over-year to 166,000 boe/d, largely due to decreased drilling and completion activity in the Bakken shale. Total offshore crude oil production dropped 27% from the prior year to 33,000 boe/d, while total U.S. production decreased 27% to 112,000 boe/d.
EARNINGS & GROWTH ANALYSISFor 2021, Hess now projects net production, excluding
Libya, to be approximately 295,000 boe/d, at the high end of the previous guidance range of 290,000-295,000 boe/d. The increase reflects the better-than-expected production results thus far in 2021. The company continues to project full-year capital and exploratory expenditures of $1.9 billion, up from $1.786 billion in 2020. In 2020, net production averaged 331,000 boe/d.
We are raising our 2021 EPS estimate to $1.95 from $1.00 to reflect the better-than-expected 2Q results and the recent rebound in crude oil prices, which are currently above $73 per barrel. The consensus calls for a profit of $1.96 per share.
We are also raising our 2022 EPS estimate to $4.23 from $2.39 based on our expectations for further growth in crude oil pricing next year. The 2022 consensus estimate is $4.26.
FINANCIAL STRENGTH & DIVIDENDWe rate Hess's financial strength as Medium-High, the
second-highest rank on our five-point scale. The company's debt is rated BBB-/stable by Standard & Poor's and Ba1/stable by Moody's. Fitch rates Hess's debt at BBB-/stable.
At the end of 2Q21, the total debt/capitalization ratio was 57.8%, up from 54.7% a year earlier. The total debt/cap ratio is meaningfully above the peer average and has averaged 40.6% over the past five years.
Debt totaled $8.944 billion at the end of 2Q21, up from $8.896 billion at the end of 2Q20. Hess had cash and cash equivalents of $2.42 billion at the end of 2Q21, compared to $1.65 billion at the end of 2Q20.
The current annualized dividend of $1.00 yields about 1.3%. We expect the dividend to remain at this level in 2021 and 2022. Hess repurchased $250 million of its stock in 4Q18, completing a $1.0 billion buyback authorization. It currently has no plans to initiate a new program.
MANAGEMENT & RISKSJohn B. Hess has been the company's CEO since 1995. He
Section 2.113
GROWTH / VALUE STOCKSis the son of Hess founder Leon B. Hess.
Investors in HES shares face risks. The share prices of oil companies often move in tandem with oil prices. This is particularly true for companies such as Hess, whose earnings depend heavily on the results of exploration efforts. Given the relatively high proportion of oil in its production profile, its comparatively high cost structure, and the potential upside associated with its exploration efforts, Hess is more leveraged to oil prices than other integrated firms. An additional element of risk is the possibility that the company's high-cost exploration efforts will fail to yield commercial quantities of hydrocarbons or meet investor expectations.
COMPANY DESCRIPTIONHess Corp., an integrated exploration and production
company, develops, produces, purchases, transports, and sells crude oil, natural gas liquids, and natural gas. The company operates in the United States, Denmark, Norway, Equatorial Guinea, Thailand, and Malaysia. The company was founded in 1920 and is based in New York.
INDUSTRYWe have lowered our rating on the Energy sector to
Under-Weight from Market-Weight. The year-to-date surge in Energy stocks has not been matched by rising production levels. Instead, Energy companies continue to cut production as more electric vehicles are introduced by mainstream automotive OEMs, and as utilities redouble their efforts to add to their renewable generation sources.
Energy now accounts for 2.9% of S&P 500 market cap; over the past five years, the weighting has ranged from 2% to 10%. We think that investors should consider allocating about 2% of their diversified portfolios to the Energy group. The sector includes the major integrated firms, as well as exploration & production, refining, and oilfield & drilling services companies. The sector is outperforming thus far in 2021, with a gain of 44.5%. It underperformed in 2020, with a loss of 37.3%, and in 2019, with a gain of 7.6%.
Our 2021 forecast for the average price of a barrel of West Texas Intermediate crude oil is now $59, up from $53. Our estimate assumes that OPEC and OPEC+ members coordinate on production cuts and that global economic activity continues to gradually improve. Our forecast also reflects the long-term downward pressure on crude prices as 'peak oil' approaches. This trend, though not a smooth decline, may be seen in recent average annual prices: $40 in 2020, $57 in 2019, $65 in 2018, $51 in 2017, $43 in 2016, $49 in 2015, $93 in 2014 and $98 in 2013. Further, we anticipate that President Biden's policies will continue to favor clean energy initiatives rather than carbon-based energy. Our range for WTI through 2021 is now $70 on the upside and $50 on the downside. Our 2021 forecast for the average wellhead price of Henry Hub natural gas remains $3.13 per MMbtu, with a range
of $2.50-$3.75. The average price in 2020 was $2.05 per MMbtu.
VALUATIONHess shares have traded between $34.82 and $91.09 over
the past 52 weeks and are currently toward the high end of this range. To value the stock on a fundamental basis, we use peer group and historical multiple comparisons, as well as a dividend discount model.
The shares are trading at 40-times our 2021 EPS estimate and at 18-times our 2022 forecast, compared to a 10-year annual average range of 4-11. On other valuation metrics, the shares are trading above the high end of the range for price/book (4.4 versus a range of 1.2-2.1) and for price/sales (4.0 versus a range of 1.7-3.3). The price/cash flow multiple is 11.9, versus a range of 6.3-14.3. Based on these valuation metrics and the company's continued high leverage, we are maintaining our HOLD rating.
On July 29, HOLD-rated HES closed at $77.66, up $0.17. (Bill Selesky, 7/29/21)
Hilton Worldwide Holdings Inc (HLT)Publication Date: 8/2/21Current Rating: BUY
HIGHLIGHTS*HLT: Raising target price to $154*We believe that the continued rollout of coronavirus
vaccines will lead to increased room demand, along with higher RevPAR and management fees.
*Management noted that 99% of the company's hotels had reopened as of July 21, 2021.
*We are raising our 2021 EPS estimate to $2.64 from $2.60 and our 2022 estimate to $4.15 from $4.05. Both estimates are above consensus.
*Our long-term rating on HLT remains BUY based on the company's solid development pipeline, new brands, and well-regarded loyalty program.
ANALYSIS
INVESTMENT THESISWe are maintaining our BUY rating on Hilton Worldwide
Holdings Inc. (NYSE: HLT) and raising our target price to $154 from $145. We believe that the continued rollout of coronavirus vaccines will lead to increased room demand, along with higher RevPAR and management fees, by allowing consumers to travel more freely.
Our long-term rating on HLT remains BUY based on the company's solid development pipeline, new brands, and well-regarded loyalty program. We also expect earnings to benefit from the spinoff of the timeshare businesses and the sale of additional company-owned hotels.
RECENT DEVELOPMENTS
Section 2.114
GROWTH / VALUE STOCKSSince our upgrade to BUY on November 10, 2020, HLT
shares have risen 29%.
On July 29, Hilton reported 2Q21 operating earnings of $0.56 per share, up from a loss of $0.61 per share a year earlier. The consensus estimate had called for earnings of $0.40 per share. GAAP earnings totaled $0.46 per share, up from a loss of $1.55 per share in 2Q20.
Second-quarter adjusted EBITDA totaled $400 million, above the consensus of $334 million and up from $51 million a year earlier. The adjusted EBITDA margin was 69%, up from 28% in the prior-year period.
Reflecting higher franchise and licensing fees, overall revenue rose 136% to $1.33 billion. Revenue per available room (RevPAR) increased nearly 234% in constant currency on higher room rates and occupancy. The consensus estimate had called for a 219% increase in RevPAR.
Franchise and licensing fees totaled $369 million, up from $132 million a year earlier, while base and other management fees rose to $42 million from $8 million. Revenue from owned and leased hotels increased by $90 million to $121 million.
Interest expense fell to $101 million from $106 million, and the share count rose by 4 million to 281 million.
In response to the pandemic, Hilton suspended dividend payments and share buybacks in March 2020. In addition, it announced a range of pay cuts and furloughs and said that CEO Christopher Nassetta would receive no pay.
In 2020, revenue fell to $4.3 billion from $9.5 billion in 2019, while adjusted EPS fell to $0.10 from $3.90.
In March 2017, HNA Tourism Group Co. acquired 82.5 million Hilton shares (a 25% equity interest) from Blackstone Group L.P.
In January 2017, following the spinoff of Park Hotels & Resorts (PK) and Hilton Grand Vacations (HGV), Hilton shareholders received one share of PK stock for every five shares of Hilton stock and one share of HGV stock for every ten shares of Hilton stock.
EARNINGS & GROWTH ANALYSISBased on prospects for solid unit growth, the reopening of
the remainder of the company's hotels, increased travel demand, and prospects for accelerated growth in management fees, we are raising our 2021 EPS estimate to $2.64 from $2.60 and our 2022 estimate to $4.15 from $4.05. Both estimates are above consensus. Our long-term earnings growth rate forecast remains 15%.
FINANCIAL STRENGTH & DIVIDEND
Our financial strength rating on Hilton is Medium. At the end of 2Q21, cash and cash equivalents totaled $1.1 billion and long-term debt totaled $8.9 billion.
Hilton suspended share buybacks and dividends in March 2020, though we expect it to resume dividend payments later in 2021. Our dividend estimates are $0.15 for 2021 and $0.18 for 2022.
MANAGEMENT & RISKSAfter taking Hilton public in 2007, Blackstone Group
L.P., which had maintained majority control, named Christopher Nassetta as the company's CEO. The company has strengthened its balance sheet and ramped up its development pipeline under Mr. Nassetta's leadership.
Blackstone subsequently reduced its ownership stake to 46% in May 2015, and sold a 25% interest in Hilton to HNA Tourism Group in March 2017. The still significant Blackstone and HNA ownership interest may make it difficult for activist investors to push for changes at the company.
Like its peers, Hilton has been battered by the coronavirus pandemic. The company is also subject to strikes by unionized employees. The threat of terrorism is also a risk. In addition, Hilton's debt could be a burden in the event of an industry slowdown.
The stock also trades at relatively high valuation multiples, and could fall sharply if the company reports disappointing results.
COMPANY DESCRIPTIONWith 880,000 rooms in 103 countries and territories,
Hilton Worldwide is among the world's largest hotel companies. Its principal brands range from budget to luxury and include Hilton, Conrad, Waldorf Astoria, Doubletree, Embassy Suites, Hampton Inn, Hilton Garden Inn, Homewood Suites, Home2 Suites, Curio, Canopy and Tru. With a market cap near $38 billion, the shares are generally regarded as large-cap growth.
VALUATIONHLT shares appear attractively valued at 32-times our
revised 2022 EPS estimate, below the average of 41 for industry peers. We believe that a higher multiple is warranted as we expect HLT to benefit from economic reopening and the continued rollout of coronavirus vaccines. This should allow consumers to travel more freely and result in higher RevPAR and management fees. We are maintaining our BUY rating with a revised target price of $154.
On July 30, BUY-rated HLT closed at $131.45, down $3.05. (John Staszak, CFA, 7/30/21)
Hologic, Inc. (HOLX)
Section 2.115
GROWTH / VALUE STOCKS
Publication Date: 8/3/21Current Rating: BUY
HIGHLIGHTS*HOLX: Reaffirming BUY and $95 target *While Hologic is preparing for a near-term decline in
COVID-19 testing revenue, it is also using its strong cash flow to make acquisitions that will help to drive future growth.
*We also see continued strength in its non-COVID businesses, including breast imaging, surgical, and non-COVID diagnostics, helped by a return to more normal levels of wellness visits and cancer screenings.
*On July 28, Hologic reported fiscal 3Q21 adjusted EPS of $1.33, up 77% from the prior year and $0.20 above consensus. Organic revenue rose 34% to $1.168 billion.
*HOLX shares appear attractively valued at 15.2-times our FY22 EPS estimate, well below the average multiple of 26.1 for our coverage universe of med-tech stocks.
ANALYSIS
INVESTMENT THESISWe are maintaining our BUY rating on Hologic Inc.
(NGS: HOLX), which is using its strong operating cash flow to make acquisitions and accelerate the launch of new products. We expect these investments to drive future growth. While Hologic faces a near-term slowdown in COVID-19 testing revenue, we believe that its growth model remains intact. In particular, we expect a return to more normal levels of cancer screenings and elective procedures to benefit the company's Breast Health and GYN Surgical segments. Hologic has also expanded its installed base of Panther diagnostic systems, which will help to boost recurring revenue. Our target price is $95.
RECENT DEVELOPMENTSThe company reported fiscal 3Q21 results on July 28.
Adjusted EPS rose 77% from the prior year to $1.33 and topped the consensus estimate by $0.20. GAAP net income was $268 million or $1.04 per share, up from $138 million or $0.53 per share a year earlier. Revenue rose to $1.168 billion (+42.0% reported; +34.2% organic).
By segment, Breast Health posted revenue of $349 million (+53.2% operational). Revenue in both the breast imaging (+43%) and interventional businesses (+120%) rose strongly from last year's pandemic lows. Revenue was also driven by the introduction of new interventional products for surgical procedures.
In the Diagnostics segment, revenue rose to $665 million (+20.3% operational). COVID-19-related assays generated revenue of $291 million. Excluding COVID-related revenue, the base business in Molecular Diagnostics grew 76% organically from fiscal 3Q20 and in the mid-teens from the pre-pandemic 3Q19.
In the Surgical segment, revenue was $128 million
(+143.4% operational). While this performance reflects a strong recovery from the worst months of the pandemic, segment revenue remains below fiscal 3Q19 levels.
By measures of profitability, the adjusted gross margin was 66.1%, up 140 basis points, and the adjusted operating margin was 39.5%, up 650 basis points. The adjusted EBITDA margin was 41.4%, up 510 basis points.
Despite the projected decline in COVID-related test assay revenue, Hologic has expanded its installed base of Panther automated diagnostic systems. It has also expanded its test menu beyond COVID and sexually transmitted diseases. Over the last 18 months, Hologic has increased its installed base of Panther systems by more than 50%. It now has approximately 1,500 Panthers in the U.S. and 1,200 in overseas markets. As COVID testing wanes, customers are beginning to use these systems to run more non-COVID assays for gynecological conditions and infectious diseases.
We expect the expanded base of Panther systems and the broader assay menu to drive revenue growth in molecular diagnostics.
EARNINGS & GROWTH ANALYSISHologic has provided guidance for fiscal 4Q21. It expects
revenue of $1.0-$1.04 billion, implying an organic decline of 26.6%-29.6%. It also projects adjusted EPS of $0.92-$1.00 against a tough comparison with fiscal 4Q20, when COVID-19 testing revenue ramped up sharply and overall Diagnostics revenue rose 202%.
Based on the updated outlook, we are lowering our adjusted EPS estimates to $7.90 from $8.50 for FY21 and to $5.00 from $6.60 for FY22. Our revised estimates reflect the expected decline in COVID-related diagnostics revenue, partly offset by growth in non-COVID businesses such as Breast Health and Surgical.
While our FY22 EPS estimate implies a decline from FY21, we note that it still represents strong growth from $2.43 in pre-pandemic FY19.
While we are not providing an EPS estimate for FY23, we expect Hologic to continue to invest in M&A and the launch of new products, and to further expand the installed base of Panther systems.
FINANCIAL STRENGTHOur financial strength rating on Hologic is Medium-High,
the second-highest point our five-point scale. Hologic's strong operational results over the past six months, driven by COVID-19 test revenue, have bolstered the balance sheet, enabling the company to pay down debt and providing resources for M&A and R&D. Cash flow from operations was $1.865 billion in the first nine months of FY21, up from $455
Section 2.116
GROWTH / VALUE STOCKSmillion a year earlier.
The company does not pay a dividend. In the near term, we expect it to deploy capital for M&A and internal R&D, as well as for debt repayment.
RISKSHologic faces competition from the imaging businesses of
larger companies such as GE and Siemens. In molecular diagnostics, it faces competition from Roche, Abbott, and BD.
Hologic also faces challenges in obtaining FDA approval for new products.
COMPANY DESCRIPTIONHologic develops and manufactures diagnostic and
medical imaging systems, primarily serving the healthcare needs of women. In addition to equipment and device sales, it generates more than half of its revenue from consumables and disposables. Its customers include hospitals, imaging clinics, and private practices, as well as healthcare organizations and pharmaceutical companies.
VALUATIONHOLX shares trade at 15.2-times our FY22 EPS estimate,
well below the average multiple of 26.1 for our coverage universe of med-tech stocks. We believe this is an attractive valuation. Sales of an expanded range of test assays are driving placements of Panther diagnostic systems and helping Hologic to gain molecular diagnostics share in overseas markets. Based on the company's growth opportunities in its Breast Health, Diagnostics, and GYN Surgical segments, we are reiterating our BUY rating with a target price of $95.
On August 2, BUY-rated HOLX closed at $75.83, up $0.79. (David Toung, 8/2/21)
Huntington Bancshares, Inc. (HBAN)Publication Date: 8/3/21Current Rating: HOLD
HIGHLIGHTS*HBAN: Reaffirming HOLD following 2Q results*On July 29, Huntington reported a 2Q21 loss of $0.05
per share, down from earnings of $0.13 per share in 2Q20.*The company incurred $0.40 per share in costs related to
the TCF acquisition and increased its provisions for loan losses by $211 million.
*We are lowering our 2021 EPS estimate to $1.15 from $1.57 and our 2022 estimate to $1.56 from $1.60.
*Huntington pays a quarterly dividend of $0.15 per share, or $0.60 annually, for a yield of about 4.2%, well above the peer average.
ANALYSIS
INVESTMENT THESISWe are reiterating our HOLD recommendation on
Huntington Bancshares Inc. (NGS: HBAN). HBAN continues
to grow its presence in the Midwest, which will be aided by its recently completed merger with Detroit-based TCF Financial. The company has a strong balance sheet and a focus on shareholder returns. However, it posted a loss in 2Q due to costs associated with the TCF acquisition.
HBAN is trading at 12-times our 2021 EPS estimate, above the peer average. The company is facing pressure from loan quality and from a low interest rate environment; however, it has initiated a hedging program to help mitigate the impact of lower interest rates. It is also working to boost organic growth while maintaining a low- to moderate-risk lending profile.
RECENT DEVELOPMENTSHBAN shares have outperformed the broad market over
the past year, rising 51% versus a 34% gain for the S&P 500; however, they have underperformed the SPDR S&P Regional Banking ETF (KRE), which has gained 66% over the past year.
On July 29, Huntington reported a 2Q21 loss of $0.05 per share, down from earnings of $0.13 per share a year earlier. The company incurred $0.40 per share in costs related to the TCF acquisition and increased provisions for loan losses by $211 million. Revenue rose 8% to $1.29 billion.
Second-quarter net interest income rose 6% from the prior year. The increase reflected an increase in average earning assets, offset by a 28-basis-point decrease in the net interest margin to 2.66%. Noninterest income rose 14%, primarily due to increased service charges and card fees, offset by lower mortgage banking revenue. Noninterest expense rose 59% from the prior year due to higher personnel and marketing costs. The efficiency ratio rose to 83.1% from 55.9% a year earlier, reflecting the higher expenses.
On June 9, Huntington completed its $22 billion merger with TCF Financial - creating a top 10 U.S. regional bank with headquarters in Columbus and Detroit. With TCF, Huntington has added approximately $50 billion in total assets, $34 billion in loans and leases, and $39 billion in deposits. Management said that the integration is proceeding as planned, with the consolidation of 44 Meijer in-store branches in mid-June, and most branch and system conversions expected to take place in October.
HBAN is one of the largest SBA lenders, and has been able to seamlessly process Paycheck Protection loans. In the first round of the Paycheck Protection Program, it made more than $6.6 billion in loans to approximately 38,500 small and medium-sized businesses. It made an additional $2.0 billion in loans in the second round. Management expects 85% of all PPP loans to be forgiven.
EARNINGS & GROWTH ANALYSIS
Section 2.117
GROWTH / VALUE STOCKSWe expect Huntington to post low single-digit growth in
net interest income in 2021. We look for sluggish growth in consumer lending and a lower net interest margin to be offset by a solid mortgage lending pipeline.
Credit quality will remain a headwind over the next few quarters as the full effects of the pandemic remain unknown. The company's allowance for loans losses rose to $2.2 billion, or 1.98% of total loans, in 2Q. In 2020, HBAN set aside over $1 billion in provisions. After reserve releases of $60 million in 1Q, the company took reserves of $211 million related to the TCF merger. In 2Q, net charge-offs fell to $62 million (0.28% of total average loans) from $107 million a year earlier.
Going forward, we expect low to mid-single-digit growth in noninterest income, as growth in card fees and mortgage banking income is partly offset by weaker 'other income.' We also expect a slight increase in noninterest expense due to higher compensation costs. We expect capital markets income to face pressure from low interest rates and equity market volatility.
We are lowering our 2021 EPS estimate to $1.15 from $1.57 and our 2022 estimate to $1.56 from $1.60.
FINANCIAL STRENGTH & DIVIDENDOur financial strength rating on HBAN is Medium-High,
the second-highest rank on our five-point scale, based on the company's solid capital levels. The company's tier 1 capital ratio was 9.97% as of June 30, 2021, up from 9.89% a year earlier and within management's 9%-10% target range. Tangible book value was $8.23 per share as of June 30.
The company did not repurchase any stock during 2Q; however, the board authorized the repurchase of up to $800 million of HBAN shares over the next four quarters.
The company pays a quarterly dividend of $0.15 per share, or $0.60 annually, for a yield of about 4.2%, well above the peer average. Our dividend estimates are $0.60 for 2021 and $0.64 for 2022.
MANAGEMENT & RISKSHBAN is led by President and CEO Steve Steinour. The
company is transparent with its growth strategy and cost-savings initiatives, and provides guidance with respect to loan growth, noninterest expense, and efficiency and credit quality metrics.
The company is subject to a number of risks, including changes in interest rates, credit quality, loan demand, and capital markets liquidity. It also faces risks from financial services regulation. Huntington is most sensitive to economic and housing market conditions in the Midwest.
COMPANY DESCRIPTION
Based in Columbus, Ohio, Huntington is a regional bank providing a range of retail and commercial banking, residential mortgage lending, and asset management services. The company has $114 billion in assets and branch offices in Ohio, Michigan, Pennsylvania, Indiana, Illinois, West Virginia and Kentucky.
VALUATIONHBAN trades at 12-times our revised 2021 EPS estimate,
well above the peer average. While HBAN and other regional bank stocks have recovered from their pandemic lows, they have recently given back some of their gains amid the decline in long-term interest rates and concerns about the pace of the economic recovery going forward. We believe that HBAN is fully valued given the company's current outlook, including additional costs related to the integration of TCF, and that a HOLD rating remains appropriate.
On August 3 at midday, HOLD-rated HBAN traded at $14.29, up $0.28. (Kevin Heal and Caleigh McGough, 8/3/21)
Illinois Tool Works, Inc. (ITW)Publication Date: 8/2/21Current Rating: BUY
HIGHLIGHTS*ITW: Recent weakness offers buying opportunity *ITW shares have underperformed over the past three
months, falling 3% while the S&P 500 has gained 5%.*The company has reported 2Q EPS that rose 140%
year-over-year and topped analyst expectations. The results were an improvement from the 7% gain in 4Q.
*Management has raised guidance but also cautioned about the impact of inflation on margins.
*We like the company's shareholder-friendly approach toward raising the dividend and buying back stock.
*Blending our fundamental valuation approaches, and discounting for the current uncertainty over the inflation environment and the pandemic, we arrive at our target price of $260.
ANALYSIS
INVESTMENT THESISOur rating on Illinois Tool Works Inc. (NYSE: ITW) is
BUY. This leading blue-chip industrial company appears on track to deliver low single-digit sales growth over the long term, which, along with margin expansion and a share buyback program, has the potential to drive low double-digit EPS growth over the course of the economic cycle. Management is clearly focused on generating shareholder value: the company has raised its dividend for more than 50 straight years and continues to deliver best-in-class margins. In this pandemic, we think that companies with strong balance sheets and experienced management teams are in the best position to survive and thrive. Financial strength will carry a company through the crisis, and talented management will lead it to the other side. ITW scores high on both counts. We like the
Section 2.118
GROWTH / VALUE STOCKScompany's shareholder-friendly approach toward raising the dividend and buying back stock. Blending our fundamental valuation approaches, and discounting for the current uncertainty over the inflation environment and the pandemic, we arrive at our target price of $260. ITW remains a suitable core Industrial equity holding in a diversified portfolio.
RECENT DEVELOPMENTSITW shares have underperformed over the past three
months, falling 3% while the S&P 500 has gained 5%. The shares have also underperformed the market over the past year, with a 20% gain compared to a 36% advance for the S&P 500. ITW has underperformed the industry (ETF is IYJ) over the past year but has performed in line with the industry and the broad market over the past five years. The beta on ITW is 1.10.
The company recently reported 2Q EPS that rose 140% year-over-year on a GAAP basis and topped analyst expectations. On July 30, ITW reported that organic revenue rose 43% year-over-year to $3.7 billion. The operating margin widened by 680 basis points to 24.3%. Second-quarter GAAP EPS came to $2.45, above the consensus forecast of $2.05. (Note: the 2Q GAAP EPS included a one-time tax benefit of $0.35; we expect the Street to focus on the GAAP results so we will include that one-time benefit in our estimates and valuation.)
Along with the 2Q results, the company once again raised guidance. The company now expects full-year GAAP EPS in a range of $8.55-$8.95 per share (essentially the one-time benefit), up from its earlier outlook of $8.20-$8.60 per share. Organic growth is now expected to be 13%-16% (up from 10-12%). The operating margin is expected to 24.5-25.5% (down from 25%-26%). Free cash flow is expected to be greater than 100% of net income. The company plans to repurchase approximately $1 billion of its shares in 2021.
The company has a growth-by-acquisition strategy. In 1Q, the company announced it will be acquiring MTS System Corp.'s Test & Simulation business.
EARNINGS & GROWTH ANALYSISIllinois Tool Works has seven primary segments:
Automotive OEM (23% of revenue), which designs and manufactures powertrain and braking systems; Test & Measurement and Electronics (16%); Food Equipment (13%), which designs and manufactures dishwashing, cooking, refrigeration and food processing equipment; Polymers & Fluids (12%), which includes brands such as Permatex, RainX and Wynn's; Welding (12%); Construction Products (13%), which focuses on fasteners; and Specialty Products (13%), which range from zippers on resealable bags to six-pack rings to coatings for branded products.
Revenue trends were positive in 2Q. The segments that
reported the strongest organic growth included, as expected, Automotive OEM (+95%), Food Equipment (53%), Welding (35%) and Test & Measurement/Electronics (33%). We continue to expect higher-than-normal demand in 2021 as the impact of the pandemic recedes, and then more normal demand in 2022 and beyond.
Management continues to focus on controlling costs through its '80/20 front-to-back' business system, which is designed to reduce the complexity and lower the overhead associated with smaller product lines and customers. In 2Q, the operating margin widened by 680 basis points to 24.3%, with 120 basis points of improvement due to enterprise initiatives. Management commented that raw material cost inflation currently projects to 7%, and has lowered its target operating margin for 2021 to 24.5%-25.5%, compared to 22.9% in 2020.
Based on recent sales and margin trends, which are improving, we are raising our 2021 EPS forecast to $8.90 from $8.50. Our estimate implies year-over-year growth of 34% and is near the top of management's guidance range. We look for growth to continue in 2022 and are raising our preliminary EPS estimate to $9.75 from $9.35. Our five-year earnings growth rate forecast is 10%.
FINANCIAL STRENGTH & DIVIDENDOur financial strength rating on Illinois Tool Works is
Medium, the midpoint on our five-point scale. The company scores above average on profitability and fixed-cost coverage, but only average on debt/cap as it has borrowed money to buy back stock. The after-tax ROIC in 2020 was a healthy 26.2%.
The company pays a dividend, which it has raised annually without interruption for more than 50 years. In August 2020, the board raised the quarterly payout by 7% to $1.14 per share, or $4.56 annually, for a yield of about 2.0%. We think the dividend is secure and likely to grow. Our dividend estimates are $4.78 for 2021 and $5.16 for 2022.
Illinois Tool Works also buys back stock.
MANAGEMENT & RISKSE. Scott Santi has been president and CEO of Illinois Tool
since 2012 and has been with the company for more than 30 years. He is also the company's chairman. Michael Larsen is SVP and CFO.
The company is focused on generating solid growth, with best-in-class margins and returns on capital.
Performance goals by 2023 include:
-- Organic growth of 3%-5%.
-- An operating margin of 28%.
Section 2.119
GROWTH / VALUE STOCKS-- An after-tax ROIC of 40%.
-- Free cash flow of 100%+ of net income.
-- 7%-10% annual EPS growth.
-- A 50% dividend payout ratio.
The company has long relied on innovative cost-control strategies, including the 80/20 rule and, more recently, its 'Finish the Job' Enterprise Initiatives program and strategic sourcing initiative.
Illinois Tool generates more than 50% of its revenue from overseas, and its results are typically linked to global economic trends.
There are risks to owning ITW shares. On a macro basis, the company's results are impacted by global economic conditions. Downturns in the markets served by the company could adversely affect its businesses, results of operations, or financial condition. The global nature of the company's operations also subjects it to political and economic risks. On a more micro basis, the benefits from the company's Enterprise Initiatives program may not be as expected and the company's financial results could be adversely impacted. ITW may also fail to meet its long-term financial targets.
Illinois Tool is also sensitive to trends in the dollar. Looking ahead, we think the greenback is more likely to trend sideways than higher given current levels. A stable-to-weaker dollar would be a positive development for the Industrial sector and Illinois Tool Works.
The bear case against ITW shares also includes valuation levels, which are high compared to the peer group. The share price is susceptible to pullbacks if earnings disappoint, as has happened in recent quarters despite double-digit growth.
COMPANY DESCRIPTIONIllinois Tool Works is a global manufacturer of
engineered industrial products and equipment. The company's operations are divided into seven segments: Test & Measurement and Electronics, Automotive OEM, Polymers & Fluids, Food Equipment, Welding, Construction Products, and Specialty Products. The shares are a component of the S&P 500. The company has 43,000 employees.
VALUATIONWe think that ITW shares are attractively valued at
current prices near $223, above the midpoint of their 52-week range of $182-$242. On a technical basis, prior to the pandemic, the shares had established a double-bottom near $124 in 4Q18, and had been in a bullish pattern of higher highs and higher lows. Following the March 2020 pandemic lows, that bullish pattern has resumed.
To value the stock on a fundamental basis, we use peer and historical multiple comparisons, as well as a dividend discount model. ITW shares are trading at 23-times projected 2022 earnings, above the midpoint of the historical range of 15-27. On a price/sales basis, the shares are trading near the high end of the five-year range of 2.5-6.0. The dividend yield of about 2.0% is above the peer average and higher than the market yield, signaling value. ITW's multiples are generally in line with or slightly above industry averages, but we think that this well-managed company should trade at a premium. Our dividend discount model indicates value to $270 per share. Blending our approaches, we arrive at our target price of $260.
On July 30, BUY-rated ITW closed at $226.67, down $1.73. (John Eade, 7/30/21)
International Paper Co. (IP)Publication Date: 8/2/21Current Rating: BUY
HIGHLIGHTS*IP: Maintaining BUY with $75 target*We view International Paper as a well-run company with
a strong track record in its industry, and expect its products and services to be in high demand on the other side of the pandemic.
*The company recently reported 2Q21 results that topped expectations. Adjusted diluted EPS rose to $1.06 from $0.77 a year earlier - above the consensus estimate of $1.05. Revenue rose to $5.62 billion from $4.87 billion in 2Q20.
*We are raising our 2021 adjusted EPS estimate to $4.82 from $4.56. We are also boosting our 2022 forecast to $5.32 from $4.95.
*IP pays a dividend. In October 2019, it raised its quarterly payout by 2.5% to $0.5125, or $2.05 annually, for a yield of about 3.5% - above the peer average of 2.7%.
ANALYSIS
INVESTMENT THESISWe are maintaining our BUY rating on International
Paper Co. (NYSE: IP). We view International Paper as a well-run company with a strong track record in its industry, and expect its products and services to be in high demand on the other side of the pandemic. The balance sheet is solid and the dividend yield of about 3.5% is attractive in a low interest rate environment. From a technical standpoint, the shares had been in a bearish pattern of lower lows and lower highs from January 2018 until their pandemic lows in March 2020. They then rose strongly until mid-June 2021 before falling to current levels. We see room for further gains and are maintaining our $75 target price.
RECENT DEVELOPMENTSIP shares have underperformed over the past quarter,
falling less than 1% compared to a gain of 6% for the S&P 500. They have outperformed over the past year, but have
Section 2.120
GROWTH / VALUE STOCKSunderperformed over the past five years.
IP reported 2Q21 results on July 29. Adjusted diluted EPS rose to $1.06 from $0.77 a year earlier, and topped the consensus estimate of $1.05. Revenue rose to $5.62 billion from $4.87 billion in 2Q20.
In 2020, adjusted EPS fell to $2.80 from $4.44 in 2019.
On June 7, IP began a tender offer to repurchase its outstanding 4.4% notes due 2047, its 4.35% notes due 2048, its 4.8% notes due 2044, and its 5.0% notes due 2035. The company could spend up to $700 million to repurchase these notes.
On April 1, IP acquired two box plants in Spain for 72 million euros (approximately $85 million based on the March 31 exchange rate). In April, it also took a $115 million noncontrolling interest in a U.S-based corrugated packaging producer.
In December 2020, IP announced plans to sell a controlling interest in its Printing Papers segment, while retaining a roughly 20% stake. In October 2020, it also completed the sale of its Brazilian Industrial Packaging business for R$330 million ($58.5 million).
EARNINGS & GROWTH ANALYSISInternational Paper has three main operating segments:
Industrial Packaging (76% of 2Q21 sales), Global Cellulose Fibers (12%), and Printing Papers (12%).
Revenue in the Industrial Packaging segment rose to $4.056 billion in 2Q21 from $3.633 billion in 2Q20, while operating profit fell to $408 million from $449 million. In North America, higher prices for boxes and export containerboard were more than offset by higher planned maintenance outage expenses and higher input costs.
In Global Cellulose Fibers, revenue rose to $671 million from $605 million in 2Q20. Operating earnings were $10 million, compared to a loss of $10 million a year earlier.
In the Printing Papers segment, IP posted 2Q21 revenue of $846 million, up from $583 million in 2Q20. The segment operating profit was $76 million, compared to a loss of $11 million in 2Q20.
The company did not provide guidance.
Turning to our estimates, based on recent business trends, we are raising our 2021 adjusted EPS forecast to $4.82 from $4.56. We are also boosting our 2022 forecast to $5.32 from $4.95. We expect IP to benefit over time from its geographically diverse revenue base, cost-reduction efforts, and recent acquisitions. Our long-term EPS growth rate
forecast is 6%.
FINANCIAL STRENGTH & DIVIDENDWe rate International Paper's financial strength as
Medium, the midpoint on our five-point scale. The company receives average scores on our main financial strength criteria of debt levels, fixed-cost coverage, profitability, and cash flow generation. IP's debt is rated Baa2/stable by Moody's and BBB/stable by Standard & Poor's.
The company had cash of $706 million at the end of 2Q. Debt of $7.5 billion accounted for 47% of total capitalization. Management has said that debt repayment is a priority. In 2020, IP lowered long-term debt by $1.7 billion and generated $2.3 billion in free cash flow.
IP has a stock buyback program. It repurchased $57 million of its stock in 2Q21 and $155 million in 1Q21.
On June 17, 2021, IP amended its five-year, $1.5 billion revolving credit agreement.
The company pays a dividend. In October 2019, it raised its quarterly payout by 2.5% to $0.5125, or $2.05 annually, for a yield of about 3.5% - above the peer average of 2.7%. We think the dividend is secure. Our dividend estimates are $2.05 for 2021 and $2.10 for 2022.
MANAGEMENT & RISKSMark S. Sutton became IP's CEO on November 1, 2014
and chairman on January 1, 2015. Mr. Sutton was previously the company's chief operating officer. In June 2018, Tim Nicholls became the company's CFO. In February 2020, Sophie Beckman became the chief sustainability officer.
Investors in International Paper face a range of risks. In addition to the industry-wide issues of competition, trade disputes, operational efficiency, environmental compliance, and potential litigation, the firm has significant debt. Pulp and paper prices can also be highly volatile. The company also faces risks related to the pandemic.
COMPANY DESCRIPTIONInternational Paper is a global producer of renewable
fiber-based packaging, pulp and paper products with manufacturing operations in North America, South America, Europe, North Africa, India, and Russia. The company is based in Memphis, Tennessee. It has 50,000 employees and serves more than 25,000 customers in 150 countries. Net sales were $20.6 billion in 2020.
VALUATIONWe think that IP shares are attractively valued at current
prices near $58, near the high end of their 52-week range of $34-$65. From a technical standpoint, the shares had been in a bearish pattern of lower lows and lower highs from January 2018 until their pandemic lows in March 2020. They then rose
Section 2.121
GROWTH / VALUE STOCKSstrongly until mid-June 2021 before falling to current levels. On the fundamentals, the numbers are mixed. IP is trading at 12-times our 2021 EPS forecast, near the midpoint of the historical range of 10-15 but below the average multiple of 15 for a peer group that includes Packaging Corp. of America (PKG), WestRock Company (WRK), and Sonoco Products (SON). The price/sales ratio is 1.3, in line with the five-year historical average. The dividend yield of about 3.5% is above the peer average of 2.7%, indicating value. We think that valuations are attractive and are reaffirming our target price of $75.
On August 2 at midday, BUY-rated IP traded at $57.96, up $0.20. (David Coleman, 8/2/21)
JetBlue Airways Corp (JBLU)Publication Date: 7/29/21Current Rating: HOLD
HIGHLIGHTS*JBLU: Maintaining HOLD; challenging near-term
outlook *JetBlue has been battered by the pandemic and will
likely face a difficult recovery given its high leverage and competition in key markets.
*On July 27, JetBlue posted an adjusted 2Q21 loss of $0.65 per share, narrower than the loss of $2.02 per share in 2Q20 and the consensus loss forecast of $0.74 per share.
*We are narrowing our 2021 loss estimate to $2.30 per share from $2.54, but are lowering our 2022 EPS estimate to $0.65 from $0.72.
*We will look to return this well-managed airline to our BUY list on signs of positive earnings growth as business and leisure travel return to pre-pandemic levels.
ANALYSIS
INVESTMENT THESISWe are maintaining our HOLD rating on JetBlue Airways
Corp. (NGS: JBLU). JBLU shares had a strong run from 2012 to 2016, with a return of 235%. Earnings rose strongly during that four-year period, driven by impressive traffic and capacity growth, as well as by low fuel costs. However, like other airlines, JetBlue has been battered by the pandemic and will likely face a difficult recovery given its high leverage and competition in key markets. We will look to return this well-managed airline to our BUY list on signs of positive earnings growth as business and leisure travel return to pre-pandemic levels.
RECENT DEVELOPMENTSOn July 27, JetBlue posted an adjusted 2Q21 loss of $0.65
per share, narrower than the loss of $2.02 per share in 2Q20 and the consensus loss forecast of $0.74 per share.
Revenue rose to $1.39 billion, up from $250 million a year earlier but below the consensus estimate of $1.45 billion. Revenue passenger miles, or traffic, rose to 10.8 billion from
816 million a year earlier. The second-quarter load factor was 79.2%, up from 33.8% in the prior-year period. The yield per passenger mile fell 38.5% to $0.1282. Passenger revenue per available seat mile (PRASM) rose 44% from the prior year to $0.1018. Operating expense per available seat mile (RASM), a measure of unit revenue, decreased 61.7% to $0.0991.
For all of 2020, the company posted an adjusted loss of $5.68 per share and revenue of $2.95 billion. In 2019, revenue rose 5.7% to $8.1 billion and operating earnings increased to $1.99 per share from $1.58 in 2018.
In 3Q21, JetBlue projects adjusted EBITDA of $75-$175 million, which assumes a 4%-9% decline in revenue. It expects 3Q21 CASM ex-fuel to be up 11%-13% from 3Q19. The average realized fuel price in 2Q21 was $1.91 per gallon, down 12% from the prior year. As of July 27, 2021, JetBlue had not entered into derivative contracts to hedge its third-quarter fuel costs. Based on the forward curve as of July 19, 2021, JetBlue expects an average all-in fuel cost of $2.09 per gallon in the third quarter.
On May 6, 2021, JetBlue entered into a Payroll Support Program 3 Agreement (PSP3) with the Treasury Department governing its participation in the federal payroll support program for air carriers. Under the terms of the agreement, the Treasury provided JetBlue with $270.6 million to help with the payment of employee wages, salaries, and benefits. In April 2020 and September 2020, JetBlue received funding under the original payroll support program. The Payroll Support 3 payment includes a grant of $219.4 million and a loan of $51.2 million, evidenced by a promissory note issued by JetBlue to the Treasury Department. JetBlue also gave the Treasury warrants to purchase 257,175 shares of JBLU common stock, $0.01 par value per share, at an exercise price of $19.90 per share. The promissory note will mature in May 2031, and the warrants will expire in May 2026.
EARNINGS & GROWTH ANALYSISWe expect air travel to return to pre-pandemic levels as
COVID vaccines are rolled out, though the Delta variant may cause some potential travelers to avoid plane flights. Rising fuel costs may also weigh on the company's near-term results.
On the positive side, we expect JBLU to benefit from its recent deal with American Airlines in which TrueBlue members may receive points for travel on American Airlines. The company has also broadened its range of destinations.
We are narrowing our 2021 loss estimate to $2.30 per share from $2.54, but are lowering our 2022 EPS estimate to $0.65 from $0.72.
FINANCIAL STRENGTHOur financial strength rating on JetBlue is Medium-Low.
The company ended 2Q21 with more than $3.7 billion in cash
Section 2.122
GROWTH / VALUE STOCKSand cash equivalents and investment securities, up from $3.05 billion at the end of 2020. Total debt was $4.4 billion, down from $5.7 billion at the end of 2020. The company is targeting a debt/cap ratio of 30%-40% by 2025.
JBLU does not pay a dividend, and we do not expect it to initiate one in the near term.
The company's long-term debt is rated Ba2/negative by Moody's, B+/negative by S&P, and BB-/negative by Fitch. The company has a debt/cap ratio of 54%, down from 59% at the end of 2020.
MANAGEMENT & RISKSRobin Hayes took the reins as JetBlue's CEO in February
2015, succeeding David Barger. Mr. Hayes previously served as the company's president. CFO Steve Priest has been succeeded by Ursula Hurley. In addition to serving as Acting CFO, Ms. Hurley is the company's treasurer and head of investor relations.
Investors in JBLU shares face significant risks from outbreaks of disease, such as the coronavirus, as well as from terrorist attacks.
JetBlue also faces tough competition from other low-cost carriers, as well as from legacy airlines that have slashed fares in recent years. The company's biggest challenge is to expand its route structure while sustaining margin and earnings growth.
JBLU's internal operations have not always kept pace with capacity. As it is based in New York City, the airline also faces the risk of delays caused by traffic congestion and storms.
We note that JetBlue employees, unlike those of many airlines, are not unionized. As a result, the company has been able to design a competitive pay structure that responds well to market changes, incorporating profit-sharing and stock-based compensation.
COMPANY DESCRIPTIONJetBlue Airways is a low-cost airline based at New York's
JFK Airport. The airline operates a fleet of Airbus A320s and Embraer E190s, and runs an average of 1000 daily flights to 101 destinations. JetBlue posted revenues of $8.1 billion in 2019 and $3 billion in 2020.
VALUATIONTo value the stock on a fundamental basis, we use peer
and historical multiple comparisons. The current-year P/E is meaningless based on our loss estimate. The projected 2022 P/E is 23. JetBlue shares are trading at a price/sales multiple of 1.4, above the five-year average of 1.0 though below the peer average of 1.7. The price/book ratio of 1.3 is in line with the five-year average of 1.3 and below the peer average. Based on prospects for weak flight demand and continued losses this
year, and the uncertain impact of the Delta variant, we see limited near-term upside for JBLU. Our rating remains HOLD.
On July 29 at midday, HOLD-rated JBLU traded at $15.34, up $0.02. (David Coleman, 7/29/21)
KKR & Co. Inc. (KKR)Publication Date: 8/4/21Current Rating: BUY
HIGHLIGHTS*KKR: Raising target to $72*On August 3, KKR reported 2Q21 distributable earnings
of $1.05 per share, up from $0.39 a year earlier and above the consensus of $0.83.
*Assets under management jumped 93% to $429 billion at June 30, largely reflecting the February 2021 acquisition of Global Atlantic, a retirement and life insurance company with $90 billion in assets.
*Management has outlined plans to boost distributable earnings to $4-$5 per share in 2023-2024, up from $1.78 in 2020.
*KKR trades at 19-times our 2021 distributable earnings estimate, just below the multiples of larger rivals Blackstone Group and Apollo Global. Our revised target price of $72 reflects the improving environment for asset values and realizations.
ANALYSIS
INVESTMENT THESISWe are maintaining our BUY rating on KKR & Co. Inc.
(NYSE: KKR) following 2Q earnings, which benefited from growth in management and transaction fees and the acquisition of Global Atlantic. We continue to view the environment for both fund raising and realizations as favorable for the private equity industry.
In February 2021, KKR acquired Global Atlantic Financial Group Ltd., a retirement and life insurance company, for about 1.0-times Global Atlantic's book value. The operations were a significant addition to KKR's business, as they increased fee-paying AUM by 48%. They also boosted perpetual capital to over $90 billion from $19 billion. The acquisition adds scale to KKR's real estate credit and principal finance operations, and expands its distribution capabilities.
In April 2021, the company held an Investor Day, its first since July 2018, in which it highlighted strong recent and expected growth in fee-related earnings. KKR intends to focus on the large addressable end markets of traditional private equity, real estate, infrastructure, alternative credit, leveraged credit, and hedge funds. In 2021-2022, the company expects capital raising of $100 billion, including $40-50 billion in private equity, $15-20 billion in infrastructure, $10-15 billion in real estate, and $20-25 billion in credit. It also expects to raise fee-related earnings to more than $2 per share in 2022. The company's goal is to raise after-tax distributable earnings
Section 2.123
GROWTH / VALUE STOCKSto $4-5 per share in 2023-2024, up from $1.78 in 2020.
The company's conversion to corporate status from a partnership structure took place on July 1, 2018. We believe the strong share price improvement since then reflects the company's broader shareholder base, as many mutual funds are unable to invest in partnerships and many other investors are reluctant to deal with K-1 dividend forms. The conversion has also made the shares eligible for a range of indices. Management has noted a meaningful change in the company's shareholder base, with increased mutual fund ownership, index fund sponsorship, and a decline in ownership by hedge funds and broker/dealers. KKR was a trendsetter in the conversion to corporate from partnership status, with Blackstone and Apollo Global following suit in 2019.
The stock's yield is about 0.9%. Our target price of $72 (raised from $65) implies a multiple of 21-times our 2022 distributable earnings estimate, more in line with the multiples of other alternative asset managers we cover, all of which have converted to corporate status and are expanding their shareholder base.
RECENT DEVELOPMENTSOver the past year, KKR shares have risen 80%,
compared to a 35% advance for the broad market.
On August 3, KKR reported 2Q21 distributable earnings of $1.05 per share, up from $0.39 a year earlier and above the consensus of $0.83. Revenues rose 95% to $1.74 billion, aided by strong growth in management fees and realized investment income. Fee-related earnings of $470 million ($0.53 per share) were up 68% from the prior year.
Assets under management were $429 billion at June 30, 2021, up 93% from the prior year, largely reflecting the February 2021 acquisition of Global Atlantic.
EARNINGS & GROWTH ANALYSISThe company historically reported results for four
operating segments: Private Markets, Public Markets, Capital Markets and Principal Activities. However, quarterly earnings now focus on total firm performance, while segment P&Ls are reported only in quarterly and annual SEC filings. The change in reporting was prompted in part by the growth of the company's balance sheet since its public offering. The new Principal Activities segment shows stand-alone balance sheet performance, as well as the allocation of operating expenses across segments. It also shows the impact of capital commitments previously excluded from AUM, and the pro rata portion of strategic partnerships.
Aside from the Global Atlantic acquisition, recent AUM growth has benefited from strong capital raising and real estate and leveraged credit strategies, as well as from an increase in the value of private equity holdings. The company raised $59
billion in 2Q and has raised $94 billion over the past 12 months. The company's top five holdings as of June 30 were USI Inc., Fiserv, PetVet Care Centers, BridgeBio Pharma, and Heartland Dental, with a total carrying value of $4.4 billion. Other investments of $13.2 billion brought total investments to $17.6 billion. We note that the Fiserv holding came about after Fiserv acquired First Data, in which the company had a significant stake.
Fee-paying assets have been growing nicely, nearly doubling in 2Q due to the Global Atlantic acquisition, although organic growth has also remained strong.
Reflecting the continued rebound in asset values and growth in fee-related earnings, we are raising our 2021 distributable earnings estimate to $3.36 from $3.06 and our 2022 forecast to $3.46 from $3.38.
FINANCIAL STRENGTH & DIVIDENDOur financial strength rating on KKR is Medium, the
midpoint on our five-point scale. The company ended 2Q21 with a book value of $27.03 per share, up 17% from the end of 2020, aided by asset appreciation in the investment portfolio. KKR's primary asset is a portfolio of investments with a fair value of about $17.6 billion as of June 30, 2021, of which 65% were classified as private equity, 18% as real estate, and 11% as credit.
Between December 31, 2020 and April 30, 2021, KKR spent $181 million to buy back 1.6 million common shares and to retire equity awards representing 2.4 million shares.
Prior to 4Q15, the company made quarterly cash distributions of substantially all cash earnings from its investment management business. It made distributions of $1.58 per unit in 2015. In 1Q16, it began paying a fixed distribution (initially $0.16 per quarter) tied to its fee-generating business, and in 1Q17, it raised this amount to $0.17 per quarter, which continued through 2Q18. However, along with the change in status from a partnership to a corporation, the company began paying an annualized dividend of $0.50 in 3Q18. It increased the annualized payout to $0.54 per share beginning in 2Q20 and to $0.58 in 2Q21. Our dividend estimates are $0.57 for 2021 and $0.58 for 2022.
MANAGEMENT & RISKSKKR is led by co-chairman and co-CEOs Henry R. Kravis
and George R. Roberts, who co-founded the firm in 1976.
An investment in KKR carries substantial risks. Investors must be comfortable with the opaque nature of the alternative asset manager business model. In short, investors in KKR are betting that the company's outstanding investment track record will continue in the future. The firm also depends on favorable credit market and fund raising conditions in order to fund its investments.
Section 2.124
GROWTH / VALUE STOCKS
COMPANY DESCRIPTIONFounded in 1976, KKR & Co. is a leading global
investment management firm. KKR manages assets through a variety of investment funds and accounts covering multiple asset classes, mostly private equity. It seeks to create value by bringing operational expertise to its portfolio companies and through the active oversight and monitoring of its investments.
VALUATIONAlternative asset managers are an admittedly difficult
group to value. Realized gains and carried interest are difficult to predict. However, the company's change to corporate status has simplified its reporting structure.
We believe that book value and multiples on distributable earnings are useful valuation tools. KKR's book value was $27.03 per share as of June 30, implying a price/book multiple of 2.4. The stock trades at 19-times our 2021 distributable earnings estimate, just below the DE multiples of larger rivals Blackstone Group and Apollo Global. Our revised target price is $72, raised from $65 to reflect the improving environment for asset values and realizations.
On August 3, BUY-rated KKR closed at $64.80, up $1.26. (Stephen Biggar, 8/3/21)
Linde Plc (LIN)Publication Date: 8/3/21Current Rating: BUY
HIGHLIGHTS*LIN: Reaffirming BUY following 2Q21 financial results*On July 30, Linde reported adjusted 2Q21 net income of
$1.42 billion or $2.70 per diluted share, up from $1.01 billion or $1.90 per share in the prior-year quarter.
*The higher earnings largely reflected higher pricing and higher volumes, led by healthcare, electronics and a recovery in the cyclical end markets of manufacturing, metals, chemicals and refining.
*Linde has raised its 2021 adjusted diluted earnings per share guidance to $10.10-$10.30 from $9.60-$9.80. This guidance assumes 3% currency tailwind versus 2020.
*Full-year capital expenditures are expected to be in the range of $3.0 billion to $3.4 billion to support maintenance and growth requirements including the contractual project backlog.
ANALYSIS
INVESTMENT THESISWe are reaffirming our BUY rating on Linde plc (NYSE:
LIN) with a price target of $352. Linde, a global provider of industrial gases and engineering services, was formed in October 2018 through the merger of Linde AG and Praxair Inc.; the new Linde is the worlds' largest industrial gas producer.
For the remainder of 2021 and throughout 2022, we
expect Linde to benefit from significant merger synergies and to meaningfully benefit from increased demand for industrial gases following the easing of COVID-19 restrictions.
The company has a strong presence in defensive end markets, including healthcare, food, beverages, and electronics, that should generate steady revenue despite the impact of the pandemic. It also has a broad geographic presence and a substantial $7.5 billion backlog of projects, mostly under contract with blue-chip companies. In addition, Linde generates steady cash flow and has a solid balance sheet, providing resources for future growth. The company also pays a sustainable dividend with a yield of about 1.4%.
RECENT DEVELOPMENTSOn July 30, Linde reported adjusted 2Q21 net income of
$1.42 billion or $2.70 per diluted share, up from $1.01 billion or $1.90 per share in the prior-year quarter. EPS beat our estimate of $2.40 and the consensus estimate of $2.56.
The higher earnings largely reflected higher pricing and higher volumes, led by healthcare, electronics and a recovery in the cyclical end markets of manufacturing, metals, chemicals and refining. Revenue of $7.584 billion grew 19% from the prior year. The consensus estimate was $7.39 billion.
Linde has created a new segment reporting structure following the Praxair merger, and has recast prior-period results to conform to the new structure. Second-quarter 2021 results by segment are summarized below.
In the Americas segment, 2Q21 sales were $3.020 billion, up 25% compared to the prior-year quarter. Pricing rose 3%, while volume improved 18%. Cost pass-throughs boosted sales by 2%, while the positive impact of currency translation added 2%. Segment operating profit was $871 million, up 40% from the prior year, driven by higher pricing and productivity initiatives, primarily in manufacturing, metals, and food & beverage end markets.
Sales in the Asia-Pacific region (APAC) rose 19% to $1.544 billion, reflecting higher pricing (up 2%), higher volume (up 19%), favorable currency translation (a positive 8% impact) and cost pass-throughs (up 2%). This more than offset the impact of recent asset divestitures (down 12%). The 2Q21 segment operating profit was $389 million, up 32% from 2Q20, led by growth in the electronics, manufacturing and cyclical end markets plus project start-ups.
Sales in the Europe, Middle East & Africa (EMEA) segment rose 29% to $1.875 billion, reflecting higher pricing (up 4%), higher volume (up 12%), positive cost pass-throughs (up4%) and favorable currency effects (a 10% contribution), which more than offset the impact of asset divestitures (down 1%). Segment operating profit increased to $487 million from $303 million a year earlier, reflecting positive pricing and
Section 2.125
GROWTH / VALUE STOCKSproductivity initiatives.
Linde Engineering posted 2Q21 sales of $646 million, down from $810 million in 2Q20. The decline was attributable to costs associated with the timing of a plant completion. Operating earnings declined to $108 million from $138 million, as a result of the above.
EARNINGS & GROWTH ANALYSISLinde has raised its adjusted diluted earnings per share
guidance to $10.10-$10.30, up from $9.60-$9.80. This guidance assumes 3% currency tailwind versus 2020. Full-year capital expenditures are expected to be in the range of $3.0 billion to $3.4 billion to support maintenance and growth requirements including the contractual project backlog.
We are raising our 2021 EPS estimate to $10.20 from $9.70. We are using the midpoint of the guidance provided as our point estimate for 2021. The consensus estimate is $10.10.
We are also raising our 2022 EPS estimate to $11.22 from $10.99 per share to reflect continued growth in pricing, volume and margins in 2022, following the diminishing effects of COVID-19 on global economic growth. Consensus for 2022 is currently $11.09 per share.
FINANCIAL STRENGTH & DIVIDENDWe rate LIN's financial strength as Medium, the midpoint
on our five-point scale. The company's debt is rated A2/stable by Moody's and A/stable by S&P.
At the end of 2Q21, the total debt/cap ratio was 24.7%, compared to 25.7% a year earlier. The debt/cap ratio is well below those of the company's closest peers.
Debt totaled $15.492 billion at the end of 2Q21, which included $9.964 billion in long-term borrowings and $5.508 billion in short-term borrowings. This compares to a total of $17.480 billion at the end of 2Q20.
Cash and cash equivalents were $3.14 billion at the end of 2Q21, compared to $4.94 billion a year earlier. Cash from operating activities in 2Q21 was $1.827 billion, compared to $1.764 billion in 2Q20.
Linde completed a $6 billion share repurchase program at the end of 2020. On January 25, 2021, it initiated a new $5 billion program, with the goal of repurchasing 15% of the company's stock by July 31, 2023.
In January 2021, Linde announced a 10% increase in its quarterly dividend to $1.06 per share, or $4.24 annually. The current yield is 1.4%. Our dividend estimates are $4.24 for 2021 and $4.28 for 2022.
MANAGEMENT & RISKSThe Linde plc management team includes senior
executives from the two predecessor companies. Former Praxair CEO Steven Angel is the CEO. Mr. Angel served as CEO of Praxair from 2007 until 2018. During this period, Praxair consistently delivered industry-leading operating margins and returns on invested capital. Before Praxair, Mr. Angel spent 22 years at GE in a range of management positions.
Former Linde AG Chairman Wolfgang Reitzle is the chairman of Linde plc. He served twice as chairman of the board of Linde AG, first in 2002-2014 and again in 2016-2018.
Linde shareholders face a range of risks. The company's growth is highly dependent on the health of the global economy. In addition, the company faces a range of risks associated with commodity and energy costs, foreign exchange rates, environmental issues, litigation, and capacity utilization.
The company operates in a highly concentrated industry with significant customer switching costs. Its major competitors are Air Products & Chemicals and Air Liquide.
COMPANY DESCRIPTIONLinde plc is a leading global industrial gas and
engineering services company formed from the October 2018 merger of Linde AG and Praxair Inc. The company has approximately 80,000 employees and serves customers in more than 100 countries.
VALUATIONLIN shares have traded between $214.14 and $310.18
over the past 52 weeks and are currently above the midpoint of this range. To value the stock on a fundamental basis, we use peer group and historical multiple comparisons, as well as a dividend discount model.
The shares are trading at 29.9-times our 2021 EPS estimate and at 27.1-times our 2022 forecast, compared to a 4-year annual average range of 25-49. On other valuation metrics, the shares are trading above the high end of the range for price/book (3.5 versus a range of 2.0-2.6), price/sales (5.6 versus a range of 3.4-4.6) and below midpoint valuations for price/cash flow (19.5 versus a range of 18.0-24.7) and at a price/EBITDA multiple of 17.8, versus a range of 15.1-21.1.
We believe that these relatively high multiples are warranted based on LIN's size, geographic reach, and industrial gas portfolio. We also believe that the dividend is safe and sustainable. Our price target of $352 implies a multiple of 31.4-times our 2022 EPS estimate and a total potential return, including the dividend, of 17% from current levels.
On August 2, BUY-rated LIN traded at $300.22, down $7.17. (Bill Selesky, 8/2/21)
Section 2.126
GROWTH / VALUE STOCKS
L'Oreal S.A. (LRLCY)Publication Date: 8/3/21Current Rating: BUY
HIGHLIGHTS*LRLCY: Reiterating BUY*The world's largest cosmetics company, L'Oreal, benefits
from its strong brand reputation, premium products, expanding e-commerce business, and significant presence in Asia.
*We expect L'Oreal to continue to take advantage of positive trends in the cosmetics industry.
*Given its clean balance sheet, we also expect the company to continue to raise the dividend and repurchase shares.
*Our target price of $106, combined with the dividend, implies a total potential return of 15% from current levels. Our long-term rating is also BUY.
ANALYSIS
INVESTMENT THESISWe are reiterating our BUY rating and $106 price target
on L'Oreal S.A. (OTC: LRLCY). L'Oreal benefits from its strong brand reputation, premium cosmetic products, expanding e-commerce business, and significant presence in Asia. As such, we expect L'Oreal to post strong revenue and earnings, as well as continued market share gains, over the next several years. Given its clean balance sheet, we also expect the company to continue to raise the dividend and repurchase shares. Based on its shareholder-friendly policies and strong industry tailwinds, we believe that L'Oreal currently offers one of the best investment opportunities in the Consumer Staples sector. Our target price of $106, combined with the dividend, implies a total potential return of 15% from current levels. Our long-term rating is also BUY.
L'Oreal common shares trade on the Euronext exchange and in the U.S. as American Depository Receipts. One common share equals five ADRs.
RECENT DEVELOPMENTSLRLCY shares have posted a more than 82% total return
since we initiated coverage with a BUY on 3/13/19.
On July 29, L'Oreal reported that revenue for the first half of 2021 rose 16.2% to 15.2 billion euros ($18.1 billion). Foreign exchange was a 560-basis-point tailwind. We think the company's e-commerce initiatives and emphasis on China helped it endure a difficult 1H21. E-commerce sales were up 29%. Sales of Luxe high-end cosmetics rose 24.9% to approximately 5.5 billion euros, helped by reopenings in certain regions, solid results in North Asia, and strong sales in China. Consumer Products revenue rose 1.9% to nearly 6.0 billion euros on across-the-board improvement, particularly in Brazil and China. E-commerce rose rapidly and was nearly 20% of revenue. Sales of Professional Products rose approximately 33%, to 1.8 billion euros, reflecting the growth of e-commerce and the rise of freelance salons. In Active
Cosmetics, sales rose 32%, to just under 2.0 billion euros, reflecting strong sales of skin care products and growth in e-commerce revenue.
As for profitability, gross profit rose to 11.3 billion euros from 9.6 billion euros a year earlier and was 74.5% of revenue, up 140 basis points from the prior-year period. The operating margin rose 170 basis points to 19.7%.
EPS rose to 4.63 euros per share in the first half of 2021 from 3.82 euros in the first half of 2020. Based on the ratio of 5 ADRs to each common share, and average exchange rates for each period, adjusted earnings were $1.10 per ADR in the first half of 2021 and $0.86 per ADR in the first half of 2020.
EARNINGS & GROWTH ANALYSISWe expect retail sales to improve and e-commerce
revenue to accelerate in the coming quarters. To support new product launches and current products, we expect L'Oreal to spend heavily on advertising and promotions. Nevertheless, we project an operating margin near 19% over the next two years, up from 18.6% in 2020.
In the first half of 2021, operating cash flow totaled 2.7 billion euros, which should provide resources for additional share buybacks. Reflecting management's recent comments that it was confident the company would report higher revenue and earnings in 2021, we are raising our 2021 earnings estimate to $2.20 from $2.06 and increasing our 2022 estimate to $2.40 from $2.26. Our five-year earnings growth rate forecast is 10%.
FINANCIAL STRENGTH & DIVIDENDOur financial strength rating on L'Oreal is Medium-High,
the second-highest rank on our five-point scale. In the first half of 2021, the company had an adjusted operating margin of 19.7%, up 170 basis points from the first half of 2020.
The company pays an annual dividend. The most recent dividend was paid on July 31, 2021 to shareholders of record as of July 2. Our U.S. dollar dividend estimates are $0.90 per ADR for 2021 and $0.94 for 2022. The current yield is about 1.1%.
MANAGEMENT & RISKSNicolas Hieronimus replaced CEO Jean-Paul Agon in
May 2021. Mr. Agon remains chairman of the board. Christophe Babule became the company's finance chief and executive vice president in February 2018. He joined the company in 1988.
Risks for L'Oreal include heightened competition and weak sales at department stores. Due to its focus on high-end cosmetics, L'Oreal is also dependent on healthy global economic conditions and strong discretionary spending. L'Oreal's customers are loyal and unlikely to purchase cheaper products; however, they could reduce consumption during
Section 2.127
GROWTH / VALUE STOCKSperiods of economic weakness. As a major international company, L'Oreal also faces significant currency risks.
COMPANY DESCRIPTIONHeadquartered in Clichy, France, L'Oreal manufactures
and markets cosmetics and other personal care products. The company has four divisions: Consumer Products, L'Oreal Luxe, Professional Products, and Active Cosmetics. The company was founded in 1909. It owns a more than 9% stake in French drug company Sanofi SA (SNY: BUY). With a market cap of $263 billion, the shares are considered large-cap value.
VALUATIONLRLCY shares appear favorably valued at 38.9-times our
revised EPS estimate for 2022 (when we expect a recovery in high-end beauty products, particularly makeup, and continued strength in e-commerce sales), above the peer average of 36. We believe that L'Oreal's strong brand reputation, above-peer-average earnings growth, and prospects for margin improvement warrant a higher valuation. Our target price of $106 implies a multiple of 44.2-times our revised 2022 earnings estimate, and a potential total return, including the dividend, of 15% from current levels.
On August 2, BUY-rated LRLCY closed at $93.05, up $1.57. (John Staszak, CFA, 8/2/21)
Magellan Midstream Pntr L.P (MMP)Publication Date: 8/2/21Current Rating: HOLD
HIGHLIGHTS*MMP: Reiterating HOLD following 2Q results*On July 29, Magellan reported adjusted 2Q21 net
income of $280.4 million or $1.26 per diluted unit, up from $133.8 million or $0.59 per unit in the prior-year quarter.
*The results exceeded our estimate and the consensus forecast of $0.93 per unit, reflecting higher-than-expected refined product shipments, higher commodity prices, and lower expenses.
*Magellan continues to project 2021 distributable cash flow of $1.07 billion, as the strong 2Q results are likely to be offset by less favorable hedging and higher costs in the second half of the year.
*The company plans to maintain its quarterly cash distribution of $1.0275 per unit in the second half. The current annualized payout of $4.11 yields about 8.8%.
ANALYSIS
INVESTMENT THESISWe are maintaining our HOLD rating on Magellan
Midstream Partners L.P. (NYSE: MMP). While 2Q21 earnings topped consensus expectations, we were disappointed by management's decision to maintain, rather than increase, the company's quarterly cash distribution for the remainder of 2021. Given that MLP's such as Magellan are valued primarily
on their distribution yields, we believe that the flat distribution warrants caution and that a HOLD rating remains appropriate.
RECENT DEVELOPMENTSOn July 29, Magellan reported adjusted 2Q21 net income
of $280.4 million or $1.26 per diluted unit, up from $133.8 million or $0.59 per unit in the prior-year quarter. The results exceeded our estimate and the consensus forecast of $0.93 per unit, reflecting higher-than-expected refined product shipments, higher commodity prices, and lower expenses.
Revenue rose 49% from the prior year to $654 million and topped the consensus of $550 million. Distributable cash flow (DCF) was $268.0 million in 2Q21, up from $209.5 million in 2Q20. DCF is a non-GAAP financial measure that represents cash generated during the period that is available to pay distributions.
EARNINGS & GROWTH ANALYSISMagellan continues to project 2021 DCF of $1.07 billion,
as the strong 2Q results are likely to be offset by less favorable hedging and higher costs in the second half of the year. As noted above, the company also plans to maintain its current quarterly cash distribution of $1.0275 per unit in the second half.
We are raising our 2021 EPS estimate to $4.06 from $3.96, reflecting the second-quarter results and our expectations for modest volume growth over the remainder of the year. The consensus forecast is $4.11.
We are also boosting our 2022 EPS estimate to $4.16 from $4.12, which assumes further volume improvement and higher commodity pricing next year. The consensus forecast is $4.19.
FINANCIAL STRENGTH & DIVIDENDWe rate Magellan's financial strength as Medium-High,
the second-highest rating on our five-point scale. The company's debt is rated BBB+/stable by Standard & Poor's and Baa1/stable by Moody's.
At the end of 2Q21, MMP's total debt/capitalization ratio was 69.3%, up from 66.9% a year earlier and slightly above the peer average. Debt totaled $5.170 billion at the end of 2Q21, up from $4.954 billion at the end of 2Q20.
On April 22, Magellan paid a quarterly distribution of $1.0275 per unit, unchanged from the prior quarter. The annualized distribution of $4.11 yields about 8.8%. Our distribution estimates are $4.11 for both 2021 and 2022.
Magellan had cash and cash equivalents of $258 million at the end of 2Q21, up from $170 million at the end of 2Q20. The company has drawn $6.3 million on its $1.25 billion revolving credit facility.
Section 2.128
GROWTH / VALUE STOCKSMagellan repurchased $82.3 million of its stock in 2Q21.
It has approximately $390 million remaining on its $750 million repurchase authorization, which runs through 2022.
MANAGEMENT & RISKSMMP has a strong management team, with significant
experience in the pipeline and terminal business. With the 2009 buyout of the general partner, the company strengthened its corporate governance and gave a larger voice to the limited partners. The company remains financially conservative and shareholder-friendly.
Key risks in the energy business include commodity prices, adverse weather conditions, environmental effects, and the possibility of explosions and fires. Regulatory decisions at the federal and state level also affect pipeline companies. In addition, the capital-intensive nature of the pipeline and terminal business and the MLP structure results in substantial funding risk, as MLPs are required to pay out a large portion of cash flow to unit holders and are dependent on funding from the capital markets. The inability to access these markets could adversely affect the company's operations and growth prospects.
COMPANY DESCRIPTIONBased in Tulsa, Magellan Midstream Partners is a master
limited partnership that transports, stores and distributes refined petroleum products (including gasoline, aviation fuel, kerosene, heating oil, liquefied petroleum gases, blendstocks, and heavy oils and feedstocks) and ammonia. MMP organizes its revenues into three reporting segments: Refined Products, Crude Oil, and Marine Storage. The partnership's primary assets include the longest petroleum products pipeline system in the continental U.S., at 9,700 miles, which can access more than 50% of the country's refining capacity; 2,200 miles of crude oil pipelines; and storage facilities with capacity of approximately 28 million barrels.
VALUATIONMMP has traded between $32.61 and $53.85 over the past
52 weeks and is currently above the midpoint of this range. To value the stock on a fundamental basis, we use peer group and historical multiple comparisons, as well as a dividend discount model. The shares are trading at 11.5-times our 2021 EPS estimate and at 11.2-times our 2022 forecast, compared to a 10-year annual average range of 16-23. On other valuation metrics, the shares are trading below the low end of the range for price/book (4.7 versus a range of 5.5-8.2), price/sales (4.3 versus a range of 4.9-7.3), and price/cash flow (9.4 versus a range of 11.5-17.2). They are also trading at a price/EBITDA multiple of 7.9, below the low end of the range of 11.5-16.3.
On July 30, HOLD-rated MMP closed at $46.60, down $1.02. (Bill Selesky, 7/30/21)
Mastercard Incorporated (MA)
Publication Date: 7/30/21Current Rating: BUY
HIGHLIGHTS*MA: Strong rebound in 2Q spending volumes, though
rebates/incentives weigh*On July 29, Mastercard reported adjusted 2Q21
operating earnings of $1.95 per share, up from $1.36 a year earlier and above the $1.72 consensus. Net revenue of $4.5 billion rose 36%.
*Spending trends continued to improve in 2Q, with cross-border volume also rebounding after several weak quarters as some international travel restriction eased.
*Rebates and incentives continued to climb higher, on new and renewed deals as competition remains intense, and is the primary reason for a modest lowering of our 2021 EPS estimate.
*Our target price remains $450, implying a multiple of 43-times our EPS estimate for 2022, when we expect earnings to return to trend-line growth.
ANALYSIS
INVESTMENT THESISWe are maintaining our BUY rating on Mastercard Inc.
(NYSE: MA) following 2Q earnings, which showed solid recovery in spending volumes including a rebound in cross-border transactions as some international travel restrictions eased. We expect spending volume to improve in nearly all categories over the remainder of 2021.
While MasterCard has not provided 2021 guidance due to pandemic-related uncertainty, management believes that the company's long-term fundamentals remain intact. At its last Investor Day in September 2019, management emphasized that growth would be driven by expanding the company's core consumer and commercial solutions, building acceptance, increasing share, and adding new service offerings. The company's three-year (2019-2021) financial goals previously included a low-teens revenue CAGR, an annual operating margin of at least 50%, and an EPS CAGR in the high teens.
We like Mastercard's long-term growth story, particularly relative to the broad market. In our view, the company will continue to benefit from the secular shift from cash to credit cards, driven by the rapid growth of online shopping, the security and convenience of cards, and the opportunity to take advantage of rewards programs. Mastercard should also benefit from growth in emerging markets and expanded merchant acceptance. Our target price is $450.
RECENT DEVELOPMENTSMA shares have risen 25% over the past year, below the
broad market which rose 37%.
On July 29, Mastercard reported adjusted 2Q21 operating earnings of $1.95 per share, up from $1.36 a year earlier and above the $1.72 consensus. Net revenue of $4.5 billion rose
Section 2.129
GROWTH / VALUE STOCKS36%, with a 31% increase in currency-neutral revenue.
Gross dollar volume rose 33% from the prior year to $1.9 trillion, while the number of switched transactions (formerly processed transactions, or transactions that Mastercard has authorized, cleared or settled) rose 41% on an adjusted basis to 27.2 billion.
Adjusted operating expenses were up 32%, with a 26% increase in G&A expense. The remaining increase was primarily due to increased personnel costs to support investments in strategic initiatives, and increased spending on data processing and advertising and marketing costs. The 2Q adjusted operating margin was 53.2%, down from 51.8% a year earlier. Adjusted net income rose 41% to $1.94 billion.
EARNINGS & GROWTH ANALYSISDeterioration in cross-border volume was finally halted in
2Q, rebounding to 58% growth, while gross dollar volume and switched transaction metrics were positive as well, seeing growth of 33% and 41%, respectively. Spending volume continues to improve in nearly all categories, although travel & entertainment spending will likely remain a challenge in the near term. Rebates and incentives have also moved higher as competition has been intense, rising to 37.3% in 2Q21, from 35.3% in the year earlier quarter.
Management has suspended revenue guidance due to the pandemic; however, on the 2Q earnings call, the company said it plans to provide periodic updates to operating metrics.
After a 9% decline in 2020, we look for revenues to grow 22% in 2021 as spending volumes rebound. The pace of recovery in cross-border transactions remains a large wild card for volume growth and is dependent on relaxed rules for international travel. Still, we believe that MasterCard will continue to benefit from favorable secular trends in the payments industry as more spending moves online.
On accelerated rebates and incentives, we are lowering our 2021 EPS estimate to $8.09 from $8.20, while maintaining our 2022 forecast of $10.49.
FINANCIAL STRENGTH & DIVIDENDWe rate Mastercard's financial strength as High, the
highest point on our five-point scale.
In March 2014, Mastercard completed its first debt offering. The company sold $1.5 billion of 5- and 10-year notes at very attractive spreads over comparable Treasuries. Long-term debt increased to $13.3 billion at June 30 from $12.0 billion at the end of 2020.
Mastercard suspended its share buyback program in March 2020 to conserve capital, while retaining the common stock dividend, but resumed buybacks late in 2Q. In 2Q21, it
repurchased 4.6 million shares for $1.7 billion. Quarter-to-date through July 26, the company has repurchased an additional 1.1 million shares for $398 million, leaving $6.4 billion remaining on its repurchase program. In 2020, Mastercard repurchased 14.3 million shares for $4.5 billion.
In late 2020, Mastercard raised its dividend by 10% to $0.44 per share, or $1.76 annually, for a yield of about 0.4%. Our dividend estimates are $1.76 per share for 2021 and $1.92 per share for 2022.
MANAGEMENT & RISKSMastercard is led by President and CEO Michael
Miebach, who took over from Ajay Banga as of January 1, 2021.
Government regulation remains a risk for the company. In particular, interchange fees are constantly being reviewed in the U.S. as well as in other countries.
While the secular shift from cash to electronic payments remains a long-term tailwind, Mastercard's revenues remain subject to near-term trends in consumer spending. Cross-border transactions may also face pressure from geopolitical developments, exchange rates, and international travel restrictions.
COMPANY DESCRIPTIONMastercard operates the world's second-largest electronic
payments network, providing processing services and payment product platforms, including credit, debit, ATM, prepaid and commercial payments under the Mastercard, Maestro, and Cirrus brands. Mastercard went public in 2006 and is a member of the S&P 500.
VALUATIONMA shares trade at 48-times our 2021 EPS estimate and at
37-times our 2022 estimate, well above the historical average multiple in the high 20s, but reflecting expectations for sharply improved earnings as spending volumes rebound. Apart from coronavirus-inspired weakness in 2020, we expect revenue at Mastercard to continue to grow at least at a low-teens rate over the next several years given strong cyclical and secular trends in the payments processing industry. Operating margins in the high-50% range are also enviable, even if slightly below those of peer Visa Inc. We believe that Mastercard's overall operating metrics, particularly its record margins, merit a valuation above the stock's historical average. Our 12-month price target of $450 implies a multiple of 43-times our EPS estimate for 2022, when we expect earnings to return to trend-line growth.
On July 30 at midday, BUY-rated MA traded at $384.58, down $4.23. (Stephen Biggar, 7/30/21)
Mattel, Inc. (MAT)
Section 2.130
GROWTH / VALUE STOCKS
Publication Date: 7/30/21Current Rating: BUY
HIGHLIGHTS*MAT: Maintaining target of $26 *We believe that Mattel has turned the corner in its efforts
to become an IP-driven toy company.*Mattel is developing live-action films with major studios
(Sony, Warner Brothers, Paramount and MJM) as well as animated programming on Netflix, which is driving demand for its toys. The company has also stepped up efforts to increase online sales.
*Mattel recently reported 2Q net sales of $1.03 billion, up 40% from the prior year. The adjusted earnings rose to $0.03 per share from a loss of $0.26 a year earlier and topped the consensus loss estimate of $0.06.
*Management raised guidance and now expects 2021 net sales growth of 12%-14% in constant currency (up from its previous forecast of 6%-8) and has raised expectations for adjusted EBITDA to $875-$900 million (up from $800-$825 million).
ANALYSIS
INVESTMENT THESISWe are maintaining our BUY rating on Mattel Inc. (NGS:
MAT). We believe that Mattel has turned the corner in its efforts to become an IP-driven toy company - transforming its business with help from a new film franchise. To boost demand for its toys, Mattel is developing live-action films with major studios (Sony, Warner Brothers, Paramount and MJM). It is also developing animated programming on Netflix and expanding agreements with Disney and Pixar to develop products for future films. In addition, Mattel has stepped up efforts to increase online sales following the bankruptcy of Toys 'R' Us.
According to NPD Group, for the fourth quarter in a row, Mattel gained market share globally in all regions and was the largest and fastest growing of the top five toy manufacturers in the US on a year-to-date basis. Several brands, including Barbie, Hot Wheels and UNO, were the number-one toy properties in their respective categories last year. The company has also reduced costs, generating $1 billion in savings over the last three years, and has refinanced and redeemed debt to provide additional flexibility.
On a fundamental basis, the shares are trading at 22-times our 2021 EPS forecast and at 18-times our 2022 EPS forecast, compared to a five-year historical average range of 22-34. We are maintaining our BUY rating with a target price of $26, implying a potential gain of 21% from current levels.
RECENT DEVELOPMENTSMattel shares have underperformed over the last three
months, falling 5% compared to a 6% increase for the S&P 500. Over the past year, the stock has outperformed, gaining 83% compared to gains of 37% for the index and 35% for the
industry (ETF RXI). Over the past five years, the shares have underperformed. The beta on MAT is 1.51.
Mattel recently reported 2Q results that topped analyst expectations. The company reported 2Q net sales of $1.03 billion, up 40% from the prior year and up nearly 20% from 2Q19. The adjusted gross margin of 47.5% grew 370 basis points. Adjusted operating income of $67 million rose from a loss of $28 million a year earlier, and the adjusted operating margin rose to 6.5% from a negative 3.8%. Adjusted EBITDA was $131 million, up from $29 million. Adjusted earnings of $0.03 per share increased from a loss of $0.26 a year earlier (and the 2Q19 loss of $0.25), topping the consensus loss estimate of $0.06. Year-to-date cash flow improved by $207 million.
The company has generated $1 billion in cost savings over the last three years from its 'structural simplification' and 'capital-light' programs, above its initial target of $650 million. As part of this effort, management closed three plants in 2019 (in Mexico, China and Indonesia).
During the 4Q earnings call, the company announced an 'optimization for growth' initiative to further improve operations and to boost margins through lower costs. Management had expected to save an additional $75 million under the plan in 2021 and a total of $250 million by 2023. To date, Mattel has generated $49 million in savings, prompting management to raise its 2021 savings target to $80-$90 million. Management believes that the 'optimization for growth' program will more than offset the impact of higher transportation and resin costs on gross margins.
Management raised guidance and now expects 2021 net sales growth of 12%-14% in constant currency (up from 6%-8%). It continues to look for an adjusted gross margin of 47.6%-48.1% and has raised expectations for adjusted EBITDA to $875-$900 million (up from its previous forecast of $800-$825 million).
EARNINGS & GROWTH ANALYSISMattel has four categories: Dolls (34% of revenue); Infant
Toddler and Preschool (20%); Vehicles (23%); and Action Figures, Building Sets and Games (23%). Second-quarter results by category are summarized below:
Mattel saw double-digit growth in all geographic regions and all four categories in 2Q21. In the Dolls category, sales rose 47% in constant currency, led by the Barbie, Polly Pocket and American Girl lines. In Action Figures, Building Sets and Games, revenue rose 28%, driven by Jurassic Park action figures, and MEGA building sets. Sales rose 62% in constant currency in the Vehicles segment, with strength in Matchbox and Hot Wheels toys. In the Infant Toddler and Preschool segment, sales rose 12% in constant currency on higher sales of Fisher-Price and Thomas toys.
Section 2.131
GROWTH / VALUE STOCKS
On the expense side, the company's cost-savings initiatives benefited gross margins by 220 basis points in the quarter. Adjusted SG&A expenses increased 16% to $333 million and were 32% of sales, down 690 basis points. The 2Q adjusted gross margin rose 370 basis points to 47.5%, despite the negative impact of cost inflation. The adjusted operating margin rose to 6.5% from a negative 3.8% a year earlier.
Turning to our estimates, based on the company's guidance and recent results, we are reiterating our 2021 net sales estimate of $5.2 billion, implying growth of 14% from 2020. We are also reiterating our 2021 EPS estimate of $0.96, which is above guidance and implies growth of 78% this year. Our 2022 estimate remains $1.23.
FINANCIAL STRENGTH & DIVIDENDOur financial strength rating on Mattel remains Medium,
the midpoint on our five-point scale. The company had $385 million in cash and equivalents at the end of 2Q21, down from $462 million a year earlier. It also had $0.2 million in short-term borrowings from senior secured revolving credit facilities. At the end of 2Q21, inventories were $818 million, up $90 million, primarily due to cost inflation,
Long-term debt at the end of 2Q21 was $2.8 billion, consistent with the prior year. The debt/capital ratio was 84%, down from 110%, and the debt/adjusted EBITDA leverage ratio was 3.0, down from 4.0 at the end of 4Q20 and 8.4 at the end of 2Q20. Mattel expects to continue to use free cash flow to pay down its debt.
In 1Q21, Mattel benefited from credit rating upgrades from all three rating agencies and refinanced $1.2 billion of debt at attractive rates. In 3Q21, the company redeemed an additional $275 million in notes. As a result of these transactions, Mattel reduced its interest expense by $59 million per year. In March 2021, Fitch raised Mattel's rating to BB after raising it to B in November 2020.
The company suspended its dividend in October 2017. In the 2Q21 earnings call, management said that its priority is to obtain an investment grade debt rating. Once achieved, they will consider reinstating the dividend.
MANAGEMENT & RISKSIn April 2018, the company announced the resignation of
CEO Margo Georgiadis after only 14 months on the job. She has been succeeded by Ynon Kreiz, the former CEO of digital media provider Maker Studios, which was acquired by Disney in 2014. In July 2020, Mattel announced that Anthony DiSilvestro would replace Joe Euteneur as CFO. The change follows a 2019 whistleblower probe that revealed accounting weaknesses at Mattel. Mr. DiSilvestro joined Mattel in June from the Campbell Soup Company, where he served as CFO.
Mattel's success depends on its ability to stay ahead of trends in the toy industry, drive demand for its products through media ventures, and anticipate the changing tastes of children. This has become increasingly important as product lifecycles have shortened. If Mattel is able to stay ahead of new trends and drive demand for its products, its earnings and stock price should benefit; however, if it falls behind and fails to keep consumers engaged, it could see lower sales and earnings and corresponding declines in the stock price.
COMPANY DESCRIPTIONMattel Inc. is a designer and manufacturer of a wide range
of children's toys. Its most popular brands include Monster High, Barbie, Hot Wheels, Fisher-Price, and American Girl. Mattel also develops and markets toys based on popular movies, such as 'Cars,' 'Toy Story,' 'Batman' and 'Superman.' In 2019, Mattel began the Mattel Film franchise, which includes films, television, digital gaming, and live events, and has helped drive demand for its toys. Founded in 1945, the company is based in El Segundo, California and has approximately 28,000 employees.
VALUATIONAt current prices near $21, MAT shares are trading
toward the high end of their 52-week range of $10.54-$23.31. From a technical standpoint, prior to the pandemic, the shares had been in a bearish pattern since September 2016. They have risen strongly from their pandemic lows in March 2020, but remain 40% below their all-time high, and in our view continue to offer value. On a fundamental basis, the shares are trading at 22-times our 2021 EPS forecast and at 18-times our 2022 EPS forecast, compared to a five-year historical average range of 22-34. We are reiterating our BUY rating with a target price of $26, implying a potential gain of 21% from current levels.
On July 29, BUY-rated MAT closed at $21.50, down $0.04. (Kristina Ruggeri, 7/29/21)
McDonald`s Corp (MCD)Publication Date: 7/29/21Current Rating: BUY
HIGHLIGHTS*MCD: Maintaining BUY and raising target to $275*We expect McDonald's, with its strong digital, delivery
and drive-thru businesses, to endure a period of weak industry sales better than most other restaurant chains.
*On July 28, McDonald's posted 2Q21 adjusted earnings of $2.37 per share, up from $0.66 in the same period a year earlier and $0.26 above consensus.
*Overall same-store sales rose 40.5%, better than the consensus estimate calling for a 38.9% gain. We note that second-quarter same-store sales exceeded pre-pandemic levels.
*We are keeping our 2021 EPS estimate at $8.50 and raising our 2022 estimate to $9.70 from $9.10. Our long-term earnings growth rate forecast is 10%.
Section 2.132
GROWTH / VALUE STOCKS
ANALYSIS
INVESTMENT THESISWe are maintaining our BUY rating and raising our price
target to $275 from $260 on McDonald's Corp. (NYSE: MCD). We expect McDonald's, with its strong digital, delivery and drive-thru businesses, to endure a period of weak industry sales better than most other restaurant chains. During the current period of industry weakness, we prefer large restaurant chains like McDonald's that offer value menus, spend heavily on advertising, and have clean balance sheets.
Based on the company's ongoing turnaround efforts and prospects for post-pandemic recovery, our long-term rating remains BUY.
RECENT DEVELOPMENTSOn July 28, McDonald's posted 2Q21 adjusted earnings of
$2.37 per share, up from $0.66 in the same period a year earlier and $0.26 above consensus. Second-quarter revenue of $5.9 billion rose 57% from the prior year and came in $300 million above consensus. We note that second-quarter revenue exceeded pre-pandemic levels.
Overall same-store sales rose 40.5%, better than the consensus estimate calling for a 38.9% gain. We were impressed that U.S. same-store sales increased 25.9%, above the consensus estimate calling for a 24.1% increase. Same-store sales in the International Operated segment rose 75.1% and increased 32% in International Developed Markets. Consensus estimates had called for comps to increase 63.6% at the International Operated segment and rise 33.6% at the International Developed Markets segment. Operating income rose to $2.7 billion from $961 million a year earlier. The operating margin increased to 45.7% in 2Q21 from 25.5% in 2Q20 and was above the consensus estimate of 41.8%.
As discussed in a previous note, in 2020, revenue fell to $19.2 billion from $21.4 billion while EPS fell to $6.05 from $8.02. The share count decreased to 750 million from 765 million at the end of 2018.
During the conference call, management said that same-store sales were up sequentially in the U.S. Reflecting the positive impact of government stimulus checks, it expects same-store sales in the U.S. to increase at a high-single digit pace in January.
Management also said that it was encouraging loyalty-program customers to place more orders digitally and highlighted its success with kiosks. Since the start of the kiosk program in 2016, kiosks have been placed in 25% of stores, up from 11%-12% in 2017. MCD said that kiosk installations have resulted in additional sales without requiring significant additional labor. The company is also offering delivery at about 700 restaurants. The average delivery order is about
twice as large as the typical order, adding to restaurant revenue.
In January 2018, McDonald's sold the majority of its mainland China and Hong Kong businesses to a consortium led by government-backed CITC and Caryle, a private equity firm, for $2.1 billion. The new owners will operate as a McDonald's master franchise for the next 20 years. CITC will have a 52% stake; Caryle will have 28%, and McDonald's 20%.
EARNINGS & GROWTH ANALYSIS.
MCD has adjusted to an evolving consumer environment. While drive-thrus have provided about 70% of revenue for decades, simplified menus have enabled MCD to increase the number of orders it can process during the pandemic. Moreover, the company has invested in deliveries and mobile and ordering payment systems in recent years. Based on these factors, we are keeping our 2021 estimate at $8.50 and raising our 2022 estimate to $9.70 from $9.10. Our long-term earnings growth rate forecast is 10%.
FINANCIAL STRENGTH & DIVIDENDOur financial strength rating for McDonald's remains
Medium-High, the second-highest rank on our five-point scale. We are encouraged by the company's efforts to refranchise stores, as these locations require no capital expenditures. MCD did not include a balance sheet with its second-quarter earnings announcement. For 1Q21, cash and cash equivalents fell year-over-year to $3.0 billion from $5.4 billion. Excluding capitalized leases, long-term debt fell to $34.8 billion from $38 billion at the end of 1Q20. The shareholders' deficit fell to $7.3 billion at the end of 1Q21 from $9.3 billion at the end of 1Q20.
We think that McDonald's can continue to raise its dividend by reducing capital expenditures, suspending share repurchases, and raising additional capital, as it did in the first quarter. The current yield is about 2.1%. On October 7, 2020, management raised the quarterly dividend 3% to $1.29. The new dividend was paid on December 15, 2020 to shareholders of record as of December 1, 2020. Our dividend estimates are $5.20 for 2021 and $5.36 for 2022.
RISKSA key risk to our estimates and target price is the cost of
beef. We estimate that a 7%-9% increase in beef prices would reduce annual EPS by a penny. Since 65% of the company's revenue is generated outside the U.S., unfavorable foreign currency movements have a significant impact on earnings.
COMPANY DESCRIPTIONMcDonald's is the world's largest restaurant chain, with
more than 37,000 fast-food restaurants in 119 countries. The company is a member of the Dow Jones Industrial Average and the S&P 500. With a market capitalization of about $180
Section 2.133
GROWTH / VALUE STOCKSbillion, MCD is generally considered a large-cap growth stock.
VALUATIONMCD shares are trading at 28.4-times our 2021 EPS
estimate and at 24.9-times our new 2022 estimate. Based on our expectations for gains from restaurant refranchising, as well as benefits from delivery expansion, value menus and renovated restaurants, and the mobile order-and-pay system, we believe that a higher multiple is warranted. We also expect the company to recover from the impact of the coronavirus next year. Our revised target price of $275 implies a multiple of 28.4-times our revised 2022 estimate, and a potential total return, including the dividend, of 16% from current levels.
On July 28, BUY-rated MCD closed at $241.78, down $4.57. (John Staszak, CFA, 7/28/21)
Microsoft Corporation (MSFT)Publication Date: 7/30/21Current Rating: BUY
HIGHLIGHTS*MSFT: Strong June quarter; raising target price to $325*While Microsoft's recent results may suffer in
comparison to those of its big-tech brethren Alphabet, Apple, and Facebook, the company nonetheless posted 49% EPS growth on 21% revenue growth in fiscal 4Q21.
*Microsoft's revenue gains were again broad-based in 4Q, with Azure turning in another strong performance.
*We are raising our FY22 non-GAAP EPS estimate to $8.98 from $8.08 and establishing an FY23 forecast of $10.10.
*CEO Satya Nadella has pivoted Microsoft toward high-value commercial and cloud application businesses - just the right product set as enterprises accelerate their digital transformation.
ANALYSIS
INVESTMENT THESISWe are maintaining our BUY rating on Microsoft Corp.
(NGS: MSFT) and raising our target price to $325 from $300. We believe that Microsoft is well positioned to take advantage of increased enterprise IT spending as the pandemic recedes. Microsoft is one of the few companies with a product set aimed at enterprise efficiency, cloud transformation and collaboration, and has a large and loyal customer base. We should also mention Microsoft's large cash cushion and rock-solid balance sheet as important differentiators.
CEO Satya Nadella has pivoted Microsoft toward high-value commercial and cloud application businesses as the company has shaken off past missteps in the wireless phone handset market. The company is also riding the positive secular trends of growing IT spending, particularly with regard to hybrid cloud solutions. Microsoft has about doubled its market share to 17% in public cloud infrastructure over the last few years. It remains in the number-three position, behind Amazon Web Services and Alibaba but still well ahead of
other competitors. Management believes that the company has a number of competitive advantages in this area. It does not compete with the clients of Microsoft Azure, the company's cloud solution, in those clients' core businesses - in contrast to cloud rival Amazon. Microsoft also has an integrated software stack that addresses client needs across the enterprise IT landscape in both hybrid and cloud-native environments. Finally, Microsoft enables AWS clients to prevent vendor lock-in for critical cloud services.
Given Microsoft's massive commercial user base and long-term relationships, we believe that it is well positioned to grow commercial revenue as the process of enterprise digital transformation accelerates. Microsoft's Teams collaboration software is a natural product extension that the company can market to its huge installed base, again with a focus on cloud-based subscription and usage-based models. The pandemic has led to substantial changes in how people work, and these changes should continue to fuel robust growth in the Teams business. In the future, Mr. Nadella expects to leverage the company's Azure cloud platform and Intelligent Edge computing to power the Internet of Things (IoT), as this category begins a strong secular ramp. The company's large consumer business is growing more slowly, though profitability has improved.
In addition to returning Microsoft to its roots as a business productivity company, Mr. Nadella has opened up the company's culture to push open-source code solutions and a myriad of partnerships. These themes are exemplified by the acquisition of GitHub and the placement of MS Office on the iPad and iPhone. Along the same lines, the company has integrated the Microsoft voice virtual assistant Cortana with Amazon's Alexa and the Google Assistant.
MSFT shares have had a strong run and have been a haven for some investors during the pandemic. The company is equally well positioned to capitalize on the ramp-up in IT spending that comes with renewed economic growth.
Microsoft is also one of the few tech companies in our coverage group that pays a dividend that we consider safe.
RECENT DEVELOPMENTSMicrosoft reported results for fiscal 4Q21 (ended June
2021) after the market close on July 27. Revenue beat the consensus estimate by $1.9 billion and EPS topped the consensus by $0.25.
Fourth-quarter revenue rose a remarkable 21% year-over-year to $46.15 billion as the company rebounded from its pandemic trough in fiscal 4Q20. Positive currency effects added four percentage points, or $1.465 billion, to growth. Revenue growth was again broad-based, though the Intelligent Cloud and Productivity and Business Process divisions were particularly strong, with 30% and 25% growth,
Section 2.134
GROWTH / VALUE STOCKSrespectively, from 4Q20. Azure Cloud grew constant-currency revenue by 45%. Some might view this as evidence of a worrying deterioration from 46% growth in 3Q21 and 48% growth in 2Q21 - though it is also hard to argue with a 40%-plus increase in revenue. The More Personal Computing segment's 9% revenue growth benefited from Windows Commercial, Gaming and Search revenue, which offset weakness in the OEM and Surface business lines due to supply-chain constraints. Xbox hardware revenue rose 272% as sales of the new Xbox Series continued to ramp up. Windows OEM revenue declined 3% as Surface revenue declined 20% from the prior year. Microsoft's networking site LinkedIn also showed continued recovery from the pandemic, with overall revenue up 46% and ad revenue up 97% in 4Q21.
The consolidated gross margin was 70%, up 200 basis points. Operating income rose 42% to $19.1 billion (up 35% in constant currency). The operating margin expanded by six percentage points to 41%. Diluted EPS rose 49% to $2.17.
For FY21, revenue rose 17.5% to $168 billion, and non-GAAP diluted EPS rose 38% to $7.97.
In June, Microsoft announced that Windows 11, the refresh its PC operating system software, would be released in time for the 2021 holiday season (and the typical spike in PC sales around the holidays). While the move of the 'Start' button to the middle of the screen made headlines, many of the new features are directed at worker productivity, in line with CEO Nadella's goals. Windows 11 also includes videogame enhancements.
Updates to Windows 11 are intended to refresh the software for the mobile application age as well as for the new hybrid work-from-home environment. Windows 11 makes digital communications easier, deepening the integration of Microsoft Teams software to enhance collaboration. Windows 11 also introduces a new Microsoft app store - even including Google Android applications through integration with the Amazon app store. We note here that Microsoft is looking to attract application developers by proposing a 15% app-store developer fee, half of Apple's 30% fee. A Windows 11 upgrade will be available for free to Windows 10 users who have the necessary hardware.
On April 12, Microsoft agreed to acquire Nuance Communications for $56 per share in cash for an enterprise value of $19.7 billion. The acquisition price represents a 23% premium to the NUAN closing price on April 9, the last trading day before the deal announcement. Nuance provides 'conversational AI and cloud-based ambient clinical intelligence for healthcare providers.' Some might call these applications virtual assistants, or perhaps bots. Bots are automated software applications programmed to do certain repetitive tasks, often interfacing with humans and leveraging Nuance's pioneering work in natural language speech
recognition software. Nuance's systems are built on Microsoft's Azure cloud service, and the companies have had a strategic partnership since October 2019. Nuance has been focused on healthcare solutions, with a strong base in electronic health records, though it also has solutions for customer engagement and security that should appeal to enterprise clients outside of healthcare. We see a broadening of Nuance's industry verticals, as well as international expansion, as likely growth vectors given Microsoft's large global installed base and sales teams. Microsoft is already talking about integration with Microsoft Teams, Dynamics, and Microsoft 365.
The parties expect to complete the deal by the end of calendar 2021. Microsoft expects the Nuance acquisition to dilute EPS by less than 1% in FY22 (ending June 2022) and to become accretive in FY23 on a non-GAAP basis, excluding the impact of purchase accounting rules and transaction/integration expenses. Nuance reported non-GAAP EPS of $0.83 on $1.48 billion in revenue in FY20 (ended September 2020). Nuance will integrate with Microsoft's Intelligent Cloud segment for reporting purposes. While large, the Nuance acquisition is not as large as Microsoft's $26 billion acquisition of LinkedIn in 2016; however, it is much larger than the 2018 acquisition of GitHub or the recent acquisition of ZeniMax, each for about $7.5 billion. Microsoft maintains a very large cash balance. The deal will need to be approved by a majority of Nuance shareholders and undergo the usual regulatory reviews.
On March 31, the U.S. Army announced that it had awarded Microsoft 'a fixed price production agreement to manufacture the Integrated Visual Augmentation System (IVAS).' IVAS is a headset with a 'heads-up display' with integrated high-resolution, night, thermal, and soldier-borne sensors for use by combat personnel. While the Army announcement did not mention the amount of the new contract, subsequent reporting by CNBC indicated that the contract could be worth up to $21.9 billion over ten years, with Microsoft supplying 120,000 headsets. While IVAS will obviously be customized for the Army's needs, it is based on the HoloLens augmented-reality headset that Microsoft has been marketing to enterprises for frontline-worker applications since 2016. The new contract is important for Microsoft as it provides significant proof-of-concept for enterprise applications using the HoloLens platform. It also demonstrates that Microsoft has caught up to, or perhaps moved past, the competition in the emerging market for augmented-reality/virtual-reality (AR/VR) headsets or glasses. Facebook was the early leader in the space with its Oculus headset, though it has focused on VR for the consumer market. Other competitors, like Apple and Alphabet/Google, are likely looking to leverage their positions in mobile computing to extend into AR/VR.
On March 2, Microsoft identified a new hack of its Microsoft Mail server software. The cyber-attack allegedly
Section 2.135
GROWTH / VALUE STOCKSoriginated in China by a group dubbed Hafnium. The attack was particularly serious due to the ubiquitous use of Microsoft Mail by large and small businesses around the world. Microsoft quickly issued patches for the vulnerabilities exploited in the attack. While Microsoft is certainly the largest hacker target around, and has invested large sums in cybersecurity, the hack is a black eye for the company - especially as it comes soon after the SolarWinds hack in 2020.
EARNINGS & GROWTH ANALYSISWe are raising our FY22 non-GAAP EPS estimate to
$8.98 from $8.08 and establishing an FY23 forecast of $10.10. Our EPS estimates imply 12.5% growth over the next two years. Our long-term earnings growth rate forecast is 11%.
CEO Satya Nadella wants Microsoft to help businesses and consumers become more productive. His goal is for Microsoft to 'change the nature of work through digital technology.' This means putting Microsoft at the center of business process digital transformation, a strong secular growth area, through Microsoft products that improve productivity and security. Mr. Nadella thinks that COVID-19 has accelerated a new wave of business process transformation across industries, one that is critical to increasing both enterprise resilience and revenue growth. Given Microsoft's strong performance over the last few quarters, the company's clients may agree. Microsoft sees its Azure cloud as a competitive advantage for enterprise hybrid on-premise/cloud environments. Microsoft's new software-as-a-service (SaaS) products from Office 365 to Azure also enable the company to reach small and medium-sized business customers - though this market segment has probably suffered the most from the pandemic. Customers may initially come for Azure cloud computing power and storage, and then move on to the company's AI-powered 'intelligent edge' platforms. Mr. Nadella has refocused the company on investments in core commercial business productivity and platform development. We think that this has meant business systems like the company's Azure cloud service, Dynamics 365, SQL Server, Office 365, and new products like its Teams collaborative software. Meanwhile, traditional stalwarts like Windows have faded and essentially been downgraded.
On March 9, Microsoft completed the acquisition of ZeniMax Media, the parent company of videogame publisher Bethesda Softworks, for $7.5 billion in cash. Bethesda Softworks publishes a portfolio of videogames, including the popular titles 'DOOM,' 'Fallout,' 'The Elder Scrolls,' and 'Wolfenstein.' Through the acquisition, Microsoft will add Bethesda's games to the Xbox Game Pass, its videogame cloud streaming subscription service, and will boost the number of videogame studios that it oversees from 15 to 23. Xbox Game Pass already had 18 million subscribers at the end of 2Q21. Microsoft expects the acquisition to have a minimal impact on non-GAAP operating income in FY21 and FY22. As an aside, this $7.5 billion acquisition barely puts a dent in Microsoft's
extremely large cash and short-term investment balance.
We think it's no accident that Microsoft is using the ZeniMax acquisition to increase the value of its videogame content and Xbox Game Pass with the launch of its next-generation videogame consoles, the Xbox Series X and cheaper Series S, on November 11, 2020. With the console refresh, Microsoft has also begun to offer 24-month subscription installment plans of $34.99 for the Series X and $24.99 for the Series S, both including a Game Pass Ultimate (premium level) subscription. Given that the retail upfront costs are expected to be $499 for the Series X and $299 for the Series S, the two-year subscription offers a discount of $19 on the Series X and $59 on the Series S. Microsoft is thereby providing two incentives for players to take the subscription, both by avoiding the large upfront cost for a new console and by providing a discount over the term of the subscription. We see this as a shrewd strategic shift for Microsoft as it looks to build a more valuable long-term subscriber base, with recurring revenues, rather than opt for the one-time transactional revenue from console sales. As prices for videogames continue to rise, with new games moving to $70 (a $10 premium over the previous price point), players may find a subscription even more appealing. Add to this the increased value brought by the ZeniMax acquisition, and Microsoft may be in a good position to win share.
FINANCIAL STRENGTH & DIVIDENDOur financial strength rating on Microsoft is High, the top
of our five-point scale. Total debt stood at $58 billion at the end of fiscal FY21, of which $8 billion was current. Microsoft's debt is dwarfed by an extremely large cash and short-term investment balance of $130.3 billion. Trailing 12-month free cash flow rose 24% to $56.2 billion in FY21. Microsoft is triple A-rated by the credit agencies and outlooks are stable.
Microsoft's quarterly dividend is $0.56 per share or $2.24 annually, for a yield of about 0.8%. Our FY22 dividend estimate is $2.41 and our FY23 forecast is $2.65. Over the past five years, the dividend has grown at a compound annual rate of 10%.
Microsoft repurchased $27.4 billion of its stock in the FY21, accelerating its recent pace. The company bought back $23 billion of its stock in FY20, $19.5 billion in FY19, $10.7 billion in FY18, $11.8 billion in FY17, and $16.0 billion in FY16.
RISKSAlthough Microsoft has moved past the initial risk to its
supply chain from the pandemic as hardware component assembly plants in China quickly reopened after the 2020 shutdown, a new risk has emerged with the much publicized microchip shortage. Microchips are a critical component of Microsoft's many different commercial and consumer
Section 2.136
GROWTH / VALUE STOCKSproducts, and as 4Q amply demonstrated, supply shortages can dampen sales of both Microsoft's own hardware products (like the Surface tablet) and the PC's of other manufacturers that use Microsoft's Windows operating system. However, Microsoft remains a key strategic partner to many chip manufacturers and device OEMs. Microsoft remains exposed to macroeconomic risk and the risk that enterprises could cut back on technology spending in response to economic weakness. The company's Bing search engine and LinkedIn professional networking website have much wider exposure to volatility in advertising spending due to macroeconomic factors. For now, advertising spending appears to be rebounding from its pandemic lows.
Investors in Microsoft face potential losses if the company's operating performance falls short of expectations. For example, Microsoft took a $7.5 billion write-off for Nokia Devices and Services (NDS), writing down 80% of the purchase price in a little more than a year following the acquisition. The company has also taken additional large write-offs, most recently the $450 million charge related to the closure of its retail store locations. Other risks include the migration of consumers away from the PC to mobile devices that do not use a Microsoft-based operating system (e.g. Apple's iPad); the potential for a prolonged downturn in global software investment spending; the well-publicized security vulnerabilities in the company's products; the possible adoption of Linux, and/or other open-source software applications; increased competition in the internet space; and legal risks. Also, piracy of the company's software in developing markets like China and India is an ongoing problem and presents the company with huge missed revenue opportunities. Another risk is management's ability to execute its business plan and deliver new products on schedule.
When Microsoft pulled out of the mobile smartphone market, the company gave up on a critically important vector of future growth that underpins the success of other tech titans Apple (iOS) and Google (Android). Microsoft has tiptoed back into phone hardware with a handset that runs on Android. Microsoft could one day find itself and its application ecosystem at the mercy of competitors who control mobile systems and devices. While not in the context of Microsoft, Apple has demonstrated the power it wields over application vendors with its recent iOS 14 update.
While Microsoft may be the third-largest public cloud provider, its market share is dwarfed by industry leader Amazon Web Services. Amazon has achieved a scale which could make it difficult for Microsoft to reap a sustainable profit from its cloud services business.
In the case of the Xbox 360, highly aggressive pricing from both Sony and Nintendo may hamper Microsoft's efforts to generate acceptable long-term profits in this area.
The company also faces intense direct competition from Google in many areas, including internet search, operating system software, and internet-based software applications. This competition could potentially erode the dominance of Microsoft's core operating system and Office applications. Google has established itself as the dominant online search player, and has leveraged its position to move into direct competition with Microsoft with its Chrome internet browser and operating system software. Microsoft has struck back through an alliance between its internet search engine Bing and Yahoo.
COMPANY DESCRIPTIONMicrosoft is the world's largest independent software
developer. The company was founded on the MS Windows operating system and MS Office business applications suite for PCs. As it has grown, Microsoft has expanded into enterprise software with Windows Server, SQL Server, Dynamics CRM, SharePoint, Azure and Lync; hardware with the Xbox gaming/media platform and the Surface tablet; and online services through MSN and Bing. Microsoft acquired Skype, the internet VoIP communications service, in October 2011. The company acquired Nokia's Devices and Services Business in April 2014. More than 50% of revenue is generated outside the U.S.
VALUATIONMicrosoft shares have risen 29.4% in the last year on a
total-return basis, compared to an 18.7% increase for the S&P 500, an 18.4% gain for the S&P Information Technology Index, and a 14.6% gain for the iShares Expanded Tech-Software Sector ETF (IGV). With a trailing enterprise value/EBITDA multiple of 25.7, MSFT trades above the peer median of 24 and the high end of its five-year historical average range of 15.7-18.4. Microsoft's forward enterprise value/EBITDA multiple of 22.2 is 9% above the peer average, greater than the average premium of 4% over the past two years. We are reaffirming our BUY rating on Microsoft to a target price $325.
On July 30 at midday, BUY-rated MSFT traded at $284.88, down $1.62. (Joseph Bonner, CFA, 7/30/21)
Moody`s Corp. (MCO)Publication Date: 8/3/21Current Rating: BUY
HIGHLIGHTS*MCO: Raising target price*MCO shares have outperformed the market over the past
quarter, gaining 16% while the S&P 500 has risen 5%.*The company recently reported 2Q results that topped
consensus forecasts, and we are raising our estimates for the next two years.
*Management has boosted the dividend 11%, signaling confidence in its outlook, despite rising interest rates.
*From a technical standpoint, the shares have been in a bullish pattern of higher highs and higher lows since December
Section 2.137
GROWTH / VALUE STOCKS2018.
ANALYSIS
INVESTMENT THESISOur rating on Moody's Corp. (NYSE: MCO) is BUY.
Moody's is a large-cap financial services company focusing on credit ratings and risk management and analytics. The company has an impressive track record, with historical compound annual growth rates for sales and EPS in the low double-digit range. We expect Moody's to benefit over the long run from the secular trends of global GDP growth and debt market disintermediation. Management also has opportunities to develop new products and raise margins, and to expand through targeted acquisitions. Management recently navigated through a legal issue involving the company's performance during the financial crisis. The company now faces COVID-19-related risks related to defaults in the corporate bond market and uneven conditions in corporate debt issuance as interest rates rise. However, we think that management will be able to navigate through these challenges as well. The MCO share price has risen steadily over the past five years, as have earnings. We still see value in the shares, which are trading well below our dividend discount model fair value target. Blending our valuation approaches, we arrive at our target price of $420, up from $375.
RECENT DEVELOPMENTSMCO shares have outperformed the market over the past
quarter, gaining 16% while the S&P 500 has risen 5%. They have performed in line over the past year, rising 3%. The shares have outpaced the market over the past 5- and 10-year periods. The beta on MCO is 1.17.
Moody's recently reported 2Q adjusted EPS that rose 15% year-over-year and topped analyst expectations. The results were reported on July 28. Revenue in 2Q rose 8% year-over-year to $1.6 billion. Adjusted operating income (before depreciation, amortization, and acquisition-related expenses) increased 12%, as the adjusted operating margin widened by 200 basis points to 55.4%. Adjusted EPS came to $3.22, above the consensus forecast of $2.74. For the first half, the company has earned $7.28 per share on an adjusted basis.
Along with the 2Q report, management once again raised guidance for 2021. It expects mid-single-digit revenue growth and adjusted EPS of $11.55-$11.85, up from its prior outlook of adjusted EPS of $11.00-$11.30.
EARNINGS & GROWTH ANALYSISMoody's Corp. has two operating segments: Moody's
Investor Service (MIS) and Moody's Analytics (MA). MIS, which publishes credit ratings on debt obligations, accounted for 61% of 2Q21 revenue. MA provides research and financial risk management for institutions; it accounted for 39% of 2Q revenue. Recent trends and outlooks are discussed below.
In the latest quarter, MIS revenue was up 2% year-over-year on an organic basis. Corporate finance revenue declined 4% from the prior-year period, due to a drop in global investment grade activity as compared to a historically strong second quarter in 2020. Financial institution revenue rose 6% as EMEA banks continued to solidify their capital bases. Public, project and infrastructure finance revenue was down 2% from the prior-year period due to a reduction in supply. Structured finance revenue rose 73% as spreads tightened for CLO and CMBS issuance. Looking ahead, an improving default outlook (the forecast global default rate in 2021 is 3.2%, down from 6% in 2020 and below the historical average of 4.2%) and tight spreads create a supportive environment for issuance.
MA revenue rose 13% on an organic basis. Segment revenue was once again driven by the research, data & analytics business (RDA), with 16% pro forma growth that reflected demand for compliance solutions and ratings data feeds. Enterprise risk solutions revenue rose 3%.
Moving to margins, we note that the 2Q21 adjusted operating margin was 55.4%, above management's target of 49%-50%. Ongoing cost efficiency initiatives held expenses approximately flat.
Turning to our estimates, based on trends and forecasts for issuance and in analysis, we are raising our 2021 adjusted EPS forecast to $11.85 from $11.30. Our estimate is at the high end of management's guidance range and implies year-over-year growth of 17%. We look for growth to continue in 2022 and are raising our preliminary adjusted EPS forecast from $12.45 to $13.05. Our long-term earnings growth rate forecast remains 10%.
FINANCIAL STRENGTH & DIVIDENDWe rate the financial strength of Moody's as Medium, the
midpoint on our five-point scale. The company scores above-average on key tests such as fixed-cost coverage and profitability, but debt levels are on the high side.
Cash and cash equivalents totaled $2.8 billion at the end of 2Q21. Debt totaled $6.4 billion, and accounted for a high 74% of total capitalization. Cash flow covered net interest expense by a factor of 13 in 2020. The 2020 adjusted operating margin was a robust 49.7%.
Moody's pays a dividend. In February 2021, the company raised the payout by 11%. The current quarterly dividend is now $0.62 per share, or $2.48 annually, for a yield of about 0.7%. We think the dividend is secure and likely to grow. Our dividend estimates are $2.48 for 2021 and $2.74 for 2022.
The company also has a share repurchase program.
MANAGEMENT & RISKS
Section 2.138
GROWTH / VALUE STOCKSMoody's is going through a management transition. The
longtime CEO of Moody's, Raymond McDaniel, has retired and is now non-executive chairman of the company. Robert Scott Fauber, the former COO, is the new CEO. The company recently appointed a new CFO, Mark Kaye. Mr. Kaye joined Moody's from Massachusetts Mutual Life Insurance Company, where he served as senior vice president and head of Financial Planning and Analysis, as well as chief financial officer of MassMutual U.S.
Moody's is positioned to benefit from long-term secular trends such as global GDP growth and the disintermediation of credit markets in developed and emerging economies. The company continues to pursue targeted acquisitions and sees the opportunity for operating margin expansion. Share buybacks are also expected to boost EPS. Management's goals are revenue growth in the high single-digit range and EPS growth in the mid-teens range.
Investors in Moody's face numerous risks. The ratings industry may be affected by a slowing economy or by rising interest rates, both of which could reduce demand for corporate debt and ratings. The industry is also competitive.
As a global company, Moody's also faces currency risk. A stable or lower dollar would be a positive development for companies such as Moody's.
The company continues to face regulatory risks. On January 13, 2017, it reached a settlement with the U.S. Department of Justice, 21 U.S. states and the District of Columbia that resolved pending and potential civil claims related to credit ratings that Moody's assigned to certain structured finance instruments. Moody's agreed to pay a total of $864 million; the agreement did not state that the company had violated the law. The episode was reminiscent of the $1.375 billion settlement that S&P reached with the government in 2015. The company's 2017 settlement has strained the balance sheet.
The company is also subject to regulatory oversight in Europe.
COMPANY DESCRIPTIONA large-cap financial services company, Moody's provides
credit ratings on 11,000 corporate issuers and 18,000 public finance issuers in 120 countries. Its analytics division provides clients with financial analysis and risk management services. The stock is a component of the S&P 500. The company has 11,500 employees.
VALUATIONWe think that MCO shares are attractively valued at
current prices near $379. The shares have traded between $253 and $384 over the past 52 weeks and are currently near the high end of the range. From a technical standpoint, the shares
have been in a bullish pattern of higher highs and higher lows since December 2018.
Looking ahead, we expect solid earnings growth, multiple expansion and a higher share price as the company continues to refine its business model. We have examined a group of the company's publicly traded peers, including Morningstar, IHS Markit, FactSet Research Systems, and S&P Global, among others. These companies trade at an average of 32-times projected 2021 EPS, with a range of 25-45. Moody's trades at a P/E of 29-times our 2022 EPS estimate, below the industry average. On price/sales, the stock is trading at a multiple of 12, at the high end of the peer group range of 6-12. However, we believe this is warranted given the company's record of high profitability and consistent growth. Our dividend discount model renders a fair value of around $450 per share. Blending our approaches, we arrive at our new target price of $420.
On August 3 at midday, BUY-rated MCO traded at $376.65, down $2.57. (John Eade, 8/3/21)
New Residential Invt Cor (NRZ)Publication Date: 8/2/21Current Rating: BUY
HIGHLIGHTS*NRZ: Reiterating target price of $12 *New Residential has transformed its business model
since the financing crisis in late March 2020. It continues to grow its mortgage origination and servicing business, while also taking advantage of strategic investment opportunities.
*On July 29, NRZ reported 2Q GAAP earnings of $121 million or $0.26 per share and core earnings of $147 million or $0.31 per share. Core earnings were in line with the consensus forecast and down from $0.34 per share a year earlier.
*On April 14, the company announced the acquisition of Caliber Home Loans for $1.675 billion (1.0-times book value) in an all-cash deal.
*With the stock trading at 87% of book value and the 8.1% dividend yield, we believe that a BUY rating remains appropriate.
ANALYSIS
INVESTMENT THESISWe are maintaining our BUY rating and target price of
$12 on New Residential Investment Corp. (NYSE: NRZ). The company has transformed its business model since the financing crisis in late March 2020. It continues to grow its mortgage origination and servicing business while also taking advantage of strategic investment opportunities. In 2Q21, NRZ announced the acquisition of Caliber Home Loans. The acquisition will make NRZ the third-largest nonbank mortgage lender.
New Residential, which invests in and manages residential mortgage-related assets in the United States, had relied heavily on the repo market to fund its investment portfolio. However,
Section 2.139
GROWTH / VALUE STOCKSduring the second quarter, it continued to reduce its reliance on this short-term funding, as 100% of the residential loan book and approximately 90% of the nonagency book are no longer subject to daily mark-to-market pricing. With the stock trading at 87% of book value and the 8.1% dividend yield, we believe that a BUY rating remains appropriate.
RECENT DEVELOPMENTSNRZ shares have underperformed the broad market over
the past year, rising 20% compared to gains of 36% for the S&P 500. The beta is 1.91. NRZ comprises 5.5% of the iShares Mortgage Real Estate Capped ETF REM.
On July 29, NRZ reported 2Q GAAP earnings of $121 million or $0.26 per share and core earnings of $147 million or $0.31 per share. Core earnings were in line with the consensus forecast and down from $0.34 per share a year earlier.
On April 14, the company announced the acquisition of Caliber Home Loans for $1.675 billion (1.0-times book value) in an all-cash deal. The purchase will be funded with cash on hand and proceeds from the company's recent secondary stock offering. The deal is expected to close in 3Q21. The combined company will add $159 billion in mortgage servicing rights (MSRs) to NRZ's $306 billion MSR portfolio, expand mortgage production, and improve mortgage recapture efforts.
The company is also expanding into the single family rental market. It currently has a $300 million portfolio consisting of 1400 units, but expects to expand this to $5 billion over time.
On June 17, NRZ declared a 1Q21 dividend of $0.20 per share. In February, the board authorized the repurchase of up to $200 million of NRZ stock through December 31, 2021. The company also declared dividends on its three preferred issues: Series A (7.5%), Series B (7.125%), and Series C (6.375%). In 4Q20, the board authorized the repurchase of up to $100 million of preferred stock through December 31, 2021. We note that CEO Michael Nierenberg purchased $1.0 million of NRZ stock at an average price of $10.10 per share in 1Q21.
EARNINGS & GROWTH ANALYSISNew Residential invests in and manages residential
mortgage-related assets in the U.S. The company has two segments: Operating Business, consisting of mortgage originations and servicing, and the Investment Portfolio, encompassing mortgage servicing rights (MSRs), servicer advances, and residential loans and securities.
In the Operating Business, mortgage originations of $23.5 billion contributed $75 million to 2Q revenue, down 61% from 1Q21, reflecting higher mortgage rates and a lower gain-on-sale margin. The servicing portfolio was flat sequentially at $305 billion. These two businesses offset each
other with regard to income and value. As mortgage refinancings ease, originations decline while mortgage servicing rights generate higher income and increase in value.
The company's investment portfolio is uniquely positioned in that it controls a number of MSRs and nonagency securities that cannot be replicated. It also owns a number of legacy precrisis securities and call rights that cannot be duplicated. The portfolio generates additional yield via the repo funding market, where the securities may be leveraged. We note that 99% of the portfolio no longer has daily mark-to-market exposure, as extended funding terms have reduced volatility. The $29.2 billion portfolio consists mainly of agency securities and MSR-related investments along with smaller amounts of originations, nonagency securities, residential loans and consumer loans. Overall leverage was unchanged at 3.5-times in 2Q and leverage excluding agency securities was unchanged at 1.1-times.
In addition, NRZ controls the call rights to $80 billion, or approximately one-third, of the nonagency market, of which $47 billion is currently callable. This is where earnings can be a bit lumpy. NRZ can call the deals for which it owns the rights, and then turn around and securitize the called assets. The decision to call a deal and the timing of the call depend on market demand and deal economics. In 2Q, the company called 26 deals with collateral totaling $666 million.
NRZ has recently made a number of acquisitions and entered into partnerships with companies that provide services to the mortgage market. NewRez is the company's mortgage originator. Shellpoint, a mortgage servicer, was acquired in 2018. Others investments were made to capture the entire mortgage relationship with customers, and should help to diversify revenue in different interest rate environments.
Based on the recent secondary offering, we are lowering our 2021 core EPS estimate to $1.42 from $1.52. At the same time, we are raising our 2022 estimate to $1.71 from $1.64 based on expected contributions from the Caliber acquisition. Our five-year earnings growth rate forecast is 7%.
FINANCIAL STRENGTH & DIVIDENDOur financial strength rating on NRZ is Medium-High.
The company scores well above average on our three main measures of financial strength: leverage based on debt/cap, profitability, and interest coverage. The company has reduced investment portfolio leverage to 3.5-times from 4.3-times prior to the pandemic. Excluding agency securities, the leverage ratio drops to 1.1. At June 30, NRZ had cash of $956 million, net equity of $6.1 billion, and a book value of $11.27 per common share.
In 4Q20, the company raised its quarterly dividend to $0.20 per share. The annualized payout of $0.80 yields about 8.1%. We are maintaining our dividend estimates of $0.80 for
Section 2.140
GROWTH / VALUE STOCKS2021 and $1.20 for 2022.
MANAGEMENT & RISKSNew Residential was spun out from Newcastle in May
2013. The company is managed by an affiliate of Fortress Investment Group LLC, an investment management firm headquartered in New York. Michael Nierenberg serves as chairman, CEO and president. Mr. Nierenberg was previously the head of Global Mortgages and Securitized Products at Bank of America Merrill Lynch. Nick Santoro is the CFO.
Investors in NRZ shares face numerous risks. On a macro level, the company is heavily dependent on a stable housing market. Investments in MSRs are very interest rate-sensitive, especially in a declining rate environment. As mortgage prepayments increase, the value of MSRs fall. Liquidity risks are also significant as NRZ must be able to fund its securities through repurchase agreements and complete asset securitizations. Credit risks exist in the nonagency portion of the portfolio. If default rates rise, they could negatively impact the portfolio. The company also faces regulatory risks at both the national and state level.
COMPANY DESCRIPTIONNew Residential Investment Corp. is a publicly traded
REIT focused on residential housing. The company's investment portfolio consists of servicing assets, residential securities and loans, nonagency securitization call rights, and consumer loans. Operating business include mortgage lending, servicing, appraisal, title insurance, diversified mortgage services, insurance, and property management.
VALUATIONWe continue to have a favorable view of the company's
experienced management team and business diversification, and expect it to take advantage of new investment opportunities such as the recent acquisition of Caliber Home Loans. NRZ continues to focus on mortgages backed by government agencies, with less reliance on repo funding. Demand for nonagency mortgage products has returned to pre-pandemic levels, and we expect NRZ to take advantage of this trend with further securitizations and call activity. With the stock trading at 87% of book value and the 8.1% dividend yield, we believe that a BUY rating remains appropriate. Our target price is $12.
On July 30, BUY-rated NRZ closed at $9.76, down $0.11. (Kevin Heal, 7/30/21)
Norfolk Southern Corp. (NSC)Publication Date: 8/3/21Current Rating: BUY
HIGHLIGHTS*NSC: Recent weakness offers buying opportunity*NSC shares have underperformed the market over the
past quarter, falling 8%, while the S&P 500 has risen 5%.*We like NSC on a macro basis: the rail industry has been
on a secular growth path compared to other transport options - i.e., water, pipelines, trucks - for the past 20 years.
*On a micro basis, we like this well-managed company's history of paying and raising the dividend - including a 10% hike last month.
*In terms of valuation, using our upwardly revised EPS estimates and blending our approaches, we arrive at a revised target price of $310.
ANALYSIS
INVESTMENT THESISOur rating on Norfolk Southern Corp. (NYSE: NSC) is
BUY. NSC is among the largest operators in the rail industry, which has been on a secular growth path compared to other transport options - i.e., water, pipelines, trucks - for the past 20 years. The coronavirus disrupted rail activity, but volumes have picked up in recent quarters and margins are again rising. On the other side of the crisis, the domestic supply chain will be more important than ever, and NSC is a critical link. A potential Biden infrastructure spending plan is an additional plus. The balance sheet is clean, and management recently boosted the dividend 10%, signaling confidence in the outlook. In terms of valuation, using our upwardly revised EPS estimates and blending our approaches, we arrive at our target price of $310.
RECENT DEVELOPMENTSNSC shares have underperformed the market over the past
quarter, falling 8%, while the S&P 500 has risen 5%. Over the past year, the shares have performed in line with the market, gaining 33%. The shares have underperformed the Industrial sector ETF IYJ over the past year but outperformed the past five years. The beta on NSC is 1.29.
The company reported 2Q EPS that rose 114% year-over-year and topped analyst expectations. On July 28, Norfolk Southern reported that total railway-operating revenues increased 34% from the prior-year period to $2.8 billion. Total volume was up 25% year-over-year. Income from railway operations was an all-time quarterly record, rising 91%. The railway-operating ratio (expenses divided by revenue) was 58.3%. EPS came to $3.28, and topped the consensus forecast of $2.94. For the first half of the year, the company has earned $5.94 per share.
For 2021, the company now expects 12% year-over-year sales growth, with further improvement in the operating ratio, which was 64.4% in 2020. The company's strategic plan, begun last year, calls for a reduction in the operating ratio to 60% by 2021. The plan draws on the popular 'precision scheduled railroading' program that was created by the late CSX CEO Hunter Harrison. The program focuses on productivity gains that come from streamlining operations and fully leveraging assets, including cars, train crews and yards.
EARNINGS & GROWTH ANALYSIS
Section 2.141
GROWTH / VALUE STOCKSNorfolk Southern has three main operating segments:
General Merchandise, which accounted for 60% of 2Q sales; Coal, 11%; and Intermodal, 29%. Recent results and outlooks for each segment are provided below.
In the Merchandise segment, sales rose 29%, reflecting higher shipments in the Automotive and Metals and Construction categories. The recovery in the merchandise segment is driven primarily by recovery from COVID-19 related shutdowns in the prior period. Looking ahead, we expect favorable conditions to continue in 2021, led by automotive (once the semiconductor supply issue is resolved), steel and energy.
In the Intermodal segment, revenue rose 41%. Volume was up 20%. The segment has faced challenging industry conditions in recent quarters, but volume is expected to recover further in 2021 as businesses replenish inventories and truck capacity is currently tight.
Coal segment revenue was up 52% from the same period a year earlier, based on a 552% increase in volume and a 1% decline in pricing. Looking ahead, we expect segment volume to rebound for the next two-to-three quarters to support global energy demand and steel production, before the challenge of low natural gas prices returns.
The operating ratio (expenses/revenues) is widely used by railroad investors to assess efficiency; a lower operating ratio signals rising margins and is positive. Norfolk Southern had lowered its ratio for 17 consecutive quarters, but the trend reversed due to the pandemic in 2Q20. Management got back on track in 3Q20, and the operating ratio in 2Q21 to 58.3%. During the second quarter, railway-operating costs declined for compensation and benefits, purchased services, materials, and fuel. Management continues to focus on lowering its annual operating ratio to 60%.
Turning to our estimates, based on the latest volume trends, as well as management's focus on costs and our expectations for strong GDP growth in 2021, we are raising our 2021 EPS forecast from $11.50 to $11.90. Our estimate implies growth of 29% for the year. We expect growth to continue in 2022 and are raising our preliminary EPS forecast to $13.30 from $13.20. Our long-term earnings growth rate forecast is 10%.
FINANCIAL STRENGTH & DIVIDENDOur financial strength rating for NSC is Medium-High,
the second-highest rank on our five-point scale. The company receives above-average scores on our main financial strength criteria of debt levels, fixed-cost coverage, cash flow generation, earnings quality and profitability.
The company had $1.7 billion in cash and short-term investments at the end of the latest quarter. Total debt of $13.7
billion resulted in a debt/total capitalization ratio of 49%. EBITDA covered interest expense by a factor of 6 in 2020. Norfolk Southern's long-term debt is rated Baa1 by Moody's, with a stable outlook.
NSC has a stock buyback program.
The company pays a dividend. In July 2021, management announced a 10% increase in its annualized payout to $4.36 per share, for a projected yield of about 1.5%. We think the dividend is secure and expect it to grow. Our dividend estimates are $4.16 for 2021 and $4.60 for 2022.
MANAGEMENT & RISKSThe chairman and CEO of Norfolk Southern is James A.
Squires. Mr. Squires joined NSC in 1992 and most recently served as its president. Mark George was appointed CFO on November 1, 2019; he has 30 years of experience in financial management.
Management announced a plan in early 2019 with the goal of streamlining operations and driving growth. Through the plan, management expects to bring its operating ratio below 60%. The plan includes steps such as reducing the headcount by 3,000 employees; reducing the active locomotive fleet size by 500 units; increasing the average train weight; cutting car dwell; boosting train speed; and maximizing fuel efficiency.
The plan goes beyond cost cuts, though, as management anticipates revenue growth from both pricing and volume increases. Management's goal is 5% annual top-line growth, fueled by increases in consumer spending, e-commerce growth, and manufacturing.
Investors in NSC shares face risks. On an industry level, railroads appear poised for a period of consolidation, and pricing dynamics may change, as Canadian National (CNIP HOLD) finalizes a merger with Kansas City Southern.
Rail carriers are also highly sensitive to the macroeconomic environment, and are subject to risk from fluctuating fuel prices, fuel hedges, bad weather, strikes and other labor actions, and government regulation.
NSC also faces risks related to government regulation, and may incur extraordinary costs related to positive train control systems, the transportation of flammable liquids, and braking standards.
We note that NSC has a relatively high exposure to coal shipments among the railroads in Argus coverage. The company's operating margins are also on the low side, which could make the stock a target for activist investors.
COMPANY DESCRIPTIONNorfolk Southern Corp., through its Norfolk Southern
Section 2.142
GROWTH / VALUE STOCKSRailway Company, operates approximately 19,500 route miles in 22 eastern states and the District of Columbia. The railroad serves all major eastern ports and connects with rail partners in the western U.S. and Canada. Norfolk Southern also has an extensive intermodal network in the eastern U.S. The stock is a component of the S&P 500. The company has approximately 19,000 employees.
VALUATIONWe believe that NSC shares are attractively valued at
current prices near $259, above the midpoint of their 52 week range of $189-$295. From a technical standpoint, since the pandemic selloff in March 2020, the NSC shares have been in a bullish pattern of higher highs and higher lows, though that pattern has turned somewhat neutral in recent weeks.
To value the stock on a fundamental basis, we use peer and historical multiple comparisons, as well as a dividend discount model. NSC shares are trading at 19-times projected 2022 earnings, near the high end of the historical range of 12-21. On price/sales, they are trading at the midpoint of the five-year range. The dividend yield of 1.5% is below the historical average. Compared to the peer group, NSC's multiples are mixed, but generally on the low side. Our dividend discount model points to value above $320. We are maintaining our BUY rating on this well-managed company and our target price of $310.
On August 3 at midday, BUY-rated NSC traded at $259.59, up $3.43. (John Eade, 8/3/21)
Northrop Grumman Corp. (NOC)Publication Date: 7/30/21Current Rating: BUY
HIGHLIGHTS*NOC: Growth and income opportunity*NOC shares have outperformed the market over the past
quarter, rising 9% while the S&P 500 has risen 5%.*The company recently reported 2Q21 EPS that topped
expectations, and management once again raised guidance.*The NOC board also recently raised the dividend 8%,
signaling confidence in the outlook.*Valuations are attractive; the current P/E ratio is at the
low end of the historical range.
ANALYSIS
INVESTMENT THESISBUY-rated Northrop Grumman (NYSE: NOC) is a
leading company in one of the U.S. economy's core competency industries: Aerospace & Defense. The company has consistently delivered positive surprises to the Street in recent years, regardless of whether defense spending is rising or falling, or a Republican or a Democrat occupies the White House. Lately, government spending on certain segments of Defense has picked up - a trend we think is likely to continue. We also have a favorable view of the company's focus on
international revenue diversification (now more than 15% of sales), and expect ongoing geopolitical tension to benefit sales and earnings going forward. The shares face headline risk, particularly as the White House and Congress turn Democratic. The company is mindful of shareholder returns and has consistently raised the dividend at an accelerated rate. NOC's multiples are now slightly below industry averages and we think the stock merits a premium valuation. On a technical basis, after forming a double-bottom in January 2021, the shares have been in a bullish pattern of higher highs and higher lows. Our target price is $410. We view the shares as a suitable core holding in a diversified portfolio.
RECENT DEVELOPMENTSNOC shares have outperformed the market over the past
quarter, rising 9% while the S&P 500 has risen 5%. Over the past year, however, the shares have underperformed, gaining 17% while the S&P 500 has advanced 37%. The shares have underperformed the Industrial sector ETF IYJ over the past year, and have now underperformed the sector and the broad market over the past five years. The beta on NOC is 0.83.
The company recently posted 2Q21 EPS that increased 7% year-over-year and topped Street expectations. On July 29, Northrop reported that 2Q revenue increased 10% to $9.2 billion. Segment operating income rose 8%, as the segment operating margin widened by 60 basis points to 12.2%. Adjusted EPS came to $6.42, ahead of the consensus forecast of $5.83. For the first half, the company has earned $13.00 per share.
Along with the 2Q results, management once again raised guidance for 2021. The company expects adjusted EPS of $24.40-$24.80, up from its prior outlook of $24.00-$24.50; and a sales guidance increase to $35.8-$36.2 billion.
Second-quarter 2021 net awards totaled $6.5 billion and the backlog was $76.6 billion. Significant quarter new awards included $1.7 billion for restricted programs, $0.4 billion for F-35 and $0.3 billion for E-2 early warning aircraft.
EARNINGS & GROWTH ANALYSISNorthrop Grumman now has four reporting segments:
Aeronautics Systems (32% of sales), which includes military aircraft and space systems; Mission Systems (28%), such as control rooms and cyber solutions; Defense Systems (15%), such as logistics, systems security and fraud detection; and Space Systems (29%), which includes the former Orbital ATK space and munition operations, which Northrop Grumman acquired in 2018.
Segment revenue trends were mixed in 2Q. The Aeronautics Systems division was flat year-over-year on a pro forma basis, due to higher restricted and E-2 production volume that was offset by a reduction in A350 production activity. The Defense Systems division's revenue rose 3%
Section 2.143
GROWTH / VALUE STOCKSorganically on higher volume for the Guided Missile Launch Rocket System program. Mission Systems revenue rose 6% due to higher sales in Airborne Sensors and Maritime/Land Systems and Sensors. Space Systems revenue rose 349%, due to higher sales in both Space and Launch & Strategic Missiles.
On the expense side, the segment operating margin was 12.2% in 2Q21. Margins increased in all segments except for Aeronautics. For 2021, we look for margins to continue to widen a bit from the 12.0% segment posted in 1Q.
Turning to our estimates, based on the sales and margin trends, we are raising our 2021 EPS estimate to $24.90 from $24.50. Our estimate is above the high end of management's guidance range, as we look for another positive EPS surprise in 3Q. We look for growth to accelerate in 2022, driven in part by the company's backlog, and we are boosting our preliminary EPS estimate to $27.00 from $26.50. Our five-year EPS growth rate forecast is 10%.
FINANCIAL STRENGTH & DIVIDENDOur financial strength ranking for Northrop Grumman is
Medium, the midpoint on our five-point scale. The company receives average scores on our main financial strength criteria: debt levels, fixed-cost coverage, cash flow generation and profitability.
The company had $3.9 billion in cash and equivalents at the end of 2Q21. Long-term debt was $12.8 billion at the end of the quarter and the total debt/total capital ratio was 55%. Cash flow covered interest expense by a factor of 9 in 2020.
Northrop has a share buyback program. Shares outstanding were down 3.5% year-over-year at the end of the most recent quarter.
Northrop pays a dividend. The company typically reviews the dividend in May. In May 2021, it boosted the payout by 8% to the current quarterly rate of $1.57 per share. We think the dividend is secure and likely to grow. Our dividend estimates are $6.16 for 2021 and $6.66 for 2022.
MANAGEMENT & RISKSKathy J. Warden became CEO, President and Chairman
on January 1, 2019, replacing Wes Bush, the CEO since 2010. She had been COO. David Keffer is the CFO. Prior to joining Northrop Grumman, Keffer was a general partner at Blue Delta Capital Partners. He also previously served as the chief financial officer of CSRA, Inc.
Investors in NOC shares face risks. Northrop Grumman is a key supplier to the U.S. military (we estimate approximately 83% of total sales) and thus vulnerable to debates over and potential cuts in domestic and international defense spending. The company is subject to a number of procurement laws and regulations, and evolving U.S. government procurement
policies and increased emphasis on cost over performance could adversely affect Northrop Grumman's business. The Defense industry is competitive, with other deep-pocketed players. Northrop Grumman is the prime contractor on most of its contracts, and is thus also dependent on subcontractors and suppliers. The company's international business exposes it to additional risks, including risks related to geopolitical and economic factors, laws and regulations. The company is under constant pressure to build its backlog. In 2020, the backlog grew 25% to $81 billion, though the backlog fell a bit in 1H21. The segment showing the greatest backlog growth in recent quarters has been Space Systems. Space Systems was the segment with the largest backlog at the end of 2020, with $35 billion.
COMPANY DESCRIPTIONNorthrop Grumman is a leading global defense contractor,
providing systems integration, defense electronics, information technology, and advanced aircraft and space technology. The shares are a component of the S&P 500. The company has 97,000 employees.
VALUATIONNOC shares appear attractively valued at current prices
near $367. The shares are trading at the high of their 52-week range of $282-$379. On a technical basis, after forming a double-bottom in January 2021, the shares have been in a bullish pattern of higher highs and higher lows.
To value the stock on a fundamental basis, we use peer and historical multiple comparisons, as well as a dividend discount model. NOC shares are trading at 14-times our 2022 EPS estimate, at the low end of the historical range of 12-23. On a price/sales basis, the shares are at the midpoint of the five-year range. The dividend yield of about 1.7% is above the S&P 500 yield, signaling value. The shares are generally undervalued compared to the peer group. Given management's history of topping expectations, we think the shares deserve to trade at above-peer-average multiples. Our revised dividend discount model points to a value above $450 per share. Blending our approaches, we arrive at our target price of $410.
On July 29, BUY-rated NOC closed at $365.66, up $5.55. (John Eade, 7/29/21)
NOV Inc (NOV)Publication Date: 7/30/21Current Rating: HOLD
HIGHLIGHTS*NOV: Maintaining HOLD following 2Q21 results*On July 27 after the close, NOV reported a 2Q21
adjusted net loss of $9 million or $0.04 per share, compared to an adjusted net loss of $8 million or $0.03 per share in 2Q20.
*The slightly wider year-over-year loss reflected weak results in the Completion & Production Solutions business, where ongoing COVID-19 operational disruptions in Southeast Asia impacted performance.
Section 2.144
GROWTH / VALUE STOCKS*We are narrowing our 2021 loss estimate to $0.34 from
$0.43 per share to reflect second-quarter performance, which beat our quarterly forecast by $0.09 per share. The consensus currently calls for a loss of $0.47.
*At the same time, we are raising our 2022 EPS estimate to $0.20 from $0.13 based on our expectations for modestly higher commodity prices in 2022, which should lead to higher spending by E&P companies. The consensus EPS estimate is $0.24.
ANALYSIS
INVESTMENT THESISWe are maintaining our HOLD rating on NOV Inc.
(NYSE: NOV). The outlook for oilfield services and equipment companies has generally improved over the last year due to the rebound in oil and gas prices; however, we believe that the July 18 OPEC/OPEC+ supply agreement will weigh on energy prices (due to additional capacity) in the coming quarters. In addition, global GDP growth could face pressure from a resurgence in COVID-19 cases. We expect these factors to limit drilling activity and reduce demand for companies such as NOV in the near term.
RECENT DEVELOPMENTSOn July 27 after the close, NOV reported a 2Q21 adjusted
net loss of $9 million or $0.04 per share, compared to an adjusted net loss of $8 million or $0.03 per share in 2Q20. The loss was narrower than our loss estimate and the consensus loss estimate of $0.13.
The slightly wider year-over-year loss reflected weak results in the Completion & Production Solutions business, where ongoing COVID-19 operational disruptions in Southeast Asia impacted performance. This was partly offset by higher drill rig activity in North America.
Second-quarter 2021 revenue of $1.417 billion fell 5% year-over-year but increased 14% on a sequential basis from $1.249 billion in 1Q21. For the current quarter, the StreetAccount consensus was $1.380 billion.
The company has combined its Rig Systems and Rig Aftermarket segments into a single segment called Rig Technologies. It now has three reporting segments: Rig Technologies (29% of 2020 sales), Wellbore Technologies (31%), and Completion & Production Solutions (40%). Segment results for 2Q21 are summarized below.
The Rig Technologies segment generated revenue of $487 million, up 2% from the prior year. Adjusted EBITDA increased to $75 million in the quarter from $14 million in 2Q20. The improvement was attributable to settlement fees received from the cancelation of offshore rig projects, cost reduction programs, and stronger order book demand.
In Completion & Production Solutions, revenue fell 19%
from the prior year to $497 million, while adjusted EBITDA totaled $4 million, down from $68 million in the year-ago quarter. The decline mostly reflected ongoing COVID-19 operational disruptions in Southeast Asia, and raw material shortages. However, new orders rose 37% sequentially to $462 million. The end-of-quarter backlog in the segment was $1.003 billion, up 24% from the prior quarter.
In Wellbore Technologies, revenue increased 5% to $463 million in 2Q21, reflecting improving growth in North American activity levels and a modest improvement in international markets. Adjusted EBITDA jumped 50% from the prior year to $63 million.
EARNINGS & GROWTH ANALYSISNOV does not provide a formal financial outlook;
however, on the 2Q21 conference call, CEO Clay Williams said that the company was encouraged by rising inquiries and activity, and believed that a post-pandemic global economic recovery would spur further top-line growth.
We are narrowing our 2021 loss estimate to $0.34 from $0.43 per share to reflect second-quarter performance, which beat our quarterly forecast by $0.09 per share. The consensus currently calls for a loss of $0.47.
At the same time, we are raising our 2022 EPS estimate to $0.20 from $0.13 based on our expectations for modestly higher commodity prices in 2022, which should lead to higher spending by E&P companies. The consensus EPS estimate is $0.24.
FINANCIAL STRENGTH & DIVIDENDWe rate NOV's financial strength as Medium-High, the
second-highest rating on our five-point scale. The company's debt is rated BBB+/negative by Standard & Poor's and Baa2/negative by Moody's.
At the end of 2Q21, NOV's total debt/capitalization ratio was 31.5%, below the 33.5% reported a year earlier. The total debt/cap ratio is well below the peer average. It has averaged 22.5% over the past five years.
Outstanding debt totaled $2.386 billion at the end of 2Q21, down from $2.781 billion at the end of 2Q20. NOV had cash and cash equivalents of $1.6 billion at the end of the quarter, up from $1.5 billion at the end of 2Q20. It also has $3.0 billion of undrawn capacity on its revolving credit facility.
In the third quarter of 2015, NOV completed its share repurchase program by buying 10.85 million shares for $444 million. In all, the company repurchased 55.6 million shares, or 13% of its outstanding stock, under this authorization. The company has not announced a new buyback program since then and we do not anticipate one in the near term.
Section 2.145
GROWTH / VALUE STOCKS
On May 20, 2020, the company suspended its dividend in response to weak energy markets. Prior to this announcement, it had paid a quarterly dividend of $0.05 per share or $0.20 annually. It previously cut the payout from $0.46 per share.
RISKSThe Oil Services, Drilling and Equipment industry is one
of the most volatile and unpredictable industries in the S&P 500. The main investment risk is the overall health of the global economy, though the industry also faces significant geopolitical risk.
COMPANY DESCRIPTIONNOV Inc. is the result of the acquisition by National
Oilwell of Varco International in 2005. The company designs, manufactures and sells major mechanical components and integrated systems for both land-based and offshore drilling rigs. It manufactures complete land drilling and well-servicing rigs, the largest line of lifting and handling equipment in the industry, a broad offering of downhole drilling motors, and specialized drilling tools. The company was founded in 1862 and is based in Houston.
VALUATIONNOV shares have traded between $7.70 and $18.02 over
the past 52 weeks and are currently below the midpoint of the range. To value the stock on a fundamental basis, we use peer group and historical multiple comparisons, as well as a dividend discount model. In this case, valuation based on P/E is meaningless given our loss estimate for 2021 and small profit forecast for 2022.
On other metrics, the shares are trading at a trailing price/book multiple of 1.0, below the midpoint of the historical range of 0.8-1.4, and at a price/sales multiple of 1.1, near the low end of the range of 1.0-1.8. The price/cash flow multiple of 8.1 is below the low end of the ten-year range of 10.0-20.2.
Looking ahead, we expect NOV to face earnings pressure from reduced capital spending by E&P customers, and believe that renewed spending would require a sustained recovery in oil prices to the $65-$70 per barrel range.
On July 30 at midday, HOLD-rated NOV traded at $13.74, down $0.63. (Bill Selesky, 7/30/21)
Old Dominion Freight Line, Inc (ODFL)Publication Date: 7/28/21Current Rating: BUY
HIGHLIGHTS*ODFL: Raising target price to $290*ODFL shares have outperformed the market over the
past the past year, rising 40% versus a 37% gain for the S&P 500 index.
*The company recently reported 2Q21 earnings that rose 85% year-over-year and topped expectations.
*We like ODFL on a macro basis: the trucking industry has been a consistent market share leader compared to other transport options - i.e., water, pipelines, rails - for the past 20 years.
*On a micro basis, we like the company's history of raising the dividend and buying back stock.
ANALYSIS
INVESTMENT THESISOur rating on Old Dominion Freight Line Inc. (NGS:
ODFL), a leading U.S. freight services company, is BUY and our target price is $290, raised from $285. This well-managed company is among the most efficient operators in the trucking industry, which has been a consistent market share leader compared to other transport options - i.e., water, pipelines, rails - for the past 20 years. The company's business strategy is to provide customers with best-in-class service and network capacity, supporting premium pricing and ultimately improving yield, which then allows management to further reinvest in the business. The coronavirus has had an impact on results, and has slowed ODFL's historic growth rate, at least for 2020. On the other side of the crisis, though, the domestic supply chain will be more important than ever, particularly if the Biden Infrastructure Plan materializes, and ODFL is a critical link. The company has a strong balance sheet and an experienced management team. From a technical standpoint, the shares are in a bullish pattern of higher highs and higher lows that dates to January 2016. We think the shares are suitable as a core Industrial sector holding in a diversified portfolio.
RECENT DEVELOPMENTSODFL shares have underperformed the market over the
past quarter, with a flat performance compared to a 5% gain for the S&P 500. They have outperformed over the past year, rising 40% versus a 37% gain for the index, though the stock's returns trail in the industry ETF IYJ over the period. The stock has outperformed the market and the industry ETF IYJ over the past five years. The beta on ODFL is 1.01.
The company reported 2Q21 earnings that rose 85% year-over-year and topped expectations. On July 28, the company posted 2Q21 revenue of $1.3 billion - up 47% year-over-year, compared to a gain of 14% in the prior quarter. Operating income rose 84% as the operating ratio improved by 550 basis points to 72.3%. Reported EPS rose 85% year-over-year to $2.31 and topped the consensus forecast of $2.09. For the first half, the company has earned $4.01 per share.
Management does not provide specific revenue or EPS guidance. Management commented in the earnings press release that it intends to hire additional employees through 3Q 'to support anticipated growth.' The company's board also approved a new share repurchase program that authorizes Old Dominion to repurchase up to $2.0 billion of its outstanding
Section 2.146
GROWTH / VALUE STOCKSstock.
EARNINGS & GROWTH ANALYSISOld Dominion is a less-than-truckload shipper. The
company's business model is fairly straightforward. The company generates revenue by transporting goods in its trucks, and has expenses that include salaries, supplies, licenses and insurance, among others.
In 2Q21, revenue growth reflected a 28% increase year-over-year in LTL tonnage (volume) and a 15% increase in LTL revenue per hundredweight (higher pricing). The increase in volume was driven by a higher number of shipments (up 34%) offset by a lower weight per shipment (down 4.0%).
On the expense side of the income statement, total operating expenses accounted for 72.3% of revenue, down from 77.8% in the prior-year period. Old Dominion recorded year-over-year percentage-of-sales declines in salaries, wages & benefits, general supplies and taxes and licenses. Purchased transportation costs rose 130% year-over-year. Full-time employees rose 5% from the prior quarter to 21,621.
Turning to our estimates, we are raising our 2021 EPS forecast of $7.05 to $8.00, which implies earnings growth of 40% this year. We look for continued growth in 2022 and our EPS estimate is now $9.00, up from $8.10, as we expect the company's exceptional service to lead to greater market share. Over the long term, we look for Old Dominion to post average earnings growth of 10%.
FINANCIAL STRENGTH & DIVIDENDOur financial strength rating on Old Dominion is
Medium-High. The company receives above-average scores on our main financial strength criteria of debt levels, fixed-cost coverage, cash flow generation and profitability.
Cash and cash equivalents totaled $484 million at the end of the quarter. The company had long-term debt of $100 million at the end of the quarter, and a debt-to-total capitalization ratio of 3%.
Old Dominion pays a dividend. The company increased the dividend in February 2021 by 33% to a current annualized $0.80 per share, for a yield of about 0.3%. We think the dividend is secure and likely to grow. Our dividend estimates are $0.80 for 2021 and $1.00 for 2022.
The company has a share repurchase plan and has been buying back stock.
MANAGEMENT & RISKSGreg Gantt became the company's CEO in 2018,
succeeding David Congdon, who is now executive chairman. Mr. Gantt had served as COO since 2011. He joined the company in 1994 as a regional vice president. Adam
Satterfield has served as CFO since late 2015, and has been with the company since 2004.
There are risks to owning ODFL shares. The trucking industry is an asset-intensive business and requires a large network of distribution centers and terminals. This creates high fixed costs that can magnify losses during an economic downturn.
Competition among trucking companies is fierce and consists of both large and small companies. Over the past 10 years, transport industry leaders like FedEx (FDX) and United Parcel Service (UPS) have been increasing their presence in the less-than-truckload segment, though UPS is now divesting this business line. Old Dominion also competes against small owner/operators.
The trucking industry is cyclical: carriers may be forced to cut rates during economic downturns, which may weigh on earnings.
Other risks include a shortage of drivers and increased government regulation, including new vehicle emissions standards.
COMPANY DESCRIPTIONOperating primarily as a less-than-truckload carrier, Old
Dominion is among the top freight services company in the United States. It operates 245 terminals in 48 states. The company is based in Thomasville, North Carolina. The ODFL shares are a component of the S&P 500.
VALUATIONWe think that ODFL shares are attractively valued at
current prices near $259, near the high end of their 52-week range of $176-$276. From a technical standpoint, the shares are in a bullish pattern of higher highs and higher lows that dates to January 2016.
On the fundamentals, the shares are trading at 29-times our 2022 estimate, compared to a three-year historical range of 15-37. Compared to the transportation peer group (CSX, CP, UNP, CNI, NSC, JBHT), valuations are mixed. We believe that a higher P/E multiple is warranted given the company's consistently strong results. Our dividend discount model, factoring in the new dividend, points to fair value near $300. Blending our approaches, our target price is now $290.
On July 28 at midday, BUY-rated ODFL traded at $256.02, down $3.25. (John Eade, 7/28/21)
Omnicom Group, Inc. (OMC)Publication Date: 7/28/21Current Rating: HOLD
HIGHLIGHTS*OMC: Reiterating HOLD following 2Q results*On July 20, Omnicom reported 2Q21 non-GAAP
Section 2.147
GROWTH / VALUE STOCKSearnings of $1.46 per share, up from a loss of $0.11 a year earlier and $0.47 above the consensus forecast. Revenue rose 27.5% to $3.6 billion and topped the consensus by $269 million.
*The reduced impacts of the pandemic have allowed Omnicom's revenue to begin to stabilize.
*We are boosting our 2021 EPS estimate to $6.32 from $6.10 and our 2022 estimate to $6.61 from $6.37. We expect a continued sequential recovery, though with considerable risk due to the pandemic.
*OMC pays an attractive dividend, with a yield of about 3.8%.
ANALYSIS
INVESTMENT THESISWe are maintaining our HOLD rating on Omnicom Group
Inc. (NYSE: OMC). Prior to the pandemic, Omnicom was seeing signs of improvement in North America, which accounts for more than half of total revenue. However, the coronavirus has weighed on Omnicom as clients have cut back on marketing and advertising spending, especially in such areas as events and field marketing. In response, the company has cut headcount by 6,100, suspended new hiring, and cut nonessential spending. It has also received government subsidies, extended its credit facilities and debt maturities, and suspended share repurchases. These actions, which are expected to generate $500 million in cost savings, will help offset the impact of lower revenue. Though the near term remains uncertain, we look for revenue stabilization in 2021.
We remain bullish on Omnicom over the long term based on its leading industry position and our high regard for management, which has a history of topping Street expectations and achieving high returns on invested capital. The company has also boosted overall revenue through acquisitions, and has been divesting lower-margin noncore and underperforming businesses and consolidating real estate. Over the last several years, it has been expanding its investments in CRM, and accelerating investments in its precision marketing, digital transformation, and data analytics capabilities - key growth drivers as companies focus on virtual strategies. OMC also pays an attractive dividend, with a yield of about 3.8%.
RECENT DEVELOPMENTSOn July 20, Omnicom reported 2Q21 non-GAAP earnings
of $1.46 per share, up from a loss of $0.11 a year earlier and $0.09 above the consensus forecast. Revenue rose 27.5% to $3.6 billion and topped the consensus by $269 million, reflecting strong performance across all major geographic markets and across all of the company's service disciplines. The 2Q operating margin expanded to 15.9% from 2.2% a year earlier, reflecting a gain on the disposition of ICON International.
In June 2021, Omnicom announced the divestiture of
ICON International, a specialty media business. The sale of ICON is part of Omnicom's continuing realignment of its portfolio businesses and is consistent with its strategic plan and investment priorities. The disposition is not expected to have a material impact on Omnicom's ongoing operating income in 2021.
Management does not provide EPS guidance, though it expects organic growth in 2021. It has resumed share repurchases in 2Q21. It expects foreign exchanges rates to increase revenue by approximately 2.5%.
In 1Q19, Omnicom sold its Marketstar business, and in August 2018, it completed the sale of Sellbytel Group, a noncore business, to Webhelp Group. It also sold 18 other noncore businesses in 3Q18, primarily in CRM Execution & Support. Approximately 7,000 jobs were cut; however, management said that it would fill 500 positions in ongoing operations. In 3Q18, Omnicom also acquired two businesses: management and IT consulting firm Credera, which focuses on platforms that drive sales through consumer engagement; and United Digital Group, a marketing firm. Management continues to pursue acquisitions in the areas of data analytics, digital transformation, and precision marketing.
EARNINGS & GROWTH ANALYSISOmnicom has benefited from its focus on improved
efficiency, stronger IT capabilities, new initiatives in specialty healthcare, and strategic acquisitions.
In an effort to provide meaningful information to investors, Omnicom has organized its presentation of the CRM business into four subsegments: (1) CRM Precision Marketing, which includes precision marketing and digital direct marketing agencies; (2) CRM Commerce and Brand Consulting, which includes the Omnicom Commerce Group and brand consulting agencies; (3) CRM Experiential, which includes events and sports marketing; and (4) CRM Execution & Support, which includes field marketing, merchandising and point-of-sale, research, and not-for-profit consulting agencies. It also renamed Specialty Communications as the Healthcare segment, which includes both Healthcare Marketing and Communication Services.
The core advertising business, representing 56.4% of 2Q revenue, posted a 30% increase in organic revenue. The healthcare business (9% of revenue) rose 4.5% compared to 2Q20. CRM Experiential, which accounts for 3.5% of revenue, saw organic revenue grow 53% due to lifts on lockdown orders, as events were virtually shut down for March and April of 2020. In CRM Precision Marketing (8.2% of revenue), sales rose 25%, while sales in CRM Commerce and Brand Consulting (6.2% of revenue) rose 15.2%. CRM Execution & Support (7% of revenue) rose 22.7%, reflecting a recovery in client spending in field marketing and merchandising and point of sale business. Public Relations (9.7% of revenue) rose
Section 2.148
GROWTH / VALUE STOCKS15.1%.
Regionally, second-quarter organic revenue in the U.S. (52% of revenue) rose 20%, all U.S. disciplines had double-digit growth except healthcare. North American organic revenue outside the U.S. increased 37%. Organic revenue was up 24% in the UK, and 34.5% in Europe (excluding the UK), with all disciplines in double-digits. In Asia Pacific, organic revenue rose 28%, with all major countries experiencing double-digit growth. Organic revenue rose 43% in the Middle East and Africa, and 21% in Latin America reflecting positive performance in Mexico, Colombia and Brazil.
We are boosting our 2021 EPS estimate to $6.32 from $6.10 and our 2022 estimate to $6.61 from $6.37. We expect continued sequential recovery, though with considerable risk due to the impact of the pandemic.
FINANCIAL STRENGTH & DIVIDENDWe rate Omnicom's financial strength as Medium. The
company generates average scores on our three main criteria of debt levels, fixed-cost coverage, and profitability. During the pandemic, to strengthen liquidity, Omnicom has extended its $2.5 billion credit facility to February 2025; redeemed its $600 million 4.45% senior notes, and issued $600 million in 10-year, 2.45% senior notes. In April 2020, it also issued an additional $600 million in 10-year, 4.20% senior notes, and entered into a $400 million revolving credit facility that also expires in February 2025. In April 2021, the credit facilities from April 2020 expired without being drawn. Total debt at the end of 2Q was $5.3 billion, versus $5.7 billion a year earlier. The company has no long-term debt maturing until May 2022.
In February 2021, the company raised its quarterly dividend by 7.7% to $0.70, or $2.80 annually. The current yield is about 3.8%. Our dividend estimates are $2.80 for both 2021 and 2022.
OMC resumed share repurchases in 2Q21 after suspending them at the beginning of the pandemic. It regards buybacks as an important use of free cash flow. In 2Q21, it repurchased $95 million of its stock. It repurchased $603.7 million of its stock in 2019 and $200 million in 1Q20.
MANAGEMENT & RISKSThe CEO of Omnicom Group is John D. Wren. He
became CEO in January 1997, and has been with the firm for 30 years. Phil Angelastro is the CFO. The company has made a number of changes to its board, and is working to improve governance and communications with shareholders. Lead director Len Coleman has taken on additional responsibilities for shareholder communications, and Debbie Kissire, a former vice chairman of Ernst & Young, has joined the board and become a member of the audit committee.
Investors in Omnicom face specific risks. Given low capital requirements, the advertising industry has low barriers to entry. OMC and its two major global rivals (WPP Group and Interpublic Group), as well as countless regional and local agencies, are all fighting for market share.
Omnicom has substantial exposure to Europe, which faces political uncertainty from Brexit.
COMPANY DESCRIPTIONBased in New York, Omnicom is a leading global
advertising, marketing and corporate communications company. It serves more than 5,000 clients in over 100 countries, and almost half of revenues come from overseas operations. Agency brands include BBDO Worldwide, DDB Worldwide, TBWA Worldwide, Agency.com, and FleishmanHillard, among others. The company has focused on providing marketing services, such as public relations and customer relationship management (branding consultation and event and sports marketing, for example), in addition to traditional advertising services. Omnicom is a component of the S&P 500.
VALUATIONWe think that OMC shares are reasonably valued at
current prices, near the high end of the 52-week range of $44.50-$86.38. The shares are trading at 11.6-times our 2021 EPS estimate, below the low end of the five-year historical average range of 12.5-19.2 and below the industry average. Based on the company's current challenges, our near-term rating remains HOLD. However, we remain bullish on Omnicom over the long term based on its leading industry position and our high regard for management, which has a history of topping Street expectations and achieving high returns on invested capital.
On July 28 at midday, HOLD-rated OMC traded at $73.00, down $0.47. (Taylor Conrad, 7/28/21)
Owens Corning (OC)Publication Date: 8/4/21Current Rating: BUY
HIGHLIGHTS*OC: Recent weakness offers buying opportunity*OC shares have underperformed over the past three
months, falling 1.3% compared to a 5.2% advance for the S&P 5000.
*Business is good: Owens Corning recently reported 2Q21 results that were well ahead of investor expectations, and we have raised our estimates.
*A new CEO has taken over and has strategies to boost margins and EPS growth.
*On the fundamentals, the shares are generally trading at a deep discount to those of other building supply companies.
ANALYSIS
Section 2.149
GROWTH / VALUE STOCKS
INVESTMENT THESISOur rating on Owens Corning Inc. (NYSE: OC), a leading
manufacturer of composite and building materials, is BUY. OC is a cyclical company subject to macroeconomic changes in the housing and construction markets. While OC's Insulation business had been struggling, Composites and Roofing are both growing, due in part to the pandemic-driven 'Home as Sanctuary' trend. And now the Insulation business is picking up. The company's balance sheet is clean, and management recently hiked the dividend by 8%, signaling confidence in the outlook. From a technical perspective, prior to the pandemic, OC shares had been in a bullish pattern of higher highs and higher lows, and since bottoming in March 2020, they have resumed their positive trend. On the fundamentals, the shares are generally trading at a deep discount to those of other building supply companies. We believe that these discounts are no longer warranted, and that OC's financial strength and valuation fundamentals merit a BUY recommendation. Our 12-month target price of $120 implies a multiple of 13-times projected 2022 EPS, still below the peer group average.
RECENT DEVELOPMENTSOC shares have underperformed over the past three
months, falling 1.3% compared to a 5.2% advance for the S&P 500. They have outperformed the broad market over the past year, gaining 58% compared to the S&P 500's increase of 34%. The shares have outperformed the industry benchmark ETF IYJ over the past year, but have underperformed over the past five years. The beta on OC is 1.55.
Owens Corning recently reported 2Q21 earnings that rose 185% from the prior year and topped investor expectations. On July 28, OC reported adjusted EPS of $2.60, above the consensus forecast of $2.13. Net sales rose 37% from the prior year on a constant-currency basis, to $2.2 billion. Adjusted EBIT rose 144% as the adjusted EBIT margin widened by 800 basis points to 18%. In the first half, the company earned $4.32 on an adjusted basis.
The company does not provide specific EPS guidance, but management said on the 2Q conference call that it expected the U.S. residential housing market - a key driver of OC's results -to remain strong in the near term. It also looks for improvement in global commercial and industrial markets.
The company is continually refining its portfolio of businesses. In July, the company announced the acquisition of vliepa GmbH, which specializes in the coating, printing and finishing of nonwovens, paper and film for the building materials industry. The acquisition will broaden OC's global nonwovens portfolio and help the company to better serve European customers.
Also in July, Owens Corning agreed to sell the company's
Insulation site in Santa Clara, California, to commercial real estate developer Panattoni. The company expects to continue operations at this facility through 3Q22 and to complete the transaction in 1Q23.
Owens Corning will host an Investor Day on November 10, 2021.
EARNINGS & GROWTH ANALYSISOwens Corning has three segments: Composites (24% of
sales), Insulation (34%), and Roofing (42%). We discuss recent business trends and outlooks for these segments below.
Insulation revenue rose 35% in 2Q21 - better than the negative performance in 2Q20. The segment EBIT margin widened to 14% from 5%. The recovery in the North American residential fiberglass insulation business benefited results, and technical and other building insulation businesses also improved. In 2021, we expect a further pickup in sales to residential markets, as home sales grow, and look for margins to improve.
Composites revenue rose 46% in the second quarter. The segment EBIT margin widened to 17% from 2%, as both volume and pricing improved.
Roofing revenue soared 35% in 2Q, and the EBIT margin widened by 400 basis points to 26%. This segment is benefiting from the emerging 'Home as Sanctuary' trend. In 2021, we look for strong revenue growth and improved margins.
Turning to our estimates, based on the quicker-than-expected improvement in demand, we are raising our 2021 adjusted EPS estimate to $8.50 from $8.00. Our estimate implies an increase of 63% for the year. We look for growth to continue in 2022 and are boosting our EPS estimate to $9.35 from $8.80. Our five-year earnings growth rate forecast is 8%.
FINANCIAL STRENGTH & DIVIDENDOur financial strength rating on Owens Corning is
Medium, the middle rank on our five-point scale. The company receives average marks on our key financial strength criteria of debt levels, fixed-cost coverage, cash flow generation and profitability.
The company finished the latest quarter with $888 million in cash on the balance sheet and debt of $3.1 billion. The long-term debt/equity ratio was 43%. Cash flow covered interest expense by a factor of 22 in 2020. The free cash flow conversion ratio last year was 146%.
Owens Corning pays a dividend. In February 2021, the board increased the dividend by 8%. The current quarterly dividend is $0.26 per share, or $1.04 annually, for a yield of
Section 2.150
GROWTH / VALUE STOCKSabout 1.1%. Our dividend forecasts are $1.04 for 2021 and $1.12 for 2022.
The company also has a stock buyback plan and has been buying back shares.
MANAGEMENT & RISKSBrian Chambers succeeded Mike Thaman as CEO in April
2019. Mr. Thaman remains the company's chairman. CEO Chambers became president and chief operating officer of Owens Corning in August 2018. He previously served as president of the Roofing business and as vice president and managing director of Engineered Solutions in the Composites business.
Owens Corning also has a new CFO. Kenneth Parks, formerly the CFO of Mylan, became CFO in September 2020.
Owens Corning relies heavily on construction activity, and its results would be hurt by any downturn in this market. Demand for OC products could also face pressure from rising interest rates and weaker global economic conditions. Owens Corning must also contend with input cost inflation, as price hikes implemented to offset inflation may not be well received by customers.
In addition, OC's business requires substantial levels of capital spending, and is subject to risks associated with investments in new manufacturing capacity, the integration of acquisitions, and the expansion of international operations. The company could also face potential product liability and warranty claims.
COMPANY DESCRIPTIONOwens Corning is a leading global manufacturer of
composite and building materials. The company's products range from glass fiber used to reinforce composite materials for the transportation, electronics, marine, infrastructure, wind-energy and other high-performance markets, to insulation and roofing for residential, commercial and industrial applications. The company has 19,000 employees. The shares are a component of the S&P 400 Mid-Cap index.
VALUATIONWe think that OC shares are attractively valued at current
prices near $96. Over the past 52 weeks, the shares have traded between $60 and $110. From a technical perspective, prior to the pandemic, the shares had been in a bullish pattern of higher highs and higher lows, and since bottoming in March 2020, they have resumed their positive trend.
On the fundamentals, the shares are generally trading at a discount to those of other building supply companies such as FAST, JCI, SWK and MAS. At current prices, they are trading at 10-times our 2022 EPS estimate, below the peer average of 20. The price/sales ratio of 1.3 is below the industry average of 2.4.
We believe that these deep discounts are no longer warranted given the company's new CEO and plans for restructuring, not to mention the strength in the roofing business due to the 'Home as Sanctuary' trend. We think that OC's financial strength and valuation fundamentals support a BUY recommendation. Our target price of $120 implies a multiple of 13-times projected 2022 EPS, still below the peer group average.
On August 3, BUY-rated OC closed at $96.10, up $1.69. (John Eade and Caleigh McGough, 8/3/21)
Paccar Inc. (PCAR)Publication Date: 7/29/21Current Rating: BUY
HIGHLIGHTS*PCAR: Reaffirming BUY following 2Q21 results*On July 27, PACCAR reported adjusted 2Q21 earnings
from continuing operations of $493 million or $1.41 per diluted share, up from $148 million or $0.43 per share in 2Q20.
*The higher profit was driven by strong freight activity, high truck utilization, and investments in distribution and technology, including the company's e-commerce platform.
*We are boosting our 2021 EPS estimate to $5.84 from $5.81 to reflect the second-quarter results, which topped our estimate by $0.03. The current consensus is $5.81.
ANALYSIS
INVESTMENT THESISWe are reaffirming our BUY rating on PACCAR Inc.
(NGS: PCAR), a major manufacturer of trucks and aftermarket truck parts, with a price target of $111. We view PCAR as a well-run company that produces a highly regarded line of trucks. PACCAR has created a specialized niche of high-quality vehicles that command premium prices, and offer enhanced comfort, quality and reliability. After closing its manufacturing plants during the first phase of the pandemic, the company has resumed operations and seen improved order activity in recent months. We expect PACCAR to generate significantly stronger top- and bottom-line growth in the coming quarters and are raising our 2021 and 2022 EPS estimates.
RECENT DEVELOPMENTSOn July 27, PACCAR reported adjusted 2Q21 earnings
from continuing operations of $493 million or $1.41 per diluted share, up from $148 million or $0.43 per share in the prior-year quarter. EPS beat our estimate of $1.38 and the consensus estimate of $1.40.
The improvement in operating profit was driven by robust freight activity, high truck utilization, and investments in distribution and technology, including the company's e-commerce platform.
Section 2.151
GROWTH / VALUE STOCKS
In the Truck division, revenue rose 123% to $4.152 billion, while segment pretax profit rose to $255 million following an operating loss of $46 million in the prior-year quarter. New truck deliveries totaled 40,100 units, up 122% from 2Q20. On a geographic basis, the United States and Canada recorded a 95% increase in deliveries. Deliveries rose 70% in Europe and 121% in the rest of the world.
In the Aftermarket Parts business, second-quarter sales rose 47% to $1.211 billion while segment pretax profit rose 75% to $266 million. The results reflected improved economic conditions, increased vehicle utilization, and growth in the e-commerce business.
In Financial Services (PFS), revenue increased 27% to $456 million, and segment pretax profit rose 92% to $107 million. Loan and lease origination activity was strong and used truck sales rose to record levels. Vehicle resale values were comparable with 1Q21. The current $15.6 billion asset portfolio includes 205,000 trucks.
While the pandemic had a material impact on 2Q20 and 3Q20 results, management said that it did not have a meaningful impact in 4Q20 or in the first half of 2021. It noted that all manufacturing facilities are now back in operation and that production is increasing.
In January 2021, PACCAR signed an agreement with autonomous driving company Aurora to develop autonomous Peterbilt 579 and Kenworth T680 trucks. The partnership will integrate PACCAR's autonomous vehicle platform with Aurora self-driving technologies. Management expects customers to benefit from the autonomous vehicles' enhanced safety and operational efficiency. Kenworth T680 and Peterbilt 579 trucks incorporating Aurora technology are expected to be developed over the next several years.
EARNINGS & GROWTH ANALYSISPACCAR does not provide detailed earnings guidance but
does offer an industry outlook. In its 2Q21 earnings release, management noted that freight tonnage, industry truck utilization, and customer demand for new trucks were strong. However, the company also noted that truck markets were being hurt by the industrywide shortage of semiconductors. As a result, the company had 6,500 trucks waiting for components at the end of the second quarter.
Due to the semiconductor shortage, PCAR now projects U.S. and Canadian sales of 260,000-280,000 Class 8 trucks in 2021, down at the high end from its prior forecast of 260,000-290,000. Retail unit sales were 216,500 in 2020, 309,000 in 2019, 285,000 in 2018, and 218,000 in 2017.
We are boosting our 2021 EPS estimate to $5.84 from $5.81 to reflect the second-quarter results, which topped our
estimate by $0.03. The current consensus is $5.81.
We are also raising our 2022 EPS estimate to $7.08 from $6.98 based on our expectations for growth in orders, margins, and market share next year. The consensus forecast is $7.03.
Over the long term, we expect the company to benefit from innovation in truck components, and specifically from new automated transmissions developed by Cummins Inc. (CMI: BUY) and Eaton Corp. (ETN: BUY). Cummins and Eaton believe that the next-generation transmissions produced by their JV will result in significant fuel efficiency improvements for OEM customers and partners, including PACCAR.
PACCAR recently participated in the 2021 Consumer Electronics Show in Las Vegas, exhibiting a battery-electric Kenworth K270E, a Level 4 autonomous Kenworth T680, and a battery-electric Peterbilt Model 520EV. The company is also working on a PACCAR parts delivery drone. Kenworth, Peterbilt and DAF remain leaders in zero-omission vehicles, with customers currently testing more than 60 electric, hydrogen fuel cell, and hybrid trucks in North America and Europe. The company expects to begin delivery of these models this year.
FINANCIAL STRENGTH & DIVIDENDWe rate PCAR's financial strength as Medium, the middle
rank on our five-point scale. The company's debt is rated A1/stable by Moody's and A+/stable by Standard & Poor's. Both ratings are considered investment grade. We view this as a competitive advantage as it provides the company with ready access to the credit markets.
At the end of 2Q21, the company had total debt of $11.947 billion (linked mostly to the Financial Services division), compared to $10.397 billion at the end of 2Q20. PCAR had cash and equivalents of $4.40 billion at the end of 2Q21, down from $4.83 billion. The company also has access to a $3.58 billion credit line with $3.27 billion available. The company has no unfunded pension obligations.
We continue to monitor inventories at PCAR. At the end of 2Q21, net inventories were up 68% from the same period a year earlier due to the semiconductor shortage.
PACCAR pays a standard quarterly dividend and a special annual dividend. It recently raised its standard quarterly dividend by 6% to $0.34 per share, or $1.36 annually. The current yield is about 1.6%. Our regular dividend estimates are $1.34 for 2021 and $1.40 for 2022. PCAR has paid a dividend every year since 1941.
The company normally announces its special dividend in December, which it pays the following January. In December 2020, it announced a special dividend of $0.70 per share,
Section 2.152
GROWTH / VALUE STOCKSdown from $2.30 in 2019 and $2.00 in 2018. The special dividend was paid in January 2021. We expect total dividends (standard plus special) of $2.04 in 2021 and $2.80 in 2022.
PCAR has a stock buyback program. As of December 31, it had $390 million remaining on its $500 million authorization. The company has temporarily suspended buybacks due to volatile industry conditions.
MANAGEMENT & RISKSPreston Feight became the company's new CEO on July 1,
2019, replacing Ronald Armstrong, who has now retired. Mr. Feight previously served as EVP of PACCAR; he joined the company in 1998. Harrie Schippers is the CFO. Mark C. Pigott, who served for many years as CEO, is the executive chairman.
PACCAR investors face a range of risks. The company operates in a highly competitive and economically sensitive industry, and its earnings could be hurt by rising raw material costs as well as by costs related to new environmental and safety regulations.
COMPANY DESCRIPTIONPACCAR manufactures and distributes light-, medium-
and heavy-duty commercial trucks; distributes aftermarket parts; and provides vehicle financing to customers and dealers. The company's trucks are marketed under the Kenworth, Peterbilt and DAF names. The company has 27,000 employees.
INDUSTRYOur rating on the Industrial sector is Over-Weight. After
enduring the challenges of the pandemic, the cyclical stocks in the Industrial sector appear well positioned within the changing political environment. Specifically, we believe that Industrial stocks will benefit from enhanced infrastructure investment and more lenient trade policies under the Biden administration.
The Industrial sector accounts for 8.5% of S&P 500 market capitalization. Over the past five years, the weighting has ranged from 7% to 12%. We think that investors should allocate 9%-10% of their diversified portfolios to the group. The sector includes industries such as transportation, aerospace & defense, heavy machinery, and electrical equipment.
The sector is outperforming the market thus far in 2021, with a gain of 16.5%. It underperformed in 2020, with a gain of 9.0%, and slightly underperformed in 2019, with a gain of 26.8%.
By our calculations, the 2022 P/E ratio is 20, in line with the market multiple. Earnings are expected to rise 130% in 2021 and 37% in 2022 after a decline of 62% in 2020. The sector's debt/cap ratio of 50% is above the market average.
The yield of 0.8% is below the market average.
VALUATIONPCAR shares have traded between $80.36 and $103.19
over the past 52 weeks and are currently below the midpoint of this range. To value the stock on a fundamental basis, we use peer group and historical multiple comparisons, as well as a dividend discount model.
The shares are trading at 14.2-times our 2021 EPS estimate and at 11.7-times our 2022 forecast, compared to a four-year annual average range of 11-19. On other valuation metrics, the shares are trading below the midpoint of the historical range for price/book (2.6 versus a range of 2.3-3.3), above the midpoint of the range for price/sales (1.3 versus a range of 0.9-1.5), and below the midpoint for price/cash flow (7.6 versus a range of 6.5-9.9). They are also trading at a price/EBITDA multiple of 7.9, above the midpoint of the range of 5.7-9.4.
We view these metrics as attractive based on PCAR's size, geographic reach, and broad product portfolio. We also believe that the dividend is safe and sustainable. Our price target of $111 implies a multiple of 15.7-times our 2022 EPS estimate and a total potential return, including the dividend, of 34% from current levels.
On July 28, BUY-rated PCAR closed at $82.75, down $1.86. (Bill Selesky, 7/28/21)
PayPal Holdings Inc (PYPL)Publication Date: 7/29/21Current Rating: BUY
HIGHLIGHTS*PYPL: Strong payment trends intact but weak guidance
as eBay transition accelerates*On July 28, PayPal reported adjusted 2Q21 EPS of
$1.15, up from $1.07 a year earlier and above the $1.13 consensus.
*Total 2Q payment volume surged 40% from the prior year to $311 billion. Venmo volume rose an even stronger 58%.
*Revenue and earnings guidance for 3Q was a bit weak, as eBay accelerates payment migration away from PayPal, and we believe was responsible for post-earnings share price weakness. However, total payment volume growth remains in a strong uptrend, and the acceleration will make for easier comparisons in 2022.
*PayPal continues to benefit from a shift to digital payments, accelerated by the coronavirus pandemic but also we believe remains a secular benefit.
*Despite the weaker near-term guidance, with favorable payment volume trends intact, our target price remains $310.
ANALYSIS
INVESTMENT THESIS
Section 2.153
GROWTH / VALUE STOCKSWe are maintaining our BUY rating on PayPal Holdings
Inc. (NYSE: PYPL) following 2Q results, which included a 40% increase in total payment volumes and continued good growth in active accounts. Volumes have benefited as consumers have increased online spending amid shelter-at-home restrictions, an acceleration that we believe will remain a long-term secular trend.
PayPal is actively innovating in the payments space. The company recently expanded its 'Buy Now Pay Later' offering by introducing short-term installment products in the U.S. and UK. In October 2020, it introduced the Venmo Credit Card (issued by Synchrony), which gives customers cash back on eligible purchases, as well as the ability to manage the card in the Venmo app. The company also recently launched a new service enabling customers to buy, hold and sell cryptocurrency directly from their PayPal accounts. PayPal plans to increase cryptocurrency's utility by making it available as a funding source for purchases at its 28 million merchants worldwide. Also in 4Q20, PayPal introduced a new 'Cash a Check' feature that provides Venmo users with a secure way to cash paper checks directly from the Venmo app.
The company has also remained acquisitive. In January 2020, it acquired Honey Science Corp. for $4 billion in cash. Founded in 2012, Honey, with 17 million monthly active users, has an online shopping tool that provides consumers with discounts, a rewards program, and price-tracking tools and alerts. Honey works with about 30,000 online retailers in industries ranging from fashion and technology to travel and pizza delivery. The company believes the acquisition will provide a transformative shopping experience for PayPal consumers, while increasing sales and customer engagement for its merchants. While the $4 billion transaction price was 40-times Honey's $100 million revenue base, the firm was already profitable, with the potential for vastly greater scale given PayPal's base of over 400 million active users and 28 million merchants. We also believe that Honey, which has a high percentage of millennial-generation customers, has the potential to improve PayPal's spending volume by adding to customer engagement.
Turning to recent financials, the company's 2Q earnings report again demonstrated strong growth in payment volumes and in the number of active accounts. We believe volume growth will be helped by a rebound in consumer spending, additional merchant acceptance, and the more widespread use of digital payments.
PayPal, which was spun off from eBay in July 2015, is taking advantage of the changing payments landscape, and we believe that several trends favor the company's growth. These include greater adoption of mobile devices for payments, and the technological integration of different payment types and channels. In January 2018, the company announced an extension of its agreement with eBay to feature PayPal at
checkout on the eBay Marketplace through July 2023. However, eBay announced that PayPal would no longer be its primary payments processor, and that customers would have the option of using competitors. Management has noted that eBay now accounts for under 4% of payment volumes, a figure expected to be under 2.5% by the end of 2021.
Unlike MasterCard and Visa, PayPal's network enables account holders to both pay and be paid for merchandise or services. PayPal is accepted at more than 75 of the top 100 retailers in the U.S., and we expect even greater penetration in the next year. Total payment volume rose 40% in 2Q20, and the number of payment transactions rose 27%.
In our view, the company has several competitive advantages as it seeks to grow payment volumes. These include a strong international presence, with 100 million non-U.S. users in more than 200 countries. The company also provides merchants with end-to-end payment authorization and settlement capabilities, as well as instant access to funds.
Our target price of $310 implies a projected 2022 P/E of 54, above the low-40s multiples of Visa and MasterCard, but merited, in our view, based on PayPal's stronger growth prospects.
RECENT DEVELOPMENTSOver the past year, PYPL shares have gained 70%, versus
a 37% advance for the broad market.
On July 28, PayPal reported adjusted 2Q21 EPS of $1.15, up from $1.07 a year earlier and above the $1.13 consensus. Revenues rose 19% to $6.24 billion (up 17% on an FX-adjusted basis) and adjusted net income rose 8% to $1.36 billion.
Total 2Q payment volume rose 40% from the prior year to $311 billion, and was primarily responsible for the revenue gain. The number of active PayPal accounts was 403 million at June 30, up 16% from the prior year, while the number of payment transactions was 4.74 billion, up 27%.
The company remains acquisitive. In 2Q21, it acquired Chargehound and Happy Returns, which it said would enhance its merchant value proposition by adding capabilities related to chargeback automation and returns solutions.
In 1Q19, PayPal made a $750 million strategic investment in MercadoLibre, an e-commerce and payments company in Latin America. It also announced a partnership with Instagram, in which payments using Instagram's new 'checkout' feature will be processed in partnership with PayPal.
In 3Q18, PayPal acquired iZettle, a small business commerce platform in Europe and Latin America, for US$2.2 billion. In November 2018, the company acquired
Section 2.154
GROWTH / VALUE STOCKSHyperwallet, which provides payment solutions to e-commerce platforms, for about $400 million in cash.
In July 2018, PayPal completed a deal with Synchrony Financial in which Synchrony acquired about $6.8 billion of PYPL's consumer receivables. The deal also extended an existing co-brand consumer credit card program, with Synchrony becoming the exclusive issuer of PayPal's online consumer financing program for 10 years. In October 2019, PayPal and Synchrony said they would expand and extend their strategic relationship, with Synchrony becoming the exclusive issuer of a Venmo co-branded consumer credit card.
On July 17, 2015, eBay Inc. completed the spinoff of PayPal, distributing one share of PayPal stock for each share of eBay.
EARNINGS & GROWTH ANALYSISWe expect revenue growth at PayPal to benefit from
increased merchant acceptance of the company's services, growth in the number of mobile devices using mobile payment apps, and an increase in average transactions per active account (the latter increased to 43.5, on an annualized basis, in 2Q21, up 11% from the prior year). Another positive trend is the expansion of active accounts, which grew 16% year-over-year in 2Q to 403 million. On the 2Q earnings call, management said it expected net new active accounts to increase by 52-55 million in 2021, the same as the guidance issued along with 1Q earnings.
As the COVID-19 pandemic has shifted more shopping online, PayPal should also benefit from secular trends that have boosted growth for credit card processors, such as the increasing use of digital payments over checks and cash for both convenience and security. We expect further market share gains as the company leverages its platforms globally and takes advantage of its strong brand recognition and rapid growth in merchant acceptance.
Mobile payment volume growth is also strong. Venmo, the popular social payment app, accounted for $58 billion of payment volume in 2Q, up 58% from the prior year.
We look for revenue growth of 20% in 2021 on continued strong digital consumer spending trends, but down from our prior 21% estimate on eBay's faster transition to its own payment platform. PayPal saw a surge in new accounts during the pandemic as customers diverted spending online amid shelter-at-home policies. Net revenue as a percentage of total payment volume (known as the 'take rate') has been falling, reflecting lower eBay volumes, lower currency volatility, and reduced FX fees. Still, we expect operating margins to benefit as the company leverages the scale of its network.
The company has traditionally been transparent with its financial goals. In the third quarter of 2021, it expects revenue
growth of 13%-14% and EPS of $1.07. For the full year, it projects total payment volume growth of 33%-35% (up from a prior 30%), revenue growth of 20%, and non-GAAP earnings growth of 21%.
On the reduced revenue growth, we are lowering our 2021 EPS estimate to $4.70 from $4.72, while raising our 2022 forecast to $5.71 from $5.62 as eBay becomes less of a headwind.
FINANCIAL STRENGTH & DIVIDENDOur financial strength rating on PayPal is High. Balance
sheet metrics are favorable, with cash and short-term investments as of June 30, 2021 of $12.4 billion and long-term debt of $8.9 billion. PayPal accessed the public debt markets for the first time in 3Q19, raising $5.0 billion in senior fixed-rate notes at favorable interest rates, as it seeks to optimize its capital structure. PayPal issued $4 billion in debt in May 2020 at an effective rate of 2.26%.
Free cash flow is expected to be reinvested in the business and used for acquisitions and buybacks. In 2017, the company announced a new $10 billion share buyback plan. PayPal repurchased 765,000 million shares in 2Q21 for $200 million.
The company does not expect to pay a regular cash dividend. Management plans to return 40%-50% of free cash flow to shareholders, and to spend $1-$3 billion per year on acquisitions and strategic investments.
MANAGEMENT & RISKSPayPal is led by president and CEO Dan Schulman, who
joined the company in 2014 from American Express. In August 2015, John Rainey joined PayPal as chief financial officer. He was previously with United Continental Holdings.
PayPal faces considerable competition in the payments market from well-established brands, including Apple's ApplePay, Visa's Checkout, MasterCard's MasterPass, and American Express's Later Pay services, as well as other digital products from Facebook and Google. Customers generally have a range of payment options in addition to PayPal at the point of sale, and the company must compete on convenience and transaction price. The company must also respond quickly to changing customer preferences, including the increasing demand for mobile payment services.
COMPANY DESCRIPTIONSpun off from eBay in July 2015, PayPal is a technology
platform company that enables digital and mobile payments on behalf of consumers and merchants worldwide. It accepts payments from merchant websites, mobile devices and applications, and at offline retail locations through its PayPal, PayPal Credit, Venmo and Braintree products.
PayPal processes transactions in more than 200 markets and in more than 100 currencies, and allows customers to
Section 2.155
GROWTH / VALUE STOCKSwithdraw funds from bank accounts in 56 currencies and hold balances in PayPal accounts in 25 currencies.
VALUATIONPayPal shares are trading in the upper end of their
52-week high, having risen some 70% over the past year, far outpacing the market amid the surge in online spending. We expect PayPal to show steady long-term growth in payment volumes as it adds merchants, signs additional partnerships, increases the number of transactions per customer, and benefits from both a recovery in global spending and an accelerated shift to digital payments. PayPal competes in the payments space with American Express, Discover, Visa and MasterCard, as well as with other mobile payment services such as ApplePay.
To value the stock, we believe that processing pure-plays Visa and MasterCard still offer the best comparisons. PayPal is a smaller player in the payments market, though it also has a strong brand and a record of innovation. As such, we expect it to post above-industry-average earnings growth for many years, and believe that it merits a premium multiple. Consistent operating margin improvement also argues for an improved valuation. Our 12-month target price of $310 implies a multiple of 54-times our 2022 EPS estimate, above the low-40s multiples of Visa and MasterCard but near the PEG ratio of 2.5 for those firms.
On July 29 at midday, BUY-rated PYPL traded at $285.32, down $16.66. (Stephen Biggar, 7/29/21)
Pfizer Inc. (PFE)Publication Date: 7/29/21Current Rating: BUY
HIGHLIGHTS*PFE: Reaffirming BUY with $55 target*We expect Pfizer to generate sustainable revenue from
its coronavirus vaccine, and to reinvest its vaccine earnings in acquisitions and in the development of new therapies.
*With additional contracts, the company has increased its guidance for 2021 COVID-19 vaccine revenue to $33.5 billion from $26 billion.
*Pfizer has also raised its overall 2021 revenue guidance to $78.0-$80.0 billion from $70.5-$72.5 billion, and its adjusted EPS forecast to $3.95-$4.05 from $3.55-$3.65.
*Based on the updated guidance, including the upward revision of vaccine revenue, and the strong performance of the core business, we are raising our adjusted EPS estimates to $4.00 from $3.60 for 2021 and to $4.10 from $3.50 for 2022.
ANALYSIS
INVESTMENT THESISWe are reaffirming our BUY rating on Pfizer Inc. (NYSE:
PFE) with a $55 price target. We see stronger top-line growth in 2021 and beyond as the company moves past the spinoff of the Upjohn business. We also expect Pfizer to generate
sustainable revenue from its coronavirus vaccine, and to reinvest its vaccine earnings in acquisitions and in the development of new therapies. Given the stock's below-peer-average P/E, we believe that investors are underestimating the sustainability of the COVID-19 vaccine franchise and its revenue contribution beyond 2021.
We also like Pfizer's innovative Biopharma business, which includes growth drivers such as Ibrance, Eliquis, Vyndaqel, Xtandi, Xejanz, and Prevnar13; a robust pipeline of biologics; and strong R&D capabilities.
RECENT DEVELOPMENTSPfizer delivered strong 2Q21 results on July 28. Adjusted
EPS rose 73% from the prior year to $1.07 and topped the consensus estimate by $0.10.
The results included a strong contribution from the COVID-19 vaccine (BNT162b2), co-developed with BioNTech. With additional purchasing contracts from governments around the world over the past three months, Pfizer has raised its 2021 guidance for vaccine revenue. It now expects $33.5 billion in vaccine revenue in 2021, up from a prior forecast of $26 billion. This guidance reflects 2.1 billion doses slated for delivery in 2021 under signed contracts as of mid-July.
Second-quarter GAAP net income was $5.563 billion or $0.98 per share, compared to $3.489 billion or $0.62 per share a year earlier. Revenue was $19.0 billion, up 86% on an operational basis. Revenue from the BNT162b2 vaccine was $7.838 billion ($2.034 billion in the U.S.; $5.804 billion overseas). Excluding BNT162b2, revenue grew 10% operationally.
In the core business, the growth drivers were Vyndaqel, Eliquis, Prevnar, Ibrance (outside the U.S.), Inlyta, and Xtandi. We note that Prevnar sales grew 34% in the U.S. as increased medical and wellness visits drove demand for both the pediatric and adult indications. (The FDA also recently approved Prevnar 20 for the prevention of invasive disease and pneumonia caused by 20 streptococcus serotypes.) Hospital product sales rose 17%, reflecting growth in contract manufacturing activities for BioNTech and Gilead (the production of remdesivir). Biosimilar sales grew 88%, driven by the recent launches of oncology drugs.
Pfizer is engaged in ongoing discussions with regulators regarding a third dose or booster of the COVID-19 vaccine as the protection offered by the initial two-dose administration could wane over time. Pfizer said that such a booster would raise the level of neutralizing antibodies and be effective against the Delta variant. U.S. and international regulators must determine whether to recommend the booster shot and which populations should receive it. If the booster is approved, the likely initial focus would be on older immunocompromised
Section 2.156
GROWTH / VALUE STOCKSadults.
Pfizer is also pursuing authorization of the vaccine for children ages 5-11. It believes that it could receive this authorization by the end of September.
Pfizer's operating results now exclude Upjohn, which was spun off in November 2020 and combined with Mylan to create Viatris. Revenue and expenses associated with Upjohn have been recategorized as discontinued operations and excluded from adjusted results. With the Upjohn spinoff, Pfizer parted ways with legendary products such as Lipitor, Lyrica, Celebrex, and Viagra.
EARNINGS & GROWTH ANALYSISPfizer has raised its guidance for 2021. Including the
coronavirus vaccine, it now expects revenue of $78.0-$80.0 billion, up from a prior view of $70.5-$72.5 billion. It also expects adjusted EPS of $3.95-$4.05, up from a prior $3.55-$3.65.
Based on the updated guidance, including the upward revision of projected vaccine revenue, and the strong performance of the core business, we are raising our adjusted EPS estimates to $4.00 from $3.60 for 2021 and to $4.10 from $3.50 for 2022.
FINANCIAL STRENGTH & DIVIDENDWe rate Pfizer's financial strength as Medium-High, the
second-highest peg on our five-point scale.
The company generated strong cash flow from operations in 2020, which has continued into 2021. Cash flow from operations was $14.4 billion in 2020, up from $12.6 billion in 2019. Cash flow from operations was $4.5 billion in 1Q, compared to $3.1 billion a year earlier. We will update this data when the company reports cash flow for the first half of the year.
Pfizer currently pays an annualized dividend of $1.56, for a yield of about 3.7%. Our dividend estimates are $1.56 for 2021 and $1.64 for 2022.
RISKSRisks for Pfizer include any disruptions from the Upjohn
spinoff, as well as the expiration of patents for key products, long product development cycles, and political and regulatory hurdles.
Like other pharmaceutical companies, Pfizer faces risks related to reimbursement coverage for its drugs. Insurers in the U.S. and national health agencies in overseas markets may also restrict or deny coverage for certain high-cost drugs, limiting access to these products.
COMPANY DESCRIPTIONPfizer is a leading global developer and manufacturer of
pharmaceuticals and biotech drugs. Its products include oncology and immunology drugs, treatments for rare diseases, and vaccines.
VALUATIONPFE trades at 10.3-times our 2022 EPS estimate, below
the mean of 18.1 for our coverage universe of large-cap biopharma stocks. We believe that Pfizer is well positioned for post-pandemic recovery, and expect stronger top-line growth from the Biopharma business following the Upjohn spinoff. Pfizer's coronavirus vaccine and antiviral drugs are additional revenue drivers. We are reaffirming our BUY rating on PFE with a target price of $55.
On July 29 at midday, BUY-rated PFE traded at $42.89, down $0.17. (David Toung, 7/29/21)
Qualcomm, Inc. (QCOM)Publication Date: 7/29/21Current Rating: BUY
HIGHLIGHTS*QCOM: Continued strength and strong guidance;
reiterating BUY *Qualcomm posted fiscal 2Q21 sales and adjusted EPS
that blew out Street expectations.*Revenue from QCT, the semiconductor business, was up
70%, reflecting broadbased strength led by RF front-end and IoT.
*QTL royalty revenue also came in well above consensus; all major handset makers are now Qualcomm licensees.
*QCOM has underperformed peers and the market in 2021 even as Qualcomm anticipates strong revenue and EPS growth for fiscal 2021 and beyond.
ANALYSIS
INVESTMENT THESISBUY-rated Qualcomm Inc. (NGS: QCOM) rose by 3% in
an up market on 7/29/21 after delivering fiscal 3Q21 sales and adjusted EPS that far exceeded Street expectations. Revenue benefited from a third full-quarter contribution of thin modem revenue from Apple driven by the huge success of the 5G-based iPhone 12 family. Sales also benefited from licensing revenue from recent licensees.
Revenue rose 65%, led by equipment (QCT) revenue, while non-GAAP EPS of $1.92 rose 123% year-over-year and topped the consensus estimate by $0.24. Revenue from QCT, the semiconductor business, was up 70%, reflecting broadbased strength led by RF front-end and IoT. QTL royalty revenue also came in well above consensus; all major handset makers are now Qualcomm licensees.
Intel, fighting to regain its undisputed crown in CPUs under energetic new CEO Pat Gelsinger, has announced comprehensive and aggressive changes in its strategy. These include a merchant fab strategy whereby Intel will offer use of
Section 2.157
GROWTH / VALUE STOCKSits semiconductor foundries to fabless companies, as an alternative to Taiwan Semi. Qualcomm has emerged as the most high-profile participant in the program, although the extent of its involvement has yet to be determined.
We believe that Qualcomm has barely begun to monetize its significant intellectual capital and multigenerational lead in 5G technology. As the 5G ramp moves from mainly infrastructure investment to the mass adoption of 5G handsets, we continue to look for a significant boost to revenue, margins, and EPS.
Qualcomm executed a seamless leadership transition, with President Christian Amon taking over as chief executive from long-time CEO Steve Mollenkopf. QCOM has underperformed peers and the market in 2021 amid sector rotation, supply-chain bottlenecks, and concern about lumpiness in 5G buildouts. The shares have been discounted even as Qualcomm anticipates strong revenue and EPS growth for fiscal 2021 and beyond. We are reiterating our BUY rating on QCOM and our 12-month target price of $175.
RECENT DEVELOPMENTSQCOM is down 8% year-to-date in 2021, while peers are
up 11%. QCOM rose 67% in 2020, while the peer group of communications and information processing semiconductor companies in Argus coverage advanced 49%. QCOM rose 60% in 2019, while peers rose 54%. QCOM shares declined 11% in 2018, compared to a 4% decline for peers. QCOM declined 2% in 2017, compared to a 31% simple average gain for peers. QCOM rose 30% in 2016, versus 60% for peers.
For fiscal 3Q21 (calendar 2Q21), Qualcomm reported GAAP revenue of $8.06 billion, which was up 65% year-over-year and up 2% sequentially. Revenue for 3Q21 was above the high end of management's wide $7.1-$7.9 billion guidance range and topped the $7.55 billion consensus forecast by $500 million. Non-GAAP EPS of $1.92 for fiscal 3Q21 rose 123% from $0.86 in the prior year, came in above the high end of management's $1.55-$1.75 guidance range, and also smoked the $1.67 consensus forecast.
CEO Christiano Amon, participating in his first quarterly earnings report in that role, noted that the company was benefiting from demand strength across virtually every industry. Qualcomm is leading and expects to continue to lead in mobile, but sees multiple other growth markets and opportunities.
Qualcomm aims to lead the evolution of the connected intelligent edge by transforming connectivity and processing in cars, the home, smart factories, edge devices, wearables, and more. The foundation of Qualcomm's IoT strategy is 'edge connectivity and processing for the growing cloud-based economy.'
The CEO also noted that Qualcomm is tapping multiple markets beyond mobile-phone 5G as the business continues to diversify. Primarily from QCT (semiconductor) sales and partly from royalty licensing, Qualcomm is on tap to generate '$10 billion of annual revenue across RF front-end, IoT, and automotive,' the CEO stated.
Qualcomm is providing solutions that are 'fueling the connected intelligent edge,' which is enabling the cloud-based economy. Qualcomm is seeing unprecedented demand for its technologies as the pace of digital transformation accelerates.
For 3Q21, Qualcomm CDMA Technologies (QCT) revenue of $6.47 billion rose 70% annually and 3% sequentially, with annual and sequential growth reflecting continued thin modem demand by renewed customer Apple. QCT earnings before taxes (EBT) of $1.80 billion were up 198% annually. QCT EBT margin for 3Q21 expanded to 27.7% for 3Q21, from 15.8% for 3Q20. QCT's 5G design wins, along with higher share of dollar content per device, continue to drive top-line growth and margin expansion.
Qualcomm discontinued furnishing chipset-unit shipment data as of the end of FY20, and is instead furnishing QCT revenue by end market. The market break-out shows a surprising diversity of revenue sources. Handset revenue (60% of QCT total revenue for 3Q21) was up 57% annually and down 5% sequentially, in the third full quarter of the Apple iPhone 12 ramp.
Nearly all handset customer are Snapdragon customers; only Apple has historically used the modem function rather than the full apps processor from Qualcomm. Apple's massive baseband demand (an estimated 200 million-plus devices annually) could pressure QCT margins slightly, although we expect volume leverage to partly offset the mix issue.
Snapdragon 8 series mobile platforms have shown 'significant design win momentum,' with more than half of new smartphone design wins using 8 series. Total design wins for Snapdragon 8 increased 20% sequentially. Snapdragon series 7 for upper and mid-tier is also building momentum, with 40 new 7-series based devices announced shipped in the June quarter.
For the overall 3G/4G/5G global smartphone market, the company continues to model high-single-digit percentage growth in units in calendar 2021 compared with 2020. However, the company now has an 'upward bias' within that guidance, suggesting the potential for strong overall smartphone growth in 2021 after multiple years of low growthThe CEO stated that Qualcomm is on track to 'materially improve supply' by the end of the calendar year. Qualcomm is securing incremental capacity across new and older nodes, and also making progress with multi-sourcing initiatives. Intel recently highlighted Qualcomm as among over
Section 2.158
GROWTH / VALUE STOCKS100 semiconductor companies investigating using Intel fabs on a merchant-fab basis.
Also in QCT, RF Front End revenue for 3Q21 (15% of QCT total) grew 114% annually and 6% sequentially. Qualcomm believes the RF Front End SAM will grow at a 12% CAGR through CY22 to $18 billion. The company also believes it can become the largest RF front end supplier by revenue, thanks to what the CEO called Qualcomm's technology leadership in that area.
Automotive (4% of QCT revenue) grew 83% annually in 3Q21 and also grew 5% sequentially from 2Q21, as global automotive production continues to recover and electronic content per vehicle rises. The automotive design win pipeline has reached almost $10 billion, according to the CEO.
IoT (a best-ever 22% of QCT total) was up 83% year-over-year and grew a robust 30% sequentially. Auto SAM is forecast to grow at a 12% CAGR through CY22, while IoT addresses a potential $18 billion SAM as of FY22. Industrial product offerings are purpose-built for key verticals, such as transportation & logistics, warehousing, video collaboration, smart cameras, and more.
QTL revenue of $1.49 billion for 3Q21 rose 43% year-over-year while dropping 8% sequentially. Reflecting higher volume leverage and better overhead absorption, QTL EBT of $1.05 billion increased 63% year-over-year. QTL margin was 70.7% for 3Q21, vs. 73.3% for 2Q21 and 61.9% for fiscal 3Q20.
In 4Q20, Huawei became a Qualcomm licensee and paid a $1.8 billion royalty catch-up fee. All major handset makers are now under license, and Qualcomm has more than 155 5G royalty-bearing licensing agreements as of the fiscal 2021 nine-month mark. That is up from 111 licensees as of the end of fiscal 2020. Qualcomm expects 5G to have a longer life cycle than prior generations, due to its broad applications not only in phones but across multiple IoT applications.
During 2Q21, Qualcomm completed the acquisition of privately held Nuvia for $1.4 billion. The acquisition provides Qualcomm with industry-leading expertise in high-performance CPUs and SoCs while accelerating Qualcomm's development of ARM-based CPUs for cloud and data center applications.
Nuvia is currently developing new ARM-based CPU cores, with a goal to enter the HPC and enterprise markets with server SoCs and other products. Nuvia could help jump-start Qualcomm's stalled efforts in the market for AMR-based server CPUs. The combined team will look to drive step-function improvements in CPU performance and power efficiency to meet the demands of 5G computing.
After outperforming peers in 2019-2020, QCOM has lagged peers and the broad market in 2021, even though it is now experiencing the best growth since early 3G days. We are reiterating our BUY rating on QCOM and our 12-month target price of $175
EARNINGS & GROWTH ANALYSISFor fiscal 3Q21 (calendar 2Q21), Qualcomm reported
GAAP revenue of $8.06 billion, which was up 65% year-over-year and up 2% sequentially. Revenue for 3Q21 was above the high end of management's wide $7.1-$7.9 billion guidance range and topped the $7.55 billion consensus forecast by $500 million.
The GAAP gross margin was 57.8% in 3Q21, versus 56.6% in 2Q21 and 57.5% a year earlier. The non-GAAP operating margin was 33.1% in 3Q21, compared to 33.7% in 2Q21 and 22.0% a year earlier.
Non-GAAP EPS of $1.92 for fiscal 3Q21 rose 123% from $0.86 in the prior year, came in above the high end of management's $1.55-$1.75 guidance range, and also smoked the $1.67 consensus forecast.
For all of FY20, revenue of $23.9 billion declined 3% from $24.6 billion in FY19. Non-GAAP earnings were $4.19 per diluted share, up 18% from $3.54 per diluted share in FY19.
For fiscal 4Q21, Qualcomm is modeling revenue of $8.4-$9.2 billion. At the $8.8 billion guidance midpoint, revenue would be up 5% year-over-year - even though 4Q20 included a $1.8 billion catch-up payment from Huawei. Excluding that contribution, revenue at the midpoint would be up 35% annually. The company is also modeling non-GAAP EPS of $2.15-$2.35 per diluted share; at the guidance midpoint of $2.25, non-GAAP EPS would be up 55% year-over-year.
We are raising our FY21 non-GAAP forecast to $8.37 per diluted share, from $7.78. We are also raising our non-GAAP EPS projection for FY22 to $9.34 per diluted share, from $8.73. We regard our estimates, which remain above consensus, as fluid and subject to revision. Our long-term earnings growth rate forecast is 10%.
FINANCIAL STRENGTH & DIVIDENDOur financial strength rating for Qualcomm is
Medium-High.
As a result of share-repurchase programs announced since July 2018, when the company failed to acquire NXP, Qualcomm's cash position has been meaningfully reduced. Apple and Huawei both provided cash infusions, and a more normal royalty revenue stream going forward may enable Qualcomm to resume growth in cash on the balance sheet.
Section 2.159
GROWTH / VALUE STOCKS
Cash was $12.9 billion at the end of fiscal 3Q21. Cash was $11.2 billion at the end of fiscal 2020, $12.3 billion at the end of fiscal 2019, $12.1 billion at the end of fiscal 2018, $39.8 billion at the end of fiscal 2017, and $32.4 billion at the end of fiscal 2016.
Cash flow from operations was $9.45 billion in the first nine months of FY21, vs. $4.07 billion a year earlier. Cash flow from operations was $5.82 billion in FY20 (including the Huawei catch-up payment), $7.28 billion in FY19 (including the Apple catch-up payment), $3.90 billion in FY18, $5.00 billion in FY17, and $7.40 billion in FY16.
Debt was $15.7 billion at the end of fiscal 3Q21. Debt was $15.73 billion at the end of FY20, $15.9 billion at the end of FY19, $16.4 billion at the end of FY18, $21.9 billion at the end of FY17, and $11.8 billion at the end of FY16.
Expressing confidence in its 5G ramp, and following the thwarted NXP bid, Qualcomm repurchased $30 billion of its stock, equivalent to one-third of its market cap at the time. Outside this program, Qualcomm's capital-allocation strategy targets a return of at least 75% of free cash flow to shareholders. Qualcomm has returned a cumulative $88 billion to shareholders since 2007.
In March 2021, Qualcomm announced a 5% hike in the quarterly dividend, to $0.68 from $0.65. Previously, Qualcomm raised its dividend by 5% in March 2020 to $0.65 from $0.62; and by 9% in March 2018 to $0.62 per share. Our dividend estimates are $2.69 for FY21 and $2.84 for FY22.
MANAGEMENT & RISKSChristiano Amon, who has served as Qualcomm president
since 2018, became CEO in June 2021. He succeeded Steve Mollenkopf, who served as CEO from 2014 to June 2021; Mollenkopf remains special advisor. Akash Palikhwala is CFO. Donald Rosenberg has long served as chief counsel, a role of significant importance at a litigation target such as Qualcomm.
We expect Mr. Amon, who has been with Qualcomm since 1995, to hold both president and CEO roles simultaneously. In time, Qualcomm's board will likely appoint a president, to be groomed as the next successor. The CEO transition has been a non-event.
In August 2019, Qualcomm appointed Mark McLaughlin as chairman of the board. He replaced Jeffery Henderson, an independent director since 2016, who had served in the chairman role since March 2019 and will remain on the board. The post of executive chairman has been discontinued.
The FTC issue represented the final substantial risk to Qualcomm's fundamental royalty licensing model. While the
federal appeals court for the ninth circuit has overruled the FTC decision, there remains a risk that this ruling could itself be overturned on appeal. We see that risk as low, however, given the strong impetus at the DoJ to champion U.S. leaders in 5G.
The settlements with Huawei and Apple significantly reduce risks to Qualcomm's licensing model but do not eliminate them altogether. Qualcomm paid fines to settle KFTC (Korean) and EU investigations, and that might encourage other national agencies to go after Qualcomm. For the EU investigation, the language regarding the use of rebates and incentives for silicon sales smacks of a smaller vendor objecting to volume discounts for larger vendors (Apple and Samsung, for example). In Korea, we expect Qualcomm to pay a fine and renegotiate royalty rates with Samsung and LG; the amount of the fine may be negotiable.
COMPANY DESCRIPTIONQualcomm is a designer and manufacturer of advanced
semiconductors for mobile phones and commercial wireless applications. It provides integrated solutions, including processors, GPS, WiFi, basebands and other applications, for smartphones, tablets, and mobile PCs. Qualcomm has extended its leadership in the 3G CDMA wireless standard into the 4G LTE niche. It derives substantial royalty and licensing revenue from its extensive intellectual property portfolio for 3G, 4G and now 5G technologies.
VALUATIONQCOM shares are trading at 16.9-times our FY21
non-GAAP EPS forecast and at 15.1-times our FY22 projection; the two-year forward P/E of 16.0 is below the average P/E of 17.0 for FY16-FY20 - even though EPS growth prospects for the next two years are much stronger than for the preceding five years. In a rising market, the two-year forward relative P/E of 0.67 is meaningfully below the relative multiple of 0.92 on a trailing five-year basis, and also at a meaningful discount to the market. Our historical comparables model signals value in the $170s, in a rising trend and above current prices.
With QCOM trading at discounts on most price-based multiples, our peer-indicated value is in the $230s and remains well above current prices. Our discounted free cash flow model signals value above $250, based on prospects for higher long-term EPS and cash flow growth with 5G now a reality. Our blended valuation for QCOM is in the $230s, again in a rising trend and well above current prices.
Appreciation to our 12-month target price of $175, along with the annualized dividend yield of about 1.9%, implies a risk-adjusted return exceeding our benchmark forecast.
On July 29 at midday, BUY-rated QCOM traded at $150.60, up $8.16. (Jim Kelleher, CFA, 7/29/21)
Section 2.160
GROWTH / VALUE STOCKS
Republic Services, Inc. (RSG)Publication Date: 7/30/21Current Rating: BUY
HIGHLIGHTS*RSG: Maintaining BUY and raising target to $135*Republic is a fully integrated waste management
company, with operations ranging from waste collection and compacting to recycling and renewable energy generation.
*We believe that RSG is poised for share price gains as the U.S. economy recovers.
*The company recently reported 2Q results that topped expectations.
*We are raising our 2021 EPS estimate to $4.03 from $3.79 and our 2022 forecast to $4.43 from $4.00.
ANALYSIS
INVESTMENT THESISOur rating on Republic Services Inc. (NYSE: RSG) is
BUY with a revised target price of $135, raised from $124. Republic is a fully integrated waste management company, with operations ranging from waste collection and compacting to recycling and renewable energy generation. We believe that RSG is poised for share price gains as the U.S. economy recovers. From a technical standpoint, prior to the pandemic the shares had been in a bullish pattern of higher highs and higher lows that dated to 2016. They have recovered since their pandemic lows in March 2020. On valuation, we believe this well-run company deserves to trade at a premium to historical average multiples based on its solid balance sheet, focus on growth through acquisitions, and strong industry position.
RECENT DEVELOPMENTSRSG shares have outperformed over the past three
months, with a gain of 9% compared to gains of 6% for the S&P 500 and 3% for the industry (ETF IYJ). The shares have underperformed over the past year, gaining 35% compared to gains of 38% for the index and 44% for the industry. Over the past five years, RSG has outperformed, with a gain of 149% compared to a 124% advance for the index and a 112% gain for the industry. The beta on RSG is 0.7.
The company recently reported 2Q results that topped expectations. On July 29, RSG posted 2Q21 adjusted earnings of $1.09 per diluted share, up 36% from the prior year and above the consensus forecast of $0.96. Revenue came to $2.813 billion, up 35%.
Management has raised its 2021 guidance. It expects to generate free cash flow of $1.45-$1.47 billion, up from its previous forecast of $1.35-$1.40 billion and from $1.235 billion in 2020. It also expects adjusted diluted EPS of $4.00-$4.05, up from a prior $3.74-$3.79 and above the $3.56 earned in 2020. It projects an increase in the average yield of approximately 2.5% and volume growth of 1.5%-2.0% this year.
RSG has a growth-by-acquisition strategy in the fragmented waste hauling industry. It invested $613 million in acquisitions in 2020, or $580 million net of divestitures. It expects to invest about $600 million in acquisitions and to make $125 million in solar energy investments in 2021. It completed the purchase of Santek on May 5, 2021.
EARNINGS & GROWTH ANALYSISBy segment, second-quarter revenue in the collection
business (74% of total revenue), rose 13% year-over-year. Revenue rose 7% in residential collection, 14% in the small container business, and 20% in the large container business. In the transfer segment (6% of revenue), sales rose 17%. In the landfill segment (13% of revenue), revenue rose 17%. Sales of recycled commodities (4% of revenue) rose 40% as the average recycled commodity price per ton rose to $170, up $69 per ton from the prior year and $37 per ton from the prior quarter. In the environmental solutions segment (1% of revenue), sales fell 3%.
Based on current business trends and management's focus on costs, we are raising our 2021 EPS estimate to $4.03 from $3.79 and our 2022 forecast to $4.43 from $4.00. Our five-year earnings growth rate forecast is 7%.
FINANCIAL STRENGTH & DIVIDENDOur financial strength ranking on Republic Services is
Medium-High, the second-highest rank on our five-point scale. The company receives above-average marks on our key financial strength criteria of debt levels, fixed-cost coverage, profitability, cash flow generation, and earnings quality. The company's credit is rated Baa2/stable by Moody's, BBB+/stable by Standard & Poor's, and BBB/stable by Fitch - all investment-grade ratings.
The company scores high on profitability - its 2Q21 EBITDA margin was 30.6%, up 110 basis points from the prior year. The company had $8.8 billion in debt at the end of the second quarter, and the debt/total capitalization ratio was 51%. EBITDA covered interest expense by a factor of 9.
Cash and cash equivalents totaled $34 million at the end of the second quarter, down from $38.2 million at the end of 2020.
RSG pays a quarterly dividend of $0.46 per share, or $1.84 annually, for a yield of about 1.5%. Our dividend forecasts are $1.84 (raised from $1.74) for 2021 and $1.92 (raised from $1.84) for 2022.
RSG also has a stock buyback plan. It repurchased 0.7 million shares in 2Q21 and 0.1 million in 1Q21. It also repurchased 1.2 million shares in 1Q20, but none over the remainder of 2020. The company has $1.9 billion remaining on its $2 billion repurchase authorization, which runs through
Section 2.161
GROWTH / VALUE STOCKSDecember 31, 2023.
MANAGEMENT & RISKSOn June 25, Jon Vander Ark succeeded Donald W. Slager
as the company's CEO. Mr. Slager had served as CEO for more than a decade. Mr. Vander Ark, who continues to serve as president, has also become a member of the board. He previously served as COO.
Investors in RSG shares face risks. The primary risks faced by investors in Republic Services are the company's sensitivity to economic conditions and substantial capital requirements, the competitive nature of the waste management industry, and the highly regulated nature of the business.
COMPANY DESCRIPTIONRepublic Services is the second-largest domestic provider
of nonhazardous waste services, as measured by revenue. The company serves 14 million customers. As of December 31, 2020, it had operations in 41 states and Puerto Rico. These included 345 collection operations, 220 transfer stations, 186 active landfills, 76 recycling centers, 6 treatment, recovery and disposal facilities, 9 salt water disposal wells, 7 deep injection wells, and 75 landfill gas and renewable energy projects. The average estimated remaining life of the company's landfills is 62 years. The company was founded in 1996 and is based in Phoenix. Republic Services has 36,000 employees. The shares are a component of the S&P 500.
VALUATIONWe think that RSG shares are attractively valued at recent
prices near $117. The shares have traded between $86 and $117 over the past year and are currently near the top of that range. From a technical standpoint, they have been in a long-term upward trend of higher highs and higher lows that was briefly interrupted by the pandemic selloff in March 2020.
On the fundamentals, the shares appear favorably valued at 29-times our 2021 EPS estimate, above the midpoint of the five-year range of 20-32, and at 27-times our 2022 estimate. The stock is trading at a price/sales ratio of 3.4, near the high end of the range of 1.5-3.5. We believe this well-run company deserves to trade at a premium to historical average multiples based on its solid balance sheet, focus on growth through acquisitions, and industry position. Our rating remains BUY with a target price of $135.
On July 30 at midday, BUY-rated RSG traded at $117.74, up $2.25. (David Coleman, 7/30/21)
Rio Tinto PLC (RIO)Publication Date: 8/4/21Current Rating: BUY
HIGHLIGHTS*RIO: Maintaining BUY and $108 target*Rio Tinto has strengthened its operating performance
and balance sheet by cutting costs and selling noncore assets.
It also continues to return cash to shareholders through dividend increases.
*On July 28, the company released its midyear results for the six months ended June 30. Underlying first-half EPS rose 156% from the prior year to $7.52.
*RIO ADRs appear favorably valued at 6-times our 2021 EPS estimate, below the low end of the five-year historical average range of 8-13.
*Our target price of $108 implies a potential return of more than 28% including the dividend.
ANALYSIS
INVESTMENT THESISOur rating on Rio Tinto plc (NYSE: RIO), a leading
international mining and metals company, is BUY. Rio Tinto has strengthened its operating performance and balance sheet by cutting costs and selling noncore assets. It also continues to return cash to shareholders through dividend increases. The company has traditionally performed well during difficult economic times, and, in our view, has strong long-term growth opportunities. On the fundamentals, RIO ADRs appear favorably valued at 6-times our 2021 EPS estimate, below the low end of the five-year historical average range of 8-13. Our target price is $108.
RECENT DEVELOPMENTSRIO shares have underperformed the S&P 500 over the
past three months, rising 2% while the index has risen 6%. The shares have outperformed over the past year, with a gain of 54%, compared to a gain of 36% for the index.
The company has begun operations at the $2.6 billion Gudai-Darri replacement iron ore mine in Western Australia, with more than nine million cubic meters of pre-stripping completed in June.
In May 2021, Rio Tinto and InoBat signed a memorandum of understanding to accelerate the establishment of a 'cradle-to-cradle' battery manufacturing and recycling value chain in Serbia. The partnership will cover the 'full commodity lifecycle' from lithium mining to battery manufacturing and recycling.
Also in May, Rio Tinto agreed to partner with Comptech in the design of new aluminum alloys for use in electric vehicles and 5G antennas.
Rio Tinto is based in London and reports results in U.S. dollars. The company posts full results at midyear and year-end, and production updates after 1Q and 3Q.
On July 28, the company reported midyear results for the six months ended June 30. Underlying first-half EPS rose 156% from the prior year to $7.52. Consolidated revenue rose to $33.1 billion from $19.4 billion a year earlier. Underlying EBITDA rose 118% to $21.0 billion with an underlying
Section 2.162
GROWTH / VALUE STOCKSmargin of 61%.
FINANCIAL STRENGTH & DIVIDENDOur financial strength rating on RIO is Medium-High, the
second-highest rank on our five-point scale. The company receives above-average scores on our key financial strength criteria of debt levels, fixed-cost coverage, profitability, cash flow generation, and earnings quality. The company's credit is rated A2/stable by Moody's, A/stable by S&P, and A/stable by Fitch.
Cash and cash equivalents were $13.1 billion at the end of 2020, compared to $10.6 billion at the end of 2019. Total debt was $3.84 billion, and the debt/capitalization ratio was 21.4%.
Rio Tinto generated 2020 operating cash flow of $15.9 billion, up 6% from 2019. Free cash flow was $9.4 billion, up 3%.
Rio Tinto pays a dividend. Management's target payout ratio is 40%-60% of underlying earnings. The company pays regular dividends twice a year, in April and September, and occasionally pays a special dividend. The 2018 dividend was $4.08, or $3.08 from the regular dividend plus a $1.00 special dividend. The 2019 dividend was $4.43, including a regular dividend of $3.82 and a special dividend of $0.61. The company had a payout ratio of 72% in 2020, including a regular dividend of $4.64 and a special dividend of $0.93. Our 2021 dividend estimate is $9.63 (raised from $6.00) and our 2022 estimate is $4.50.
MANAGEMENT & RISKSJean-Sebastien Jacques, the company's CEO since July
2016, resigned in September 2020 after the company destroyed two ancient aboriginal sites in Western Australia. Jakob Stausholm took over as CEO on January 1, 2021. Mr. Stausholm has served as CFO since 2018. Prior to joining Rio Tinto, Mr. Stausholm was the chief strategy, finance and transformation officer for the Maersk Group. Simon Thompson is the company's chairman. On June 3, the company announced the appointment of Ben Wyatt to its board, effective September 1, 2021. Mr. Wyatt, the former Treasurer of Western Australia, will be the first Aboriginal member of the board. Peter Cunningham became the company's CFO in June 2021.
The greatest risk for RIO investors is the cyclicality of the company's business, as economic downturns can sharply lower demand and pricing for iron ore, copper, and other commodities.
The company is global, and faces a host of different regulatory environments. As noted above, it has faced public and shareholder outcry due to its destruction of sacred aboriginal sites in Australia. It is also in arbitration with Turquoise Hill related to cost overruns at the Oyu Tolgoi mine
in Mongolia.
COMPANY DESCRIPTIONRio Tinto is a leading global mining and metals group.
The company's primary product groups are iron ore, aluminum, copper, and diamonds & minerals. The company is based in London and has 46,000 employees.
VALUATIONWe think that RIO shares are attractively valued at current
prices near $89. Over the past 52 weeks, the shares have traded between $54 and $96. On a technical basis, the shares are in a bullish pattern of higher highs and higher lows that dates to the pandemic lows of March 2020.
On the fundamentals, RIO ADRs are trading at 6-times our 2021 EPS estimate, below the low end of the five-year historical average range of 8-13. They are also trading at a price/book multiple of 2.7, near the peer average of 2.8 but above the historical average of 2.0. The price/cash flow multiple is 5.9, below the five-year average of 6.9. We are maintaining our BUY rating with a target price of $108, implying a potential return of more than 28% including the dividend.
On August 3, BUY-rated RIO closed at $89.39, up $2.09. (David Coleman, 8/3/21)
EARNINGS AND GROWTH ANALYSISThe company is organized into four segments: Iron Ore
(75% of 2020 EBITDA), Aluminum (9%), Copper & Diamonds (10%), and Energy & Minerals (7%). We review recent results and outlooks for these businesses below.
Iron Ore. First-half iron ore shipments of 154.1 million tons fell 3% year-over-year. Production was 5% lower due to wet weather, mine shutdowns, and labor shortages. The company continues to expect 2021 production of 325-340 million tons, compared to 331 million tons in 2020.
Aluminum. First-half aluminum production of 1.619 million tons rose 3% from the prior year. The company expects 2021 production of 3.1-3.3 million tons, compared to 3.2 million tons in 2020. First-half bauxite production fell 4% year-over-year to 27.3 million tons. The company expects full-year production of 56-59 million tons.
Copper. First-half mined copper production fell 11% from the prior year to 236,100 tons due to lower recoveries and throughput at the Escondida and Kennecott mines. The company expects 2021 copper production of 500,000-550,000 tons, compared to 528,000 tons in 2020.
Energy & Materials. The production of pellets and concentrate fell 5% in the first half to 5.1 million tons. The company expects production of 10.5-12.0 million tons in 2021, up from 10.4 million tons in 2020.
Section 2.163
GROWTH / VALUE STOCKSTurning to our estimates, based on the company's pricing
forecasts and production targets and management's focus on margins, we are raising our 2021 underlying EPS estimate to $15.82 from $12.50. Our estimate implies a gain of 106% for the year. Our 2022 EPS estimate is $11.80, raised from $8.90.
Royal Dutch Shell PLC (RDS/A)Publication Date: 8/2/21Current Rating: BUY
HIGHLIGHTS*RDS/A: Reaffirming BUY following 2Q21 results*On July 29, Shell reported adjusted 2Q21 net earnings,
on a current cost-of-supplies basis, of $5.534 billion or $1.42 per ADS (equal to two common shares), up from $638 million or $0.16 per ADS in the prior-year quarter.
*The increased earnings reflected higher realized oil prices and chemical margins, partly offset by lower realized refining and marketing margins.
*Together with its 2Q21 earnings release, the company announced a $2 billion share repurchase program, effective immediately. The program is expected to be completed by the end of 2021.
*We are raising our 2021 EPS estimate to $4.90 from $2.10 to reflect our expectations for continued energy market recovery and expanding margins. The consensus forecast is $4.80.
ANALYSIS
INVESTMENT THESISWe are reaffirming our BUY rating on Royal Dutch Shell
plc (NYSE: RDS.A) with a price target of $46. Shell reported meaningfully higher adjusted earnings in 2Q21 and we expect near-term performance to remain strong, driven by higher pricing, expanding margins, and capital spending discipline.
Shell has been working to increase portfolio returns by selling less profitable assets, and, more recently, by cutting capital and operating costs. As the company moves past the recent period of heavy capital spending and continues to lower costs, we expect free cash flow to improve significantly - providing additional resources for dividend hikes and share buybacks.
RECENT DEVELOPMENTSOn July 29, Shell reported adjusted 2Q21 net earnings, on
a current cost-of-supplies basis, of $5.534 billion or $1.42 per ADS (equal to two common shares), up from $638 million or $0.16 per ADS in the prior-year quarter. EPS topped our estimate of $0.53 and the consensus estimate of $0.66.
The increased earnings reflected higher realized oil prices and chemical margins, partly offset by lower realized refining and marketing margins. Second-quarter sales totaled $60.515 billion, up 86% from the prior year and below the consensus of $67.920 billion.
Second-quarter 2021 results by division are summarized below.
In the Upstream division, Shell recorded an adjusted net profit of $2.469 billion, up from a loss of $1.512 billion in the year-ago quarter. The gain mostly reflected higher realized oil prices and lower depreciation. Worldwide production available for sale totaled 2.262 million boe/d in 2Q21, down 6% from the prior year. The decline was attributable to increased maintenance and asset sales. The impact of field declines was largely offset by growth from new fields.
In the Oil Products segment (formerly the Downstream segment), the company reported a second-quarter adjusted profit of $1.299 billion, down from $2.411 billion a year earlier. The decrease reflected lower realized refining and marketing margins.
In the Chemicals business, second-quarter adjusted profit rose to $670 million from $206 million in 2Q20, reflecting higher realized margins in base chemicals and intermediates. Manufacturing plant utilization was 82%, up from 75% a year earlier.
In the Integrated Gas division, Shell reported a second-quarter adjusted net profit of $1.609 billion, up from $362 million a year earlier, reflecting higher realized prices for LNG, oil and gas, lower comparative operating expenses due to credit provisions in the first quarter 2021 and favorable deferred tax movements. This was partly offset by lower contributions from trading and optimization. Total production fell 3% due to higher maintenance activities.
Finally, together with its 2Q21 earnings release, the company announced a $2 billion share repurchase program, effective immediately. The program is expected to be completed by the end of 2021.
EARNINGS & GROWTH ANALYSISShell does not provide formal guidance, though
management said that it expected higher commodity prices and refining margins to strengthen earnings in the near term.
We are raising our 2021 EPS estimate to $4.90 from $2.10 to reflect our expectations for continued energy market recovery and expanding margins. The consensus forecast is $4.80.
We are also boosting our 2022 EPS estimate to $5.60 from $2.45. The current consensus is $5.48.
FINANCIAL STRENGTH & DIVIDENDWe rate Shell's financial strength as Medium-High, the
second-highest rank on our five-point scale. The company's debt is rated A+/stable by Standard & Poor's and Aa2/stable
Section 2.164
GROWTH / VALUE STOCKSby Moody's. Fitch rates Shell's debt at AA-/stable. All ratings are investment grade.
At the end of 2Q21, Shell's total debt/capitalization ratio was 36.9%, down from 39.6% a year earlier. The debt/cap ratio is slightly below the peer average; the ratio has averaged 30.1% over the past five years.
Outstanding debt totaled $100.1 billion at the end of 2Q21, down from $105.0 billion at the end of 2Q20. We view Shell's access to outside capital as superior and believe that it provides the company with a competitive advantage.
Shell had cash and cash equivalents of $34.1 billion at the end of 2Q21, compared to $27.9 billion a year earlier. Cash from operating activities was $454 million in 2Q21, compared to $390 million in 2Q20. The company has an undrawn $4.65 billion revolving credit facility.
On July 29, Shell announced a 7% increase in its quarterly dividend to $0.3725, or $1.49 annually, for a projected yield of about 3.7%. The first payment at the new rate will be made on September 20, 2021 to holders of record as of August 13. We note that the company cut its dividend in April 2020 due to weak energy markets. Our revised dividend estimates are $1.44 (raised from $1.38) for 2021 and $1.49 (raised from $1.43) for 2022.
MANAGEMENT & RISKSBen Van Beurden became the CEO of Royal Dutch Shell
on January 1, 2014. Mr. Van Beurden joined Shell in 1983 and has held a range of executive positions in both Upstream and Downstream operations and in the LNG business. Prior to becoming CEO, Mr. Van Beurden was the director of the Downstream division and had responsibility for Europe and Turkey.
Shell faces a number of risks, including the possibility that volatile oil prices and refining margins may destabilize earnings. In addition, the company operates in regions of the world where official corruption is endemic, heightening its exposure to unethical business practices. The company's operations may also be disrupted by political instability. Like other major oil companies, Shell is also exposed to significant environmental risks.
COMPANY DESCRIPTIONRoyal Dutch Shell plc is an Anglo-Dutch multinational oil
and gas company headquartered in the Netherlands and incorporated in the United Kingdom. Created by the merger of Royal Dutch Petroleum and UK-based Shell Transport & Trading, it is the seventh largest company in the world in terms of revenue and one of the six oil and gas 'supermajors.'
INDUSTRYWe have lowered our rating on the Energy sector to
Under-Weight from Market-Weight. The year-to-date surge in
Energy stocks has not been matched by rising production levels. Instead, Energy companies continue to cut production as more electric vehicles are introduced by mainstream automotive OEMs, and as utilities redouble their efforts to add to their renewable generation sources.
Energy now accounts for 2.9% of S&P 500 market cap; over the past five years, the weighting has ranged from 2% to 10%. We think that investors should consider allocating about 2% of their diversified portfolios to the Energy group. The sector includes the major integrated firms, as well as exploration & production, refining, and oilfield & drilling services companies. The sector is outperforming thus far in 2021, with a gain of 44.5%. It underperformed in 2020, with a loss of 37.3%, and in 2019, with a gain of 7.6%.
Our 2021 forecast for the average price of a barrel of West Texas Intermediate crude oil is now $59, up from $53. Our estimate assumes that OPEC and OPEC+ members coordinate on production cuts and that global economic activity continues to gradually improve. Our forecast also reflects the long-term downward pressure on crude prices as 'peak oil' approaches. This trend, though not a smooth decline, may be seen in recent average annual prices: $40 in 2020, $57 in 2019, $65 in 2018, $51 in 2017, $43 in 2016, $49 in 2015, $93 in 2014 and $98 in 2013. Further, we anticipate that President Biden's policies will continue to favor clean energy initiatives rather than carbon-based energy. Our range for WTI through 2021 is now $70 on the upside and $50 on the downside. Our 2021 forecast for the average wellhead price of Henry Hub natural gas remains $3.13 per MMbtu, with a range of $2.50-$3.75. The average price in 2020 was $2.05 per MMbtu.
VALUATIONRDSA shares have traded between $23.07 and $44.50
over the past 52 weeks and are currently above the midpoint of this range. To value the stock on a fundamental basis, we use peer group and historical multiple comparisons, as well as a dividend discount model. The shares are trading at 8.3-times our 2021 EPS estimate and at 7.3-times our 2022 forecast, compared to a 10-year annual average range of 16-34.
On other valuation metrics, the shares are trading below the low end of the range for price/book (0.9 versus a range of 1.0-1.3), near the high end of the range for price/sales (0.8 versus a range of 0.5-0.8), and at the low end of the range for price/cash flow (4.6 versus a range of 4.5-7.9). They are also trading at a price/EBITDA multiple of 4.2, above the midpoint of the range of 2.9-4.7.
We view the company's valuation metrics as mixed, but attractive within our coverage universe of integrated oil company stocks. We also believe that the dividend is safe and sustainable. Our price target of $46 implies a multiple of 8.2-times our 2022 EPS estimate and a total potential return,
Section 2.165
GROWTH / VALUE STOCKSincluding the dividend, of 17% from current levels.
On August 2 at midday, BUY-rated RDS.A traded at $40.83, up $0.22. (Bill Selesky, 8/2/21)
S&P Global Inc (SPGI)Publication Date: 8/3/21Current Rating: BUY
HIGHLIGHTS*SPGI: Raising target price*SPGI shares have outperformed the market over the past
quarter, rising 11% compared to a 5% advance for the S&P 500.
*S&P Global recently reported 1Q EPS that topped Street expectations, and management once again raised guidance.
*Management has signaled confidence in its outlook with a 15% increase to the dividend.
*The company is planning to merge with IHS Markit, in a deal that we think will strengthen SPGI's product offerings.
ANALYSIS
INVESTMENT THESISOur rating on S&P Global Financial Inc. (NYSE: SPGI) is
BUY. S&P Global has put the finishing touches on a multiyear restructuring and is now focused on its faster-growing financial businesses, including the lucrative and not-very-competitive business of rating bonds. The company has a transparent management team and consistently 'underpromises and overdelivers' with financial results. While a $1.5 billion settlement with the DoJ has strained the balance sheet, the company is beginning to repair the damage with strong cash flow. The company is planning to merge with IHS Markit, in a deal that we think will strengthen and diversify SPGI's product offerings. The company faces risks related to trade and tariff threats, as well as the risk of rising defaults in the corporate bond market and rising long-term interest rates. The onset of COVID-19 is another challenge, but so far has not impacted results. The SPGI share price has risen steadily over the past 10 years, as have earnings. We see value in the SPGI shares, despite the strong run. Our new target price is $490, up from $445. The shares are a suitable core Financial Services holding in a diversified portfolio.
RECENT DEVELOPMENTSSPGI shares have outperformed the market over the past
quarter, rising 11% compared to a 5% advance for the S&P 500. Over the past year, SPGI has underperformed, rising 24% while the broad market has gained 34%. The shares have sharply outpaced the market over the past 5- and 10-year periods. The beta on SPGI is around 0.95.
S&P Global recently reported 2Q adjusted diluted EPS that grew 6% year-over-year and topped Street expectations. The results were reported on July 29, 2021. Revenue of $2.1 billion grew 8% from the prior year on an organic basis. The adjusted operating margin narrowed by 40 basis points to
58.3%. Adjusted diluted EPS rose 3% to $3.62 and came in $0.38 above the consensus forecast. For the first half of the year, the company has earned $7.01 per share on an adjusted basis.
Along with the 2Q results, management once again raised guidance for 2021. The company is planning for EPS of $12.95-$13.15, up from its previous outlook of $12.55-$12.75. SPGI management has a history of setting the earnings bar low early in the year and raising it as the year progresses.
The company has a growth-by-acquisition strategy. In November 2020, the company announced that it is merging with IHS Markit in an all-stock transaction which values IHS Markit at an enterprise value of $44 billion. The transaction will create a company with increased scale, world-class products in core markets and strong joint offerings in high-growth adjacencies, including private assets, small and medium enterprises, counterparty risk management, supply chain and trade and alternative data. Combined, the two companies will provide comprehensive solutions across data, platforms, benchmarks and analytics in ESG, climate and energy transition. The combined company's board will include the current S&P Global Board of Directors and four directors from the IHS Markit Board. Richard Thornburgh, current Chairman of S&P Global, will serve as chairman of the combined company. The leadership team will comprise senior leaders from both organizations. Douglas Peterson, President and Chief Executive Officer of S&P Global, will serve as CEO of the combined company. Lance Uggla, Chairman and Chief Executive Officer of IHS Markit, will stay on as a special advisor to the company for one year following closing. Ewout Steenbergen, Executive Vice President and Chief Financial Officer of S&P Global, will serve as Chief Financial Officer of the combined company. The transaction is expected to be accretive to earnings by the end of the second full year post-closing. The combined company expects to deliver annual run-rate cost synergies of approximately $480 million, with approximately $390 million of those expected by the end of the second year post-closing, and $350 million in run-rate revenue synergies for an expected total run-rate EBITA impact of approximately $680 million by the end of the fifth full year after closing. The transaction is expected to close in 4Q21.
EARNINGS & GROWTH ANALYSISThe company operates in four segments: S&P Global
Ratings (51% of 2Q revenue), S&P Market Intelligence (26%), S&P Dow Jones Indices (13%), and Platts (11%). We review recent results and provide our outlook by division below.
S&P Global Ratings reported that revenue rose 7% in 2Q. Within the segment, Transaction revenue fell 1% to $615 million primarily due to a substantial decline in investment-grade issuance. Non-transaction revenue increased 19% to $458 million due to new-entity ratings, fees associated
Section 2.166
GROWTH / VALUE STOCKSwith surveillance, and Rating Evaluation Service activity. The adjusted operating margin was 67.9%. Looking ahead, we expect falling default rates and tighter spreads to support issuance over the next few quarters. We note that management has a long history of boosting margins in this group over time.
In S&P Market Intelligence, revenue rose 8%. The adjusted operating margin widened 100 basis points to 35.4%. We look for this business to grow in the mid-single digits in 2021. We also expect margins to widen as management keeps a tight focus on costs.
S&P Dow Jones Indices LLC reported 16% revenue growth. The adjusted operating margin was a healthy 70.7%. This segment is seeing increased demand as more investors turn to passive investments; quarter-ending ETF AUM associated with S&P indices was $2.4 trillion, a 50% increase from 2Q20.
S&P Global Platts reported revenue growth of 9%. The operating margin was 57.9%. This segment should get much larger as the IHS Markit operations are integrated.
Moving to margins, we note that the 2Q adjusted operating margin was a robust 58.3%. Management's goal over the next few years is to lift the adjusted operating margin from 46.5% in 2018 to the low 50s. The 2020 adjusted operating margin was 53.3%, up 310 basis points year-over-year.
Turning to our estimates, based on the sales and margin trends, as well as management's outlook, we are raising our 2021 adjusted EPS estimate to $13.15 from $12.75. Our estimate is at the high end of management's guidance range and implies 13% growth this year. We expect stronger growth in 2022, as the company should be able to buy back shares again post-merger. We are raising our 2022 adjusted EPS estimate from $14.05 to $14.40.
Our five-year EPS growth rate forecast is 10%.
FINANCIAL STRENGTH & DIVIDENDOur financial strength rating on S&P Global is Medium.
The company achieves mixed scores on our main measures of financial strength: leverage based on debt/cap, profitability, fixed-cost coverage, profitability, cash flow generation and earnings quality.
Cash, cash equivalents, and restricted cash at the end of 2Q21 were $5.2 billion. Debt of $4.1 billion accounted for a high 79% of total capitalization, but operating profit covered interest expense by a factor of 36 in 2Q21. The adjusted operating margin is high, above 50%.
S&P Global has a history of paying - and growing - dividends. In January 2021, it increased its annualized dividend by 15% to $3.08. The current yield is about 0.7%.
Forecast earnings cover the dividend by a factor of 4.0, and we consider the payout to be secure. S&P Global has raised its dividend annually for 48 consecutive years. Our dividend estimates are $3.08 for 2021 and $3.54 for 2022.
SPGI also has a share buyback program. Management has suspended the repurchasing program as the merger with IHS Markit is pursued.
MANAGEMENT & RISKSDoug Peterson, formerly the head of the company's credit
rating business, assumed the roles of CEO and president in 2013, taking over from Harold McGraw III, a member of the founding family who led the company for more than 20 years. Ewout Lucien Steenbergen became CFO in 2016. Richard E. Thornburgh is the Non-Executive Chairman of the Board. All are slated to retain their positions post-merger.
S&P Global is extremely transparent with investors, and provides substantial detail about its businesses through reports, webcasts and presentations. The company has a long history of 'underpromising and overdelivering' results to the Street.
The company has refined its business mix over the years, most recently in launching ESG-related products. In 2012-2013, in response to overtures from an activist investor, Starboard Value, S&P Global divested its Publishing division to focus on its ratings, indices and media operations. Now it will integrate IHS Markit's technical information, databases, decision-support tools and related services into is operations.
Investors in SPGI shares face risks.
The shares have performed well despite ongoing headline risk related to the company's role in the 2007-2009 financial crisis. In 2015, the company announced settlements totaling $1.38 billion with the DOJ, the SEC, state attorneys general, and other parties on legal and regulatory matters stemming from the crisis. The company reached a separate $125 million settlement with the California public employee retirement system regarding ratings on three structured investment vehicles. These settlements have strained the balance sheet.
In addition to legal risks, investors in S&P Global face a range of macroeconomic, competitive and regulatory risks. At the macro level, the company's bond-ratings business suffered during the credit crunch and the drop-off in structured-finance securities issuance; the business also remains susceptible to hikes in interest rates, as corporate debt issuance could fall if rates increase significantly. While the movement from active to passive investments could weigh on Market Intelligence revenue, investment management comprises only 25% of contract-based revenue. The consumer base has shifted to enterprise-wide contracts, resulting in less customer volatility. The company also faces business integration risks as it grows through M&A; there are no assurances that management will
Section 2.167
GROWTH / VALUE STOCKSmeet its financial forecasts with the merger of IHS Markit.
As a global business, S&P also faces international risks. Britain's exit from the EU and the depreciation of the British pound could have a negative impact.
COMPANY DESCRIPTIONS&P Global Financial Inc., based in New York, is a
diversified financial services company. The company's divisions include S&P Global Ratings, S&P Market and Commodities Intelligence, and S&P Dow Jones Indices. The company has 23,000 employees. SPGI shares are a component of the S&P 500.
VALUATIONWe think that SPGI shares are attractively valued at
current prices near $434. The shares have traded between $303 and $436 over the past 52 weeks. From a technical standpoint, the shares have been in a long-term bullish pattern of higher highs and higher lows that dates to 2013.
Looking ahead, we expect solid earnings growth, multiple expansion, and a higher share price over time as the company continues its transformation and sheds legal risks. We have compared S&P Global Financial to a group of publicly traded peers, including Morningstar, IHS Markit, FactSet Research Systems, and Moody's. SPGI currently trades at 30-times our 2022 EPS estimate, below the peer average of 32. On price/sales, the stock is trading at a multiple of 13, at the high end of the peer group range of 3-13. Our dividend discount model points to a value above $500. Blending our approaches, we arrive at our target price of $490.
On August 3 at midday, BUY-rated SPGI traded at $431.89, down $2.36. (John Eade, 8/3/21)
Sherwin-Williams Co. (SHW)Publication Date: 7/28/21Current Rating: BUY
HIGHLIGHTS*SHW: Reaffirming BUY and $325 target*On July 27, Sherwin-Williams reported an adjusted
2Q21 net profit of $708.8 million or $2.65 per diluted share, up from $653.1 million or $2.37 per share in the prior-year quarter.
*Consolidated net sales rose 17% from the prior year to $5.380 billion, but came in slightly below the consensus forecast of $5.390 billion.
*We are increasing our 2021 EPS estimate to $9.30, at the midpoint of management's revised guidance range, from $9.20. The consensus is $9.42.
*We are also raising our 2022 EPS estimate to $10.63 from $10.22 based on expectations for better-than-average growth next year as the pandemic recedes. The 2022 consensus is $10.62.
ANALYSIS
INVESTMENT THESISWe are reaffirming our BUY rating on Sherwin-Williams
Company (NYSE: SHW) with a price target of $325. We believe that the market has underestimated the company's 2021 earnings power and failed to recognize SHW as a play on the reopening of the economy.
The company managed to grow EPS in 2020 despite the impact of the pandemic, as demand for 'do it yourself' (DIY) paint in the Consumer Brands segment more than offset relatively flat sales at the company's paint stores, which cater to professional 'do it for me' (DIFM) customers. We expect that dynamic to reverse as the economy reopens, but look for continued strong sales and earnings in the coming quarters.
RECENT DEVELOPMENTSOn July 27, Sherwin-Williams reported an adjusted 2Q21
net profit of $708.8 million or $2.65 per diluted share, up from $653.1 million or $2.37 per share in the prior-year quarter. EPS topped our estimate of $2.58 but missed the consensus estimate of $2.67. (The results reflect the company's 3-for-1 stock split on March 31.)
The higher earnings were driven by revenue growth in all segments, with particular strength in the Performance Coatings Group (PCG). Consolidated net sales rose 17% from the prior year to $5.380 billion, but came in slightly below the consensus forecast of $5.390 billion.
The 2Q21 consolidated gross margin was 44.8%, down from 48.0% a year earlier, reflecting the impact of higher raw material costs. SG&A expense rose 11% to $1.438 billion, but fell to 26.7% of sales from 28.0% in 2Q20. Currency translation had no material impact on revenue.
As a result of the Valspar acquisition, Sherwin-Williams has changed its reporting structure. The company now has three reporting segments: the Americas Group, the Consumer Brands Group, and the Performance Coatings Group. Second-quarter results by segment are summarized below.
In the Americas Group (TAG), revenue rose 23% from the prior year to $3.093 billion, while operating profit climbed 21% to $727 million. Net sales benefited from higher sales in professional end markets (which more than offset the decrease in DIY) and from higher selling prices. Segment profit benefited from higher volume and price increases, partially offset by increased raw material costs.
In the Consumer Brands Group (CBG), revenue fell 25% from the prior year to $732 million, while operating profit dropped 45% to $144 million. The lower sales primarily reflected the impact of the recent Wattyl divestiture. Segment profit fell due to lower volume and higher raw material costs, partially offset by selling price increases and strong cost
Section 2.168
GROWTH / VALUE STOCKScontrols.
In the Performance Coatings Group (PCG), revenue rose 41% to $1.555 billion, with sales rising in all end markets due to higher volume and price increases. The segment posted an operating profit of $201 million, up from $150 million in 2Q20. Acquisition-related amortization expense reduced segment profit as a percentage of net external sales by 370 basis points, compared to 470 basis points in the second quarter of 2020.
EARNINGS & GROWTH ANALYSISBased on the strong 2Q21 results, Sherwin-Williams now
projects high single-digit to low double-digit (about 9%-14%) revenue growth in 2021, up from its prior forecast of high single-digit growth. It also raised its adjusted EPS forecast to $9.15-$9.45 from $8.80-$9.07.
CEO John Morikis noted that while demand remains strong in most end markets, raw material inflation has been more significant and sustained than originally anticipated. The company believes that it will offset these higher costs with previously announced price increases.
We are increasing our 2021 EPS estimate to $9.30, at the midpoint of management's revised guidance range, from $9.20. The consensus is $9.42.
We are also raising our 2022 EPS estimate to $10.63 from $10.22 based on expectations for better-than-average growth next year as the pandemic recedes. The 2022 consensus is $10.62.
FINANCIAL STRENGTH & DIVIDENDWe rate Sherwin-Williams' financial strength as Medium,
the midpoint on our five-point scale. The company's debt is rated BBB/stable by Standard & Poor's and Baa2/positive by Moody's. Fitch rates the company's debt at BBB/stable.
At the end of 2Q21, SHW's total debt/capitalization ratio was 79.3%, up slightly from 73.3% a year earlier. The total debt/cap ratio is above the peer average. Over the past five years, the debt/cap ratio has averaged 71.2%.
Outstanding debt totaled $10.876 billion at the end of 2Q21, up from $10.610 billion at the end of 2Q20. Most of the debt is long term. Sherwin-Williams had cash and cash equivalents of $220 million at the end of 2Q21, compared to $188 million a year earlier.
Sherwin-Williams suspended share buybacks from March 2016 to June 2017 as it pursued the Valspar acquisition. However, following the completion of the merger, it resumed its buyback program and repurchased 1.075 million shares in 2Q19. As of March 31, 2020, it had a remaining authorization of 6.75 million shares. We believe that SHW has paused share
repurchases due to the pandemic, but expect it to complete its authorization in the coming quarters.
Sherwin-Williams pays an annual dividend of $2.20 per share, for a yield of about 0.8%. Our dividend estimates are $2.40 for 2021 and $2.60 for 2022. Going forward, the company anticipates a dividend payout of about 30% of prior-year earnings.
MANAGEMENT & RISKSJohn Morikis succeeded Christopher Connor as the
company's CEO on January 1, 2016, following more than nine years as president and COO (he retains the title of president). Mr. Morikis joined Sherwin-Williams in 1984 as a management trainee.
SHW investors face risks related to the highly cyclical nature of the company's end markets, particularly construction, housing and manufacturing. The company also faces risks related to the integration of its many acquisitions.
COMPANY DESCRIPTIONSherwin-Williams is the largest U.S. producer of paint,
coatings and related products. The company operates over 4,100 retail stores and supplies coatings directly to retailers, distributors, industrial & commercial customers, and other industry professionals. The company acquired Valspar in 2017.
VALUATIONSHW shares have traded between $207.19 and $293.05
over the past 52 weeks and are currently near the high end of this range. To value the stock on a fundamental basis, we use peer group and historical multiple comparisons, as well as a dividend discount model.
The shares are trading at 31-times our 2021 EPS estimate and at 27-times our 2022 forecast, compared to a 10-year annual average range of 23-35. They are also trading above the high end of their historical range for price/book (26.7 versus a range of 12.0-20.2) and price/sales (3.9 versus a range of 2.0-2.9), and above the midpoint of the range for price/cash flow (21.8 versus a range of 16.4-24.9). They are trading at a price/EBITDA multiple of 21.4, above the high end of the range of 13.5-19.3.
We believe that these relatively high multiples are warranted based on SHW's size, geographic reach, and broad product portfolio. We also believe that the dividend is safe and sustainable. Our price target of $325 implies a multiple of 31-times our 2022 EPS estimate and a total potential return, including the dividend, of 13% from current levels.
On July 28 at midday, BUY-rated SHW traded at $288.13, up $0.41. (Bill Selesky, 7/28/21)
Shopify Inc (SHOP)
Section 2.169
GROWTH / VALUE STOCKS
Publication Date: 7/29/21Current Rating: BUY
HIGHLIGHTS*SHOP: Good growth even as shoppers return to stores;
reiterating BUY *Shopify delivered well-above-consensus revenue and
non-GAAP EPS for 2Q21.*Non-GAAP EPS of $2.24 for 2Q21 more than doubled
the consensus forecast while rising by $0.23 sequentially.*Shopify's GMV of $42.2 billion in 2Q21 surpassed that
in holiday-driven 4Q20, when consumers are perceived to spend the most.
*We believe Shopify has only partly penetrated the small to mid-sized merchant market, while its Shopify Plus platform is gaining ground with large brands.
ANALYSIS
INVESTMENT THESISBUY-rated Shopify Inc. (NYSE: SHOP) was unchanged
in a mixed market on 7/28/21 after delivering well-above-consensus revenue and non-GAAP EPS for 2Q21. While revenue slightly exceeded Street estimates, non-GAAP EPS of $2.24 for the quarter more than doubled the consensus forecast. Revenue rose more than 50% year-over-year. The company did express some caution on the pace of growth in gross merchandise volume, but was positive on margin trends going forward.
Shopify in February 2021 expressed caution on its market outlook, stating that while 2021 results would exceed any pre-pandemic year, they would lag the prime pandemic year of 2020. That caution was based on what was expected to an environment in which COVID-19 was receding.
Partly because the disease has proven to be resurgent but mainly because of the secular digital transition underway, Shopify's momentum has not slowed in the year to date, as merchants in key market territories continue to recognize the benefits of a merchandising strategy integrated across physical and virtual realms.
In the era of 'evil empire' Amazon.com, Shopify has emerged as the locus of a de facto 'rebel alliance' of small to mid-sized merchants anxious to control their own retail destiny. Using its successful trial period strategy, Shopify has become a key enabler of integrated retail platforms for small and medium businesses.
The aggregate of U.S. merchant GMV on Shopify's platforms in 2020 would have made it the second-largest U.S. online retailer. Shopify expects to attract more vendors and will continuing investing in its platform on their behalf. The company is partnering with Wal-Mart, Tik Tok, and Facebook, along with other platforms, to improve the merchant and customer experience.
Despite expectations that pandemic-driven gains in its merchant business would wind down, SHOP's second-quarter data suggests that merchants will continue to prioritize enabling integrated retail platforms that include physical, online, and mobile presence. In this environment, Shopify in our view has a strong runway for growth.
SHOP ran up sharply in 2020 and has enjoyed a summer 2021 surge. At the same time, Shopify has only partly penetrated the small to mid-sized merchant market, while its Shopify Plus platform is gaining ground with large brands.
Given prospects for further strong growth, we are reiterating our near-term BUY rating and raising our 12-month target price to $1,850, from $1,650. We continue to recommend the stock for risk-tolerant investors aware of the volatility in high-beta names.
RECENT DEVELOPMENTSSHOP is up 38% in 2021 year-to-date; immediate peers
are up 21% year-to-date. SHOP soared by 185% in 2020, versus 89% for the peer group of Argus-covered cloud, social media, and internet service providers. SHOP rose 197% in 2019, while peers advanced 51%. Shopify went public in May 2015 at $17 per share.
For 2Q21, Shopify posted revenue of $1.12 billion, which was up 57% year-over-year and 13% sequentially. Revenue topped the $1.05 billion consensus forecast; management issued only directional 2Q21 guidance. With costs running up less quickly than revenues, Shopify posted a non-GAAP profit of $2.24 per diluted share in 2Q21, up 113% from $1.09 a year earlier and up $0.23 sequentially from 1Q21. Shopify more than doubled the Street consensus non-GAAP profit estimate of $0.96 per diluted share, which had been rising throughout the quarter. GAAP profits were $6.90 per diluted share for 2Q21 and included a one-time $780 million gain.
Even with consumers exiting their homes and cautiously retuning to now-open malls, management noted that digital commerce tailwinds remained strong. That may be because May and June optimism around tamping down the pandemic has been replaced by caution related to the resurgent virus and especially the highly infectious Delta variant. The U.S. CDC has restored mask mandates for indoor gatherings in states and counties with high infection rates per 100,000 individuals.
Shopify has been unusually well-positioned to grow in the pandemic environment. As pandemic shutdowns accelerated in spring 2020, tens of thousands of merchants realized that their online presence was either lacking or non-existent. Shopify served as an alternative to adopting a third-party merchant role on Amazon, whose platform power can put merchants at a disadvantage.
The company's use of free trial programs proved to be a
Section 2.170
GROWTH / VALUE STOCKSlifeline for many physical-only merchants suddenly unable to conduct business. Many of these merchants have recognized the effectiveness of an integrated merchandising model, even as they reopen physical stores. Shopify accordingly has experienced strong conversions from free and freemium merchants to full clients.
Shopify is now beginning to lap those quarters when its growth went suddenly from moderate to explosive. Although tougher comps lie ahead, Shopify continues to drive double-digit annual growth and - in a sign that its momentum has not yet been broken - even experienced double-digit sequential top-line growth in 2Q21.
For 2Q21, Merchant Solutions revenue of $785 million (70% of total) rose 52% year-over-year and 18% sequentially, after dipping 4% sequentially in 1Q21. Shopify's Subscription Solutions revenue of $334 million (30% of total) was up 70% annually and 4% sequentially. Subscription Solutions segment growth was aided by more merchants joining the platform, and their purchase of apps, themes, and other growth aids.
Monthly recurring revenue (MRR) of $95.1 million was up 67% annually and 6% sequentially. Shopify Plus (for major brands) represented 26% of MMR and grew 52% year-over-year, to $25.2 million. Shopify's partner ecosystem continues to expand, as tens of thousands of partners referred a merchant to Shopify over the past 12 months.
Gross Merchandise Volume (GMV) across Shopify's customer platforms totaled $42.2 billion for 2Q21, which was up 40% year-over-year and 13% sequentially; GMV in 2Q21 surpassed that in holiday-driven 4Q20, when consumers are perceived to spend the most. Gross payments volume (GPV) of $20.3 billion grew 51% year-over-year and was equivalent to 48% of GMV, compared with GPV representing 45% of 2Q20 GMV.
Founder and CEO Toby Lutke, speaking at the company's recent Shopify Unite Developers conference, noted that the past year had been one of 'great uncertainty for independent merchants.' With the help of Shopify, these merchants responded in real time by transitioning physical retail platforms into integrated offerings spanning online, mobile, and brick & mortar.
The pandemic rapidly accelerated the digitization of many industries, retail among them. What used to be two completely different industries, retail and online commerce, have now simply become the commerce industry, according to the CEO. Shopify believes it is building the online infrastructure for this increasingly digital world to allow as many people as possible to participate, the CEO declared.
At the company's recent virtual Shopify Unite Developers conference, the company announced 'ways we are helping
merchants and developers build the future of commerce on the internet.' Merchants can develop more flexible and customizable storefronts via the Online Store 2.0 upgrade. New APIs help merchants add richer features such as enhanced cart functionality, selling plans, tools for international pricing, and local pickup.
Shopify announced improvements to Shopify Checkout to make it faster and capable of handling more purchases per minute, while making it more scalable and easier to customize. Shop (mobile shopping assistant) and Shop Pay both received upgrades, with use of Shop Pay becoming available even to merchants not on the platform. Shopify also announced a more developer-friendly royalty schedule in order to attract more developers to the platform.
Reiterating its guidance from earlier in the year, Shopify continues to model strong growth for all of 2021, but at a slower pace than in 2020. The company expects Subscriptions Solutions revenue growth to be driven by more merchants worldwide joining the platform. Merchant solutions growth is forecast to be driven by GMV growth.
Growth rates of merchant solutions and subscriptions solutions are expected to be more similar to each other than in the recent past.
Accordingly, Shopify does not expect the 'surge in GMV' that drove merchant solutions in 2020 to repeat in 2021. 1Q21 is still forecast to the lowest and 4Q21 the highest revenue quarters of 2021; revenue is forecast to be more evenly spread across all quarters than it has been historically. The company now anticipates full-year 2021 adjusted operating income to be above the 2020 level.
Shopify's caution weighed upon the stock when it reported first-quarter results in spring 2021. The more muted response to this reiterated caution reflects investors' sense that Shopify is underselling its momentum, given two straight quarter of blow-out numbers.
Despite expectations that pandemic-driven gains in its merchant business would wind down, SHOP's second-quarter data suggests that merchants will continue to prioritize enabling integrated retail platforms that include physical, online, and mobile presence. In this environment, Shopify in our view has a strong runway for growth.
EARNINGS & GROWTH ANALYSISFor 2Q21, Shopify posted revenue of $1.12 billion, which
was up 57% year-over-year and 13% sequentially. Revenue topped the $1.05 billion consensus forecast; management issued only directional 2Q21 guidance.
Non-GAAP gross margin was 56.0% for 2Q21, vs. 57.2% for 1Q21; year-earlier GM was 56.1%. With costs running up
Section 2.171
GROWTH / VALUE STOCKSless quickly than revenues, non-GAAP operating margin was 21.2% for 2Q21, vs. 21.3% for 1Q21 and 15.9% a year earlier.
Shopify posted a non-GAAP profit of $2.24 per diluted share in 2Q21, up 113% from $1.09 a year earlier and up $0.23 sequentially from 1Q21. Shopify more than doubled the Street consensus non-GAAP profit estimate of $0.96 per diluted share, which had been rising throughout the quarter. GAAP profits were $6.90 per diluted share for 2Q21 and included a one-time $780 million gain.
For all of 2020, revenue of $2.93 billion was up 86% from $1.59 billion for 2019. Non-GAAP EPS was $3.96 for 2020, vs $0.41 for 2019.
Shopify is providing mainly directional guidance for future quarters. Shopify looks for revenue growth in 2021 to be lower than in 2020 but higher than in any prior year. The company now anticipates full-year 2021 adjusted operating income to be above the 2020 level.
We are raising our 2021 non-GAAP EPS forecast to $7.26 per diluted share from $6.08. We are also raising our non-GAAP EPS projection for 2022 to $7.91 per diluted share, from a preliminary $6.55. Our five-year annual EPS growth rate forecast is 18%, among the highest in the Argus coverage universe.
FINANCIAL STRENGTH & DIVIDENDOur financial strength rating on Shopify is High, now
under review though unlikely to change in the near term. The company has substantial cash holdings, and has grown its balance sheet cash rapidly in recent years.
Debt was $909 million at 2Q21. During 3Q20, Shopify issued $750 million in Senior Convertible Notes. Debt was $758 million at year-end 2020.
Shopify's cash & equivalents and marketable securities totaled $7.78 billion at the end of 2Q21. Cash & equivalents and marketable securities totaled $6.39 billion at the end of 2020, $2.46 billion at the end of 2019, $1.97 billion at the end of 2018, and $938 million at the end of 2017.
As a rapidly growing company, Shopify's cash needs weigh on cash flow growth. Cash from operations was $425 million for 2020, up from $71 million in 2019 and $9 million in 2018.
Shopify does not pay a dividend and we do not expect it to pay one for the foreseeable future. Any share repurchases are meant to offset dilution from stock option compensation.
MANAGEMENT & RISKSFounder Tobias Lutke is chairman and CEO. Amy
Shapero is the CFO, and Harvey Finkelstein is the COO. Craig
Miller is the chief product officer and Brittany Forsyth is the chief talent officer.
Risks facing Shopify include its ability to sustain its extremely rapid growth, which has been dependent on attracting new merchants to the platform and increasing sales to both new and existing merchants. We believe that the coronavirus pandemic has increased demand for Shopify's multiplatform approach to merchandising and commerce.
The company may also face risks as it seeks to move into new regional markets and operating adjacencies. An additional risk relates to the company's software platform, which is vulnerable to competition from new platforms, changes in technology, internal failures, and cyber-attacks and security breaches. Finally, Shopify is reliant on third-party technology and other vendors and suppliers, and must seek to maintain and enhance those relationships.
COMPANY DESCRIPTIONBased in Ottawa, Canada, Shopify provides a cloud-based
commerce platform for small and medium-sized businesses. The company's software provides customers with a single view of multiple sales channels, including web-based and mobile online platforms, physical retail locations, social media storefronts, marketplaces, and other venues.
VALUATIONShopify has run up rapidly in recent years, but there are
now signs that EPS growth is catching up with valuations. SHOP trades at a two-year average forward P/E multiple of 205-times for 2021 and 2022, compared to a five-year (2018-2020) historical average P/E of 394-times. On a historical comparables basis, SHOP shares are valued near $2,000, in a rapidly rising trend and now above current share prices.
Compared to a peer group of fast-growing app economy and software stocks, SHOP trades at heavy premiums on price/sales, P/E, and EV/EBITDA. Our peer-indicated value for SHOP is around $1,200, near current prices and stable.
On two-stage and three-stage discounted free cash flow valuation, SHOP is valued in the $2,250 range. Our blended valuation model, which is heavily weighted to DFCF given the company's strong growth prospects, renders a fair value for SHOP in the $2,000 range, in a clearly rising trend. Appreciation to our 12-month target price of $1,850 (raised from $1,650) implies a risk-adjusted return greater than our forecast for the broad market and is thus consistent with a BUY rating.
On July 28, BUY-rated SHOP closed at $1538.00, down $17.10. (Jim Kelleher, CFA, 7/28/21)
Skyworks Solutions, Inc. (SWKS)
Section 2.172
GROWTH / VALUE STOCKS
Publication Date: 8/3/21Current Rating: BUY
HIGHLIGHTS*SWKS: Strong growth, raises dividend; BUY to $210*Skyworks posted revenue for fiscal 3Q21 (calendar
3Q21) that modestly exceeded internal guidance and consensus expectations while rising sharply on a year-over-year basis.
*Skyworks has announced a 12% hike in its quarterly dividend, to $0.56 per common share from a prior $0.50. The company has stepped up its shareholder return policy in recent years
*The now-completed acquisition of the infrastructure and automotive businesses of Silicon Labs is highly complementary rather than overlapping, and is forecast to be immediately accretive.
*Although SWSKS has more than doubled since our upgrade a year ago, SWKS in our view is in the early innings of a significant growth expansion both in mobility and in broad markets.
ANALYSIS
INVESTMENT THESISBUY-rated Skyworks Solutions Inc. (NGS: SWKS) fell
by 4% in a down market on 7/30/21 despite delivering revenue and adjusted EPS for fiscal 3Q21 (calendar 3Q21) that edged past consensus expectations. Sales of $1.11 billion were about $10 million ahead of consensus, but also up 51% year-over-year. Non-GAAP EPS edged the consensus by a penny while also rising in high double-digits annually.
For a second straight quarter, SWKS was hit by profit-taking following a strong quarterly performance and some caution on the go-forward period. Although guidance was perceived as soft, Skyworks is positioned for sequential revenue growth in the low-double-digits and annual growth in the mid-30% range. EPS is similarly poised for strong quarterly and annual momentum. While some of the growth is M&A related, organic growth is also in double-digits.
Skyworks has announced a 12% hike in its quarterly dividend, to $0.56 per common share from a prior $0.50. The company has stepped up its shareholder return policy in recent years. Late in July, Skyworks completed the acquisition of the Infrastructure & Automotive business of Silicon Labs in an all-cash $2.75 billion deal. The I&A business comprises highly complementary technology portfolios and related assets in power/isolation, timing, and broadcast end markets. The acquisition is expected to be immediately accretive to non-GAAP results. It also adds more than $400 million in annual revenue and expands Skyworks' TAM to more than $20 billion.
We raised our rating on SWKS to BUY in March 2020 with the shares trading just below $90. Although the stock has more than doubled since our upgrade on accelerating prospects
for its mobility and broad markets businesses, SWKS appears to be in the early innings of a significant growth expansion. We are reiterating our near-term BUY rating and our 12-month target price of $210. Our long-term rating remains BUY.
RECENT DEVELOPMENTSSWKS is up 21% so far in 2021, while peer are up 15%
year-to-date. SWKS rose by 27% in 2020 versus a 45% gain for the peer group of Argus semiconductor stocks. SWKS jumped 80% in 2019, outstripping the 38% gain for Argus-covered semiconductor peers. SWKS declined 29% in 2018 versus a 4% decline for peers. SWKS rose 27% in 2017, compared to a 33% gain for peers, and edged down 1% in 2016, below the 70% peer-group gain.
For fiscal 3Q21 (calendar 3Q21), Skyworks reported revenue of $1.12 billion, which was up 52% year-over-year and down 5% sequentially. Revenue was above the $1.10 billion midpoint of management's $1.075-$1.125 billion guidance range, and also edged past the $1.10 billion consensus forecast. Non-GAAP earnings for fiscal 3Q21 totaled $2.15 per diluted share, which was up 70% annually and down $0.22 sequentially. Adjusted EPS topped management's guidance (at the revenue midpoint) of $2.13, as well as the $2.14 consensus call.
In a seasonally slower fiscal 3Q21 period, Skyworks saw its EPS and revenue step down from fiscal 2Q21 calendar 2021. At the same time, growth was above the midpoint of management's guidance, despite product and component shortages mainly at other suppliers. Skyworks operates its own semiconductor fabrication plants in California and Washington. In many cases, final shipment of a product such as a smartphone or WiFi access point was delayed because other suppliers were unable to source the needed components. This impacted Skyworks' revenue in the quarter, along with margin and profits.
Despite supply chain challenges, Skyworks delivered record fiscal 3Q21 non-GAAP EPS. Given 'strong and predictable' cash generation, the company announced a double-digit dividend hike. Going forward, the company looks for continued momentum as it executes on a large pipeline of design wins with mobile and broad-markets customers.
CEO Liam Griffin called out 5G as triggering a 'tipping point' beyond the mobile phone opportunity. 5G is acting as a catalyst that is transforming entire industries from telemedicine and autonomous driving to automated factories and intelligent energy management. Implementing smart 5G-enabled solutions also lowers carbon footprint.
Skyworks believes it is at the center of this technological shift, given its more than 20 years of innovation in the wireless connectivity space. The combination of innovative solutions,
Section 2.173
GROWTH / VALUE STOCKSdeep customer engagement and 'unrivaled manufacturing scale' drove another quarter of strong growth and continued design wins.
Key wins in the period include Sky5 for upcoming smartphone launches from Google, Oppo, Vivo, and Xiaomi; and RF front-end solutions for multiple WiFi 6 modules, including Facebook and Peloton. Skyworks also ramped WiFi platforms with Altice, Charter Communications, Linksys, and Aruba; connected home solutions with Honeywell; and small cell and MIMO launches with multiple Tier 1 OEMs who provide gear to wireless service providers.
Skyworks now provides directional rather than explicit segment results. For fiscal 3Q21 (calendar 2Q21), mobility revenue of about $774 million (69% of total) was up 52% annually, and down 2% sequentially. Beyond iPhone's dominance in Skyworks' mobility business, Skyworks is also 'powering an impactful set of 5G customers.' The company specifically sees opportunities in China, based on pipeline wins with multiple handset OEMs.
Top customer Apple accounted for about 50% of total revenue and more than two-thirds of mobility revenue in fiscal 1Q21. iPhone 12 represents a major step up in smartphone complexity, and also a substantial dollar-per-unit revenue opportunity for Skyworks. Skyworks' bill of materials in Apple's 5G phones exceeds $10 per unit, compared with about half that for prior generation phones and much less in mid-tier phones from other OEMs. Skyworks is already contracted to provide content for the fall 2021 iPhone lineup.
Also for fiscal 3Q21, Broad Markets revenue of $343 million (31% of total) was up 50% annually and down 11% sequentially. Since returning to annual growth in 4Q20, Broad Markets revenue growth has been accelerating. While the recent and current quarters represent easy comps for Skyworks and many technology companies, Skyworks' broad market revenue in 3Q21 was also 21% higher than in 3Q19.
The broad markets business is now benefiting from earlier contract wins across the breadth of Skyworks' diverse portfolio. Key markets served by broad markets include automotive, infrastructure, and cognitive wireless audio. Particular areas of strength include WiFi 6. In 5G infrastructure, the C-band wireless spectrum auction in the U.S. is expected to result in billions of dollars being spent on network upgrades.
In automotive, where Skyworks is benefiting from demand recovery around global reopening, management believes the market opportunity is barely tapped. Currently, Skyworks' content per vehicle is below $10, reflecting existing embedded and other opportunities such as Bluetooth and WiFi. With vehicles now adding 5G and with full autonomous on the horizon, Skyworks believes its per-vehicle content opportunity
could approach $50 in years and decades ahead.
The broad markets business will get a big lift from the acquisition of Silicon Labs' infrastructure & automotive (I&A) electronics business. The $2.75 billion acquisition closed on 7/26/21. The acquired I&A business has been generating about $400 million in annual revenue, with some seasonality, and it will contribute to Skyworks' top-line for two months and a partial week in fiscal 4Q21.
The acquisition adds about high-margined annualized revenue to Broad Market's current $1.2-$1.4 billion organic revenue base. For example, non-GAAP gross margins in the acquired businesses are closer to 60%, vs. low-50% for Skyworks. Given margins that are higher than the Skyworks average, management expects the acquisition to be immediately accretive to non-GAAP earnings.
The I&A business comprises highly complementary technology portfolios and related assets in power/isolation, timing, and broadcast end markets. CEO Griffin stated that Skyworks will capitalize on the quality of technology that the Silicon Labs' asset teams bring to the market. Skyworks intends to use its existing expertise to scale this expertise, bringing great products to new customers, channel partners, and others. The company is also discovering new cost synergy opportunities.
I&A operations can eventually be brought in-house to Skyworks fabs, for added efficiency and diversification opportunities. Ownership of fabs on the U.S. East and West Coasts has been a strategic differentiator at a time of worldwide semiconductor shortages. Apple recently warned that inability of some vendors to get it needed parts in time could curtail its calendar 3Q21 iPhone shipments.
Similar challenges face Android phone makers. Although the company's integrated in-house model means the company has not missed any deliveries, failures by other vendors is impacting shipments of final products, in turn impacting Skyworks' near-term revenue prospects. On the upside, as these supply chain challenges subside, Skyworks should continue to benefit from strong underlying demand.
We raised our rating on SWKS to BUY in March 2020 with the shares trading just below $90. Although the stock has more than doubled since our upgrade on accelerating prospects for its mobility and broad markets businesses, SWKS appears to be in the early innings of a significant growth expansion.
EARNINGS & GROWTH ANALYSISFor fiscal 3Q21 (calendar 3Q21), Skyworks reported
revenue of $1.12 billion, which was up 52% year-over-year and down 5% sequentially. Revenue was above the $1.10 billion midpoint of management's $1.075-$1.125 billion guidance range, and also edged past the $1.10 billion
Section 2.174
GROWTH / VALUE STOCKSconsensus forecast.
Non-GAAP gross margin was 50.6% for 3Q21, vs. 50.8% for 2Q21 and 50.1% a year earlier. Non-GAAP operating margin was 36.1% for 3Q21 vs. 37.6% for 2Q21 and 31.3% a year earlier.
Non-GAAP earnings for fiscal 3Q21 totaled $2.15 per diluted share, which was up 70% annually and down $0.22 sequentially. Adjusted EPS topped management's guidance (at the revenue midpoint) of $2.13, as well as the $2.14 consensus call.
For fiscal 2020, Skyworks had revenue of $3.36 billion, which was down 1% from $3.38 billion for fiscal 2019. Non-GAAP EPS for FY20 totaled $6.14, down less than 1% from $6.16 for fiscal 2019.
For fiscal 4Q21, Skyworks guided for revenue of $1.27-$1.33 billion. We estimate the two-month revenue contrition from I&A to be about $70 million. Gross margin guidance of 51.25% reflects the addition of higher-margined I&A assets. At the $1.30 billion midpoint, revenue would be up about 36% on an annual basis. At the revenue guidance midpoint, management forecast non-GAAP EPS of $2.53, which would be up about 37% year-over-year.
We are raising our FY21 forecast to $10.47 per diluted share from $10.22. Off the higher base, and assuming full-year margin improvement from adding I&A, we are raising our FY22 non-GAAP EPS forecast to $11.79 per diluted share from $10.57. We regard our estimates as fluid and subject to revision given pandemic uncertainties. Our five-year annualized EPS growth rate forecast is 10%.
FINANCIAL STRENGTH & DIVIDENDOur financial strength rating on SWKS is Medium-High,
the second-highest rank on our five-point scale. We have long withheld a High financial strength rating because of Skyworks' smaller revenue base relative to peers; its reliance on the inherently unstable mobile device market for over two-thirds of revenue; and its reliance on one customer, Apple.
The purchase of I&A occurred after the quarter end and is not reflected in the numbers below. Historically debt-free Skyworks did add about $1.5 billion in order to finance the $2.75 billion all-cash I&A deal.
Cash, equivalents & investments totaled $2.98 billion in advance of the asset purchase, up from $1.43 billion at 2Q21. Cash, equivalents & investments totaled $1.00 billion at the end of FY20, $1.11 billion at the end of FY19, $1.05 billion at the end of FY18, $1.62 billion at the end of FY17, $1.08 billion at the end of FY16, and $1.04 billion at the end of FY15.
Skyworks, which historically carried no debt, had debt of $1.49 billion as of 3Q21.
Cash flow from operations totaled $1.20 billion in FY20, $1.37 billion in FY19, $1.26 billion in FY18, $1.47 billion in FY17, and $1.10 billion in FY16.
In January 2020, Skyworks' board authorized the repurchase of up to $2 billion of SWKS stock. In February 2019, Skyworks announced a $2 billion share-repurchase authorization. That followed a $1 billion authorization in February 2018.
In July 2021, the board announced a 12% hike in the quarterly dividend, to $0.56 per common share. Skyworks also raised its dividend in July 2020, by 14%; in August 2019, by 16%; in July 2018, by 19%; in August 2017, by 14%; and in May 2016, by 8%. We estimate a dividend coverage ratio of 2.5-3.0 based on forecast free cash flow.
Our dividend estimates are $2.06 for FY21 and $2.30 for FY22.
MANAGEMENT & RISKSLiam Griffin is the CEO of Skyworks. Kris Sennesael is
the CFO. Other key executives include Chief Technology Officer Peter Gammel, and Steven Machuga, VP of Worldwide Operations.
The Silicon Labs deal, in our view, makes sense, given the complementary nature of assets and reasonable price. Because Skyworks acquired assets, not an entire company, Chinese regulatory approval was not required. For political and/or economic purposes, China has withheld regulatory approval and effectively killed planned acquisitions by Qualcomm, Applied Materials, and others.
Skyworks derives about one-quarter of revenue from China. The company's parts are manufactured in the U.S., Singapore, China, and Mexico and participate in complex global supply chains. Skyworks products are not currently subject to tariffs either here or abroad. Management is watching this situation carefully.
Risks facing Skyworks also include its 50% revenue reliance on Apple, which has a reputation of extracting tight margins from vendors and sometimes dumping vendors unexpectedly. Skyworks reduces that risk by supplying multiple products for the iPhone, including low-band power amplifier modules, quad band GSM power amplifiers, and RF and other parts.
Skyworks is growing its handset business faster with other vendors than with Apple, which should reduce the relative revenue contribution from Apple over time. Skyworks is also developing its Broad Markets business, which should reduce
Section 2.175
GROWTH / VALUE STOCKSits reliance on handset revenue.
Other risks relate to the highly cyclical semiconductor industry, which can contribute to sharp annual and quarterly fluctuations in operating and financial results. The semiconductor space is also highly competitive, which creates persistent pressure on average selling prices. We believe that Skyworks is positioned to mitigate these risks based on its industry expertise, broad product set, deep customer relationships, and focus on both innovation and market expansion.
COMPANY DESCRIPTIONSkyworks designs, develops and produces analog
semiconductors primarily focused on the RF chain. The company operates worldwide, with engineering, manufacturing and sales & service facilities throughout Asia, Europe and North America. Addressed markets include mobile device, automotive, industrial, connected home, factory automation, medical, wearable technology, smart energy and other. Key products include amplifiers, attenuators, modulators & demodulators, filters, diodes, front-end modules, switches and opto products.
VALUATIONSWKS trades at 17.6-times projected non-GAAP FY21
EPS and at 15.7-times our FY22 non-GAAP projection. The two-year average forward P/E of 16.6 is now above the five-year average (FY16-FY20) of 14.4. However, the current two-year forward relative P/E of 0.70 is below the five-year average of 0.77. On other measures of comparable historical valuation such as price/book and price/cash flow, SWKS has an indicated value of $160-$170 in a now rising trend, though below current levels.
SWKS trades at discounts to the peer group on absolute P/E, relative P/E, price/sales, EV/EBITDA, and PEGY. In a rising market for technology shares, indicated peer value has moved above $250 and is well above the current price. Our more forward-looking two- and three-stage discounted free cash flow valuation yields terminal values in the $290 range, in a gradually rising trend.
Our blended valuation is around $300, in a rising trend and above current levels. We raised our rating on the SWKS shares to BUY in mid-March; the shares, trading below $90 at the time on nonfundamental price action (the broad market selloff), appeared to offer value at that level.
Although the stock has rallied on prospects for a solid 5G device launch, SWKS continues to appear attractive based on prospects for recovery in broad market verticals and the positive outlook for the 5G cycle. We are reiterating our near-term BUY rating and raising our 12-month price of $210. Our long-term rating remains BUY.
On August 2, BUY-rated SWKS closed at $187.33, up
$2.82. (Jim Kelleher, CFA, 8/2/21)
Square Inc (SQ)Publication Date: 8/3/21Current Rating: BUY
HIGHLIGHTS*SQ: Square payment volumes soar in 2Q, agrees to
acquire Afterpay *On August 2, Square reported adjusted 2Q21 earnings of
$0.66 per share, versus $0.18 a year earlier. The consensus was $0.30 per share. Gross payment volumes jumped 88% from a weak year earlier quarter due to the pandemic.
*Net revenue rose 143% to $4.68 billion, though excluding bitcoin revenues the figure drops to 87%. We note that bitcoin profitability is small, with bitcoin expenses absorbing 98% of bitcoin revenues.
*The company also agreed to acquire Australian-based Afterpay Limited, which has a Buy Now, Pay Later platform that Square will integrate into its Seller and Cash App business units, for $29 billion in stock.
*Square shares have nearly doubled over the past year, which we believe reflects expectations for continued hyper-growth in revenues. Our target price is $320, raised from $275.
ANALYSIS
INVESTMENT THESISWe are maintaining our BUY rating on Square Inc.
(NYSE: SQ) following 2Q results that showed continued improvement in transaction revenues as spending volume grew, and the announced acquisition of Afterpay, which has a global Buy Now, Pay Later (BNPL) platform. We believe strong cross-selling opportunities exist between the companies, as Square integrates Afterpay into its Seller and Cash App platforms. Greater integration of these platforms has been a long-standing goal for the company. BNPL allows customers to receive products immediately and pay for their purchases over installments, free from interest and service fees for customers who pay on time. BNPL has seen rapid growth recently, with more companies beginning to offer the service, although we caution that it has not been time-tested through an economic cycle, and could become a source of losses during an economic downturn. Still, we like the accretive near-term financial metrics of this transaction, and the global platform expansion opportunities being given the U.S.-focused Square.
Seeing a substantial growth opportunity in the current environment, the company expects to invest heavily in its ecosystem in 2021, guiding toward a 50% increase in operating expenses for the full year. For its Cash App product, it will invest in sales and marketing to drive new customer acquisition. In the Seller segment, it will work to boost new seller acquisition and step up the hiring of engineers to advance the product roadmap.
Section 2.176
GROWTH / VALUE STOCKSSquare moved quickly in the early days of the coronavirus
pandemic by launching curbside pickup and delivery options in its Square Online Store, as well as by offering a gift card portal for buyers to support local businesses. The company's Square Capital segment also secured Small Business Administration approval to offer Paycheck Protection Program loans.
Over the long term, we believe that Square is taking advantage of the changing payments landscape, including the greater use of mobile devices for payments and the technological integration of different payment channels. The company benefits from strong brand recognition, an expanding international presence, and the ability to provide merchants with end-to-end payment authorization and settlement capabilities, as well as instant access to funds. In addition, unlike MasterCard and Visa (but similar to PayPal), Square's network enables account holders to both make and receive payments for merchandise or services.
Square has grown through both technical innovation and acquisitions. Square launched its peer-to peer mobile payment system CashApp in 2015, and expanded the app to include bitcoin trading in 2018. CashApp revenue rose 177% in 2Q21. With CashApp, the company is also expanding access to stock investing by enabling customers to buy fractional shares of stock for as little as $1.00, with no commission fees.
Square's bitcoin revenue rose 3-fold in 2Q, to $2.7 billion, reflecting an increase in the year-over-year price of bitcoin, bitcoin actives, and growth in customer demand. In 4Q20, the company launched Boost, which allows customers to earn bitcoin instantly on Cash Card purchases. The company also launched a kitchen display system (KDS), which helps automate the complexities of running a restaurant. We believe this strengthens the integration of the company's Seller and Cash App ecosystems.
SQ shares are currently trading at a lofty 114-times our 2022 EPS estimate. Square is in hyper-growth mode (as evidenced by 87% revenue growth in 2Q, excluding bitcoin), and we believe the shares are pricing in substantial high growth for years to come. We currently expect 127% EPS growth in 2021 (which includes a rebound from pandemic-related weakness), followed by 27% growth in 2022. Our target price is $320, raised from $275. We believe the stock can support a PEG multiple of 2.6, in line with those of other payments companies, including Visa, MasterCard and PayPal.
RECENT DEVELOPMENTSOver the past year, SQ shares are up 90%, far outpacing
the broad market's 35% gain. The shares do carry a high beta of 2.41.
On August 2, Square reported adjusted 2Q21 earnings of
$0.66 per share, versus $0.18 a year earlier. The consensus was $0.30 per share.
Net revenue rose 143% to $4.68 billion, aided by sharply higher bitcoin revenues and strong growth in subscription revenues. Excluding bitcoin, net revenue growth was 87%. Total 2Q gross payment volume (GPV) was $42.8 billion, up 88% from the prior year. Operating expenses rose 64% as the company continued to reinvest in growth, and included a $45.3 million of bitcoin impairment losses. (Beginning in 4Q19, the company discontinued the use of adjusted revenue following the receipt of a comment letter from the SEC regarding non-GAAP performance measures.)
In August 2021, Square reached an agreement to acquire Australian-based Afterpay Limited for $29 billion in stock. Afterpay operates a global 'buy now, pay later' (BNPL) platform with more than 16 million consumers and nearly 100,000 merchants globally. Square said it planned to integrate Afterpay into its Seller and Cash App business units, enabling smaller merchants to offer BNPL at checkout, give Afterpay consumers the ability to manage their installment payments directly in Cash App, and give Cash App customers the ability to discover merchants and BNPL offers directly within the app. Closing is expected in 1Q22.
In April 2021, Square acquired a significant majority ownership stake in TIDAL, a global music and entertainment platform, for $302 million. The company said the acquisition would extend its purpose of economic empowerment to music artists.
In 4Q20, Square acquired Credit Karma Tax for $50 million, which it intends to fold into its Cash App ecosystem as a tax filing product for individuals.
In October 2019, the company sold Caviar, its food ordering platform, for $410 million in cash and preferred stock to logistics company DoorDash. Management said the sale would allow it to focus on its payment ecosystems for businesses and individuals. During 4Q19, Square disposed of an investment in Eventbrite, resulting in a $4 million gain.
EARNINGS & GROWTH ANALYSISGross payment volume rose 88% in 2Q, up significantly
from the 29% pace in 1Q, as consumer spending showed a continued rebound amid re-opening economies. Looking ahead, we expect long-term revenue growth at Square to benefit from higher consumer spending, increased merchant acceptance of the company's services, growth in the number of mobile devices using payment apps, and an increase in average transactions per account. The company should also benefit from trends that have boosted overall credit card usage, including the greater convenience and security of cards relative to cash and checks and the ability to participate in rewards programs. Meanwhile, subscription-based services
Section 2.177
GROWTH / VALUE STOCKShave typically offered a strong growth profile, while strong adoption of bitcoin investing has provided a surprise boost to revenue. Overall, we look for revenue to grow 123% in 2021, as gross payments volumes reach new highs. We note that bitcoin revenues, which were nearly 60% of total 2Q revenue, offer an extremely volatile component to revenues, and that 98% of those revenues were absorbed by bitcoin expenses.
Seeing a substantial growth opportunity in the current environment, the company expects to invest heavily in its ecosystem in 2021. The company has guided toward non-GAAP product development, sales and marketing, and general and administrative expenses to increase by $1.0-$1.5 billion.
Reflecting a very strong 2Q and expected continued strength in gross payment volume, we are raising our 2021 EPS estimate to $1.91 from $1.45, and our 2022 forecast to $2.42 from $2.02.
FINANCIAL STRENGTH & DIVIDENDOur financial strength rating on Square is Medium. The
company's balance sheet metrics are favorable, with cash and short-term investments of $5.6 billion and long-term debt of $4.8 billion at June 30, 2021. In May 2021, Square completed an offering of $2.0 billion in senior notes maturing in 2026 and 2031 and with coupons of 2.75% and 3.50%, respectively.
The company does not expect to pay a regular cash dividend.
MANAGEMENT & RISKSSquare is led by Chairman and CEO Jack Dorsey, who
cofounded the company in 2009 after cofounding Twitter. In January 2020, Amrita Ahuja joined Square as CFO. She was previously the CFO of Blizzard Entertainment.
Square faces significant competition in the payments market from Apple's ApplePay, Visa's Checkout, MasterCard's MasterPass, and PayPal, as well as from other digital products from Facebook and Google. Customers generally have a range of payment options in addition to Square, and the company must compete on convenience and transaction price. It must also respond quickly to changing customer preferences, including the increasing demand for mobile payment services.
COMPANY DESCRIPTIONSquare is a technology platform company that provides
payment and point-of-sale solutions to merchants worldwide. It provides hardware for sales and payment solutions to merchants along with software that converts iPads to payment terminals. Payments can be made on Square terminals via a tap, dip, or swipe, or through the company's Square Cash electronic tender. Square also provides CashApp, which allows consumers to send, spend, and store money on an app. Square processes transactions in the U.S. and internationally.
VALUATIONAlthough Square faces competition from PayPal,
Discover, Visa and MasterCard as well as from other mobile payment services, it has a strong brand and a record of innovation. Looking ahead, we expect Square to show steady growth in payment volumes as it adds merchants, increases the number of transactions per customer, and benefits from higher global spending.
SQ shares are currently trading at a lofty 114-times our 2022 EPS estimate. Square is in hyper-growth mode (as evidenced by 87% revenue growth in 2Q, excluding bitcoin), and we believe the shares are pricing in substantial high growth for years to come. We currently expect 127% EPS growth in 2021 (which includes a rebound from pandemic-related weakness), followed by 27% growth in 2022.
Our target price is $320, raised from $275. We believe the stock can support a PEG multiple of 2.6, in line with those of other payments companies, including Visa, MasterCard and PayPal.
On August 2, BUY-rated SQ closed at $272.38, up $25.12. (Stephen Biggar, 8/2/21)
Stanley Black & Decker Inc (SWK)Publication Date: 8/3/21Current Rating: HOLD
HIGHLIGHTS*SWK: Raising estimates as tool sales remain strong*On July 27, Stanley Black & Decker reported 2Q21
consolidated revenues of $4.3 billion, up 37% from the prior-year period driven by impressive 33% organic sales growth. Our estimate was $4.04 billion. The StreetAccount consensus was $4.22 billion.
*The company earned an adjusted $3.08 per share in 2Q, up 93% from the prior-year quarter. The average analyst estimate was $2.88, according to StreetAccount. Our estimate was $2.72.
*Sales in the Tools & Storage segment were up 46%. North America was below the segment average but organic growth was still up an impressive 30%. Sales through big-box stores and e-commerce remained strong and sales to commercial and industrial customers surged sequentially.
*We are raising our 2021 EPS estimate to $11.55 from $11.00. The biggest driver of the increase is better-than-expected earnings in 2Q. We are raising our sales forecast for the Tools & Storage business. We are raising our 2022 EPS estimate to $12.25 from $11.75.
ANALYSIS
INVESTMENT THESISWe are maintaining our HOLD recommendation on
Stanley Black & Decker Inc. (NYSE: SWK). Stanley has an experienced management team that is focused on improving
Section 2.178
GROWTH / VALUE STOCKSefficiency. It proved that by delivering better-than-expected results during the Great Recession and by doing it during the COVID pandemic. Stanley will also benefit from being relevant and having innovative, market-leading products. In the first year of the pandemic, many consumers used their time sheltering at home to take on do-it-yourself improvement projects. While we expect pent-up demand for travel, eating at restaurants and away-from-home entertainment we believe that home improvement spending will be a greater priority than it was before COVID.
As the crisis eases, we expect a specific emphasis on enhancing the Craftsman brand and improving financial strength. We expect CEO James Loree and the senior management team to extend their record of innovation in the tool businesses, boost profitability in the security business, and improve the operating efficiency, cost structure, cash conversion and financial strength of the overall enterprise. We expect a 50/50 allocation of capital between acquisitions and the return of cash to shareholders.
One long-term question is whether new acquisitions can generate adequate returns on investment to reward shareholders. Management is aiming to maintain cash flow ROI of 12%-15% over time, compared to 13% in 2014 and 2015, 9% in 2013, and 10% in 2012. The company reached 16% in 2016, 14% in 2017, 12% in 2018, 14% in 2019, and 16% in 2020. We ultimately expect the company to focus on acquisitions that have higher margins and stronger growth prospects than the core operation, and that will help to consolidate the Tool business, expand the Engineered Fastening businesses, build the Lawn & Garden businesses, and raise the company's presence in emerging markets to more than 20% of sales. Working capital efficiency is also a priority for the company; we expect management to deliver working capital turnover above 10-times over the long term. The company delivered a very impressive 10.6-times in 2016, up from 9.2-times at the end of 2015. Excluding acquisitions, turns were flat in 2017, about 8.8-times in 2018, 9.9-times in 2019, and 10.4-times in 2020.
We like the acquisitions of the Craftsman brand and Newell tools, which includes Irwin Tools and Lenox. We expect Stanley to exercise its option to acquire MTD which makes lawn mowers and outdoor power tools. The period to exercise the option opened in July and Stanley was in negotiations at the time of the 2Q earnings release. We see a lot of opportunity to expand the Craftsman brand, especially with Craftsman's reputation in lawn mowers and trimmers and SWK's growing expertise in battery technology.
RECENT DEVELOPMENTSOn July 27, Stanley Black & Decker reported 2Q21
consolidated revenues of $4.3 billion, up 37% from the prior-year period driven by impressive 33% organic sales growth. Our estimate was $4.04 billion. The StreetAccount
consensus was $4.22 billion.
The company earned an adjusted $3.08 per share in 2Q, up 93% from the prior-year quarter. The average analyst estimate was $2.88, according to StreetAccount. Our estimate was $2.72. The company earned $2.81 per share on a GAAP basis, compared to $1.52 a year earlier. GAAP earnings included acquisition and restructuring changes.
In the 2Q21 release, SWK raised the adjusted guidance range to $11.35-$11.65 from $10.70-$11.00. The company reiterated the expectation for free cash flow to be about the same as net income. The increased guidance was driven by better-than-expected 2Q earnings, strong volume and price increases which are expected to be partially offset by higher transit costs in the Tools & Storage business and an increase in commodity inflation.
Sales in the Tools & Storage segment were up 46%. North America was below the segment average but organic growth was still up an impressive 30%. Sales through big-box stores and e-commerce remained strong and sales to commercial and industrial customers surged sequentially.
The 37% increase in enterprise sales reflected a 2-percentage-point lift from pricing, a 31-point boost from higher volume and a 5-point benefit from currencies offset by a 1 point drag from divestitures.
Sales in existing businesses, which the company calls organic sales, were up 23% in the U.S. and up 46% in Europe. Organic sales in emerging markets were up 69%. The U.S. and Europe represented almost 80% of 2Q revenue. Among other reported regions, Canada was up 31%, Japan was up 31%, and Australia jumped 30%.
Adjusted operating profit of $668 million topped our estimate of $591 million and the StreetAccount consensus of $638 million.
The Tools & Storage business saw a stunning 46% increase in organic revenue. North America was up 30% and the North America Retail segment, which has sales through Home Depot and Lowe's delivered 22% organic growth. Operating profit in the division jumped by 73%, and the operating margin was up 320 basis points. The division saw margin benefits from strong volume.
In the Industrial business, organic revenue was up 16%, with a 26% increase in the fastening business and an 11% decline in Infrastructure on a decline in oil-and-gas pipeline activity. The Vehicle and General Industrial businesses grew, but there was pressure on the Aerospace market. The Infrastructure business was down 11%. Oil and Gas was down on a reduction in pipeline activity. Operating profit was up 43%.
Section 2.179
GROWTH / VALUE STOCKS
In the Security business, organic revenue rose 14%, with operating profit up 3% and operating margin down 110 basis points, hurt by wage inflation.
Stanley had cash inflow from operations of $444 million in the second quarter. That was better than an inflow of $328 million in the prior-year period. Despite strong earnings there was a drag from working capital as the company significantly boosted inventories.
EARNINGS & GROWTH ANALYSISWe are raising our 2021 EPS estimate to $11.55 from
$11.00. The biggest driver of the increase is better-than-expected earnings in 2Q. The company expects expense leverage on improved second-half demand, partially offset by the need for expedited shipping costs to meet strong demand in tools. Like many other companies, Stanley is seeing commodity inflation, notably in steel. Management expects to offset about half of the current-year inflation with price increases and cost reductions. Within our model the biggest change is that we are raising our sales forecast for the Tools & Storage business with a small reduction to our estimate of segment operating margin. We also made a small increase to our estimate of the share count. We are raising our 3Q estimate to $2.52 from $2.49 and we are raising our 4Q estimate to $2.85 from $2.63. Our full-year operating income estimate is now $2.63 billion, up from $2.47 billion previously.
We are raising our 2022 EPS estimate to $12.25 from $11.75. We are modeling sales of about $17.7 billion, up from $16.8 billion. We now project operating income of about $2.7 billion up from $2.5 billion.
We expect earnings to grow at a compound annual growth rate of 10% over the next five years. We do not like to tinker with our growth rate. In any case, it is good to have a roadmap of what a company is hoping to accomplish. We see this as an impressive growth rate for a mature business. Management's objective to grow EPS 10%-12%. This includes 7%-9% organic growth and excludes acquisition-related charges. This is based on 4%-6% organic revenue growth, and total revenue growth of 10%-12. The focus of future acquisitions is likely to be on further consolidating the tool business, engineered fastening and infrastructure, and building the Lawn & Garden business. We believe that when the time comes, management will be looking for businesses with operating profitability over 15% and the ability to generate value that is greater than simply repurchasing shares, which will likely require a cash flow return on investment in excess of 12% for strategic acquisitions and more than 15% for bolt-on acquisitions. We also expect long-term growth to be boosted by an emphasis on emerging markets, although management will need to see hefty returns to justify the risk. We expect steady dividend increases and a resumption of share repurchases supported by free cash flow matching or exceeding net income. Stanley has been very
successful in working capital management and we expect that to continue.
FINANCIAL STRENGTH & DIVIDENDOur financial strength rating on Stanley Black & Decker is
Medium, the midpoint on our five-point scale. The company ended 2Q21 with $440 million in cash and equivalents, down from $1.4 billion at the end of 4Q20. SWK doesn't normally maintain big cash balances. As a mature company it needs to manage working capital very efficiently and it has access to commercial paper markets in most environments.
Total debt was $4.25 billion or 28% of total capital. The company ended 2Q with an additional $3 billion of liquidity under its undrawn $3 billion commercial paper program.
In April of 2020, Stanley amended the covenants on its $3 billion of revolving credit facilities (which back up the commercial paper program) to allow for additional restructuring and other charges related to the pandemic and to lower the minimum interest coverage ratio from 3.5-times to 2.5-times. The amendment expires at the end of FY21.
In 2014, management reduced debt to 1.9-times EBITDA from 2.9-times at the end of 2013. Management's goal is to maintain debt at 2-times to 2.3-times. The company ended 2015 at 1.8-times, 2016 at 1.9-times, 2017 at 1.8-times, 2018 at 2.6-times, 2019 at 2.1-times, and 2020 at 2.4-times. The company used proceeds from the remarketing of preferred equity units to repay short-term debt in 2Q20.
As a result of the company's significant M&A activity, goodwill and intangibles, represented 58% of total assets at the end of 2Q21, dwarfing tangible assets. The company suspended M&A activity as a result of the COVID-19 crisis. In the 3Q20 call, management said that it had removed the 'pause' on M&A and share repurchases, but expressed that its priority was for reducing debt.
As of the end of 2014, Stanley's post-retirement benefits had a balance-sheet liability of $750 million. The balance was $670 million at the end of 2015, $644 million at the end of 2016, $629 million at the end of 2017, $595 million at the end of 2018 and $609 million at the end of 2019. The company made cash contributions of approximately $60 million in 2015, $57 million in 2016, $67 billion in 2017, $45 million in 2018, $48 million in 2019, and $40 in 2020. The company expects to contribute about $41 million in 2021.
Free cash flow was $1.67 billion, 136% of net income, in 2020, compared with $1.08 billion, or 113% of net income, in 2019. SWK delivered $769 in 2018, which was a 90% conversion rate, and $976 million in 2017, which was approximately 100% of net income on an adjusted basis, which excludes a gain from divesting a business and some other one-time items. Free cash flow in 2016 was $1.14
Section 2.180
GROWTH / VALUE STOCKSbillion, an impressive 118% of net income.
In 2Q12, SWK announced a new 20 million share buyback authorization, equivalent to about $1.2 billion. Management announced plans to repurchase up to $1 billion of shares in 2014 and 2015. SWK repurchased approximately $650 million of its stock in 2015 and about $520 million in 2016. Stanley repurchased $374 million of its stock in 2017. In July 2017, the company announced a new authorization to repurchase 15 million shares. The company repurchased $500 million of its stock in 2018, $1 million in 2Q19, and $2.7 million in 3Q19, and $14.6 million in 4Q. The company had a remaining authorization to repurchase 11.5 million shares at the end of 2020. The company said in the 3Q call that it has removed the 'pause' on share repurchases, but debt repayment is their priority for capital deployment. In the 1Q21 earnings release SWK announced that it increased the share repurchase authorization to 20 million shares. That entire amount was available at the end of 2Q21.
Management is well attuned to the importance of maintaining a dividend and high credit rating. SWK's long-term debt is rated Baa1 by Moody's and A by Standard & Poor's. Moody's has a stable outlook. S&P has a negative outlook. The company's short-term ratings are 'split': a top-tier A-1 from S&P and P-2 from Moody's. Stanley provides its credit ratings in its quarterly reports.
The company has paid a dividend for 145 consecutive years, and maintains the longest quarterly dividend record of any industrial company listed on the New York Stock Exchange. In 2015, dividend payments were $2.14 per share. The company raised its quarterly payout to $0.58 per share from $0.55 per share with the September 2016 payment. 2016 payments were $2.26. In 2017, dividends totaled $2.42 per share. 2018 dividends totaled $2.58. 2019 dividends were $2.70 per share. 2020 dividends were $2.78 per share. On July 21 Stanley raised to quarterly payout to $0.79 from $0.70. We are raising our 2021 dividend estimate to $2.98 per share from $2.82 reflecting two payments at the old rate and two payments at the new rate. This marks 54 consecutive years in which the company had increased the dividend. The company is targeting a dividend payout of 30%-35% of earnings. SWK's plan is to split its free cash flow, with half going to acquisitions and half to shareholders through dividends and share repurchases. Capital expenditures are targeted at about 3.0%-3.5% of sales. Our 2021 dividend estimate is now about 26% of our increased EPS estimate. The company's target payout ratio is 30%-35%. The company has increased the dividend at an annual rate of 5.7% over the last five years. We are raising our 2022 dividend estimate to $3.25 from $2.90.
MANAGEMENT & RISKSThe biggest near-term risk facing Stanley is that
COVID-19 has caused economic disruptions. Another wave of travel restrictions could put pressure on the economy. On the
plus side SWK's big box customers Home Depot, Lowe's and Walmart have all been open for business. Many companies are seeing cost pressures, from wages for warehouse workers and carpenters to raw materials, packaging costs and delivery fees.
In 2016, John Lundgren retired as CEO. He was replaced by James Loree, the company's President and COO. Mr. Loree was thoroughly groomed for this position and it was the kind of well-telegraphed, low-drama transition we like to see. Mr. Lundgren had been the company's CEO since early 2004. He replaced former Black & Decker chief Nolan Archibald as chairman in 2013. Mr. Lundgren continued as chairman through 2016 and he remained with the company as an adviser for part of 2017. Donald Allen has served as CFO since 2009, after holding various financial positions at the company.
The Tools & Storage business has impressed us. The division continues to deliver impressive innovation that is based on a deep understanding of what builders and construction workers do and what they need. One answer has been lighter tools with longer lasting batteries that make it easier to complete long jobs. The Flex Volt system is making it possible for contractors to share batteries between devices. One challenge we've had is that amps are still important. Our experience is that a 20-volt, 1.5 amp battery that comes with a drill doesn't do a good job driving a weed trimmer or a leaf blower. The 20-volt, 3- or 4-amp battery that comes with the bigger tool will run a drill for a long time, but adds significant weight. Jeff Ansell, the division's very successful president announced that he will be transitioning responsibilities to Jamie Ramirez. Mr. Ansell will be spending more time on personal endeavors and will stay on as a strategic advisor through 2023.
Stanley Black & Decker faces commodity price risk. In the past, the company has not been able to consistently offset input cost inflation with price increases, so volume growth, operating efficiency, and profitable acquisitions must compensate for the remaining impact. We believe that Stanley is doing an excellent job in adapting to various headwinds.
Strategies include shifting production, raising prices and cutting costs to maintain margins. We look forward to a less turbulent environment in which the company's efficiency improvements can be reflected as EPS growth. A downturn in homebuilding or a recession could pressure the demand for tools. SWK is a mature player in many developed markets, and increasing competition provides a difficult environment in which to grow market share. That said, the Tool business has an outstanding record of innovation. We think many of the consumer products would be envious of what SWK has achieved. As noted above, emerging markets represent an attractive source of growth, although the risk of market volatility in these regions is ever-present. As the company expands its international presence, currency becomes a bigger risk and a bigger analytical challenge.
Section 2.181
GROWTH / VALUE STOCKS
Approximately 26% of the company's revenue is related to residential repair and remodeling, 22% is tied to new-home construction, 13% is tied to commercial construction, 11% is tied to general industrial production, and about 6% is linked to automobile production. The remaining exposures are smaller. Retailers are major clients of the Security business but they are only 4% of the overall business.
Both Stanley and Black & Decker have long histories and a reputation for product quality. Their brands are staples at large home-improvement and industrial construction retailers, and maintaining a base of loyal consumers is crucial. Any decline in product quality would almost certainly dent consumer loyalty, as customers tend to feel a strong sense of attachment to their tools.
The company also has some client risk associated with its relationship with big-box retailers including Lowe's and Home Depot, which represent 15% and 10% of sales in the Tool & Storage segment. Sales to home centers and mass merchants represented 40% of total-company revenue at the end of 2019. Stanley's goal is to get Tools & Storage from 70% of revenue to less than 60%. One initiative is to substantially increase the lawn and garden business.
Amazon should not present a major problem for SWK, as it does for pure retailers. The online marketplace presents a bigger risk for retailers or 'middle men' than manufacturers. That said, AMZN's presence will keep pricing sharp as the online retailer strives to gain market share and Home Depot and Lowe's compete to maintain share or gain it from smaller players. One secondary risk is that increasing price transparency on Stanley products will probably push HD and LOW to develop private-label products that can be sold at lower price points than Stanley or DeWalt, and perhaps earn higher margins. This just means that SWK will need to continue to innovate if it wishes to maintain its shelf space at big-box stores. To date, it has done a pretty good job.
Ernst & Young has been the company's auditor since 1932.
COMPANY DESCRIPTIONStanley Black & Decker was formed from the
combination of Stanley Works and Black & Decker in 2010. The company's headquarters is in New Britain, Connecticut, where Stanley has been based. The company generated approximately $14.5 billion in 2020 revenue. SWK operates within a divisional structure, with approximately 71% of revenue coming from the Tools and Storage segment, about 13% from Security, and about 16% from the Industrial segments. Fifty-five percent of revenue is generated in the U.S. The company has now paid a dividend for 145 consecutive years and raised it for 53 consecutive years.
The Tools and Storage segment generated about $10 billion of 2020 revenue, with about $6 billion from Power Tools and $4 billion from hand tools, accessories and storage products. The Security segment generated $1.9 billion of revenue, with $1.4 billion from electronic/convergent security products and services, $150 million from monitoring and services for hospitals; and $300 million from Mechanical Access, which includes automatic doors at offices, stores and restaurants. The $2.4 billion Industrial segment includes Engineered Fastening products for cars, aerospace, electronics construction, and medical with revenue of $1.8 billion; and the $635 million Infrastructure business includes hydraulics, as well as products and services for oil and gas pipelines.
VALUATIONSWK shares have risen 26% over the last 12 months,
rebounding from the selloff at the beginning of the pandemic. They are up almost 10% this year. The shares are trading at 17-times our 2021 estimate and 16-times our 2022 estimate.
We believe that Stanley should trade in line with the market multiple over time. Right now (which is certainly not a normal time), the S&P 500 is trading at 23-times our 2021 estimate and 21-times our 2022 estimate. On the positive side, the company has solid financial strength, an enviable record of paying dividends, an excellent record of new-product innovation, and initiatives to drive international growth, particularly in emerging markets. On the negative side, Stanley is a mature, cyclical, business that faces intense competition in its tool business, a concentration of sales among a small number of retailers, and challenges in finding attractively priced acquisition candidates to support future growth. Over the last five years, the shares have traded at an average of 19-times trailing earnings.
Here is a very rough estimate. If the company reaches our estimate of $12.25 per share in 2022 and grows at 10% for the following three years, adjusted EPS would rise to about $16.34. At 17-times projected earnings, the shares would be worth approximately $277 per share in 4.5 years. Discounted to the present at 8.0%, the shares would be worth approximately $195.
Using a two-stage dividend discount model, a terminal multiple of 17-times assumes about three years of 10% growth with a 30% payout and an 8% cost of equity followed by steady-state growth of 3% along with a 75% payout and an 8% cost of equity.
Using a full dividend discount model, which incorporates a transition period between 10% growth and 3% growth, the shares would be worth approximately $195-$200.
Two catalysts for raising our recommendation would be a pullback in the shares or an increase in our five-year growth rate.
Section 2.182
GROWTH / VALUE STOCKSOn August 3 at midday, HOLD-rated SWK traded at
$198.61, up $2.82. (Christopher Graja, CFA, 8/3/21)
Starbucks Corp. (SBUX)Publication Date: 7/28/21Current Rating: BUY
HIGHLIGHTS*SBUX: Raising target to $140*We think that specialty coffee retailers have been hurt by
the coronavirus pandemic and that some smaller coffee retailers have had to close, reducing competition for Starbucks.
*With its strong brand, clean balance sheet, and robust mobile ordering and payment platform, we expect Starbucks to recover from the pandemic faster than other restaurant chains.
*Because Starbucks has paid its employees hazard pay during the pandemic and raised its wages in December 2020, we believe it is also less likely than other restaurant chains to have difficulty retaining employees.
*Reflecting the better-than-expected fiscal 3Q21 earnings, management's revised guidance and the easing of dining restrictions in many states, we are raising our FY21 EPS estimate to $3.15 from $3.08. For FY22, we are raising our estimate to $3.70 from $3.60.
ANALYSIS
INVESTMENT THESISWe are maintaining our BUY rating and raising our price
target on Starbucks Corp. (NGS: SBUX) to $140 from $132. We think that specialty coffee retailers have been hurt by the coronavirus pandemic and that some smaller retailers have had to close, reducing competition for Starbucks. In addition, because Starbucks has paid its employees hazard pay during the pandemic and raised wages in December 2020, we believe it is less likely than other restaurant chains to have difficulty retaining employees. With its strong brand, clean balance sheet, and robust mobile ordering and payment platform, we expect Starbucks to recover from the pandemic faster than other restaurant chains.
Our long-term rating remains BUY.
RECENT DEVELOPMENTSRECENT DEVELOPMENTS
On July 27 after the close, Starbucks posted fiscal 3Q21 operating earnings of $1.01 per share, up from a loss of $0.46 in the prior-year period and above the consensus estimate of $0.77. The increase reflected strong performance in the U.S. and a high operating margin. Reflecting 73% higher same-store sales, revenue rose 78% to $7.5 billion - $240 million above the consensus estimate.
Geographically, comps rose 84% in the Americas, driven by an 82% increase in the average ticket and a 1% gain in customer traffic. The consensus estimate had called for an
increase of 74.7%. In the U.S., same-store sales rose 83%. In 2Q20, SBUX adopted a new reporting structure that combines EMEA and China/Asia Pacific into an International division. The new division saw comps increase 41% in fiscal 3Q21, reflecting 55% higher customer traffic and a 9% decrease in the average ticket. The consensus had called for a comp gain of 59%. In China, same-store sales were up 19%, driven by a 30% increase in customer traffic, offset in part by a 9% lower average ticket. The adjusted operating margin rose to 20.5% from 12.6%, and came in 230 basis points above consensus. In 3Q21, weighted-average shares outstanding rose by 2 million to 1.19 billion.
As discussed in a previous note, for all of FY20, revenue fell 11% to $23.5 billion, with same-store sales down 14%. Full-year earnings fell to $1.16 per share from $2.83 in FY19.
EARNINGS & GROWTH ANALYSISStarbucks increased its guidance in the 3Q21 press
release. It now expects overall FY21 revenue of $29.1-$29.3 billion, up from a prior estimate of $28.5-$29.3 billion. The guidance midpoint is above the consensus estimate of $28.8 billion prior to the earnings release. It also expects EPS of $3.20-$3.25, compared to a prerelease consensus forecast of $2.99. The new estimate includes a $0.10 benefit from a 53rd week.
Starbucks issued other guidance. It expects global comps to increase 20%-21% in FY21. In the Americas and the U.S., the company projects 21%-22% higher same-store sales. Internationally, SBUX expects same-store sales growth of 15%-17%, with China growing 18%-20%.
Reflecting the better-than-expected fiscal 3Q21 earnings, management's revised guidance and the easing of dining restrictions in many states, we are raising our FY21 EPS estimate to $3.15 from $3.08. For FY22, we are raising our estimate to $3.70 from $3.60.
FINANCIAL STRENGTH & DIVIDENDWe rate Starbucks' financial strength as High, our top
ranking. The adjusted operating margin was 20.5% in 3Q21, up from 12.6% in the prior-year period due to sales leveraging. Interest expense fell to $113 million in 3Q21 from $121 million in 3Q20.
The company's long-term debt was $13.6 billion at the end of fiscal 3Q21, down from $14.7 billion at the end of 3Q20.
On April 8, 2020, management said that it had secured an additional $5.25 billion in short and long-term funding. At the end of 3Q21, Starbucks had $4.9 billion in cash and cash equivalents and short-term investments.
The company has suspended stock buybacks to conserve cash during the pandemic.
Section 2.183
GROWTH / VALUE STOCKS
In November 2020, SBUX raised its quarterly dividend by 10% to $0.45 per share, or $1.80 annually. Our dividend estimates are $1.80 for FY21 and $1.96 for FY22. The current yield is about 1.4%.
RISKSEfforts by McDonald's to sell gourmet coffee and
aggressive expansion by Dunkin Donuts and even Tim Horton's could hinder Starbucks' growth. The price of SBUX shares usually reflects the market's expectations for high growth, and could drop sharply if the company reports disappointing earnings or same-store sales. In the U.S., unit growth could also reach the point where new locations cannibalize sales at existing stores. In addition, the company's international expansion plans could prove overly ambitious. Finally, increases in food and beverage costs could reduce margins and earnings.
COMPANY DESCRIPTIONStarbucks is a leading retailer of fresh-brewed coffee and
branded merchandise. Its brands include Starbucks, Tazo Tea, and Frappuccino. With a market cap of approximately $148 billion, SBUX shares are generally considered large-cap growth.
VALUATIONThe shares fell 3% on July 28 after Starbucks issued
guidance for international same-store sales that came in below expectations. Based on the company's prospects for post-pandemic recovery and positive earnings surprises, as well as market share gains, we believe that the shares remain attractively valued. Our revised target price of $140, combined with the dividend, implies a potential total return of 16% from current levels.
On July 28 at midday, BUY-rated SBUX traded at $123.12, down $2.91. (John Staszak, CFA, 7/28/21)
Stryker Corp. (SYK)Publication Date: 7/29/21Current Rating: BUY
HIGHLIGHTS*SYK: Reaffirming BUY; raising target to $320*With elective surgery volumes recovering, Stryker
delivered strong second-quarter results.*Management said that 2Q results at the recently acquired
Wright Medical were better than expected and that the integration was proceeding smoothly.
*The company has raised its sales and EPS guidance for 2021.
*Based on the updated guidance, we are boosting our adjusted EPS estimates to $9.26 from $9.23 for 2021 and to $10.50 from $10.45 for 2022.
ANALYSIS
INVESTMENT THESIS
We are reaffirming our BUY rating on Stryker Corp. (NYSE: SYK) with a revised price target of $320, raised from $280. We expect Stryker's Mako robotics system for orthopedic surgery to continue to gain share among freestanding surgery centers and competitive accounts. We also expect solid growth in the company's Orthopedics, MedSurg, and Neurotechnology businesses.
RECENT DEVELOPMENTSStryker delivered strong 2Q21 results on July 27.
Adjusted EPS rose 251% from the prior year to $2.25 and topped the consensus estimate by $0.11. GAAP net income was $592 million or $1.55 per share, compared to a net loss of $83 million or $0.22 per share a year earlier. Net sales rose to $4.3 billion (+55.4% reported; +42.9% organic). Organic growth excluded acquisitions/divestitures and the effects of foreign exchange.
Given the substantial pandemic-driven weakness in 2Q20, Stryker also provided comparisons with the pre-pandemic second quarter of 2019. Net sales grew a solid 9.3% organically from 2Q19. That said, we believe that many elective procedures continue to be deferred, notably for hip and knee replacements.
Second-quarter sales comparisons, by business segment, are summarized below. Orthopedics sales grew 50.7% on an organic basis from 2Q20 and 6.7% from 2Q19. MedSurg sales grew 29.6% from 2Q20 and 8.3% from 2Q19. Neurotechnology and Spine sales grew 61.8% from the prior year and 15.5% from 2Q19.
Stryker said performance at Wright Medical, which was acquired in November 2020, was better than expected. The integration of the business has proceeded well, with less sales force disruption than anticipated.
The MAKO robotics systems for orthopedic surgeries is driving strong sales in the Orthopedics segment, leading to increased share among ambulatory surgery centers.
EARNINGS & GROWTH ANALYSISReflecting the strong first-half performance, and the
better-than-expected contribution from Wright Medical, Stryker now expects 2021 adjusted EPS of $9.25-$9.40, up from a prior view of $9.05-$9.30. The revised guidance assumes a currency benefit of $0.10 per share, compared to a prior projected benefit of $0.05-$0.10 per share. Management also expects organic sales growth of 9%-10%, up at the low end from a prior 8%-10%.
Based on the updated guidance, we are raising our adjusted EPS estimates to $9.26 from $9.23 for 2021 and to $10.50 from $10.45 for 2022.
FINANCIAL STRENGTH & DIVIDENDOur financial strength rating on Stryker is Medium, the
Section 2.184
GROWTH / VALUE STOCKSmiddle peg on our five-point scale. The company is generating strong cash flow from operations. Operating cash flow in the first six months of 2021 was $1.330 billion, up from $1.211 billion in the prior-year period.
Stryker pays an annualized dividend of $2.52 for a yield of about 0.9%. Our dividend estimates are $2.52 for 2021 and $2.64 for 2022.
RISKSStryker faces risks as its operations are affected by the
pandemic, though it has been able to offset the impact in part by controlling expenses. It is now integrating Wright Medical, its largest acquisition to date.
Stryker faces pricing pressure from budget-constrained hospitals, as well as regulatory risks. Prior to marketing, Stryker's products must be approved by the FDA and relevant agencies in overseas markets.
COMPANY DESCRIPTIONBased in Kalamazoo, Michigan, Stryker manufactures and
markets medical devices, primarily in the orthopedic market. The Orthopedics segment sells joint reconstructive products (hips, knees and shoulders) and trauma implants. The MedSurg Equipment segment sells powered surgical instruments, surgical navigation systems, endoscopic products, medical video imaging equipment, and hospital beds and patient-handling systems. The Neurotechnology unit includes the neurovascular business as well as the interventional spine and spinal implants business.
VALUATIONSYK trades at 25.6-times our 2022 EPS estimate, slightly
above the average multiple of 25.2 for our coverage universe of medical device stocks. We believe the premium is warranted given the company's solid growth prospects in its Orthopedics, MedSurg, and Neurotechnology businesses. We expect stronger growth as the pandemic recedes and hospitals resume elective procedures. We also see the Mako robotic surgical system as a clear differentiator in orthopedic surgery and as a means for Stryker to gain market share among surgeons.
On July 28, BUY-rated SYK closed at $268.68, up $0.33. (David Toung, 7/28/21)
SVB Financial Group (SIVB)Publication Date: 7/28/21Current Rating: HOLD
HIGHLIGHTS*SIVB: Reaffirming HOLD on valuation *On July 22, SIVB reported 2Q21 EPS of $9.09, up from
$4.67 a year earlier and above the consensus forecast of $6.48. Revenue rose 70% from the prior year to a record $1.5 billion.
*The net interest margin fell to 2.06%, down 70 basis points from the prior-year quarter.
*We believe that SVB has promising growth prospects that should benefit ROE and EPS over time.
*However, based on management's outlook, the stock's recent run-up, and unpredictable revenue timing in certain businesses, we believe that SVB is fully valued at 18-times our 2021 EPS estimate.
ANALYSIS
INVESTMENT THESISWe are maintaining our HOLD rating on SVB Financial
Group Inc. (NGS: SIVB), a diversified financial services company. The company's 2Q results benefited from gains in investment securities and equity warrants, higher average loans, and gains in fixed-income securities. At the same time, we note that after reserve releases in 3Q and 4Q, SIVB added another $35 million in credit loss provisions in 2Q21 and $19 million in 1Q21.
Management's updated outlook for 2021, including the Boston Private acquisition, calls for mid-40s loan growth, low 90s growth in deposits, mid-40s growth in net interest income, and high teens growth in fee income, offset by higher noninterest expenses. We believe that recent acquisitions will allow SIVB to continue to serve its growing customer base. However, we also expect the company to face continued pressure from lower interest rates and elevated mortgage prepayments. Based on management's outlook, the stock's recent run-up, and the unpredictable revenue timing in certain businesses, we believe that SVB is fully valued at 18-times our 2021 EPS estimate.
RECENT DEVELOPMENTSOver the past year, SIVB shares have risen 145%,
compared to a 36% increase in the broad market and a 55% increase in the S&P Bank ETF KBE. We note that the outperformance began in 4Q20 and continued through 2Q21. The stock's beta is 2.04, well above the peer average.
On July 22, SIVB reported 2Q21 EPS of $9.09 versus $4.67 a year earlier and above the consensus forecast of $6.48. Revenue rose 70% from the prior year to a record $1.5 billion. Revenue and earnings were boosted by outsized gains in investment securities and equity warrant assets.
On July 1, 2021 the company completed the acquisition of Boston Private Financial Holdings for approximately $1.2 billion.
EARNINGS & GROWTH ANALYSISWe expect SVB to post low double-digit net interest
income growth in 2021, below management's forecast. We expect further growth in loans, but also look for continued pressure on the net interest margin and lower investment portfolio returns, as well as higher noninterest expenses. We note that the net interest margin fell to 2.06% in 2Q21, down 70 basis points from the prior year. Management projects a
Section 2.185
GROWTH / VALUE STOCKSfull-year net interest margin of 2.00%-2.10%, based on expectations for increased deposit and loan balances and deployments of surplus cash into investment securities. We look for mid- to high single-digit revenue growth in 2021, driven by gains in investment securities, equity warrants, and continued strength in investment banking revenues.
The loan book totaled $49.8 billion at the end of 2Q, with $46.8 billion (94%) in variable-rate loans. Some 67% of the variable loans are based on prime-lending rates and 33% are based on LIBOR. The 2Q provision for loan losses was $35 million, compared to $66 million a year earlier. The allowance for credit losses fell to $396 million in 2Q from $590 million in the prior-year quarter, and represented 0.78% of loans.
Management expects the effective tax rate to hold steady in the 25%-27% range in 2021.
Based on the 2Q earnings, we are raising our 2021 EPS estimate to $30.41 from $27.13 and our 2022 EPS estimate to $24.86 from $23.79. The company's stock buyback authorization expired on October 29, 2020 and no new program has been announced. SIVB did not repurchase any shares in 2Q21 as it is using excess cash for acquisitions.
FINANCIAL STRENGTH & DIVIDENDOur financial strength rating on SVB is Medium, the
midpoint on our five-point scale. Moody's rates SVB's debt at A3/stable, while S&P has a rating of BBB/stable.
Long-term debt was $1.60 billion at the end of 2Q21, up from $1.16 billion at the end of 1Q and $490 million at the end of 2Q20. The CET 1 ratio was 13.66% at June 30, 2021, up from 11.08% a year earlier. Book value rose to $176.10 per share from $134.89 per share.
On July 22, 2021, the board declared a quarterly cash dividend of $13.125 per share (representing $0.328125 per depositary share) on the series A preferred stock; $1,025 per share (representing $10.25 per depositary share) on the series B preferred stock; and $1,022.222 per share (representing $10.22222 per depositary share) on the series C preferred stock. The preferred stock dividends are payable on August 16, 2021 to holders of record at the close of business on August 2, 2021.
With the preferred stock issuance, total stockholders' equity increased to $11.7 billion at June 30, 2021 from $9.9 billion at March 31, 2021. The company also issued 300,000 shares of common stock under the full exercise of the underwriter's overallotment option. Stockholders' equity also benefited from net income of $502 million in 2Q21 and from an increase in other comprehensive income.
MANAGEMENT & RISKSSVB is led by President and CEO Gregory Becker. The
CFO is Daniel Beck. The company is transparent with its performance and offers guidance for average deposit growth, net interest income growth, and net interest margin. The company is subject to a range of risks, including changes in interest rates, credit quality, regulatory complexity, and market volatility.
COMPANY DESCRIPTIONSVB Financial Group, a diversified financial services
company, provides banking and financial services. The company operates through three segments: Global Commercial Bank, SVB Private Bank, and SVB Capital. It was founded in 1983 and is headquartered in Santa Clara, California. As of June 30, 2021, SVB Financial Group had $163 billion in assets and $329 billion total client funds.
INDUSTRYOur rating on the Financial Services sector is
Over-Weight. With market optimism rising on positive vaccine developments and the new administration in Washington, interest rates have started to move higher at the long end of the yield curve. We expect banks to benefit from wider net interest margins and lower loan-loss provisions as the economy normalizes, and insurance companies to generate higher income in their investment portfolios.
The sector accounts for 11.3% of the S&P 500, down from 16.3% following the exclusion of REIT stocks. Over the past five years, the weighting has ranged from 9% to 17%. We think the sector should account for 12%-13% of diversified portfolios. The Financial sector is outperforming the market thus far in 2021, with a gain of 15.4%. It underperformed in 2020, with a loss of 4.1%, and slightly outperformed in 2019, with a gain of 29.2%.
The projected P/E ratio on 2021 earnings is 16, below the market multiple of 23. As for earnings expectations, analysts now expect earnings to rise 12.6% in both 2021 and 2022 after falling 24.8% in 2020 and rising 39.0% in 2019. Yields are slightly above the market average. Dividends and share repurchases also remain subject to regulatory approval for large banks deemed too-big-to-fail.
VALUATIONWe believe that SVB has promising growth prospects that
should benefit ROE and EPS over time. The acquisition of healthcare-focused Leerink Partners has been a boon to investment banking revenues. The acquisition of Boston Private Financial Holdings will also help to expand the wealth management business. However, based on management's 2021 guidance and the stock's recent run-up, we believe that SVB is fully valued at 18-times our EPS estimate for 2021. We also note that the recent gains in investment securities and equity warrants may not be sustainable. The company does not pay a common stock dividend and has a high beta of 2.1. We also expect SVB to face pressure from continued low interest rates.
On July 28 at midday, HOLD-rated SIVB traded at
Section 2.186
GROWTH / VALUE STOCKS$562.33, up $8.01. (Kevin Heal and Ava Caravela, 7/28/21)
T. Rowe Price Group Inc. (TROW)Publication Date: 7/30/21Current Rating: HOLD
HIGHLIGHTS*TROW: U.S. mutual fund outflows continue; reiterating
HOLD*On July 29, T. Rowe Price reported adjusted 2Q21
earnings of $3.31 per share, up from $2.29 a year earlier and above the $3.16 consensus.
*Net revenues rose 36% to $1.93 billion, on a 39% increase in average AUM, but market appreciation drove all of the increase, as outflows from U.S. mutual funds outpaced inflows to other products.
*TROW has projected relatively high 12%-15% operating expense growth in 2021 due to AUM-related expenses and as it transitions technology staff to an outside relationship.
*Given current competitive challenges, we believe that TROW shares are fairly valued at nearly 16-times our 2021 EPS estimate.
ANALYSIS
INVESTMENT THESISWe are maintaining our HOLD rating on T. Rowe Price
Group Inc. (NGS: TROW) following the company's 2Q results. T. Rowe Price posted a solid 39% increase in 2Q average AUM, better than peers in a rebounding equity market environment. However, outflows continued for U.S. mutual funds, which continue to face headwinds from passive asset solutions, with market appreciation accounting for all of the AUM increase in the first half of 2021. We believe that T. Rowe Price will face pressure to reduce fund fees to remain competitive, and is likely to spend more aggressively on advertising to retain actively managed assets.
While competitive pressure remains, the company has seen strong performance from its actively managed funds, generally a good sign for asset attraction and retention, and its focus on the growing retirement market has helped to stabilize assets under management. We also expect its emphasis on target-date funds and the launch of new products to support growth in AUM over time. The company also has high operating margins and a strong financial position, with no debt. As such, our long-term rating remains BUY.
RECENT DEVELOPMENTSOver the past year, TROW shares have risen 49%,
compared to a 36% advance for the broad market.
On July 29, T. Rowe Price reported adjusted 2Q21 earnings of $3.31 per share, up from $2.29 a year earlier and above the $3.16 consensus. Net revenues rose 36% to $1.93 billion, as a 39% increase in average AUM was partly offset by lower fee rates as clients shifted to lower-fee products and
share classes.
Adjusted operating expenses rose 19%, and adjusted net income rose 44% to $779 million.
The company continues to achieve strong fund performance. Some 69% of its mutual funds have outperformed their comparable Morningstar averages on a total-return basis over the past year, while 70% have outperformed over the past five years and 76% over the past 10 years.
EARNINGS & GROWTH ANALYSISTROW has managed to grow assets under management,
revenue, earnings and dividends over the past five years through a combination of organic growth, partnerships, and new product development. However, equity mutual funds flows have been hurt by outflows from actively managed funds to lower-cost passive funds. In 2Q21, mutual fund products had $0.6 billion of net outflows (after client transfers). In U.S. mutual funds, there were net outflows of $8.1 billion as fixed-income inflows were entirely offset by equity and multi-asset outflows. Net market appreciation accounted for all the sequential AUM gain in 2Q.
However, even in down markets, we expect AUM to hold up better at T. Rowe Price than at most active asset managers based on the company's asset mix and historically strong performance relative to peers.
The company's core target-date retirement portfolios have historically been a driver, although these funds may also face some pressure from the trend toward passive investing. T. Rowe Price has been at the forefront of target-date investing; these instruments accounted for $379 billion, or 23%, of AUM as of June 30, 2021. However, with its assets tied to actively managed products, the company has had to spend heavily to prevent funds from shifting to passive products.
We expect average assets to rise in the high 20% range in 2021, on top of a 12% increase in 2020, aided by the continued rebound in equities. The company has generally been able to grow AUM during periods of market volatility, and its favorable fund performance relative to other asset managers, as well as the popularity of its target-date funds, should add stability to asset growth. T. Rowe has had to reduce the management fees on certain mutual funds to remain competitive, while client transfers to lower-fee vehicles have also hurt fee rates, a trend that is likely to continue; this has resulted in investment-management fees growing more slowly than AUM.
Turning to expenses, in 2Q the company expanded its relationship with Fidelity National Information (FIS), whereby FIS will provide technology development and recordkeeping core operations for TROW. Some 800 TROW employees will
Section 2.187
GROWTH / VALUE STOCKSbecome employees of FIS as part of the agreement, starting August 1. TROW now sees operating expense growth of 12%-15% in 2021, up from earlier guidance of 10%-14%.
Reflecting our higher AUM assumptions, we are raising our 2021 EPS estimate to $12.76 from $12.30 and our 2022 forecast to $13.40 from $12.80.
FINANCIAL STRENGTH & DIVIDENDOur financial strength rating for T. Rowe Price is High,
the highest point on our five-point scale.
The operating margin in 2020 was a healthy 44.2% (the peer average is in the low 40% range). Cash and cash equivalents totaled $3.51 billion at June 30, 2021. The company remains debt-free.
In 1Q21, TROW raised its quarterly dividend by 20% to $1.08 per share, or $4.32 annually, for a yield of about 2.1%. The company has raised its dividend for 34 consecutive years, usually a few weeks after reporting 4Q results. Our dividend estimates are $4.32 for 2021 and $4.60 for 2022. The company also paid a special dividend of $3.00 per share in July 2021.
T. Rowe repurchased 0.2 million common shares for $41.3 million in 2Q21.
MANAGEMENT & RISKSIn July 2021, the company announced that CEO William
J. Stromberg would be stepping down at the end of 2021 and be succeeded by Rob Sharps, the current president and a 24-year veteran of the firm. Jen Dardis was also named CFO, effective August 1.
Investors in TROW face numerous risks. Management is under constant pressure to have the right products to meet the evolving needs of investors. The company has achieved its current product portfolio through partnerships and internal product development; unlike many in the industry, TROW has avoided growth via acquisitions. As the industry consolidates, management will be under increasing pressure to have the right products to maintain market share. A current hole in the portfolio is a lack of ETFs and other passive investment vehicles.
The company's results are also dependent on product performance, and a prolonged downturn in investment results could be devastating to sales, earnings and the share price.
COMPANY DESCRIPTIONT. Rowe Price is an independent global investment
manager; it provides a variety of mutual funds, subadvisory services, and separate account management to individuals, institutions, retirement plans, and financial intermediaries worldwide.
VALUATION
TROW shares have traded between $121 and $212 over the past year and are currently near the top of that range. TROW tends to trade at a premium to peers on P/E and price/book, which we believe is warranted based on the company's strong fund performance through market cycles, its focus on the retirement account market (which provides more predictable growth and stability in AUM), and its above-average operating margins.
However, the company has been facing pressure both from outflows in actively managed equity funds and from lower fees as investors switch to lower-cost products. Net cash flows were only slightly positive in 2020, with market appreciation accounting for 99% of AUM growth, a trend that continued in the first half of 2021. In keeping with industry trends, the company has lowered fees on actively managed funds to better compete with passive funds. With inflows remaining sluggish, our rating remains HOLD.
On July 30 at midday, HOLD-rated TROW traded at $203.90, down $0.05. (Stephen Biggar, 7/30/21)
Thermo Fisher Scientific Inc. (TMO)Publication Date: 8/4/21Current Rating: BUY
HIGHLIGHTS*TMO: Reaffirming BUY and raising target to $600 *Thermo Fisher is using its strong operating cash flow to
develop and launch new products, expand capacity, and acquire growth assets.
*On July 28, the company reported 2Q21 adjusted EPS of $5.60, up 44% from the prior year and above the consensus of $5.47.
*Management has raised its full-year guidance based on the strong 2Q performance and its upbeat outlook for the second half.
*TMO appears favorably valued at 25-times our 2022 EPS estimate, compared to an average multiple of 31 for our coverage universe of life sciences stocks.
ANALYSIS
INVESTMENT THESISWe are reaffirming our BUY rating on Thermo Fisher
Scientific Inc. (NYSE: TMO) and raising our target price to $600 from $530. The company is investing its substantial cash flow in product development, capacity expansions, and acquisitions. We believe that these investments and strength in the base business (excluding COVID-19 testing revenue) will drive growth on the other side of the pandemic.
RECENT DEVELOPMENTSThermo Fisher is adding growth drivers to offset the
anticipated decline in COVID-19 testing revenue. The company generated strong operating cash flow in the first half of 2021, providing resources for these investments. First-half cash flow from operations rose to $4.205 billion from $2.242
Section 2.188
GROWTH / VALUE STOCKSbillion a year earlier.
On July 28, the company reported 2Q21 adjusted EPS of $5.60, up 44% from the prior year and above the consensus of $5.47. GAAP net income rose to $1.828 billion or $4.61 per share from $1.156 billion or $2.90 per share a year earlier. Revenue rose to $9.27 billion (+34% reported; +28% organic). Excluding COVID-19 testing revenue, organic sales in the base business rose 27%. COVID testing revenue fell to $1.9 billion from $2.9 billion in 1Q21. (We note that Thermo continues to see revenue growth related to the development of COVID-19 vaccines and therapies, even as revenue from testing solutions declines.)
Revenue in the base business rose 27% year-over-year in 2Q21, up from 13% growth in 1Q, driven by strong demand for products and services to support biotech drug development. By measures of profitability, the 2Q adjusted gross margin was 50.6%, flat with the prior year. The adjusted operating margin was 32.3%, up 760 basis points.
The company announced a range of new initiatives in 2Q that we see as future growth drivers. These are summarized below.:
-- Collaboration with leading academic medical centers. These collaborations include a partnership with the Mayo Clinic to accelerate the development of more precise diagnostics for blood-based cancers. Thermo is also collaborating with the University of California, San Francisco to operate a new clinical and commercial cGMP cell therapy manufacturing facility.
-- Launch of new products to support small-molecule research and smaller and complex semiconductors. The company has launched the Orbitrap IQ-X Tribrid Mass Spectrometer to advance complex small-molecule research. It has also developed a new scanning electron microscope to support the development of smaller and more complex semiconductors.
-- Opening of a new plasmid DNA facility. Thermo has opened a new plasmid DNA facility in Carlsbad, California to meet growing demand for plasmid DNA-based therapies and mRNA-based vaccines.
-- Agreement to acquire PPD. Thermo has agreed to acquire PPD, a clinical research organization, for $17.4 billion. The transaction is expected to close by the end of 2021. PPD will become a part of Thermo's Laboratory Products and Services segment, which already includes Patheon, a contract drug manufacturer, and Brammer Bio, a manufacturer of viral vectors used in cell and gene therapies. In addition to providing products, instruments, reagents and chemicals for biopharma customers, Thermo is increasing the range of services it provides for the development and
production of biotech drugs.
Thermo also has vaccine production agreements with Pfizer and Moderna.
EARNINGS & GROWTH ANALYSISFollowing the strong 2Q results, management has raised
its full-year guidance. It now expects revenue of $35.9 billion, up by $300 million from its prior forecast. It also expects 12% organic growth in the base business, up from a prior forecast of 8% growth, along with slightly slower growth in COVID-19 response revenue. It projects 2021 adjusted EPS of $22.07, up from a prior $21.97 and implying 13% growth this year.
Based on the company's updated guidance and strong recent performance, we are raising our 2021 adjusted EPS estimate to $22.20 from $22.10. We are maintaining our 2022 estimate of $21.70.
FINANCIAL STRENGTH & DIVIDENDWe rate TMO's financial strength as Medium-High, the
second-highest peg on our five-point scale. Thermo intends to invest its robust operating cash flow in technology upgrades, capacity expansions, and acquisitions - all contributing to future growth. As noted above, cash flow from operations in the first six months of 2021 was $4.205 billion, up from $2.242 billion a year earlier.
The company pays an annualized dividend of $1.04 for a yield of about 0.2%. Our dividend estimates are $1.04 for 2021 and $1.12 for 2022.
COMPANY DESCRIPTIONThermo Fisher manufactures scientific instruments,
consumables, and chemicals. It provides analytical instruments, lab equipment, software reagents and supplies to pharmaceutical companies, hospitals, clinical diagnostic labs, universities, research institutions and government agencies.
VALUATIONTMO trades at 25-times our 2022 EPS estimate, compared
to an average multiple of 31 for our coverage universe of life sciences stocks. We believe this is an attractive valuation based on the company's strong growth opportunities in the U.S. and in overseas markets, including China, and record of successful acquisitions. Looking ahead, we expect TMO to continue to benefit from the launch of new products and the expansion of its production and service capabilities.
On August 3, BUY-rated TMO closed at $536.99, up $3.31. (David Toung and Caleigh McGough, 8/3/21)
Twilio Inc (TWLO)Publication Date: 8/3/21Current Rating: BUY
HIGHLIGHTS*TWLO: Ongoing revenue and customer momentum;
Section 2.189
GROWTH / VALUE STOCKSreiterating BUY
*Twilio continues to post revenues far above its own tight guidance ranges and consensus expectations.
*Revenue continues to grow faster than Twilio's end markets, rising 67% annually in 2Q20 while handily topping consensus estimate. The company's active customer base was up about 20% year-over-year.
*The strong outperformance of revenue growth in relation to customer account growth signals that Twilio is succeeding in its mission to capture more of its customers' spending.
*We continue to recommend TWLO for investors aware of the risks of investing in new digital technologies.
ANALYSIS
INVESTMENT THESISBUY-rated Twilio Inc. (NYSE: TWLO) fell 5% in a down
market on 7/30/21 after returning to a non-GAAP loss position for 2Q21. That broke a five-quarter string of profitable quarters, most of which followed loss guidance from management. Twilio posted an $0.11 per-share loss in 2Q21, which was two cents better than consensus.
Revenue continues to grow faster than Twilio's end markets, rising 67% annually in 2Q20 while handily topping the consensus estimate. The company's active customer base was up about 20% year-over-year.
The strong outperformance of revenue growth in relation to customer account growth signals that Twilio is succeeding in its mission to capture more of its customers' spending. Growth in Twilio's dollar-based net expansion rate (revenue growth from existing customers) remained robust, confirming the positive trend.
Twilio's solutions enable e-commerce and other company-to-customer virtual interactions. As a facilitator of apps that companies can embed in their sites to improve customer interaction, the company saw business accelerate as the pandemic took hold. We believe the company's solutions will continue to flourish in a post-pandemic world. Twilio appears to be in the very early innings of a significant market opportunity, in our view.
Twilio offered strong revenue guidance for 3Q21 that was ahead of consensus; guidance for a higher-than-consensus non-GAAP loss in 3Q sparked a selloff in the stock. We see an opportunity for investors to initiate or dollar-average into positions in a company with nearly unmatched growth prospects in coming years. We continue to recommend TWLO for investors aware of the risks of investing in new digital technologies, where unpredictable revenue and investing patterns can cause volatile results and drive big stock swings. We are reiterating our BUY rating on TWLO to a 12-month target price of $520.
RECENT DEVELOPMENTS
TWLO is up 10% so far in 2021, immediate peers are up 21%. TWLO rallied by 244% in 2020, versus an 89% gain for the peer group of Argus-covered cloud, social media, and internet service providers. TWLO appreciated 10% in 2019, while peers advanced 51%. TWLO soared 278% in 2018, making it one of the best-performing stocks in Argus technology coverage; the peer group rose just 4% following a late-year selloff. In 2017, TWLO declined 18%, compared to a gain of 39% for a peer group of cloud and internet service providers. For the half year in which the stock traded in 2016, it advanced less than 1%.
For 2Q21, Twilio reported revenue of $669 million, up 67% year-over-year and 13% on a sequential basis. Revenue was well above the high end of management's tight guidance range of $591-$601 million. Revenue also topped the consensus forecast of $600 million. Twilio posted a non-GAAP loss of $0.11 per diluted share in 2Q21, compared with a non-GAAP profit of $0.05 per diluted share in 1Q21 and a non-GAAP profit of $0.09 per diluted share a year earlier. Management had guided for a non-GAAP loss in the $0.13-$0.16 range for 2Q21; consensus expectations had called for a loss of $0.13 per share.
Since 2020, when the company first (sporadically) posted profits on a non-GAAP basis, Twilio has warned of the possibility of further losses as it pursued growth initiatives. Twilio nonetheless posted profits in every quarter in 2020 and in 1Q21, perhaps lulling investors and analysts (us included) into assuming that the company would post a non-GAAP profit in 2Q21 despite warning of a loss.
Over the preceding five quarters, Twilio's strong top-line growth, scale efficiencies and overhead absorption enabled the company to generate modest profits ahead of company plans and despite aggressive investment in its operations. In 2Q21, the stepped up pace of this investment led to the forecast but still somewhat unexpected loss.
Twilio works with developers to help companies provide solutions to enable e-commerce and other company-to-customer virtual interactions. As a facilitator of apps that companies can embed in their sites to improve customer interaction, the company saw business accelerate as the pandemic took hold. We believe the company's solutions will continue to flourish in a post-pandemic world.
Twilio appears to be in the very early innings of a significant market opportunity. Twilio's software enables developers to build, scale and provide a cloud-based communications platform as a service (CPaaS), enabling voice, video, messaging and email directly within a company's software platform. Twilio has guided for 30%-plus annual revenue growth for at least the next four years. Given organic growth and acquisitions that have broadened its end markets, Twilio has only moderately penetrated a total available market
Section 2.190
GROWTH / VALUE STOCKSexceeding $85 billion.
CEO and founder Jeff Lawson noted that companies are turning to Twilio's customer engagement platform to drive their digital transformation. The environment has undergone a significant change in how companies interact with their customers, spurred first by the pre-pandemic shift to online engagement and interactions. The pandemic massively accelerated this transformation. And now, as the post-pandemic hybrid world emerges, the way companies engage with their customers is driving a generational opportunity for Twilio, according to the CEO.
The CEO, who commonly devotes the bulk of this commentary to business development, detailed Twilio's contribution to the Gavi global vaccination program. Twilio is the second-largest contributor among private companies to Gavi and the largest in the technology sector. The company has a history of giving back, which may prove a sound business strategy in a world where ESG scores are figuring in institutional investment decisions and portfolio-building.
As of mid-year 2021, Twilio's active customer count exceeded 240,000. Active customer count grew about 15%-20% annually, or by 41,600 accounts, from 2Q20. And active accounts grew an estimated 4% sequentially, or by 14,000 accounts, from 4Q20.
Beginning in 2019, the SendGrid acquisition caused average revenue per user to decline. Twilio anniversaried that acquisition in 2Q20; this metric stabilized and is again rising sequentially. We estimate that average revenue per user of about $2,700 for 2Q21 increased 6%-8% sequentially from $2,511 for 1Q21 and 35%-40% annually from $1,965 for 2Q20.
Strength in this metric is reinforced by the dollar-based net expansion rate, which measures growth in revenue from existing customers. The dollar-based net expansion rate for 1Q21 was 135%, up from 133% for 1Q21 and 132% a year earlier.
Top 10 customers contributed 12% of revenue for 2Q21, compared with 15% of revenue a year earlier. Despite the smaller percentage concentration, which is healthy for revenue stability, the top 10 revenue contributions grew 34% year-over-year. Revenue from all other customers grew a very healthy 73% year-over-year, as Twilio broadens its customer base.
On a geographic basis, North American revenue (68% of total) increased 55% year-over-year, while international revenue (32% of total) was up a best-ever 98% year-over-year and a strong 25% sequentially. Even with an enormous market opportunity in the U.S., Twilio's global growth prospects are much more substantial. International revenue growth is
accelerating, in a sign that increased investment in the platform is paying off.
In February 2021, Twilio issued its 'State of Customer Engagement' report. The report indicates that over 95% of businesses plan to maintain or increase current digital communication channel offerings, based on widespread belief that digital is critical to growth and engagement. The report found that 92% of CIOs identified software developers as being crucial to solving business challenges. IDC data indicates that investments in digital transformation will be approximately $2.3 trillion by 2023, representing more than half of total IT spending worldwide.
Twilio believes its core business has never been stronger, and that the company is seeing great traction in emerging products such as Flex and Video. Customers have also been highly positive about the new Twilio Segment business. Twilio acquired Segment in November 2020, calling it the market-leading customer data platform (CDP). The addition of Segment's CDP platform to Twilio's customer engagement platform, management believes, gives businesses a single view of the customer across channels.
This integrated solution enables organizations to create personalized, timely and impactful customer experiences to deepen relationships with consumers. The $3.2 billion Segment deal did not carry the burden of acquisition debt due to being all-stock. While the deal results in some stock dilution, the cost has been absorbed into Twilio's $60-plus billion capitalization without disruption.
Twilio has always brought digital engagement, software agility, and cloud scale to its customers, which are enabling organizations to innovate more rapidly. Messaging, email, voice and video allow companies to engage with their customers safely while creating digital engagement strategies that will be resilient for years. Integration of Segment's CDP solution adds another element to this offering.
The emergence of telehealth, contactless delivery, distance learning and other now-familiar consequences of the pandemic present opportunities and reflect challenges as companies seek new ways to engage with customers. Twilio appeals to customers of all sizes by offering a largely usage-based model that provides a grow-to-scale model. At the same time, Twilio's unmatched base of software developer partners allows customers to deliver advanced communications tools tailored to their business models.
Twilio faces a gross margin headwind going forward from servicing the SMS business of a major customer, AT&T. As with an existing relationship with Verizon, the payoff from increased long-term revenue and relationship expansion opportunities more than outweigh the near-term margin hit.
Section 2.191
GROWTH / VALUE STOCKS
For 3Q21, management guided for revenue of $670-$680 million; midpoint guidance is consistent with annual top-line growth of about 50%. Management also forecast a non-GAAP loss from operations of $27-$22 million, resulting in a loss per share in the $0.14-$0.17 range. Twilio's conservative guidance has the effect of preventing estimates from soaring to unattainable levels, as the company continues to prioritize investing in its platform as opposed to appeasing Wall Street analysts.
Twilio offered guidance for a higher-than-consensus non-GAAP loss in 3Q21, which sparked a modest selloff in the stock. We see an opportunity for investors to initiate or dollar-average into positions in a company with nearly unmatched growth prospects in coming years. We continue to recommend TWLO for investors aware of the risks of investing in new digital technologies.
EARNINGS & GROWTH ANALYSISFor 2Q21, Twilio reported revenue of $669 million, up
67% year-over-year and 13% on a sequential basis. Revenue was well above the high end of management's tight guidance range of $591-$601 million. Revenue also topped the consensus forecast of $600 million.
Non-GAAP gross profit tightened to 53.9% in 2Q21 from 55.5% in 1Q21 and from 55.9% a year earlier. Non-GAAP operating margin was 0.6% for 2Q21, vs. 2.9% for 1Q21 and 1.7% a year earlier.
Twilio posted a non-GAAP loss of $0.11 per diluted share in 2Q21, compared with a non-GAAP profit of $0.05 per diluted share in 1Q21 and a non-GAAP profit of $0.09 per diluted share a year earlier. Management had guided for a non-GAAP loss in the $0.13-$0.16 range for 2Q21; consensus expectations had called for a loss of $0.13 per share.
For all of 2020, Twilio generated revenue of $1.76 billion, which was up 55% from $1.13 billion in 2019. Non-GAAP profit for 2020 totaled $0.23 per diluted share, up 45% from $0.16 per diluted share for 2019.
For 3Q21, management guided for revenue of $670-$680 million; midpoint guidance is consistent with annual top-line growth of about 50%. Management also forecast a non-GAAP loss from operations of $27-$22 million, resulting in a loss per share in the $0.14-$0.17 range. Twilio's conservative guidance has the effect of preventing estimates from soaring to unattainable levels, as the company continues to prioritize investing in its platform as opposed to appeasing Wall Street analysts.
Given higher costs related to integrating Segment, the AT&T headwind to gross margins, and ongoing costs of investing in the business, we are trimming our non-GAAP EPS
forecast for 2021 to $0.11 per diluted share from $0.24. We have also reduced our preliminary 2022 non-GAAP EPS projection to $0.44, from a preliminary $0.53.
Our more conservative estimates are predicated on expectations that Twilio will continue to prioritize investments in the business over immediate profit growth. We consider both estimates to be fluid and subject to revision. Our long-term annualized five-year EPS growth rate forecast is 12%.
FINANCIAL STRENGTH & DIVIDENDOur financial strength ranking on TWLO is
Medium-High, given Twilio's growth and its rising net-cash position.
During 3Q20, Twilio completed a follow-on offering of Class A common shares, which raised $1.4 billion after all costs. Proceeds will be used for general corporate purposes, potentially including additional acquisitions. Twilio also added to its debt in 1Q21.
As a result of the secondary offering and debt issuance, but primarily from strong cash generation in the business, Twilio had cash & equivalents of $5.93 billion at the end of 2Q21. Twilio had cash & equivalents of $3.04 billion at the end of 2020, $1.85 billion at the end of 2019, $794 million at the end of 2018, $291 million at the end of 2017, and $306 million at the end of 2016. Year-end 2016 cash and equivalents included $156 million raised in the June 2016 IPO and $55 million, net of expenses, raised in the October 2016 secondary offering.
Debt was $985 million at the end of 2Q21. Debt was $532 million at the end of 2020, $458 million at year-end 2019, and $461 million at year-end 2018. Twilio in May 2018 issued $475 million in convertible senior notes (due 2023) in a private offering. Prior to that issuance, the company had no debt.
Net cash was $2.51 billion at year-end 2020, up from $1.43 billion at mid-year 2020. Net cash was $1.39 billion at the end of 2019 and $314 million at the end of 2018.
Cash flow from operations was $32.6 million for 2020. Cash flow from operations was $14.0 million for 2019 and $8.0 million for 2018. We expect cash flow from operations to exceed $40 million for 2020.
We do not expect Twilio to pay a dividend in the near term.
MANAGEMENT & RISKSJeff Lawson, one of the company's founders, has served as
CEO since April 2008 and as chairman since November 2015. Mr. Lawson previously founded and served as the chief
Section 2.192
GROWTH / VALUE STOCKStechnology officer of Nine Star, a multichannel equipment and apparel retailer for the action sports industry, and was a technical product manager at Amazon.
Khozema Shipchandler became CFO effective 11/12/18. George Hu is chief operating officer, having joined Twilio in October 2018 from a similar role at Salesforce.com. Twilio added another veteran executive from Salesforce.com, Sara Varni, as Twilio's chief marketing officer (CMO). Chew Chee has stepped down as chief product office, replaced by Twilio Segment CEO Peter Reinhardt.
Investors in TWLO face a range of risks. These include the company's record of losses and the newness of its technology, the need to increase market awareness and attract outside developers, and threats from competing services. In addition, the company's directors, executive officers, and other insiders hold about 66% of the voting stock through their class B shares, and their interests may not coincide with those of minority shareholders.
COMPANY DESCRIPTIONTwilio provides a cloud-based communications platform
that enables businesses to embed messaging, voice, video, and authentication capabilities directly into their software applications. The company's platform allows developers to build and manage applications without the complexity of creating and maintaining underlying infrastructure. The company completed its initial public offering in June 2016.
VALUATIONBased on historical comparisons, we calculate a value
above current levels for TWLO, but note that several inputs are speculative given the company's short trading history. On a comparable historical basis versus the company's own trading history, TWLO is valued in the mid-$600, in a stable trend.
The shares generally trade at premiums to peer multiples, resulting in a peer-indicated value that is well below current prices. Our discounted free cash flow valuation points to a value in the mid-$800s, in a stable to rising trend.
Our blended fair value estimate for Twilio is in the mid-$650s, in a flattening trend as business accelerates but costs rise. Appreciation to our 12-month target price of $520 implies a risk-adjusted return in excess of our forecast for the S&P 500 and is thus consistent with a BUY rating.
We continue to recommend TWLO for investors aware of the risks of investing in new digital technologies, where unpredictable revenue and investing patterns can cause volatile results and drive big stock swings.
On August 3 at midday, BUY-rated TWLO traded at $365.79, down $13.76. (Jim Kelleher, CFA, 8/3/21)
United Rentals, Inc. (URI)Publication Date: 7/30/21Current Rating: BUY
HIGHLIGHTS*URI: Recent price weakness offers buying opportunity*URI shares have underperformed over the past three
months, declining 1% compared to a 6% gain in the S&P 500.*The company recently reported 2Q EPS that fell short of
consensus forecasts.*Even so, management raised guidance and we are once
again raising our EPS estimates.*Based on these generally favorable valuation multiples
we are maintaining our BUY rating and our target price of $360.
ANALYSIS
INVESTMENT THESISOur rating on United Rentals Inc. (NYSE: URI) is BUY.
United Rentals is the largest rental equipment company in the world, with a store network nearly three-times the size of any other provider in the fragmented industry. We are comfortable with this well-managed company's ability to navigate the pandemic as well as with its adoption of new technology that will help it to grow in a post-COVID-19 world. On the fundamentals, URI shares trade at 13-times our 2022 EPS estimate, compared to a five-year range of 6-14, and at a price/sales ratio of 2.7, near the high end of the historical range. Based on these generally favorable multiples - as we note that sales and earnings are abnormally depressed -- we are maintaining our BUY rating and our target price of $360.
RECENT DEVELOPMENTSURI shares have underperformed over the past three
months, declining 1% compared to a 6% gain in the S&P 500. Over the past year, the shares have gained 103%, versus a 37% gain for the index and a 44% gain for the Industry ETF IYJ. The stock has also outperformed its benchmarks over the past five years. The returns can be volatile; the beta on URI is 2.05.
The company recently reported second-quarter adjusted EPS that rose 26% year-over-year but fell short of consensus forecasts. On July 28, URI posted adjusted 2Q20 EPS of $4.66, up 26% year-over-year, which was better than the 3% increase in the prior quarter, and but was below the consensus forecast of $4.85. Total 2Q21 revenue rose 21% year over year to $2.3 billion. The adjusted EBITDA margin narrowed by 270 basis points to 43.7%. For the first half of the year, the company has earned $8.11 per share on an adjusted basis.
Along with the results, management raised guidance for 2021. The total revenue outlook is now $9.45-$9.75 billion, compared to $8.535 billion in 2020. The adjusted EBITDA outlook is $4.225-$4.375 billion, compared to $4.355 billion in 2020.
Management also commented that volume trends have
Section 2.193
GROWTH / VALUE STOCKSsteadily improved over the past four quarters and that the company is in position to 'deliver strong growth and returns in the second half of the year.'
The company has a growth-by-acquisition strategy. In May, the company closed on the $1 billion acquisition of General Finance Corp. General Finance, which operates as Pac-Van and Container King in the U.S. and Canada, and as Royal Wolf in Australia and New Zealand, is a leading provider of mobile storage and modular office space. In April the company acquired Franklin Equipment, LLC, a regional provider of equipment rentals, sales and related services in the Midwest and Southeast United States.
EARNINGS & GROWTH ANALYSISThe company has two primary operating segments:
General Rentals (64% of sales), which includes the rental of general construction and industrial equipment, aerial work platforms, and general tools and lighting equipment; and the Specialty Rentals business (21%), which includes the rental of specialty construction equipment such as trench safety equipment, power and HVAC equipment, and pumps that are used by industrial, mining, construction, and agribusiness customers. URI also sells used equipment (9% of sales).
In General Rentals, revenue in the latest quarter rose 17% from the prior year. Revenue in the Specialty segment rose 25%. Equipment sales rose 10%.
United Rentals uses Fleet Productivity to measure the decisions made by managers in support of growth and returns. Fleet Productivity aggregates, in one metric, the impact of changes in rates, utilization, and mix on owned-equipment rental revenue. In 2Q, Fleet Productivity rose 18%.
Management keeps a close eye on expenses. In 2Q, the adjusted EBITDA margin narrowed by 270 basis points to 43.7%. The contraction reflected higher bonus accruals and increased delivery expense.
Based on recent trends in sales, margins Fleet Productivity, we are raising our adjusted 2021 EPS estimate to $21.10 from $20.30. Our estimate implies EPS growth of 21% this year. We look for growth to continue next year and are raising our 2022 adjusted EPS forecast to $24.50 from $23.50.
FINANCIAL STRENGTH & DIVIDENDOur financial strength ranking on URI is Medium-Low.
The company generally receives below-average marks on our key financial strength criteria of debt levels, fixed-cost coverage, cash flow generation and profitability. S&P rates URI's credit as BB/stable, below investment-grade but up from a prior BB-/positive. Moody's no longer rates URI's credit.
URI is highly leveraged, with $10.2 billion in debt as of the end of the latest quarter. The debt/capital ratio at the end of
the quarter was 67%. Cash flow covered interest expense by a factor of 6 in 2020. URI had cash of $336 million at the end of 2Q.
Margins are high; the company's 2Q EBITDA margin was 43.7%. And earnings are high-quality: the average free cash flow conversion ratio from 2011-2020 has been 124%. ROIC was 9.2% for the 12 months ended 6/30/2021. In the past year, ROIC exceeded the company's current weighted-average cost of capital of 8.0%.
The company has a stock buyback plan, which has been paused due to COVID-19.
The company has not paid a cash dividend since its inception, and we do not expect any payments in 2021 or 2022.
MANAGEMENT & RISKSMatthew Flannery is the company's president and CEO.
Former CEO Michael J. Kneeland is the chairman. Bobby Griffin, a member of the board for 10 years and the chairman of the Strategy Committee, is now lead independent director. Dale Asplund became the COO in May 2019. Jessica Graziano is the CFO. Ms. Graziano was promoted to EVP and chief financial officer in October 2018, after serving as senior vice president, controller and principal accounting officer since March 2017.
The company's competitive position in its industry - No. 1 in market share, with 13% in North America - is enhanced by the size, breadth and diversity of its fleet; investments in technology; and proven management team.
URI investors face risks. These include the company's highly cyclical business, significant debt, and exposure to the oil and gas industry. The business is also capital-intensive; the company must spend heavily to expand and maintain its fleet of rental equipment.
COMPANY DESCRIPTIONUnited Rentals is the largest rental equipment company in
the world, with a store network nearly three times the size of any other provider, and locations in 49 states and all Canadian provinces. The company has over 18,000 employees and approximately 1,275 rental locations in the U.S. and Canada and 10 locations in Europe. The shares are a component of the S&P 500.
VALUATIONWe think that URI shares are attractively valued at current
prices near $322. Over the past 52 weeks, the shares have traded between $151 and $354. From a technical standpoint, the shares had been in bullish pattern of higher highs and higher lows that dates to March 2020, though the trend has turned somewhat neutral in recent weeks.
Section 2.194
GROWTH / VALUE STOCKSOn the fundamentals, URI trades at 13-times our 2022
EPS estimate, compared to a five-year range of 6-14, and at a price/sales ratio of 2.8, near the high end of the historical range of 1-3. Based on these generally favorable multiples - as we note that sales and earnings are abnormally depressed -- we are maintaining our BUY rating. Our target price is $360.
On July 29, BUY-rated URI closed at $322.46, down $3.43. (John Eade, 7/29/21)
Valero Energy Corp. (VLO)Publication Date: 8/2/21Current Rating: BUY
HIGHLIGHTS*VLO: Reaffirming BUY after second-quarter results*On July 29, Valero reported a 2Q21 adjusted net profit
from continuing operations of $197 million or $0.48 per share, compared to an adjusted net loss of $504 million or $1.25 per share in 2Q20. Second-quarter revenue jumped 167% from the prior year to $27.748 billion.
*We expect steadily improving demand for gasoline during a strong summer driving season, as well as increased demand for diesel and jet fuel.
*Valero does not provide formal guidance; however, management projects capital spending of $2.0 billion per year in 2021 (60% for sustaining capex and 40% for growth projects). Approximately 40% of the spending on growth projects will be allocated to the renewable diesel business.
*Valero pays a quarterly dividend of $0.98 per share, or $3.92 annually, for a yield of about 5.8%.
ANALYSIS
INVESTMENT THESISWe are reaffirming our BUY rating on Valero Energy
Corp. (NYSE: VLO) with a price target of $83. We expect steadily improving demand for gasoline during a strong summer driving season, as well as increased demand for diesel and jet fuel. We also look for improved refining margins. As such, we expect sales and earnings to rise in the coming quarters. Over the long term, we expect Valero to benefit from its size, scale, and diversified business portfolio, which includes refining, midstream, chemicals, and marketing and specialty operations.
RECENT DEVELOPMENTSOn July 29, Valero reported a 2Q21 adjusted net profit
from continuing operations of $197 million or $0.48 per share, compared to an adjusted net loss of $504 million or $1.25 per share in 2Q20. EPS missed our estimate of $0.76 but topped the consensus of $0.14. Second-quarter revenue jumped 167% from the prior year to $27.748 billion.
The Refining segment reported an adjusted 2Q21 operating profit of $361 million, compared to an operating loss of $383 million a year earlier (which excludes an LCM inventory valuation adjustment). The improvement reflected
higher throughput and margin growth. Refining throughput volume averaged 2.8 million barrels per day, up from 2.3 million in 2Q20. Segment operating income was $1.40 per barrel, compared to a loss of $1.82 per barrel a year earlier. Valero's refineries operated at 90% throughput capacity in 2Q21, up from 74% in 2Q20.
The Ethanol segment reported a 2Q21 adjusted operating profit of $99 million, up 9% from 2Q20 on modestly higher margins. The company produced 4.203 million gallons of ethanol per day in 2Q21, up from 2.316 million in 2Q20.
Valero created a new Renewable Diesel segment on January 1, 2019, encompassing the operations of Diamond Green Diesel (DGD), a consolidated joint venture. The new segment reflects the growing importance of renewable fuels and the growth of Valero's investments in renewable fuel production. The segment reported $248 million of operating income in 2Q21, helped by plant expansion, up from $129 million in 2Q20.
EARNINGS & GROWTH ANALYSISValero does not provide formal financial guidance;
however, management projects capital spending of $2.0 billion per year in 2021 (60% for sustaining capex and 40% for growth projects). Approximately 40% of the spending on growth projects will be allocated to the renewable diesel business. Capital expenditures in 2020 were $2.0 billion.
We are lowering our 2021 EPS estimate to $0.50 from $0.78 to reflect the second-quarter results, which missed our forecast by $0.28. We are also lowering our 2022 EPS estimate to $5.14 from $5.74 based on our expectations for slightly lower margins and higher capital spending next year.
FINANCIAL STRENGTH & DIVIDENDWe rate Valero's financial strength as Medium, the
midpoint on our five-point scale. The company's debt is rated BBB/negative by Standard & Poor's and Baa2/negative by Moody's. Fitch rates Valero's debt at BBB/negative.
At the end of 2Q21, VLO's total debt/capitalization ratio was 44.0%, up from 40.3% a year earlier. The total debt/cap ratio is in line with the peer average and has averaged 32.6% over the past five years.
Long-term debt totaled $14.680 billion at the end of 2Q21, up from $13.922 billion at the end of 2Q20. The company has minimal short-term debt. Valero had cash and cash equivalents of $3.6 billion at the end of 2Q21, compared to $2.3 billion at the end of 2Q20.
In the second quarter of 2021, Valero returned $401 million to stockholders in the form of dividends. In 2020, it returned $1.8 billion to shareholders, compared to $2.3 billion in 2019 and $3.1 billion in 2018. The company has $1.4
Section 2.195
GROWTH / VALUE STOCKSbillion remaining on its existing buyback authorizations, but recently said that it would suspend share repurchases until energy markets improve.
Valero pays a quarterly dividend of $0.98 per share, or $3.92 annually, for a yield of about 5.8%. Our dividend estimates are $4.07 for 2021 and $4.11 for 2022.
RISKSValero participates in the downstream segment of the oil
and gas industry. As such, it is at the bottom of the food chain in terms of its ability to set prices. Refiners can be hurt by rising crude oil prices since crude oil is a primary input. They can also be hurt if gas prices rise too much, causing demand for gas to decline.
COMPANY DESCRIPTIONWith total capacity of approximately 2.9 million barrels
per day, Valero is the world's largest independent petroleum refiner and marketer. The company has 15 refineries and 11 ethanol plants in the U.S., Canada, the United Kingdom and the Caribbean, and its refineries are able to process heavy, low-quality crude oil. Through subsidiaries, Valero owns the general partner of Valero Energy Partners LP (NYSE: VLP), a midstream master limited partnership.
INDUSTRYWe have lowered our rating on the Energy sector to
Under-Weight from Market-Weight. The year-to-date surge in Energy stocks has not been matched by rising production levels. Instead, Energy companies continue to cut production as more electric vehicles are introduced by mainstream automotive OEMs, and as utilities redouble their efforts to add to their renewable generation sources.
Energy now accounts for 2.9% of S&P 500 market cap; over the past five years, the weighting has ranged from 2% to 10%. We think that investors should consider allocating about 2% of their diversified portfolios to the Energy group. The sector includes the major integrated firms, as well as exploration & production, refining, and oilfield & drilling services companies. The sector is outperforming thus far in 2021, with a gain of 44.5%. It underperformed in 2020, with a loss of 37.3%, and in 2019, with a gain of 7.6%.
Our 2021 forecast for the average price of a barrel of West Texas Intermediate crude oil is now $59, up from $53. Our estimate assumes that OPEC and OPEC+ members coordinate on production cuts and that global economic activity continues to gradually improve. Our forecast also reflects the long-term downward pressure on crude prices as 'peak oil' approaches. This trend, though not a smooth decline, may be seen in recent average annual prices: $40 in 2020, $57 in 2019, $65 in 2018, $51 in 2017, $43 in 2016, $49 in 2015, $93 in 2014 and $98 in 2013. Further, we anticipate that President Biden's policies will continue to favor clean energy initiatives rather than carbon-based energy. Our range for WTI
through 2021 is now $70 on the upside and $50 on the downside. Our 2021 forecast for the average wellhead price of Henry Hub natural gas remains $3.13 per MMbtu, with a range of $2.50-$3.75. The average price in 2020 was $2.05 per MMbtu.
VALUATIONValero shares have traded between $35.44 and $84.95
over the past 52 weeks and are currently above the midpoint of that range. To value the stock on a fundamental basis, we use peer and historical multiple comparisons, as well as a dividend discount model. VLO is trading at 13-times our 2022 estimate, compared to a ten-year average annual range of 7-14. The stock is also trading at a trailing price/book multiple of 1.6, above the midpoint of the historical range of 1.1-1.8, and at a price/sales multiple of 0.3, at the midpoint of the range of 0.2-0.4. The price/cash flow multiple of 12.4 is slightly above the high end of the ten-year range of 5.4-12.2. We are reiterating our BUY rating with a target price of $83.
On August 2 at midday, BUY-rated VLO traded at $67.22, up $0.25. (Bill Selesky, 8/2/21)
Visa Inc (V)Publication Date: 7/29/21Current Rating: BUY
HIGHLIGHTS*V: Raising EPS estimates; 3Q shows improvement in
payment volume*On July 27, Visa reported EPS of $1.49 for fiscal 3Q21
(ended June 30), above the $1.06 of the prior year and above the $1.34 consensus.
*Payment volume was strong, up 34%, while cross-border volume also rebounded as some international travel restrictions were eased.
*We expect Visa to benefit from secular growth in online payments, the capture of new payment streams, and the expansion of value-added client services.
*Our target price of $270 implies a multiple of 38-times our EPS estimate for FY22, when we expect a return to over 20% earnings growth.
ANALYSIS
INVESTMENT THESISWe are maintaining our BUY rating on Visa Inc. (NYSE:
V) following the company's fiscal 3Q earnings. Payment volume was strong, up 34%, while cross-border volume also rebounded as some international travel restrictions were eased. Payment volume and processed transactions bottomed in April 2020 and have been improving consistently since then. We continue to expect secular growth in payment volumes and believe that solid cost controls and strong buyback activity will aid earnings.
Visa held an Investor Day in February 2020. The company is focused on growing revenue from consumer
Section 2.196
GROWTH / VALUE STOCKSpayments (expanding credentials and acceptance points and driving user engagement), as well as from new flows (capturing new sources of payments and money movement between individuals, businesses and governments) and value-added services (helping clients grow profits and deepen partnerships). It is also working to strengthen its brand, and improve technology and security. Over the past two years, new flows and value-added services have grown significantly faster than consumer payments.
Visa noted that only 14% of the $25 trillion in global annual spending in 2019 was in digital form, indicating a long runway for growth as payments shift to digital. In the U.S., the company said that cash accounted for 55% of transactions under $10, representing a significant opportunity as Visa expands frictionless payment capabilities and as merchants lower their minimum charge requirements.
Visa noted that between 2009 and 2019, its 21% compound annual EPS growth was driven by operating levers (16%), including revenue growth and operating leverage, and financial levers (5%), such as lower tax rates and stock buybacks. Capital allocation priorities going forward include funding growth initiatives, returning excess cash through stock buybacks, and paying 20%-25% of earnings in dividends.
Visa has been especially active on the acquisition front. In July 2019, Visa acquired Earthport, which provides cross-border payment services to banks, money-transfer service providers, and businesses. Other acquisitions announced in the second half of 2019 include the token services and ticketing businesses of Rambus; Verifi, which provides technology solutions to reduce charge-backs; and Payworks, a provider of payment gateway software for point-of-sale.
We believe that tailwinds for Visa are both cyclical and structural in nature, and include generally favorable economic conditions (despite current coronavirus pressures), as well as the continued transition from cash to plastic for convenience, safety and rewards program benefits. We also note that the market for payment processors is far from saturated given that more than 80% of the world's retail transactions are still done with cash and checks.
Our target price of $270 implies a multiple of 38-times our FY22 EPS estimate, at the high end of the historical range, but justified, in our view, by optimism over rebounding spending volumes and the company's record operating margins in the high 60s.
RECENT DEVELOPMENTSVisa shares are up 25% over the past year, versus a 36%
advance for the broad market.
On July 27, Visa reported EPS of $1.49 for fiscal 3Q21
(ended June 30), above the $1.06 of the prior year and above the $1.34 consensus.
Third-quarter net revenue totaled $6.1 billion, up 27% from the prior year, on strong gains in payment volumes and a rebound in international transaction revenues.
Payment volume in 3Q, on a constant-dollar basis, rose 34% year-over-year, to $2.72 trillion, while processed transactions were up 39%, to 42.6 billion. Cross-border volume increased 53%.
Adjusted operating expenses were up 12%, mostly on higher personnel costs and marketing expenses.
In January 2020, Visa agreed to acquire Plaid, a network that allows people to securely connect financial accounts to the apps they use to manage their finances, for $4.9 billion in cash and $0.4 billion of retention equity and deferred equity consideration. However, the acquisition ran into antitrust issues and was terminated in January 2021.
In June 2016, Visa acquired Visa Europe in a transaction valued at 18.5 billion euros. The company noted that major aspects of the integration were concluded successfully in 4Q18, with the completion of platform migration and a shift to commercial client contracts. The agreement called for an upfront cash payment of 12.2 billion euros, preferred stock valued at 5.3 billion euros, and an additional 1.0 billion euros (plus 4% interest) payable on the third anniversary of the closing; the payment was made in June 2019.
EARNINGS & GROWTH ANALYSISAlong with its fiscal 3Q results, management again said
that it would not provide revenue or EPS guidance due to pandemic-related uncertainty.
The company's primary sources of revenue are services, derived mainly from payment volume on Visa-branded cards; data processing fees, from the number of transactions processed; and international transaction fees on cross-border transactions. Transaction volumes have generally benefited from both economic growth and the increased use of cards rather than cash, although the COVID-19 pandemic has continued to lower overall spending, particularly in cross-border transactions due to international travel restrictions.
Payment volume and transactions processed have shown month-to-month improvement since bottoming in April 2020. After a 5% revenue decline in FY20, we look for a recovery to 9% growth in FY21. Cross-border transactions have rebounded a bit but are likely to remain about even with FY20 levels.
Trends in client incentives (a revenue offset) are important
Section 2.197
GROWTH / VALUE STOCKSto watch. These have typically been in the 22.5%-23.5% range of gross revenues, but recent renewals, including on some large size deals, are expected to push the figure over the 25% mark in FY21. Given the challenging revenue environment, management remains keenly focused on operating expenses, especially marketing costs. In 3Q, client incentives were $2.1 billion and represented 25.8% of gross revenues.
Mostly on the rebound in cross-border volumes, we are raising our FY21 EPS forecast to $5.79 from $5.59, and our FY22 estimate to $7.07 from $6.81.
MANAGEMENT & RISKSAlfred F. Kelly became the company's CEO in December
2016 after Charles W. Scharf resigned. Mr. Kelly had joined Visa's board in 2014 as an independent director. He was elected chairman in April 2019.
Management is transparent with investors, in our view, providing a range of financial projections for the business, including revenue growth, client incentives, operating margins, tax rate and earnings growth.
Visa faces risks from regulation, including rules capping interchange reimbursement rates, as well as from economic variables that could impact service revenues, data processing fees, and cross-border transaction fees. Geopolitical factors, which could result in business disruption, are also a risk.
COMPANY DESCRIPTIONVisa Inc. operates the world's largest electronic payments
network, providing processing services and payment product platforms, including credit, debit, prepaid and commercial payments under the brands Visa, Visa Electron, Interlink and PLUS. Visa/PLUS is one of the world's largest ATM networks, offering cash access in local currency in more than 200 countries and territories.
VALUATIONVisa shares trade at 43-times our fiscal 2021 EPS
estimate, below the upper 40s multiple for peer MasterCard. We think that Visa and MasterCard merit similar multiples. Visa has higher operating margins, while MasterCard is growing earnings slightly faster. Visa is a large-cap name with consistent, and, we believe, enviable mid-teens earnings growth prospects.
We are keeping our 12-month target price at $270, which implies a multiple of about 38-times our EPS estimate for fiscal 2022 (which starts October 1), a bit elevated from historical on optimism about accelerated spending volumes and as global economies recover and more spending shifts online..
On July 29 at midday, BUY-rated V traded at $248.42, up $1.48. (Stephen Biggar and Caleigh McGough, 7/29/21)
FINANCIAL STRENGTH AND DIVIDEND
We rate Visa's financial strength as Medium-High, the second-highest rank on our five-point scale.
In August 2020, Visa issued fixed-rate senior notes in a principal amount of $3.25 billion with maturities ranging between 7 and 30 years, and interest rates from 0.75% to 2.0%. As of June 30, 2021, the company had long-term debt of $21.0 billion and a debt/equity ratio of 56%, but with high operating margins in the upper 60s.
The company has raised its dividend substantially over the last several years from a low base. In October 2020, it announced a 7% increase in the quarterly payout to $0.32, or $1.28 annually, for a yield of about 0.5%. Our dividend estimates are $1.28 for FY21 and $1.36 for FY22.
Visa repurchased 9.3 million class A shares in 3Q21 for $2.2 billion. We look for a 2% lower average share count in FY21.
Waste Management, Inc. (WM)Publication Date: 7/28/21Current Rating: BUY
HIGHLIGHTS*WM: Maintaining BUY and boosting target to $165*Waste Management is North America's largest provider
of comprehensive waste management services, serving municipal, commercial, industrial and residential customers.
*The company recently reported 2Q results that topped consensus expectations. Revenue rose to $4.48 billion from $3.56 billion a year earlier. Adjusted net income rose to $538 million or $1.27 per diluted share from $307 million or $0.88 per share in 2Q20.
*We are raising our 2021 adjusted EPS estimate to $4.94 from $4.82. We are maintaining our 2022 forecast of $5.37.
*Our revised target of $165, combined with the dividend, implies a potential total return of 14% from current levels.
ANALYSIS
INVESTMENT THESISOur rating on Waste Management Inc. (NYSE: WM) is
BUY with a 12-month target price of $165, raised from $155. Waste Management is North America's largest provider of comprehensive waste management services, serving municipal, commercial, industrial and residential customers. We believe that WM is poised for share price appreciation as the U.S. economy recovers. From a technical standpoint, prior to the pandemic, the shares had been in a bullish pattern of higher highs and higher lows that dated to 2016. They recovered from their pandemic lows in March 2020, and have since moved higher. On a fundamental basis, WM shares are trading at 30-times our 2021 EPS forecast, in line with peers. We believe this well-run company deserves to trade at a premium based on its solid balance sheet, focus on growth through acquisitions, and strong free cash flow. Our revised target price of $165,
Section 2.198
GROWTH / VALUE STOCKScombined with the dividend, implies a potential total return of 14% from current levels.
RECENT DEVELOPMENTSWM shares have outperformed over the past three months,
gaining 9% compared to gains of 6% for the S&P 500 and 1% for the industry (ETF IYJ). The shares have risen 37% over the last year, in line with the index but below the industry's 45% advance. Over the past five years, WM shares have outperformed, gaining 147% compared to gains of 122% for the index and 110% for the industry. The beta on WM is 0.8.
The company recently reported 2Q21 earnings that topped consensus expectations. On July 27, the company reported second-quarter revenue of $4.48 billion, up from $3.56 billion a year earlier. Adjusted net income rose to $538 million or $1.27 per diluted share from $307 million or $0.88 per share in 2Q20. The adjusted EBITDA margin widened to 29.3% from 28.8%.
For all of 2020, the company earned $3.91 per share, down from $4.40 in 2019.
Along with the 2Q results, management updated its 2021 guidance. It expects revenue growth of 15.5%-16.0% (up from 12.5%-13.0%) and adjusted operating EBITDA of $5.0-$5.1 billion (up from $4.875-$4.975 billion). It expects free cash flow of $2.5-$2.6 billion (up from $2.325-$2.425 billion). In 2021, management expects $80-$85 million of cost synergies, bringing annual run-rate synergies to about $150 million at the end of the year.
The company has a growth-by-acquisition strategy in a fragmented industry, and recently acquired Advanced Disposal Services. WM financed the $4.6 billion acquisition, net of proceeds from its asset sale to GFL Environmental, with a combination of credit facilities and commercial paper.
EARNINGS & GROWTH ANALYSISWaste Management has five major business segments:
Collection (54% of 2Q sales), which is in turn organized into four customer groups, commercial (40%), residential (27%), industrial (28%), and other collection (5%); Landfill (20%); Transfer (10%); Recycling (7%); and Other (9%).
Waste Management's revenue is driven by price and volume. In 1Q21, core pricing, which includes both prices and service fees (other than fuel surcharges) net of rollbacks, was 6.2% compared to 1.3% in the second quarter of 2020. Total volume rose 9.6% following a decline of 9.9% in 2Q20.
In 2Q21, Collection revenue rose to $2.92 billion from $2.33 billion. Within Collection revenue, commercial revenue rose 27% to $1.178 million, residential revenue rose 21% to $794 million, and industrial revenue rose 30% to $811 million. Landfill revenue was up 23% year-over-year and Transfer
revenue rose 5%. Recycling revenue rose 44% and Other revenue rose 25%.
Operating expenses as a percentage of revenue were about flat with the prior year at 61.1%.
Turning to our estimates, and based on recent volume and margin trends, as well as management's guidance, we are raising our 2021 adjusted EPS estimate to $4.94 from $4.82. We are maintaining our 2022 forecast of $5.37.
FINANCIAL STRENGTH & DIVIDENDOur financial strength rating on Waste Management is
Medium-High. The company generally receives average to above-average scores on our main financial strength criteria of debt levels, fixed-cost coverage, profitability, and cash flow generation. The company is rated Baa1/stable by Moody's, A-/stable by S&P, and BBB+/negative by Fitch.
Waste Management ended 2Q21 with cash of $148 million. Debt was $13.2 billion, or 64.3% of total capitalization. Cash flow covered interest expense by a factor of 9 in 2020. Net cash provided by operating activities was $2.16 billion in 2Q21, up from $1.62 million in 2Q20. Free cash flow was $649 million, up from $423 million. The company believes that its investment-grade credit ratings and the value of its unencumbered assets will enable it to obtain adequate financing despite disruptions from the pandemic.
Waste Management recently raised its quarterly dividend by 5.5% to $0.575 per share, or $2.30 annually. The first payment at the new rate was made on March 26, 2021. The current yield is about 1.6%. Our dividend estimates are $2.30 for 2021 and $2.40 for 2022.
The company also has a stock buyback program. In December 2020, the board renewed the company's authorization, allowing for the repurchase of up to $1.35 billion of common stock. The company repurchased $199 million of its stock in 1Q21 and $250 million in 2Q21. The company expects to complete the repurchase program in 2021.
MANAGEMENT & RISKSJames Fish became the company's CEO in July 2016. John
Morris became the new COO in January 2019 following the retirement of Jim Trevathan. Davina Rankin has served as CFO since 2017.
WM is at risk from changes in short-term interest rates, as much of its debt is variable-rate. In addition, WM faces execution risk in its aggressive price-hike campaign, as higher rates may not be sufficient to offset lost volume, especially given increased competition.
We note that hurricanes and other severe weather may actually boost volumes for Waste Management, although this
Section 2.199
GROWTH / VALUE STOCKStype of short-notice work tends to be relatively low margin. Hurricanes also raise the risk of damage to company property.
COMPANY DESCRIPTIONHouston-based Waste Management Inc. is North
America's largest provider of comprehensive waste management services, serving municipal, commercial, industrial and residential customers. The company has five business segments: Collection, Landfill, Transfer, Recycling and Other. It is also a leading developer, operator and owner of landfill gas-to-energy facilities in the United States. WM has a market capitalization of about $62 billion. The shares are a component of the S&P 500.
VALUATIONWe think that WM shares are attractively valued at recent
prices near $147, near the high end of their 52-week range of $106-$150. From a technical standpoint, prior to the pandemic, the shares were in a long-term bullish pattern of higher highs and higher lows that dated to 2013. Since the pandemic lows in March 2020, that pattern has reemerged.
On a fundamental basis, WM shares are trading at 30-times our 2021 EPS forecast, above the five-year average though in line with peers. The price/sales ratio is 3.8, above the five-year average of 2.7 and the peer average of 3.3. We believe this well-run company deserves to trade at a premium based on its solid balance sheet, focus on growth through acquisitions, and strong free cash flow. Our revised target of $165, combined with the dividend, implies a potential total return of 14% from current levels.
On July 28 at midday, BUY-rated WM traded at $146.28, down $0.68. (David Coleman, 7/28/21)
Wolverine World Wide, Inc. (WWW)Publication Date: 8/3/21Current Rating: BUY
HIGHLIGHTS*WWW: Strong 2Q; maintaining BUY*We believe that spending on footwear will continue to
grow as the economy improves and consumer confidence increases, and we expect this to benefit Wolverine over time.
*On July 29, Wolverine reported 2Q21 revenue of $632 million, up 81% from the prior year and more than $65 million above consensus. Adjusted EPS rose to $0.67 from $0.08 a year earlier and matched the consensus estimate. The shares rose slightly following the report.
*Reflecting the strong e-commerce revenue, management's revised guidance and a recovering economy, we are raising our 2021 EPS estimate to $2.20 from $2.06 and our 2022 estimate to $2.50 from $2.40.
*Our long-term rating remains BUY. We caution that WWW shares are likely to be volatile and thus suitable only for risk-tolerant investors.
ANALYSIS
INVESTMENT THESISWe are maintaining our BUY rating on Wolverine World
Wide Inc. (NYSE: WWW) and leaving our price target at $45. The company is making progress with its Global Growth Agenda, which consists of launching new products with creative designs, investing regionally to drive international growth, and improving its e-commerce business. Indeed, among the company's sales channels, e-commerce has done the most to drive growth.
We believe that spending on footwear will continue to grow as the economy improves and consumer confidence increases, and we expect this to benefit Wolverine over time. We also have a positive view of the acquisition of PLG, which has expanded the company's retail footprint, particularly in the athletic and children's markets. Our long-term rating remains BUY. We caution that WWW shares are likely to be volatile and thus suitable only for risk-tolerant investors.
RECENT DEVELOPMENTSOn July 29, Wolverine reported 2Q21 revenue of $632
million, up 81% from the prior year and more than $65 million above consensus. E-commerce revenue declined 2.7% year-over-year. In constant currency, underlying revenue was up 78%. Adjusted EPS rose to $0.67 from $0.08 a year earlier and topped the consensus estimate. The cost of goods sold as a percentage of sales fell 60 basis points year-over-year to 57.3%. The adjusted gross margin was 44.5%, up from 42.2%, driven by highly profitable e-commerce sales and a more favorable product mix. Operating expenses rose by $67 million to $307 million, and fell as a percentage of revenue to 32.7% from 40.0% a year earlier. The adjusted operating margin rose 800 basis points to 10.1%. Interest expense decreased to $9.7 million from $10.5 million. The share count increased to 83.6 million from 80.9 million.
In 2021, Wolverine now expects revenue of $2.34-$2.40 billion, implying growth of 31%-34% year-over-year. WWW's prior forecast had called for revenue of $2.24-$2.30 billion. Management projects adjusted EPS of $2.20-$2.30, up from $1.95-$2.10 previously. Currently, the consensus estimate is $2.12 per share.
As discussed in a previous note, in 2020, revenue decreased 21% to $1.79 billion while EPS fell to $0.93 from $2.25 in 2019.
EARNINGS & GROWTH ANALYSISReflecting the strong e-commerce revenue, management's
revised guidance and a recovering economy, we are raising our 2021 EPS estimate to $2.20 from $2.06 and our 2022 estimate to $2.50 from $2.40. Our long-term earnings growth rate forecast remains 10%.
FINANCIAL STRENGTH & DIVIDENDOur financial strength rating on Wolverine World Wide
Section 2.200
GROWTH / VALUE STOCKSremains Medium-High, the second-highest rank on our five-point scale. At the end of 2Q21, the company had $346 million in cash and cash equivalents, down from $473 million at the end of 2Q20. Long-term debt at the end of 2Q21 totaled $708 million, putting the long-term debt/cap ratio at 52%, up from 36.5% at the end of 4Q20. The 2Q adjusted operating margin was 12.6%, up 750 basis points from the prior year. Inventories fell by $46 million to $332 million.
In May 2019, the company raised its quarterly dividend by 25% to $0.10 per share, or $0.40 annually, for a yield of about 1.0%. The dividend has held steady since then. A quarterly dividend payment of $0.10 was paid on August 3, 2021 to shareholders of record as of June 1, 2021. Our dividend estimates are now $0.40 for 2021 and $0.52 for 2022.
COMPANY DESCRIPTIONWolverine World Wide Inc., based in Rockford,
Michigan, designs, manufactures and markets footwear and slippers in the branded casual, active lifestyle, work, outdoor sport and uniform categories. Wolverine's brands include Bates, Caterpillar, Harley-Davidson, Hush Puppies, HyTest, Merrell, Sebago, Stanley, Patagonia and the namesake Wolverine. The company does business in about 180 countries.
VALUATIONOn July 29, WWW shares rose slightly after revenue and
earnings topped consensus estimates. WWW shares are trading at 13.6-times our revised EPS forecast for 2022 (when we expect much stronger consumer spending), near the midpoint of the five-year annual average range of 8-20. The price/sales ratio of 1.7 is near the top of the five-year range of 0.6-1.8. We believe the current valuation inadequately reflects the company's efforts to prune underperforming brands, develop new products, and invest in its e-commerce platform. As such, our rating remains BUY with a target price of $45. We caution that WWW shares are likely to be volatile and thus suitable only for risk-tolerant investors. At current prices, our target, if achieved, offers investors the prospect of a 33% return including the dividend.
On August 2, BUY-rated WWW closed at $33.65, up $0.11. (John Staszak, CFA, 8/2/21)
MANAGEMENT AND RISKSBlake Krueger is the company's CEO and Brendan
Hoffman serves as president. Mr. Hoffman is expected to succeed Mr. Krueger over time.
Wolverine's sales are subject to changing order rates from retailers. Management believes that retailers are behaving more conservatively than the average U.S. retail customer and are holding back on futures orders to keep inventory low and reduce risk. The company is also seeing slower order activity from European retailers. Raw material cost inflation and higher labor costs from Asian factories may also weigh on margins.
Xilinx, Inc. (XLNX)Publication Date: 7/29/21Current Rating: HOLD
HIGHLIGHTS*XLNX: AMD wins regulatory approvals to acquire*Xilinx delivered fiscal 1Q21 results that exceeded
consensus expectations amid solid demand for its programmable and applications acceleration solutions.
*AMD has won regulatory approval for UK and EU authorities to acquire Xilinx, although Chinese regulators could block the deal through inaction.
*XLNX and AMD shareholders have already approved the deal.
*Although the company's fundamentals are improving, XLNX is trading on its relation to the AMD share-price, given the all-stock nature of the deal.
ANALYSIS
INVESTMENT THESISHOLD-rated Xilinx Inc. (NGS: XLNX) was little changed
in a rising market on 7/29/21 after the maker of programmable logic devices (PLDs) posted results for fiscal 1Q22 (calendar 2Q21) that beat consensus expectations. After multiple challenging quarters, XLNX for a third straight quarter delivered positive top- and bottom-line comps, albeit against what is likely to be its easiest comp of FY22. Fiscal 1Q22 revenue rose 21% from the prior year, while non-GAAP EPS was up 45%.
Xilinx in fiscal 1Q22 continued to see recovery in its Advanced Products business, which had lagged in the fiscal 2021 first half before beginning to recover in 2H21. On an end-market basis, Xilinx's Automotive, Broadcast & Consumer segment and its Wired & Wireless segment both posted double-digit annual growth against the pandemic-impacted year-earlier period. The Data Center group showed strong sequential momentum for its high-end offerings.
The semiconductor universe is in a consolidation phase. For Xilinx, the planned acquisition by AMD provides a safe landing spot in a semiconductor market in which consolidation is creating industry giants. In such an environment, the costs of remaining technologically relevant risk outstripping the capabilities of smaller and even mid-sized players. Given little overlap between the two companies, we believe Xilinx can thrive within the bigger AMD organization.
AMD has indicated that it has regulatory approval from EU and UK authorities to acquire Xilinx. XLNX and AMD shareholders have already approved the deal. The big unknown is whether the deal can win Chinese regulatory approval. By failing to rule one way or another on deals that had won approvals in all other regions, China effectively blocked Qualcomm's acquisition of NXP Semiconductor and
Section 2.201
GROWTH / VALUE STOCKSApplied Materials' acquisition of Kokusai Electric. A new U.S-China trade deal might help in this matter, but that does not seem to be on Washington's radar.
If the deal is not completed, the company's strong long-term growth prospects relative to peers signal continued value in the stock. Given these dynamics, and the fact that XLNX is no longer trading on fundamentals, we believe that a HOLD rating remains appropriate.
RECENT DEVELOPMENTSXLNX is up 1% year-to-date in 2021, versus a 10% gain
for the peer group and 10% gain for the SOX (Philadelphia Semiconductor) index. XLNX rose 45% in 2020, in line with the Argus semiconductor peer group. XLNX rose 15% in 2019, while peers advanced 54%. XLNX shares advanced 26% in 2018, versus a 4% decline for the peer group. XLNX rose 12% in 2017, lagging the 31% gain for the peer group and the 38% gain for the SOX index. XLNX shares rose 29% in 2016, while the peer group was up a simple average 70%, fueled by NVDA and AMD.
For the first quarter of the March 2022 fiscal year (calendar 2Q21), Xilinx reported revenue of $879 million, which was up 21% annually and 3% sequentially. Due to its pending acquisition, Xilinx is no longer holding post-earnings conference calls or providing financial guidance. Revenue was above the $857 million consensus estimate. Non-GAAP EPS of $0.95 advanced 45% year-over-year and by $0.13 on a sequential basis from $0.82 for fiscal 4Q21. Non-GAAP EPS easily topped the consensus estimate of $0.77.
Although Xilinx is no longer holding post-earnings conference calls, CEO Victor Peng did provide come color on the quarter in the earnings release. He called demand for Xilinx products robust, 'despite an unprecedented and challenging supply-constrained environment.' Xilinx is actively managing the supply situation with its partners. That includes qualifying a new supplier (unnamed) in a key part of the supply chain.
The CEO attributed record 1Q revenue to strength across diversified end markets, while citing continued sequential momentum in the data center market. Two end markets, Industrial & TME and Automotive, Broadcast, & Consumer, posted all-time record revenue.
Returning to the supply chain theme, the CEO forecast that inventory could remain relatively stable near current levels as new supply sources help ease supply chain constraints. COVID-19 surges in Asia caused a blip in channel inventory that Xilinx views as transitory; channel inventory decreased early in 2Q22. Xilinx expects to continue navigating a challenging supply chain environment while being proactive in adding new resources.
For fiscal 1Q22 in terms of product categories, Advanced Products (72% of revenue) grew 28% year-over-year and 2% on a sequential basis. This category had grown at sharp double-digit rates for years before slowing in mid-FY20 due to global pandemic effects, inventory drawdowns by data center customers, and a spending pause by network customers. Core Product revenue (28% of total) grew 6% year-over-year and 7% sequentially.
On an end-market basis, Aerospace-Defense, Industrial, & TME (AIT, 36% of revenue) declined 3% annually and 9% sequentially. The AIT business includes core nontechnology markets of Aerospace-Defense and Industrial, along with Technology, Media, and Entertainment (TME). Nontechnology industrial end markets continue to recover from shutdowns in calendar 1H20. Although Xilinx has called Aerospace-Defense a 'secular driver' within its core business, we believe this category has been deprioritized by the U.S. federal government in this period of fiscal stimulus.
Automotive, Broadcast, & Consumer (ABC, 20% of revenue) rose 99% year-over-year and 15% on a sequential basis. Automotive continues to show signs of recovery while continuing to run below pre-pandemic levels. Consumer spending is being aided by government stimulus along with higher levels of employment and wage income.
The Wired & Wireless Group (WWG, 30% of revenue) rose 13% annually and was flat sequentially in 1Q22. WWG has recently seen a significant revenue contribution from tier 1 O E M c u s t o m e r s r a m p i n g u p R F S o C (radio-frequency-on-a-chip) applications amid the 5G global rollout.
Data Center Group (DCG, 9% of revenue) was up 2% annually though up 15% sequentially in 1Q22. Growth in recent quarters has been driven by broad deployment of Alveo-based compute AI clusters and Solarflare NIC adapters.
In April 2021, the shareholders of Advanced Micro Devices and Xilinx voted to approve the pending acquisition of Xilinx by AMD. The deal was first announced in October 2020, when AMD announced it would acquire Xilinx in an all-stock deal valued at $35 billion.
Post-transaction, AMD will be able to offer a compelling and complementary portfolio of high-performance processor technologies, combining CPUs, GPUs, FPGAs (field programmable gate arrays), adaptive SoCs, applications acceleration, Smart NICs, and deep software expertise. The combined company will be well positioned within technology's most important growth segments, from data center to gaming, PCs, communications, automotive, industrial, and aerospace & defense.
Xilinx brings a revenue base that we calculate at $3.1
Section 2.202
GROWTH / VALUE STOCKSbillion for the March 2021 fiscal year, compared with AMD's roughly $15 billion revenue base (which has grown sharply in just the past year from $10 billion). Importantly, Xilinx is expected to derive about 55% of FY21 revenue from nontechnology end markets, including aerospace & defense, industrial, automotive, broadcast, and consumer. These now all become growth venues for AMD's sales and go-to-market teams.
Given the enterprise value of the deal at $35 billion, AMD is paying approximately 10-times revenue and, based on our calculations, a little less than 35-times EBITDA for Xilinx. We think these valuations are fair, particularly given that AMD will not be encumbered with deal debt following the transaction.
By acquiring Xilinx, which we regard as the No. 1 provider of adaptive computing solutions and programmable devices, AMD increases its total available market to $110 billion. Given the all-stock nature of the deal, which enables AMD to avoid taking on crushing debt, the combination should be immediately accretive to AMD's margins, cash flow and EPS.
For Xilinx, the deal provides a safe landing spot in a semiconductor market in which consolidation is creating industry giants. In such an environment, the costs of remaining technologically relevant risk outstripping the capabilities of smaller and even mid-sized players.
The closing of the transaction remains subject to the satisfaction of other customary closing conditions, including the receipt of required regulatory approvals. The companies expect the transaction to close by the end of calendar 2021.
In our view, winning approval from China has always been the main obstacle to deal completion. China recently approved Marvell's acquisition of Inphi; the resultant company will be relatively small, with about $3.6 billion in annual revenue. And the combined company's storage components, network processors, and (via Inphi) optical interconnects are not market-dominant and will compete in crowded markets.
If the deal is not completed, the company's strong long-term growth prospects relative to peers signal continued value in the stock. Given these dynamics, and the fact that XLNX is no longer trading on fundamentals, we believe that a HOLD rating remains appropriate.
EARNINGS & GROWTH ANALYSISFor the first quarter of the March 2022 fiscal year
(calendar 2Q21), Xilinx reported revenue of $879 million, which was up 21% annually and 3% sequentially. Due to its pending acquisition, Xilinx is no longer holding post-earnings conference calls or providing financial guidance. Revenue was above the $857 million consensus estimate.
Non-GAAP gross margin was 67.8% for 1Q22, vs. 69.3% for 4Q20 and 67.6% a year earlier. Non-GAAP operating margin was 28.0% for 1Q22, vs. 26.7% for 4Q20 and 25.7% a year earlier
Non-GAAP EPS of $0.95 advanced 45% year-over-year and by $0.13 on a sequential basis from $0.82 for fiscal 4Q21. Non-GAAP EPS easily topped the consensus estimate of $0.77.
Full-year FY21 revenue of $3.15 billion was down less than 1% year-over-year from $3.17 billion in FY20. Non-GAAP diluted EPS of $3.08 was down 8% from $3.33 in FY20.
We will maintain coverage of XLNX until the AMD deal is completed; we will also maintain coverage if the deal fails to go through. We are raising our FY22 earnings estimate to $3.66 per diluted share from $3.47. We are also raising our preliminary FY23 projection to $4.01, from an initial $3.94. Our estimates are fluid and subject to revision, and are for standalone Xilinx assuming it does not get acquired.
FINANCIAL STRENGTH & DIVIDENDOur financial strength ranking on Xilinx is Medium-High.
Cash was $3.39 billion at the end of 1Q22. Cash was $3.08 billion at the end of FY21, $2.43 billion at the end of FY20, $3.23 billion at the end of FY19, $3.55 billion at the end of FY18, $3.44 billion at the end of FY17, and $3.56 billion at the end of FY16.
Debt was $1.49 billion at the end of 1Q22. Debt was $1.49 billion at the end of FY21, $1.25 billion at the end of FY20, $1.24 billion at the end of FY19, $1.71 billion at the end of fiscal FY18, $1.45 billion at the end of FY17, and $1.58 billion at the end of FY16.
The debt/cap ratio was 32.1% at the end of FY20, 30.1% at the end of FY19, 42.4% at the end of FY18, 36.7% at the end of FY17, and 39.0% at the end of FY16.Xilinx returned $1.58 billion to shareholders in FY20, including $372 million in dividends and $1.21 billion in buybacks. Xilinx returned $526 million to shareholders in FY19, including $364 million in dividends and $162 million in buybacks. Prior to the merger announcement, Xilinx had raised its dividend for 13 straight years.
Pursuant to terms of its AMD merger, Xilinx has agreed to stop paying quarterly dividends and repurchasing stock.
We have suspended our dividend estimates pending consummation or cancelation of the AMD deal.
MANAGEMENT & RISKS
Section 2.203
GROWTH / VALUE STOCKSVictor Peng succeeded Moshe Gavrielov as CEO and
president in January 2018. Formerly SVP of the Programmable Products Group, Mr. Peng had been promoted to COO in April 2017. Brice Hill became CFO in April 2020. Former CFO Lorenzo Flores stepped down in September 2019 to become vice chairman at Toshiba Memory.
The newest risk for Xilinx is that recent appreciation in the stock price risks being wiped out should the AMD transaction fail to go forward for any reason. The all-stock nature of the deal means that the XLNX share price is explicitly tied to the AMD share price, which has seen a stronger-than-peers run-up in recent years.
In the period before deal close, a remaining risk for XLNX as for other semiconductor companies, is the possibility of a general economic downturn and a corresponding dip in technology hardware sales due to the pandemic. We believe XLNX has the financial strength, market leadership, and growth characteristics to weather this storm and emerge a stronger player. We also believe the percentage of hours worked away from the office will continue to increase. That should drive long-term demand for XLNX's data center acceleration products.
Long operating within a virtual duopoly in PLDs, Xilinx could fall behind its chief competitor now that Altera is part of powerful Intel. In our view, the PLD industry leaders have a larger opportunity in displacing non-PLD vendors, including ASIC and ASSP companies, than in battling one another for market share. Additionally, Xilinx believes it has claimed four percentage points of PLD market share in recent years.
As a fabless semiconductor company, Xilinx is at risk should one or more of its foundry partners encounter production issues, product defects, or work stoppages. Altera's partnership with Intel adds a new wrinkle to the industry. Xilinx primarily uses United Microelectronics as its fab partner and industry leader Taiwan Semiconductor for its 28 nm products.
COMPANY DESCRIPTIONBased in San Jose, California, Xilinx designs, produces
and markets programmable logic devices (PLDs); system-on-a-chip (SoC) products encompassing FPGAs and an ARM core processor; 3D IC chips combining transceivers and FPGAs that are used in telecommunications networks; and software and development tools. Xilinx's PLDs consist of field-programmable gate arrays (FPGAs) and complex programmable logic devices (CPLDs). Xilinx serves customers in communications, data center & data storage, instrumentation, medical, automotive, aerospace-defense, and other industries. In October 2020, Xilinx agreed to be acquired by Advanced Micro Devices.
VALUATION
XLNX shares trade at 37.8-times our FY22 forecast and at 34.6-times our FY23 projection; the two-year forward average P/E of 36.2 is above the five-year (FY17-FY21) historical average of 29.0. The shares, which have historically commanded a 62% premium to the market P/E multiple, now trade at a 75% premium, based on fiscal 2022-2023 EPS projections for Xilinx and calendar 2021-2022 EPS projections for the S&P 500. Our valuation based on historical comparables is in the low $100s, up slightly but below current prices.
XLNX trades at premiums to peers based on P/E, EV/EBITDA, and PEGY ratios. Peer-derived value is around $80, in a stable trend and also below current prices. Discounted free cash flow modeling signals value in the $140s, in a declining trend though even with current price levels.
Our blended fair-value calculation is in the mid-$120s. Our calculated fair value is within 10% of the current XLNX share price, within the 10%-plus to 10%-minus band of our forecast return for the broad market, and is thus consistent with a HOLD rating.
Given the all-stock nature of the acquisition by AMD, XLNX is no longer trading on fundamentals. We are reiterating our HOLD rating on XLNX.
On July 29 at midday, HOLD-rated XLNX traded at $145.41, up $6.87. (Jim Kelleher, CFA, 7/29/21)
Yum Brands Inc. (YUM)Publication Date: 7/30/21Current Rating: BUY
HIGHLIGHTS*YUM: Raising target price to $145*Our optimism reflects YUM's diverse brands, prospects
for higher same-store sales, global operations, and asset-light business model.
*Given that 98% of the company's restaurants are franchised, we expect capital expenditures to decline and free cash flow to improve.
*Following restaurant closures in 2020, YUM plans to resume unit expansion in 2021 and 2022.
*We are raising our 2021 EPS estimate to $4.20 from $4.15 and our 2022 estimate to $4.80 from $4.64.
ANALYSIS
INVESTMENT THESISWe are maintaining our BUY rating on Yum! Brands Inc.
(NYSE: YUM) and raising our target price to $145 from $135. Our optimism reflects YUM's diverse brands, prospects for higher same-store sales, global operations, and asset-light business model. Given that 98% of the company's restaurants are franchised, we expect capital expenditures to decline and free cash flow to improve. We also expect G&A expense to fall to 17% of revenue. Following restaurant closures in 2020,
Section 2.204
GROWTH / VALUE STOCKSYUM plans to resume unit expansion in 2021 and 2022.
Our long-term rating is BUY, as we expect the company to benefit over time from growing orders placed through GrubHub, the exclusive delivery service for KFC and Taco Bell.
RECENT DEVELOPMENTSOn July 29, Yum reported 2Q21 operating EPS of $1.16,
up from $0.82 in the prior-year period and $0.20 above consensus. On a GAAP basis, EPS rose to $1.29 from $0.67. Overall revenue increased 34% to $1.6 billion, and topped the consensus estimate by $180 million. Following a 21% decrease in 2Q20, same-store sales at KFC restaurants rose 30% in 2Q21; the consensus had called for a gain of 28%. After a 9% decline in 2Q20, comps at Pizza Hut were up 10%, in line with the consensus estimate. Following an 8% decrease in 2Q20, Taco Bell comps rose 21%, above the consensus estimate calling for a 1,470-basis-point gain. Overall, same-store sales increased 23%; the consensus had called for 20.7% higher comps.
In 2Q21, the operating margin rose to 35.4% from 25.0% a year earlier. The consensus estimate had called for an operating margin of 33.4%.
Reflecting the resumption of buybacks in the fourth quarter, the share count fell to 304 million shares from 307 million. Second-quarter interest expense rose to $159 million from $132 million.
As discussed in a previous note, on March 24, YUM announced that it had acquired Tictuk, an online ordering and marketing platform. We think the acquisition complements the company's other online initiatives, which include a new e-commerce platform at KFC and technology improvements at Pizza Hut and Taco Bell.
In 2020, revenue rose 1% to approximately $5.7 billion and EPS rose to $3.62 from $3.55 in 2019.
GrubHub has become the exclusive delivery service for KFC and Taco Bell. As part of this agreement, Yum purchased $200 million of GrubHub stock and the president of Pizza Hut joined the GrubHub board.
Management has hired consultants to identify ways to reduce delivery time and increase digital transactions at Pizza Hut restaurants. In addition, under a recent agreement with Pizza Hut franchisees, the company plans to invest in new restaurant equipment and remodeling in return for greater marketing control. Management also believes that it has an opportunity to increase KFC deliveries. Approximately 5,000 KFC restaurants currently deliver orders. Management is also seeking to increase the number of Taco Bell restaurants that deliver meals.
EARNINGS & GROWTH ANALYSISReflecting the company's technology investments and
higher average unit volume, we project an 11% revenue increase in 2021, to $6.3 billion. We also expect same-store sales to increase 5%, helped by improvement at Taco Bell and Pizza Hut. In 2022, we project a further revenue recovery to just above $6.7 billion. Moving down the income statement, we expect a 50-basis-point increase in the 2021 operating margin, to 32%, as operating income recovers.
To reflect the company's better-than-expected first and second-quarter earnings and prospects for strong results in 3Q21, we are raising our 2021 EPS estimate to $4.20 from $4.15. We are also raising our 2022 estimate to $4.80 from $4.64.
FINANCIAL STRENGTH & DIVIDENDWe are maintaining our financial strength rating on Yum!
of Medium-Low, the second-lowest point on our five-point scale.
Driven by lower G&A and franchise and property expenses, the second-quarter operating margin was 35.4%, up from 25.0% in 2Q20. Second-quarter operating profit covered interest expense by a factor of 3.6, up from 2.3 in the prior-year period. We prefer operating income to be at least five-times interest expense. Long-term debt totaled $10.3 billion, down $14 million from the end of 4Q19.
In March 2021, the company raised its quarterly dividend by 6% to $0.50, or $2.00 annually, for a yield of about 1.7%. Our dividend estimates are $2.00 for 2021 and $2.12 for 2022.
MANAGEMENT & RISKSDavid Gibbs, formerly the company's president and COO,
succeeded Greg Creed as CEO on January 1, 2020. Mr. Creed remains on the company's board. Mr. Gibbs has also served as CFO, CEO of Pizza Hut, and president and CFO of Yum Restaurants International. He has been heavily involved with YUM's transition to a franchised business model.
Risks to our earnings estimates and rating include price wars, higher wages, and rising commodity prices. The company's results may also be hurt by slower consumer spending and unfavorable currency translation.
COMPANY DESCRIPTIONYum! Brands owns three of the most popular fast-food
brands in the world: KFC, Pizza Hut and Taco Bell. The company and its franchisees operate more than 48,000 restaurants in 140 countries and territories. YUM is a leader in multibranding, offering combinations of its KFC, Taco Bell and Pizza Hut brands at single locations. It has spun off its China business into a separately traded company. With a market cap of about $35.6 billion and a consistent record of growth, YUM is generally classified as a large-cap growth
Section 2.205
GROWTH / VALUE STOCKSstock.
VALUATIONYUM shares are trading at 26.9-times our revised EPS
forecast for 2022, in the upper half of the two-year historical range of 15-30. We believe the current multiple inadequately reflects our expectations for strong revenue and earnings growth at Yum over the next 12 months. As such, we are keeping our rating at BUY and raising our target price to $145 from $135. Our target implies a potential total return of 14% including the dividend.
On July 29, BUY-rated YUM closed at $130.31, up $7.70. (John Staszak, CFA, 7/29/21)
Section 2.206

UTILITY SCOPE
There are no companies updated in the Utility Scope category this week.
Section 2.207

STOCKS TO AVOID
There are no companies updated in the Stocks to Avoid category this week.
Section 2.208
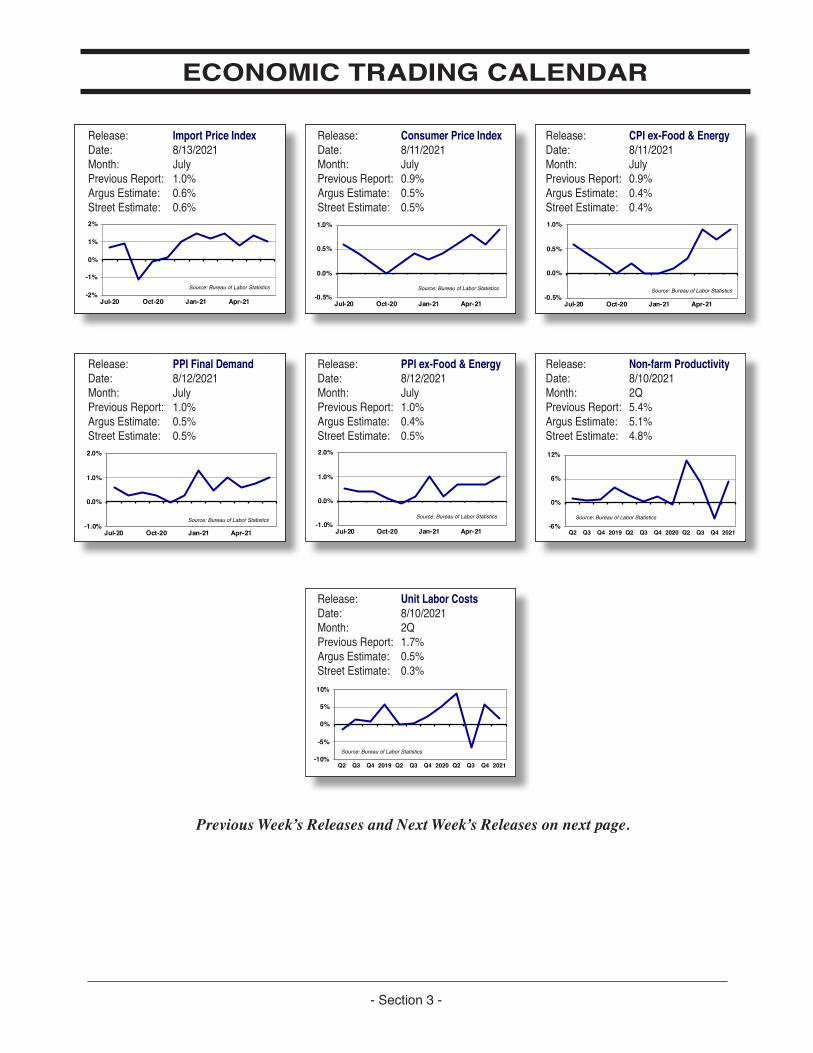
ECONOMIC TRADING CALENDAR
- Section 3 -
Previous Week’s Releases and Next Week’s Releases on next page.
Release:Date: Month:Previous Report:Argus EstiStreet Estimate:
Import Price Index8/13/2021July1.0%0.6%0.6%
Release:Date: Month:Previous Report:Argus Estimate:Street Estimate:
Release:Date: Month:Previous Re-port:Argus Esti-mate:
CPI ex-Food & Energy8/11/2021July0.9%0.4%0.4%
Release:Date: Month:Previous Report:Argus Estimate:Street Estimate:
Consumer Price Index8/11/2021July0.9%0.5%0.5%
Release:Date: Month:Previous Report:Argus Estimate:Street Estimate:
Release:Date: Month:Previous Report:Argus EstiStreet Estimate:
PPI Final Demand8/12/2021July1.0%0.5%0.5%
Release:Date: Month:Previous Report:Argus Estimate:Street Estimate:
Release:Date: Month:Previous Re-port:Argus Esti-mate:
Non-farm Productivity8/10/20212Q5.4%5.1%4.8%
Release:Date: Month:Previous Report:Argus Estimate:Street Estimate:
PPI ex-Food & Energy8/12/2021July1.0%0.4%0.5%
Release:Date: Month:Previous Report:Argus Estimate:Street Estimate:
Unit Labor Costs8/10/20212Q1.7%0.5%0.3%
Release:Date: Month:Previous Report:Argus Estimate:Street Estimate:
-2%
-1%
0%
1%
2%
Jul-20 Oct-20 Jan-21 Apr-21
Source: Bureau of Labor Statistics
-0.5%
0.0%
0.5%
1.0%
Jul-20 Oct-20 Jan-21 Apr-21
Source: Bureau of Labor Statistics
-0.5%
0.0%
0.5%
1.0%
Jul-20 Oct-20 Jan-21 Apr-21
Source: Bureau of Labor Statistics
-1.0%
0.0%
1.0%
2.0%
Jul-20 Oct-20 Jan-21 Apr-21
Source: Bureau of Labor Statistics-1.0%
0.0%
1.0%
2.0%
Jul-20 Oct-20 Jan-21 Apr-21
Source: Bureau of Labor Statistics
-6%
0%
6%
12%
Q2 Q3 Q4 2019 Q2 Q3 Q4 2020 Q2 Q3 Q4 2021
Source: Bureau of Labor Statistics
-10%
-5%
0%
5%
10%
Q2 Q3 Q4 2019 Q2 Q3 Q4 2020 Q2 Q3 Q4 2021
Source: Bureau of Labor Statistics
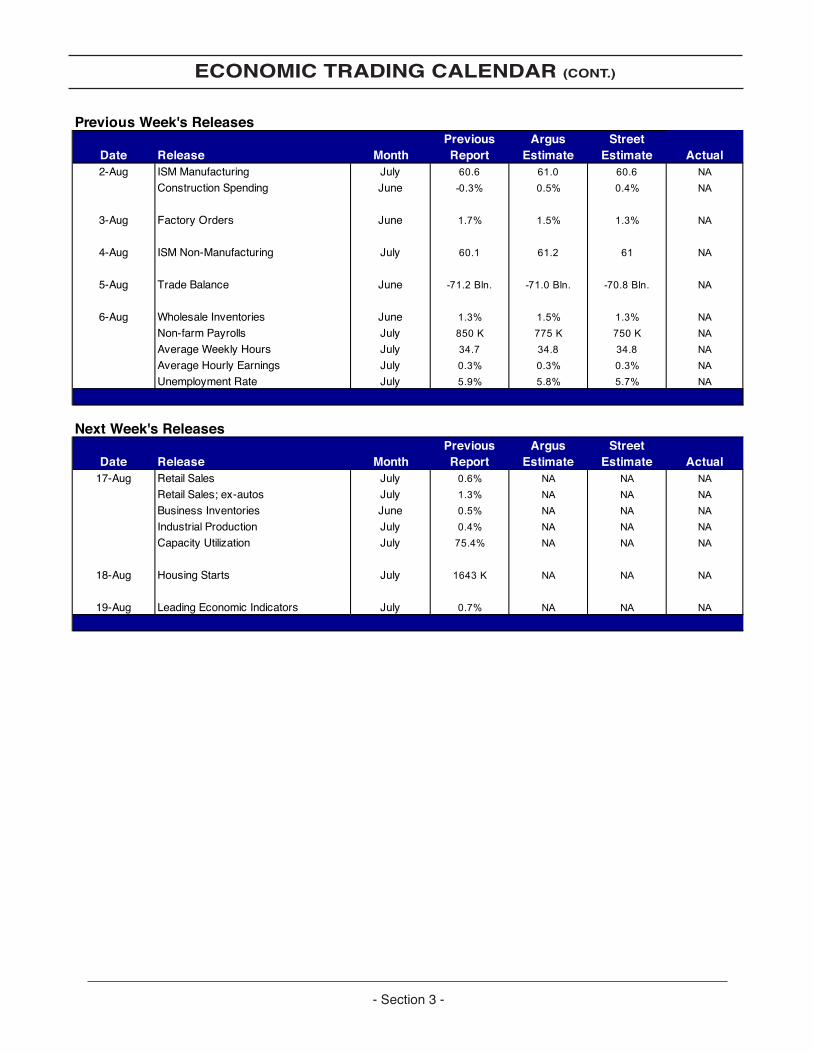
ECONOMIC TRADING CALENDAR (CONT.)
- Section 3 -
Previous Week's Releases Previous Argus Street
Date Release Month Report Estimate Estimate Actual2-Aug ISM Manufacturing July 60.6 61.0 60.6 NA
Construction Spending June -0.3% 0.5% 0.4% NA
3-Aug Factory Orders June 1.7% 1.5% 1.3% NA
4-Aug ISM Non-Manufacturing July 60.1 61.2 61 NA
5-Aug Trade Balance June -71.2 Bln. -71.0 Bln. -70.8 Bln. NA
6-Aug Wholesale Inventories June 1.3% 1.5% 1.3% NANon-farm Payrolls July 850 K 775 K 750 K NAAverage Weekly Hours July 34.7 34.8 34.8 NAAverage Hourly Earnings July 0.3% 0.3% 0.3% NAUnemployment Rate July 5.9% 5.8% 5.7% NA
Next Week's Releases Previous Argus Street
Date Release Month Report Estimate Estimate Actual17-Aug Retail Sales July 0.6% NA NA NA
Retail Sales; ex-autos July 1.3% NA NA NABusiness Inventories June 0.5% NA NA NAIndustrial Production July 0.4% NA NA NACapacity Utilization July 75.4% NA NA NA
18-Aug Housing Starts July 1643 K NA NA NA
19-Aug Leading Economic Indicators July 0.7% NA NA NA
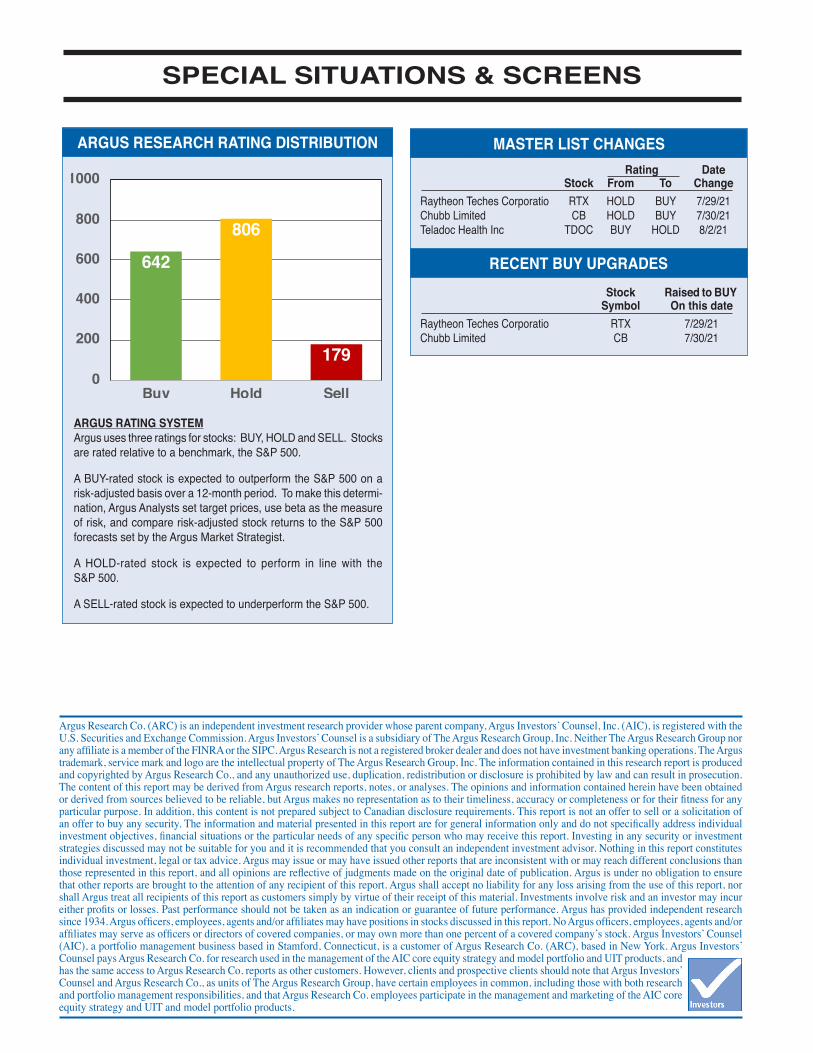
Argus Research Co. (ARC) is an independent investment research provider whose parent company, Argus Investors’ Counsel, Inc. (AIC), is registered with the U.S. Securities and Exchange Commission. Argus Investors’ Counsel is a subsidiary of The Argus Research Group, Inc. Neither The Argus Research Group nor any affiliate is a member of the FINRA or the SIPC. Argus Research is not a registered broker dealer and does not have investment banking operations. The Argus trademark, service mark and logo are the intellectual property of The Argus Research Group, Inc. The information contained in this research report is produced and copyrighted by Argus Research Co., and any unauthorized use, duplication, redistribution or disclosure is prohibited by law and can result in prosecution. The content of this report may be derived from Argus research reports, notes, or analyses. The opinions and information contained herein have been obtained or derived from sources believed to be reliable, but Argus makes no representation as to their timeliness, accuracy or completeness or for their fitness for any particular purpose. In addition, this content is not prepared subject to Canadian disclosure requirements. This report is not an offer to sell or a solicitation of an offer to buy any security. The information and material presented in this report are for general information only and do not specifically address individual investment objectives, financial situations or the particular needs of any specific person who may receive this report. Investing in any security or investment strategies discussed may not be suitable for you and it is recommended that you consult an independent investment advisor. Nothing in this report constitutes individual investment, legal or tax advice. Argus may issue or may have issued other reports that are inconsistent with or may reach different conclusions than those represented in this report, and all opinions are reflective of judgments made on the original date of publication. Argus is under no obligation to ensure that other reports are brought to the attention of any recipient of this report. Argus shall accept no liability for any loss arising from the use of this report, nor shall Argus treat all recipients of this report as customers simply by virtue of their receipt of this material. Investments involve risk and an investor may incur either profits or losses. Past performance should not be taken as an indication or guarantee of future performance. Argus has provided independent research since 1934. Argus officers, employees, agents and/or affiliates may have positions in stocks discussed in this report. No Argus officers, employees, agents and/or affiliates may serve as officers or directors of covered companies, or may own more than one percent of a covered company’s stock. Argus Investors’ Counsel (AIC), a portfolio management business based in Stamford, Connecticut, is a customer of Argus Research Co. (ARC), based in New York. Argus Investors’ Counsel pays Argus Research Co. for research used in the management of the AIC core equity strategy and model portfolio and UIT products, and has the same access to Argus Research Co. reports as other customers. However, clients and prospective clients should note that Argus Investors’ Counsel and Argus Research Co., as units of The Argus Research Group, have certain employees in common, including those with both research and portfolio management responsibilities, and that Argus Research Co. employees participate in the management and marketing of the AIC core equity strategy and UIT and model portfolio products.
SPECIAL SITUATIONS & SCREENS
ARGUS RESEARCH RATING DISTRIBUTION
ARGUS RATING SYSTEMArgus uses three ratings for stocks: BUY, HOLD and SELL. Stocks are rated relative to a benchmark, the S&P 500.
A BUY-rated stock is expected to outperform the S&P 500 on a risk-adjusted basis over a 12-month period. To make this determi-nation, Argus Analysts set target prices, use beta as the measure of risk, and compare risk-adjusted stock returns to the S&P 500 forecasts set by the Argus Market Strategist.
A HOLD-rated stock is expected to perform in line with the S&P 500.
A SELL-rated stock is expected to underperform the S&P 500.
HubSpotInc HUBS 10/19/20QuestDiagnostics,Inc. DGX 10/21/20
RECENT BUY UPGRADES
MASTER LIST CHANGES Rating Date Stock From To ChangeRaytheon Teches Corporatio RTX HOLD BUY 7/29/21Chubb Limited CB HOLD BUY 7/30/21Teladoc Health Inc TDOC BUY HOLD 8/2/21
Stock Raised to BUY Symbol On this date
642
806
1790
200
400
600
800
1000
Buy Hold Sell
Raytheon Teches Corporatio RTX 7/29/21Chubb Limited CB 7/30/21


![¼kík f]r»k - Krushi Prabhat](https://img.dokumen.tips/doc/110x75/635b92b04a2996bcc4017592/kik-frk-krushi-prabhat.jpg)