Embed Size (px)
Citation preview
GOVERNMENT OF TAMILNADU
VOLUME 1
FINANCE ACCOUNTS
2011 - 2012

Volume 1
Volume 2
Part I - Summarised Statements
Part II - Detailed Statements
Part III - Appendices
B
B
D
D
D
D
E
E
E
E
F
F
F
F
F
F
G
G
G
G
G
G
G
G
G
H
H
H
H
1
2
3
4
5
6
7
8
9
10
11
12
13
14
15
16
17
18
19
II
III
IV
V
Certificate of the Comptroller and Auditor General of India
Guide to Finance Accounts
Statement of Financial Position
Statement of Receipts and Disbursements
Statement of Receipts (Consolidated Fund)
Statement of Expenditure (Consolidated Fund)
* By Function
* By Nature
Notes to Accounts
Appendix I : Cash Balances and Investments of Cash Balances
Statement of Progressive Capital Expenditure
Statement of Borrowings and other Liabilities
Statement of Loans and Advances given by the Government
Statement of Grants-in-Aid given by the Government
Statement of Guarantees given by the Government
Statement of Voted and Charged Expenditure
Detailed Statement of Revenue and Capital Receipts by minor heads
Detailed Statement of Revenue Expenditure by minor heads
Detailed Statement of Capital Expenditure
Detailed Statement of Investments of the Government
Detailed Statement on Borrowings and other Liabilities
Detailed Statement on Loans and Advances made by Government
Detailed Statement on Sources and Application of funds for Expenditure otherthan on Revenue Account
Detailed Statement on Contingency Fund and Public Account transactions
Detailed Statement on Investments of Earmarked Funds
Comparative Expenditure on Salary
Comparative Expenditure on Subsidy
Grants-in-Aid / Assistance given by the State Government (Institutionwise andSchemewise)
Details of Externally Aided Projects
(iii)
(vii)
2
4
6
12
17
19
43
48
53
59
65
67
73
76
111
260
348
372
393
480
484
504
510
513
522
529
.
.
.
.
.
.
.
.
.
.
.
.
.
.
.
.
.
.
.
PAGE
TABLE OF CONTENTS
Volume 2
Part III - Appendices
H
H
H
H
H
H
H
H
H
H
H
VI
A
B
VII
VIII
IX
X
XI
XII
XIII
XIV
Plan Scheme Expenditure
Central Schemes
State Schemes
Direct transfer of Central Scheme Funds to implementing Agencies in the State(Funds routed outside State Budgets) (unaudited figures)
Summary of Balances under Consolidated Fund, Contingency Fund and PublicAccount
Financial results of Irrigation Schemes
Statement of Commitments on Incomplete Public Works Contracts
Statement of items for which allocation of balances as a result of re-organisation States has not been finalised
Statement on Maintenance Expenditure of the State (Salary and Non-Salaryportion)
Detailed Accounts Showing transfer to ULBs/PRIs and direct transfer of funds toULBs/PRIs
Implications of Major Policy Decisions of the Government
534
542
549
551
559
585
613
634
651
653
PAGE
TABLE OF CONTENTS -concld.
-concld.
-concld.
------x------
CERTIFICATE OF THE COMPTROLLER AND AUDITOR GENERAL OF INDIA
This compilation containing the Finance Accounts of the Government of Tamil Nadu for the year
ending 31st March 2012 presents the financial position along with accounts of the receipts and
disbursements of the Government for the year. These accounts are presented in two volumes, Volume 1
contains the consolidated position of the state of finances and Volume 2 depicts the accounts in detail.
The Appropriation Accounts of the Government for the year for Grants and Charged Appropriations are
presented in a separate compilation.
The Finance Accounts have been prepared under my supervision in accordance with the
requirements of the Comptroller and Auditor General's (Duties, Powers and Conditions of Service) Act,
1971 and have been compiled from the accounts rendered by the treasuries and departments responsible
for the keeping of such accounts functioning under the control of the Government of Tamil Nadu and the
Statements received from the Reserve Bank of India. Statements 7(ii), 9,14, explanatory notes to
Statements 11,12 and Appendices VII, IX and X in this compilation have been prepared directly from the
information received from the Government of Tamil Nadu/Corporations/Companies/Societies who are
responsible to ensure the correctness of such information.
The treasuries, offices and / or departments functioning under the control of the Government of
Tamil Nadu are primarily responsible for preparation and correctness of the initial and subsidiary
accounts as well as ensuring the regularity of transactions in accordance with the applicable laws,
standards, rules and regulations relating to such accounts and transactions. I am responsible for
preparation and submission of Annual Accounts to the State Legislature. My responsibility for the
preparation of accounts is discharged through the office of the Principal Accountant General (A&E). The
audit of these accounts is independently conducted through the office of the Principal Accountant General
(Civil Audit) in accordance with the requirements of Articles 149 and 151 of the Constitution of India and
the Comptroller and Auditor General's (Duties, Powers and Conditions of Service) Act, 1971, for
expressing an opinion on these accounts based on the results of such audit. These offices are
independent organisations with distinct cadres, separate reporting lines and management structure.

The audit was conducted in accordance with the Auditing Standards generally accepted in India.
These Standards require that we plan and perform the audit to obtain reasonable assurance that the
accounts are free from material misstatement. An audit includes examination, on a test basis, of evidence
relevant to the amounts and disclosures in the financial statements.
On the basis of the information and explanations that my officers required and have obtained,
and according to the best of my information as a result of test audit of the accounts and on consideration
of explanations given, I certify that, to the best of my knowledge and belief, the Finance Accounts read
with the explanatory 'Notes to Accounts' give a true and fair view of the financial position, and the receipts
and disbursements of the Government of Tamil Nadu for the year 2011-12.
Points of interest arising from study of these accounts as well as test audit conducted during the
year or earlier years are contained in my Reports on the Government of Tamil Nadu being presented
separately for the year ended 31st March 2012.
New Delhi, ( VINOD RAI )
The Comptroller and Auditor General of India

Guide to Finance Accounts
A. Broad overview of the Structure of Government Accounts
1. The Accounts of the Government are kept in three parts:
Part I: The Consolidated Fund: All receipts and expenditure on Revenue and Capital Account,
Public Debt and Loans & Advances form the Consolidated Fund of the State.
Part II: The Contingency Fund: Legislature may by law, establish a Contingency Fund which is
in the nature of an imprest. The fund is placed at the disposal of the Governor to enable advances to be
made for meeting unforeseen expenditure pending authorisation of such expenditure by the State
Legislature. The fund is recouped by debiting the expenditure to the concerned functional major head in
the Consolidated Fund of the State.
Part III: The Public Account: All other public moneys received by or on behalf of the
Government are credited to the Public Account. The expenditure out of this account is not subject to the
vote of the Legislature. In respect of the receipts into this account, the Government acts as a banker or
trustee. Transactions relating to Debt (other than Public Debt in Part I), Deposits, Advances, Reserve
Funds, Remittances and Suspense form the Public Account.
2. Divisions, Sections, Sectors, etc.,
The two main divisions of the Accounts in the Consolidated Fund are, ‘Revenue' and ‘Capital,
Public Debt, Loans etc.’ which are divided into sections ‘Receipts’ and ‘Expenditure’. Within each of the
Divisions and Sections of the Consolidated Fund the transactions on the expenditure side are grouped
into Sectors such as, "General Services", "Social Services", "Economic Services", under which specific
functions or services are grouped. The Sectors are sub-divided into subsectors/Major heads of
account. Major heads correspond to functions and are further divided into sub major heads (sub
functions) and minor heads (programmes) which are depicted in Volume 2 of the Finance Accounts. The
classification below minor heads of account i.e. subheads (schemes) and detailed and object heads
(objects of expenditure) are not depicted in the Finance Accounts (minor exceptions exist), though some
details are included in the appendices.
A pictorial representation of the Structure of Government Accounts is in the following

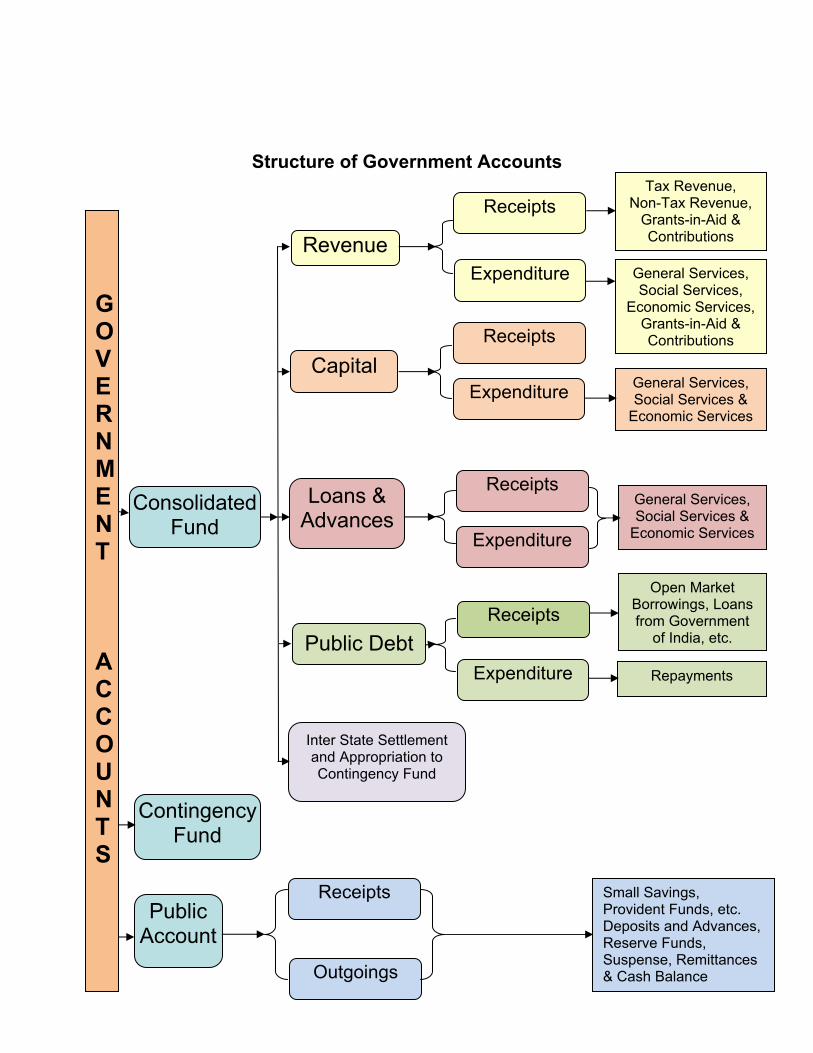
Structure of Government Accounts
ConsolidatedFund
ContingencyFund
PublicAccount
Outgoings
Receipts
Receipts
Expenditure
Receipts
Receipts
Expenditure
Expenditure
Receipts
Expenditure
Small Savings, Provident Funds, etc.Deposits and Advances, Reserve Funds, Suspense, Remittances & Cash Balance
Revenue
Inter State Settlement and Appropriation to Contingency Fund
Public Debt
Capital
Loans & Advances
Tax Revenue, Non-Tax Revenue,
Grants-in-Aid & Contributions
General Services, Social Services,
Economic Services, Grants-in-Aid & Contributions
General Services, Social Services &
Economic Services
General Services, Social Services &
Economic Services
Open Market Borrowings, Loans from Government
of India, etc.
Repayments
GOVERNMENT
ACCOUNTS
CB. What do the Statements contain
The Finance Accounts have been divided into two volumes. Volume 1 presents the financial
statements of the Government in the form of commonly understood summarised form, while the details are
presented in Volume 2.
Volume 1 contains the Certificate of the Comptroller and Auditor General of India, four summary
statements as given below and Notes to Accounts including the accounting policies.
1. Statement of Financial Position: Cumulative figures of assets and liabilities of the
Government, as they stand at the end of the year, are depicted in the statement. The assets
are valued at historical cost. The assets comprise Financial Assets and Physical Assets. The
latter are shown against “(i) Capital Expenditure and (ii) Other Capital Expenditure” in this
Statement.
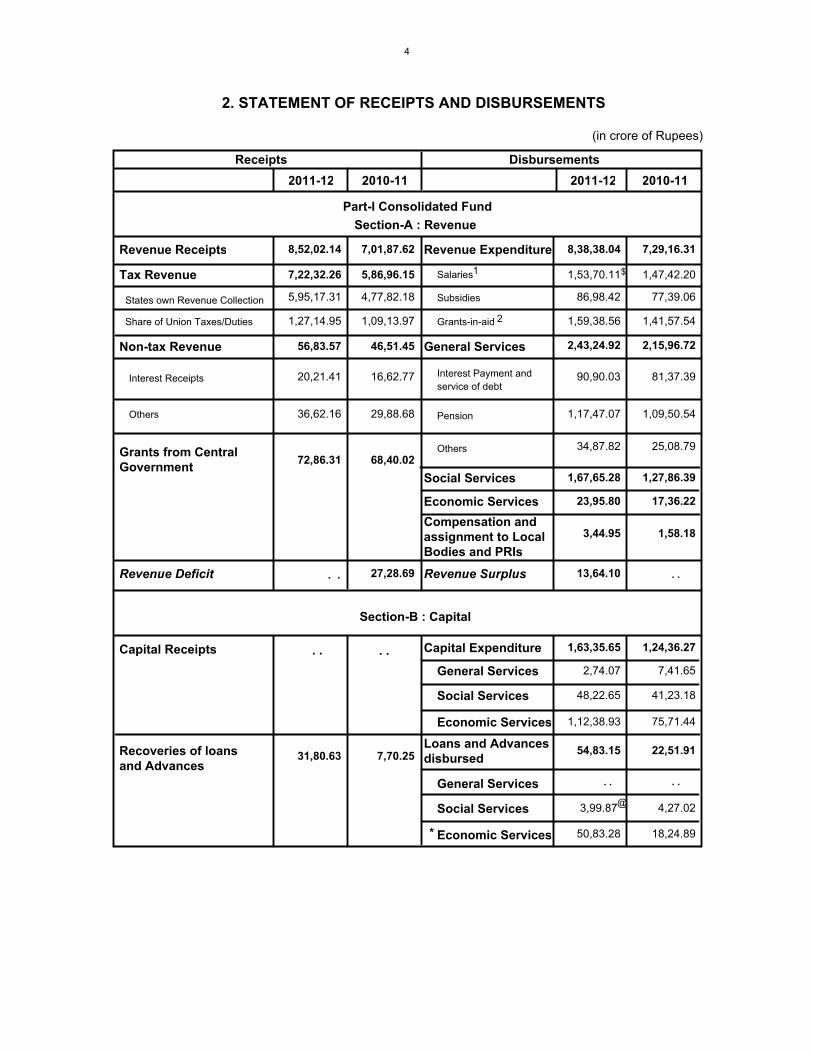
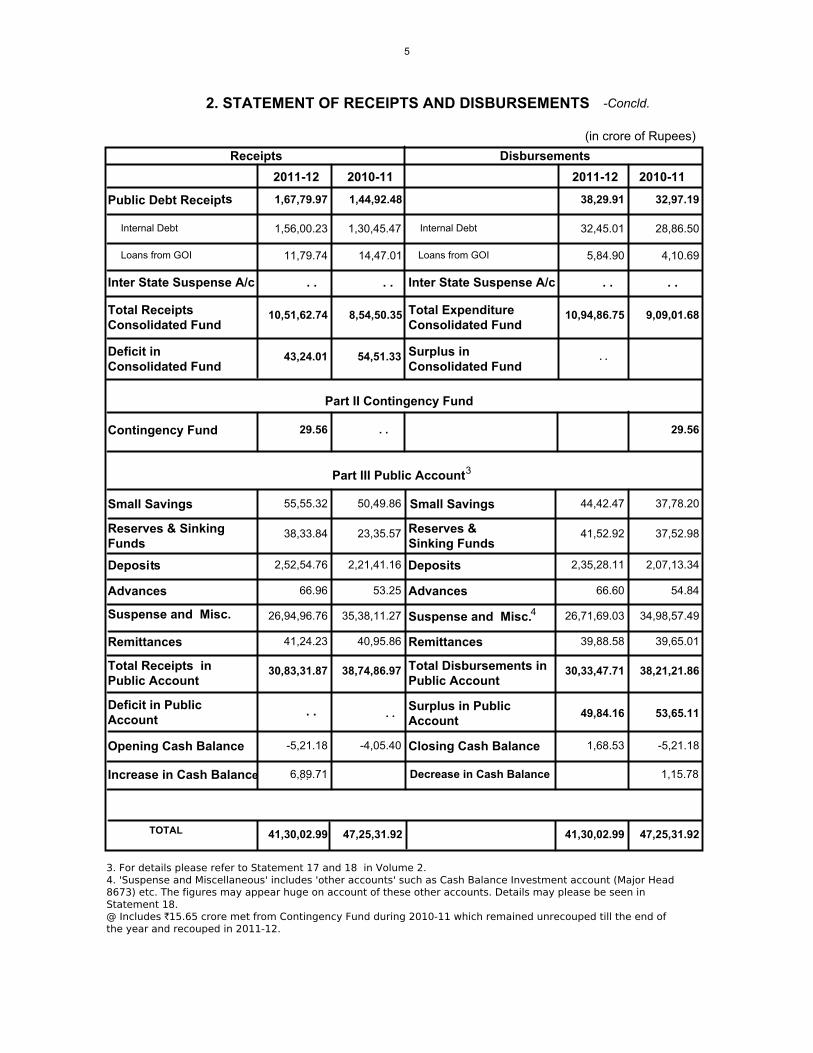
2. Statement of Receipts and Disbursements: This is a summarised statement showing all
receipts and disbursements of the Government during the year in all the three parts in which
Government account is kept, namely, the Consolidated Fund, Contingency Fund and Public
Account. Further within the Consolidated Fund, receipts and expenditure on revenue and
capital account are depicted distinctly.
The fiscal parameters of the Government, i.e. the primary, revenue and fiscal deficit are
calculated on the operations of the Consolidated Fund of the State. Hence the following two statements
give the operations of the Consolidated Fund in a summarized form.
3. Statement of Receipts (Consolidated Fund): This statement comprises revenue and capital
receipts and receipts from borrowings of the Government consisting of loans from the
Government of India, other institutions, market loans raised by the Government and
recoveries on account of loans and advances made by the Government.
4. Statement of Expenditure (Consolidated Fund): This statement not only gives expenditure by
function (activity) but also summarises expenditure by nature of activity (objects of
expenditure).
In addition, the volume comprises an appendix, i.e., Appendix 1, which exhibits the Cash
Balances and Investments of Cash Balances.
Volume 2 comprises three parts. Part I contains six statements as given below:
5. Statement of Progressive Capital Expenditure: This statement details progressive Capital
expenditure by functions, the aggregate of which is depicted in Statement 1.
6. Statement of Borrowings and Other liabilities: Borrowings of the Government comprise
market loans raised by it (internal debt) and Loans and Advances received from the
Government of India. Both these together form the public debt of the State Government. In
addition, this summary statement depicts ‘other liabilities’ which are the balances under
various sectors in the Public Account. In respect of the latter, the Government acts as a
trustee or custodian of the funds, hence these constitute liabilities of the Government. The
Statement also contains an Explanatory Note, i.e., a note on the quantum of net interest
charges met from Revenue Receipts.
7. Statement of Loans and Advances given by the Government: The loans and advances given
by the State Government are depicted in statement 1 and recoveries, disbursements feature
in statement 2, 3 and 4. Here, loans and advances are summarised sector and loanee group
wise. This is followed by a note on the recoveries in arrear in respect of loans, details of
which are maintained by the State departments.
8. Statement of Grants-in-Aid given by the State Government: Presented grantee institutions
groupwise. It includes a note on grants given in kind also.
9. Statement of Guarantees given by the Government: Guarantees given by the State
Government for repayment of loans, etc.,raised by Statutory Corporations, Government
Companies, Local Bodies and Other institutions during the year and sums guaranteed
outstanding as at the end of the year are presented in this statement.
10. Statement of Voted and Charged Expenditure: This statement presents details of voted and
charged expenditure of the Government.
Part II Volume 2: This part contains 9 statements presenting details of transactions by minor
heads corresponding to statements in Volume 1 and Part 1 of Volume 2.
11. Detailed Statement of Revenue and Capital Receipts by minor heads: This statement
presents the revenue and capital receipts of the Government in detail.
12. Detailed Statement of Revenue Expenditure by minor heads: This statement presents the
details of revenue expenditure of the Government. Non Plan and Plan figures are
depicted separately and a comparison with the figures for the previous year are available.
13. Detailed Statement of Capital Expenditure: This statement presents the details of capital
expenditure of the Government. Non-Plan and Plan figures are depicted separately
and a comparison with the figures for the previous year are available. Cumulative capital
expenditure upto the end of the year is also depicted.
14. Detailed Statement of Investments of the Government: The position of Government's
investment in the share capital of different concerns is depicted in this statement for the
current and previous year. Details include type of shares held, face value, dividend received
etc.
15. Detailed Statement on Borrowings and other Liabilities: Details of borrowings (market loans
raised by the Government and Loans etc., from GoI) by minor heads, the maturity and
repayment profile of all loans are provided in this statement. This is the detailed statement
corresponding to Statement 6 in Part 1 Volume 2.
16. Detailed Statement on Loans and Advances made by the Government: The details of loans
and advances given by the Government, the changes in loan balances, loans written off,
interest received on loans etc., are presented in this statement. It also presents plan loans
separately. This is the detailed statement corresponding to Statement 7 in Part 1 Volume 2.
17. Detailed Statement on Sources and Application of Funds for expenditure other than on
revenue account: The capital and other expenditure (other than on revenue account)and the
sources of fund for the expenditure are depicted in this statement.
18. Detailed Statement on Contingency Fund and Public Account transactions: The statement
shows changes in Contingency Fund during the year, the appropriations to the Fund,
expenditure, amount recouped etc. It also depicts the transactions in Public Account in detail.
19. Detailed Statement on Investment of Earmarked Funds: This statement shows the details of
investment out of Reserve Funds in Public Account.
Part III Volume 2 contains appendices on Salaries, Subsidies,Grants-in-Aid (institutionwise and
schemewise), details of externally aided projects, schemewise expenditure in respect of major Central
schemes and State Plan schemes etc. These details are present in the accounts below minor head levels
at subhead levels or below and so are not depicted in the Finance accounts. For a detailed list please
refer to the index in Volume 1 or 2. The Statements read with the appendices give a complete picture of
the state of finances prevailing in the State Government.
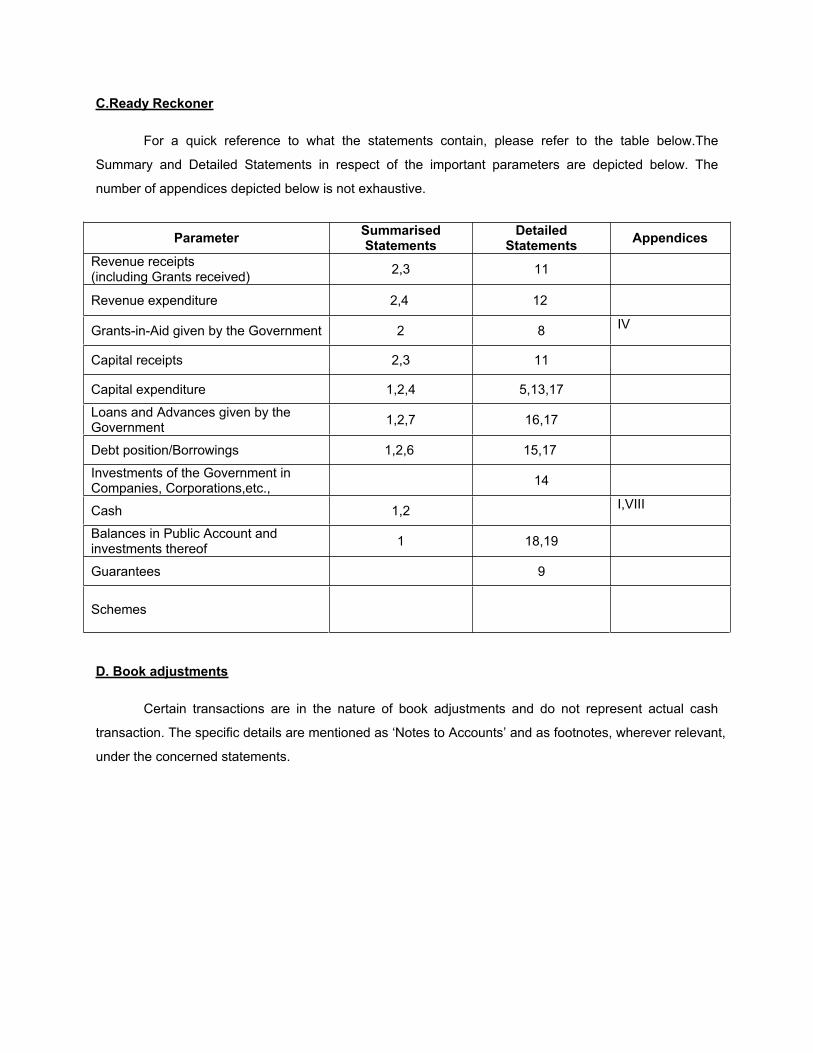
C.Ready Reckoner
For a quick reference to what the statements contain, please refer to the table below.The
Summary and Detailed Statements in respect of the important parameters are depicted below. The
number of appendices depicted below is not exhaustive.
ParameterSummarisedStatements
DetailedStatements
Appendices
Revenue receipts(including Grants received)
2,3 11
Revenue expenditure 2,4 12
Grants-in-Aid given by the Government 2 8 IV
Capital receipts 2,3 11
Capital expenditure 1,2,4 5,13,17
Loans and Advances given by the Government
1,2,7 16,17
Debt position/Borrowings 1,2,6 15,17
Investments of the Government in Companies, Corporations,etc.,
14
Cash 1,2 I,VIII
Balances in Public Account and investments thereof
1 18,19
Guarantees 9
Schemes
D. Book adjustments
Certain transactions are in the nature of book adjustments and do not represent actual cash
transaction. The specific details are mentioned as ‘Notes to Accounts’ and as footnotes, wherever relevant,
under the concerned statements.
Volume 1 - Summarised Statements
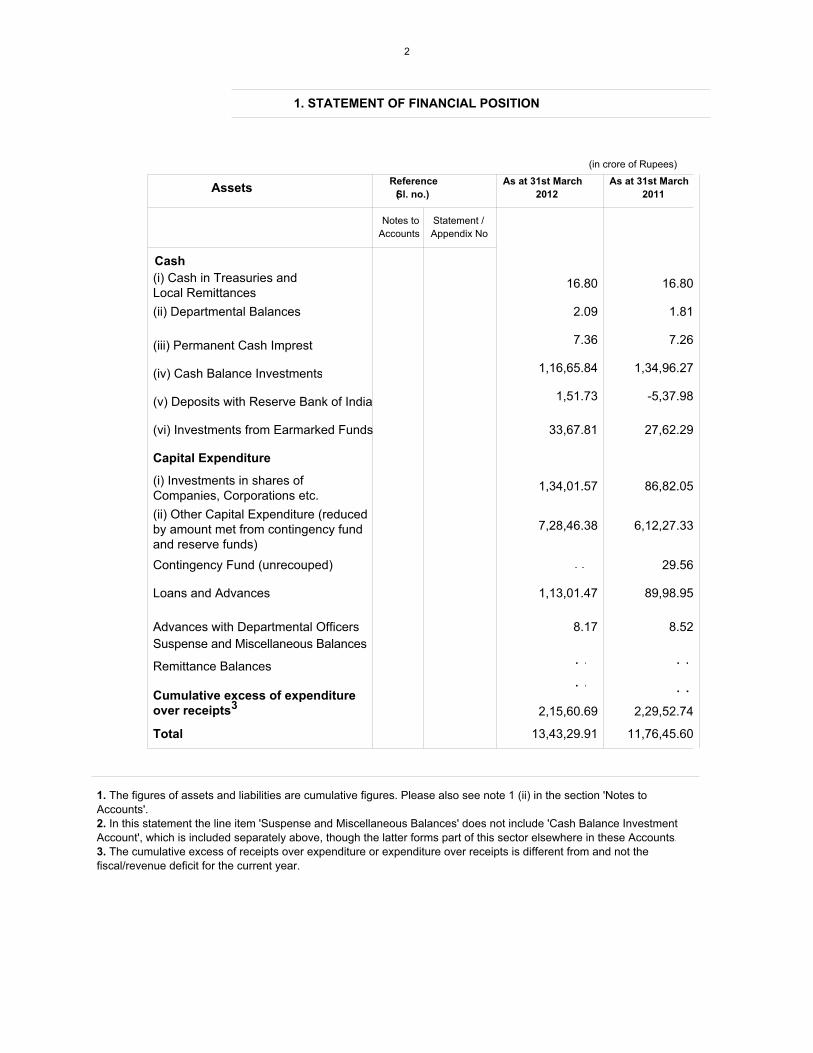
1. STATEMENT OF FINANCIAL POSITION
(in crore of Rupees)
AssetsReference
(Sl. no.)
As at 31st March
2012
As at 31st March
2011
Notes to
Accounts
Statement /
Appendix No
Cash
(i) Cash in Treasuries andLocal Remittances
(ii) Departmental Balances
(iii) Permanent Cash Imprest
(iv) Cash Balance Investments
(v) Deposits with Reserve Bank of India
(vi) Investments from Earmarked Funds
Capital Expenditure
(i) Investments in shares ofCompanies, Corporations etc.
(ii) Other Capital Expenditure (reducedby amount met from contingency fundand reserve funds)
Contingency Fund (unrecouped)
Loans and Advances
Advances with Departmental Officers
Suspense and Miscellaneous Balances
Remittance Balances
Cumulative excess of expenditure
over receipts
Total
16.80 16.80
2.09 1.81
7.36 7.26
1,16,65.84 1,34,96.27
1,51.73 -5,37.98
33,67.81 27,62.29
1,34,01.57 86,82.05
7,28,46.38 6,12,27.33
29.56
1,13,01.47 89,98.95
8.17 8.52
2,15,60.69 2,29,52.74
13,43,29.91 11,76,45.60
1. The figures of assets and liabilities are cumulative figures. Please also see note 1 (ii) in the section 'Notes to
Accounts'.
2. In this statement the line item 'Suspense and Miscellaneous Balances' does not include 'Cash Balance Investment
Account', which is included separately above, though the latter forms part of this sector elsewhere in these Accounts.
3. The cumulative excess of receipts over expenditure or expenditure over receipts is different from and not the
fiscal/revenue deficit for the current year.
. .
. . . .
. .
3
. .
2
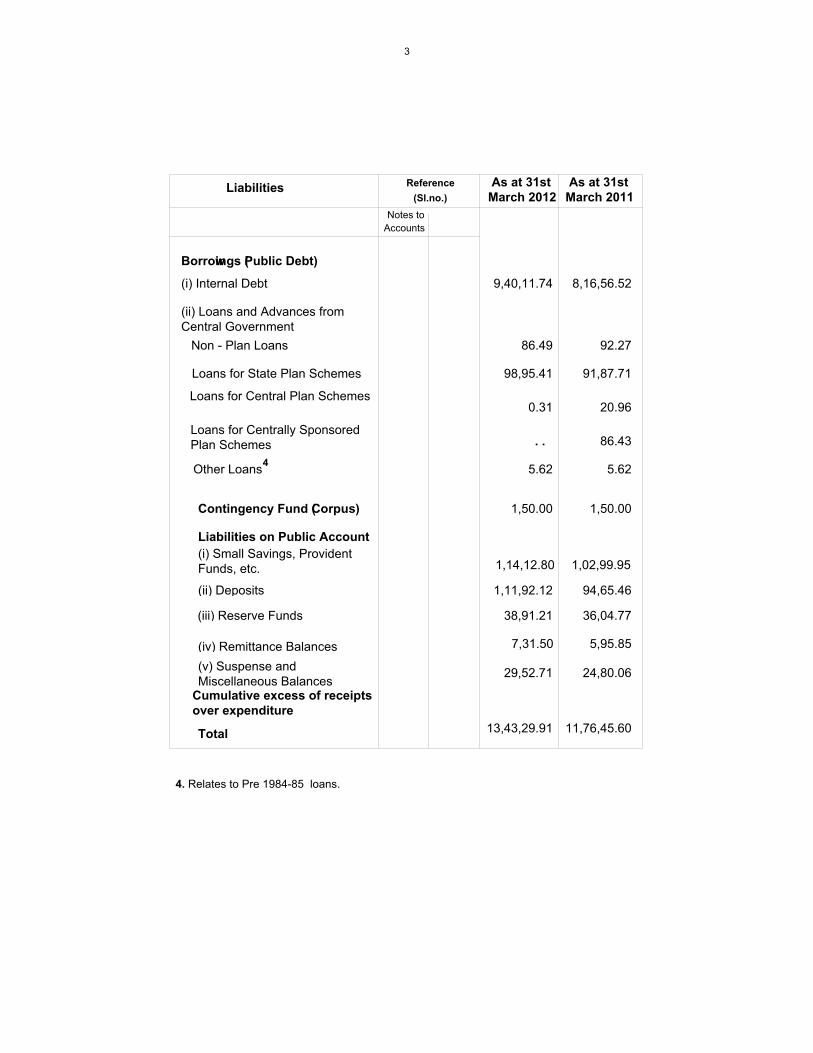
Liabilities Reference
(Sl.no.)
As at 31st
March 2012
As at 31st
March 2011
Notes to
Accounts
Borrowings (Public Debt)
(i) Internal Debt
(ii) Loans and Advances fromCentral Government
Non - Plan Loans
Loans for State Plan Schemes
Loans for Central Plan Schemes
Loans for Centrally SponsoredPlan Schemes
Other Loans
Contingency Fund (Corpus)
Liabilities on Public Account
(i) Small Savings, ProvidentFunds, etc.
(ii) Deposits
(iii) Reserve Funds
(iv) Remittance Balances
(v) Suspense andMiscellaneous Balances
Cumulative excess of receipts
over expenditure
Total
9,40,11.74 8,16,56.52
86.49 92.27
98,95.41 91,87.71
0.31 20.96
86.43
5.62 5.62
1,50.00 1,50.00
1,14,12.80 1,02,99.95
1,11,92.12 94,65.46
38,91.21 36,04.77
7,31.50 5,95.85
29,52.71 24,80.06
13,43,29.91 11,76,45.60
. .
4
4. Relates to Pre 1984-85 loans.
3
Receipts Disbursements
2011-12 2010-11 2011-12 2010-11
Part-I Consolidated Fund
Section-A : Revenue
Revenue Receipts Revenue Expenditure
Tax Revenue
Non-tax Revenue
Interest Receipts
Others
Salaries
Subsidies
Grants-in-aid
General Services
Interest Payment and
service of debt
Pension
Others
Social Services
Economic Services
Grants from Central
Government
Compensation and
assignment to Local
Bodies and PRIs
Revenue Deficit Revenue Surplus
Section-B : Capital
Capital Receipts Capital Expenditure
General Services
Social Services
Economic Services
Recoveries of loans
and Advances
Loans and Advances
disbursed
General Services
Social Services
Economic Services
7,22,32.26 5,86,96.15
56,83.57 46,51.45
20,21.41 16,62.77
36,62.16 29,88.68
72,86.31 68,40.02
1,53,70.11 1,47,42.20
86,98.42 77,39.06
1,59,38.56 1,41,57.54
90,90.03 81,37.39
1,17,47.07 1,09,50.54
34,87.82 25,08.79
2,43,24.92 2,15,96.72
1,67,65.28 1,27,86.39
23,95.80 17,36.22
3,44.95 1,58.18
2,74.07 7,41.65
48,22.65 41,23.18
1,12,38.93 75,71.44
31,80.63 7,70.25
3,99.87 4,27.02
50,83.28 18,24.89
States own Revenue Collection
Share of Union Taxes/Duties 1,27,14.95 1,09,13.97
5,95,17.31 4,77,82.18
27,28.69 13,64.10
*
8,52,02.14 7,01,87.62 8,38,38.04 7,29,16.31
1,63,35.65 1,24,36.27
54,83.15 22,51.91
2. STATEMENT OF RECEIPTS AND DISBURSEMENTS
(in crore of Rupees)
. . . .
. . . .
. .
$1
2
@
. .
4
Receipts Disbursements
2011-12 2010-11 2011-12 2010-11
Public Debt Receipts
Internal Debt Internal Debt
Loans from GOI Loans from GOI
Total Receipts
Consolidated Fund
Total Expenditure
Consolidated Fund
Deficit in
Consolidated Fund
Surplus in
Consolidated Fund
Part II Contingency Fund
Contingency Fund
Part III Public Account
Small Savings Small Savings
Reserves & Sinking
Funds
Reserves &
Sinking Funds
Deposi ts Deposits
Advances Advances
Suspense and Misc. Suspense and Misc.
Remittances Remittances
Total Receipts in
Public Account
Total Disbursements in
Public Account
Surplus in Public
Account
Deficit in Public
Account
Opening Cash Balance Closing Cash Balance
Increase in Cash Balance Decrease in Cash Balance
3. For details please refer to Statement 17 and 18 in Volume 2.
4. 'Suspense and Miscellaneous' includes 'other accounts' such as Cash Balance Investment account (Major Head
8673) etc. The figures may appear huge on account of these other accounts. Details may please be seen in
Statement 18.
@ Includes `15.65 crore met from Contingency Fund during 2010-11 which remained unrecouped till the end of
the year and recouped in 2011-12.
1,56,00.23 1,30,45.47
11,79.74 14,47.01
32,45.01 28,86.50
5,84.90 4,10.69
10,51,62.74 8,54,50.35 10,94,86.75 9,09,01.68
29.56 . . 29.56
55,55.32 50,49.86 44,42.47 37,78.20
38,33.84 23,35.57 41,52.92 37,52.98
2,52,54.76 2,21,41.16 2,35,28.11 2,07,13.34
66.96 53.25 66.60 54.84
26,94,96.76 35,38,11.27 26,71,69.03 34,98,57.49
41,24.23 40,95.86 39,88.58 39,65.01
30,83,31.87 38,74,86.97 30,33,47.71 38,21,21.86
. . 49,84.16 53,65.11
-5,21.18 -4,05.40 1,68.53 -5,21.18
43,24.01 54,51.33
6,89.71 1,15.78
TOTAL 41,30,02.99 47,25,31.92 41,30,02.99 47,25,31.92
1,67,79.97 1,44,92.48 38,29.91 32,97.19
Inter State Suspense A/c . . . . . .Inter State Suspense A/c . .
(in crore of Rupees)
. .
. .
. .
2. STATEMENT OF RECEIPTS AND DISBURSEMENTS -Concld.
4
3
5
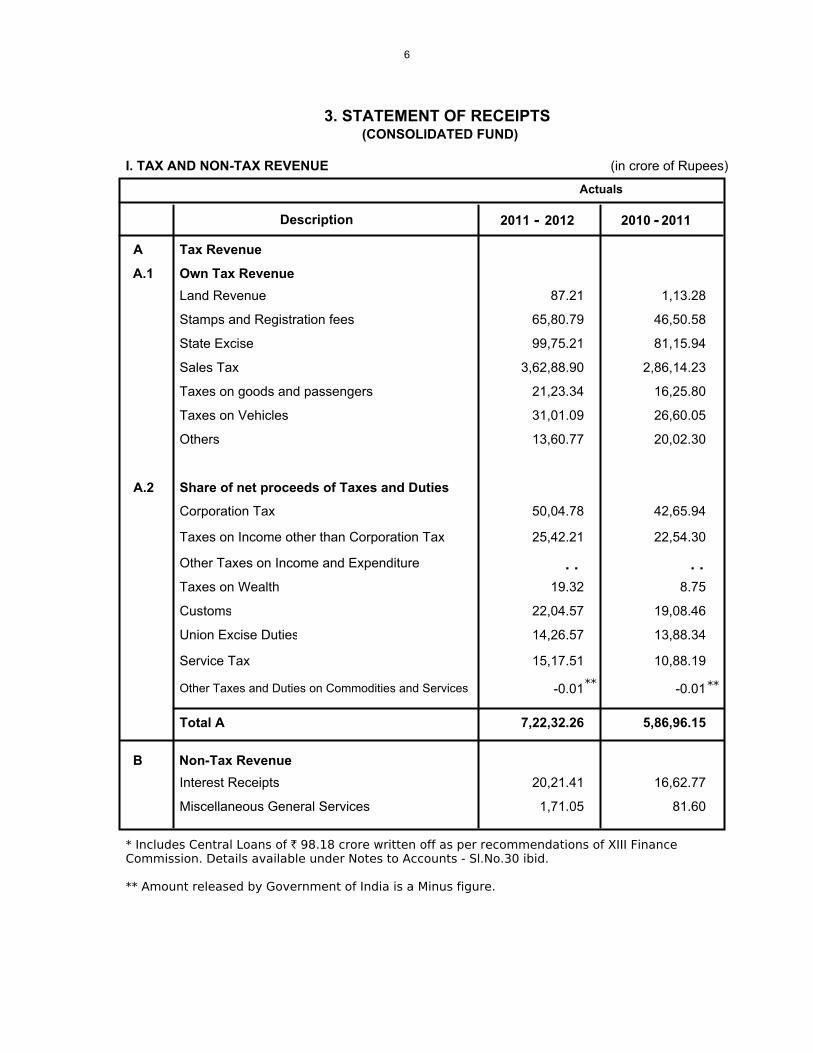
(in crore of Rupees)
Description
A Tax Revenue
A.1 Own Tax Revenue
Land Revenue 87.21 1,13.28
Stamps and Registration fees 65,80.79 46,50.58
State Excise 99,75.21 81,15.94
Sales Tax 3,62,88.90 2,86,14.23
Taxes on goods and passengers 21,23.34 16,25.80
Taxes on Vehicles 31,01.09 26,60.05
Others 13,60.77 20,02.30
A.2 Share of net proceeds of Taxes and Duties
Corporation Tax 50,04.78 42,65.94
Taxes on Income other than Corporation Tax 25,42.21 22,54.30
Other Taxes on Income and Expenditure
Taxes on Wealth 19.32 8.75
Customs 22,04.57 19,08.46
Union Excise Duties 14,26.57 13,88.34
Service Tax 15,17.51 10,88.19
Other Taxes and Duties on Commodities and Services -0.01 -0.01
Total A 7,22,32.26 5,86,96.15
B Non-Tax Revenue
Interest Receipts
Miscellaneous General Services
20,21.41 16,62.77
1,71.05 81.60
* Includes Central Loans of ` 98.18 crore written off as per recommendations of XIII FinanceCommission. Details available under Notes to Accounts - Sl.No.30 ibid.
** Amount released by Government of India is a Minus figure.
Actuals
2011 2012 20112010 --
I. TAX AND NON-TAX REVENUE
. . . .
** **
3. STATEMENT OF RECEIPTS(CONSOLIDATED FUND)
6
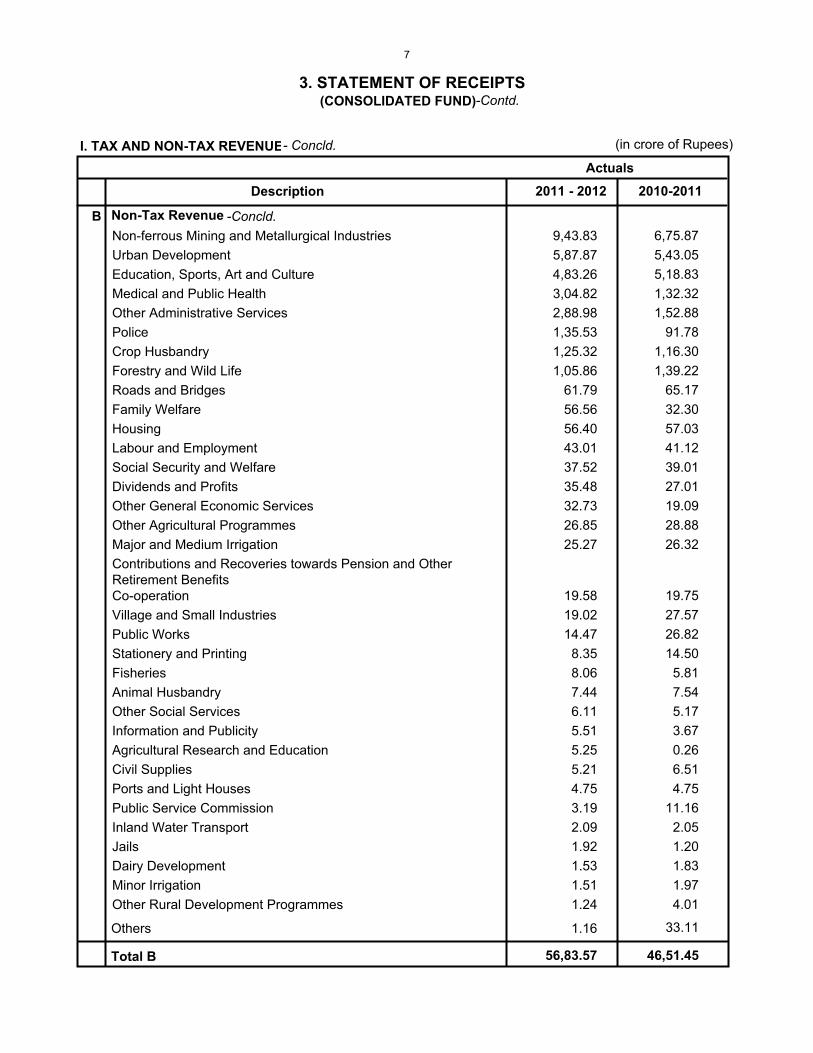
Non-ferrous Mining and Metallurgical Industries
Urban Development
Education, Sports, Art and Culture
Medical and Public Health
Other Administrative Services
Police
Crop Husbandry
Forestry and Wild Life
Roads and Bridges
Family Welfare
Housing
Labour and Employment
Social Security and Welfare
Dividends and Profits
Other General Economic Services
Other Agricultural Programmes
Major and Medium Irrigation
Contributions and Recoveries towards Pension and OtherRetirement BenefitsCo-operation
Village and Small Industries
Public Works
Stationery and Printing
Fisheries
Animal Husbandry
Other Social Services
Information and Publicity
Agricultural Research and Education
Civil Supplies
Ports and Light Houses
Public Service Commission
Inland Water Transport
Jails
Dairy Development
Minor Irrigation
Other Rural Development Programmes
9,43.83
5,87.87
4,83.26
3,04.82
2,88.98
1,35.53
1,25.32
1,05.86
61.79
56.56
56.40
43.01
37.52
35.48
32.73
26.85
25.27
19.58
19.02
14.47
8.35
8.06
7.44
6.11
5.51
5.25
5.21
4.75
3.19
2.09
1.92
1.53
1.51
1.24
6,75.87
5,43.05
5,18.83
1,32.32
1,52.88
91.78
1,16.30
1,39.22
65.17
32.30
57.03
41.12
39.01
27.01
19.09
28.88
26.32
19.75
27.57
26.82
14.50
5.81
7.54
5.17
3.67
0.26
6.51
4.75
11.16
2.05
1.20
1.83
1.97
4.01
Others 33.11 1.16
Total B 56,83.57 46,51.45
2011 - 2012 2010-2011
I. TAX AND NON-TAX REVENUE (in crore of Rupees)
Description
Non-Tax RevenueB
- Concld.
Actuals
3. STATEMENT OF RECEIPTS(CONSOLIDATED FUND)-Contd.
-Concld.
7
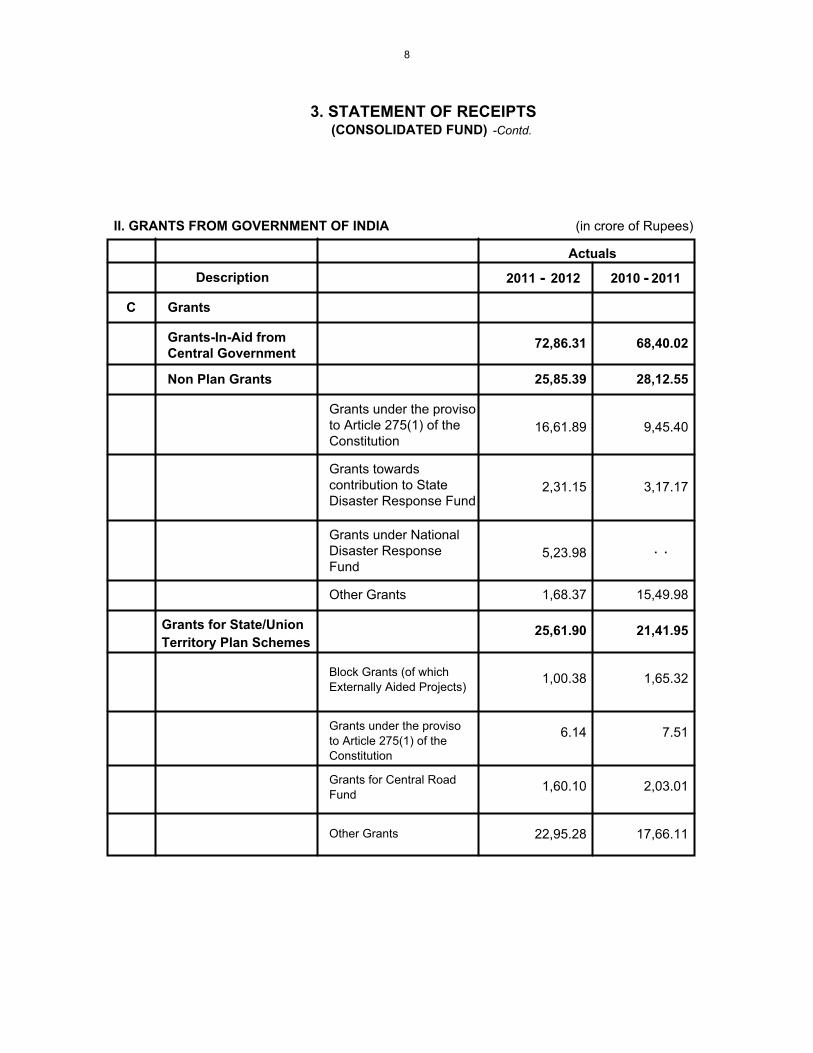
II. GRANTS FROM GOVERNMENT OF INDIA (in crore of Rupees)
Actuals
Description
C Grants
Grants-In-Aid from
Central Government
Non Plan Grants
Grants under the provisoto Article 275(1) of theConstitution
Grants towardscontribution to StateDisaster Response Fund
Grants under NationalDisaster ResponseFund
Other Grants
Grants for State/Union
Territory Plan Schemes
Block Grants (of which
Externally Aided Projects)
Grants under the proviso
to Article 275(1) of the
Constitution
Grants for Central Road
Fund
Other Grants
16,61.89 9,45.40
2,31.15 3,17.17
5,23.98
1,68.37 15,49.98
1,00.38 1,65.32
6.14 7.51
1,60.10 2,03.01
22,95.28 17,66.11
72,86.31 68,40.02
2011 2012 20112010 --
25,85.39 28,12.55
25,61.90 21,41.95
. .
3. STATEMENT OF RECEIPTS(CONSOLIDATED FUND) -Contd.
8
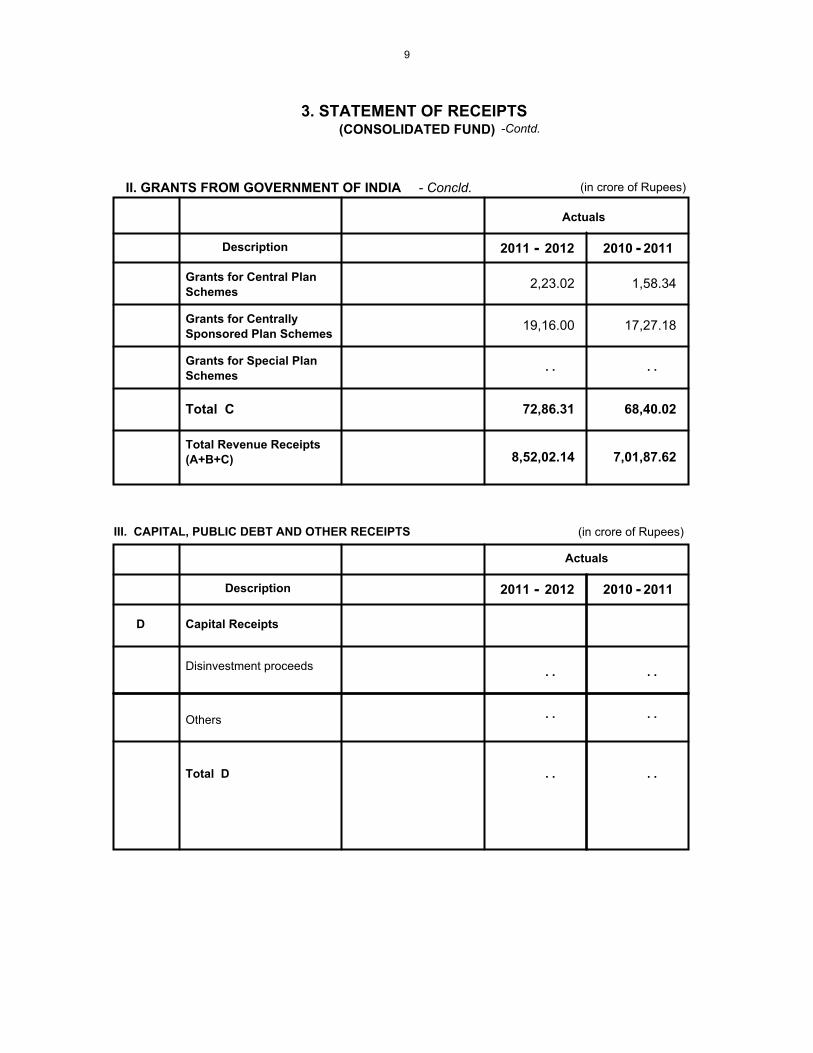
(in crore of Rupees)
Actuals
Description
Grants for Central Plan
Schemes 2,23.02 1,58.34
Grants for Centrally
Sponsored Plan Schemes 19,16.00 17,27.18
Grants for Special Plan
Schemes . . . .
Total C 72,86.31 68,40.02
Total Revenue Receipts
(A+B+C) 8,52,02.14 7,01,87.62
III. CAPITAL, PUBLIC DEBT AND OTHER RECEIPTS
Actuals
Description
D Capital Receipts
Disinvestment proceeds
Others
Total D
II. GRANTS FROM GOVERNMENT OF INDIA
2011 2012 20112010 --
2011 2012 20112010 --
. . . .
. . . .
. . . .
- Concld.
(in crore of Rupees)
3. STATEMENT OF RECEIPTS(CONSOLIDATED FUND) -Contd.
9
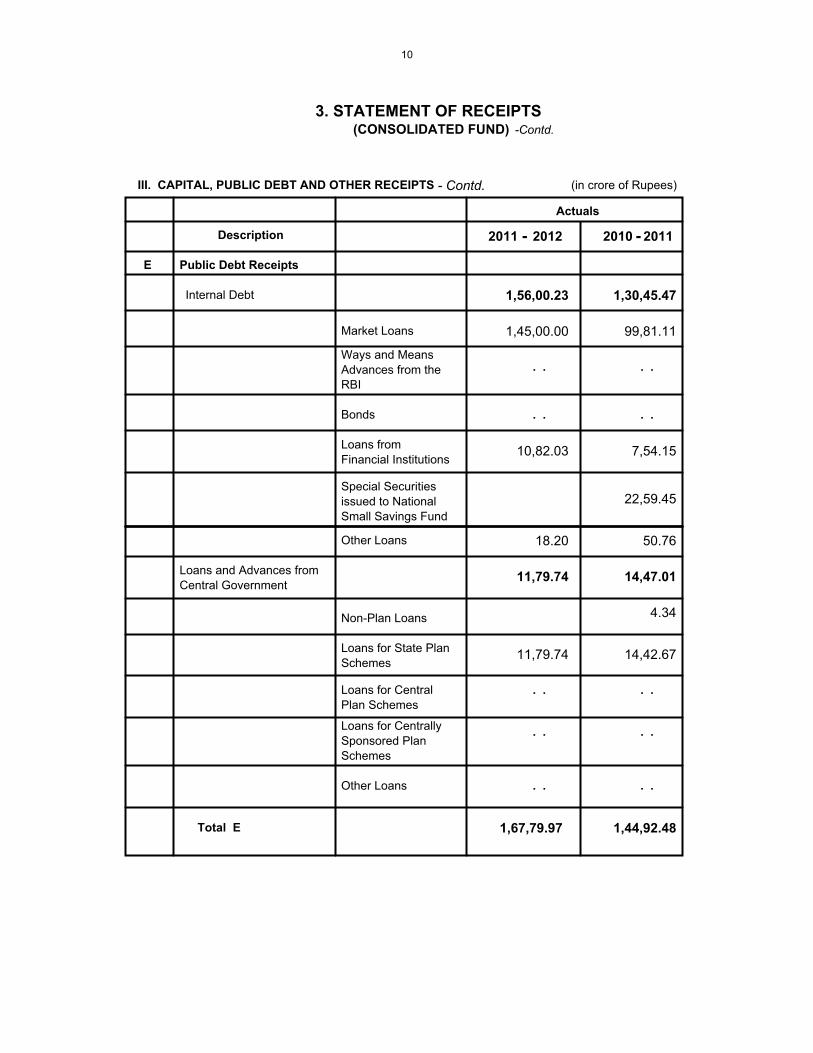
III. CAPITAL, PUBLIC DEBT AND OTHER RECEIPTS (in crore of Rupees)
Actuals
Description
E Public Debt Receipts
Internal Debt
Market Loans
Ways and Means
Advances from the
RBI
Bonds
Loans from
Financial Institutions
Special Securities
issued to National
Small Savings Fund
Other Loans
Loans and Advances from
Central Government
Non-Plan Loans
Loans for State Plan
Schemes
Loans for Central
Plan Schemes
Loans for Centrally
Sponsored Plan
Schemes
Other Loans
1,45,00.00 99,81.11
10,82.03 7,54.15
22,59.45
18.20 50.76
4.34
11,79.74 14,42.67
. . . .
- Contd.
2011 2012 20112010 --
Total E 1,67,79.97 1,44,92.48
1,56,00.23 1,30,45.47
. . . .
. . . .
. . . .
. . . .
11,79.74 14,47.01
3. STATEMENT OF RECEIPTS(CONSOLIDATED FUND) -Contd.
10
Actuals
Description
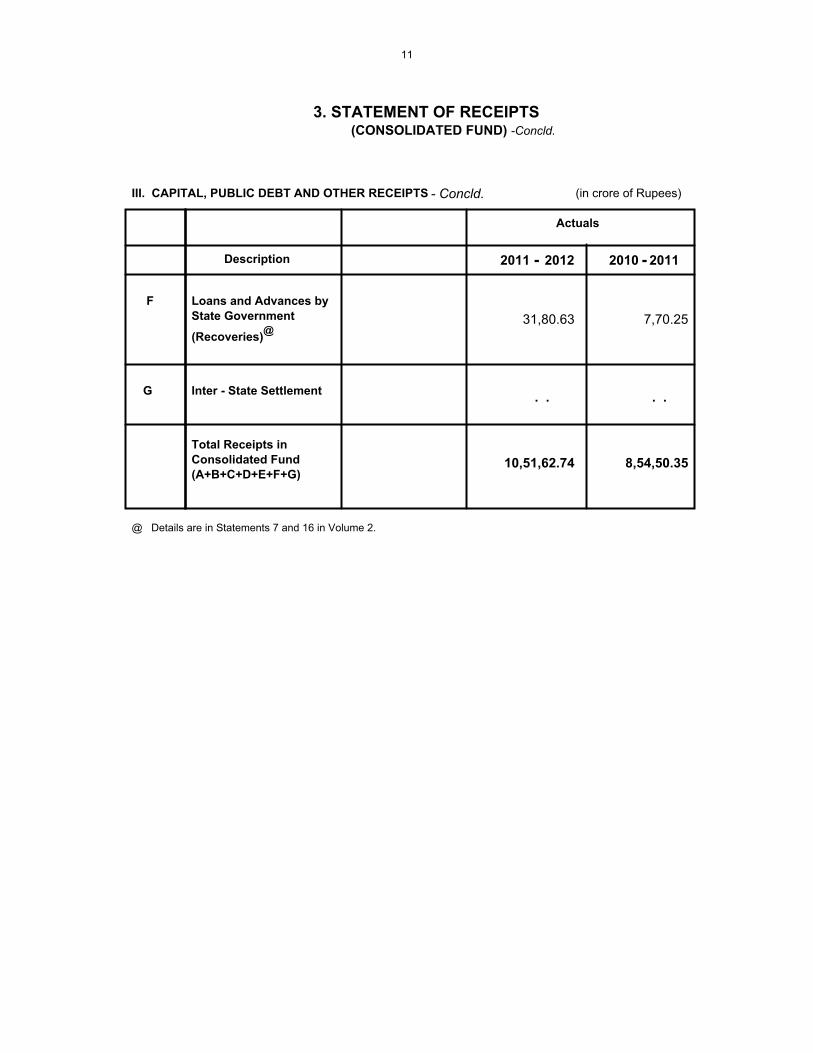
F Loans and Advances by
State Government
G Inter - State Settlement
Total Receipts in
Consolidated Fund
(A+B+C+D+E+F+G)
31,80.63 7,70.25
. . . .
10,51,62.74 8,54,50.35
(Recoveries)@
@ Details are in Statements 7 and 16 in Volume 2.
(in crore of Rupees)
2011 2012 20112010 --
III. CAPITAL, PUBLIC DEBT AND OTHER RECEIPTS - Concld.
3. STATEMENT OF RECEIPTS(CONSOLIDATED FUND) -Concld.
11
Aa
b
c
d
e
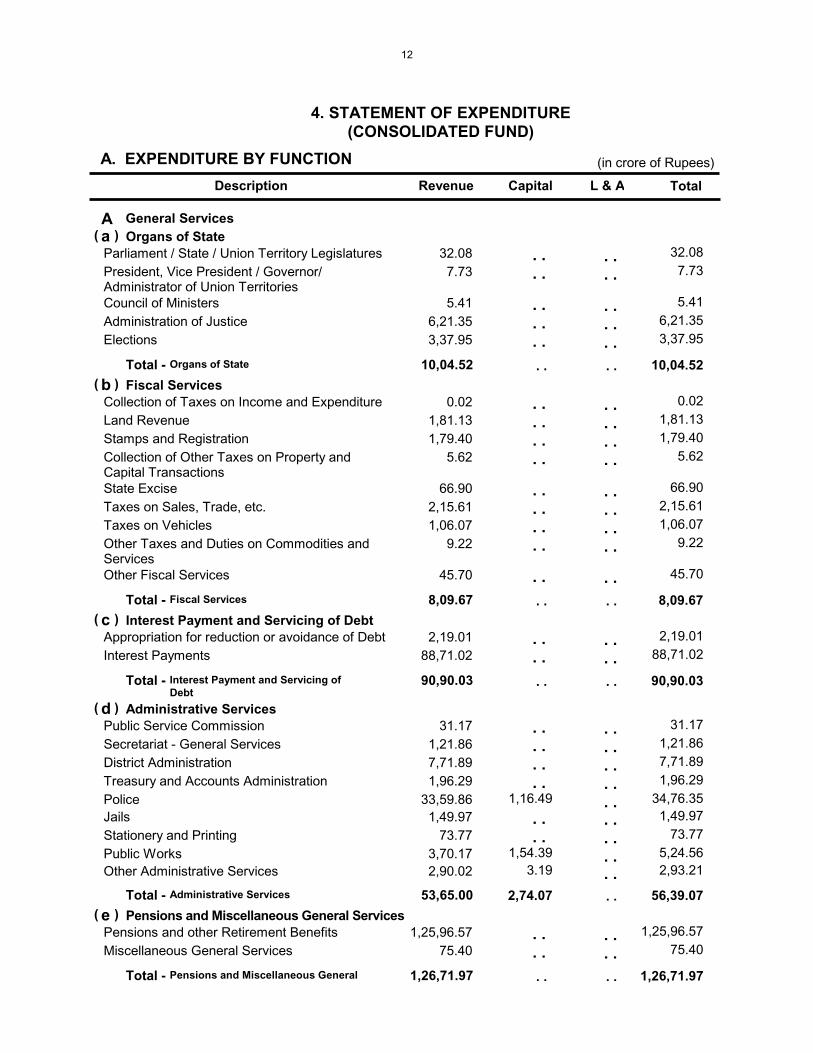
10,04.52
8,09.67
90,90.03
53,65.00
1,26,71.97
Parliament / State / Union Territory LegislaturesPresident, Vice President / Governor/Administrator of Union TerritoriesCouncil of MinistersAdministration of JusticeElections
Collection of Taxes on Income and ExpenditureLand RevenueStamps and RegistrationCollection of Other Taxes on Property andCapital TransactionsState ExciseTaxes on Sales, Trade, etc.Taxes on VehiclesOther Taxes and Duties on Commodities andServicesOther Fiscal Services
Appropriation for reduction or avoidance of DebtInterest Payments
Public Service CommissionSecretariat - General ServicesDistrict AdministrationTreasury and Accounts AdministrationPoliceJailsStationery and PrintingPublic WorksOther Administrative Services
Pensions and other Retirement BenefitsMiscellaneous General Services
32.08 7.73
5.41 6,21.35 3,37.95
0.02 1,81.13 1,79.40
5.62
66.90 2,15.61 1,06.07
9.22
45.70
2,19.01 88,71.02
31.17 1,21.86 7,71.89 1,96.29
33,59.86 1,49.97
73.77 3,70.17 2,90.02
1,25,96.57 75.40
Total -
Total -
Total -
Total -
Total -
1,16.49
1,54.39 3.19
32.08 7.73
5.41 6,21.35 3,37.95
0.02 1,81.13 1,79.40
5.62
66.90 2,15.61 1,06.07
9.22
45.70
2,19.01 88,71.02
31.17 1,21.86 7,71.89 1,96.29
34,76.35 1,49.97
73.77 5,24.56 2,93.21
1,25,96.57 75.40
2,74.07
10,04.52
8,09.67
90,90.03
56,39.07
1,26,71.97
General ServicesOrgans of State
Fiscal Services
Interest Payment and Servicing of Debt
Administrative Services
Pensions and Miscellaneous General Services
Description Revenue Capital L & A Total
A. EXPENDITURE BY FUNCTION
4. STATEMENT OF EXPENDITURE(CONSOLIDATED FUND)
(in crore of Rupees)
. .
. .
. .
. .
. .
. .
. .
. .
. .
. .
. .
. .
. .
. .
. .
. .
. .
. .
. .
. .
. .
. .
. .
. .
. .
. .
. .
. .
. .
. .
. .
. .
. .
. .
. .
. .
. .
. .
. .
. .
. .
. .
. .
. .
. .
. .
. .
. .
. .
. .
. .
. .
. .
. .
. .
. .
. .
. .
. .
. .
Organs of State
Fiscal Services
Interest Payment and Servicing ofDebt
Administrative Services
Pensions and Miscellaneous General
(
(
(
(
(
)
)
)
)
)
12
A
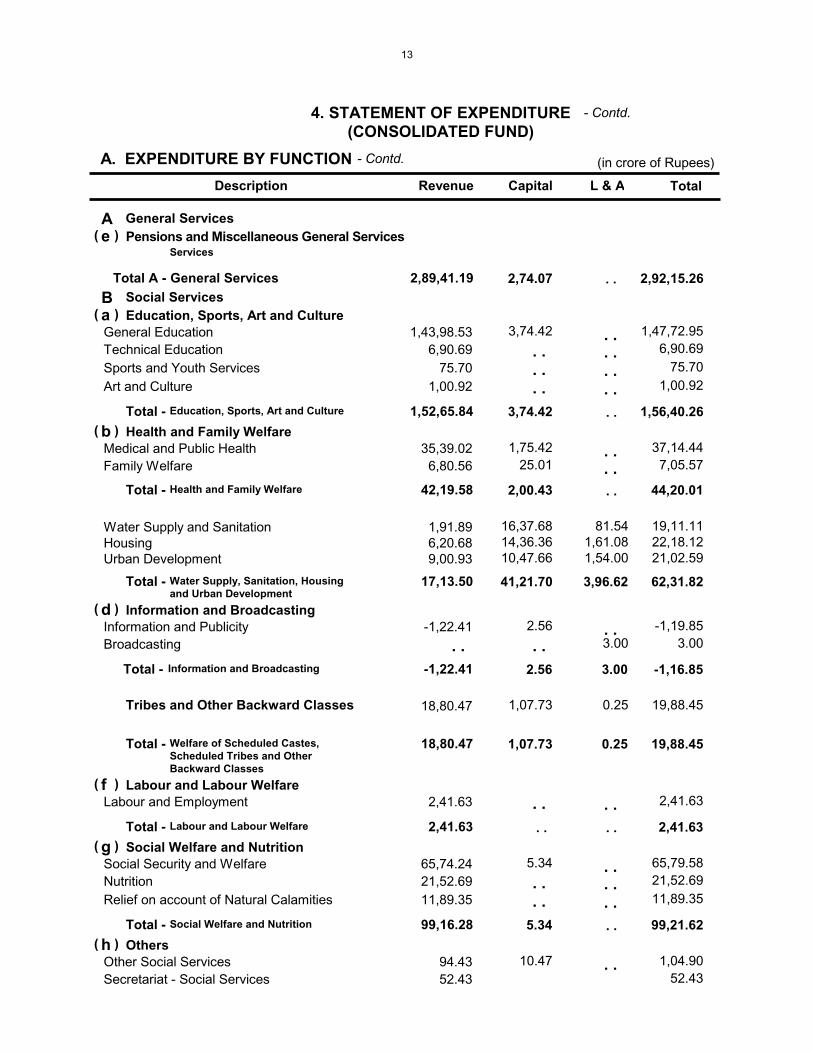
B 2,89,41.19Total A -
e
a
b
d
f
g
h
1,52,65.84
42,19.58
17,13.50
-1,22.41
18,80.47
2,41.63
99,16.28
General EducationTechnical EducationSports and Youth ServicesArt and Culture
Medical and Public HealthFamily Welfare
Water Supply and SanitationHousingUrban Development
Information and PublicityBroadcasting
Labour and Employment
Social Security and WelfareNutritionRelief on account of Natural Calamities
Other Social ServicesSecretariat - Social Services
1,43,98.53 6,90.69
75.70 1,00.92
35,39.02 6,80.56
1,91.89 6,20.68 9,00.93
-1,22.41
18,80.47
2,41.63
65,74.24 21,52.69 11,89.35
94.43 52.43
Total -
Total -
Total -
Total -
Total -
Total -
Total -
3,74.42
1,75.42 25.01
16,37.68 14,36.36 10,47.66
2.56
1,07.73
5.34
10.47
81.54 1,61.08 1,54.00
3.00
0.25
1,47,72.95 6,90.69
75.70 1,00.92
37,14.44 7,05.57
19,11.11 22,18.12 21,02.59
-1,19.85 3.00
19,88.45
2,41.63
65,79.58 21,52.69 11,89.35
1,04.90 52.43
3,74.42
2,00.43
41,21.70
2.56
1,07.73
5.34
3,96.62
3.00
0.25
1,56,40.26
44,20.01
62,31.82
-1,16.85
19,88.45
2,41.63
99,21.62
2,74.07 2,92,15.26
General Services
Social Services
Pensions and Miscellaneous General Services
Education, Sports, Art and Culture
Health and Family Welfare
Information and Broadcasting
Tribes and Other Backward Classes
Labour and Labour Welfare
Social Welfare and Nutrition
Others
Description Revenue Capital L & A Total
A. EXPENDITURE BY FUNCTION
4. STATEMENT OF EXPENDITURE(CONSOLIDATED FUND)
(in crore of Rupees)
. .
. .
. .
. .
. .
. .
. .
. .
. .
. .
. .
. .
. .
. .
. .
. .
. .
. .
. .
. .
. .
. .
. .
. .
. .
Services
Education, Sports, Art and Culture
Health and Family Welfare
Water Supply, Sanitation, Housingand Urban Development
Information and Broadcasting
Welfare of Scheduled Castes,Scheduled Tribes and OtherBackward Classes
Labour and Labour Welfare
Social Welfare and Nutrition
General Services . .
(
(
(
(
(
(
(
)
)
)
)
)
)
)
- Contd.
- Contd.
13
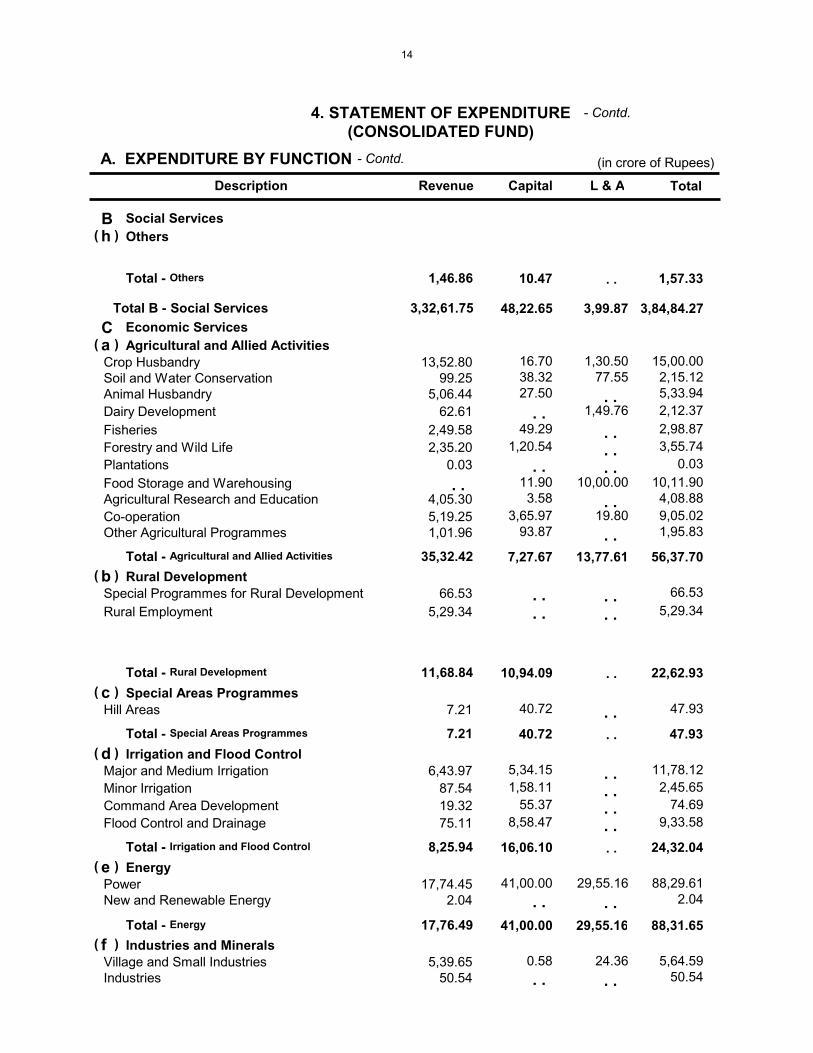
B
C 3,32,61.75Total B -
h
a
b
c
d
e
f
1,46.86
35,32.42
11,68.84
7.21
8,25.94
17,76.49
Crop HusbandrySoil and Water ConservationAnimal HusbandryDairy DevelopmentFisheriesForestry and Wild LifePlantationsFood Storage and WarehousingAgricultural Research and EducationCo-operationOther Agricultural Programmes
Special Programmes for Rural DevelopmentRural Employment
Hill Areas
Major and Medium IrrigationMinor IrrigationCommand Area DevelopmentFlood Control and Drainage
PowerNew and Renewable Energy
Village and Small IndustriesIndustries
13,52.80 99.25
5,06.44 62.61
2,49.58 2,35.20
0.03
4,05.30 5,19.25 1,01.96
66.53 5,29.34
7.21
6,43.97 87.54 19.32 75.11
17,74.45 2.04
5,39.65 50.54
Total -
Total -
Total -
Total -
Total -
Total -
16.70 38.32 27.50
49.29 1,20.54
11.90 3.58
3,65.97 93.87
40.72
5,34.15 1,58.11
55.37 8,58.47
41,00.00
0.58
1,30.50 77.55
1,49.76
10,00.00
19.80
29,55.16
24.36
15,00.00 2,15.12 5,33.94 2,12.37 2,98.87 3,55.74
0.03 10,11.90 4,08.88 9,05.02 1,95.83
66.53 5,29.34
47.93
11,78.12 2,45.65
74.69 9,33.58
88,29.61 2.04
5,64.59 50.54
10.47
7,27.67
10,94.09
40.72
16,06.10
41,00.00
13,77.61
29,55.16
1,57.33
56,37.70
22,62.93
47.93
24,32.04
88,31.65
48,22.65 3,99.87 3,84,84.27
Social Services
Economic Services
Others
Agricultural and Allied Activities
Rural Development
Special Areas Programmes
Irrigation and Flood Control
Energy
Industries and Minerals
Description Revenue Capital L & A Total
A. EXPENDITURE BY FUNCTION
4. STATEMENT OF EXPENDITURE(CONSOLIDATED FUND)
(in crore of Rupees)
. .
. .
. .
. .
. .
. .
. .
. .
. .
. .
. .
. .
. .
. .
. .
. .
. .
. .
. .
. .
. .
. .
. .
. .
. .
. .
Others
Agricultural and Allied Activities
Rural Development
Special Areas Programmes
Irrigation and Flood Control
Energy
Social Services
(
(
(
(
(
(
(
)
)
)
)
)
)
)
- Contd.
- Contd.
14
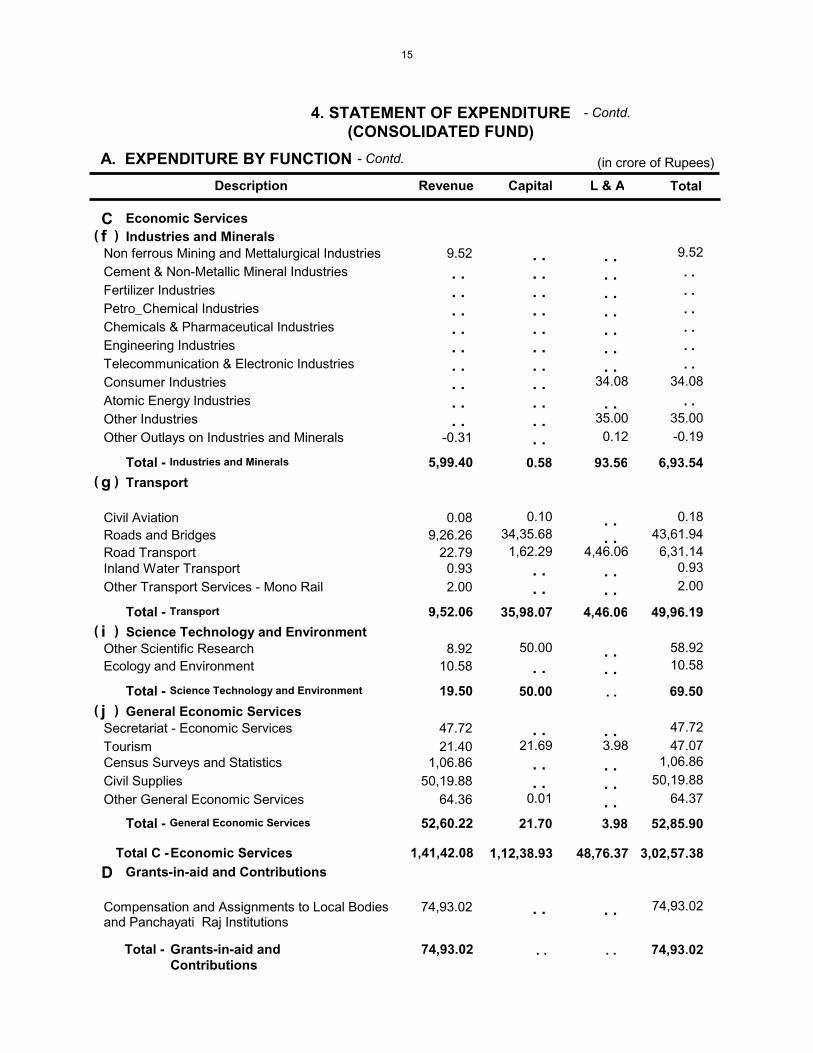
C
D 1,41,42.08
74,93.02
Total C -
Total -
f
g
i
j
5,99.40
9,52.06
19.50
52,60.22
Non ferrous Mining and Mettalurgical IndustriesCement & Non-Metallic Mineral IndustriesFertilizer IndustriesPetro_Chemical IndustriesChemicals & Pharmaceutical IndustriesEngineering IndustriesTelecommunication & Electronic IndustriesConsumer IndustriesAtomic Energy IndustriesOther IndustriesOther Outlays on Industries and Minerals
Civil AviationRoads and BridgesRoad TransportInland Water TransportOther Transport Services - Mono Rail
Other Scientific ResearchEcology and Environment
Secretariat - Economic ServicesTourismCensus Surveys and StatisticsCivil SuppliesOther General Economic Services
Compensation and Assignments to Local Bodiesand Panchayati Raj Institutions
9.52
-0.31
0.08 9,26.26
22.79 0.93 2.00
8.92 10.58
47.72 21.40
1,06.86 50,19.88
64.36
74,93.02
Total -
Total -
Total -
Total -
0.10 34,35.68 1,62.29
50.00
21.69
0.01
34.08
35.00 0.12
4,46.06
3.98
9.52
34.08
35.00-0.19
0.18 43,61.94 6,31.14
0.93 2.00
58.92 10.58
47.72 47.07
1,06.86 50,19.88
64.37
74,93.02
0.58
35,98.07
50.00
21.70
93.56
4,46.06
3.98
6,93.54
49,96.19
69.50
52,85.90
1,12,38.93 48,76.37 3,02,57.38
74,93.02
Economic Services
Grants-in-aid and Contributions
Industries and Minerals
Transport
Science Technology and Environment
General Economic Services
Description Revenue Capital L & A Total
A. EXPENDITURE BY FUNCTION
4. STATEMENT OF EXPENDITURE(CONSOLIDATED FUND)
(in crore of Rupees)
. .
. .
. .
. .
. .
. .
. .
. .
. .
. .
. .
. .
. .
. .
. .
. .
. .
. .
. .
. .
. .
. .
. .
. .
. .
. .
. .
. .
. .
. .
. .
. .
. .
. .
. .
. .
. .
. . . . . . . . . . . . . . . . . .
. .
Industries and Minerals
Transport
Science Technology and Environment
General Economic Services
Economic Services
Grants-in-aid andContributions
. . . .
(
(
(
(
)
)
)
)
- Contd.
- Contd.
. . . . . . . . . . . .
. .
15
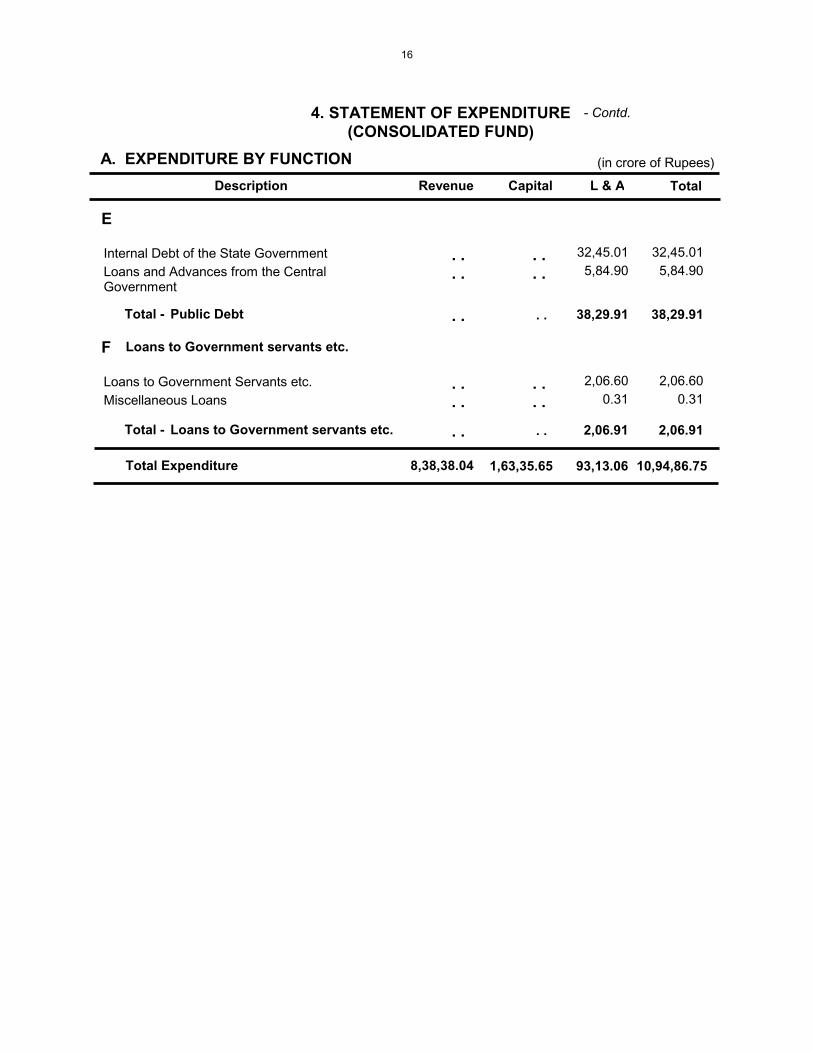
8,38,38.04Total Expenditure
E
F
Total -
Total -
Internal Debt of the State GovernmentLoans and Advances from the CentralGovernment
Loans to Government Servants etc.Miscellaneous Loans
32,45.01 5,84.90
2,06.60 0.31
32,45.01 5,84.90
2,06.60 0.31
38,29.91
2,06.91
38,29.91
2,06.91
1,63,35.65 93,13.06 10,94,86.75
Loans to Government servants etc.
Description Revenue Capital L & A Total
A. EXPENDITURE BY FUNCTION
4. STATEMENT OF EXPENDITURE(CONSOLIDATED FUND)
(in crore of Rupees)
. .
. .
. .
. .
. . . .
. . . .
Public Debt
Loans to Government servants etc.
. .
. .
. .
. .
- Contd.
16
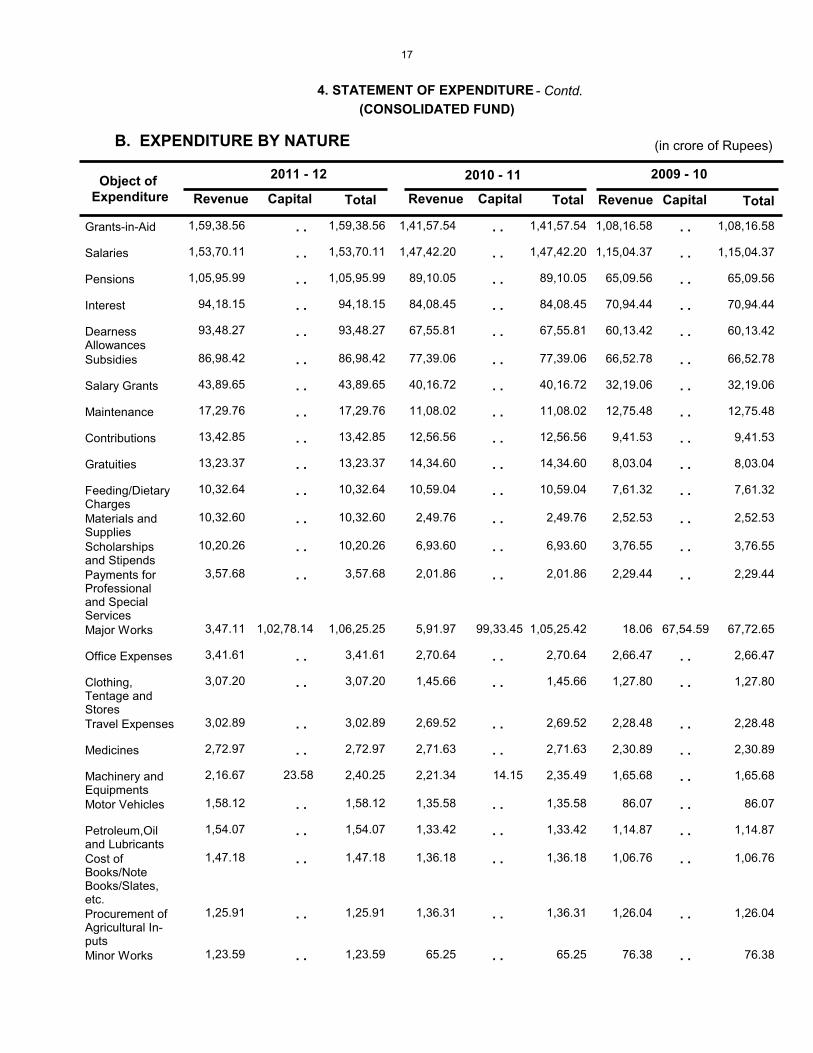
B. EXPENDITURE BY NATURE
4. STATEMENT OF EXPENDITURE(CONSOLIDATED FUND)
1,59,38.56
1,53,70.11
1,05,95.99
94,18.15
93,48.27
86,98.42
43,89.65
17,29.76
13,42.85
13,23.37
10,32.64
10,32.60
10,20.26
3,57.68
3,47.11
3,41.61
3,07.20
3,02.89
2,72.97
2,16.67
1,58.12
1,54.07
1,47.18
1,25.91
1,23.59
1,02,78.14
23.58
1,59,38.56
1,53,70.11
1,05,95.99
94,18.15
93,48.27
86,98.42
43,89.65
17,29.76
13,42.85
13,23.37
10,32.64
10,32.60
10,20.26
3,57.68
1,06,25.25
3,41.61
3,07.20
3,02.89
2,72.97
2,40.25
1,58.12
1,54.07
1,47.18
1,25.91
1,23.59
1,41,57.54
1,47,42.20
89,10.05
84,08.45
67,55.81
77,39.06
40,16.72
11,08.02
12,56.56
14,34.60
10,59.04
2,49.76
6,93.60
2,01.86
5,91.97
2,70.64
1,45.66
2,69.52
2,71.63
2,21.34
1,35.58
1,33.42
1,36.18
1,36.31
65.25
99,33.45
14.15
1,41,57.54
1,47,42.20
89,10.05
84,08.45
67,55.81
77,39.06
40,16.72
11,08.02
12,56.56
14,34.60
10,59.04
2,49.76
6,93.60
2,01.86
1,05,25.42
2,70.64
1,45.66
2,69.52
2,71.63
2,35.49
1,35.58
1,33.42
1,36.18
1,36.31
65.25
1,08,16.58
1,15,04.37
65,09.56
70,94.44
60,13.42
66,52.78
32,19.06
12,75.48
9,41.53
8,03.04
7,61.32
2,52.53
3,76.55
2,29.44
18.06
2,66.47
1,27.80
2,28.48
2,30.89
1,65.68
86.07
1,14.87
1,06.76
1,26.04
76.38
67,54.59
1,08,16.58
1,15,04.37
65,09.56
70,94.44
60,13.42
66,52.78
32,19.06
12,75.48
9,41.53
8,03.04
7,61.32
2,52.53
3,76.55
2,29.44
67,72.65
2,66.47
1,27.80
2,28.48
2,30.89
1,65.68
86.07
1,14.87
1,06.76
1,26.04
76.38
Grants-in-Aid
Salaries
Pensions
Interest
DearnessAllowancesSubsidies
Salary Grants
Maintenance
Contributions
Gratuities
Feeding/DietaryChargesMaterials andSuppliesScholarshipsand StipendsPayments forProfessionaland SpecialServicesMajor Works
Office Expenses
Clothing,Tentage andStoresTravel Expenses
Medicines
Machinery andEquipmentsMotor Vehicles
Petroleum,Oiland LubricantsCost ofBooks/NoteBooks/Slates,etc.Procurement ofAgricultural In-putsMinor Works
Object of Expenditure Revenue Capital Total Revenue Capital Total Revenue Capital Total
. .
. .
. .
. .
. .
. .
. .
. .
. .
. .
. .
. .
. .
. .
. .
. .
. .
. .
. .
. .
. .
. .
. .
. .
. .
. .
. .
. .
. .
. .
. .
. .
. .
. .
. .
. .
. .
. .
. .
. .
. .
. .
. .
. .
. .
. .
. .
. .
. .
. .
. .
. .
. .
. .
. .
. .
. .
. .
. .
. .
. .
. .
. .
. .
. .
. .
. .
. .
. .
. .
2011 - 12 2010 - 11 2009 - 10
(in crore of Rupees)
- Contd.
17

B. EXPENDITURE BY NATURE
4. STATEMENT OF EXPENDITURE(CONSOLIDATED FUND)
8,49,79.93 1,63,74.91 10,13,54.84 7,39,66.29 1,26,40.86 8,66,07.15 5,94,91.58 85,71.30 6,80,62.88
1,03.86
1,02.04
88.23
87.28
81.09
80.49
75.06
62.03
61.21
52.08
43.65
18.73
17.51
11.04
29.00
68.55
51,56.91
8,18.73
1,03.86
1,02.04
1,17.23
87.28
81.09
80.49
75.06
62.03
61.21
52.08
43.65
87.28
17.51
11.04
51,56.91
8,18.73
97.58
1,00.79
1,22.00
67.93
71.51
62.16
59.31
87.93
56.32
32.66
63.84
. .
18.42
. .
. .
15.07
. .
1,01.29
25,91.97
97.58
1,00.79
1,22.00
67.93
71.51
62.16
59.31
87.93
56.32
32.66
63.84
1,01.29
18.42
. .
25,91.97
15.07
. .
4,59.84
95.44
1,29.38
55.46
64.02
43.56
45.54
35.33
49.71
26.73
46.13
12.05
14.59
. .
0.00
10.58
4,05.62
89.67
13,65.72
3,61.32
4,59.84
95.44
1,29.38
55.46
64.02
43.56
45.54
35.33
49.71
26.73
46.13
1,01.72
14.59
. .
13,65.72
10.58
7,66.94
Compensation
Rent, Rates andTaxesComputer andAccessoriesStores andEquipmentsWages
Rewards
Printing Charges
Service orCommitmentChargesTraining
Feeding andCash DolesAdvertising andPublicityLands
TransportChargesSecret ServiceExpenditureInvestments
Prizes andAwardsInter-AccountTransfers
Object of Expenditure Revenue Capital Total Revenue Capital Total Revenue Capital Total
Total
-11,41.89 -39.26 -11,81.15 -1049.98 -204.59 -1254.57 -116.23 1.29 -114.94Others
8,38,38.04 1,63,35.65 10,01,73.69 7,29,16.31 1,24,36.27 8,53,52.58 5,93,75.35 85,72.59 6,79,47.94Total
. .
. .
. .
. .
. .
. .
. .
. .
. .
. .
. .
. .
. .
. .
. .
. .
. .
. .
. .
. .
. .
. .
. .
. .
. .
. .
. .
. .
. .
. .
. .
. .
. .
. .
. .
. .
. .
. .
. .
. .
. .
. .
2011 - 12 2010 - 11 2009 - 10
(in crore of Rupees)
. .
. .
. .
. .
- Concld.
18
NOTES TO ACCOUNTS
1. Summary of significant accounting policies:
(i) Entity and Accounting period: These accounts present the transactions of
the Government of Tamil Nadu for the period from 1st April 2011 to
31st
March 2012.
(ii) Basis of Accounting: With the exception of some book adjustments, the
accounts represent the actual cash receipts and disbursements during the
accounting period.
(iii) Currency in which the Accounts are kept: The accounts of the
Government are maintained in Indian Rupees.
(iv) Form of Accounts: Under Article 150 of the Constitution of India, the
accounts of the Union and of the States are kept in such form as the
President may on the advice of the Comptroller and Auditor General of
India prescribe. The word ‘Form’ used in Article 150 has a comprehensive
meaning so as to include the prescription not only of the broad form in
which the accounts are kept but also the basis for selecting appropriate
heads under which the transactions are to be classified.
(v) Rendition of Accounts: The Account rendering units, namely, the
Treasuries, Pay and Accounts Offices, Public Works and Forest Divisions
render the monthly accounts to the Accountant General for compilation of
the monthly accounts of the State.
(vi) Classification between Revenue and Capital: While revenue expenditure
is recurring in nature, capital expenditure is an expenditure incurred with
the object of increasing concrete assets of a material and permanent
character. Expenditure on Grants in Aid is recorded as revenue
expenditure in the books of the grantor and as revenue receipts in the
books of the recipient.
(vii) Classification and accounting of transactions pertaining to more than one
major head of account: All instances of receipts/charges relating to more
than one major head of account are initially booked under one head.
Necessary apportionment to other heads of account is carried out before
the accounts of the year are closed. Value of such adjustments carried out
for the year works out to ` 751.33 crore, as listed in the following page.
19
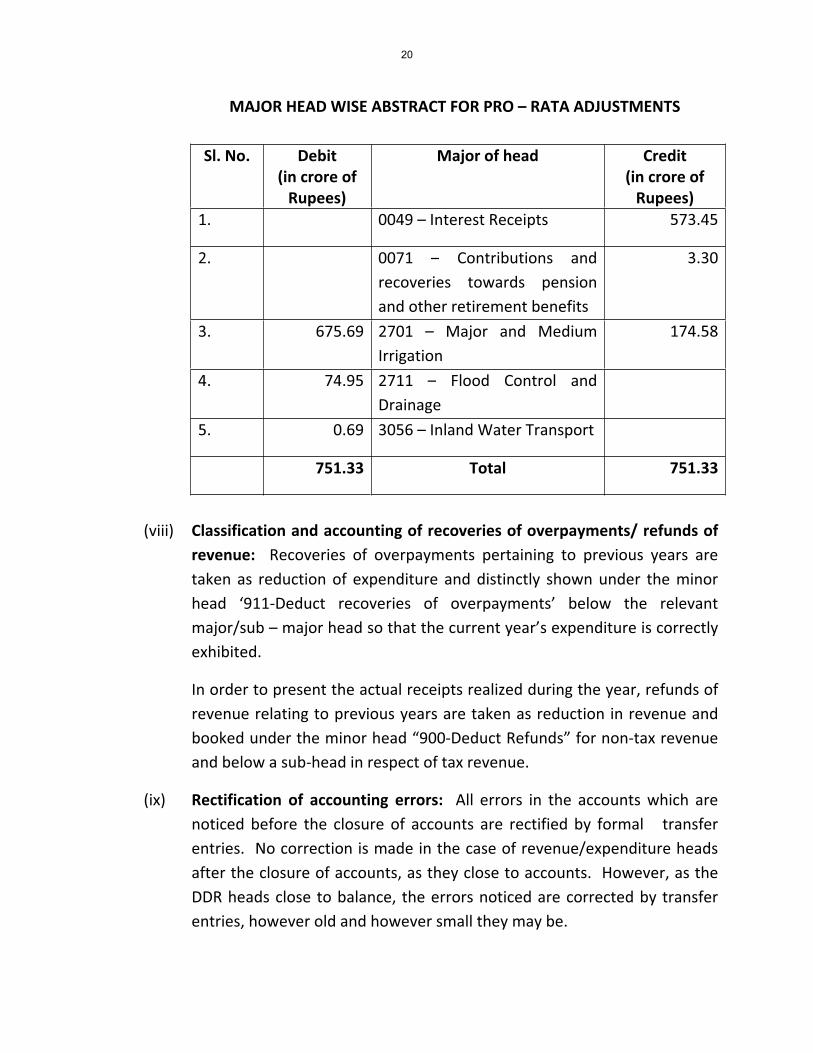
MAJOR HEAD WISE ABSTRACT FOR PRO – RATA ADJUSTMENTS
Sl. No. Debit
(in crore of
Rupees)
Major of head Credit
(in crore of
Rupees)
1. 0049 – Interest Receipts 573.45
2. 0071 – Contributions and
recoveries towards pension
and other retirement benefits
3.30
3. 675.69 2701 – Major and Medium
Irrigation
174.58
4. 74.95 2711 – Flood Control and
Drainage
5. 0.69 3056 – Inland Water Transport
751.33 Total 751.33
(viii) Classification and accounting of recoveries of overpayments/ refunds of
revenue: Recoveries of overpayments pertaining to previous years are
taken as reduction of expenditure and distinctly shown under the minor
head ‘911 Deduct recoveries of overpayments’ below the relevant
major/sub – major head so that the current year’s expenditure is correctly
exhibited.
In order to present the actual receipts realized during the year, refunds of
revenue relating to previous years are taken as reduction in revenue and
booked under the minor head “900 Deduct Refunds” for non tax revenue
and below a sub head in respect of tax revenue.
(ix) Rectification of accounting errors: All errors in the accounts which are
noticed before the closure of accounts are rectified by formal transfer
entries. No correction is made in the case of revenue/expenditure heads
after the closure of accounts, as they close to accounts. However, as the
DDR heads close to balance, the errors noticed are corrected by transfer
entries, however old and however small they may be.
20
(x) Criteria for write off of balances from DDR heads: All irrecoverable
amounts due to Government constitute a loss to Government. They are
written off from the concerned debt head of account by debit to
appropriate expenditure head. All amounts due from Government
remaining unclaimed for such time as prescribed by Government, e.g.
unclaimed deposits in the General Provident Fund and Market Loans
notified for discharge remaining unclaimed are credited to revenue of the
Government by debit to the Debt or Deposit head concerned. All balances
outstanding due to book keeping errors under DDR heads are written off
to “Miscellaneous Government Account”. An amount of `25.04 crore has
been written off during 2011 12.
2. Pension and other retirement benefits:
The expenditure on pensionary benefits of State Government employees during the
year was `11,747.07 crore (14.01% of total revenue expenditure). However, the
liability towards future retirement benefits for the past and the present service of
Government employees who joined government service prior to 1.4.2003 is not
reflected in the accounts. The State Government employees recruited from 1.4.2003
are covered under the “New Pension Scheme”. An amount of `1108.82 crore being the
employees’ contribution and Government’s share during the year has been kept under
the head “8342 – Other Deposits – 117 – Defined Contribution Pension Scheme for
Government employees”. As no pension regulatory body/fund has been formed, the
total accumulation of `2397.04 crore on account of this scheme is lying as deposits
with the Government of Tamil Nadu as on 31st
March 2012.
3. Transfer of Funds to Personal Deposit (PD) Accounts:
Government is authorized to open PD accounts through special enactments to deposit
money to be utilized for specific purpose which will be managed by ‘Administrators’.
Transfer to PD account is booked as expenditure under the concerned service major
head in the Consolidated Fund of the State. 40 PD accounts involving a sum of `556.40
crore were opened during the year. Administrators are required to close such accounts
on the last working day of the year and to transfer the unspent balances back to the
Government accounts. As on 31st
August 2012 all the PD accounts have been closed.
21
4. Reconciliation of Receipts and Expenditure :
All the Drawing and Disbursing Officers are required to reconcile the receipts and
expenditure of the Government with the figures compiled by the Accountant General.
Such reconciliation has been completed for 99.97% of expenditure and 100% of
receipts as on 31st August 2012.
5. Deposits with Reserve Bank of India:
As reported by RBI on 16th
April 2012 cash balance showed a credit balance of `103.63
crore as against a debit balance of `151.73 crore in the Accountant General’s books for
March 2012. The difference of `90.13 crore (Dr.) and `42.03 crore (cr.) is mainly due
to non reporting of transactions by the agency banks. Difference to the extent of `73.22
crore (Dr.) and `16.88 crore (Cr. ) stands cleared at the end of June 2012.
6. 8670 – Cheques and Bills:
An amount of `2564.93 crore represents cheques issued but remaining uncashed at the
close of the year. The uncashed cheques will have no impact on expenditure figures as
debits to the relevant heads have already been afforded.
7. Ways and Means Advances :
Minimum balance of `3.25 crore was maintained throughout the accounting period
without availing of any Ways and Means Advances.
8. Guarantees:
Guarantees reported in Statement No.9 are based on the information received from
the Corporations/Government Companies and is prepared as per Indian Government
Accounting Standards (IGAS I) for the current year 2011 12. Sector wise disclosure for each class in
the prescribed format is reported in the Statement. The total outstanding guarantees at
the end of the year were to the extent of ` 97,51.29 crore which was within the total
revenue receipts of ` 7,01,87.62 crore of the preceding year 2010 11 and less than 10
per cent of GSDP of Tamil Nadu (GSDP : `63,90,24.60 crore) for the year 2011 12.
Guarantee Redemption Fund has been constituted for meeting the expenditure incurred
towards discharging the “Guarantees invoked” and is credited out of the revenue
collected towards Guarantee Fees of ` 2.58 crore as well as Government’s
contributions. The balance at the credit of the Fund at the beginning of the year was
22
`19.24 crore. During the year 2011 12, an amount of ` 4,02.46 crore was credited to
the Fund and `3,91.77 crore was incurred from the Fund for Fresh investment and
reinvestment in Treasury Bills. The balance at the credit of the Fund as on 31st March
2012 was ` 29.93 crore.
9. Loans and Advances:
Loans and Advances are sanctioned by State Government to various Government
Departments, Public Sector Undertakings, Local Bodies etc. and also to Government
employees. Detailed accounts are maintained by Accountant General in respect of All
India Service Officers only for which confirmation of balances are issued to individuals.
10. Information on ‘Committed Liabilities’ and ‘implications of major policy decisions’:
Information on “Committed Liabilities” has not been made available by the
Government of Tamil Nadu.
In respect of ‘implications of major policy decisions’, material information collected
from the Budget speech of Honourable Finance Minister of the Government of Tamil
Nadu and the related Budget documents has been included in Appendix XIV.
11. Investments:
Government has its holdings in various Public Sector Undertakings, Government
Companies, Joint Stock Companies and Co operative Institutions. The total investment
of the Government is `14,455.66 crore. A difference of `465.31 crore
involving 24 cases existed between the investment details received through the
accounts (Statement 13) and those received from the concerned entities (Statement
14). These differences are under reconciliation and suitable remarks indicated in
Statement 14.
12. Reserve Funds: There are 32 Reserve Funds maintained by Government of Tamil
Nadu each operated for a specific purpose. The table given below lists such of those
Reserve Funds with closing balances as on 31st
March 2012 where no transactions have
taken place during 2011 12.
23
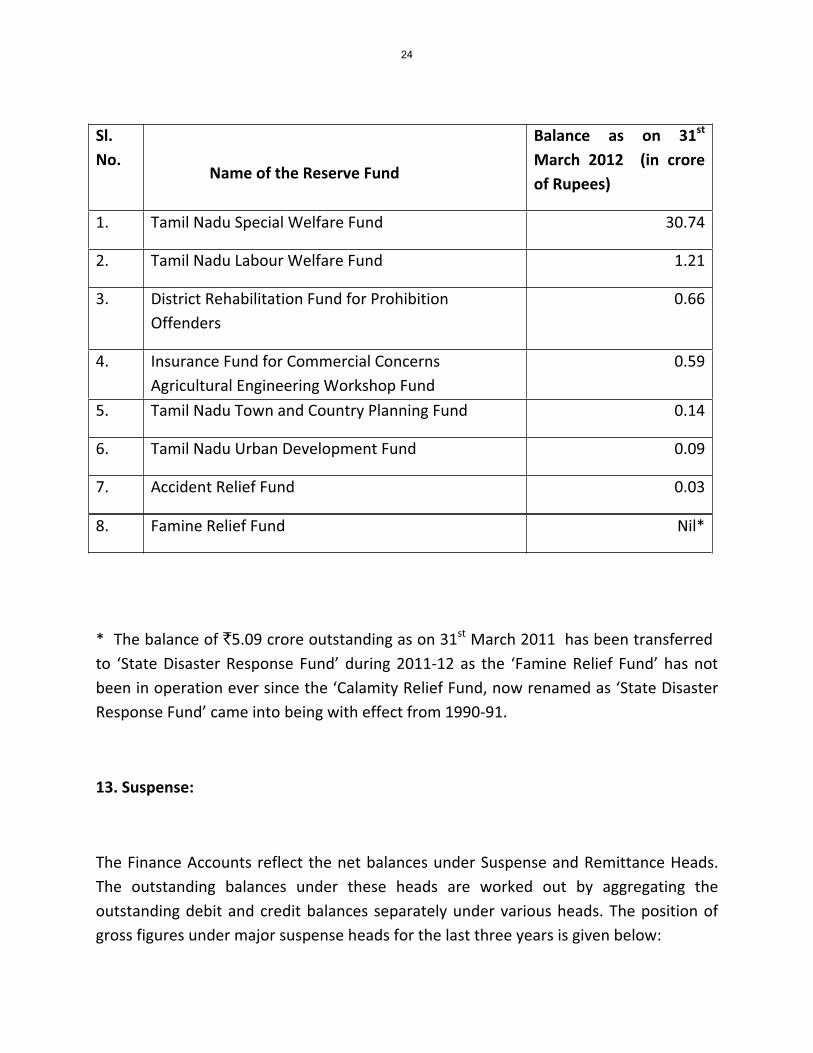
* The balance of `5.09 crore outstanding as on 31st
March 2011 has been transferred
to ‘State Disaster Response Fund’ during 2011 12 as the ‘Famine Relief Fund’ has not
been in operation ever since the ‘Calamity Relief Fund, now renamed as ‘State Disaster
Response Fund’ came into being with effect from 1990 91.
13. Suspense:
The Finance Accounts reflect the net balances under Suspense and Remittance Heads.
The outstanding balances under these heads are worked out by aggregating the
outstanding debit and credit balances separately under various heads. The position of
gross figures under major suspense heads for the last three years is given below:
Sl.
No. Name of the Reserve Fund
Balance as on 31st
March 2012 (in crore
of Rupees)
1. Tamil Nadu Special Welfare Fund 30.74
2. Tamil Nadu Labour Welfare Fund 1.21
3. District Rehabilitation Fund for Prohibition
Offenders
0.66
4. Insurance Fund for Commercial Concerns
Agricultural Engineering Workshop Fund
0.59
5. Tamil Nadu Town and Country Planning Fund 0.14
6. Tamil Nadu Urban Development Fund 0.09
7. Accident Relief Fund 0.03
8. Famine Relief Fund Nil*
24
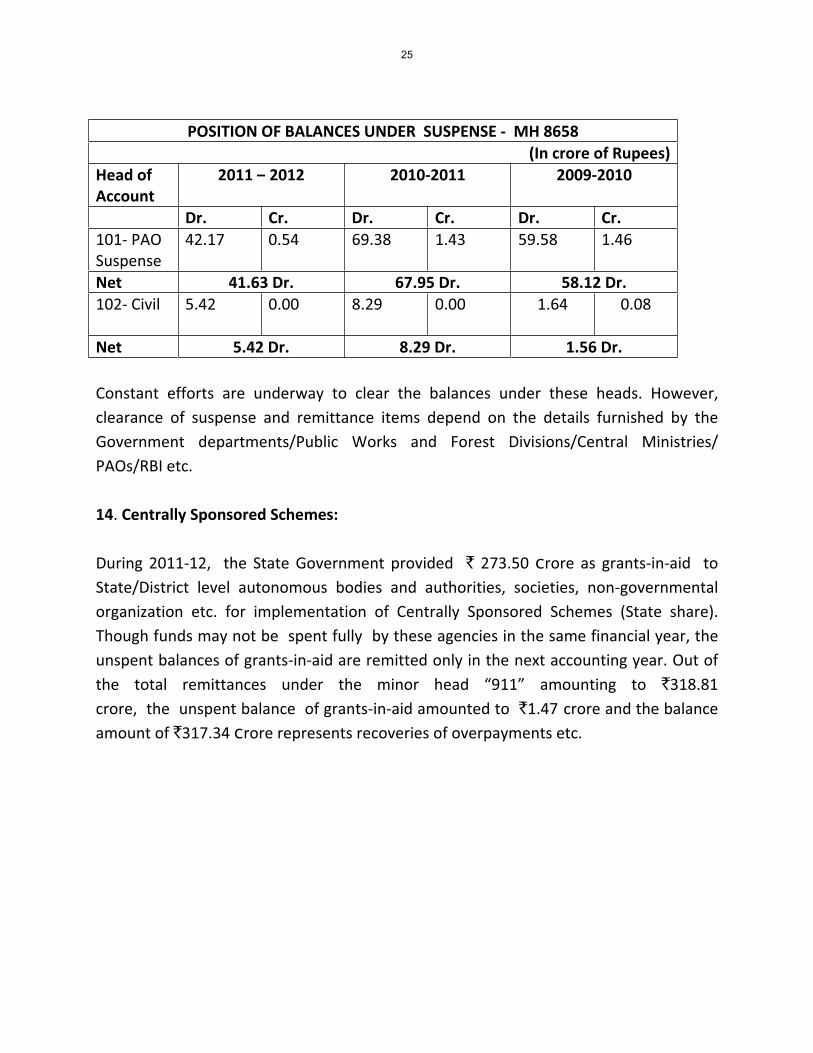
POSITION OF BALANCES UNDER SUSPENSE MH 8658
(In crore of Rupees)
Head of
Account
2011 – 2012 2010 2011 2009 2010
Dr. Cr. Dr. Cr. Dr. Cr.
101 PAO
Suspense
42.17 0.54 69.38 1.43 59.58 1.46
Net 41.63 Dr. 67.95 Dr. 58.12 Dr.
102 Civil 5.42 0.00 8.29 0.00 1.64 0.08
Net 5.42 Dr. 8.29 Dr. 1.56 Dr.
Constant efforts are underway to clear the balances under these heads. However,
clearance of suspense and remittance items depend on the details furnished by the
Government departments/Public Works and Forest Divisions/Central Ministries/
PAOs/RBI etc.
14. Centrally Sponsored Schemes:
During 2011 12, the State Government provided ` 273.50 crore as grants in aid to
State/District level autonomous bodies and authorities, societies, non governmental
organization etc. for implementation of Centrally Sponsored Schemes (State share).
Though funds may not be spent fully by these agencies in the same financial year, the
unspent balances of grants in aid are remitted only in the next accounting year. Out of
the total remittances under the minor head “911” amounting to `318.81
crore, the unspent balance of grants in aid amounted to `1.47 crore and the balance
amount of `317.34 crore represents recoveries of overpayments etc.
25
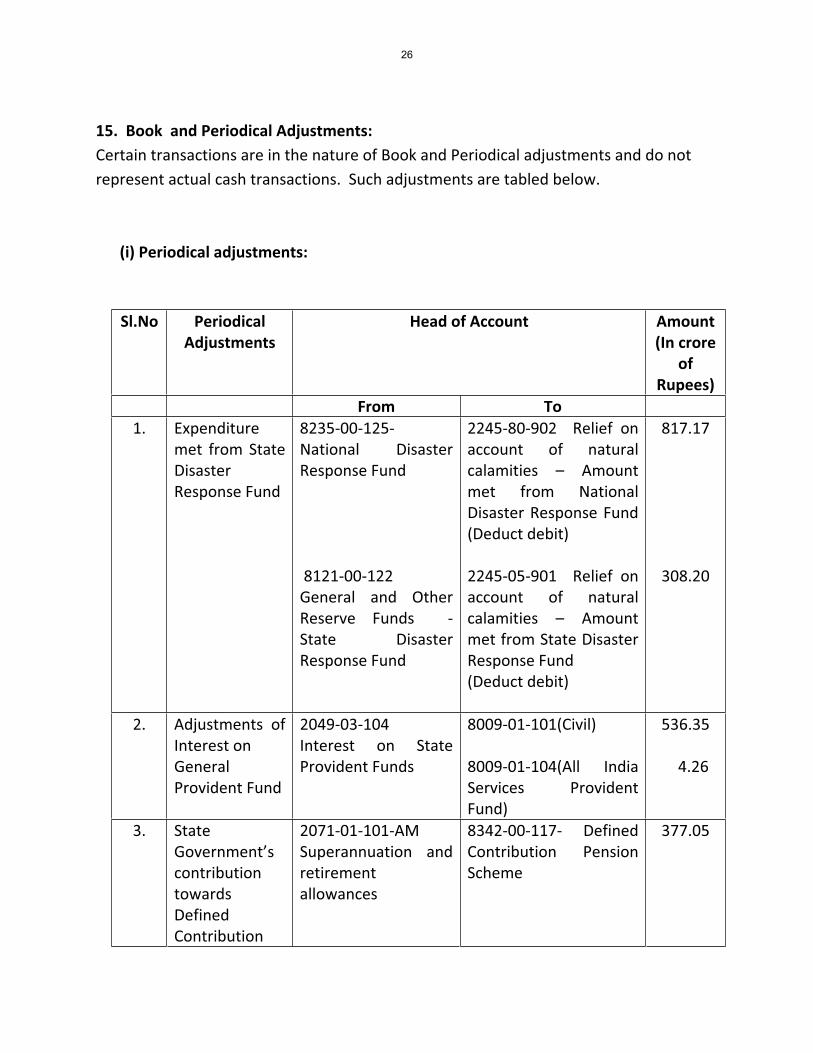
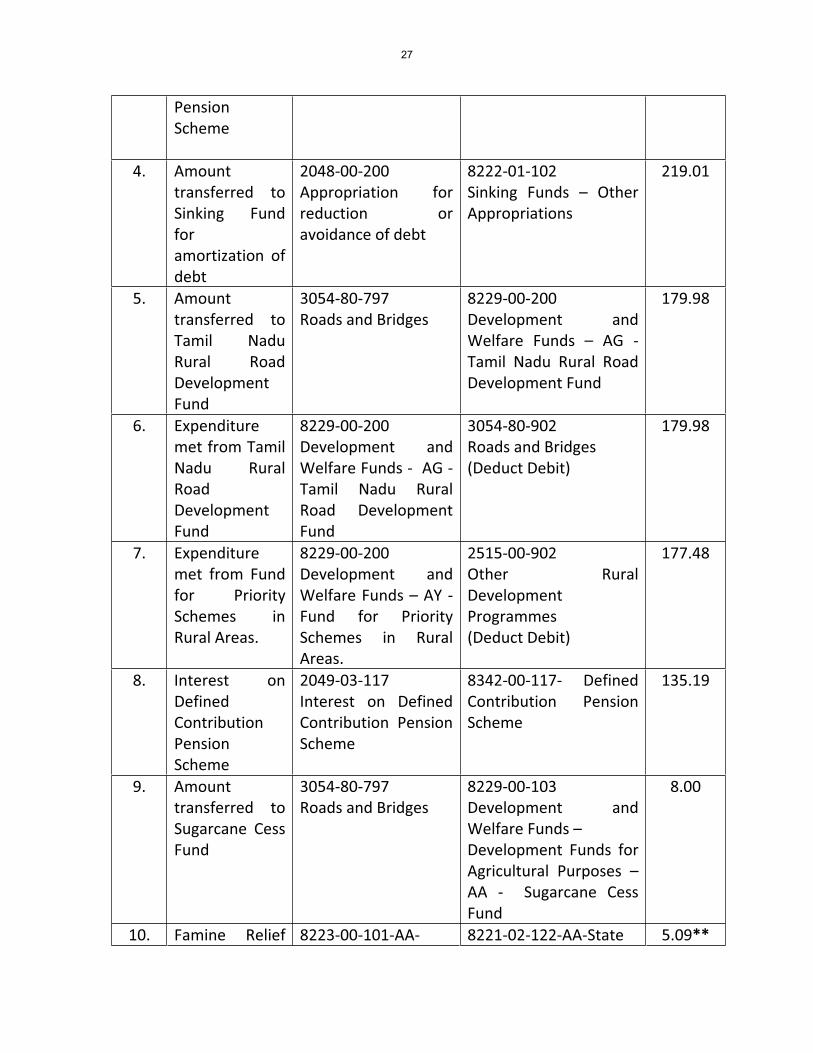
15. Book and Periodical Adjustments:
Certain transactions are in the nature of Book and Periodical adjustments and do not
represent actual cash transactions. Such adjustments are tabled below.
(i) Periodical adjustments:
Sl.No Periodical
Adjustments
Head of Account Amount
(In crore
of
Rupees)
From To
1. Expenditure
met from State
Disaster
Response Fund
8235 00 125
National Disaster
Response Fund
8121 00 122
General and Other
Reserve Funds
State Disaster
Response Fund
2245 80 902 Relief on
account of natural
calamities – Amount
met from National
Disaster Response Fund
(Deduct debit)
2245 05 901 Relief on
account of natural
calamities – Amount
met from State Disaster
Response Fund
(Deduct debit)
817.17
308.20
2. Adjustments of
Interest on
General
Provident Fund
2049 03 104
Interest on State
Provident Funds
8009 01 101(Civil)
8009 01 104(All India
Services Provident
Fund)
536.35
4.26
3. State
Government’s
contribution
towards
Defined
Contribution
2071 01 101 AM
Superannuation and
retirement
allowances
8342 00 117 Defined
Contribution Pension
Scheme
377.05
26
Pension
Scheme
4. Amount
transferred to
Sinking Fund
for
amortization of
debt
2048 00 200
Appropriation for
reduction or
avoidance of debt
8222 01 102
Sinking Funds – Other
Appropriations
219.01
5. Amount
transferred to
Tamil Nadu
Rural Road
Development
Fund
3054 80 797
Roads and Bridges
8229 00 200
Development and
Welfare Funds – AG
Tamil Nadu Rural Road
Development Fund
179.98
6. Expenditure
met from Tamil
Nadu Rural
Road
Development
Fund
8229 00 200
Development and
Welfare Funds AG
Tamil Nadu Rural
Road Development
Fund
3054 80 902
Roads and Bridges
(Deduct Debit)
179.98
7. Expenditure
met from Fund
for Priority
Schemes in
Rural Areas.
8229 00 200
Development and
Welfare Funds – AY
Fund for Priority
Schemes in Rural
Areas.
2515 00 902
Other Rural
Development
Programmes
(Deduct Debit)
177.48
8. Interest on
Defined
Contribution
Pension
Scheme
2049 03 117
Interest on Defined
Contribution Pension
Scheme
8342 00 117 Defined
Contribution Pension
Scheme
135.19
9. Amount
transferred to
Sugarcane Cess
Fund
3054 80 797
Roads and Bridges
8229 00 103
Development and
Welfare Funds –
Development Funds for
Agricultural Purposes –
AA Sugarcane Cess
Fund
8.00
10. Famine Relief 8223 00 101 AA 8221 02 122 AA State 5.09**
27
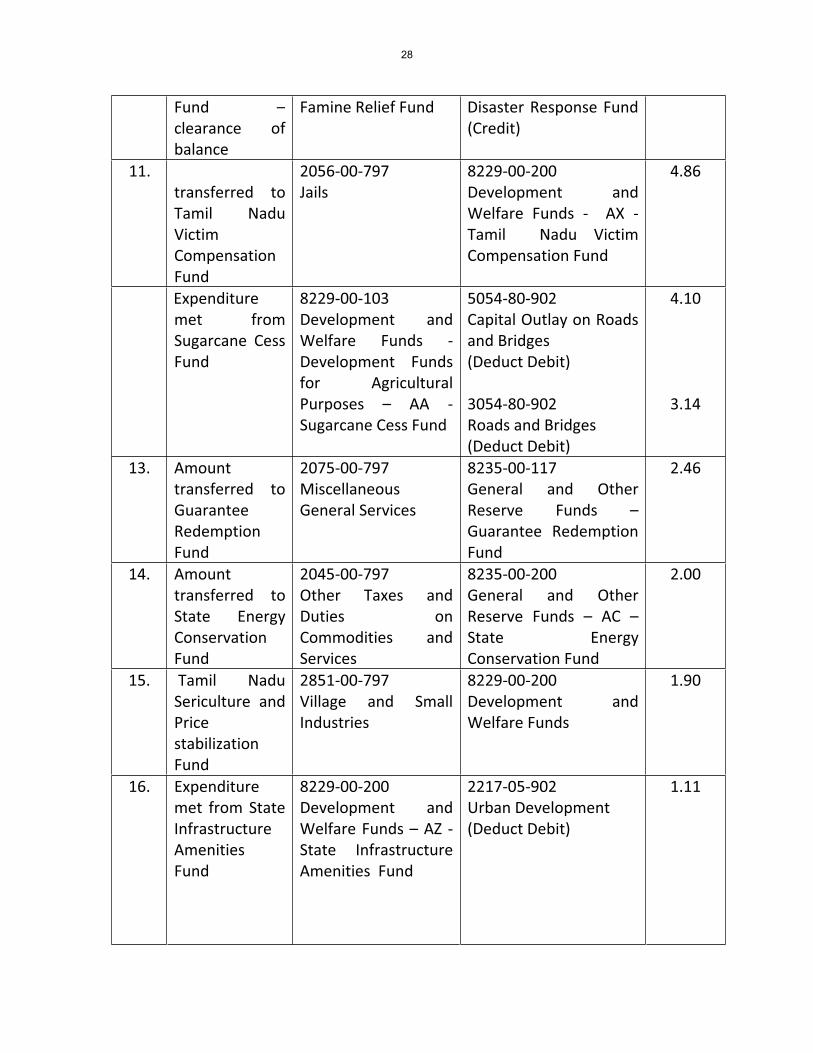
Fund –
clearance of
balance
Famine Relief Fund Disaster Response Fund
(Credit)
11.
transferred to
Tamil Nadu
Victim
Compensation
Fund
2056 00 797
Jails
8229 00 200
Development and
Welfare Funds AX
Tamil Nadu Victim
Compensation Fund
4.86
Expenditure
met from
Sugarcane Cess
Fund
8229 00 103
Development and
Welfare Funds
Development Funds
for Agricultural
Purposes – AA
Sugarcane Cess Fund
5054 80 902
Capital Outlay on Roads
and Bridges
(Deduct Debit)
3054 80 902
Roads and Bridges
(Deduct Debit)
4.10
3.14
13. Amount
transferred to
Guarantee
Redemption
Fund
2075 00 797
Miscellaneous
General Services
8235 00 117
General and Other
Reserve Funds –
Guarantee Redemption
Fund
2.46
14. Amount
transferred to
State Energy
Conservation
Fund
2045 00 797
Other Taxes and
Duties on
Commodities and
Services
8235 00 200
General and Other
Reserve Funds – AC –
State Energy
Conservation Fund
2.00
15. Tamil Nadu
Sericulture and
Price
stabilization
Fund
2851 00 797
Village and Small
Industries
8229 00 200
Development and
Welfare Funds
1.90
16. Expenditure
met from State
Infrastructure
Amenities
Fund
8229 00 200
Development and
Welfare Funds – AZ
State Infrastructure
Amenities Fund
2217 05 902
Urban Development
(Deduct Debit)
1.11
28
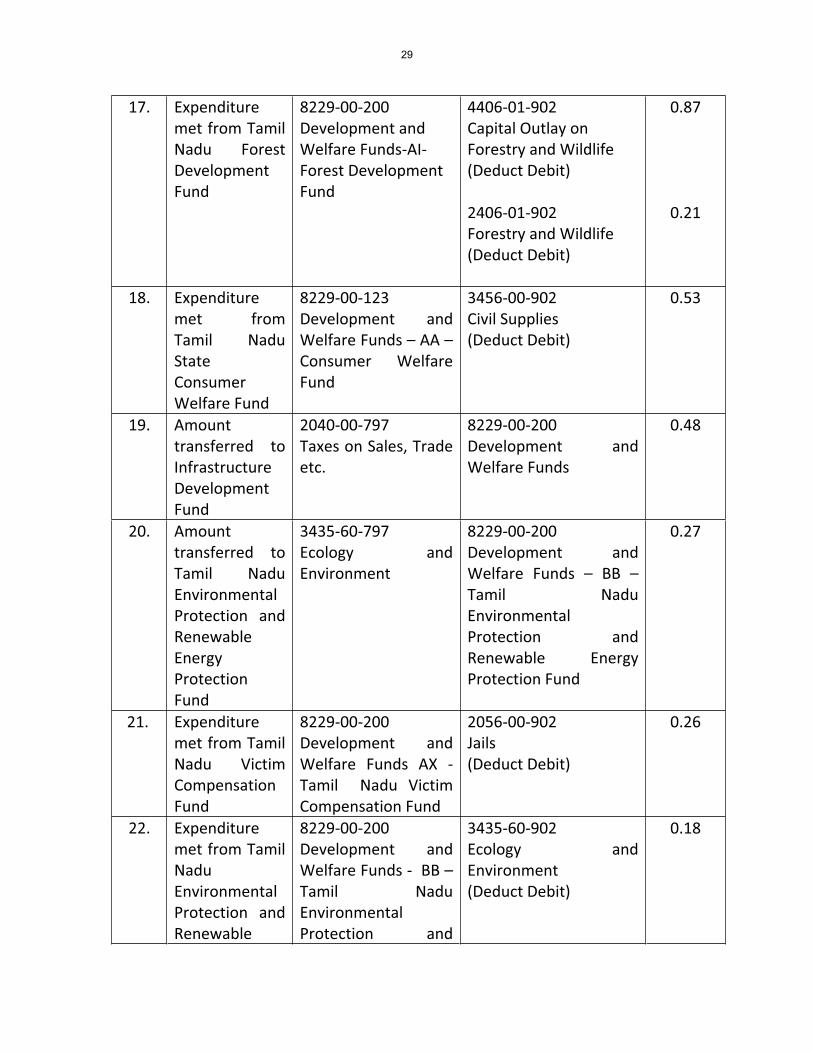
17. Expenditure
met from Tamil
Nadu Forest
Development
Fund
8229 00 200
Development and
Welfare Funds AI
Forest Development
Fund
4406 01 902
Capital Outlay on
Forestry and Wildlife
(Deduct Debit)
2406 01 902
Forestry and Wildlife
(Deduct Debit)
0.87
0.21
18. Expenditure
met from
Tamil Nadu
State
Consumer
Welfare Fund
8229 00 123
Development and
Welfare Funds – AA –
Consumer Welfare
Fund
3456 00 902
Civil Supplies
(Deduct Debit)
0.53
19. Amount
transferred to
Infrastructure
Development
Fund
2040 00 797
Taxes on Sales, Trade
etc.
8229 00 200
Development and
Welfare Funds
0.48
20. Amount
transferred to
Tamil Nadu
Environmental
Protection and
Renewable
Energy
Protection
Fund
3435 60 797
Ecology and
Environment
8229 00 200
Development and
Welfare Funds – BB –
Tamil Nadu
Environmental
Protection and
Renewable Energy
Protection Fund
0.27
21. Expenditure
met from Tamil
Nadu Victim
Compensation
Fund
8229 00 200
Development and
Welfare Funds AX
Tamil Nadu Victim
Compensation Fund
2056 00 902
Jails
(Deduct Debit)
0.26
22. Expenditure
met from Tamil
Nadu
Environmental
Protection and
Renewable
8229 00 200
Development and
Welfare Funds BB –
Tamil Nadu
Environmental
Protection and
3435 60 902
Ecology and
Environment
(Deduct Debit)
0.18
29
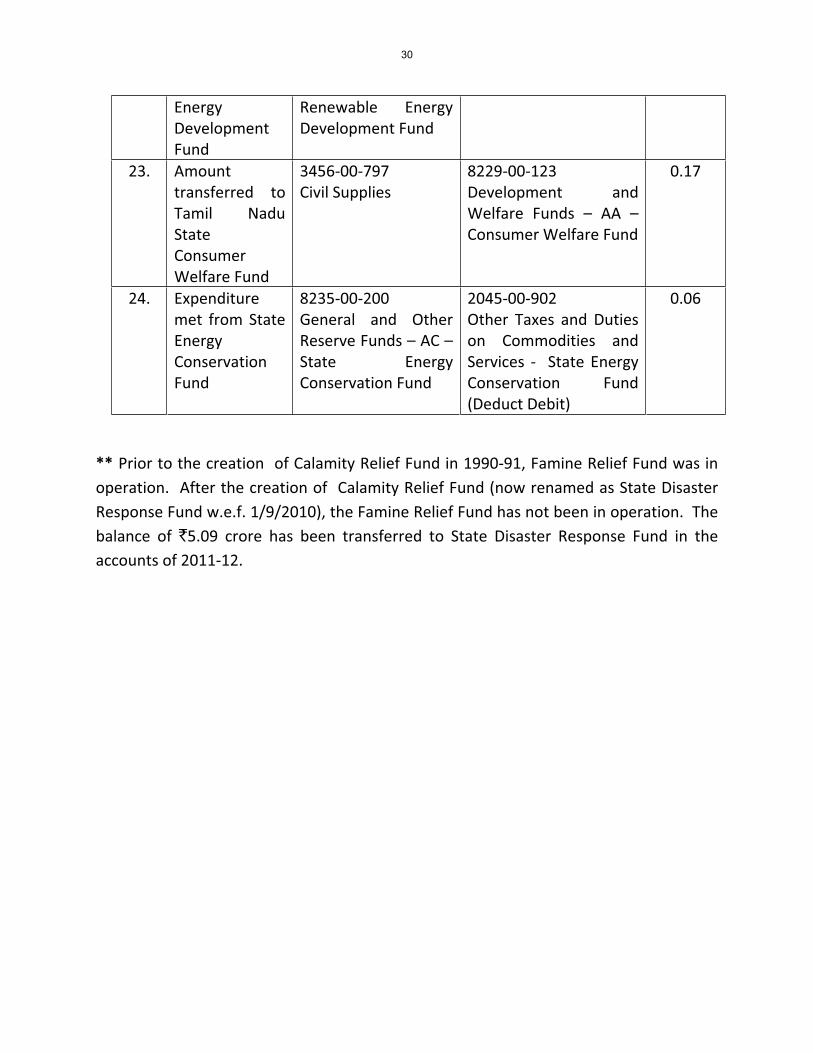
** Prior to the creation of Calamity Relief Fund in 1990 91, Famine Relief Fund was in
operation. After the creation of Calamity Relief Fund (now renamed as State Disaster
Response Fund w.e.f. 1/9/2010), the Famine Relief Fund has not been in operation. The
balance of `5.09 crore has been transferred to State Disaster Response Fund in the
accounts of 2011 12.
Energy
Development
Fund
Renewable Energy
Development Fund
23. Amount
transferred to
Tamil Nadu
State
Consumer
Welfare Fund
3456 00 797
Civil Supplies
8229 00 123
Development and
Welfare Funds – AA –
Consumer Welfare Fund
0.17
24. Expenditure
met from State
Energy
Conservation
Fund
8235 00 200
General and Other
Reserve Funds – AC –
State Energy
Conservation Fund
2045 00 902
Other Taxes and Duties
on Commodities and
Services State Energy
Conservation Fund
(Deduct Debit)
0.06
30
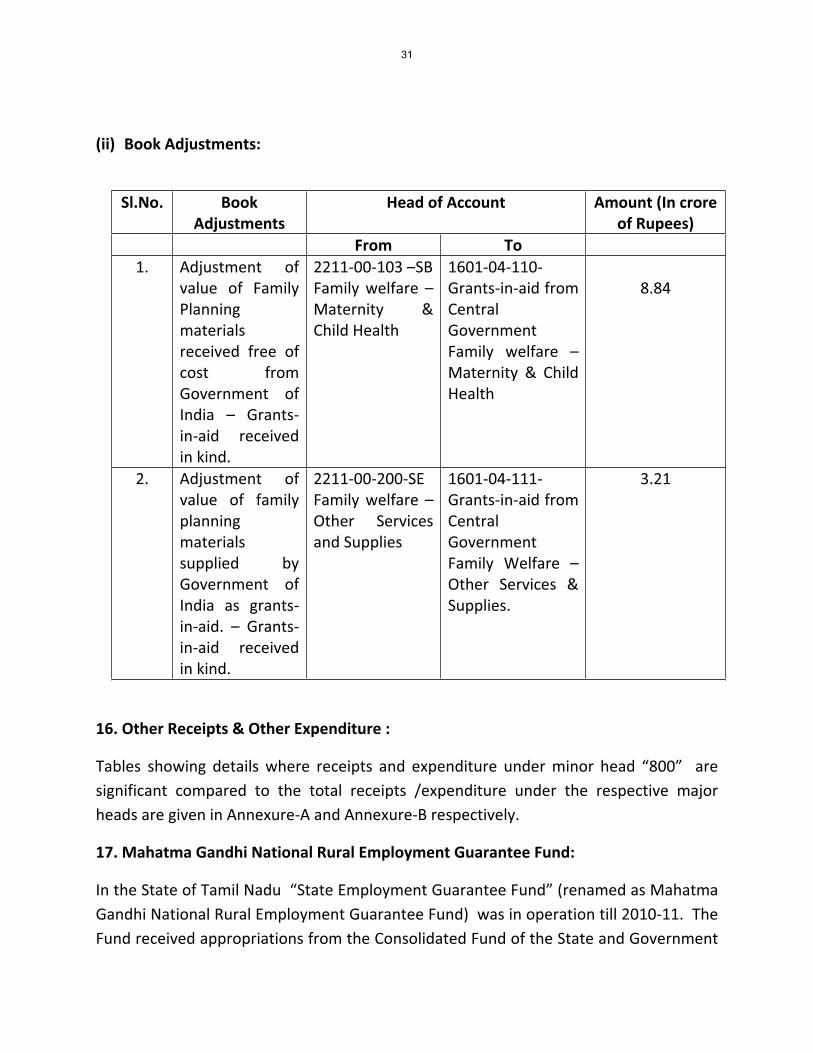
(ii) Book Adjustments:
16. Other Receipts & Other Expenditure :
Tables showing details where receipts and expenditure under minor head “800” are
significant compared to the total receipts /expenditure under the respective major
heads are given in Annexure A and Annexure B respectively.
17. Mahatma Gandhi National Rural Employment Guarantee Fund:
In the State of Tamil Nadu “State Employment Guarantee Fund” (renamed as Mahatma
Gandhi National Rural Employment Guarantee Fund) was in operation till 2010 11. The
Fund received appropriations from the Consolidated Fund of the State and Government
Sl.No. Book
Adjustments
Head of Account Amount (In crore
of Rupees)
From To
1. Adjustment of
value of Family
Planning
materials
received free of
cost from
Government of
India – Grants
in aid received
in kind.
2211 00 103 –SB
Family welfare –
Maternity &
Child Health
1601 04 110
Grants in aid from
Central
Government
Family welfare –
Maternity & Child
Health
8.84
2. Adjustment of
value of family
planning
materials
supplied by
Government of
India as grants
in aid. – Grants
in aid received
in kind.
2211 00 200 SE
Family welfare –
Other Services
and Supplies
1601 04 111
Grants in aid from
Central
Government
Family Welfare –
Other Services &
Supplies.
3.21
31
of India share was also contributed to the Fund. With effect from 2011 12, the
operations of the Fund went out of the purview of State Government control, the
management of the Fund being vested in a “Society” formed by the State Government
for the specific purpose of administering the Fund through a non lapsable account in
Nationalised Bank. Appropriations to the Fund by the State Government were stopped
during 2011 12.
18. Non accounting of Reserve Fund and non availability of provision of funds in the
Budget.
i. Tamil Nadu Victim Assistance Fund for differently abled persons:
The Fund has been constituted in 2010 11. No budget provision has been made in
2011 12 for contribution to the Fund and no expenditure has been incurred from the
Fund during the year.
ii Tamil Nadu State Renewal Fund:
No amount was appropriated to the Fund during 2011 12. However, an amount of
`1.04 crore was expended from the balance available in the Fund.
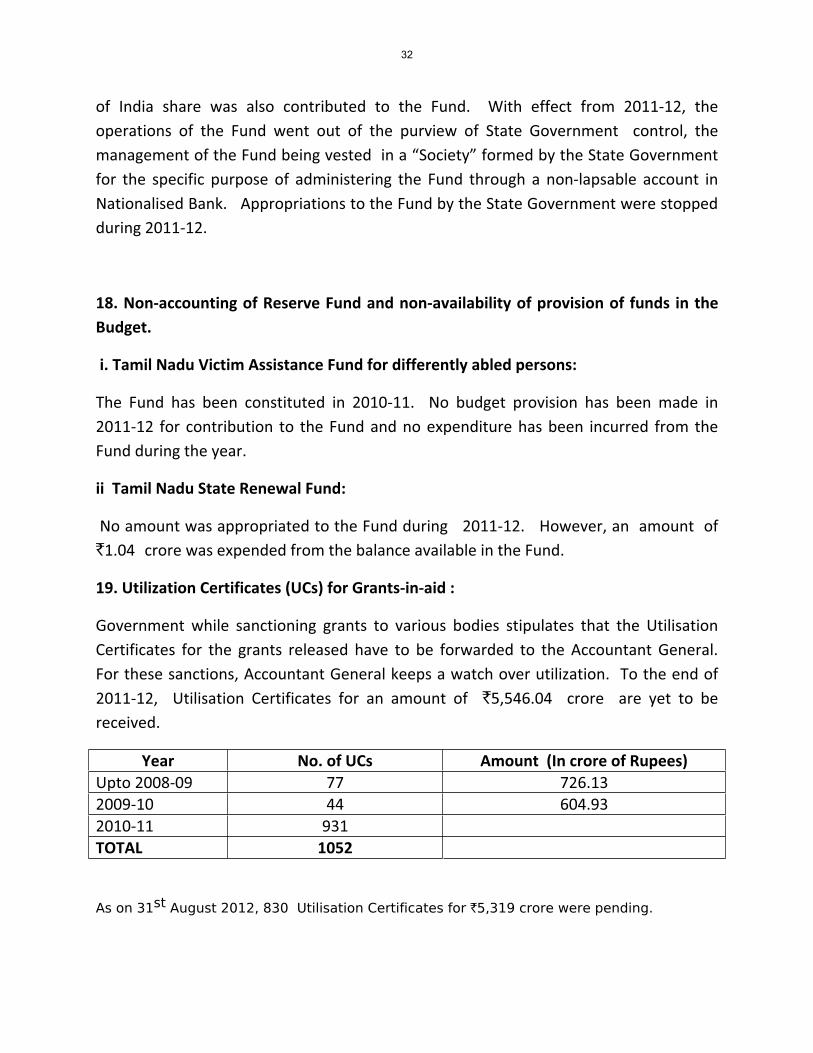
19. Utilization Certificates (UCs) for Grants in aid :
Government while sanctioning grants to various bodies stipulates that the Utilisation
Certificates for the grants released have to be forwarded to the Accountant General.
For these sanctions, Accountant General keeps a watch over utilization. To the end of
2011 12, Utilisation Certificates for an amount of `5,546.04 crore are yet to be
received.
Year No. of UCs Amount (In crore of Rupees)
Upto 2008 09 77 726.13
2009 10 44 604.93
2010 11 931
TOTAL 1052
As on 31st August 2012, 830 Utilisation Certificates for `5,319 crore were pending.
32
20. Contingency Fund:
An amount of `29.56 crore which remained unrecouped at the end of 31st
March 2011
was recouped during the current year 2011 12. No amount remains unrecouped to the
Fund as on 31st
March 2012.
21. Operation of Unauthorised heads :
The head of account 2216 – Housing and Urban Development – 01 Government
Residential Buildings – 106 – General Pool Accommodation has been deleted from List
of Major and Minor Heads of Account at minor head level and has been upgraded to
sub-major head level 06 General Pool Accommodation vide correction slip
No. 535 dated 30.12.04. However, Government of Tamil Nadu still continues to operate
the head at minor head level.
22. Financial Status:
The State economy registered a revenue surplus of `1364 crore against a budgeted
deficit estimate of `445 crore and fiscal deficit of `17275 crore as against the projected
deficit of `21629 crore as per State Government budget estimates and accounts
rendered by the accounts rendering units and compiled by Principal Accountant
General (Accounts & Entitlements).
23. Cash with Departmental Officers (Electronic Clearance System (ECS) payments
remaining undisbursed):
Payments made by Pay and Accounts Offices (PAOs), and Treasury Officers through ECS,
sometimes, remain undisbursed for the reasons such as incorrect account numbers. The
undisbursed ECS payments left with the banks are returned by them to the PAOs and
TOs through cheques which are kept outside Government accounts. During the year
2011 12, an amount of ` 3.55 crore remained undisbursed by 47 Sub Treasuries, 14
District Treasuries and 3 PAOs on account of ECS payments. The matter is under
correspondence with the Commissioner of Treasuries and Accounts for suitable
regularization of such transactions.
33
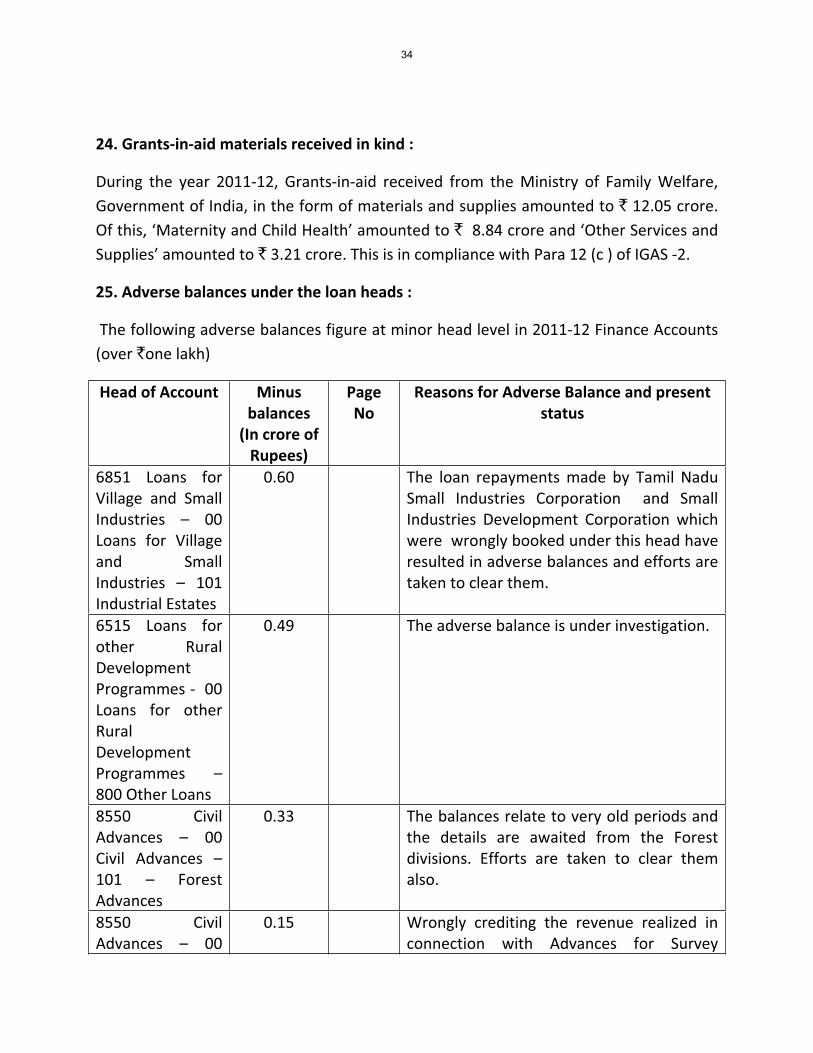
24. Grants in aid materials received in kind :
During the year 2011 12, Grants in aid received from the Ministry of Family Welfare,
Government of India, in the form of materials and supplies amounted to ` 12.05 crore.
Of this, ‘Maternity and Child Health’ amounted to ` 8.84 crore and ‘Other Services and
Supplies’ amounted to ` 3.21 crore. This is in compliance with Para 12 (c ) of IGAS 2.
25. Adverse balances under the loan heads :
The following adverse balances figure at minor head level in 2011 12 Finance Accounts
(over `one lakh)
Head of Account Minus
balances
(In crore of
Rupees)
Page
No
Reasons for Adverse Balance and present
status
6851 Loans for
Village and Small
Industries – 00
Loans for Village
and Small
Industries – 101
Industrial Estates
0.60 The loan repayments made by Tamil Nadu
Small Industries Corporation and Small
Industries Development Corporation which
were wrongly booked under this head have
resulted in adverse balances and efforts are
taken to clear them.
6515 Loans for
other Rural
Development
Programmes 00
Loans for other
Rural
Development
Programmes –
800 Other Loans
0.49 The adverse balance is under investigation.
8550 Civil
Advances – 00
Civil Advances –
101 – Forest
Advances
0.33 The balances relate to very old periods and
the details are awaited from the Forest
divisions. Efforts are taken to clear them
also.
8550 Civil
Advances – 00
0.15 Wrongly crediting the revenue realized in
connection with Advances for Survey
34
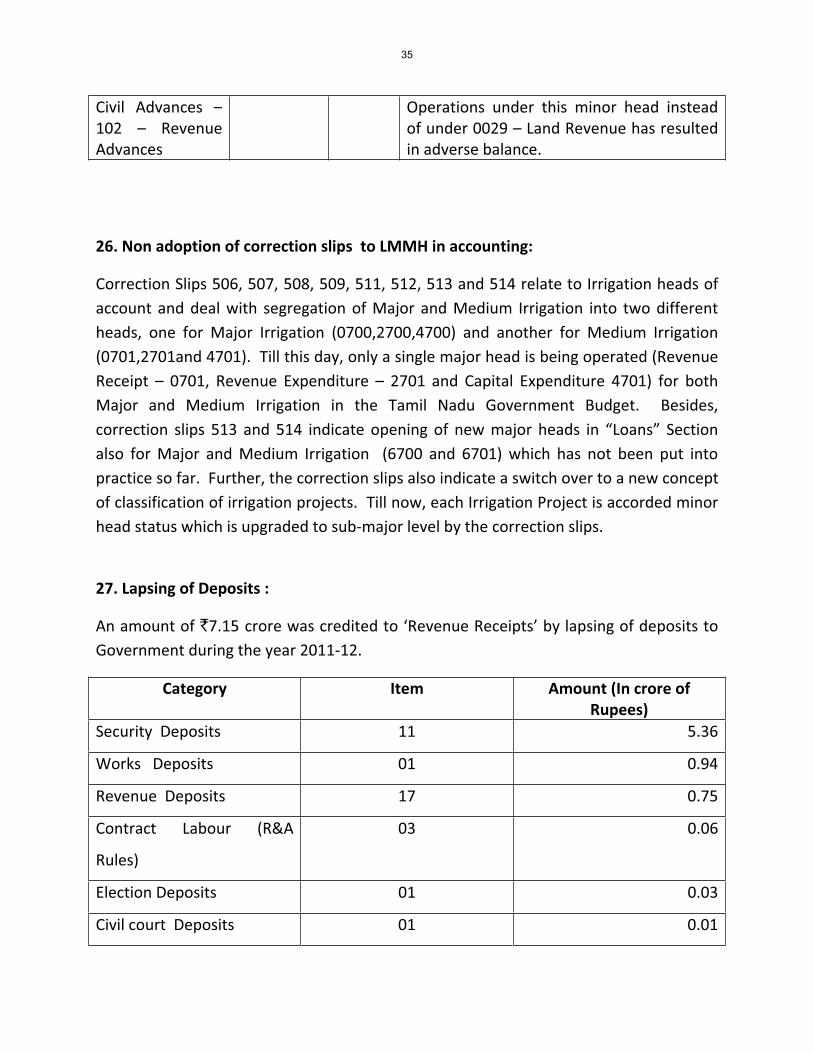
Civil Advances –
102 – Revenue
Advances
Operations under this minor head instead
of under 0029 – Land Revenue has resulted
in adverse balance.
26. Non adoption of correction slips to LMMH in accounting:
Correction Slips 506, 507, 508, 509, 511, 512, 513 and 514 relate to Irrigation heads of
account and deal with segregation of Major and Medium Irrigation into two different
heads, one for Major Irrigation (0700,2700,4700) and another for Medium Irrigation
(0701,2701and 4701). Till this day, only a single major head is being operated (Revenue
Receipt – 0701, Revenue Expenditure – 2701 and Capital Expenditure 4701) for both
Major and Medium Irrigation in the Tamil Nadu Government Budget. Besides,
correction slips 513 and 514 indicate opening of new major heads in “Loans” Section
also for Major and Medium Irrigation (6700 and 6701) which has not been put into
practice so far. Further, the correction slips also indicate a switch over to a new concept
of classification of irrigation projects. Till now, each Irrigation Project is accorded minor
head status which is upgraded to sub major level by the correction slips.
27. Lapsing of Deposits :
An amount of `7.15 crore was credited to ‘Revenue Receipts’ by lapsing of deposits to
Government during the year 2011 12.
Category Item Amount (In crore of
Rupees)
Security Deposits 11 5.36
Works Deposits 01 0.94
Revenue Deposits 17 0.75
Contract Labour (R&A
Rules)
03 0.06
Election Deposits 01 0.03
Civil court Deposits 01 0.01
35
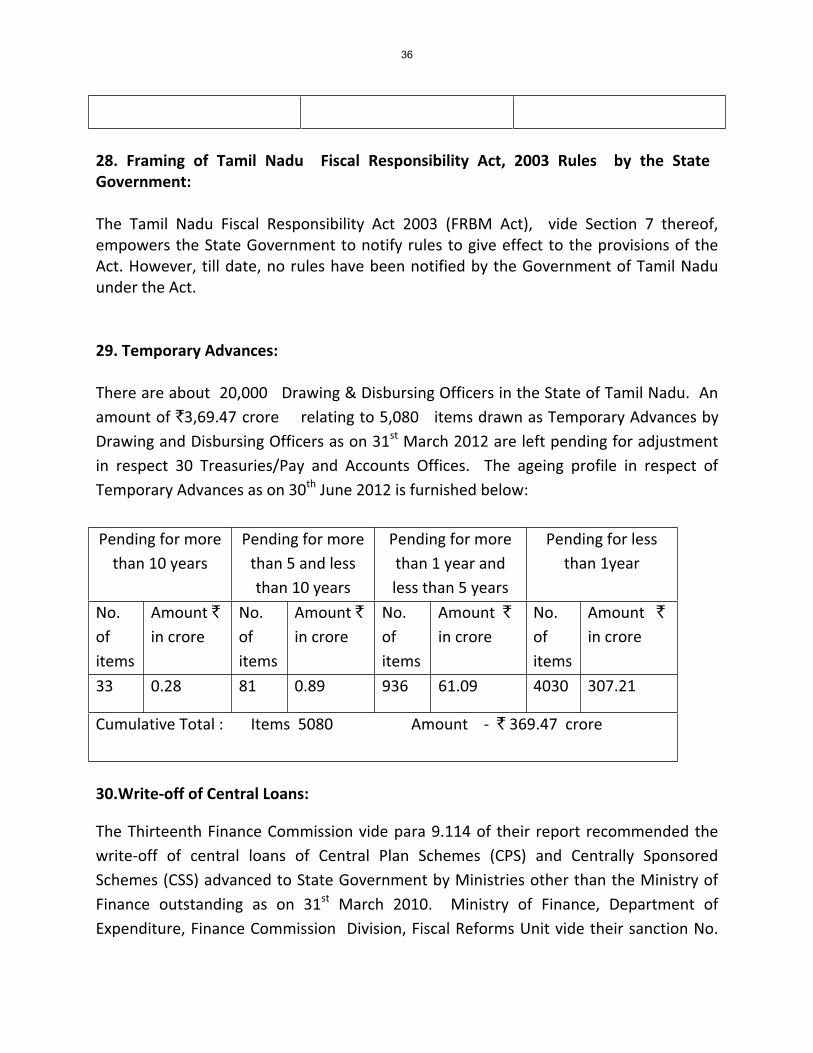
28. Framing of Tamil Nadu Fiscal Responsibility Act, 2003 Rules by the State
Government:
The Tamil Nadu Fiscal Responsibility Act 2003 (FRBM Act), vide Section 7 thereof,
empowers the State Government to notify rules to give effect to the provisions of the
Act. However, till date, no rules have been notified by the Government of Tamil Nadu
under the Act.
29. Temporary Advances:
There are about 20,000 Drawing & Disbursing Officers in the State of Tamil Nadu. An
amount of `3,69.47 crore relating to 5,080 items drawn as Temporary Advances by
Drawing and Disbursing Officers as on 31st
March 2012 are left pending for adjustment
in respect 30 Treasuries/Pay and Accounts Offices. The ageing profile in respect of
Temporary Advances as on 30th
June 2012 is furnished below:
Pending for more
than 10 years
Pending for more
than 5 and less
than 10 years
Pending for more
than 1 year and
less than 5 years
Pending for less
than 1year
No.
of
items
Amount `
in crore
No.
of
items
Amount `
in crore
No.
of
items
Amount `
in crore
No.
of
items
Amount `
in crore
33 0.28 81 0.89 936 61.09 4030 307.21
Cumulative Total : Items 5080 Amount ` 369.47 crore
30.Write off of Central Loans:
The Thirteenth Finance Commission vide para 9.114 of their report recommended the
write off of central loans of Central Plan Schemes (CPS) and Centrally Sponsored
Schemes (CSS) advanced to State Government by Ministries other than the Ministry of
Finance outstanding as on 31st
March 2010. Ministry of Finance, Department of
Expenditure, Finance Commission Division, Fiscal Reforms Unit vide their sanction No.
36
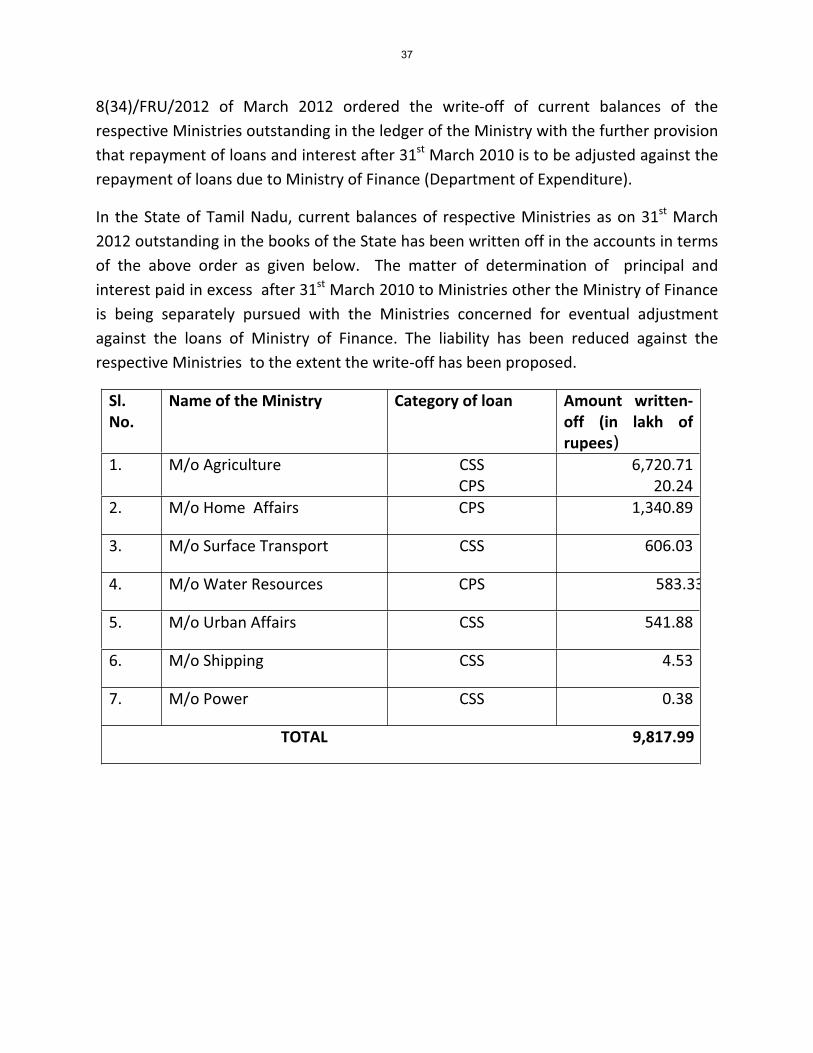
8(34)/FRU/2012 of March 2012 ordered the write off of current balances of the
respective Ministries outstanding in the ledger of the Ministry with the further provision
that repayment of loans and interest after 31st
March 2010 is to be adjusted against the
repayment of loans due to Ministry of Finance (Department of Expenditure).
In the State of Tamil Nadu, current balances of respective Ministries as on 31st
March
2012 outstanding in the books of the State has been written off in the accounts in terms
of the above order as given below. The matter of determination of principal and
interest paid in excess after 31st
March 2010 to Ministries other the Ministry of Finance
is being separately pursued with the Ministries concerned for eventual adjustment
against the loans of Ministry of Finance. The liability has been reduced against the
respective Ministries to the extent the write off has been proposed.
Sl.
No.
Name of the Ministry Category of loan Amount written
off (in lakh of
rupees)
1. M/o Agriculture CSS
CPS
6,720.71
20.24
2. M/o Home Affairs CPS 1,340.89
3. M/o Surface Transport CSS 606.03
4. M/o Water Resources CPS 583.33
5. M/o Urban Affairs CSS 541.88
6. M/o Shipping CSS 4.53
7. M/o Power CSS 0.38
TOTAL 9,817.99
37
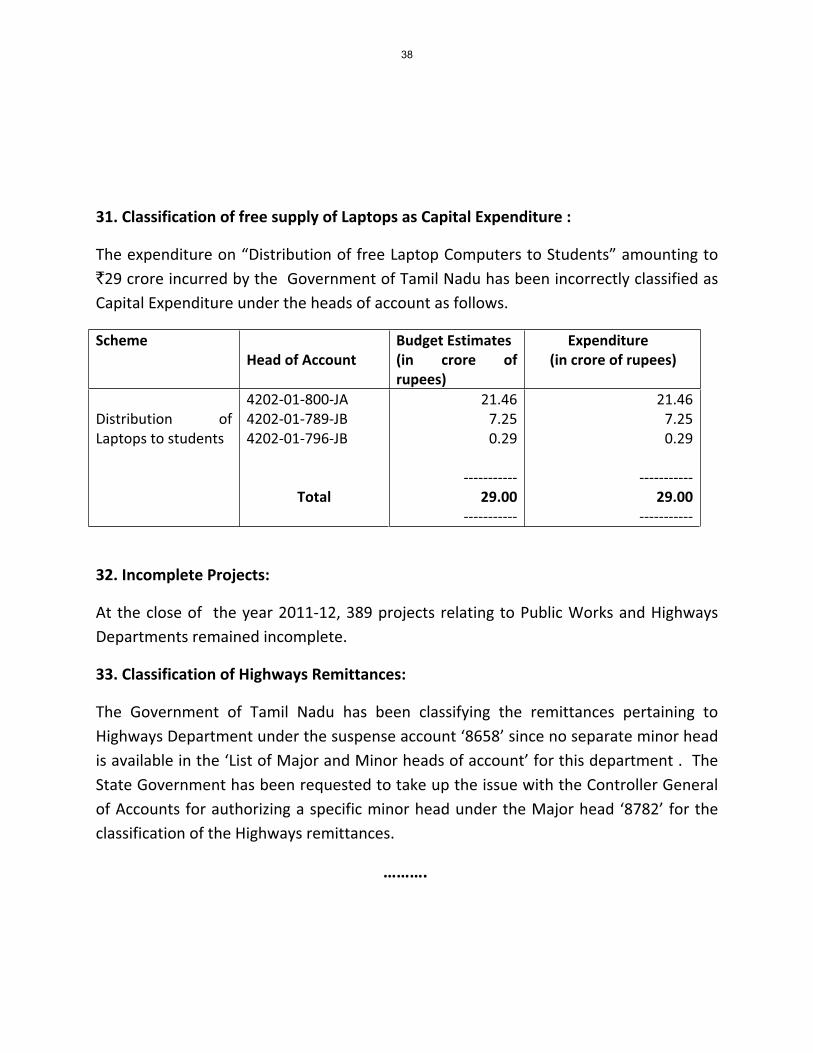
31. Classification of free supply of Laptops as Capital Expenditure :
The expenditure on “Distribution of free Laptop Computers to Students” amounting to
`29 crore incurred by the Government of Tamil Nadu has been incorrectly classified as
Capital Expenditure under the heads of account as follows.
Scheme
Head of Account
Budget Estimates
(in crore of
rupees)
Expenditure
(in crore of rupees)
Distribution of
Laptops to students
4202 01 800 JA
4202 01 789 JB
4202 01 796 JB
Total
21.46
7.25
0.29
29.00
21.46
7.25
0.29
29.00
32. Incomplete Projects:
At the close of the year 2011 12, 389 projects relating to Public Works and Highways
Departments remained incomplete.
33. Classification of Highways Remittances:
The Government of Tamil Nadu has been classifying the remittances pertaining to
Highways Department under the suspense account ‘8658’ since no separate minor head
is available in the ‘List of Major and Minor heads of account’ for this department . The
State Government has been requested to take up the issue with the Controller General
of Accounts for authorizing a specific minor head under the Major head ‘8782’ for the
classification of the Highways remittances.
……….
38
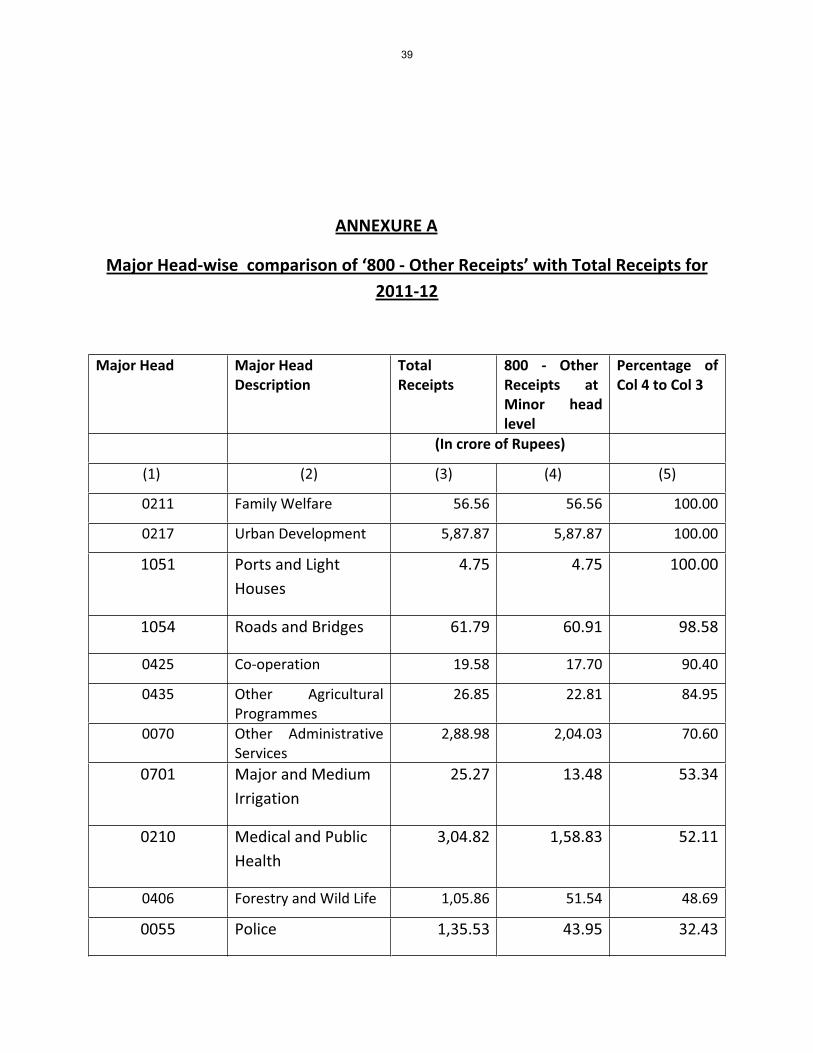
ANNEXURE A
Major Head wise comparison of ‘800 Other Receipts’ with Total Receipts for
2011 12
Major Head Major Head
Description
Total
Receipts
800 Other
Receipts at
Minor head
level
Percentage of
Col 4 to Col 3
(In crore of Rupees)
(1) (2) (3) (4) (5)
0211 Family Welfare 56.56 56.56 100.00
0217 Urban Development 5,87.87 5,87.87 100.00
1051 Ports and Light
Houses
4.75 4.75 100.00
1054 Roads and Bridges 61.79 60.91 98.58
0425 Co operation 19.58 17.70 90.40
0435 Other Agricultural
Programmes
26.85 22.81 84.95
0070 Other Administrative
Services
2,88.98 2,04.03 70.60
0701 Major and Medium
Irrigation
25.27 13.48 53.34
0210 Medical and Public
Health
3,04.82 1,58.83 52.11
0406 Forestry and Wild Life 1,05.86 51.54 48.69
0055 Police 1,35.53 43.95 32.43
39
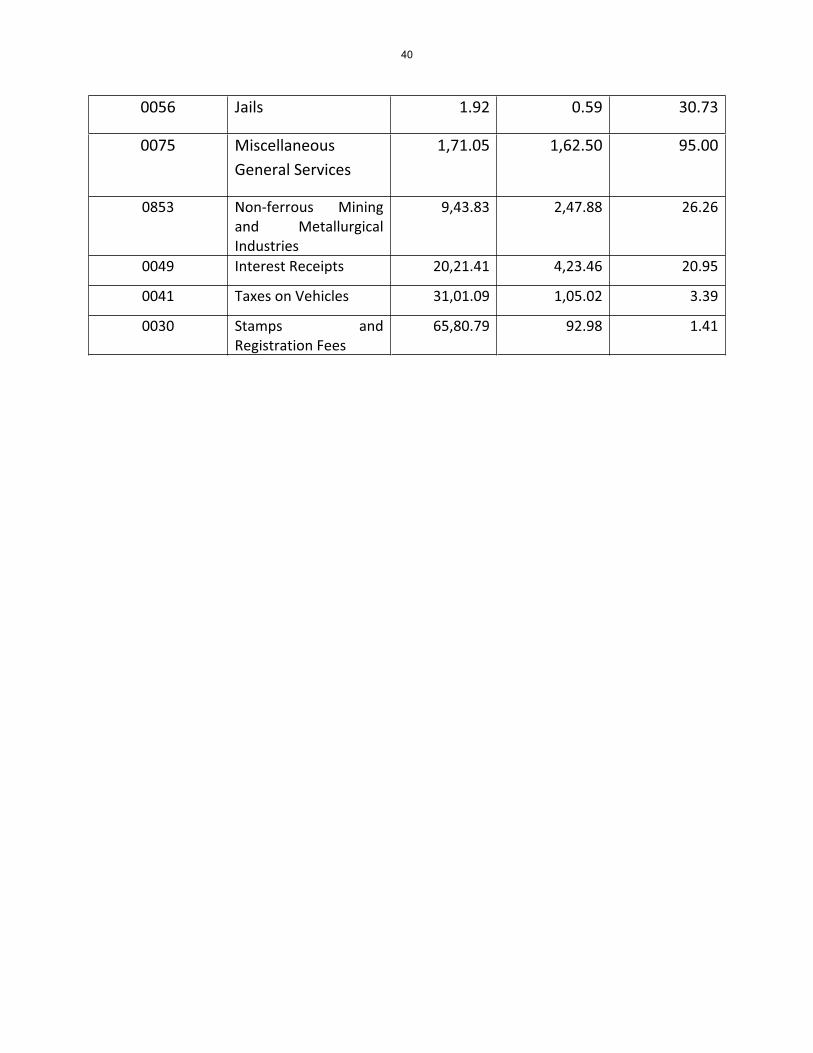
0056 Jails 1.92 0.59 30.73
0075 Miscellaneous
General Services
1,71.05 1,62.50 95.00
0853 Non ferrous Mining
and Metallurgical
Industries
9,43.83 2,47.88 26.26
0049 Interest Receipts 20,21.41 4,23.46 20.95
0041 Taxes on Vehicles 31,01.09 1,05.02 3.39
0030 Stamps and
Registration Fees
65,80.79 92.98 1.41
40
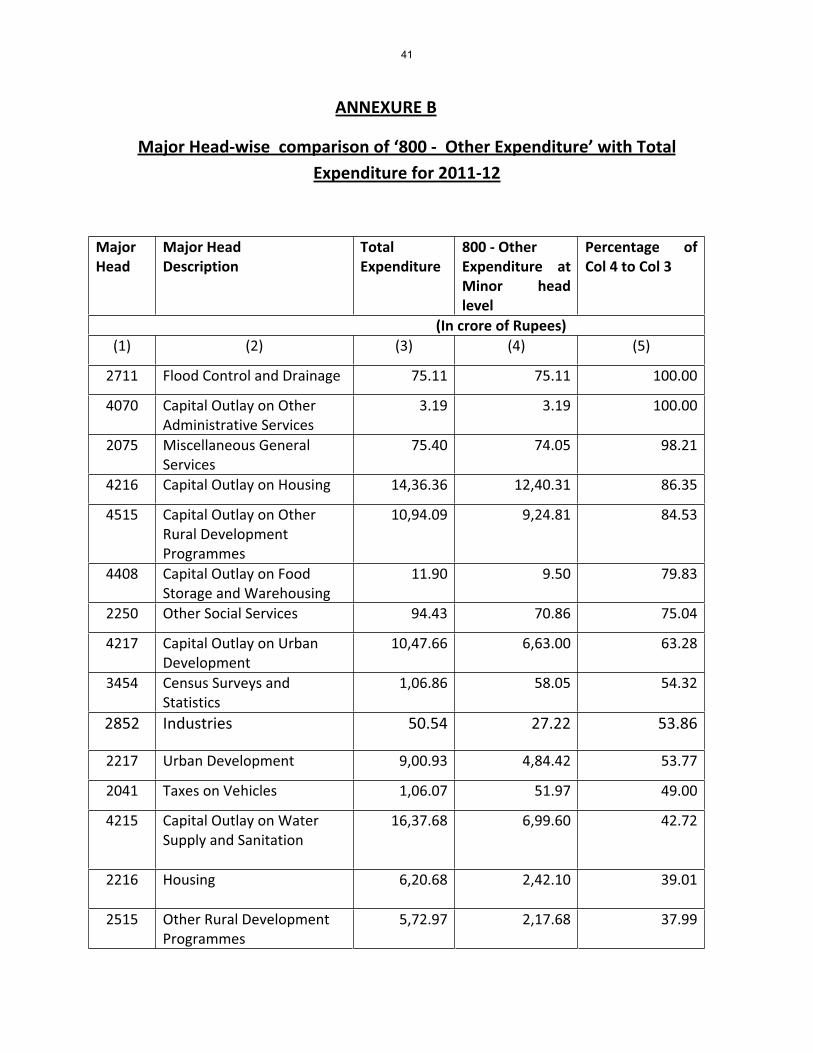
ANNEXURE B
Major Head wise comparison of ‘800 Other Expenditure’ with Total
Expenditure for 2011 12
Major
Head
Major Head
Description
Total
Expenditure
800 Other
Expenditure at
Minor head
level
Percentage of
Col 4 to Col 3
(In crore of Rupees)
(1) (2) (3) (4) (5)
2711 Flood Control and Drainage 75.11 75.11 100.00
4070 Capital Outlay on Other
Administrative Services
3.19 3.19 100.00
2075 Miscellaneous General
Services
75.40 74.05 98.21
4216 Capital Outlay on Housing 14,36.36 12,40.31 86.35
4515 Capital Outlay on Other
Rural Development
Programmes
10,94.09 9,24.81 84.53
4408 Capital Outlay on Food
Storage and Warehousing
11.90 9.50 79.83
2250 Other Social Services 94.43 70.86 75.04
4217 Capital Outlay on Urban
Development
10,47.66 6,63.00 63.28
3454 Census Surveys and
Statistics
1,06.86 58.05 54.32
2852 Industries 50.54 27.22 53.86
2217 Urban Development 9,00.93 4,84.42 53.77
2041 Taxes on Vehicles 1,06.07 51.97 49.00
4215 Capital Outlay on Water
Supply and Sanitation
16,37.68 6,99.60 42.72
2216 Housing 6,20.68 2,42.10 39.01
2515 Other Rural Development
Programmes
5,72.97 2,17.68 37.99
41
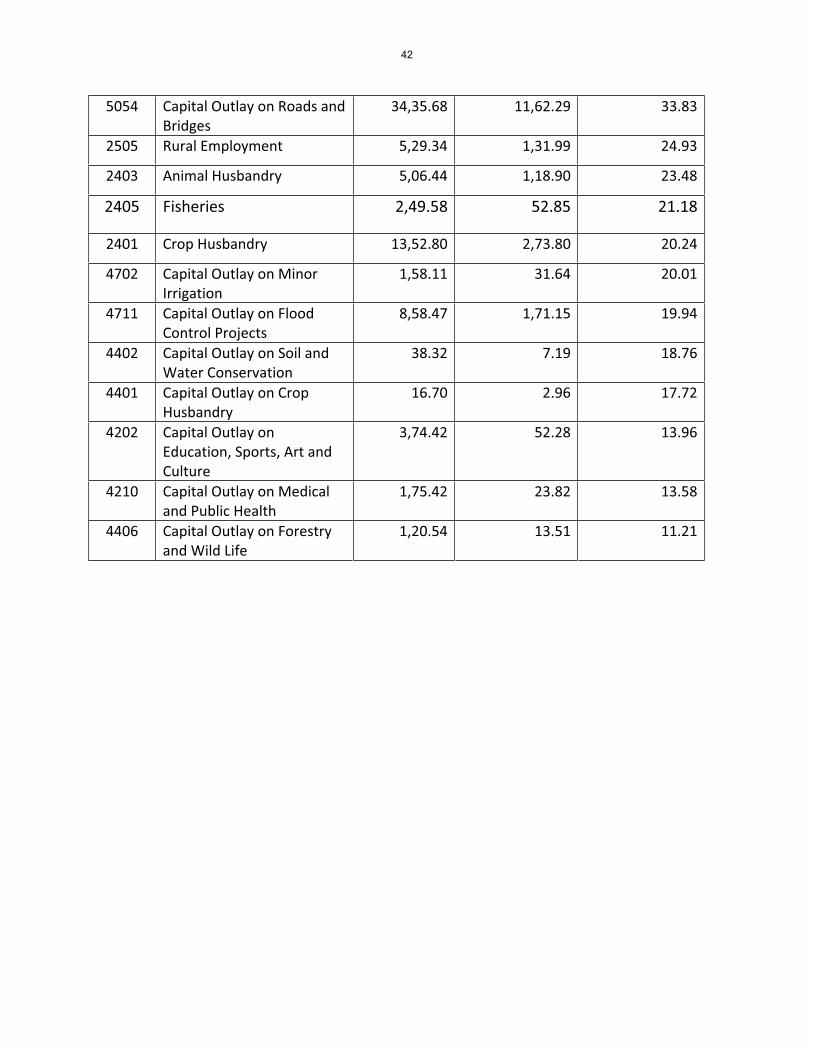
5054 Capital Outlay on Roads and
Bridges
34,35.68 11,62.29 33.83
2505 Rural Employment 5,29.34 1,31.99 24.93
2403 Animal Husbandry 5,06.44 1,18.90 23.48
2405 Fisheries 2,49.58 52.85 21.18
2401 Crop Husbandry 13,52.80 2,73.80 20.24
4702 Capital Outlay on Minor
Irrigation
1,58.11 31.64 20.01
4711 Capital Outlay on Flood
Control Projects
8,58.47 1,71.15 19.94
4402 Capital Outlay on Soil and
Water Conservation
38.32 7.19 18.76
4401 Capital Outlay on Crop
Husbandry
16.70 2.96 17.72
4202 Capital Outlay on
Education, Sports, Art and
Culture
3,74.42 52.28 13.96
4210 Capital Outlay on Medical
and Public Health
1,75.42 23.82 13.58
4406 Capital Outlay on Forestry
and Wild Life
1,20.54 13.51 11.21
42
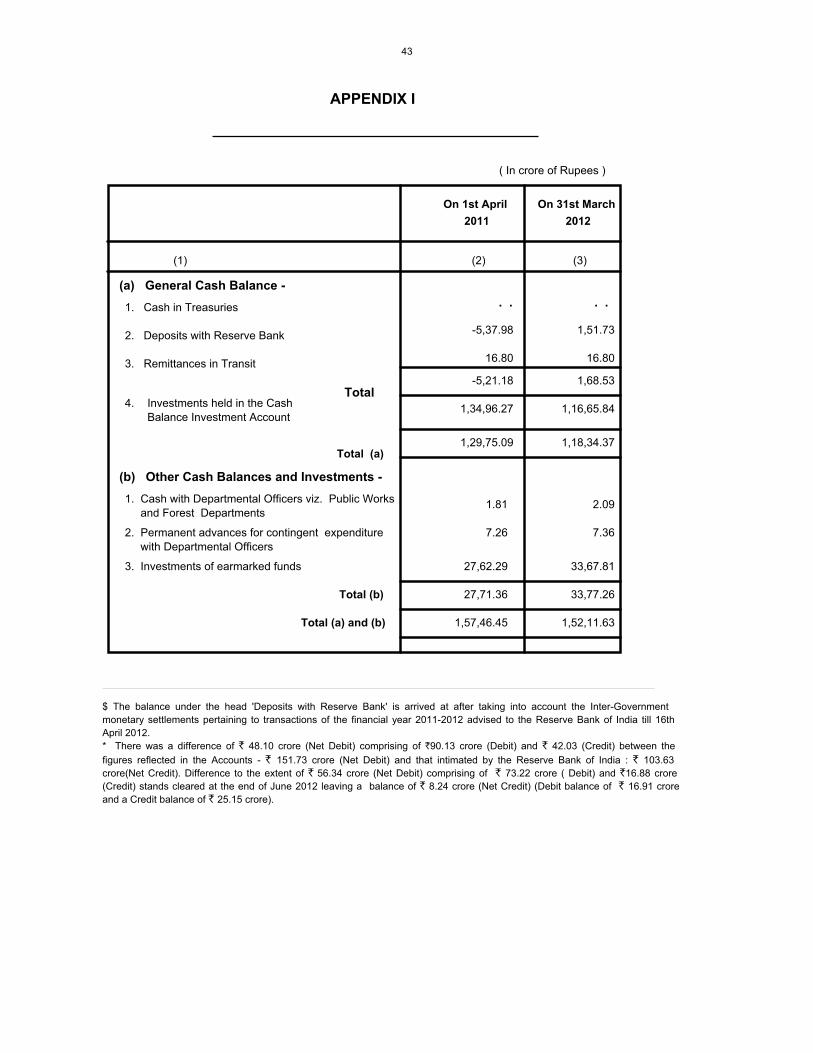
APPENDIX I
(1)
On 1st April On 31st March
(2) (3)
( In crore of Rupees )
(a) General Cash Balance -
1. Cash in Treasuries
2. Deposits with Reserve Bank
3. Remittances in Transit
TotalInvestments held in the Cash
Balance Investment Account
4.
Total (a)
-5,37.98 1,51.73
16.8016.80
-5,21.18 1,68.53
1,34,96.27 1,16,65.84
1,29,75.09 1,18,34.37
2011 2012
(b) Other Cash Balances and Investments -
1. Cash with Departmental Officers viz. Public Works
and Forest Departments
2. Permanent advances for contingent expenditure
with Departmental Officers
3. Investments of earmarked funds
Total (b)
Total (a) and (b)
1.81 2.09
7.26 7.36
27,62.29 33,67.81
27,71.36 33,77.26
1,57,46.45 1,52,11.63
$ The balance under the head 'Deposits with Reserve Bank' is arrived at after taking into account the Inter-Government
monetary settlements pertaining to transactions of the financial year 2011-2012 advised to the Reserve Bank of India till 16th
April 2012.
* There was a difference of ` 48.10 crore (Net Debit) comprising of `90.13 crore (Debit) and ` 42.03 (Credit) between the
figures reflected in the Accounts - ` 151.73 crore (Net Debit) and that intimated by the Reserve Bank of India : ` 103.63
crore(Net Credit). Difference to the extent of ` 56.34 crore (Net Debit) comprising of ` 73.22 crore ( Debit) and `16.88 crore
(Credit) stands cleared at the end of June 2012 leaving a balance of ` 8.24 crore (Net Credit) (Debit balance of ` 16.91 crore
and a Credit balance of ` 25.15 crore).
. .. .
43
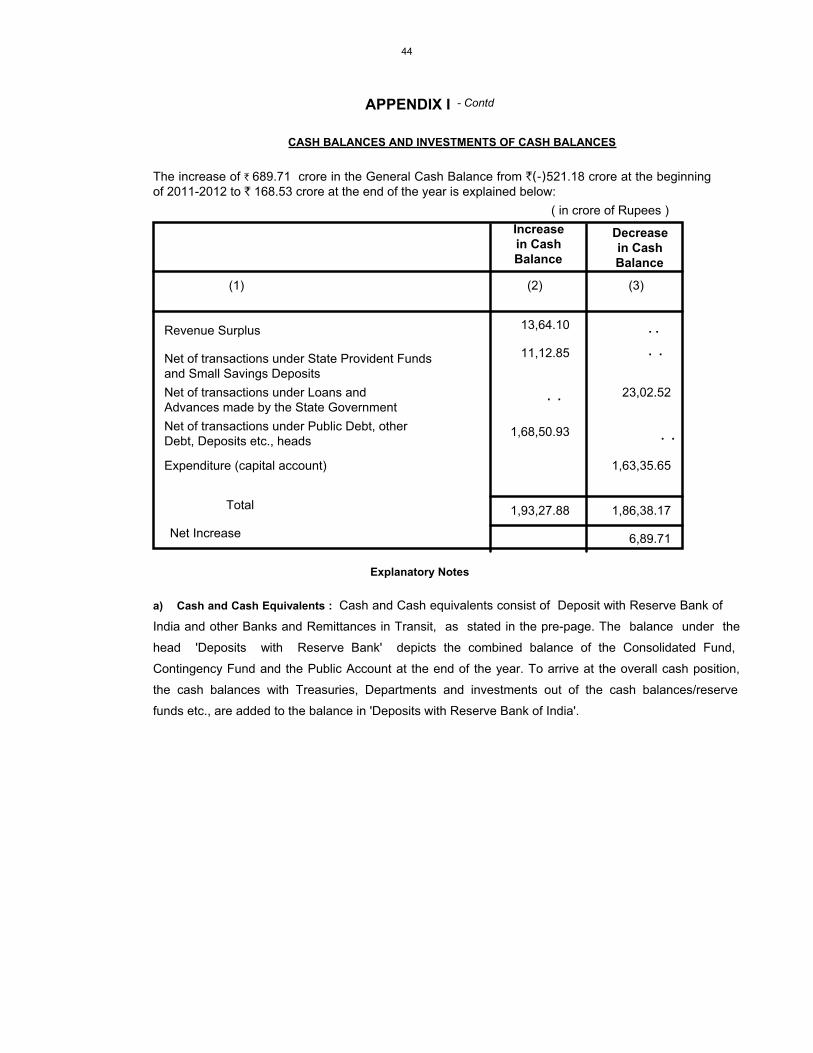
CASH BALANCES AND INVESTMENTS OF CASH BALANCES
The increase of ` 689.71 crore in the General Cash Balance from `(-)521.18 crore at the beginningof 2011-2012 to ` 168.53 crore at the end of the year is explained below:
Increase
in Cash
Balance
Decrease
in Cash
Balance
(1) (2) (3)
( in crore of Rupees )
Revenue Surplus
Net of transactions under State Provident Fundsand Small Savings Deposits
Net of transactions under Loans andAdvances made by the State Government
Net of transactions under Public Debt, otherDebt, Deposits etc., heads
Expenditure (capital account)
Total
Net Increase
13,64.10
11,12.85
23,02.52
1,68,50.93
1,63,35.65
1,93,27.88 1,86,38.17
6,89.71
Explanatory Notes
a) Cash and Cash Equivalents : Cash and Cash equivalents consist of Deposit with Reserve Bank of
India and other Banks and Remittances in Transit, as stated in the pre-page. The balance under the
head 'Deposits with Reserve Bank' depicts the combined balance of the Consolidated Fund,
Contingency Fund and the Public Account at the end of the year. To arrive at the overall cash position,
the cash balances with Treasuries, Departments and investments out of the cash balances/reserve
funds etc., are added to the balance in 'Deposits with Reserve Bank of India'.
APPENDIX I - Contd
. .
. .
. .
. .
44
CASH BALANCES AND INVESTMENTS OF CASH BALANCES
(b) Daily Cash balance : Under an agreement with the Reserve Bank of India,
the State Government has to maintain a minimum cash balance of ` 3.25 crore
with the Bank. If the balance falls below the agreed minimum on any day, the
deficiency is made good by taking Ordinary and Special Ways and Means
Advances/Overdrafts from time to time.
For arriving at the daily cash balance for the purpose of grant of Ways and
Means Advances/Overdraft, the Reserve Bank of India evaluates the holdings of
the 14 day Treasury Bills along with the transactions reported (at Reserve bank
of India counters, Inter Government transactions and Treasury transactions
reported by the agency banks) for the day. To the cash balance so arrived, the
maturity of 14 day Treasury Bills if any, is added and excess balance, if any,
after maintaining the minimum cash balance is reinvested in Treasury Bills. If the
net cash balance arrived at results in less than the minimum cash balance or a
credit balance and if there are no 14 day Treasury Bills maturing on that day,
Reserve Bank of India rediscounts the holdings of the 14 day Treasury bills and
makes good the shortfall. If there is no holding of 14 day Treasury Bills on the
day, the State Government applies for Ways and Means Advances/Special Ways
and Means Advances/Overdraft.
(c) The limit for Ordinary Ways and Means Advances to the State
Government was ` 730 crore with effect from 1st April 2011 . The
Reserve Bank of India has also agreed to give Special Ways and Means
Advances against the pledge of Government Securities. The limit of Special ways
and Means Advances is revised by the Bank from time to time.
No Ways and Means Advances were obtained during the year.
@ The cash balance ('Deposits with Reserve Bank of India') above is the closing cash balance of the year as on 31st
March but worked out by 16th April and not simply the daily balance on 31st March.
APPENDIX I - Contd
45
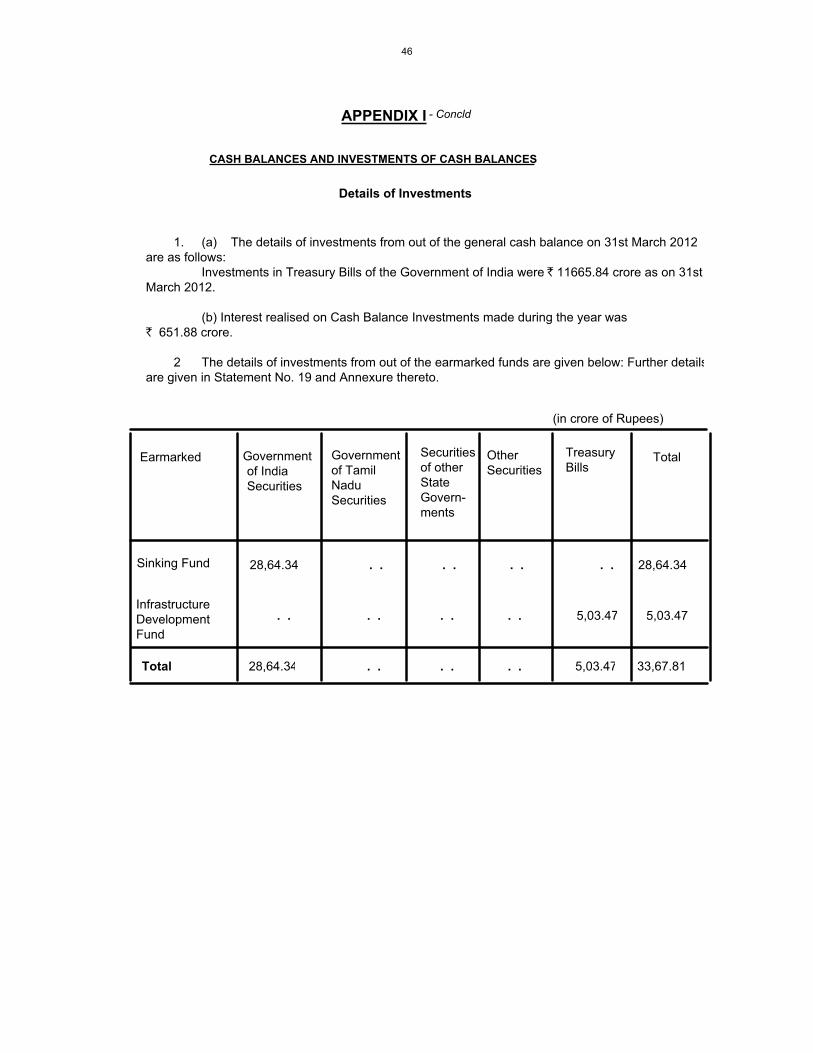
1. (a) The details of investments from out of the general cash balance on 31st March 2012are as follows: Investments in Treasury Bills of the Government of India were ̀ 11665.84 crore as on 31stMarch 2012.
(b) Interest realised on Cash Balance Investments made during the year was` 651.88 crore.
2 The details of investments from out of the earmarked funds are given below: Further detailsare given in Statement No. 19 and Annexure thereto.
Earmarked Governmentof IndiaSecurities
Governmentof TamilNaduSecurities
Securitiesof otherStateGovern-ments
OtherSecurities
TreasuryBills
Total
Sinking Fund
CASH BALANCES AND INVESTMENTS OF CASH BALANCES
28,64.34 28,64.34. . . . . . . .
Details of Investments
APPENDIX I
(in crore of Rupees)
InfrastructureDevelopmentFund
. . . . . .. . 5,03.47 5,03.47
Total 28,64.34 . . . . . . 5,03.47 33,67.81
- Concld
46
GOVERNMENT OF TAMILNADU
2011-2012
FINANCE ACCOUNTS
VOLUME 2
Volume 1
Volume 2
Part I - Summarised Statements
Part II - Detailed Statements
B
B
D
D
D
D
E
E
E
E
F
F
F
F
F
F
G
G
G
G
G
G
1
2
3
4
5
6
7
8
9
10
11
12
13
14
15
16
Certificate of the Comptroller and Auditor General of India
Guide to Finance Accounts
Statement of Financial Position
Statement of Receipts and Disbursements
Statement of Receipts (Consolidated Fund)
Statement of Expenditure (Consolidated Fund)
* By Function
* By Nature
Notes to Accounts
Appendix I : Cash Balances and Investments of Cash Balances
Statement of Progressive Capital Expenditure
Statement of Borrowings and other Liabilities
Statement of Loans and Advances given by the Government
Statement of Grants-in-Aid given by the Government
Statement of Guarantees given by the Government
Statement of Voted and Charged Expenditure
Detailed Statement of Revenue and Capital Receipts by minor heads
Detailed Statement of Revenue Expenditure by minor heads
Detailed Statement of Capital Expenditure
Detailed Statement of Investments of the Government
Detailed Statement on Borrowings and other Liabilities
Detailed Statement on Loans and Advances made by Government
(iii)
(vii)
2
4
6
12
17
19
43
48
53
59
65
67
73
76
111
260
348
372
393
.
.
.
.
.
.
.
.
.
.
.
.
.
.
.
.
PAGE
TABLE OF CONTENTS
Volume 2
Part II - Detailed Statements
Part III - Appendices
G
G
G
H
H
H
H
H
H
H
H
H
H
H
H
H
H
H
17
18
19
II
III
IV
V
VI
A
B
VII
VIII
IX
X
XI
XII
XIII
XIV
Detailed Statement on Sources and Application of funds for Expenditure other than on RevenueAccount
Detailed Statement on Contingency Fund and Public Account transactions
Detailed Statement on Investments of Earmarked Funds
Comparative Expenditure on Salary
Comparative Expenditure on Subsidy
Grants-in-Aid / Assistance given by the State Government (Institutionwise and Schemewise)
Details of Externally Aided Projects
Plan Scheme Expenditure
Central Schemes
State Schemes
Direct transfer of Central Scheme Funds to implementing Agencies in the State (Funds routedoutside State Budgets) (unaudited figures)
Summary of Balances under Consolidated Fund, Contingency Fund and Public Account
Financial results of Irrigation Schemes
Statement of Commitments on Incomplete Public Works Contracts
Statement of items for which allocation of balances as a result of re-organisation of States hasnot been finalised
Statement on Maintenance Expenditure of the State (Salary and Non-Salary portion)
Detailed Accounts Showing transfer to ULBs/PRIs and direct transfer of funds to ULBs/PRIs
Implications of Major Policy Decisions of the Government
480
484
504
510
513
522
529
534
542
549
551
559
585
613
634
651
653
.
.
.
PAGE
TABLE OF CONTENTS -concld.
- Concld.
-concld.
------x------
Volume 2 - Part I - Summarised Statements
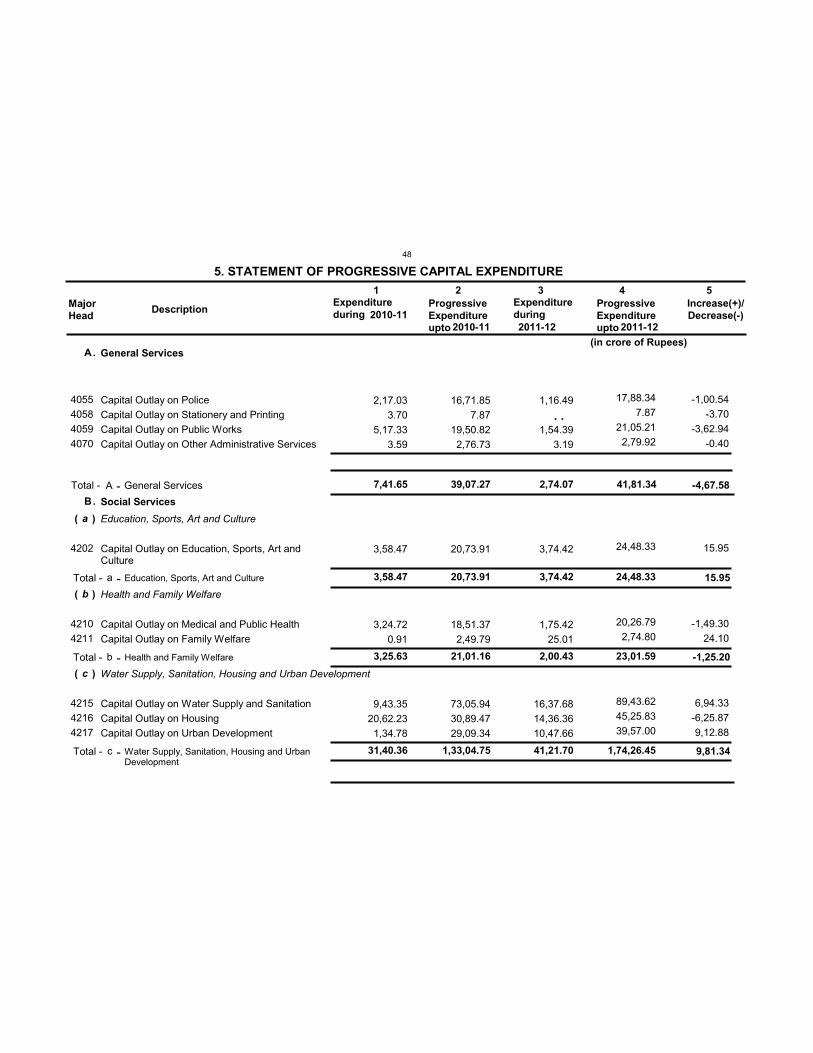
A
B
7,41.65 39,07.27 2,74.07 41,81.34
a
b
c
3,58.47
3,25.63
31,40.36
20,73.91
21,01.16
1,33,04.75
3,74.42
2,00.43
41,21.70
24,48.33
23,01.59
1,74,26.45
4055405840594070
4202
42104211
421542164217
2,17.03 3.70
5,17.33 3.59
3,58.47
3,24.72 0.91
9,43.35 20,62.23 1,34.78
16,71.85 7.87
19,50.82 2,76.73
20,73.91
18,51.37 2,49.79
73,05.94 30,89.47 29,09.34
1,16.49
1,54.39 3.19
3,74.42
1,75.42 25.01
16,37.68 14,36.36 10,47.66
17,88.34 7.87
21,05.21 2,79.92
24,48.33
20,26.79 2,74.80
89,43.62 45,25.83 39,57.00
General Services
Social Services
Education, Sports, Art and Culture
Health and Family Welfare
Water Supply, Sanitation, Housing and Urban Development
Capital Outlay on PoliceCapital Outlay on Stationery and PrintingCapital Outlay on Public WorksCapital Outlay on Other Administrative Services
Capital Outlay on Education, Sports, Art andCulture
Capital Outlay on Medical and Public HealthCapital Outlay on Family Welfare
Capital Outlay on Water Supply and SanitationCapital Outlay on HousingCapital Outlay on Urban Development
Education, Sports, Art and Culture
Health and Family Welfare
Water Supply, Sanitation, Housing and UrbanDevelopment
General Services
Total -
Total -
Total -
a
b
c
Total - A
.
.
MajorHead
DescriptionExpenditureduring
ProgressiveExpenditureupto
Expenditureduring
ProgressiveExpenditureupto
Increase(+)/Decrease(-)
1 2 3 4 5
5. STATEMENT OF PROGRESSIVE CAPITAL EXPENDITURE
(
(
(
)
)
)
-1,00.54-3.70
-3,62.94-0.40
15.95
-1,49.30 24.10
6,94.33-6,25.87 9,12.88
. .
15.95
-1,25.20
9,81.34
-4,67.58
-
-
-
-
(in crore of Rupees)
2010-112010-11 2011-12 2011-12
48
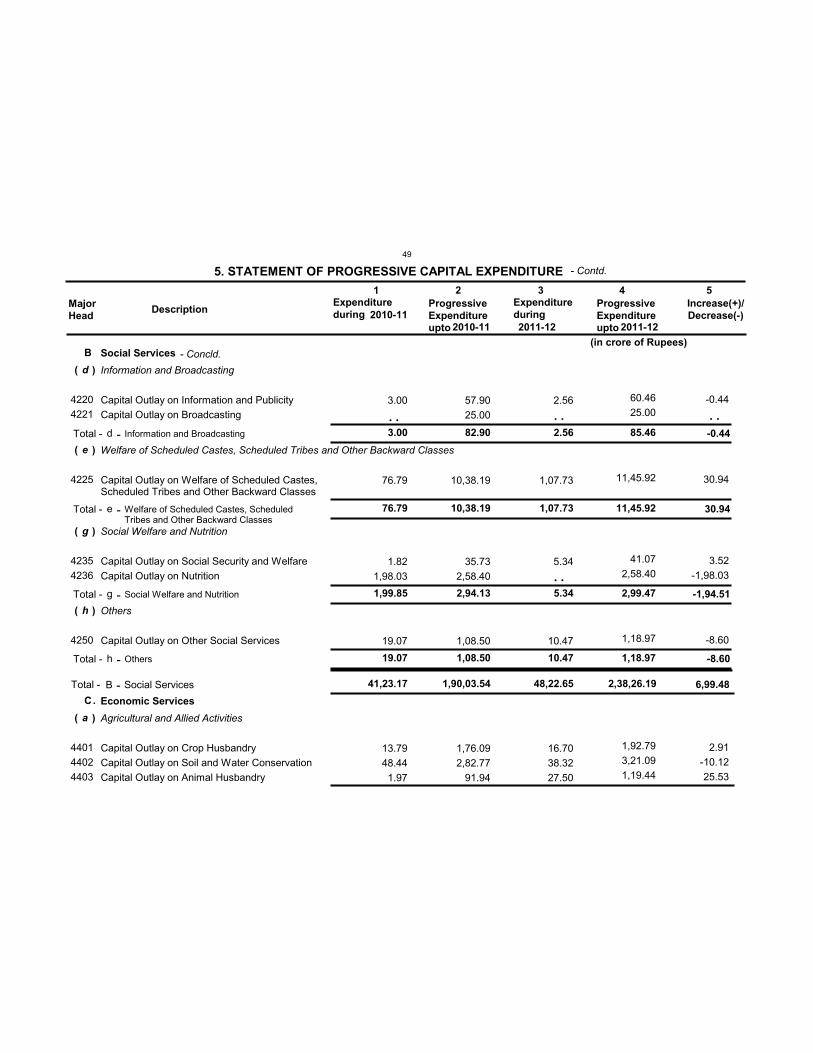
B
C
41,23.17 1,90,03.54 48,22.65 2,38,26.19
d
e
g
h
a
3.00
76.79
1,99.85
19.07
82.90
10,38.19
2,94.13
1,08.50
2.56
1,07.73
5.34
10.47
85.46
11,45.92
2,99.47
1,18.97
42204221
4225
42354236
4250
440144024403
3.00
76.79
1.82 1,98.03
19.07
13.79 48.44 1.97
57.90 25.00
10,38.19
35.73 2,58.40
1,08.50
1,76.09 2,82.77
91.94
2.56
1,07.73
5.34
10.47
16.70 38.32 27.50
60.46 25.00
11,45.92
41.07 2,58.40
1,18.97
1,92.79 3,21.09 1,19.44
Social Services
Economic Services
Information and Broadcasting
Welfare of Scheduled Castes, Scheduled Tribes and Other Backward Classes
Social Welfare and Nutrition
Others
Agricultural and Allied Activities
Capital Outlay on Information and PublicityCapital Outlay on Broadcasting
Capital Outlay on Welfare of Scheduled Castes,Scheduled Tribes and Other Backward Classes
Capital Outlay on Social Security and WelfareCapital Outlay on Nutrition
Capital Outlay on Other Social Services
Capital Outlay on Crop HusbandryCapital Outlay on Soil and Water ConservationCapital Outlay on Animal Husbandry
Information and Broadcasting
Welfare of Scheduled Castes, ScheduledTribes and Other Backward Classes
Social Welfare and Nutrition
Others
Social Services
Total -
Total -
Total -
Total -
d
e
g
h
Total - B
.
MajorHead
DescriptionExpenditureduring
ProgressiveExpenditureupto
Expenditureduring
ProgressiveExpenditureupto
Increase(+)/Decrease(-)
1 2 3 4 5
5. STATEMENT OF PROGRESSIVE CAPITAL EXPENDITURE
(
(
(
(
(
)
)
)
)
)
-0.44
30.94
3.52-1,98.03
-8.60
2.91-10.12 25.53
. . . .
. .
. .-0.44
30.94
-1,94.51
-8.60
6,99.48
-
-
-
-
-
(in crore of Rupees)
2010-112010-11 2011-12 2011-12
- Contd.
- Concld.
49
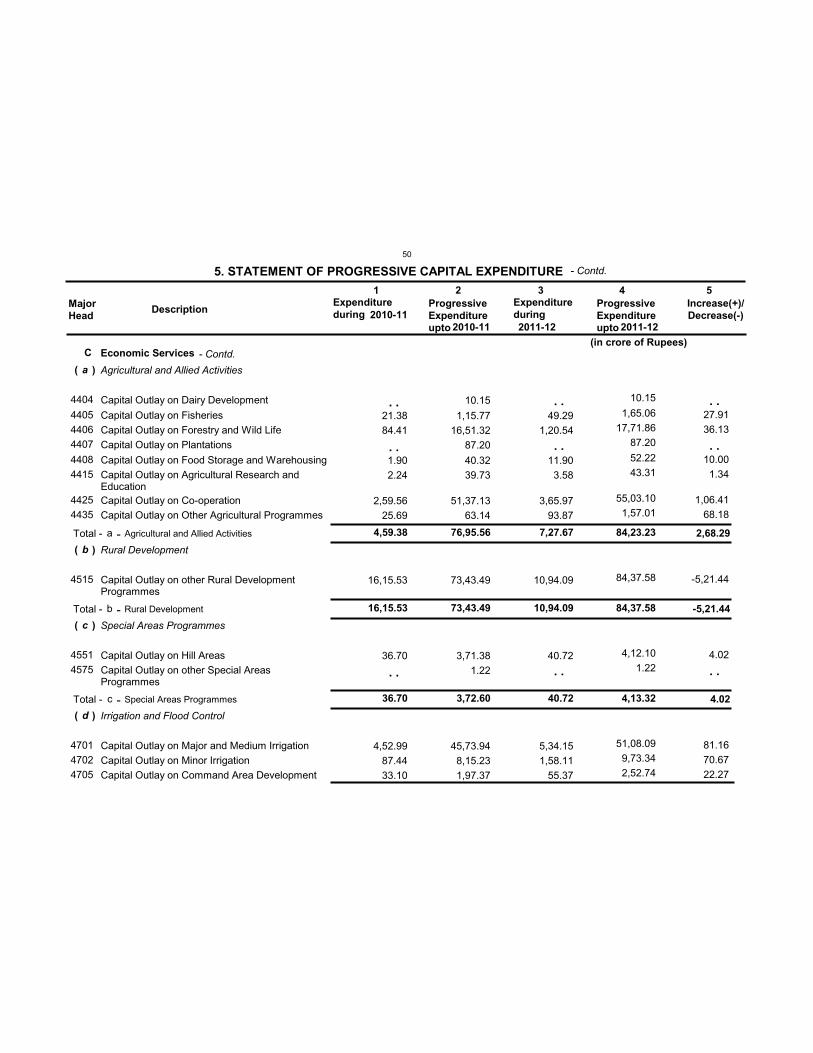
C
a
b
c
d
4,59.38
16,15.53
36.70
76,95.56
73,43.49
3,72.60
7,27.67
10,94.09
40.72
84,23.23
84,37.58
4,13.32
4404
440544064407
44084415
44254435
4515
45514575
470147024705
21.38 84.41
1.90 2.24
2,59.56 25.69
16,15.53
36.70
4,52.99 87.44 33.10
10.15
1,15.77 16,51.32
87.20
40.32 39.73
51,37.13 63.14
73,43.49
3,71.38 1.22
45,73.94 8,15.23 1,97.37
49.29 1,20.54
11.90 3.58
3,65.97 93.87
10,94.09
40.72
5,34.15 1,58.11
55.37
10.15
1,65.06 17,71.86
87.20
52.22 43.31
55,03.10 1,57.01
84,37.58
4,12.10 1.22
51,08.09 9,73.34 2,52.74
Economic Services
Agricultural and Allied Activities
Rural Development
Special Areas Programmes
Irrigation and Flood Control
Capital Outlay on Dairy Development
Capital Outlay on FisheriesCapital Outlay on Forestry and Wild LifeCapital Outlay on Plantations
Capital Outlay on Food Storage and WarehousingCapital Outlay on Agricultural Research andEducationCapital Outlay on Co-operationCapital Outlay on Other Agricultural Programmes
Capital Outlay on other Rural DevelopmentProgrammes
Capital Outlay on Hill AreasCapital Outlay on other Special AreasProgrammes
Capital Outlay on Major and Medium IrrigationCapital Outlay on Minor IrrigationCapital Outlay on Command Area Development
Agricultural and Allied Activities
Rural Development
Special Areas Programmes
Total -
Total -
Total -
a
b
c
MajorHead
DescriptionExpenditureduring
ProgressiveExpenditureupto
Expenditureduring
ProgressiveExpenditureupto
Increase(+)/Decrease(-)
1 2 3 4 5
5. STATEMENT OF PROGRESSIVE CAPITAL EXPENDITURE
(
(
(
(
)
)
)
)
27.91 36.13
10.00 1.34
1,06.41 68.18
-5,21.44
4.02
81.16 70.67 22.27
. .
. .
. .
. .
. .
. .
. .
. .
. .
2,68.29
-5,21.44
4.02
-
-
-
(in crore of Rupees)
2010-112010-11 2011-12 2011-12
- Contd.
- Contd.
50
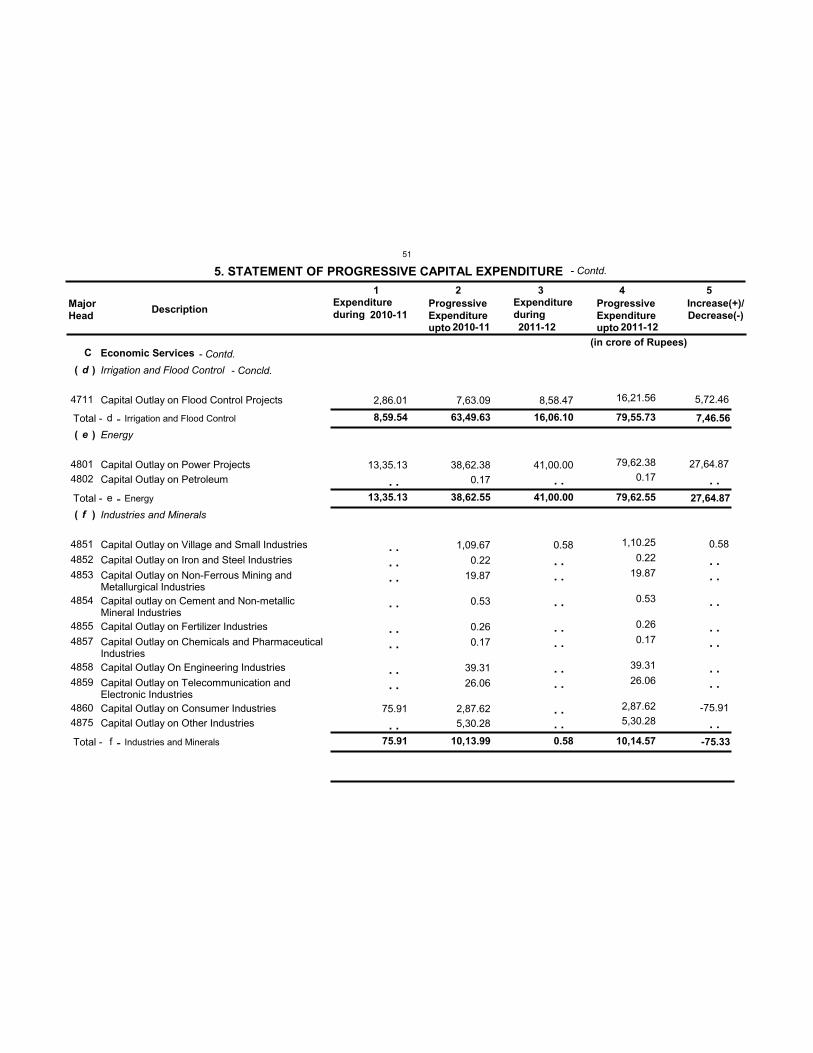
C
d
e
f
8,59.54
13,35.13
75.91
63,49.63
38,62.55
10,13.99
16,06.10
41,00.00
0.58
79,55.73
79,62.55
10,14.57
4711
48014802
4851
4852
4853
4854
4855
4857
4858
4859
48604875
2,86.01
13,35.13
75.91
7,63.09
38,62.38 0.17
1,09.67
0.22
19.87
0.53
0.26
0.17
39.31
26.06
2,87.62 5,30.28
8,58.47
41,00.00
0.58
16,21.56
79,62.38 0.17
1,10.25
0.22
19.87
0.53
0.26
0.17
39.31
26.06
2,87.62 5,30.28
Economic Services
Irrigation and Flood Control
Energy
Industries and Minerals
Capital Outlay on Flood Control Projects
Capital Outlay on Power ProjectsCapital Outlay on Petroleum
Capital Outlay on Village and Small Industries
Capital Outlay on Iron and Steel Industries
Capital Outlay on Non-Ferrous Mining andMetallurgical IndustriesCapital outlay on Cement and Non-metallicMineral IndustriesCapital Outlay on Fertilizer Industries
Capital Outlay on Chemicals and PharmaceuticalIndustriesCapital Outlay On Engineering Industries
Capital Outlay on Telecommunication andElectronic IndustriesCapital Outlay on Consumer IndustriesCapital Outlay on Other Industries
Irrigation and Flood Control
Energy
Industries and Minerals
Total -
Total -
Total -
d
e
f
MajorHead
DescriptionExpenditureduring
ProgressiveExpenditureupto
Expenditureduring
ProgressiveExpenditureupto
Increase(+)/Decrease(-)
1 2 3 4 5
5. STATEMENT OF PROGRESSIVE CAPITAL EXPENDITURE
(
(
(
)
)
)
5,72.46
27,64.87
0.58
-75.91
. .
. . . . . .
. .
. . . .
. . . .
. .
. .
. . . .
. .
. . . .
. . . .
. . . .
. .
. . . .
. .
. . . .
. . . .
. .
7,46.56
27,64.87
-75.33
-
-
-
(in crore of Rupees)
2010-112010-11 2011-12 2011-12
- Contd.
- Contd.
- Concld.
51
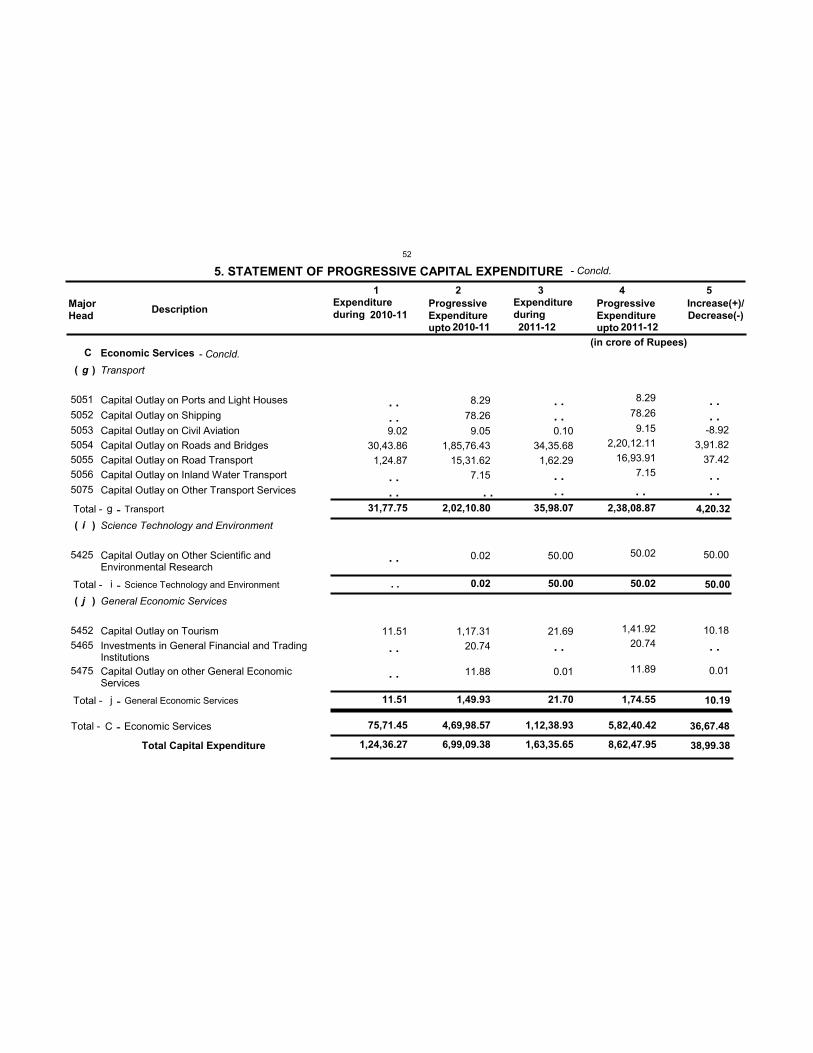
1,24,36.27 6,99,09.38 1,63,35.65 8,62,47.95
C
75,71.45 4,69,98.57 1,12,38.93 5,82,40.42
g
i
j
31,77.75
11.51
2,02,10.80
0.02
1,49.93
35,98.07
50.00
21.70
2,38,08.87
50.02
1,74.55
5051
5052
5053505450555056
5075
5425
54525465
5475
9.02 30,43.86 1,24.87
11.51
8.29
78.26
9.05 1,85,76.43
15,31.62 7.15
0.02
1,17.31 20.74
11.88
0.10 34,35.68 1,62.29
50.00
21.69
0.01
8.29
78.26
9.15 2,20,12.11
16,93.91 7.15
50.02
1,41.92 20.74
11.89
Economic Services
Transport
Science Technology and Environment
General Economic Services
Capital Outlay on Ports and Light Houses
Capital Outlay on Shipping
Capital Outlay on Civil AviationCapital Outlay on Roads and BridgesCapital Outlay on Road TransportCapital Outlay on Inland Water Transport
Capital Outlay on Other Transport Services
Capital Outlay on Other Scientific andEnvironmental Research
Capital Outlay on TourismInvestments in General Financial and TradingInstitutionsCapital Outlay on other General EconomicServices
Transport
Science Technology and Environment
General Economic Services
Economic Services
Total -
Total -
Total -
g
i
j
Total - C
MajorHead
DescriptionExpenditureduring
ProgressiveExpenditureupto
Expenditureduring
ProgressiveExpenditureupto
Increase(+)/Decrease(-)
1 2 3 4 5
5. STATEMENT OF PROGRESSIVE CAPITAL EXPENDITURE
(
(
(
)
)
)
Total Capital Expenditure
-8.92 3,91.82
37.42
50.00
10.18
0.01
. . . .
. . . .
. .
. .
. .
. .
. . . .
. . . .
. .
. .
. . . .
. . . .
. .
4,20.32
50.00
10.19
36,67.48
-
-
-
- 38,99.38
(in crore of Rupees)
2010-112010-11 2011-12 2011-12
. .
- Concld.
- Concld.
52
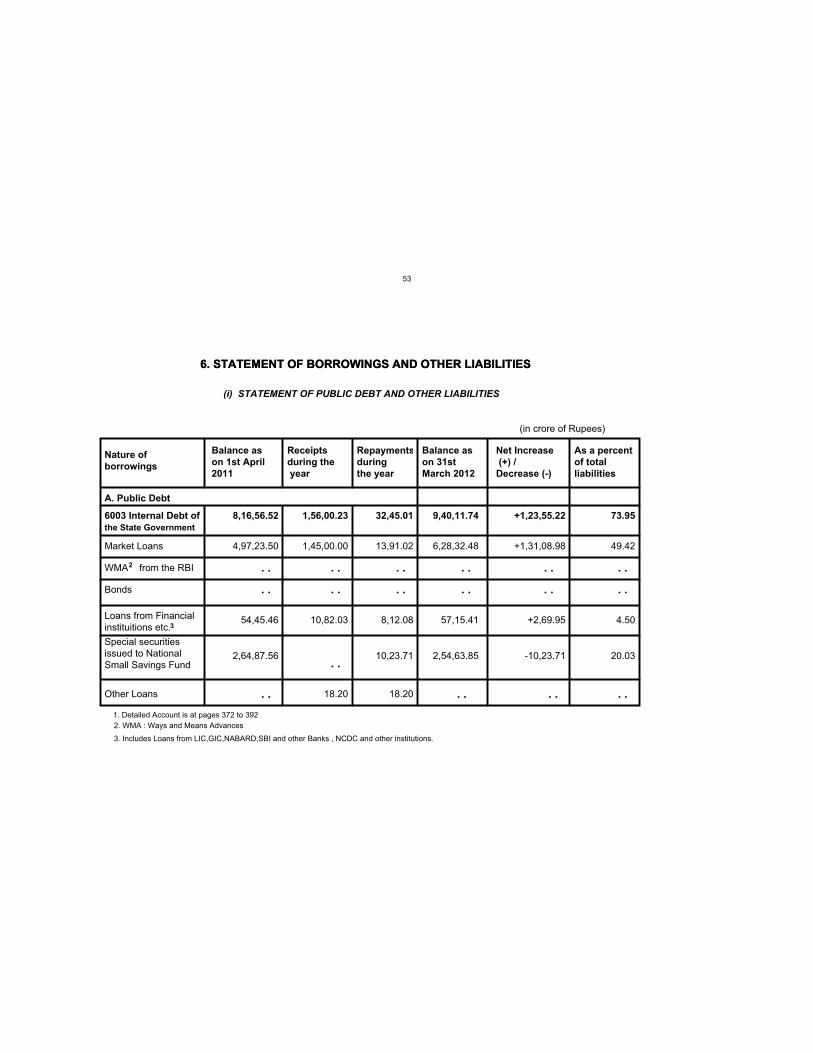
6. STATEMENT OF BORROWINGS AND OTHER LIABILITIES
(in crore of Rupees)
Nature of
borrowings
Balance as
on 1st April
2011
Receipts
during the
year
Repayments
during
the year
Net Increase
(+) /
Decrease (-)
As a percent
of total
liabilities
A. Public Debt
6003 Internal Debt of
the State Government
4,97,23.50 1,45,00.00 13,91.02 +1,31,08.98
Balance as
on 31st
March 2012
6,28,32.48 49.42Market Loans
WMA
Bonds
Loans from Financialinstituitions etc.
54,45.46 10,82.03 8,12.08 57,15.41 +2,69.95 4.50
Special securitiesissued to NationalSmall Savings Fund
2,64,87.56 10,23.71 2,54,63.85 -10,23.71 20.03
Other Loans 18.20 18.20
from the RBI
(i) STATEMENT OF PUBLIC DEBT AND OTHER LIABILITIES
1. Detailed Account is at pages 372 to 392
. .
8,16,56.52 1,56,00.23 32,45.01 9,40,11.74 +1,23,55.22 73.95
2. WMA : Ways and Means Advances
. . . . . . . . . . . .
. . . . . . . . . . . .
. .
. . . . . . . .
2
6. STATEMENT OF BORROWINGS AND OTHER LIABILITIES
3
3. Includes Loans from LIC,GIC,NABARD,SBI and other Banks , NCDC and other institutions.
53
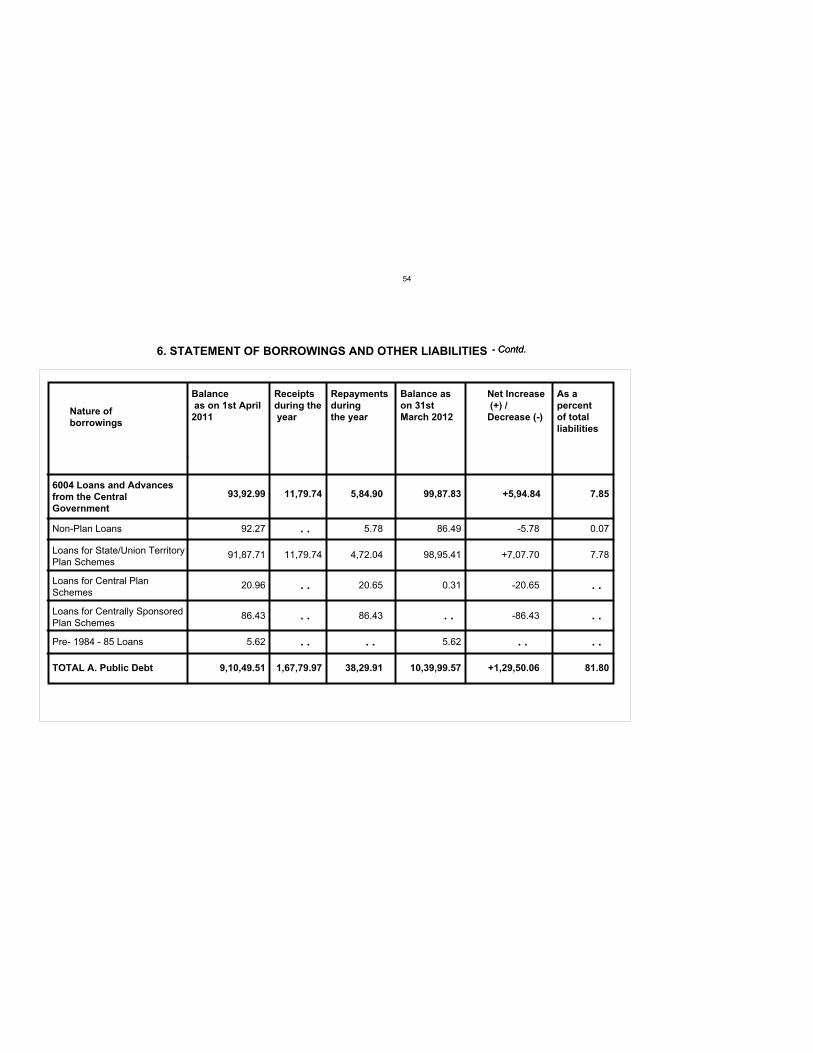
Nature of
borrowings
Balance
as on 1st April
2011
Receipts
during the
year
Repayments
during
the year
Net Increase
(+) /
Decrease (-)
As a
percent
of total
liabilities
Balance as
on 31st
March 2012
6004 Loans and Advances
from the Central
Government
Non-Plan Loans
Loans for State/Union TerritoryPlan Schemes
Loans for Central PlanSchemes
Loans for Centrally SponsoredPlan Schemes
Pre- 1984 - 85 Loans
TOTAL A. Public Debt
92.27 5.78 86.49 -5.78 0.07
91,87.71 11,79.74 4,72.04 98,95.41 +7,07.70 7.78
20.96 20.65 0.31 -20.65
86.43 86.43 -86.43
5.62 5.62
9,10,49.51 1,67,79.97 38,29.91 10,39,99.57 +1,29,50.06 81.80
93,92.99 11,79.74 5,84.90 99,87.83 +5,94.84 7.85
. .
. .
. .
. . . . . .
. .
. .
. .
. .
6. STATEMENT OF BORROWINGS AND OTHER LIABILITIES - Contd.- Contd.
54
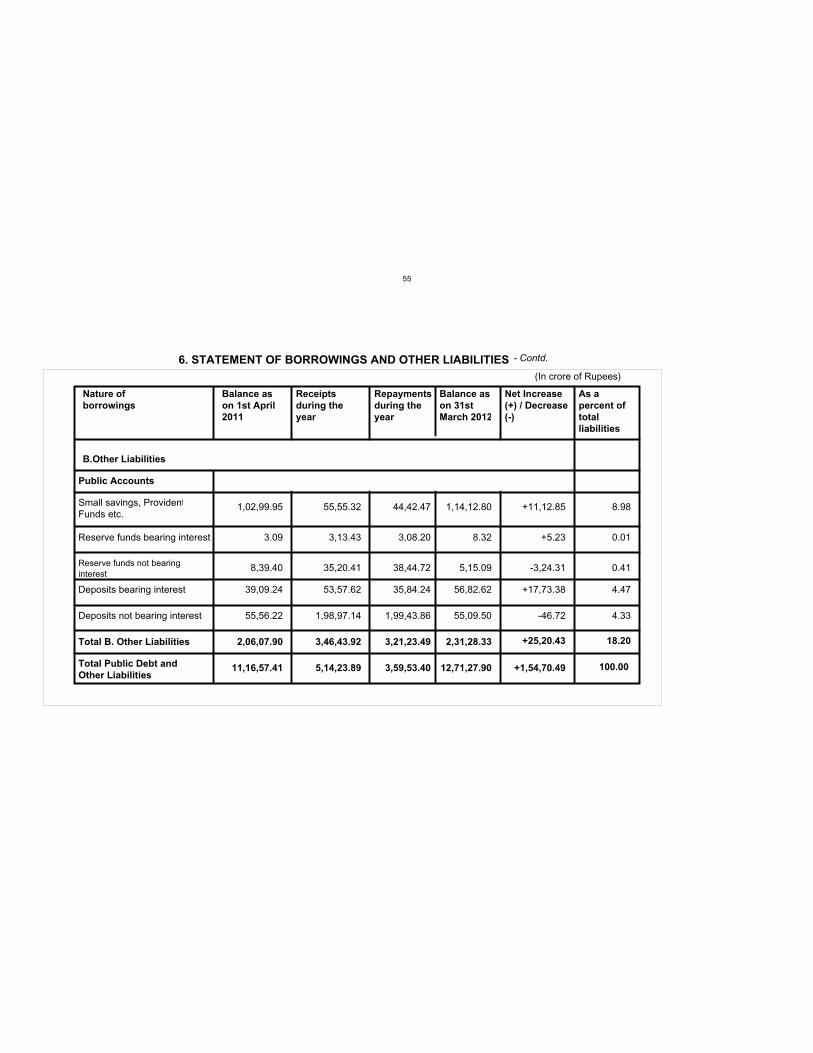
Nature of
borrowings
Balance as
on 1st April
2011
Receipts
during the
year
Repayments
during the
year
Balance as
on 31st
March 2012
Net Increase
(+) / Decrease
(-)
As a
percent of
total
liabilities
B.Other Liabilities
Public Accounts
Small savings, ProvidentFunds etc.
1,02,99.95 55,55.32 44,42.47 1,14,12.80 +11,12.85 8.98
Reserve funds bearing interest 3.09 3,13.43 3,08.20 8.32 +5.23 0.01
Reserve funds not bearing
interest 8,39.40 35,20.41 38,44.72 5,15.09 -3,24.31 0.41
Deposits bearing interest 39,09.24 53,57.62 35,84.24 56,82.62 +17,73.38 4.47
Deposits not bearing interest 55,56.22 1,98,97.14 1,99,43.86 55,09.50 -46.72 4.33
Total B. Other Liabilities 2,06,07.90 3,46,43.92 3,21,23.49 2,31,28.33
Total Public Debt and
Other Liabilities 11,16,57.41 5,14,23.89 3,59,53.40 12,71,27.90 +1,54,70.49
18.20+25,20.43
100.00
6. STATEMENT OF BORROWINGS AND OTHER LIABILITIES
(In crore of Rupees)
- Contd.
55
Explanatory Notes to Statement 6
1. Amortization arrangements/Appropriation for reduction or avoidance of Debt - Sinking Fund is created by transferring Funds fromrevenue for amortisation of Open Market Loans, Central Government Loans and Special Securities issued to National Small Savings Fund. During the year, a sum of ` 2,19.01crore has been transferred from revenue to the Fund towards amortisation of Central Government
Loans and Special Securities issued to National Small Savings Fund. The accretion in the Sinking Fund together with the income earned on the investments of the Fund would be invested in easily encashable investments in Central Government dated Securities.
The balance in the Fund at the end of 2011-12 was ` 30,23.59 crore. Out of total balance in the Fund, ` 28,64.34 crore were investedin Securities. The market value of these Securities on 31st March 2012 as reported by Government was `28,16.34 crore.
2. Loans from Small Savings Fund - Loans out of the collection in the 'Small Savings Schemes' and 'Public Provident Fund' in the Postoffices are being shared between the State Government and the Central Government. A separate Fund viz. 'National Small Savings Fund' wascreated in 1999-2000 for the purpose of release of loans out of Small Savings collections. The loans amounted to `10,23.71 crore was repaidduring the year. The balance outstanding at the end of the year was ` 2,54,63.85 crore which was 24.48 per cent of the total Public Debt of theState Government as on 31st March 2012.
___________________________________________________________________________________________________________
(a) This amount includes a sum of `.0.06 lakh which does not constitute an investment but is a residual balance awaiting futureinvestments by Reserve Bank of India on behalf of Government of Tamil Nadu. This residual balance has been kept under the head ofaccount '8222-02-101-AB-003'.
(a)
6. STATEMENT OF BORROWINGS AND OTHER LIABILITIES - Contd.
56
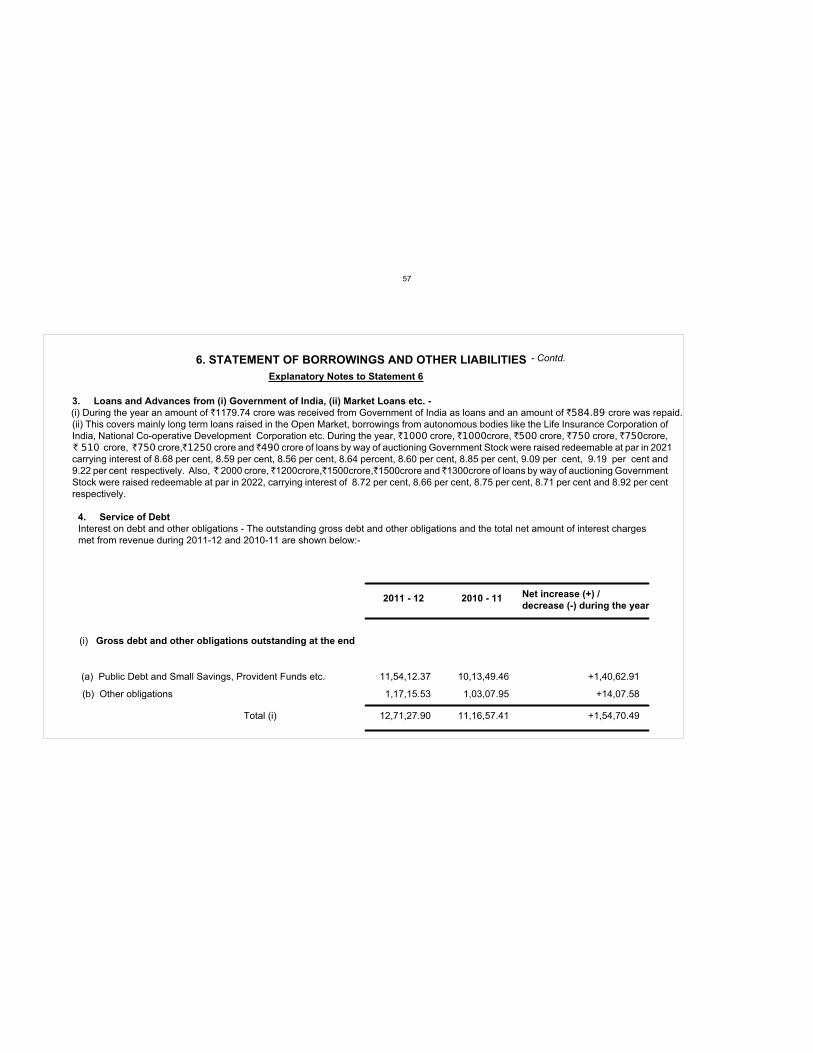
Explanatory Notes to Statement 6
3. Loans and Advances from (i) Government of India, (ii) Market Loans etc. -
(i) During the year an amount of `1179.74 crore was received from Government of India as loans and an amount of `584.89 crore was repaid.(ii) This covers mainly long term loans raised in the Open Market, borrowings from autonomous bodies like the Life Insurance Corporation ofIndia, National Co-operative Development Corporation etc. During the year, `1000 crore, `1000crore, `500 crore, `750 crore, `750crore,` 510 crore, `750 crore,`1250 crore and `490 crore of loans by way of auctioning Government Stock were raised redeemable at par in 2021carrying interest of 8.68 per cent, 8.59 per cent, 8.56 per cent, 8.64 percent, 8.60 per cent, 8.85 per cent, 9.09 per cent, 9.19 per cent and9.22 per cent respectively. Also, ` 2000 crore, `1200crore,`1500crore,`1500crore and `1300crore of loans by way of auctioning GovernmentStock were raised redeemable at par in 2022, carrying interest of 8.72 per cent, 8.66 per cent, 8.75 per cent, 8.71 per cent and 8.92 per centrespectively.
4. Service of Debt
Interest on debt and other obligations - The outstanding gross debt and other obligations and the total net amount of interest charges met from revenue during 2011-12 and 2010-11 are shown below:-
2011 - 12 2010 - 11 Net increase (+) /
decrease (-) during the year
(i) Gross debt and other obligations outstanding at the end
(a) Public Debt and Small Savings, Provident Funds etc.
(b) Other obligations
11,54,12.37 10,13,49.46 +1,40,62.91
1,17,15.53 1,03,07.95 +14,07.58
12,71,27.90 11,16,57.41 +1,54,70.49Total (i)
6. STATEMENT OF BORROWINGS AND OTHER LIABILITIES - Contd.
57
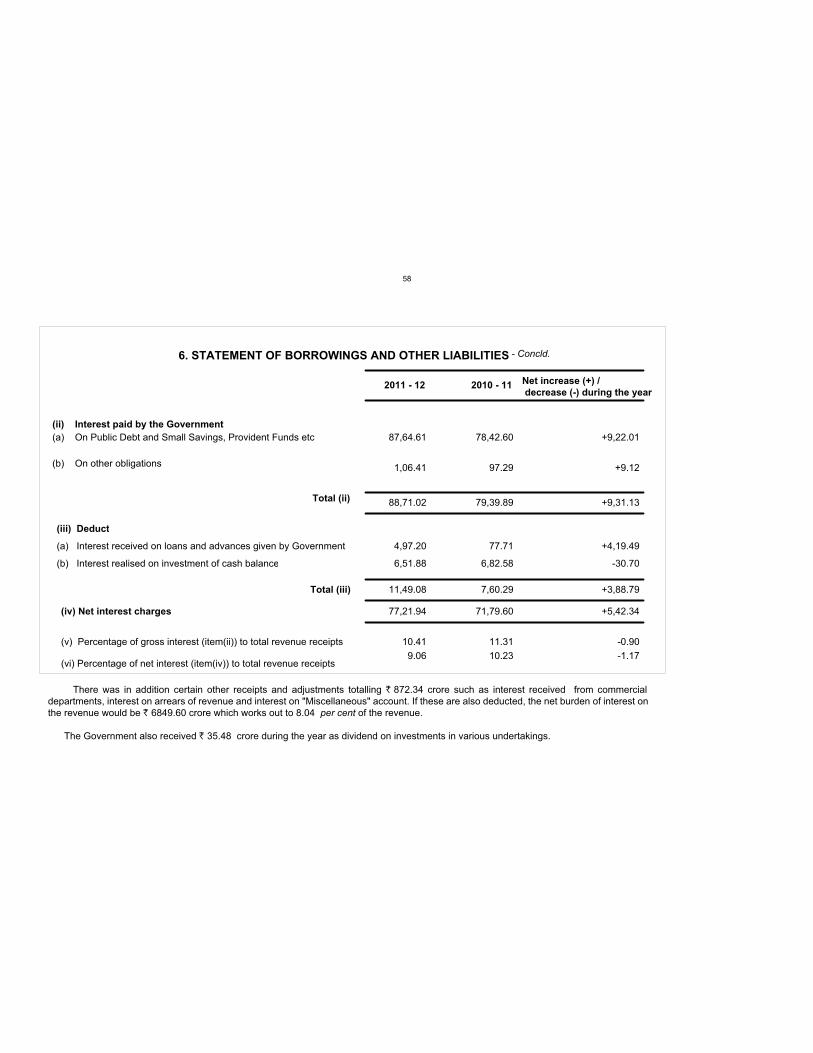
2011 - 12 2010 - 11 Net increase (+) /
decrease (-) during the year
(ii) Interest paid by the Government
(a) On Public Debt and Small Savings, Provident Funds etc
(b) On other obligations
87,64.61 78,42.60 +9,22.01
1,06.41 97.29 +9.12
88,71.02 79,39.89 +9,31.13Total (ii)
(iii) Deduct
(a) Interest received on loans and advances given by Government 4,97.20 77.71 +4,19.49
(b) Interest realised on investment of cash balance 6,51.88 6,82.58 -30.70
11,49.08 7,60.29 +3,88.79Total (iii)
(iv) Net interest charges 77,21.94 71,79.60
(v) Percentage of gross interest (item(ii)) to total revenue receipts 10.41 11.31
(vi) Percentage of net interest (item(iv)) to total revenue receipts 9.06 10.23
+5,42.34
-0.90
-1.17
6. STATEMENT OF BORROWINGS AND OTHER LIABILITIES - Concld.
There was in addition certain other receipts and adjustments totalling ` 872.34 crore such as interest received from commercialdepartments, interest on arrears of revenue and interest on "Miscellaneous" account. If these are also deducted, the net burden of interest onthe revenue would be ` 6849.60 crore which works out to 8.04 per cent of the revenue.
The Government also received ` 35.48 crore during the year as dividend on investments in various undertakings.
58
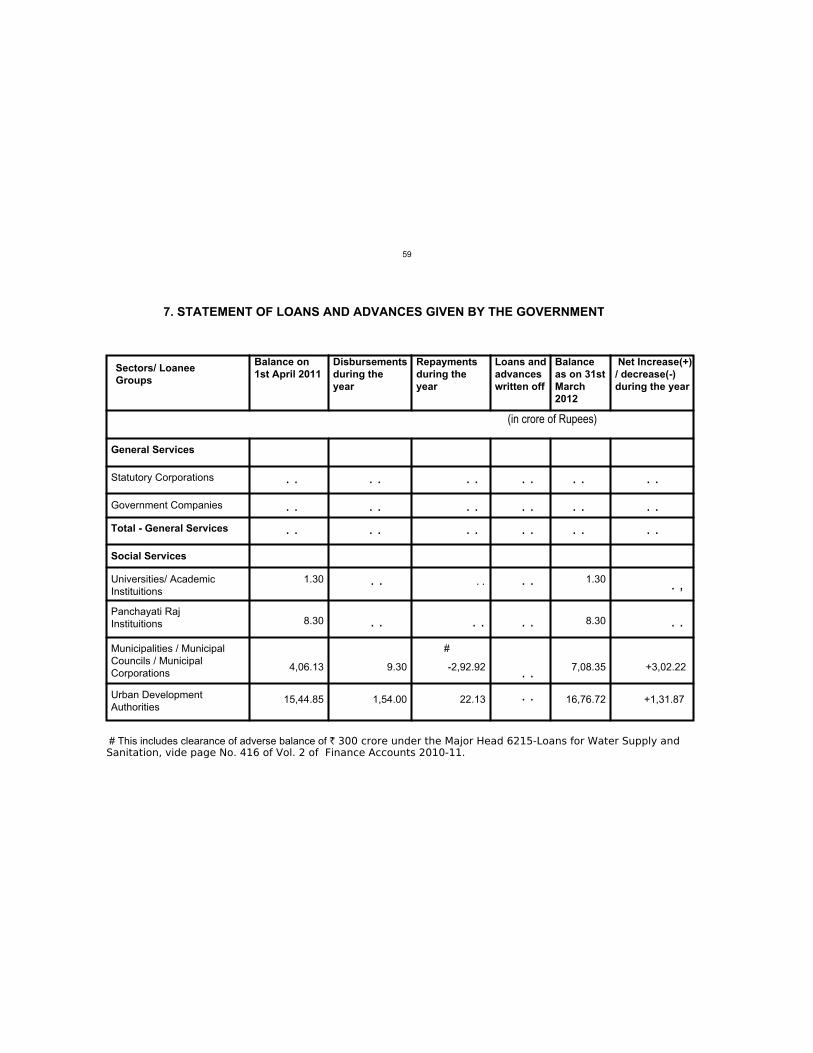
7. STATEMENT OF LOANS AND ADVANCES GIVEN BY THE GOVERNMENT
Sectors/ Loanee
Groups
Balance on
1st April 2011
Disbursements
during the
year
Repayments
during the
year
Loans and
advances
written off
Balance
as on 31st
March
Net Increase(+)
/ decrease(-)
during the year
(in crore of Rupees)
General Services
Statutory Corporations
Government Companies
Total - General Services
Universities/ AcademicInstituitions
Panchayati RajInstituitions
Municipalities / MunicipalCouncils / MunicipalCorporations
Urban DevelopmentAuthorities
1.30 1.30
8.30 8.30
4,06.13 9.30 -2,92.92 7,08.35 +3,02.22
15,44.85 1,54.00 22.13 16,76.72 +1,31.87
Social Services
. . . . . . . . . . . .
. . . . . . . . . . . .
. .
. .
. .
. .
. .
. . . . . .
2012
# This includes clearance of adverse balance of ` 300 crore under the Major Head 6215-Loans for Water Supply andSanitation, vide page No. 416 of Vol. 2 of Finance Accounts 2010-11.
#
. . . . . . . . . . . .
. .. ,
59
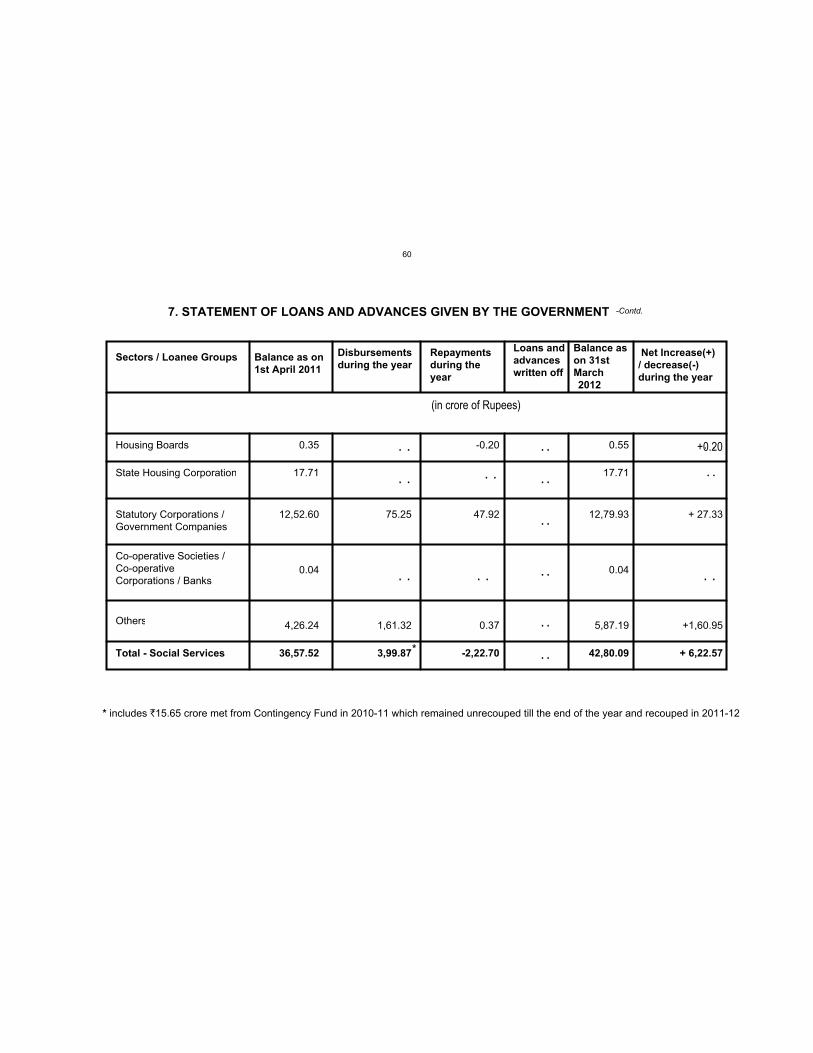
Sectors / Loanee Groups Balance as on
1st April 2011
Disbursements
during the year
Repayments
during the
year
Loans and
advances
written off
Balance as
on 31st
March
Net Increase(+)
/ decrease(-)
during the year
(in crore of Rupees)
Housing Boards 0.35 -0.20 0.55 +0.20
State Housing Corporation 17.71 17.71
Statutory Corporations /Government Companies
12,52.60 75.25 47.92 12,79.93 + 27.33
Co-operative Societies /Co-operativeCorporations / Banks
0.04 0.04
Others 4,26.24 1,61.32 0.37 5,87.19 +1,60.95
Total - Social Services 36,57.52 3,99.87 -2,22.70 42,80.09 + 6,22.57
. .
. .
. .
. .
. .
. .
. .. .
. .
. . . . . .
7. STATEMENT OF LOANS AND ADVANCES GIVEN BY THE GOVERNMENT
2012
*
* includes `15.65 crore met from Contingency Fund in 2010-11 which remained unrecouped till the end of the year and recouped in 2011-12
-Contd.
. .. .
60
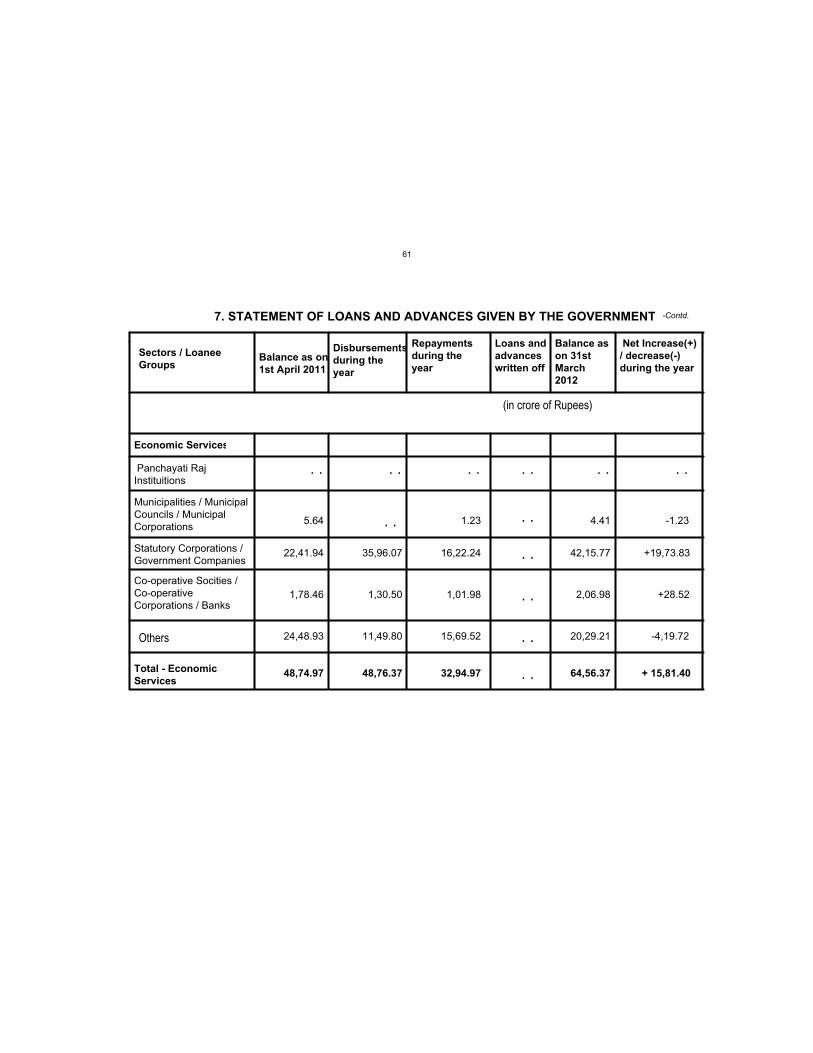
Sectors / Loanee
GroupsBalance as on
1st April 2011
Disbursementsduring the
year
Repayments
during the
year
Loans and
advances
written off
Balance as
on 31st
March
(in crore of Rupees)
Economic Services
Panchayati RajInstituitions
Municipalities / MunicipalCouncils / MunicipalCorporations
Statutory Corporations /Government Companies
Co-operative Socities /Co-operativeCorporations / Banks
Others
Total - Economic
Services
Net Increase(+)
/ decrease(-)
during the year
5.64 1.23 4.41 -1.23
22,41.94 35,96.07 16,22.24 42,15.77 +19,73.83
1,78.46 1,30.50 1,01.98 2,06.98 +28.52
24,48.93 11,49.80 15,69.52 20,29.21 -4,19.72
48,74.97 48,76.37 32,94.97 64,56.37 + 15,81.40
. .
. .
. .
. .
. .
. .
. . . . . . . . . .
. .
2012
7. STATEMENT OF LOANS AND ADVANCES GIVEN BY THE GOVERNMENT -Contd.
61
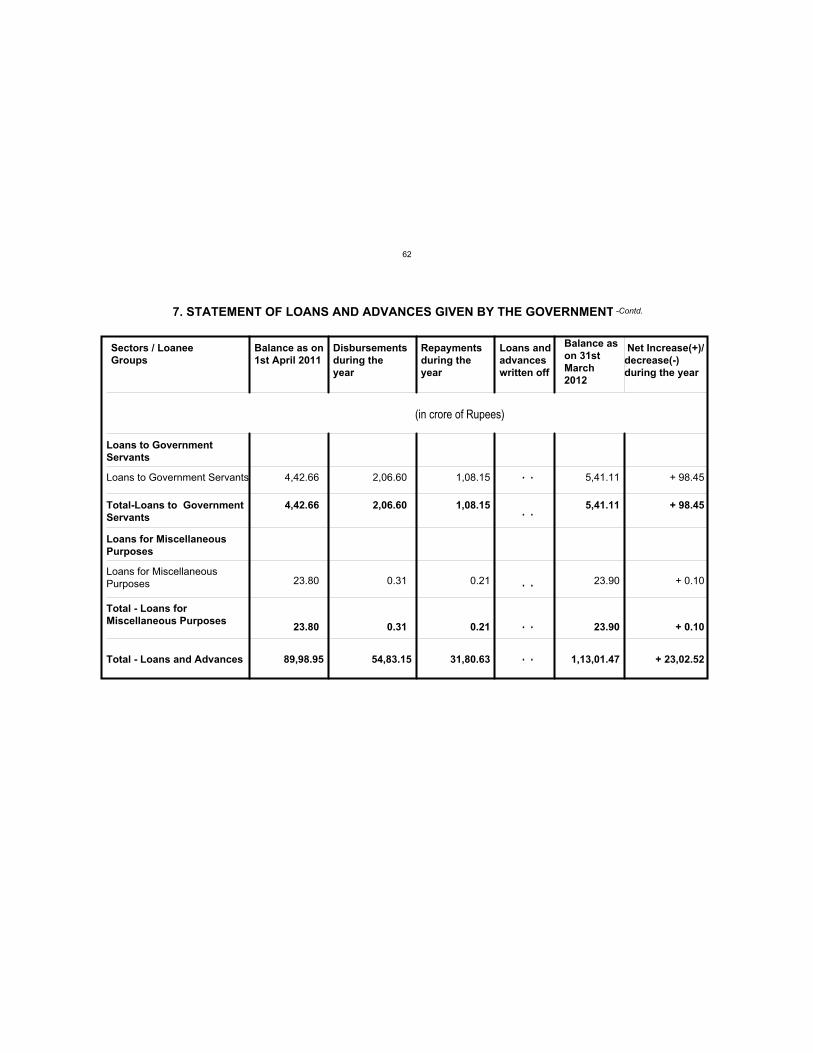
Sectors / Loanee
Groups
Balance as on
1st April 2011
Disbursements
during the
year
Repayments
during the
year
Loans and
advances
written off
Balance as
on 31st
March
Net Increase(+)/
decrease(-)
during the year
(in crore of Rupees)
Loans to Government
Servants
Loans to Government Servants
Total-Loans to Government
Servants
Loans for Miscellaneous
Purposes
Loans for MiscellaneousPurposes
Total - Loans for
Miscellaneous Purposes
Total - Loans and Advances
4,42.66 2,06.60 1,08.15 5,41.11 + 98.45
4,42.66 2,06.60 1,08.15 5,41.11 + 98.45
23.80 0.31 0.21 23.90 + 0.10
23.80 0.31 0.21 23.90 + 0.10
89,98.95 54,83.15 31,80.63 1,13,01.47 + 23,02.52
. .
. .
. .
. .
. .
7. STATEMENT OF LOANS AND ADVANCES GIVEN BY THE GOVERNMENT
2012
-Contd.
62
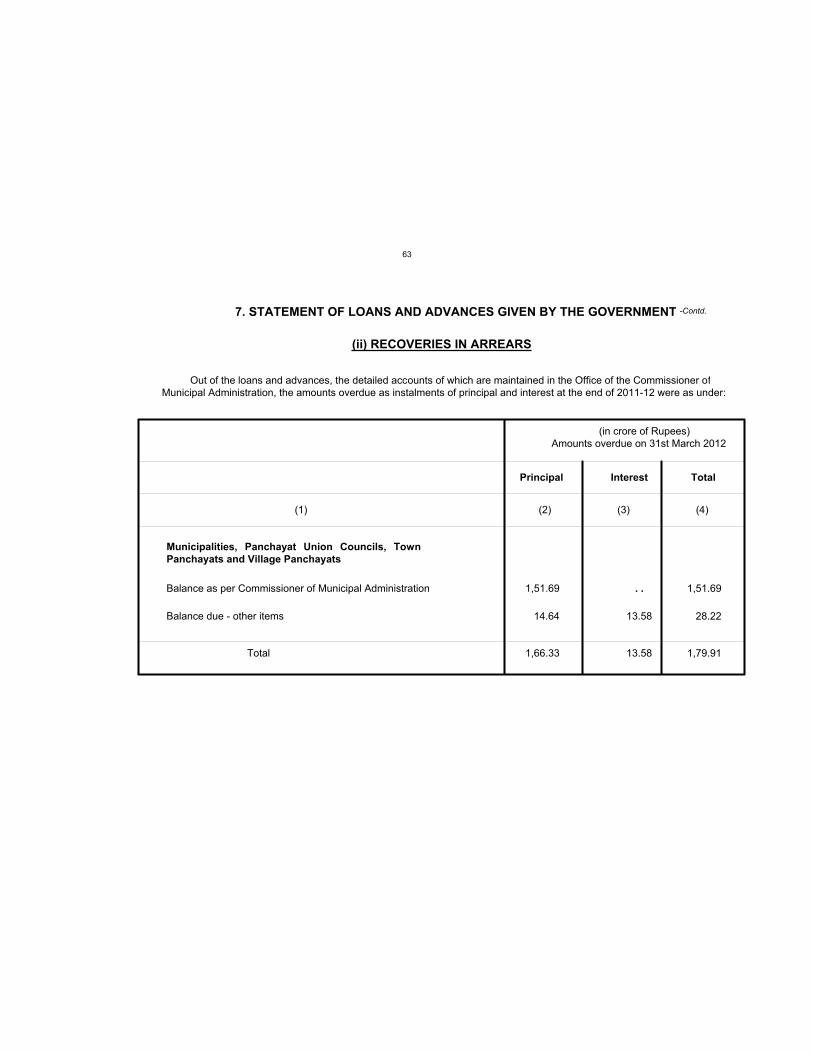
(ii) RECOVERIES IN ARREARS
7. STATEMENT OF LOANS AND ADVANCES GIVEN BY THE GOVERNMENT -Contd.
Out of the loans and advances, the detailed accounts of which are maintained in the Office of the Commissioner ofMunicipal Administration, the amounts overdue as instalments of principal and interest at the end of 2011-12 were as under:
(in crore of Rupees)Amounts overdue on 31st March 2012
Municipalities, Panchayat Union Councils, Town
Panchayats and Village Panchayats
Balance as per Commissioner of Municipal Administration
Balance due - other items
Principal Interest Total
(1) (2) (3) (4)
Total
1,51.69
14.64
1,66.33
. .
13.58
13.58
1,51.69
28.22
1,79.91
63
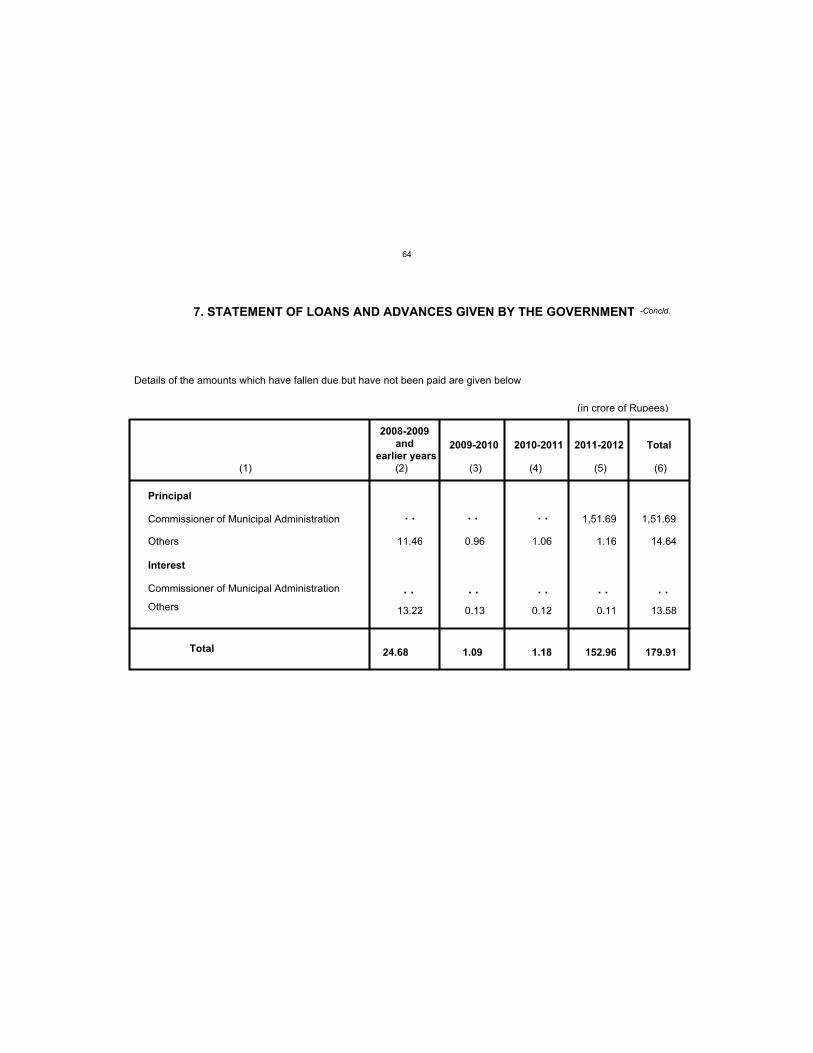
7. STATEMENT OF LOANS AND ADVANCES GIVEN BY THE GOVERNMENT -Concld.
(in crore of Rupees)
Details of the amounts which have fallen due but have not been paid are given below:
Total2011-20122010-20112009-2010
2008-2009
and
earlier years(1) (2) (3) (4) (5) (6)
Principal
Commissioner of Municipal Administration
Others
Interest
Commissioner of Municipal Administration
Others
Total
1,51.69 1,51.69
11.46 0.96 1.16 14.64
13.22 0.13 0.11 13.580.12
1.06
24.68 1.09 152.96 179.911.18
. . . . . .
. . . . . . . . . .
64
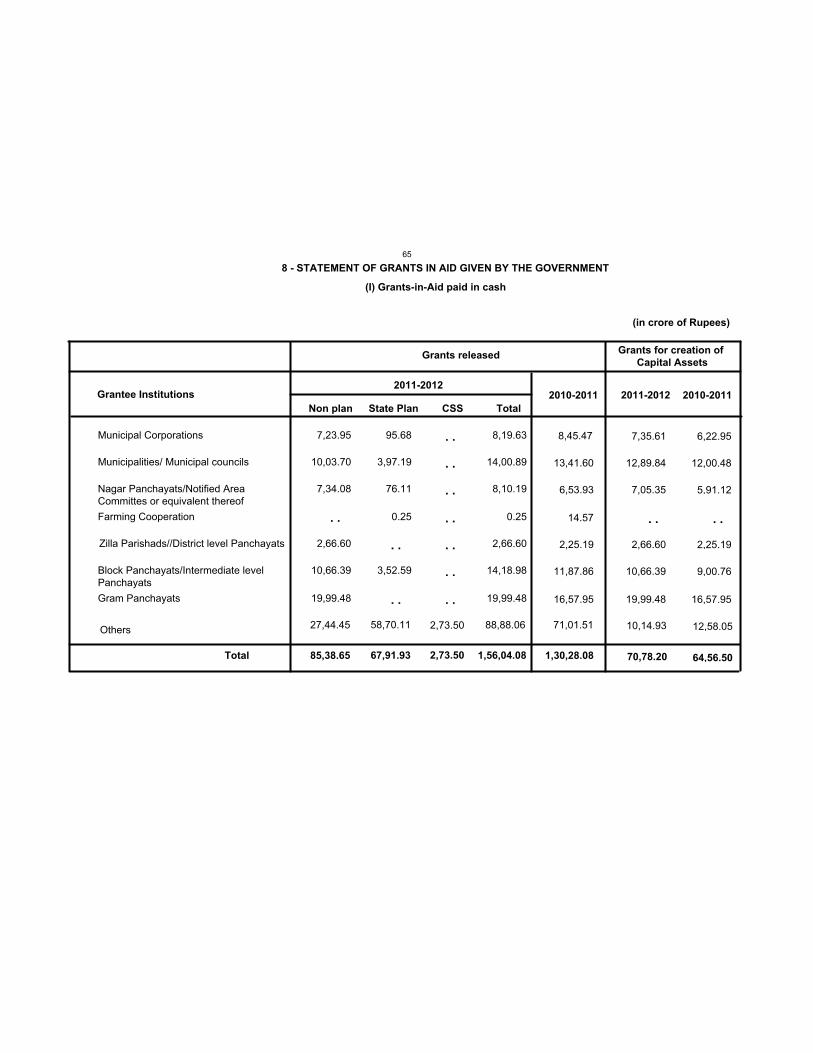
Municipal Corporations
Municipalities/ Municipal councils
Nagar Panchayats/Notified AreaCommittes or equivalent thereof
Farming Cooperation
Zilla Parishads//District level Panchayats
Block Panchayats/Intermediate levelPanchayats
Gram Panchayats
7,23.95
10,03.70
7,34.08
2,66.60
10,66.39
19,99.48
95.68
3,97.19
76.11
0.25
3,52.59
8,19.63
14,00.89
8,10.19
0.25
2,66.60
14,18.98
19,99.48
Grantee Institutions
Non plan State Plan CSS Total
13,41.60
6,53.93
14.57
2,25.19
11,87.86
16,57.95
7,35.61
12,89.84
7,05.35
2,66.60
10,66.39
19,99.48
2011-20122010-2011 2011-2012 2010-2011
Grants for creation of
Capital AssetsGrants released
(in crore of Rupees)
8 - STATEMENT OF GRANTS IN AID GIVEN BY THE GOVERNMENT
(I) Grants-in-Aid paid in cash
71,01.51
1,30,28.08
27,44.45 58,70.11 2,73.50
85,38.65 67,91.93 2,73.50
88,88.06
1,56,04.08Total
10,14.93
70,78.20
Others
6,22.95
12,00.48
5,91.12
2,25.19
9,00.76
16,57.95
64,56.50
12,58.05
. .
. .
. .
. .
. .
. .
. .
. .
. .
. .
. .. .
8,45.47
65
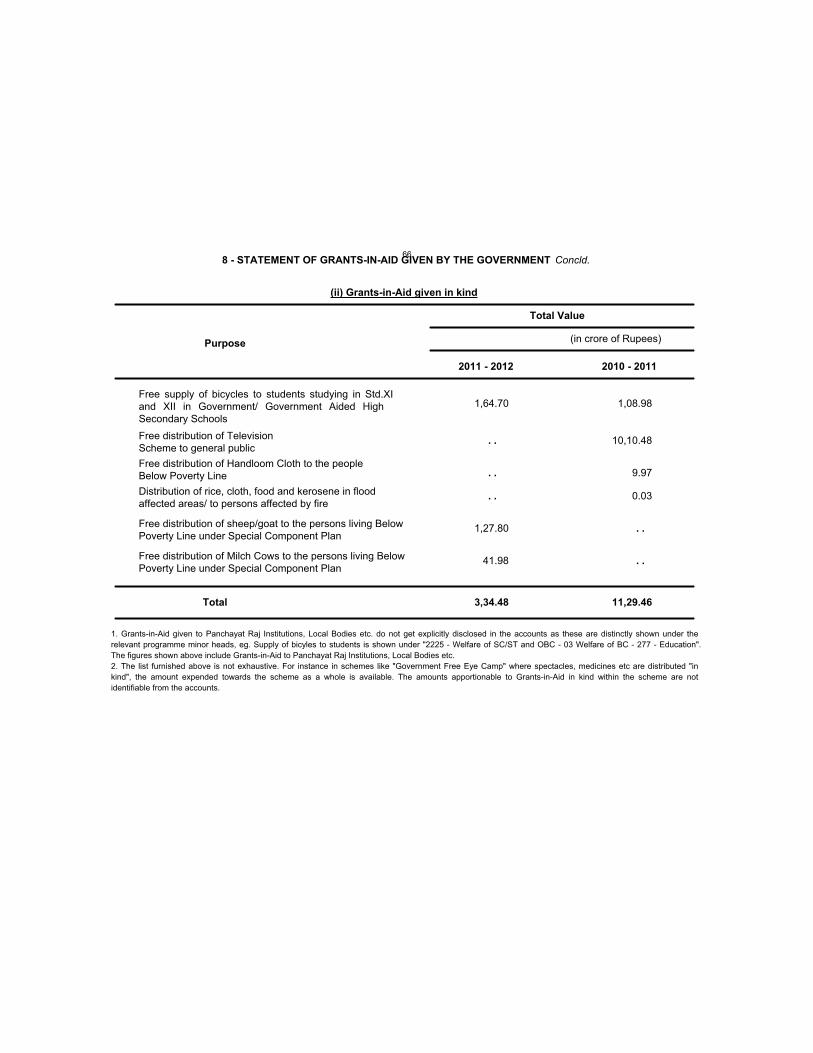
8 - STATEMENT OF GRANTS-IN-AID GIVEN BY THE GOVERNMENT Concld.
(ii) Grants-in-Aid given in kind
Total Value
(in crore of Rupees)
2011 - 2012 2010 - 2011
Purpose
Free supply of bicycles to students studying in Std.XIand XII in Government/ Government Aided HighSecondary Schools
Free distribution of TelevisionScheme to general public
Free distribution of Handloom Cloth to the peopleBelow Poverty Line
Distribution of rice, cloth, food and kerosene in floodaffected areas/ to persons affected by fire
1,08.98
10,10.48
9.97
0.03
Total 11,29.46
1,64.70
3,34.48
1. Grants-in-Aid given to Panchayat Raj Institutions, Local Bodies etc. do not get explicitly disclosed in the accounts as these are distinctly shown under the
relevant programme minor heads, eg. Supply of bicyles to students is shown under "2225 - Welfare of SC/ST and OBC - 03 Welfare of BC - 277 - Education".
The figures shown above include Grants-in-Aid to Panchayat Raj Institutions, Local Bodies etc.
2. The list furnished above is not exhaustive. For instance in schemes like "Government Free Eye Camp" where spectacles, medicines etc are distributed "in
kind", the amount expended towards the scheme as a whole is available. The amounts apportionable to Grants-in-Aid in kind within the scheme are not
identifiable from the accounts.
Free distribution of sheep/goat to the persons living BelowPoverty Line under Special Component Plan
Free distribution of Milch Cows to the persons living BelowPoverty Line under Special Component Plan
1,27.80
41.98
. .
. .
. .
. .
. .
66
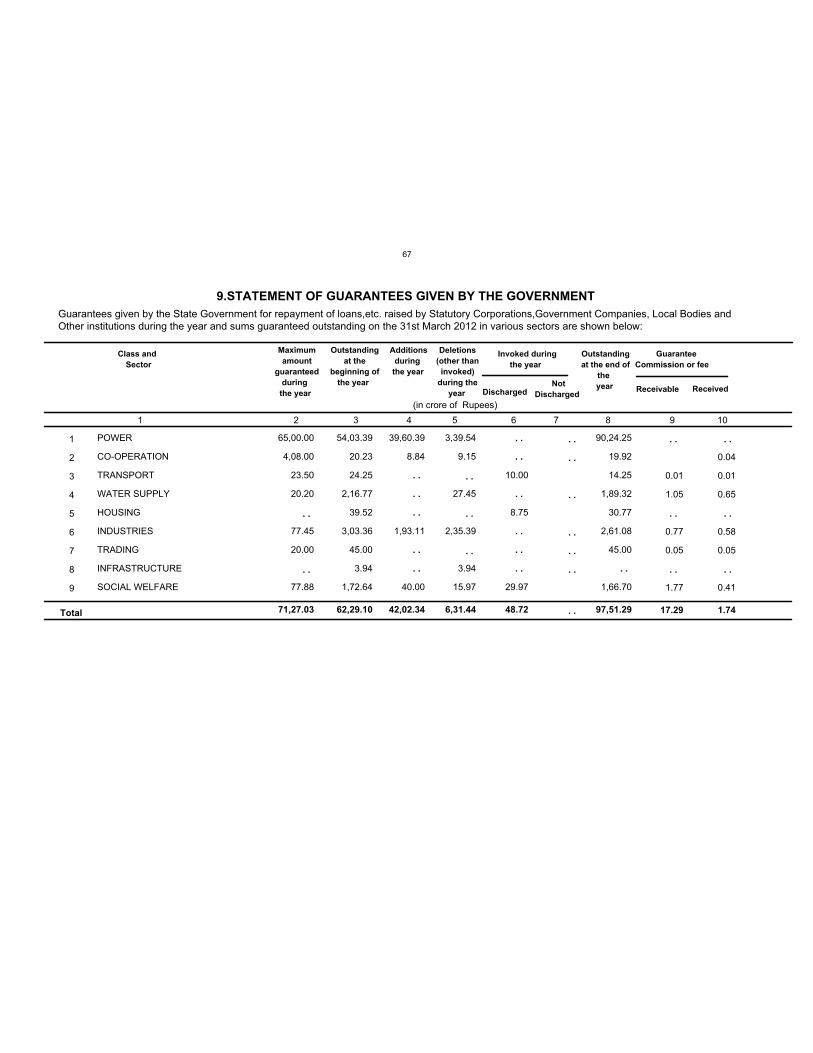
1
2
3
4
5
6
7
8
9
POWER
CO-OPERATION
TRANSPORT
WATER SUPPLY
HOUSING
INDUSTRIES
TRADING
INFRASTRUCTURE
SOCIAL WELFARE
65,00.00
4,08.00
23.50
20.20
77.45
20.00
77.88
54,03.39
20.23
24.25
2,16.77
39.52
3,03.36
45.00
3.94
1,72.64
39,60.39
8.84
1,93.11
40.00
3,39.54
9.15
27.45
2,35.39
3.94
15.97
10.00
8.75
29.97
90,24.25
19.92
14.25
1,89.32
30.77
2,61.08
45.00
1,66.70
0.01
1.05
0.77
0.05
1.77
0.04
0.01
0.65
0.58
0.05
0.41
Class and
Sector
Maximum
amount
guaranteed
during
the year
Outstanding
at the
beginning of
the year
Additions
during
the year
Deletions
(other than
invoked)
during the
year
Invoked during
the year
Outstanding
at the end of
the
yearDischarged
Not
Discharged
Guarantee
Commission or fee
Receivable Received
Total 71,27.03 62,29.10 42,02.34 6,31.44 48.72 97,51.29 17.29 1.74
. .
. .
. .
. .
. .
. .
. .
. .
. .
. .
. .
. .
. .
. .
. .
. .
. .
. .
. .
. .
. .
. . . .
. .
. .
. .
. .
. .
. .
9.STATEMENT OF GUARANTEES GIVEN BY THE GOVERNMENT
. .
1 2 3 4 5 6 7 8 9 10
(in crore of Rupees)
Guarantees given by the State Government for repayment of loans,etc. raised by Statutory Corporations,Government Companies, Local Bodies and Other institutions during the year and sums guaranteed outstanding on the 31st March 2012 in various sectors are shown below:
67
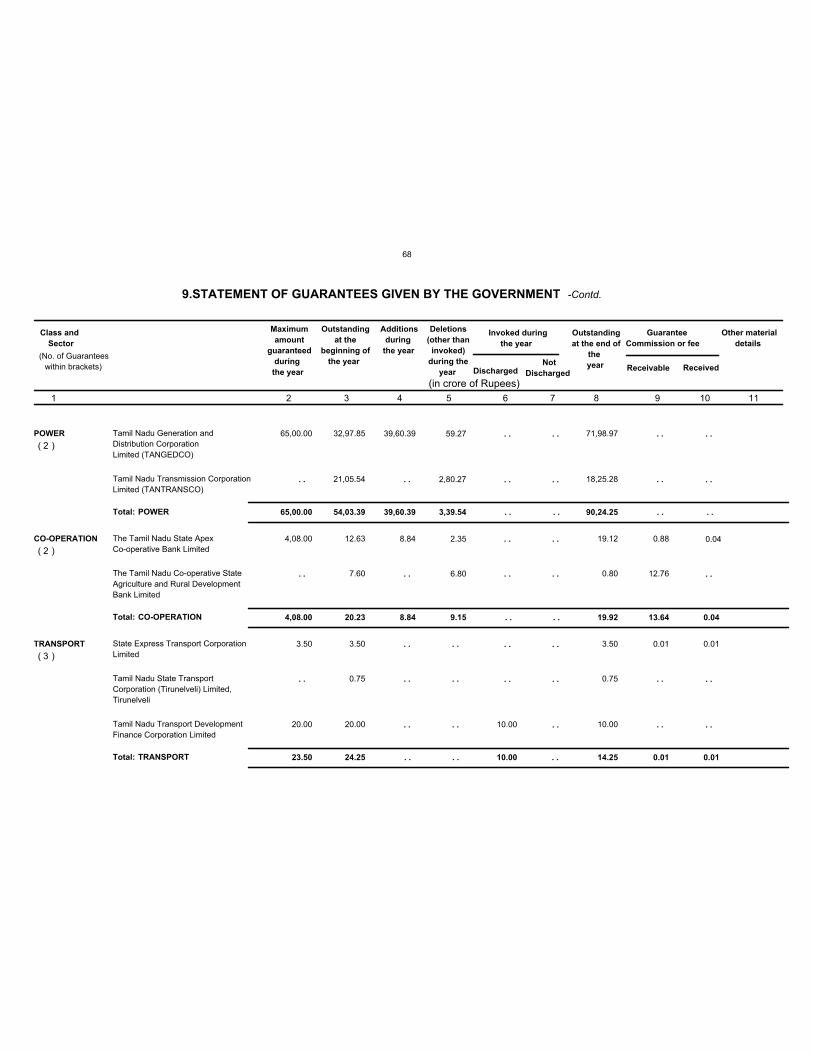
Sector
POWER
CO-OPERATION
TRANSPORT
Class and
Sector
(i)
(ii)
(i)
(ii)
(iii)
( )
(b)
( )
(b)
( )
Tamil Nadu Generation and
Distribution Corporation
Limited (TANGEDCO)
Tamil Nadu Transmission Corporation
Limited (TANTRANSCO)
The Tamil Nadu State Apex
Co-operative Bank Limited
The Tamil Nadu Co-operative State
Agriculture and Rural Development
Bank Limited
State Express Transport Corporation
Limited
Tamil Nadu State Transport
Corporation (Tirunelveli) Limited,
Tirunelveli
Tamil Nadu Transport Development
Finance Corporation Limited
65,00.00
4,08.00
23.50
54,03.39
20.23
24.25
39,60.39
8.84
. .
3,39.54
9.15
. .
. .
. .
10.00
. .
. .
. .
90,24.25
19.92
14.25
. .
0.04
0.01
. .
13.64
0.01
65,00.00
4,08.00
3.50
20.00
Maximum
amount
guaranteed
during
the year
32,97.85
21,05.54
12.63
7.60
3.50
0.75
20.00
Outstanding
at the
beginning of
the year
39,60.39
8.84
Additions
during
the year
59.27
2,80.27
2.35
6.80
Deletions
(other than
invoked)
during the
year
10.00
Invoked during
the year
71,98.97
18,25.28
19.12
0.80
3.50
0.75
10.00
Outstanding
at the end of
the
year
0.01
0.88
12.76
0.01
Total:
Total:
Total:
POWER
CO-OPERATION
TRANSPORT
DischargedNot
Discharged
Guarantee
Commission or fee
Receivable Received
Other material
details
(in crore of Rupees)
. .
. .
. .
. .
. .
. .
. .
. .
. .
. .
. .
. .
. .
. .
. .
. .
. .
. .
. .
. .
. .
. .
. .
. .
. .
. .
. .
. .
. .
. .
0.04
. .
. .
. .
1 2 3 4 5 6 7 8 9 10 11
2
2
3
(
(
(
)
)
)
(No. of Guarantees
within brackets)
9.STATEMENT OF GUARANTEES GIVEN BY THE GOVERNMENT -Contd.
68
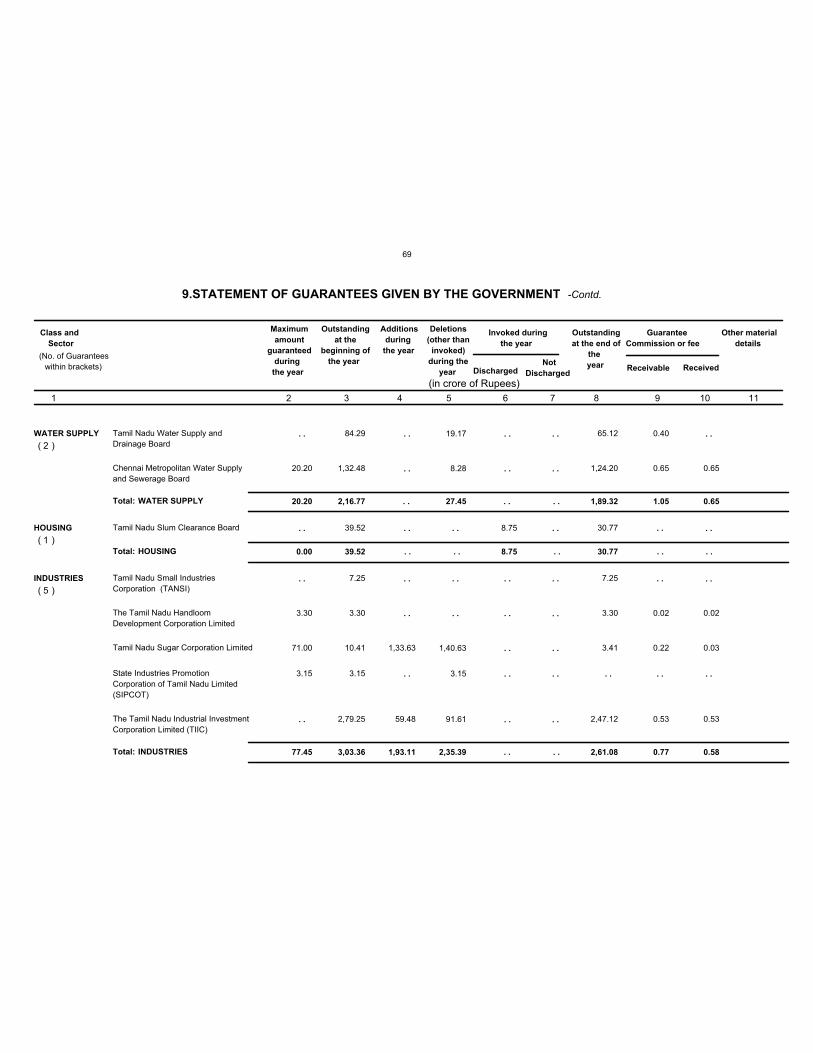
Sector
WATER SUPPLY
HOUSING
INDUSTRIES
Class and
Sector
(i)
(ii)
(i)
(i)
(ii)
(iii)
(i
( )
( )
(b)
( )
( )
(b)
(c)
(d)
( )
Tamil Nadu Water Supply and
Drainage Board
Chennai Metropolitan Water Supply
and Sewerage Board
Tamil Nadu Slum Clearance Board
Tamil Nadu Small Industries
Corporation (TANSI)
The Tamil Nadu Handloom
Development Corporation Limited
Tamil Nadu Sugar Corporation Limited
State Industries Promotion
Corporation of Tamil Nadu Limited
(SIPCOT)
The Tamil Nadu Industrial Investment
Corporation Limited (TIIC)
20.20
0.00
77.45
2,16.77
39.52
3,03.36
. .
. .
1,93.11
27.45
. .
2,35.39
. .
8.75
. .
. .
. .
. .
1,89.32
30.77
2,61.08
0.65
. .
0.58
1.05
. .
0.77
20.20
3.30
71.00
3.15
Maximum
amount
guaranteed
during
the year
84.29
1,32.48
39.52
7.25
3.30
10.41
3.15
2,79.25
Outstanding
at the
beginning of
the year
1,33.63
59.48
Additions
during
the year
19.17
8.28
1,40.63
3.15
91.61
Deletions
(other than
invoked)
during the
year
8.75
Invoked during
the year
65.12
1,24.20
30.77
7.25
3.30
3.41
2,47.12
Outstanding
at the end of
the
year
0.65
0.02
0.03
0.53
0.40
0.65
0.02
0.22
0.53
Total:
Total:
Total:
WATER SUPPLY
HOUSING
INDUSTRIES
DischargedNot
Discharged
Guarantee
Commission or fee
Receivable Received
Other material
details
(in crore of Rupees)
. .
. .
. .
. .
. .
. .
. .
. .
. .
. .
. .
. .
. .
. .
. .
. .
. .
. .
. .
. .
. .
. .
. .
. .
. .
. .
. .
. .
. .
. .
. .
. .
. .
. .
. .
. .
1 2 3 4 5 6 7 8 9 10 11
2
1
5
(
(
(
)
)
)
(No. of Guarantees
within brackets)
9.STATEMENT OF GUARANTEES GIVEN BY THE GOVERNMENT -Contd.
69
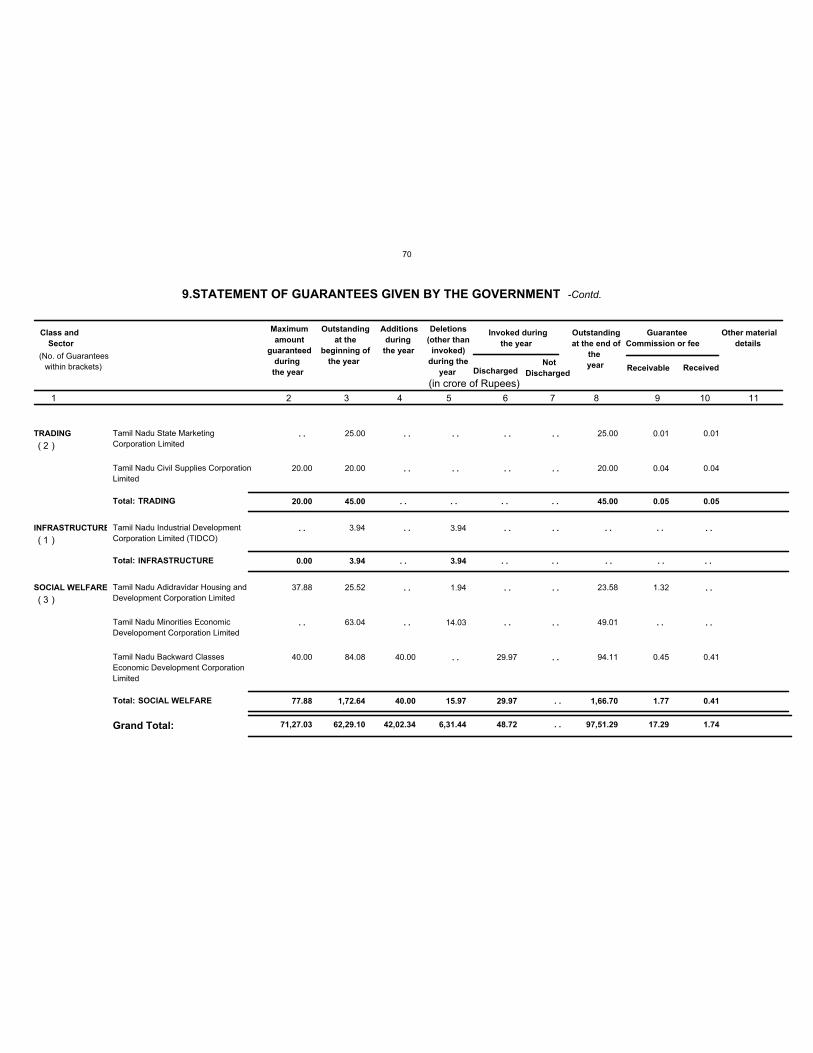
71,27.03 62,29.10 42,02.34 6,31.44 48.72 . . 97,51.29 1.7417.29
Sector
TRADING
INFRASTRUCTURE
SOCIAL WELFARE
Class and
Sector
Grand Total:
(i)
(ii)
(i)
(i)
(ii)
(iii)
( )
(b)
( )
(a)
(b)
( )
Tamil Nadu State Marketing
Corporation Limited
Tamil Nadu Civil Supplies Corporation
Limited
Tamil Nadu Industrial Development
Corporation Limited (TIDCO)
Tamil Nadu Adidravidar Housing and
Development Corporation Limited
Tamil Nadu Minorities Economic
Developoment Corporation Limited
Tamil Nadu Backward Classes
Economic Development Corporation
Limited
20.00
0.00
77.88
45.00
3.94
1,72.64
. .
. .
40.00
. .
3.94
15.97
. .
. .
29.97
. .
. .
. .
45.00
. .
1,66.70
0.05
. .
0.41
0.05
. .
1.77
20.00
37.88
40.00
Maximum
amount
guaranteed
during
the year
25.00
20.00
3.94
25.52
63.04
84.08
Outstanding
at the
beginning of
the year
40.00
Additions
during
the year
3.94
1.94
14.03
Deletions
(other than
invoked)
during the
year
29.97
Invoked during
the year
25.00
20.00
23.58
49.01
94.11
Outstanding
at the end of
the
year
0.01
0.04
0.41
0.01
0.04
1.32
0.45
Total:
Total:
Total:
TRADING
INFRASTRUCTURE
SOCIAL WELFARE
DischargedNot
Discharged
Guarantee
Commission or fee
Receivable Received
Other material
details
(in crore of Rupees)
. .
. .
. .
. .
. .
. .
. .
. .
. .
. .
. .
. .
. .
. .
. .
. .
. .
. .
. .
. .
. .
. .
. . . .
. .
. .
. .
. .
1 2 3 4 5 6 7 8 9 10 11
2
1
3
(
(
(
)
)
)
(No. of Guarantees
within brackets)
9.STATEMENT OF GUARANTEES GIVEN BY THE GOVERNMENT -Contd.
70
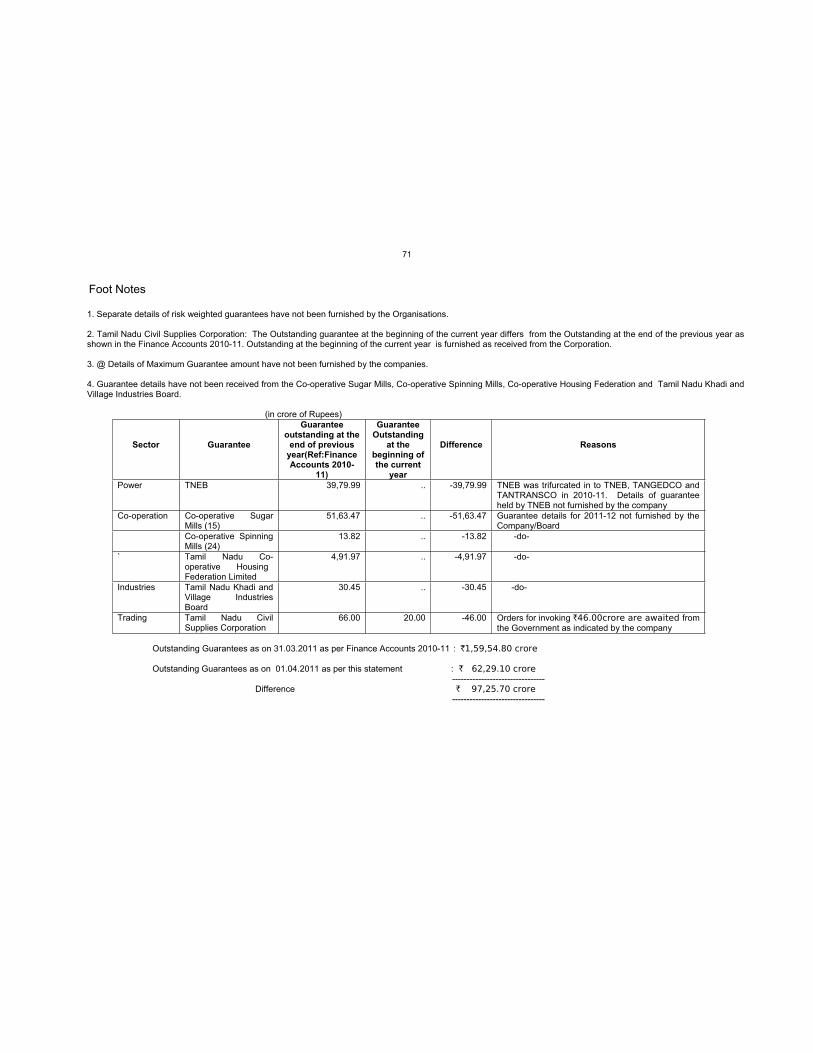
Foot Notes
1. Separate details of risk weighted guarantees have not been furnished by the Organisations.
2. Tamil Nadu Civil Supplies Corporation: The Outstanding guarantee at the beginning of the current year differs from the Outstanding at the end of the previous year as shown in the Finance Accounts 2010-11. Outstanding at the beginning of the current year is furnished as received from the Corporation.
3. @ Details of Maximum Guarantee amount have not been furnished by the companies.
4. Guarantee details have not been received from the Co-operative Sugar Mills, Co-operative Spinning Mills, Co-operative Housing Federation and Tamil Nadu Khadi and Village Industries Board.
(in crore of Rupees)
Sector Guarantee
Guarantee outstanding at the
end of previous year(Ref:Finance Accounts 2010-
11)
Guarantee Outstanding
at the beginning of the current
year
Difference Reasons
Power TNEB 39,79.99 .. -39,79.99 TNEB was trifurcated in to TNEB, TANGEDCO and TANTRANSCO in 2010-11. Details of guarantee held by TNEB not furnished by the company
Co-operation Co-operative Sugar Mills (15)
51,63.47 .. -51,63.47 Guarantee details for 2011-12 not furnished by the Company/Board
Co-operative Spinning Mills (24)
13.82 .. -13.82 -do-
` Tamil Nadu Co-operative Housing Federation Limited
4,91.97 .. -4,91.97 -do-
Industries Tamil Nadu Khadi and Village Industries Board
30.45 .. -30.45 -do-
Trading Tamil Nadu Civil Supplies Corporation
66.00 20.00 -46.00 Orders for invoking `46.00crore are awaited from the Government as indicated by the company
Outstanding Guarantees as on 31.03.2011 as per Finance Accounts 2010-11 : `1,59,54.80 crore
Outstanding Guarantees as on 01.04.2011 as per this statement : ` 62,29.10 crore
-------------------------------- Difference ` 97,25.70 crore
--------------------------------
71
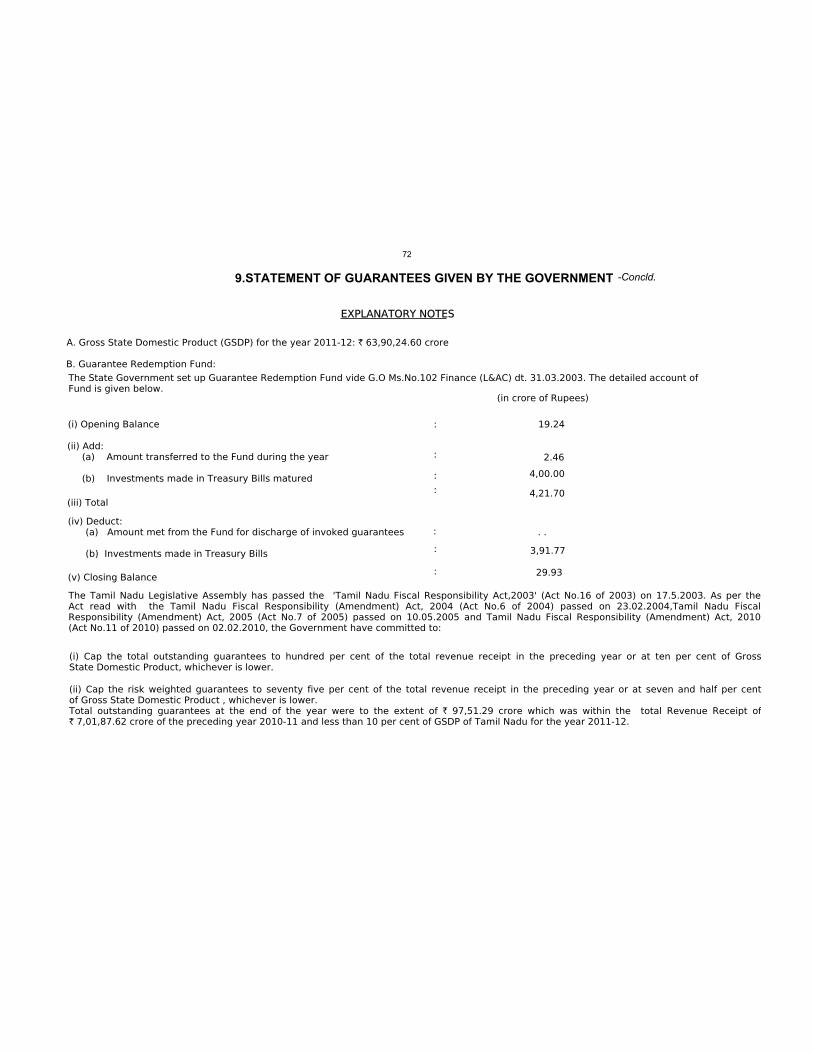
EXPLANATORY NOTES
A. Gross State Domestic Product (GSDP) for the year 2011-12: ` 63,90,24.60 crore
The State Government set up Guarantee Redemption Fund vide G.O Ms.No.102 Finance (L&AC) dt. 31.03.2003. The detailed account ofFund is given below.
(in crore of Rupees)
(i) Opening Balance : 19.24
(ii) Add: (a) Amount transferred to the Fund during the year
(b) Investments made in Treasury Bills matured
:
4,00.00
(iii) Total
:
4,21.70
(iv) Deduct: (a) Amount met from the Fund for discharge of invoked guarantees
(b) Investments made in Treasury Bills:
29.93
The Tamil Nadu Legislative Assembly has passed the 'Tamil Nadu Fiscal Responsibility Act,2003' (Act No.16 of 2003) on 17.5.2003. As per theAct read with the Tamil Nadu Fiscal Responsibility (Amendment) Act, 2004 (Act No.6 of 2004) passed on 23.02.2004,Tamil Nadu FiscalResponsibility (Amendment) Act, 2005 (Act No.7 of 2005) passed on 10.05.2005 and Tamil Nadu Fiscal Responsibility (Amendment) Act, 2010(Act No.11 of 2010) passed on 02.02.2010, the Government have committed to:
(i) Cap the total outstanding guarantees to hundred per cent of the total revenue receipt in the preceding year or at ten per cent of GrossState Domestic Product, whichever is lower.
(ii) Cap the risk weighted guarantees to seventy five per cent of the total revenue receipt in the preceding year or at seven and half per centof Gross State Domestic Product , whichever is lower.Total outstanding guarantees at the end of the year were to the extent of ` 97,51.29 crore which was within the total Revenue Receipt of` 7,01,87.62 crore of the preceding year 2010-11 and less than 10 per cent of GSDP of Tamil Nadu for the year 2011-12.
(v) Closing Balance
:
B. Guarantee Redemption Fund:
9.STATEMENT OF GUARANTEES GIVEN BY THE GOVERNMENT -Concld.
2.46
. .
3,91.77
:
:
72
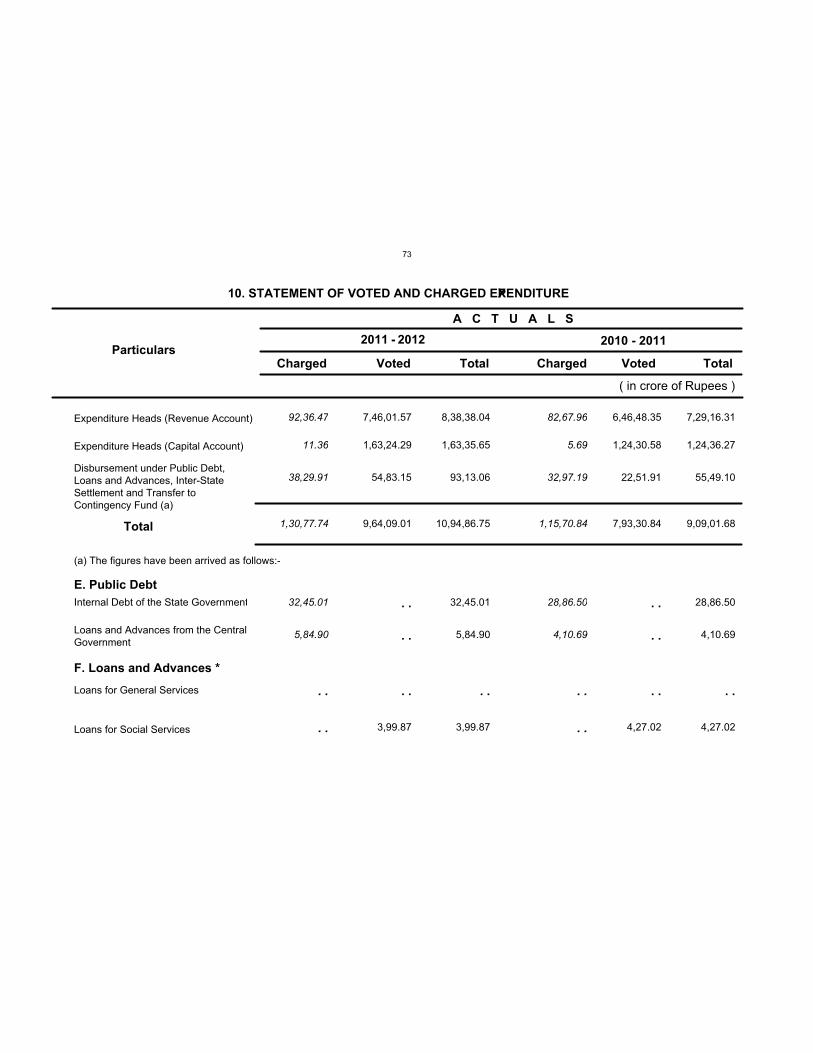
10. STATEMENT OF VOTED AND CHARGED EXPENDITURE
Particulars
A C T U A L S
Charged Voted Total Charged Voted Total
Expenditure Heads (Revenue Account)
Expenditure Heads (Capital Account)
Disbursement under Public Debt,Loans and Advances, Inter-StateSettlement and Transfer toContingency Fund (a)
Total
(a) The figures have been arrived as follows:-
E. Public Debt
Internal Debt of the State Government
Loans and Advances from the CentralGovernment
82,67.96 6,46,48.35 7,29,16.3192,36.47 7,46,01.57 8,38,38.04
5.69 1,24,30.58 1,24,36.2711.36 1,63,24.29 1,63,35.65
32,97.19 22,51.91 55,49.1038,29.91 54,83.15 93,13.06
1,15,70.84 7,93,30.84 9,09,01.68 1,30,77.74 9,64,09.01 10,94,86.75
28,86.50 . . 28,86.50 32,45.01 . . 32,45.01
4,10.69 . . 4,10.69 5,84.90 . . 5,84.90
F. Loans and Advances *
Loans for General Services
Loans for Social Services
. .. .
. . 4,27.02 4,27.02. . 3,99.87 3,99.87
. . . . . . . .
( in crore of Rupees )
2011 - 2012 2010 - 2011
73
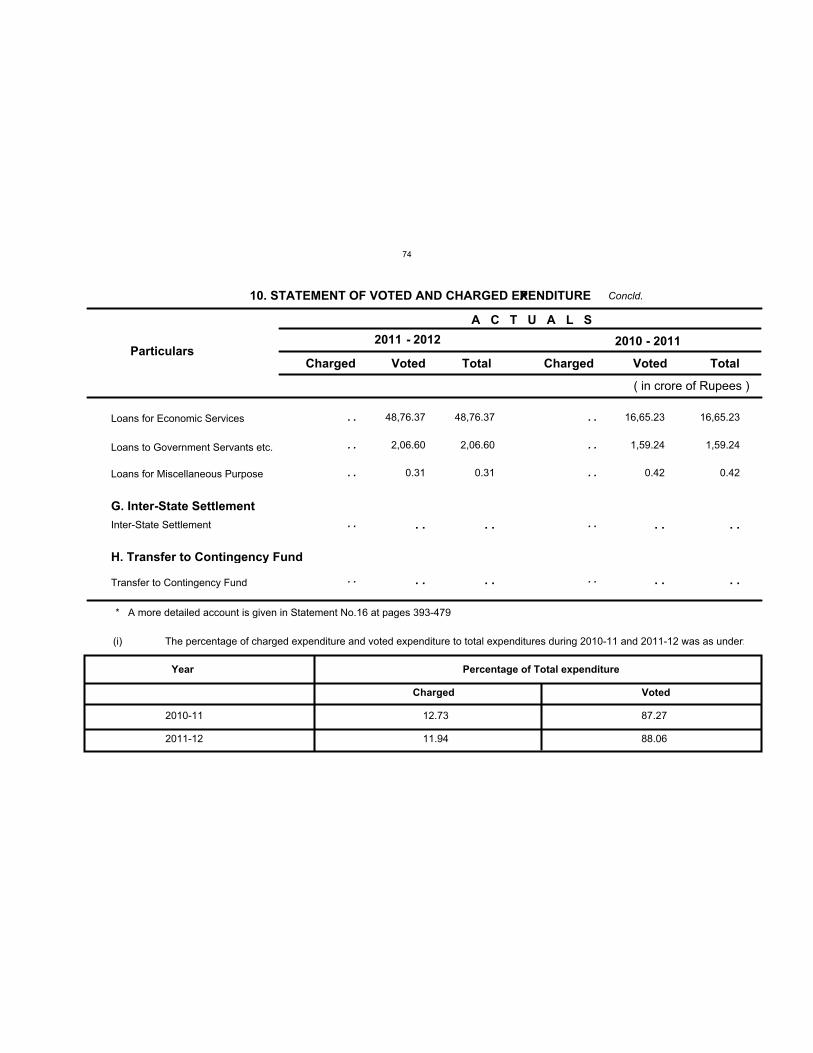
Particulars
A C T U A L S
Charged Voted Total Charged Voted Total
Loans for Economic Services
Loans to Government Servants etc.
Loans for Miscellaneous Purpose
G. Inter-State Settlement
Inter-State Settlement
H. Transfer to Contingency Fund
Transfer to Contingency Fund
* A more detailed account is given in Statement No.16 at pages 393-479
(i) The percentage of charged expenditure and voted expenditure to total expenditures during 2010-11 and 2011-12 was as under:
. . 16,65.23 16,65.23. . 48,76.37 48,76.37
. . 1,59.24 1,59.24. . 2,06.60 2,06.60
. . 0.42 0.42. . 0.31 0.31
. .. .
. .. .
Year Percentage of Total expenditure
2010-11
2011-12
Charged Voted
11.94 88.06
12.73 87.27
. . . . . . . .
. .. .. .. .
( in crore of Rupees )
2011 - 2012
10. STATEMENT OF VOTED AND CHARGED EXPENDITURE Concld.
2010 - 2011
74
Volume 2 - Part II - Detailed Statements
75
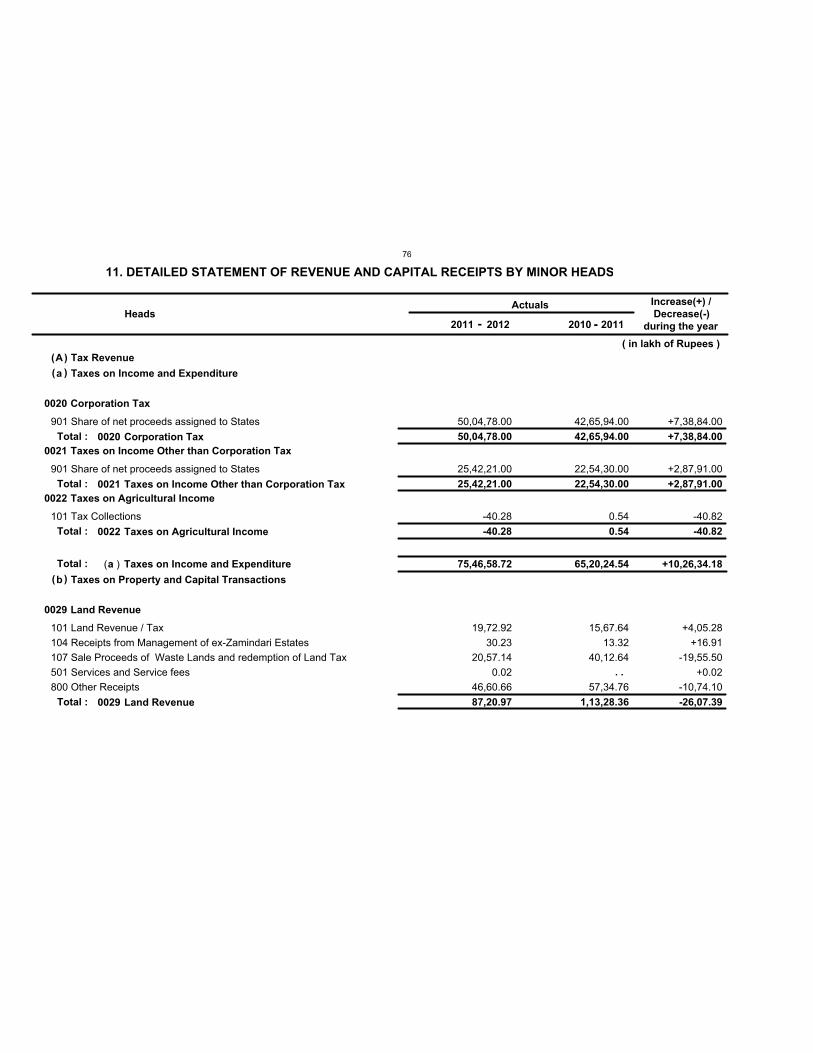
A Tax Revenue
a
b
Taxes on Income and Expenditure
Taxes on Property and Capital Transactions
75,46,58.72 65,20,24.54
0020
0021
0022
0029
Corporation Tax
Taxes on Income Other than Corporation Tax
Taxes on Agricultural Income
Land Revenue
50,04,78.00
25,42,21.00
-40.28
87,20.97
42,65,94.00
22,54,30.00
0.54
1,13,28.36
50,04,78.00
25,42,21.00
-40.28
19,72.92
30.23
20,57.14
0.02
46,60.66
42,65,94.00
22,54,30.00
0.54
15,67.64
13.32
40,12.64
57,34.76
HeadsActuals
( in lakh of Rupees )
Increase(+) /
Decrease(-)
during the year
901
901
101
101
104
107
501
800
Share of net proceeds assigned to States
Share of net proceeds assigned to States
Tax Collections
Land Revenue / Tax
Receipts from Management of ex-Zamindari Estates
Sale Proceeds of Waste Lands and redemption of Land Tax
Services and Service fees
Other Receipts
0020
0021
0022
0029
Corporation Tax
Taxes on Income Other than Corporation Tax
Taxes on Agricultural Income
Land Revenue
a Taxes on Income and Expenditure
+7,38,84.00
+2,87,91.00
-40.82
+4,05.28
+16.91
-19,55.50
+0.02
-10,74.10
+7,38,84.00
+2,87,91.00
-40.82
-26,07.39
+10,26,34.18
Total :
Total :
Total :
Total :
Total :
11. DETAILED STATEMENT OF REVENUE AND CAPITAL RECEIPTS BY MINOR HEADS
2011 - 2012 20112010 -
( )
(
(
)
)
. .
( )
76
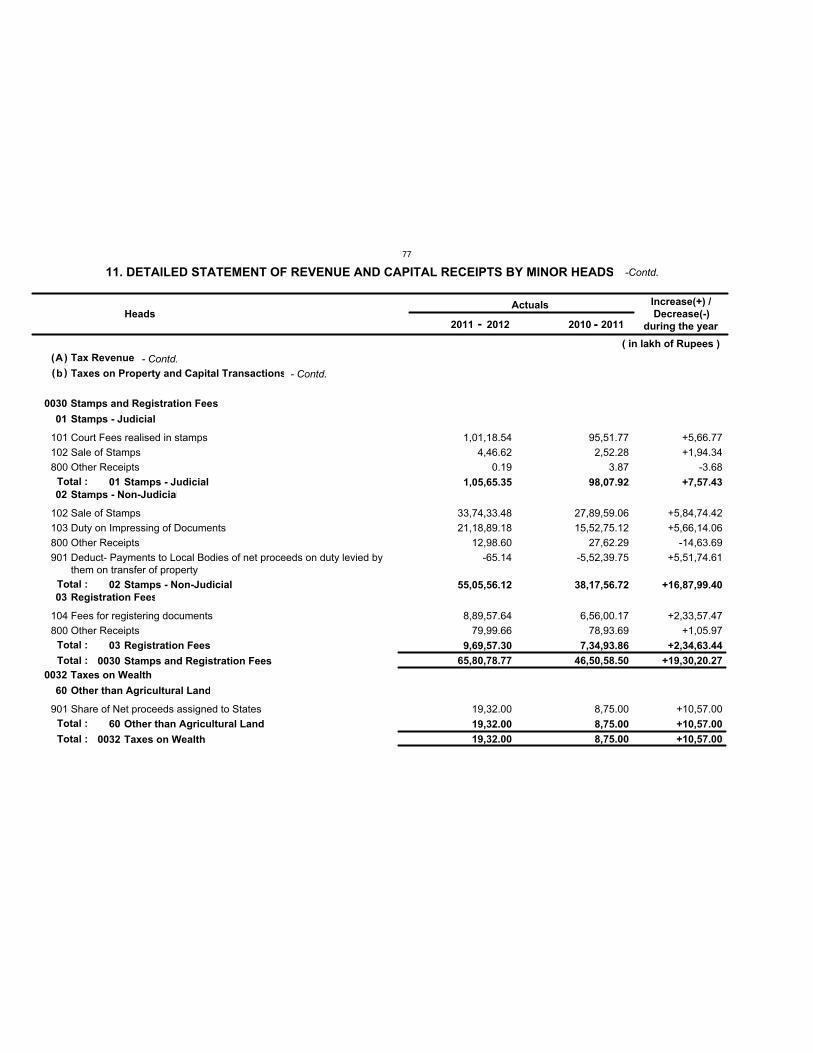
A Tax Revenue
b Taxes on Property and Capital Transactions
0030
0032
Stamps and Registration Fees
Taxes on Wealth
65,80,78.77
19,32.00
46,50,58.50
8,75.00
01
02
03
60
Stamps - Judicial
Stamps - Non-Judicial
Registration Fees
Other than Agricultural Land
1,05,65.35
55,05,56.12
9,69,57.30
19,32.00
98,07.92
38,17,56.72
7,34,93.86
8,75.00
1,01,18.54
4,46.62
0.19
33,74,33.48
21,18,89.18
12,98.60
-65.14
8,89,57.64
79,99.66
19,32.00
95,51.77
2,52.28
3.87
27,89,59.06
15,52,75.12
27,62.29
-5,52,39.75
6,56,00.17
78,93.69
8,75.00
HeadsActuals
( in lakh of Rupees )
Increase(+) /
Decrease(-)
during the year
101
102
800
102
103
800
901
104
800
901
Court Fees realised in stamps
Sale of Stamps
Other Receipts
Sale of Stamps
Duty on Impressing of Documents
Other Receipts
Deduct- Payments to Local Bodies of net proceeds on duty levied bythem on transfer of property
Fees for registering documents
Other Receipts
Share of Net proceeds assigned to States
01
02
03
60
Stamps - Judicial
Stamps - Non-Judicial
Registration Fees
Other than Agricultural Land
0030
0032
Stamps and Registration Fees
Taxes on Wealth
+5,66.77
+1,94.34
-3.68
+5,84,74.42
+5,66,14.06
-14,63.69
+5,51,74.61
+2,33,57.47
+1,05.97
+10,57.00
+7,57.43
+16,87,99.40
+2,34,63.44
+10,57.00
+19,30,20.27
+10,57.00
Total :
Total :
Total :
Total :
Total :
Total :
11. DETAILED STATEMENT OF REVENUE AND CAPITAL RECEIPTS BY MINOR HEADS
2011 - 2012 20112010 -
( )
( )
-Contd.
- Contd.
- Contd.
77
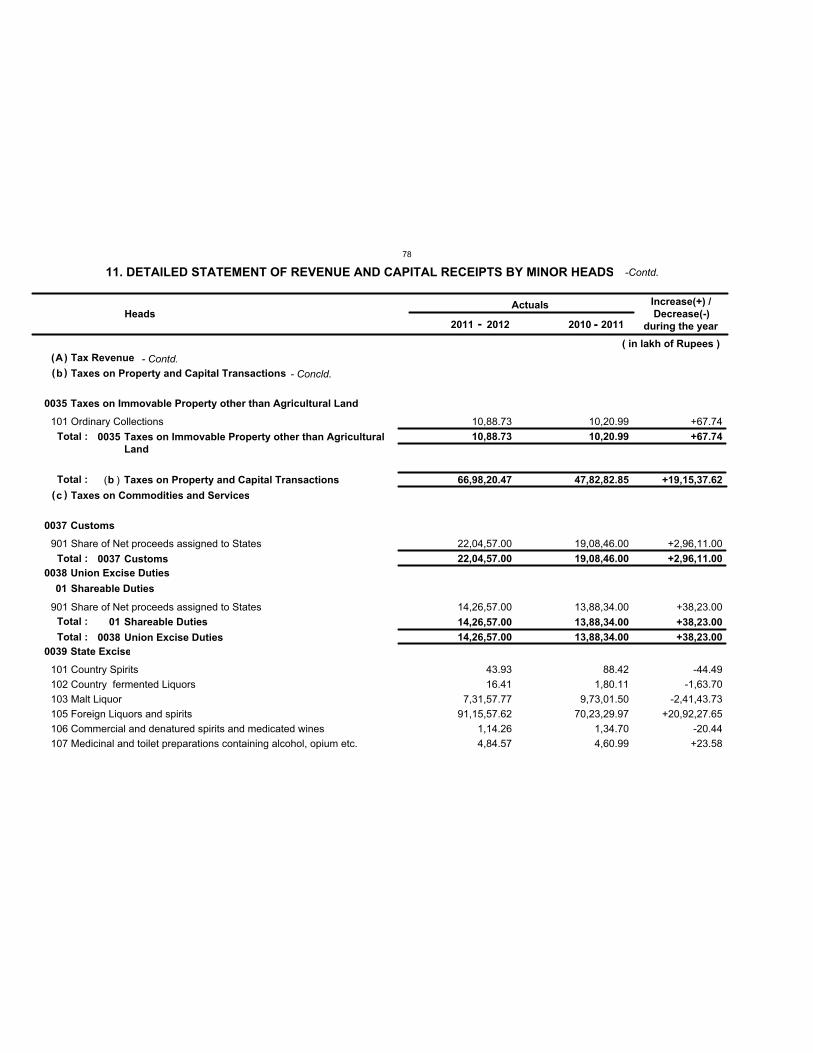
A Tax Revenue
b
c
Taxes on Property and Capital Transactions
Taxes on Commodities and Services
66,98,20.47 47,82,82.85
0035
0037
0038
0039
Taxes on Immovable Property other than Agricultural Land
Customs
Union Excise Duties
State Excise
10,88.73
22,04,57.00
14,26,57.00
10,20.99
19,08,46.00
13,88,34.00
01 Shareable Duties
14,26,57.00 13,88,34.00
10,88.73
22,04,57.00
14,26,57.00
43.93
16.41
7,31,57.77
91,15,57.62
1,14.26
4,84.57
10,20.99
19,08,46.00
13,88,34.00
88.42
1,80.11
9,73,01.50
70,23,29.97
1,34.70
4,60.99
HeadsActuals
( in lakh of Rupees )
Increase(+) /
Decrease(-)
during the year
101
901
901
101
102
103
105
106
107
Ordinary Collections
Share of Net proceeds assigned to States
Share of Net proceeds assigned to States
Country Spirits
Country fermented Liquors
Malt Liquor
Foreign Liquors and spirits
Commercial and denatured spirits and medicated wines
Medicinal and toilet preparations containing alcohol, opium etc.
01 Shareable Duties
0035
0037
0038
Taxes on Immovable Property other than Agricultural
Land
Customs
Union Excise Duties
b Taxes on Property and Capital Transactions
+67.74
+2,96,11.00
+38,23.00
-44.49
-1,63.70
-2,41,43.73
+20,92,27.65
-20.44
+23.58
+38,23.00
+67.74
+2,96,11.00
+38,23.00
+19,15,37.62
Total :
Total :
Total :
Total :
Total :
11. DETAILED STATEMENT OF REVENUE AND CAPITAL RECEIPTS BY MINOR HEADS
2011 - 2012 20112010 -
( )
(
(
)
)
-Contd.
- Contd.
- Concld.
( )
78
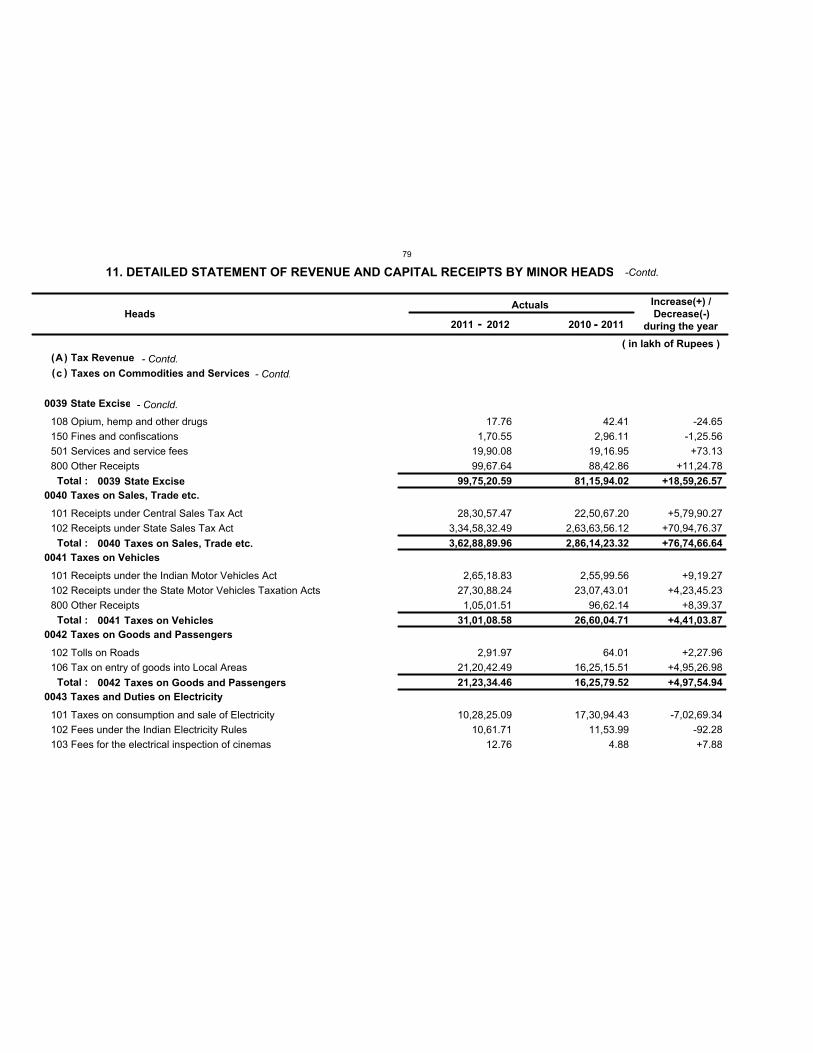
A Tax Revenue
c Taxes on Commodities and Services
0039
0040
0041
0042
0043
State Excise
Taxes on Sales, Trade etc.
Taxes on Vehicles
Taxes on Goods and Passengers
Taxes and Duties on Electricity
99,75,20.59
3,62,88,89.96
31,01,08.58
21,23,34.46
81,15,94.02
2,86,14,23.32
26,60,04.71
16,25,79.52
17.76
1,70.55
19,90.08
99,67.64
28,30,57.47
3,34,58,32.49
2,65,18.83
27,30,88.24
1,05,01.51
2,91.97
21,20,42.49
10,28,25.09
10,61.71
12.76
42.41
2,96.11
19,16.95
88,42.86
22,50,67.20
2,63,63,56.12
2,55,99.56
23,07,43.01
96,62.14
64.01
16,25,15.51
17,30,94.43
11,53.99
4.88
HeadsActuals
( in lakh of Rupees )
Increase(+) /
Decrease(-)
during the year
108
150
501
800
101
102
101
102
800
102
106
101
102
103
Opium, hemp and other drugs
Fines and confiscations
Services and service fees
Other Receipts
Receipts under Central Sales Tax Act
Receipts under State Sales Tax Act
Receipts under the Indian Motor Vehicles Act
Receipts under the State Motor Vehicles Taxation Acts
Other Receipts
Tolls on Roads
Tax on entry of goods into Local Areas
Taxes on consumption and sale of Electricity
Fees under the Indian Electricity Rules
Fees for the electrical inspection of cinemas
0039
0040
0041
0042
State Excise
Taxes on Sales, Trade etc.
Taxes on Vehicles
Taxes on Goods and Passengers
-24.65
-1,25.56
+73.13
+11,24.78
+5,79,90.27
+70,94,76.37
+9,19.27
+4,23,45.23
+8,39.37
+2,27.96
+4,95,26.98
-7,02,69.34
-92.28
+7.88
+18,59,26.57
+76,74,66.64
+4,41,03.87
+4,97,54.94
Total :
Total :
Total :
Total :
11. DETAILED STATEMENT OF REVENUE AND CAPITAL RECEIPTS BY MINOR HEADS
2011 - 2012 20112010 -
( )
( )
-Contd.
- Contd.
- Contd.
- Concld.
79
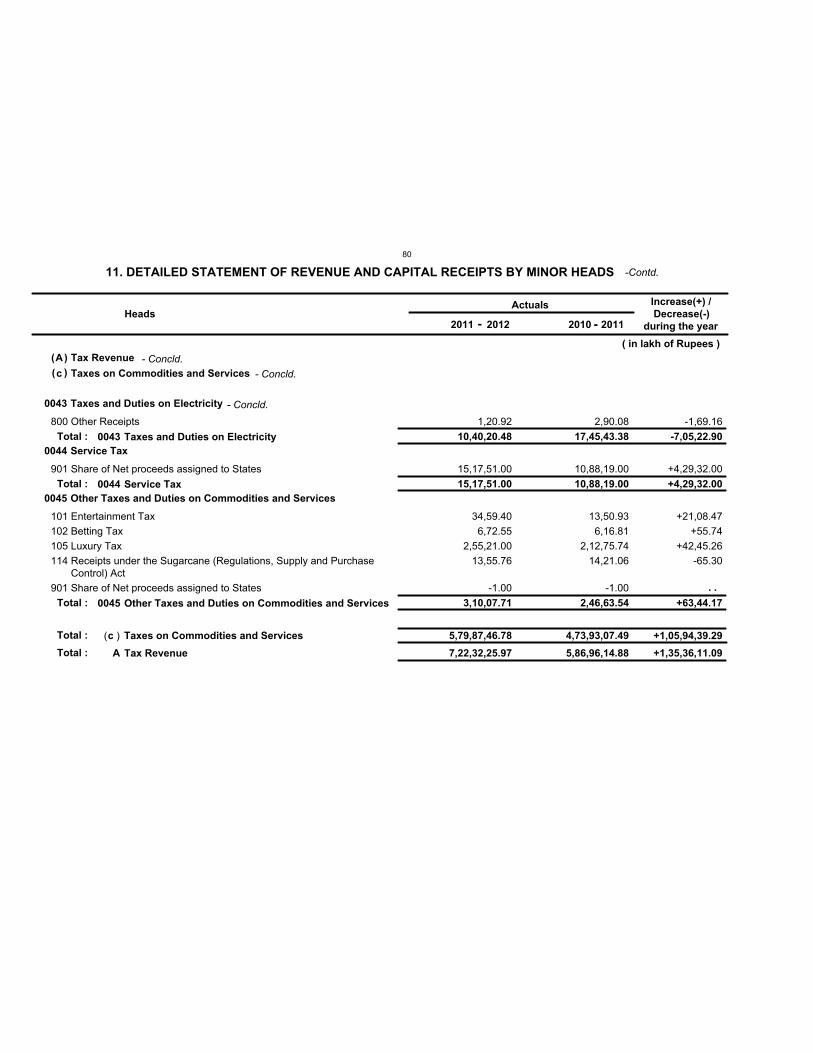
A Tax Revenue
7,22,32,25.97 5,86,96,14.88
c Taxes on Commodities and Services
5,79,87,46.78 4,73,93,07.49
0043
0044
0045
Taxes and Duties on Electricity
Service Tax
Other Taxes and Duties on Commodities and Services
10,40,20.48
15,17,51.00
3,10,07.71
17,45,43.38
10,88,19.00
2,46,63.54
1,20.92
15,17,51.00
34,59.40
6,72.55
2,55,21.00
13,55.76
-1.00
2,90.08
10,88,19.00
13,50.93
6,16.81
2,12,75.74
14,21.06
-1.00
HeadsActuals
( in lakh of Rupees )
Increase(+) /
Decrease(-)
during the year
800
901
101
102
105
114
901
Other Receipts
Share of Net proceeds assigned to States
Entertainment Tax
Betting Tax
Luxury Tax
Receipts under the Sugarcane (Regulations, Supply and PurchaseControl) Act
Share of Net proceeds assigned to States
0043
0044
0045
Taxes and Duties on Electricity
Service Tax
Other Taxes and Duties on Commodities and Services
c Taxes on Commodities and Services
A Tax Revenue
-1,69.16
+4,29,32.00
+21,08.47
+55.74
+42,45.26
-65.30
-7,05,22.90
+4,29,32.00
+63,44.17
+1,05,94,39.29
+1,35,36,11.09
Total :
Total :
Total :
Total :
Total :
11. DETAILED STATEMENT OF REVENUE AND CAPITAL RECEIPTS BY MINOR HEADS
2011 - 2012 20112010 -
( )
( )
-Contd.
- Concld.- Concld.
- Concld.
. .
( )
80
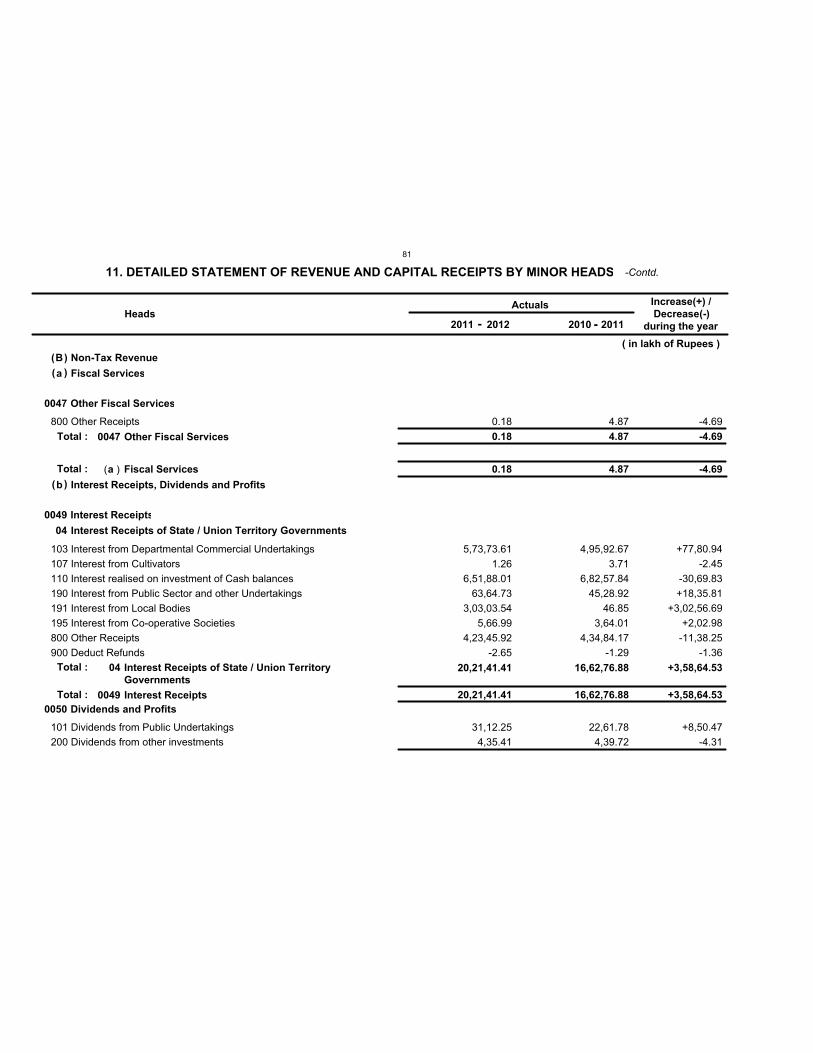
B Non-Tax Revenue
a
b
Fiscal Services
Interest Receipts, Dividends and Profits
0.18 4.87
0047
0049
0050
Other Fiscal Services
Interest Receipts
Dividends and Profits
0.18
20,21,41.41
4.87
16,62,76.88
04 Interest Receipts of State / Union Territory Governments
20,21,41.41 16,62,76.88
0.18
5,73,73.61
1.26
6,51,88.01
63,64.73
3,03,03.54
5,66.99
4,23,45.92
-2.65
31,12.25
4,35.41
4.87
4,95,92.67
3.71
6,82,57.84
45,28.92
46.85
3,64.01
4,34,84.17
-1.29
22,61.78
4,39.72
HeadsActuals
( in lakh of Rupees )
Increase(+) /
Decrease(-)
during the year
800
103
107
110
190
191
195
800
900
101
200
Other Receipts
Interest from Departmental Commercial Undertakings
Interest from Cultivators
Interest realised on investment of Cash balances
Interest from Public Sector and other Undertakings
Interest from Local Bodies
Interest from Co-operative Societies
Other Receipts
Deduct Refunds
Dividends from Public Undertakings
Dividends from other investments
04 Interest Receipts of State / Union Territory
Governments
0047
0049
Other Fiscal Services
Interest Receipts
a Fiscal Services
-4.69
+77,80.94
-2.45
-30,69.83
+18,35.81
+3,02,56.69
+2,02.98
-11,38.25
-1.36
+8,50.47
-4.31
+3,58,64.53
-4.69
+3,58,64.53
-4.69
Total :
Total :
Total :
Total :
11. DETAILED STATEMENT OF REVENUE AND CAPITAL RECEIPTS BY MINOR HEADS
2011 - 2012 20112010 -
( )
(
(
)
)
-Contd.
( )
81
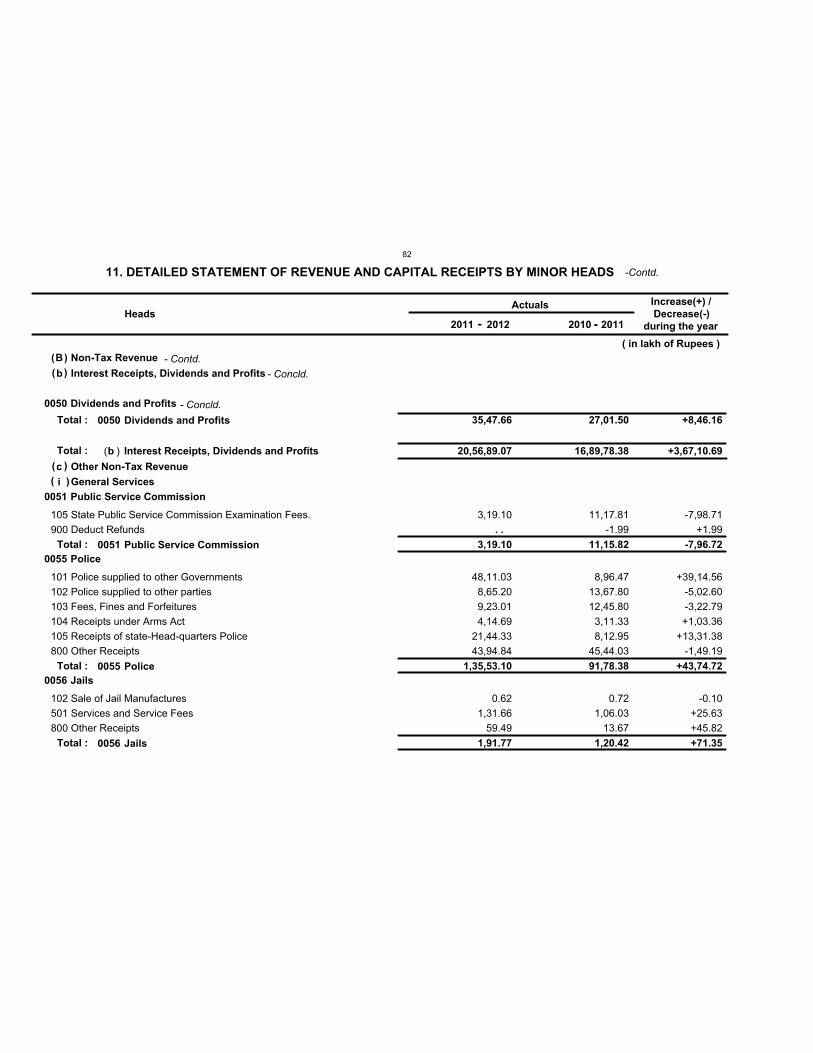
B Non-Tax Revenue
b
c
Interest Receipts, Dividends and Profits
Other Non-Tax Revenue
20,56,89.07 16,89,78.38
i General Services
0050
0051
0055
0056
Dividends and Profits
Public Service Commission
Police
Jails
35,47.66
3,19.10
1,35,53.10
1,91.77
27,01.50
11,15.82
91,78.38
1,20.42
3,19.10
48,11.03
8,65.20
9,23.01
4,14.69
21,44.33
43,94.84
0.62
1,31.66
59.49
11,17.81
-1.99
8,96.47
13,67.80
12,45.80
3,11.33
8,12.95
45,44.03
0.72
1,06.03
13.67
HeadsActuals
( in lakh of Rupees )
Increase(+) /
Decrease(-)
during the year
105
900
101
102
103
104
105
800
102
501
800
State Public Service Commission Examination Fees.
Deduct Refunds
Police supplied to other Governments
Police supplied to other parties
Fees, Fines and Forfeitures
Receipts under Arms Act
Receipts of state-Head-quarters Police
Other Receipts
Sale of Jail Manufactures
Services and Service Fees
Other Receipts
0050
0051
0055
0056
Dividends and Profits
Public Service Commission
Police
Jails
b Interest Receipts, Dividends and Profits
-7,98.71
+1.99
+39,14.56
-5,02.60
-3,22.79
+1,03.36
+13,31.38
-1,49.19
-0.10
+25.63
+45.82
+8,46.16
-7,96.72
+43,74.72
+71.35
+3,67,10.69
Total :
Total :
Total :
Total :
Total :
11. DETAILED STATEMENT OF REVENUE AND CAPITAL RECEIPTS BY MINOR HEADS
2011 - 2012 20112010 -
( )
(
(
)
)
( )
-Contd.
- Contd.
- Concld.
- Concld.
. .
( )
82
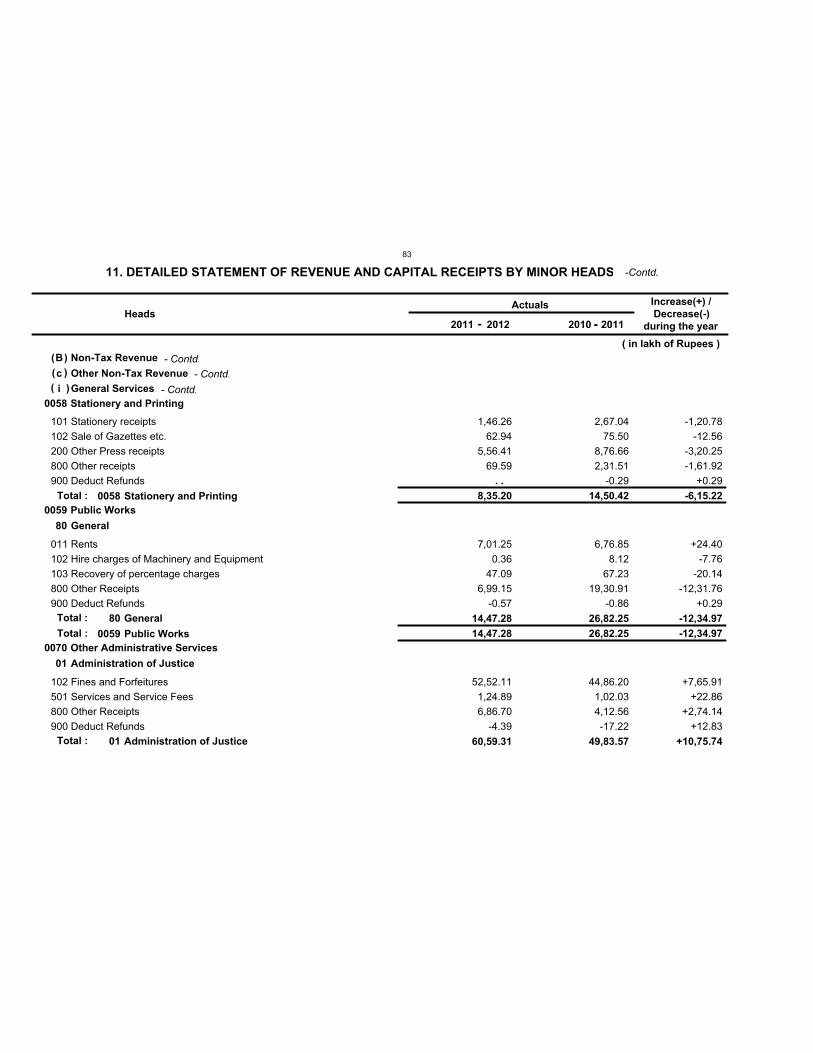
B Non-Tax Revenue
c Other Non-Tax Revenue
i General Services
0058
0059
0070
Stationery and Printing
Public Works
Other Administrative Services
8,35.20
14,47.28
14,50.42
26,82.25
80
01
General
Administration of Justice
14,47.28
60,59.31
26,82.25
49,83.57
1,46.26
62.94
5,56.41
69.59
7,01.25
0.36
47.09
6,99.15
-0.57
52,52.11
1,24.89
6,86.70
-4.39
2,67.04
75.50
8,76.66
2,31.51
-0.29
6,76.85
8.12
67.23
19,30.91
-0.86
44,86.20
1,02.03
4,12.56
-17.22
HeadsActuals
( in lakh of Rupees )
Increase(+) /
Decrease(-)
during the year
101
102
200
800
900
011
102
103
800
900
102
501
800
900
Stationery receipts
Sale of Gazettes etc.
Other Press receipts
Other receipts
Deduct Refunds
Rents
Hire charges of Machinery and Equipment
Recovery of percentage charges
Other Receipts
Deduct Refunds
Fines and Forfeitures
Services and Service Fees
Other Receipts
Deduct Refunds
80
01
General
Administration of Justice
0058
0059
Stationery and Printing
Public Works
-1,20.78
-12.56
-3,20.25
-1,61.92
+0.29
+24.40
-7.76
-20.14
-12,31.76
+0.29
+7,65.91
+22.86
+2,74.14
+12.83
-12,34.97
+10,75.74
-6,15.22
-12,34.97
Total :
Total :
Total :
Total :
11. DETAILED STATEMENT OF REVENUE AND CAPITAL RECEIPTS BY MINOR HEADS
2011 - 2012 20112010 -
( )
( )
( )
-Contd.
- Contd.
- Contd.
- Contd.
. .
83
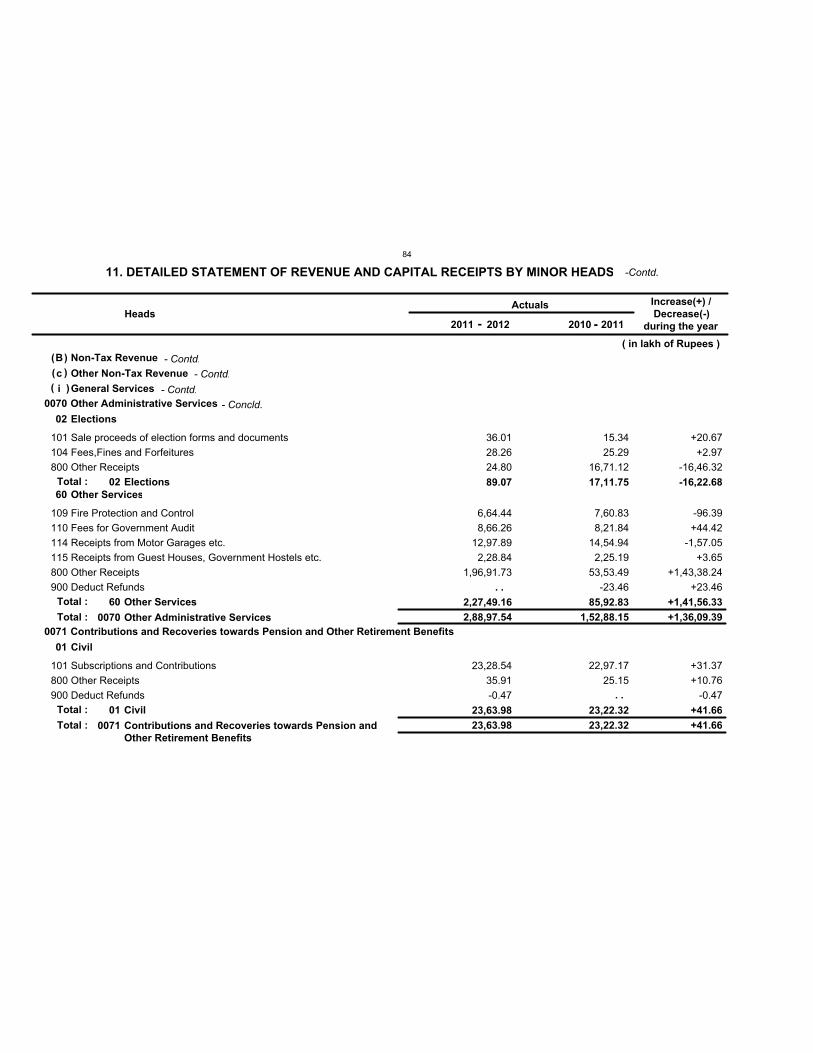
B Non-Tax Revenue
c Other Non-Tax Revenue
i General Services
0070
0071
Other Administrative Services
Contributions and Recoveries towards Pension and Other Retirement Benefits2,88,97.54
23,63.98
1,52,88.15
23,22.32
02
60
01
Elections
Other Services
Civil
89.07
2,27,49.16
23,63.98
17,11.75
85,92.83
23,22.32
36.01
28.26
24.80
6,64.44
8,66.26
12,97.89
2,28.84
1,96,91.73
23,28.54
35.91
-0.47
15.34
25.29
16,71.12
7,60.83
8,21.84
14,54.94
2,25.19
53,53.49
-23.46
22,97.17
25.15
HeadsActuals
( in lakh of Rupees )
Increase(+) /
Decrease(-)
during the year
101
104
800
109
110
114
115
800
900
101
800
900
Sale proceeds of election forms and documents
Fees,Fines and Forfeitures
Other Receipts
Fire Protection and Control
Fees for Government Audit
Receipts from Motor Garages etc.
Receipts from Guest Houses, Government Hostels etc.
Other Receipts
Deduct Refunds
Subscriptions and Contributions
Other Receipts
Deduct Refunds
02
60
01
Elections
Other Services
Civil
0070
0071
Other Administrative Services
Contributions and Recoveries towards Pension and
Other Retirement Benefits
+20.67
+2.97
-16,46.32
-96.39
+44.42
-1,57.05
+3.65
+1,43,38.24
+23.46
+31.37
+10.76
-0.47
-16,22.68
+1,41,56.33
+41.66
+1,36,09.39
+41.66
Total :
Total :
Total :
Total :
Total :
11. DETAILED STATEMENT OF REVENUE AND CAPITAL RECEIPTS BY MINOR HEADS
2011 - 2012 20112010 -
( )
( )
( )
-Contd.
- Contd.
- Contd.
- Contd.
- Concld.
. .
. .
84
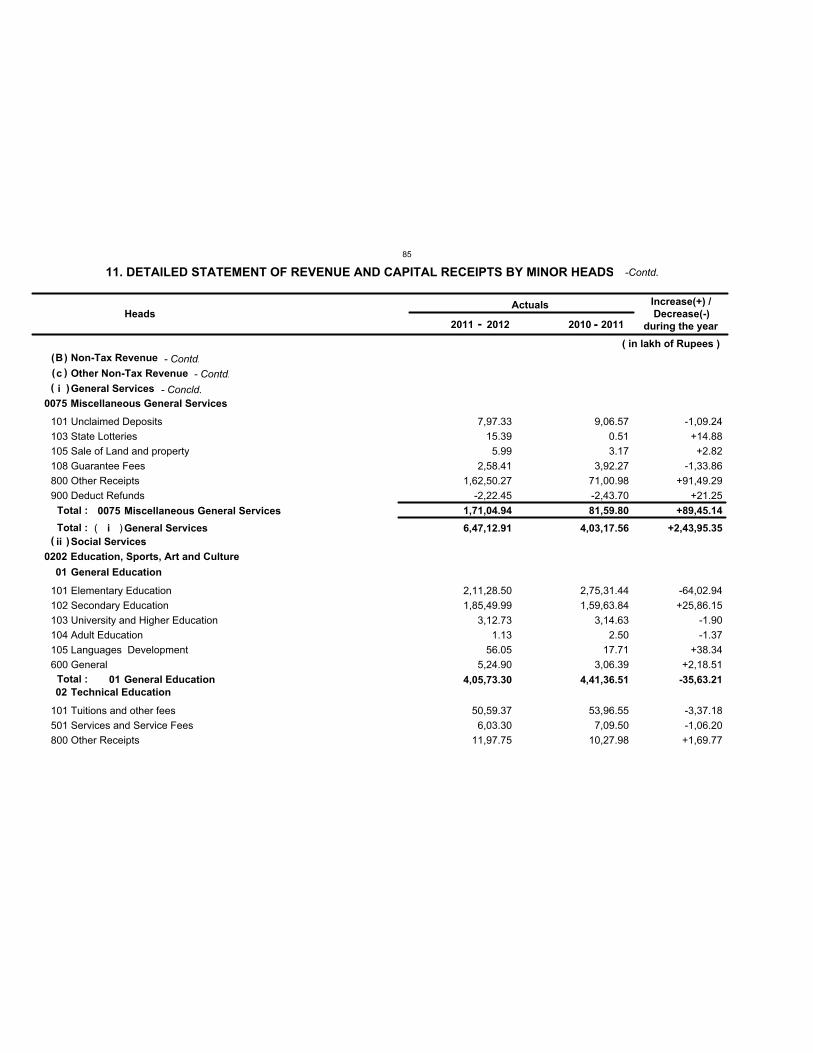
B Non-Tax Revenue
c Other Non-Tax Revenue
i
ii
General Services
Social Services
6,47,12.91 4,03,17.56
0075
0202
Miscellaneous General Services
Education, Sports, Art and Culture
1,71,04.94 81,59.80
01
02
General Education
Technical Education
4,05,73.30 4,41,36.51
7,97.33
15.39
5.99
2,58.41
1,62,50.27
-2,22.45
2,11,28.50
1,85,49.99
3,12.73
1.13
56.05
5,24.90
50,59.37
6,03.30
11,97.75
9,06.57
0.51
3.17
3,92.27
71,00.98
-2,43.70
2,75,31.44
1,59,63.84
3,14.63
2.50
17.71
3,06.39
53,96.55
7,09.50
10,27.98
HeadsActuals
( in lakh of Rupees )
Increase(+) /
Decrease(-)
during the year
101
103
105
108
800
900
101
102
103
104
105
600
101
501
800
Unclaimed Deposits
State Lotteries
Sale of Land and property
Guarantee Fees
Other Receipts
Deduct Refunds
Elementary Education
Secondary Education
University and Higher Education
Adult Education
Languages Development
General
Tuitions and other fees
Services and Service Fees
Other Receipts
01 General Education
0075 Miscellaneous General Services
i General Services
-1,09.24
+14.88
+2.82
-1,33.86
+91,49.29
+21.25
-64,02.94
+25,86.15
-1.90
-1.37
+38.34
+2,18.51
-3,37.18
-1,06.20
+1,69.77
-35,63.21
+89,45.14
+2,43,95.35
Total :
Total :
Total :
11. DETAILED STATEMENT OF REVENUE AND CAPITAL RECEIPTS BY MINOR HEADS
2011 - 2012 20112010 -
( )
( )
(
(
)
)
-Contd.
- Contd.
- Contd.
- Concld.
( )
85
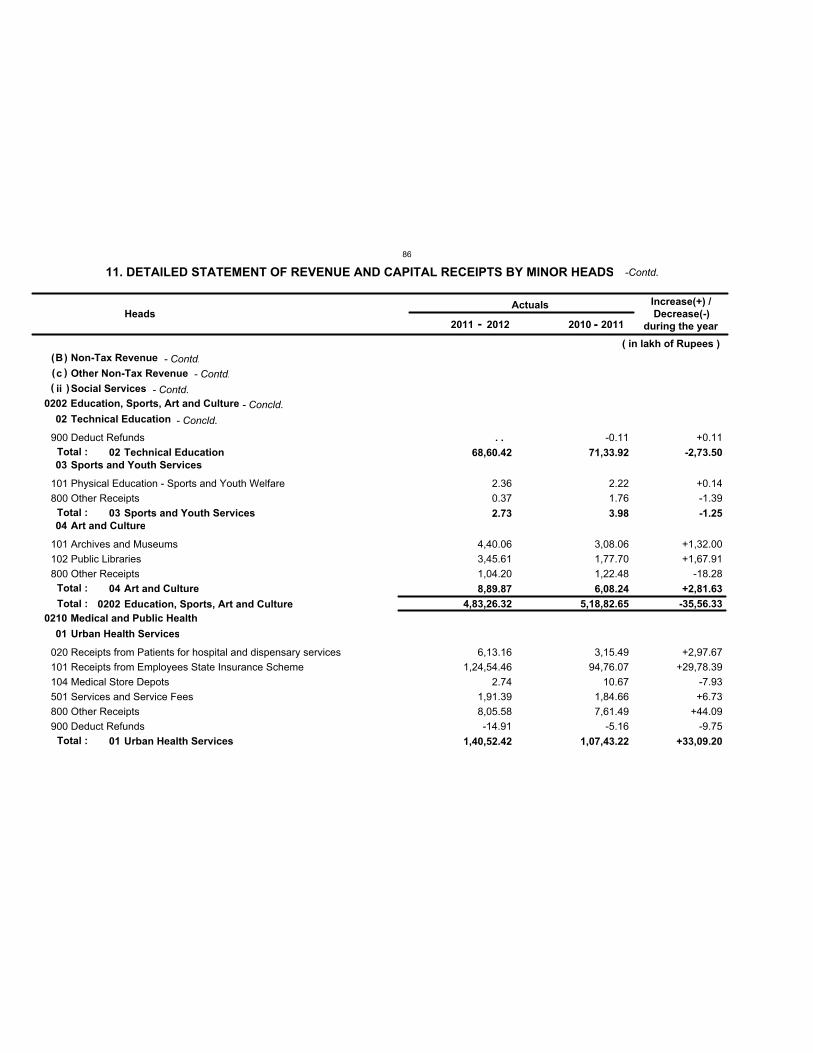
B Non-Tax Revenue
c Other Non-Tax Revenue
ii Social Services
0202
0210
Education, Sports, Art and Culture
Medical and Public Health
4,83,26.32 5,18,82.65
02
03
04
01
Technical Education
Sports and Youth Services
Art and Culture
Urban Health Services
68,60.42
2.73
8,89.87
1,40,52.42
71,33.92
3.98
6,08.24
1,07,43.22
2.36
0.37
4,40.06
3,45.61
1,04.20
6,13.16
1,24,54.46
2.74
1,91.39
8,05.58
-14.91
-0.11
2.22
1.76
3,08.06
1,77.70
1,22.48
3,15.49
94,76.07
10.67
1,84.66
7,61.49
-5.16
HeadsActuals
( in lakh of Rupees )
Increase(+) /
Decrease(-)
during the year
900
101
800
101
102
800
020
101
104
501
800
900
Deduct Refunds
Physical Education - Sports and Youth Welfare
Other Receipts
Archives and Museums
Public Libraries
Other Receipts
Receipts from Patients for hospital and dispensary services
Receipts from Employees State Insurance Scheme
Medical Store Depots
Services and Service Fees
Other Receipts
Deduct Refunds
02
03
04
01
Technical Education
Sports and Youth Services
Art and Culture
Urban Health Services
0202 Education, Sports, Art and Culture
+0.11
+0.14
-1.39
+1,32.00
+1,67.91
-18.28
+2,97.67
+29,78.39
-7.93
+6.73
+44.09
-9.75
-2,73.50
-1.25
+2,81.63
+33,09.20
-35,56.33
Total :
Total :
Total :
Total :
Total :
11. DETAILED STATEMENT OF REVENUE AND CAPITAL RECEIPTS BY MINOR HEADS
2011 - 2012 20112010 -
( )
( )
( )
-Contd.
- Contd.
- Contd.
- Contd.
- Concld.
- Concld.
. .
86
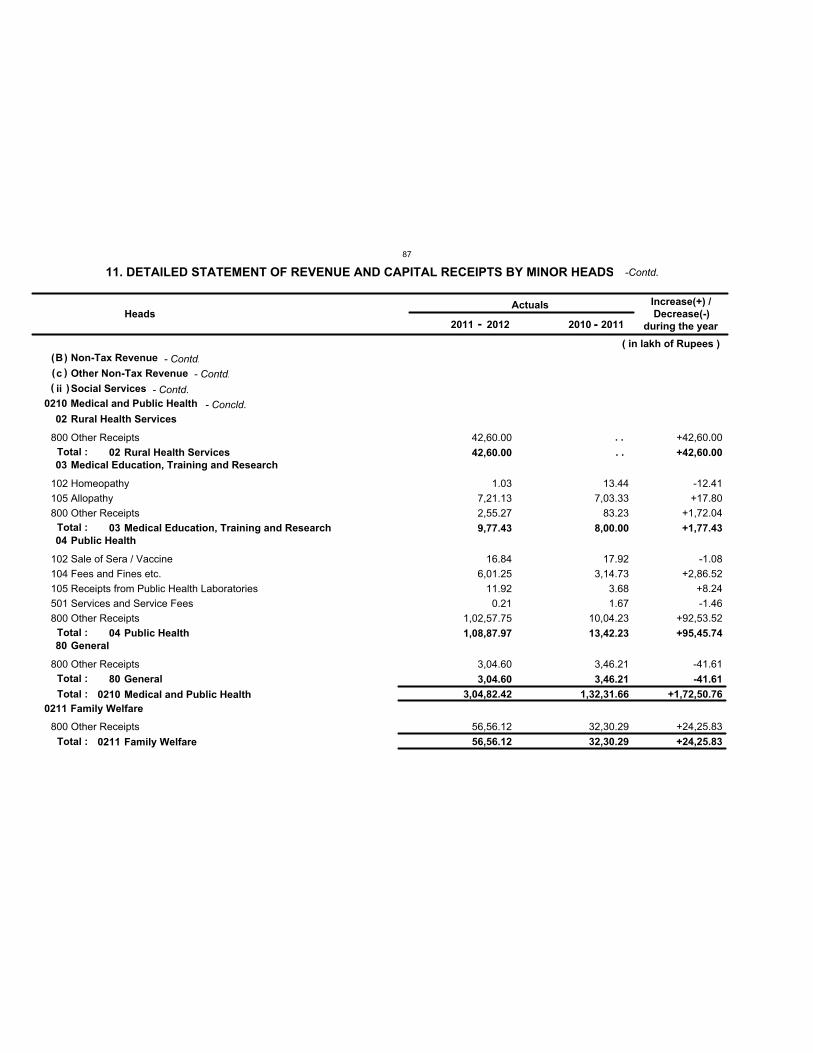
B Non-Tax Revenue
c Other Non-Tax Revenue
ii Social Services
0210
0211
Medical and Public Health
Family Welfare
3,04,82.42
56,56.12
1,32,31.66
32,30.29
02
03
04
80
Rural Health Services
Medical Education, Training and Research
Public Health
General
42,60.00
9,77.43
1,08,87.97
3,04.60
8,00.00
13,42.23
3,46.21
42,60.00
1.03
7,21.13
2,55.27
16.84
6,01.25
11.92
0.21
1,02,57.75
3,04.60
56,56.12
13.44
7,03.33
83.23
17.92
3,14.73
3.68
1.67
10,04.23
3,46.21
32,30.29
HeadsActuals
( in lakh of Rupees )
Increase(+) /
Decrease(-)
during the year
800
102
105
800
102
104
105
501
800
800
800
Other Receipts
Homeopathy
Allopathy
Other Receipts
Sale of Sera / Vaccine
Fees and Fines etc.
Receipts from Public Health Laboratories
Services and Service Fees
Other Receipts
Other Receipts
Other Receipts
02
03
04
80
Rural Health Services
Medical Education, Training and Research
Public Health
General
0210
0211
Medical and Public Health
Family Welfare
+42,60.00
-12.41
+17.80
+1,72.04
-1.08
+2,86.52
+8.24
-1.46
+92,53.52
-41.61
+24,25.83
+42,60.00
+1,77.43
+95,45.74
-41.61
+1,72,50.76
+24,25.83
Total :
Total :
Total :
Total :
Total :
Total :
11. DETAILED STATEMENT OF REVENUE AND CAPITAL RECEIPTS BY MINOR HEADS
2011 - 2012 20112010 -
( )
( )
( )
-Contd.
- Contd.
- Contd.
- Contd.
- Concld.
. .
. .
87
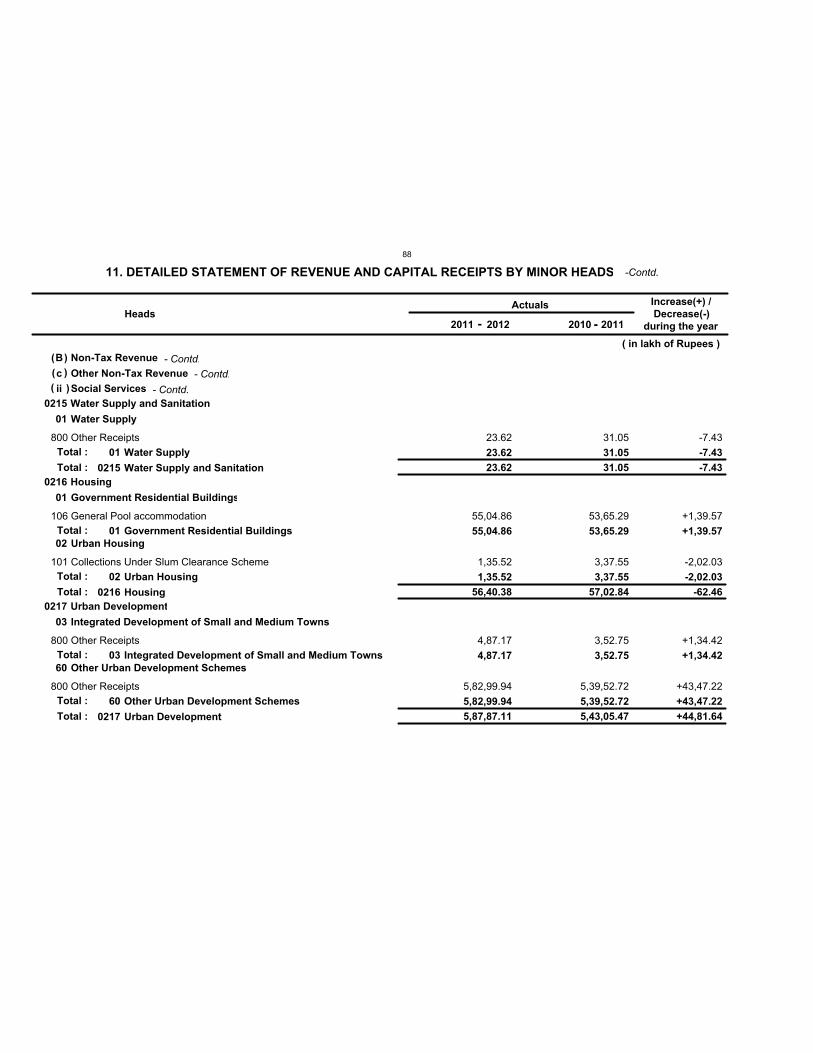
B Non-Tax Revenue
c Other Non-Tax Revenue
ii Social Services
0215
0216
0217
Water Supply and Sanitation
Housing
Urban Development
23.62
56,40.38
5,87,87.11
31.05
57,02.84
5,43,05.47
01
01
02
03
60
Water Supply
Government Residential Buildings
Urban Housing
Integrated Development of Small and Medium Towns
Other Urban Development Schemes
23.62
55,04.86
1,35.52
4,87.17
5,82,99.94
31.05
53,65.29
3,37.55
3,52.75
5,39,52.72
23.62
55,04.86
1,35.52
4,87.17
5,82,99.94
31.05
53,65.29
3,37.55
3,52.75
5,39,52.72
HeadsActuals
( in lakh of Rupees )
Increase(+) /
Decrease(-)
during the year
800
106
101
800
800
Other Receipts
General Pool accommodation
Collections Under Slum Clearance Scheme
Other Receipts
Other Receipts
01
01
02
03
60
Water Supply
Government Residential Buildings
Urban Housing
Integrated Development of Small and Medium Towns
Other Urban Development Schemes
0215
0216
0217
Water Supply and Sanitation
Housing
Urban Development
-7.43
+1,39.57
-2,02.03
+1,34.42
+43,47.22
-7.43
+1,39.57
-2,02.03
+1,34.42
+43,47.22
-7.43
-62.46
+44,81.64
Total :
Total :
Total :
Total :
Total :
Total :
Total :
Total :
11. DETAILED STATEMENT OF REVENUE AND CAPITAL RECEIPTS BY MINOR HEADS
2011 - 2012 20112010 -
( )
( )
( )
-Contd.
- Contd.
- Contd.
- Contd.
88
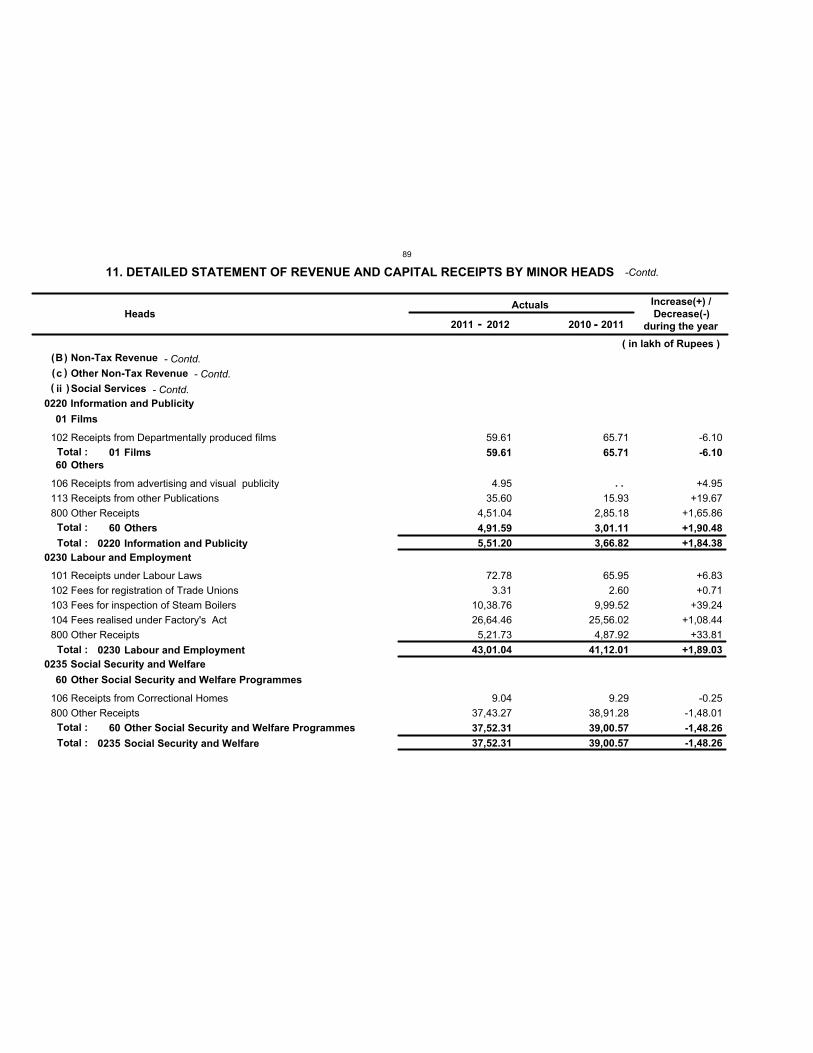
B Non-Tax Revenue
c Other Non-Tax Revenue
ii Social Services
0220
0230
0235
Information and Publicity
Labour and Employment
Social Security and Welfare
5,51.20
43,01.04
37,52.31
3,66.82
41,12.01
39,00.57
01
60
60
Films
Others
Other Social Security and Welfare Programmes
59.61
4,91.59
37,52.31
65.71
3,01.11
39,00.57
59.61
4.95
35.60
4,51.04
72.78
3.31
10,38.76
26,64.46
5,21.73
9.04
37,43.27
65.71
15.93
2,85.18
65.95
2.60
9,99.52
25,56.02
4,87.92
9.29
38,91.28
HeadsActuals
( in lakh of Rupees )
Increase(+) /
Decrease(-)
during the year
102
106
113
800
101
102
103
104
800
106
800
Receipts from Departmentally produced films
Receipts from advertising and visual publicity
Receipts from other Publications
Other Receipts
Receipts under Labour Laws
Fees for registration of Trade Unions
Fees for inspection of Steam Boilers
Fees realised under Factory's Act
Other Receipts
Receipts from Correctional Homes
Other Receipts
01
60
60
Films
Others
Other Social Security and Welfare Programmes
0220
0230
0235
Information and Publicity
Labour and Employment
Social Security and Welfare
-6.10
+4.95
+19.67
+1,65.86
+6.83
+0.71
+39.24
+1,08.44
+33.81
-0.25
-1,48.01
-6.10
+1,90.48
-1,48.26
+1,84.38
+1,89.03
-1,48.26
Total :
Total :
Total :
Total :
Total :
Total :
11. DETAILED STATEMENT OF REVENUE AND CAPITAL RECEIPTS BY MINOR HEADS
2011 - 2012 20112010 -
( )
( )
( )
-Contd.
- Contd.
- Contd.
- Contd.
. .
89
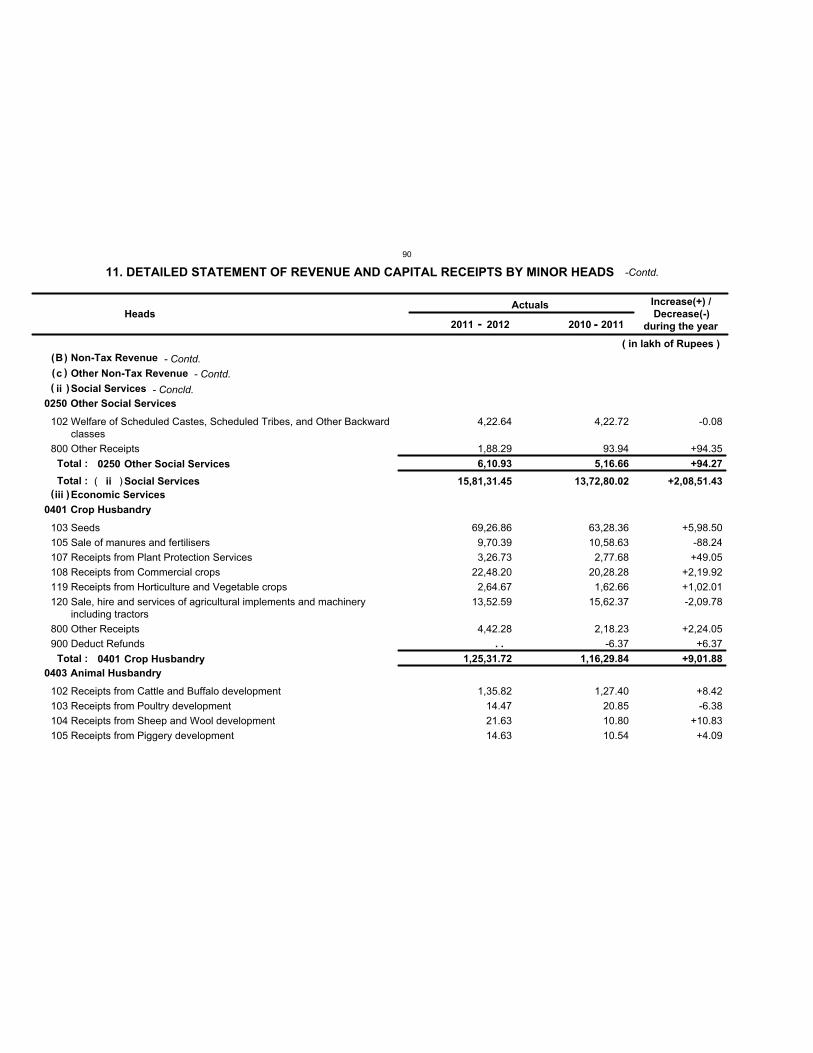
B Non-Tax Revenue
c Other Non-Tax Revenue
ii
iii
Social Services
Economic Services 15,81,31.45 13,72,80.02
0250
0401
0403
Other Social Services
Crop Husbandry
Animal Husbandry
6,10.93
1,25,31.72
5,16.66
1,16,29.84
4,22.64
1,88.29
69,26.86
9,70.39
3,26.73
22,48.20
2,64.67
13,52.59
4,42.28
1,35.82
14.47
21.63
14.63
4,22.72
93.94
63,28.36
10,58.63
2,77.68
20,28.28
1,62.66
15,62.37
2,18.23
-6.37
1,27.40
20.85
10.80
10.54
HeadsActuals
( in lakh of Rupees )
Increase(+) /
Decrease(-)
during the year
102
800
103
105
107
108
119
120
800
900
102
103
104
105
Welfare of Scheduled Castes, Scheduled Tribes, and Other Backwardclasses
Other Receipts
Seeds
Sale of manures and fertilisers
Receipts from Plant Protection Services
Receipts from Commercial crops
Receipts from Horticulture and Vegetable crops
Sale, hire and services of agricultural implements and machineryincluding tractors
Other Receipts
Deduct Refunds
Receipts from Cattle and Buffalo development
Receipts from Poultry development
Receipts from Sheep and Wool development
Receipts from Piggery development
0250
0401
Other Social Services
Crop Husbandry
ii Social Services
-0.08
+94.35
+5,98.50
-88.24
+49.05
+2,19.92
+1,02.01
-2,09.78
+2,24.05
+6.37
+8.42
-6.38
+10.83
+4.09
+94.27
+9,01.88
+2,08,51.43
Total :
Total :
Total :
11. DETAILED STATEMENT OF REVENUE AND CAPITAL RECEIPTS BY MINOR HEADS
2011 - 2012 20112010 -
( )
( )
(
(
)
)
-Contd.
- Contd.
- Contd.
- Concld.
. .
( )
90
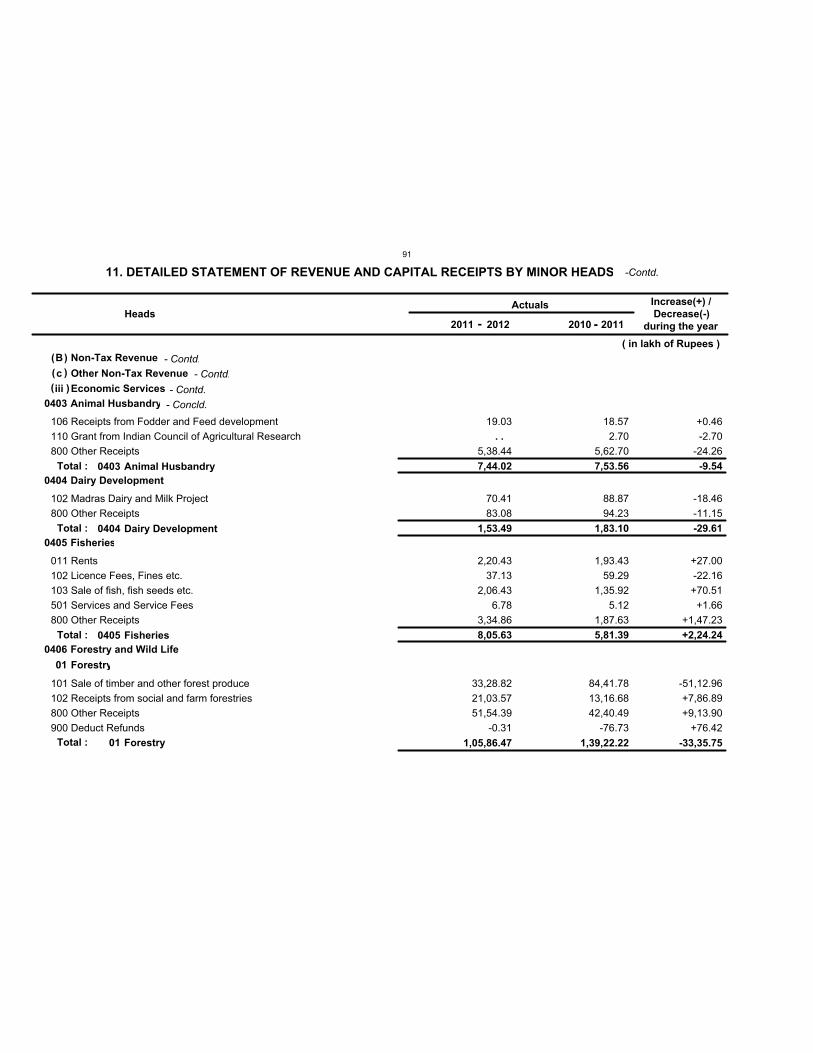
B Non-Tax Revenue
c Other Non-Tax Revenue
iii Economic Services0403
0404
0405
0406
Animal Husbandry
Dairy Development
Fisheries
Forestry and Wild Life
7,44.02
1,53.49
8,05.63
7,53.56
1,83.10
5,81.39
01 Forestry
1,05,86.47 1,39,22.22
19.03
5,38.44
70.41
83.08
2,20.43
37.13
2,06.43
6.78
3,34.86
33,28.82
21,03.57
51,54.39
-0.31
18.57
2.70
5,62.70
88.87
94.23
1,93.43
59.29
1,35.92
5.12
1,87.63
84,41.78
13,16.68
42,40.49
-76.73
HeadsActuals
( in lakh of Rupees )
Increase(+) /
Decrease(-)
during the year
106
110
800
102
800
011
102
103
501
800
101
102
800
900
Receipts from Fodder and Feed development
Grant from Indian Council of Agricultural Research
Other Receipts
Madras Dairy and Milk Project
Other Receipts
Rents
Licence Fees, Fines etc.
Sale of fish, fish seeds etc.
Services and Service Fees
Other Receipts
Sale of timber and other forest produce
Receipts from social and farm forestries
Other Receipts
Deduct Refunds
01 Forestry
0403
0404
0405
Animal Husbandry
Dairy Development
Fisheries
+0.46
-2.70
-24.26
-18.46
-11.15
+27.00
-22.16
+70.51
+1.66
+1,47.23
-51,12.96
+7,86.89
+9,13.90
+76.42
-33,35.75
-9.54
-29.61
+2,24.24
Total :
Total :
Total :
Total :
11. DETAILED STATEMENT OF REVENUE AND CAPITAL RECEIPTS BY MINOR HEADS
2011 - 2012 20112010 -
( )
( )
( )
-Contd.
- Contd.
- Contd.
- Contd.
- Concld.
. .
91
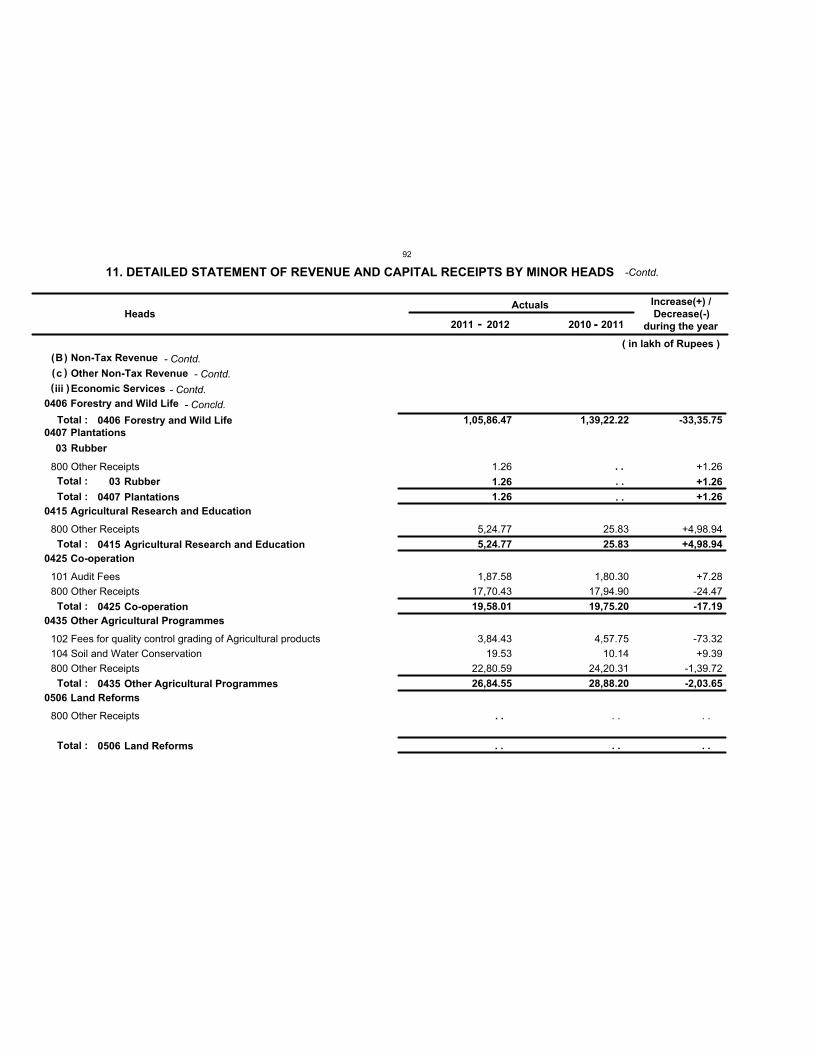
B Non-Tax Revenue
c Other Non-Tax Revenue
iii Economic Services0406
0407
0415
0425
0435
0506
Forestry and Wild Life
Plantations
Agricultural Research and Education
Co-operation
Other Agricultural Programmes
Land Reforms
1,05,86.47
1.26
5,24.77
19,58.01
26,84.55
. .
1,39,22.22
25.83
19,75.20
28,88.20
. .
03 Rubber
1.26
1.26
5,24.77
1,87.58
17,70.43
3,84.43
19.53
22,80.59
25.83
1,80.30
17,94.90
4,57.75
10.14
24,20.31
. .
HeadsActuals
( in lakh of Rupees )
Increase(+) /
Decrease(-)
during the year
800
800
101
800
102
104
800
800
Other Receipts
Other Receipts
Audit Fees
Other Receipts
Fees for quality control grading of Agricultural products
Soil and Water Conservation
Other Receipts
Other Receipts
03 Rubber
0406
0407
0415
0425
0435
0506
Forestry and Wild Life
Plantations
Agricultural Research and Education
Co-operation
Other Agricultural Programmes
Land Reforms
+1.26
+4,98.94
+7.28
-24.47
-73.32
+9.39
-1,39.72
. .
+1.26
-33,35.75
+1.26
+4,98.94
-17.19
-2,03.65
. .
Total :
Total :
Total :
Total :
Total :
Total :
Total :
11. DETAILED STATEMENT OF REVENUE AND CAPITAL RECEIPTS BY MINOR HEADS
2011 - 2012 20112010 -
( )
( )
( )
-Contd.
- Contd.
- Contd.
- Contd.
- Concld.
. .
. .
. .
. .
92
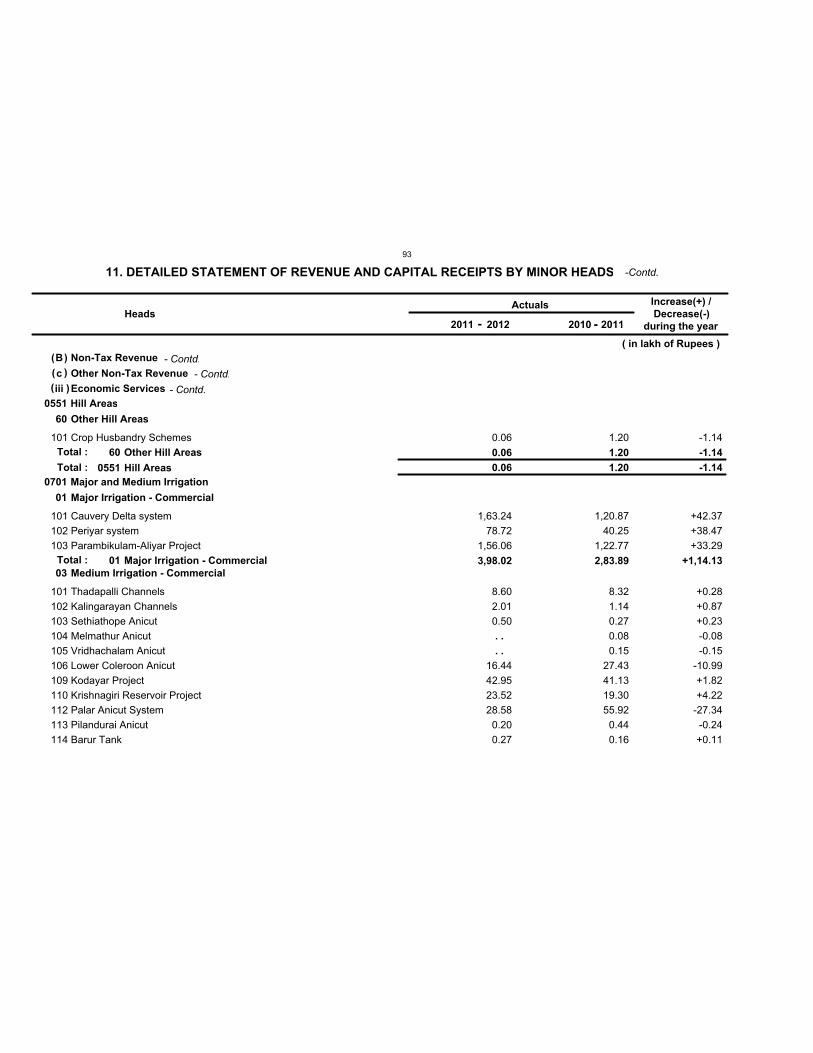
B Non-Tax Revenue
c Other Non-Tax Revenue
iii Economic Services0551
0701
Hill Areas
Major and Medium Irrigation
0.06 1.20
60
01
03
Other Hill Areas
Major Irrigation - Commercial
Medium Irrigation - Commercial
0.06
3,98.02
1.20
2,83.89
0.06
1,63.24
78.72
1,56.06
8.60
2.01
0.50
16.44
42.95
23.52
28.58
0.20
0.27
1.20
1,20.87
40.25
1,22.77
8.32
1.14
0.27
0.08
0.15
27.43
41.13
19.30
55.92
0.44
0.16
HeadsActuals
( in lakh of Rupees )
Increase(+) /
Decrease(-)
during the year
101
101
102
103
101
102
103
104
105
106
109
110
112
113
114
Crop Husbandry Schemes
Cauvery Delta system
Periyar system
Parambikulam-Aliyar Project
Thadapalli Channels
Kalingarayan Channels
Sethiathope Anicut
Melmathur Anicut
Vridhachalam Anicut
Lower Coleroon Anicut
Kodayar Project
Krishnagiri Reservoir Project
Palar Anicut System
Pilandurai Anicut
Barur Tank
60
01
Other Hill Areas
Major Irrigation - Commercial
0551 Hill Areas
-1.14
+42.37
+38.47
+33.29
+0.28
+0.87
+0.23
-0.08
-0.15
-10.99
+1.82
+4.22
-27.34
-0.24
+0.11
-1.14
+1,14.13
-1.14
Total :
Total :
Total :
11. DETAILED STATEMENT OF REVENUE AND CAPITAL RECEIPTS BY MINOR HEADS
2011 - 2012 20112010 -
( )
( )
( )
-Contd.
- Contd.
- Contd.
- Contd.
. .
. .
93
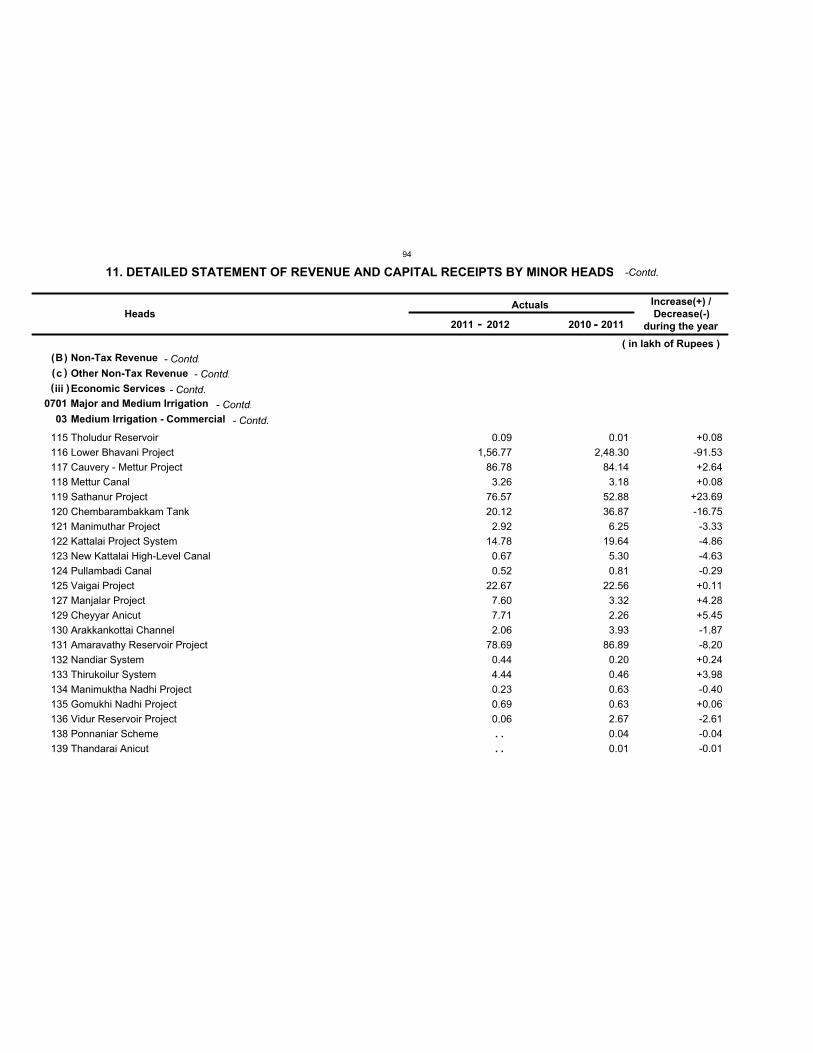
B Non-Tax Revenue
c Other Non-Tax Revenue
iii Economic Services0701 Major and Medium Irrigation
03 Medium Irrigation - Commercial
0.09
1,56.77
86.78
3.26
76.57
20.12
2.92
14.78
0.67
0.52
22.67
7.60
7.71
2.06
78.69
0.44
4.44
0.23
0.69
0.06
0.01
2,48.30
84.14
3.18
52.88
36.87
6.25
19.64
5.30
0.81
22.56
3.32
2.26
3.93
86.89
0.20
0.46
0.63
0.63
2.67
0.04
0.01
HeadsActuals
( in lakh of Rupees )
Increase(+) /
Decrease(-)
during the year
115
116
117
118
119
120
121
122
123
124
125
127
129
130
131
132
133
134
135
136
138
139
Tholudur Reservoir
Lower Bhavani Project
Cauvery - Mettur Project
Mettur Canal
Sathanur Project
Chembarambakkam Tank
Manimuthar Project
Kattalai Project System
New Kattalai High-Level Canal
Pullambadi Canal
Vaigai Project
Manjalar Project
Cheyyar Anicut
Arakkankottai Channel
Amaravathy Reservoir Project
Nandiar System
Thirukoilur System
Manimuktha Nadhi Project
Gomukhi Nadhi Project
Vidur Reservoir Project
Ponnaniar Scheme
Thandarai Anicut
+0.08
-91.53
+2.64
+0.08
+23.69
-16.75
-3.33
-4.86
-4.63
-0.29
+0.11
+4.28
+5.45
-1.87
-8.20
+0.24
+3.98
-0.40
+0.06
-2.61
-0.04
-0.01
11. DETAILED STATEMENT OF REVENUE AND CAPITAL RECEIPTS BY MINOR HEADS
2011 - 2012 20112010 -
( )
( )
( )
-Contd.
- Contd.
- Contd.
- Contd.
- Contd.
- Contd.
. .
. .
94
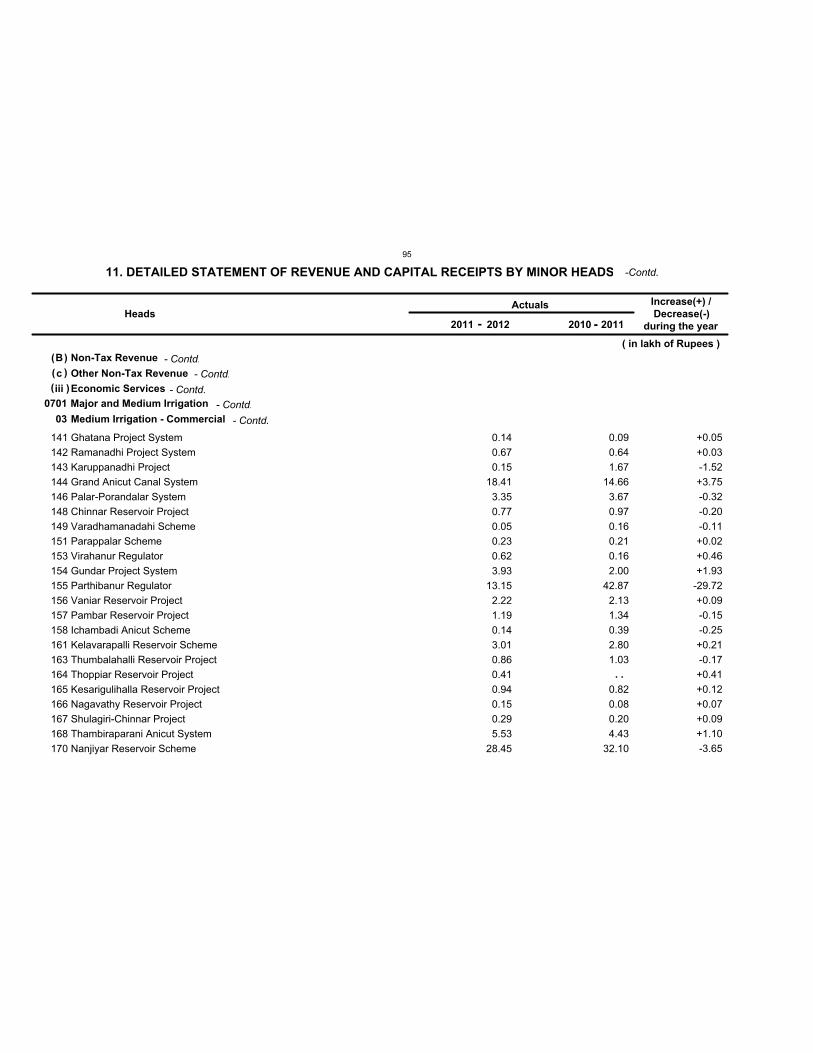
B Non-Tax Revenue
c Other Non-Tax Revenue
iii Economic Services0701 Major and Medium Irrigation
03 Medium Irrigation - Commercial
0.14
0.67
0.15
18.41
3.35
0.77
0.05
0.23
0.62
3.93
13.15
2.22
1.19
0.14
3.01
0.86
0.41
0.94
0.15
0.29
5.53
28.45
0.09
0.64
1.67
14.66
3.67
0.97
0.16
0.21
0.16
2.00
42.87
2.13
1.34
0.39
2.80
1.03
0.82
0.08
0.20
4.43
32.10
HeadsActuals
( in lakh of Rupees )
Increase(+) /
Decrease(-)
during the year
141
142
143
144
146
148
149
151
153
154
155
156
157
158
161
163
164
165
166
167
168
170
Ghatana Project System
Ramanadhi Project System
Karuppanadhi Project
Grand Anicut Canal System
Palar-Porandalar System
Chinnar Reservoir Project
Varadhamanadahi Scheme
Parappalar Scheme
Virahanur Regulator
Gundar Project System
Parthibanur Regulator
Vaniar Reservoir Project
Pambar Reservoir Project
Ichambadi Anicut Scheme
Kelavarapalli Reservoir Scheme
Thumbalahalli Reservoir Project
Thoppiar Reservoir Project
Kesarigulihalla Reservoir Project
Nagavathy Reservoir Project
Shulagiri-Chinnar Project
Thambiraparani Anicut System
Nanjiyar Reservoir Scheme
+0.05
+0.03
-1.52
+3.75
-0.32
-0.20
-0.11
+0.02
+0.46
+1.93
-29.72
+0.09
-0.15
-0.25
+0.21
-0.17
+0.41
+0.12
+0.07
+0.09
+1.10
-3.65
11. DETAILED STATEMENT OF REVENUE AND CAPITAL RECEIPTS BY MINOR HEADS
2011 - 2012 20112010 -
( )
( )
( )
-Contd.
- Contd.
- Contd.
- Contd.
- Contd.
- Contd.
. .
95
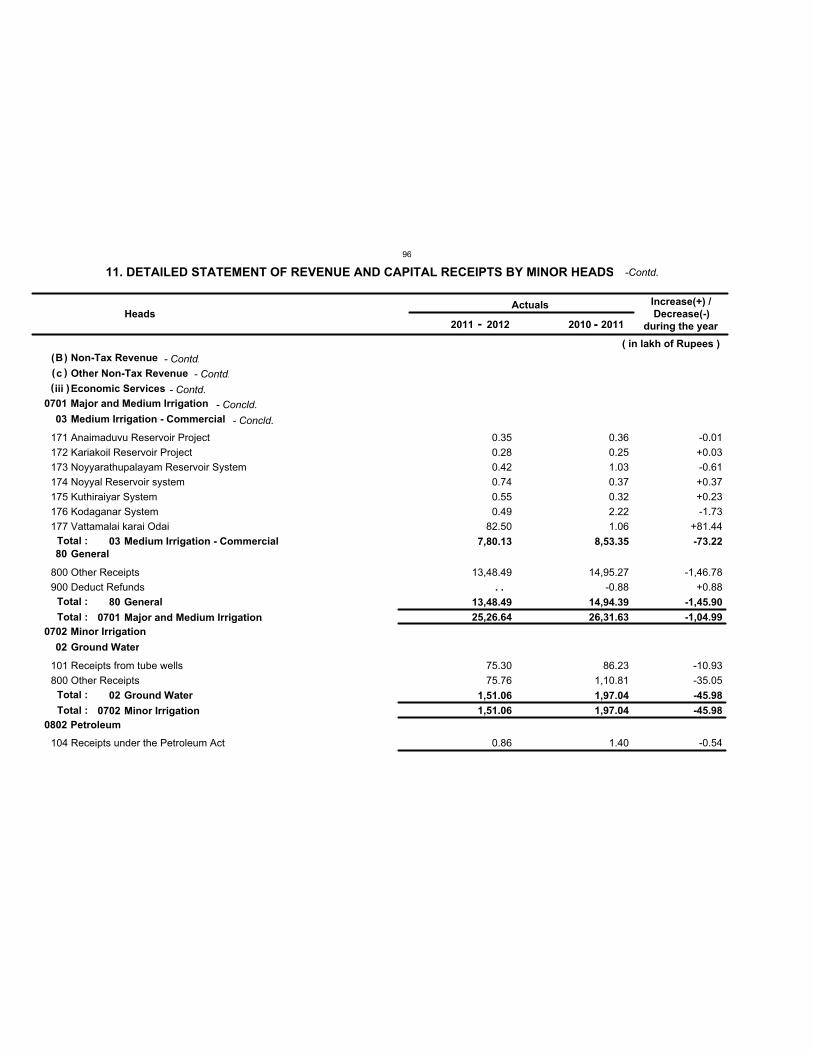
B Non-Tax Revenue
c Other Non-Tax Revenue
iii Economic Services0701
0702
0802
Major and Medium Irrigation
Minor Irrigation
Petroleum
25,26.64
1,51.06
26,31.63
1,97.04
03
80
02
Medium Irrigation - Commercial
General
Ground Water
7,80.13
13,48.49
1,51.06
8,53.35
14,94.39
1,97.04
0.35
0.28
0.42
0.74
0.55
0.49
82.50
13,48.49
75.30
75.76
0.86
0.36
0.25
1.03
0.37
0.32
2.22
1.06
14,95.27
-0.88
86.23
1,10.81
1.40
HeadsActuals
( in lakh of Rupees )
Increase(+) /
Decrease(-)
during the year
171
172
173
174
175
176
177
800
900
101
800
104
Anaimaduvu Reservoir Project
Kariakoil Reservoir Project
Noyyarathupalayam Reservoir System
Noyyal Reservoir system
Kuthiraiyar System
Kodaganar System
Vattamalai karai Odai
Other Receipts
Deduct Refunds
Receipts from tube wells
Other Receipts
Receipts under the Petroleum Act
03
80
02
Medium Irrigation - Commercial
General
Ground Water
0701
0702
Major and Medium Irrigation
Minor Irrigation
-0.01
+0.03
-0.61
+0.37
+0.23
-1.73
+81.44
-1,46.78
+0.88
-10.93
-35.05
-0.54
-73.22
-1,45.90
-45.98
-1,04.99
-45.98
Total :
Total :
Total :
Total :
Total :
11. DETAILED STATEMENT OF REVENUE AND CAPITAL RECEIPTS BY MINOR HEADS
2011 - 2012 20112010 -
( )
( )
( )
-Contd.
- Contd.
- Contd.
- Contd.
- Concld.
- Concld.
. .
96
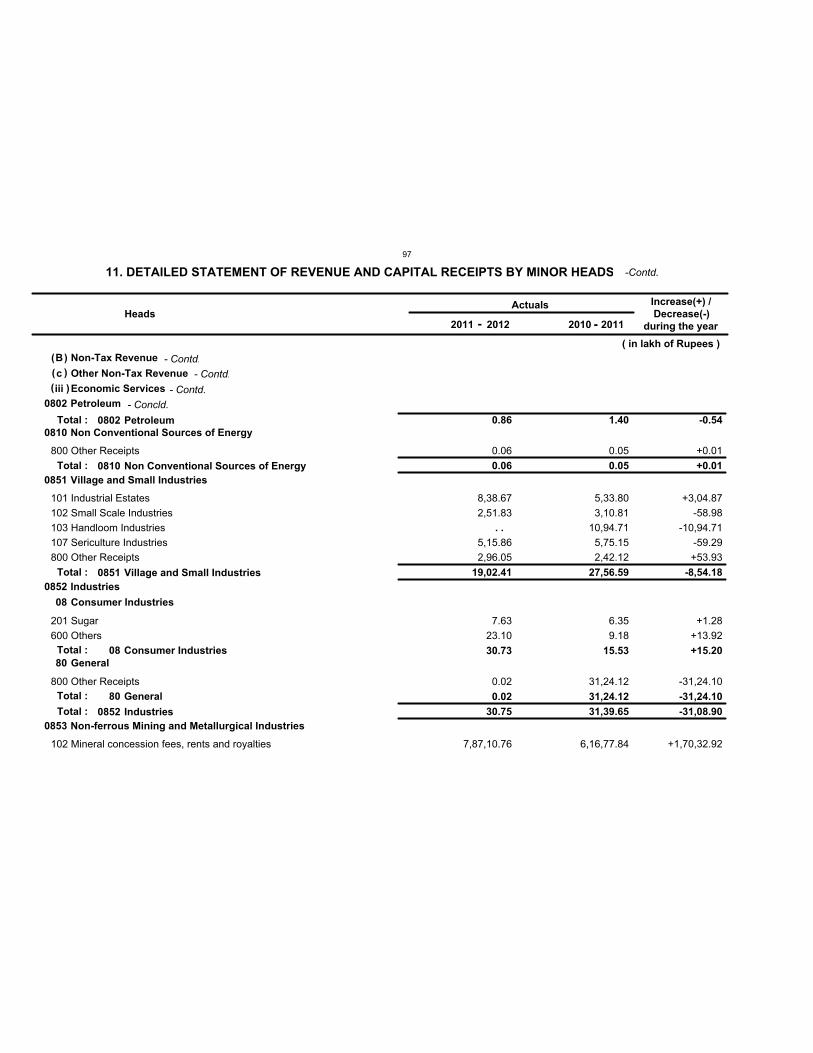
B Non-Tax Revenue
c Other Non-Tax Revenue
iii Economic Services0802
0810
0851
0852
0853
Petroleum
Non Conventional Sources of Energy
Village and Small Industries
Industries
Non-ferrous Mining and Metallurgical Industries
0.86
0.06
19,02.41
30.75
1.40
0.05
27,56.59
31,39.65
08
80
Consumer Industries
General
30.73
0.02
15.53
31,24.12
0.06
8,38.67
2,51.83
5,15.86
2,96.05
7.63
23.10
0.02
7,87,10.76
0.05
5,33.80
3,10.81
10,94.71
5,75.15
2,42.12
6.35
9.18
31,24.12
6,16,77.84
HeadsActuals
( in lakh of Rupees )
Increase(+) /
Decrease(-)
during the year
800
101
102
103
107
800
201
600
800
102
Other Receipts
Industrial Estates
Small Scale Industries
Handloom Industries
Sericulture Industries
Other Receipts
Sugar
Others
Other Receipts
Mineral concession fees, rents and royalties
08
80
Consumer Industries
General
0802
0810
0851
0852
Petroleum
Non Conventional Sources of Energy
Village and Small Industries
Industries
+0.01
+3,04.87
-58.98
-10,94.71
-59.29
+53.93
+1.28
+13.92
-31,24.10
+1,70,32.92
+15.20
-31,24.10
-0.54
+0.01
-8,54.18
-31,08.90
Total :
Total :
Total :
Total :
Total :
Total :
11. DETAILED STATEMENT OF REVENUE AND CAPITAL RECEIPTS BY MINOR HEADS
2011 - 2012 20112010 -
( )
( )
( )
-Contd.
- Contd.
- Contd.
- Contd.
- Concld.
. .
97
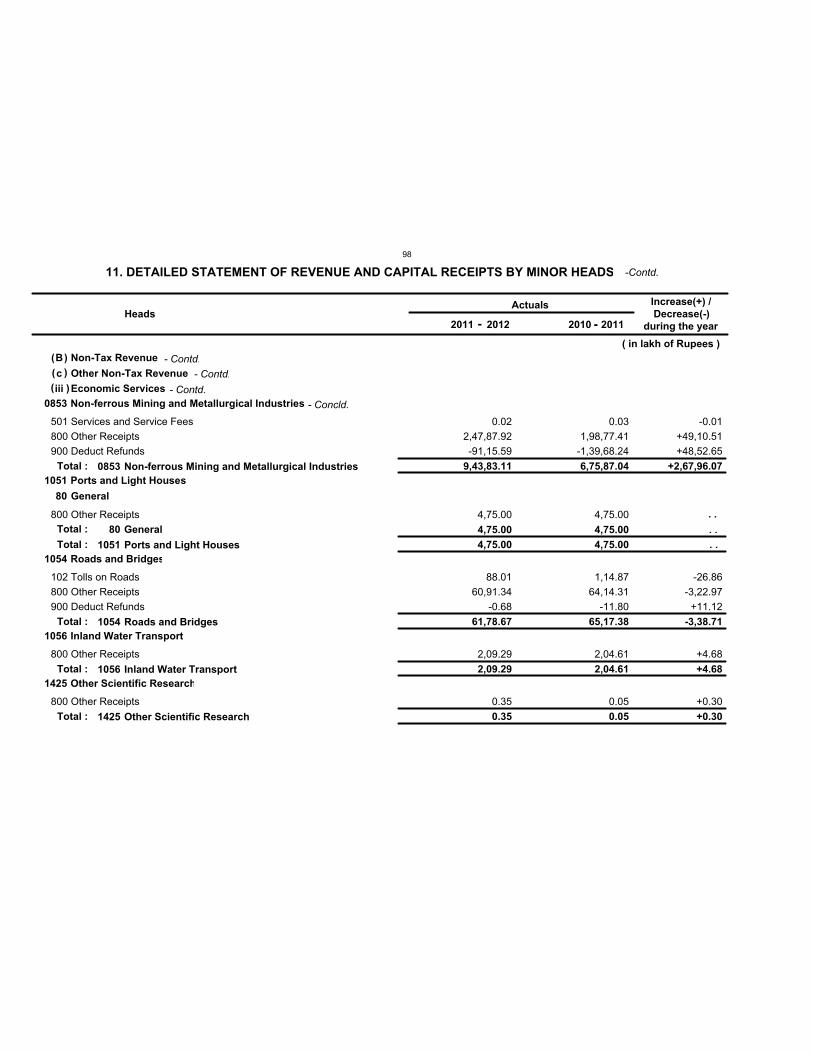
B Non-Tax Revenue
c Other Non-Tax Revenue
iii Economic Services0853
1051
1054
1056
1425
Non-ferrous Mining and Metallurgical Industries
Ports and Light Houses
Roads and Bridges
Inland Water Transport
Other Scientific Research
9,43,83.11
4,75.00
61,78.67
2,09.29
0.35
6,75,87.04
4,75.00
65,17.38
2,04.61
0.05
80 General
4,75.00 4,75.00
0.02
2,47,87.92
-91,15.59
4,75.00
88.01
60,91.34
-0.68
2,09.29
0.35
0.03
1,98,77.41
-1,39,68.24
4,75.00
1,14.87
64,14.31
-11.80
2,04.61
0.05
HeadsActuals
( in lakh of Rupees )
Increase(+) /
Decrease(-)
during the year
501
800
900
800
102
800
900
800
800
Services and Service Fees
Other Receipts
Deduct Refunds
Other Receipts
Tolls on Roads
Other Receipts
Deduct Refunds
Other Receipts
Other Receipts
80 General
0853
1051
1054
1056
1425
Non-ferrous Mining and Metallurgical Industries
Ports and Light Houses
Roads and Bridges
Inland Water Transport
Other Scientific Research
-0.01
+49,10.51
+48,52.65
-26.86
-3,22.97
+11.12
+4.68
+0.30
+2,67,96.07
-3,38.71
+4.68
+0.30
Total :
Total :
Total :
Total :
Total :
Total :
11. DETAILED STATEMENT OF REVENUE AND CAPITAL RECEIPTS BY MINOR HEADS
2011 - 2012 20112010 -
( )
( )
( )
-Contd.
- Contd.
- Contd.
- Contd.
- Concld.
. .
. .
. .
98
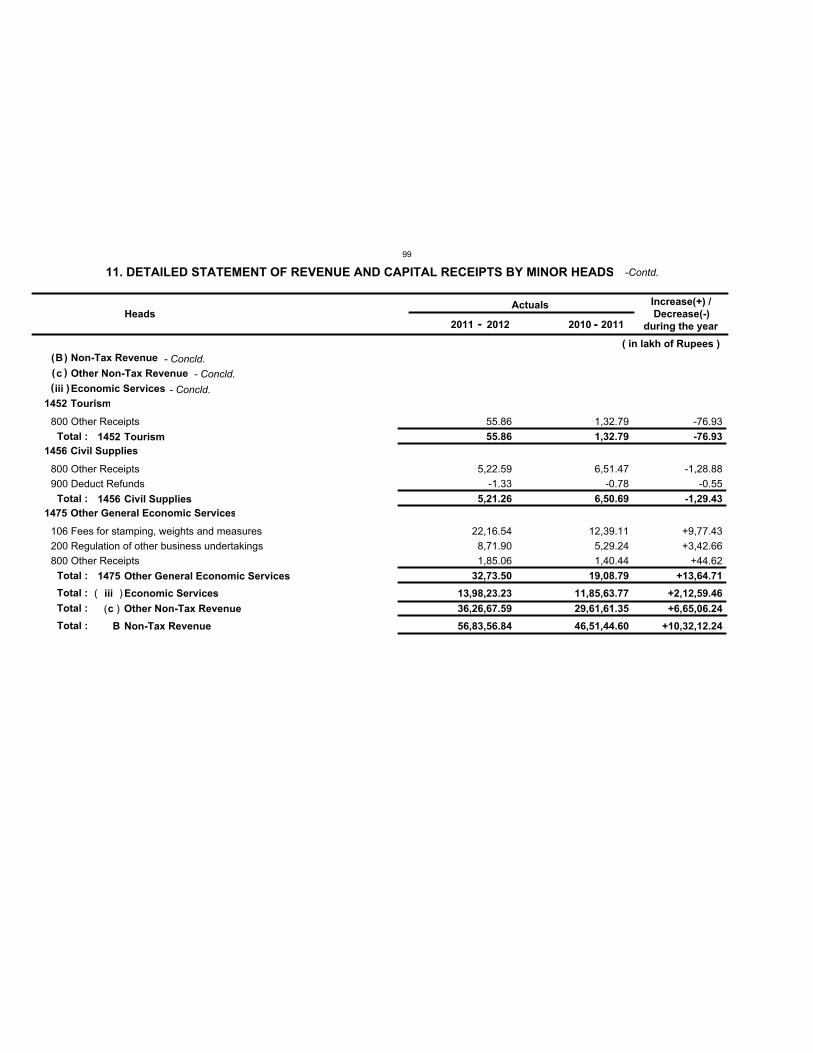
B Non-Tax Revenue
56,83,56.84 46,51,44.60
c Other Non-Tax Revenue
36,26,67.59 29,61,61.35
iii Economic Services
13,98,23.23 11,85,63.77
1452
1456
1475
Tourism
Civil Supplies
Other General Economic Services
55.86
5,21.26
32,73.50
1,32.79
6,50.69
19,08.79
55.86
5,22.59
-1.33
22,16.54
8,71.90
1,85.06
1,32.79
6,51.47
-0.78
12,39.11
5,29.24
1,40.44
HeadsActuals
( in lakh of Rupees )
Increase(+) /
Decrease(-)
during the year
800
800
900
106
200
800
Other Receipts
Other Receipts
Deduct Refunds
Fees for stamping, weights and measures
Regulation of other business undertakings
Other Receipts
1452
1456
1475
Tourism
Civil Supplies
Other General Economic Services
iii Economic Services
c Other Non-Tax Revenue
B Non-Tax Revenue
-76.93
-1,28.88
-0.55
+9,77.43
+3,42.66
+44.62
-76.93
-1,29.43
+13,64.71
+2,12,59.46
+6,65,06.24
+10,32,12.24
Total :
Total :
Total :
Total :
Total :
Total :
11. DETAILED STATEMENT OF REVENUE AND CAPITAL RECEIPTS BY MINOR HEADS
2011 - 2012 20112010 -
( )
( )
( )
-Contd.
- Concld.- Concld.
- Concld.
(
(
)
)
99
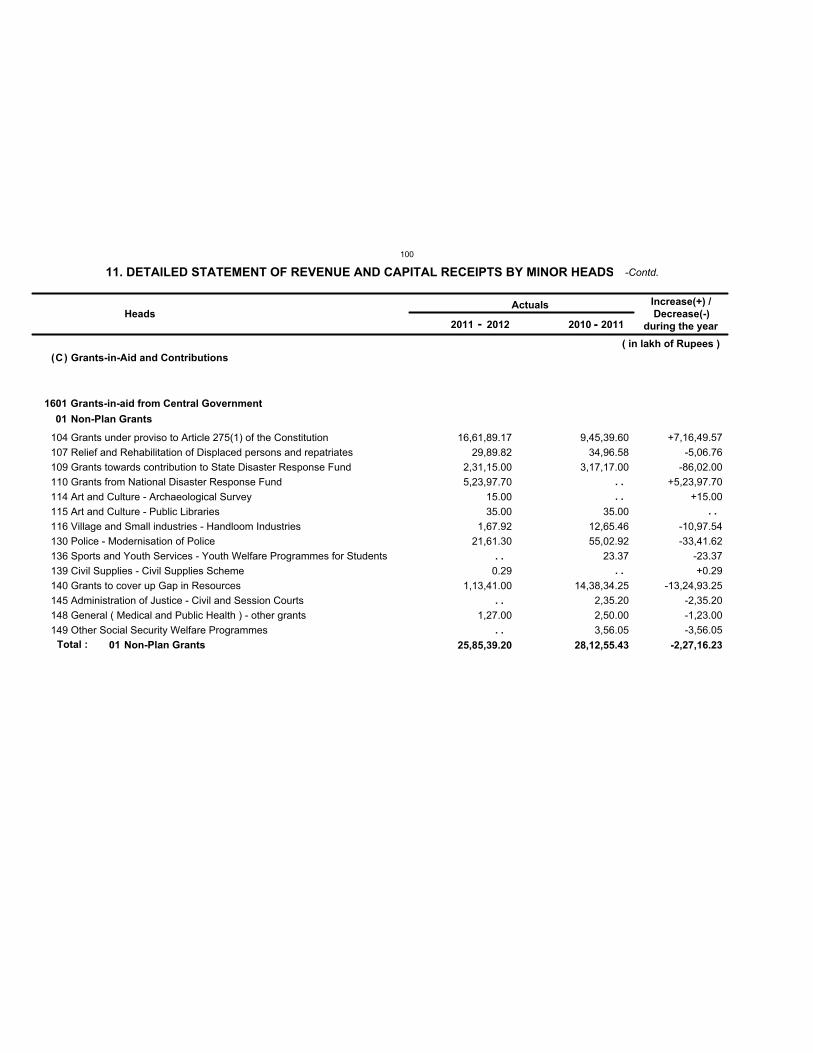
C Grants-in-Aid and Contributions
1601 Grants-in-aid from Central Government
01 Non-Plan Grants
25,85,39.20 28,12,55.43
16,61,89.17
29,89.82
2,31,15.00
5,23,97.70
15.00
35.00
1,67.92
21,61.30
0.29
1,13,41.00
1,27.00
9,45,39.60
34,96.58
3,17,17.00
35.00
12,65.46
55,02.92
23.37
14,38,34.25
2,35.20
2,50.00
3,56.05
HeadsActuals
( in lakh of Rupees )
Increase(+) /
Decrease(-)
during the year
104
107
109
110
114
115
116
130
136
139
140
145
148
149
Grants under proviso to Article 275(1) of the Constitution
Relief and Rehabilitation of Displaced persons and repatriates
Grants towards contribution to State Disaster Response Fund
Grants from National Disaster Response Fund
Art and Culture - Archaeological Survey
Art and Culture - Public Libraries
Village and Small industries - Handloom Industries
Police - Modernisation of Police
Sports and Youth Services - Youth Welfare Programmes for Students
Civil Supplies - Civil Supplies Scheme
Grants to cover up Gap in Resources
Administration of Justice - Civil and Session Courts
General ( Medical and Public Health ) - other grants
Other Social Security Welfare Programmes
01 Non-Plan Grants
+7,16,49.57
-5,06.76
-86,02.00
+5,23,97.70
+15.00
-10,97.54
-33,41.62
-23.37
+0.29
-13,24,93.25
-2,35.20
-1,23.00
-3,56.05
-2,27,16.23Total :
11. DETAILED STATEMENT OF REVENUE AND CAPITAL RECEIPTS BY MINOR HEADS
2011 - 2012 20112010 -
( )
-Contd.
. .
. .
. .
. .
. .
. .
. .
100
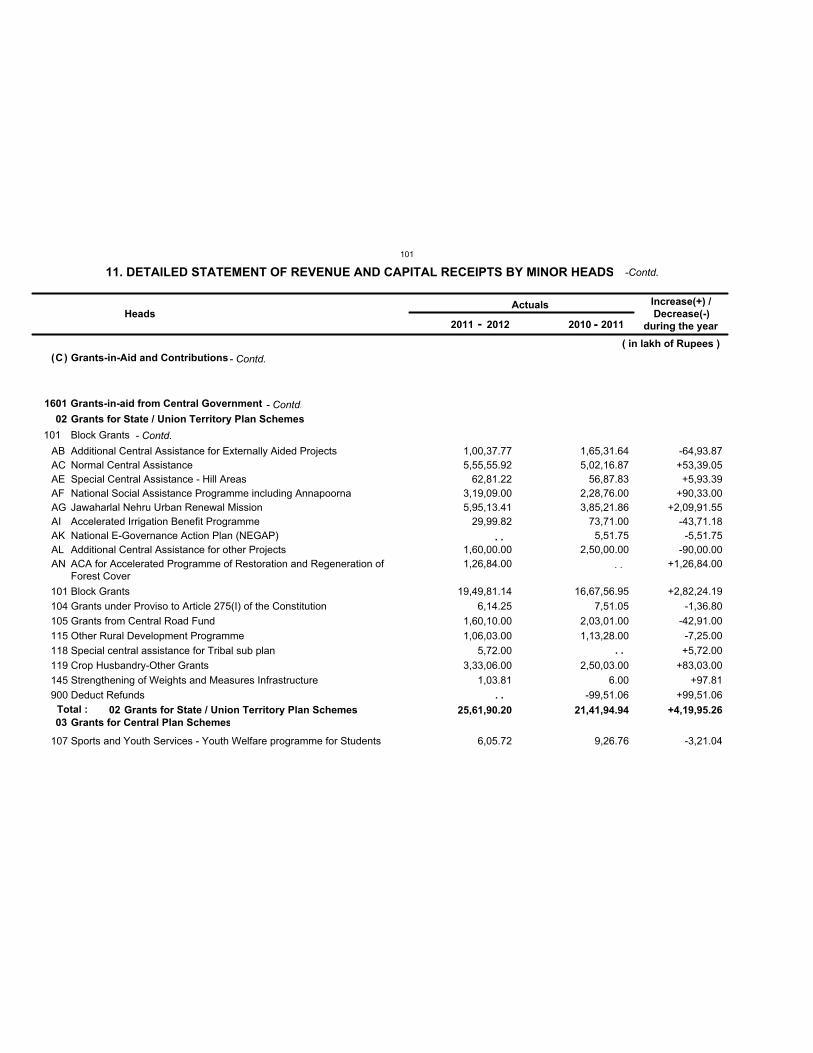
C Grants-in-Aid and Contributions
1601 Grants-in-aid from Central Government
02
03
Grants for State / Union Territory Plan Schemes
Grants for Central Plan Schemes
25,61,90.20 21,41,94.94
101 Block Grants
19,49,81.14
6,14.25
1,60,10.00
1,06,03.00
5,72.00
3,33,06.00
1,03.81
6,05.72
16,67,56.95
7,51.05
2,03,01.00
1,13,28.00
2,50,03.00
6.00
-99,51.06
9,26.76
AB
AC
AE
AF
AG
AI
AK
AL
AN
1,00,37.77
5,55,55.92
62,81.22
3,19,09.00
5,95,13.41
29,99.82
1,60,00.00
1,26,84.00
1,65,31.64
5,02,16.87
56,87.83
2,28,76.00
3,85,21.86
73,71.00
5,51.75
2,50,00.00
Additional Central Assistance for Externally Aided Projects
Normal Central Assistance
Special Central Assistance - Hill Areas
National Social Assistance Programme including Annapoorna
Jawaharlal Nehru Urban Renewal Mission
Accelerated Irrigation Benefit Programme
National E-Governance Action Plan (NEGAP)
Additional Central Assistance for other Projects
ACA for Accelerated Programme of Restoration and Regeneration ofForest Cover
HeadsActuals
( in lakh of Rupees )
Increase(+) /
Decrease(-)
during the year
101
104
105
115
118
119
145
900
107
Block Grants
Grants under Proviso to Article 275(I) of the Constitution
Grants from Central Road Fund
Other Rural Development Programme
Special central assistance for Tribal sub plan
Crop Husbandry-Other Grants
Strengthening of Weights and Measures Infrastructure
Deduct Refunds
Sports and Youth Services - Youth Welfare programme for Students
02 Grants for State / Union Territory Plan Schemes
-64,93.87
+53,39.05
+5,93.39
+90,33.00
+2,09,91.55
-43,71.18
-5,51.75
-90,00.00
+1,26,84.00
+2,82,24.19
-1,36.80
-42,91.00
-7,25.00
+5,72.00
+83,03.00
+97.81
+99,51.06
-3,21.04
+4,19,95.26Total :
11. DETAILED STATEMENT OF REVENUE AND CAPITAL RECEIPTS BY MINOR HEADS
2011 - 2012 20112010 -
( )
-Contd.
- Contd.
- Contd.
- Contd.
. .
. .
. .
. .
101
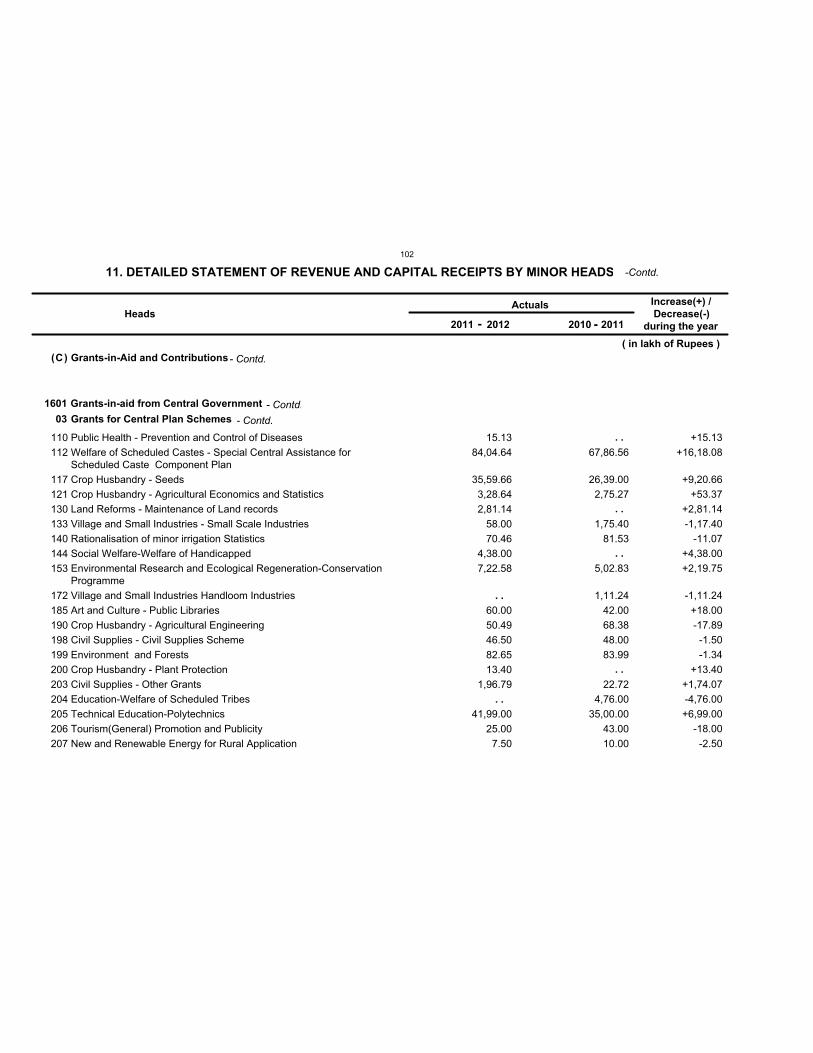
C Grants-in-Aid and Contributions
1601 Grants-in-aid from Central Government
03 Grants for Central Plan Schemes
15.13
84,04.64
35,59.66
3,28.64
2,81.14
58.00
70.46
4,38.00
7,22.58
60.00
50.49
46.50
82.65
13.40
1,96.79
41,99.00
25.00
7.50
67,86.56
26,39.00
2,75.27
1,75.40
81.53
5,02.83
1,11.24
42.00
68.38
48.00
83.99
22.72
4,76.00
35,00.00
43.00
10.00
HeadsActuals
( in lakh of Rupees )
Increase(+) /
Decrease(-)
during the year
110
112
117
121
130
133
140
144
153
172
185
190
198
199
200
203
204
205
206
207
Public Health - Prevention and Control of Diseases
Welfare of Scheduled Castes - Special Central Assistance forScheduled Caste Component Plan
Crop Husbandry - Seeds
Crop Husbandry - Agricultural Economics and Statistics
Land Reforms - Maintenance of Land records
Village and Small Industries - Small Scale Industries
Rationalisation of minor irrigation Statistics
Social Welfare-Welfare of Handicapped
Environmental Research and Ecological Regeneration-ConservationProgramme
Village and Small Industries Handloom Industries
Art and Culture - Public Libraries
Crop Husbandry - Agricultural Engineering
Civil Supplies - Civil Supplies Scheme
Environment and Forests
Crop Husbandry - Plant Protection
Civil Supplies - Other Grants
Education-Welfare of Scheduled Tribes
Technical Education-Polytechnics
Tourism(General) Promotion and Publicity
New and Renewable Energy for Rural Application
+15.13
+16,18.08
+9,20.66
+53.37
+2,81.14
-1,17.40
-11.07
+4,38.00
+2,19.75
-1,11.24
+18.00
-17.89
-1.50
-1.34
+13.40
+1,74.07
-4,76.00
+6,99.00
-18.00
-2.50
11. DETAILED STATEMENT OF REVENUE AND CAPITAL RECEIPTS BY MINOR HEADS
2011 - 2012 20112010 -
( )
-Contd.
- Contd.
- Contd.
- Contd.
. .
. .
. .
. .
. .
. .
102
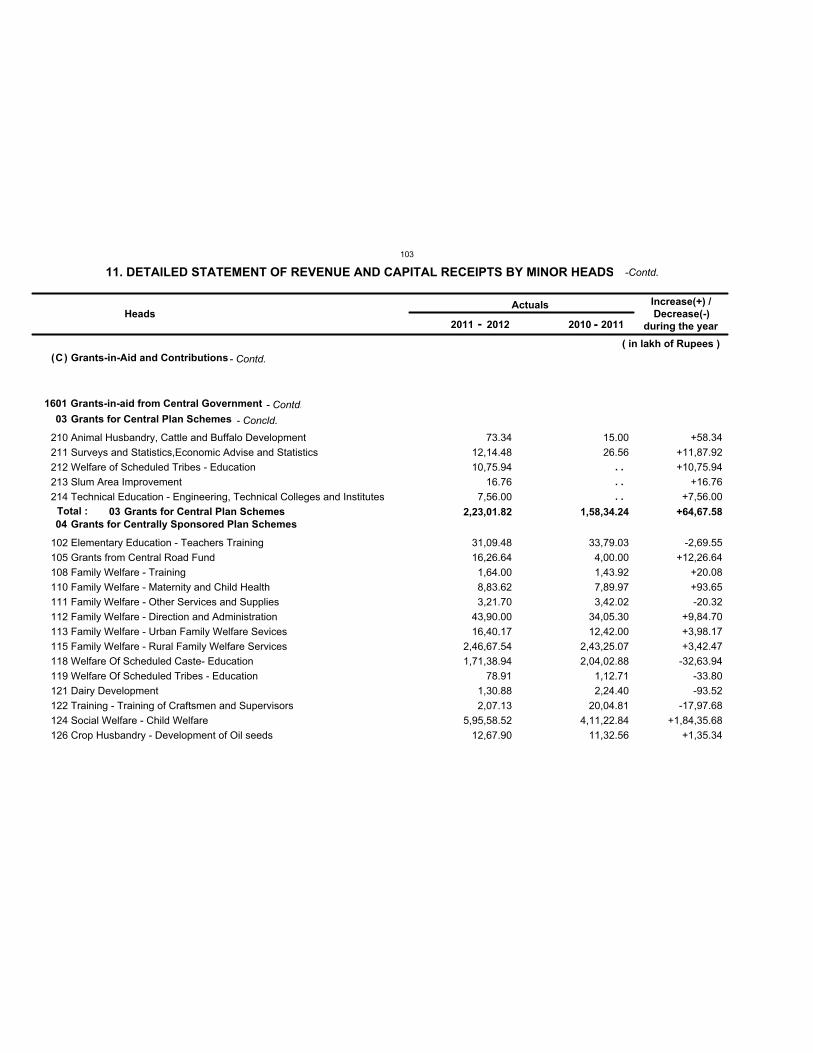
C Grants-in-Aid and Contributions
1601 Grants-in-aid from Central Government
03
04
Grants for Central Plan Schemes
Grants for Centrally Sponsored Plan Schemes 2,23,01.82 1,58,34.24
73.34
12,14.48
10,75.94
16.76
7,56.00
31,09.48
16,26.64
1,64.00
8,83.62
3,21.70
43,90.00
16,40.17
2,46,67.54
1,71,38.94
78.91
1,30.88
2,07.13
5,95,58.52
12,67.90
15.00
26.56
33,79.03
4,00.00
1,43.92
7,89.97
3,42.02
34,05.30
12,42.00
2,43,25.07
2,04,02.88
1,12.71
2,24.40
20,04.81
4,11,22.84
11,32.56
HeadsActuals
( in lakh of Rupees )
Increase(+) /
Decrease(-)
during the year
210
211
212
213
214
102
105
108
110
111
112
113
115
118
119
121
122
124
126
Animal Husbandry, Cattle and Buffalo Development
Surveys and Statistics,Economic Advise and Statistics
Welfare of Scheduled Tribes - Education
Slum Area Improvement
Technical Education - Engineering, Technical Colleges and Institutes
Elementary Education - Teachers Training
Grants from Central Road Fund
Family Welfare - Training
Family Welfare - Maternity and Child Health
Family Welfare - Other Services and Supplies
Family Welfare - Direction and Administration
Family Welfare - Urban Family Welfare Sevices
Family Welfare - Rural Family Welfare Services
Welfare Of Scheduled Caste- Education
Welfare Of Scheduled Tribes - Education
Dairy Development
Training - Training of Craftsmen and Supervisors
Social Welfare - Child Welfare
Crop Husbandry - Development of Oil seeds
03 Grants for Central Plan Schemes
+58.34
+11,87.92
+10,75.94
+16.76
+7,56.00
-2,69.55
+12,26.64
+20.08
+93.65
-20.32
+9,84.70
+3,98.17
+3,42.47
-32,63.94
-33.80
-93.52
-17,97.68
+1,84,35.68
+1,35.34
+64,67.58Total :
11. DETAILED STATEMENT OF REVENUE AND CAPITAL RECEIPTS BY MINOR HEADS
2011 - 2012 20112010 -
( )
-Contd.
- Contd.
- Contd.
- Concld.
. .
. .
. .
103
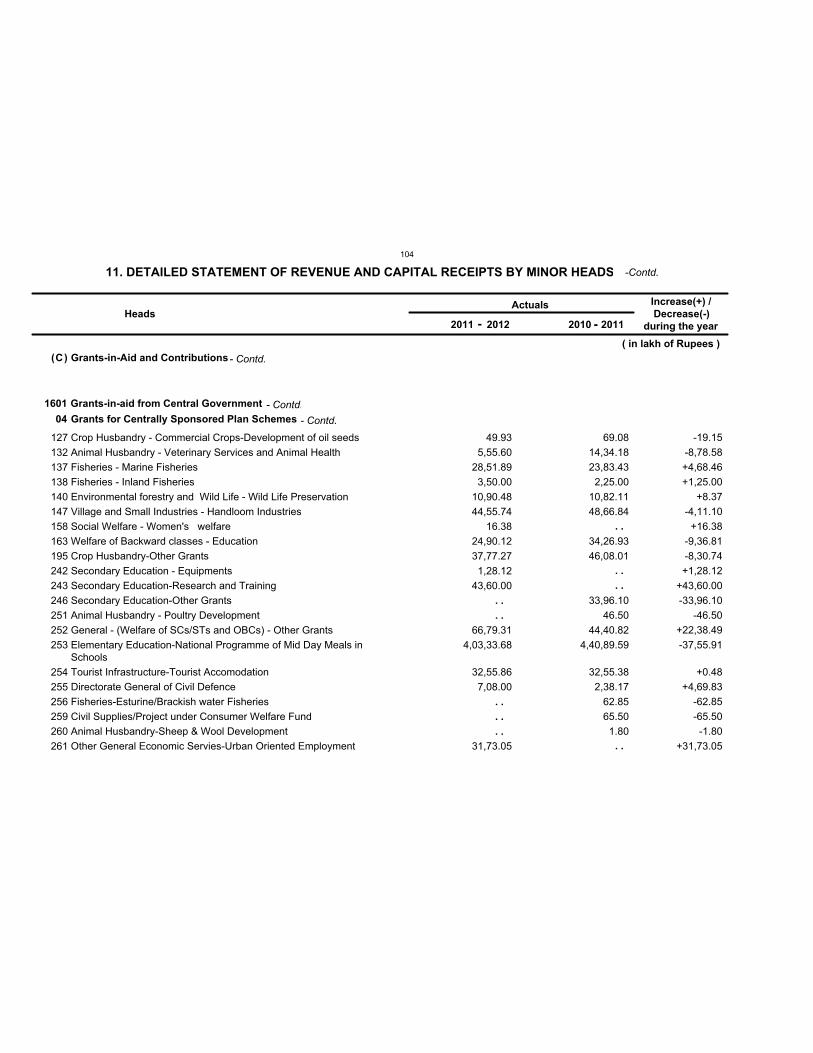
C Grants-in-Aid and Contributions
1601 Grants-in-aid from Central Government
04 Grants for Centrally Sponsored Plan Schemes
49.93
5,55.60
28,51.89
3,50.00
10,90.48
44,55.74
16.38
24,90.12
37,77.27
1,28.12
43,60.00
66,79.31
4,03,33.68
32,55.86
7,08.00
31,73.05
69.08
14,34.18
23,83.43
2,25.00
10,82.11
48,66.84
34,26.93
46,08.01
33,96.10
46.50
44,40.82
4,40,89.59
32,55.38
2,38.17
62.85
65.50
1.80
HeadsActuals
( in lakh of Rupees )
Increase(+) /
Decrease(-)
during the year
127
132
137
138
140
147
158
163
195
242
243
246251
252
253
254
255
256
259
260
261
Crop Husbandry - Commercial Crops-Development of oil seeds
Animal Husbandry - Veterinary Services and Animal Health
Fisheries - Marine Fisheries
Fisheries - Inland Fisheries
Environmental forestry and Wild Life - Wild Life Preservation
Village and Small Industries - Handloom Industries
Social Welfare - Women's welfare
Welfare of Backward classes - Education
Crop Husbandry-Other Grants
Secondary Education - Equipments
Secondary Education-Research and Training
Secondary Education-Other GrantsAnimal Husbandry - Poultry Development
General - (Welfare of SCs/STs and OBCs) - Other Grants
Elementary Education-National Programme of Mid Day Meals inSchools
Tourist Infrastructure-Tourist Accomodation
Directorate General of Civil Defence
Fisheries-Esturine/Brackish water Fisheries
Civil Supplies/Project under Consumer Welfare Fund
Animal Husbandry-Sheep & Wool Development
Other General Economic Servies-Urban Oriented Employment
-19.15
-8,78.58
+4,68.46
+1,25.00
+8.37
-4,11.10
+16.38
-9,36.81
-8,30.74
+1,28.12
+43,60.00
-33,96.10
-46.50
+22,38.49
-37,55.91
+0.48
+4,69.83
-62.85
-65.50
-1.80
+31,73.05
11. DETAILED STATEMENT OF REVENUE AND CAPITAL RECEIPTS BY MINOR HEADS
2011 - 2012 20112010 -
( )
-Contd.
- Contd.
- Contd.
- Contd.
. .
. .
. .
. .
. .
. .
. .
. .
. .
104
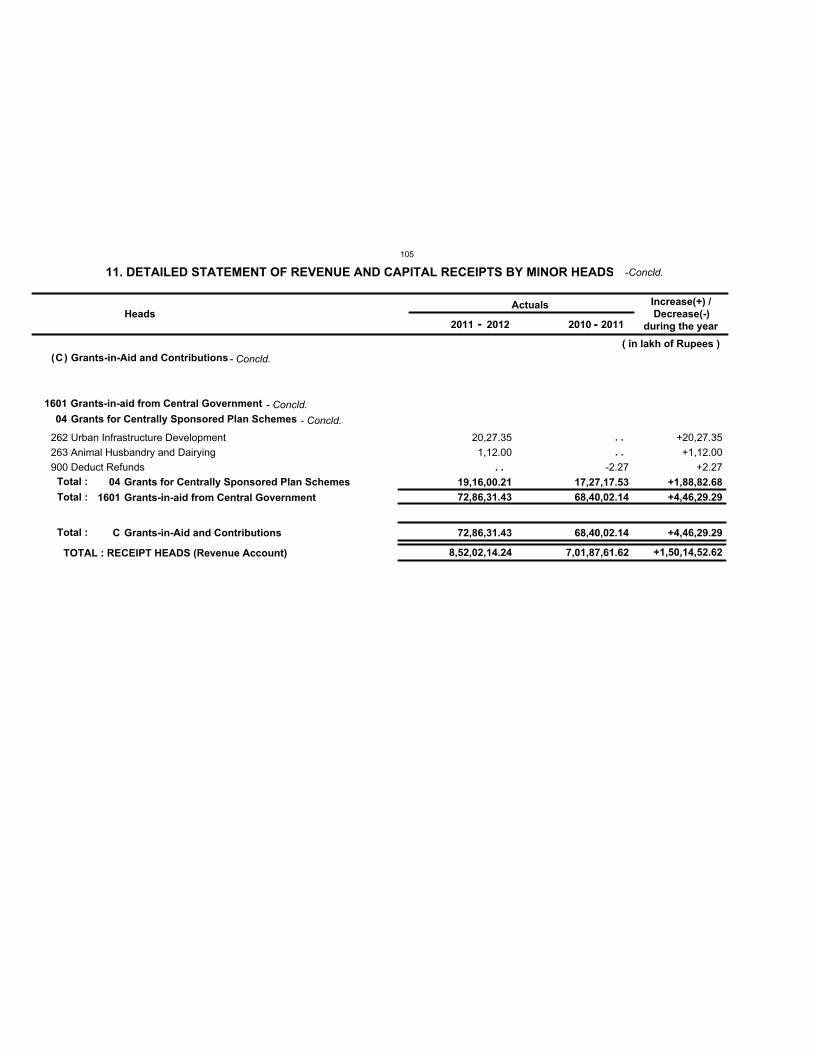
8,52,02,14.24 7,01,87,61.62
C Grants-in-Aid and Contributions
72,86,31.43 68,40,02.14
1601 Grants-in-aid from Central Government
72,86,31.43 68,40,02.14
04 Grants for Centrally Sponsored Plan Schemes
19,16,00.21 17,27,17.53
20,27.35
1,12.00
-2.27
HeadsActuals
( in lakh of Rupees )
Increase(+) /
Decrease(-)
during the year
262
263
900
Urban Infrastructure Development
Animal Husbandry and Dairying
Deduct Refunds
04 Grants for Centrally Sponsored Plan Schemes
1601 Grants-in-aid from Central Government
C Grants-in-Aid and Contributions
+20,27.35
+1,12.00
+2.27
+1,88,82.68
+4,46,29.29
+4,46,29.29
TOTAL : RECEIPT HEADS (Revenue Account) +1,50,14,52.62
Total :
Total :
Total :
11. DETAILED STATEMENT OF REVENUE AND CAPITAL RECEIPTS BY MINOR HEADS
2011 - 2012 20112010 -
( )
-Concld.
- Concld.
- Concld.
- Concld.
. .
. .
. .
105
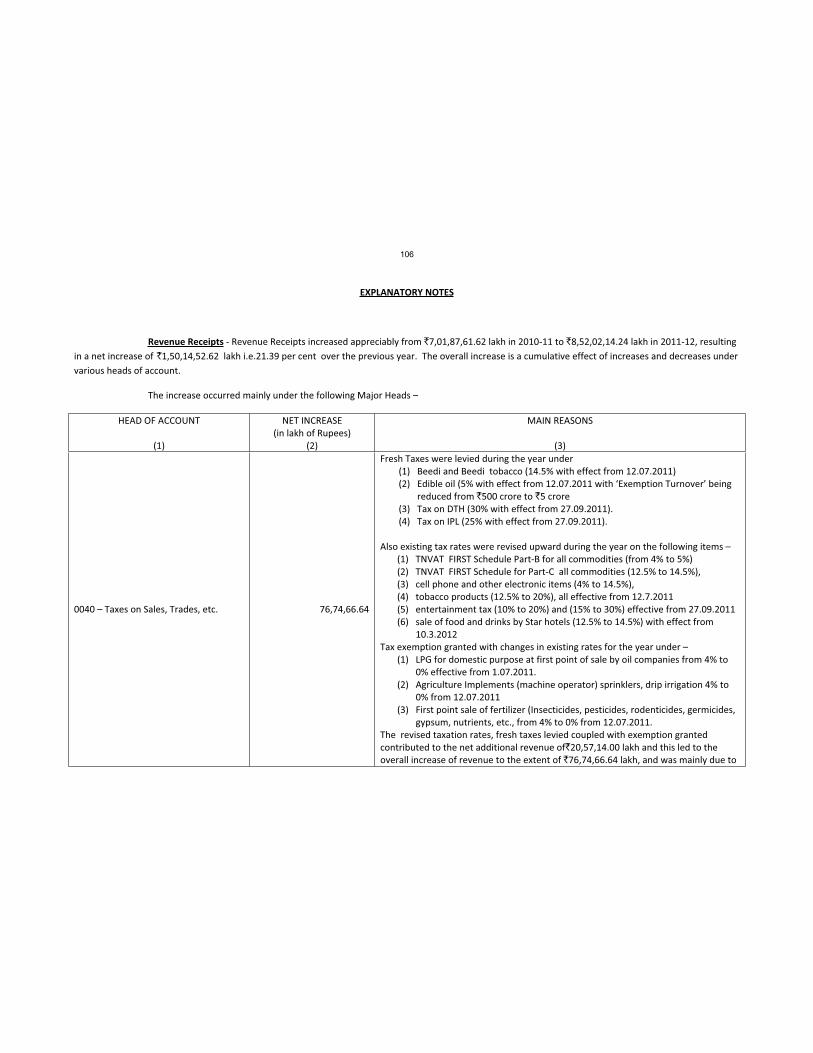
EXPLANATORY NOTES
Revenue Receipts Revenue Receipts increased appreciably from `7,01,87,61.62 lakh in 2010 11 to `8,52,02,14.24 lakh in 2011 12, resulting
in a net increase of `1,50,14,52.62 lakh i.e.21.39 per cent over the previous year. The overall increase is a cumulative effect of increases and decreases under
various heads of account.
The increase occurred mainly under the following Major Heads –
HEAD OF ACCOUNT
(1)
NET INCREASE
(in lakh of Rupees)
(2)
MAIN REASONS
(3)
0040 – Taxes on Sales, Trades, etc. 76,74,66.64
Fresh Taxes were levied during the year under
(1) Beedi and Beedi tobacco (14.5% with effect from 12.07.2011)
(2) Edible oil (5% with effect from 12.07.2011 with ‘Exemption Turnover’ being
reduced from `500 crore to `5 crore
(3) Tax on DTH (30% with effect from 27.09.2011).
(4) Tax on IPL (25% with effect from 27.09.2011).
Also existing tax rates were revised upward during the year on the following items –
(1) TNVAT FIRST Schedule Part B for all commodities (from 4% to 5%)
(2) TNVAT FIRST Schedule for Part C all commodities (12.5% to 14.5%),
(3) cell phone and other electronic items (4% to 14.5%),
(4) tobacco products (12.5% to 20%), all effective from 12.7.2011
(5) entertainment tax (10% to 20%) and (15% to 30%) effective from 27.09.2011
(6) sale of food and drinks by Star hotels (12.5% to 14.5%) with effect from
10.3.2012
Tax exemption granted with changes in existing rates for the year under –
(1) LPG for domestic purpose at first point of sale by oil companies from 4% to
0% effective from 1.07.2011.
(2) Agriculture Implements (machine operator) sprinklers, drip irrigation 4% to
0% from 12.07.2011
(3) First point sale of fertilizer (Insecticides, pesticides, rodenticides, germicides,
gypsum, nutrients, etc., from 4% to 0% from 12.07.2011.
The revised taxation rates, fresh taxes levied coupled with exemption granted
contributed to the net additional revenue of`20,57,14.00 lakh and this led to the
overall increase of revenue to the extent of `76,74,66.64 lakh, and was mainly due to
106
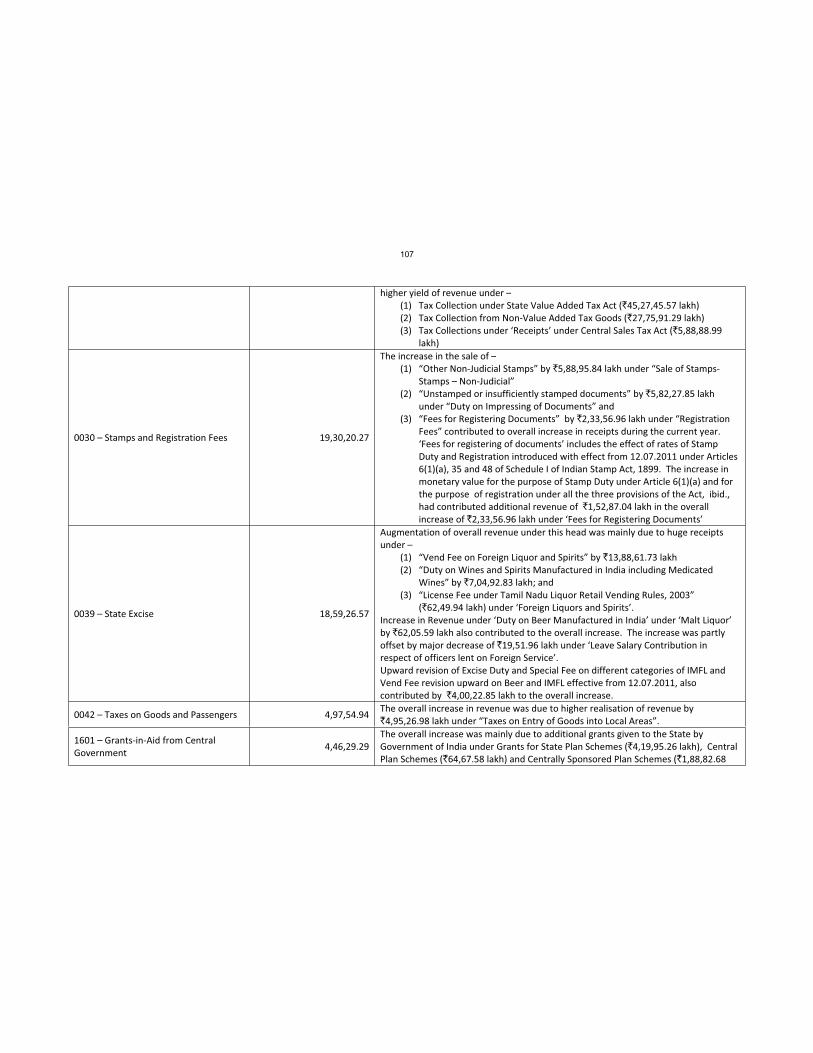
higher yield of revenue under –
(1) Tax Collection under State Value Added Tax Act (`45,27,45.57 lakh)
(2) Tax Collection from Non Value Added Tax Goods (`27,75,91.29 lakh)
(3) Tax Collections under ‘Receipts’ under Central Sales Tax Act (`5,88,88.99
lakh)
0030 – Stamps and Registration Fees 19,30,20.27
The increase in the sale of –
(1) “Other Non Judicial Stamps” by `5,88,95.84 lakh under “Sale of Stamps
Stamps – Non Judicial”
(2) “Unstamped or insufficiently stamped documents” by `5,82,27.85 lakh
under “Duty on Impressing of Documents” and
(3) “Fees for Registering Documents” by `2,33,56.96 lakh under “Registration
Fees” contributed to overall increase in receipts during the current year.
‘Fees for registering of documents’ includes the effect of rates of Stamp
Duty and Registration introduced with effect from 12.07.2011 under Articles
6(1)(a), 35 and 48 of Schedule I of Indian Stamp Act, 1899. The increase in
monetary value for the purpose of Stamp Duty under Article 6(1)(a) and for
the purpose of registration under all the three provisions of the Act, ibid.,
had contributed additional revenue of `1,52,87.04 lakh in the overall
increase of `2,33,56.96 lakh under ‘Fees for Registering Documents’
0039 – State Excise 18,59,26.57
Augmentation of overall revenue under this head was mainly due to huge receipts
under –
(1) “Vend Fee on Foreign Liquor and Spirits” by `13,88,61.73 lakh
(2) “Duty on Wines and Spirits Manufactured in India including Medicated
Wines” by `7,04,92.83 lakh; and
(3) “License Fee under Tamil Nadu Liquor Retail Vending Rules, 2003”
(`62,49.94 lakh) under ‘Foreign Liquors and Spirits’.
Increase in Revenue under ‘Duty on Beer Manufactured in India’ under ‘Malt Liquor’
by `62,05.59 lakh also contributed to the overall increase. The increase was partly
offset by major decrease of `19,51.96 lakh under ‘Leave Salary Contribution in
respect of officers lent on Foreign Service’.
Upward revision of Excise Duty and Special Fee on different categories of IMFL and
Vend Fee revision upward on Beer and IMFL effective from 12.07.2011, also
contributed by `4,00,22.85 lakh to the overall increase.
0042 – Taxes on Goods and Passengers 4,97,54.94 The overall increase in revenue was due to higher realisation of revenue by
`4,95,26.98 lakh under “Taxes on Entry of Goods into Local Areas”.
1601 – Grants in Aid from Central
Government4,46,29.29
The overall increase was mainly due to additional grants given to the State by
Government of India under Grants for State Plan Schemes (`4,19,95.26 lakh), Central
Plan Schemes (`64,67.58 lakh) and Centrally Sponsored Plan Schemes (`1,88,82.68
107
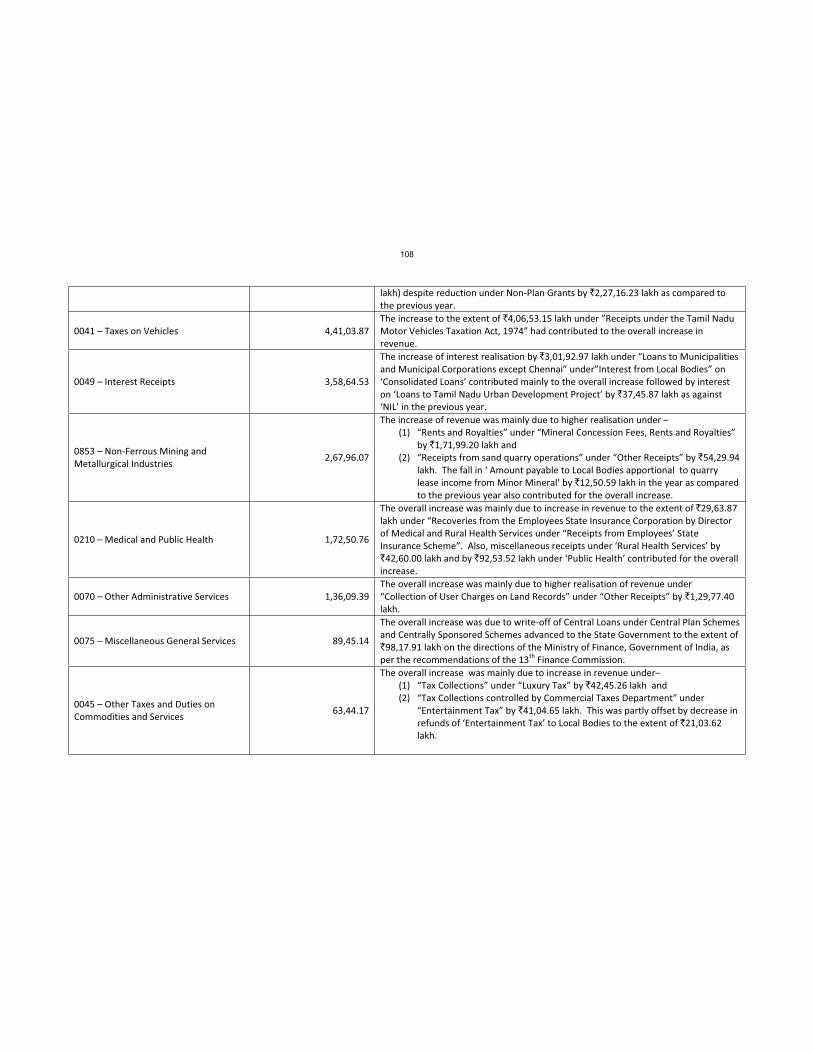
lakh) despite reduction under Non Plan Grants by `2,27,16.23 lakh as compared to
the previous year.
0041 – Taxes on Vehicles 4,41,03.87
The increase to the extent of `4,06,53.15 lakh under ”Receipts under the Tamil Nadu
Motor Vehicles Taxation Act, 1974” had contributed to the overall increase in
revenue.
0049 – Interest Receipts 3,58,64.53
The increase of interest realisation by `3,01,92.97 lakh under “Loans to Municipalities
and Municipal Corporations except Chennai” under”Interest from Local Bodies” on
‘Consolidated Loans’ contributed mainly to the overall increase followed by interest
on ‘Loans to Tamil Nadu Urban Development Project’ by `37,45.87 lakh as against
‘NIL’ in the previous year.
0853 – Non Ferrous Mining and
Metallurgical Industries 2,67,96.07
The increase of revenue was mainly due to higher realisation under –
(1) “Rents and Royalties” under “Mineral Concession Fees, Rents and Royalties”
by `1,71,99.20 lakh and
(2) “Receipts from sand quarry operations” under “Other Receipts” by `54,29.94
lakh. The fall in ‘ Amount payable to Local Bodies apportional to quarry
lease income from Minor Mineral’ by `12,50.59 lakh in the year as compared
to the previous year also contributed for the overall increase.
0210 – Medical and Public Health 1,72,50.76
The overall increase was mainly due to increase in revenue to the extent of `29,63.87
lakh under “Recoveries from the Employees State Insurance Corporation by Director
of Medical and Rural Health Services under “Receipts from Employees’ State
Insurance Scheme”. Also, miscellaneous receipts under ‘Rural Health Services’ by
`42,60.00 lakh and by `92,53.52 lakh under ‘Public Health’ contributed for the overall
increase.
0070 – Other Administrative Services 1,36,09.39
The overall increase was mainly due to higher realisation of revenue under
“Collection of User Charges on Land Records” under “Other Receipts” by `1,29,77.40
lakh.
0075 – Miscellaneous General Services 89,45.14
The overall increase was due to write off of Central Loans under Central Plan Schemes
and Centrally Sponsored Schemes advanced to the State Government to the extent of
`98,17.91 lakh on the directions of the Ministry of Finance, Government of India, as
per the recommendations of the 13th
Finance Commission.
0045 – Other Taxes and Duties on
Commodities and Services 63,44.17
The overall increase was mainly due to increase in revenue under–
(1) “Tax Collections” under “Luxury Tax” by `42,45.26 lakh and
(2) “Tax Collections controlled by Commercial Taxes Department” under
“Entertainment Tax” by `41,04.65 lakh. This was partly offset by decrease in
refunds of ‘Entertainment Tax’ to Local Bodies to the extent of `21,03.62
lakh.
108
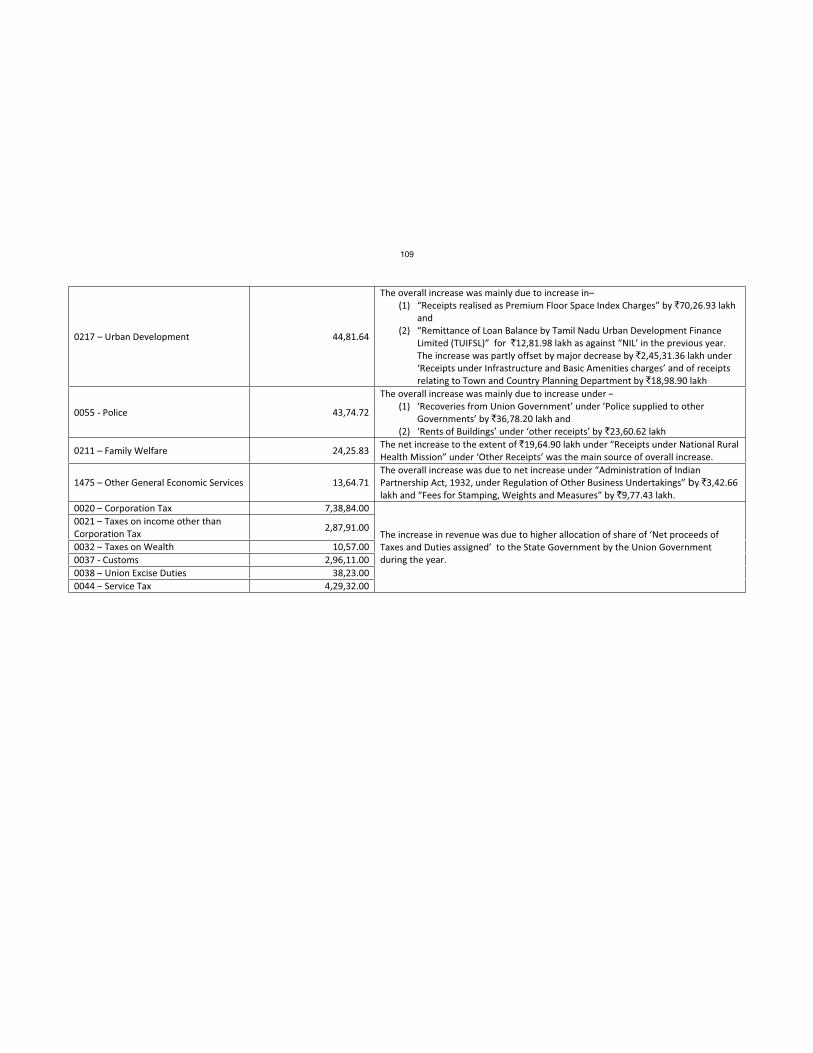
0217 – Urban Development 44,81.64
The overall increase was mainly due to increase in–
(1) “Receipts realised as Premium Floor Space Index Charges” by `70,26.93 lakh
and
(2) “Remittance of Loan Balance by Tamil Nadu Urban Development Finance
Limited (TUIFSL)” for `12,81.98 lakh as against “NIL’ in the previous year.
The increase was partly offset by major decrease by `2,45,31.36 lakh under
‘Receipts under Infrastructure and Basic Amenities charges’ and of receipts
relating to Town and Country Planning Department by `18,98.90 lakh
0055 Police 43,74.72
The overall increase was mainly due to increase under –
(1) ‘Recoveries from Union Government’ under ‘Police supplied to other
Governments’ by `36,78.20 lakh and
(2) ‘Rents of Buildings’ under ‘other receipts’ by `23,60.62 lakh
0211 – Family Welfare 24,25.83 The net increase to the extent of `19,64.90 lakh under “Receipts under National Rural
Health Mission” under ‘Other Receipts’ was the main source of overall increase.
1475 – Other General Economic Services 13,64.71
The overall increase was due to net increase under “Administration of Indian
Partnership Act, 1932, under Regulation of Other Business Undertakings” by `3,42.66
lakh and “Fees for Stamping, Weights and Measures” by `9,77.43 lakh.
0020 – Corporation Tax 7,38,84.00
The increase in revenue was due to higher allocation of share of ‘Net proceeds of
Taxes and Duties assigned’ to the State Government by the Union Government
during the year.
0021 – Taxes on income other than
Corporation Tax 2,87,91.00
0032 – Taxes on Wealth 10,57.00
0037 Customs 2,96,11.00
0038 – Union Excise Duties 38,23.00
0044 – Service Tax 4,29,32.00
109
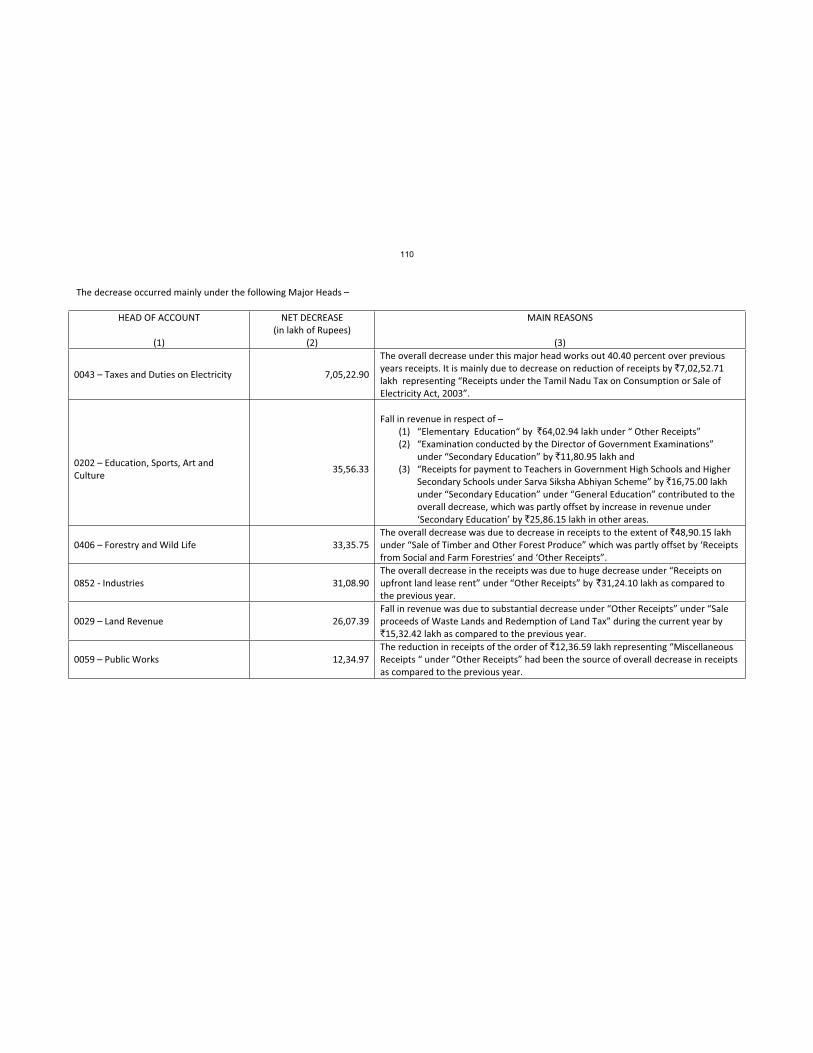
The decrease occurred mainly under the following Major Heads –
HEAD OF ACCOUNT
(1)
NET DECREASE
(in lakh of Rupees)
(2)
MAIN REASONS
(3)
0043 – Taxes and Duties on Electricity 7,05,22.90
The overall decrease under this major head works out 40.40 percent over previous
years receipts. It is mainly due to decrease on reduction of receipts by `7,02,52.71
lakh representing “Receipts under the Tamil Nadu Tax on Consumption or Sale of
Electricity Act, 2003”.
0202 – Education, Sports, Art and
Culture 35,56.33
Fall in revenue in respect of –
(1) “Elementary Education“ by `64,02.94 lakh under “ Other Receipts”
(2) “Examination conducted by the Director of Government Examinations”
under “Secondary Education” by `11,80.95 lakh and
(3) “Receipts for payment to Teachers in Government High Schools and Higher
Secondary Schools under Sarva Siksha Abhiyan Scheme” by `16,75.00 lakh
under “Secondary Education” under “General Education” contributed to the
overall decrease, which was partly offset by increase in revenue under
‘Secondary Education’ by `25,86.15 lakh in other areas.
0406 – Forestry and Wild Life 33,35.75
The overall decrease was due to decrease in receipts to the extent of `48,90.15 lakh
under “Sale of Timber and Other Forest Produce” which was partly offset by ‘Receipts
from Social and Farm Forestries’ and ‘Other Receipts”.
0852 Industries 31,08.90
The overall decrease in the receipts was due to huge decrease under “Receipts on
upfront land lease rent” under “Other Receipts” by `31,24.10 lakh as compared to
the previous year.
0029 – Land Revenue 26,07.39
Fall in revenue was due to substantial decrease under “Other Receipts” under “Sale
proceeds of Waste Lands and Redemption of Land Tax” during the current year by
`15,32.42 lakh as compared to the previous year.
0059 – Public Works 12,34.97
The reduction in receipts of the order of `12,36.59 lakh representing “Miscellaneous
Receipts “ under ”Other Receipts” had been the source of overall decrease in receipts
as compared to the previous year.
110
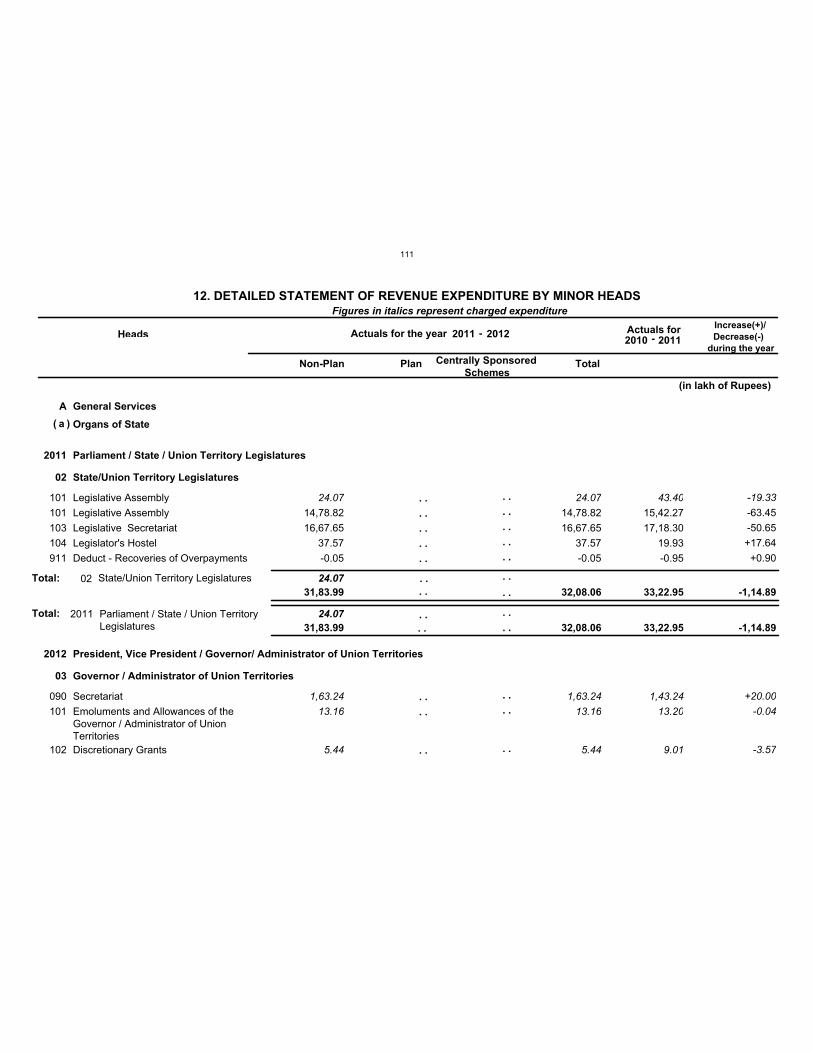
A General Services
a Organs of State
2011
2012
Parliament / State / Union Territory Legislatures
President, Vice President / Governor/ Administrator of Union Territories
24.07Total:
02
03
State/Union Territory Legislatures
Governor / Administrator of Union Territories
24.07
101
101
103
104
911
090
101
102
Legislative Assembly
Legislative Assembly
Legislative Secretariat
Legislator's Hostel
Deduct - Recoveries of Overpayments
Secretariat
Emoluments and Allowances of theGovernor / Administrator of UnionTerritories
Discretionary Grants
C
V
V
V
V
C
C
C
24.07
14,78.82
16,67.65
37.57
-0.05
1,63.24
13.16
5.44
24.07
14,78.82
16,67.65
37.57
-0.05
1,63.24
13.16
5.44
43.40
15,42.27
17,18.30
19.93
-0.95
1,43.24
13.20
9.01
-19.33
-63.45
-50.65
+17.64
+0.90
+20.00
-0.04
-3.57
Total: 02 State/Union Territory Legislatures
2011 Parliament / State / Union TerritoryLegislatures
Figures in italics represent charged expenditure
Heads Actuals for the year Actuals for Increase(+)/
Decrease(-)
during the year
Non-Plan Plan Centrally Sponsored
Schemes Total
31,83.99 32,08.06 33,22.95 -1,14.89
31,83.99 32,08.06 33,22.95 -1,14.89
(in lakh of Rupees)
( )
. .
. .
. .
. .
. .
. .
. .
. .
. .
. .
. .
. .
. .
. .
. .
. .
. .
. .
. .
. .
. .
. .
. .
. .
12. DETAILED STATEMENT OF REVENUE EXPENDITURE BY MINOR HEADS
2011 -2010 -2012
2011
111
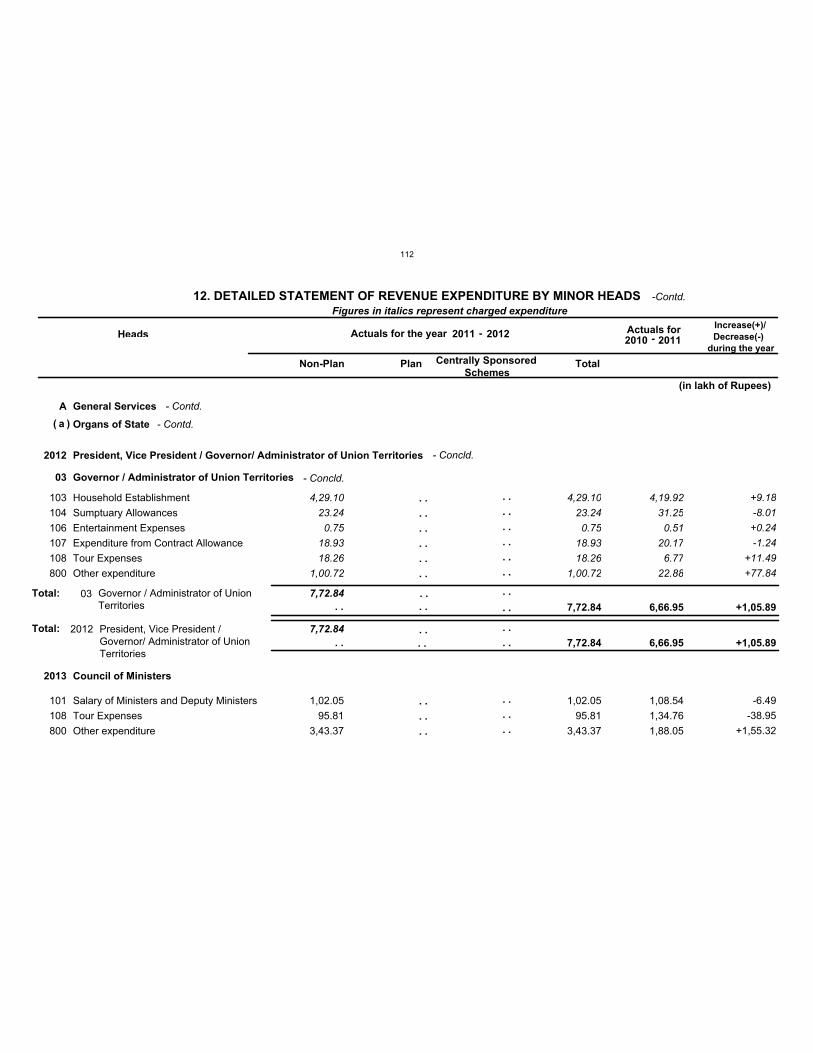
A General Services
a Organs of State
2012
2013
President, Vice President / Governor/ Administrator of Union Territories
Council of Ministers
7,72.84Total:
03 Governor / Administrator of Union Territories
7,72.84
103
104
106
107
108
800
101
108
800
Household Establishment
Sumptuary Allowances
Entertainment Expenses
Expenditure from Contract Allowance
Tour Expenses
Other expenditure
Salary of Ministers and Deputy Ministers
Tour Expenses
Other expenditure
C
C
C
C
C
C
V
V
V
4,29.10
23.24
0.75
18.93
18.26
1,00.72
1,02.05
95.81
3,43.37
4,29.10
23.24
0.75
18.93
18.26
1,00.72
1,02.05
95.81
3,43.37
4,19.92
31.25
0.51
20.17
6.77
22.88
1,08.54
1,34.76
1,88.05
+9.18
-8.01
+0.24
-1.24
+11.49
+77.84
-6.49
-38.95
+1,55.32
Total: 03 Governor / Administrator of UnionTerritories
2012 President, Vice President /Governor/ Administrator of UnionTerritories
Figures in italics represent charged expenditure
Heads Actuals for the year Actuals for Increase(+)/
Decrease(-)
during the year
Non-Plan Plan Centrally Sponsored
Schemes Total
7,72.84 6,66.95 +1,05.89
7,72.84 6,66.95 +1,05.89
(in lakh of Rupees)
( )
. .
. .
. .
. .
. .
. .
. .
. .
. .
. .
. .
. .
. .
. .
. .
. .
. .
. .
. .
. .
. .
. .
. .
. .
. .
. .
. .
. .
12. DETAILED STATEMENT OF REVENUE EXPENDITURE BY MINOR HEADS
2011 -2010 -2012
2011
- Contd.
- Contd.
- Concld.
- Concld.
-Contd.
112
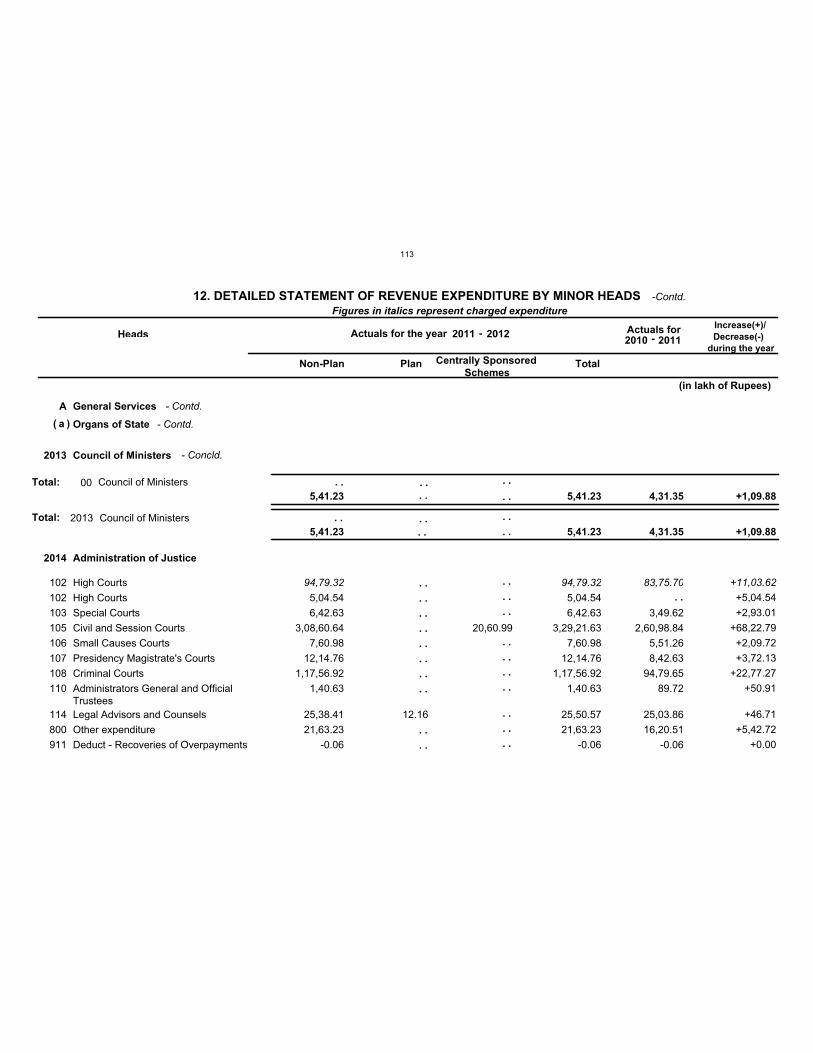
A General Services
a Organs of State
2013
2014
Council of Ministers
Administration of Justice
Total:
102
102
103
105
106
107
108
110
114
800
911
High Courts
High Courts
Special Courts
Civil and Session Courts
Small Causes Courts
Presidency Magistrate's Courts
Criminal Courts
Administrators General and OfficialTrustees
Legal Advisors and Counsels
Other expenditure
Deduct - Recoveries of Overpayments
C
V
V
V
V
V
V
V
V
V
V
94,79.32
5,04.54
6,42.63
3,08,60.64
7,60.98
12,14.76
1,17,56.92
1,40.63
25,38.41
21,63.23
-0.06
12.16
20,60.99
94,79.32
5,04.54
6,42.63
3,29,21.63
7,60.98
12,14.76
1,17,56.92
1,40.63
25,50.57
21,63.23
-0.06
83,75.70
3,49.62
2,60,98.84
5,51.26
8,42.63
94,79.65
89.72
25,03.86
16,20.51
-0.06
+11,03.62
+5,04.54
+2,93.01
+68,22.79
+2,09.72
+3,72.13
+22,77.27
+50.91
+46.71
+5,42.72
+0.00
Total: 00 Council of Ministers
2013 Council of Ministers
Figures in italics represent charged expenditure
Heads Actuals for the year Actuals for Increase(+)/
Decrease(-)
during the year
Non-Plan Plan Centrally Sponsored
Schemes Total
5,41.23 5,41.23 4,31.35 +1,09.88
5,41.23 5,41.23 4,31.35 +1,09.88
(in lakh of Rupees)
( )
. .
. .
. .
. .
. .
. .
. .
. .
. .
. .
. .
. .
. .
. .
. .
. .
. .
. .
. .
. .
. .
. . . .
. .
. .
. .
. . . .
. .
. .
. .
12. DETAILED STATEMENT OF REVENUE EXPENDITURE BY MINOR HEADS
2011 -2010 -2012
2011
- Contd.
- Contd.
- Concld.
-Contd.
113
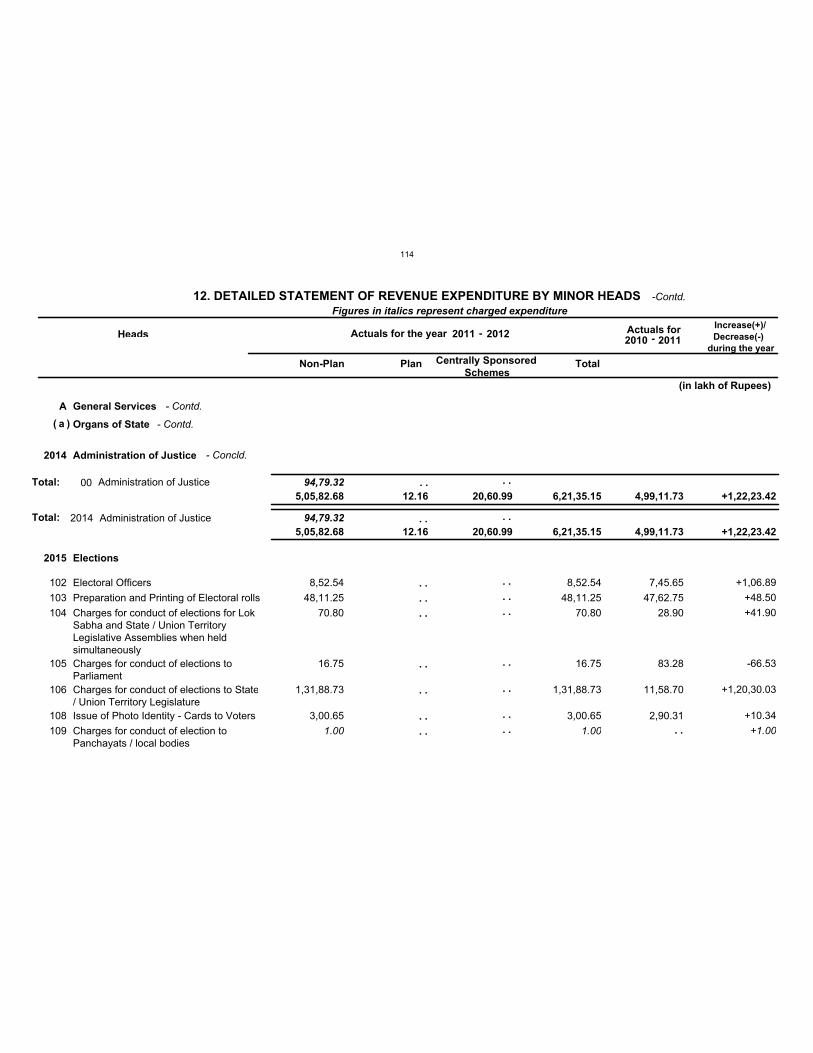
A General Services
a Organs of State
2014
2015
Administration of Justice
Elections
94,79.32Total:
94,79.32
102
103
104
105
106
108
109
Electoral Officers
Preparation and Printing of Electoral rolls
Charges for conduct of elections for LokSabha and State / Union TerritoryLegislative Assemblies when heldsimultaneously
Charges for conduct of elections toParliament
Charges for conduct of elections to State/ Union Territory Legislature
Issue of Photo Identity - Cards to Voters
Charges for conduct of election toPanchayats / local bodies
V
V
V
V
V
V
C
8,52.54
48,11.25
70.80
16.75
1,31,88.73
3,00.65
1.00
8,52.54
48,11.25
70.80
16.75
1,31,88.73
3,00.65
1.00
7,45.65
47,62.75
28.90
83.28
11,58.70
2,90.31
+1,06.89
+48.50
+41.90
-66.53
+1,20,30.03
+10.34
+1.00
Total: 00 Administration of Justice
2014 Administration of Justice
Figures in italics represent charged expenditure
Heads Actuals for the year Actuals for Increase(+)/
Decrease(-)
during the year
Non-Plan Plan Centrally Sponsored
Schemes Total
5,05,82.68 12.16 20,60.99 6,21,35.15 4,99,11.73 +1,22,23.42
5,05,82.68 12.16 20,60.99 6,21,35.15 4,99,11.73 +1,22,23.42
(in lakh of Rupees)
( )
. .
. .
. .
. .
. .
. .
. .
. .
. .
. .
. .
. .
. .
. . . .
. . . .
. . . .
12. DETAILED STATEMENT OF REVENUE EXPENDITURE BY MINOR HEADS
2011 -2010 -2012
2011
- Contd.
- Contd.
- Concld.
-Contd.
114
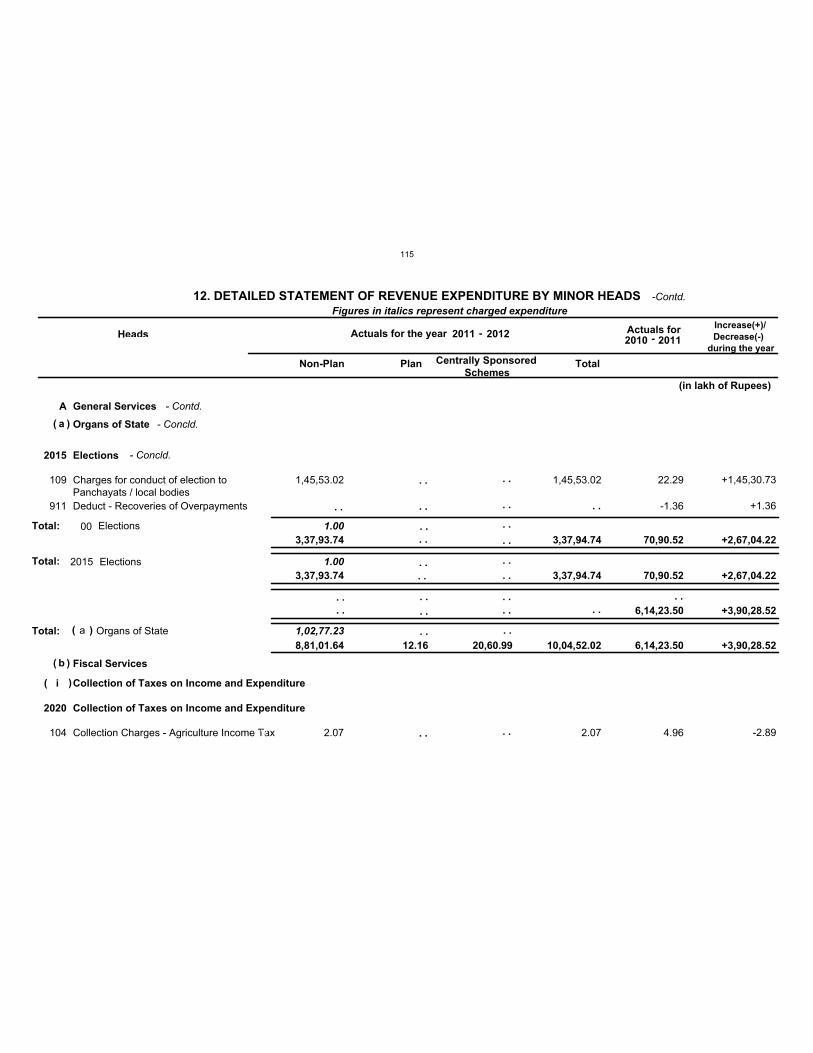
A General Services
a
b
Organs of State
Fiscal Services
1,02,77.23Total:
i Collection of Taxes on Income and Expenditure
2015
2020
Elections
Collection of Taxes on Income and Expenditure
1.00Total:
1.00
109
911
104
Charges for conduct of election toPanchayats / local bodies
Deduct - Recoveries of Overpayments
Collection Charges - Agriculture Income Tax
V
V
V
1,45,53.02
2.07
1,45,53.02
2.07
22.29
-1.36
4.96
+1,45,30.73
+1.36
-2.89
Total: 00 Elections
2015 Elections
a Organs of State
Figures in italics represent charged expenditure
Heads Actuals for the year Actuals for Increase(+)/
Decrease(-)
during the year
Non-Plan Plan Centrally Sponsored
Schemes Total
3,37,93.74 3,37,94.74 70,90.52 +2,67,04.22
3,37,93.74 3,37,94.74 70,90.52 +2,67,04.22
6,14,23.50 +3,90,28.52
8,81,01.64 12.16 20,60.99 10,04,52.02 6,14,23.50 +3,90,28.52
(in lakh of Rupees)
(
(
)
)
( )
( )
. .
. .
. .
. .
. .
. .
. .
. .
. .
. .
. .
. .
. .
. .
. .
. .
. .
. .
. .
. .
. .
. . . .
. .
. . . .
12. DETAILED STATEMENT OF REVENUE EXPENDITURE BY MINOR HEADS
2011 -2010 -2012
2011
- Contd.
- Concld.
- Concld.
-Contd.
115
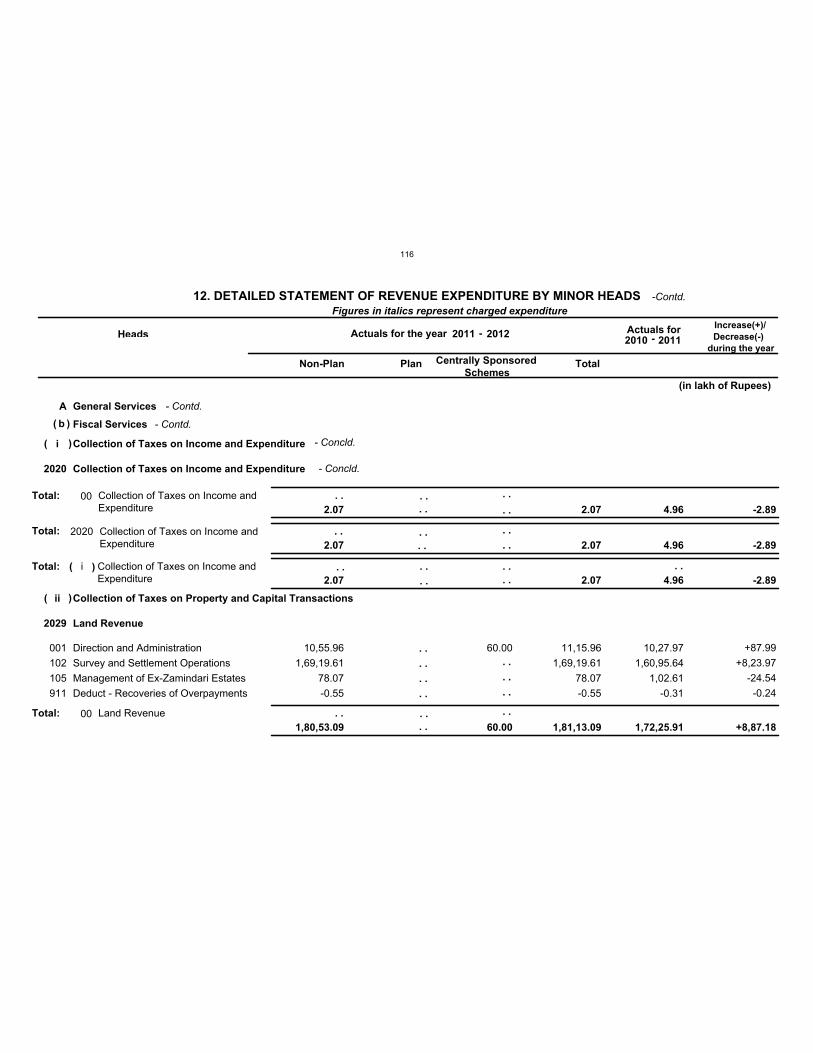
A General Services
b Fiscal Services
i
ii
Collection of Taxes on Income and Expenditure
Collection of Taxes on Property and Capital Transactions
Total:
2020
2029
Collection of Taxes on Income and Expenditure
Land Revenue
Total:
001
102
105
911
Direction and Administration
Survey and Settlement Operations
Management of Ex-Zamindari Estates
Deduct - Recoveries of Overpayments
V
V
V
V
10,55.96
1,69,19.61
78.07
-0.55
60.00 11,15.96
1,69,19.61
78.07
-0.55
10,27.97
1,60,95.64
1,02.61
-0.31
+87.99
+8,23.97
-24.54
-0.24
Total:
Total:
00
00
Collection of Taxes on Income andExpenditure
Land Revenue
2020 Collection of Taxes on Income andExpenditure
i Collection of Taxes on Income andExpenditure
Figures in italics represent charged expenditure
Heads Actuals for the year Actuals for Increase(+)/
Decrease(-)
during the year
Non-Plan Plan Centrally Sponsored
Schemes Total
2.07
1,80,53.09 60.00
2.07
1,81,13.09
4.96
1,72,25.91
-2.89
+8,87.18
2.07 2.07 4.96 -2.89
2.07 2.07 4.96 -2.89
(in lakh of Rupees)
( )
(
(
)
)
( )
. .
. .
. .
. .
. .
. .
. .
. .
. .
. .
. .
. .
. .
. .
. .
. .
. . . .
. .
. .
. .
. . . .
. .
. .
. .
. .
12. DETAILED STATEMENT OF REVENUE EXPENDITURE BY MINOR HEADS
2011 -2010 -2012
2011
- Contd.
- Contd.
- Concld.
- Concld.
-Contd.
116
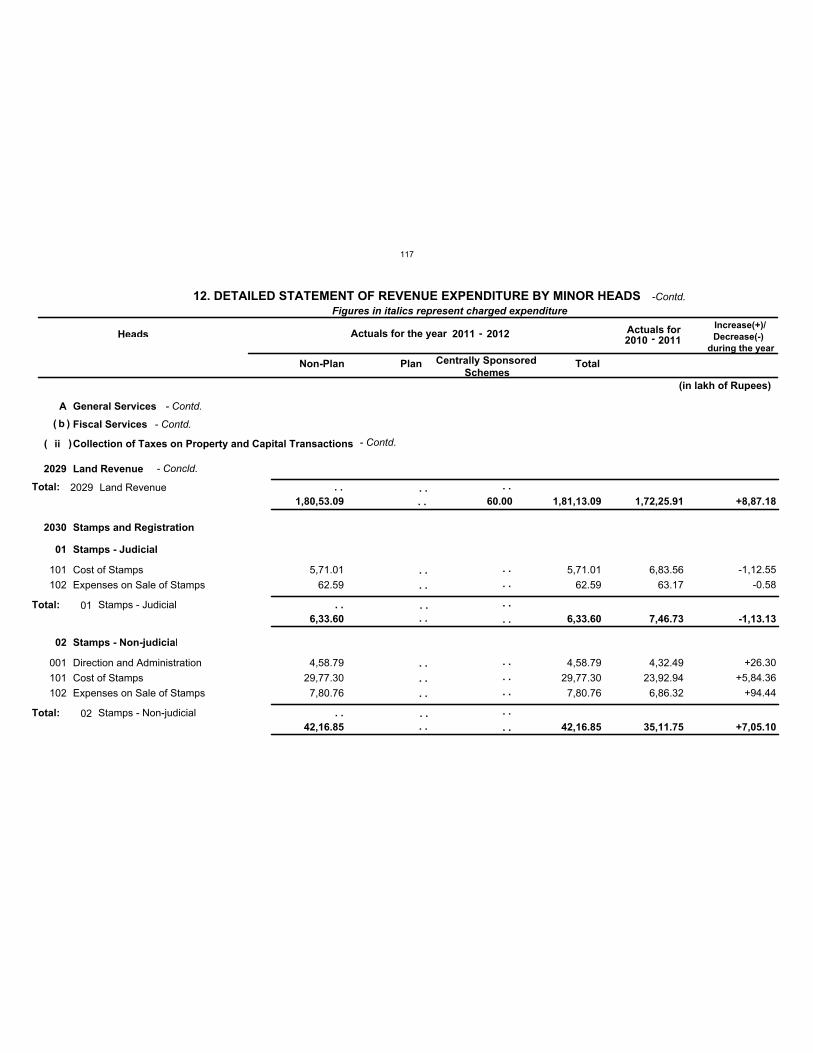
A General Services
b Fiscal Services
ii Collection of Taxes on Property and Capital Transactions
2029
2030
Land Revenue
Stamps and Registration
Total:
01
02
Stamps - Judicial
Stamps - Non-judicial
101
102
001
101
102
Cost of Stamps
Expenses on Sale of Stamps
Direction and Administration
Cost of Stamps
Expenses on Sale of Stamps
V
V
V
V
V
5,71.01
62.59
4,58.79
29,77.30
7,80.76
5,71.01
62.59
4,58.79
29,77.30
7,80.76
6,83.56
63.17
4,32.49
23,92.94
6,86.32
-1,12.55
-0.58
+26.30
+5,84.36
+94.44
Total:
Total:
01
02
Stamps - Judicial
Stamps - Non-judicial
2029 Land Revenue
Figures in italics represent charged expenditure
Heads Actuals for the year Actuals for Increase(+)/
Decrease(-)
during the year
Non-Plan Plan Centrally Sponsored
Schemes Total
6,33.60
42,16.85
6,33.60
42,16.85
7,46.73
35,11.75
-1,13.13
+7,05.10
1,80,53.09 60.00 1,81,13.09 1,72,25.91 +8,87.18
(in lakh of Rupees)
( )
( )
. .
. .
. .
. .
. .
. .
. .
. .
. .
. .
. .
. .
. .
. .
. .
. .
. .
. .
. .
. .
. . . .
. .
. .
12. DETAILED STATEMENT OF REVENUE EXPENDITURE BY MINOR HEADS
2011 -2010 -2012
2011
- Contd.
- Contd.
- Contd.
- Concld.
-Contd.
117
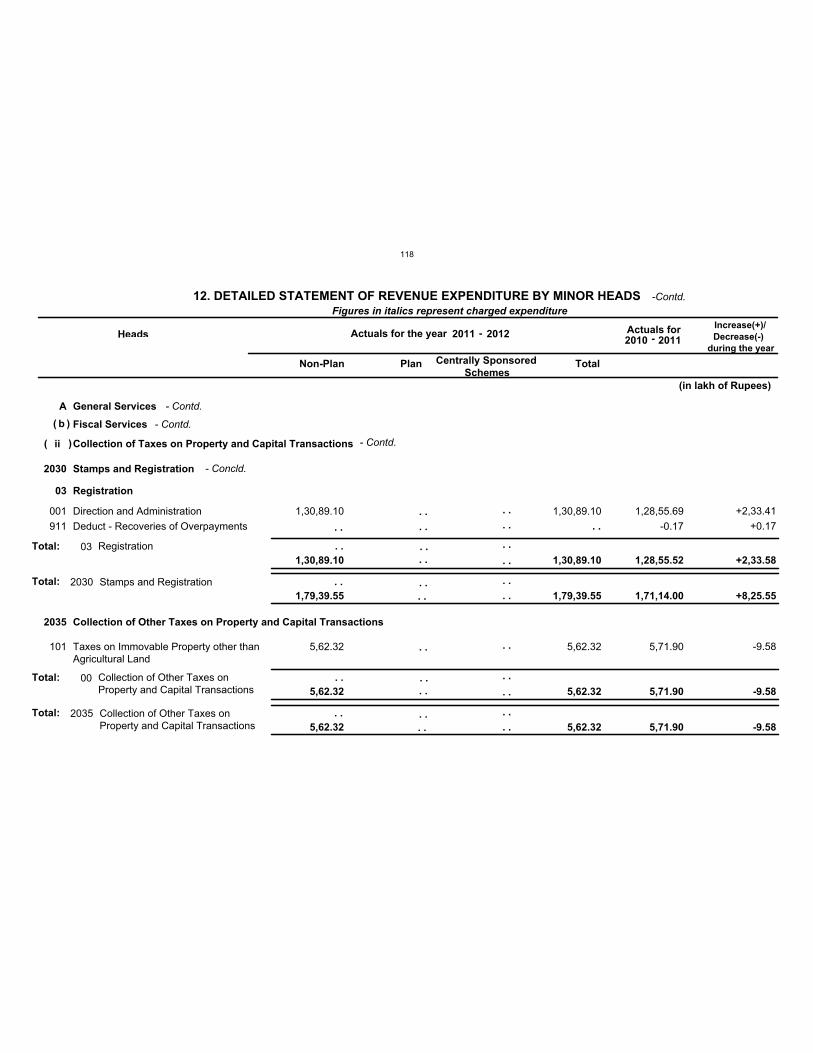
A General Services
b Fiscal Services
ii Collection of Taxes on Property and Capital Transactions
2030
2035
Stamps and Registration
Collection of Other Taxes on Property and Capital Transactions
Total:
Total:
03 Registration
001
911
101
Direction and Administration
Deduct - Recoveries of Overpayments
Taxes on Immovable Property other thanAgricultural Land
V
V
V
1,30,89.10
5,62.32
1,30,89.10
5,62.32
1,28,55.69
-0.17
5,71.90
+2,33.41
+0.17
-9.58
Total:
Total:
03
00
Registration
Collection of Other Taxes onProperty and Capital Transactions
2030
2035
Stamps and Registration
Collection of Other Taxes onProperty and Capital Transactions
Figures in italics represent charged expenditure
Heads Actuals for the year Actuals for Increase(+)/
Decrease(-)
during the year
Non-Plan Plan Centrally Sponsored
Schemes Total
1,30,89.10
5,62.32
1,30,89.10
5,62.32
1,28,55.52
5,71.90
+2,33.58
-9.58
1,79,39.55
5,62.32
1,79,39.55
5,62.32
1,71,14.00
5,71.90
+8,25.55
-9.58
(in lakh of Rupees)
( )
( )
. .
. .
. .
. .
. .
. .
. .
. .
. .
. .
. .
. .
. .
. .
. .
. .
. .
. .
. .
. .
. .
. .
. .
. .
. .
. .
. .
. .
12. DETAILED STATEMENT OF REVENUE EXPENDITURE BY MINOR HEADS
2011 -2010 -2012
2011
- Contd.
- Contd.
- Contd.
- Concld.
-Contd.
118
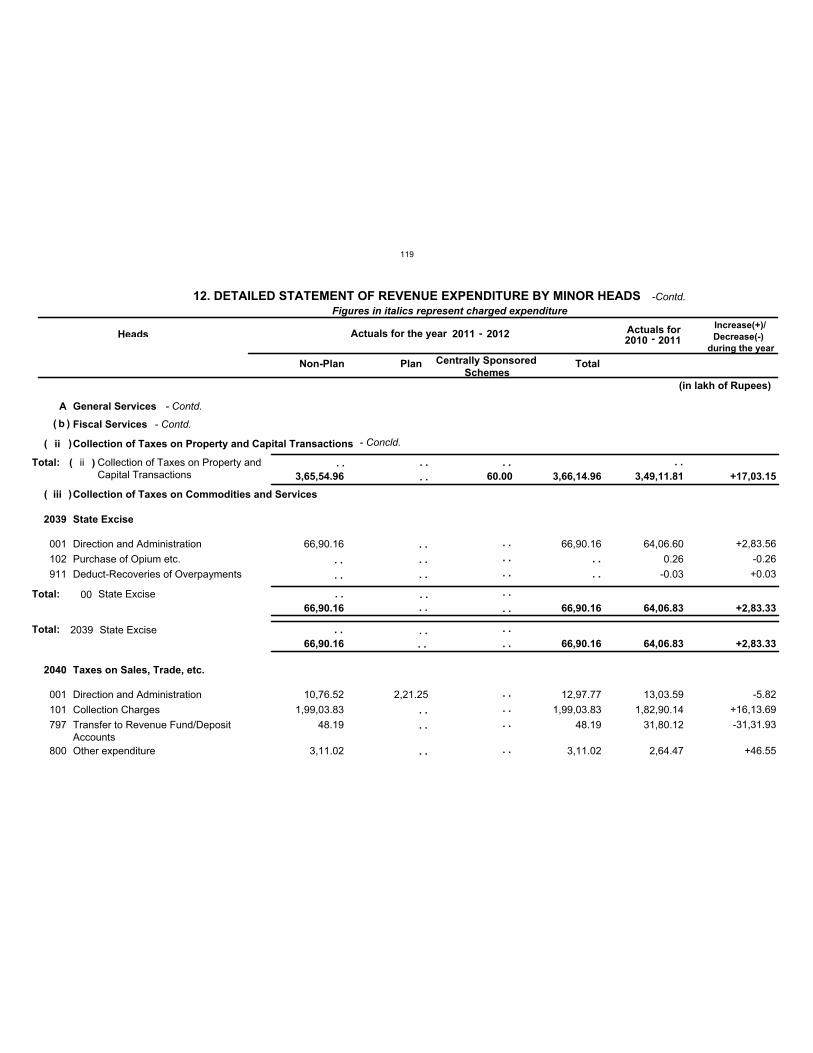
A General Services
b Fiscal Services
ii
iii
Collection of Taxes on Property and Capital Transactions
Collection of Taxes on Commodities and Services
Total:
2039
2040
State Excise
Taxes on Sales, Trade, etc.
Total:
001
102
911
001
101
797
800
Direction and Administration
Purchase of Opium etc.
Deduct-Recoveries of Overpayments
Direction and Administration
Collection Charges
Transfer to Revenue Fund/DepositAccounts
Other expenditure
V
V
V
V
V
V
V
66,90.16
10,76.52
1,99,03.83
48.19
3,11.02
2,21.25
66,90.16
12,97.77
1,99,03.83
48.19
3,11.02
64,06.60
0.26
-0.03
13,03.59
1,82,90.14
31,80.12
2,64.47
+2,83.56
-0.26
+0.03
-5.82
+16,13.69
-31,31.93
+46.55
Total: 00 State Excise
2039 State Excise
ii Collection of Taxes on Property andCapital Transactions
Figures in italics represent charged expenditure
Heads Actuals for the year Actuals for Increase(+)/
Decrease(-)
during the year
Non-Plan Plan Centrally Sponsored
Schemes Total
66,90.16 66,90.16 64,06.83 +2,83.33
66,90.16 66,90.16 64,06.83 +2,83.33
3,65,54.96 60.00 3,66,14.96 3,49,11.81 +17,03.15
(in lakh of Rupees)
( )
(
(
)
)
( )
. .
. .
. .
. .
. .
. .
. .
. .
. .
. .
. .
. .
. .
. .
. .
. .
. .
. . . .
. .
. .
. .
. . . .
. .
. .
. .
. . . .
. .
. . . .
12. DETAILED STATEMENT OF REVENUE EXPENDITURE BY MINOR HEADS
2011 -2010 -2012
2011
- Contd.
- Contd.
- Concld.
-Contd.
119
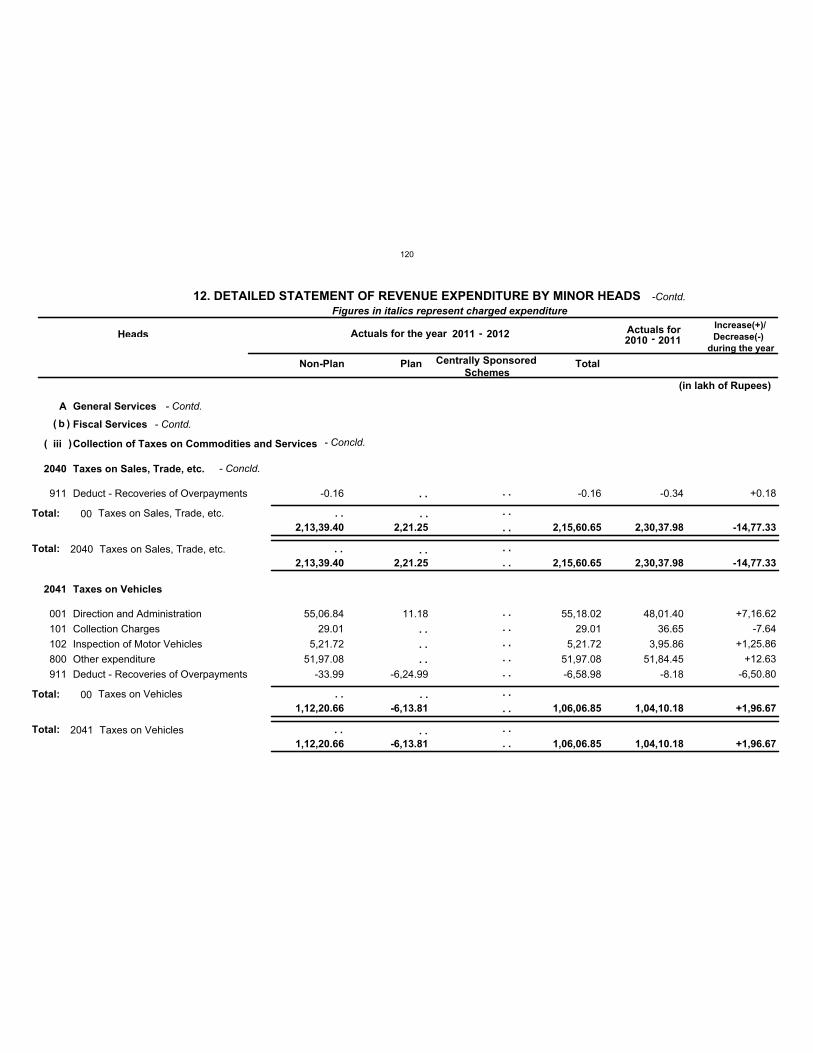
A General Services
b Fiscal Services
iii Collection of Taxes on Commodities and Services
2040
2041
Taxes on Sales, Trade, etc.
Taxes on Vehicles
Total:
Total:
911
001
101
102
800
911
Deduct - Recoveries of Overpayments
Direction and Administration
Collection Charges
Inspection of Motor Vehicles
Other expenditure
Deduct - Recoveries of Overpayments
V
V
V
V
V
V
-0.16
55,06.84
29.01
5,21.72
51,97.08
-33.99
11.18
-6,24.99
-0.16
55,18.02
29.01
5,21.72
51,97.08
-6,58.98
-0.34
48,01.40
36.65
3,95.86
51,84.45
-8.18
+0.18
+7,16.62
-7.64
+1,25.86
+12.63
-6,50.80
Total:
Total:
00
00
Taxes on Sales, Trade, etc.
Taxes on Vehicles
2040
2041
Taxes on Sales, Trade, etc.
Taxes on Vehicles
Figures in italics represent charged expenditure
Heads Actuals for the year Actuals for Increase(+)/
Decrease(-)
during the year
Non-Plan Plan Centrally Sponsored
Schemes Total
2,13,39.40
1,12,20.66
2,21.25
-6,13.81
2,15,60.65
1,06,06.85
2,30,37.98
1,04,10.18
-14,77.33
+1,96.67
2,13,39.40
1,12,20.66
2,21.25
-6,13.81
2,15,60.65
1,06,06.85
2,30,37.98
1,04,10.18
-14,77.33
+1,96.67
(in lakh of Rupees)
( )
( )
. .
. .
. .
. .
. .
. .
. .
. .
. .
. .
. .
. .
. .
. .
. .
. .
. .
. .
. .
. .
. .
. .
. .
. .
. .
. .
12. DETAILED STATEMENT OF REVENUE EXPENDITURE BY MINOR HEADS
2011 -2010 -2012
2011
- Contd.
- Contd.
- Concld.
- Concld.
-Contd.
120
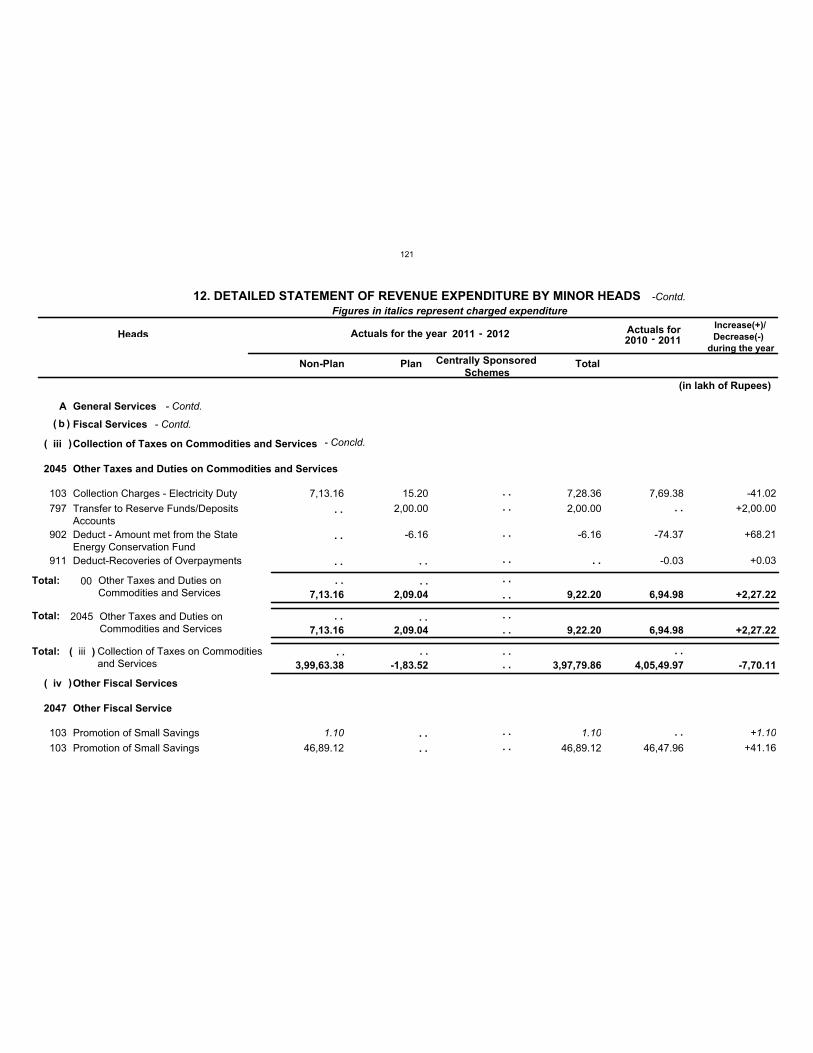
A General Services
b Fiscal Services
iii
iv
Collection of Taxes on Commodities and Services
Other Fiscal Services
Total:
2045
2047
Other Taxes and Duties on Commodities and Services
Other Fiscal Service
Total:
103
797
902
911
103
103
Collection Charges - Electricity Duty
Transfer to Reserve Funds/DepositsAccounts
Deduct - Amount met from the StateEnergy Conservation Fund
Deduct-Recoveries of Overpayments
Promotion of Small Savings
Promotion of Small Savings
V
V
V
V
C
V
7,13.16
1.10
46,89.12
15.20
2,00.00
-6.16
7,28.36
2,00.00
-6.16
1.10
46,89.12
7,69.38
-74.37
-0.03
46,47.96
-41.02
+2,00.00
+68.21
+0.03
+1.10
+41.16
Total: 00 Other Taxes and Duties onCommodities and Services
2045 Other Taxes and Duties onCommodities and Services
iii Collection of Taxes on Commoditiesand Services
Figures in italics represent charged expenditure
Heads Actuals for the year Actuals for Increase(+)/
Decrease(-)
during the year
Non-Plan Plan Centrally Sponsored
Schemes Total
7,13.16 2,09.04 9,22.20 6,94.98 +2,27.22
7,13.16 2,09.04 9,22.20 6,94.98 +2,27.22
3,99,63.38 -1,83.52 3,97,79.86 4,05,49.97 -7,70.11
(in lakh of Rupees)
( )
(
(
)
)
( )
. .
. .
. . . .
. .
. .
. .
. .
. .
. .
. .
. .
. .
. .
. .
. . . . . .
. .
. . . . . .
. .
. . . . . .
. .
. .
12. DETAILED STATEMENT OF REVENUE EXPENDITURE BY MINOR HEADS
2011 -2010 -2012
2011
- Contd.
- Contd.
- Concld.
-Contd.
121
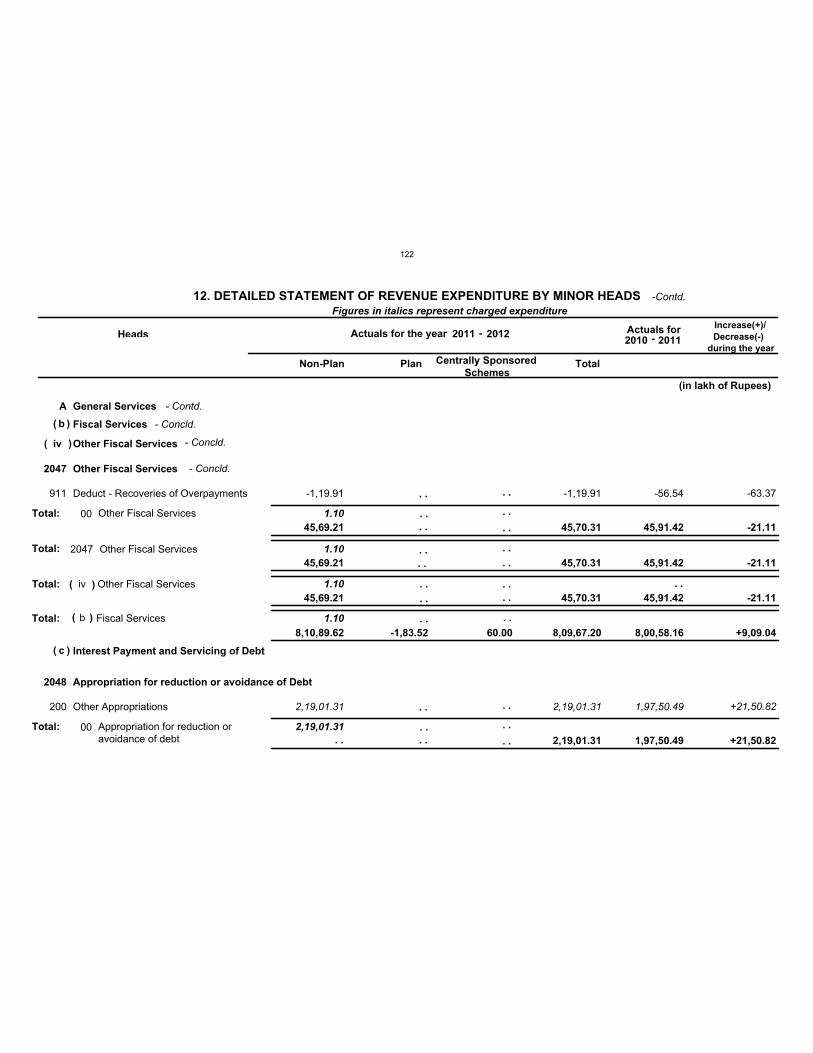
A General Services
b
c
Fiscal Services
Interest Payment and Servicing of Debt
1.10Total:
iv Other Fiscal Services
1.10Total:
2047
2048
Other Fiscal Services
Appropriation for reduction or avoidance of Debt
1.10Total:
1.10
2,19,01.31
911
200
Deduct - Recoveries of Overpayments
Other Appropriations
V
C
-1,19.91
2,19,01.31
-1,19.91
2,19,01.31
-56.54
1,97,50.49
-63.37
+21,50.82
Total:
Total:
00
00
Other Fiscal Services
Appropriation for reduction oravoidance of debt
2047 Other Fiscal Services
iv Other Fiscal Services
b Fiscal Services
Figures in italics represent charged expenditure
Heads Actuals for the year Actuals for Increase(+)/
Decrease(-)
during the year
Non-Plan Plan Centrally Sponsored
Schemes Total
45,69.21 45,70.31
2,19,01.31
45,91.42
1,97,50.49
-21.11
+21,50.82
45,69.21 45,70.31 45,91.42 -21.11
45,69.21 45,70.31 45,91.42 -21.11
8,10,89.62 -1,83.52 60.00 8,09,67.20 8,00,58.16 +9,09.04
(in lakh of Rupees)
(
(
)
)
( )
( )
( )
. .
. .
. .
. .
. .
. .
. .
. .
. .
. .
. .
. .
. .
. .
. .
. .
. .
. .
. .
. .
. .
. .
. . . .
12. DETAILED STATEMENT OF REVENUE EXPENDITURE BY MINOR HEADS
2011 -2010 -2012
2011
- Contd.
- Concld.
- Concld.
- Concld.
-Contd.
122
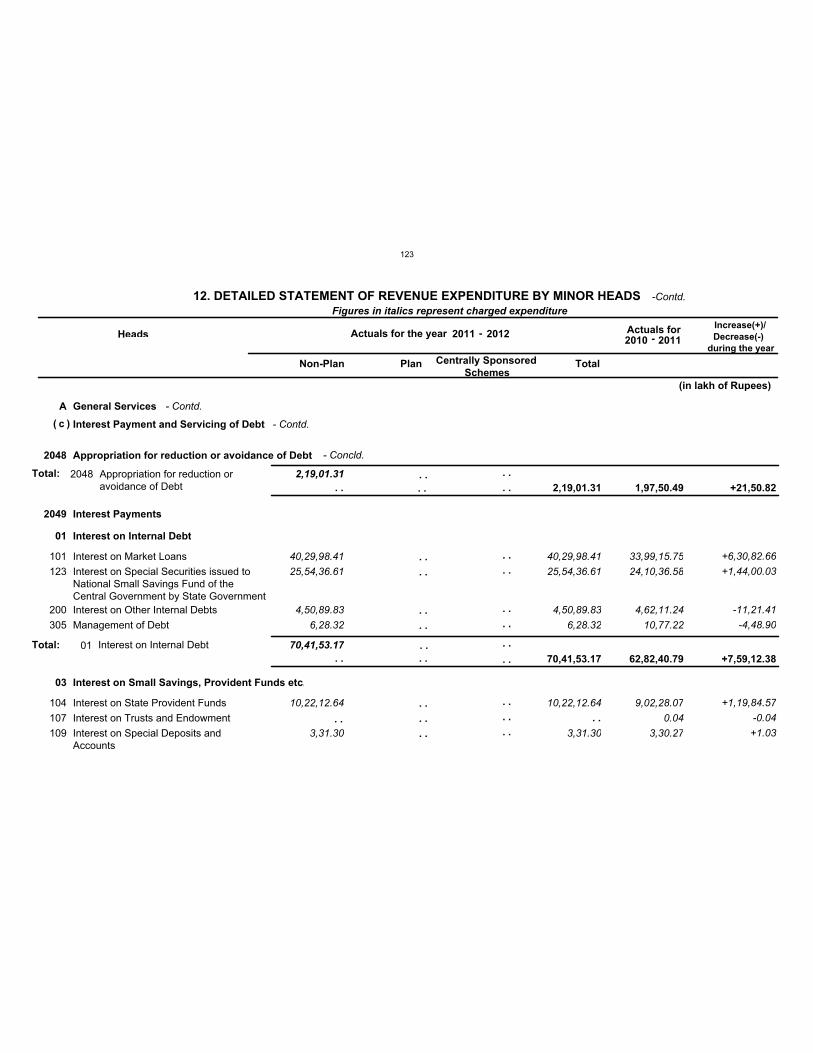
A General Services
c Interest Payment and Servicing of Debt
2048
2049
Appropriation for reduction or avoidance of Debt
Interest Payments
2,19,01.31Total:
01
03
Interest on Internal Debt
Interest on Small Savings, Provident Funds etc.
70,41,53.17
101
123
200
305
104
107
109
Interest on Market Loans
Interest on Special Securities issued toNational Small Savings Fund of theCentral Government by State Government
Interest on Other Internal Debts
Management of Debt
Interest on State Provident Funds
Interest on Trusts and Endowment
Interest on Special Deposits andAccounts
C
C
C
C
C
C
C
40,29,98.41
25,54,36.61
4,50,89.83
6,28.32
10,22,12.64
3,31.30
40,29,98.41
25,54,36.61
4,50,89.83
6,28.32
10,22,12.64
3,31.30
33,99,15.75
24,10,36.58
4,62,11.24
10,77.22
9,02,28.07
0.04
3,30.27
+6,30,82.66
+1,44,00.03
-11,21.41
-4,48.90
+1,19,84.57
-0.04
+1.03
Total: 01 Interest on Internal Debt
2048 Appropriation for reduction oravoidance of Debt
Figures in italics represent charged expenditure
Heads Actuals for the year Actuals for Increase(+)/
Decrease(-)
during the year
Non-Plan Plan Centrally Sponsored
Schemes Total
70,41,53.17 62,82,40.79 +7,59,12.38
2,19,01.31 1,97,50.49 +21,50.82
(in lakh of Rupees)
( )
. .
. .
. .
. .
. .
. .
. .
. .
. .
. .
. .
. .
. .
. .
. .
. .
. .
. .
. .
. .
. .
. .
. .
. .
. .
. .
12. DETAILED STATEMENT OF REVENUE EXPENDITURE BY MINOR HEADS
2011 -2010 -2012
2011
- Contd.
- Contd.
- Concld.
-Contd.
123
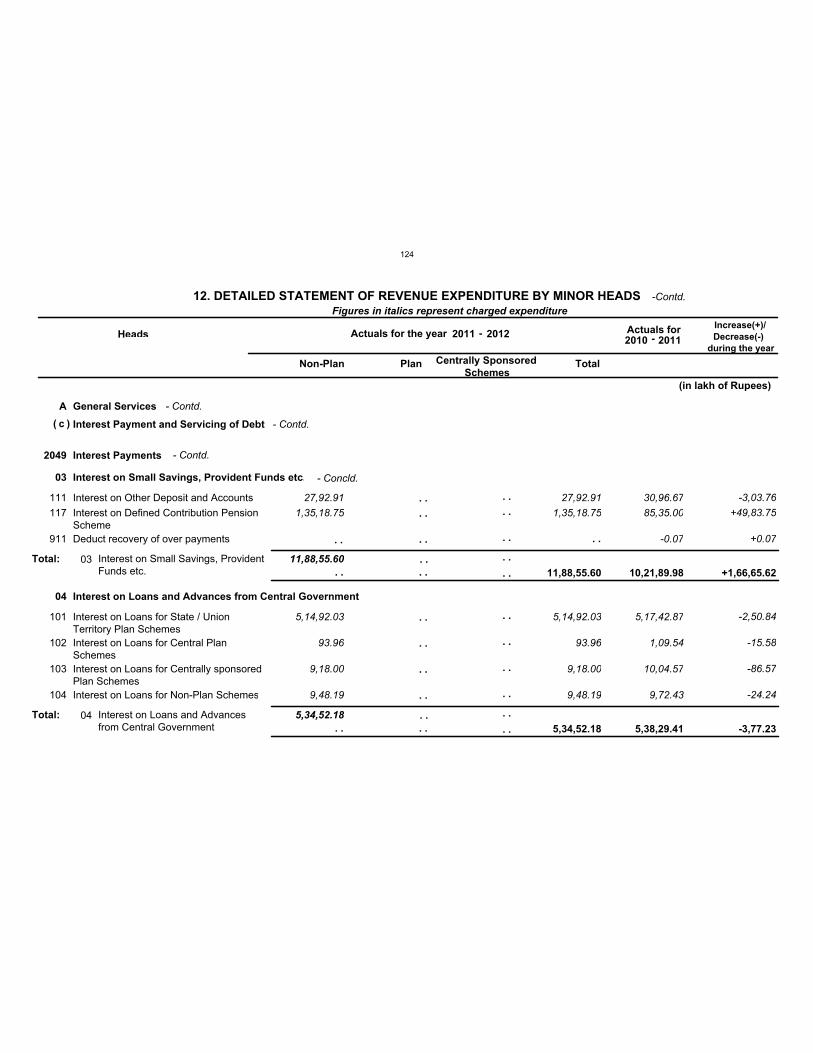
A General Services
c Interest Payment and Servicing of Debt
2049 Interest Payments
03
04
Interest on Small Savings, Provident Funds etc.
Interest on Loans and Advances from Central Government
11,88,55.60
5,34,52.18
111
117
911
101
102
103
104
Interest on Other Deposit and Accounts
Interest on Defined Contribution PensionScheme
Deduct recovery of over payments
Interest on Loans for State / UnionTerritory Plan Schemes
Interest on Loans for Central PlanSchemes
Interest on Loans for Centrally sponsoredPlan Schemes
Interest on Loans for Non-Plan Schemes
C
C
C
C
C
C
C
27,92.91
1,35,18.75
5,14,92.03
93.96
9,18.00
9,48.19
27,92.91
1,35,18.75
5,14,92.03
93.96
9,18.00
9,48.19
30,96.67
85,35.00
-0.07
5,17,42.87
1,09.54
10,04.57
9,72.43
-3,03.76
+49,83.75
+0.07
-2,50.84
-15.58
-86.57
-24.24
Total:
Total:
03
04
Interest on Small Savings, ProvidentFunds etc.
Interest on Loans and Advancesfrom Central Government
Figures in italics represent charged expenditure
Heads Actuals for the year Actuals for Increase(+)/
Decrease(-)
during the year
Non-Plan Plan Centrally Sponsored
Schemes Total
11,88,55.60
5,34,52.18
10,21,89.98
5,38,29.41
+1,66,65.62
-3,77.23
(in lakh of Rupees)
( )
. .
. .
. .
. .
. .
. .
. .
. .
. .
. .
. .
. .
. .
. .
. .
. .
. .
. .
. .
. .
. .
. .
. .
. .
. .
. .
12. DETAILED STATEMENT OF REVENUE EXPENDITURE BY MINOR HEADS
2011 -2010 -2012
2011
- Contd.
- Contd.
- Contd.
- Concld.
-Contd.
124
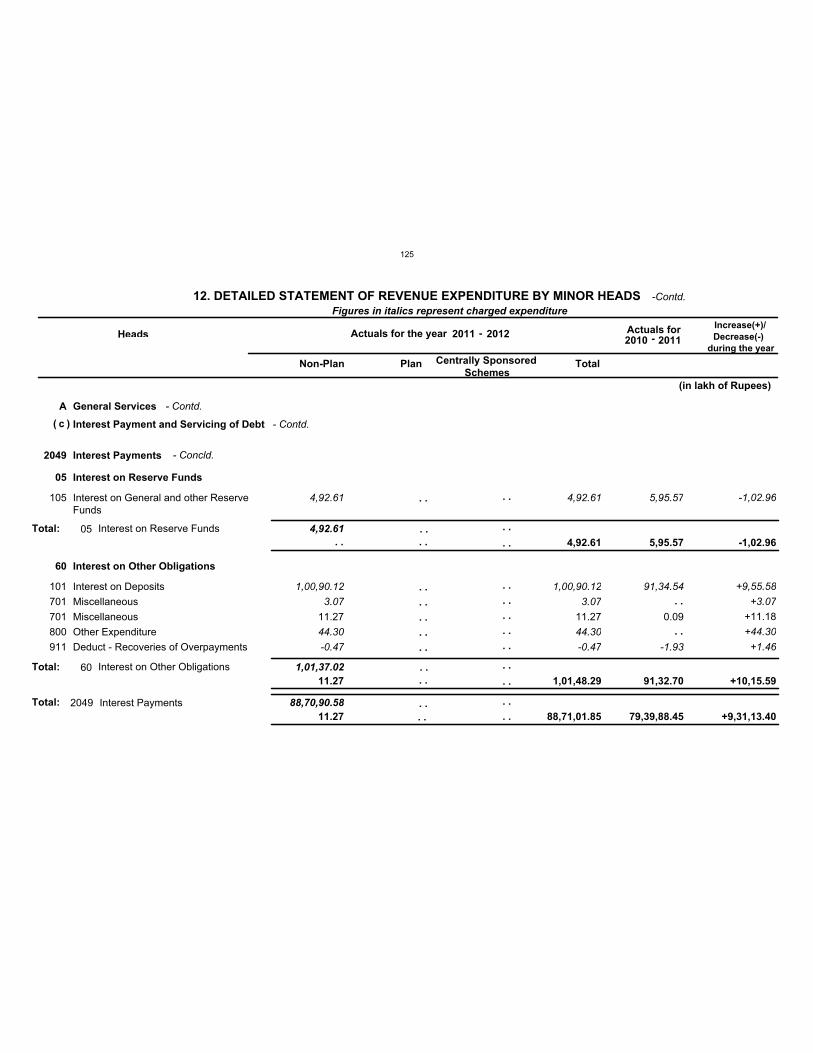
A General Services
c Interest Payment and Servicing of Debt
2049 Interest Payments
88,70,90.58Total:
05
60
Interest on Reserve Funds
Interest on Other Obligations
4,92.61
1,01,37.02
105
101
701
701
800
911
Interest on General and other ReserveFunds
Interest on Deposits
Miscellaneous
Miscellaneous
Other Expenditure
Deduct - Recoveries of Overpayments
C
C
C
V
C
C
4,92.61
1,00,90.12
3.07
11.27
44.30
-0.47
4,92.61
1,00,90.12
3.07
11.27
44.30
-0.47
5,95.57
91,34.54
0.09
-1.93
-1,02.96
+9,55.58
+3.07
+11.18
+44.30
+1.46
Total:
Total:
05
60
Interest on Reserve Funds
Interest on Other Obligations
2049 Interest Payments
Figures in italics represent charged expenditure
Heads Actuals for the year Actuals for Increase(+)/
Decrease(-)
during the year
Non-Plan Plan Centrally Sponsored
Schemes Total
11.27
4,92.61
1,01,48.29
5,95.57
91,32.70
-1,02.96
+10,15.59
11.27 88,71,01.85 79,39,88.45 +9,31,13.40
(in lakh of Rupees)
( )
. .
. .
. .
. .
. .
. .
. .
. .
. .
. .
. .
. .
. .
. .
. .
. .
. .
. .
. .
. .
. .
. .
. .
. .
. .
. .
. .
12. DETAILED STATEMENT OF REVENUE EXPENDITURE BY MINOR HEADS
2011 -2010 -2012
2011
- Contd.
- Contd.
- Concld.
-Contd.
125
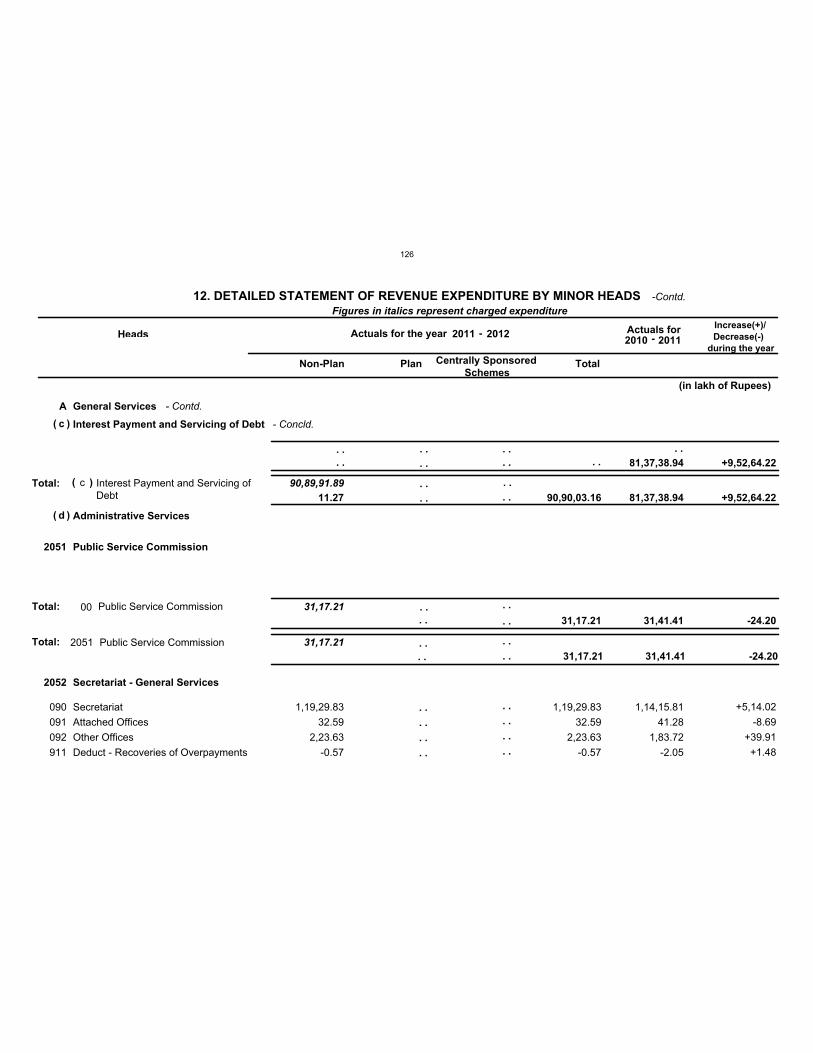
A General Services
c
d
Interest Payment and Servicing of Debt
Administrative Services
90,89,91.89Total:
2051
2052
Public Service Commission
Secretariat - General Services
31,17.21Total:
31,17.21
090
091
092
911
Secretariat
Attached Offices
Other Offices
Deduct - Recoveries of Overpayments
C
V
V
V
V
V
1,19,29.83
32.59
2,23.63
-0.57
1,19,29.83
32.59
2,23.63
-0.57
1,14,15.81
41.28
1,83.72
-2.05
+5,14.02
-8.69
+39.91
+1.48
Total: 00 Public Service Commission
2051 Public Service Commission
c Interest Payment and Servicing ofDebt
Figures in italics represent charged expenditure
Heads Actuals for the year Actuals for Increase(+)/
Decrease(-)
during the year
Non-Plan Plan Centrally Sponsored
Schemes Total
31,17.21 31,41.41 -24.20
31,17.21 31,41.41 -24.20
81,37,38.94 +9,52,64.22
11.27 90,90,03.16 81,37,38.94 +9,52,64.22
(in lakh of Rupees)
(
(
)
)
( )
. .
. .
. .
. .
. .
. .
. .
. .
. .
. .
. .
. .
. .
. .
. .
. .
. .
. .
. .
. .
. .
. . . .
. .
. .
. .
. .
. .
12. DETAILED STATEMENT OF REVENUE EXPENDITURE BY MINOR HEADS
2011 -2010 -2012
2011
- Contd.
- Concld.
-Contd.
126
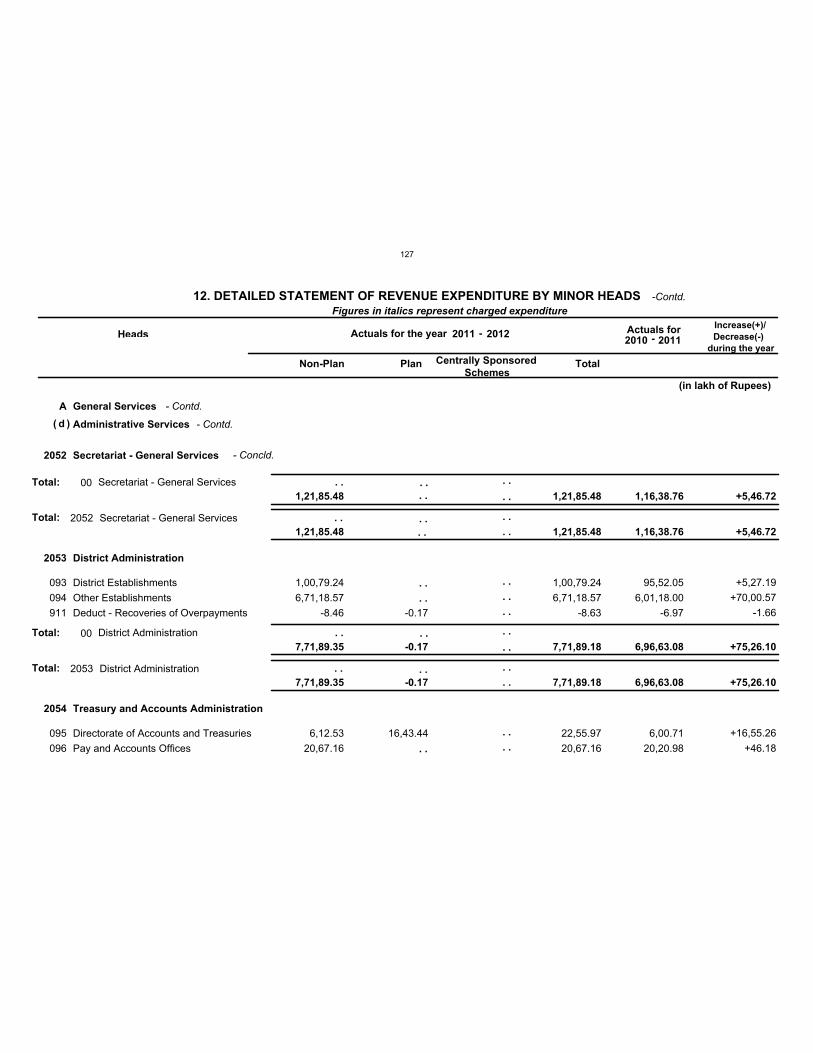
A General Services
d Administrative Services
2052
2053
2054
Secretariat - General Services
District Administration
Treasury and Accounts Administration
Total:
Total:
093
094
911
095
096
District Establishments
Other Establishments
Deduct - Recoveries of Overpayments
Directorate of Accounts and Treasuries
Pay and Accounts Offices
V
V
V
V
V
1,00,79.24
6,71,18.57
-8.46
6,12.53
20,67.16
-0.17
16,43.44
1,00,79.24
6,71,18.57
-8.63
22,55.97
20,67.16
95,52.05
6,01,18.00
-6.97
6,00.71
20,20.98
+5,27.19
+70,00.57
-1.66
+16,55.26
+46.18
Total:
Total:
00
00
Secretariat - General Services
District Administration
2052
2053
Secretariat - General Services
District Administration
Figures in italics represent charged expenditure
Heads Actuals for the year Actuals for Increase(+)/
Decrease(-)
during the year
Non-Plan Plan Centrally Sponsored
Schemes Total
1,21,85.48
7,71,89.35 -0.17
1,21,85.48
7,71,89.18
1,16,38.76
6,96,63.08
+5,46.72
+75,26.10
1,21,85.48
7,71,89.35 -0.17
1,21,85.48
7,71,89.18
1,16,38.76
6,96,63.08
+5,46.72
+75,26.10
(in lakh of Rupees)
( )
. .
. .
. .
. .
. .
. .
. .
. .
. .
. .
. .
. .
. .
. .
. .
. .
. .
. .
. .
. .
. .
. .
. .
. .
. .
. .
12. DETAILED STATEMENT OF REVENUE EXPENDITURE BY MINOR HEADS
2011 -2010 -2012
2011
- Contd.
- Contd.
- Concld.
-Contd.
127
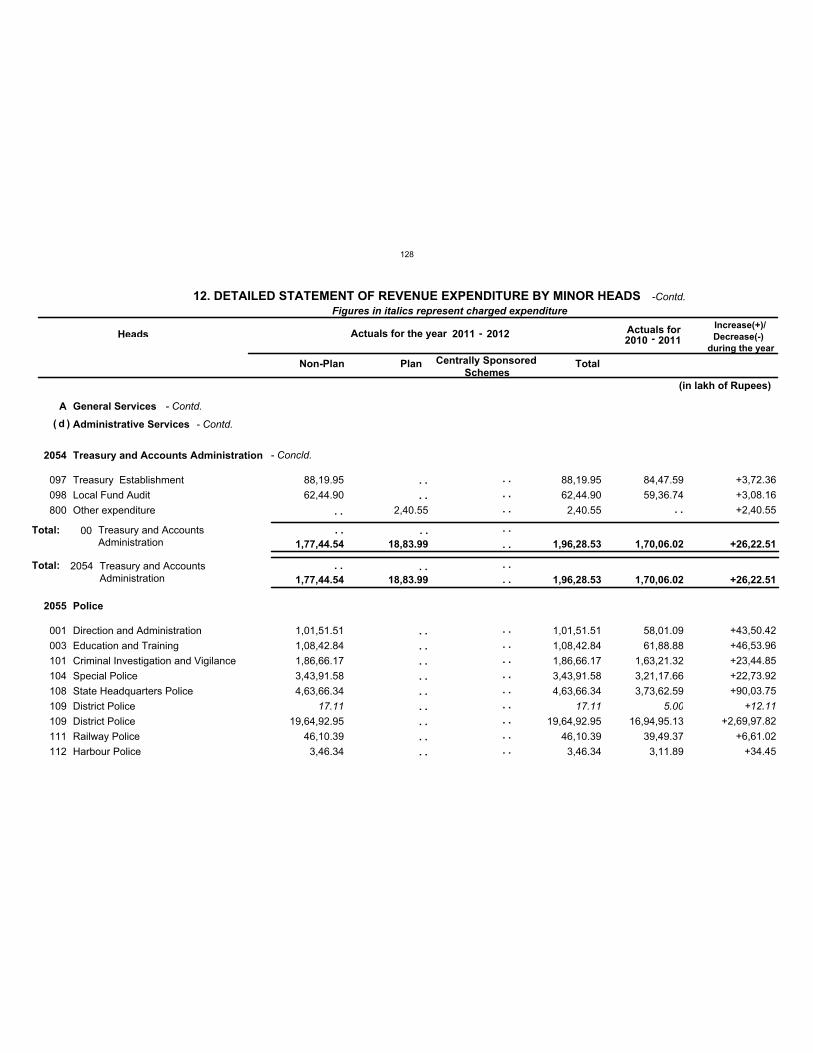
A General Services
d Administrative Services
2054
2055
Treasury and Accounts Administration
Police
Total:
097
098
800
001
003
101
104
108
109
109
111
112
Treasury Establishment
Local Fund Audit
Other expenditure
Direction and Administration
Education and Training
Criminal Investigation and Vigilance
Special Police
State Headquarters Police
District Police
District Police
Railway Police
Harbour Police
V
V
V
V
V
V
V
V
C
V
V
V
88,19.95
62,44.90
1,01,51.51
1,08,42.84
1,86,66.17
3,43,91.58
4,63,66.34
17.11
19,64,92.95
46,10.39
3,46.34
2,40.55
88,19.95
62,44.90
2,40.55
1,01,51.51
1,08,42.84
1,86,66.17
3,43,91.58
4,63,66.34
17.11
19,64,92.95
46,10.39
3,46.34
84,47.59
59,36.74
58,01.09
61,88.88
1,63,21.32
3,21,17.66
3,73,62.59
5.00
16,94,95.13
39,49.37
3,11.89
+3,72.36
+3,08.16
+2,40.55
+43,50.42
+46,53.96
+23,44.85
+22,73.92
+90,03.75
+12.11
+2,69,97.82
+6,61.02
+34.45
Total: 00 Treasury and AccountsAdministration
2054 Treasury and AccountsAdministration
Figures in italics represent charged expenditure
Heads Actuals for the year Actuals for Increase(+)/
Decrease(-)
during the year
Non-Plan Plan Centrally Sponsored
Schemes Total
1,77,44.54 18,83.99 1,96,28.53 1,70,06.02 +26,22.51
1,77,44.54 18,83.99 1,96,28.53 1,70,06.02 +26,22.51
(in lakh of Rupees)
( )
. .
. .
. .
. .
. .
. .
. .
. .
. .
. .
. .
. .
. .
. .
. .
. .
. .
. .
. .
. .
. .
. .
. .
. .
. .
. . . . . .
. .
. . . . . .
. .
12. DETAILED STATEMENT OF REVENUE EXPENDITURE BY MINOR HEADS
2011 -2010 -2012
2011
- Contd.
- Contd.
- Concld.
-Contd.
128
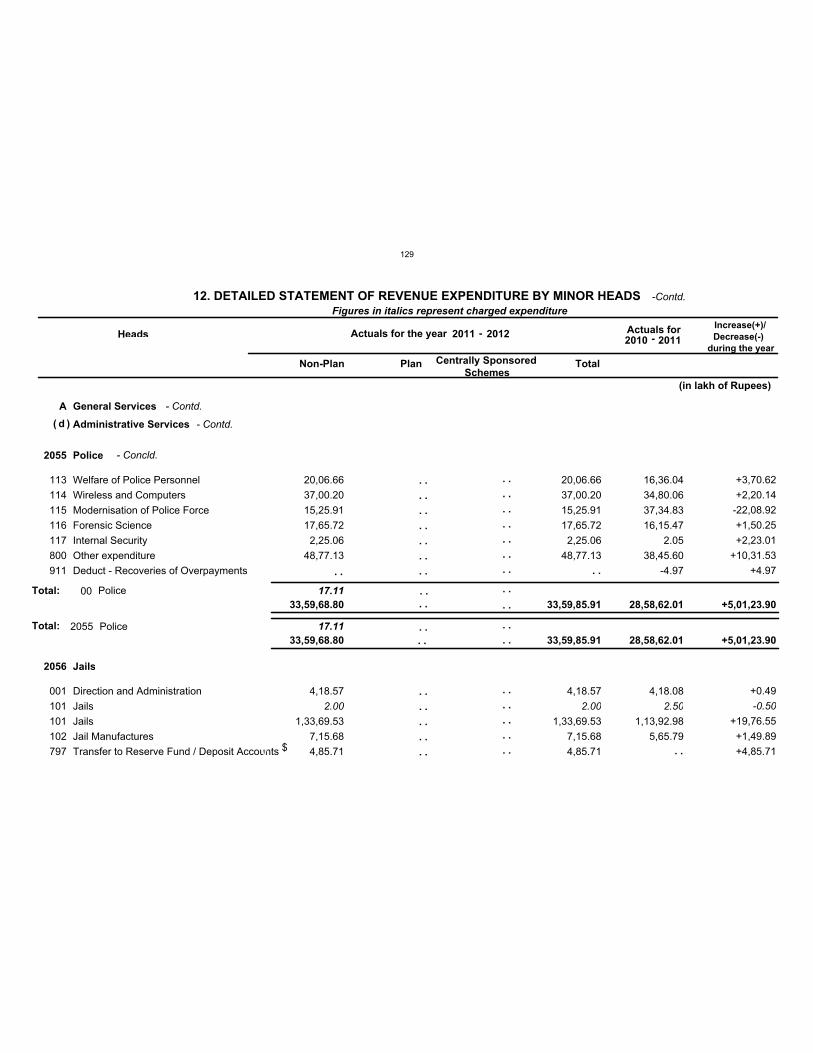
A General Services
d Administrative Services
2055
2056
Police
Jails
17.11Total:
17.11
113
114
115
116
117
800
911
001
101
101
102
797
Welfare of Police Personnel
Wireless and Computers
Modernisation of Police Force
Forensic Science
Internal Security
Other expenditure
Deduct - Recoveries of Overpayments
Direction and Administration
Jails
Jails
Jail Manufactures
Transfer to Reserve Fund / Deposit Accounts $
V
V
V
V
V
V
V
V
C
V
V
V
20,06.66
37,00.20
15,25.91
17,65.72
2,25.06
48,77.13
4,18.57
2.00
1,33,69.53
7,15.68
4,85.71
20,06.66
37,00.20
15,25.91
17,65.72
2,25.06
48,77.13
4,18.57
2.00
1,33,69.53
7,15.68
4,85.71
16,36.04
34,80.06
37,34.83
16,15.47
2.05
38,45.60
-4.97
4,18.08
2.50
1,13,92.98
5,65.79
+3,70.62
+2,20.14
-22,08.92
+1,50.25
+2,23.01
+10,31.53
+4.97
+0.49
-0.50
+19,76.55
+1,49.89
+4,85.71
Total: 00 Police
2055 Police
Figures in italics represent charged expenditure
Heads Actuals for the year Actuals for Increase(+)/
Decrease(-)
during the year
Non-Plan Plan Centrally Sponsored
Schemes Total
33,59,68.80 33,59,85.91 28,58,62.01 +5,01,23.90
33,59,68.80 33,59,85.91 28,58,62.01 +5,01,23.90
(in lakh of Rupees)
( )
. .
. .
. .
. .
. .
. .
. .
. .
. .
. .
. .
. .
. .
. .
. .
. .
. .
. .
. .
. .
. .
. .
. .
. .
. .
. .
. .
. .
. .
. .
. .
. .
. .
. .
. .
12. DETAILED STATEMENT OF REVENUE EXPENDITURE BY MINOR HEADS
2011 -2010 -2012
2011
- Contd.
- Contd.
- Concld.
-Contd.
129
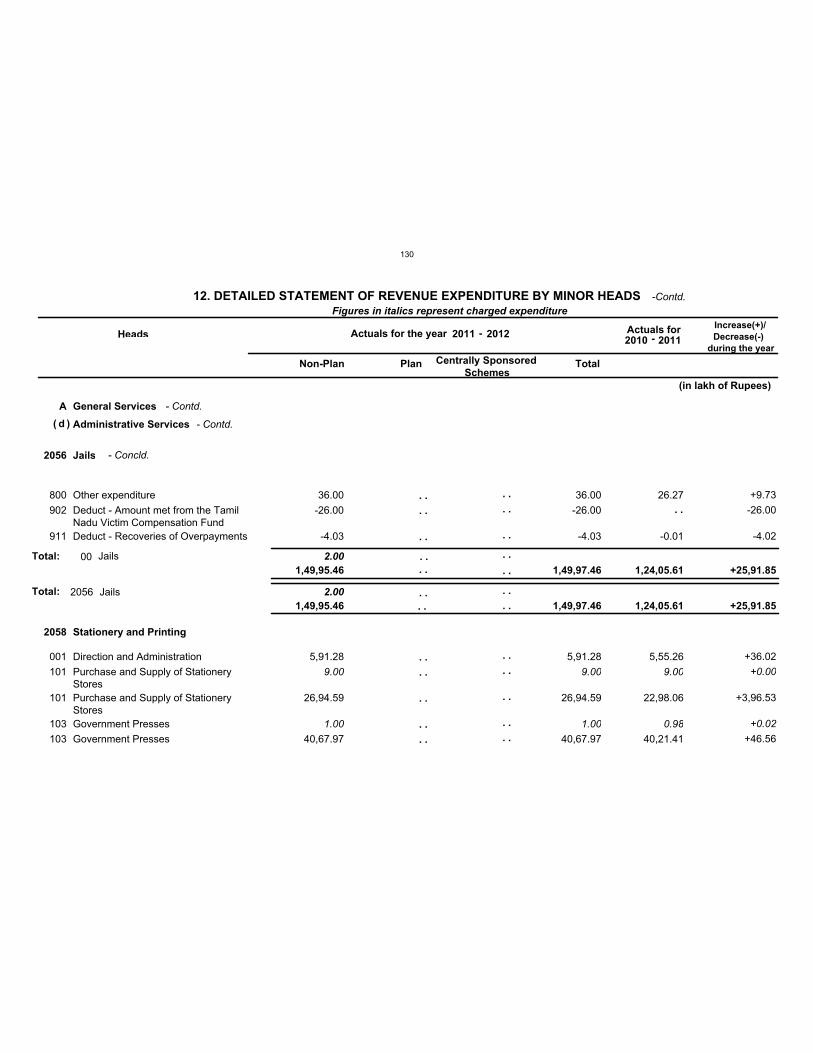
A General Services
d Administrative Services
2056
2058
Jails
Stationery and Printing
2.00Total:
2.00
800
902
911
001
101
101
103
103
Other expenditure
Deduct - Amount met from the TamilNadu Victim Compensation Fund
Deduct - Recoveries of Overpayments
Direction and Administration
Purchase and Supply of StationeryStores
Purchase and Supply of StationeryStores
Government Presses
Government Presses
V
V
V
V
C
V
C
V
36.00
-26.00
-4.03
5,91.28
9.00
26,94.59
1.00
40,67.97
36.00
-26.00
-4.03
5,91.28
9.00
26,94.59
1.00
40,67.97
26.27
-0.01
5,55.26
9.00
22,98.06
0.98
40,21.41
+9.73
-26.00
-4.02
+36.02
+0.00
+3,96.53
+0.02
+46.56
Total: 00 Jails
2056 Jails
Figures in italics represent charged expenditure
Heads Actuals for the year Actuals for Increase(+)/
Decrease(-)
during the year
Non-Plan Plan Centrally Sponsored
Schemes Total
1,49,95.46 1,49,97.46 1,24,05.61 +25,91.85
1,49,95.46 1,49,97.46 1,24,05.61 +25,91.85
(in lakh of Rupees)
( )
. .
. .
. .
. .
. .
. .
. .
. .
. .
. .
. .
. .
. .
. .
. .
. .
. .
. .
. .
. .
. .
. .
. .
. .
. .
12. DETAILED STATEMENT OF REVENUE EXPENDITURE BY MINOR HEADS
2011 -2010 -2012
2011
- Contd.
- Contd.
- Concld.
-Contd.
130
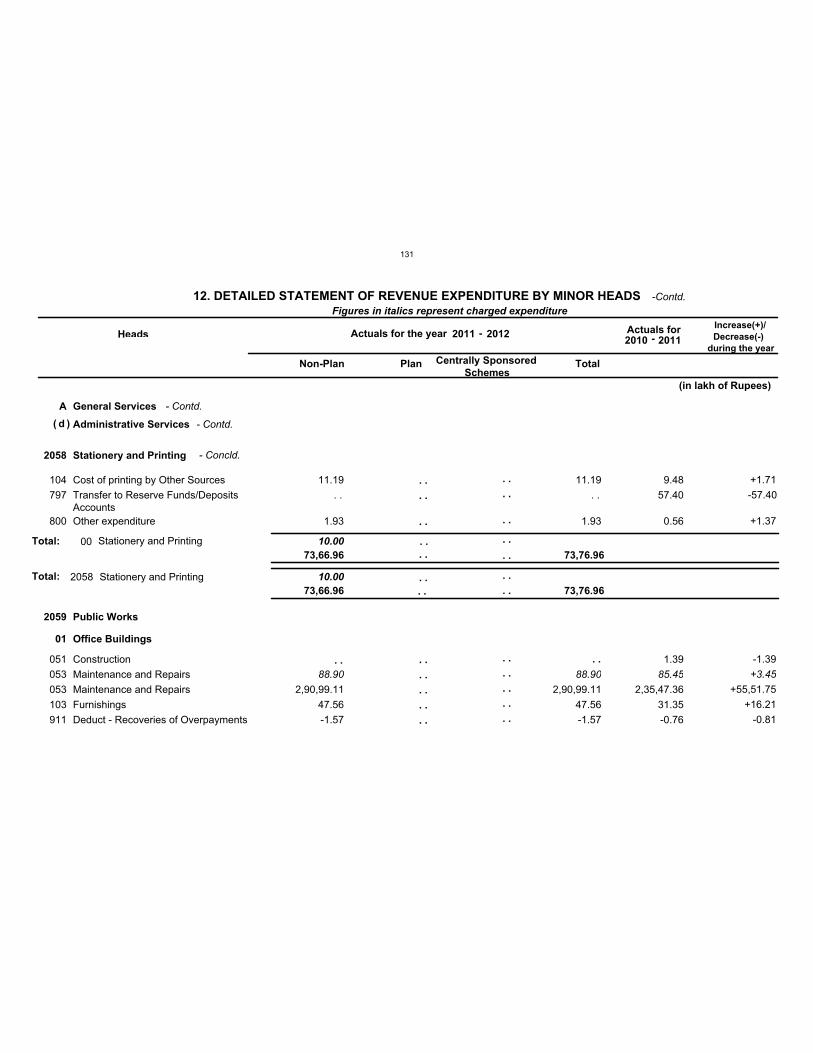
A General Services
d Administrative Services
2058
2059
Stationery and Printing
Public Works
10.00Total:
01 Office Buildings
10.00
104
797
800
051
053
053
103
911
Cost of printing by Other Sources
Transfer to Reserve Funds/DepositsAccounts
Other expenditure
Construction
Maintenance and Repairs
Maintenance and Repairs
Furnishings
Deduct - Recoveries of Overpayments
V
V
V
V
C
V
V
V
11.19
. .
1.93
88.90
2,90,99.11
47.56
-1.57
11.19
. .
1.93
88.90
2,90,99.11
47.56
-1.57
9.48
57.40
0.56
1.39
85.45
2,35,47.36
31.35
-0.76
+1.71
-57.40
+1.37
-1.39
+3.45
+55,51.75
+16.21
-0.81
Total: 00 Stationery and Printing
2058 Stationery and Printing
Figures in italics represent charged expenditure
Heads Actuals for the year Actuals for Increase(+)/
Decrease(-)
during the year
Non-Plan Plan Centrally Sponsored
Schemes Total
73,66.96 73,76.96
73,66.96 73,76.96
(in lakh of Rupees)
( )
. .
. .
. .
. .
. .
. .
. .
. .
. .
. .
. .
. .
. .
. .
. .
. .
. .
. .
. .
. .
. .
. .
. .
. .
. .
. .
12. DETAILED STATEMENT OF REVENUE EXPENDITURE BY MINOR HEADS
2011 -2010 -2012
2011
- Contd.
- Contd.
- Concld.
-Contd.
131
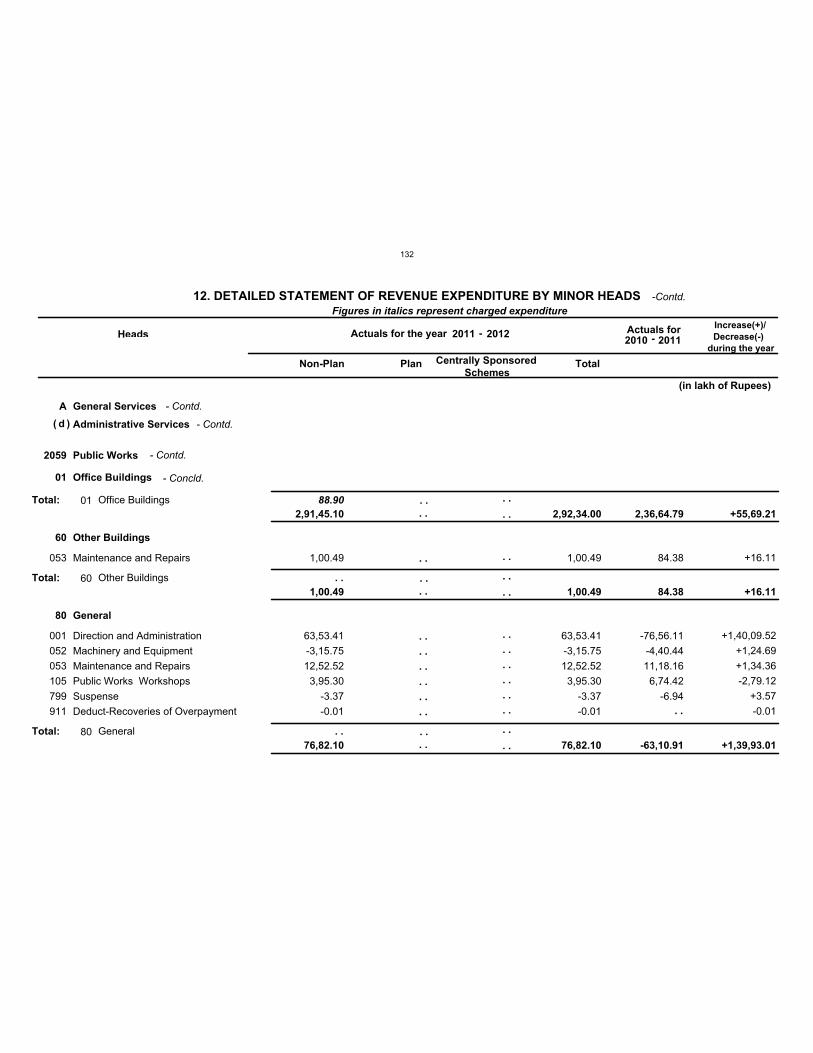
A General Services
d Administrative Services
2059 Public Works
01
60
80
Office Buildings
Other Buildings
General
88.90
053
001
052
053
105
799
911
Maintenance and Repairs
Direction and Administration
Machinery and Equipment
Maintenance and Repairs
Public Works Workshops
Suspense
Deduct-Recoveries of Overpayment
V
V
V
V
V
V
V
1,00.49
63,53.41
-3,15.75
12,52.52
3,95.30
-3.37
-0.01
1,00.49
63,53.41
-3,15.75
12,52.52
3,95.30
-3.37
-0.01
84.38
-76,56.11
-4,40.44
11,18.16
6,74.42
-6.94
+16.11
+1,40,09.52
+1,24.69
+1,34.36
-2,79.12
+3.57
-0.01
Total:
Total:
Total:
01
60
80
Office Buildings
Other Buildings
General
Figures in italics represent charged expenditure
Heads Actuals for the year Actuals for Increase(+)/
Decrease(-)
during the year
Non-Plan Plan Centrally Sponsored
Schemes Total
2,91,45.10
1,00.49
76,82.10
2,92,34.00
1,00.49
76,82.10
2,36,64.79
84.38
-63,10.91
+55,69.21
+16.11
+1,39,93.01
(in lakh of Rupees)
( )
. .
. .
. .
. .
. .
. .
. .
. .
. .
. .
. .
. .
. .
. . . .
. .
. .
. .
. .
. .
. .
. .
. .
. .
. .
. .
. .
. .
. .
12. DETAILED STATEMENT OF REVENUE EXPENDITURE BY MINOR HEADS
2011 -2010 -2012
2011
- Contd.
- Contd.
- Contd.
- Concld.
-Contd.
132
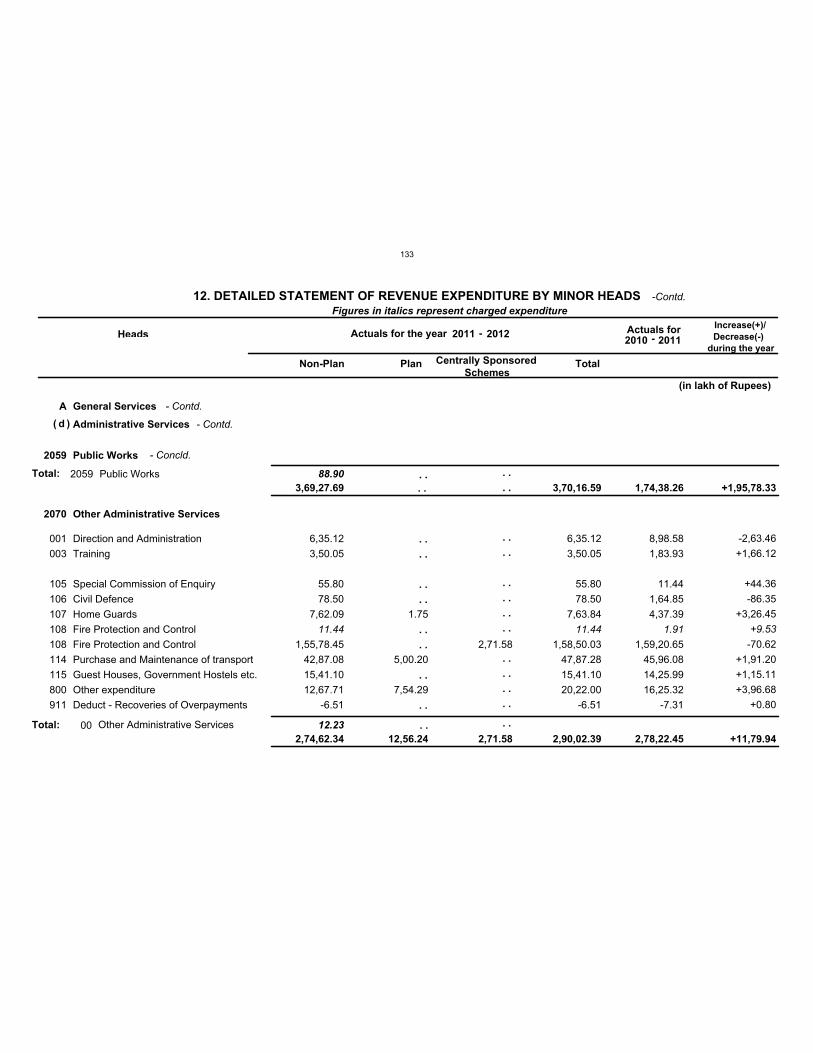
A General Services
d Administrative Services
2059
2070
Public Works
Other Administrative Services
88.90Total:
12.23
001
003
105
106
107
108
108
114
115
800
911
Direction and Administration
Training
Special Commission of Enquiry
Civil Defence
Home Guards
Fire Protection and Control
Fire Protection and Control
Purchase and Maintenance of transport
Guest Houses, Government Hostels etc.
Other expenditure
Deduct - Recoveries of Overpayments
V
V
V
V
V
V
C
V
V
V
V
V
6,35.12
3,50.05
55.80
78.50
7,62.09
11.44
1,55,78.45
42,87.08
15,41.10
12,67.71
-6.51
1.75
5,00.20
7,54.29
2,71.58
6,35.12
3,50.05
55.80
78.50
7,63.84
11.44
1,58,50.03
47,87.28
15,41.10
20,22.00
-6.51
8,98.58
1,83.93
11.44
1,64.85
4,37.39
1.91
1,59,20.65
45,96.08
14,25.99
16,25.32
-7.31
-2,63.46
+1,66.12
+44.36
-86.35
+3,26.45
+9.53
-70.62
+1,91.20
+1,15.11
+3,96.68
+0.80
Total: 00 Other Administrative Services
2059 Public Works
Figures in italics represent charged expenditure
Heads Actuals for the year Actuals for Increase(+)/
Decrease(-)
during the year
Non-Plan Plan Centrally Sponsored
Schemes Total
2,74,62.34 12,56.24 2,71.58 2,90,02.39 2,78,22.45 +11,79.94
3,69,27.69 3,70,16.59 1,74,38.26 +1,95,78.33
(in lakh of Rupees)
( )
. .
. .
. .
. .
. .
. .
. .
. .
. .
. .
. .
. .
. .
. .
. .
. .
. .
. .
. . . .
. .
. .
. .
. .
12. DETAILED STATEMENT OF REVENUE EXPENDITURE BY MINOR HEADS
2011 -2010 -2012
2011
- Contd.
- Contd.
- Concld.
-Contd.
133
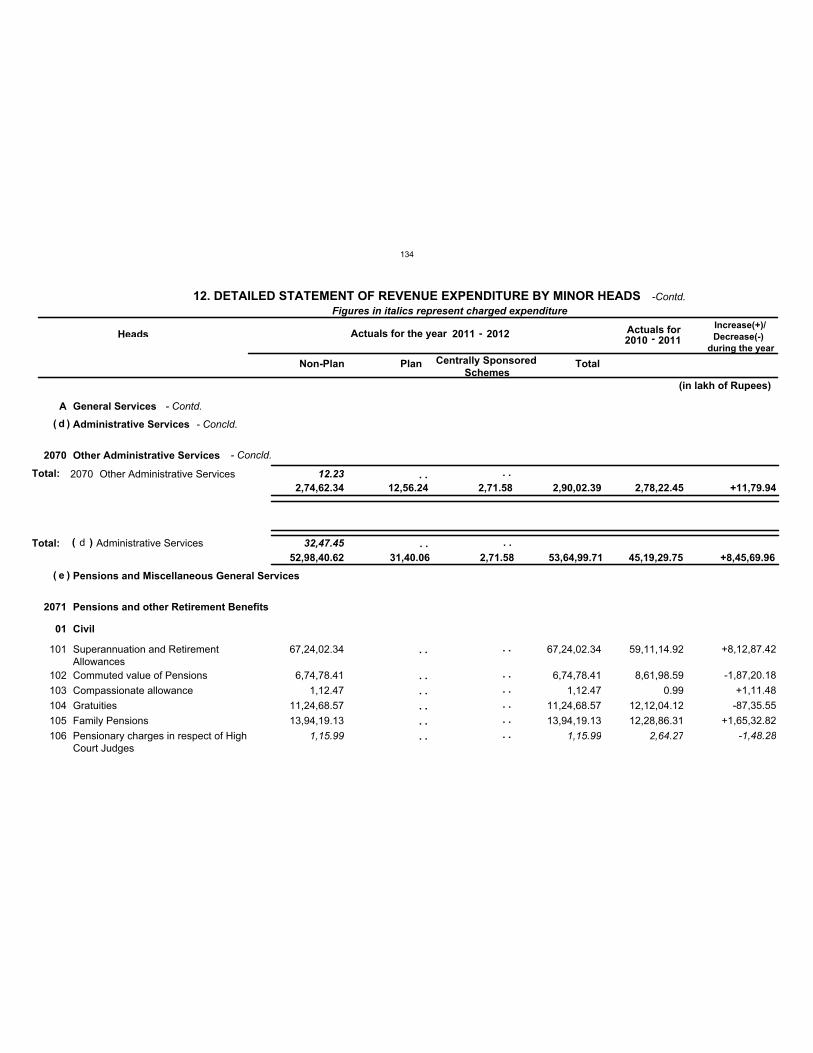
A General Services
d
e
Administrative Services
Pensions and Miscellaneous General Services
32,47.45Total:
2070
2071
Other Administrative Services
Pensions and other Retirement Benefits
12.23Total:
01 Civil
101
102
103
104
105
106
Superannuation and RetirementAllowances
Commuted value of Pensions
Compassionate allowance
Gratuities
Family Pensions
Pensionary charges in respect of HighCourt Judges
V
V
V
V
V
C
67,24,02.34
6,74,78.41
1,12.47
11,24,68.57
13,94,19.13
1,15.99
67,24,02.34
6,74,78.41
1,12.47
11,24,68.57
13,94,19.13
1,15.99
59,11,14.92
8,61,98.59
0.99
12,12,04.12
12,28,86.31
2,64.27
+8,12,87.42
-1,87,20.18
+1,11.48
-87,35.55
+1,65,32.82
-1,48.28
2070 Other Administrative Services
d Administrative Services
Figures in italics represent charged expenditure
Heads Actuals for the year Actuals for Increase(+)/
Decrease(-)
during the year
Non-Plan Plan Centrally Sponsored
Schemes Total
2,74,62.34 12,56.24 2,71.58 2,90,02.39 2,78,22.45 +11,79.94
52,98,40.62 31,40.06 2,71.58 53,64,99.71 45,19,29.75 +8,45,69.96
(in lakh of Rupees)
(
(
)
)
( )
. .
. .
. .
. .
. .
. .
. .
. .
. .
. .
. .
. .
. . . .
. . . .
12. DETAILED STATEMENT OF REVENUE EXPENDITURE BY MINOR HEADS
2011 -2010 -2012
2011
- Contd.
- Concld.
- Concld.
-Contd.
134
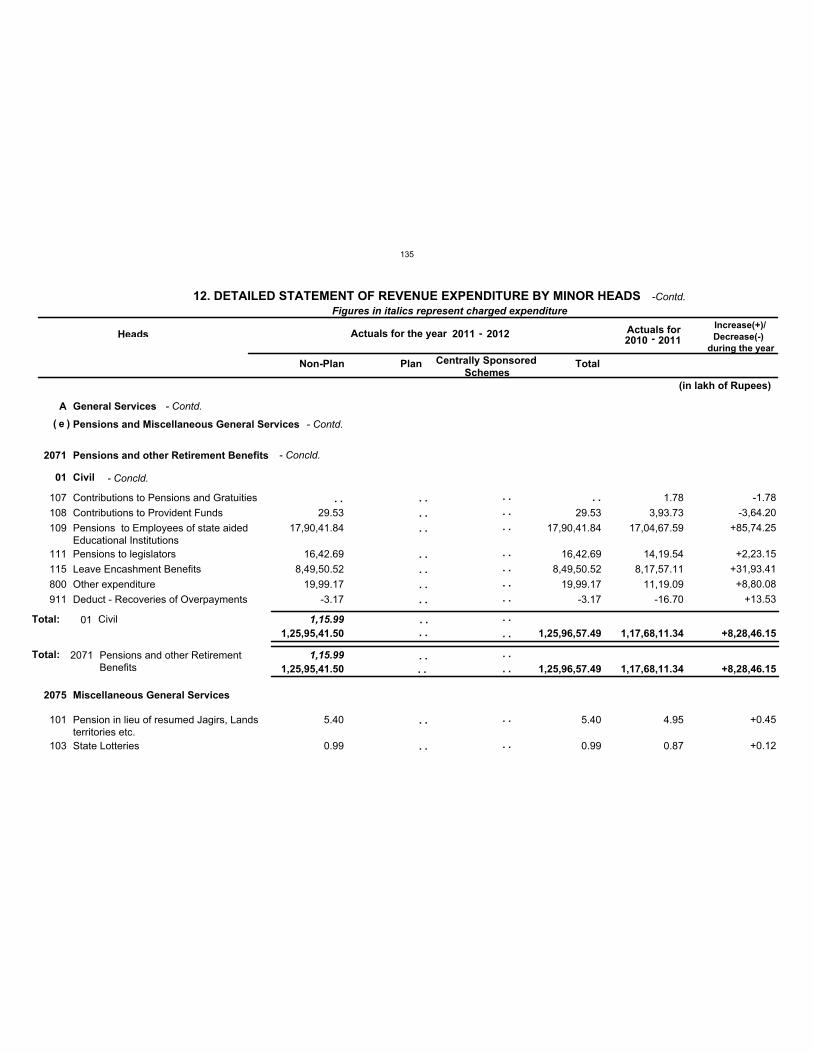
A General Services
e Pensions and Miscellaneous General Services
2071
2075
Pensions and other Retirement Benefits
Miscellaneous General Services
1,15.99Total:
01 Civil
1,15.99
107
108
109
111
115
800
911
101
103
Contributions to Pensions and Gratuities
Contributions to Provident Funds
Pensions to Employees of state aidedEducational Institutions
Pensions to legislators
Leave Encashment Benefits
Other expenditure
Deduct - Recoveries of Overpayments
Pension in lieu of resumed Jagirs, Landsterritories etc.
State Lotteries
V
V
V
V
V
V
V
V
V
29.53
17,90,41.84
16,42.69
8,49,50.52
19,99.17
-3.17
5.40
0.99
29.53
17,90,41.84
16,42.69
8,49,50.52
19,99.17
-3.17
5.40
0.99
1.78
3,93.73
17,04,67.59
14,19.54
8,17,57.11
11,19.09
-16.70
4.95
0.87
-1.78
-3,64.20
+85,74.25
+2,23.15
+31,93.41
+8,80.08
+13.53
+0.45
+0.12
Total: 01 Civil
2071 Pensions and other RetirementBenefits
Figures in italics represent charged expenditure
Heads Actuals for the year Actuals for Increase(+)/
Decrease(-)
during the year
Non-Plan Plan Centrally Sponsored
Schemes Total
1,25,95,41.50 1,25,96,57.49 1,17,68,11.34 +8,28,46.15
1,25,95,41.50 1,25,96,57.49 1,17,68,11.34 +8,28,46.15
(in lakh of Rupees)
( )
. . . .
. .
. .
. .
. .
. .
. .
. .
. .
. .
. .
. .
. .
. .
. .
. .
. .
. .
. .
. .
. .
. .
. .
. .
. .
. .
. .
12. DETAILED STATEMENT OF REVENUE EXPENDITURE BY MINOR HEADS
2011 -2010 -2012
2011
- Contd.
- Contd.
- Concld.
- Concld.
-Contd.
135
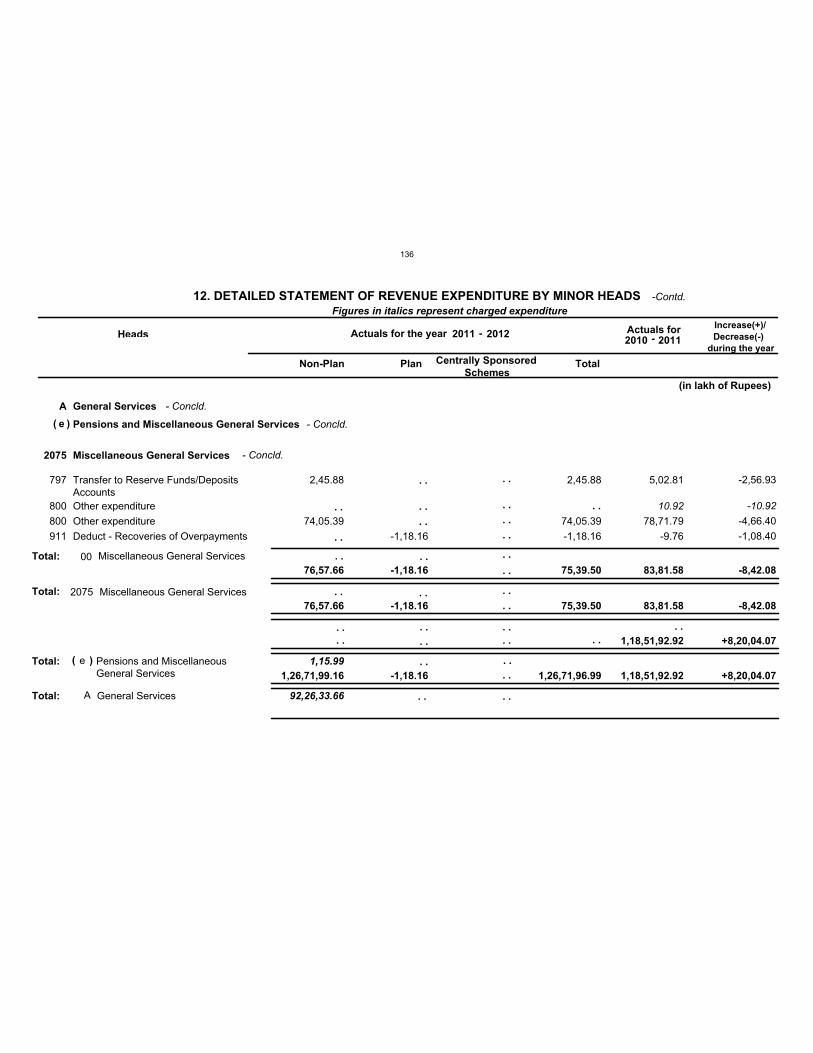
A General Services
92,26,33.66Total:
e Pensions and Miscellaneous General Services
1,15.99Total:
2075 Miscellaneous General Services
Total:
797
800
800
911
Transfer to Reserve Funds/DepositsAccounts
Other expenditure
Other expenditure
Deduct - Recoveries of Overpayments
V
C
V
V
2,45.88
74,05.39
-1,18.16
2,45.88
74,05.39
-1,18.16
5,02.81
10.92
78,71.79
-9.76
-2,56.93
-10.92
-4,66.40
-1,08.40
Total: 00 Miscellaneous General Services
2075 Miscellaneous General Services
e Pensions and MiscellaneousGeneral Services
A General Services
Figures in italics represent charged expenditure
Heads Actuals for the year Actuals for Increase(+)/
Decrease(-)
during the year
Non-Plan Plan Centrally Sponsored
Schemes Total
76,57.66 -1,18.16 75,39.50 83,81.58 -8,42.08
76,57.66 -1,18.16 75,39.50 83,81.58 -8,42.08
1,18,51,92.92 +8,20,04.07
1,26,71,99.16 -1,18.16 1,26,71,96.99 1,18,51,92.92 +8,20,04.07
(in lakh of Rupees)
( )
( )
. .
. .
. .
. .
. .
. .
. .
. .
. .
. .
. . . . . .
. .
. . . . . .
. .
. .
. .
. .
. .
. .
. . . .
. .
. . . .
. .
. . . .
12. DETAILED STATEMENT OF REVENUE EXPENDITURE BY MINOR HEADS
2011 -2010 -2012
2011
- Concld.
- Concld.
- Concld.
-Contd.
136
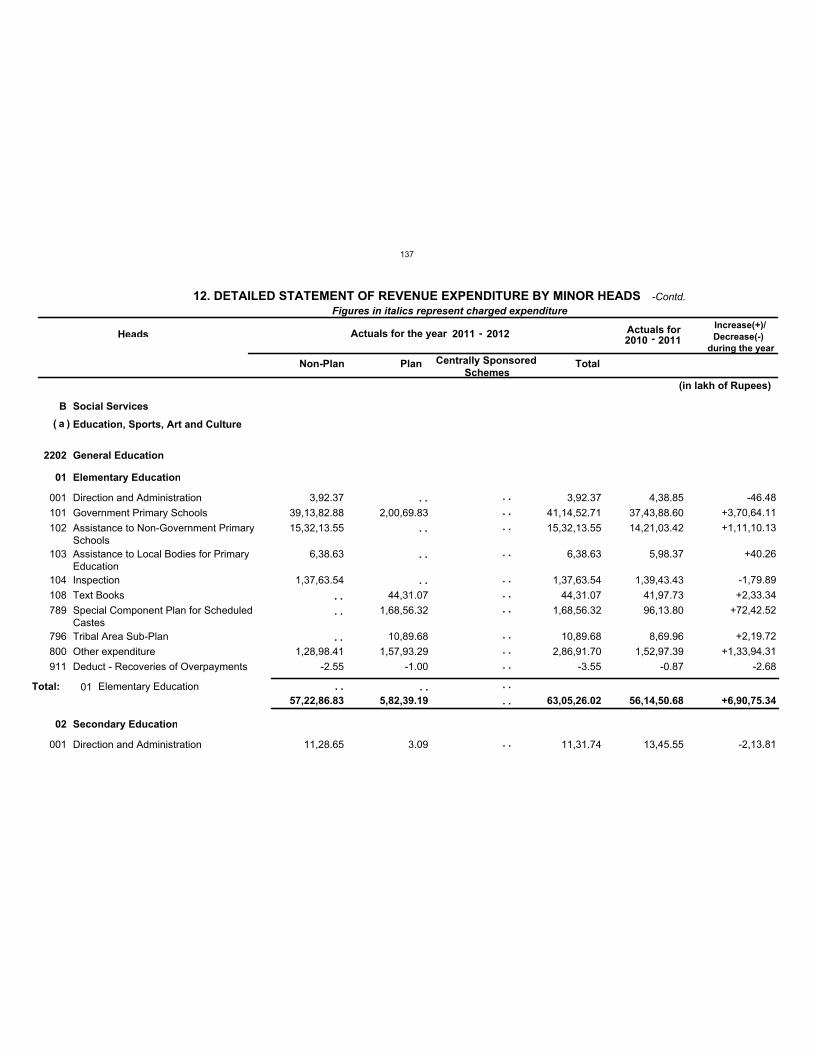
B Social Services
a Education, Sports, Art and Culture
2202 General Education
01
02
Elementary Education
Secondary Education
001
101
102
103
104
108
789
796
800
911
001
Direction and Administration
Government Primary Schools
Assistance to Non-Government PrimarySchools
Assistance to Local Bodies for PrimaryEducation
Inspection
Text Books
Special Component Plan for ScheduledCastes
Tribal Area Sub-Plan
Other expenditure
Deduct - Recoveries of Overpayments
Direction and Administration
V
V
V
V
V
V
V
V
V
V
V
3,92.37
39,13,82.88
15,32,13.55
6,38.63
1,37,63.54
1,28,98.41
-2.55
11,28.65
2,00,69.83
44,31.07
1,68,56.32
10,89.68
1,57,93.29
-1.00
3.09
3,92.37
41,14,52.71
15,32,13.55
6,38.63
1,37,63.54
44,31.07
1,68,56.32
10,89.68
2,86,91.70
-3.55
11,31.74
4,38.85
37,43,88.60
14,21,03.42
5,98.37
1,39,43.43
41,97.73
96,13.80
8,69.96
1,52,97.39
-0.87
13,45.55
-46.48
+3,70,64.11
+1,11,10.13
+40.26
-1,79.89
+2,33.34
+72,42.52
+2,19.72
+1,33,94.31
-2.68
-2,13.81
Total: 01 Elementary Education
Figures in italics represent charged expenditure
Heads Actuals for the year Actuals for Increase(+)/
Decrease(-)
during the year
Non-Plan Plan Centrally Sponsored
Schemes Total
57,22,86.83 5,82,39.19 63,05,26.02 56,14,50.68 +6,90,75.34
(in lakh of Rupees)
( )
. .
. .
. .
. .
. .
. .
. .
. .
. .
. .
. .
. .
. .
. .
. .
. .
. .
. .
. . . . . .
. .
12. DETAILED STATEMENT OF REVENUE EXPENDITURE BY MINOR HEADS
2011 -2010 -2012
2011
-Contd.
137
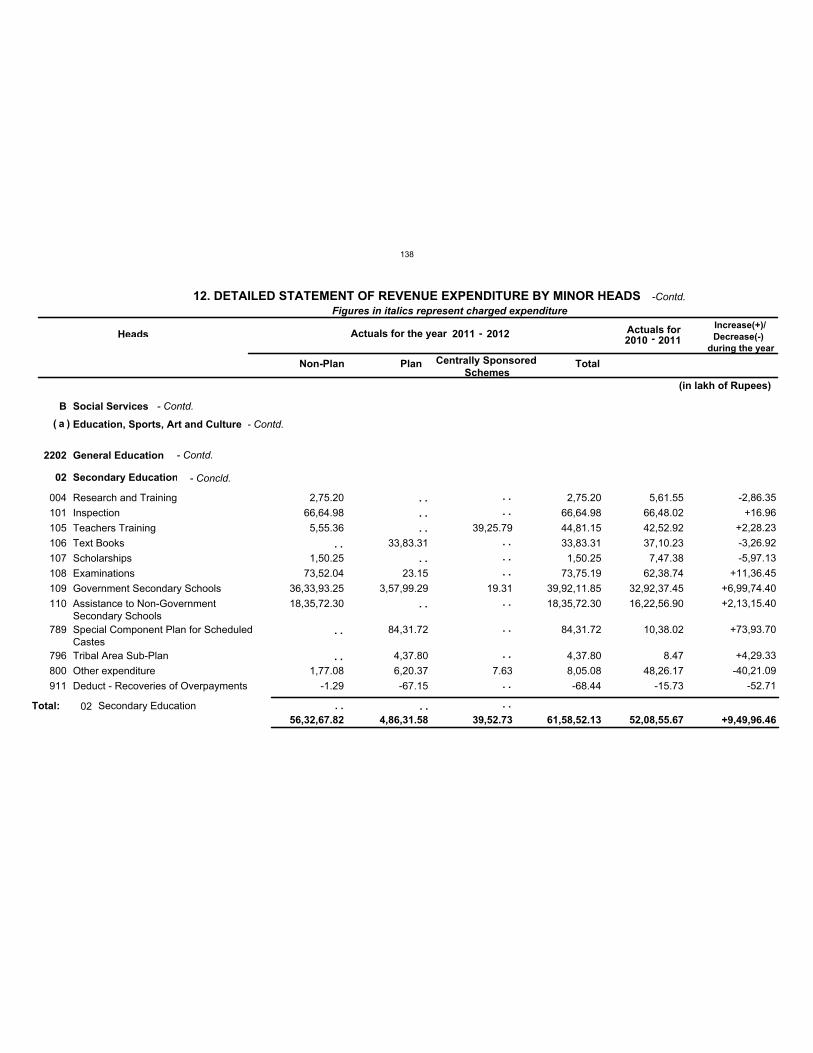
B Social Services
a Education, Sports, Art and Culture
2202 General Education
02 Secondary Education
004
101
105
106
107
108
109
110
789
796
800
911
Research and Training
Inspection
Teachers Training
Text Books
Scholarships
Examinations
Government Secondary Schools
Assistance to Non-GovernmentSecondary Schools
Special Component Plan for ScheduledCastes
Tribal Area Sub-Plan
Other expenditure
Deduct - Recoveries of Overpayments
V
V
V
V
V
V
V
V
V
V
V
V
2,75.20
66,64.98
5,55.36
1,50.25
73,52.04
36,33,93.25
18,35,72.30
1,77.08
-1.29
33,83.31
23.15
3,57,99.29
84,31.72
4,37.80
6,20.37
-67.15
39,25.79
19.31
7.63
2,75.20
66,64.98
44,81.15
33,83.31
1,50.25
73,75.19
39,92,11.85
18,35,72.30
84,31.72
4,37.80
8,05.08
-68.44
5,61.55
66,48.02
42,52.92
37,10.23
7,47.38
62,38.74
32,92,37.45
16,22,56.90
10,38.02
8.47
48,26.17
-15.73
-2,86.35
+16.96
+2,28.23
-3,26.92
-5,97.13
+11,36.45
+6,99,74.40
+2,13,15.40
+73,93.70
+4,29.33
-40,21.09
-52.71
Total: 02 Secondary Education
Figures in italics represent charged expenditure
Heads Actuals for the year Actuals for Increase(+)/
Decrease(-)
during the year
Non-Plan Plan Centrally Sponsored
Schemes Total
56,32,67.82 4,86,31.58 39,52.73 61,58,52.13 52,08,55.67 +9,49,96.46
(in lakh of Rupees)
( )
. .
. .
. .
. .
. .
. .
. .
. .
. .
. .
. .
. .
. .
. .
. .
. .
. .
. . . . . .
12. DETAILED STATEMENT OF REVENUE EXPENDITURE BY MINOR HEADS
2011 -2010 -2012
2011
- Contd.
- Contd.
- Contd.
- Concld.
-Contd.
138
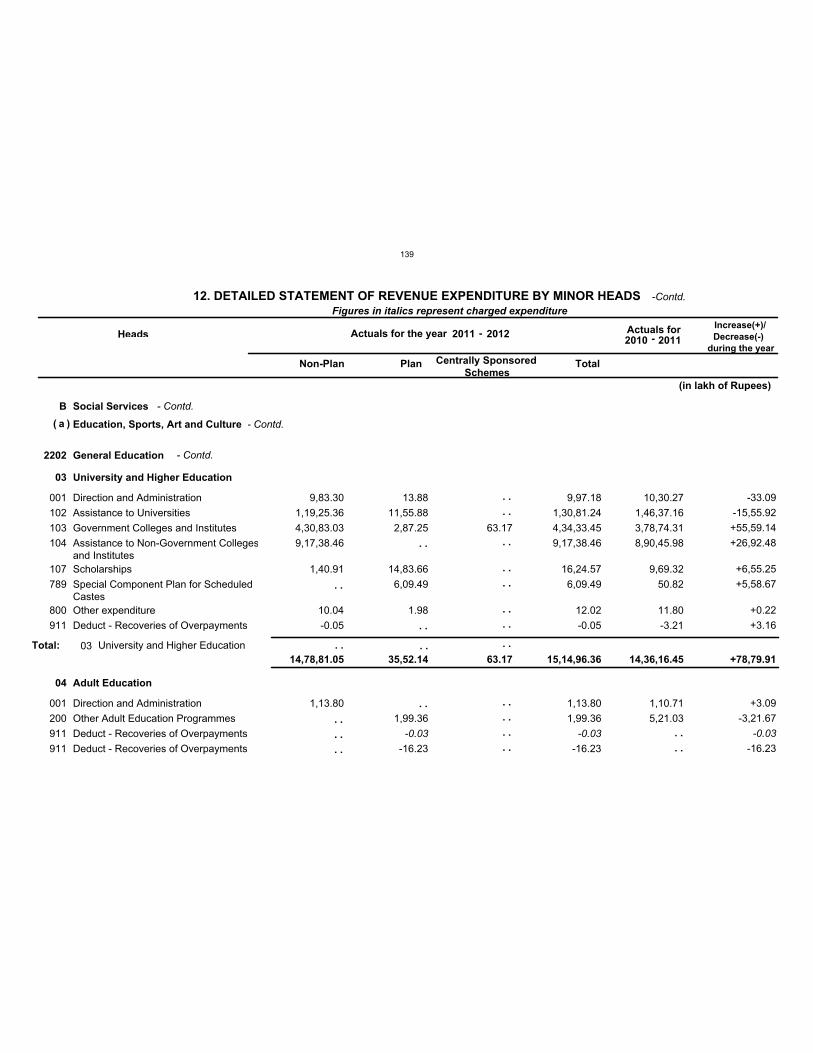
B Social Services
a Education, Sports, Art and Culture
2202 General Education
03
04
University and Higher Education
Adult Education
001
102
103
104
107
789
800
911
001
200
911
911
Direction and Administration
Assistance to Universities
Government Colleges and Institutes
Assistance to Non-Government Collegesand Institutes
Scholarships
Special Component Plan for ScheduledCastes
Other expenditure
Deduct - Recoveries of Overpayments
Direction and Administration
Other Adult Education Programmes
Deduct - Recoveries of Overpayments
Deduct - Recoveries of Overpayments
V
V
V
V
V
V
V
V
V
V
C
V
9,83.30
1,19,25.36
4,30,83.03
9,17,38.46
1,40.91
10.04
-0.05
1,13.80
13.88
11,55.88
2,87.25
14,83.66
6,09.49
1.98
1,99.36
-0.03
-16.23
63.17
9,97.18
1,30,81.24
4,34,33.45
9,17,38.46
16,24.57
6,09.49
12.02
-0.05
1,13.80
1,99.36
-0.03
-16.23
10,30.27
1,46,37.16
3,78,74.31
8,90,45.98
9,69.32
50.82
11.80
-3.21
1,10.71
5,21.03
-33.09
-15,55.92
+55,59.14
+26,92.48
+6,55.25
+5,58.67
+0.22
+3.16
+3.09
-3,21.67
-0.03
-16.23
Total: 03 University and Higher Education
Figures in italics represent charged expenditure
Heads Actuals for the year Actuals for Increase(+)/
Decrease(-)
during the year
Non-Plan Plan Centrally Sponsored
Schemes Total
14,78,81.05 35,52.14 63.17 15,14,96.36 14,36,16.45 +78,79.91
(in lakh of Rupees)
( )
. .
. .
. .
. .
. .
. .
. .
. .
. .
. .
. .
. .
. .
. .
. .
. .
. .
. .
. .
. .
. . . . . .
12. DETAILED STATEMENT OF REVENUE EXPENDITURE BY MINOR HEADS
2011 -2010 -2012
2011
- Contd.
- Contd.
- Contd.
-Contd.
139
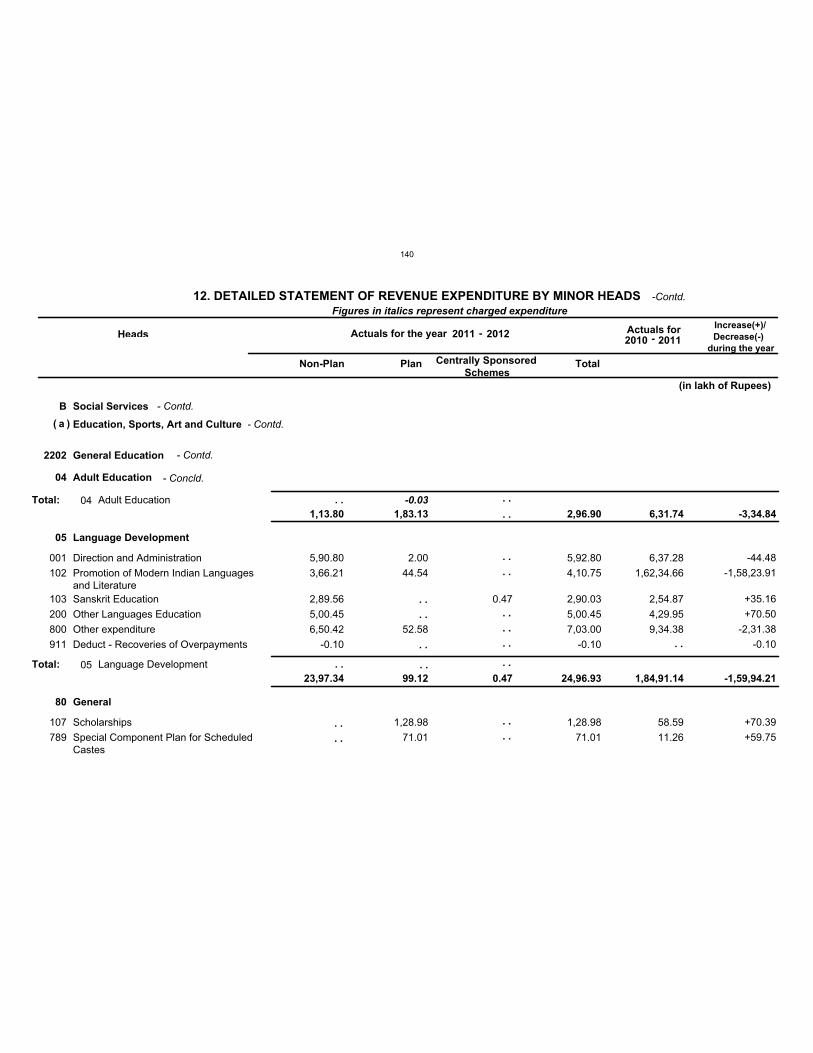
B Social Services
a Education, Sports, Art and Culture
2202 General Education
04
05
80
Adult Education
Language Development
General
-0.03
001
102
103
200
800
911
107
789
Direction and Administration
Promotion of Modern Indian Languagesand Literature
Sanskrit Education
Other Languages Education
Other expenditure
Deduct - Recoveries of Overpayments
Scholarships
Special Component Plan for ScheduledCastes
V
V
V
V
V
V
V
V
5,90.80
3,66.21
2,89.56
5,00.45
6,50.42
-0.10
2.00
44.54
52.58
1,28.98
71.01
0.47
5,92.80
4,10.75
2,90.03
5,00.45
7,03.00
-0.10
1,28.98
71.01
6,37.28
1,62,34.66
2,54.87
4,29.95
9,34.38
58.59
11.26
-44.48
-1,58,23.91
+35.16
+70.50
-2,31.38
-0.10
+70.39
+59.75
Total:
Total:
04
05
Adult Education
Language Development
Figures in italics represent charged expenditure
Heads Actuals for the year Actuals for Increase(+)/
Decrease(-)
during the year
Non-Plan Plan Centrally Sponsored
Schemes Total
1,13.80
23,97.34
1,83.13
99.12 0.47
2,96.90
24,96.93
6,31.74
1,84,91.14
-3,34.84
-1,59,94.21
(in lakh of Rupees)
( )
. .
. .
. .
. .
. .
. .
. .
. .
. .
. .
. .
. .
. .
. .
. . . .
. .
. .
. .
12. DETAILED STATEMENT OF REVENUE EXPENDITURE BY MINOR HEADS
2011 -2010 -2012
2011
- Contd.
- Contd.
- Contd.
- Concld.
-Contd.
140
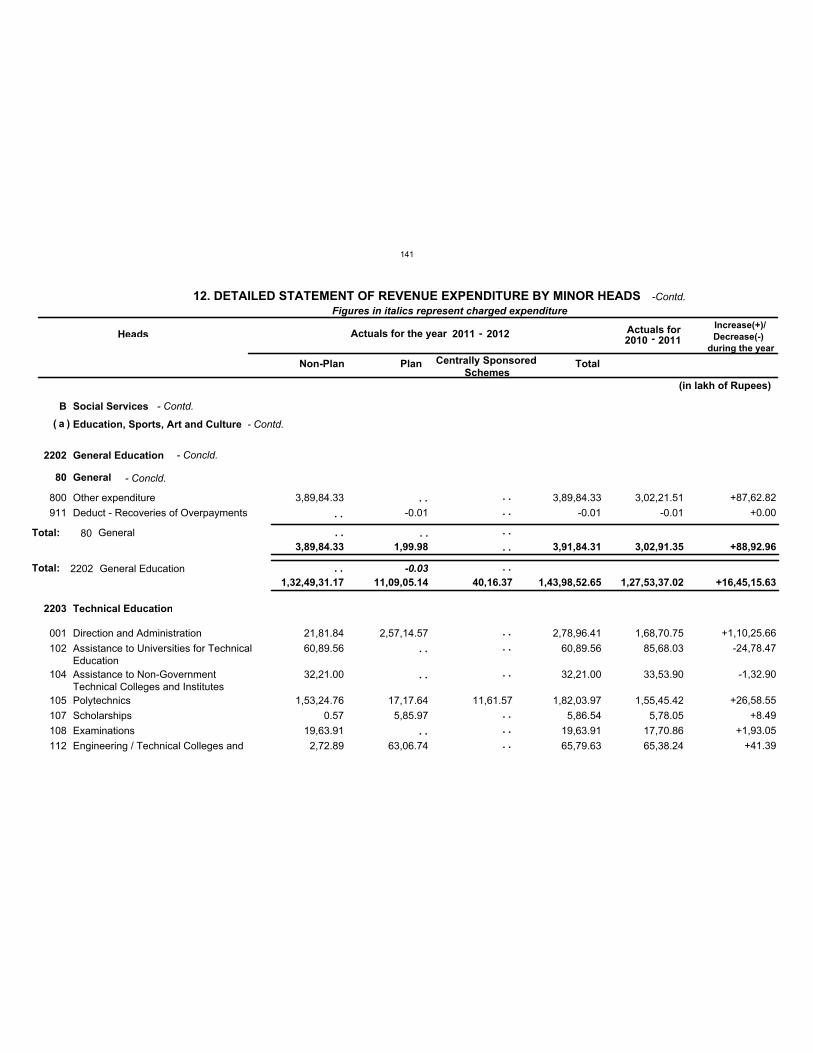
B Social Services
a Education, Sports, Art and Culture
2202
2203
General Education
Technical Education
Total: -0.03
80 General
800
911
001
102
104
105
107
108
112
Other expenditure
Deduct - Recoveries of Overpayments
Direction and Administration
Assistance to Universities for TechnicalEducation
Assistance to Non-Government Technical Colleges and Institutes
Polytechnics
Scholarships
Examinations
Engineering / Technical Colleges and
V
V
V
V
V
V
V
V
V
3,89,84.33
21,81.84
60,89.56
32,21.00
1,53,24.76
0.57
19,63.91
2,72.89
-0.01
2,57,14.57
17,17.64
5,85.97
63,06.74
11,61.57
3,89,84.33
-0.01
2,78,96.41
60,89.56
32,21.00
1,82,03.97
5,86.54
19,63.91
65,79.63
3,02,21.51
-0.01
1,68,70.75
85,68.03
33,53.90
1,55,45.42
5,78.05
17,70.86
65,38.24
+87,62.82
+0.00
+1,10,25.66
-24,78.47
-1,32.90
+26,58.55
+8.49
+1,93.05
+41.39
Total: 80 General
2202 General Education
Figures in italics represent charged expenditure
Heads Actuals for the year Actuals for Increase(+)/
Decrease(-)
during the year
Non-Plan Plan Centrally Sponsored
Schemes Total
3,89,84.33 1,99.98 3,91,84.31 3,02,91.35 +88,92.96
1,32,49,31.17 11,09,05.14 40,16.37 1,43,98,52.65 1,27,53,37.02 +16,45,15.63
(in lakh of Rupees)
( )
. .
. .
. .
. .
. .
. .
. .
. .
. .
. .
. .
. .
. .
. . . . . .
. .
. . . .
12. DETAILED STATEMENT OF REVENUE EXPENDITURE BY MINOR HEADS
2011 -2010 -2012
2011
- Contd.
- Contd.
- Concld.
- Concld.
-Contd.
141
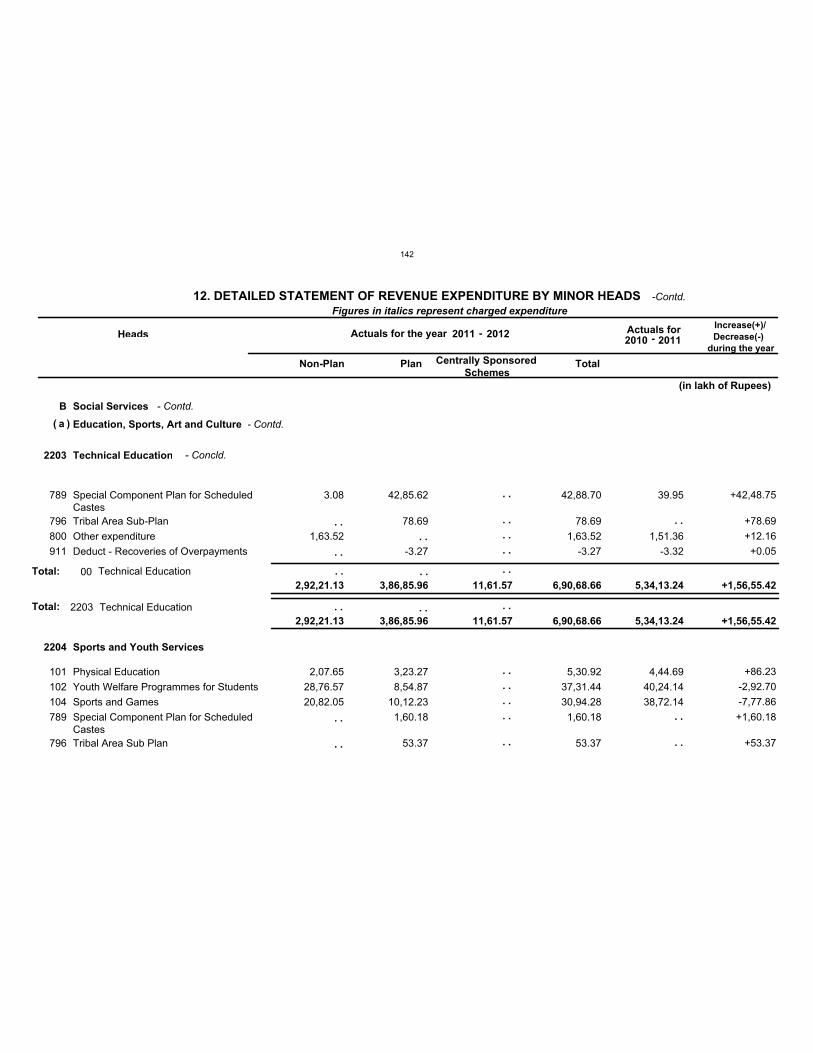
B Social Services
a Education, Sports, Art and Culture
2203
2204
Technical Education
Sports and Youth Services
Total:
789
796
800
911
101
102
104
789
796
Special Component Plan for ScheduledCastes
Tribal Area Sub-Plan
Other expenditure
Deduct - Recoveries of Overpayments
Physical Education
Youth Welfare Programmes for Students
Sports and Games
Special Component Plan for ScheduledCastes
Tribal Area Sub Plan
V
V
V
V
V
V
V
V
V
3.08
1,63.52
2,07.65
28,76.57
20,82.05
42,85.62
78.69
-3.27
3,23.27
8,54.87
10,12.23
1,60.18
53.37
42,88.70
78.69
1,63.52
-3.27
5,30.92
37,31.44
30,94.28
1,60.18
53.37
39.95
1,51.36
-3.32
4,44.69
40,24.14
38,72.14
+42,48.75
+78.69
+12.16
+0.05
+86.23
-2,92.70
-7,77.86
+1,60.18
+53.37
Total: 00 Technical Education
2203 Technical Education
Figures in italics represent charged expenditure
Heads Actuals for the year Actuals for Increase(+)/
Decrease(-)
during the year
Non-Plan Plan Centrally Sponsored
Schemes Total
2,92,21.13 3,86,85.96 11,61.57 6,90,68.66 5,34,13.24 +1,56,55.42
2,92,21.13 3,86,85.96 11,61.57 6,90,68.66 5,34,13.24 +1,56,55.42
(in lakh of Rupees)
( )
. .
. .
. .
. .
. .
. .
. .
. .
. .
. .
. .
. .
. .
. .
. .
. .
. .
. . . . . .
. . . . . .
12. DETAILED STATEMENT OF REVENUE EXPENDITURE BY MINOR HEADS
2011 -2010 -2012
2011
- Contd.
- Contd.
- Concld.
-Contd.
142
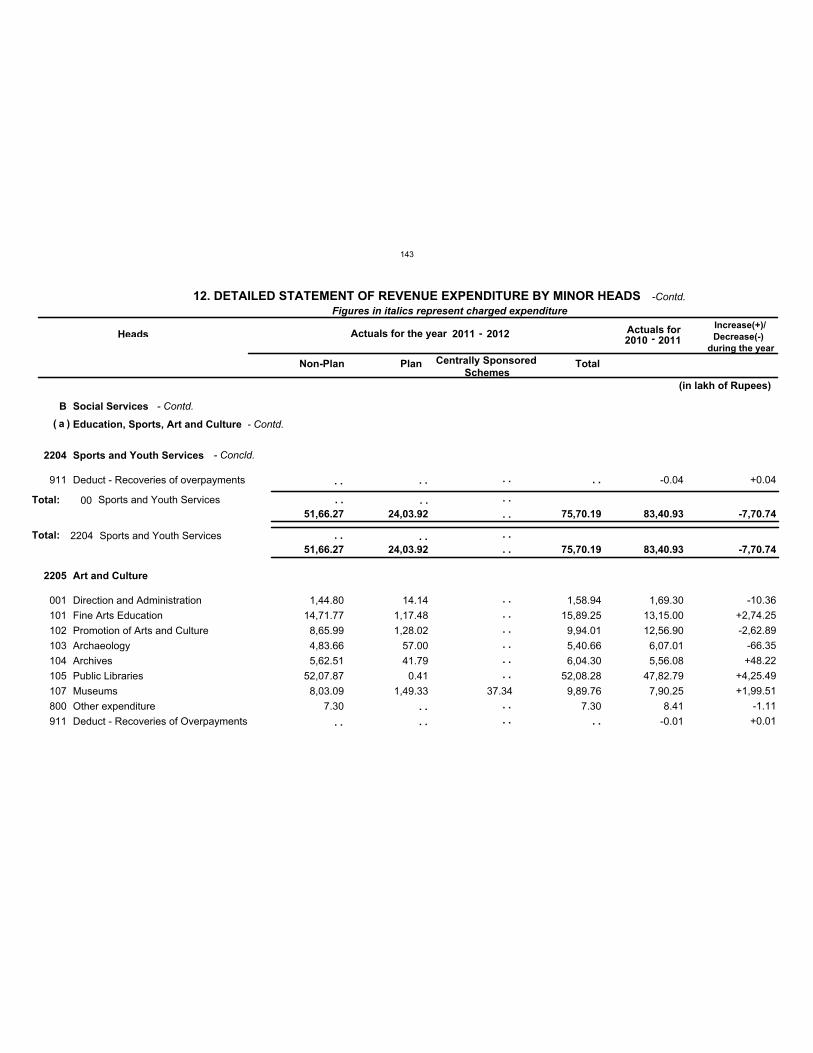
B Social Services
a Education, Sports, Art and Culture
2204
2205
Sports and Youth Services
Art and Culture
Total:
911
001
101
102
103
104
105
107
800
911
Deduct - Recoveries of overpayments
Direction and Administration
Fine Arts Education
Promotion of Arts and Culture
Archaeology
Archives
Public Libraries
Museums
Other expenditure
Deduct - Recoveries of Overpayments
V
V
V
V
V
V
V
V
V
V
1,44.80
14,71.77
8,65.99
4,83.66
5,62.51
52,07.87
8,03.09
7.30
14.14
1,17.48
1,28.02
57.00
41.79
0.41
1,49.33 37.34
1,58.94
15,89.25
9,94.01
5,40.66
6,04.30
52,08.28
9,89.76
7.30
-0.04
1,69.30
13,15.00
12,56.90
6,07.01
5,56.08
47,82.79
7,90.25
8.41
-0.01
+0.04
-10.36
+2,74.25
-2,62.89
-66.35
+48.22
+4,25.49
+1,99.51
-1.11
+0.01
Total: 00 Sports and Youth Services
2204 Sports and Youth Services
Figures in italics represent charged expenditure
Heads Actuals for the year Actuals for Increase(+)/
Decrease(-)
during the year
Non-Plan Plan Centrally Sponsored
Schemes Total
51,66.27 24,03.92 75,70.19 83,40.93 -7,70.74
51,66.27 24,03.92 75,70.19 83,40.93 -7,70.74
(in lakh of Rupees)
( )
. .
. .
. .
. .
. .
. .
. .
. .
. .
. .
. .
. .
. .
. .
. .
. .
. . . . . .
. .
. . . . . .
. .
12. DETAILED STATEMENT OF REVENUE EXPENDITURE BY MINOR HEADS
2011 -2010 -2012
2011
- Contd.
- Contd.
- Concld.
-Contd.
143
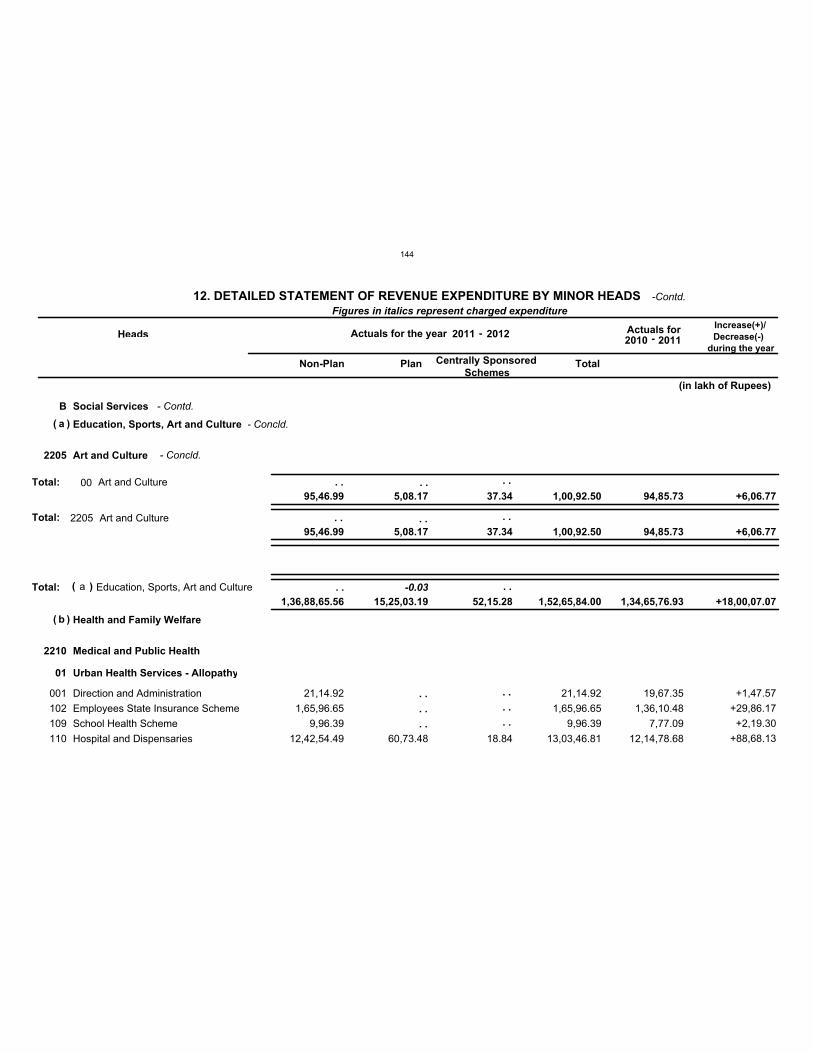
B Social Services
a
b
Education, Sports, Art and Culture
Health and Family Welfare
Total: -0.03
2205
2210
Art and Culture
Medical and Public Health
Total:
01 Urban Health Services - Allopathy
001
102
109
110
Direction and Administration
Employees State Insurance Scheme
School Health Scheme
Hospital and Dispensaries
V
V
V
V
21,14.92
1,65,96.65
9,96.39
12,42,54.49 60,73.48 18.84
21,14.92
1,65,96.65
9,96.39
13,03,46.81
19,67.35
1,36,10.48
7,77.09
12,14,78.68
+1,47.57
+29,86.17
+2,19.30
+88,68.13
Total: 00 Art and Culture
2205 Art and Culture
a Education, Sports, Art and Culture
Figures in italics represent charged expenditure
Heads Actuals for the year Actuals for Increase(+)/
Decrease(-)
during the year
Non-Plan Plan Centrally Sponsored
Schemes Total
95,46.99 5,08.17 37.34 1,00,92.50 94,85.73 +6,06.77
95,46.99 5,08.17 37.34 1,00,92.50 94,85.73 +6,06.77
1,36,88,65.56 15,25,03.19 52,15.28 1,52,65,84.00 1,34,65,76.93 +18,00,07.07
(in lakh of Rupees)
(
(
)
)
( )
. .
. .
. .
. .
. .
. .
. . . . . .
. . . . . .
. . . .
12. DETAILED STATEMENT OF REVENUE EXPENDITURE BY MINOR HEADS
2011 -2010 -2012
2011
- Contd.
- Concld.
- Concld.
-Contd.
144
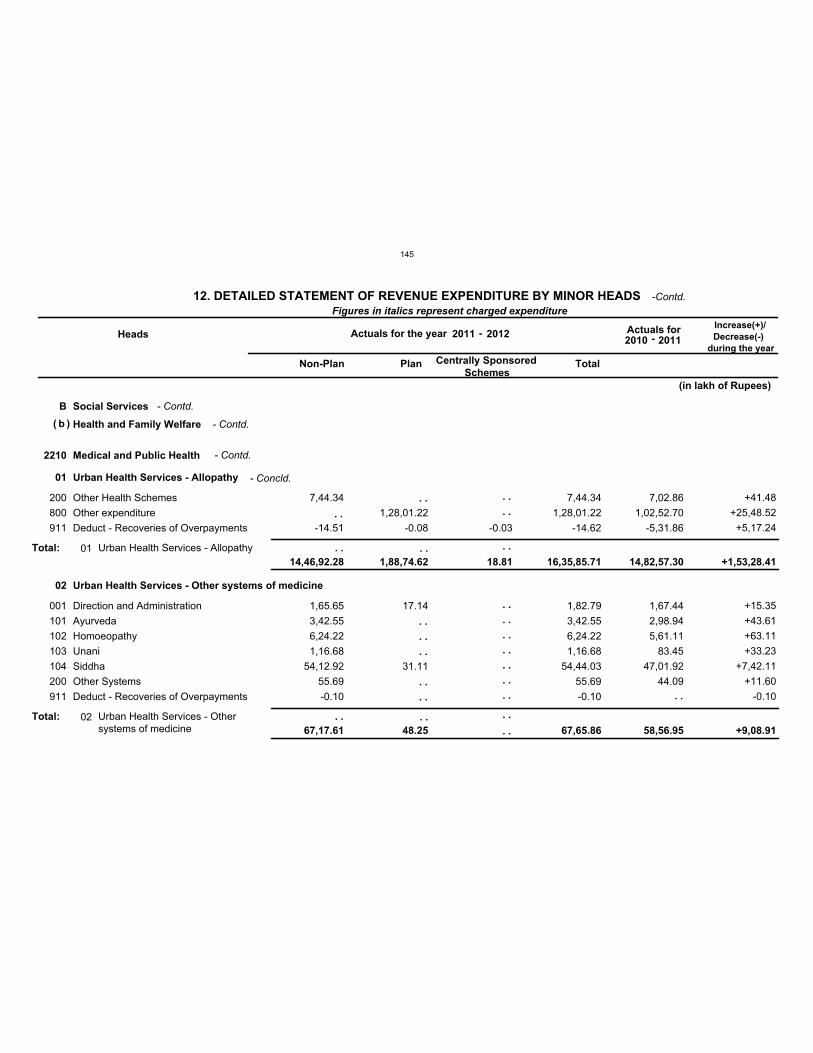
B Social Services
b Health and Family Welfare
2210 Medical and Public Health
01
02
Urban Health Services - Allopathy
Urban Health Services - Other systems of medicine
200
800
911
001
101
102
103
104
200
911
Other Health Schemes
Other expenditure
Deduct - Recoveries of Overpayments
Direction and Administration
Ayurveda
Homoeopathy
Unani
Siddha
Other Systems
Deduct - Recoveries of Overpayments
V
V
V
V
V
V
V
V
V
V
7,44.34
-14.51
1,65.65
3,42.55
6,24.22
1,16.68
54,12.92
55.69
-0.10
1,28,01.22
-0.08
17.14
31.11
-0.03
7,44.34
1,28,01.22
-14.62
1,82.79
3,42.55
6,24.22
1,16.68
54,44.03
55.69
-0.10
7,02.86
1,02,52.70
-5,31.86
1,67.44
2,98.94
5,61.11
83.45
47,01.92
44.09
+41.48
+25,48.52
+5,17.24
+15.35
+43.61
+63.11
+33.23
+7,42.11
+11.60
-0.10
Total:
Total:
01
02
Urban Health Services - Allopathy
Urban Health Services - Othersystems of medicine
Figures in italics represent charged expenditure
Heads Actuals for the year Actuals for Increase(+)/
Decrease(-)
during the year
Non-Plan Plan Centrally Sponsored
Schemes Total
14,46,92.28
67,17.61
1,88,74.62
48.25
18.81 16,35,85.71
67,65.86
14,82,57.30
58,56.95
+1,53,28.41
+9,08.91
(in lakh of Rupees)
( )
. .
. .
. .
. .
. .
. .
. .
. .
. .
. .
. .
. .
. .
. .
. .
. . . .
. .
. .
. .
. .
. .
. .
. .
12. DETAILED STATEMENT OF REVENUE EXPENDITURE BY MINOR HEADS
2011 -2010 -2012
2011
- Contd.
- Contd.
- Contd.
- Concld.
-Contd.
145
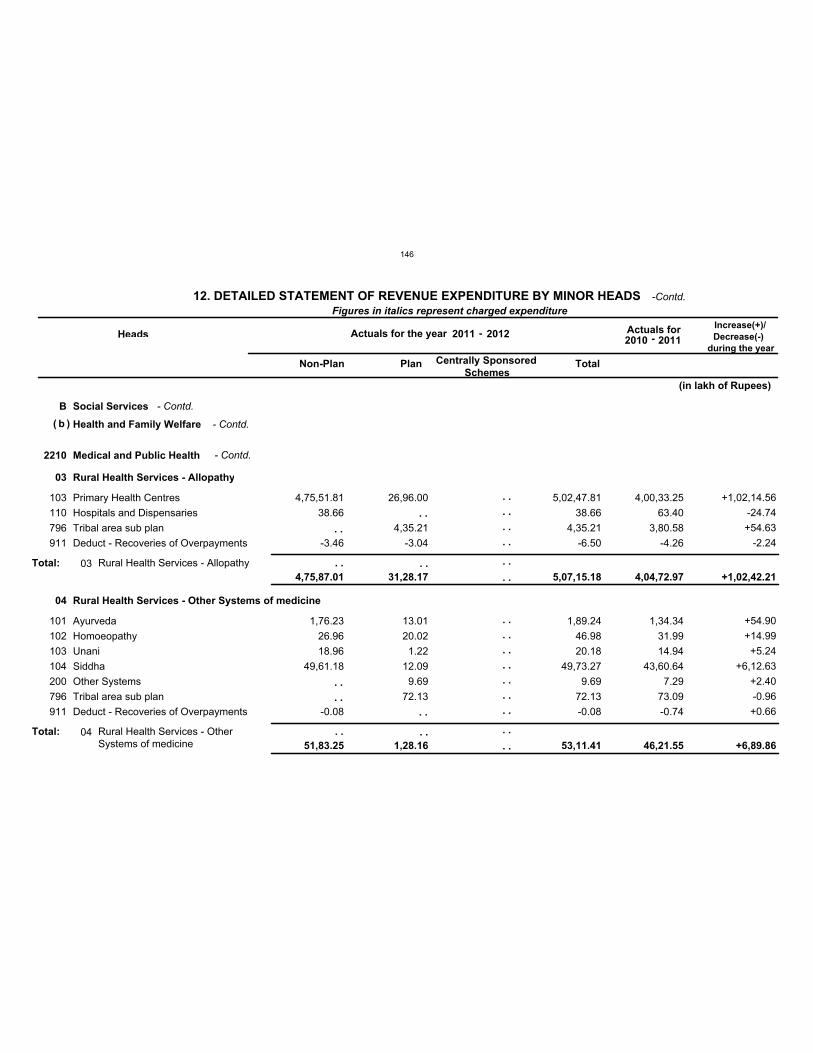
B Social Services
b Health and Family Welfare
2210 Medical and Public Health
03
04
Rural Health Services - Allopathy
Rural Health Services - Other Systems of medicine
103
110
796
911
101
102
103
104
200
796
911
Primary Health Centres
Hospitals and Dispensaries
Tribal area sub plan
Deduct - Recoveries of Overpayments
Ayurveda
Homoeopathy
Unani
Siddha
Other Systems
Tribal area sub plan
Deduct - Recoveries of Overpayments
V
V
V
V
V
V
V
V
V
V
V
4,75,51.81
38.66
-3.46
1,76.23
26.96
18.96
49,61.18
-0.08
26,96.00
4,35.21
-3.04
13.01
20.02
1.22
12.09
9.69
72.13
5,02,47.81
38.66
4,35.21
-6.50
1,89.24
46.98
20.18
49,73.27
9.69
72.13
-0.08
4,00,33.25
63.40
3,80.58
-4.26
1,34.34
31.99
14.94
43,60.64
7.29
73.09
-0.74
+1,02,14.56
-24.74
+54.63
-2.24
+54.90
+14.99
+5.24
+6,12.63
+2.40
-0.96
+0.66
Total:
Total:
03
04
Rural Health Services - Allopathy
Rural Health Services - OtherSystems of medicine
Figures in italics represent charged expenditure
Heads Actuals for the year Actuals for Increase(+)/
Decrease(-)
during the year
Non-Plan Plan Centrally Sponsored
Schemes Total
4,75,87.01
51,83.25
31,28.17
1,28.16
5,07,15.18
53,11.41
4,04,72.97
46,21.55
+1,02,42.21
+6,89.86
(in lakh of Rupees)
( )
. .
. .
. .
. .
. .
. .
. .
. .
. .
. .
. .
. .
. .
. .
. .
. .
. .
. .
. .
. .
. .
. .
. .
. .
12. DETAILED STATEMENT OF REVENUE EXPENDITURE BY MINOR HEADS
2011 -2010 -2012
2011
- Contd.
- Contd.
- Contd.
-Contd.
146
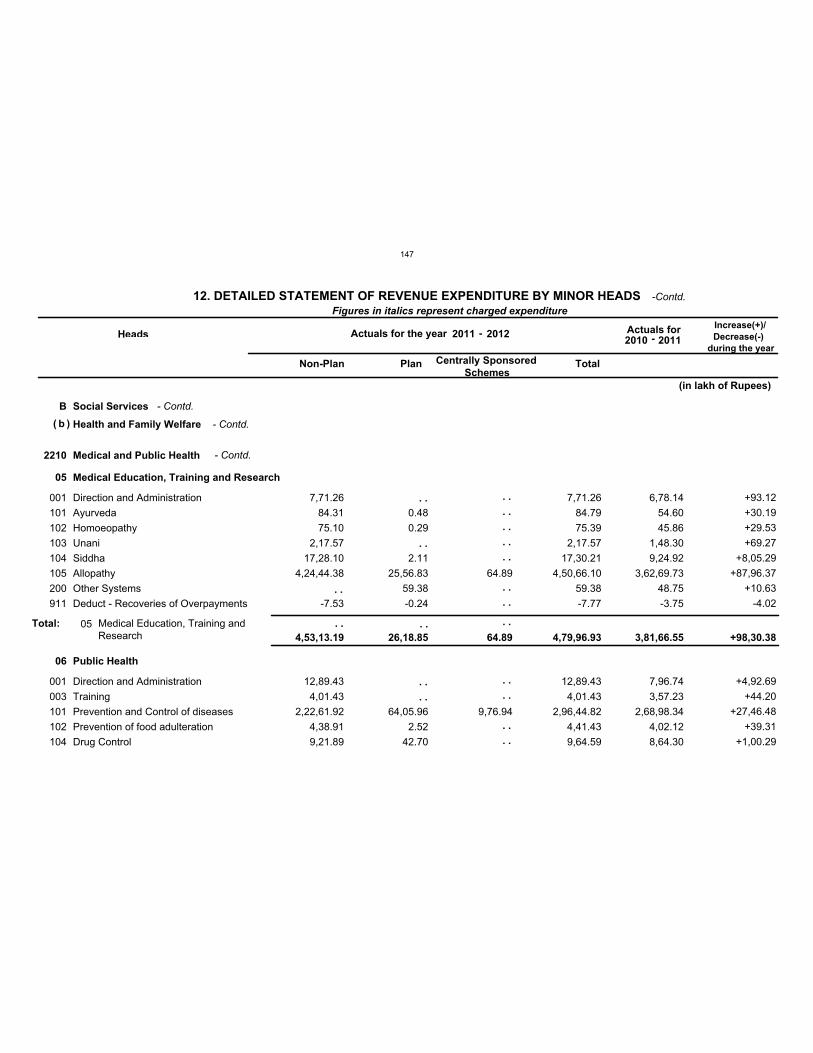
B Social Services
b Health and Family Welfare
2210 Medical and Public Health
05
06
Medical Education, Training and Research
Public Health
001
101
102
103
104
105
200
911
001
003
101
102
104
Direction and Administration
Ayurveda
Homoeopathy
Unani
Siddha
Allopathy
Other Systems
Deduct - Recoveries of Overpayments
Direction and Administration
Training
Prevention and Control of diseases
Prevention of food adulteration
Drug Control
V
V
V
V
V
V
V
V
V
V
V
V
V
7,71.26
84.31
75.10
2,17.57
17,28.10
4,24,44.38
-7.53
12,89.43
4,01.43
2,22,61.92
4,38.91
9,21.89
0.48
0.29
2.11
25,56.83
59.38
-0.24
64,05.96
2.52
42.70
64.89
9,76.94
7,71.26
84.79
75.39
2,17.57
17,30.21
4,50,66.10
59.38
-7.77
12,89.43
4,01.43
2,96,44.82
4,41.43
9,64.59
6,78.14
54.60
45.86
1,48.30
9,24.92
3,62,69.73
48.75
-3.75
7,96.74
3,57.23
2,68,98.34
4,02.12
8,64.30
+93.12
+30.19
+29.53
+69.27
+8,05.29
+87,96.37
+10.63
-4.02
+4,92.69
+44.20
+27,46.48
+39.31
+1,00.29
Total: 05 Medical Education, Training andResearch
Figures in italics represent charged expenditure
Heads Actuals for the year Actuals for Increase(+)/
Decrease(-)
during the year
Non-Plan Plan Centrally Sponsored
Schemes Total
4,53,13.19 26,18.85 64.89 4,79,96.93 3,81,66.55 +98,30.38
(in lakh of Rupees)
( )
. .
. .
. .
. .
. .
. .
. .
. .
. .
. .
. .
. .
. .
. .
. .
. .
. . . . . .
12. DETAILED STATEMENT OF REVENUE EXPENDITURE BY MINOR HEADS
2011 -2010 -2012
2011
- Contd.
- Contd.
- Contd.
-Contd.
147
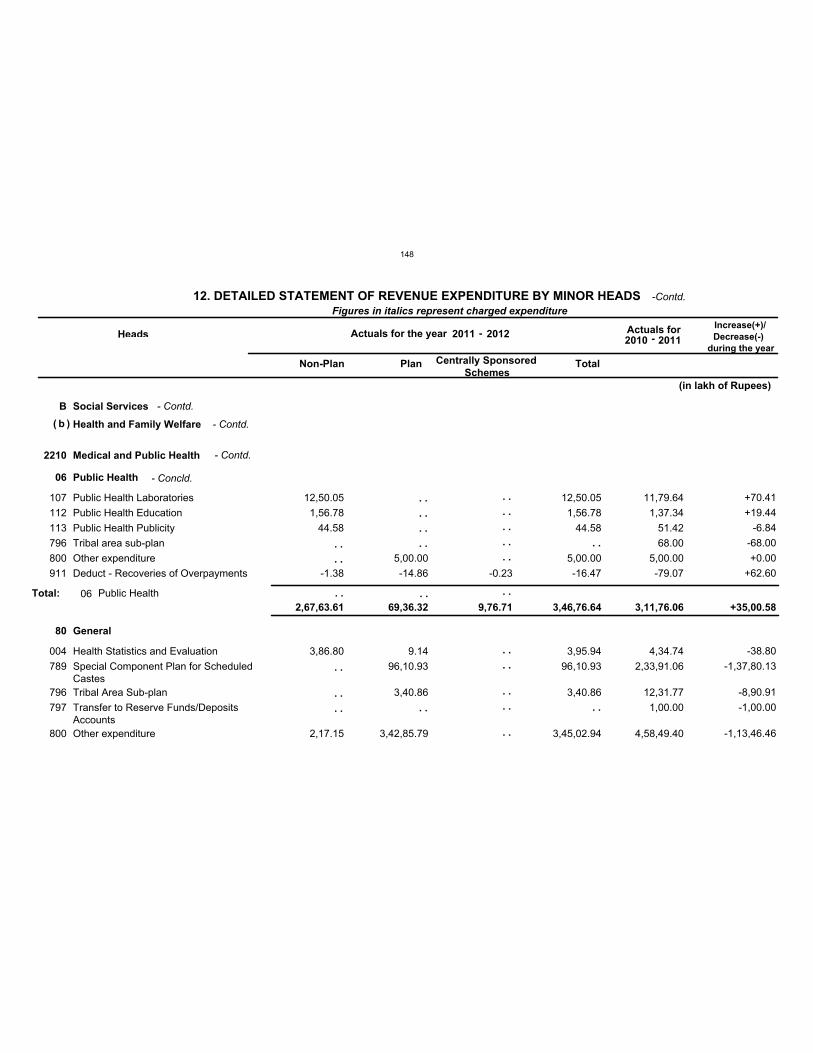
B Social Services
b Health and Family Welfare
2210 Medical and Public Health
06
80
Public Health
General
107
112
113
796
800
911
004
789
796
797
800
Public Health Laboratories
Public Health Education
Public Health Publicity
Tribal area sub-plan
Other expenditure
Deduct - Recoveries of Overpayments
Health Statistics and Evaluation
Special Component Plan for ScheduledCastes
Tribal Area Sub-plan
Transfer to Reserve Funds/DepositsAccounts
Other expenditure
V
V
V
V
V
V
V
V
V
V
V
12,50.05
1,56.78
44.58
-1.38
3,86.80
2,17.15
5,00.00
-14.86
9.14
96,10.93
3,40.86
3,42,85.79
-0.23
12,50.05
1,56.78
44.58
5,00.00
-16.47
3,95.94
96,10.93
3,40.86
3,45,02.94
11,79.64
1,37.34
51.42
68.00
5,00.00
-79.07
4,34.74
2,33,91.06
12,31.77
1,00.00
4,58,49.40
+70.41
+19.44
-6.84
-68.00
+0.00
+62.60
-38.80
-1,37,80.13
-8,90.91
-1,00.00
-1,13,46.46
Total: 06 Public Health
Figures in italics represent charged expenditure
Heads Actuals for the year Actuals for Increase(+)/
Decrease(-)
during the year
Non-Plan Plan Centrally Sponsored
Schemes Total
2,67,63.61 69,36.32 9,76.71 3,46,76.64 3,11,76.06 +35,00.58
(in lakh of Rupees)
( )
. .
. .
. .
. .
. .
. .
. .
. .
. .
. .
. .
. .
. .
. .
. .
. .
. .
. .
. .
. .
. .
. .
. . . . . .
12. DETAILED STATEMENT OF REVENUE EXPENDITURE BY MINOR HEADS
2011 -2010 -2012
2011
- Contd.
- Contd.
- Contd.
- Concld.
-Contd.
148
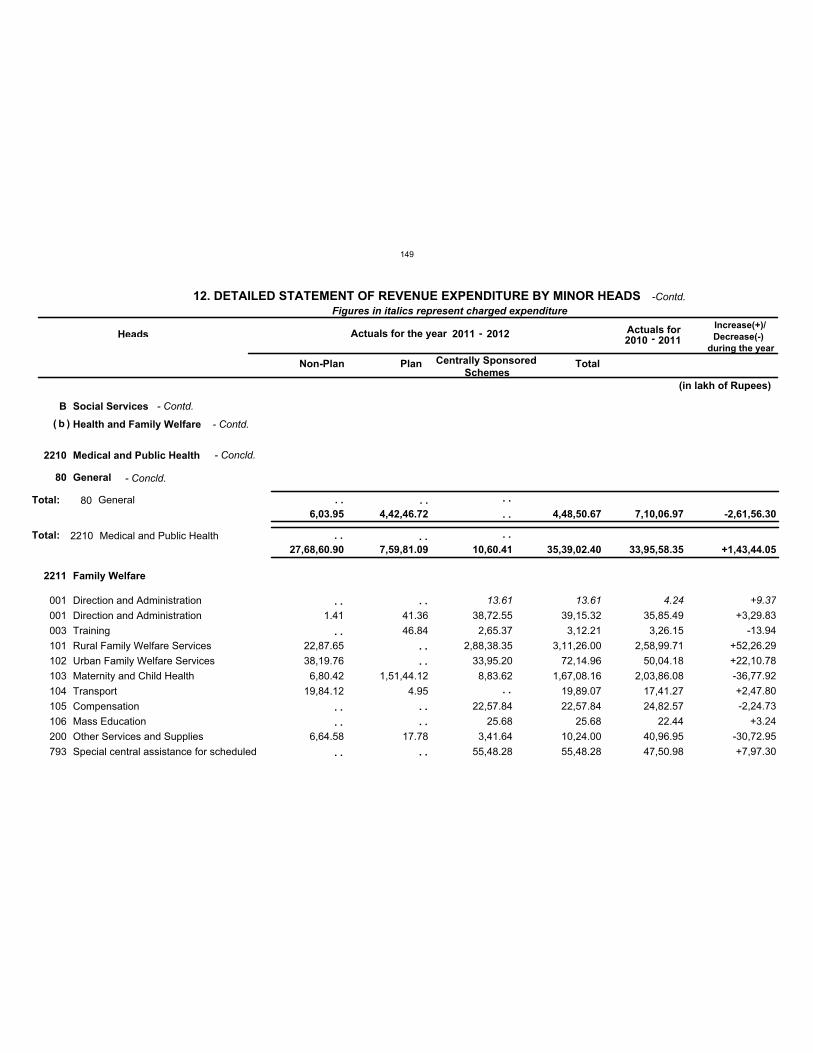
B Social Services
b Health and Family Welfare
2210
2211
Medical and Public Health
Family Welfare
Total:
80 General
001
001
003
101
102
103
104
105
106
200
793
Direction and Administration
Direction and Administration
Training
Rural Family Welfare Services
Urban Family Welfare Services
Maternity and Child Health
Transport
Compensation
Mass Education
Other Services and Supplies
Special central assistance for scheduled
C
V
V
V
V
V
V
V
V
V
V
1.41
22,87.65
38,19.76
6,80.42
19,84.12
6,64.58
41.36
46.84
1,51,44.12
4.95
17.78
13.61
38,72.55
2,65.37
2,88,38.35
33,95.20
8,83.62
22,57.84
25.68
3,41.64
55,48.28
13.61
39,15.32
3,12.21
3,11,26.00
72,14.96
1,67,08.16
19,89.07
22,57.84
25.68
10,24.00
55,48.28
4.24
35,85.49
3,26.15
2,58,99.71
50,04.18
2,03,86.08
17,41.27
24,82.57
22.44
40,96.95
47,50.98
+9.37
+3,29.83
-13.94
+52,26.29
+22,10.78
-36,77.92
+2,47.80
-2,24.73
+3.24
-30,72.95
+7,97.30
Total: 80 General
2210 Medical and Public Health
Figures in italics represent charged expenditure
Heads Actuals for the year Actuals for Increase(+)/
Decrease(-)
during the year
Non-Plan Plan Centrally Sponsored
Schemes Total
6,03.95 4,42,46.72 4,48,50.67 7,10,06.97 -2,61,56.30
27,68,60.90 7,59,81.09 10,60.41 35,39,02.40 33,95,58.35 +1,43,44.05
(in lakh of Rupees)
( )
. .
. .
. .
. .
. .
. .
. .
. .
. .
. .
. .
. .
. . . . . .
. .
. . . . . .
12. DETAILED STATEMENT OF REVENUE EXPENDITURE BY MINOR HEADS
2011 -2010 -2012
2011
- Contd.
- Contd.
- Concld.
- Concld.
-Contd.
149
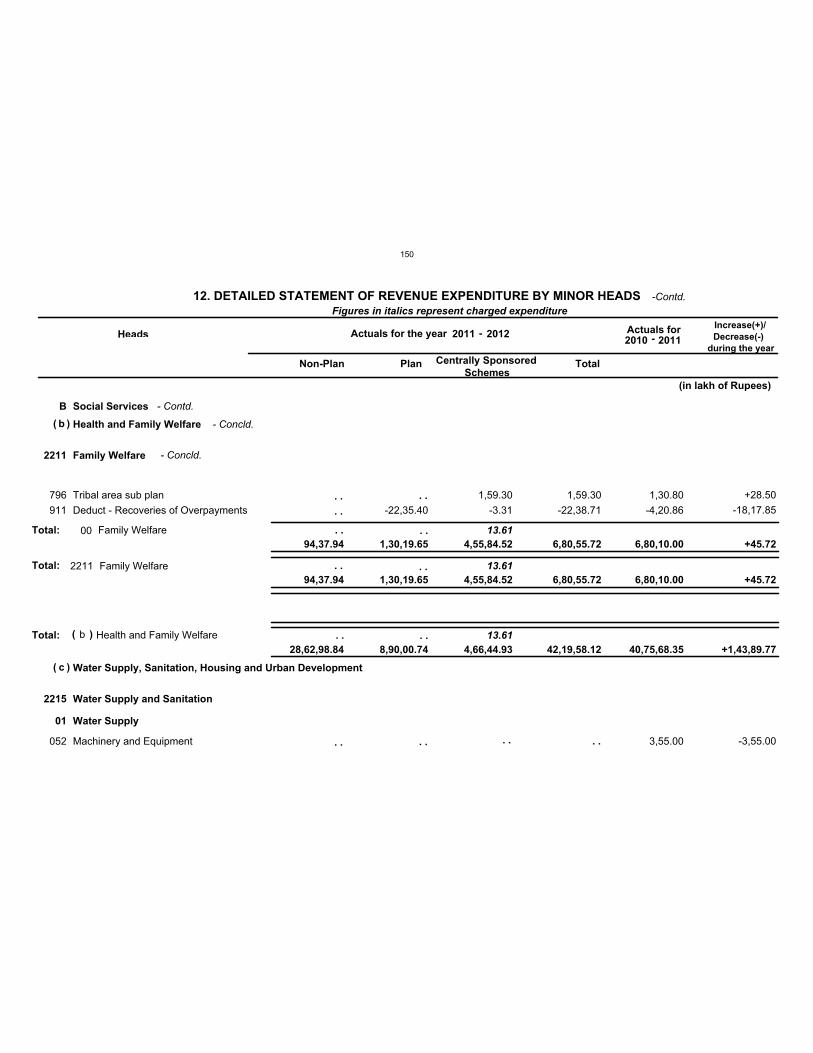
B Social Services
b
c
Health and Family Welfare
Water Supply, Sanitation, Housing and Urban Development
Total: 13.61
2211
2215
Family Welfare
Water Supply and Sanitation
Total: 13.61
01 Water Supply
13.61
796
911
052
Tribal area sub plan
Deduct - Recoveries of Overpayments
Machinery and Equipment
V
V
V
-22,35.40
1,59.30
-3.31
1,59.30
-22,38.71
1,30.80
-4,20.86
3,55.00
+28.50
-18,17.85
-3,55.00
Total: 00 Family Welfare
2211 Family Welfare
b Health and Family Welfare
Figures in italics represent charged expenditure
Heads Actuals for the year Actuals for Increase(+)/
Decrease(-)
during the year
Non-Plan Plan Centrally Sponsored
Schemes Total
94,37.94 1,30,19.65 4,55,84.52 6,80,55.72 6,80,10.00 +45.72
94,37.94 1,30,19.65 4,55,84.52 6,80,55.72 6,80,10.00 +45.72
28,62,98.84 8,90,00.74 4,66,44.93 42,19,58.12 40,75,68.35 +1,43,89.77
(in lakh of Rupees)
(
(
)
)
( )
. .
. .
. .
. .
. . . . . .
. . . .
. . . .
. . . .
12. DETAILED STATEMENT OF REVENUE EXPENDITURE BY MINOR HEADS
2011 -2010 -2012
2011
- Contd.
- Concld.
- Concld.
-Contd.
150
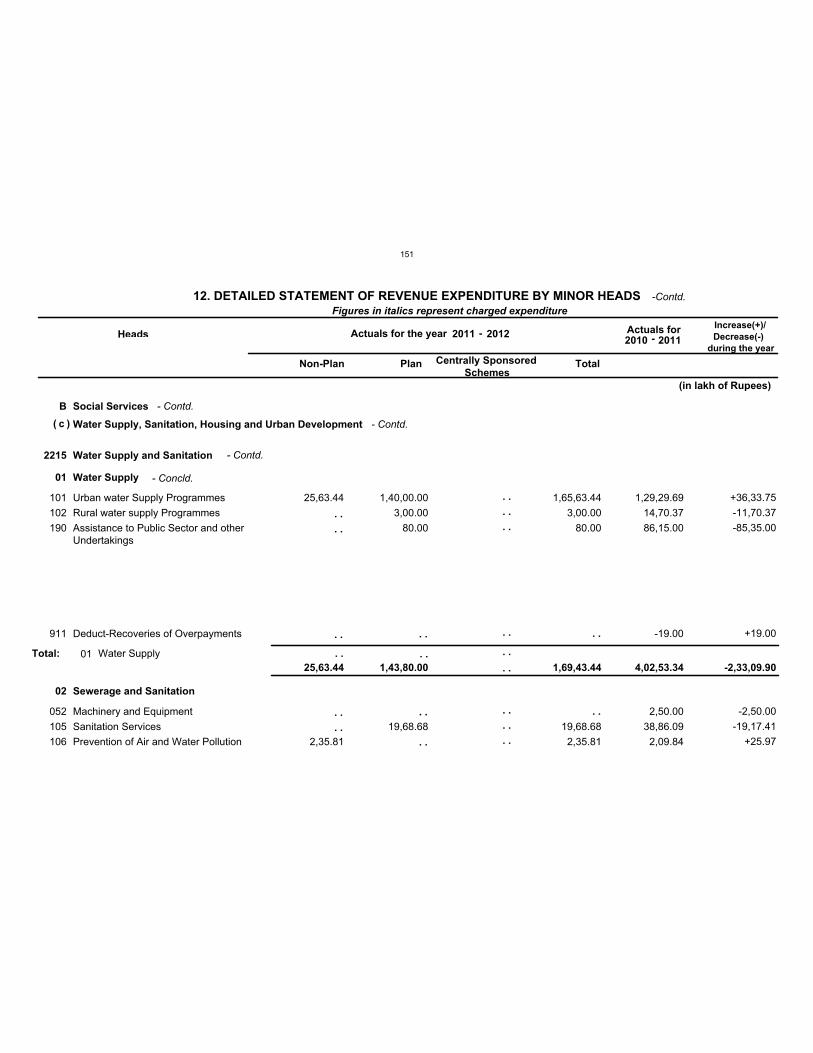
B Social Services
c Water Supply, Sanitation, Housing and Urban Development
2215 Water Supply and Sanitation
01
02
Water Supply
Sewerage and Sanitation
101
102
190
911
052
105
106
Urban water Supply Programmes
Rural water supply Programmes
Assistance to Public Sector and otherUndertakings
Deduct-Recoveries of Overpayments
Machinery and Equipment
Sanitation Services
Prevention of Air and Water Pollution
V
V
V
V
V
V
V
V
V
V
25,63.44
2,35.81
1,40,00.00
3,00.00
80.00
19,68.68
1,65,63.44
3,00.00
80.00
19,68.68
2,35.81
1,29,29.69
14,70.37
86,15.00
-19.00
2,50.00
38,86.09
2,09.84
+36,33.75
-11,70.37
-85,35.00
+19.00
-2,50.00
-19,17.41
+25.97
Total: 01 Water Supply
Figures in italics represent charged expenditure
Heads Actuals for the year Actuals for Increase(+)/
Decrease(-)
during the year
Non-Plan Plan Centrally Sponsored
Schemes Total
25,63.44 1,43,80.00 1,69,43.44 4,02,53.34 -2,33,09.90
(in lakh of Rupees)
( )
. .
. .
. .
. .
. .
. .
. .
. .
. .
. .
. .
. .
. .
. .
. .
. .
. .
. . . . . .
. .
12. DETAILED STATEMENT OF REVENUE EXPENDITURE BY MINOR HEADS
2011 -2010 -2012
2011
- Contd.
- Contd.
- Contd.
- Concld.
-Contd.
151
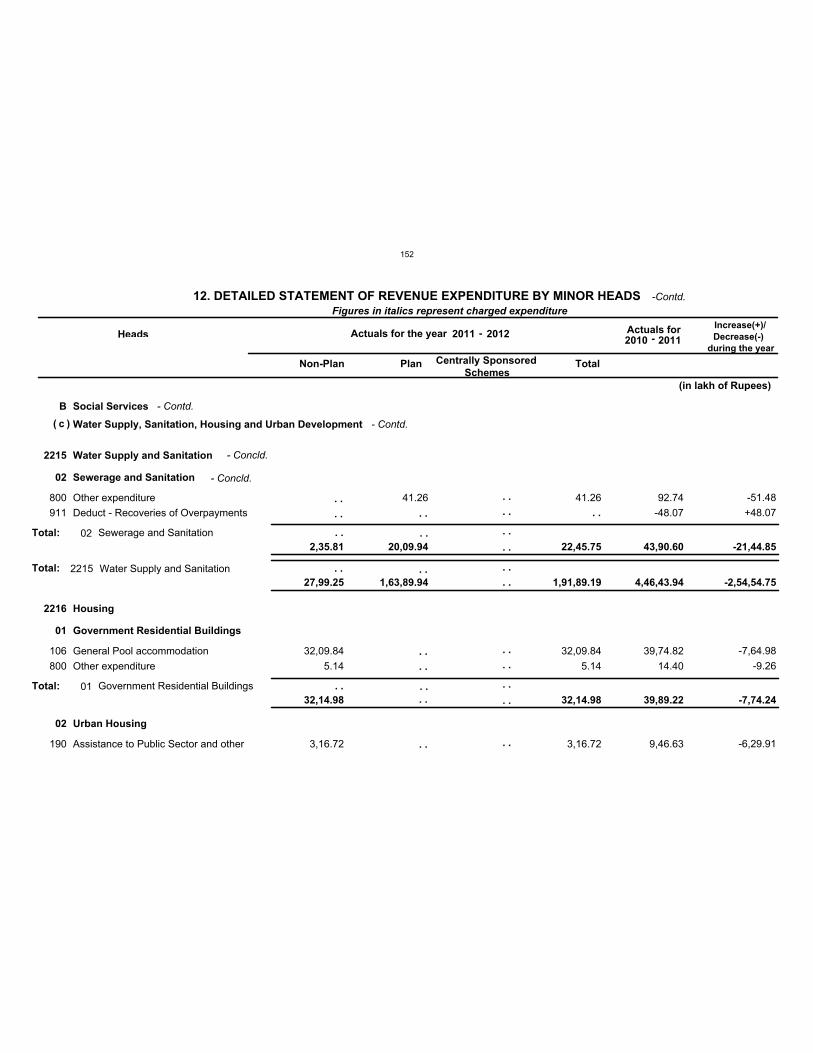
B Social Services
c Water Supply, Sanitation, Housing and Urban Development
2215
2216
Water Supply and Sanitation
Housing
Total:
02
01
02
Sewerage and Sanitation
Government Residential Buildings
Urban Housing
800
911
106
800
190
Other expenditure
Deduct - Recoveries of Overpayments
General Pool accommodation
Other expenditure
Assistance to Public Sector and other
V
V
V
V
V
32,09.84
5.14
3,16.72
41.26 41.26
32,09.84
5.14
3,16.72
92.74
-48.07
39,74.82
14.40
9,46.63
-51.48
+48.07
-7,64.98
-9.26
-6,29.91
Total:
Total:
02
01
Sewerage and Sanitation
Government Residential Buildings
2215 Water Supply and Sanitation
Figures in italics represent charged expenditure
Heads Actuals for the year Actuals for Increase(+)/
Decrease(-)
during the year
Non-Plan Plan Centrally Sponsored
Schemes Total
2,35.81
32,14.98
20,09.94 22,45.75
32,14.98
43,90.60
39,89.22
-21,44.85
-7,74.24
27,99.25 1,63,89.94 1,91,89.19 4,46,43.94 -2,54,54.75
(in lakh of Rupees)
( )
. .
. . . .
. .
. .
. .
. .
. .
. .
. .
. .
. .
. .
. .
. .
. .
. .
. .
. .
. .
. .
. . . . . .
. .
12. DETAILED STATEMENT OF REVENUE EXPENDITURE BY MINOR HEADS
2011 -2010 -2012
2011
- Contd.
- Contd.
- Concld.
- Concld.
-Contd.
152
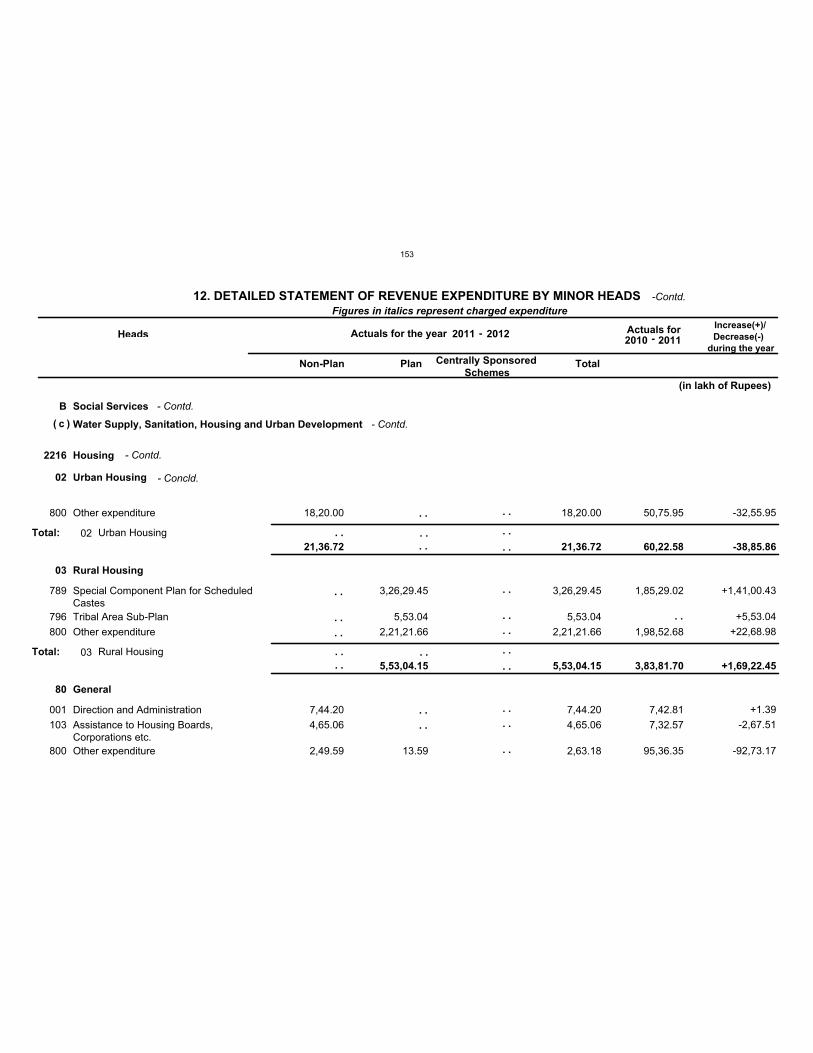
B Social Services
c Water Supply, Sanitation, Housing and Urban Development
2216 Housing
02
03
80
Urban Housing
Rural Housing
General
800
789
796
800
001
103
800
Other expenditure
Special Component Plan for ScheduledCastes
Tribal Area Sub-Plan
Other expenditure
Direction and Administration
Assistance to Housing Boards,Corporations etc.
Other expenditure
V
V
V
V
V
V
V
18,20.00
7,44.20
4,65.06
2,49.59
3,26,29.45
5,53.04
2,21,21.66
13.59
18,20.00
3,26,29.45
5,53.04
2,21,21.66
7,44.20
4,65.06
2,63.18
50,75.95
1,85,29.02
1,98,52.68
7,42.81
7,32.57
95,36.35
-32,55.95
+1,41,00.43
+5,53.04
+22,68.98
+1.39
-2,67.51
-92,73.17
Total:
Total:
02
03
Urban Housing
Rural Housing
Figures in italics represent charged expenditure
Heads Actuals for the year Actuals for Increase(+)/
Decrease(-)
during the year
Non-Plan Plan Centrally Sponsored
Schemes Total
21,36.72
5,53,04.15
21,36.72
5,53,04.15
60,22.58
3,83,81.70
-38,85.86
+1,69,22.45
(in lakh of Rupees)
( )
. .
. .
. .
. .
. .
. .
. .
. .
. .
. .
. .
. .
. .
. .
. .
. .
. .
. .
. .
. .
. .
. .
. .
. .
12. DETAILED STATEMENT OF REVENUE EXPENDITURE BY MINOR HEADS
2011 -2010 -2012
2011
- Contd.
- Contd.
- Contd.
- Concld.
-Contd.
153
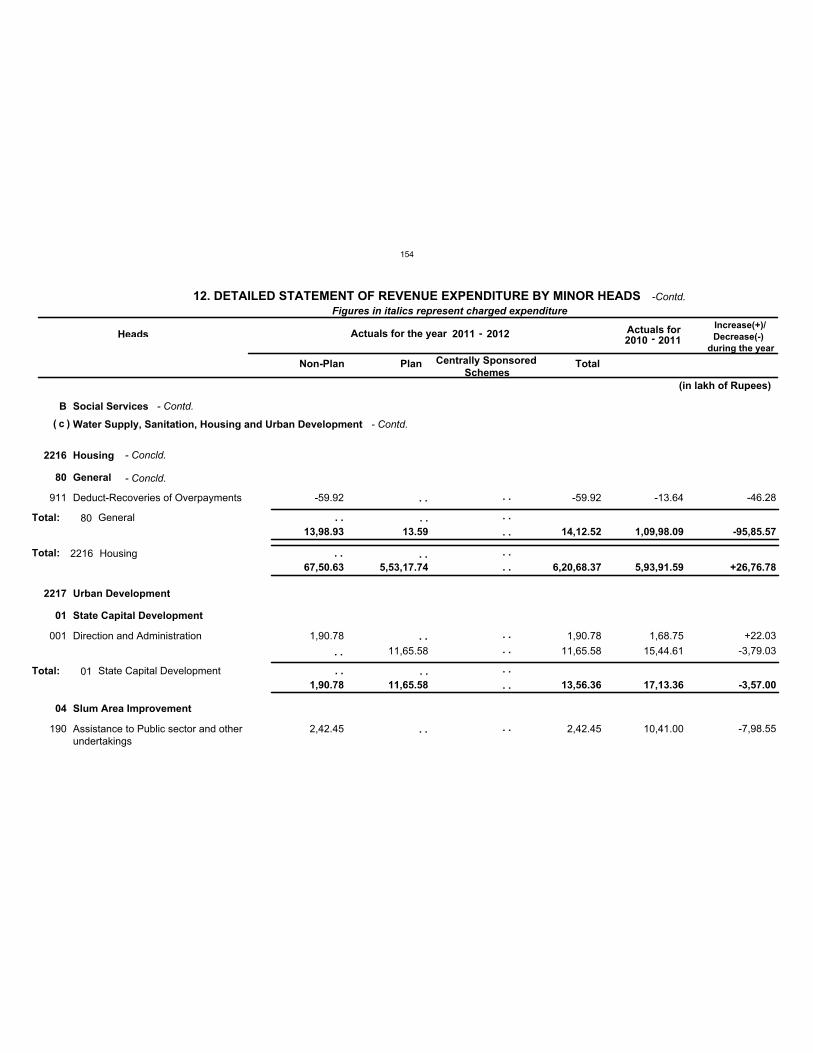
B Social Services
c Water Supply, Sanitation, Housing and Urban Development
2216
2217
Housing
Urban Development
Total:
80
01
04
General
State Capital Development
Slum Area Improvement
911
001
190
Deduct-Recoveries of Overpayments
Direction and Administration
Assistance to Public sector and otherundertakings
V
V
V
V
-59.92
1,90.78
2,42.45
11,65.58
-59.92
1,90.78
11,65.58
2,42.45
-13.64
1,68.75
15,44.61
10,41.00
-46.28
+22.03
-3,79.03
-7,98.55
Total:
Total:
80
01
General
State Capital Development
2216 Housing
Figures in italics represent charged expenditure
Heads Actuals for the year Actuals for Increase(+)/
Decrease(-)
during the year
Non-Plan Plan Centrally Sponsored
Schemes Total
13,98.93
1,90.78
13.59
11,65.58
14,12.52
13,56.36
1,09,98.09
17,13.36
-95,85.57
-3,57.00
67,50.63 5,53,17.74 6,20,68.37 5,93,91.59 +26,76.78
(in lakh of Rupees)
( )
. .
. .
. .
. .
. .
. .
. .
. .
. .
. .
. .
. .
. .
. .
. .
. .
. . . . . .
. .
12. DETAILED STATEMENT OF REVENUE EXPENDITURE BY MINOR HEADS
2011 -2010 -2012
2011
- Contd.
- Contd.
- Concld.
- Concld.
-Contd.
154
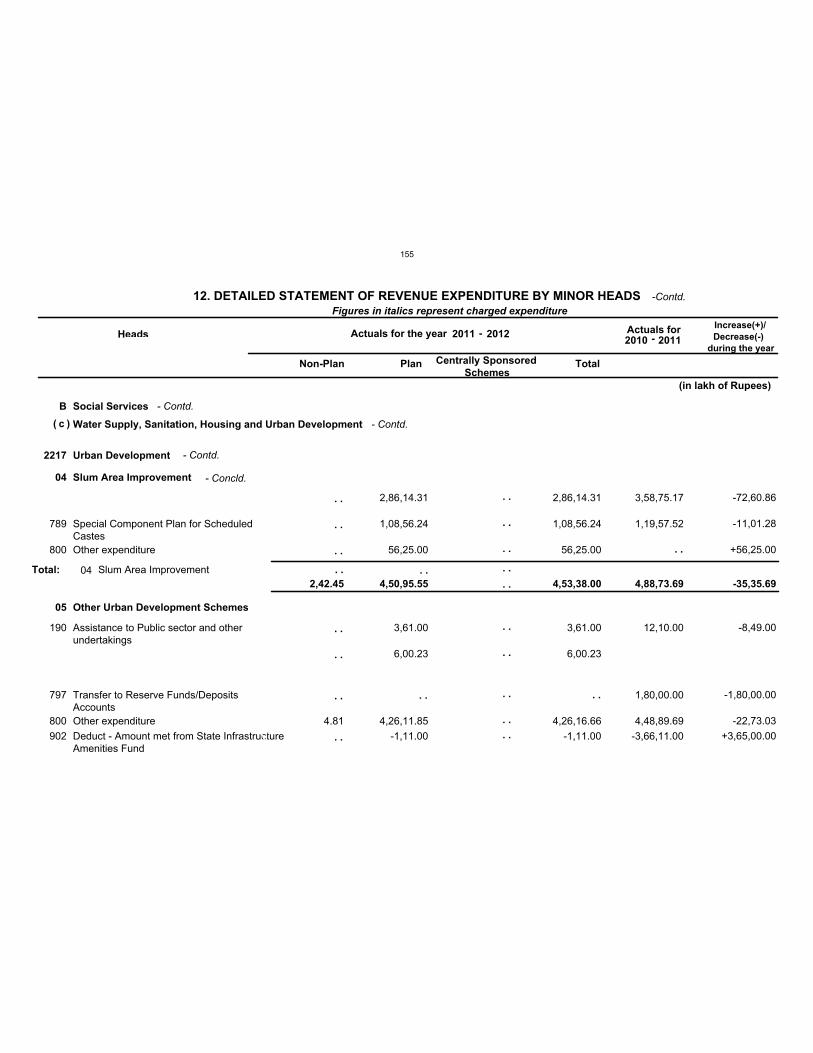
B Social Services
c Water Supply, Sanitation, Housing and Urban Development
2217 Urban Development
04
05
Slum Area Improvement
Other Urban Development Schemes
789
800
190
797
800
902
Special Component Plan for ScheduledCastes
Other expenditure
Assistance to Public sector and otherundertakings
Transfer to Reserve Funds/DepositsAccounts
Other expenditure
Deduct - Amount met from State InfrastructureAmenities Fund
V
V
V
V
V
V
V
V
V
4.81
2,86,14.31
1,08,56.24
56,25.00
3,61.00
6,00.23
4,26,11.85
-1,11.00
2,86,14.31
1,08,56.24
56,25.00
3,61.00
6,00.23
4,26,16.66
-1,11.00
3,58,75.17
1,19,57.52
12,10.00
1,80,00.00
4,48,89.69
-3,66,11.00
-72,60.86
-11,01.28
+56,25.00
-8,49.00
-1,80,00.00
-22,73.03
+3,65,00.00
Total: 04 Slum Area Improvement
Figures in italics represent charged expenditure
Heads Actuals for the year Actuals for Increase(+)/
Decrease(-)
during the year
Non-Plan Plan Centrally Sponsored
Schemes Total
2,42.45 4,50,95.55 4,53,38.00 4,88,73.69 -35,35.69
(in lakh of Rupees)
( )
. .
. .
. .
. .
. .
. .
. .
. .
. .
. .
. .
. .
. .
. .
. .
. .
. .
. .
. . . . . .
. .
12. DETAILED STATEMENT OF REVENUE EXPENDITURE BY MINOR HEADS
2011 -2010 -2012
2011
- Contd.
- Contd.
- Contd.
- Concld.
-Contd.
155
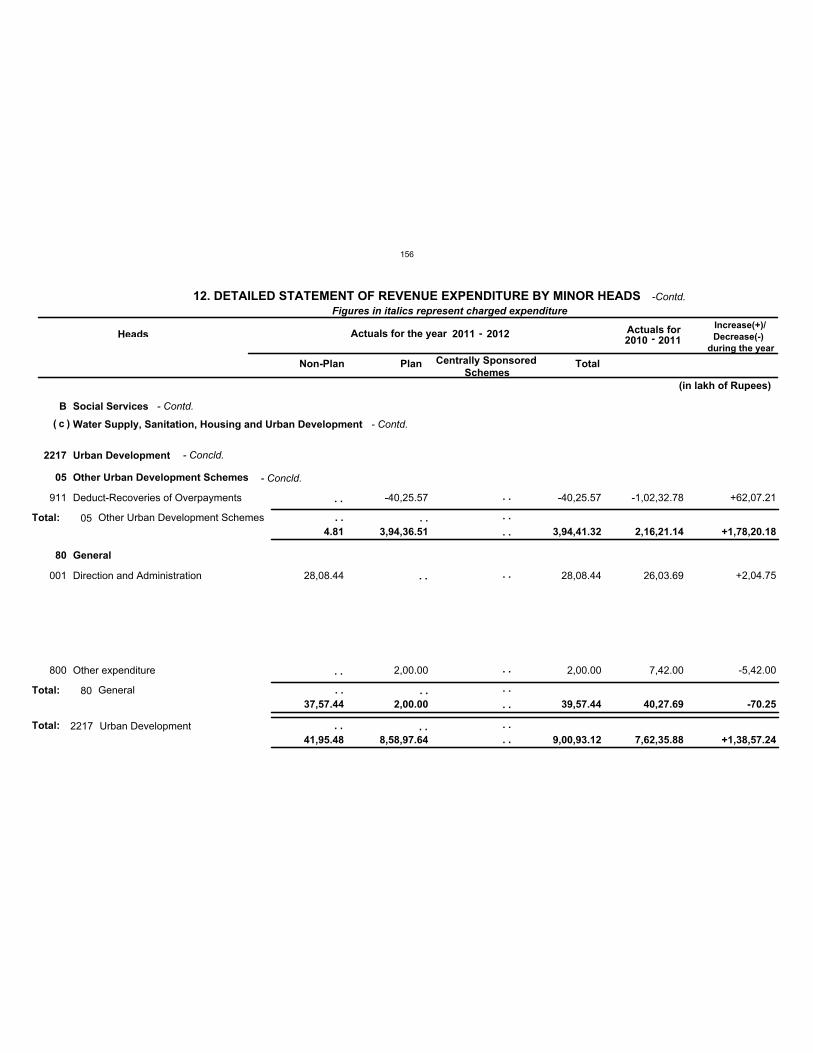
B Social Services
c Water Supply, Sanitation, Housing and Urban Development
2217 Urban Development
Total:
05
80
Other Urban Development Schemes
General
911
001
800
Deduct-Recoveries of Overpayments
Direction and Administration
Other expenditure
V
V
V
V
V
V
28,08.44
-40,25.57
2,00.00
-40,25.57
28,08.44
2,00.00
-1,02,32.78
26,03.69
7,42.00
+62,07.21
+2,04.75
-5,42.00
Total:
Total:
05
80
Other Urban Development Schemes
General
2217 Urban Development
Figures in italics represent charged expenditure
Heads Actuals for the year Actuals for Increase(+)/
Decrease(-)
during the year
Non-Plan Plan Centrally Sponsored
Schemes Total
4.81
37,57.44
3,94,36.51
2,00.00
3,94,41.32
39,57.44
2,16,21.14
40,27.69
+1,78,20.18
-70.25
41,95.48 8,58,97.64 9,00,93.12 7,62,35.88 +1,38,57.24
(in lakh of Rupees)
( )
. .
. .
. .
. .
. .
. .
. .
. .
. .
. .
. .
. .
. .
. .
. . . . . .
. .
12. DETAILED STATEMENT OF REVENUE EXPENDITURE BY MINOR HEADS
2011 -2010 -2012
2011
- Contd.
- Contd.
- Concld.
- Concld.
-Contd.
156
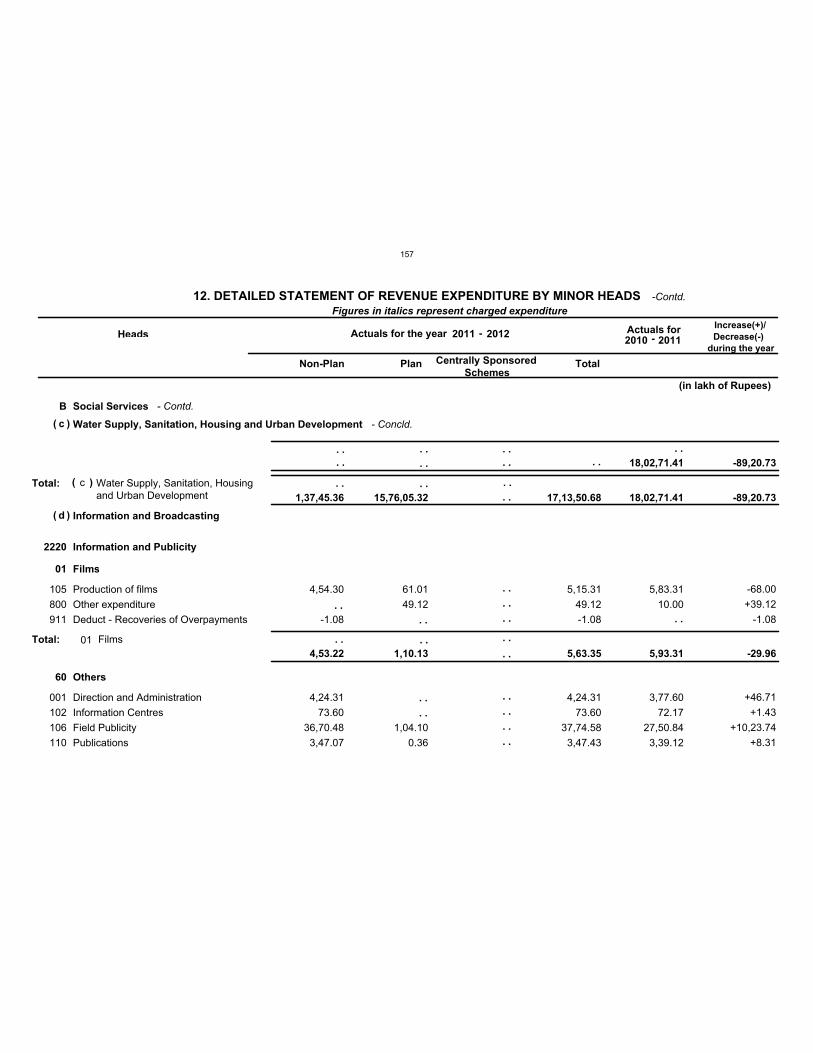
B Social Services
c
d
Water Supply, Sanitation, Housing and Urban Development
Information and Broadcasting
Total:
2220 Information and Publicity
01
60
Films
Others
105
800
911
001
102
106
110
Production of films
Other expenditure
Deduct - Recoveries of Overpayments
Direction and Administration
Information Centres
Field Publicity
Publications
V
V
V
V
V
V
V
4,54.30
-1.08
4,24.31
73.60
36,70.48
3,47.07
61.01
49.12
1,04.10
0.36
5,15.31
49.12
-1.08
4,24.31
73.60
37,74.58
3,47.43
5,83.31
10.00
3,77.60
72.17
27,50.84
3,39.12
-68.00
+39.12
-1.08
+46.71
+1.43
+10,23.74
+8.31
Total: 01 Films
c Water Supply, Sanitation, Housingand Urban Development
Figures in italics represent charged expenditure
Heads Actuals for the year Actuals for Increase(+)/
Decrease(-)
during the year
Non-Plan Plan Centrally Sponsored
Schemes Total
4,53.22 1,10.13 5,63.35 5,93.31 -29.96
18,02,71.41 -89,20.73
1,37,45.36 15,76,05.32 17,13,50.68 18,02,71.41 -89,20.73
(in lakh of Rupees)
(
(
)
)
( )
. .
. .
. .
. .
. .
. .
. .
. .
. .
. .
. .
. .
. . . . . .
. .
. .
. .
. .
. .
. .
. . . .
. .
. . . . . .
. .
12. DETAILED STATEMENT OF REVENUE EXPENDITURE BY MINOR HEADS
2011 -2010 -2012
2011
- Contd.
- Concld.
-Contd.
157
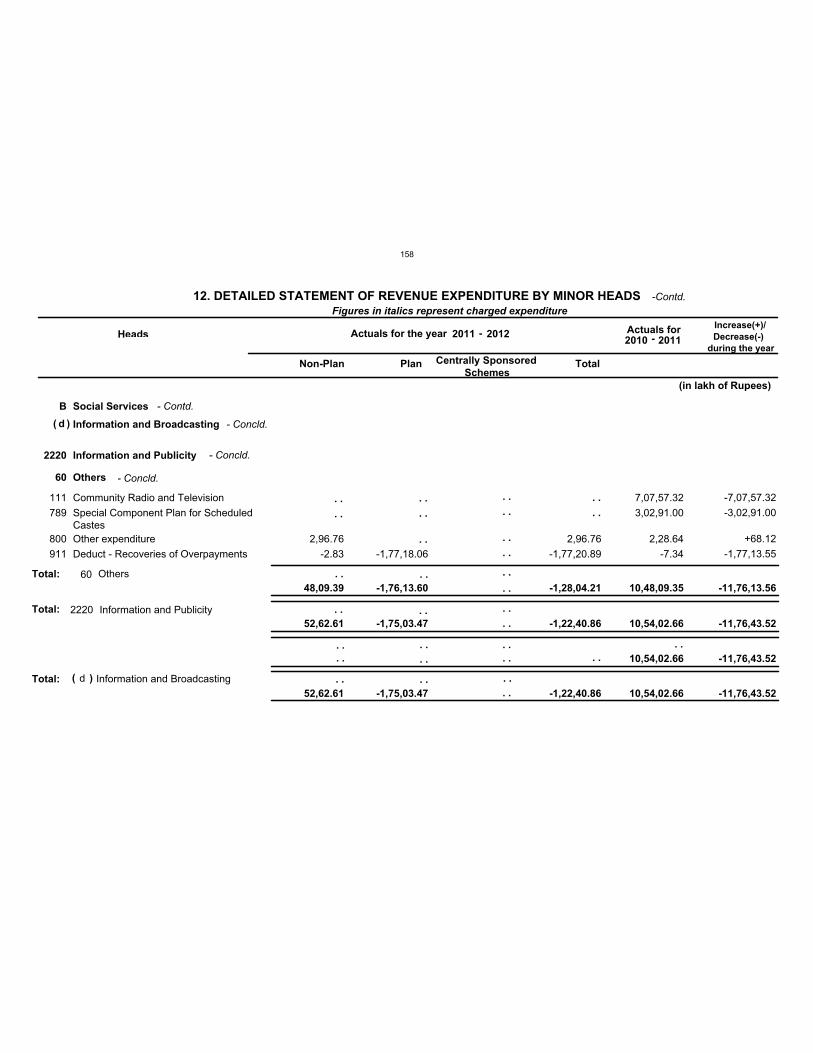
B Social Services
d Information and Broadcasting
Total:
2220 Information and Publicity
Total:
60 Others
111
789
800
911
Community Radio and Television
Special Component Plan for ScheduledCastes
Other expenditure
Deduct - Recoveries of Overpayments
V
V
V
V
2,96.76
-2.83 -1,77,18.06
2,96.76
-1,77,20.89
7,07,57.32
3,02,91.00
2,28.64
-7.34
-7,07,57.32
-3,02,91.00
+68.12
-1,77,13.55
Total: 60 Others
2220 Information and Publicity
d Information and Broadcasting
Figures in italics represent charged expenditure
Heads Actuals for the year Actuals for Increase(+)/
Decrease(-)
during the year
Non-Plan Plan Centrally Sponsored
Schemes Total
48,09.39 -1,76,13.60 -1,28,04.21 10,48,09.35 -11,76,13.56
52,62.61 -1,75,03.47 -1,22,40.86 10,54,02.66 -11,76,43.52
10,54,02.66 -11,76,43.52
52,62.61 -1,75,03.47 -1,22,40.86 10,54,02.66 -11,76,43.52
(in lakh of Rupees)
( )
( )
. .
. .
. .
. .
. .
. .
. .
. .
. .
. .
. .
. . . . . .
. .
. . . . . .
. .
. .
. .
. .
. .
. .
. . . .
. .
. . . . . .
. .
12. DETAILED STATEMENT OF REVENUE EXPENDITURE BY MINOR HEADS
2011 -2010 -2012
2011
- Contd.
- Concld.
- Concld.
- Concld.
-Contd.
158
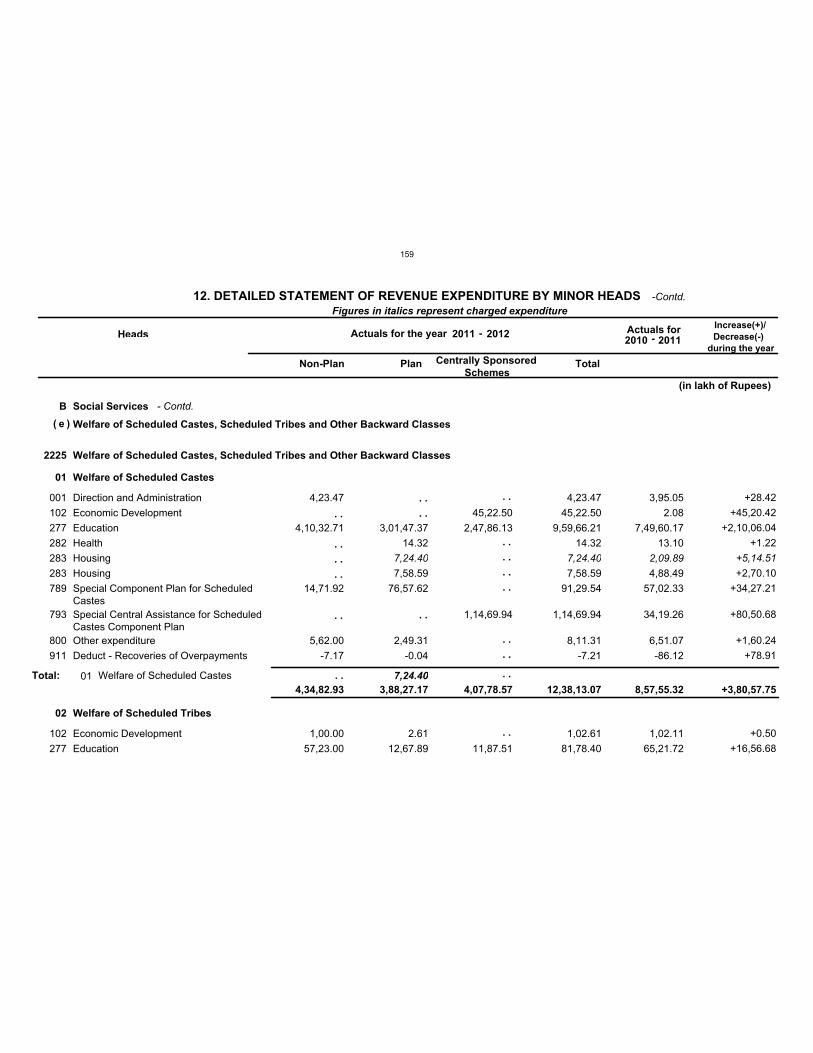
B Social Services
e Welfare of Scheduled Castes, Scheduled Tribes and Other Backward Classes
2225 Welfare of Scheduled Castes, Scheduled Tribes and Other Backward Classes
01
02
Welfare of Scheduled Castes
Welfare of Scheduled Tribes
7,24.40
001
102
277
282
283
283
789
793
800
911
102
277
Direction and Administration
Economic Development
Education
Health
Housing
Housing
Special Component Plan for ScheduledCastes
Special Central Assistance for ScheduledCastes Component Plan
Other expenditure
Deduct - Recoveries of Overpayments
Economic Development
Education
V
V
V
V
C
V
V
V
V
V
V
V
4,23.47
4,10,32.71
14,71.92
5,62.00
-7.17
1,00.00
57,23.00
3,01,47.37
14.32
7,24.40
7,58.59
76,57.62
2,49.31
-0.04
2.61
12,67.89
45,22.50
2,47,86.13
1,14,69.94
11,87.51
4,23.47
45,22.50
9,59,66.21
14.32
7,24.40
7,58.59
91,29.54
1,14,69.94
8,11.31
-7.21
1,02.61
81,78.40
3,95.05
2.08
7,49,60.17
13.10
2,09.89
4,88.49
57,02.33
34,19.26
6,51.07
-86.12
1,02.11
65,21.72
+28.42
+45,20.42
+2,10,06.04
+1.22
+5,14.51
+2,70.10
+34,27.21
+80,50.68
+1,60.24
+78.91
+0.50
+16,56.68
Total: 01 Welfare of Scheduled Castes
Figures in italics represent charged expenditure
Heads Actuals for the year Actuals for Increase(+)/
Decrease(-)
during the year
Non-Plan Plan Centrally Sponsored
Schemes Total
4,34,82.93 3,88,27.17 4,07,78.57 12,38,13.07 8,57,55.32 +3,80,57.75
(in lakh of Rupees)
( )
. .
. .
. .
. .
. .
. .
. .
. .
. .
. .
. .
. .
. .
. .
. .
. .
. . . .
12. DETAILED STATEMENT OF REVENUE EXPENDITURE BY MINOR HEADS
2011 -2010 -2012
2011
- Contd.
-Contd.
159
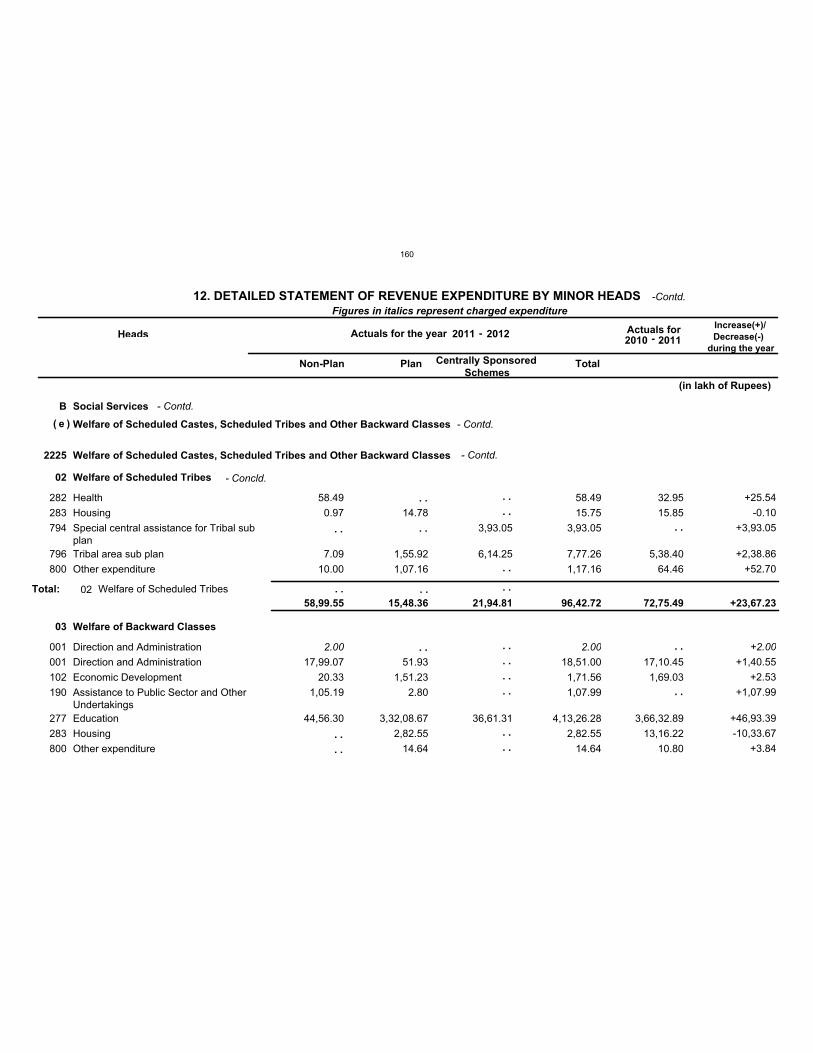
B Social Services
e Welfare of Scheduled Castes, Scheduled Tribes and Other Backward Classes
2225 Welfare of Scheduled Castes, Scheduled Tribes and Other Backward Classes
02
03
Welfare of Scheduled Tribes
Welfare of Backward Classes
282
283
794
796
800
001
001
102
190
277
283
800
Health
Housing
Special central assistance for Tribal subplan
Tribal area sub plan
Other expenditure
Direction and Administration
Direction and Administration
Economic Development
Assistance to Public Sector and OtherUndertakings
Education
Housing
Other expenditure
V
V
V
V
V
C
V
V
V
V
V
V
58.49
0.97
7.09
10.00
2.00
17,99.07
20.33
1,05.19
44,56.30
14.78
1,55.92
1,07.16
51.93
1,51.23
2.80
3,32,08.67
2,82.55
14.64
3,93.05
6,14.25
36,61.31
58.49
15.75
3,93.05
7,77.26
1,17.16
2.00
18,51.00
1,71.56
1,07.99
4,13,26.28
2,82.55
14.64
32.95
15.85
5,38.40
64.46
17,10.45
1,69.03
3,66,32.89
13,16.22
10.80
+25.54
-0.10
+3,93.05
+2,38.86
+52.70
+2.00
+1,40.55
+2.53
+1,07.99
+46,93.39
-10,33.67
+3.84
Total: 02 Welfare of Scheduled Tribes
Figures in italics represent charged expenditure
Heads Actuals for the year Actuals for Increase(+)/
Decrease(-)
during the year
Non-Plan Plan Centrally Sponsored
Schemes Total
58,99.55 15,48.36 21,94.81 96,42.72 72,75.49 +23,67.23
(in lakh of Rupees)
( )
. .
. .
. .
. .
. .
. .
. .
. .
. .
. .
. .
. .
. .
. .
. .
. .
. .
. .
. . . . . .
12. DETAILED STATEMENT OF REVENUE EXPENDITURE BY MINOR HEADS
2011 -2010 -2012
2011
- Contd.
- Contd.
- Contd.
- Concld.
-Contd.
160
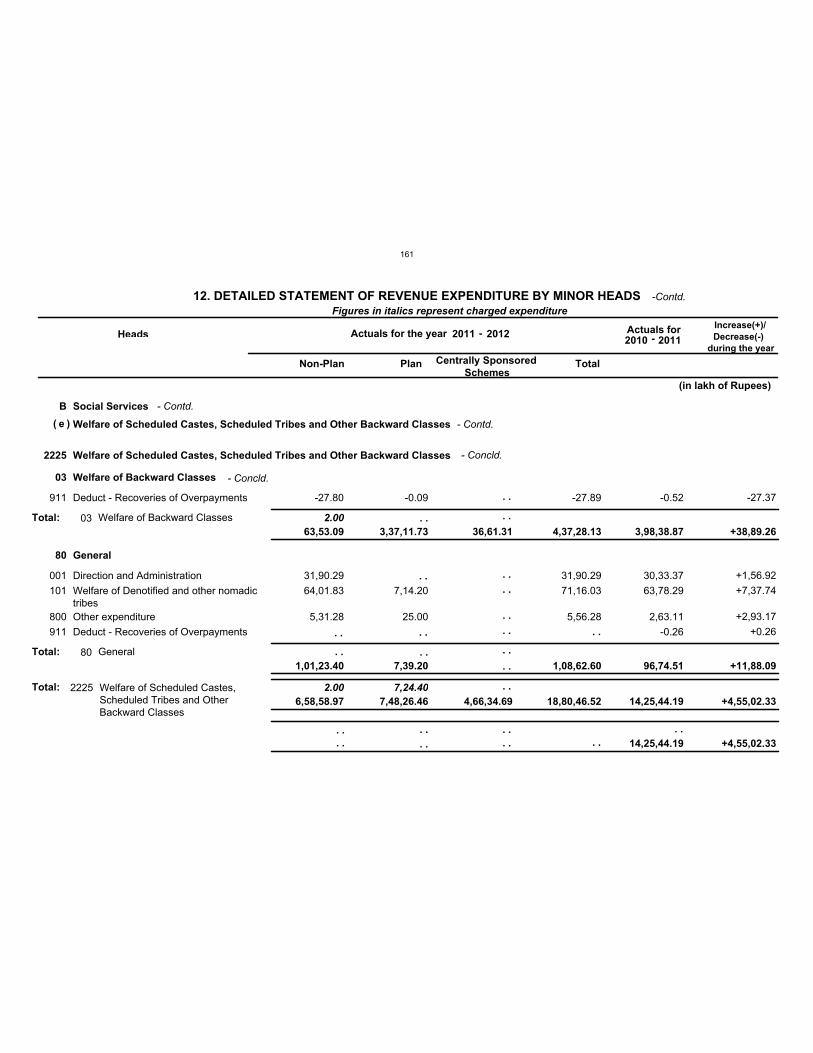
B Social Services
e Welfare of Scheduled Castes, Scheduled Tribes and Other Backward Classes
2225 Welfare of Scheduled Castes, Scheduled Tribes and Other Backward Classes
2.00Total: 7,24.40
03
80
Welfare of Backward Classes
General
2.00
911
001
101
800
911
Deduct - Recoveries of Overpayments
Direction and Administration
Welfare of Denotified and other nomadictribes
Other expenditure
Deduct - Recoveries of Overpayments
V
V
V
V
V
-27.80
31,90.29
64,01.83
5,31.28
-0.09
7,14.20
25.00
-27.89
31,90.29
71,16.03
5,56.28
-0.52
30,33.37
63,78.29
2,63.11
-0.26
-27.37
+1,56.92
+7,37.74
+2,93.17
+0.26
Total:
Total:
03
80
Welfare of Backward Classes
General
2225 Welfare of Scheduled Castes,Scheduled Tribes and OtherBackward Classes
Figures in italics represent charged expenditure
Heads Actuals for the year Actuals for Increase(+)/
Decrease(-)
during the year
Non-Plan Plan Centrally Sponsored
Schemes Total
63,53.09
1,01,23.40
3,37,11.73
7,39.20
36,61.31 4,37,28.13
1,08,62.60
3,98,38.87
96,74.51
+38,89.26
+11,88.09
6,58,58.97 7,48,26.46 4,66,34.69 18,80,46.52 14,25,44.19 +4,55,02.33
14,25,44.19 +4,55,02.33
(in lakh of Rupees)
( )
. .
. .
. .
. .
. .
. .
. .
. . . .
. .
. .
. .
. .
. .
. .
. .
. .
. .
. .
. .
. .
. . . .
. .
12. DETAILED STATEMENT OF REVENUE EXPENDITURE BY MINOR HEADS
2011 -2010 -2012
2011
- Contd.
- Contd.
- Concld.
- Concld.
-Contd.
161
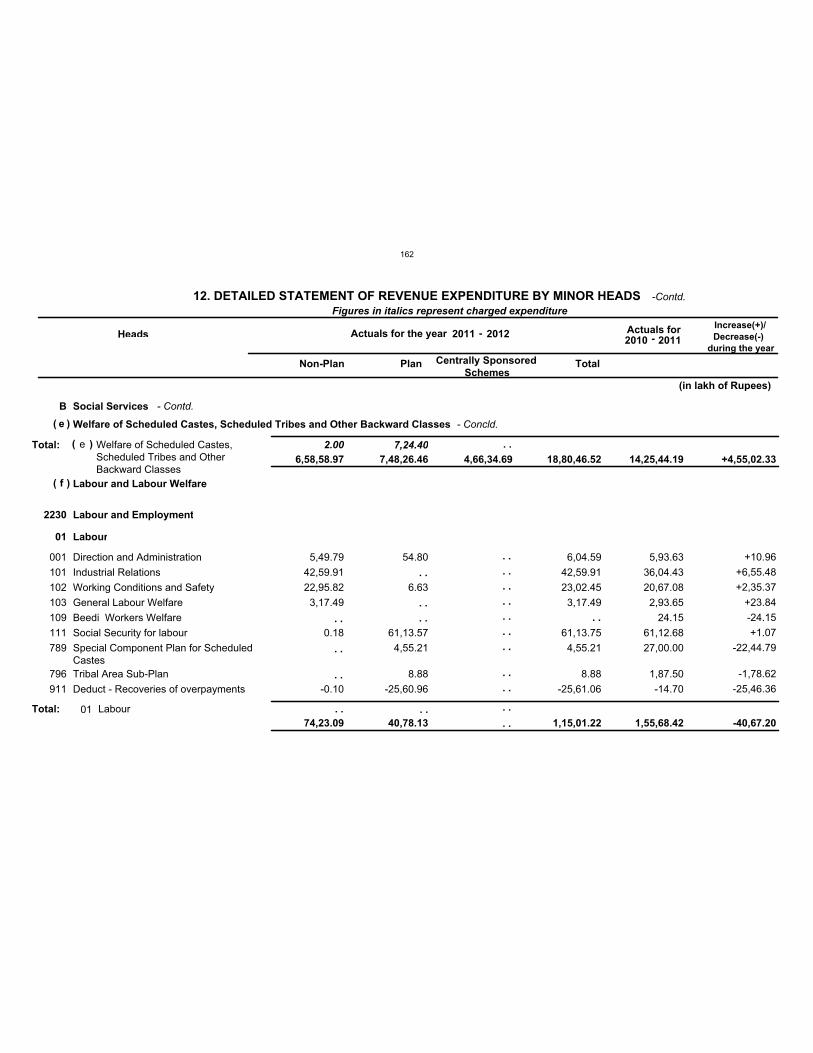
B Social Services
e
f
Welfare of Scheduled Castes, Scheduled Tribes and Other Backward Classes
Labour and Labour Welfare
2.00Total: 7,24.40
2230 Labour and Employment
01 Labour
001
101
102
103
109
111
789
796
911
Direction and Administration
Industrial Relations
Working Conditions and Safety
General Labour Welfare
Beedi Workers Welfare
Social Security for labour
Special Component Plan for ScheduledCastes
Tribal Area Sub-Plan
Deduct - Recoveries of overpayments
V
V
V
V
V
V
V
V
V
5,49.79
42,59.91
22,95.82
3,17.49
0.18
-0.10
54.80
6.63
61,13.57
4,55.21
8.88
-25,60.96
6,04.59
42,59.91
23,02.45
3,17.49
61,13.75
4,55.21
8.88
-25,61.06
5,93.63
36,04.43
20,67.08
2,93.65
24.15
61,12.68
27,00.00
1,87.50
-14.70
+10.96
+6,55.48
+2,35.37
+23.84
-24.15
+1.07
-22,44.79
-1,78.62
-25,46.36
Total: 01 Labour
e Welfare of Scheduled Castes,Scheduled Tribes and OtherBackward Classes
Figures in italics represent charged expenditure
Heads Actuals for the year Actuals for Increase(+)/
Decrease(-)
during the year
Non-Plan Plan Centrally Sponsored
Schemes Total
74,23.09 40,78.13 1,15,01.22 1,55,68.42 -40,67.20
6,58,58.97 7,48,26.46 4,66,34.69 18,80,46.52 14,25,44.19 +4,55,02.33
(in lakh of Rupees)
(
(
)
)
( )
. .
. .
. .
. .
. .
. .
. .
. .
. .
. .
. .
. .
. .
. .
. .
. .
. . . . . .
. .
. .
12. DETAILED STATEMENT OF REVENUE EXPENDITURE BY MINOR HEADS
2011 -2010 -2012
2011
- Contd.
- Concld.
-Contd.
162
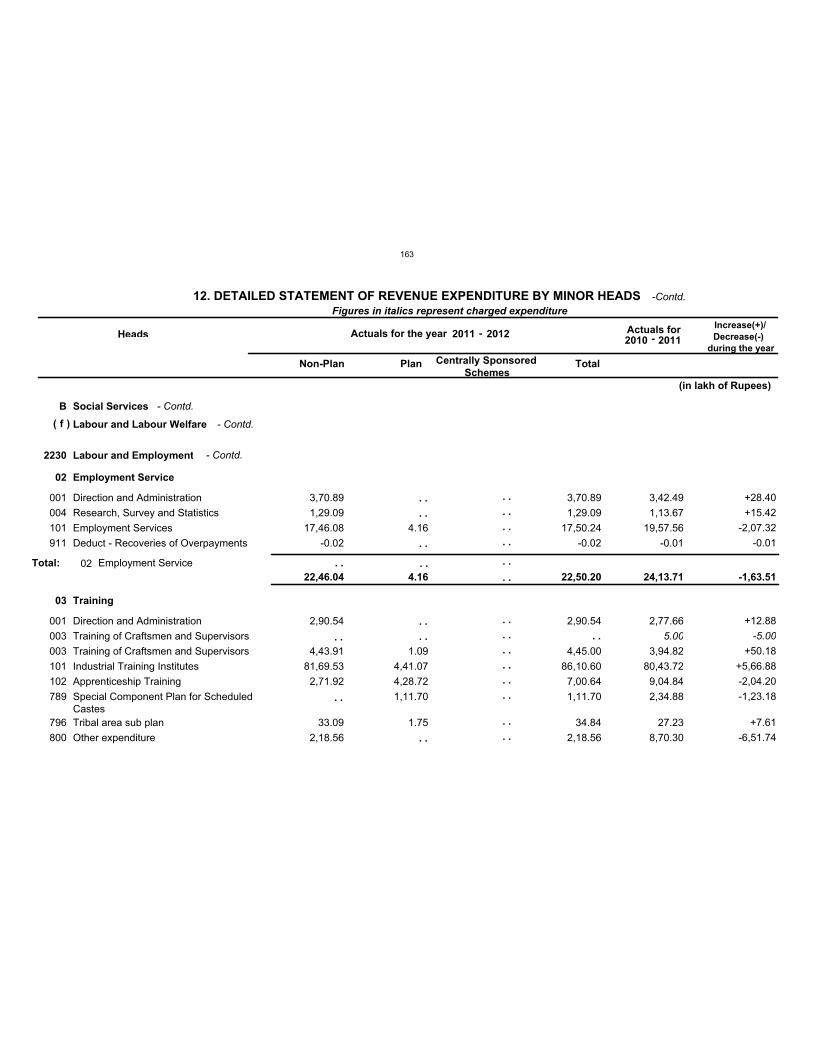
B Social Services
f Labour and Labour Welfare
2230 Labour and Employment
02
03
Employment Service
Training
001
004
101
911
001
003
003
101
102
789
796
800
Direction and Administration
Research, Survey and Statistics
Employment Services
Deduct - Recoveries of Overpayments
Direction and Administration
Training of Craftsmen and Supervisors
Training of Craftsmen and Supervisors
Industrial Training Institutes
Apprenticeship Training
Special Component Plan for ScheduledCastes
Tribal area sub plan
Other expenditure
V
V
V
V
V
C
V
V
V
V
V
V
3,70.89
1,29.09
17,46.08
-0.02
2,90.54
4,43.91
81,69.53
2,71.92
33.09
2,18.56
4.16
1.09
4,41.07
4,28.72
1,11.70
1.75
3,70.89
1,29.09
17,50.24
-0.02
2,90.54
4,45.00
86,10.60
7,00.64
1,11.70
34.84
2,18.56
3,42.49
1,13.67
19,57.56
-0.01
2,77.66
5.00
3,94.82
80,43.72
9,04.84
2,34.88
27.23
8,70.30
+28.40
+15.42
-2,07.32
-0.01
+12.88
-5.00
+50.18
+5,66.88
-2,04.20
-1,23.18
+7.61
-6,51.74
Total: 02 Employment Service
Figures in italics represent charged expenditure
Heads Actuals for the year Actuals for Increase(+)/
Decrease(-)
during the year
Non-Plan Plan Centrally Sponsored
Schemes Total
22,46.04 4.16 22,50.20 24,13.71 -1,63.51
(in lakh of Rupees)
( )
. .
. .
. .
. .
. .
. .
. .
. .
. .
. .
. .
. .
. .
. .
. .
. .
. .
. .
. .
. .
. .
. . . . . .
. .
12. DETAILED STATEMENT OF REVENUE EXPENDITURE BY MINOR HEADS
2011 -2010 -2012
2011
- Contd.
- Contd.
- Contd.
-Contd.
163
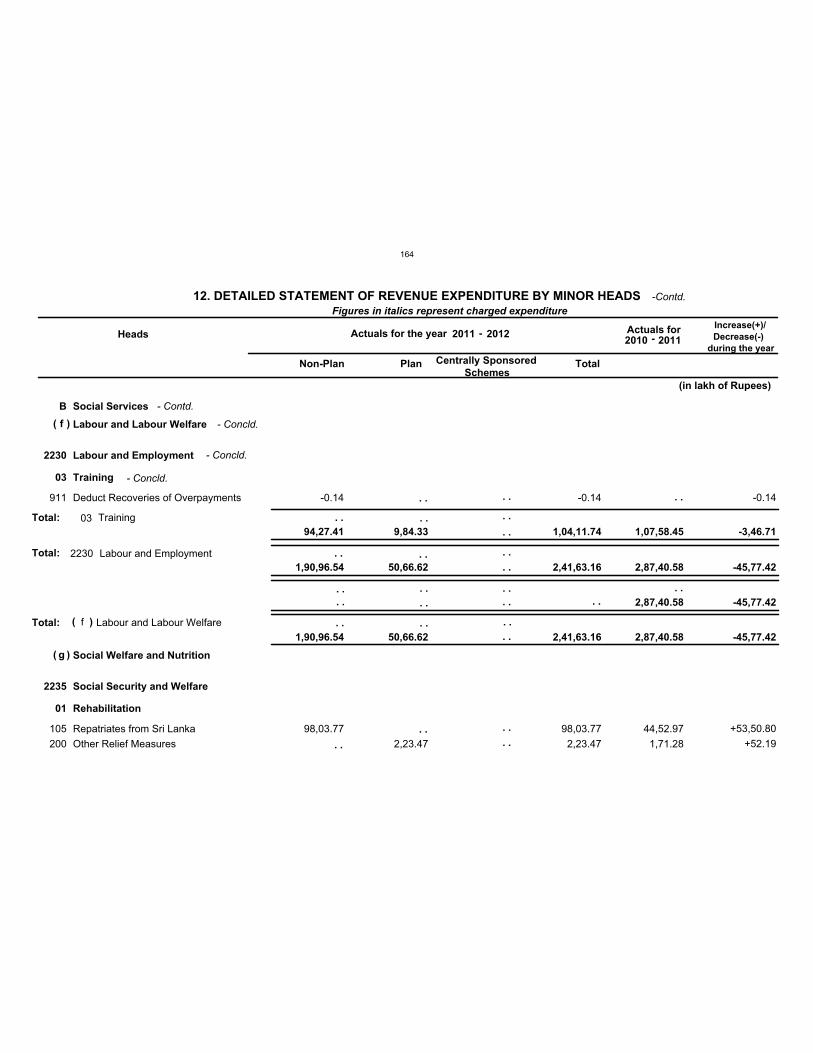
B Social Services
f
g
Labour and Labour Welfare
Social Welfare and Nutrition
Total:
2230
2235
Labour and Employment
Social Security and Welfare
Total:
03
01
Training
Rehabilitation
911
105
200
Deduct Recoveries of Overpayments
Repatriates from Sri Lanka
Other Relief Measures
V
V
V
-0.14
98,03.77
2,23.47
-0.14
98,03.77
2,23.47
44,52.97
1,71.28
-0.14
+53,50.80
+52.19
Total: 03 Training
2230 Labour and Employment
f Labour and Labour Welfare
Figures in italics represent charged expenditure
Heads Actuals for the year Actuals for Increase(+)/
Decrease(-)
during the year
Non-Plan Plan Centrally Sponsored
Schemes Total
94,27.41 9,84.33 1,04,11.74 1,07,58.45 -3,46.71
1,90,96.54 50,66.62 2,41,63.16 2,87,40.58 -45,77.42
2,87,40.58 -45,77.42
1,90,96.54 50,66.62 2,41,63.16 2,87,40.58 -45,77.42
(in lakh of Rupees)
(
(
)
)
( )
. .
. .
. .
. .
. .
. .
. .
. . . . . .
. .
. . . . . .
. .
. .
. .
. .
. .
. .
. . . .
. .
. . . . . .
. .
12. DETAILED STATEMENT OF REVENUE EXPENDITURE BY MINOR HEADS
2011 -2010 -2012
2011
- Contd.
- Concld.
- Concld.
- Concld.
-Contd.
164
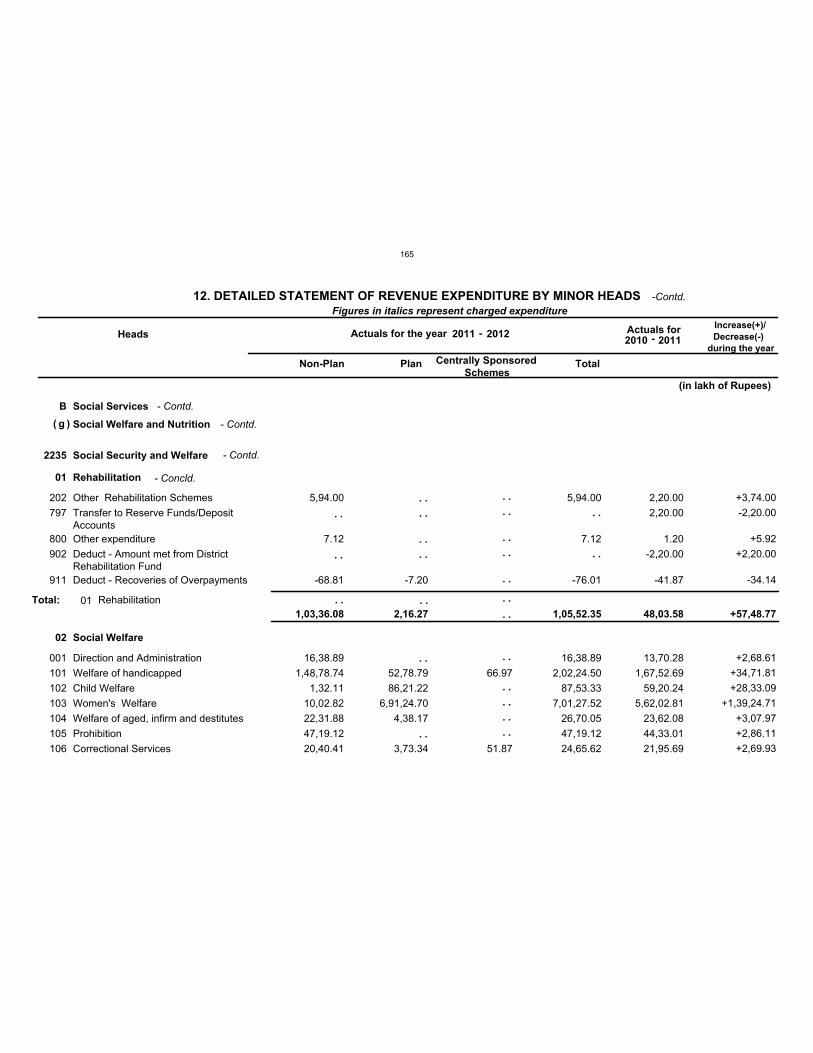
B Social Services
g Social Welfare and Nutrition
2235 Social Security and Welfare
01
02
Rehabilitation
Social Welfare
202
797
800
902
911
001
101
102
103
104
105
106
Other Rehabilitation Schemes
Transfer to Reserve Funds/DepositAccounts
Other expenditure
Deduct - Amount met from DistrictRehabilitation Fund
Deduct - Recoveries of Overpayments
Direction and Administration
Welfare of handicapped
Child Welfare
Women's Welfare
Welfare of aged, infirm and destitutes
Prohibition
Correctional Services
V
V
V
V
V
V
V
V
V
V
V
V
5,94.00
7.12
-68.81
16,38.89
1,48,78.74
1,32.11
10,02.82
22,31.88
47,19.12
20,40.41
-7.20
52,78.79
86,21.22
6,91,24.70
4,38.17
3,73.34
66.97
51.87
5,94.00
7.12
-76.01
16,38.89
2,02,24.50
87,53.33
7,01,27.52
26,70.05
47,19.12
24,65.62
2,20.00
2,20.00
1.20
-2,20.00
-41.87
13,70.28
1,67,52.69
59,20.24
5,62,02.81
23,62.08
44,33.01
21,95.69
+3,74.00
-2,20.00
+5.92
+2,20.00
-34.14
+2,68.61
+34,71.81
+28,33.09
+1,39,24.71
+3,07.97
+2,86.11
+2,69.93
Total: 01 Rehabilitation
Figures in italics represent charged expenditure
Heads Actuals for the year Actuals for Increase(+)/
Decrease(-)
during the year
Non-Plan Plan Centrally Sponsored
Schemes Total
1,03,36.08 2,16.27 1,05,52.35 48,03.58 +57,48.77
(in lakh of Rupees)
( )
. .
. .
. .
. .
. .
. .
. .
. .
. .
. .
. .
. .
. .
. .
. .
. .
. .
. .
. .
. .
. . . . . .
. .
12. DETAILED STATEMENT OF REVENUE EXPENDITURE BY MINOR HEADS
2011 -2010 -2012
2011
- Contd.
- Contd.
- Contd.
- Concld.
-Contd.
165

B Social Services
g Social Welfare and Nutrition
2235 Social Security and Welfare
02
60
Social Welfare
Other Social Security and Welfare programmes
190
200
789
796
800
911
102
105
110
200
Assistance to Public Sector and OtherUndertakings
Other programmes
Special Component Plan for ScheduledCastes
Tribal Area Sub plan
Other expenditure
Deduct - Recoveries of Overpayments
Pensions under Social SecuritySchemes
Government Employees InsuranceScheme
Other Insurance Schemes
Other Programmes
V
V
V
V
V
V
V
V
V
C
0.65
9,84.45
-0.15
50,54.59
2.23
34,75.28
1,66.39
15,27.93
2,39,90.73
7,31.99
-77.37
18,78,91.99 3,37,16.41
0.65
15,27.93
2,39,90.73
7,31.99
9,84.45
-77.52
22,66,62.99
2.23
34,75.28
1,66.39
15,26.52
1,78,56.10
3,23.32
7,30.66
-34.70
9,30,15.16
2.27
35,99.13
1,12.82
+0.65
+1.41
+61,34.63
+4,08.67
+2,53.79
-42.82
+13,36,47.83
-0.04
-1,23.85
+53.57
Total: 02 Social Welfare
Figures in italics represent charged expenditure
Heads Actuals for the year Actuals for Increase(+)/
Decrease(-)
during the year
Non-Plan Plan Centrally Sponsored
Schemes Total
2,76,28.92 11,00,09.50 1,18.84 13,77,57.26 10,96,38.70 +2,81,18.56
(in lakh of Rupees)
( )
. .
. .
. .
. .
. .
. .
. .
. .
. .
. .
. .
. .
. .
. .
. .
. .
. .
. .
. . . . . .
12. DETAILED STATEMENT OF REVENUE EXPENDITURE BY MINOR HEADS
2011 -2010 -2012
2011
- Contd.
- Contd.
- Contd.
- Concld.
-Contd.
166
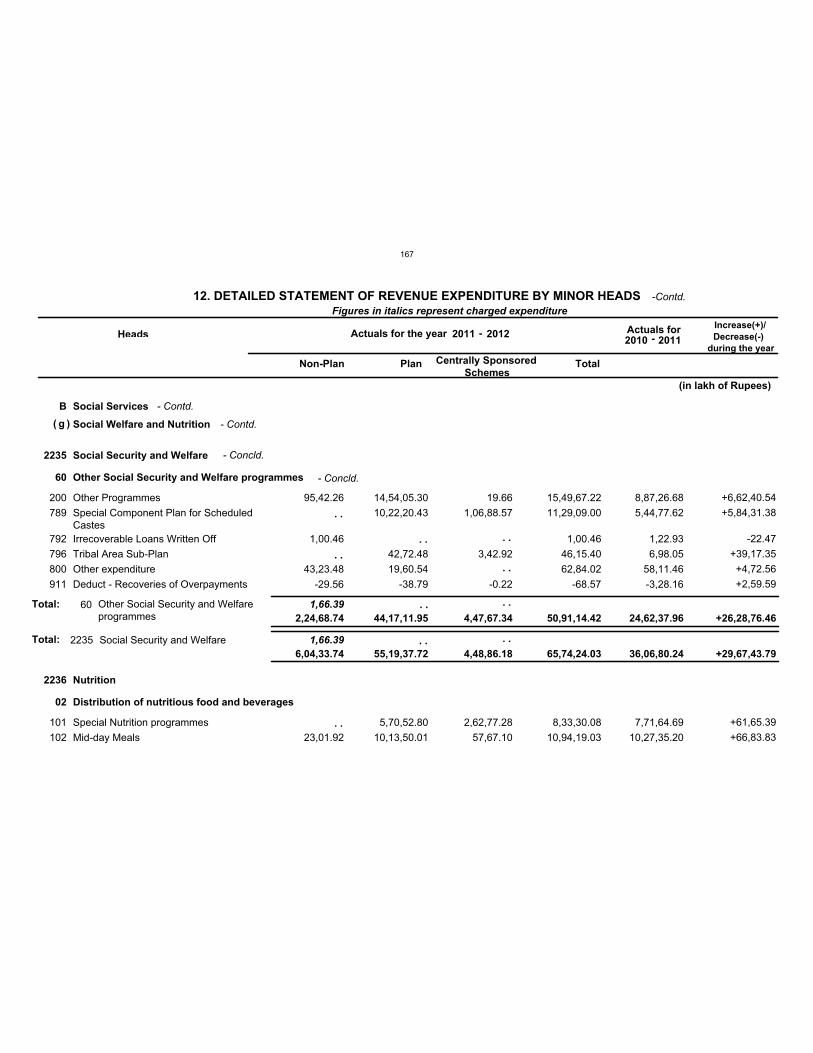
B Social Services
g Social Welfare and Nutrition
2235
2236
Social Security and Welfare
Nutrition
1,66.39Total:
60
02
Other Social Security and Welfare programmes
Distribution of nutritious food and beverages
1,66.39
200
789
792
796
800
911
101
102
Other Programmes
Special Component Plan for ScheduledCastes
Irrecoverable Loans Written Off
Tribal Area Sub-Plan
Other expenditure
Deduct - Recoveries of Overpayments
Special Nutrition programmes
Mid-day Meals
V
V
V
V
V
V
V
V
95,42.26
1,00.46
43,23.48
-29.56
23,01.92
14,54,05.30
10,22,20.43
42,72.48
19,60.54
-38.79
5,70,52.80
10,13,50.01
19.66
1,06,88.57
3,42.92
-0.22
2,62,77.28
57,67.10
15,49,67.22
11,29,09.00
1,00.46
46,15.40
62,84.02
-68.57
8,33,30.08
10,94,19.03
8,87,26.68
5,44,77.62
1,22.93
6,98.05
58,11.46
-3,28.16
7,71,64.69
10,27,35.20
+6,62,40.54
+5,84,31.38
-22.47
+39,17.35
+4,72.56
+2,59.59
+61,65.39
+66,83.83
Total: 60 Other Social Security and Welfareprogrammes
2235 Social Security and Welfare
Figures in italics represent charged expenditure
Heads Actuals for the year Actuals for Increase(+)/
Decrease(-)
during the year
Non-Plan Plan Centrally Sponsored
Schemes Total
2,24,68.74 44,17,11.95 4,47,67.34 50,91,14.42 24,62,37.96 +26,28,76.46
6,04,33.74 55,19,37.72 4,48,86.18 65,74,24.03 36,06,80.24 +29,67,43.79
(in lakh of Rupees)
( )
. .
. .
. .
. . . .
. .
. . . .
. . . .
12. DETAILED STATEMENT OF REVENUE EXPENDITURE BY MINOR HEADS
2011 -2010 -2012
2011
- Contd.
- Contd.
- Concld.
- Concld.
-Contd.
167

B Social Services
g Social Welfare and Nutrition
2236 Nutrition
Total:
02
80
Distribution of nutritious food and beverages
General
789
796
911
001
Special Component Plan for ScheduledCastes
Tribal area sub plan
Deduct - Recoveries of Overpayments
Direction and Administration
V
V
V
V
-0.08
10.05
2,16,05.45
10,19.34
-1.31 -1,13.85
2,16,05.45
10,19.34
-1,15.24
10.05
2,34,70.32
4,58.54
-1,01.78
7.89
-18,64.87
+5,60.80
-13.46
+2.16
Total:
Total:
02
80
Distribution of nutritious food andbeverages
General
2236 Nutrition
Figures in italics represent charged expenditure
Heads Actuals for the year Actuals for Increase(+)/
Decrease(-)
during the year
Non-Plan Plan Centrally Sponsored
Schemes Total
23,01.84
10.05
18,10,26.29 3,19,30.53 21,52,58.66
10.05
20,37,26.97
7.89
+1,15,31.69
+2.16
23,11.89 18,10,26.29 3,19,30.53 21,52,68.71 20,37,34.86 +1,15,33.85
(in lakh of Rupees)
( )
. .
. .
. .
. .
. .
. .
. .
. .
. .
. .
. .
. .
. .
. .
. . . . . .
12. DETAILED STATEMENT OF REVENUE EXPENDITURE BY MINOR HEADS
2011 -2010 -2012
2011
- Contd.
- Contd.
- Concld.
- Concld.
-Contd.
168
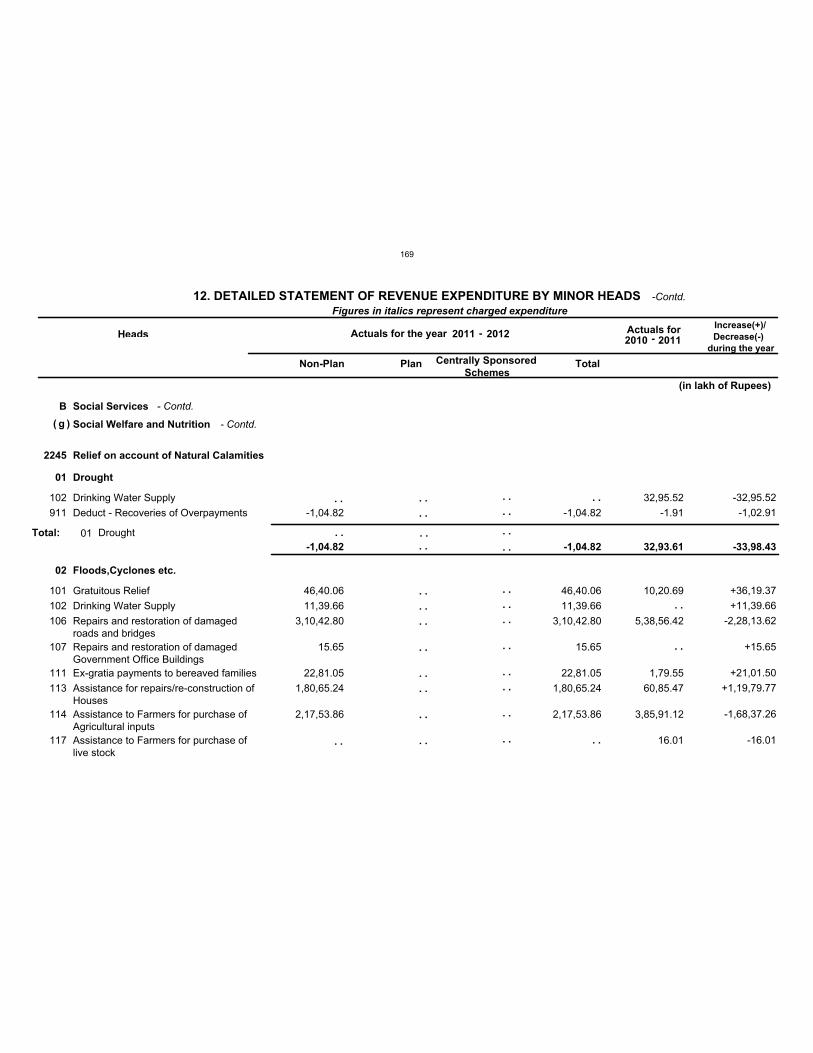
B Social Services
g Social Welfare and Nutrition
2245 Relief on account of Natural Calamities
01
02
Drought
Floods,Cyclones etc.
102
911
101
102
106
107
111
113
114
117
Drinking Water Supply
Deduct - Recoveries of Overpayments
Gratuitous Relief
Drinking Water Supply
Repairs and restoration of damagedroads and bridges
Repairs and restoration of damagedGovernment Office Buildings
Ex-gratia payments to bereaved families
Assistance for repairs/re-construction ofHouses
Assistance to Farmers for purchase ofAgricultural inputs
Assistance to Farmers for purchase oflive stock
V
V
V
V
V
V
V
V
V
V
-1,04.82
46,40.06
11,39.66
3,10,42.80
15.65
22,81.05
1,80,65.24
2,17,53.86
-1,04.82
46,40.06
11,39.66
3,10,42.80
15.65
22,81.05
1,80,65.24
2,17,53.86
32,95.52
-1.91
10,20.69
5,38,56.42
1,79.55
60,85.47
3,85,91.12
16.01
-32,95.52
-1,02.91
+36,19.37
+11,39.66
-2,28,13.62
+15.65
+21,01.50
+1,19,79.77
-1,68,37.26
-16.01
Total: 01 Drought
Figures in italics represent charged expenditure
Heads Actuals for the year Actuals for Increase(+)/
Decrease(-)
during the year
Non-Plan Plan Centrally Sponsored
Schemes Total
-1,04.82 -1,04.82 32,93.61 -33,98.43
(in lakh of Rupees)
( )
. .
. .
. .
. .
. .
. .
. .
. .
. .
. .
. .
. .
. .
. .
. .
. .
. .
. .
. .
. .
. .
. .
. .
. .
. .
. .
. . . .
. .
. .
. .
12. DETAILED STATEMENT OF REVENUE EXPENDITURE BY MINOR HEADS
2011 -2010 -2012
2011
- Contd.
- Contd.
-Contd.
169
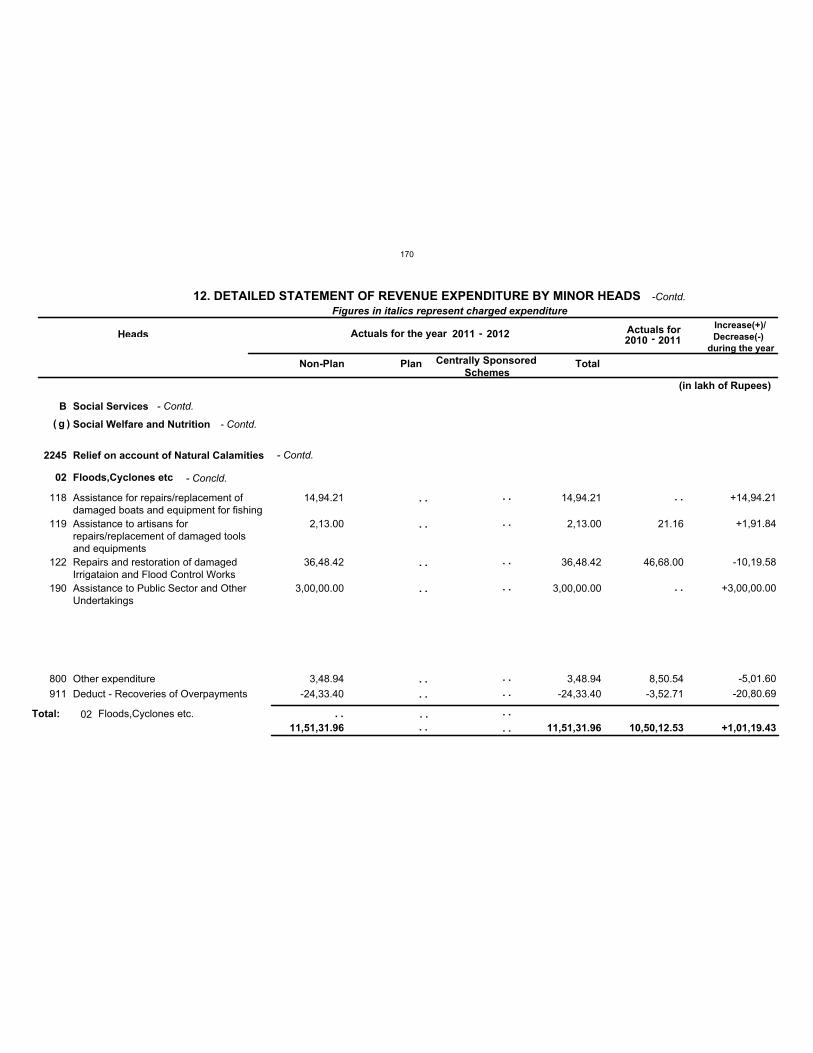
B Social Services
g Social Welfare and Nutrition
2245 Relief on account of Natural Calamities
02 Floods,Cyclones etc
118
119
122
190
800
911
Assistance for repairs/replacement ofdamaged boats and equipment for fishing
Assistance to artisans forrepairs/replacement of damaged toolsand equipments
Repairs and restoration of damagedIrrigataion and Flood Control Works
Assistance to Public Sector and OtherUndertakings
Other expenditure
Deduct - Recoveries of Overpayments
V
V
V
V
V
V
V
V
14,94.21
2,13.00
36,48.42
3,00,00.00
3,48.94
-24,33.40
14,94.21
2,13.00
36,48.42
3,00,00.00
3,48.94
-24,33.40
21.16
46,68.00
8,50.54
-3,52.71
+14,94.21
+1,91.84
-10,19.58
+3,00,00.00
-5,01.60
-20,80.69
Total: 02 Floods,Cyclones etc.
Figures in italics represent charged expenditure
Heads Actuals for the year Actuals for Increase(+)/
Decrease(-)
during the year
Non-Plan Plan Centrally Sponsored
Schemes Total
11,51,31.96 11,51,31.96 10,50,12.53 +1,01,19.43
(in lakh of Rupees)
( )
. .
. .
. .
. .
. .
. .
. .
. .
. .
. .
. .
. .
. .
. .
. . . .
. .
. .
. .
12. DETAILED STATEMENT OF REVENUE EXPENDITURE BY MINOR HEADS
2011 -2010 -2012
2011
- Contd.
- Contd.
- Contd.
- Concld.
-Contd.
170
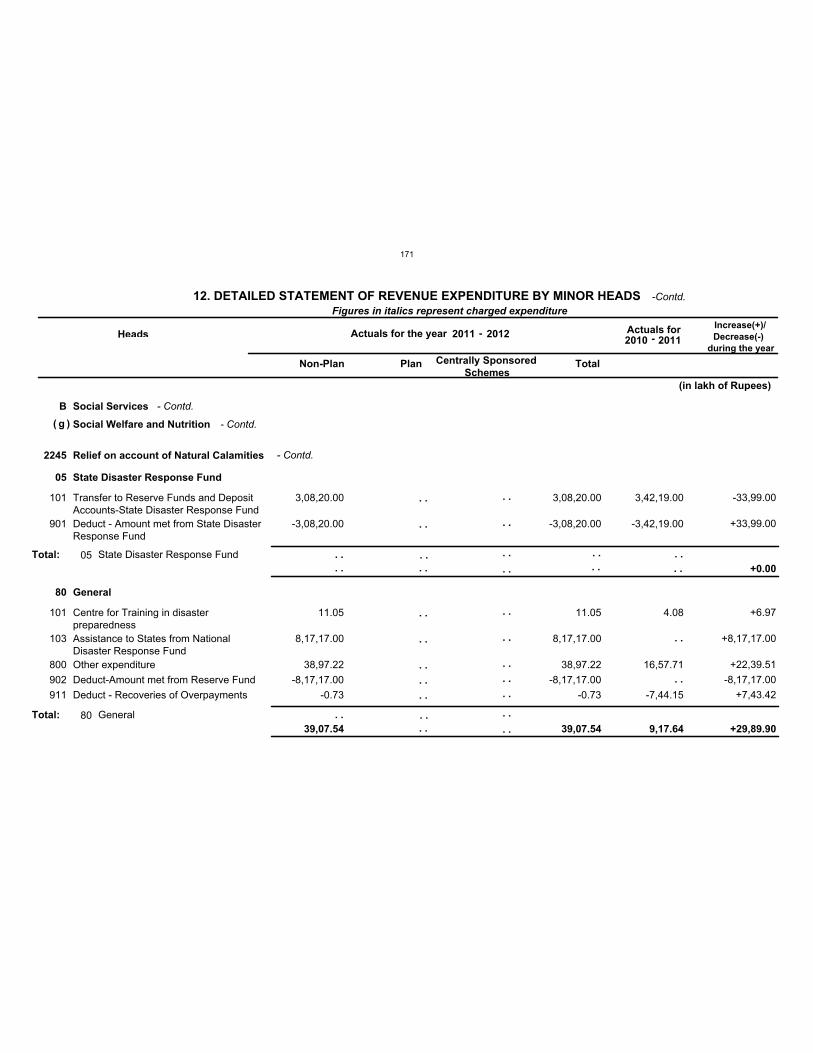
B Social Services
g Social Welfare and Nutrition
2245 Relief on account of Natural Calamities
05
80
State Disaster Response Fund
General
101
901
101
103
800
902
911
Transfer to Reserve Funds and DepositAccounts-State Disaster Response Fund
Deduct - Amount met from State DisasterResponse Fund
Centre for Training in disasterpreparedness
Assistance to States from NationalDisaster Response Fund
Other expenditure
Deduct-Amount met from Reserve Fund
Deduct - Recoveries of Overpayments
V
V
V
V
V
V
V
3,08,20.00
-3,08,20.00
11.05
8,17,17.00
38,97.22
-8,17,17.00
-0.73
3,08,20.00
-3,08,20.00
11.05
8,17,17.00
38,97.22
-8,17,17.00
-0.73
3,42,19.00
-3,42,19.00
4.08
16,57.71
-7,44.15
-33,99.00
+33,99.00
+6.97
+8,17,17.00
+22,39.51
-8,17,17.00
+7,43.42
Total:
Total:
05
80
State Disaster Response Fund
General
Figures in italics represent charged expenditure
Heads Actuals for the year Actuals for Increase(+)/
Decrease(-)
during the year
Non-Plan Plan Centrally Sponsored
Schemes Total
39,07.54 39,07.54 9,17.64
+0.00
+29,89.90
(in lakh of Rupees)
( )
. .
. .
. .
. .
. .
. .
. .
. .
. .
. .
. .
. .
. .
. .
. .
. .
. .
. .
. .
. .
. .
. .
. .
. .
. .
. .
. .
. .
. .
. .
. .
12. DETAILED STATEMENT OF REVENUE EXPENDITURE BY MINOR HEADS
2011 -2010 -2012
2011
- Contd.
- Contd.
- Contd.
-Contd.
171
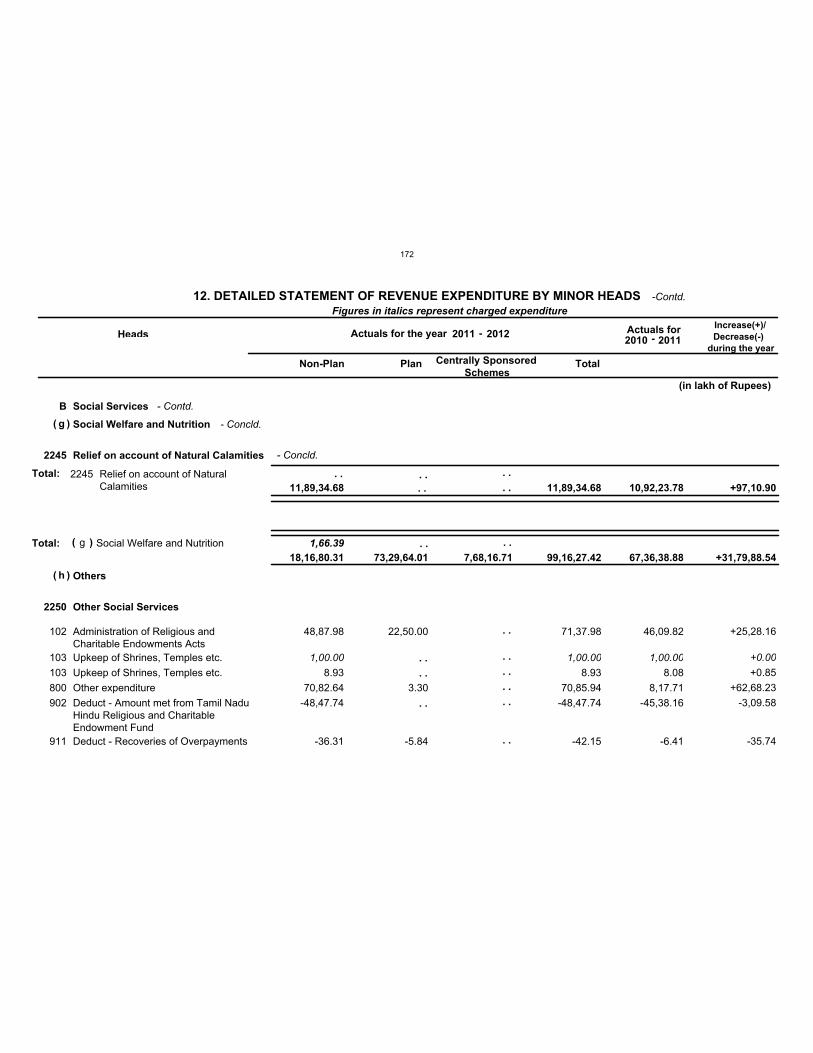
B Social Services
g
h
Social Welfare and Nutrition
Others
1,66.39Total:
2245
2250
Relief on account of Natural Calamities
Other Social Services
Total:
102
103
103
800
902
911
Administration of Religious andCharitable Endowments Acts
Upkeep of Shrines, Temples etc.
Upkeep of Shrines, Temples etc.
Other expenditure
Deduct - Amount met from Tamil NaduHindu Religious and CharitableEndowment Fund
Deduct - Recoveries of Overpayments
V
C
V
V
V
V
48,87.98
1,00.00
8.93
70,82.64
-48,47.74
-36.31
22,50.00
3.30
-5.84
71,37.98
1,00.00
8.93
70,85.94
-48,47.74
-42.15
46,09.82
1,00.00
8.08
8,17.71
-45,38.16
-6.41
+25,28.16
+0.00
+0.85
+62,68.23
-3,09.58
-35.74
2245 Relief on account of NaturalCalamities
g Social Welfare and Nutrition
Figures in italics represent charged expenditure
Heads Actuals for the year Actuals for Increase(+)/
Decrease(-)
during the year
Non-Plan Plan Centrally Sponsored
Schemes Total
11,89,34.68 11,89,34.68 10,92,23.78 +97,10.90
18,16,80.31 73,29,64.01 7,68,16.71 99,16,27.42 67,36,38.88 +31,79,88.54
(in lakh of Rupees)
(
(
)
)
( )
. .
. .
. .
. .
. .
. .
. .
. .
. .
. . . .
. .
. .
. .
. . . .
12. DETAILED STATEMENT OF REVENUE EXPENDITURE BY MINOR HEADS
2011 -2010 -2012
2011
- Contd.
- Concld.
- Concld.
-Contd.
172
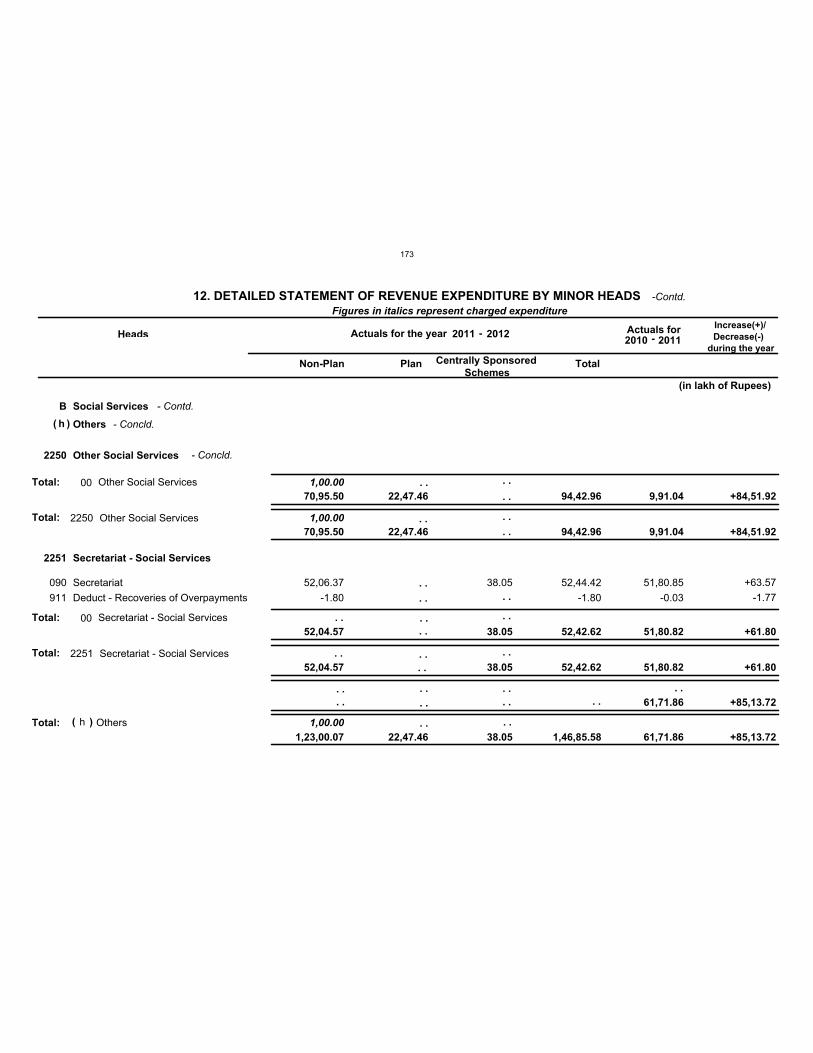
B Social Services
h Others
1,00.00Total:
2250
2251
Other Social Services
Secretariat - Social Services
1,00.00Total:
Total:
1,00.00
090
911
Secretariat
Deduct - Recoveries of Overpayments
V
V
52,06.37
-1.80
38.05 52,44.42
-1.80
51,80.85
-0.03
+63.57
-1.77
Total:
Total:
00
00
Other Social Services
Secretariat - Social Services
2250
2251
Other Social Services
Secretariat - Social Services
h Others
Figures in italics represent charged expenditure
Heads Actuals for the year Actuals for Increase(+)/
Decrease(-)
during the year
Non-Plan Plan Centrally Sponsored
Schemes Total
70,95.50
52,04.57
22,47.46
38.05
94,42.96
52,42.62
9,91.04
51,80.82
+84,51.92
+61.80
70,95.50
52,04.57
22,47.46
38.05
94,42.96
52,42.62
9,91.04
51,80.82
+84,51.92
+61.80
61,71.86 +85,13.72
1,23,00.07 22,47.46 38.05 1,46,85.58 61,71.86 +85,13.72
(in lakh of Rupees)
( )
( )
. .
. . . .
. .
. .
. .
. .
. .
. .
. .
. .
. .
. .
. .
. .
. .
. .
. .
. .
. .
. .
. .
. . . .
. .
. . . .
12. DETAILED STATEMENT OF REVENUE EXPENDITURE BY MINOR HEADS
2011 -2010 -2012
2011
- Contd.
- Concld.
- Concld.
-Contd.
173
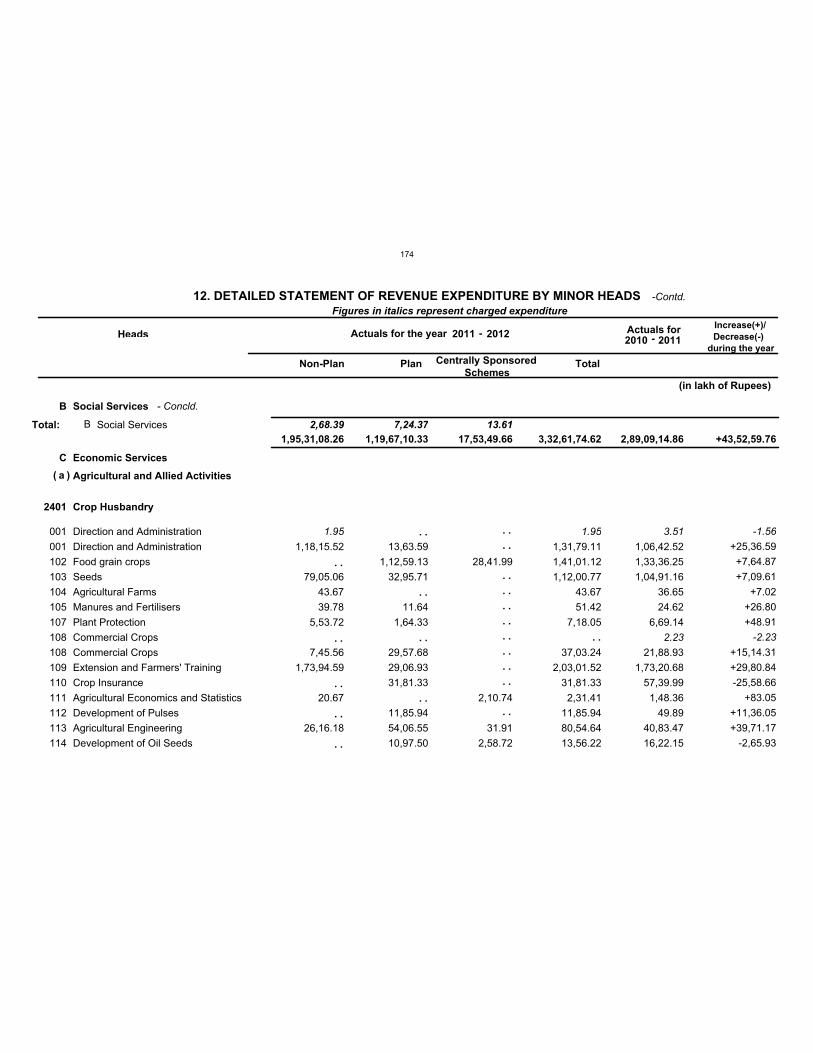
B
C
Social Services
Economic Services
2,68.39Total: 7,24.37 13.61
a Agricultural and Allied Activities
2401 Crop Husbandry
001
001
102
103
104
105
107
108
108
109
110
111
112
113
114
Direction and Administration
Direction and Administration
Food grain crops
Seeds
Agricultural Farms
Manures and Fertilisers
Plant Protection
Commercial Crops
Commercial Crops
Extension and Farmers' Training
Crop Insurance
Agricultural Economics and Statistics
Development of Pulses
Agricultural Engineering
Development of Oil Seeds
C
V
V
V
V
V
V
C
V
V
V
V
V
V
V
1.95
1,18,15.52
79,05.06
43.67
39.78
5,53.72
7,45.56
1,73,94.59
20.67
26,16.18
13,63.59
1,12,59.13
32,95.71
11.64
1,64.33
29,57.68
29,06.93
31,81.33
11,85.94
54,06.55
10,97.50
28,41.99
2,10.74
31.91
2,58.72
1.95
1,31,79.11
1,41,01.12
1,12,00.77
43.67
51.42
7,18.05
37,03.24
2,03,01.52
31,81.33
2,31.41
11,85.94
80,54.64
13,56.22
3.51
1,06,42.52
1,33,36.25
1,04,91.16
36.65
24.62
6,69.14
2.23
21,88.93
1,73,20.68
57,39.99
1,48.36
49.89
40,83.47
16,22.15
-1.56
+25,36.59
+7,64.87
+7,09.61
+7.02
+26.80
+48.91
-2.23
+15,14.31
+29,80.84
-25,58.66
+83.05
+11,36.05
+39,71.17
-2,65.93
B Social Services
Figures in italics represent charged expenditure
Heads Actuals for the year Actuals for Increase(+)/
Decrease(-)
during the year
Non-Plan Plan Centrally Sponsored
Schemes Total
1,95,31,08.26 1,19,67,10.33 17,53,49.66 3,32,61,74.62 2,89,09,14.86 +43,52,59.76
(in lakh of Rupees)
( )
. .
. .
. .
. .
. .
. .
. .
. .
. .
. .
. .
. .
. .
. .
. .
. .
. .
. .
. .
. .
. .
12. DETAILED STATEMENT OF REVENUE EXPENDITURE BY MINOR HEADS
2011 -2010 -2012
2011
- Concld.
-Contd.
174
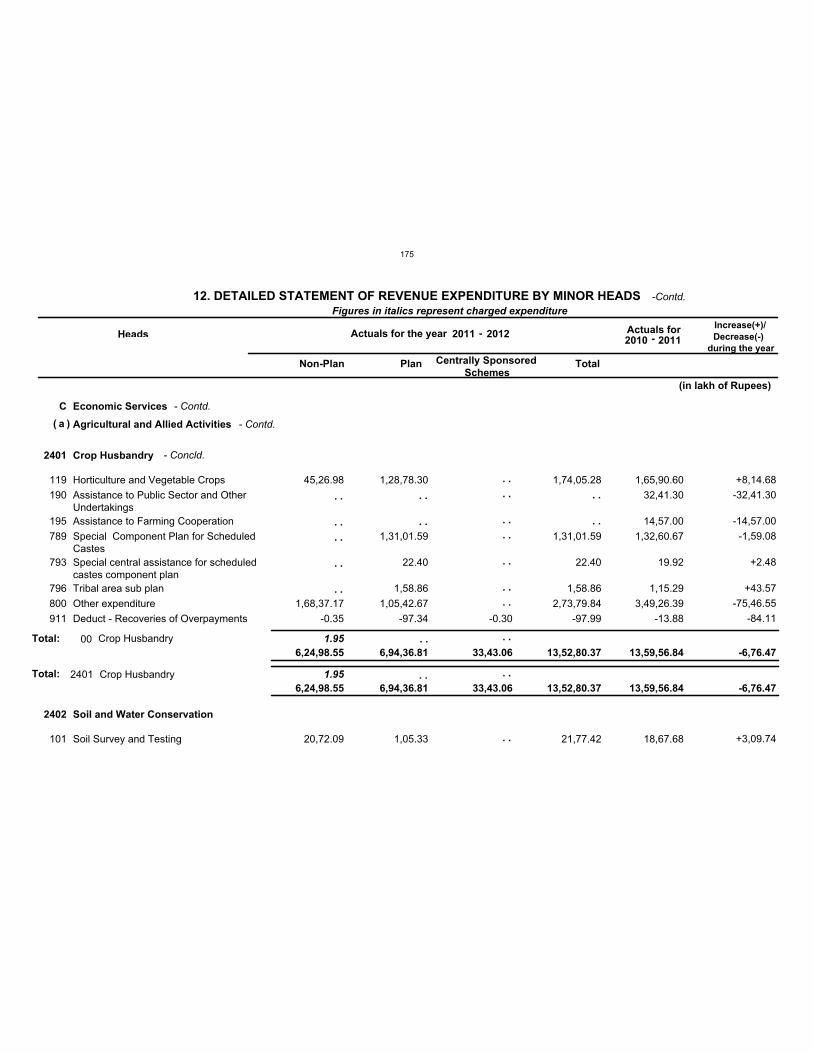
C Economic Services
a Agricultural and Allied Activities
2401
2402
Crop Husbandry
Soil and Water Conservation
1.95Total:
1.95
119
190
195
789
793
796
800
911
101
Horticulture and Vegetable Crops
Assistance to Public Sector and OtherUndertakings
Assistance to Farming Cooperation
Special Component Plan for ScheduledCastes
Special central assistance for scheduledcastes component plan
Tribal area sub plan
Other expenditure
Deduct - Recoveries of Overpayments
Soil Survey and Testing
V
V
V
V
V
V
V
V
V
45,26.98
1,68,37.17
-0.35
20,72.09
1,28,78.30
1,31,01.59
22.40
1,58.86
1,05,42.67
-97.34
1,05.33
-0.30
1,74,05.28
1,31,01.59
22.40
1,58.86
2,73,79.84
-97.99
21,77.42
1,65,90.60
32,41.30
14,57.00
1,32,60.67
19.92
1,15.29
3,49,26.39
-13.88
18,67.68
+8,14.68
-32,41.30
-14,57.00
-1,59.08
+2.48
+43.57
-75,46.55
-84.11
+3,09.74
Total: 00 Crop Husbandry
2401 Crop Husbandry
Figures in italics represent charged expenditure
Heads Actuals for the year Actuals for Increase(+)/
Decrease(-)
during the year
Non-Plan Plan Centrally Sponsored
Schemes Total
6,24,98.55 6,94,36.81 33,43.06 13,52,80.37 13,59,56.84 -6,76.47
6,24,98.55 6,94,36.81 33,43.06 13,52,80.37 13,59,56.84 -6,76.47
(in lakh of Rupees)
( )
. .
. .
. .
. .
. .
. .
. .
. .
. .
. .
. .
. .
. .
. .
. .
. .
. .
. . . .
. . . .
12. DETAILED STATEMENT OF REVENUE EXPENDITURE BY MINOR HEADS
2011 -2010 -2012
2011
- Contd.
- Contd.
- Concld.
-Contd.
175
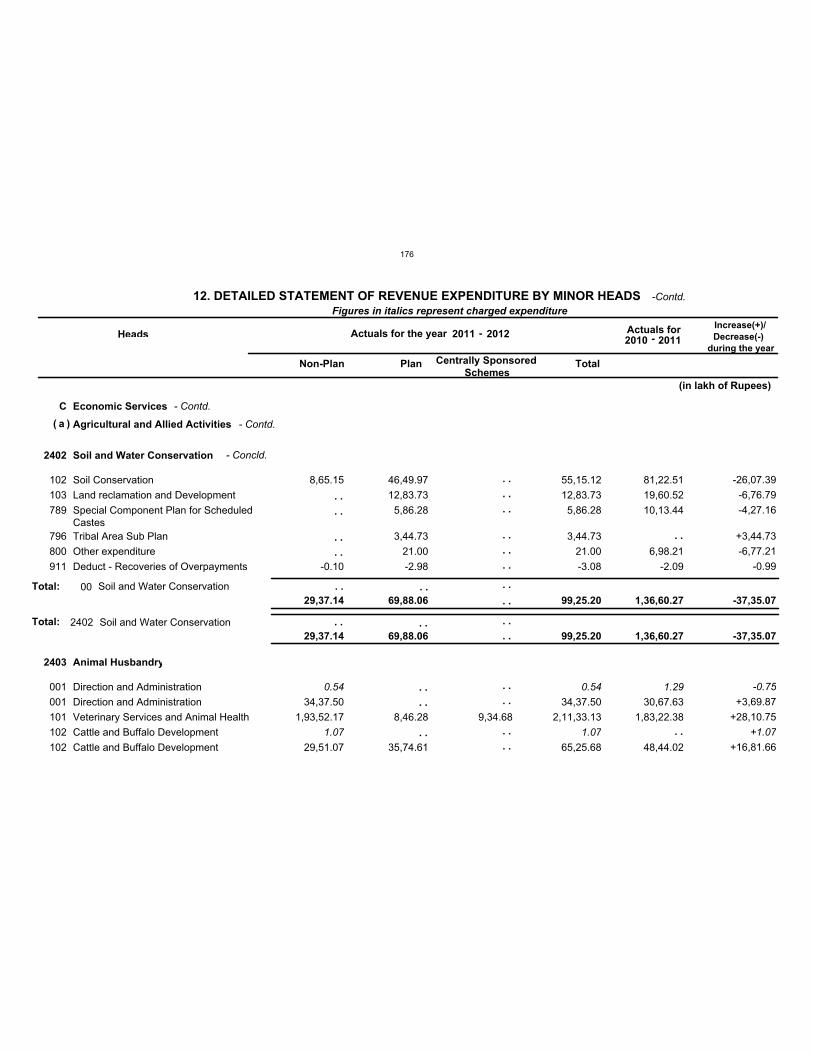
C Economic Services
a Agricultural and Allied Activities
2402
2403
Soil and Water Conservation
Animal Husbandry
Total:
102
103
789
796
800
911
001
001
101
102
102
Soil Conservation
Land reclamation and Development
Special Component Plan for ScheduledCastes
Tribal Area Sub Plan
Other expenditure
Deduct - Recoveries of Overpayments
Direction and Administration
Direction and Administration
Veterinary Services and Animal Health
Cattle and Buffalo Development
Cattle and Buffalo Development
V
V
V
V
V
V
C
V
V
C
V
8,65.15
-0.10
0.54
34,37.50
1,93,52.17
1.07
29,51.07
46,49.97
12,83.73
5,86.28
3,44.73
21.00
-2.98
8,46.28
35,74.61
9,34.68
55,15.12
12,83.73
5,86.28
3,44.73
21.00
-3.08
0.54
34,37.50
2,11,33.13
1.07
65,25.68
81,22.51
19,60.52
10,13.44
6,98.21
-2.09
1.29
30,67.63
1,83,22.38
48,44.02
-26,07.39
-6,76.79
-4,27.16
+3,44.73
-6,77.21
-0.99
-0.75
+3,69.87
+28,10.75
+1.07
+16,81.66
Total: 00 Soil and Water Conservation
2402 Soil and Water Conservation
Figures in italics represent charged expenditure
Heads Actuals for the year Actuals for Increase(+)/
Decrease(-)
during the year
Non-Plan Plan Centrally Sponsored
Schemes Total
29,37.14 69,88.06 99,25.20 1,36,60.27 -37,35.07
29,37.14 69,88.06 99,25.20 1,36,60.27 -37,35.07
(in lakh of Rupees)
( )
. .
. .
. .
. .
. .
. .
. .
. .
. .
. .
. .
. .
. .
. .
. .
. .
. .
. .
. .
. . . . . .
. .
. . . . . .
. .
12. DETAILED STATEMENT OF REVENUE EXPENDITURE BY MINOR HEADS
2011 -2010 -2012
2011
- Contd.
- Contd.
- Concld.
-Contd.
176
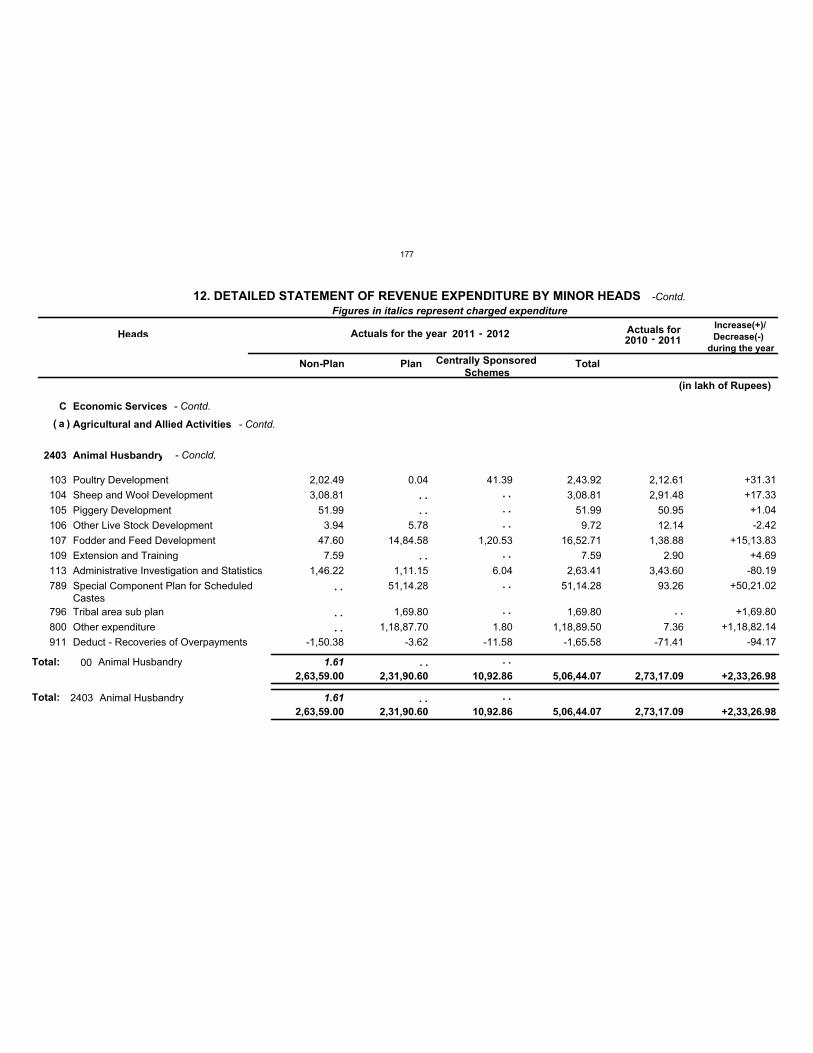
C Economic Services
a Agricultural and Allied Activities
2403 Animal Husbandry
1.61Total:
1.61
103
104
105
106
107
109
113
789
796
800
911
Poultry Development
Sheep and Wool Development
Piggery Development
Other Live Stock Development
Fodder and Feed Development
Extension and Training
Administrative Investigation and Statistics
Special Component Plan for ScheduledCastes
Tribal area sub plan
Other expenditure
Deduct - Recoveries of Overpayments
V
V
V
V
V
V
V
V
V
V
V
2,02.49
3,08.81
51.99
3.94
47.60
7.59
1,46.22
-1,50.38
0.04
5.78
14,84.58
1,11.15
51,14.28
1,69.80
1,18,87.70
-3.62
41.39
1,20.53
6.04
1.80
-11.58
2,43.92
3,08.81
51.99
9.72
16,52.71
7.59
2,63.41
51,14.28
1,69.80
1,18,89.50
-1,65.58
2,12.61
2,91.48
50.95
12.14
1,38.88
2.90
3,43.60
93.26
7.36
-71.41
+31.31
+17.33
+1.04
-2.42
+15,13.83
+4.69
-80.19
+50,21.02
+1,69.80
+1,18,82.14
-94.17
Total: 00 Animal Husbandry
2403 Animal Husbandry
Figures in italics represent charged expenditure
Heads Actuals for the year Actuals for Increase(+)/
Decrease(-)
during the year
Non-Plan Plan Centrally Sponsored
Schemes Total
2,63,59.00 2,31,90.60 10,92.86 5,06,44.07 2,73,17.09 +2,33,26.98
2,63,59.00 2,31,90.60 10,92.86 5,06,44.07 2,73,17.09 +2,33,26.98
(in lakh of Rupees)
( )
. .
. .
. .
. .
. .
. .
. .
. .
. .
. .
. .
. . . .
. . . .
. . . .
12. DETAILED STATEMENT OF REVENUE EXPENDITURE BY MINOR HEADS
2011 -2010 -2012
2011
- Contd.
- Contd.
- Concld.
-Contd.
177
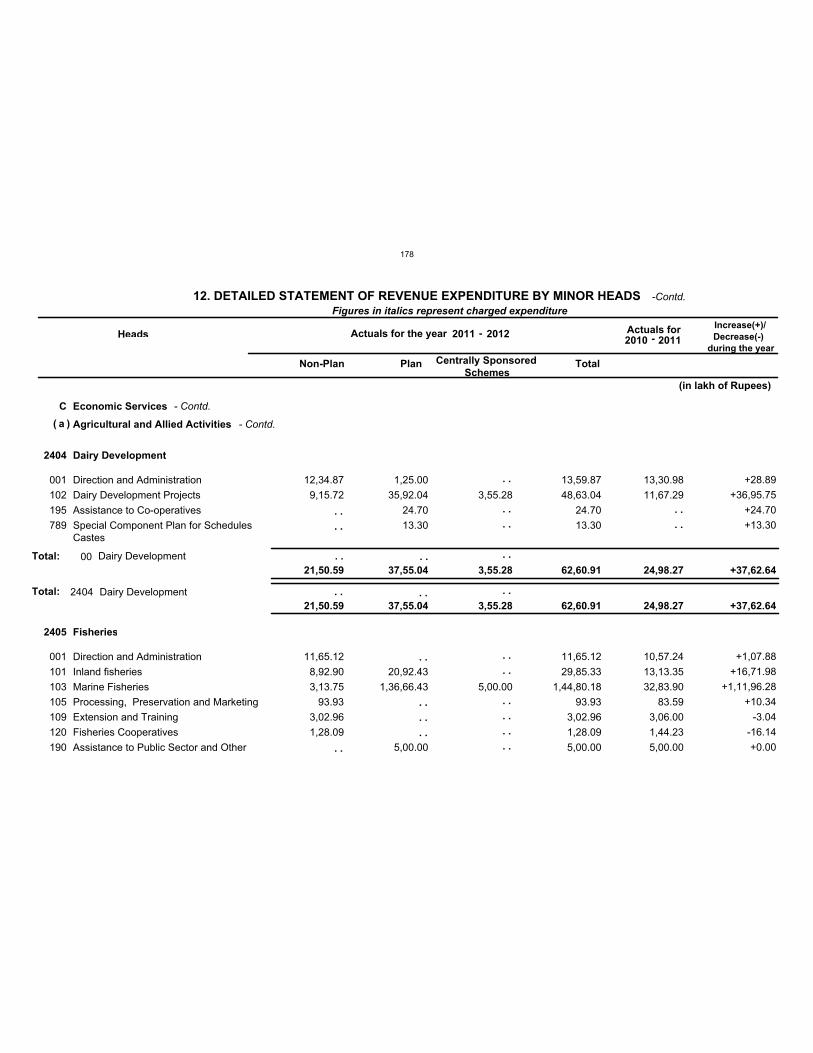
C Economic Services
a Agricultural and Allied Activities
2404
2405
Dairy Development
Fisheries
Total:
001
102
195
789
001
101
103
105
109
120
190
Direction and Administration
Dairy Development Projects
Assistance to Co-operatives
Special Component Plan for SchedulesCastes
Direction and Administration
Inland fisheries
Marine Fisheries
Processing, Preservation and Marketing
Extension and Training
Fisheries Cooperatives
Assistance to Public Sector and Other
V
V
V
V
V
V
V
V
V
V
V
12,34.87
9,15.72
11,65.12
8,92.90
3,13.75
93.93
3,02.96
1,28.09
1,25.00
35,92.04
24.70
13.30
20,92.43
1,36,66.43
5,00.00
3,55.28
5,00.00
13,59.87
48,63.04
24.70
13.30
11,65.12
29,85.33
1,44,80.18
93.93
3,02.96
1,28.09
5,00.00
13,30.98
11,67.29
10,57.24
13,13.35
32,83.90
83.59
3,06.00
1,44.23
5,00.00
+28.89
+36,95.75
+24.70
+13.30
+1,07.88
+16,71.98
+1,11,96.28
+10.34
-3.04
-16.14
+0.00
Total: 00 Dairy Development
2404 Dairy Development
Figures in italics represent charged expenditure
Heads Actuals for the year Actuals for Increase(+)/
Decrease(-)
during the year
Non-Plan Plan Centrally Sponsored
Schemes Total
21,50.59 37,55.04 3,55.28 62,60.91 24,98.27 +37,62.64
21,50.59 37,55.04 3,55.28 62,60.91 24,98.27 +37,62.64
(in lakh of Rupees)
( )
. .
. .
. .
. .
. .
. .
. .
. .
. .
. .
. .
. .
. .
. .
. .
. .
. .
. .
. . . . . .
. . . . . .
12. DETAILED STATEMENT OF REVENUE EXPENDITURE BY MINOR HEADS
2011 -2010 -2012
2011
- Contd.
- Contd.
-Contd.
178
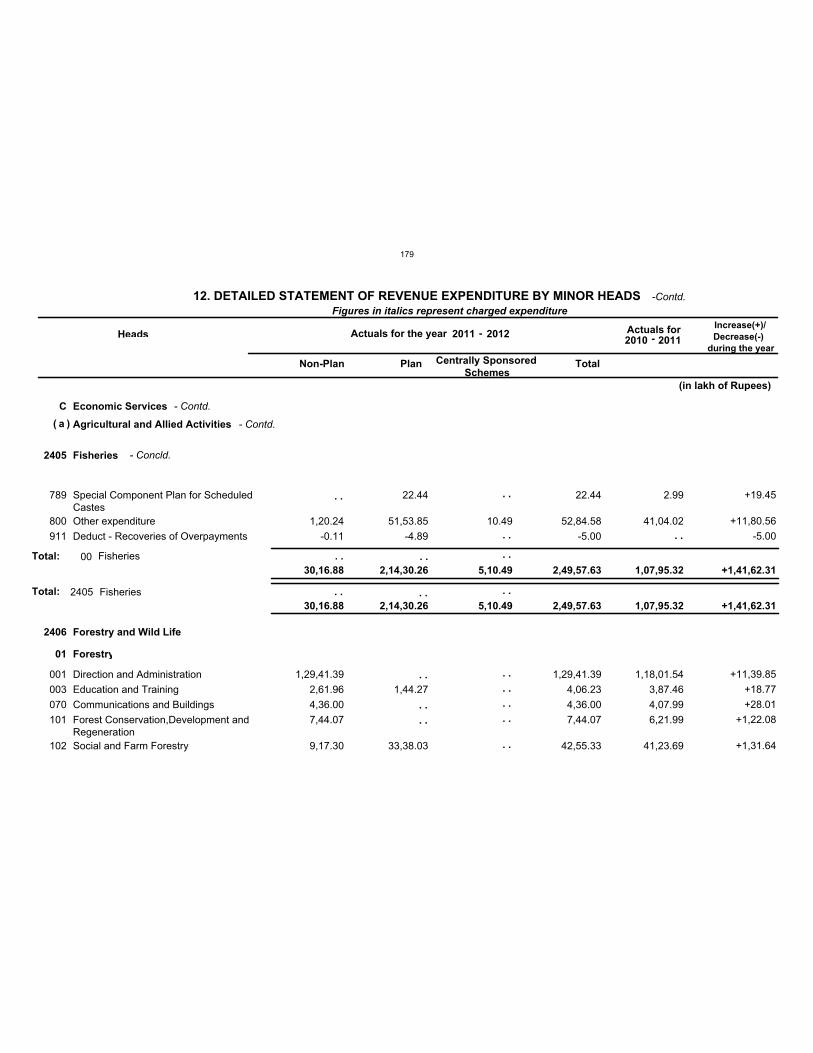
C Economic Services
a Agricultural and Allied Activities
2405
2406
Fisheries
Forestry and Wild Life
Total:
01 Forestry
789
800
911
001
003
070
101
102
Special Component Plan for ScheduledCastes
Other expenditure
Deduct - Recoveries of Overpayments
Direction and Administration
Education and Training
Communications and Buildings
Forest Conservation,Development andRegeneration
Social and Farm Forestry
V
V
V
V
V
V
V
V
1,20.24
-0.11
1,29,41.39
2,61.96
4,36.00
7,44.07
9,17.30
22.44
51,53.85
-4.89
1,44.27
33,38.03
10.49
22.44
52,84.58
-5.00
1,29,41.39
4,06.23
4,36.00
7,44.07
42,55.33
2.99
41,04.02
1,18,01.54
3,87.46
4,07.99
6,21.99
41,23.69
+19.45
+11,80.56
-5.00
+11,39.85
+18.77
+28.01
+1,22.08
+1,31.64
Total: 00 Fisheries
2405 Fisheries
Figures in italics represent charged expenditure
Heads Actuals for the year Actuals for Increase(+)/
Decrease(-)
during the year
Non-Plan Plan Centrally Sponsored
Schemes Total
30,16.88 2,14,30.26 5,10.49 2,49,57.63 1,07,95.32 +1,41,62.31
30,16.88 2,14,30.26 5,10.49 2,49,57.63 1,07,95.32 +1,41,62.31
(in lakh of Rupees)
( )
. .
. .
. .
. .
. .
. .
. .
. .
. .
. .
. .
. .
. . . . . .
. . . . . .
12. DETAILED STATEMENT OF REVENUE EXPENDITURE BY MINOR HEADS
2011 -2010 -2012
2011
- Contd.
- Contd.
- Concld.
-Contd.
179
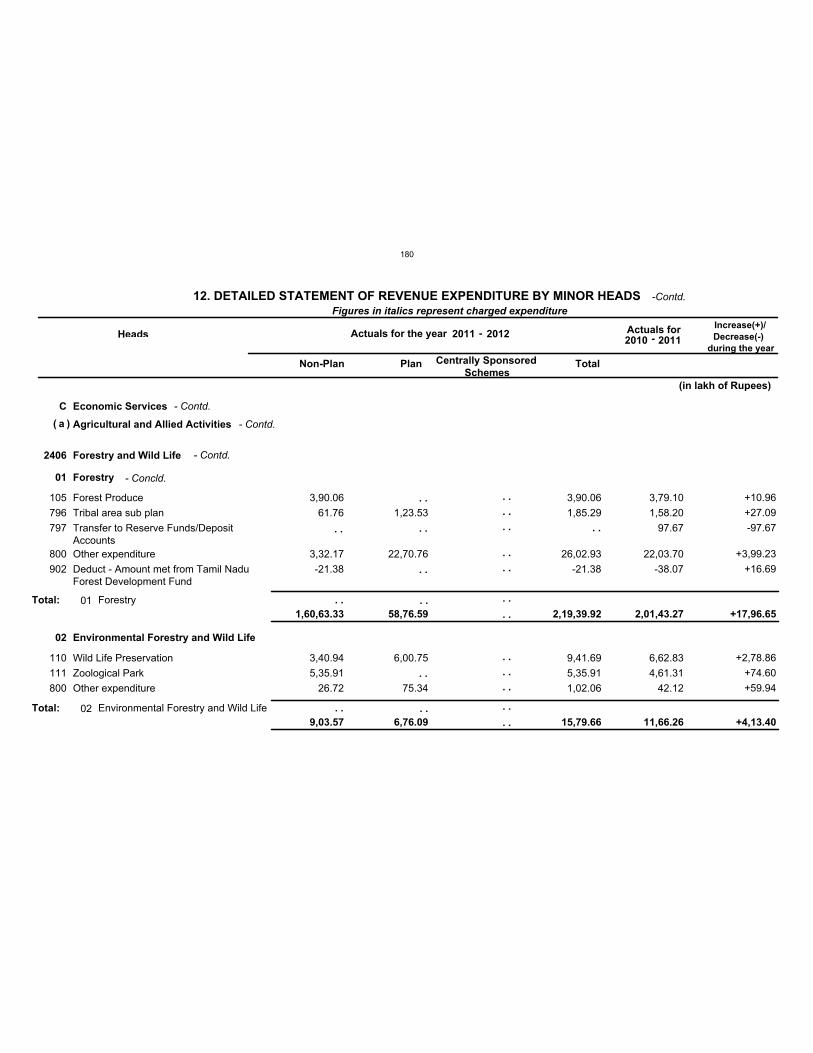
C Economic Services
a Agricultural and Allied Activities
2406 Forestry and Wild Life
01
02
Forestry
Environmental Forestry and Wild Life
105
796
797
800
902
110
111
800
Forest Produce
Tribal area sub plan
Transfer to Reserve Funds/DepositAccounts
Other expenditure
Deduct - Amount met from Tamil NaduForest Development Fund
Wild Life Preservation
Zoological Park
Other expenditure
V
V
V
V
V
V
V
V
3,90.06
61.76
3,32.17
-21.38
3,40.94
5,35.91
26.72
1,23.53
22,70.76
6,00.75
75.34
3,90.06
1,85.29
26,02.93
-21.38
9,41.69
5,35.91
1,02.06
3,79.10
1,58.20
97.67
22,03.70
-38.07
6,62.83
4,61.31
42.12
+10.96
+27.09
-97.67
+3,99.23
+16.69
+2,78.86
+74.60
+59.94
Total:
Total:
01
02
Forestry
Environmental Forestry and Wild Life
Figures in italics represent charged expenditure
Heads Actuals for the year Actuals for Increase(+)/
Decrease(-)
during the year
Non-Plan Plan Centrally Sponsored
Schemes Total
1,60,63.33
9,03.57
58,76.59
6,76.09
2,19,39.92
15,79.66
2,01,43.27
11,66.26
+17,96.65
+4,13.40
(in lakh of Rupees)
( )
. .
. .
. .
. .
. .
. .
. .
. .
. .
. .
. .
. .
. .
. .
. .
. .
. .
. .
. .
. .
. .
. .
12. DETAILED STATEMENT OF REVENUE EXPENDITURE BY MINOR HEADS
2011 -2010 -2012
2011
- Contd.
- Contd.
- Contd.
- Concld.
-Contd.
180
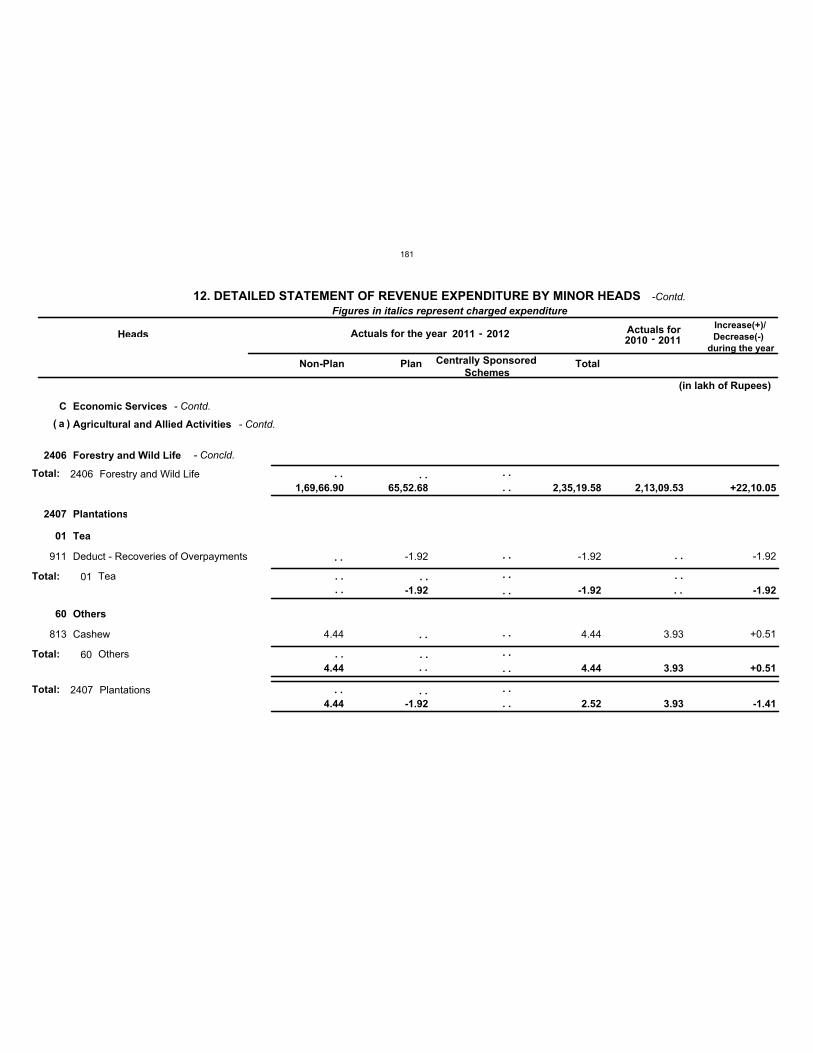
C Economic Services
a Agricultural and Allied Activities
2406
2407
Forestry and Wild Life
Plantations
Total:
Total:
01
60
Tea
Others
911
813
Deduct - Recoveries of Overpayments
Cashew
V
V 4.44
-1.92 -1.92
4.44 3.93
-1.92
+0.51
Total:
Total:
01
60
Tea
Others
2406
2407
Forestry and Wild Life
Plantations
Figures in italics represent charged expenditure
Heads Actuals for the year Actuals for Increase(+)/
Decrease(-)
during the year
Non-Plan Plan Centrally Sponsored
Schemes Total
4.44
-1.92 -1.92
4.44 3.93
-1.92
+0.51
1,69,66.90
4.44
65,52.68
-1.92
2,35,19.58
2.52
2,13,09.53
3.93
+22,10.05
-1.41
(in lakh of Rupees)
( )
. .
. .
. .
. .
. .
. .
. .
. .
. .
. .
. .
. .
. .
. .
. .
. .
. .
. .
. .
. .
. .
. .
. .
. .
. .
12. DETAILED STATEMENT OF REVENUE EXPENDITURE BY MINOR HEADS
2011 -2010 -2012
2011
- Contd.
- Contd.
- Concld.
-Contd.
181
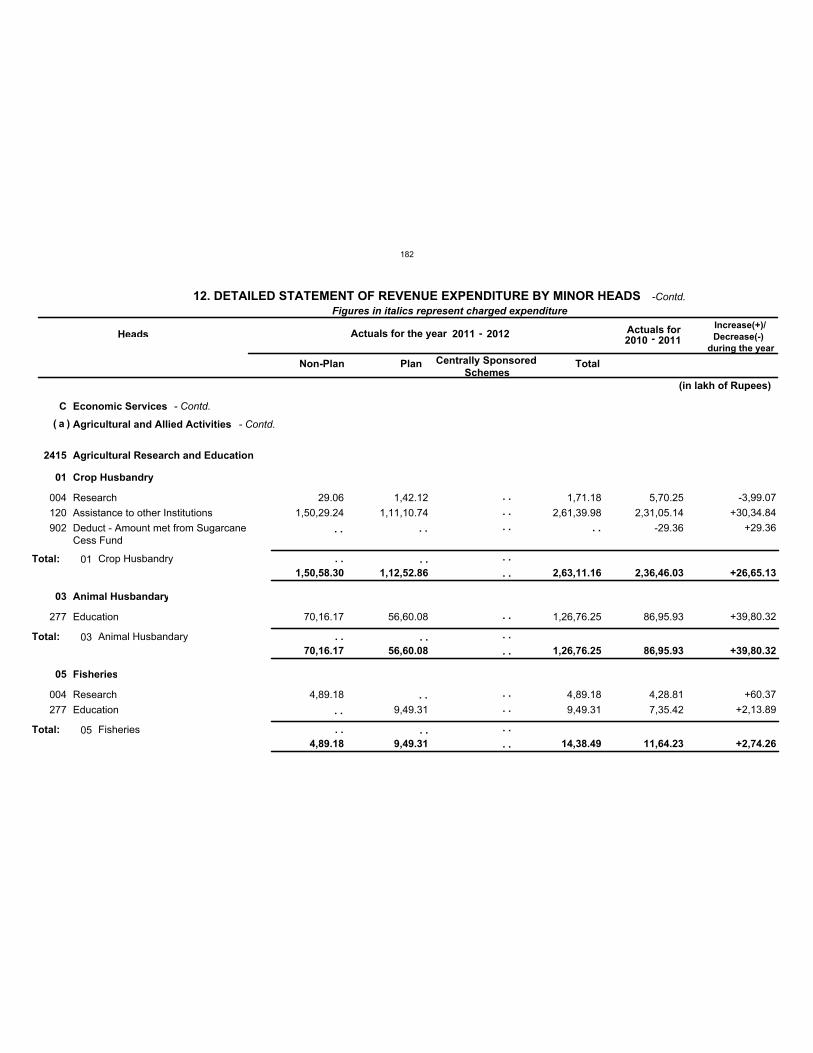
C Economic Services
a Agricultural and Allied Activities
2415 Agricultural Research and Education
01
03
05
Crop Husbandry
Animal Husbandary
Fisheries
004
120
902
277
004
277
Research
Assistance to other Institutions
Deduct - Amount met from SugarcaneCess Fund
Education
Research
Education
V
V
V
V
V
V
29.06
1,50,29.24
70,16.17
4,89.18
1,42.12
1,11,10.74
56,60.08
9,49.31
1,71.18
2,61,39.98
1,26,76.25
4,89.18
9,49.31
5,70.25
2,31,05.14
-29.36
86,95.93
4,28.81
7,35.42
-3,99.07
+30,34.84
+29.36
+39,80.32
+60.37
+2,13.89
Total:
Total:
Total:
01
03
05
Crop Husbandry
Animal Husbandary
Fisheries
Figures in italics represent charged expenditure
Heads Actuals for the year Actuals for Increase(+)/
Decrease(-)
during the year
Non-Plan Plan Centrally Sponsored
Schemes Total
1,50,58.30
70,16.17
4,89.18
1,12,52.86
56,60.08
9,49.31
2,63,11.16
1,26,76.25
14,38.49
2,36,46.03
86,95.93
11,64.23
+26,65.13
+39,80.32
+2,74.26
(in lakh of Rupees)
( )
. .
. .
. .
. .
. .
. .
. .
. .
. .
. .
. .
. .
. .
. .
. .
. .
. .
. .
. .
. .
. .
. .
. .
12. DETAILED STATEMENT OF REVENUE EXPENDITURE BY MINOR HEADS
2011 -2010 -2012
2011
- Contd.
- Contd.
-Contd.
182
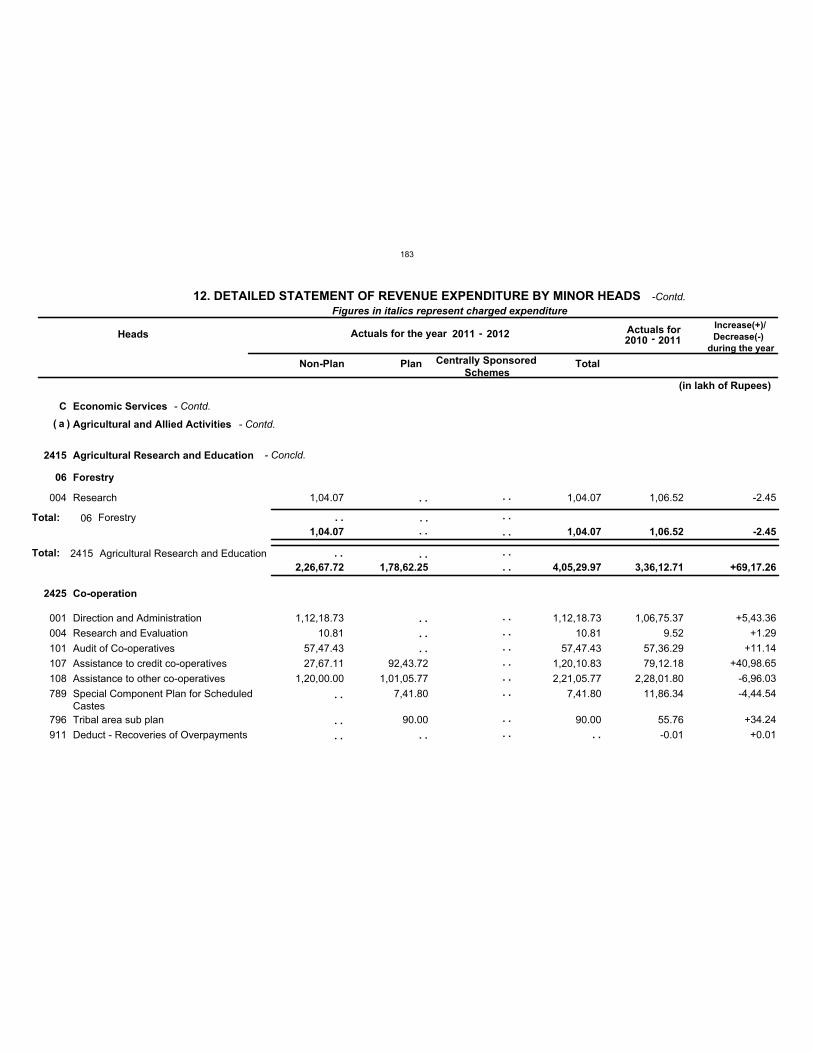
C Economic Services
a Agricultural and Allied Activities
2415
2425
Agricultural Research and Education
Co-operation
Total:
06 Forestry
004
001
004
101
107
108
789
796
911
Research
Direction and Administration
Research and Evaluation
Audit of Co-operatives
Assistance to credit co-operatives
Assistance to other co-operatives
Special Component Plan for ScheduledCastes
Tribal area sub plan
Deduct - Recoveries of Overpayments
V
V
V
V
V
V
V
V
V
1,04.07
1,12,18.73
10.81
57,47.43
27,67.11
1,20,00.00
92,43.72
1,01,05.77
7,41.80
90.00
1,04.07
1,12,18.73
10.81
57,47.43
1,20,10.83
2,21,05.77
7,41.80
90.00
1,06.52
1,06,75.37
9.52
57,36.29
79,12.18
2,28,01.80
11,86.34
55.76
-0.01
-2.45
+5,43.36
+1.29
+11.14
+40,98.65
-6,96.03
-4,44.54
+34.24
+0.01
Total: 06 Forestry
2415 Agricultural Research and Education
Figures in italics represent charged expenditure
Heads Actuals for the year Actuals for Increase(+)/
Decrease(-)
during the year
Non-Plan Plan Centrally Sponsored
Schemes Total
1,04.07 1,04.07 1,06.52 -2.45
2,26,67.72 1,78,62.25 4,05,29.97 3,36,12.71 +69,17.26
(in lakh of Rupees)
( )
. .
. .
. .
. .
. .
. .
. .
. .
. .
. .
. .
. .
. .
. .
. .
. .
. . . .
. . . .
. .
. .
. .
. . . . . .
. .
12. DETAILED STATEMENT OF REVENUE EXPENDITURE BY MINOR HEADS
2011 -2010 -2012
2011
- Contd.
- Contd.
- Concld.
-Contd.
183
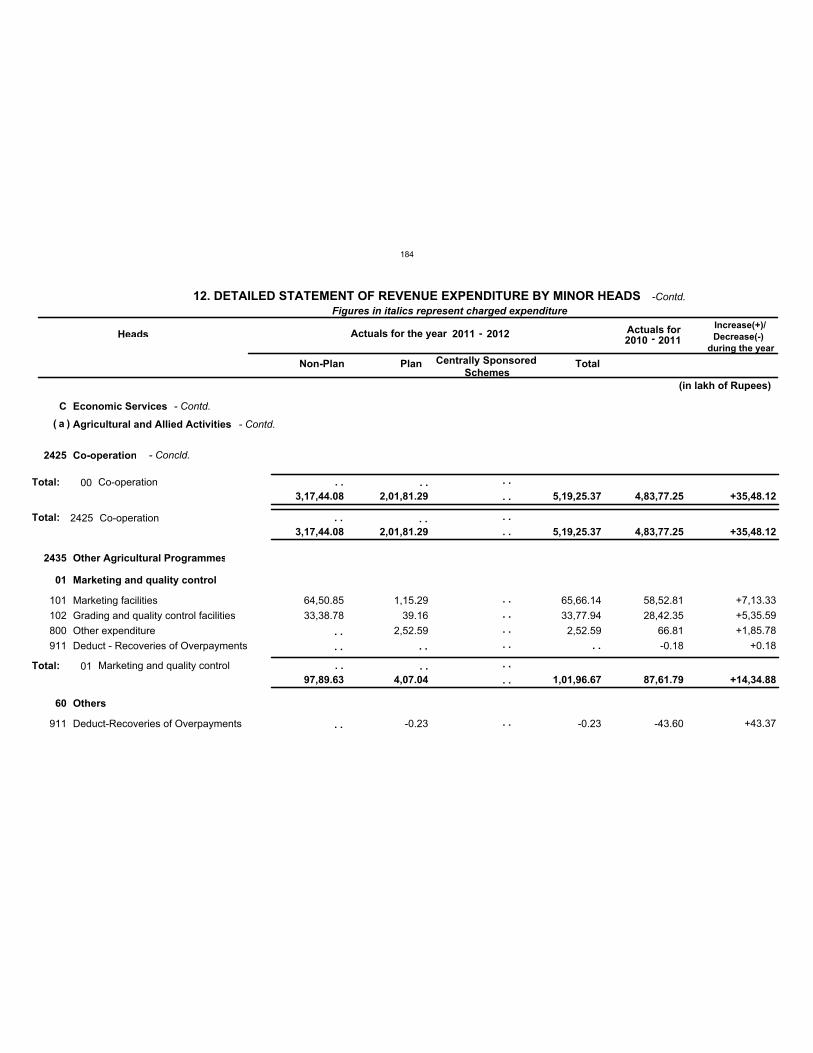
C Economic Services
a Agricultural and Allied Activities
2425
2435
Co-operation
Other Agricultural Programmes
Total:
01
60
Marketing and quality control
Others
101
102
800
911
911
Marketing facilities
Grading and quality control facilities
Other expenditure
Deduct - Recoveries of Overpayments
Deduct-Recoveries of Overpayments
V
V
V
V
V
64,50.85
33,38.78
1,15.29
39.16
2,52.59
-0.23
65,66.14
33,77.94
2,52.59
-0.23
58,52.81
28,42.35
66.81
-0.18
-43.60
+7,13.33
+5,35.59
+1,85.78
+0.18
+43.37
Total:
Total:
00
01
Co-operation
Marketing and quality control
2425 Co-operation
Figures in italics represent charged expenditure
Heads Actuals for the year Actuals for Increase(+)/
Decrease(-)
during the year
Non-Plan Plan Centrally Sponsored
Schemes Total
3,17,44.08
97,89.63
2,01,81.29
4,07.04
5,19,25.37
1,01,96.67
4,83,77.25
87,61.79
+35,48.12
+14,34.88
3,17,44.08 2,01,81.29 5,19,25.37 4,83,77.25 +35,48.12
(in lakh of Rupees)
( )
. .
. .
. .
. .
. .
. .
. .
. .
. .
. .
. .
. .
. .
. .
. .
. .
. .
. .
. . . . . .
. .
12. DETAILED STATEMENT OF REVENUE EXPENDITURE BY MINOR HEADS
2011 -2010 -2012
2011
- Contd.
- Contd.
- Concld.
-Contd.
184
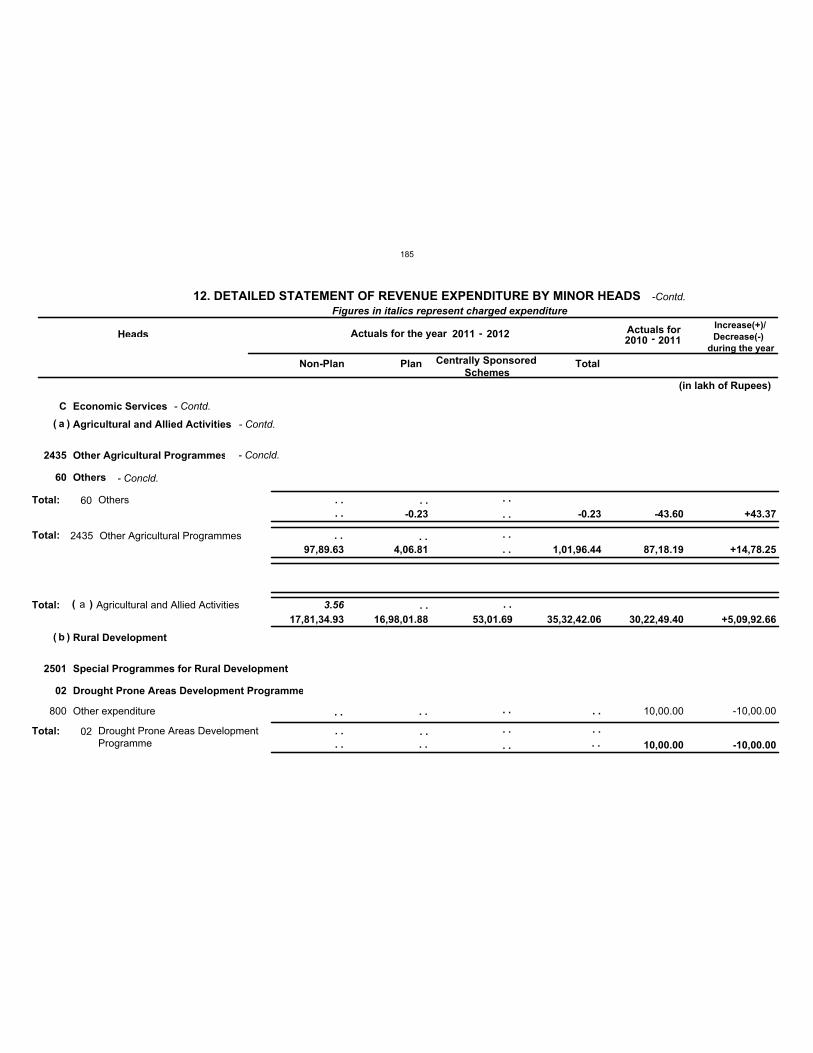
C Economic Services
a
b
Agricultural and Allied Activities
Rural Development
3.56Total:
2435
2501
Other Agricultural Programmes
Special Programmes for Rural Development
Total:
60
02
Others
Drought Prone Areas Development Programme
800 Other expenditure V 10,00.00 -10,00.00
Total:
Total:
60
02
Others
Drought Prone Areas DevelopmentProgramme
2435 Other Agricultural Programmes
a Agricultural and Allied Activities
Figures in italics represent charged expenditure
Heads Actuals for the year Actuals for Increase(+)/
Decrease(-)
during the year
Non-Plan Plan Centrally Sponsored
Schemes Total
-0.23 -0.23 -43.60
10,00.00
+43.37
-10,00.00
97,89.63 4,06.81 1,01,96.44 87,18.19 +14,78.25
17,81,34.93 16,98,01.88 53,01.69 35,32,42.06 30,22,49.40 +5,09,92.66
(in lakh of Rupees)
(
(
)
)
( )
. . . . . . . .
. .
. .
. .
. .
. .
. .
. .
. .
. .
. .
. .
. .
. .
. . . . . .
. .
. . . .
12. DETAILED STATEMENT OF REVENUE EXPENDITURE BY MINOR HEADS
2011 -2010 -2012
2011
- Contd.
- Contd.
- Concld.
- Concld.
-Contd.
185
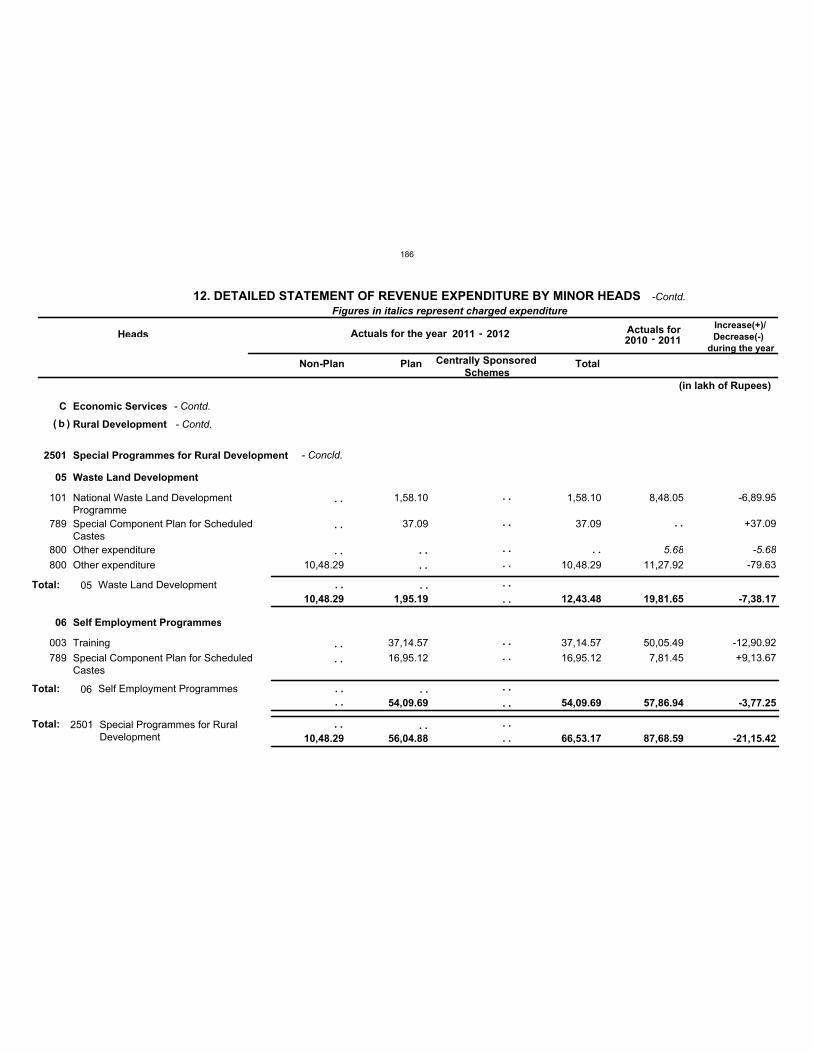
C Economic Services
b Rural Development
2501 Special Programmes for Rural Development
Total:
05
06
Waste Land Development
Self Employment Programmes
101
789
800
800
003
789
National Waste Land DevelopmentProgramme
Special Component Plan for ScheduledCastes
Other expenditure
Other expenditure
Training
Special Component Plan for ScheduledCastes
V
V
C
V
V
V
10,48.29
1,58.10
37.09
37,14.57
16,95.12
1,58.10
37.09
10,48.29
37,14.57
16,95.12
8,48.05
5.68
11,27.92
50,05.49
7,81.45
-6,89.95
+37.09
-5.68
-79.63
-12,90.92
+9,13.67
Total:
Total:
05
06
Waste Land Development
Self Employment Programmes
2501 Special Programmes for RuralDevelopment
Figures in italics represent charged expenditure
Heads Actuals for the year Actuals for Increase(+)/
Decrease(-)
during the year
Non-Plan Plan Centrally Sponsored
Schemes Total
10,48.29 1,95.19
54,09.69
12,43.48
54,09.69
19,81.65
57,86.94
-7,38.17
-3,77.25
10,48.29 56,04.88 66,53.17 87,68.59 -21,15.42
(in lakh of Rupees)
( )
. .
. .
. .
. .
. .
. .
. .
. .
. .
. .
. .
. .
. .
. .
. .
. .
. .
. .
. .
. .
. .
. .
. .
. .
. . . . . .
. .
12. DETAILED STATEMENT OF REVENUE EXPENDITURE BY MINOR HEADS
2011 -2010 -2012
2011
- Contd.
- Contd.
- Concld.
-Contd.
186
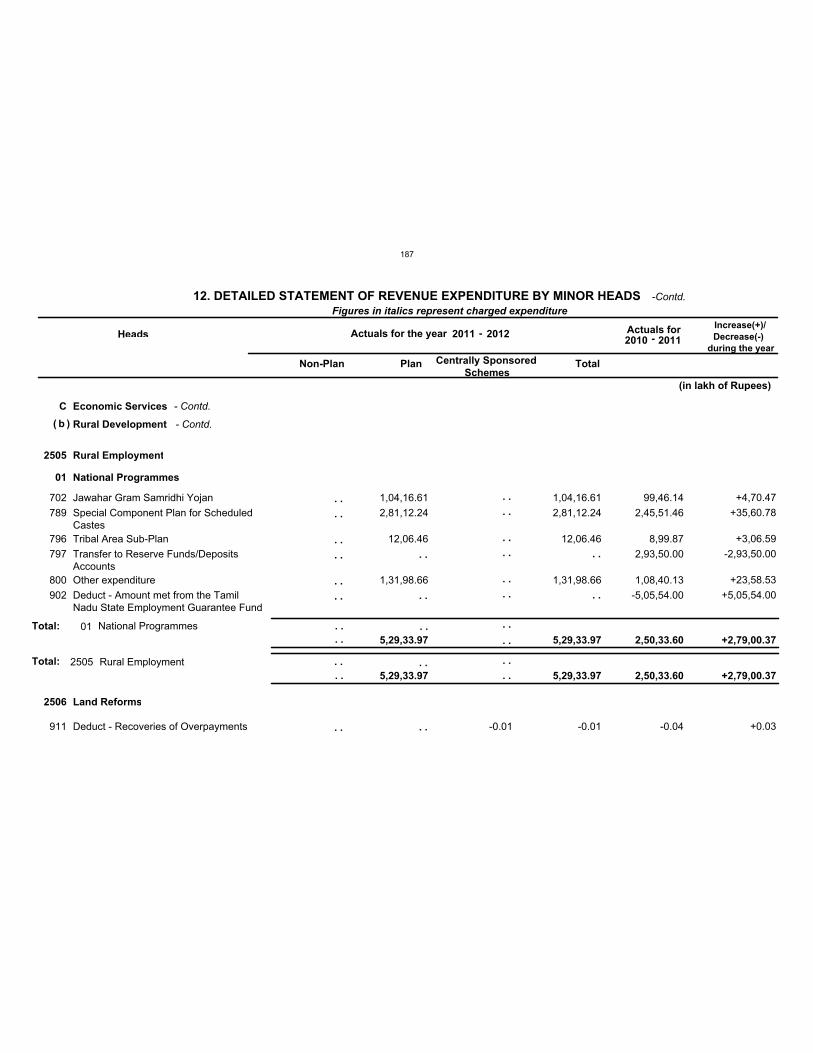
C Economic Services
b Rural Development
2505
2506
Rural Employment
Land Reforms
Total:
01 National Programmes
702
789
796
797
800
902
911
Jawahar Gram Samridhi Yojan
Special Component Plan for ScheduledCastes
Tribal Area Sub-Plan
Transfer to Reserve Funds/DepositsAccounts
Other expenditure
Deduct - Amount met from the TamilNadu State Employment Guarantee Fund
Deduct - Recoveries of Overpayments
V
V
V
V
V
V
V
1,04,16.61
2,81,12.24
12,06.46
1,31,98.66
-0.01
1,04,16.61
2,81,12.24
12,06.46
1,31,98.66
-0.01
99,46.14
2,45,51.46
8,99.87
2,93,50.00
1,08,40.13
-5,05,54.00
-0.04
+4,70.47
+35,60.78
+3,06.59
-2,93,50.00
+23,58.53
+5,05,54.00
+0.03
Total: 01 National Programmes
2505 Rural Employment
Figures in italics represent charged expenditure
Heads Actuals for the year Actuals for Increase(+)/
Decrease(-)
during the year
Non-Plan Plan Centrally Sponsored
Schemes Total
5,29,33.97 5,29,33.97 2,50,33.60 +2,79,00.37
5,29,33.97 5,29,33.97 2,50,33.60 +2,79,00.37
(in lakh of Rupees)
( )
. .
. .
. .
. .
. .
. .
. .
. .
. .
. .
. .
. .
. .
. .
. .
. .
. .
. .
. .
. .
. . . .
. .
. .
. .
. . . .
. .
12. DETAILED STATEMENT OF REVENUE EXPENDITURE BY MINOR HEADS
2011 -2010 -2012
2011
- Contd.
- Contd.
-Contd.
187
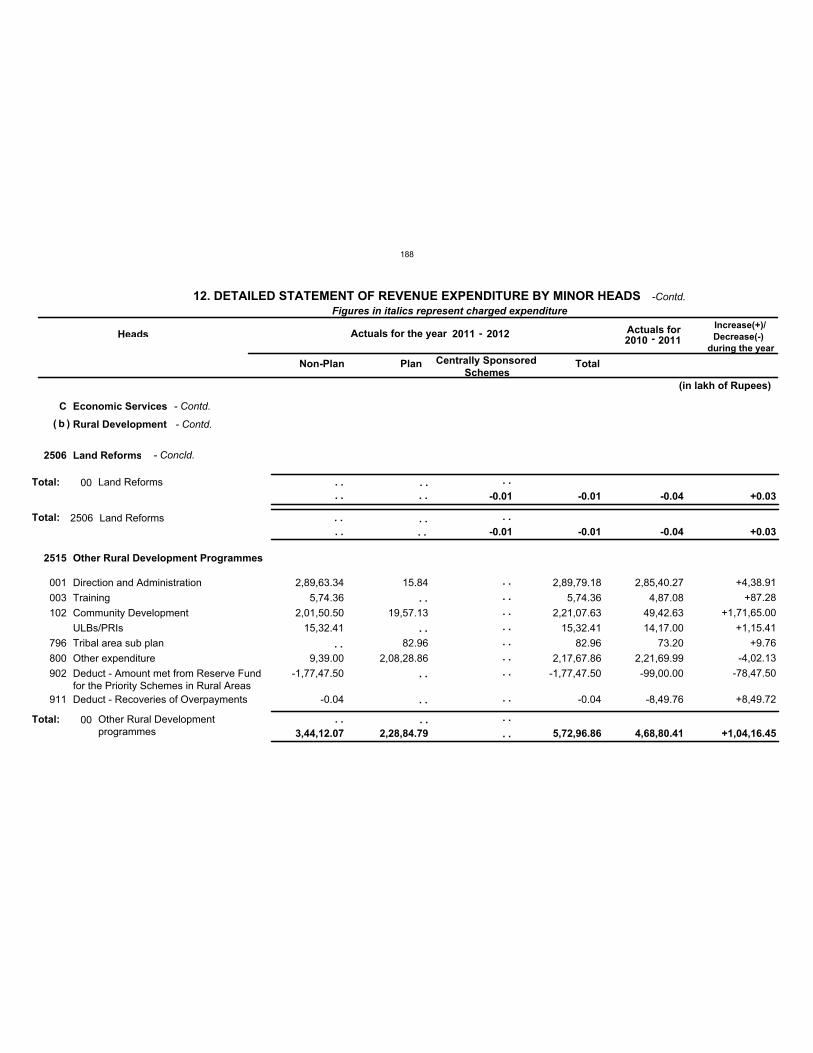
C Economic Services
b Rural Development
2506
2515
Land Reforms
Other Rural Development Programmes
Total:
001
003
102
796
800
902
911
Direction and Administration
Training
Community Development
ULBs/PRIs
Tribal area sub plan
Other expenditure
Deduct - Amount met from Reserve Fundfor the Priority Schemes in Rural Areas
Deduct - Recoveries of Overpayments
V
V
V
V
V
V
V
V
2,89,63.34
5,74.36
2,01,50.50
15,32.41
9,39.00
-1,77,47.50
-0.04
15.84
19,57.13
82.96
2,08,28.86
2,89,79.18
5,74.36
2,21,07.63
15,32.41
82.96
2,17,67.86
-1,77,47.50
-0.04
2,85,40.27
4,87.08
49,42.63
14,17.00
73.20
2,21,69.99
-99,00.00
-8,49.76
+4,38.91
+87.28
+1,71,65.00
+1,15.41
+9.76
-4,02.13
-78,47.50
+8,49.72
Total:
Total:
00
00
Land Reforms
Other Rural Developmentprogrammes
2506 Land Reforms
Figures in italics represent charged expenditure
Heads Actuals for the year Actuals for Increase(+)/
Decrease(-)
during the year
Non-Plan Plan Centrally Sponsored
Schemes Total
3,44,12.07 2,28,84.79
-0.01 -0.01
5,72,96.86
-0.04
4,68,80.41
+0.03
+1,04,16.45
-0.01 -0.01 -0.04 +0.03
(in lakh of Rupees)
( )
. .
. .
. .
. .
. .
. .
. .
. .
. .
. .
. .
. .
. .
. .
. .
. .
. .
. .
. .
. .
. .
. .
. .
. .
. .
. .
. .
12. DETAILED STATEMENT OF REVENUE EXPENDITURE BY MINOR HEADS
2011 -2010 -2012
2011
- Contd.
- Contd.
- Concld.
-Contd.
188
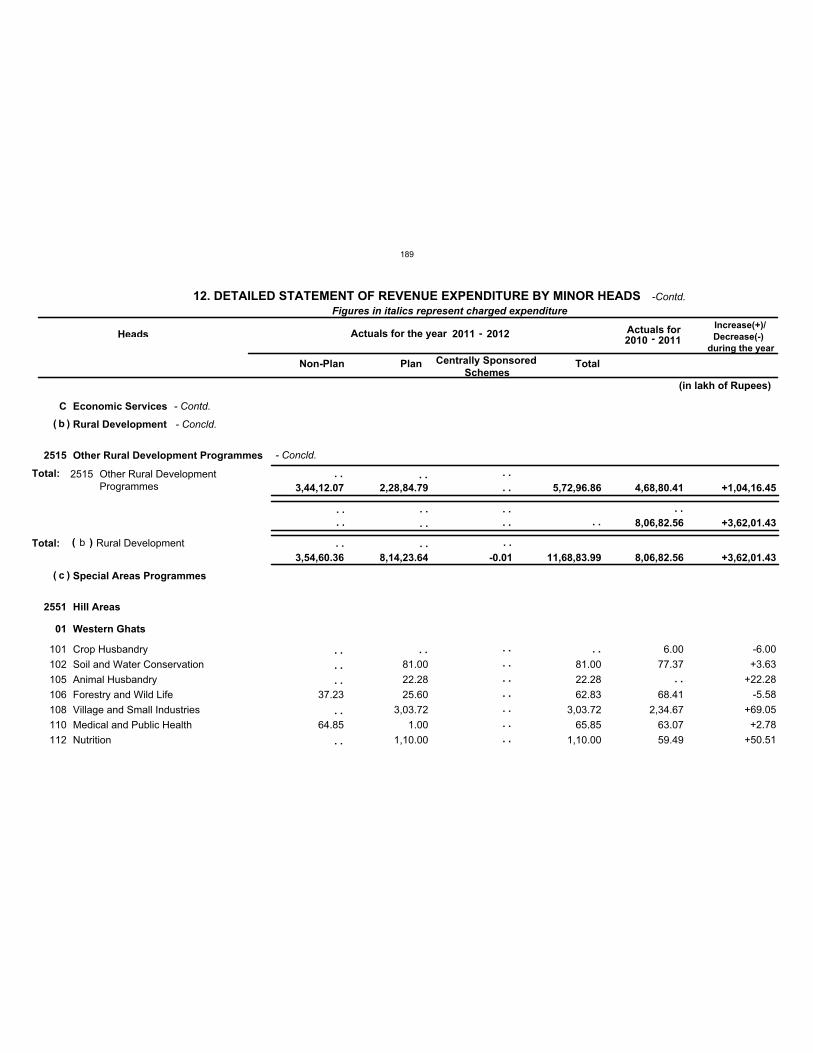
C Economic Services
b
c
Rural Development
Special Areas Programmes
Total:
2515
2551
Other Rural Development Programmes
Hill Areas
Total:
01 Western Ghats
101
102
105
106
108
110
112
Crop Husbandry
Soil and Water Conservation
Animal Husbandry
Forestry and Wild Life
Village and Small Industries
Medical and Public Health
Nutrition
V
V
V
V
V
V
V
37.23
64.85
81.00
22.28
25.60
3,03.72
1.00
1,10.00
81.00
22.28
62.83
3,03.72
65.85
1,10.00
6.00
77.37
68.41
2,34.67
63.07
59.49
-6.00
+3.63
+22.28
-5.58
+69.05
+2.78
+50.51
2515 Other Rural DevelopmentProgrammes
b Rural Development
Figures in italics represent charged expenditure
Heads Actuals for the year Actuals for Increase(+)/
Decrease(-)
during the year
Non-Plan Plan Centrally Sponsored
Schemes Total
3,44,12.07 2,28,84.79 5,72,96.86 4,68,80.41 +1,04,16.45
8,06,82.56 +3,62,01.43
3,54,60.36 8,14,23.64 -0.01 11,68,83.99 8,06,82.56 +3,62,01.43
(in lakh of Rupees)
(
(
)
)
( )
. .
. .
. .
. .
. .
. . . .
. .
. .
. .
. .
. .
. .
. .
. .
. . . . . .
. .
. .
. .
. .
. .
. .
. . . .
. .
. . . . . .
12. DETAILED STATEMENT OF REVENUE EXPENDITURE BY MINOR HEADS
2011 -2010 -2012
2011
- Contd.
- Concld.
- Concld.
-Contd.
189
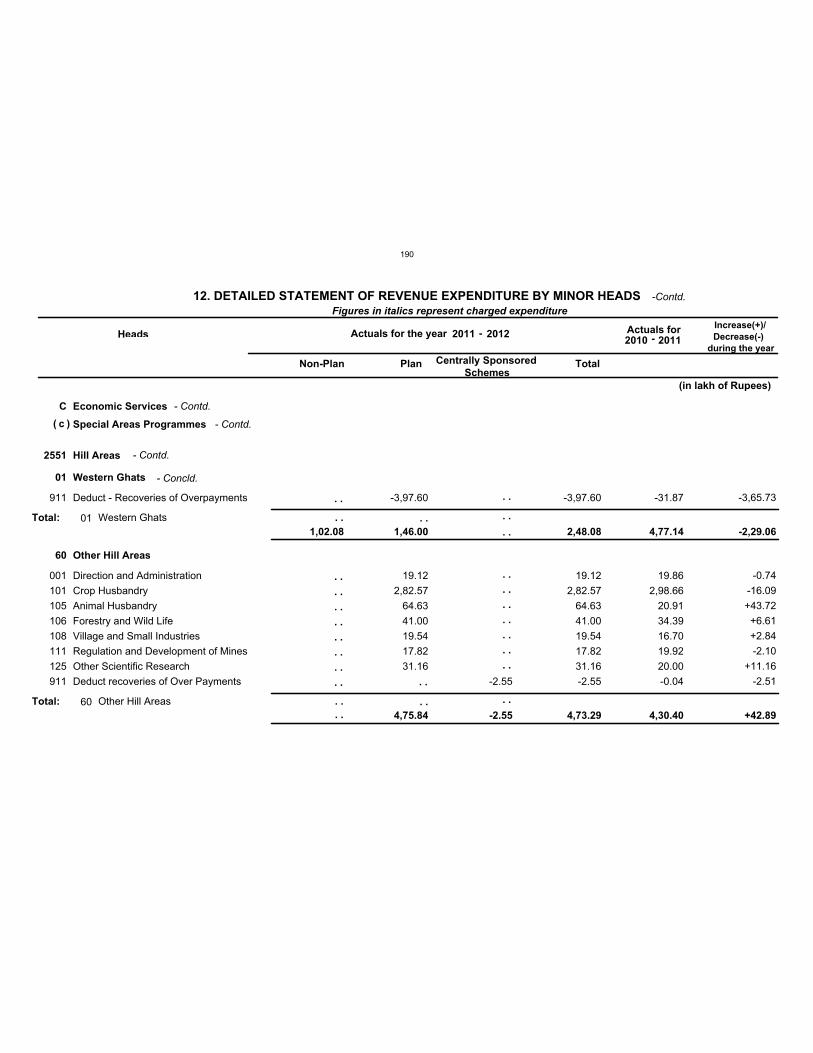
C Economic Services
c Special Areas Programmes
2551 Hill Areas
01
60
Western Ghats
Other Hill Areas
911
001
101
105
106
108
111
125
911
Deduct - Recoveries of Overpayments
Direction and Administration
Crop Husbandry
Animal Husbandry
Forestry and Wild Life
Village and Small Industries
Regulation and Development of Mines
Other Scientific Research
Deduct recoveries of Over Payments
V
V
V
V
V
V
V
V
V
-3,97.60
19.12
2,82.57
64.63
41.00
19.54
17.82
31.16
-2.55
-3,97.60
19.12
2,82.57
64.63
41.00
19.54
17.82
31.16
-2.55
-31.87
19.86
2,98.66
20.91
34.39
16.70
19.92
20.00
-0.04
-3,65.73
-0.74
-16.09
+43.72
+6.61
+2.84
-2.10
+11.16
-2.51
Total:
Total:
01
60
Western Ghats
Other Hill Areas
Figures in italics represent charged expenditure
Heads Actuals for the year Actuals for Increase(+)/
Decrease(-)
during the year
Non-Plan Plan Centrally Sponsored
Schemes Total
1,02.08 1,46.00
4,75.84 -2.55
2,48.08
4,73.29
4,77.14
4,30.40
-2,29.06
+42.89
(in lakh of Rupees)
( )
. .
. .
. .
. .
. .
. .
. .
. .
. . . .
. .
. .
. .
. .
. .
. .
. .
. .
. .
. .
. .
. .
. .
. .
. .
. .
12. DETAILED STATEMENT OF REVENUE EXPENDITURE BY MINOR HEADS
2011 -2010 -2012
2011
- Contd.
- Contd.
- Contd.
- Concld.
-Contd.
190
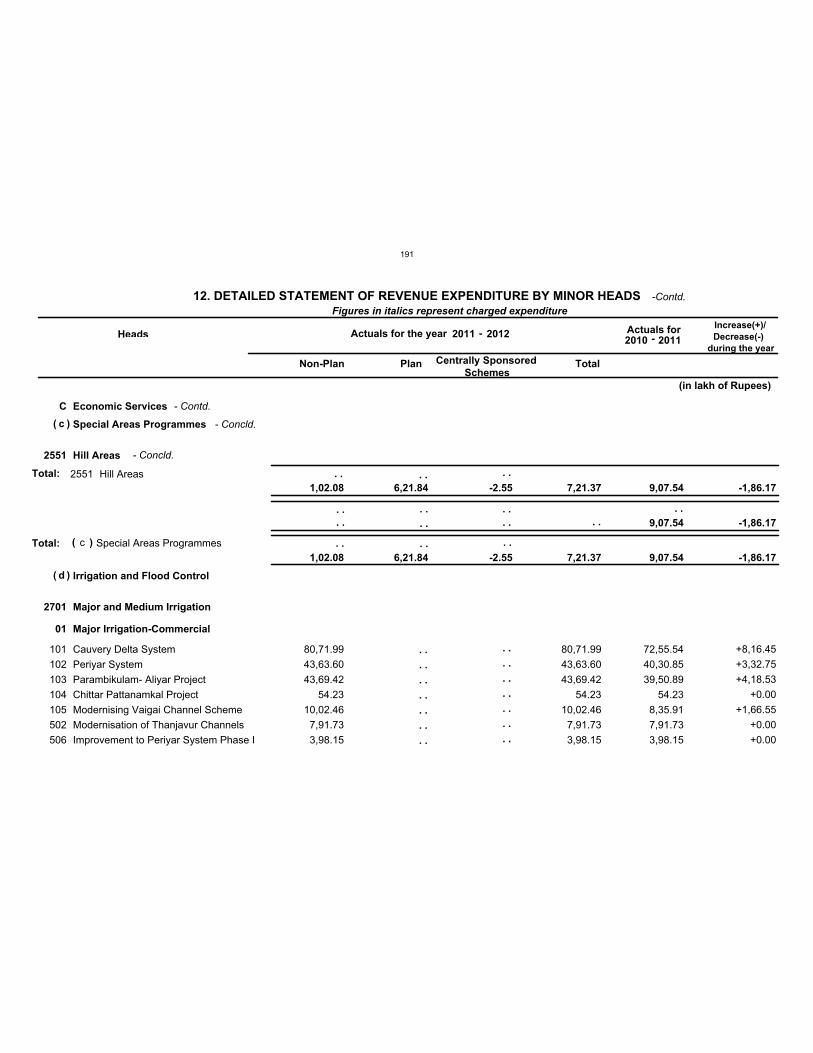
C Economic Services
c
d
Special Areas Programmes
Irrigation and Flood Control
Total:
2551
2701
Hill Areas
Major and Medium Irrigation
Total:
01 Major Irrigation-Commercial
101
102
103
104
105
502
506
Cauvery Delta System
Periyar System
Parambikulam- Aliyar Project
Chittar Pattanamkal Project
Modernising Vaigai Channel Scheme
Modernisation of Thanjavur Channels
Improvement to Periyar System Phase I
V
V
V
V
V
V
V
80,71.99
43,63.60
43,69.42
54.23
10,02.46
7,91.73
3,98.15
80,71.99
43,63.60
43,69.42
54.23
10,02.46
7,91.73
3,98.15
72,55.54
40,30.85
39,50.89
54.23
8,35.91
7,91.73
3,98.15
+8,16.45
+3,32.75
+4,18.53
+0.00
+1,66.55
+0.00
+0.00
2551 Hill Areas
c Special Areas Programmes
Figures in italics represent charged expenditure
Heads Actuals for the year Actuals for Increase(+)/
Decrease(-)
during the year
Non-Plan Plan Centrally Sponsored
Schemes Total
1,02.08 6,21.84 -2.55 7,21.37 9,07.54 -1,86.17
9,07.54 -1,86.17
1,02.08 6,21.84 -2.55 7,21.37 9,07.54 -1,86.17
(in lakh of Rupees)
(
(
)
)
( )
. .
. .
. .
. .
. .
. .
. .
. .
. .
. .
. .
. .
. .
. .
. . . . . .
. .
. .
. .
. .
. .
. . . .
. .
. . . . . .
12. DETAILED STATEMENT OF REVENUE EXPENDITURE BY MINOR HEADS
2011 -2010 -2012
2011
- Contd.
- Concld.
- Concld.
-Contd.
191
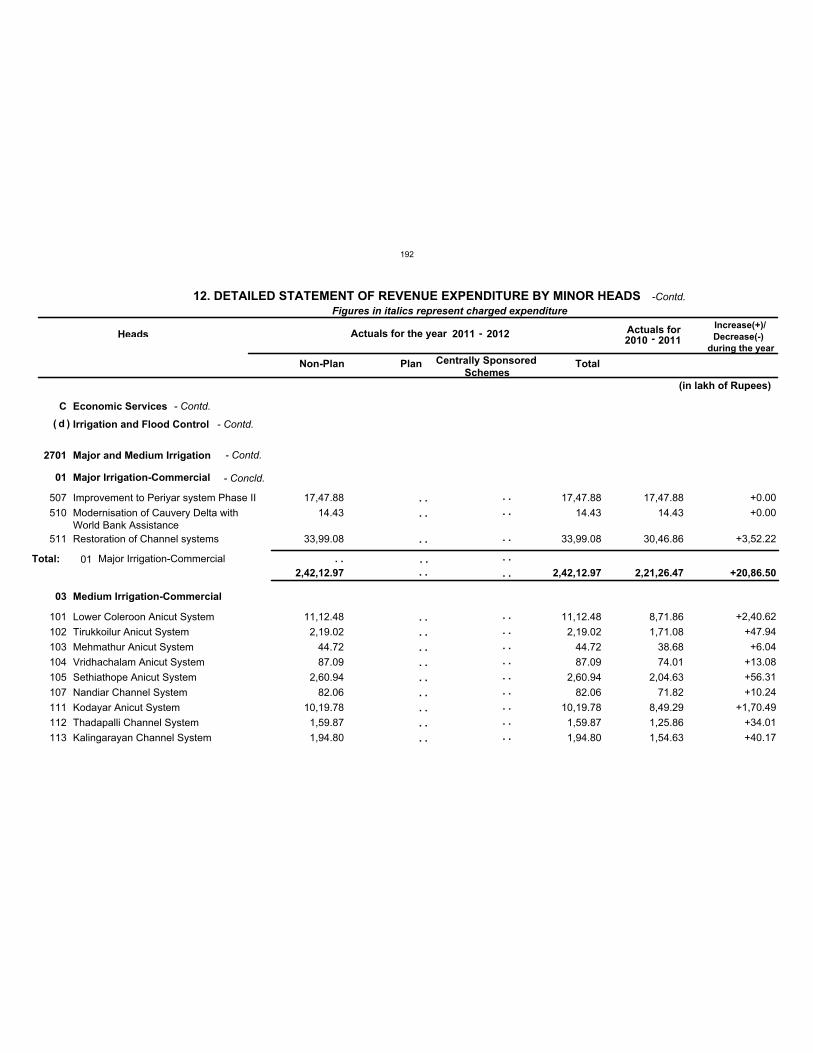
C Economic Services
d Irrigation and Flood Control
2701 Major and Medium Irrigation
01
03
Major Irrigation-Commercial
Medium Irrigation-Commercial
507
510
511
101
102
103
104
105
107
111
112
113
Improvement to Periyar system Phase II
Modernisation of Cauvery Delta withWorld Bank Assistance
Restoration of Channel systems
Lower Coleroon Anicut System
Tirukkoilur Anicut System
Mehmathur Anicut System
Vridhachalam Anicut System
Sethiathope Anicut System
Nandiar Channel System
Kodayar Anicut System
Thadapalli Channel System
Kalingarayan Channel System
V
V
V
V
V
V
V
V
V
V
V
V
17,47.88
14.43
33,99.08
11,12.48
2,19.02
44.72
87.09
2,60.94
82.06
10,19.78
1,59.87
1,94.80
17,47.88
14.43
33,99.08
11,12.48
2,19.02
44.72
87.09
2,60.94
82.06
10,19.78
1,59.87
1,94.80
17,47.88
14.43
30,46.86
8,71.86
1,71.08
38.68
74.01
2,04.63
71.82
8,49.29
1,25.86
1,54.63
+0.00
+0.00
+3,52.22
+2,40.62
+47.94
+6.04
+13.08
+56.31
+10.24
+1,70.49
+34.01
+40.17
Total: 01 Major Irrigation-Commercial
Figures in italics represent charged expenditure
Heads Actuals for the year Actuals for Increase(+)/
Decrease(-)
during the year
Non-Plan Plan Centrally Sponsored
Schemes Total
2,42,12.97 2,42,12.97 2,21,26.47 +20,86.50
(in lakh of Rupees)
( )
. .
. .
. .
. .
. .
. .
. .
. .
. .
. .
. .
. .
. .
. .
. .
. .
. .
. .
. .
. .
. .
. .
. .
. .
. . . .
. .
. .
. .
12. DETAILED STATEMENT OF REVENUE EXPENDITURE BY MINOR HEADS
2011 -2010 -2012
2011
- Contd.
- Contd.
- Contd.
- Concld.
-Contd.
192
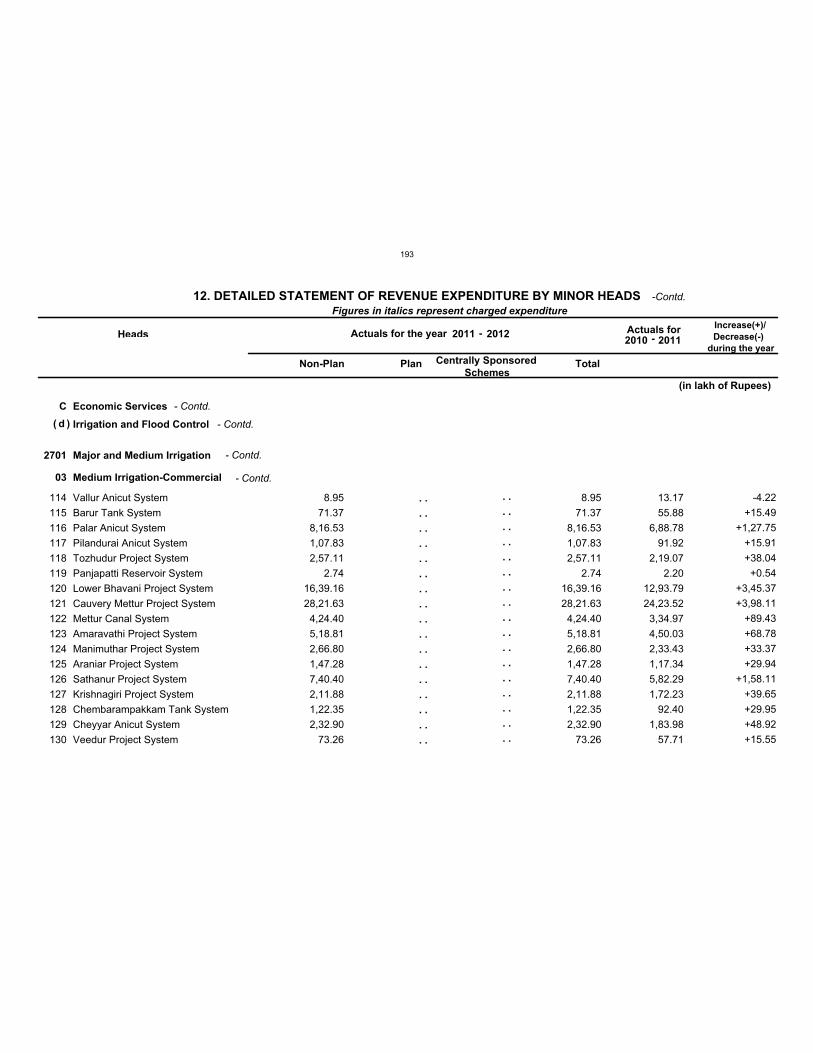
C Economic Services
d Irrigation and Flood Control
2701 Major and Medium Irrigation
03 Medium Irrigation-Commercial
114
115
116
117
118
119
120
121
122
123
124
125
126
127
128
129
130
Vallur Anicut System
Barur Tank System
Palar Anicut System
Pilandurai Anicut System
Tozhudur Project System
Panjapatti Reservoir System
Lower Bhavani Project System
Cauvery Mettur Project System
Mettur Canal System
Amaravathi Project System
Manimuthar Project System
Araniar Project System
Sathanur Project System
Krishnagiri Project System
Chembarampakkam Tank System
Cheyyar Anicut System
Veedur Project System
V
V
V
V
V
V
V
V
V
V
V
V
V
V
V
V
V
8.95
71.37
8,16.53
1,07.83
2,57.11
2.74
16,39.16
28,21.63
4,24.40
5,18.81
2,66.80
1,47.28
7,40.40
2,11.88
1,22.35
2,32.90
73.26
8.95
71.37
8,16.53
1,07.83
2,57.11
2.74
16,39.16
28,21.63
4,24.40
5,18.81
2,66.80
1,47.28
7,40.40
2,11.88
1,22.35
2,32.90
73.26
13.17
55.88
6,88.78
91.92
2,19.07
2.20
12,93.79
24,23.52
3,34.97
4,50.03
2,33.43
1,17.34
5,82.29
1,72.23
92.40
1,83.98
57.71
-4.22
+15.49
+1,27.75
+15.91
+38.04
+0.54
+3,45.37
+3,98.11
+89.43
+68.78
+33.37
+29.94
+1,58.11
+39.65
+29.95
+48.92
+15.55
Figures in italics represent charged expenditure
Heads Actuals for the year Actuals for Increase(+)/
Decrease(-)
during the year
Non-Plan Plan Centrally Sponsored
Schemes Total
(in lakh of Rupees)
( )
. .
. .
. .
. .
. .
. .
. .
. .
. .
. .
. .
. .
. .
. .
. .
. .
. .
. .
. .
. .
. .
. .
. .
. .
. .
. .
. .
. .
. .
. .
. .
. .
. .
. .
12. DETAILED STATEMENT OF REVENUE EXPENDITURE BY MINOR HEADS
2011 -2010 -2012
2011
- Contd.
- Contd.
- Contd.
- Contd.
-Contd.
193
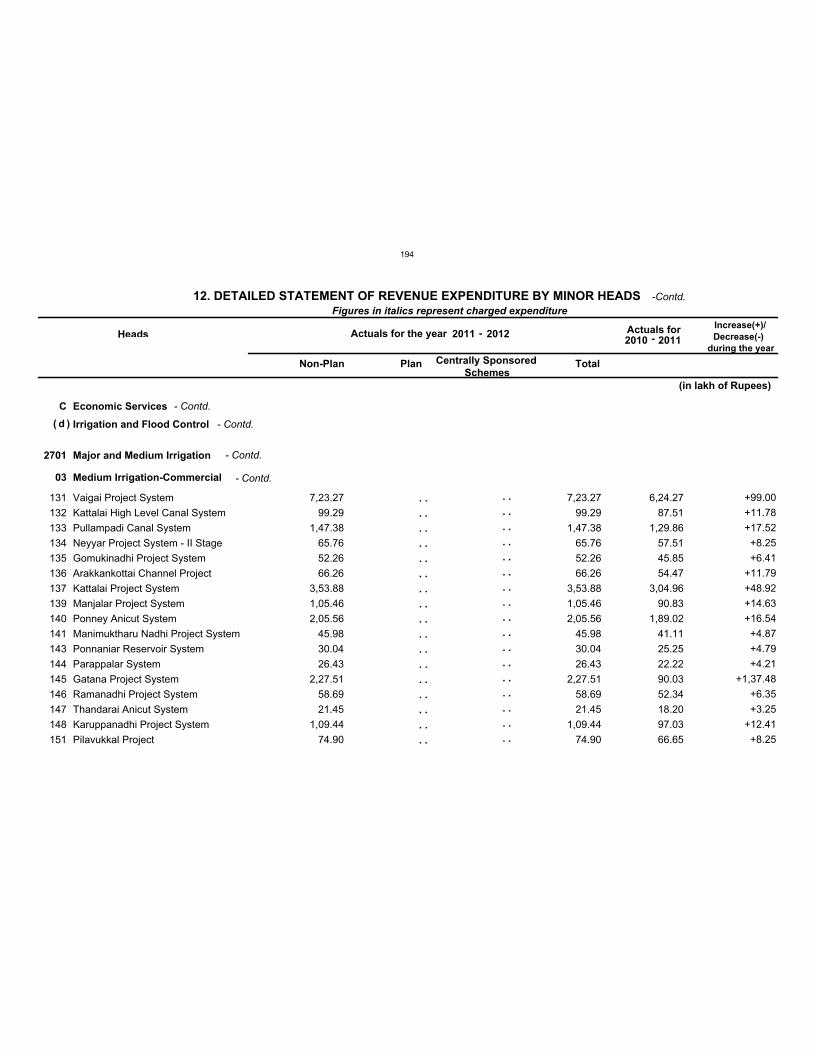
C Economic Services
d Irrigation and Flood Control
2701 Major and Medium Irrigation
03 Medium Irrigation-Commercial
131
132
133
134
135
136
137
139
140
141
143
144
145
146
147
148
151
Vaigai Project System
Kattalai High Level Canal System
Pullampadi Canal System
Neyyar Project System - II Stage
Gomukinadhi Project System
Arakkankottai Channel Project
Kattalai Project System
Manjalar Project System
Ponney Anicut System
Manimuktharu Nadhi Project System
Ponnaniar Reservoir System
Parappalar System
Gatana Project System
Ramanadhi Project System
Thandarai Anicut System
Karuppanadhi Project System
Pilavukkal Project
V
V
V
V
V
V
V
V
V
V
V
V
V
V
V
V
V
7,23.27
99.29
1,47.38
65.76
52.26
66.26
3,53.88
1,05.46
2,05.56
45.98
30.04
26.43
2,27.51
58.69
21.45
1,09.44
74.90
7,23.27
99.29
1,47.38
65.76
52.26
66.26
3,53.88
1,05.46
2,05.56
45.98
30.04
26.43
2,27.51
58.69
21.45
1,09.44
74.90
6,24.27
87.51
1,29.86
57.51
45.85
54.47
3,04.96
90.83
1,89.02
41.11
25.25
22.22
90.03
52.34
18.20
97.03
66.65
+99.00
+11.78
+17.52
+8.25
+6.41
+11.79
+48.92
+14.63
+16.54
+4.87
+4.79
+4.21
+1,37.48
+6.35
+3.25
+12.41
+8.25
Figures in italics represent charged expenditure
Heads Actuals for the year Actuals for Increase(+)/
Decrease(-)
during the year
Non-Plan Plan Centrally Sponsored
Schemes Total
(in lakh of Rupees)
( )
. .
. .
. .
. .
. .
. .
. .
. .
. .
. .
. .
. .
. .
. .
. .
. .
. .
. .
. .
. .
. .
. .
. .
. .
. .
. .
. .
. .
. .
. .
. .
. .
. .
. .
12. DETAILED STATEMENT OF REVENUE EXPENDITURE BY MINOR HEADS
2011 -2010 -2012
2011
- Contd.
- Contd.
- Contd.
- Contd.
-Contd.
194

C Economic Services
d Irrigation and Flood Control
2701 Major and Medium Irrigation
03 Medium Irrigation-Commercial
152
153
154
155
156
157
158
159
160
161
162
163
164
165
166
167
169
Marudhanadhi Reservoir Project
P.T. Rajan Channel Scheme
Palar-Porandalar Scheme
Varadhamanadhi Scheme
Vattamalaikarai Odai Scheme
Chinnar Reservoir System
Thumbalahalli Reservoir System
Pambar Reservoir System
Gundar Project System
Vaniar Reservoir Project
Ichambadi Anicut System
Thoppiar Reservoir System
Sulagiri Chinnar Reservoir System
Nagavathi Reservoir System
Varattupallam Reservoir System
Gunderipallam Reservoir System
Kesarigulihalla Reservoir System
V
V
V
V
V
V
V
V
V
V
V
V
V
V
V
V
V
92.56
54.53
3,47.50
69.43
48.44
66.03
56.04
77.80
20.06
2,06.03
95.04
1,06.49
53.49
52.29
49.97
34.61
73.57
92.56
54.53
3,47.50
69.43
48.44
66.03
56.04
77.80
20.06
2,06.03
95.04
1,06.49
53.49
52.29
49.97
34.61
73.57
85.18
48.50
3,18.50
66.66
44.43
54.68
47.11
70.56
18.74
1,86.23
83.08
94.82
46.05
48.83
42.83
29.70
64.61
+7.38
+6.03
+29.00
+2.77
+4.01
+11.35
+8.93
+7.24
+1.32
+19.80
+11.96
+11.67
+7.44
+3.46
+7.14
+4.91
+8.96
Figures in italics represent charged expenditure
Heads Actuals for the year Actuals for Increase(+)/
Decrease(-)
during the year
Non-Plan Plan Centrally Sponsored
Schemes Total
(in lakh of Rupees)
( )
. .
. .
. .
. .
. .
. .
. .
. .
. .
. .
. .
. .
. .
. .
. .
. .
. .
. .
. .
. .
. .
. .
. .
. .
. .
. .
. .
. .
. .
. .
. .
. .
. .
. .
12. DETAILED STATEMENT OF REVENUE EXPENDITURE BY MINOR HEADS
2011 -2010 -2012
2011
- Contd.
- Contd.
- Contd.
- Contd.
-Contd.
195
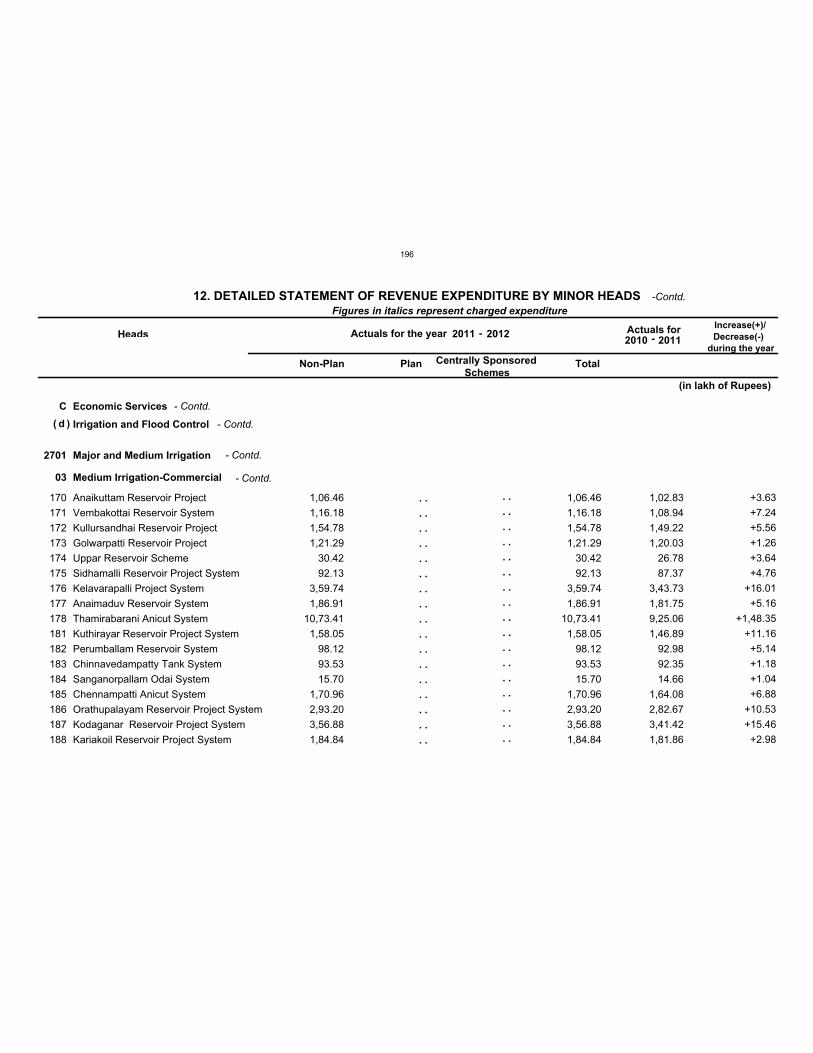
C Economic Services
d Irrigation and Flood Control
2701 Major and Medium Irrigation
03 Medium Irrigation-Commercial
170
171
172
173
174
175
176
177
178
181
182
183
184
185
186
187
188
Anaikuttam Reservoir Project
Vembakottai Reservoir System
Kullursandhai Reservoir Project
Golwarpatti Reservoir Project
Uppar Reservoir Scheme
Sidhamalli Reservoir Project System
Kelavarapalli Project System
Anaimaduv Reservoir System
Thamirabarani Anicut System
Kuthirayar Reservoir Project System
Perumballam Reservoir System
Chinnavedampatty Tank System
Sanganorpallam Odai System
Chennampatti Anicut System
Orathupalayam Reservoir Project System
Kodaganar Reservoir Project System
Kariakoil Reservoir Project System
V
V
V
V
V
V
V
V
V
V
V
V
V
V
V
V
V
1,06.46
1,16.18
1,54.78
1,21.29
30.42
92.13
3,59.74
1,86.91
10,73.41
1,58.05
98.12
93.53
15.70
1,70.96
2,93.20
3,56.88
1,84.84
1,06.46
1,16.18
1,54.78
1,21.29
30.42
92.13
3,59.74
1,86.91
10,73.41
1,58.05
98.12
93.53
15.70
1,70.96
2,93.20
3,56.88
1,84.84
1,02.83
1,08.94
1,49.22
1,20.03
26.78
87.37
3,43.73
1,81.75
9,25.06
1,46.89
92.98
92.35
14.66
1,64.08
2,82.67
3,41.42
1,81.86
+3.63
+7.24
+5.56
+1.26
+3.64
+4.76
+16.01
+5.16
+1,48.35
+11.16
+5.14
+1.18
+1.04
+6.88
+10.53
+15.46
+2.98
Figures in italics represent charged expenditure
Heads Actuals for the year Actuals for Increase(+)/
Decrease(-)
during the year
Non-Plan Plan Centrally Sponsored
Schemes Total
(in lakh of Rupees)
( )
. .
. .
. .
. .
. .
. .
. .
. .
. .
. .
. .
. .
. .
. .
. .
. .
. .
. .
. .
. .
. .
. .
. .
. .
. .
. .
. .
. .
. .
. .
. .
. .
. .
. .
12. DETAILED STATEMENT OF REVENUE EXPENDITURE BY MINOR HEADS
2011 -2010 -2012
2011
- Contd.
- Contd.
- Contd.
- Contd.
-Contd.
196

C Economic Services
d Irrigation and Flood Control
2701 Major and Medium Irrigation
03 Medium Irrigation-Commercial
189
190
191
192
193
194
195
196
197
198
200
201
202
203
204
Noyyal River System
Kallar,Coonar and Bhavani River System
Kodumudiyar Project system
Sothuparai Project system
Poigaiyar Reservoir System
Nambiyar Project system
Mordhana Project system
Rajathopukanur Project system
Adavinainarkoil Project system
Vadakkupachaiyar Project System
Vasistha Nadhi Project
Miruganda Nadhi Reservoir Project
Rajakumarapalayam and MohanurChannel
Shanmuga Nadhi Reservoir Project
Rehabilitation of works under Tamil NaduIrrigated Agricultural Modernization andWater Bodies Restoration and
V
V
V
V
V
V
V
V
V
V
V
V
V
V
V
2,44.22
49.55
51.05
20.58
6.33
14.31
69.47
4.46
59.19
83.07
21.75
24.01
1,30.51
31.74
12,56.85 12,95.28
2,44.22
49.55
51.05
20.58
6.33
14.31
69.47
4.46
59.19
83.07
21.75
24.01
1,30.51
31.74
25,52.13
2,24.82
40.67
44.04
16.78
5.03
11.98
58.66
4.31
50.82
66.31
22.18
18.00
1,12.76
27.28
8,94.98
+19.40
+8.88
+7.01
+3.80
+1.30
+2.33
+10.81
+0.15
+8.37
+16.76
-0.43
+6.01
+17.75
+4.46
+16,57.15
Figures in italics represent charged expenditure
Heads Actuals for the year Actuals for Increase(+)/
Decrease(-)
during the year
Non-Plan Plan Centrally Sponsored
Schemes Total
(in lakh of Rupees)
( )
. .
. .
. .
. .
. .
. .
. .
. .
. .
. .
. .
. .
. .
. .
. .
. .
. .
. .
. .
. .
. .
. .
. .
. .
. .
. .
. .
. .
. .
12. DETAILED STATEMENT OF REVENUE EXPENDITURE BY MINOR HEADS
2011 -2010 -2012
2011
- Contd.
- Contd.
- Contd.
- Contd.
-Contd.
197

C Economic Services
d Irrigation and Flood Control
2701 Major and Medium Irrigation
03 Medium Irrigation-Commercial
205
206
207
208
209
210
211
512
513
514
515
516
517
Nanganjiyar Reservoir Project System
Varattar Reservoir Project System
Andiappanur Odai Reservoir ProjectSystem
Pothiyampallam Anicut
Nallathangal Odai Reservoir ProjectSystem
Sasthakoil Reservoir Project System
Kuppanatham Reservoir Project System
Sathanur Project - Stage II
Restoration of Nandan Channel
Excavation of right side channel abovethe Sathanur Pickup Anicut
Reconstruction of Thirukoilur Anicut
Kodumudiyar Scheme - WaterResources Consolidation Project
Remodelling of Irrigation Channels underVeeranam Tank Scheme
V
V
V
V
V
V
V
V
V
V
V
V
V
59.15
35.99
53.89
2.41
44.31
53.10
67.98
0.17
7.29
33.05
5.84
3,49.81
0.94
59.15
35.99
53.89
2.41
44.31
53.10
67.98
0.17
7.29
33.05
5.84
3,49.81
0.94
46.72
28.68
40.76
3.81
33.66
41.30
17.60
0.17
7.29
33.05
5.84
3,49.81
0.94
+12.43
+7.31
+13.13
-1.40
+10.65
+11.80
+50.38
+0.00
+0.00
+0.00
+0.00
+0.00
+0.00
Figures in italics represent charged expenditure
Heads Actuals for the year Actuals for Increase(+)/
Decrease(-)
during the year
Non-Plan Plan Centrally Sponsored
Schemes Total
(in lakh of Rupees)
( )
. .
. .
. .
. .
. .
. .
. .
. .
. .
. .
. .
. .
. .
. .
. .
. .
. .
. .
. .
. .
. .
. .
. .
. .
. .
. .
12. DETAILED STATEMENT OF REVENUE EXPENDITURE BY MINOR HEADS
2011 -2010 -2012
2011
- Contd.
- Contd.
- Contd.
- Contd.
-Contd.
198

C Economic Services
d Irrigation and Flood Control
2701 Major and Medium Irrigation
03 Medium Irrigation-Commercial
518
519
520
522
523
524
525
526
527
Seruvalar Hydro-electric - cum - IrrigationProject
Modernisation of Ananthanar Channel
Modernisation of Right Bank Canal ofThirupparappu Anicut
Excavation of channel fromMadurantakam Tank
National Water Management Project
Shanmuganadhi Reservoir Scheme -Water Resources Consolidation Project
Formation of a Reservoir acrossPoigaiyar Scheme near AralvoimozhiVillage in Thovala Taluk, KanyakumariDistrict - Water Resources ConsolidationProject
Formation of a Reservoir acrossNambiyar near Kottai Karungulam Villagein Radhapuram Taluk - Water ResourcesConsolidation Project
Kattalai High Level Canal System
V
V
V
V
V
V
V
V
V
94.94
54.24
7.18
1,25.03
16,24.71
1,98.74
3,08.40
3,80.14
1.35
94.94
54.24
7.18
1,25.03
16,24.71
1,98.74
3,08.40
3,80.14
1.35
94.94
54.24
7.18
1,25.03
16,24.50
1,98.74
3,08.40
3,80.14
1.35
+0.00
+0.00
+0.00
+0.00
+0.21
+0.00
+0.00
+0.00
+0.00
Figures in italics represent charged expenditure
Heads Actuals for the year Actuals for Increase(+)/
Decrease(-)
during the year
Non-Plan Plan Centrally Sponsored
Schemes Total
(in lakh of Rupees)
( )
. .
. .
. .
. .
. .
. .
. .
. .
. .
. .
. .
. .
. .
. .
. .
. .
. .
. .
12. DETAILED STATEMENT OF REVENUE EXPENDITURE BY MINOR HEADS
2011 -2010 -2012
2011
- Contd.
- Contd.
- Contd.
- Contd.
-Contd.
199
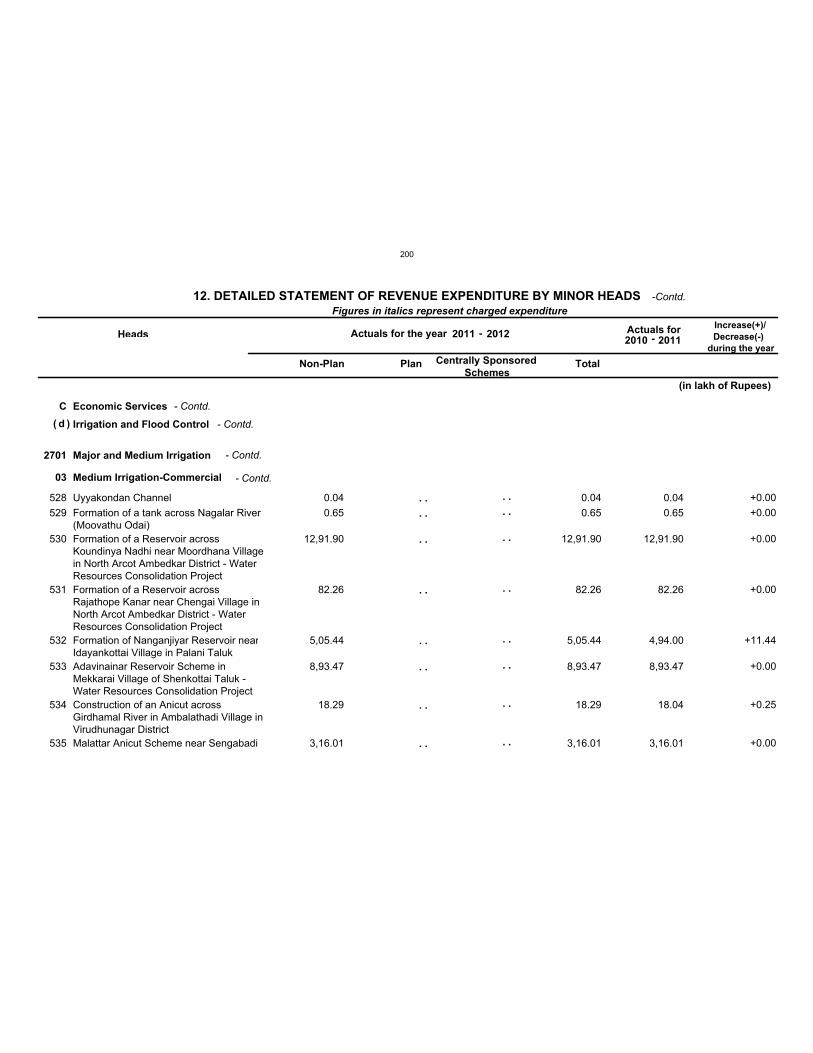
C Economic Services
d Irrigation and Flood Control
2701 Major and Medium Irrigation
03 Medium Irrigation-Commercial
528
529
530
531
532
533
534
535
Uyyakondan Channel
Formation of a tank across Nagalar River(Moovathu Odai)
Formation of a Reservoir acrossKoundinya Nadhi near Moordhana Villagein North Arcot Ambedkar District - WaterResources Consolidation Project
Formation of a Reservoir acrossRajathope Kanar near Chengai Village inNorth Arcot Ambedkar District - WaterResources Consolidation Project
Formation of Nanganjiyar Reservoir nearIdayankottai Village in Palani Taluk
Adavinainar Reservoir Scheme inMekkarai Village of Shenkottai Taluk -Water Resources Consolidation Project
Construction of an Anicut acrossGirdhamal River in Ambalathadi Village inVirudhunagar District
Malattar Anicut Scheme near Sengabadi
V
V
V
V
V
V
V
V
0.04
0.65
12,91.90
82.26
5,05.44
8,93.47
18.29
3,16.01
0.04
0.65
12,91.90
82.26
5,05.44
8,93.47
18.29
3,16.01
0.04
0.65
12,91.90
82.26
4,94.00
8,93.47
18.04
3,16.01
+0.00
+0.00
+0.00
+0.00
+11.44
+0.00
+0.25
+0.00
Figures in italics represent charged expenditure
Heads Actuals for the year Actuals for Increase(+)/
Decrease(-)
during the year
Non-Plan Plan Centrally Sponsored
Schemes Total
(in lakh of Rupees)
( )
. .
. .
. .
. .
. .
. .
. .
. .
. .
. .
. .
. .
. .
. .
. .
. .
12. DETAILED STATEMENT OF REVENUE EXPENDITURE BY MINOR HEADS
2011 -2010 -2012
2011
- Contd.
- Contd.
- Contd.
- Contd.
-Contd.
200

C Economic Services
d Irrigation and Flood Control
2701 Major and Medium Irrigation
03 Medium Irrigation-Commercial
536
537
538
539
540
541
Irukkangudi Reservoir Scheme in SatturTaluk in Virudhunagar District
Reconstruction of a Cart-Track-Cum-FootBridge across the Chakkilian Voikkal inPudupatti Village in NagapattinamDistrict
Controlling arrangements to the open off-takes in Vaigai River between Virahanurand Parthibanur Regulator - Improvementto channels
Construction of a Regulator acrossCauvery at Thiruvalangadu andMayavaram in Moovalur Village inNagapattinam District
Construction of a Regulator acrossVennar at Renganatha Cauvery andKurungalur Village in Thanjavur Taluk andDistrict
Construction of an Anicut across
V
V
V
V
V
V
7,75.99
1.59
10.99
2.28
0.11
50.19
7,75.99
1.59
10.99
2.28
0.11
50.19
7,75.58
1.59
10.99
2.28
0.11
50.18
+0.41
+0.00
+0.00
+0.00
+0.00
+0.01
Figures in italics represent charged expenditure
Heads Actuals for the year Actuals for Increase(+)/
Decrease(-)
during the year
Non-Plan Plan Centrally Sponsored
Schemes Total
(in lakh of Rupees)
( )
. .
. .
. .
. .
. .
. .
. .
. .
. .
. .
. .
. .
12. DETAILED STATEMENT OF REVENUE EXPENDITURE BY MINOR HEADS
2011 -2010 -2012
2011
- Contd.
- Contd.
- Contd.
- Contd.
-Contd.
201

C Economic Services
d Irrigation and Flood Control
2701 Major and Medium Irrigation
03 Medium Irrigation-Commercial
542
543
544
545
546
Girdhamal River at Athikulam Village ofTiruchuli Taluk in Virudhunagar District -Water Resources Consolidation Project
Formation of a Reservoir across VadakkuPachaiyar near Manjuvilai Village inNanguneri Taluk in Tirunelveli District
Modernisation and Rehabilitation of Damand Canal of Palar Anicut System underWater Resources Consolidation Project -Stage I
Modernisation and Rehabilitation ofCheyyar Anicut System under WaterResources Consolidation Project - StageI
Modernisation and Rehabilitation of Damand Canal of Ponney Anicut Systemunder Water Resources ConsolidationProject - Stage I
Modernisation and Rehabilitation of Damand Canal of Parambikulam - AliyarProject System under Water Resources
V
V
V
V
V
5,82.35
2,60.09
79.08
88.16
20,14.90
5,82.35
2,60.09
79.08
88.16
20,14.90
5,82.35
2,60.09
79.08
88.16
20,14.90
+0.00
+0.00
+0.00
+0.00
+0.00
Figures in italics represent charged expenditure
Heads Actuals for the year Actuals for Increase(+)/
Decrease(-)
during the year
Non-Plan Plan Centrally Sponsored
Schemes Total
(in lakh of Rupees)
( )
. .
. .
. .
. .
. .
. .
. .
. .
. .
. .
12. DETAILED STATEMENT OF REVENUE EXPENDITURE BY MINOR HEADS
2011 -2010 -2012
2011
- Contd.
- Contd.
- Contd.
- Contd.
-Contd.
202
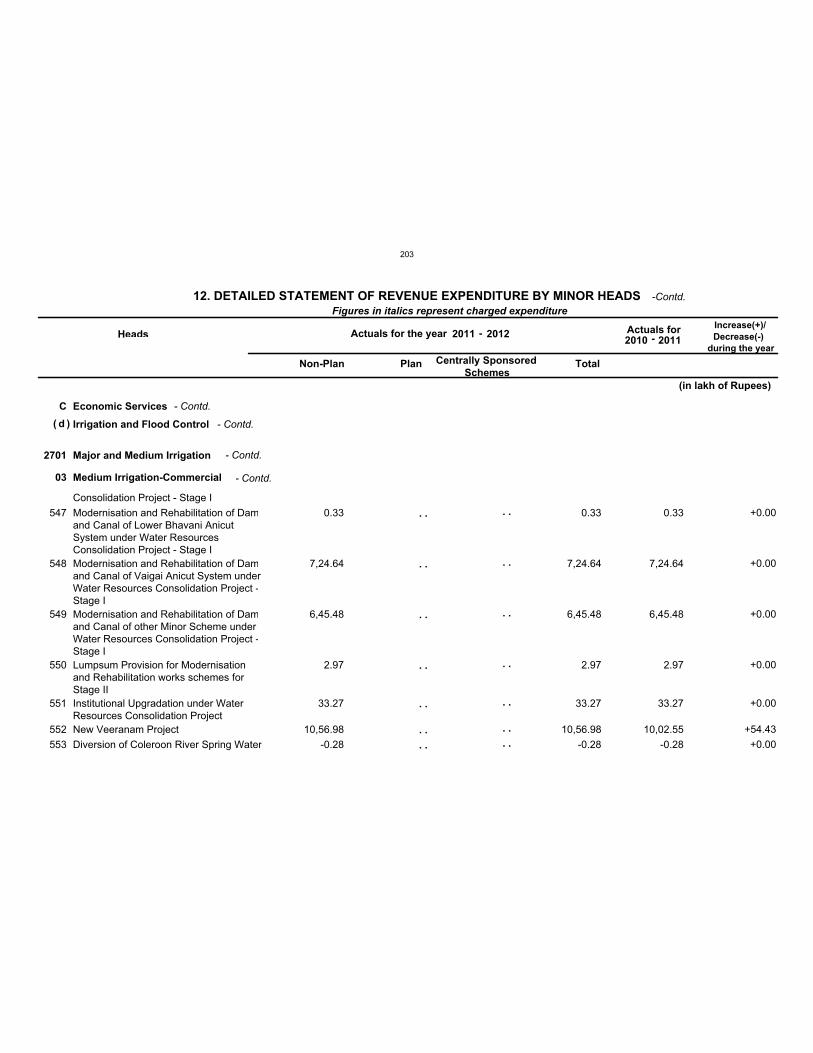
C Economic Services
d Irrigation and Flood Control
2701 Major and Medium Irrigation
03 Medium Irrigation-Commercial
547
548
549
550
551
552
553
Consolidation Project - Stage I
Modernisation and Rehabilitation of Damand Canal of Lower Bhavani AnicutSystem under Water ResourcesConsolidation Project - Stage I
Modernisation and Rehabilitation of Damand Canal of Vaigai Anicut System underWater Resources Consolidation Project -Stage I
Modernisation and Rehabilitation of Damand Canal of other Minor Scheme underWater Resources Consolidation Project -Stage I
Lumpsum Provision for Modernisationand Rehabilitation works schemes forStage II
Institutional Upgradation under WaterResources Consolidation Project
New Veeranam Project
Diversion of Coleroon River Spring Water
V
V
V
V
V
V
V
0.33
7,24.64
6,45.48
2.97
33.27
10,56.98
-0.28
0.33
7,24.64
6,45.48
2.97
33.27
10,56.98
-0.28
0.33
7,24.64
6,45.48
2.97
33.27
10,02.55
-0.28
+0.00
+0.00
+0.00
+0.00
+0.00
+54.43
+0.00
Figures in italics represent charged expenditure
Heads Actuals for the year Actuals for Increase(+)/
Decrease(-)
during the year
Non-Plan Plan Centrally Sponsored
Schemes Total
(in lakh of Rupees)
( )
. .
. .
. .
. .
. .
. .
. .
. .
. .
. .
. .
. .
. .
. .
12. DETAILED STATEMENT OF REVENUE EXPENDITURE BY MINOR HEADS
2011 -2010 -2012
2011
- Contd.
- Contd.
- Contd.
- Contd.
-Contd.
203
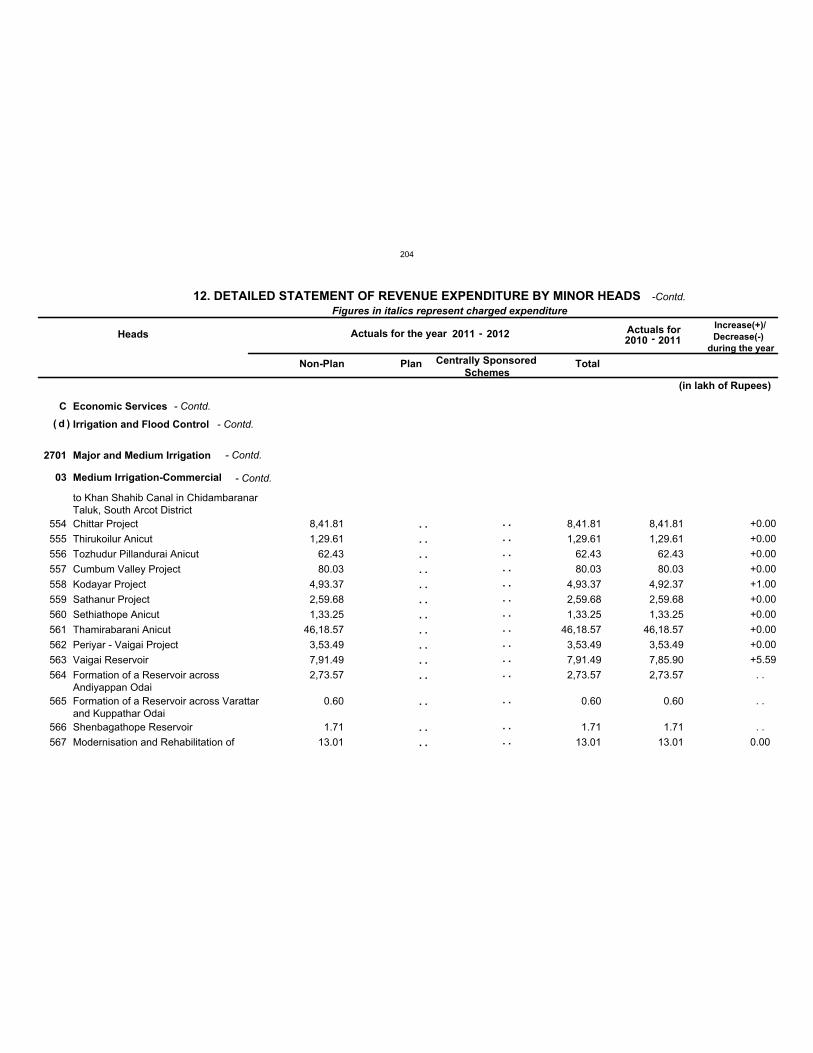
C Economic Services
d Irrigation and Flood Control
2701 Major and Medium Irrigation
03 Medium Irrigation-Commercial
554
555
556
557
558
559
560
561
562
563
564
565
566
567
to Khan Shahib Canal in ChidambaranarTaluk, South Arcot District
Chittar Project
Thirukoilur Anicut
Tozhudur Pillandurai Anicut
Cumbum Valley Project
Kodayar Project
Sathanur Project
Sethiathope Anicut
Thamirabarani Anicut
Periyar - Vaigai Project
Vaigai Reservoir
Formation of a Reservoir acrossAndiyappan Odai
Formation of a Reservoir across Varattarand Kuppathar Odai
Shenbagathope Reservoir
Modernisation and Rehabilitation of
V
V
V
V
V
V
V
V
V
V
V
V
V
V
8,41.81
1,29.61
62.43
80.03
4,93.37
2,59.68
1,33.25
46,18.57
3,53.49
7,91.49
2,73.57
0.60
1.71
13.01
8,41.81
1,29.61
62.43
80.03
4,93.37
2,59.68
1,33.25
46,18.57
3,53.49
7,91.49
2,73.57
0.60
1.71
13.01
8,41.81
1,29.61
62.43
80.03
4,92.37
2,59.68
1,33.25
46,18.57
3,53.49
7,85.90
2,73.57
0.60
1.71
13.01
+0.00
+0.00
+0.00
+0.00
+1.00
+0.00
+0.00
+0.00
+0.00
+5.59
. .
. .
. .
0.00
Figures in italics represent charged expenditure
Heads Actuals for the year Actuals for Increase(+)/
Decrease(-)
during the year
Non-Plan Plan Centrally Sponsored
Schemes Total
(in lakh of Rupees)
( )
. .
. .
. .
. .
. .
. .
. .
. .
. .
. .
. .
. .
. .
. .
. .
. .
. .
. .
. .
. .
. .
. .
. .
. .
. .
. .
. .
. .
12. DETAILED STATEMENT OF REVENUE EXPENDITURE BY MINOR HEADS
2011 -2010 -2012
2011
- Contd.
- Contd.
- Contd.
- Contd.
-Contd.
204

C Economic Services
d Irrigation and Flood Control
2701 Major and Medium Irrigation
03 Medium Irrigation-Commercial
568
569
570
571
572
573
574
Modernisation and Rehabilitation ofMarudhanadhi Project under WaterResources Consolidation Project
Construction of Shenbagathope Reservoirwith the Loan assistance from NationalBank for Agriculture and RuralDevelopment
Formation of a Reservoir across VarattarRiver near Vallimalai Village of HarurTaluk
Formation of a Reservoir across CheyyarScheme
Widening and Extension of SadayaneriChannel
Formation of a Reservoir across Malattarnear Bathabulapalli Village inGudiyatham Taluk
Cauvery Channel
V
V
V
V
V
V
V
17.85
3,36.07
4,01.21
3,80.60
1,57.10
78.19
65.20
17.85
3,36.07
4,01.21
3,80.60
1,57.10
78.19
65.20
17.85
3,35.86
4,01.21
3,80.60
1,57.10
77.60
65.20
+0.00
+0.21
+0.00
+0.00
+0.00
+0.59
+0.00
Figures in italics represent charged expenditure
Heads Actuals for the year Actuals for Increase(+)/
Decrease(-)
during the year
Non-Plan Plan Centrally Sponsored
Schemes Total
(in lakh of Rupees)
( )
. .
. .
. .
. .
. .
. .
. .
. .
. .
. .
. .
. .
. .
. .
12. DETAILED STATEMENT OF REVENUE EXPENDITURE BY MINOR HEADS
2011 -2010 -2012
2011
- Contd.
- Contd.
- Contd.
- Contd.
-Contd.
205

C Economic Services
d Irrigation and Flood Control
2701 Major and Medium Irrigation
03 Medium Irrigation-Commercial
575
576
577
578
579
580
581
582
583
Formation of a Tank across Uppar Odainear Sirivayalur Village
Formation of a Tank across MudaliMuthuvari in Chennampatti Village
Gadana Extension Schemes -Ambasamudram Taluk in TirunelveliDistrict
Formation of a Tank across Noydal inKannivadi Village in Dindigul
Formation of a Reservoir acrossNallathangal Odai in Ponnivadi Village inDharapuram Taluk
Construction of Anicut across Andi Odainear Kalagam Village in Lalgudi Taluk
Formation of a New Tank acrossRamakkal Odai and Anaivilundan Odai
Formation of a Reservoir across Nagariarnear Sasthan Koil in Rajapalayam Taluk
Formation of a Reservoir acrossSirumalaiyar near Rajathanikottai Village
V
V
V
V
V
V
V
V
V
49.38
95.08
1,34.72
86.03
4,43.07
38.46
63.99
1,18.91
80.42
49.38
95.08
1,34.72
86.03
4,43.07
38.46
63.99
1,18.91
80.42
49.38
95.08
1,34.72
86.03
4,43.07
38.46
63.99
1,18.91
80.42
+0.00
+0.00
+0.00
+0.00
+0.00
+0.00
+0.00
+0.00
+0.00
Figures in italics represent charged expenditure
Heads Actuals for the year Actuals for Increase(+)/
Decrease(-)
during the year
Non-Plan Plan Centrally Sponsored
Schemes Total
(in lakh of Rupees)
( )
. .
. .
. .
. .
. .
. .
. .
. .
. .
. .
. .
. .
. .
. .
. .
. .
. .
. .
12. DETAILED STATEMENT OF REVENUE EXPENDITURE BY MINOR HEADS
2011 -2010 -2012
2011
- Contd.
- Contd.
- Contd.
- Contd.
-Contd.
206

C Economic Services
d Irrigation and Flood Control
2701 Major and Medium Irrigation
03 Medium Irrigation-Commercial
584
585
586
587
588
590
591
592
593
594
595
Improvements and Beautification of Parkin and around Reservoirs in Tamil Nadu
Formation of 18th Channel acrossVairavanar Anicut
Formation of Ullar Reservoir Schemes
Formation of a Reservoir acrossMirukanda Nadhi River
Marudhanadhi Scheme under WaterResources Consolidation Project
Formation of a Reservoir acrossVarahanadhi - Sothuparai ReservoirSystem
Formation of a Reservoir acrossVellakkalkavar near Winnamangalam
Formation of a Reservoir acrossMambalathurayar
Extension of Nilayur Channel
Dam safety works
Modernisation of Rainfed tanks
V
V
V
V
V
V
V
V
V
V
V
48.00
2,21.91
1.71
2,17.37
0.05
6,07.87
11.00
1,60.24
2,52.63
2,07.25
8,55.83
48.00
2,21.91
1.71
2,17.37
0.05
6,07.87
11.00
1,60.24
2,52.63
2,07.25
8,55.83
48.00
2,21.91
1.71
2,17.37
0.05
6,07.87
11.00
1,41.57
2,17.69
2,07.25
8,55.83
+0.00
+0.00
+0.00
+0.00
+0.00
+0.00
+0.00
+18.67
+34.94
+0.00
+0.00
Figures in italics represent charged expenditure
Heads Actuals for the year Actuals for Increase(+)/
Decrease(-)
during the year
Non-Plan Plan Centrally Sponsored
Schemes Total
(in lakh of Rupees)
( )
. .
. .
. .
. .
. .
. .
. .
. .
. .
. .
. .
. .
. .
. .
. .
. .
. .
. .
. .
. .
. .
. .
12. DETAILED STATEMENT OF REVENUE EXPENDITURE BY MINOR HEADS
2011 -2010 -2012
2011
- Contd.
- Contd.
- Contd.
- Contd.
-Contd.
207
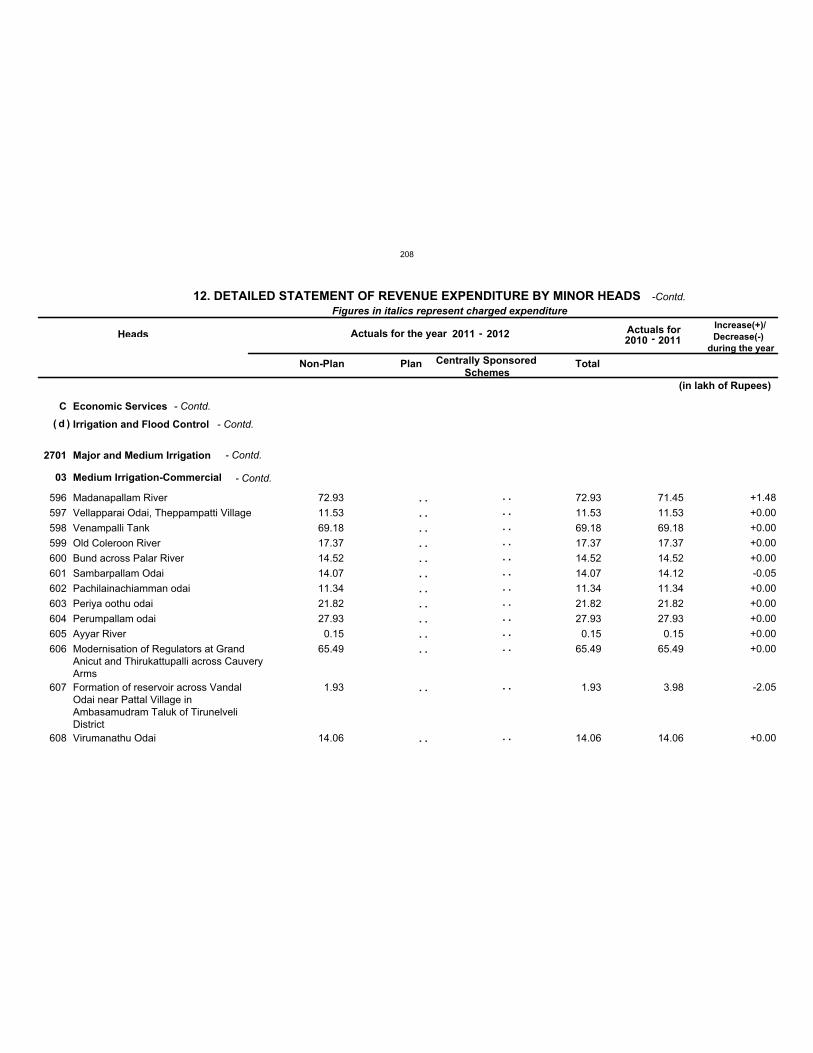
C Economic Services
d Irrigation and Flood Control
2701 Major and Medium Irrigation
03 Medium Irrigation-Commercial
596
597
598
599
600
601
602
603
604
605
606
607
608
Madanapallam River
Vellapparai Odai, Theppampatti Village
Venampalli Tank
Old Coleroon River
Bund across Palar River
Sambarpallam Odai
Pachilainachiamman odai
Periya oothu odai
Perumpallam odai
Ayyar River
Modernisation of Regulators at GrandAnicut and Thirukattupalli across CauveryArms
Formation of reservoir across VandalOdai near Pattal Village inAmbasamudram Taluk of TirunelveliDistrict
Virumanathu Odai
V
V
V
V
V
V
V
V
V
V
V
V
V
72.93
11.53
69.18
17.37
14.52
14.07
11.34
21.82
27.93
0.15
65.49
1.93
14.06
72.93
11.53
69.18
17.37
14.52
14.07
11.34
21.82
27.93
0.15
65.49
1.93
14.06
71.45
11.53
69.18
17.37
14.52
14.12
11.34
21.82
27.93
0.15
65.49
3.98
14.06
+1.48
+0.00
+0.00
+0.00
+0.00
-0.05
+0.00
+0.00
+0.00
+0.00
+0.00
-2.05
+0.00
Figures in italics represent charged expenditure
Heads Actuals for the year Actuals for Increase(+)/
Decrease(-)
during the year
Non-Plan Plan Centrally Sponsored
Schemes Total
(in lakh of Rupees)
( )
. .
. .
. .
. .
. .
. .
. .
. .
. .
. .
. .
. .
. .
. .
. .
. .
. .
. .
. .
. .
. .
. .
. .
. .
. .
. .
12. DETAILED STATEMENT OF REVENUE EXPENDITURE BY MINOR HEADS
2011 -2010 -2012
2011
- Contd.
- Contd.
- Contd.
- Contd.
-Contd.
208

C Economic Services
d Irrigation and Flood Control
2701 Major and Medium Irrigation
03 Medium Irrigation-Commercial
609
610
611
612
613
614
615
616
Sanagulian Koil Odai/Sinathu Odai
Palar Basin
Manjalneer Channel
Medium Irrigation Schemes
Construction of checkdam across koilMalaiyar at Melarasampattu Village inVellore District
Construction and Renovation ofInspection Bungalows
Renovation of Dam and Canals of AliyarSub Basin under Tamil Nadu IrrigatedAgriculture Modernization and WaterBodies Restoration ansd ManagementProject (IAMWARM)
Renovation of Dam, Canal and Tanks ofPalar (Coimbatore) Sub Basin underTamil Nadu Irrigated AgricultureModernization and Water BodiesRestoration and Management Project(IAMWARM)
V
V
V
V
V
V
V
V
29.72
-0.01
22.28
27,14.03
31.42
14.71
1,29.48
9,40.39
29.72
-0.01
22.28
27,14.03
31.42
14.71
1,29.48
9,40.39
28.57
-0.01
22.28
22,19.13
31.41
14.09
1,29.48
9,12.09
+1.15
+0.00
+0.00
+4,94.90
+0.01
+0.62
+0.00
+28.30
Figures in italics represent charged expenditure
Heads Actuals for the year Actuals for Increase(+)/
Decrease(-)
during the year
Non-Plan Plan Centrally Sponsored
Schemes Total
(in lakh of Rupees)
( )
. .
. .
. .
. .
. .
. .
. .
. .
. .
. .
. .
. .
. .
. .
. .
. .
12. DETAILED STATEMENT OF REVENUE EXPENDITURE BY MINOR HEADS
2011 -2010 -2012
2011
- Contd.
- Contd.
- Contd.
- Contd.
-Contd.
209

C Economic Services
d Irrigation and Flood Control
2701 Major and Medium Irrigation
03 Medium Irrigation-Commercial
617
618
619
620
Renovation of Dam, Canal and Tanks ofUpper Vellar (Salem) Sub Basin underTamil Nadu Irrigated AgricultureModernization and Water BodiesRestoration and Management Project(IAMWARM)
Renovation of Dam, Canal and Tanks ofSouth Vellar (Pudukottai) Sub Basinunder Tamil Nadu Irrigated AgricultureModernisation and Water BodiesRestoration and Management Project(IAMWARM)
Renovation of Dam, Canal and Tanks ofVarahanadhi (Tiruvannamalai andVillupuram Sub Basin under Tamil Nadu(IAMWARM)
Renovation of Dam, Canal and Tanks ofPambar (Pudukottai) Sub Basin underTamil Nadu Irrigated AgricultureModernization and Water BodiesRestoration and Management Project
V
V
V
V
2,42.72
5,00.52
1,34.41
4,29.04
2,42.72
5,00.52
1,34.41
4,29.04
2,42.72
4,60.21
1,20.28
3,97.21
+0.00
+40.31
+14.13
+31.83
Figures in italics represent charged expenditure
Heads Actuals for the year Actuals for Increase(+)/
Decrease(-)
during the year
Non-Plan Plan Centrally Sponsored
Schemes Total
(in lakh of Rupees)
( )
. .
. .
. .
. .
. .
. .
. .
. .
12. DETAILED STATEMENT OF REVENUE EXPENDITURE BY MINOR HEADS
2011 -2010 -2012
2011
- Contd.
- Contd.
- Contd.
- Contd.
-Contd.
210

C Economic Services
d Irrigation and Flood Control
2701 Major and Medium Irrigation
03 Medium Irrigation-Commercial
621
622
623
624
(IAMWARM)
Renovation of Dam, Canal and Tanks ofKottakaraiyar (Sivagangai) Sub Basinunder Tamil Nadu Irrigated AgricultureModernization and Water BodiesRestoration and Management Project(IAMWARM)
Renovation of Dam, Canal and Tanks ofManimuthar (Sivagangai) Sub Basinunder Tamil Nadu Irrigated AgricultureModernization and Water BodiesRestoration and Management Project(IAMWARM)
Renovation of Dam, Canal and Tanks ofArjunanadhi (Virudhunagar) Sub Basinunder Tamil Nadu Irrigated AgricultureModernization and Water BodiesRestoration and Management Project(IAMWARM)
Rehabilitation and Strengthening ofWellington Reservoir at Cuddalore
V
V
V
V
3,87.61
5,19.85
2,90.07
2,56.51
3,87.61
5,19.85
2,90.07
2,56.51
3,75.69
5,13.91
2,79.10
1,90.59
+11.92
+5.94
+10.97
+65.92
Figures in italics represent charged expenditure
Heads Actuals for the year Actuals for Increase(+)/
Decrease(-)
during the year
Non-Plan Plan Centrally Sponsored
Schemes Total
(in lakh of Rupees)
( )
. .
. .
. .
. .
. .
. .
. .
. .
12. DETAILED STATEMENT OF REVENUE EXPENDITURE BY MINOR HEADS
2011 -2010 -2012
2011
- Contd.
- Contd.
- Contd.
- Contd.
-Contd.
211

C Economic Services
d Irrigation and Flood Control
2701 Major and Medium Irrigation
03 Medium Irrigation-Commercial
625
626
627
628
Renovation of Dam, Canal and Tanks ofAnaivari Odai (Perambalur) Sub Basinunder Tamil Nadu Irrigated AgricultureModernisation and Water BodiesRestoration and Management Project(IAMWARM)
Renovation of Dam, Canal and Tanks ofChinnar (Perambalur) Sub Basin underTamil Nadu Irrigated AgricultureModernization and Water BodiesRestoration and Management Project(IAMWARM)
Renovation of Dam, Canal and Tanks ofAgniyar (Pudukottai) Sub Basin underTamil Nadu Irrigated AgricultureModernization and Water BodiesRestoration and Management Project(IAMWARM)
Renovation of Dam, Canal and Tanks ofAmbuliar (Pudukottai) Sub Basin underTamil Nadu Irrigated Agriculture
V
V
V
V
19.64
49.89
3,31.99
1,82.84
19.64
49.89
3,31.99
1,82.84
14.60
40.25
2,34.04
1,46.25
+5.04
+9.64
+97.95
+36.59
Figures in italics represent charged expenditure
Heads Actuals for the year Actuals for Increase(+)/
Decrease(-)
during the year
Non-Plan Plan Centrally Sponsored
Schemes Total
(in lakh of Rupees)
( )
. .
. .
. .
. .
. .
. .
. .
. .
12. DETAILED STATEMENT OF REVENUE EXPENDITURE BY MINOR HEADS
2011 -2010 -2012
2011
- Contd.
- Contd.
- Contd.
- Contd.
-Contd.
212

C Economic Services
d Irrigation and Flood Control
2701 Major and Medium Irrigation
03 Medium Irrigation-Commercial
629
630
631
Modernization and Water BodiesRestoration and Management Project(IAMWARM)
Renovation of Dam, Canal and Tanks ofUpper Vaigai (Theni) Sub Basin underTamil Nadu Irrigated AgricultureModernization and Water BodiesRestoration and Management Project(IAMWARM)
Renovation of Dam, Canal and Tanks ofVarattar - Nagalar (Theni) Sub Basinunder Tamil Nadu Irrigated AgricultureModernization and Water BodiesRestoration and Management Project(IAMWARM)
Renovation of Dam, Canal and Tanks ofUpper Gundar (Madurai) Sub Basin underTamil Nadu Irrigated AgricultureModernization and Water BodiesRestoration and Management Project(IAMWARM)
V
V
V
16.88
13.11
72.86
16.88
13.11
72.86
16.88
13.11
69.87
+0.00
+0.00
+2.99
Figures in italics represent charged expenditure
Heads Actuals for the year Actuals for Increase(+)/
Decrease(-)
during the year
Non-Plan Plan Centrally Sponsored
Schemes Total
(in lakh of Rupees)
( )
. .
. .
. .
. .
. .
. .
12. DETAILED STATEMENT OF REVENUE EXPENDITURE BY MINOR HEADS
2011 -2010 -2012
2011
- Contd.
- Contd.
- Contd.
- Contd.
-Contd.
213

C Economic Services
d Irrigation and Flood Control
2701 Major and Medium Irrigation
03 Medium Irrigation-Commercial
632
633
634
635
Renovation of Dam, Canal and Tanks ofTerkar (Madurai) Sub Basin under TamilNadu Irrigated Agriculture Modernizationand Water Bodies Restoration andManagement Project (IAMWARM)
Renovation of Dam, Canal and Tanks ofNichaba Nadhi (Tirunelveli) Sub Basinunder Tamil Nadu Irrigated AgricultureModernization and Water BodiesRestoration and Management Project(IAMWARM)
Renovation of Dam, Canal and Tanks ofKalinganar (Tirunelveli) Sub Basin underTamil Nadu Irrigated AgricultureModernization and Water BodiesRestoration and Management Project(IAMWARM)
Renovation of Dam, Canal and Tanks ofSindapalli Uppodai (Virudhunagar) SubBasin under Tamil Nadu IrrigatedAgriculture Modernization and Water
V
V
V
V
3,13.50
1,14.15
44.41
10.07
3,13.50
1,14.15
44.41
10.07
1,84.97
76.98
39.49
7.90
+1,28.53
+37.17
+4.92
+2.17
Figures in italics represent charged expenditure
Heads Actuals for the year Actuals for Increase(+)/
Decrease(-)
during the year
Non-Plan Plan Centrally Sponsored
Schemes Total
(in lakh of Rupees)
( )
. .
. .
. .
. .
. .
. .
. .
. .
12. DETAILED STATEMENT OF REVENUE EXPENDITURE BY MINOR HEADS
2011 -2010 -2012
2011
- Contd.
- Contd.
- Contd.
- Contd.
-Contd.
214

C Economic Services
d Irrigation and Flood Control
2701 Major and Medium Irrigation
03 Medium Irrigation-Commercial
636
637
638
639
Bodies Restoration and ManagementProject (IAMWARM)
Renovation of Dam, Canal and Tanks ofSenkottaiyar (Virudhunagar) Sub Basinunder Tamil Nadu Irrigated AgricultureModernization and Water BodiesRestoration and Management Project(IAMWARM)
Renovation of Dam, Canal and Tanks ofCoovum (Chennai) Sub Basin under TamilNadu Irrigated Agriculture Modernizationand Water Bodies Restoration andManagement Project (IAMWARM)
Renovation of Dam, Canal and Tanks ofPennaiyar upto Krishnagiri (Ponniyar)Sub Basin under Tamil Nadu IrrigatedAgriculture Modernization and WaterBodies Restoration and ManagementProject (IAMWARM)
Renovation of Dam, Canal and Tanks ofPoiney (Palar) Sub Basin under Tamil
V
V
V
V
55.14
13.35
2,79.38
1,97.36
55.14
13.35
2,79.38
1,97.36
45.10
7.31
2,12.73
1,44.67
+10.04
+6.04
+66.65
+52.69
Figures in italics represent charged expenditure
Heads Actuals for the year Actuals for Increase(+)/
Decrease(-)
during the year
Non-Plan Plan Centrally Sponsored
Schemes Total
(in lakh of Rupees)
( )
. .
. .
. .
. .
. .
. .
. .
. .
12. DETAILED STATEMENT OF REVENUE EXPENDITURE BY MINOR HEADS
2011 -2010 -2012
2011
- Contd.
- Contd.
- Contd.
- Contd.
-Contd.
215
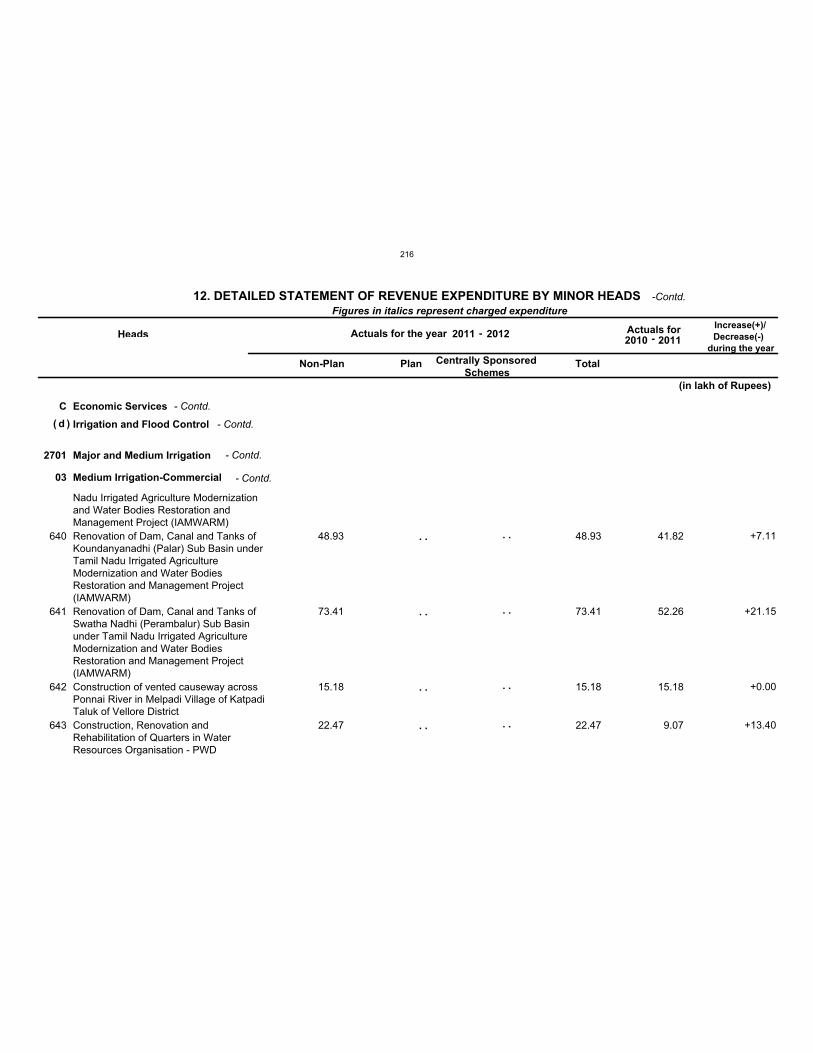
C Economic Services
d Irrigation and Flood Control
2701 Major and Medium Irrigation
03 Medium Irrigation-Commercial
640
641
642
643
Nadu Irrigated Agriculture Modernizationand Water Bodies Restoration andManagement Project (IAMWARM)
Renovation of Dam, Canal and Tanks ofKoundanyanadhi (Palar) Sub Basin underTamil Nadu Irrigated AgricultureModernization and Water BodiesRestoration and Management Project(IAMWARM)
Renovation of Dam, Canal and Tanks ofSwatha Nadhi (Perambalur) Sub Basinunder Tamil Nadu Irrigated AgricultureModernization and Water BodiesRestoration and Management Project(IAMWARM)
Construction of vented causeway acrossPonnai River in Melpadi Village of KatpadiTaluk of Vellore District
Construction, Renovation andRehabilitation of Quarters in WaterResources Organisation - PWD
V
V
V
V
48.93
73.41
15.18
22.47
48.93
73.41
15.18
22.47
41.82
52.26
15.18
9.07
+7.11
+21.15
+0.00
+13.40
Figures in italics represent charged expenditure
Heads Actuals for the year Actuals for Increase(+)/
Decrease(-)
during the year
Non-Plan Plan Centrally Sponsored
Schemes Total
(in lakh of Rupees)
( )
. .
. .
. .
. .
. .
. .
. .
. .
12. DETAILED STATEMENT OF REVENUE EXPENDITURE BY MINOR HEADS
2011 -2010 -2012
2011
- Contd.
- Contd.
- Contd.
- Contd.
-Contd.
216
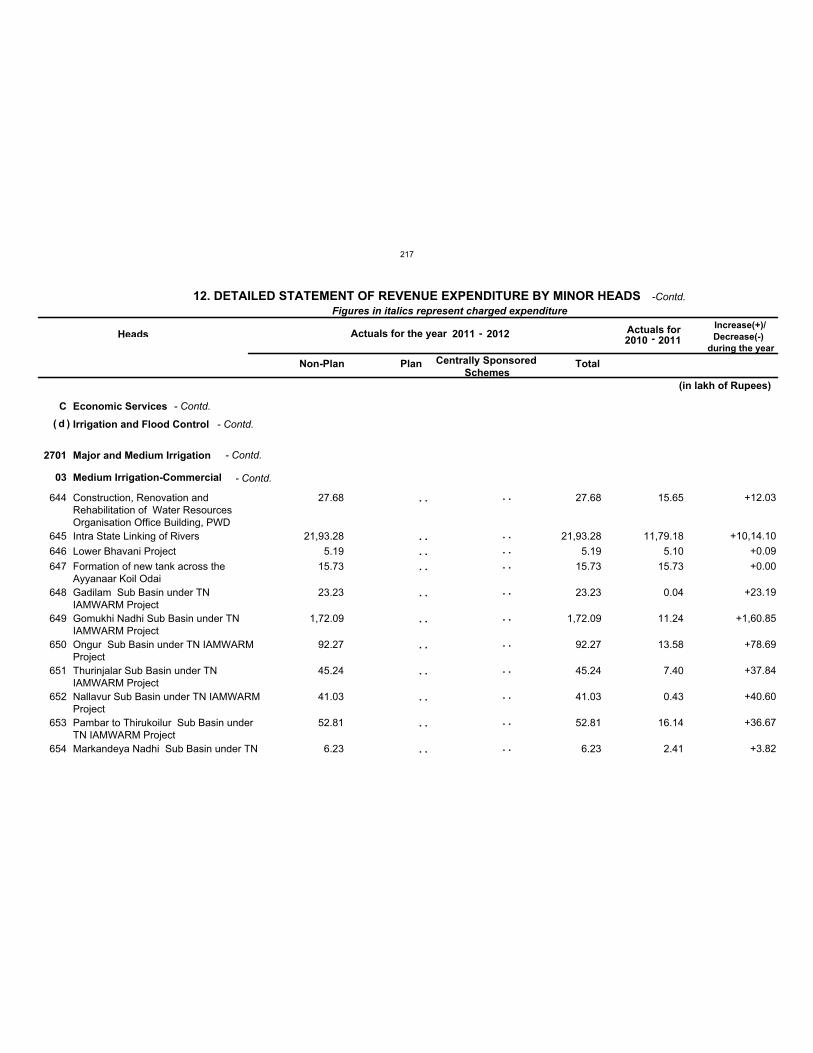
C Economic Services
d Irrigation and Flood Control
2701 Major and Medium Irrigation
03 Medium Irrigation-Commercial
644
645
646
647
648
649
650
651
652
653
654
Construction, Renovation andRehabilitation of Water ResourcesOrganisation Office Building, PWD
Intra State Linking of Rivers
Lower Bhavani Project
Formation of new tank across theAyyanaar Koil Odai
Gadilam Sub Basin under TNIAMWARM Project
Gomukhi Nadhi Sub Basin under TNIAMWARM Project
Ongur Sub Basin under TN IAMWARMProject
Thurinjalar Sub Basin under TNIAMWARM Project
Nallavur Sub Basin under TN IAMWARMProject
Pambar to Thirukoilur Sub Basin underTN IAMWARM Project
Markandeya Nadhi Sub Basin under TN
V
V
V
V
V
V
V
V
V
V
V
27.68
21,93.28
5.19
15.73
23.23
1,72.09
92.27
45.24
41.03
52.81
6.23
27.68
21,93.28
5.19
15.73
23.23
1,72.09
92.27
45.24
41.03
52.81
6.23
15.65
11,79.18
5.10
15.73
0.04
11.24
13.58
7.40
0.43
16.14
2.41
+12.03
+10,14.10
+0.09
+0.00
+23.19
+1,60.85
+78.69
+37.84
+40.60
+36.67
+3.82
Figures in italics represent charged expenditure
Heads Actuals for the year Actuals for Increase(+)/
Decrease(-)
during the year
Non-Plan Plan Centrally Sponsored
Schemes Total
(in lakh of Rupees)
( )
. .
. .
. .
. .
. .
. .
. .
. .
. .
. .
. .
. .
. .
. .
. .
. .
. .
. .
. .
. .
. .
. .
12. DETAILED STATEMENT OF REVENUE EXPENDITURE BY MINOR HEADS
2011 -2010 -2012
2011
- Contd.
- Contd.
- Contd.
- Contd.
-Contd.
217

C Economic Services
d Irrigation and Flood Control
2701 Major and Medium Irrigation
03 Medium Irrigation-Commercial
655
656
657
658
659
660
661
662
663
664
Kambainallur Sub Basin under TNIAMWARM Project
Kovilar (Kottapatti Kallar) Sub Basinunder TN IAMWARM Project
Pambanar-Varattar Sub Basin under TNIAMWARM Project
Uthirakosamangai Sub Basin under TNIAMWARM Project
Vembar Sub Basin under TN IAMWARMProject
Palar Sub Basin under TN IAMWARMProject
Grithamal Sub Basin under TNIAMWARM Project
Lower Gundar Sub Basin under TNIAMWARM Project
Deviar Sub Basin under TN IAMWARMProject
Nagariar Sub Basin under TN
V
V
V
V
V
V
V
V
V
V
33.74
4.05
15.13
66.69
18.40
13.45
82.53
34.87
57.18
14.23
33.74
4.05
15.13
66.69
18.40
13.45
82.53
34.87
57.18
14.23
5.84
1.30
3.85
5.98
4.14
0.52
7.92
1.94
8.30
2.20
+27.90
+2.75
+11.28
+60.71
+14.26
+12.93
+74.61
+32.93
+48.88
+12.03
Figures in italics represent charged expenditure
Heads Actuals for the year Actuals for Increase(+)/
Decrease(-)
during the year
Non-Plan Plan Centrally Sponsored
Schemes Total
(in lakh of Rupees)
( )
. .
. .
. .
. .
. .
. .
. .
. .
. .
. .
. .
. .
. .
. .
. .
. .
. .
. .
. .
. .
12. DETAILED STATEMENT OF REVENUE EXPENDITURE BY MINOR HEADS
2011 -2010 -2012
2011
- Contd.
- Contd.
- Contd.
- Contd.
-Contd.
218

C Economic Services
d Irrigation and Flood Control
2701 Major and Medium Irrigation
03 Medium Irrigation-Commercial
665
666
667
668
669
670
671
672
673
674
Sevalaperiyar Sub Basin under TNIAMWARM Project
Uppathurar Sub Basin under TNIAMWARM Project
Vallampatti Sub Basin under TNIAMWARM Project
Main River (Vaippar) Sub Basin under TNIAMWARM Project
Uppodai Sub Basin under TN IAMWARMProject
Salikulamar Sub Basin under TNIAMWARM Project
Korampallam Aaru Sub Basin under TNIAMWARM Project
Theniar Sub Basin under TN IAMWARMProject
Hanumanadhi (Nambiyar) Sub Basinunder TN IAMWARM Project
Karumeniar Sub Basin under TN
V
V
V
V
V
V
V
V
V
V
19.53
5.93
2.37
21.59
19.53
6.68
13.22
22.62
29.47
39.72
19.53
5.93
2.37
21.59
19.53
6.68
13.22
22.62
29.47
39.72
9.20
1.75
0.22
0.66
1.05
1.14
0.73
0.37
1.50
1.53
+10.33
+4.18
+2.15
+20.93
+18.48
+5.54
+12.49
+22.25
+27.97
+38.19
Figures in italics represent charged expenditure
Heads Actuals for the year Actuals for Increase(+)/
Decrease(-)
during the year
Non-Plan Plan Centrally Sponsored
Schemes Total
(in lakh of Rupees)
( )
. .
. .
. .
. .
. .
. .
. .
. .
. .
. .
. .
. .
. .
. .
. .
. .
. .
. .
. .
. .
12. DETAILED STATEMENT OF REVENUE EXPENDITURE BY MINOR HEADS
2011 -2010 -2012
2011
- Contd.
- Contd.
- Contd.
- Contd.
-Contd.
219

C Economic Services
d Irrigation and Flood Control
2701 Major and Medium Irrigation
03 Medium Irrigation-Commercial
675
676
677
678
679
680
681
682
683
684
Rehabilitation and Improvement of Dams
Rehabilitation, Renovation andModernisation Irrigation Structures
Modernisation of Contour Canal
Modernisation of Thirumeni Tank and itsfeeder channels
Gomukhi Nadhi Sub Basin under TNIAMWARM Project
Accelerated Irrigation Benefit Programme
Adayar Sub Basin under TN IAMWARMProject
Kosasthalayar Sub Basin under TNIAMWARM Project
Cheyyar Sub Basin under TN IAMWARMProject
Renovation of Dam, Canal and Tanks ofParaliyar Sub Basin under Tamil NaduIrrigated Agriculture Modernisation andWater Bodies Restoration and
V
V
V
V
V
V
V
V
V
V
1.53
26.18
64.39
6.41
21.55
2.19
0.96
1.49
12.92
8.66
1.53
26.18
64.39
6.41
21.55
2.19
0.96
1.49
12.92
8.66
0.62
12.26
0.43
1.31
+0.91
+13.92
+63.96
+5.10
+21.55
+2.19
+0.96
+1.49
+12.92
+8.66
Figures in italics represent charged expenditure
Heads Actuals for the year Actuals for Increase(+)/
Decrease(-)
during the year
Non-Plan Plan Centrally Sponsored
Schemes Total
(in lakh of Rupees)
( )
. .
. .
. .
. .
. .
. .
. .
. .
. .
. .
. .
. .
. .
. .
. .
. .
. .
. .
. .
. .
. .
. .
. .
. .
. .
. .
12. DETAILED STATEMENT OF REVENUE EXPENDITURE BY MINOR HEADS
2011 -2010 -2012
2011
- Contd.
- Contd.
- Contd.
- Contd.
-Contd.
220
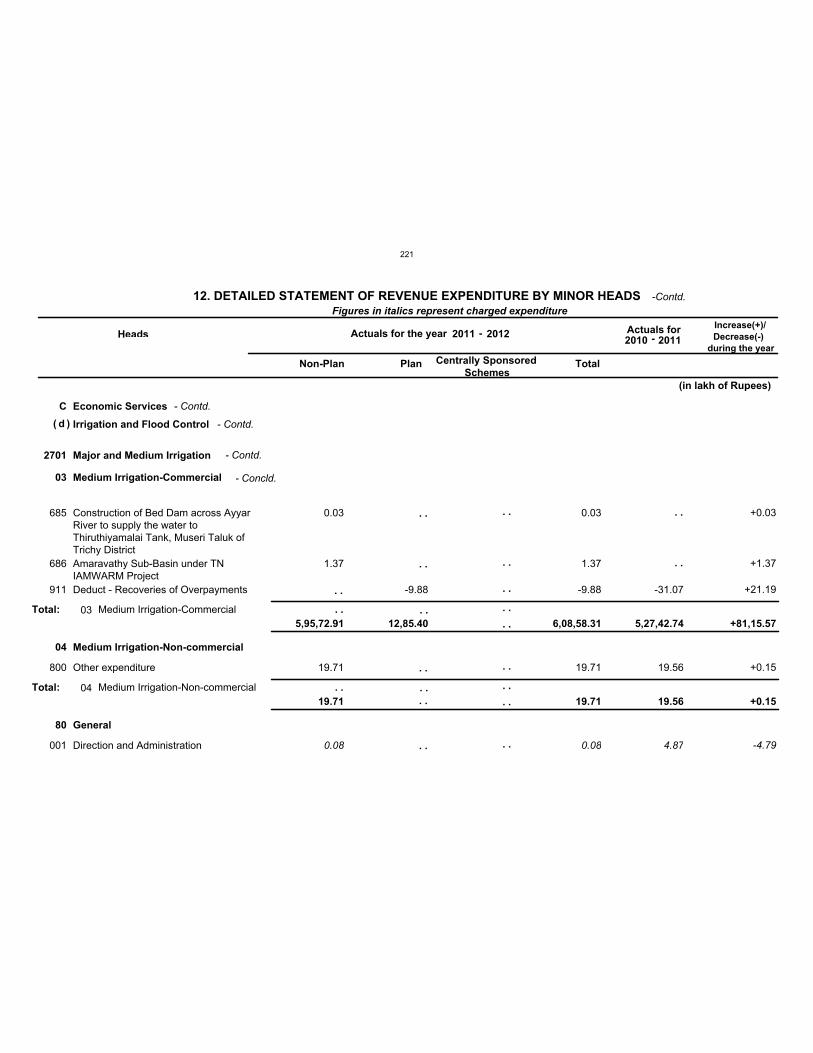
C Economic Services
d Irrigation and Flood Control
2701 Major and Medium Irrigation
03
04
80
Medium Irrigation-Commercial
Medium Irrigation-Non-commercial
General
685
686
911
800
001
Construction of Bed Dam across AyyarRiver to supply the water toThiruthiyamalai Tank, Museri Taluk ofTrichy District
Amaravathy Sub-Basin under TNIAMWARM Project
Deduct - Recoveries of Overpayments
Other expenditure
Direction and Administration
V
V
V
V
C
0.03
1.37
19.71
0.08
-9.88
0.03
1.37
-9.88
19.71
0.08
-31.07
19.56
4.87
+0.03
+1.37
+21.19
+0.15
-4.79
Total:
Total:
03
04
Medium Irrigation-Commercial
Medium Irrigation-Non-commercial
Figures in italics represent charged expenditure
Heads Actuals for the year Actuals for Increase(+)/
Decrease(-)
during the year
Non-Plan Plan Centrally Sponsored
Schemes Total
5,95,72.91
19.71
12,85.40 6,08,58.31
19.71
5,27,42.74
19.56
+81,15.57
+0.15
(in lakh of Rupees)
( )
. .
. .
. .
. .
. .
. .
. .
. .
. .
. .
. .
. .
. .
. .
. .
. .
. .
. .
. .
. .
. .
12. DETAILED STATEMENT OF REVENUE EXPENDITURE BY MINOR HEADS
2011 -2010 -2012
2011
- Contd.
- Contd.
- Contd.
- Concld.
-Contd.
221
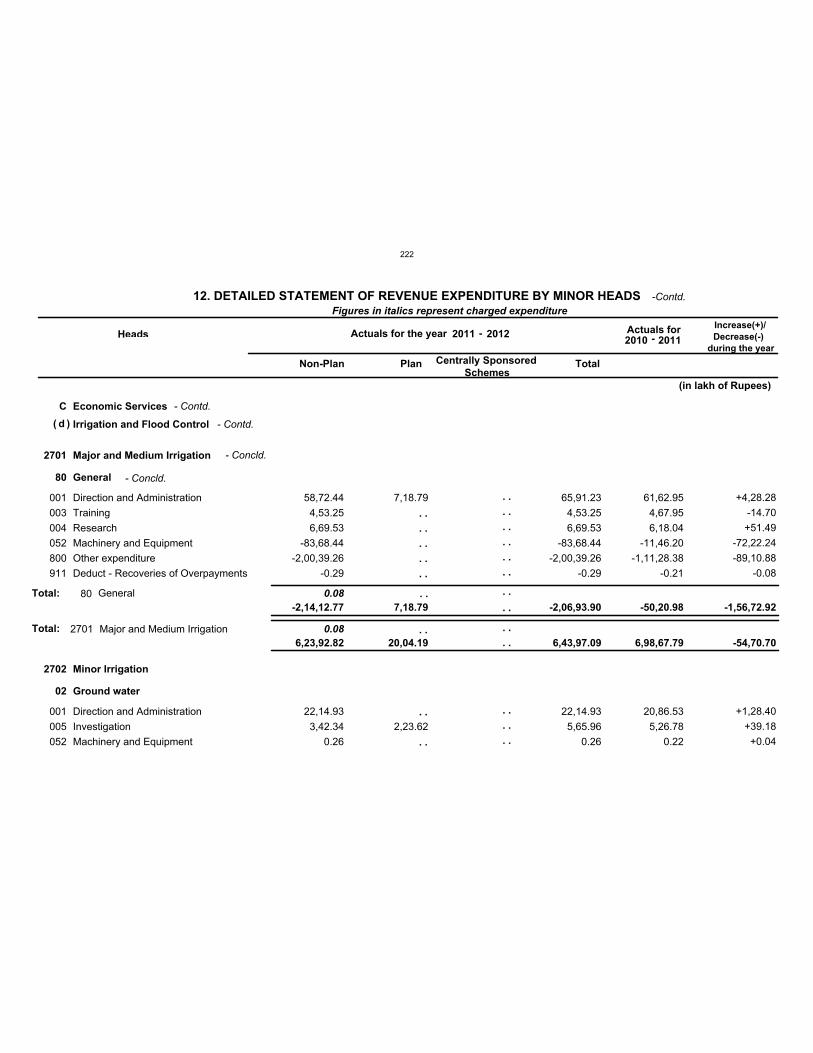
C Economic Services
d Irrigation and Flood Control
2701
2702
Major and Medium Irrigation
Minor Irrigation
0.08Total:
80
02
General
Ground water
0.08
001
003
004
052
800
911
001
005
052
Direction and Administration
Training
Research
Machinery and Equipment
Other expenditure
Deduct - Recoveries of Overpayments
Direction and Administration
Investigation
Machinery and Equipment
V
V
V
V
V
V
V
V
V
58,72.44
4,53.25
6,69.53
-83,68.44
-2,00,39.26
-0.29
22,14.93
3,42.34
0.26
7,18.79
2,23.62
65,91.23
4,53.25
6,69.53
-83,68.44
-2,00,39.26
-0.29
22,14.93
5,65.96
0.26
61,62.95
4,67.95
6,18.04
-11,46.20
-1,11,28.38
-0.21
20,86.53
5,26.78
0.22
+4,28.28
-14.70
+51.49
-72,22.24
-89,10.88
-0.08
+1,28.40
+39.18
+0.04
Total: 80 General
2701 Major and Medium Irrigation
Figures in italics represent charged expenditure
Heads Actuals for the year Actuals for Increase(+)/
Decrease(-)
during the year
Non-Plan Plan Centrally Sponsored
Schemes Total
-2,14,12.77 7,18.79 -2,06,93.90 -50,20.98 -1,56,72.92
6,23,92.82 20,04.19 6,43,97.09 6,98,67.79 -54,70.70
(in lakh of Rupees)
( )
. .
. .
. .
. .
. .
. .
. .
. .
. .
. .
. .
. .
. .
. .
. .
. .
. . . .
. .
. . . .
. .
12. DETAILED STATEMENT OF REVENUE EXPENDITURE BY MINOR HEADS
2011 -2010 -2012
2011
- Contd.
- Contd.
- Concld.
- Concld.
-Contd.
222
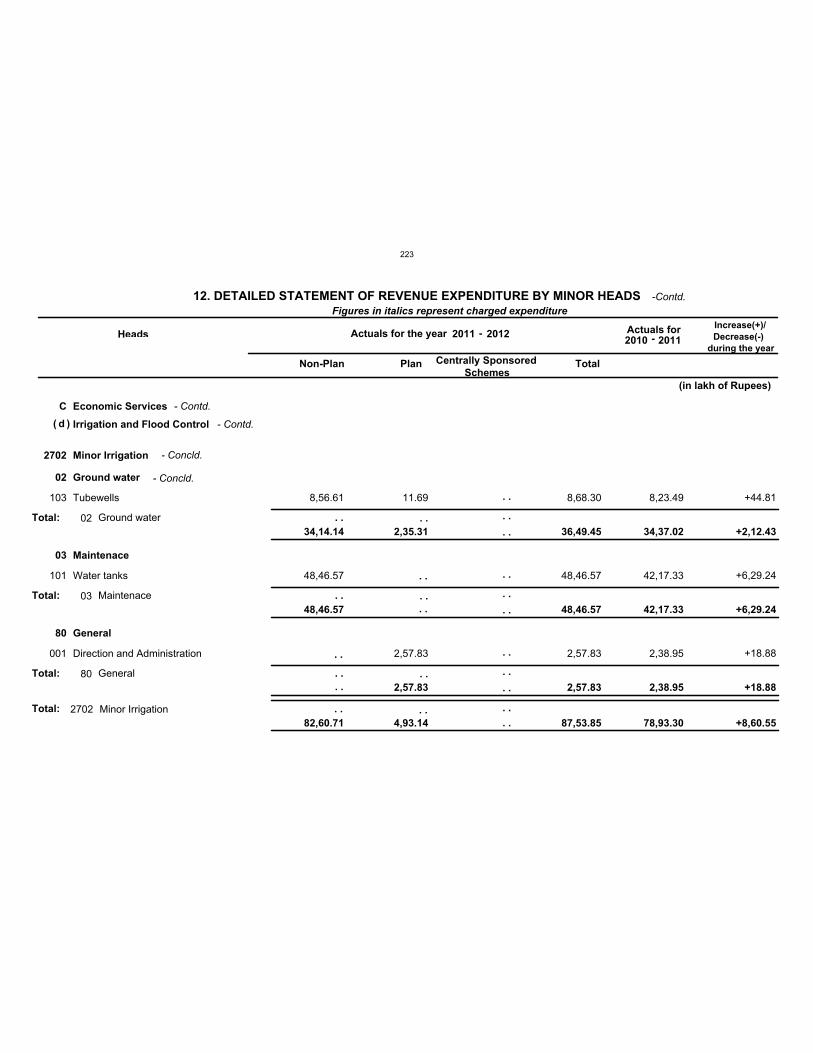
C Economic Services
d Irrigation and Flood Control
2702 Minor Irrigation
Total:
02
03
80
Ground water
Maintenace
General
103
101
001
Tubewells
Water tanks
Direction and Administration
V
V
V
8,56.61
48,46.57
11.69
2,57.83
8,68.30
48,46.57
2,57.83
8,23.49
42,17.33
2,38.95
+44.81
+6,29.24
+18.88
Total:
Total:
Total:
02
03
80
Ground water
Maintenace
General
2702 Minor Irrigation
Figures in italics represent charged expenditure
Heads Actuals for the year Actuals for Increase(+)/
Decrease(-)
during the year
Non-Plan Plan Centrally Sponsored
Schemes Total
34,14.14
48,46.57
2,35.31
2,57.83
36,49.45
48,46.57
2,57.83
34,37.02
42,17.33
2,38.95
+2,12.43
+6,29.24
+18.88
82,60.71 4,93.14 87,53.85 78,93.30 +8,60.55
(in lakh of Rupees)
( )
. .
. .
. .
. .
. .
. .
. .
. .
. .
. .
. .
. .
. .
. .
. .
. .
. .
. .
. .
. . . . . .
. .
12. DETAILED STATEMENT OF REVENUE EXPENDITURE BY MINOR HEADS
2011 -2010 -2012
2011
- Contd.
- Contd.
- Concld.
- Concld.
-Contd.
223
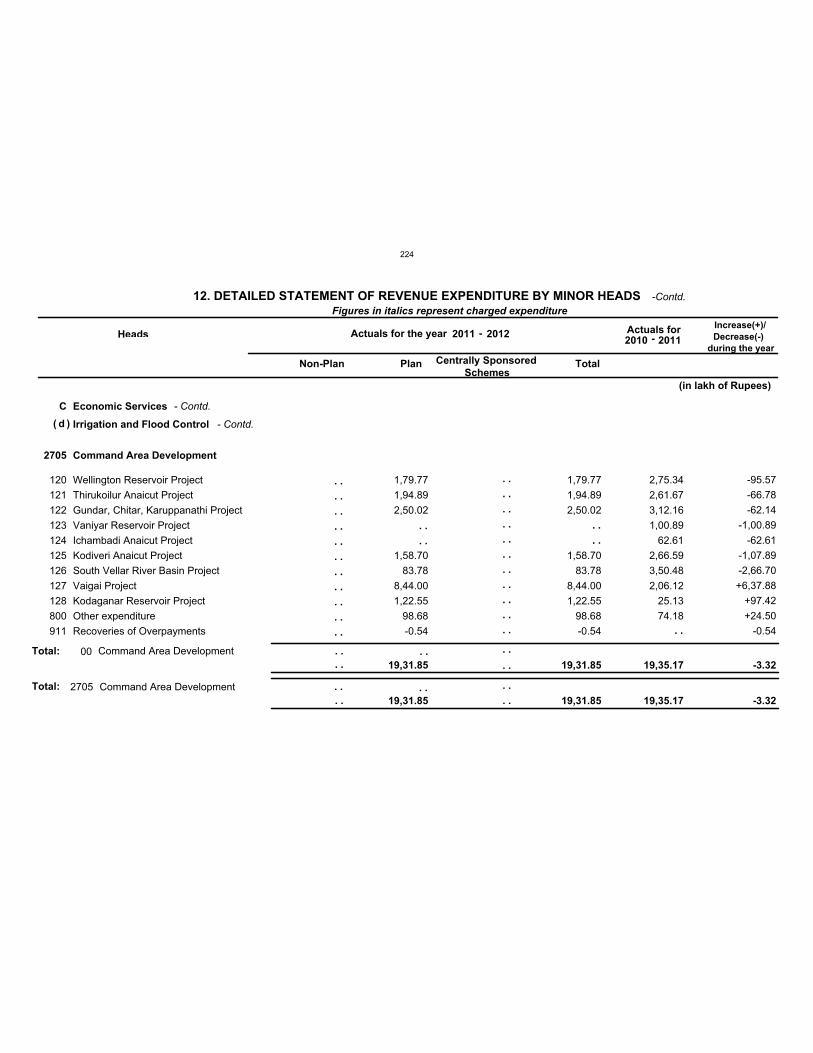
C Economic Services
d Irrigation and Flood Control
2705 Command Area Development
Total:
120
121
122
123
124
125
126
127
128
800
911
Wellington Reservoir Project
Thirukoilur Anaicut Project
Gundar, Chitar, Karuppanathi Project
Vaniyar Reservoir Project
Ichambadi Anaicut Project
Kodiveri Anaicut Project
South Vellar River Basin Project
Vaigai Project
Kodaganar Reservoir Project
Other expenditure
Recoveries of Overpayments
V
V
V
V
V
V
V
V
V
V
V
1,79.77
1,94.89
2,50.02
1,58.70
83.78
8,44.00
1,22.55
98.68
-0.54
1,79.77
1,94.89
2,50.02
1,58.70
83.78
8,44.00
1,22.55
98.68
-0.54
2,75.34
2,61.67
3,12.16
1,00.89
62.61
2,66.59
3,50.48
2,06.12
25.13
74.18
-95.57
-66.78
-62.14
-1,00.89
-62.61
-1,07.89
-2,66.70
+6,37.88
+97.42
+24.50
-0.54
Total: 00 Command Area Development
2705 Command Area Development
Figures in italics represent charged expenditure
Heads Actuals for the year Actuals for Increase(+)/
Decrease(-)
during the year
Non-Plan Plan Centrally Sponsored
Schemes Total
19,31.85 19,31.85 19,35.17 -3.32
19,31.85 19,31.85 19,35.17 -3.32
(in lakh of Rupees)
( )
. .
. .
. .
. .
. .
. .
. .
. .
. .
. .
. .
. .
. .
. .
. .
. .
. .
. .
. .
. .
. .
. .
. .
. .
. .
. .
. .
. .
. .
. . . .
. .
. .
. .
. . . .
. .
12. DETAILED STATEMENT OF REVENUE EXPENDITURE BY MINOR HEADS
2011 -2010 -2012
2011
- Contd.
- Contd.
-Contd.
224
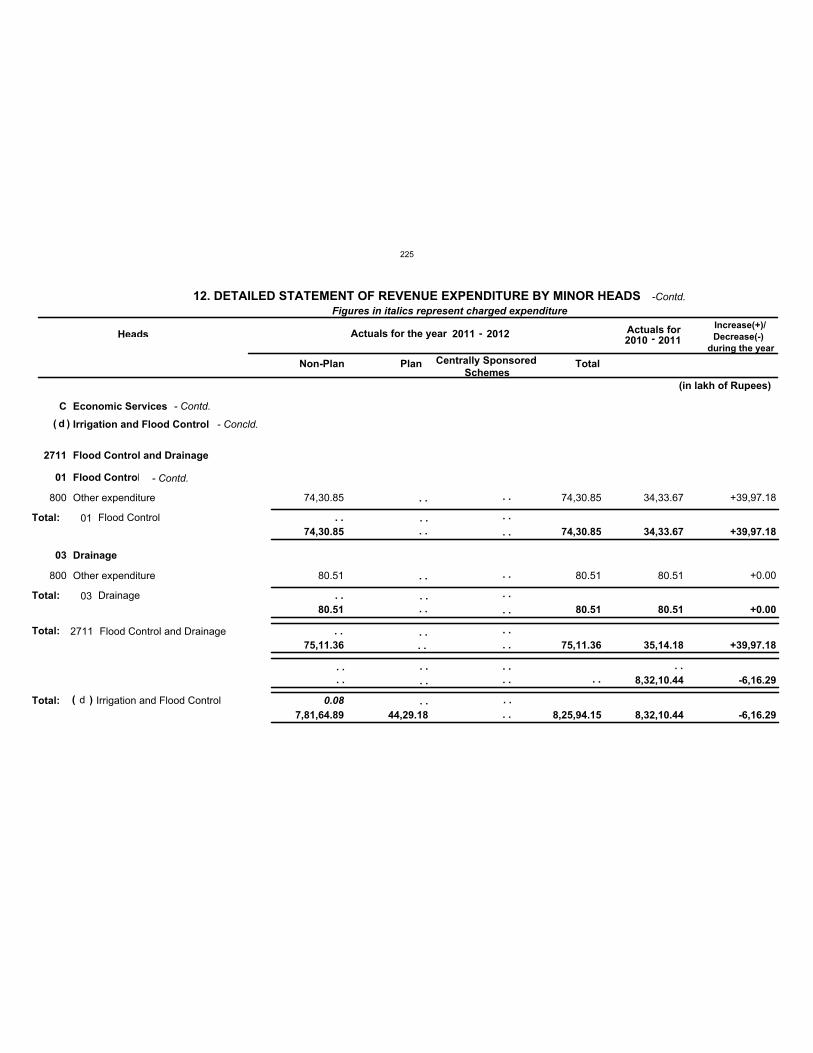
C Economic Services
d Irrigation and Flood Control
0.08Total:
2711 Flood Control and Drainage
Total:
01
03
Flood Control
Drainage
800
800
Other expenditure
Other expenditure
V
V
74,30.85
80.51
74,30.85
80.51
34,33.67
80.51
+39,97.18
+0.00
Total:
Total:
01
03
Flood Control
Drainage
2711 Flood Control and Drainage
d Irrigation and Flood Control
Figures in italics represent charged expenditure
Heads Actuals for the year Actuals for Increase(+)/
Decrease(-)
during the year
Non-Plan Plan Centrally Sponsored
Schemes Total
74,30.85
80.51
74,30.85
80.51
34,33.67
80.51
+39,97.18
+0.00
75,11.36 75,11.36 35,14.18 +39,97.18
8,32,10.44 -6,16.29
7,81,64.89 44,29.18 8,25,94.15 8,32,10.44 -6,16.29
(in lakh of Rupees)
( )
( )
. .
. .
. .
. .
. .
. .
. .
. .
. .
. .
. .
. .
. .
. .
. . . .
. .
. .
. .
. .
. .
. .
. .
. .
. . . .
. .
. . . .
. .
12. DETAILED STATEMENT OF REVENUE EXPENDITURE BY MINOR HEADS
2011 -2010 -2012
2011
- Contd.
- Concld.
- Contd.
-Contd.
225
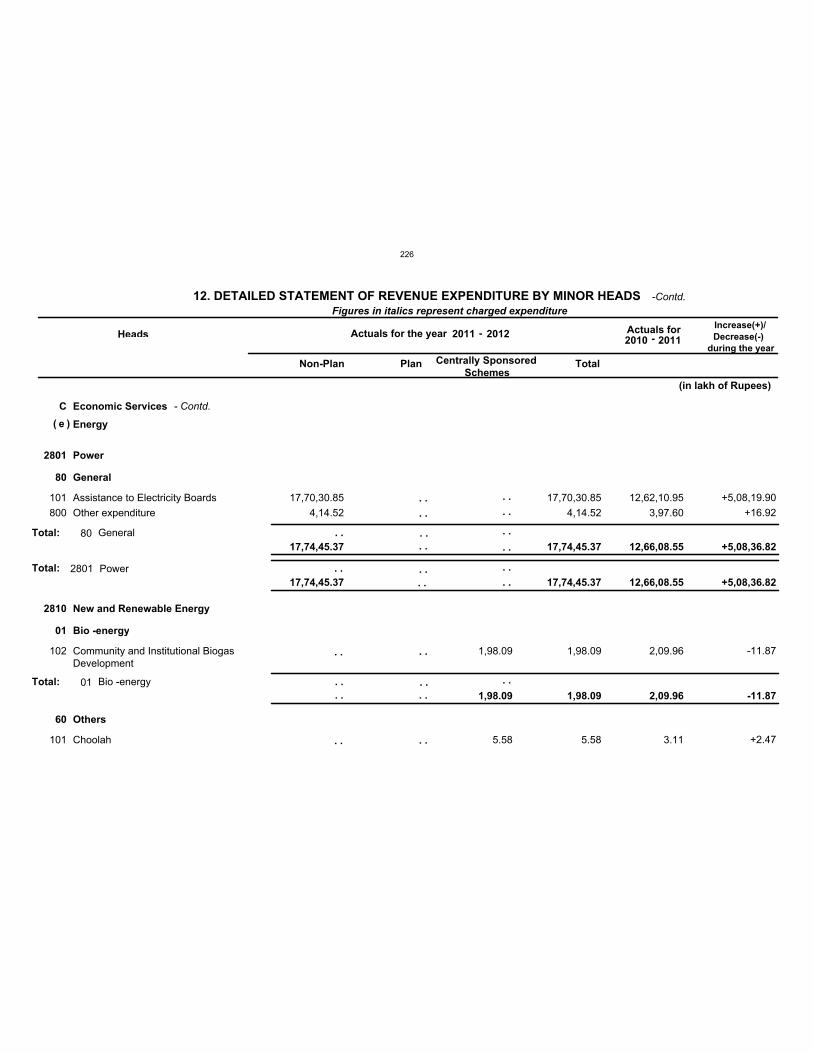
C Economic Services
e Energy
2801
2810
Power
New and Renewable Energy
Total:
80
01
60
General
Bio -energy
Others
101
800
102
101
Assistance to Electricity Boards
Other expenditure
Community and Institutional BiogasDevelopment
Choolah
V
V
V
V
17,70,30.85
4,14.52
1,98.09
5.58
17,70,30.85
4,14.52
1,98.09
5.58
12,62,10.95
3,97.60
2,09.96
3.11
+5,08,19.90
+16.92
-11.87
+2.47
Total:
Total:
80
01
General
Bio -energy
2801 Power
Figures in italics represent charged expenditure
Heads Actuals for the year Actuals for Increase(+)/
Decrease(-)
during the year
Non-Plan Plan Centrally Sponsored
Schemes Total
17,74,45.37
1,98.09
17,74,45.37
1,98.09
12,66,08.55
2,09.96
+5,08,36.82
-11.87
17,74,45.37 17,74,45.37 12,66,08.55 +5,08,36.82
(in lakh of Rupees)
( )
. .
. .
. .
. .
. .
. .
. .
. .
. .
. .
. .
. .
. .
. .
. .
. .
. .
. .
. . . .
. .
. .
. .
12. DETAILED STATEMENT OF REVENUE EXPENDITURE BY MINOR HEADS
2011 -2010 -2012
2011
- Contd.
-Contd.
226
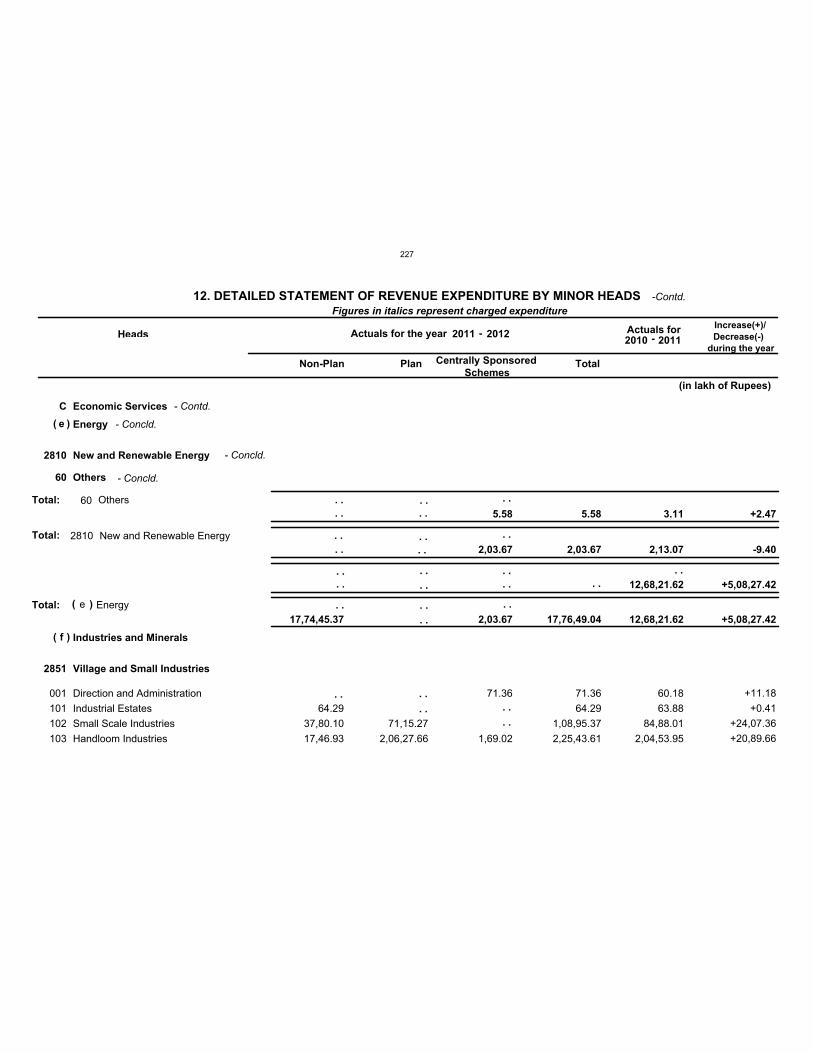
C Economic Services
e
f
Energy
Industries and Minerals
Total:
2810
2851
New and Renewable Energy
Village and Small Industries
Total:
60 Others
001
101
102
103
Direction and Administration
Industrial Estates
Small Scale Industries
Handloom Industries
V
V
V
V
64.29
37,80.10
17,46.93
71,15.27
2,06,27.66
71.36
1,69.02
71.36
64.29
1,08,95.37
2,25,43.61
60.18
63.88
84,88.01
2,04,53.95
+11.18
+0.41
+24,07.36
+20,89.66
Total: 60 Others
2810 New and Renewable Energy
e Energy
Figures in italics represent charged expenditure
Heads Actuals for the year Actuals for Increase(+)/
Decrease(-)
during the year
Non-Plan Plan Centrally Sponsored
Schemes Total
5.58 5.58 3.11 +2.47
2,03.67 2,03.67 2,13.07 -9.40
12,68,21.62 +5,08,27.42
17,74,45.37 2,03.67 17,76,49.04 12,68,21.62 +5,08,27.42
(in lakh of Rupees)
(
(
)
)
( )
. . . .
. . . .
. .
. .
. .
. .
. .
. .
. .
. .
. .
. .
. .
. .
. .
. .
. .
. .
. . . .
. .
. . . .
. .
. .
12. DETAILED STATEMENT OF REVENUE EXPENDITURE BY MINOR HEADS
2011 -2010 -2012
2011
- Contd.
- Concld.
- Concld.
- Concld.
-Contd.
227
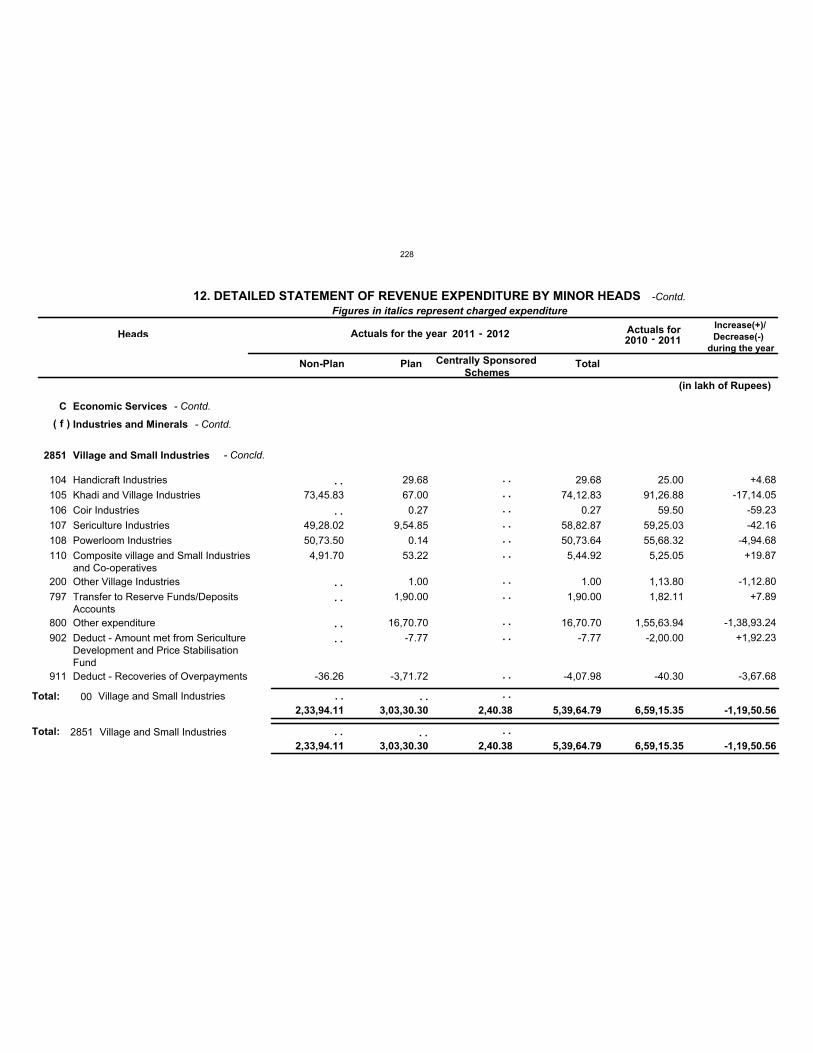
C Economic Services
f Industries and Minerals
2851 Village and Small Industries
Total:
104
105
106
107
108
110
200
797
800
902
911
Handicraft Industries
Khadi and Village Industries
Coir Industries
Sericulture Industries
Powerloom Industries
Composite village and Small Industriesand Co-operatives
Other Village Industries
Transfer to Reserve Funds/DepositsAccounts
Other expenditure
Deduct - Amount met from SericultureDevelopment and Price StabilisationFund
Deduct - Recoveries of Overpayments
V
V
V
V
V
V
V
V
V
V
V
73,45.83
49,28.02
50,73.50
4,91.70
-36.26
29.68
67.00
0.27
9,54.85
0.14
53.22
1.00
1,90.00
16,70.70
-7.77
-3,71.72
29.68
74,12.83
0.27
58,82.87
50,73.64
5,44.92
1.00
1,90.00
16,70.70
-7.77
-4,07.98
25.00
91,26.88
59.50
59,25.03
55,68.32
5,25.05
1,13.80
1,82.11
1,55,63.94
-2,00.00
-40.30
+4.68
-17,14.05
-59.23
-42.16
-4,94.68
+19.87
-1,12.80
+7.89
-1,38,93.24
+1,92.23
-3,67.68
Total: 00 Village and Small Industries
2851 Village and Small Industries
Figures in italics represent charged expenditure
Heads Actuals for the year Actuals for Increase(+)/
Decrease(-)
during the year
Non-Plan Plan Centrally Sponsored
Schemes Total
2,33,94.11 3,03,30.30 2,40.38 5,39,64.79 6,59,15.35 -1,19,50.56
2,33,94.11 3,03,30.30 2,40.38 5,39,64.79 6,59,15.35 -1,19,50.56
(in lakh of Rupees)
( )
. .
. .
. .
. .
. .
. .
. .
. .
. .
. .
. .
. .
. .
. .
. .
. .
. .
. . . . . .
. . . . . .
12. DETAILED STATEMENT OF REVENUE EXPENDITURE BY MINOR HEADS
2011 -2010 -2012
2011
- Contd.
- Contd.
- Concld.
-Contd.
228
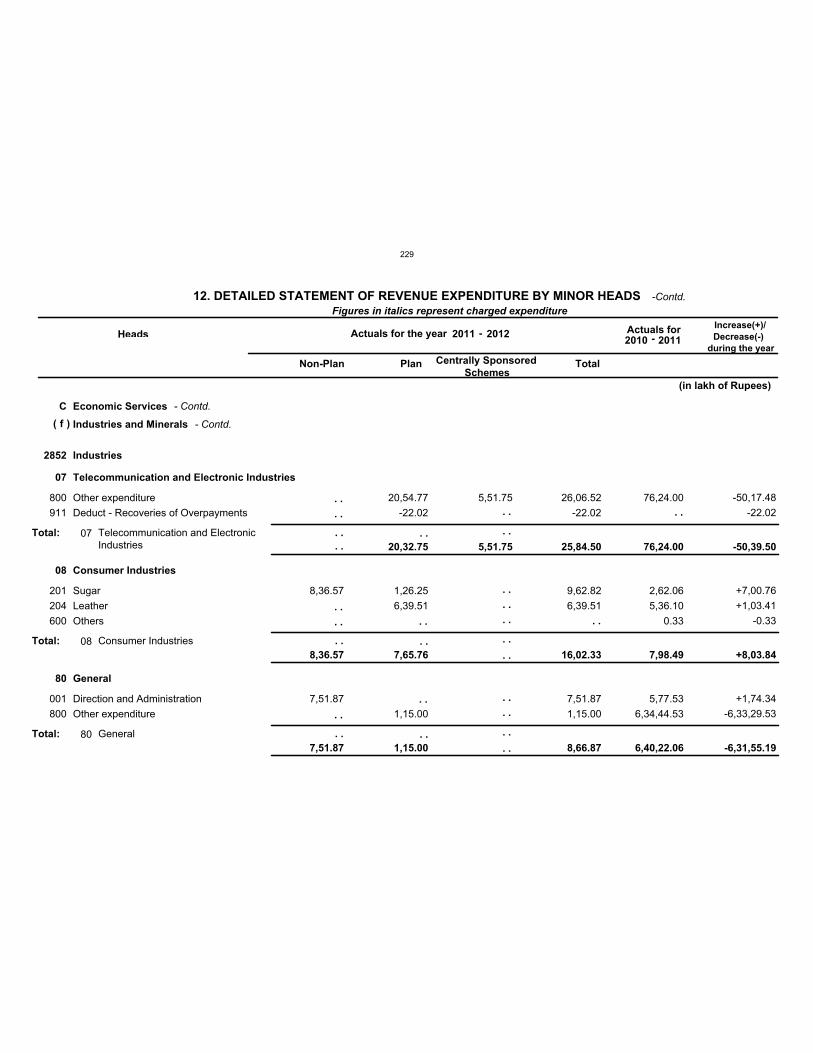
C Economic Services
f Industries and Minerals
2852 Industries
07
08
80
Telecommunication and Electronic Industries
Consumer Industries
General
800
911
201
204
600
001
800
Other expenditure
Deduct - Recoveries of Overpayments
Sugar
Leather
Others
Direction and Administration
Other expenditure
V
V
V
V
V
V
V
8,36.57
7,51.87
20,54.77
-22.02
1,26.25
6,39.51
1,15.00
5,51.75 26,06.52
-22.02
9,62.82
6,39.51
7,51.87
1,15.00
76,24.00
2,62.06
5,36.10
0.33
5,77.53
6,34,44.53
-50,17.48
-22.02
+7,00.76
+1,03.41
-0.33
+1,74.34
-6,33,29.53
Total:
Total:
Total:
07
08
80
Telecommunication and ElectronicIndustries
Consumer Industries
General
Figures in italics represent charged expenditure
Heads Actuals for the year Actuals for Increase(+)/
Decrease(-)
during the year
Non-Plan Plan Centrally Sponsored
Schemes Total
8,36.57
7,51.87
20,32.75
7,65.76
1,15.00
5,51.75 25,84.50
16,02.33
8,66.87
76,24.00
7,98.49
6,40,22.06
-50,39.50
+8,03.84
-6,31,55.19
(in lakh of Rupees)
( )
. .
. .
. .
. .
. .
. .
. .
. .
. .
. .
. .
. .
. .
. .
. .
. .
. .
. .
. .
. .
. .
. .
. .
. .
. .
. .
. .
12. DETAILED STATEMENT OF REVENUE EXPENDITURE BY MINOR HEADS
2011 -2010 -2012
2011
- Contd.
- Contd.
-Contd.
229
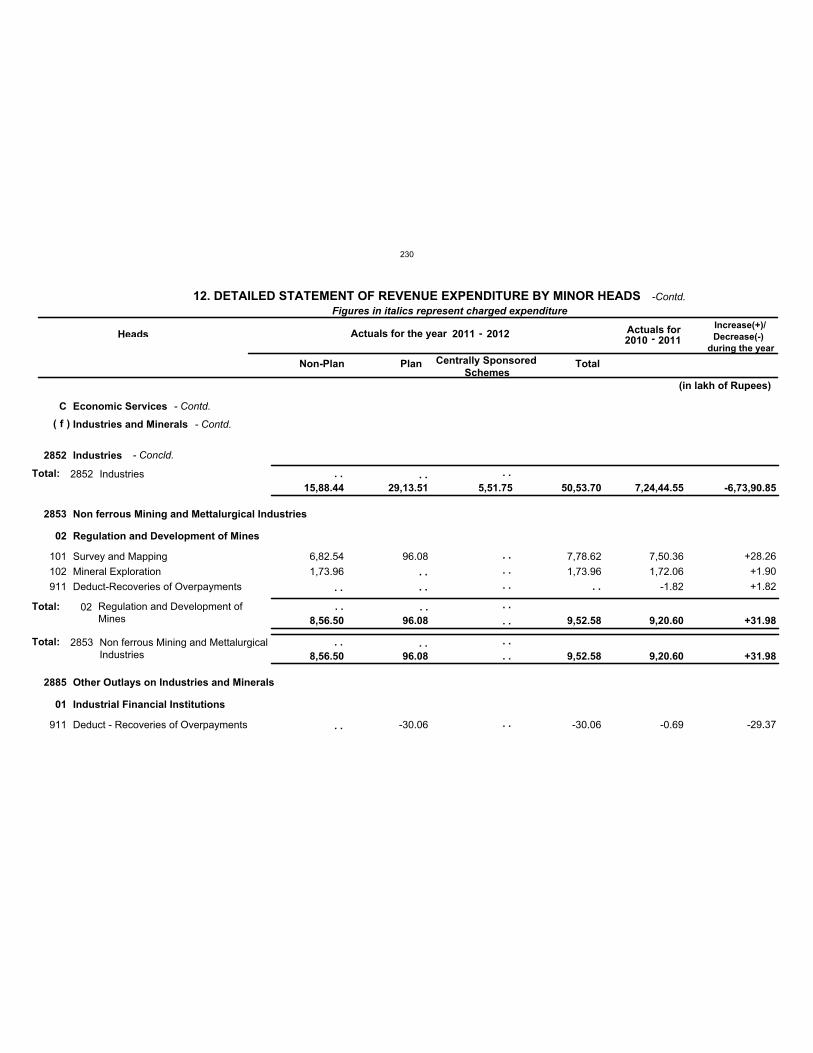
C Economic Services
f Industries and Minerals
2852
2853
2885
Industries
Non ferrous Mining and Mettalurgical Industries
Other Outlays on Industries and Minerals
Total:
Total:
02
01
Regulation and Development of Mines
Industrial Financial Institutions
101
102
911
911
Survey and Mapping
Mineral Exploration
Deduct-Recoveries of Overpayments
Deduct - Recoveries of Overpayments
V
V
V
V
6,82.54
1,73.96
96.08
-30.06
7,78.62
1,73.96
-30.06
7,50.36
1,72.06
-1.82
-0.69
+28.26
+1.90
+1.82
-29.37
Total: 02 Regulation and Development ofMines
2852
2853
Industries
Non ferrous Mining and MettalurgicalIndustries
Figures in italics represent charged expenditure
Heads Actuals for the year Actuals for Increase(+)/
Decrease(-)
during the year
Non-Plan Plan Centrally Sponsored
Schemes Total
8,56.50 96.08 9,52.58 9,20.60 +31.98
15,88.44
8,56.50
29,13.51
96.08
5,51.75 50,53.70
9,52.58
7,24,44.55
9,20.60
-6,73,90.85
+31.98
(in lakh of Rupees)
( )
. .
. .
. .
. .
. .
. .
. .
. .
. .
. . . . . .
. .
. .
. .
. .
. .
. .
. .
. .
12. DETAILED STATEMENT OF REVENUE EXPENDITURE BY MINOR HEADS
2011 -2010 -2012
2011
- Contd.
- Contd.
- Concld.
-Contd.
230
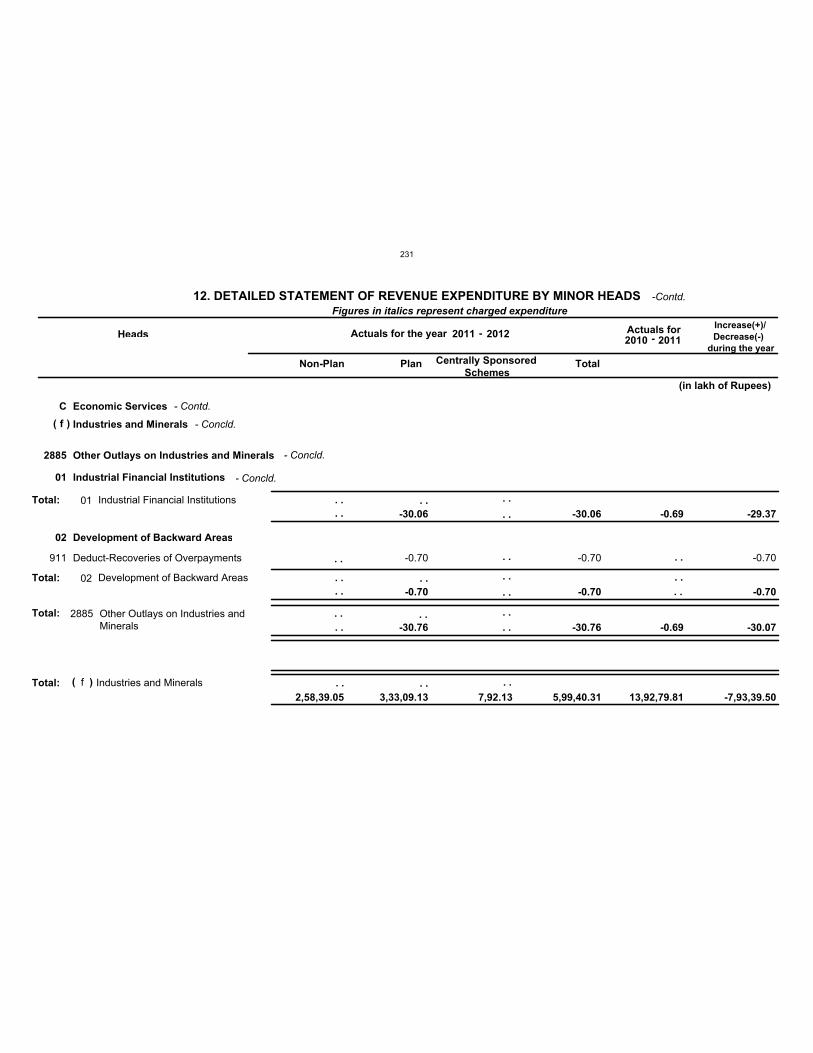
C Economic Services
f Industries and Minerals
Total:
2885 Other Outlays on Industries and Minerals
Total:
01
02
Industrial Financial Institutions
Development of Backward Areas
911 Deduct-Recoveries of Overpayments V -0.70 -0.70 -0.70
Total:
Total:
01
02
Industrial Financial Institutions
Development of Backward Areas
2885 Other Outlays on Industries andMinerals
f Industries and Minerals
Figures in italics represent charged expenditure
Heads Actuals for the year Actuals for Increase(+)/
Decrease(-)
during the year
Non-Plan Plan Centrally Sponsored
Schemes Total
-30.06
-0.70
-30.06
-0.70
-0.69 -29.37
-0.70
-30.76 -30.76 -0.69 -30.07
2,58,39.05 3,33,09.13 7,92.13 5,99,40.31 13,92,79.81 -7,93,39.50
(in lakh of Rupees)
( )
( )
. . . . . .
. .
. .
. .
. .
. .
. .
. .
. .
. .
. .
. .
. .
. . . .
. .
. .
. .
. . . . . .
12. DETAILED STATEMENT OF REVENUE EXPENDITURE BY MINOR HEADS
2011 -2010 -2012
2011
- Contd.
- Concld.
- Concld.
- Concld.
-Contd.
231
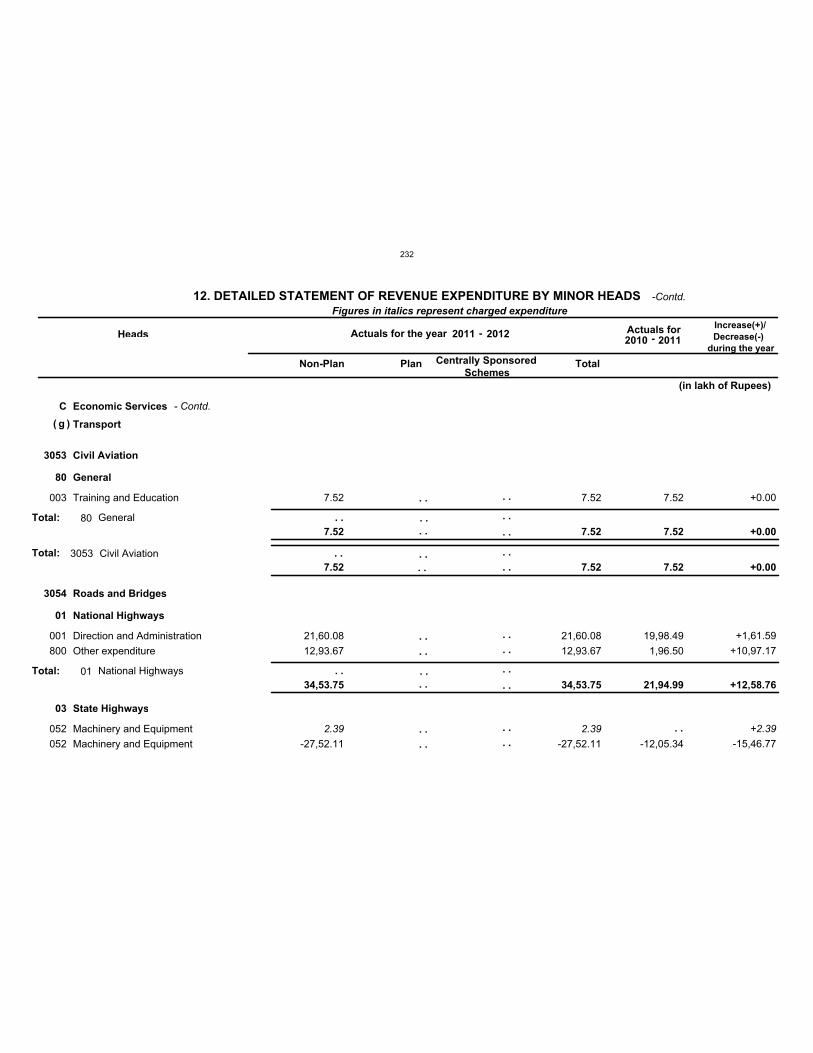
C Economic Services
g Transport
3053
3054
Civil Aviation
Roads and Bridges
Total:
80
01
03
General
National Highways
State Highways
003
001
800
052
052
Training and Education
Direction and Administration
Other expenditure
Machinery and Equipment
Machinery and Equipment
V
V
V
C
V
7.52
21,60.08
12,93.67
2.39
-27,52.11
7.52
21,60.08
12,93.67
2.39
-27,52.11
7.52
19,98.49
1,96.50
-12,05.34
+0.00
+1,61.59
+10,97.17
+2.39
-15,46.77
Total:
Total:
80
01
General
National Highways
3053 Civil Aviation
Figures in italics represent charged expenditure
Heads Actuals for the year Actuals for Increase(+)/
Decrease(-)
during the year
Non-Plan Plan Centrally Sponsored
Schemes Total
7.52
34,53.75
7.52
34,53.75
7.52
21,94.99
+0.00
+12,58.76
7.52 7.52 7.52 +0.00
(in lakh of Rupees)
( )
. .
. .
. .
. .
. .
. .
. .
. .
. .
. .
. .
. .
. .
. .
. .
. .
. .
. .
. .
. .
. .
. . . .
. .
. .
. .
12. DETAILED STATEMENT OF REVENUE EXPENDITURE BY MINOR HEADS
2011 -2010 -2012
2011
- Contd.
-Contd.
232
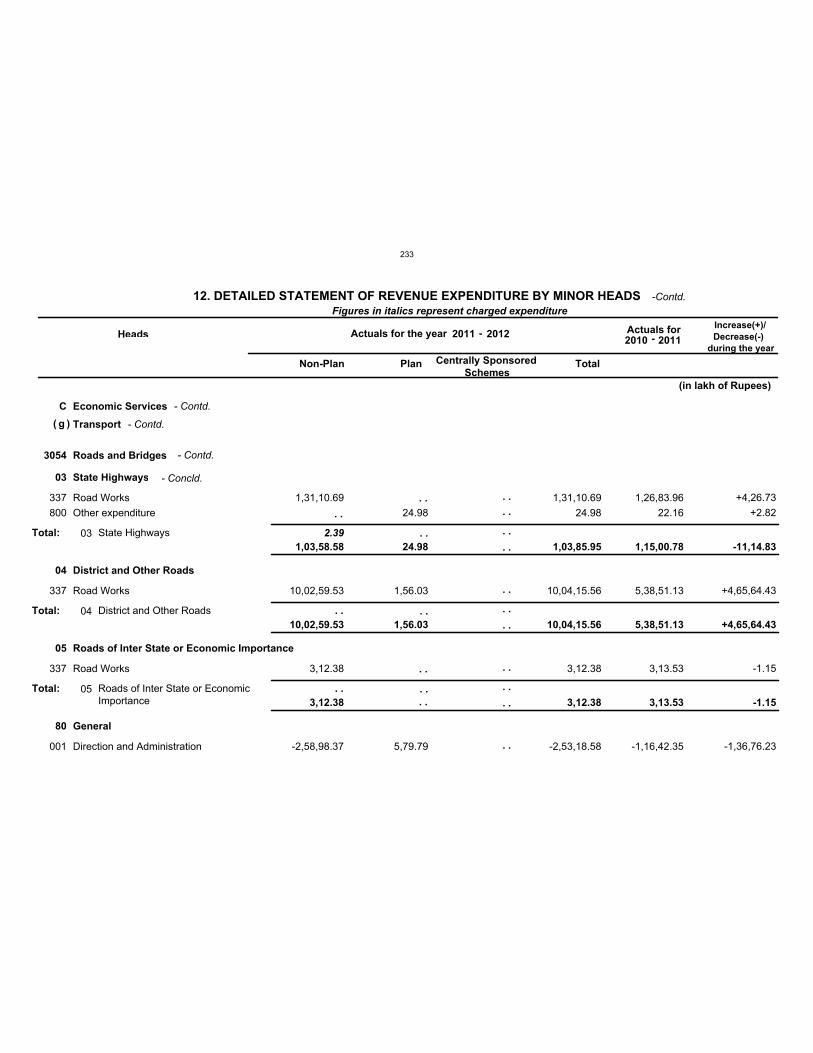
C Economic Services
g Transport
3054 Roads and Bridges
03
04
05
80
State Highways
District and Other Roads
Roads of Inter State or Economic Importance
General
2.39
337
800
337
337
001
Road Works
Other expenditure
Road Works
Road Works
Direction and Administration
V
V
V
V
V
1,31,10.69
10,02,59.53
3,12.38
-2,58,98.37
24.98
1,56.03
5,79.79
1,31,10.69
24.98
10,04,15.56
3,12.38
-2,53,18.58
1,26,83.96
22.16
5,38,51.13
3,13.53
-1,16,42.35
+4,26.73
+2.82
+4,65,64.43
-1.15
-1,36,76.23
Total:
Total:
Total:
03
04
05
State Highways
District and Other Roads
Roads of Inter State or EconomicImportance
Figures in italics represent charged expenditure
Heads Actuals for the year Actuals for Increase(+)/
Decrease(-)
during the year
Non-Plan Plan Centrally Sponsored
Schemes Total
1,03,58.58
10,02,59.53
3,12.38
24.98
1,56.03
1,03,85.95
10,04,15.56
3,12.38
1,15,00.78
5,38,51.13
3,13.53
-11,14.83
+4,65,64.43
-1.15
(in lakh of Rupees)
( )
. .
. .
. .
. .
. .
. .
. .
. .
. .
. .
. .
. .
. .
. .
. .
. .
. .
. .
. .
. .
12. DETAILED STATEMENT OF REVENUE EXPENDITURE BY MINOR HEADS
2011 -2010 -2012
2011
- Contd.
- Contd.
- Contd.
- Concld.
-Contd.
233
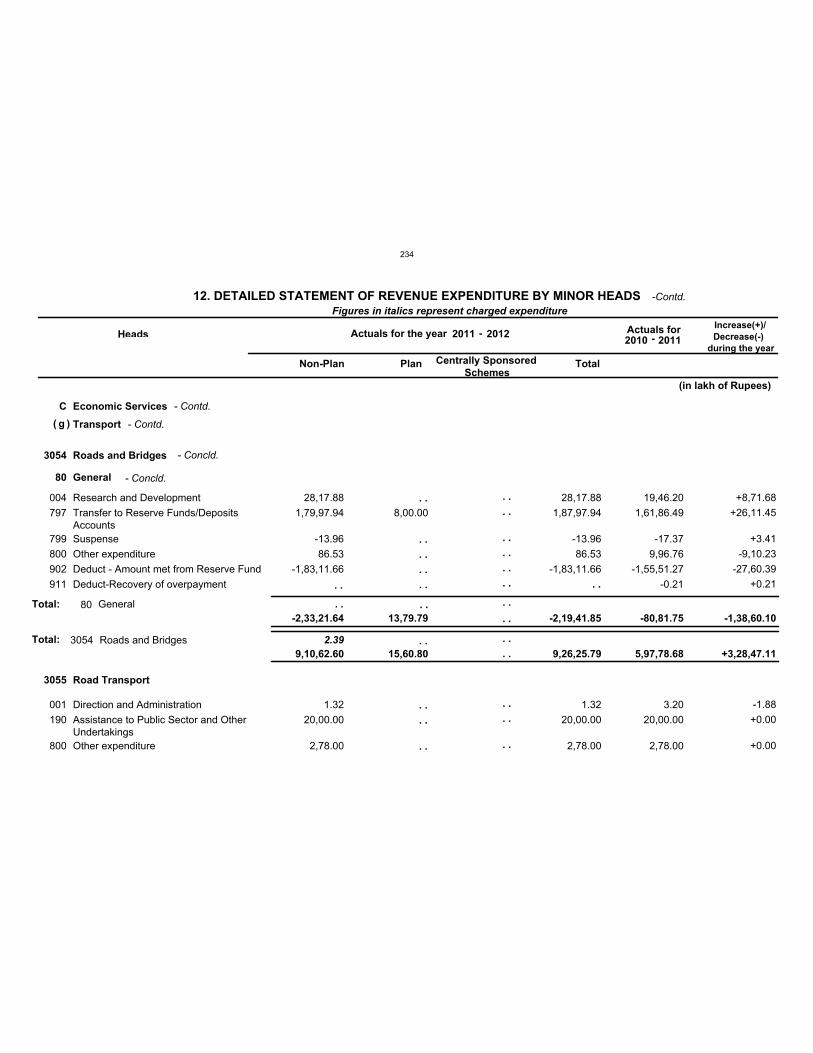
C Economic Services
g Transport
3054
3055
Roads and Bridges
Road Transport
2.39Total:
80 General
004
797
799
800
902
911
001
190
800
Research and Development
Transfer to Reserve Funds/DepositsAccounts
Suspense
Other expenditure
Deduct - Amount met from Reserve Fund
Deduct-Recovery of overpayment
Direction and Administration
Assistance to Public Sector and OtherUndertakings
Other expenditure
V
V
V
V
V
V
V
V
V
28,17.88
1,79,97.94
-13.96
86.53
-1,83,11.66
1.32
20,00.00
2,78.00
8,00.00
28,17.88
1,87,97.94
-13.96
86.53
-1,83,11.66
1.32
20,00.00
2,78.00
19,46.20
1,61,86.49
-17.37
9,96.76
-1,55,51.27
-0.21
3.20
20,00.00
2,78.00
+8,71.68
+26,11.45
+3.41
-9,10.23
-27,60.39
+0.21
-1.88
+0.00
+0.00
Total: 80 General
3054 Roads and Bridges
Figures in italics represent charged expenditure
Heads Actuals for the year Actuals for Increase(+)/
Decrease(-)
during the year
Non-Plan Plan Centrally Sponsored
Schemes Total
-2,33,21.64 13,79.79 -2,19,41.85 -80,81.75 -1,38,60.10
9,10,62.60 15,60.80 9,26,25.79 5,97,78.68 +3,28,47.11
(in lakh of Rupees)
( )
. .
. .
. .
. .
. .
. .
. .
. .
. .
. .
. .
. .
. .
. .
. .
. .
. .
. .
. .
. . . . . .
. .
. . . .
. .
12. DETAILED STATEMENT OF REVENUE EXPENDITURE BY MINOR HEADS
2011 -2010 -2012
2011
- Contd.
- Contd.
- Concld.
- Concld.
-Contd.
234
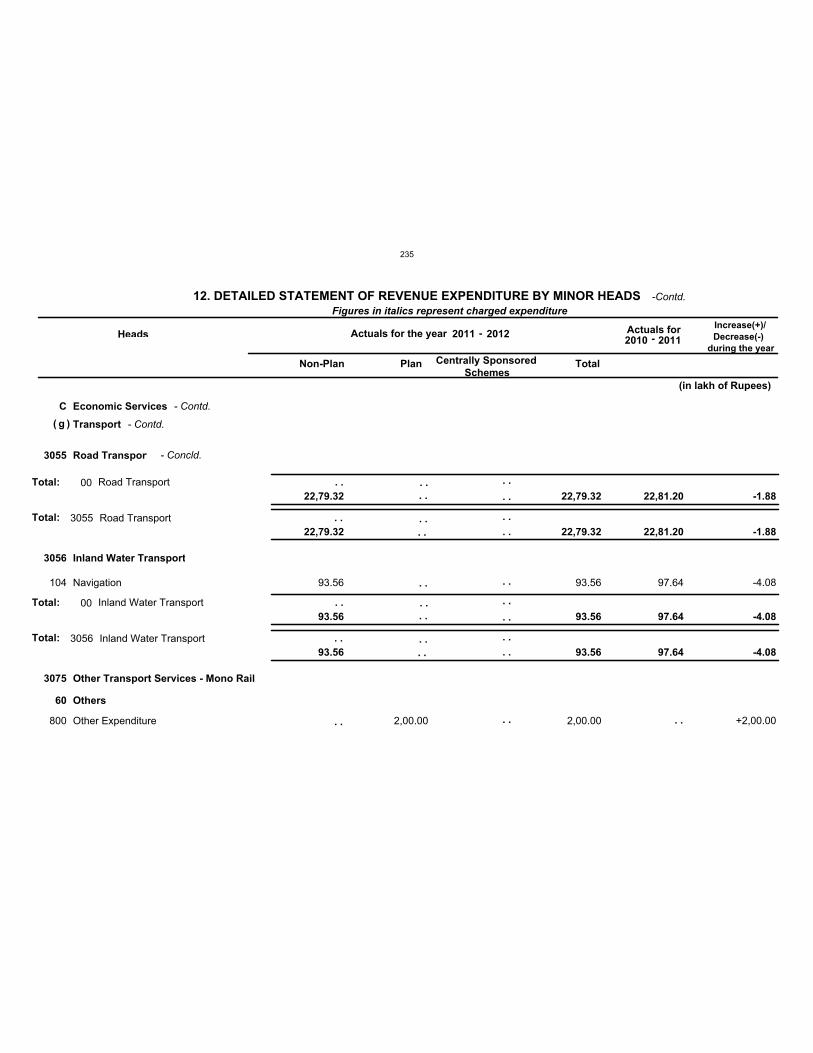
C Economic Services
g Transport
3055
3056
3075
Road Transport
Inland Water Transport
Other Transport Services - Mono Rail
Total:
Total:
60 Others
104
800
Navigation
Other Expenditure
V
V
93.56
2,00.00
93.56
2,00.00
97.64 -4.08
+2,00.00
Total:
Total:
00
00
Road Transport
Inland Water Transport
3055
3056
Road Transport
Inland Water Transport
Figures in italics represent charged expenditure
Heads Actuals for the year Actuals for Increase(+)/
Decrease(-)
during the year
Non-Plan Plan Centrally Sponsored
Schemes Total
22,79.32
93.56
22,79.32
93.56
22,81.20
97.64
-1.88
-4.08
22,79.32
93.56
22,79.32
93.56
22,81.20
97.64
-1.88
-4.08
(in lakh of Rupees)
( )
. .
. . . .
. . . .
. .
. .
. .
. .
. .
. .
. .
. .
. .
. .
. .
. .
. .
. .
. .
. .
. .
. .
. .
. .
12. DETAILED STATEMENT OF REVENUE EXPENDITURE BY MINOR HEADS
2011 -2010 -2012
2011
- Contd.
- Contd.
- Concld.
-Contd.
235
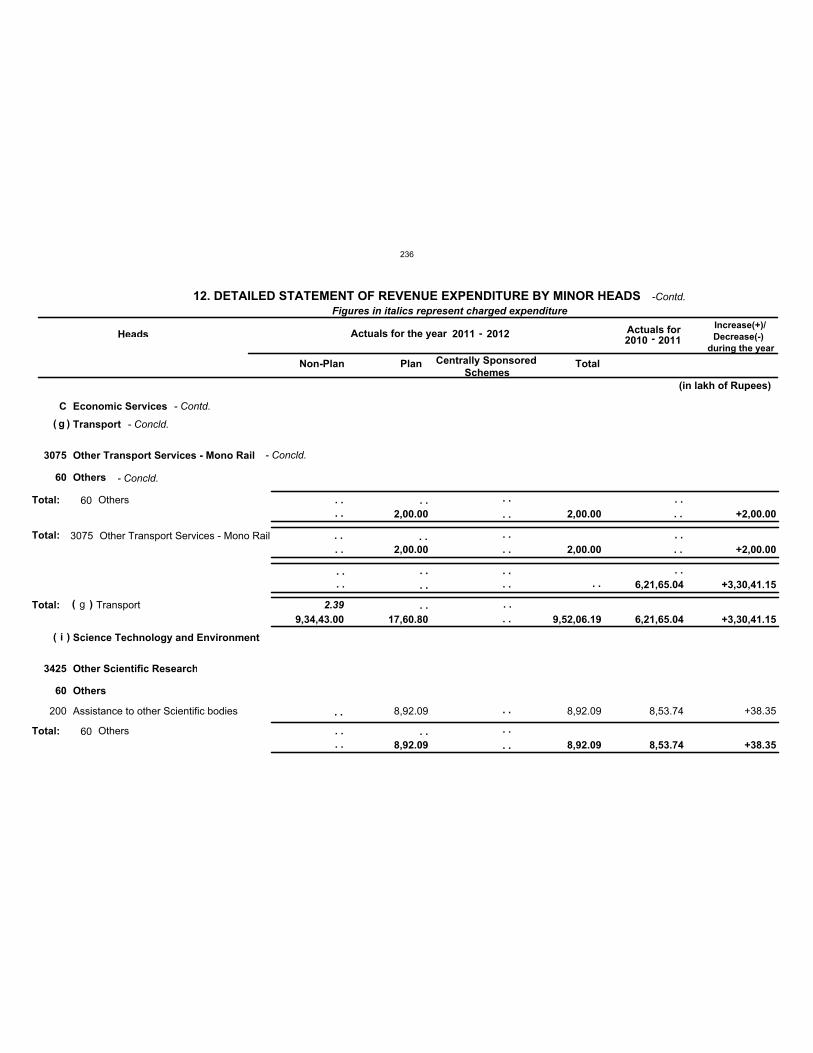
C Economic Services
g
i
Transport
Science Technology and Environment
2.39Total:
3075
3425
Other Transport Services - Mono Rail
Other Scientific Research
Total:
60
60
Others
Others
200 Assistance to other Scientific bodies V 8,92.09 8,92.09 8,53.74 +38.35
Total:
Total:
60
60
Others
Others
3075 Other Transport Services - Mono Rail
g Transport
Figures in italics represent charged expenditure
Heads Actuals for the year Actuals for Increase(+)/
Decrease(-)
during the year
Non-Plan Plan Centrally Sponsored
Schemes Total
2,00.00
8,92.09
2,00.00
8,92.09 8,53.74
+2,00.00
+38.35
2,00.00 2,00.00 +2,00.00
6,21,65.04 +3,30,41.15
9,34,43.00 17,60.80 9,52,06.19 6,21,65.04 +3,30,41.15
(in lakh of Rupees)
(
(
)
)
( )
. . . .
. .
. .
. .
. .
. .
. .
. .
. .
. .
. .
. .
. .
. . . .
. .
. .
. .
. .
. .
. .
. .
. .
. .
. .
. . . .
. .
. . . .
. .
12. DETAILED STATEMENT OF REVENUE EXPENDITURE BY MINOR HEADS
2011 -2010 -2012
2011
- Contd.
- Concld.
- Concld.
- Concld.
-Contd.
236
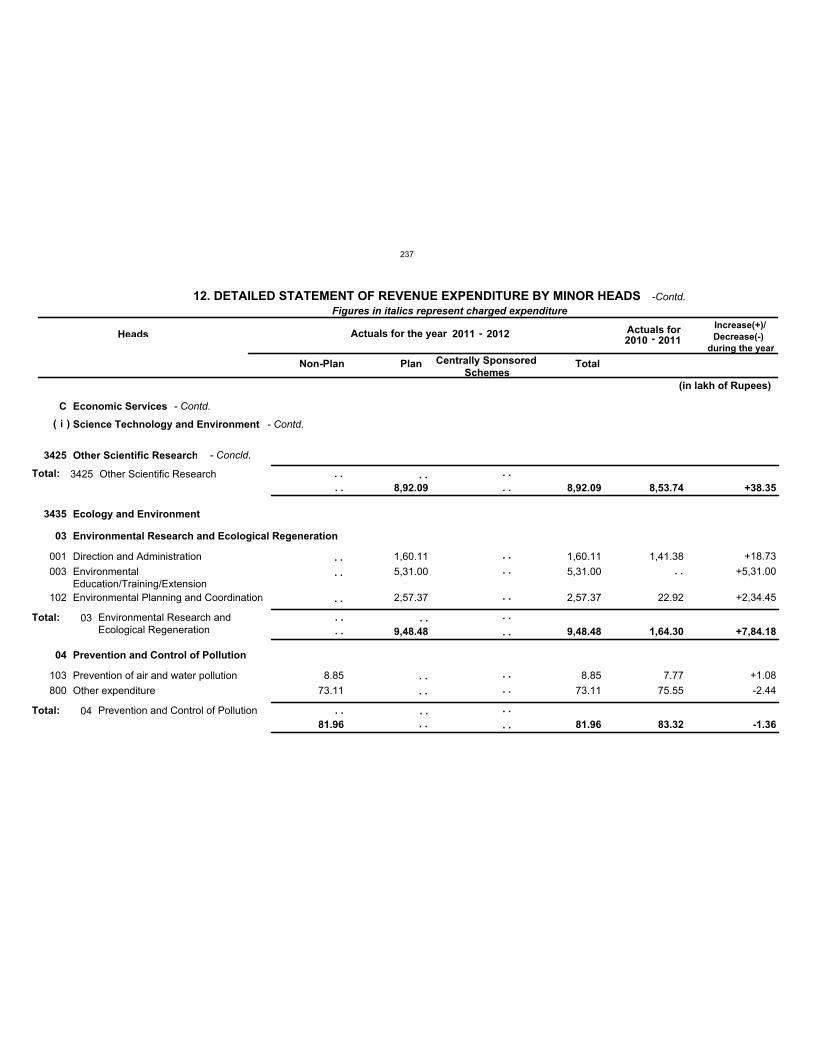
C Economic Services
i Science Technology and Environment
3425
3435
Other Scientific Research
Ecology and Environment
Total:
03
04
Environmental Research and Ecological Regeneration
Prevention and Control of Pollution
001
003
102
103
800
Direction and Administration
EnvironmentalEducation/Training/Extension
Environmental Planning and Coordination
Prevention of air and water pollution
Other expenditure
V
V
V
V
V
8.85
73.11
1,60.11
5,31.00
2,57.37
1,60.11
5,31.00
2,57.37
8.85
73.11
1,41.38
22.92
7.77
75.55
+18.73
+5,31.00
+2,34.45
+1.08
-2.44
Total:
Total:
03
04
Environmental Research andEcological Regeneration
Prevention and Control of Pollution
3425 Other Scientific Research
Figures in italics represent charged expenditure
Heads Actuals for the year Actuals for Increase(+)/
Decrease(-)
during the year
Non-Plan Plan Centrally Sponsored
Schemes Total
81.96
9,48.48 9,48.48
81.96
1,64.30
83.32
+7,84.18
-1.36
8,92.09 8,92.09 8,53.74 +38.35
(in lakh of Rupees)
( )
. .
. .
. .
. .
. .
. .
. .
. .
. .
. .
. .
. .
. .
. .
. .
. .
. .
. .
. .
. .
. .
. .
. .
. . . .
. .
12. DETAILED STATEMENT OF REVENUE EXPENDITURE BY MINOR HEADS
2011 -2010 -2012
2011
- Contd.
- Contd.
- Concld.
-Contd.
237
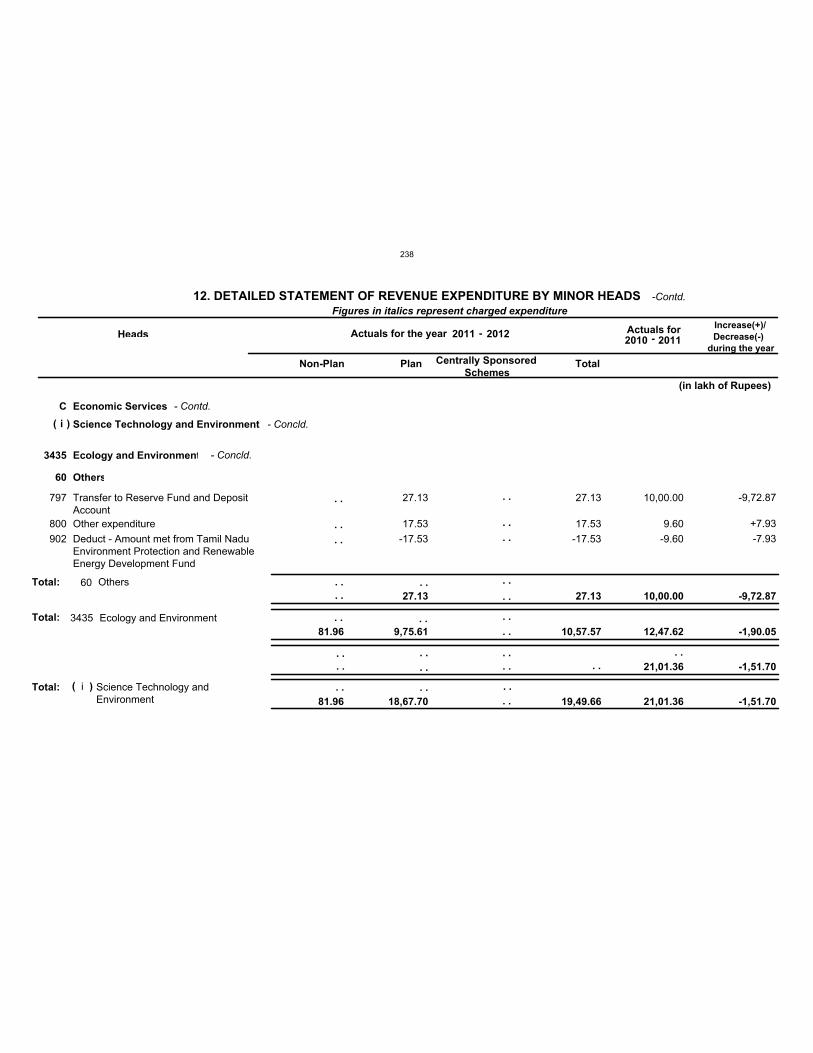
C Economic Services
i Science Technology and Environment
Total:
3435 Ecology and Environment
Total:
60 Others
797
800
902
Transfer to Reserve Fund and DepositAccount
Other expenditure
Deduct - Amount met from Tamil NaduEnvironment Protection and RenewableEnergy Development Fund
V
V
V
27.13
17.53
-17.53
27.13
17.53
-17.53
10,00.00
9.60
-9.60
-9,72.87
+7.93
-7.93
Total: 60 Others
3435 Ecology and Environment
i Science Technology andEnvironment
Figures in italics represent charged expenditure
Heads Actuals for the year Actuals for Increase(+)/
Decrease(-)
during the year
Non-Plan Plan Centrally Sponsored
Schemes Total
27.13 27.13 10,00.00 -9,72.87
81.96 9,75.61 10,57.57 12,47.62 -1,90.05
21,01.36 -1,51.70
81.96 18,67.70 19,49.66 21,01.36 -1,51.70
(in lakh of Rupees)
( )
( )
. .
. .
. .
. .
. .
. .
. .
. .
. . . .
. .
. . . . . .
. .
. .
. .
. .
. .
. .
. . . .
. .
. . . . . .
. .
12. DETAILED STATEMENT OF REVENUE EXPENDITURE BY MINOR HEADS
2011 -2010 -2012
2011
- Contd.
- Concld.
- Concld.
-Contd.
238
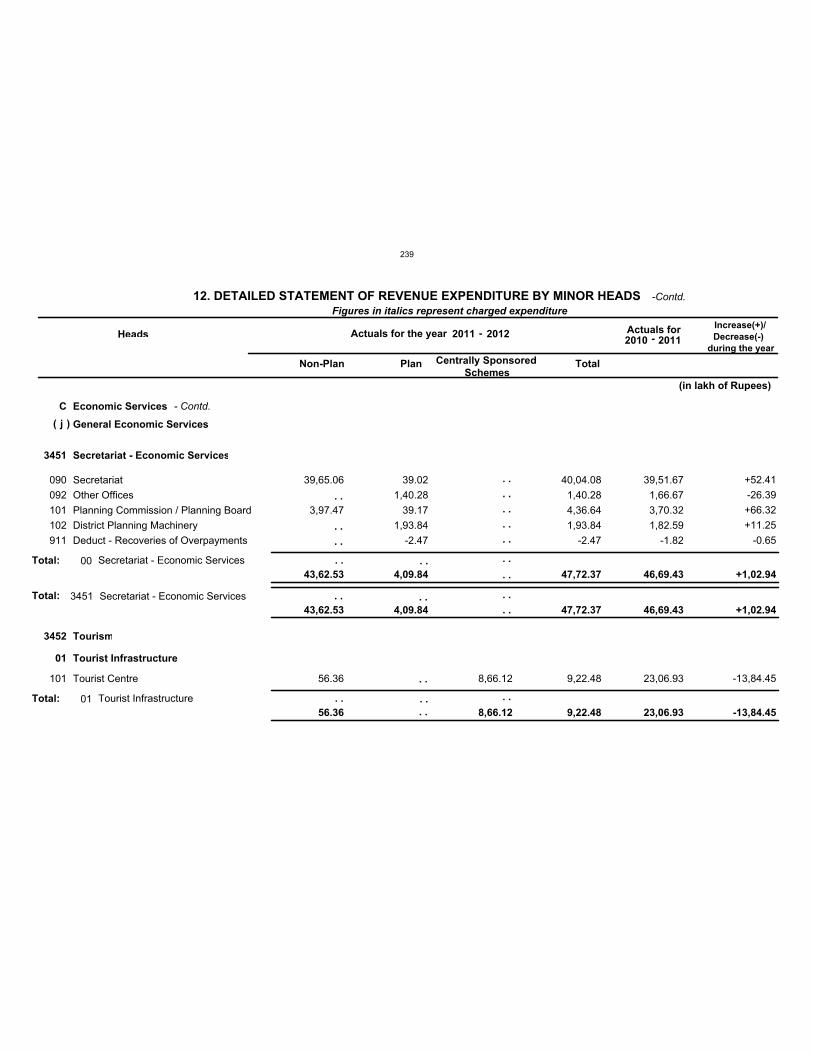
C Economic Services
j General Economic Services
3451
3452
Secretariat - Economic Services
Tourism
Total:
01 Tourist Infrastructure
090
092
101
102
911
101
Secretariat
Other Offices
Planning Commission / Planning Board
District Planning Machinery
Deduct - Recoveries of Overpayments
Tourist Centre
V
V
V
V
V
V
39,65.06
3,97.47
56.36
39.02
1,40.28
39.17
1,93.84
-2.47
8,66.12
40,04.08
1,40.28
4,36.64
1,93.84
-2.47
9,22.48
39,51.67
1,66.67
3,70.32
1,82.59
-1.82
23,06.93
+52.41
-26.39
+66.32
+11.25
-0.65
-13,84.45
Total:
Total:
00
01
Secretariat - Economic Services
Tourist Infrastructure
3451 Secretariat - Economic Services
Figures in italics represent charged expenditure
Heads Actuals for the year Actuals for Increase(+)/
Decrease(-)
during the year
Non-Plan Plan Centrally Sponsored
Schemes Total
43,62.53
56.36
4,09.84
8,66.12
47,72.37
9,22.48
46,69.43
23,06.93
+1,02.94
-13,84.45
43,62.53 4,09.84 47,72.37 46,69.43 +1,02.94
(in lakh of Rupees)
( )
. .
. .
. .
. .
. .
. .
. .
. .
. .
. .
. .
. .
. .
. .
. .
. .
. .
. . . . . .
. .
12. DETAILED STATEMENT OF REVENUE EXPENDITURE BY MINOR HEADS
2011 -2010 -2012
2011
- Contd.
-Contd.
239
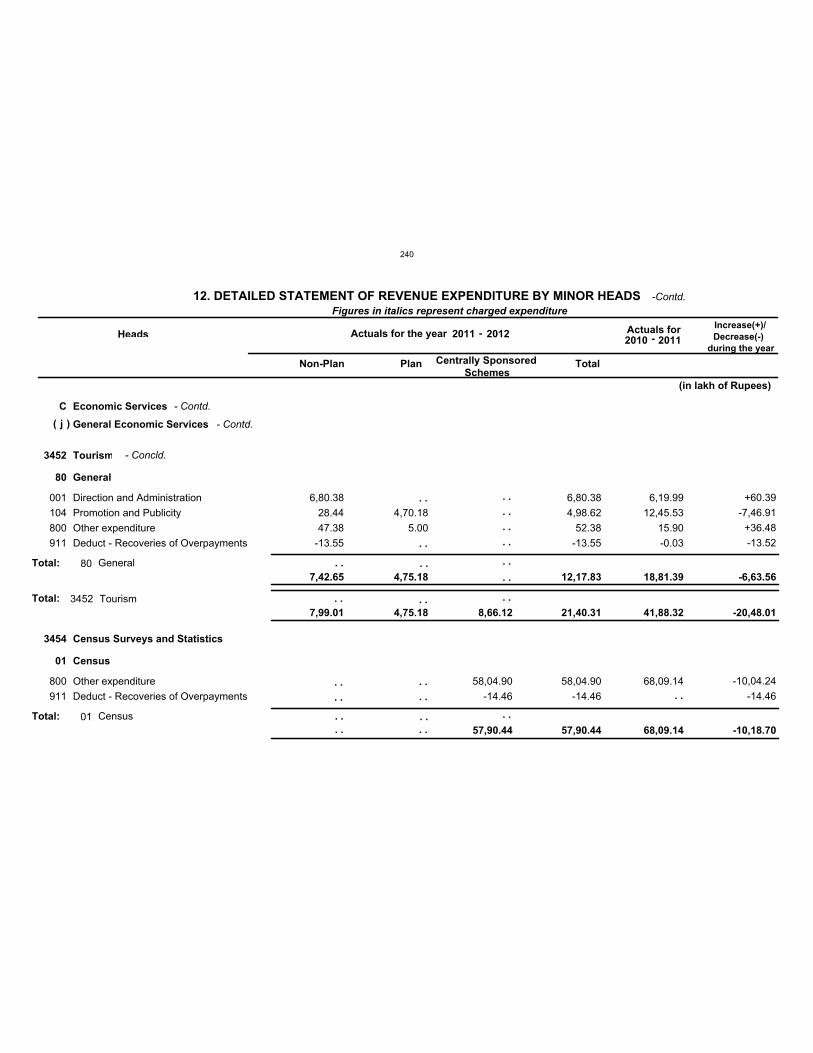
C Economic Services
j General Economic Services
3452
3454
Tourism
Census Surveys and Statistics
Total:
80
01
General
Census
001
104
800
911
800
911
Direction and Administration
Promotion and Publicity
Other expenditure
Deduct - Recoveries of Overpayments
Other expenditure
Deduct - Recoveries of Overpayments
V
V
V
V
V
V
6,80.38
28.44
47.38
-13.55
4,70.18
5.00
58,04.90
-14.46
6,80.38
4,98.62
52.38
-13.55
58,04.90
-14.46
6,19.99
12,45.53
15.90
-0.03
68,09.14
+60.39
-7,46.91
+36.48
-13.52
-10,04.24
-14.46
Total:
Total:
80
01
General
Census
3452 Tourism
Figures in italics represent charged expenditure
Heads Actuals for the year Actuals for Increase(+)/
Decrease(-)
during the year
Non-Plan Plan Centrally Sponsored
Schemes Total
7,42.65 4,75.18
57,90.44
12,17.83
57,90.44
18,81.39
68,09.14
-6,63.56
-10,18.70
7,99.01 4,75.18 8,66.12 21,40.31 41,88.32 -20,48.01
(in lakh of Rupees)
( )
. .
. .
. .
. .
. .
. .
. .
. .
. .
. .
. .
. .
. .
. .
. .
. .
. .
. .
. .
. .
. . . . . .
12. DETAILED STATEMENT OF REVENUE EXPENDITURE BY MINOR HEADS
2011 -2010 -2012
2011
- Contd.
- Contd.
- Concld.
-Contd.
240
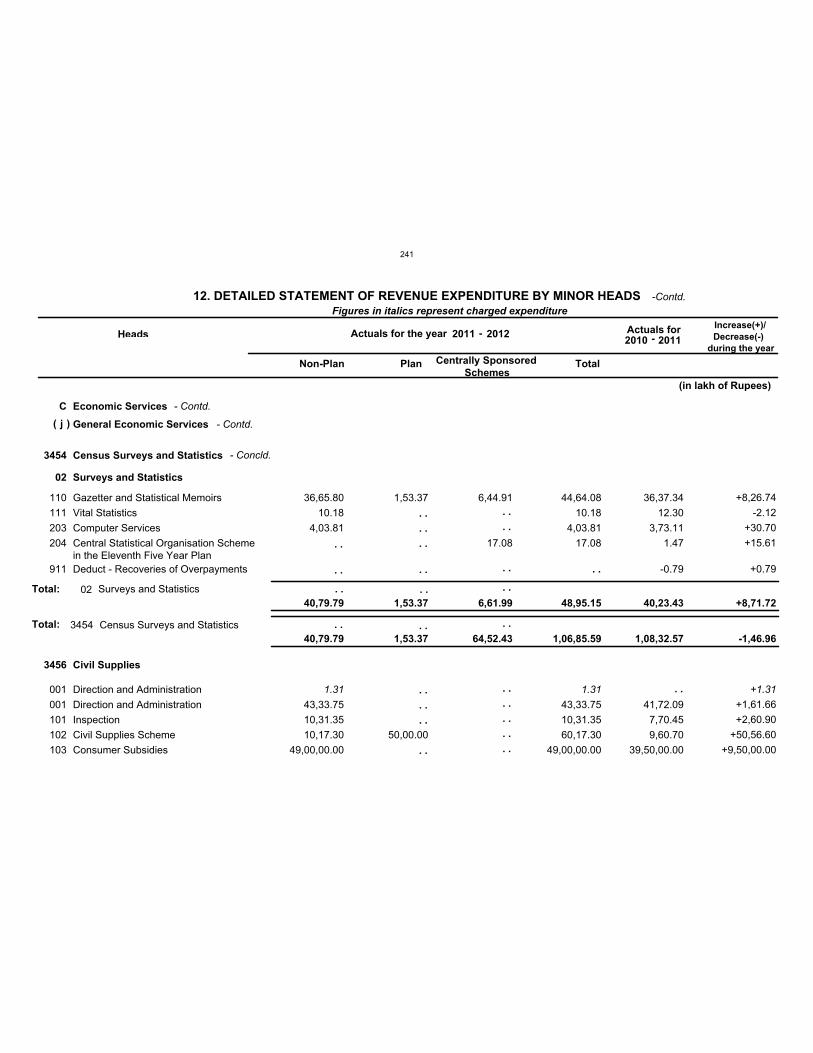
C Economic Services
j General Economic Services
3454
3456
Census Surveys and Statistics
Civil Supplies
Total:
02 Surveys and Statistics
110
111
203
204
911
001
001
101
102
103
Gazetter and Statistical Memoirs
Vital Statistics
Computer Services
Central Statistical Organisation Schemein the Eleventh Five Year Plan
Deduct - Recoveries of Overpayments
Direction and Administration
Direction and Administration
Inspection
Civil Supplies Scheme
Consumer Subsidies
V
V
V
V
V
C
V
V
V
V
36,65.80
10.18
4,03.81
1.31
43,33.75
10,31.35
10,17.30
49,00,00.00
1,53.37
50,00.00
6,44.91
17.08
44,64.08
10.18
4,03.81
17.08
1.31
43,33.75
10,31.35
60,17.30
49,00,00.00
36,37.34
12.30
3,73.11
1.47
-0.79
41,72.09
7,70.45
9,60.70
39,50,00.00
+8,26.74
-2.12
+30.70
+15.61
+0.79
+1.31
+1,61.66
+2,60.90
+50,56.60
+9,50,00.00
Total: 02 Surveys and Statistics
3454 Census Surveys and Statistics
Figures in italics represent charged expenditure
Heads Actuals for the year Actuals for Increase(+)/
Decrease(-)
during the year
Non-Plan Plan Centrally Sponsored
Schemes Total
40,79.79 1,53.37 6,61.99 48,95.15 40,23.43 +8,71.72
40,79.79 1,53.37 64,52.43 1,06,85.59 1,08,32.57 -1,46.96
(in lakh of Rupees)
( )
. .
. .
. .
. .
. .
. .
. .
. .
. .
. .
. .
. .
. .
. .
. .
. .
. .
. .
. .
. .
. . . . . .
. . . . . .
12. DETAILED STATEMENT OF REVENUE EXPENDITURE BY MINOR HEADS
2011 -2010 -2012
2011
- Contd.
- Contd.
- Concld.
-Contd.
241
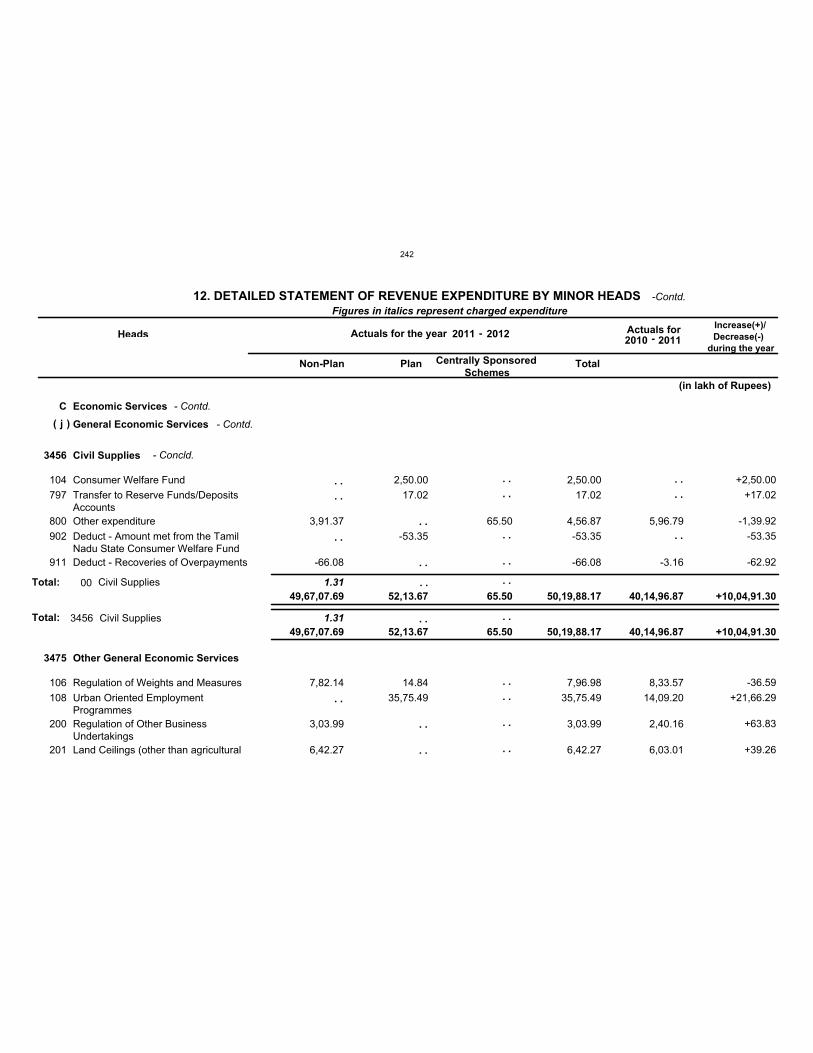
C Economic Services
j General Economic Services
3456
3475
Civil Supplies
Other General Economic Services
1.31Total:
1.31
104
797
800
902
911
106
108
200
201
Consumer Welfare Fund
Transfer to Reserve Funds/DepositsAccounts
Other expenditure
Deduct - Amount met from the TamilNadu State Consumer Welfare Fund
Deduct - Recoveries of Overpayments
Regulation of Weights and Measures
Urban Oriented EmploymentProgrammes
Regulation of Other BusinessUndertakings
Land Ceilings (other than agricultural
V
V
V
V
V
V
V
V
V
3,91.37
-66.08
7,82.14
3,03.99
6,42.27
2,50.00
17.02
-53.35
14.84
35,75.49
65.50
2,50.00
17.02
4,56.87
-53.35
-66.08
7,96.98
35,75.49
3,03.99
6,42.27
5,96.79
-3.16
8,33.57
14,09.20
2,40.16
6,03.01
+2,50.00
+17.02
-1,39.92
-53.35
-62.92
-36.59
+21,66.29
+63.83
+39.26
Total: 00 Civil Supplies
3456 Civil Supplies
Figures in italics represent charged expenditure
Heads Actuals for the year Actuals for Increase(+)/
Decrease(-)
during the year
Non-Plan Plan Centrally Sponsored
Schemes Total
49,67,07.69 52,13.67 65.50 50,19,88.17 40,14,96.87 +10,04,91.30
49,67,07.69 52,13.67 65.50 50,19,88.17 40,14,96.87 +10,04,91.30
(in lakh of Rupees)
( )
. .
. .
. .
. .
. .
. .
. .
. .
. .
. .
. .
. .
. .
. .
. .
. .
. .
. .
. .
. . . .
. . . .
12. DETAILED STATEMENT OF REVENUE EXPENDITURE BY MINOR HEADS
2011 -2010 -2012
2011
- Contd.
- Contd.
- Concld.
-Contd.
242
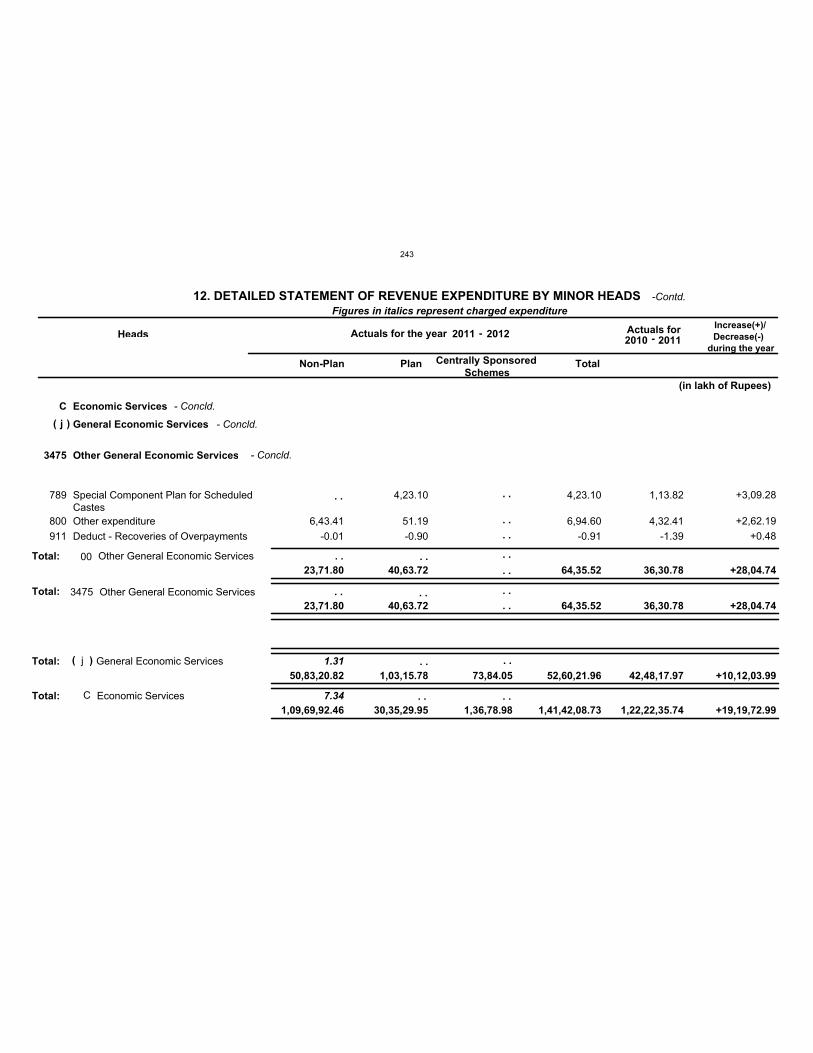
C Economic Services
7.34Total:
j General Economic Services
1.31Total:
3475 Other General Economic Services
Total:
789
800
911
Special Component Plan for ScheduledCastes
Other expenditure
Deduct - Recoveries of Overpayments
V
V
V
6,43.41
-0.01
4,23.10
51.19
-0.90
4,23.10
6,94.60
-0.91
1,13.82
4,32.41
-1.39
+3,09.28
+2,62.19
+0.48
Total: 00 Other General Economic Services
3475 Other General Economic Services
j General Economic Services
C Economic Services
Figures in italics represent charged expenditure
Heads Actuals for the year Actuals for Increase(+)/
Decrease(-)
during the year
Non-Plan Plan Centrally Sponsored
Schemes Total
23,71.80 40,63.72 64,35.52 36,30.78 +28,04.74
23,71.80 40,63.72 64,35.52 36,30.78 +28,04.74
50,83,20.82 1,03,15.78 73,84.05 52,60,21.96 42,48,17.97 +10,12,03.99
1,09,69,92.46 30,35,29.95 1,36,78.98 1,41,42,08.73 1,22,22,35.74 +19,19,72.99
(in lakh of Rupees)
( )
( )
. . . .
. .
. .
. . . . . .
. .
. . . . . .
. .
. . . .
. . . .
12. DETAILED STATEMENT OF REVENUE EXPENDITURE BY MINOR HEADS
2011 -2010 -2012
2011
- Concld.
- Concld.
- Concld.
-Contd.
243
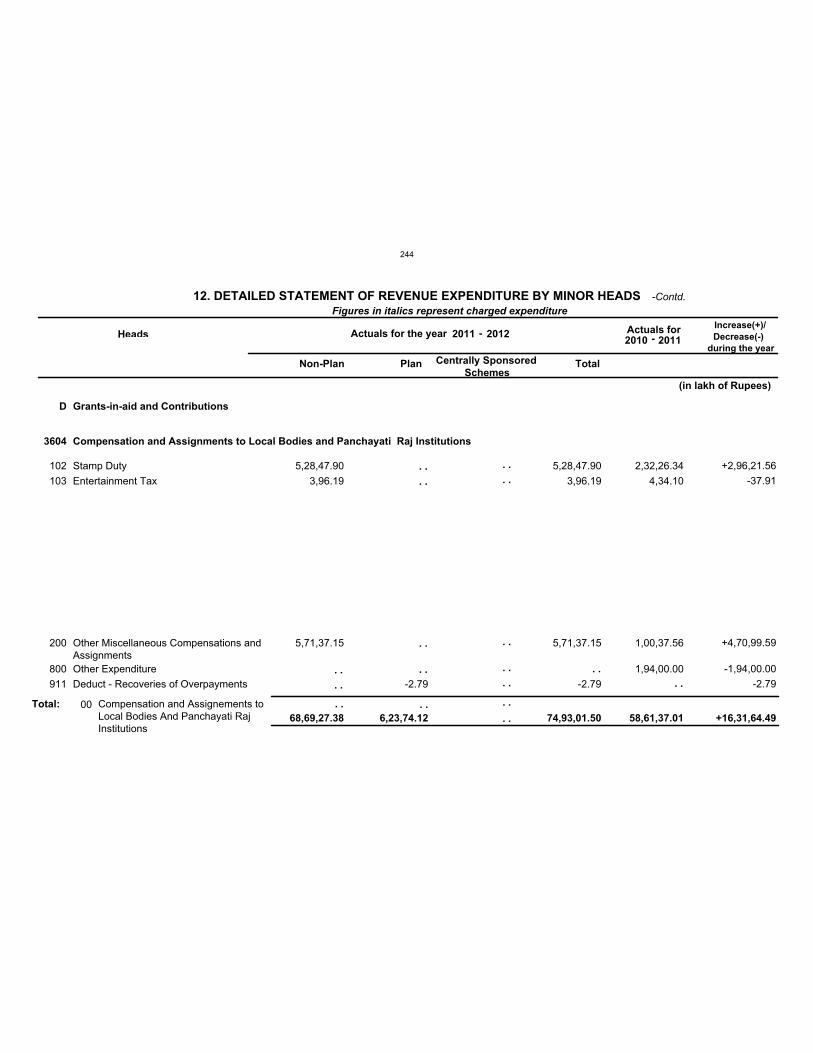
D Grants-in-aid and Contributions
3604 Compensation and Assignments to Local Bodies and Panchayati Raj Institutions
102
103
200
800
911
Stamp Duty
Entertainment Tax
Other Miscellaneous Compensations andAssignments
Other Expenditure
Deduct - Recoveries of Overpayments
V
V
V
V
V
V
V
V
V
V
V
5,28,47.90
3,96.19
5,71,37.15
-2.79
5,28,47.90
3,96.19
5,71,37.15
-2.79
2,32,26.34
4,34.10
1,00,37.56
1,94,00.00
+2,96,21.56
-37.91
+4,70,99.59
-1,94,00.00
-2.79
Total: 00 Compensation and Assignements toLocal Bodies And Panchayati RajInstitutions
Figures in italics represent charged expenditure
Heads Actuals for the year Actuals for Increase(+)/
Decrease(-)
during the year
Non-Plan Plan Centrally Sponsored
Schemes Total
68,69,27.38 6,23,74.12 74,93,01.50 58,61,37.01 +16,31,64.49
(in lakh of Rupees)
. .
. .
. .
. .
. .
. .
. .
. .
. .
. .
. .
. .
. .
. . . . . .
. .
12. DETAILED STATEMENT OF REVENUE EXPENDITURE BY MINOR HEADS
2011 -2010 -2012
2011
-Contd.
244
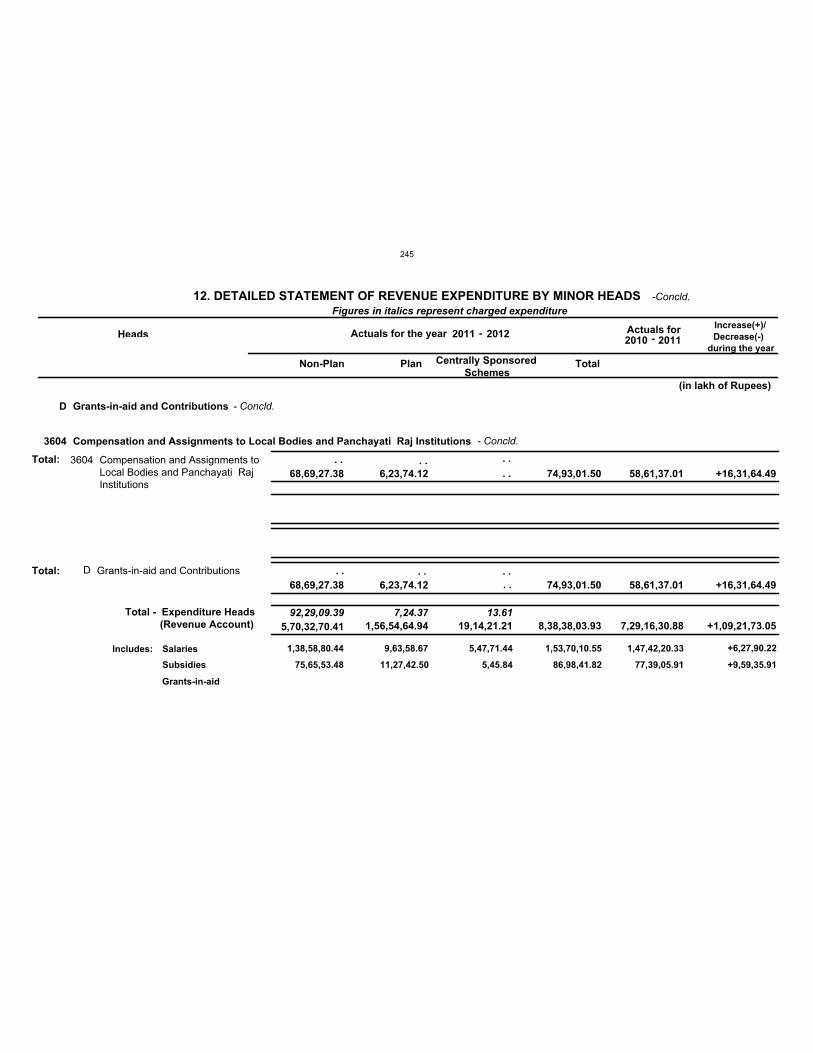
92,29,09.39Total - Expenditure Heads
(Revenue Account)7,24.37 13.61
D Grants-in-aid and Contributions
Total:
3604 Compensation and Assignments to Local Bodies and Panchayati Raj Institutions
Total: 3604 Compensation and Assignments toLocal Bodies and Panchayati RajInstitutions
D Grants-in-aid and Contributions
Figures in italics represent charged expenditure
Heads Actuals for the year Actuals for Increase(+)/
Decrease(-)
during the year
Non-Plan Plan Centrally Sponsored
Schemes Total
68,69,27.38 6,23,74.12 74,93,01.50 58,61,37.01 +16,31,64.49
68,69,27.38 6,23,74.12 74,93,01.50 58,61,37.01 +16,31,64.49
5,70,32,70.41 1,56,54,64.94 19,14,21.21 8,38,38,03.93 7,29,16,30.88 +1,09,21,73.05
(in lakh of Rupees)
1,38,58,80.44 9,63,58.67 5,47,71.44 1,53,70,10.55 1,47,42,20.33Salaries
Subsidies 75,65,53.48 11,27,42.50 5,45.84 86,98,41.82 77,39,05.91
Grants-in-aid
+9,59,35.91
Includes:
. . . . . .
. .
. . . . . .
. .
12. DETAILED STATEMENT OF REVENUE EXPENDITURE BY MINOR HEADS
2011 -2010 -2012
2011
+6,27,90.22
- Concld.
- Concld.
-Concld.
245
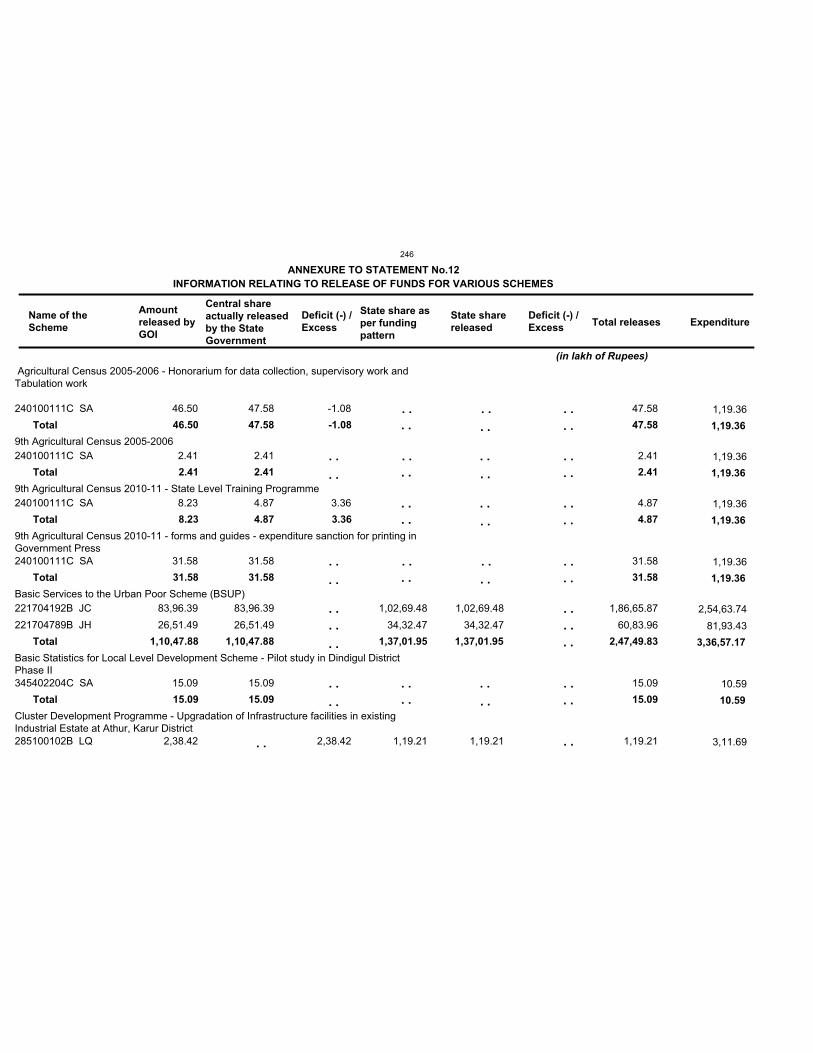
Agricultural Census 2005-2006 - Honorarium for data collection, supervisory work andTabulation work
9th Agricultural Census 2005-2006
9th Agricultural Census 2010-11 - State Level Training Programme
9th Agricultural Census 2010-11 - forms and guides - expenditure sanction for printing inGovernment Press
Basic Services to the Urban Poor Scheme (BSUP)
Basic Statistics for Local Level Development Scheme - Pilot study in Dindigul DistrictPhase II
Cluster Development Programme - Upgradation of Infrastructure facilities in existingIndustrial Estate at Athur, Karur District
46.50
2.41
8.23
31.58
1,10,47.88
15.09
47.58
2.41
4.87
31.58
1,10,47.88
15.09
-1.08
3.36
1,37,01.95 1,37,01.95
47.58
2.41
4.87
31.58
2,47,49.83
15.09
240100111C SA
240100111C SA
240100111C SA
240100111C SA
221704192B JC
221704789B JH
345402204C SA
285100102B LQ
46.50
2.41
8.23
31.58
83,96.39
26,51.49
15.09
2,38.42
47.58
2.41
4.87
31.58
83,96.39
26,51.49
15.09
-1.08
3.36
2,38.42
1,02,69.48
34,32.47
1,19.21
1,02,69.48
34,32.47
1,19.21
47.58
2.41
4.87
31.58
1,86,65.87
60,83.96
15.09
1,19.21
Total
Total
Total
Total
Total
Total
1,19.36
1,19.36
1,19.36
1,19.36
2,54,63.74
81,93.43
10.59
3,11.69
ANNEXURE TO STATEMENT No.12
INFORMATION RELATING TO RELEASE OF FUNDS FOR VARIOUS SCHEMES
Name of the
Scheme
Amount
released by
GOI
Central share
actually released
by the State
Government
Deficit (-) /
Excess
State share as
per funding
pattern
State share
released
Deficit (-) /
ExcessTotal releases Expenditure
(in lakh of Rupees)
. .
. .
. .
. .
. .
. .
. .
. .
. .
. .
. .
. .
. .
. .
. .
. .
. .
. .
. .
. .
. .
. .
. .
1,19.36
1,19.36
1,19.36
1,19.36
3,36,57.17
10.59
. .
. .
. .
. .
. .
. .
. .
. .
. .
. .
. .
. .
. .
. .
. .
. .
. .
. .
. .
. .
. .
246
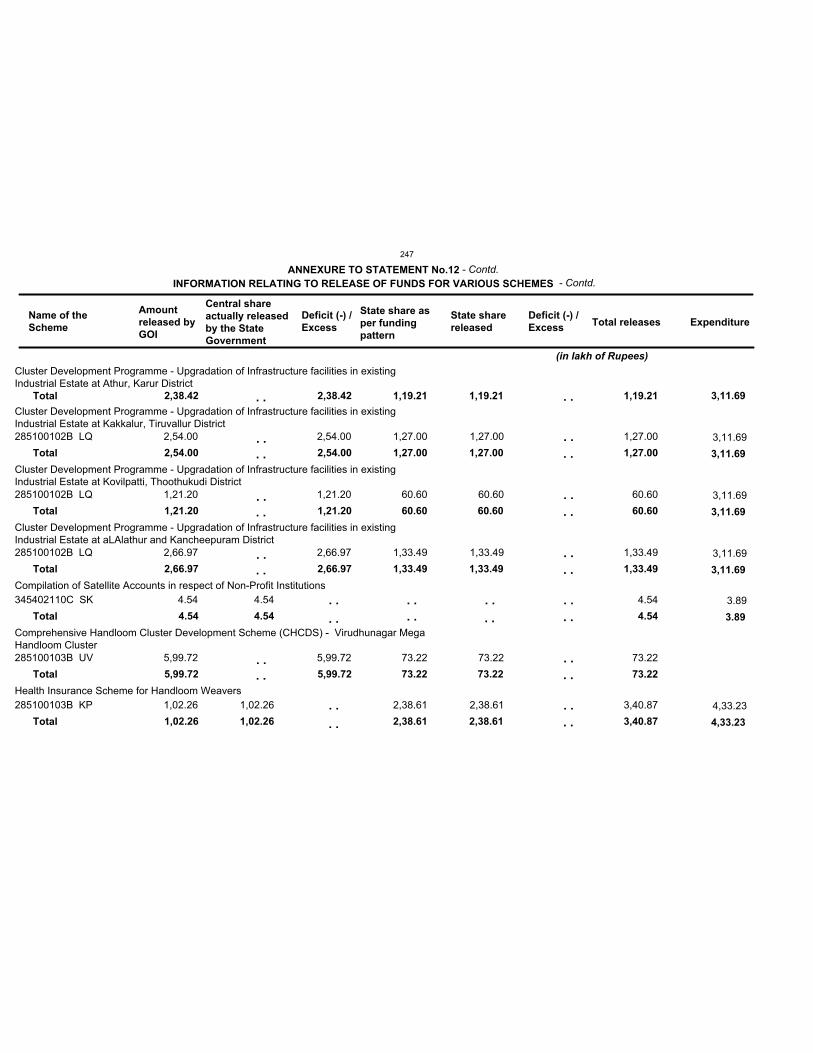
Cluster Development Programme - Upgradation of Infrastructure facilities in existingIndustrial Estate at Athur, Karur District
Cluster Development Programme - Upgradation of Infrastructure facilities in existingIndustrial Estate at Kakkalur, Tiruvallur District
Cluster Development Programme - Upgradation of Infrastructure facilities in existingIndustrial Estate at Kovilpatti, Thoothukudi District
Cluster Development Programme - Upgradation of Infrastructure facilities in existingIndustrial Estate at aLAlathur and Kancheepuram District
Compilation of Satellite Accounts in respect of Non-Profit Institutions
Comprehensive Handloom Cluster Development Scheme (CHCDS) - Virudhunagar MegaHandloom Cluster
Health Insurance Scheme for Handloom Weavers
2,38.42
2,54.00
1,21.20
2,66.97
4.54
5,99.72
1,02.26
4.54
1,02.26
2,38.42
2,54.00
1,21.20
2,66.97
5,99.72
1,19.21
1,27.00
60.60
1,33.49
73.22
2,38.61
1,19.21
1,27.00
60.60
1,33.49
73.22
2,38.61
1,19.21
1,27.00
60.60
1,33.49
4.54
73.22
3,40.87
285100102B LQ
285100102B LQ
285100102B LQ
345402110C SK
285100103B UV
285100103B KP
2,54.00
1,21.20
2,66.97
4.54
5,99.72
1,02.26
4.54
1,02.26
2,54.00
1,21.20
2,66.97
5,99.72
1,27.00
60.60
1,33.49
73.22
2,38.61
1,27.00
60.60
1,33.49
73.22
2,38.61
1,27.00
60.60
1,33.49
4.54
73.22
3,40.87
Total
Total
Total
Total
Total
Total
Total
3,11.69
3,11.69
3,11.69
3.89
4,33.23
ANNEXURE TO STATEMENT No.12
INFORMATION RELATING TO RELEASE OF FUNDS FOR VARIOUS SCHEMES
Name of the
Scheme
Amount
released by
GOI
Central share
actually released
by the State
Government
Deficit (-) /
Excess
State share as
per funding
pattern
State share
released
Deficit (-) /
ExcessTotal releases Expenditure
(in lakh of Rupees)
. .
. .
. . . .
. .
. .
. .
. .
. .
. .
3,11.69
3,11.69
3,11.69
3,11.69
3.89
4,33.23
. .
. .
. .
. .
. .
. .
. .
. .
. .
. .
. .
. . . .
. .
. .
. .
. .
. .
. .
. .
- Contd.
- Contd.
247
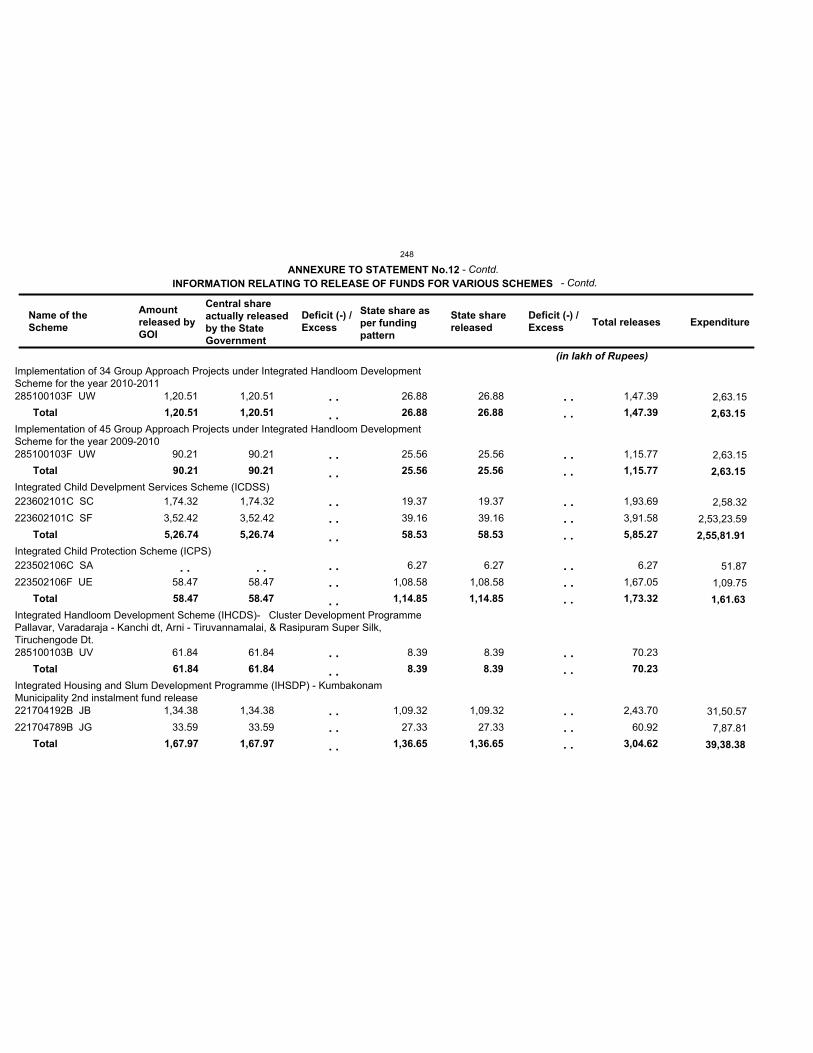
Implementation of 34 Group Approach Projects under Integrated Handloom DevelopmentScheme for the year 2010-2011
Implementation of 45 Group Approach Projects under Integrated Handloom DevelopmentScheme for the year 2009-2010
Integrated Child Develpment Services Scheme (ICDSS)
Integrated Child Protection Scheme (ICPS)
Integrated Handloom Development Scheme (IHCDS)- Cluster Development ProgrammePallavar, Varadaraja - Kanchi dt, Arni - Tiruvannamalai, & Rasipuram Super Silk,Tiruchengode Dt.
Integrated Housing and Slum Development Programme (IHSDP) - KumbakonamMunicipality 2nd instalment fund release
1,20.51
90.21
5,26.74
58.47
61.84
1,67.97
1,20.51
90.21
5,26.74
58.47
61.84
1,67.97
26.88
25.56
58.53
1,14.85
8.39
1,36.65
26.88
25.56
58.53
1,14.85
8.39
1,36.65
1,47.39
1,15.77
5,85.27
1,73.32
70.23
3,04.62
285100103F UW
285100103F UW
223602101C SC
223602101C SF
223502106C SA
223502106F UE
285100103B UV
221704192B JB
221704789B JG
1,20.51
90.21
1,74.32
3,52.42
58.47
61.84
1,34.38
33.59
1,20.51
90.21
1,74.32
3,52.42
58.47
61.84
1,34.38
33.59
26.88
25.56
19.37
39.16
6.27
1,08.58
8.39
1,09.32
27.33
26.88
25.56
19.37
39.16
6.27
1,08.58
8.39
1,09.32
27.33
1,47.39
1,15.77
1,93.69
3,91.58
6.27
1,67.05
70.23
2,43.70
60.92
Total
Total
Total
Total
Total
Total
2,63.15
2,63.15
2,58.32
2,53,23.59
51.87
1,09.75
31,50.57
7,87.81
ANNEXURE TO STATEMENT No.12
INFORMATION RELATING TO RELEASE OF FUNDS FOR VARIOUS SCHEMES
Name of the
Scheme
Amount
released by
GOI
Central share
actually released
by the State
Government
Deficit (-) /
Excess
State share as
per funding
pattern
State share
released
Deficit (-) /
ExcessTotal releases Expenditure
(in lakh of Rupees)
. .
. .
. .
. .
. .
. .
. .
. .
. .
. .
. .
. .
. .
. .
. .
. .
. .
. .
2,63.15
2,63.15
2,55,81.91
1,61.63
39,38.38
. . . .
. .
. .
. .
. .
. .
. .
. .
. .
. .
. .
. .
. .
- Contd.
- Contd.
248
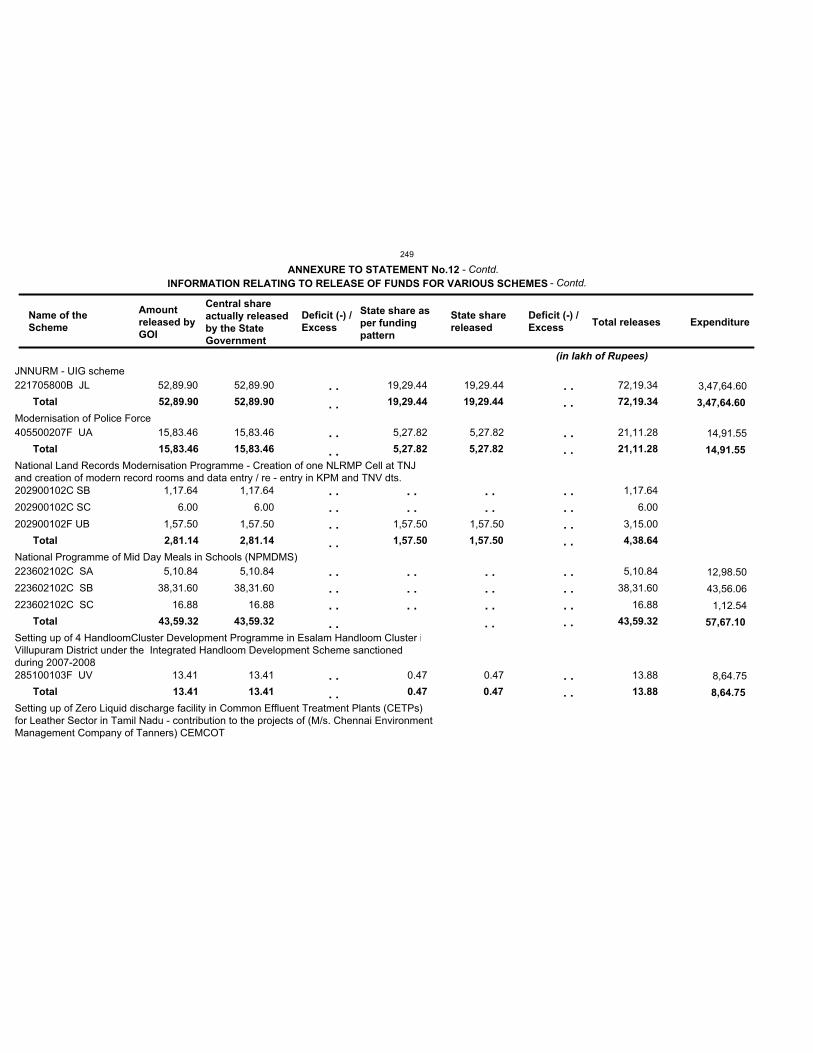
JNNURM - UIG scheme
Modernisation of Police Force
National Land Records Modernisation Programme - Creation of one NLRMP Cell at TNJand creation of modern record rooms and data entry / re - entry in KPM and TNV dts.
National Programme of Mid Day Meals in Schools (NPMDMS)
Setting up of 4 HandloomCluster Development Programme in Esalam Handloom Cluster iVillupuram District under the Integrated Handloom Development Scheme sanctionedduring 2007-2008
Setting up of Zero Liquid discharge facility in Common Effluent Treatment Plants (CETPs)for Leather Sector in Tamil Nadu - contribution to the projects of (M/s. Chennai EnvironmentManagement Company of Tanners) CEMCOT
52,89.90
15,83.46
2,81.14
43,59.32
13.41
52,89.90
15,83.46
2,81.14
43,59.32
13.41
19,29.44
5,27.82
1,57.50
0.47
19,29.44
5,27.82
1,57.50
0.47
72,19.34
21,11.28
4,38.64
43,59.32
13.88
221705800B JL
405500207F UA
202900102C SB
202900102C SC
202900102F UB
223602102C SA
223602102C SB
223602102C SC
285100103F UV
52,89.90
15,83.46
1,17.64
6.00
1,57.50
5,10.84
38,31.60
16.88
13.41
52,89.90
15,83.46
1,17.64
6.00
1,57.50
5,10.84
38,31.60
16.88
13.41
19,29.44
5,27.82
1,57.50
0.47
19,29.44
5,27.82
1,57.50
0.47
72,19.34
21,11.28
1,17.64
6.00
3,15.00
5,10.84
38,31.60
16.88
13.88
Total
Total
Total
Total
Total
3,47,64.60
14,91.55
12,98.50
43,56.06
1,12.54
8,64.75
ANNEXURE TO STATEMENT No.12
INFORMATION RELATING TO RELEASE OF FUNDS FOR VARIOUS SCHEMES
Name of the
Scheme
Amount
released by
GOI
Central share
actually released
by the State
Government
Deficit (-) /
Excess
State share as
per funding
pattern
State share
released
Deficit (-) /
ExcessTotal releases Expenditure
(in lakh of Rupees)
. .
. .
. .
. .
. .
. .
. .
. .
. .
. .
. .
. .
. .
. .
. .
. .
. .
. .
. .
. .
. .
. .
. .
. .
. .
. .
. .
. .
3,47,64.60
14,91.55
57,67.10
8,64.75
. .
. .
. .
. .
. .
. .
. .
. .
. .
. .
. .
- Contd.
- Contd.
249
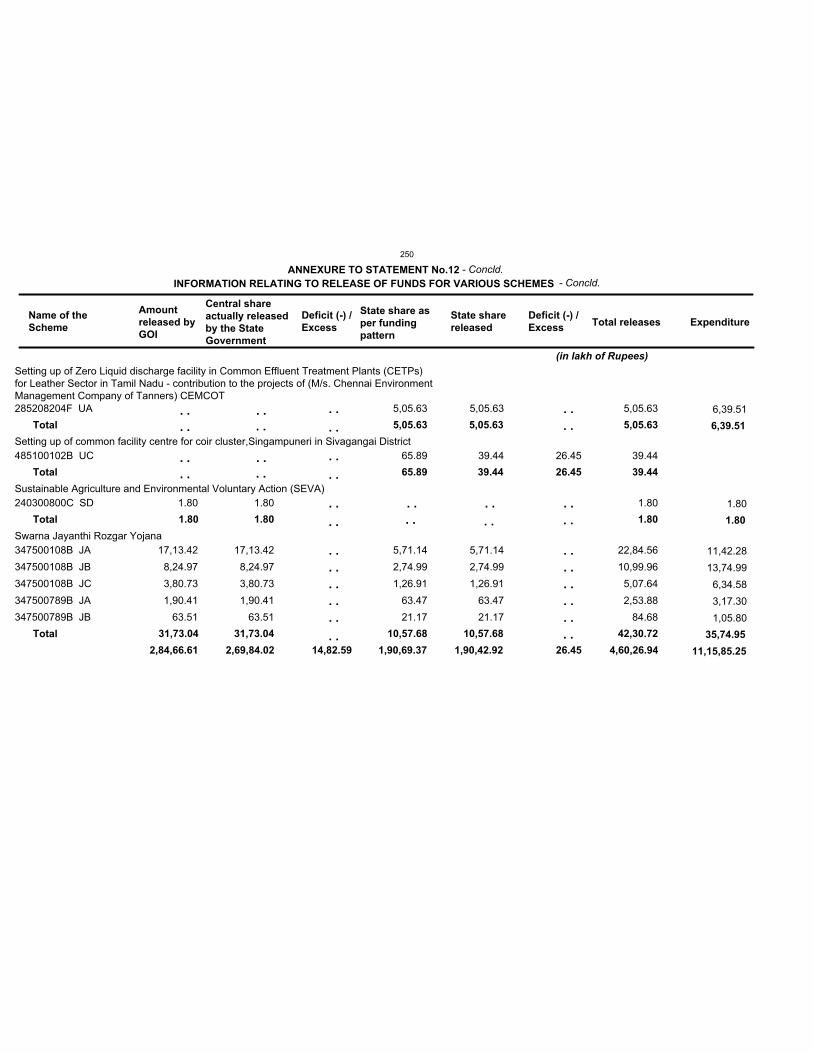
2,84,66.61 2,69,84.02 14,82.59 1,90,69.37 1,90,42.92 26.45 4,60,26.94
Setting up of Zero Liquid discharge facility in Common Effluent Treatment Plants (CETPs)for Leather Sector in Tamil Nadu - contribution to the projects of (M/s. Chennai EnvironmentManagement Company of Tanners) CEMCOT
Setting up of common facility centre for coir cluster,Singampuneri in Sivagangai District
Sustainable Agriculture and Environmental Voluntary Action (SEVA)
Swarna Jayanthi Rozgar Yojana
1.80
31,73.04
1.80
31,73.04
5,05.63
65.89
10,57.68
5,05.63
39.44
10,57.68
26.45
5,05.63
39.44
1.80
42,30.72
285208204F UA
485100102B UC
240300800C SD
347500108B JA
347500108B JB
347500108B JC
347500789B JA
347500789B JB
1.80
17,13.42
8,24.97
3,80.73
1,90.41
63.51
1.80
17,13.42
8,24.97
3,80.73
1,90.41
63.51
5,05.63
65.89
5,71.14
2,74.99
1,26.91
63.47
21.17
5,05.63
39.44
5,71.14
2,74.99
1,26.91
63.47
21.17
26.45
5,05.63
39.44
1.80
22,84.56
10,99.96
5,07.64
2,53.88
84.68
Total
Total
Total
Total
6,39.51
1.80
11,42.28
13,74.99
6,34.58
3,17.30
1,05.80
ANNEXURE TO STATEMENT No.12
INFORMATION RELATING TO RELEASE OF FUNDS FOR VARIOUS SCHEMES
Name of the
Scheme
Amount
released by
GOI
Central share
actually released
by the State
Government
Deficit (-) /
Excess
State share as
per funding
pattern
State share
released
Deficit (-) /
ExcessTotal releases Expenditure
(in lakh of Rupees)
. .
. .
. .
. .
. .
. .
. .
. .
. . . .
. .
. .
. .
. .
. .
. .
. .
6,39.51
1.80
35,74.95
11,15,85.25
. .
. .
. .
. .
. .
. .
. .
. .
. .
. .
. .
. .
. . . .
. .
. .
. .
- Concld.
- Concld.
250
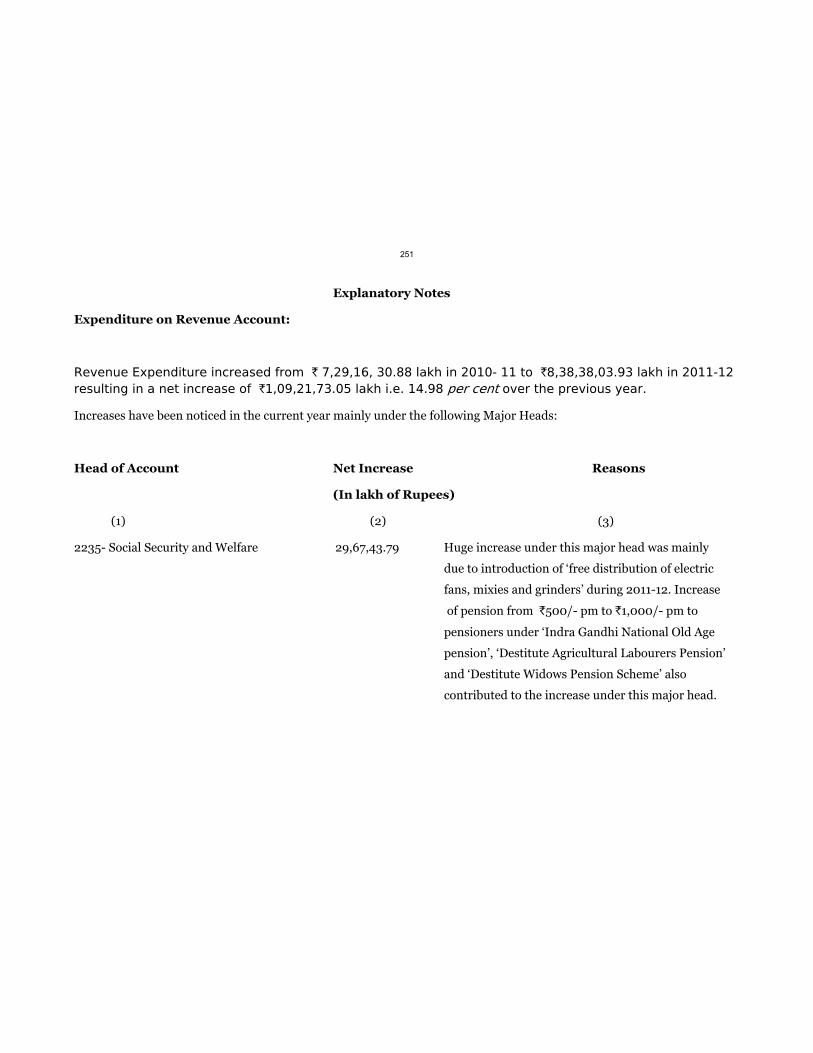
Explanatory Notes
Expenditure on Revenue Account:
Revenue Expenditure increased from ` 7,29,16, 30.88 lakh in 2010- 11 to `8,38,38,03.93 lakh in 2011-12
resulting in a net increase of `1,09,21,73.05 lakh i.e. 14.98 per cent over the previous year.
Increases have been noticed in the current year mainly under the following Major Heads:
Head of Account Net Increase Reasons
(In lakh of Rupees)
(1) (2) (3)
2235- Social Security and Welfare 29,67,43.79 Huge increase under this major head was mainly
due to introduction of ‘free distribution of electric
fans, mixies and grinders’ during 2011-12. Increase
of pension from `500/- pm to `1,000/- pm to
pensioners under ‘Indra Gandhi National Old Age
pension’, ‘Destitute Agricultural Labourers Pension’
and ‘Destitute Widows Pension Scheme’ also
contributed to the increase under this major head.
251
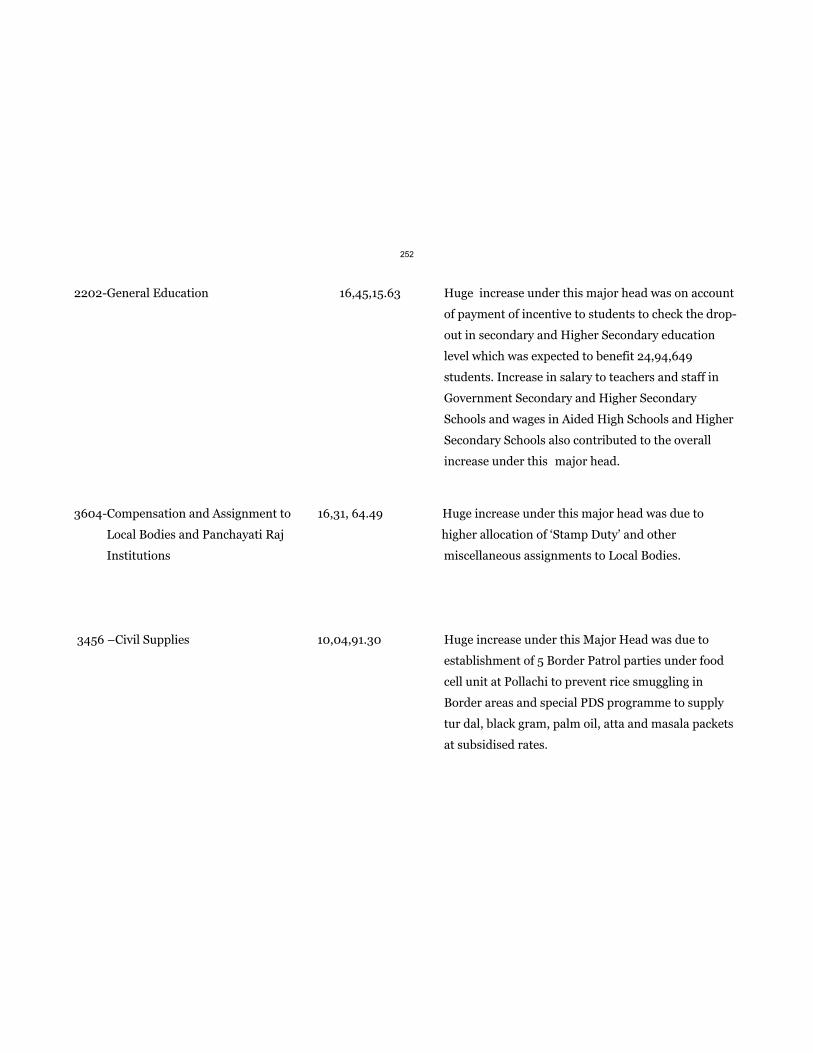
2202-General Education 16,45,15.63 Huge increase under this major head was on account
of payment of incentive to students to check the drop-
out in secondary and Higher Secondary education
level which was expected to benefit 24,94,649
students. Increase in salary to teachers and staff in
Government Secondary and Higher Secondary
Schools and wages in Aided High Schools and Higher
Secondary Schools also contributed to the overall
increase under this major head.
3604-Compensation and Assignment to 16,31, 64.49 Huge increase under this major head was due to
Local Bodies and Panchayati Raj higher allocation of ‘Stamp Duty’ and other
Institutions miscellaneous assignments to Local Bodies.
3456 –Civil Supplies 10,04,91.30 Huge increase under this Major Head was due to
establishment of 5 Border Patrol parties under food
cell unit at Pollachi to prevent rice smuggling in
Border areas and special PDS programme to supply
tur dal, black gram, palm oil, atta and masala packets
at subsidised rates.
252
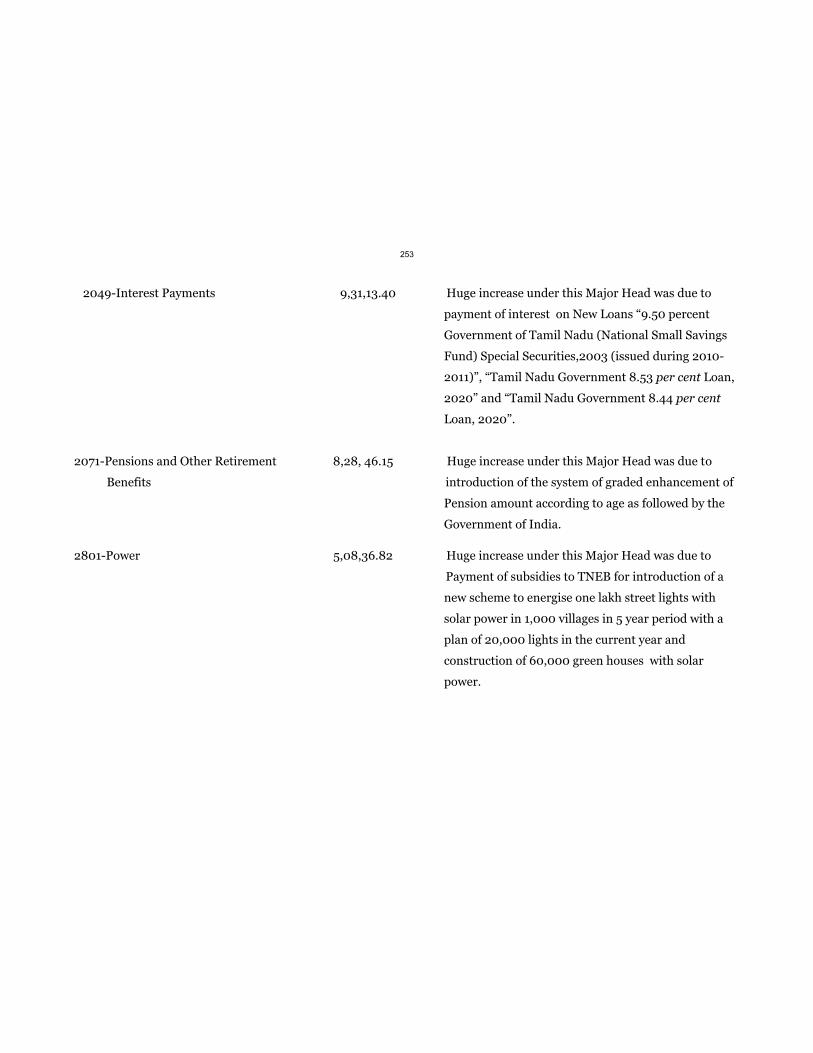
2049-Interest Payments 9,31,13.40 Huge increase under this Major Head was due to
payment of interest on New Loans “9.50 percent
Government of Tamil Nadu (National Small Savings
Fund) Special Securities,2003 (issued during 2010-
2011)”, “Tamil Nadu Government 8.53 per cent Loan,
2020” and “Tamil Nadu Government 8.44 per cent
Loan, 2020”.
2071-Pensions and Other Retirement 8,28, 46.15 Huge increase under this Major Head was due to
Benefits introduction of the system of graded enhancement of
Pension amount according to age as followed by the
Government of India.
2801-Power 5,08,36.82 Huge increase under this Major Head was due to
Payment of subsidies to TNEB for introduction of a
new scheme to energise one lakh street lights with
solar power in 1,000 villages in 5 year period with a
plan of 20,000 lights in the current year and
construction of 60,000 green houses with solar
power.
253
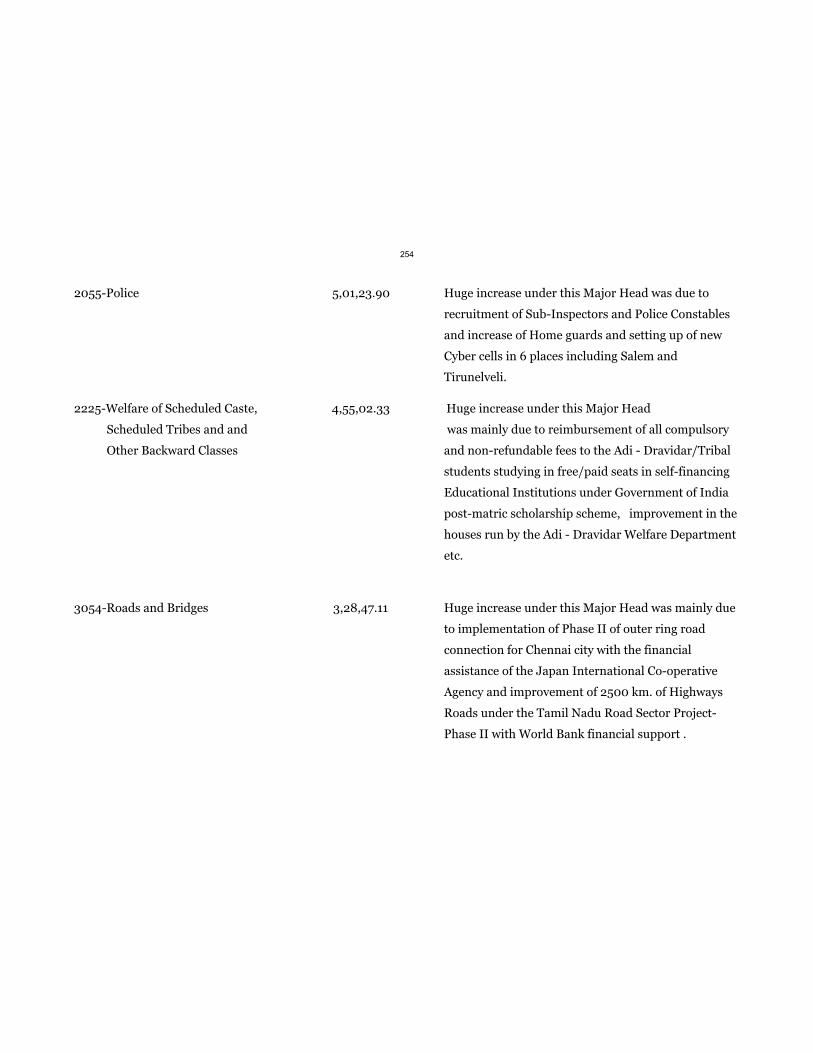
2055-Police 5,01,23.90 Huge increase under this Major Head was due to
recruitment of Sub-Inspectors and Police Constables
and increase of Home guards and setting up of new
Cyber cells in 6 places including Salem and
Tirunelveli.
2225-Welfare of Scheduled Caste, 4,55,02.33 Huge increase under this Major Head
Scheduled Tribes and and was mainly due to reimbursement of all compulsory
Other Backward Classes and non-refundable fees to the Adi - Dravidar/Tribal
students studying in free/paid seats in self-financing
Educational Institutions under Government of India
post-matric scholarship scheme, improvement in the
houses run by the Adi - Dravidar Welfare Department
etc.
3054-Roads and Bridges 3,28,47.11 Huge increase under this Major Head was mainly due
to implementation of Phase II of outer ring road
connection for Chennai city with the financial
assistance of the Japan International Co-operative
Agency and improvement of 2500 km. of Highways
Roads under the Tamil Nadu Road Sector Project-
Phase II with World Bank financial support .
254
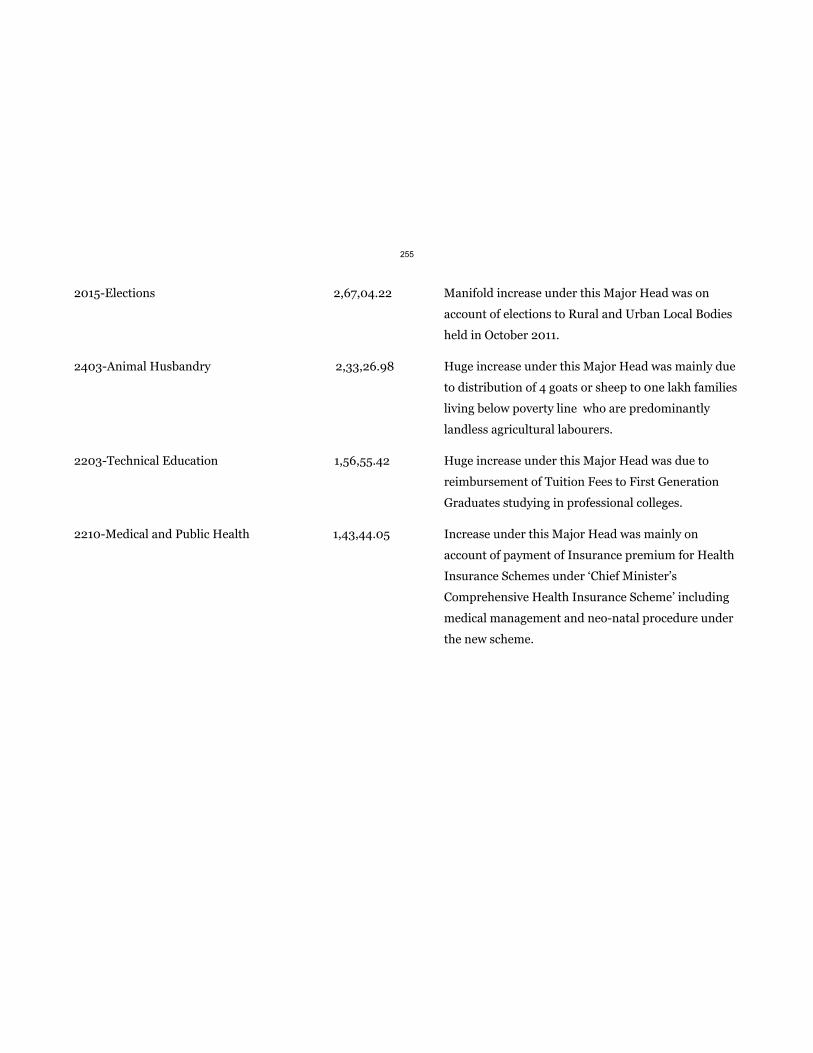
2015-Elections 2,67,04.22 Manifold increase under this Major Head was on
account of elections to Rural and Urban Local Bodies
held in October 2011.
2403-Animal Husbandry 2,33,26.98 Huge increase under this Major Head was mainly due
to distribution of 4 goats or sheep to 0ne lakh families
living below poverty line who are predominantly
landless agricultural labourers.
2203-Technical Education 1,56,55.42 Huge increase under this Major Head was due to
reimbursement of Tuition Fees to First Generation
Graduates studying in professional colleges.
2210-Medical and Public Health 1,43,44.05 Increase under this Major Head was mainly on
account of payment of Insurance premium for Health
Insurance Schemes under ‘Chief Minister’s
Comprehensive Health Insurance Scheme’ including
medical management and neo-natal procedure under
the new scheme.
255
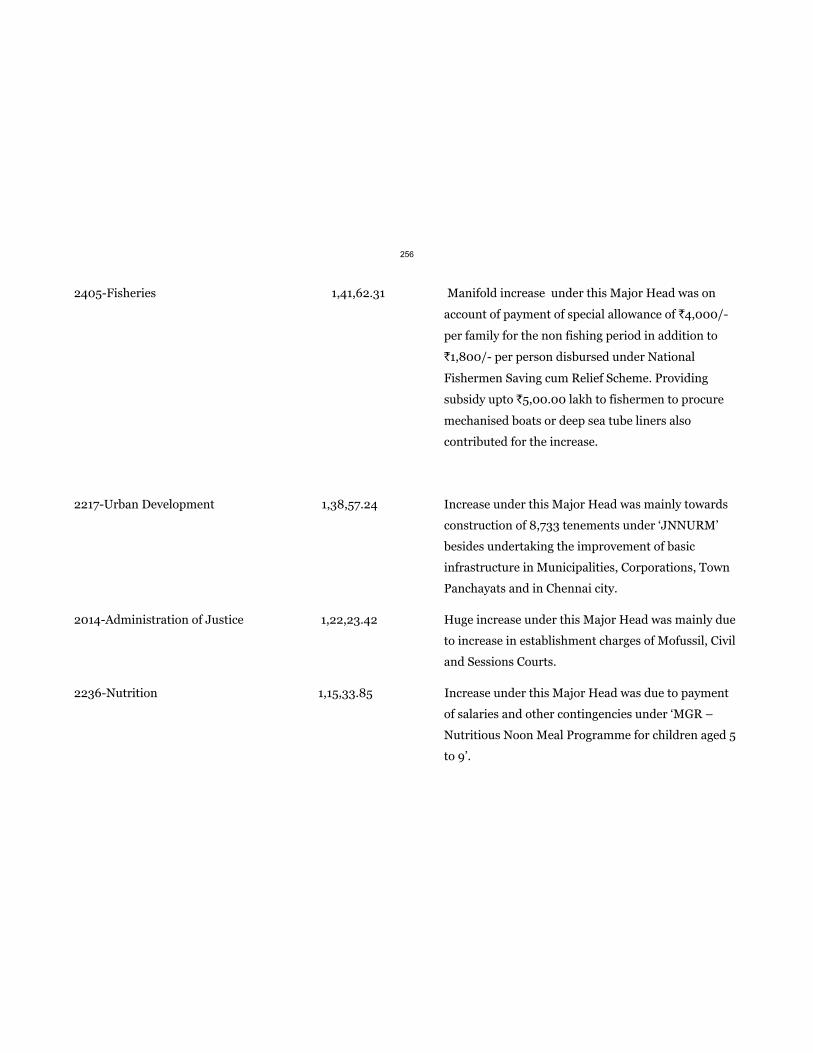
2405-Fisheries 1,41,62.31 Manifold increase under this Major Head was on
account of payment of special allowance of `4,000/-
per family for the non fishing period in addition to
`1,800/- per person disbursed under National
Fishermen Saving cum Relief Scheme. Providing
subsidy upto `5,00.00 lakh to fishermen to procure
mechanised boats or deep sea tube liners also
contributed for the increase.
2217-Urban Development 1,38,57.24 Increase under this Major Head was mainly towards
construction of 8,733 tenements under ‘JNNURM’
besides undertaking the improvement of basic
infrastructure in Municipalities, Corporations, Town
Panchayats and in Chennai city.
2014-Administration of Justice 1,22,23.42 Huge increase under this Major Head was mainly due
to increase in establishment charges of Mofussil, Civil
and Sessions Courts.
2236-Nutrition 1,15,33.85 Increase under this Major Head was due to payment
of salaries and other contingencies under ‘MGR –
Nutritious Noon Meal Programme for children aged 5
to 9’.
256
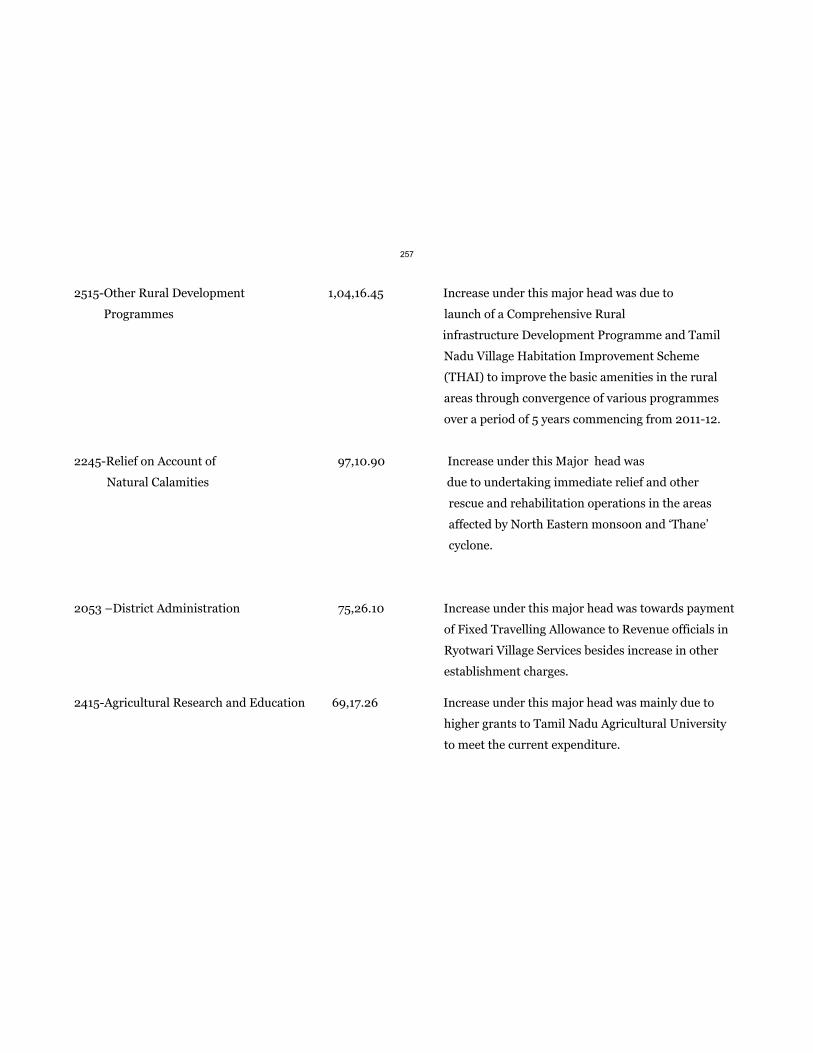
2515-Other Rural Development 1,04,16.45 Increase under this major head was due to
Programmes launch of a Comprehensive Rural
infrastructure Development Programme and Tamil
Nadu Village Habitation Improvement Scheme
(THAI) to improve the basic amenities in the rural
areas through convergence of various programmes
over a period of 5 years commencing from 2011-12.
2245-Relief on Account of 97,10.90 Increase under this Major head was
Natural Calamities due to undertaking immediate relief and other
rescue and rehabilitation operations in the areas
affected by North Eastern monsoon and ‘Thane’
cyclone.
2053 –District Administration 75,26.10 Increase under this major head was towards payment
of Fixed Travelling Allowance to Revenue officials in
Ryotwari Village Services besides increase in other
establishment charges.
2415-Agricultural Research and Education 69,17.26 Increase under this major head was mainly due to
higher grants to Tamil Nadu Agricultural University
to meet the current expenditure.
257
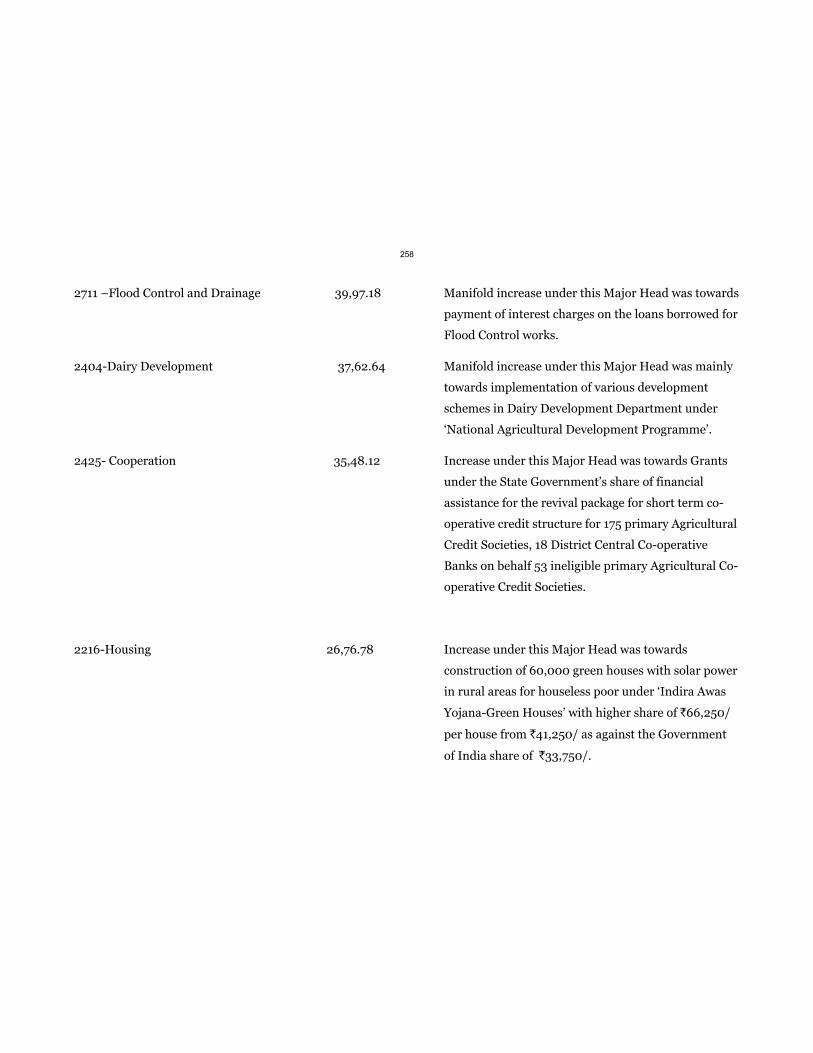
2711 –Flood Control and Drainage 39,97.18 Manifold increase under this Major Head was towards
payment of interest charges on the loans borrowed for
Flood Control works.
2404-Dairy Development 37,62.64 Manifold increase under this Major Head was mainly
towards implementation of various development
schemes in Dairy Development Department under
‘National Agricultural Development Programme’.
2425- Cooperation 35,48.12 Increase under this Major Head was towards Grants
under the State Government’s share of financial
assistance for the revival package for short term co-
operative credit structure for 175 primary Agricultural
Credit Societies, 18 District Central Co-operative
Banks on behalf 53 ineligible primary Agricultural Co-
operative Credit Societies.
2216-Housing 26,76.78 Increase under this Major Head was towards
construction of 60,000 green houses with solar power
in rural areas for houseless poor under ‘Indira Awas
Yojana-Green Houses’ with higher share of `66,250/
per house from `41,250/ as against the Government
of India share of `33,750/.
258
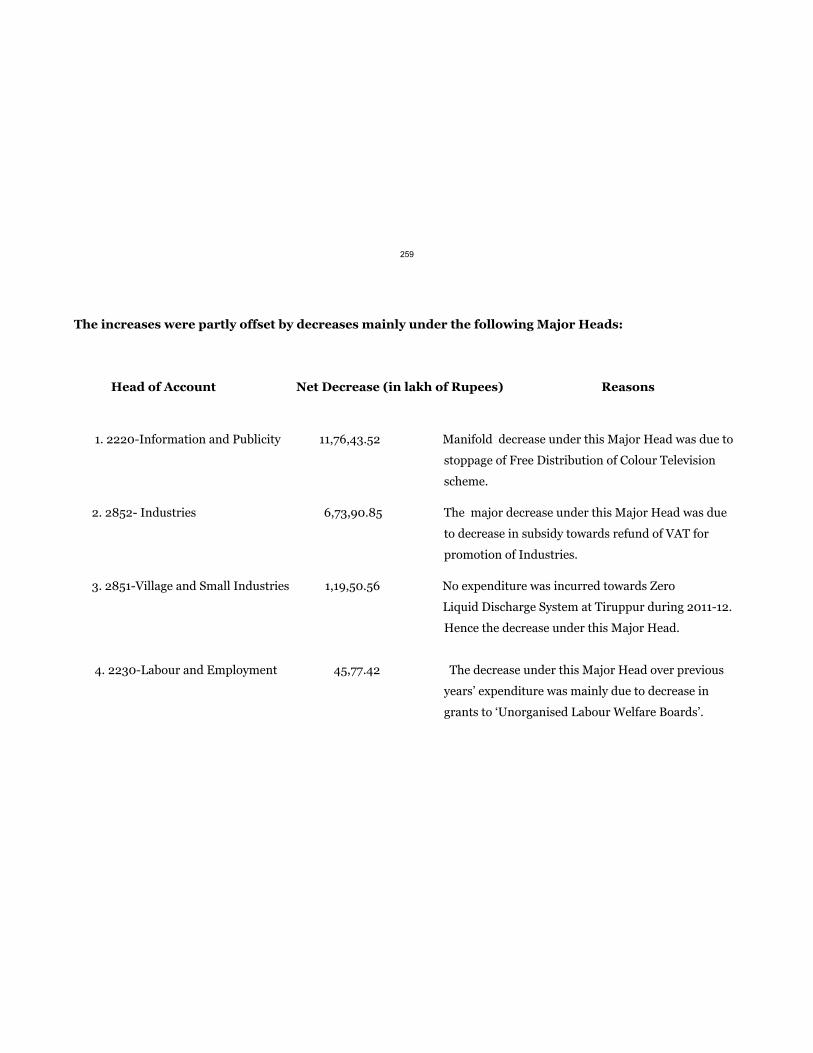
The increases were partly offset by decreases mainly under the following Major Heads:
Head of Account Net Decrease (in lakh of Rupees) Reasons
1. 2220-Information and Publicity 11,76,43.52 Manifold decrease under this Major Head was due to
stoppage of Free Distribution of Colour Television
scheme.
2. 2852- Industries 6,73,90.85 The major decrease under this Major Head was due
to decrease in subsidy towards refund of VAT for
promotion of Industries.
3. 2851-Village and Small Industries 1,19,50.56 No expenditure was incurred towards Zero
Liquid Discharge System at Tiruppur during 2011-12.
Hence the decrease under this Major Head.
4. 2230-Labour and Employment 45,77.42 The decrease under this Major Head over previous
years’ expenditure was mainly due to decrease in
grants to ‘Unorganised Labour Welfare Boards’.
259
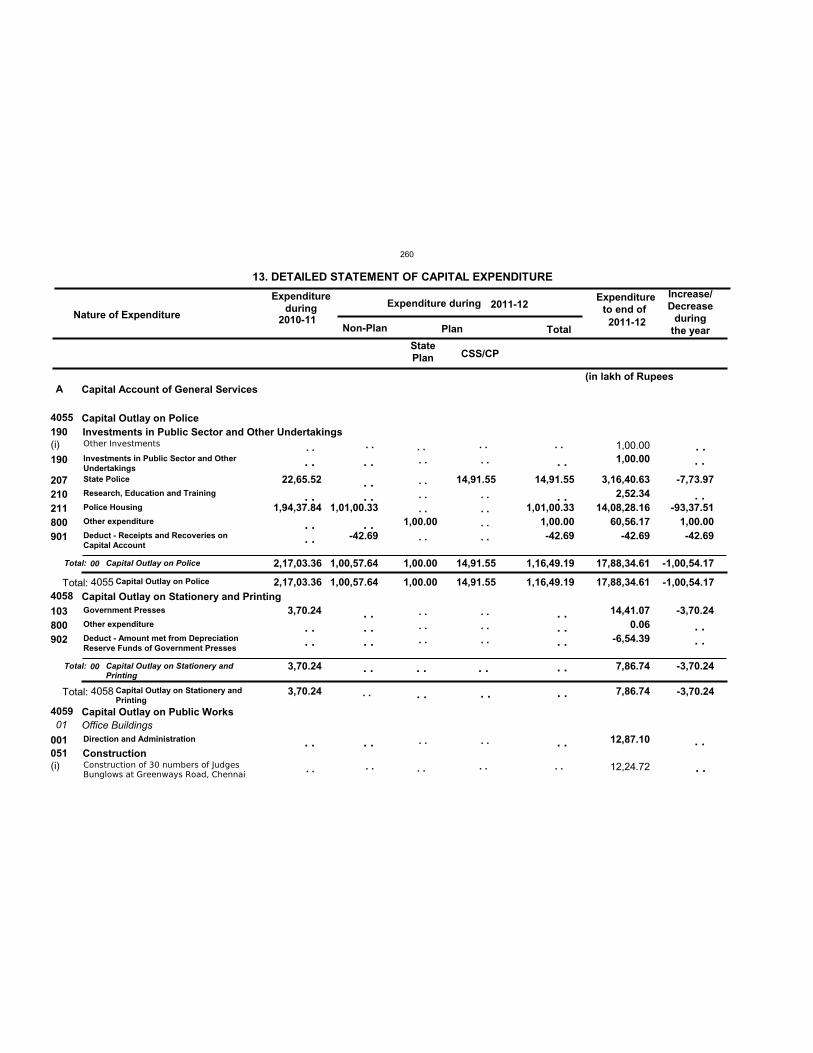
Nature of Expenditure
Expenditureduring Expenditure during
Expenditureto end of
Non-Plan Plan Total
13. DETAILED STATEMENT OF CAPITAL EXPENDITURE Increase/Decrease
duringthe year
2011-122010-11
2011-12
A
4055
4058
4059
2,17,03.36
3,70.24
1,00,57.64 1,00.00 14,91.55 1,16,49.19 17,88,34.61
7,86.74
01
2,17,03.36
3,70.24
1,00,57.64 1,00.00 14,91.55 1,16,49.19 17,88,34.61
7,86.74
190
051
22,65.52
1,94,37.84
3,70.24
1,01,00.33
-42.69 1,00.00
14,91.55 14,91.55
1,01,00.33 1,00.00
-42.69
1,00.00
3,16,40.63 2,52.34
14,08,28.16 60,56.17
-42.69
14,41.07 0.06
-6,54.39
12,87.10
(i)
(i)
1,00.00
12,24.72
StatePlan
Capital Account of General Services
Capital Outlay on Police
Capital Outlay on Stationery and Printing
Capital Outlay on Public WorksOffice Buildings
Investments in Public Sector and Other Undertakings
Construction
Investments in Public Sector and OtherUndertakingsState Police
Research, Education and Training
Police Housing
Other expenditure
Deduct - Receipts and Recoveries onCapital Account
Government Presses
Other expenditure
Deduct - Amount met from DepreciationReserve Funds of Government Presses
Direction and Administration
190
207210211800901
103800902
001
Other Investments
Construction of 30 numbers of JudgesBunglows at Greenways Road, Chennai
Total:
Total:
Capital Outlay on Police
Capital Outlay on Stationery andPrinting
Total:
Total:
Capital Outlay on Police
Capital Outlay on Stationery andPrinting
00
00
4055
4058
. .
. .
. .
. .
. .
. .
. .
. .
. .
. .
. .
. .
. . . .
. . . .
. .
. .
. . . .
. .
. . . . . .
. .
. .
. . . . . .
. .
. . . . . .
. .
. .
. . . . . . . .
. . . . . .
. .
. .
. .
. . . . . .
. .
-7,73.97
-93,37.51 1,00.00
-42.69
-3,70.24
. .
. .
. .
. .
. . . .
. .
. . . . . . . .
. . . . . . . .
-1,00,54.17
-3,70.24
-1,00,54.17
-3,70.24
(in lakh of Rupees
CSS/CP
260
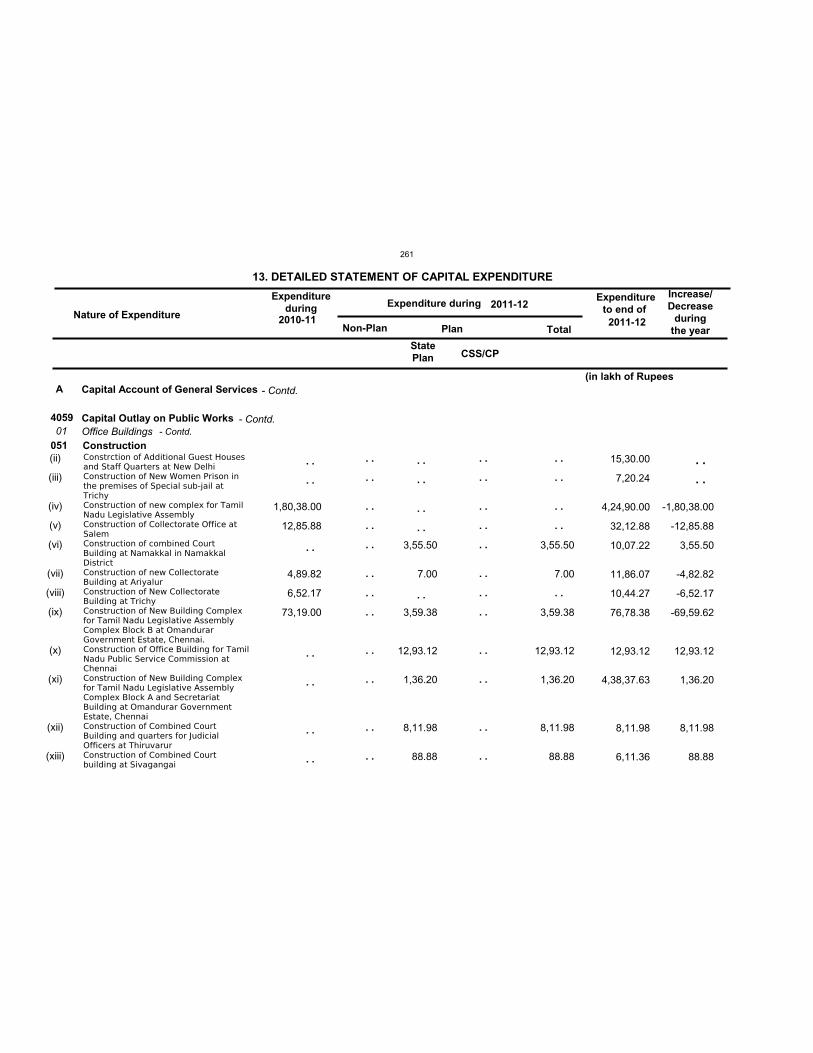
Nature of Expenditure
Expenditureduring Expenditure during
Expenditureto end of
Non-Plan Plan Total
13. DETAILED STATEMENT OF CAPITAL EXPENDITURE Increase/Decrease
duringthe year
2011-122010-11
2011-12
A
405901
051(ii)
(iii)
(iv)
(v)
(vi)
(vii)
(viii)
(ix)
(x)
(xi)
(xii)
(xiii)
1,80,38.00
12,85.88
4,89.82
6,52.17
73,19.00
3,55.50
7.00
3,59.38
12,93.12
1,36.20
8,11.98
88.88
3,55.50
7.00
3,59.38
12,93.12
1,36.20
8,11.98
88.88
15,30.00
7,20.24
4,24,90.00
32,12.88
10,07.22
11,86.07
10,44.27
76,78.38
12,93.12
4,38,37.63
8,11.98
6,11.36
StatePlan
Capital Account of General Services
Capital Outlay on Public WorksOffice BuildingsConstructionConstrction of Additional Guest Housesand Staff Quarters at New DelhiConstruction of New Women Prison inthe premises of Special sub-jail atTrichyConstruction of new complex for TamilNadu Legislative AssemblyConstruction of Collectorate Office atSalemConstruction of combined CourtBuilding at Namakkal in NamakkalDistrictConstruction of new CollectorateBuilding at AriyalurConstruction of New CollectorateBuilding at TrichyConstruction of New Building Complexfor Tamil Nadu Legislative AssemblyComplex Block B at OmandurarGovernment Estate, Chennai.Construction of Office Building for TamilNadu Public Service Commission atChennaiConstruction of New Building Complexfor Tamil Nadu Legislative AssemblyComplex Block A and SecretariatBuilding at Omandurar GovernmentEstate, ChennaiConstruction of Combined CourtBuilding and quarters for JudicialOfficers at ThiruvarurConstruction of Combined Courtbuilding at Sivagangai
. .
. .
. .
. .
. .
. .
. .
. .
. .
. .
. .
. .
. .
. .
. .
. .
. .
. .
. .
. .
. .
. .
. .
. .
. .
. .
. .
. .
. .
. .
. .
. .
. .
. .
. .
. .
. .
. .
. .
. .
. .
-1,80,38.00
-12,85.88
3,55.50
-4,82.82
-6,52.17
-69,59.62
12,93.12
1,36.20
8,11.98
88.88
. .
. .
(in lakh of Rupees
CSS/CP
- Contd.
- Contd.- Contd.
261
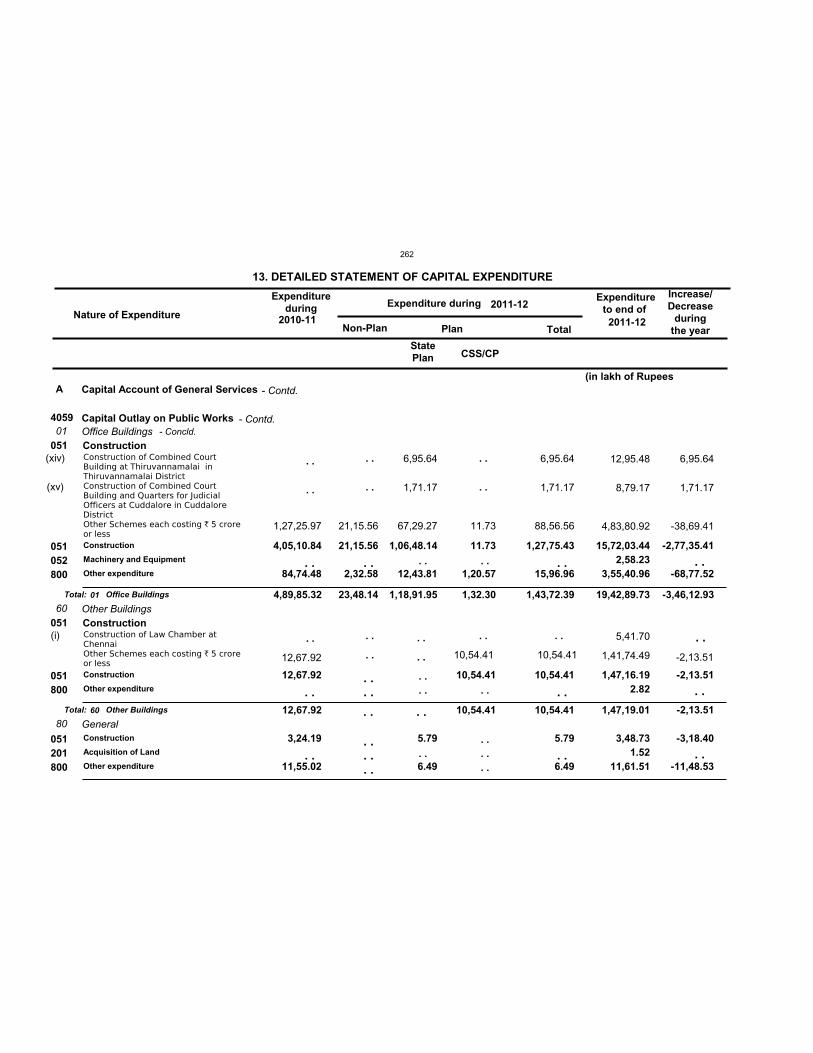
Nature of Expenditure
Expenditureduring Expenditure during
Expenditureto end of
Non-Plan Plan Total
13. DETAILED STATEMENT OF CAPITAL EXPENDITURE Increase/Decrease
duringthe year
2011-122010-11
2011-12
A
405901
60
80
4,89,85.32
12,67.92
23,48.14 1,18,91.95 1,32.30
10,54.41
1,43,72.39
10,54.41
19,42,89.73
1,47,19.01
051
051
4,05,10.84
84,74.48
12,67.92
3,24.19
11,55.02
21,15.56
2,32.58
1,06,48.14
12,43.81
5.79
6.49
11.73
1,20.57
10,54.41
1,27,75.43
15,96.96
10,54.41
5.79
6.49
15,72,03.44 2,58.23
3,55,40.96
1,47,16.19 2.82
3,48.73 1.52
11,61.51
(xiv)
(xv)
(i)
1,27,25.97 21,15.56
6,95.64
1,71.17
67,29.27 11.73
6,95.64
1,71.17
88,56.56
12,95.48
8,79.17
4,83,80.92
5,41.70
1,41,74.49
StatePlan
Capital Account of General Services
Capital Outlay on Public WorksOffice Buildings
Other Buildings
General
Construction
Construction
Construction
Machinery and Equipment
Other expenditure
Construction
Other expenditure
Construction
Acquisition of Land
Other expenditure
051052800
051800
051201800
Construction of Combined CourtBuilding at Thiruvannamalai inThiruvannamalai DistrictConstruction of Combined CourtBuilding and Quarters for JudicialOfficers at Cuddalore in CuddaloreDistrictOther Schemes each costing ` 5 croreor less
Construction of Law Chamber atChennaiOther Schemes each costing ` 5 croreor less
Total:
Total:
Office Buildings
Other Buildings
01
60
. .
. .
. .
. .
. .
. .
. .
. .
. .
10,54.41
. .
10,54.41
. .
. .
. .
12,67.92
. .
. .
. .
. .
. . . .
. . . . . .
. .
. . . .
. .
. .
. .
. . . . . .
. .
. .
. .
6,95.64
1,71.17
-38,69.41
-2,77,35.41
-68,77.52
-2,13.51
-3,18.40
-11,48.53
. .
-2,13.51
. .
. .
. .
. . . .
-3,46,12.93
-2,13.51
(in lakh of Rupees
CSS/CP
- Contd.
- Contd.- Concld.
262
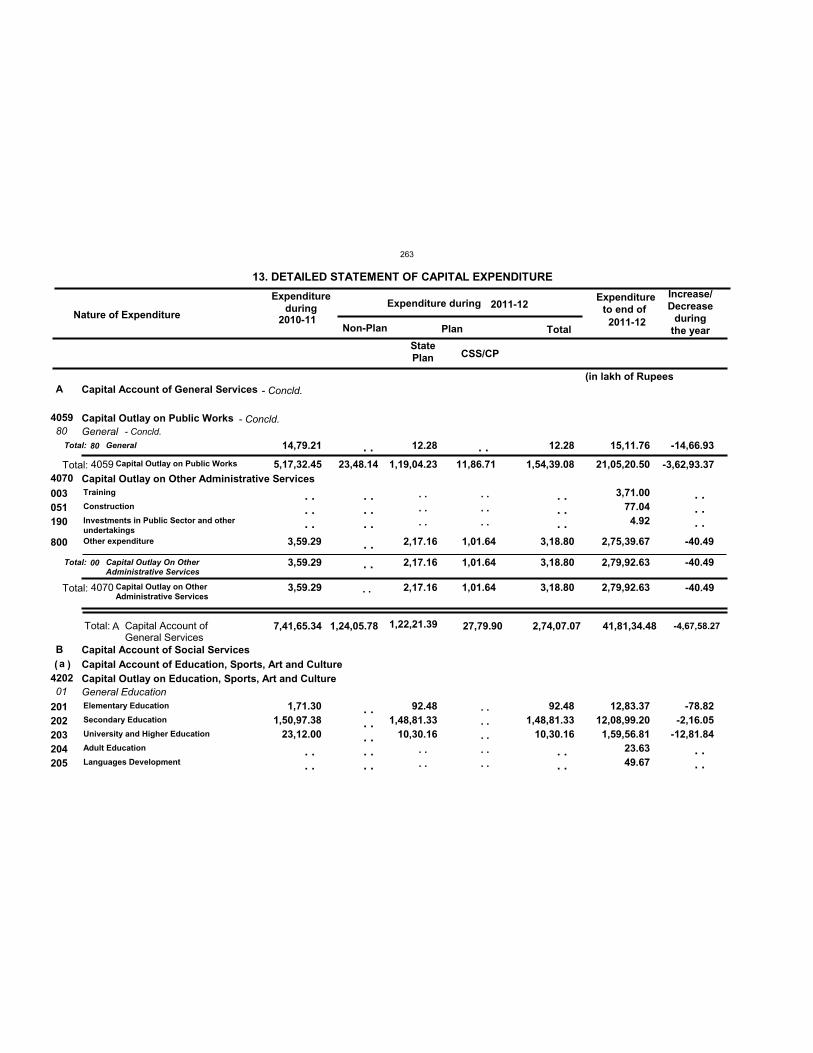
Nature of Expenditure
Expenditureduring Expenditure during
Expenditureto end of
Non-Plan Plan Total
13. DETAILED STATEMENT OF CAPITAL EXPENDITURE Increase/Decrease
duringthe year
2011-122010-11
2011-12
A
B
7,41,65.34 1,24,05.78 1,22,21.39 27,79.90 2,74,07.07 41,81,34.48
a
4059
4070
4202
5,17,32.45
3,59.29
23,48.14 1,19,04.23
2,17.16
11,86.71
1,01.64
1,54,39.08
3,18.80
21,05,20.50
2,79,92.63
80
01
14,79.21
3,59.29
12.28
2,17.16 1,01.64
12.28
3,18.80
15,11.76
2,79,92.63
3,59.29
1,71.30 1,50,97.38
23,12.00
2,17.16
92.48 1,48,81.33
10,30.16
1,01.64 3,18.80
92.48 1,48,81.33
10,30.16
3,71.00 77.04 4.92
2,75,39.67
12,83.37 12,08,99.20 1,59,56.81
23.63 49.67
StatePlan
Capital Account of General Services
Capital Account of Social ServicesCapital Account of Education, Sports, Art and Culture
Capital Outlay on Public Works
Capital Outlay on Other Administrative Services
Capital Outlay on Education, Sports, Art and Culture
General
General Education
Training
Construction
Investments in Public Sector and otherundertakingsOther expenditure
Elementary Education
Secondary Education
University and Higher Education
Adult Education
Languages Development
003051190
800
201202203204205
Total:
Total:
General
Capital Outlay On OtherAdministrative Services
Total:
Total:
Capital Outlay on Public Works
Capital Outlay on OtherAdministrative Services
Total: Capital Account ofGeneral Services
( )
80
00
4059
4070
A
. . . . . .
. . . .
. . . . . .
. .
. . . . . . . . . .
. . . . . .
. . . .
. . . . . .
. . . . . . . . . .
. . . . . .
. . . .
-40.49
-78.82-2,16.05
-12,81.84
. . . . . .
. . . .
. .
. .
. .
. .
-14,66.93
-40.49
-3,62,93.37
-40.49
-4,67,58.27
(in lakh of Rupees
CSS/CP
- Concld.
- Concld.- Concld.
263
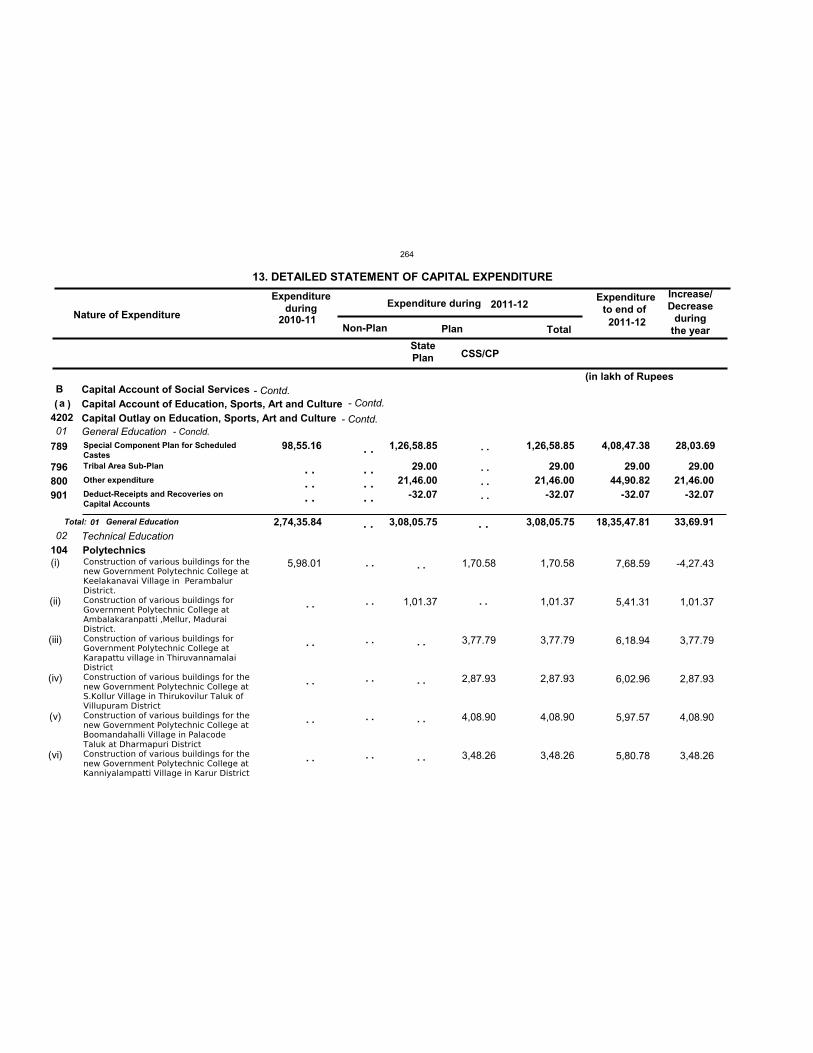
Nature of Expenditure
Expenditureduring Expenditure during
Expenditureto end of
Non-Plan Plan Total
13. DETAILED STATEMENT OF CAPITAL EXPENDITURE Increase/Decrease
duringthe year
2011-122010-11
2011-12
Ba
420201
02 2,74,35.84 3,08,05.75 3,08,05.75 18,35,47.81
104
98,55.16 1,26,58.85
29.00 21,46.00
-32.07
1,26,58.85
29.00 21,46.00
-32.07
4,08,47.38 28,03.69
29.00 44,90.82
-32.07
(i)
(ii)
(iii)
(iv)
(v)
(vi)
5,98.01
1,01.37
1,70.58
3,77.79
2,87.93
4,08.90
3,48.26
1,70.58
1,01.37
3,77.79
2,87.93
4,08.90
3,48.26
7,68.59
5,41.31
6,18.94
6,02.96
5,97.57
5,80.78
StatePlan
Capital Account of Social ServicesCapital Account of Education, Sports, Art and CultureCapital Outlay on Education, Sports, Art and CultureGeneral Education
Technical EducationPolytechnics
Special Component Plan for ScheduledCastesTribal Area Sub-Plan
Other expenditure
Deduct-Receipts and Recoveries onCapital Accounts
789
796800901
Construction of various buildings for thenew Government Polytechnic College atKeelakanavai Village in PerambalurDistrict.Construction of various buildings forGovernment Polytechnic College atAmbalakaranpatti ,Mellur, MaduraiDistrict.Construction of various buildings forGovernment Polytechnic College atKarapattu village in ThiruvannamalaiDistrictConstruction of various buildings for thenew Government Polytechnic College atS.Kollur Village in Thirukovilur Taluk ofVillupuram DistrictConstruction of various buildings for thenew Government Polytechnic College atBoomandahalli Village in PalacodeTaluk at Dharmapuri DistrictConstruction of various buildings for thenew Government Polytechnic College atKanniyalampatti Village in Karur District
Total: General Education
( )
01
. .
. .
. .
. .
. .
. .
. .
. .
. .
. .
. .
. .. .
. .
. .
. .
. .
. . . . . .
. .
. . . . . .
. .
. . . . . .
-4,27.43
1,01.37
3,77.79
2,87.93
4,08.90
3,48.26
29.00 21,46.00
-32.07
. . . . 33,69.91
(in lakh of Rupees
CSS/CP
- Contd.
- Contd.- Concld.
- Contd.
264
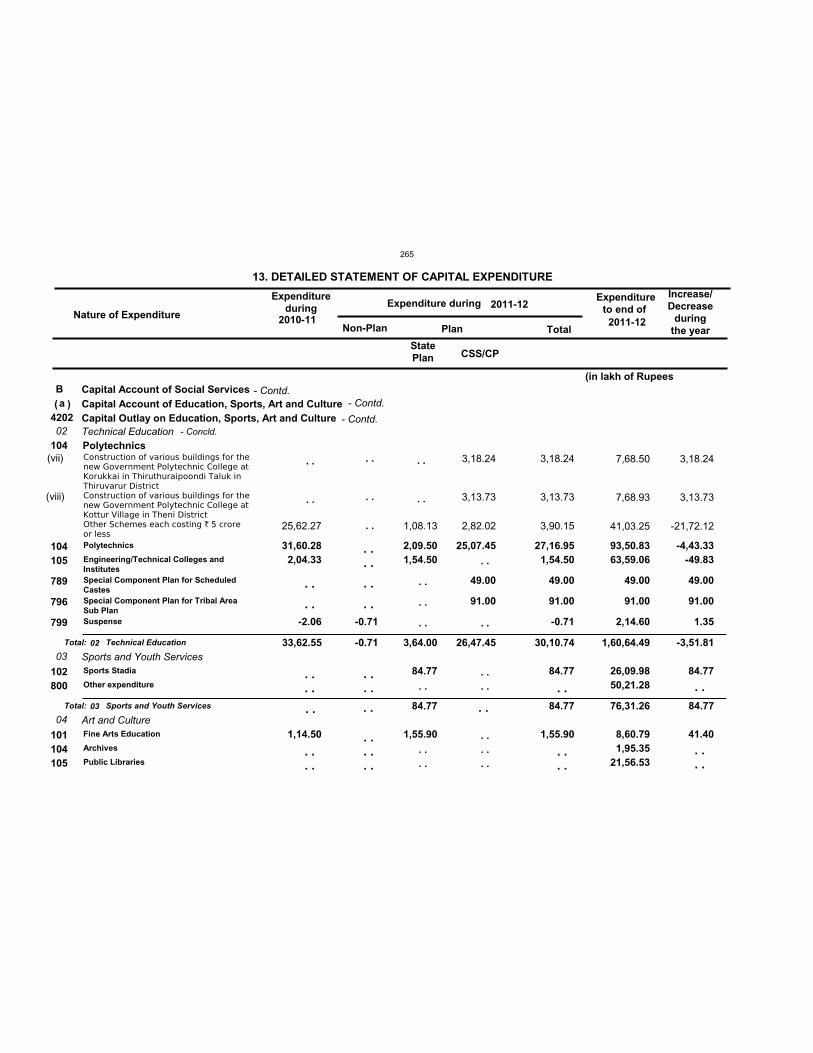
Nature of Expenditure
Expenditureduring Expenditure during
Expenditureto end of
Non-Plan Plan Total
13. DETAILED STATEMENT OF CAPITAL EXPENDITURE Increase/Decrease
duringthe year
2011-122010-11
2011-12
Ba
420202
03
04
33,62.55 -0.71 3,64.00
84.77
26,47.45 30,10.74
84.77
1,60,64.49
76,31.26
104
31,60.28 2,04.33
-2.06
1,14.50
-0.71
2,09.50 1,54.50
84.77
1,55.90
25,07.45
49.00
91.00
27,16.95 1,54.50
49.00
91.00
-0.71
84.77
1,55.90
93,50.83 63,59.06
49.00
91.00
2,14.60
26,09.98 50,21.28
8,60.79 1,95.35
21,56.53
(vii)
(viii)
25,62.27 1,08.13
3,18.24
3,13.73
2,82.02
3,18.24
3,13.73
3,90.15
7,68.50
7,68.93
41,03.25
StatePlan
Capital Account of Social ServicesCapital Account of Education, Sports, Art and CultureCapital Outlay on Education, Sports, Art and CultureTechnical Education
Sports and Youth Services
Art and Culture
Polytechnics
Polytechnics
Engineering/Technical Colleges andInstitutesSpecial Component Plan for ScheduledCastesSpecial Component Plan for Tribal AreaSub PlanSuspense
Sports Stadia
Other expenditure
Fine Arts Education
Archives
Public Libraries
104105
789
796
799
102800
101104105
Construction of various buildings for thenew Government Polytechnic College atKorukkai in Thiruthuraipoondi Taluk inThiruvarur DistrictConstruction of various buildings for thenew Government Polytechnic College atKottur Village in Theni DistrictOther Schemes each costing ` 5 croreor less
Total:
Total:
Technical Education
Sports and Youth Services
( )
02
03
. .
. .
. .
. .
. .
. .
. .
. .
. .
. . . .
. . . .
. . . .
. .
. .
. . . .
. . . . . .
. .
. .
. .
. .
. . . .
. .
. .
. . . .
. . . . . .
. .
. . . .
3,18.24
3,13.73
-21,72.12
-4,43.33-49.83
49.00
91.00
1.35
84.77
41.40
. .
. . . .
. . . . . .
-3,51.81
84.77
(in lakh of Rupees
CSS/CP
- Contd.
- Contd.- Concld.
- Contd.
265
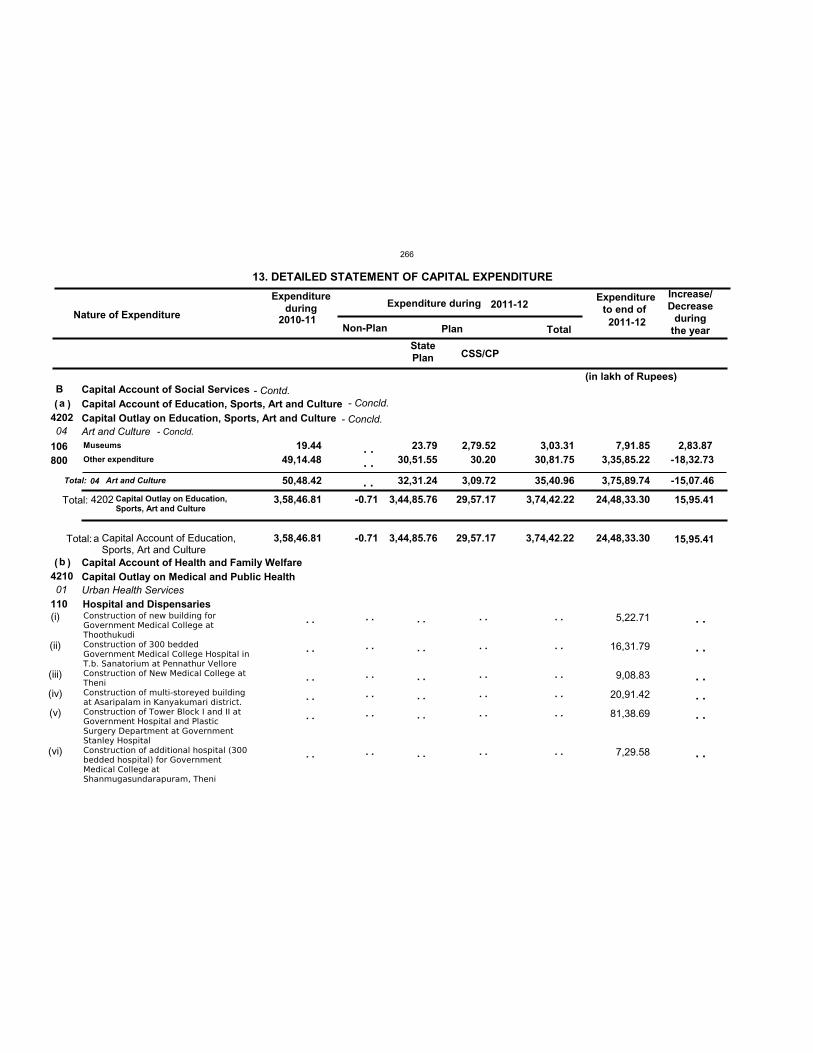
Nature of Expenditure
Expenditureduring Expenditure during
Expenditureto end of
Non-Plan Plan Total
13. DETAILED STATEMENT OF CAPITAL EXPENDITURE Increase/Decrease
duringthe year
2011-122010-11
2011-12
Ba
b
3,58,46.81 -0.71 3,44,85.76 29,57.17 3,74,42.22 24,48,33.30
4202
4210
3,58,46.81 -0.71 3,44,85.76 29,57.17 3,74,42.22 24,48,33.30
04
01
50,48.42 32,31.24 3,09.72 35,40.96 3,75,89.74
110
19.44 49,14.48
23.79 30,51.55
2,79.52 30.20
3,03.31 30,81.75
7,91.85 2,83.87 3,35,85.22
(i)
(ii)
(iii)
(iv)
(v)
(vi)
5,22.71
16,31.79
9,08.83
20,91.42
81,38.69
7,29.58
StatePlan
Capital Account of Social ServicesCapital Account of Education, Sports, Art and Culture
Capital Account of Health and Family Welfare
Capital Outlay on Education, Sports, Art and Culture
Capital Outlay on Medical and Public Health
Art and Culture
Urban Health ServicesHospital and Dispensaries
Museums
Other expenditure106800
Construction of new building forGovernment Medical College atThoothukudiConstruction of 300 beddedGovernment Medical College Hospital inT.b. Sanatorium at Pennathur VelloreConstruction of New Medical College atTheniConstruction of multi-storeyed buildingat Asaripalam in Kanyakumari district.Construction of Tower Block I and II atGovernment Hospital and PlasticSurgery Department at GovernmentStanley HospitalConstruction of additional hospital (300bedded hospital) for GovernmentMedical College atShanmugasundarapuram, Theni
Total: Art and Culture
Total: Capital Outlay on Education,Sports, Art and Culture
Total: Capital Account of Education,Sports, Art and Culture
(
(
)
)
04
4202
a
. .
. .
. .
. .
. .
. .
. .
. .
. .
. .
. .
. .
. .
. .
. .
. .
. .
. .
. .
. .
. .
. .
. .
. .
. .
. .
. .
. .
. .
. .
. . . . -18,32.73
. .
. .
. .
. .
. .
. .
. . -15,07.46
15,95.41
15,95.41
(in lakh of Rupees)
CSS/CP
- Contd.
- Concld.- Concld.
- Concld.
266
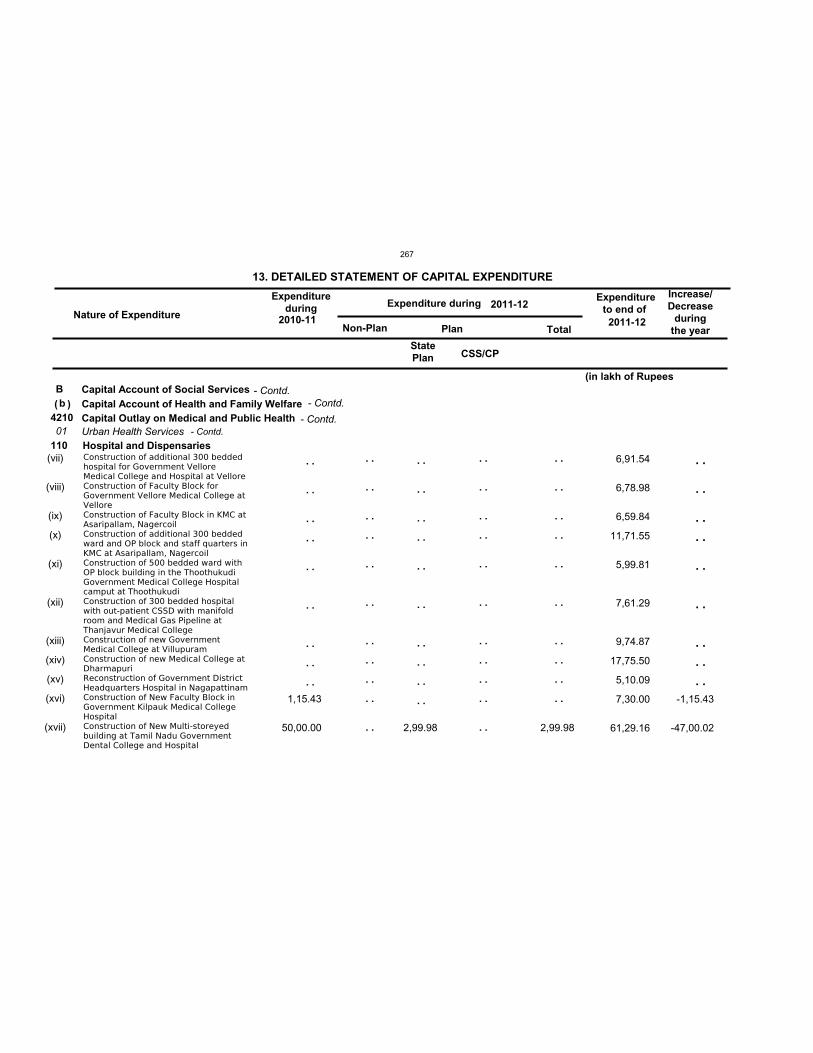
Nature of Expenditure
Expenditureduring Expenditure during
Expenditureto end of
Non-Plan Plan Total
13. DETAILED STATEMENT OF CAPITAL EXPENDITURE Increase/Decrease
duringthe year
2011-122010-11
2011-12
Bb
421001
110(vii)
(viii)
(ix)
(x)
(xi)
(xii)
(xiii)
(xiv)
(xv)
(xvi)
(xvii)
1,15.43
50,00.00 2,99.98 2,99.98
6,91.54
6,78.98
6,59.84
11,71.55
5,99.81
7,61.29
9,74.87
17,75.50
5,10.09
7,30.00
61,29.16
StatePlan
Capital Account of Social ServicesCapital Account of Health and Family WelfareCapital Outlay on Medical and Public HealthUrban Health ServicesHospital and DispensariesConstruction of additional 300 beddedhospital for Government VelloreMedical College and Hospital at VelloreConstruction of Faculty Block forGovernment Vellore Medical College atVelloreConstruction of Faculty Block in KMC atAsaripallam, NagercoilConstruction of additional 300 beddedward and OP block and staff quarters inKMC at Asaripallam, NagercoilConstruction of 500 bedded ward withOP block building in the ThoothukudiGovernment Medical College Hospitalcamput at ThoothukudiConstruction of 300 bedded hospitalwith out-patient CSSD with manifoldroom and Medical Gas Pipeline atThanjavur Medical CollegeConstruction of new GovernmentMedical College at VillupuramConstruction of new Medical College atDharmapuriReconstruction of Government DistrictHeadquarters Hospital in NagapattinamConstruction of New Faculty Block inGovernment Kilpauk Medical CollegeHospitalConstruction of New Multi-storeyedbuilding at Tamil Nadu GovernmentDental College and Hospital
( )
. .
. .
. .
. .
. .
. .
. .
. .
. .
. .
. .
. .
. .
. .
. .
. .
. .
. .
. .
. .
. .
. .
. .
. .
. .
. .
. .
. .
. .
. .
. .
. .
. .
. .
. .
. .
. .
. .
. .
. .
. .
. .
. .
. .
. .
. .
. .
. .
. .
. .
. .
-1,15.43
-47,00.02
. .
. .
. .
. .
. .
. .
. .
. .
. .
(in lakh of Rupees
CSS/CP
- Contd.
- Contd.- Contd.
- Contd.
267
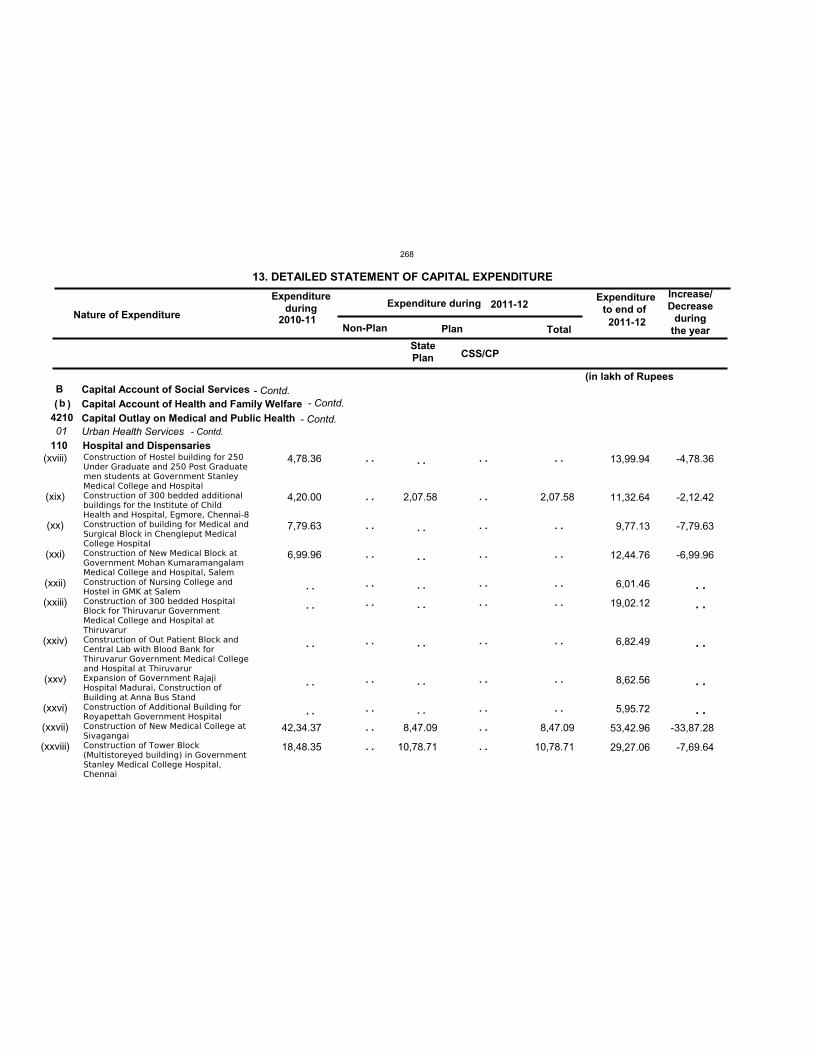
Nature of Expenditure
Expenditureduring Expenditure during
Expenditureto end of
Non-Plan Plan Total
13. DETAILED STATEMENT OF CAPITAL EXPENDITURE Increase/Decrease
duringthe year
2011-122010-11
2011-12
Bb
421001
110(xviii)
(xix)
(xx)
(xxi)
(xxii)
(xxiii)
(xxiv)
(xxv)
(xxvi)
(xxvii)
(xxviii)
4,78.36
4,20.00
7,79.63
6,99.96
42,34.37
18,48.35
2,07.58
8,47.09
10,78.71
2,07.58
8,47.09
10,78.71
13,99.94
11,32.64
9,77.13
12,44.76
6,01.46
19,02.12
6,82.49
8,62.56
5,95.72
53,42.96
29,27.06
StatePlan
Capital Account of Social ServicesCapital Account of Health and Family WelfareCapital Outlay on Medical and Public HealthUrban Health ServicesHospital and DispensariesConstruction of Hostel building for 250Under Graduate and 250 Post Graduatemen students at Government StanleyMedical College and HospitalConstruction of 300 bedded additionalbuildings for the Institute of ChildHealth and Hospital, Egmore, Chennai-8Construction of building for Medical andSurgical Block in Chengleput MedicalCollege HospitalConstruction of New Medical Block atGovernment Mohan KumaramangalamMedical College and Hospital, SalemConstruction of Nursing College andHostel in GMK at SalemConstruction of 300 bedded HospitalBlock for Thiruvarur GovernmentMedical College and Hospital atThiruvarurConstruction of Out Patient Block andCentral Lab with Blood Bank forThiruvarur Government Medical Collegeand Hospital at ThiruvarurExpansion of Government RajajiHospital Madurai, Construction ofBuilding at Anna Bus StandConstruction of Additional Building forRoyapettah Government HospitalConstruction of New Medical College atSivagangaiConstruction of Tower Block(Multistoreyed building) in GovernmentStanley Medical College Hospital,Chennai
( )
. .
. .
. .
. .
. .
. .
. .
. .
. .
. .
. .
. .
. .
. .
. .
. .
. .
. .
. .
. .
. .
. .
. .
. .
. .
. .
. .
. .
. .
. .
. .
. .
. .
. .
. .
. .
. .
. .
. .
. .
. .
. .
. .
-4,78.36
-2,12.42
-7,79.63
-6,99.96
-33,87.28
-7,69.64
. .
. .
. .
. .
. .
(in lakh of Rupees
CSS/CP
- Contd.
- Contd.- Contd.
- Contd.
268
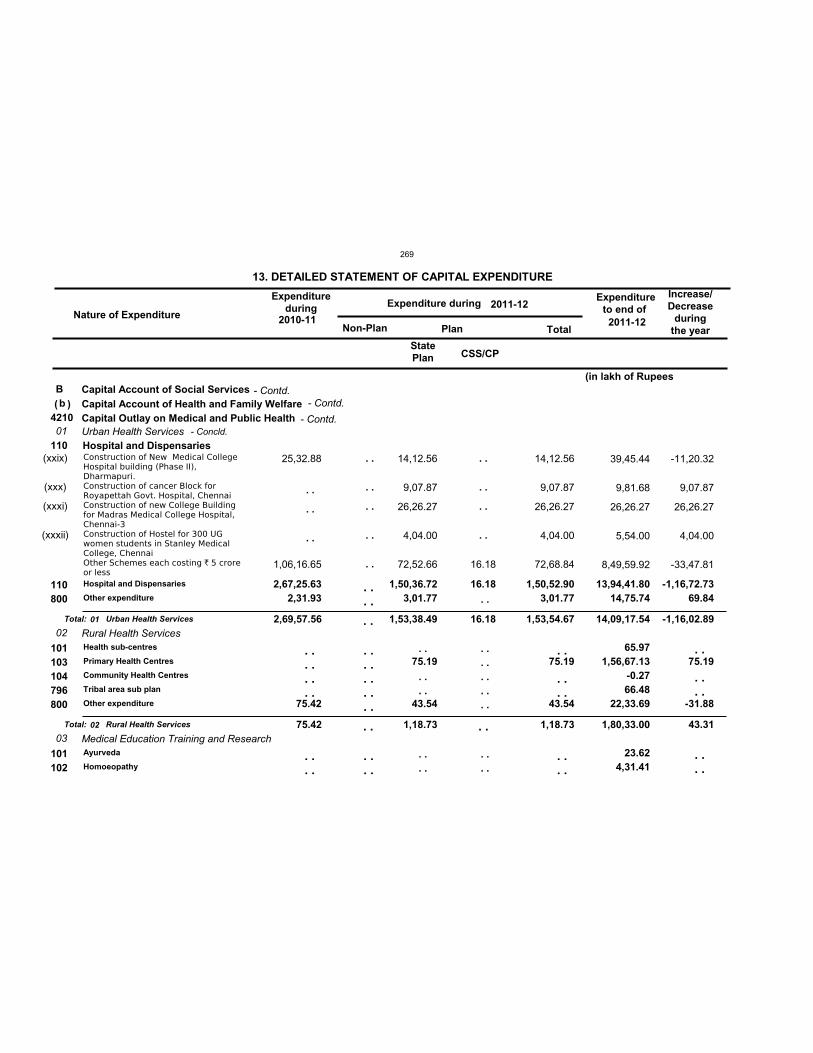
Nature of Expenditure
Expenditureduring Expenditure during
Expenditureto end of
Non-Plan Plan Total
13. DETAILED STATEMENT OF CAPITAL EXPENDITURE Increase/Decrease
duringthe year
2011-122010-11
2011-12
Bb
421001
02
03
2,69,57.56
75.42
1,53,38.49
1,18.73
16.18 1,53,54.67
1,18.73
14,09,17.54
1,80,33.00
110
2,67,25.63 2,31.93
75.42
1,50,36.72 3,01.77
75.19
43.54
16.18 1,50,52.90 3,01.77
75.19
43.54
13,94,41.80 14,75.74
65.97 1,56,67.13
-0.27 66.48
22,33.69
23.62 4,31.41
(xxix)
(xxx)
(xxxi)
(xxxii)
25,32.88
1,06,16.65
14,12.56
9,07.87
26,26.27
4,04.00
72,52.66 16.18
14,12.56
9,07.87
26,26.27
4,04.00
72,68.84
39,45.44
9,81.68
26,26.27
5,54.00
8,49,59.92
StatePlan
Capital Account of Social ServicesCapital Account of Health and Family WelfareCapital Outlay on Medical and Public HealthUrban Health Services
Rural Health Services
Medical Education Training and Research
Hospital and Dispensaries
Hospital and Dispensaries
Other expenditure
Health sub-centres
Primary Health Centres
Community Health Centres
Tribal area sub plan
Other expenditure
Ayurveda
Homoeopathy
110800
101103104796800
101102
Construction of New Medical CollegeHospital building (Phase II),Dharmapuri.Construction of cancer Block forRoyapettah Govt. Hospital, ChennaiConstruction of new College Buildingfor Madras Medical College Hospital,Chennai-3Construction of Hostel for 300 UGwomen students in Stanley MedicalCollege, ChennaiOther Schemes each costing ` 5 croreor less
Total:
Total:
Urban Health Services
Rural Health Services
( )
01
02
. .
. .
. .
. .
. .
. .
. .
. .
. .
. .
. .
. .
. . . . . . . .
. . . .
. . . .
. . . . . . . . . .
. . . .
. .
. . . .
. . . .
. .
. . . . . . . . . .
. . . .
. .
. . . .
. . . .
-11,20.32
9,07.87
26,26.27
4,04.00
-33,47.81
-1,16,72.73 69.84
75.19
-31.88
. .
. . . .
. . . .
. .
. . . .
-1,16,02.89
43.31
(in lakh of Rupees
CSS/CP
- Contd.
- Contd.- Concld.
- Contd.
269
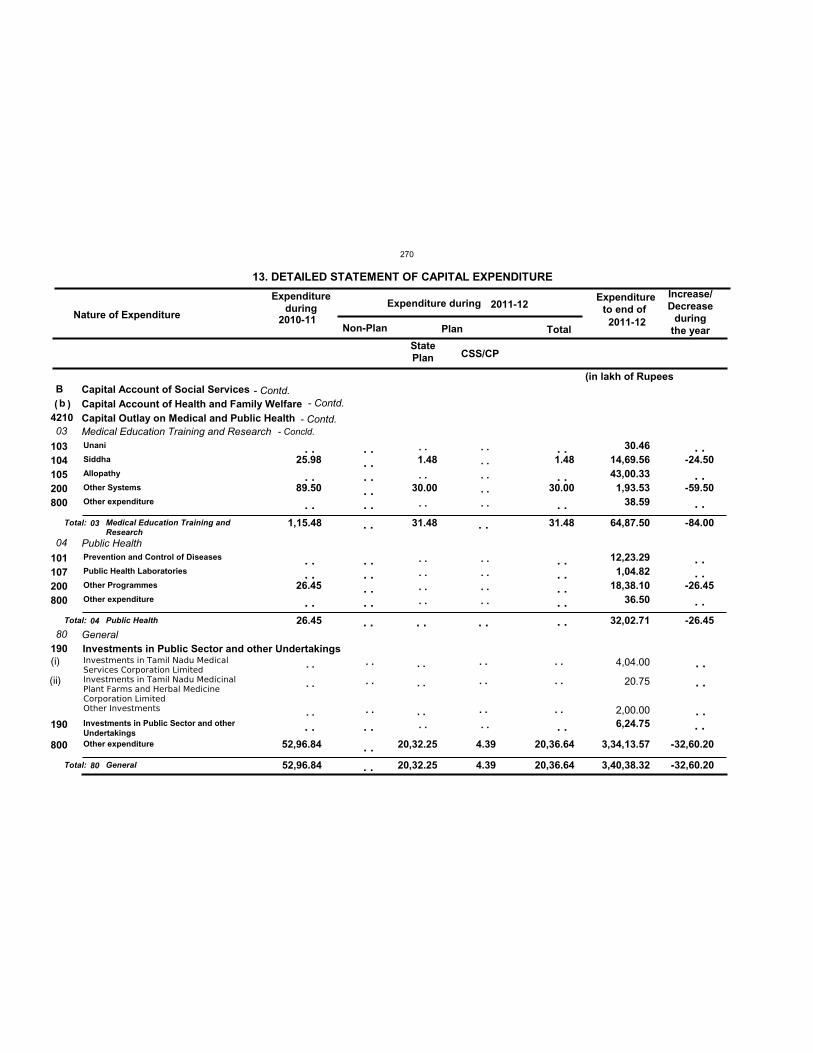
Nature of Expenditure
Expenditureduring Expenditure during
Expenditureto end of
Non-Plan Plan Total
13. DETAILED STATEMENT OF CAPITAL EXPENDITURE Increase/Decrease
duringthe year
2011-122010-11
2011-12
Bb
421003
04
80
1,15.48
26.45
52,96.84
31.48
20,32.25 4.39
31.48
20,36.64
64,87.50
32,02.71
3,40,38.32
190
25.98
89.50
26.45
52,96.84
1.48
30.00
20,32.25 4.39
1.48
30.00
20,36.64
30.46 14,69.56 43,00.33 1,93.53
38.59
12,23.29 1,04.82
18,38.10 36.50
6,24.75
3,34,13.57
(i)
(ii)
4,04.00
20.75
2,00.00
StatePlan
Capital Account of Social ServicesCapital Account of Health and Family WelfareCapital Outlay on Medical and Public HealthMedical Education Training and Research
Public Health
GeneralInvestments in Public Sector and other Undertakings
Unani
Siddha
Allopathy
Other Systems
Other expenditure
Prevention and Control of Diseases
Public Health Laboratories
Other Programmes
Other expenditure
Investments in Public Sector and otherUndertakingsOther expenditure
103104105200800
101107200800
190
800
Investments in Tamil Nadu MedicalServices Corporation LimitedInvestments in Tamil Nadu MedicinalPlant Farms and Herbal MedicineCorporation LimitedOther Investments
Total:
Total:
Total:
Medical Education Training andResearch
Public Health
General
( )
03
04
80
. .
. .
. .
. .
. .
. .
. .
. .
. .
. .
. .
. .
. .
. .
. .
. .
. .
. .
. . . .
. .
. .
. . . . . . . . . .
. . . . . . . .
. .
. .
. .
. .
. .
. . . . . . . .
. .
. . . . . . . . . .
. . . . . . . .
. .
. .
. .
. .
. . . . . . . .
. .
-24.50
-59.50
-26.45
-32,60.20
. .
. .
. .
. .
. .
. .
. . . .
. .
. .
. .
. .
. .
. .
. .
. . . .
-84.00
-26.45
-32,60.20
(in lakh of Rupees
CSS/CP
- Contd.
- Contd.- Concld.
- Contd.
270
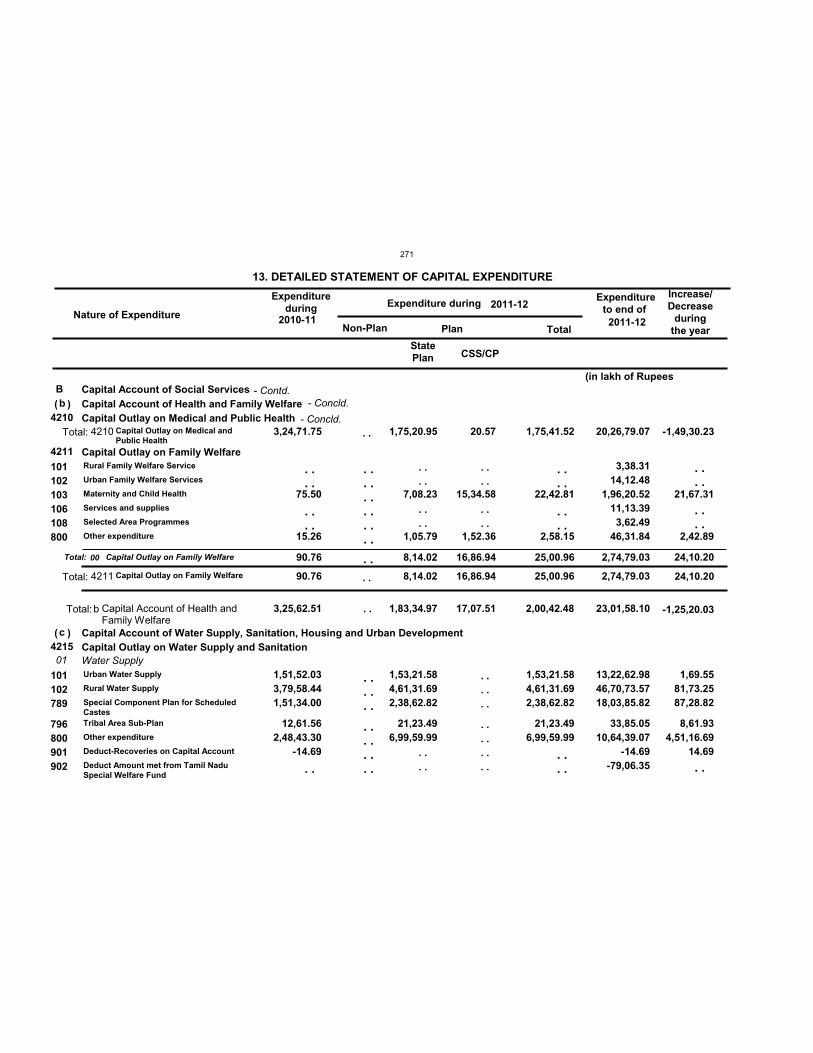
Nature of Expenditure
Expenditureduring Expenditure during
Expenditureto end of
Non-Plan Plan Total
13. DETAILED STATEMENT OF CAPITAL EXPENDITURE Increase/Decrease
duringthe year
2011-122010-11
2011-12
Bb
c
3,25,62.51 1,83,34.97 17,07.51 2,00,42.48 23,01,58.10
4210
4211
4215
3,24,71.75
90.76
1,75,20.95
8,14.02
20.57
16,86.94
1,75,41.52
25,00.96
20,26,79.07
2,74,79.03
01
90.76 8,14.02 16,86.94 25,00.96 2,74,79.03
75.50
15.26
1,51,52.03 3,79,58.44 1,51,34.00
12,61.56 2,48,43.30
-14.69
7,08.23
1,05.79
1,53,21.58 4,61,31.69 2,38,62.82
21,23.49 6,99,59.99
15,34.58
1,52.36
22,42.81
2,58.15
1,53,21.58 4,61,31.69 2,38,62.82
21,23.49 6,99,59.99
3,38.31 14,12.48
1,96,20.52 11,13.39 3,62.49
46,31.84
13,22,62.98 46,70,73.57 18,03,85.82
33,85.05 10,64,39.07
-14.69-79,06.35
StatePlan
Capital Account of Social ServicesCapital Account of Health and Family Welfare
Capital Account of Water Supply, Sanitation, Housing and Urban Development
Capital Outlay on Medical and Public Health
Capital Outlay on Family Welfare
Capital Outlay on Water Supply and SanitationWater Supply
Rural Family Welfare Service
Urban Family Welfare Services
Maternity and Child Health
Services and supplies
Selected Area Programmes
Other expenditure
Urban Water Supply
Rural Water Supply
Special Component Plan for ScheduledCastesTribal Area Sub-Plan
Other expenditure
Deduct-Recoveries on Capital Account
Deduct Amount met from Tamil NaduSpecial Welfare Fund
101102103106108800
101102789
796800901902
Total: Capital Outlay on Family Welfare
Total:
Total:
Capital Outlay on Medical andPublic Health
Capital Outlay on Family Welfare
Total: Capital Account of Health andFamily Welfare
(
(
)
)
00
4210
4211
b
. . . .
. . . .
. .
. . . . . . . . . . . .
. . . . . .
. . . . . . . .
. . . .
. . . .
. . . .
. . . .
. . . .
. . . . . .
. . . . . . . .
. . . .
. . . .
. . . .
21,67.31
2,42.89
1,69.55 81,73.25 87,28.82
8,61.93 4,51,16.69
14.69
. . . .
. . . .
. .
. .
. .
. .
24,10.20
-1,49,30.23
24,10.20
-1,25,20.03
(in lakh of Rupees
CSS/CP
. .
- Contd.
- Concld.
- Concld.
271
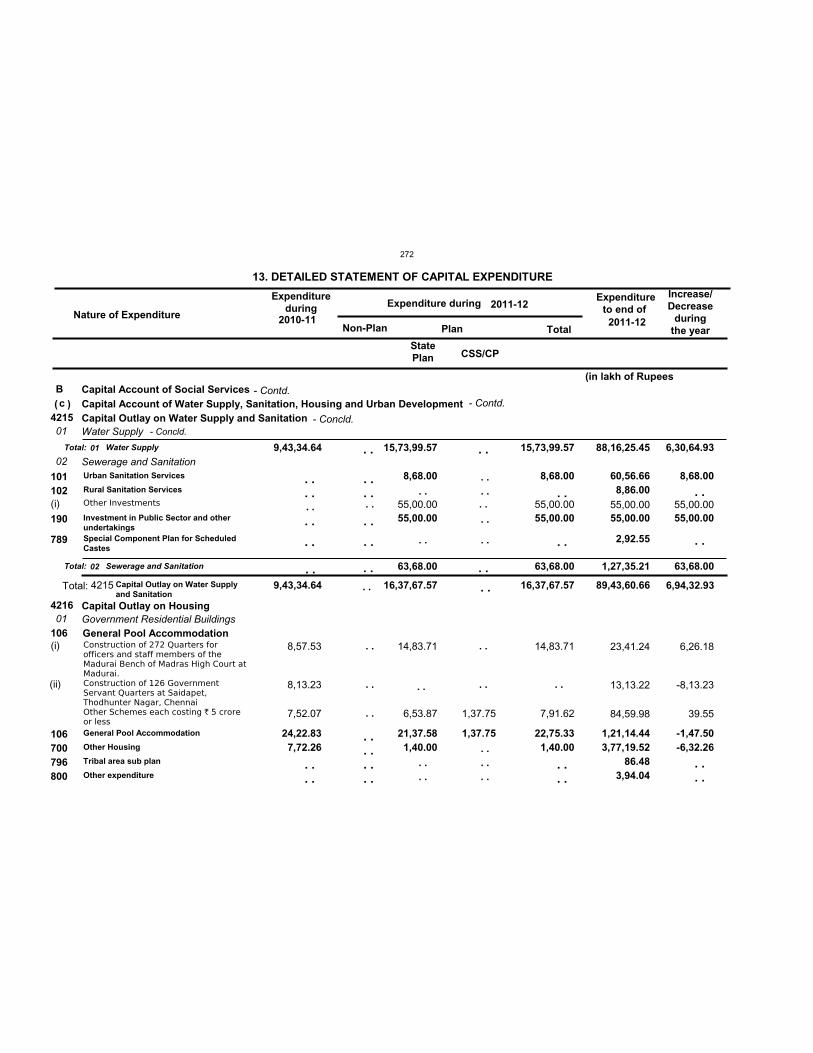
Nature of Expenditure
Expenditureduring Expenditure during
Expenditureto end of
Non-Plan Plan Total
13. DETAILED STATEMENT OF CAPITAL EXPENDITURE Increase/Decrease
duringthe year
2011-122010-11
2011-12
Bc
4215
4216
9,43,34.64 16,37,67.57 16,37,67.57 89,43,60.66
01
02
01
9,43,34.64 15,73,99.57
63,68.00
15,73,99.57
63,68.00
88,16,25.45
1,27,35.21
106
24,22.83 7,72.26
8,68.00
55,00.00
21,37.58 1,40.00
1,37.75
8,68.00
55,00.00
22,75.33 1,40.00
60,56.66 8,86.00
55,00.00
2,92.55
1,21,14.44 3,77,19.52
86.48 3,94.04
(i)
(i)
(ii)
8,57.53
8,13.23
7,52.07
55,00.00
14,83.71
6,53.87 1,37.75
55,00.00
14,83.71
7,91.62
55,00.00
23,41.24
13,13.22
84,59.98
StatePlan
Capital Account of Social ServicesCapital Account of Water Supply, Sanitation, Housing and Urban DevelopmentCapital Outlay on Water Supply and Sanitation
Capital Outlay on Housing
Water Supply
Sewerage and Sanitation
Government Residential BuildingsGeneral Pool Accommodation
Urban Sanitation Services
Rural Sanitation Services
Investment in Public Sector and otherundertakingsSpecial Component Plan for ScheduledCastes
General Pool Accommodation
Other Housing
Tribal area sub plan
Other expenditure
101102
190
789
106700796800
Other Investments
Construction of 272 Quarters forofficers and staff members of theMadurai Bench of Madras High Court atMadurai.Construction of 126 GovernmentServant Quarters at Saidapet,Thodhunter Nagar, ChennaiOther Schemes each costing ` 5 croreor less
Total:
Total:
Water Supply
Sewerage and Sanitation
Total: Capital Outlay on Water Supplyand Sanitation
( )
01
02
4215
. .
. .
. .
. .
. .
. .
. .
. . . .
. .
. . . .
. .
. .
. . . .
. . . .
. .
. .
. . . . . . . .
. .
. .
. . . .
. . . .
. .
. .
. . . . . .
. .
. .
. . . .
55,00.00
6,26.18
-8,13.23
39.55
8,68.00
55,00.00
-1,47.50-6,32.26
. .
. .
. . . .
. .
. .
. .
. .
. . . . . .
6,30,64.93
63,68.00
6,94,32.93
(in lakh of Rupees
CSS/CP
- Contd.
- Concld.- Concld.
- Contd.
272
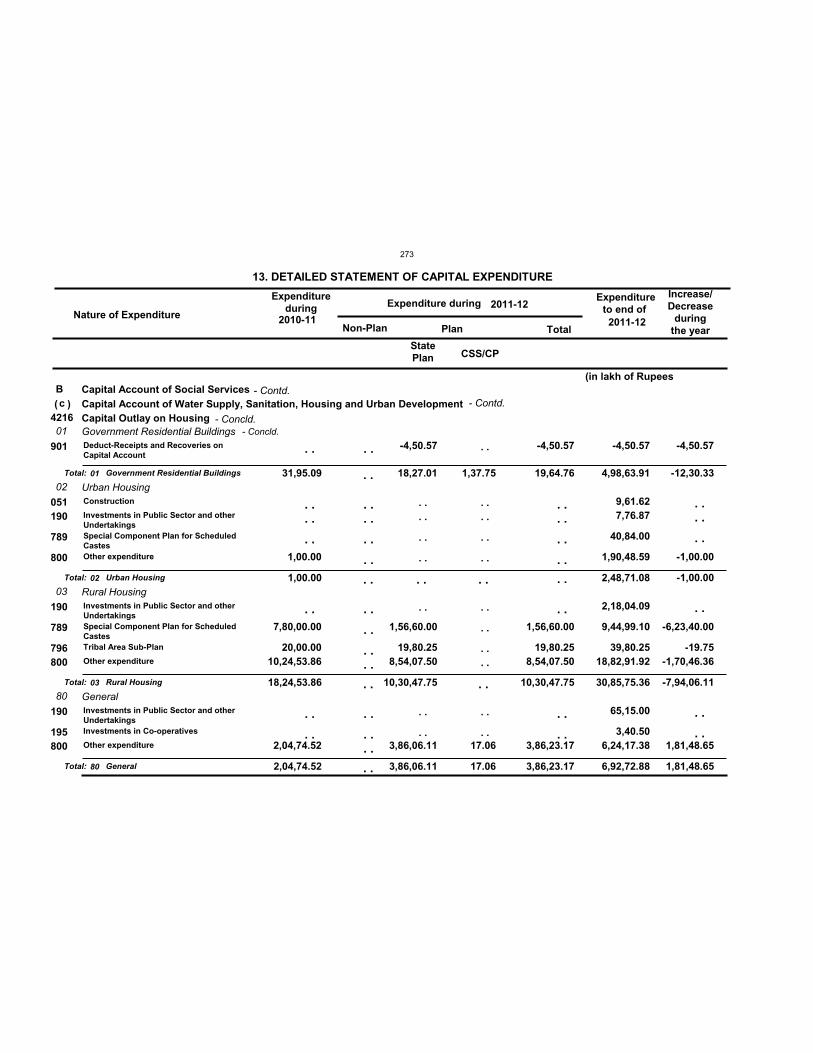
Nature of Expenditure
Expenditureduring Expenditure during
Expenditureto end of
Non-Plan Plan Total
13. DETAILED STATEMENT OF CAPITAL EXPENDITURE Increase/Decrease
duringthe year
2011-122010-11
2011-12
Bc
421601
02
03
80
31,95.09
1,00.00
18,24,53.86
2,04,74.52
18,27.01
10,30,47.75
3,86,06.11
1,37.75
17.06
19,64.76
10,30,47.75
3,86,23.17
4,98,63.91
2,48,71.08
30,85,75.36
6,92,72.88
1,00.00
7,80,00.00
20,00.00 10,24,53.86
2,04,74.52
-4,50.57
1,56,60.00
19,80.25 8,54,07.50
3,86,06.11 17.06
-4,50.57
1,56,60.00
19,80.25 8,54,07.50
3,86,23.17
-4,50.57
9,61.62 7,76.87
40,84.00
1,90,48.59
2,18,04.09
9,44,99.10
39,80.25 18,82,91.92
65,15.00
3,40.50 6,24,17.38
StatePlan
Capital Account of Social ServicesCapital Account of Water Supply, Sanitation, Housing and Urban DevelopmentCapital Outlay on HousingGovernment Residential Buildings
Urban Housing
Rural Housing
General
Deduct-Receipts and Recoveries onCapital Account
Construction
Investments in Public Sector and otherUndertakingsSpecial Component Plan for ScheduledCastesOther expenditure
Investments in Public Sector and otherUndertakingsSpecial Component Plan for ScheduledCastesTribal Area Sub-Plan
Other expenditure
Investments in Public Sector and otherUndertakingsInvestments in Co-operatives
Other expenditure
901
051190
789
800
190
789
796800
190
195800
Total:
Total:
Total:
Total:
Government Residential Buildings
Urban Housing
Rural Housing
General
( )
01
02
03
80
. .
. . . .
. .
. .
. .
. .
. .
. . . .
. .
. .
. .
. .
. . . .
. .
. . . .
. . . .
. .
. .
. .
. .
. .
. .
. . . .
. .
. .
. .
. .
. . . .
. .
. .
. . . .
. .
. .
. .
. .
. .
-4,50.57
-1,00.00
-6,23,40.00
-19.75-1,70,46.36
1,81,48.65
. . . .
. .
. .
. .
. .
. .
. .
. .
. .
. . . .
. .
. .
-12,30.33
-1,00.00
-7,94,06.11
1,81,48.65
(in lakh of Rupees
CSS/CP
- Contd.
- Concld.- Concld.
- Contd.
273
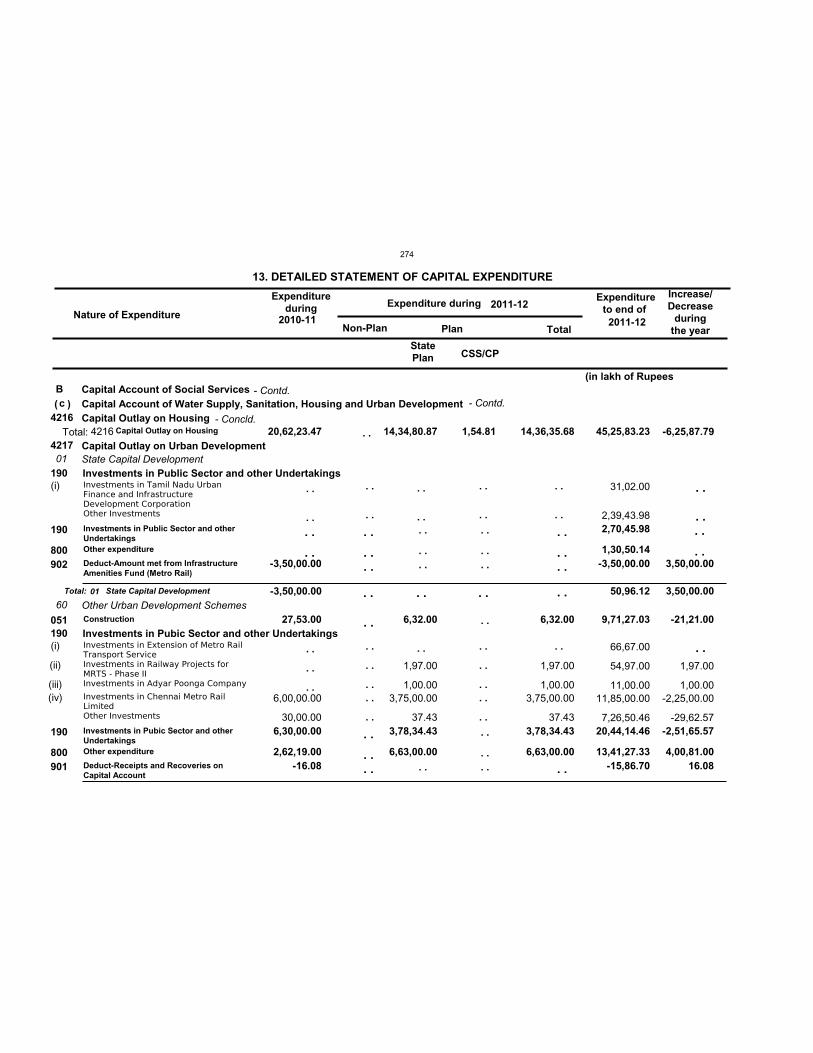
Nature of Expenditure
Expenditureduring Expenditure during
Expenditureto end of
Non-Plan Plan Total
13. DETAILED STATEMENT OF CAPITAL EXPENDITURE Increase/Decrease
duringthe year
2011-122010-11
2011-12
Bc
4216
4217 20,62,23.47 14,34,80.87 1,54.81 14,36,35.68 45,25,83.23
01
60-3,50,00.00 50,96.12
190
190
-3,50,00.00
27,53.00
6,30,00.00
2,62,19.00-16.08
6,32.00
3,78,34.43
6,63,00.00
6,32.00
3,78,34.43
6,63,00.00
2,70,45.98
1,30,50.14-3,50,00.00
9,71,27.03
20,44,14.46
13,41,27.33-15,86.70
(i)
(i)
(ii)
(iii)(iv) 6,00,00.00
30,00.00
1,97.00
1,00.00 3,75,00.00
37.43
1,97.00
1,00.00 3,75,00.00
37.43
31,02.00
2,39,43.98
66,67.00
54,97.00
11,00.00 11,85,00.00
7,26,50.46
StatePlan
Capital Account of Social ServicesCapital Account of Water Supply, Sanitation, Housing and Urban DevelopmentCapital Outlay on Housing
Capital Outlay on Urban DevelopmentState Capital Development
Other Urban Development Schemes
Investments in Public Sector and other Undertakings
Investments in Pubic Sector and other Undertakings
Investments in Public Sector and otherUndertakingsOther expenditure
Deduct-Amount met from InfrastructureAmenities Fund (Metro Rail)
Construction
Investments in Pubic Sector and otherUndertakingsOther expenditure
Deduct-Receipts and Recoveries onCapital Account
190
800902
051
190
800901
Investments in Tamil Nadu UrbanFinance and InfrastructureDevelopment CorporationOther Investments
Investments in Extension of Metro RailTransport ServiceInvestments in Railway Projects forMRTS - Phase IIInvestments in Adyar Poonga Company
Investments in Chennai Metro RailLimitedOther Investments
Total: State Capital Development
Total: Capital Outlay on Housing
( )
01
4216
. .
. .
. .
. .
. .
. .
. .
. .
. .
. .
. .
. .
. .
. .
. .
. .
. .
. .
. .
. .
. .
. .
. .
. .
. .
. .
. .
. .
. . . .
. .
. .
. . . .
. .
. . . .
. .
. .
. . . .
. .
. .
. . . .
. .
. . . .
. .
1,97.00
1,00.00-2,25,00.00
-29,62.57
3,50,00.00
-21,21.00
-2,51,65.57
4,00,81.00 16.08
. .
. .
. .
. .
. .
. . . . . . . .
. .
3,50,00.00
-6,25,87.79
(in lakh of Rupees
CSS/CP
- Contd.
- Concld.
- Contd.
274
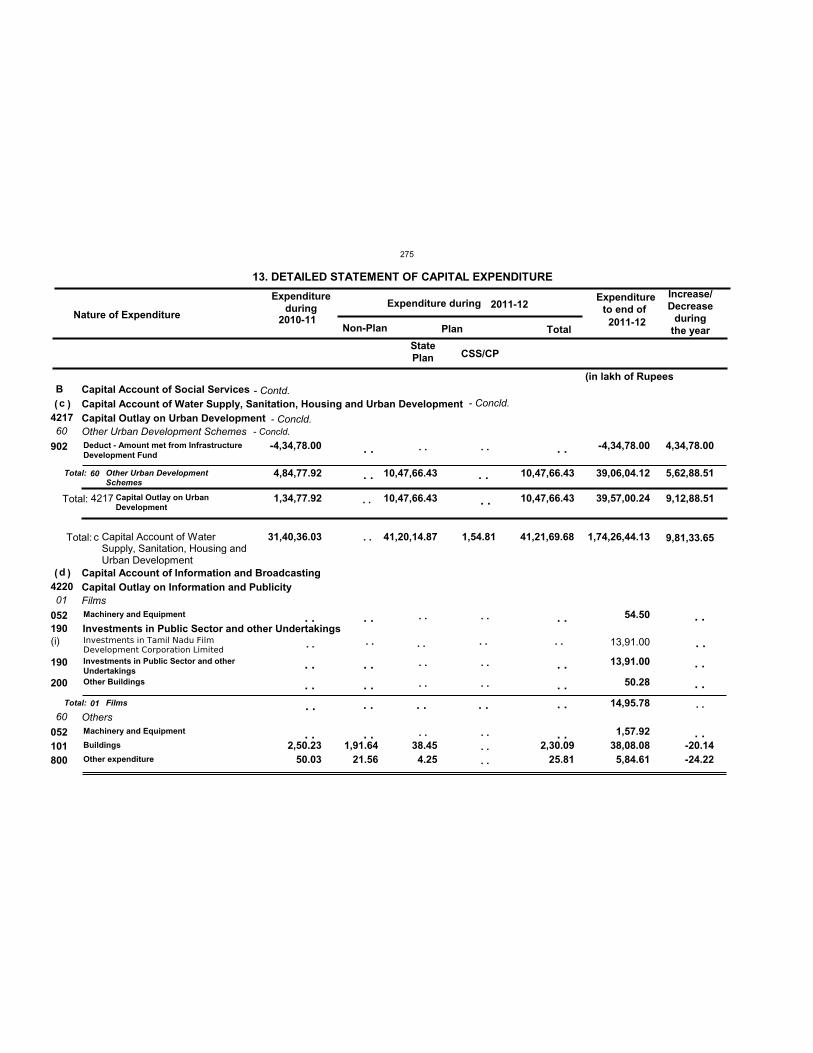
Nature of Expenditure
Expenditureduring Expenditure during
Expenditureto end of
Non-Plan Plan Total
13. DETAILED STATEMENT OF CAPITAL EXPENDITURE Increase/Decrease
duringthe year
2011-122010-11
2011-12
Bc
d
31,40,36.03 41,20,14.87 1,54.81 41,21,69.68 1,74,26,44.13
4217
4220
1,34,77.92 10,47,66.43 10,47,66.43 39,57,00.24
60
01
60
4,84,77.92 10,47,66.43 10,47,66.43 39,06,04.12
14,95.78
190
-4,34,78.00
2,50.23 50.03
1,91.64 21.56
38.45 4.25
2,30.09 25.81
-4,34,78.00
54.50
13,91.00
50.28
1,57.92 38,08.08 5,84.61
(i) 13,91.00
StatePlan
Capital Account of Social ServicesCapital Account of Water Supply, Sanitation, Housing and Urban Development
Capital Account of Information and Broadcasting
Capital Outlay on Urban Development
Capital Outlay on Information and Publicity
Other Urban Development Schemes
Films
Others
Investments in Public Sector and other Undertakings
Deduct - Amount met from InfrastructureDevelopment Fund
Machinery and Equipment
Investments in Public Sector and otherUndertakingsOther Buildings
Machinery and Equipment
Buildings
Other expenditure
902
052
190
200
052101800
Investments in Tamil Nadu FilmDevelopment Corporation Limited
Total:
Total:
Other Urban DevelopmentSchemes
Films
Total: Capital Outlay on UrbanDevelopment
Total: Capital Account of WaterSupply, Sanitation, Housing andUrban Development
(
(
)
)
60
01
4217
c
. . . . . . . .. .
. .
. .
. .
. .
. .
. .
. .
. .
. .
. .
. .
. .
. .
. .
. .
. .
. .
. .
. . . . . .
. .
. .
. .
. .
. .
4,34,78.00
-20.14-24.22
. .
. .
. .
. .
. .
. .
. .
. . . .
. .
. . . .
. . . .
5,62,88.51
9,12,88.51
9,81,33.65
(in lakh of Rupees
CSS/CP
. .
. .
- Contd.
- Concld.- Concld.
- Concld.
275
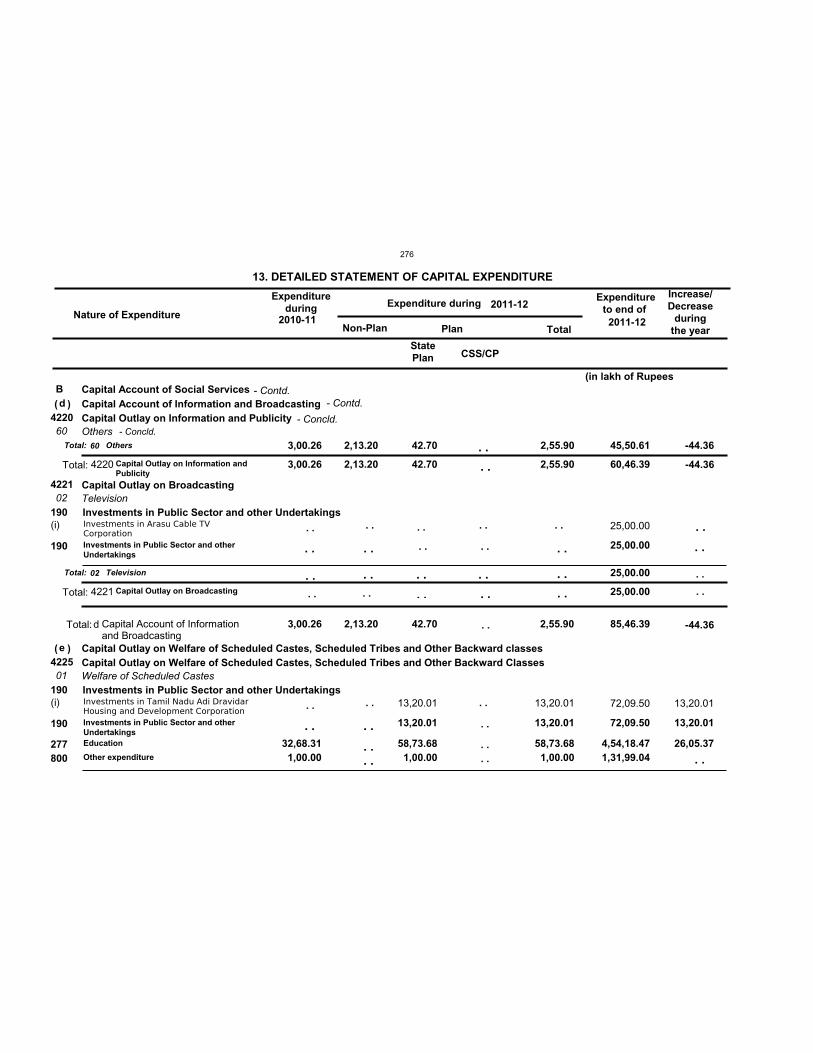
Nature of Expenditure
Expenditureduring Expenditure during
Expenditureto end of
Non-Plan Plan Total
13. DETAILED STATEMENT OF CAPITAL EXPENDITURE Increase/Decrease
duringthe year
2011-122010-11
2011-12
Bd
e
3,00.26 2,13.20 42.70 2,55.90 85,46.39
4220
4221
4225
3,00.26 2,13.20 42.70 2,55.90 60,46.39
25,00.00
60
02
01
3,00.26 2,13.20 42.70 2,55.90 45,50.61
25,00.00
190
190
32,68.31 1,00.00
13,20.01
58,73.68 1,00.00
13,20.01
58,73.68 1,00.00
25,00.00
72,09.50
4,54,18.47 1,31,99.04
(i)
(i) 13,20.01 13,20.01
25,00.00
72,09.50
StatePlan
Capital Account of Social ServicesCapital Account of Information and Broadcasting
Capital Outlay on Welfare of Scheduled Castes, Scheduled Tribes and Other Backward classes
Capital Outlay on Information and Publicity
Capital Outlay on Broadcasting
Capital Outlay on Welfare of Scheduled Castes, Scheduled Tribes and Other Backward Classes
Others
Television
Welfare of Scheduled Castes
Investments in Public Sector and other Undertakings
Investments in Public Sector and other Undertakings
Investments in Public Sector and otherUndertakings
Investments in Public Sector and otherUndertakingsEducation
Other expenditure
190
190
277800
Investments in Arasu Cable TVCorporation
Investments in Tamil Nadu Adi DravidarHousing and Development Corporation
Total:
Total:
Others
Television
Total:
Total:
Capital Outlay on Information andPublicity
Capital Outlay on Broadcasting
Total: Capital Account of Informationand Broadcasting
(
(
)
)
60
02
4220
4221
d
. .
. .
. . . .
. .
. .. .
. .
. .
. .
. .
. .
. . . .
. . . .
. .
. . . .
. .
13,20.01
13,20.01
26,05.37
. .
. .
. .
. . . . . .
. .
. . . .
. . . . . .
. .
. . . .
. .
-44.36
-44.36
-44.36
(in lakh of Rupees
CSS/CP
. .
. .
- Contd.
- Concld.- Concld.
- Contd.
276
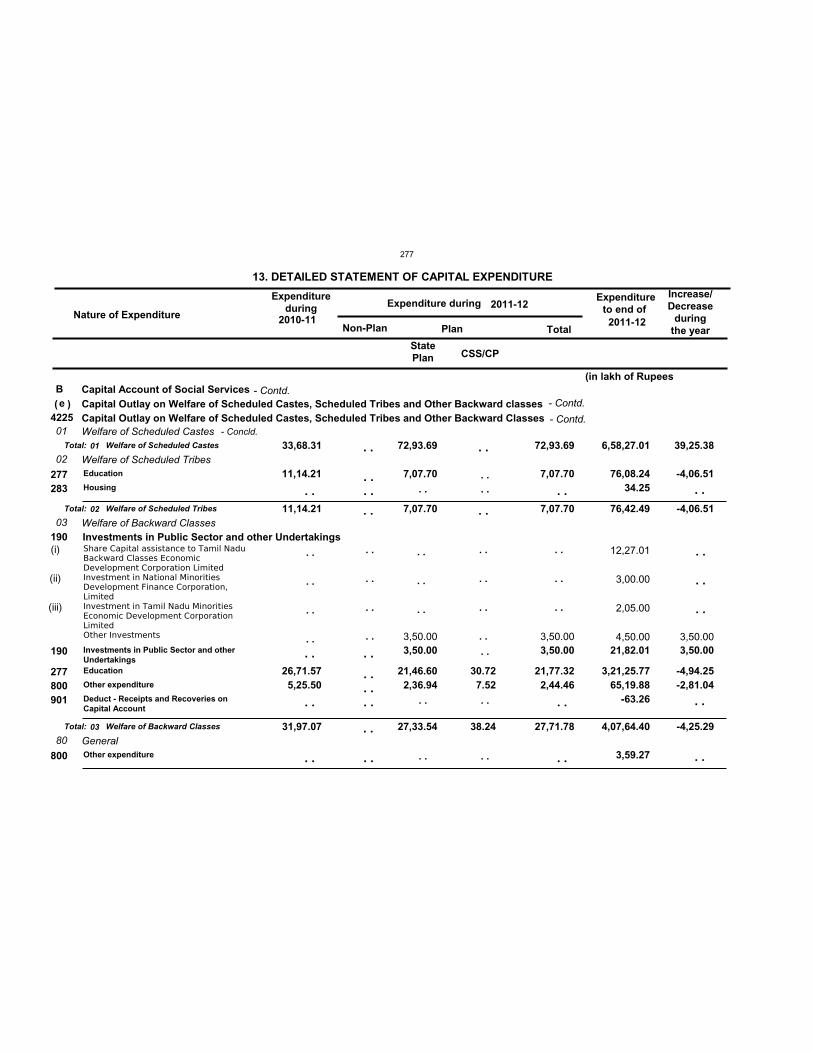
Nature of Expenditure
Expenditureduring Expenditure during
Expenditureto end of
Non-Plan Plan Total
13. DETAILED STATEMENT OF CAPITAL EXPENDITURE Increase/Decrease
duringthe year
2011-122010-11
2011-12
Be
422501
02
03
80
33,68.31
11,14.21
31,97.07
72,93.69
7,07.70
27,33.54 38.24
72,93.69
7,07.70
27,71.78
6,58,27.01
76,42.49
4,07,64.40
190
11,14.21
26,71.57 5,25.50
7,07.70
3,50.00
21,46.60 2,36.94
30.72 7.52
7,07.70
3,50.00
21,77.32 2,44.46
76,08.24 34.25
21,82.01
3,21,25.77 65,19.88
-63.26
3,59.27
(i)
(ii)
(iii)
3,50.00 3,50.00
12,27.01
3,00.00
2,05.00
4,50.00
StatePlan
Capital Account of Social ServicesCapital Outlay on Welfare of Scheduled Castes, Scheduled Tribes and Other Backward classesCapital Outlay on Welfare of Scheduled Castes, Scheduled Tribes and Other Backward ClassesWelfare of Scheduled Castes
Welfare of Scheduled Tribes
Welfare of Backward Classes
General
Investments in Public Sector and other Undertakings
Education
Housing
Investments in Public Sector and otherUndertakingsEducation
Other expenditure
Deduct - Receipts and Recoveries onCapital Account
Other expenditure
277283
190
277800901
800
Share Capital assistance to Tamil NaduBackward Classes EconomicDevelopment Corporation LimitedInvestment in National MinoritiesDevelopment Finance Corporation,LimitedInvestment in Tamil Nadu MinoritiesEconomic Development CorporationLimitedOther Investments
Total:
Total:
Total:
Welfare of Scheduled Castes
Welfare of Scheduled Tribes
Welfare of Backward Classes
( )
01
02
03
. .
. .
. .
. .
. .
. .
. .
. .
. .
. .
. .
. .
. .
. .
. .
. .
. .
. .
. .
. .
. .
. .
. . . .
. .
. . . . . .
. .
. .
. .
. .
. . . .
. .
. .
. .
. .
. .
. .
3,50.00
-4,06.51
3,50.00
-4,94.25-2,81.04
. .
. .
. .
. .
. .
. .
. .
. .
. .
. .
. .
39,25.38
-4,06.51
-4,25.29
(in lakh of Rupees
CSS/CP
- Contd.
- Contd.- Concld.
- Contd.
277
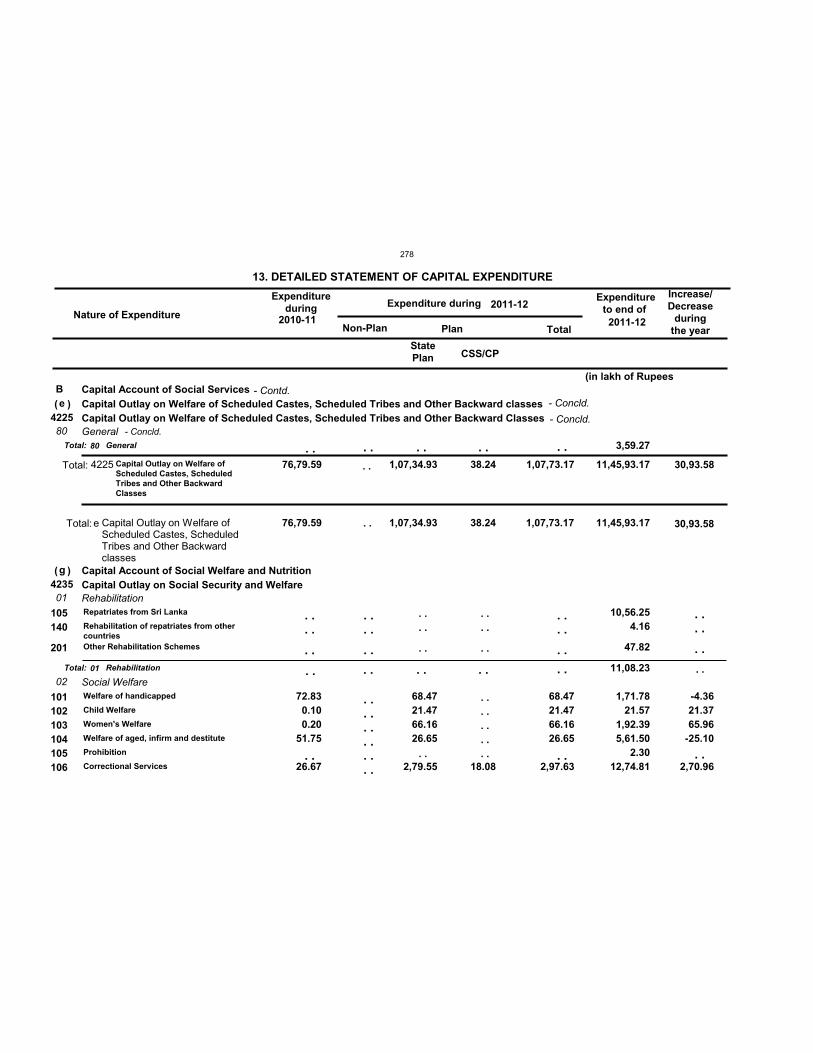
Nature of Expenditure
Expenditureduring Expenditure during
Expenditureto end of
Non-Plan Plan Total
13. DETAILED STATEMENT OF CAPITAL EXPENDITURE Increase/Decrease
duringthe year
2011-122010-11
2011-12
Be
g
76,79.59 1,07,34.93 38.24 1,07,73.17 11,45,93.17
4225
4235
76,79.59 1,07,34.93 38.24 1,07,73.17 11,45,93.17
80
01
02
3,59.27
11,08.23
72.83 0.10 0.20
51.75
26.67
68.47 21.47 66.16 26.65
2,79.55 18.08
68.47 21.47 66.16 26.65
2,97.63
10,56.25 4.16
47.82
1,71.78 21.57
1,92.39 5,61.50
2.30 12,74.81
StatePlan
Capital Account of Social ServicesCapital Outlay on Welfare of Scheduled Castes, Scheduled Tribes and Other Backward classes
Capital Account of Social Welfare and Nutrition
Capital Outlay on Welfare of Scheduled Castes, Scheduled Tribes and Other Backward Classes
Capital Outlay on Social Security and Welfare
General
Rehabilitation
Social Welfare
Repatriates from Sri Lanka
Rehabilitation of repatriates from othercountriesOther Rehabilitation Schemes
Welfare of handicapped
Child Welfare
Women's Welfare
Welfare of aged, infirm and destitute
Prohibition
Correctional Services
105140
201
101102103104105106
Total:
Total:
General
Rehabilitation
Total: Capital Outlay on Welfare ofScheduled Castes, ScheduledTribes and Other BackwardClasses
Total: Capital Outlay on Welfare ofScheduled Castes, ScheduledTribes and Other Backwardclasses
(
(
)
)
80
01
4225
e
. . . .
. .
. .
. . . .
. .
. . . . . . . . . . . .
. . . .
. .
. .
. . . .
. .
. . . . . . . . . .
. . . .
. .
. .
-4.36 21.37 65.96-25.10
2,70.96
. . . .
. .
. .
. .
. .
. .
. .
. .
. .
. .
. .
. .
. .
. . 30,93.58
30,93.58
(in lakh of Rupees
CSS/CP
. .
. .
- Contd.
- Concld.- Concld.
- Concld.
278
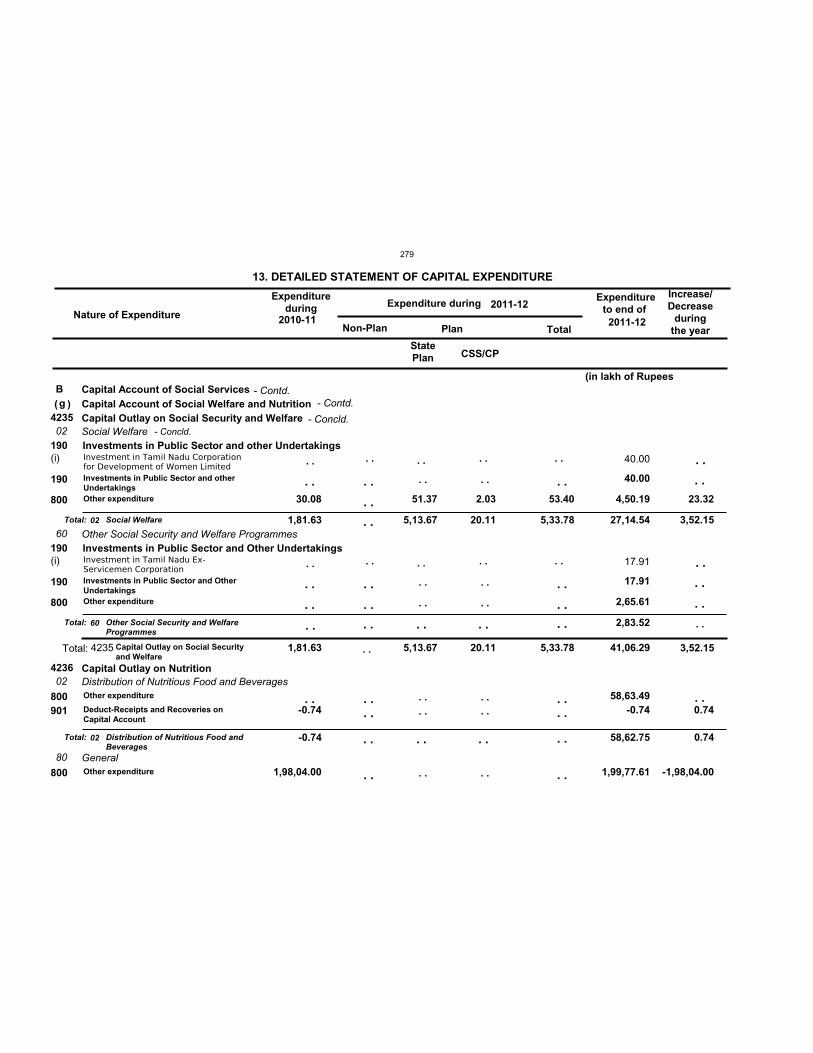
Nature of Expenditure
Expenditureduring Expenditure during
Expenditureto end of
Non-Plan Plan Total
13. DETAILED STATEMENT OF CAPITAL EXPENDITURE Increase/Decrease
duringthe year
2011-122010-11
2011-12
Bg
4235
4236
1,81.63 5,13.67 20.11 5,33.78 41,06.29
02
60
02
80
1,81.63
-0.74
5,13.67 20.11 5,33.78 27,14.54
2,83.52
58,62.75
190
190
30.08
-0.74
1,98,04.00
51.37 2.03 53.40
40.00
4,50.19
17.91
2,65.61
58,63.49-0.74
1,99,77.61
(i)
(i)
40.00
17.91
StatePlan
Capital Account of Social ServicesCapital Account of Social Welfare and NutritionCapital Outlay on Social Security and Welfare
Capital Outlay on Nutrition
Social Welfare
Other Social Security and Welfare Programmes
Distribution of Nutritious Food and Beverages
General
Investments in Public Sector and other Undertakings
Investments in Public Sector and Other Undertakings
Investments in Public Sector and otherUndertakingsOther expenditure
Investments in Public Sector and OtherUndertakingsOther expenditure
Other expenditure
Deduct-Receipts and Recoveries onCapital Account
Other expenditure
190
800
190
800
800901
800
Investment in Tamil Nadu Corporationfor Development of Women Limited
Investment in Tamil Nadu Ex-Servicemen Corporation
Total:
Total:
Total:
Social Welfare
Other Social Security and WelfareProgrammes
Distribution of Nutritious Food andBeverages
Total: Capital Outlay on Social Securityand Welfare
( )
02
60
02
4235
. .
. .
. .
. .
. .
. .
. .
. .
. .
. .
. .
. .
. .
. .
. .
. .
. .
. .
. . . .
. .
. .
. .
. .
. . . .
. .
. .
. .
. .
. . . .
. .
. .
. .
. .
. . . .
. .
23.32
0.74
-1,98,04.00
. .
. .
. .
. .
. .
. .
. .
. .
. .
. .
. .
. .
. .
. .
. .
. .
. .
3,52.15
0.74
3,52.15
(in lakh of Rupees
CSS/CP
. .
- Contd.
- Concld.- Concld.
- Contd.
279
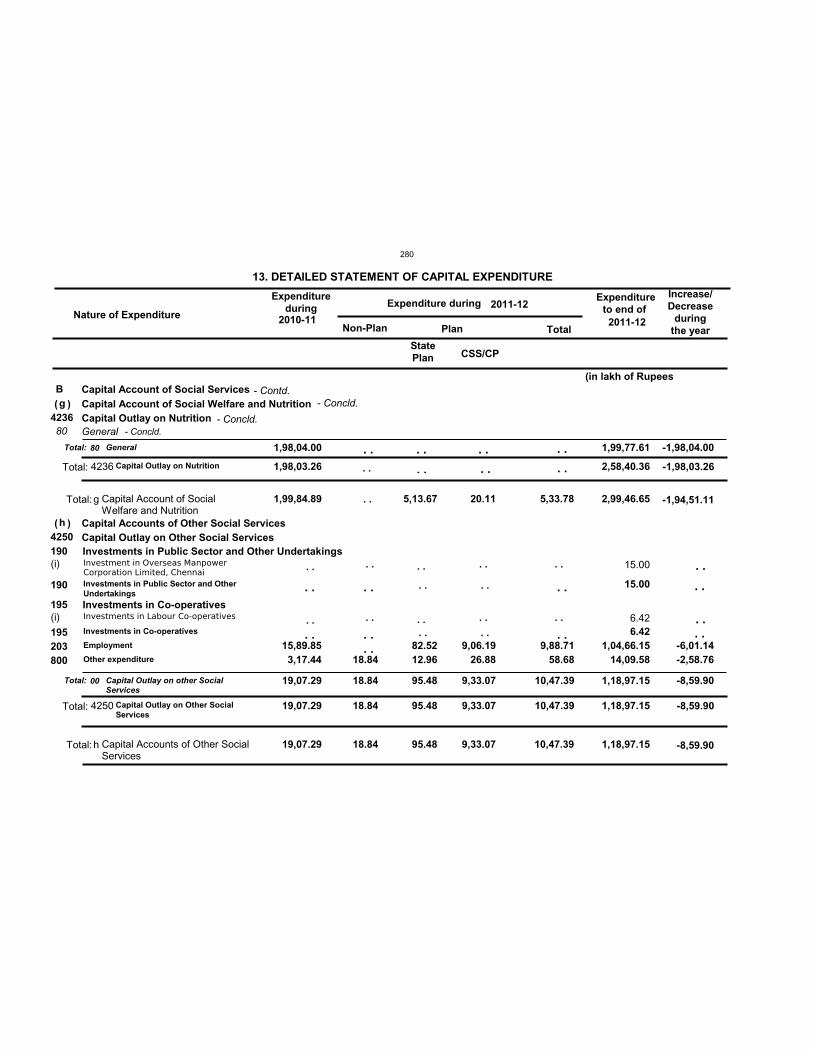
Nature of Expenditure
Expenditureduring Expenditure during
Expenditureto end of
Non-Plan Plan Total
13. DETAILED STATEMENT OF CAPITAL EXPENDITURE Increase/Decrease
duringthe year
2011-122010-11
2011-12
Bg
h
1,99,84.89
19,07.29 18.84
5,13.67
95.48
20.11
9,33.07
5,33.78
10,47.39
2,99,46.65
1,18,97.15
4236
4250
1,98,03.26
19,07.29 18.84 95.48 9,33.07 10,47.39
2,58,40.36
1,18,97.15
80
1,98,04.00
19,07.29 18.84 95.48 9,33.07 10,47.39
1,99,77.61
1,18,97.15
190
195
15,89.85 3,17.44 18.84
82.52 12.96
9,06.19 26.88
9,88.71 58.68
15.00
6.42 1,04,66.15
14,09.58
(i)
(i)
15.00
6.42
StatePlan
Capital Account of Social ServicesCapital Account of Social Welfare and Nutrition
Capital Accounts of Other Social Services
Capital Outlay on Nutrition
Capital Outlay on Other Social Services
General
Investments in Public Sector and Other Undertakings
Investments in Co-operatives
Investments in Public Sector and OtherUndertakings
Investments in Co-operatives
Employment
Other expenditure
190
195203800
Investment in Overseas ManpowerCorporation Limited, Chennai
Investments in Labour Co-operatives
Total:
Total:
General
Capital Outlay on other SocialServices
Total:
Total:
Capital Outlay on Nutrition
Capital Outlay on Other SocialServices
Total:
Total:
Capital Account of SocialWelfare and Nutrition
Capital Accounts of Other SocialServices
(
(
)
)
80
00
4236
4250
g
h
. .
. .
. .
. .
. .
. .
. .
. .
. .
. .
. .
. .
. .
. . . .
. .
. .
. .
. .
. .
. .-6,01.14-2,58.76
. .
. .
. .
. .
. . . . . . . .
. . . . . . . .
-1,98,04.00
-8,59.90
-1,98,03.26
-8,59.90
-1,94,51.11
-8,59.90
(in lakh of Rupees
CSS/CP
. .
- Contd.
- Concld.- Concld.
- Concld.
280
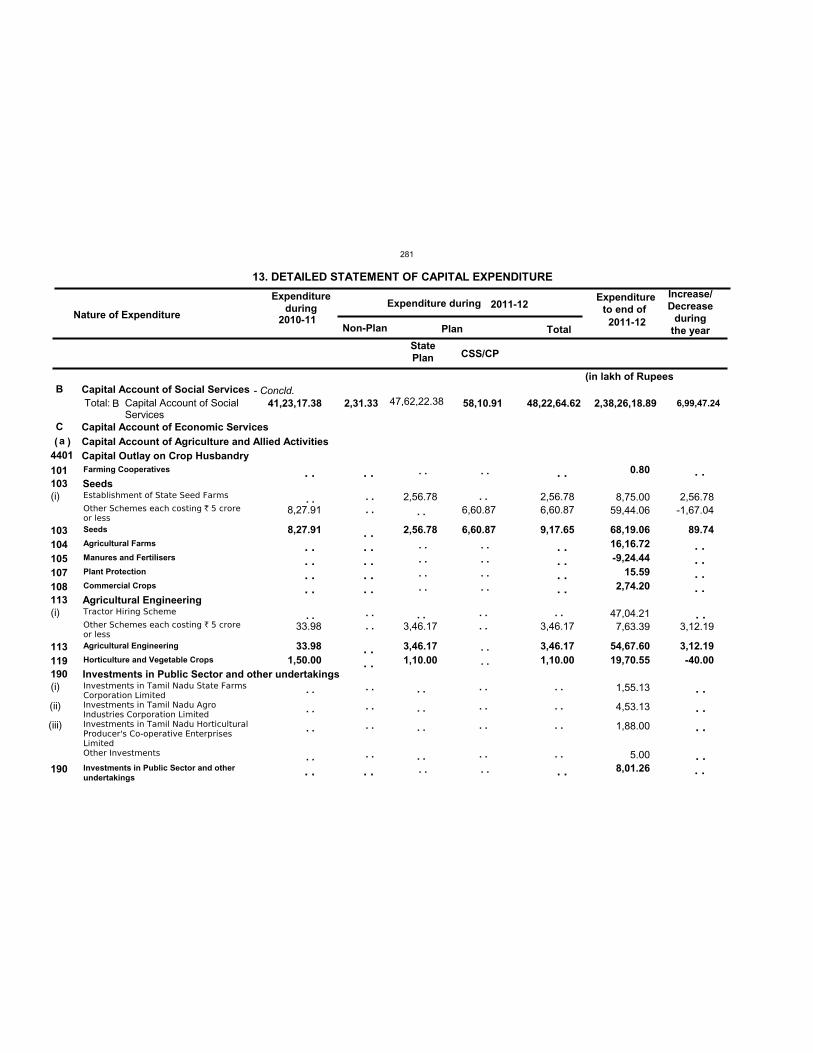
Nature of Expenditure
Expenditureduring Expenditure during
Expenditureto end of
Non-Plan Plan Total
13. DETAILED STATEMENT OF CAPITAL EXPENDITURE Increase/Decrease
duringthe year
2011-122010-11
2011-12
B
C
41,23,17.38 2,31.33 47,62,22.38 58,10.91 48,22,64.62 2,38,26,18.89
a4401
103
113
190
8,27.91
33.98 1,50.00
2,56.78
3,46.17 1,10.00
6,60.87 9,17.65
3,46.17 1,10.00
0.80
68,19.06 16,16.72-9,24.44
15.59 2,74.20
54,67.60 19,70.55
8,01.26
(i)
(i)
(i)
(ii)
(iii)
8,27.91
33.98
2,56.78
3,46.17
6,60.87 2,56.78 6,60.87
3,46.17
8,75.00 59,44.06
47,04.21 7,63.39
1,55.13
4,53.13
1,88.00
5.00
StatePlan
Capital Account of Social Services
Capital Account of Economic ServicesCapital Account of Agriculture and Allied ActivitiesCapital Outlay on Crop Husbandry
Seeds
Agricultural Engineering
Investments in Public Sector and other undertakings
Farming Cooperatives
Seeds
Agricultural Farms
Manures and Fertilisers
Plant Protection
Commercial Crops
Agricultural Engineering
Horticulture and Vegetable Crops
Investments in Public Sector and otherundertakings
101
103104105107108
113119
190
Establishment of State Seed Farms
Other Schemes each costing ` 5 croreor less
Tractor Hiring Scheme
Other Schemes each costing ` 5 croreor less
Investments in Tamil Nadu State FarmsCorporation LimitedInvestments in Tamil Nadu AgroIndustries Corporation LimitedInvestments in Tamil Nadu HorticulturalProducer's Co-operative EnterprisesLimitedOther Investments
Total: Capital Account of SocialServices
( )
B
. .
. .
. .
. .
. .
. .
. .
. .
. .
. .
. .
. .
. .
. .
. .
. .
. .
. .
. .
. .
. .
. .
. .
. .
. .
. .
. .
. .
. .
. .
. .
. .
. .
. . . . . . . .
. .
. .
. . . . . . . . . .
. . . .
. .
. .
. . . . . . . .
. .
. .
. . . . . . . .
. . . .
. .
. .
. . . . . . . .
. .
2,56.78-1,67.04
3,12.19
89.74
3,12.19-40.00
. .
. .
. .
. .
. .
. .
. . . . . . . .
. .
6,99,47.24
(in lakh of Rupees
CSS/CP
- Concld.
281
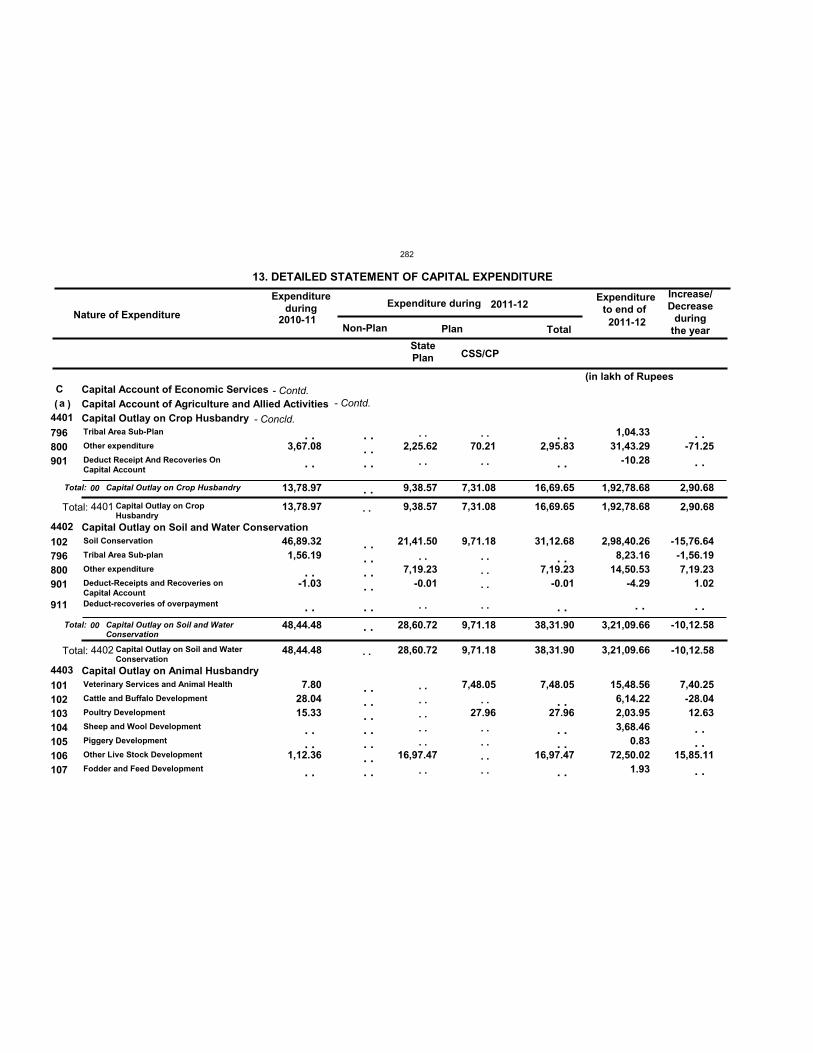
Nature of Expenditure
Expenditureduring Expenditure during
Expenditureto end of
Non-Plan Plan Total
13. DETAILED STATEMENT OF CAPITAL EXPENDITURE Increase/Decrease
duringthe year
2011-122010-11
2011-12
Ca
4401
4402
4403
13,78.97
48,44.48
9,38.57
28,60.72
7,31.08
9,71.18
16,69.65
38,31.90
1,92,78.68
3,21,09.66
13,78.97
48,44.48
9,38.57
28,60.72
7,31.08
9,71.18
16,69.65
38,31.90
1,92,78.68
3,21,09.66
3,67.08
46,89.32 1,56.19
-1.03
7.80 28.04 15.33
1,12.36
2,25.62
21,41.50
7,19.23-0.01
16,97.47
70.21
9,71.18
7,48.05
27.96
2,95.83
31,12.68
7,19.23-0.01
7,48.05
27.96
16,97.47
1,04.33 31,43.29
-10.28
2,98,40.26 8,23.16
14,50.53-4.29
15,48.56 6,14.22 2,03.95 3,68.46
0.83 72,50.02
1.93
StatePlan
Capital Account of Economic ServicesCapital Account of Agriculture and Allied ActivitiesCapital Outlay on Crop Husbandry
Capital Outlay on Soil and Water Conservation
Capital Outlay on Animal Husbandry
Tribal Area Sub-Plan
Other expenditure
Deduct Receipt And Recoveries OnCapital Account
Soil Conservation
Tribal Area Sub-plan
Other expenditure
Deduct-Receipts and Recoveries onCapital AccountDeduct-recoveries of overpayment
Veterinary Services and Animal Health
Cattle and Buffalo Development
Poultry Development
Sheep and Wool Development
Piggery Development
Other Live Stock Development
Fodder and Feed Development
796800901
102796800901
911
101102103104105106107
Total:
Total:
Capital Outlay on Crop Husbandry
Capital Outlay on Soil and WaterConservation
Total:
Total:
Capital Outlay on CropHusbandry
Capital Outlay on Soil and WaterConservation
( )
00
00
4401
4402
. .
. .
. .
. .
. . . .
. .
. . . . . .
. . . . . . . .
. .
. . . . . . . . . . . . . .
. .
. .
. .
. .
. . . . . . . . . .
. .
. .
. .
. . . . . .
. .
. .
. . . . . . . .
. .
. .
. .
. .
. .
. . . .
. .
-71.25
-15,76.64-1,56.19 7,19.23
1.02
7,40.25-28.04 12.63
15,85.11
. .
. .
. .
. . . .
. .
. .
. .
. .
. .
2,90.68
-10,12.58
2,90.68
-10,12.58
. .
(in lakh of Rupees
CSS/CP
- Contd.
- Concld.
- Contd.
282
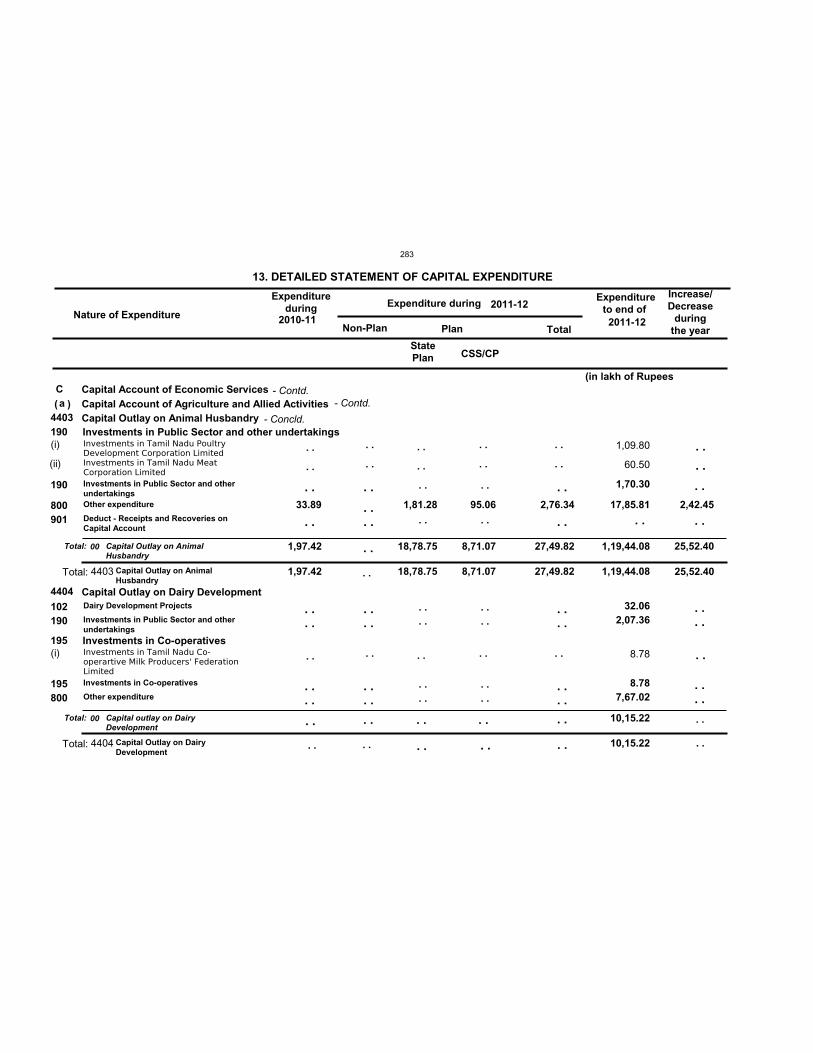
Nature of Expenditure
Expenditureduring Expenditure during
Expenditureto end of
Non-Plan Plan Total
13. DETAILED STATEMENT OF CAPITAL EXPENDITURE Increase/Decrease
duringthe year
2011-122010-11
2011-12
Ca
4403
4404
1,97.42 18,78.75 8,71.07 27,49.82 1,19,44.08
10,15.22
1,97.42 18,78.75 8,71.07 27,49.82 1,19,44.08
10,15.22
190
195
33.89 1,81.28 95.06 2,76.34
1,70.30
17,85.81
32.06 2,07.36
8.78 7,67.02
(i)
(ii)
(i)
1,09.80
60.50
8.78
StatePlan
Capital Account of Economic ServicesCapital Account of Agriculture and Allied ActivitiesCapital Outlay on Animal Husbandry
Capital Outlay on Dairy Development
Investments in Public Sector and other undertakings
Investments in Co-operatives
Investments in Public Sector and otherundertakingsOther expenditure
Deduct - Receipts and Recoveries onCapital Account
Dairy Development Projects
Investments in Public Sector and otherundertakings
Investments in Co-operatives
Other expenditure
190
800901
102190
195800
Investments in Tamil Nadu PoultryDevelopment Corporation LimitedInvestments in Tamil Nadu MeatCorporation Limited
Investments in Tamil Nadu Co-operartive Milk Producers' FederationLimited
Total:
Total:
Capital Outlay on AnimalHusbandry
Capital outlay on DairyDevelopment
Total:
Total:
Capital Outlay on AnimalHusbandry
Capital Outlay on DairyDevelopment
( )
00
00
4403
4404
. .
. .
. .
. .
. .
. .
. .
. .
. .
. .
. .
. .
. .
. .
. .
. .
. .
. . . .
. . . .
. .
. . . .
. . . .
. . . .
. .
. .
. . . .
. . . .
. .
. .
. . . .
. . . .
. .
. .
. . . .
. . . .
2,42.45
. .
. .
. .
. .
. .
. . . .
. . . .
. .
. .
. . . . . . . .
. .
. .
. . . . . . . .
25,52.40
25,52.40
. .
(in lakh of Rupees
CSS/CP
. .
. .
- Contd.
- Concld.
- Contd.
283
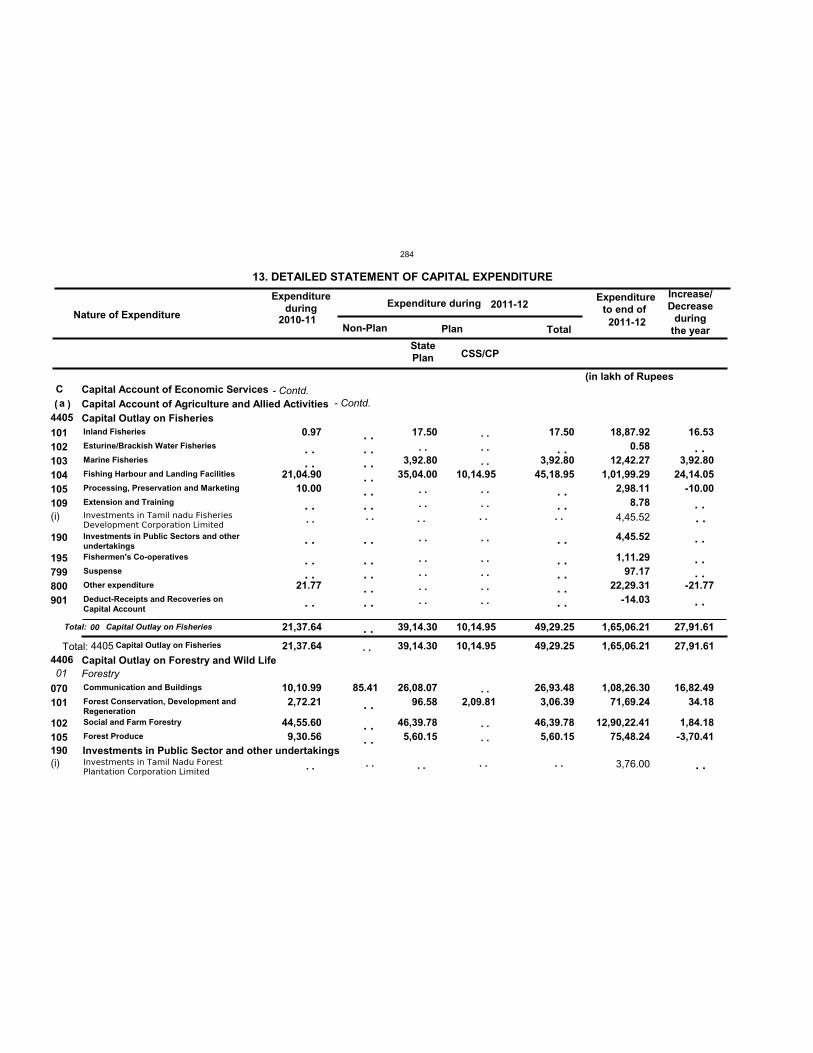
Nature of Expenditure
Expenditureduring Expenditure during
Expenditureto end of
Non-Plan Plan Total
13. DETAILED STATEMENT OF CAPITAL EXPENDITURE Increase/Decrease
duringthe year
2011-122010-11
2011-12
Ca
4405
4406 21,37.64 39,14.30 10,14.95 49,29.25 1,65,06.21
01
21,37.64 39,14.30 10,14.95 49,29.25 1,65,06.21
190
0.97
21,04.90 10.00
21.77
10,10.99 2,72.21
44,55.60 9,30.56
85.41
17.50
3,92.80 35,04.00
26,08.07 96.58
46,39.78 5,60.15
10,14.95
2,09.81
17.50
3,92.80 45,18.95
26,93.48 3,06.39
46,39.78 5,60.15
18,87.92 0.58
12,42.27 1,01,99.29
2,98.11 8.78
4,45.52
1,11.29 97.17
22,29.31-14.03
1,08,26.30 71,69.24
12,90,22.41 75,48.24
(i)
(i)
4,45.52
3,76.00
StatePlan
Capital Account of Economic ServicesCapital Account of Agriculture and Allied ActivitiesCapital Outlay on Fisheries
Capital Outlay on Forestry and Wild LifeForestry
Investments in Public Sector and other undertakings
Inland Fisheries
Esturine/Brackish Water Fisheries
Marine Fisheries
Fishing Harbour and Landing Facilities
Processing, Preservation and Marketing
Extension and Training
Investments in Public Sectors and otherundertakingsFishermen's Co-operatives
Suspense
Other expenditure
Deduct-Receipts and Recoveries onCapital Account
Communication and Buildings
Forest Conservation, Development andRegenerationSocial and Farm Forestry
Forest Produce
101102103104105109
190
195799800901
070101
102105
Investments in Tamil nadu FisheriesDevelopment Corporation Limited
Investments in Tamil Nadu ForestPlantation Corporation Limited
Total: Capital Outlay on Fisheries
Total: Capital Outlay on Fisheries
( )
00
4405
. .
. .
. .
. .
. .
. .
. .
. .
. .
. .
. . . .
. .
. .
. . . .
. .
. . . . . . . . . . . .
. .
. . . . . . . .
. .
. . . .
. .
. . . .
. .
. . . . . . . .
. . . . . .
. . . .
. .
. . . . . . . .
. .
. . . .
. .
. . . .
. .
. . . . . . . .
16.53
3,92.80 24,14.05
-10.00
-21.77
16,82.49 34.18
1,84.18-3,70.41
. .
. .
. .
. .
. .
. . . .
. .
. . . .
27,91.61
27,91.61
(in lakh of Rupees
CSS/CP
- Contd.- Contd.
284
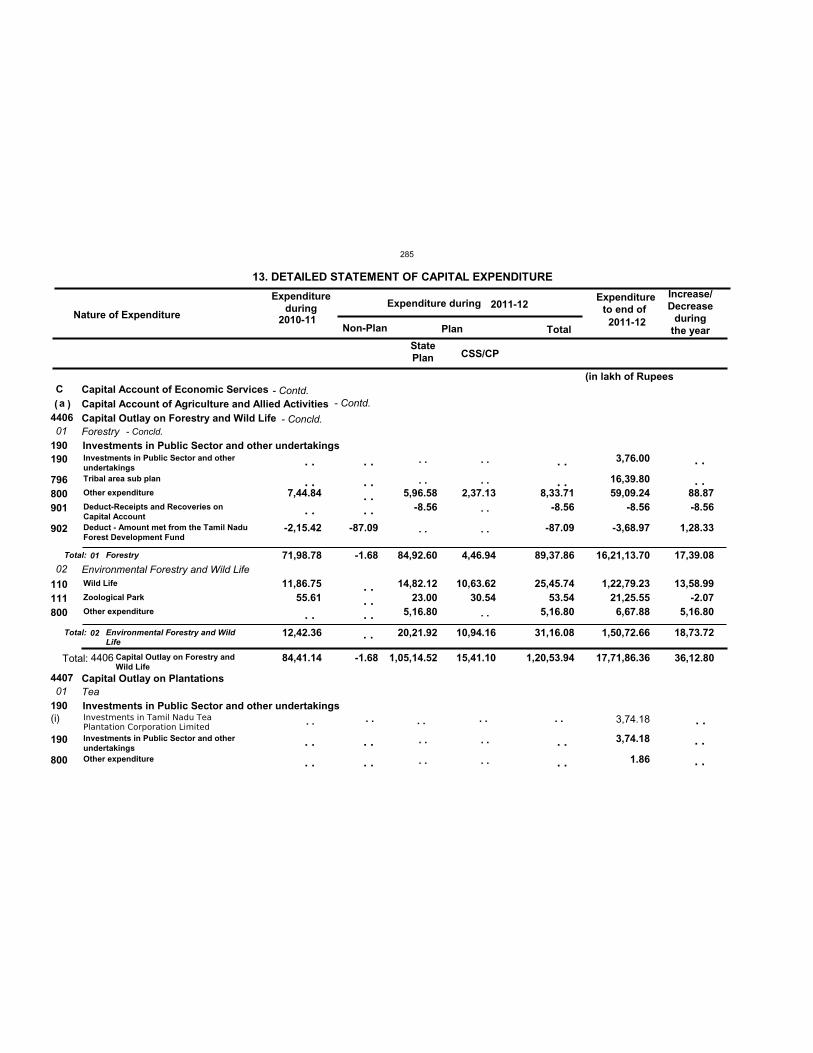
Nature of Expenditure
Expenditureduring Expenditure during
Expenditureto end of
Non-Plan Plan Total
13. DETAILED STATEMENT OF CAPITAL EXPENDITURE Increase/Decrease
duringthe year
2011-122010-11
2011-12
Ca
4406
4407
84,41.14 -1.68 1,05,14.52 15,41.10 1,20,53.94 17,71,86.36
01
02
01
71,98.78
12,42.36
-1.68 84,92.60
20,21.92
4,46.94
10,94.16
89,37.86
31,16.08
16,21,13.70
1,50,72.66
190
190
7,44.84
-2,15.42
11,86.75 55.61
-87.09
5,96.58-8.56
14,82.12 23.00
5,16.80
2,37.13
10,63.62 30.54
8,33.71-8.56
-87.09
25,45.74 53.54
5,16.80
3,76.00
16,39.80 59,09.24
-8.56
-3,68.97
1,22,79.23 21,25.55 6,67.88
3,74.18
1.86
(i) 3,74.18
StatePlan
Capital Account of Economic ServicesCapital Account of Agriculture and Allied ActivitiesCapital Outlay on Forestry and Wild Life
Capital Outlay on Plantations
Forestry
Environmental Forestry and Wild Life
Tea
Investments in Public Sector and other undertakings
Investments in Public Sector and other undertakings
Investments in Public Sector and otherundertakingsTribal area sub plan
Other expenditure
Deduct-Receipts and Recoveries onCapital AccountDeduct - Amount met from the Tamil NaduForest Development Fund
Wild Life
Zoological Park
Other expenditure
Investments in Public Sector and otherundertakingsOther expenditure
190
796800901
902
110111800
190
800
Investments in Tamil Nadu TeaPlantation Corporation Limited
Total:
Total:
Forestry
Environmental Forestry and WildLife
Total: Capital Outlay on Forestry andWild Life
( )
01
02
4406
. . . . . . . .. .
. .
. .
. .
. .
. .
. .
. .
. . . . . .
. . . . . .
. .
. .
. .
. .
. .
. .
. .
. .
. .
. .
. .
. .
. .
. .
. .
. .
. .
. .
88.87-8.56
1,28.33
13,58.99-2.07
5,16.80
. .
. .
. .
. .
. .
. .
17,39.08
18,73.72
36,12.80
(in lakh of Rupees
CSS/CP
- Contd.
- Concld.- Concld.
- Contd.
285
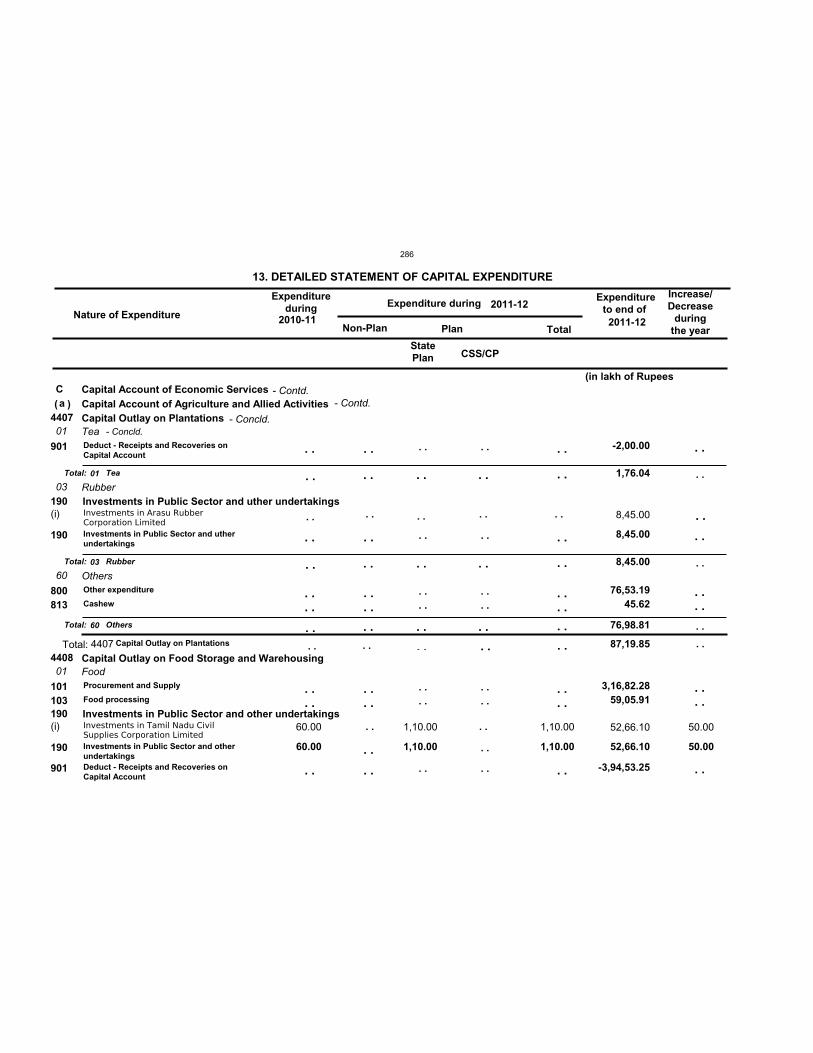
Nature of Expenditure
Expenditureduring Expenditure during
Expenditureto end of
Non-Plan Plan Total
13. DETAILED STATEMENT OF CAPITAL EXPENDITURE Increase/Decrease
duringthe year
2011-122010-11
2011-12
Ca
4407
4408 87,19.85
01
03
60
01
1,76.04
8,45.00
76,98.81
190
190
60.00 1,10.00 1,10.00
-2,00.00
8,45.00
76,53.19 45.62
3,16,82.28 59,05.91
52,66.10
-3,94,53.25
(i)
(i) 60.00 1,10.00 1,10.00
8,45.00
52,66.10
StatePlan
Capital Account of Economic ServicesCapital Account of Agriculture and Allied ActivitiesCapital Outlay on Plantations
Capital Outlay on Food Storage and Warehousing
Tea
Rubber
Others
Food
Investments in Public Sector and uther undertakings
Investments in Public Sector and other undertakings
Deduct - Receipts and Recoveries onCapital Account
Investments in Public Sector and utherundertakings
Other expenditure
Cashew
Procurement and Supply
Food processing
Investments in Public Sector and otherundertakingsDeduct - Receipts and Recoveries onCapital Account
901
190
800813
101103
190
901
Investments in Arasu RubberCorporation Limited
Investments in Tamil Nadu CivilSupplies Corporation Limited
Total:
Total:
Total:
Tea
Rubber
Others
Total: Capital Outlay on Plantations
( )
01
03
60
4407
. .
. .
. . . .
. .
. .. .
. .
. .
. . . .
. . . .
. .
. .
. .
. . . .
. . . .
. .
. .
. .
. .
. . . .
. . . .
. .
. .
. .
. . . .
. . . .
. .
. .
. .
. .
. . . .
. . . .
. .
50.00
50.00
. .
. .
. .
. . . .
. . . .
. .
. .
. .
. .
. .
. .
. .
. .
. .
. .
. .
. .
. .
. .
. .
. .
. . . . . . . . . .
(in lakh of Rupees
CSS/CP
. .
. .
. .
. .
- Contd.
- Concld.- Concld.
- Contd.
286
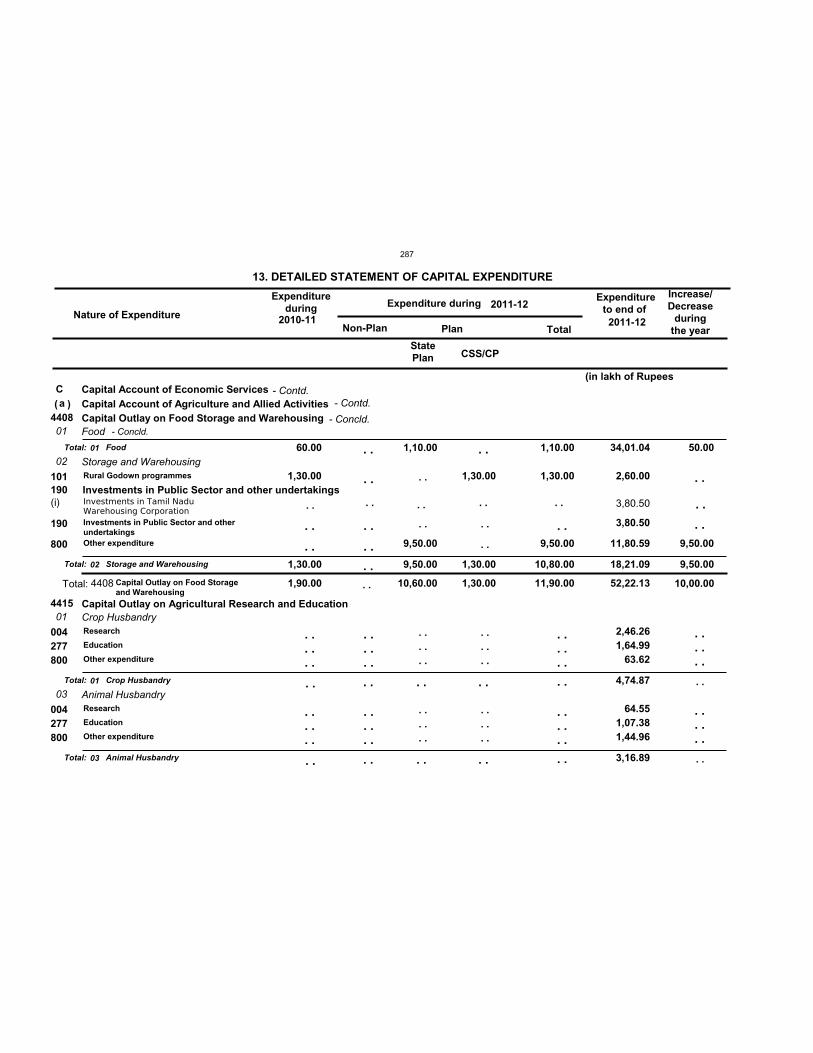
Nature of Expenditure
Expenditureduring Expenditure during
Expenditureto end of
Non-Plan Plan Total
13. DETAILED STATEMENT OF CAPITAL EXPENDITURE Increase/Decrease
duringthe year
2011-122010-11
2011-12
Ca
4408
4415
1,90.00 10,60.00 1,30.00 11,90.00 52,22.13
01
02
01
03
60.00
1,30.00
1,10.00
9,50.00 1,30.00
1,10.00
10,80.00
34,01.04
18,21.09
4,74.87
3,16.89
190 1,30.00
9,50.00
1,30.00 1,30.00
9,50.00
2,60.00
3,80.50
11,80.59
2,46.26 1,64.99
63.62
64.55 1,07.38 1,44.96
(i) 3,80.50
StatePlan
Capital Account of Economic ServicesCapital Account of Agriculture and Allied ActivitiesCapital Outlay on Food Storage and Warehousing
Capital Outlay on Agricultural Research and Education
Food
Storage and Warehousing
Crop Husbandry
Animal Husbandry
Investments in Public Sector and other undertakingsRural Godown programmes
Investments in Public Sector and otherundertakingsOther expenditure
Research
Education
Other expenditure
Research
Education
Other expenditure
101
190
800
004277800
004277800
Investments in Tamil NaduWarehousing Corporation
Total:
Total:
Total:
Total:
Food
Storage and Warehousing
Crop Husbandry
Animal Husbandry
Total: Capital Outlay on Food Storageand Warehousing
( )
01
02
01
03
4408
. . . . . . . .. .
. .
. .
. . . . . .
. . . . . .
. .
. .
. .
. . . . . .
. . . . . .
. .
. .
. . . . . .
. . . . . .
. .
. .
. . . . . .
. . . . . .
. .
. . . . . .
. . . . . .
9,50.00
. .
. .
. .
. . . . . .
. . . . . .
. .
. .
. .
. .
. .
. .
. .
. .
. .
. .
. .
. .
. .
. .
50.00
9,50.00
10,00.00
(in lakh of Rupees
CSS/CP
. .
. .
- Contd.
- Concld.- Concld.
- Contd.
287
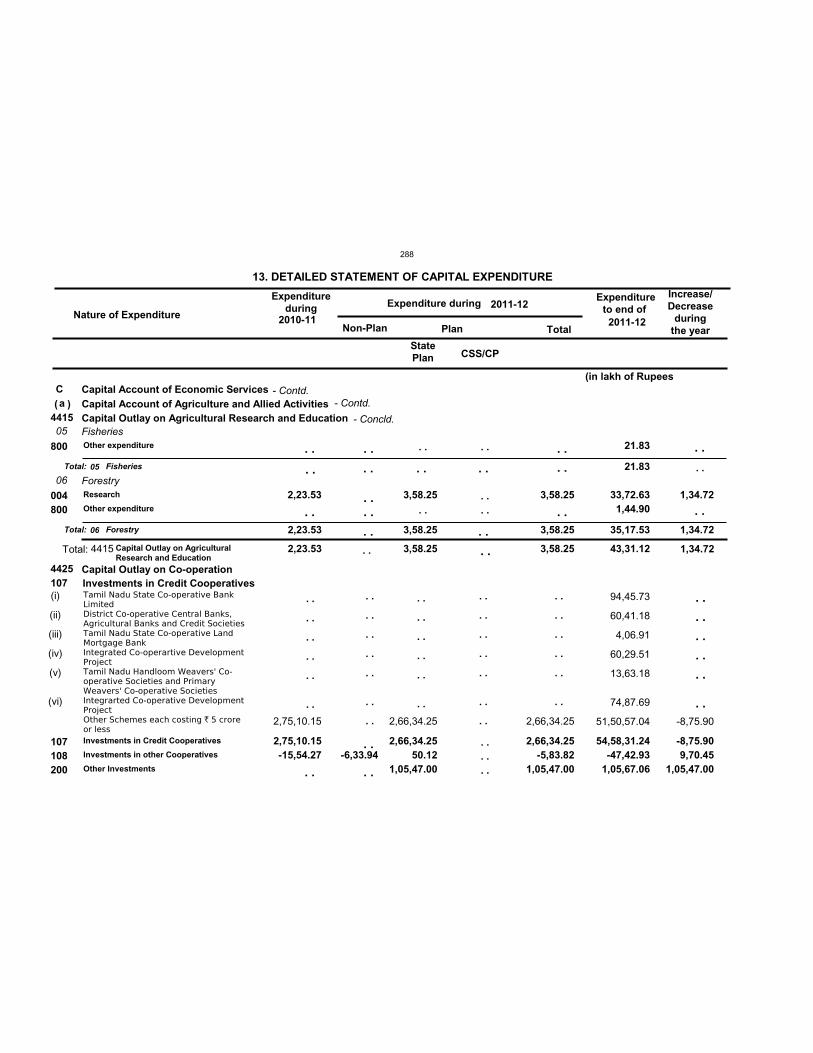
Nature of Expenditure
Expenditureduring Expenditure during
Expenditureto end of
Non-Plan Plan Total
13. DETAILED STATEMENT OF CAPITAL EXPENDITURE Increase/Decrease
duringthe year
2011-122010-11
2011-12
Ca
4415
4425
2,23.53 3,58.25 3,58.25 43,31.12
05
06
2,23.53 3,58.25 3,58.25
21.83
35,17.53
107
2,23.53
2,75,10.15-15,54.27 -6,33.94
3,58.25
2,66,34.25 50.12
1,05,47.00
3,58.25
2,66,34.25-5,83.82
1,05,47.00
21.83
33,72.63 1,44.90
54,58,31.24-47,42.93
1,05,67.06
(i)
(ii)
(iii)
(iv)
(v)
(vi)
2,75,10.15 2,66,34.25 2,66,34.25
94,45.73
60,41.18
4,06.91
60,29.51
13,63.18
74,87.69
51,50,57.04
StatePlan
Capital Account of Economic ServicesCapital Account of Agriculture and Allied ActivitiesCapital Outlay on Agricultural Research and Education
Capital Outlay on Co-operation
Fisheries
Forestry
Investments in Credit Cooperatives
Other expenditure
Research
Other expenditure
Investments in Credit Cooperatives
Investments in other Cooperatives
Other Investments
800
004800
107108200
Tamil Nadu State Co-operative BankLimitedDistrict Co-operative Central Banks,Agricultural Banks and Credit SocietiesTamil Nadu State Co-operative LandMortgage BankIntegrated Co-operartive DevelopmentProjectTamil Nadu Handloom Weavers' Co-operative Societies and PrimaryWeavers' Co-operative SocietiesIntegrarted Co-operative DevelopmentProjectOther Schemes each costing ` 5 croreor less
Total:
Total:
Fisheries
Forestry
Total: Capital Outlay on AgriculturalResearch and Education
( )
05
06
4415
. .
. .
. .
. .
. .
. .
. .
. .
. .
. .
. .
. .
. .
. .
. .
. .
. .
. .
. .
. .
. .
. .
. .
. .
. .
. .
. .
. .
. .
. .
. .
. .
. .
. .
. .
. .
. . . .
. .
. .
. .
. .
. .
. . . .
. . . . . .
. .
. .
-8,75.90
1,34.72
-8,75.90 9,70.45
1,05,47.00
. .
. .
. .
. .
. .
. .
. .
. .
. . . .
. .
. . . .
. .
. .
. . . .
1,34.72
1,34.72
(in lakh of Rupees
CSS/CP
. .
- Contd.
- Concld.
- Contd.
288
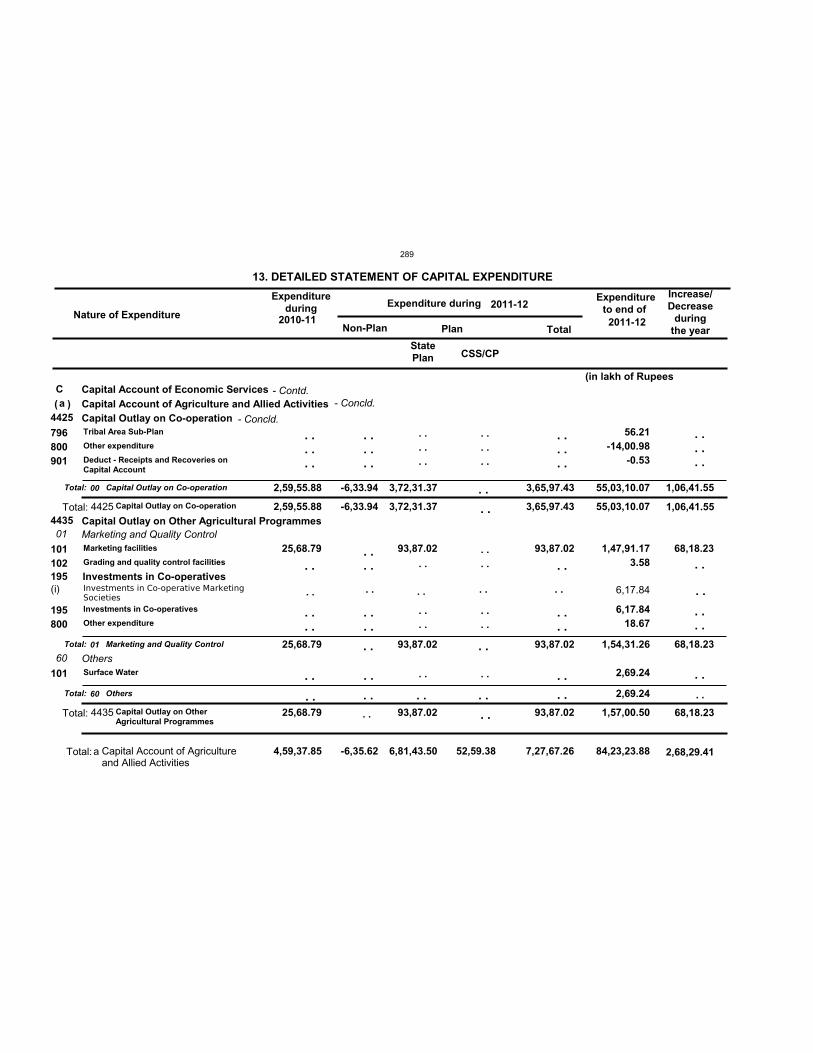
Nature of Expenditure
Expenditureduring Expenditure during
Expenditureto end of
Non-Plan Plan Total
13. DETAILED STATEMENT OF CAPITAL EXPENDITURE Increase/Decrease
duringthe year
2011-122010-11
2011-12
Ca
4,59,37.85 -6,35.62 6,81,43.50 52,59.38 7,27,67.26 84,23,23.88
4425
4435 2,59,55.88
25,68.79
-6,33.94 3,72,31.37
93,87.02
3,65,97.43
93,87.02
55,03,10.07
1,57,00.50
01
60
2,59,55.88
25,68.79
-6,33.94 3,72,31.37
93,87.02
3,65,97.43
93,87.02
55,03,10.07
1,54,31.26
2,69.24
195
25,68.79 93,87.02 93,87.02
56.21-14,00.98
-0.53
1,47,91.17 3.58
6,17.84 18.67
2,69.24
(i) 6,17.84
StatePlan
Capital Account of Economic ServicesCapital Account of Agriculture and Allied ActivitiesCapital Outlay on Co-operation
Capital Outlay on Other Agricultural ProgrammesMarketing and Quality Control
Others
Investments in Co-operatives
Tribal Area Sub-Plan
Other expenditure
Deduct - Receipts and Recoveries onCapital Account
Marketing facilities
Grading and quality control facilities
Investments in Co-operatives
Other expenditure
Surface Water
796800901
101102
195800
101
Investments in Co-operative MarketingSocieties
Total:
Total:
Total:
Capital Outlay on Co-operation
Marketing and Quality Control
Others
Total:
Total:
Capital Outlay on Co-operation
Capital Outlay on OtherAgricultural Programmes
Total: Capital Account of Agricultureand Allied Activities
( )
00
01
60
4425
4435
a
. . . . . . . .. .
. . . . . .
. .
. . . .
. .
. . . . . .
. . . .
. . . .
. .
. . . . . .
. .
. . . .
. .
. . . . . .
. . . .
. . . .
. .
. . . . . .
. .
. . . .
. .
68,18.23
. .
. . . . . .
. .
. . . .
. .
. .
. .
. . . .
. .
. .
. . . .
. .
. .
. .
1,06,41.55
68,18.23
1,06,41.55
68,18.23
2,68,29.41
(in lakh of Rupees
CSS/CP
. .
- Contd.
- Concld.
- Concld.
289
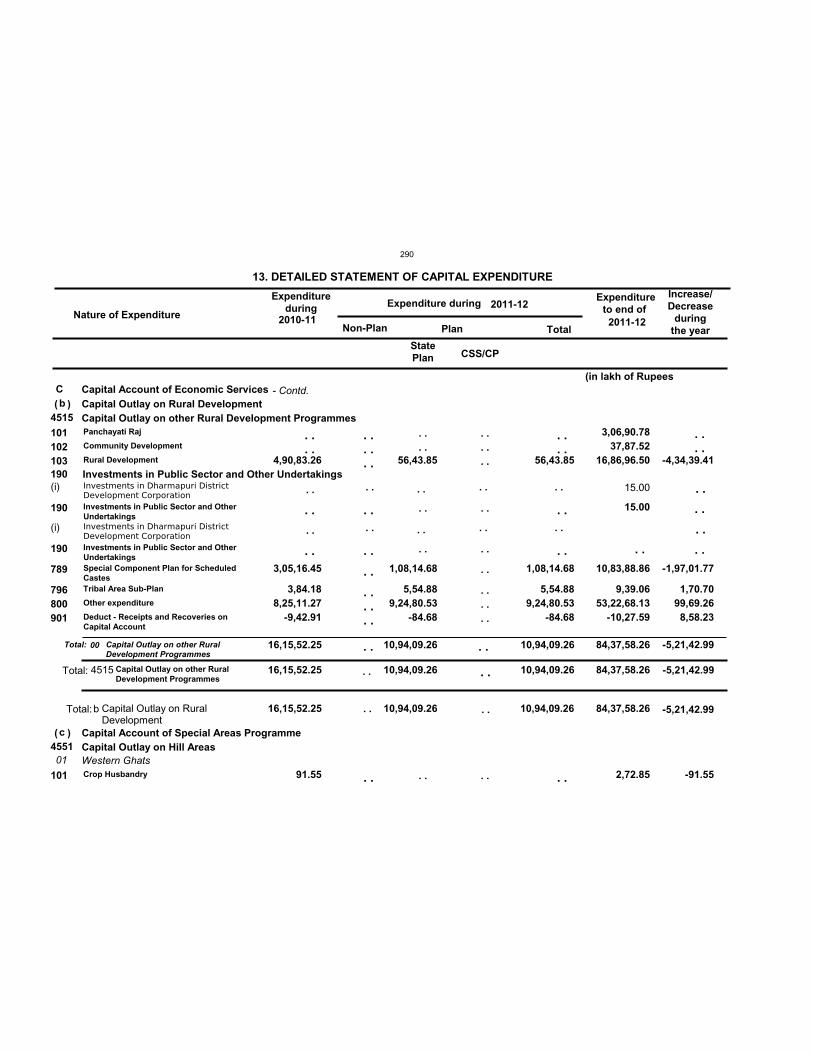
Nature of Expenditure
Expenditureduring Expenditure during
Expenditureto end of
Non-Plan Plan Total
13. DETAILED STATEMENT OF CAPITAL EXPENDITURE Increase/Decrease
duringthe year
2011-122010-11
2011-12
Cb
c
16,15,52.25 10,94,09.26 10,94,09.26 84,37,58.26
4515
4551
16,15,52.25 10,94,09.26 10,94,09.26 84,37,58.26
01
16,15,52.25 10,94,09.26 10,94,09.26 84,37,58.26
190 4,90,83.26
3,05,16.45
3,84.18 8,25,11.27
-9,42.91
91.55
56,43.85
1,08,14.68
5,54.88 9,24,80.53
-84.68
56,43.85
1,08,14.68
5,54.88 9,24,80.53
-84.68
3,06,90.78 37,87.52
16,86,96.50
15.00
10,83,88.86
9,39.06 53,22,68.13
-10,27.59
2,72.85
(i)
(i)
15.00
StatePlan
Capital Account of Economic ServicesCapital Outlay on Rural Development
Capital Account of Special Areas Programme
Capital Outlay on other Rural Development Programmes
Capital Outlay on Hill AreasWestern Ghats
Investments in Public Sector and Other Undertakings
Panchayati Raj
Community Development
Rural Development
Investments in Public Sector and OtherUndertakings
Investments in Public Sector and OtherUndertakingsSpecial Component Plan for ScheduledCastesTribal Area Sub-Plan
Other expenditure
Deduct - Receipts and Recoveries onCapital Account
Crop Husbandry
101102103
190
190
789
796800901
101
Investments in Dharmapuri DistrictDevelopment Corporation
Investments in Dharmapuri DistrictDevelopment Corporation
Total: Capital Outlay on other RuralDevelopment Programmes
Total: Capital Outlay on other RuralDevelopment Programmes
Total: Capital Outlay on RuralDevelopment
(
(
)
)
00
4515
b
. .
. .
. .
. .
. .
. .
. .
. .
. .
. .
. . . .
. .
. .
. . . . . .
. .
. .
. .
. . . . . .
. .
. . . .
. .
. .
. .
. . . . . .
. .
. .
. .
. . . . . .
. .
. . . .
. .
. .
. .
-4,34,39.41
-1,97,01.77
1,70.70 99,69.26 8,58.23
-91.55
. .
. .
. . . .
. .
. .
. . . .
. . . .
. .
-5,21,42.99
-5,21,42.99
-5,21,42.99
. .
(in lakh of Rupees
CSS/CP
. .
- Contd.
290
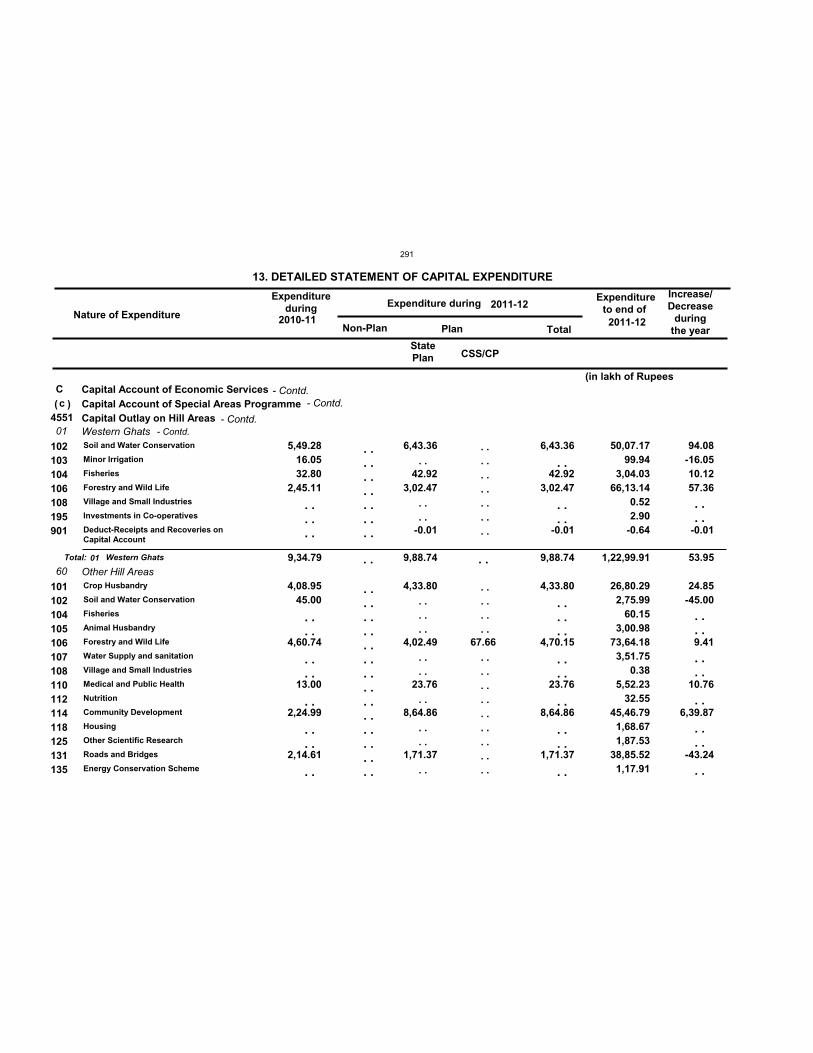
Nature of Expenditure
Expenditureduring Expenditure during
Expenditureto end of
Non-Plan Plan Total
13. DETAILED STATEMENT OF CAPITAL EXPENDITURE Increase/Decrease
duringthe year
2011-122010-11
2011-12
Cc
455101
60 9,34.79 9,88.74 9,88.74 1,22,99.91
5,49.28 16.05 32.80
2,45.11
4,08.95 45.00
4,60.74
13.00
2,24.99
2,14.61
6,43.36
42.92 3,02.47
-0.01
4,33.80
4,02.49
23.76
8,64.86
1,71.37
67.66
6,43.36
42.92 3,02.47
-0.01
4,33.80
4,70.15
23.76
8,64.86
1,71.37
50,07.17 99.94
3,04.03 66,13.14
0.52 2.90-0.64
26,80.29 2,75.99
60.15 3,00.98
73,64.18 3,51.75
0.38 5,52.23
32.55 45,46.79 1,68.67 1,87.53
38,85.52 1,17.91
StatePlan
Capital Account of Economic ServicesCapital Account of Special Areas ProgrammeCapital Outlay on Hill AreasWestern Ghats
Other Hill Areas
Soil and Water Conservation
Minor Irrigation
Fisheries
Forestry and Wild Life
Village and Small Industries
Investments in Co-operatives
Deduct-Receipts and Recoveries onCapital Account
Crop Husbandry
Soil and Water Conservation
Fisheries
Animal Husbandry
Forestry and Wild Life
Water Supply and sanitation
Village and Small Industries
Medical and Public Health
Nutrition
Community Development
Housing
Other Scientific Research
Roads and Bridges
Energy Conservation Scheme
102103104106108195901
101102104105106107108110112114118125131135
Total: Western Ghats
( )
01
. . . . . .
. . . .
. . . .
. .
. . . .
. .
. . . . . . . . . . . . . .
. . . . . . . . . . . . . . . . . . . . . . . . . . . .
. .
. . . .
. . . . . .
. . . .
. .
. . . .
. .
. . . . . . . . . . . . . .
. . . . . . . .
. . . . . . . . . . . . . . . . . .
. .
. . . .
. . . . . .
. . . .
. .
. . . .
. .
94.08-16.05 10.12 57.36
-0.01
24.85-45.00
9.41
10.76
6,39.87
-43.24
. . . .
. . . .
. . . .
. .
. . . .
. .
. . . . 53.95
(in lakh of Rupees
CSS/CP
- Contd.
- Contd.- Contd.
- Contd.
291
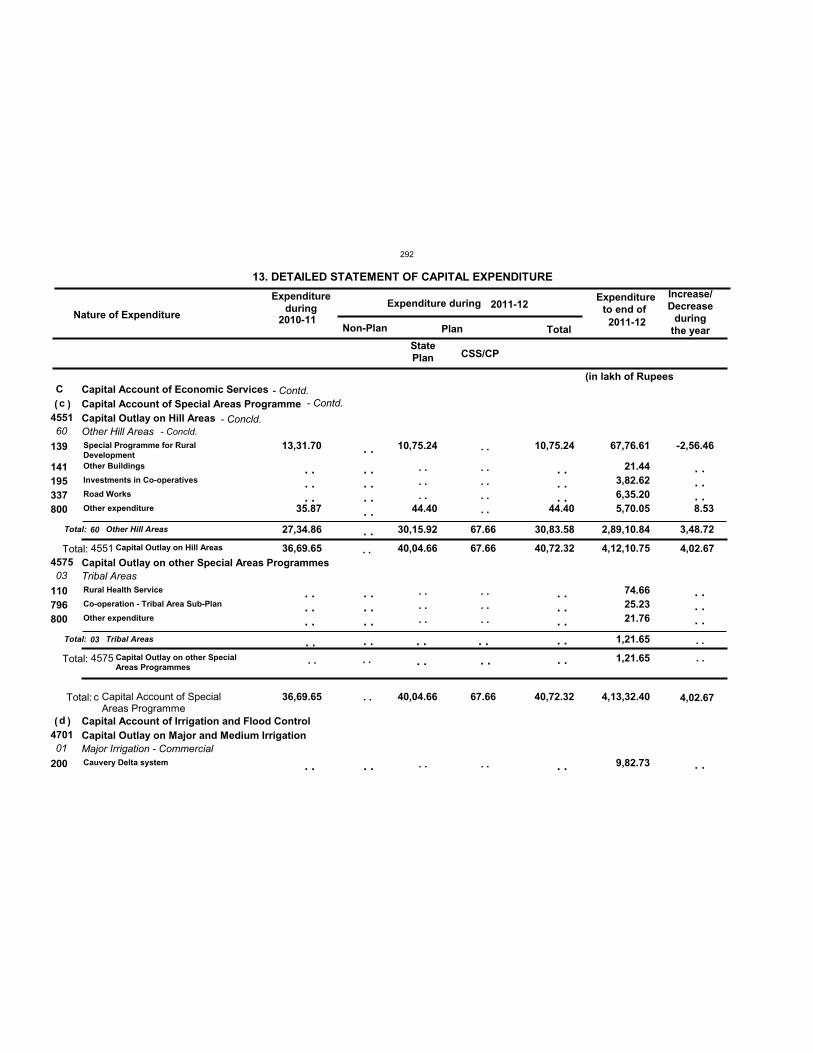
Nature of Expenditure
Expenditureduring Expenditure during
Expenditureto end of
Non-Plan Plan Total
13. DETAILED STATEMENT OF CAPITAL EXPENDITURE Increase/Decrease
duringthe year
2011-122010-11
2011-12
Cc
d
36,69.65 40,04.66 67.66 40,72.32 4,13,32.40
4551
4575
4701
36,69.65 40,04.66 67.66 40,72.32 4,12,10.75
1,21.65
60
03
01
27,34.86 30,15.92 67.66 30,83.58 2,89,10.84
1,21.65
13,31.70
35.87
10,75.24
44.40
10,75.24
44.40
67,76.61
21.44 3,82.62 6,35.20 5,70.05
74.66 25.23 21.76
9,82.73
StatePlan
Capital Account of Economic ServicesCapital Account of Special Areas Programme
Capital Account of Irrigation and Flood Control
Capital Outlay on Hill Areas
Capital Outlay on other Special Areas Programmes
Capital Outlay on Major and Medium Irrigation
Other Hill Areas
Tribal Areas
Major Irrigation - Commercial
Special Programme for RuralDevelopmentOther Buildings
Investments in Co-operatives
Road Works
Other expenditure
Rural Health Service
Co-operation - Tribal Area Sub-Plan
Other expenditure
Cauvery Delta system
139
141195337800
110796800
200
Total:
Total:
Other Hill Areas
Tribal Areas
Total:
Total:
Capital Outlay on Hill Areas
Capital Outlay on other SpecialAreas Programmes
Total: Capital Account of SpecialAreas Programme
(
(
)
)
60
03
4551
4575
c
. . . . . .
. . . . . .
. .
. .
. . . . . . . .
. . . . . .
. .
. . . . . .
. . . . . .
. .
. .
. . . . . . . .
. . . . . .
. .
. . . . . .
. . . . . .
. .
-2,56.46
8.53
. . . . . .
. . . . . .
. .
. .
. .
. . . . . . . .
. .
. .
. . . . . . . .
3,48.72
4,02.67
4,02.67
(in lakh of Rupees
CSS/CP
. .
. .
. .
- Contd.
- Concld.- Concld.
- Contd.
292
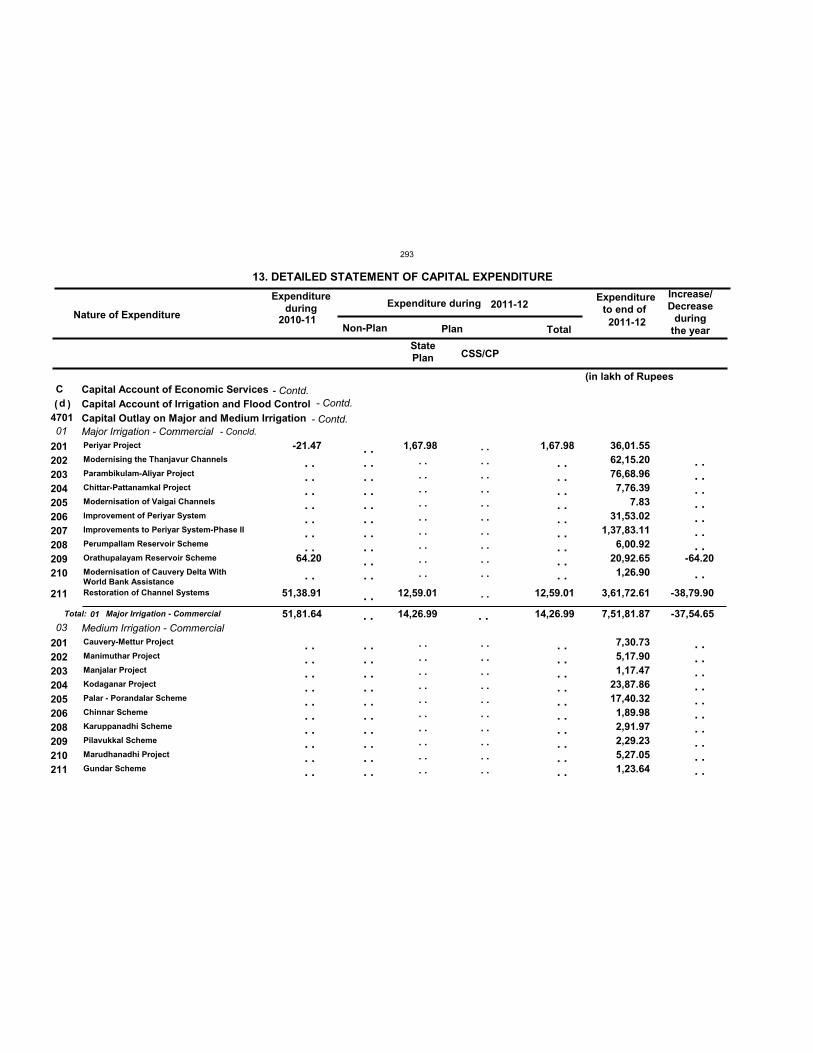
Nature of Expenditure
Expenditureduring Expenditure during
Expenditureto end of
Non-Plan Plan Total
13. DETAILED STATEMENT OF CAPITAL EXPENDITURE Increase/Decrease
duringthe year
2011-122010-11
2011-12
Cd
470101
03 51,81.64 14,26.99 14,26.99 7,51,81.87
-21.47
64.20
51,38.91
1,67.98
12,59.01
1,67.98
12,59.01
36,01.55 62,15.20 76,68.96 7,76.39
7.83 31,53.02
1,37,83.11 6,00.92
20,92.65 1,26.90
3,61,72.61
7,30.73 5,17.90 1,17.47
23,87.86 17,40.32 1,89.98 2,91.97 2,29.23 5,27.05 1,23.64
StatePlan
Capital Account of Economic ServicesCapital Account of Irrigation and Flood ControlCapital Outlay on Major and Medium IrrigationMajor Irrigation - Commercial
Medium Irrigation - Commercial
Periyar Project
Modernising the Thanjavur Channels
Parambikulam-Aliyar Project
Chittar-Pattanamkal Project
Modernisation of Vaigai Channels
Improvement of Periyar System
Improvements to Periyar System-Phase II
Perumpallam Reservoir Scheme
Orathupalayam Reservoir Scheme
Modernisation of Cauvery Delta WithWorld Bank AssistanceRestoration of Channel Systems
Cauvery-Mettur Project
Manimuthar Project
Manjalar Project
Kodaganar Project
Palar - Porandalar Scheme
Chinnar Scheme
Karuppanadhi Scheme
Pilavukkal Scheme
Marudhanadhi Project
Gundar Scheme
201202203204205206207208209210
211
201202203204205206208209210211
Total: Major Irrigation - Commercial
( )
01
. . . . . . . . . . . . . .
. .
. . . . . . . . . . . . . . . . . . . .
. . . . . . . . . . . . . . . . . . . .
. .
. . . . . . . . . . . . . . . . . . . .
. . . . . . . . . . . . . . . . . .
. . . . . . . . . . . . . . . . . . . .
. . . . . . . . . . . . . . . . . . . .
. .
. . . . . . . . . . . . . . . . . . . .
. . . . . . . . . . . . . . . . . .
. . . . . . . . . . . . . . . . . . . .
-64.20
-38,79.90
. . . . . . . . . . . . . .
. .
. . . . . . . . . . . . . . . . . . . .
. . . . -37,54.65
(in lakh of Rupees
CSS/CP
- Contd.
- Contd.- Concld.
- Contd.
293
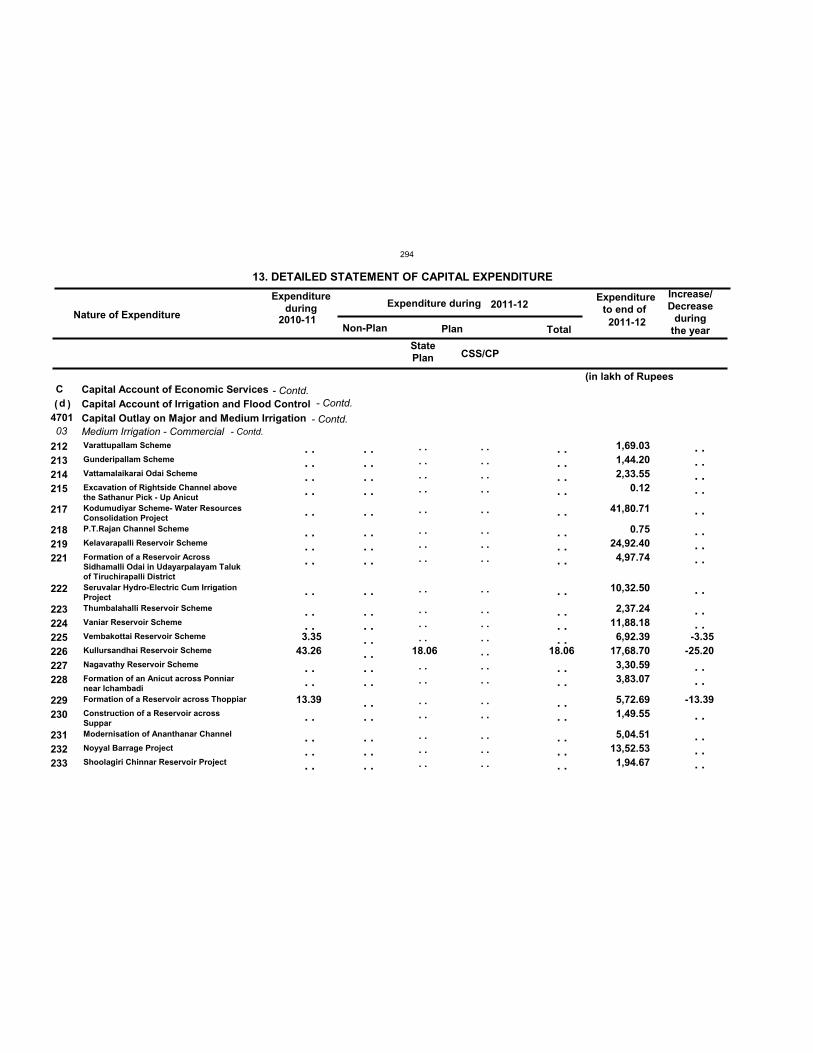
Nature of Expenditure
Expenditureduring Expenditure during
Expenditureto end of
Non-Plan Plan Total
13. DETAILED STATEMENT OF CAPITAL EXPENDITURE Increase/Decrease
duringthe year
2011-122010-11
2011-12
Cd
470103
3.35 43.26
13.39
18.06 18.06
1,69.03 1,44.20 2,33.55
0.12
41,80.71
0.75 24,92.40 4,97.74
10,32.50
2,37.24 11,88.18 6,92.39
17,68.70 3,30.59 3,83.07
5,72.69 1,49.55
5,04.51 13,52.53 1,94.67
StatePlan
Capital Account of Economic ServicesCapital Account of Irrigation and Flood ControlCapital Outlay on Major and Medium IrrigationMedium Irrigation - CommercialVarattupallam Scheme
Gunderipallam Scheme
Vattamalaikarai Odai Scheme
Excavation of Rightside Channel abovethe Sathanur Pick - Up AnicutKodumudiyar Scheme- Water ResourcesConsolidation ProjectP.T.Rajan Channel Scheme
Kelavarapalli Reservoir Scheme
Formation of a Reservoir AcrossSidhamalli Odai in Udayarpalayam Talukof Tiruchirapalli DistrictSeruvalar Hydro-Electric Cum IrrigationProjectThumbalahalli Reservoir Scheme
Vaniar Reservoir Scheme
Vembakottai Reservoir Scheme
Kullursandhai Reservoir Scheme
Nagavathy Reservoir Scheme
Formation of an Anicut across Ponniarnear IchambadiFormation of a Reservoir across Thoppiar
Construction of a Reservoir acrossSupparModernisation of Ananthanar Channel
Noyyal Barrage Project
Shoolagiri Chinnar Reservoir Project
212213214215
217
218219221
222
223224225226227228
229230
231232233
( )
. . . . . . . .
. .
. . . . . .
. .
. . . .
. . . .
. .
. . . . . .
. . . . . . . .
. .
. . . . . .
. .
. . . . . . . . . . . .
. . . .
. . . . . .
. . . . . . . .
. .
. . . . . .
. .
. . . . . .
. . . .
. . . .
. . . . . .
. . . . . . . .
. .
. . . . . .
. .
. . . . . . . . . . . .
. . . .
. . . . . .
. . . . . . . .
. .
. . . . . .
. .
. . . . . .
. . . .
. . . .
. . . . . .
-3.35-25.20
-13.39
. . . . . . . .
. .
. . . . . .
. .
. . . .
. . . .
. .
. . . . . .
(in lakh of Rupees
CSS/CP
- Contd.
- Contd.- Contd.
- Contd.
294
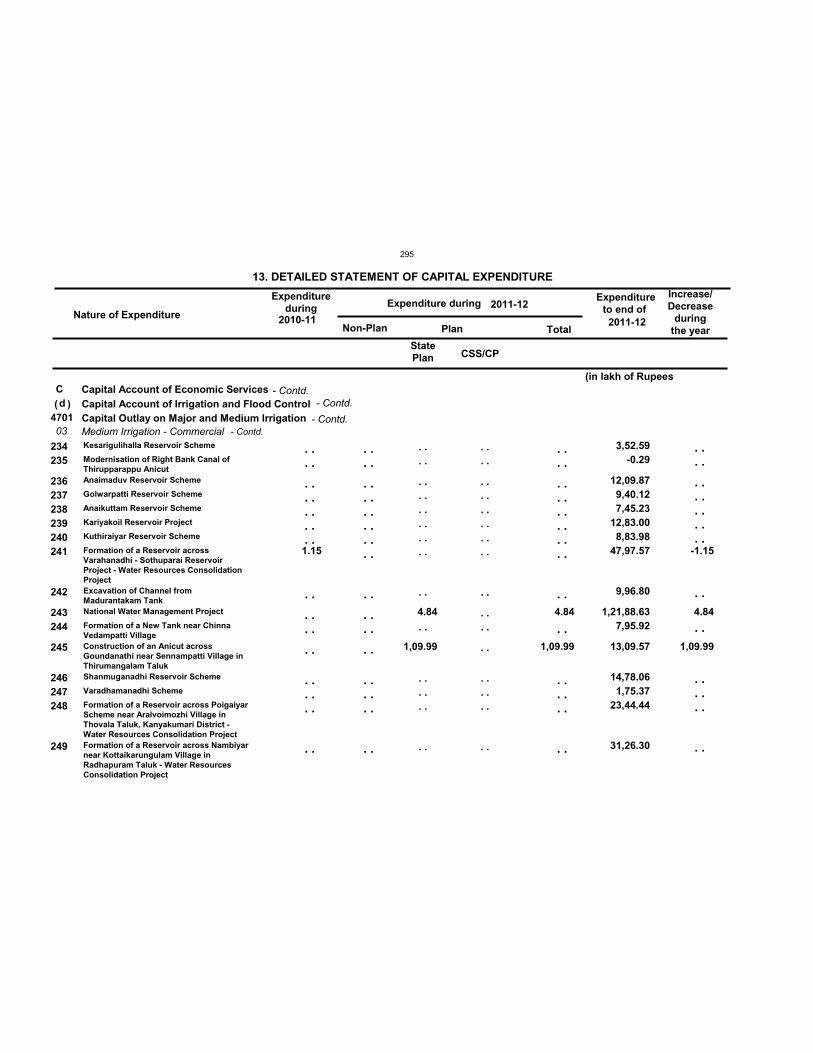
Nature of Expenditure
Expenditureduring Expenditure during
Expenditureto end of
Non-Plan Plan Total
13. DETAILED STATEMENT OF CAPITAL EXPENDITURE Increase/Decrease
duringthe year
2011-122010-11
2011-12
Cd
470103
1.15
4.84
1,09.99
4.84
1,09.99
3,52.59-0.29
12,09.87 9,40.12 7,45.23
12,83.00 8,83.98
47,97.57
9,96.80
1,21,88.63 7,95.92
13,09.57
14,78.06 1,75.37
23,44.44
31,26.30
StatePlan
Capital Account of Economic ServicesCapital Account of Irrigation and Flood ControlCapital Outlay on Major and Medium IrrigationMedium Irrigation - CommercialKesarigulihalla Reservoir Scheme
Modernisation of Right Bank Canal ofThirupparappu AnicutAnaimaduv Reservoir Scheme
Golwarpatti Reservoir Scheme
Anaikuttam Reservoir Scheme
Kariyakoil Reservoir Project
Kuthiraiyar Reservoir Scheme
Formation of a Reservoir acrossVarahanadhi - Sothuparai ReservoirProject - Water Resources ConsolidationProjectExcavation of Channel fromMadurantakam TankNational Water Management Project
Formation of a New Tank near ChinnaVedampatti VillageConstruction of an Anicut acrossGoundanathi near Sennampatti Village inThirumangalam TalukShanmuganadhi Reservoir Scheme
Varadhamanadhi Scheme
Formation of a Reservoir across PoigaiyarScheme near Aralvoimozhi Village inThovala Taluk, Kanyakumari District -Water Resources Consolidation ProjectFormation of a Reservoir across Nambiyarnear Kottaikarungulam Village inRadhapuram Taluk - Water ResourcesConsolidation Project
234235
236237238239240241
242
243244
245
246247248
249
( )
. . . .
. . . . . . . . . .
. .
. . . .
. .
. . . . . .
. .
. . . .
. . . . . . . . . . . .
. .
. . . .
. .
. . . . . .
. .
. . . .
. . . . . . . . . . . .
. .
. .
. . . . . .
. .
. . . .
. . . . . . . . . . . .
. .
. . . .
. .
. . . . . .
. .
. . . .
. . . . . . . . . . . .
. .
. .
. . . . . .
. .
-1.15
4.84
1,09.99
. . . .
. . . . . . . . . .
. .
. .
. . . . . .
. .
(in lakh of Rupees
CSS/CP
- Contd.
- Contd.- Contd.
- Contd.
295
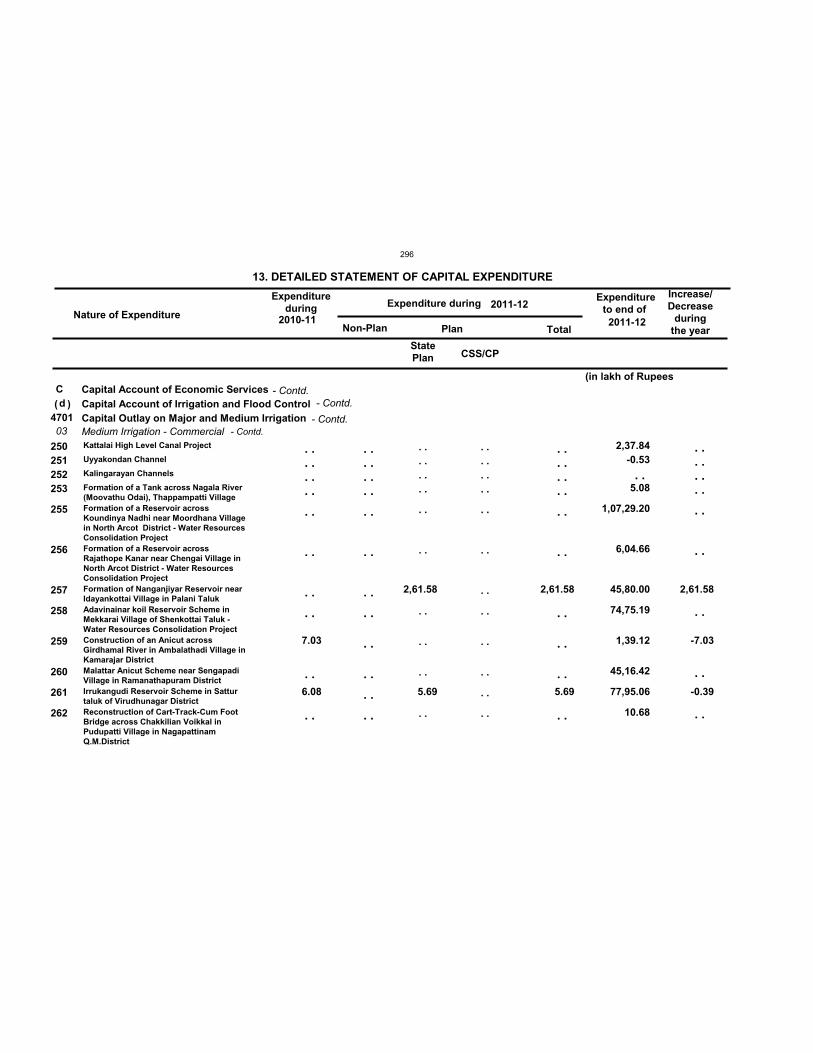
Nature of Expenditure
Expenditureduring Expenditure during
Expenditureto end of
Non-Plan Plan Total
13. DETAILED STATEMENT OF CAPITAL EXPENDITURE Increase/Decrease
duringthe year
2011-122010-11
2011-12
Cd
470103
7.03
6.08
2,61.58
5.69
2,61.58
5.69
2,37.84-0.53
5.08
1,07,29.20
6,04.66
45,80.00
74,75.19
1,39.12
45,16.42
77,95.06
10.68
StatePlan
Capital Account of Economic ServicesCapital Account of Irrigation and Flood ControlCapital Outlay on Major and Medium IrrigationMedium Irrigation - CommercialKattalai High Level Canal Project
Uyyakondan Channel
Kalingarayan Channels
Formation of a Tank across Nagala River(Moovathu Odai), Thappampatti VillageFormation of a Reservoir acrossKoundinya Nadhi near Moordhana Villagein North Arcot District - Water ResourcesConsolidation ProjectFormation of a Reservoir acrossRajathope Kanar near Chengai Village inNorth Arcot District - Water ResourcesConsolidation ProjectFormation of Nanganjiyar Reservoir nearIdayankottai Village in Palani TalukAdavinainar koil Reservoir Scheme inMekkarai Village of Shenkottai Taluk -Water Resources Consolidation ProjectConstruction of an Anicut acrossGirdhamal River in Ambalathadi Village inKamarajar DistrictMalattar Anicut Scheme near SengapadiVillage in Ramanathapuram DistrictIrrukangudi Reservoir Scheme in Satturtaluk of Virudhunagar DistrictReconstruction of Cart-Track-Cum FootBridge across Chakkilian Voikkal inPudupatti Village in NagapattinamQ.M.District
250251252253
255
256
257
258
259
260
261
262
( )
. . . . . . . .
. .
. .
. .
. .
. .
. .
. . . . . . . .
. .
. .
. .
. .
. .
. .
. .
. .
. . . . . . . .
. .
. .
. .
. .
. .
. .
. . . . . . . .
. .
. .
. .
. .
. .
. .
. .
. .
. . . . . . . .
. .
. .
. .
. .
. .
. .
2,61.58
-7.03
-0.39
. . . . . . . .
. .
. .
. .
. .
. .
. .
(in lakh of Rupees
CSS/CP
- Contd.
- Contd.- Contd.
- Contd.
296
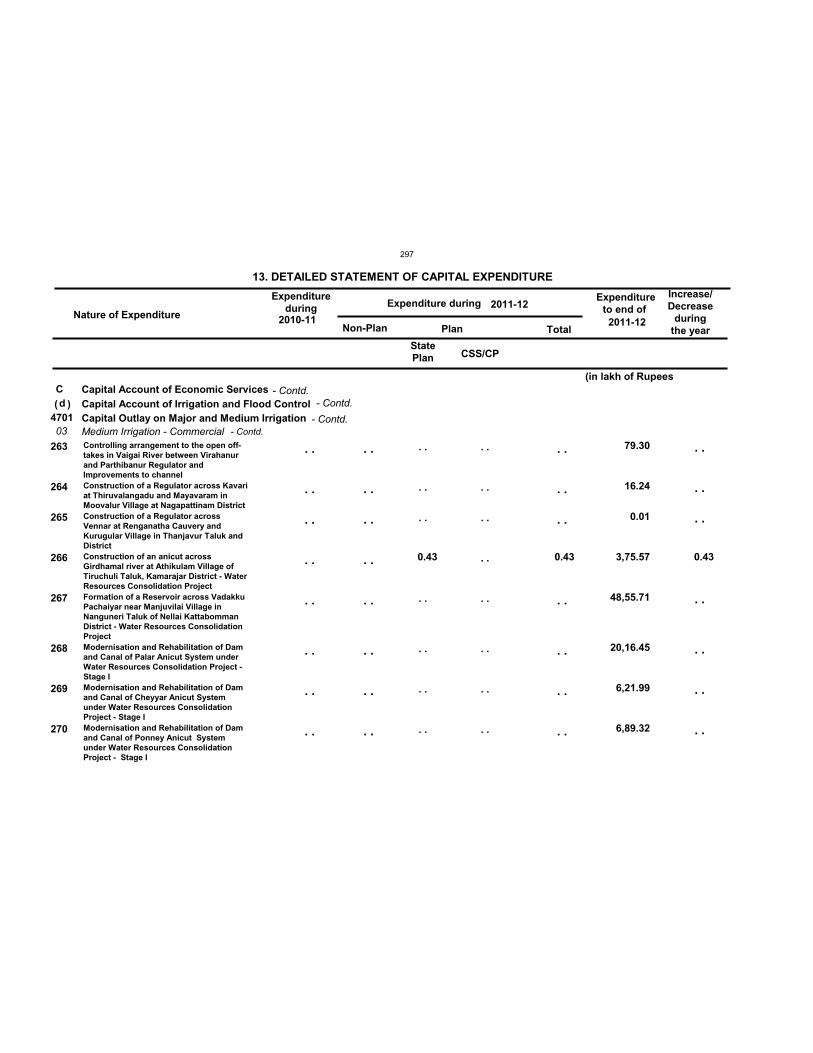
Nature of Expenditure
Expenditureduring Expenditure during
Expenditureto end of
Non-Plan Plan Total
13. DETAILED STATEMENT OF CAPITAL EXPENDITURE Increase/Decrease
duringthe year
2011-122010-11
2011-12
Cd
470103
0.43 0.43
79.30
16.24
0.01
3,75.57
48,55.71
20,16.45
6,21.99
6,89.32
StatePlan
Capital Account of Economic ServicesCapital Account of Irrigation and Flood ControlCapital Outlay on Major and Medium IrrigationMedium Irrigation - CommercialControlling arrangement to the open off-takes in Vaigai River between Virahanurand Parthibanur Regulator andImprovements to channelConstruction of a Regulator across Kavariat Thiruvalangadu and Mayavaram inMoovalur Village at Nagapattinam DistrictConstruction of a Regulator acrossVennar at Renganatha Cauvery andKurugular Village in Thanjavur Taluk andDistrictConstruction of an anicut acrossGirdhamal river at Athikulam Village ofTiruchuli Taluk, Kamarajar District - WaterResources Consolidation ProjectFormation of a Reservoir across VadakkuPachaiyar near Manjuvilai Village inNanguneri Taluk of Nellai KattabommanDistrict - Water Resources ConsolidationProjectModernisation and Rehabilitation of Damand Canal of Palar Anicut System underWater Resources Consolidation Project -Stage IModernisation and Rehabilitation of Damand Canal of Cheyyar Anicut Systemunder Water Resources ConsolidationProject - Stage IModernisation and Rehabilitation of Damand Canal of Ponney Anicut Systemunder Water Resources ConsolidationProject - Stage I
263
264
265
266
267
268
269
270
( )
. .
. .
. .
. .
. .
. .
. .
. .
. .
. .
. .
. .
. .
. .
. .
. .
. .
. .
. .
. .
. .
. .
. .
. .
. .
. .
. .
. .
. .
. .
. .
. .
. .
. .
. .
. .
. .
. .
0.43
. .
. .
. .
. .
. .
. .
. .
(in lakh of Rupees
CSS/CP
- Contd.
- Contd.- Contd.
- Contd.
297
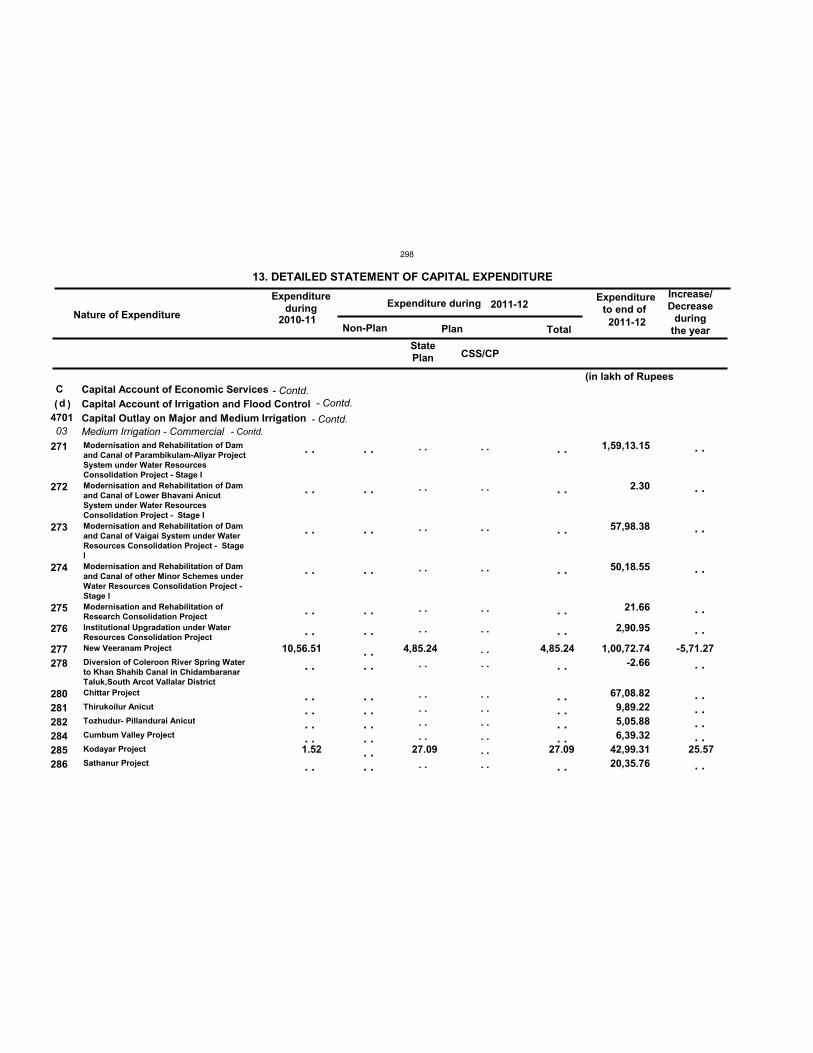
Nature of Expenditure
Expenditureduring Expenditure during
Expenditureto end of
Non-Plan Plan Total
13. DETAILED STATEMENT OF CAPITAL EXPENDITURE Increase/Decrease
duringthe year
2011-122010-11
2011-12
Cd
470103
10,56.51
1.52
4,85.24
27.09
4,85.24
27.09
1,59,13.15
2.30
57,98.38
50,18.55
21.66
2,90.95
1,00,72.74-2.66
67,08.82 9,89.22 5,05.88 6,39.32
42,99.31 20,35.76
StatePlan
Capital Account of Economic ServicesCapital Account of Irrigation and Flood ControlCapital Outlay on Major and Medium IrrigationMedium Irrigation - CommercialModernisation and Rehabilitation of Damand Canal of Parambikulam-Aliyar ProjectSystem under Water ResourcesConsolidation Project - Stage IModernisation and Rehabilitation of Damand Canal of Lower Bhavani AnicutSystem under Water ResourcesConsolidation Project - Stage IModernisation and Rehabilitation of Damand Canal of Vaigai System under WaterResources Consolidation Project - StageIModernisation and Rehabilitation of Damand Canal of other Minor Schemes underWater Resources Consolidation Project -Stage IModernisation and Rehabilitation ofResearch Consolidation ProjectInstitutional Upgradation under WaterResources Consolidation ProjectNew Veeranam Project
Diversion of Coleroon River Spring Waterto Khan Shahib Canal in ChidambaranarTaluk,South Arcot Vallalar DistrictChittar Project
Thirukoilur Anicut
Tozhudur- Pillandurai Anicut
Cumbum Valley Project
Kodayar Project
Sathanur Project
271
272
273
274
275
276
277278
280281282284285286
( )
. .
. .
. .
. .
. .
. .
. .
. . . . . . . .
. .
. .
. .
. .
. .
. .
. .
. . . .
. . . . . . . . . . . .
. .
. .
. .
. .
. .
. .
. .
. . . . . . . .
. .
. .
. .
. .
. .
. .
. .
. . . .
. . . . . . . . . . . .
. .
. .
. .
. .
. .
. .
. .
. . . . . . . .
. .
-5,71.27
25.57
. .
. .
. .
. .
. .
. .
. .
. . . . . . . .
. .
(in lakh of Rupees
CSS/CP
- Contd.
- Contd.- Contd.
- Contd.
298
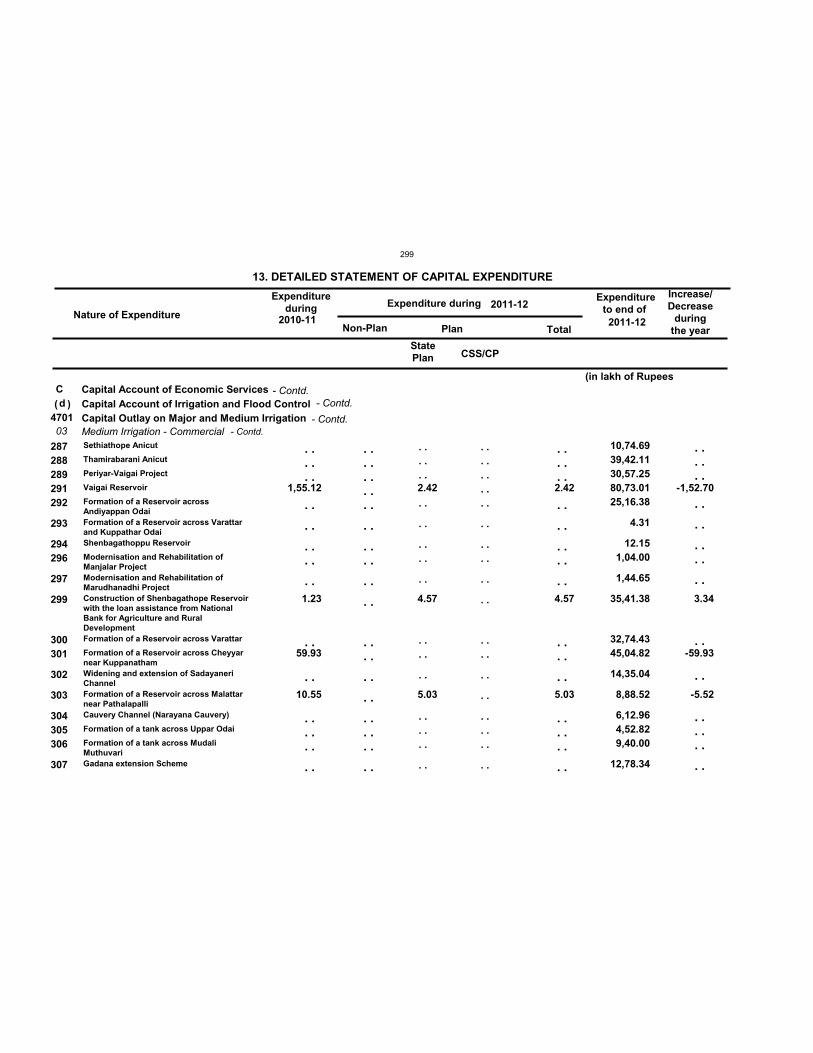
Nature of Expenditure
Expenditureduring Expenditure during
Expenditureto end of
Non-Plan Plan Total
13. DETAILED STATEMENT OF CAPITAL EXPENDITURE Increase/Decrease
duringthe year
2011-122010-11
2011-12
Cd
470103
1,55.12
1.23
59.93
10.55
2.42
4.57
5.03
2.42
4.57
5.03
10,74.69 39,42.11 30,57.25 80,73.01 25,16.38
4.31
12.15 1,04.00
1,44.65
35,41.38
32,74.43 45,04.82
14,35.04
8,88.52
6,12.96 4,52.82 9,40.00
12,78.34
StatePlan
Capital Account of Economic ServicesCapital Account of Irrigation and Flood ControlCapital Outlay on Major and Medium IrrigationMedium Irrigation - CommercialSethiathope Anicut
Thamirabarani Anicut
Periyar-Vaigai Project
Vaigai Reservoir
Formation of a Reservoir acrossAndiyappan OdaiFormation of a Reservoir across Varattarand Kuppathar OdaiShenbagathoppu Reservoir
Modernisation and Rehabilitation ofManjalar ProjectModernisation and Rehabilitation ofMarudhanadhi ProjectConstruction of Shenbagathope Reservoirwith the loan assistance from NationalBank for Agriculture and RuralDevelopmentFormation of a Reservoir across Varattar
Formation of a Reservoir across Cheyyarnear KuppanathamWidening and extension of SadayaneriChannelFormation of a Reservoir across Malattarnear PathalapalliCauvery Channel (Narayana Cauvery)
Formation of a tank across Uppar Odai
Formation of a tank across MudaliMuthuvariGadana extension Scheme
287288289291292
293
294296
297
299
300301
302
303
304305306
307
( )
. . . . . .
. .
. .
. . . .
. .
. .
. .
. . . . . .
. .
. . . . . . . . . .
. .
. . . .
. .
. .
. . . .
. .
. .
. . . . . .
. .
. . . . . .
. .
. .
. . . .
. .
. . . .
. .
. . . . . .
. .
. . . . . . . . . .
. .
. . . .
. .
. .
. . . .
. .
. .
. . . . . .
. .
. . . . . .
. .
. .
. . . .
. .
. . . .
. .
. . . . . .
. .
-1,52.70
3.34
-59.93
-5.52
. . . . . .
. .
. .
. . . .
. .
. .
. .
. . . . . .
. .
(in lakh of Rupees
CSS/CP
- Contd.
- Contd.- Contd.
- Contd.
299
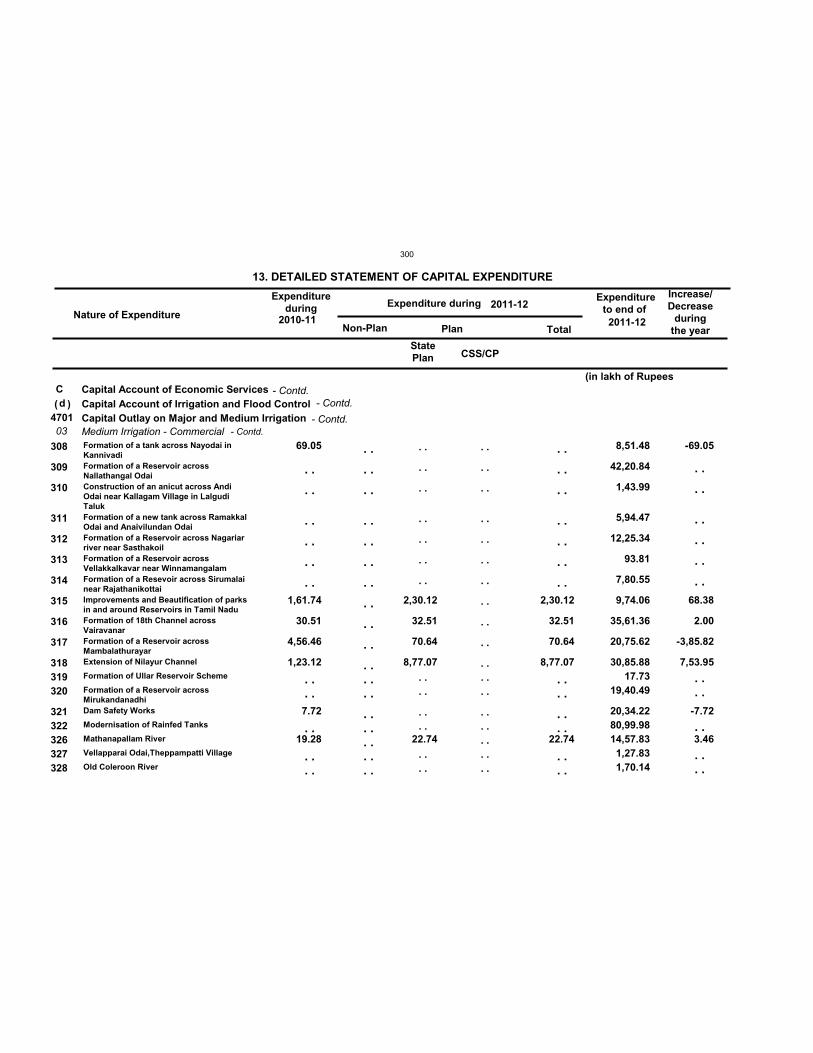
Nature of Expenditure
Expenditureduring Expenditure during
Expenditureto end of
Non-Plan Plan Total
13. DETAILED STATEMENT OF CAPITAL EXPENDITURE Increase/Decrease
duringthe year
2011-122010-11
2011-12
Cd
470103
69.05
1,61.74
30.51
4,56.46
1,23.12
7.72
19.28
2,30.12
32.51
70.64
8,77.07
22.74
2,30.12
32.51
70.64
8,77.07
22.74
8,51.48
42,20.84
1,43.99
5,94.47
12,25.34
93.81
7,80.55
9,74.06
35,61.36
20,75.62
30,85.88 17.73
19,40.49
20,34.22 80,99.98 14,57.83 1,27.83 1,70.14
StatePlan
Capital Account of Economic ServicesCapital Account of Irrigation and Flood ControlCapital Outlay on Major and Medium IrrigationMedium Irrigation - CommercialFormation of a tank across Nayodai inKannivadiFormation of a Reservoir acrossNallathangal OdaiConstruction of an anicut across AndiOdai near Kallagam Village in LalgudiTalukFormation of a new tank across RamakkalOdai and Anaivilundan OdaiFormation of a Reservoir across Nagariarriver near SasthakoilFormation of a Reservoir acrossVellakkalkavar near WinnamangalamFormation of a Resevoir across Sirumalainear RajathanikottaiImprovements and Beautification of parksin and around Reservoirs in Tamil NaduFormation of 18th Channel acrossVairavanarFormation of a Reservoir acrossMambalathurayarExtension of Nilayur Channel
Formation of Ullar Reservoir Scheme
Formation of a Reservoir acrossMirukandanadhiDam Safety Works
Modernisation of Rainfed Tanks
Mathanapallam River
Vellapparai Odai,Theppampatti Village
Old Coleroon River
308
309
310
311
312
313
314
315
316
317
318319320
321322326327328
( )
. .
. .
. .
. .
. .
. .
. . . .
. .
. . . .
. .
. .
. .
. .
. .
. .
. .
. .
. .
. .
. . . . . .
. . . . . . . . . .
. .
. .
. .
. .
. .
. .
. .
. . . .
. . . .
. . . .
. .
. .
. .
. .
. .
. .
. .
. .
. .
. .
. . . . . .
. . . . . . . . . .
. .
. .
. .
. .
. .
. .
. .
. . . .
. . . .
. . . .
-69.05
68.38
2.00
-3,85.82
7,53.95
-7.72
3.46
. .
. .
. .
. .
. .
. .
. . . .
. .
. . . .
(in lakh of Rupees
CSS/CP
- Contd.
- Contd.- Contd.
- Contd.
300
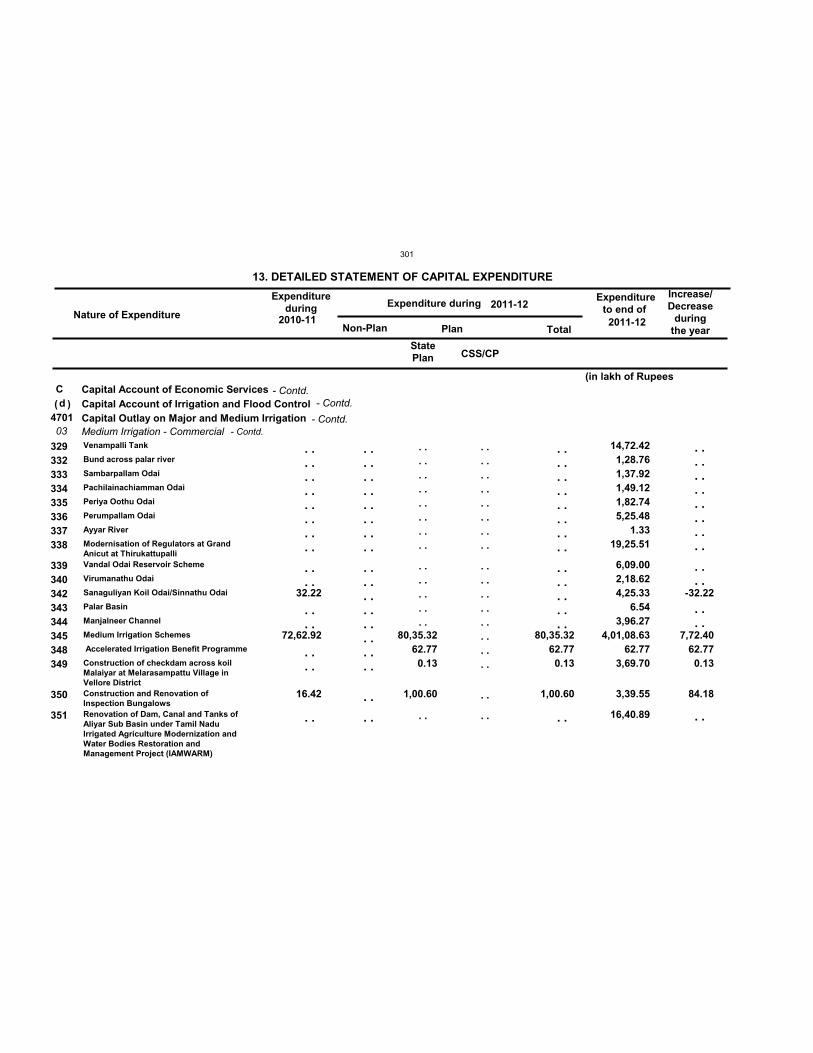
Nature of Expenditure
Expenditureduring Expenditure during
Expenditureto end of
Non-Plan Plan Total
13. DETAILED STATEMENT OF CAPITAL EXPENDITURE Increase/Decrease
duringthe year
2011-122010-11
2011-12
Cd
470103
32.22
72,62.92
16.42
80,35.32 62.77 0.13
1,00.60
80,35.32 62.77 0.13
1,00.60
14,72.42 1,28.76 1,37.92 1,49.12 1,82.74 5,25.48
1.33 19,25.51
6,09.00 2,18.62 4,25.33
6.54 3,96.27
4,01,08.63 62.77
3,69.70
3,39.55
16,40.89
StatePlan
Capital Account of Economic ServicesCapital Account of Irrigation and Flood ControlCapital Outlay on Major and Medium IrrigationMedium Irrigation - CommercialVenampalli Tank
Bund across palar river
Sambarpallam Odai
Pachilainachiamman Odai
Periya Oothu Odai
Perumpallam Odai
Ayyar River
Modernisation of Regulators at GrandAnicut at ThirukattupalliVandal Odai Reservoir Scheme
Virumanathu Odai
Sanaguliyan Koil Odai/Sinnathu Odai
Palar Basin
Manjalneer Channel
Medium Irrigation Schemes
Accelerated Irrigation Benefit Programme
Construction of checkdam across koilMalaiyar at Melarasampattu Village inVellore DistrictConstruction and Renovation ofInspection BungalowsRenovation of Dam, Canal and Tanks ofAliyar Sub Basin under Tamil NaduIrrigated Agriculture Modernization andWater Bodies Restoration andManagement Project (IAMWARM)
329332333334335336337338
339340342343344345348349
350
351
( )
. . . . . . . . . . . . . . . .
. . . .
. . . .
. . . .
. .
. . . . . . . . . . . . . . . .
. . . . . . . . . . . . . . . .
. .
. .
. . . . . . . . . . . . . . . .
. . . . . . . . . .
. .
. . . . . . . . . . . . . . . .
. . . . . . . . . . . . . . . .
. .
. .
. . . . . . . . . . . . . . . .
. . . . . . . . . .
. .
-32.22
7,72.40 62.77 0.13
84.18
. . . . . . . . . . . . . . . .
. . . .
. . . .
. .
(in lakh of Rupees
CSS/CP
- Contd.
- Contd.- Contd.
- Contd.
301
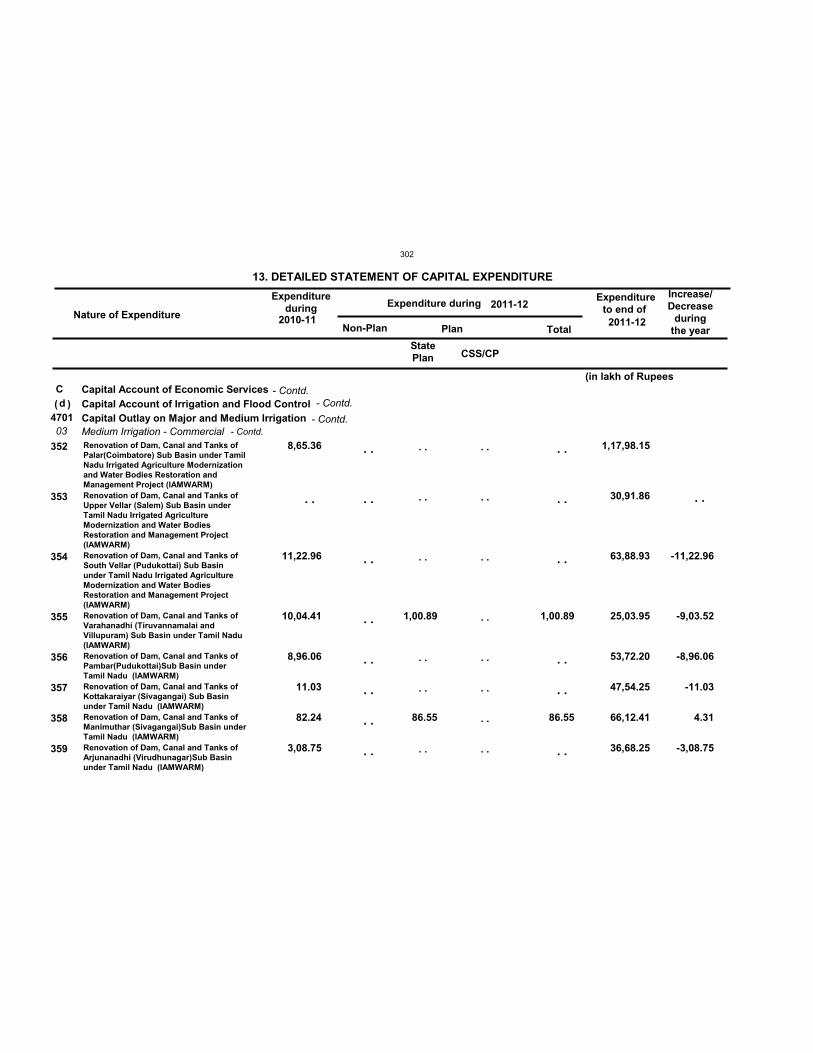
Nature of Expenditure
Expenditureduring Expenditure during
Expenditureto end of
Non-Plan Plan Total
13. DETAILED STATEMENT OF CAPITAL EXPENDITURE Increase/Decrease
duringthe year
2011-122010-11
2011-12
Cd
470103
8,65.36
11,22.96
10,04.41
8,96.06
11.03
82.24
3,08.75
1,00.89
86.55
1,00.89
86.55
1,17,98.15
30,91.86
63,88.93
25,03.95
53,72.20
47,54.25
66,12.41
36,68.25
StatePlan
Capital Account of Economic ServicesCapital Account of Irrigation and Flood ControlCapital Outlay on Major and Medium IrrigationMedium Irrigation - CommercialRenovation of Dam, Canal and Tanks ofPalar(Coimbatore) Sub Basin under TamilNadu Irrigated Agriculture Modernizationand Water Bodies Restoration andManagement Project (IAMWARM)Renovation of Dam, Canal and Tanks ofUpper Vellar (Salem) Sub Basin underTamil Nadu Irrigated AgricultureModernization and Water BodiesRestoration and Management Project(IAMWARM)Renovation of Dam, Canal and Tanks ofSouth Vellar (Pudukottai) Sub Basinunder Tamil Nadu Irrigated AgricultureModernization and Water BodiesRestoration and Management Project(IAMWARM)Renovation of Dam, Canal and Tanks ofVarahanadhi (Tiruvannamalai andVillupuram) Sub Basin under Tamil Nadu(IAMWARM)Renovation of Dam, Canal and Tanks ofPambar(Pudukottai)Sub Basin underTamil Nadu (IAMWARM)Renovation of Dam, Canal and Tanks ofKottakaraiyar (Sivagangai) Sub Basinunder Tamil Nadu (IAMWARM)Renovation of Dam, Canal and Tanks ofManimuthar (Sivagangai)Sub Basin underTamil Nadu (IAMWARM)Renovation of Dam, Canal and Tanks ofArjunanadhi (Virudhunagar)Sub Basinunder Tamil Nadu (IAMWARM)
352
353
354
355
356
357
358
359
( )
. .
. .
. .
. .
. .
. .
. .
. .
. .
. .
. .
. .
. .
. .
. .
. .
. .
. .
. .
. .
. .
. .
. .
. .
. .
. .
. .
. .
. .
-11,22.96
-9,03.52
-8,96.06
-11.03
4.31
-3,08.75
. .
(in lakh of Rupees
CSS/CP
- Contd.
- Contd.- Contd.
- Contd.
302
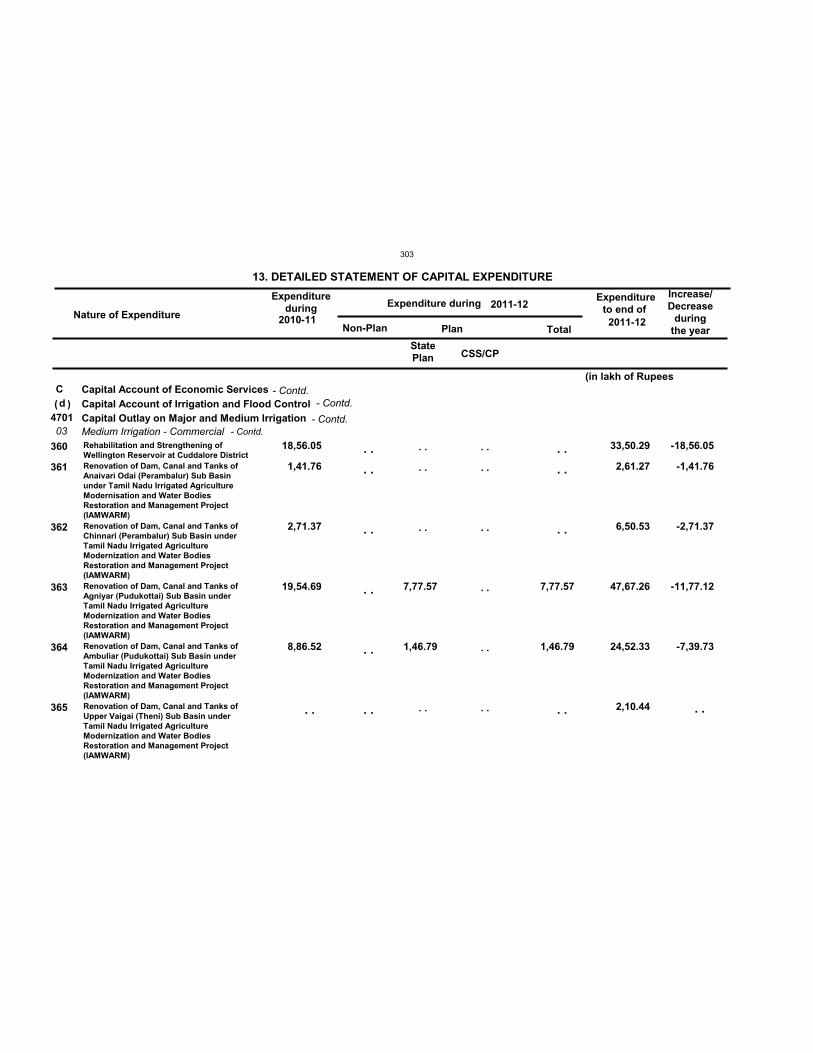
Nature of Expenditure
Expenditureduring Expenditure during
Expenditureto end of
Non-Plan Plan Total
13. DETAILED STATEMENT OF CAPITAL EXPENDITURE Increase/Decrease
duringthe year
2011-122010-11
2011-12
Cd
470103
18,56.05
1,41.76
2,71.37
19,54.69
8,86.52
7,77.57
1,46.79
7,77.57
1,46.79
33,50.29
2,61.27
6,50.53
47,67.26
24,52.33
2,10.44
StatePlan
Capital Account of Economic ServicesCapital Account of Irrigation and Flood ControlCapital Outlay on Major and Medium IrrigationMedium Irrigation - CommercialRehabilitation and Strengthening ofWellington Reservoir at Cuddalore DistrictRenovation of Dam, Canal and Tanks ofAnaivari Odai (Perambalur) Sub Basinunder Tamil Nadu Irrigated AgricultureModernisation and Water BodiesRestoration and Management Project(IAMWARM)Renovation of Dam, Canal and Tanks ofChinnari (Perambalur) Sub Basin underTamil Nadu Irrigated AgricultureModernization and Water BodiesRestoration and Management Project(IAMWARM)Renovation of Dam, Canal and Tanks ofAgniyar (Pudukottai) Sub Basin underTamil Nadu Irrigated AgricultureModernization and Water BodiesRestoration and Management Project(IAMWARM)Renovation of Dam, Canal and Tanks ofAmbuliar (Pudukottai) Sub Basin underTamil Nadu Irrigated AgricultureModernization and Water BodiesRestoration and Management Project(IAMWARM)Renovation of Dam, Canal and Tanks ofUpper Vaigai (Theni) Sub Basin underTamil Nadu Irrigated AgricultureModernization and Water BodiesRestoration and Management Project(IAMWARM)
360
361
362
363
364
365
( )
. .
. .
. .
. .
. .
. .
. .
. .
. .
. .
. .
. .
. .
. .
. .
. .
. .
. .
. .
. .
. .
-18,56.05
-1,41.76
-2,71.37
-11,77.12
-7,39.73
. .
(in lakh of Rupees
CSS/CP
- Contd.
- Contd.- Contd.
- Contd.
303
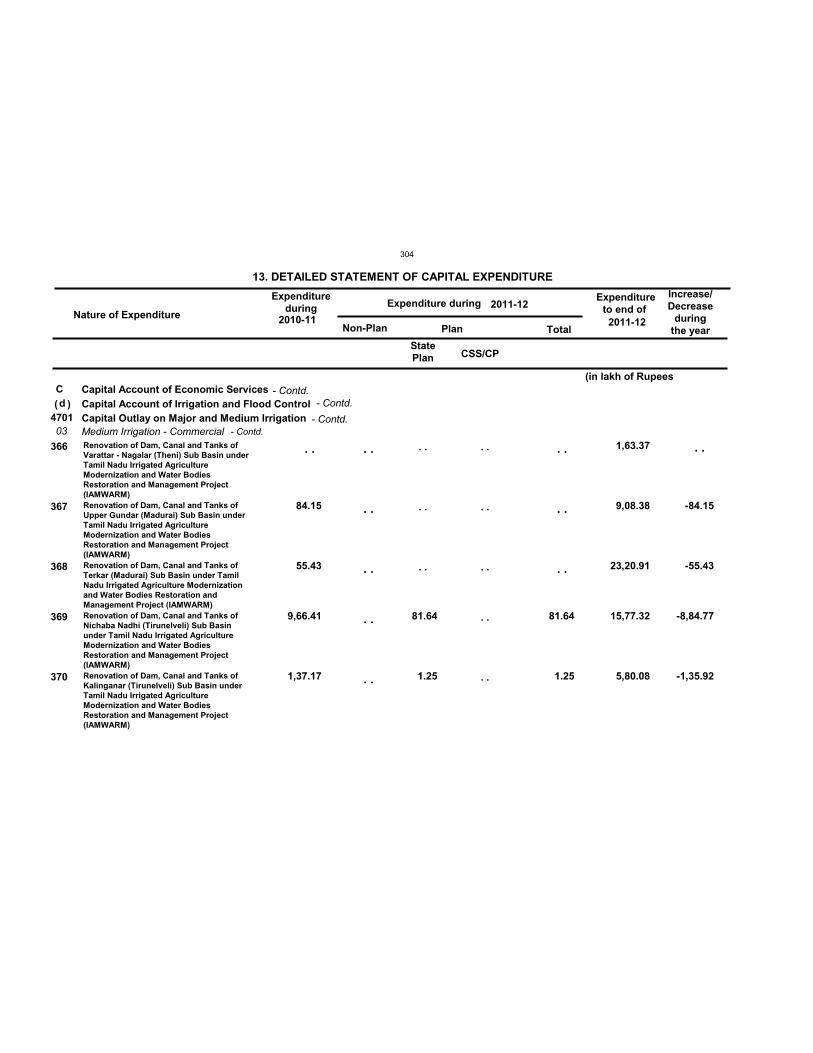
Nature of Expenditure
Expenditureduring Expenditure during
Expenditureto end of
Non-Plan Plan Total
13. DETAILED STATEMENT OF CAPITAL EXPENDITURE Increase/Decrease
duringthe year
2011-122010-11
2011-12
Cd
470103
84.15
55.43
9,66.41
1,37.17
81.64
1.25
81.64
1.25
1,63.37
9,08.38
23,20.91
15,77.32
5,80.08
StatePlan
Capital Account of Economic ServicesCapital Account of Irrigation and Flood ControlCapital Outlay on Major and Medium IrrigationMedium Irrigation - CommercialRenovation of Dam, Canal and Tanks ofVarattar - Nagalar (Theni) Sub Basin underTamil Nadu Irrigated AgricultureModernization and Water BodiesRestoration and Management Project(IAMWARM)Renovation of Dam, Canal and Tanks ofUpper Gundar (Madurai) Sub Basin underTamil Nadu Irrigated AgricultureModernization and Water BodiesRestoration and Management Project(IAMWARM)Renovation of Dam, Canal and Tanks ofTerkar (Madurai) Sub Basin under TamilNadu Irrigated Agriculture Modernizationand Water Bodies Restoration andManagement Project (IAMWARM)Renovation of Dam, Canal and Tanks ofNichaba Nadhi (Tirunelveli) Sub Basinunder Tamil Nadu Irrigated AgricultureModernization and Water BodiesRestoration and Management Project(IAMWARM)Renovation of Dam, Canal and Tanks ofKalinganar (Tirunelveli) Sub Basin underTamil Nadu Irrigated AgricultureModernization and Water BodiesRestoration and Management Project(IAMWARM)
366
367
368
369
370
( )
. . . .
. .
. .
. .
. .
. .
. .
. .
. .
. .
. .
. .
. .
. .
. .
. .
-84.15
-55.43
-8,84.77
-1,35.92
. .
(in lakh of Rupees
CSS/CP
- Contd.
- Contd.- Contd.
- Contd.
304
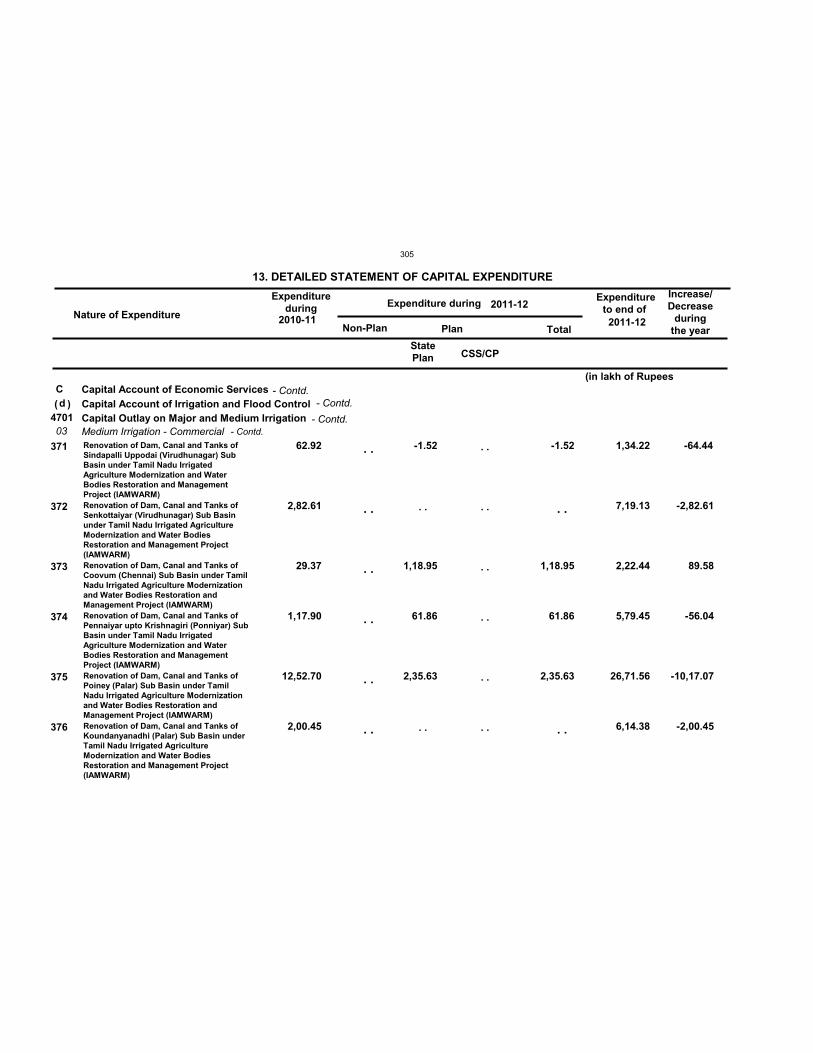
Nature of Expenditure
Expenditureduring Expenditure during
Expenditureto end of
Non-Plan Plan Total
13. DETAILED STATEMENT OF CAPITAL EXPENDITURE Increase/Decrease
duringthe year
2011-122010-11
2011-12
Cd
470103
62.92
2,82.61
29.37
1,17.90
12,52.70
2,00.45
-1.52
1,18.95
61.86
2,35.63
-1.52
1,18.95
61.86
2,35.63
1,34.22 -64.44
7,19.13
2,22.44
5,79.45
26,71.56
6,14.38
StatePlan
Capital Account of Economic ServicesCapital Account of Irrigation and Flood ControlCapital Outlay on Major and Medium IrrigationMedium Irrigation - CommercialRenovation of Dam, Canal and Tanks ofSindapalli Uppodai (Virudhunagar) SubBasin under Tamil Nadu IrrigatedAgriculture Modernization and WaterBodies Restoration and ManagementProject (IAMWARM)Renovation of Dam, Canal and Tanks ofSenkottaiyar (Virudhunagar) Sub Basinunder Tamil Nadu Irrigated AgricultureModernization and Water BodiesRestoration and Management Project(IAMWARM)Renovation of Dam, Canal and Tanks ofCoovum (Chennai) Sub Basin under TamilNadu Irrigated Agriculture Modernizationand Water Bodies Restoration andManagement Project (IAMWARM)Renovation of Dam, Canal and Tanks ofPennaiyar upto Krishnagiri (Ponniyar) SubBasin under Tamil Nadu IrrigatedAgriculture Modernization and WaterBodies Restoration and ManagementProject (IAMWARM)Renovation of Dam, Canal and Tanks ofPoiney (Palar) Sub Basin under TamilNadu Irrigated Agriculture Modernizationand Water Bodies Restoration andManagement Project (IAMWARM)Renovation of Dam, Canal and Tanks ofKoundanyanadhi (Palar) Sub Basin underTamil Nadu Irrigated AgricultureModernization and Water BodiesRestoration and Management Project(IAMWARM)
371
372
373
374
375
376
( )
. .
. .
. .
. .
. .
. .
. .
. .
. .
. .
. .
. .
. .
. .
. .
. .
-2,82.61
89.58
-56.04
-10,17.07
-2,00.45
(in lakh of Rupees
CSS/CP
- Contd.
- Contd.- Contd.
- Contd.
305
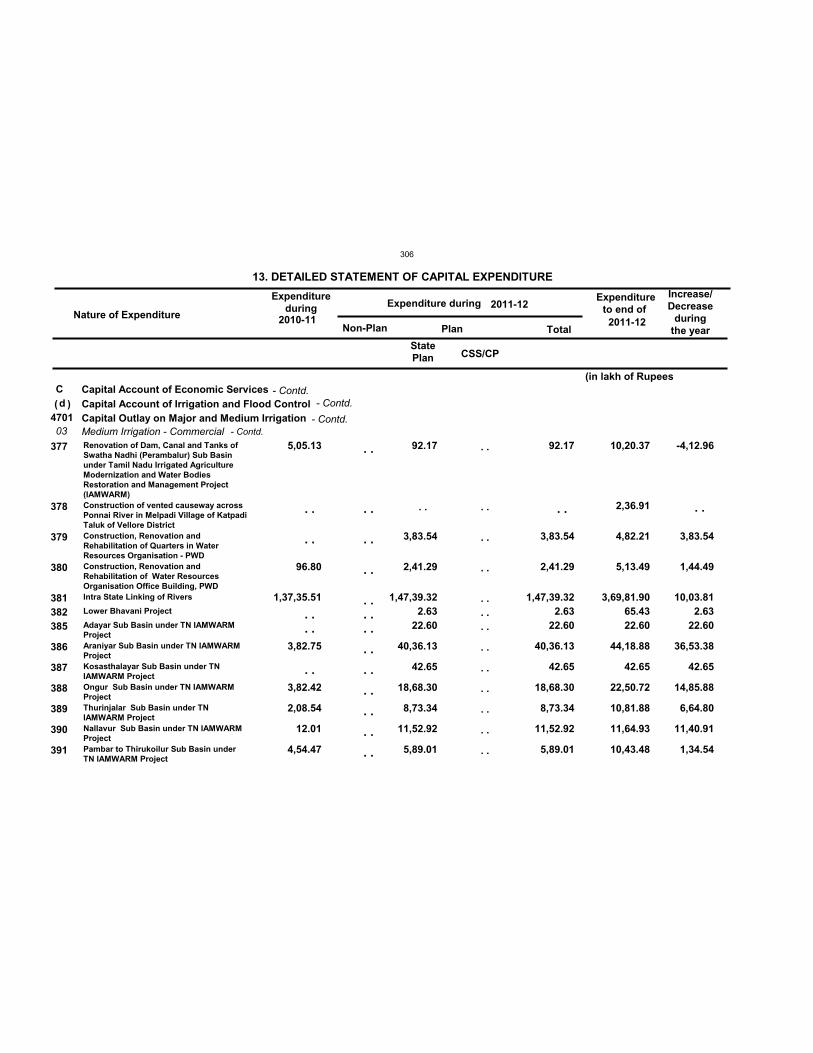
Nature of Expenditure
Expenditureduring Expenditure during
Expenditureto end of
Non-Plan Plan Total
13. DETAILED STATEMENT OF CAPITAL EXPENDITURE Increase/Decrease
duringthe year
2011-122010-11
2011-12
Cd
470103
5,05.13
96.80
1,37,35.51
3,82.75
3,82.42
2,08.54
12.01
4,54.47
92.17
3,83.54
2,41.29
1,47,39.32 2.63
22.60
40,36.13
42.65
18,68.30
8,73.34
11,52.92
5,89.01
92.17
3,83.54
2,41.29
1,47,39.32 2.63
22.60
40,36.13
42.65
18,68.30
8,73.34
11,52.92
5,89.01
10,20.37
2,36.91
4,82.21
5,13.49
3,69,81.90 65.43 22.60
44,18.88
42.65
22,50.72
10,81.88
11,64.93
10,43.48
StatePlan
Capital Account of Economic ServicesCapital Account of Irrigation and Flood ControlCapital Outlay on Major and Medium IrrigationMedium Irrigation - CommercialRenovation of Dam, Canal and Tanks ofSwatha Nadhi (Perambalur) Sub Basinunder Tamil Nadu Irrigated AgricultureModernization and Water BodiesRestoration and Management Project(IAMWARM)Construction of vented causeway acrossPonnai River in Melpadi Village of KatpadiTaluk of Vellore DistrictConstruction, Renovation andRehabilitation of Quarters in WaterResources Organisation - PWDConstruction, Renovation andRehabilitation of Water ResourcesOrganisation Office Building, PWDIntra State Linking of Rivers
Lower Bhavani Project
Adayar Sub Basin under TN IAMWARMProjectAraniyar Sub Basin under TN IAMWARMProjectKosasthalayar Sub Basin under TNIAMWARM ProjectOngur Sub Basin under TN IAMWARMProjectThurinjalar Sub Basin under TNIAMWARM ProjectNallavur Sub Basin under TN IAMWARMProjectPambar to Thirukoilur Sub Basin underTN IAMWARM Project
377
378
379
380
381382385
386
387
388
389
390
391
( )
. .
. .
. . . .
. .
. .
. .
. .
. .
. . . . . .
. .
. .
. .
. .
. .
. .
. .
. .
. .
. .
. .
. . . . . .
. .
. .
. .
. .
. .
. .
. .
-4,12.96
3,83.54
1,44.49
10,03.81 2.63
22.60
36,53.38
42.65
14,85.88
6,64.80
11,40.91
1,34.54
. .
(in lakh of Rupees
CSS/CP
- Contd.
- Contd.- Contd.
- Contd.
306

Nature of Expenditure
Expenditureduring Expenditure during
Expenditureto end of
Non-Plan Plan Total
13. DETAILED STATEMENT OF CAPITAL EXPENDITURE Increase/Decrease
duringthe year
2011-122010-11
2011-12
Cd
470103
67.74
1,64.59
36.69
1,08.30
0.68
5.06
50.54
1,68.51
1,16.61
14.71
2,15.64
54.73
2,33.78
61.93
2,59.01
40.77
6,32.70
41.40
2,13.50
6,48.94
6,05.94
3,70.60
2,94.12
15,70.36
2,90.20
3,55.91
19,63.13
8,88.86
11,64.18
2,82.24
32.64
40.77
6,32.70
41.40
2,13.50
6,48.94
6,05.94
3,70.60
2,94.12
15,70.36
2,90.20
3,55.91
19,63.13
8,88.86
11,64.18
2,82.24
32.64
1,08.51
7,97.29
78.09
3,21.80
6,49.82
6,11.00
3,70.60
3,44.66
17,38.87
4,06.81
3,70.62
21,78.77
9,43.59
13,97.96
3,44.17
2,91.65
StatePlan
Capital Account of Economic ServicesCapital Account of Irrigation and Flood ControlCapital Outlay on Major and Medium IrrigationMedium Irrigation - CommercialMarkandeya Nadhi Sub Basin under TNIAMWARM ProjectKambainallur Sub Basin under TNIAMWARM ProjectKovilar (Kottapatti Kallar) Sub Basinunder TN IAMWARM ProjectPambanar-Varattar Sub Basin under TNIAMWARM ProjectGadilam Sub Basin under TN IAMWARMProjectGomudhi Nadhi Sub Basin under TNIAMWARM ProjectCheyyar Sub Basin under TN IAMWARMProjectKanal Odai Sub Basin under TNIAMWARM ProjectUthirakosamangai Sub Basin under TNIAMWARM ProjectVembar Sub Basin under TN IAMWARMProjectPalar Sub Basin under TN IAMWARMProjectGrithamal Sub Basin under TN IAMWARMProjectLower Gundar Sub Basin under TNIAMWARM ProjectDeviar Sub Basin under TN IAMWARMProjectNagariar Sub Basin under TN IAMWARMProjectSevalaperiayar Sub Basin under TNIAMWARM Project
392
393
394
395
398
399
401
402
403
404
405
406
407
408
409
410
( )
. .
. .
. .
. .
. .
. .
. .
. .
. .
. .
. .
. .
. .
. .
. .
. .
. .
. .
. .
. .
. .
. .
. .
. .
. .
. .
. .
. .
. .
. .
. .
. .
. .
4,68.11
4.71
1,05.20
6,48.26
6,00.88
3,70.60
2,43.58
14,01.85
1,73.59
3,41.20
17,47.49
8,34.13
9,30.40
2,20.31
-2,26.37
(in lakh of Rupees
CSS/CP
- Contd.
- Contd.- Contd.
- Contd.
307
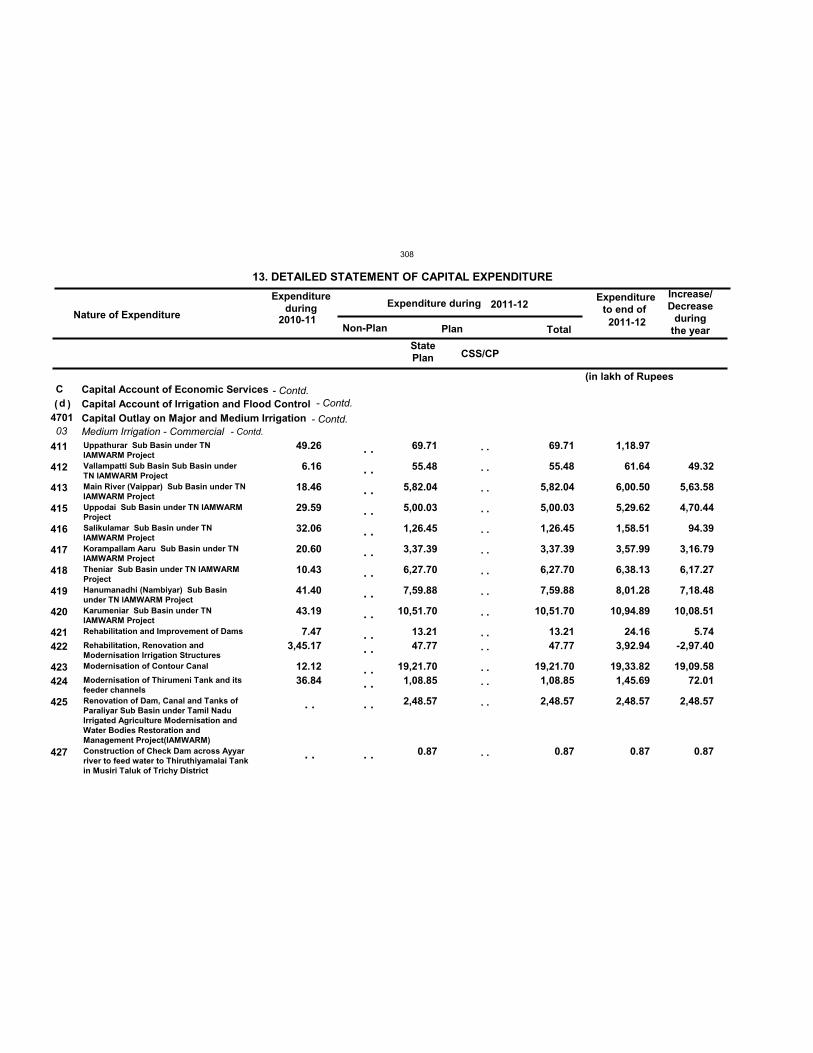
Nature of Expenditure
Expenditureduring Expenditure during
Expenditureto end of
Non-Plan Plan Total
13. DETAILED STATEMENT OF CAPITAL EXPENDITURE Increase/Decrease
duringthe year
2011-122010-11
2011-12
Cd
470103
49.26
6.16
18.46
29.59
32.06
20.60
10.43
41.40
43.19
7.47 3,45.17
12.12 36.84
69.71
55.48
5,82.04
5,00.03
1,26.45
3,37.39
6,27.70
7,59.88
10,51.70
13.21 47.77
19,21.70 1,08.85
2,48.57
0.87
69.71
55.48
5,82.04
5,00.03
1,26.45
3,37.39
6,27.70
7,59.88
10,51.70
13.21 47.77
19,21.70 1,08.85
2,48.57
0.87
1,18.97
61.64
6,00.50
5,29.62
1,58.51
3,57.99
6,38.13
8,01.28
10,94.89
24.16 3,92.94
19,33.82 1,45.69
2,48.57
0.87
StatePlan
Capital Account of Economic ServicesCapital Account of Irrigation and Flood ControlCapital Outlay on Major and Medium IrrigationMedium Irrigation - CommercialUppathurar Sub Basin under TNIAMWARM ProjectVallampatti Sub Basin Sub Basin underTN IAMWARM ProjectMain River (Vaippar) Sub Basin under TNIAMWARM ProjectUppodai Sub Basin under TN IAMWARMProjectSalikulamar Sub Basin under TNIAMWARM ProjectKorampallam Aaru Sub Basin under TNIAMWARM ProjectTheniar Sub Basin under TN IAMWARMProjectHanumanadhi (Nambiyar) Sub Basinunder TN IAMWARM ProjectKarumeniar Sub Basin under TNIAMWARM ProjectRehabilitation and Improvement of Dams
Rehabilitation, Renovation andModernisation Irrigation StructuresModernisation of Contour Canal
Modernisation of Thirumeni Tank and itsfeeder channelsRenovation of Dam, Canal and Tanks ofParaliyar Sub Basin under Tamil NaduIrrigated Agriculture Modernisation andWater Bodies Restoration andManagement Project(IAMWARM)Construction of Check Dam across Ayyarriver to feed water to Thiruthiyamalai Tankin Musiri Taluk of Trichy District
411
412
413
415
416
417
418
419
420
421422
423424
425
427
( )
. .
. .
. .
. .
. .
. .
. .
. .
. .
. .
. .
. . . .
. . . .
. .
. .
. .
. .
. .
. .
. .
. .
. .
. .
. .
. . . .
. . . .
. .
. .
49.32
5,63.58
4,70.44
94.39
3,16.79
6,17.27
7,18.48
10,08.51
5.74-2,97.40
19,09.58 72.01
2,48.57
0.87
(in lakh of Rupees
CSS/CP
- Contd.
- Contd.- Contd.
- Contd.
308
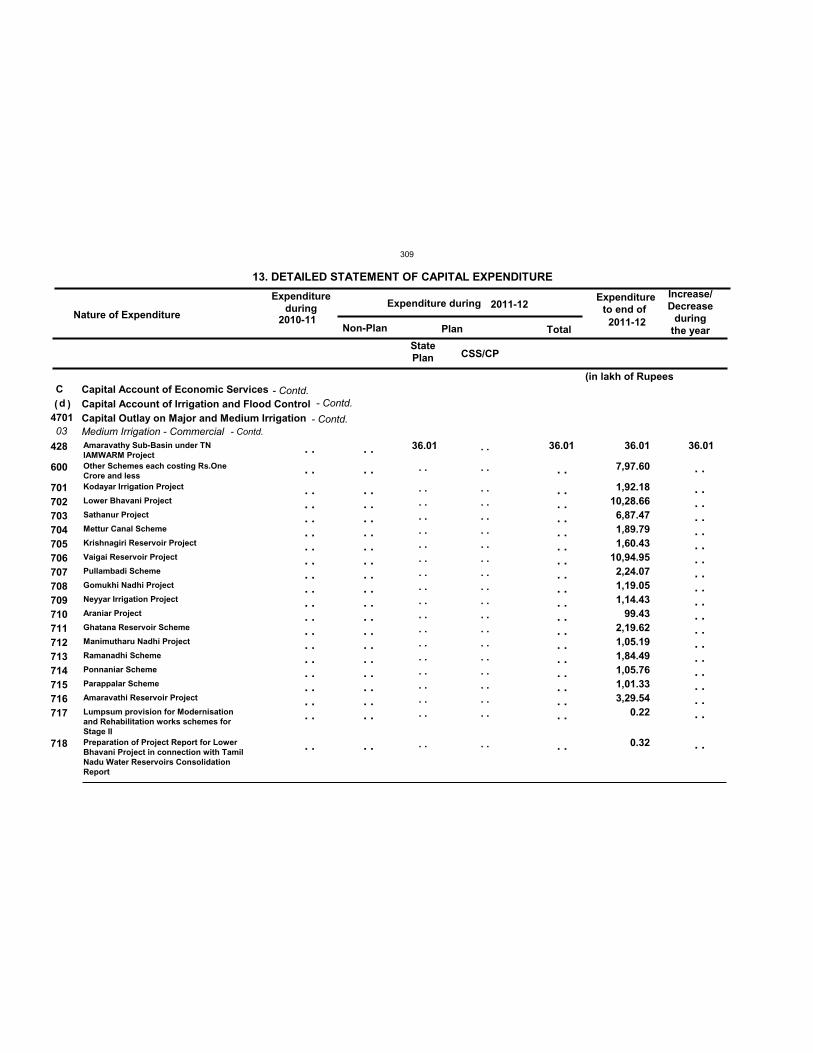
Nature of Expenditure
Expenditureduring Expenditure during
Expenditureto end of
Non-Plan Plan Total
13. DETAILED STATEMENT OF CAPITAL EXPENDITURE Increase/Decrease
duringthe year
2011-122010-11
2011-12
Cd
470103
36.01 36.01 36.01
7,97.60
1,92.18 10,28.66 6,87.47 1,89.79 1,60.43
10,94.95 2,24.07 1,19.05 1,14.43
99.43 2,19.62 1,05.19 1,84.49 1,05.76 1,01.33 3,29.54
0.22
0.32
StatePlan
Capital Account of Economic ServicesCapital Account of Irrigation and Flood ControlCapital Outlay on Major and Medium IrrigationMedium Irrigation - CommercialAmaravathy Sub-Basin under TNIAMWARM ProjectOther Schemes each costing Rs.OneCrore and lessKodayar Irrigation Project
Lower Bhavani Project
Sathanur Project
Mettur Canal Scheme
Krishnagiri Reservoir Project
Vaigai Reservoir Project
Pullambadi Scheme
Gomukhi Nadhi Project
Neyyar Irrigation Project
Araniar Project
Ghatana Reservoir Scheme
Manimutharu Nadhi Project
Ramanadhi Scheme
Ponnaniar Scheme
Parappalar Scheme
Amaravathi Reservoir Project
Lumpsum provision for Modernisationand Rehabilitation works schemes forStage IIPreparation of Project Report for LowerBhavani Project in connection with TamilNadu Water Reservoirs ConsolidationReport
428
600
701702703704705706707708709710711712713714715716717
718
( )
. .
. .
. . . . . . . . . . . . . . . . . . . . . . . . . . . . . . . . . .
. .
. .
. .
. . . . . . . . . . . . . . . . . . . . . . . . . . . . . . . . . .
. .
. .
. . . . . . . . . . . . . . . . . . . . . . . . . . . . . . . . . .
. .
. .
. .
. . . . . . . . . . . . . . . . . . . . . . . . . . . . . . . . . .
. .
. .
. . . . . . . . . . . . . . . . . . . . . . . . . . . . . . . . . .
. .
36.01
. .
. . . . . . . . . . . . . . . . . . . . . . . . . . . . . . . . . .
. .
(in lakh of Rupees
CSS/CP
- Contd.
- Contd.- Contd.
- Contd.
309
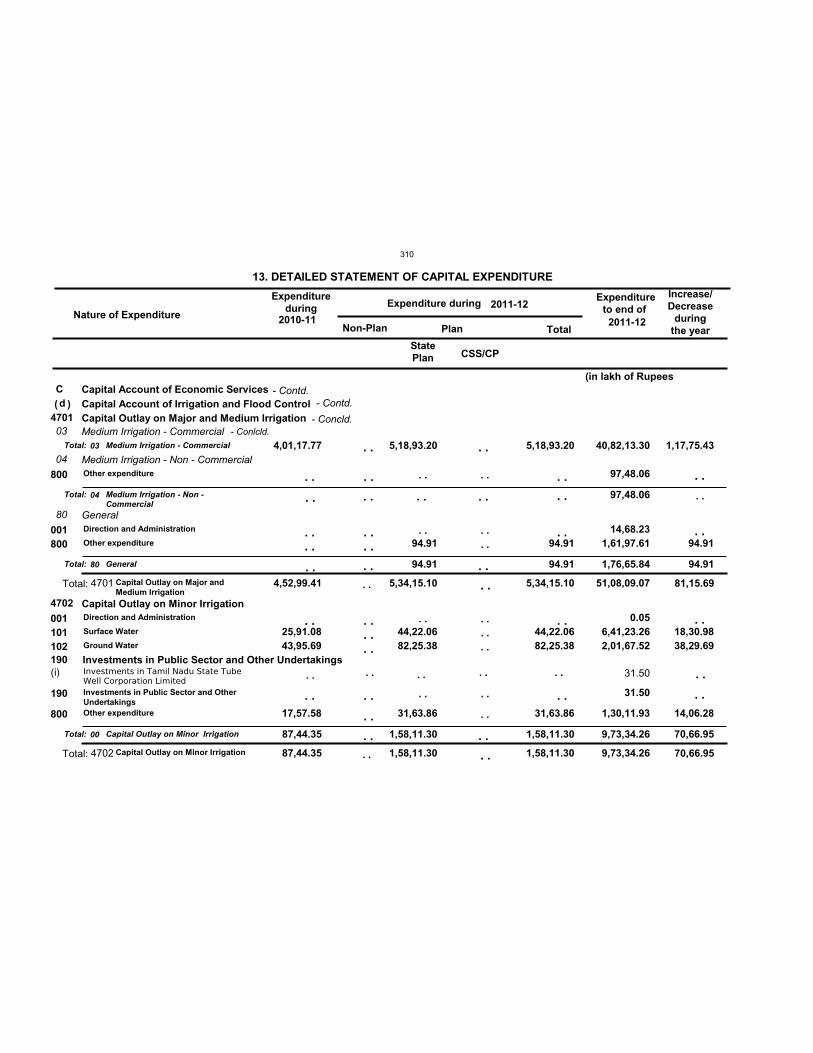
Nature of Expenditure
Expenditureduring Expenditure during
Expenditureto end of
Non-Plan Plan Total
13. DETAILED STATEMENT OF CAPITAL EXPENDITURE Increase/Decrease
duringthe year
2011-122010-11
2011-12
Cd
4701
4702
4,52,99.41
87,44.35
5,34,15.10
1,58,11.30
5,34,15.10
1,58,11.30
51,08,09.07
9,73,34.26
03
04
80
4,01,17.77
87,44.35
5,18,93.20
94.91
1,58,11.30
5,18,93.20
94.91
1,58,11.30
40,82,13.30
97,48.06
1,76,65.84
9,73,34.26
190
25,91.08 43,95.69
17,57.58
94.91
44,22.06 82,25.38
31,63.86
94.91
44,22.06 82,25.38
31,63.86
97,48.06
14,68.23 1,61,97.61
0.05 6,41,23.26 2,01,67.52
31.50
1,30,11.93
(i) 31.50
StatePlan
Capital Account of Economic ServicesCapital Account of Irrigation and Flood ControlCapital Outlay on Major and Medium Irrigation
Capital Outlay on Minor Irrigation
Medium Irrigation - Commercial
Medium Irrigation - Non - Commercial
General
Investments in Public Sector and Other Undertakings
Other expenditure
Direction and Administration
Other expenditure
Direction and Administration
Surface Water
Ground Water
Investments in Public Sector and OtherUndertakingsOther expenditure
800
001800
001101102
190
800
Investments in Tamil Nadu State TubeWell Corporation Limited
Total:
Total:
Total:
Total:
Medium Irrigation - Commercial
Medium Irrigation - Non -Commercial
General
Capital Outlay on Minor Irrigation
Total:
Total:
Capital Outlay on Major andMedium Irrigation
Capital Outlay on Minor Irrigation
( )
03
04
80
00
4701
4702
. . . . . . . .. .
. .
. . . .
. .
. .
. .
. . . .
. . . . . .
. .
. .
. .
. .
. .
. .
. .
. . . .
. . . . . .
. .
. .
. .
. .
. .
. .
94.91
18,30.98 38,29.69
14,06.28
. .
. .
. .
. .
. .
. .
. .
. .
. .
. .
. .
. .
. .
. .
. .
. .
. .
. .
. .
. .
. .
1,17,75.43
94.91
70,66.95
81,15.69
70,66.95
(in lakh of Rupees
CSS/CP
. .
- Contd.
- Concld.- Conlcld.
- Contd.
310
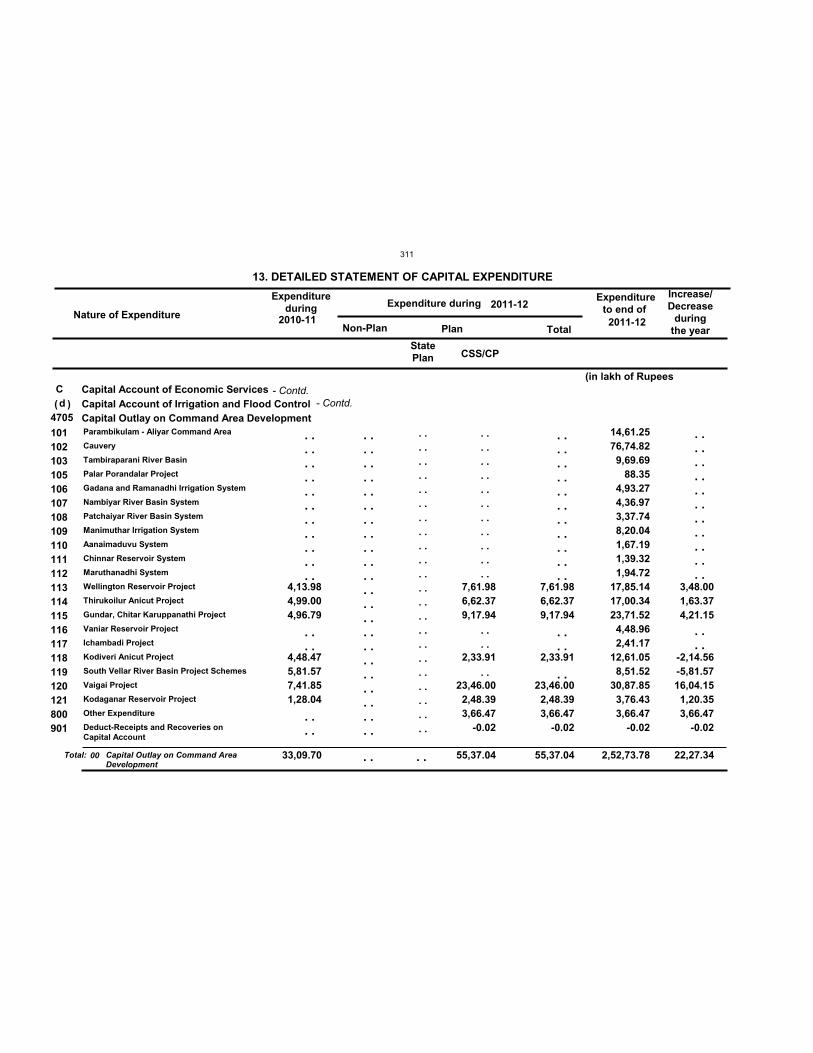
Nature of Expenditure
Expenditureduring Expenditure during
Expenditureto end of
Non-Plan Plan Total
13. DETAILED STATEMENT OF CAPITAL EXPENDITURE Increase/Decrease
duringthe year
2011-122010-11
2011-12
Cd
4705
33,09.70 55,37.04 55,37.04 2,52,73.78
4,13.98 4,99.00 4,96.79
4,48.47 5,81.57 7,41.85 1,28.04
7,61.98 6,62.37 9,17.94
2,33.91
23,46.00 2,48.39 3,66.47
-0.02
7,61.98 6,62.37 9,17.94
2,33.91
23,46.00 2,48.39 3,66.47
-0.02
14,61.25 76,74.82 9,69.69
88.35 4,93.27 4,36.97 3,37.74 8,20.04 1,67.19 1,39.32 1,94.72
17,85.14 17,00.34 23,71.52 4,48.96 2,41.17
12,61.05 8,51.52
30,87.85 3,76.43 3,66.47
-0.02
StatePlan
Capital Account of Economic ServicesCapital Account of Irrigation and Flood ControlCapital Outlay on Command Area DevelopmentParambikulam - Aliyar Command Area
Cauvery
Tambiraparani River Basin
Palar Porandalar Project
Gadana and Ramanadhi Irrigation System
Nambiyar River Basin System
Patchaiyar River Basin System
Manimuthar Irrigation System
Aanaimaduvu System
Chinnar Reservoir System
Maruthanadhi System
Wellington Reservoir Project
Thirukoilur Anicut Project
Gundar, Chitar Karuppanathi Project
Vaniar Reservoir Project
Ichambadi Project
Kodiveri Anicut Project
South Vellar River Basin Project Schemes
Vaigai Project
Kodaganar Reservoir Project
Other Expenditure
Deduct-Receipts and Recoveries onCapital Account
101102103105106107108109110111112113114115116117118119120121800901
Total: Capital Outlay on Command AreaDevelopment
( )
00
. . . . . . . . . . . . . . . . . . . . . .
. . . .
. . . .
. . . . . . . . . . . . . . . . . . . . . . . . . . . . . . . . . . . . . . . . . . . .
. . . . . . . . . . . . . . . . . . . . . . . . . . . . . . . . . . . . . . . . . . . .
. . . . . . . . . . . . . . . . . . . . . .
. . . .
. .
. . . . . . . . . . . . . . . . . . . . . .
. . . .
. .
3,48.00 1,63.37 4,21.15
-2,14.56-5,81.57
16,04.15 1,20.35 3,66.47
-0.02
. . . . . . . . . . . . . . . . . . . . . .
. . . .
. . . . 22,27.34
(in lakh of Rupees
CSS/CP
- Contd.- Contd.
311
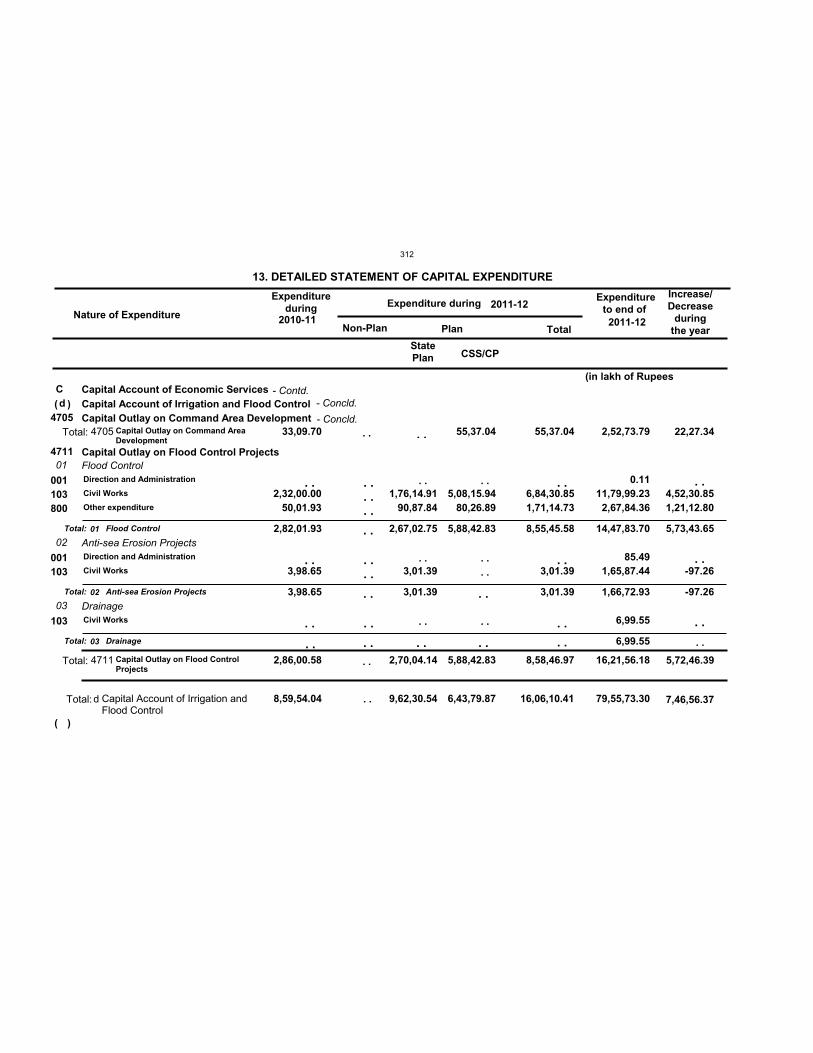
Nature of Expenditure
Expenditureduring Expenditure during
Expenditureto end of
Non-Plan Plan Total
13. DETAILED STATEMENT OF CAPITAL EXPENDITURE Increase/Decrease
duringthe year
2011-122010-11
2011-12
Cd
8,59,54.04 9,62,30.54 6,43,79.87 16,06,10.41 79,55,73.30
4705
4711
33,09.70
2,86,00.58 2,70,04.14
55,37.04
5,88,42.83
55,37.04
8,58,46.97
2,52,73.79
16,21,56.18
01
02
03
2,82,01.93
3,98.65
2,67,02.75
3,01.39
5,88,42.83 8,55,45.58
3,01.39
14,47,83.70
1,66,72.93
6,99.55
2,32,00.00 50,01.93
3,98.65
1,76,14.91 90,87.84
3,01.39
5,08,15.94 80,26.89
6,84,30.85 1,71,14.73
3,01.39
0.11 11,79,99.23 2,67,84.36
85.49 1,65,87.44
6,99.55
StatePlan
Capital Account of Economic ServicesCapital Account of Irrigation and Flood ControlCapital Outlay on Command Area Development
Capital Outlay on Flood Control ProjectsFlood Control
Anti-sea Erosion Projects
Drainage
Direction and Administration
Civil Works
Other expenditure
Direction and Administration
Civil Works
Civil Works
001103800
001103
103
Total:
Total:
Total:
Flood Control
Anti-sea Erosion Projects
Drainage
Total:
Total:
Capital Outlay on Command AreaDevelopment
Capital Outlay on Flood ControlProjects
Total: Capital Account of Irrigation andFlood Control
(
(
)
)
01
02
03
4705
4711
d
. .
. .
. .
. . . . . .
. . . .
. .
. .
. .
. .
. .
. . . .
. .
. .
. .
. .
4,52,30.85 1,21,12.80
-97.26
. .
. .
. .
. .
. .
. .
. . . .
. .
. . . .
. .
. .
. .
5,73,43.65
-97.26
22,27.34
5,72,46.39
7,46,56.37
(in lakh of Rupees
CSS/CP
. .
. .
- Contd.
- Concld.
- Concld.
312
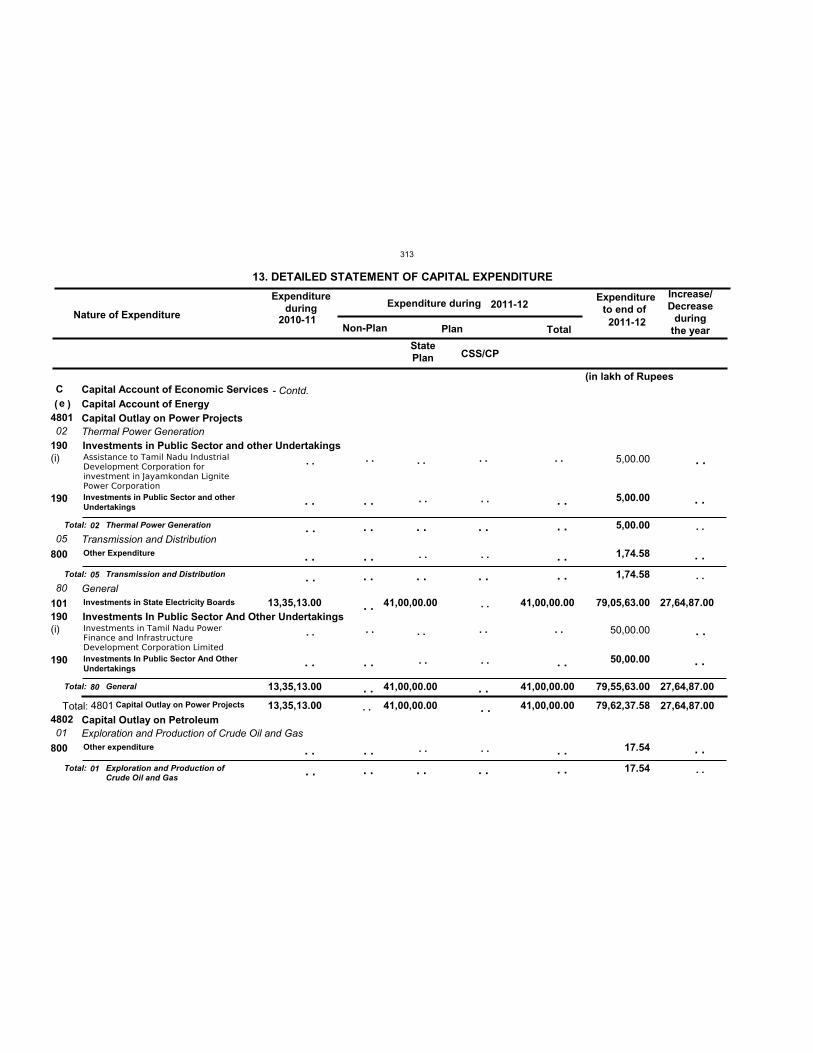
Nature of Expenditure
Expenditureduring Expenditure during
Expenditureto end of
Non-Plan Plan Total
13. DETAILED STATEMENT OF CAPITAL EXPENDITURE Increase/Decrease
duringthe year
2011-122010-11
2011-12
Ce
4801
4802 13,35,13.00 41,00,00.00 41,00,00.00 79,62,37.58
02
05
80
01
13,35,13.00 41,00,00.00 41,00,00.00
5,00.00
1,74.58
79,55,63.00
17.54
190
190 13,35,13.00 41,00,00.00 41,00,00.00
5,00.00
1,74.58
79,05,63.00
50,00.00
17.54
(i)
(i)
5,00.00
50,00.00
StatePlan
Capital Account of Economic ServicesCapital Account of EnergyCapital Outlay on Power Projects
Capital Outlay on Petroleum
Thermal Power Generation
Transmission and Distribution
General
Exploration and Production of Crude Oil and Gas
Investments in Public Sector and other Undertakings
Investments In Public Sector And Other Undertakings
Investments in Public Sector and otherUndertakings
Other Expenditure
Investments in State Electricity Boards
Investments In Public Sector And OtherUndertakings
Other expenditure
190
800
101
190
800
Assistance to Tamil Nadu IndustrialDevelopment Corporation forinvestment in Jayamkondan LignitePower Corporation
Investments in Tamil Nadu PowerFinance and InfrastructureDevelopment Corporation Limited
Total:
Total:
Total:
Total:
Thermal Power Generation
Transmission and Distribution
General
Exploration and Production ofCrude Oil and Gas
Total: Capital Outlay on Power Projects
( )
02
05
80
01
4801
. .
. .
. .
. .
. .
. .
. .
. .
. .
. .
. .
. .
. .
. .
. .
. .
. .
. .
. .
. .
. .
. .
. .
. .
. .
. .
. .
. .
. .
. .
. .
. .
27,64,87.00
. .
. .
. .
. .
. .
. .
. .
. .
. .
. .
. .
. .
. .
. .
. .
. .
. .
. .
. .
. .
. .
. .
. .
. . . .
27,64,87.00
27,64,87.00
(in lakh of Rupees
CSS/CP
. .
. .
. .
- Contd.
313
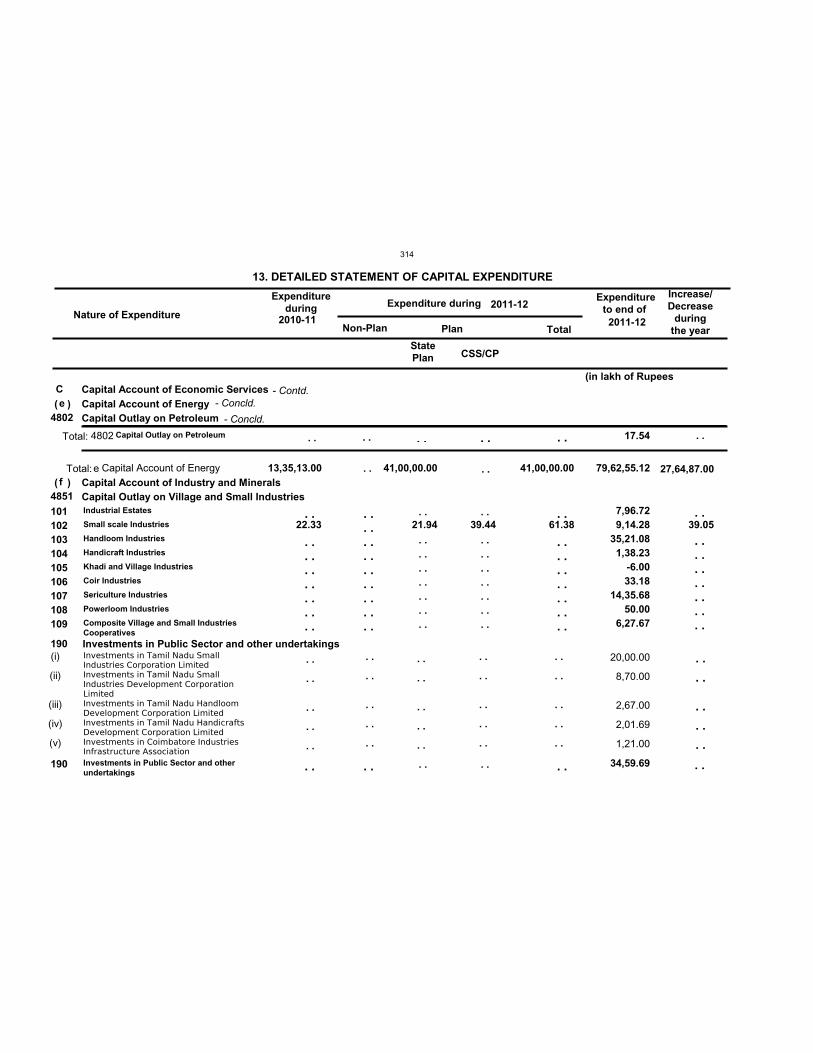
Nature of Expenditure
Expenditureduring Expenditure during
Expenditureto end of
Non-Plan Plan Total
13. DETAILED STATEMENT OF CAPITAL EXPENDITURE Increase/Decrease
duringthe year
2011-122010-11
2011-12
Ce
f 13,35,13.00 41,00,00.00 41,00,00.00 79,62,55.12
4802
4851
17.54
190
22.33 21.94 39.44 61.38 7,96.72 9,14.28
35,21.08 1,38.23
-6.00 33.18
14,35.68 50.00
6,27.67
34,59.69
(i)
(ii)
(iii)
(iv)
(v)
20,00.00
8,70.00
2,67.00
2,01.69
1,21.00
StatePlan
Capital Account of Economic ServicesCapital Account of Energy
Capital Account of Industry and Minerals
Capital Outlay on Petroleum
Capital Outlay on Village and Small Industries
Investments in Public Sector and other undertakings
Industrial Estates
Small scale Industries
Handloom Industries
Handicraft Industries
Khadi and Village Industries
Coir Industries
Sericulture Industries
Powerloom Industries
Composite Village and Small IndustriesCooperatives
Investments in Public Sector and otherundertakings
101102103104105106107108109
190
Investments in Tamil Nadu SmallIndustries Corporation LimitedInvestments in Tamil Nadu SmallIndustries Development CorporationLimitedInvestments in Tamil Nadu HandloomDevelopment Corporation LimitedInvestments in Tamil Nadu HandicraftsDevelopment Corporation LimitedInvestments in Coimbatore IndustriesInfrastructure Association
Total: Capital Outlay on Petroleum
Total: Capital Account of Energy
(
(
)
)
4802
e
. .
. .
. .
. .
. .
. .
. .
. .
. .
. .
. .
. .
. .
. .
. .
. .
. .
. .
. .
. .
. .
. .
. .
. .
. .
. .
. . . . . . . . . . . . . .
. .
. . . . . . . . . . . . . . . . . .
. .
. .
. . . . . . . . . . . . . .
. .
. .
. . . . . . . . . . . . . .
. .
. .
. . . . . . . . . . . . . .
. .
39.05
. .
. .
. .
. .
. .
. .
. . . . . . . . . . . . . .
. .
. . . . . . . . . .
. . 27,64,87.00
(in lakh of Rupees
CSS/CP
. .
. .
- Contd.
- Concld.
- Concld.
314
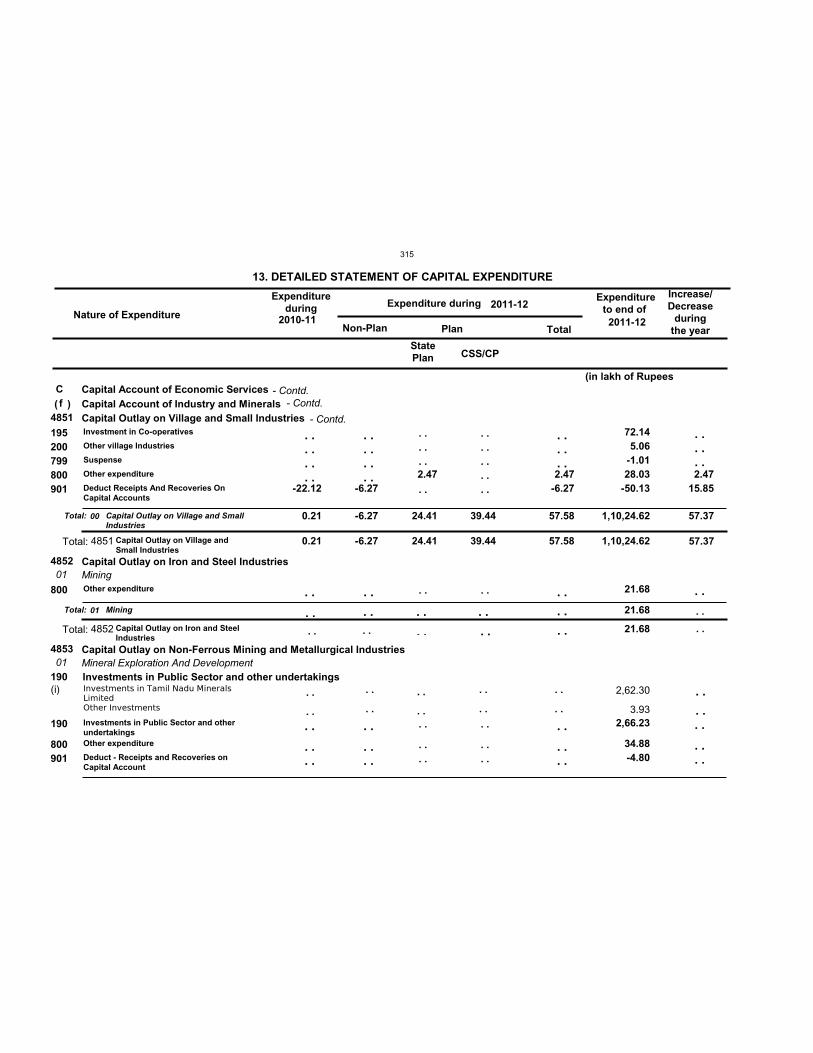
Nature of Expenditure
Expenditureduring Expenditure during
Expenditureto end of
Non-Plan Plan Total
13. DETAILED STATEMENT OF CAPITAL EXPENDITURE Increase/Decrease
duringthe year
2011-122010-11
2011-12
Cf
4851
4852
4853
0.21 -6.27 24.41 39.44 57.58 1,10,24.62
21.68
01
01
0.21 -6.27 24.41 39.44 57.58 1,10,24.62
21.68
190
-22.12 -6.27 2.47 2.47
-6.27
72.14 5.06-1.01
28.03-50.13
21.68
2,66.23
34.88-4.80
(i) 2,62.30
3.93
StatePlan
Capital Account of Economic ServicesCapital Account of Industry and MineralsCapital Outlay on Village and Small Industries
Capital Outlay on Iron and Steel Industries
Capital Outlay on Non-Ferrous Mining and Metallurgical Industries
Mining
Mineral Exploration And DevelopmentInvestments in Public Sector and other undertakings
Investment in Co-operatives
Other village Industries
Suspense
Other expenditure
Deduct Receipts And Recoveries OnCapital Accounts
Other expenditure
Investments in Public Sector and otherundertakingsOther expenditure
Deduct - Receipts and Recoveries onCapital Account
195200799800901
800
190
800901
Investments in Tamil Nadu MineralsLimitedOther Investments
Total:
Total:
Capital Outlay on Village and SmallIndustries
Mining
Total:
Total:
Capital Outlay on Village andSmall Industries
Capital Outlay on Iron and SteelIndustries
( )
00
01
4851
4852
. .
. .
. .
. .
. .
. .
. .
. .
. .
. .
. . . . . . . .
. .
. .
. . . .
. . . . . . . .
. .
. .
. . . .
. . . . . .
. .
. .
. .
. . . .
. . . . . . . . . .
. .
. .
. . . .
. . . . . .
. .
. .
. . . .
2.47 15.85
. .
. .
. . . . . .
. .
. .
. . . .
. . . . . . . . . .
. . . . . . . . . .
57.37
57.37
(in lakh of Rupees
CSS/CP
. .
. .
- Contd.
- Contd.
- Contd.
315
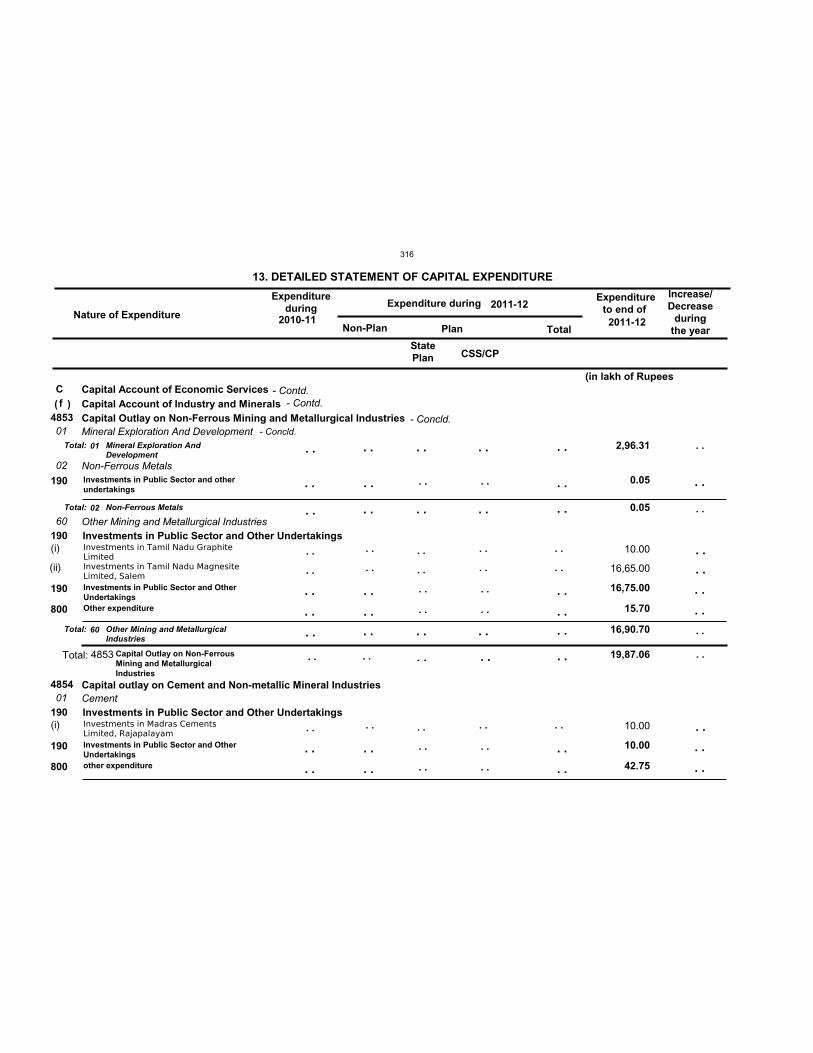
Nature of Expenditure
Expenditureduring Expenditure during
Expenditureto end of
Non-Plan Plan Total
13. DETAILED STATEMENT OF CAPITAL EXPENDITURE Increase/Decrease
duringthe year
2011-122010-11
2011-12
Cf
4853
4854
19,87.06
01
02
60
01
2,96.31
0.05
16,90.70
190
190
0.05
16,75.00
15.70
10.00
42.75
(i)
(ii)
(i)
10.00
16,65.00
10.00
StatePlan
Capital Account of Economic ServicesCapital Account of Industry and MineralsCapital Outlay on Non-Ferrous Mining and Metallurgical Industries
Capital outlay on Cement and Non-metallic Mineral Industries
Mineral Exploration And Development
Non-Ferrous Metals
Other Mining and Metallurgical Industries
Cement
Investments in Public Sector and Other Undertakings
Investments in Public Sector and Other Undertakings
Investments in Public Sector and otherundertakings
Investments in Public Sector and OtherUndertakingsOther expenditure
Investments in Public Sector and OtherUndertakingsother expenditure
190
190
800
190
800
Investments in Tamil Nadu GraphiteLimitedInvestments in Tamil Nadu MagnesiteLimited, Salem
Investments in Madras CementsLimited, Rajapalayam
Total:
Total:
Total:
Mineral Exploration AndDevelopment
Non-Ferrous Metals
Other Mining and MetallurgicalIndustries
Total: Capital Outlay on Non-FerrousMining and MetallurgicalIndustries
( )
01
02
60
4853
. .
. .
. .
. .
. .
. .
. .
. .
. .
. .
. .
. .
. .
. .
. .
. .
. .
. .
. .
. .
. .
. .
. .
. .
. .
. .
. .
. .
. .
. .
. .
. .
. .
. .
. .
. .
. .
. .
. .
. .
. .
. .
. .
. .
. .
. .
. .
. .
. .
. .
. .
. .
. .
. .
. .
. .
. .
. .
. .
. .
. .
. .
. .
. . . . . . . . . .
(in lakh of Rupees
CSS/CP
. .
. .
. .
. .
- Contd.
- Concld.- Concld.
- Contd.
316
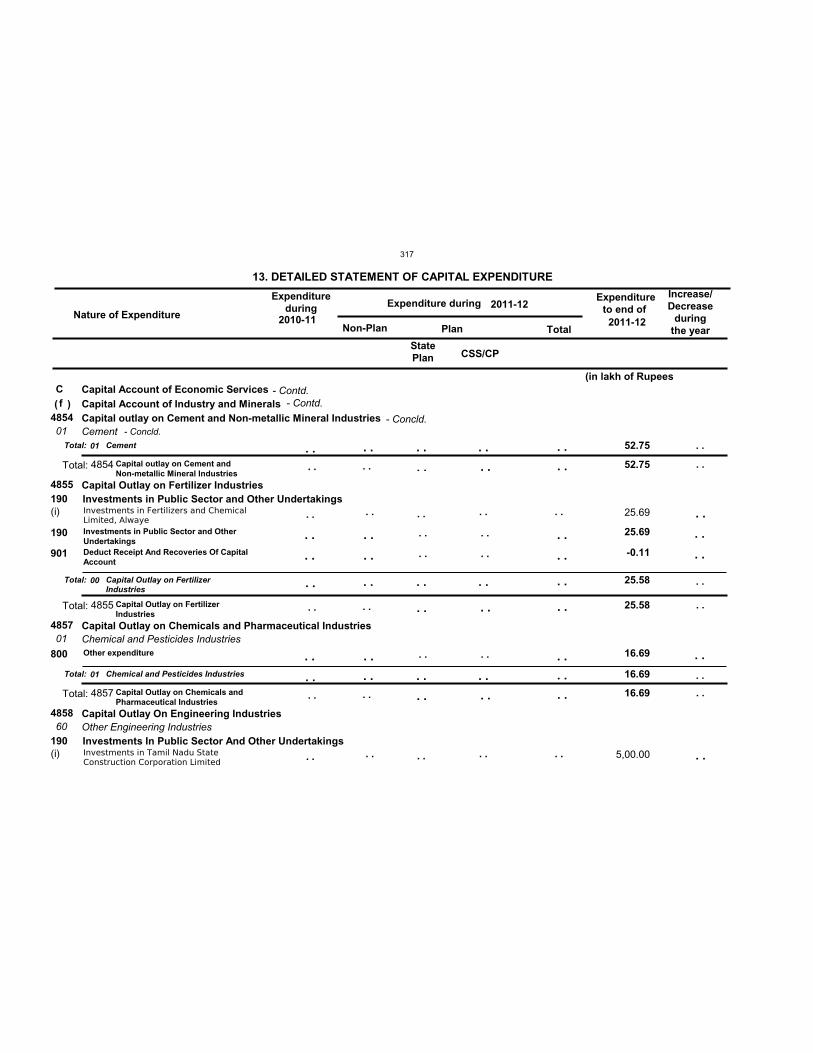
Nature of Expenditure
Expenditureduring Expenditure during
Expenditureto end of
Non-Plan Plan Total
13. DETAILED STATEMENT OF CAPITAL EXPENDITURE Increase/Decrease
duringthe year
2011-122010-11
2011-12
Cf
4854
4855
4857
4858
52.75
25.58
16.69
01
01
60
52.75
25.58
16.69
190
190
25.69
-0.11
16.69
(i)
(i)
25.69
5,00.00
StatePlan
Capital Account of Economic ServicesCapital Account of Industry and MineralsCapital outlay on Cement and Non-metallic Mineral Industries
Capital Outlay on Fertilizer Industries
Capital Outlay on Chemicals and Pharmaceutical Industries
Capital Outlay On Engineering Industries
Cement
Chemical and Pesticides Industries
Other Engineering Industries
Investments in Public Sector and Other Undertakings
Investments In Public Sector And Other Undertakings
Investments in Public Sector and OtherUndertakingsDeduct Receipt And Recoveries Of CapitalAccount
Other expenditure
190
901
800
Investments in Fertilizers and ChemicalLimited, Alwaye
Investments in Tamil Nadu StateConstruction Corporation Limited
Total:
Total:
Total:
Cement
Capital Outlay on FertilizerIndustries
Chemical and Pesticides Industries
Total:
Total:
Total:
Capital outlay on Cement andNon-metallic Mineral Industries
Capital Outlay on FertilizerIndustries
Capital Outlay on Chemicals andPharmaceutical Industries
( )
01
00
01
4854
4855
4857
. .
. .
. .
. .
. .
. .
. .
. .
. .
. .
. .
. .
. .
. .
. .
. .
. .
. .
. .
. .
. .
. .
. .
. .
. .
. .
. .
. .
. .
. .
. .
. .
. .
. .
. .
. .
. .
. .
. .
. .
. .
. .
. .
. .
. .
. .
. .
. .
. .
. .
. .
. .
. .
. .
. .
. .
. .
. .
. .
. .
(in lakh of Rupees
CSS/CP
. .
. .
. .
. .
. .
. .
- Contd.
- Concld.- Concld.
- Contd.
317
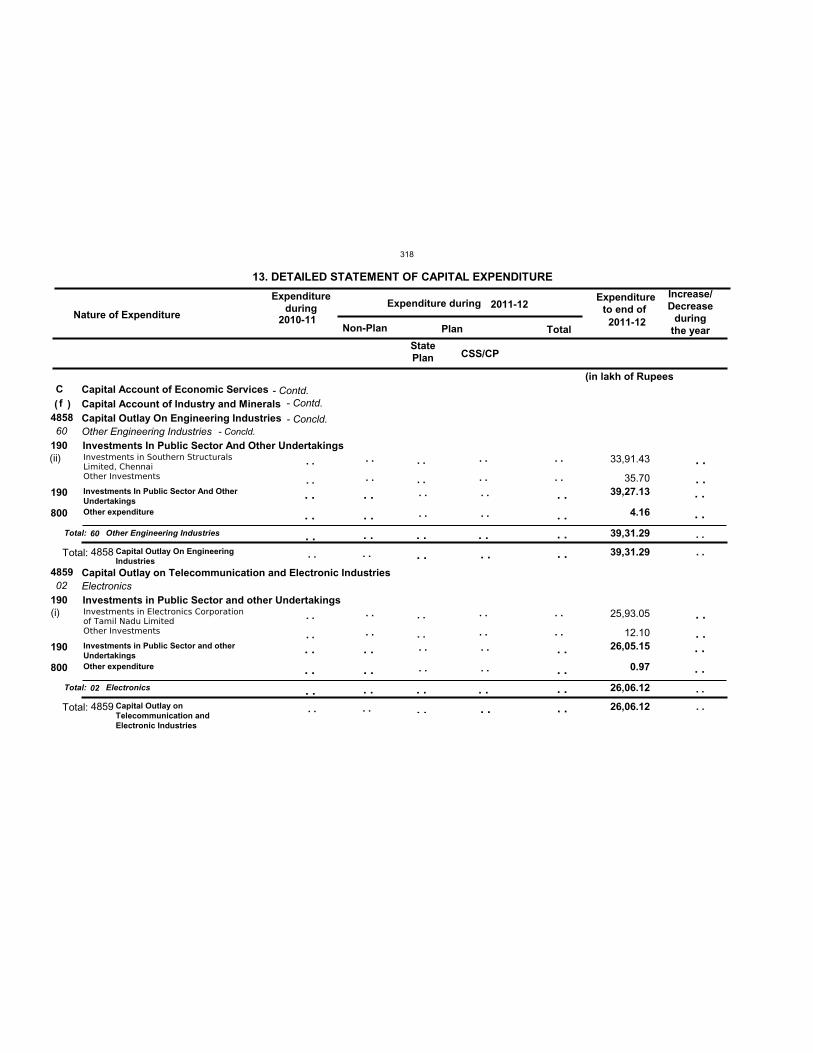
Nature of Expenditure
Expenditureduring Expenditure during
Expenditureto end of
Non-Plan Plan Total
13. DETAILED STATEMENT OF CAPITAL EXPENDITURE Increase/Decrease
duringthe year
2011-122010-11
2011-12
Cf
4858
4859
39,31.29
26,06.12
60
02
39,31.29
26,06.12
190
190
39,27.13
4.16
26,05.15
0.97
(ii)
(i)
33,91.43
35.70
25,93.05
12.10
StatePlan
Capital Account of Economic ServicesCapital Account of Industry and MineralsCapital Outlay On Engineering Industries
Capital Outlay on Telecommunication and Electronic Industries
Other Engineering Industries
Electronics
Investments In Public Sector And Other Undertakings
Investments in Public Sector and other Undertakings
Investments In Public Sector And OtherUndertakingsOther expenditure
Investments in Public Sector and otherUndertakingsOther expenditure
190
800
190
800
Investments in Southern StructuralsLimited, ChennaiOther Investments
Investments in Electronics Corporationof Tamil Nadu LimitedOther Investments
Total:
Total:
Other Engineering Industries
Electronics
Total:
Total:
Capital Outlay On EngineeringIndustries
Capital Outlay onTelecommunication andElectronic Industries
( )
60
02
4858
4859
. .
. .
. .
. .
. .
. .
. .
. .
. .
. .
. .
. .
. .
. .
. .
. .
. .
. .
. .
. .
. .
. .
. .
. .
. .
. .
. .
. .
. .
. .
. .
. .
. .
. .
. .
. .
. .
. .
. .
. .
. .
. .
. .
. .
. .
. .
. .
. .
. .
. .
. .
. .
. .
. .
. .
. .
. .
. .
. .
. .
. .
. .
. .
. .
. .
. .
. .
. .
(in lakh of Rupees
CSS/CP
. .
. .
. .
. .
- Contd.
- Concld.- Concld.
- Contd.
318
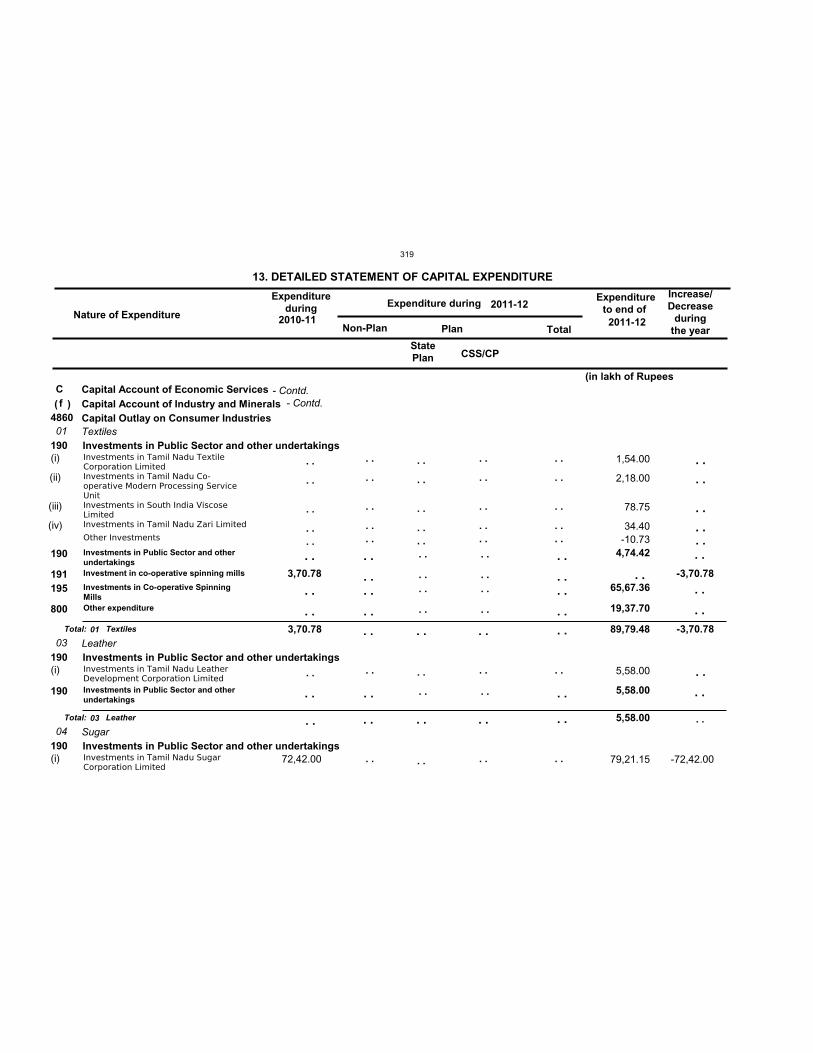
Nature of Expenditure
Expenditureduring Expenditure during
Expenditureto end of
Non-Plan Plan Total
13. DETAILED STATEMENT OF CAPITAL EXPENDITURE Increase/Decrease
duringthe year
2011-122010-11
2011-12
Cf
486001
03
04
3,70.78 89,79.48
5,58.00
190
190
190
3,70.78
4,74.42
65,67.36
19,37.70
5,58.00
(i)
(ii)
(iii)
(iv)
(i)
(i) 72,42.00
1,54.00
2,18.00
78.75
34.40-10.73
5,58.00
79,21.15
StatePlan
Capital Account of Economic ServicesCapital Account of Industry and MineralsCapital Outlay on Consumer IndustriesTextiles
Leather
Sugar
Investments in Public Sector and other undertakings
Investments in Public Sector and other undertakings
Investments in Public Sector and other undertakings
Investments in Public Sector and otherundertakingsInvestment in co-operative spinning mills
Investments in Co-operative SpinningMillsOther expenditure
Investments in Public Sector and otherundertakings
190
191195
800
190
Investments in Tamil Nadu TextileCorporation LimitedInvestments in Tamil Nadu Co-operative Modern Processing ServiceUnitInvestments in South India ViscoseLimitedInvestments in Tamil Nadu Zari Limited
Other Investments
Investments in Tamil Nadu LeatherDevelopment Corporation Limited
Investments in Tamil Nadu SugarCorporation Limited
Total:
Total:
Textiles
Leather
( )
01
03
. .
. .
. .
. .
. .
. .
. .
. .
. .
. .
. .
. .
. .
. .
. .
. .
. .
. .
. .
. .
. .
. .
. .
. .
. .
. .
. .
. .
. .
. .
. .
. .
. .
. .
. .
. .
. .
. .
. .
. . . .
. .
. .
. .
. . . .
. .
. .
. .
. . . .
. .
. .
. .
. . . .
. .
. .
-72,42.00
-3,70.78
. .
. .
. .
. . . .
. .
. .
. .
. .
. .
. .
. .
. .
. .
. .
. .
. .
. .
. .
-3,70.78
. .
(in lakh of Rupees
CSS/CP
. .
- Contd.- Contd.
319
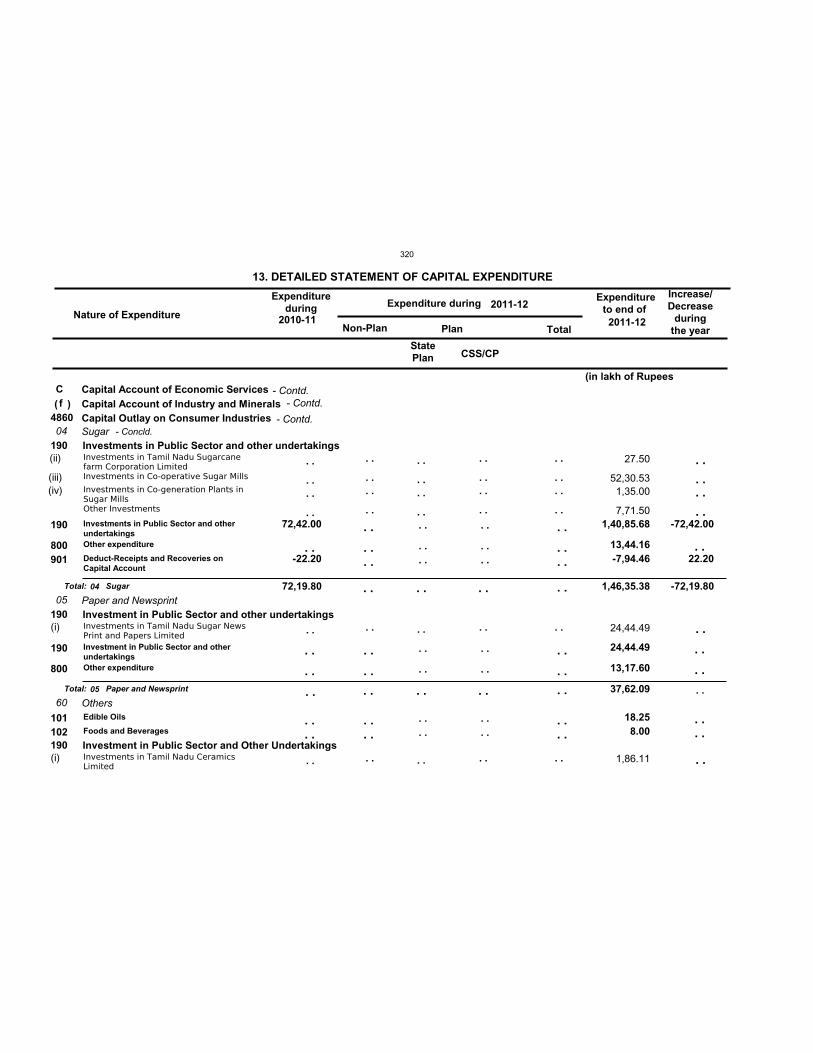
Nature of Expenditure
Expenditureduring Expenditure during
Expenditureto end of
Non-Plan Plan Total
13. DETAILED STATEMENT OF CAPITAL EXPENDITURE Increase/Decrease
duringthe year
2011-122010-11
2011-12
Cf
486004
05
60
72,19.80 1,46,35.38
37,62.09
190
190
190
72,42.00
-22.20
1,40,85.68
13,44.16-7,94.46
24,44.49
13,17.60
18.25 8.00
(ii)
(iii)(iv)
(i)
(i)
27.50
52,30.53 1,35.00
7,71.50
24,44.49
1,86.11
StatePlan
Capital Account of Economic ServicesCapital Account of Industry and MineralsCapital Outlay on Consumer IndustriesSugar
Paper and Newsprint
Others
Investments in Public Sector and other undertakings
Investment in Public Sector and other undertakings
Investment in Public Sector and Other Undertakings
Investments in Public Sector and otherundertakingsOther expenditure
Deduct-Receipts and Recoveries onCapital Account
Investment in Public Sector and otherundertakingsOther expenditure
Edible Oils
Foods and Beverages
190
800901
190
800
101102
Investments in Tamil Nadu Sugarcanefarm Corporation LimitedInvestments in Co-operative Sugar Mills
Investments in Co-generation Plants inSugar MillsOther Investments
Investments in Tamil Nadu Sugar NewsPrint and Papers Limited
Investments in Tamil Nadu CeramicsLimited
Total:
Total:
Sugar
Paper and Newsprint
( )
04
05
. .
. .
. .
. .
. .
. .
. .
. .
. .
. .
. .
. .
. .
. .
. .
. .
. .
. .
. .
. .
. .
. .
. .
. .
. .
. .
. .
. .
. .
. .
. .
. .
. .
. . . .
. .
. . . .
. .
. .
. . . .
. .
. . . .
. .
. .
. . . .
. .
. . . .
. .
. .
. . . .
. .
. . . .
. .
. .
. . . .
-72,42.00
22.20
. .
. . . .
. .
. .
. .
. .
. .
. .
. . . .
. .
. .
. .
. .
. .
. .
. .
. .
. .
-72,19.80
(in lakh of Rupees
CSS/CP
. .
- Contd.
- Contd.- Concld.
- Contd.
320
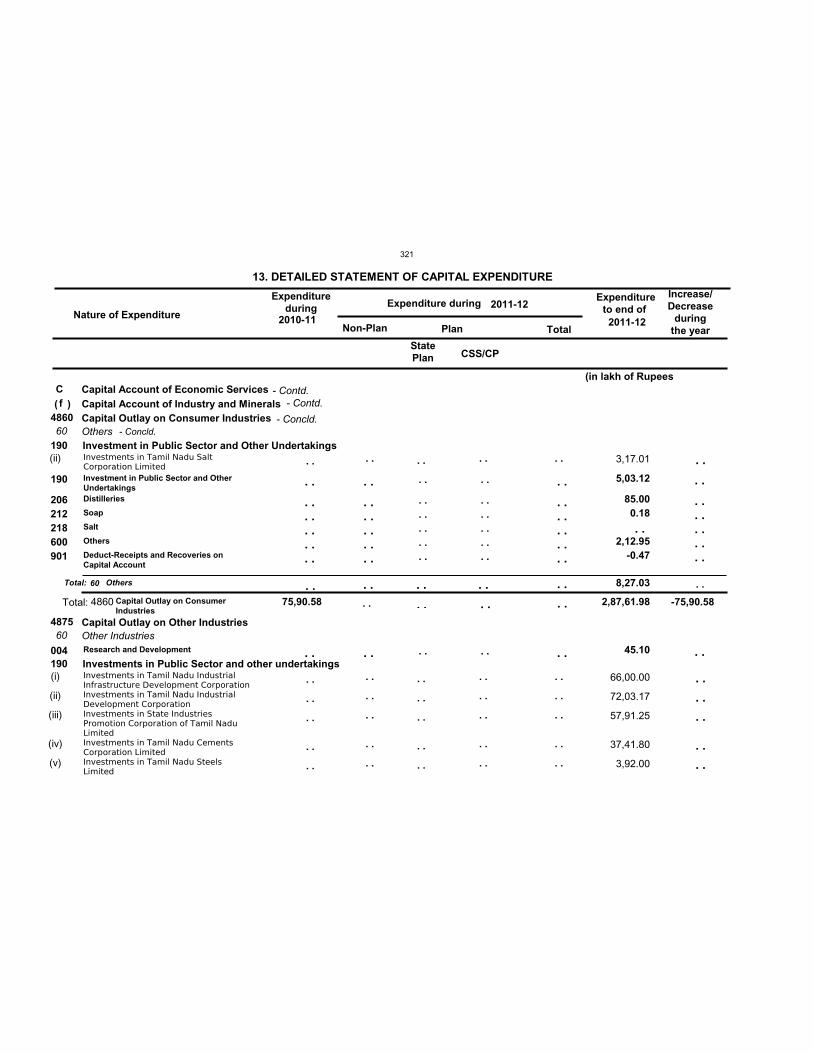
Nature of Expenditure
Expenditureduring Expenditure during
Expenditureto end of
Non-Plan Plan Total
13. DETAILED STATEMENT OF CAPITAL EXPENDITURE Increase/Decrease
duringthe year
2011-122010-11
2011-12
Cf
4860
4875
75,90.58 2,87,61.98
60
60
8,27.03
190
190
5,03.12
85.00 0.18
2,12.95-0.47
45.10
(ii)
(i)
(ii)
(iii)
(iv)
(v)
3,17.01
66,00.00
72,03.17
57,91.25
37,41.80
3,92.00
StatePlan
Capital Account of Economic ServicesCapital Account of Industry and MineralsCapital Outlay on Consumer Industries
Capital Outlay on Other Industries
Others
Other Industries
Investment in Public Sector and Other Undertakings
Investments in Public Sector and other undertakings
Investment in Public Sector and OtherUndertakingsDistilleries
Soap
Salt
Others
Deduct-Receipts and Recoveries onCapital Account
Research and Development
190
206212218600901
004
Investments in Tamil Nadu SaltCorporation Limited
Investments in Tamil Nadu IndustrialInfrastructure Development CorporationInvestments in Tamil Nadu IndustrialDevelopment CorporationInvestments in State IndustriesPromotion Corporation of Tamil NaduLimitedInvestments in Tamil Nadu CementsCorporation LimitedInvestments in Tamil Nadu SteelsLimited
Total: Others
Total: Capital Outlay on ConsumerIndustries
( )
60
4860
. .
. .
. .
. .
. .
. .
. .
. .
. .
. .
. .
. .
. .
. .
. .
. .
. .
. .
. .
. .
. .
. .
. .
. .
. .
. .
. .
. .
. .
. .
. .
. . . . . . . . . .
. .
. .
. . . . . . . . . .
. .
. .
. . . . . . . . . .
. .
. .
. . . . . . . . . .
. .
. .
. . . . . . . . . .
. .
. .
. .
. .
. .
. .
. .
. .
. . . . . . . . . .
. .
. . . . . . . . . .
. . . . . . . . -75,90.58
. .
(in lakh of Rupees
CSS/CP
. .
- Contd.
- Concld.- Concld.
- Contd.
321
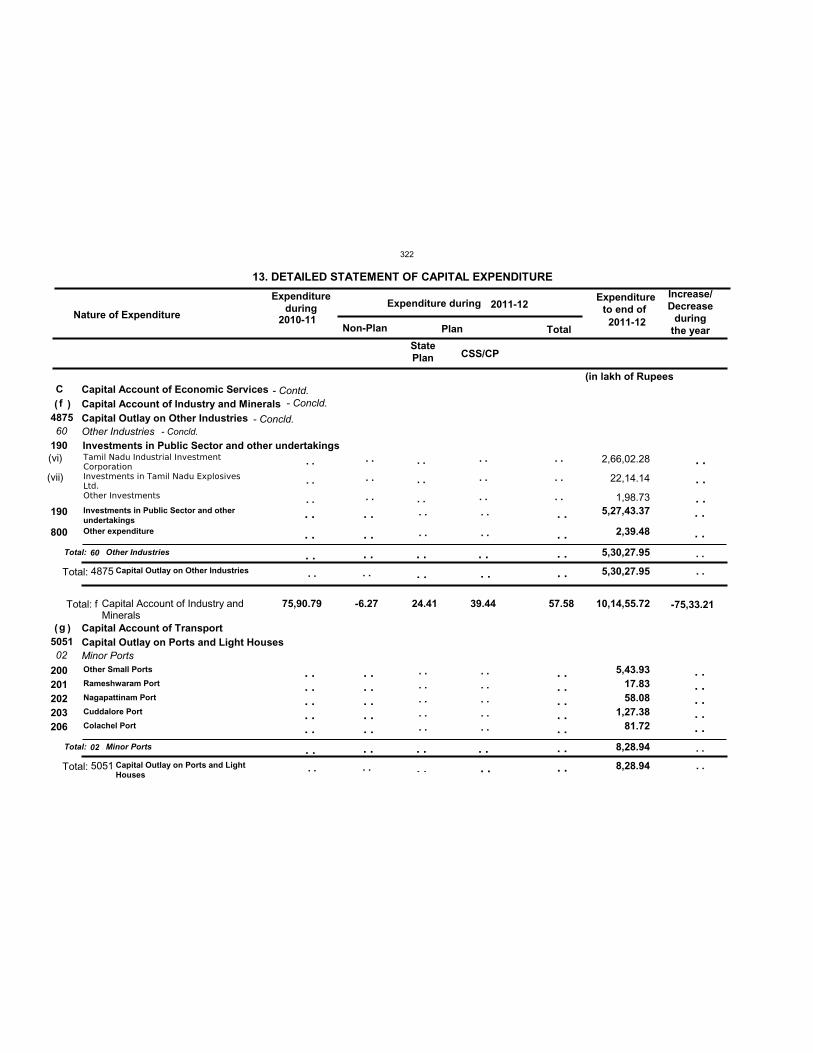
Nature of Expenditure
Expenditureduring Expenditure during
Expenditureto end of
Non-Plan Plan Total
13. DETAILED STATEMENT OF CAPITAL EXPENDITURE Increase/Decrease
duringthe year
2011-122010-11
2011-12
Cf
g
75,90.79 -6.27 24.41 39.44 57.58 10,14,55.72
4875
5051
5,30,27.95
8,28.94
60
02
5,30,27.95
8,28.94
190
5,27,43.37
2,39.48
5,43.93 17.83 58.08
1,27.38 81.72
(vi)
(vii)
2,66,02.28
22,14.14
1,98.73
StatePlan
Capital Account of Economic ServicesCapital Account of Industry and Minerals
Capital Account of Transport
Capital Outlay on Other Industries
Capital Outlay on Ports and Light Houses
Other Industries
Minor Ports
Investments in Public Sector and other undertakings
Investments in Public Sector and otherundertakingsOther expenditure
Other Small Ports
Rameshwaram Port
Nagapattinam Port
Cuddalore Port
Colachel Port
190
800
200201202203206
Tamil Nadu Industrial InvestmentCorporationInvestments in Tamil Nadu ExplosivesLtd.Other Investments
Total:
Total:
Other Industries
Minor Ports
Total:
Total:
Capital Outlay on Other Industries
Capital Outlay on Ports and LightHouses
Total: Capital Account of Industry andMinerals
(
(
)
)
60
02
4875
5051
f
. .
. .
. .
. .
. .
. .
. .
. .
. .
. .
. .
. .
. .
. .
. . . .
. .
. . . . . . . . . .
. .
. .
. . . . . . . . . .
. .
. .
. . . . . . . . . .
. .
. .
. . . . . . . . . .
. .
. .
. . . . . . . . . .
. .
. .
. . . .
. .
. . . . . . . . . .
. .
. .
. .
. .
. .
. .
. .
. .
. .
. .
. .
. .
. .
. .
. .
. .
. .
. .
. .
. .
-75,33.21
(in lakh of Rupees
CSS/CP
. .
. .
. .
. .
- Contd.
- Concld.- Concld.
- Concld.
322
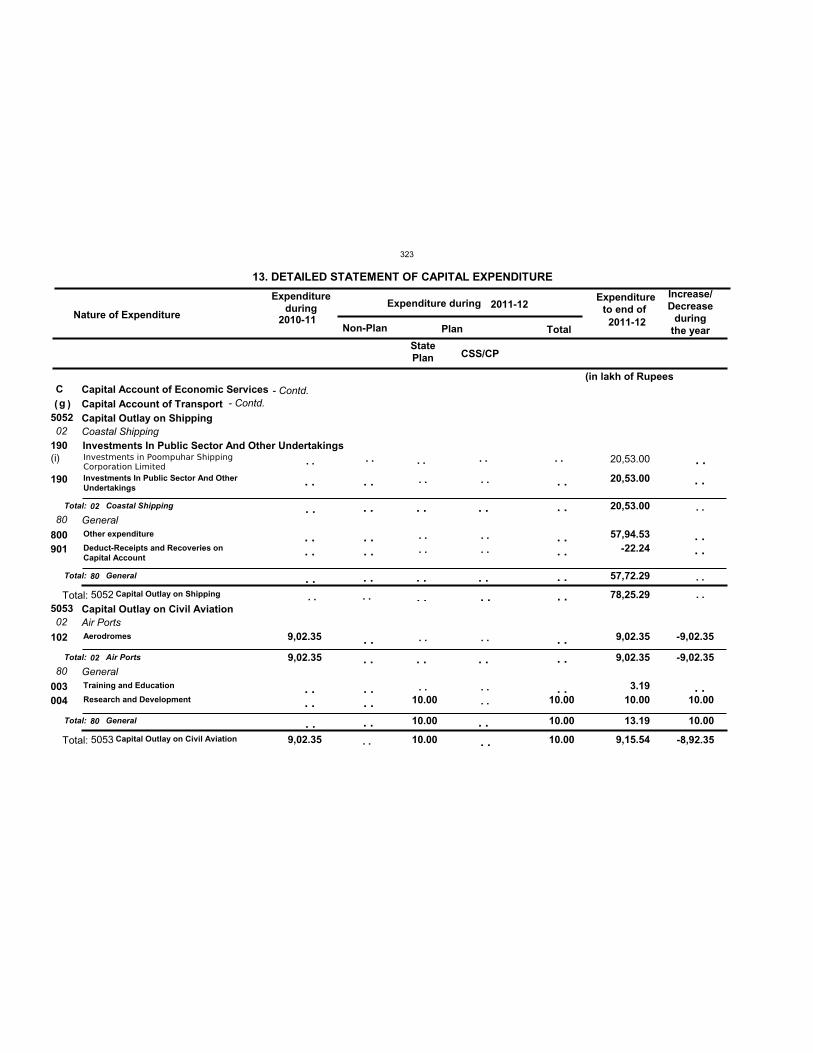
Nature of Expenditure
Expenditureduring Expenditure during
Expenditureto end of
Non-Plan Plan Total
13. DETAILED STATEMENT OF CAPITAL EXPENDITURE Increase/Decrease
duringthe year
2011-122010-11
2011-12
Cg
5052
5053
9,02.35 10.00 10.00
78,25.29
9,15.54
02
80
02
80 9,02.35
10.00 10.00
20,53.00
57,72.29
9,02.35
13.19
190
9,02.35
10.00 10.00
20,53.00
57,94.53-22.24
9,02.35
3.19 10.00
(i) 20,53.00
StatePlan
Capital Account of Economic ServicesCapital Account of TransportCapital Outlay on Shipping
Capital Outlay on Civil Aviation
Coastal Shipping
General
Air Ports
General
Investments In Public Sector And Other Undertakings
Investments In Public Sector And OtherUndertakings
Other expenditure
Deduct-Receipts and Recoveries onCapital Account
Aerodromes
Training and Education
Research and Development
190
800901
102
003004
Investments in Poompuhar ShippingCorporation Limited
Total:
Total:
Total:
Total:
Coastal Shipping
General
Air Ports
General
Total:
Total:
Capital Outlay on Shipping
Capital Outlay on Civil Aviation
( )
02
80
02
80
5052
5053
. . . . . . . .. .
. .
. . . .
. . . .
. .
. . . .
. .
. . . .
. .
. . . .
. .
. .
. .
. . . .
. .
. . . .
. .
. . . .
. .
. .
-9,02.35
10.00
. .
. .
. . . .
. .
. .
. .
. .
. .
. .
. .
. .
. .
. .
. .
. .
. .
. .
. .
. .
. .
. .
. . . .
. .
. . . .
. .
. .
-9,02.35
10.00
-8,92.35
(in lakh of Rupees
CSS/CP
. .
. .
. .
- Contd.- Contd.
323
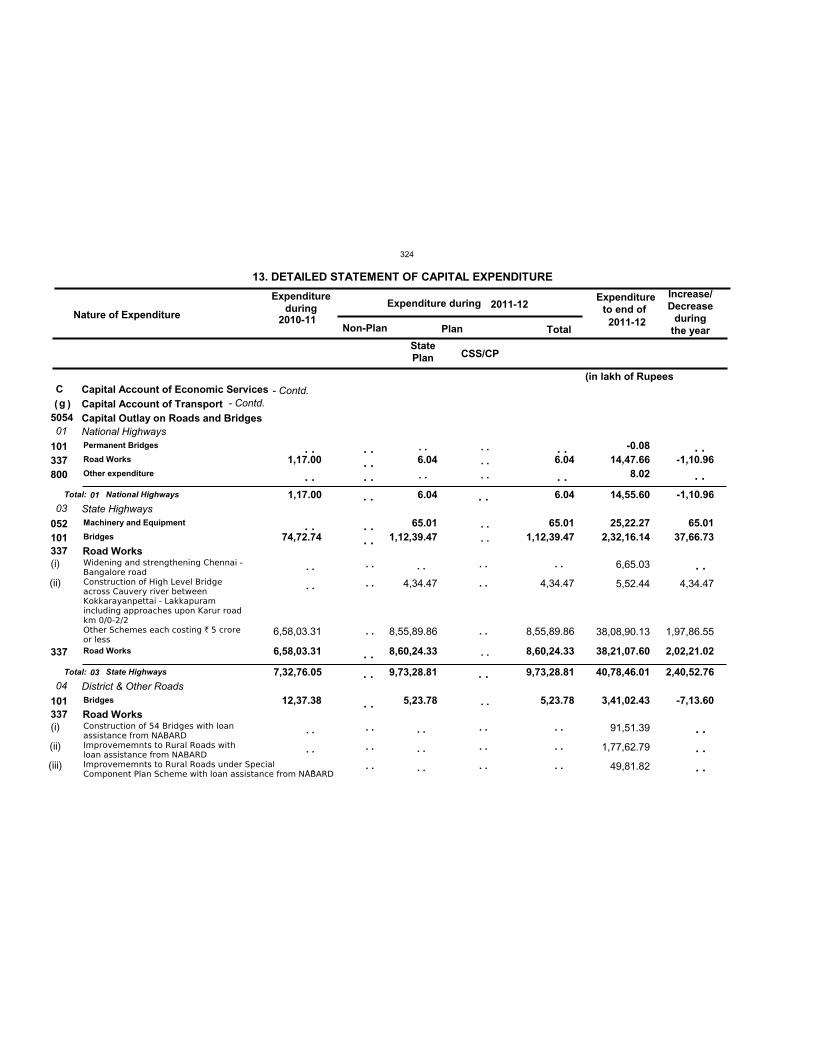
Nature of Expenditure
Expenditureduring Expenditure during
Expenditureto end of
Non-Plan Plan Total
13. DETAILED STATEMENT OF CAPITAL EXPENDITURE Increase/Decrease
duringthe year
2011-122010-11
2011-12
Cg
505401
03
04
1,17.00
7,32,76.05
6.04
9,73,28.81
6.04
9,73,28.81
14,55.60
40,78,46.01
337
337
1,17.00
74,72.74
6,58,03.31
12,37.38
6.04
65.01 1,12,39.47
8,60,24.33
5,23.78
6.04
65.01 1,12,39.47
8,60,24.33
5,23.78
-0.08 14,47.66
8.02
25,22.27 2,32,16.14
38,21,07.60
3,41,02.43
(i)
(ii)
(i)
(ii)
(iii)
6,58,03.31
4,34.47
8,55,89.86
4,34.47
8,55,89.86
6,65.03
5,52.44
38,08,90.13
91,51.39
1,77,62.79
49,81.82
StatePlan
Capital Account of Economic ServicesCapital Account of TransportCapital Outlay on Roads and BridgesNational Highways
State Highways
District & Other Roads
Road Works
Road Works
Permanent Bridges
Road Works
Other expenditure
Machinery and Equipment
Bridges
Road Works
Bridges
101337800
052101
337
101
Widening and strengthening Chennai -Bangalore roadConstruction of High Level Bridgeacross Cauvery river betweenKokkarayanpettai - Lakkapuramincluding approaches upon Karur roadkm 0/0-2/2Other Schemes each costing ` 5 croreor less
Construction of 54 Bridges with loanassistance from NABARDImprovememnts to Rural Roads withloan assistance from NABARDImprovememnts to Rural Roads under SpecialComponent Plan Scheme with loan assistance from NABARD
Total:
Total:
National Highways
State Highways
( )
01
03
. .
. .
. .
. .
. .
. .
. .
. .
. .
. .
. .
. .
. .
. .
. .
. .
. .
. .
. .
. .
. .
. .
. .
. .
. .
. .
. .
. .
. . . . . .
. . . .
. .
. .
. .
. .
. . . . . .
. . . .
. .
. .
. .
. .
4,34.47
1,97,86.55
-1,10.96
65.01 37,66.73
2,02,21.02
-7,13.60
. .
. .
. .
. .
. .
. .
. .
. .
. .
. .
-1,10.96
2,40,52.76
(in lakh of Rupees
CSS/CP
- Contd.- Contd.
324
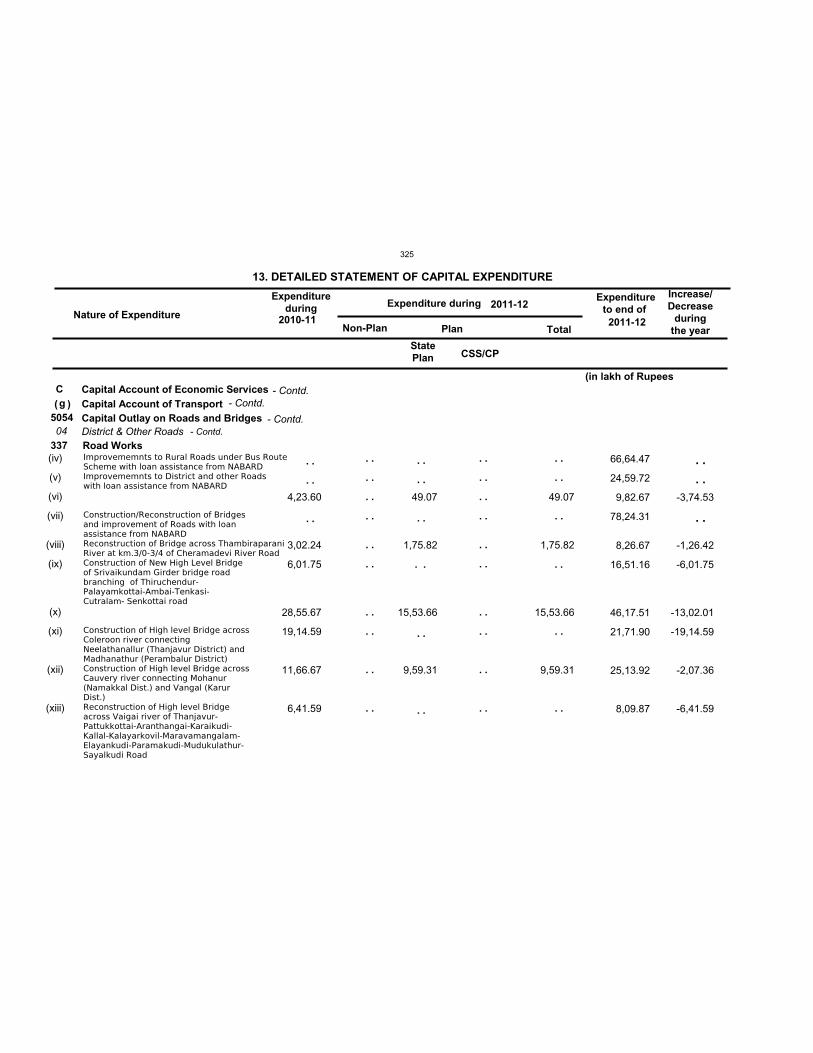
Nature of Expenditure
Expenditureduring Expenditure during
Expenditureto end of
Non-Plan Plan Total
13. DETAILED STATEMENT OF CAPITAL EXPENDITURE Increase/Decrease
duringthe year
2011-122010-11
2011-12
Cg
505404
337(iv)
(v)
(vi)
(vii)
(viii)
(ix)
(x)
(xi)
(xii)
(xiii)
4,23.60
3,02.24
6,01.75
28,55.67
19,14.59
11,66.67
6,41.59
49.07
1,75.82
. .
15,53.66
9,59.31
49.07
1,75.82
. .
15,53.66
9,59.31
66,64.47
24,59.72
9,82.67
78,24.31
8,26.67
16,51.16
46,17.51
21,71.90
25,13.92
8,09.87
StatePlan
Capital Account of Economic ServicesCapital Account of TransportCapital Outlay on Roads and BridgesDistrict & Other RoadsRoad WorksImprovememnts to Rural Roads under Bus RouteScheme with loan assistance from NABARDImprovememnts to District and other Roadswith loan assistance from NABARD
Construction/Reconstruction of Bridgesand improvement of Roads with loanassistance from NABARDReconstruction of Bridge across ThambiraparaniRiver at km.3/0-3/4 of Cheramadevi River RoadConstruction of New High Level Bridgeof Srivaikundam Girder bridge roadbranching of Thiruchendur-Palayamkottai-Ambai-Tenkasi-Cutralam- Senkottai road
Construction of High level Bridge acrossColeroon river connectingNeelathanallur (Thanjavur District) andMadhanathur (Perambalur District)Construction of High level Bridge acrossCauvery river connecting Mohanur(Namakkal Dist.) and Vangal (KarurDist.)Reconstruction of High level Bridgeacross Vaigai river of Thanjavur-Pattukkottai-Aranthangai-Karaikudi-Kallal-Kalayarkovil-Maravamangalam-Elayankudi-Paramakudi-Mudukulathur-Sayalkudi Road
( )
. .
. .
. .
. .
. .
. .
. .
. .
. .
. .
. .
. .
. .
. .
. .
. .
. .
. .
. .
. .
. .
. .
. .
. .
. .
. .
. .
. .
. .
. .
. .
. .
. .
-3,74.53
-1,26.42
-6,01.75
-13,02.01
-19,14.59
-2,07.36
-6,41.59
. .
. .
. .
(in lakh of Rupees
CSS/CP
- Contd.
- Contd.- Contd.
- Contd.
325
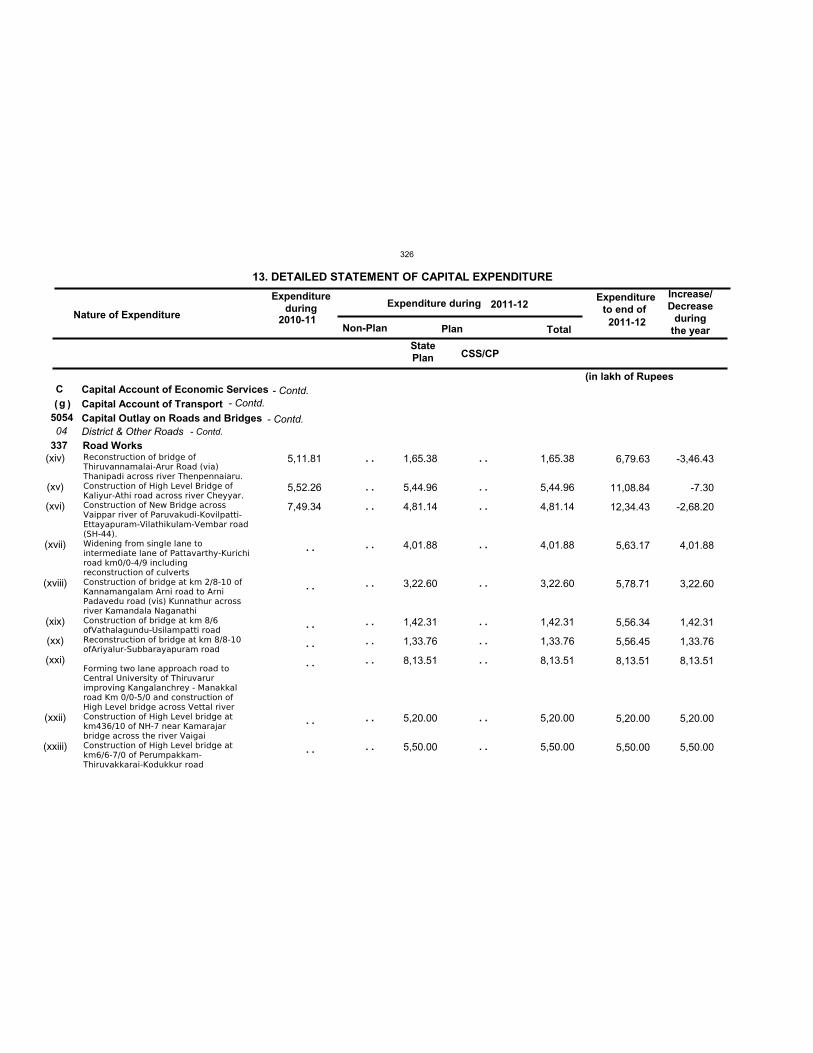
Nature of Expenditure
Expenditureduring Expenditure during
Expenditureto end of
Non-Plan Plan Total
13. DETAILED STATEMENT OF CAPITAL EXPENDITURE Increase/Decrease
duringthe year
2011-122010-11
2011-12
Cg
505404
337(xiv)
(xv)
(xvi)
(xvii)
(xviii)
(xix)
(xx)
(xxi)
(xxii)
(xxiii)
5,11.81
5,52.26
7,49.34
1,65.38
5,44.96
4,81.14
4,01.88
3,22.60
1,42.31
1,33.76
8,13.51
5,20.00
5,50.00
1,65.38
5,44.96
4,81.14
4,01.88
3,22.60
1,42.31
1,33.76
8,13.51
5,20.00
5,50.00
6,79.63
11,08.84
12,34.43
5,63.17
5,78.71
5,56.34
5,56.45
8,13.51
5,20.00
5,50.00
StatePlan
Capital Account of Economic ServicesCapital Account of TransportCapital Outlay on Roads and BridgesDistrict & Other RoadsRoad WorksReconstruction of bridge ofThiruvannamalai-Arur Road (via)Thanipadi across river Thenpennaiaru.Construction of High Level Bridge ofKaliyur-Athi road across river Cheyyar.Construction of New Bridge acrossVaippar river of Paruvakudi-Kovilpatti-Ettayapuram-Vilathikulam-Vembar road(SH-44).Widening from single lane tointermediate lane of Pattavarthy-Kurichiroad km0/0-4/9 includingreconstruction of culvertsConstruction of bridge at km 2/8-10 ofKannamangalam Arni road to ArniPadavedu road (vis) Kunnathur acrossriver Kamandala NaganathiConstruction of bridge at km 8/6ofVathalagundu-Usilampatti roadReconstruction of bridge at km 8/8-10ofAriyalur-Subbarayapuram road
Forming two lane approach road toCentral University of Thiruvarurimproving Kangalanchrey - Manakkalroad Km 0/0-5/0 and construction ofHigh Level bridge across Vettal riverConstruction of High Level bridge atkm436/10 of NH-7 near Kamarajarbridge across the river VaigaiConstruction of High Level bridge atkm6/6-7/0 of Perumpakkam-Thiruvakkarai-Kodukkur road
( )
. .
. .
. .
. .
. .
. .
. .
. .
. .
. .
. .
. .
. .
. .
. .
. .
. .
. .
. .
. .
. .
. .
. .
. .
. .
. .
. .
-3,46.43
-7.30
-2,68.20
4,01.88
3,22.60
1,42.31
1,33.76
8,13.51
5,20.00
5,50.00
(in lakh of Rupees
CSS/CP
- Contd.
- Contd.- Contd.
- Contd.
326
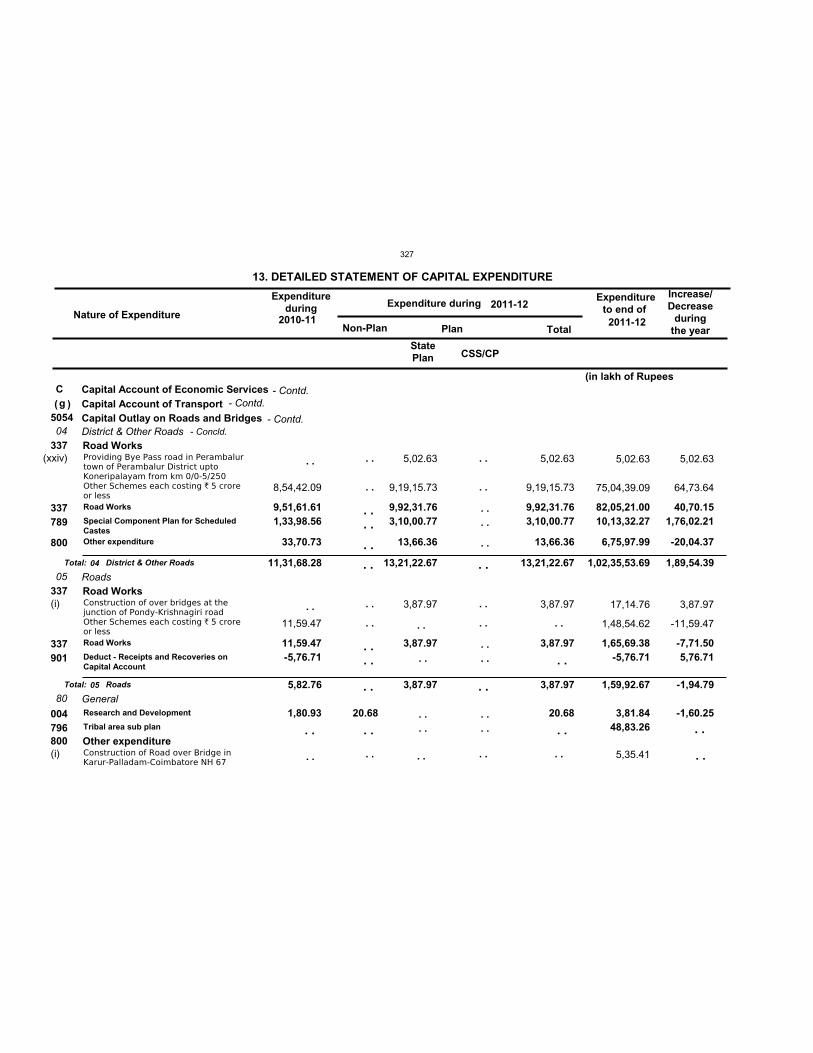
Nature of Expenditure
Expenditureduring Expenditure during
Expenditureto end of
Non-Plan Plan Total
13. DETAILED STATEMENT OF CAPITAL EXPENDITURE Increase/Decrease
duringthe year
2011-122010-11
2011-12
Cg
505404
05
80
11,31,68.28
5,82.76
13,21,22.67
3,87.97
13,21,22.67
3,87.97
1,02,35,53.69
1,59,92.67
337
337
800
9,51,61.61 1,33,98.56
33,70.73
11,59.47-5,76.71
1,80.93 20.68
9,92,31.76
3,10,00.77
13,66.36
3,87.97
9,92,31.76
3,10,00.77
13,66.36
3,87.97
20.68
82,05,21.00
10,13,32.27
6,75,97.99
1,65,69.38-5,76.71
3,81.84 48,83.26
(xxiv)
(i)
(i)
8,54,42.09
11,59.47
5,02.63
9,19,15.73
3,87.97
5,02.63
9,19,15.73
3,87.97
5,02.63
75,04,39.09
17,14.76
1,48,54.62
5,35.41
StatePlan
Capital Account of Economic ServicesCapital Account of TransportCapital Outlay on Roads and BridgesDistrict & Other Roads
Roads
General
Road Works
Road Works
Other expenditure
Road Works
Special Component Plan for ScheduledCastesOther expenditure
Road Works
Deduct - Receipts and Recoveries onCapital Account
Research and Development
Tribal area sub plan
337789
800
337901
004796
Providing Bye Pass road in Perambalurtown of Perambalur District uptoKoneripalayam from km 0/0-5/250Other Schemes each costing ` 5 croreor less
Construction of over bridges at thejunction of Pondy-Krishnagiri roadOther Schemes each costing ` 5 croreor less
Construction of Road over Bridge inKarur-Palladam-Coimbatore NH 67
Total:
Total:
District & Other Roads
Roads
( )
04
05
. .
. .
. .
. .
. .
. .
. .
. .
. .
. .
. .
. .
. .
. .
. .
. .
. .
. .
. . . .
. .
. . . .
. .
. .
. . . .
. . . .
. .
. . . .
. . . .
. .
. .
5,02.63
64,73.64
3,87.97
-11,59.47
40,70.15
1,76,02.21
-20,04.37
-7,71.50 5,76.71
-1,60.25
. .
. .
. .
. .
. .
. .
1,89,54.39
-1,94.79
(in lakh of Rupees
CSS/CP
- Contd.
- Contd.- Concld.
- Contd.
327
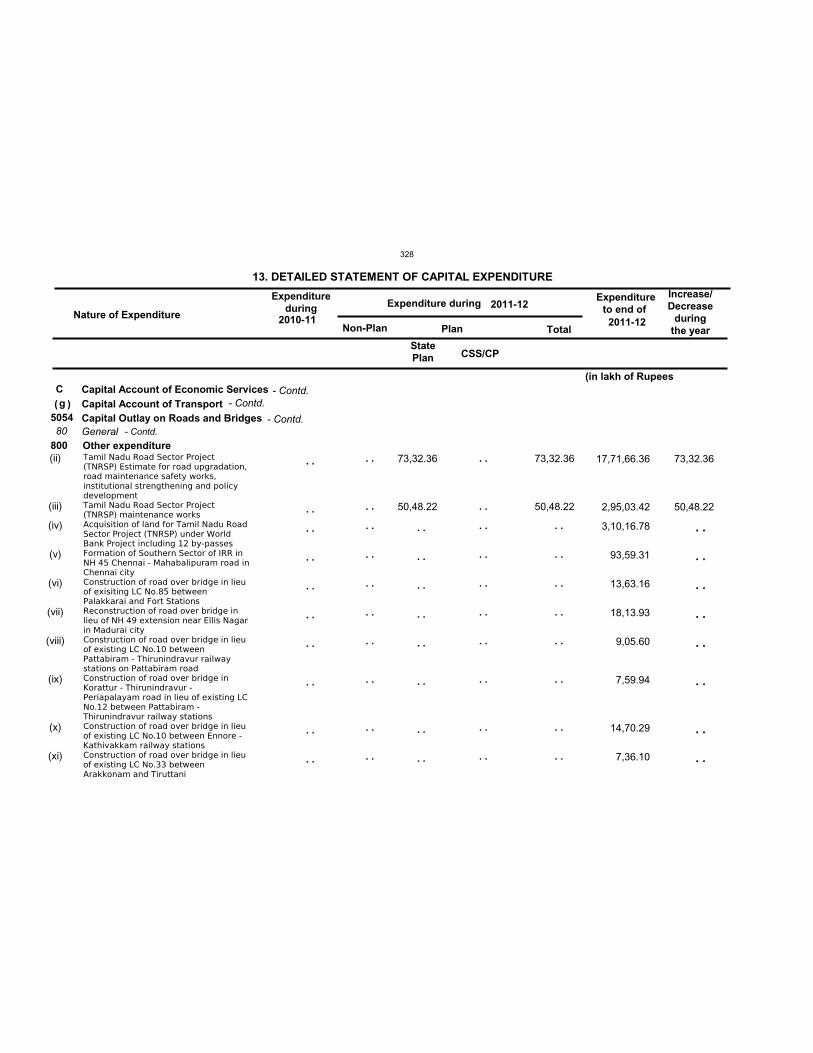
Nature of Expenditure
Expenditureduring Expenditure during
Expenditureto end of
Non-Plan Plan Total
13. DETAILED STATEMENT OF CAPITAL EXPENDITURE Increase/Decrease
duringthe year
2011-122010-11
2011-12
Cg
505480
800(ii)
(iii)
(iv)
(v)
(vi)
(vii)
(viii)
(ix)
(x)
(xi)
73,32.36
50,48.22
73,32.36
50,48.22
17,71,66.36
2,95,03.42
3,10,16.78
93,59.31
13,63.16
18,13.93
9,05.60
7,59.94
14,70.29
7,36.10
StatePlan
Capital Account of Economic ServicesCapital Account of TransportCapital Outlay on Roads and BridgesGeneralOther expenditureTamil Nadu Road Sector Project(TNRSP) Estimate for road upgradation,road maintenance safety works,institutional strengthening and policydevelopmentTamil Nadu Road Sector Project(TNRSP) maintenance worksAcquisition of land for Tamil Nadu RoadSector Project (TNRSP) under WorldBank Project including 12 by-passesFormation of Southern Sector of IRR inNH 45 Chennai - Mahabalipuram road inChennai cityConstruction of road over bridge in lieuof exisiting LC No.85 betweenPalakkarai and Fort StationsReconstruction of road over bridge inlieu of NH 49 extension near Ellis Nagarin Madurai cityConstruction of road over bridge in lieuof existing LC No.10 betweenPattabiram - Thirunindravur railwaystations on Pattabiram roadConstruction of road over bridge inKorattur - Thirunindravur -Periapalayam road in lieu of existing LCNo.12 between Pattabiram -Thirunindravur railway stationsConstruction of road over bridge in lieuof existing LC No.10 between Ennore -Kathivakkam railway stationsConstruction of road over bridge in lieuof existing LC No.33 betweenArakkonam and Tiruttani
( )
. .
. .
. .
. .
. .
. .
. .
. .
. .
. .
. .
. .
. .
. .
. .
. .
. .
. .
. .
. .
. .
. .
. .
. .
. .
. .
. .
. .
. .
. .
. .
. .
. .
. .
. .
. .
. .
. .
. .
. .
. .
. .
. .
. .
. .
. .
73,32.36
50,48.22
. .
. .
. .
. .
. .
. .
. .
. .
(in lakh of Rupees
CSS/CP
- Contd.
- Contd.- Contd.
- Contd.
328
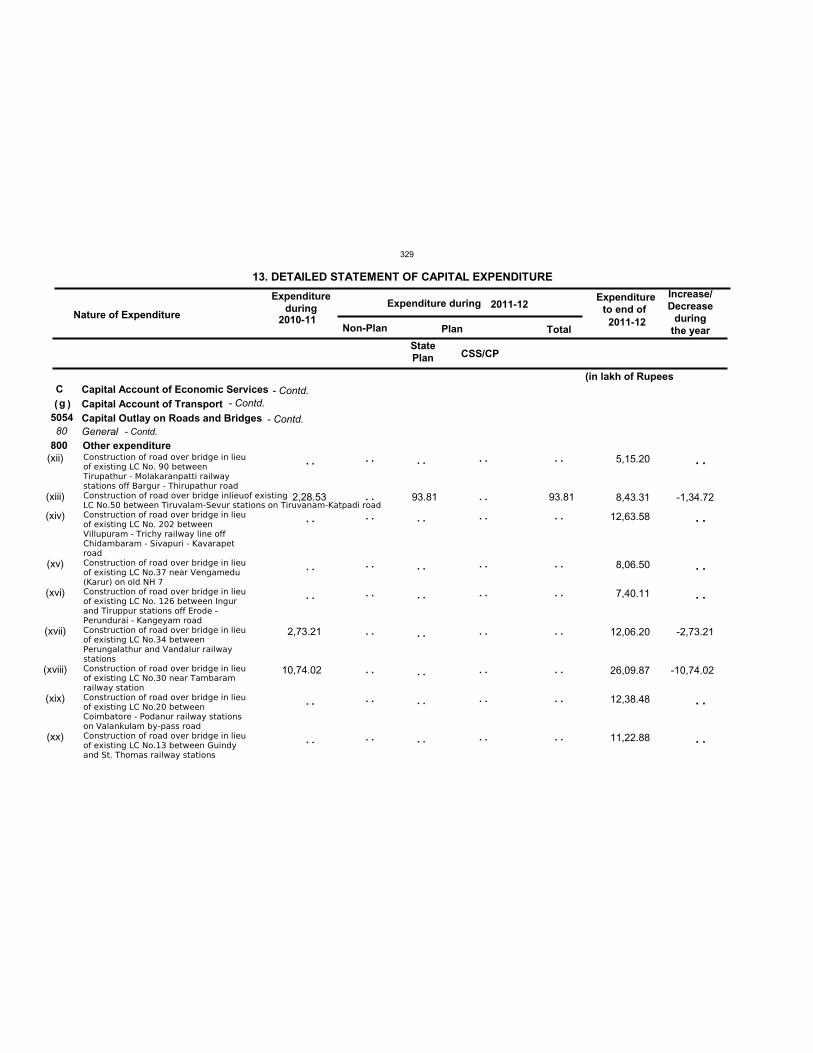
Nature of Expenditure
Expenditureduring Expenditure during
Expenditureto end of
Non-Plan Plan Total
13. DETAILED STATEMENT OF CAPITAL EXPENDITURE Increase/Decrease
duringthe year
2011-122010-11
2011-12
Cg
505480
800(xii)
(xiii)
(xiv)
(xv)
(xvi)
(xvii)
(xviii)
(xix)
(xx)
2,28.53
2,73.21
10,74.02
93.81 93.81
5,15.20
8,43.31
12,63.58
8,06.50
7,40.11
12,06.20
26,09.87
12,38.48
11,22.88
StatePlan
Capital Account of Economic ServicesCapital Account of TransportCapital Outlay on Roads and BridgesGeneralOther expenditureConstruction of road over bridge in lieuof existing LC No. 90 betweenTirupathur - Molakaranpatti railwaystations off Bargur - Thirupathur roadConstruction of road over bridge inlieuof existingLC No.50 between Tiruvalam-Sevur stations on Tiruvanam-Katpadi road Construction of road over bridge in lieuof existing LC No. 202 betweenVillupuram - Trichy railway line offChidambaram - Sivapuri - KavarapetroadConstruction of road over bridge in lieuof existing LC No.37 near Vengamedu(Karur) on old NH 7Construction of road over bridge in lieuof existing LC No. 126 between Ingurand Tiruppur stations off Erode -Perundurai - Kangeyam roadConstruction of road over bridge in lieuof existing LC No.34 betweenPerungalathur and Vandalur railwaystationsConstruction of road over bridge in lieuof existing LC No.30 near Tambaramrailway stationConstruction of road over bridge in lieuof existing LC No.20 betweenCoimbatore - Podanur railway stationson Valankulam by-pass roadConstruction of road over bridge in lieuof existing LC No.13 between Guindyand St. Thomas railway stations
( )
. .
. .
. .
. .
. .
. .
. .
. .
. .
. .
. .
. .
. .
. .
. .
. .
. .
. .
. .
. .
. .
. .
. .
. .
. .
. .
. .
. .
. .
. .
. .
. .
. .
. .
. .
. .
. .
. .
. .
. .
-1,34.72
-2,73.21
-10,74.02
. .
. .
. .
. .
. .
. .
(in lakh of Rupees
CSS/CP
- Contd.
- Contd.- Contd.
- Contd.
329
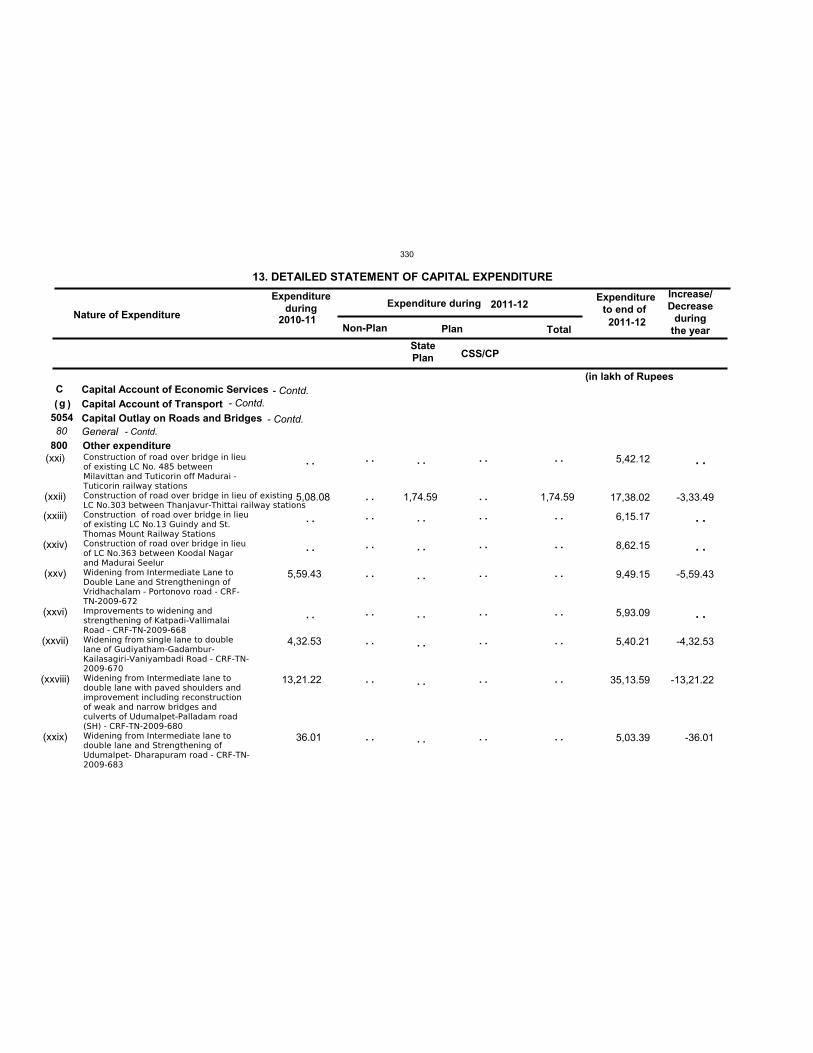
Nature of Expenditure
Expenditureduring Expenditure during
Expenditureto end of
Non-Plan Plan Total
13. DETAILED STATEMENT OF CAPITAL EXPENDITURE Increase/Decrease
duringthe year
2011-122010-11
2011-12
Cg
505480
800(xxi)
(xxii)
(xxiii)
(xxiv)
(xxv)
(xxvi)
(xxvii)
(xxviii)
(xxix)
5,08.08
5,59.43
4,32.53
13,21.22
36.01
1,74.59 1,74.59
5,42.12
17,38.02
6,15.17
8,62.15
9,49.15
5,93.09
5,40.21
35,13.59
5,03.39
StatePlan
Capital Account of Economic ServicesCapital Account of TransportCapital Outlay on Roads and BridgesGeneralOther expenditureConstruction of road over bridge in lieuof existing LC No. 485 betweenMilavittan and Tuticorin off Madurai -Tuticorin railway stationsConstruction of road over bridge in lieu of existingLC No.303 between Thanjavur-Thittai railway stationsConstruction of road over bridge in lieuof existing LC No.13 Guindy and St.Thomas Mount Railway StationsConstruction of road over bridge in lieuof LC No.363 between Koodal Nagarand Madurai SeelurWidening from Intermediate Lane toDouble Lane and Strengtheningn ofVridhachalam - Portonovo road - CRF-TN-2009-672Improvements to widening andstrengthening of Katpadi-VallimalaiRoad - CRF-TN-2009-668Widening from single lane to doublelane of Gudiyatham-Gadambur-Kailasagiri-Vaniyambadi Road - CRF-TN-2009-670Widening from Intermediate lane todouble lane with paved shoulders andimprovement including reconstructionof weak and narrow bridges andculverts of Udumalpet-Palladam road(SH) - CRF-TN-2009-680Widening from Intermediate lane todouble lane and Strengthening ofUdumalpet- Dharapuram road - CRF-TN-2009-683
( )
. .
. .
. .
. .
. .
. .
. .
. .
. .
. .
. .
. .
. .
. .
. .
. .
. .
. .
. .
. .
. .
. .
. .
. .
. .
. .
. .
. .
. .
. .
. .
. .
. .
. .
. .
. .
. .
. .
-3,33.49
-5,59.43
-4,32.53
-13,21.22
-36.01
. .
. .
. .
. .
(in lakh of Rupees
CSS/CP
- Contd.
- Contd.- Contd.
- Contd.
330
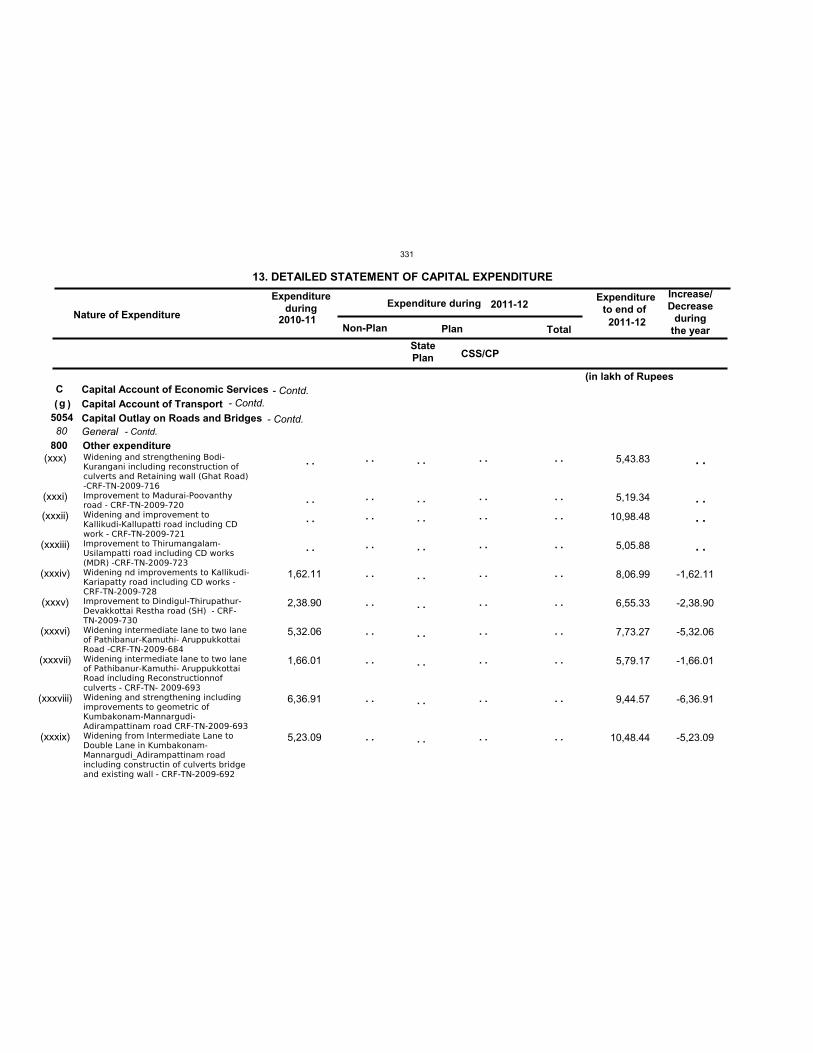
Nature of Expenditure
Expenditureduring Expenditure during
Expenditureto end of
Non-Plan Plan Total
13. DETAILED STATEMENT OF CAPITAL EXPENDITURE Increase/Decrease
duringthe year
2011-122010-11
2011-12
Cg
505480
800(xxx)
(xxxi)
(xxxii)
(xxxiii)
(xxxiv)
(xxxv)
(xxxvi)
(xxxvii)
(xxxviii)
(xxxix)
1,62.11
2,38.90
5,32.06
1,66.01
6,36.91
5,23.09
5,43.83
5,19.34
10,98.48
5,05.88
8,06.99
6,55.33
7,73.27
5,79.17
9,44.57
10,48.44
StatePlan
Capital Account of Economic ServicesCapital Account of TransportCapital Outlay on Roads and BridgesGeneralOther expenditureWidening and strengthening Bodi-Kurangani including reconstruction ofculverts and Retaining wall (Ghat Road)-CRF-TN-2009-716Improvement to Madurai-Poovanthyroad - CRF-TN-2009-720Widening and improvement toKallikudi-Kallupatti road including CDwork - CRF-TN-2009-721Improvement to Thirumangalam-Usilampatti road including CD works(MDR) -CRF-TN-2009-723Widening nd improvements to Kallikudi-Kariapatty road including CD works -CRF-TN-2009-728Improvement to Dindigul-Thirupathur-Devakkottai Restha road (SH) - CRF-TN-2009-730Widening intermediate lane to two laneof Pathibanur-Kamuthi- AruppukkottaiRoad -CRF-TN-2009-684Widening intermediate lane to two laneof Pathibanur-Kamuthi- AruppukkottaiRoad including Reconstructionnofculverts - CRF-TN- 2009-693Widening and strengthening includingimprovements to geometric ofKumbakonam-Mannargudi-Adirampattinam road CRF-TN-2009-693Widening from Intermediate Lane toDouble Lane in Kumbakonam-Mannargudi_Adirampattinam roadincluding constructin of culverts bridgeand existing wall - CRF-TN-2009-692
( )
. .
. .
. .
. .
. .
. .
. .
. .
. .
. .
. .
. .
. .
. .
. .
. .
. .
. .
. .
. .
. .
. .
. .
. .
. .
. .
. .
. .
. .
. .
. .
. .
. .
. .
. .
. .
. .
. .
. .
. .
. .
. .
. .
. .
-1,62.11
-2,38.90
-5,32.06
-1,66.01
-6,36.91
-5,23.09
. .
. .
. .
. .
(in lakh of Rupees
CSS/CP
- Contd.
- Contd.- Contd.
- Contd.
331
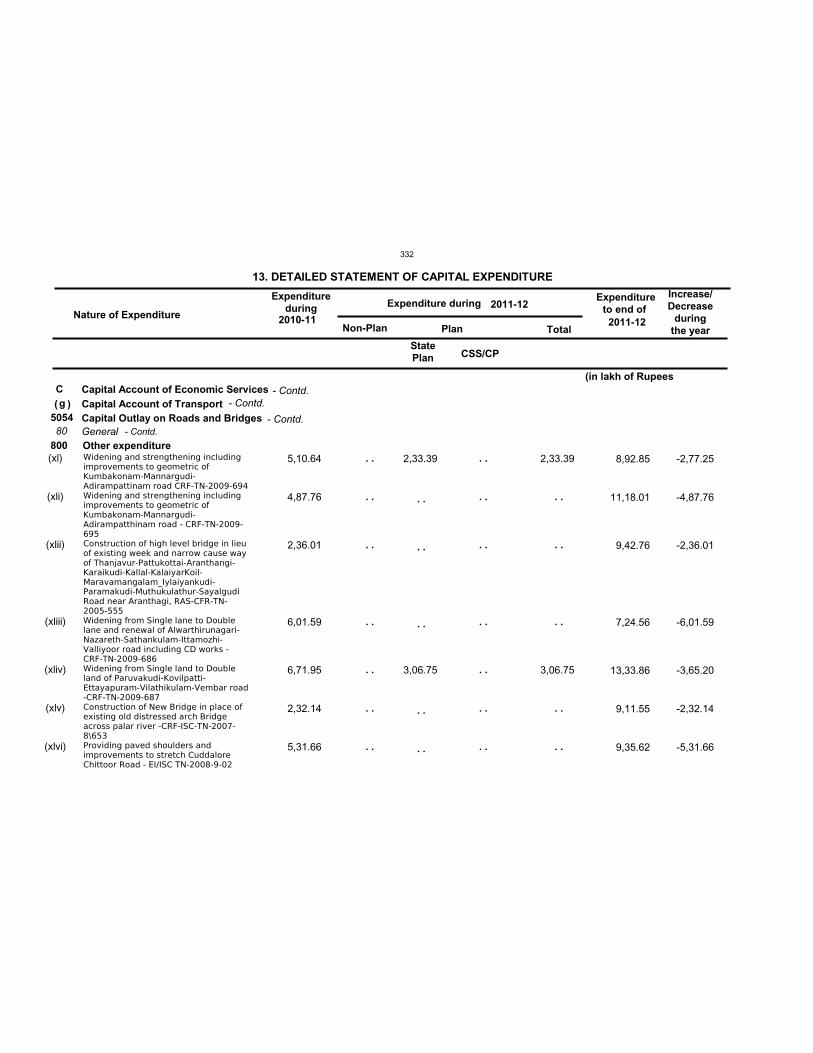
Nature of Expenditure
Expenditureduring Expenditure during
Expenditureto end of
Non-Plan Plan Total
13. DETAILED STATEMENT OF CAPITAL EXPENDITURE Increase/Decrease
duringthe year
2011-122010-11
2011-12
Cg
505480
800(xl)
(xli)
(xlii)
(xliii)
(xliv)
(xlv)
(xlvi)
5,10.64
4,87.76
2,36.01
6,01.59
6,71.95
2,32.14
5,31.66
2,33.39
3,06.75
2,33.39
3,06.75
8,92.85
11,18.01
9,42.76
7,24.56
13,33.86
9,11.55
9,35.62
StatePlan
Capital Account of Economic ServicesCapital Account of TransportCapital Outlay on Roads and BridgesGeneralOther expenditureWidening and strengthening includingimprovements to geometric ofKumbakonam-Mannargudi-Adirampattinam road CRF-TN-2009-694Widening and strengthening includingimprovements to geometric ofKumbakonam-Mannargudi-Adirampatthinam road - CRF-TN-2009-695Construction of high level bridge in lieuof existing week and narrow cause wayof Thanjavur-Pattukottai-Aranthangi-Karaikudi-Kallal-KalaiyarKoil-Maravamangalam_Iylaiyankudi-Paramakudi-Muthukulathur-SayalgudiRoad near Aranthagi, RAS-CFR-TN-2005-555Widening from Single lane to Doublelane and renewal of Alwarthirunagari-Nazareth-Sathankulam-Ittamozhi-Valliyoor road including CD works -CRF-TN-2009-686Widening from Single land to Doubleland of Paruvakudi-Kovilpatti-Ettayapuram-Vilathikulam-Vembar road-CRF-TN-2009-687Construction of New Bridge in place ofexisting old distressed arch Bridgeacross palar river -CRF-ISC-TN-2007-8\653Providing paved shoulders andimprovements to stretch Cuddalore Chittoor Road - EI/ISC TN-2008-9-02
( )
. .
. .
. .
. .
. .
. .
. .
. .
. .
. .
. .
. .
. .
. .
. .
. .
. .
. .
. .
. .
. .
. .
. .
. .
-2,77.25
-4,87.76
-2,36.01
-6,01.59
-3,65.20
-2,32.14
-5,31.66
(in lakh of Rupees
CSS/CP
- Contd.
- Contd.- Contd.
- Contd.
332
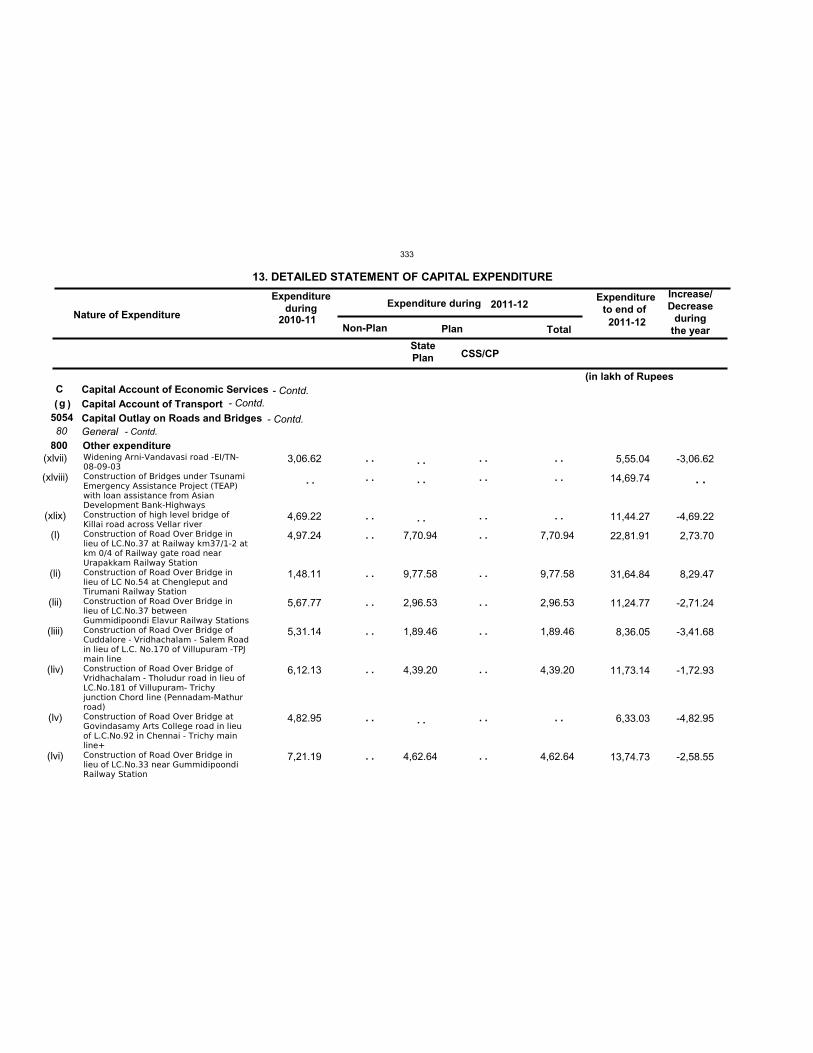
Nature of Expenditure
Expenditureduring Expenditure during
Expenditureto end of
Non-Plan Plan Total
13. DETAILED STATEMENT OF CAPITAL EXPENDITURE Increase/Decrease
duringthe year
2011-122010-11
2011-12
Cg
505480
800(xlvii)
(xlviii)
(xlix)
(l)
(li)
(lii)
(liii)
(liv)
(lv)
(lvi)
3,06.62
4,69.22
4,97.24
1,48.11
5,67.77
5,31.14
6,12.13
4,82.95
7,21.19
7,70.94
9,77.58
2,96.53
1,89.46
4,39.20
4,62.64
7,70.94
9,77.58
2,96.53
1,89.46
4,39.20
4,62.64
5,55.04
14,69.74
11,44.27
22,81.91
31,64.84
11,24.77
8,36.05
11,73.14
6,33.03
13,74.73
StatePlan
Capital Account of Economic ServicesCapital Account of TransportCapital Outlay on Roads and BridgesGeneralOther expenditureWidening Arni-Vandavasi road -EI/TN-08-09-03Construction of Bridges under TsunamiEmergency Assistance Project (TEAP)with loan assistance from AsianDevelopment Bank-HighwaysConstruction of high level bridge ofKillai road across Vellar riverConstruction of Road Over Bridge inlieu of LC.No.37 at Railway km37/1-2 atkm 0/4 of Railway gate road nearUrapakkam Railway StationConstruction of Road Over Bridge inlieu of LC No.54 at Chengleput andTirumani Railway StationConstruction of Road Over Bridge inlieu of LC.No.37 betweenGummidipoondi Elavur Railway StationsConstruction of Road Over Bridge ofCuddalore - Vridhachalam - Salem Roadin lieu of L.C. No.170 of Villupuram -TPJmain lineConstruction of Road Over Bridge ofVridhachalam - Tholudur road in lieu ofLC.No.181 of Villupuram- Trichyjunction Chord line (Pennadam-Mathurroad)Construction of Road Over Bridge atGovindasamy Arts College road in lieuof L.C.No.92 in Chennai - Trichy mainline+Construction of Road Over Bridge inlieu of LC.No.33 near GummidipoondiRailway Station
( )
. .
. .
. .
. .
. .
. .
. .
. .
. .
. .
. .
. .
. .
. .
. .
. .
. .
. .
. .
. .
. .
. .
. .
. .
. .
. .
. .
. .
. .
-3,06.62
-4,69.22
2,73.70
8,29.47
-2,71.24
-3,41.68
-1,72.93
-4,82.95
-2,58.55
. .
(in lakh of Rupees
CSS/CP
- Contd.
- Contd.- Contd.
- Contd.
333
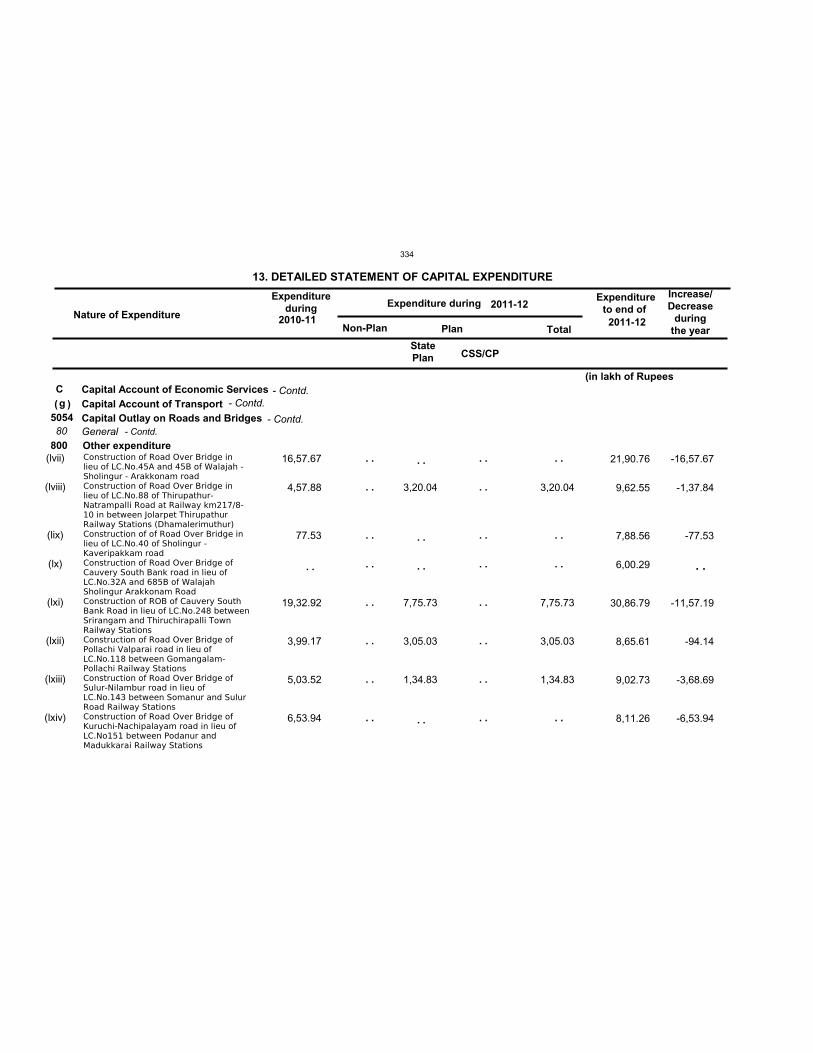
Nature of Expenditure
Expenditureduring Expenditure during
Expenditureto end of
Non-Plan Plan Total
13. DETAILED STATEMENT OF CAPITAL EXPENDITURE Increase/Decrease
duringthe year
2011-122010-11
2011-12
Cg
505480
800(lvii)
(lviii)
(lix)
(lx)
(lxi)
(lxii)
(lxiii)
(lxiv)
16,57.67
4,57.88
77.53
19,32.92
3,99.17
5,03.52
6,53.94
3,20.04
7,75.73
3,05.03
1,34.83
3,20.04
7,75.73
3,05.03
1,34.83
21,90.76
9,62.55
7,88.56
6,00.29
30,86.79
8,65.61
9,02.73
8,11.26
StatePlan
Capital Account of Economic ServicesCapital Account of TransportCapital Outlay on Roads and BridgesGeneralOther expenditureConstruction of Road Over Bridge inlieu of LC.No.45A and 45B of Walajah -Sholingur - Arakkonam roadConstruction of Road Over Bridge inlieu of LC.No.88 of Thirupathur-Natrampalli Road at Railway km217/8-10 in between Jolarpet ThirupathurRailway Stations (Dhamalerimuthur)Construction of of Road Over Bridge inlieu of LC.No.40 of Sholingur -Kaveripakkam roadConstruction of Road Over Bridge ofCauvery South Bank road in lieu ofLC.No.32A and 685B of WalajahSholingur Arakkonam RoadConstruction of ROB of Cauvery SouthBank Road in lieu of LC.No.248 betweenSrirangam and Thiruchirapalli TownRailway StationsConstruction of Road Over Bridge ofPollachi Valparai road in lieu ofLC.No.118 between Gomangalam-Pollachi Railway StationsConstruction of Road Over Bridge ofSulur-Nilambur road in lieu ofLC.No.143 between Somanur and SulurRoad Railway StationsConstruction of Road Over Bridge ofKuruchi-Nachipalayam road in lieu ofLC.No151 between Podanur andMadukkarai Railway Stations
( )
. .
. .
. .
. .
. .
. .
. .
. .
. .
. .
. .
. .
. .
. .
. .
. .
. .
. .
. .
. .
. .
. .
. .
. .
. .
-16,57.67
-1,37.84
-77.53
-11,57.19
-94.14
-3,68.69
-6,53.94
. .
(in lakh of Rupees
CSS/CP
- Contd.
- Contd.- Contd.
- Contd.
334
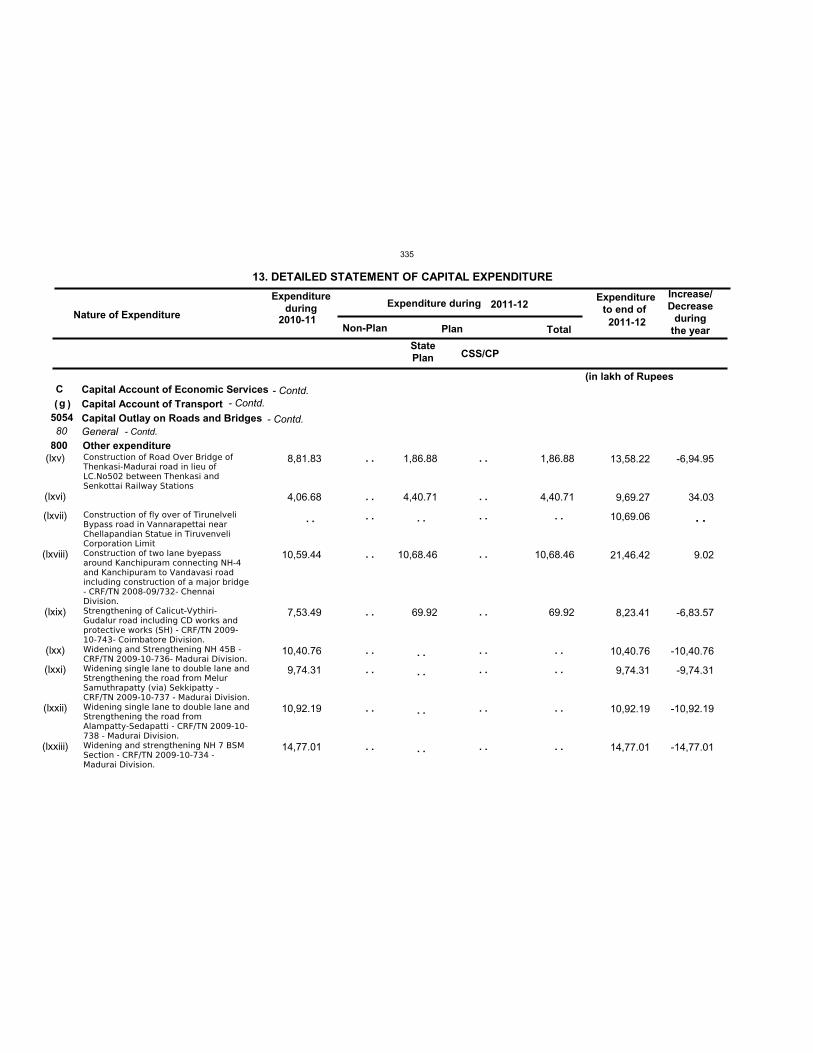
Nature of Expenditure
Expenditureduring Expenditure during
Expenditureto end of
Non-Plan Plan Total
13. DETAILED STATEMENT OF CAPITAL EXPENDITURE Increase/Decrease
duringthe year
2011-122010-11
2011-12
Cg
505480
800(lxv)
(lxvi)
(lxvii)
(lxviii)
(lxix)
(lxx)
(lxxi)
(lxxii)
(lxxiii)
8,81.83
4,06.68
10,59.44
7,53.49
10,40.76
9,74.31
10,92.19
14,77.01
1,86.88
4,40.71
10,68.46
69.92
1,86.88
4,40.71
10,68.46
69.92
13,58.22
9,69.27
10,69.06
21,46.42
8,23.41
10,40.76
9,74.31
10,92.19
14,77.01
StatePlan
Capital Account of Economic ServicesCapital Account of TransportCapital Outlay on Roads and BridgesGeneralOther expenditureConstruction of Road Over Bridge ofThenkasi-Madurai road in lieu ofLC.No502 between Thenkasi andSenkottai Railway Stations
Construction of fly over of TirunelveliBypass road in Vannarapettai nearChellapandian Statue in TiruvenveliCorporation LimitConstruction of two lane byepassaround Kanchipuram connecting NH-4and Kanchipuram to Vandavasi roadincluding construction of a major bridge- CRF/TN 2008-09/732- ChennaiDivision.Strengthening of Calicut-Vythiri-Gudalur road including CD works andprotective works (SH) - CRF/TN 2009-10-743- Coimbatore Division.Widening and Strengthening NH 45B -CRF/TN 2009-10-736- Madurai Division.Widening single lane to double lane andStrengthening the road from MelurSamuthrapatty (via) Sekkipatty -CRF/TN 2009-10-737 - Madurai Division.Widening single lane to double lane andStrengthening the road fromAlampatty-Sedapatti - CRF/TN 2009-10-738 - Madurai Division.Widening and strengthening NH 7 BSMSection - CRF/TN 2009-10-734 -Madurai Division.
( )
. .
. .
. .
. .
. .
. .
. .
. .
. .
. .
. .
. .
. .
. .
. .
. .
. .
. .
. .
. .
. .
. .
. .
. .
. .
. .
. .
. .
. .
-6,94.95
34.03
9.02
-6,83.57
-10,40.76
-9,74.31
-10,92.19
-14,77.01
. .
(in lakh of Rupees
CSS/CP
- Contd.
- Contd.- Contd.
- Contd.
335
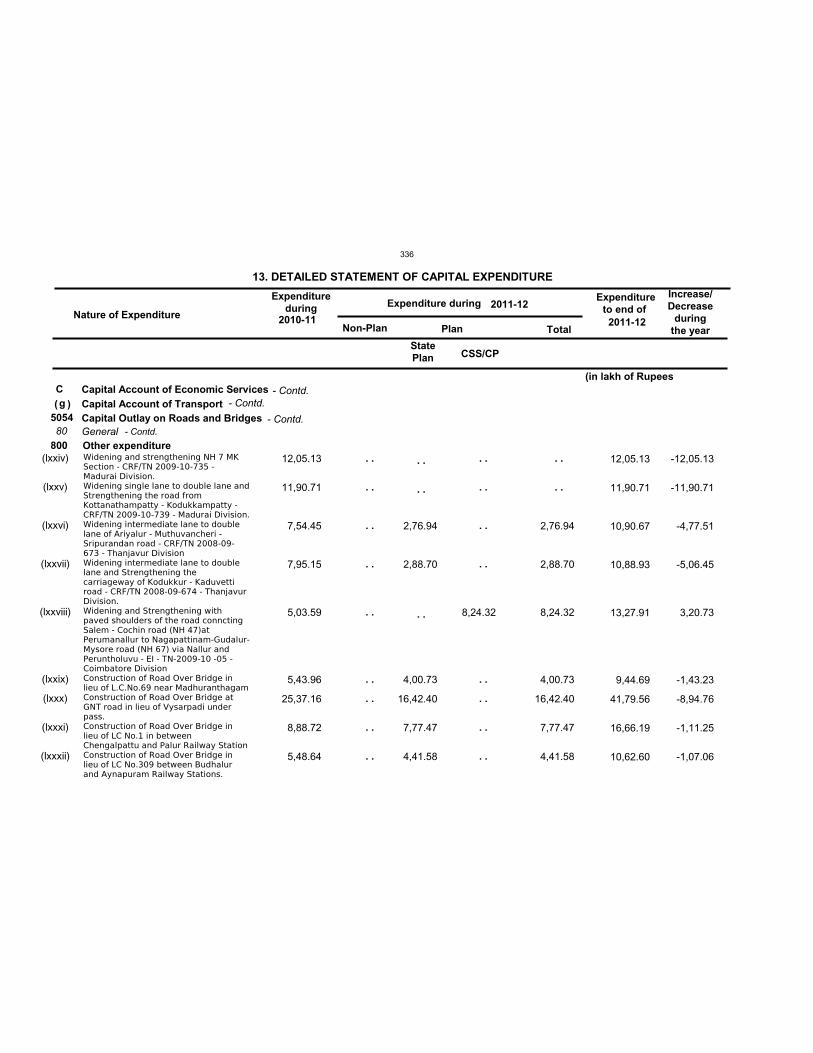
Nature of Expenditure
Expenditureduring Expenditure during
Expenditureto end of
Non-Plan Plan Total
13. DETAILED STATEMENT OF CAPITAL EXPENDITURE Increase/Decrease
duringthe year
2011-122010-11
2011-12
Cg
505480
800(lxxiv)
(lxxv)
(lxxvi)
(lxxvii)
(lxxviii)
(lxxix)
(lxxx)
(lxxxi)
(lxxxii)
12,05.13
11,90.71
7,54.45
7,95.15
5,03.59
5,43.96
25,37.16
8,88.72
5,48.64
2,76.94
2,88.70
4,00.73
16,42.40
7,77.47
4,41.58
8,24.32
2,76.94
2,88.70
8,24.32
4,00.73
16,42.40
7,77.47
4,41.58
12,05.13
11,90.71
10,90.67
10,88.93
13,27.91
9,44.69
41,79.56
16,66.19
10,62.60
StatePlan
Capital Account of Economic ServicesCapital Account of TransportCapital Outlay on Roads and BridgesGeneralOther expenditureWidening and strengthening NH 7 MKSection - CRF/TN 2009-10-735 -Madurai Division.Widening single lane to double lane andStrengthening the road fromKottanathampatty - Kodukkampatty -CRF/TN 2009-10-739 - Madurai Division.Widening intermediate lane to doublelane of Ariyalur - Muthuvancheri -Sripurandan road - CRF/TN 2008-09-673 - Thanjavur DivisionWidening intermediate lane to doublelane and Strengthening thecarriageway of Kodukkur - Kaduvettiroad - CRF/TN 2008-09-674 - ThanjavurDivision.Widening and Strengthening withpaved shoulders of the road connctingSalem - Cochin road (NH 47)atPerumanallur to Nagapattinam-Gudalur-Mysore road (NH 67) via Nallur andPeruntholuvu - EI - TN-2009-10 -05 -Coimbatore DivisionConstruction of Road Over Bridge inlieu of L.C.No.69 near MadhuranthagamConstruction of Road Over Bridge atGNT road in lieu of Vysarpadi underpass.Construction of Road Over Bridge inlieu of LC No.1 in betweenChengalpattu and Palur Railway StationConstruction of Road Over Bridge inlieu of LC No.309 between Budhalurand Aynapuram Railway Stations.
( )
. .
. .
. .
. .
. .
. .
. .
. .
. .
. .
. .
. .
. .
. .
. .
. .
. .
. .
. .
. .
. .
. .
-12,05.13
-11,90.71
-4,77.51
-5,06.45
3,20.73
-1,43.23
-8,94.76
-1,11.25
-1,07.06
(in lakh of Rupees
CSS/CP
- Contd.
- Contd.- Contd.
- Contd.
336
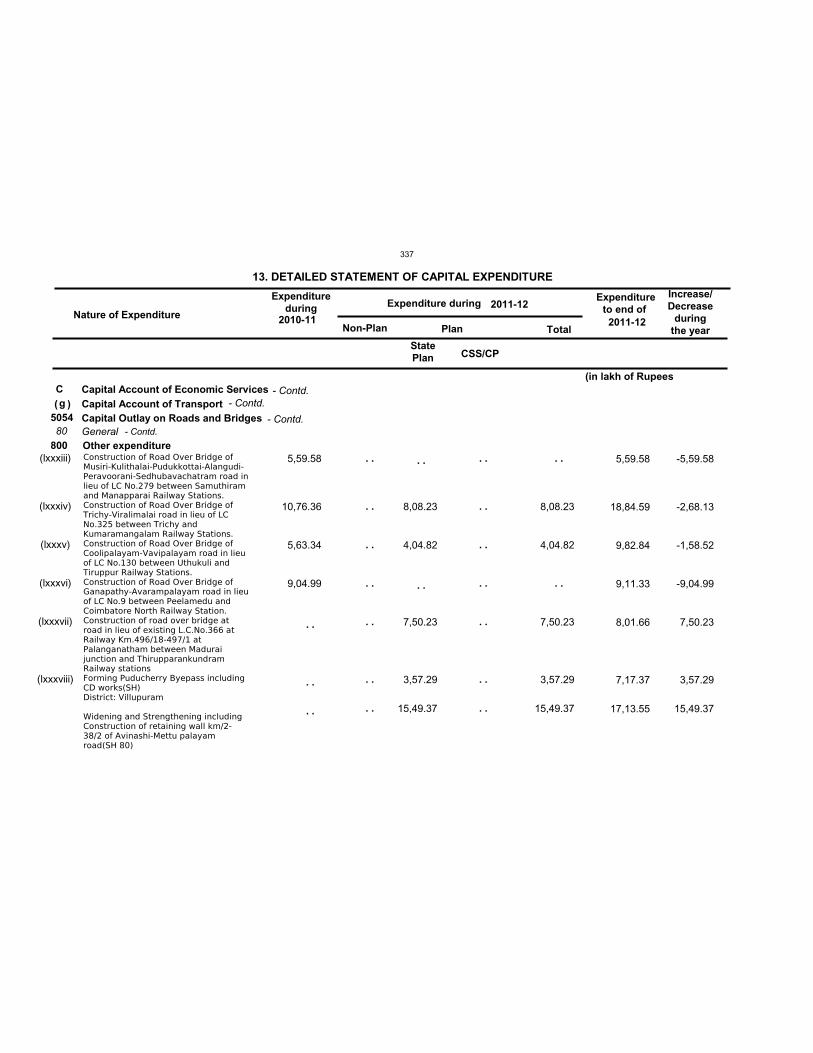
Nature of Expenditure
Expenditureduring Expenditure during
Expenditureto end of
Non-Plan Plan Total
13. DETAILED STATEMENT OF CAPITAL EXPENDITURE Increase/Decrease
duringthe year
2011-122010-11
2011-12
Cg
505480
800(lxxxiii)
(lxxxiv)
(lxxxv)
(lxxxvi)
(lxxxvii)
(lxxxviii)
5,59.58
10,76.36
5,63.34
9,04.99
8,08.23
4,04.82
7,50.23
3,57.29
15,49.37
8,08.23
4,04.82
7,50.23
3,57.29
15,49.37
5,59.58
18,84.59
9,82.84
9,11.33
8,01.66
7,17.37
17,13.55
StatePlan
Capital Account of Economic ServicesCapital Account of TransportCapital Outlay on Roads and BridgesGeneralOther expenditureConstruction of Road Over Bridge ofMusiri-Kulithalai-Pudukkottai-Alangudi-Peravoorani-Sedhubavachatram road inlieu of LC No.279 between Samuthiramand Manapparai Railway Stations.Construction of Road Over Bridge ofTrichy-Viralimalai road in lieu of LCNo.325 between Trichy andKumaramangalam Railway Stations.Construction of Road Over Bridge ofCoolipalayam-Vavipalayam road in lieuof LC No.130 between Uthukuli andTiruppur Railway Stations.Construction of Road Over Bridge ofGanapathy-Avarampalayam road in lieuof LC No.9 between Peelamedu andCoimbatore North Railway Station.Construction of road over bridge atroad in lieu of existing L.C.No.366 atRailway Km.496/18-497/1 atPalanganatham between Maduraijunction and ThirupparankundramRailway stationsForming Puducherry Byepass includingCD works(SH)District: Villupuram
Widening and Strengthening includingConstruction of retaining wall km/2-38/2 of Avinashi-Mettu palayamroad(SH 80)
( )
. .
. .
. .
. .
. .
. .
. .
. .
. .
. .
. .
. .
. .
. .
. .
. .
. .
. .
. .
. .
. .
-5,59.58
-2,68.13
-1,58.52
-9,04.99
7,50.23
3,57.29
15,49.37
(in lakh of Rupees
CSS/CP
- Contd.
- Contd.- Contd.
- Contd.
337
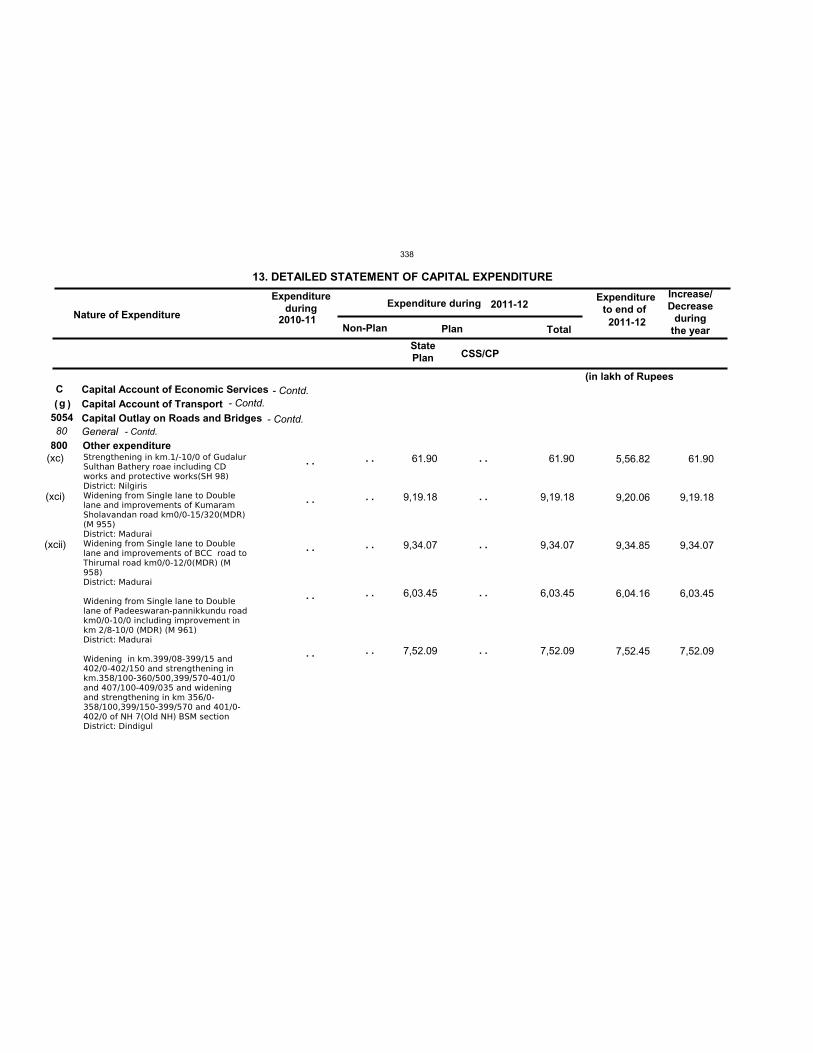
Nature of Expenditure
Expenditureduring Expenditure during
Expenditureto end of
Non-Plan Plan Total
13. DETAILED STATEMENT OF CAPITAL EXPENDITURE Increase/Decrease
duringthe year
2011-122010-11
2011-12
Cg
505480
800(xc)
(xci)
(xcii)
61.90
9,19.18
9,34.07
6,03.45
7,52.09
61.90
9,19.18
9,34.07
6,03.45
7,52.09
5,56.82
9,20.06
9,34.85
6,04.16
7,52.45
StatePlan
Capital Account of Economic ServicesCapital Account of TransportCapital Outlay on Roads and BridgesGeneralOther expenditureStrengthening in km.1/-10/0 of GudalurSulthan Bathery roae including CDworks and protective works(SH 98)District: NilgirisWidening from Single lane to Doublelane and improvements of KumaramSholavandan road km0/0-15/320(MDR)(M 955)District: MaduraiWidening from Single lane to Doublelane and improvements of BCC road toThirumal road km0/0-12/0(MDR) (M958)District: Madurai
Widening from Single lane to Doublelane of Padeeswaran-pannikkundu roadkm0/0-10/0 including improvement inkm 2/8-10/0 (MDR) (M 961)District: Madurai
Widening in km.399/08-399/15 and402/0-402/150 and strengthening inkm.358/100-360/500,399/570-401/0and 407/100-409/035 and wideningand strengthening in km 356/0-358/100,399/150-399/570 and 401/0-402/0 of NH 7(Old NH) BSM sectionDistrict: Dindigul
( )
. .
. .
. .
. .
. .
. .
. .
. .
. .
. .
. .
. .
. .
. .
. .
61.90
9,19.18
9,34.07
6,03.45
7,52.09
(in lakh of Rupees
CSS/CP
- Contd.
- Contd.- Contd.
- Contd.
338
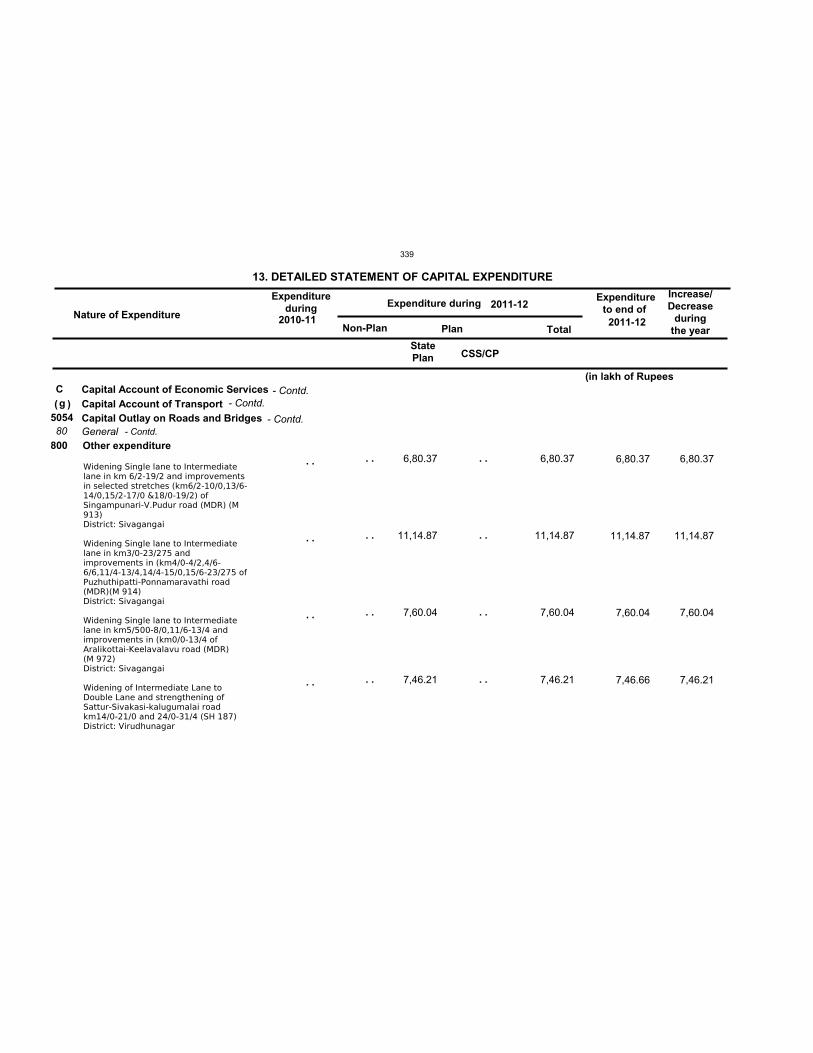
Nature of Expenditure
Expenditureduring Expenditure during
Expenditureto end of
Non-Plan Plan Total
13. DETAILED STATEMENT OF CAPITAL EXPENDITURE Increase/Decrease
duringthe year
2011-122010-11
2011-12
Cg
505480
800 6,80.37
11,14.87
7,60.04
7,46.21
6,80.37
11,14.87
7,60.04
7,46.21
6,80.37
11,14.87
7,60.04
7,46.66
StatePlan
Capital Account of Economic ServicesCapital Account of TransportCapital Outlay on Roads and BridgesGeneralOther expenditure
Widening Single lane to Intermediatelane in km 6/2-19/2 and improvementsin selected stretches (km6/2-10/0,13/6-14/0,15/2-17/0 &18/0-19/2) ofSingampunari-V.Pudur road (MDR) (M913)District: Sivagangai
Widening Single lane to Intermediatelane in km3/0-23/275 andimprovements in (km4/0-4/2,4/6-6/6,11/4-13/4,14/4-15/0,15/6-23/275 ofPuzhuthipatti-Ponnamaravathi road(MDR)(M 914)District: Sivagangai
Widening Single lane to Intermediatelane in km5/500-8/0,11/6-13/4 andimprovements in (km0/0-13/4 ofAralikottai-Keelavalavu road (MDR) (M 972)District: Sivagangai
Widening of Intermediate Lane toDouble Lane and strengthening ofSattur-Sivakasi-kalugumalai roadkm14/0-21/0 and 24/0-31/4 (SH 187)District: Virudhunagar
( )
. .
. .
. .
. .
. .
. .
. .
. .
. .
. .
. .
. .
6,80.37
11,14.87
7,60.04
7,46.21
(in lakh of Rupees
CSS/CP
- Contd.
- Contd.- Contd.
- Contd.
339

Nature of Expenditure
Expenditureduring Expenditure during
Expenditureto end of
Non-Plan Plan Total
13. DETAILED STATEMENT OF CAPITAL EXPENDITURE Increase/Decrease
duringthe year
2011-122010-11
2011-12
Cg
505480
800
(c)
(ci)
(cii)
(ciii)
(civ)
2,81.22
4,57.84
5,84.71
4,26.10
2,41.38
6,24.53 6,24.53
2,81.22
4,57.84
5,84.71
4,26.10
2,41.38
6,28.84
6,04.84
13,73.68
18,82.14
7,65.63
8,00.96
StatePlan
Capital Account of Economic ServicesCapital Account of TransportCapital Outlay on Roads and BridgesGeneralOther expenditure
Widening from Single Lane to DoubleLane in Km0/0-3/4 and 8/6-11/0 andwidening from Intermediate Lane toDouble Lane in km 5/0-5/6 and Km11/0-15/0 of Sivaramapettai - Panpoli -Shenkottai road(MDR)District: TirunelveliConstruction of Rad Over Bridge in lieuof existing L.C. No.40 in betweenVandalur - Guduvancheri onMadambakkam Adanur Padappai RoadConstruction of Road Over Bridge inlieu of existing L.C. No.36 in betweenVandalur- Guduvancheri RailwayStation at Tailway km36/12-14(NearUrapakkam)Construction of Road Over Bridge inlieu of existing L.C. No.47 in betweenGuduvancheri - Singaperumal RailwayStationConstruction of road over bridge in lieuof existing L.C. No.228 of km 0/4 ofSirudhaiyur Colrroon Bank Road atRailway km 313/3 in between Katturand Lalgudi Railway StationsConstruction of road over bridge in lieuof existing L.C. No.279 of km 41/2 ofMusiri-Kulithalai -Pudukottai -AlangudiPeravoorani-Sedhubavachatram Roadat Railway km 331/0-1 in betweenSamuthiram -Manapparai RailwayStations
( )
. .
. .
. .
. .
. .
. .
. .
. .
. .
. .
. .
. .
. .
. .
. .
. .
. .
. .
6,24.53
2,81.22
4,57.84
5,84.71
4,26.10
2,41.38
(in lakh of Rupees
CSS/CP
- Contd.
- Contd.- Contd.
- Contd.
340
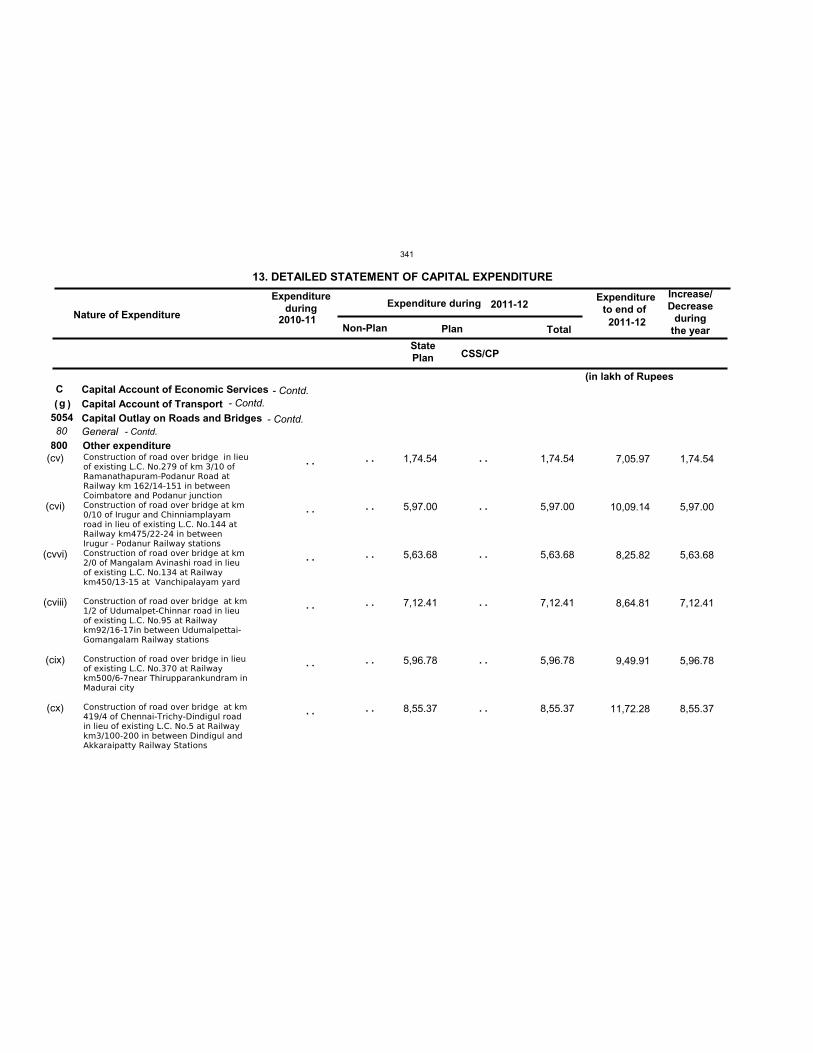
Nature of Expenditure
Expenditureduring Expenditure during
Expenditureto end of
Non-Plan Plan Total
13. DETAILED STATEMENT OF CAPITAL EXPENDITURE Increase/Decrease
duringthe year
2011-122010-11
2011-12
Cg
505480
800(cv)
(cvi)
(cvvi)
(cviii)
(cix)
(cx)
1,74.54
5,97.00
5,63.68
7,12.41
5,96.78
8,55.37
1,74.54
5,97.00
5,63.68
7,12.41
5,96.78
8,55.37
7,05.97
10,09.14
8,25.82
8,64.81
9,49.91
11,72.28
StatePlan
Capital Account of Economic ServicesCapital Account of TransportCapital Outlay on Roads and BridgesGeneralOther expenditureConstruction of road over bridge in lieuof existing L.C. No.279 of km 3/10 ofRamanathapuram-Podanur Road atRailway km 162/14-151 in betweenCoimbatore and Podanur junctionConstruction of road over bridge at km0/10 of Irugur and Chinniamplayamroad in lieu of existing L.C. No.144 atRailway km475/22-24 in betweenIrugur - Podanur Railway stationsConstruction of road over bridge at km2/0 of Mangalam Avinashi road in lieuof existing L.C. No.134 at Railwaykm450/13-15 at Vanchipalayam yard
Construction of road over bridge at km1/2 of Udumalpet-Chinnar road in lieuof existing L.C. No.95 at Railwaykm92/16-17in between Udumalpettai-Gomangalam Railway stations
Construction of road over bridge in lieuof existing L.C. No.370 at Railwaykm500/6-7near Thirupparankundram inMadurai city
Construction of road over bridge at km419/4 of Chennai-Trichy-Dindigul roadin lieu of existing L.C. No.5 at Railwaykm3/100-200 in between Dindigul andAkkaraipatty Railway Stations
( )
. .
. .
. .
. .
. .
. .
. .
. .
. .
. .
. .
. .
. .
. .
. .
. .
. .
. .
1,74.54
5,97.00
5,63.68
7,12.41
5,96.78
8,55.37
(in lakh of Rupees
CSS/CP
- Contd.
- Contd.- Contd.
- Contd.
341
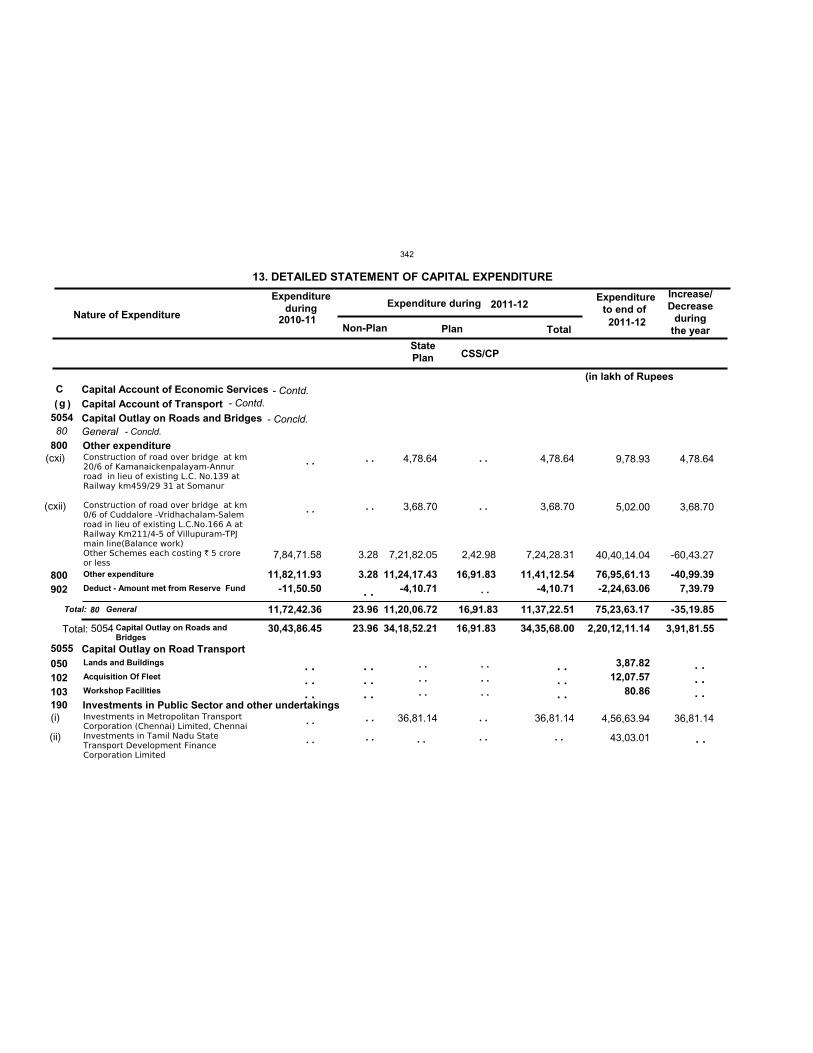
Nature of Expenditure
Expenditureduring Expenditure during
Expenditureto end of
Non-Plan Plan Total
13. DETAILED STATEMENT OF CAPITAL EXPENDITURE Increase/Decrease
duringthe year
2011-122010-11
2011-12
Cg
5054
5055
30,43,86.45 23.96 34,18,52.21 16,91.83 34,35,68.00 2,20,12,11.14
80
11,72,42.36 23.96 11,20,06.72 .16,91.83 11,37,22.51 75,23,63.17
800
190
11,82,11.93-11,50.50
3.28 11,24,17.43
-4,10.71 16,91.83 11,41,12.54
-4,10.71 76,95,61.13
-2,24,63.06
3,87.82 12,07.57
80.86
(cxi)
(cxii)
(i)
(ii)
7,84,71.58 3.28
4,78.64
3,68.70
7,21,82.05
36,81.14
2,42.98
4,78.64
3,68.70
7,24,28.31
36,81.14
9,78.93
5,02.00
40,40,14.04
4,56,63.94
43,03.01
StatePlan
Capital Account of Economic ServicesCapital Account of TransportCapital Outlay on Roads and Bridges
Capital Outlay on Road Transport
GeneralOther expenditure
Investments in Public Sector and other undertakings
Other expenditure
Deduct - Amount met from Reserve Fund
Lands and Buildings
Acquisition Of Fleet
Workshop Facilities
800902
050102103
Construction of road over bridge at km20/6 of Kamanaickenpalayam-Annurroad in lieu of existing L.C. No.139 atRailway km459/29 31 at Somanur
Construction of road over bridge at km0/6 of Cuddalore -Vridhachalam-Salemroad in lieu of existing L.C.No.166 A atRailway Km211/4-5 of Villupuram-TPJmain line(Balance work)Other Schemes each costing ` 5 croreor less
Investments in Metropolitan TransportCorporation (Chennai) Limited, ChennaiInvestments in Tamil Nadu StateTransport Development FinanceCorporation Limited
Total: General
Total: Capital Outlay on Roads andBridges
( )
80
5054
. .
. .
. .
. . . .
. .
. .
. .
. . . .
. .
. .
. .
. .
. . . . . .
. .
. . . . . .
. . . . . .
. .
. . . . . .
. . . . . .
4,78.64
3,68.70
-60,43.27
36,81.14
-40,99.39
7,39.79
. .
. . . . . .
-35,19.85
3,91,81.55
(in lakh of Rupees
CSS/CP
- Contd.
- Concld.- Concld.
- Contd.
342
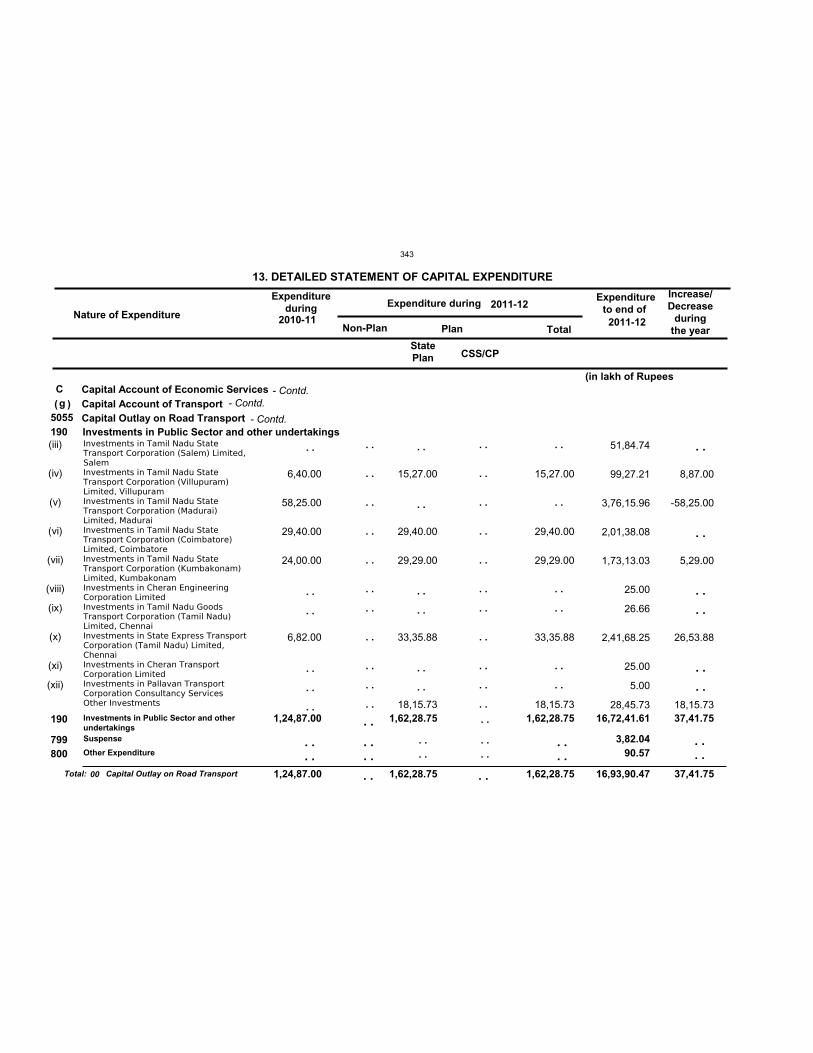
Nature of Expenditure
Expenditureduring Expenditure during
Expenditureto end of
Non-Plan Plan Total
13. DETAILED STATEMENT OF CAPITAL EXPENDITURE Increase/Decrease
duringthe year
2011-122010-11
2011-12
Cg
5055
1,24,87.00 1,62,28.75 1,62,28.75 16,93,90.47
190
1,24,87.00 1,62,28.75 1,62,28.75 16,72,41.61
3,82.04 90.57
(iii)
(iv)
(v)
(vi)
(vii)
(viii)
(ix)
(x)
(xi)
(xii)
6,40.00
58,25.00
29,40.00
24,00.00
6,82.00
15,27.00
29,40.00
29,29.00
33,35.88
18,15.73
15,27.00
29,40.00
29,29.00
33,35.88
18,15.73
51,84.74
99,27.21
3,76,15.96
2,01,38.08
1,73,13.03
25.00
26.66
2,41,68.25
25.00
5.00
28,45.73
StatePlan
Capital Account of Economic ServicesCapital Account of TransportCapital Outlay on Road TransportInvestments in Public Sector and other undertakings
Investments in Public Sector and otherundertakingsSuspense
Other Expenditure
190
799800
Investments in Tamil Nadu StateTransport Corporation (Salem) Limited,SalemInvestments in Tamil Nadu StateTransport Corporation (Villupuram)Limited, VillupuramInvestments in Tamil Nadu StateTransport Corporation (Madurai)Limited, MaduraiInvestments in Tamil Nadu StateTransport Corporation (Coimbatore)Limited, CoimbatoreInvestments in Tamil Nadu StateTransport Corporation (Kumbakonam)Limited, KumbakonamInvestments in Cheran EngineeringCorporation LimitedInvestments in Tamil Nadu GoodsTransport Corporation (Tamil Nadu)Limited, ChennaiInvestments in State Express TransportCorporation (Tamil Nadu) Limited,ChennaiInvestments in Cheran TransportCorporation LimitedInvestments in Pallavan TransportCorporation Consultancy ServicesOther Investments
Total: Capital Outlay on Road Transport
( )
00
. .
. .
. .
. .
. .
. .
. .
. .
. .
. .
. .
. .
. .
. .
. .
. .
. .
. .
. .
. .
. .
. .
. .
. .
. .
. .
. .
. .
. .
. .
. .
. .
. .
. .
. .
. .
. .
. .
. .
. .
. . . .
. .
. . . .
. . . .
. .
. . . .
. . . .
8,87.00
-58,25.00
5,29.00
26,53.88
18,15.73 37,41.75
. .
. .
. .
. .
. .
. .
. . . .
. . . . 37,41.75
(in lakh of Rupees
CSS/CP
- Contd.
- Contd.
- Contd.
343
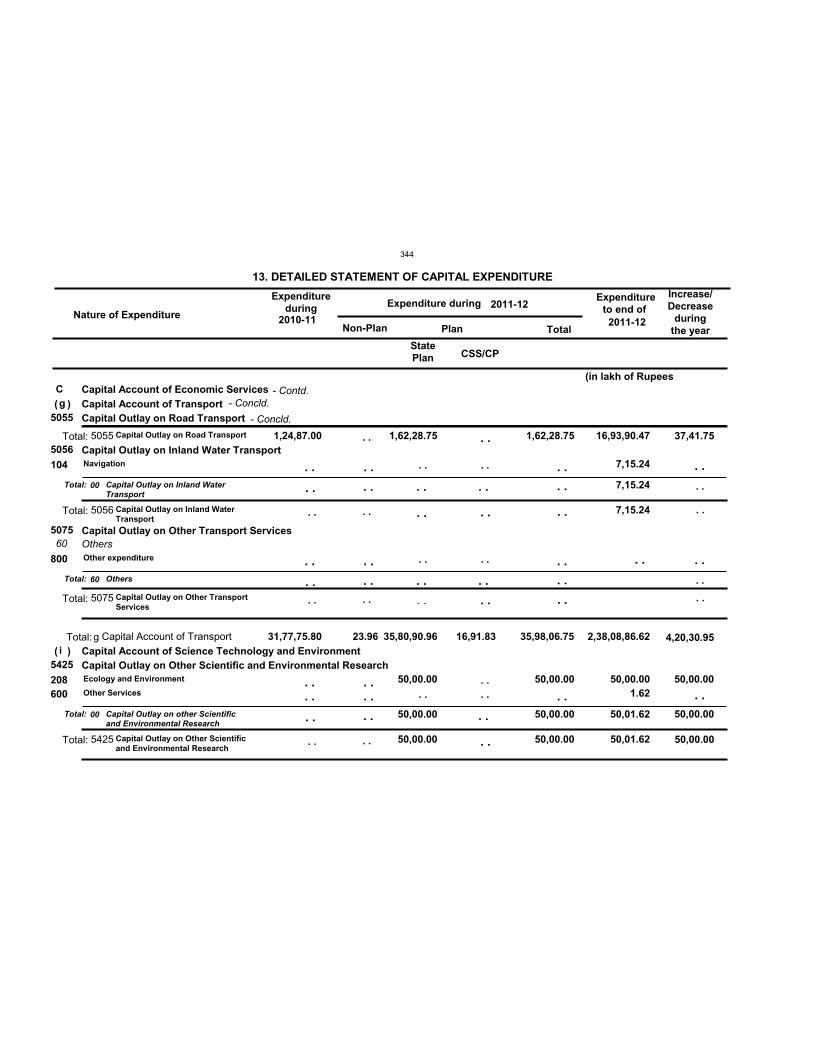
Nature of Expenditure
Expenditureduring Expenditure during
Expenditureto end of
Non-Plan Plan Total
13. DETAILED STATEMENT OF CAPITAL EXPENDITURE Increase/Decrease
duringthe year
2011-122010-11
2011-12
Cg
i 31,77,75.80 23.96 35,80,90.96 16,91.83 35,98,06.75 2,38,08,86.62
5055
5056
5075
5425
1,24,87.00 1,62,28.75
50,00.00
1,62,28.75
50,00.00
16,93,90.47
7,15.24
50,01.62
60
50,00.00 50,00.00
7,15.24
50,01.62
50,00.00 50,00.00
7,15.24
50,00.00 1.62
StatePlan
Capital Account of Economic ServicesCapital Account of Transport
Capital Account of Science Technology and Environment
Capital Outlay on Road Transport
Capital Outlay on Inland Water Transport
Capital Outlay on Other Transport Services
Capital Outlay on Other Scientific and Environmental Research
Others
Navigation
Other expenditure
Ecology and Environment
Other Services
104
800
208600
Total:
Total:
Total:
Capital Outlay on Inland WaterTransport
Others
Capital Outlay on other Scientificand Environmental Research
Total:
Total:
Total:
Total:
Capital Outlay on Road Transport
Capital Outlay on Inland WaterTransport
Capital Outlay on Other TransportServices
Capital Outlay on Other Scientificand Environmental Research
Total: Capital Account of Transport
(
(
)
)
00
60
00
5055
5056
5075
5425
g
. .
. .
. . . .
. .
. .
. . . .
. .
. .
. .
. .
. .
. . . .
. .
. .
. . 50,00.00
. .
. .
. .
. .
. .
. .
. .
. .
. .
. .
. .
. .
. .
. .
. .
. .
. .
. .
. .
. .
. .
. .
. .
. .
. .
. .
. .
. .
. .
. .
. .
50,00.00
37,41.75
50,00.00
4,20,30.95
. .
(in lakh of Rupees
CSS/CP
. .
. .
. .
. .
- Contd.
- Concld.
- Concld.
344
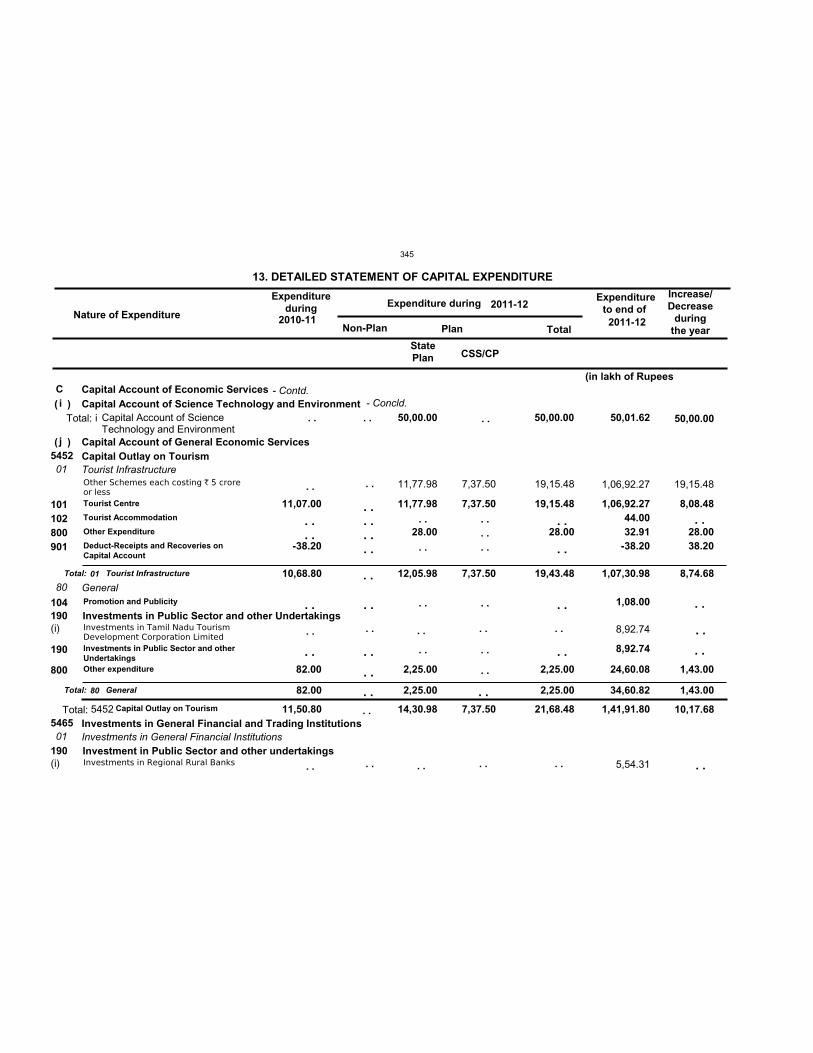
Nature of Expenditure
Expenditureduring Expenditure during
Expenditureto end of
Non-Plan Plan Total
13. DETAILED STATEMENT OF CAPITAL EXPENDITURE Increase/Decrease
duringthe year
2011-122010-11
2011-12
Ci
j
50,00.00 50,00.00 50,01.62
5452
5465 11,50.80 14,30.98 7,37.50 21,68.48 1,41,91.80
01
80
01
10,68.80
82.00
12,05.98
2,25.00
7,37.50 19,43.48
2,25.00
1,07,30.98
34,60.82
190
190
11,07.00
-38.20
82.00
11,77.98
28.00
2,25.00
7,37.50 19,15.48
28.00
2,25.00
1,06,92.27 44.00 32.91-38.20
1,08.00
8,92.74
24,60.08
(i)
(i)
11,77.98 7,37.50 19,15.48 1,06,92.27
8,92.74
5,54.31
StatePlan
Capital Account of Economic ServicesCapital Account of Science Technology and Environment
Capital Account of General Economic ServicesCapital Outlay on Tourism
Investments in General Financial and Trading Institutions
Tourist Infrastructure
General
Investments in General Financial Institutions
Investments in Public Sector and other Undertakings
Investment in Public Sector and other undertakings
Tourist Centre
Tourist Accommodation
Other Expenditure
Deduct-Receipts and Recoveries onCapital Account
Promotion and Publicity
Investments in Public Sector and otherUndertakingsOther expenditure
101102800901
104
190
800
Other Schemes each costing ` 5 croreor less
Investments in Tamil Nadu TourismDevelopment Corporation Limited
Investments in Regional Rural Banks
Total:
Total:
Tourist Infrastructure
General
Total: Capital Outlay on Tourism
Total: Capital Account of ScienceTechnology and Environment
(
(
)
)
01
80
5452
i
. .
. .
. .
. .
. .
. .
. .
. .
. .
. .
. .
. .
. . . .
. .
. .
. . . . . . . .
. .
. .
. .
. .
. .
. .
. .
. . . . . .
. .
. .
. .
. .
. .
. .
. .
19,15.48
8,08.48
28.00 38.20
1,43.00
. .
. .
. .
. .
. .
. .
. . . . . .
. .
8,74.68
1,43.00
10,17.68
50,00.00
(in lakh of Rupees
CSS/CP
. . . .
- Contd.- Concld.
345
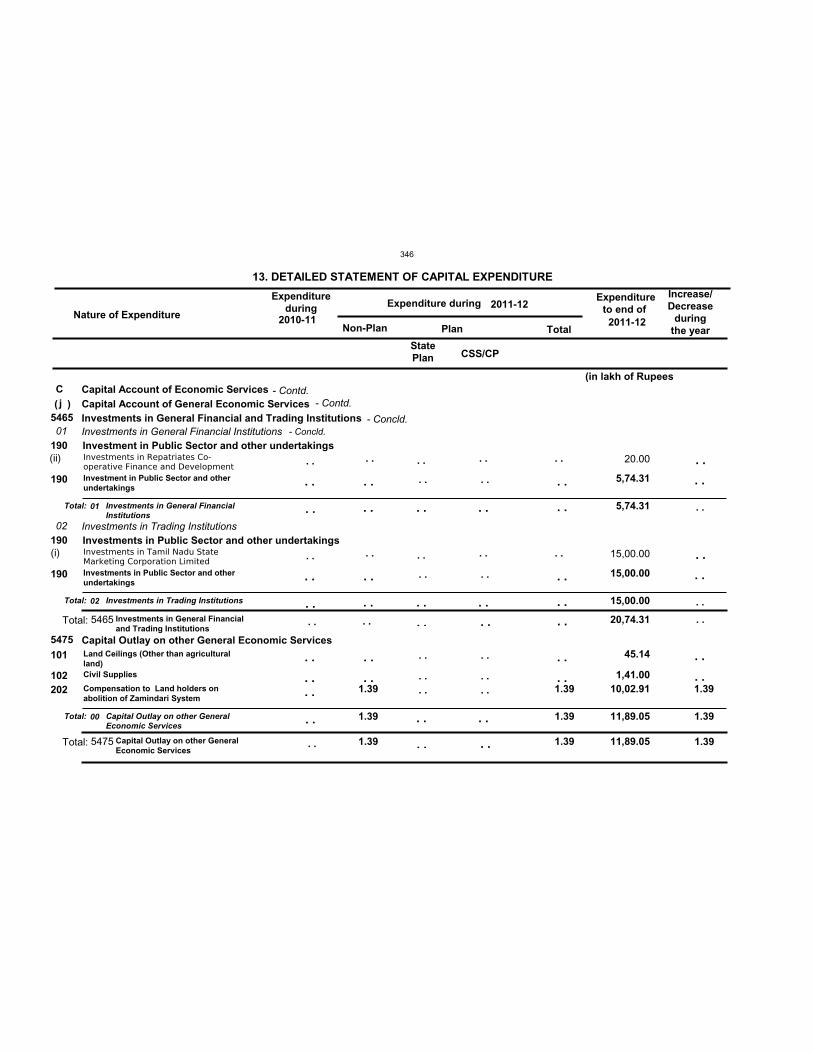
Nature of Expenditure
Expenditureduring Expenditure during
Expenditureto end of
Non-Plan Plan Total
13. DETAILED STATEMENT OF CAPITAL EXPENDITURE Increase/Decrease
duringthe year
2011-122010-11
2011-12
Cj
5465
5475
1.39 1.39
20,74.31
11,89.05
01
02
1.39 1.39
5,74.31
15,00.00
11,89.05
190
190
1.39 1.39
5,74.31
15,00.00
45.14
1,41.00 10,02.91
(ii)
(i)
20.00
15,00.00
StatePlan
Capital Account of Economic ServicesCapital Account of General Economic ServicesInvestments in General Financial and Trading Institutions
Capital Outlay on other General Economic Services
Investments in General Financial Institutions
Investments in Trading Institutions
Investment in Public Sector and other undertakings
Investments in Public Sector and other undertakings
Investment in Public Sector and otherundertakings
Investments in Public Sector and otherundertakings
Land Ceilings (Other than agriculturalland)Civil Supplies
Compensation to Land holders onabolition of Zamindari System
190
190
101
102202
Investments in Repatriates Co-operative Finance and Development
Investments in Tamil Nadu StateMarketing Corporation Limited
Total:
Total:
Total:
Investments in General FinancialInstitutions
Investments in Trading Institutions
Capital Outlay on other GeneralEconomic Services
Total:
Total:
Investments in General Financialand Trading Institutions
Capital Outlay on other GeneralEconomic Services
( )
01
02
00
5465
5475
. .
. .
. .
. .
. .
. .
. .
. .
. .
. .
. .
. .
. .
. . . .
. .
. .
. .
. .
. .
. .
. .
. . . .
. .
. .
. .
. . . .
. .
. .
. .
. . 1.39
. .
. .
. .
. .
. .
. .
. .
. .
. .
. .
. .
. .
. .
. .
. .
. .
. .
. .
. .
. .
. .
. . . .
. .
. .
. .
. .
1.39
1.39
(in lakh of Rupees
CSS/CP
. .
. .
. .
- Contd.
- Concld.- Concld.
- Contd.
346
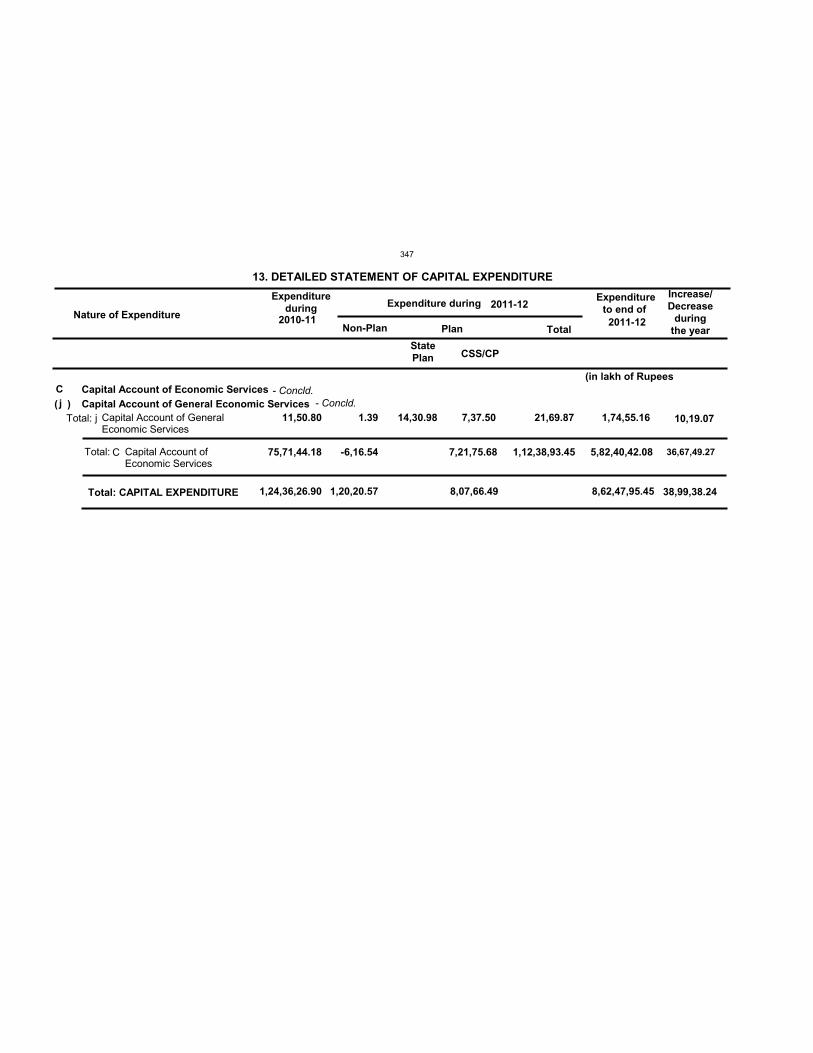
Nature of Expenditure
Expenditureduring Expenditure during
Expenditureto end of
Non-Plan Plan Total
13. DETAILED STATEMENT OF CAPITAL EXPENDITURE Increase/Decrease
duringthe year
2011-122010-11
2011-12
1,24,36,26.90 1,20,20.57 8,07,66.49 8,62,47,95.45
C
75,71,44.18 -6,16.54 7,21,75.68 1,12,38,93.45 5,82,40,42.08
j 11,50.80 1.39 14,30.98 7,37.50 21,69.87 1,74,55.16
StatePlan
Capital Account of Economic ServicesCapital Account of General Economic Services
Total: Capital Account of GeneralEconomic Services
Total: Capital Account ofEconomic Services
Total: CAPITAL EXPENDITURE
( )j
C
10,19.07
36,67,49.27
38,99,38.24
(in lakh of Rupees
CSS/CP
- Concld.- Concld.
347
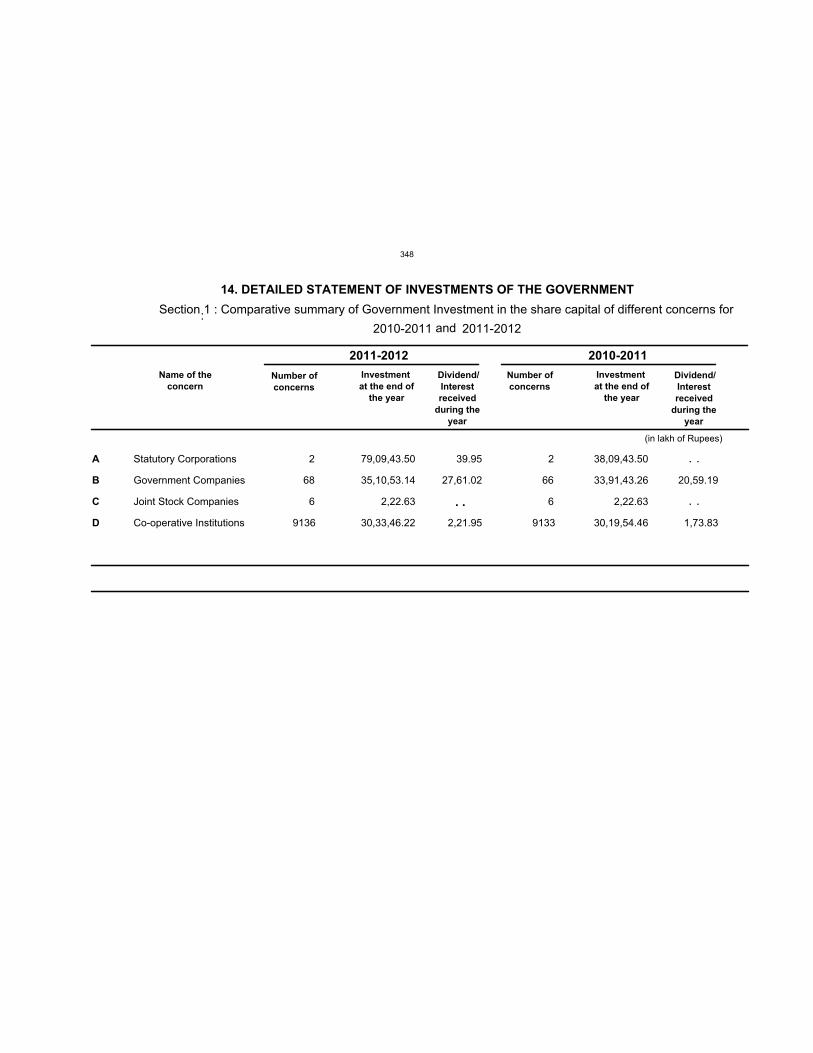
A
B
C
D
Statutory Corporations
Government Companies
Joint Stock Companies
Co-operative Institutions
2
68
6
9136
79,09,43.50
35,10,53.14
2,22.63
30,33,46.22
39.95
27,61.02
2,21.95
2
66
6
9133
38,09,43.50
33,91,43.26
2,22.63
30,19,54.46
20,59.19
1,73.83
Name of the
concernNumber of
concerns
Investment
at the end of
the year
Number of
concerns
Investment
at the end of
the year
Dividend/
Interest
received
during the
year
Dividend/
Interest
received
during the
year
. .
14. DETAILED STATEMENT OF INVESTMENTS OF THE GOVERNMENT
:Section 1 : Comparative summary of Government Investment in the share capital of different concerns for
2011-2012 2010-2011
2011-20122010-2011 and
(in lakh of Rupees)
. .
. .
348
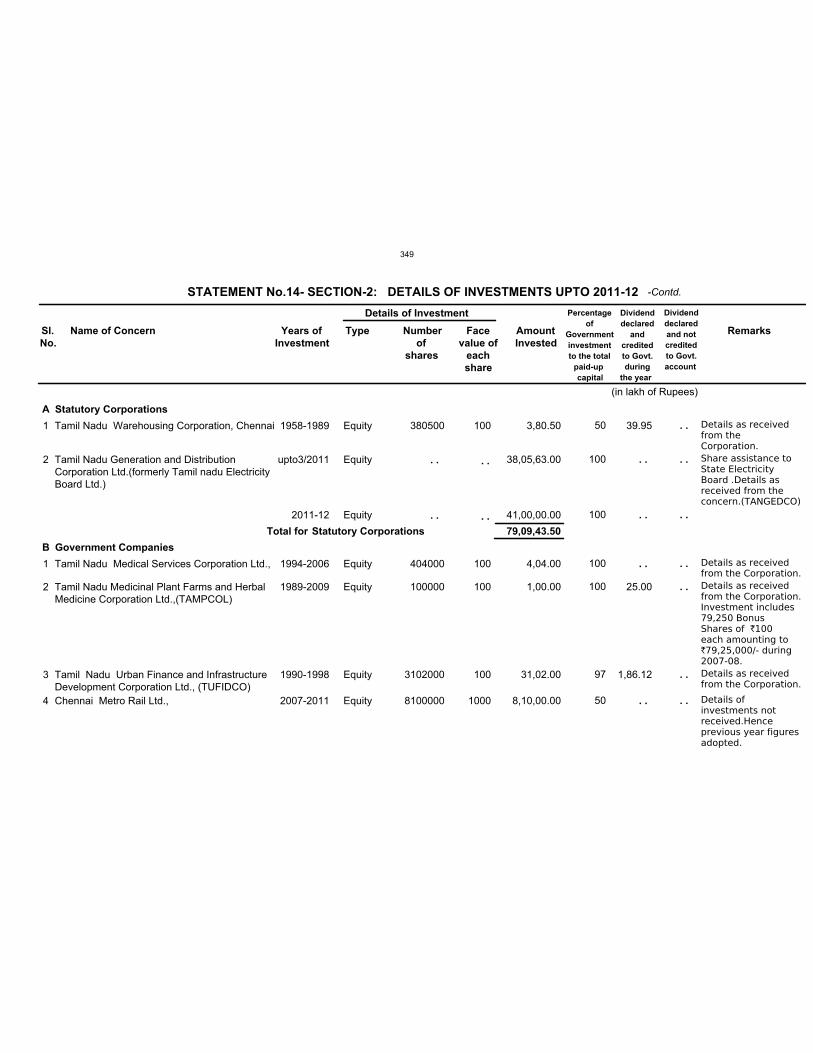
A
B
1
2
1
2
3
4
Tamil Nadu Warehousing Corporation, Chennai
Tamil Nadu Generation and DistributionCorporation Ltd.(formerly Tamil nadu ElectricityBoard Ltd.)
Tamil Nadu Medical Services Corporation Ltd.,
Tamil Nadu Medicinal Plant Farms and HerbalMedicine Corporation Ltd.,(TAMPCOL)
Tamil Nadu Urban Finance and InfrastructureDevelopment Corporation Ltd., (TUFIDCO)
Chennai Metro Rail Ltd.,
1958-1989
upto3/2011
2011-12
1994-2006
1989-2009
1990-1998
2007-2011
Equity
Equity
Equity
Equity
Equity
Equity
Equity
380500
404000
100000
3102000
8100000
100
100
100
100
1000
3,80.50
38,05,63.00
41,00,00.00
4,04.00
1,00.00
31,02.00
8,10,00.00
50
100
100
100
100
97
50
39.95
25.00
1,86.12
Details as receivedfrom theCorporation.
Share assistance toState ElectricityBoard .Details asreceived from theconcern.(TANGEDCO)
Details as receivedfrom the Corporation.
Details as receivedfrom the Corporation.Investment includes79,250 BonusShares of `100each amounting to`79,25,000/- during2007-08.
Details as receivedfrom the Corporation.
Details ofinvestments notreceived.Henceprevious year figuresadopted.
STATEMENT No.14- SECTION-2: DETAILS OF INVESTMENTS UPTO 2011-12
Sl.
No.
Name of Concern Years of
Investment
Type Number
of
shares
Face
value of
each
share
Amount
Invested
Dividend
declared
and
credited
to Govt.
during
the year
Dividend
declared
and not
credited
to Govt.
account
Remarks
Statutory Corporations
Government Companies
79,09,43.50Total for Statutory Corporations
(in lakh of Rupees)
Details of Investment Percentage
of
Government
investment
to the total
paid-up
capital
. .
. .
. .
. .
. .
. .
. .
. .
. .
. .
. .
. .
. .
. .
. .
-Contd.
349

B
5
6
Adyar Poonga Company (Adyar Poonga -Special Purpose Vechicle)
Arasu Cable TV Corporation Ltd.,
upto3/2010
2008-09
Equity
Equity
100000
25000000
10
10
10.00
25,00.00
100
100
Adyar Poonga Trusthas been changedas Chennai RiversRestoration Trustvide GO No 15MunicipalAdministration &Water Supply Deptdt 22.1.10 andAdyar PoongaCompany wasformed underCompanies Act1856.Out of theinvestment of`10,00.00 lakhsrelating to erstwhileAdyar Poonga Trust,upto 2009-10 an amount of `10 lakhonly has been retainedas share capitalcontribution to AdyarPoonga Companyin the form of invest- ment and balancetransferred to Chennai
Rivers Restoration Trust.
Details ofinvestments notreceived.Henceprevious year figuresadopted.
STATEMENT No.14- SECTION-2: DETAILS OF INVESTMENTS UPTO 2011-12
Sl.
No.
Name of Concern Years of
Investment
Type Number
of
shares
Face
value of
each
share
Amount
Invested
Dividend
declared
and
credited
to Govt.
during
the year
Dividend
declared
and not
credited
to Govt.
account
Remarks
Government Companies
(in lakh of Rupees)
Details of Investment Percentage
of
Government
investment
to the total
paid-up
capital
. .
. .
. .
. .
-Contd.
350
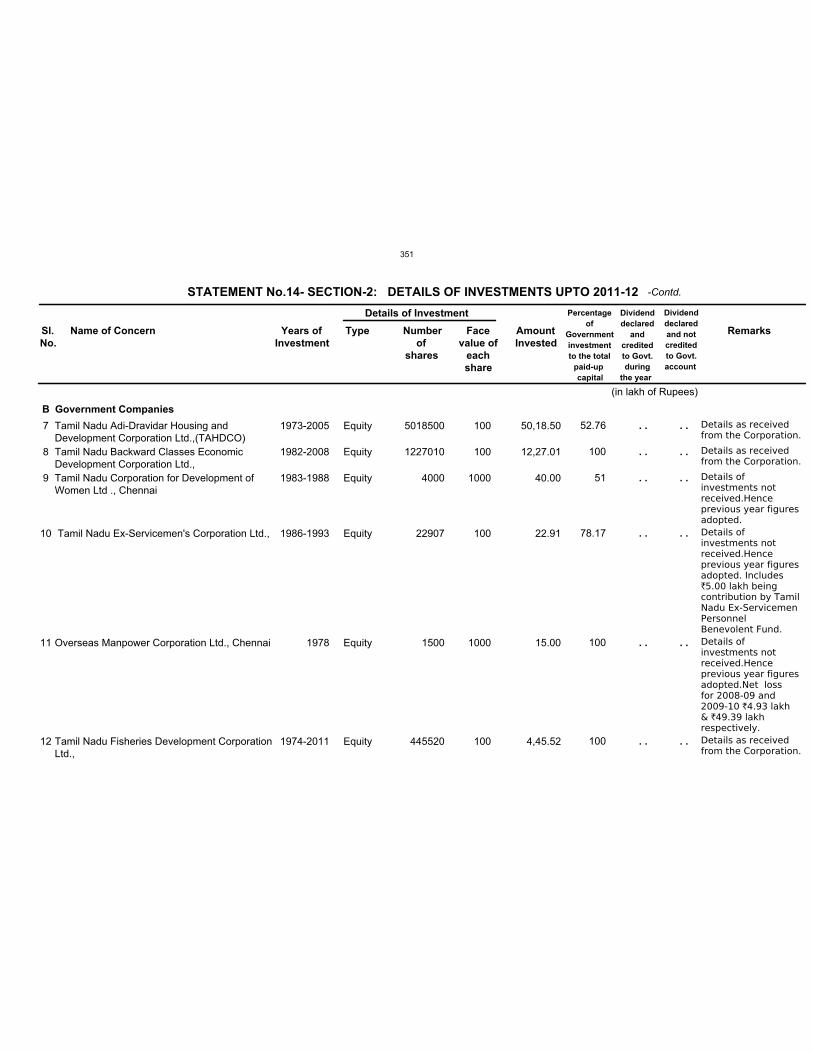
B
7
8
9
10
11
12
Tamil Nadu Adi-Dravidar Housing andDevelopment Corporation Ltd.,(TAHDCO)
Tamil Nadu Backward Classes EconomicDevelopment Corporation Ltd.,
Tamil Nadu Corporation for Development ofWomen Ltd ., Chennai
Tamil Nadu Ex-Servicemen's Corporation Ltd.,
Overseas Manpower Corporation Ltd., Chennai
Tamil Nadu Fisheries Development CorporationLtd.,
1973-2005
1982-2008
1983-1988
1986-1993
1978
1974-2011
Equity
Equity
Equity
Equity
Equity
Equity
5018500
1227010
4000
22907
1500
445520
100
100
1000
100
1000
100
50,18.50
12,27.01
40.00
22.91
15.00
4,45.52
52.76
100
51
78.17
100
100
Details as receivedfrom the Corporation.
Details as receivedfrom the Corporation.
Details ofinvestments notreceived.Henceprevious year figuresadopted.
Details ofinvestments notreceived.Henceprevious year figuresadopted. Includes`5.00 lakh beingcontribution by TamilNadu Ex-ServicemenPersonnelBenevolent Fund.
Details ofinvestments notreceived.Henceprevious year figuresadopted.Net lossfor 2008-09 and2009-10 `4.93 lakh& `49.39 lakhrespectively.
Details as receivedfrom the Corporation.
STATEMENT No.14- SECTION-2: DETAILS OF INVESTMENTS UPTO 2011-12
Sl.
No.
Name of Concern Years of
Investment
Type Number
of
shares
Face
value of
each
share
Amount
Invested
Dividend
declared
and
credited
to Govt.
during
the year
Dividend
declared
and not
credited
to Govt.
account
Remarks
Government Companies
(in lakh of Rupees)
Details of Investment Percentage
of
Government
investment
to the total
paid-up
capital
. .
. .
. .
. .
. .
. .
. .
. .
. .
. .
. .
. .
-Contd.
351
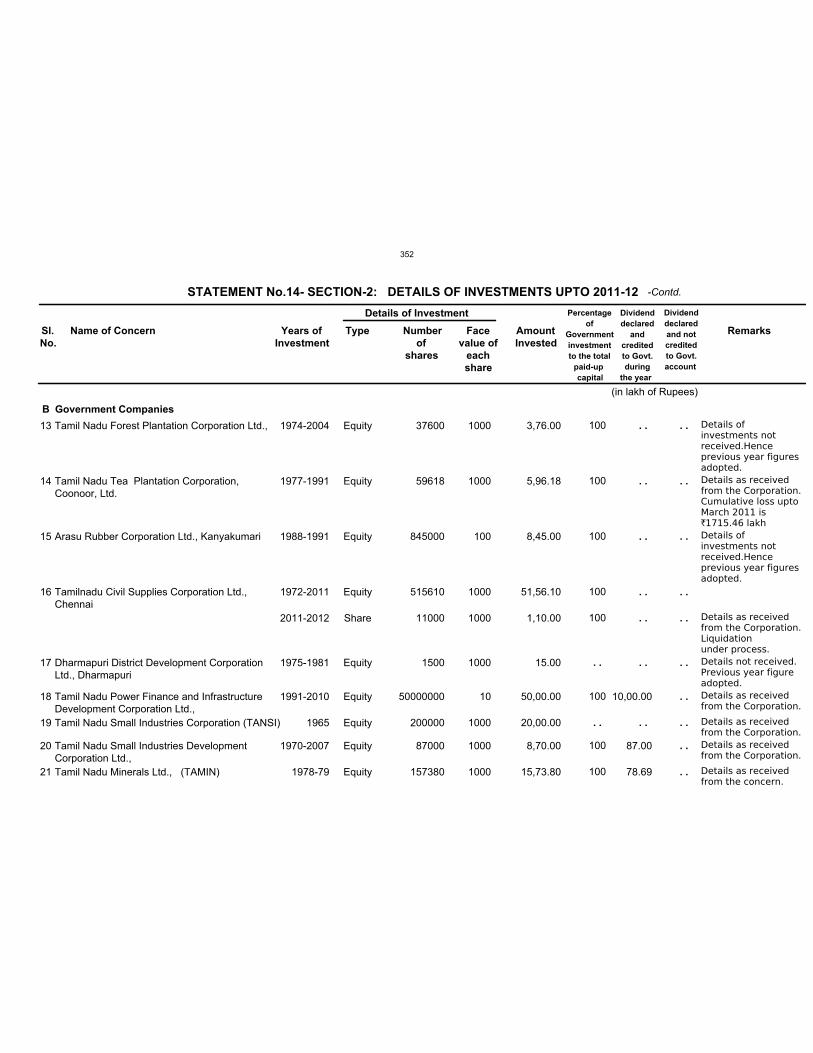
B
13
14
15
16
17
18
19
20
21
Tamil Nadu Forest Plantation Corporation Ltd.,
Tamil Nadu Tea Plantation Corporation,Coonoor, Ltd.
Arasu Rubber Corporation Ltd., Kanyakumari
Tamilnadu Civil Supplies Corporation Ltd.,Chennai
Dharmapuri District Development CorporationLtd., Dharmapuri
Tamil Nadu Power Finance and InfrastructureDevelopment Corporation Ltd.,
Tamil Nadu Small Industries Corporation (TANSI)
Tamil Nadu Small Industries DevelopmentCorporation Ltd.,
Tamil Nadu Minerals Ltd., (TAMIN)
1974-2004
1977-1991
1988-1991
1972-2011
2011-2012
1975-1981
1991-2010
1965
1970-2007
1978-79
Equity
Equity
Equity
Equity
Share
Equity
Equity
Equity
Equity
Equity
37600
59618
845000
515610
11000
1500
50000000
200000
87000
157380
1000
1000
100
1000
1000
1000
10
1000
1000
1000
3,76.00
5,96.18
8,45.00
51,56.10
1,10.00
15.00
50,00.00
20,00.00
8,70.00
15,73.80
100
100
100
100
100
100
100
100
10,00.00
87.00
78.69
Details ofinvestments notreceived.Henceprevious year figuresadopted.
Details as receivedfrom the Corporation.Cumulative loss uptoMarch 2011 is`1715.46 lakh
Details ofinvestments notreceived.Henceprevious year figuresadopted.
Details as receivedfrom the Corporation.Liquidationunder process.
Details not received.Previous year figureadopted.
Details as receivedfrom the Corporation.
Details as receivedfrom the Corporation.
Details as receivedfrom the Corporation.
Details as receivedfrom the concern..
STATEMENT No.14- SECTION-2: DETAILS OF INVESTMENTS UPTO 2011-12
Sl.
No.
Name of Concern Years of
Investment
Type Number
of
shares
Face
value of
each
share
Amount
Invested
Dividend
declared
and
credited
to Govt.
during
the year
Dividend
declared
and not
credited
to Govt.
account
Remarks
Government Companies
(in lakh of Rupees)
Details of Investment Percentage
of
Government
investment
to the total
paid-up
capital
. .
. .
. .
. .
. .
. .
. .
. .
. .
. .
. .
. .
. .
. .
. .
. .
. .
. .
. .
-Contd.
352

B
22
23
24
25
26
27
28
The Tamil Nadu Handicrafts DevelopmentCorporation Ltd.,
The Tamil Nadu Handloom DevelopmentCorporation Ltd.,
Tamil Nadu Magnasite Ltd., Salem (TANMAG)
The Fertilizer And Chemicals (Travancore) Ltd.,Alwaye
Tamil Nadu State Construction Corporation Ltd.Madurai
Southern Stucturals
Eletronics Corporation of Tamil Nadu Ltd.,(ELCOT)
1974-2010
1990-1991
1979-1993
1948
1980-1997
1977-1997
1977-1997
Equity
Equity
Equity
Equity
Equity
Equity
Equity
205275
2670000
1665000
256933
500000
152688875
259305
100
10
100
10
100
2.25
1000
2,05.28
2,67.00
16,65.00
25.69
5,00.00
34,35.50
25,93.05
63.75
62
100
100
99.56
100 1,29.65
Details as receivedfrom Corporation
Cumulative loss upto31/3/2010 `192.04lakh. Previous yearfigures adopted.
Cumulative loss upto31/3/2011- `1065.99lakh. Details asreceived fromthe concern.
Details notreceived. Previousyear figure adopted.
Details not received.Previous year figureadopted.
Details as receivedfrom theconcern.Cumulativeloss as on31.03.2012`21091.06lakh(provisional)
Details ofinvestments notreceived.Henceprevious year figuresadopted.
STATEMENT No.14- SECTION-2: DETAILS OF INVESTMENTS UPTO 2011-12
Sl.
No.
Name of Concern Years of
Investment
Type Number
of
shares
Face
value of
each
share
Amount
Invested
Dividend
declared
and
credited
to Govt.
during
the year
Dividend
declared
and not
credited
to Govt.
account
Remarks
Government Companies
(in lakh of Rupees)
Details of Investment Percentage
of
Government
investment
to the total
paid-up
capital
. .
. .
. .
. .
. .
. .
. .
. .
. .
. .
. .
. .
. .
. .
-Contd.
353
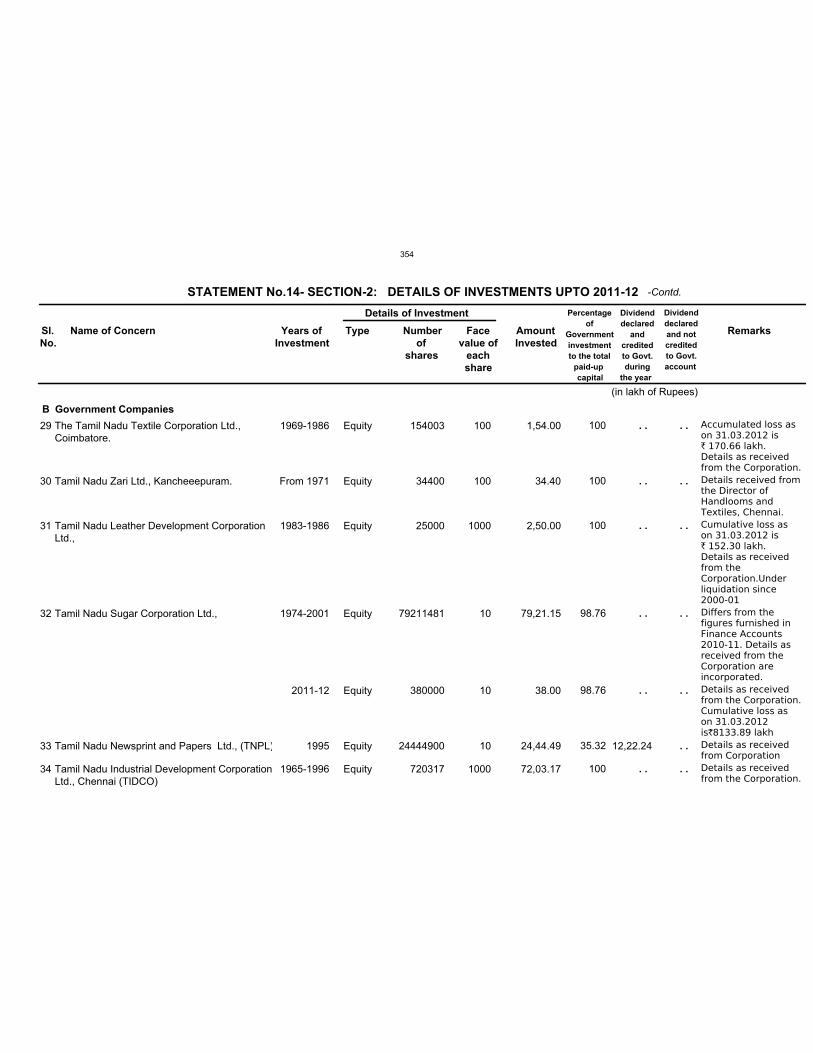
B
29
30
31
32
33
34
The Tamil Nadu Textile Corporation Ltd.,Coimbatore.
Tamil Nadu Zari Ltd., Kancheeepuram.
Tamil Nadu Leather Development CorporationLtd.,
Tamil Nadu Sugar Corporation Ltd.,
Tamil Nadu Newsprint and Papers Ltd., (TNPL)
Tamil Nadu Industrial Development CorporationLtd., Chennai (TIDCO)
1969-1986
From 1971
1983-1986
1974-2001
2011-12
1995
1965-1996
Equity
Equity
Equity
Equity
Equity
Equity
Equity
154003
34400
25000
79211481
380000
24444900
720317
100
100
1000
10
10
10
1000
1,54.00
34.40
2,50.00
79,21.15
38.00
24,44.49
72,03.17
100
100
100
98.76
98.76
35.32
100
12,22.24
Accumulated loss ason 31.03.2012 is` 170.66 lakh.Details as receivedfrom the Corporation.
Details received fromthe Director ofHandlooms andTextiles, Chennai.
Cumulative loss ason 31.03.2012 is` 152.30 lakh.Details as receivedfrom the Corporation.Underliquidation since2000-01
Differs from thefigures furnished inFinance Accounts2010-11. Details asreceived from theCorporation areincorporated.
Details as receivedfrom the Corporation.Cumulative loss ason 31.03.2012is`8133.89 lakh
Details as receivedfrom Corporation
Details as receivedfrom the Corporation.
STATEMENT No.14- SECTION-2: DETAILS OF INVESTMENTS UPTO 2011-12
Sl.
No.
Name of Concern Years of
Investment
Type Number
of
shares
Face
value of
each
share
Amount
Invested
Dividend
declared
and
credited
to Govt.
during
the year
Dividend
declared
and not
credited
to Govt.
account
Remarks
Government Companies
(in lakh of Rupees)
Details of Investment Percentage
of
Government
investment
to the total
paid-up
capital
. .
. .
. .
. .
. .
. .
. .
. .
. .
. .
. .
. .
. .
-Contd.
354
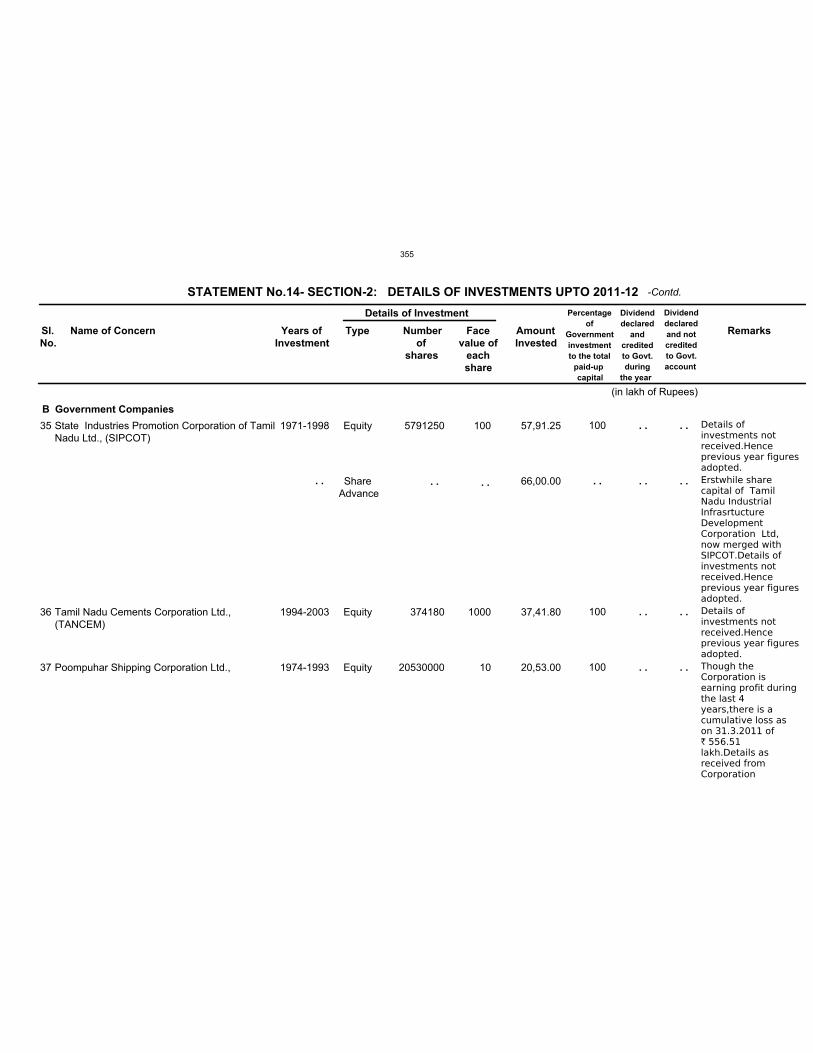
B
35
36
37
State Industries Promotion Corporation of TamilNadu Ltd., (SIPCOT)
Tamil Nadu Cements Corporation Ltd.,(TANCEM)
Poompuhar Shipping Corporation Ltd.,
1971-1998
1994-2003
1974-1993
Equity
ShareAdvance
Equity
Equity
5791250
374180
20530000
100
1000
10
57,91.25
66,00.00
37,41.80
20,53.00
100
100
100
Details ofinvestments notreceived.Henceprevious year figuresadopted.
Erstwhile sharecapital of TamilNadu IndustrialInfrasrtuctureDevelopmentCorporation Ltd,now merged withSIPCOT.Details ofinvestments notreceived.Henceprevious year figuresadopted.
Details ofinvestments notreceived.Henceprevious year figuresadopted.
Though theCorporation isearning profit duringthe last 4years,there is acumulative loss ason 31.3.2011 of` 556.51lakh.Details asreceived fromCorporation
STATEMENT No.14- SECTION-2: DETAILS OF INVESTMENTS UPTO 2011-12
Sl.
No.
Name of Concern Years of
Investment
Type Number
of
shares
Face
value of
each
share
Amount
Invested
Dividend
declared
and
credited
to Govt.
during
the year
Dividend
declared
and not
credited
to Govt.
account
Remarks
Government Companies
(in lakh of Rupees)
Details of Investment Percentage
of
Government
investment
to the total
paid-up
capital
. . . . . .
. .
. .
. .
. .
. .
. .
. .
. .
. .
-Contd.
355
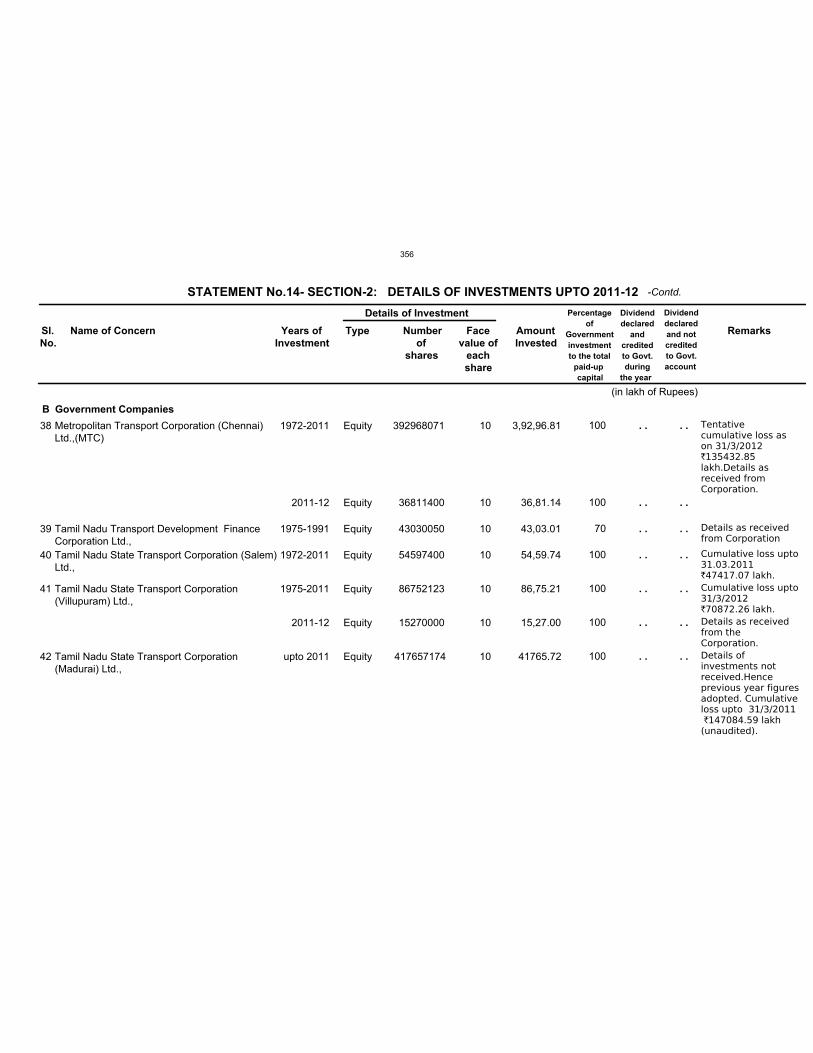
B
38
39
40
41
42
Metropolitan Transport Corporation (Chennai)Ltd.,(MTC)
Tamil Nadu Transport Development FinanceCorporation Ltd.,
Tamil Nadu State Transport Corporation (Salem)Ltd.,
Tamil Nadu State Transport Corporation(Villupuram) Ltd.,
Tamil Nadu State Transport Corporation(Madurai) Ltd.,
1972-2011
2011-12
1975-1991
1972-2011
1975-2011
2011-12
upto 2011
Equity
Equity
Equity
Equity
Equity
Equity
Equity
392968071
36811400
43030050
54597400
86752123
15270000
417657174
10
10
10
10
10
10
10
3,92,96.81
36,81.14
43,03.01
54,59.74
86,75.21
15,27.00
41765.72
100
100
70
100
100
100
100
Tentativecumulative loss ason 31/3/2012`135432.85lakh.Details asreceived fromCorporation.
Details as receivedfrom Corporation
Cumulative loss upto31.03.2011`47417.07 lakh.
Cumulative loss upto31/3/2012`70872.26 lakh.
Details as receivedfrom theCorporation.
Details ofinvestments notreceived.Henceprevious year figuresadopted. Cumulativeloss upto 31/3/2011 `147084.59 lakh(unaudited).
STATEMENT No.14- SECTION-2: DETAILS OF INVESTMENTS UPTO 2011-12
Sl.
No.
Name of Concern Years of
Investment
Type Number
of
shares
Face
value of
each
share
Amount
Invested
Dividend
declared
and
credited
to Govt.
during
the year
Dividend
declared
and not
credited
to Govt.
account
Remarks
Government Companies
(in lakh of Rupees)
Details of Investment Percentage
of
Government
investment
to the total
paid-up
capital
. .
. .
. .
. .
. .
. .
. .
. .
. .
. .
. .
. .
. .
. .
-Contd.
356
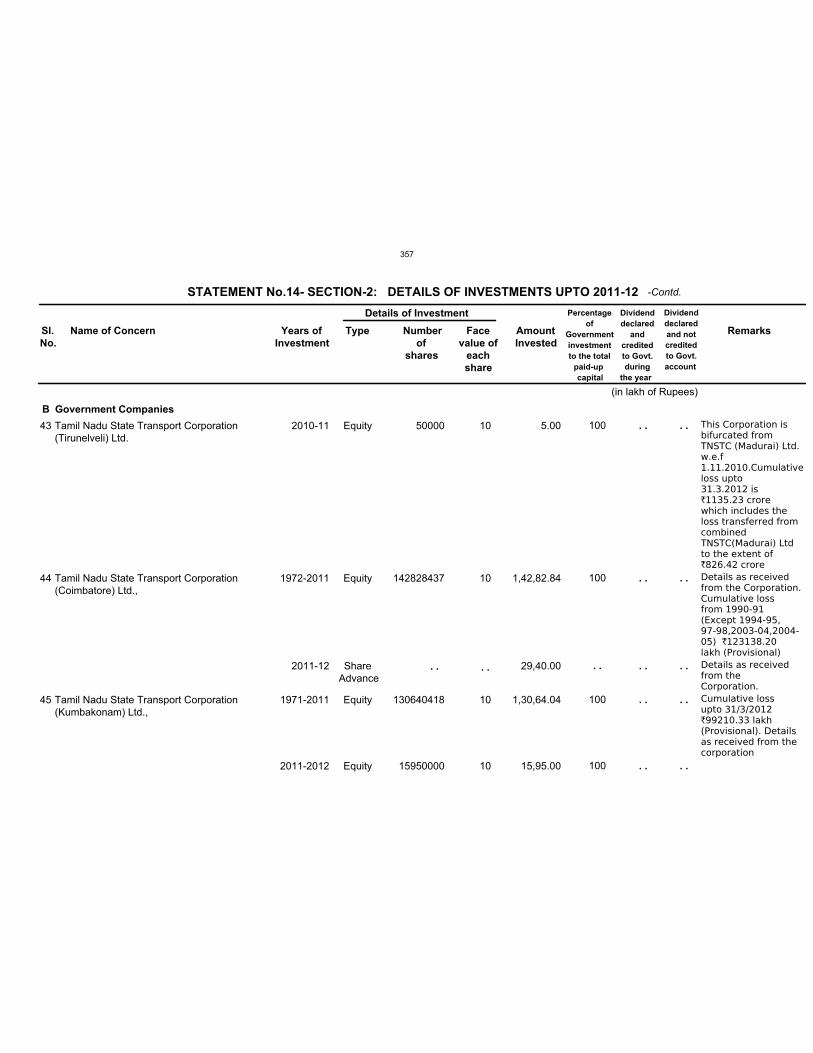
B
43
44
45
Tamil Nadu State Transport Corporation(Tirunelveli) Ltd.
Tamil Nadu State Transport Corporation(Coimbatore) Ltd.,
Tamil Nadu State Transport Corporation(Kumbakonam) Ltd.,
2010-11
1972-2011
2011-12
1971-2011
2011-2012
Equity
Equity
ShareAdvance
Equity
Equity
50000
142828437
130640418
15950000
10
10
10
10
5.00
1,42,82.84
29,40.00
1,30,64.04
15,95.00
100
100
100
100
This Corporation isbifurcated fromTNSTC (Madurai) Ltd.w.e.f1.11.2010.Cumulativeloss upto31.3.2012 is`1135.23 crorewhich includes theloss transferred fromcombinedTNSTC(Madurai) Ltdto the extent of`826.42 crore
Details as receivedfrom the Corporation.Cumulative lossfrom 1990-91(Except 1994-95,97-98,2003-04,2004-05) `123138.20lakh (Provisional)
Details as receivedfrom theCorporation.
Cumulative lossupto 31/3/2012`99210.33 lakh(Provisional). Detailsas received from thecorporation
STATEMENT No.14- SECTION-2: DETAILS OF INVESTMENTS UPTO 2011-12
Sl.
No.
Name of Concern Years of
Investment
Type Number
of
shares
Face
value of
each
share
Amount
Invested
Dividend
declared
and
credited
to Govt.
during
the year
Dividend
declared
and not
credited
to Govt.
account
Remarks
Government Companies
(in lakh of Rupees)
Details of Investment Percentage
of
Government
investment
to the total
paid-up
capital
. . . . . .
. .
. .
. .
. .
. .
. .
. .
. .
. .
. .
-Contd.
357
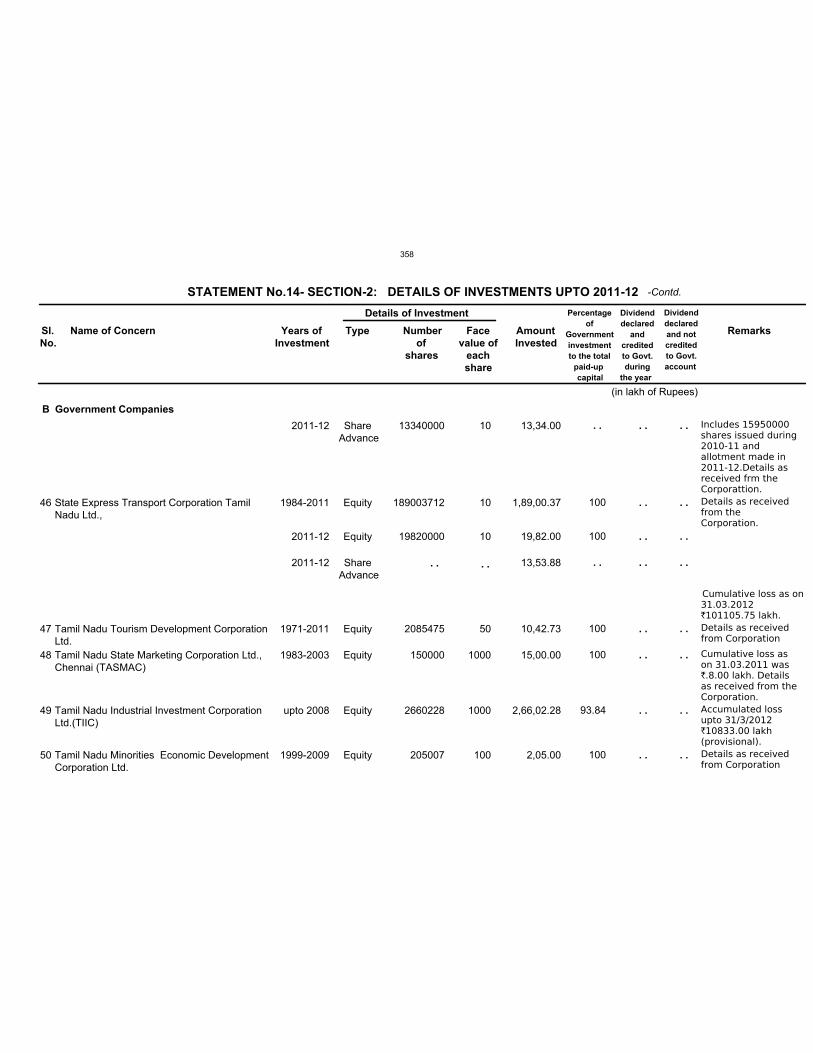
B
46
47
48
49
50
State Express Transport Corporation Tamil Nadu Ltd.,
Tamil Nadu Tourism Development CorporationLtd.
Tamil Nadu State Marketing Corporation Ltd.,Chennai (TASMAC)
Tamil Nadu Industrial Investment CorporationLtd.(TIIC)
Tamil Nadu Minorities Economic DevelopmentCorporation Ltd.
2011-12
1984-2011
2011-12
2011-12
1971-2011
1983-2003
upto 2008
1999-2009
ShareAdvance
Equity
Equity
ShareAdvance
Equity
Equity
Equity
Equity
13340000
189003712
19820000
2085475
150000
2660228
205007
10
10
10
50
1000
1000
100
13,34.00
1,89,00.37
19,82.00
13,53.88
10,42.73
15,00.00
2,66,02.28
2,05.00
100
100
100
100
93.84
100
Includes 15950000shares issued during2010-11 andallotment made in2011-12.Details asreceived frm theCorporattion.
Details as receivedfrom theCorporation.
Cumulative loss as on31.03.2012`101105.75 lakh.
Details as receivedfrom Corporation
Cumulative loss ason 31.03.2011 was`.8.00 lakh. Detailsas received from theCorporation.
Accumulated lossupto 31/3/2012`10833.00 lakh(provisional).
Details as receivedfrom Corporation
STATEMENT No.14- SECTION-2: DETAILS OF INVESTMENTS UPTO 2011-12
Sl.
No.
Name of Concern Years of
Investment
Type Number
of
shares
Face
value of
each
share
Amount
Invested
Dividend
declared
and
credited
to Govt.
during
the year
Dividend
declared
and not
credited
to Govt.
account
Remarks
Government Companies
(in lakh of Rupees)
Details of Investment Percentage
of
Government
investment
to the total
paid-up
capital
. . . .
. .
. .
. .
. .
. .
. .
. .
. .
. .
. .
. .
. .
. .
. .
. .
. .
. .
. .
-Contd.
358
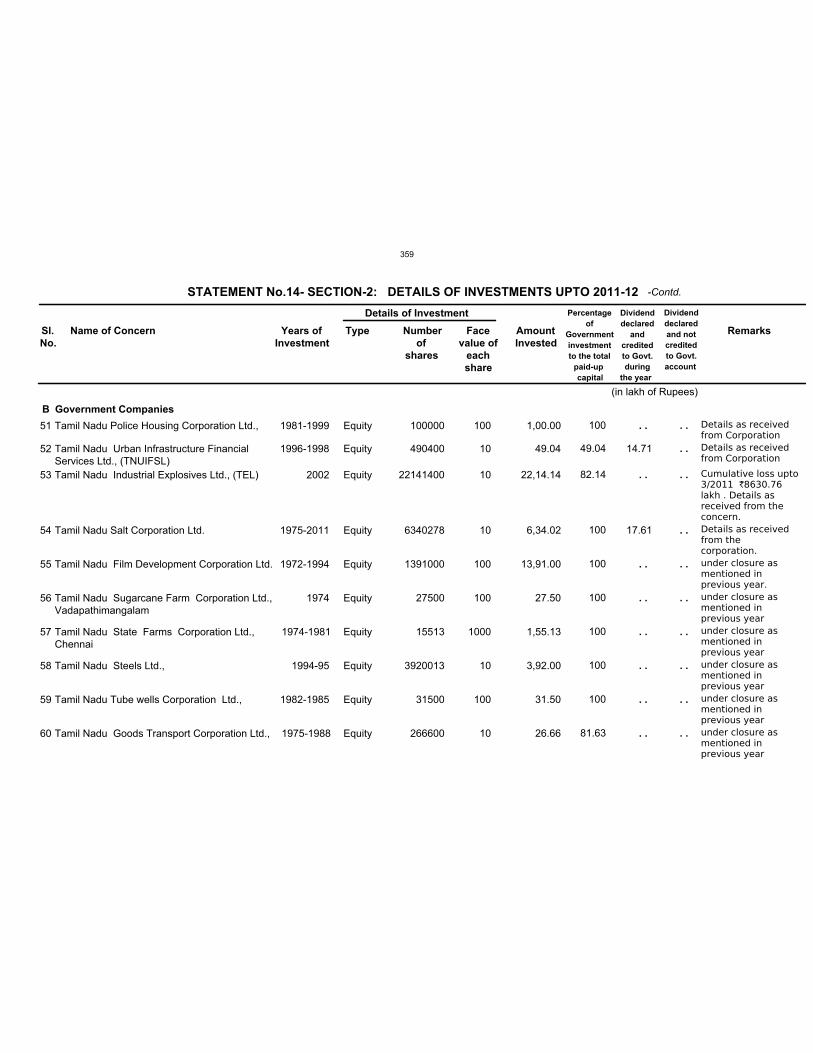
B
51
52
53
54
55
56
57
58
59
60
Tamil Nadu Police Housing Corporation Ltd.,
Tamil Nadu Urban Infrastructure FinancialServices Ltd., (TNUIFSL)
Tamil Nadu Industrial Explosives Ltd., (TEL)
Tamil Nadu Salt Corporation Ltd.
Tamil Nadu Film Development Corporation Ltd.
Tamil Nadu Sugarcane Farm Corporation Ltd.,Vadapathimangalam
Tamil Nadu State Farms Corporation Ltd.,Chennai
Tamil Nadu Steels Ltd.,
Tamil Nadu Tube wells Corporation Ltd.,
Tamil Nadu Goods Transport Corporation Ltd.,
1981-1999
1996-1998
2002
1975-2011
1972-1994
1974
1974-1981
1994-95
1982-1985
1975-1988
Equity
Equity
Equity
Equity
Equity
Equity
Equity
Equity
Equity
Equity
100000
490400
22141400
6340278
1391000
27500
15513
3920013
31500
266600
100
10
10
10
100
100
1000
10
100
10
1,00.00
49.04
22,14.14
6,34.02
13,91.00
27.50
1,55.13
3,92.00
31.50
26.66
100
49.04
82.14
100
100
100
100
100
100
81.63
14.71
17.61
Details as receivedfrom Corporation
Details as receivedfrom Corporation
Cumulative loss upto3/2011 `8630.76lakh . Details asreceived from theconcern.
Details as receivedfrom thecorporation.
under closure asmentioned inprevious year.
under closure asmentioned inprevious year
under closure asmentioned inprevious year
under closure asmentioned inprevious year
under closure asmentioned inprevious year
under closure asmentioned inprevious year
STATEMENT No.14- SECTION-2: DETAILS OF INVESTMENTS UPTO 2011-12
Sl.
No.
Name of Concern Years of
Investment
Type Number
of
shares
Face
value of
each
share
Amount
Invested
Dividend
declared
and
credited
to Govt.
during
the year
Dividend
declared
and not
credited
to Govt.
account
Remarks
Government Companies
(in lakh of Rupees)
Details of Investment Percentage
of
Government
investment
to the total
paid-up
capital
. .
. .
. .
. .
. .
. .
. .
. .
. .
. .
. .
. .
. .
. .
. .
. .
. .
. .
-Contd.
359
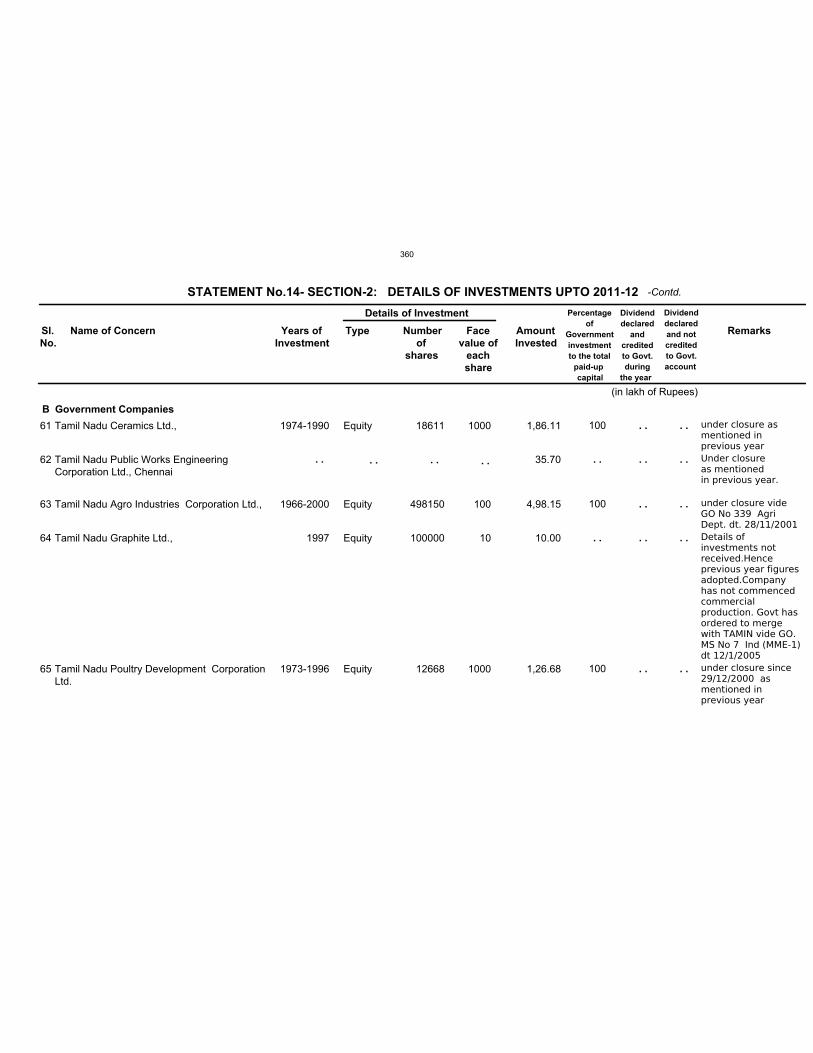
B
61
62
63
64
65
Tamil Nadu Ceramics Ltd.,
Tamil Nadu Public Works EngineeringCorporation Ltd., Chennai
Tamil Nadu Agro Industries Corporation Ltd.,
Tamil Nadu Graphite Ltd.,
Tamil Nadu Poultry Development CorporationLtd.
1974-1990
1966-2000
1997
1973-1996
Equity
Equity
Equity
Equity
18611
498150
100000
12668
1000
100
10
1000
1,86.11
35.70
4,98.15
10.00
1,26.68
100
100
100
under closure asmentioned inprevious year
Under closureas mentionedin previous year.
under closure videGO No 339 AgriDept. dt. 28/11/2001
Details ofinvestments notreceived.Henceprevious year figuresadopted.Companyhas not commencedcommercialproduction. Govt hasordered to mergewith TAMIN vide GO.MS No 7 Ind (MME-1)dt 12/1/2005
under closure since29/12/2000 asmentioned inprevious year
STATEMENT No.14- SECTION-2: DETAILS OF INVESTMENTS UPTO 2011-12
Sl.
No.
Name of Concern Years of
Investment
Type Number
of
shares
Face
value of
each
share
Amount
Invested
Dividend
declared
and
credited
to Govt.
during
the year
Dividend
declared
and not
credited
to Govt.
account
Remarks
Government Companies
(in lakh of Rupees)
Details of Investment Percentage
of
Government
investment
to the total
paid-up
capital
. . . . . .
. .
. .
. .
. .
. .
. .
. .
. .
. .
. .
. .
. . . .
-Contd.
360
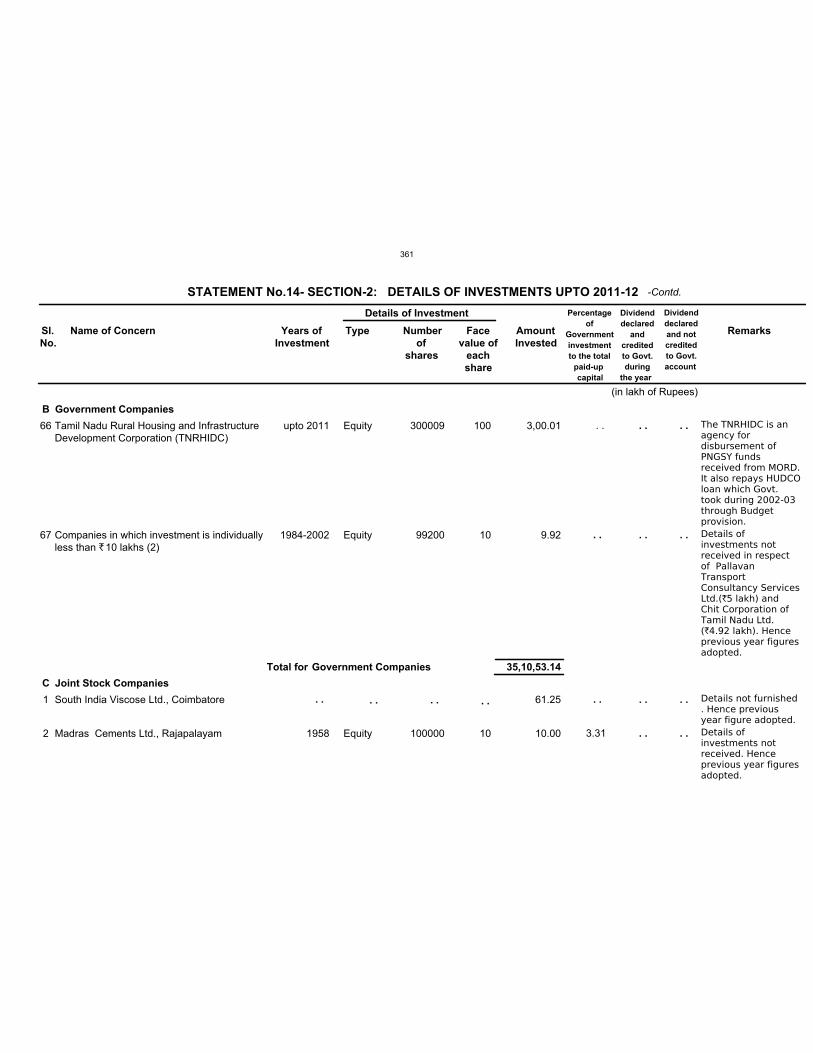
B
C
66
67
1
2
Tamil Nadu Rural Housing and InfrastructureDevelopment Corporation (TNRHIDC)
Companies in which investment is individuallyless than ̀10 lakhs (2)
South India Viscose Ltd., Coimbatore
Madras Cements Ltd., Rajapalayam
upto 2011
1984-2002
1958
Equity
Equity
Equity
300009
99200
100000
100
10
10
3,00.01
9.92
61.25
10.00
. .
3.31
The TNRHIDC is anagency fordisbursement ofPNGSY fundsreceived from MORD.It also repays HUDCOloan which Govt.took during 2002-03through Budgetprovision.
Details ofinvestments notreceived in respectof PallavanTransportConsultancy ServicesLtd.(`5 lakh) andChit Corporation ofTamil Nadu Ltd.(`4.92 lakh). Henceprevious year figuresadopted.
Details not furnished. Hence previousyear figure adopted.
Details ofinvestments notreceived. Henceprevious year figuresadopted.
STATEMENT No.14- SECTION-2: DETAILS OF INVESTMENTS UPTO 2011-12
Sl.
No.
Name of Concern Years of
Investment
Type Number
of
shares
Face
value of
each
share
Amount
Invested
Dividend
declared
and
credited
to Govt.
during
the year
Dividend
declared
and not
credited
to Govt.
account
Remarks
Government Companies
Joint Stock Companies
35,10,53.14Total for Government Companies
(in lakh of Rupees)
Details of Investment Percentage
of
Government
investment
to the total
paid-up
capital
. . . .
. .
. .
. .
. .
. .
. .
. .
. .
. .
. .
. . . .
-Contd.
361
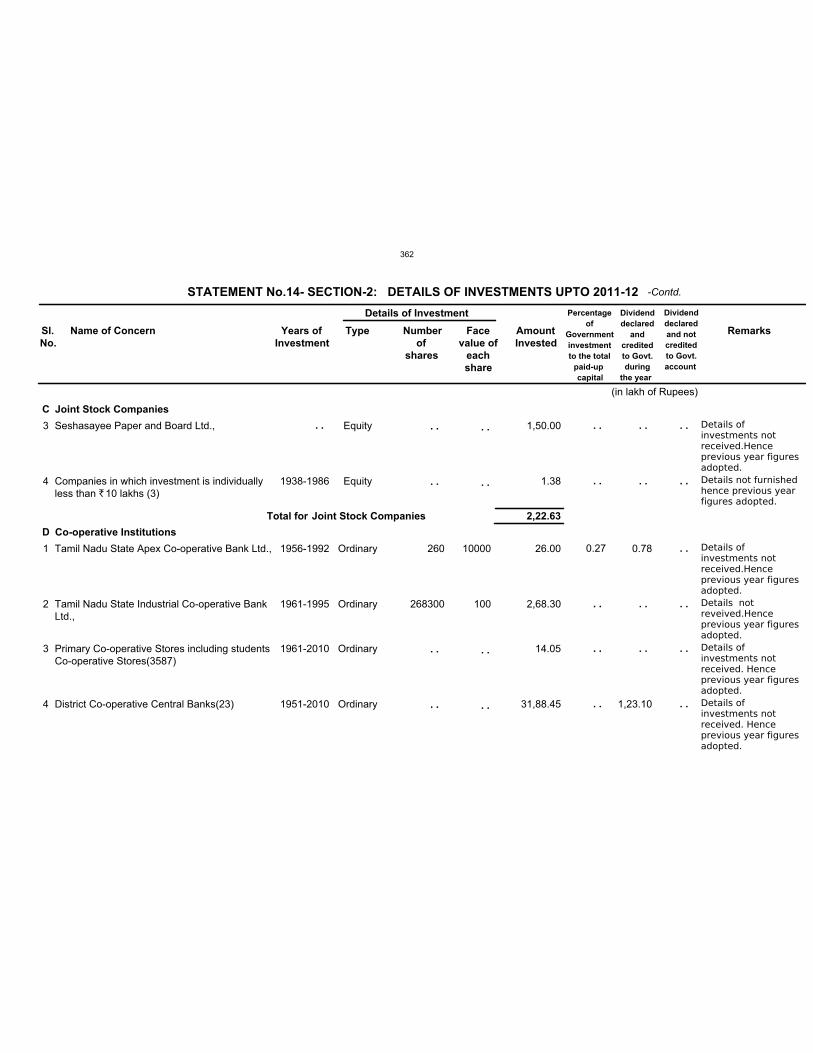
C
D
3
4
1
2
3
4
Seshasayee Paper and Board Ltd.,
Companies in which investment is individuallyless than ̀10 lakhs (3)
Tamil Nadu State Apex Co-operative Bank Ltd.,
Tamil Nadu State Industrial Co-operative BankLtd.,
Primary Co-operative Stores including studentsCo-operative Stores(3587)
District Co-operative Central Banks(23)
1938-1986
1956-1992
1961-1995
1961-2010
1951-2010
Equity
Equity
Ordinary
Ordinary
Ordinary
Ordinary
260
268300
10000
100
1,50.00
1.38
26.00
2,68.30
14.05
31,88.45
0.27 0.78
1,23.10
Details ofinvestments notreceived.Henceprevious year figuresadopted.
Details not furnishedhence previous yearfigures adopted.
Details ofinvestments notreceived.Henceprevious year figuresadopted.
Details notreveived.Henceprevious year figuresadopted.
Details ofinvestments notreceived. Henceprevious year figuresadopted.
Details ofinvestments notreceived. Henceprevious year figuresadopted.
STATEMENT No.14- SECTION-2: DETAILS OF INVESTMENTS UPTO 2011-12
Sl.
No.
Name of Concern Years of
Investment
Type Number
of
shares
Face
value of
each
share
Amount
Invested
Dividend
declared
and
credited
to Govt.
during
the year
Dividend
declared
and not
credited
to Govt.
account
Remarks
Joint Stock Companies
Co-operative Institutions
2,22.63Total for Joint Stock Companies
(in lakh of Rupees)
Details of Investment Percentage
of
Government
investment
to the total
paid-up
capital
. .
. .
. .
. .
. .
. .
. .
. .
. .
. .
. .
. .
. .
. .
. .
. .
. .
. .
. .
. .
. .
. .
. .
. .
-Contd.
362
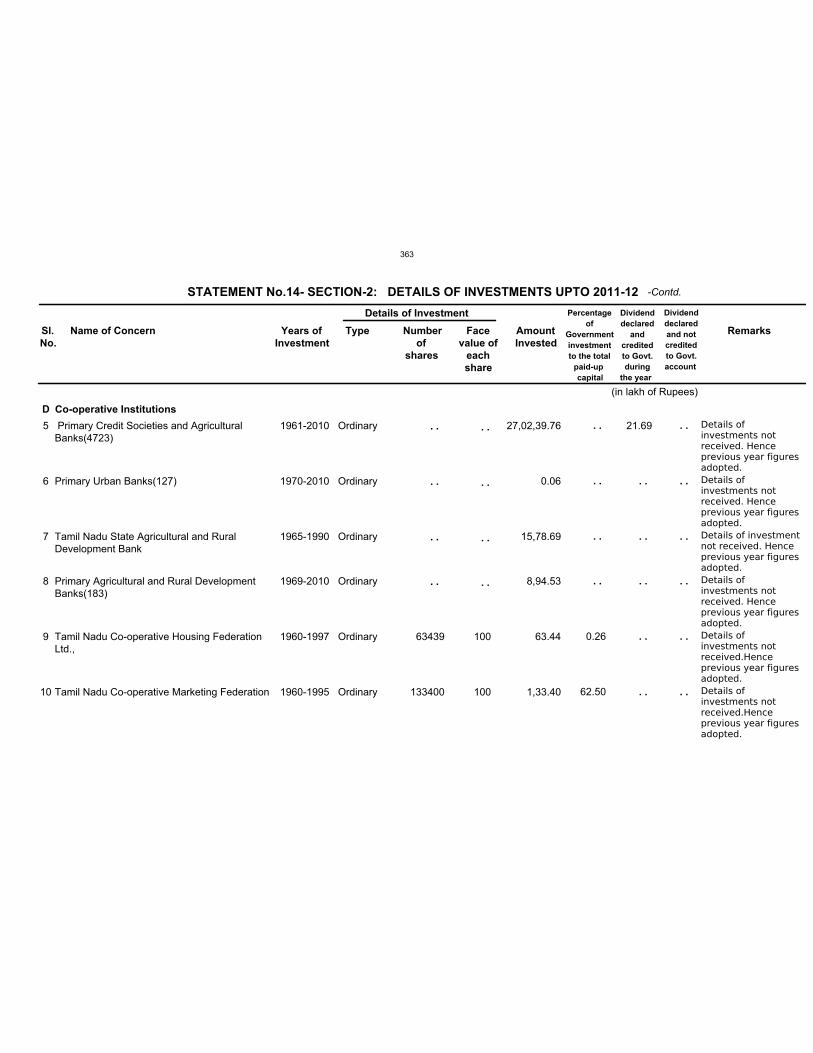
D
5
6
7
8
9
10
Primary Credit Societies and AgriculturalBanks(4723)
Primary Urban Banks(127)
Tamil Nadu State Agricultural and RuralDevelopment Bank
Primary Agricultural and Rural DevelopmentBanks(183)
Tamil Nadu Co-operative Housing FederationLtd.,
Tamil Nadu Co-operative Marketing Federation
1961-2010
1970-2010
1965-1990
1969-2010
1960-1997
1960-1995
Ordinary
Ordinary
Ordinary
Ordinary
Ordinary
Ordinary
63439
133400
100
100
27,02,39.76
0.06
15,78.69
8,94.53
63.44
1,33.40
0.26
62.50
21.69 Details ofinvestments notreceived. Henceprevious year figuresadopted.
Details ofinvestments notreceived. Henceprevious year figuresadopted.
Details of investmentnot received. Henceprevious year figuresadopted.
Details ofinvestments notreceived. Henceprevious year figuresadopted.
Details ofinvestments notreceived.Henceprevious year figuresadopted.
Details ofinvestments notreceived.Henceprevious year figuresadopted.
STATEMENT No.14- SECTION-2: DETAILS OF INVESTMENTS UPTO 2011-12
Sl.
No.
Name of Concern Years of
Investment
Type Number
of
shares
Face
value of
each
share
Amount
Invested
Dividend
declared
and
credited
to Govt.
during
the year
Dividend
declared
and not
credited
to Govt.
account
Remarks
Co-operative Institutions
(in lakh of Rupees)
Details of Investment Percentage
of
Government
investment
to the total
paid-up
capital
. .
. .
. .
. .
. .
. .
. .
. .
. .
. .
. .
. .
. .
. .
. .
. .
. .
. .
. .
. .
. .
. .
. .
-Contd.
363
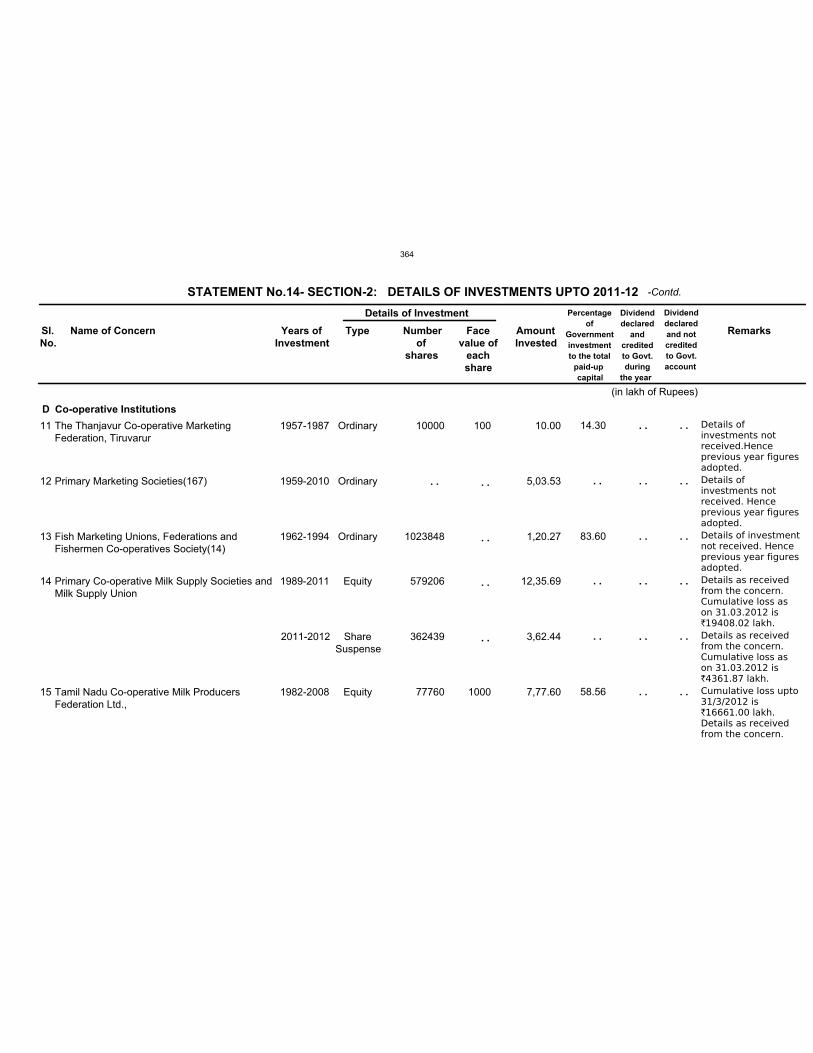
D
11
12
13
14
15
The Thanjavur Co-operative MarketingFederation, Tiruvarur
Primary Marketing Societies(167)
Fish Marketing Unions, Federations andFishermen Co-operatives Society(14)
Primary Co-operative Milk Supply Societies andMilk Supply Union
Tamil Nadu Co-operative Milk ProducersFederation Ltd.,
1957-1987
1959-2010
1962-1994
1989-2011
2011-2012
1982-2008
Ordinary
Ordinary
Ordinary
Equity
ShareSuspense
Equity
10000
1023848
579206
362439
77760
100
1000
10.00
5,03.53
1,20.27
12,35.69
3,62.44
7,77.60
14.30
83.60
58.56
Details ofinvestments notreceived.Henceprevious year figuresadopted.
Details ofinvestments notreceived. Henceprevious year figuresadopted.
Details of investmentnot received. Henceprevious year figuresadopted.
Details as receivedfrom the concern.Cumulative loss ason 31.03.2012 is`19408.02 lakh.
Details as receivedfrom the concern.Cumulative loss ason 31.03.2012 is`4361.87 lakh.
Cumulative loss upto31/3/2012 is`16661.00 lakh.Details as receivedfrom the concern.
STATEMENT No.14- SECTION-2: DETAILS OF INVESTMENTS UPTO 2011-12
Sl.
No.
Name of Concern Years of
Investment
Type Number
of
shares
Face
value of
each
share
Amount
Invested
Dividend
declared
and
credited
to Govt.
during
the year
Dividend
declared
and not
credited
to Govt.
account
Remarks
Co-operative Institutions
(in lakh of Rupees)
Details of Investment Percentage
of
Government
investment
to the total
paid-up
capital
. . . .
. .
. .
. .
. .
. .
. .
. .
. .
. .
. .
. .
. .
. .
. .
. .
. .
. .
. .
-Contd.
364
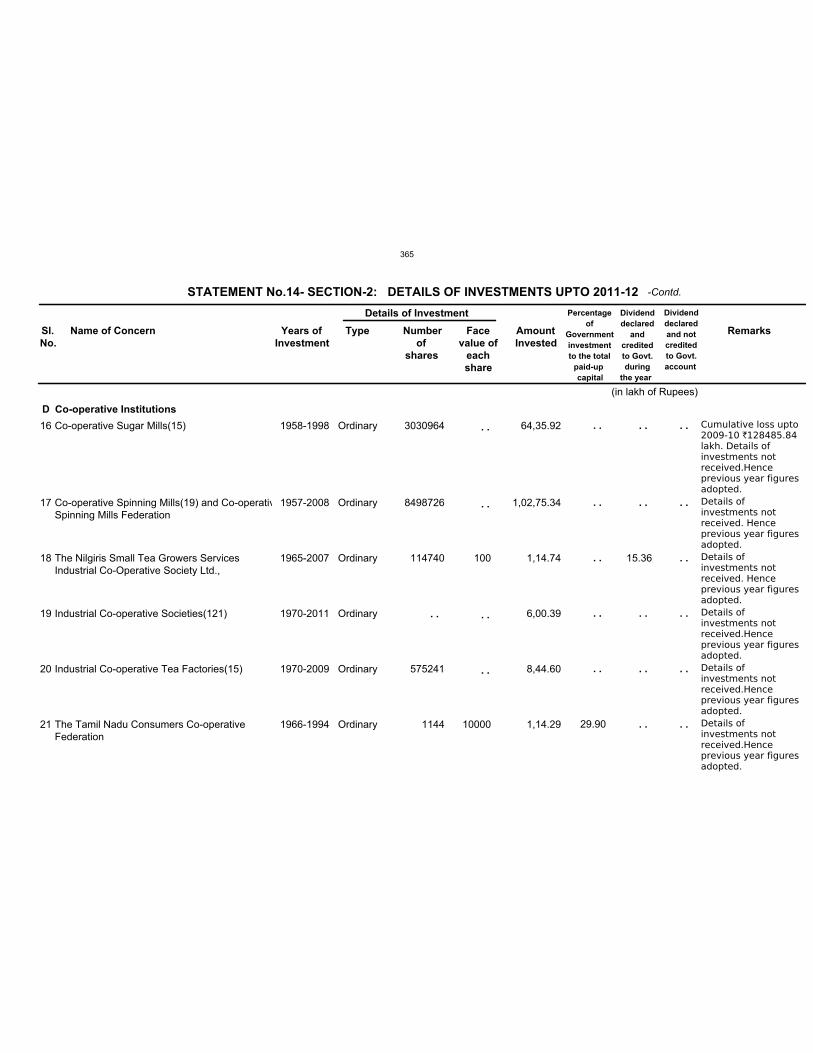
D
16
17
18
19
20
21
Co-operative Sugar Mills(15)
Co-operative Spinning Mills(19) and Co-operativSpinning Mills Federation
The Nilgiris Small Tea Growers ServicesIndustrial Co-Operative Society Ltd.,
Industrial Co-operative Societies(121)
Industrial Co-operative Tea Factories(15)
The Tamil Nadu Consumers Co-operativeFederation
1958-1998
1957-2008
1965-2007
1970-2011
1970-2009
1966-1994
Ordinary
Ordinary
Ordinary
Ordinary
Ordinary
Ordinary
3030964
8498726
114740
575241
1144
100
10000
64,35.92
1,02,75.34
1,14.74
6,00.39
8,44.60
1,14.29 29.90
15.36
Cumulative loss upto2009-10 `128485.84lakh. Details ofinvestments notreceived.Henceprevious year figuresadopted.
Details ofinvestments notreceived. Henceprevious year figuresadopted.
Details ofinvestments notreceived. Henceprevious year figuresadopted.
Details ofinvestments notreceived.Henceprevious year figuresadopted.
Details ofinvestments notreceived.Henceprevious year figuresadopted.
Details ofinvestments notreceived.Henceprevious year figuresadopted.
STATEMENT No.14- SECTION-2: DETAILS OF INVESTMENTS UPTO 2011-12
Sl.
No.
Name of Concern Years of
Investment
Type Number
of
shares
Face
value of
each
share
Amount
Invested
Dividend
declared
and
credited
to Govt.
during
the year
Dividend
declared
and not
credited
to Govt.
account
Remarks
Co-operative Institutions
(in lakh of Rupees)
Details of Investment Percentage
of
Government
investment
to the total
paid-up
capital
. .
. .
. .
. .
. .
. .
. .
. .
. .
. .
. .
. .
. .
. .
. .
. .
. .
. .
. .
. .
. .
-Contd.
365
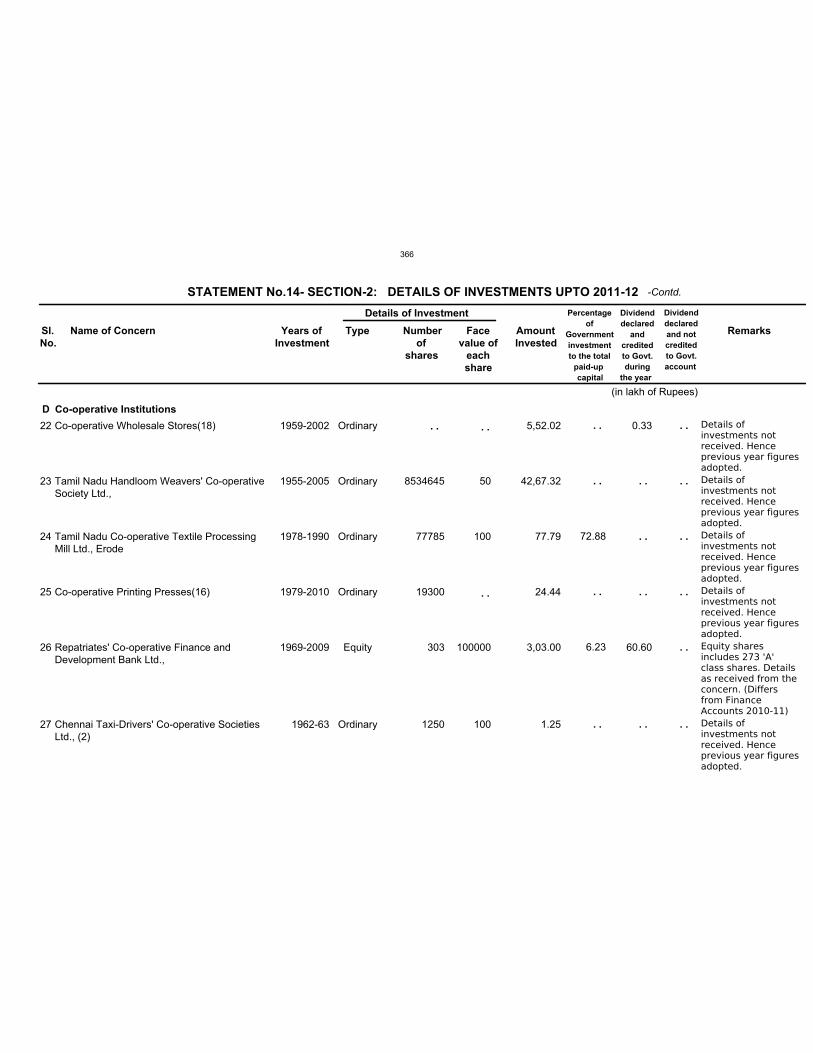
D
22
23
24
25
26
27
Co-operative Wholesale Stores(18)
Tamil Nadu Handloom Weavers' Co-operativeSociety Ltd.,
Tamil Nadu Co-operative Textile ProcessingMill Ltd., Erode
Co-operative Printing Presses(16)
Repatriates' Co-operative Finance andDevelopment Bank Ltd.,
Chennai Taxi-Drivers' Co-operative SocietiesLtd., (2)
1959-2002
1955-2005
1978-1990
1979-2010
1969-2009
1962-63
Ordinary
Ordinary
Ordinary
Ordinary
Equity
Ordinary
8534645
77785
19300
303
1250
50
100
100000
100
5,52.02
42,67.32
77.79
24.44
3,03.00
1.25
72.88
6.23
0.33
60.60
Details ofinvestments notreceived. Henceprevious year figuresadopted.
Details ofinvestments notreceived. Henceprevious year figuresadopted.
Details ofinvestments notreceived. Henceprevious year figuresadopted.
Details ofinvestments notreceived. Henceprevious year figuresadopted.
Equity sharesincludes 273 'A'class shares. Detailsas received from theconcern. (Differsfrom FinanceAccounts 2010-11)
Details ofinvestments notreceived. Henceprevious year figuresadopted.
STATEMENT No.14- SECTION-2: DETAILS OF INVESTMENTS UPTO 2011-12
Sl.
No.
Name of Concern Years of
Investment
Type Number
of
shares
Face
value of
each
share
Amount
Invested
Dividend
declared
and
credited
to Govt.
during
the year
Dividend
declared
and not
credited
to Govt.
account
Remarks
Co-operative Institutions
(in lakh of Rupees)
Details of Investment Percentage
of
Government
investment
to the total
paid-up
capital
. . . .
. .
. .
. .
. .
. .
. .
. .
. .
. .
. .
. .
. .
. .
. .
. .
-Contd.
366
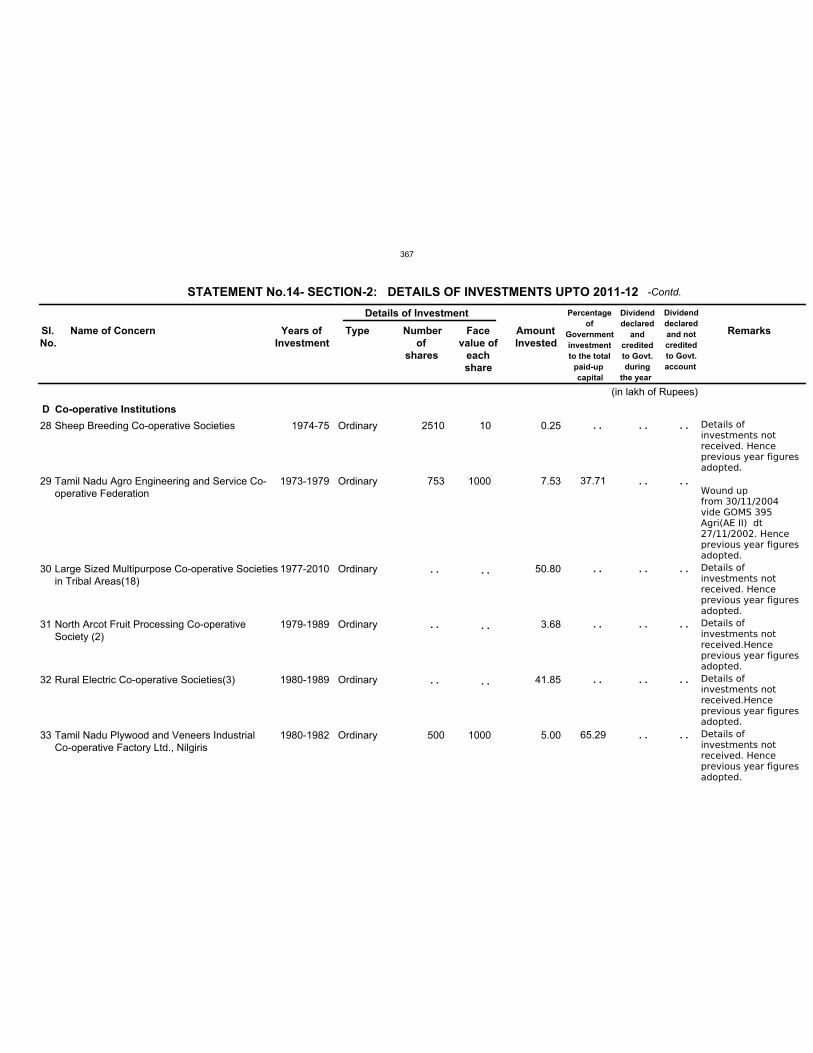
D
28
29
30
31
32
33
Sheep Breeding Co-operative Societies
Tamil Nadu Agro Engineering and Service Co-operative Federation
Large Sized Multipurpose Co-operative Societiesin Tribal Areas(18)
North Arcot Fruit Processing Co-operativeSociety (2)
Rural Electric Co-operative Societies(3)
Tamil Nadu Plywood and Veneers Industrial Co-operative Factory Ltd., Nilgiris
1974-75
1973-1979
1977-2010
1979-1989
1980-1989
1980-1982
Ordinary
Ordinary
Ordinary
Ordinary
Ordinary
Ordinary
2510
753
500
10
1000
1000
0.25
7.53
50.80
3.68
41.85
5.00
37.71
65.29
Details ofinvestments notreceived. Henceprevious year figuresadopted.
Wound upfrom 30/11/2004vide GOMS 395Agri(AE II) dt27/11/2002. Henceprevious year figuresadopted.
Details ofinvestments notreceived. Henceprevious year figuresadopted.
Details ofinvestments notreceived.Henceprevious year figuresadopted.
Details ofinvestments notreceived.Henceprevious year figuresadopted.
Details ofinvestments notreceived. Henceprevious year figuresadopted.
STATEMENT No.14- SECTION-2: DETAILS OF INVESTMENTS UPTO 2011-12
Sl.
No.
Name of Concern Years of
Investment
Type Number
of
shares
Face
value of
each
share
Amount
Invested
Dividend
declared
and
credited
to Govt.
during
the year
Dividend
declared
and not
credited
to Govt.
account
Remarks
Co-operative Institutions
(in lakh of Rupees)
Details of Investment Percentage
of
Government
investment
to the total
paid-up
capital
. .
. .
. .
. .
. .
. .
. .
. .
. .
. .
. .
. .
. .
. .
. .
. .
. .
. .
. .
. .
. .
. .
-Contd.
367
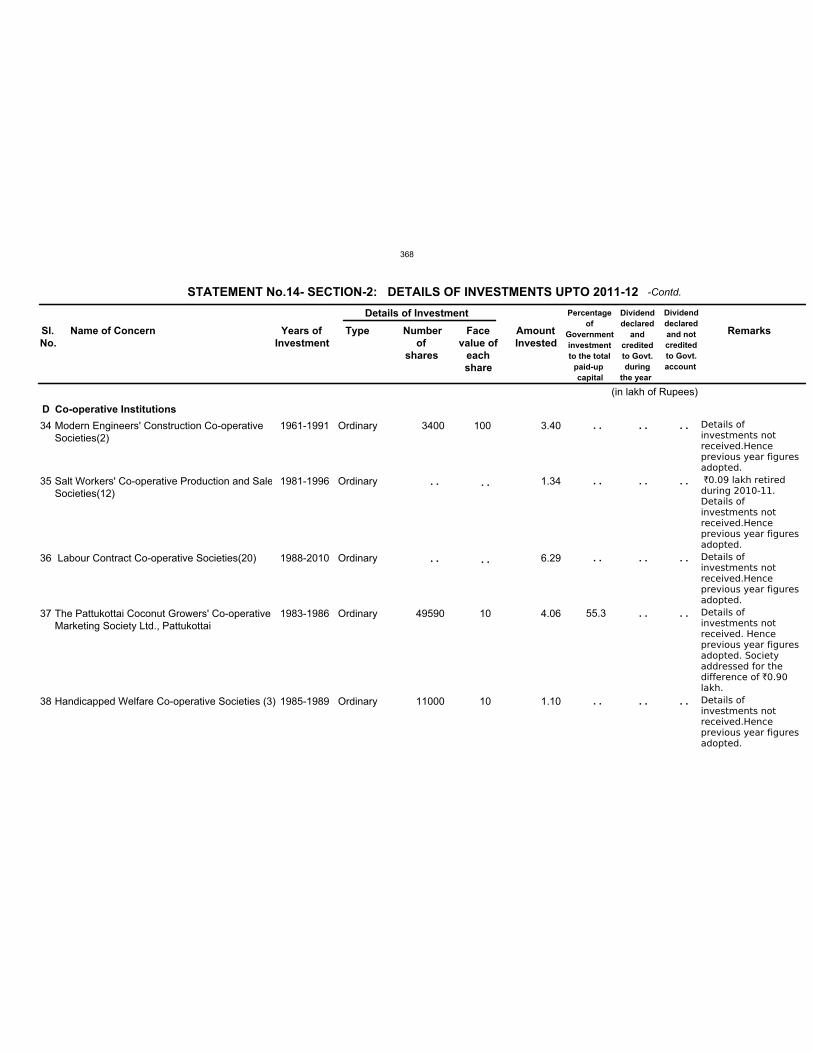
D
34
35
36
37
38
Modern Engineers' Construction Co-operativeSocieties(2)
Salt Workers' Co-operative Production and SaleSocieties(12)
Labour Contract Co-operative Societies(20)
The Pattukottai Coconut Growers' Co-operativeMarketing Society Ltd., Pattukottai
Handicapped Welfare Co-operative Societies (3)
1961-1991
1981-1996
1988-2010
1983-1986
1985-1989
Ordinary
Ordinary
Ordinary
Ordinary
Ordinary
3400
49590
11000
100
10
10
3.40
1.34
6.29
4.06
1.10
55.3
Details ofinvestments notreceived.Henceprevious year figuresadopted.
`0.09 lakh retiredduring 2010-11.Details ofinvestments notreceived.Henceprevious year figuresadopted.
Details ofinvestments notreceived.Henceprevious year figuresadopted.
Details ofinvestments notreceived. Henceprevious year figuresadopted. Societyaddressed for thedifference of `0.90lakh.
Details ofinvestments notreceived.Henceprevious year figuresadopted.
STATEMENT No.14- SECTION-2: DETAILS OF INVESTMENTS UPTO 2011-12
Sl.
No.
Name of Concern Years of
Investment
Type Number
of
shares
Face
value of
each
share
Amount
Invested
Dividend
declared
and
credited
to Govt.
during
the year
Dividend
declared
and not
credited
to Govt.
account
Remarks
Co-operative Institutions
(in lakh of Rupees)
Details of Investment Percentage
of
Government
investment
to the total
paid-up
capital
. .
. .
. .
. .
. .
. .
. .
. .
. .
. .
. .
. .
. .
. .
. .
. .
. .
. .
-Contd.
368
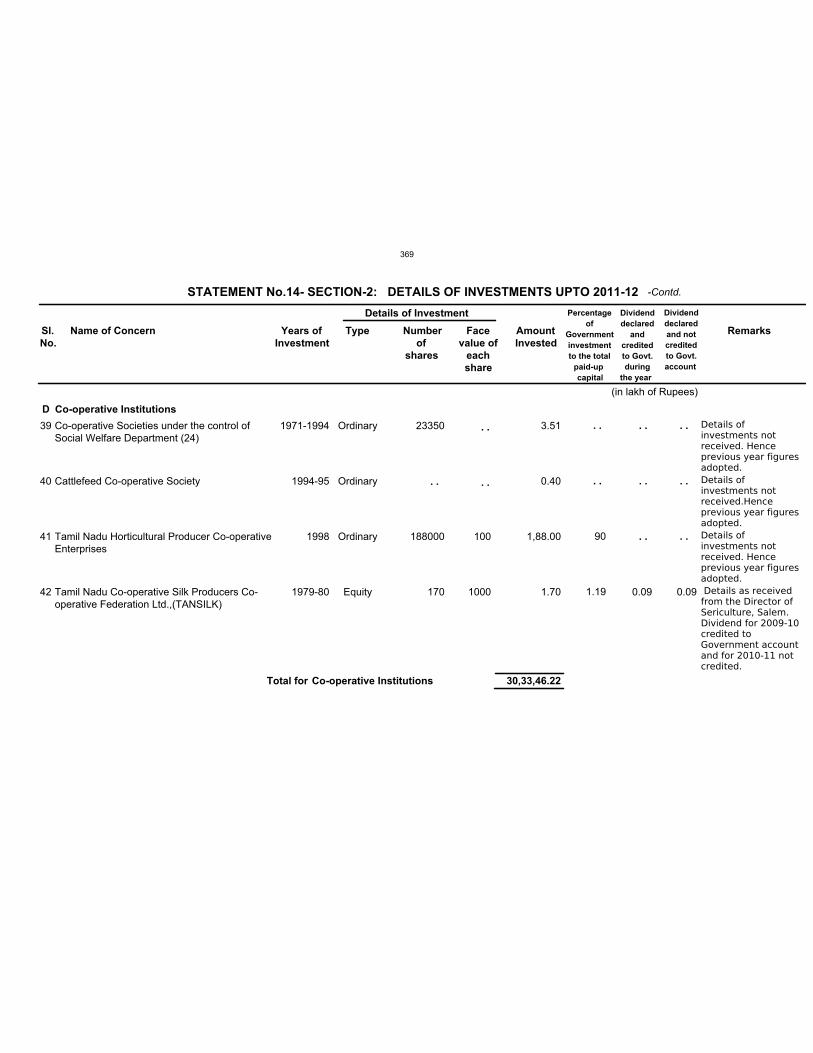
D
39
40
41
42
Co-operative Societies under the control ofSocial Welfare Department (24)
Cattlefeed Co-operative Society
Tamil Nadu Horticultural Producer Co-operativeEnterprises
Tamil Nadu Co-operative Silk Producers Co-operative Federation Ltd.,(TANSILK)
1971-1994
1994-95
1998
1979-80
Ordinary
Ordinary
Ordinary
Equity
23350
188000
170
100
1000
3.51
0.40
1,88.00
1.70
90
1.19 0.09 0.09
Details ofinvestments notreceived. Henceprevious year figuresadopted.
Details ofinvestments notreceived.Henceprevious year figuresadopted.
Details ofinvestments notreceived. Henceprevious year figuresadopted.
Details as receivedfrom the Director ofSericulture, Salem.Dividend for 2009-10credited toGovernment accountand for 2010-11 notcredited.
STATEMENT No.14- SECTION-2: DETAILS OF INVESTMENTS UPTO 2011-12
Sl.
No.
Name of Concern Years of
Investment
Type Number
of
shares
Face
value of
each
share
Amount
Invested
Dividend
declared
and
credited
to Govt.
during
the year
Dividend
declared
and not
credited
to Govt.
account
Remarks
Co-operative Institutions
30,33,46.22Total for Co-operative Institutions
(in lakh of Rupees)
Details of Investment Percentage
of
Government
investment
to the total
paid-up
capital
. .
. .
. .
. .
. .
. .
. .
. .
. .
. .
. .
-Contd.
369
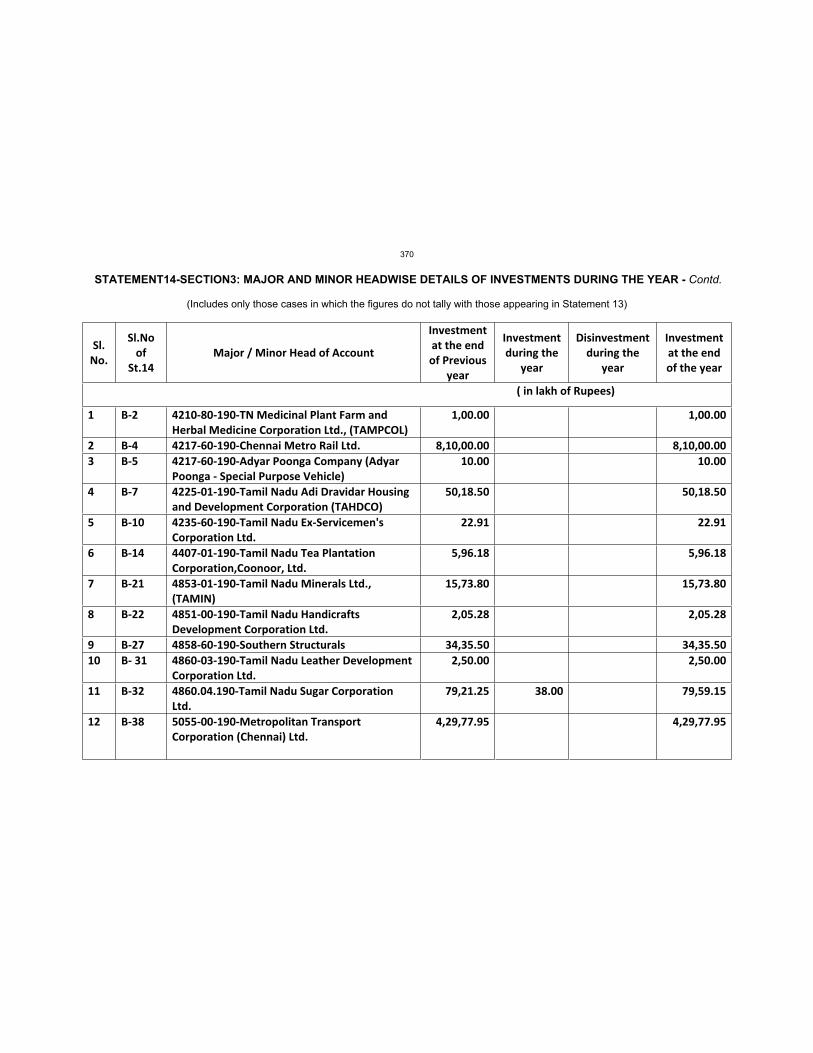
STATEMENT14-SECTION3: MAJOR AND MINOR HEADWISE DETAILS OF INVESTMENTS DURING THE YEAR - Contd.
(Includes only those cases in which the figures do not tally with those appearing in Statement 13)
Sl.
No.
Sl.No
of
St.14
Major / Minor Head of Account
Investment
at the end
of Previous
year
Investment
during the
year
Disinvestment
during the
year
Investment
at the end
of the year
( in lakh of Rupees)
1 B 2 4210 80 190 TN Medicinal Plant Farm and
Herbal Medicine Corporation Ltd., (TAMPCOL)
1,00.00 1,00.00
2 B 4 4217 60 190 Chennai Metro Rail Ltd. 8,10,00.00 8,10,00.00
3 B 5 4217 60 190 Adyar Poonga Company (Adyar
Poonga Special Purpose Vehicle)
10.00 10.00
4 B 7 4225 01 190 Tamil Nadu Adi Dravidar Housing
and Development Corporation (TAHDCO)
50,18.50 50,18.50
5 B 10 4235 60 190 Tamil Nadu Ex Servicemen's
Corporation Ltd.
22.91 22.91
6 B 14 4407 01 190 Tamil Nadu Tea Plantation
Corporation,Coonoor, Ltd.
5,96.18 5,96.18
7 B 21 4853 01 190 Tamil Nadu Minerals Ltd.,
(TAMIN)
15,73.80 15,73.80
8 B 22 4851 00 190 Tamil Nadu Handicrafts
Development Corporation Ltd.
2,05.28 2,05.28
9 B 27 4858 60 190 Southern Structurals 34,35.50 34,35.50
10 B 31 4860 03 190 Tamil Nadu Leather Development
Corporation Ltd.
2,50.00 2,50.00
11 B 32 4860.04.190 Tamil Nadu Sugar Corporation
Ltd.
79,21.25 38.00 79,59.15
12 B 38 5055 00 190 Metropolitan Transport
Corporation (Chennai) Ltd.
4,29,77.95 4,29,77.95
370
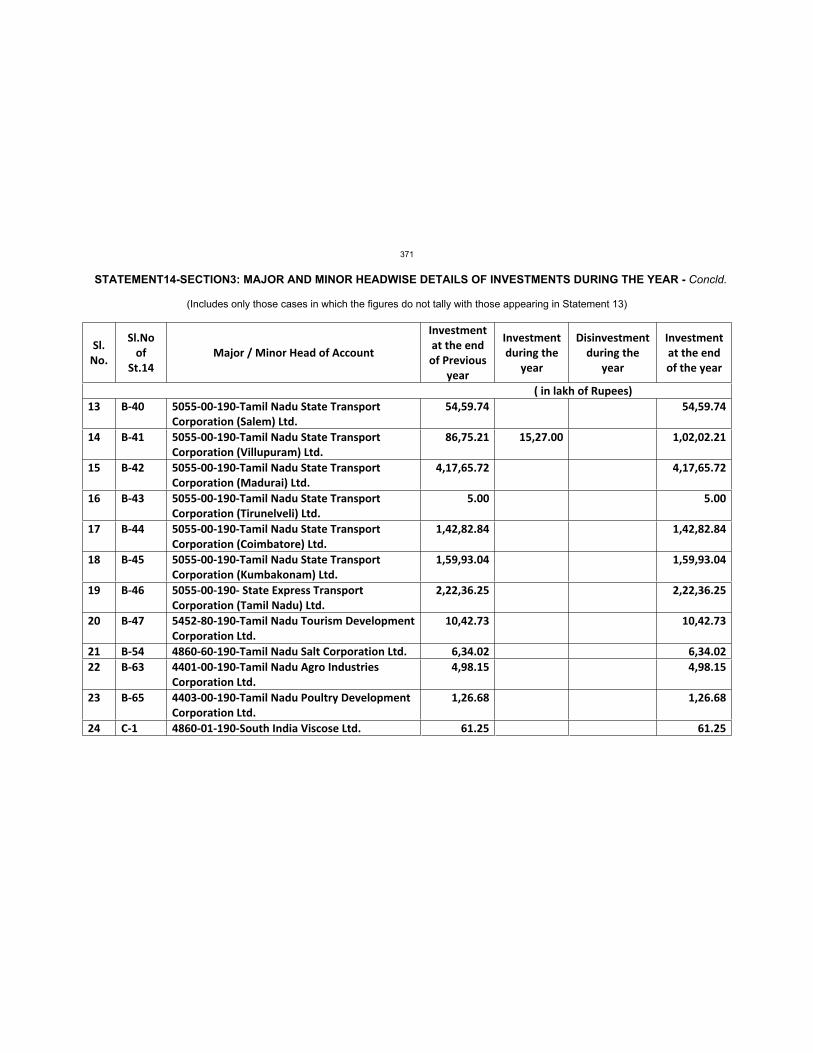
STATEMENT14-SECTION3: MAJOR AND MINOR HEADWISE DETAILS OF INVESTMENTS DURING THE YEAR - Concld.
(Includes only those cases in which the figures do not tally with those appearing in Statement 13)
Sl.
No.
Sl.No
of
St.14
Major / Minor Head of Account
Investment
at the end
of Previous
year
Investment
during the
year
Disinvestment
during the
year
Investment
at the end
of the year
( in lakh of Rupees)
13 B 40 5055 00 190 Tamil Nadu State Transport
Corporation (Salem) Ltd.
54,59.74 54,59.74
14 B 41 5055 00 190 Tamil Nadu State Transport
Corporation (Villupuram) Ltd.
86,75.21 15,27.00 1,02,02.21
15 B 42 5055 00 190 Tamil Nadu State Transport
Corporation (Madurai) Ltd.
4,17,65.72 4,17,65.72
16 B 43 5055 00 190 Tamil Nadu State Transport
Corporation (Tirunelveli) Ltd.
5.00 5.00
17 B 44 5055 00 190 Tamil Nadu State Transport
Corporation (Coimbatore) Ltd.
1,42,82.84 1,42,82.84
18 B 45 5055 00 190 Tamil Nadu State Transport
Corporation (Kumbakonam) Ltd.
1,59,93.04 1,59,93.04
19 B 46 5055 00 190 State Express Transport
Corporation (Tamil Nadu) Ltd.
2,22,36.25 2,22,36.25
20 B 47 5452 80 190 Tamil Nadu Tourism Development
Corporation Ltd.
10,42.73 10,42.73
21 B 54 4860 60 190 Tamil Nadu Salt Corporation Ltd. 6,34.02 6,34.02
22 B 63 4401 00 190 Tamil Nadu Agro Industries
Corporation Ltd.
4,98.15 4,98.15
23 B 65 4403 00 190 Tamil Nadu Poultry Development
Corporation Ltd.
1,26.68 1,26.68
24 C 1 4860 01 190 South India Viscose Ltd. 61.25 61.25
371
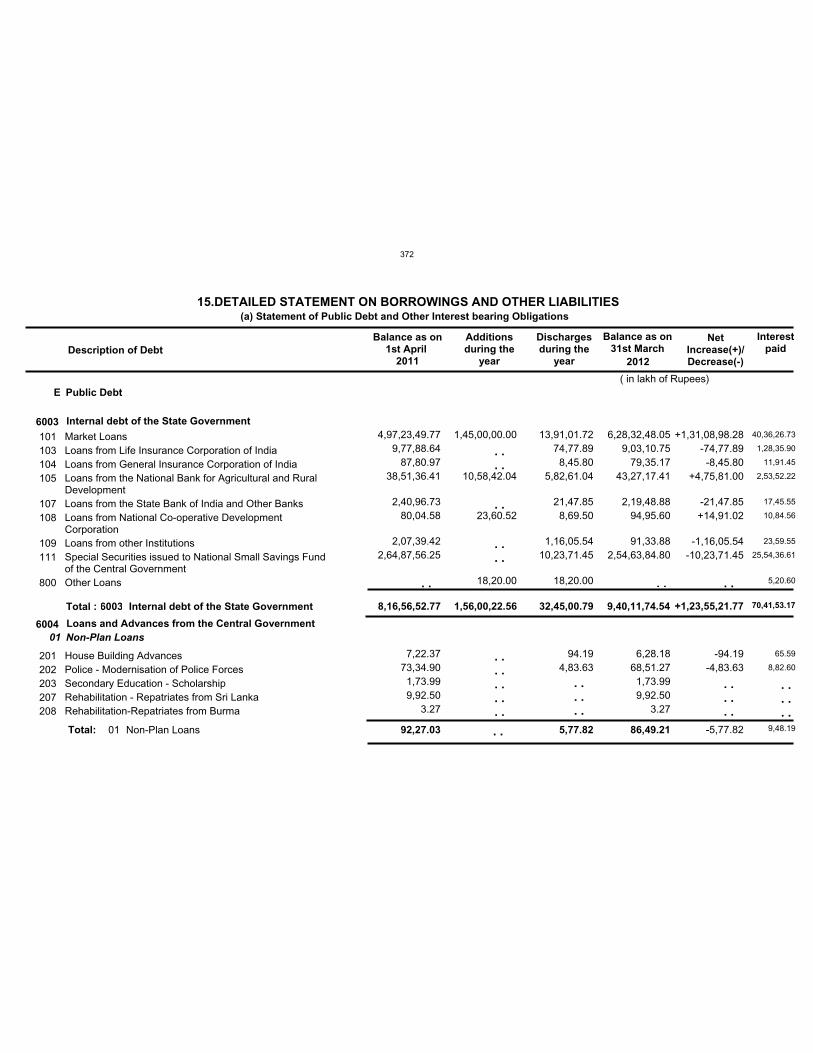
E
6003
6004
8,16,56,52.77 1,56,00,22.56 32,45,00.79 9,40,11,74.54
01
92,27.03 5,77.82 86,49.21
101103104105
107108
109111
800
201202203207208
4,97,23,49.77 9,77,88.64
87,80.97 38,51,36.41
2,40,96.73 80,04.58
2,07,39.42 2,64,87,56.25
7,22.37 73,34.90
1,73.99 9,92.50
3.27
1,45,00,00.00
10,58,42.04
23,60.52
18,20.00
13,91,01.72 74,77.89
8,45.80 5,82,61.04
21,47.85 8,69.50
1,16,05.54 10,23,71.45
18,20.00
94.19 4,83.63
6,28,32,48.05 9,03,10.75
79,35.17 43,27,17.41
2,19,48.88 94,95.60
91,33.88 2,54,63,84.80
6,28.18 68,51.27
1,73.99 9,92.50
3.27
Total:
Public Debt
Internal debt of the State Government
Loans and Advances from the Central GovernmentNon-Plan Loans
Market LoansLoans from Life Insurance Corporation of IndiaLoans from General Insurance Corporation of IndiaLoans from the National Bank for Agricultural and RuralDevelopmentLoans from the State Bank of India and Other BanksLoans from National Co-operative DevelopmentCorporationLoans from other InstitutionsSpecial Securities issued to National Small Savings Fundof the Central GovernmentOther Loans
House Building AdvancesPolice - Modernisation of Police ForcesSecondary Education - ScholarshipRehabilitation - Repatriates from Sri LankaRehabilitation-Repatriates from Burma
15.DETAILED STATEMENT ON BORROWINGS AND OTHER LIABILITIES
Description of DebtBalance as on
1st April 2011
Additionsduring the
year
Dischargesduring the
year
Balance as on31st March
NetIncrease(+)/Decrease(-)
Interestpaid
( in lakh of Rupees)
01 Non-Plan Loans
Total : 6003 Internal debt of the State Government
. .
. .
. .
. .
. .
. .
. .
. .
. .
. .
. .
. .
. .
. .
. .
+1,31,08,98.28-74,77.89
-8,45.80+4,75,81.00
-21,47.85+14,91.02
-1,16,05.54-10,23,71.45
-94.19-4,83.63
-5,77.82
+1,23,55,21.77
. .
. . . . . .
. .
(a) Statement of Public Debt and Other Interest bearing Obligations
2012
40,36,26.73
1,28,35.90
11,91.45
2,53,52.22
17,45.55
10,84.56
23,59.55
25,54,36.61
5,20.60
65.59
8,82.60
9,48.19
70,41,53.17
. . . . . .
372
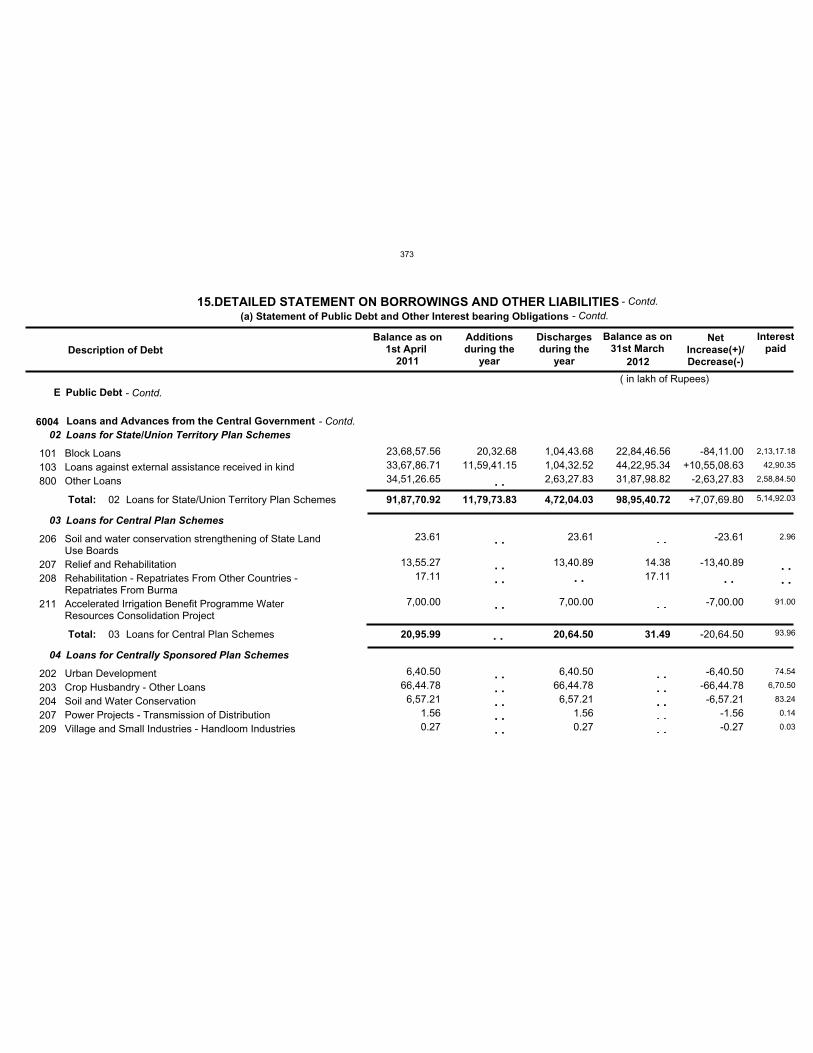
E
600402
03
04
91,87,70.92
20,95.99
11,79,73.83 4,72,04.03
20,64.50
98,95,40.72
31.49
101103800
206
207208
211
202203204207209
23,68,57.56 33,67,86.71 34,51,26.65
23.61
13,55.27 17.11
7,00.00
6,40.50 66,44.78
6,57.21 1.56 0.27
20,32.68 11,59,41.15
1,04,43.68 1,04,32.52 2,63,27.83
23.61
13,40.89
7,00.00
6,40.50 66,44.78
6,57.21 1.56 0.27
22,84,46.56 44,22,95.34 31,87,98.82
14.38 17.11
Total:
Total:
Public Debt
Loans and Advances from the Central GovernmentLoans for State/Union Territory Plan Schemes
Loans for Central Plan Schemes
Loans for Centrally Sponsored Plan Schemes
Block LoansLoans against external assistance received in kindOther Loans
Soil and water conservation strengthening of State LandUse BoardsRelief and RehabilitationRehabilitation - Repatriates From Other Countries -Repatriates From BurmaAccelerated Irrigation Benefit Programme WaterResources Consolidation Project
Urban DevelopmentCrop Husbandry - Other LoansSoil and Water ConservationPower Projects - Transmission of DistributionVillage and Small Industries - Handloom Industries
15.DETAILED STATEMENT ON BORROWINGS AND OTHER LIABILITIES
Description of DebtBalance as on
1st April 2011
Additionsduring the
year
Dischargesduring the
year
Balance as on31st March
NetIncrease(+)/Decrease(-)
Interestpaid
( in lakh of Rupees)
02
03
Loans for State/Union Territory Plan Schemes
Loans for Central Plan Schemes
. .
. .
. .
. .
. .
. .
. .
. .
. .
. .
. .
. .
. .
. .
. .
. .
. .
. .
-84,11.00+10,55,08.63
-2,63,27.83
-23.61
-13,40.89
-7,00.00
-6,40.50-66,44.78
-6,57.21-1.56-0.27
+7,07,69.80
-20,64.50
. .
. .
(a) Statement of Public Debt and Other Interest bearing Obligations- Contd.
- Contd.
2012
- Contd.
- Contd.
2,13,17.18
42,90.35
2,58,84.50
2.96
91.00
74.54
6,70.50
83.24
0.14
0.03
5,14,92.03
93.96
. . . .
373
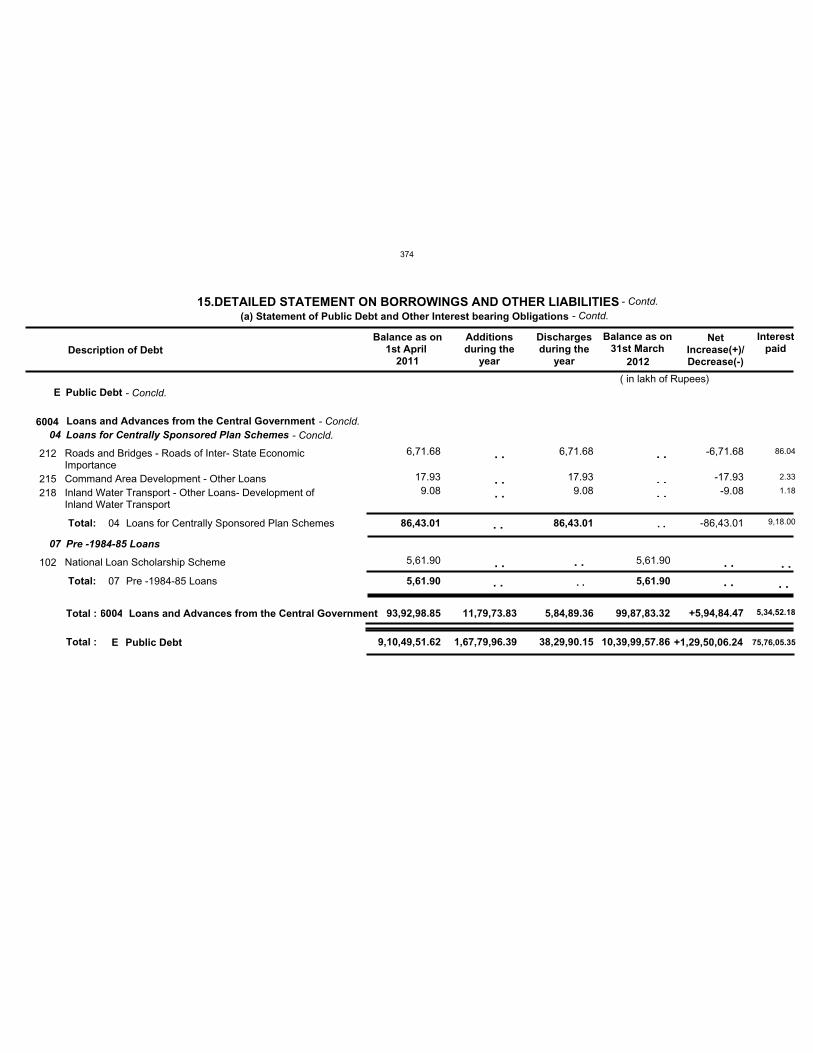
E
9,10,49,51.62 1,67,79,96.39 38,29,90.15 10,39,99,57.86
6004
93,92,98.85 11,79,73.83 5,84,89.36 99,87,83.32
04
07
86,43.01
5,61.90
86,43.01
5,61.90
212
215218
102
6,71.68
17.93 9.08
5,61.90
6,71.68
17.93 9.08
5,61.90
Total:
Total:
Public Debt
Loans and Advances from the Central GovernmentLoans for Centrally Sponsored Plan Schemes
Pre -1984-85 Loans
Roads and Bridges - Roads of Inter- State EconomicImportanceCommand Area Development - Other LoansInland Water Transport - Other Loans- Development ofInland Water Transport
National Loan Scholarship Scheme
15.DETAILED STATEMENT ON BORROWINGS AND OTHER LIABILITIES
Description of DebtBalance as on
1st April 2011
Additionsduring the
year
Dischargesduring the
year
Balance as on31st March
NetIncrease(+)/Decrease(-)
Interestpaid
( in lakh of Rupees)
04
07
Loans for Centrally Sponsored Plan Schemes
Pre -1984-85 Loans
Total : 6004 Loans and Advances from the Central Government
Total : E Public Debt
. .
. .
. .
. . . .
. .
. .
. .
-6,71.68
-17.93-9.08
-86,43.01
+5,94,84.47
+1,29,50,06.24
. .
. .
. . . .
(a) Statement of Public Debt and Other Interest bearing Obligations- Contd.
- Contd.
2012
- Concld.
- Concld.- Concld.
. .
86.04
2.33
1.18
9,18.00
5,34,52.18
75,76,05.35
. .
. . . .
374
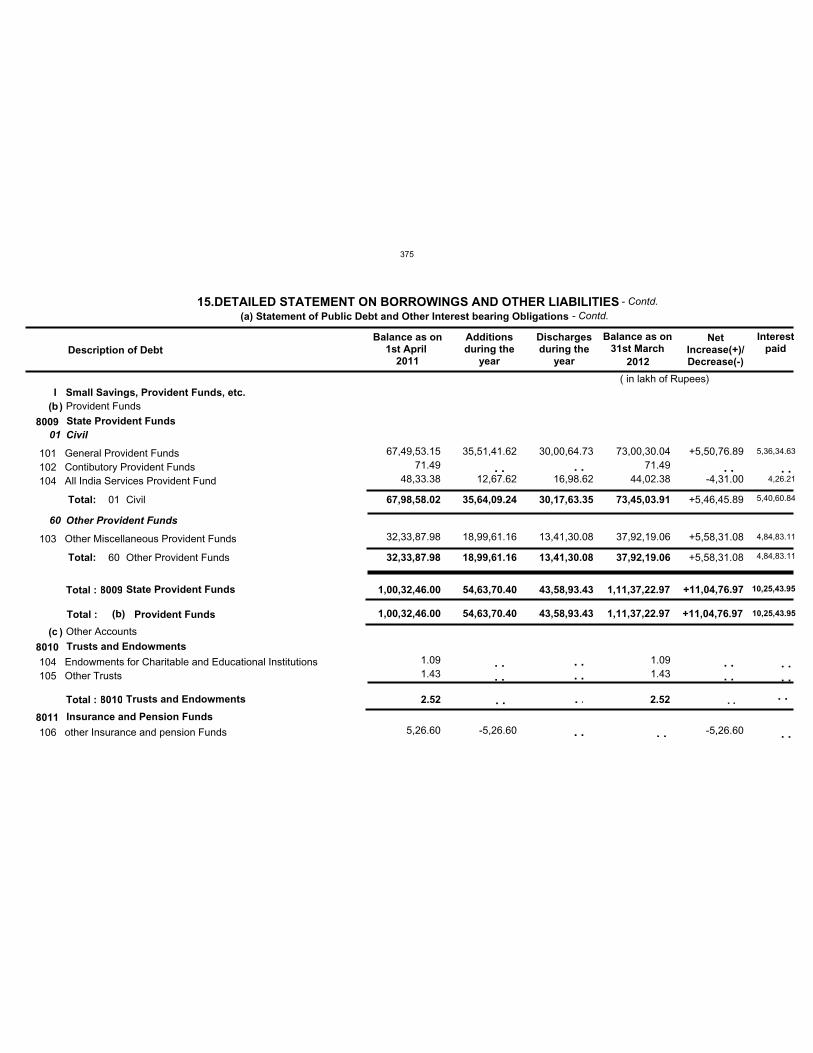
Ib
c
1,00,32,46.00 54,63,70.40 43,58,93.43 1,11,37,22.97
8009
8010
8011
1,00,32,46.00
2.52
54,63,70.40 43,58,93.43 1,11,37,22.97
2.52
01
60
67,98,58.02
32,33,87.98
35,64,09.24
18,99,61.16
30,17,63.35
13,41,30.08
73,45,03.91
37,92,19.06
101102104
103
104105
106
67,49,53.15 71.49
48,33.38
32,33,87.98
1.09 1.43
5,26.60
35,51,41.62
12,67.62
18,99,61.16
-5,26.60
30,00,64.73
16,98.62
13,41,30.08
73,00,30.04 71.49
44,02.38
37,92,19.06
1.09 1.43
Total:
Total:
Small Savings, Provident Funds, etc.Provident Funds
Other Accounts
State Provident Funds
Trusts and Endowments
Insurance and Pension Funds
Civil
Other Provident Funds
General Provident FundsContibutory Provident FundsAll India Services Provident Fund
Other Miscellaneous Provident Funds
Endowments for Charitable and Educational InstitutionsOther Trusts
other Insurance and pension Funds
15.DETAILED STATEMENT ON BORROWINGS AND OTHER LIABILITIES
Description of DebtBalance as on
1st April 2011
Additionsduring the
year
Dischargesduring the
year
Balance as on31st March
NetIncrease(+)/Decrease(-)
Interestpaid
( in lakh of Rupees)
01
60
Civil
Other Provident Funds
Total :
Total :
8009
8010
State Provident Funds
Trusts and Endowments
Total : (b) Provident Funds
. .
. .
. .
. .
. .
. .
. . . .
+5,50,76.89
-4,31.00
+5,58,31.08
-5,26.60
. . . .
+5,46,45.89
+5,58,31.08
+11,04,76.97
+11,04,76.97
. .
. . . .
(a) Statement of Public Debt and Other Interest bearing Obligations- Contd.
- Contd.
2012
(
(
)
)
. .
5,36,34.63
4,26.21
4,84,83.11
5,40,60.84
4,84,83.11
10,25,43.95
10,25,43.95
. .
. . . .
. .
. .
375
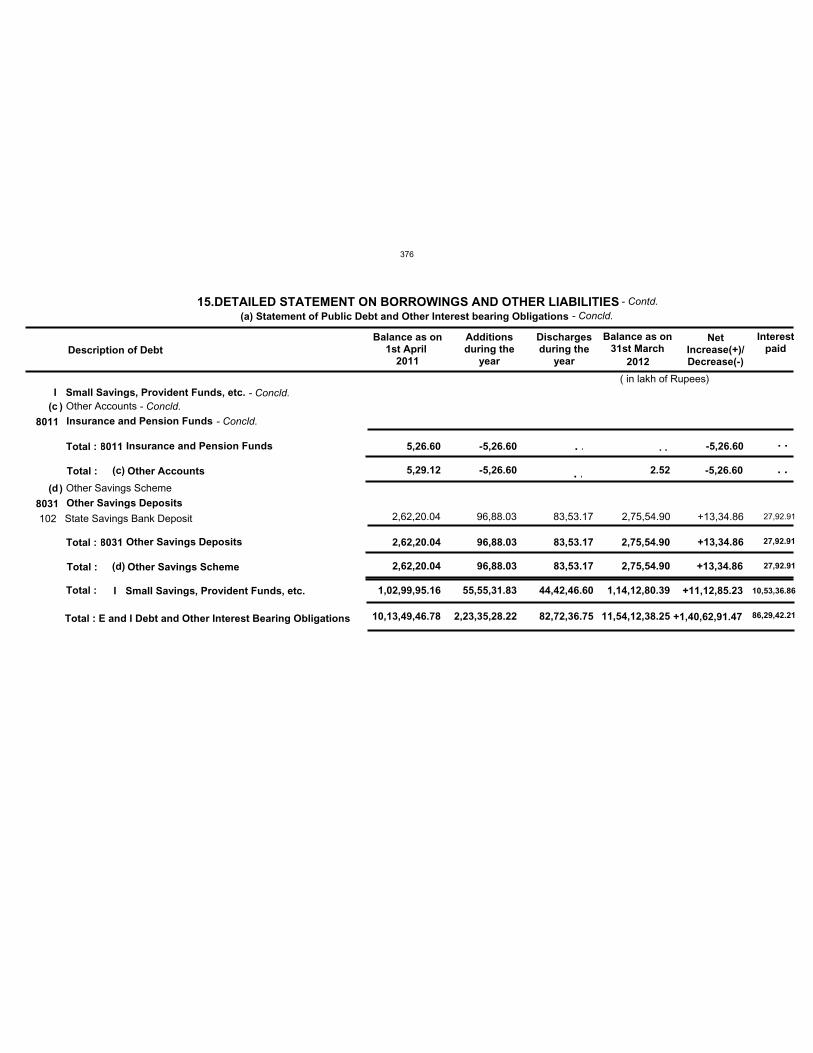
10,13,49,46.78 2,23,35,28.22 82,72,36.75 11,54,12,38.25
I
1,02,99,95.16 55,55,31.83 44,42,46.60 1,14,12,80.39
c
d
5,29.12
2,62,20.04
-5,26.60
96,88.03 83,53.17
2.52
2,75,54.90
8011
8031
5,26.60
2,62,20.04
-5,26.60
96,88.03 83,53.17 2,75,54.90
102 2,62,20.04 96,88.03 83,53.17 2,75,54.90
Small Savings, Provident Funds, etc.Other Accounts
Other Savings Scheme
Insurance and Pension Funds
Other Savings Deposits
State Savings Bank Deposit
15.DETAILED STATEMENT ON BORROWINGS AND OTHER LIABILITIES
Description of DebtBalance as on
1st April 2011
Additionsduring the
year
Dischargesduring the
year
Balance as on31st March
NetIncrease(+)/Decrease(-)
Interestpaid
( in lakh of Rupees)
Total :
Total :
8011
8031
Insurance and Pension Funds
Other Savings Deposits
Total :
Total :
(c)
(d)
Other Accounts
Other Savings Scheme
Total : I Small Savings, Provident Funds, etc.
Total : E and I Debt and Other Interest Bearing Obligations
+13,34.86
. . -5,26.60
+13,34.86
-5,26.60
+13,34.86
+11,12,85.23
+1,40,62,91.47
(a) Statement of Public Debt and Other Interest bearing Obligations- Contd.
- Concld.
2012
- Concld.- Concld.
- Concld.(
(
)
)
. .
27,92.91
27,92.91
27,92.91
10,53,36.86
86,29,42.21
. .
. . . .
376
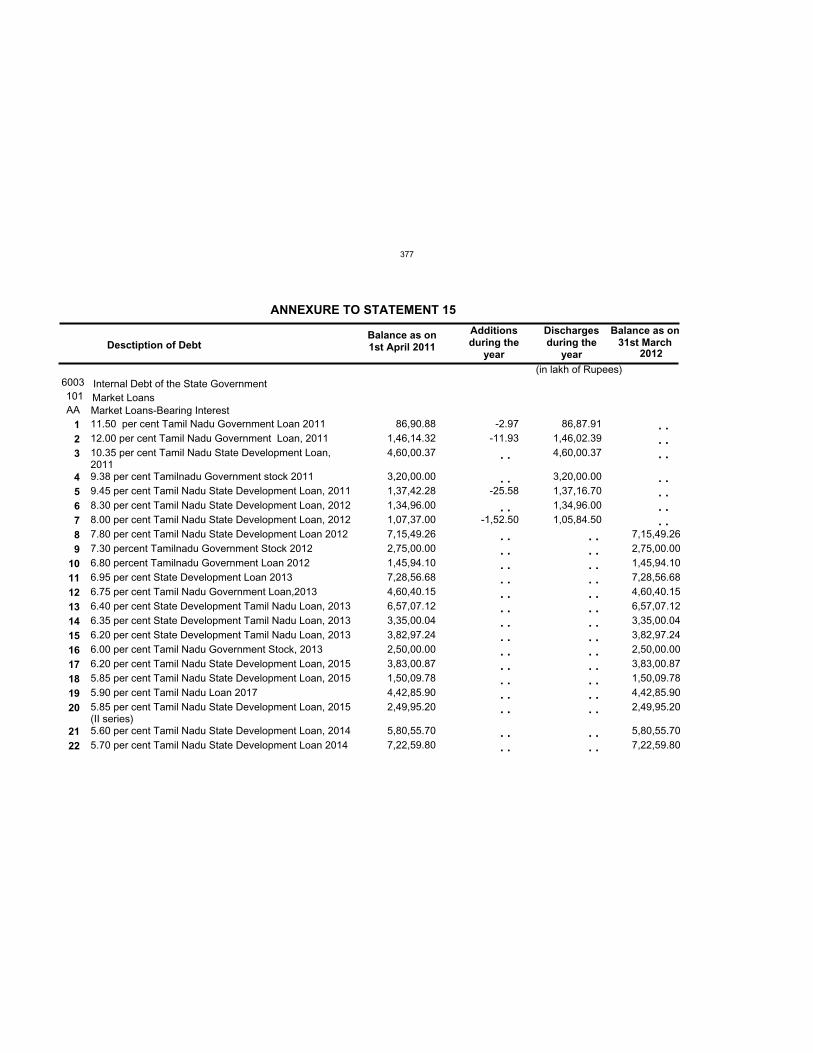
6003101AA
86,90.88 1,46,14.32 4,60,00.37
3,20,00.00 1,37,42.28 1,34,96.00 1,07,37.00 7,15,49.26 2,75,00.00 1,45,94.10 7,28,56.68 4,60,40.15 6,57,07.12 3,35,00.04 3,82,97.24 2,50,00.00 3,83,00.87 1,50,09.78 4,42,85.90 2,49,95.20
5,80,55.70 7,22,59.80
-2.97-11.93
-25.58
-1,52.50
86,87.91 1,46,02.39 4,60,00.37
3,20,00.00 1,37,16.70 1,34,96.00 1,05,84.50
7,15,49.26 2,75,00.00 1,45,94.10 7,28,56.68 4,60,40.15 6,57,07.12 3,35,00.04 3,82,97.24 2,50,00.00 3,83,00.87 1,50,09.78 4,42,85.90 2,49,95.20
5,80,55.70 7,22,59.80
Internal Debt of the State GovernmentMarket Loans
11.50 per cent Tamil Nadu Government Loan 201112.00 per cent Tamil Nadu Government Loan, 201110.35 per cent Tamil Nadu State Development Loan,20119.38 per cent Tamilnadu Government stock 20119.45 per cent Tamil Nadu State Development Loan, 20118.30 per cent Tamil Nadu State Development Loan, 20128.00 per cent Tamil Nadu State Development Loan, 20127.80 per cent Tamil Nadu State Development Loan 20127.30 percent Tamilnadu Government Stock 20126.80 percent Tamilnadu Government Loan 20126.95 per cent State Development Loan 20136.75 per cent Tamil Nadu Government Loan,20136.40 per cent State Development Tamil Nadu Loan, 20136.35 per cent State Development Tamil Nadu Loan, 20136.20 per cent State Development Tamil Nadu Loan, 20136.00 per cent Tamil Nadu Government Stock, 20136.20 per cent Tamil Nadu State Development Loan, 20155.85 per cent Tamil Nadu State Development Loan, 20155.90 per cent Tamil Nadu Loan 20175.85 per cent Tamil Nadu State Development Loan, 2015(II series)5.60 per cent Tamil Nadu State Development Loan, 20145.70 per cent Tamil Nadu State Development Loan 2014
Market Loans-Bearing Interest
ANNEXURE TO STATEMENT 15
Desctiption of DebtBalance as on1st April 2011
Additionsduring the
year
Dischargesduring the
year
Balance as on31st March
(in lakh of Rupees)
. .
. .
. .
. . . . . . . . . . . . . . . . . . . . . . . . . .
. . . .
. . . . . . . . . . . . . . . . . . . . . . . . . .
. . . .
2012
123
456789
1011121314151617181920
2122
. . . . . .
. . . . . . . .
377
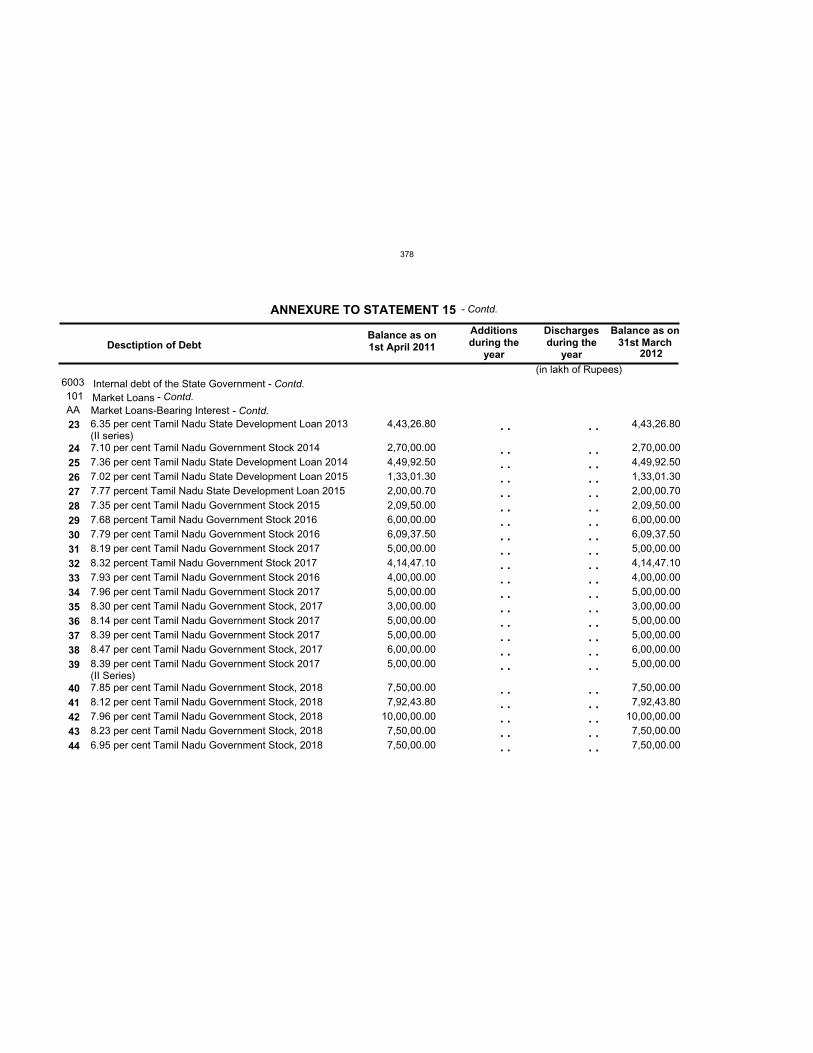
6003101AA
4,43,26.80
2,70,00.00 4,49,92.50 1,33,01.30 2,00,00.70 2,09,50.00 6,00,00.00 6,09,37.50 5,00,00.00 4,14,47.10 4,00,00.00 5,00,00.00 3,00,00.00 5,00,00.00 5,00,00.00 6,00,00.00 5,00,00.00
7,50,00.00 7,92,43.80
10,00,00.00 7,50,00.00 7,50,00.00
4,43,26.80
2,70,00.00 4,49,92.50 1,33,01.30 2,00,00.70 2,09,50.00 6,00,00.00 6,09,37.50 5,00,00.00 4,14,47.10 4,00,00.00 5,00,00.00 3,00,00.00 5,00,00.00 5,00,00.00 6,00,00.00 5,00,00.00
7,50,00.00 7,92,43.80
10,00,00.00 7,50,00.00 7,50,00.00
Internal debt of the State GovernmentMarket Loans
6.35 per cent Tamil Nadu State Development Loan 2013(II series)7.10 per cent Tamil Nadu Government Stock 20147.36 per cent Tamil Nadu State Development Loan 20147.02 per cent Tamil Nadu State Development Loan 20157.77 percent Tamil Nadu State Development Loan 20157.35 per cent Tamil Nadu Government Stock 20157.68 percent Tamil Nadu Government Stock 20167.79 per cent Tamil Nadu Government Stock 20168.19 per cent Tamil Nadu Government Stock 20178.32 percent Tamil Nadu Government Stock 20177.93 per cent Tamil Nadu Government Stock 20167.96 per cent Tamil Nadu Government Stock 20178.30 per cent Tamil Nadu Government Stock, 20178.14 per cent Tamil Nadu Government Stock 20178.39 per cent Tamil Nadu Government Stock 20178.47 per cent Tamil Nadu Government Stock, 20178.39 per cent Tamil Nadu Government Stock 2017 (II Series)7.85 per cent Tamil Nadu Government Stock, 20188.12 per cent Tamil Nadu Government Stock, 20187.96 per cent Tamil Nadu Government Stock, 20188.23 per cent Tamil Nadu Government Stock, 20186.95 per cent Tamil Nadu Government Stock, 2018
Market Loans-Bearing Interest
ANNEXURE TO STATEMENT 15
Desctiption of DebtBalance as on1st April 2011
Additionsduring the
year
Dischargesduring the
year
Balance as on31st March
(in lakh of Rupees)
. .
. . . . . . . . . . . . . . . . . . . . . . . . . . . . . . . .
. . . . . . . . . .
. .
. . . . . . . . . . . . . . . . . . . . . . . . . . . . . . . .
. . . . . . . . . .
2012
23
24252627282930313233343536373839
4041424344
- Contd.
- Contd.- Contd.
- Contd.
378
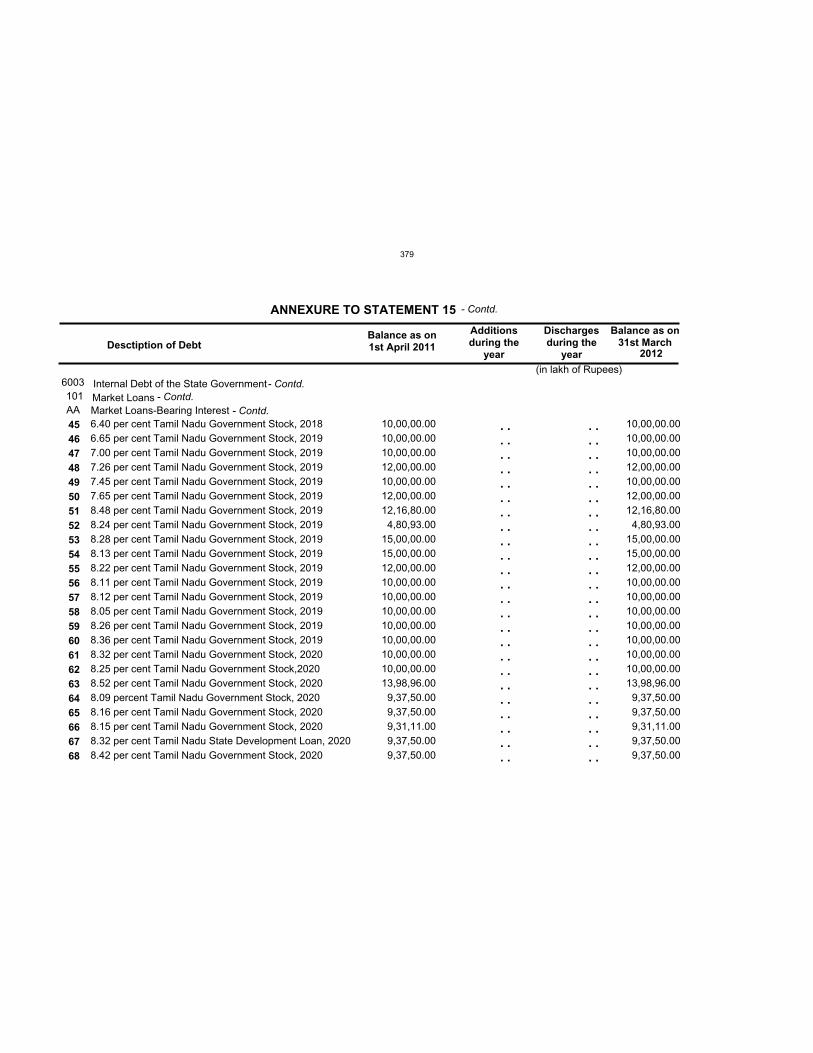
6003101AA
10,00,00.00 10,00,00.00 10,00,00.00 12,00,00.00 10,00,00.00 12,00,00.00 12,16,80.00
4,80,93.00 15,00,00.00 15,00,00.00 12,00,00.00 10,00,00.00 10,00,00.00 10,00,00.00 10,00,00.00 10,00,00.00 10,00,00.00 10,00,00.00 13,98,96.00
9,37,50.00 9,37,50.00 9,31,11.00 9,37,50.00 9,37,50.00
10,00,00.00 10,00,00.00 10,00,00.00 12,00,00.00 10,00,00.00 12,00,00.00 12,16,80.00
4,80,93.00 15,00,00.00 15,00,00.00 12,00,00.00 10,00,00.00 10,00,00.00 10,00,00.00 10,00,00.00 10,00,00.00 10,00,00.00 10,00,00.00 13,98,96.00
9,37,50.00 9,37,50.00 9,31,11.00 9,37,50.00 9,37,50.00
Internal Debt of the State GovernmentMarket Loans
6.40 per cent Tamil Nadu Government Stock, 20186.65 per cent Tamil Nadu Government Stock, 20197.00 per cent Tamil Nadu Government Stock, 20197.26 per cent Tamil Nadu Government Stock, 20197.45 per cent Tamil Nadu Government Stock, 20197.65 per cent Tamil Nadu Government Stock, 20198.48 per cent Tamil Nadu Government Stock, 20198.24 per cent Tamil Nadu Government Stock, 20198.28 per cent Tamil Nadu Government Stock, 20198.13 per cent Tamil Nadu Government Stock, 20198.22 per cent Tamil Nadu Government Stock, 20198.11 per cent Tamil Nadu Government Stock, 20198.12 per cent Tamil Nadu Government Stock, 20198.05 per cent Tamil Nadu Government Stock, 20198.26 per cent Tamil Nadu Government Stock, 20198.36 per cent Tamil Nadu Government Stock, 20198.32 per cent Tamil Nadu Government Stock, 20208.25 per cent Tamil Nadu Government Stock,20208.52 per cent Tamil Nadu Government Stock, 20208.09 percent Tamil Nadu Government Stock, 20208.16 per cent Tamil Nadu Government Stock, 20208.15 per cent Tamil Nadu Government Stock, 20208.32 per cent Tamil Nadu State Development Loan, 20208.42 per cent Tamil Nadu Government Stock, 2020
Market Loans-Bearing Interest
ANNEXURE TO STATEMENT 15
Desctiption of DebtBalance as on1st April 2011
Additionsduring the
year
Dischargesduring the
year
Balance as on31st March
(in lakh of Rupees)
. . . . . . . . . . . . . . . . . . . . . . . . . . . . . . . . . . . . . . . . . . . . . . . .
. . . . . . . . . . . . . . . . . . . . . . . . . . . . . . . . . . . . . . . . . . . . . . . .
2012
454647484950515253545556575859606162636465666768
- Contd.
- Contd.- Contd.
- Contd.
379
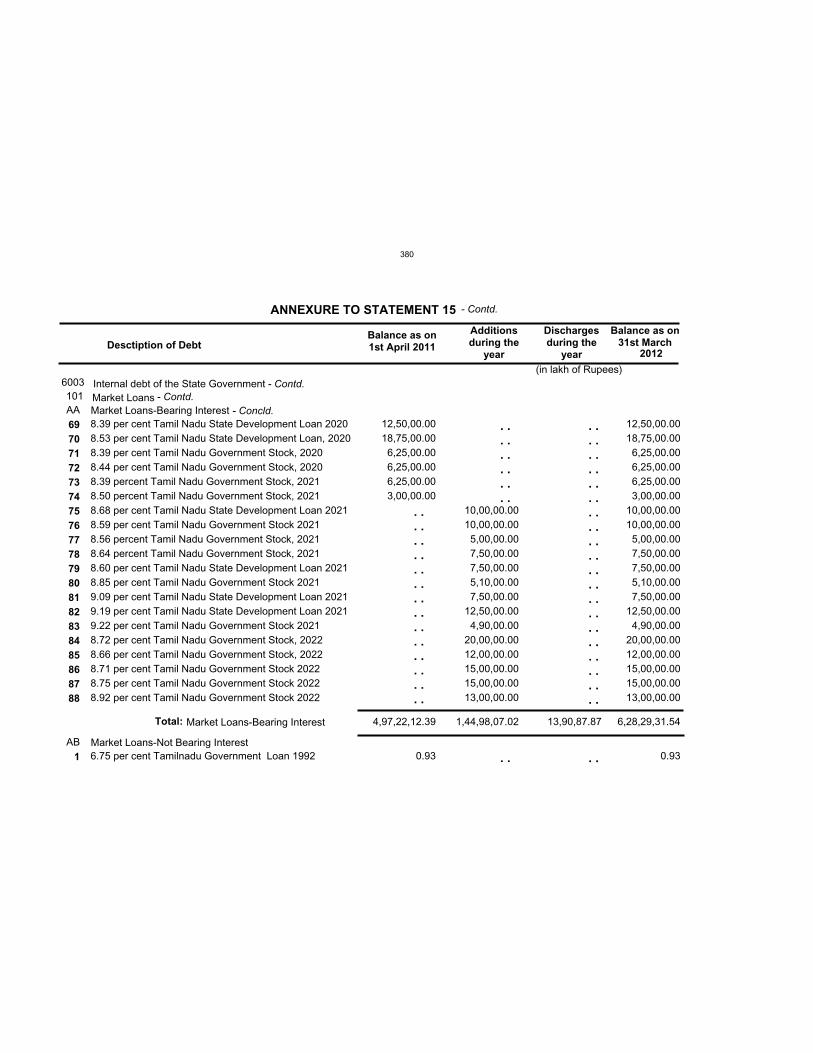
6003101AA
AB
4,97,22,12.39 1,44,98,07.02 13,90,87.87 6,28,29,31.54
12,50,00.00 18,75,00.00
6,25,00.00 6,25,00.00 6,25,00.00 3,00,00.00
0.93
10,00,00.00 10,00,00.00
5,00,00.00 7,50,00.00 7,50,00.00 5,10,00.00 7,50,00.00
12,50,00.00 4,90,00.00
20,00,00.00 12,00,00.00 15,00,00.00 15,00,00.00 13,00,00.00
12,50,00.00 18,75,00.00
6,25,00.00 6,25,00.00 6,25,00.00 3,00,00.00
10,00,00.00 10,00,00.00
5,00,00.00 7,50,00.00 7,50,00.00 5,10,00.00 7,50,00.00
12,50,00.00 4,90,00.00
20,00,00.00 12,00,00.00 15,00,00.00 15,00,00.00 13,00,00.00
0.93
Total:
Internal debt of the State GovernmentMarket Loans
8.39 per cent Tamil Nadu State Development Loan 20208.53 per cent Tamil Nadu State Development Loan, 20208.39 per cent Tamil Nadu Government Stock, 20208.44 per cent Tamil Nadu Government Stock, 20208.39 percent Tamil Nadu Government Stock, 20218.50 percent Tamil Nadu Government Stock, 20218.68 per cent Tamil Nadu State Development Loan 20218.59 per cent Tamil Nadu Government Stock 20218.56 percent Tamil Nadu Government Stock, 20218.64 percent Tamil Nadu Government Stock, 20218.60 per cent Tamil Nadu State Development Loan 20218.85 per cent Tamil Nadu Government Stock 20219.09 per cent Tamil Nadu State Development Loan 20219.19 per cent Tamil Nadu State Development Loan 20219.22 per cent Tamil Nadu Government Stock 20218.72 per cent Tamil Nadu Government Stock, 20228.66 per cent Tamil Nadu Government Stock, 20228.71 per cent Tamil Nadu Government Stock 20228.75 per cent Tamil Nadu Government Stock 20228.92 per cent Tamil Nadu Government Stock 2022
6.75 per cent Tamilnadu Government Loan 1992
Market Loans-Bearing Interest
Market Loans-Not Bearing Interest
ANNEXURE TO STATEMENT 15
Desctiption of DebtBalance as on1st April 2011
Additionsduring the
year
Dischargesduring the
year
Balance as on31st March
(in lakh of Rupees)
Market Loans-Bearing Interest
. . . . . . . . . . . .
. .
. . . . . . . . . . . . . . . . . . . . . . . . . . . . . . . . . . . . . . . .
. .
2012
6970717273747576777879808182838485868788
1
- Contd.
- Contd.- Contd.
- Concld.
. . . . . . . . . . . . . . . . . . . . . . . . . . . .
380
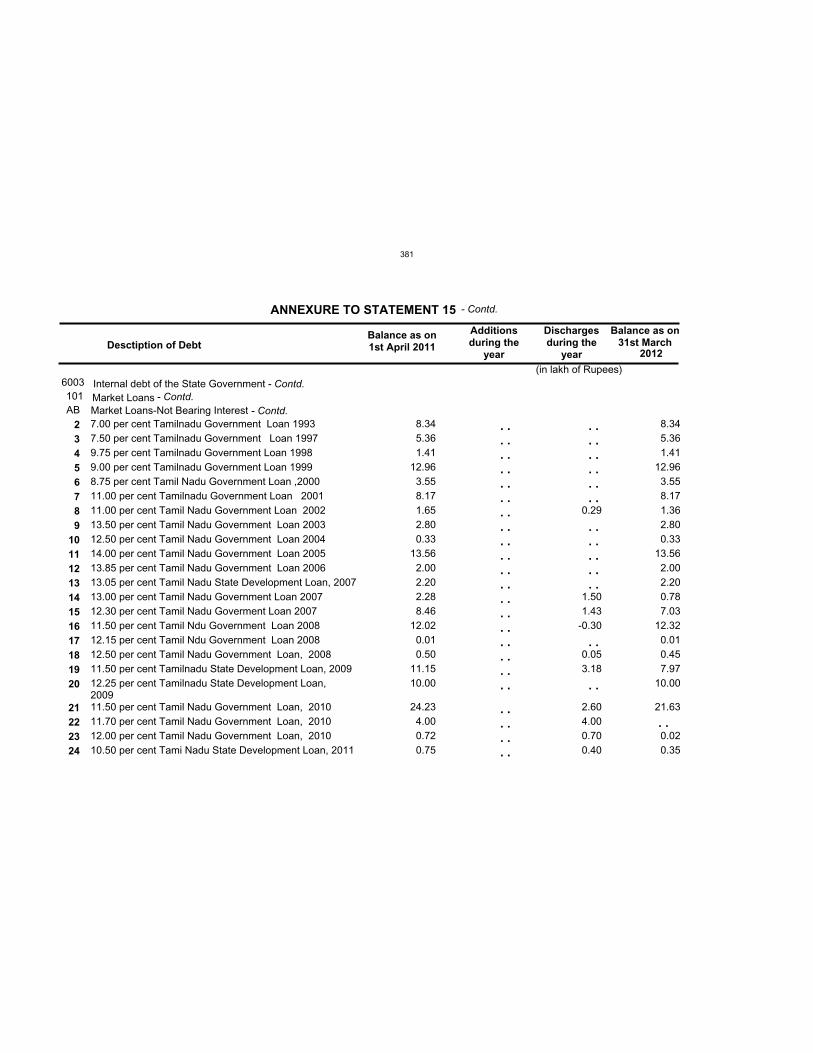
6003101AB
8.34 5.36 1.41
12.96 3.55 8.17 1.65 2.80 0.33
13.56 2.00 2.20 2.28 8.46
12.02 0.01 0.50
11.15 10.00
24.23 4.00 0.72 0.75
0.29
1.50 1.43-0.30
0.05 3.18
2.60 4.00 0.70 0.40
8.34 5.36 1.41
12.96 3.55 8.17 1.36 2.80 0.33
13.56 2.00 2.20 0.78 7.03
12.32 0.01 0.45 7.97
10.00
21.63
0.02 0.35
Internal debt of the State GovernmentMarket Loans
7.00 per cent Tamilnadu Government Loan 19937.50 per cent Tamilnadu Government Loan 19979.75 per cent Tamilnadu Government Loan 19989.00 per cent Tamilnadu Government Loan 19998.75 per cent Tamil Nadu Government Loan ,200011.00 per cent Tamilnadu Government Loan 200111.00 per cent Tamil Nadu Government Loan 200213.50 per cent Tamil Nadu Government Loan 200312.50 per cent Tamil Nadu Government Loan 200414.00 per cent Tamil Nadu Government Loan 200513.85 per cent Tamil Nadu Government Loan 200613.05 per cent Tamil Nadu State Development Loan, 200713.00 per cent Tamil Nadu Government Loan 200712.30 per cent Tamil Nadu Goverment Loan 200711.50 per cent Tamil Ndu Government Loan 200812.15 per cent Tamil Ndu Government Loan 200812.50 per cent Tamil Nadu Government Loan, 200811.50 per cent Tamilnadu State Development Loan, 200912.25 per cent Tamilnadu State Development Loan,200911.50 per cent Tamil Nadu Government Loan, 201011.70 per cent Tamil Nadu Government Loan, 201012.00 per cent Tamil Nadu Government Loan, 201010.50 per cent Tami Nadu State Development Loan, 2011
Market Loans-Not Bearing Interest
ANNEXURE TO STATEMENT 15
Desctiption of DebtBalance as on1st April 2011
Additionsduring the
year
Dischargesduring the
year
Balance as on31st March
(in lakh of Rupees)
. . . . . . . . . . . . . . . . . . . . . . . . . . . . . . . . . . . . . .
. . . . . . . .
. . . . . . . . . . . .
. . . . . . . . . .
. .
. .
2012
23456789
1011121314151617181920
21222324
- Contd.
- Contd.- Contd.
- Contd.
. .
381
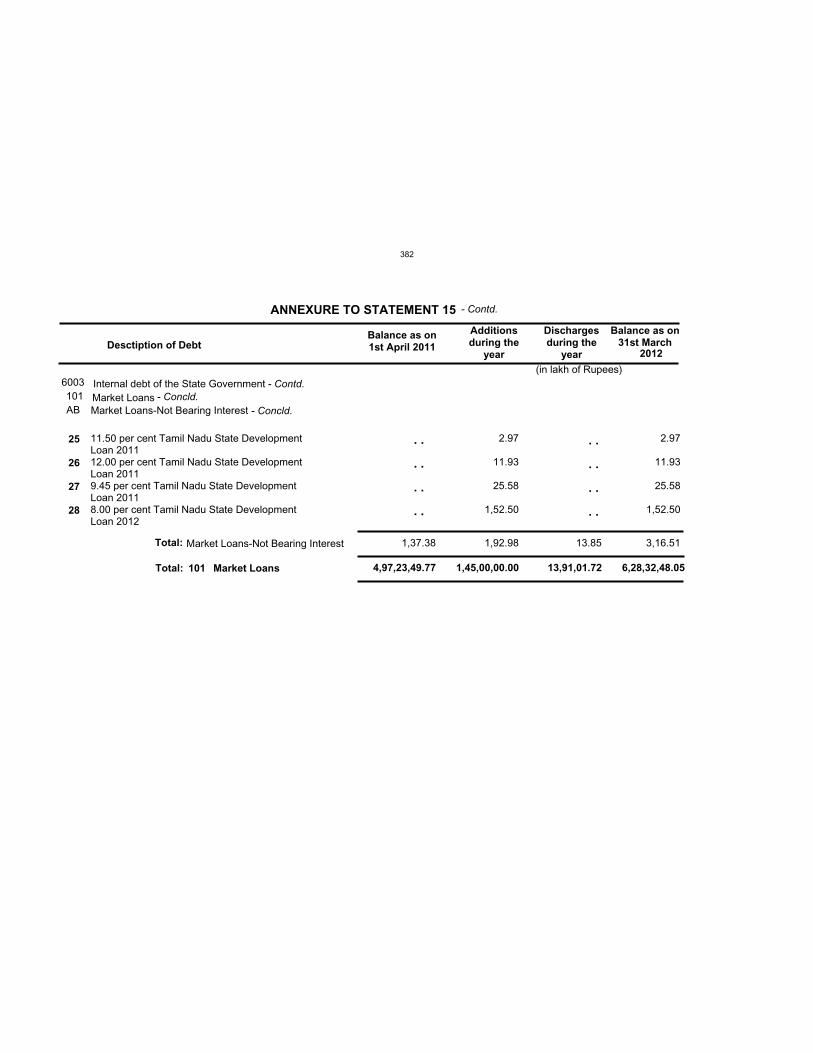
6003101
4,97,23,49.77 1,45,00,00.00 13,91,01.72 6,28,32,48.05
AB
1,37.38 1,92.98 13.85 3,16.51
2.97
11.93
25.58
1,52.50
2.97
11.93
25.58
1,52.50
Total:
Internal debt of the State GovernmentMarket Loans
11.50 per cent Tamil Nadu State DevelopmentLoan 201112.00 per cent Tamil Nadu State DevelopmentLoan 20119.45 per cent Tamil Nadu State DevelopmentLoan 20118.00 per cent Tamil Nadu State DevelopmentLoan 2012
Market Loans-Not Bearing Interest
ANNEXURE TO STATEMENT 15
Desctiption of DebtBalance as on1st April 2011
Additionsduring the
year
Dischargesduring the
year
Balance as on31st March
(in lakh of Rupees)
Market Loans-Not Bearing Interest
Total: 101 Market Loans
. .
. .
. .
. .
2012
25
26
27
28
- Contd.
- Contd.- Concld.
- Concld.
. .
. .
. .
. .
382
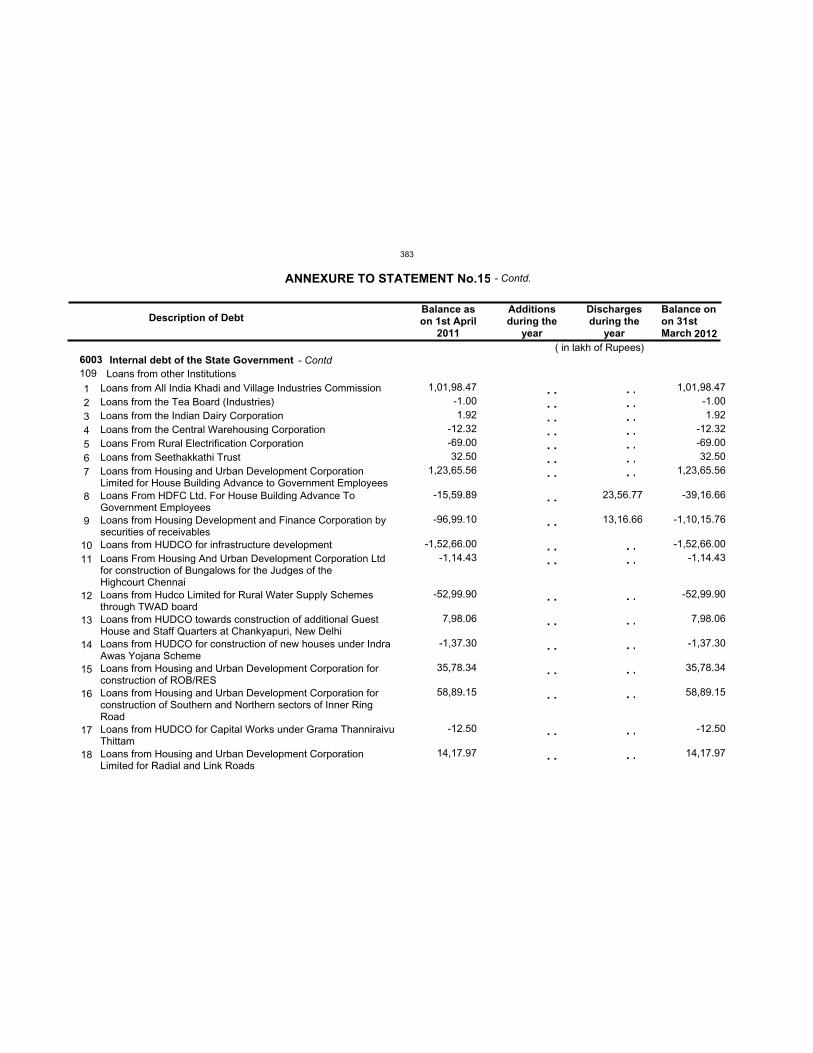
6003109
1,01,98.47-1.00 1.92
-12.32-69.00 32.50
1,23,65.56
-15,59.89
-96,99.10
-1,52,66.00-1,14.43
-52,99.90
7,98.06
-1,37.30
35,78.34
58,89.15
-12.50
14,17.97
23,56.77
13,16.66
1,01,98.47-1.00 1.92
-12.32-69.00 32.50
1,23,65.56
-39,16.66
-1,10,15.76
-1,52,66.00-1,14.43
-52,99.90
7,98.06
-1,37.30
35,78.34
58,89.15
-12.50
14,17.97
Internal debt of the State GovernmentLoans from other Institutions
Loans from All India Khadi and Village Industries CommissionLoans from the Tea Board (Industries)Loans from the Indian Dairy CorporationLoans from the Central Warehousing CorporationLoans From Rural Electrification CorporationLoans from Seethakkathi TrustLoans from Housing and Urban Development CorporationLimited for House Building Advance to Government EmployeesLoans From HDFC Ltd. For House Building Advance ToGovernment EmployeesLoans from Housing Development and Finance Corporation bysecurities of receivablesLoans from HUDCO for infrastructure developmentLoans From Housing And Urban Development Corporation Ltdfor construction of Bungalows for the Judges of theHighcourt ChennaiLoans from Hudco Limited for Rural Water Supply Schemesthrough TWAD boardLoans from HUDCO towards construction of additional GuestHouse and Staff Quarters at Chankyapuri, New DelhiLoans from HUDCO for construction of new houses under IndraAwas Yojana SchemeLoans from Housing and Urban Development Corporation forconstruction of ROB/RESLoans from Housing and Urban Development Corporation forconstruction of Southern and Northern sectors of Inner RingRoadLoans from HUDCO for Capital Works under Grama ThanniraivuThittamLoans from Housing and Urban Development CorporationLimited for Radial and Link Roads
1234567
8
9
1011
12
13
14
15
16
17
18
Description of DebtBalance ason 1st April
2011
Additionsduring the
year
Dischargesduring the
year
Balance onon 31stMarch
( in lakh of Rupees)
ANNEXURE TO STATEMENT No.15
. . . . . . . . . . . . . .
. .
. .
. . . .
. .
. .
. .
. .
. .
. .
. .
. . . . . . . . . . . . . .
. . . .
. .
. .
. .
. .
. .
. .
. .
2012
- Contd.
- Contd
383
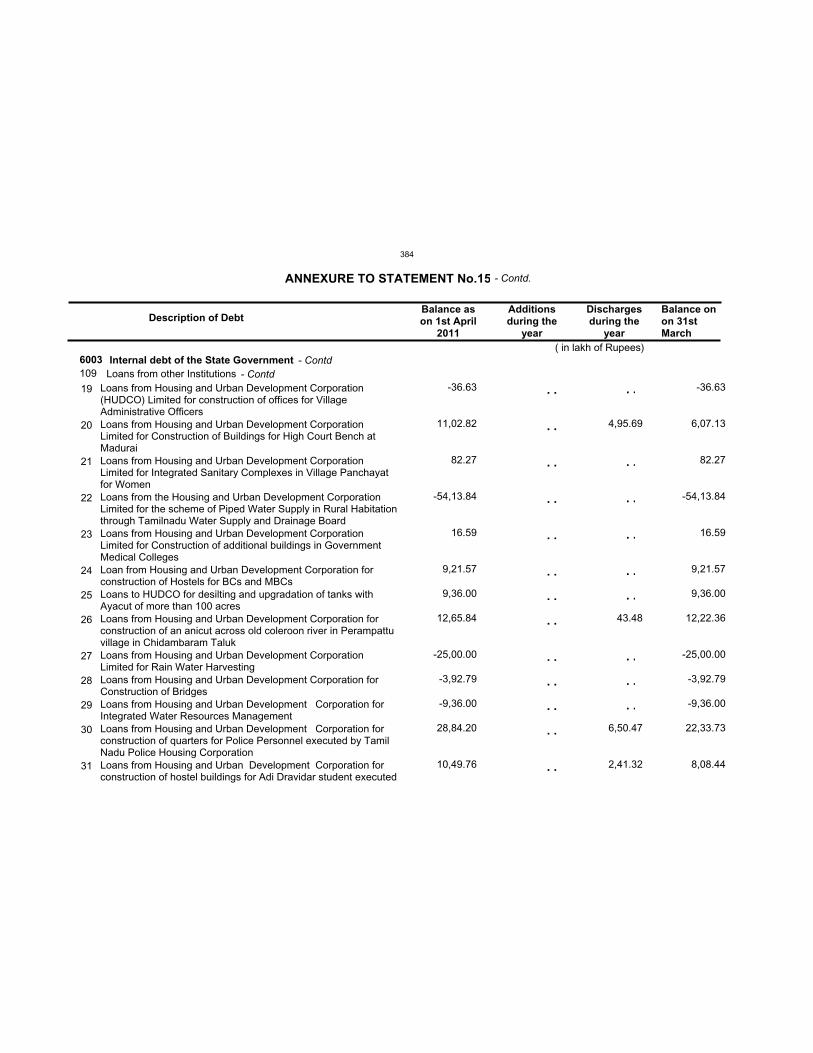
6003109
-36.63
11,02.82
82.27
-54,13.84
16.59
9,21.57
9,36.00
12,65.84
-25,00.00
-3,92.79
-9,36.00
28,84.20
10,49.76
4,95.69
43.48
6,50.47
2,41.32
-36.63
6,07.13
82.27
-54,13.84
16.59
9,21.57
9,36.00
12,22.36
-25,00.00
-3,92.79
-9,36.00
22,33.73
8,08.44
Internal debt of the State GovernmentLoans from other Institutions
Loans from Housing and Urban Development Corporation(HUDCO) Limited for construction of offices for VillageAdministrative OfficersLoans from Housing and Urban Development CorporationLimited for Construction of Buildings for High Court Bench atMaduraiLoans from Housing and Urban Development CorporationLimited for Integrated Sanitary Complexes in Village Panchayatfor WomenLoans from the Housing and Urban Development CorporationLimited for the scheme of Piped Water Supply in Rural Habitationthrough Tamilnadu Water Supply and Drainage BoardLoans from Housing and Urban Development CorporationLimited for Construction of additional buildings in GovernmentMedical CollegesLoan from Housing and Urban Development Corporation forconstruction of Hostels for BCs and MBCsLoans to HUDCO for desilting and upgradation of tanks withAyacut of more than 100 acresLoans from Housing and Urban Development Corporation forconstruction of an anicut across old coleroon river in Perampattuvillage in Chidambaram TalukLoans from Housing and Urban Development CorporationLimited for Rain Water HarvestingLoans from Housing and Urban Development Corporation forConstruction of BridgesLoans from Housing and Urban Development Corporation forIntegrated Water Resources ManagementLoans from Housing and Urban Development Corporation forconstruction of quarters for Police Personnel executed by TamilNadu Police Housing CorporationLoans from Housing and Urban Development Corporation forconstruction of hostel buildings for Adi Dravidar student executed
19
20
21
22
23
24
25
26
27
28
29
30
31
Description of DebtBalance ason 1st April
2011
Additionsduring the
year
Dischargesduring the
year
Balance onon 31stMarch
( in lakh of Rupees)
ANNEXURE TO STATEMENT No.15
. .
. .
. .
. .
. .
. .
. .
. .
. .
. .
. .
. .
. .
. .
. .
. .
. .
. .
. .
. .
. .
. .
- Contd.
- Contd- Contd
384
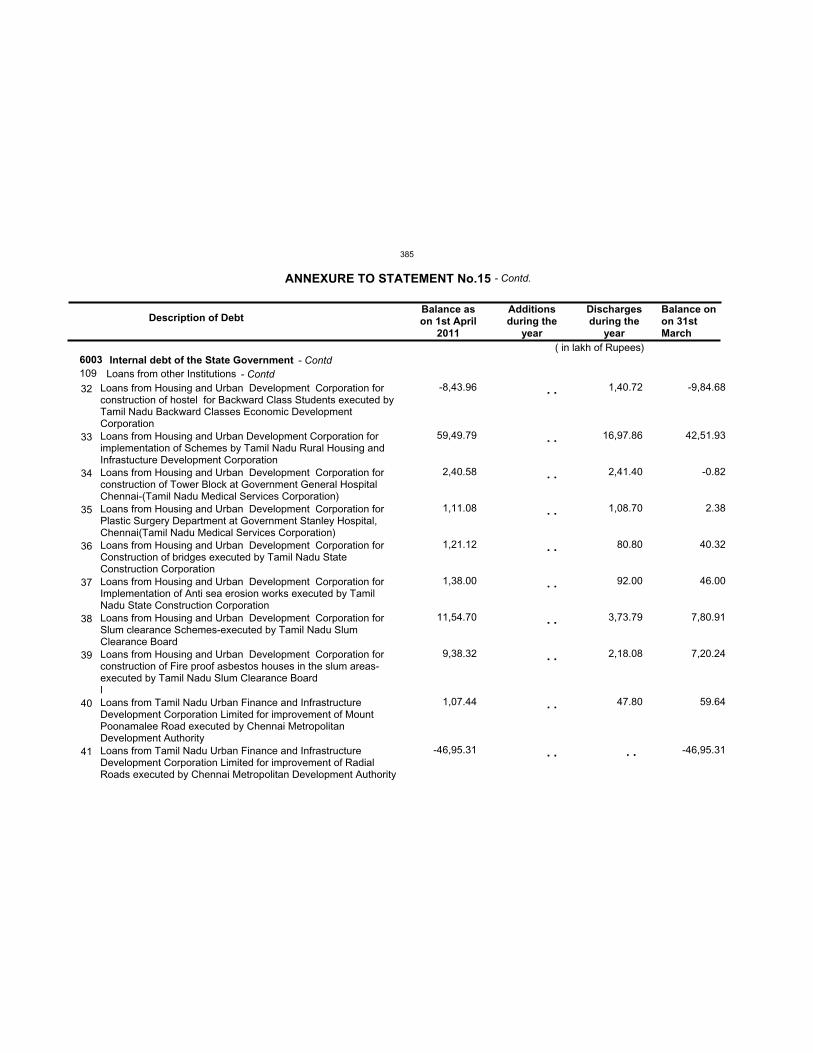
6003109
-8,43.96
59,49.79
2,40.58
1,11.08
1,21.12
1,38.00
11,54.70
9,38.32
1,07.44
-46,95.31
1,40.72
16,97.86
2,41.40
1,08.70
80.80
92.00
3,73.79
2,18.08
47.80
-9,84.68
42,51.93
-0.82
2.38
40.32
46.00
7,80.91
7,20.24
59.64
-46,95.31
Internal debt of the State GovernmentLoans from other Institutions
Loans from Housing and Urban Development Corporation forconstruction of hostel for Backward Class Students executed byTamil Nadu Backward Classes Economic DevelopmentCorporationLoans from Housing and Urban Development Corporation forimplementation of Schemes by Tamil Nadu Rural Housing andInfrastucture Development CorporationLoans from Housing and Urban Development Corporation forconstruction of Tower Block at Government General HospitalChennai-(Tamil Nadu Medical Services Corporation)Loans from Housing and Urban Development Corporation forPlastic Surgery Department at Government Stanley Hospital,Chennai(Tamil Nadu Medical Services Corporation)Loans from Housing and Urban Development Corporation forConstruction of bridges executed by Tamil Nadu StateConstruction CorporationLoans from Housing and Urban Development Corporation forImplementation of Anti sea erosion works executed by TamilNadu State Construction CorporationLoans from Housing and Urban Development Corporation forSlum clearance Schemes-executed by Tamil Nadu SlumClearance BoardLoans from Housing and Urban Development Corporation forconstruction of Fire proof asbestos houses in the slum areas-executed by Tamil Nadu Slum Clearance BoardlLoans from Tamil Nadu Urban Finance and InfrastructureDevelopment Corporation Limited for improvement of MountPoonamalee Road executed by Chennai MetropolitanDevelopment AuthorityLoans from Tamil Nadu Urban Finance and InfrastructureDevelopment Corporation Limited for improvement of RadialRoads executed by Chennai Metropolitan Development Authority
32
33
34
35
36
37
38
39
40
41
Description of DebtBalance ason 1st April
2011
Additionsduring the
year
Dischargesduring the
year
Balance onon 31stMarch
( in lakh of Rupees)
ANNEXURE TO STATEMENT No.15
. .
. .
. .
. .
. .
. .
. .
. .
. .
. . . .
- Contd.
- Contd- Contd
385
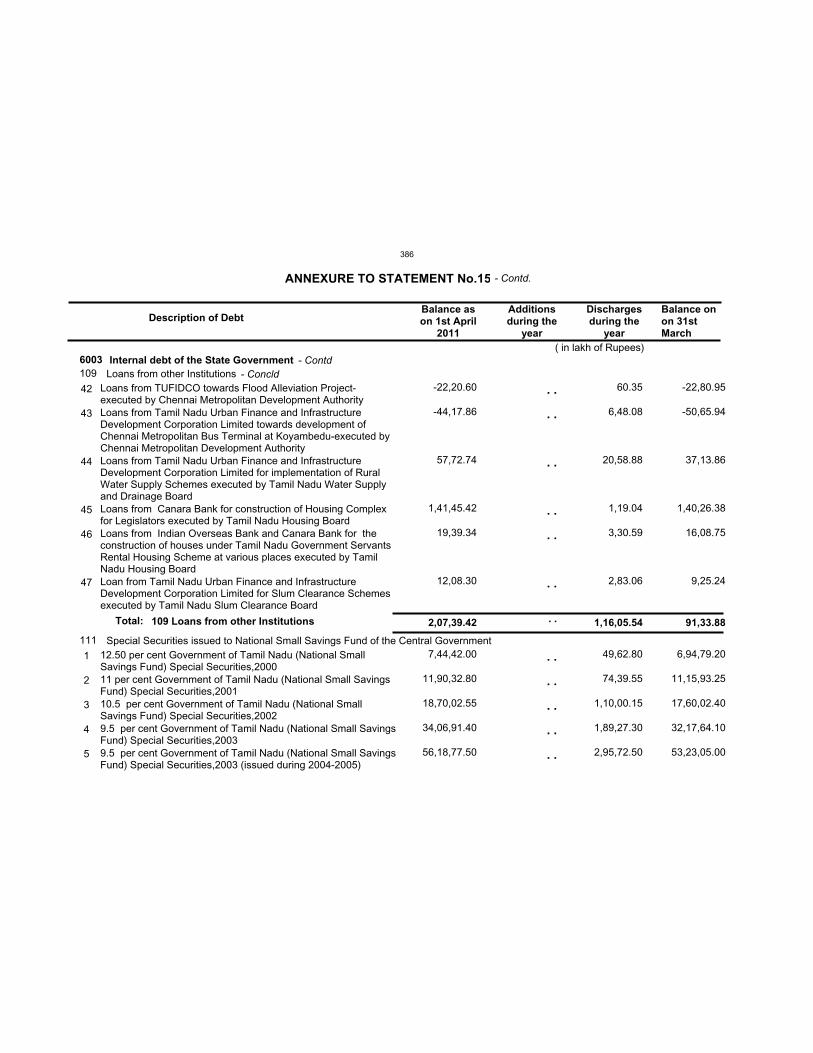
6003109
111
2,07,39.42 1,16,05.54 91,33.88
-22,20.60
-44,17.86
57,72.74
1,41,45.42
19,39.34
12,08.30
7,44,42.00
11,90,32.80
18,70,02.55
34,06,91.40
56,18,77.50
60.35
6,48.08
20,58.88
1,19.04
3,30.59
2,83.06
49,62.80
74,39.55
1,10,00.15
1,89,27.30
2,95,72.50
-22,80.95
-50,65.94
37,13.86
1,40,26.38
16,08.75
9,25.24
6,94,79.20
11,15,93.25
17,60,02.40
32,17,64.10
53,23,05.00
Total:
Internal debt of the State GovernmentLoans from other Institutions
Special Securities issued to National Small Savings Fund of the Central Government
Loans from TUFIDCO towards Flood Alleviation Project-executed by Chennai Metropolitan Development AuthorityLoans from Tamil Nadu Urban Finance and InfrastructureDevelopment Corporation Limited towards development ofChennai Metropolitan Bus Terminal at Koyambedu-executed byChennai Metropolitan Development AuthorityLoans from Tamil Nadu Urban Finance and InfrastructureDevelopment Corporation Limited for implementation of RuralWater Supply Schemes executed by Tamil Nadu Water Supplyand Drainage BoardLoans from Canara Bank for construction of Housing Complexfor Legislators executed by Tamil Nadu Housing BoardLoans from Indian Overseas Bank and Canara Bank for theconstruction of houses under Tamil Nadu Government ServantsRental Housing Scheme at various places executed by TamilNadu Housing BoardLoan from Tamil Nadu Urban Finance and InfrastructureDevelopment Corporation Limited for Slum Clearance Schemesexecuted by Tamil Nadu Slum Clearance Board
12.50 per cent Government of Tamil Nadu (National SmallSavings Fund) Special Securities,200011 per cent Government of Tamil Nadu (National Small SavingsFund) Special Securities,200110.5 per cent Government of Tamil Nadu (National SmallSavings Fund) Special Securities,20029.5 per cent Government of Tamil Nadu (National Small SavingsFund) Special Securities,20039.5 per cent Government of Tamil Nadu (National Small SavingsFund) Special Securities,2003 (issued during 2004-2005)
42
43
44
45
46
47
1
2
3
4
5
Description of DebtBalance ason 1st April
2011
Additionsduring the
year
Dischargesduring the
year
Balance onon 31stMarch
( in lakh of Rupees)
ANNEXURE TO STATEMENT No.15
109 Loans from other Institutions
. .
. .
. .
. .
. .
. .
. .
. .
. .
. .
. .
- Contd.
- Contd- Concld
. .
386
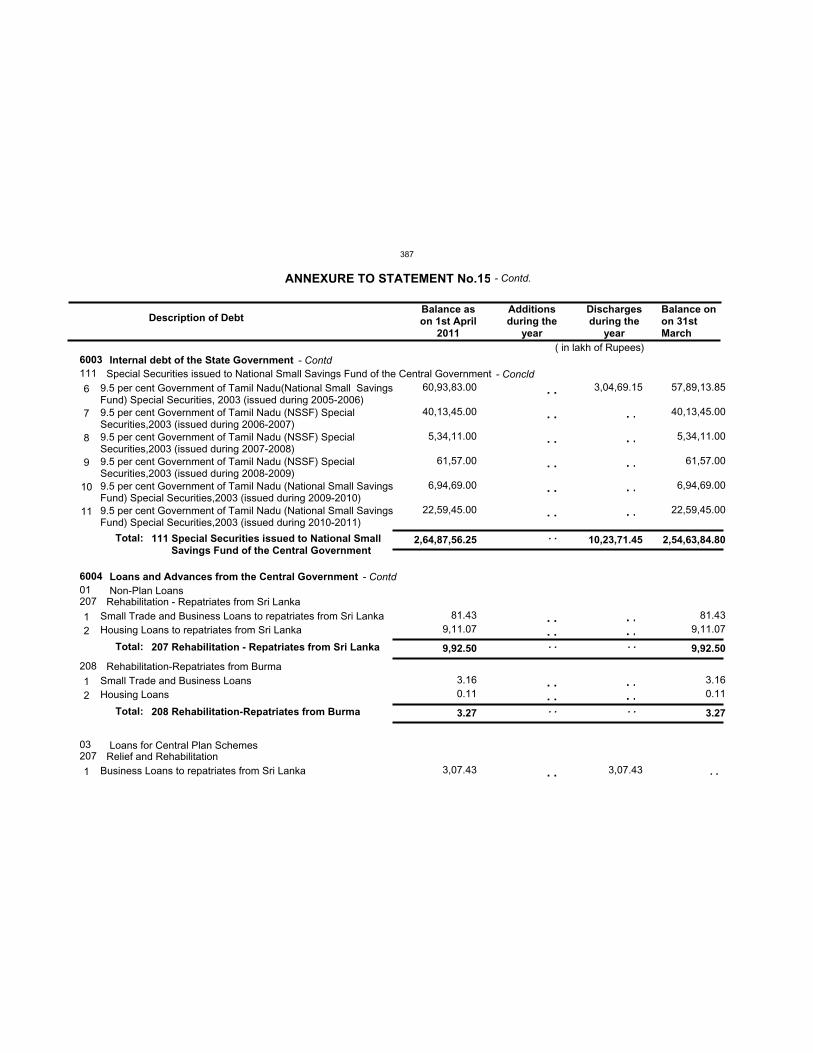
6003
600401
03
111
207
208
207
2,64,87,56.25
9,92.50
3.27
10,23,71.45 2,54,63,84.80
9,92.50
3.27
60,93,83.00
40,13,45.00
5,34,11.00
61,57.00
6,94,69.00
22,59,45.00
81.43 9,11.07
3.16 0.11
3,07.43
3,04,69.15
3,07.43
57,89,13.85
40,13,45.00
5,34,11.00
61,57.00
6,94,69.00
22,59,45.00
81.43 9,11.07
3.16 0.11
Total:
Total:
Total:
Internal debt of the State Government
Loans and Advances from the Central GovernmentNon-Plan Loans
Loans for Central Plan Schemes
Special Securities issued to National Small Savings Fund of the Central Government
Rehabilitation - Repatriates from Sri Lanka
Rehabilitation-Repatriates from Burma
Relief and Rehabilitation
9.5 per cent Government of Tamil Nadu(National Small SavingsFund) Special Securities, 2003 (issued during 2005-2006)9.5 per cent Government of Tamil Nadu (NSSF) SpecialSecurities,2003 (issued during 2006-2007)9.5 per cent Government of Tamil Nadu (NSSF) SpecialSecurities,2003 (issued during 2007-2008)9.5 per cent Government of Tamil Nadu (NSSF) SpecialSecurities,2003 (issued during 2008-2009)9.5 per cent Government of Tamil Nadu (National Small SavingsFund) Special Securities,2003 (issued during 2009-2010)9.5 per cent Government of Tamil Nadu (National Small SavingsFund) Special Securities,2003 (issued during 2010-2011)
Small Trade and Business Loans to repatriates from Sri LankaHousing Loans to repatriates from Sri Lanka
Small Trade and Business LoansHousing Loans
Business Loans to repatriates from Sri Lanka
6
7
8
9
10
11
12
12
1
Description of DebtBalance ason 1st April
2011
Additionsduring the
year
Dischargesduring the
year
Balance onon 31stMarch
( in lakh of Rupees)
ANNEXURE TO STATEMENT No.15
111 Special Securities issued to National SmallSavings Fund of the Central Government
207 Rehabilitation - Repatriates from Sri Lanka
208 Rehabilitation-Repatriates from Burma
. .
. .
. .
. .
. .
. .
. . . .
. . . .
. .
. .
. .
. .
. .
. .
. . . .
. . . .
- Contd.
- Contd
- Contd
- Concld
. .
. .
. .
. .
. .
. .
387
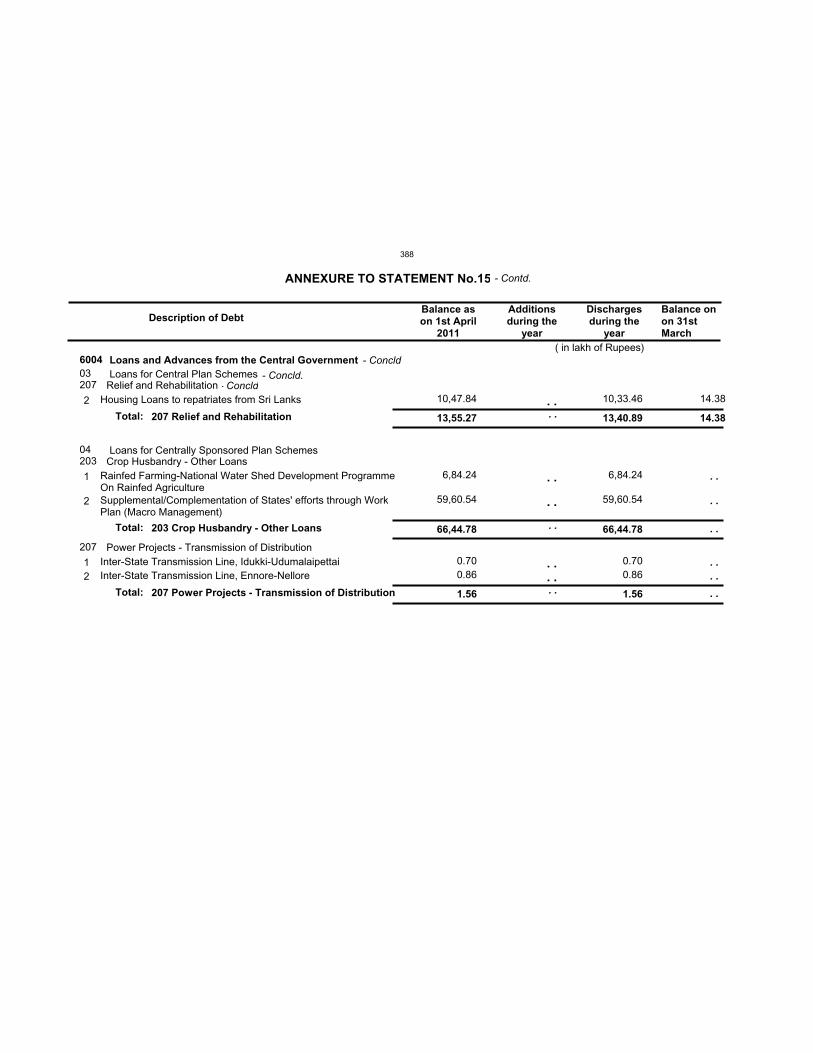
600403
04
207
203
207
13,55.27
66,44.78
1.56
13,40.89
66,44.78
1.56
14.38
10,47.84
6,84.24
59,60.54
0.70 0.86
10,33.46
6,84.24
59,60.54
0.70 0.86
14.38
Total:
Total:
Total:
Loans and Advances from the Central GovernmentLoans for Central Plan Schemes
Loans for Centrally Sponsored Plan Schemes
Relief and Rehabilitation
Crop Husbandry - Other Loans
Power Projects - Transmission of Distribution
Housing Loans to repatriates from Sri Lanks
Rainfed Farming-National Water Shed Development ProgrammeOn Rainfed AgricultureSupplemental/Complementation of States' efforts through WorkPlan (Macro Management)
Inter-State Transmission Line, Idukki-UdumalaipettaiInter-State Transmission Line, Ennore-Nellore
2
1
2
12
Description of DebtBalance ason 1st April
2011
Additionsduring the
year
Dischargesduring the
year
Balance onon 31stMarch
( in lakh of Rupees)
ANNEXURE TO STATEMENT No.15
207 Relief and Rehabilitation
203 Crop Husbandry - Other Loans
207 Power Projects - Transmission of Distribution
. .
. .
. .
. . . .
- Contd.
- Concld- Concld.
- Concld
. .
. .
. .
. .
. .
. . . .
. .
. .
388
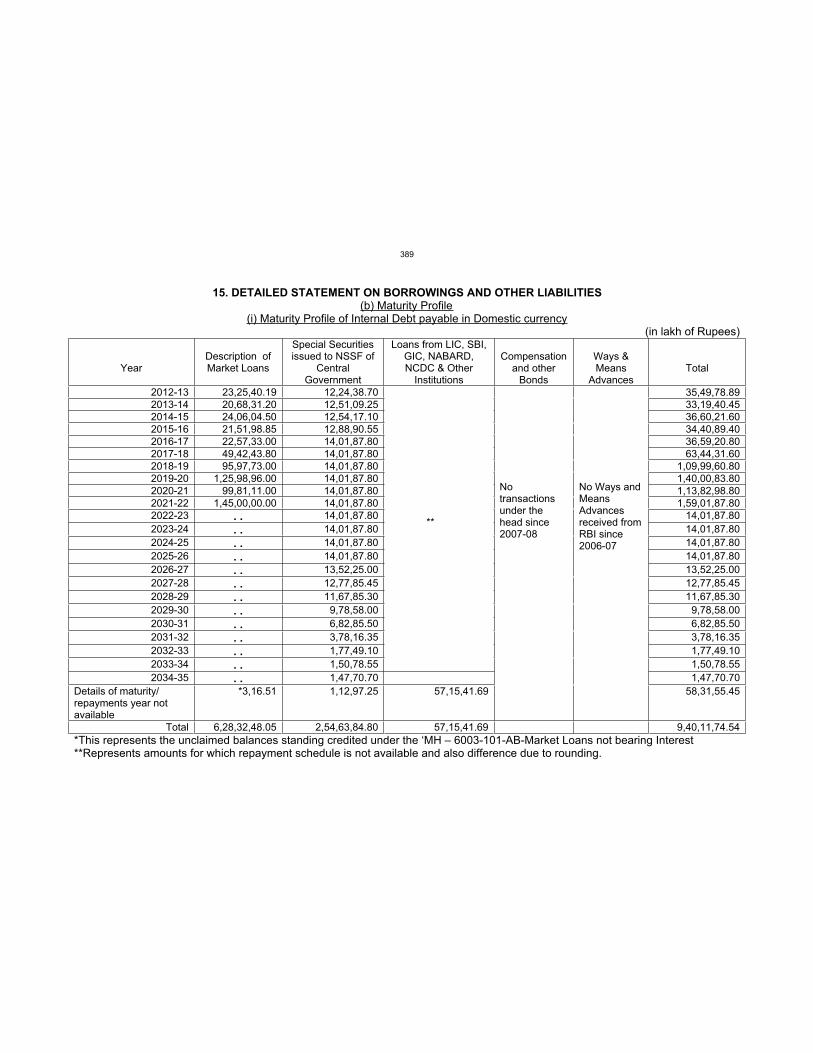
15. DETAILED STATEMENT ON BORROWINGS AND OTHER LIABILITIES(b) Maturity Profile
(i) Maturity Profile of Internal Debt payable in Domestic currency (in lakh of Rupees)
YearDescription of Market Loans
Special Securities issued to NSSF of
CentralGovernment
Loans from LIC, SBI, GIC, NABARD, NCDC & Other
Institutions
Compensation and other
Bonds
Ways & Means
Advances Total
2012-13 23,25,40.19 12,24,38.70
**
Notransactions under the head since 2007-08
No Ways and Means Advances received from RBI since 2006-07
35,49,78.892013-14 20,68,31.20 12,51,09.25 33,19,40.452014-15 24,06,04.50 12,54,17.10 36,60,21.602015-16 21,51,98.85 12,88,90.55 34,40,89.402016-17 22,57,33.00 14,01,87.80 36,59,20.802017-18 49,42,43.80 14,01,87.80 63,44,31.602018-19 95,97,73.00 14,01,87.80 1,09,99,60.802019-20 1,25,98,96.00 14,01,87.80 1,40,00,83.802020-21 99,81,11.00 14,01,87.80 1,13,82,98.802021-22 1,45,00,00.00 14,01,87.80 1,59,01,87.802022-23 . . 14,01,87.80 14,01,87.80
2023-24 . . 14,01,87.80 14,01,87.80
2024-25 . . 14,01,87.80 14,01,87.80
2025-26 . . 14,01,87.80 14,01,87.80
2026-27 . . 13,52,25.00 13,52,25.00
2027-28 . . 12,77,85.45 12,77,85.45
2028-29 . . 11,67,85.30 11,67,85.30
2029-30 . . 9,78,58.00 9,78,58.00
2030-31 . . 6,82,85.50 6,82,85.50
2031-32 . . 3,78,16.35 3,78,16.35
2032-33 . . 1,77,49.10 1,77,49.10
2033-34 . . 1,50,78.55 1,50,78.55
2034-35 . . 1,47,70.70 1,47,70.70
Details of maturity/ repayments year not available
*3,16.51 1,12,97.25 57,15,41.69 58,31,55.45
Total 6,28,32,48.05 2,54,63,84.80 57,15,41.69 9,40,11,74.54
*This represents the unclaimed balances standing credited under the ‘MH – 6003-101-AB-Market Loans not bearing Interest **Represents amounts for which repayment schedule is not available and also difference due to rounding.
389
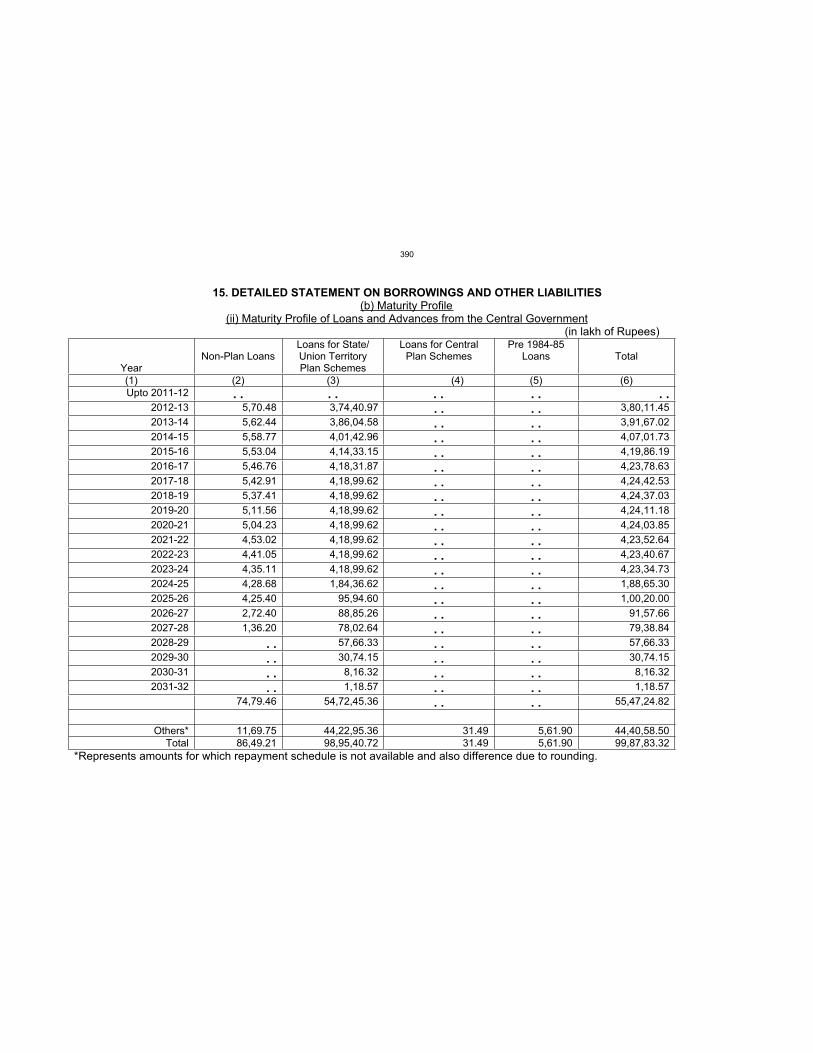
15. DETAILED STATEMENT ON BORROWINGS AND OTHER LIABILITIES(b) Maturity Profile
(ii) Maturity Profile of Loans and Advances from the Central Government (in lakh of Rupees)
YearNon-Plan Loans
Loans for State/ Union Territory Plan Schemes
Loans for Central Plan Schemes
Pre 1984-85 Loans Total
(1) (2) (3) (4) (5) (6) Upto 2011-12 . . . . . . . . . .
2012-13 5,70.48 3,74,40.97 . . . . 3,80,11.45
2013-14 5,62.44 3,86,04.58 . . . . 3,91,67.02
2014-15 5,58.77 4,01,42.96 . . . . 4,07,01.73
2015-16 5,53.04 4,14,33.15 . . . . 4,19,86.19
2016-17 5,46.76 4,18,31.87 . . . . 4,23,78.63
2017-18 5,42.91 4,18,99.62 . . . . 4,24,42.53
2018-19 5,37.41 4,18,99.62 . . . . 4,24,37.03
2019-20 5,11.56 4,18,99.62 . . . . 4,24,11.18
2020-21 5,04.23 4,18,99.62 . . . . 4,24,03.85
2021-22 4,53.02 4,18,99.62 . . . . 4,23,52.64
2022-23 4,41.05 4,18,99.62 . . . . 4,23,40.67
2023-24 4,35.11 4,18,99.62 . . . . 4,23,34.73
2024-25 4,28.68 1,84,36.62 . . . . 1,88,65.30
2025-26 4,25.40 95,94.60 . . . . 1,00,20.00
2026-27 2,72.40 88,85.26 . . . . 91,57.66
2027-28 1,36.20 78,02.64 . . . . 79,38.84
2028-29 . . 57,66.33 . . . . 57,66.33
2029-30 . . 30,74.15 . . . . 30,74.15
2030-31 . . 8,16.32 . . . . 8,16.32
2031-32 . . 1,18.57 . . . . 1,18.57
74,79.46 54,72,45.36 . . . . 55,47,24.82
Others* 11,69.75 44,22,95.36 31.49 5,61.90 44,40,58.50Total 86,49.21 98,95,40.72 31.49 5,61.90 99,87,83.32
*Represents amounts for which repayment schedule is not available and also difference due to rounding.
390
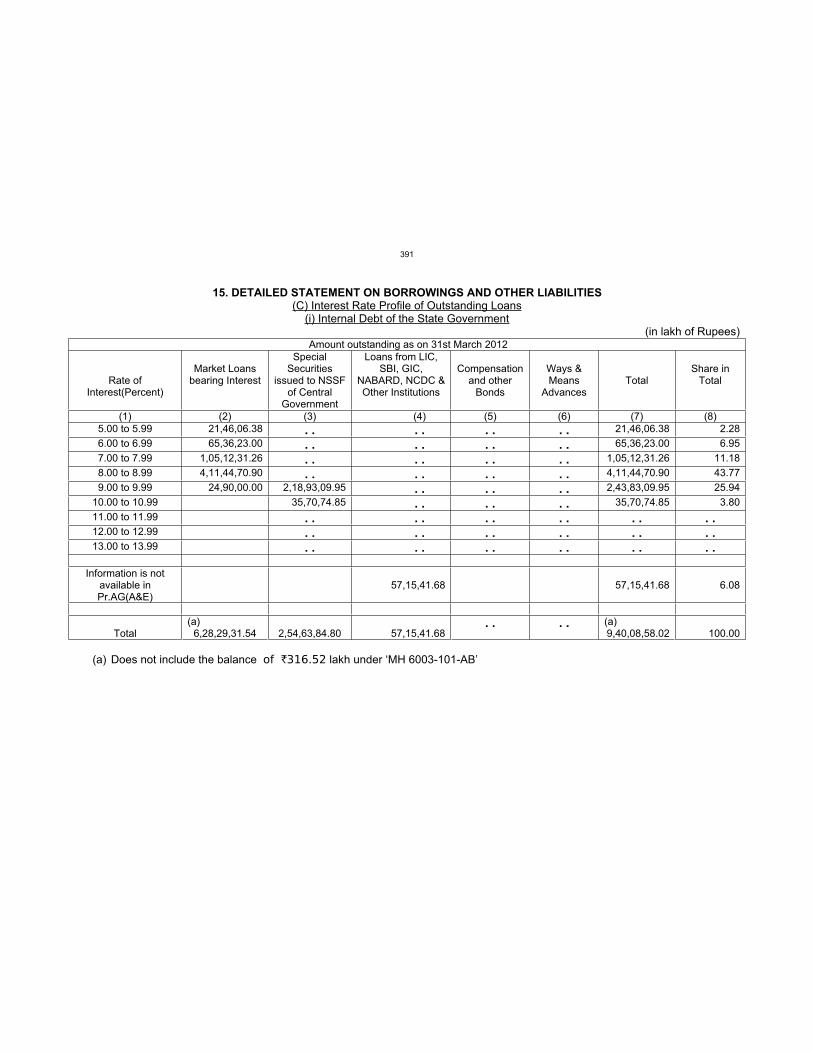
15. DETAILED STATEMENT ON BORROWINGS AND OTHER LIABILITIES(C) Interest Rate Profile of Outstanding Loans
(i) Internal Debt of the State Government (in lakh of Rupees)
Amount outstanding as on 31st March 2012
Rate of Interest(Percent)
Market Loans bearing Interest
SpecialSecurities
issued to NSSF of Central
Government
Loans from LIC, SBI, GIC,
NABARD, NCDC & Other Institutions
Compensation and other
Bonds
Ways & Means
Advances Total
Share in Total
(1) (2) (3) (4) (5) (6) (7) (8) 5.00 to 5.99 21,46,06.38 . . . . . . . . 21,46,06.38 2.28
6.00 to 6.99 65,36,23.00 . . . . . . . . 65,36,23.00 6.95
7.00 to 7.99 1,05,12,31.26 . . . . . . . . 1,05,12,31.26 11.18
8.00 to 8.99 4,11,44,70.90 . . . . . . . . 4,11,44,70.90 43.77
9.00 to 9.99 24,90,00.00 2,18,93,09.95 . . . . . . 2,43,83,09.95 25.94
10.00 to 10.99 35,70,74.85 . . . . . . 35,70,74.85 3.80
11.00 to 11.99 . . . . . . . . . . . .12.00 to 12.99 . . . . . . . . . . . .13.00 to 13.99 . . . . . . . . . . . .
Information is not
available in Pr.AG(A&E)
57,15,41.68 57,15,41.68 6.08
Total(a)
6,28,29,31.54 2,54,63,84.80 57,15,41.68. . . . (a)
9,40,08,58.02 100.00
(a) Does not include the balance of `316.52 lakh under ‘MH 6003-101-AB’
391
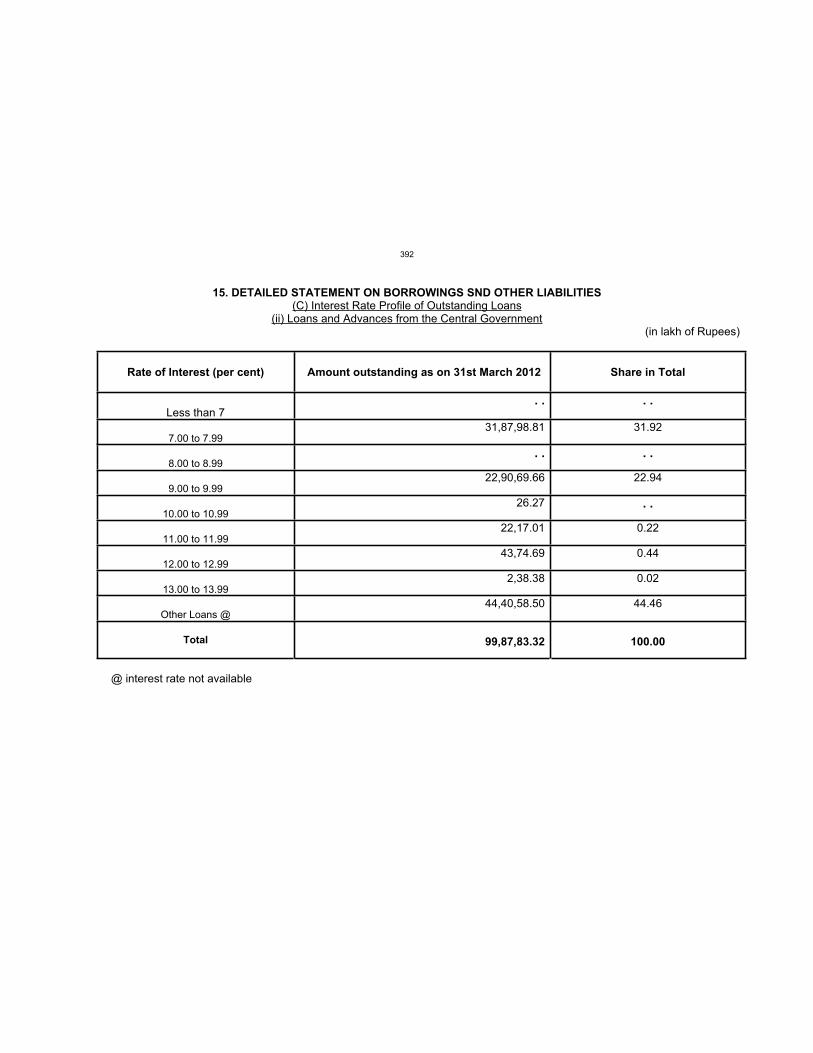
15. DETAILED STATEMENT ON BORROWINGS SND OTHER LIABILITIES (C) Interest Rate Profile of Outstanding Loans
(ii) Loans and Advances from the Central Government (in lakh of Rupees)
Rate of Interest (per cent) Amount outstanding as on 31st March 2012 Share in Total
Less than 7 . . . .
7.00 to 7.99 31,87,98.81 31.92
8.00 to 8.99 . . . .
9.00 to 9.99 22,90,69.66 22.94
10.00 to 10.99 26.27 . .
11.00 to 11.99 22,17.01 0.22
12.00 to 12.99 43,74.69 0.44
13.00 to 13.99 2,38.38 0.02
Other Loans @ 44,40,58.50 44.46
Total 99,87,83.32 100.00
@ interest rate not available
392
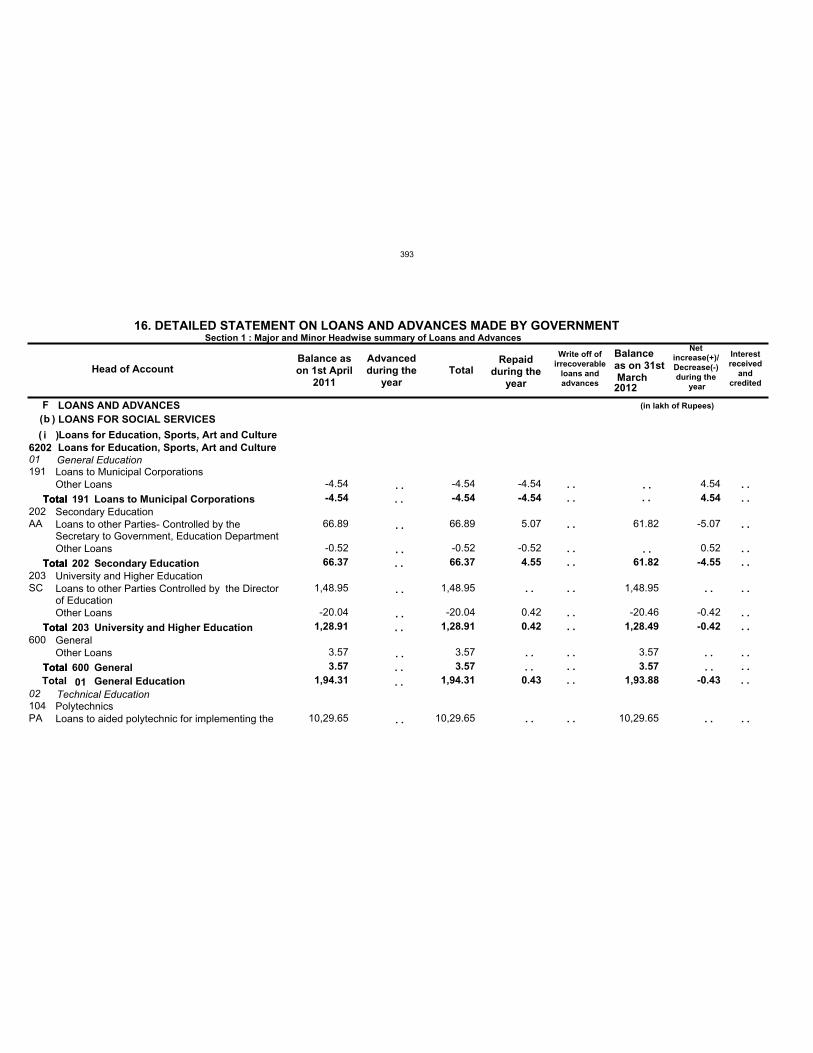
Fb
i620201
02 1,94.31 1,94.31 0.43 1,93.88 -0.43
191
202
203
600
104
-4.54
66.37
1,28.91
3.57
-4.54
66.37
1,28.91
3.57
-4.54
4.55
0.42
61.82
1,28.49
3.57
4.54
-4.55
-0.42
AA
SC
PA
-4.54
66.89
-0.52
1,48.95
-20.04
3.57
10,29.65
-4.54
66.89
-0.52
1,48.95
-20.04
3.57
10,29.65
-4.54
5.07
-0.52
0.42
61.82
1,48.95
-20.46
3.57
10,29.65
4.54
-5.07
0.52
-0.42
LOANS AND ADVANCESLOANS FOR SOCIAL SERVICES
Loans for Education, Sports, Art and CultureLoans for Education, Sports, Art and CultureGeneral Education
Technical Education
Loans to Municipal Corporations
Secondary Education
University and Higher Education
General
Polytechnics
Other Loans
Loans to other Parties- Controlled by theSecretary to Government, Education DepartmentOther Loans
Loans to other Parties Controlled by the Directorof EducationOther Loans
Other Loans
Loans to aided polytechnic for implementing the
Head of AccountBalance ason 1st April
2011
Advancedduring the
yearTotal
Repaidduring the
year
Write off ofirrecoverable
loans andadvances
Balanceas on 31st March
Netincrease(+)/Decrease(-)during the
year
16. DETAILED STATEMENT ON LOANS AND ADVANCES MADE BY GOVERNMENTSection 1 : Major and Minor Headwise summary of Loans and Advances
(in lakh of Rupees)
2012
( )
( )
. .
. .
. .
. .
. .
. .
. .
. .
. .
. .
. .
. .
. .
. . . .
Total
Total
Total
Total
191
202
203
600
Loans to Municipal Corporations
Secondary Education
University and Higher Education
General
. .
. .
. .
. .
Interestreceived
andcredited
. .
. .
. .
. .
. .
. .
. .
. .
. .
. .
. .Total
Total
Total
Total
Total01 General Education
. .
. .
. .
. .
. .
. .
. .
. .
. .
. .
. .
. . . . . .
. .
. .
. .
393
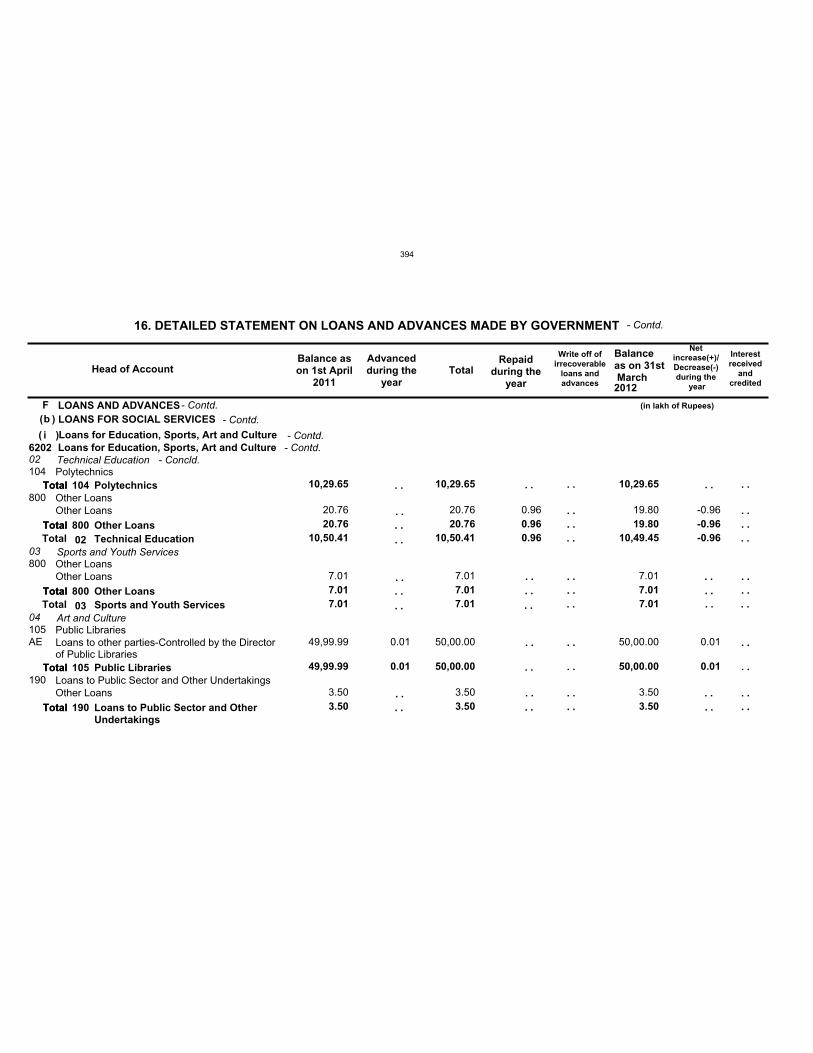
Fb
i620202
03
04
10,50.41
7.01
10,50.41
7.01
0.96 10,49.45
7.01
-0.96
104
800
800
105
190
10,29.65
20.76
7.01
49,99.99
3.50
0.01
10,29.65
20.76
7.01
50,00.00
3.50
0.96
10,29.65
19.80
7.01
50,00.00
3.50
-0.96
0.01
AE
20.76
7.01
49,99.99
3.50
0.01
20.76
7.01
50,00.00
3.50
0.96 19.80
7.01
50,00.00
3.50
-0.96
0.01
LOANS AND ADVANCESLOANS FOR SOCIAL SERVICES
Loans for Education, Sports, Art and CultureLoans for Education, Sports, Art and CultureTechnical Education
Sports and Youth Services
Art and Culture
Polytechnics
Other Loans
Other Loans
Public Libraries
Loans to Public Sector and Other Undertakings
Other Loans
Other Loans
Loans to other parties-Controlled by the Directorof Public Libraries
Other Loans
Head of AccountBalance ason 1st April
2011
Advancedduring the
yearTotal
Repaidduring the
year
Write off ofirrecoverable
loans andadvances
Balanceas on 31st March
Netincrease(+)/Decrease(-)during the
year
16. DETAILED STATEMENT ON LOANS AND ADVANCES MADE BY GOVERNMENT
(in lakh of Rupees)
2012
- Contd.
- Contd.( )
( )- Contd.
- Contd.
. .
. .
. .
. .
. .
. .
. .
. .
. .
. .
. .
. .
. .
. .
Total
Total
Total
Total
Total
104
800
800
105
190
Polytechnics
Other Loans
Other Loans
Public Libraries
Loans to Public Sector and OtherUndertakings
. .
. .
. .
. .
. .
Interestreceived
andcredited
. .
. .
. .
. .
. .
. .
. .
. .
. .
Total
Total
Total
Total
Total
Total
Total
02
03
Technical Education
Sports and Youth Services
. .
. .
. .
. .
. .
. .
. .
. .
. .
- Contd.
. .
. . . .
. .
. .
. .
. .. .
- Concld.
394
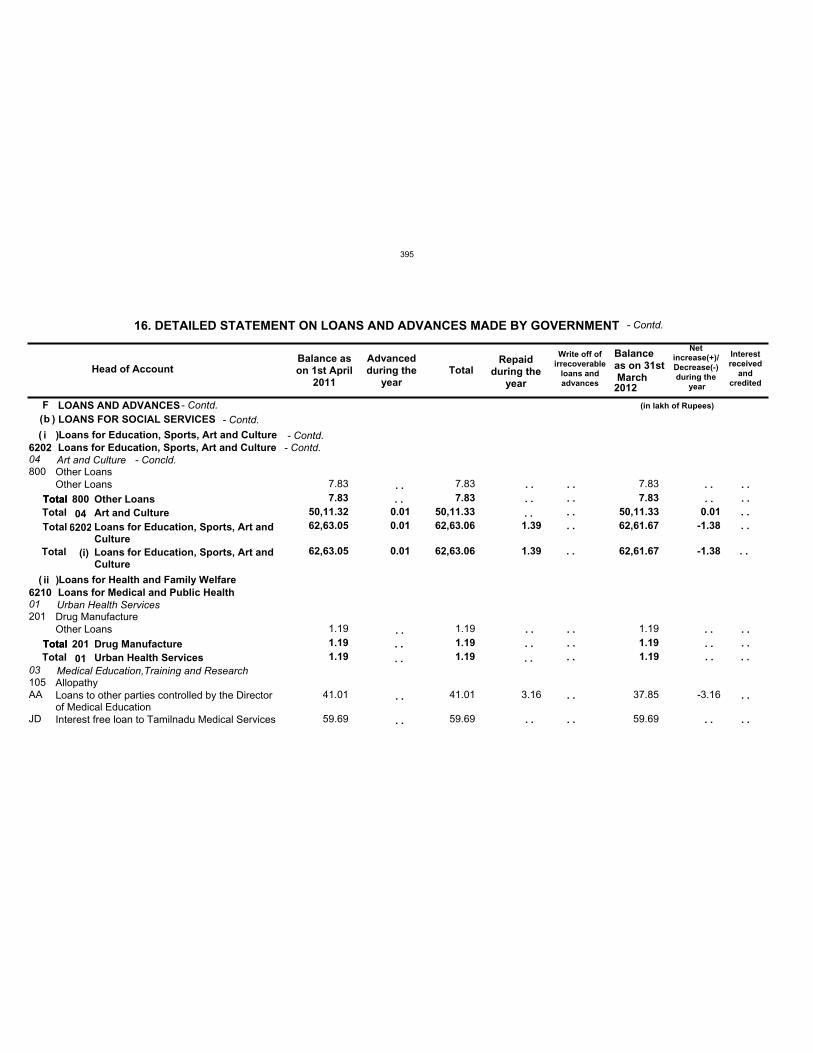
Fb
i
ii
62,63.05 0.01 62,63.06 1.39 62,61.67 -1.38
6202
6210
62,63.05 0.01 62,63.06 1.39 62,61.67 -1.38
04
01
03
50,11.32
1.19
0.01 50,11.33
1.19
50,11.33
1.19
0.01
800
201
105
7.83
1.19
7.83
1.19
7.83
1.19
AA
JD
7.83
1.19
41.01
59.69
7.83
1.19
41.01
59.69
3.16
7.83
1.19
37.85
59.69
-3.16
LOANS AND ADVANCESLOANS FOR SOCIAL SERVICES
Loans for Education, Sports, Art and Culture
Loans for Health and Family Welfare
Loans for Education, Sports, Art and Culture
Loans for Medical and Public Health
Art and Culture
Urban Health Services
Medical Education,Training and Research
Other Loans
Drug Manufacture
Allopathy
Other Loans
Other Loans
Loans to other parties controlled by the Directorof Medical EducationInterest free loan to Tamilnadu Medical Services
Head of AccountBalance ason 1st April
2011
Advancedduring the
yearTotal
Repaidduring the
year
Write off ofirrecoverable
loans andadvances
Balanceas on 31st March
Netincrease(+)/Decrease(-)during the
year
16. DETAILED STATEMENT ON LOANS AND ADVANCES MADE BY GOVERNMENT
(in lakh of Rupees)
2012
- Contd.
- Contd.( )
(
(
)
)
- Contd.
- Contd.
. .
. .
. .
. .
. .
. .
. .
. .
. .
. .
. .
Total
Total
800
201
Other Loans
Drug Manufacture
. .
. .
. .
. .
. .
Interestreceived
andcredited
. .
. .
. .
. .
. .
. .
Total
Total
Total
Total
Total
Total
04
01
6202
(i)
Art and Culture
Urban Health Services
Loans for Education, Sports, Art andCultureLoans for Education, Sports, Art andCulture
. .
. .
. .
. .
. .
. .
- Contd.
. .
. .
. .
. . . .
. . . .
. .
. .
. .
. .. .
- Concld.
395
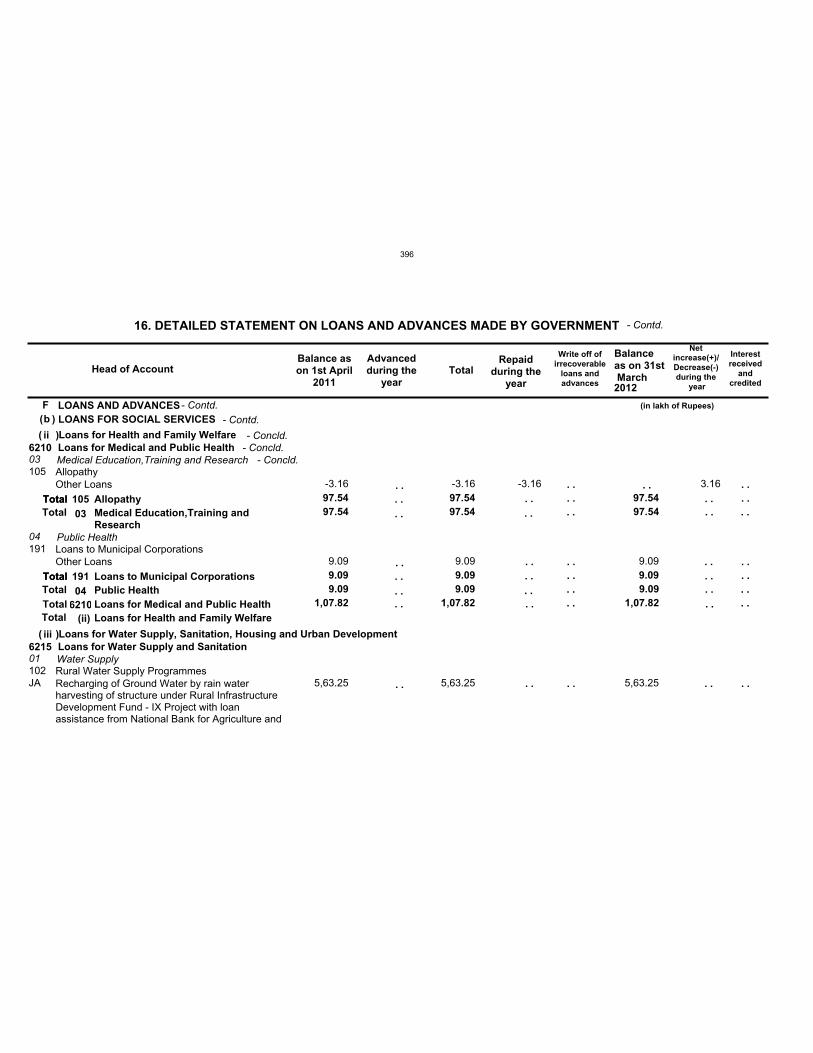
Fb
ii
iii
6210
6215
1,07.82 1,07.82 1,07.82
03
04
01
97.54
9.09
97.54
9.09
97.54
9.09
105
191
102
97.54
9.09
97.54
9.09
97.54
9.09
JA
-3.16
9.09
5,63.25
-3.16
9.09
5,63.25
-3.16
9.09
5,63.25
3.16
LOANS AND ADVANCESLOANS FOR SOCIAL SERVICES
Loans for Health and Family Welfare
Loans for Water Supply, Sanitation, Housing and Urban Development
Loans for Medical and Public Health
Loans for Water Supply and Sanitation
Medical Education,Training and Research
Public Health
Water Supply
Allopathy
Loans to Municipal Corporations
Rural Water Supply Programmes
Other Loans
Other Loans
Recharging of Ground Water by rain waterharvesting of structure under Rural InfrastructureDevelopment Fund - IX Project with loanassistance from National Bank for Agriculture and
Head of AccountBalance ason 1st April
2011
Advancedduring the
yearTotal
Repaidduring the
year
Write off ofirrecoverable
loans andadvances
Balanceas on 31st March
Netincrease(+)/Decrease(-)during the
year
16. DETAILED STATEMENT ON LOANS AND ADVANCES MADE BY GOVERNMENT
(in lakh of Rupees)
2012
- Contd.
- Contd.( )
(
(
)
)
- Contd.
- Concld.
. .
. .
. .
. .
. .
. .
. .
. .
. .
Total
Total
105
191
Allopathy
Loans to Municipal Corporations. .
. .
. .
. .
Interestreceived
andcredited
. .
. .
. .
. .
. .
Total
TotalTotalTotal
Total
Total
03
046210
(ii)
Medical Education,Training andResearch
Public HealthLoans for Medical and Public HealthLoans for Health and Family Welfare
. .
. .
. .
. .
. .
- Concld.
. .
. .
. .
. .. . . .. . . .
. .
. .
. .
. .
. .
. .
. .
. .
- Concld.
396
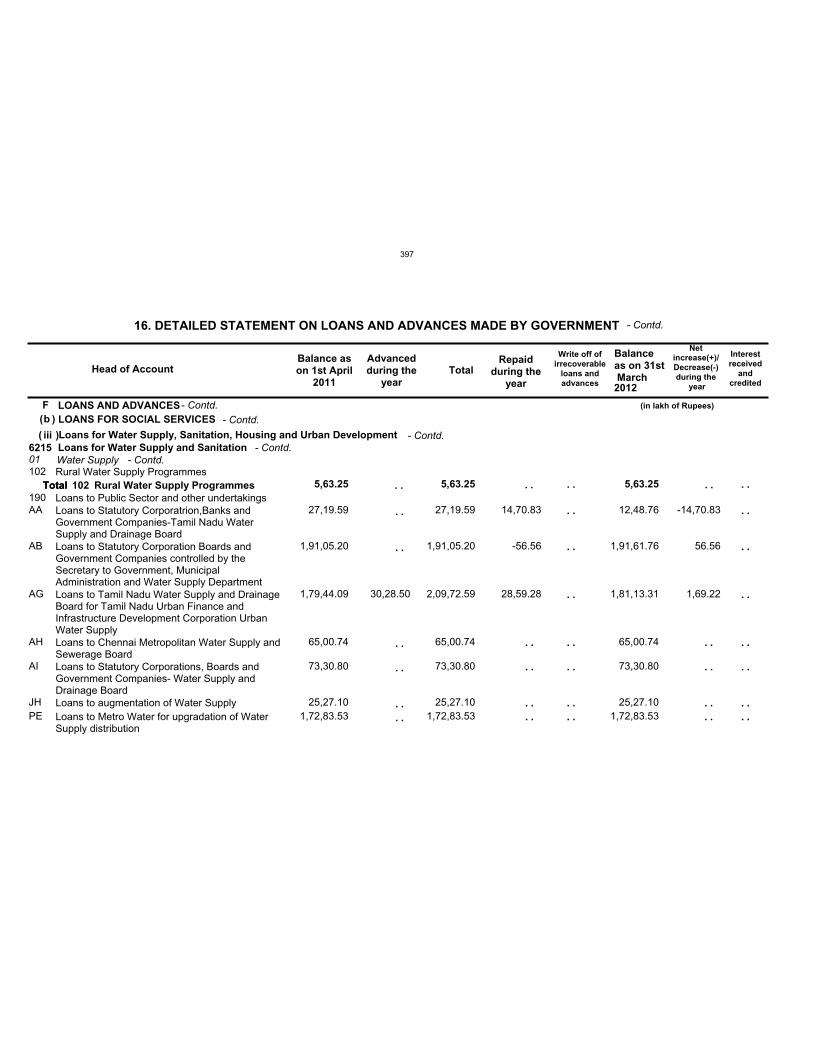
Fb
iii621501102
190 5,63.25 5,63.25 5,63.25
AA
AB
AG
AH
AI
JHPE
27,19.59
1,91,05.20
1,79,44.09
65,00.74
73,30.80
25,27.10 1,72,83.53
30,28.50
27,19.59
1,91,05.20
2,09,72.59
65,00.74
73,30.80
25,27.10 1,72,83.53
14,70.83
-56.56
28,59.28
12,48.76
1,91,61.76
1,81,13.31
65,00.74
73,30.80
25,27.10 1,72,83.53
-14,70.83
56.56
1,69.22
LOANS AND ADVANCESLOANS FOR SOCIAL SERVICES
Loans for Water Supply, Sanitation, Housing and Urban DevelopmentLoans for Water Supply and SanitationWater SupplyRural Water Supply Programmes
Loans to Public Sector and other undertakingsLoans to Statutory Corporatrion,Banks andGovernment Companies-Tamil Nadu WaterSupply and Drainage BoardLoans to Statutory Corporation Boards andGovernment Companies controlled by theSecretary to Government, MunicipalAdministration and Water Supply DepartmentLoans to Tamil Nadu Water Supply and DrainageBoard for Tamil Nadu Urban Finance andInfrastructure Development Corporation UrbanWater SupplyLoans to Chennai Metropolitan Water Supply andSewerage BoardLoans to Statutory Corporations, Boards andGovernment Companies- Water Supply andDrainage BoardLoans to augmentation of Water SupplyLoans to Metro Water for upgradation of WaterSupply distribution
Head of AccountBalance ason 1st April
2011
Advancedduring the
yearTotal
Repaidduring the
year
Write off ofirrecoverable
loans andadvances
Balanceas on 31st March
Netincrease(+)/Decrease(-)during the
year
16. DETAILED STATEMENT ON LOANS AND ADVANCES MADE BY GOVERNMENT
(in lakh of Rupees)
2012
- Contd.
- Contd.( )
( )- Contd.
- Contd.
. .
. .
. .
. .
. .
. .
. .
. .
. .
. .
. . . .Total 102 Rural Water Supply Programmes
. .
. .
. .
. .
. .
Interestreceived
andcredited
. .
. .
. .
. .
. .
. .
. .
. .Total
. .
. .
. .
. .
. .
. .
. .
. .
- Contd.- Contd.
397
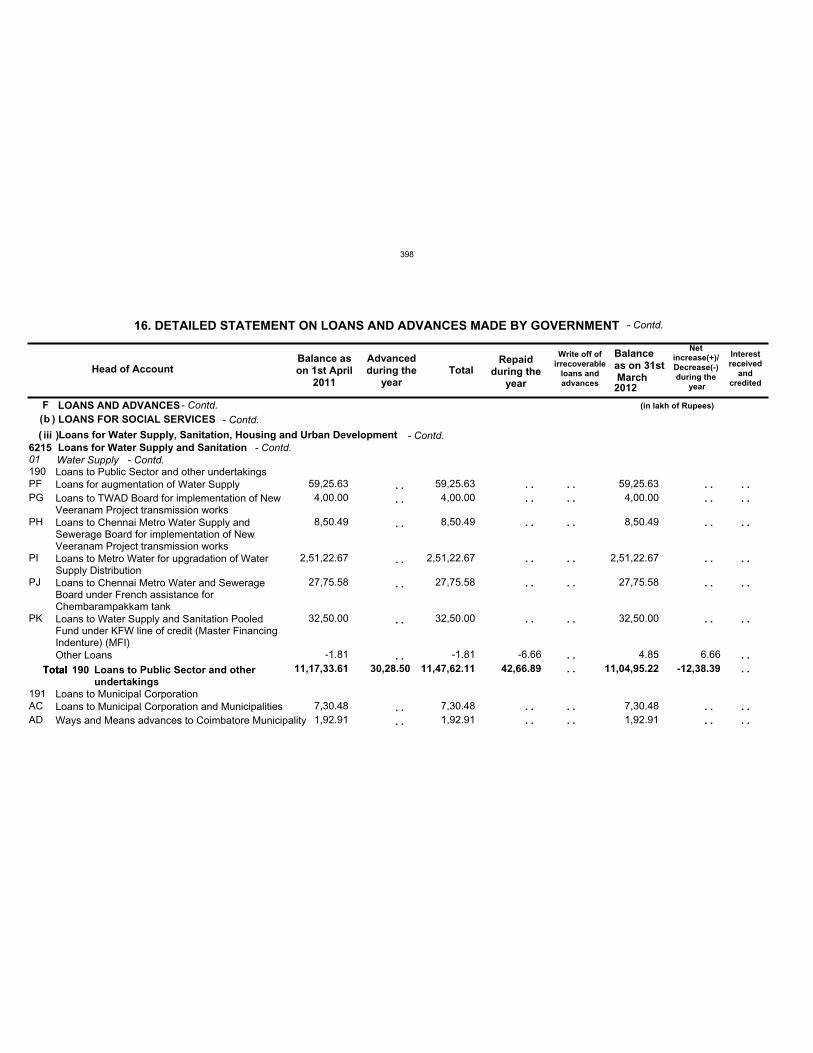
Fb
iii621501190
191
11,17,33.61 30,28.50 11,47,62.11 42,66.89 11,04,95.22 -12,38.39
PFPG
PH
PI
PJ
PK
ACAD
59,25.63 4,00.00
8,50.49
2,51,22.67
27,75.58
32,50.00
-1.81
7,30.48 1,92.91
59,25.63 4,00.00
8,50.49
2,51,22.67
27,75.58
32,50.00
-1.81
7,30.48 1,92.91
-6.66
59,25.63 4,00.00
8,50.49
2,51,22.67
27,75.58
32,50.00
4.85
7,30.48 1,92.91
6.66
LOANS AND ADVANCESLOANS FOR SOCIAL SERVICES
Loans for Water Supply, Sanitation, Housing and Urban DevelopmentLoans for Water Supply and SanitationWater SupplyLoans to Public Sector and other undertakings
Loans to Municipal Corporation
Loans for augmentation of Water SupplyLoans to TWAD Board for implementation of NewVeeranam Project transmission worksLoans to Chennai Metro Water Supply andSewerage Board for implementation of NewVeeranam Project transmission worksLoans to Metro Water for upgradation of WaterSupply DistributionLoans to Chennai Metro Water and SewerageBoard under French assistance forChembarampakkam tankLoans to Water Supply and Sanitation PooledFund under KFW line of credit (Master FinancingIndenture) (MFI)Other Loans
Loans to Municipal Corporation and MunicipalitiesWays and Means advances to Coimbatore Municipality
Head of AccountBalance ason 1st April
2011
Advancedduring the
yearTotal
Repaidduring the
year
Write off ofirrecoverable
loans andadvances
Balanceas on 31st March
Netincrease(+)/Decrease(-)during the
year
16. DETAILED STATEMENT ON LOANS AND ADVANCES MADE BY GOVERNMENT
(in lakh of Rupees)
2012
- Contd.
- Contd.( )
( )- Contd.
- Contd.
. .
. .
. .
. .
. .
. .
. .
. .
. .
. .
. .
. .
. .
. .
. .
. .
. .
Total 190 Loans to Public Sector and otherundertakings
. .
. .
. .
. .
. .
. .
. .
. .
Interestreceived
andcredited
. .
. .
. .
. .
. .
. .
. .
. .
. .
. .Total
. .
. .
. .
. .
. .
. .
. .
. .
. .
. .
- Contd.- Contd.
398
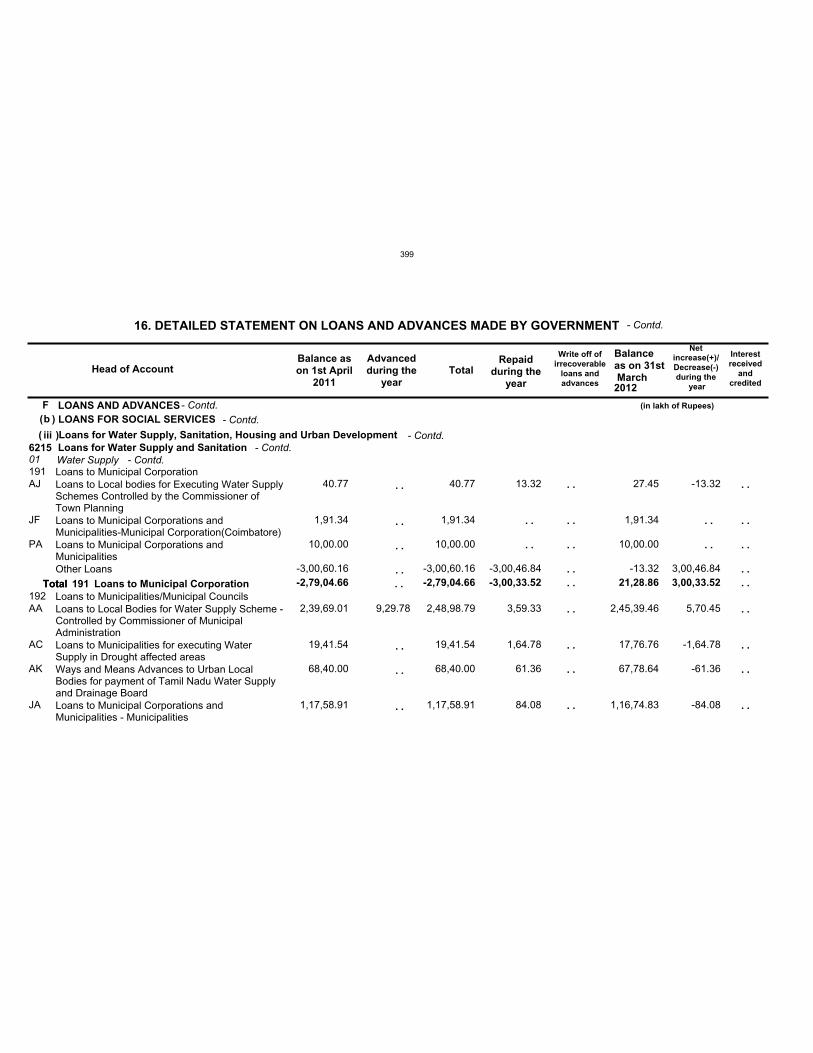
Fb
iii621501191
192-2,79,04.66 -2,79,04.66 -3,00,33.52 21,28.86 3,00,33.52
AJ
JF
PA
AA
AC
AK
JA
40.77
1,91.34
10,00.00
-3,00,60.16
2,39,69.01
19,41.54
68,40.00
1,17,58.91
9,29.78
40.77
1,91.34
10,00.00
-3,00,60.16
2,48,98.79
19,41.54
68,40.00
1,17,58.91
13.32
-3,00,46.84
3,59.33
1,64.78
61.36
84.08
27.45
1,91.34
10,00.00
-13.32
2,45,39.46
17,76.76
67,78.64
1,16,74.83
-13.32
3,00,46.84
5,70.45
-1,64.78
-61.36
-84.08
LOANS AND ADVANCESLOANS FOR SOCIAL SERVICES
Loans for Water Supply, Sanitation, Housing and Urban DevelopmentLoans for Water Supply and SanitationWater SupplyLoans to Municipal Corporation
Loans to Municipalities/Municipal Councils
Loans to Local bodies for Executing Water SupplySchemes Controlled by the Commissioner ofTown PlanningLoans to Municipal Corporations andMunicipalities-Municipal Corporation(Coimbatore)Loans to Municipal Corporations andMunicipalitiesOther Loans
Loans to Local Bodies for Water Supply Scheme -Controlled by Commissioner of MunicipalAdministrationLoans to Municipalities for executing WaterSupply in Drought affected areasWays and Means Advances to Urban LocalBodies for payment of Tamil Nadu Water Supplyand Drainage BoardLoans to Municipal Corporations andMunicipalities - Municipalities
Head of AccountBalance ason 1st April
2011
Advancedduring the
yearTotal
Repaidduring the
year
Write off ofirrecoverable
loans andadvances
Balanceas on 31st March
Netincrease(+)/Decrease(-)during the
year
16. DETAILED STATEMENT ON LOANS AND ADVANCES MADE BY GOVERNMENT
(in lakh of Rupees)
2012
- Contd.
- Contd.( )
( )- Contd.
- Contd.
. .
. .
. .
. .
. .
. .
. .
. .
. .
. .Total 191 Loans to Municipal Corporation
. .
. .
Interestreceived
andcredited
. .
. .
. .
. .
. .
. .
. .
. .
. .Total
. .
. .
. .
. .
. .
. .
. .
. .
. .
- Contd.- Contd.
399
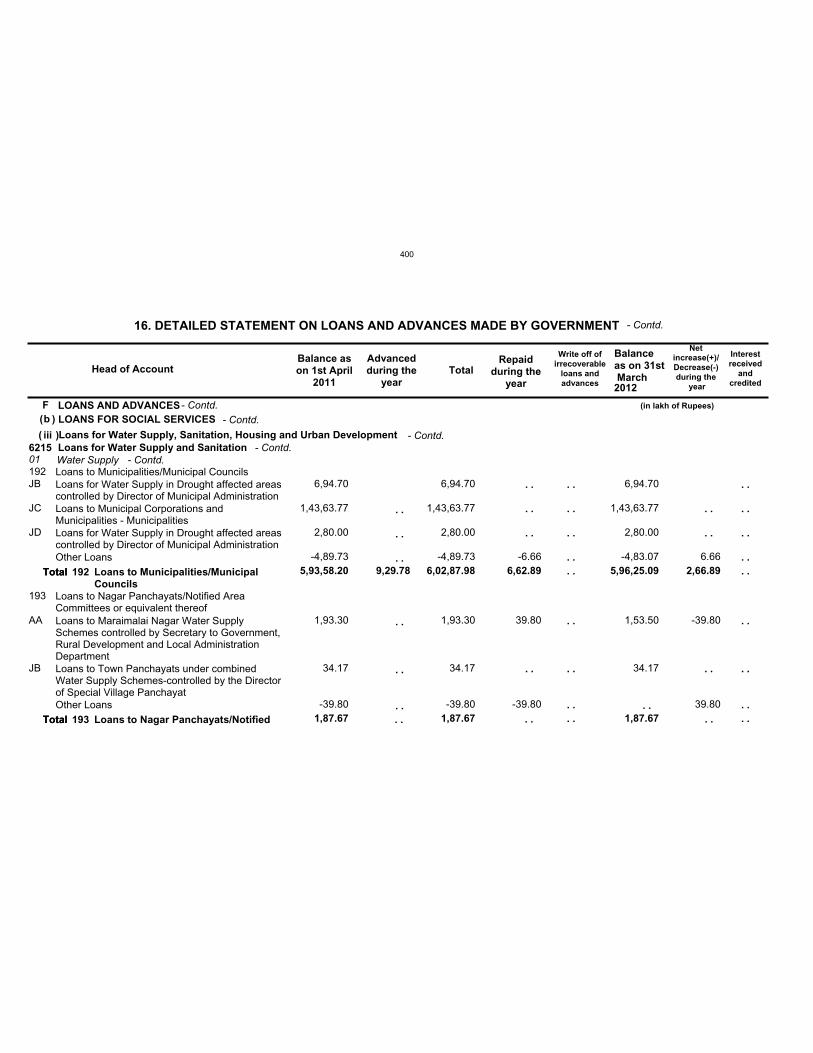
Fb
iii621501192
193
5,93,58.20
1,87.67
9,29.78 6,02,87.98
1,87.67
6,62.89 5,96,25.09
1,87.67
2,66.89
JB
JC
JD
AA
JB
6,94.70
1,43,63.77
2,80.00
-4,89.73
1,93.30
34.17
-39.80
6,94.70
1,43,63.77
2,80.00
-4,89.73
1,93.30
34.17
-39.80
-6.66
39.80
-39.80
6,94.70
1,43,63.77
2,80.00
-4,83.07
1,53.50
34.17
6.66
-39.80
39.80
LOANS AND ADVANCESLOANS FOR SOCIAL SERVICES
Loans for Water Supply, Sanitation, Housing and Urban DevelopmentLoans for Water Supply and SanitationWater SupplyLoans to Municipalities/Municipal Councils
Loans to Nagar Panchayats/Notified AreaCommittees or equivalent thereof
Loans for Water Supply in Drought affected areascontrolled by Director of Municipal AdministrationLoans to Municipal Corporations andMunicipalities - MunicipalitiesLoans for Water Supply in Drought affected areascontrolled by Director of Municipal AdministrationOther Loans
Loans to Maraimalai Nagar Water SupplySchemes controlled by Secretary to Government,Rural Development and Local AdministrationDepartmentLoans to Town Panchayats under combinedWater Supply Schemes-controlled by the Directorof Special Village PanchayatOther Loans
Head of AccountBalance ason 1st April
2011
Advancedduring the
yearTotal
Repaidduring the
year
Write off ofirrecoverable
loans andadvances
Balanceas on 31st March
Netincrease(+)/Decrease(-)during the
year
16. DETAILED STATEMENT ON LOANS AND ADVANCES MADE BY GOVERNMENT
(in lakh of Rupees)
2012
- Contd.
- Contd.( )
( )- Contd.
- Contd.
. .
. .
. .
. .
. .
. .
. .
. .
. .
. .
. . . .
Total
Total
192
193
Loans to Municipalities/MunicipalCouncils
Loans to Nagar Panchayats/Notified
. .
. .
. .
. .
Interestreceived
andcredited
. .
. .
. .
. .
. .
. .
. .
. .
. .
Total
Total
. .
. .
. .
. .
. .
. .
. .
. .
. .
- Contd.
. .
- Contd.
400
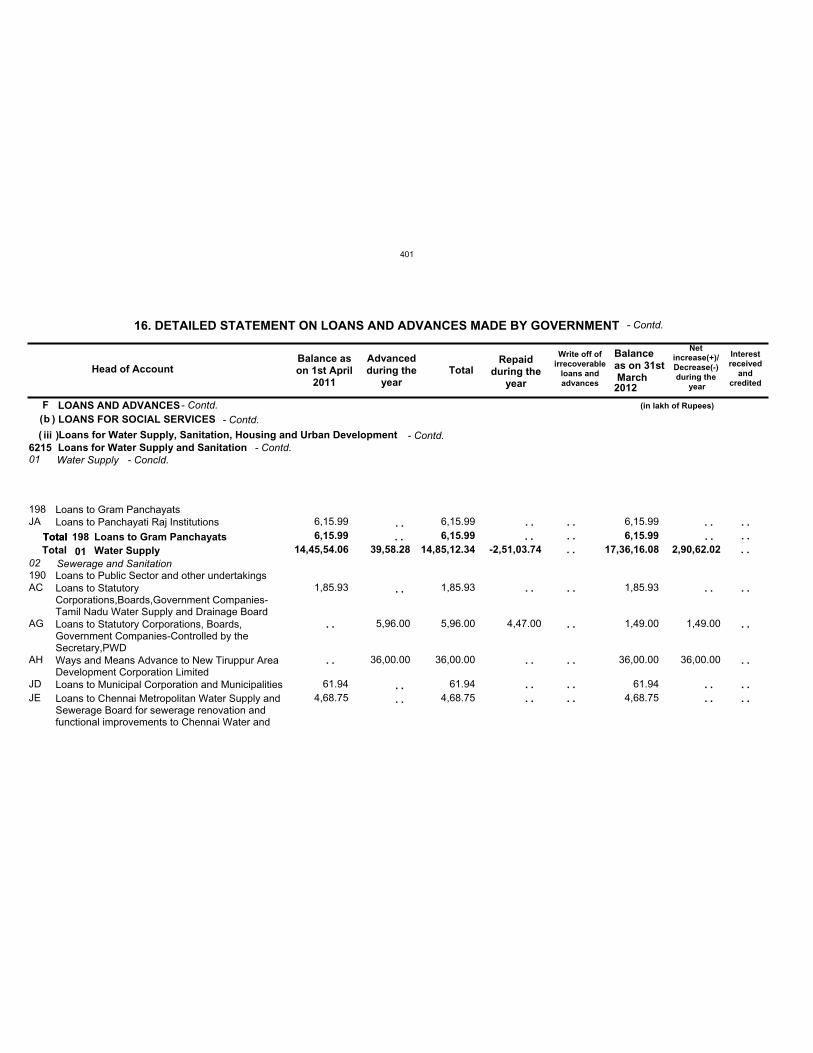
Fb
iii621501
02 14,45,54.06 39,58.28 14,85,12.34 -2,51,03.74 17,36,16.08 2,90,62.02
198
190
6,15.99 6,15.99 6,15.99JA
AC
AG
AH
JDJE
6,15.99
1,85.93
61.94 4,68.75
5,96.00
36,00.00
6,15.99
1,85.93
5,96.00
36,00.00
61.94 4,68.75
4,47.00
6,15.99
1,85.93
1,49.00
36,00.00
61.94 4,68.75
1,49.00
36,00.00
LOANS AND ADVANCESLOANS FOR SOCIAL SERVICES
Loans for Water Supply, Sanitation, Housing and Urban DevelopmentLoans for Water Supply and SanitationWater Supply
Sewerage and Sanitation
Loans to Gram Panchayats
Loans to Public Sector and other undertakings
Loans to Panchayati Raj Institutions
Loans to StatutoryCorporations,Boards,Government Companies-Tamil Nadu Water Supply and Drainage BoardLoans to Statutory Corporations, Boards,Government Companies-Controlled by theSecretary,PWDWays and Means Advance to New Tiruppur AreaDevelopment Corporation LimitedLoans to Municipal Corporation and MunicipalitiesLoans to Chennai Metropolitan Water Supply andSewerage Board for sewerage renovation andfunctional improvements to Chennai Water and
Head of AccountBalance ason 1st April
2011
Advancedduring the
yearTotal
Repaidduring the
year
Write off ofirrecoverable
loans andadvances
Balanceas on 31st March
Netincrease(+)/Decrease(-)during the
year
16. DETAILED STATEMENT ON LOANS AND ADVANCES MADE BY GOVERNMENT
(in lakh of Rupees)
2012
- Contd.
- Contd.( )
( )- Contd.
- Contd.
. .
. .
. .
. .
. .
. .
. .
. .
. .
. . . .
. .
. .
Total 198 Loans to Gram Panchayats. .
. .
. .
. .
. .
Interestreceived
andcredited
. .
. .
. .
. .
. .
. .
. .TotalTotal
01 Water Supply
. .
. .
. .
. .
. .
. .
. .
- Contd.
. . . .
- Concld.
401
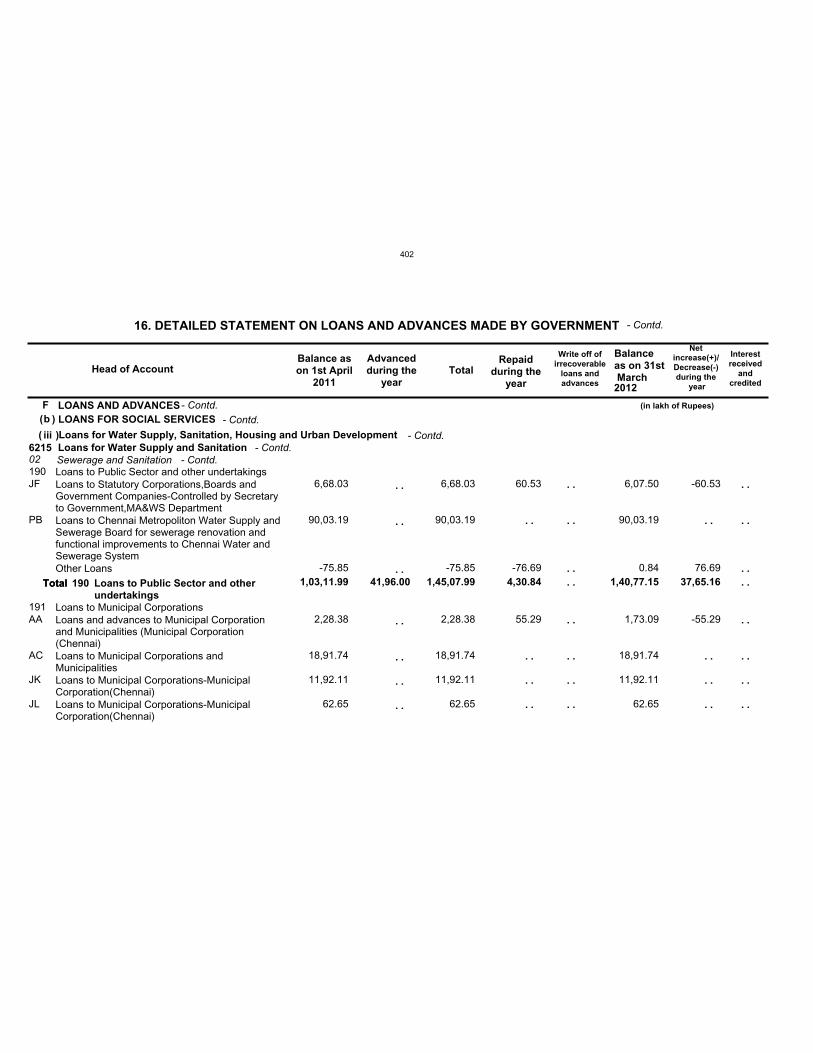
Fb
iii621502190
191
1,03,11.99 41,96.00 1,45,07.99 4,30.84 1,40,77.15 37,65.16
JF
PB
AA
AC
JK
JL
6,68.03
90,03.19
-75.85
2,28.38
18,91.74
11,92.11
62.65
6,68.03
90,03.19
-75.85
2,28.38
18,91.74
11,92.11
62.65
60.53
-76.69
55.29
6,07.50
90,03.19
0.84
1,73.09
18,91.74
11,92.11
62.65
-60.53
76.69
-55.29
LOANS AND ADVANCESLOANS FOR SOCIAL SERVICES
Loans for Water Supply, Sanitation, Housing and Urban DevelopmentLoans for Water Supply and SanitationSewerage and SanitationLoans to Public Sector and other undertakings
Loans to Municipal Corporations
Loans to Statutory Corporations,Boards andGovernment Companies-Controlled by Secretaryto Government,MA&WS DepartmentLoans to Chennai Metropoliton Water Supply andSewerage Board for sewerage renovation andfunctional improvements to Chennai Water andSewerage SystemOther Loans
Loans and advances to Municipal Corporationand Municipalities (Municipal Corporation(Chennai)Loans to Municipal Corporations andMunicipalitiesLoans to Municipal Corporations-MunicipalCorporation(Chennai)Loans to Municipal Corporations-MunicipalCorporation(Chennai)
Head of AccountBalance ason 1st April
2011
Advancedduring the
yearTotal
Repaidduring the
year
Write off ofirrecoverable
loans andadvances
Balanceas on 31st March
Netincrease(+)/Decrease(-)during the
year
16. DETAILED STATEMENT ON LOANS AND ADVANCES MADE BY GOVERNMENT
(in lakh of Rupees)
2012
- Contd.
- Contd.( )
( )- Contd.
- Contd.
. .
. .
. .
. .
. .
. .
. .
. .
. .
. .
. .
Total 190 Loans to Public Sector and otherundertakings
. .
. .
. .
. .
Interestreceived
andcredited
. .
. .
. .
. .
. .
. .
. .
. .Total
. .
. .
. .
. .
. .
. .
. .
. .
- Contd.- Contd.
402
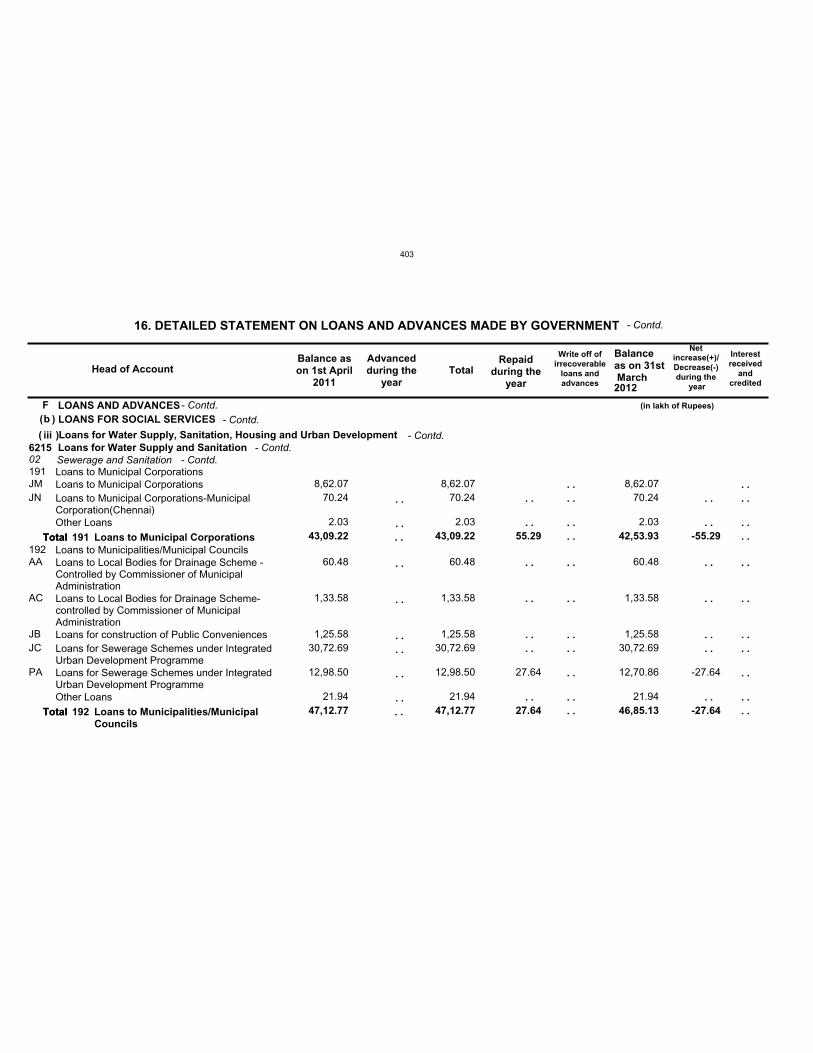
Fb
iii621502191
192 43,09.22
47,12.77
43,09.22
47,12.77
55.29
27.64
42,53.93
46,85.13
-55.29
-27.64
JMJN
AA
AC
JBJC
PA
8,62.07 70.24
2.03
60.48
1,33.58
1,25.58 30,72.69
12,98.50
21.94
8,62.07 70.24
2.03
60.48
1,33.58
1,25.58 30,72.69
12,98.50
21.94
27.64
8,62.07 70.24
2.03
60.48
1,33.58
1,25.58 30,72.69
12,70.86
21.94
-27.64
LOANS AND ADVANCESLOANS FOR SOCIAL SERVICES
Loans for Water Supply, Sanitation, Housing and Urban DevelopmentLoans for Water Supply and SanitationSewerage and SanitationLoans to Municipal Corporations
Loans to Municipalities/Municipal Councils
Loans to Municipal CorporationsLoans to Municipal Corporations-MunicipalCorporation(Chennai)Other Loans
Loans to Local Bodies for Drainage Scheme -Controlled by Commissioner of MunicipalAdministrationLoans to Local Bodies for Drainage Scheme-controlled by Commissioner of MunicipalAdministrationLoans for construction of Public ConveniencesLoans for Sewerage Schemes under IntegratedUrban Development ProgrammeLoans for Sewerage Schemes under IntegratedUrban Development ProgrammeOther Loans
Head of AccountBalance ason 1st April
2011
Advancedduring the
yearTotal
Repaidduring the
year
Write off ofirrecoverable
loans andadvances
Balanceas on 31st March
Netincrease(+)/Decrease(-)during the
year
16. DETAILED STATEMENT ON LOANS AND ADVANCES MADE BY GOVERNMENT
(in lakh of Rupees)
2012
- Contd.
- Contd.( )
( )- Contd.
- Contd.
. .
. .
. .
. .
. .
. .
. .
. .
. .
. .
. .
. .
. .
. .
. .
. .
. .
Total
Total
191
192
Loans to Municipal Corporations
Loans to Municipalities/MunicipalCouncils
. .
. .
. .
. .
. .
. .
. .
Interestreceived
andcredited
. .
. .
. .
. .
. .
. .
. .
. .
. .
. .
. .
Total
Total
. .
. .
. .
. .
. .
. .
. .
. .
. .
. .
. .
- Contd.- Contd.
403
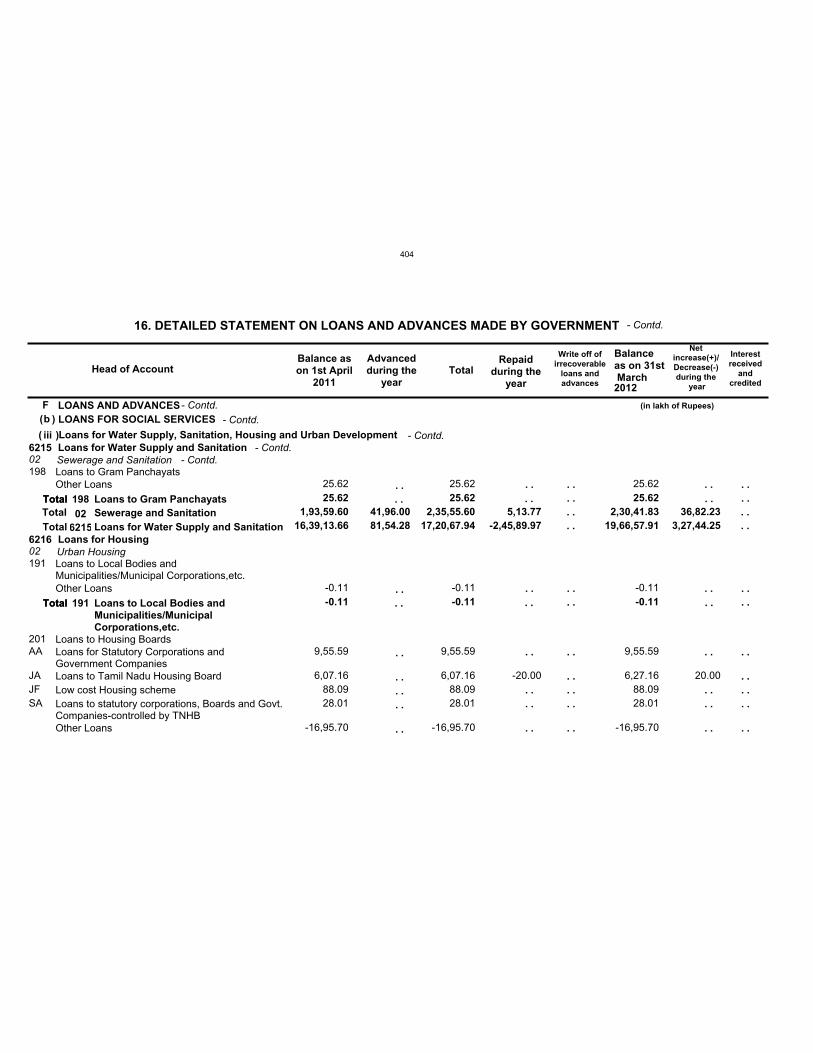
Fb
iii6215
6216 16,39,13.66 81,54.28 17,20,67.94 -2,45,89.97 19,66,57.91 3,27,44.25
02
02
1,93,59.60 41,96.00 2,35,55.60 5,13.77 2,30,41.83 36,82.23
198
191
201
25.62
-0.11
25.62
-0.11
25.62
-0.11
AA
JAJFSA
25.62
-0.11
9,55.59
6,07.16 88.09 28.01
-16,95.70
25.62
-0.11
9,55.59
6,07.16 88.09 28.01
-16,95.70
-20.00
25.62
-0.11
9,55.59
6,27.16 88.09 28.01
-16,95.70
20.00
LOANS AND ADVANCESLOANS FOR SOCIAL SERVICES
Loans for Water Supply, Sanitation, Housing and Urban DevelopmentLoans for Water Supply and Sanitation
Loans for Housing
Sewerage and Sanitation
Urban Housing
Loans to Gram Panchayats
Loans to Local Bodies andMunicipalities/Municipal Corporations,etc.
Loans to Housing Boards
Other Loans
Other Loans
Loans for Statutory Corporations andGovernment CompaniesLoans to Tamil Nadu Housing BoardLow cost Housing schemeLoans to statutory corporations, Boards and Govt.Companies-controlled by TNHBOther Loans
Head of AccountBalance ason 1st April
2011
Advancedduring the
yearTotal
Repaidduring the
year
Write off ofirrecoverable
loans andadvances
Balanceas on 31st March
Netincrease(+)/Decrease(-)during the
year
16. DETAILED STATEMENT ON LOANS AND ADVANCES MADE BY GOVERNMENT
(in lakh of Rupees)
2012
- Contd.
- Contd.( )
( )- Contd.
- Contd.
. .
. .
. .
. .
. .
. .
. .
. .
. .
. .
. .
. .
. .
. .
. .
. .
. .
Total
Total
198
191
Loans to Gram Panchayats
Loans to Local Bodies andMunicipalities/MunicipalCorporations,etc.
. .
. .
. .
. .
. .
. .
. .
. .
Interestreceived
andcredited
. .
. .
. .
. .
. .
. .
. .
. .
. .
TotalTotal
Total
Total
026215
Sewerage and SanitationLoans for Water Supply and Sanitation
. .
. .
. .
. .
. .
. .
. .
. .
. .
- Contd.
. . . .
. . . .
- Contd.
404
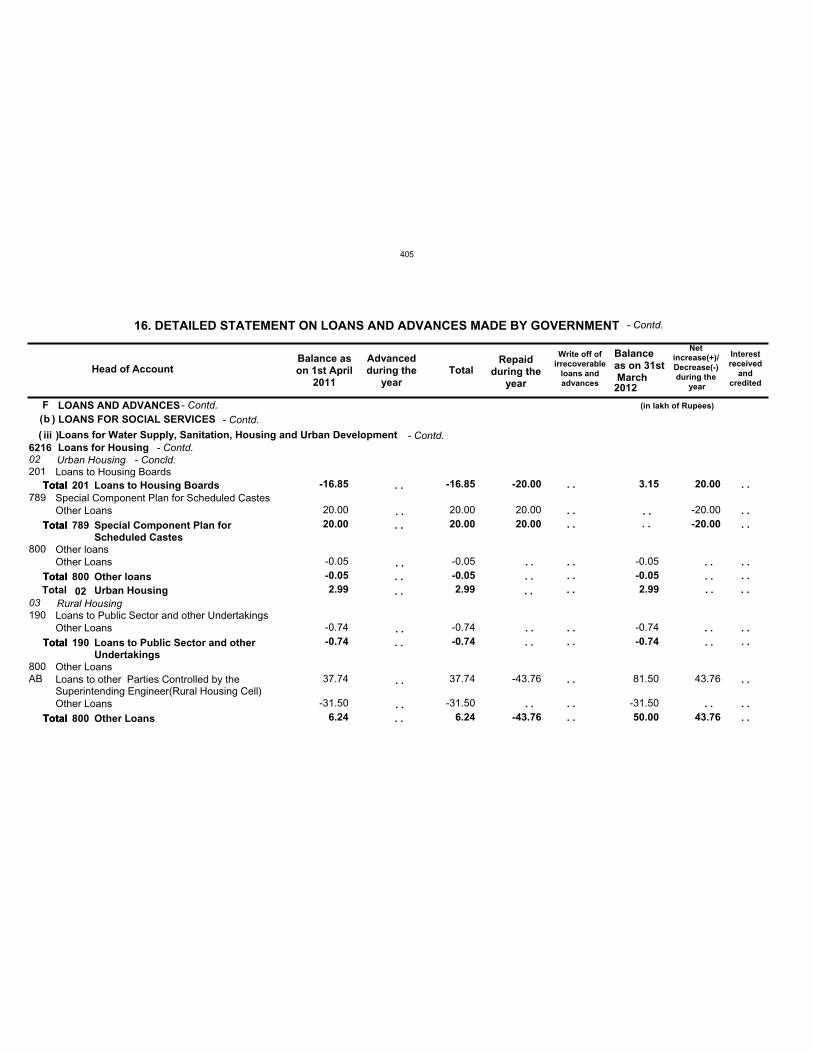
Fb
iii621602
03 2.99 2.99 2.99
201
789
800
190
800
-16.85
20.00
-0.05
-0.74
6.24
-16.85
20.00
-0.05
-0.74
6.24
-20.00
20.00
-43.76
3.15
-0.05
-0.74
50.00
20.00
-20.00
43.76
AB
20.00
-0.05
-0.74
37.74
-31.50
20.00
-0.05
-0.74
37.74
-31.50
20.00
-43.76
-0.05
-0.74
81.50
-31.50
-20.00
43.76
LOANS AND ADVANCESLOANS FOR SOCIAL SERVICES
Loans for Water Supply, Sanitation, Housing and Urban DevelopmentLoans for HousingUrban Housing
Rural Housing
Loans to Housing Boards
Special Component Plan for Scheduled Castes
Other loans
Loans to Public Sector and other Undertakings
Other Loans
Other Loans
Other Loans
Other Loans
Loans to other Parties Controlled by theSuperintending Engineer(Rural Housing Cell)Other Loans
Head of AccountBalance ason 1st April
2011
Advancedduring the
yearTotal
Repaidduring the
year
Write off ofirrecoverable
loans andadvances
Balanceas on 31st March
Netincrease(+)/Decrease(-)during the
year
16. DETAILED STATEMENT ON LOANS AND ADVANCES MADE BY GOVERNMENT
(in lakh of Rupees)
2012
- Contd.
- Contd.( )
( )- Contd.
- Contd.
. .
. .
. .
. .
. .
. .
. .
. .
. .
. .
. .
. .
. .
. .
. .
Total
Total
Total
Total
Total
201
789
800
190
800
Loans to Housing Boards
Special Component Plan forScheduled Castes
Other loans
Loans to Public Sector and otherUndertakings
Other Loans
. .
. .
. .
. .
. .
Interestreceived
andcredited
. .
. .
. .
. .
. .
. .
. .
. .
. .
. .
Total
Total
Total
Total
Total
Total
02 Urban Housing
. .
. .
. .
. .
. .
. .
. .
. .
. .
. .
- Contd.
. . . . . . . .. .
. .
. .
- Concld.
405
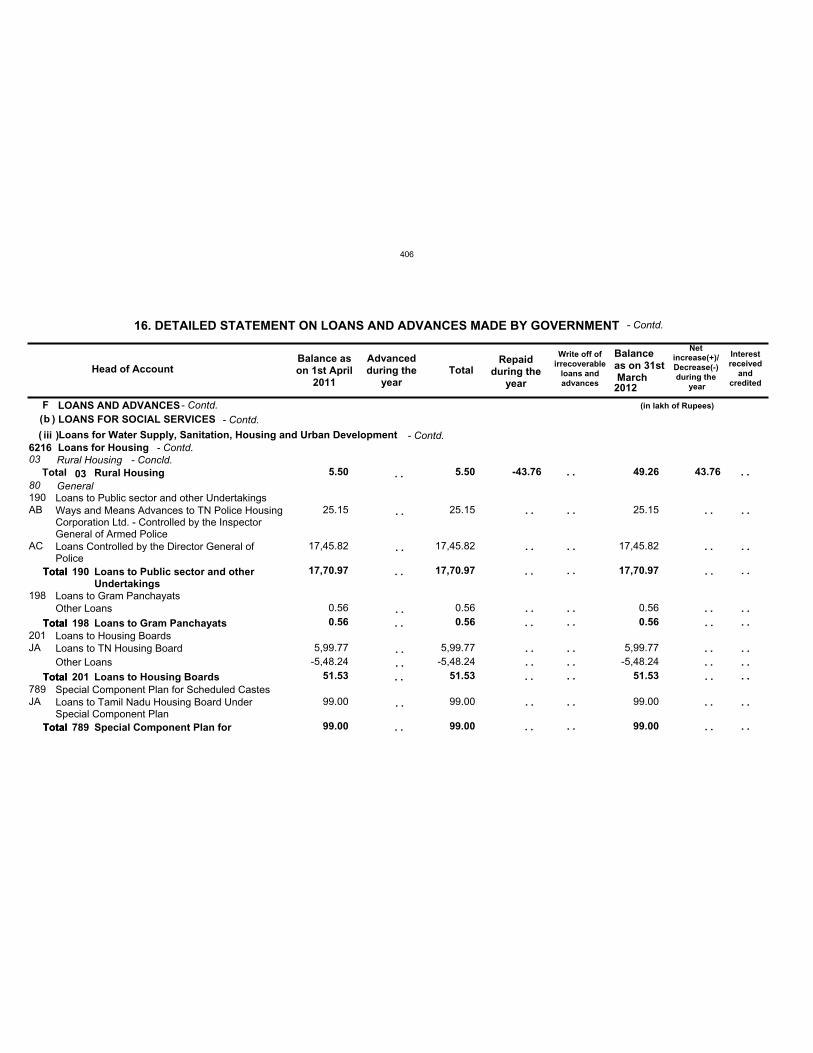
Fb
iii621603
80 5.50 5.50 -43.76 49.26 43.76
190
198
201
789
17,70.97
0.56
51.53
99.00
17,70.97
0.56
51.53
99.00
17,70.97
0.56
51.53
99.00
AB
AC
JA
JA
25.15
17,45.82
0.56
5,99.77-5,48.24
99.00
25.15
17,45.82
0.56
5,99.77-5,48.24
99.00
25.15
17,45.82
0.56
5,99.77-5,48.24
99.00
LOANS AND ADVANCESLOANS FOR SOCIAL SERVICES
Loans for Water Supply, Sanitation, Housing and Urban DevelopmentLoans for HousingRural Housing
GeneralLoans to Public sector and other Undertakings
Loans to Gram Panchayats
Loans to Housing Boards
Special Component Plan for Scheduled Castes
Ways and Means Advances to TN Police HousingCorporation Ltd. - Controlled by the InspectorGeneral of Armed PoliceLoans Controlled by the Director General ofPolice
Other Loans
Loans to TN Housing BoardOther Loans
Loans to Tamil Nadu Housing Board UnderSpecial Component Plan
Head of AccountBalance ason 1st April
2011
Advancedduring the
yearTotal
Repaidduring the
year
Write off ofirrecoverable
loans andadvances
Balanceas on 31st March
Netincrease(+)/Decrease(-)during the
year
16. DETAILED STATEMENT ON LOANS AND ADVANCES MADE BY GOVERNMENT
(in lakh of Rupees)
2012
- Contd.
- Contd.( )
( )- Contd.
- Contd.
. .
. .
. .
. .
. .
. .
. .
. .
. .
. .
. .
. .
. .
. .
. .
. .
. .
. .
. .
. .
Total
Total
Total
Total
190
198
201
789
Loans to Public sector and otherUndertakings
Loans to Gram Panchayats
Loans to Housing Boards
Special Component Plan for
. .
. .
. .
. .
. .
. .
. .
. .
. .
. .
Interestreceived
andcredited
. .
. .
. .
. .
. .
. .
. .
. .
. .
. .
Total
Total
Total
Total
Total
03 Rural Housing
. .
. .
. .
. .
. .
. .
. .
. .
. .
. .
- Contd.
. . . . . .- Concld.
406
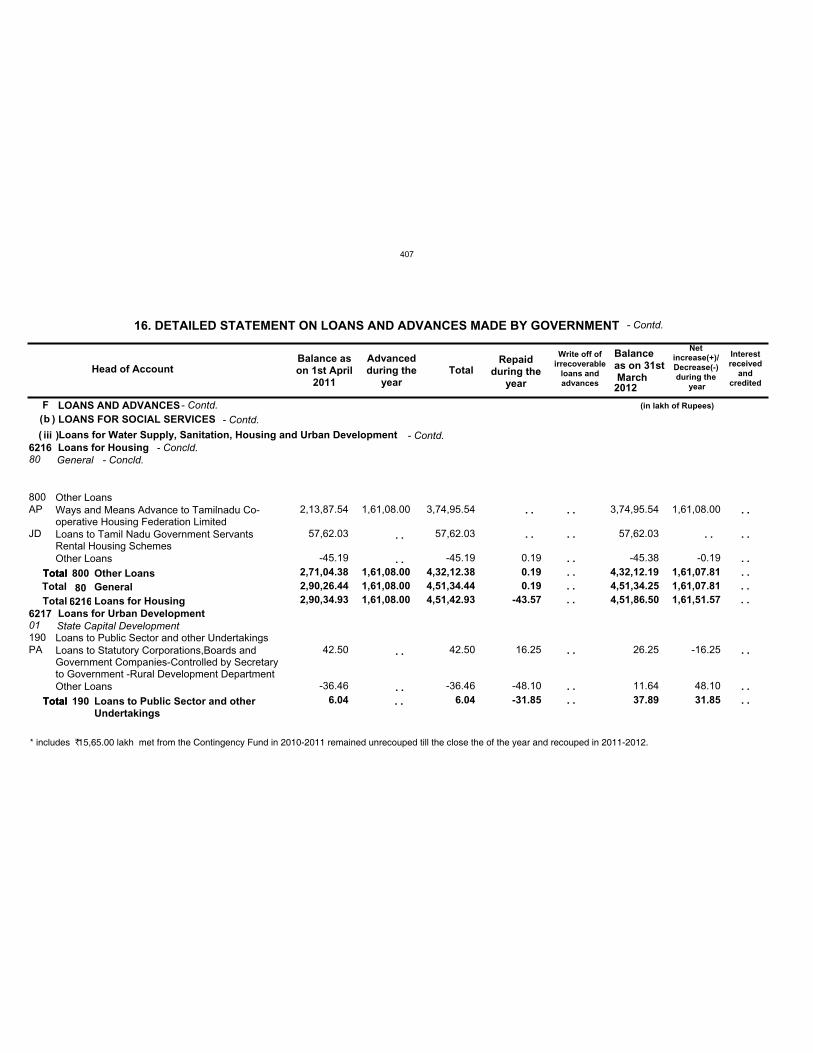
Fb
iii6216
6217 2,90,34.93 1,61,08.00 4,51,42.93 -43.57 4,51,86.50 1,61,51.57
80
01
2,90,26.44 1,61,08.00 4,51,34.44 0.19 4,51,34.25 1,61,07.81
800
190
2,71,04.38
6.04
1,61,08.00 4,32,12.38
6.04
0.19
-31.85
4,32,12.19
37.89
1,61,07.81
31.85
AP
JD
PA
2,13,87.54
57,62.03
-45.19
42.50
-36.46
1,61,08.00 3,74,95.54
57,62.03
-45.19
42.50
-36.46
0.19
16.25
-48.10
3,74,95.54
57,62.03
-45.38
26.25
11.64
1,61,08.00
-0.19
-16.25
48.10
LOANS AND ADVANCESLOANS FOR SOCIAL SERVICES
Loans for Water Supply, Sanitation, Housing and Urban DevelopmentLoans for Housing
Loans for Urban Development
General
State Capital Development
Other Loans
Loans to Public Sector and other Undertakings
Ways and Means Advance to Tamilnadu Co-operative Housing Federation LimitedLoans to Tamil Nadu Government ServantsRental Housing SchemesOther Loans
Loans to Statutory Corporations,Boards andGovernment Companies-Controlled by Secretaryto Government -Rural Development DepartmentOther Loans
Head of AccountBalance ason 1st April
2011
Advancedduring the
yearTotal
Repaidduring the
year
Write off ofirrecoverable
loans andadvances
Balanceas on 31st March
Netincrease(+)/Decrease(-)during the
year
16. DETAILED STATEMENT ON LOANS AND ADVANCES MADE BY GOVERNMENT
(in lakh of Rupees)
2012
- Contd.
- Contd.( )
( )- Contd.
- Contd.
. .
. .
. .
. .
. .
. .
. .
Total
Total
800
190
Other Loans
Loans to Public Sector and otherUndertakings
. .
Interestreceived
andcredited
. .
. .
. .
. .
. .
. .
. .
TotalTotal
Total
Total
806216
GeneralLoans for Housing
. .
. .
. .
. .
. .
. .
. .
- Concld.
. . . .
. . . .
- Concld.
* includes 1̀5,65.00 lakh met from the Contingency Fund in 2010-2011 remained unrecouped till the close the of the year and recouped in 2011-2012.
407
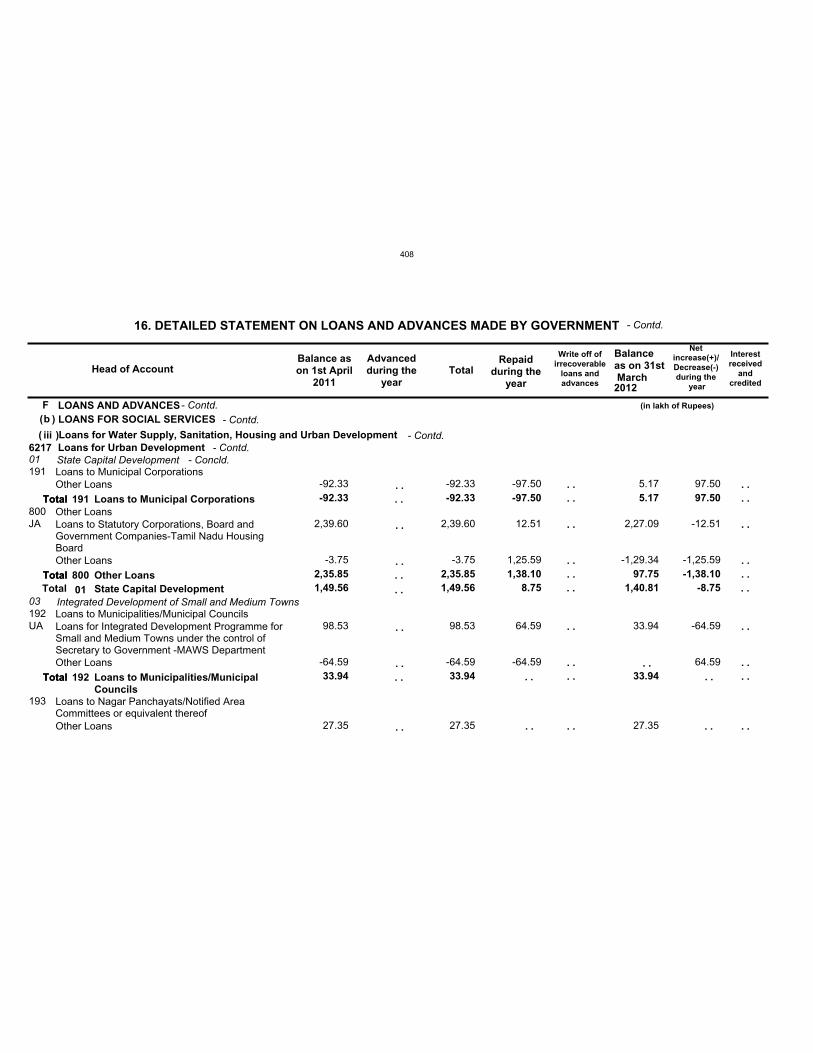
Fb
iii621701
03 1,49.56 1,49.56 8.75 1,40.81 -8.75
191
800
192
193
-92.33
2,35.85
33.94
-92.33
2,35.85
33.94
-97.50
1,38.10
5.17
97.75
33.94
97.50
-1,38.10
JA
UA
-92.33
2,39.60
-3.75
98.53
-64.59
27.35
-92.33
2,39.60
-3.75
98.53
-64.59
27.35
-97.50
12.51
1,25.59
64.59
-64.59
5.17
2,27.09
-1,29.34
33.94
27.35
97.50
-12.51
-1,25.59
-64.59
64.59
LOANS AND ADVANCESLOANS FOR SOCIAL SERVICES
Loans for Water Supply, Sanitation, Housing and Urban DevelopmentLoans for Urban DevelopmentState Capital Development
Integrated Development of Small and Medium Towns
Loans to Municipal Corporations
Other Loans
Loans to Municipalities/Municipal Councils
Loans to Nagar Panchayats/Notified AreaCommittees or equivalent thereof
Other Loans
Loans to Statutory Corporations, Board andGovernment Companies-Tamil Nadu HousingBoardOther Loans
Loans for Integrated Development Programme forSmall and Medium Towns under the control ofSecretary to Government -MAWS DepartmentOther Loans
Other Loans
Head of AccountBalance ason 1st April
2011
Advancedduring the
yearTotal
Repaidduring the
year
Write off ofirrecoverable
loans andadvances
Balanceas on 31st March
Netincrease(+)/Decrease(-)during the
year
16. DETAILED STATEMENT ON LOANS AND ADVANCES MADE BY GOVERNMENT
(in lakh of Rupees)
2012
- Contd.
- Contd.( )
( )- Contd.
- Contd.
. .
. .
. .
. .
. .
. . . .
. .
. .
. . . .
Total
Total
Total
191
800
192
Loans to Municipal Corporations
Other Loans
Loans to Municipalities/MunicipalCouncils
. .
. .
Interestreceived
andcredited
. .
. .
. .
. .
. .
. .
. .
. .
. .
Total
Total
Total
Total
01 State Capital Development
. .
. .
. .
. .
. .
. .
. .
. .
. .
- Contd.
. . . . . .
. .
- Concld.
408
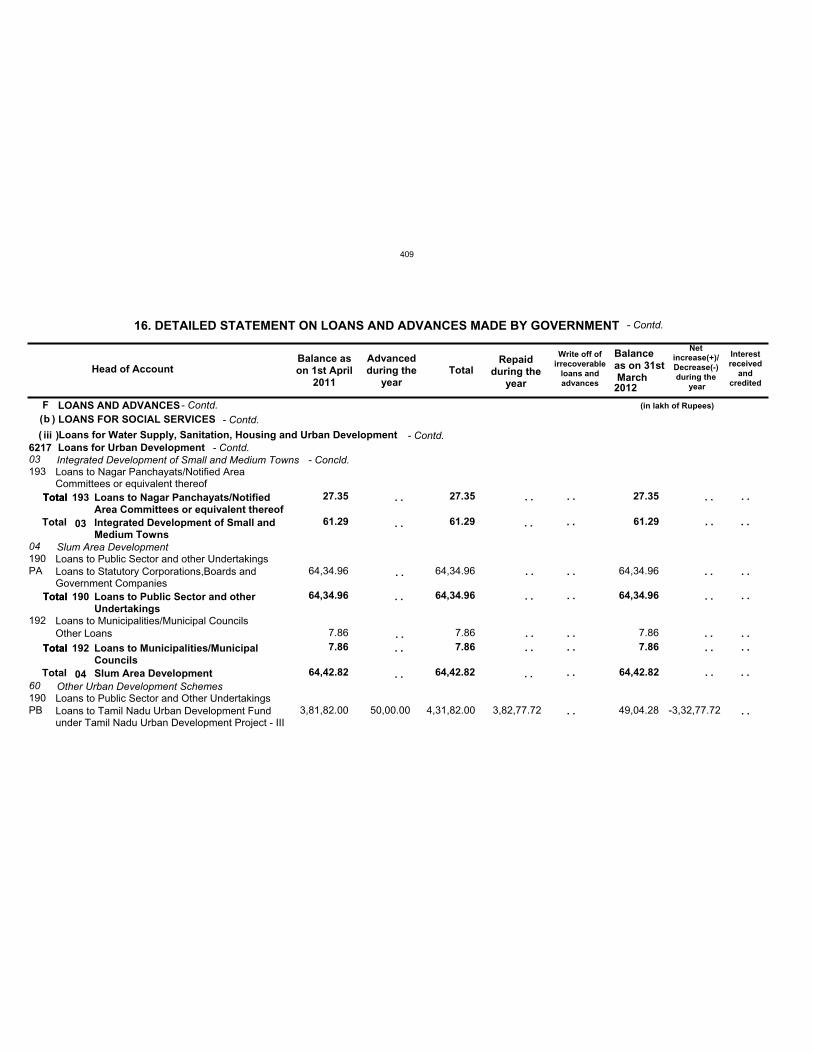
Fb
iii621703
04
60
61.29
64,42.82
61.29
64,42.82
61.29
64,42.82
193
190
192
190
27.35
64,34.96
7.86
27.35
64,34.96
7.86
27.35
64,34.96
7.86
PA
PB
64,34.96
7.86
3,81,82.00 50,00.00
64,34.96
7.86
4,31,82.00 3,82,77.72
64,34.96
7.86
49,04.28 -3,32,77.72
LOANS AND ADVANCESLOANS FOR SOCIAL SERVICES
Loans for Water Supply, Sanitation, Housing and Urban DevelopmentLoans for Urban DevelopmentIntegrated Development of Small and Medium Towns
Slum Area Development
Other Urban Development Schemes
Loans to Nagar Panchayats/Notified AreaCommittees or equivalent thereof
Loans to Public Sector and other Undertakings
Loans to Municipalities/Municipal Councils
Loans to Public Sector and Other Undertakings
Loans to Statutory Corporations,Boards andGovernment Companies
Other Loans
Loans to Tamil Nadu Urban Development Fundunder Tamil Nadu Urban Development Project - III
Head of AccountBalance ason 1st April
2011
Advancedduring the
yearTotal
Repaidduring the
year
Write off ofirrecoverable
loans andadvances
Balanceas on 31st March
Netincrease(+)/Decrease(-)during the
year
16. DETAILED STATEMENT ON LOANS AND ADVANCES MADE BY GOVERNMENT
(in lakh of Rupees)
2012
- Contd.
- Contd.( )
( )- Contd.
- Contd.
. .
. .
. .
. .
. .
. .
. .
. .
. .
. .
Total
Total
Total
193
190
192
Loans to Nagar Panchayats/NotifiedArea Committees or equivalent thereof
Loans to Public Sector and otherUndertakings
Loans to Municipalities/MunicipalCouncils
. .
. .
. .
. .
. .
Interestreceived
andcredited
. .
. .
. .
. .
. .
. .
Total
Total
Total
Total
Total
03
04
Integrated Development of Small andMedium Towns
Slum Area Development
. .
. .
. .
. .
. .
. .
- Contd.
. .
. .
. .
. .
. .
. .
. .
. .
. .
. .
- Concld.
409
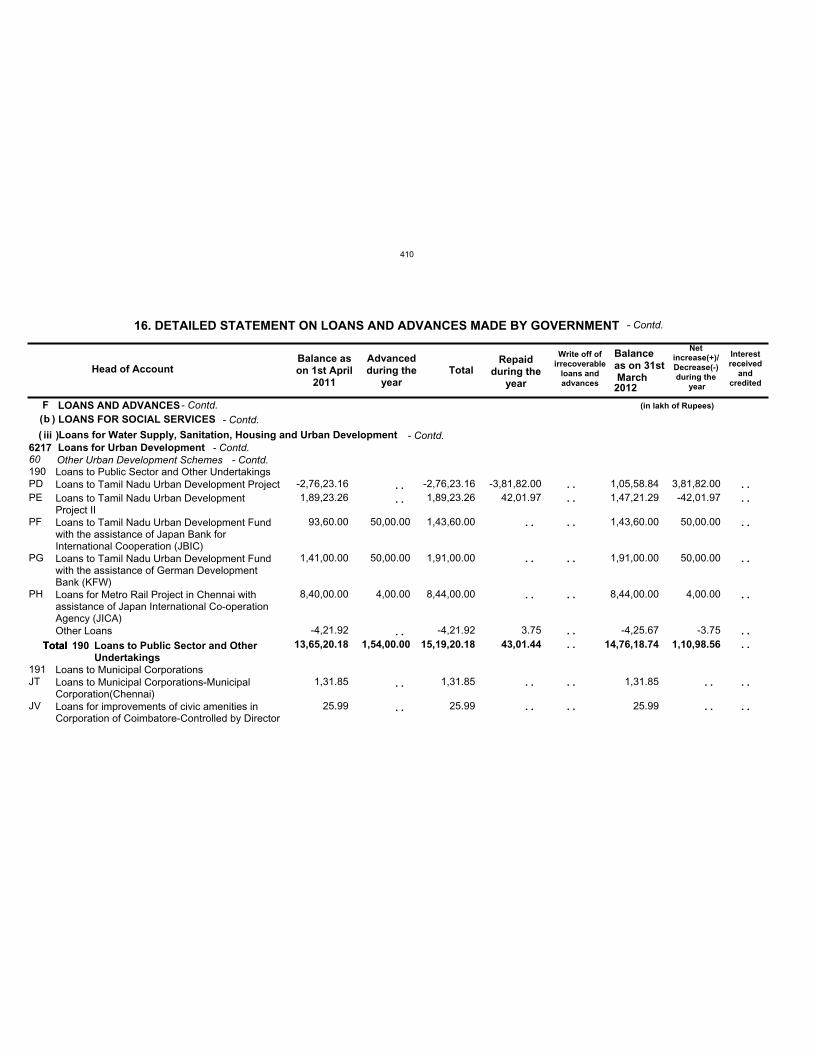
Fb
iii621760190
191
13,65,20.18 1,54,00.00 15,19,20.18 43,01.44 14,76,18.74 1,10,98.56
PDPE
PF
PG
PH
JT
JV
-2,76,23.16 1,89,23.26
93,60.00
1,41,00.00
8,40,00.00
-4,21.92
1,31.85
25.99
50,00.00
50,00.00
4,00.00
-2,76,23.16 1,89,23.26
1,43,60.00
1,91,00.00
8,44,00.00
-4,21.92
1,31.85
25.99
-3,81,82.00 42,01.97
3.75
1,05,58.84 1,47,21.29
1,43,60.00
1,91,00.00
8,44,00.00
-4,25.67
1,31.85
25.99
3,81,82.00-42,01.97
50,00.00
50,00.00
4,00.00
-3.75
LOANS AND ADVANCESLOANS FOR SOCIAL SERVICES
Loans for Water Supply, Sanitation, Housing and Urban DevelopmentLoans for Urban DevelopmentOther Urban Development SchemesLoans to Public Sector and Other Undertakings
Loans to Municipal Corporations
Loans to Tamil Nadu Urban Development ProjectLoans to Tamil Nadu Urban Development Project IILoans to Tamil Nadu Urban Development Fundwith the assistance of Japan Bank forInternational Cooperation (JBIC)Loans to Tamil Nadu Urban Development Fundwith the assistance of German DevelopmentBank (KFW)Loans for Metro Rail Project in Chennai withassistance of Japan International Co-operationAgency (JICA)Other Loans
Loans to Municipal Corporations-MunicipalCorporation(Chennai)Loans for improvements of civic amenities inCorporation of Coimbatore-Controlled by Director
Head of AccountBalance ason 1st April
2011
Advancedduring the
yearTotal
Repaidduring the
year
Write off ofirrecoverable
loans andadvances
Balanceas on 31st March
Netincrease(+)/Decrease(-)during the
year
16. DETAILED STATEMENT ON LOANS AND ADVANCES MADE BY GOVERNMENT
(in lakh of Rupees)
2012
- Contd.
- Contd.( )
( )- Contd.
- Contd.
. .
. .
. .
. .
. .
. .
. .
. .
. .
. .
Total 190 Loans to Public Sector and OtherUndertakings
. .
. .
Interestreceived
andcredited
. .
. .
. .
. .
. .
. .
. .
. .
. .Total
. .
. .
. .
. .
. .
. .
. .
. .
. .
- Contd.- Contd.
410
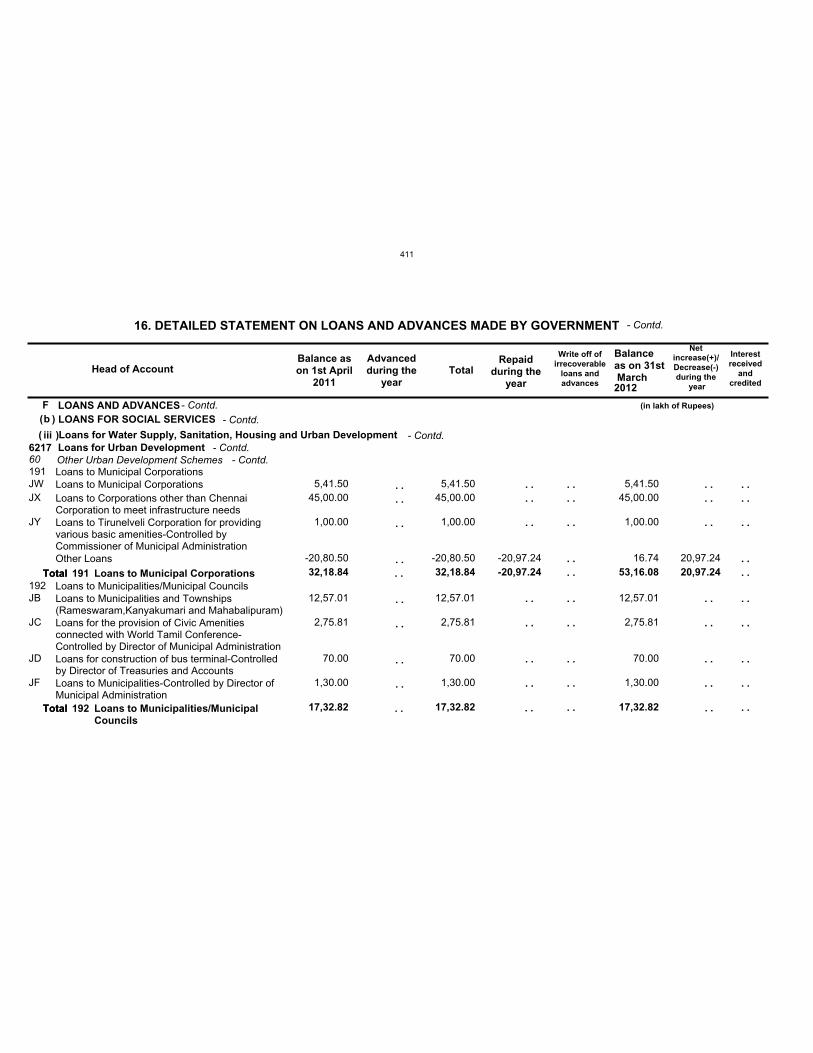
Fb
iii621760191
192 32,18.84
17,32.82
32,18.84
17,32.82
-20,97.24 53,16.08
17,32.82
20,97.24
JWJX
JY
JB
JC
JD
JF
5,41.50 45,00.00
1,00.00
-20,80.50
12,57.01
2,75.81
70.00
1,30.00
5,41.50 45,00.00
1,00.00
-20,80.50
12,57.01
2,75.81
70.00
1,30.00
-20,97.24
5,41.50 45,00.00
1,00.00
16.74
12,57.01
2,75.81
70.00
1,30.00
20,97.24
LOANS AND ADVANCESLOANS FOR SOCIAL SERVICES
Loans for Water Supply, Sanitation, Housing and Urban DevelopmentLoans for Urban DevelopmentOther Urban Development SchemesLoans to Municipal Corporations
Loans to Municipalities/Municipal Councils
Loans to Municipal CorporationsLoans to Corporations other than ChennaiCorporation to meet infrastructure needsLoans to Tirunelveli Corporation for providingvarious basic amenities-Controlled byCommissioner of Municipal AdministrationOther Loans
Loans to Municipalities and Townships(Rameswaram,Kanyakumari and Mahabalipuram)Loans for the provision of Civic Amenitiesconnected with World Tamil Conference-Controlled by Director of Municipal AdministrationLoans for construction of bus terminal-Controlledby Director of Treasuries and AccountsLoans to Municipalities-Controlled by Director ofMunicipal Administration
Head of AccountBalance ason 1st April
2011
Advancedduring the
yearTotal
Repaidduring the
year
Write off ofirrecoverable
loans andadvances
Balanceas on 31st March
Netincrease(+)/Decrease(-)during the
year
16. DETAILED STATEMENT ON LOANS AND ADVANCES MADE BY GOVERNMENT
(in lakh of Rupees)
2012
- Contd.
- Contd.( )
( )- Contd.
- Contd.
. .
. .
. .
. .
. .
. .
. .
. .
. .
. .
. .
. .
. .
. .
. .
. .
. . . .
Total
Total
191
192
Loans to Municipal Corporations
Loans to Municipalities/MunicipalCouncils
. .
. .
. .
. .
. .
. .
. .
. .
Interestreceived
andcredited
. .
. .
. .
. .
. .
. .
. .
. .
. .
. .
Total
Total
. .
. .
. .
. .
. .
. .
. .
. .
. .
. .
- Contd.- Contd.
411
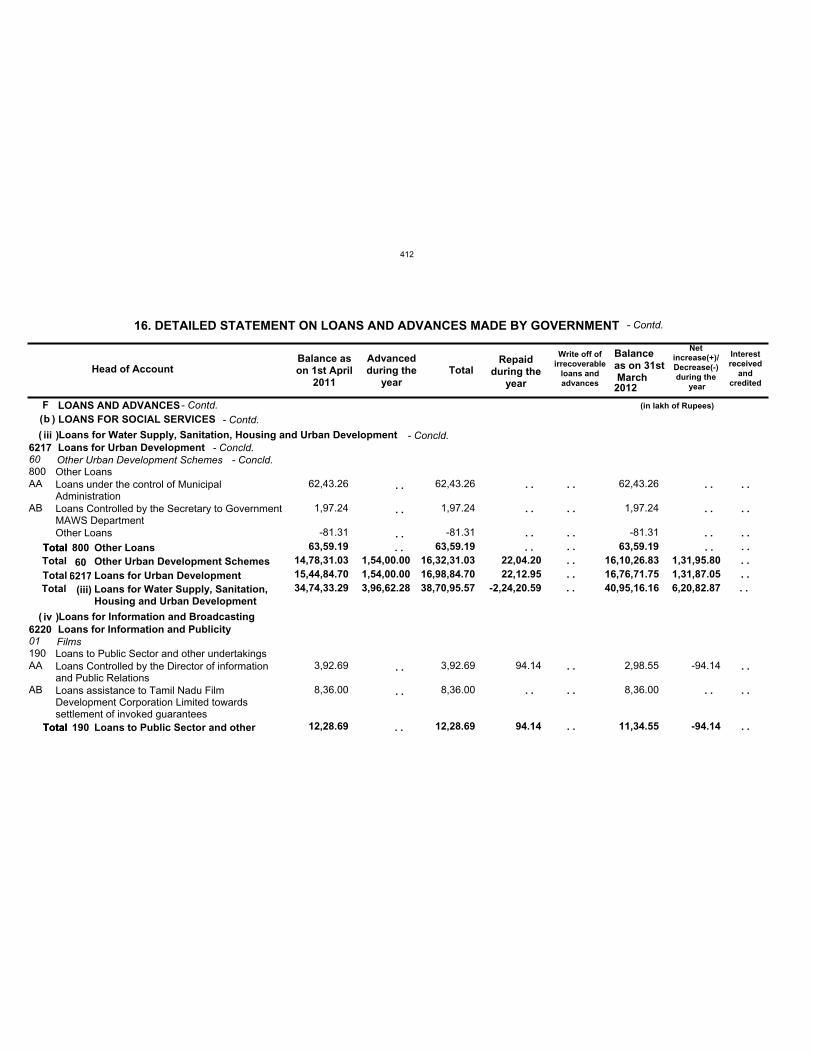
Fb
iii
iv
34,74,33.29 3,96,62.28 38,70,95.57 -2,24,20.59 40,95,16.16 6,20,82.87
6217
6220
15,44,84.70 1,54,00.00 16,98,84.70 22,12.95 16,76,71.75 1,31,87.05
60
01
14,78,31.03 1,54,00.00 16,32,31.03 22,04.20 16,10,26.83 1,31,95.80
800
190
63,59.19
12,28.69
63,59.19
12,28.69 94.14
63,59.19
11,34.55 -94.14
AA
AB
AA
AB
62,43.26
1,97.24
-81.31
3,92.69
8,36.00
62,43.26
1,97.24
-81.31
3,92.69
8,36.00
94.14
62,43.26
1,97.24
-81.31
2,98.55
8,36.00
-94.14
LOANS AND ADVANCESLOANS FOR SOCIAL SERVICES
Loans for Water Supply, Sanitation, Housing and Urban Development
Loans for Information and Broadcasting
Loans for Urban Development
Loans for Information and Publicity
Other Urban Development Schemes
Films
Other Loans
Loans to Public Sector and other undertakings
Loans under the control of MunicipalAdministrationLoans Controlled by the Secretary to GovernmentMAWS DepartmentOther Loans
Loans Controlled by the Director of informationand Public RelationsLoans assistance to Tamil Nadu FilmDevelopment Corporation Limited towardssettlement of invoked guarantees
Head of AccountBalance ason 1st April
2011
Advancedduring the
yearTotal
Repaidduring the
year
Write off ofirrecoverable
loans andadvances
Balanceas on 31st March
Netincrease(+)/Decrease(-)during the
year
16. DETAILED STATEMENT ON LOANS AND ADVANCES MADE BY GOVERNMENT
(in lakh of Rupees)
2012
- Contd.
- Contd.( )
(
(
)
)
- Contd.
- Concld.
. .
. .
. .
. .
. .
. .
. .
. .
. .
. .
. .
. .Total
Total
800
190
Other Loans
Loans to Public Sector and other
. .
. .
. .
. .
. .
Interestreceived
andcredited
. .
. .
. .
. .
. .
. .
. .
TotalTotalTotal
Total
Total
606217
(iii)
Other Urban Development SchemesLoans for Urban DevelopmentLoans for Water Supply, Sanitation,Housing and Urban Development
. .
. .
. .
. .
. .
. .
. .
- Concld.
. . . .
. . . .
. . . .
- Concld.
412
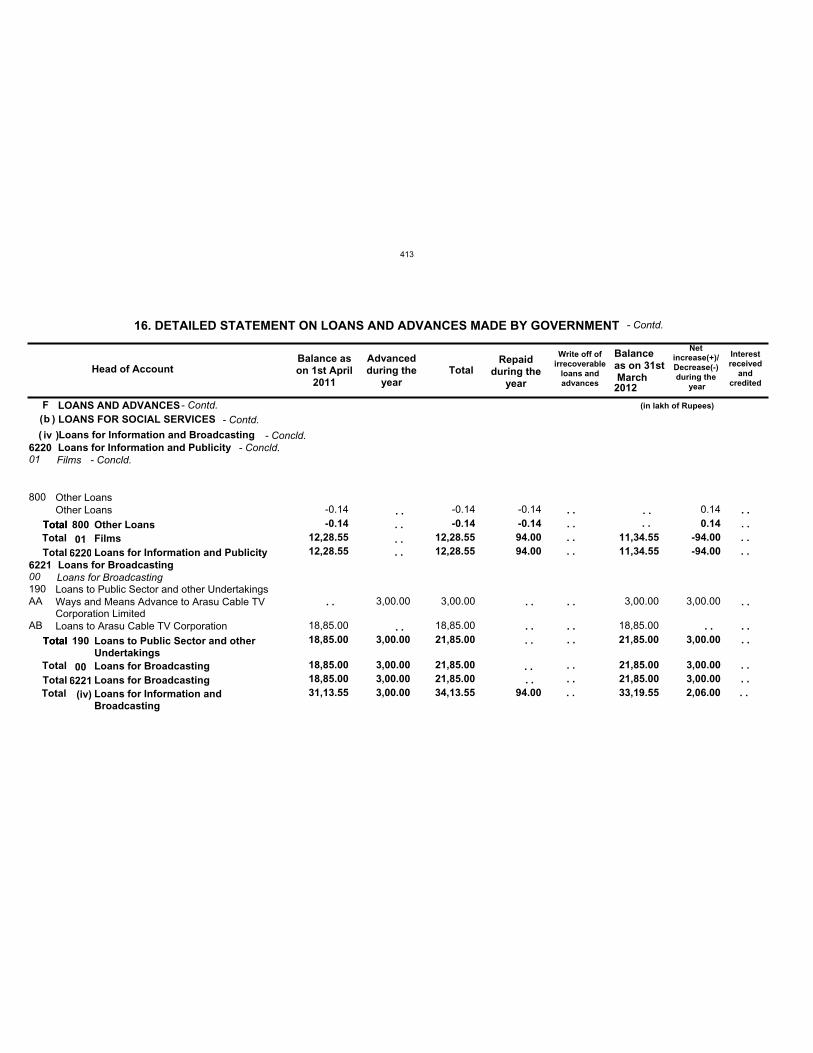
Fb
iv
31,13.55 3,00.00 34,13.55 94.00 33,19.55 2,06.00
6220
6221 12,28.55
18,85.00 3,00.00
12,28.55
21,85.00
94.00 11,34.55
21,85.00
-94.00
3,00.00
01
00
12,28.55
18,85.00 3,00.00
12,28.55
21,85.00
94.00 11,34.55
21,85.00
-94.00
3,00.00
800
190
-0.14
18,85.00 3,00.00
-0.14
21,85.00
-0.14
21,85.00
0.14
3,00.00
AA
AB
-0.14
18,85.00
3,00.00
-0.14
3,00.00
18,85.00
-0.14
3,00.00
18,85.00
0.14
3,00.00
LOANS AND ADVANCESLOANS FOR SOCIAL SERVICES
Loans for Information and BroadcastingLoans for Information and Publicity
Loans for Broadcasting
Films
Loans for Broadcasting
Other Loans
Loans to Public Sector and other Undertakings
Other Loans
Ways and Means Advance to Arasu Cable TVCorporation LimitedLoans to Arasu Cable TV Corporation
Head of AccountBalance ason 1st April
2011
Advancedduring the
yearTotal
Repaidduring the
year
Write off ofirrecoverable
loans andadvances
Balanceas on 31st March
Netincrease(+)/Decrease(-)during the
year
16. DETAILED STATEMENT ON LOANS AND ADVANCES MADE BY GOVERNMENT
(in lakh of Rupees)
2012
- Contd.
- Contd.( )
( )- Contd.
- Concld.
. .
. .
. .
. .
. .
. .
. .
Total
Total
800
190
Other Loans
Loans to Public Sector and otherUndertakings
. .
Interestreceived
andcredited
. .
. .
. .
. .
. .
Total
Total
Total
TotalTotal
Total
Total
01
00
6220
6221(iv)
Films
Loans for Broadcasting
Loans for Information and Publicity
Loans for BroadcastingLoans for Information andBroadcasting
. .
. .
. .
. .
. .
- Concld.
. .
. .
. .
. .
. .
. .. . . .
. .
. .
. .
. .
. .
. .
. .
. .
- Concld.
413
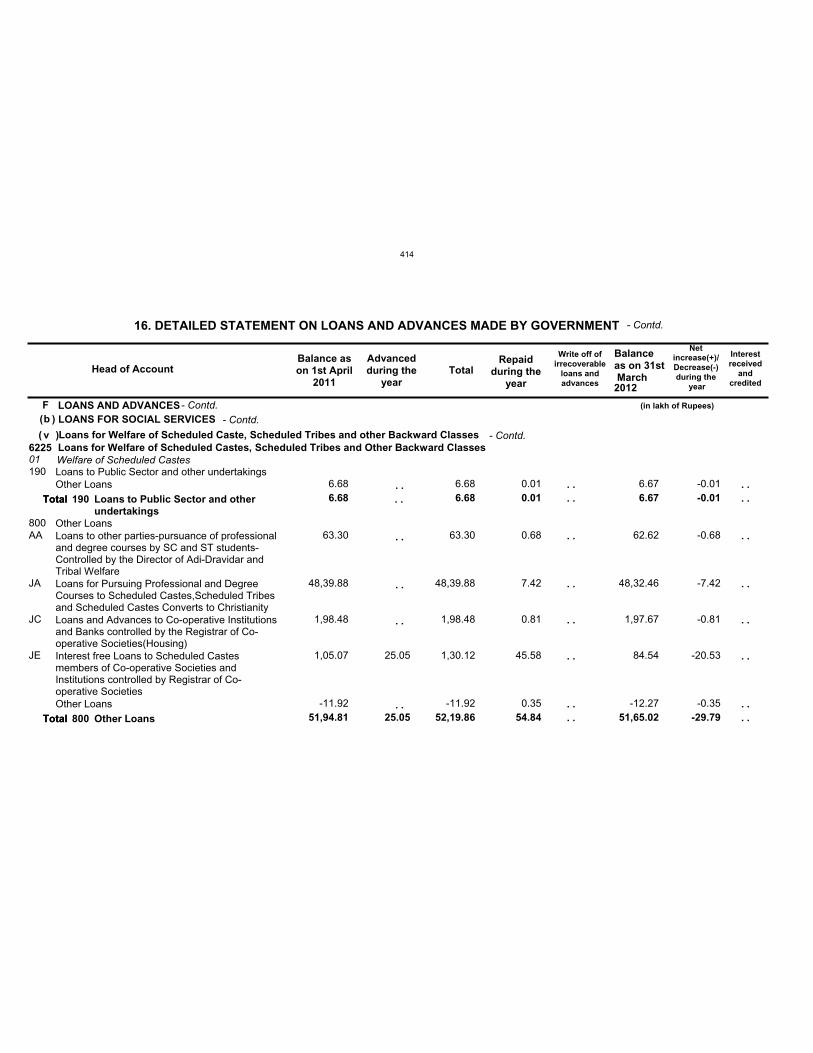
Fb
v622501190
800
6.68
51,94.81 25.05
6.68
52,19.86
0.01
54.84
6.67
51,65.02
-0.01
-29.79
AA
JA
JC
JE
6.68
63.30
48,39.88
1,98.48
1,05.07
-11.92
25.05
6.68
63.30
48,39.88
1,98.48
1,30.12
-11.92
0.01
0.68
7.42
0.81
45.58
0.35
6.67
62.62
48,32.46
1,97.67
84.54
-12.27
-0.01
-0.68
-7.42
-0.81
-20.53
-0.35
LOANS AND ADVANCESLOANS FOR SOCIAL SERVICES
Loans for Welfare of Scheduled Caste, Scheduled Tribes and other Backward ClassesLoans for Welfare of Scheduled Castes, Scheduled Tribes and Other Backward ClassesWelfare of Scheduled CastesLoans to Public Sector and other undertakings
Other Loans
Other Loans
Loans to other parties-pursuance of professionaland degree courses by SC and ST students-Controlled by the Director of Adi-Dravidar andTribal WelfareLoans for Pursuing Professional and DegreeCourses to Scheduled Castes,Scheduled Tribesand Scheduled Castes Converts to ChristianityLoans and Advances to Co-operative Institutionsand Banks controlled by the Registrar of Co-operative Societies(Housing)Interest free Loans to Scheduled Castesmembers of Co-operative Societies andInstitutions controlled by Registrar of Co-operative SocietiesOther Loans
Head of AccountBalance ason 1st April
2011
Advancedduring the
yearTotal
Repaidduring the
year
Write off ofirrecoverable
loans andadvances
Balanceas on 31st March
Netincrease(+)/Decrease(-)during the
year
16. DETAILED STATEMENT ON LOANS AND ADVANCES MADE BY GOVERNMENT
(in lakh of Rupees)
2012
- Contd.
- Contd.( )
( )- Contd.
- Contd.
. .
. .
. .
. .
. .
. .Total
Total
190
800
Loans to Public Sector and otherundertakings
Other Loans
Interestreceived
andcredited
. .
. .
. .
. .
. .
. .
. .
. .
Total
Total
. .
. .
. .
. .
. .
. .
. .
. .
414
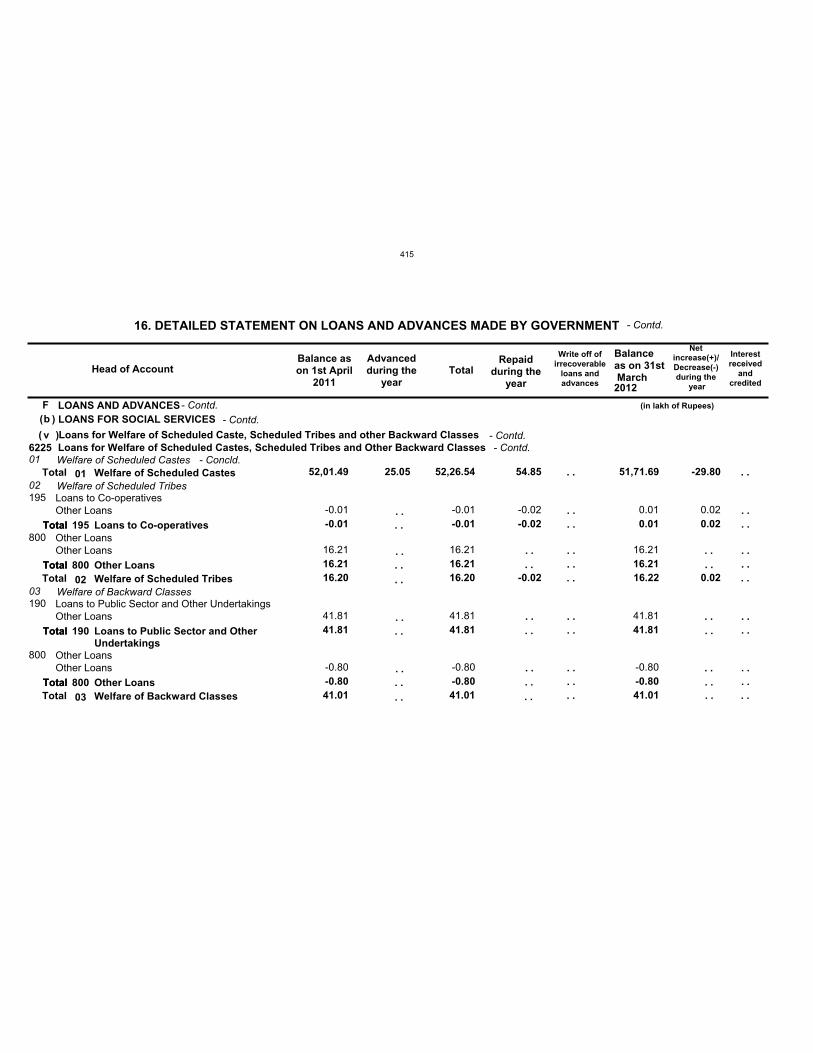
Fb
v622501
02
03
52,01.49
16.20
41.01
25.05 52,26.54
16.20
41.01
54.85
-0.02
51,71.69
16.22
41.01
-29.80
0.02
195
800
190
800
-0.01
16.21
41.81
-0.80
-0.01
16.21
41.81
-0.80
-0.02 0.01
16.21
41.81
-0.80
0.02-0.01
16.21
41.81
-0.80
-0.01
16.21
41.81
-0.80
-0.02 0.01
16.21
41.81
-0.80
0.02
LOANS AND ADVANCESLOANS FOR SOCIAL SERVICES
Loans for Welfare of Scheduled Caste, Scheduled Tribes and other Backward ClassesLoans for Welfare of Scheduled Castes, Scheduled Tribes and Other Backward ClassesWelfare of Scheduled Castes
Welfare of Scheduled Tribes
Welfare of Backward Classes
Loans to Co-operatives
Other Loans
Loans to Public Sector and Other Undertakings
Other Loans
Other Loans
Other Loans
Other Loans
Other Loans
Head of AccountBalance ason 1st April
2011
Advancedduring the
yearTotal
Repaidduring the
year
Write off ofirrecoverable
loans andadvances
Balanceas on 31st March
Netincrease(+)/Decrease(-)during the
year
16. DETAILED STATEMENT ON LOANS AND ADVANCES MADE BY GOVERNMENT
(in lakh of Rupees)
2012
- Contd.
- Contd.( )
( )- Contd.
- Contd.
. .
. .
. .
. .
. .
. .
. .
. .
. .
. .
. .
. .
. .
. .
Total
Total
Total
Total
195
800
190
800
Loans to Co-operatives
Other Loans
Loans to Public Sector and OtherUndertakings
Other Loans
. .
. .
. .
. .
. .
. .
Interestreceived
andcredited
. .
. .
. .
. .
. .
. .
. .
. .
Total
Total
Total
Total
Total
Total
Total
01
02
03
Welfare of Scheduled Castes
Welfare of Scheduled Tribes
Welfare of Backward Classes
. .
. .
. .
. .
. .
. .
. .
. .
- Contd.
. .
. . . .
. .
. .
. .
. .
. .
. .. .
- Concld.
415
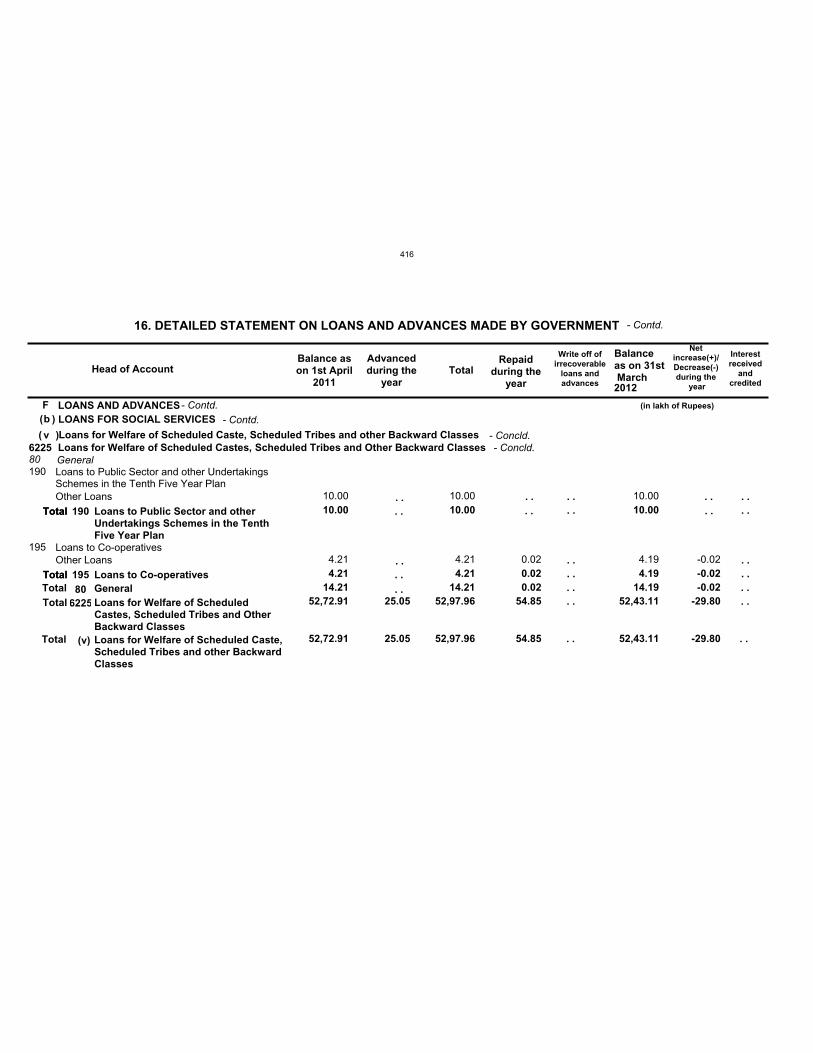
Fb
v
52,72.91 25.05 52,97.96 54.85 52,43.11 -29.80
6225
52,72.91 25.05 52,97.96 54.85 52,43.11 -29.80
80
14.21 14.21 0.02 14.19 -0.02
190
195
10.00
4.21
10.00
4.21 0.02
10.00
4.19 -0.02
10.00
4.21
10.00
4.21 0.02
10.00
4.19 -0.02
LOANS AND ADVANCESLOANS FOR SOCIAL SERVICES
Loans for Welfare of Scheduled Caste, Scheduled Tribes and other Backward ClassesLoans for Welfare of Scheduled Castes, Scheduled Tribes and Other Backward ClassesGeneralLoans to Public Sector and other UndertakingsSchemes in the Tenth Five Year Plan
Loans to Co-operatives
Other Loans
Other Loans
Head of AccountBalance ason 1st April
2011
Advancedduring the
yearTotal
Repaidduring the
year
Write off ofirrecoverable
loans andadvances
Balanceas on 31st March
Netincrease(+)/Decrease(-)during the
year
16. DETAILED STATEMENT ON LOANS AND ADVANCES MADE BY GOVERNMENT
(in lakh of Rupees)
2012
- Contd.
- Contd.( )
( )- Contd.
- Concld.
. .
. .
. .. .
. .
. .Total
Total
190
195
Loans to Public Sector and otherUndertakings Schemes in the TenthFive Year Plan
Loans to Co-operatives
. .
. .
Interestreceived
andcredited
. .
. .
. .
. .TotalTotal
Total
Total
Total80
6225
(v)
GeneralLoans for Welfare of ScheduledCastes, Scheduled Tribes and OtherBackward ClassesLoans for Welfare of Scheduled Caste,Scheduled Tribes and other BackwardClasses
. .
. .
. .
. .
- Concld.
. .. . . .
. . . .
. . . .
416
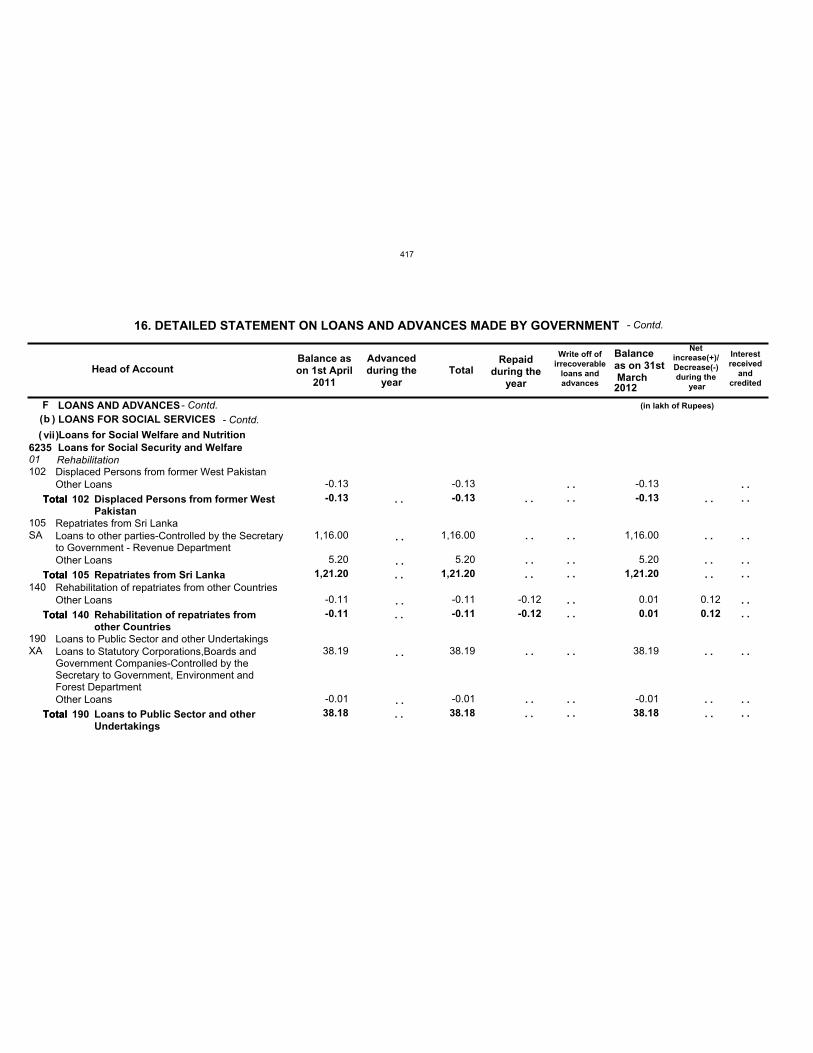
Fb
vii623501102
105
140
190
-0.13
1,21.20
-0.11
38.18
-0.13
1,21.20
-0.11
38.18
-0.12
-0.13
1,21.20
0.01
38.18
0.12
SA
XA
-0.13
1,16.00
5.20
-0.11
38.19
-0.01
-0.13
1,16.00
5.20
-0.11
38.19
-0.01
-0.12
-0.13
1,16.00
5.20
0.01
38.19
-0.01
0.12
LOANS AND ADVANCESLOANS FOR SOCIAL SERVICES
Loans for Social Welfare and NutritionLoans for Social Security and WelfareRehabilitationDisplaced Persons from former West Pakistan
Repatriates from Sri Lanka
Rehabilitation of repatriates from other Countries
Loans to Public Sector and other Undertakings
Other Loans
Loans to other parties-Controlled by the Secretaryto Government - Revenue DepartmentOther Loans
Other Loans
Loans to Statutory Corporations,Boards andGovernment Companies-Controlled by theSecretary to Government, Environment andForest DepartmentOther Loans
Head of AccountBalance ason 1st April
2011
Advancedduring the
yearTotal
Repaidduring the
year
Write off ofirrecoverable
loans andadvances
Balanceas on 31st March
Netincrease(+)/Decrease(-)during the
year
16. DETAILED STATEMENT ON LOANS AND ADVANCES MADE BY GOVERNMENT
(in lakh of Rupees)
2012
- Contd.
- Contd.( )
( )- Contd.
. .
. .
. .
. .
. .
. .
. .
. .
. .
. .
. .
. .
. .
. .
. .
. .
Total
Total
Total
Total
102
105
140
190
Displaced Persons from former WestPakistan
Repatriates from Sri Lanka
Rehabilitation of repatriates fromother Countries
Loans to Public Sector and otherUndertakings
. .
. .
. .
. .
. .
. .
. .
Interestreceived
andcredited
. .
. .
. .
. .
. .
. .
. .
. .
. .
. .
Total
Total
Total
Total
. .
. .
. .
. .
. .
. .
. .
. .
. .
. .
417
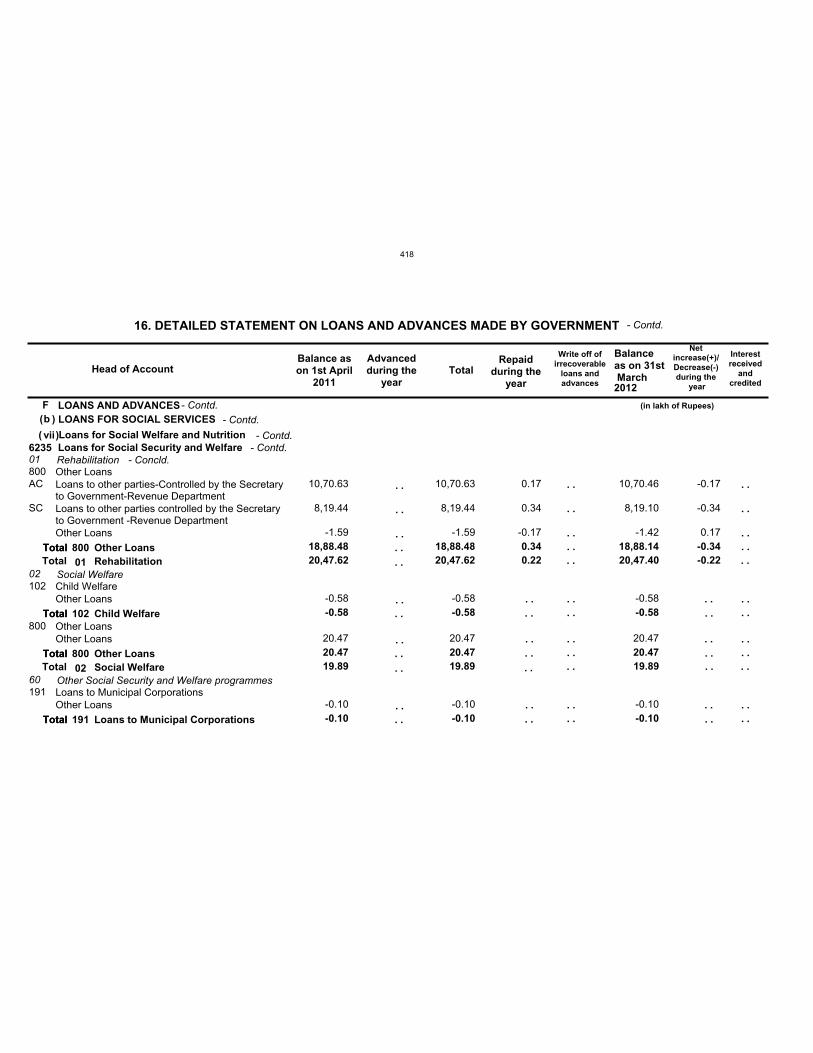
Fb
vii623501
02
60
20,47.62
19.89
20,47.62
19.89
0.22 20,47.40
19.89
-0.22
800
102
800
191
18,88.48
-0.58
20.47
-0.10
18,88.48
-0.58
20.47
-0.10
0.34 18,88.14
-0.58
20.47
-0.10
-0.34
AC
SC
10,70.63
8,19.44
-1.59
-0.58
20.47
-0.10
10,70.63
8,19.44
-1.59
-0.58
20.47
-0.10
0.17
0.34
-0.17
10,70.46
8,19.10
-1.42
-0.58
20.47
-0.10
-0.17
-0.34
0.17
LOANS AND ADVANCESLOANS FOR SOCIAL SERVICES
Loans for Social Welfare and NutritionLoans for Social Security and WelfareRehabilitation
Social Welfare
Other Social Security and Welfare programmes
Other Loans
Child Welfare
Other Loans
Loans to Municipal Corporations
Loans to other parties-Controlled by the Secretaryto Government-Revenue DepartmentLoans to other parties controlled by the Secretaryto Government -Revenue DepartmentOther Loans
Other Loans
Other Loans
Other Loans
Head of AccountBalance ason 1st April
2011
Advancedduring the
yearTotal
Repaidduring the
year
Write off ofirrecoverable
loans andadvances
Balanceas on 31st March
Netincrease(+)/Decrease(-)during the
year
16. DETAILED STATEMENT ON LOANS AND ADVANCES MADE BY GOVERNMENT
(in lakh of Rupees)
2012
- Contd.
- Contd.( )
( )- Contd.
- Contd.
. .
. .
. .
. .
. .
. .
. .
. .
. .
. .
. .
. .
. .
. .
. .
. .
Total
Total
Total
Total
800
102
800
191
Other Loans
Child Welfare
Other Loans
Loans to Municipal Corporations
. .
. .
. .
. .
. .
. .
Interestreceived
andcredited
. .
. .
. .
. .
. .
. .
. .
. .
. .
. .
Total
Total
Total
Total
Total
Total
01
02
Rehabilitation
Social Welfare
. .
. .
. .
. .
. .
. .
. .
. .
. .
. .
- Contd.
. .
. . . .
. .
. .
. .
. .. .
- Concld.
418
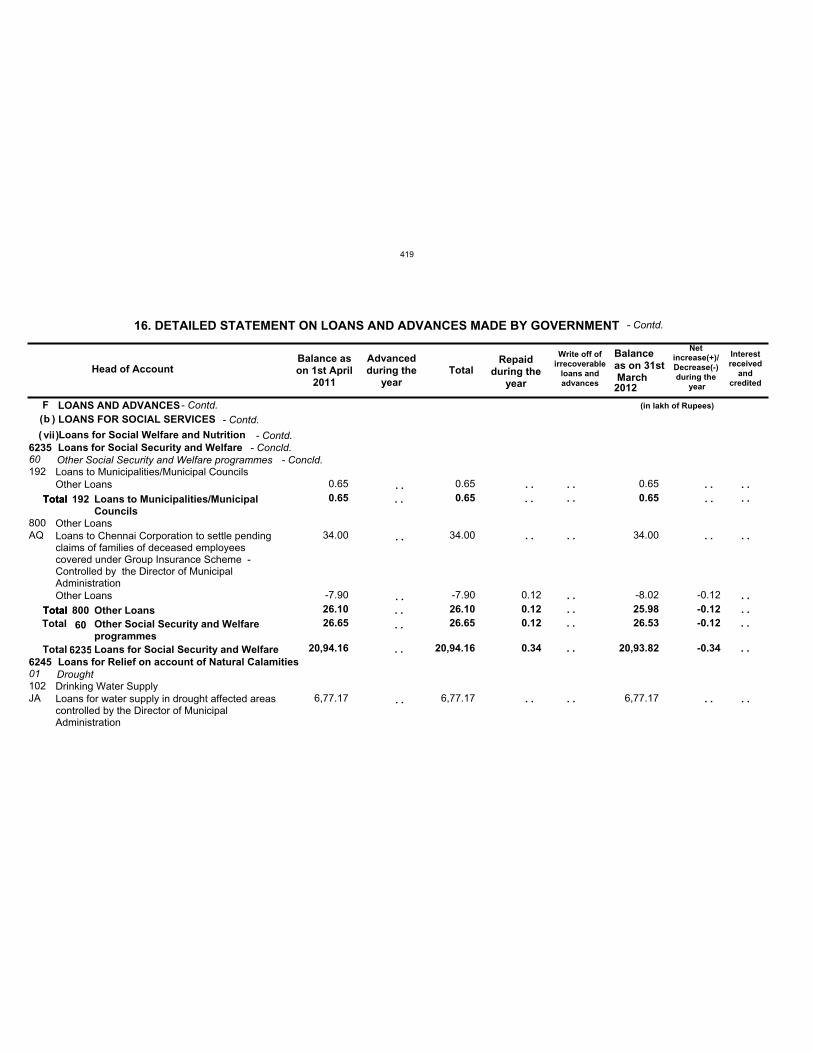
Fb
vii6235
6245 20,94.16 20,94.16 0.34 20,93.82 -0.34
60
01
26.65 26.65 0.12 26.53 -0.12
192
800
102
0.65
26.10
0.65
26.10 0.12
0.65
25.98 -0.12
AQ
JA
0.65
34.00
-7.90
6,77.17
0.65
34.00
-7.90
6,77.17
0.12
0.65
34.00
-8.02
6,77.17
-0.12
LOANS AND ADVANCESLOANS FOR SOCIAL SERVICES
Loans for Social Welfare and NutritionLoans for Social Security and Welfare
Loans for Relief on account of Natural Calamities
Other Social Security and Welfare programmes
Drought
Loans to Municipalities/Municipal Councils
Other Loans
Drinking Water Supply
Other Loans
Loans to Chennai Corporation to settle pendingclaims of families of deceased employeescovered under Group Insurance Scheme -Controlled by the Director of MunicipalAdministrationOther Loans
Loans for water supply in drought affected areascontrolled by the Director of MunicipalAdministration
Head of AccountBalance ason 1st April
2011
Advancedduring the
yearTotal
Repaidduring the
year
Write off ofirrecoverable
loans andadvances
Balanceas on 31st March
Netincrease(+)/Decrease(-)during the
year
16. DETAILED STATEMENT ON LOANS AND ADVANCES MADE BY GOVERNMENT
(in lakh of Rupees)
2012
- Contd.
- Contd.( )
( )- Contd.
- Contd.
. .
. .
. .
. .
. .
. .
. .
. .
. .
. .Total
Total
192
800
Loans to Municipalities/MunicipalCouncils
Other Loans
. .
. .
. .
. .
Interestreceived
andcredited
. .
. .
. .
. .
. .
. .Total
Total
Total
Total60
6235
Other Social Security and WelfareprogrammesLoans for Social Security and Welfare
. .
. .
. .
. .
. .
. .
- Concld.
. .
. . . .. .
. . . .
- Concld.
419
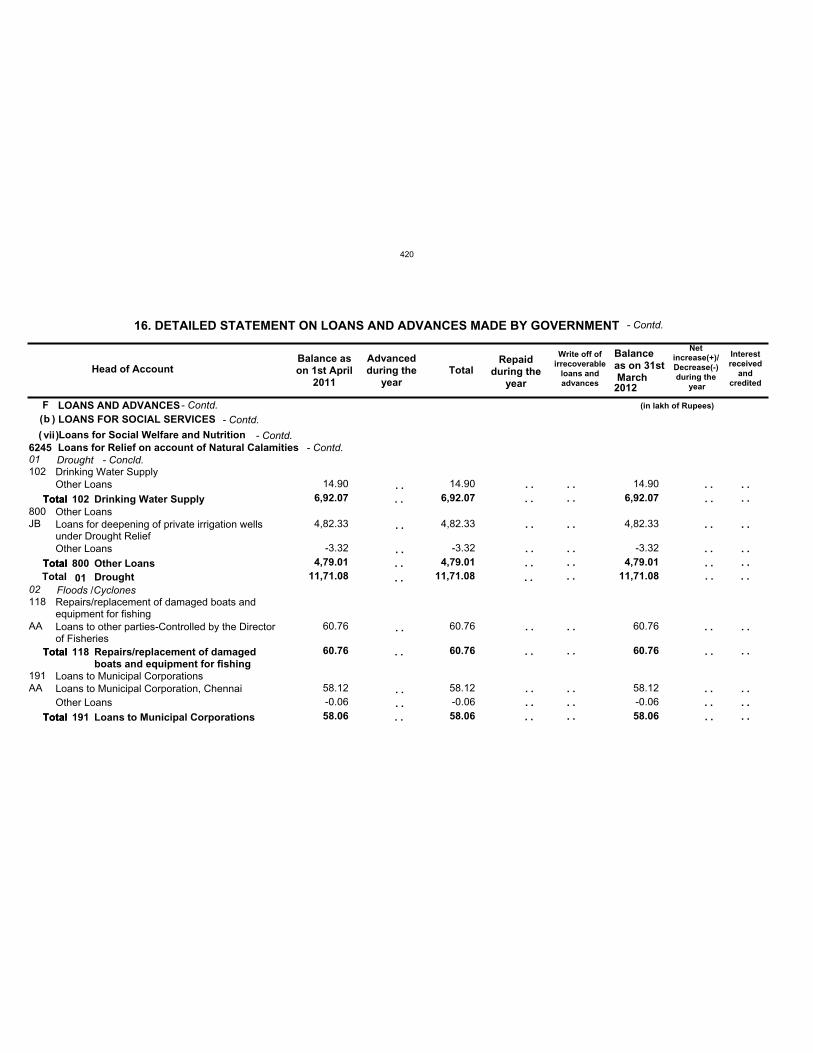
Fb
vii624501
02 11,71.08 11,71.08 11,71.08
102
800
118
191
6,92.07
4,79.01
60.76
58.06
6,92.07
4,79.01
60.76
58.06
6,92.07
4,79.01
60.76
58.06
JB
AA
AA
14.90
4,82.33
-3.32
60.76
58.12-0.06
14.90
4,82.33
-3.32
60.76
58.12-0.06
14.90
4,82.33
-3.32
60.76
58.12-0.06
LOANS AND ADVANCESLOANS FOR SOCIAL SERVICES
Loans for Social Welfare and NutritionLoans for Relief on account of Natural CalamitiesDrought
Floods /Cyclones
Drinking Water Supply
Other Loans
Repairs/replacement of damaged boats andequipment for fishing
Loans to Municipal Corporations
Other Loans
Loans for deepening of private irrigation wellsunder Drought ReliefOther Loans
Loans to other parties-Controlled by the Directorof Fisheries
Loans to Municipal Corporation, ChennaiOther Loans
Head of AccountBalance ason 1st April
2011
Advancedduring the
yearTotal
Repaidduring the
year
Write off ofirrecoverable
loans andadvances
Balanceas on 31st March
Netincrease(+)/Decrease(-)during the
year
16. DETAILED STATEMENT ON LOANS AND ADVANCES MADE BY GOVERNMENT
(in lakh of Rupees)
2012
- Contd.
- Contd.( )
( )- Contd.
- Contd.
. .
. .
. .
. .
. .
. .
. .
. .
. .
. .
. .
. .
. .
. .
. .
. .
. .
. .
. .
. .
Total
Total
Total
Total
102
800
118
191
Drinking Water Supply
Other Loans
Repairs/replacement of damagedboats and equipment for fishing
Loans to Municipal Corporations
. .
. .
. .
. .
. .
. .
. .
. .
. .
. .
Interestreceived
andcredited
. .
. .
. .
. .
. .
. .
. .
. .
. .
. .
Total
Total
Total
Total
Total
01 Drought
. .
. .
. .
. .
. .
. .
. .
. .
. .
. .
- Contd.
. . . . . . . .. .
- Concld.
420
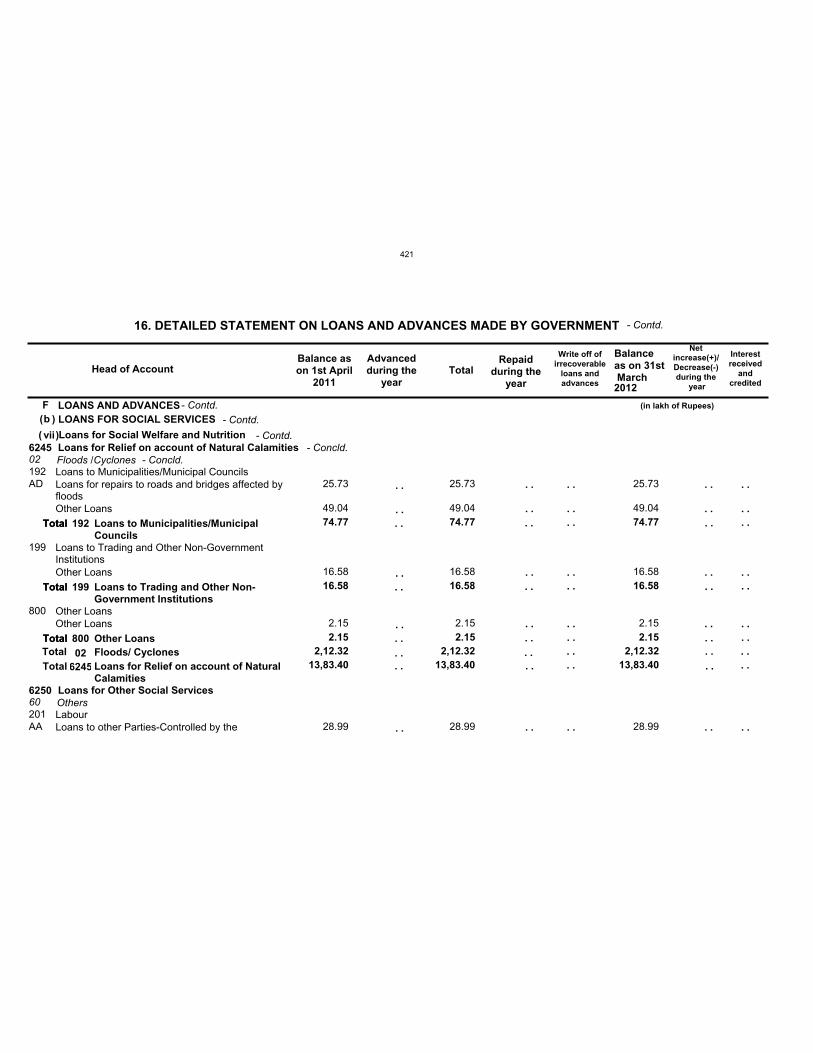
Fb
vii6245
6250
13,83.40 13,83.40 13,83.40
02
60
2,12.32 2,12.32 2,12.32
192
199
800
201
74.77
16.58
2.15
74.77
16.58
2.15
74.77
16.58
2.15
AD
AA
25.73
49.04
16.58
2.15
28.99
25.73
49.04
16.58
2.15
28.99
25.73
49.04
16.58
2.15
28.99
LOANS AND ADVANCESLOANS FOR SOCIAL SERVICES
Loans for Social Welfare and NutritionLoans for Relief on account of Natural Calamities
Loans for Other Social Services
Floods /Cyclones
Others
Loans to Municipalities/Municipal Councils
Loans to Trading and Other Non-GovernmentInstitutions
Other Loans
Labour
Loans for repairs to roads and bridges affected byfloodsOther Loans
Other Loans
Other Loans
Loans to other Parties-Controlled by the
Head of AccountBalance ason 1st April
2011
Advancedduring the
yearTotal
Repaidduring the
year
Write off ofirrecoverable
loans andadvances
Balanceas on 31st March
Netincrease(+)/Decrease(-)during the
year
16. DETAILED STATEMENT ON LOANS AND ADVANCES MADE BY GOVERNMENT
(in lakh of Rupees)
2012
- Contd.
- Contd.( )
( )- Contd.
- Contd.
. .
. .
. .
. .
. .
. .
. .
. .
. .
. .
. .
. .
. .
. .
. .
. .
Total
Total
Total
192
199
800
Loans to Municipalities/MunicipalCouncils
Loans to Trading and Other Non-Government Institutions
Other Loans
. .
. .
. .
. .
. .
. .
. .
. .
Interestreceived
andcredited
. .
. .
. .
. .
. .
. .
. .
. .TotalTotal
Total
Total
Total02
6245Floods/ CyclonesLoans for Relief on account of NaturalCalamities
. .
. .
. .
. .
. .
. .
. .
. .
- Concld.
. . . .. . . .. . . .. . . .. .
. .
- Concld.
421
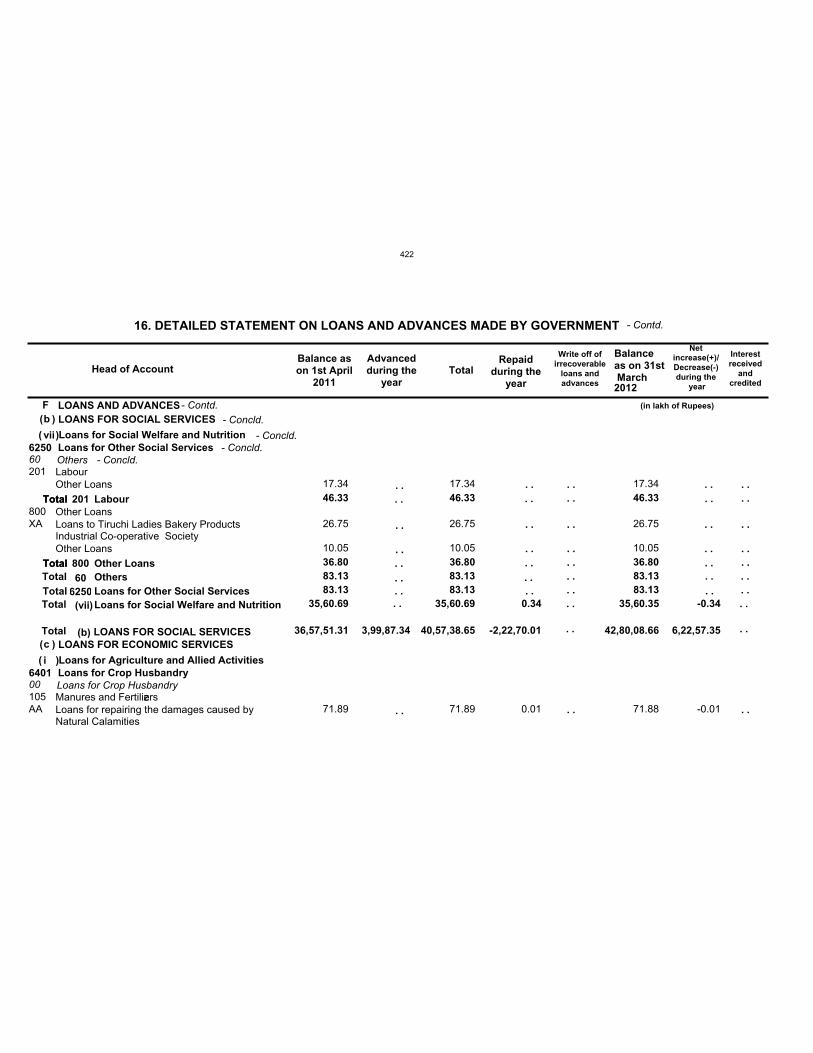
Fb
c 36,57,51.31 3,99,87.34 40,57,38.65 -2,22,70.01 42,80,08.66 6,22,57.35
vii
i
35,60.69 . . 35,60.69 0.34 35,60.35 -0.34
6250
6401
83.13 83.13 83.13
60
00
83.13 83.13 83.13
201
800
105
46.33
36.80
46.33
36.80
46.33
36.80
XA
AA
17.34
26.75
10.05
71.89
17.34
26.75
10.05
71.89 0.01
17.34
26.75
10.05
71.88 -0.01
LOANS AND ADVANCESLOANS FOR SOCIAL SERVICES
LOANS FOR ECONOMIC SERVICES
Loans for Social Welfare and Nutrition
Loans for Agriculture and Allied Activities
Loans for Other Social Services
Loans for Crop Husbandry
Others
Loans for Crop Husbandry
Labour
Other Loans
Manures and Fertilizers
Other Loans
Loans to Tiruchi Ladies Bakery ProductsIndustrial Co-operative SocietyOther Loans
Loans for repairing the damages caused byNatural Calamities
Head of AccountBalance ason 1st April
2011
Advancedduring the
yearTotal
Repaidduring the
year
Write off ofirrecoverable
loans andadvances
Balanceas on 31st March
Netincrease(+)/Decrease(-)during the
year
16. DETAILED STATEMENT ON LOANS AND ADVANCES MADE BY GOVERNMENT
(in lakh of Rupees)
2012
- Contd.
- Contd.(
(
)
)
(
(
)
)
- Concld.
- Concld.
. .
. .
. .
. .
. .
. .
. .
. .
. .
. .
. .
Total
Total
201
800
Labour
Other Loans
. .
. .
. .
. .
. .
Interestreceived
andcredited
. .
. .
. .
. .
. .
. .TotalTotalTotal
Total
Total
Total60
6250(vii)
(b)
OthersLoans for Other Social ServicesLoans for Social Welfare and Nutrition
LOANS FOR SOCIAL SERVICES
. .
. .
. .
. .
. .
. .
- Concld.
. . . .. . . .. . . .
. . . .
. . . .. . . .. .
. .
- Concld.
422
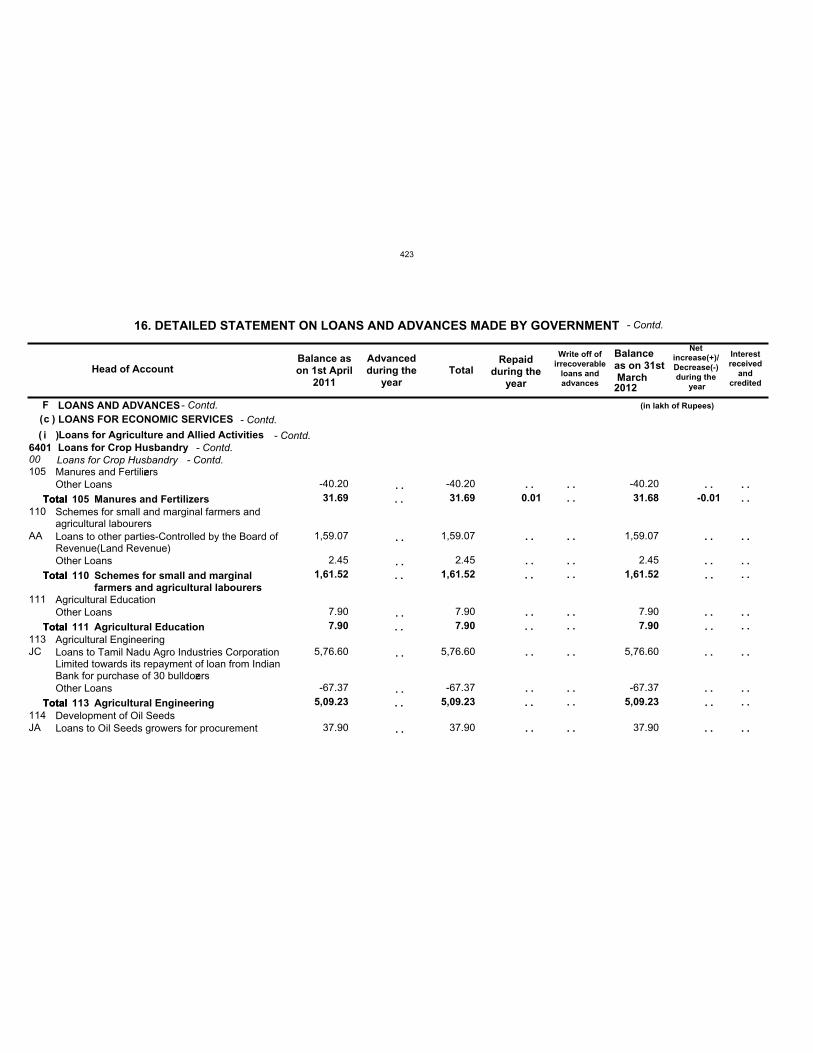
Fc
i640100105
110
111
113
114
31.69
1,61.52
7.90
5,09.23
31.69
1,61.52
7.90
5,09.23
0.01 31.68
1,61.52
7.90
5,09.23
-0.01
AA
JC
JA
-40.20
1,59.07
2.45
7.90
5,76.60
-67.37
37.90
-40.20
1,59.07
2.45
7.90
5,76.60
-67.37
37.90
-40.20
1,59.07
2.45
7.90
5,76.60
-67.37
37.90
LOANS AND ADVANCESLOANS FOR ECONOMIC SERVICES
Loans for Agriculture and Allied ActivitiesLoans for Crop HusbandryLoans for Crop HusbandryManures and Fertilizers
Schemes for small and marginal farmers andagricultural labourers
Agricultural Education
Agricultural Engineering
Development of Oil Seeds
Other Loans
Loans to other parties-Controlled by the Board ofRevenue(Land Revenue)Other Loans
Other Loans
Loans to Tamil Nadu Agro Industries CorporationLimited towards its repayment of loan from IndianBank for purchase of 30 bulldozersOther Loans
Loans to Oil Seeds growers for procurement
Head of AccountBalance ason 1st April
2011
Advancedduring the
yearTotal
Repaidduring the
year
Write off ofirrecoverable
loans andadvances
Balanceas on 31st March
Netincrease(+)/Decrease(-)during the
year
16. DETAILED STATEMENT ON LOANS AND ADVANCES MADE BY GOVERNMENT
(in lakh of Rupees)
2012
- Contd.
- Contd.( )
( )- Contd.
- Contd.
. .
. .
. .
. .
. .
. .
. .
. .
. .
. .
. .
. .
. .
. .
. .
. .
. .
. .
. .
. .
. .
Total
Total
Total
Total
105
110
111
113
Manures and Fertilizers
Schemes for small and marginalfarmers and agricultural labourers
Agricultural Education
Agricultural Engineering
. .
. .
. .
. .
. .
. .
. .
. .
. .
. .
Interestreceived
andcredited
. .
. .
. .
. .
. .
. .
. .
. .
. .
. .
. .
Total
Total
Total
Total
. .
. .
. .
. .
. .
. .
. .
. .
. .
. .
. .
- Contd.- Contd.
423
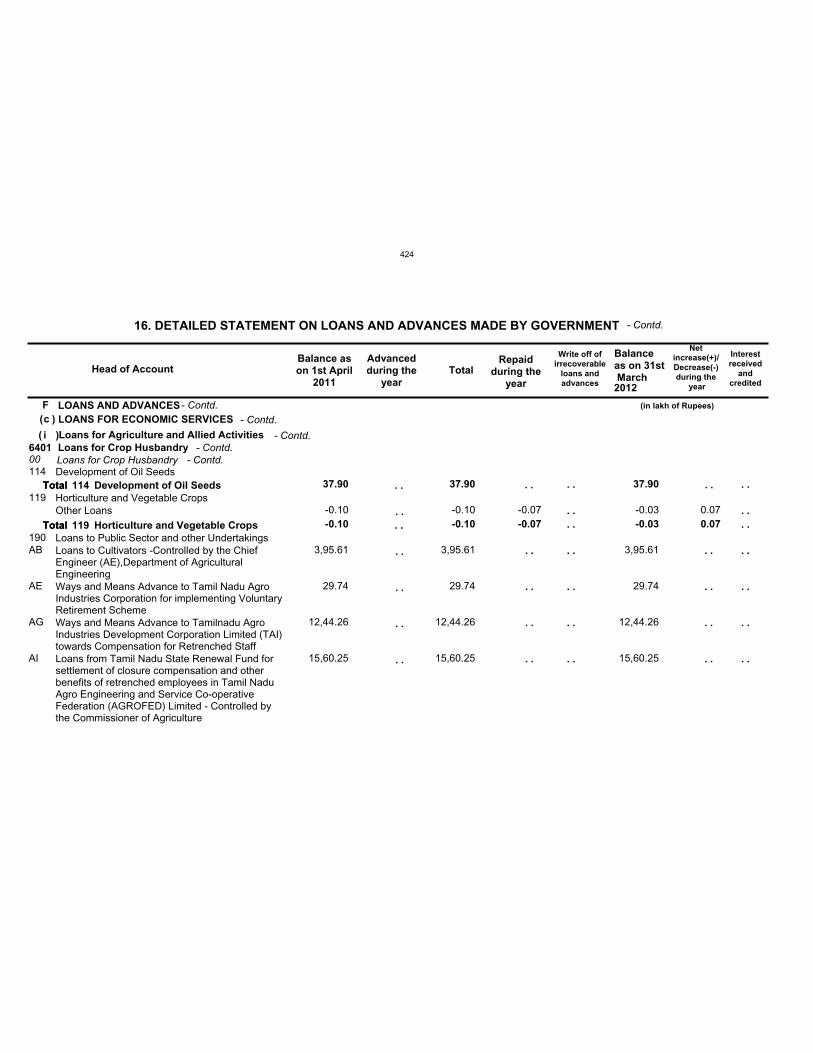
Fc
i640100114
119
190
37.90
-0.10
37.90
-0.10 -0.07
37.90
-0.03 0.07
AB
AE
AG
AI
-0.10
3,95.61
29.74
12,44.26
15,60.25
-0.10
3,95.61
29.74
12,44.26
15,60.25
-0.07 -0.03
3,95.61
29.74
12,44.26
15,60.25
0.07
LOANS AND ADVANCESLOANS FOR ECONOMIC SERVICES
Loans for Agriculture and Allied ActivitiesLoans for Crop HusbandryLoans for Crop HusbandryDevelopment of Oil Seeds
Horticulture and Vegetable Crops
Loans to Public Sector and other Undertakings
Other Loans
Loans to Cultivators -Controlled by the ChiefEngineer (AE),Department of AgriculturalEngineeringWays and Means Advance to Tamil Nadu AgroIndustries Corporation for implementing VoluntaryRetirement SchemeWays and Means Advance to Tamilnadu AgroIndustries Development Corporation Limited (TAI)towards Compensation for Retrenched StaffLoans from Tamil Nadu State Renewal Fund forsettlement of closure compensation and otherbenefits of retrenched employees in Tamil NaduAgro Engineering and Service Co-operativeFederation (AGROFED) Limited - Controlled bythe Commissioner of Agriculture
Head of AccountBalance ason 1st April
2011
Advancedduring the
yearTotal
Repaidduring the
year
Write off ofirrecoverable
loans andadvances
Balanceas on 31st March
Netincrease(+)/Decrease(-)during the
year
16. DETAILED STATEMENT ON LOANS AND ADVANCES MADE BY GOVERNMENT
(in lakh of Rupees)
2012
- Contd.
- Contd.( )
( )- Contd.
- Contd.
. .
. .
. .
. .
. .
. .
. .
. .
. .
. .
. .
. .Total
Total
114
119
Development of Oil Seeds
Horticulture and Vegetable Crops
. .
. .
. .
. .
. .
Interestreceived
andcredited
. .
. .
. .
. .
. .
. .
. .
Total
Total. .
. .
. .
. .
. .
. .
. .
- Contd.- Contd.
424
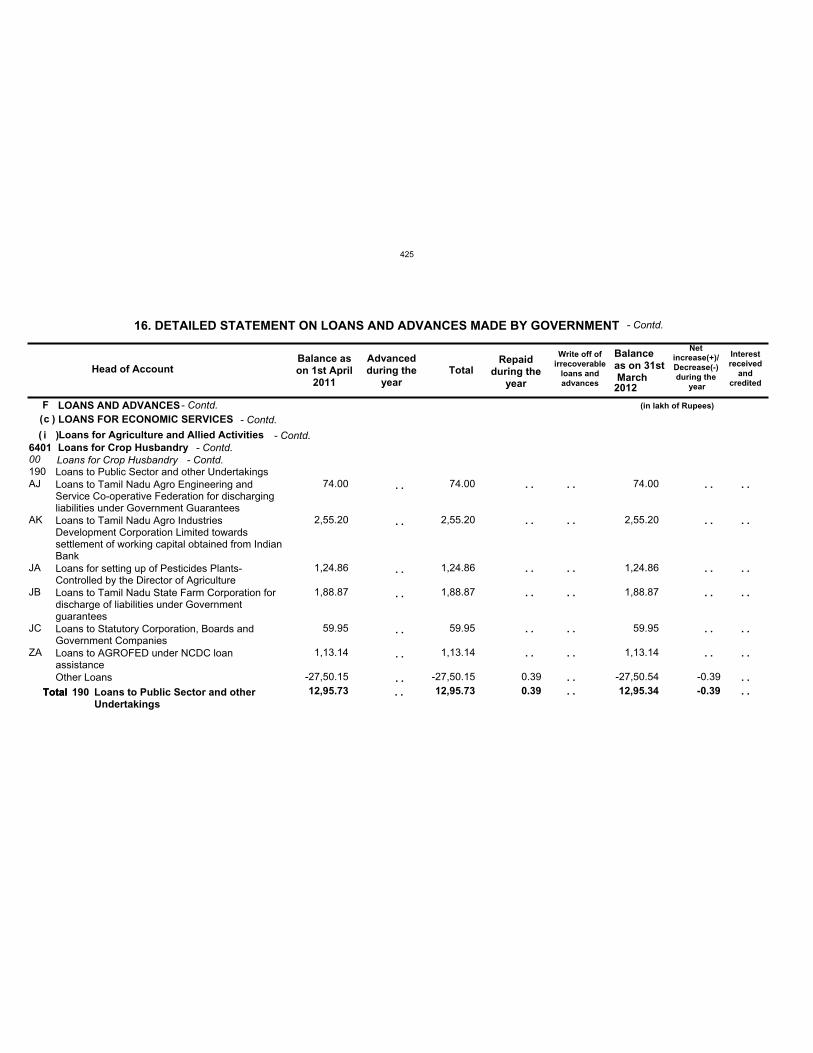
Fc
i640100190
12,95.73 12,95.73 0.39 12,95.34 -0.39
AJ
AK
JA
JB
JC
ZA
74.00
2,55.20
1,24.86
1,88.87
59.95
1,13.14
-27,50.15
74.00
2,55.20
1,24.86
1,88.87
59.95
1,13.14
-27,50.15 0.39
74.00
2,55.20
1,24.86
1,88.87
59.95
1,13.14
-27,50.54 -0.39
LOANS AND ADVANCESLOANS FOR ECONOMIC SERVICES
Loans for Agriculture and Allied ActivitiesLoans for Crop HusbandryLoans for Crop HusbandryLoans to Public Sector and other UndertakingsLoans to Tamil Nadu Agro Engineering andService Co-operative Federation for dischargingliabilities under Government GuaranteesLoans to Tamil Nadu Agro IndustriesDevelopment Corporation Limited towardssettlement of working capital obtained from IndianBankLoans for setting up of Pesticides Plants-Controlled by the Director of AgricultureLoans to Tamil Nadu State Farm Corporation fordischarge of liabilities under GovernmentguaranteesLoans to Statutory Corporation, Boards andGovernment CompaniesLoans to AGROFED under NCDC loanassistanceOther Loans
Head of AccountBalance ason 1st April
2011
Advancedduring the
yearTotal
Repaidduring the
year
Write off ofirrecoverable
loans andadvances
Balanceas on 31st March
Netincrease(+)/Decrease(-)during the
year
16. DETAILED STATEMENT ON LOANS AND ADVANCES MADE BY GOVERNMENT
(in lakh of Rupees)
2012
- Contd.
- Contd.( )
( )- Contd.
- Contd.
. .
. .
. .
. .
. .
. .
. .
. .
. .
. .
. .
. .
. .
. .Total 190 Loans to Public Sector and otherUndertakings
. .
. .
. .
. .
. .
. .
Interestreceived
andcredited
. .
. .
. .
. .
. .
. .
. .
. .Total
. .
. .
. .
. .
. .
. .
. .
. .
- Contd.- Contd.
425
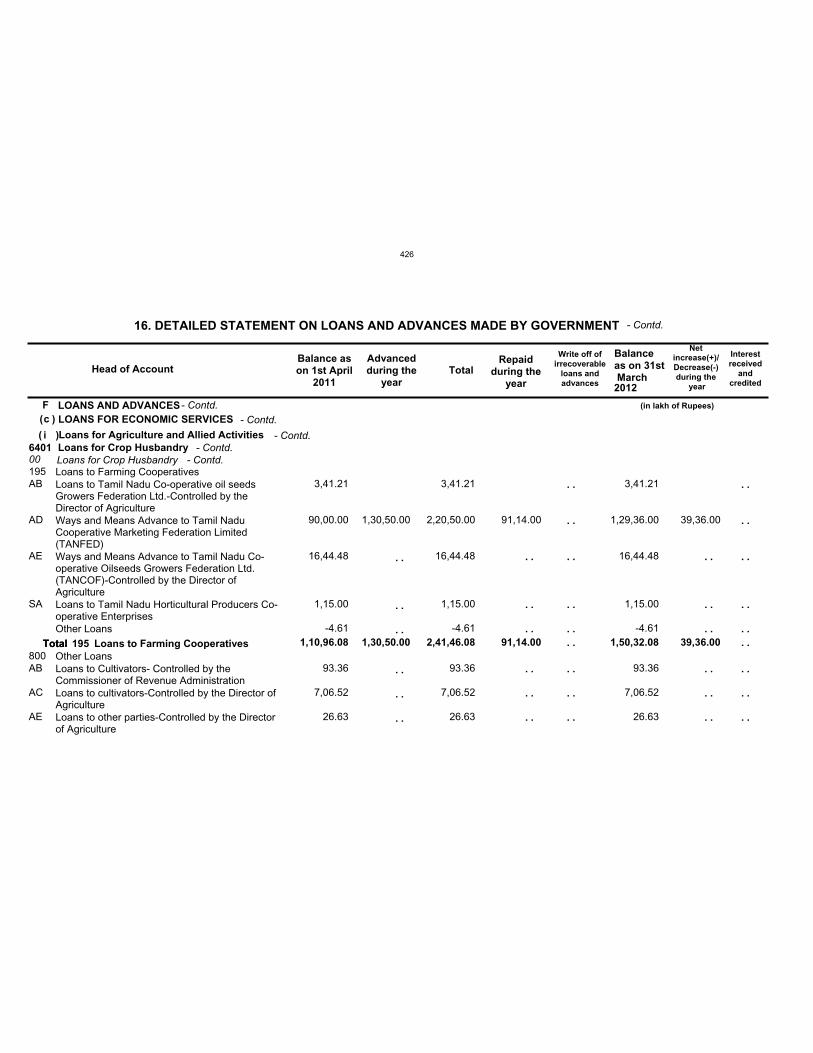
Fc
i640100195
800 1,10,96.08 1,30,50.00 2,41,46.08 91,14.00 1,50,32.08 39,36.00
AB
AD
AE
SA
AB
AC
AE
3,41.21
90,00.00
16,44.48
1,15.00
-4.61
93.36
7,06.52
26.63
1,30,50.00
3,41.21
2,20,50.00
16,44.48
1,15.00
-4.61
93.36
7,06.52
26.63
91,14.00
3,41.21
1,29,36.00
16,44.48
1,15.00
-4.61
93.36
7,06.52
26.63
39,36.00
LOANS AND ADVANCESLOANS FOR ECONOMIC SERVICES
Loans for Agriculture and Allied ActivitiesLoans for Crop HusbandryLoans for Crop HusbandryLoans to Farming Cooperatives
Other Loans
Loans to Tamil Nadu Co-operative oil seedsGrowers Federation Ltd.-Controlled by theDirector of AgricultureWays and Means Advance to Tamil NaduCooperative Marketing Federation Limited(TANFED)Ways and Means Advance to Tamil Nadu Co-operative Oilseeds Growers Federation Ltd.(TANCOF)-Controlled by the Director ofAgricultureLoans to Tamil Nadu Horticultural Producers Co-operative EnterprisesOther Loans
Loans to Cultivators- Controlled by theCommissioner of Revenue AdministrationLoans to cultivators-Controlled by the Director ofAgricultureLoans to other parties-Controlled by the Directorof Agriculture
Head of AccountBalance ason 1st April
2011
Advancedduring the
yearTotal
Repaidduring the
year
Write off ofirrecoverable
loans andadvances
Balanceas on 31st March
Netincrease(+)/Decrease(-)during the
year
16. DETAILED STATEMENT ON LOANS AND ADVANCES MADE BY GOVERNMENT
(in lakh of Rupees)
2012
- Contd.
- Contd.( )
( )- Contd.
- Contd.
. .
. .
. .
. .
. .
. .
. .
. .
. .
. .
. .
. .
Total 195 Loans to Farming Cooperatives
. .
. .
. .
. .
. .
. .
Interestreceived
andcredited
. .
. .
. .
. .
. .
. .
. .
. .
. .Total
. .
. .
. .
. .
. .
. .
. .
. .
. .
- Contd.- Contd.
426
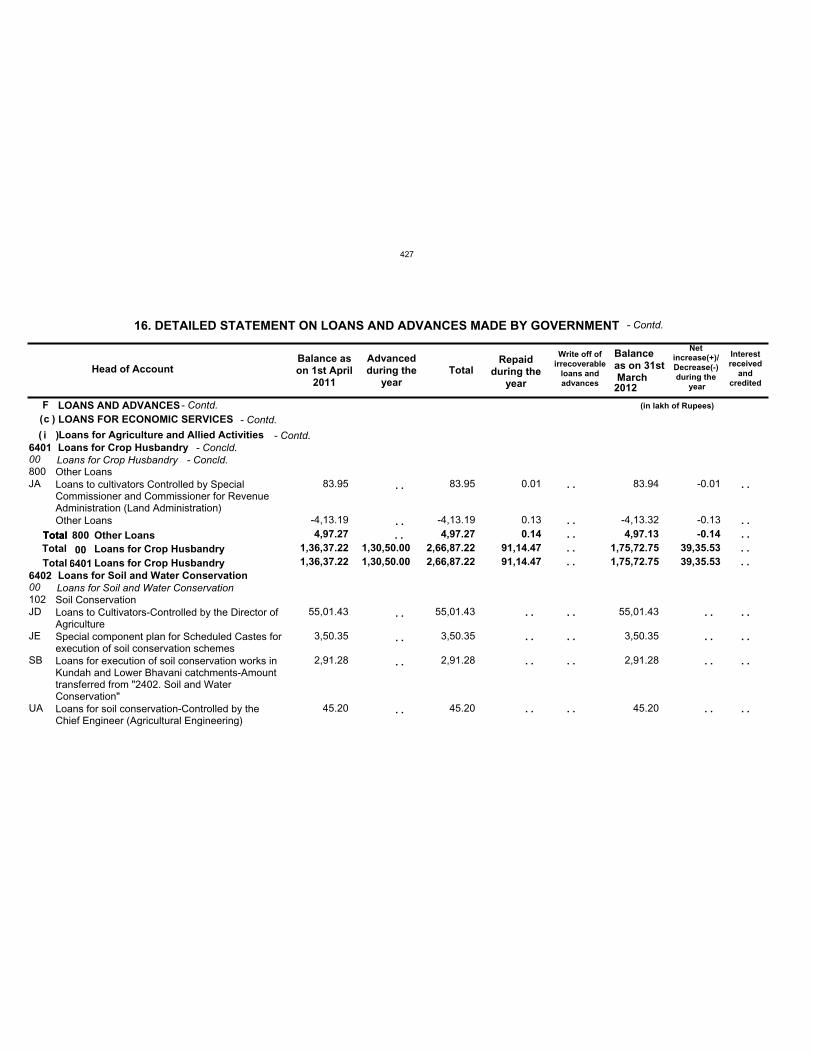
Fc
i6401
6402 1,36,37.22 1,30,50.00 2,66,87.22 91,14.47 1,75,72.75 39,35.53
00
00
1,36,37.22 1,30,50.00 2,66,87.22 91,14.47 1,75,72.75 39,35.53
800
102
4,97.27 4,97.27 0.14 4,97.13 -0.14
JA
JD
JE
SB
UA
83.95
-4,13.19
55,01.43
3,50.35
2,91.28
45.20
83.95
-4,13.19
55,01.43
3,50.35
2,91.28
45.20
0.01
0.13
83.94
-4,13.32
55,01.43
3,50.35
2,91.28
45.20
-0.01
-0.13
LOANS AND ADVANCESLOANS FOR ECONOMIC SERVICES
Loans for Agriculture and Allied ActivitiesLoans for Crop Husbandry
Loans for Soil and Water Conservation
Loans for Crop Husbandry
Loans for Soil and Water Conservation
Other Loans
Soil Conservation
Loans to cultivators Controlled by SpecialCommissioner and Commissioner for RevenueAdministration (Land Administration)Other Loans
Loans to Cultivators-Controlled by the Director ofAgricultureSpecial component plan for Scheduled Castes forexecution of soil conservation schemesLoans for execution of soil conservation works inKundah and Lower Bhavani catchments-Amounttransferred from "2402. Soil and WaterConservation"Loans for soil conservation-Controlled by theChief Engineer (Agricultural Engineering)
Head of AccountBalance ason 1st April
2011
Advancedduring the
yearTotal
Repaidduring the
year
Write off ofirrecoverable
loans andadvances
Balanceas on 31st March
Netincrease(+)/Decrease(-)during the
year
16. DETAILED STATEMENT ON LOANS AND ADVANCES MADE BY GOVERNMENT
(in lakh of Rupees)
2012
- Contd.
- Contd.( )
( )- Contd.
- Contd.
. .
. .
. .
. .
. .
. .
. .
. .
. .
. .
. .Total 800 Other Loans
. .
. .
. .
. .
Interestreceived
andcredited
. .
. .
. .
. .
. .
. .
. .TotalTotal
Total00
6401Loans for Crop HusbandryLoans for Crop Husbandry
. .
. .
. .
. .
. .
. .
. .
- Concld.
. . . .
. . . .
- Concld.
427
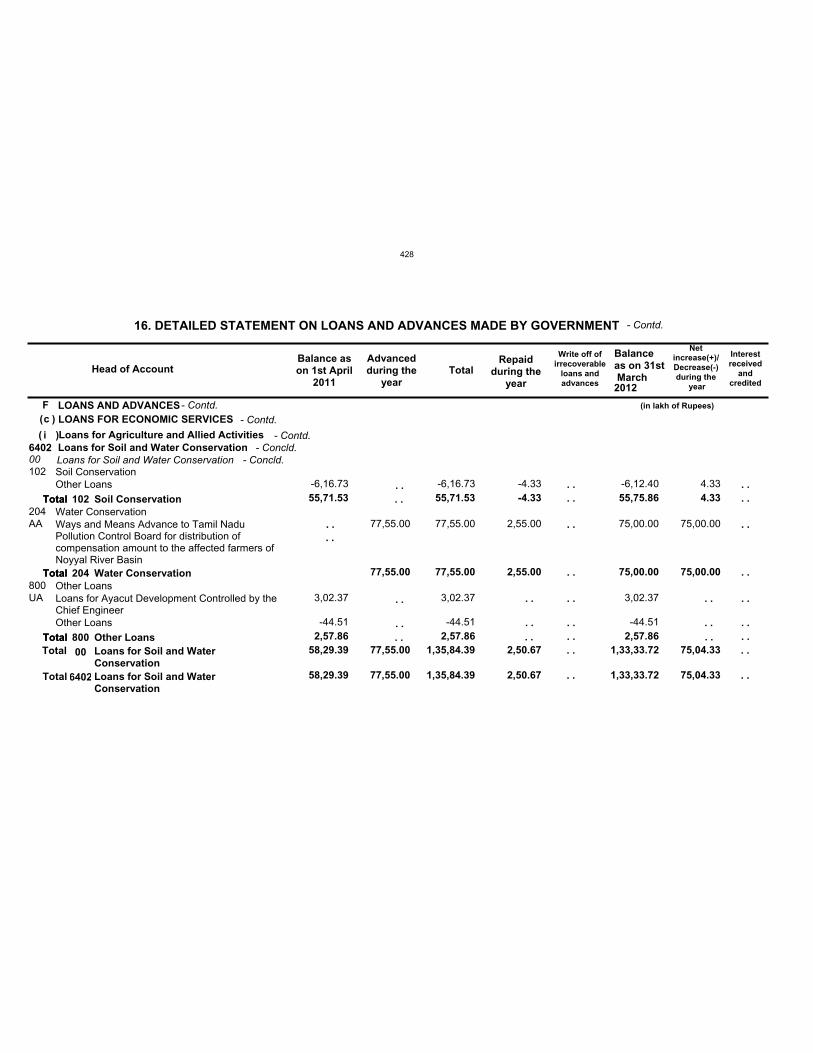
Fc
i6402
58,29.39 77,55.00 1,35,84.39 2,50.67 1,33,33.72 75,04.33
00
58,29.39 77,55.00 1,35,84.39 2,50.67 1,33,33.72 75,04.33
102
204
800
55,71.53
2,57.86
77,55.00
55,71.53
77,55.00
2,57.86
-4.33
2,55.00
55,75.86
75,00.00
2,57.86
4.33
75,00.00
AA
UA
-6,16.73
3,02.37
-44.51
77,55.00
-6,16.73
77,55.00
3,02.37
-44.51
-4.33
2,55.00
-6,12.40
75,00.00
3,02.37
-44.51
4.33
75,00.00
LOANS AND ADVANCESLOANS FOR ECONOMIC SERVICES
Loans for Agriculture and Allied ActivitiesLoans for Soil and Water ConservationLoans for Soil and Water ConservationSoil Conservation
Water Conservation
Other Loans
Other Loans
Ways and Means Advance to Tamil NaduPollution Control Board for distribution ofcompensation amount to the affected farmers ofNoyyal River Basin
Loans for Ayacut Development Controlled by theChief EngineerOther Loans
Head of AccountBalance ason 1st April
2011
Advancedduring the
yearTotal
Repaidduring the
year
Write off ofirrecoverable
loans andadvances
Balanceas on 31st March
Netincrease(+)/Decrease(-)during the
year
16. DETAILED STATEMENT ON LOANS AND ADVANCES MADE BY GOVERNMENT
(in lakh of Rupees)
2012
- Contd.
- Contd.( )
( )- Contd.
- Contd.
. .
. .
. .
. .
. .
. .
. . . .
. .
. .
Total
Total
Total
102
204
800
Soil Conservation
Water Conservation
Other Loans
. .
. .
. .
Interestreceived
andcredited
. .
. .
. .
. .
. .
. .
. .Total
Total
Total
Total
Total00
6402
Loans for Soil and WaterConservationLoans for Soil and WaterConservation
. .
. .
. .
. .
. .
. .
. .
- Concld.
. . . .
. . . .
- Concld.
428
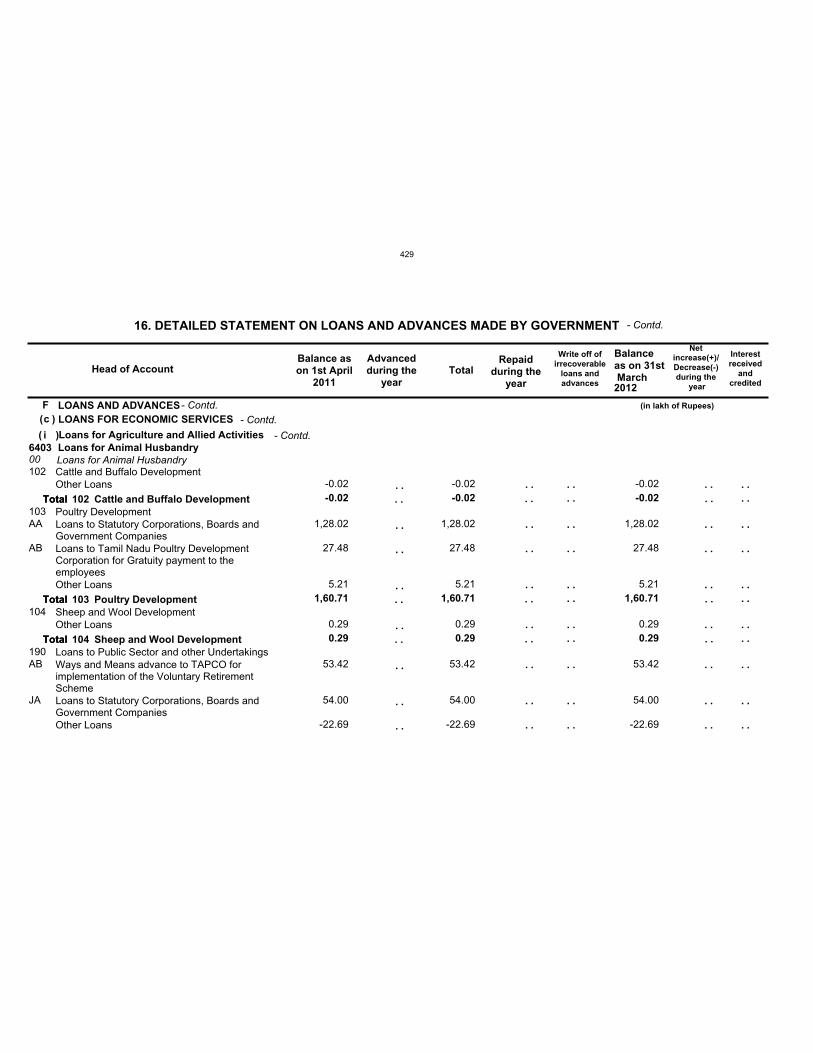
Fc
i640300102
103
104
190
-0.02
1,60.71
0.29
-0.02
1,60.71
0.29
-0.02
1,60.71
0.29
AA
AB
AB
JA
-0.02
1,28.02
27.48
5.21
0.29
53.42
54.00
-22.69
-0.02
1,28.02
27.48
5.21
0.29
53.42
54.00
-22.69
-0.02
1,28.02
27.48
5.21
0.29
53.42
54.00
-22.69
LOANS AND ADVANCESLOANS FOR ECONOMIC SERVICES
Loans for Agriculture and Allied ActivitiesLoans for Animal HusbandryLoans for Animal HusbandryCattle and Buffalo Development
Poultry Development
Sheep and Wool Development
Loans to Public Sector and other Undertakings
Other Loans
Loans to Statutory Corporations, Boards andGovernment CompaniesLoans to Tamil Nadu Poultry DevelopmentCorporation for Gratuity payment to theemployeesOther Loans
Other Loans
Ways and Means advance to TAPCO forimplementation of the Voluntary RetirementSchemeLoans to Statutory Corporations, Boards andGovernment CompaniesOther Loans
Head of AccountBalance ason 1st April
2011
Advancedduring the
yearTotal
Repaidduring the
year
Write off ofirrecoverable
loans andadvances
Balanceas on 31st March
Netincrease(+)/Decrease(-)during the
year
16. DETAILED STATEMENT ON LOANS AND ADVANCES MADE BY GOVERNMENT
(in lakh of Rupees)
2012
- Contd.
- Contd.( )
( )- Contd.
- Contd.
. .
. .
. .
. .
. .
. .
. .
. .
. .
. .
. .
. .
. .
. .
. .
. .
. .
. .
. .
. .
. .
. .
Total
Total
Total
102
103
104
Cattle and Buffalo Development
Poultry Development
Sheep and Wool Development
. .
. .
. .
. .
. .
. .
. .
. .
. .
. .
. .
Interestreceived
andcredited
. .
. .
. .
. .
. .
. .
. .
. .
. .
. .
. .
Total
Total
Total
. .
. .
. .
. .
. .
. .
. .
. .
. .
. .
. .
429
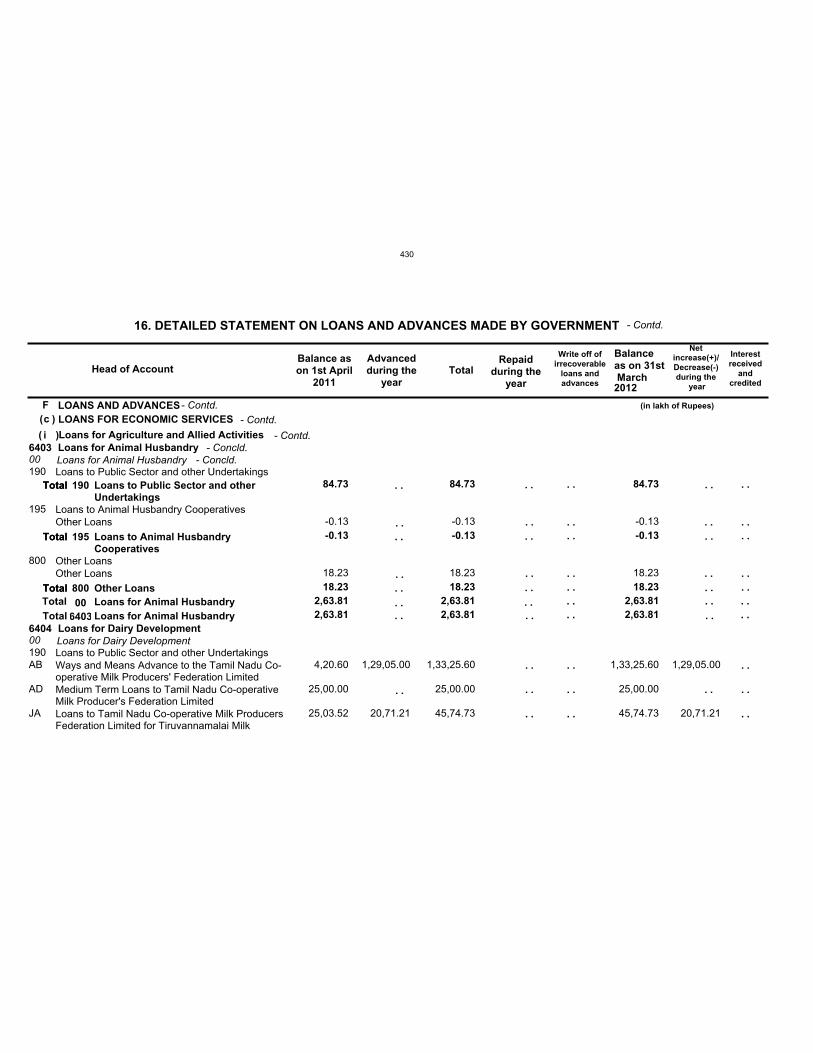
Fc
i6403
6404 2,63.81 2,63.81 2,63.81
00
00
2,63.81 2,63.81 2,63.81
190
195
800
190
84.73
-0.13
18.23
84.73
-0.13
18.23
84.73
-0.13
18.23
AB
AD
JA
-0.13
18.23
4,20.60
25,00.00
25,03.52
1,29,05.00
20,71.21
-0.13
18.23
1,33,25.60
25,00.00
45,74.73
-0.13
18.23
1,33,25.60
25,00.00
45,74.73
1,29,05.00
20,71.21
LOANS AND ADVANCESLOANS FOR ECONOMIC SERVICES
Loans for Agriculture and Allied ActivitiesLoans for Animal Husbandry
Loans for Dairy Development
Loans for Animal Husbandry
Loans for Dairy Development
Loans to Public Sector and other Undertakings
Loans to Animal Husbandry Cooperatives
Other Loans
Loans to Public Sector and other Undertakings
Other Loans
Other Loans
Ways and Means Advance to the Tamil Nadu Co-operative Milk Producers' Federation LimitedMedium Term Loans to Tamil Nadu Co-operativeMilk Producer's Federation LimitedLoans to Tamil Nadu Co-operative Milk ProducersFederation Limited for Tiruvannamalai Milk
Head of AccountBalance ason 1st April
2011
Advancedduring the
yearTotal
Repaidduring the
year
Write off ofirrecoverable
loans andadvances
Balanceas on 31st March
Netincrease(+)/Decrease(-)during the
year
16. DETAILED STATEMENT ON LOANS AND ADVANCES MADE BY GOVERNMENT
(in lakh of Rupees)
2012
- Contd.
- Contd.( )
( )- Contd.
- Contd.
. .
. .
. .
. .
. .
. .
. .
. .
. .
. .
. .
. .
. .
. .
Total
Total
Total
190
195
800
Loans to Public Sector and otherUndertakings
Loans to Animal HusbandryCooperatives
Other Loans
. .
. .
. .
. .
. .
. .
Interestreceived
andcredited
. .
. .
. .
. .
. .
. .
. .
. .TotalTotal
Total
Total
Total00
6403Loans for Animal HusbandryLoans for Animal Husbandry
. .
. .
. .
. .
. .
. .
. .
. .
- Concld.
. . . .. . . .. . . .. . . .. .
. .
- Concld.
430
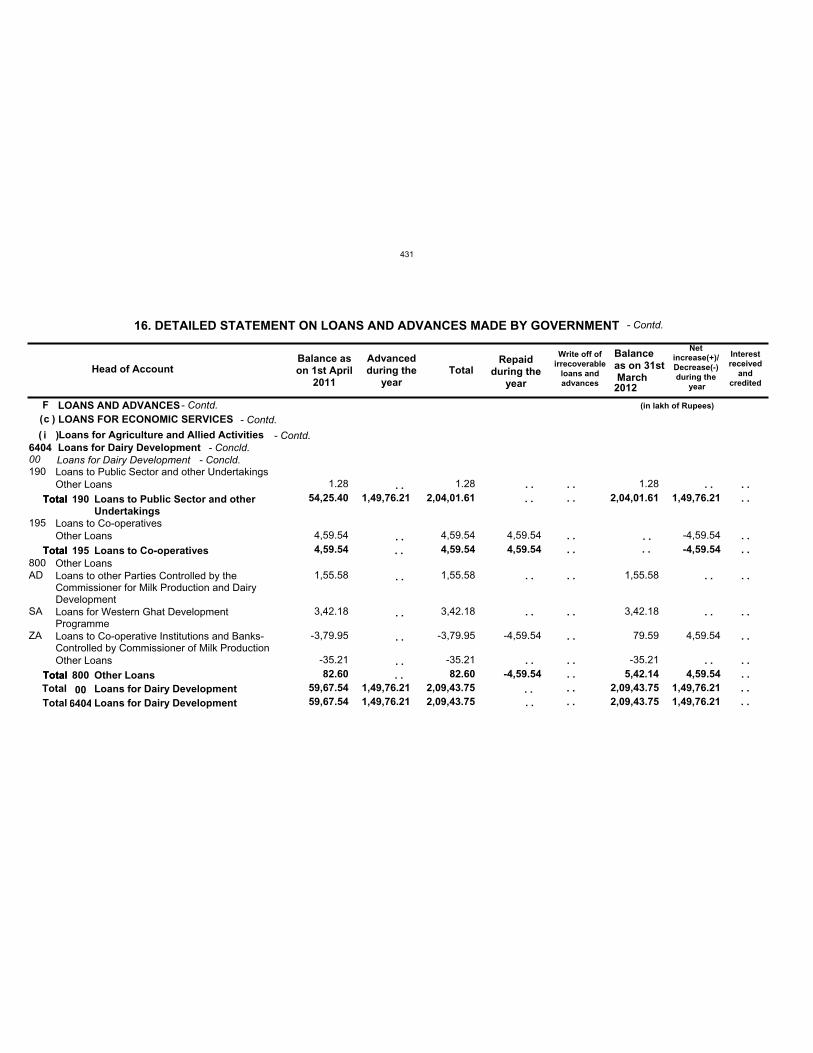
Fc
i6404
59,67.54 1,49,76.21 2,09,43.75 2,09,43.75 1,49,76.21
00
59,67.54 1,49,76.21 2,09,43.75 2,09,43.75 1,49,76.21
190
195
800
54,25.40
4,59.54
82.60
1,49,76.21 2,04,01.61
4,59.54
82.60
4,59.54
-4,59.54
2,04,01.61
5,42.14
1,49,76.21
-4,59.54
4,59.54
AD
SA
ZA
1.28
4,59.54
1,55.58
3,42.18
-3,79.95
-35.21
1.28
4,59.54
1,55.58
3,42.18
-3,79.95
-35.21
4,59.54
-4,59.54
1.28
1,55.58
3,42.18
79.59
-35.21
-4,59.54
4,59.54
LOANS AND ADVANCESLOANS FOR ECONOMIC SERVICES
Loans for Agriculture and Allied ActivitiesLoans for Dairy DevelopmentLoans for Dairy DevelopmentLoans to Public Sector and other Undertakings
Loans to Co-operatives
Other Loans
Other Loans
Other Loans
Loans to other Parties Controlled by theCommissioner for Milk Production and DairyDevelopmentLoans for Western Ghat DevelopmentProgrammeLoans to Co-operative Institutions and Banks-Controlled by Commissioner of Milk ProductionOther Loans
Head of AccountBalance ason 1st April
2011
Advancedduring the
yearTotal
Repaidduring the
year
Write off ofirrecoverable
loans andadvances
Balanceas on 31st March
Netincrease(+)/Decrease(-)during the
year
16. DETAILED STATEMENT ON LOANS AND ADVANCES MADE BY GOVERNMENT
(in lakh of Rupees)
2012
- Contd.
- Contd.( )
( )- Contd.
- Contd.
. .
. .
. .
. .
. .
. .
. .
. .
. .
. .
. .
. .
. .Total
Total
Total
190
195
800
Loans to Public Sector and otherUndertakings
Loans to Co-operatives
Other Loans
. .
. .
. .
. .
Interestreceived
andcredited
. .
. .
. .
. .
. .
. .
. .
. .
. .TotalTotal
Total
Total
Total00
6404Loans for Dairy DevelopmentLoans for Dairy Development
. .
. .
. .
. .
. .
. .
. .
. .
. .
- Concld.
. .. . . .. .. . . .
. .
. .
- Concld.
431
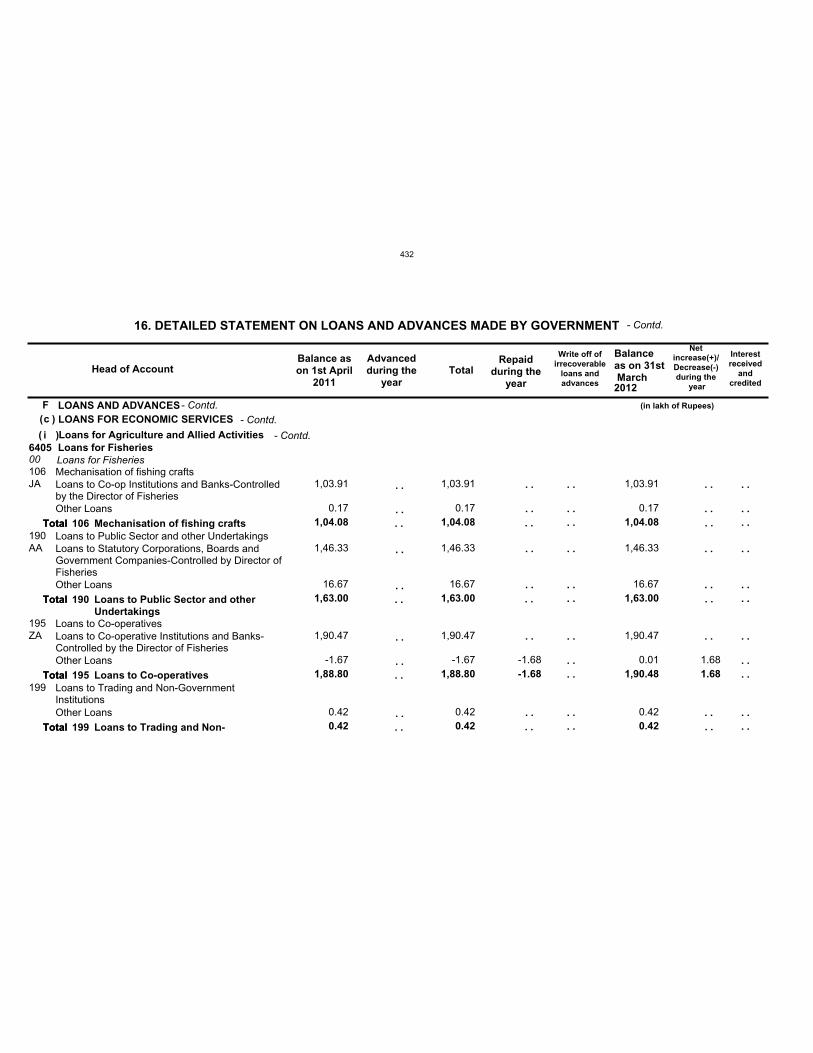
Fc
i640500106
190
195
199
1,04.08
1,63.00
1,88.80
0.42
1,04.08
1,63.00
1,88.80
0.42
-1.68
1,04.08
1,63.00
1,90.48
0.42
1.68
JA
AA
ZA
1,03.91
0.17
1,46.33
16.67
1,90.47
-1.67
0.42
1,03.91
0.17
1,46.33
16.67
1,90.47
-1.67
0.42
-1.68
1,03.91
0.17
1,46.33
16.67
1,90.47
0.01
0.42
1.68
LOANS AND ADVANCESLOANS FOR ECONOMIC SERVICES
Loans for Agriculture and Allied ActivitiesLoans for FisheriesLoans for FisheriesMechanisation of fishing crafts
Loans to Public Sector and other Undertakings
Loans to Co-operatives
Loans to Trading and Non-GovernmentInstitutions
Loans to Co-op Institutions and Banks-Controlledby the Director of FisheriesOther Loans
Loans to Statutory Corporations, Boards andGovernment Companies-Controlled by Director ofFisheriesOther Loans
Loans to Co-operative Institutions and Banks-Controlled by the Director of FisheriesOther Loans
Other Loans
Head of AccountBalance ason 1st April
2011
Advancedduring the
yearTotal
Repaidduring the
year
Write off ofirrecoverable
loans andadvances
Balanceas on 31st March
Netincrease(+)/Decrease(-)during the
year
16. DETAILED STATEMENT ON LOANS AND ADVANCES MADE BY GOVERNMENT
(in lakh of Rupees)
2012
- Contd.
- Contd.( )
( )- Contd.
- Contd.
. .
. .
. .
. .
. .
. .
. .
. .
. .
. .
. .
. .
. .
. .
. .
. .
. .
. .
. .
. .
Total
Total
Total
Total
106
190
195
199
Mechanisation of fishing crafts
Loans to Public Sector and otherUndertakings
Loans to Co-operatives
Loans to Trading and Non-
. .
. .
. .
. .
. .
. .
. .
. .
. .
Interestreceived
andcredited
. .
. .
. .
. .
. .
. .
. .
. .
. .
. .
. .
Total
Total
Total
Total
. .
. .
. .
. .
. .
. .
. .
. .
. .
. .
. .
432

Fc
i6405
6407 10,96.18 10,96.18 10,96.18
00
01
10,96.18 10,96.18 10,96.18
199
800
190
6,39.88
40.06
6,39.88
40.06
1.68 6,38.20
40.06
-1.68
AA
AB
ADJB
AA
85.69
3,97.40
37.83 71.60
47.36
40.06
85.69
3,97.40
37.83 71.60
47.36
40.06
1.68
85.69
3,95.72
37.83 71.60
47.36
40.06
-1.68
LOANS AND ADVANCESLOANS FOR ECONOMIC SERVICES
Loans for Agriculture and Allied ActivitiesLoans for Fisheries
Loans for Plantations
Loans for Fisheries
Tea
Loans to Trading and Non-GovernmentInstitutions
Other Loans
Loans to Public Sector and other Undertakings
Loans to other parties-Controlled byCommissioner of FisheriesLoans to Co-operative Institutions and Banks-Controlled by the Director of FisheriesLoans for employment promotion programmeLoans to other parties-Controlled by the Directorof FisheriesOther Loans
Loans and Advances-Controlled by the ChiefConservator of Forests
Head of AccountBalance ason 1st April
2011
Advancedduring the
yearTotal
Repaidduring the
year
Write off ofirrecoverable
loans andadvances
Balanceas on 31st March
Netincrease(+)/Decrease(-)during the
year
16. DETAILED STATEMENT ON LOANS AND ADVANCES MADE BY GOVERNMENT
(in lakh of Rupees)
2012
- Contd.
- Contd.( )
( )- Contd.
- Contd.
. .
. .
. .
. .
. .
. .
. .
. .
. .
. .
. .
. .
. . . .
Total
Total
800
190
Other Loans
Loans to Public Sector and other
. .
. .
. .
. .
. .
. .
Interestreceived
andcredited
. .
. .
. .
. .
. .
. .
. .
. .
TotalTotal
Total
Total
006405
Loans for FisheriesLoans for Fisheries
. .
. .
. .
. .
. .
. .
. .
. .
- Concld.
. . . .. . . .. . . .. . . .. .
. .
- Concld.
433

Fc
i640701
03 5,99.83 5,99.83 2,98.27 3,01.56 -2,98.27
190
195
800
190
5,56.77
3.00
5,56.77
3.00
2,98.27 2,58.50
3.00
-2,98.27
ZA
ZH
AA
AC
4,91.37
65.40
3.00
47.42
4,29.00
4,91.37
65.40
3.00
47.42
4,29.00
2,98.27 1,93.10
65.40
3.00
47.42
4,29.00
-2,98.27
LOANS AND ADVANCESLOANS FOR ECONOMIC SERVICES
Loans for Agriculture and Allied ActivitiesLoans for PlantationsTea
Rubber
Loans to Public Sector and other Undertakings
Loans to Cooperatives
Other Loans
Loans to Public Sector and other Undertakings
Loans to Co-operative Institutions and Banks-Controlled by the Director of Industries andCommerceLoans to Co-operative Institutions and Boards-Controlled by the Director of Industries andCommerce
Other Loans
Ways and Means Advances for RubberPlantations Corporation-Controlled by ChiefConservator of ForestsLoans to Arasu Rubber Corporation forrevamping from financial crisis
Head of AccountBalance ason 1st April
2011
Advancedduring the
yearTotal
Repaidduring the
year
Write off ofirrecoverable
loans andadvances
Balanceas on 31st March
Netincrease(+)/Decrease(-)during the
year
16. DETAILED STATEMENT ON LOANS AND ADVANCES MADE BY GOVERNMENT
(in lakh of Rupees)
2012
- Contd.
- Contd.( )
( )- Contd.
- Contd.
. .
. .
. .
. .
. .
. .
. .
. .
. .
. .
. . . .
Total
Total
195
800
Loans to Cooperatives
Other Loans
. .
. .
. .
. .
. .
Interestreceived
andcredited
. .
. .
. .
. .
. .
. .
. .Total
Total
Total01 Tea
. .
. .
. .
. .
. .
. .
. .
- Contd.
. . . . . .
- Concld.
434
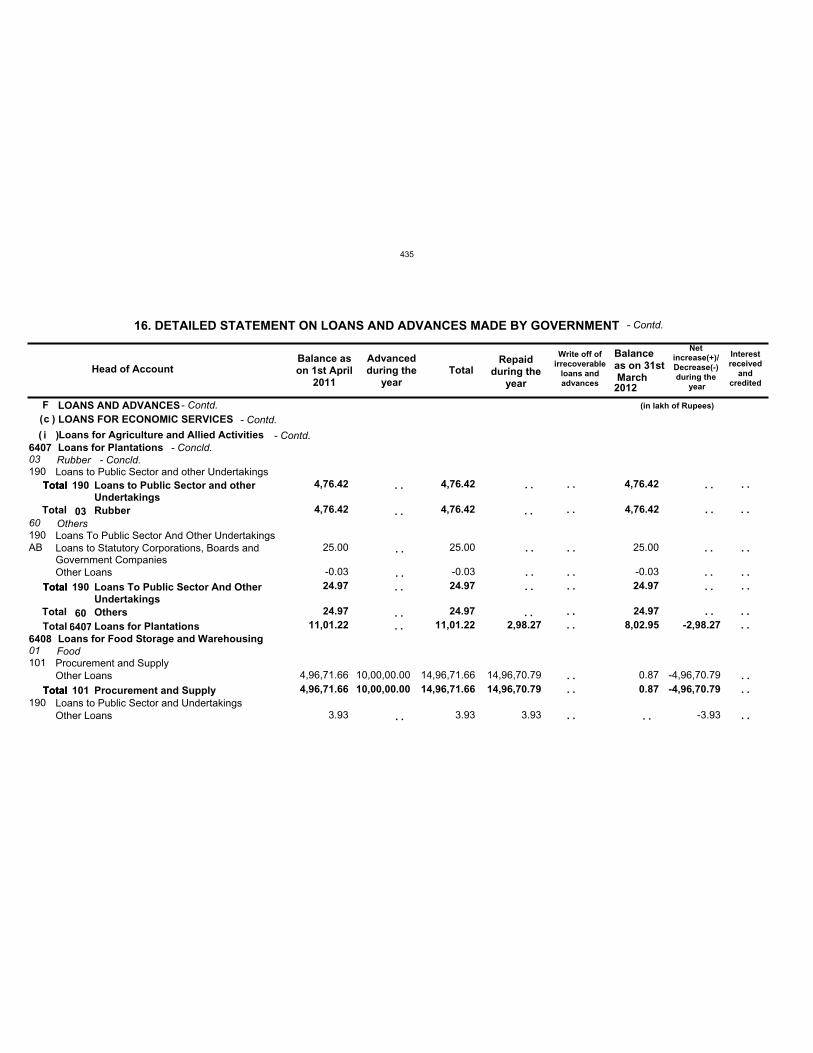
Fc
i6407
6408 11,01.22 11,01.22 2,98.27 8,02.95 -2,98.27
03
60
01
4,76.42
24.97
4,76.42
24.97
4,76.42
24.97
190
190
101
190
4,76.42
24.97
4,96,71.66 10,00,00.00
4,76.42
24.97
14,96,71.66 14,96,70.79
4,76.42
24.97
0.87 -4,96,70.79
AB 25.00
-0.03
4,96,71.66
3.93
10,00,00.00
25.00
-0.03
14,96,71.66
3.93
14,96,70.79
3.93
25.00
-0.03
0.87 -4,96,70.79
-3.93
LOANS AND ADVANCESLOANS FOR ECONOMIC SERVICES
Loans for Agriculture and Allied ActivitiesLoans for Plantations
Loans for Food Storage and Warehousing
Rubber
Others
Food
Loans to Public Sector and other Undertakings
Loans To Public Sector And Other Undertakings
Procurement and Supply
Loans to Public Sector and Undertakings
Loans to Statutory Corporations, Boards andGovernment CompaniesOther Loans
Other Loans
Other Loans
Head of AccountBalance ason 1st April
2011
Advancedduring the
yearTotal
Repaidduring the
year
Write off ofirrecoverable
loans andadvances
Balanceas on 31st March
Netincrease(+)/Decrease(-)during the
year
16. DETAILED STATEMENT ON LOANS AND ADVANCES MADE BY GOVERNMENT
(in lakh of Rupees)
2012
- Contd.
- Contd.( )
( )- Contd.
- Contd.
. .
. .
. .
. .
. .
. .
. .
. .
. .
Total
Total
Total
190
190
101
Loans to Public Sector and otherUndertakings
Loans To Public Sector And OtherUndertakings
Procurement and Supply
. .
. .
. .
. .
Interestreceived
andcredited
. .
. .
. .
. .
. .
. .
. .
Total
TotalTotal
Total
Total
Total
03
606407
Rubber
OthersLoans for Plantations
. .
. .
. .
. .
. .
. .
. .
- Concld.
. .
. .
. .
. .. . . .. .
. .
. .
. .
. .
. .
. .
. .
- Concld.
435
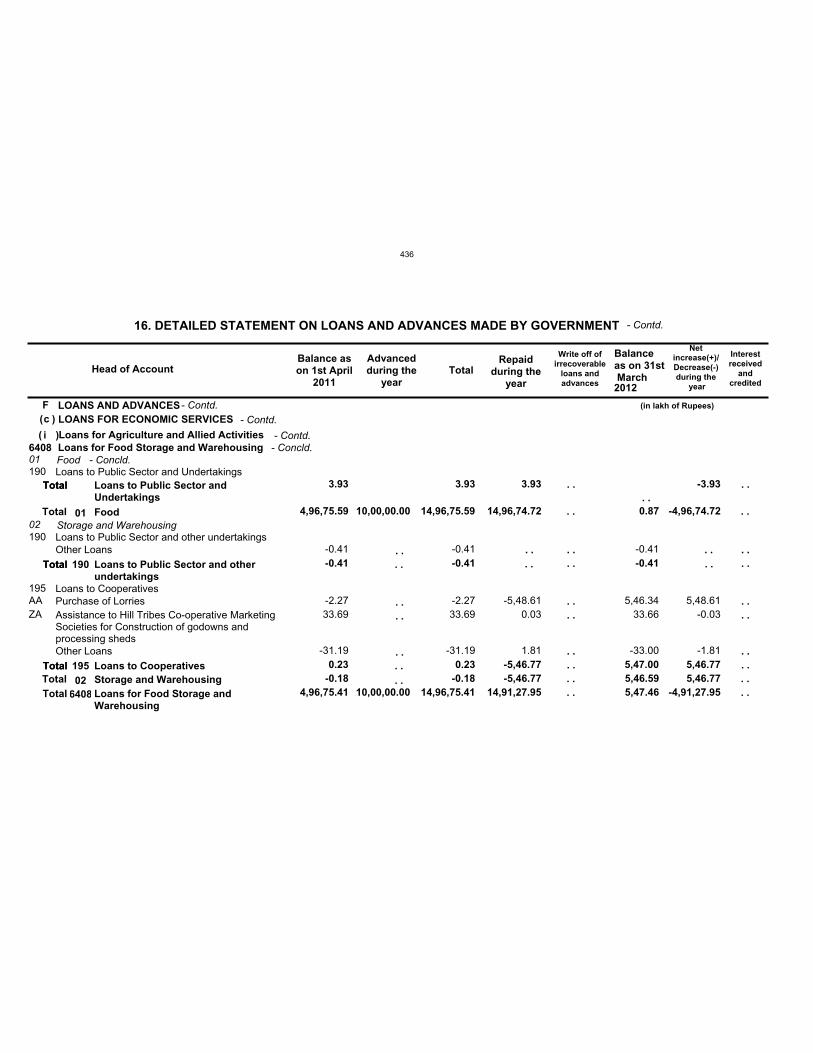
Fc
i6408
4,96,75.41 10,00,00.00 14,96,75.41 14,91,27.95 5,47.46 -4,91,27.95
01
02 4,96,75.59
-0.18
10,00,00.00 14,96,75.59
-0.18
14,96,74.72
-5,46.77
0.87
5,46.59
-4,96,74.72
5,46.77
190
190
195
3.93
-0.41
0.23
3.93
-0.41
0.23
3.93
-5,46.77
-0.41
5,47.00
-3.93
5,46.77
AAZA
-0.41
-2.27 33.69
-31.19
-0.41
-2.27 33.69
-31.19
-5,48.61 0.03
1.81
-0.41
5,46.34 33.66
-33.00
5,48.61-0.03
-1.81
LOANS AND ADVANCESLOANS FOR ECONOMIC SERVICES
Loans for Agriculture and Allied ActivitiesLoans for Food Storage and WarehousingFood
Storage and Warehousing
Loans to Public Sector and Undertakings
Loans to Public Sector and other undertakings
Loans to Cooperatives
Other Loans
Purchase of LorriesAssistance to Hill Tribes Co-operative MarketingSocieties for Construction of godowns andprocessing shedsOther Loans
Head of AccountBalance ason 1st April
2011
Advancedduring the
yearTotal
Repaidduring the
year
Write off ofirrecoverable
loans andadvances
Balanceas on 31st March
Netincrease(+)/Decrease(-)during the
year
16. DETAILED STATEMENT ON LOANS AND ADVANCES MADE BY GOVERNMENT
(in lakh of Rupees)
2012
- Contd.
- Contd.( )
( )- Contd.
- Contd.
. .
. .
. .
. .
. .. .
. .
. .
Total
Total
Total
190
195
Loans to Public Sector andUndertakings
Loans to Public Sector and otherundertakings
Loans to Cooperatives
. .
. .
Interestreceived
andcredited
. .
. .
. .
. .
. .
. .
. .
Total
TotalTotal
Total
Total
Total
01
026408
Food
Storage and WarehousingLoans for Food Storage andWarehousing
. .
. .
. .
. .
. .
. .
. .
- Concld.
. .. . . .
. .
. .
. .
. .
. .
- Concld.
436
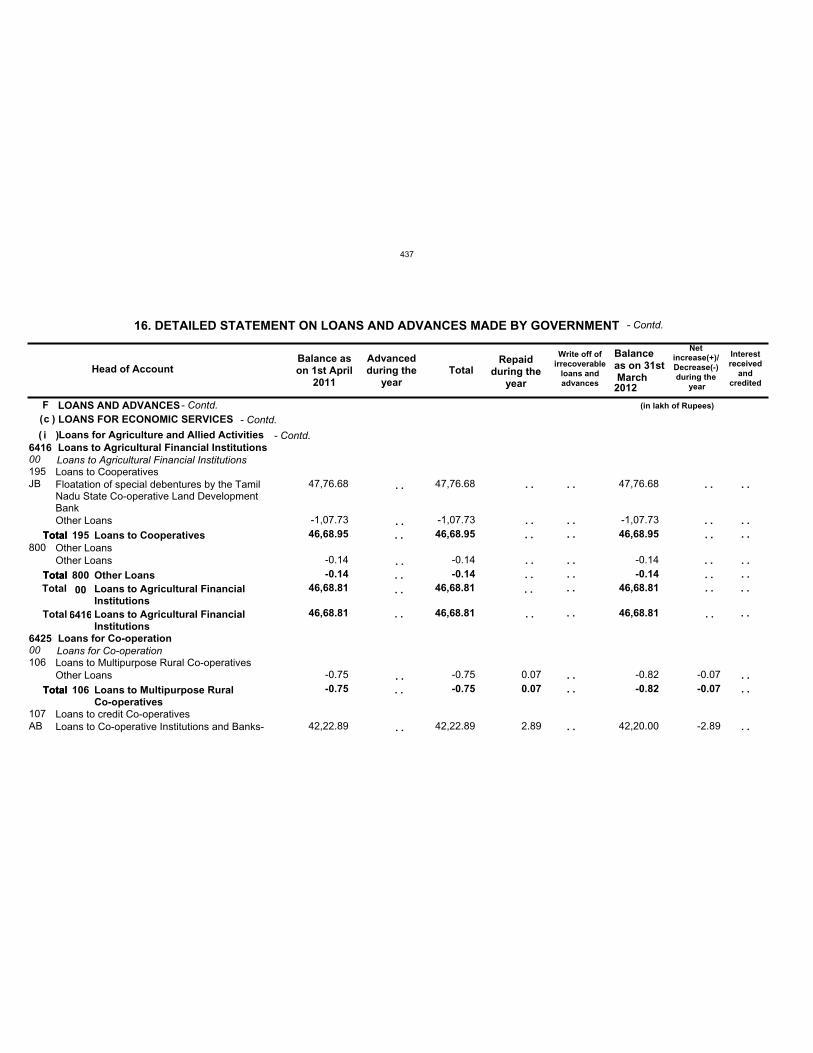
Fc
i6416
6425
46,68.81 46,68.81 46,68.81
00
00
46,68.81 46,68.81 46,68.81
195
800
106
107
46,68.95
-0.14
-0.75
46,68.95
-0.14
-0.75 0.07
46,68.95
-0.14
-0.82 -0.07
JB
AB
47,76.68
-1,07.73
-0.14
-0.75
42,22.89
47,76.68
-1,07.73
-0.14
-0.75
42,22.89
0.07
2.89
47,76.68
-1,07.73
-0.14
-0.82
42,20.00
-0.07
-2.89
LOANS AND ADVANCESLOANS FOR ECONOMIC SERVICES
Loans for Agriculture and Allied ActivitiesLoans to Agricultural Financial Institutions
Loans for Co-operation
Loans to Agricultural Financial Institutions
Loans for Co-operation
Loans to Cooperatives
Other Loans
Loans to Multipurpose Rural Co-operatives
Loans to credit Co-operatives
Floatation of special debentures by the TamilNadu State Co-operative Land DevelopmentBankOther Loans
Other Loans
Other Loans
Loans to Co-operative Institutions and Banks-
Head of AccountBalance ason 1st April
2011
Advancedduring the
yearTotal
Repaidduring the
year
Write off ofirrecoverable
loans andadvances
Balanceas on 31st March
Netincrease(+)/Decrease(-)during the
year
16. DETAILED STATEMENT ON LOANS AND ADVANCES MADE BY GOVERNMENT
(in lakh of Rupees)
2012
- Contd.
- Contd.( )
( )- Contd.
- Contd.
. .
. .
. .
. .
. .
. .
. .
. .
. .
. .
. .
. .
. .
Total
Total
Total
195
800
106
Loans to Cooperatives
Other Loans
Loans to Multipurpose RuralCo-operatives
. .
. .
. .
. .
. .
Interestreceived
andcredited
. .
. .
. .
. .
. .
. .
. .
. .
Total
Total
Total
Total
Total
00
6416
Loans to Agricultural FinancialInstitutionsLoans to Agricultural FinancialInstitutions
. .
. .
. .
. .
. .
. .
. .
. .
. . . .
. . . .. . . .
. . . .. .
. .
437

Fc
i642500107AC
AG
AH
JB
JE
JF
JG
79.99
67.41
2,34.82
19,21.53
17,77.97
43,17.60
20,83.33
25.00
19,43.09
79.99
67.41
2,34.82
19,46.53
17,77.97
62,60.69
20,83.33
0.03
13,22.75
0.24
1,04.31
79.96
67.41
2,34.82
6,23.78
17,77.73
61,56.38
20,83.33
-0.03
-12,97.75
-0.24
18,38.78
LOANS AND ADVANCESLOANS FOR ECONOMIC SERVICES
Loans for Agriculture and Allied ActivitiesLoans for Co-operationLoans for Co-operationLoans to credit Co-operativesLoans to Credit Co-operatives for interest Relief tofarmers Controlled by the Registrar of Co-operative SocietiesLoans to Co-operatives for Collection of Cost ofStaff -Controlled by the Registrar of Co-operativeSocietiesWays and Means Advances to District CentralCo-operative Bank for implementation of I.C.D.P.-Controlled by the Registrar ofCo-operative SocietiesLoans to Co-operative institutions and Banks-controlled by the Registrar of Co-operativeSocietiesLoans to Hill tribes Lamp Co-operative Societiesother than tribal Sub Plan area -Controlled by theRegistrar of Co-operative SocietiesLoans to Co-operatives under Integrated Co-operative Development Programme - Controlledby the Registrar of Co-operative SocietiesLoans to Primary Co-operative Agriculture andRural Development Banks - controlled by
Head of AccountBalance ason 1st April
2011
Advancedduring the
yearTotal
Repaidduring the
year
Write off ofirrecoverable
loans andadvances
Balanceas on 31st March
Netincrease(+)/Decrease(-)during the
year
16. DETAILED STATEMENT ON LOANS AND ADVANCES MADE BY GOVERNMENT
(in lakh of Rupees)
2012
- Contd.
- Contd.( )
( )- Contd.
- Contd.
. .
. .
. .
. .
. .
. .
. .
. .
. .
. .
. .
Interestreceived
andcredited
. .
. .
. .
. .
. .
. .
. .
. .
. .
. .
. .
. .
. .
. .
- Contd.- Contd.
438
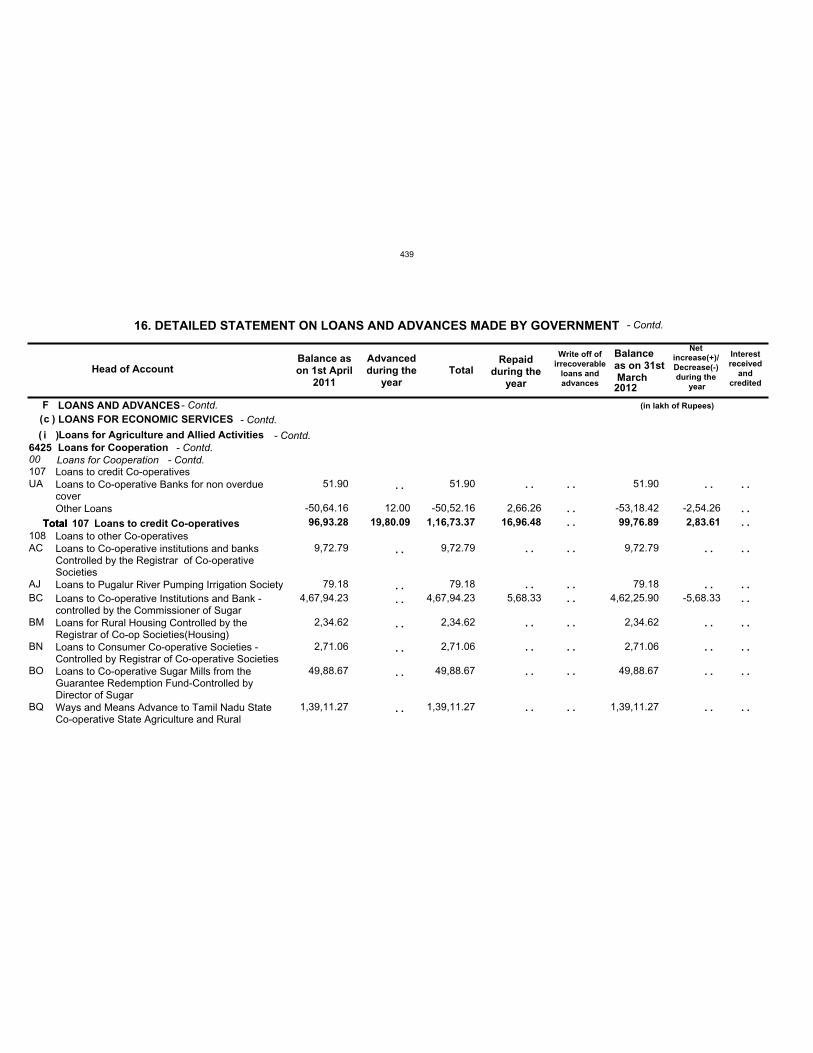
Fc
i642500107
108 96,93.28 19,80.09 1,16,73.37 16,96.48 99,76.89 2,83.61
UA
AC
AJBC
BM
BN
BO
BQ
51.90
-50,64.16
9,72.79
79.18 4,67,94.23
2,34.62
2,71.06
49,88.67
1,39,11.27
12.00
51.90
-50,52.16
9,72.79
79.18 4,67,94.23
2,34.62
2,71.06
49,88.67
1,39,11.27
2,66.26
5,68.33
51.90
-53,18.42
9,72.79
79.18 4,62,25.90
2,34.62
2,71.06
49,88.67
1,39,11.27
-2,54.26
-5,68.33
LOANS AND ADVANCESLOANS FOR ECONOMIC SERVICES
Loans for Agriculture and Allied ActivitiesLoans for CooperationLoans for CooperationLoans to credit Co-operatives
Loans to other Co-operatives
Loans to Co-operative Banks for non overduecoverOther Loans
Loans to Co-operative institutions and banksControlled by the Registrar of Co-operativeSocietiesLoans to Pugalur River Pumping Irrigation SocietyLoans to Co-operative Institutions and Bank -controlled by the Commissioner of SugarLoans for Rural Housing Controlled by theRegistrar of Co-op Societies(Housing)Loans to Consumer Co-operative Societies -Controlled by Registrar of Co-operative SocietiesLoans to Co-operative Sugar Mills from theGuarantee Redemption Fund-Controlled byDirector of SugarWays and Means Advance to Tamil Nadu StateCo-operative State Agriculture and Rural
Head of AccountBalance ason 1st April
2011
Advancedduring the
yearTotal
Repaidduring the
year
Write off ofirrecoverable
loans andadvances
Balanceas on 31st March
Netincrease(+)/Decrease(-)during the
year
16. DETAILED STATEMENT ON LOANS AND ADVANCES MADE BY GOVERNMENT
(in lakh of Rupees)
2012
- Contd.
- Contd.( )
( )- Contd.
- Contd.
. .
. .
. .
. .
. .
. .
. .
. .
. .
. .
. .
. .
. .
. .
. .
Total 107 Loans to credit Co-operatives
. .
. .
. .
. .
. .
. .
. .
Interestreceived
andcredited
. .
. .
. .
. .
. .
. .
. .
. .
. .
. .Total
. .
. .
. .
. .
. .
. .
. .
. .
. .
. .
- Contd.- Contd.
439
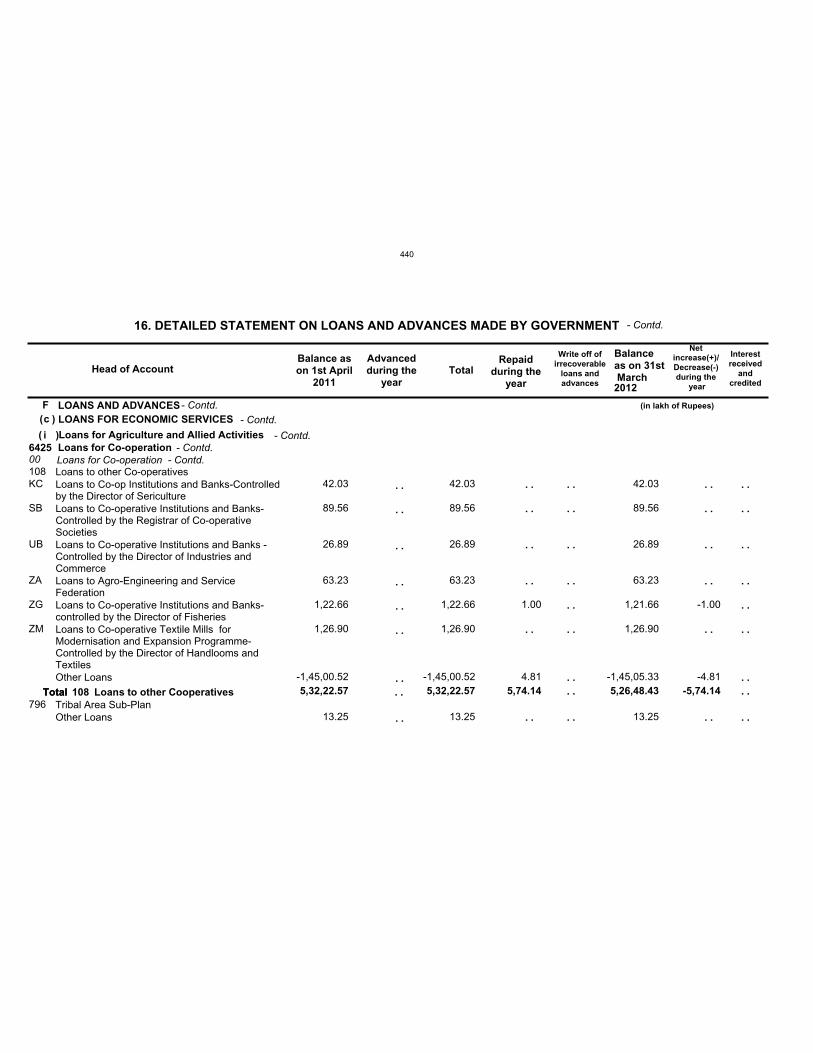
Fc
i642500108
796 5,32,22.57 5,32,22.57 5,74.14 5,26,48.43 -5,74.14
KC
SB
UB
ZA
ZG
ZM
42.03
89.56
26.89
63.23
1,22.66
1,26.90
-1,45,00.52
13.25
42.03
89.56
26.89
63.23
1,22.66
1,26.90
-1,45,00.52
13.25
1.00
4.81
42.03
89.56
26.89
63.23
1,21.66
1,26.90
-1,45,05.33
13.25
-1.00
-4.81
LOANS AND ADVANCESLOANS FOR ECONOMIC SERVICES
Loans for Agriculture and Allied ActivitiesLoans for Co-operationLoans for Co-operationLoans to other Co-operatives
Tribal Area Sub-Plan
Loans to Co-op Institutions and Banks-Controlledby the Director of SericultureLoans to Co-operative Institutions and Banks-Controlled by the Registrar of Co-operativeSocietiesLoans to Co-operative Institutions and Banks -Controlled by the Director of Industries andCommerceLoans to Agro-Engineering and ServiceFederationLoans to Co-operative Institutions and Banks-controlled by the Director of FisheriesLoans to Co-operative Textile Mills forModernisation and Expansion Programme-Controlled by the Director of Handlooms andTextilesOther Loans
Other Loans
Head of AccountBalance ason 1st April
2011
Advancedduring the
yearTotal
Repaidduring the
year
Write off ofirrecoverable
loans andadvances
Balanceas on 31st March
Netincrease(+)/Decrease(-)during the
year
16. DETAILED STATEMENT ON LOANS AND ADVANCES MADE BY GOVERNMENT
(in lakh of Rupees)
2012
- Contd.
- Contd.( )
( )- Contd.
- Contd.
. .
. .
. .
. .
. .
. .
. .
. .
. .
. .
. .
. .
. .
. .
. .Total 108 Loans to other Cooperatives
. .
. .
. .
. .
. .
. .
Interestreceived
andcredited
. .
. .
. .
. .
. .
. .
. .
. .
. .Total
. .
. .
. .
. .
. .
. .
. .
. .
. .
- Contd.- Contd.
440
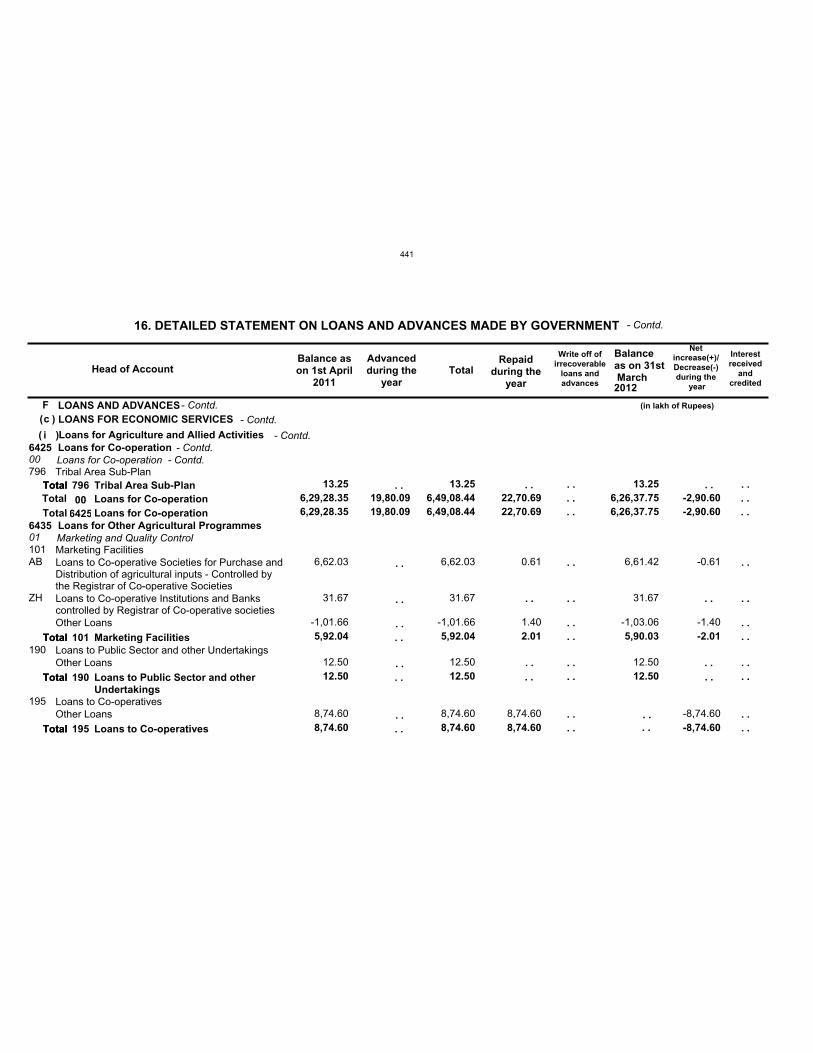
Fc
i6425
6435 6,29,28.35 19,80.09 6,49,08.44 22,70.69 6,26,37.75 -2,90.60
00
01
6,29,28.35 19,80.09 6,49,08.44 22,70.69 6,26,37.75 -2,90.60
796
101
190
195
13.25
5,92.04
12.50
8,74.60
13.25
5,92.04
12.50
8,74.60
2.01
8,74.60
13.25
5,90.03
12.50
-2.01
-8,74.60
AB
ZH
6,62.03
31.67
-1,01.66
12.50
8,74.60
6,62.03
31.67
-1,01.66
12.50
8,74.60
0.61
1.40
8,74.60
6,61.42
31.67
-1,03.06
12.50
-0.61
-1.40
-8,74.60
LOANS AND ADVANCESLOANS FOR ECONOMIC SERVICES
Loans for Agriculture and Allied ActivitiesLoans for Co-operation
Loans for Other Agricultural Programmes
Loans for Co-operation
Marketing and Quality Control
Tribal Area Sub-Plan
Marketing Facilities
Loans to Public Sector and other Undertakings
Loans to Co-operatives
Loans to Co-operative Societies for Purchase andDistribution of agricultural inputs - Controlled bythe Registrar of Co-operative SocietiesLoans to Co-operative Institutions and Bankscontrolled by Registrar of Co-operative societiesOther Loans
Other Loans
Other Loans
Head of AccountBalance ason 1st April
2011
Advancedduring the
yearTotal
Repaidduring the
year
Write off ofirrecoverable
loans andadvances
Balanceas on 31st March
Netincrease(+)/Decrease(-)during the
year
16. DETAILED STATEMENT ON LOANS AND ADVANCES MADE BY GOVERNMENT
(in lakh of Rupees)
2012
- Contd.
- Contd.( )
( )- Contd.
- Contd.
. .
. .
. .
. .
. .
. .
. .
. .
. .
. .
. .
. .
. .
Total
Total
Total
Total
796
101
190
195
Tribal Area Sub-Plan
Marketing Facilities
Loans to Public Sector and otherUndertakings
Loans to Co-operatives
. .
. .
. .
. .
Interestreceived
andcredited
. .
. .
. .
. .
. .
. .
. .
. .
. .
TotalTotal
Total
Total
Total
Total
006425
Loans for Co-operationLoans for Co-operation
. .
. .
. .
. .
. .
. .
. .
. .
. .
- Contd.
. . . .
. . . .
. .
. .
- Contd.
441
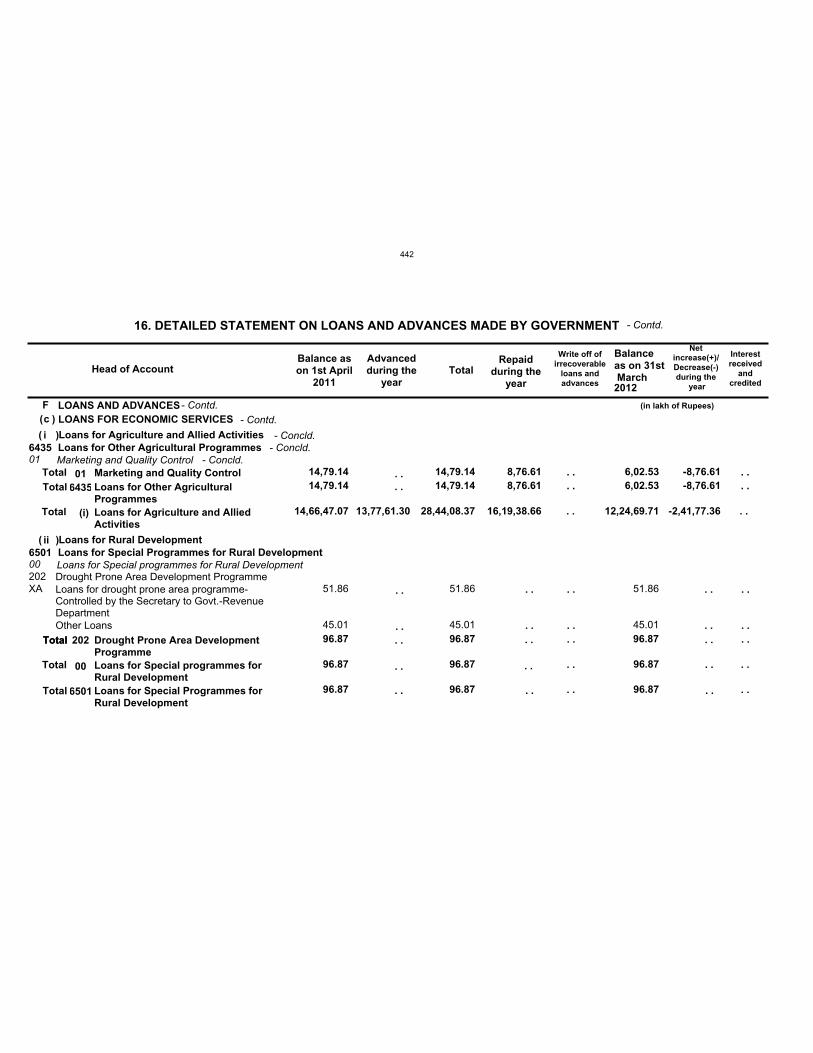
Fc
i
ii
14,66,47.07 13,77,61.30 28,44,08.37 16,19,38.66 12,24,69.71 -2,41,77.36
6435
6501
14,79.14
96.87
14,79.14
96.87
8,76.61 6,02.53
96.87
-8,76.61
01
00
14,79.14
96.87
14,79.14
96.87
8,76.61 6,02.53
96.87
-8,76.61
202
96.87 96.87 96.87
XA 51.86
45.01
51.86
45.01
51.86
45.01
LOANS AND ADVANCESLOANS FOR ECONOMIC SERVICES
Loans for Agriculture and Allied Activities
Loans for Rural Development
Loans for Other Agricultural Programmes
Loans for Special Programmes for Rural Development
Marketing and Quality Control
Loans for Special programmes for Rural DevelopmentDrought Prone Area Development ProgrammeLoans for drought prone area programme-Controlled by the Secretary to Govt.-RevenueDepartmentOther Loans
Head of AccountBalance ason 1st April
2011
Advancedduring the
yearTotal
Repaidduring the
year
Write off ofirrecoverable
loans andadvances
Balanceas on 31st March
Netincrease(+)/Decrease(-)during the
year
16. DETAILED STATEMENT ON LOANS AND ADVANCES MADE BY GOVERNMENT
(in lakh of Rupees)
2012
- Contd.
- Contd.( )
(
(
)
)
- Contd.
- Concld.
. .
. .
. .
. .. . . .Total 202 Drought Prone Area Development
Programme
. .
. .
. .
Interestreceived
andcredited
. .
. .
. .
Total
Total
Total
Total
Total
Total
01
00
6435
6501
(i)
Marketing and Quality Control
Loans for Special programmes forRural Development
Loans for Other AgriculturalProgrammes
Loans for Special Programmes forRural Development
Loans for Agriculture and AlliedActivities
. .
. .
. .
- Concld.
. .
. . . .
. .
. .
. .
. .
. . . .
. .
. . . .
. .
. .
. .
. .. .
. .
- Concld.
442
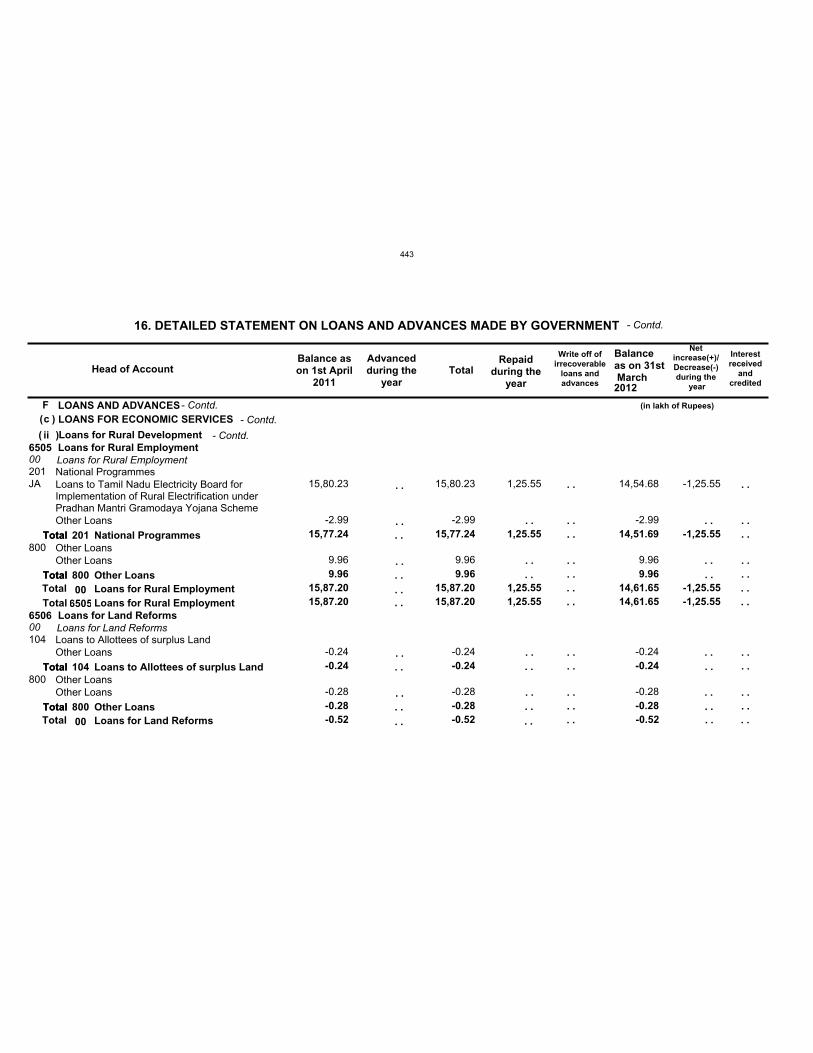
Fc
ii6505
6506 15,87.20 15,87.20 1,25.55 14,61.65 -1,25.55
00
00
15,87.20
-0.52
15,87.20
-0.52
1,25.55 14,61.65
-0.52
-1,25.55
201
800
104
800
15,77.24
9.96
-0.24
-0.28
15,77.24
9.96
-0.24
-0.28
1,25.55 14,51.69
9.96
-0.24
-0.28
-1,25.55
JA 15,80.23
-2.99
9.96
-0.24
-0.28
15,80.23
-2.99
9.96
-0.24
-0.28
1,25.55 14,54.68
-2.99
9.96
-0.24
-0.28
-1,25.55
LOANS AND ADVANCESLOANS FOR ECONOMIC SERVICES
Loans for Rural DevelopmentLoans for Rural Employment
Loans for Land Reforms
Loans for Rural Employment
Loans for Land Reforms
National Programmes
Other Loans
Loans to Allottees of surplus Land
Other Loans
Loans to Tamil Nadu Electricity Board forImplementation of Rural Electrification underPradhan Mantri Gramodaya Yojana SchemeOther Loans
Other Loans
Other Loans
Other Loans
Head of AccountBalance ason 1st April
2011
Advancedduring the
yearTotal
Repaidduring the
year
Write off ofirrecoverable
loans andadvances
Balanceas on 31st March
Netincrease(+)/Decrease(-)during the
year
16. DETAILED STATEMENT ON LOANS AND ADVANCES MADE BY GOVERNMENT
(in lakh of Rupees)
2012
- Contd.
- Contd.( )
( )- Contd.
- Contd.
. .
. .
. .
. .
. .
. .
. .
. .
. .
. .
. .
. .
. .
. .
. .
. .
Total
Total
Total
Total
201
800
104
800
National Programmes
Other Loans
Loans to Allottees of surplus Land
Other Loans
. .
. .
. .
. .
. .
. .
. .
Interestreceived
andcredited
. .
. .
. .
. .
. .
. .
. .
. .
. .
Total
Total
Total
Total
Total
Total
Total
00
00
6505Loans for Rural Employment
Loans for Land Reforms
Loans for Rural Employment
. .
. .
. .
. .
. .
. .
. .
. .
. .
. .
. . . .
. . . .. .
. .
. .
. .
. .. .
443
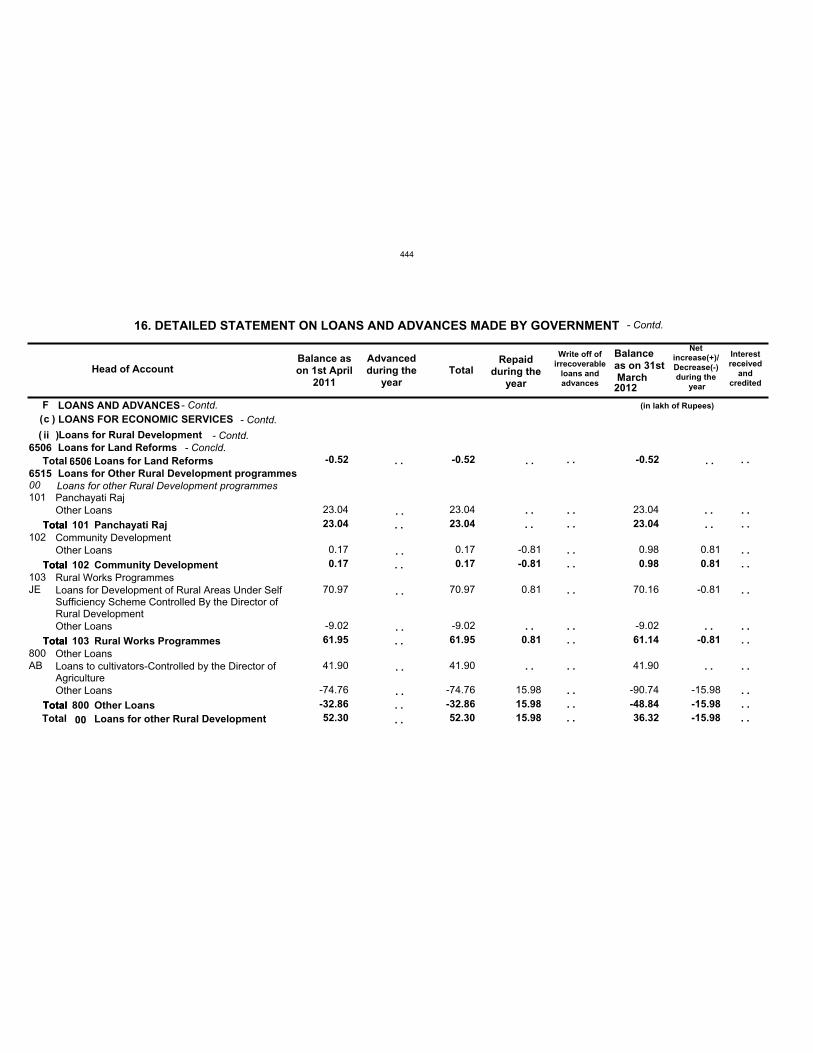
Fc
ii6506
6515-0.52 -0.52 -0.52
00
52.30 52.30 15.98 36.32 -15.98
101
102
103
800
23.04
0.17
61.95
-32.86
23.04
0.17
61.95
-32.86
-0.81
0.81
15.98
23.04
0.98
61.14
-48.84
0.81
-0.81
-15.98
JE
AB
23.04
0.17
70.97
-9.02
41.90
-74.76
23.04
0.17
70.97
-9.02
41.90
-74.76
-0.81
0.81
15.98
23.04
0.98
70.16
-9.02
41.90
-90.74
0.81
-0.81
-15.98
LOANS AND ADVANCESLOANS FOR ECONOMIC SERVICES
Loans for Rural DevelopmentLoans for Land Reforms
Loans for Other Rural Development programmesLoans for other Rural Development programmesPanchayati Raj
Community Development
Rural Works Programmes
Other Loans
Other Loans
Other Loans
Loans for Development of Rural Areas Under SelfSufficiency Scheme Controlled By the Director ofRural DevelopmentOther Loans
Loans to cultivators-Controlled by the Director ofAgricultureOther Loans
Head of AccountBalance ason 1st April
2011
Advancedduring the
yearTotal
Repaidduring the
year
Write off ofirrecoverable
loans andadvances
Balanceas on 31st March
Netincrease(+)/Decrease(-)during the
year
16. DETAILED STATEMENT ON LOANS AND ADVANCES MADE BY GOVERNMENT
(in lakh of Rupees)
2012
- Contd.
- Contd.( )
( )- Contd.
- Contd.
. .
. .
. .
. .
. .
. .
. .
. .
. .
. .
. .
. .
. .
. .Total
Total
Total
Total
101
102
103
800
Panchayati Raj
Community Development
Rural Works Programmes
Other Loans
. .
. .
. .
. .
Interestreceived
andcredited
. .
. .
. .
. .
. .
. .
. .
. .
. .
. .Total
Total
Total
Total
Total
Total00
6506
Loans for other Rural Development
Loans for Land Reforms
. .
. .
. .
. .
. .
. .
. .
. .
. .
. .
- Concld.
. .
. . . .. . . .
. . . .
. .
444
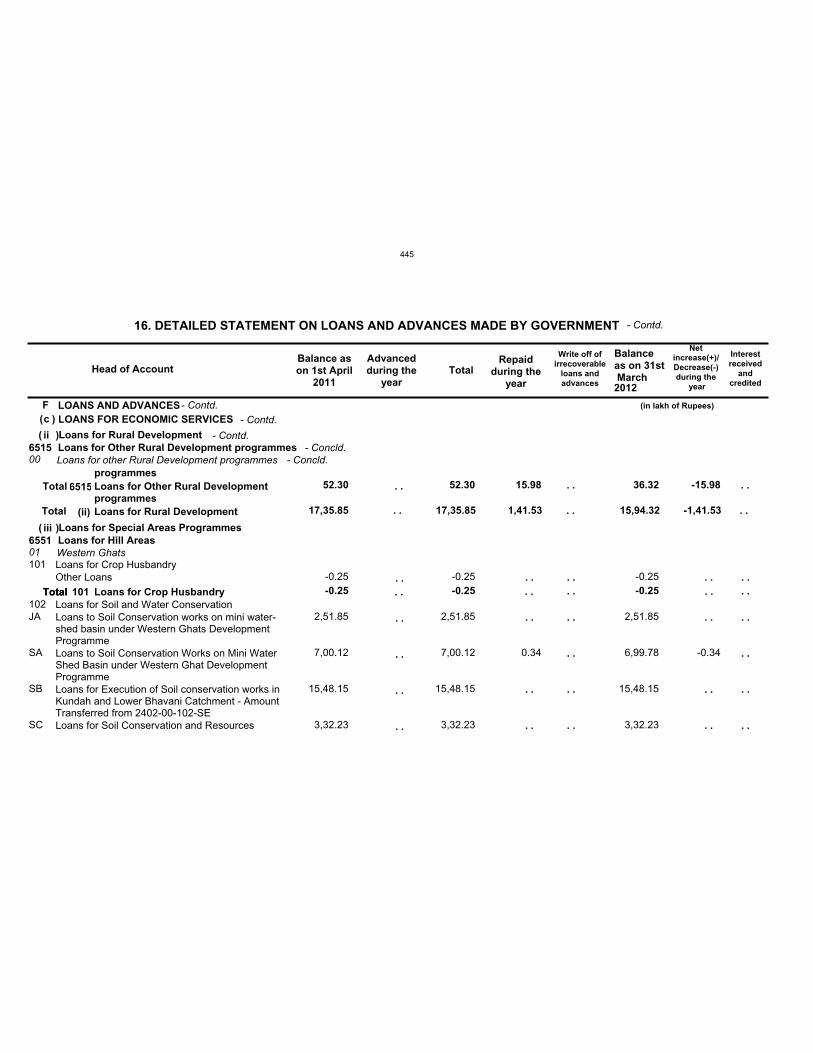
Fc
ii
iii
17,35.85 . . 17,35.85 1,41.53 15,94.32 -1,41.53
6515
6551
52.30 52.30 15.98 36.32 -15.98
00
01101
102-0.25 -0.25 -0.25
JA
SA
SB
SC
-0.25
2,51.85
7,00.12
15,48.15
3,32.23
-0.25
2,51.85
7,00.12
15,48.15
3,32.23
0.34
-0.25
2,51.85
6,99.78
15,48.15
3,32.23
-0.34
LOANS AND ADVANCESLOANS FOR ECONOMIC SERVICES
Loans for Rural Development
Loans for Special Areas Programmes
Loans for Other Rural Development programmes
Loans for Hill Areas
Loans for other Rural Development programmes
Western GhatsLoans for Crop Husbandry
Loans for Soil and Water Conservation
Other Loans
Loans to Soil Conservation works on mini water-shed basin under Western Ghats DevelopmentProgrammeLoans to Soil Conservation Works on Mini WaterShed Basin under Western Ghat DevelopmentProgrammeLoans for Execution of Soil conservation works inKundah and Lower Bhavani Catchment - AmountTransferred from 2402-00-102-SELoans for Soil Conservation and Resources
Head of AccountBalance ason 1st April
2011
Advancedduring the
yearTotal
Repaidduring the
year
Write off ofirrecoverable
loans andadvances
Balanceas on 31st March
Netincrease(+)/Decrease(-)during the
year
16. DETAILED STATEMENT ON LOANS AND ADVANCES MADE BY GOVERNMENT
(in lakh of Rupees)
2012
- Contd.
- Contd.( )
(
(
)
)
- Contd.
- Contd.
. .
. .
. .
. .
. .
. .
. .
. .
. .
. . . .Total 101 Loans for Crop Husbandry. .
. .
. .
. .
. .
Interestreceived
andcredited
. .
. .
. .
. .
. .
. .
Total
Total
Total
6515
(ii)
programmesLoans for Other Rural DevelopmentprogrammesLoans for Rural Development
. .
. .
. .
. .
. .
. .
- Concld.
. . . .
. . . .
. .
- Concld.
445
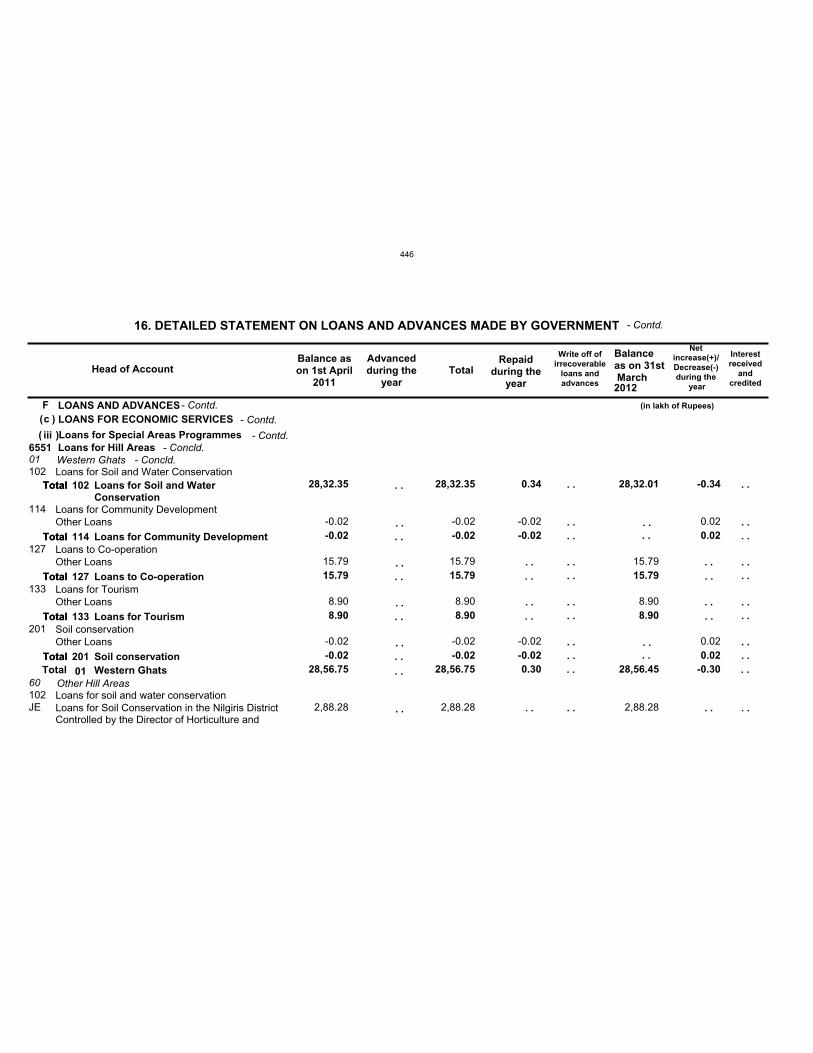
Fc
iii655101
60 28,56.75 28,56.75 0.30 28,56.45 -0.30
102
114
127
133
201
102
28,32.35
-0.02
15.79
8.90
-0.02
28,32.35
-0.02
15.79
8.90
-0.02
0.34
-0.02
-0.02
28,32.01
15.79
8.90
-0.34
0.02
0.02
JE
-0.02
15.79
8.90
-0.02
2,88.28
-0.02
15.79
8.90
-0.02
2,88.28
-0.02
-0.02
15.79
8.90
2,88.28
0.02
0.02
LOANS AND ADVANCESLOANS FOR ECONOMIC SERVICES
Loans for Special Areas ProgrammesLoans for Hill AreasWestern Ghats
Other Hill Areas
Loans for Soil and Water Conservation
Loans for Community Development
Loans to Co-operation
Loans for Tourism
Soil conservation
Loans for soil and water conservation
Other Loans
Other Loans
Other Loans
Other Loans
Loans for Soil Conservation in the Nilgiris DistrictControlled by the Director of Horticulture and
Head of AccountBalance ason 1st April
2011
Advancedduring the
yearTotal
Repaidduring the
year
Write off ofirrecoverable
loans andadvances
Balanceas on 31st March
Netincrease(+)/Decrease(-)during the
year
16. DETAILED STATEMENT ON LOANS AND ADVANCES MADE BY GOVERNMENT
(in lakh of Rupees)
2012
- Contd.
- Contd.( )
( )- Contd.
- Contd.
. .
. .
. .
. .
. .
. .
. .
. .
. .
. .
. .
. .
. .
. .
. .
Total
Total
Total
Total
Total
102
114
127
133
201
Loans for Soil and WaterConservation
Loans for Community Development
Loans to Co-operation
Loans for Tourism
Soil conservation
. .
. .
. .
. .
. .
Interestreceived
andcredited
. .
. .
. .
. .
. .
. .
. .
. .
. .
. .Total
Total
Total
Total
Total
Total01 Western Ghats
. .
. .
. .
. .
. .
. .
. .
. .
. .
. .
- Concld.
. . . . . .
. .
. .
. .
. .
- Concld.
446
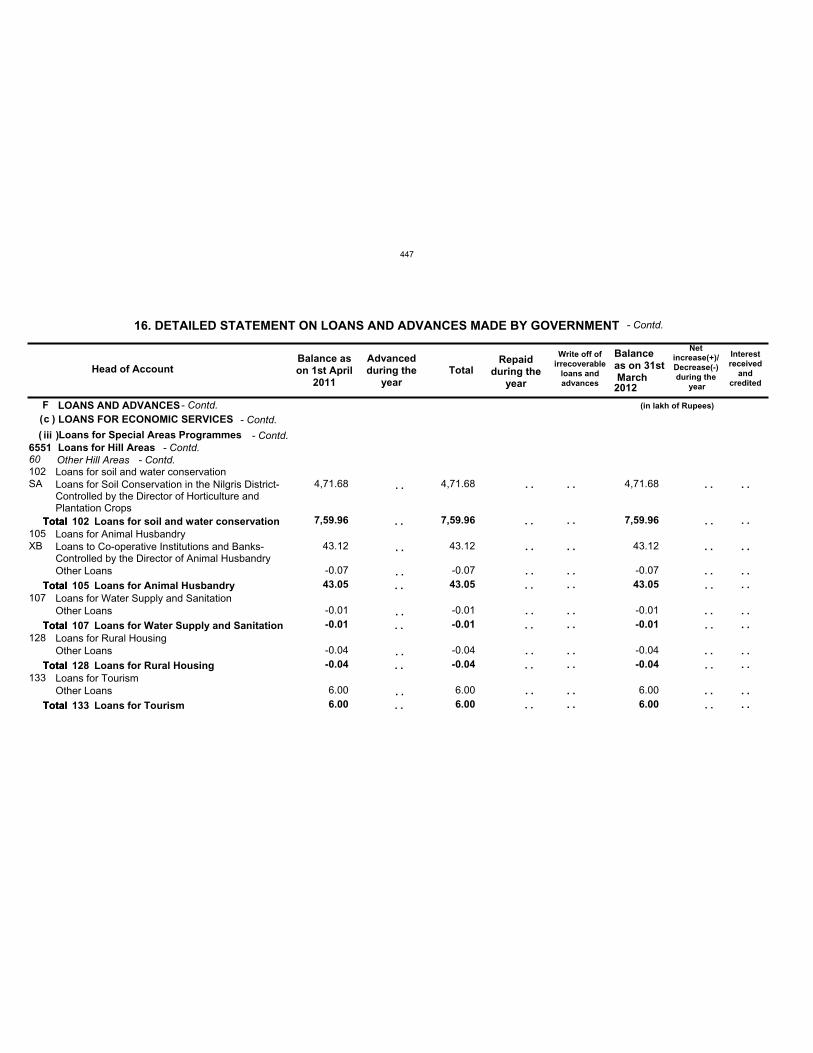
Fc
iii655160102
105
107
128
133
7,59.96
43.05
-0.01
-0.04
6.00
7,59.96
43.05
-0.01
-0.04
6.00
7,59.96
43.05
-0.01
-0.04
6.00
SA
XB
4,71.68
43.12
-0.07
-0.01
-0.04
6.00
4,71.68
43.12
-0.07
-0.01
-0.04
6.00
4,71.68
43.12
-0.07
-0.01
-0.04
6.00
LOANS AND ADVANCESLOANS FOR ECONOMIC SERVICES
Loans for Special Areas ProgrammesLoans for Hill AreasOther Hill AreasLoans for soil and water conservation
Loans for Animal Husbandry
Loans for Water Supply and Sanitation
Loans for Rural Housing
Loans for Tourism
Loans for Soil Conservation in the Nilgris District-Controlled by the Director of Horticulture andPlantation Crops
Loans to Co-operative Institutions and Banks-Controlled by the Director of Animal HusbandryOther Loans
Other Loans
Other Loans
Other Loans
Head of AccountBalance ason 1st April
2011
Advancedduring the
yearTotal
Repaidduring the
year
Write off ofirrecoverable
loans andadvances
Balanceas on 31st March
Netincrease(+)/Decrease(-)during the
year
16. DETAILED STATEMENT ON LOANS AND ADVANCES MADE BY GOVERNMENT
(in lakh of Rupees)
2012
- Contd.
- Contd.( )
( )- Contd.
- Contd.
. .
. .
. .
. .
. .
. .
. .
. .
. .
. .
. .
. .
. .
. .
. .
. .
. .
. .
. .
. .
. .
. .
Total
Total
Total
Total
Total
102
105
107
128
133
Loans for soil and water conservation
Loans for Animal Husbandry
Loans for Water Supply and Sanitation
Loans for Rural Housing
Loans for Tourism
. .
. .
. .
. .
. .
. .
. .
. .
. .
. .
. .
Interestreceived
andcredited
. .
. .
. .
. .
. .
. .
. .
. .
. .
. .
. .
Total
Total
Total
Total
Total
. .
. .
. .
. .
. .
. .
. .
. .
. .
. .
. .
- Contd.- Contd.
447
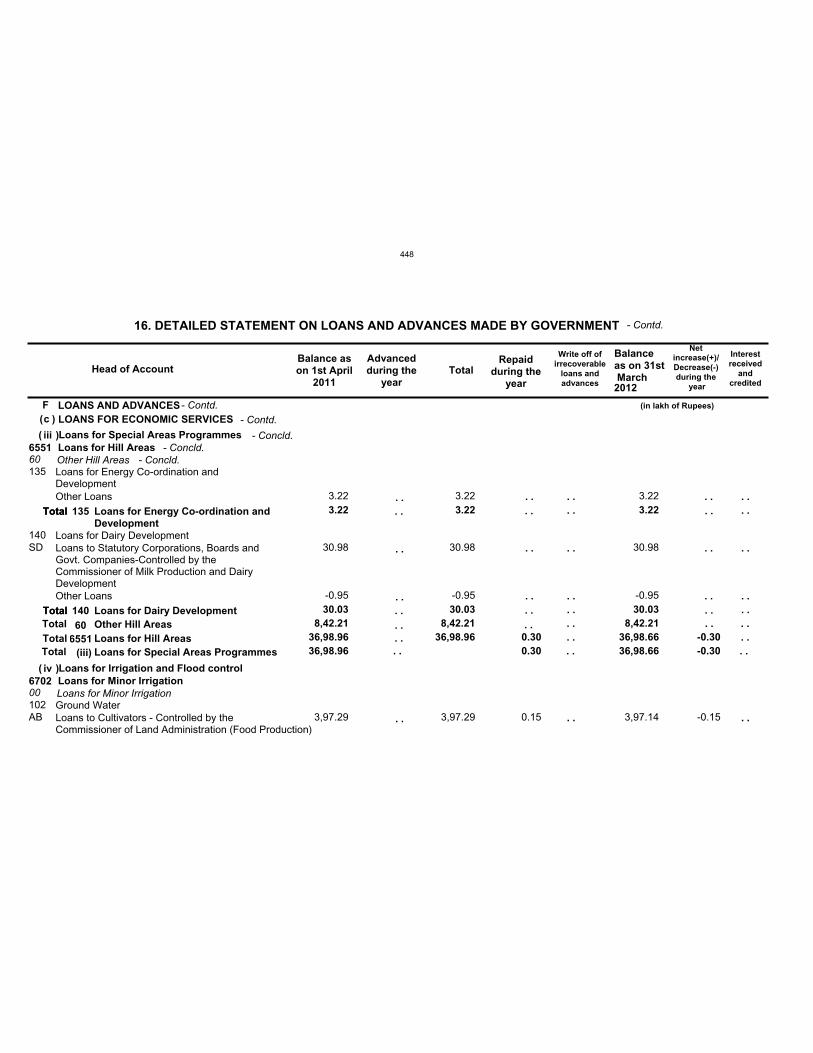
Fc
iii
iv
36,98.96 . . 0.30 36,98.66 -0.30
6551
6702
36,98.96 36,98.96 0.30 36,98.66 -0.30
60
00
8,42.21 8,42.21 8,42.21
135
140
102
3.22
30.03
3.22
30.03
3.22
30.03
SD
AB
3.22
30.98
-0.95
3,97.29
3.22
30.98
-0.95
3,97.29 0.15
3.22
30.98
-0.95
3,97.14 -0.15
LOANS AND ADVANCESLOANS FOR ECONOMIC SERVICES
Loans for Special Areas Programmes
Loans for Irrigation and Flood control
Loans for Hill Areas
Loans for Minor Irrigation
Other Hill Areas
Loans for Minor Irrigation
Loans for Energy Co-ordination andDevelopment
Loans for Dairy Development
Ground Water
Other Loans
Loans to Statutory Corporations, Boards andGovt. Companies-Controlled by theCommissioner of Milk Production and DairyDevelopmentOther Loans
Loans to Cultivators - Controlled by theCommissioner of Land Administration (Food Production)
Head of AccountBalance ason 1st April
2011
Advancedduring the
yearTotal
Repaidduring the
year
Write off ofirrecoverable
loans andadvances
Balanceas on 31st March
Netincrease(+)/Decrease(-)during the
year
16. DETAILED STATEMENT ON LOANS AND ADVANCES MADE BY GOVERNMENT
(in lakh of Rupees)
2012
- Contd.
- Contd.( )
(
(
)
)
- Contd.
- Concld.
. .
. .
. .
. .
. .
. .
. .
. .
. .
. .
. .
Total
Total
135
140
Loans for Energy Co-ordination andDevelopment
Loans for Dairy Development
. .
. .
. .
. .
. .
Interestreceived
andcredited
. .
. .
. .
. .
. .
. .TotalTotalTotal
Total
Total60
6551(iii)
Other Hill AreasLoans for Hill AreasLoans for Special Areas Programmes
. .
. .
. .
. .
. .
. .
- Concld.
. . . .. . . .. . . .
. .. . . .. .
- Concld.
448
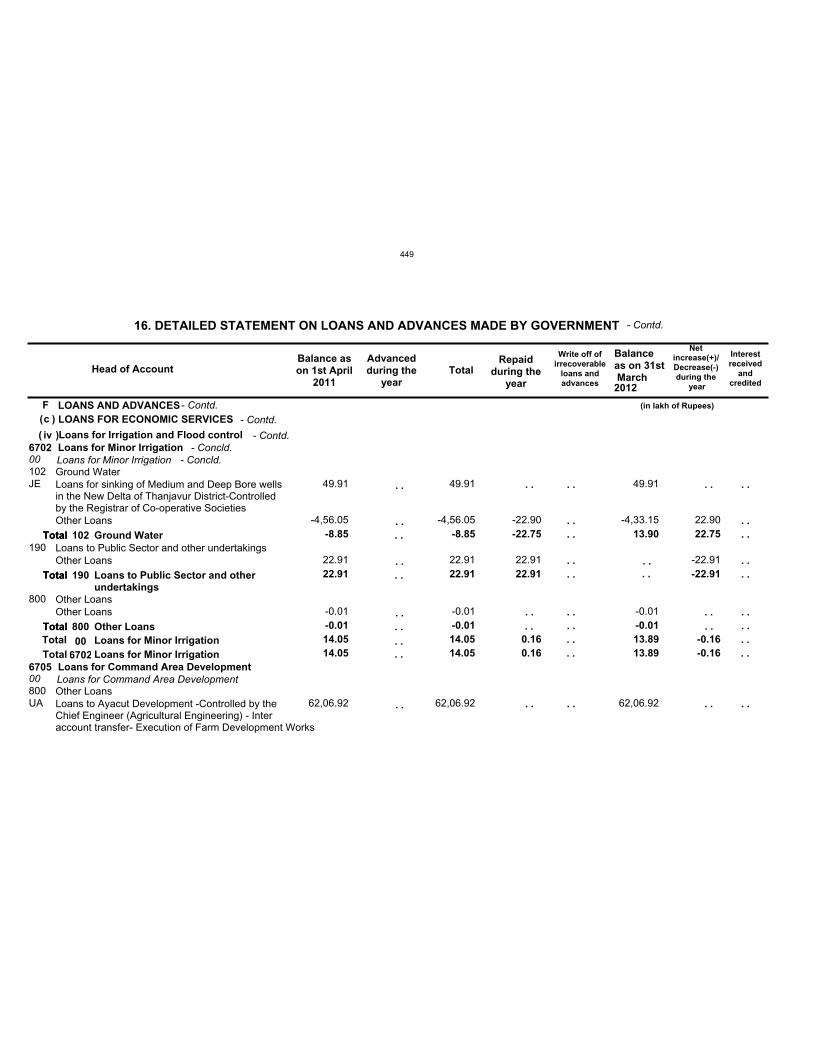
Fc
iv6702
6705 14.05 14.05 0.16 13.89 -0.16
00
00
14.05 14.05 0.16 13.89 -0.16
102
190
800
800
-8.85
22.91
-0.01
-8.85
22.91
-0.01
-22.75
22.91
13.90
-0.01
22.75
-22.91
JE
UA
49.91
-4,56.05
22.91
-0.01
62,06.92
49.91
-4,56.05
22.91
-0.01
62,06.92
-22.90
22.91
49.91
-4,33.15
-0.01
62,06.92
22.90
-22.91
LOANS AND ADVANCESLOANS FOR ECONOMIC SERVICES
Loans for Irrigation and Flood controlLoans for Minor Irrigation
Loans for Command Area Development
Loans for Minor Irrigation
Loans for Command Area Development
Ground Water
Loans to Public Sector and other undertakings
Other Loans
Other Loans
Loans for sinking of Medium and Deep Bore wellsin the New Delta of Thanjavur District-Controlledby the Registrar of Co-operative SocietiesOther Loans
Other Loans
Other Loans
Loans to Ayacut Development -Controlled by theChief Engineer (Agricultural Engineering) - Interaccount transfer- Execution of Farm Development Works
Head of AccountBalance ason 1st April
2011
Advancedduring the
yearTotal
Repaidduring the
year
Write off ofirrecoverable
loans andadvances
Balanceas on 31st March
Netincrease(+)/Decrease(-)during the
year
16. DETAILED STATEMENT ON LOANS AND ADVANCES MADE BY GOVERNMENT
(in lakh of Rupees)
2012
- Contd.
- Contd.( )
( )- Contd.
- Contd.
. .
. .
. .
. .
. .
. .
. .
. .
. .
. .
. . . .
Total
Total
Total
102
190
800
Ground Water
Loans to Public Sector and otherundertakings
Other Loans
. .
. .
. .
. .
Interestreceived
andcredited
. .
. .
. .
. .
. .
. .
. .
. .TotalTotal
Total
Total
Total00
6702Loans for Minor IrrigationLoans for Minor Irrigation
. .
. .
. .
. .
. .
. .
. .
. .
- Concld.
. .. . . .. .. . . .
. .
. .
- Concld.
449
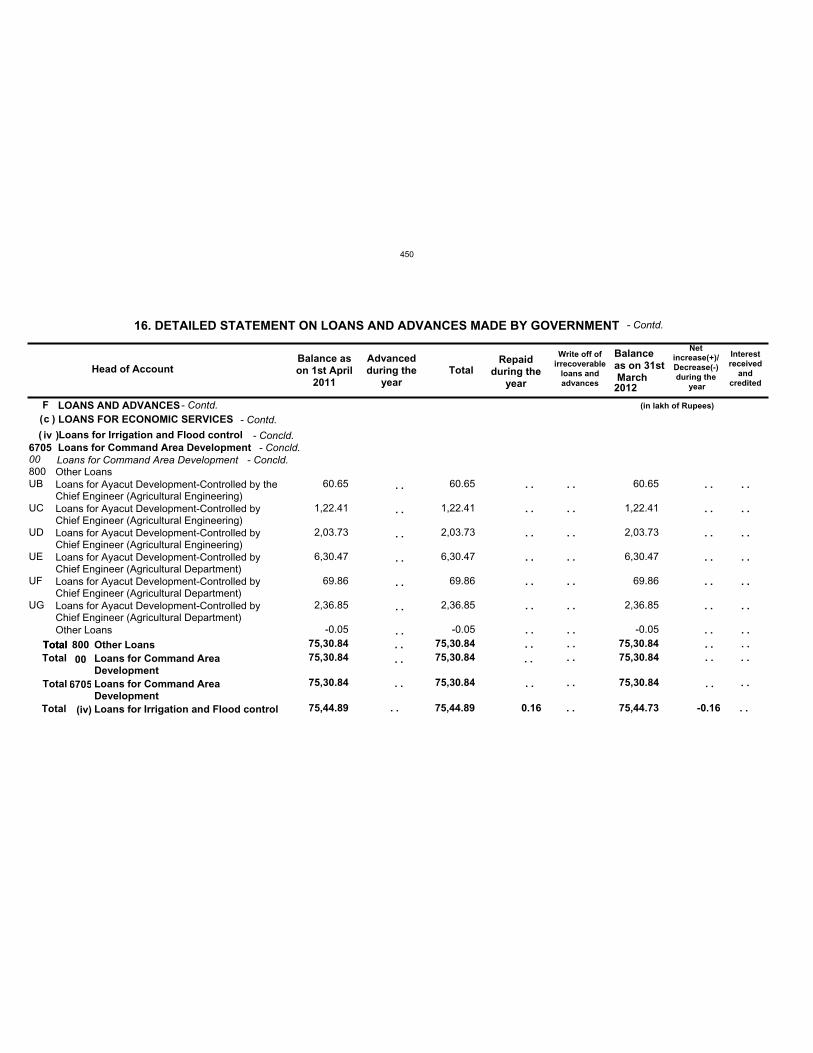
Fc
iv
75,44.89 . . 75,44.89 0.16 75,44.73 -0.16
6705
75,30.84 75,30.84 75,30.84
00
75,30.84 75,30.84 75,30.84
800
75,30.84 75,30.84 75,30.84
UB
UC
UD
UE
UF
UG
60.65
1,22.41
2,03.73
6,30.47
69.86
2,36.85
-0.05
60.65
1,22.41
2,03.73
6,30.47
69.86
2,36.85
-0.05
60.65
1,22.41
2,03.73
6,30.47
69.86
2,36.85
-0.05
LOANS AND ADVANCESLOANS FOR ECONOMIC SERVICES
Loans for Irrigation and Flood controlLoans for Command Area DevelopmentLoans for Command Area DevelopmentOther LoansLoans for Ayacut Development-Controlled by theChief Engineer (Agricultural Engineering)Loans for Ayacut Development-Controlled byChief Engineer (Agricultural Engineering)Loans for Ayacut Development-Controlled byChief Engineer (Agricultural Engineering)Loans for Ayacut Development-Controlled byChief Engineer (Agricultural Department)Loans for Ayacut Development-Controlled byChief Engineer (Agricultural Department)Loans for Ayacut Development-Controlled byChief Engineer (Agricultural Department)Other Loans
Head of AccountBalance ason 1st April
2011
Advancedduring the
yearTotal
Repaidduring the
year
Write off ofirrecoverable
loans andadvances
Balanceas on 31st March
Netincrease(+)/Decrease(-)during the
year
16. DETAILED STATEMENT ON LOANS AND ADVANCES MADE BY GOVERNMENT
(in lakh of Rupees)
2012
- Contd.
- Contd.( )
( )- Contd.
- Concld.
. .
. .
. .
. .
. .
. .
. .
. .
. .
. .
. .
. .
. .
. .. . . .Total 800 Other Loans
. .
. .
. .
. .
. .
. .
. .
. .
Interestreceived
andcredited
. .
. .
. .
. .
. .
. .
. .
. .Total
Total
Total
Total00
6705
(iv)
Loans for Command AreaDevelopmentLoans for Command AreaDevelopmentLoans for Irrigation and Flood control
. .
. .
. .
. .
. .
. .
. .
. .
- Concld.
. . . .
. . . .
. . . .
. . . .
. . . .. .
. .
- Concld.
450
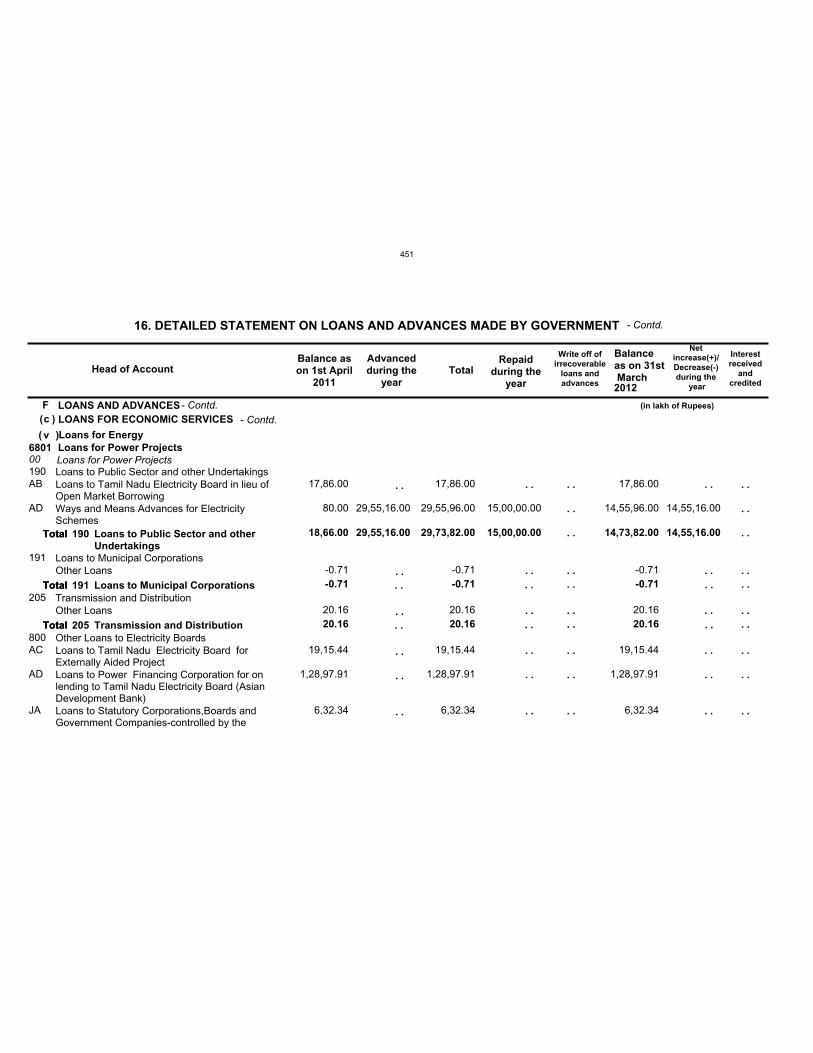
Fc
v680100190
191
205
800
18,66.00
-0.71
20.16
29,55,16.00 29,73,82.00
-0.71
20.16
15,00,00.00 14,73,82.00
-0.71
20.16
14,55,16.00
AB
AD
AC
AD
JA
17,86.00
80.00
-0.71
20.16
19,15.44
1,28,97.91
6,32.34
29,55,16.00
17,86.00
29,55,96.00
-0.71
20.16
19,15.44
1,28,97.91
6,32.34
15,00,00.00
17,86.00
14,55,96.00
-0.71
20.16
19,15.44
1,28,97.91
6,32.34
14,55,16.00
LOANS AND ADVANCESLOANS FOR ECONOMIC SERVICES
Loans for EnergyLoans for Power ProjectsLoans for Power ProjectsLoans to Public Sector and other Undertakings
Loans to Municipal Corporations
Transmission and Distribution
Other Loans to Electricity Boards
Loans to Tamil Nadu Electricity Board in lieu ofOpen Market BorrowingWays and Means Advances for ElectricitySchemes
Other Loans
Other Loans
Loans to Tamil Nadu Electricity Board forExternally Aided ProjectLoans to Power Financing Corporation for onlending to Tamil Nadu Electricity Board (AsianDevelopment Bank)Loans to Statutory Corporations,Boards andGovernment Companies-controlled by the
Head of AccountBalance ason 1st April
2011
Advancedduring the
yearTotal
Repaidduring the
year
Write off ofirrecoverable
loans andadvances
Balanceas on 31st March
Netincrease(+)/Decrease(-)during the
year
16. DETAILED STATEMENT ON LOANS AND ADVANCES MADE BY GOVERNMENT
(in lakh of Rupees)
2012
- Contd.
- Contd.( )
( )- Contd.
. .
. .
. .
. .
. .
. .
. .
. .
. .
. .
. .
. .
. .
. .
. .
. .
Total
Total
Total
190
191
205
Loans to Public Sector and otherUndertakings
Loans to Municipal Corporations
Transmission and Distribution
. .
. .
. .
. .
. .
. .
. .
. .
Interestreceived
andcredited
. .
. .
. .
. .
. .
. .
. .
. .
. .
. .
Total
Total
Total
. .
. .
. .
. .
. .
. .
. .
. .
. .
. .
451
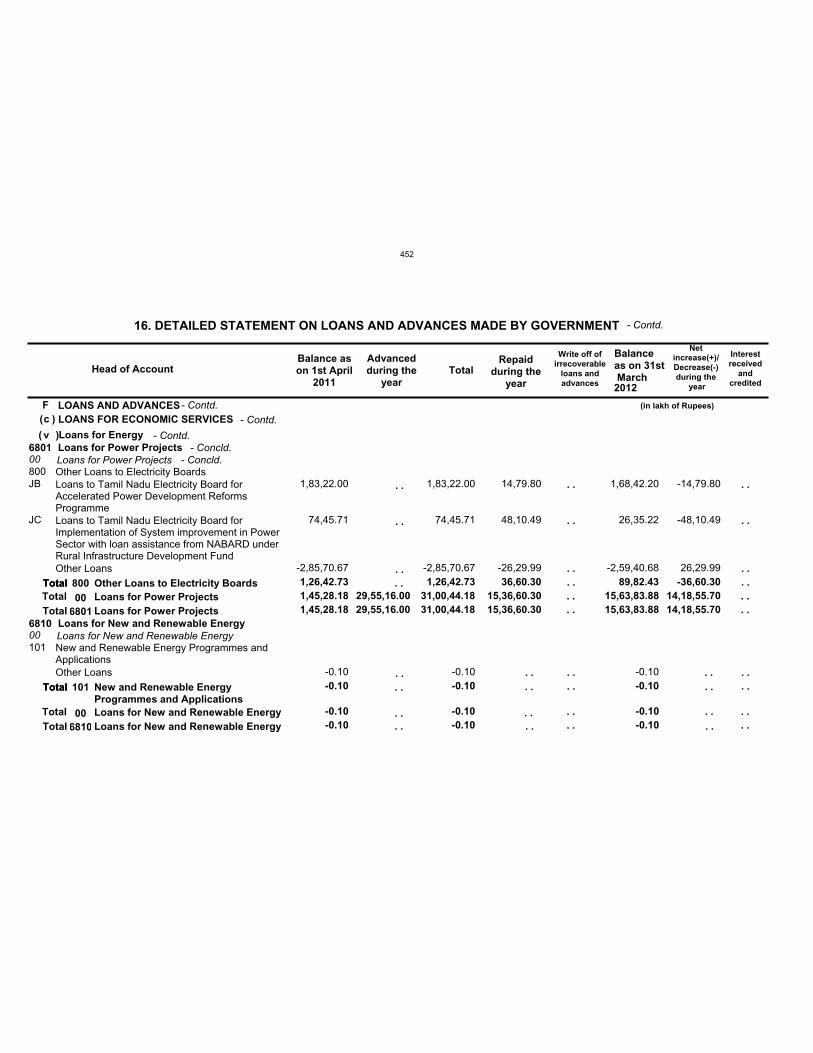
Fc
v6801
6810 1,45,28.18
-0.10
29,55,16.00 31,00,44.18
-0.10
15,36,60.30 15,63,83.88
-0.10
14,18,55.70
00
00
1,45,28.18
-0.10
29,55,16.00 31,00,44.18
-0.10
15,36,60.30 15,63,83.88
-0.10
14,18,55.70
800
101
1,26,42.73
-0.10
1,26,42.73
-0.10
36,60.30 89,82.43
-0.10
-36,60.30
JB
JC
1,83,22.00
74,45.71
-2,85,70.67
-0.10
1,83,22.00
74,45.71
-2,85,70.67
-0.10
14,79.80
48,10.49
-26,29.99
1,68,42.20
26,35.22
-2,59,40.68
-0.10
-14,79.80
-48,10.49
26,29.99
LOANS AND ADVANCESLOANS FOR ECONOMIC SERVICES
Loans for EnergyLoans for Power Projects
Loans for New and Renewable Energy
Loans for Power Projects
Loans for New and Renewable Energy
Other Loans to Electricity Boards
New and Renewable Energy Programmes andApplications
Loans to Tamil Nadu Electricity Board forAccelerated Power Development ReformsProgrammeLoans to Tamil Nadu Electricity Board forImplementation of System improvement in PowerSector with loan assistance from NABARD underRural Infrastructure Development FundOther Loans
Other Loans
Head of AccountBalance ason 1st April
2011
Advancedduring the
yearTotal
Repaidduring the
year
Write off ofirrecoverable
loans andadvances
Balanceas on 31st March
Netincrease(+)/Decrease(-)during the
year
16. DETAILED STATEMENT ON LOANS AND ADVANCES MADE BY GOVERNMENT
(in lakh of Rupees)
2012
- Contd.
- Contd.( )
( )- Contd.
- Contd.
. .
. .
. .
. . . .
. .
. . . .
Total
Total
800
101
Other Loans to Electricity Boards
New and Renewable EnergyProgrammes and Applications
. .
. .
Interestreceived
andcredited
. .
. .
. .
. .
. .
. .
Total
Total
Total
Total
Total
Total
00
00
6801
6810
Loans for Power Projects
Loans for New and Renewable Energy
Loans for Power Projects
Loans for New and Renewable Energy
. .
. .
. .
. .
. .
. .
- Concld.
. . . .
. .
. .
. .
. .. . . .
. .
. .
. .
. .. .. .
- Concld.
452
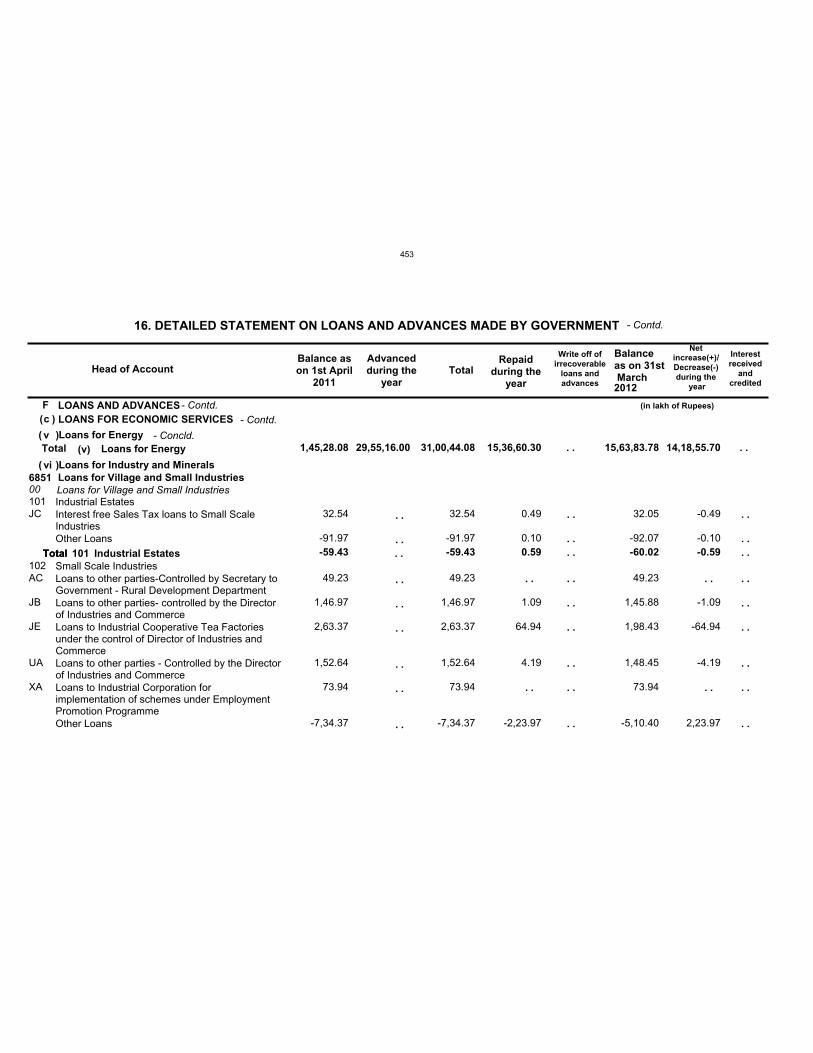
Fc
v
vi
1,45,28.08 29,55,16.00 31,00,44.08 15,36,60.30 15,63,83.78 14,18,55.70
685100101
102-59.43 -59.43 0.59 -60.02 -0.59
JC
AC
JB
JE
UA
XA
32.54
-91.97
49.23
1,46.97
2,63.37
1,52.64
73.94
-7,34.37
32.54
-91.97
49.23
1,46.97
2,63.37
1,52.64
73.94
-7,34.37
0.49
0.10
1.09
64.94
4.19
-2,23.97
32.05
-92.07
49.23
1,45.88
1,98.43
1,48.45
73.94
-5,10.40
-0.49
-0.10
-1.09
-64.94
-4.19
2,23.97
LOANS AND ADVANCESLOANS FOR ECONOMIC SERVICES
Loans for Energy
Loans for Industry and MineralsLoans for Village and Small IndustriesLoans for Village and Small IndustriesIndustrial Estates
Small Scale Industries
Interest free Sales Tax loans to Small ScaleIndustriesOther Loans
Loans to other parties-Controlled by Secretary toGovernment - Rural Development DepartmentLoans to other parties- controlled by the Directorof Industries and CommerceLoans to Industrial Cooperative Tea Factoriesunder the control of Director of Industries andCommerceLoans to other parties - Controlled by the Directorof Industries and CommerceLoans to Industrial Corporation forimplementation of schemes under EmploymentPromotion ProgrammeOther Loans
Head of AccountBalance ason 1st April
2011
Advancedduring the
yearTotal
Repaidduring the
year
Write off ofirrecoverable
loans andadvances
Balanceas on 31st March
Netincrease(+)/Decrease(-)during the
year
16. DETAILED STATEMENT ON LOANS AND ADVANCES MADE BY GOVERNMENT
(in lakh of Rupees)
2012
- Contd.
- Contd.( )
(
(
)
)
- Contd.
- Concld.
. .
. .
. .
. .
. .
. .
. .
. .
. .
. .
. .Total 101 Industrial Estates
. .
. .
Interestreceived
andcredited
. .
. .
. .
. .
. .
. .
. .
. .
. .
Total
Total
(v) Loans for Energy
. .
. .
. .
. .
. .
. .
. .
. .
. .
. . . .
453
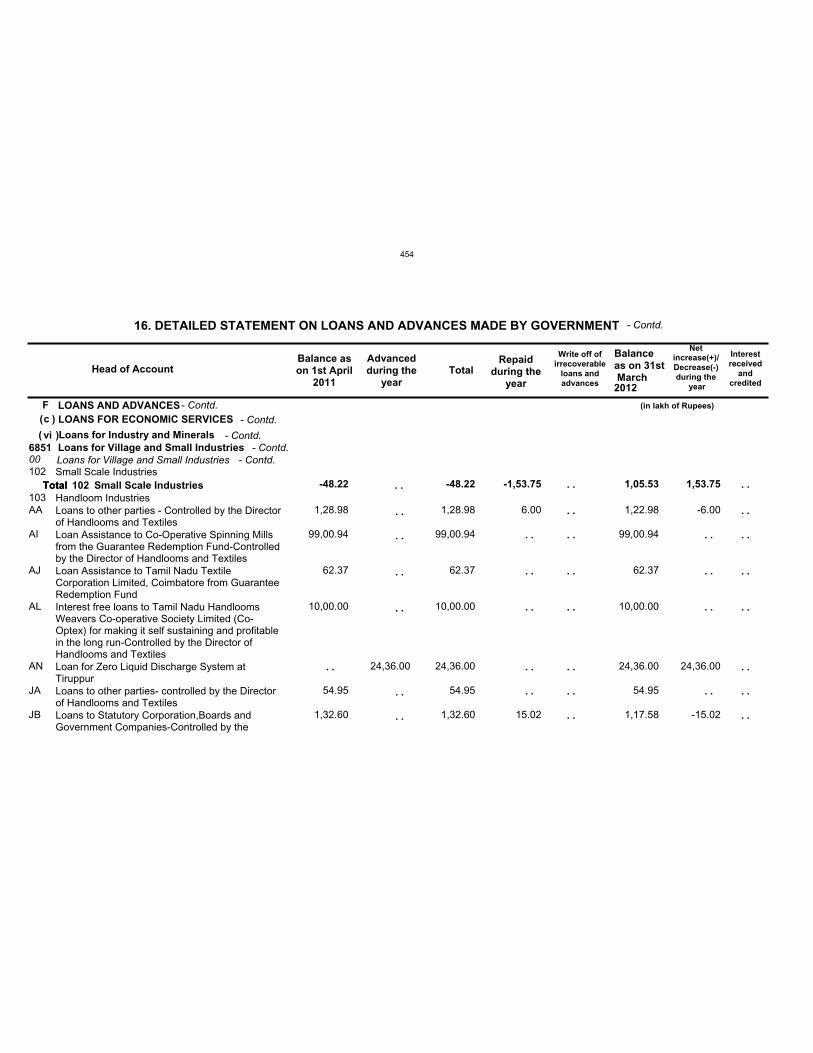
Fc
vi685100102
103-48.22 -48.22 -1,53.75 1,05.53 1,53.75
AA
AI
AJ
AL
AN
JA
JB
1,28.98
99,00.94
62.37
10,00.00
54.95
1,32.60
24,36.00
1,28.98
99,00.94
62.37
10,00.00
24,36.00
54.95
1,32.60
6.00
15.02
1,22.98
99,00.94
62.37
10,00.00
24,36.00
54.95
1,17.58
-6.00
24,36.00
-15.02
LOANS AND ADVANCESLOANS FOR ECONOMIC SERVICES
Loans for Industry and MineralsLoans for Village and Small IndustriesLoans for Village and Small IndustriesSmall Scale Industries
Handloom IndustriesLoans to other parties - Controlled by the Directorof Handlooms and TextilesLoan Assistance to Co-Operative Spinning Millsfrom the Guarantee Redemption Fund-Controlledby the Director of Handlooms and TextilesLoan Assistance to Tamil Nadu TextileCorporation Limited, Coimbatore from GuaranteeRedemption FundInterest free loans to Tamil Nadu HandloomsWeavers Co-operative Society Limited (Co-Optex) for making it self sustaining and profitablein the long run-Controlled by the Director ofHandlooms and TextilesLoan for Zero Liquid Discharge System atTiruppurLoans to other parties- controlled by the Directorof Handlooms and TextilesLoans to Statutory Corporation,Boards andGovernment Companies-Controlled by the
Head of AccountBalance ason 1st April
2011
Advancedduring the
yearTotal
Repaidduring the
year
Write off ofirrecoverable
loans andadvances
Balanceas on 31st March
Netincrease(+)/Decrease(-)during the
year
16. DETAILED STATEMENT ON LOANS AND ADVANCES MADE BY GOVERNMENT
(in lakh of Rupees)
2012
- Contd.
- Contd.( )
( )- Contd.
- Contd.
. .
. .
. .
. .
. .
. .
. .
. .
. .
. .
. .
. .
. .
Total 102 Small Scale Industries
. .
. .
. .
. .
Interestreceived
andcredited
. .
. .
. .
. .
. .
. .
. .
. .Total
. .
. .
. .
. .
. .
. .
. .
. .
- Contd.- Contd.
454

Fc
vi685100103JF
JH
SA
UA
UB
XA
ZI
70.10
36.36
2,54.02
2,45.87
1,56.46
1,17.00
1,11.07
70.10
36.36
2,54.02
2,45.87
1,56.46
1,17.00
1,11.07
1.00
1.16
11.52
69.10
36.36
2,54.02
2,44.71
1,44.94
1,17.00
1,11.07
-1.00
-1.16
-11.52
LOANS AND ADVANCESLOANS FOR ECONOMIC SERVICES
Loans for Industry and MineralsLoans for Village and Small IndustriesLoans for Village and Small IndustriesHandloom IndustriesLoans to Statutory Corporation, Boards andGovernment Companies-Controlled by theDirector of Handlooms and TextilesLoans to Tamil Nadu Zari Limited, for theinstallation of X-Ray Fluorescence AnalyserLoans to Co-operative Institutions and Banks-Controlled bythe Director of Handloom andTextilesLoans to Co-operative Institutions and Banks -Controlled by the Director of Handlooms,Textilesand KhadiLoans for Implementation of project packagescheme for Handloom weavers - Controlled bythe Director of Handlooms and TextilesLoans to Statutory Corprations, Boards and Govt.Companies-Controlled by the Director ofHandlooms and TextilesLoans to Co-operative Institutions and Banksunder National Co-operative Bank DevelopmentCorporation assistance Controlled by the Directorof Handlooms and Textiles
Head of AccountBalance ason 1st April
2011
Advancedduring the
yearTotal
Repaidduring the
year
Write off ofirrecoverable
loans andadvances
Balanceas on 31st March
Netincrease(+)/Decrease(-)during the
year
16. DETAILED STATEMENT ON LOANS AND ADVANCES MADE BY GOVERNMENT
(in lakh of Rupees)
2012
- Contd.
- Contd.( )
( )- Contd.
- Contd.
. .
. .
. .
. .
. .
. .
. .
. .
. .
. .
. .
. .
. .
. .
. .
Interestreceived
andcredited
. .
. .
. .
. .
. .
. .
. .
. .
. .
. .
. .
. .
. .
. .
- Contd.- Contd.
455
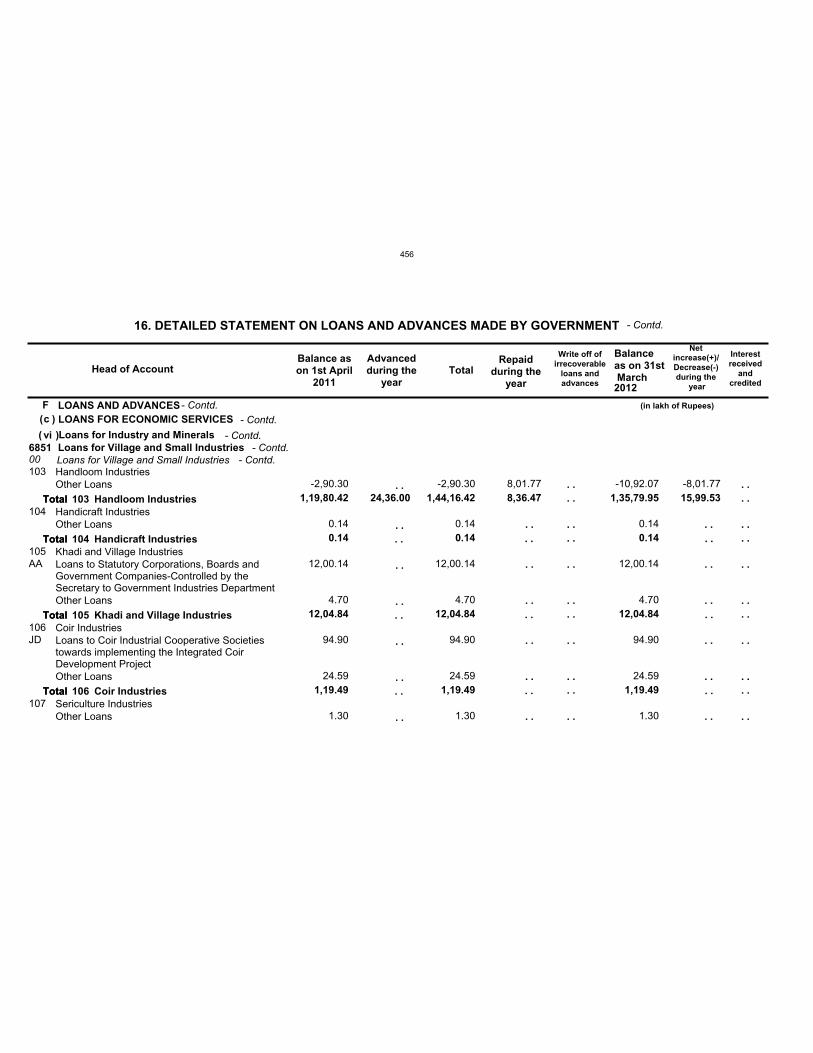
Fc
vi685100103
104
105
106
107
1,19,80.42
0.14
12,04.84
1,19.49
24,36.00 1,44,16.42
0.14
12,04.84
1,19.49
8,36.47 1,35,79.95
0.14
12,04.84
1,19.49
15,99.53
AA
JD
-2,90.30
0.14
12,00.14
4.70
94.90
24.59
1.30
-2,90.30
0.14
12,00.14
4.70
94.90
24.59
1.30
8,01.77 -10,92.07
0.14
12,00.14
4.70
94.90
24.59
1.30
-8,01.77
LOANS AND ADVANCESLOANS FOR ECONOMIC SERVICES
Loans for Industry and MineralsLoans for Village and Small IndustriesLoans for Village and Small IndustriesHandloom Industries
Handicraft Industries
Khadi and Village Industries
Coir Industries
Sericulture Industries
Other Loans
Other Loans
Loans to Statutory Corporations, Boards andGovernment Companies-Controlled by theSecretary to Government Industries DepartmentOther Loans
Loans to Coir Industrial Cooperative Societiestowards implementing the Integrated CoirDevelopment ProjectOther Loans
Other Loans
Head of AccountBalance ason 1st April
2011
Advancedduring the
yearTotal
Repaidduring the
year
Write off ofirrecoverable
loans andadvances
Balanceas on 31st March
Netincrease(+)/Decrease(-)during the
year
16. DETAILED STATEMENT ON LOANS AND ADVANCES MADE BY GOVERNMENT
(in lakh of Rupees)
2012
- Contd.
- Contd.( )
( )- Contd.
- Contd.
. .
. .
. .
. .
. .
. .
. .
. .
. .
. .
. .
. .
. .
. .
. .
. .
. .
. .
. .
Total
Total
Total
Total
103
104
105
106
Handloom Industries
Handicraft Industries
Khadi and Village Industries
Coir Industries
. .
. .
. .
. .
. .
. .
. .
. .
. .
Interestreceived
andcredited
. .
. .
. .
. .
. .
. .
. .
. .
. .
. .
. .
Total
Total
Total
Total
. .
. .
. .
. .
. .
. .
. .
. .
. .
. .
. .
- Contd.- Contd.
456
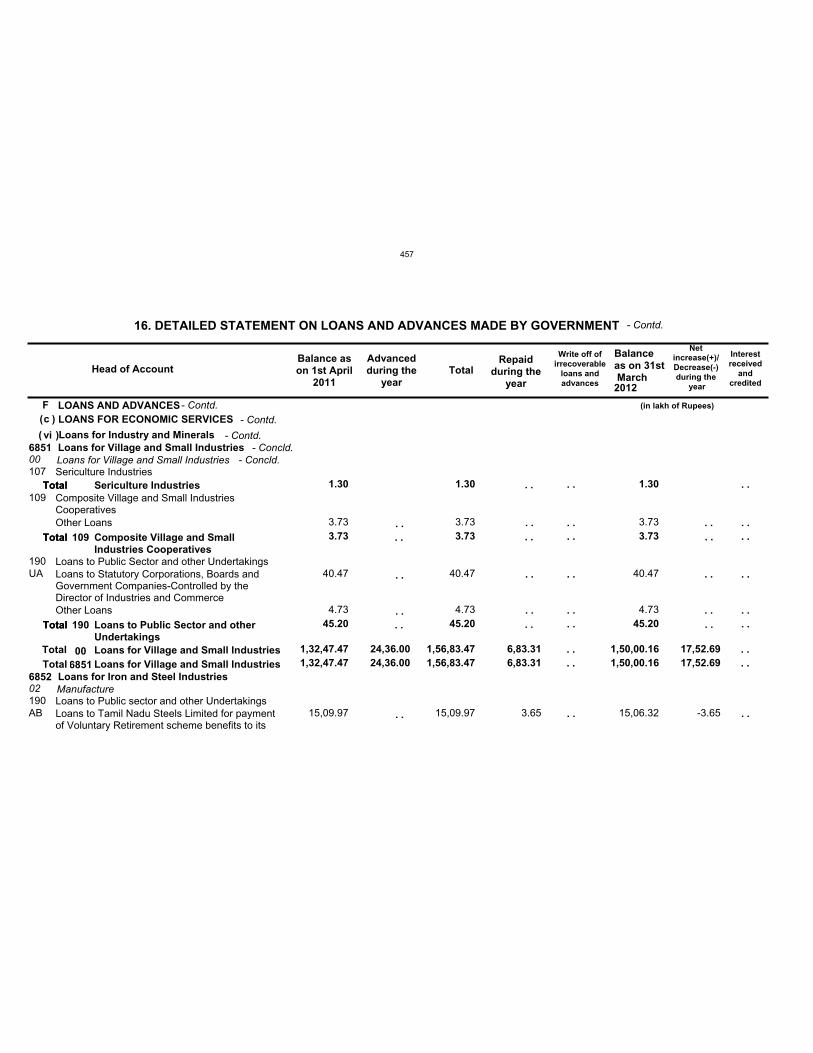
Fc
vi6851
6852 1,32,47.47 24,36.00 1,56,83.47 6,83.31 1,50,00.16 17,52.69
00
02
1,32,47.47 24,36.00 1,56,83.47 6,83.31 1,50,00.16 17,52.69
107
109
190
190
1.30
3.73
45.20
1.30
3.73
45.20
1.30
3.73
45.20
UA
AB
3.73
40.47
4.73
15,09.97
3.73
40.47
4.73
15,09.97 3.65
3.73
40.47
4.73
15,06.32 -3.65
LOANS AND ADVANCESLOANS FOR ECONOMIC SERVICES
Loans for Industry and MineralsLoans for Village and Small Industries
Loans for Iron and Steel Industries
Loans for Village and Small Industries
Manufacture
Sericulture Industries
Composite Village and Small IndustriesCooperatives
Loans to Public Sector and other Undertakings
Loans to Public sector and other Undertakings
Other Loans
Loans to Statutory Corporations, Boards andGovernment Companies-Controlled by theDirector of Industries and CommerceOther Loans
Loans to Tamil Nadu Steels Limited for paymentof Voluntary Retirement scheme benefits to its
Head of AccountBalance ason 1st April
2011
Advancedduring the
yearTotal
Repaidduring the
year
Write off ofirrecoverable
loans andadvances
Balanceas on 31st March
Netincrease(+)/Decrease(-)during the
year
16. DETAILED STATEMENT ON LOANS AND ADVANCES MADE BY GOVERNMENT
(in lakh of Rupees)
2012
- Contd.
- Contd.( )
( )- Contd.
- Contd.
. .
. .
. .
. .
. .
. .
. .
. .
. .
. .
. .
. .
Total
Total
Total
109
190
Sericulture Industries
Composite Village and SmallIndustries Cooperatives
Loans to Public Sector and otherUndertakings
. .
. .
. .
. .
. .
Interestreceived
andcredited
. .
. .
. .
. .
. .
. .
. .
TotalTotal
Total
Total
Total
006851
Loans for Village and Small IndustriesLoans for Village and Small Industries
. .
. .
. .
. .
. .
. .
. .
- Concld.
. . . .
. . . .
- Concld.
457
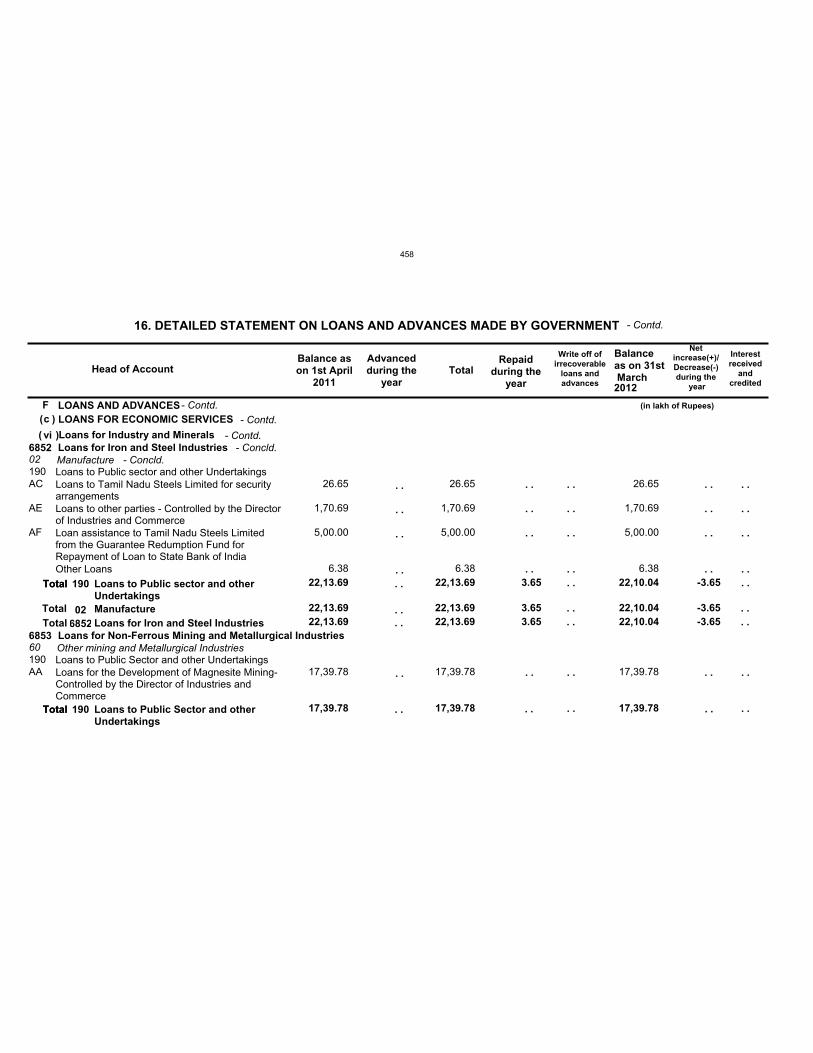
Fc
vi6852
6853 22,13.69 22,13.69 3.65 22,10.04 -3.65
02
60
22,13.69 22,13.69 3.65 22,10.04 -3.65
190
190
22,13.69
17,39.78
22,13.69
17,39.78
3.65 22,10.04
17,39.78
-3.65
AC
AE
AF
AA
26.65
1,70.69
5,00.00
6.38
17,39.78
26.65
1,70.69
5,00.00
6.38
17,39.78
26.65
1,70.69
5,00.00
6.38
17,39.78
LOANS AND ADVANCESLOANS FOR ECONOMIC SERVICES
Loans for Industry and MineralsLoans for Iron and Steel Industries
Loans for Non-Ferrous Mining and Metallurgical Industries
Manufacture
Other mining and Metallurgical Industries
Loans to Public sector and other Undertakings
Loans to Public Sector and other Undertakings
Loans to Tamil Nadu Steels Limited for securityarrangementsLoans to other parties - Controlled by the Directorof Industries and CommerceLoan assistance to Tamil Nadu Steels Limitedfrom the Guarantee Redumption Fund forRepayment of Loan to State Bank of IndiaOther Loans
Loans for the Development of Magnesite Mining-Controlled by the Director of Industries andCommerce
Head of AccountBalance ason 1st April
2011
Advancedduring the
yearTotal
Repaidduring the
year
Write off ofirrecoverable
loans andadvances
Balanceas on 31st March
Netincrease(+)/Decrease(-)during the
year
16. DETAILED STATEMENT ON LOANS AND ADVANCES MADE BY GOVERNMENT
(in lakh of Rupees)
2012
- Contd.
- Contd.( )
( )- Contd.
- Contd.
. .
. .
. .
. .
. .
. .
. .
. .
. .
. .
. .
. . . .
Total
Total
190
190
Loans to Public sector and otherUndertakings
Loans to Public Sector and otherUndertakings
. .
. .
. .
. .
. .
. .
Interestreceived
andcredited
. .
. .
. .
. .
. .
. .
. .
TotalTotal
Total
Total
026852
ManufactureLoans for Iron and Steel Industries
. .
. .
. .
. .
. .
. .
. .
- Concld.
. .. . . .. .. . . .
- Concld.
458
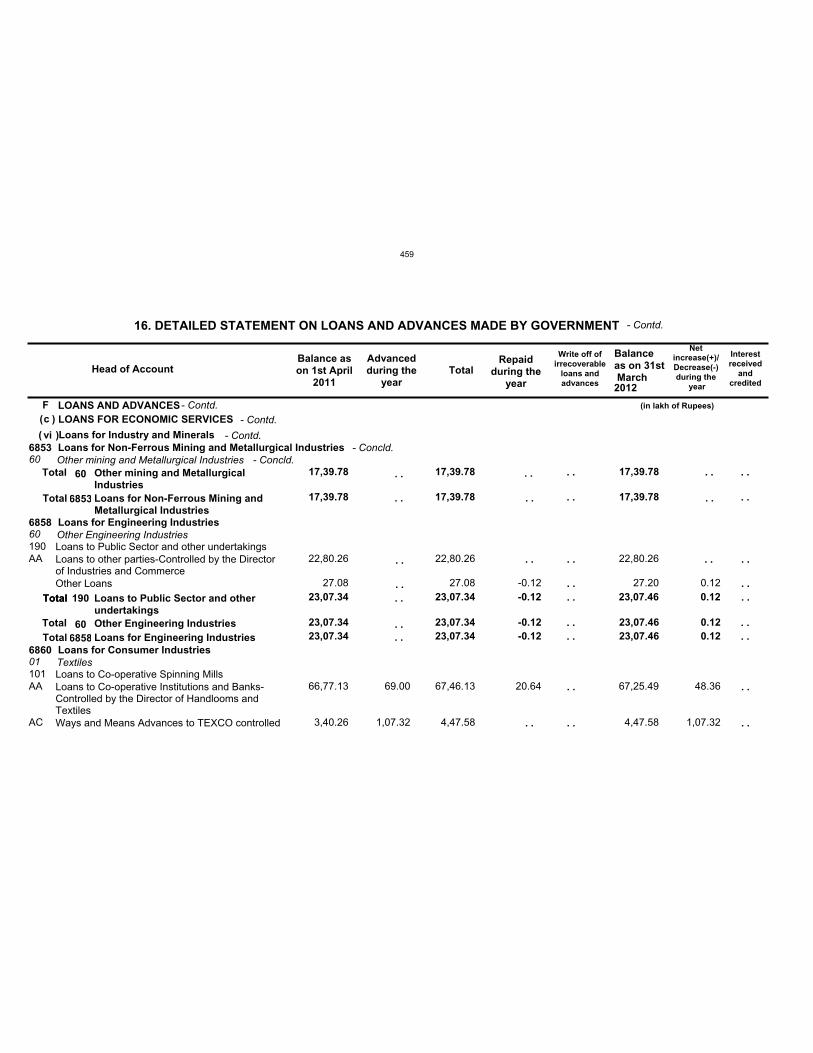
Fc
vi6853
6858
6860
17,39.78
23,07.34
17,39.78
23,07.34 -0.12
17,39.78
23,07.46 0.12
60
60
01
17,39.78
23,07.34
17,39.78
23,07.34 -0.12
17,39.78
23,07.46 0.12
190
101
23,07.34 23,07.34 -0.12 23,07.46 0.12
AA
AA
AC
22,80.26
27.08
66,77.13
3,40.26
69.00
1,07.32
22,80.26
27.08
67,46.13
4,47.58
-0.12
20.64
22,80.26
27.20
67,25.49
4,47.58
0.12
48.36
1,07.32
LOANS AND ADVANCESLOANS FOR ECONOMIC SERVICES
Loans for Industry and MineralsLoans for Non-Ferrous Mining and Metallurgical Industries
Loans for Engineering Industries
Loans for Consumer Industries
Other mining and Metallurgical Industries
Other Engineering Industries
Textiles
Loans to Public Sector and other undertakings
Loans to Co-operative Spinning Mills
Loans to other parties-Controlled by the Directorof Industries and CommerceOther Loans
Loans to Co-operative Institutions and Banks-Controlled by the Director of Handlooms andTextilesWays and Means Advances to TEXCO controlled
Head of AccountBalance ason 1st April
2011
Advancedduring the
yearTotal
Repaidduring the
year
Write off ofirrecoverable
loans andadvances
Balanceas on 31st March
Netincrease(+)/Decrease(-)during the
year
16. DETAILED STATEMENT ON LOANS AND ADVANCES MADE BY GOVERNMENT
(in lakh of Rupees)
2012
- Contd.
- Contd.( )
( )- Contd.
- Contd.
. .
. .
. .
. .
. .Total 190 Loans to Public Sector and otherundertakings
. .
Interestreceived
andcredited
. .
. .
. .
. .
. .
Total
Total
Total
Total
Total
60
60
6853
6858
Other mining and MetallurgicalIndustries
Other Engineering Industries
Loans for Non-Ferrous Mining andMetallurgical Industries
Loans for Engineering Industries
. .
. .
. .
. .
. .
- Concld.
. .
. .
. .
. .
. .
. .
. .
. .
. .
. .
. .
. .
. .
. .
. .
. .
- Concld.
459
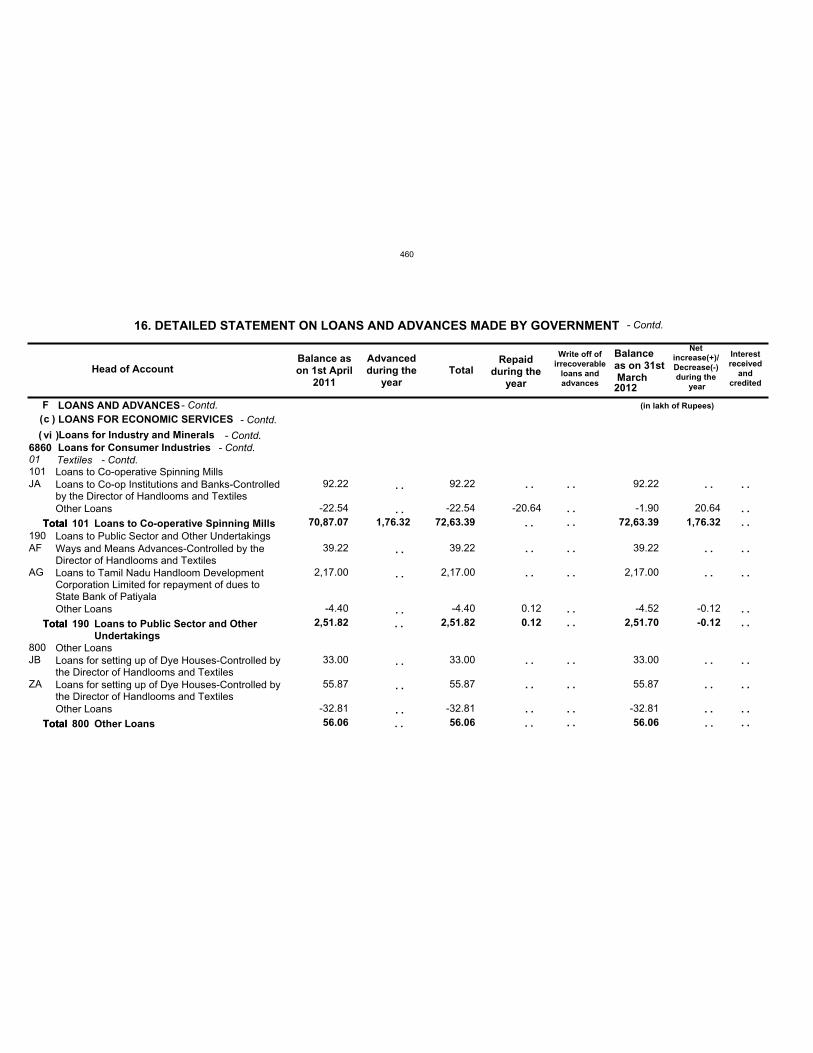
Fc
vi686001101
190
800
70,87.07
2,51.82
56.06
1,76.32 72,63.39
2,51.82
56.06
0.12
72,63.39
2,51.70
56.06
1,76.32
-0.12
JA
AF
AG
JB
ZA
92.22
-22.54
39.22
2,17.00
-4.40
33.00
55.87
-32.81
92.22
-22.54
39.22
2,17.00
-4.40
33.00
55.87
-32.81
-20.64
0.12
92.22
-1.90
39.22
2,17.00
-4.52
33.00
55.87
-32.81
20.64
-0.12
LOANS AND ADVANCESLOANS FOR ECONOMIC SERVICES
Loans for Industry and MineralsLoans for Consumer IndustriesTextilesLoans to Co-operative Spinning Mills
Loans to Public Sector and Other Undertakings
Other Loans
Loans to Co-op Institutions and Banks-Controlledby the Director of Handlooms and TextilesOther Loans
Ways and Means Advances-Controlled by theDirector of Handlooms and TextilesLoans to Tamil Nadu Handloom DevelopmentCorporation Limited for repayment of dues toState Bank of PatiyalaOther Loans
Loans for setting up of Dye Houses-Controlled bythe Director of Handlooms and TextilesLoans for setting up of Dye Houses-Controlled bythe Director of Handlooms and TextilesOther Loans
Head of AccountBalance ason 1st April
2011
Advancedduring the
yearTotal
Repaidduring the
year
Write off ofirrecoverable
loans andadvances
Balanceas on 31st March
Netincrease(+)/Decrease(-)during the
year
16. DETAILED STATEMENT ON LOANS AND ADVANCES MADE BY GOVERNMENT
(in lakh of Rupees)
2012
- Contd.
- Contd.( )
( )- Contd.
- Contd.
. .
. .
. .
. .
. .
. .
. .
. .
. .
. .
. .
. .
. .
. .
. .
. .
. .
. .
Total
Total
Total
101
190
800
Loans to Co-operative Spinning Mills
Loans to Public Sector and OtherUndertakings
Other Loans
. .
. .
. .
. .
. .
. .
. .
Interestreceived
andcredited
. .
. .
. .
. .
. .
. .
. .
. .
. .
. .
. .
Total
Total
Total
. .
. .
. .
. .
. .
. .
. .
. .
. .
. .
. .
- Contd.- Contd.
460
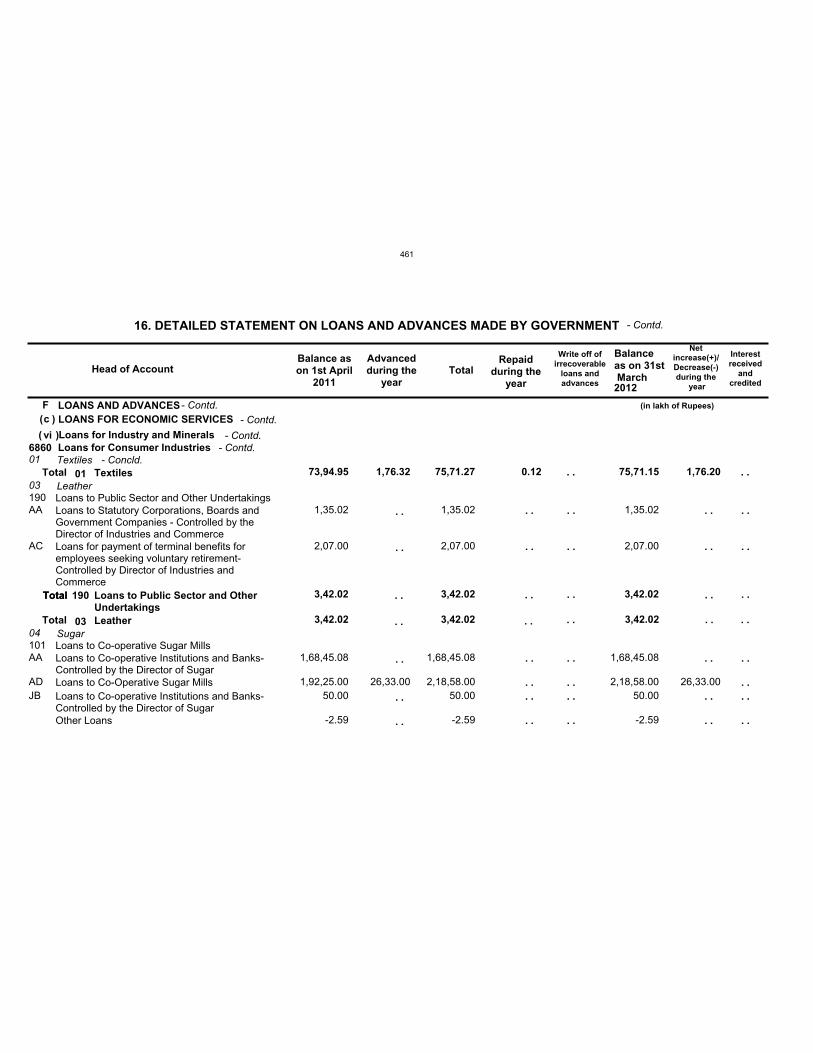
Fc
vi686001
03
04
73,94.95
3,42.02
1,76.32 75,71.27
3,42.02
0.12 75,71.15
3,42.02
1,76.20
190
101
3,42.02 3,42.02 3,42.02
AA
AC
AA
ADJB
1,35.02
2,07.00
1,68,45.08
1,92,25.00 50.00
-2.59
26,33.00
1,35.02
2,07.00
1,68,45.08
2,18,58.00 50.00
-2.59
1,35.02
2,07.00
1,68,45.08
2,18,58.00 50.00
-2.59
26,33.00
LOANS AND ADVANCESLOANS FOR ECONOMIC SERVICES
Loans for Industry and MineralsLoans for Consumer IndustriesTextiles
Leather
Sugar
Loans to Public Sector and Other Undertakings
Loans to Co-operative Sugar Mills
Loans to Statutory Corporations, Boards andGovernment Companies - Controlled by theDirector of Industries and CommerceLoans for payment of terminal benefits foremployees seeking voluntary retirement-Controlled by Director of Industries andCommerce
Loans to Co-operative Institutions and Banks-Controlled by the Director of SugarLoans to Co-Operative Sugar MillsLoans to Co-operative Institutions and Banks-Controlled by the Director of SugarOther Loans
Head of AccountBalance ason 1st April
2011
Advancedduring the
yearTotal
Repaidduring the
year
Write off ofirrecoverable
loans andadvances
Balanceas on 31st March
Netincrease(+)/Decrease(-)during the
year
16. DETAILED STATEMENT ON LOANS AND ADVANCES MADE BY GOVERNMENT
(in lakh of Rupees)
2012
- Contd.
- Contd.( )
( )- Contd.
- Contd.
. .
. .
. .
. .
. .
. .
. .
. .
. .
. .
. .
. . . .Total 190 Loans to Public Sector and OtherUndertakings
. .
. .
. .
. .
. .
. .
Interestreceived
andcredited
. .
. .
. .
. .
. .
. .
. .
Total
Total
Total
01
03
Textiles
Leather
. .
. .
. .
. .
. .
. .
. .
- Contd.
. . . .
. .
. .
. .
. .. .
- Concld.
461
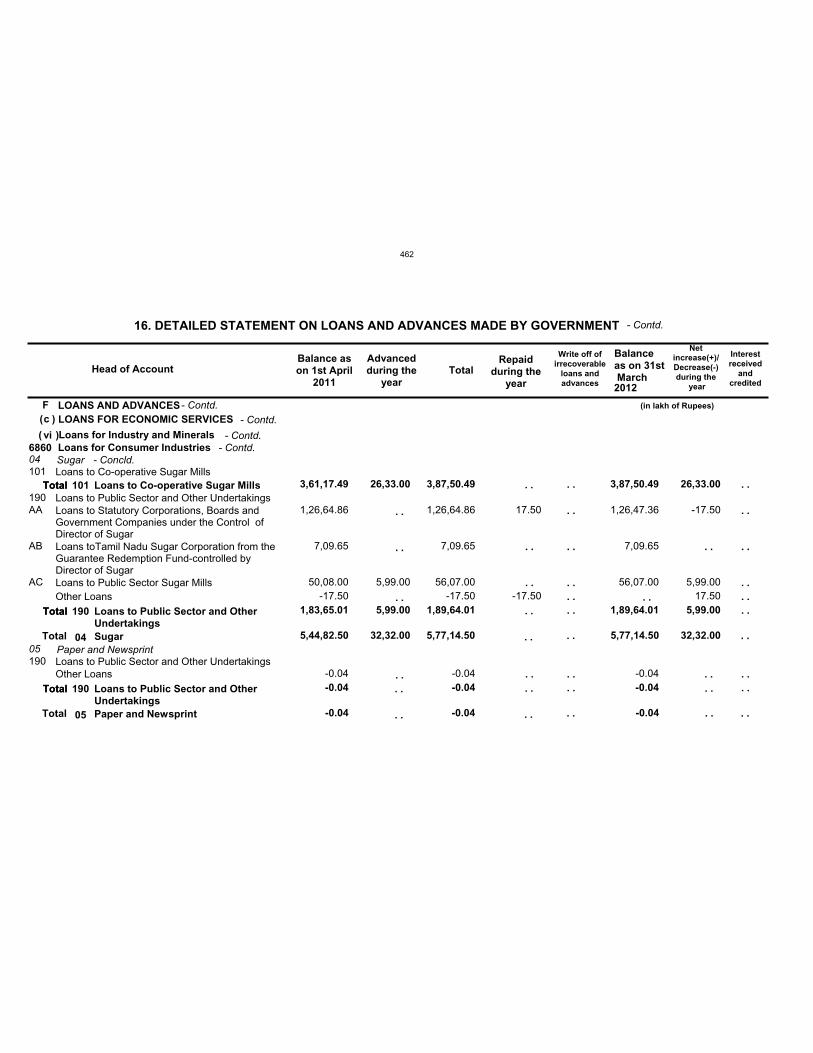
Fc
vi686004
05 5,44,82.50
-0.04
32,32.00 5,77,14.50
-0.04
5,77,14.50
-0.04
32,32.00
101
190
190
3,61,17.49
1,83,65.01
-0.04
26,33.00
5,99.00
3,87,50.49
1,89,64.01
-0.04
3,87,50.49
1,89,64.01
-0.04
26,33.00
5,99.00
AA
AB
AC
1,26,64.86
7,09.65
50,08.00-17.50
-0.04
5,99.00
1,26,64.86
7,09.65
56,07.00-17.50
-0.04
17.50
-17.50
1,26,47.36
7,09.65
56,07.00
-0.04
-17.50
5,99.00 17.50
LOANS AND ADVANCESLOANS FOR ECONOMIC SERVICES
Loans for Industry and MineralsLoans for Consumer IndustriesSugar
Paper and Newsprint
Loans to Co-operative Sugar Mills
Loans to Public Sector and Other Undertakings
Loans to Public Sector and Other Undertakings
Loans to Statutory Corporations, Boards andGovernment Companies under the Control ofDirector of SugarLoans toTamil Nadu Sugar Corporation from theGuarantee Redemption Fund-controlled byDirector of SugarLoans to Public Sector Sugar MillsOther Loans
Other Loans
Head of AccountBalance ason 1st April
2011
Advancedduring the
yearTotal
Repaidduring the
year
Write off ofirrecoverable
loans andadvances
Balanceas on 31st March
Netincrease(+)/Decrease(-)during the
year
16. DETAILED STATEMENT ON LOANS AND ADVANCES MADE BY GOVERNMENT
(in lakh of Rupees)
2012
- Contd.
- Contd.( )
( )- Contd.
- Contd.
. .
. .
. .
. .
. .
. .
. .. .
. .
. .
. .
Total
Total
Total
101
190
190
Loans to Co-operative Sugar Mills
Loans to Public Sector and OtherUndertakings
Loans to Public Sector and OtherUndertakings
. .
. .
. .
Interestreceived
andcredited
. .
. .
. .
. .
. .
. .
. .
. .
Total
Total
Total
Total
Total
04
05
Sugar
Paper and Newsprint
. .
. .
. .
. .
. .
. .
. .
. .
- Contd.
. .
. .
. .
. .
. .
. .
. .. .
. .
- Concld.
462
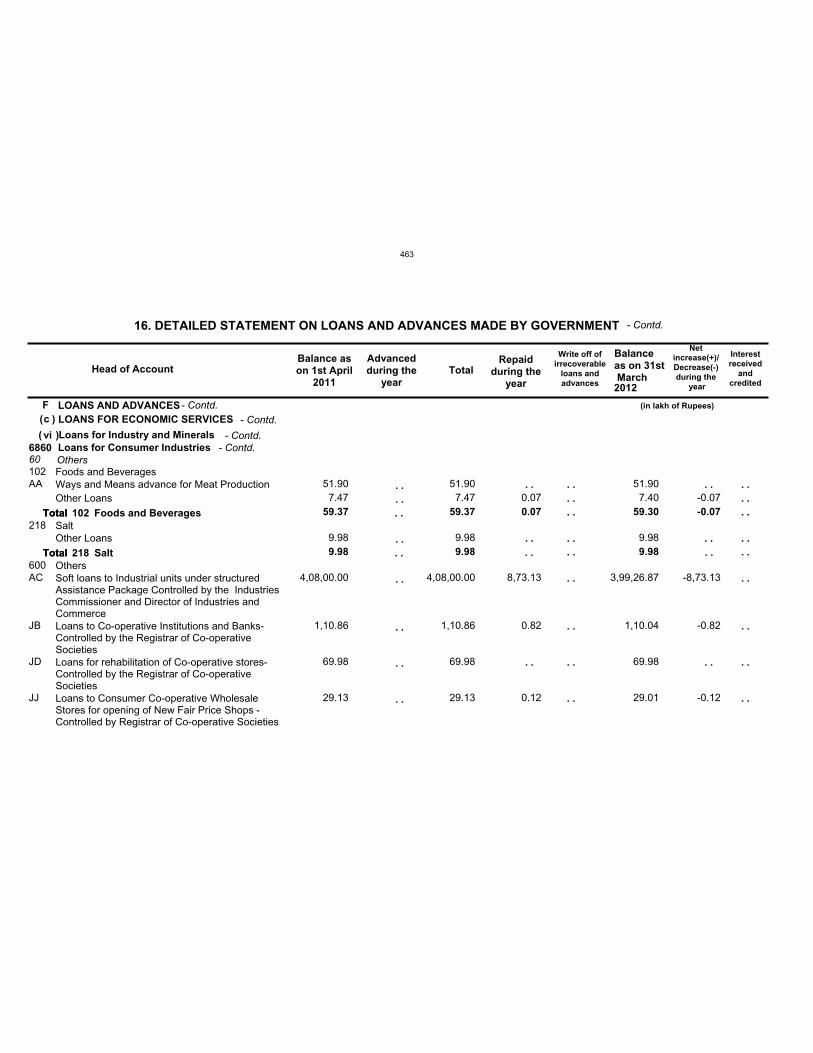
Fc
vi686060102
218
600
59.37
9.98
59.37
9.98
0.07 59.30
9.98
-0.07
AA
AC
JB
JD
JJ
51.90 7.47
9.98
4,08,00.00
1,10.86
69.98
29.13
51.90 7.47
9.98
4,08,00.00
1,10.86
69.98
29.13
0.07
8,73.13
0.82
0.12
51.90 7.40
9.98
3,99,26.87
1,10.04
69.98
29.01
-0.07
-8,73.13
-0.82
-0.12
LOANS AND ADVANCESLOANS FOR ECONOMIC SERVICES
Loans for Industry and MineralsLoans for Consumer IndustriesOthersFoods and Beverages
Salt
Others
Ways and Means advance for Meat ProductionOther Loans
Other Loans
Soft loans to Industrial units under structuredAssistance Package Controlled by the IndustriesCommissioner and Director of Industries andCommerceLoans to Co-operative Institutions and Banks-Controlled by the Registrar of Co-operativeSocietiesLoans for rehabilitation of Co-operative stores-Controlled by the Registrar of Co-operativeSocietiesLoans to Consumer Co-operative WholesaleStores for opening of New Fair Price Shops -Controlled by Registrar of Co-operative Societies
Head of AccountBalance ason 1st April
2011
Advancedduring the
yearTotal
Repaidduring the
year
Write off ofirrecoverable
loans andadvances
Balanceas on 31st March
Netincrease(+)/Decrease(-)during the
year
16. DETAILED STATEMENT ON LOANS AND ADVANCES MADE BY GOVERNMENT
(in lakh of Rupees)
2012
- Contd.
- Contd.( )
( )- Contd.
- Contd.
. .
. .
. .
. .
. .
. .
. .
. .
. .
. .
. .
. . . .
Total
Total
102
218
Foods and Beverages
Salt
. .
. .
. .
. .
Interestreceived
andcredited
. .
. .
. .
. .
. .
. .
. .
. .
. .
Total
Total
. .
. .
. .
. .
. .
. .
. .
. .
. .
- Contd.
463
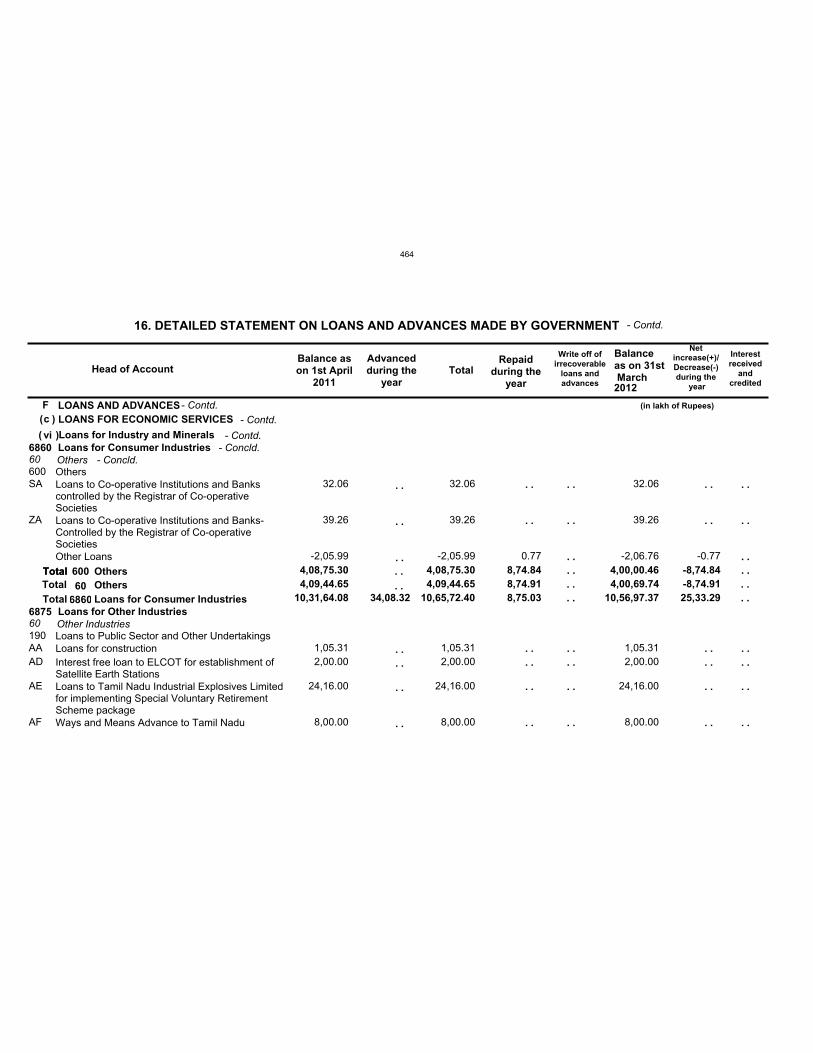
Fc
vi6860
6875 10,31,64.08 34,08.32 10,65,72.40 8,75.03 10,56,97.37 25,33.29
60
60
4,09,44.65 4,09,44.65 8,74.91 4,00,69.74 -8,74.91
600
190
4,08,75.30 4,08,75.30 8,74.84 4,00,00.46 -8,74.84
SA
ZA
AAAD
AE
AF
32.06
39.26
-2,05.99
1,05.31 2,00.00
24,16.00
8,00.00
32.06
39.26
-2,05.99
1,05.31 2,00.00
24,16.00
8,00.00
0.77
32.06
39.26
-2,06.76
1,05.31 2,00.00
24,16.00
8,00.00
-0.77
LOANS AND ADVANCESLOANS FOR ECONOMIC SERVICES
Loans for Industry and MineralsLoans for Consumer Industries
Loans for Other Industries
Others
Other Industries
Others
Loans to Public Sector and Other Undertakings
Loans to Co-operative Institutions and Bankscontrolled by the Registrar of Co-operativeSocietiesLoans to Co-operative Institutions and Banks-Controlled by the Registrar of Co-operativeSocietiesOther Loans
Loans for constructionInterest free loan to ELCOT for establishment ofSatellite Earth StationsLoans to Tamil Nadu Industrial Explosives Limitedfor implementing Special Voluntary RetirementScheme packageWays and Means Advance to Tamil Nadu
Head of AccountBalance ason 1st April
2011
Advancedduring the
yearTotal
Repaidduring the
year
Write off ofirrecoverable
loans andadvances
Balanceas on 31st March
Netincrease(+)/Decrease(-)during the
year
16. DETAILED STATEMENT ON LOANS AND ADVANCES MADE BY GOVERNMENT
(in lakh of Rupees)
2012
- Contd.
- Contd.( )
( )- Contd.
- Contd.
. .
. .
. .
. .
. .
. .
. .
. .
. .
. .
. .
. .
. .
. .Total 600 Others
. .
. .
. .
. .
. .
. .
Interestreceived
andcredited
. .
. .
. .
. .
. .
. .
. .
. .TotalTotal
Total60
6860OthersLoans for Consumer Industries
. .
. .
. .
. .
. .
. .
. .
. .
- Concld.
. .. . . .. . . .
- Concld.
464
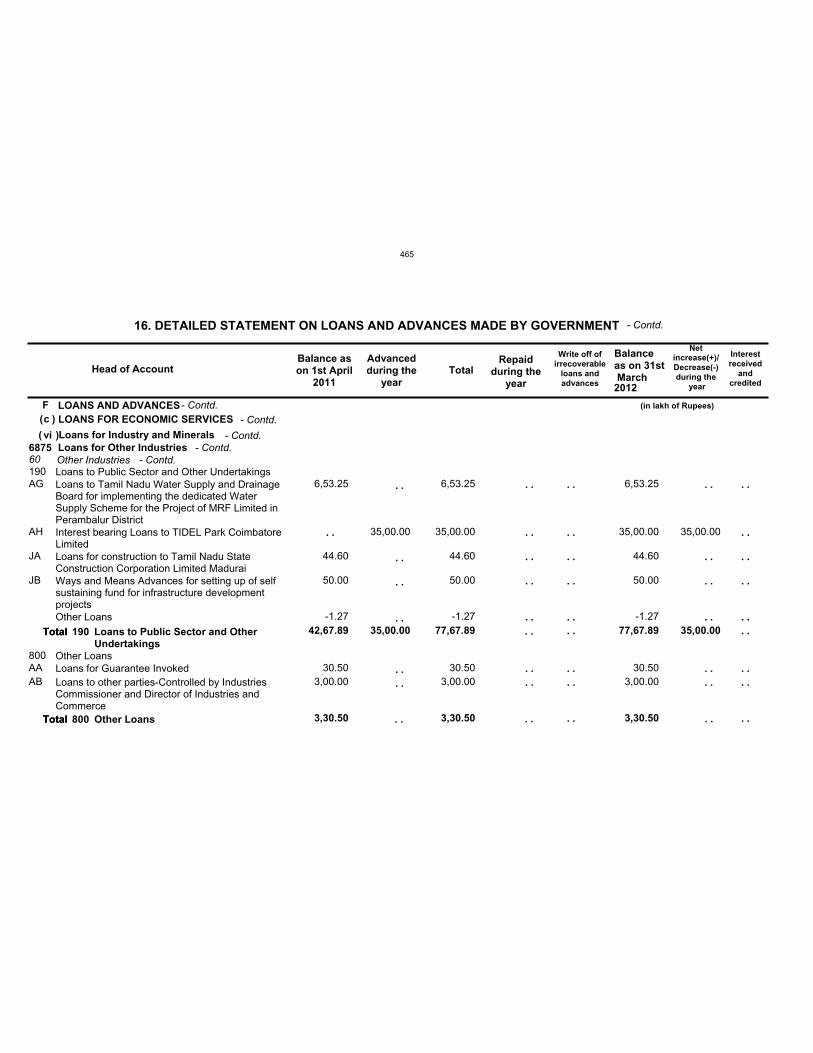
Fc
vi687560190
800
42,67.89
3,30.50
35,00.00 77,67.89
3,30.50
77,67.89
3,30.50
35,00.00
AG
AH
JA
JB
AAAB
6,53.25
44.60
50.00
-1.27
30.50 3,00.00
35,00.00
6,53.25
35,00.00
44.60
50.00
-1.27
30.50 3,00.00
6,53.25
35,00.00
44.60
50.00
-1.27
30.50 3,00.00
35,00.00
LOANS AND ADVANCESLOANS FOR ECONOMIC SERVICES
Loans for Industry and MineralsLoans for Other IndustriesOther IndustriesLoans to Public Sector and Other Undertakings
Other Loans
Loans to Tamil Nadu Water Supply and DrainageBoard for implementing the dedicated WaterSupply Scheme for the Project of MRF Limited inPerambalur DistrictInterest bearing Loans to TIDEL Park CoimbatoreLimitedLoans for construction to Tamil Nadu StateConstruction Corporation Limited MaduraiWays and Means Advances for setting up of selfsustaining fund for infrastructure developmentprojectsOther Loans
Loans for Guarantee InvokedLoans to other parties-Controlled by IndustriesCommissioner and Director of Industries andCommerce
Head of AccountBalance ason 1st April
2011
Advancedduring the
yearTotal
Repaidduring the
year
Write off ofirrecoverable
loans andadvances
Balanceas on 31st March
Netincrease(+)/Decrease(-)during the
year
16. DETAILED STATEMENT ON LOANS AND ADVANCES MADE BY GOVERNMENT
(in lakh of Rupees)
2012
- Contd.
- Contd.( )
( )- Contd.
- Contd.
. .
. .
. .
. .
. .
. .
. .
. .
. .
. .
. .
. .
. .
. .
. .
. .
. .
Total
Total
190
800
Loans to Public Sector and OtherUndertakings
Other Loans
. .
. .
. .
. .
. .
. .
. .
Interestreceived
andcredited
. .
. .
. .
. .
. .
. .
. .
. .
. .
Total
Total
. .
. .
. .
. .
. .
. .
. .
. .
. .
- Contd.- Contd.
465

Fc
vi6875
6885 45,98.39 35,00.00 80,98.39 80,98.39 35,00.00
60
01
45,98.39
2,17,42.68
35,00.00
12.00
80,98.39
2,17,54.68 2,96.98
80,98.39
2,14,57.70
35,00.00
-2,84.98
190
2,17,42.68 12.00 2,17,54.68 2,96.98 2,14,57.70 -2,84.98
AA
ABACAI
AJJC
5,79.12
9,64.73 1,76,97.59
8,59.40
5,25.07 13,57.77
-2,41.00
12.00
5,79.12
9,64.73 1,77,09.59
8,59.40
5,25.07 13,57.77
-2,41.00
3,95.12
1,00.00
42.86
-2,41.00
1,84.00
9,64.73 1,76,09.59
8,59.40
5,25.07 13,14.91
-3,95.12
-88.00
-42.86
2,41.00
LOANS AND ADVANCESLOANS FOR ECONOMIC SERVICES
Loans for Industry and MineralsLoans for Other Industries
Other Loans to Industries and Minerals
Other Industries
Loans to Industrial Financial InstitutionsLoans to Public Sector and other UndertakingsLoans to Statutory Corporations, Boards andGovernment Companies-Controlled by Director ofIndustries and CommerceLoans to Tamil Nadu Industrial CorporationLoans to Statutory Corporations, Boards etc.Loans to Statutory Corporations, Boards andGovt. CompaniesLoans to Statutory CorporationsLoans to other parties Controlled by the Directorof Industries and CommerceOther Loans
Head of AccountBalance ason 1st April
2011
Advancedduring the
yearTotal
Repaidduring the
year
Write off ofirrecoverable
loans andadvances
Balanceas on 31st March
Netincrease(+)/Decrease(-)during the
year
16. DETAILED STATEMENT ON LOANS AND ADVANCES MADE BY GOVERNMENT
(in lakh of Rupees)
2012
- Contd.
- Contd.( )
( )- Contd.
- Contd.
. .
. .
. .
. .
. .
. .
. .
. .
. .
Total 190 Loans to Public Sector and otherUndertakings
. .
. .
. .
Interestreceived
andcredited
. .
. .
. .
. .
. .
. .
. .
. .
Total
Total
Total
Total
60
01
6875Other Industries
Loans to Industrial FinancialInstitutions
Loans for Other Industries
. .
. .
. .
. .
. .
. .
. .
. .
- Concld.
. .. . . .. .. .
. .
. .
. .
. .
- Concld.
466
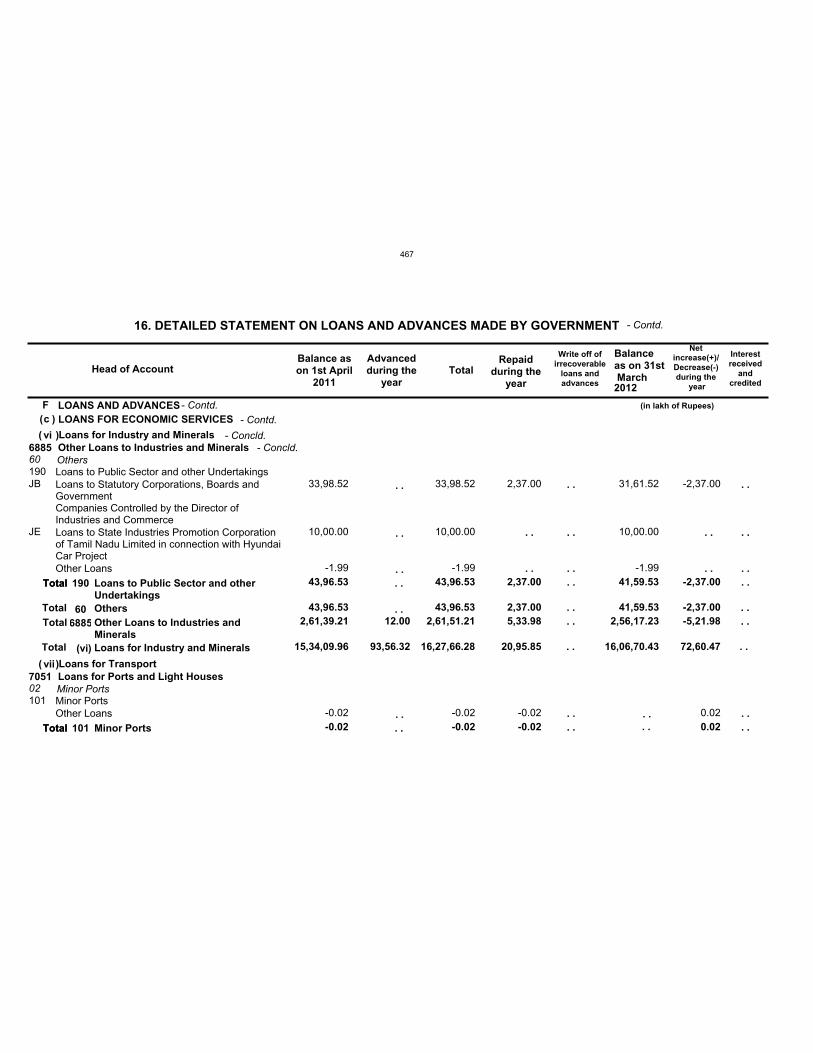
Fc
vi
vii
15,34,09.96 93,56.32 16,27,66.28 20,95.85 16,06,70.43 72,60.47
6885
7051
2,61,39.21 12.00 2,61,51.21 5,33.98 2,56,17.23 -5,21.98
60
02
43,96.53 43,96.53 2,37.00 41,59.53 -2,37.00
190
101
43,96.53
-0.02
43,96.53
-0.02
2,37.00
-0.02
41,59.53 -2,37.00
0.02
JB
JE
33,98.52
10,00.00
-1.99
-0.02
33,98.52
10,00.00
-1.99
-0.02
2,37.00
-0.02
31,61.52
10,00.00
-1.99
-2,37.00
0.02
LOANS AND ADVANCESLOANS FOR ECONOMIC SERVICES
Loans for Industry and Minerals
Loans for Transport
Other Loans to Industries and Minerals
Loans for Ports and Light Houses
Others
Minor Ports
Loans to Public Sector and other Undertakings
Minor Ports
Loans to Statutory Corporations, Boards andGovernmentCompanies Controlled by the Director ofIndustries and CommerceLoans to State Industries Promotion Corporationof Tamil Nadu Limited in connection with HyundaiCar ProjectOther Loans
Other Loans
Head of AccountBalance ason 1st April
2011
Advancedduring the
yearTotal
Repaidduring the
year
Write off ofirrecoverable
loans andadvances
Balanceas on 31st March
Netincrease(+)/Decrease(-)during the
year
16. DETAILED STATEMENT ON LOANS AND ADVANCES MADE BY GOVERNMENT
(in lakh of Rupees)
2012
- Contd.
- Contd.( )
(
(
)
)
- Contd.
- Concld.
. .
. .
. .
. .
. .
. .. .
. .
Total
Total
190
101
Loans to Public Sector and otherUndertakings
Minor Ports
. .
. .
Interestreceived
andcredited
. .
. .
. .
. .
. .
. .
TotalTotal
Total
Total
Total
606885
(vi)
OthersOther Loans to Industries andMineralsLoans for Industry and Minerals
. .
. .
. .
. .
. .
. .
- Concld.
. .. . . .
. . . .
. . . .
. .
. .
467
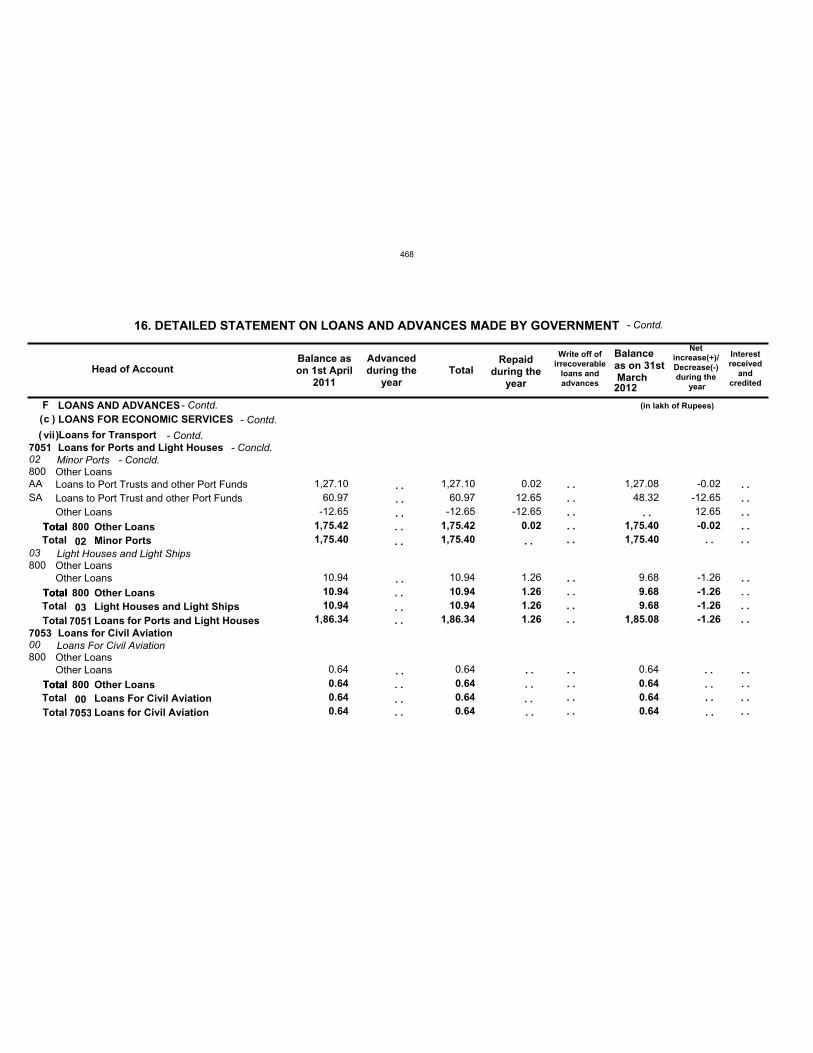
Fc
vii7051
7053 1,86.34
0.64
1,86.34
0.64
1.26 1,85.08
0.64
-1.26
02
03
00
1,75.40
10.94
0.64
1,75.40
10.94
0.64
1.26
1,75.40
9.68
0.64
-1.26
800
800
800
1,75.42
10.94
0.64
1,75.42
10.94
0.64
0.02
1.26
1,75.40
9.68
0.64
-0.02
-1.26
AASA
1,27.10 60.97-12.65
10.94
0.64
1,27.10 60.97-12.65
10.94
0.64
0.02 12.65-12.65
1.26
1,27.08 48.32
9.68
0.64
-0.02-12.65 12.65
-1.26
LOANS AND ADVANCESLOANS FOR ECONOMIC SERVICES
Loans for TransportLoans for Ports and Light Houses
Loans for Civil Aviation
Minor Ports
Light Houses and Light Ships
Loans For Civil Aviation
Other Loans
Other Loans
Other Loans
Loans to Port Trusts and other Port FundsLoans to Port Trust and other Port FundsOther Loans
Other Loans
Other Loans
Head of AccountBalance ason 1st April
2011
Advancedduring the
yearTotal
Repaidduring the
year
Write off ofirrecoverable
loans andadvances
Balanceas on 31st March
Netincrease(+)/Decrease(-)during the
year
16. DETAILED STATEMENT ON LOANS AND ADVANCES MADE BY GOVERNMENT
(in lakh of Rupees)
2012
- Contd.
- Contd.( )
( )- Contd.
- Contd.
. .
. .
. .
. .
. . . .
. .
. .
. . . .
Total
Total
Total
800
800
800
Other Loans
Other Loans
Other Loans. .. .
Interestreceived
andcredited
. .
. .
. .
. .
. .
. .
. .
. .
Total
Total
Total
Total
Total
Total
Total
Total
02
03
00
7051
7053
Minor Ports
Light Houses and Light Ships
Loans For Civil Aviation
Loans for Ports and Light Houses
Loans for Civil Aviation
. .
. .
. .
. .
. .
. .
. .
. .
- Concld.
. .
. .
. .
. .
. .
. .
. .
. .
. .
. .
. . . .
. .
. .
. .
. .
. .
. .
. .
. .
. .
. .
- Concld.
468
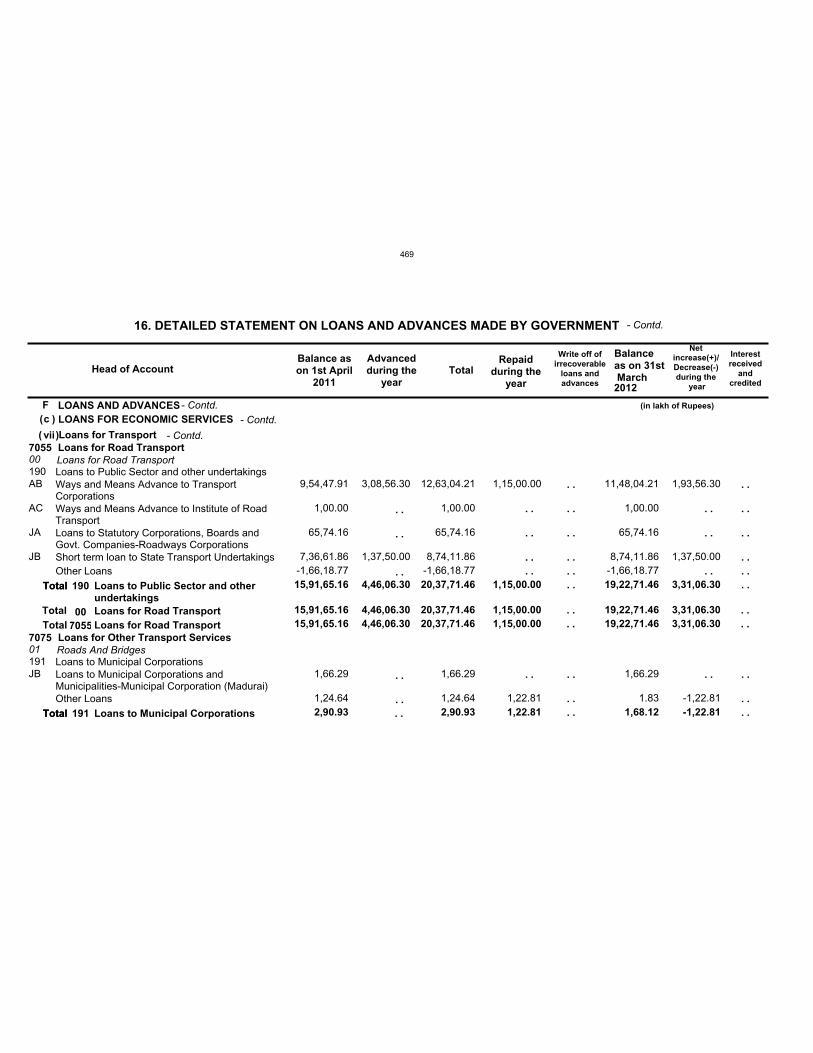
Fc
vii7055
7075 15,91,65.16 4,46,06.30 20,37,71.46 1,15,00.00 19,22,71.46 3,31,06.30
00
01
15,91,65.16 4,46,06.30 20,37,71.46 1,15,00.00 19,22,71.46 3,31,06.30
190
191
15,91,65.16
2,90.93
4,46,06.30 20,37,71.46
2,90.93
1,15,00.00
1,22.81
19,22,71.46
1,68.12
3,31,06.30
-1,22.81
AB
AC
JA
JB
JB
9,54,47.91
1,00.00
65,74.16
7,36,61.86-1,66,18.77
1,66.29
1,24.64
3,08,56.30
1,37,50.00
12,63,04.21
1,00.00
65,74.16
8,74,11.86-1,66,18.77
1,66.29
1,24.64
1,15,00.00
1,22.81
11,48,04.21
1,00.00
65,74.16
8,74,11.86-1,66,18.77
1,66.29
1.83
1,93,56.30
1,37,50.00
-1,22.81
LOANS AND ADVANCESLOANS FOR ECONOMIC SERVICES
Loans for TransportLoans for Road Transport
Loans for Other Transport Services
Loans for Road Transport
Roads And Bridges
Loans to Public Sector and other undertakings
Loans to Municipal Corporations
Ways and Means Advance to TransportCorporationsWays and Means Advance to Institute of RoadTransportLoans to Statutory Corporations, Boards andGovt. Companies-Roadways CorporationsShort term loan to State Transport UndertakingsOther Loans
Loans to Municipal Corporations andMunicipalities-Municipal Corporation (Madurai)Other Loans
Head of AccountBalance ason 1st April
2011
Advancedduring the
yearTotal
Repaidduring the
year
Write off ofirrecoverable
loans andadvances
Balanceas on 31st March
Netincrease(+)/Decrease(-)during the
year
16. DETAILED STATEMENT ON LOANS AND ADVANCES MADE BY GOVERNMENT
(in lakh of Rupees)
2012
- Contd.
- Contd.( )
( )- Contd.
- Contd.
. .
. .
. .
. .
. .
. .
. .
. .
. .
. .
. .
Total
Total
190
191
Loans to Public Sector and otherundertakings
Loans to Municipal Corporations
. .
. .
. .
. .
Interestreceived
andcredited
. .
. .
. .
. .
. .
. .
. .
. .
. .
TotalTotal
Total
Total
007055
Loans for Road TransportLoans for Road Transport
. .
. .
. .
. .
. .
. .
. .
. .
. .
. . . .
. . . .
469
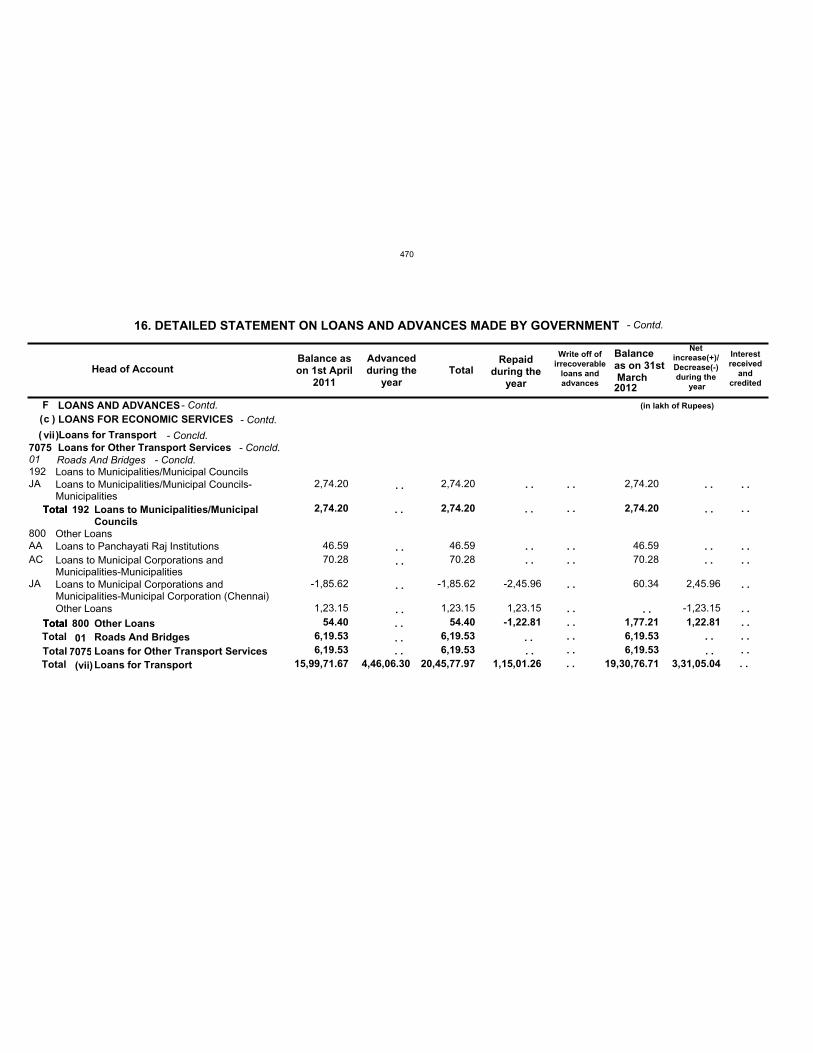
Fc
vii
15,99,71.67 4,46,06.30 20,45,77.97 1,15,01.26 19,30,76.71 3,31,05.04
7075
6,19.53 6,19.53 6,19.53
01
6,19.53 6,19.53 6,19.53
192
800
2,74.20
54.40
2,74.20
54.40 -1,22.81
2,74.20
1,77.21 1,22.81
JA
AAAC
JA
2,74.20
46.59 70.28
-1,85.62
1,23.15
2,74.20
46.59 70.28
-1,85.62
1,23.15
-2,45.96
1,23.15
2,74.20
46.59 70.28
60.34 2,45.96
-1,23.15
LOANS AND ADVANCESLOANS FOR ECONOMIC SERVICES
Loans for TransportLoans for Other Transport ServicesRoads And BridgesLoans to Municipalities/Municipal Councils
Other Loans
Loans to Municipalities/Municipal Councils-Municipalities
Loans to Panchayati Raj InstitutionsLoans to Municipal Corporations andMunicipalities-MunicipalitiesLoans to Municipal Corporations andMunicipalities-Municipal Corporation (Chennai)Other Loans
Head of AccountBalance ason 1st April
2011
Advancedduring the
yearTotal
Repaidduring the
year
Write off ofirrecoverable
loans andadvances
Balanceas on 31st March
Netincrease(+)/Decrease(-)during the
year
16. DETAILED STATEMENT ON LOANS AND ADVANCES MADE BY GOVERNMENT
(in lakh of Rupees)
2012
- Contd.
- Contd.( )
( )- Contd.
- Concld.
. .
. .
. .
. .
. .
. .
. .
. .
. .
. .
. .Total
Total
192
800
Loans to Municipalities/MunicipalCouncils
Other Loans
. .
. .
. .
. .
Interestreceived
andcredited
. .
. .
. .
. .
. .
. .
. .TotalTotalTotal
Total
Total01
7075(vii)
Roads And BridgesLoans for Other Transport ServicesLoans for Transport
. .
. .
. .
. .
. .
. .
. .
- Concld.
. . . .. . . .. . . .
. . . .. . . .. .
. .
. .
- Concld.
470
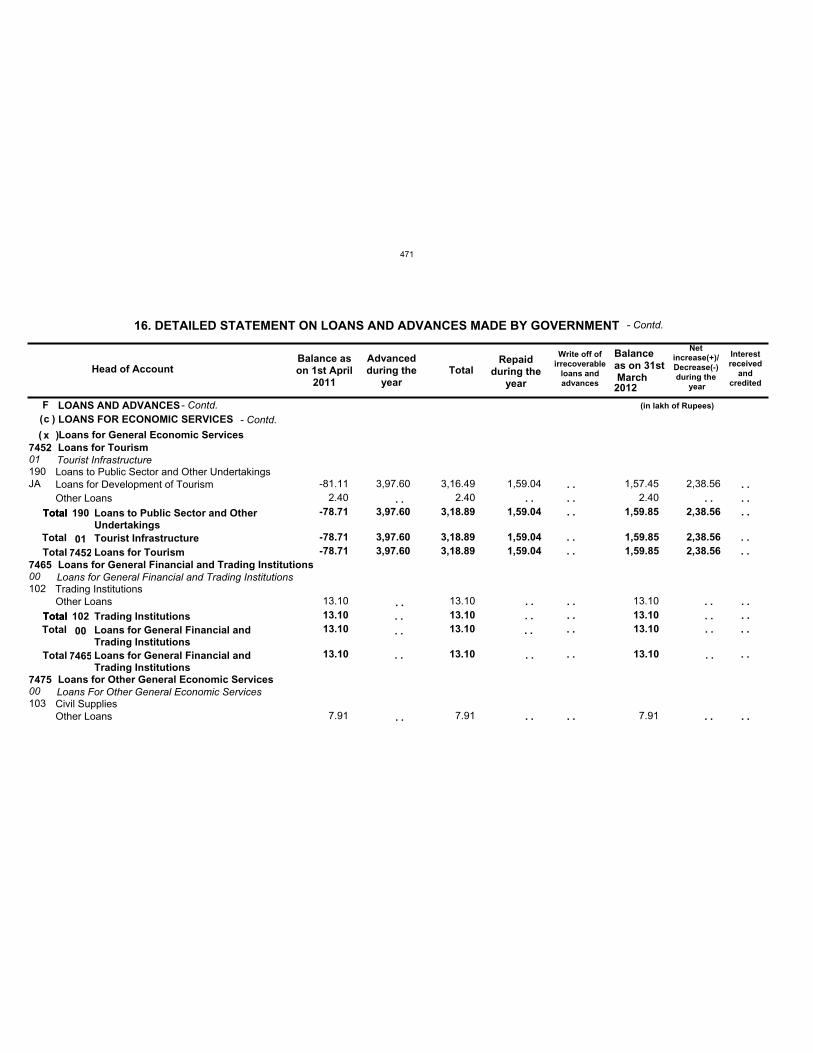
Fc
x7452
7465
7475
-78.71
13.10
3,97.60 3,18.89
13.10
1,59.04 1,59.85
13.10
2,38.56
01
00
00
-78.71
13.10
3,97.60 3,18.89
13.10
1,59.04 1,59.85
13.10
2,38.56
190
102
103
-78.71
13.10
3,97.60 3,18.89
13.10
1,59.04 1,59.85
13.10
2,38.56
JA -81.11 2.40
13.10
7.91
3,97.60 3,16.49 2.40
13.10
7.91
1,59.04 1,57.45 2.40
13.10
7.91
2,38.56
LOANS AND ADVANCESLOANS FOR ECONOMIC SERVICES
Loans for General Economic ServicesLoans for Tourism
Loans for General Financial and Trading Institutions
Loans for Other General Economic Services
Tourist Infrastructure
Loans for General Financial and Trading Institutions
Loans For Other General Economic Services
Loans to Public Sector and Other Undertakings
Trading Institutions
Civil Supplies
Loans for Development of TourismOther Loans
Other Loans
Other Loans
Head of AccountBalance ason 1st April
2011
Advancedduring the
yearTotal
Repaidduring the
year
Write off ofirrecoverable
loans andadvances
Balanceas on 31st March
Netincrease(+)/Decrease(-)during the
year
16. DETAILED STATEMENT ON LOANS AND ADVANCES MADE BY GOVERNMENT
(in lakh of Rupees)
2012
- Contd.
- Contd.( )
( )- Contd.
. .
. .
. .
. .
. .
. .
. . . .
Total
Total
190
102
Loans to Public Sector and OtherUndertakings
Trading Institutions
. .
. .
. .
. .
Interestreceived
andcredited
. .
. .
. .
. .
. .
. .
Total
Total
Total
Total
Total
Total
01
00
7452
7465
Tourist Infrastructure
Loans for General Financial andTrading Institutions
Loans for Tourism
Loans for General Financial andTrading Institutions
. .
. .
. .
. .
. .
. .
. . . .
. .
. .
. .
. .. . . .
. .
. .
. .
. .. .
. .
471
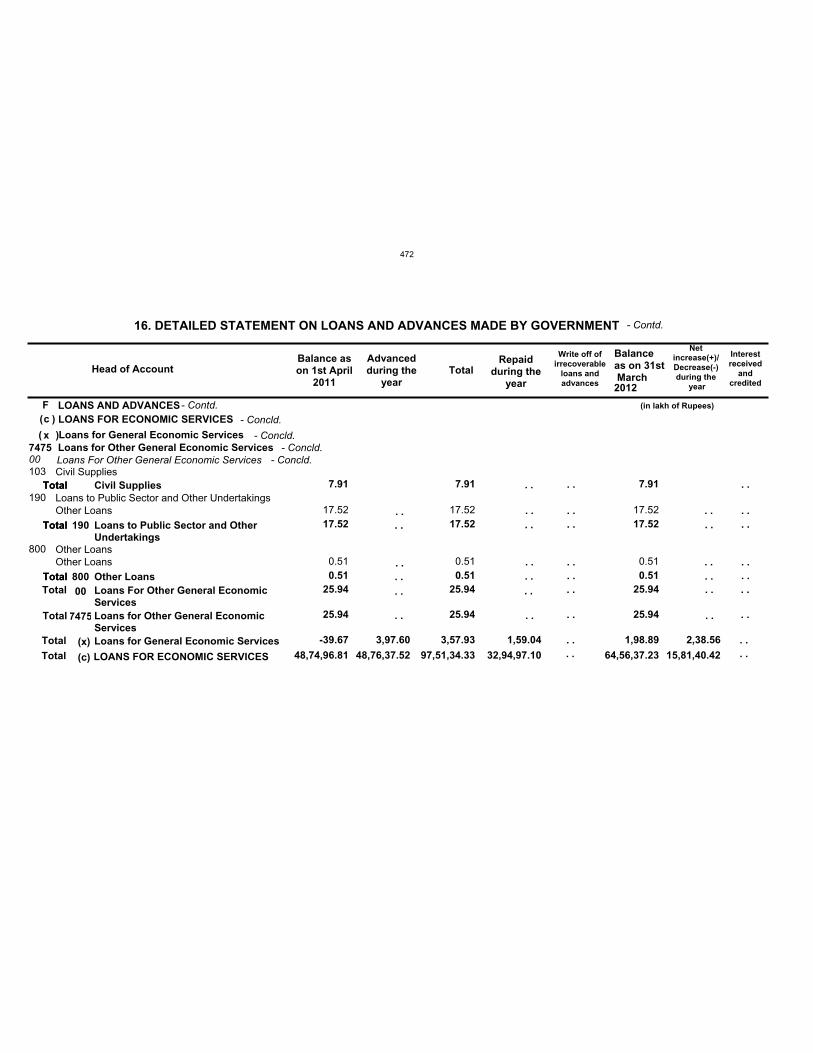
Fc
48,74,96.81 48,76,37.52 97,51,34.33 32,94,97.10 64,56,37.23 15,81,40.42
x
-39.67 3,97.60 3,57.93 1,59.04 1,98.89 2,38.56
7475
25.94 25.94 25.94
00
25.94 25.94 25.94
103
190
800
7.91
17.52
0.51
7.91
17.52
0.51
7.91
17.52
0.51
17.52
0.51
17.52
0.51
17.52
0.51
LOANS AND ADVANCESLOANS FOR ECONOMIC SERVICES
Loans for General Economic ServicesLoans for Other General Economic ServicesLoans For Other General Economic ServicesCivil Supplies
Loans to Public Sector and Other Undertakings
Other Loans
Other Loans
Other Loans
Head of AccountBalance ason 1st April
2011
Advancedduring the
yearTotal
Repaidduring the
year
Write off ofirrecoverable
loans andadvances
Balanceas on 31st March
Netincrease(+)/Decrease(-)during the
year
16. DETAILED STATEMENT ON LOANS AND ADVANCES MADE BY GOVERNMENT
(in lakh of Rupees)
2012
- Contd.
- Contd.( )
( )- Concld.
- Concld.
. .
. .
. .
. .
. .
. .
. .
. .
. .
Total
Total
Total
190
800
Civil Supplies
Loans to Public Sector and OtherUndertakings
Other Loans
. .
. .
. .
. .
Interestreceived
andcredited
. .
. .
. .
. .
. .Total
Total
TotalTotal
Total
Total
Total00
7475
(x)
(c)
Loans For Other General EconomicServicesLoans for Other General EconomicServicesLoans for General Economic Services
LOANS FOR ECONOMIC SERVICES
. .
. .
. .
. .
. .
- Concld.
. . . .
. . . .
. . . .
. . . .
. . . .
. . . .. .
. .
- Concld.
472
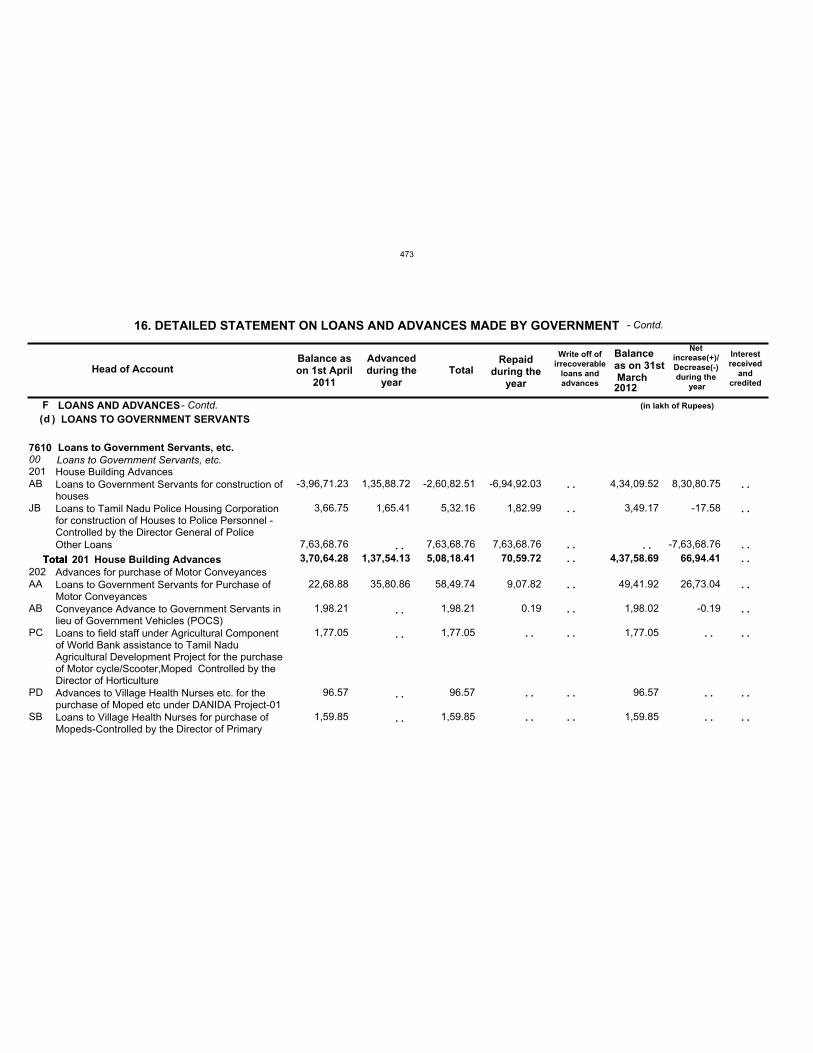
Fd
761000201
202 3,70,64.28 1,37,54.13 5,08,18.41 70,59.72 4,37,58.69 66,94.41
AB
JB
AA
AB
PC
PD
SB
-3,96,71.23
3,66.75
7,63,68.76
22,68.88
1,98.21
1,77.05
96.57
1,59.85
1,35,88.72
1,65.41
35,80.86
-2,60,82.51
5,32.16
7,63,68.76
58,49.74
1,98.21
1,77.05
96.57
1,59.85
-6,94,92.03
1,82.99
7,63,68.76
9,07.82
0.19
4,34,09.52
3,49.17
49,41.92
1,98.02
1,77.05
96.57
1,59.85
8,30,80.75
-17.58
-7,63,68.76
26,73.04
-0.19
LOANS AND ADVANCES LOANS TO GOVERNMENT SERVANTS
Loans to Government Servants, etc.Loans to Government Servants, etc.House Building Advances
Advances for purchase of Motor Conveyances
Loans to Government Servants for construction ofhousesLoans to Tamil Nadu Police Housing Corporationfor construction of Houses to Police Personnel -Controlled by the Director General of PoliceOther Loans
Loans to Government Servants for Purchase ofMotor ConveyancesConveyance Advance to Government Servants inlieu of Government Vehicles (POCS)Loans to field staff under Agricultural Componentof World Bank assistance to Tamil NaduAgricultural Development Project for the purchaseof Motor cycle/Scooter,Moped Controlled by theDirector of HorticultureAdvances to Village Health Nurses etc. for thepurchase of Moped etc under DANIDA Project-01Loans to Village Health Nurses for purchase ofMopeds-Controlled by the Director of Primary
Head of AccountBalance ason 1st April
2011
Advancedduring the
yearTotal
Repaidduring the
year
Write off ofirrecoverable
loans andadvances
Balanceas on 31st March
Netincrease(+)/Decrease(-)during the
year
16. DETAILED STATEMENT ON LOANS AND ADVANCES MADE BY GOVERNMENT
(in lakh of Rupees)
2012
- Contd.
- Contd.( )
. .
. .
. .
. .
. .
. .
. .
. .
Total 201 House Building Advances
. .
. .
. .
Interestreceived
andcredited
. .
. .
. .
. .
. .
. .
. .
. .
. .Total
. .
. .
. .
. .
. .
. .
. .
. .
. .. .
473
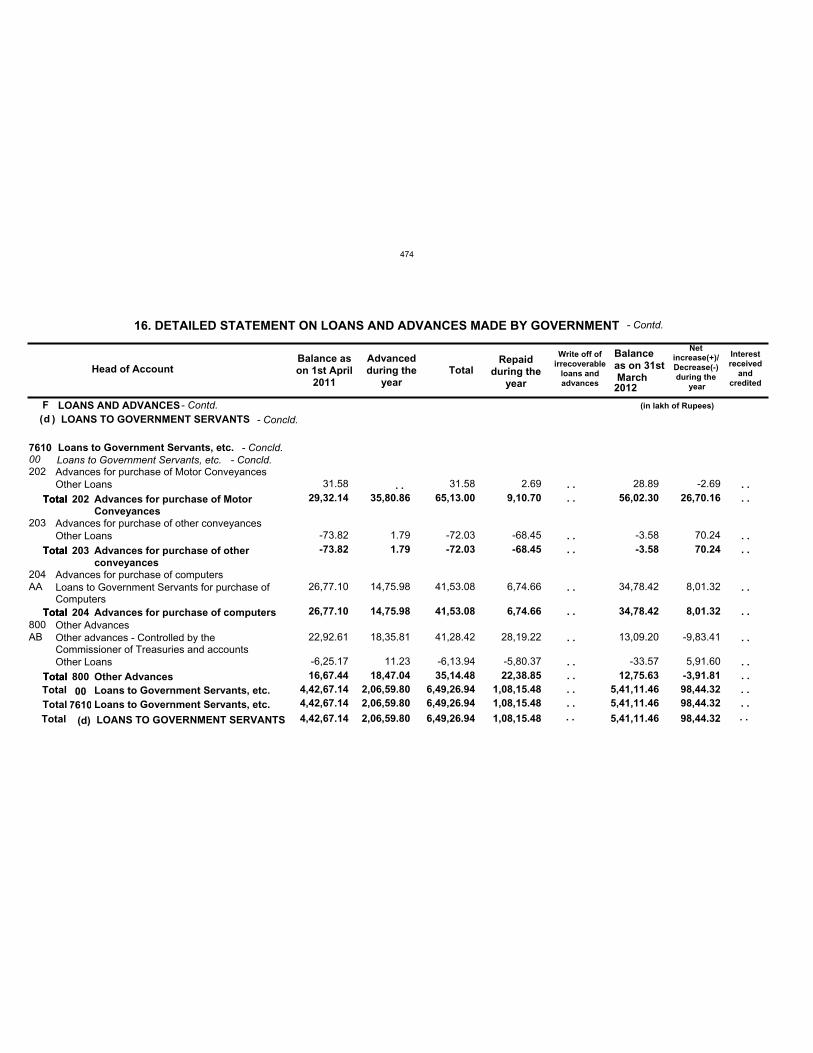
Fd
4,42,67.14 2,06,59.80 6,49,26.94 1,08,15.48 5,41,11.46 98,44.32
7610
4,42,67.14 2,06,59.80 6,49,26.94 1,08,15.48 5,41,11.46 98,44.32
00
4,42,67.14 2,06,59.80 6,49,26.94 1,08,15.48 5,41,11.46 98,44.32
202
203
204
800
29,32.14
-73.82
26,77.10
16,67.44
35,80.86
1.79
14,75.98
18,47.04
65,13.00
-72.03
41,53.08
35,14.48
9,10.70
-68.45
6,74.66
22,38.85
56,02.30
-3.58
34,78.42
12,75.63
26,70.16
70.24
8,01.32
-3,91.81
AA
AB
31.58
-73.82
26,77.10
22,92.61
-6,25.17
1.79
14,75.98
18,35.81
11.23
31.58
-72.03
41,53.08
41,28.42
-6,13.94
2.69
-68.45
6,74.66
28,19.22
-5,80.37
28.89
-3.58
34,78.42
13,09.20
-33.57
-2.69
70.24
8,01.32
-9,83.41
5,91.60
LOANS AND ADVANCES LOANS TO GOVERNMENT SERVANTS
Loans to Government Servants, etc.Loans to Government Servants, etc.Advances for purchase of Motor Conveyances
Advances for purchase of other conveyances
Advances for purchase of computers
Other Advances
Other Loans
Other Loans
Loans to Government Servants for purchase ofComputers
Other advances - Controlled by theCommissioner of Treasuries and accountsOther Loans
Head of AccountBalance ason 1st April
2011
Advancedduring the
yearTotal
Repaidduring the
year
Write off ofirrecoverable
loans andadvances
Balanceas on 31st March
Netincrease(+)/Decrease(-)during the
year
16. DETAILED STATEMENT ON LOANS AND ADVANCES MADE BY GOVERNMENT
(in lakh of Rupees)
2012
- Contd.
- Contd.( ) - Concld.
. .Total
Total
Total
Total
202
203
204
800
Advances for purchase of MotorConveyances
Advances for purchase of otherconveyances
Advances for purchase of computers
Other Advances
Interestreceived
andcredited
. .
. .
. .
. .
. .
. .
. .
. .
. .TotalTotalTotal
Total
Total
Total
Total00
7610
(d)
Loans to Government Servants, etc.Loans to Government Servants, etc.
LOANS TO GOVERNMENT SERVANTS
. .
. .
. .
. .
. .
. .
. .
. .
. .
- Concld.
. . . .
. . . .
. . . .
- Concld.
474
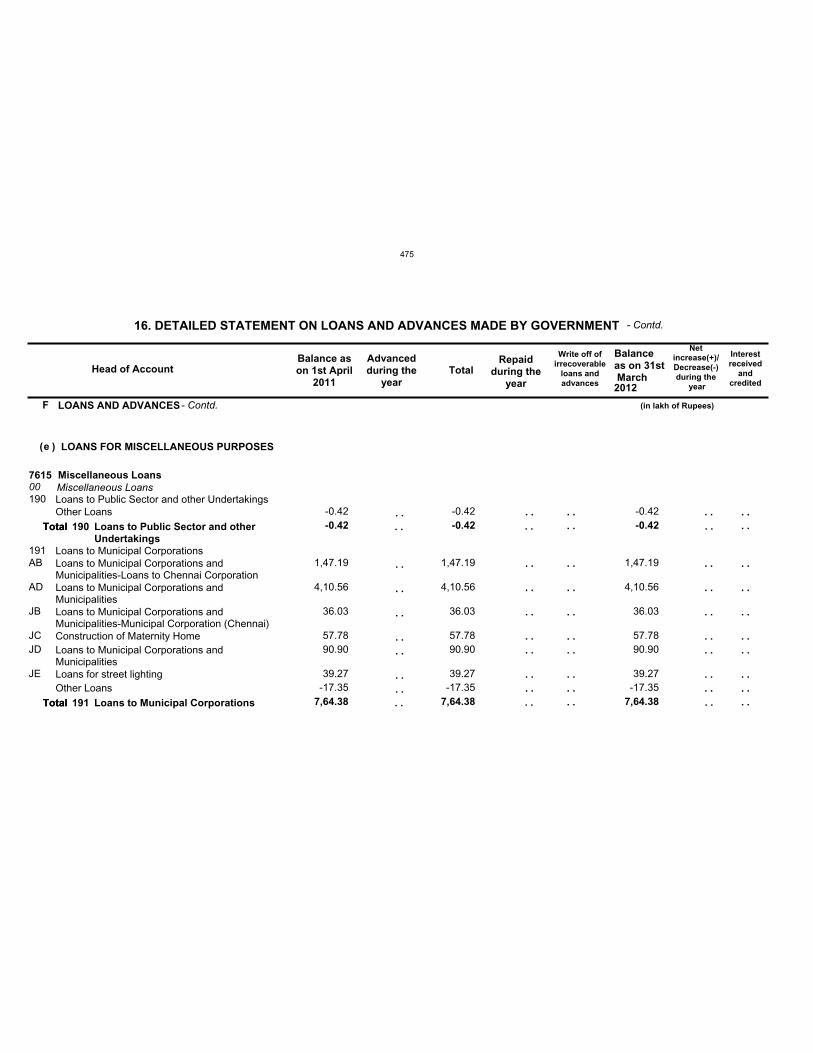
F
e
761500190
191
-0.42
7,64.38
-0.42
7,64.38
-0.42
7,64.38
AB
AD
JB
JCJD
JE
-0.42
1,47.19
4,10.56
36.03
57.78 90.90
39.27-17.35
-0.42
1,47.19
4,10.56
36.03
57.78 90.90
39.27-17.35
-0.42
1,47.19
4,10.56
36.03
57.78 90.90
39.27-17.35
LOANS AND ADVANCES
LOANS FOR MISCELLANEOUS PURPOSES
Miscellaneous LoansMiscellaneous LoansLoans to Public Sector and other Undertakings
Loans to Municipal Corporations
Other Loans
Loans to Municipal Corporations andMunicipalities-Loans to Chennai CorporationLoans to Municipal Corporations andMunicipalitiesLoans to Municipal Corporations andMunicipalities-Municipal Corporation (Chennai)Construction of Maternity HomeLoans to Municipal Corporations andMunicipalitiesLoans for street lightingOther Loans
Head of AccountBalance ason 1st April
2011
Advancedduring the
yearTotal
Repaidduring the
year
Write off ofirrecoverable
loans andadvances
Balanceas on 31st March
Netincrease(+)/Decrease(-)during the
year
16. DETAILED STATEMENT ON LOANS AND ADVANCES MADE BY GOVERNMENT
(in lakh of Rupees)
2012
- Contd.
- Contd.
( )
. .
. .
. .
. .
. .
. .
. .
. .
. .
. .
. .
. .
. .
. .
. .
. .
. .
. .
. .
. .
Total
Total
190
191
Loans to Public Sector and otherUndertakings
Loans to Municipal Corporations
. .
. .
. .
. .
. .
. .
. .
. .
. .
. .
Interestreceived
andcredited
. .
. .
. .
. .
. .
. .
. .
. .
. .
. .
Total
Total
. .
. .
. .
. .
. .
. .
. .
. .
. .
. .
475
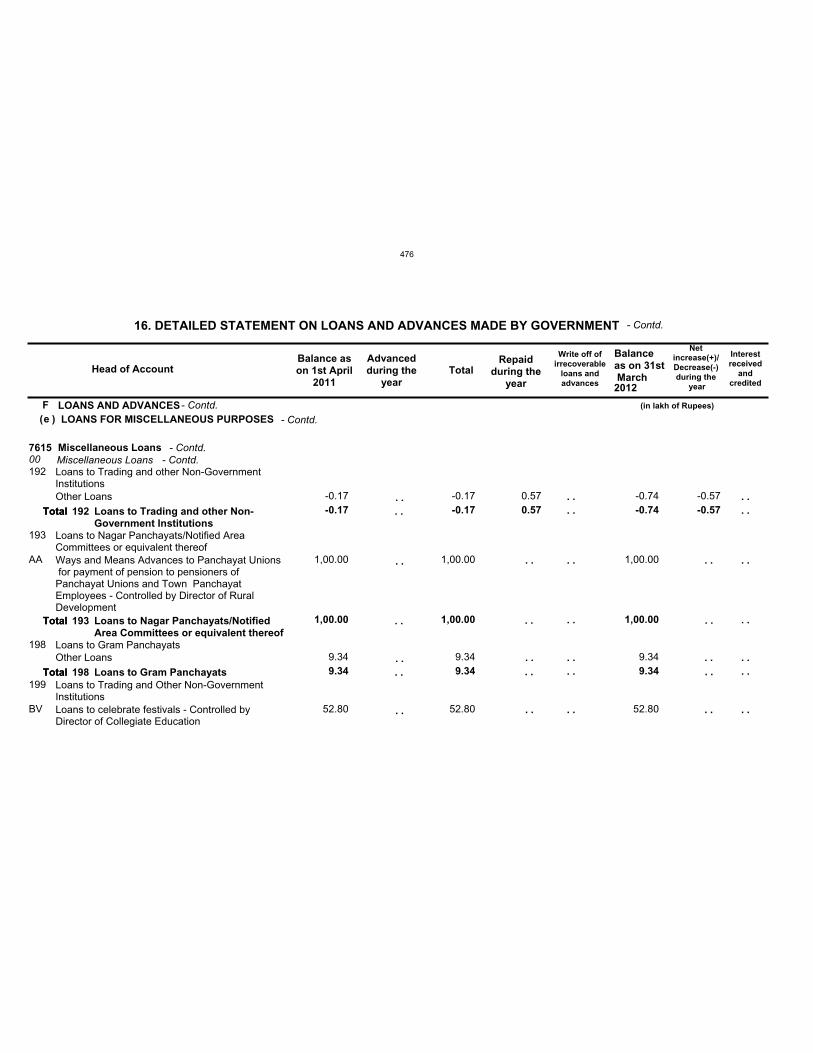
Fe
761500192
193
198
199
-0.17
1,00.00
9.34
-0.17
1,00.00
9.34
0.57 -0.74
1,00.00
9.34
-0.57
AA
BV
-0.17
1,00.00
9.34
52.80
-0.17
1,00.00
9.34
52.80
0.57 -0.74
1,00.00
9.34
52.80
-0.57
LOANS AND ADVANCES LOANS FOR MISCELLANEOUS PURPOSES
Miscellaneous LoansMiscellaneous LoansLoans to Trading and other Non-GovernmentInstitutions
Loans to Nagar Panchayats/Notified AreaCommittees or equivalent thereof
Loans to Gram Panchayats
Loans to Trading and Other Non-GovernmentInstitutions
Other Loans
Ways and Means Advances to Panchayat Unions for payment of pension to pensioners ofPanchayat Unions and Town PanchayatEmployees - Controlled by Director of RuralDevelopment
Other Loans
Loans to celebrate festivals - Controlled byDirector of Collegiate Education
Head of AccountBalance ason 1st April
2011
Advancedduring the
yearTotal
Repaidduring the
year
Write off ofirrecoverable
loans andadvances
Balanceas on 31st March
Netincrease(+)/Decrease(-)during the
year
16. DETAILED STATEMENT ON LOANS AND ADVANCES MADE BY GOVERNMENT
(in lakh of Rupees)
2012
- Contd.
- Contd.( ) - Contd.
. .
. .
. .
. .
. .
. .
. .
. .
. .
. .
. .
. .
Total
Total
Total
192
193
198
Loans to Trading and other Non-Government Institutions
Loans to Nagar Panchayats/NotifiedArea Committees or equivalent thereof
Loans to Gram Panchayats
. .
. .
. .
. .
. .
Interestreceived
andcredited
. .
. .
. .
. .
. .
. .
. .
Total
Total
Total
. .
. .
. .
. .
. .
. .
. .
- Contd.- Contd.
476
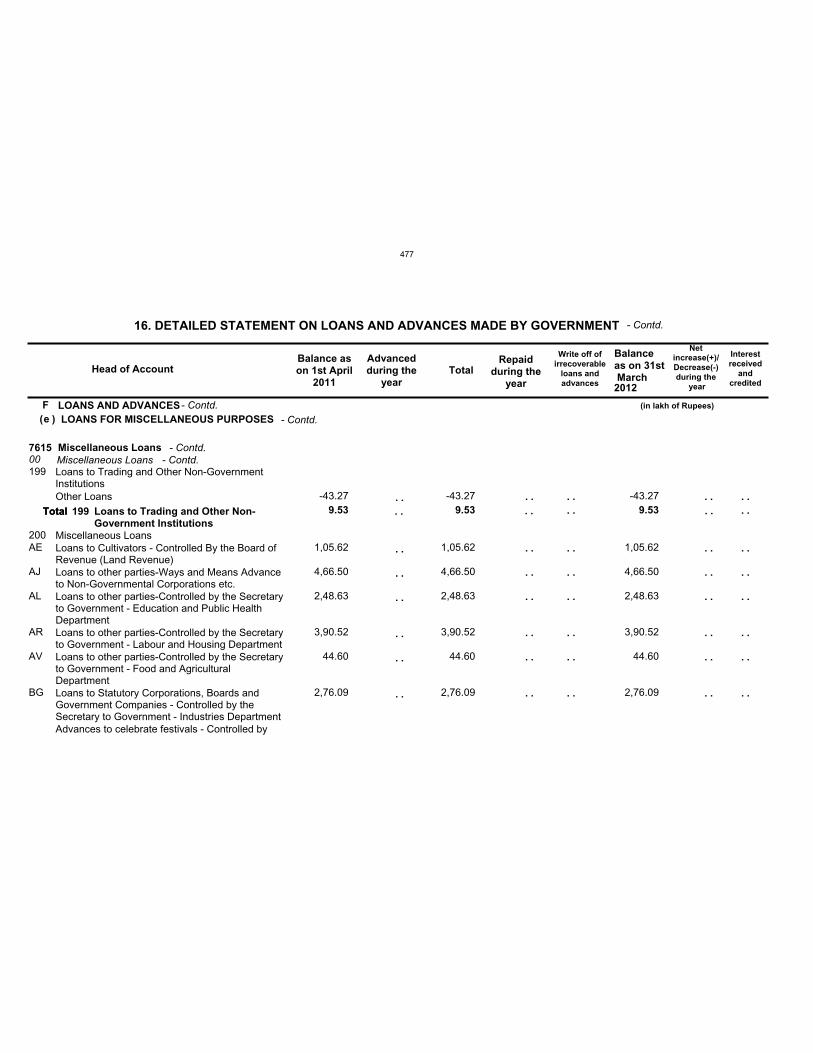
Fe
761500199
200
9.53 9.53 9.53
AE
AJ
AL
AR
AV
BG
-43.27
1,05.62
4,66.50
2,48.63
3,90.52
44.60
2,76.09
-43.27
1,05.62
4,66.50
2,48.63
3,90.52
44.60
2,76.09
-43.27
1,05.62
4,66.50
2,48.63
3,90.52
44.60
2,76.09
LOANS AND ADVANCES LOANS FOR MISCELLANEOUS PURPOSES
Miscellaneous LoansMiscellaneous LoansLoans to Trading and Other Non-GovernmentInstitutions
Miscellaneous Loans
Other Loans
Loans to Cultivators - Controlled By the Board ofRevenue (Land Revenue)Loans to other parties-Ways and Means Advanceto Non-Governmental Corporations etc.Loans to other parties-Controlled by the Secretaryto Government - Education and Public HealthDepartmentLoans to other parties-Controlled by the Secretaryto Government - Labour and Housing DepartmentLoans to other parties-Controlled by the Secretaryto Government - Food and AgriculturalDepartmentLoans to Statutory Corporations, Boards andGovernment Companies - Controlled by theSecretary to Government - Industries DepartmentAdvances to celebrate festivals - Controlled by
Head of AccountBalance ason 1st April
2011
Advancedduring the
yearTotal
Repaidduring the
year
Write off ofirrecoverable
loans andadvances
Balanceas on 31st March
Netincrease(+)/Decrease(-)during the
year
16. DETAILED STATEMENT ON LOANS AND ADVANCES MADE BY GOVERNMENT
(in lakh of Rupees)
2012
- Contd.
- Contd.( ) - Contd.
. .
. .
. .
. .
. .
. .
. .
. .
. .
. .
. .
. .
. .
. .
. . . .Total 199 Loans to Trading and Other Non-Government Institutions
. .
. .
. .
. .
. .
. .
. .
. .
Interestreceived
andcredited
. .
. .
. .
. .
. .
. .
. .
. .Total. .
. .
. .
. .
. .
. .
. .
. .
- Contd.- Contd.
477
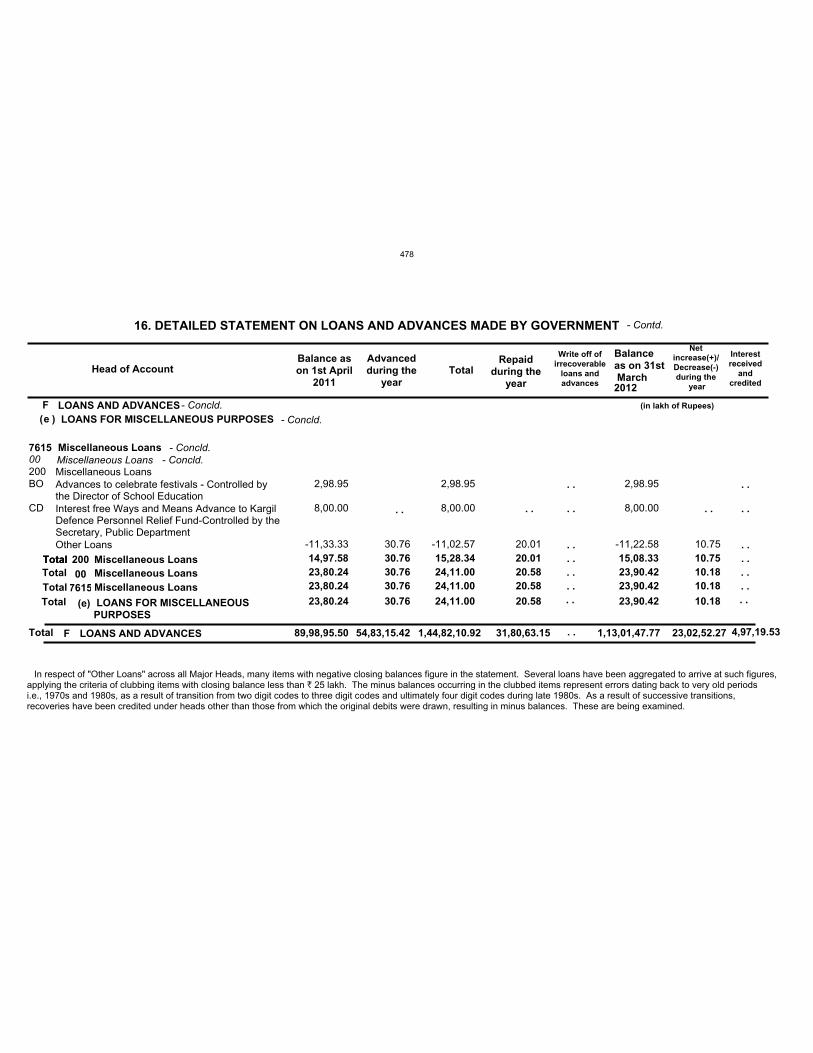
F
89,98,95.50 54,83,15.42 1,44,82,10.92 31,80,63.15 1,13,01,47.77 23,02,52.27
e
23,80.24 30.76 24,11.00 20.58 23,90.42 10.18
7615
23,80.24 30.76 24,11.00 20.58 23,90.42 10.18
00
23,80.24 30.76 24,11.00 20.58 23,90.42 10.18
200
14,97.58 30.76 15,28.34 20.01 15,08.33 10.75
BO
CD
2,98.95
8,00.00
-11,33.33 30.76
2,98.95
8,00.00
-11,02.57 20.01
2,98.95
8,00.00
-11,22.58 10.75
LOANS AND ADVANCES LOANS FOR MISCELLANEOUS PURPOSES
Miscellaneous LoansMiscellaneous LoansMiscellaneous LoansAdvances to celebrate festivals - Controlled bythe Director of School EducationInterest free Ways and Means Advance to KargilDefence Personnel Relief Fund-Controlled by theSecretary, Public DepartmentOther Loans
Head of AccountBalance ason 1st April
2011
Advancedduring the
yearTotal
Repaidduring the
year
Write off ofirrecoverable
loans andadvances
Balanceas on 31st March
Netincrease(+)/Decrease(-)during the
year
16. DETAILED STATEMENT ON LOANS AND ADVANCES MADE BY GOVERNMENT
(in lakh of Rupees)
2012
- Contd.
- Concld.( ) - Concld.
. . . .
Total 200 Miscellaneous Loans
. .
Interestreceived
andcredited
. .
. .
. .
. .TotalTotalTotal
Total
Total00
7615
(e)
F
Miscellaneous LoansMiscellaneous Loans
LOANS FOR MISCELLANEOUSPURPOSES
LOANS AND ADVANCES
. .
. .
. .
. .
- Concld.
. . . .
. . . .
. . 4,97,19.53
. . . .
- Concld.
In respect of "Other Loans" across all Major Heads, many items with negative closing balances figure in the statement. Several loans have been aggregated to arrive at such figures,applying the criteria of clubbing items with closing balance less than ` 25 lakh. The minus balances occurring in the clubbed items represent errors dating back to very old periodsi.e., 1970s and 1980s, as a result of transition from two digit codes to three digit codes and ultimately four digit codes during late 1980s. As a result of successive transitions,recoveries have been credited under heads other than those from which the original debits were drawn, resulting in minus balances. These are being examined.
478
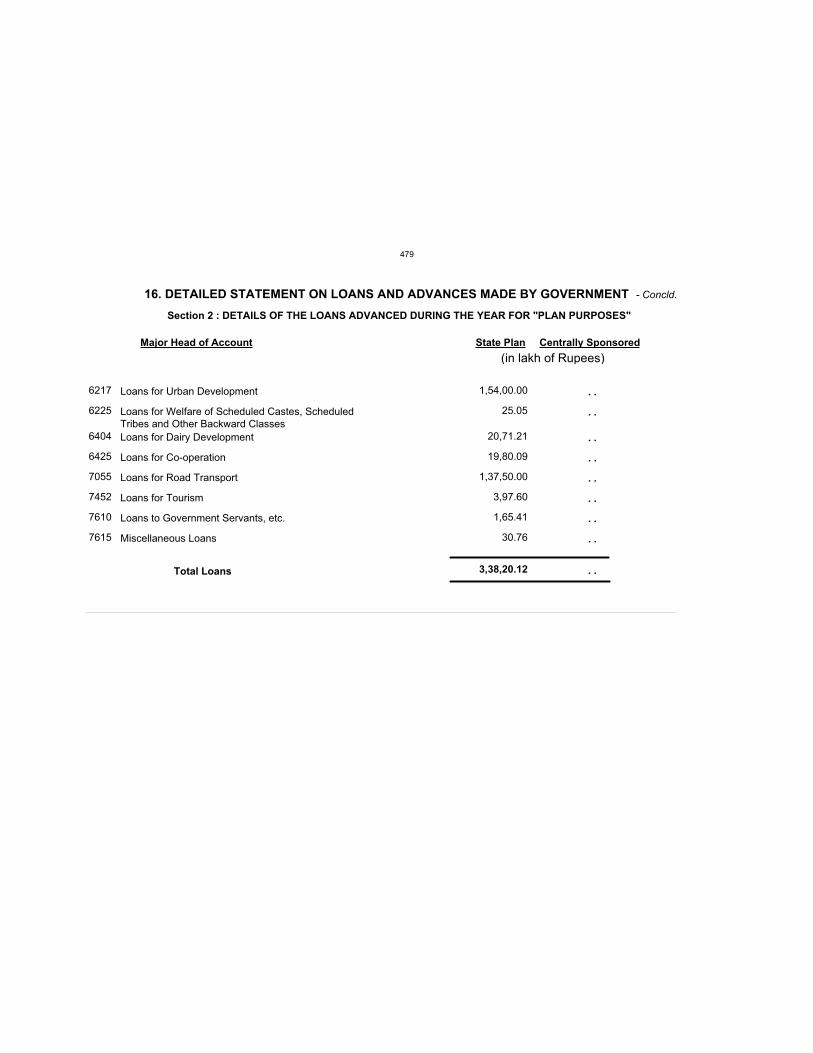
3,38,20.12
6217
6225
6404
6425
7055
7452
7610
7615
1,54,00.00
25.05
20,71.21
19,80.09
1,37,50.00
3,97.60
1,65.41
30.76
Major Head of Account State Plan Centrally Sponsored
16. DETAILED STATEMENT ON LOANS AND ADVANCES MADE BY GOVERNMENT
Section 2 : DETAILS OF THE LOANS ADVANCED DURING THE YEAR FOR "PLAN PURPOSES"
Loans for Urban Development
Loans for Welfare of Scheduled Castes, ScheduledTribes and Other Backward Classes
Loans for Dairy Development
Loans for Co-operation
Loans for Road Transport
Loans for Tourism
Loans to Government Servants, etc.
Miscellaneous Loans
- Concld.
. .
. .
. .
. .
. .
. .
. .
. .
. .Total Loans
(in lakh of Rupees)
479
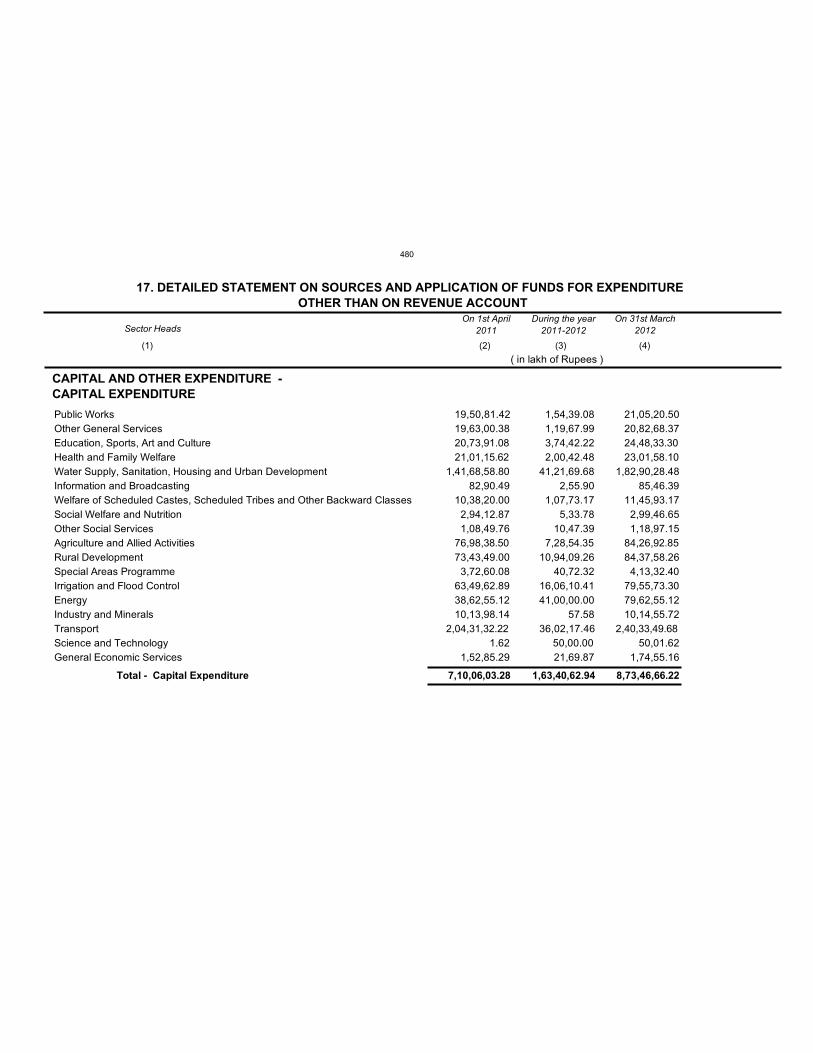
7,10,06,03.28 1,63,40,62.94 8,73,46,66.22
Public WorksOther General ServicesEducation, Sports, Art and CultureHealth and Family WelfareWater Supply, Sanitation, Housing and Urban DevelopmentInformation and BroadcastingWelfare of Scheduled Castes, Scheduled Tribes and Other Backward ClassesSocial Welfare and NutritionOther Social ServicesAgriculture and Allied ActivitiesRural DevelopmentSpecial Areas ProgrammeIrrigation and Flood ControlEnergyIndustry and MineralsTransportScience and TechnologyGeneral Economic Services
19,50,81.42 19,63,00.38 20,73,91.08 21,01,15.62
1,41,68,58.80 82,90.49
10,38,20.00 2,94,12.87 1,08,49.76
76,98,38.50 73,43,49.00
3,72,60.08 63,49,62.89 38,62,55.12 10,13,98.14
2,04,31,32.22 1.62
1,52,85.29
1,54,39.08 1,19,67.99 3,74,42.22 2,00,42.48
41,21,69.68 2,55.90
1,07,73.17 5,33.78
10,47.39 7,28,54.35
10,94,09.26 40,72.32
16,06,10.41 41,00,00.00
57.5836,02,17.46
50,00.00 21,69.87
21,05,20.50 20,82,68.37 24,48,33.30 23,01,58.10
1,82,90,28.48 85,46.39
11,45,93.17 2,99,46.65 1,18,97.15
84,26,92.85 84,37,58.26
4,13,32.40 79,55,73.30 79,62,55.12 10,14,55.72
2,40,33,49.68 50,01.62
1,74,55.16
Total - Capital Expenditure
17. DETAILED STATEMENT ON SOURCES AND APPLICATION OF FUNDS FOR EXPENDITUREOTHER THAN ON REVENUE ACCOUNT
Sector HeadsOn 1st April
2011During the year
2011-2012On 31st March
2012
(1) (2) (3) (4)
( in lakh of Rupees )
CAPITAL AND OTHER EXPENDITURE -CAPITAL EXPENDITURE
480
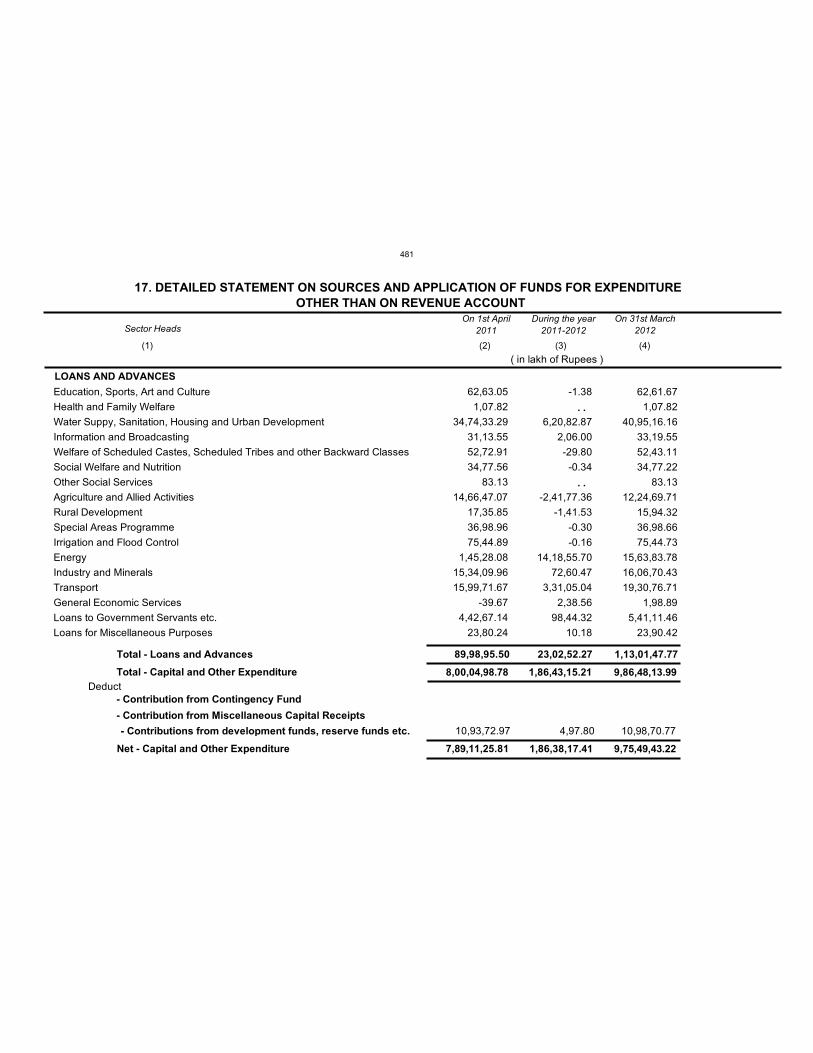
17. DETAILED STATEMENT ON SOURCES AND APPLICATION OF FUNDS FOR EXPENDITUREOTHER THAN ON REVENUE ACCOUNT
Sector HeadsOn 1st April
2011During the year
2011-2012On 31st March
2012
(1) (2) (3) (4)
( in lakh of Rupees )
89,98,95.50 23,02,52.27 1,13,01,47.77Total - Loans and Advances
8,00,04,98.78 1,86,43,15.21 9,86,48,13.99Total - Capital and Other Expenditure
Net - Capital and Other Expenditure
Deduct- Contribution from Contingency Fund
- Contribution from Miscellaneous Capital Receipts
- Contributions from development funds, reserve funds etc. 10,93,72.97 4,97.80 10,98,70.77
7,89,11,25.81 1,86,38,17.41 9,75,49,43.22
LOANS AND ADVANCES
Education, Sports, Art and CultureHealth and Family WelfareWater Suppy, Sanitation, Housing and Urban Development
Information and BroadcastingWelfare of Scheduled Castes, Scheduled Tribes and other Backward ClassesSocial Welfare and Nutrition
Other Social ServicesAgriculture and Allied ActivitiesRural DevelopmentSpecial Areas Programme
Irrigation and Flood ControlEnergyIndustry and Minerals
TransportGeneral Economic ServicesLoans to Government Servants etc.Loans for Miscellaneous Purposes
62,63.05 1,07.82
34,74,33.29
31,13.55 52,72.91 34,77.56
83.13
14,66,47.07 17,35.85 36,98.96
75,44.89 1,45,28.08
15,34,09.96 15,99,71.67
-39.67 4,42,67.14
23,80.24
-1.38
6,20,82.87
2,06.00-29.80
-0.34
-2,41,77.36-1,41.53
-0.30
-0.16 14,18,55.70
72,60.47 3,31,05.04
2,38.56 98,44.32
10.18
62,61.67 1,07.82
40,95,16.16 33,19.55
52,43.11 34,77.22
83.13
12,24,69.71 15,94.32 36,98.66 75,44.73
15,63,83.78 16,06,70.43 19,30,76.71
1,98.89 5,41,11.46
23,90.42
. .
. .
481
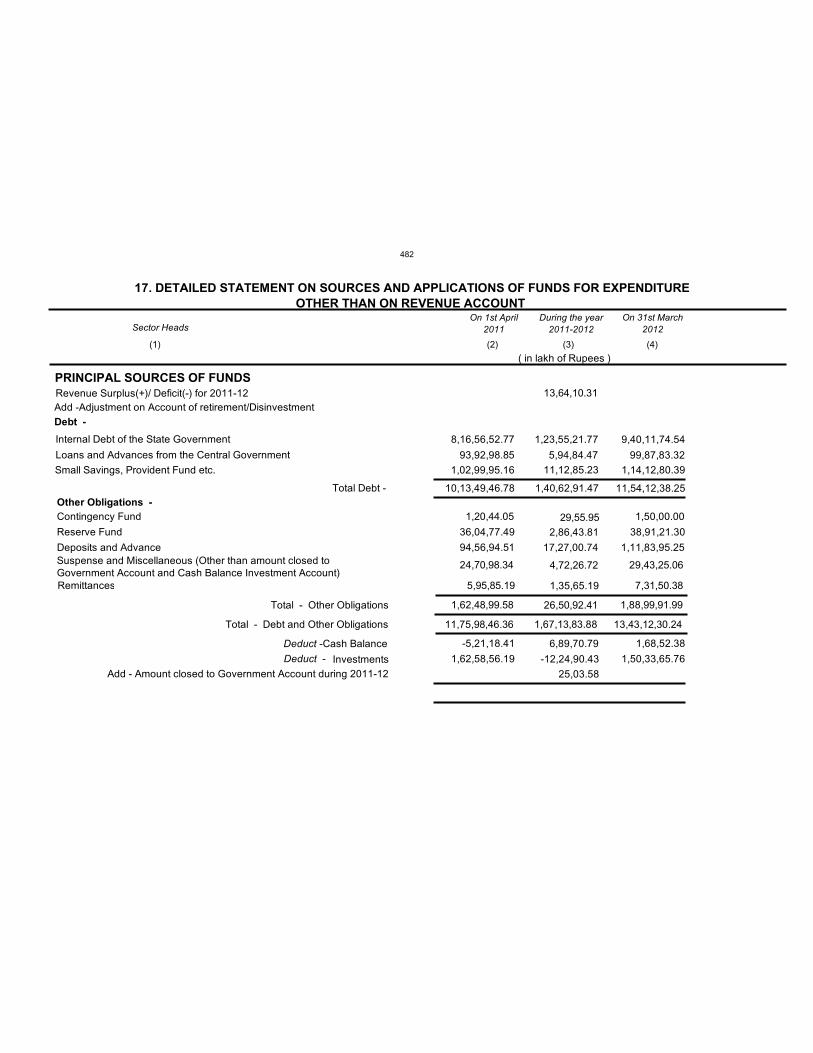
93,92,98.85 5,94,84.47 99,87,83.32 1,02,99,95.16 11,12,85.23 1,14,12,80.39
10,13,49,46.78 11,54,12,38.25 1,40,62,91.47
17. DETAILED STATEMENT ON SOURCES AND APPLICATIONS OF FUNDS FOR EXPENDITUREOTHER THAN ON REVENUE ACCOUNT
PRINCIPAL SOURCES OF FUNDS
Other Obligations -Contingency Fund
Reserve Fund
Deposits and AdvanceSuspense and Miscellaneous (Other than amount closed toGovernment Account and Cash Balance Investment Account) Remittances
Total - Other Obligations
Total - Debt and Other Obligations
Deduct -Cash Balance
Deduct - Investments
1,20,44.05 1,50,00.00
36,04,77.49 2,86,43.81 38,91,21.30
94,56,94.51 17,27,00.74 1,11,83,95.25
24,70,98.34 4,72,26.72 29,43,25.06
5,95,85.19 1,35,65.19 7,31,50.38
11,75,98,46.36 1,67,13,83.88 13,43,12,30.24
1,62,48,99.58 26,50,92.41 1,88,99,91.99
-5,21,18.41 6,89,70.79 1,68,52.38
1,62,58,56.19 -12,24,90.43 1,50,33,65.76
Revenue Surplus(+)/ Deficit(-) for 2011-12Add -Adjustment on Account of retirement/Disinvestment Debt -
Internal Debt of the State Government
Loans and Advances from the Central Government
Small Savings, Provident Fund etc.
8,16,56,52.77 1,23,55,21.77 9,40,11,74.54
Total Debt -
Add - Amount closed to Government Account during 2011-12 25,03.58
13,64,10.31
Sector HeadsOn 1st April
2011During the year
2011-2012On 31st March
2012
(1) (2) (3) (4)
( in lakh of Rupees )
29,55.95
482
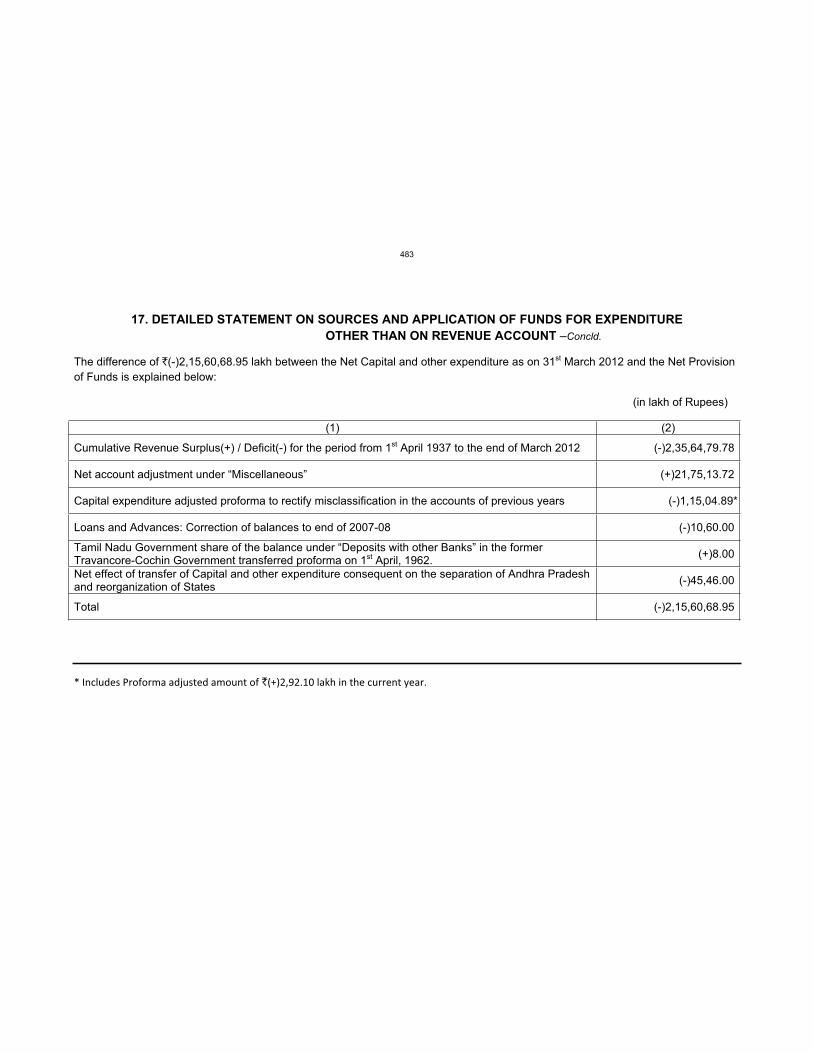
17. DETAILED STATEMENT ON SOURCES AND APPLICATION OF FUNDS FOR EXPENDITURE
OTHER THAN ON REVENUE ACCOUNT –Concld.
The difference of `(-)2,15,60,68.95 lakh between the Net Capital and other expenditure as on 31st March 2012 and the Net Provision
of Funds is explained below:
(in lakh of Rupees)
(1) (2)
Cumulative Revenue Surplus(+) / Deficit(-) for the period from 1st April 1937 to the end of March 2012 (-)2,35,64,79.78
Net account adjustment under “Miscellaneous” (+)21,75,13.72
Capital expenditure adjusted proforma to rectify misclassification in the accounts of previous years (-)1,15,04.89*
Loans and Advances: Correction of balances to end of 2007-08 (-)10,60.00
Tamil Nadu Government share of the balance under “Deposits with other Banks” in the former Travancore-Cochin Government transferred proforma on 1st April, 1962.
(+)8.00
Net effect of transfer of Capital and other expenditure consequent on the separation of Andhra Pradesh and reorganization of States
(-)45,46.00
Total (-)2,15,60,68.95
* Includes Proforma adjusted amount of `(+)2,92.10 lakh in the current year.
483
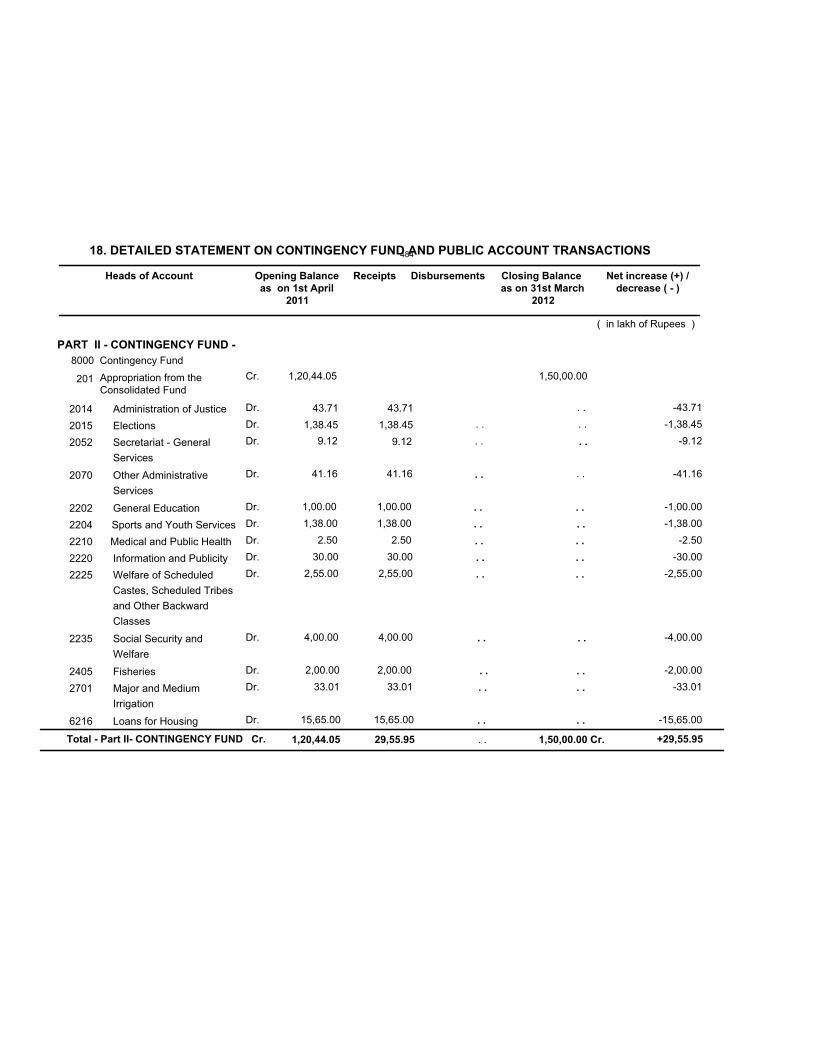
18. DETAILED STATEMENT ON CONTINGENCY FUND AND PUBLIC ACCOUNT TRANSACTIONS
2014
2015
2052
2070
2202
2204
2210
2220
2225
2235
2405
2701
6216
. .
. .
9.12
41.16
1,00.00
1,38.00
2.50
30.00
2,55.00
4,00.00
2,00.00
33.01
15,65.00
Administration of Justice
Elections
Secretariat - General
Services
Other Administrative
Services
General Education
Sports and Youth Services
Medical and Public Health
Information and Publicity
Welfare of Scheduled
Castes, Scheduled Tribes
and Other Backward
Classes
Social Security and
Welfare
Fisheries
Major and Medium
Irrigation
Loans for Housing
1,50,00.00
Heads of Account Opening Balance
as on 1st April
2011
Receipts Disbursements Closing Balance
as on 31st March
2012
( in lakh of Rupees )
PART II - CONTINGENCY FUND -
8000 Contingency Fund
Appropriation from theConsolidated Fund
Cr.
Net increase (+) /
decrease ( - )
201 1,20,44.05
1,20,44.05 29,55.95 . . 1,50,00.00 Cr.
. .
. .
41.16
1,00.00
1,38.00
2.50
30.00
2,55.00
4,00.00
2,00.00
33.01
15,65.00
-43.71
-1,38.45
-9.12
-41.16
-1,00.00
-1,38.00
-2.50
-30.00
-2,55.00
-4,00.00
-2,00.00
-33.01
-15,65.00
+29,55.95
Dr.
Dr.
Dr.
Dr.
Dr.
Dr.
Dr.
Dr.
Dr.
Dr.
Dr.
Dr.
Dr.
. .
43.71
1,38.45
. .
. .
. .
. .
. .
. .
. .
. .
. .
. .
43.71
1,38.45
9.12
. .
. .
. .
. .
. .
. .
. .
. .
. .
. .
Total - Part II- CONTINGENCY FUND Cr.
484
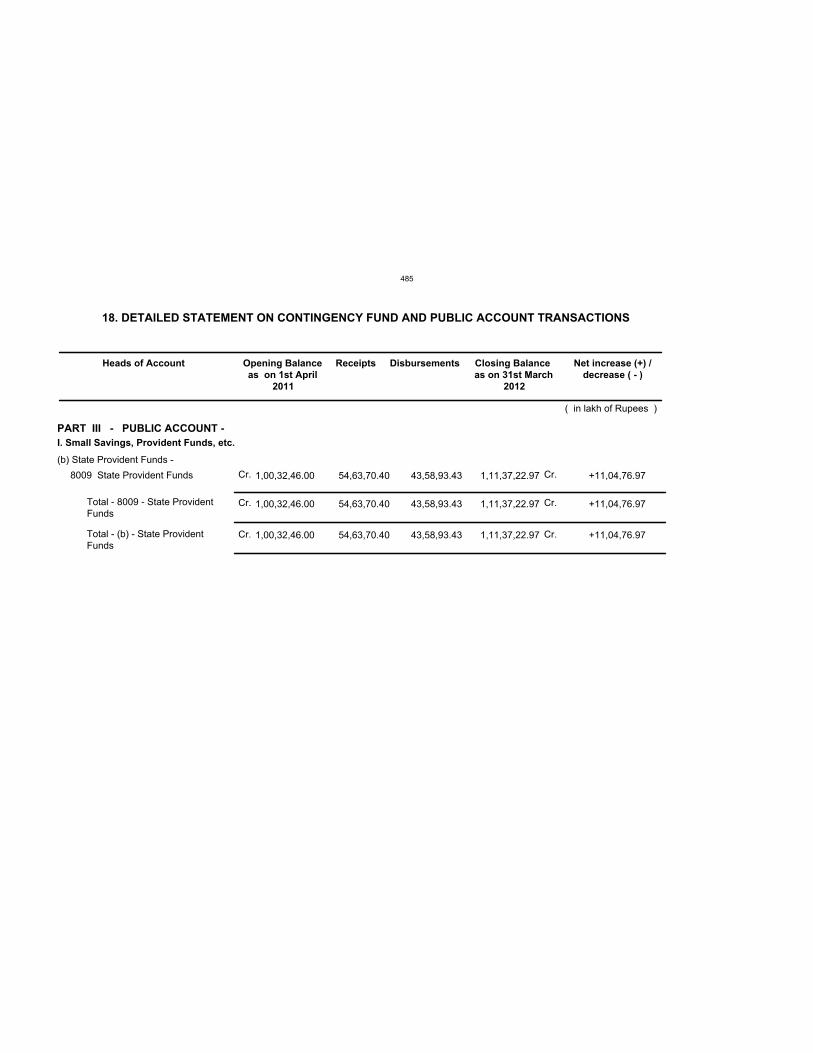
18. DETAILED STATEMENT ON CONTINGENCY FUND AND PUBLIC ACCOUNT TRANSACTIONS
Heads of Account Opening Balance
as on 1st April
2011
Receipts Disbursements Closing Balance
as on 31st March
2012
( in lakh of Rupees )
Net increase (+) /
decrease ( - )
PART III - PUBLIC ACCOUNT -
I. Small Savings, Provident Funds, etc.
(b) State Provident Funds -
8009 State Provident Funds
Total - 8009 - State ProvidentFunds
Total - (b) - State ProvidentFunds
1,00,32,46.00 54,63,70.40 43,58,93.43 1,11,37,22.97 +11,04,76.97
1,00,32,46.00 54,63,70.40 43,58,93.43 1,11,37,22.97 +11,04,76.97
Cr.
Cr.
Cr.
Cr.
Cr.
Cr.
1,00,32,46.00 54,63,70.40 43,58,93.43 1,11,37,22.97 +11,04,76.97
485
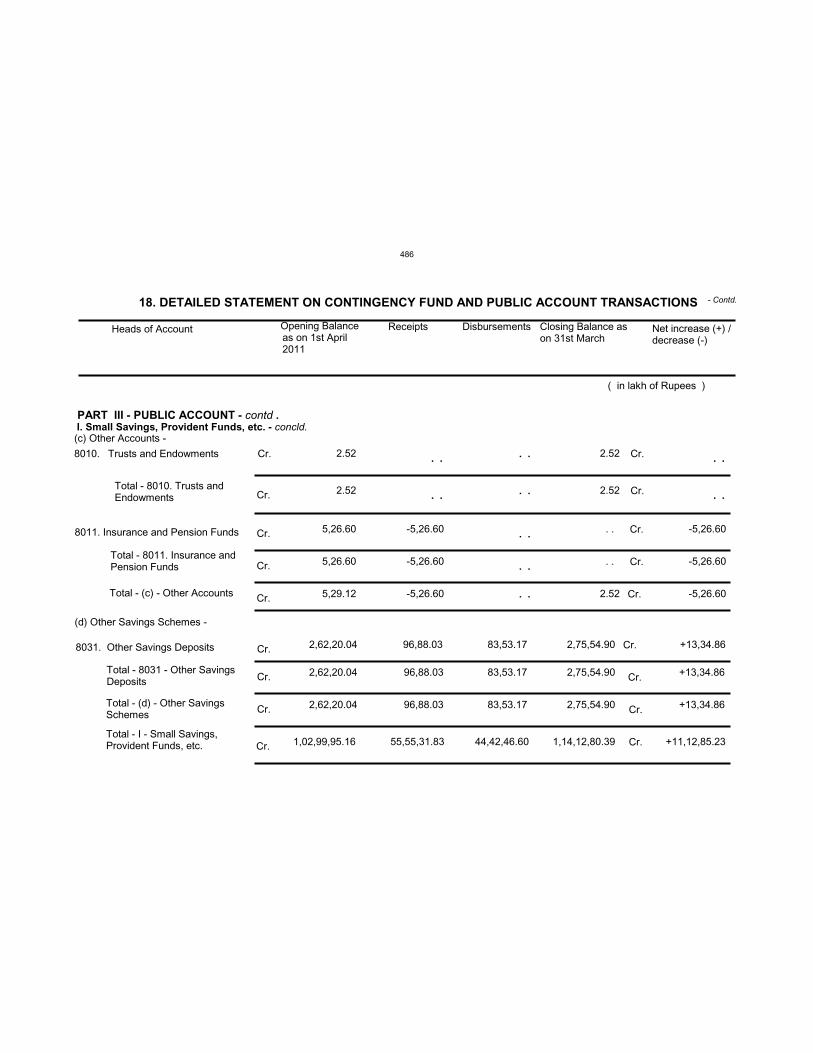
18. DETAILED STATEMENT ON CONTINGENCY FUND AND PUBLIC ACCOUNT TRANSACTIONS - Contd.
Heads of Account Opening Balanceas on 1st April2011
Receipts Disbursements Closing Balance ason 31st March
( in lakh of Rupees )
PART III - PUBLIC ACCOUNT - contd .
Cr.
(d) Other Savings Schemes -
8031. Other Savings Deposits
Total - 8031 - Other SavingsDeposits
Total - (d) - Other SavingsSchemes
I. Small Savings, Provident Funds, etc. - concld.(c) Other Accounts -
Total - 8010. Trusts andEndowments
8011. Insurance and Pension Funds
Total - 8011. Insurance andPension Funds
Cr.
Total - I - Small Savings,Provident Funds, etc.
Total - (c) - Other Accounts
Net increase (+) /decrease (-)
2.52 2.52
2.52 2.52
Cr.
Cr.
Trusts and Endowments8010.
5,26.60Cr. -5,26.60 . . Cr. -5,26.60
5,26.60Cr. -5,26.60 . . Cr. -5,26.60
5,29.12Cr. -5,26.60 2.52 Cr. -5,26.60
2,62,20.04Cr. 96,88.03 83,53.17 2,75,54.90 Cr. +13,34.86
2,62,20.04Cr. 96,88.03 83,53.17 2,75,54.90 +13,34.86Cr.
2,62,20.04Cr. 96,88.03 83,53.17 2,75,54.90 +13,34.86Cr.
1,02,99,95.16Cr. 55,55,31.83 44,42,46.60 1,14,12,80.39 +11,12,85.23Cr.
. .
. . . .
. .
. .
. .
. .
. .
. .
486
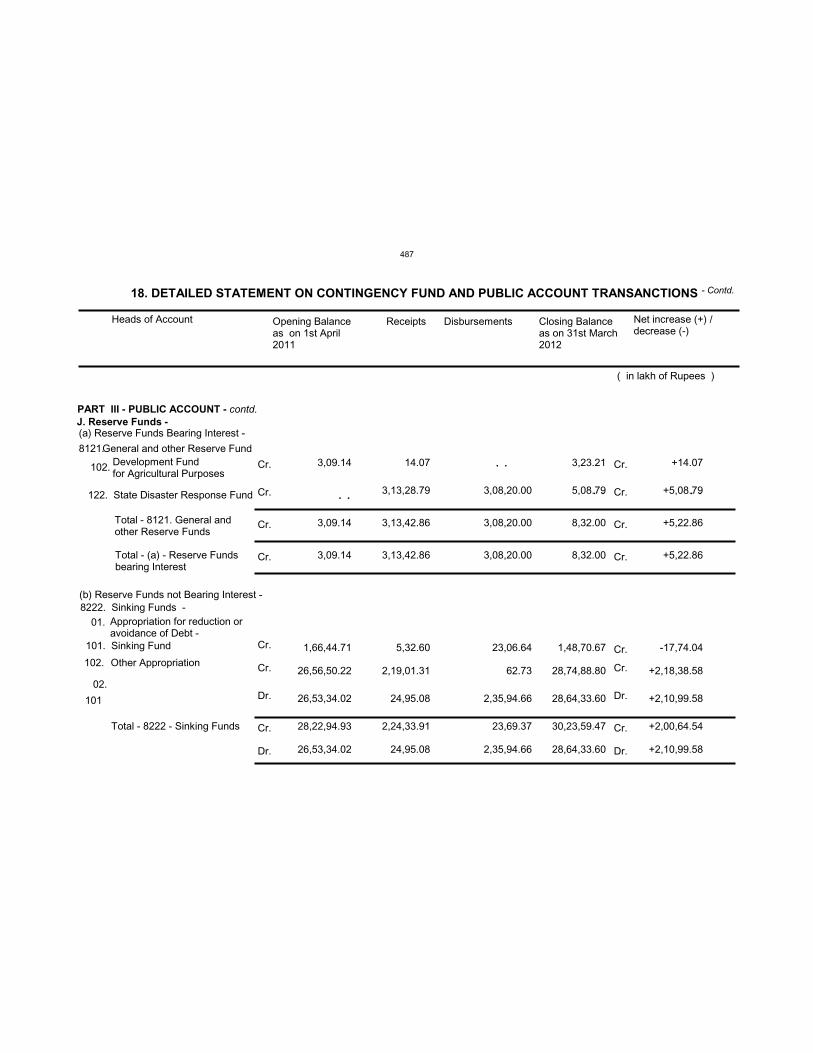
Heads of Account Opening Balanceas on 1st April2011
Receipts Disbursements Closing Balanceas on 31st March2012
( in lakh of Rupees )
PART III - PUBLIC ACCOUNT - contd.
General and other Reserve Fund8121.
Cr.
(b) Reserve Funds not Bearing Interest -8222. Sinking Funds -
Total - 8222 - Sinking Funds
J. Reserve Funds -(a) Reserve Funds Bearing Interest -
Total - 8121. General andother Reserve Funds
Total - (a) - Reserve Fundsbearing Interest
Development Fundfor Agricultural Purposes
Appropriation for reduction oravoidance of Debt -
01.
101. Sinking Fund
102. Other Appropriation
02.
101
Net increase (+) /decrease (-)
3,09.14 14.07 3,23.21 +14.07Cr.
Cr. 3,09.14 3,13,42.86 3,08,20.00 8,32.00 +5,22.86Cr.
Cr. 3,09.14 3,13,42.86 3,08,20.00 8,32.00 +5,22.86Cr.
Cr. 1,66,44.71 5,32.60 23,06.64 1,48,70.67 -17,74.04Cr.
Cr. 26,56,50.22 2,19,01.31 62.73 28,74,88.80 +2,18,38.58Cr.
Dr. 26,53,34.02 24,95.08 2,35,94.66 28,64,33.60 +2,10,99.58Dr.
Dr. 26,53,34.02 24,95.08 2,35,94.66 28,64,33.60 +2,10,99.58Dr.
Cr. 28,22,94.93 2,24,33.91 23,69.37 30,23,59.47 +2,00,64.54Cr.
18. DETAILED STATEMENT ON CONTINGENCY FUND AND PUBLIC ACCOUNT TRANSANCTIONS
102.
122. State Disaster Response Fund Cr. 3,13,28.79 3,08,20.00 5,08.79 +5,08.79Cr.
. .
. . . . . .
- Contd.
487
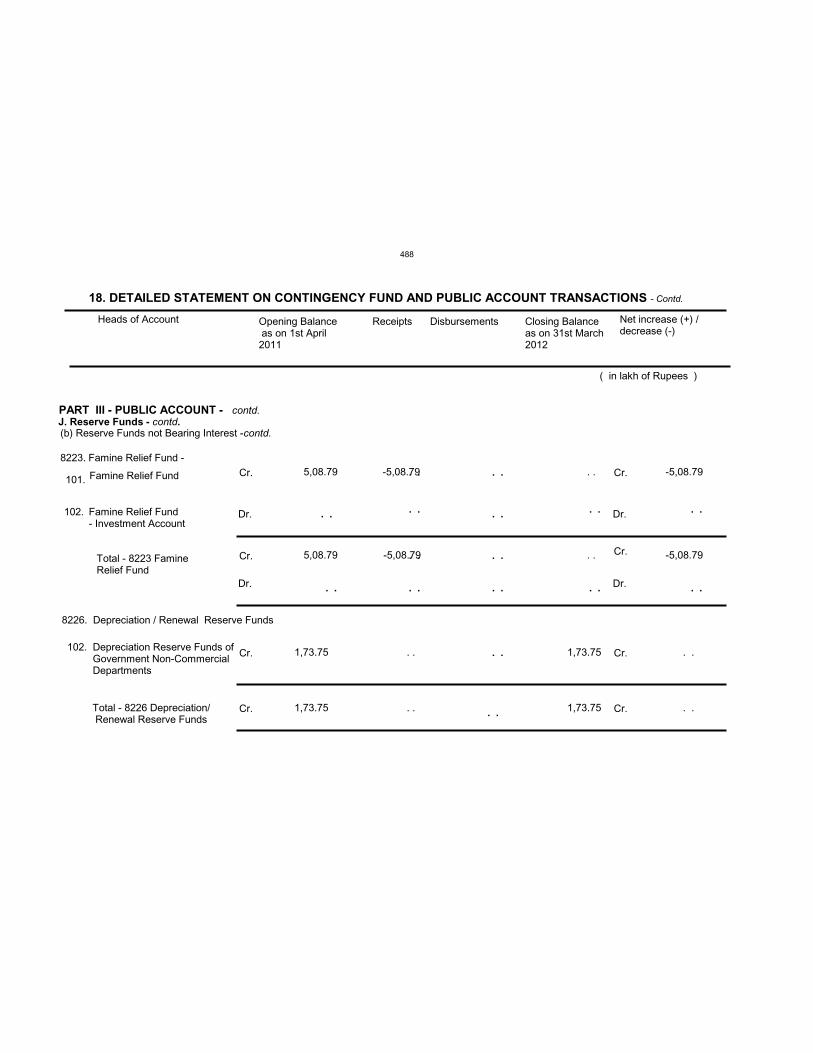
Heads of Account Opening Balance as on 1st April2011
Receipts Disbursements Closing Balanceas on 31st March2012
( in lakh of Rupees )
Net increase (+) /decrease (-)
PART III - PUBLIC ACCOUNT -
Famine Relief Fund -8223.Cr.
8226. Depreciation / Renewal Reserve Funds
J. Reserve Funds - contd.(b) Reserve Funds not Bearing Interest -contd.
Total - 8223 FamineRelief Fund
Dr.
Famine Relief Fund
102. Depreciation Reserve Funds ofGovernment Non-CommercialDepartments
101.
102. Famine Relief Fund- Investment Account
contd.
Total - 8226 Depreciation/Renewal Reserve Funds
5,08.79 -5,08.79 . . -5,08.79Cr.
Dr.
Cr. 5,08.79 -5,08.79 . . -5,08.79Cr.
Dr. Dr.
1,73.75Cr. . . 1,73.75 Cr. . .
1,73.75Cr. . . 1,73.75 Cr. . .
. . . .
. .. .. .. .. .
. . . .
. . . . . . . . . .
. .
. .
18. DETAILED STATEMENT ON CONTINGENCY FUND AND PUBLIC ACCOUNT TRANSACTIONS - Contd.
488
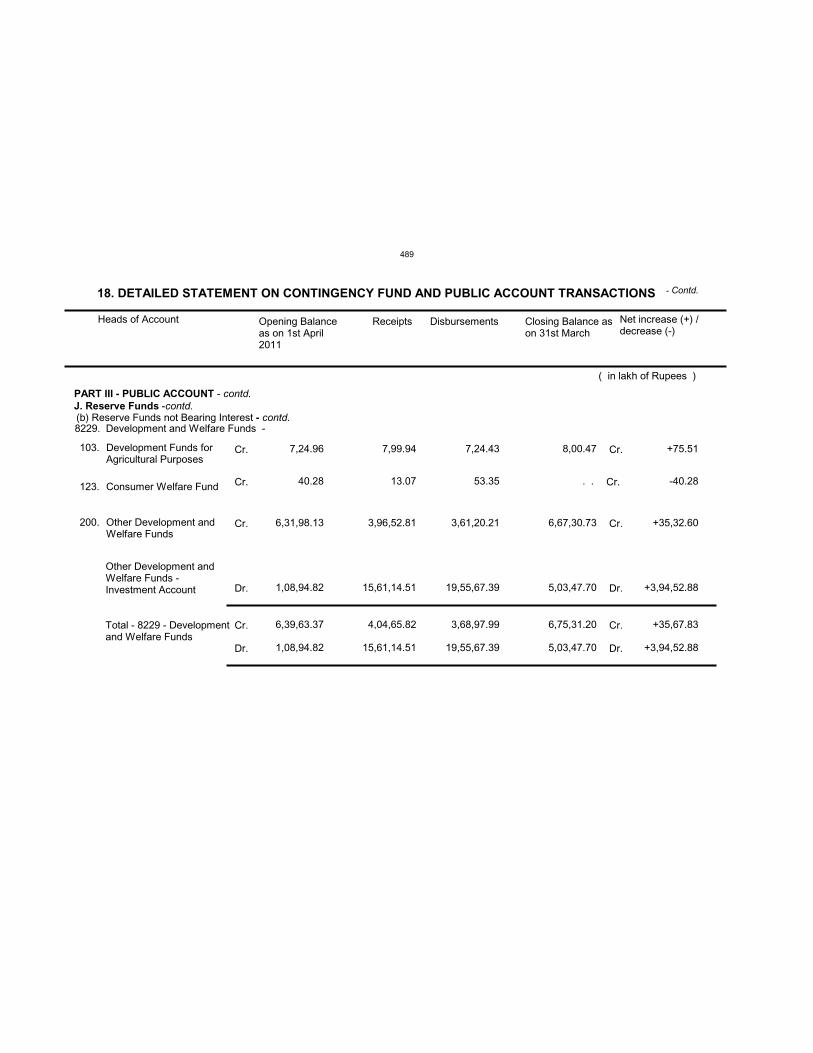
Total - 8229 - Developmentand Welfare Funds
103. Development Funds forAgricultural Purposes
8229. Development and Welfare Funds -
123. Consumer Welfare Fund
200. Other Development andWelfare Funds
Other Development andWelfare Funds -Investment Account
Heads of Account Opening Balanceas on 1st April2011
Receipts Disbursements Closing Balance ason 31st March
( in lakh of Rupees )
Net increase (+) /decrease (-)
7,24.96Cr. 7,99.94 7,24.43 8,00.47 Cr. +75.51
Cr. 40.28 13.07 53.35 . . Cr. -40.28
Cr. 6,31,98.13 3,96,52.81 3,61,20.21 6,67,30.73 Cr. +35,32.60
Dr. 1,08,94.82 15,61,14.51 19,55,67.39 5,03,47.70 Dr. +3,94,52.88
Cr. 6,39,63.37 4,04,65.82 3,68,97.99 6,75,31.20 Cr. +35,67.83
Dr. 1,08,94.82 15,61,14.51 19,55,67.39 5,03,47.70 Dr. +3,94,52.88
18. DETAILED STATEMENT ON CONTINGENCY FUND AND PUBLIC ACCOUNT TRANSACTIONS
PART III - PUBLIC ACCOUNT - contd.J. Reserve Funds -contd.(b) Reserve Funds not Bearing Interest - contd.
- Contd.
489
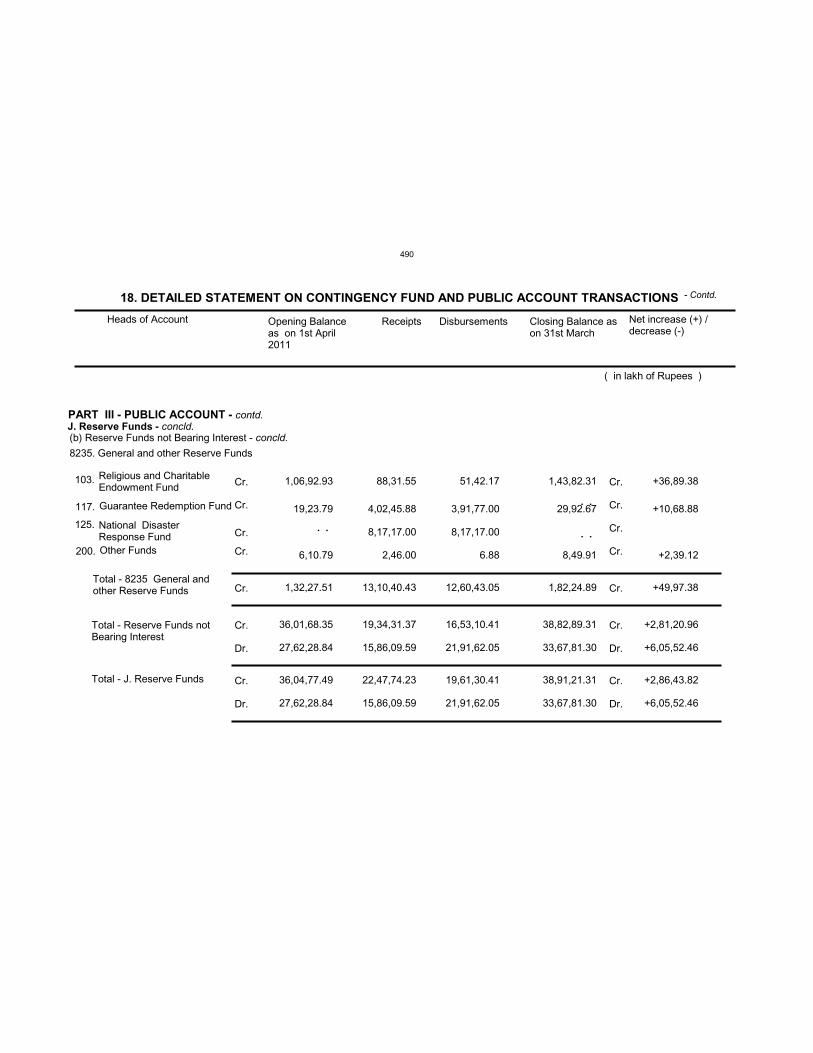
18. DETAILED STATEMENT ON CONTINGENCY FUND AND PUBLIC ACCOUNT TRANSACTIONS - Contd.
PART III - PUBLIC ACCOUNT - contd.
8235.
Total - Reserve Funds notBearing Interest
J. Reserve Funds - concld.(b) Reserve Funds not Bearing Interest - concld.
Religious and CharitableEndowment Fund
103.
National DisasterResponse Fund
125.
Guarantee Redemption Fund117.
Other Funds200.
Total - 8235 General andother Reserve Funds
Total - J. Reserve Funds
Heads of Account Opening Balanceas on 1st April2011
Receipts Disbursements Closing Balance ason 31st March
( in lakh of Rupees )
Net increase (+) /decrease (-)
Cr. 1,06,92.93 88,31.55 51,42.17 1,43,82.31 Cr. +36,89.38
Cr. 8,17,17.00 8,17,17.00 Cr.
Cr. 19,23.79 4,02,45.88 3,91,77.00 29,92.67 Cr. +10,68.88
Cr. 6,10.79 2,46.00 6.88 8,49.91 Cr. +2,39.12
Cr. 1,32,27.51 13,10,40.43 12,60,43.05 1,82,24.89 Cr. +49,97.38
Cr. 36,01,68.35 19,34,31.37 16,53,10.41 38,82,89.31 Cr. +2,81,20.96
General and other Reserve Funds
Dr. 27,62,28.84 15,86,09.59 21,91,62.05 33,67,81.30 Dr. +6,05,52.46
Cr. 36,04,77.49 22,47,74.23 19,61,30.41 38,91,21.31 Cr. +2,86,43.82
Dr. 27,62,28.84 15,86,09.59 21,91,62.05 33,67,81.30 Dr. +6,05,52.46
. .
. .
. .
490
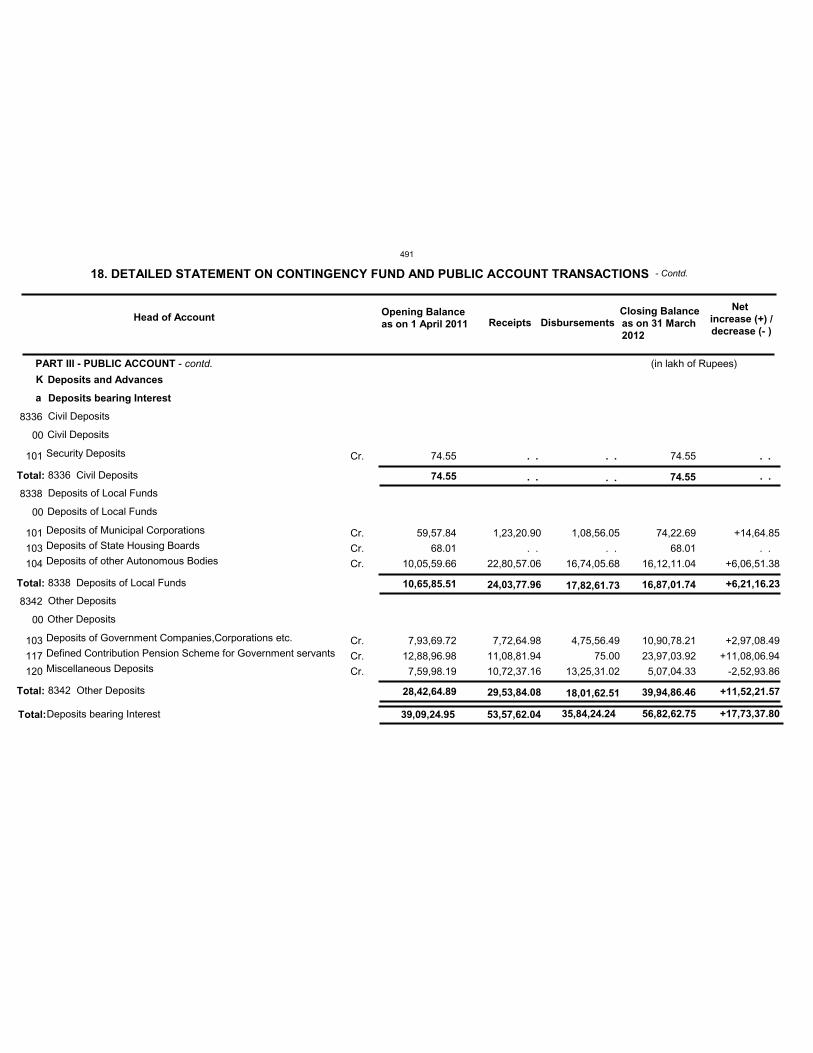
K
a
39,09,24.95Total: 53,57,62.04 35,84,24.24 56,82,62.75 +17,73,37.80
8336
8338
8342
74.55
10,65,85.51
28,42,64.89
Total:
Total:
Total:
. .
24,03,77.96
29,53,84.08
. .
17,82,61.73
18,01,62.51
74.55
16,87,01.74
39,94,86.46
. .
+6,21,16.23
+11,52,21.57
00
00
00
101
101
103
104
103
117
120
Cr.
Cr.
Cr.
Cr.
Cr.
Cr.
Cr.
74.55
59,57.84
68.01
10,05,59.66
7,93,69.72
12,88,96.98
7,59,98.19
. .
1,23,20.90
. .
22,80,57.06
7,72,64.98
11,08,81.94
10,72,37.16
. .
1,08,56.05
. .
16,74,05.68
4,75,56.49
75.00
13,25,31.02
74.55
74,22.69
68.01
16,12,11.04
10,90,78.21
23,97,03.92
5,07,04.33
. .
+14,64.85
. .
+6,06,51.38
+2,97,08.49
+11,08,06.94
-2,52,93.86
Civil Deposits
Deposits of Local Funds
Other Deposits
Security Deposits
Deposits of Municipal Corporations
Deposits of State Housing Boards
Deposits of other Autonomous Bodies
Deposits of Government Companies,Corporations etc.
Defined Contribution Pension Scheme for Government servants
Miscellaneous Deposits
Civil Deposits
Deposits of Local Funds
Other Deposits
Deposits bearing Interest
Deposits and Advances
Deposits bearing Interest
8336 Civil Deposits
8338 Deposits of Local Funds
8342 Other Deposits
Head of Account Opening Balance as on 1 April 2011 Receipts Disbursements
Closing Balance as on 31 March2012
Netincrease (+) /decrease (- )
18. DETAILED STATEMENT ON CONTINGENCY FUND AND PUBLIC ACCOUNT TRANSACTIONS
PART III - PUBLIC ACCOUNT - contd. (in lakh of Rupees)
- Contd.
491
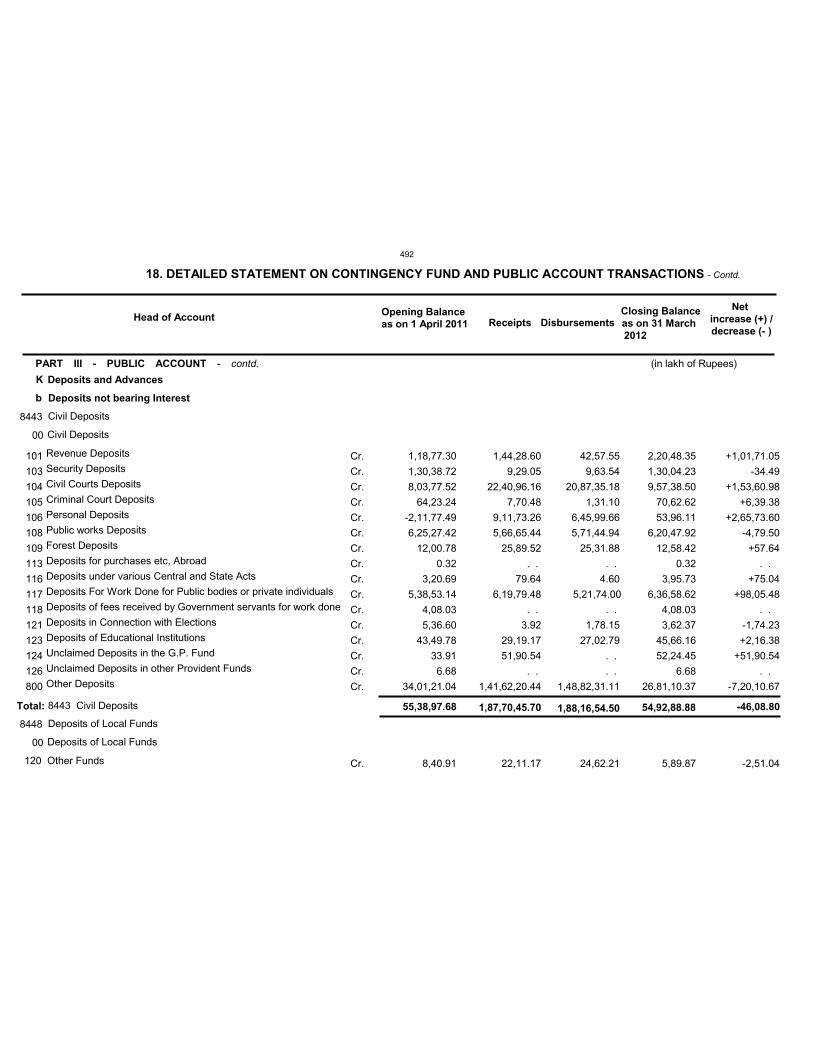
K
b
8443
8448
55,38,97.68Total: 1,87,70,45.70 1,88,16,54.50 54,92,88.88 -46,08.80
00
00
101
103
104
105
106
108
109
113
116
117
118
121
123
124
126
800
Cr.
Cr.
Cr.
Cr.
Cr.
Cr.
Cr.
Cr.
Cr.
Cr.
Cr.
Cr.
Cr.
Cr.
Cr.
Cr.
Cr.
1,18,77.30
1,30,38.72
8,03,77.52
64,23.24
-2,11,77.49
6,25,27.42
12,00.78
0.32
3,20.69
5,38,53.14
4,08.03
5,36.60
43,49.78
33.91
6.68
34,01,21.04
8,40.91
1,44,28.60
9,29.05
22,40,96.16
7,70.48
9,11,73.26
5,66,65.44
25,89.52
. .
79.64
6,19,79.48
. .
3.92
29,19.17
51,90.54
. .
1,41,62,20.44
22,11.17
42,57.55
9,63.54
20,87,35.18
1,31.10
6,45,99.66
5,71,44.94
25,31.88
. .
4.60
5,21,74.00
. .
1,78.15
27,02.79
. .
. .
1,48,82,31.11
24,62.21
2,20,48.35
1,30,04.23
9,57,38.50
70,62.62
53,96.11
6,20,47.92
12,58.42
0.32
3,95.73
6,36,58.62
4,08.03
3,62.37
45,66.16
52,24.45
6.68
26,81,10.37
5,89.87
+1,01,71.05
-34.49
+1,53,60.98
+6,39.38
+2,65,73.60
-4,79.50
+57.64
. .
+75.04
+98,05.48
. .
-1,74.23
+2,16.38
+51,90.54
. .
-7,20,10.67
-2,51.04
Civil Deposits
Deposits of Local Funds
Revenue Deposits
Security Deposits
Civil Courts Deposits
Criminal Court Deposits
Personal Deposits
Public works Deposits
Forest Deposits
Deposits for purchases etc, Abroad
Deposits under various Central and State Acts
Deposits For Work Done for Public bodies or private individuals
Deposits of fees received by Government servants for work done
Deposits in Connection with Elections
Deposits of Educational Institutions
Unclaimed Deposits in the G.P. Fund
Unclaimed Deposits in other Provident Funds
Other Deposits
120 Other Funds
Civil Deposits
Deposits of Local Funds
Deposits not bearing Interest
Deposits and Advances
8443 Civil Deposits
Head of Account Opening Balance as on 1 April 2011 Receipts Disbursements
Closing Balance as on 31 March2012
Netincrease (+) /decrease (- )
18. DETAILED STATEMENT ON CONTINGENCY FUND AND PUBLIC ACCOUNT TRANSACTIONS - Contd.
PART III - PUBLIC ACCOUNT - contd. (in lakh of Rupees)
492
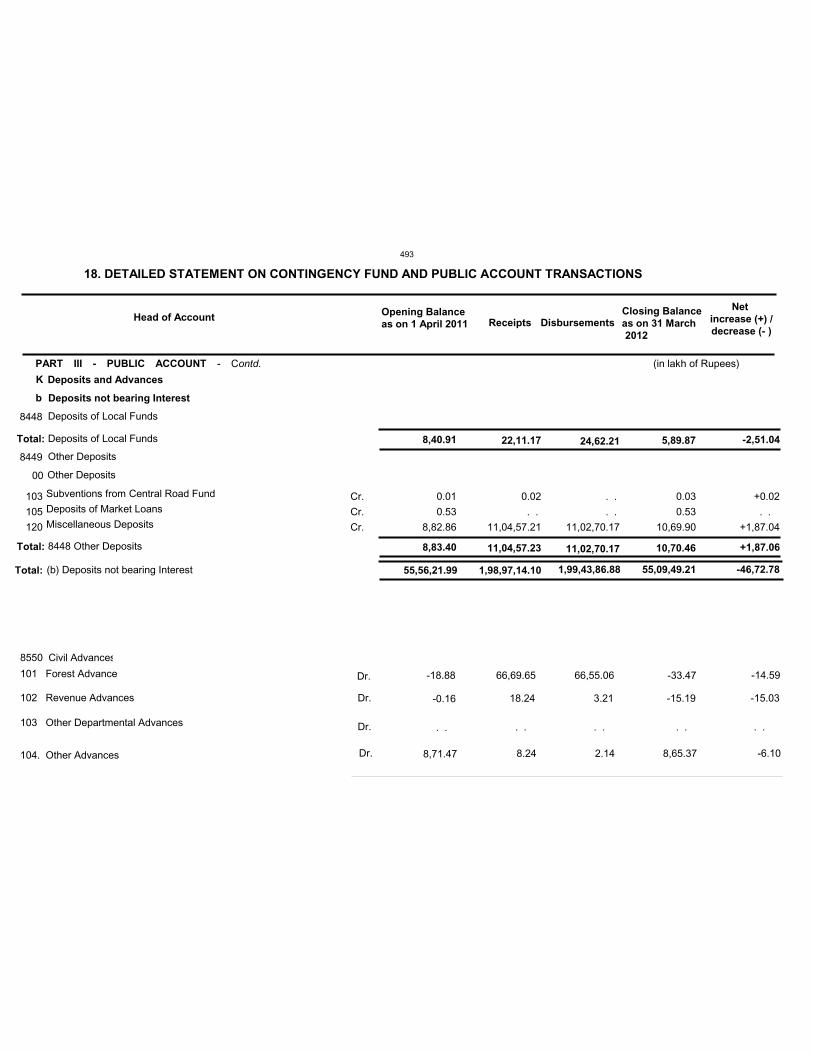
94,65,46.94GRAND TOTAL 2,52,54,76.14 2,35,28,11.12 1,11,92,11.96 +17,26,65.02
K
94,65,46.94Total: 2,52,54,76.14 2,35,28,11.12 1,11,92,11.96 +17,26,65.02
b
55,56,21.99Total: 1,98,97,14.10 1,99,43,86.88 55,09,49.21 -46,72.78
8448
8449
8,40.91
8,83.40
Total:
Total:
22,11.17
11,04,57.23
24,62.21
11,02,70.17
5,89.87
10,70.46
-2,51.04
+1,87.06
00
103
105
120
Cr.
Cr.
Cr.
0.01
0.53
8,82.86
0.02
. .
11,04,57.21
. .
. .
11,02,70.17
0.03
0.53
10,69.90
+0.02
. .
+1,87.04
Other Deposits
Subventions from Central Road Fund
Deposits of Market Loans
Miscellaneous Deposits
Deposits of Local Funds
Other Deposits
Deposits not bearing Interest
Deposits and Advances
Deposits and Advances
(b) Deposits not bearing Interest
Deposits of Local Funds
8448 Other Deposits
Head of Account Opening Balance as on 1 April 2011 Receipts Disbursements
Closing Balance as on 31 March
2012
Netincrease (+) /decrease (- )
8550 Civil Advances
101 Forest Advance
102 Revenue Advances
104. Other Advances
Dr.
103 Other Departmental Advances
-18.88 66,69.65 66,55.06 -33.47 -14.59
-0.16Dr. 18.24 3.21 -15.19 -15.03
. .Dr. . . . . . . . .
8,71.47Dr. 8.24 2.14 8,65.37 -6.10
18. DETAILED STATEMENT ON CONTINGENCY FUND AND PUBLIC ACCOUNT TRANSACTIONS
PART III - PUBLIC ACCOUNT - Contd. (in lakh of Rupees)
493
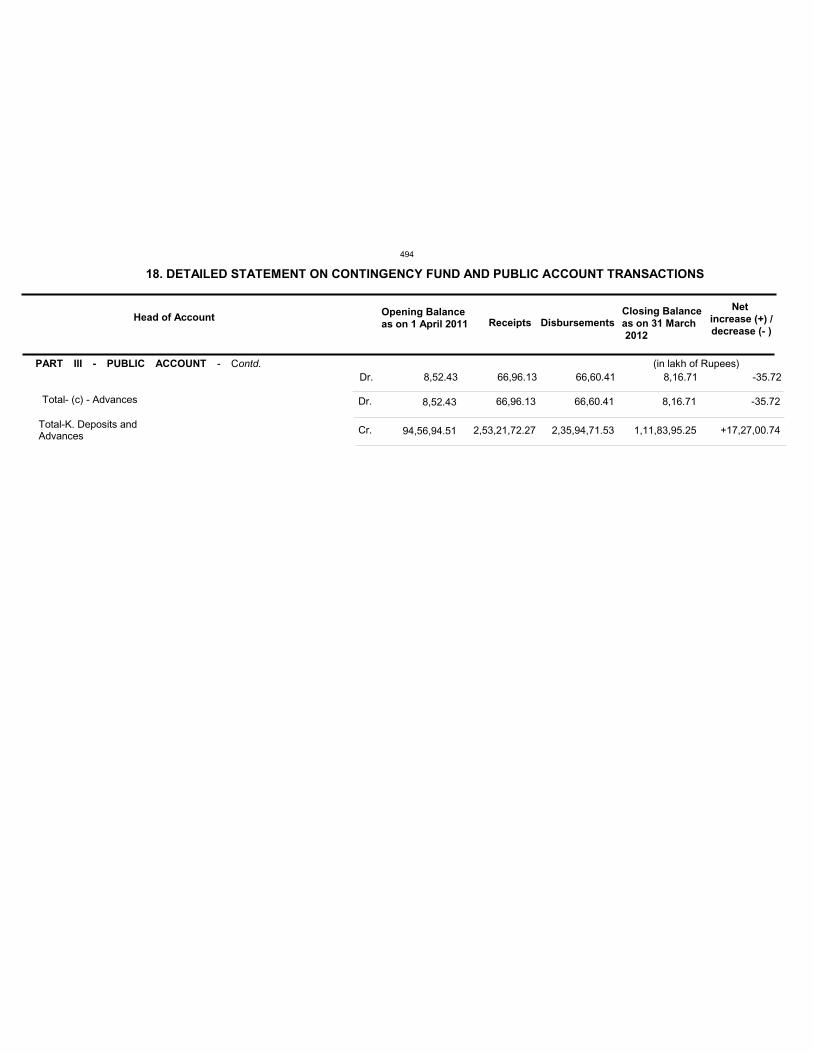
Head of Account Opening Balance as on 1 April 2011 Receipts Disbursements
Closing Balance as on 31 March
2012
Netincrease (+) /decrease (- )
Total- (c) - Advances
Total-K. Deposits andAdvances
8,52.43Dr. 66,96.13 66,60.41 8,16.71 -35.72
8,52.43Dr. 66,96.13 66,60.41 8,16.71 -35.72
94,56,94.51Cr. 2,53,21,72.27 2,35,94,71.53 1,11,83,95.25 +17,27,00.74
18. DETAILED STATEMENT ON CONTINGENCY FUND AND PUBLIC ACCOUNT TRANSACTIONS
PART III - PUBLIC ACCOUNT - Contd. (in lakh of Rupees)
494
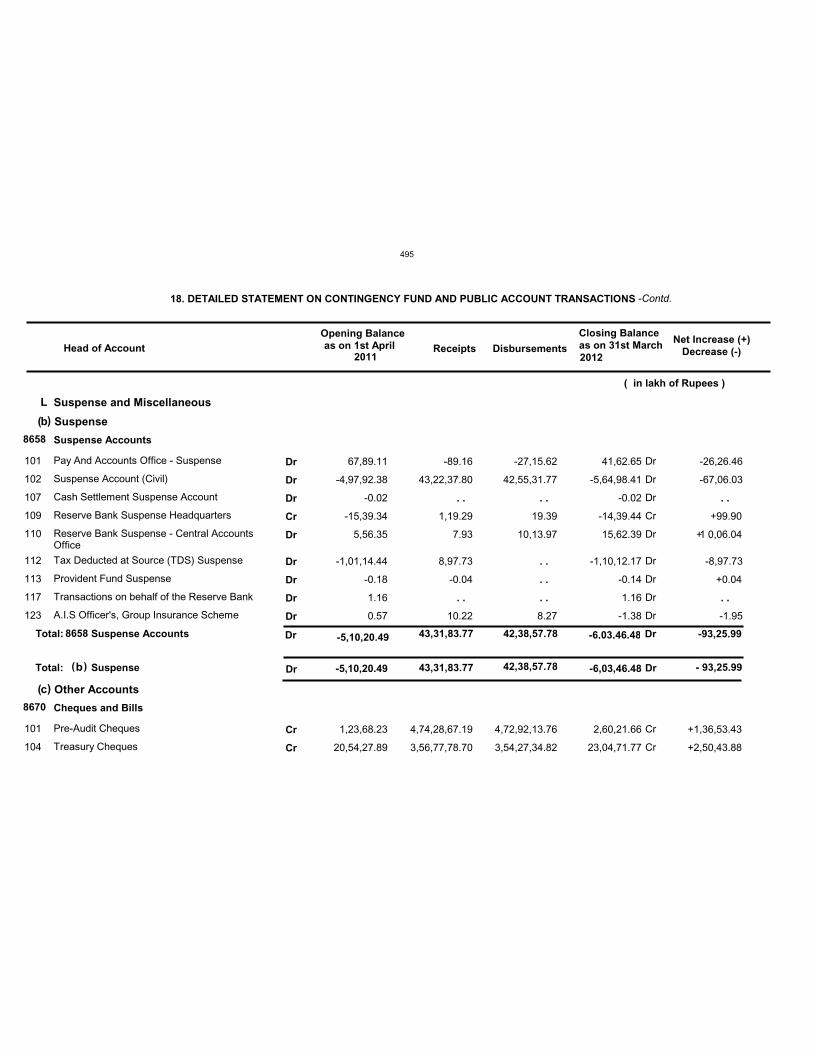
L
b
c
Total: 43,31,83.77 42,38,57.78
8658
8670
43,31,83.77 42,38,57.78
101
102
107
109
110
112
113
117
123
101
104
Dr
Dr
Dr
Cr
Dr
Dr
Dr
Dr
Dr
Cr
Cr
67,89.11
-4,97,92.38
-0.02
-15,39.34
5,56.35
-1,01,14.44
-0.18
1.16
0.57
1,23,68.23
20,54,27.89
-89.16
43,22,37.80
1,19.29
7.93
8,97.73
-0.04
10.22
4,74,28,67.19
3,56,77,78.70
-27,15.62
42,55,31.77
19.39
10,13.97
8.27
4,72,92,13.76
3,54,27,34.82
41,62.65
-5,64,98.41
-0.02
-14,39.44
15,62.39
-1,10,12.17
-0.14
1.16
-1.38
2,60,21.66
23,04,71.77
-26,26.46
-67,06.03
+99.90
+1 0,06.04
-8,97.73
+0.04
-1.95
+1,36,53.43
+2,50,43.88
Total:
Suspense and Miscellaneous
Suspense
Other Accounts
Suspense Accounts
Cheques and Bills
Pay And Accounts Office - Suspense
Suspense Account (Civil)
Cash Settlement Suspense Account
Reserve Bank Suspense Headquarters
Reserve Bank Suspense - Central AccountsOffice
Tax Deducted at Source (TDS) Suspense
Provident Fund Suspense
Transactions on behalf of the Reserve Bank
A.I.S Officer's, Group Insurance Scheme
Pre-Audit Cheques
Treasury Cheques
Head of AccountOpening Balance as on 1st April Receipts Disbursements
Closing Balanceas on 31st March Net Increase (+)
Decrease (-)
( in lakh of Rupees )
Suspense Accounts
Suspense
8658
b
18. DETAILED STATEMENT ON CONTINGENCY FUND AND PUBLIC ACCOUNT TRANSACTIONS -Contd.
(
(
)
)
-5,10,20.49
-5,10,20.49
-6,03,46.48
-6,03,46.48
-93,25.99
- 93,25.99
. .
. .
. .
. .
. .
. .
. .
. .
Dr
Dr
Dr
Dr
Dr
Dr
Cr
Dr
Dr
Dr
Dr
Dr
Cr
Cr
Dr( )
2011 2012
495
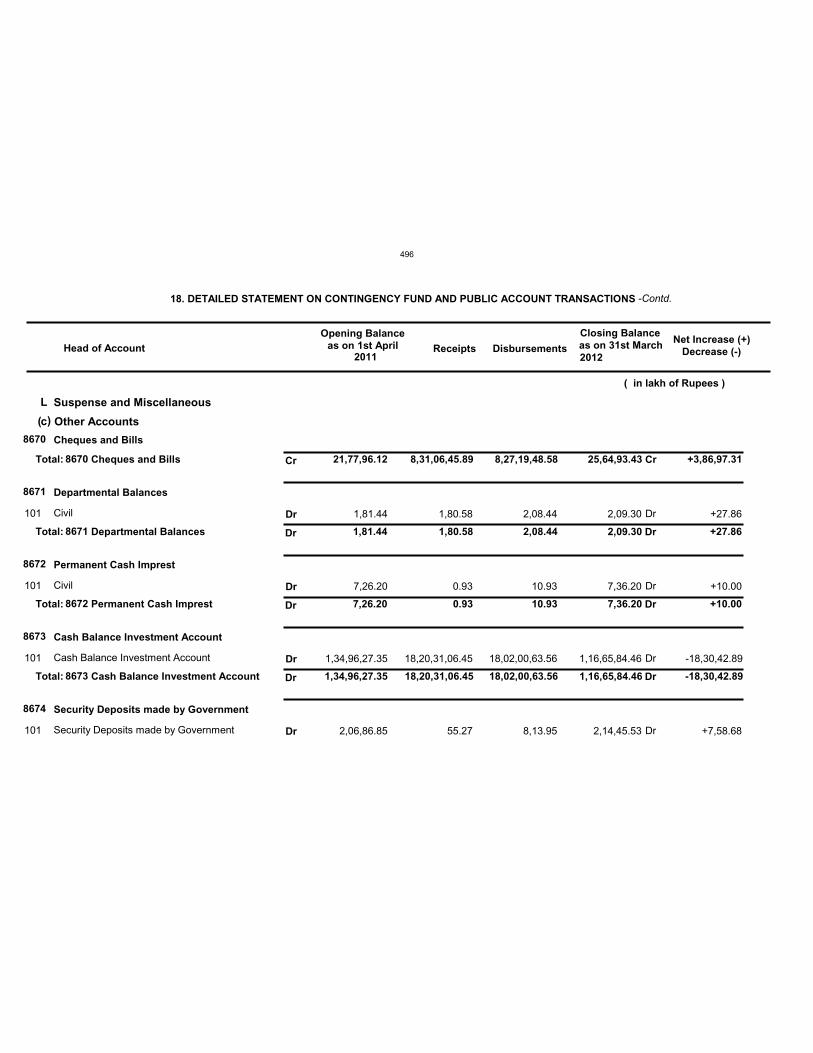
L
c
8670
8671
8672
8673
8674
21,77,96.12
1,81.44
7,26.20
1,34,96,27.35
8,31,06,45.89
1,80.58
0.93
18,20,31,06.45
8,27,19,48.58
2,08.44
10.93
18,02,00,63.56
25,64,93.43
2,09.30
7,36.20
1,16,65,84.46
+3,86,97.31
+27.86
+10.00
-18,30,42.89
101
101
101
101
Dr
Dr
Dr
Dr
1,81.44
7,26.20
1,34,96,27.35
2,06,86.85
1,80.58
0.93
18,20,31,06.45
55.27
2,08.44
10.93
18,02,00,63.56
8,13.95
2,09.30
7,36.20
1,16,65,84.46
2,14,45.53
+27.86
+10.00
-18,30,42.89
+7,58.68
Total:
Total:
Total:
Total:
Suspense and Miscellaneous
Other Accounts
Cheques and Bills
Departmental Balances
Permanent Cash Imprest
Cash Balance Investment Account
Security Deposits made by Government
Civil
Civil
Cash Balance Investment Account
Security Deposits made by Government
Head of AccountOpening Balance as on 1st April Receipts Disbursements
Closing Balanceas on 31st March Net Increase (+)
Decrease (-)
( in lakh of Rupees )
Cheques and Bills
Departmental Balances
Permanent Cash Imprest
Cash Balance Investment Account
8670
8671
8672
8673
18. DETAILED STATEMENT ON CONTINGENCY FUND AND PUBLIC ACCOUNT TRANSACTIONS -Contd.
( )
Dr
Dr
Dr
Cr
Dr
Dr
Dr
Dr
Dr
Dr
Dr
Cr
2011 2012
496
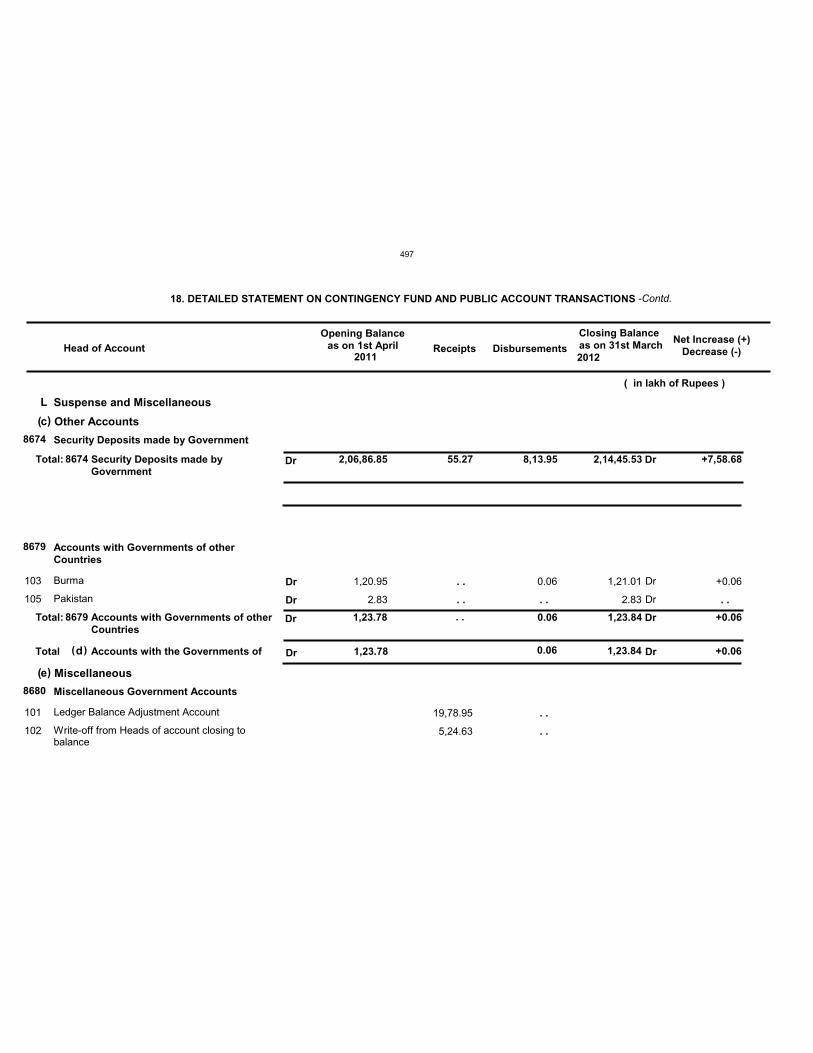
L
c
e
1,23.78Total 0.06 1,23.84 +0.06
8674
8679
8680
2,06,86.85
1,23.78
55.27 8,13.95
0.06
2,14,45.53
1,23.84
+7,58.68
+0.06
103
105
101
102
Dr
Dr
1,20.95
2.83
19,78.95
5,24.63
0.06 1,21.01
2.83
+0.06
Total:
Total:
Suspense and Miscellaneous
Other Accounts
Miscellaneous
Security Deposits made by Government
Accounts with Governments of otherCountries
Miscellaneous Government Accounts
Burma
Pakistan
Ledger Balance Adjustment Account
Write-off from Heads of account closing tobalance
Head of AccountOpening Balance as on 1st April Receipts Disbursements
Closing Balanceas on 31st March Net Increase (+)
Decrease (-)
( in lakh of Rupees )
Security Deposits made byGovernment
Accounts with Governments of otherCountries
Accounts with the Governments of
8674
8679
d
18. DETAILED STATEMENT ON CONTINGENCY FUND AND PUBLIC ACCOUNT TRANSACTIONS -Contd.
(
(
)
)
. .
. . . .
. .
. .
. .
. .
Dr
Dr
Dr
Dr
Dr
Dr
Dr
Dr( )
2011 2012
497
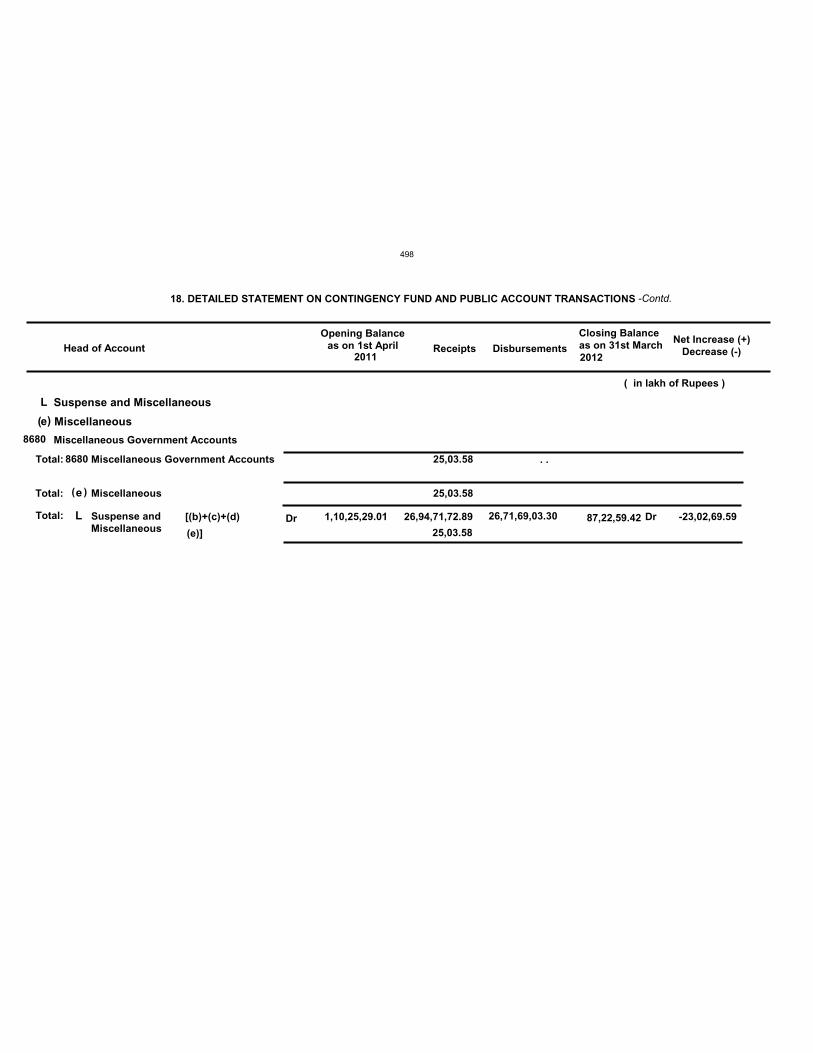
L
Total:
e
Total: 25,03.58
8680
25,03.58Total:
Suspense and Miscellaneous
Miscellaneous
Miscellaneous Government Accounts
Head of AccountOpening Balance as on 1st April Receipts Disbursements
Closing Balanceas on 31st March Net Increase (+)
Decrease (-)
( in lakh of Rupees )
Miscellaneous Government Accounts
Miscellaneous
Suspense andMiscellaneous
8680
e
L
18. DETAILED STATEMENT ON CONTINGENCY FUND AND PUBLIC ACCOUNT TRANSACTIONS -Contd.
1,10,25,29.01
( )
26,94,71,72.89 26,71,69,03.30
25,03.58 87,22,59.42 -23,02,69.59
. .
Dr[(b)+(c)+(d)
(e)]
Dr
( )
2011 2012
498
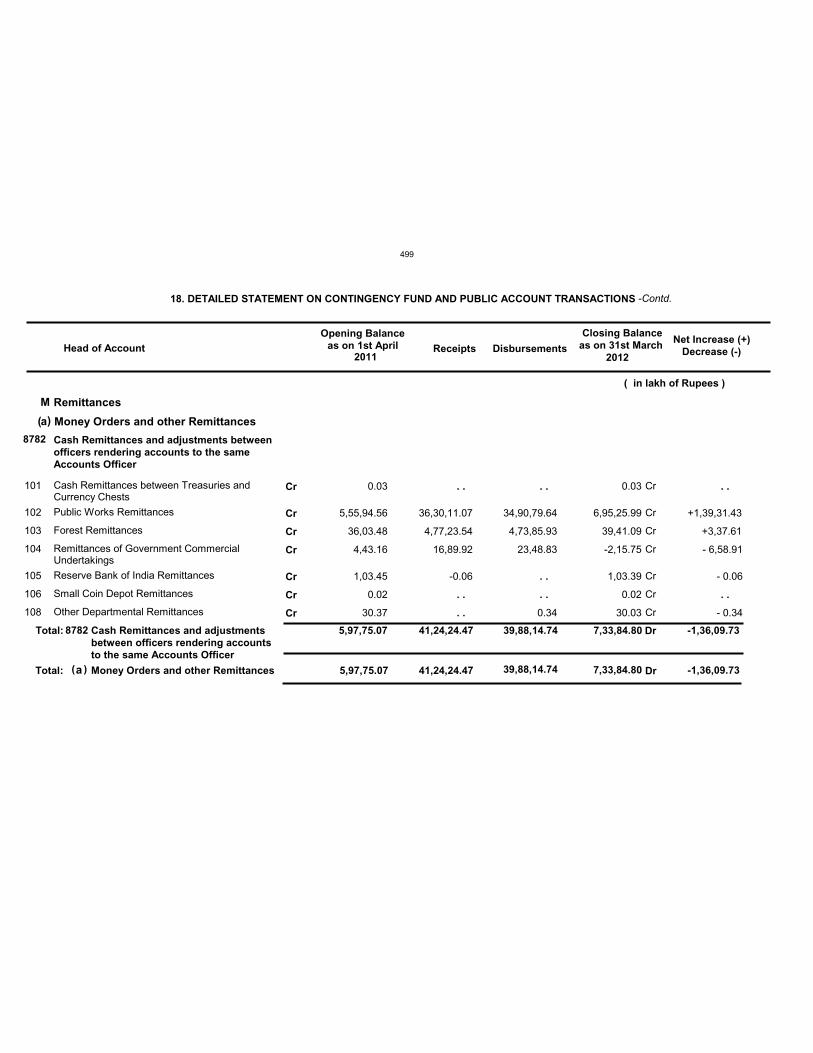
M
a
5,97,75.07Total: 41,24,24.47 39,88,14.74 7,33,84.80 -1,36,09.73
8782
5,97,75.07 41,24,24.47 39,88,14.74 7,33,84.80 -1,36,09.73
101
102
103
104
105
106
108
Cr
Cr
Cr
Cr
Cr
Cr
Cr
0.03
5,55,94.56
36,03.48
4,43.16
1,03.45
0.02
30.37
36,30,11.07
4,77,23.54
16,89.92
-0.06
34,90,79.64
4,73,85.93
23,48.83
0.34
0.03
6,95,25.99
39,41.09
-2,15.75
1,03.39
0.02
30.03
+1,39,31.43
+3,37.61
- 6,58.91
- 0.06
- 0.34
Total:
Remittances
Money Orders and other Remittances
Cash Remittances and adjustments betweenofficers rendering accounts to the sameAccounts Officer
Cash Remittances between Treasuries andCurrency Chests
Public Works Remittances
Forest Remittances
Remittances of Government CommercialUndertakings
Reserve Bank of India Remittances
Small Coin Depot Remittances
Other Departmental Remittances
Head of AccountOpening Balance as on 1st April Receipts Disbursements
Closing Balanceas on 31st March Net Increase (+)
Decrease (-)
( in lakh of Rupees )
Cash Remittances and adjustmentsbetween officers rendering accountsto the same Accounts Officer
Money Orders and other Remittances
8782
a
18. DETAILED STATEMENT ON CONTINGENCY FUND AND PUBLIC ACCOUNT TRANSACTIONS -Contd.
( )
. .
. .
. .
. .
. .
. .
. .
. .
Dr
Cr
Cr
Cr
Cr
Cr
Cr
Cr
Dr( )
2011 2012
499
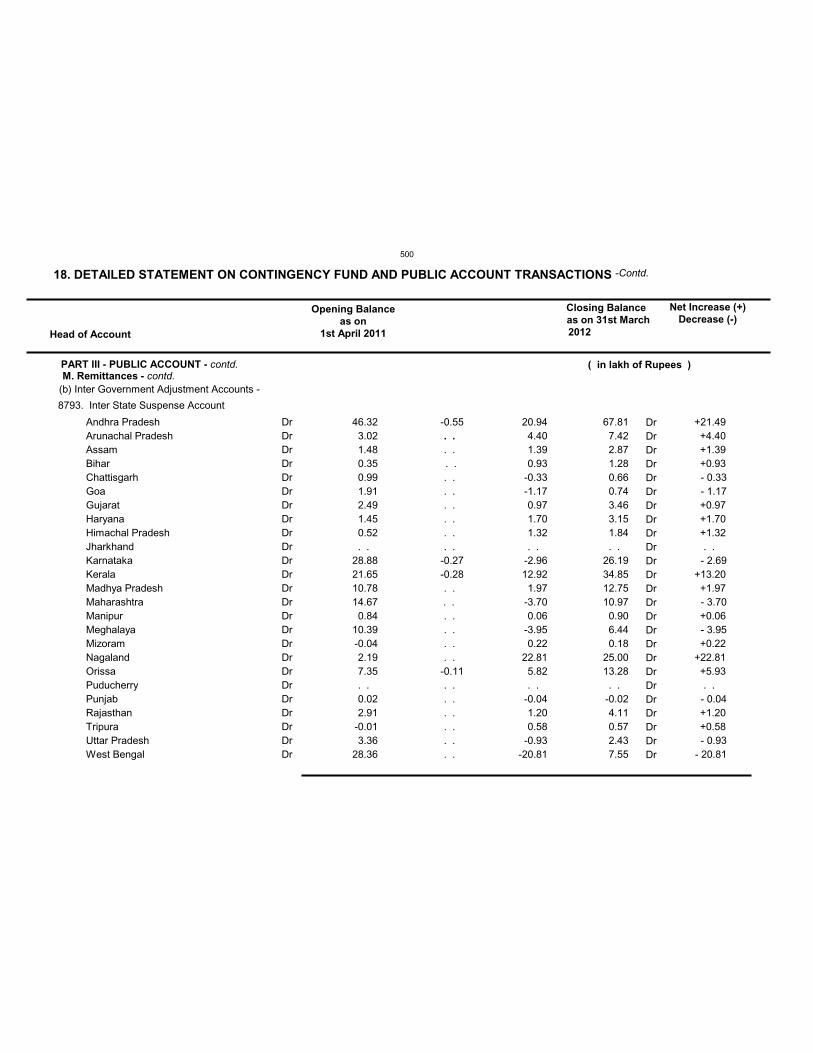
Andhra PradeshArunachal PradeshAssamBiharChattisgarhGoaGujaratHaryanaHimachal PradeshJharkhandKarnatakaKeralaMadhya PradeshMaharashtraManipurMeghalayaMizoramNagalandOrissaPuducherryPunjabRajasthanTripuraUttar PradeshWest Bengal
DrDrDrDrDrDrDrDrDrDrDrDrDrDrDrDrDrDrDrDrDrDrDrDrDr
46.32 3.02 1.48 0.35 0.99 1.91 2.49 1.45 0.52. .
28.88 21.65 10.78 14.67 0.84
10.39-0.04 2.19 7.35. . 0.02 2.91-0.01 3.36
28.36
-0.55. .
. .. .. .. .. .. .. .. .
-0.27-0.28. .. .. .. .. .. .
-0.11. .. .. .. .. .. .
20.94 4.40 1.39 0.93-0.33-1.17 0.97 1.70 1.32. .
-2.96 12.92 1.97-3.70 0.06-3.95 0.22
22.81 5.82. .
-0.04 1.20 0.58-0.93
-20.81
67.81 7.42 2.87 1.28 0.66 0.74 3.46 3.15 1.84. .
26.19 34.85 12.75 10.97 0.90 6.44 0.18
25.00 13.28
. .-0.02 4.11 0.57 2.43 7.55
8793. Inter State Suspense Account
(b) Inter Government Adjustment Accounts -
DrDrDrDrDrDrDrDrDrDrDrDrDrDrDrDrDrDrDrDrDrDrDrDrDr
+21.49+4.40+1.39+0.93- 0.33- 1.17+0.97+1.70+1.32. .- 2.69
+13.20+1.97- 3.70+0.06- 3.95+0.22
+22.81+5.93. .- 0.04+1.20+0.58- 0.93
- 20.81
Head of Account
Opening Balance as on
1st April 2011
Closing Balanceas on 31st March2012
Net Increase (+)Decrease (-)
( in lakh of Rupees )
18. DETAILED STATEMENT ON CONTINGENCY FUND AND PUBLIC ACCOUNT TRANSACTIONS -Contd.
PART III - PUBLIC ACCOUNT - contd.M. Remittances - contd.
500
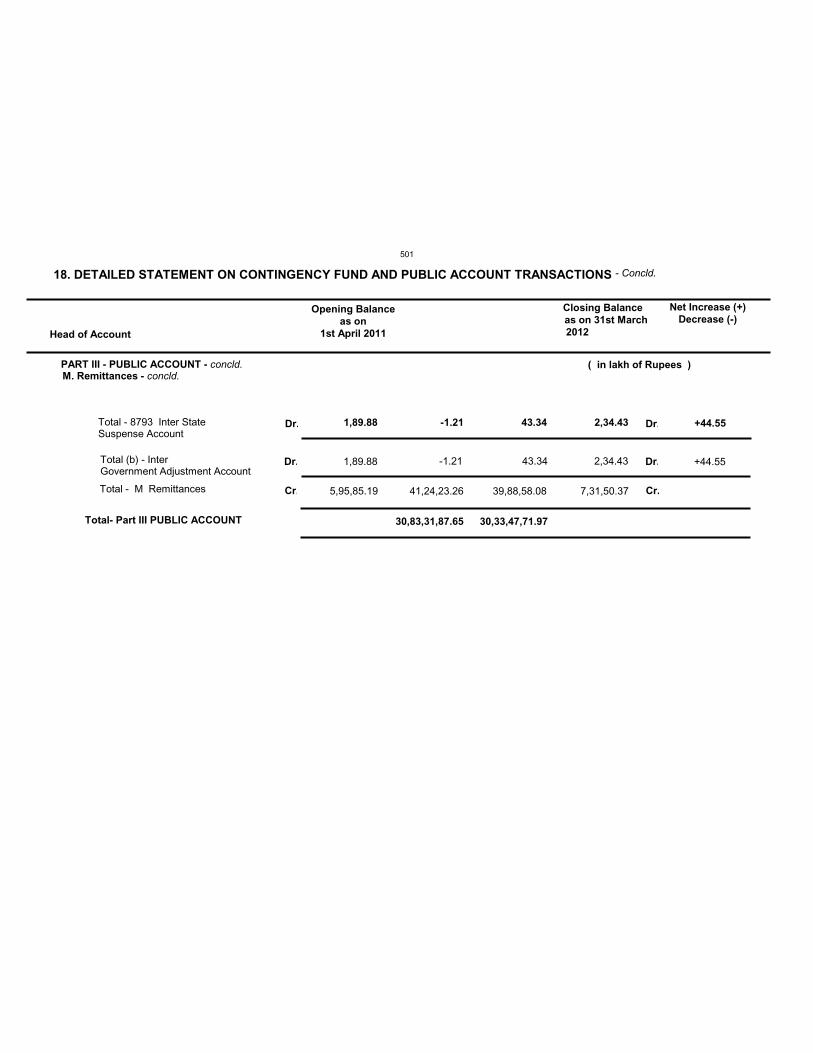
1,89.88 -1.21 43.34 2,34.43Total - 8793 Inter StateSuspense Account
Dr.
Total (b) - InterGovernment Adjustment Account
Dr. 1,89.88 -1.21 43.34 2,34.43
Total - M Remittances 5,95,85.19 41,24,23.26 39,88,58.08 7,31,50.37
30,83,31,87.65 30,33,47,71.97Total- Part III PUBLIC ACCOUNT
Cr.
Dr.
Dr.
Cr.
+44.55
+44.55
Head of Account
Opening Balance as on
1st April 2011
Closing Balanceas on 31st March2012
Net Increase (+)Decrease (-)
( in lakh of Rupees )
18. DETAILED STATEMENT ON CONTINGENCY FUND AND PUBLIC ACCOUNT TRANSACTIONS - Concld.
PART III - PUBLIC ACCOUNT - concld.M. Remittances - concld.
501
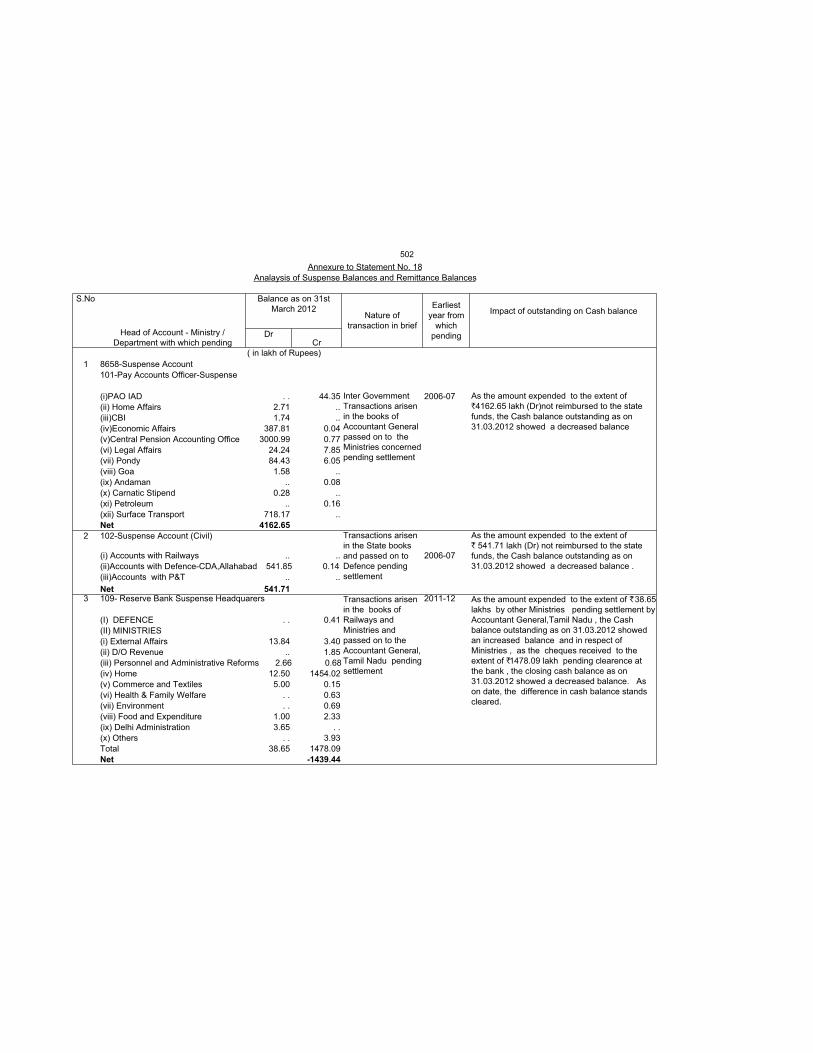
DrCr
( in lakh of Rupees)
1 8658-Suspense Account
101-Pay Accounts Officer-Suspense
(i)PAO IAD . . 44.35 2006-07
(ii) Home Affairs 2.71 ..
(iii)CBI 1.74 ..
(iv)Economic Affairs 387.81 0.04
(v)Central Pension Accounting Office 3000.99 0.77
(vi) Legal Affairs 24.24 7.85
(vii) Pondy 84.43 6.05
(viii) Goa 1.58 ..
(ix) Andaman .. 0.08
(x) Carnatic Stipend 0.28 ..
(xi) Petroleum .. 0.16
(xii) Surface Transport 718.17 ..
Net 4162.65
2 102-Suspense Account (Civil)
(i) Accounts with Railways .. .. 2006-07
(ii)Accounts with Defence-CDA,Allahabad 541.85 0.14
(iii)Accounts with P&T .. ..
Net 541.713 109- Reserve Bank Suspense Headquarers 2011-12
(I) DEFENCE . . 0.41
(II) MINISTRIES
(i) External Affairs 13.84 3.40
(ii) D/O Revenue .. 1.85
(iii) Personnel and Administrative Reforms 2.66 0.68
(iv) Home 12.50 1454.02
(v) Commerce and Textiles 5.00 0.15
(vi) Health & Family Welfare . . 0.63
(vii) Environment . . 0.69
(viii) Food and Expenditure 1.00 2.33
(ix) Delhi Administration 3.65 . .
(x) Others . . 3.93
Total 38.65 1478.09
Net -1439.44
Nature of transaction in brief
Head of Account - Ministry / Department with which pending
Earliestyear from
whichpending
As the amount expended to the extent of `4162.65 lakh (Dr)not reimbursed to the state funds, the Cash balance outstanding as on 31.03.2012 showed a decreased balance
As the amount expended to the extent of ` 541.71 lakh (Dr) not reimbursed to the state funds, the Cash balance outstanding as on 31.03.2012 showed a decreased balance .
Transactions arisenin the State books and passed on to Defence pending settlement
Annexure to Statement No. 18
Analaysis of Suspense Balances and Remittance Balances
S.No
Impact of outstanding on Cash balance
Balance as on 31st March 2012
Inter Government Transactions arisen in the books of Accountant General passed on to theMinistries concerned pending settlement
Transactions arisenin the books of Railways and Ministries and passed on to the Accountant General, Tamil Nadu pending settlement
As the amount expended to the extent of ̀38.65lakhs by other Ministries pending settlement by Accountant General,Tamil Nadu , the Cash balance outstanding as on 31.03.2012 showedan increased balance and in respect of Ministries , as the cheques received to the extent of 1̀478.09 lakh pending clearence at the bank , the closing cash balance as on 31.03.2012 showed a decreased balance. As on date, the difference in cash balance stands cleared.
502
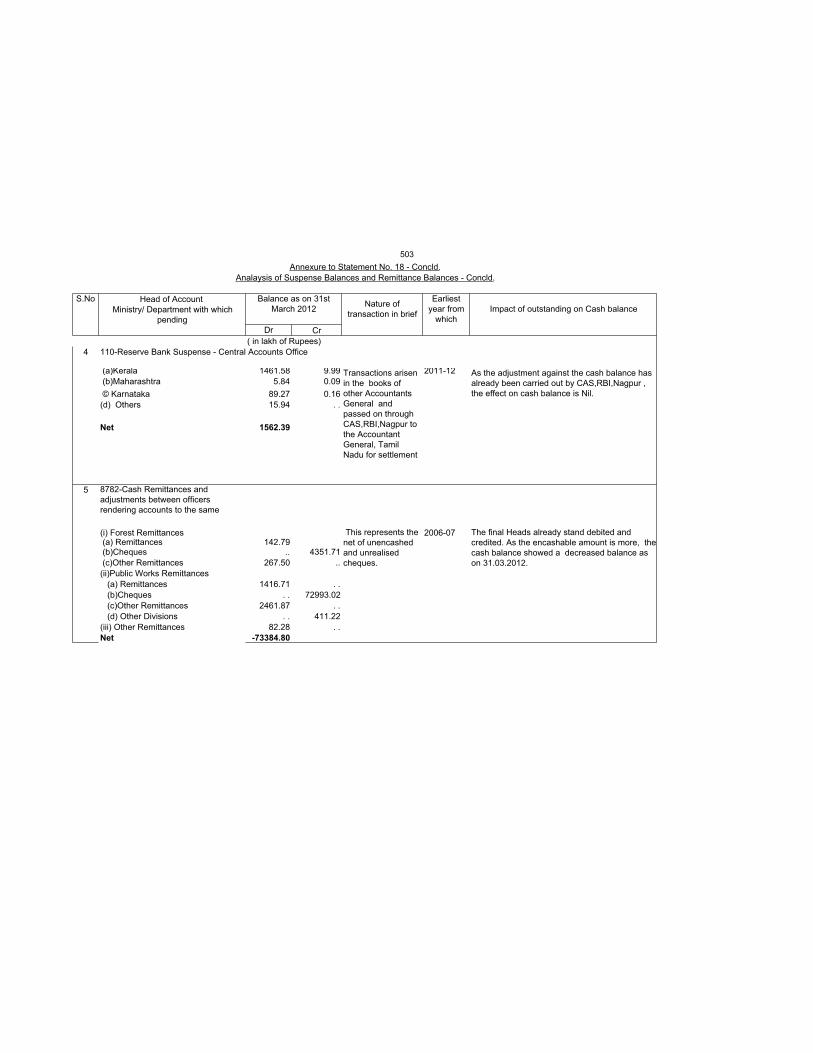
Head of Account Ministry/ Department with which
pendingDr Cr
( in lakh of Rupees)
4 110-Reserve Bank Suspense - Central Accounts Office
(a)Kerala 1461.58 9.99 2011-12
(b)Maharashtra 5.84 0.09
© Karnataka 89.27 0.16
(d) Others 15.94 . .
Net 1562.39
5
(i) Forest Remittances 2006-07 (a) Remittances 142.79 (b)Cheques .. 4351.71
(c)Other Remittances 267.50 ..
(ii)Public Works Remittances
(a) Remittances 1416.71 . .
(b)Cheques . . 72993.02
(c)Other Remittances 2461.87 . .
(d) Other Divisions . . 411.22
(iii) Other Remittances 82.28 . .
Net -73384.80
Analaysis of Suspense Balances and Remittance Balances - Concld.
Impact of outstanding on Cash balance
This represents thenet of unencashed and unrealised cheques.
The final Heads already stand debited and credited. As the encashable amount is more, the cash balance showed a decreased balance as on 31.03.2012.
As the adjustment against the cash balance has already been carried out by CAS,RBI,Nagpur , the effect on cash balance is Nil.
Annexure to Statement No. 18 - Concld.
8782-Cash Remittances and adjustments between officers rendering accounts to the same
S.No Balance as on 31st March 2012
Nature of transaction in brief
Transactions arisenin the books of other Accountants General and passed on through CAS,RBI,Nagpur to the Accountant General, Tamil Nadu for settlement
Earliestyear from
which
503
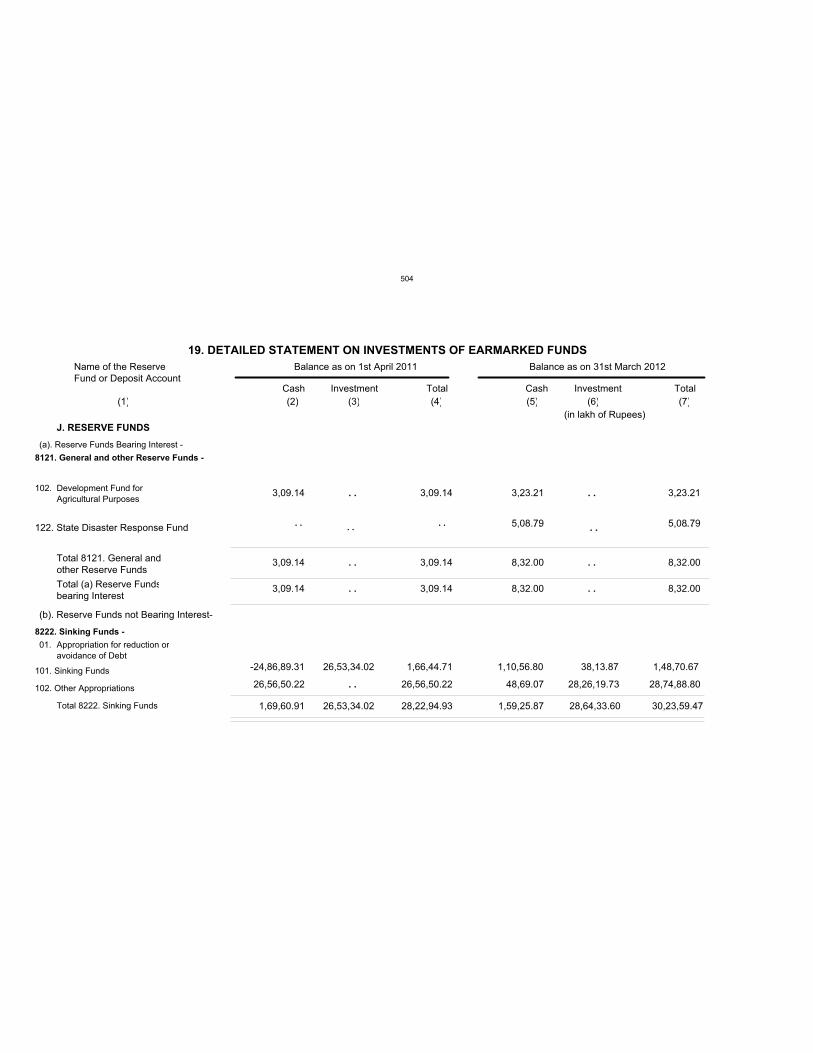
19. DETAILED STATEMENT ON INVESTMENTS OF EARMARKED FUNDS
Name of the ReserveFund or Deposit Account
Balance as on 1st April 2011 Balance as on 31st March 2012
Cash Investment Total Cash Investment Total
(1) (2) (3) (4) (5) (6) (7)
(in lakh of Rupees)
J. RESERVE FUNDS -
(a). Reserve Funds Bearing Interest -
8121. General and other Reserve Funds -
102. Development Fund for
Agricultural Purposes
Total 8121. General andother Reserve Funds
Total (a) Reserve Fundsbearing Interest
(b). Reserve Funds not Bearing Interest-
8222. Sinking Funds -
Appropriation for reduction or
avoidance of Debt
01.
101. Sinking Funds
102. Other Appropriations
Total 8222. Sinking Funds
3,09.14 3,09.14 3,23.21 3,23.21
3,09.14
3,09.14
3,09.14
3,09.14
8,32.00
8,32.00 8,32.00
8,32.00
-24,86,89.31 26,53,34.02 1,66,44.71 1,10,56.80 38,13.87 1,48,70.67
26,56,50.22 26,56,50.22
28,22,94.93 1,69,60.91 26,53,34.02
48,69.07 28,26,19.73 28,74,88.80
1,59,25.87 28,64,33.60 30,23,59.47
. . . .
. . . .
. . . .
. .
122. State Disaster Response Fund 5,08.79 5,08.79 . . . .
. . . . . . . .
504
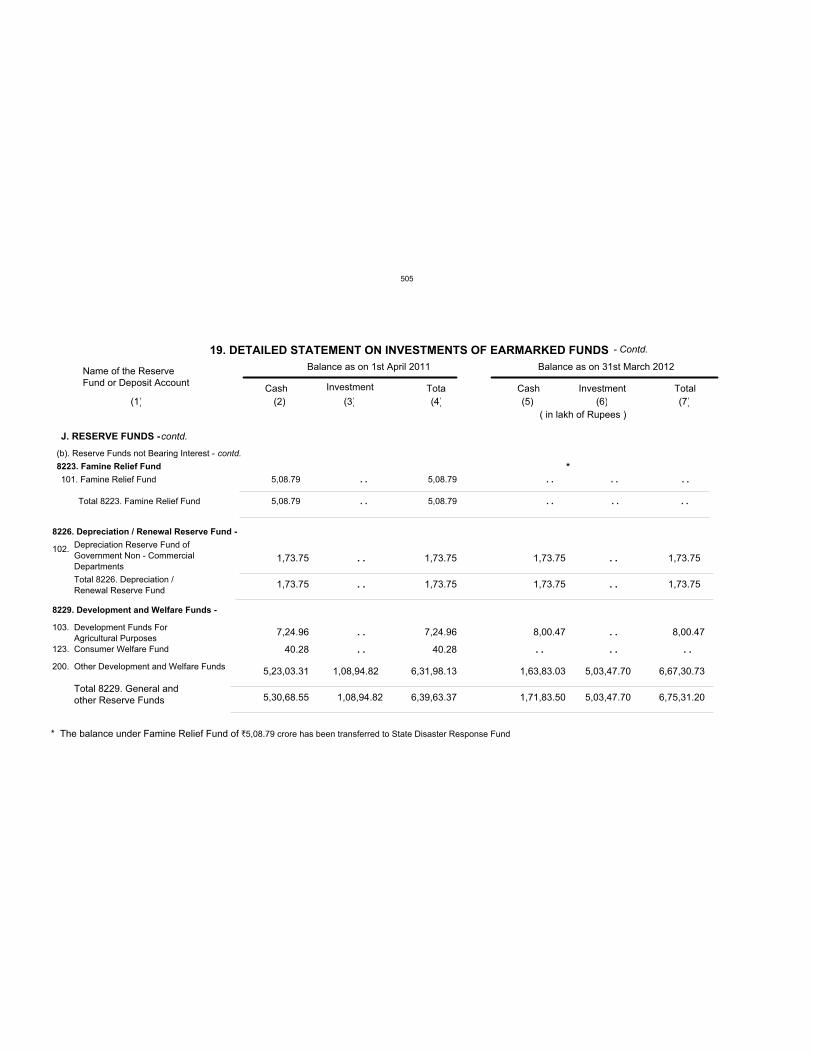
* The balance under Famine Relief Fund of `5,08.79 crore has been transferred to State Disaster Response Fund
8226. Depreciation / Renewal Reserve Fund -
Depreciation Reserve Fund of
Government Non - Commercial
Departments
102.
Total 8226. Depreciation /
Renewal Reserve Fund
1,73.75 1,73.75 1,73.75 1,73.75
1,73.75 1,73.75 1,73.75 1,73.75
19. DETAILED STATEMENT ON INVESTMENTS OF EARMARKED FUNDS
Name of the ReserveFund or Deposit Account
Balance as on 1st April 2011 Balance as on 31st March 2012
Cash Investment Total Cash Investment Total
(1) (2) (3) (4) (5) (6) (7)
( in lakh of Rupees )
J. RESERVE FUNDS -
(b). Reserve Funds not Bearing Interest -
8229. Development and Welfare Funds -
103. Development Funds For
Agricultural Purposes
Total 8229. General andother Reserve Funds
7,24.96 7,24.96 8,00.47 8,00.47
40.28 40.28
contd.
contd.
123. Consumer Welfare Fund
200. Other Development and Welfare Funds 5,23,03.31 6,31,98.13 1,63,83.03 6,67,30.73 5,03,47.70 1,08,94.82
5,30,68.55 6,39,63.37 1,71,83.50 6,75,31.20 5,03,47.70 1,08,94.82
. . . .
. . . .
. . . .
. . . . . . . .
- Contd.
8223. Famine Relief Fund -
101. Famine Relief Fund 5,08.79 5,08.79
Total 8223. Famine Relief Fund 5,08.79 5,08.79
. .
. .
. . . . . .
. . . . . .
*
505
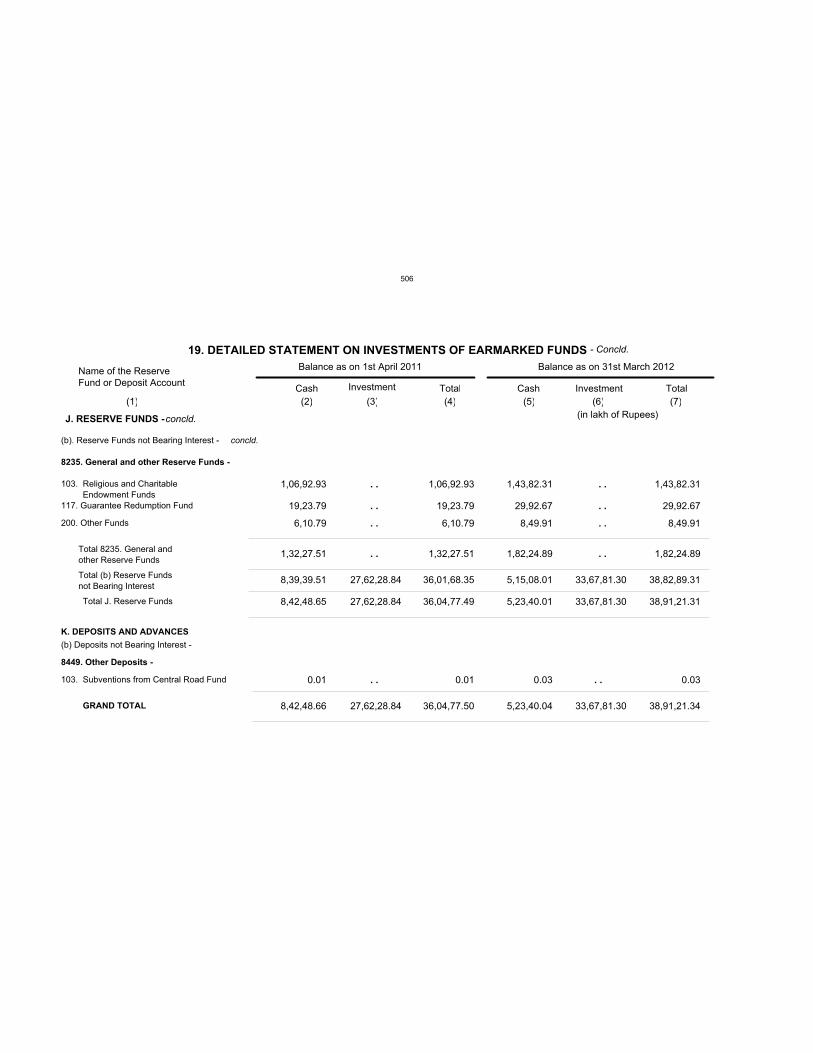
19. DETAILED STATEMENT ON INVESTMENTS OF EARMARKED FUNDS
Name of the ReserveFund or Deposit Account
Balance as on 1st April 2011 Balance as on 31st March 2012
Cash Investment Total Cash Investment Total
(1) (2) (3) (4) (5) (6) (7)
8235. General and other Reserve Funds -
Religious and Charitable
Endowment Funds
117. Guarantee Redumption Fund
Total J. Reserve Funds
8449. Other Deposits -
Subventions from Central Road Fund103.
GRAND TOTAL
1,06,92.93 1,06,92.93 1,43,82.31 1,43,82.31
19,23.79 19,23.79
1,32,27.51 1,32,27.51
8,42,48.65 27,62,28.84 36,04,77.49
1,82,24.89 1,82,24.89
5,23,40.01 33,67,81.30 38,91,21.31
0.01 0.01 0.03 0.03
8,42,48.66 36,04,77.50 5,23,40.04 38,91,21.34
103.
200. Other Funds
Total 8235. General and
other Reserve Funds
Total (b) Reserve Funds
not Bearing Interest 8,39,39.51 27,62,28.84 36,01,68.35 5,15,08.01 33,67,81.30 38,82,89.31
K. DEPOSITS AND ADVANCES
(b) Deposits not Bearing Interest -
29,92.67 29,92.67
6,10.79 6,10.79 8,49.91 8,49.91
27,62,28.84 33,67,81.30
. . . .
. . . .
. . . .
. . . .
. . . .
- Concld.
(in lakh of Rupees)J. RESERVE FUNDS -
(b). Reserve Funds not Bearing Interest -
concld.
concld.
506
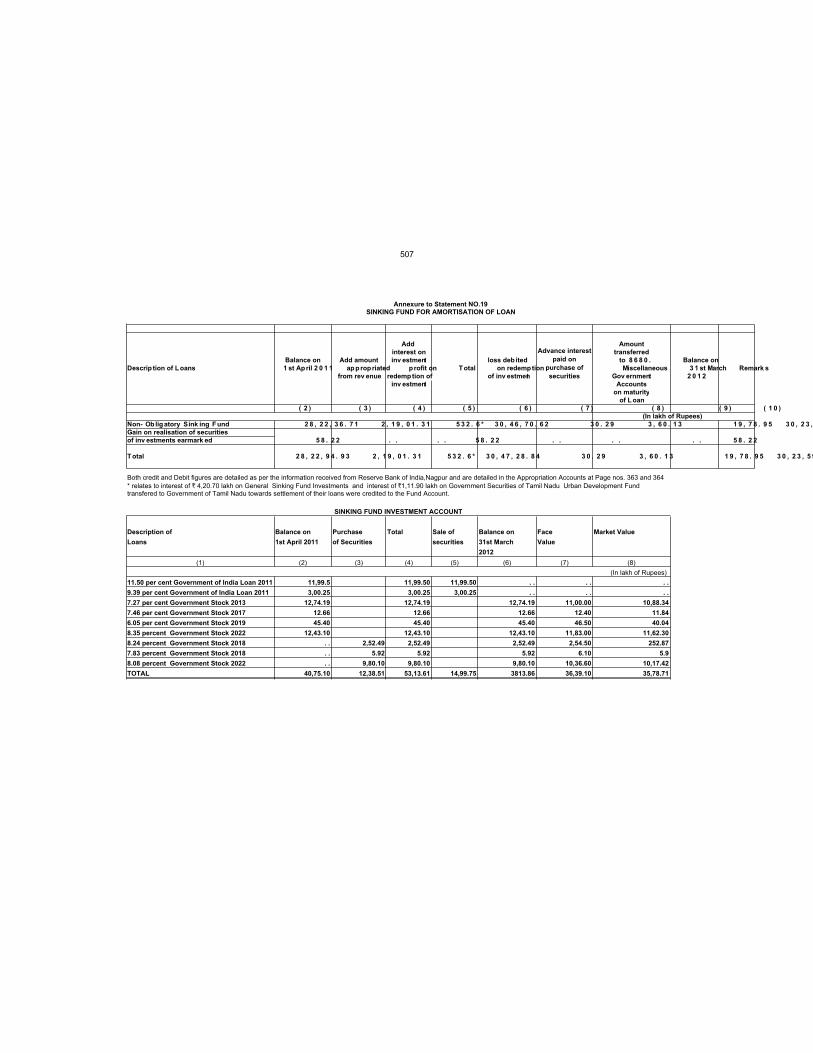
Add Amount
interest on transferred
Balance on Add amount inv estment loss deb ited to 8 6 8 0 . Balance on
Descrip tion of Loans 1 st April 2 0 1 1 ap p ropriated p rofit on Total on redemption Miscellaneous 3 1 st March Remark s
from rev enue redemption of of inv estment Gov ernment 2 0 1 2
inv estment Accounts
on maturity
of Loan
( 2 ) ( 3 ) ( 4 ) ( 5 ) ( 6 ) ( 7 ) ( 8 ) ( 9 ) ( 1 0 )
Non- Ob ligatory Sink ing Fund 2 8 , 2 2 , 3 6 . 7 1 2 , 1 9 , 0 1 . 3 1 5 3 2 . 6 * 3 0 , 4 6 , 7 0 . 6 2 3 0 . 2 9 3 , 6 0 . 1 3 1 9 , 7 8 . 9 5 3 0 , 2 3 ,
Gain on realisation of securities
of inv estments earmark ed 5 8 . 2 2 . . . . 5 8 . 2 2 . . . . . . 5 8 . 2 2
Total 2 8 , 2 2 , 9 4 . 9 3 2 , 1 9 , 0 1 . 3 1 5 3 2 . 6 * 3 0 , 4 7 , 2 8 . 8 4 3 0 . 2 9 3 , 6 0 . 1 3 1 9 , 7 8 . 9 5 3 0 , 2 3 , 5 9
Both credit and Debit figures are detailed as per the information received from Reserve Bank of India,Nagpur and are detailed in the Appropriation Accounts at Page nos. 363 and 364
Description of Balance on Purchase Total Sale of Balance on Face Market Value
Loans 1st April 2011 of Securities securities 31st March Value
2012
(1) (2) (3) (4) (5) (6) (7) (8)
11.50 per cent Government of India Loan 2011 11,99.5 11,99.50 11,99.50 . . . . . .
9.39 per cent Government of India Loan 2011 3,00.25 3,00.25 3,00.25 . . . . . .
7.27 per cent Government Stock 2013 12,74.19 12,74.19 12,74.19 11,00.00 10,88.34
7.46 per cent Government Stock 2017 12.66 12.66 12.66 12.40 11.84
6.05 per cent Government Stock 2019 45.40 45.40 45.40 46.50 40.04
8.35 percent Government Stock 2022 12,43.10 12,43.10 12,43.10 11,83.00 11,62.30
8.24 percent Government Stock 2018 . . 2,52.49 2,52.49 2,52.49 2,54.50 252.87
7.83 percent Government Stock 2018 . . 5.92 5.92 5.92 6.10 5.9
8.08 percent Government Stock 2022 . . 9,80.10 9,80.10 9,80.10 10,36.60 10,17.42
TOTAL 40,75.10 12,38.51 53,13.61 14,99.75 3813.86 36,39.10 35,78.71
(In lakh of Rupees)
transfered to Government of Tamil Nadu towards settlement of their loans were credited to the Fund Account.* relates to interest of ` 4,20.70 lakh on General Sinking Fund Investments and interest of `1,11.90 lakh on Government Securities of Tamil Nadu Urban Development Fund
(In lakh of Rupees)
Advance interest
paid on
purchase of
securities
Annexure to Statement NO.19SINKING FUND FOR AMORTISATION OF LOAN
SINKING FUND INVESTMENT ACCOUNT
507
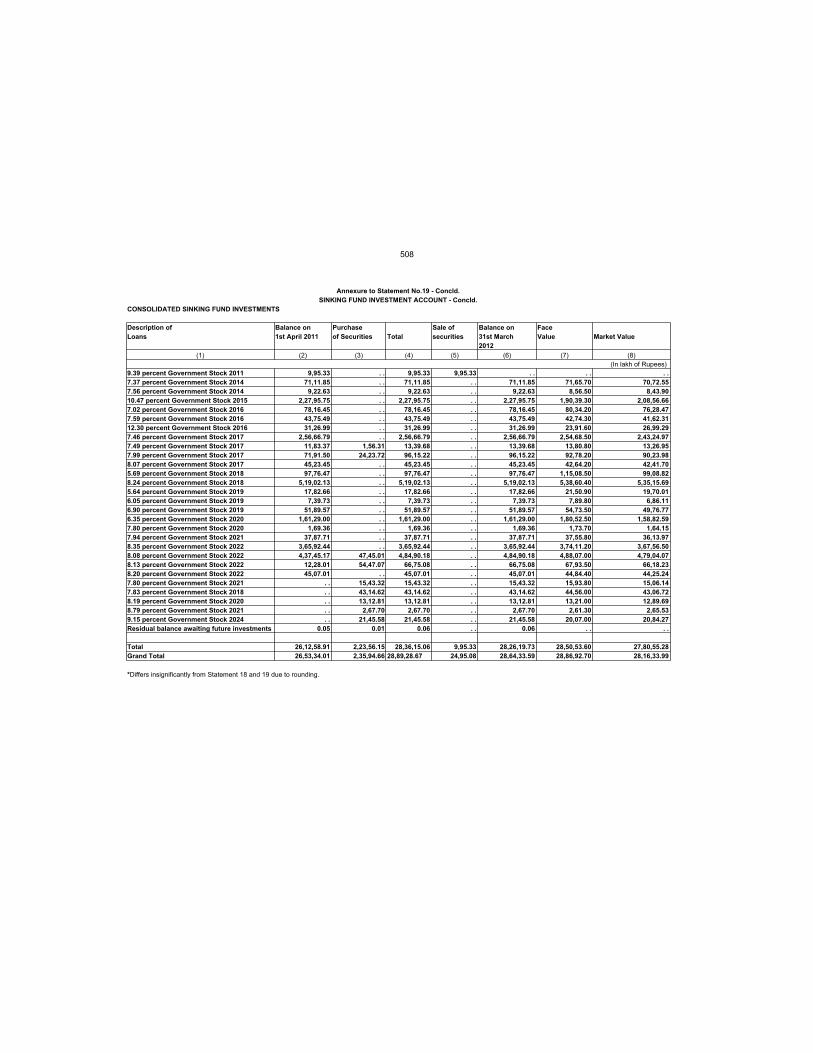
Description of Balance on Purchase Sale of Balance on Face
Loans 1st April 2011 of Securities Total securities 31st March Value Market Value
2012
(1) (2) (3) (4) (5) (6) (7) (8)
9.39 percent Government Stock 2011 9,95.33 . . 9,95.33 9,95.33 . . . . . .
7.37 percent Government Stock 2014 71,11.85 . . 71,11.85 . . 71,11.85 71,65.70 70,72.55
7.56 percent Government Stock 2014 9,22.63 . . 9,22.63 . . 9,22.63 8,56.50 8,43.90
10.47 percent Government Stock 2015 2,27,95.75 . . 2,27,95.75 . . 2,27,95.75 1,90,39.30 2,08,56.66
7.02 percent Government Stock 2016 78,16.45 . . 78,16.45 . . 78,16.45 80,34.20 76,28.47
7.59 percent Government Stock 2016 43,75.49 . . 43,75.49 . . 43,75.49 42,74.30 41,62.31
12.30 percent Government Stock 2016 31,26.99 . . 31,26.99 . . 31,26.99 23,91.60 26,99.29
7.46 percent Government Stock 2017 2,56,66.79 . . 2,56,66.79 . . 2,56,66.79 2,54,68.50 2,43,24.97
7.49 percent Government Stock 2017 11,83.37 1,56.31 13,39.68 . . 13,39.68 13,80.80 13,26.95
7.99 percent Government Stock 2017 71,91.50 24,23.72 96,15.22 . . 96,15.22 92,78.20 90,23.98
8.07 percent Government Stock 2017 45,23.45 . . 45,23.45 . . 45,23.45 42,64.20 42,41.70
5.69 percent Government Stock 2018 97,76.47 . . 97,76.47 . . 97,76.47 1,15,08.50 99,08.82
8.24 percent Government Stock 2018 5,19,02.13 . . 5,19,02.13 . . 5,19,02.13 5,38,60.40 5,35,15.69
5.64 percent Government Stock 2019 17,82.66 . . 17,82.66 . . 17,82.66 21,50.90 19,70.01
6.05 percent Government Stock 2019 7,39.73 . . 7,39.73 . . 7,39.73 7,89.80 6,86.11
6.90 percent Government Stock 2019 51,89.57 . . 51,89.57 . . 51,89.57 54,73.50 49,76.77
6.35 percent Government Stock 2020 1,61,29.00 . . 1,61,29.00 . . 1,61,29.00 1,80,52.50 1,58,82.59
7.80 percent Government Stock 2020 1,69.36 . . 1,69.36 . . 1,69.36 1,73.70 1,64.15
7.94 percent Government Stock 2021 37,87.71 . . 37,87.71 . . 37,87.71 37,55.80 36,13.97
8.35 percent Government Stock 2022 3,65,92.44 . . 3,65,92.44 . . 3,65,92.44 3,74,11.20 3,67,56.50
8.08 percent Government Stock 2022 4,37,45.17 47,45.01 4,84,90.18 . . 4,84,90.18 4,88,07.00 4,79,04.07
8.13 percent Government Stock 2022 12,28.01 54,47.07 66,75.08 . . 66,75.08 67,93.50 66,18.23
8.20 percent Government Stock 2022 45,07.01 . . 45,07.01 . . 45,07.01 44,84.40 44,25.24
7.80 percent Government Stock 2021 . . 15,43.32 15,43.32 . . 15,43.32 15,93.80 15,06.14
7.83 percent Government Stock 2018 . . 43,14.62 43,14.62 . . 43,14.62 44,56.00 43,06.72
8.19 percent Government Stock 2020 . . 13,12.81 13,12.81 . . 13,12.81 13,21.00 12,89.69
8.79 percent Government Stock 2021 . . 2,67.70 2,67.70 . . 2,67.70 2,61.30 2,65.53
9.15 percent Government Stock 2024 . . 21,45.58 21,45.58 . . 21,45.58 20,07.00 20,84.27
Residual balance awaiting future investments 0.05 0.01 0.06 . . 0.06 . . . .
Total 26,12,58.91 2,23,56.15 28,36,15.06 9,95.33 28,26,19.73 28,50,53.60 27,80,55.28
Grand Total 26,53,34.01 2,35,94.66 28,89,28.67 24,95.08 28,64,33.59 28,86,92.70 28,16,33.99
*Differs insignificantly from Statement 18 and 19 due to rounding.
Annexure to Statement No.19 - Concld.
SINKING FUND INVESTMENT ACCOUNT - Concld.
(In lakh of Rupees)
CONSOLIDATED SINKING FUND INVESTMENTS
508
Volume 2 - Part III - Appendices
509
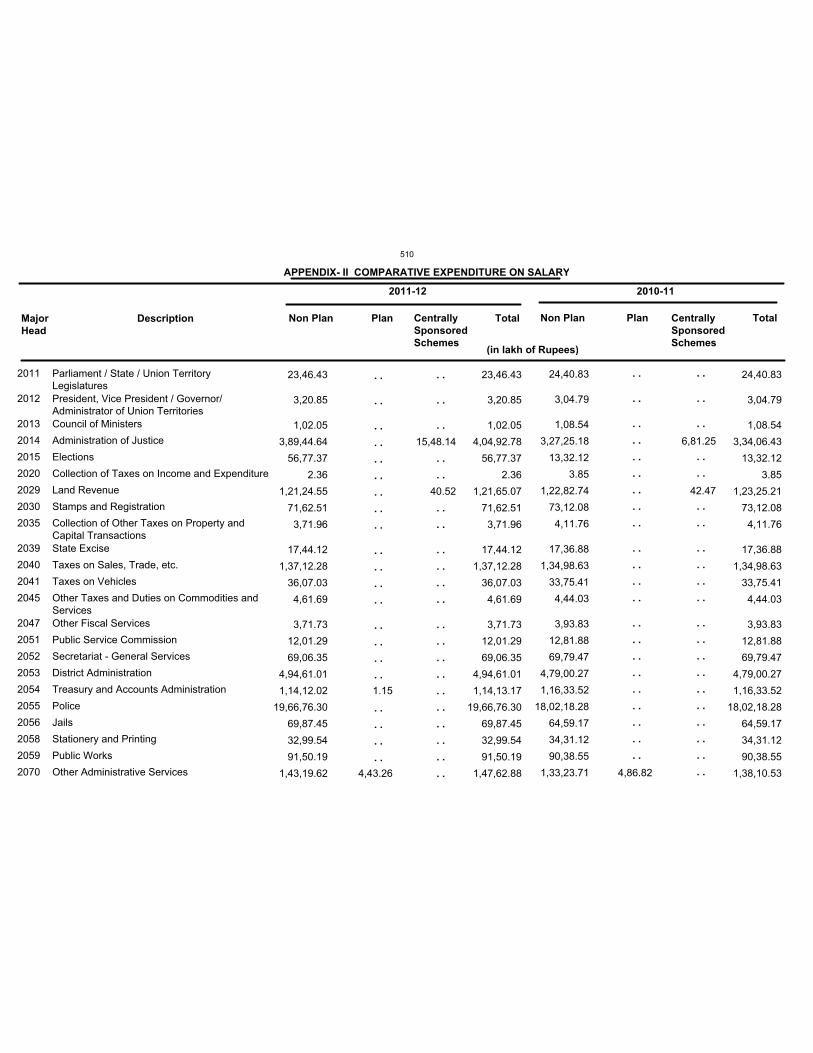
2011
2012
2013
2014
2015
2020
2029
2030
2035
2039
2040
2041
2045
2047
2051
2052
2053
2054
2055
2056
2058
2059
2070
Parliament / State / Union TerritoryLegislatures
President, Vice President / Governor/Administrator of Union Territories
Council of Ministers
Administration of Justice
Elections
Collection of Taxes on Income and Expenditure
Land Revenue
Stamps and Registration
Collection of Other Taxes on Property andCapital Transactions
State Excise
Taxes on Sales, Trade, etc.
Taxes on Vehicles
Other Taxes and Duties on Commodities andServices
Other Fiscal Services
Public Service Commission
Secretariat - General Services
District Administration
Treasury and Accounts Administration
Police
Jails
Stationery and Printing
Public Works
Other Administrative Services
Non Plan Plan Centrally
Sponsored
Schemes
TotalMajor
Head
Description
24,40.83
3,04.79
1,08.54
3,27,25.18
13,32.12
3.85
1,22,82.74
73,12.08
4,11.76
17,36.88
1,34,98.63
33,75.41
4,44.03
3,93.83
12,81.88
69,79.47
4,79,00.27
1,16,33.52
18,02,18.28
64,59.17
34,31.12
90,38.55
1,33,23.71 4,86.82
6,81.25
42.47
24,40.83
3,04.79
1,08.54
3,34,06.43
13,32.12
3.85
1,23,25.21
73,12.08
4,11.76
17,36.88
1,34,98.63
33,75.41
4,44.03
3,93.83
12,81.88
69,79.47
4,79,00.27
1,16,33.52
18,02,18.28
64,59.17
34,31.12
90,38.55
1,38,10.53
Non Plan Plan Centrally
Sponsored
Schemes
Total
23,46.43
3,20.85
1,02.05
3,89,44.64
56,77.37
2.36
1,21,24.55
71,62.51
3,71.96
17,44.12
1,37,12.28
36,07.03
4,61.69
3,71.73
12,01.29
69,06.35
4,94,61.01
1,14,12.02
19,66,76.30
69,87.45
32,99.54
91,50.19
1,43,19.62
1.15
4,43.26
15,48.14
40.52
23,46.43
3,20.85
1,02.05
4,04,92.78
56,77.37
2.36
1,21,65.07
71,62.51
3,71.96
17,44.12
1,37,12.28
36,07.03
4,61.69
3,71.73
12,01.29
69,06.35
4,94,61.01
1,14,13.17
19,66,76.30
69,87.45
32,99.54
91,50.19
1,47,62.88
. .
. .
. .
. .
. .
. .
. .
. .
. .
. .
. .
. .
. .
. .
. .
. .
. .
. .
. .
. .
. .
. .
. .
. .
. .
. .
. .
. .
. .
. .
. .
. .
. .
. .
. .
. .
. .
. .
. .
. .
. .
. .
. .
. .
. .
. .
. .
. .
. .
. .
. .
. .
. .
. .
. .
. .
. .
. .
. .
. .
. .
. .
. .
. .
. .
. .
. .
. .
. .
. .
. .
. .
. .
. .
. .
. .
. .
. .
. .
. .
. .
. .
. .
. .
. .
APPENDIX- II COMPARATIVE EXPENDITURE ON SALARY
2011-12 2010-11
(in lakh of Rupees)
510
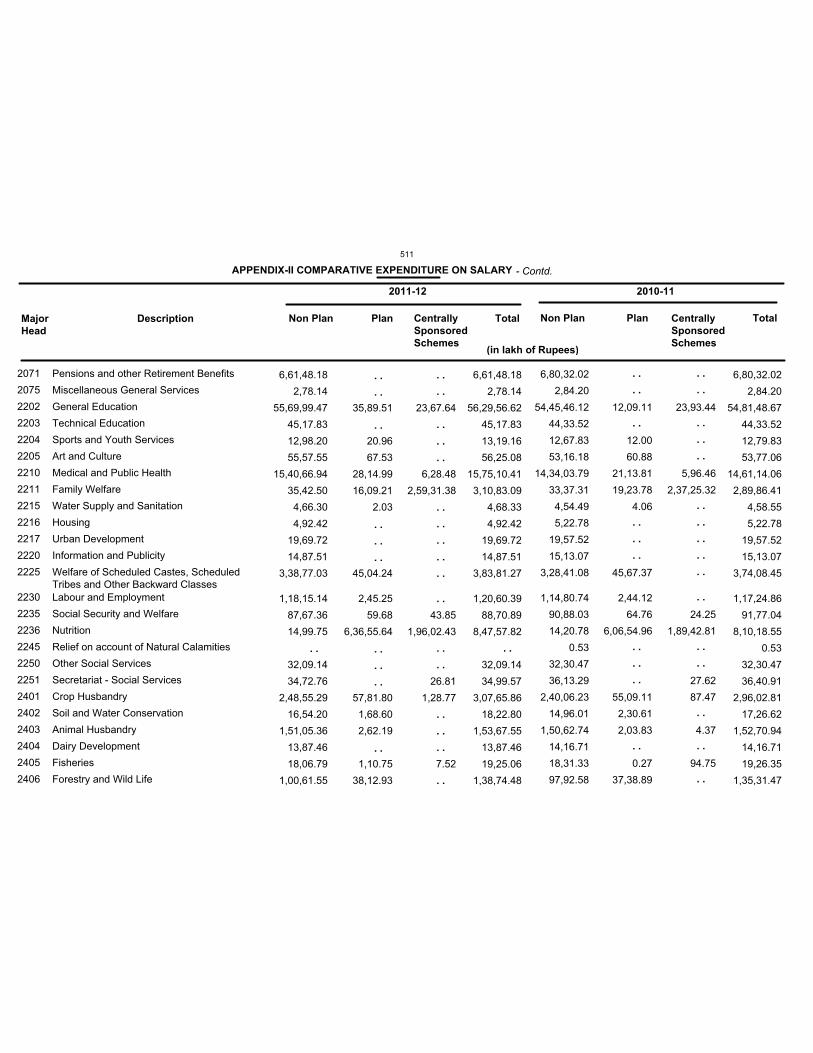
2071
2075
2202
2203
2204
2205
2210
2211
2215
2216
2217
2220
2225
2230
2235
2236
2245
2250
2251
2401
2402
2403
2404
2405
2406
Pensions and other Retirement Benefits
Miscellaneous General Services
General Education
Technical Education
Sports and Youth Services
Art and Culture
Medical and Public Health
Family Welfare
Water Supply and Sanitation
Housing
Urban Development
Information and Publicity
Welfare of Scheduled Castes, ScheduledTribes and Other Backward Classes
Labour and Employment
Social Security and Welfare
Nutrition
Relief on account of Natural Calamities
Other Social Services
Secretariat - Social Services
Crop Husbandry
Soil and Water Conservation
Animal Husbandry
Dairy Development
Fisheries
Forestry and Wild Life
Non Plan Plan Centrally
Sponsored
Schemes
TotalMajor
Head
Description
6,80,32.02
2,84.20
54,45,46.12
44,33.52
12,67.83
53,16.18
14,34,03.79
33,37.31
4,54.49
5,22.78
19,57.52
15,13.07
3,28,41.08
1,14,80.74
90,88.03
14,20.78
0.53
32,30.47
36,13.29
2,40,06.23
14,96.01
1,50,62.74
14,16.71
18,31.33
97,92.58
12,09.11
12.00
60.88
21,13.81
19,23.78
4.06
45,67.37
2,44.12
64.76
6,06,54.96
55,09.11
2,30.61
2,03.83
0.27
37,38.89
23,93.44
5,96.46
2,37,25.32
24.25
1,89,42.81
27.62
87.47
4.37
94.75
6,80,32.02
2,84.20
54,81,48.67
44,33.52
12,79.83
53,77.06
14,61,14.06
2,89,86.41
4,58.55
5,22.78
19,57.52
15,13.07
3,74,08.45
1,17,24.86
91,77.04
8,10,18.55
0.53
32,30.47
36,40.91
2,96,02.81
17,26.62
1,52,70.94
14,16.71
19,26.35
1,35,31.47
Non Plan Plan Centrally
Sponsored
Schemes
Total
6,61,48.18
2,78.14
55,69,99.47
45,17.83
12,98.20
55,57.55
15,40,66.94
35,42.50
4,66.30
4,92.42
19,69.72
14,87.51
3,38,77.03
1,18,15.14
87,67.36
14,99.75
32,09.14
34,72.76
2,48,55.29
16,54.20
1,51,05.36
13,87.46
18,06.79
1,00,61.55
35,89.51
20.96
67.53
28,14.99
16,09.21
2.03
45,04.24
2,45.25
59.68
6,36,55.64
57,81.80
1,68.60
2,62.19
1,10.75
38,12.93
23,67.64
6,28.48
2,59,31.38
43.85
1,96,02.43
26.81
1,28.77
7.52
6,61,48.18
2,78.14
56,29,56.62
45,17.83
13,19.16
56,25.08
15,75,10.41
3,10,83.09
4,68.33
4,92.42
19,69.72
14,87.51
3,83,81.27
1,20,60.39
88,70.89
8,47,57.82
32,09.14
34,99.57
3,07,65.86
18,22.80
1,53,67.55
13,87.46
19,25.06
1,38,74.48
. .
. .
. .
. .
. .
. .
. .
. .
. .
. .
. .
. .
. .
. .
. .
. .
. .
. .
. .
. .
. .
. .
. .
. .
. .
. .
. .
. .
. .
. .
. .
. .
. .
. .
. .
. .
. .
. .
. .
. .
. .
. .
. .
. .
. .
. .
. .
. .
. .
. .
. .
. .
. .
. .
. .
APPENDIX-II COMPARATIVE EXPENDITURE ON SALARY - Contd.
2011-12 2010-11
(in lakh of Rupees)
511
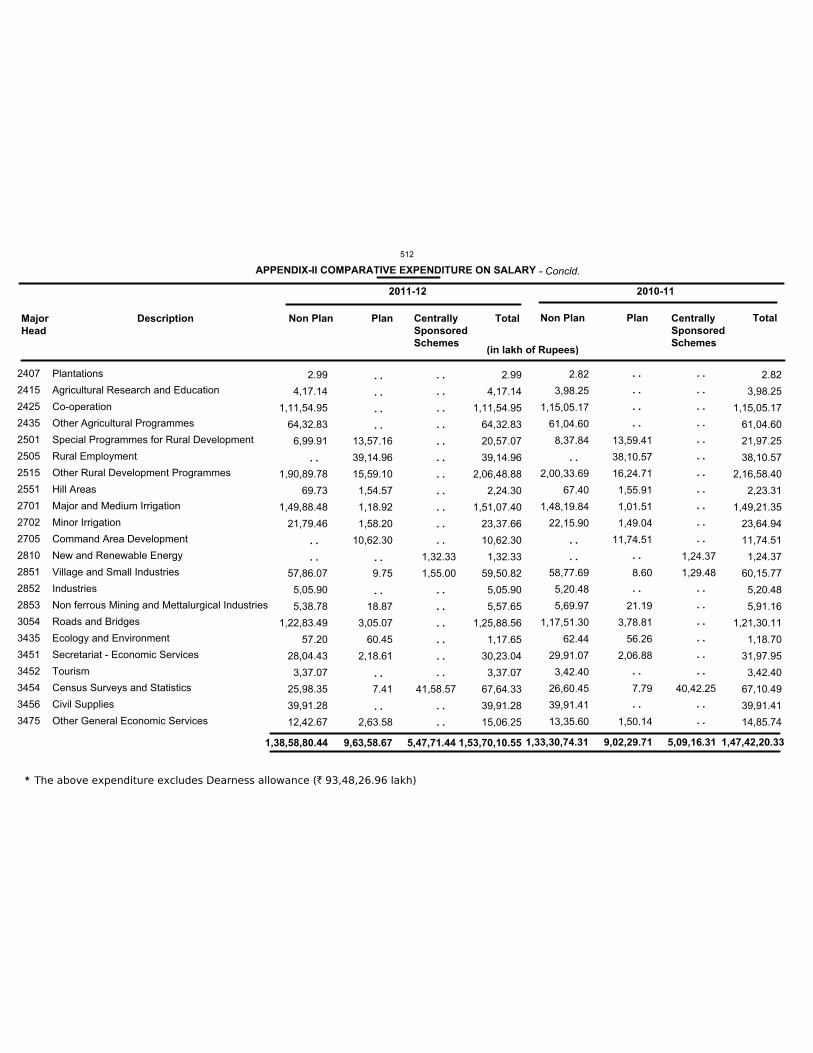
2407
2415
2425
2435
2501
2505
2515
2551
2701
2702
2705
2810
2851
2852
2853
3054
3435
3451
3452
3454
3456
3475
Plantations
Agricultural Research and Education
Co-operation
Other Agricultural Programmes
Special Programmes for Rural Development
Rural Employment
Other Rural Development Programmes
Hill Areas
Major and Medium Irrigation
Minor Irrigation
Command Area Development
New and Renewable Energy
Village and Small Industries
Industries
Non ferrous Mining and Mettalurgical Industries
Roads and Bridges
Ecology and Environment
Secretariat - Economic Services
Tourism
Census Surveys and Statistics
Civil Supplies
Other General Economic Services
Non Plan Plan Centrally
Sponsored
Schemes
TotalMajor
Head
Description
1,33,30,74.31 9,02,29.71 5,09,16.31 1,47,42,20.33
2.82
3,98.25
1,15,05.17
61,04.60
8,37.84
2,00,33.69
67.40
1,48,19.84
22,15.90
58,77.69
5,20.48
5,69.97
1,17,51.30
62.44
29,91.07
3,42.40
26,60.45
39,91.41
13,35.60
13,59.41
38,10.57
16,24.71
1,55.91
1,01.51
1,49.04
11,74.51
8.60
21.19
3,78.81
56.26
2,06.88
7.79
1,50.14
1,24.37
1,29.48
40,42.25
2.82
3,98.25
1,15,05.17
61,04.60
21,97.25
38,10.57
2,16,58.40
2,23.31
1,49,21.35
23,64.94
11,74.51
1,24.37
60,15.77
5,20.48
5,91.16
1,21,30.11
1,18.70
31,97.95
3,42.40
67,10.49
39,91.41
14,85.74
Non Plan Plan Centrally
Sponsored
Schemes
Total
1,38,58,80.44 9,63,58.67 5,47,71.44 1,53,70,10.55
2.99
4,17.14
1,11,54.95
64,32.83
6,99.91
1,90,89.78
69.73
1,49,88.48
21,79.46
57,86.07
5,05.90
5,38.78
1,22,83.49
57.20
28,04.43
3,37.07
25,98.35
39,91.28
12,42.67
13,57.16
39,14.96
15,59.10
1,54.57
1,18.92
1,58.20
10,62.30
9.75
18.87
3,05.07
60.45
2,18.61
7.41
2,63.58
1,32.33
1,55.00
41,58.57
2.99
4,17.14
1,11,54.95
64,32.83
20,57.07
39,14.96
2,06,48.88
2,24.30
1,51,07.40
23,37.66
10,62.30
1,32.33
59,50.82
5,05.90
5,57.65
1,25,88.56
1,17.65
30,23.04
3,37.07
67,64.33
39,91.28
15,06.25
. .
. .
. .
. .
. .
. .
. .
. .
. .
. .
. .
. .
. .
. .
. .
. .
. .
. .
. .
. .
. .
. .
. .
. .
. .
. .
. .
. .
. .
. .
. .
. .
. .
. .
. .
. .
. .
. .
. .
. .
. .
. .
. .
. .
. .
. .
. .
. .
. .
. .
. .
. .
. .
. .
. .
. .
. .
. .
. .
. .
APPENDIX-II COMPARATIVE EXPENDITURE ON SALARY - Concld.
2011-12 2010-11
(in lakh of Rupees)
The above expenditure excludes Dearness allowance (` 93,48,26.96 lakh)*
512
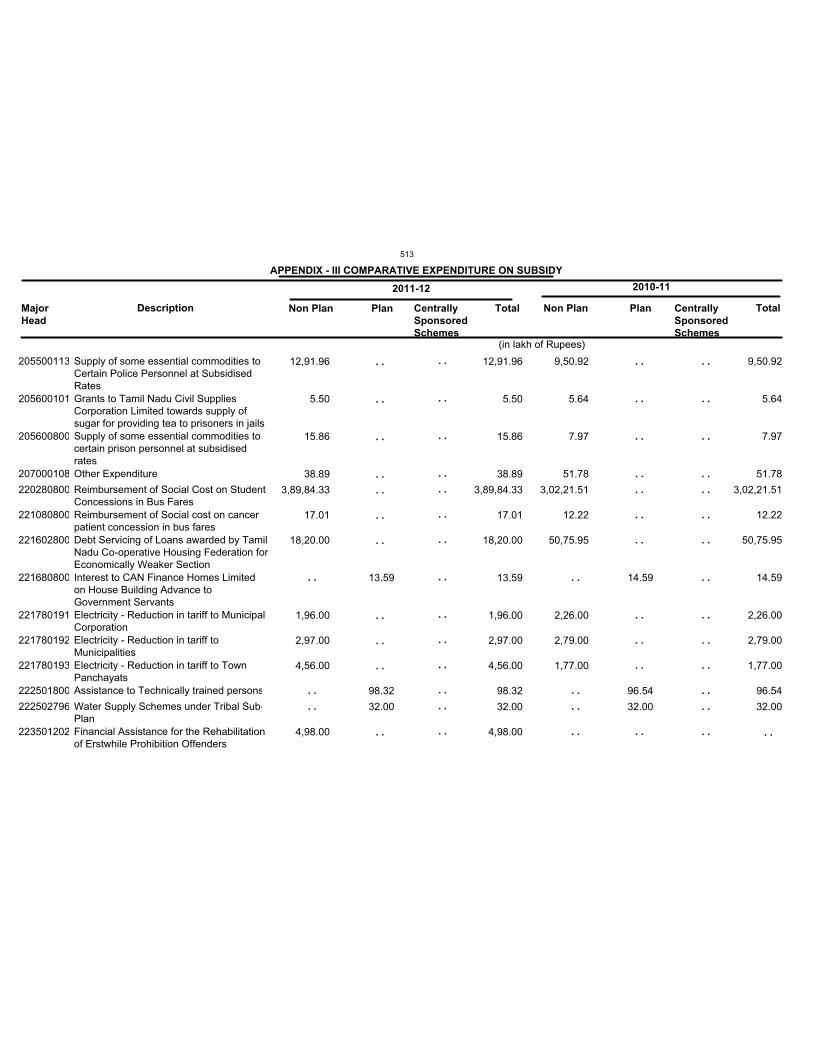
205500113
205600101
205600800
207000108
220280800
221080800
221602800
221680800
221780191
221780192
221780193
222501800
222502796
223501202
Non Plan Plan Centrally
Sponsored
Schemes
TotalMajor
Head
Description
(in lakh of Rupees)
9,50.92
5.64
7.97
51.78
3,02,21.51
12.22
50,75.95
2,26.00
2,79.00
1,77.00
14.59
96.54
32.00
9,50.92
5.64
7.97
51.78
3,02,21.51
12.22
50,75.95
14.59
2,26.00
2,79.00
1,77.00
96.54
32.00
Supply of some essential commodities toCertain Police Personnel at SubsidisedRates
Grants to Tamil Nadu Civil SuppliesCorporation Limited towards supply ofsugar for providing tea to prisoners in jailsSupply of some essential commodities tocertain prison personnel at subsidisedrates
Other Expenditure
Reimbursement of Social Cost on StudentConcessions in Bus Fares
Reimbursement of Social cost on cancerpatient concession in bus fares
Debt Servicing of Loans awarded by TamilNadu Co-operative Housing Federation forEconomically Weaker Section
Interest to CAN Finance Homes Limitedon House Building Advance toGovernment Servants
Electricity - Reduction in tariff to MunicipalCorporation
Electricity - Reduction in tariff toMunicipalities
Electricity - Reduction in tariff to TownPanchayats
Assistance to Technically trained persons
Water Supply Schemes under Tribal Sub-Plan
Financial Assistance for the Rehabilitationof Erstwhile Prohibition Offenders
Non Plan Plan Centrally
Sponsored
Schemes
Total
12,91.96
5.50
15.86
38.89
3,89,84.33
17.01
18,20.00
1,96.00
2,97.00
4,56.00
4,98.00
13.59
98.32
32.00
12,91.96
5.50
15.86
38.89
3,89,84.33
17.01
18,20.00
13.59
1,96.00
2,97.00
4,56.00
98.32
32.00
4,98.00
APPENDIX - III COMPARATIVE EXPENDITURE ON SUBSIDY
. .
. .
. .
. .
. .
. .
. .
. .
. .
. .
. .
. .
. .
. .
. .
. .
. .
. .
. .
. .
. .
. .
. .
. .
. .
. .
. .
. .
. .
. .
. .
. .
. .
. .
. .
. .
. .
. .
. .
. .
. .
. .
. .
. .
. .
. .
. .
. .
. .
. .
. .
. .
. .
. .
. .
. .
. . . .
2011-12 2010-11
513
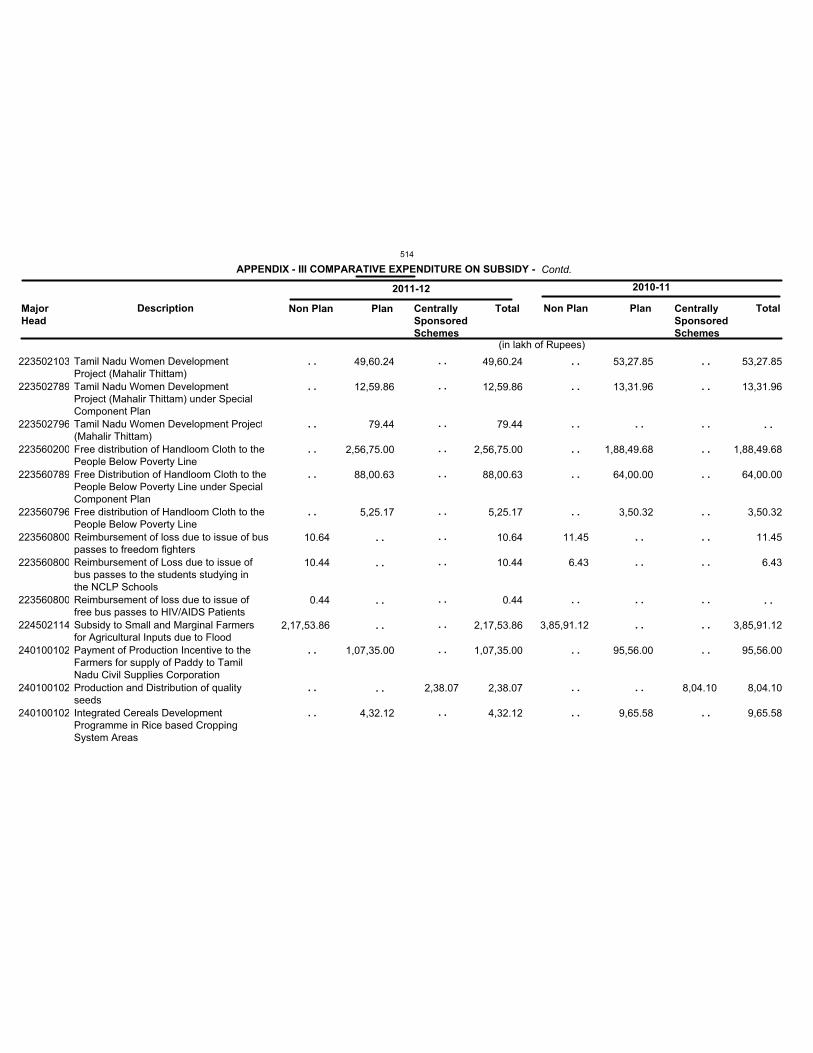
223502103
223502789
223502796
223560200
223560789
223560796
223560800
223560800
223560800
224502114
240100102
240100102
240100102
Non Plan Plan Centrally
Sponsored
Schemes
TotalMajor
Head
Description
(in lakh of Rupees)
11.45
6.43
3,85,91.12
53,27.85
13,31.96
1,88,49.68
64,00.00
3,50.32
95,56.00
9,65.58
8,04.10
53,27.85
13,31.96
1,88,49.68
64,00.00
3,50.32
11.45
6.43
3,85,91.12
95,56.00
8,04.10
9,65.58
Tamil Nadu Women DevelopmentProject (Mahalir Thittam)
Tamil Nadu Women DevelopmentProject (Mahalir Thittam) under SpecialComponent Plan
Tamil Nadu Women Development Project(Mahalir Thittam)
Free distribution of Handloom Cloth to thePeople Below Poverty Line
Free Distribution of Handloom Cloth to thePeople Below Poverty Line under SpecialComponent Plan
Free distribution of Handloom Cloth to thePeople Below Poverty Line
Reimbursement of loss due to issue of buspasses to freedom fighters
Reimbursement of Loss due to issue ofbus passes to the students studying inthe NCLP Schools
Reimbursement of loss due to issue offree bus passes to HIV/AIDS Patients
Subsidy to Small and Marginal Farmersfor Agricultural Inputs due to Flood
Payment of Production Incentive to theFarmers for supply of Paddy to TamilNadu Civil Supplies Corporation
Production and Distribution of qualityseeds
Integrated Cereals DevelopmentProgramme in Rice based CroppingSystem Areas
Non Plan Plan Centrally
Sponsored
Schemes
Total
10.64
10.44
0.44
2,17,53.86
49,60.24
12,59.86
79.44
2,56,75.00
88,00.63
5,25.17
1,07,35.00
4,32.12
2,38.07
49,60.24
12,59.86
79.44
2,56,75.00
88,00.63
5,25.17
10.64
10.44
0.44
2,17,53.86
1,07,35.00
2,38.07
4,32.12
. .
. .
. .
. .
. .
. .
. .
. .
. .
. .
. .
. .
. .
. .
. .
. .
. .
. .
. .
. .
. .
. .
. .
. .
. .
. .
. .
. .
. .
. .
. .
. .
. .
. .
. .
. .
. .
. .
. .
. .
. .
. .
. .
. .
. .
. .
. .
. .
. .
. .
. .
. .
. .
. .
. .
. .
APPENDIX - III COMPARATIVE EXPENDITURE ON SUBSIDY - Contd.
2011-12 2010-11
514
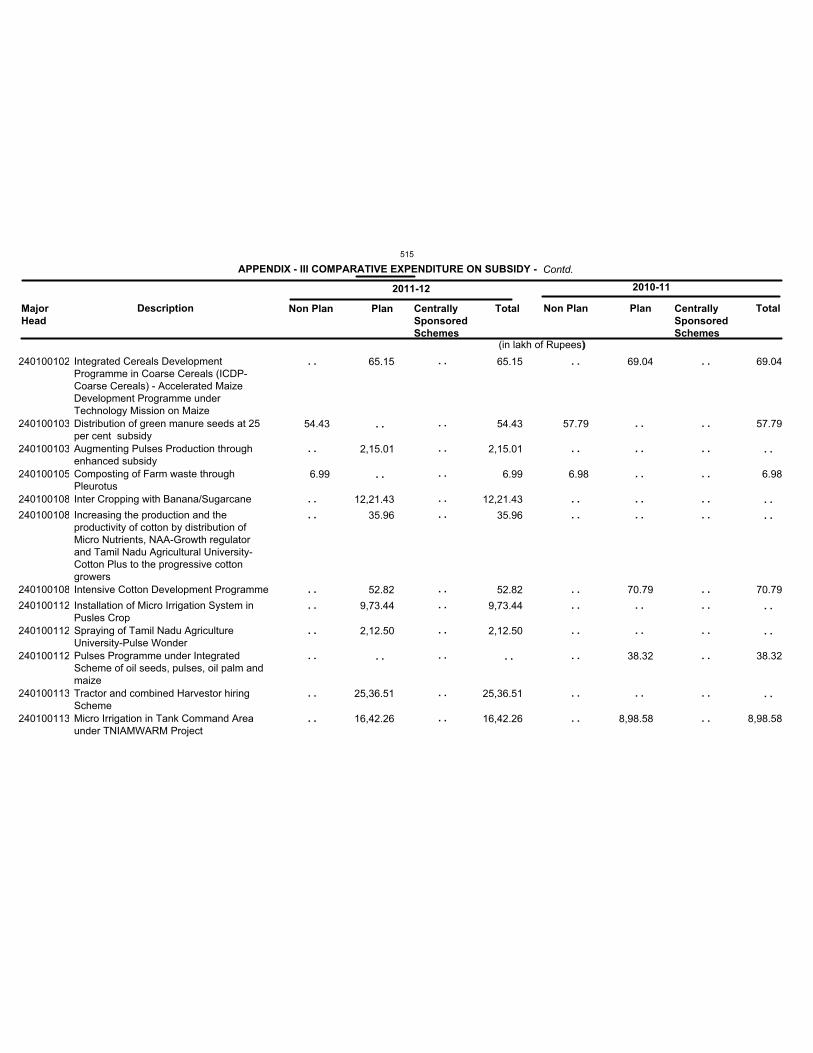
240100102
240100103
240100103
240100105
240100108
240100108
240100108
240100112
240100112
240100112
240100113
240100113
Non Plan Plan Centrally
Sponsored
Schemes
TotalMajor
Head
Description
(in lakh of Rupees))
57.79
6.98
69.04
70.79
38.32
8,98.58
69.04
57.79
6.98
70.79
38.32
8,98.58
Integrated Cereals DevelopmentProgramme in Coarse Cereals (ICDP-Coarse Cereals) - Accelerated MaizeDevelopment Programme underTechnology Mission on Maize
Distribution of green manure seeds at 25per cent subsidy
Augmenting Pulses Production throughenhanced subsidy
Composting of Farm waste throughPleurotus
Inter Cropping with Banana/Sugarcane
Increasing the production and theproductivity of cotton by distribution ofMicro Nutrients, NAA-Growth regulatorand Tamil Nadu Agricultural University-Cotton Plus to the progressive cottongrowers
Intensive Cotton Development Programme
Installation of Micro Irrigation System inPusles Crop
Spraying of Tamil Nadu AgricultureUniversity-Pulse Wonder
Pulses Programme under IntegratedScheme of oil seeds, pulses, oil palm andmaize
Tractor and combined Harvestor hiringScheme
Micro Irrigation in Tank Command Areaunder TNIAMWARM Project
Non Plan Plan Centrally
Sponsored
Schemes
Total
54.43
6.99
65.15
2,15.01
12,21.43
35.96
52.82
9,73.44
2,12.50
25,36.51
16,42.26
65.15
54.43
2,15.01
6.99
12,21.43
35.96
52.82
9,73.44
2,12.50
25,36.51
16,42.26
. .
. .
. .
. .
. .
. .
. .
. .
. .
. .
. .
. .
. .
. .
. .
. .
. .
. .
. .
. .
. .
. .
. .
. .
. .
. .
. .
. .
. .
. .
. .
. .
. .
. .
. .
. .
. .
. .
. .
. .
. .
. .
. .
. .
. .
. .
. .
. .
. .
. .
. .
. .
. .
. .
. .
. .
. .
. .
. .
. .
. .
. .
APPENDIX - III COMPARATIVE EXPENDITURE ON SUBSIDY - Contd.
2011-12 2010-11
515
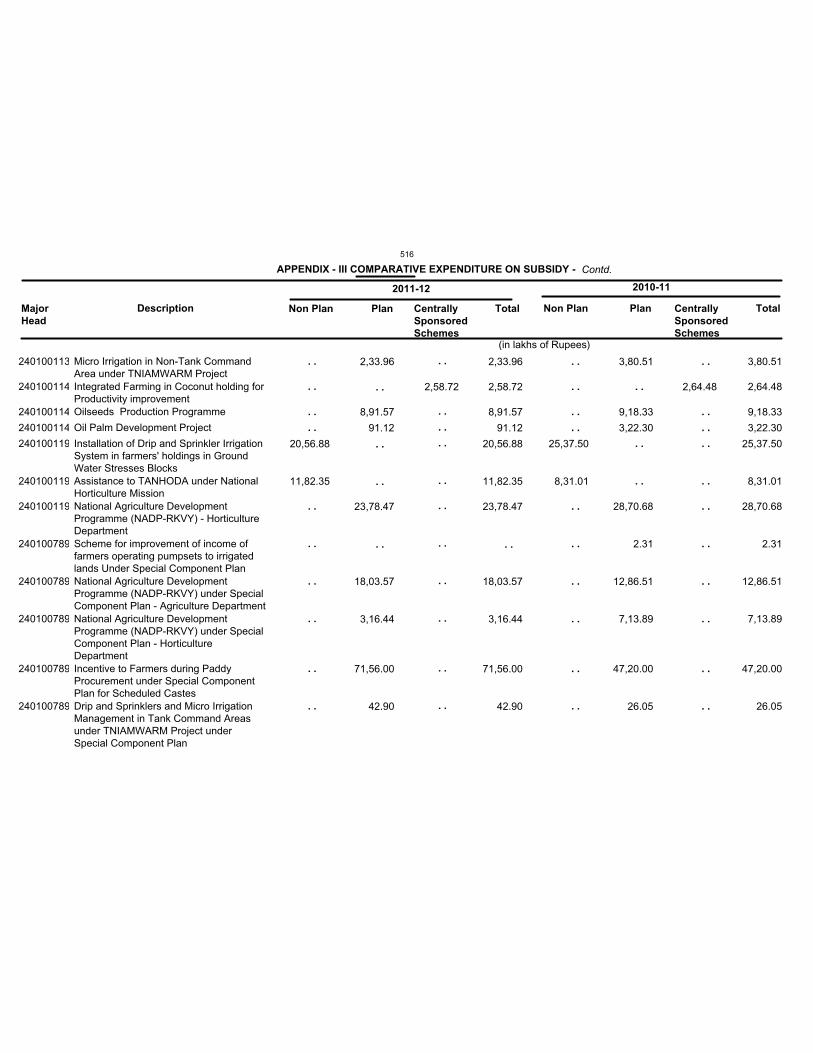
240100113
240100114
240100114
240100114
240100119
240100119
240100119
240100789
240100789
240100789
240100789
240100789
Non Plan Plan Centrally
Sponsored
Schemes
TotalMajor
Head
Description
(in lakhs of Rupees)
25,37.50
8,31.01
3,80.51
9,18.33
3,22.30
28,70.68
2.31
12,86.51
7,13.89
47,20.00
26.05
2,64.48
3,80.51
2,64.48
9,18.33
3,22.30
25,37.50
8,31.01
28,70.68
2.31
12,86.51
7,13.89
47,20.00
26.05
Micro Irrigation in Non-Tank CommandArea under TNIAMWARM Project
Integrated Farming in Coconut holding forProductivity improvement
Oilseeds Production Programme
Oil Palm Development Project
Installation of Drip and Sprinkler IrrigationSystem in farmers' holdings in GroundWater Stresses Blocks
Assistance to TANHODA under NationalHorticulture Mission
National Agriculture DevelopmentProgramme (NADP-RKVY) - HorticultureDepartment
Scheme for improvement of income offarmers operating pumpsets to irrigatedlands Under Special Component Plan
National Agriculture DevelopmentProgramme (NADP-RKVY) under SpecialComponent Plan - Agriculture DepartmentNational Agriculture DevelopmentProgramme (NADP-RKVY) under SpecialComponent Plan - HorticultureDepartment
Incentive to Farmers during PaddyProcurement under Special ComponentPlan for Scheduled Castes
Drip and Sprinklers and Micro IrrigationManagement in Tank Command Areasunder TNIAMWARM Project underSpecial Component Plan
Non Plan Plan Centrally
Sponsored
Schemes
Total
20,56.88
11,82.35
2,33.96
8,91.57
91.12
23,78.47
18,03.57
3,16.44
71,56.00
42.90
2,58.72
2,33.96
2,58.72
8,91.57
91.12
20,56.88
11,82.35
23,78.47
18,03.57
3,16.44
71,56.00
42.90
. .
. .
. .
. .
. .
. .
. .
. .
. .
. .
. .
. .
. .
. .
. .
. .
. .
. .
. .
. .
. .
. .
. .
. .
. .
. .
. .
. .
. .
. .
. .
. .
. .
. .
. .
. .
. .
. .
. .
. .
. .
. .
. .
. .
. .
. .
. .
. .
. .
. .
APPENDIX - III COMPARATIVE EXPENDITURE ON SUBSIDY - Contd.
2011-12 2010-11
516
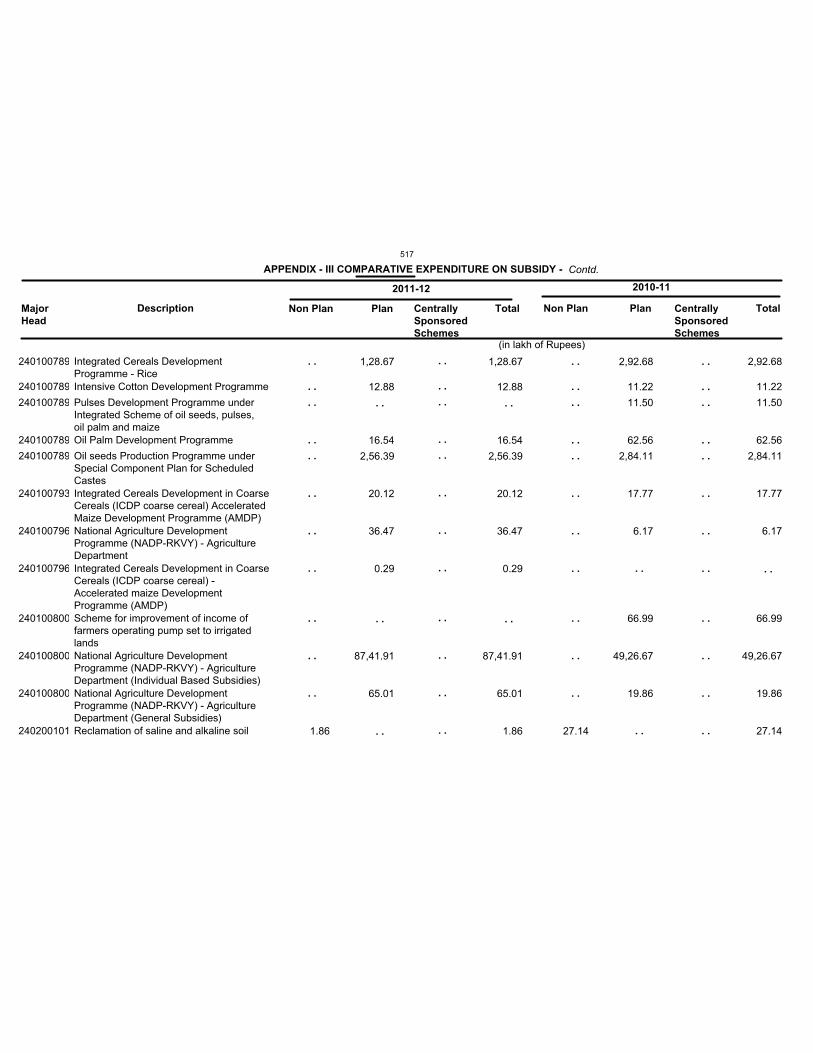
240100789
240100789
240100789
240100789
240100789
240100793
240100796
240100796
240100800
240100800
240100800
240200101
Non Plan Plan Centrally
Sponsored
Schemes
TotalMajor
Head
Description
(in lakh of Rupees)
27.14
2,92.68
11.22
11.50
62.56
2,84.11
17.77
6.17
66.99
49,26.67
19.86
2,92.68
11.22
11.50
62.56
2,84.11
17.77
6.17
66.99
49,26.67
19.86
27.14
Integrated Cereals DevelopmentProgramme - Rice
Intensive Cotton Development Programme
Pulses Development Programme underIntegrated Scheme of oil seeds, pulses,oil palm and maize
Oil Palm Development Programme
Oil seeds Production Programme underSpecial Component Plan for ScheduledCastes
Integrated Cereals Development in CoarseCereals (ICDP coarse cereal) AcceleratedMaize Development Programme (AMDP)
National Agriculture DevelopmentProgramme (NADP-RKVY) - AgricultureDepartment
Integrated Cereals Development in CoarseCereals (ICDP coarse cereal) -Accelerated maize DevelopmentProgramme (AMDP)
Scheme for improvement of income offarmers operating pump set to irrigatedlands
National Agriculture DevelopmentProgramme (NADP-RKVY) - AgricultureDepartment (Individual Based Subsidies)National Agriculture DevelopmentProgramme (NADP-RKVY) - AgricultureDepartment (General Subsidies)Reclamation of saline and alkaline soil
Non Plan Plan Centrally
Sponsored
Schemes
Total
1.86
1,28.67
12.88
16.54
2,56.39
20.12
36.47
0.29
87,41.91
65.01
1,28.67
12.88
16.54
2,56.39
20.12
36.47
0.29
87,41.91
65.01
1.86
. .
. .
. .
. .
. .
. .
. .
. .
. .
. .
. .
. .
. .
. .
. .
. .
. .
. .
. .
. .
. .
. .
. .
. .
. .
. .
. .
. .
. .
. .
. .
. .
. .
. .
. .
. .
. .
. .
. .
. .
. .
. .
. .
. .
. .
. .
. .
. .
. .
. .
. .
. .
. .
. .
APPENDIX - III COMPARATIVE EXPENDITURE ON SUBSIDY - Contd.
2011-12 2010-11
517
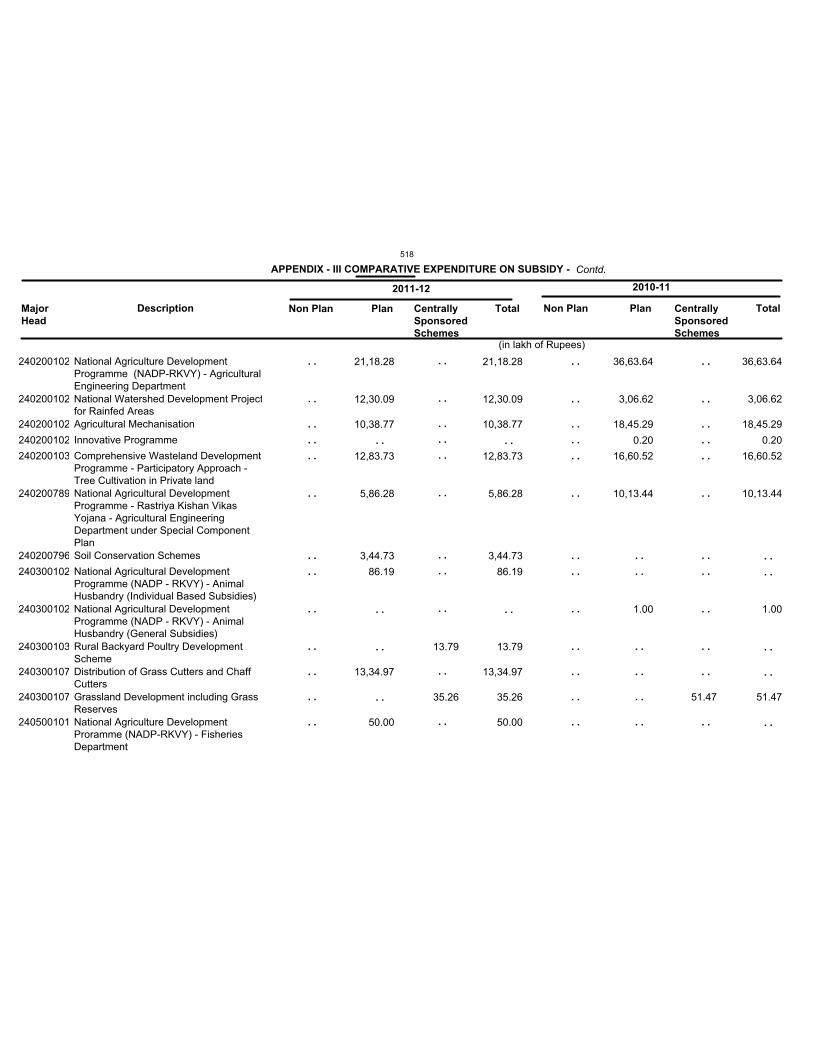
240200102
240200102
240200102
240200102
240200103
240200789
240200796
240300102
240300102
240300103
240300107
240300107
240500101
Non Plan Plan Centrally
Sponsored
Schemes
TotalMajor
Head
Description
(in lakh of Rupees)
36,63.64
3,06.62
18,45.29
0.20
16,60.52
10,13.44
1.00
51.47
36,63.64
3,06.62
18,45.29
0.20
16,60.52
10,13.44
1.00
51.47
National Agriculture DevelopmentProgramme (NADP-RKVY) - AgriculturalEngineering Department
National Watershed Development Projectfor Rainfed Areas
Agricultural Mechanisation
Innovative Programme
Comprehensive Wasteland DevelopmentProgramme - Participatory Approach -Tree Cultivation in Private land
National Agricultural DevelopmentProgramme - Rastriya Kishan VikasYojana - Agricultural EngineeringDepartment under Special ComponentPlan
Soil Conservation Schemes
National Agricultural DevelopmentProgramme (NADP - RKVY) - AnimalHusbandry (Individual Based Subsidies)National Agricultural DevelopmentProgramme (NADP - RKVY) - AnimalHusbandry (General Subsidies)Rural Backyard Poultry DevelopmentScheme
Distribution of Grass Cutters and ChaffCutters
Grassland Development including GrassReserves
National Agriculture DevelopmentProramme (NADP-RKVY) - FisheriesDepartment
Non Plan Plan Centrally
Sponsored
Schemes
Total
21,18.28
12,30.09
10,38.77
12,83.73
5,86.28
3,44.73
86.19
13,34.97
50.00
13.79
35.26
21,18.28
12,30.09
10,38.77
12,83.73
5,86.28
3,44.73
86.19
13.79
13,34.97
35.26
50.00
. .
. .
. .
. .
. .
. .
. .
. .
. .
. .
. .
. .
. .
. .
. .
. .
. .
. .
. .
. .
. .
. .
. .
. .
. .
. .
. .
. .
. .
. .
. .
. .
. .
. .
. .
. .
. .
. .
. .
. .
. .
. .
. .
. .
. .
. .
. .
. .
. .
. .
. .
. .
. .
. .
. .
. .
. .
. .
. .
. .
. .
. .
. .
. .
. .
. .
APPENDIX - III COMPARATIVE EXPENDITURE ON SUBSIDY - Contd.
2011-12 2010-11
518
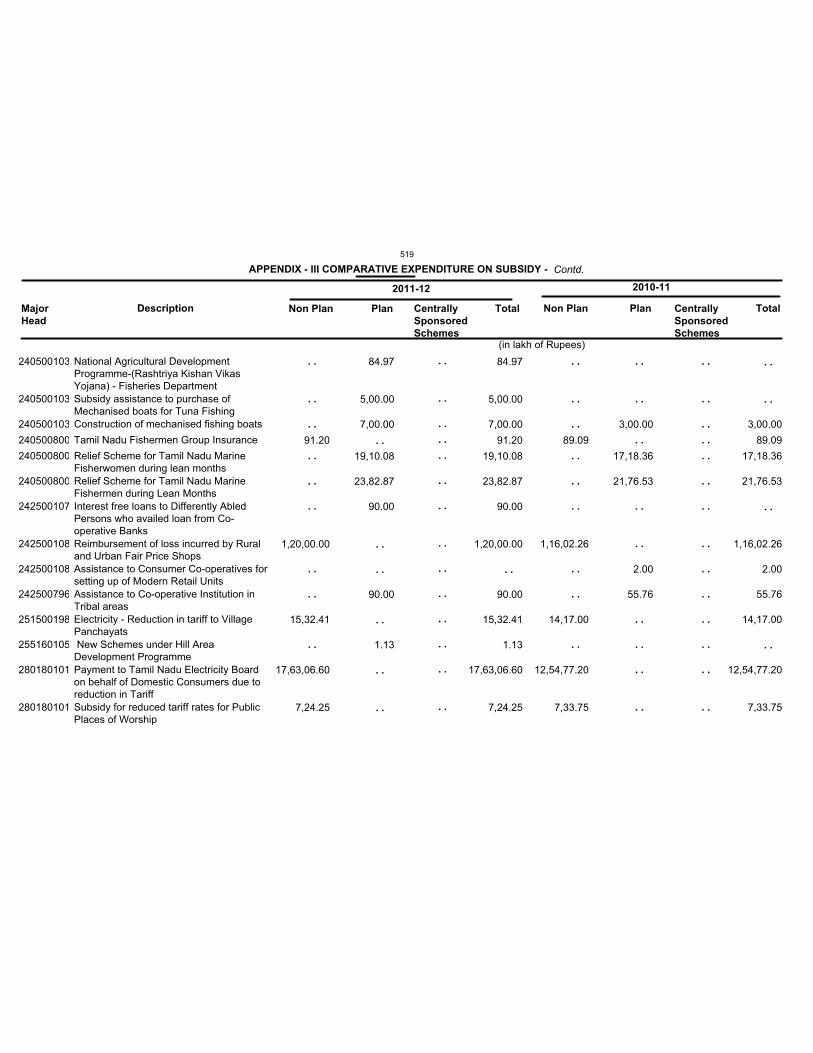
240500103
240500103
240500103
240500800
240500800
240500800
242500107
242500108
242500108
242500796
251500198
255160105
280180101
280180101
Non Plan Plan Centrally
Sponsored
Schemes
TotalMajor
Head
Description
(in lakh of Rupees)
89.09
1,16,02.26
14,17.00
12,54,77.20
7,33.75
3,00.00
17,18.36
21,76.53
2.00
55.76
3,00.00
89.09
17,18.36
21,76.53
1,16,02.26
2.00
55.76
14,17.00
12,54,77.20
7,33.75
National Agricultural DevelopmentProgramme-(Rashtriya Kishan VikasYojana) - Fisheries Department
Subsidy assistance to purchase ofMechanised boats for Tuna Fishing
Construction of mechanised fishing boats
Tamil Nadu Fishermen Group Insurance
Relief Scheme for Tamil Nadu MarineFisherwomen during lean months
Relief Scheme for Tamil Nadu MarineFishermen during Lean Months
Interest free loans to Differently AbledPersons who availed loan from Co-operative Banks
Reimbursement of loss incurred by Ruraland Urban Fair Price Shops
Assistance to Consumer Co-operatives forsetting up of Modern Retail Units
Assistance to Co-operative Institution inTribal areas
Electricity - Reduction in tariff to VillagePanchayats
New Schemes under Hill AreaDevelopment Programme
Payment to Tamil Nadu Electricity Boardon behalf of Domestic Consumers due toreduction in Tariff
Subsidy for reduced tariff rates for PublicPlaces of Worship
Non Plan Plan Centrally
Sponsored
Schemes
Total
91.20
1,20,00.00
15,32.41
17,63,06.60
7,24.25
84.97
5,00.00
7,00.00
19,10.08
23,82.87
90.00
90.00
1.13
84.97
5,00.00
7,00.00
91.20
19,10.08
23,82.87
90.00
1,20,00.00
90.00
15,32.41
1.13
17,63,06.60
7,24.25
. .
. .
. .
. .
. .
. .
. .
. .
. .
. .
. .
. .
. .
. .
. .
. .
. .
. .
. .
. .
. .
. .
. .
. .
. .
. .
. .
. .
. .
. .
. .
. .
. .
. .
. .
. .
. .
. .
. .
. .
. .
. .
. .
. .
. .
. .
. .
. .
. .
. .
. .
. .
. .
. .
. .
. .
. .
. .
. .
. .
. .
. .
. .
. .
. .
. .
APPENDIX - III COMPARATIVE EXPENDITURE ON SUBSIDY - Contd.
2011-12 2010-11
519
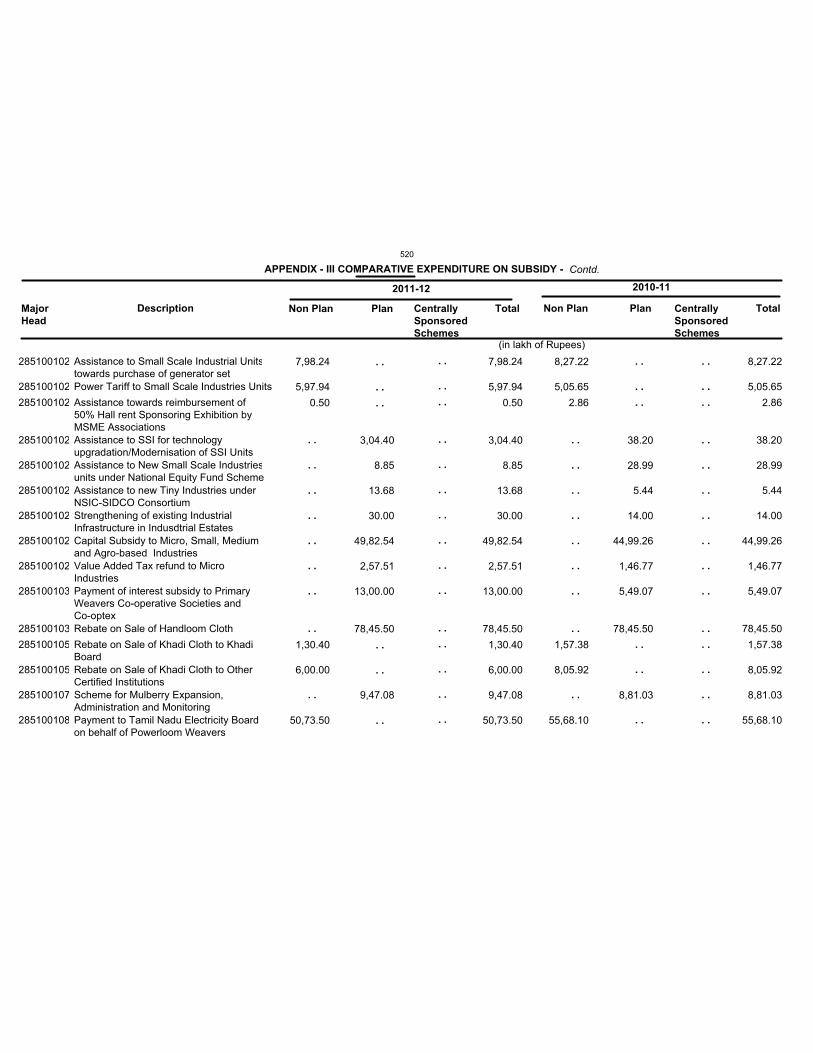
285100102
285100102
285100102
285100102
285100102
285100102
285100102
285100102
285100102
285100103
285100103
285100105
285100105
285100107
285100108
Non Plan Plan Centrally
Sponsored
Schemes
TotalMajor
Head
Description
(in lakh of Rupees)
8,27.22
5,05.65
2.86
1,57.38
8,05.92
55,68.10
38.20
28.99
5.44
14.00
44,99.26
1,46.77
5,49.07
78,45.50
8,81.03
8,27.22
5,05.65
2.86
38.20
28.99
5.44
14.00
44,99.26
1,46.77
5,49.07
78,45.50
1,57.38
8,05.92
8,81.03
55,68.10
Assistance to Small Scale Industrial Unitstowards purchase of generator set
Power Tariff to Small Scale Industries Units
Assistance towards reimbursement of50% Hall rent Sponsoring Exhibition byMSME Associations
Assistance to SSI for technologyupgradation/Modernisation of SSI Units
Assistance to New Small Scale Industriesunits under National Equity Fund SchemeAssistance to new Tiny Industries underNSIC-SIDCO Consortium
Strengthening of existing IndustrialInfrastructure in Indusdtrial Estates
Capital Subsidy to Micro, Small, Mediumand Agro-based Industries
Value Added Tax refund to MicroIndustries
Payment of interest subsidy to PrimaryWeavers Co-operative Societies and Co-optex
Rebate on Sale of Handloom Cloth
Rebate on Sale of Khadi Cloth to KhadiBoard
Rebate on Sale of Khadi Cloth to OtherCertified Institutions
Scheme for Mulberry Expansion,Administration and Monitoring
Payment to Tamil Nadu Electricity Boardon behalf of Powerloom Weavers
Non Plan Plan Centrally
Sponsored
Schemes
Total
7,98.24
5,97.94
0.50
1,30.40
6,00.00
50,73.50
3,04.40
8.85
13.68
30.00
49,82.54
2,57.51
13,00.00
78,45.50
9,47.08
7,98.24
5,97.94
0.50
3,04.40
8.85
13.68
30.00
49,82.54
2,57.51
13,00.00
78,45.50
1,30.40
6,00.00
9,47.08
50,73.50
. .
. .
. .
. .
. .
. .
. .
. .
. .
. .
. .
. .
. .
. .
. .
. .
. .
. .
. .
. .
. .
. .
. .
. .
. .
. .
. .
. .
. .
. .
. .
. .
. .
. .
. .
. .
. .
. .
. .
. .
. .
. .
. .
. .
. .
. .
. .
. .
. .
. .
. .
. .
. .
. .
. .
. .
. .
. .
. .
. .
APPENDIX - III COMPARATIVE EXPENDITURE ON SUBSIDY - Contd.
2011-12 2010-11
520
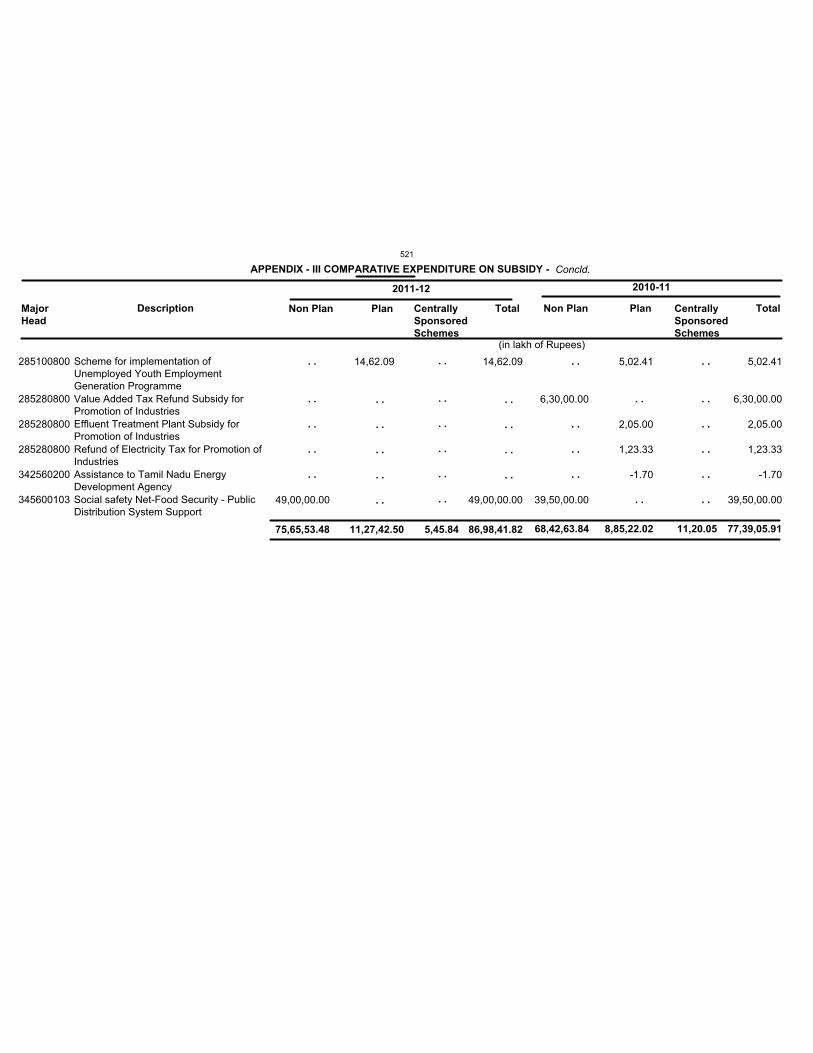
285100800
285280800
285280800
285280800
342560200
345600103
Non Plan Plan Centrally
Sponsored
Schemes
TotalMajor
Head
Description
(in lakh of Rupees)
68,42,63.84 8,85,22.02 11,20.05 77,39,05.91
6,30,00.00
39,50,00.00
5,02.41
2,05.00
1,23.33
-1.70
5,02.41
6,30,00.00
2,05.00
1,23.33
-1.70
39,50,00.00
Scheme for implementation ofUnemployed Youth EmploymentGeneration Programme
Value Added Tax Refund Subsidy forPromotion of Industries
Effluent Treatment Plant Subsidy forPromotion of Industries
Refund of Electricity Tax for Promotion ofIndustries
Assistance to Tamil Nadu EnergyDevelopment Agency
Social safety Net-Food Security - PublicDistribution System Support
Non Plan Plan Centrally
Sponsored
Schemes
Total
75,65,53.48 11,27,42.50 5,45.84 86,98,41.82
49,00,00.00
14,62.09 14,62.09
49,00,00.00
. .
. .
. .
. .
. .
. .
. .
. .
. .
. .
. .
. .
. .
. .
. .
. .
. .
. .
. .
. .
. .
. .
. .
. .
. .
. .
. .
. .
. .
. .
. .
. .
APPENDIX - III COMPARATIVE EXPENDITURE ON SUBSIDY - Concld.
2011-12 2010-11
521
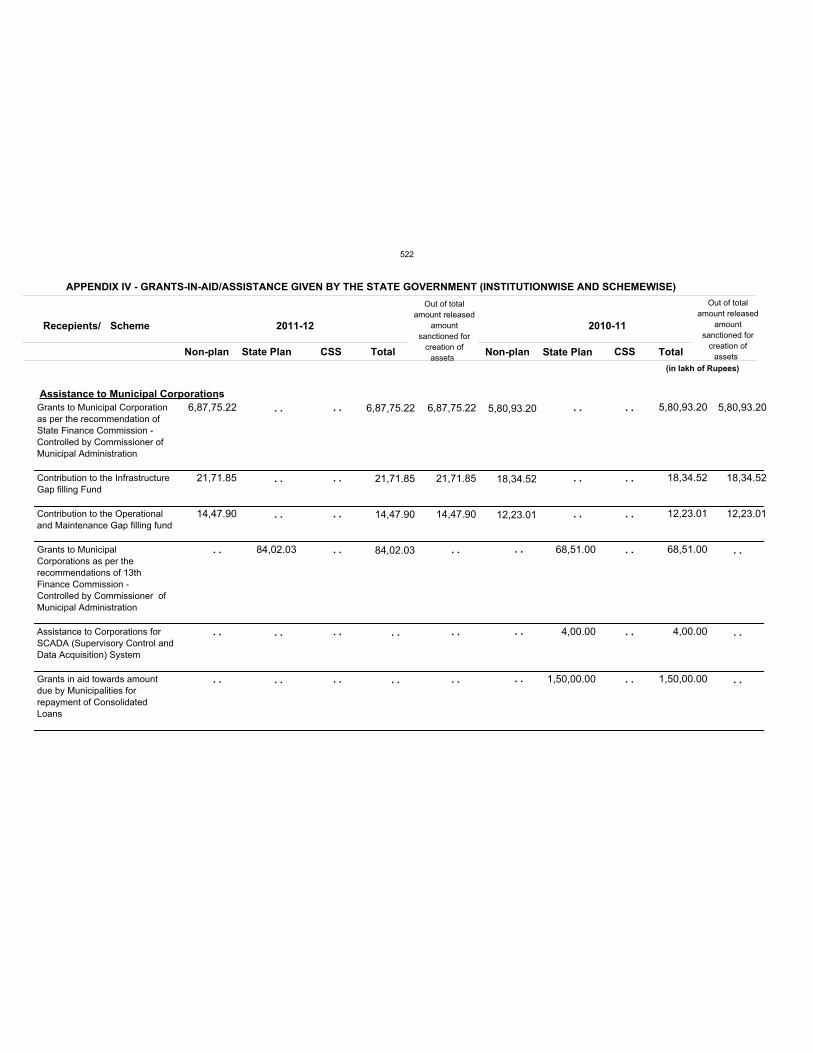
6,87,75.22
21,71.85
14,47.90
84,02.03
6,87,75.22
21,71.85
14,47.90
84,02.03
5,80,93.20
18,34.52
12,23.01
68,51.00
4,00.00
1,50,00.00
5,80,93.20
18,34.52
12,23.01
68,51.00
4,00.00
1,50,00.00
Grants to Municipal Corporation
as per the recommendation of
State Finance Commission -
Controlled by Commissioner of
Municipal Administration
Contribution to the Infrastructure
Gap filling Fund
Contribution to the Operational
and Maintenance Gap filling fund
Grants to Municipal
Corporations as per the
recommendations of 13th
Finance Commission -
Controlled by Commissioner of
Municipal Administration
Assistance to Corporations for
SCADA (Supervisory Control and
Data Acquisition) System
Grants in aid towards amount
due by Municipalities for
repayment of Consolidated
Loans
Recepients/ Scheme
Non-plan State Plan CSS Total Non-plan State Plan CSS Total
2011-12 2010-11
APPENDIX IV - GRANTS-IN-AID/ASSISTANCE GIVEN BY THE STATE GOVERNMENT (INSTITUTIONWISE AND SCHEMEWISE)
6,87,75.22
21,71.85
14,47.90
Assistance to Municipal Corporations
5,80,93.20
18,34.52
12,23.01
Out of total
amount released
amount
sanctioned for
creation of
assets
Out of total
amount released
amount
sanctioned for
creation of
assets
(in lakh of Rupees)
. .
. .
. .
. .
. .
. .
. .
. .
. .
. .
. .
. .
. .
. .
. .
. .
. .
. .
. .
. .
. .
. .
. .
. .
. .
. .
. .
. .
. .
. .
. .
. .
. .
. .
522
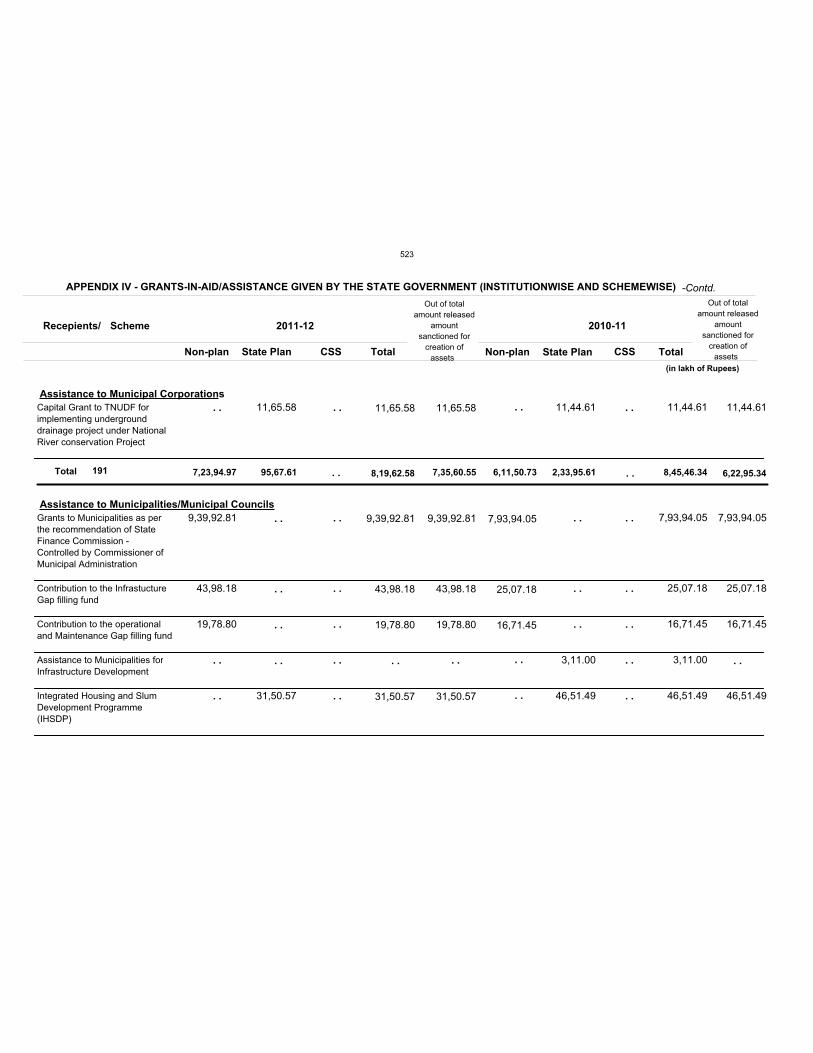
7,23,94.97 95,67.61 6,11,50.73 2,33,95.61 8,45,46.34
9,39,92.81
43,98.18
19,78.80
11,65.58
31,50.57
11,65.58
9,39,92.81
43,98.18
19,78.80
31,50.57
7,93,94.05
25,07.18
16,71.45
11,44.61
3,11.00
46,51.49
11,44.61
7,93,94.05
25,07.18
16,71.45
3,11.00
46,51.49
Capital Grant to TNUDF for
implementing underground
drainage project under National
River conservation Project
Grants to Municipalities as per
the recommendation of State
Finance Commission -
Controlled by Commissioner of
Municipal Administration
Contribution to the Infrastucture
Gap filling fund
Contribution to the operational
and Maintenance Gap filling fund
Assistance to Municipalities for
Infrastructure Development
Integrated Housing and Slum
Development Programme
(IHSDP)
Recepients/ Scheme
Non-plan State Plan CSS Total Non-plan State Plan CSS Total
2011-12 2010-11
APPENDIX IV - GRANTS-IN-AID/ASSISTANCE GIVEN BY THE STATE GOVERNMENT (INSTITUTIONWISE AND SCHEMEWISE)
11,65.58
9,39,92.81
43,98.18
19,78.80
31,50.57
Assistance to Municipal Corporations
Assistance to Municipalities/Municipal Councils
11,44.61
7,93,94.05
25,07.18
16,71.45
46,51.49
Out of total
amount released
amount
sanctioned for
creation of
assets
Out of total
amount released
amount
sanctioned for
creation of
assets
(in lakh of Rupees)
8,19,62.58
. .
. .
. .
. .
. .
. .
. .
. .
. .
. .
. .
. .
. .
. . . .
. .
. .
. .
. .
. .
. .
. .
. .
. .
. .
. .
. .
. .
. . . . 7,35,60.55 6,22,95.34Total 191
-Contd.
523
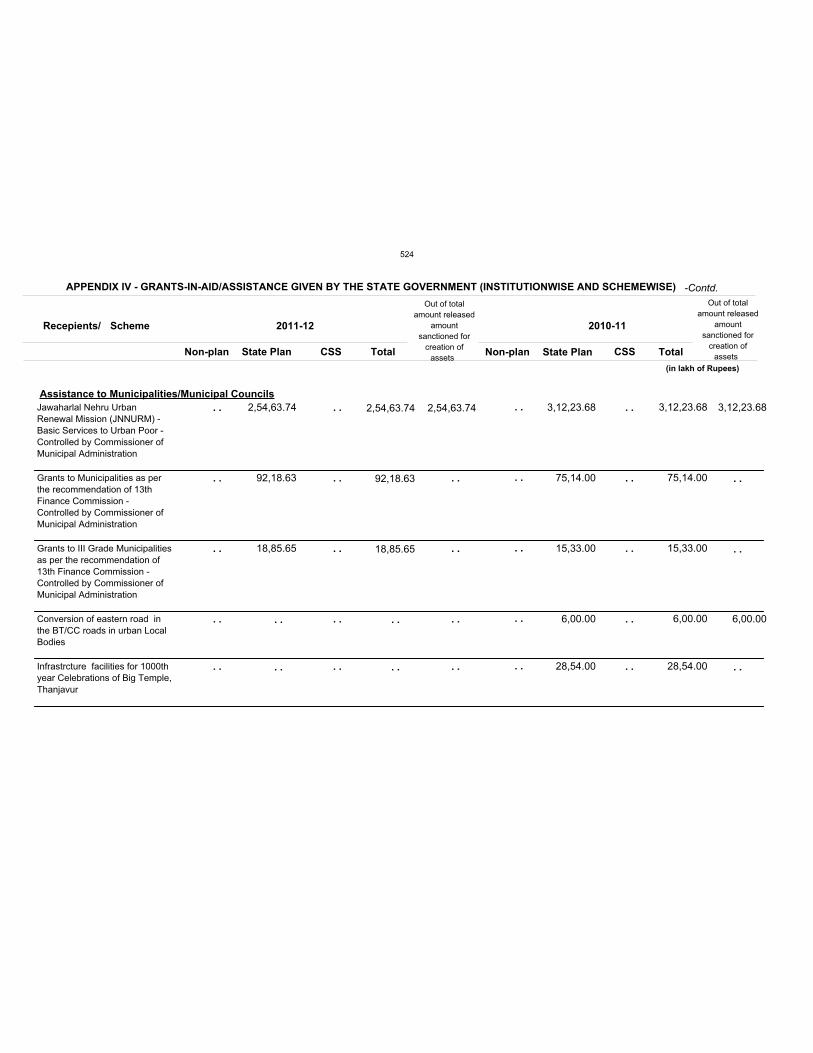
2,54,63.74
92,18.63
18,85.65
2,54,63.74
92,18.63
18,85.65
3,12,23.68
75,14.00
15,33.00
6,00.00
28,54.00
3,12,23.68
75,14.00
15,33.00
6,00.00
28,54.00
Jawaharlal Nehru Urban
Renewal Mission (JNNURM) -
Basic Services to Urban Poor -
Controlled by Commissioner of
Municipal Administration
Grants to Municipalities as per
the recommendation of 13th
Finance Commission -
Controlled by Commissioner of
Municipal Administration
Grants to III Grade Municipalities
as per the recommendation of
13th Finance Commission -
Controlled by Commissioner of
Municipal Administration
Conversion of eastern road in
the BT/CC roads in urban Local
Bodies
Infrastrcture facilities for 1000th
year Celebrations of Big Temple,
Thanjavur
Recepients/ Scheme
Non-plan State Plan CSS Total Non-plan State Plan CSS Total
2011-12 2010-11
APPENDIX IV - GRANTS-IN-AID/ASSISTANCE GIVEN BY THE STATE GOVERNMENT (INSTITUTIONWISE AND SCHEMEWISE)
2,54,63.74
Assistance to Municipalities/Municipal Councils
3,12,23.68
6,00.00
Out of total
amount released
amount
sanctioned for
creation of
assets
Out of total
amount released
amount
sanctioned for
creation of
assets
(in lakh of Rupees)
. .
. .
. .
. .
. .
. .
. .
. .
. .
. .
. .
. .
. .
. .
. .
. .
. .
. .
. .
. .
. .
. .
. .
. .
. .
. .
. .
. .
. .
. .
. .
-Contd.
524
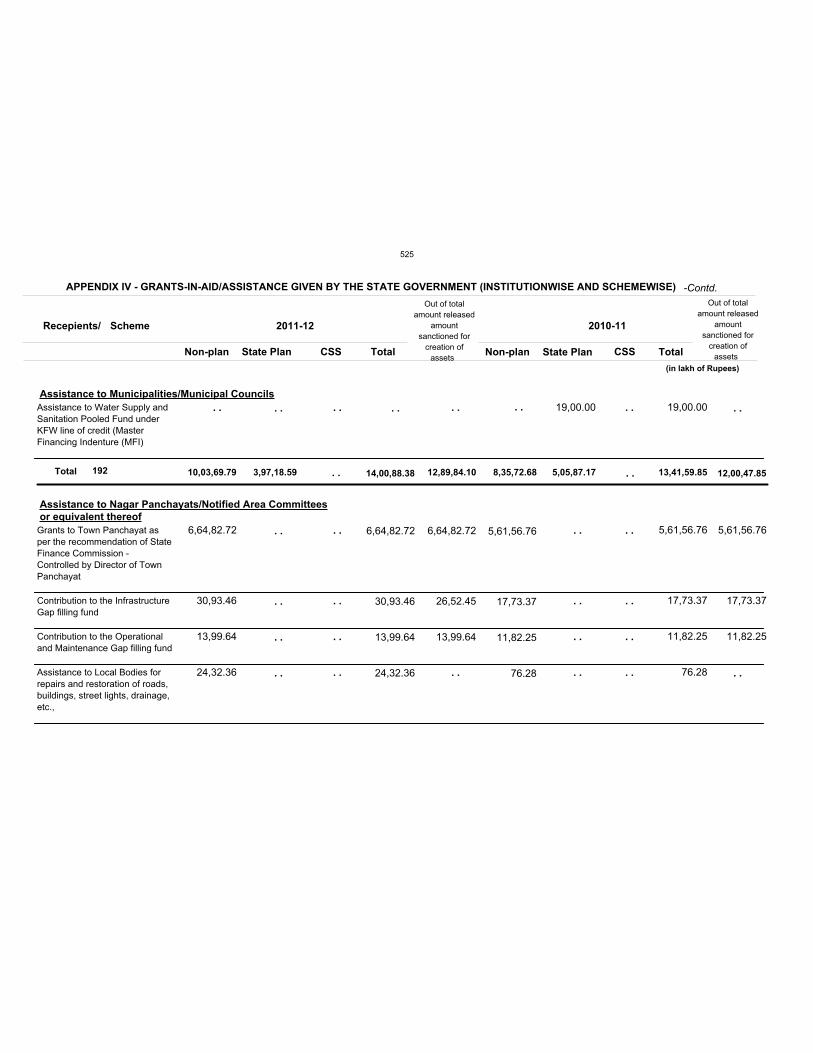
10,03,69.79 3,97,18.59 8,35,72.68 5,05,87.17 13,41,59.85
6,64,82.72
30,93.46
13,99.64
24,32.36
6,64,82.72
30,93.46
13,99.64
24,32.36
5,61,56.76
17,73.37
11,82.25
76.28
19,00.00 19,00.00
5,61,56.76
17,73.37
11,82.25
76.28
Assistance to Water Supply and
Sanitation Pooled Fund under
KFW line of credit (Master
Financing Indenture (MFI)
Grants to Town Panchayat as
per the recommendation of State
Finance Commission -
Controlled by Director of Town
Panchayat
Contribution to the Infrastructure
Gap filling fund
Contribution to the Operational
and Maintenance Gap filling fund
Assistance to Local Bodies for
repairs and restoration of roads,
buildings, street lights, drainage,
etc.,
Recepients/ Scheme
Non-plan State Plan CSS Total Non-plan State Plan CSS Total
2011-12 2010-11
APPENDIX IV - GRANTS-IN-AID/ASSISTANCE GIVEN BY THE STATE GOVERNMENT (INSTITUTIONWISE AND SCHEMEWISE)
6,64,82.72
26,52.45
13,99.64
Assistance to Municipalities/Municipal Councils
Assistance to Nagar Panchayats/Notified Area Committees
or equivalent thereof
5,61,56.76
17,73.37
11,82.25
Out of total
amount released
amount
sanctioned for
creation of
assets
Out of total
amount released
amount
sanctioned for
creation of
assets
(in lakh of Rupees)
14,00,88.38
. . . .
. .
. .
. .
. .
. .
. .
. .
. .
. .
. . . .
. .
. .
. .
. .
. .
. .
. .
. .
. .
. .
. .
. .
. .
. . . . 12,89,84.10 12,00,47.85Total 192
-Contd.
525
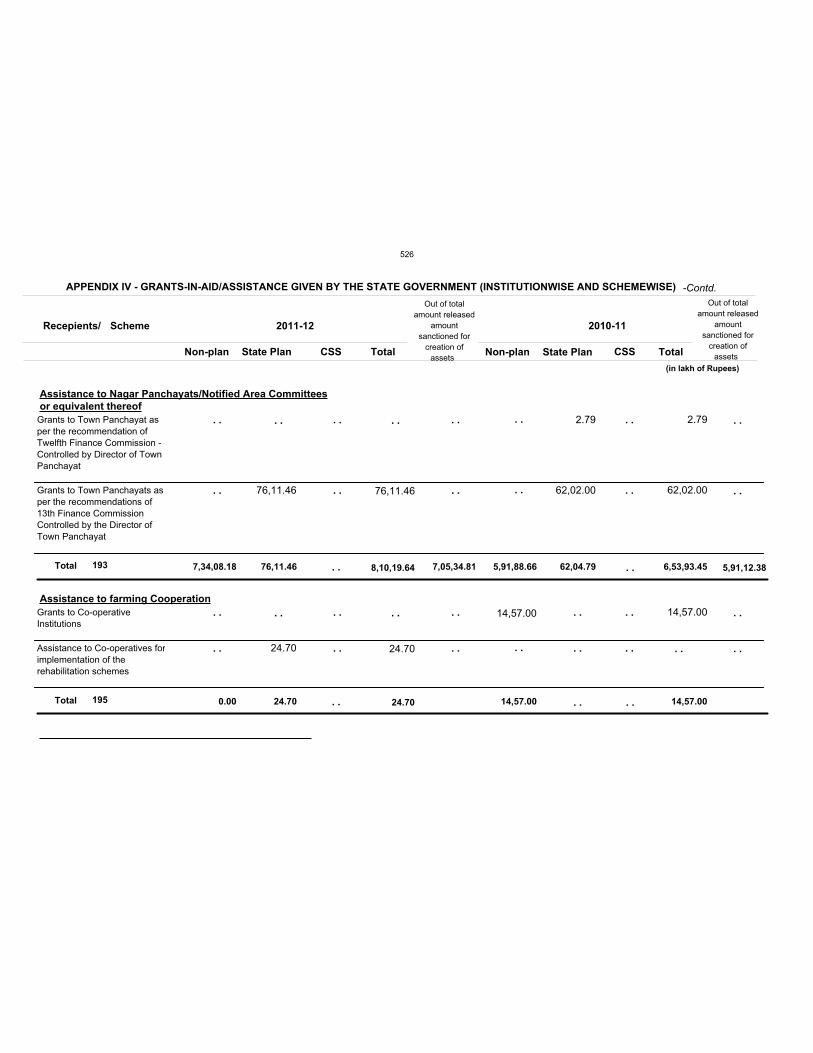
7,34,08.18
0.00
76,11.46
24.70
5,91,88.66
14,57.00
62,04.79 6,53,93.45
14,57.00
76,11.46
24.70
76,11.46
24.70
14,57.00
2.79
62,02.00
2.79
62,02.00
14,57.00
Grants to Town Panchayat as
per the recommendation of
Twelfth Finance Commission -
Controlled by Director of Town
Panchayat
Grants to Town Panchayats as
per the recommendations of
13th Finance Commission
Controlled by the Director of
Town Panchayat
Grants to Co-operative
Institutions
Assistance to Co-operatives for
implementation of the
rehabilitation schemes
Recepients/ Scheme
Non-plan State Plan CSS Total Non-plan State Plan CSS Total
2011-12 2010-11
APPENDIX IV - GRANTS-IN-AID/ASSISTANCE GIVEN BY THE STATE GOVERNMENT (INSTITUTIONWISE AND SCHEMEWISE)
Assistance to Nagar Panchayats/Notified Area Committees
or equivalent thereof
Assistance to farming Cooperation
Out of total
amount released
amount
sanctioned for
creation of
assets
Out of total
amount released
amount
sanctioned for
creation of
assets
(in lakh of Rupees)
8,10,19.64
24.70
. .
. .
. .
. .
. .
. .
. .
. .
. .
. .
. .
. .
. .
. .
. .
. .
. .
. .
. .
. .
. .
. .
. .
. .
. . . .
. .
. .
. .
. .
. .
. . . .
. .
. .
7,05,34.81 5,91,12.38Total
Total
193
195
-Contd.
526
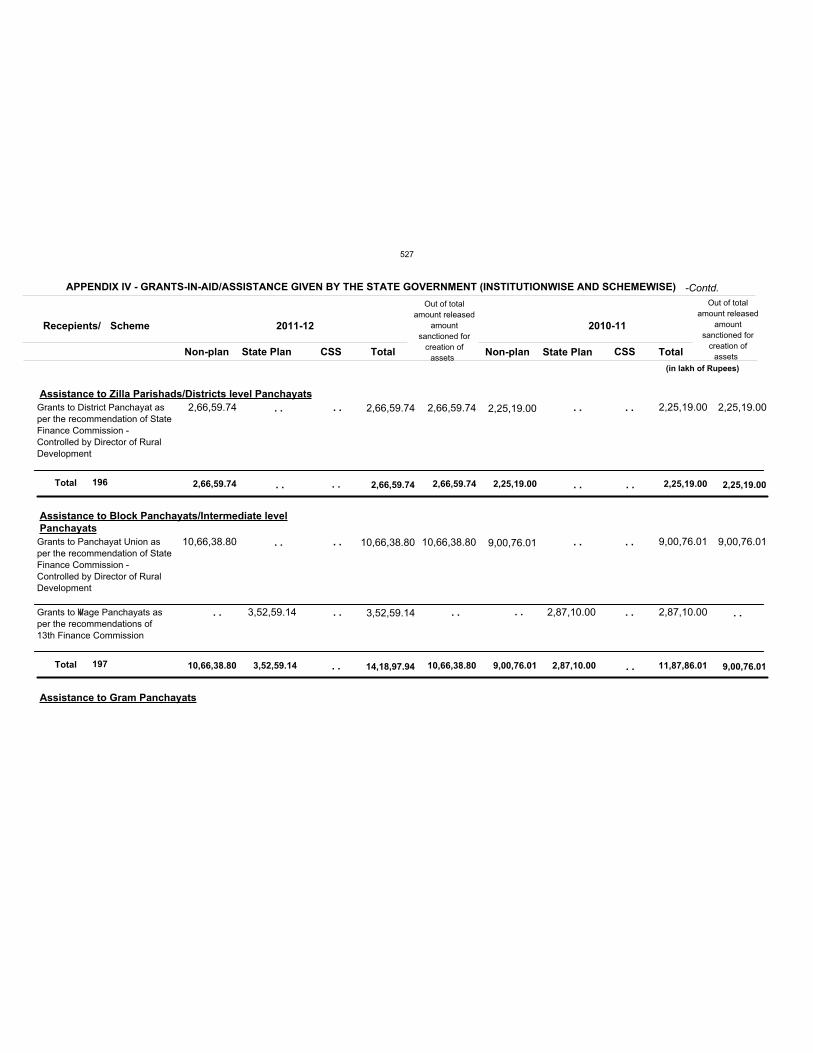
2,66,59.74
10,66,38.80 3,52,59.14
2,25,19.00
9,00,76.01 2,87,10.00
2,25,19.00
11,87,86.01
2,66,59.74
10,66,38.80
3,52,59.14
2,66,59.74
10,66,38.80
3,52,59.14
2,25,19.00
9,00,76.01
2,87,10.00
2,25,19.00
9,00,76.01
2,87,10.00
Grants to District Panchayat as
per the recommendation of State
Finance Commission -
Controlled by Director of Rural
Development
Grants to Panchayat Union as
per the recommendation of State
Finance Commission -
Controlled by Director of Rural
Development
Grants to Village Panchayats as
per the recommendations of
13th Finance Commission
Recepients/ Scheme
Non-plan State Plan CSS Total Non-plan State Plan CSS Total
2011-12 2010-11
APPENDIX IV - GRANTS-IN-AID/ASSISTANCE GIVEN BY THE STATE GOVERNMENT (INSTITUTIONWISE AND SCHEMEWISE)
2,66,59.74
10,66,38.80
Assistance to Zilla Parishads/Districts level Panchayats
Assistance to Block Panchayats/Intermediate level
Panchayats
Assistance to Gram Panchayats
2,25,19.00
9,00,76.01
Out of total
amount released
amount
sanctioned for
creation of
assets
Out of total
amount released
amount
sanctioned for
creation of
assets
(in lakh of Rupees)
2,66,59.74
14,18,97.94
. .
. .
. .
. .
. .
. . . . . .
. .
. .
. .
. .
. . . .
. . . .
. .
. . . .
. .
2,66,59.74
10,66,38.80
2,25,19.00
9,00,76.01
Total
Total
196
197
-Contd.
527
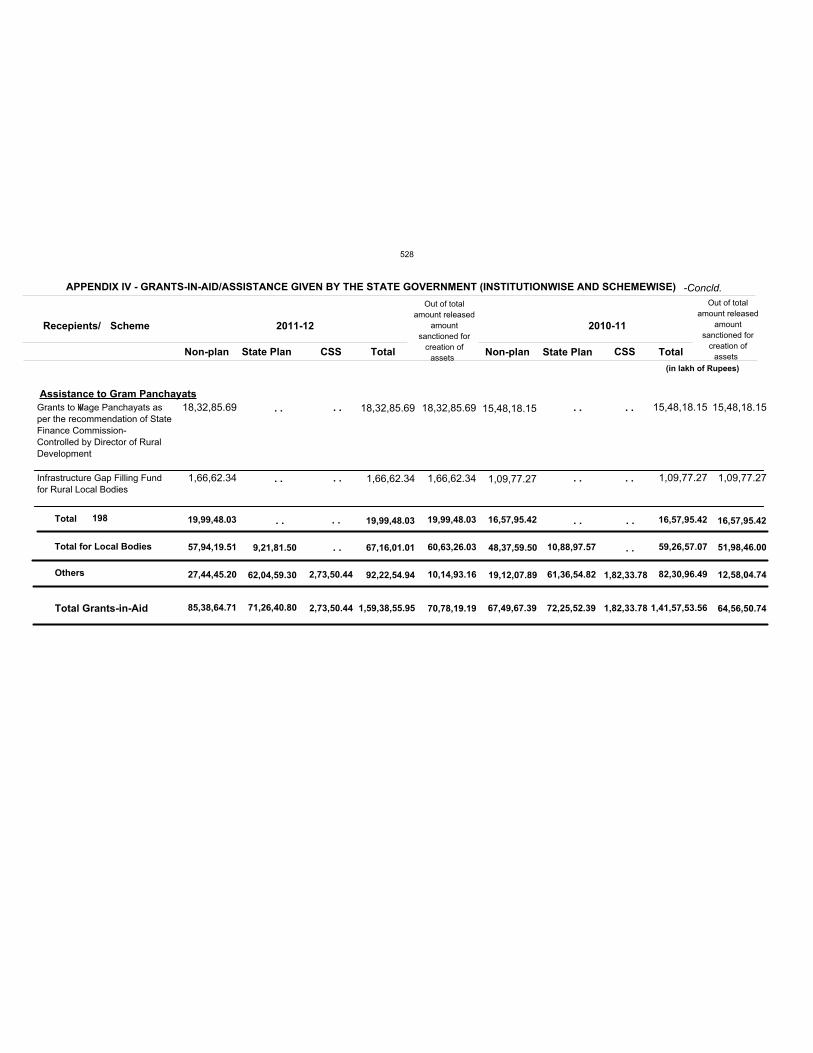
19,99,48.03 16,57,95.42 16,57,95.42
18,32,85.69
1,66,62.34
18,32,85.69
1,66,62.34
15,48,18.15
1,09,77.27
15,48,18.15
1,09,77.27
Grants to Village Panchayats as
per the recommendation of State
Finance Commission-
Controlled by Director of Rural
Development
Infrastructure Gap Filling Fund
for Rural Local Bodies
Recepients/ Scheme
Non-plan State Plan CSS Total Non-plan State Plan CSS Total
2011-12 2010-11
APPENDIX IV - GRANTS-IN-AID/ASSISTANCE GIVEN BY THE STATE GOVERNMENT (INSTITUTIONWISE AND SCHEMEWISE)
18,32,85.69
1,66,62.34
Assistance to Gram Panchayats
15,48,18.15
1,09,77.27
Out of total
amount released
amount
sanctioned for
creation of
assets
Out of total
amount released
amount
sanctioned for
creation of
assets
(in lakh of Rupees)
19,99,48.03
. .
. .
. .
. .
. .
. .
. .
. .
. . . . . . . . 19,99,48.03 16,57,95.42Total
Total Grants-in-Aid
27,44,45.20 62,04,59.30
85,38,64.71 71,26,40.80 2,73,50.44 1,59,38,55.95 70,78,19.19 67,49,67.39 72,25,52.39 1,82,33.78 1,41,57,53.56 64,56,50.74
2,73,50.44 92,22,54.94 10,14,93.16 19,12,07.89 61,36,54.82 1,82,33.78 82,30,96.49 12,58,04.74Others
198
57,94,19.51 9,21,81.50 67,16,01.01 60,63,26.03 48,37,59.50 10,88,97.57 59,26,57.07 51,98,46.00Total for Local Bodies . . . .
-Concld.
528

APPENDIX V- DETAILS OF
TF054009
IDP214
IBR4756-IN
IDA7865IN
IFAD 0662
IDA 4054
GODE71477E
GODEI42531
JPIDP204
JPIDP195
JPIDP196
IBRD4798
IBRD4846
4,79,59.00
2,98,65.00
26,02,17.00
5,00,00.00
13,34,00.00
3,44,70.00
18,84,21.00
World Bank assisted Fisheries Management andSustainable Livelyhood Projects
Tamil Nadu BiodiversityConservation and GreeningProject
Additional Financing for TamilNadu Health System Project
Additional Funding for Tamil NaduRoad Sector Project
Post Tsunami SustainableLivelyhood Programme
Tamil Nadu Emergency TsunamiReconstruction Project
Sustainable Municipal InfraStructure Financing
Sustainable Municipal InfraStructure Financing
Hogenakal Water Supply &Flurosis Mitigation Project Paseh II
Hogenakal Water Supply andFlurosis Mitigation Project
Tamil Nadu Urban InfrastructureProjects
Third Tamil Nadu UrbanDevelopment Project
Tamil Nadu Irrigated AgricultureModernisation and Water BodiesRestoration and Management
upto 2010-11
4,48.11
1,41,57.19
86,80.15
18,18.11
1,25,68.68
32,36.38
69,82.30
1,15,33.14
3,12,90.61
-59,48.10
1,20,40.14
24,73.21
2011-12
4,48.11
2,19,48.49
1,64,93.14
31,57.66
6,67,84.68
32,36.38
1,60,40.71
1,76,92.32
5,32,44.66
1,02,31.51
9,52,19.46
2,53,93.60
Total 2010-11 2011-12 Total
4,20.21 4,20.21
77,91.30
78,12.99
13,39.55
5,42,16.00
90,58.41
61,59.18
2,19,54.05
1,61,79.61
8,31,79.32
2,29,20.39
Grant Loan
Amount ReceivedAid
Agency
Total
Approved
Assistance
Scheme
Project
(in lakh of Rupees)
(1) (2) (3) (4)
1
2
3
4
5
6
7
8
9
10
11
12
13
(5) (6) (7) (9)
. .
. .
. .
. .
. .
. .
. .
. .
. .
. .
. .
. .
. .
. .
. .
. .
. .
. .
. .
. .
. .
. .
. .
. .
. .
. .
. .
. .
. .
. .
. .
. .
. .
. .
. .
. .
. .
. .
. .
. .
. . . .. .
. .
. .
. .
. .
. .
(8)
529
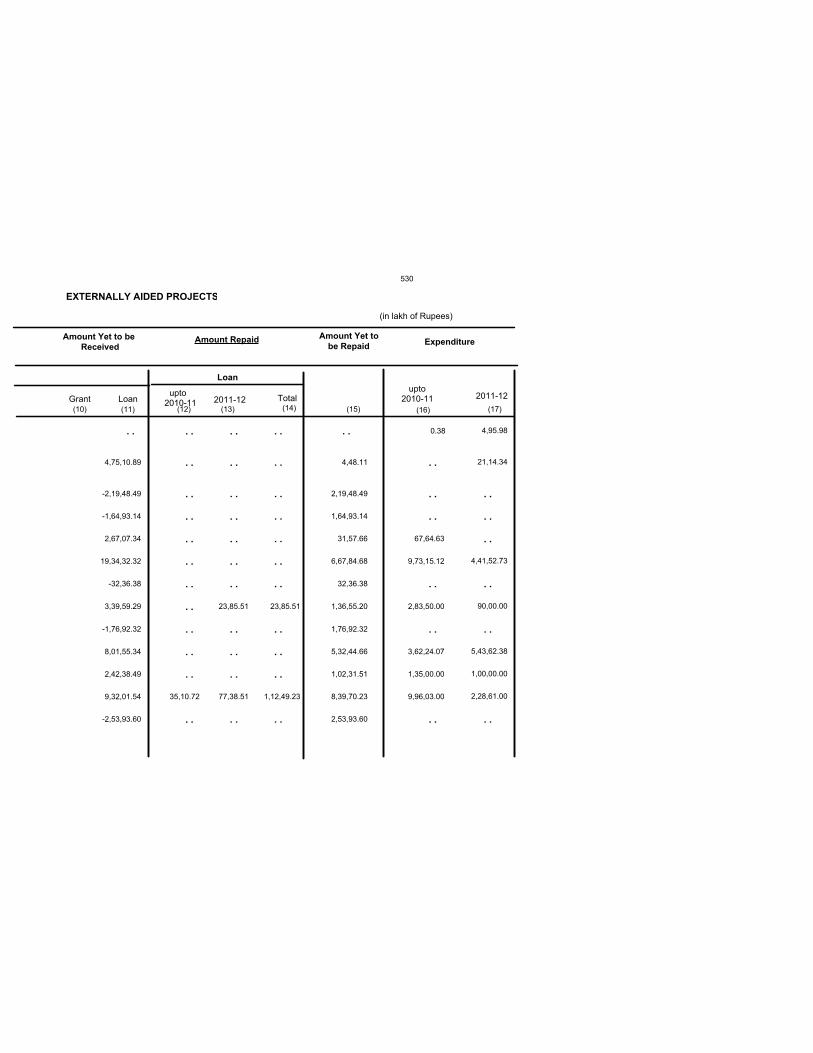
EXTERNALLY AIDED PROJECTS
0.38
67,64.63
9,73,15.12
2,83,50.00
3,62,24.07
1,35,00.00
9,96,03.00
upto2010-11
4,95.98
21,14.34
4,41,52.73
90,00.00
5,43,62.38
1,00,00.00
2,28,61.00
2011-12upto 2010-11 2011-12 Total
35,10.72
23,85.51
77,38.51
23,85.51
1,12,49.23
4,48.11
2,19,48.49
1,64,93.14
31,57.66
6,67,84.68
32,36.38
1,36,55.20
1,76,92.32
5,32,44.66
1,02,31.51
8,39,70.23
2,53,93.60
Amount Repaid Amount Yet to
be RepaidExpenditure
Amount Yet to be
Received
Grant Loan
4,75,10.89
-2,19,48.49
-1,64,93.14
2,67,07.34
19,34,32.32
-32,36.38
3,39,59.29
-1,76,92.32
8,01,55.34
2,42,38.49
9,32,01.54
-2,53,93.60
Loan
(10) (11) (12) (13) (14) (15) (16) (17)
. . . .
. .
. .
. .
. .
. .
. .
. .
. .
. .
. .
. .
. .
. .
. .
. .
. .
. .
. .
. .
. .
. .
. .
. .
. .
. .
. .
. .
. .
. .
. .
. .
. .
. .
. .
. .
. .
. .
. .
. .
. .
. .
. .
. .
. .
. .
. .
(in lakh of Rupees)
530
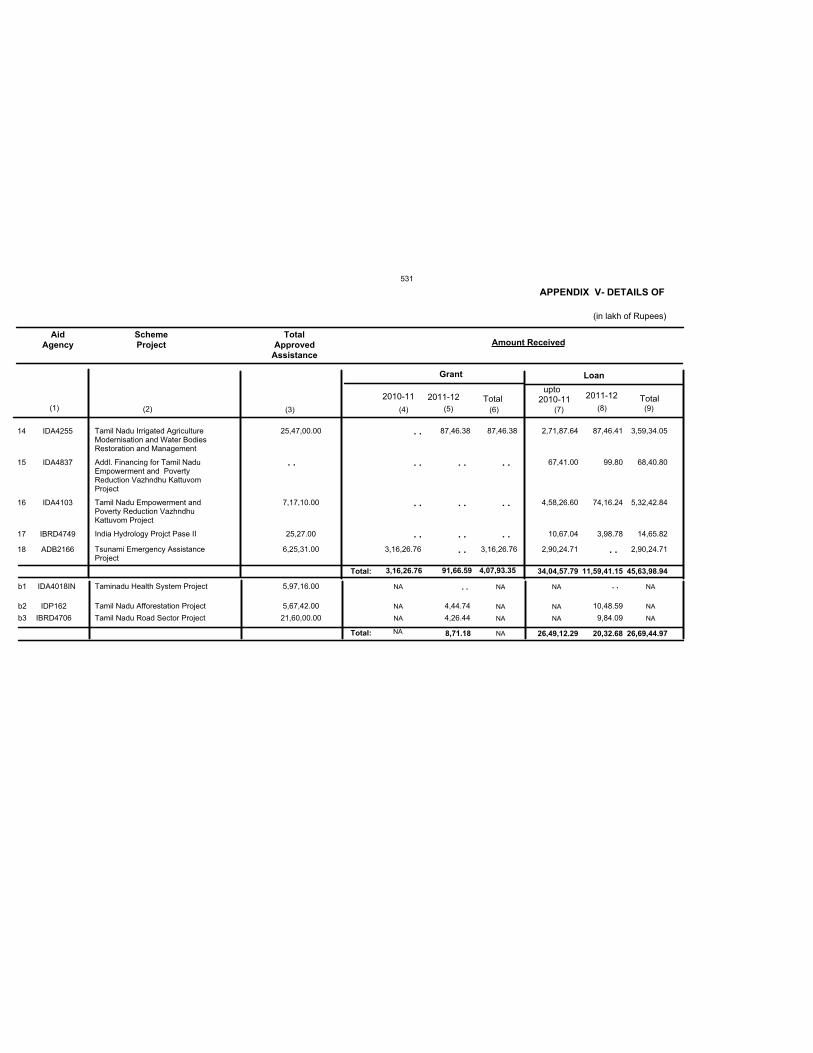
APPENDIX V- DETAILS OF
IDA4255
IDA4837
IDA4103
IBRD4749
ADB2166
25,47,00.00
7,17,10.00
25,27.00
6,25,31.00
Tamil Nadu Irrigated AgricultureModernisation and Water BodiesRestoration and Management
Addl. Financing for Tamil NaduEmpowerment and PovertyReduction Vazhndhu KattuvomProject
Tamil Nadu Empowerment andPoverty Reduction VazhndhuKattuvom Project
India Hydrology Projct Pase II
Tsunami Emergency AssistanceProject
upto 2010-11
87,46.41
99.80
74,16.24
3,98.78
2011-12
3,59,34.05
68,40.80
5,32,42.84
14,65.82
2,90,24.71
Total 2010-11 2011-12 Total
3,16,26.76
87,46.38 87,46.38
3,16,26.76
2,71,87.64
67,41.00
4,58,26.60
10,67.04
2,90,24.71
Grant Loan
34,04,57.79 11,59,41.15 45,63,98.94Total:
Amount ReceivedAid
Agency
Total
Approved
Assistance
Scheme
Project
5,97,16.00
5,67,42.00
21,60,00.00
Taminadu Health System Project
Tamil Nadu Afforestation Project
Tamil Nadu Road Sector Project
10,48.59
9,84.09
4,44.74
4,26.44
26,49,12.29 20,32.68 26,69,44.97Total:
(in lakh of Rupees)
8,71.18
NA
NA
NA
(1) (2) (3) (4)
NA
NA
NA
NA
NA
NA
NA
NA
NA
14
15
16
17
18
IDA4018IN
IDP162
IBRD4706
b1
b2
b3
(5) (6) (7) (9)
. .
. .
. .
. .
. .
. .
. .
. .
. .
. .
. .
. .
. .
. .. .
(8)
NA NA
3,16,26.76 91,66.59 4,07,93.35
531
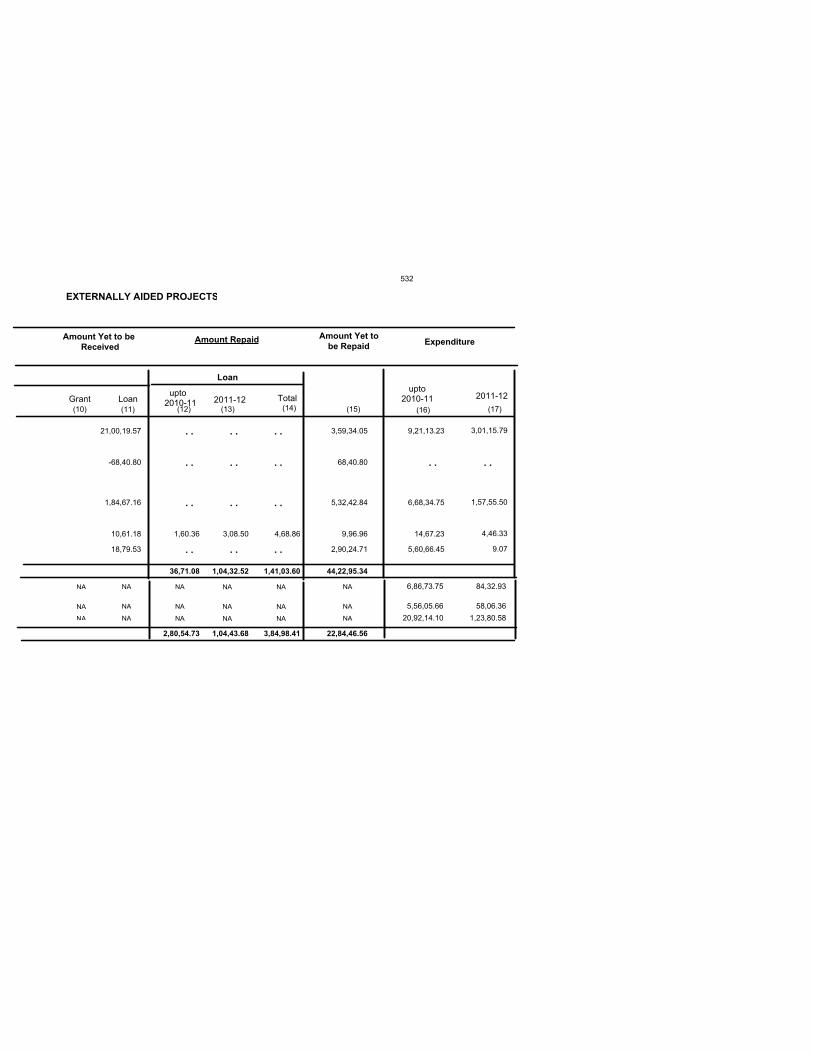
EXTERNALLY AIDED PROJECTS
9,21,13.23
6,68,34.75
14,67.23
5,60,66.45
upto2010-11
3,01,15.79
1,57,55.50
4,46.33
9.07
2011-12upto 2010-11 2011-12 Total
1,60.36 3,08.50 4,68.86
3,59,34.05
68,40.80
5,32,42.84
9,96.96
2,90,24.71
36,71.08 1,04,32.52 1,41,03.60 44,22,95.34
Amount Repaid Amount Yet to
be RepaidExpenditure
6,86,73.75
5,56,05.66
20,92,14.10
84,32.93
58,06.36
1,23,80.58
2,80,54.73 1,04,43.68 3,84,98.41 22,84,46.56
Amount Yet to be
Received
Grant Loan
21,00,19.57
-68,40.80
1,84,67.16
10,61.18
18,79.53
Loan
NA
NA
NA
NA
NA
NA
NA
NA
NA
NA
NA
NA
(10) (11) (12) (13) (14) (15) (16) (17)
NA
NA
NA
NA
NA
NA
. .
. .
. .
. .
. .
. .
. .
. .
. .
. .
. .
. .
. . . .
532
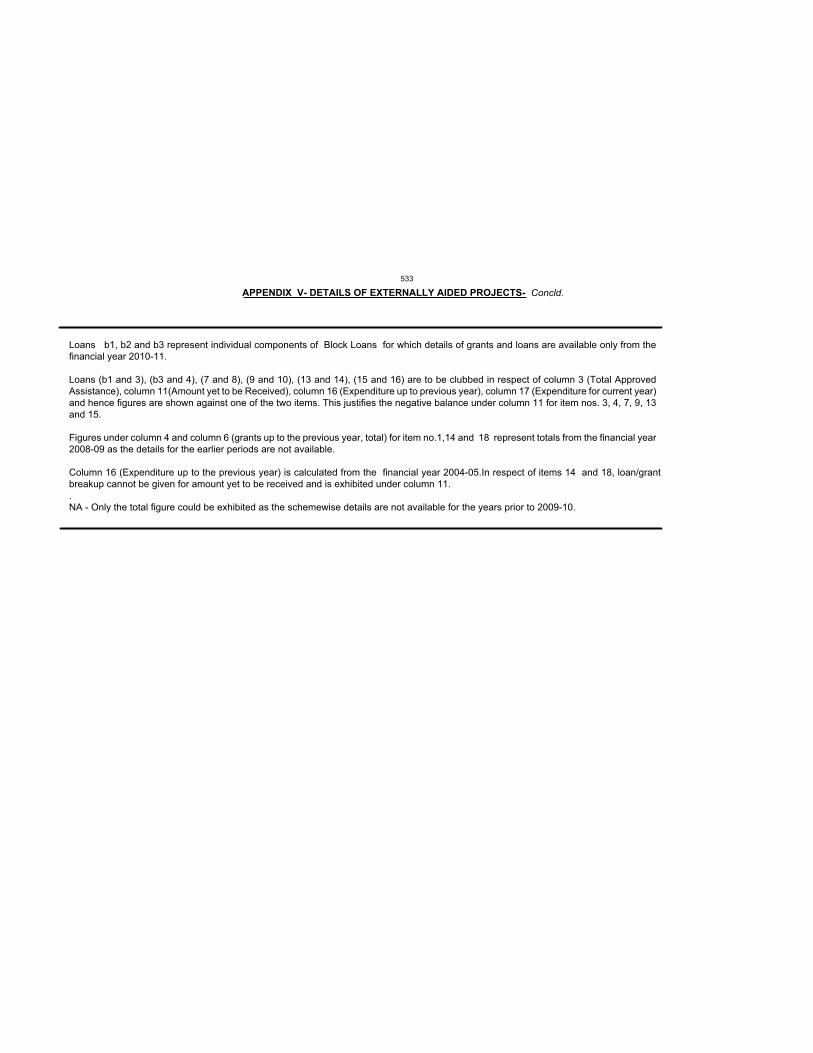
APPENDIX V- DETAILS OF EXTERNALLY AIDED PROJECTS- Concld.
Loans b1, b2 and b3 represent individual components of Block Loans for which details of grants and loans are available only from thefinancial year 2010-11.
Loans (b1 and 3), (b3 and 4), (7 and 8), (9 and 10), (13 and 14), (15 and 16) are to be clubbed in respect of column 3 (Total ApprovedAssistance), column 11(Amount yet to be Received), column 16 (Expenditure up to previous year), column 17 (Expenditure for current year)and hence figures are shown against one of the two items. This justifies the negative balance under column 11 for item nos. 3, 4, 7, 9, 13and 15.
Figures under column 4 and column 6 (grants up to the previous year, total) for item no.1,14 and 18 represent totals from the financial year2008-09 as the details for the earlier periods are not available.
Column 16 (Expenditure up to the previous year) is calculated from the financial year 2004-05.In respect of items 14 and 18, loan/grantbreakup cannot be given for amount yet to be received and is exhibited under column 11..NA - Only the total figure could be exhibited as the schemewise details are not available for the years prior to 2009-10.
533
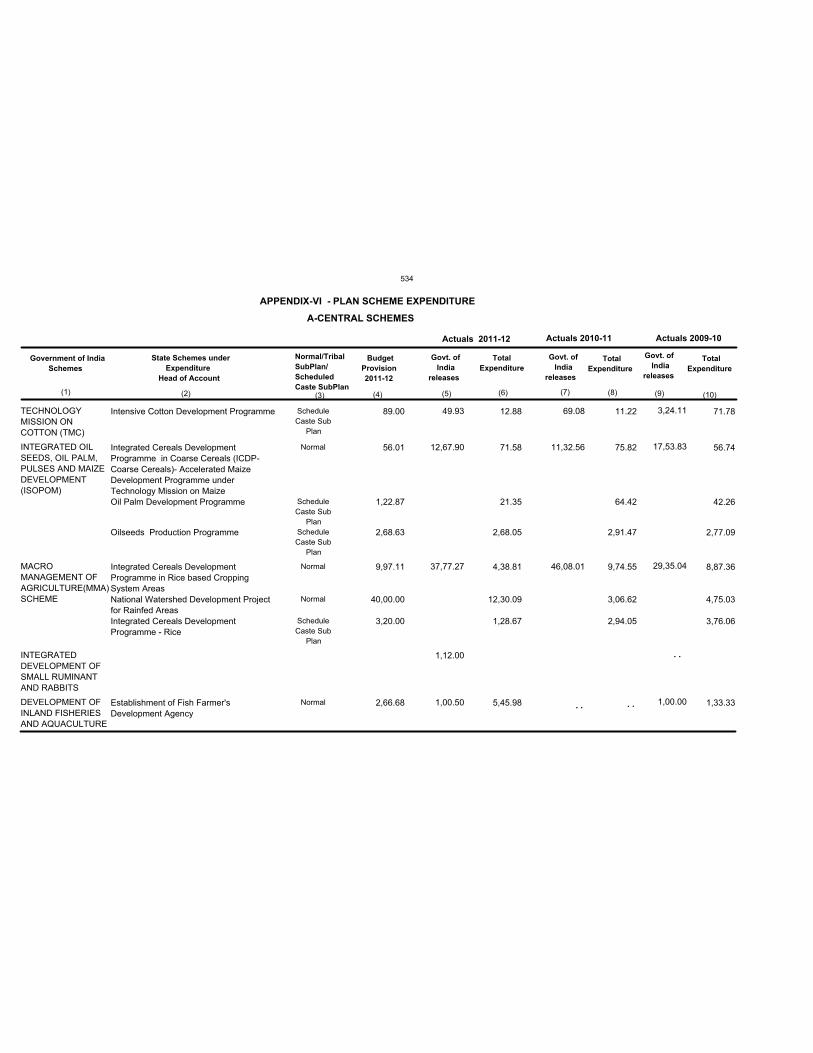
TECHNOLOGY
MISSION ON
COTTON (TMC)
INTEGRATED OIL
SEEDS, OIL PALM,PULSES AND MAIZE
DEVELOPMENT
(ISOPOM)
MACRO
MANAGEMENT OF
AGRICULTURE(MMA)
SCHEME
INTEGRATED
DEVELOPMENT OF
SMALL RUMINANT
AND RABBITS
DEVELOPMENT OF
INLAND FISHERIES
AND AQUACULTURE
Intensive Cotton Development Programme
Integrated Cereals Development
Programme in Coarse Cereals (ICDP-
Coarse Cereals)- Accelerated Maize
Development Programme under
Technology Mission on Maize
Oil Palm Development Programme
Oilseeds Production Programme
Integrated Cereals Development
Programme in Rice based Cropping
System Areas
National Watershed Development Project
for Rainfed Areas
Integrated Cereals Development
Programme - Rice
Establishment of Fish Farmer's
Development Agency
12.88
71.58
21.35
2,68.05
4,38.81
12,30.09
1,28.67
5,45.98
11.22
75.82
64.42
2,91.47
9,74.55
3,06.62
2,94.05
APPENDIX-VI - PLAN SCHEME EXPENDITURE
Government of India
Schemes
State Schemes under
Expenditure
Head of Account
Normal/Tribal
SubPlan/
Scheduled
Caste SubPlan
Budget
Provision
2011-12
Govt. of
India
releases
Total
Expenditure
Govt. of
India
releases
Total
Expenditure
Actuals 2009-10Actuals 2010-11
Schedule
Caste Sub
Plan
Normal
Schedule
Caste Sub
Plan
Schedule
Caste Sub
Plan
Normal
Normal
Schedule
Caste Sub
Plan
Normal
89.00
56.01
1,22.87
2,68.63
9,97.11
40,00.00
3,20.00
2,66.68
49.93
12,67.90
37,77.27
1,12.00
1,00.50
69.08
11,32.56
46,08.01
A-CENTRAL SCHEMES
3,24.11
17,53.83
29,35.04
1,00.00
71.78
56.74
42.26
2,77.09
8,87.36
4,75.03
3,76.06
1,33.33
Actuals 2011-12
Govt. of
India
releases
Total
Expenditure
(1) (2) (3) (4) (5) (6) (7) (8) (9) (10)
. .
. .. .
534
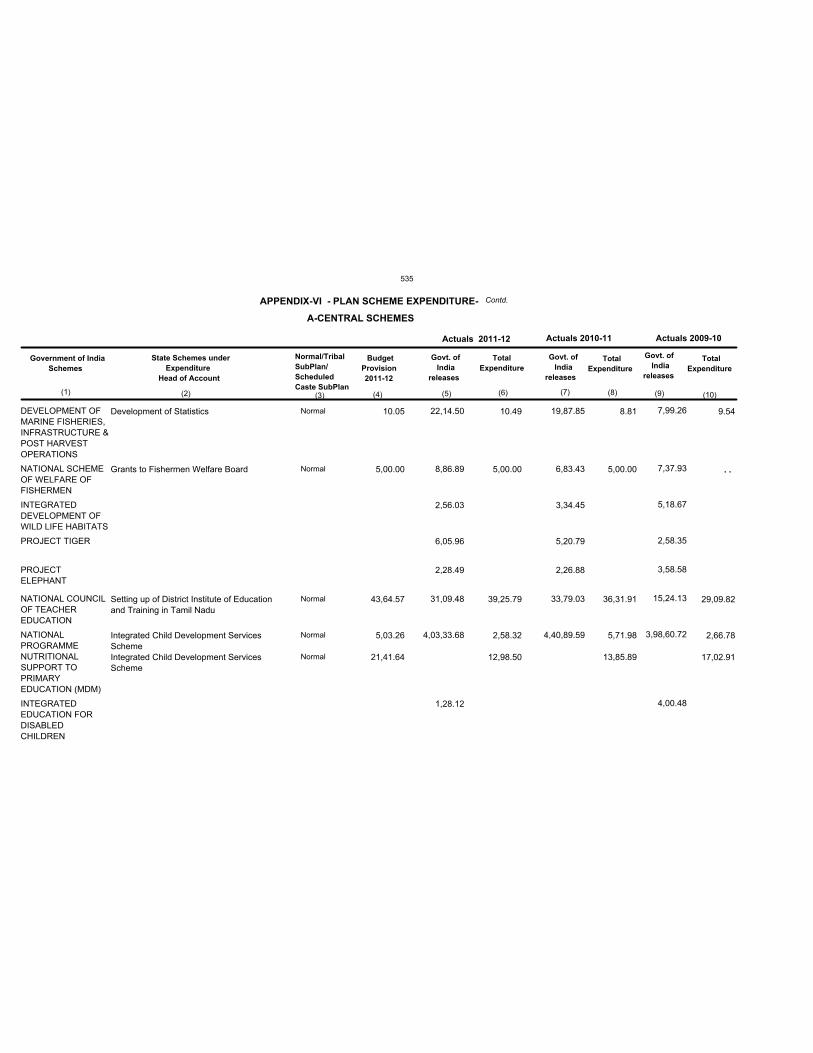
DEVELOPMENT OF
MARINE FISHERIES,
INFRASTRUCTURE &
POST HARVEST
OPERATIONS
NATIONAL SCHEME
OF WELFARE OF
FISHERMEN
INTEGRATED
DEVELOPMENT OF
WILD LIFE HABITATS
PROJECT TIGER
PROJECT
ELEPHANT
NATIONAL COUNCIL
OF TEACHER
EDUCATION
NATIONAL
PROGRAMME
NUTRITIONAL
SUPPORT TO
PRIMARY
EDUCATION (MDM)
INTEGRATED
EDUCATION FOR
DISABLED
CHILDREN
Development of Statistics
Grants to Fishermen Welfare Board
Setting up of District Institute of Education
and Training in Tamil Nadu
Integrated Child Development Services
Scheme
Integrated Child Development Services
Scheme
10.49
5,00.00
39,25.79
2,58.32
12,98.50
8.81
5,00.00
36,31.91
5,71.98
13,85.89
APPENDIX-VI - PLAN SCHEME EXPENDITURE-
Government of India
Schemes
State Schemes under
Expenditure
Head of Account
Normal/Tribal
SubPlan/
Scheduled
Caste SubPlan
Budget
Provision
2011-12
Govt. of
India
releases
Total
Expenditure
Govt. of
India
releases
Total
Expenditure
Actuals 2009-10Actuals 2010-11
Normal
Normal
Normal
Normal
Normal
10.05
5,00.00
43,64.57
5,03.26
21,41.64
22,14.50
8,86.89
2,56.03
6,05.96
2,28.49
31,09.48
4,03,33.68
1,28.12
19,87.85
6,83.43
3,34.45
5,20.79
2,26.88
33,79.03
4,40,89.59
A-CENTRAL SCHEMES
7,99.26
7,37.93
5,18.67
2,58.35
3,58.58
15,24.13
3,98,60.72
4,00.48
9.54
29,09.82
2,66.78
17,02.91
Actuals 2011-12
Govt. of
India
releases
Total
Expenditure
(1) (2) (3) (4) (5) (6) (7) (8) (9) (10)
. .
Contd.
535
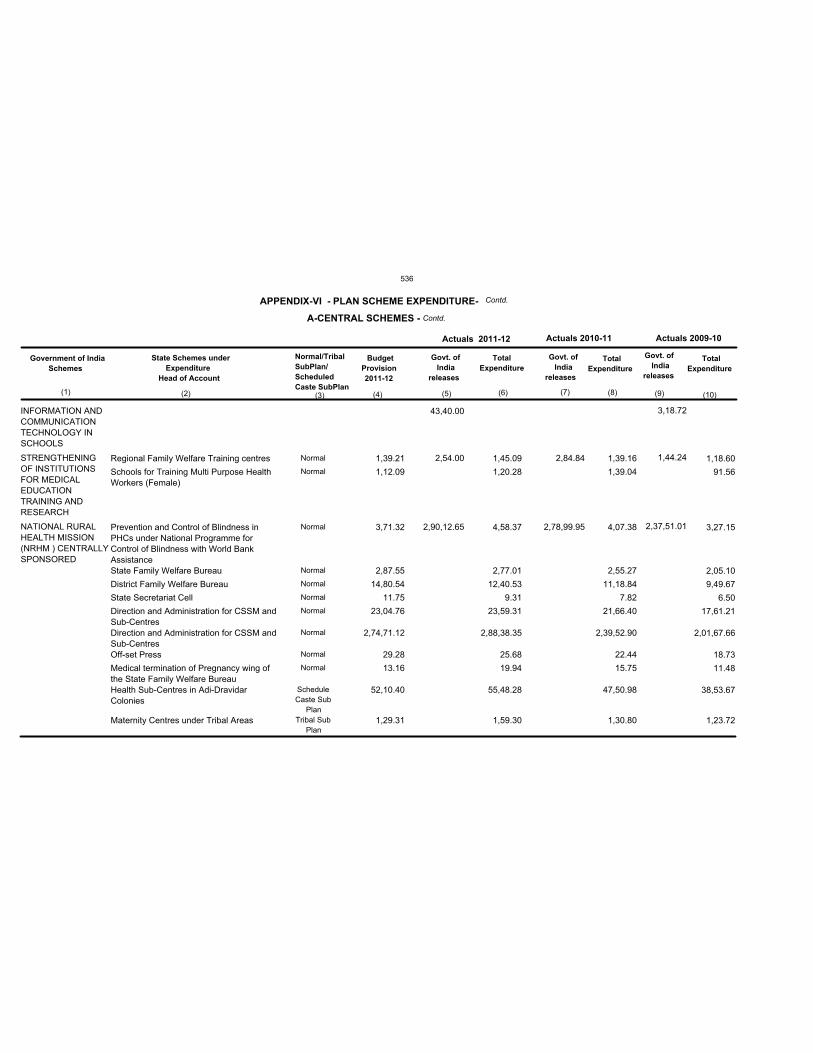
INFORMATION AND
COMMUNICATION
TECHNOLOGY IN
SCHOOLS
STRENGTHENING
OF INSTITUTIONS
FOR MEDICAL
EDUCATION
TRAINING AND
RESEARCH
NATIONAL RURAL
HEALTH MISSION
(NRHM ) CENTRALLY
SPONSORED
Regional Family Welfare Training centres
Schools for Training Multi Purpose Health
Workers (Female)
Prevention and Control of Blindness in
PHCs under National Programme for
Control of Blindness with World Bank
Assistance
State Family Welfare Bureau
District Family Welfare Bureau
State Secretariat Cell
Direction and Administration for CSSM and
Sub-Centres
Direction and Administration for CSSM and
Sub-Centres
Off-set Press
Medical termination of Pregnancy wing of
the State Family Welfare Bureau
Health Sub-Centres in Adi-Dravidar
Colonies
Maternity Centres under Tribal Areas
1,45.09
1,20.28
4,58.37
2,77.01
12,40.53
9.31
23,59.31
2,88,38.35
25.68
19.94
55,48.28
1,59.30
1,39.16
1,39.04
4,07.38
2,55.27
11,18.84
7.82
21,66.40
2,39,52.90
22.44
15.75
47,50.98
1,30.80
APPENDIX-VI - PLAN SCHEME EXPENDITURE-
Government of India
Schemes
State Schemes under
Expenditure
Head of Account
Normal/Tribal
SubPlan/
Scheduled
Caste SubPlan
Budget
Provision
2011-12
Govt. of
India
releases
Total
Expenditure
Govt. of
India
releases
Total
Expenditure
Actuals 2009-10Actuals 2010-11
Normal
Normal
Normal
Normal
Normal
Normal
Normal
Normal
Normal
Normal
Schedule
Caste Sub
Plan
Tribal Sub
Plan
1,39.21
1,12.09
3,71.32
2,87.55
14,80.54
11.75
23,04.76
2,74,71.12
29.28
13.16
52,10.40
1,29.31
43,40.00
2,54.00
2,90,12.65
2,84.84
2,78,99.95
A-CENTRAL SCHEMES - Contd.
3,18.72
1,44.24
2,37,51.01
1,18.60
91.56
3,27.15
2,05.10
9,49.67
6.50
17,61.21
2,01,67.66
18.73
11.48
38,53.67
1,23.72
Actuals 2011-12
Govt. of
India
releases
Total
Expenditure
(1) (2) (3) (4) (5) (6) (7) (8) (9) (10)
Contd.
536
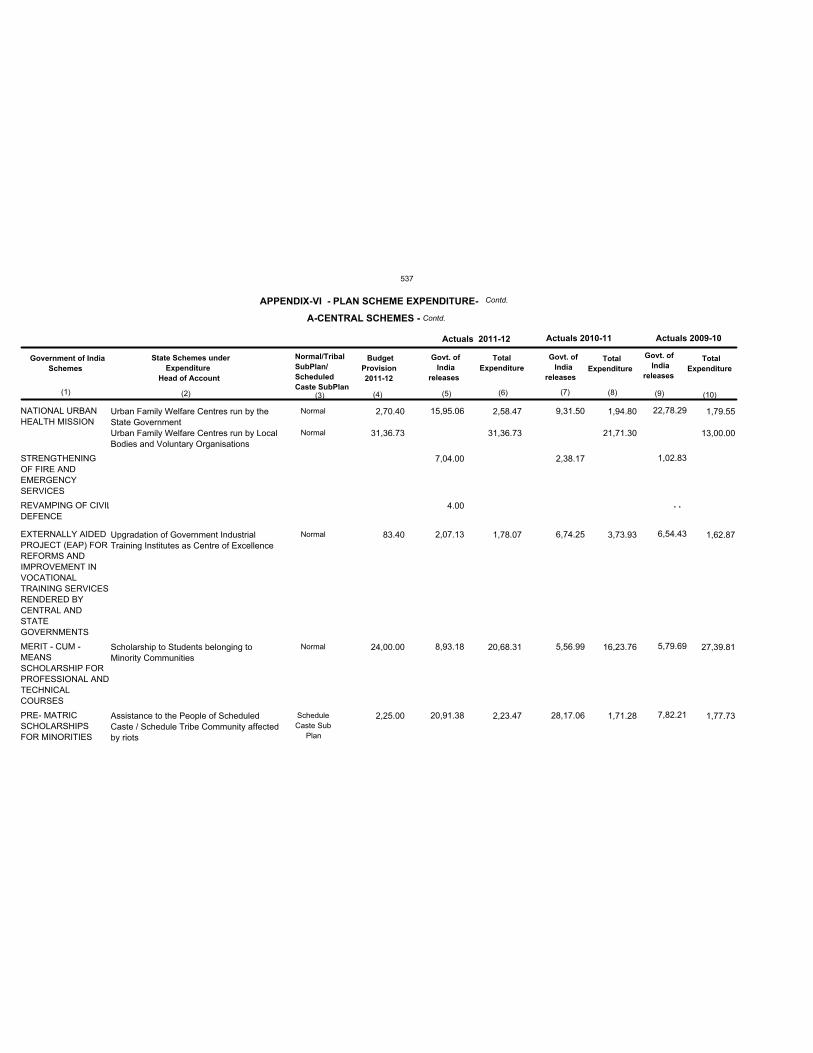
NATIONAL URBAN
HEALTH MISSION
STRENGTHENING
OF FIRE AND
EMERGENCY
SERVICES
REVAMPING OF CIVIL
DEFENCE
EXTERNALLY AIDED
PROJECT (EAP) FOR
REFORMS AND
IMPROVEMENT IN
VOCATIONAL
TRAINING SERVICES
RENDERED BY
CENTRAL AND
STATE
GOVERNMENTS
MERIT - CUM -
MEANS
SCHOLARSHIP FOR
PROFESSIONAL AND
TECHNICAL
COURSES
PRE- MATRIC
SCHOLARSHIPS
FOR MINORITIES
Urban Family Welfare Centres run by the
State Government
Urban Family Welfare Centres run by Local
Bodies and Voluntary Organisations
Upgradation of Government Industrial
Training Institutes as Centre of Excellence
Scholarship to Students belonging to
Minority Communities
Assistance to the People of Scheduled
Caste / Schedule Tribe Community affected
by riots
2,58.47
31,36.73
1,78.07
20,68.31
2,23.47
1,94.80
21,71.30
3,73.93
16,23.76
1,71.28
APPENDIX-VI - PLAN SCHEME EXPENDITURE-
Government of India
Schemes
State Schemes under
Expenditure
Head of Account
Normal/Tribal
SubPlan/
Scheduled
Caste SubPlan
Budget
Provision
2011-12
Govt. of
India
releases
Total
Expenditure
Govt. of
India
releases
Total
Expenditure
Actuals 2009-10Actuals 2010-11
Normal
Normal
Normal
Normal
Schedule
Caste Sub
Plan
2,70.40
31,36.73
83.40
24,00.00
2,25.00
15,95.06
7,04.00
4.00
2,07.13
8,93.18
20,91.38
9,31.50
2,38.17
6,74.25
5,56.99
28,17.06
A-CENTRAL SCHEMES - Contd.
22,78.29
1,02.83
6,54.43
5,79.69
7,82.21
1,79.55
13,00.00
1,62.87
27,39.81
1,77.73
Actuals 2011-12
Govt. of
India
releases
Total
Expenditure
(1) (2) (3) (4) (5) (6) (7) (8) (9) (10)
. .
Contd.
537
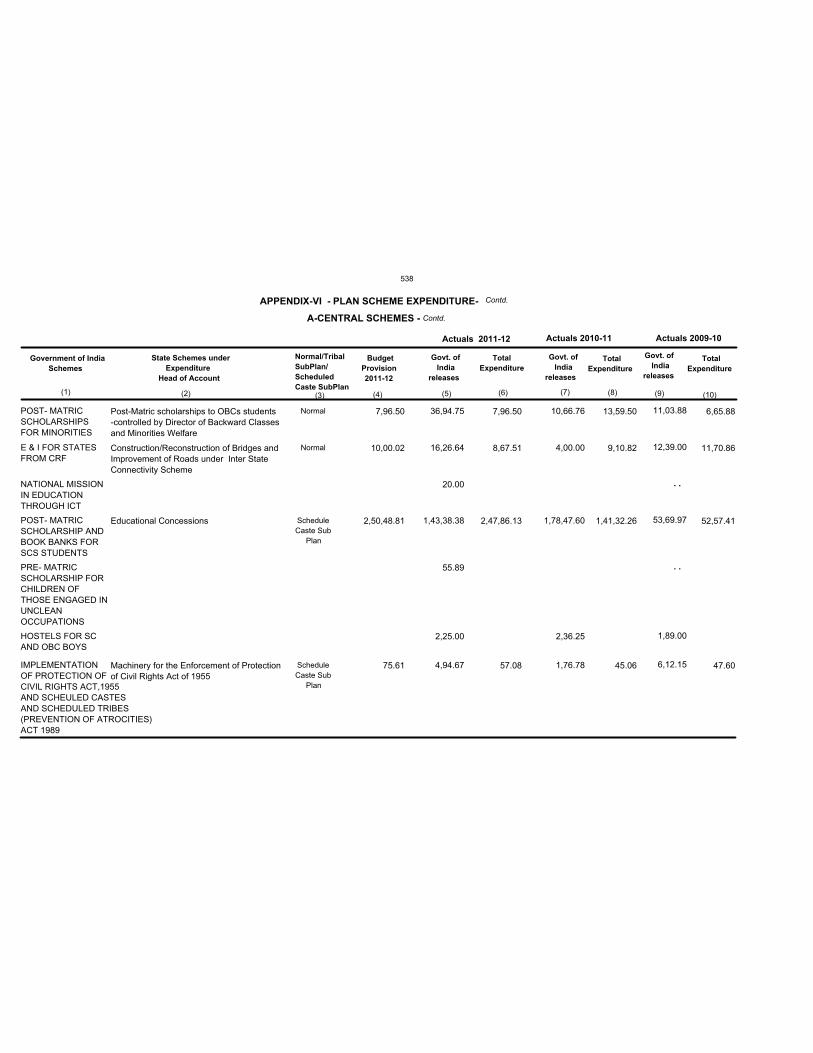
POST- MATRIC
SCHOLARSHIPS
FOR MINORITIES
E & I FOR STATES
FROM CRF
NATIONAL MISSION
IN EDUCATION
THROUGH ICT
POST- MATRIC
SCHOLARSHIP AND
BOOK BANKS FOR
SCS STUDENTS
PRE- MATRIC
SCHOLARSHIP FOR
CHILDREN OF
THOSE ENGAGED IN
UNCLEAN
OCCUPATIONS
HOSTELS FOR SC
AND OBC BOYS
IMPLEMENTATION
OF PROTECTION OF
CIVIL RIGHTS ACT,1955AND SCHEULED CASTESAND SCHEDULED TRIBES(PREVENTION OF ATROCITIES)ACT 1989
Post-Matric scholarships to OBCs students
-controlled by Director of Backward Classes
and Minorities Welfare
Construction/Reconstruction of Bridges and
Improvement of Roads under Inter State
Connectivity Scheme
Educational Concessions
Machinery for the Enforcement of Protection
of Civil Rights Act of 1955
7,96.50
8,67.51
2,47,86.13
57.08
13,59.50
9,10.82
1,41,32.26
45.06
APPENDIX-VI - PLAN SCHEME EXPENDITURE-
Government of India
Schemes
State Schemes under
Expenditure
Head of Account
Normal/Tribal
SubPlan/
Scheduled
Caste SubPlan
Budget
Provision
2011-12
Govt. of
India
releases
Total
Expenditure
Govt. of
India
releases
Total
Expenditure
Actuals 2009-10Actuals 2010-11
Normal
Normal
Schedule
Caste Sub
Plan
Schedule
Caste Sub
Plan
7,96.50
10,00.02
2,50,48.81
75.61
36,94.75
16,26.64
20.00
1,43,38.38
55.89
2,25.00
4,94.67
10,66.76
4,00.00
1,78,47.60
2,36.25
1,76.78
A-CENTRAL SCHEMES - Contd.
11,03.88
12,39.00
53,69.97
1,89.00
6,12.15
6,65.88
11,70.86
52,57.41
47.60
Actuals 2011-12
Govt. of
India
releases
Total
Expenditure
(1) (2) (3) (4) (5) (6) (7) (8) (9) (10)
. .
. .
Contd.
538
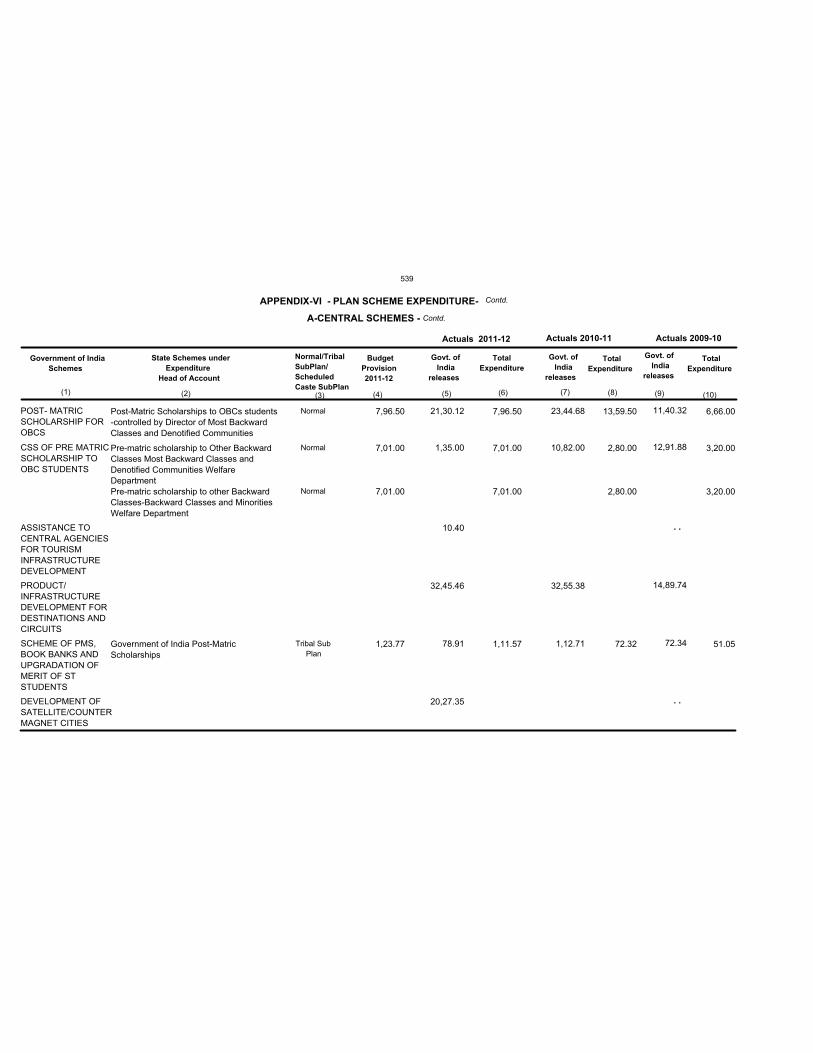
POST- MATRIC
SCHOLARSHIP FOR
OBCS
CSS OF PRE MATRIC
SCHOLARSHIP TO
OBC STUDENTS
ASSISTANCE TO
CENTRAL AGENCIES
FOR TOURISM
INFRASTRUCTURE
DEVELOPMENT
PRODUCT/
INFRASTRUCTURE
DEVELOPMENT FOR
DESTINATIONS AND
CIRCUITS
SCHEME OF PMS,
BOOK BANKS AND
UPGRADATION OF
MERIT OF ST
STUDENTS
DEVELOPMENT OF
SATELLITE/COUNTERMAGNET CITIES
Post-Matric Scholarships to OBCs students
-controlled by Director of Most Backward
Classes and Denotified Communities
Pre-matric scholarship to Other Backward
Classes Most Backward Classes and
Denotified Communities Welfare
Department
Pre-matric scholarship to other Backward
Classes-Backward Classes and Minorities
Welfare Department
Government of India Post-Matric
Scholarships
7,96.50
7,01.00
7,01.00
1,11.57
13,59.50
2,80.00
2,80.00
72.32
APPENDIX-VI - PLAN SCHEME EXPENDITURE-
Government of India
Schemes
State Schemes under
Expenditure
Head of Account
Normal/Tribal
SubPlan/
Scheduled
Caste SubPlan
Budget
Provision
2011-12
Govt. of
India
releases
Total
Expenditure
Govt. of
India
releases
Total
Expenditure
Actuals 2009-10Actuals 2010-11
Normal
Normal
Normal
Tribal Sub
Plan
7,96.50
7,01.00
7,01.00
1,23.77
21,30.12
1,35.00
10.40
32,45.46
78.91
20,27.35
23,44.68
10,82.00
32,55.38
1,12.71
A-CENTRAL SCHEMES - Contd.
11,40.32
12,91.88
14,89.74
72.34
6,66.00
3,20.00
3,20.00
51.05
Actuals 2011-12
Govt. of
India
releases
Total
Expenditure
(1) (2) (3) (4) (5) (6) (7) (8) (9) (10)
. .
. .
Contd.
539
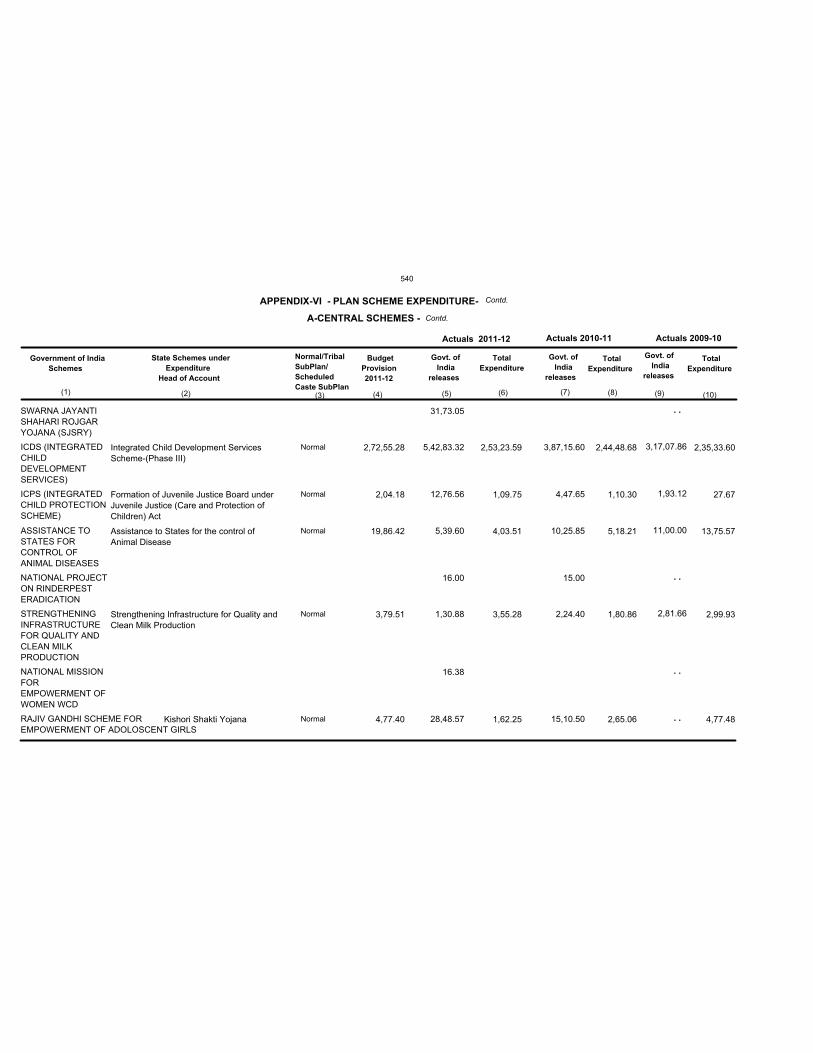
SWARNA JAYANTI
SHAHARI ROJGAR
YOJANA (SJSRY)
ICDS (INTEGRATED
CHILD
DEVELOPMENT
SERVICES)
ICPS (INTEGRATED
CHILD PROTECTION
SCHEME)
ASSISTANCE TO
STATES FOR
CONTROL OF
ANIMAL DISEASES
NATIONAL PROJECT
ON RINDERPEST
ERADICATION
STRENGTHENING
INFRASTRUCTURE
FOR QUALITY AND
CLEAN MILK
PRODUCTION
NATIONAL MISSION
FOR
EMPOWERMENT OF
WOMEN WCD
RAJIV GANDHI SCHEME FOREMPOWERMENT OF ADOLOSCENT GIRLS
Integrated Child Development Services
Scheme-(Phase III)
Formation of Juvenile Justice Board under
Juvenile Justice (Care and Protection of
Children) Act
Assistance to States for the control of
Animal Disease
Strengthening Infrastructure for Quality and
Clean Milk Production
Kishori Shakti Yojana
2,53,23.59
1,09.75
4,03.51
3,55.28
1,62.25
2,44,48.68
1,10.30
5,18.21
1,80.86
2,65.06
APPENDIX-VI - PLAN SCHEME EXPENDITURE-
Government of India
Schemes
State Schemes under
Expenditure
Head of Account
Normal/Tribal
SubPlan/
Scheduled
Caste SubPlan
Budget
Provision
2011-12
Govt. of
India
releases
Total
Expenditure
Govt. of
India
releases
Total
Expenditure
Actuals 2009-10Actuals 2010-11
Normal
Normal
Normal
Normal
Normal
2,72,55.28
2,04.18
19,86.42
3,79.51
4,77.40
31,73.05
5,42,83.32
12,76.56
5,39.60
16.00
1,30.88
16.38
28,48.57
3,87,15.60
4,47.65
10,25.85
15.00
2,24.40
15,10.50
A-CENTRAL SCHEMES - Contd.
3,17,07.86
1,93.12
11,00.00
2,81.66
2,35,33.60
27.67
13,75.57
2,99.93
4,77.48
Actuals 2011-12
Govt. of
India
releases
Total
Expenditure
(1) (2) (3) (4) (5) (6) (7) (8) (9) (10)
. .
. .
. .
. .
Contd.
540
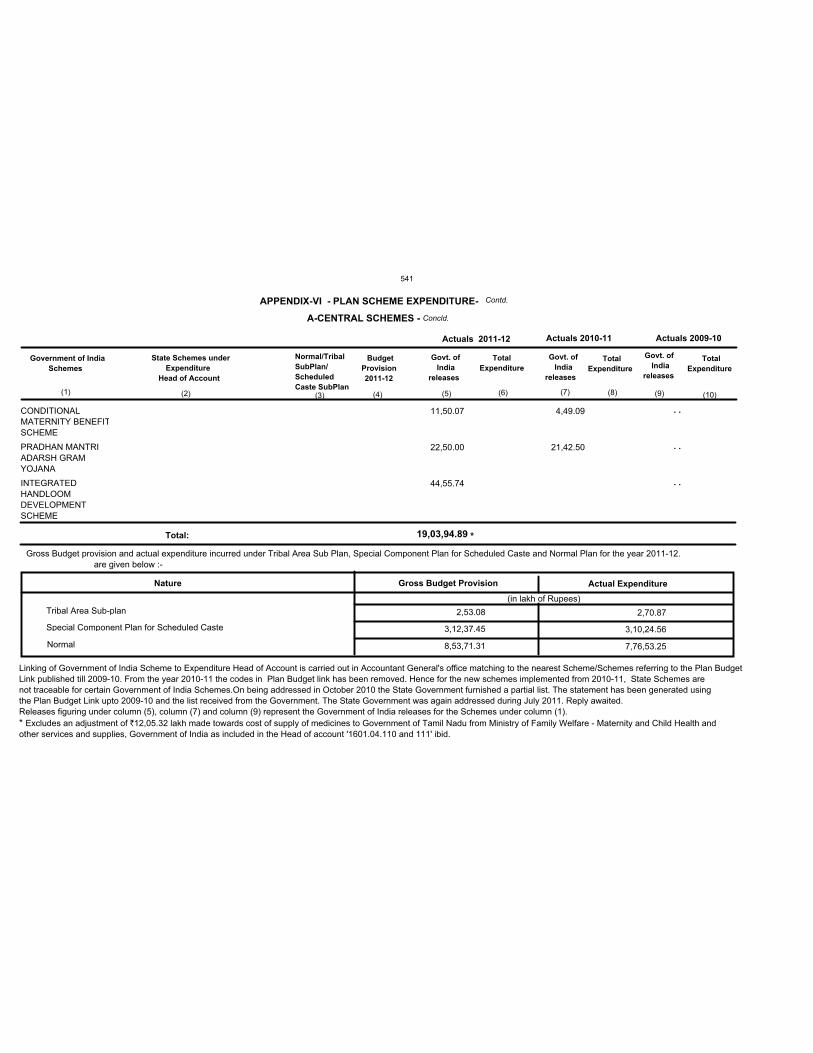
CONDITIONAL
MATERNITY BENEFIT
SCHEME
PRADHAN MANTRI
ADARSH GRAM
YOJANA
INTEGRATED
HANDLOOM
DEVELOPMENT
SCHEME
APPENDIX-VI - PLAN SCHEME EXPENDITURE-
Government of India
Schemes
State Schemes under
Expenditure
Head of Account
Normal/Tribal
SubPlan/
Scheduled
Caste SubPlan
Budget
Provision
2011-12
Govt. of
India
releases
Total
Expenditure
Govt. of
India
releases
Total
Expenditure
Actuals 2009-10Actuals 2010-11
11,50.07
22,50.00
44,55.74
4,49.09
21,42.50
A-CENTRAL SCHEMES - Concld.
Actual Expenditure
(in lakh of Rupees)
Nature
Tribal Area Sub-plan
Special Component Plan for Scheduled Caste
Normal
2,53.08
Gross Budget Provision
3,12,37.45
8,53,71.31
2,70.87
3,10,24.56
7,76,53.25
Gross Budget provision and actual expenditure incurred under Tribal Area Sub Plan, Special Component Plan for Scheduled Caste and Normal Plan for the year 2011-12.
are given below :-
Actuals 2011-12
Govt. of
India
releases
Total
Expenditure
(1) (2) (3) (4) (5) (6) (7) (8) (9) (10)
Linking of Government of India Scheme to Expenditure Head of Account is carried out in Accountant General's office matching to the nearest Scheme/Schemes referring to the Plan Budget
Link published till 2009-10. From the year 2010-11 the codes in Plan Budget link has been removed. Hence for the new schemes implemented from 2010-11, State Schemes are
not traceable for certain Government of India Schemes.On being addressed in October 2010 the State Government furnished a partial list. The statement has been generated using
the Plan Budget Link upto 2009-10 and the list received from the Government. The State Government was again addressed during July 2011. Reply awaited.
Releases figuring under column (5), column (7) and column (9) represent the Government of India releases for the Schemes under column (1).
* Excludes an adjustment of `12,05.32 lakh made towards cost of supply of medicines to Government of Tamil Nadu from Ministry of Family Welfare - Maternity and Child Health and
other services and supplies, Government of India as included in the Head of account '1601.04.110 and 111' ibid.
. .
. .
. .
Contd.
19,03,94.89Total: *
541
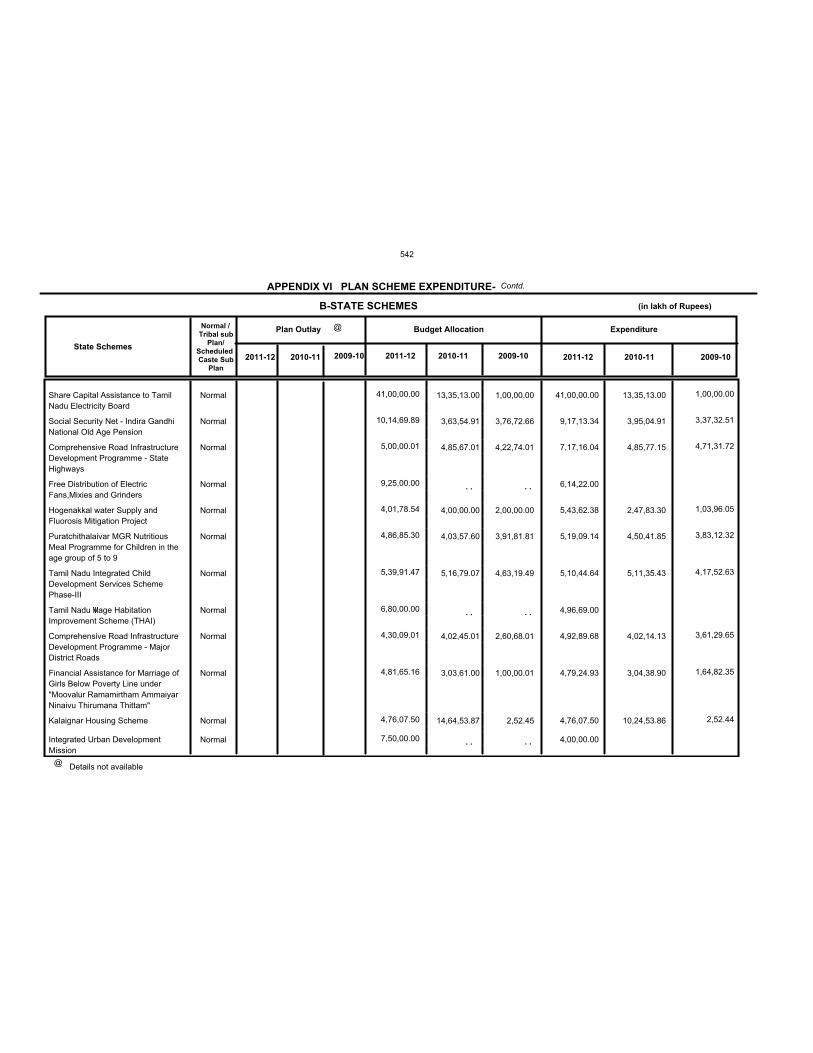
Details not available@
State Schemes
Normal /
Tribal subPlan/
ScheduledCaste Sub
Plan
Plan Outlay Budget Allocation Expenditure
2011-12 2010-11 2011-12 2010-11 2011-12 2010-11
@
(in lakh of Rupees)
41,00,00.00
9,17,13.34
7,17,16.04
6,14,22.00
5,43,62.38
5,19,09.14
5,10,44.64
4,96,69.00
4,92,89.68
4,79,24.93
4,76,07.50
4,00,00.00
Share Capital Assistance to Tamil
Nadu Electricity Board
Social Security Net - Indira Gandhi
National Old Age Pension
Comprehensive Road Infrastructure
Development Programme - State
Highways
Free Distribution of Electric
Fans,Mixies and Grinders
Hogenakkal water Supply and
Fluorosis Mitigation Project
Puratchithalaivar MGR Nutritious
Meal Programme for Children in the
age group of 5 to 9
Tamil Nadu Integrated Child
Development Services Scheme
Phase-III
Tamil Nadu Village Habitation
Improvement Scheme (THAI)
Comprehensive Road Infrastructure
Development Programme - Major
District Roads
Financial Assistance for Marriage of
Girls Below Poverty Line under
"Moovalur Ramamirtham Ammaiyar
Ninaivu Thirumana Thittam"
Kalaignar Housing Scheme
Integrated Urban Development
Mission
13,35,13.00
3,95,04.91
4,85,77.15
2,47,83.30
4,50,41.85
5,11,35.43
4,02,14.13
3,04,38.90
10,24,53.86
B-STATE SCHEMES
Normal
Normal
Normal
Normal
Normal
Normal
Normal
Normal
Normal
Normal
Normal
Normal
2009-10 2009-102009-10
1,00,00.00
3,37,32.51
4,71,31.72
1,03,96.05
3,83,12.32
4,17,52.63
3,61,29.65
1,64,82.35
2,52.44
Contd.APPENDIX VI PLAN SCHEME EXPENDITURE-
41,00,00.00
10,14,69.89
5,00,00.01
9,25,00.00
4,01,78.54
4,86,85.30
5,39,91.47
6,80,00.00
4,30,09.01
4,81,65.16
4,76,07.50
7,50,00.00
13,35,13.00
3,63,54.91
4,85,67.01
4,00,00.00
4,03,57.60
5,16,79.07
4,02,45.01
3,03,61.00
14,64,53.87
1,00,00.00
3,76,72.66
4,22,74.01
2,00,00.00
3,91,81.81
4,63,19.49
2,60,68.01
1,00,00.01
2,52.45
. .
. .
. .
. .
. .
. .
542
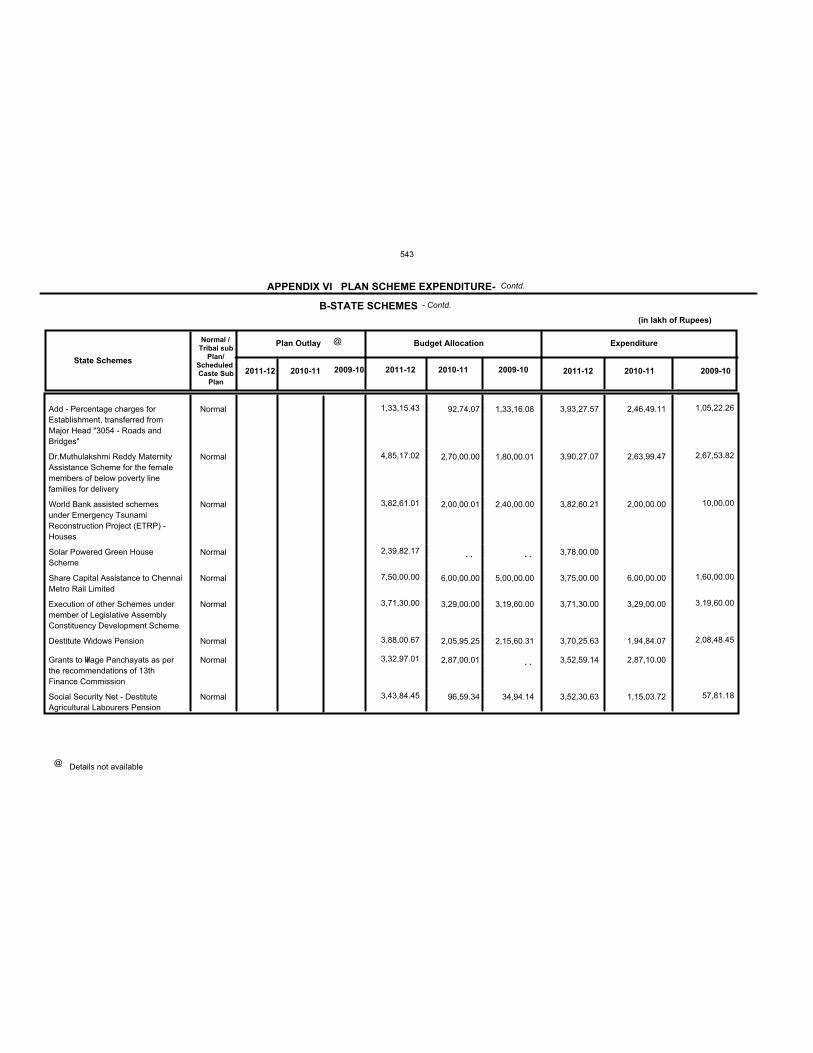
Details not available@
State Schemes
Normal /
Tribal subPlan/
ScheduledCaste Sub
Plan
Plan Outlay Budget Allocation Expenditure
2011-12 2010-11 2011-12 2010-11 2011-12 2010-11
@
(in lakh of Rupees)
3,93,27.57
3,90,27.07
3,82,60.21
3,78,00.00
3,75,00.00
3,71,30.00
3,70,25.63
3,52,59.14
3,52,30.63
Add - Percentage charges for
Establishment, transferred from
Major Head "3054 - Roads and
Bridges"
Dr.Muthulakshmi Reddy Maternity
Assistance Scheme for the female
members of below poverty line
families for delivery
World Bank assisted schemes
under Emergency Tsunami
Reconstruction Project (ETRP) -
Houses
Solar Powered Green House
Scheme
Share Capital Assistance to Chennai
Metro Rail Limited
Execution of other Schemes under
member of Legislative Assembly
Constituency Development Scheme
Destitute Widows Pension
Grants to Village Panchayats as per
the recommendations of 13th
Finance Commission
Social Security Net - Destitute
Agricultural Labourers Pension
2,46,49.11
2,63,99.47
2,00,00.00
6,00,00.00
3,29,00.00
1,94,84.07
2,87,10.00
1,15,03.72
B-STATE SCHEMES
Normal
Normal
Normal
Normal
Normal
Normal
Normal
Normal
Normal
2009-10 2009-102009-10
1,05,22.26
2,67,53.82
10,00.00
1,60,00.00
3,19,60.00
2,08,48.45
57,81.18
Contd.
- Contd.
APPENDIX VI PLAN SCHEME EXPENDITURE-
1,33,15.43
4,85,17.02
3,82,61.01
2,39,82.17
7,50,00.00
3,71,30.00
3,88,00.67
3,32,97.01
3,43,84.45
92,74.07
2,70,00.00
2,00,00.01
6,00,00.00
3,29,00.00
2,05,95.25
2,87,00.01
96,59.34
1,33,16.08
1,80,00.01
2,40,00.00
5,00,00.00
3,19,60.00
2,15,60.31
34,94.14
. . . .
. .
543
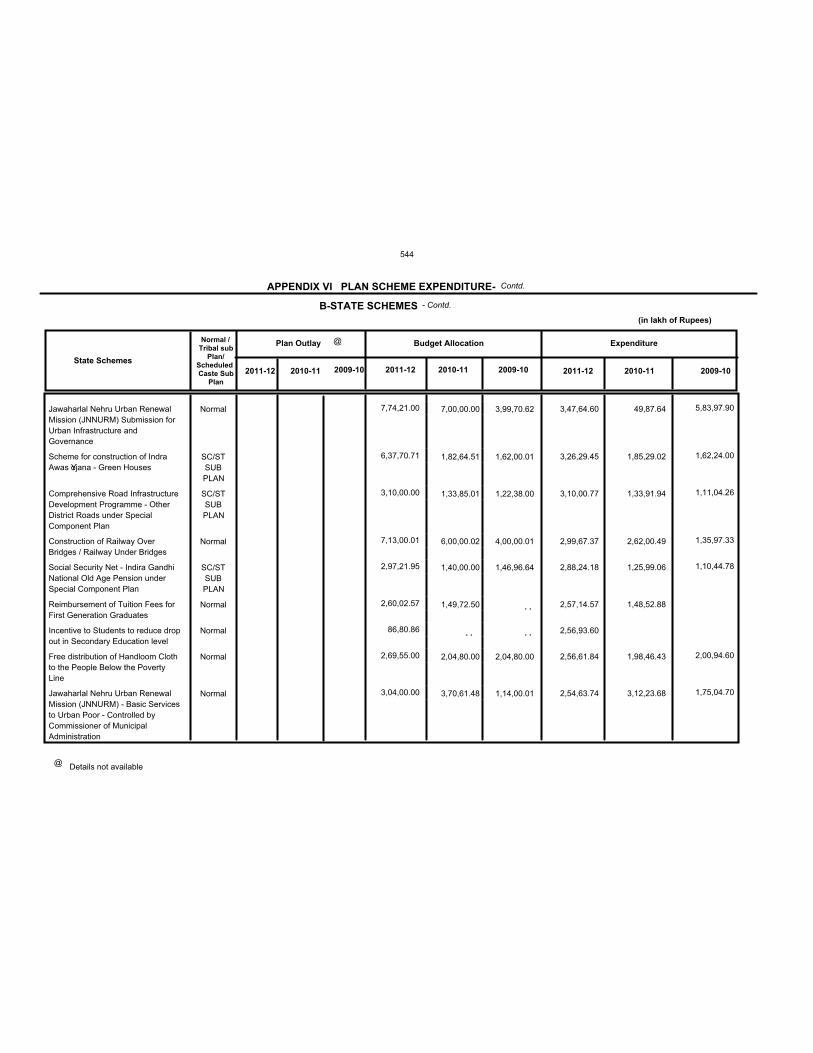
Details not available@
State Schemes
Normal /
Tribal subPlan/
ScheduledCaste Sub
Plan
Plan Outlay Budget Allocation Expenditure
2011-12 2010-11 2011-12 2010-11 2011-12 2010-11
@
(in lakh of Rupees)
3,47,64.60
3,26,29.45
3,10,00.77
2,99,67.37
2,88,24.18
2,57,14.57
2,56,93.60
2,56,61.84
2,54,63.74
Jawaharlal Nehru Urban Renewal
Mission (JNNURM) Submission for
Urban Infrastructure and
Governance
Scheme for construction of Indra
Awas Yojana - Green Houses
Comprehensive Road Infrastructure
Development Programme - Other
District Roads under Special
Component Plan
Construction of Railway Over
Bridges / Railway Under Bridges
Social Security Net - Indira Gandhi
National Old Age Pension under
Special Component Plan
Reimbursement of Tuition Fees for
First Generation Graduates
Incentive to Students to reduce drop
out in Secondary Education level
Free distribution of Handloom Cloth
to the People Below the Poverty
Line
Jawaharlal Nehru Urban Renewal
Mission (JNNURM) - Basic Services
to Urban Poor - Controlled by
Commissioner of Municipal
Administration
49,87.64
1,85,29.02
1,33,91.94
2,62,00.49
1,25,99.06
1,48,52.88
1,98,46.43
3,12,23.68
B-STATE SCHEMES
Normal
SC/ST
SUB
PLAN
SC/ST
SUB
PLAN
Normal
SC/ST
SUB
PLAN
Normal
Normal
Normal
Normal
2009-10 2009-102009-10
5,83,97.90
1,62,24.00
1,11,04.26
1,35,97.33
1,10,44.78
2,00,94.60
1,75,04.70
Contd.
- Contd.
APPENDIX VI PLAN SCHEME EXPENDITURE-
7,74,21.00
6,37,70.71
3,10,00.00
7,13,00.01
2,97,21.95
2,60,02.57
86,80.86
2,69,55.00
3,04,00.00
7,00,00.00
1,82,64.51
1,33,85.01
6,00,00.02
1,40,00.00
1,49,72.50
2,04,80.00
3,70,61.48
3,99,70.62
1,62,00.01
1,22,38.00
4,00,00.01
1,46,96.64
2,04,80.00
1,14,00.01
. .
. .
. .
544
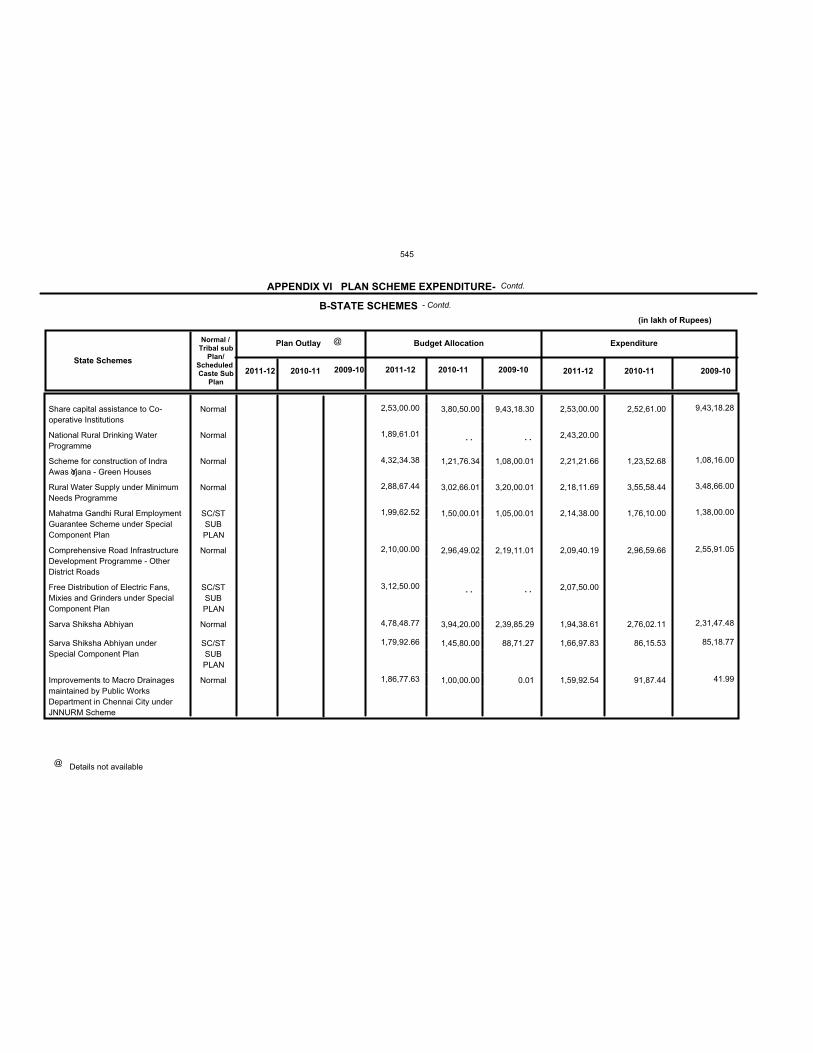
Details not available@
State Schemes
Normal /
Tribal subPlan/
ScheduledCaste Sub
Plan
Plan Outlay Budget Allocation Expenditure
2011-12 2010-11 2011-12 2010-11 2011-12 2010-11
@
(in lakh of Rupees)
2,53,00.00
2,43,20.00
2,21,21.66
2,18,11.69
2,14,38.00
2,09,40.19
2,07,50.00
1,94,38.61
1,66,97.83
1,59,92.54
Share capital assistance to Co-
operative Institutions
National Rural Drinking Water
Programme
Scheme for construction of Indra
Awas Yojana - Green Houses
Rural Water Supply under Minimum
Needs Programme
Mahatma Gandhi Rural Employment
Guarantee Scheme under Special
Component Plan
Comprehensive Road Infrastructure
Development Programme - Other
District Roads
Free Distribution of Electric Fans,
Mixies and Grinders under Special
Component Plan
Sarva Shiksha Abhiyan
Sarva Shiksha Abhiyan under
Special Component Plan
Improvements to Macro Drainages
maintained by Public Works
Department in Chennai City under
JNNURM Scheme
2,52,61.00
1,23,52.68
3,55,58.44
1,76,10.00
2,96,59.66
2,76,02.11
86,15.53
91,87.44
B-STATE SCHEMES
Normal
Normal
Normal
Normal
SC/ST
SUB
PLAN
Normal
SC/ST
SUB
PLAN
Normal
SC/ST
SUB
PLAN
Normal
2009-10 2009-102009-10
9,43,18.28
1,08,16.00
3,48,66.00
1,38,00.00
2,55,91.05
2,31,47.48
85,18.77
41.99
Contd.
- Contd.
APPENDIX VI PLAN SCHEME EXPENDITURE-
2,53,00.00
1,89,61.01
4,32,34.38
2,88,67.44
1,99,62.52
2,10,00.00
3,12,50.00
4,78,48.77
1,79,92.66
1,86,77.63
3,80,50.00
1,21,76.34
3,02,66.01
1,50,00.01
2,96,49.02
3,94,20.00
1,45,80.00
1,00,00.00
9,43,18.30
1,08,00.01
3,20,00.01
1,05,00.01
2,19,11.01
2,39,85.29
88,71.27
0.01
. .
. .
. .
. .
545
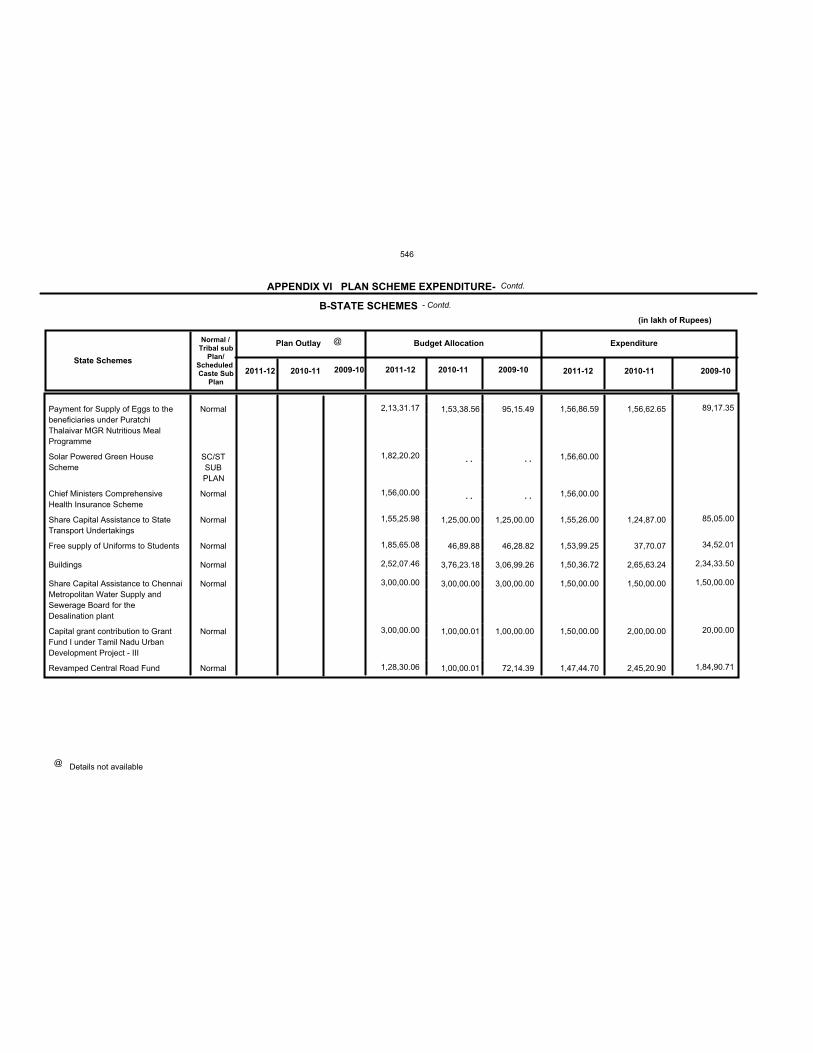
Details not available@
State Schemes
Normal /
Tribal subPlan/
ScheduledCaste Sub
Plan
Plan Outlay Budget Allocation Expenditure
2011-12 2010-11 2011-12 2010-11 2011-12 2010-11
@
(in lakh of Rupees)
1,56,86.59
1,56,60.00
1,56,00.00
1,55,26.00
1,53,99.25
1,50,36.72
1,50,00.00
1,50,00.00
1,47,44.70
Payment for Supply of Eggs to the
beneficiaries under Puratchi
Thalaivar MGR Nutritious Meal
Programme
Solar Powered Green House
Scheme
Chief Ministers Comprehensive
Health Insurance Scheme
Share Capital Assistance to State
Transport Undertakings
Free supply of Uniforms to Students
Buildings
Share Capital Assistance to Chennai
Metropolitan Water Supply and
Sewerage Board for the
Desalination plant
Capital grant contribution to Grant
Fund I under Tamil Nadu Urban
Development Project - III
Revamped Central Road Fund
1,56,62.65
1,24,87.00
37,70.07
2,65,63.24
1,50,00.00
2,00,00.00
2,45,20.90
B-STATE SCHEMES
Normal
SC/ST
SUB
PLAN
Normal
Normal
Normal
Normal
Normal
Normal
Normal
2009-10 2009-102009-10
89,17.35
85,05.00
34,52.01
2,34,33.50
1,50,00.00
20,00.00
1,84,90.71
Contd.
- Contd.
APPENDIX VI PLAN SCHEME EXPENDITURE-
2,13,31.17
1,82,20.20
1,56,00.00
1,55,25.98
1,85,65.08
2,52,07.46
3,00,00.00
3,00,00.00
1,28,30.06
1,53,38.56
1,25,00.00
46,89.88
3,76,23.18
3,00,00.00
1,00,00.01
1,00,00.01
95,15.49
1,25,00.00
46,28.82
3,06,99.26
3,00,00.00
1,00,00.00
72,14.39
. .
. .
. .
. .
546
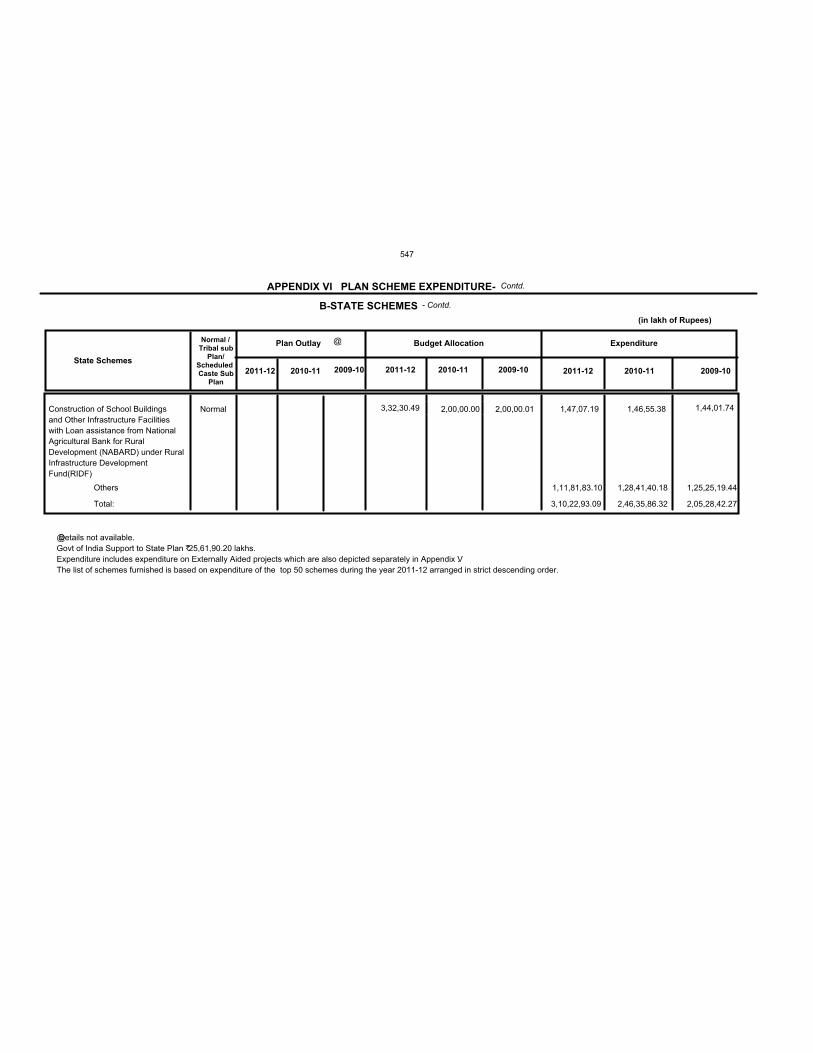
State Schemes
Normal /
Tribal subPlan/
ScheduledCaste Sub
Plan
Plan Outlay Budget Allocation Expenditure
2011-12 2010-11 2011-12 2010-11 2011-12 2010-11
@
(in lakh of Rupees)
1,47,07.19Construction of School Buildings
and Other Infrastructure Facilities
with Loan assistance from National
Agricultural Bank for Rural
Development (NABARD) under Rural
Infrastructure Development
Fund(RIDF)
1,46,55.38
1,11,81,83.10 1,28,41,40.18Others
Total: 3,10,22,93.09 2,46,35,86.32
B-STATE SCHEMES
Normal
@ Details not available.
Govt of India Support to State Plan 2̀5,61,90.20 lakhs.
Expenditure includes expenditure on Externally Aided projects which are also depicted separately in Appendix V.
The list of schemes furnished is based on expenditure of the top 50 schemes during the year 2011-12 arranged in strict descending order.
2009-10 2009-102009-10
1,44,01.74
1,25,25,19.44
2,05,28,42.27
Contd.
- Contd.
APPENDIX VI PLAN SCHEME EXPENDITURE-
3,32,30.49 2,00,00.00 2,00,00.01
547
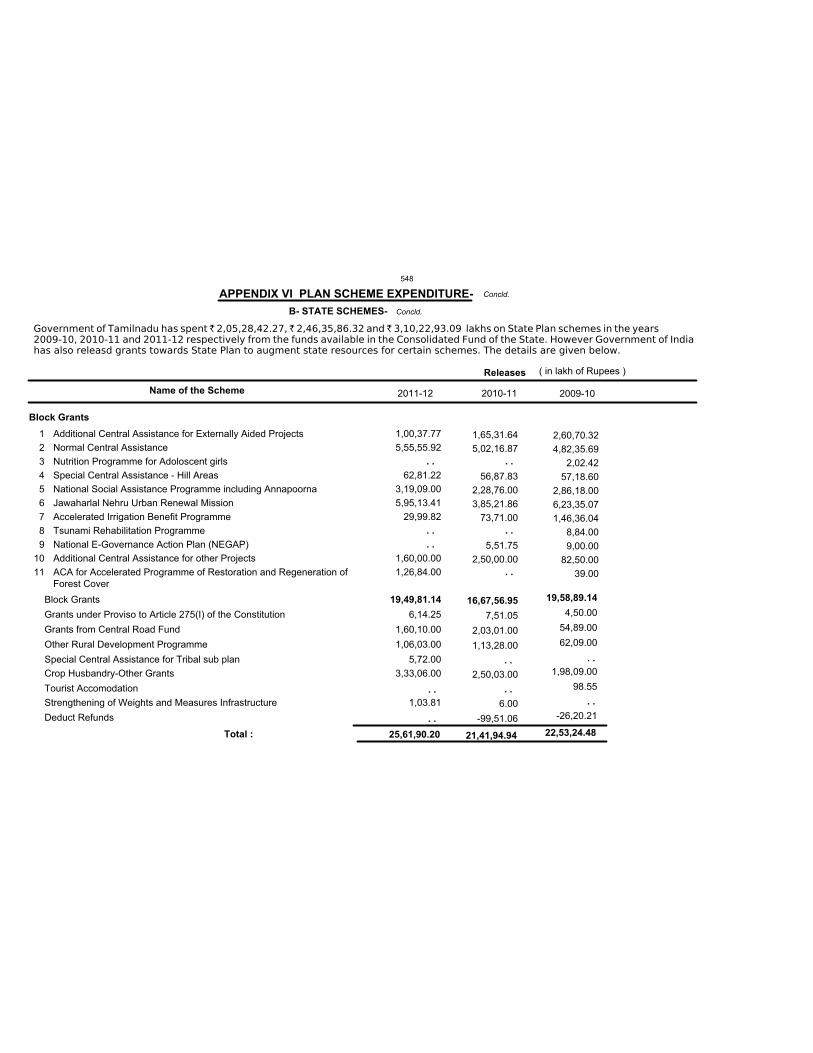
25,61,90.20
Block Grants
19,49,81.14
6,14.25
1,60,10.00
1,06,03.00
5,72.00
3,33,06.00
1,03.81
1,00,37.77
5,55,55.92
62,81.22
3,19,09.00
5,95,13.41
29,99.82
1,60,00.00
1,26,84.00
Additional Central Assistance for Externally Aided Projects
Normal Central Assistance
Nutrition Programme for Adoloscent girls
Special Central Assistance - Hill Areas
National Social Assistance Programme including Annapoorna
Jawaharlal Nehru Urban Renewal Mission
Accelerated Irrigation Benefit Programme
Tsunami Rehabilitation Programme
National E-Governance Action Plan (NEGAP)
Additional Central Assistance for other Projects
ACA for Accelerated Programme of Restoration and Regeneration of Forest Cover
Block Grants
Grants under Proviso to Article 275(I) of the Constitution
Grants from Central Road Fund
Other Rural Development Programme
Special Central Assistance for Tribal sub plan
Crop Husbandry-Other Grants
Tourist Accomodation
Strengthening of Weights and Measures Infrastructure
Deduct Refunds
Total :
APPENDIX VI PLAN SCHEME EXPENDITURE-
1
2
3
4
5
6
7
8
9
10
11
Government of Tamilnadu has spent ̀ 2,05,28,42.27, ̀ 2,46,35,86.32 and ` 3,10,22,93.09 lakhs on State Plan schemes in the years2009-10, 2010-11 and 2011-12 respectively from the funds available in the Consolidated Fund of the State. However Government of India has also releasd grants towards State Plan to augment state resources for certain schemes. The details are given below.
Name of the Scheme
Releases ( in lakh of Rupees )
Concld.
21,41,94.94
16,67,56.95
7,51.05
2,03,01.00
1,13,28.00
2,50,03.00
6.00
-99,51.06
1,65,31.64
5,02,16.87
56,87.83
2,28,76.00
3,85,21.86
73,71.00
5,51.75
2,50,00.00
22,53,24.48
19,58,89.14
4,50.00
54,89.00
62,09.00
1,98,09.00
98.55
-26,20.21
2,60,70.32
4,82,35.69
2,02.42
57,18.60
2,86,18.00
6,23,35.07
1,46,36.04
8,84.00
9,00.00
82,50.00
39.00
2011-12 2010-11 2009-10
. .
. .
. .
. .
. .
. .
. .
. .
. .
. .
. .
. .
B- STATE SCHEMES- Concld.
548
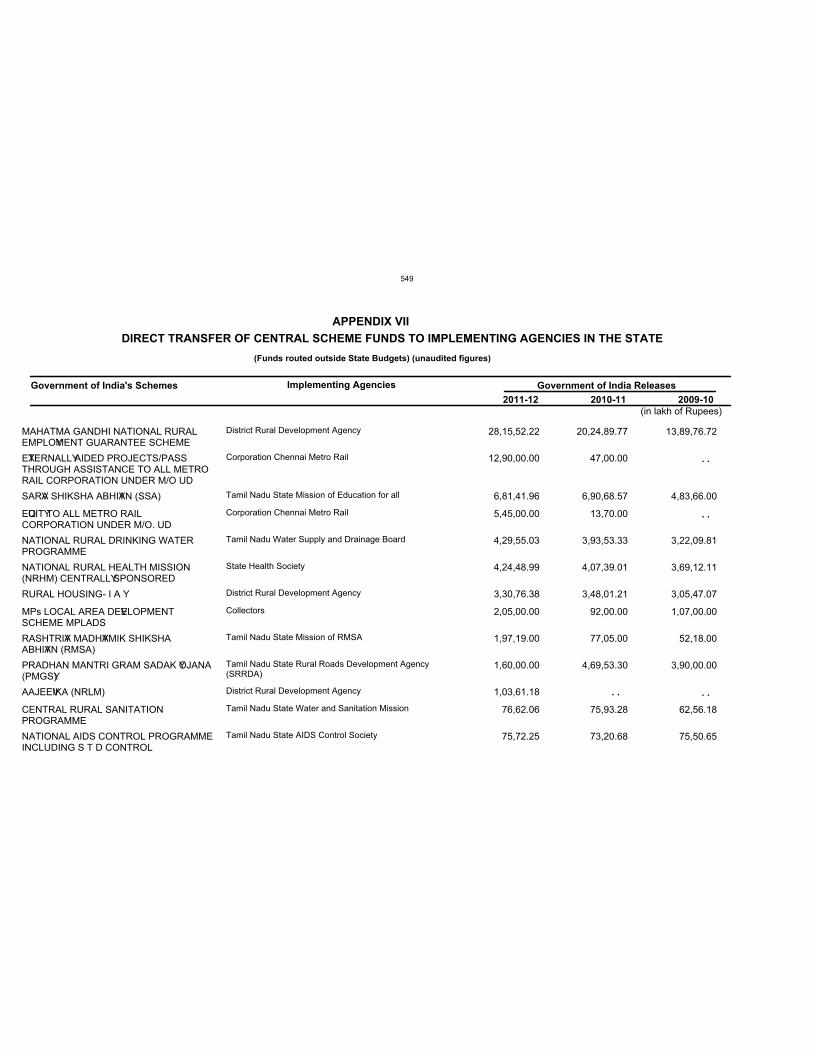
MAHATMA GANDHI NATIONAL RURALEMPLOYMENT GUARANTEE SCHEME
EXTERNALLY AIDED PROJECTS/PASSTHROUGH ASSISTANCE TO ALL METRORAIL CORPORATION UNDER M/O UD
SARVA SHIKSHA ABHIYAN (SSA)
EQUITY TO ALL METRO RAILCORPORATION UNDER M/O. UD
NATIONAL RURAL DRINKING WATERPROGRAMME
NATIONAL RURAL HEALTH MISSION(NRHM) CENTRALLY SPONSORED
RURAL HOUSING- I A Y
MPs LOCAL AREA DEVELOPMENTSCHEME MPLADS
RASHTRIYA MADHYAMIK SHIKSHAABHIYAN (RMSA)
PRADHAN MANTRI GRAM SADAK YOJANA(PMGSY)
AAJEEVIKA (NRLM)
CENTRAL RURAL SANITATIONPROGRAMME
NATIONAL AIDS CONTROL PROGRAMMEINCLUDING S T D CONTROL
District Rural Development Agency
Corporation Chennai Metro Rail
Tamil Nadu State Mission of Education for all
Corporation Chennai Metro Rail
Tamil Nadu Water Supply and Drainage Board
State Health Society
District Rural Development Agency
Collectors
Tamil Nadu State Mission of RMSA
Tamil Nadu State Rural Roads Development Agency(SRRDA)
District Rural Development Agency
Tamil Nadu State Water and Sanitation Mission
Tamil Nadu State AIDS Control Society
28,15,52.22
12,90,00.00
6,81,41.96
5,45,00.00
4,29,55.03
4,24,48.99
3,30,76.38
2,05,00.00
1,97,19.00
1,60,00.00
1,03,61.18
76,62.06
75,72.25
20,24,89.77
47,00.00
6,90,68.57
13,70.00
3,93,53.33
4,07,39.01
3,48,01.21
92,00.00
77,05.00
4,69,53.30
75,93.28
73,20.68
13,89,76.72
4,83,66.00
3,22,09.81
3,69,12.11
3,05,47.07
1,07,00.00
52,18.00
3,90,00.00
62,56.18
75,50.65
DIRECT TRANSFER OF CENTRAL SCHEME FUNDS TO IMPLEMENTING AGENCIES IN THE STATE
(Funds routed outside State Budgets) (unaudited figures)
Government of India's Schemes Implementing Agencies Government of India Releases
2011-12 2010-11 2009-10
(in lakh of Rupees)
. .
. .
. .
. .
APPENDIX VII
549
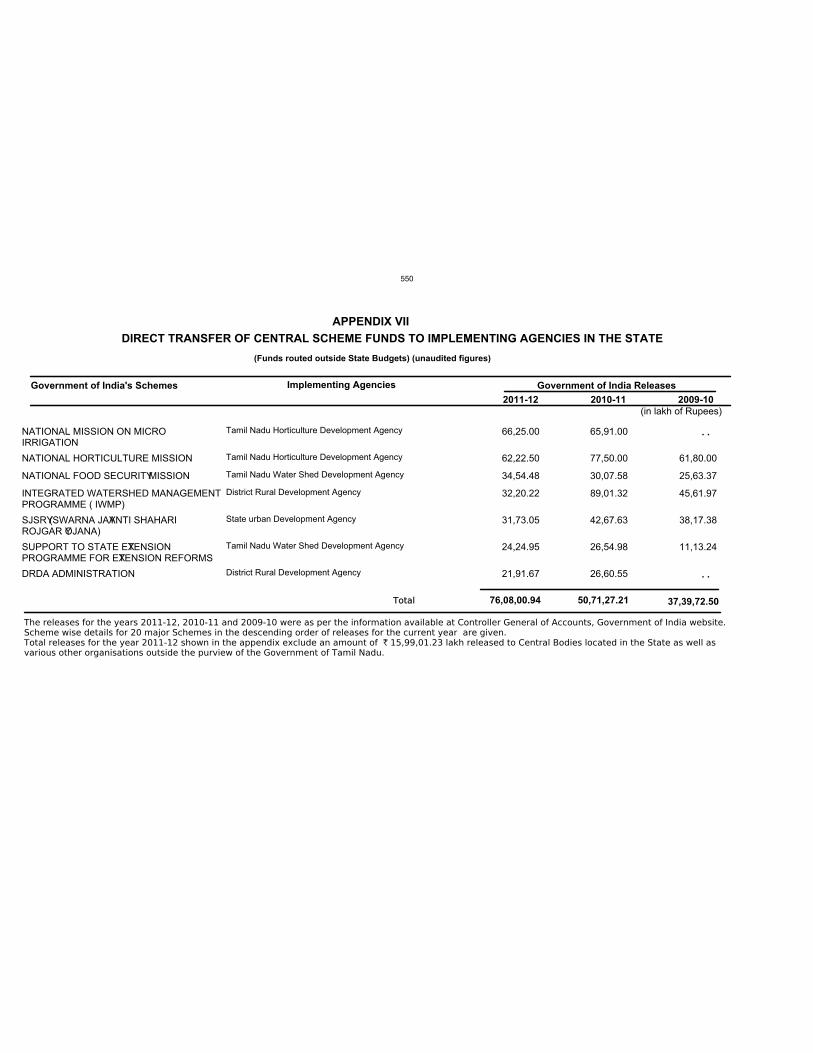
NATIONAL MISSION ON MICROIRRIGATION
NATIONAL HORTICULTURE MISSION
NATIONAL FOOD SECURITY MISSION
INTEGRATED WATERSHED MANAGEMENTPROGRAMME ( IWMP)
SJSRY (SWARNA JAYANTI SHAHARIROJGAR YOJANA)
SUPPORT TO STATE EXTENSIONPROGRAMME FOR EXTENSION REFORMS
DRDA ADMINISTRATION
Tamil Nadu Horticulture Development Agency
Tamil Nadu Horticulture Development Agency
Tamil Nadu Water Shed Development Agency
District Rural Development Agency
State urban Development Agency
Tamil Nadu Water Shed Development Agency
District Rural Development Agency
66,25.00
62,22.50
34,54.48
32,20.22
31,73.05
24,24.95
21,91.67
65,91.00
77,50.00
30,07.58
89,01.32
42,67.63
26,54.98
26,60.55
61,80.00
25,63.37
45,61.97
38,17.38
11,13.24
The releases for the years 2011-12, 2010-11 and 2009-10 were as per the information available at Controller General of Accounts, Government of India website.Scheme wise details for 20 major Schemes in the descending order of releases for the current year are given.Total releases for the year 2011-12 shown in the appendix exclude an amount of ` 15,99,01.23 lakh released to Central Bodies located in the State as well asvarious other organisations outside the purview of the Government of Tamil Nadu.
DIRECT TRANSFER OF CENTRAL SCHEME FUNDS TO IMPLEMENTING AGENCIES IN THE STATE
(Funds routed outside State Budgets) (unaudited figures)
Government of India's Schemes Implementing Agencies Government of India Releases
2011-12 2010-11 2009-10
(in lakh of Rupees)
. .
. .
76,08,00.94 50,71,27.21 37,39,72.50Total
APPENDIX VII
550
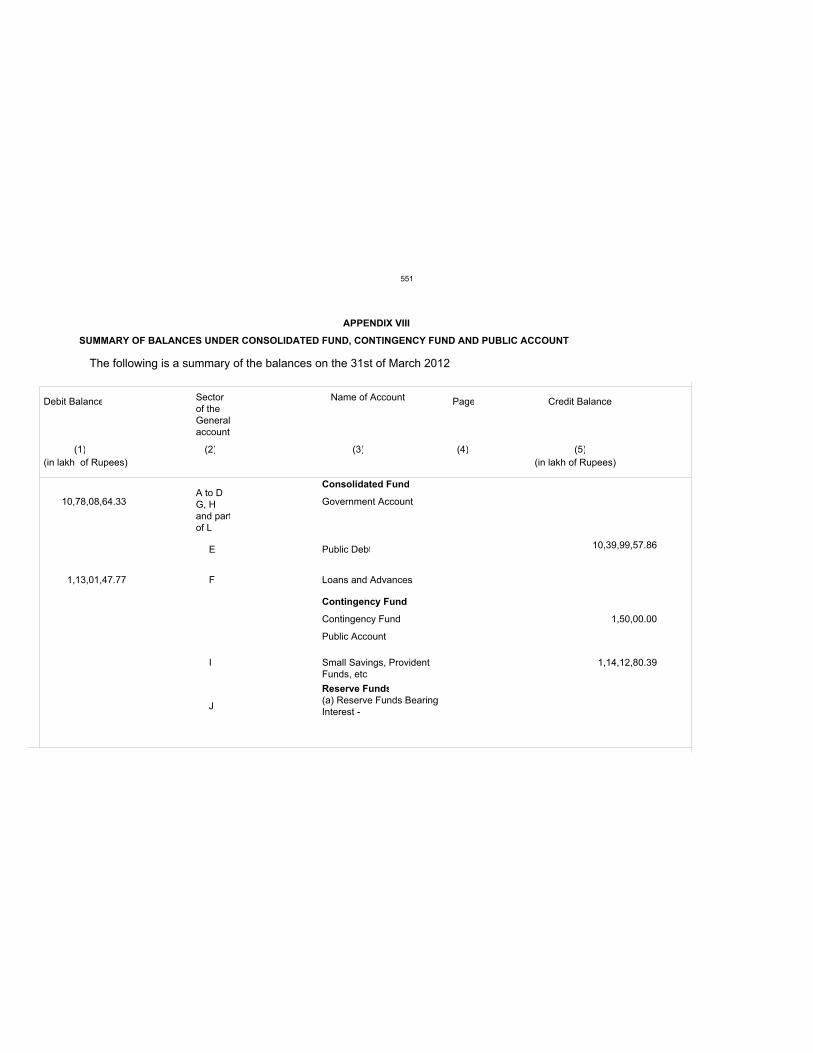
APPENDIX VIII
SUMMARY OF BALANCES UNDER CONSOLIDATED FUND, CONTINGENCY FUND AND PUBLIC ACCOUNT
The following is a summary of the balances on the 31st of March 2012
Debit Balance Sectorof theGeneralaccount
Name of Account Page Credit Balance
(1) (2) (3) (4) (5)
(in lakh of Rupees) (in lakh of Rupees)
A to DG, Hand partof L
Government Account
E Public Debt
F Loans and Advances
Contingency Fund
Public Account
I Small Savings, ProvidentFunds, etc
J(a) Reserve Funds BearingInterest -
10,78,08,64.33
10,39,99,57.86
1,13,01,47.77
1,50,00.00
1,14,12,80.39
Consolidated Fund
Contingency Fund
Reserve Funds
551
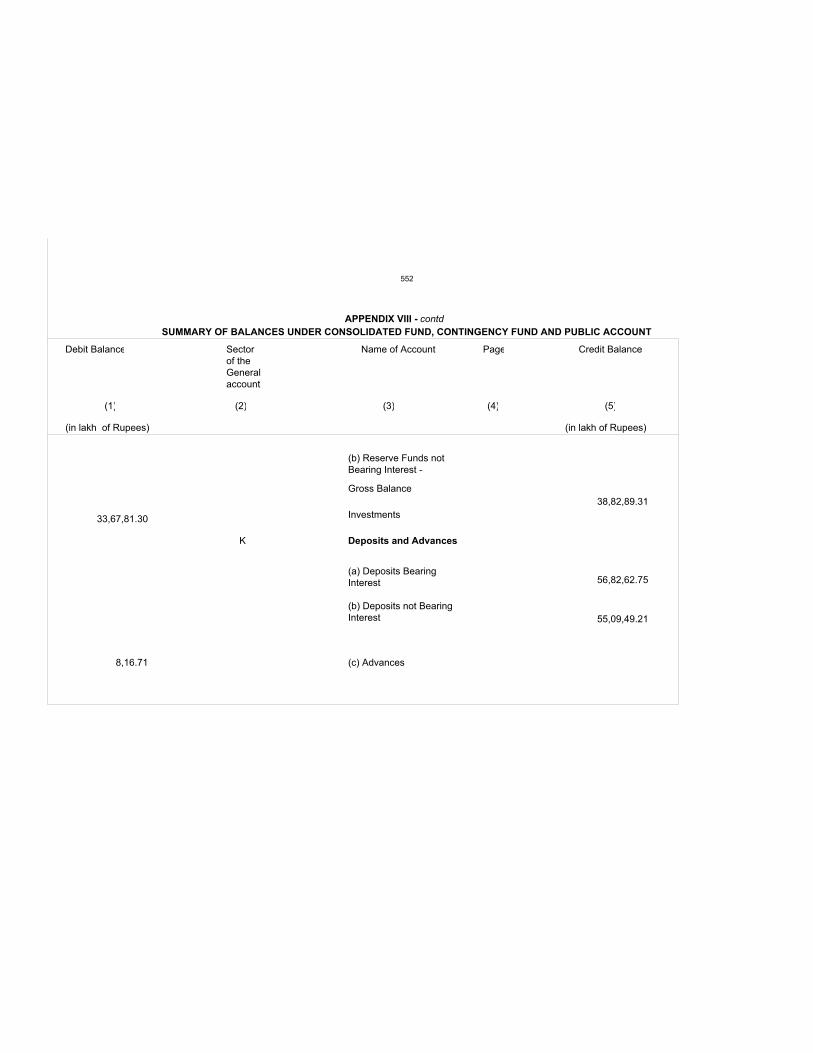
APPENDIX VIII - contd
Debit Balance Sectorof theGeneralaccount
Name of Account Page Credit Balance
(1) (2) (3) (4) (5)
(in lakh of Rupees) (in lakh of Rupees)
(b) Reserve Funds notBearing Interest -
Gross Balance
Investments
K Deposits and Advances
(a) Deposits BearingInterest
(b) Deposits not BearingInterest
(c) Advances
38,82,89.31
33,67,81.30
56,82,62.75
55,09,49.21
8,16.71
SUMMARY OF BALANCES UNDER CONSOLIDATED FUND, CONTINGENCY FUND AND PUBLIC ACCOUNT
552
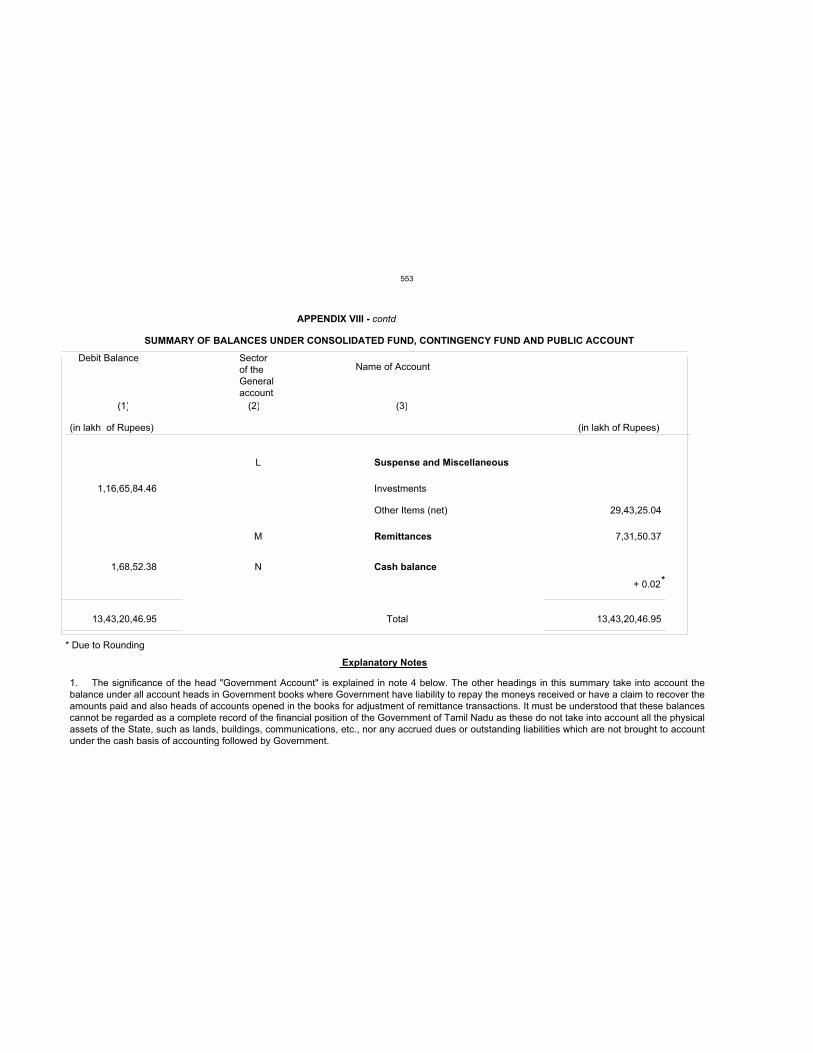
APPENDIX VIII - contd
Debit Balance Sectorof theGeneralaccount
Name of Account
(1) (2) (3)
(in lakh of Rupees) (in lakh of Rupees)
Suspense and MiscellaneousL
Investments
Other Items (net)
Remittances
Cash balance
M
N
Total
1,16,65,84.46
29,43,25.04
7,31,50.37
1,68,52.38
1. The significance of the head "Government Account" is explained in note 4 below. The other headings in this summary take into account thebalance under all account heads in Government books where Government have liability to repay the moneys received or have a claim to recover theamounts paid and also heads of accounts opened in the books for adjustment of remittance transactions. It must be understood that these balancescannot be regarded as a complete record of the financial position of the Government of Tamil Nadu as these do not take into account all the physicalassets of the State, such as lands, buildings, communications, etc., nor any accrued dues or outstanding liabilities which are not brought to accountunder the cash basis of accounting followed by Government.
13,43,20,46.95 13,43,20,46.95
* Due to Rounding
+ 0.02
SUMMARY OF BALANCES UNDER CONSOLIDATED FUND, CONTINGENCY FUND AND PUBLIC ACCOUNT
*
Explanatory Notes
553
APPENDIX VIII - contd
SUMMARY OF BALANCES UNDER CONSOLIDATED FUND, CONTINGENCY FUND AND PUBLIC ACCOUNT
2. A summary of receipts, disbursements and balances under Debt,Contingency Fund and Public Account is given in Statement 2.
In almost all cases, there were unreconciled differences in the closing balances as reported in Statement No.18 and that shown in the separate
registers of other records maintained in the Accounts Offices, departmental offices for the purpose. Steps are being taken to settle the
discrepancies as soon as possible. In many cases, full details and documents required for the purpose are awaited from departmental/treasury
officers as detailed in Annexure B.
3. Adjustments consequent on reorganisation of States
Consequent on the formation of Andhra State from 1st October 1953, the closing balances under Debt and Public Account heads of the composite
State on 30th September 1953 were allocated among the residuary Madras State, Andhra State and Mysore State on the basis laid down in the
seventh schedule to the Andhra State Act, 1953. In a few cases where the basis of allocation of balances is still under settlement, the
balances(including the balances relating to the former Bellary District passed partly to Andhra and partly to Mysore-now Karnataka) pertaining to the
Composite Madras State, have been provisionally brought over to the books of the residuary Madras State pending transfer of the portion attributable
to the other States after settlement is reached. A similar course has been followed consequent on reorganisation of States from 1st November,1956.
4. Government Account - Under the system of book-keeping followed in the Government Accounts, the amounts booked under revenue, capital heads
and other transactions of Government, the balances of which are not carried forward from year to year in the accounts are closed to a single head
called "Government Account". The balance under this head represents the cumulative result of all such transactions so that after adding thereto the
balances under Contingency Fund, Public Debt, Loans and Advances, Small Savings, Provident Funds, etc., Reserve Funds, Deposits and Advances,
Suspense and Miscellaneous (other than Miscellaneous Government Account) and Remittances, the closing cash balance at the end of the year may
be worked out and proved. The Government account for 2011-2012 given below, will show how the balance at the end of the year has been arrived at.
554
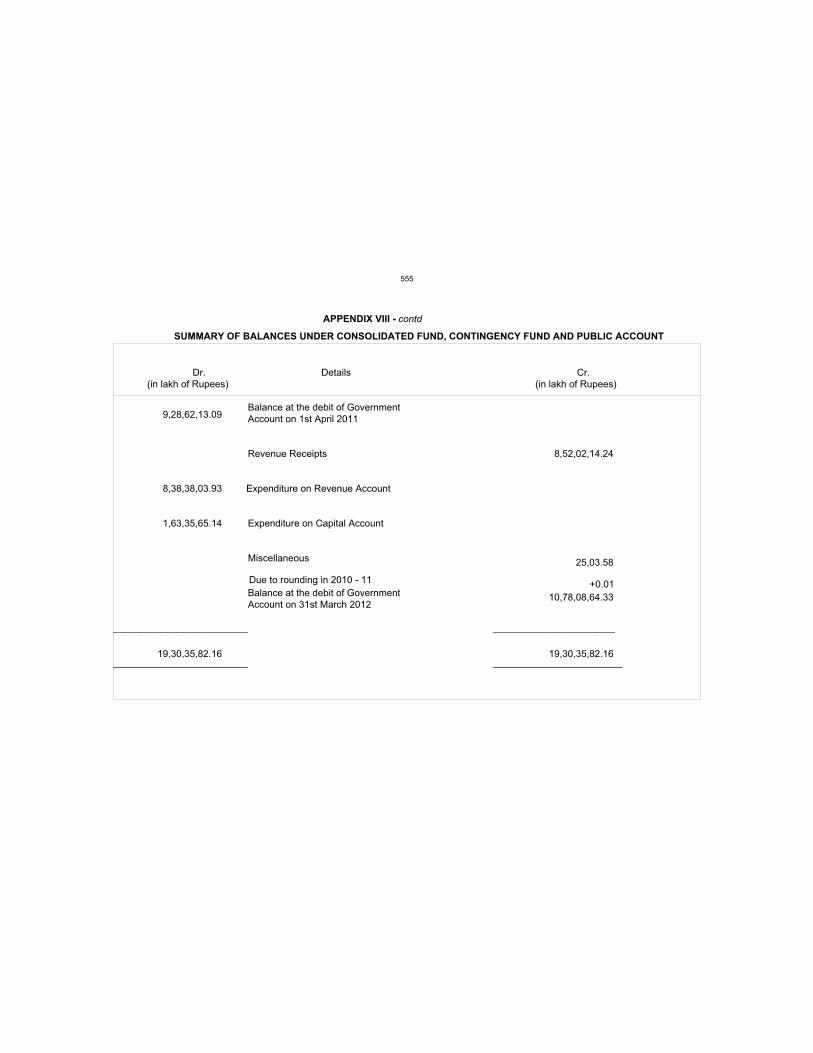
APPENDIX VIII - contd
Dr. Details Cr. (in lakh of Rupees) (in lakh of Rupees)
Balance at the debit of Government Account on 1st April 2011
Revenue Receipts
Expenditure on Revenue Account
Expenditure on Capital Account
Miscellaneous
Balance at the debit of Government Account on 31st March 2012
_________________________ _______________________
_________________________ ________________________
9,28,62,13.09
8,52,02,14.24
8,38,38,03.93
1,63,35,65.14
25,03.58
10,78,08,64.33
19,30,35,82.16 19,30,35,82.16
Due to rounding in 2010 - 11 +0.01
SUMMARY OF BALANCES UNDER CONSOLIDATED FUND, CONTINGENCY FUND AND PUBLIC ACCOUNT
555
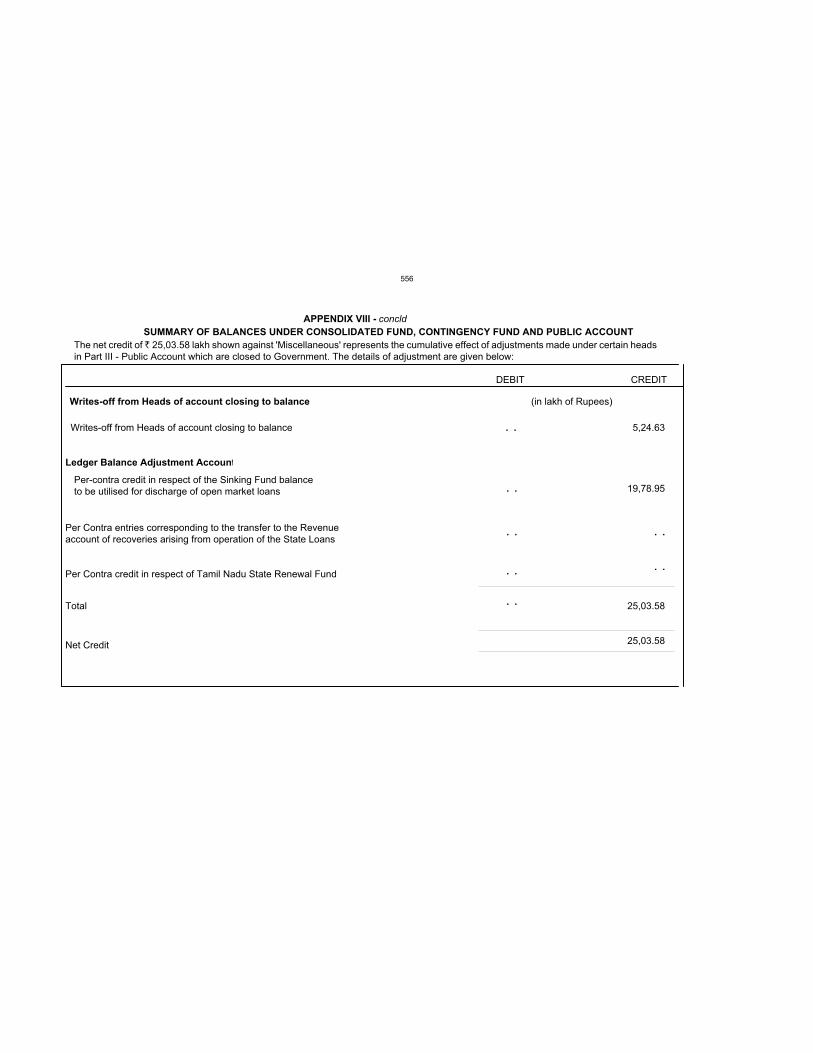
APPENDIX VIII - concld
Writes-off from Heads of account closing to balance
Writes-off from Heads of account closing to balance
Ledger Balance Adjustment Account
Per-contra credit in respect of the Sinking Fund balanceto be utilised for discharge of open market loans
DEBIT CREDIT
(in lakh of Rupees)
. . 5,24.63
19,78.95
Total
Net Credit
25,03.58
25,03.58
. .
. .
Per Contra entries corresponding to the transfer to the Revenueaccount of recoveries arising from operation of the State Loans
Per Contra credit in respect of Tamil Nadu State Renewal Fund
. .
. .
. .
. .
SUMMARY OF BALANCES UNDER CONSOLIDATED FUND, CONTINGENCY FUND AND PUBLIC ACCOUNTThe net credit of ̀ 25,03.58 lakh shown against 'Miscellaneous' represents the cumulative effect of adjustments made under certain headsin Part III - Public Account which are closed to Government. The details of adjustment are given below:
556
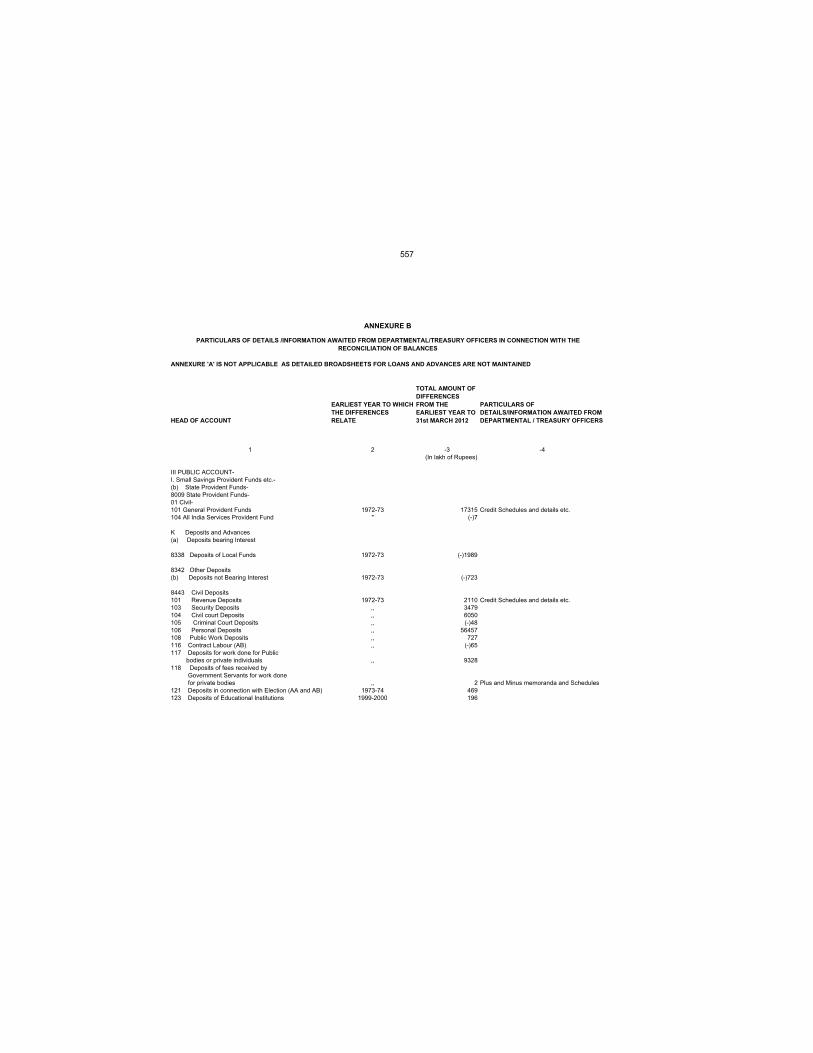
ANNEXURE 'A' IS NOT APPLICABLE AS DETAILED BROADSHEETS FOR LOANS AND ADVANCES ARE NOT MAINTAINED
HEAD OF ACCOUNT
EARLIEST YEAR TO WHICH
THE DIFFERENCES
RELATE
TOTAL AMOUNT OF
DIFFERENCES
FROM THE
EARLIEST YEAR TO
31st MARCH 2012
PARTICULARS OF
DETAILS/INFORMATION AWAITED FROM
DEPARTMENTAL / TREASURY OFFICERS
1 2 -3 -4(In lakh of Rupees)
III PUBLIC ACCOUNT-I. Small Savings Provident Funds etc.-(b) State Provident Funds-8009 State Provident Funds-01 Civil-101 General Provident Funds 1972-73 17315 Credit Schedules and details etc.104 All India Services Provident Fund " (-)7
K Deposits and Advances(a) Deposits bearing Interest
8338 Deposits of Local Funds 1972-73 (-)1989
8342 Other Deposits(b) Deposits not Bearing Interest 1972-73 (-)723
8443 Civil Deposits101 Revenue Deposits 1972-73 2110 Credit Schedules and details etc.103 Security Deposits ,, 3479104 Civil court Deposits ,, 6050105 Criminal Court Deposits ,, (-)48106 Personal Deposits ,, 56457108 Public Work Deposits ,, 727116 Contract Labour (AB) ,, (-)65117 Deposits for work done for Public bodies or private individuals ,, 9328118 Deposits of fees received by Government Servants for work done for private bodies ,, 2 Plus and Minus memoranda and Schedules121 Deposits in connection with Election (AA and AB) 1973-74 469123 Deposits of Educational Institutions 1999-2000 196
PARTICULARS OF DETAILS /INFORMATION AWAITED FROM DEPARTMENTAL/TREASURY OFFICERS IN CONNECTION WITH THE
RECONCILIATION OF BALANCES
ANNEXURE B
557
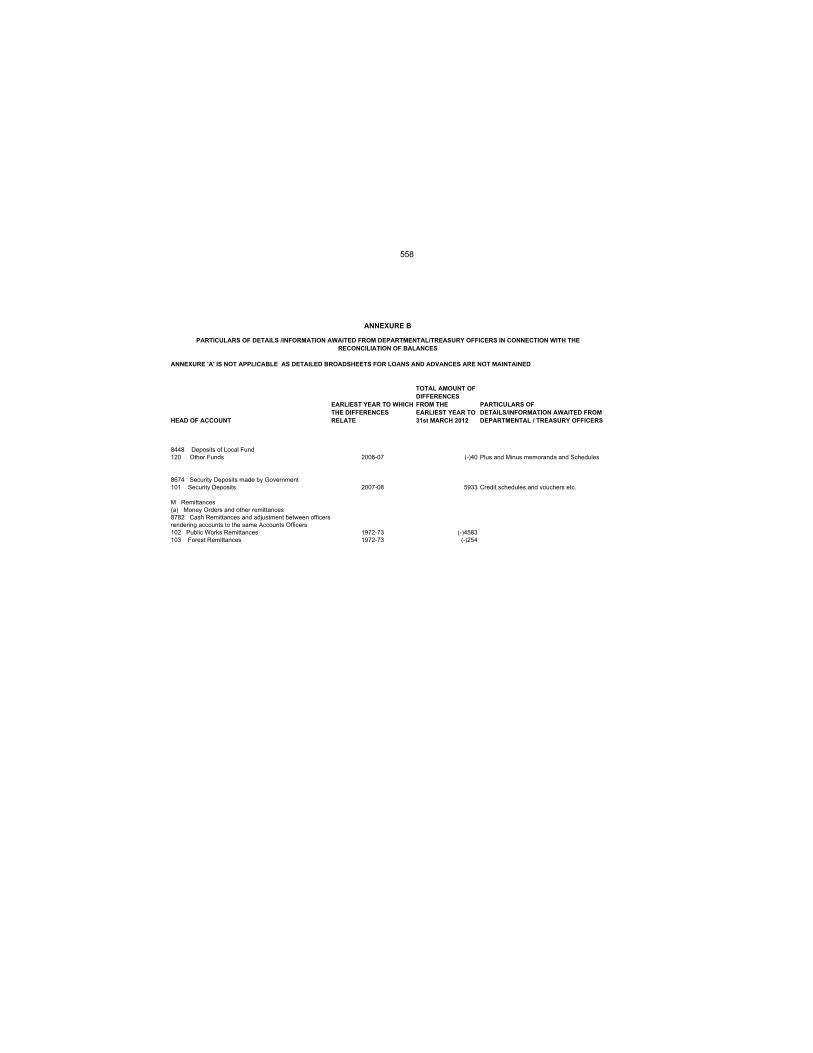
ANNEXURE 'A' IS NOT APPLICABLE AS DETAILED BROADSHEETS FOR LOANS AND ADVANCES ARE NOT MAINTAINED
HEAD OF ACCOUNT
EARLIEST YEAR TO WHICH
THE DIFFERENCES
RELATE
TOTAL AMOUNT OF
DIFFERENCES
FROM THE
EARLIEST YEAR TO
31st MARCH 2012
PARTICULARS OF
DETAILS/INFORMATION AWAITED FROM
DEPARTMENTAL / TREASURY OFFICERS
PARTICULARS OF DETAILS /INFORMATION AWAITED FROM DEPARTMENTAL/TREASURY OFFICERS IN CONNECTION WITH THE
RECONCILIATION OF BALANCES
ANNEXURE B
8448 Deposits of Local Fund120 Other Funds 2006-07 (-)40 Plus and Minus memoranda and Schedules
8674 Security Deposits made by Government 101 Security Deposits 2007-08 5933 Credit schedules and vouchers etc.
M Remittances(a) Money Orders and other remittances8782 Cash Remittances and adjustment between officersrendering accounts to the same Accounts Officers102 Public Works Remittances 1972-73 (-)4583103 Forest Remittances 1972-73 (-)254
558
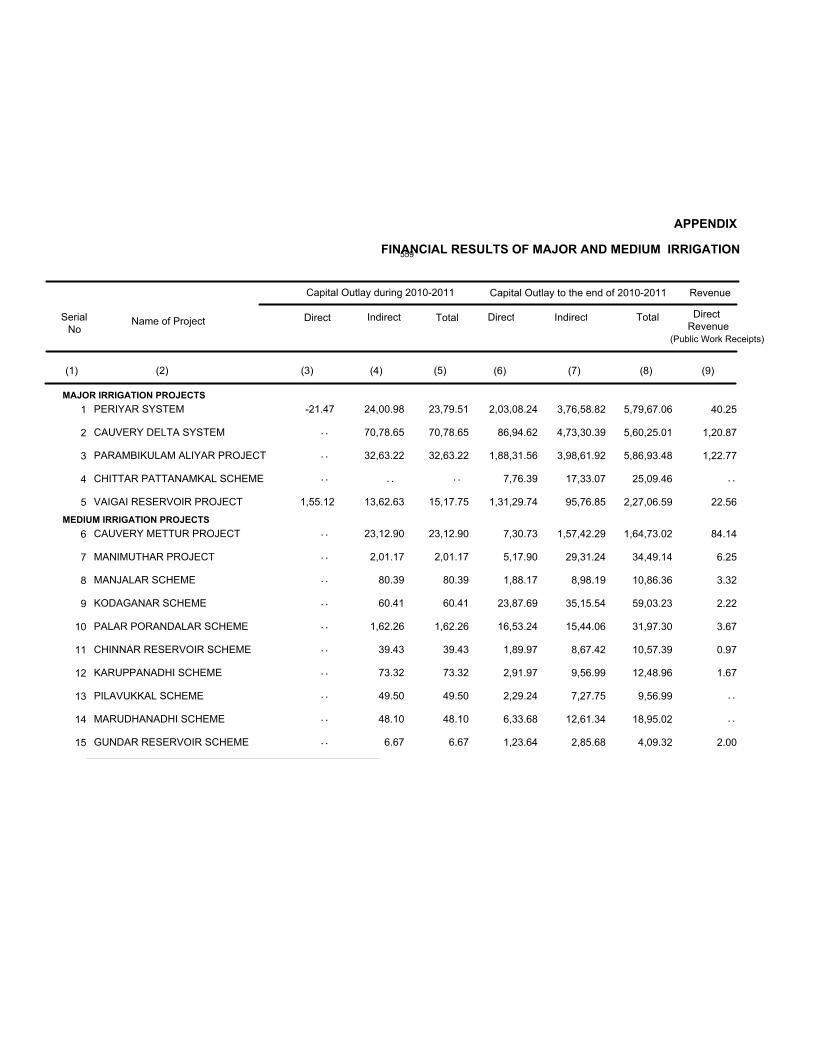
FINANCIAL RESULTS OF MAJOR AND MEDIUM IRRIGATION
APPENDIX
PERIYAR SYSTEM
CAUVERY DELTA SYSTEM
PARAMBIKULAM ALIYAR PROJECT
CHITTAR PATTANAMKAL SCHEME
VAIGAI RESERVOIR PROJECT
CAUVERY METTUR PROJECT
MANIMUTHAR PROJECT
MANJALAR SCHEME
KODAGANAR SCHEME
PALAR PORANDALAR SCHEME
CHINNAR RESERVOIR SCHEME
KARUPPANADHI SCHEME
PILAVUKKAL SCHEME
MARUDHANADHI SCHEME
GUNDAR RESERVOIR SCHEME
-21.47
1,55.12
24,00.98
70,78.65
32,63.22
13,62.63
23,12.90
2,01.17
80.39
60.41
1,62.26
39.43
73.32
49.50
48.10
6.67
23,79.51
70,78.65
32,63.22
15,17.75
23,12.90
2,01.17
80.39
60.41
1,62.26
39.43
73.32
49.50
48.10
6.67
2,03,08.24
86,94.62
1,88,31.56
7,76.39
1,31,29.74
7,30.73
5,17.90
1,88.17
23,87.69
16,53.24
1,89.97
2,91.97
2,29.24
6,33.68
1,23.64
3,76,58.82
4,73,30.39
3,98,61.92
17,33.07
95,76.85
1,57,42.29
29,31.24
8,98.19
35,15.54
15,44.06
8,67.42
9,56.99
7,27.75
12,61.34
2,85.68
5,79,67.06
5,60,25.01
5,86,93.48
25,09.46
2,27,06.59
1,64,73.02
34,49.14
10,86.36
59,03.23
31,97.30
10,57.39
12,48.96
9,56.99
18,95.02
4,09.32
40.25
1,20.87
1,22.77
22.56
84.14
6.25
3.32
2.22
3.67
0.97
1.67
2.00
Capital Outlay during 2010-2011 Capital Outlay to the end of 2010-2011 Revenue
Direct Indirect Total Direct Indirect Total DirectRevenue
(Public Work Receipts)
MAJOR IRRIGATION PROJECTS
MEDIUM IRRIGATION PROJECTS
1
2
3
4
5
6
7
8
9
10
11
12
13
14
15
. .
. .
. .
. .
. .
. .
. .
. .
. .
. .
. .
. .
. .
. . . . . .
. .
. .
SerialNo
Name of Project
(1) (2) (3) (4) (5) (6) (7) (8) (9)
559
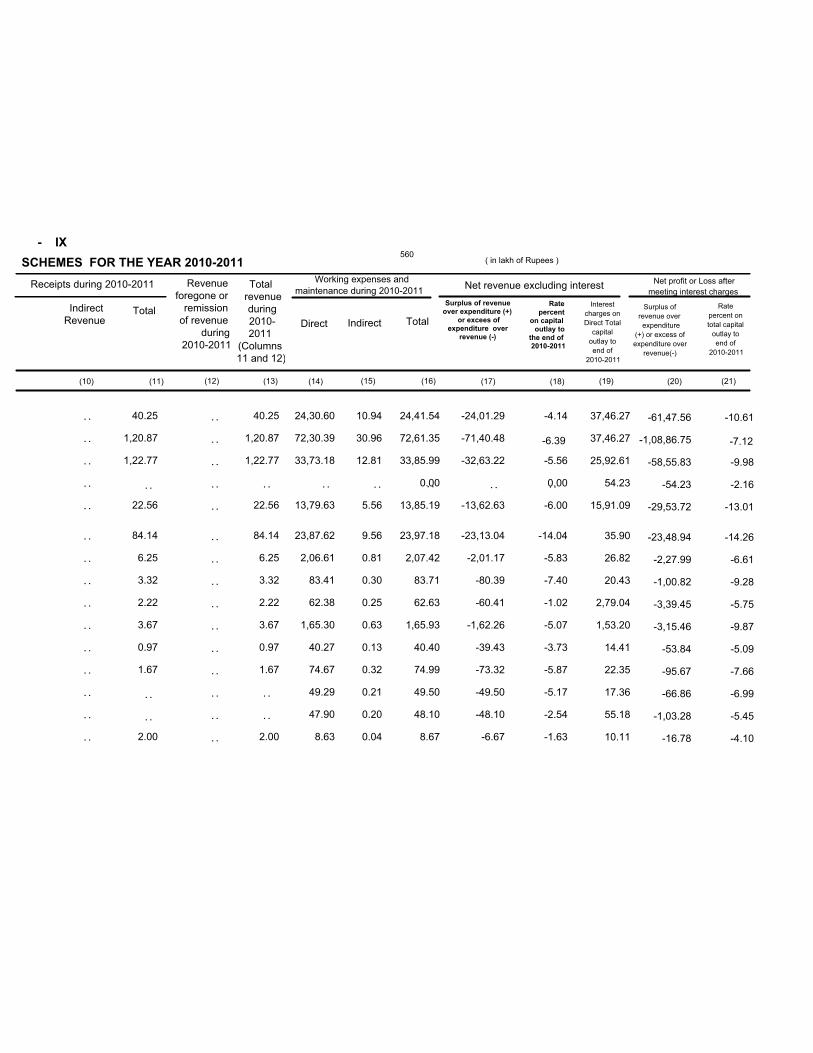
- IX
( in lakh of Rupees )SCHEMES FOR THE YEAR 2010-2011
PERIYAR SYSTEM
CAUVERY DELTA SYSTEM
PARAMBIKULAM ALIYAR PROJECT
CHITTAR PATTANAMKAL SCHEME
VAIGAI RESERVOIR PROJECT
CAUVERY METTUR PROJECT
MANIMUTHAR PROJECT
MANJALAR SCHEME
KODAGANAR SCHEME
PALAR PORANDALAR SCHEME
CHINNAR RESERVOIR SCHEME
KARUPPANADHI SCHEME
PILAVUKKAL SCHEME
MARUDHANADHI SCHEME
GUNDAR RESERVOIR SCHEME
40.25
1,20.87
1,22.77
22.56
84.14
6.25
3.32
2.22
3.67
0.97
1.67
2.00
24,30.60
72,30.39
33,73.18
13,79.63
23,87.62
2,06.61
83.41
62.38
1,65.30
40.27
74.67
49.29
47.90
8.63
10.94
30.96
12.81
5.56
9.56
0.81
0.30
0.25
0.63
0.13
0.32
0.21
0.20
0.04
24,41.54
72,61.35
33,85.99
0.00
13,85.19
23,97.18
2,07.42
83.71
62.63
1,65.93
40.40
74.99
49.50
48.10
8.67
-24,01.29
-71,40.48
-32,63.22
-13,62.63
-23,13.04
-2,01.17
-80.39
-60.41
-1,62.26
-39.43
-73.32
-49.50
-48.10
-6.67
-4.14
-5.56
0.00
-6.00
-14.04
-5.83
-7.40
-1.02
-5.07
-3.73
-5.87
-5.17
-2.54
-1.63
37,46.27
37,46.27
25,92.61
54.23
15,91.09
35.90
26.82
20.43
2,79.04
1,53.20
14.41
22.35
17.36
55.18
10.11
-61,47.56
-1,08,86.75
-58,55.83
-54.23
-29,53.72
-23,48.94
-2,27.99
-1,00.82
-3,39.45
-3,15.46
-53.84
-95.67
-66.86
-1,03.28
-16.78
-10.61
-9.98
-2.16
-13.01
-14.26
-6.61
-9.28
-5.75
-9.87
-5.09
-7.66
-6.99
-5.45
-4.10
(11) (12) (13) (14) (15) (16) (17) (18) (19) (20)
Revenueforegone or
remissionof revenue
during2010-2011
Total revenue during 2010-2011
(Columns11 and 12)
Working expenses and
maintenance during 2010-2011Net revenue excluding interest
Net profit or Loss after
meeting interest charges
Direct Indirect Total
Surplus of revenueover expenditure (+)
or excees ofexpenditure over
revenue (-)
Rate
percenton capital outlay to
the end of2010-2011
Interest
charges on
Direct Total
capital
outlay to
end of
2010-2011
Surplus of
revenue over
expenditure
(+) or excess of
expenditure over
revenue(-)
Rate
percent on
total capital
outlay to
end of
2010-2011
MAJOR IRRIGATION PROJECTS
MEDIUM IRRIGATION PROJECTS
1
2
3
4
5
6
7
8
9
10
11
12
13
14
15
. .
. .
. .
. .
. .
. .
. .
. .
. .
. .
. .
. .
. .
. .
. .
. . . . . . . . . .. .
. .
. .
40.25
1,20.87
1,22.77
22.56
84.14
6.25
3.32
2.22
3.67
0.97
1.67
2.00
. .
. .
. .
. .
. .
. .
. .
. .
. .
. .
. .
. .
. .
. .
. .
. .
. .
. .
Receipts during 2010-2011
IndirectRevenue
Total
(10) (21)
-6.39 -7.12
560

FINANCIAL RESULTS OF MAJOR AND MEDIUM IRRIGATION
APPENDIX
VARATTUPALLAM SCHEME
GUNDERIPALLAM SCHEME
VATTAMALAIKARAI ODAI SCHEME
KELAVARAPALLI RESERVOIRSCHEME
THUMBALAHALLI RESERVOIRSCHEME
VANIAR RESERVOIR SCHEME
NAGAVATHY RESERVOIR SCHEME
THOPPIAR RESERVOIR SCHEME
UPPAR RESERVOIR SCHEME
SULAGIRI CHINNAR RESERVOIRPROJECT
KESARIGULIHALLAH RESERVOIRSCHEME
VARADHAMANADHI SCHEME
SATHANUR RESERVOIR PROJECT
KODAYAR PROJECT
13.39
1.52
29.25
18.02
23.03
54.02
25.73
72.34
14.25
39.55
12.85
27.50
27.12
52.38
5,14.15
8,03.37
29.25
18.02
23.03
54.02
25.73
72.34
14.25
52.94
12.85
27.50
27.12
52.38
5,14.15
8,04.89
1,69.02
1,44.20
2,33.53
24,87.76
2,37.23
11,88.06
3,30.20
5,72.68
1,49.56
1,94.67
3,52.55
1,75.36
26,34.75
44,73.60
6,09.74
3,96.56
5,52.47
22,68.01
6,38.57
24,98.73
7,24.20
12,48.09
2,38.66
6,16.16
8,50.63
6,19.69
66,41.97
58,08.28
7,78.76
5,40.76
7,86.00
47,55.77
8,75.80
36,86.79
10,54.40
18,20.77
3,88.22
8,10.83
12,03.18
7,95.05
92,76.72
1,02,81.88
1.06
2.80
1.03
2.13
0.08
0.20
0.82
0.16
52.88
41.13
Capital Outlay during 2010-2011 Capital Outlay to the end of 2010-2011 Revenue
Direct Indirect Total Direct Indirect Total Direct RevenuePublic Works Receipts
MEDIUM IRRIGATION PROJECTS
16
17
18
19
20
21
22
23
24
25
26
27
28
29
. .
. .
. .
. .
. .
. .
. .
. .
. .
. .
. .
. .
. .
. .
. .
. .
SerialNo
Name of Project
(1) (2) (3) (4) (5) (6) (7) (8) (9)
561

- IX
( in lakh of Rupees )SCHEMES FOR THE YEAR 2010-2011
VARATTUPALLAM SCHEME
GUNDERIPALLAM SCHEME
VATTAMALAIKARAI ODAI SCHEME
KELAVARAPALLI RESERVOIRSCHEME
THUMBALAHALLI RESERVOIRSCHEME
VANIAR RESERVOIR SCHEME
NAGAVATHY RESERVOIR SCHEME
THOPPIAR RESERVOIR SCHEME
UPPAR RESERVOIR SCHEME
SULAGIRI CHINNAR RESERVOIRPROJECT
KESARIGULIHALLAH RESERVOIRSCHEME
VARADHAMANADHI SCHEME
SATHANUR RESERVOIR PROJECT
KODAYAR PROJECT
1.06
2.80
1.03
2.13
0.08
0.20
0.82
0.16
52.88
41.13
29.15
17.94
23.99
56.60
26.58
74.17
14.28
39.40
12.80
27.61
27.85
52.33
5,66.87
8,41.12
0.10
0.08
0.10
0.22
0.09
0.30
0.05
0.15
0.05
0.09
0.09
0.21
0.16
3.38
29.25
18.02
24.09
56.82
26.67
74.47
14.33
39.55
12.85
27.70
27.94
52.54
5,67.03
8,44.50
-29.25
-18.02
-23.03
-54.02
-25.64
-72.34
-14.25
-39.55
-12.85
-27.50
-27.12
-52.38
-5,14.15
-8,03.37
-3.76
-3.33
-2.93
-1.14
-2.93
-1.96
-1.35
-2.17
-3.31
-3.39
-2.25
-6.59
-5.54
-7.81
13.68
11.76
20.44
2,87.12
20.53
1,12.06
34.55
55.42
13.98
18.44
36.76
14.33
3,08.32
5,00.54
-42.93
-29.78
-43.47
-3,41.14
-46.17
-1,84.40
-48.80
-94.97
-26.83
-45.94
-63.88
-66.71
-8,22.47
-13,03.91
-5.51
-5.51
-5.53
-7.17
-5.27
-5.00
-4.63
-5.22
-6.91
-5.67
-5.31
-8.39
-8.87
-12.68
(11) (12) (13) (14) (15) (16) (17) (18) (19) (20)
Revenueforegone or
remissionof revenue
during2010-2011
Total revenue during 2010-2011
(Columns11 and 12)
Working expenses and
maintenance during 2010-2011Net revenue excluding interest
Net profit or Loss after
meeting interest charges
Direct Indirect Total
Surplus of revenueover expenditure (+)
or excees ofexpenditure over
revenue (-)
Rate
percenton capital outlay to
the end of2010-2011
Interest
charges on
Direct Total
capital
outlay to
end of
2010-2011
Surplus of
revenue over
expenditure
(+) or excess of
expenditure over
revenue(-)
Rate
percent on
total capital
outlay to
end of
2010-2011
MEDIUM IRRIGATION PROJECTS
16
17
18
19
20
21
22
23
24
25
26
27
28
29
. .
. .
. .
. .
. .
. .
. .
. .
. .
. .
. .
. .
. .
. .
. .
. .
. .
. .
1.06
2.80
1.03
2.13
0.08
0.20
0.82
0.16
52.88
41.13
. .
. .
. .
. .
. .
. .
. .
. .
. .
. .
. .
. .
. .
. .
. .
. .
. .
. .
Receipts during 2010-2011
IndirectRevenue
Total
(10) (21)
562
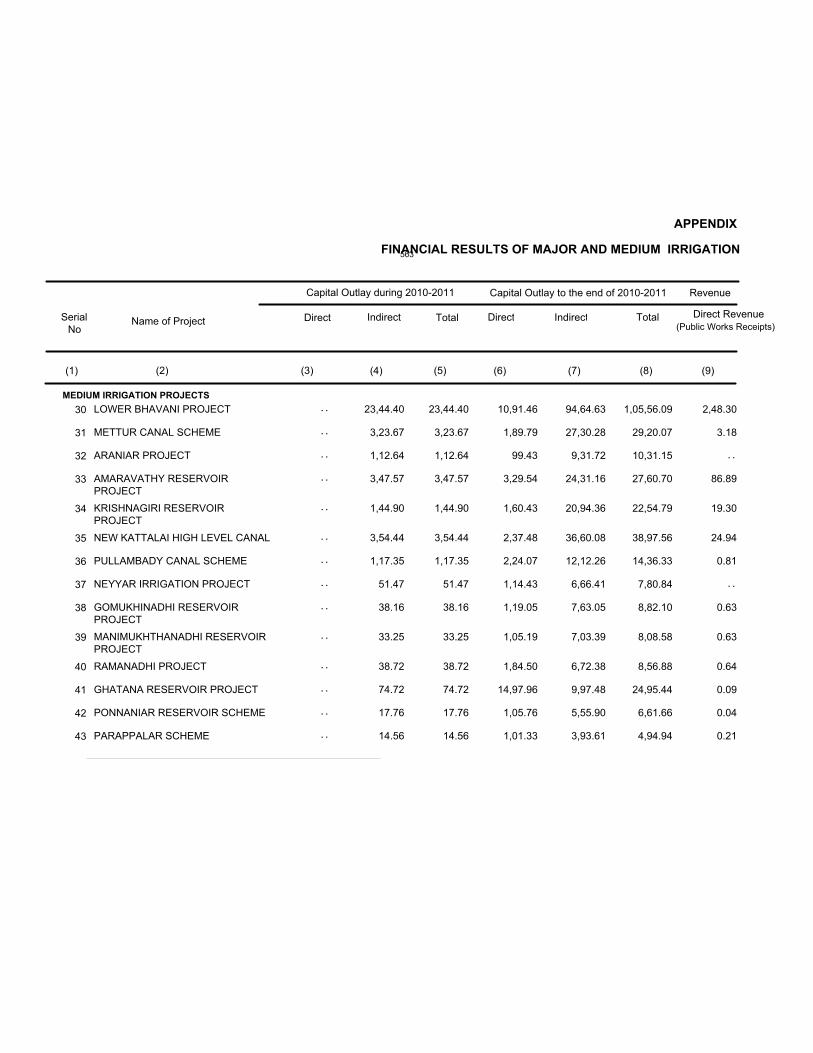
FINANCIAL RESULTS OF MAJOR AND MEDIUM IRRIGATION
APPENDIX
LOWER BHAVANI PROJECT
METTUR CANAL SCHEME
ARANIAR PROJECT
AMARAVATHY RESERVOIRPROJECT
KRISHNAGIRI RESERVOIRPROJECT
NEW KATTALAI HIGH LEVEL CANAL
PULLAMBADY CANAL SCHEME
NEYYAR IRRIGATION PROJECT
GOMUKHINADHI RESERVOIRPROJECT
MANIMUKHTHANADHI RESERVOIRPROJECT
RAMANADHI PROJECT
GHATANA RESERVOIR PROJECT
PONNANIAR RESERVOIR SCHEME
PARAPPALAR SCHEME
23,44.40
3,23.67
1,12.64
3,47.57
1,44.90
3,54.44
1,17.35
51.47
38.16
33.25
38.72
74.72
17.76
14.56
23,44.40
3,23.67
1,12.64
3,47.57
1,44.90
3,54.44
1,17.35
51.47
38.16
33.25
38.72
74.72
17.76
14.56
10,91.46
1,89.79
99.43
3,29.54
1,60.43
2,37.48
2,24.07
1,14.43
1,19.05
1,05.19
1,84.50
14,97.96
1,05.76
1,01.33
94,64.63
27,30.28
9,31.72
24,31.16
20,94.36
36,60.08
12,12.26
6,66.41
7,63.05
7,03.39
6,72.38
9,97.48
5,55.90
3,93.61
1,05,56.09
29,20.07
10,31.15
27,60.70
22,54.79
38,97.56
14,36.33
7,80.84
8,82.10
8,08.58
8,56.88
24,95.44
6,61.66
4,94.94
2,48.30
3.18
86.89
19.30
24.94
0.81
0.63
0.63
0.64
0.09
0.04
0.21
Capital Outlay during 2010-2011 Capital Outlay to the end of 2010-2011 Revenue
Direct Indirect Total Direct Indirect Total Direct Revenue(Public Works Receipts)
MEDIUM IRRIGATION PROJECTS
30
31
32
33
34
35
36
37
38
39
40
41
42
43
. .
. .
. .
. .
. .
. .
. .
. .
. .
. .
. .
. .
. .
. .
. .
. .
SerialNo
Name of Project
(1) (2) (3) (4) (5) (6) (7) (8) (9)
563
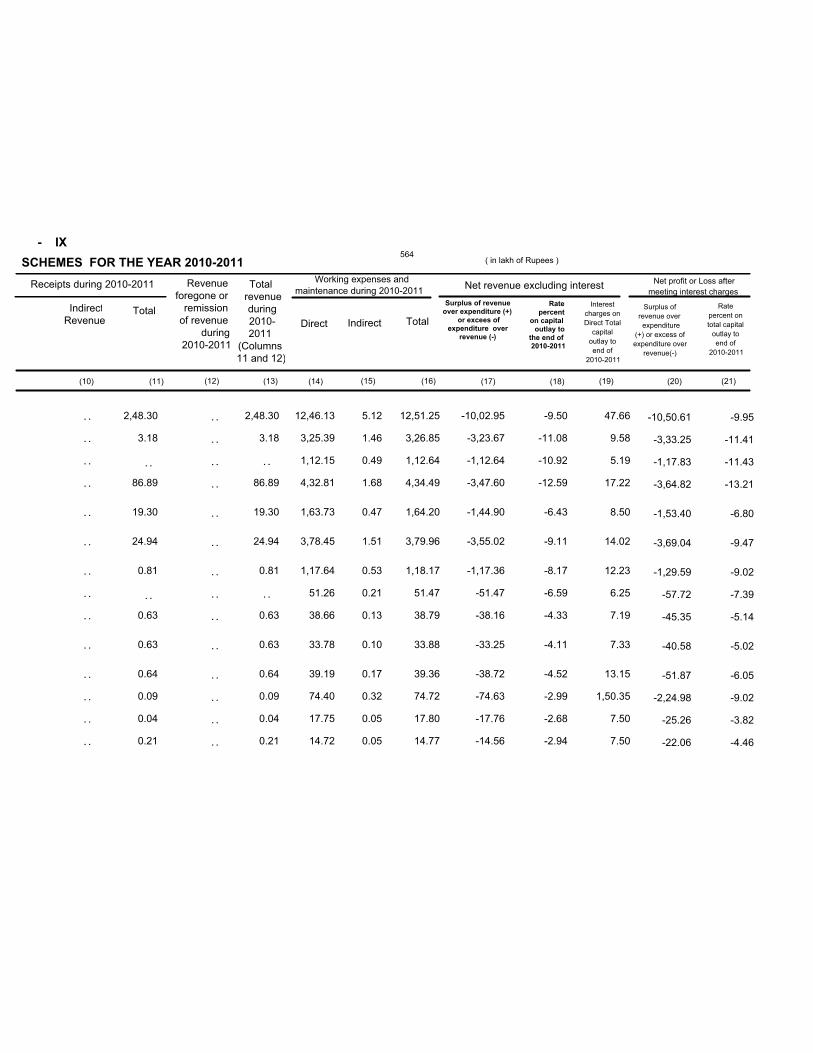
- IX
( in lakh of Rupees )SCHEMES FOR THE YEAR 2010-2011
LOWER BHAVANI PROJECT
METTUR CANAL SCHEME
ARANIAR PROJECT
AMARAVATHY RESERVOIRPROJECT
KRISHNAGIRI RESERVOIRPROJECT
NEW KATTALAI HIGH LEVELCANAL
PULLAMBADY CANAL SCHEME
NEYYAR IRRIGATION PROJECT
GOMUKHINADHI RESERVOIRPROJECT
MANIMUKHTHANADHI RESERVOIRPROJECT
RAMANADHI PROJECT
GHATANA RESERVOIR PROJECT
PONNANIAR RESERVOIR SCHEME
PARAPPALAR SCHEME
2,48.30
3.18
86.89
19.30
24.94
0.81
0.63
0.63
0.64
0.09
0.04
0.21
12,46.13
3,25.39
1,12.15
4,32.81
1,63.73
3,78.45
1,17.64
51.26
38.66
33.78
39.19
74.40
17.75
14.72
5.12
1.46
0.49
1.68
0.47
1.51
0.53
0.21
0.13
0.10
0.17
0.32
0.05
0.05
12,51.25
3,26.85
1,12.64
4,34.49
1,64.20
3,79.96
1,18.17
51.47
38.79
33.88
39.36
74.72
17.80
14.77
-10,02.95
-3,23.67
-1,12.64
-3,47.60
-1,44.90
-3,55.02
-1,17.36
-51.47
-38.16
-33.25
-38.72
-74.63
-17.76
-14.56
-9.50
-11.08
-10.92
-12.59
-6.43
-9.11
-8.17
-6.59
-4.33
-4.11
-4.52
-2.99
-2.68
-2.94
47.66
9.58
5.19
17.22
8.50
14.02
12.23
6.25
7.19
7.33
13.15
1,50.35
7.50
7.50
-10,50.61
-3,33.25
-1,17.83
-3,64.82
-1,53.40
-3,69.04
-1,29.59
-57.72
-45.35
-40.58
-51.87
-2,24.98
-25.26
-22.06
-9.95
-11.41
-11.43
-13.21
-6.80
-9.47
-9.02
-7.39
-5.14
-5.02
-6.05
-9.02
-3.82
-4.46
(11) (12) (13) (14) (15) (16) (17) (18) (19) (20)
Revenueforegone or
remissionof revenue
during2010-2011
Total revenue during 2010-2011
(Columns11 and 12)
Working expenses and
maintenance during 2010-2011Net revenue excluding interest
Net profit or Loss after
meeting interest charges
Direct Indirect Total
Surplus of revenueover expenditure (+)
or excees ofexpenditure over
revenue (-)
Rate
percenton capital outlay to
the end of2010-2011
Interest
charges on
Direct Total
capital
outlay to
end of
2010-2011
Surplus of
revenue over
expenditure
(+) or excess of
expenditure over
revenue(-)
Rate
percent on
total capital
outlay to
end of
2010-2011
MEDIUM IRRIGATION PROJECTS
30
31
32
33
34
35
36
37
38
39
40
41
42
43
. .
. .
. .
. .
. .
. .
. .
. .
. .
. .
. .
. .
. .
. .
. .
. .
2,48.30
3.18
86.89
19.30
24.94
0.81
0.63
0.63
0.64
0.09
0.04
0.21
. .
. .
. .
. .
. .
. .
. .
. .
. .
. .
. .
. .
. .
. .
. .
. .
Receipts during 2010-2011
IndirectRevenue
Total
(10) (21)
564
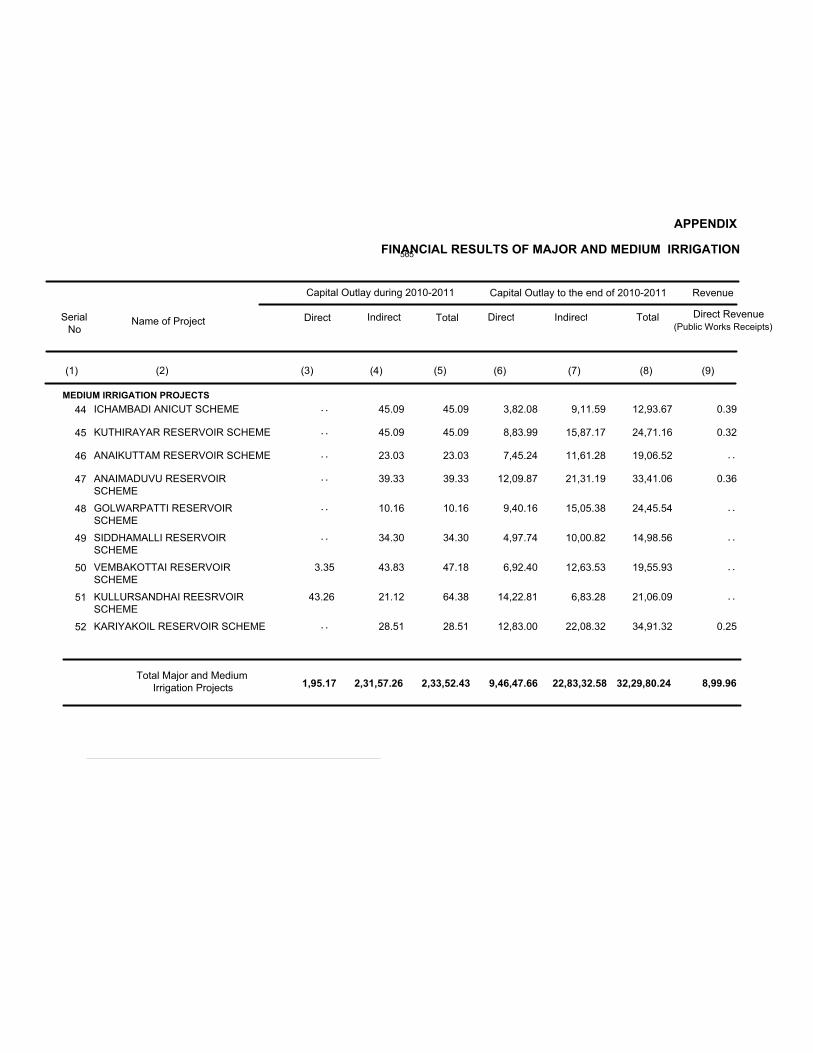
FINANCIAL RESULTS OF MAJOR AND MEDIUM IRRIGATION
APPENDIX
1,95.17 2,31,57.26 2,33,52.43 9,46,47.66 22,83,32.58 32,29,80.24 8,99.96
ICHAMBADI ANICUT SCHEME
KUTHIRAYAR RESERVOIR SCHEME
ANAIKUTTAM RESERVOIR SCHEME
ANAIMADUVU RESERVOIRSCHEME
GOLWARPATTI RESERVOIRSCHEME
SIDDHAMALLI RESERVOIRSCHEME
VEMBAKOTTAI RESERVOIRSCHEME
KULLURSANDHAI REESRVOIRSCHEME
KARIYAKOIL RESERVOIR SCHEME
3.35
43.26
45.09
45.09
23.03
39.33
10.16
34.30
43.83
21.12
28.51
45.09
45.09
23.03
39.33
10.16
34.30
47.18
64.38
28.51
3,82.08
8,83.99
7,45.24
12,09.87
9,40.16
4,97.74
6,92.40
14,22.81
12,83.00
9,11.59
15,87.17
11,61.28
21,31.19
15,05.38
10,00.82
12,63.53
6,83.28
22,08.32
12,93.67
24,71.16
19,06.52
33,41.06
24,45.54
14,98.56
19,55.93
21,06.09
34,91.32
0.39
0.32
0.36
0.25
Capital Outlay during 2010-2011 Capital Outlay to the end of 2010-2011 Revenue
Direct Indirect Total Direct Indirect Total Direct Revenue(Public Works Receipts)
MEDIUM IRRIGATION PROJECTS
44
45
46
47
48
49
50
51
52
. .
. .
. .
. .
. .
. .
. .
. .
. .
. .
. .
. .
Total Major and MediumIrrigation Projects
SerialNo
Name of Project
(1) (2) (3) (4) (5) (6) (7) (8) (9)
565
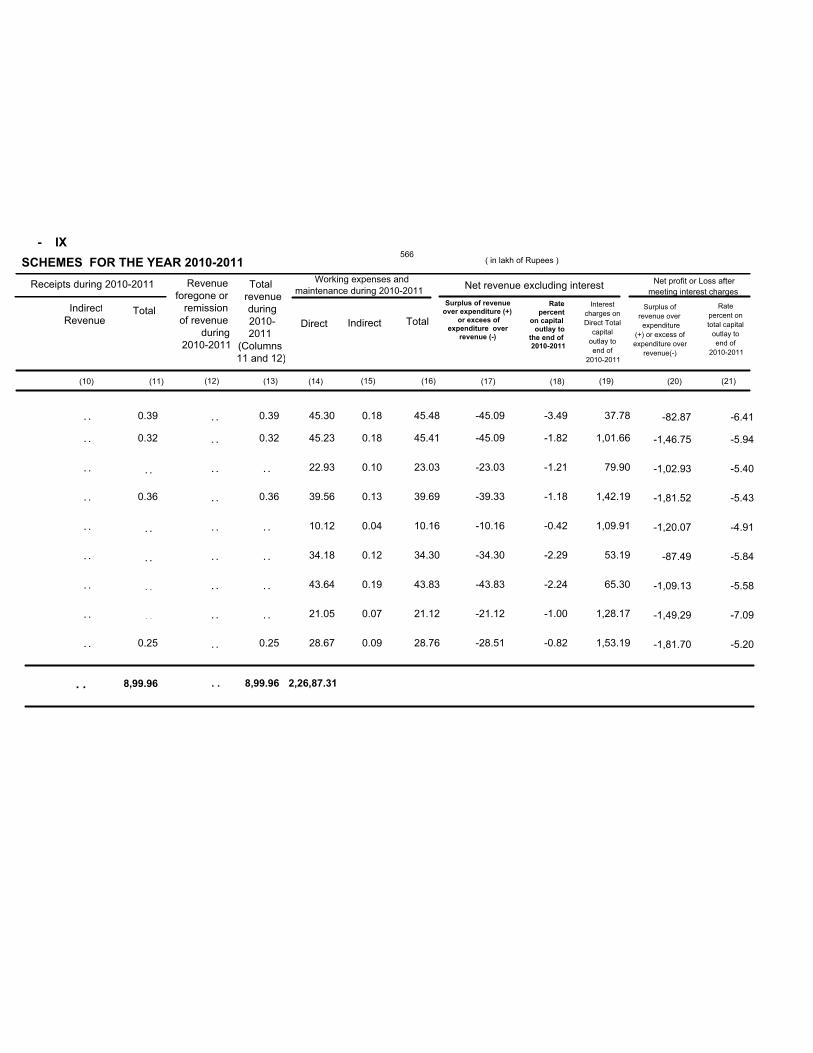
- IX
( in lakh of Rupees )SCHEMES FOR THE YEAR 2010-2011
8,99.96 2,26,87.31
ICHAMBADI ANICUT SCHEME
KUTHIRAYAR RESERVOIRSCHEME
ANAIKUTTAM RESERVOIRSCHEME
ANAIMADUVU RESERVOIRSCHEME
GOLWARPATTI RESERVOIRSCHEME
SIDDHAMALLI RESERVOIRSCHEME
VEMBAKOTTAI RESERVOIRSCHEME
KULLURSANDHAI REESRVOIRSCHEME
KARIYAKOIL RESERVOIR SCHEME
0.39
0.32
0.36
0.25
45.30
45.23
22.93
39.56
10.12
34.18
43.64
21.05
28.67
0.18
0.18
0.10
0.13
0.04
0.12
0.19
0.07
0.09
45.48
45.41
23.03
39.69
10.16
34.30
43.83
21.12
28.76
-45.09
-45.09
-23.03
-39.33
-10.16
-34.30
-43.83
-21.12
-28.51
-3.49
-1.82
-1.21
-1.18
-0.42
-2.29
-2.24
-1.00
-0.82
37.78
1,01.66
79.90
1,42.19
1,09.91
53.19
65.30
1,28.17
1,53.19
-82.87
-1,46.75
-1,02.93
-1,81.52
-1,20.07
-87.49
-1,09.13
-1,49.29
-1,81.70
-6.41
-5.94
-5.40
-5.43
-4.91
-5.84
-5.58
-7.09
-5.20
(11) (12) (13) (14) (15) (16) (17) (18) (19) (20)
Revenueforegone or
remissionof revenue
during2010-2011
Total revenue during 2010-2011
(Columns11 and 12)
Working expenses and
maintenance during 2010-2011Net revenue excluding interest
Net profit or Loss after
meeting interest charges
Direct Indirect Total
Surplus of revenueover expenditure (+)
or excees ofexpenditure over
revenue (-)
Rate
percenton capital outlay to
the end of2010-2011
Interest
charges on
Direct Total
capital
outlay to
end of
2010-2011
Surplus of
revenue over
expenditure
(+) or excess of
expenditure over
revenue(-)
Rate
percent on
total capital
outlay to
end of
2010-2011
. .
MEDIUM IRRIGATION PROJECTS
44
45
46
47
48
49
50
51
52
. .
. .
. .
. .
. .
. .
. .
. .
. .
. .
. .
. .
. .
. .
0.39
0.32
0.36
0.25
. .
. .
. .
. .
. .
. .
. .
. .
. .
. .
. .
. .
. .
. .
Receipts during 2010-2011
IndirectRevenue
Total
(10)
8,99.96
(21)
. .
566
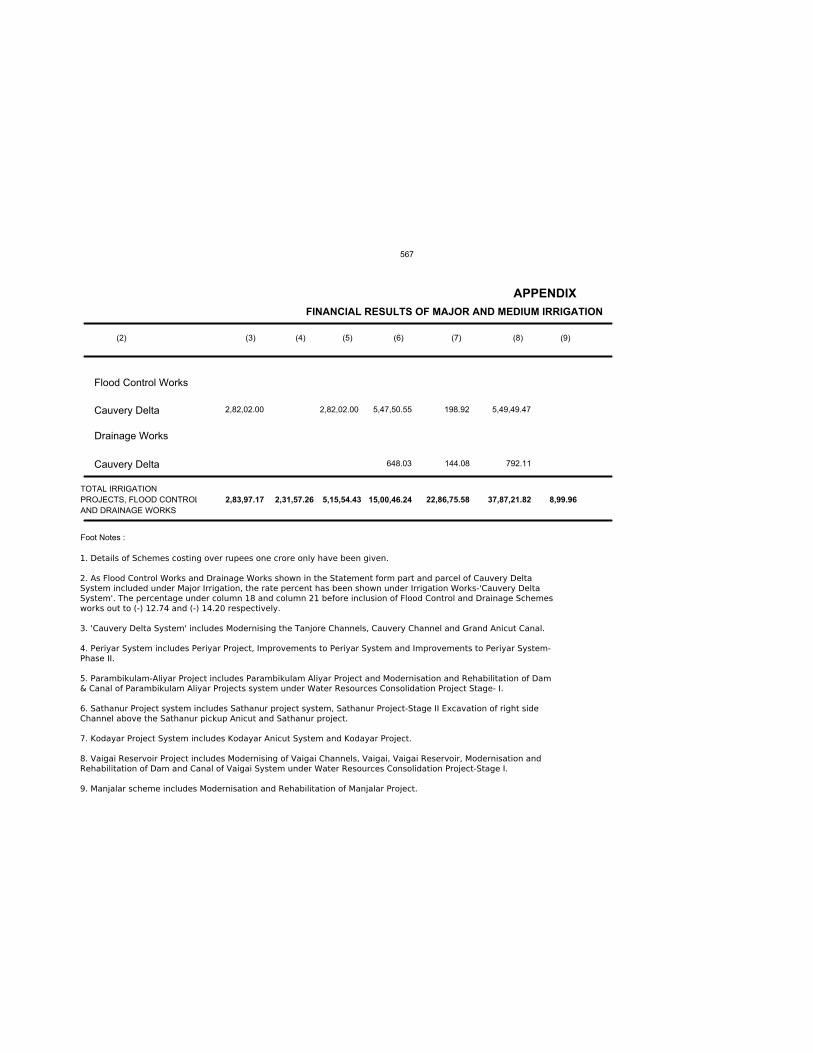
(2) (3) (4) (5) (6) (7) (8) (9)
Flood Control Works
Cauvery Delta
Drainage Works
Cauvery Delta
2,82,02.00 5,47,50.55 198.92 5,49,49.47
648.03 144.08 792.11
TOTAL IRRIGATION
PROJECTS, FLOOD CONTROL
AND DRAINAGE WORKS
2,83,97.17 2,31,57.26 5,15,54.43 15,00,46.24 22,86,75.58 37,87,21.82 8,99.96
Foot Notes :
APPENDIX
1. Details of Schemes costing over rupees one crore only have been given.
2. As Flood Control Works and Drainage Works shown in the Statement form part and parcel of Cauvery Delta
System included under Major Irrigation, the rate percent has been shown under Irrigation Works-'Cauvery Delta
System'. The percentage under column 18 and column 21 before inclusion of Flood Control and Drainage Schemes
works out to (-) 12.74 and (-) 14.20 respectively.
3. 'Cauvery Delta System' includes Modernising the Tanjore Channels, Cauvery Channel and Grand Anicut Canal.
4. Periyar System includes Periyar Project, Improvements to Periyar System and Improvements to Periyar System-
Phase II.
5. Parambikulam-Aliyar Project includes Parambikulam Aliyar Project and Modernisation and Rehabilitation of Dam
& Canal of Parambikulam Aliyar Projects system under Water Resources Consolidation Project Stage- I.
6. Sathanur Project system includes Sathanur project system, Sathanur Project-Stage II Excavation of right side
Channel above the Sathanur pickup Anicut and Sathanur project.
7. Kodayar Project System includes Kodayar Anicut System and Kodayar Project.
8. Vaigai Reservoir Project includes Modernising of Vaigai Channels, Vaigai, Vaigai Reservoir, Modernisation and
Rehabilitation of Dam and Canal of Vaigai System under Water Resources Consolidation Project-Stage I.
9. Manjalar scheme includes Modernisation and Rehabilitation of Manjalar Project.
2,82,02.00
FINANCIAL RESULTS OF MAJOR AND MEDIUM IRRIGATION
567

(12) (13) (14) (15) (16) (17) (18) (19) (20)
. . 8,99.96 2,26,87.31 91.15 2,27,78.46 -21,878.50 -5.78 1,20,68.77 -3,39,47.27 -8.96
(21)
- IX concld.
( in lakh of Rupees)
(10) (11)
. . 8,99.96
10. Marudhanadhi Scheme includes Marudhanadhi Scheme, Marudhanadhi Water Resources Consolidation Project,
Modernisation and Rehabilitation of Marudhanadhi Project.
11. Lower Bhavani includes Lower Bhavani Project System and Lower Bhavani Anicut System under Water Resources
Consolidation Project.
12. New Kattalai High Level Canal includes Kattalai Project System, New Kattalai High-Level Canal System and Kattalai
High-Level Canal System.
13. Gadana Reservoir Project includes Gadana Reservoir Scheme and Gadana Extension Schemes. The amount shown
in Column 3 includes the Capital Outlay for the years from 1998-99 to 2009-10 under Gadana Extension Schemes. The
amount for the year 2010-11 in Column-3 is Nil.
14. The system of adjustment of old Maintenance Charges representing the charges incurred on the upkeep of those old
works which were in existence prior to the improvements carried out by the erstwhile British Government and which now
form part of or have been replaced by New Irrigation System for which Capital and Revenue accounts are kept in the
regular accounts has been dispensed with by Government and instead proforma adjustment thereof is carried out in the
Administrative Accounts of the Irrigation Projects (Commercial) with effect from 1975-76.
15. The amount shown against Cauvery Delta System, Periyar System, Cauvery Mettur Project and new Kattalai High
level canal under Column 14 is inclusive of Old Maintenance Charges (Col 14 of Account 3) are `.61.83 lakh, `.0.31 lakh ,
`.0.14 lakh and ` 0.58 lakh respectively.
16. The Schemes under "Navigation" have been omitted as they are now treated as "Non-Commercial" and classified
under "3056 - Inland Water Transport".
SCHEMES FOR THE YEAR 2010-2011
568
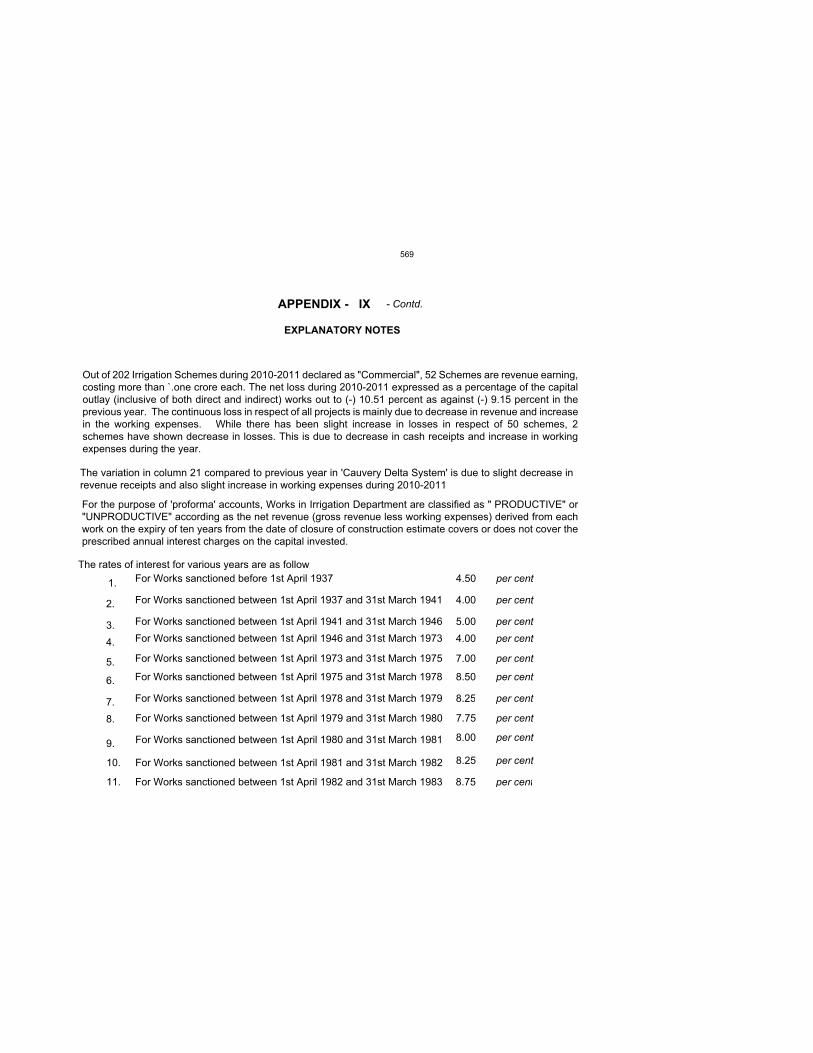
APPENDIX - IX - Contd.
EXPLANATORY NOTES
The rates of interest for various years are as follow
For Works sanctioned before 1st April 1937
For Works sanctioned between 1st April 1937 and 31st March 1941
For Works sanctioned between 1st April 1941 and 31st March 1946
For Works sanctioned between 1st April 1946 and 31st March 1973
For Works sanctioned between 1st April 1973 and 31st March 1975
For Works sanctioned between 1st April 1975 and 31st March 1978
For Works sanctioned between 1st April 1978 and 31st March 1979
1.
2.
3.
4.
5.
6.
7.
4.50 per cent
4.00 per cent
5.00 per cent
4.00 per cent
7.00 per cent
8.50 per cent
8.25 per cent
For Works sanctioned between 1st April 1979 and 31st March 1980
For Works sanctioned between 1st April 1980 and 31st March 1981
For Works sanctioned between 1st April 1981 and 31st March 1982
For Works sanctioned between 1st April 1982 and 31st March 1983
8.
9.
10.
11.
7.75 per cent
8.00 per cent
8.25 per cent
8.75 per cent
Out of 202 Irrigation Schemes during 2010-2011 declared as "Commercial", 52 Schemes are revenue earning,costing more than `.one crore each. The net loss during 2010-2011 expressed as a percentage of the capitaloutlay (inclusive of both direct and indirect) works out to (-) 10.51 percent as against (-) 9.15 percent in theprevious year. The continuous loss in respect of all projects is mainly due to decrease in revenue and increasein the working expenses. While there has been slight increase in losses in respect of 50 schemes, 2schemes have shown decrease in losses. This is due to decrease in cash receipts and increase in workingexpenses during the year.
The variation in column 21 compared to previous year in 'Cauvery Delta System' is due to slight decrease inrevenue receipts and also slight increase in working expenses during 2010-2011
For the purpose of 'proforma' accounts, Works in Irrigation Department are classified as " PRODUCTIVE" or"UNPRODUCTIVE" according as the net revenue (gross revenue less working expenses) derived from eachwork on the expiry of ten years from the date of closure of construction estimate covers or does not cover theprescribed annual interest charges on the capital invested.
569

For Works sanctioned between 1st April 1983 and 31st March 1984
For Works sanctioned between 1st April 1984 and 31st March 1985
For Works sanctioned between 1st April 1985 and 31st March 1986
12.
13.
14.
10.00 per cent
10.25 per cent
11.00 per cent
For Works sanctioned between 1st April 1986 and 31st March 1988
For Works sanctioned between 1st April 1988 and 31st March 1991
For Works sanctioned between 1st April 1991 and 31st March 1992
For Works sanctioned between 1st April 1992 and 31st March 1993
For Works sanctioned between 1st April 1993 and 31st March 1994
For Works sanctioned between 1st April 1994 and 31st March 1995
For Works sanctioned between 1st April 1995 and 31st March 1997
15.
16.
17.
18.
19.
20.
21.
12.25 per cent
12.75 per cent
13.25 per cent
13.50 per cent
14.00 per cent
13.00 per cent
14.50 per cent
For Works sanctioned between 1st April 1997 and 31st March 1998
For Works sanctioned between 1st April 1998 and 31st March 1999
22.
23.
14.00 per cent
13.00 per cent
For Works sanctioned between 1st April 1999 and 31st March 2000
For Works sanctioned between 1st April 2000 and 31st March 2001
For Works sanctioned between 1st April 2001 and 31st March 2002
For Works sanctioned between 1st April 2002 and 31st March 2003
For Works sanctioned between 1st April 2003 and 31st March 2004
For Works sanctioned between 1st April 2004 and 31st March 2005
For Works sanctioned between 1st April 2005 and 31st March 2006
24.
25.
26.
27.
28.
29.
30.
13.50 per cent
12.50 per cent
11.50 per cent
9.75 per cent
8.75 per cent
9.00 per cent
9.00 per cent
570
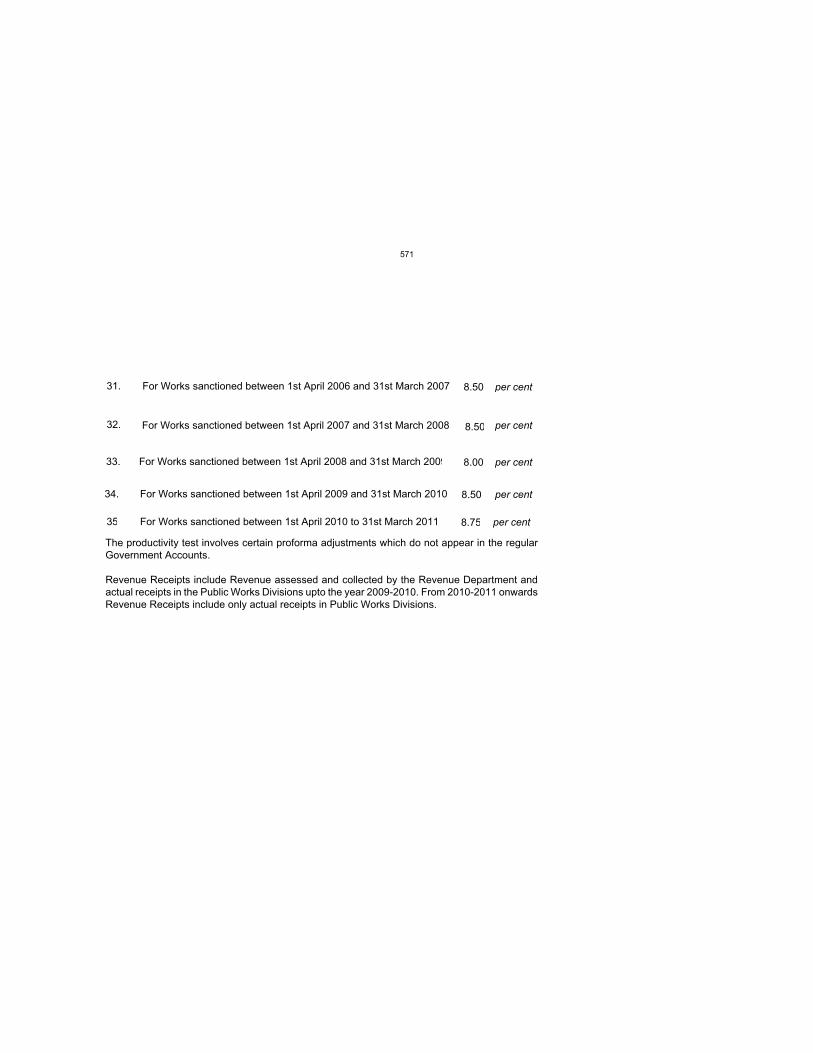
For Works sanctioned between 1st April 2006 and 31st March 200731. 8.50 per cent
The productivity test involves certain proforma adjustments which do not appear in the regularGovernment Accounts.
Revenue Receipts include Revenue assessed and collected by the Revenue Department andactual receipts in the Public Works Divisions upto the year 2009-2010. From 2010-2011 onwardsRevenue Receipts include only actual receipts in Public Works Divisions.
32. For Works sanctioned between 1st April 2007 and 31st March 2008 8.50 per cent
per cent
per cent
per cent
33. 8.00
34. For Works sanctioned between 1st April 2009 and 31st March 2010 8.50
For Works sanctioned between 1st April 2008 and 31st March 2009
35 For Works sanctioned between 1st April 2010 to 31st March 2011 8.75
571
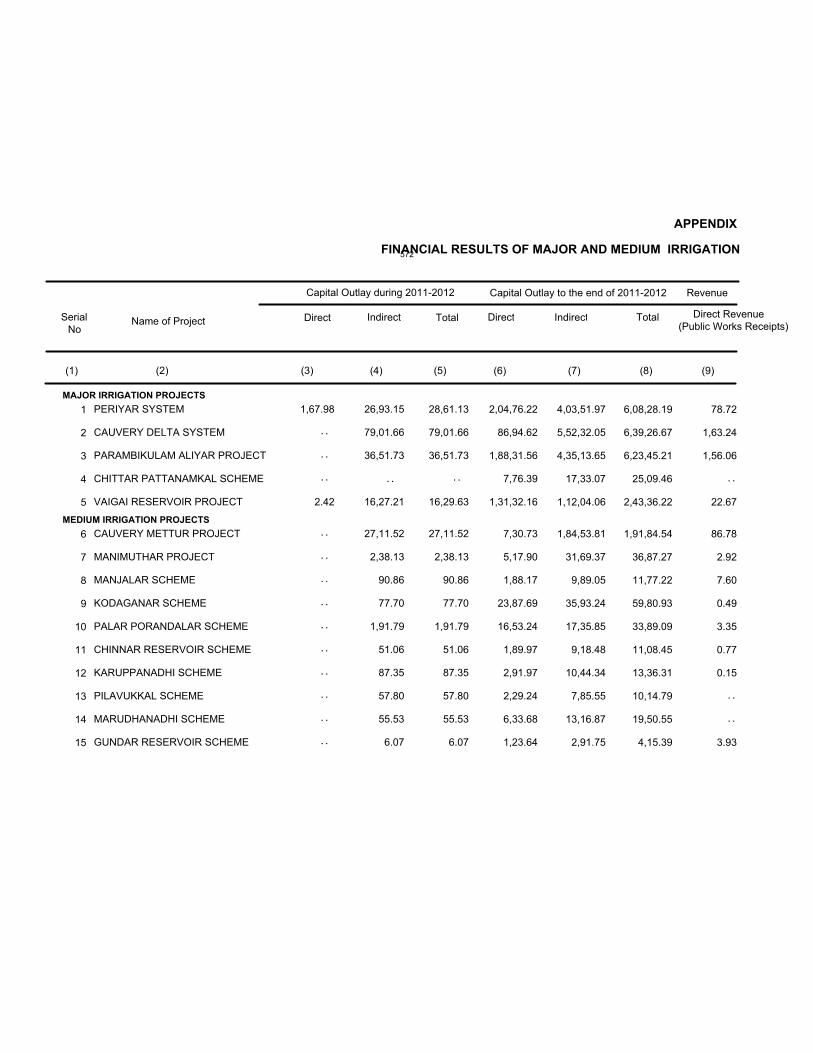
FINANCIAL RESULTS OF MAJOR AND MEDIUM IRRIGATION
APPENDIX
PERIYAR SYSTEM
CAUVERY DELTA SYSTEM
PARAMBIKULAM ALIYAR PROJECT
CHITTAR PATTANAMKAL SCHEME
VAIGAI RESERVOIR PROJECT
CAUVERY METTUR PROJECT
MANIMUTHAR PROJECT
MANJALAR SCHEME
KODAGANAR SCHEME
PALAR PORANDALAR SCHEME
CHINNAR RESERVOIR SCHEME
KARUPPANADHI SCHEME
PILAVUKKAL SCHEME
MARUDHANADHI SCHEME
GUNDAR RESERVOIR SCHEME
1,67.98
2.42
26,93.15
79,01.66
36,51.73
16,27.21
27,11.52
2,38.13
90.86
77.70
1,91.79
51.06
87.35
57.80
55.53
6.07
28,61.13
79,01.66
36,51.73
16,29.63
27,11.52
2,38.13
90.86
77.70
1,91.79
51.06
87.35
57.80
55.53
6.07
2,04,76.22
86,94.62
1,88,31.56
7,76.39
1,31,32.16
7,30.73
5,17.90
1,88.17
23,87.69
16,53.24
1,89.97
2,91.97
2,29.24
6,33.68
1,23.64
4,03,51.97
5,52,32.05
4,35,13.65
17,33.07
1,12,04.06
1,84,53.81
31,69.37
9,89.05
35,93.24
17,35.85
9,18.48
10,44.34
7,85.55
13,16.87
2,91.75
6,08,28.19
6,39,26.67
6,23,45.21
25,09.46
2,43,36.22
1,91,84.54
36,87.27
11,77.22
59,80.93
33,89.09
11,08.45
13,36.31
10,14.79
19,50.55
4,15.39
78.72
1,63.24
1,56.06
22.67
86.78
2.92
7.60
0.49
3.35
0.77
0.15
3.93
Capital Outlay during 2011-2012 Capital Outlay to the end of 2011-2012 Revenue
Direct Indirect Total Direct Indirect Total Direct Revenue(Public Works Receipts)
MAJOR IRRIGATION PROJECTS
MEDIUM IRRIGATION PROJECTS
1
2
3
4
5
6
7
8
9
10
11
12
13
14
15
. .
. .
. .
. .
. .
. .
. .
. .
. .
. .
. .
. .
. .
. . . . . .
. .
. .
SerialNo
Name of Project
(1) (2) (3) (4) (5) (6) (7) (8) (9)
572
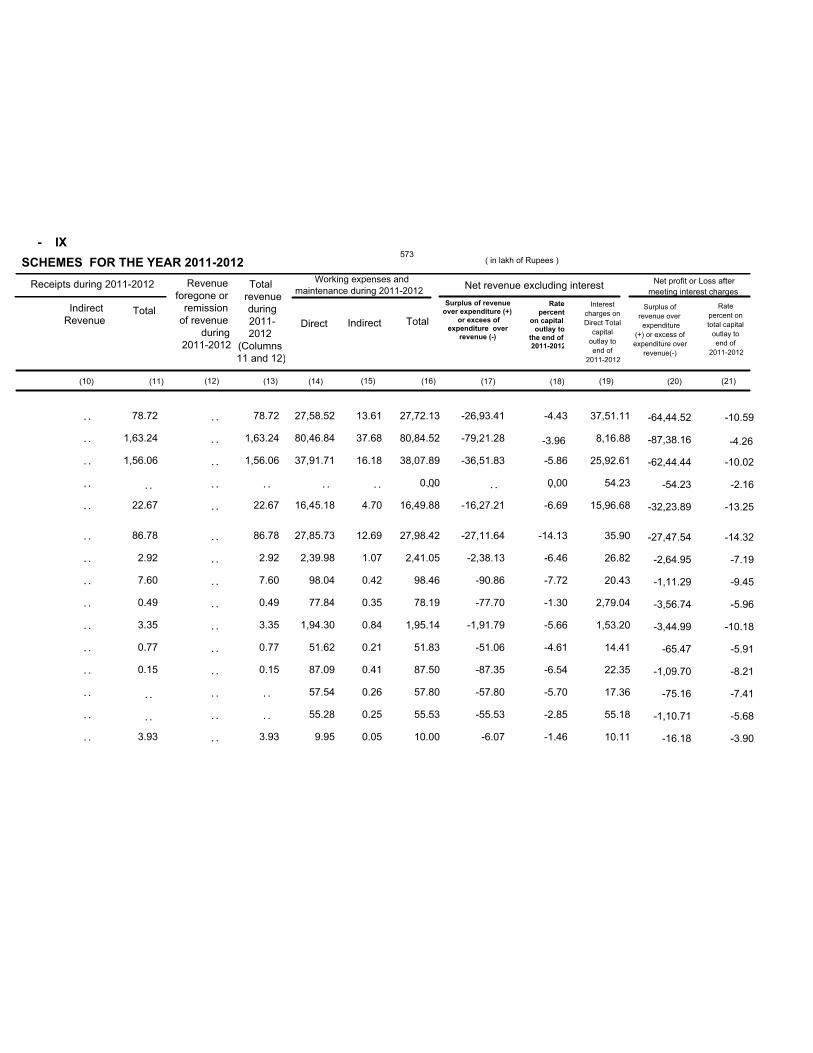
- IX
( in lakh of Rupees )SCHEMES FOR THE YEAR 2011-2012
PERIYAR SYSTEM
CAUVERY DELTA SYSTEM
PARAMBIKULAM ALIYAR PROJECT
CHITTAR PATTANAMKAL SCHEME
VAIGAI RESERVOIR PROJECT
CAUVERY METTUR PROJECT
MANIMUTHAR PROJECT
MANJALAR SCHEME
KODAGANAR SCHEME
PALAR PORANDALAR SCHEME
CHINNAR RESERVOIR SCHEME
KARUPPANADHI SCHEME
PILAVUKKAL SCHEME
MARUDHANADHI SCHEME
GUNDAR RESERVOIR SCHEME
78.72
1,63.24
1,56.06
22.67
86.78
2.92
7.60
0.49
3.35
0.77
0.15
3.93
27,58.52
80,46.84
37,91.71
16,45.18
27,85.73
2,39.98
98.04
77.84
1,94.30
51.62
87.09
57.54
55.28
9.95
13.61
37.68
16.18
4.70
12.69
1.07
0.42
0.35
0.84
0.21
0.41
0.26
0.25
0.05
27,72.13
80,84.52
38,07.89
0.00
16,49.88
27,98.42
2,41.05
98.46
78.19
1,95.14
51.83
87.50
57.80
55.53
10.00
-26,93.41
-79,21.28
-36,51.83
-16,27.21
-27,11.64
-2,38.13
-90.86
-77.70
-1,91.79
-51.06
-87.35
-57.80
-55.53
-6.07
-4.43
-5.86
0.00
-6.69
-14.13
-6.46
-7.72
-1.30
-5.66
-4.61
-6.54
-5.70
-2.85
-1.46
37,51.11
8,16.88
25,92.61
54.23
15,96.68
35.90
26.82
20.43
2,79.04
1,53.20
14.41
22.35
17.36
55.18
10.11
-64,44.52
-87,38.16
-62,44.44
-54.23
-32,23.89
-27,47.54
-2,64.95
-1,11.29
-3,56.74
-3,44.99
-65.47
-1,09.70
-75.16
-1,10.71
-16.18
-10.59
-10.02
-2.16
-13.25
-14.32
-7.19
-9.45
-5.96
-10.18
-5.91
-8.21
-7.41
-5.68
-3.90
(11) (12) (13) (14) (15) (16) (17) (18) (19) (20)
Revenueforegone or
remissionof revenue
during2011-2012
Total revenue during 2011-2012
(Columns11 and 12)
Working expenses and
maintenance during 2011-2012Net revenue excluding interest
Net profit or Loss after
meeting interest charges
Direct Indirect Total
Surplus of revenueover expenditure (+)
or excees ofexpenditure over
revenue (-)
Rate
percenton capital outlay to
the end of2011-2012
Interest
charges on
Direct Total
capital
outlay to
end of
2011-2012
Surplus of
revenue over
expenditure
(+) or excess of
expenditure over
revenue(-)
Rate
percent on
total capital
outlay to
end of
2011-2012
MAJOR IRRIGATION PROJECTS
MEDIUM IRRIGATION PROJECTS
1
2
3
4
5
6
7
8
9
10
11
12
13
14
15
. .
. .
. .
. .
. .
. .
. .
. .
. .
. .
. .
. .
. .
. .
. .
. . . . . . . . . .. .
. .
. .
78.72
1,63.24
1,56.06
22.67
86.78
2.92
7.60
0.49
3.35
0.77
0.15
3.93
. .
. .
. .
. .
. .
. .
. .
. .
. .
. .
. .
. .
. .
. .
. .
. .
. .
. .
Receipts during 2011-2012
IndirectRevenue
Total
(10) (21)
-3.96 -4.26
573
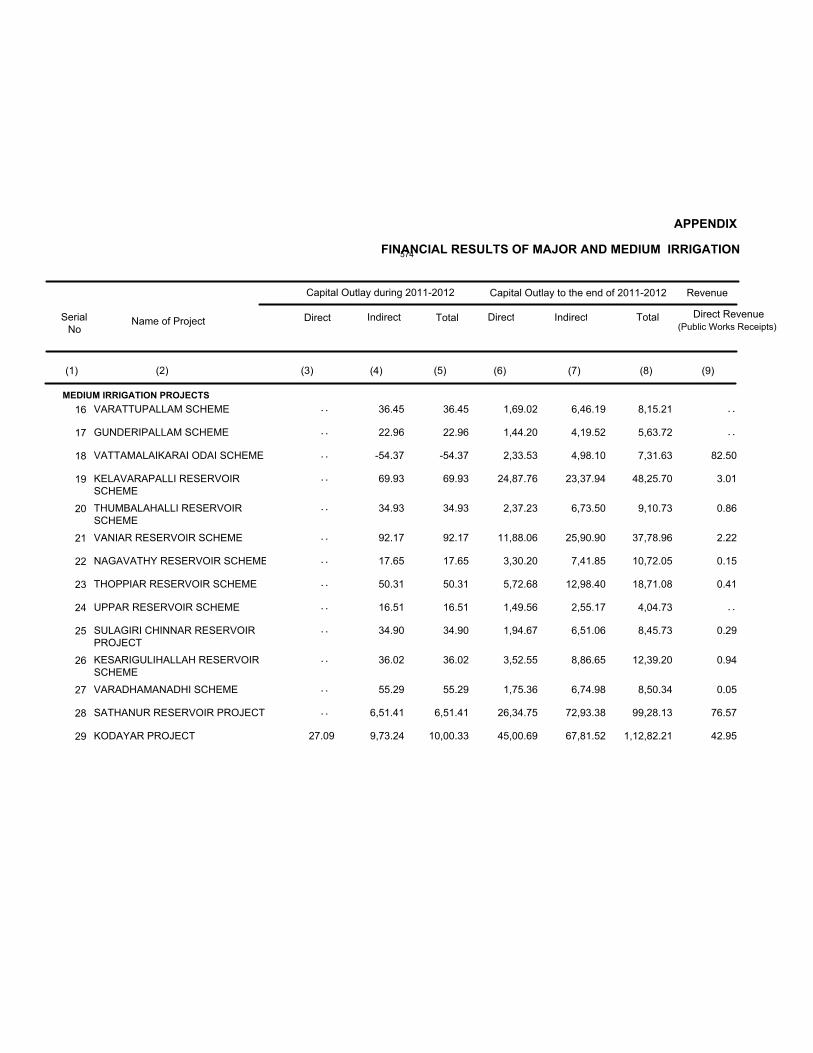
FINANCIAL RESULTS OF MAJOR AND MEDIUM IRRIGATION
APPENDIX
VARATTUPALLAM SCHEME
GUNDERIPALLAM SCHEME
VATTAMALAIKARAI ODAI SCHEME
KELAVARAPALLI RESERVOIRSCHEME
THUMBALAHALLI RESERVOIRSCHEME
VANIAR RESERVOIR SCHEME
NAGAVATHY RESERVOIR SCHEME
THOPPIAR RESERVOIR SCHEME
UPPAR RESERVOIR SCHEME
SULAGIRI CHINNAR RESERVOIRPROJECT
KESARIGULIHALLAH RESERVOIRSCHEME
VARADHAMANADHI SCHEME
SATHANUR RESERVOIR PROJECT
KODAYAR PROJECT 27.09
36.45
22.96
-54.37
69.93
34.93
92.17
17.65
50.31
16.51
34.90
36.02
55.29
6,51.41
9,73.24
36.45
22.96
-54.37
69.93
34.93
92.17
17.65
50.31
16.51
34.90
36.02
55.29
6,51.41
10,00.33
1,69.02
1,44.20
2,33.53
24,87.76
2,37.23
11,88.06
3,30.20
5,72.68
1,49.56
1,94.67
3,52.55
1,75.36
26,34.75
45,00.69
6,46.19
4,19.52
4,98.10
23,37.94
6,73.50
25,90.90
7,41.85
12,98.40
2,55.17
6,51.06
8,86.65
6,74.98
72,93.38
67,81.52
8,15.21
5,63.72
7,31.63
48,25.70
9,10.73
37,78.96
10,72.05
18,71.08
4,04.73
8,45.73
12,39.20
8,50.34
99,28.13
1,12,82.21
82.50
3.01
0.86
2.22
0.15
0.41
0.29
0.94
0.05
76.57
42.95
Capital Outlay during 2011-2012 Capital Outlay to the end of 2011-2012 Revenue
Direct Indirect Total Direct Indirect Total Direct Revenue(Public Works Receipts)
MEDIUM IRRIGATION PROJECTS
16
17
18
19
20
21
22
23
24
25
26
27
28
29
. .
. .
. .
. .
. .
. .
. .
. .
. .
. .
. .
. .
. .
. .
. .
. .
SerialNo
Name of Project
(1) (2) (3) (4) (5) (6) (7) (8) (9)
574
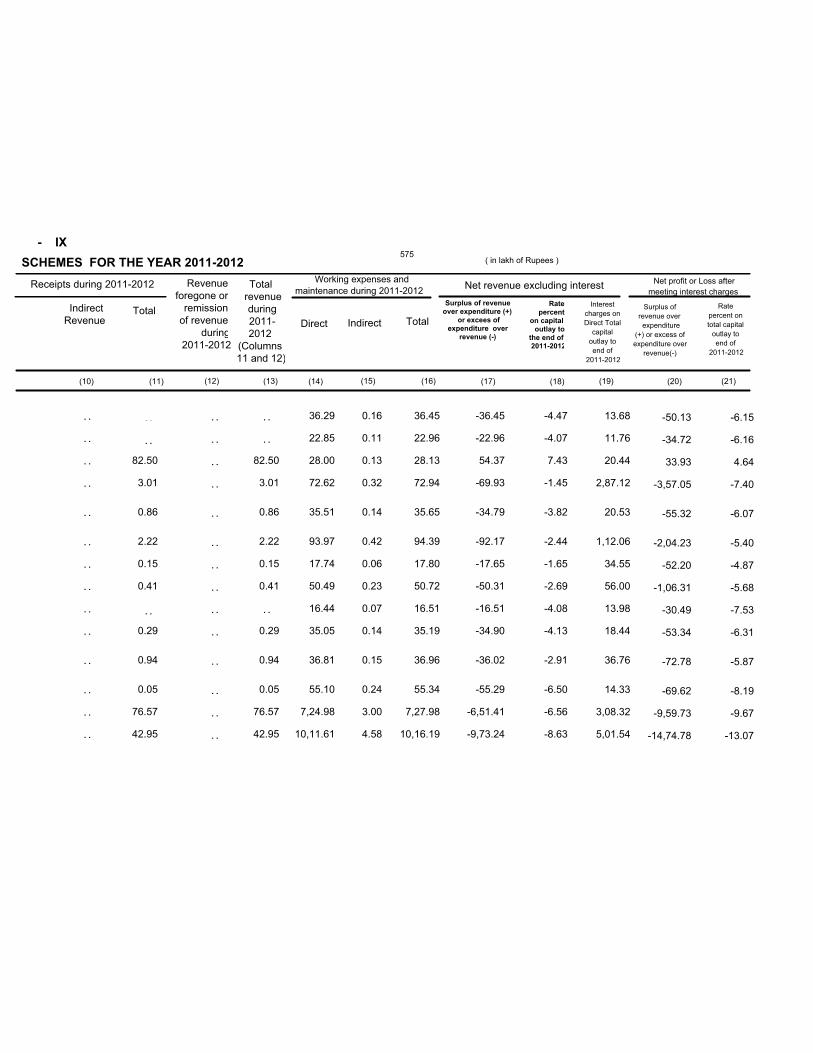
- IX
( in lakh of Rupees )SCHEMES FOR THE YEAR 2011-2012
VARATTUPALLAM SCHEME
GUNDERIPALLAM SCHEME
VATTAMALAIKARAI ODAI SCHEME
KELAVARAPALLI RESERVOIRSCHEME
THUMBALAHALLI RESERVOIRSCHEME
VANIAR RESERVOIR SCHEME
NAGAVATHY RESERVOIR SCHEME
THOPPIAR RESERVOIR SCHEME
UPPAR RESERVOIR SCHEME
SULAGIRI CHINNAR RESERVOIRPROJECT
KESARIGULIHALLAH RESERVOIRSCHEME
VARADHAMANADHI SCHEME
SATHANUR RESERVOIR PROJECT
KODAYAR PROJECT
82.50
3.01
0.86
2.22
0.15
0.41
0.29
0.94
0.05
76.57
42.95
36.29
22.85
28.00
72.62
35.51
93.97
17.74
50.49
16.44
35.05
36.81
55.10
7,24.98
10,11.61
0.16
0.11
0.13
0.32
0.14
0.42
0.06
0.23
0.07
0.14
0.15
0.24
3.00
4.58
36.45
22.96
28.13
72.94
35.65
94.39
17.80
50.72
16.51
35.19
36.96
55.34
7,27.98
10,16.19
-36.45
-22.96
54.37
-69.93
-34.79
-92.17
-17.65
-50.31
-16.51
-34.90
-36.02
-55.29
-6,51.41
-9,73.24
-4.47
-4.07
7.43
-1.45
-3.82
-2.44
-1.65
-2.69
-4.08
-4.13
-2.91
-6.50
-6.56
-8.63
13.68
11.76
20.44
2,87.12
20.53
1,12.06
34.55
56.00
13.98
18.44
36.76
14.33
3,08.32
5,01.54
-50.13
-34.72
33.93
-3,57.05
-55.32
-2,04.23
-52.20
-1,06.31
-30.49
-53.34
-72.78
-69.62
-9,59.73
-14,74.78
-6.15
-6.16
4.64
-7.40
-6.07
-5.40
-4.87
-5.68
-7.53
-6.31
-5.87
-8.19
-9.67
-13.07
(11) (12) (13) (14) (15) (16) (17) (18) (19) (20)
Revenueforegone or
remissionof revenue
during2011-2012
Total revenue during 2011-2012
(Columns11 and 12)
Working expenses and
maintenance during 2011-2012Net revenue excluding interest
Net profit or Loss after
meeting interest charges
Direct Indirect Total
Surplus of revenueover expenditure (+)
or excees ofexpenditure over
revenue (-)
Rate
percenton capital outlay to
the end of2011-2012
Interest
charges on
Direct Total
capital
outlay to
end of
2011-2012
Surplus of
revenue over
expenditure
(+) or excess of
expenditure over
revenue(-)
Rate
percent on
total capital
outlay to
end of
2011-2012
MEDIUM IRRIGATION PROJECTS
16
17
18
19
20
21
22
23
24
25
26
27
28
29
. .
. .
. .
. .
. .
. .
. .
. .
. .
. .
. .
. .
. .
. .
. .
. .
. .
82.50
3.01
0.86
2.22
0.15
0.41
0.29
0.94
0.05
76.57
42.95
. .
. .
. .
. .
. .
. .
. .
. .
. .
. .
. .
. .
. .
. .
. .
. .
. .
Receipts during 2011-2012
IndirectRevenue
Total
(10) (21)
575
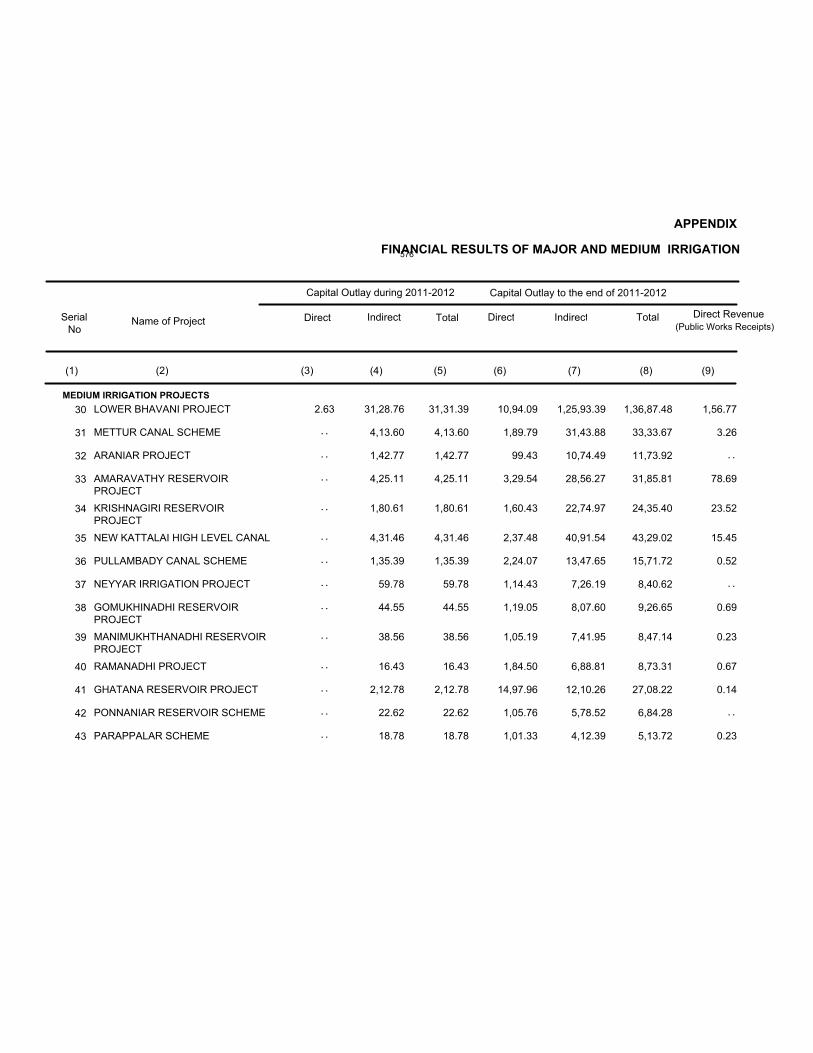
FINANCIAL RESULTS OF MAJOR AND MEDIUM IRRIGATION
APPENDIX
LOWER BHAVANI PROJECT
METTUR CANAL SCHEME
ARANIAR PROJECT
AMARAVATHY RESERVOIRPROJECT
KRISHNAGIRI RESERVOIRPROJECT
NEW KATTALAI HIGH LEVEL CANAL
PULLAMBADY CANAL SCHEME
NEYYAR IRRIGATION PROJECT
GOMUKHINADHI RESERVOIRPROJECT
MANIMUKHTHANADHI RESERVOIRPROJECT
RAMANADHI PROJECT
GHATANA RESERVOIR PROJECT
PONNANIAR RESERVOIR SCHEME
PARAPPALAR SCHEME
2.63 31,28.76
4,13.60
1,42.77
4,25.11
1,80.61
4,31.46
1,35.39
59.78
44.55
38.56
16.43
2,12.78
22.62
18.78
31,31.39
4,13.60
1,42.77
4,25.11
1,80.61
4,31.46
1,35.39
59.78
44.55
38.56
16.43
2,12.78
22.62
18.78
10,94.09
1,89.79
99.43
3,29.54
1,60.43
2,37.48
2,24.07
1,14.43
1,19.05
1,05.19
1,84.50
14,97.96
1,05.76
1,01.33
1,25,93.39
31,43.88
10,74.49
28,56.27
22,74.97
40,91.54
13,47.65
7,26.19
8,07.60
7,41.95
6,88.81
12,10.26
5,78.52
4,12.39
1,36,87.48
33,33.67
11,73.92
31,85.81
24,35.40
43,29.02
15,71.72
8,40.62
9,26.65
8,47.14
8,73.31
27,08.22
6,84.28
5,13.72
1,56.77
3.26
78.69
23.52
15.45
0.52
0.69
0.23
0.67
0.14
0.23
Capital Outlay during 2011-2012 Capital Outlay to the end of 2011-2012
Direct Indirect Total Direct Indirect Total Direct Revenue(Public Works Receipts)
MEDIUM IRRIGATION PROJECTS
30
31
32
33
34
35
36
37
38
39
40
41
42
43
. .
. .
. .
. .
. .
. .
. .
. .
. .
. .
. .
. .
. .
. .
. .
. .
SerialNo
Name of Project
(1) (2) (3) (4) (5) (6) (7) (8) (9)
576
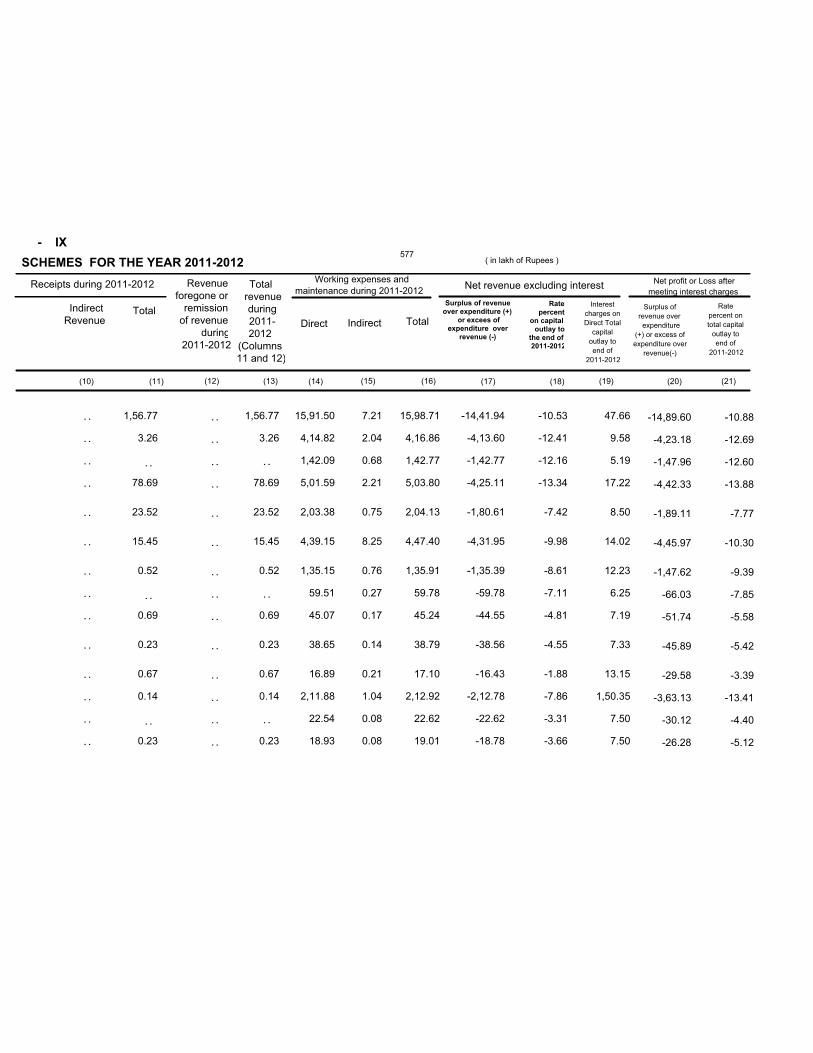
- IX
( in lakh of Rupees )SCHEMES FOR THE YEAR 2011-2012
LOWER BHAVANI PROJECT
METTUR CANAL SCHEME
ARANIAR PROJECT
AMARAVATHY RESERVOIRPROJECT
KRISHNAGIRI RESERVOIRPROJECT
NEW KATTALAI HIGH LEVELCANAL
PULLAMBADY CANAL SCHEME
NEYYAR IRRIGATION PROJECT
GOMUKHINADHI RESERVOIRPROJECT
MANIMUKHTHANADHI RESERVOIRPROJECT
RAMANADHI PROJECT
GHATANA RESERVOIR PROJECT
PONNANIAR RESERVOIR SCHEME
PARAPPALAR SCHEME
1,56.77
3.26
78.69
23.52
15.45
0.52
0.69
0.23
0.67
0.14
0.23
15,91.50
4,14.82
1,42.09
5,01.59
2,03.38
4,39.15
1,35.15
59.51
45.07
38.65
16.89
2,11.88
22.54
18.93
7.21
2.04
0.68
2.21
0.75
8.25
0.76
0.27
0.17
0.14
0.21
1.04
0.08
0.08
15,98.71
4,16.86
1,42.77
5,03.80
2,04.13
4,47.40
1,35.91
59.78
45.24
38.79
17.10
2,12.92
22.62
19.01
-14,41.94
-4,13.60
-1,42.77
-4,25.11
-1,80.61
-4,31.95
-1,35.39
-59.78
-44.55
-38.56
-16.43
-2,12.78
-22.62
-18.78
-10.53
-12.41
-12.16
-13.34
-7.42
-9.98
-8.61
-7.11
-4.81
-4.55
-1.88
-7.86
-3.31
-3.66
47.66
9.58
5.19
17.22
8.50
14.02
12.23
6.25
7.19
7.33
13.15
1,50.35
7.50
7.50
-14,89.60
-4,23.18
-1,47.96
-4,42.33
-1,89.11
-4,45.97
-1,47.62
-66.03
-51.74
-45.89
-29.58
-3,63.13
-30.12
-26.28
-10.88
-12.69
-12.60
-13.88
-7.77
-10.30
-9.39
-7.85
-5.58
-5.42
-3.39
-13.41
-4.40
-5.12
(11) (12) (13) (14) (15) (16) (17) (18) (19) (20)
Revenueforegone or
remissionof revenue
during2011-2012
Total revenue during 2011-2012
(Columns11 and 12)
Working expenses and
maintenance during 2011-2012Net revenue excluding interest
Net profit or Loss after
meeting interest charges
Direct Indirect Total
Surplus of revenueover expenditure (+)
or excees ofexpenditure over
revenue (-)
Rate
percenton capital outlay to
the end of2011-2012
Interest
charges on
Direct Total
capital
outlay to
end of
2011-2012
Surplus of
revenue over
expenditure
(+) or excess of
expenditure over
revenue(-)
Rate
percent on
total capital
outlay to
end of
2011-2012
MEDIUM IRRIGATION PROJECTS
30
31
32
33
34
35
36
37
38
39
40
41
42
43
. .
. .
. .
. .
. .
. .
. .
. .
. .
. .
. .
. .
. .
. .
. .
. .
. .
1,56.77
3.26
78.69
23.52
15.45
0.52
0.69
0.23
0.67
0.14
0.23
. .
. .
. .
. .
. .
. .
. .
. .
. .
. .
. .
. .
. .
. .
. .
. .
. .
Receipts during 2011-2012
IndirectRevenue
Total
(10) (21)
577
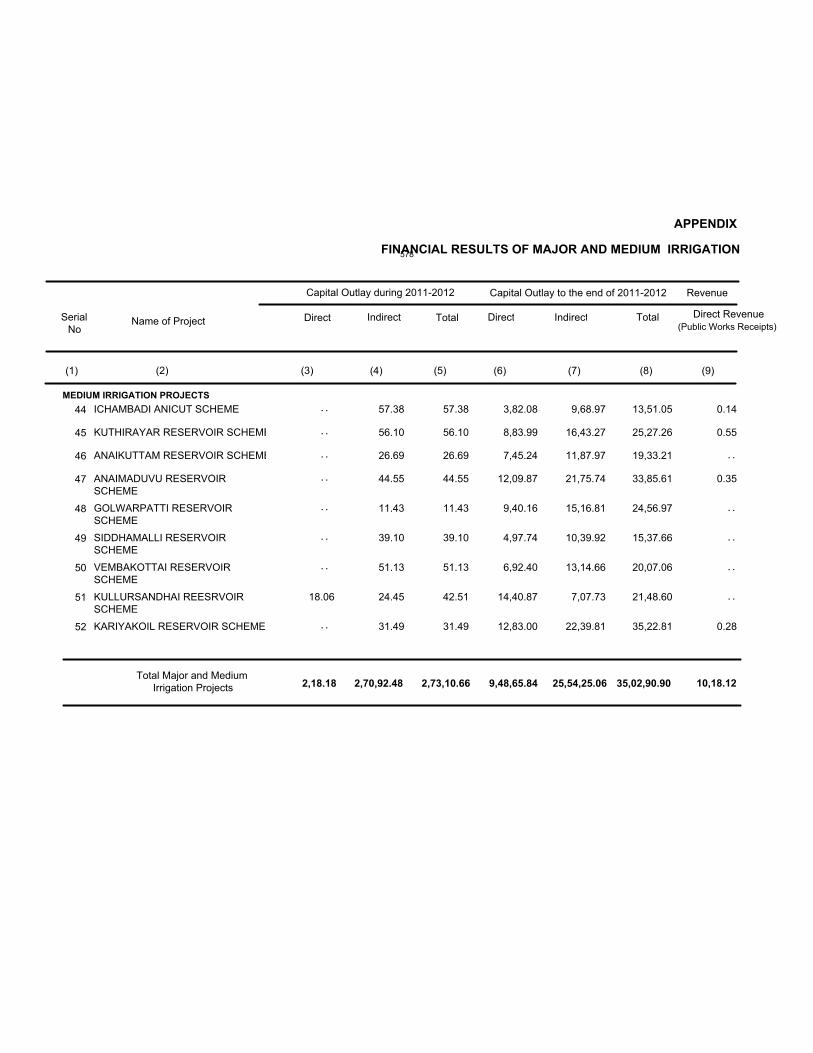
FINANCIAL RESULTS OF MAJOR AND MEDIUM IRRIGATION
APPENDIX
2,18.18 2,70,92.48 2,73,10.66 9,48,65.84 25,54,25.06 35,02,90.90 10,18.12
ICHAMBADI ANICUT SCHEME
KUTHIRAYAR RESERVOIR SCHEME
ANAIKUTTAM RESERVOIR SCHEME
ANAIMADUVU RESERVOIRSCHEME
GOLWARPATTI RESERVOIRSCHEME
SIDDHAMALLI RESERVOIRSCHEME
VEMBAKOTTAI RESERVOIRSCHEME
KULLURSANDHAI REESRVOIRSCHEME
KARIYAKOIL RESERVOIR SCHEME
18.06
57.38
56.10
26.69
44.55
11.43
39.10
51.13
24.45
31.49
57.38
56.10
26.69
44.55
11.43
39.10
51.13
42.51
31.49
3,82.08
8,83.99
7,45.24
12,09.87
9,40.16
4,97.74
6,92.40
14,40.87
12,83.00
9,68.97
16,43.27
11,87.97
21,75.74
15,16.81
10,39.92
13,14.66
7,07.73
22,39.81
13,51.05
25,27.26
19,33.21
33,85.61
24,56.97
15,37.66
20,07.06
21,48.60
35,22.81
0.14
0.55
0.35
0.28
Capital Outlay during 2011-2012 Capital Outlay to the end of 2011-2012 Revenue
Direct Indirect Total Direct Indirect Total Direct Revenue(Public Works Receipts)
MEDIUM IRRIGATION PROJECTS
44
45
46
47
48
49
50
51
52
. .
. .
. .
. .
. .
. .
. .
. .
. .
. .
. .
. .
. .
Total Major and MediumIrrigation Projects
SerialNo
Name of Project
(1) (2) (3) (4) (5) (6) (7) (8) (9)
578
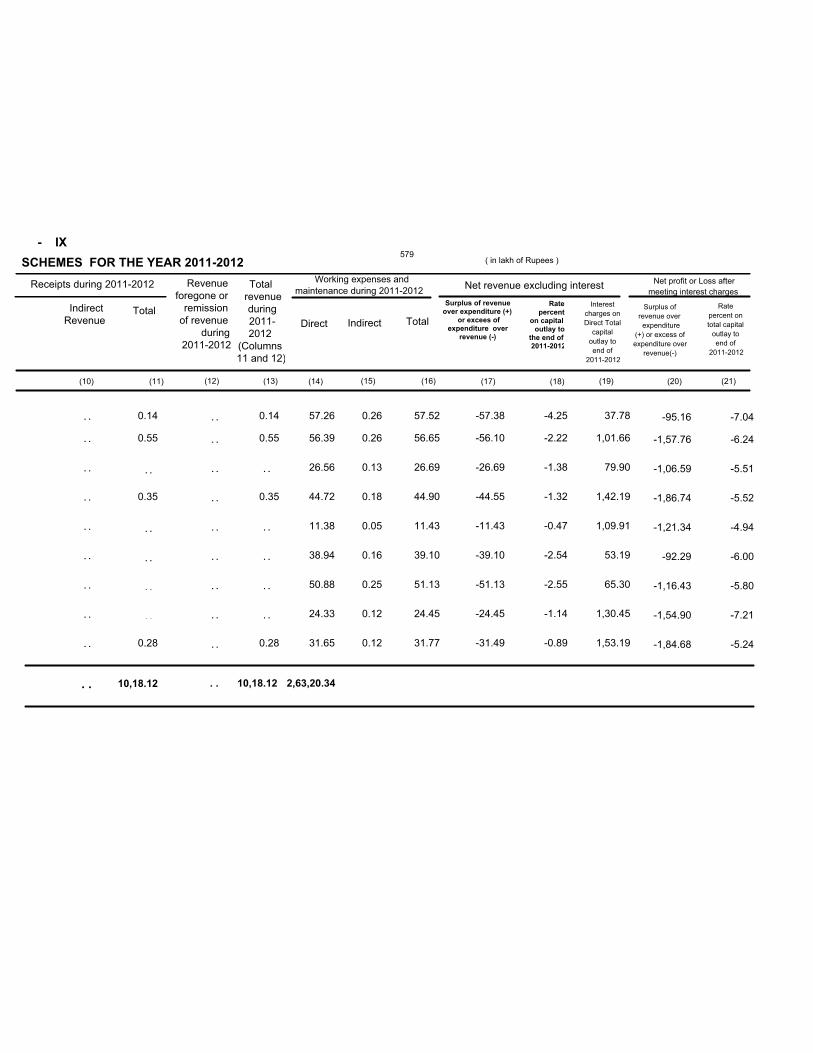
- IX
( in lakh of Rupees )SCHEMES FOR THE YEAR 2011-2012
10,18.12 2,63,20.34
ICHAMBADI ANICUT SCHEME
KUTHIRAYAR RESERVOIRSCHEME
ANAIKUTTAM RESERVOIRSCHEME
ANAIMADUVU RESERVOIRSCHEME
GOLWARPATTI RESERVOIRSCHEME
SIDDHAMALLI RESERVOIRSCHEME
VEMBAKOTTAI RESERVOIRSCHEME
KULLURSANDHAI REESRVOIRSCHEME
KARIYAKOIL RESERVOIR SCHEME
0.14
0.55
0.35
0.28
57.26
56.39
26.56
44.72
11.38
38.94
50.88
24.33
31.65
0.26
0.26
0.13
0.18
0.05
0.16
0.25
0.12
0.12
57.52
56.65
26.69
44.90
11.43
39.10
51.13
24.45
31.77
-57.38
-56.10
-26.69
-44.55
-11.43
-39.10
-51.13
-24.45
-31.49
-4.25
-2.22
-1.38
-1.32
-0.47
-2.54
-2.55
-1.14
-0.89
37.78
1,01.66
79.90
1,42.19
1,09.91
53.19
65.30
1,30.45
1,53.19
-95.16
-1,57.76
-1,06.59
-1,86.74
-1,21.34
-92.29
-1,16.43
-1,54.90
-1,84.68
-7.04
-6.24
-5.51
-5.52
-4.94
-6.00
-5.80
-7.21
-5.24
(11) (12) (13) (14) (15) (16) (17) (18) (19) (20)
Revenueforegone or
remissionof revenue
during2011-2012
Total revenue during 2011-2012
(Columns11 and 12)
Working expenses and
maintenance during 2011-2012Net revenue excluding interest
Net profit or Loss after
meeting interest charges
Direct Indirect Total
Surplus of revenueover expenditure (+)
or excees ofexpenditure over
revenue (-)
Rate
percenton capital outlay to
the end of2011-2012
Interest
charges on
Direct Total
capital
outlay to
end of
2011-2012
Surplus of
revenue over
expenditure
(+) or excess of
expenditure over
revenue(-)
Rate
percent on
total capital
outlay to
end of
2011-2012
. .
MEDIUM IRRIGATION PROJECTS
44
45
46
47
48
49
50
51
52
. .
. .
. .
. .
. .
. .
. .
. .
. .
. .
. .
. .
. .
. .
0.14
0.55
0.35
0.28
. .
. .
. .
. .
. .
. .
. .
. .
. .
. .
. .
. .
. .
. .
Receipts during 2011-2012
IndirectRevenue
Total
(10)
10,18.12
(21)
. .
579

(2) (3) (4) (5) (6) (7) (8) (9)
Flood Control Works
Cauvery Delta
Drainage Works
Cauvery Delta
2,82,02.00 5,47,50.55 198.92 5,49,49.47
648.03 144.08 792.11
TOTAL IRRIGATION
PROJECTS, FLOOD CONTROL
AND DRAINAGE WORKS
2,83,97.17 2,31,57.26 5,15,54.43 15,00,46.24 22,86,75.58 37,87,21.82 8,99.96
Foot Notes :
APPENDIX
1. Details of Schemes costing over rupees one crore only have been given.
2. As Flood Control Works and Drainage Works shown in the Statement form part and parcel of Cauvery Delta
System included under Major Irrigation, the rate percent has been shown under Irrigation Works-'Cauvery Delta
System'. The percentage under column 18 and column 21 before inclusion of Flood Control and Drainage Schemes
works out to (-) 12.74 and (-) 14.20 respectively.
3. 'Cauvery Delta System' includes Modernising the Tanjore Channels, Cauvery Channel and Grand Anicut Canal.
4. Periyar System includes Periyar Project, Improvements to Periyar System and Improvements to Periyar System-
Phase II.
5. Parambikulam-Aliyar Project includes Parambikulam Aliyar Project and Modernisation and Rehabilitation of Dam
& Canal of Parambikulam Aliyar Projects system under Water Resources Consolidation Project Stage- I.
6. Sathanur Project system includes Sathanur project system, Sathanur Project-Stage II Excavation of right side
Channel above the Sathanur pickup Anicut and Sathanur project.
7. Kodayar Project System includes Kodayar Anicut System and Kodayar Project.
8. Vaigai Reservoir Project includes Modernising of Vaigai Channels, Vaigai, Vaigai Reservoir, Modernisation and
Rehabilitation of Dam and Canal of Vaigai System under Water Resources Consolidation Project-Stage I.
9. Manjalar scheme includes Modernisation and Rehabilitation of Manjalar Project.
2,82,02.00
FINANCIAL RESULTS OF MAJOR AND MEDIUM IRRIGATION
580
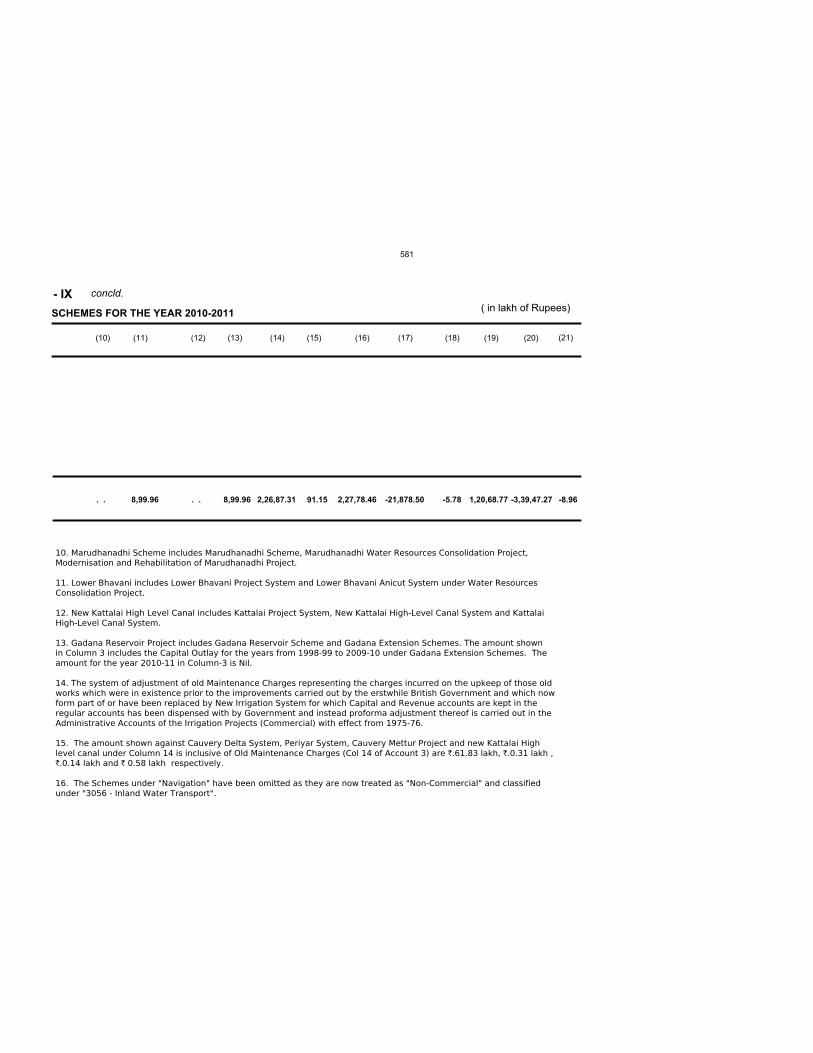
(12) (13) (14) (15) (16) (17) (18) (19) (20)
. . 8,99.96 2,26,87.31 91.15 2,27,78.46 -21,878.50 -5.78 1,20,68.77 -3,39,47.27 -8.96
(21)
- IX concld.
( in lakh of Rupees)
(10) (11)
. . 8,99.96
10. Marudhanadhi Scheme includes Marudhanadhi Scheme, Marudhanadhi Water Resources Consolidation Project,
Modernisation and Rehabilitation of Marudhanadhi Project.
11. Lower Bhavani includes Lower Bhavani Project System and Lower Bhavani Anicut System under Water Resources
Consolidation Project.
12. New Kattalai High Level Canal includes Kattalai Project System, New Kattalai High-Level Canal System and Kattalai
High-Level Canal System.
13. Gadana Reservoir Project includes Gadana Reservoir Scheme and Gadana Extension Schemes. The amount shown
in Column 3 includes the Capital Outlay for the years from 1998-99 to 2009-10 under Gadana Extension Schemes. The
amount for the year 2010-11 in Column-3 is Nil.
14. The system of adjustment of old Maintenance Charges representing the charges incurred on the upkeep of those old
works which were in existence prior to the improvements carried out by the erstwhile British Government and which now
form part of or have been replaced by New Irrigation System for which Capital and Revenue accounts are kept in the
regular accounts has been dispensed with by Government and instead proforma adjustment thereof is carried out in the
Administrative Accounts of the Irrigation Projects (Commercial) with effect from 1975-76.
15. The amount shown against Cauvery Delta System, Periyar System, Cauvery Mettur Project and new Kattalai High
level canal under Column 14 is inclusive of Old Maintenance Charges (Col 14 of Account 3) are `.61.83 lakh, `.0.31 lakh ,
`.0.14 lakh and ` 0.58 lakh respectively.
16. The Schemes under "Navigation" have been omitted as they are now treated as "Non-Commercial" and classified
under "3056 - Inland Water Transport".
SCHEMES FOR THE YEAR 2010-2011
581
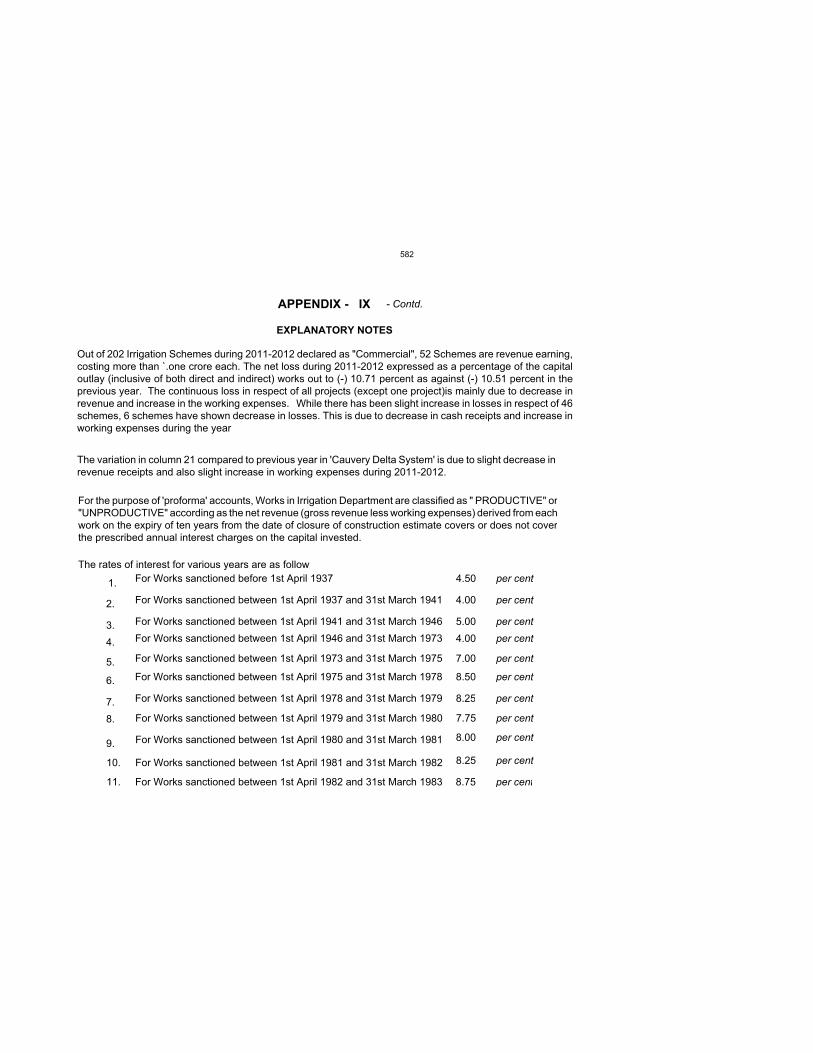
APPENDIX - IX - Contd.
EXPLANATORY NOTES
The rates of interest for various years are as follow
For Works sanctioned before 1st April 1937
For Works sanctioned between 1st April 1937 and 31st March 1941
For Works sanctioned between 1st April 1941 and 31st March 1946
For Works sanctioned between 1st April 1946 and 31st March 1973
For Works sanctioned between 1st April 1973 and 31st March 1975
For Works sanctioned between 1st April 1975 and 31st March 1978
For Works sanctioned between 1st April 1978 and 31st March 1979
1.
2.
3.
4.
5.
6.
7.
4.50 per cent
4.00 per cent
5.00 per cent
4.00 per cent
7.00 per cent
8.50 per cent
8.25 per cent
For Works sanctioned between 1st April 1979 and 31st March 1980
For Works sanctioned between 1st April 1980 and 31st March 1981
For Works sanctioned between 1st April 1981 and 31st March 1982
For Works sanctioned between 1st April 1982 and 31st March 1983
8.
9.
10.
11.
7.75 per cent
8.00 per cent
8.25 per cent
8.75 per cent
Out of 202 Irrigation Schemes during 2011-2012 declared as "Commercial", 52 Schemes are revenue earning,costing more than `.one crore each. The net loss during 2011-2012 expressed as a percentage of the capitaloutlay (inclusive of both direct and indirect) works out to (-) 10.71 percent as against (-) 10.51 percent in theprevious year. The continuous loss in respect of all projects (except one project)is mainly due to decrease inrevenue and increase in the working expenses. While there has been slight increase in losses in respect of 46schemes, 6 schemes have shown decrease in losses. This is due to decrease in cash receipts and increase inworking expenses during the year
The variation in column 21 compared to previous year in 'Cauvery Delta System' is due to slight decrease inrevenue receipts and also slight increase in working expenses during 2011-2012.
For the purpose of 'proforma' accounts, Works in Irrigation Department are classified as " PRODUCTIVE" or"UNPRODUCTIVE" according as the net revenue (gross revenue less working expenses) derived from eachwork on the expiry of ten years from the date of closure of construction estimate covers or does not coverthe prescribed annual interest charges on the capital invested.
582
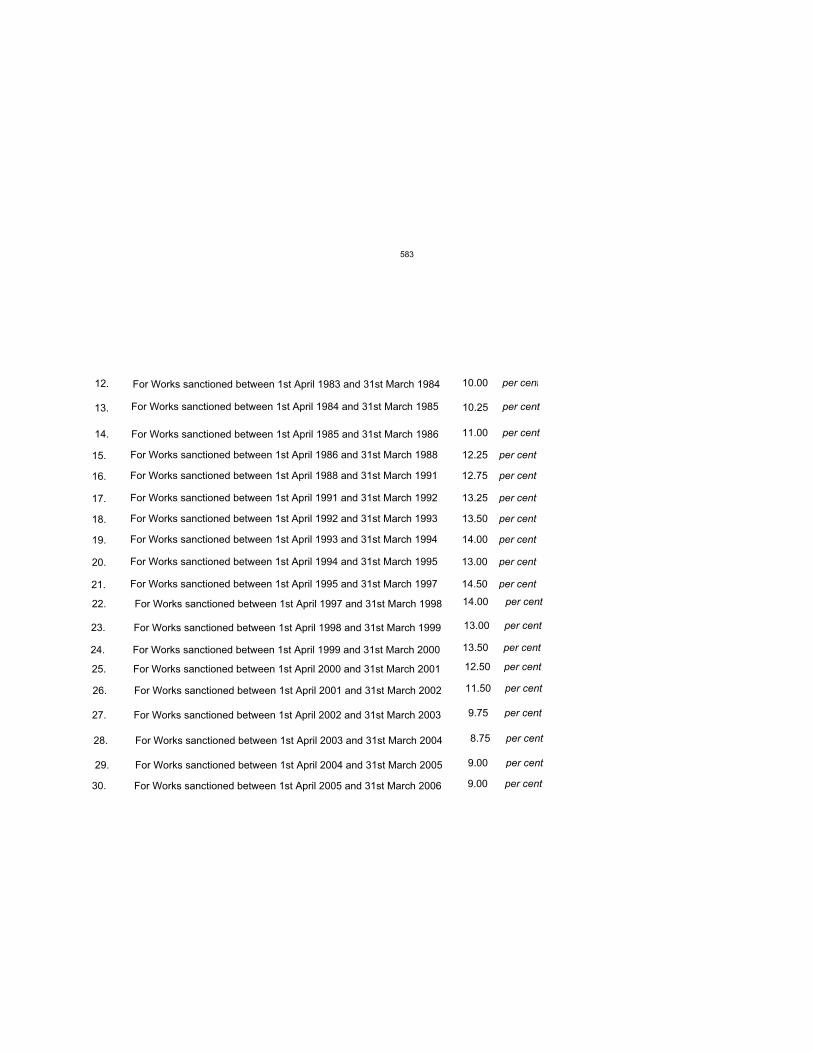
For Works sanctioned between 1st April 1983 and 31st March 1984
For Works sanctioned between 1st April 1984 and 31st March 1985
For Works sanctioned between 1st April 1985 and 31st March 1986
12.
13.
14.
10.00 per cent
10.25 per cent
11.00 per cent
For Works sanctioned between 1st April 1986 and 31st March 1988
For Works sanctioned between 1st April 1988 and 31st March 1991
For Works sanctioned between 1st April 1991 and 31st March 1992
For Works sanctioned between 1st April 1992 and 31st March 1993
For Works sanctioned between 1st April 1993 and 31st March 1994
For Works sanctioned between 1st April 1994 and 31st March 1995
For Works sanctioned between 1st April 1995 and 31st March 1997
15.
16.
17.
18.
19.
20.
21.
12.25 per cent
12.75 per cent
13.25 per cent
13.50 per cent
14.00 per cent
13.00 per cent
14.50 per cent
For Works sanctioned between 1st April 1997 and 31st March 1998
For Works sanctioned between 1st April 1998 and 31st March 1999
22.
23.
14.00 per cent
13.00 per cent
For Works sanctioned between 1st April 1999 and 31st March 2000
For Works sanctioned between 1st April 2000 and 31st March 2001
For Works sanctioned between 1st April 2001 and 31st March 2002
For Works sanctioned between 1st April 2002 and 31st March 2003
For Works sanctioned between 1st April 2003 and 31st March 2004
For Works sanctioned between 1st April 2004 and 31st March 2005
For Works sanctioned between 1st April 2005 and 31st March 2006
24.
25.
26.
27.
28.
29.
30.
13.50 per cent
12.50 per cent
11.50 per cent
9.75 per cent
8.75 per cent
9.00 per cent
9.00 per cent
583
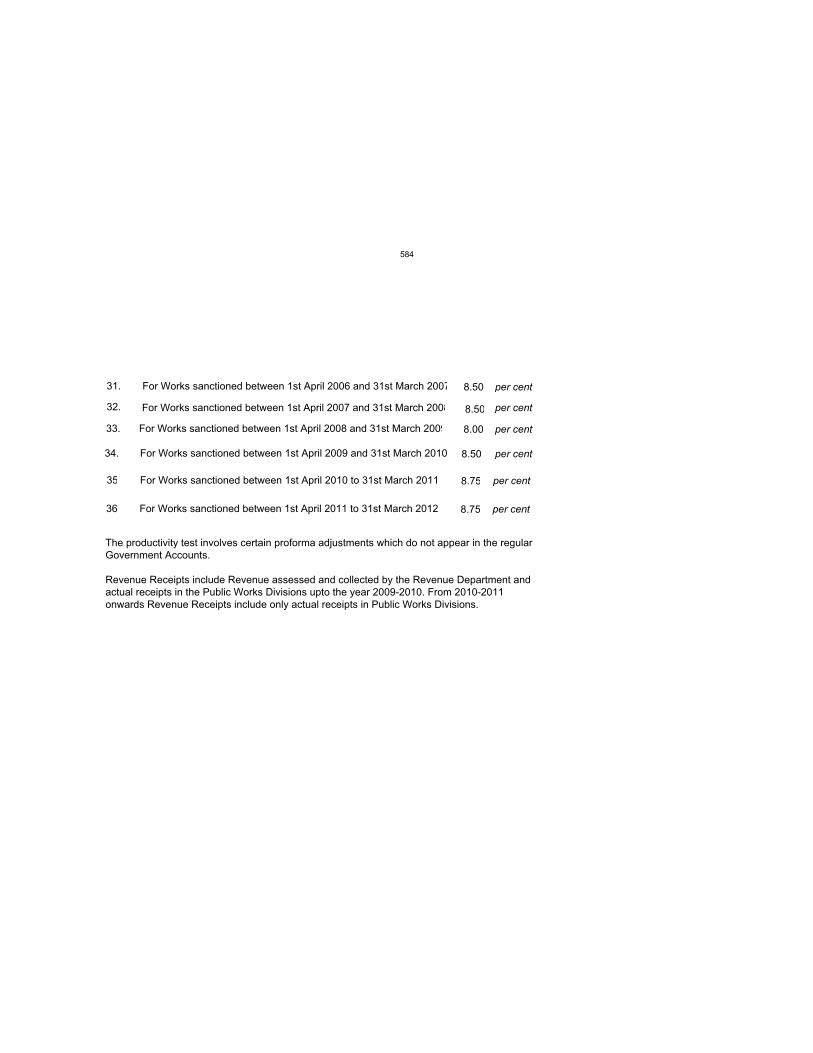
For Works sanctioned between 1st April 2006 and 31st March 200731. 8.50 per cent
The productivity test involves certain proforma adjustments which do not appear in the regularGovernment Accounts.
Revenue Receipts include Revenue assessed and collected by the Revenue Department andactual receipts in the Public Works Divisions upto the year 2009-2010. From 2010-2011 onwards Revenue Receipts include only actual receipts in Public Works Divisions.
32. For Works sanctioned between 1st April 2007 and 31st March 2008 8.50 per cent
per cent
per cent
per cent
33. 8.00
34. For Works sanctioned between 1st April 2009 and 31st March 2010 8.50
For Works sanctioned between 1st April 2008 and 31st March 2009
35 For Works sanctioned between 1st April 2010 to 31st March 2011 8.75
per cent36 For Works sanctioned between 1st April 2011 to 31st March 2012 8.75
584
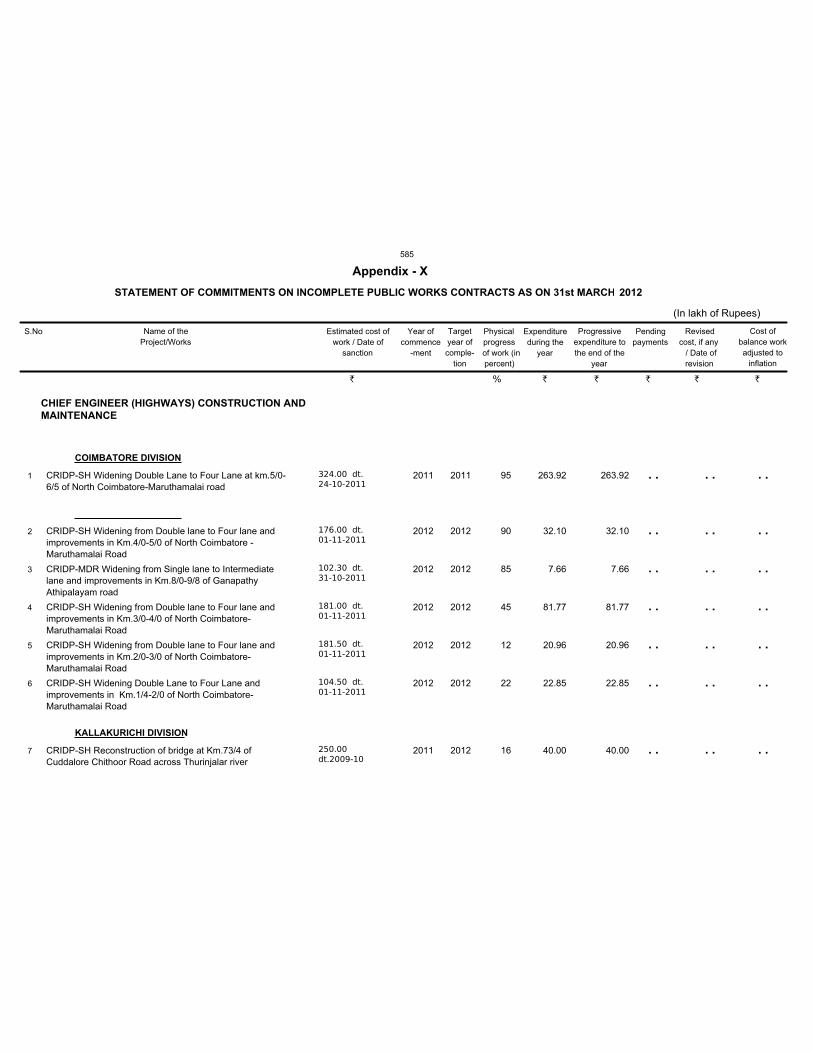
CHIEF ENGINEER (HIGHWAYS) CONSTRUCTION AND
MAINTENANCE
COIMBATORE DIVISION
KALLAKURICHI DIVISION
CRIDP-SH Widening Double Lane to Four Lane at km.5/0-
6/5 of North Coimbatore-Maruthamalai road
CRIDP-SH Widening from Double lane to Four lane and
improvements in Km.4/0-5/0 of North Coimbatore -
Maruthamalai Road
CRIDP-MDR Widening from Single lane to Intermediate
lane and improvements in Km.8/0-9/8 of Ganapathy
Athipalayam road
CRIDP-SH Widening from Double lane to Four lane and
improvements in Km.3/0-4/0 of North Coimbatore-
Maruthamalai Road
CRIDP-SH Widening from Double lane to Four lane and
improvements in Km.2/0-3/0 of North Coimbatore-
Maruthamalai Road
CRIDP-SH Widening Double Lane to Four Lane and
improvements in Km.1/4-2/0 of North Coimbatore-
Maruthamalai Road
CRIDP-SH Reconstruction of bridge at Km.73/4 of
Cuddalore Chithoor Road across Thurinjalar river
324.00 dt.
24-10-2011
176.00 dt.
01-11-2011
102.30 dt.
31-10-2011
181.00 dt.
01-11-2011
181.50 dt.
01-11-2011
104.50 dt.
01-11-2011
250.00
dt.2009-10
2011
2012
2012
2012
2012
2012
2011
2011
2012
2012
2012
2012
2012
2012
263.92
32.10
7.66
81.77
20.96
22.85
40.00
263.92
32.10
7.66
81.77
20.96
22.85
40.00
95
90
85
45
12
22
16
1
2
3
4
5
6
7
S.No Name of the
Project/Works
Estimated cost of
work / Date of
sanction
Year of
commence
-ment
Target
year of
comple-
tion
Physical
progress
of work (in
percent)
Expenditure
during the
year
Progressive
expenditure to
the end of the
year
Pending
payments
Revised
cost, if any
/ Date of
revision
STATEMENT OF COMMITMENTS ON INCOMPLETE PUBLIC WORKS CONTRACTS AS ON 31st MARCH
Appendix - X
(In lakh of Rupees)
2012
Cost of
balance work
adjusted to
inflation
. .
. .
. .
. .
. .
. .
. .
. .
. .
. .
. .
. .
. .
. .
. .
. .
. .
. .
. .
. .
. .
` % ` ` ` ` `
585
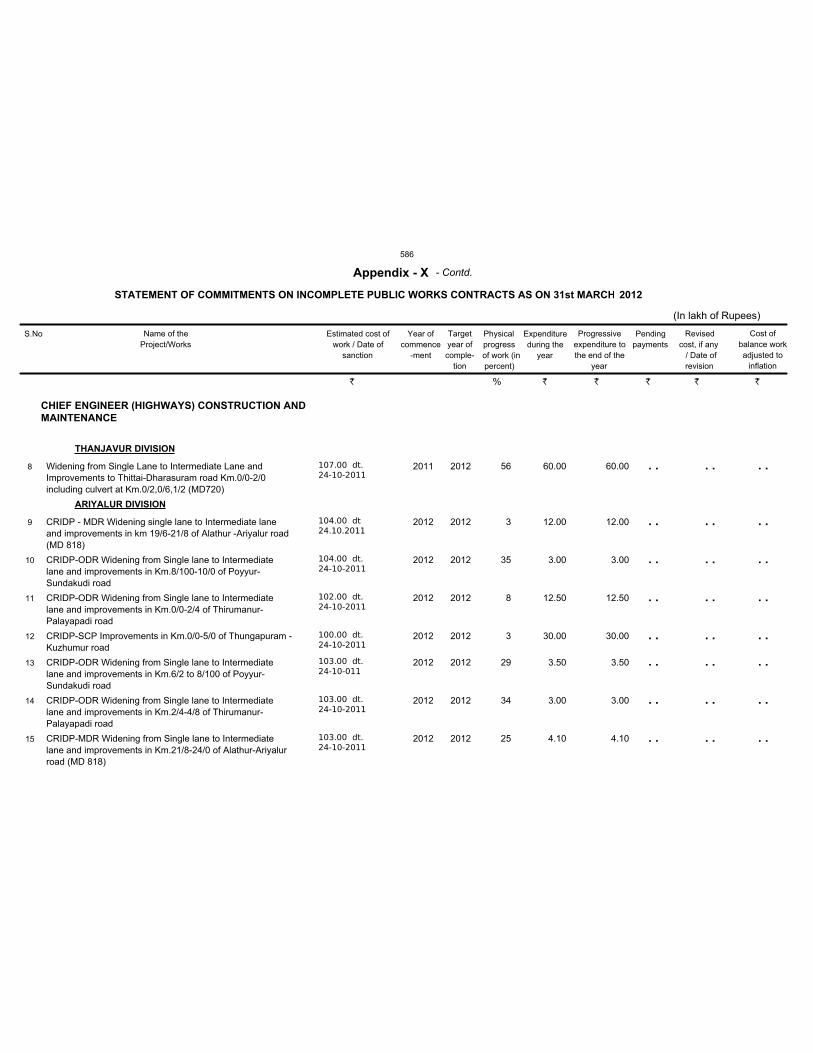
CHIEF ENGINEER (HIGHWAYS) CONSTRUCTION AND
MAINTENANCE
THANJAVUR DIVISION
ARIYALUR DIVISION
Widening from Single Lane to Intermediate Lane and
Improvements to Thittai-Dharasuram road Km.0/0-2/0
including culvert at Km.0/2,0/6,1/2 (MD720)
CRIDP - MDR Widening single lane to Intermediate lane
and improvements in km 19/6-21/8 of Alathur -Ariyalur road
(MD 818)
CRIDP-ODR Widening from Single lane to Intermediate
lane and improvements in Km.8/100-10/0 of Poyyur-
Sundakudi road
CRIDP-ODR Widening from Single lane to Intermediate
lane and improvements in Km.0/0-2/4 of Thirumanur-
Palayapadi road
CRIDP-SCP Improvements in Km.0/0-5/0 of Thungapuram -
Kuzhumur road
CRIDP-ODR Widening from Single lane to Intermediate
lane and improvements in Km.6/2 to 8/100 of Poyyur-
Sundakudi road
CRIDP-ODR Widening from Single lane to Intermediate
lane and improvements in Km.2/4-4/8 of Thirumanur-
Palayapadi road
CRIDP-MDR Widening from Single lane to Intermediate
lane and improvements in Km.21/8-24/0 of Alathur-Ariyalur
road (MD 818)
107.00 dt.
24-10-2011
104.00 dt
24.10.2011
104.00 dt.
24-10-2011
102.00 dt.
24-10-2011
100.00 dt.
24-10-2011
103.00 dt.
24-10-011
103.00 dt.
24-10-2011
103.00 dt.
24-10-2011
2011
2012
2012
2012
2012
2012
2012
2012
2012
2012
2012
2012
2012
2012
2012
2012
60.00
12.00
3.00
12.50
30.00
3.50
3.00
4.10
60.00
12.00
3.00
12.50
30.00
3.50
3.00
4.10
56
3
35
8
3
29
34
25
8
9
10
11
12
13
14
15
S.No Name of the
Project/Works
Estimated cost of
work / Date of
sanction
Year of
commence
-ment
Target
year of
comple-
tion
Physical
progress
of work (in
percent)
Expenditure
during the
year
Progressive
expenditure to
the end of the
year
Pending
payments
Revised
cost, if any
/ Date of
revision
STATEMENT OF COMMITMENTS ON INCOMPLETE PUBLIC WORKS CONTRACTS AS ON 31st MARCH
Appendix - X
(In lakh of Rupees)
2012
Cost of
balance work
adjusted to
inflation
- Contd.
. .
. .
. .
. .
. .
. .
. .
. .
. .
. .
. .
. .
. .
. .
. .
. .
. .
. .
. .
. .
. .
. .
. .
. .
` % ` ` ` ` `
586
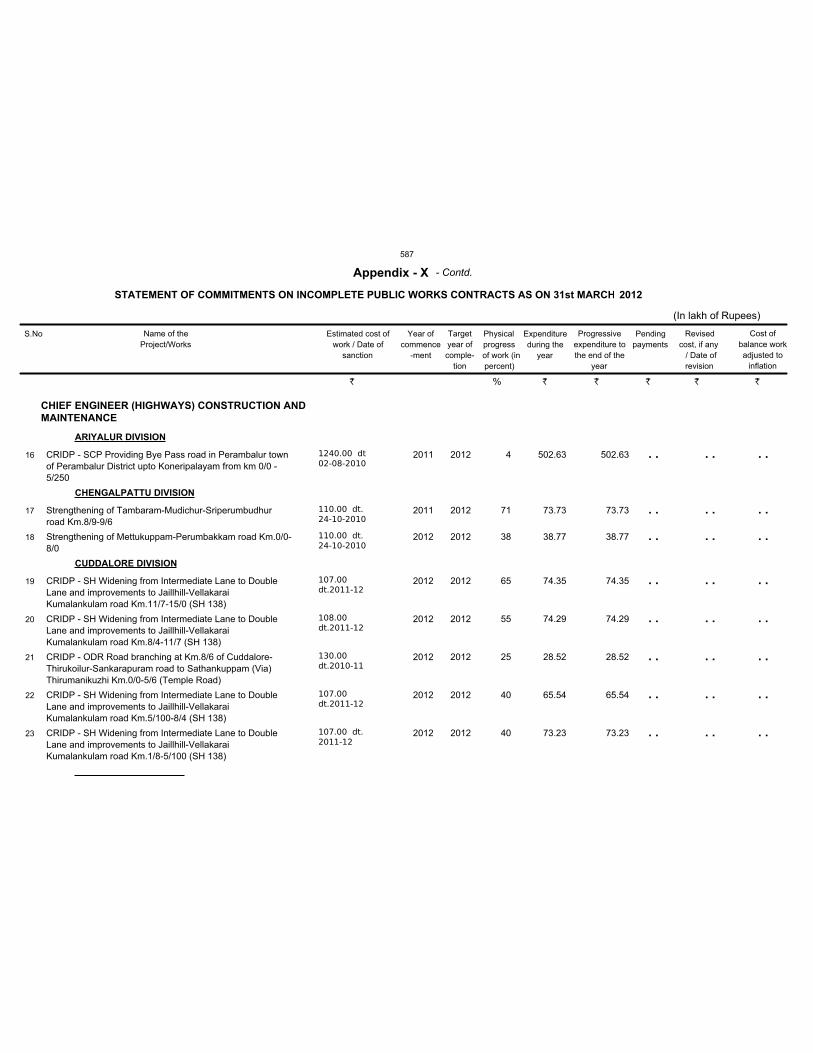
CHIEF ENGINEER (HIGHWAYS) CONSTRUCTION AND
MAINTENANCE
ARIYALUR DIVISION
CHENGALPATTU DIVISION
CUDDALORE DIVISION
CRIDP - SCP Providing Bye Pass road in Perambalur town
of Perambalur District upto Koneripalayam from km 0/0 -
5/250
Strengthening of Tambaram-Mudichur-Sriperumbudhur
road Km.8/9-9/6
Strengthening of Mettukuppam-Perumbakkam road Km.0/0-
8/0
CRIDP - SH Widening from Intermediate Lane to Double
Lane and improvements to Jaillhill-Vellakarai
Kumalankulam road Km.11/7-15/0 (SH 138)
CRIDP - SH Widening from Intermediate Lane to Double
Lane and improvements to Jaillhill-Vellakarai
Kumalankulam road Km.8/4-11/7 (SH 138)
CRIDP - ODR Road branching at Km.8/6 of Cuddalore-
Thirukoilur-Sankarapuram road to Sathankuppam (Via)
Thirumanikuzhi Km.0/0-5/6 (Temple Road)
CRIDP - SH Widening from Intermediate Lane to Double
Lane and improvements to Jaillhill-Vellakarai
Kumalankulam road Km.5/100-8/4 (SH 138)
CRIDP - SH Widening from Intermediate Lane to Double
Lane and improvements to Jaillhill-Vellakarai
Kumalankulam road Km.1/8-5/100 (SH 138)
1240.00 dt
02-08-2010
110.00 dt.
24-10-2010
110.00 dt.
24-10-2010
107.00
dt.2011-12
108.00
dt.2011-12
130.00
dt.2010-11
107.00
dt.2011-12
107.00 dt.
2011-12
2011
2011
2012
2012
2012
2012
2012
2012
2012
2012
2012
2012
2012
2012
2012
2012
502.63
73.73
38.77
74.35
74.29
28.52
65.54
73.23
502.63
73.73
38.77
74.35
74.29
28.52
65.54
73.23
4
71
38
65
55
25
40
40
16
17
18
19
20
21
22
23
S.No Name of the
Project/Works
Estimated cost of
work / Date of
sanction
Year of
commence
-ment
Target
year of
comple-
tion
Physical
progress
of work (in
percent)
Expenditure
during the
year
Progressive
expenditure to
the end of the
year
Pending
payments
Revised
cost, if any
/ Date of
revision
STATEMENT OF COMMITMENTS ON INCOMPLETE PUBLIC WORKS CONTRACTS AS ON 31st MARCH
Appendix - X
(In lakh of Rupees)
2012
Cost of
balance work
adjusted to
inflation
- Contd.
. .
. .
. .
. .
. .
. .
. .
. .
. .
. .
. .
. .
. .
. .
. .
. .
. .
. .
. .
. .
. .
. .
. .
. .
` % ` ` ` ` `
587

CHIEF ENGINEER (HIGHWAYS) CONSTRUCTION AND
MAINTENANCE
DHARAPURAM DIVISION
DHARMAPURI DIVISION
PART II Scheme Bridges Reconstruction of Highlevel Bridge
across Nasuvankaraioodai at Km 20/4 of Kanagayam -
Kodumudi road in lieu of existing piped cause way
CRIDP-ODR-SCP Forming Bye Pass road in Dharapuram
Town in Tiruppur District from Palani-Dharapuram road to
Mettur-Palakkanuthu-Oddanchatram-Dharapuram-Tirupur
road at Km.2/550-3/600
CRIDP-ODR-SCP Forming Bye pass road in Dharapuram
Town in Tiruppur District from Mettur-Palakkanuthu-
Oddanchatram-Dharapuram-Tirupur Km.74/10 to Pollachi-
Dharapuram-Karur road Km.58/2 at Km.0/0-1/2.
(Upputhuraipalayam to Madugampalayam Pirivu)
CRIDP-MDR Improvements to Udumalpet-Chinnar Road
Km.1/5-4/0 & 4/6-5/2
CRIDP - SH Widening from four lane in km 135/4 - 136/4 of
Dharamapuri state Highway (Old NH -7) Road
CRIDP - SH Widening from Double Lane to Multilane and
Improvements km 143/0-143/6 of Dharmapuri State
Highways (Old National Highways - 7) Road including
widening of culvert at km.143/2
CRIDP - MDR Widening from Single Lane to Intermediate
Lane Km.2/6-5/6 and Improvements in km.2/6-4/0 and 5/0-
5/6 including and widening of culvert at Km.3/6, 4/4 of
Bommidi Railway Station to Thoppaiyar road
240.00 dt
02-08-2010
200.00 dt.
24-10-2011
200.00 dt.
24-10-2011
100.00 dt.
24-10-2011
199.00 dt
2010-2011
110.00 dt.
2011-2012
110.00 dt.
2011-2012
2011
2012
2012
2011
2010
2012
2012
2012
2012
2012
2012
2011
2012
2012
177.24
157.44
165.94
14.30
4.20
0.59
0.37
177.24
157.44
165.94
14.30
14.70
0.59
0.37
70
40
40
70
20
70
20
24
25
26
27
28
29
30
S.No Name of the
Project/Works
Estimated cost of
work / Date of
sanction
Year of
commence
-ment
Target
year of
comple-
tion
Physical
progress
of work (in
percent)
Expenditure
during the
year
Progressive
expenditure to
the end of the
year
Pending
payments
Revised
cost, if any
/ Date of
revision
STATEMENT OF COMMITMENTS ON INCOMPLETE PUBLIC WORKS CONTRACTS AS ON 31st MARCH
Appendix - X
(In lakh of Rupees)
2012
Cost of
balance work
adjusted to
inflation
- Contd.
. .
. .
. .
. .
. .
. .
. .
. .
. .
. .
. .
. .
. .
. .
. .
. .
. .
. .
. .
. .
. .
` % ` ` ` ` `
588
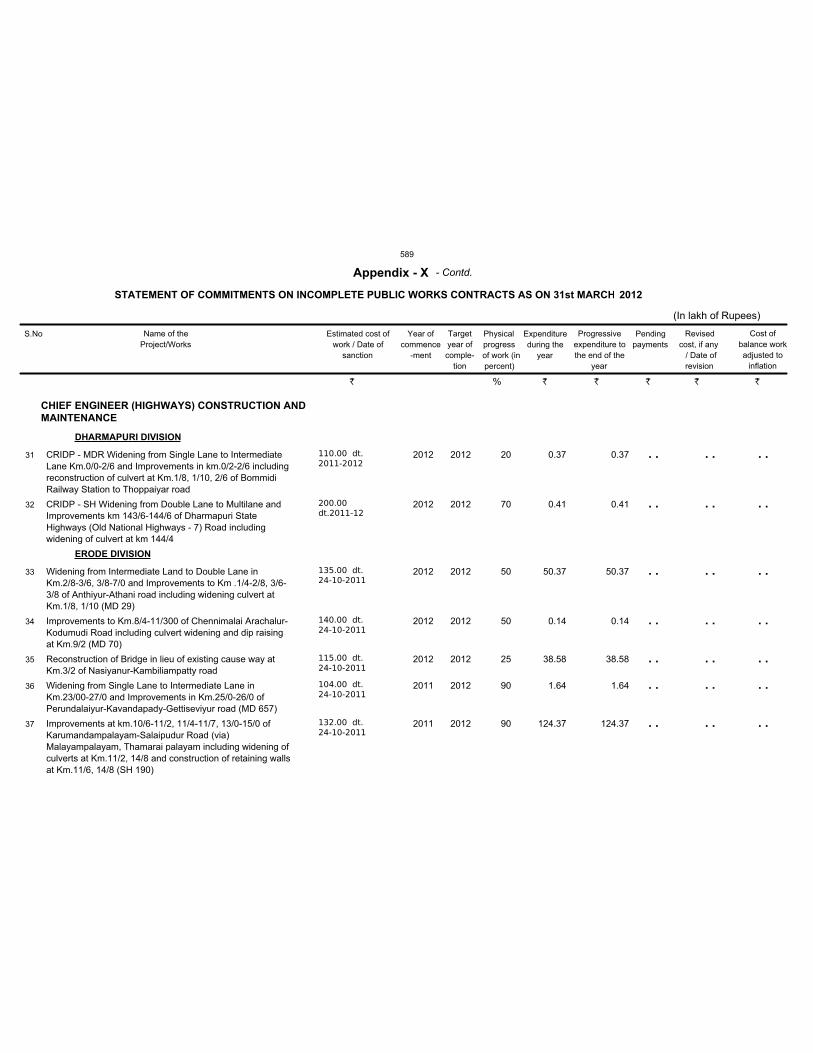
CHIEF ENGINEER (HIGHWAYS) CONSTRUCTION AND
MAINTENANCE
DHARMAPURI DIVISION
ERODE DIVISION
CRIDP - MDR Widening from Single Lane to Intermediate
Lane Km.0/0-2/6 and Improvements in km.0/2-2/6 including
reconstruction of culvert at Km.1/8, 1/10, 2/6 of Bommidi
Railway Station to Thoppaiyar road
CRIDP - SH Widening from Double Lane to Multilane and
Improvements km 143/6-144/6 of Dharmapuri State
Highways (Old National Highways - 7) Road including
widening of culvert at km 144/4
Widening from Intermediate Land to Double Lane in
Km.2/8-3/6, 3/8-7/0 and Improvements to Km .1/4-2/8, 3/6-
3/8 of Anthiyur-Athani road including widening culvert at
Km.1/8, 1/10 (MD 29)
Improvements to Km.8/4-11/300 of Chennimalai Arachalur-
Kodumudi Road including culvert widening and dip raising
at Km.9/2 (MD 70)
Reconstruction of Bridge in lieu of existing cause way at
Km.3/2 of Nasiyanur-Kambiliampatty road
Widening from Single Lane to Intermediate Lane in
Km.23/00-27/0 and Improvements in Km.25/0-26/0 of
Perundalaiyur-Kavandapady-Gettiseviyur road (MD 657)
Improvements at km.10/6-11/2, 11/4-11/7, 13/0-15/0 of
Karumandampalayam-Salaipudur Road (via)
Malayampalayam, Thamarai palayam including widening of
culverts at Km.11/2, 14/8 and construction of retaining walls
at Km.11/6, 14/8 (SH 190)
110.00 dt.
2011-2012
200.00
dt.2011-12
135.00 dt.
24-10-2011
140.00 dt.
24-10-2011
115.00 dt.
24-10-2011
104.00 dt.
24-10-2011
132.00 dt.
24-10-2011
2012
2012
2012
2012
2012
2011
2011
2012
2012
2012
2012
2012
2012
2012
0.37
0.41
50.37
0.14
38.58
1.64
124.37
0.37
0.41
50.37
0.14
38.58
1.64
124.37
20
70
50
50
25
90
90
31
32
33
34
35
36
37
S.No Name of the
Project/Works
Estimated cost of
work / Date of
sanction
Year of
commence
-ment
Target
year of
comple-
tion
Physical
progress
of work (in
percent)
Expenditure
during the
year
Progressive
expenditure to
the end of the
year
Pending
payments
Revised
cost, if any
/ Date of
revision
STATEMENT OF COMMITMENTS ON INCOMPLETE PUBLIC WORKS CONTRACTS AS ON 31st MARCH
Appendix - X
(In lakh of Rupees)
2012
Cost of
balance work
adjusted to
inflation
- Contd.
. .
. .
. .
. .
. .
. .
. .
. .
. .
. .
. .
. .
. .
. .
. .
. .
. .
. .
. .
. .
. .
` % ` ` ` ` `
589
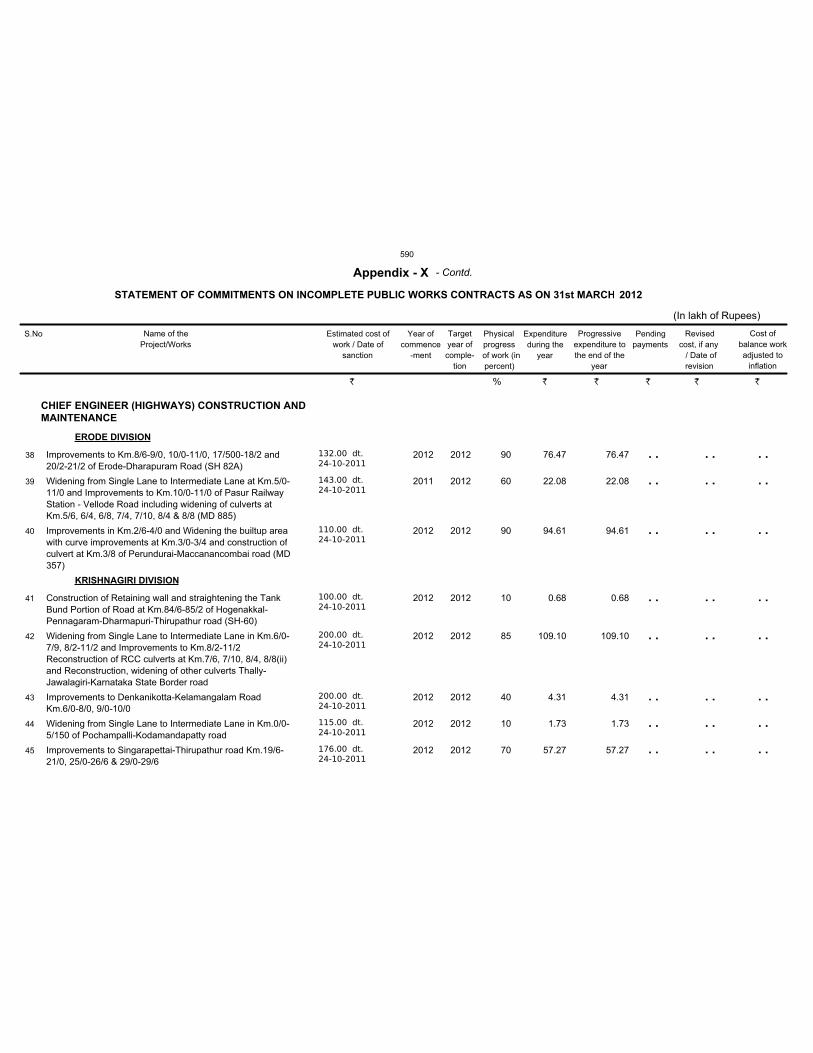
CHIEF ENGINEER (HIGHWAYS) CONSTRUCTION AND
MAINTENANCE
ERODE DIVISION
KRISHNAGIRI DIVISION
Improvements to Km.8/6-9/0, 10/0-11/0, 17/500-18/2 and
20/2-21/2 of Erode-Dharapuram Road (SH 82A)
Widening from Single Lane to Intermediate Lane at Km.5/0-
11/0 and Improvements to Km.10/0-11/0 of Pasur Railway
Station - Vellode Road including widening of culverts at
Km.5/6, 6/4, 6/8, 7/4, 7/10, 8/4 & 8/8 (MD 885)
Improvements in Km.2/6-4/0 and Widening the builtup area
with curve improvements at Km.3/0-3/4 and construction of
culvert at Km.3/8 of Perundurai-Maccanancombai road (MD
357)
Construction of Retaining wall and straightening the Tank
Bund Portion of Road at Km.84/6-85/2 of Hogenakkal-
Pennagaram-Dharmapuri-Thirupathur road (SH-60)
Widening from Single Lane to Intermediate Lane in Km.6/0-
7/9, 8/2-11/2 and Improvements to Km.8/2-11/2
Reconstruction of RCC culverts at Km.7/6, 7/10, 8/4, 8/8(ii)
and Reconstruction, widening of other culverts Thally-
Jawalagiri-Karnataka State Border road
Improvements to Denkanikotta-Kelamangalam Road
Km.6/0-8/0, 9/0-10/0
Widening from Single Lane to Intermediate Lane in Km.0/0-
5/150 of Pochampalli-Kodamandapatty road
Improvements to Singarapettai-Thirupathur road Km.19/6-
21/0, 25/0-26/6 & 29/0-29/6
132.00 dt.
24-10-2011
143.00 dt.
24-10-2011
110.00 dt.
24-10-2011
100.00 dt.
24-10-2011
200.00 dt.
24-10-2011
200.00 dt.
24-10-2011
115.00 dt.
24-10-2011
176.00 dt.
24-10-2011
2012
2011
2012
2012
2012
2012
2012
2012
2012
2012
2012
2012
2012
2012
2012
2012
76.47
22.08
94.61
0.68
109.10
4.31
1.73
57.27
76.47
22.08
94.61
0.68
109.10
4.31
1.73
57.27
90
60
90
10
85
40
10
70
38
39
40
41
42
43
44
45
S.No Name of the
Project/Works
Estimated cost of
work / Date of
sanction
Year of
commence
-ment
Target
year of
comple-
tion
Physical
progress
of work (in
percent)
Expenditure
during the
year
Progressive
expenditure to
the end of the
year
Pending
payments
Revised
cost, if any
/ Date of
revision
STATEMENT OF COMMITMENTS ON INCOMPLETE PUBLIC WORKS CONTRACTS AS ON 31st MARCH
Appendix - X
(In lakh of Rupees)
2012
Cost of
balance work
adjusted to
inflation
- Contd.
. .
. .
. .
. .
. .
. .
. .
. .
. .
. .
. .
. .
. .
. .
. .
. .
. .
. .
. .
. .
. .
. .
. .
. .
` % ` ` ` ` `
590
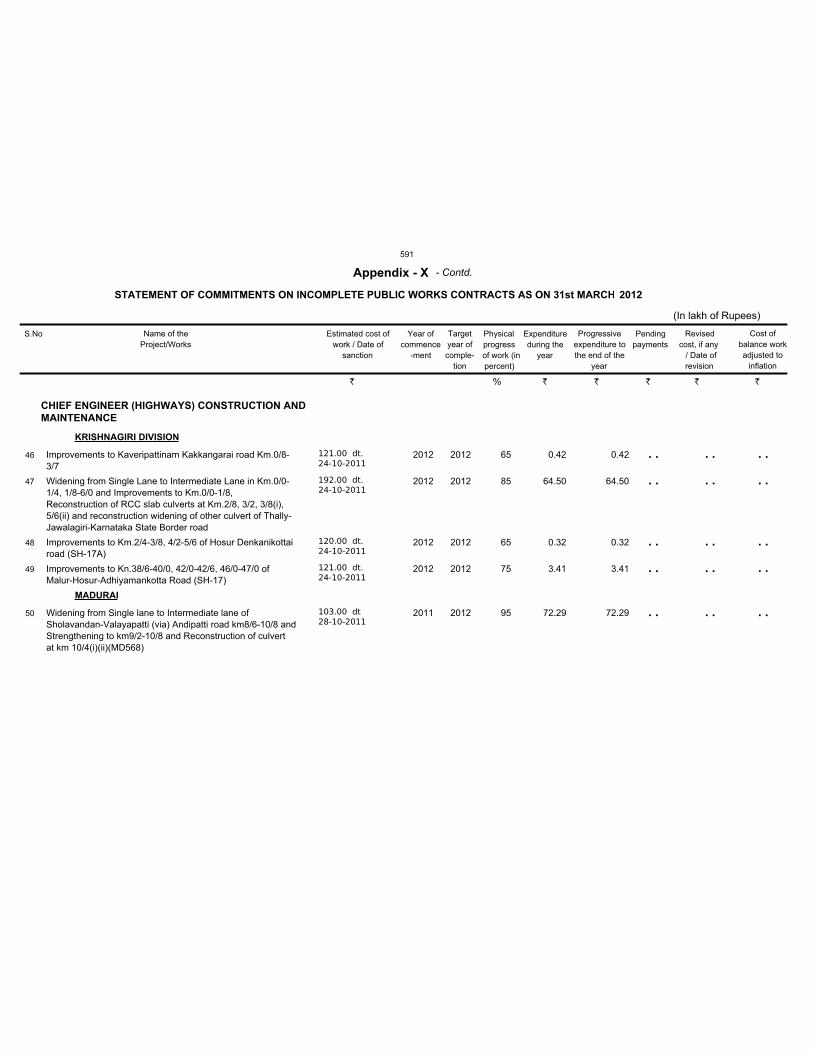
CHIEF ENGINEER (HIGHWAYS) CONSTRUCTION AND
MAINTENANCE
KRISHNAGIRI DIVISION
MADURAI
Improvements to Kaveripattinam Kakkangarai road Km.0/8-
3/7
Widening from Single Lane to Intermediate Lane in Km.0/0-
1/4, 1/8-6/0 and Improvements to Km.0/0-1/8,
Reconstruction of RCC slab culverts at Km.2/8, 3/2, 3/8(i),
5/6(ii) and reconstruction widening of other culvert of Thally-
Jawalagiri-Karnataka State Border road
Improvements to Km.2/4-3/8, 4/2-5/6 of Hosur Denkanikottai
road (SH-17A)
Improvements to Kn.38/6-40/0, 42/0-42/6, 46/0-47/0 of
Malur-Hosur-Adhiyamankotta Road (SH-17)
Widening from Single lane to Intermediate lane of
Sholavandan-Valayapatti (via) Andipatti road km8/6-10/8 and
Strengthening to km9/2-10/8 and Reconstruction of culvert
at km 10/4(i)(ii)(MD568)
121.00 dt.
24-10-2011
192.00 dt.
24-10-2011
120.00 dt.
24-10-2011
121.00 dt.
24-10-2011
103.00 dt
28-10-2011
2012
2012
2012
2012
2011
2012
2012
2012
2012
2012
0.42
64.50
0.32
3.41
72.29
0.42
64.50
0.32
3.41
72.29
65
85
65
75
95
46
47
48
49
50
S.No Name of the
Project/Works
Estimated cost of
work / Date of
sanction
Year of
commence
-ment
Target
year of
comple-
tion
Physical
progress
of work (in
percent)
Expenditure
during the
year
Progressive
expenditure to
the end of the
year
Pending
payments
Revised
cost, if any
/ Date of
revision
STATEMENT OF COMMITMENTS ON INCOMPLETE PUBLIC WORKS CONTRACTS AS ON 31st MARCH
Appendix - X
(In lakh of Rupees)
2012
Cost of
balance work
adjusted to
inflation
- Contd.
. .
. .
. .
. .
. .
. .
. .
. .
. .
. .
. .
. .
. .
. .
. .
` % ` ` ` ` `
591
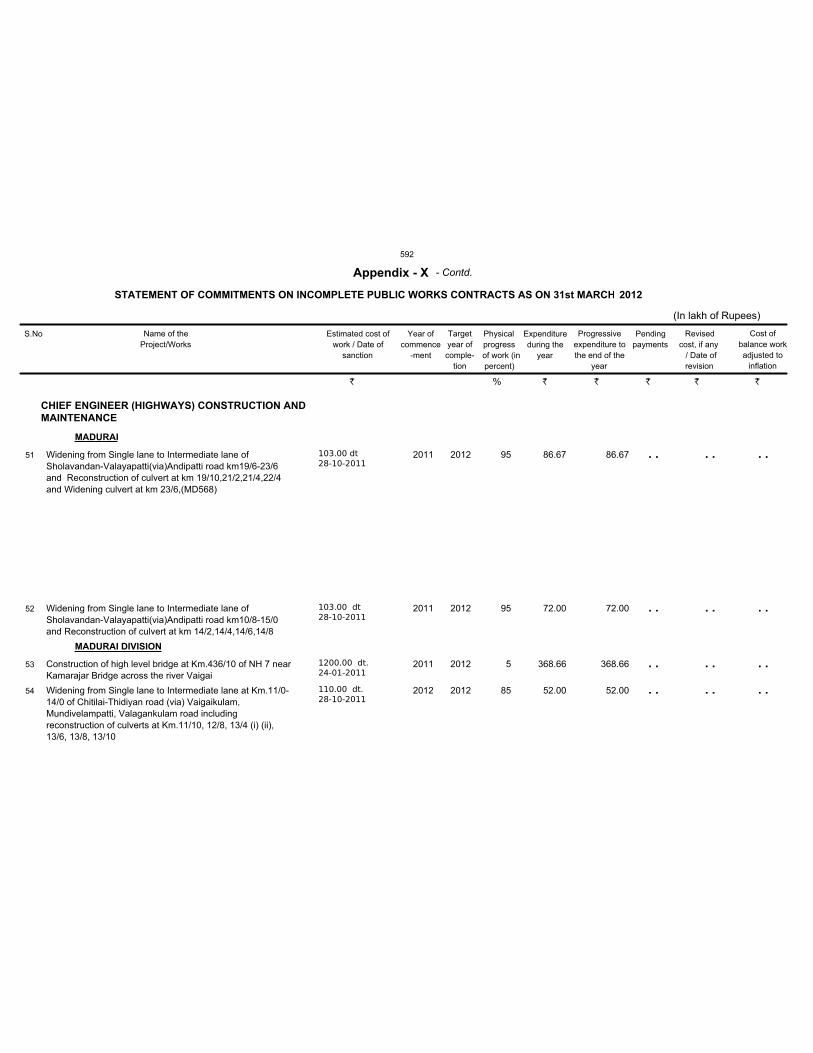
CHIEF ENGINEER (HIGHWAYS) CONSTRUCTION AND
MAINTENANCE
MADURAI
MADURAI DIVISION
Widening from Single lane to Intermediate lane of
Sholavandan-Valayapatti(via)Andipatti road km19/6-23/6
and Reconstruction of culvert at km 19/10,21/2,21/4,22/4
and Widening culvert at km 23/6,(MD568)
Widening from Single lane to Intermediate lane of
Sholavandan-Valayapatti(via)Andipatti road km10/8-15/0
and Reconstruction of culvert at km 14/2,14/4,14/6,14/8
Construction of high level bridge at Km.436/10 of NH 7 near
Kamarajar Bridge across the river Vaigai
Widening from Single lane to Intermediate lane at Km.11/0-
14/0 of Chitilai-Thidiyan road (via) Vaigaikulam,
Mundivelampatti, Valagankulam road including
reconstruction of culverts at Km.11/10, 12/8, 13/4 (i) (ii),
13/6, 13/8, 13/10
103.00 dt
28-10-2011
103.00 dt
28-10-2011
1200.00 dt.
24-01-2011
110.00 dt.
28-10-2011
2011
2011
2011
2012
2012
2012
2012
2012
86.67
72.00
368.66
52.00
86.67
72.00
368.66
52.00
95
95
5
85
51
52
53
54
S.No Name of the
Project/Works
Estimated cost of
work / Date of
sanction
Year of
commence
-ment
Target
year of
comple-
tion
Physical
progress
of work (in
percent)
Expenditure
during the
year
Progressive
expenditure to
the end of the
year
Pending
payments
Revised
cost, if any
/ Date of
revision
STATEMENT OF COMMITMENTS ON INCOMPLETE PUBLIC WORKS CONTRACTS AS ON 31st MARCH
Appendix - X
(In lakh of Rupees)
2012
Cost of
balance work
adjusted to
inflation
- Contd.
. .
. .
. .
. .
. .
. .
. .
. .
. .
. .
. .
. .
` % ` ` ` ` `
592
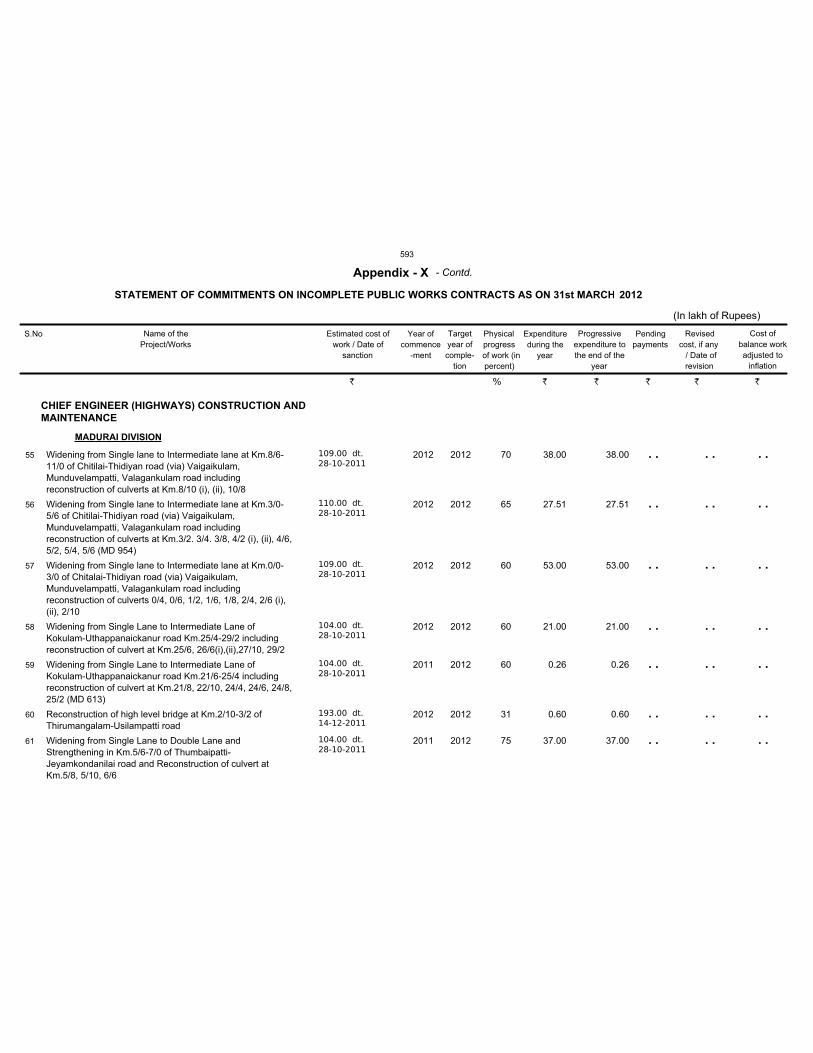
CHIEF ENGINEER (HIGHWAYS) CONSTRUCTION AND
MAINTENANCE
MADURAI DIVISION
Widening from Single lane to Intermediate lane at Km.8/6-
11/0 of Chitilai-Thidiyan road (via) Vaigaikulam,
Munduvelampatti, Valagankulam road including
reconstruction of culverts at Km.8/10 (i), (ii), 10/8
Widening from Single lane to Intermediate lane at Km.3/0-
5/6 of Chitilai-Thidiyan road (via) Vaigaikulam,
Munduvelampatti, Valagankulam road including
reconstruction of culverts at Km.3/2. 3/4. 3/8, 4/2 (i), (ii), 4/6,
5/2, 5/4, 5/6 (MD 954)
Widening from Single lane to Intermediate lane at Km.0/0-
3/0 of Chitalai-Thidiyan road (via) Vaigaikulam,
Munduvelampatti, Valagankulam road including
reconstruction of culverts 0/4, 0/6, 1/2, 1/6, 1/8, 2/4, 2/6 (i),
(ii), 2/10
Widening from Single Lane to Intermediate Lane of
Kokulam-Uthappanaickanur road Km.25/4-29/2 including
reconstruction of culvert at Km.25/6, 26/6(i),(ii),27/10, 29/2
Widening from Single Lane to Intermediate Lane of
Kokulam-Uthappanaickanur road Km.21/6-25/4 including
reconstruction of culvert at Km.21/8, 22/10, 24/4, 24/6, 24/8,
25/2 (MD 613)
Reconstruction of high level bridge at Km.2/10-3/2 of
Thirumangalam-Usilampatti road
Widening from Single Lane to Double Lane and
Strengthening in Km.5/6-7/0 of Thumbaipatti-
Jeyamkondanilai road and Reconstruction of culvert at
Km.5/8, 5/10, 6/6
109.00 dt.
28-10-2011
110.00 dt.
28-10-2011
109.00 dt.
28-10-2011
104.00 dt.
28-10-2011
104.00 dt.
28-10-2011
193.00 dt.
14-12-2011
104.00 dt.
28-10-2011
2012
2012
2012
2012
2011
2012
2011
2012
2012
2012
2012
2012
2012
2012
38.00
27.51
53.00
21.00
0.26
0.60
37.00
38.00
27.51
53.00
21.00
0.26
0.60
37.00
70
65
60
60
60
31
75
55
56
57
58
59
60
61
S.No Name of the
Project/Works
Estimated cost of
work / Date of
sanction
Year of
commence
-ment
Target
year of
comple-
tion
Physical
progress
of work (in
percent)
Expenditure
during the
year
Progressive
expenditure to
the end of the
year
Pending
payments
Revised
cost, if any
/ Date of
revision
STATEMENT OF COMMITMENTS ON INCOMPLETE PUBLIC WORKS CONTRACTS AS ON 31st MARCH
Appendix - X
(In lakh of Rupees)
2012
Cost of
balance work
adjusted to
inflation
- Contd.
. .
. .
. .
. .
. .
. .
. .
. .
. .
. .
. .
. .
. .
. .
. .
. .
. .
. .
. .
. .
. .
` % ` ` ` ` `
593
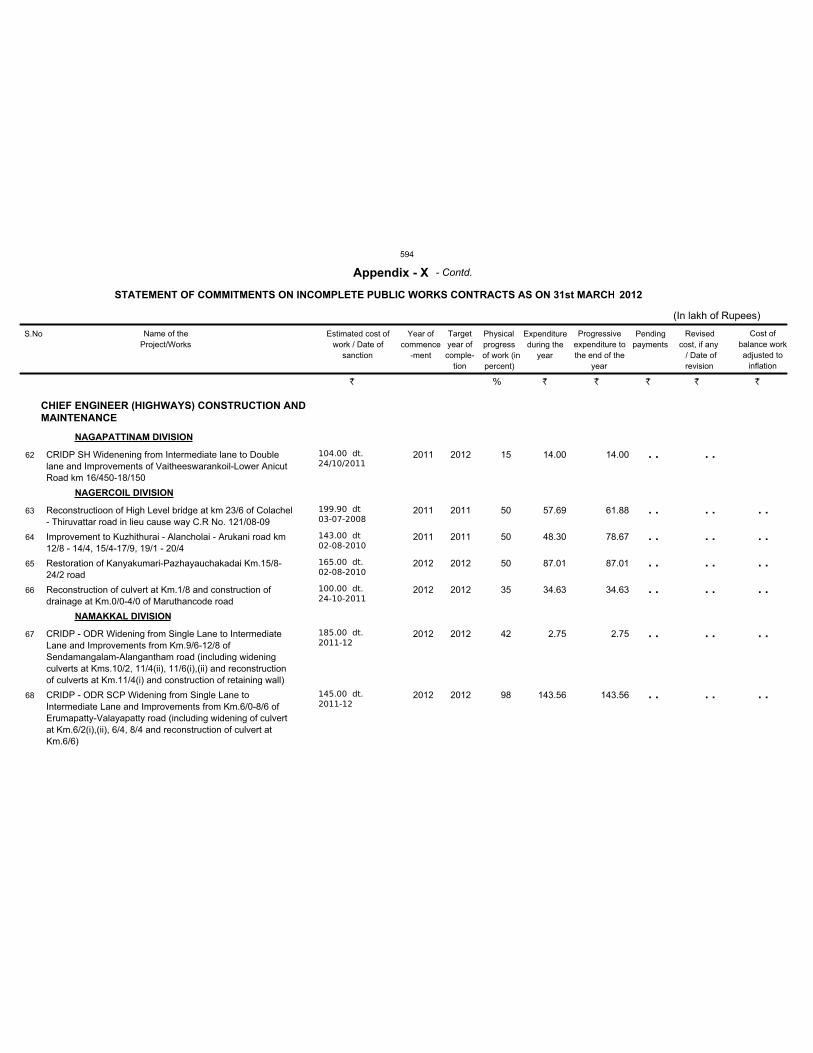
CHIEF ENGINEER (HIGHWAYS) CONSTRUCTION AND
MAINTENANCE
NAGAPATTINAM DIVISION
NAGERCOIL DIVISION
NAMAKKAL DIVISION
CRIDP SH Widenening from Intermediate lane to Double
lane and Improvements of Vaitheeswarankoil-Lower Anicut
Road km 16/450-18/150
Reconstructioon of High Level bridge at km 23/6 of Colachel
- Thiruvattar road in lieu cause way C.R No. 121/08-09
Improvement to Kuzhithurai - Alancholai - Arukani road km
12/8 - 14/4, 15/4-17/9, 19/1 - 20/4
Restoration of Kanyakumari-Pazhayauchakadai Km.15/8-
24/2 road
Reconstruction of culvert at Km.1/8 and construction of
drainage at Km.0/0-4/0 of Maruthancode road
CRIDP - ODR Widening from Single Lane to Intermediate
Lane and Improvements from Km.9/6-12/8 of
Sendamangalam-Alangantham road (including widening
culverts at Kms.10/2, 11/4(ii), 11/6(i),(ii) and reconstruction
of culverts at Km.11/4(i) and construction of retaining wall)
CRIDP - ODR SCP Widening from Single Lane to
Intermediate Lane and Improvements from Km.6/0-8/6 of
Erumapatty-Valayapatty road (including widening of culvert
at Km.6/2(i),(ii), 6/4, 8/4 and reconstruction of culvert at
Km.6/6)
104.00 dt.
24/10/2011
199.90 dt
03-07-2008
143.00 dt
02-08-2010
165.00 dt.
02-08-2010
100.00 dt.
24-10-2011
185.00 dt.
2011-12
145.00 dt.
2011-12
2011
2011
2011
2012
2012
2012
2012
2012
2011
2011
2012
2012
2012
2012
14.00
57.69
48.30
87.01
34.63
2.75
143.56
14.00
61.88
78.67
87.01
34.63
2.75
143.56
15
50
50
50
35
42
98
62
63
64
65
66
67
68
S.No Name of the
Project/Works
Estimated cost of
work / Date of
sanction
Year of
commence
-ment
Target
year of
comple-
tion
Physical
progress
of work (in
percent)
Expenditure
during the
year
Progressive
expenditure to
the end of the
year
Pending
payments
Revised
cost, if any
/ Date of
revision
STATEMENT OF COMMITMENTS ON INCOMPLETE PUBLIC WORKS CONTRACTS AS ON 31st MARCH
Appendix - X
(In lakh of Rupees)
2012
Cost of
balance work
adjusted to
inflation
- Contd.
. .
. .
. .
. .
. .
. .
. .
. .
. .
. .
. .
. .
. .
. .
. .
. .
. .
. .
. .
. .
` % ` ` ` ` `
594
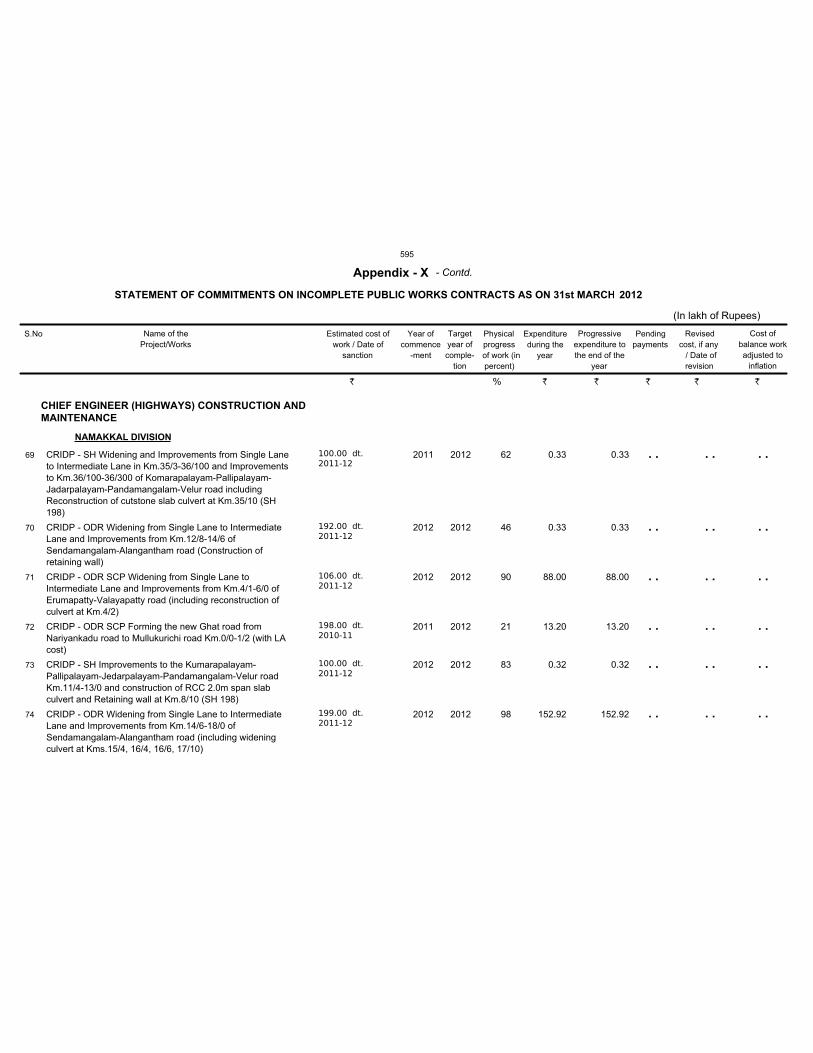
CHIEF ENGINEER (HIGHWAYS) CONSTRUCTION AND
MAINTENANCE
NAMAKKAL DIVISION
CRIDP - SH Widening and Improvements from Single Lane
to Intermediate Lane in Km.35/3-36/100 and Improvements
to Km.36/100-36/300 of Komarapalayam-Pallipalayam-
Jadarpalayam-Pandamangalam-Velur road including
Reconstruction of cutstone slab culvert at Km.35/10 (SH
198)
CRIDP - ODR Widening from Single Lane to Intermediate
Lane and Improvements from Km.12/8-14/6 of
Sendamangalam-Alangantham road (Construction of
retaining wall)
CRIDP - ODR SCP Widening from Single Lane to
Intermediate Lane and Improvements from Km.4/1-6/0 of
Erumapatty-Valayapatty road (including reconstruction of
culvert at Km.4/2)
CRIDP - ODR SCP Forming the new Ghat road from
Nariyankadu road to Mullukurichi road Km.0/0-1/2 (with LA
cost)
CRIDP - SH Improvements to the Kumarapalayam-
Pallipalayam-Jedarpalayam-Pandamangalam-Velur road
Km.11/4-13/0 and construction of RCC 2.0m span slab
culvert and Retaining wall at Km.8/10 (SH 198)
CRIDP - ODR Widening from Single Lane to Intermediate
Lane and Improvements from Km.14/6-18/0 of
Sendamangalam-Alangantham road (including widening
culvert at Kms.15/4, 16/4, 16/6, 17/10)
100.00 dt.
2011-12
192.00 dt.
2011-12
106.00 dt.
2011-12
198.00 dt.
2010-11
100.00 dt.
2011-12
199.00 dt.
2011-12
2011
2012
2012
2011
2012
2012
2012
2012
2012
2012
2012
2012
0.33
0.33
88.00
13.20
0.32
152.92
0.33
0.33
88.00
13.20
0.32
152.92
62
46
90
21
83
98
69
70
71
72
73
74
S.No Name of the
Project/Works
Estimated cost of
work / Date of
sanction
Year of
commence
-ment
Target
year of
comple-
tion
Physical
progress
of work (in
percent)
Expenditure
during the
year
Progressive
expenditure to
the end of the
year
Pending
payments
Revised
cost, if any
/ Date of
revision
STATEMENT OF COMMITMENTS ON INCOMPLETE PUBLIC WORKS CONTRACTS AS ON 31st MARCH
Appendix - X
(In lakh of Rupees)
2012
Cost of
balance work
adjusted to
inflation
- Contd.
. .
. .
. .
. .
. .
. .
. .
. .
. .
. .
. .
. .
. .
. .
. .
. .
. .
. .
` % ` ` ` ` `
595
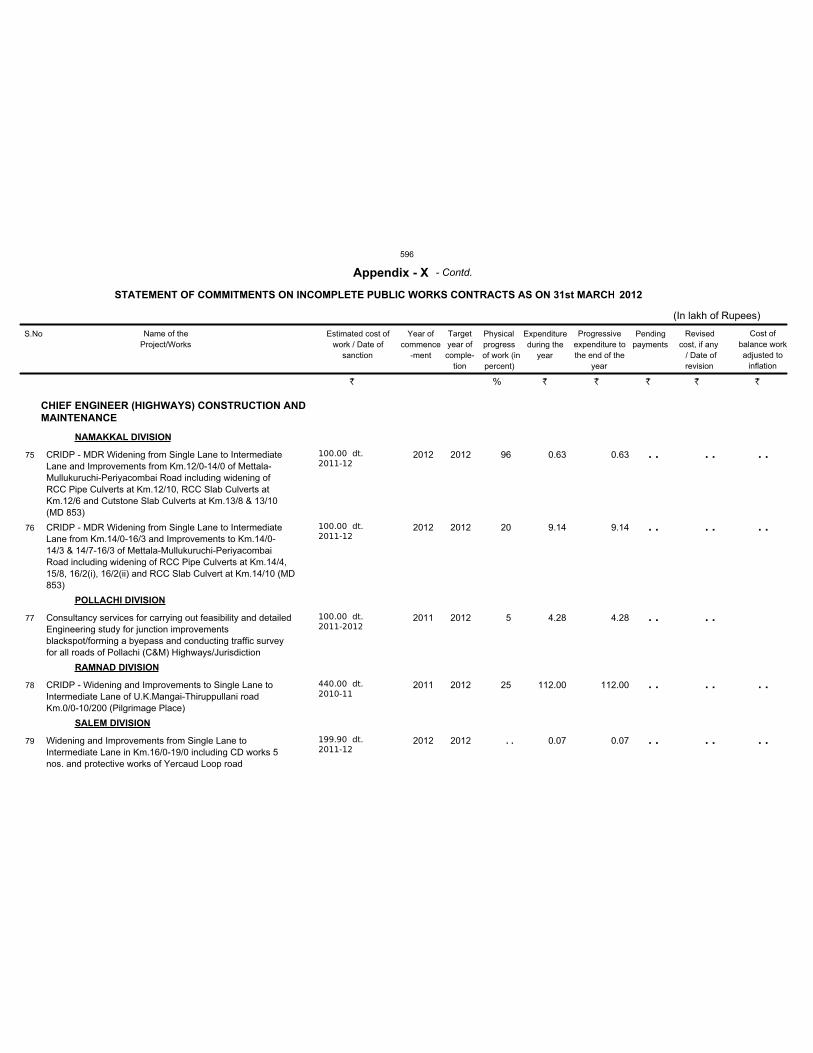
CHIEF ENGINEER (HIGHWAYS) CONSTRUCTION AND
MAINTENANCE
NAMAKKAL DIVISION
POLLACHI DIVISION
RAMNAD DIVISION
SALEM DIVISION
CRIDP - MDR Widening from Single Lane to Intermediate
Lane and Improvements from Km.12/0-14/0 of Mettala-
Mullukuruchi-Periyacombai Road including widening of
RCC Pipe Culverts at Km.12/10, RCC Slab Culverts at
Km.12/6 and Cutstone Slab Culverts at Km.13/8 & 13/10
(MD 853)
CRIDP - MDR Widening from Single Lane to Intermediate
Lane from Km.14/0-16/3 and Improvements to Km.14/0-
14/3 & 14/7-16/3 of Mettala-Mullukuruchi-Periyacombai
Road including widening of RCC Pipe Culverts at Km.14/4,
15/8, 16/2(i), 16/2(ii) and RCC Slab Culvert at Km.14/10 (MD
853)
Consultancy services for carrying out feasibility and detailed
Engineering study for junction improvements
blackspot/forming a byepass and conducting traffic survey
for all roads of Pollachi (C&M) Highways/Jurisdiction
CRIDP - Widening and Improvements to Single Lane to
Intermediate Lane of U.K.Mangai-Thiruppullani road
Km.0/0-10/200 (Pilgrimage Place)
Widening and Improvements from Single Lane to
Intermediate Lane in Km.16/0-19/0 including CD works 5
nos. and protective works of Yercaud Loop road
100.00 dt.
2011-12
100.00 dt.
2011-12
100.00 dt.
2011-2012
440.00 dt.
2010-11
199.90 dt.
2011-12
2012
2012
2011
2011
2012
2012
2012
2012
2012
2012
0.63
9.14
4.28
112.00
0.07
0.63
9.14
4.28
112.00
0.07
96
20
5
25
. .
75
76
77
78
79
S.No Name of the
Project/Works
Estimated cost of
work / Date of
sanction
Year of
commence
-ment
Target
year of
comple-
tion
Physical
progress
of work (in
percent)
Expenditure
during the
year
Progressive
expenditure to
the end of the
year
Pending
payments
Revised
cost, if any
/ Date of
revision
STATEMENT OF COMMITMENTS ON INCOMPLETE PUBLIC WORKS CONTRACTS AS ON 31st MARCH
Appendix - X
(In lakh of Rupees)
2012
Cost of
balance work
adjusted to
inflation
- Contd.
. .
. .
. .
. .
. .
. .
. .
. .
. .
. .
. .
. .
. .
. .
` % ` ` ` ` `
596
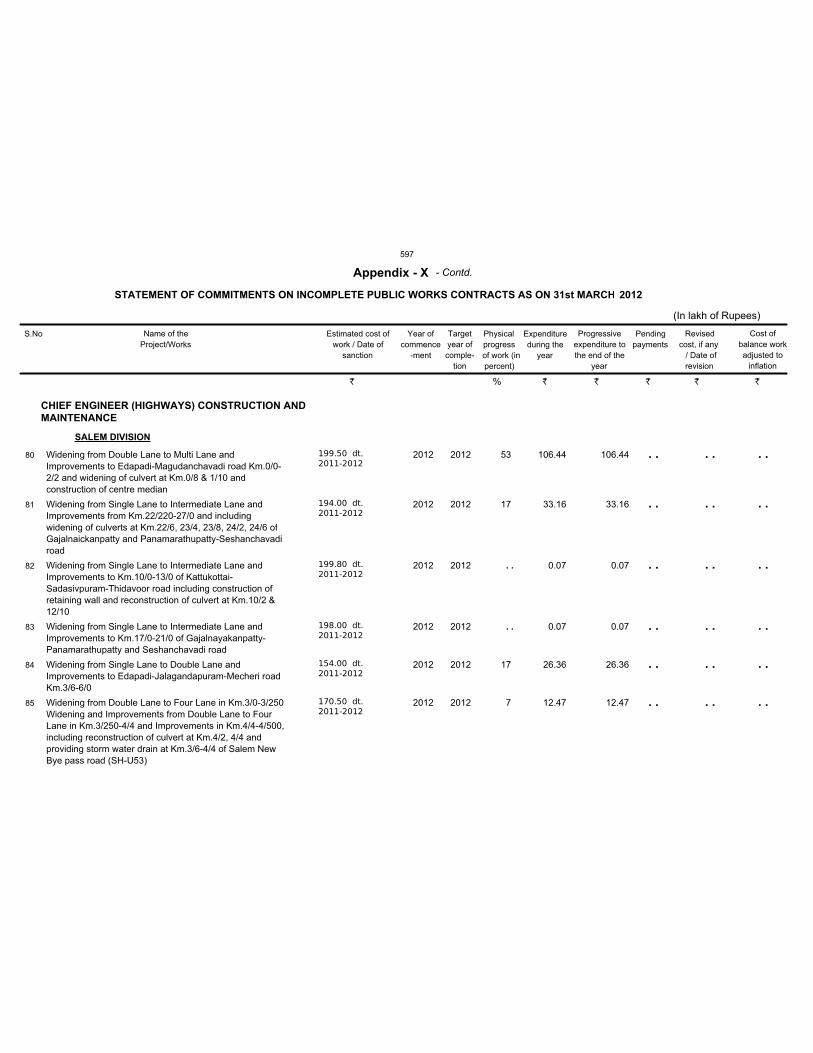
CHIEF ENGINEER (HIGHWAYS) CONSTRUCTION AND
MAINTENANCE
SALEM DIVISION
Widening from Double Lane to Multi Lane and
Improvements to Edapadi-Magudanchavadi road Km.0/0-
2/2 and widening of culvert at Km.0/8 & 1/10 and
construction of centre median
Widening from Single Lane to Intermediate Lane and
Improvements from Km.22/220-27/0 and including
widening of culverts at Km.22/6, 23/4, 23/8, 24/2, 24/6 of
Gajalnaickanpatty and Panamarathupatty-Seshanchavadi
road
Widening from Single Lane to Intermediate Lane and
Improvements to Km.10/0-13/0 of Kattukottai-
Sadasivpuram-Thidavoor road including construction of
retaining wall and reconstruction of culvert at Km.10/2 &
12/10
Widening from Single Lane to Intermediate Lane and
Improvements to Km.17/0-21/0 of Gajalnayakanpatty-
Panamarathupatty and Seshanchavadi road
Widening from Single Lane to Double Lane and
Improvements to Edapadi-Jalagandapuram-Mecheri road
Km.3/6-6/0
Widening from Double Lane to Four Lane in Km.3/0-3/250
Widening and Improvements from Double Lane to Four
Lane in Km.3/250-4/4 and Improvements in Km.4/4-4/500,
including reconstruction of culvert at Km.4/2, 4/4 and
providing storm water drain at Km.3/6-4/4 of Salem New
Bye pass road (SH-U53)
199.50 dt.
2011-2012
194.00 dt.
2011-2012
199.80 dt.
2011-2012
198.00 dt.
2011-2012
154.00 dt.
2011-2012
170.50 dt.
2011-2012
2012
2012
2012
2012
2012
2012
2012
2012
2012
2012
2012
2012
106.44
33.16
0.07
0.07
26.36
12.47
106.44
33.16
0.07
0.07
26.36
12.47
53
17
. .
. .
17
7
80
81
82
83
84
85
S.No Name of the
Project/Works
Estimated cost of
work / Date of
sanction
Year of
commence
-ment
Target
year of
comple-
tion
Physical
progress
of work (in
percent)
Expenditure
during the
year
Progressive
expenditure to
the end of the
year
Pending
payments
Revised
cost, if any
/ Date of
revision
STATEMENT OF COMMITMENTS ON INCOMPLETE PUBLIC WORKS CONTRACTS AS ON 31st MARCH
Appendix - X
(In lakh of Rupees)
2012
Cost of
balance work
adjusted to
inflation
- Contd.
. .
. .
. .
. .
. .
. .
. .
. .
. .
. .
. .
. .
. .
. .
. .
. .
. .
. .
` % ` ` ` ` `
597
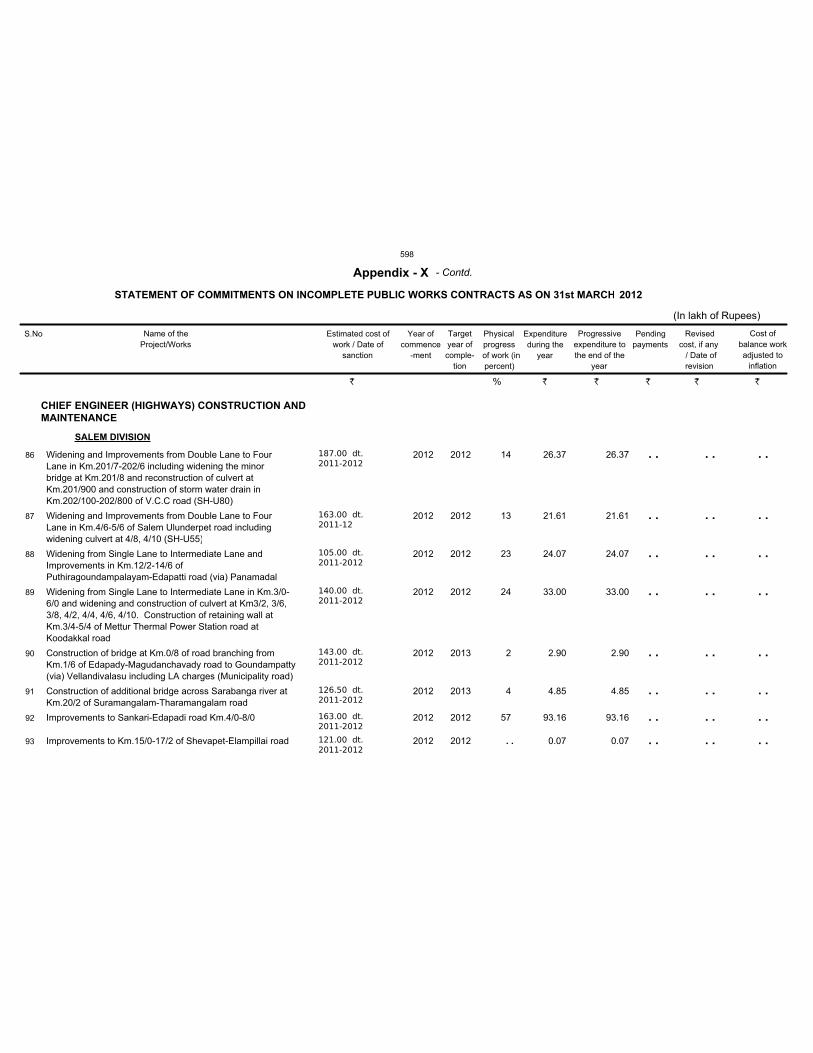
CHIEF ENGINEER (HIGHWAYS) CONSTRUCTION AND
MAINTENANCE
SALEM DIVISION
Widening and Improvements from Double Lane to Four
Lane in Km.201/7-202/6 including widening the minor
bridge at Km.201/8 and reconstruction of culvert at
Km.201/900 and construction of storm water drain in
Km.202/100-202/800 of V.C.C road (SH-U80)
Widening and Improvements from Double Lane to Four
Lane in Km.4/6-5/6 of Salem Ulunderpet road including
widening culvert at 4/8, 4/10 (SH-U55)
Widening from Single Lane to Intermediate Lane and
Improvements in Km.12/2-14/6 of
Puthiragoundampalayam-Edapatti road (via) Panamadal
Widening from Single Lane to Intermediate Lane in Km.3/0-
6/0 and widening and construction of culvert at Km3/2, 3/6,
3/8, 4/2, 4/4, 4/6, 4/10. Construction of retaining wall at
Km.3/4-5/4 of Mettur Thermal Power Station road at
Koodakkal road
Construction of bridge at Km.0/8 of road branching from
Km.1/6 of Edapady-Magudanchavady road to Goundampatty
(via) Vellandivalasu including LA charges (Municipality road)
Construction of additional bridge across Sarabanga river at
Km.20/2 of Suramangalam-Tharamangalam road
Improvements to Sankari-Edapadi road Km.4/0-8/0
Improvements to Km.15/0-17/2 of Shevapet-Elampillai road
187.00 dt.
2011-2012
163.00 dt.
2011-12
105.00 dt.
2011-2012
140.00 dt.
2011-2012
143.00 dt.
2011-2012
126.50 dt.
2011-2012
163.00 dt.
2011-2012
121.00 dt.
2011-2012
2012
2012
2012
2012
2012
2012
2012
2012
2012
2012
2012
2012
2013
2013
2012
2012
26.37
21.61
24.07
33.00
2.90
4.85
93.16
0.07
26.37
21.61
24.07
33.00
2.90
4.85
93.16
0.07
14
13
23
24
2
4
57
. .
86
87
88
89
90
91
92
93
S.No Name of the
Project/Works
Estimated cost of
work / Date of
sanction
Year of
commence
-ment
Target
year of
comple-
tion
Physical
progress
of work (in
percent)
Expenditure
during the
year
Progressive
expenditure to
the end of the
year
Pending
payments
Revised
cost, if any
/ Date of
revision
STATEMENT OF COMMITMENTS ON INCOMPLETE PUBLIC WORKS CONTRACTS AS ON 31st MARCH
Appendix - X
(In lakh of Rupees)
2012
Cost of
balance work
adjusted to
inflation
- Contd.
. .
. .
. .
. .
. .
. .
. .
. .
. .
. .
. .
. .
. .
. .
. .
. .
. .
. .
. .
. .
. .
. .
. .
. .
` % ` ` ` ` `
598
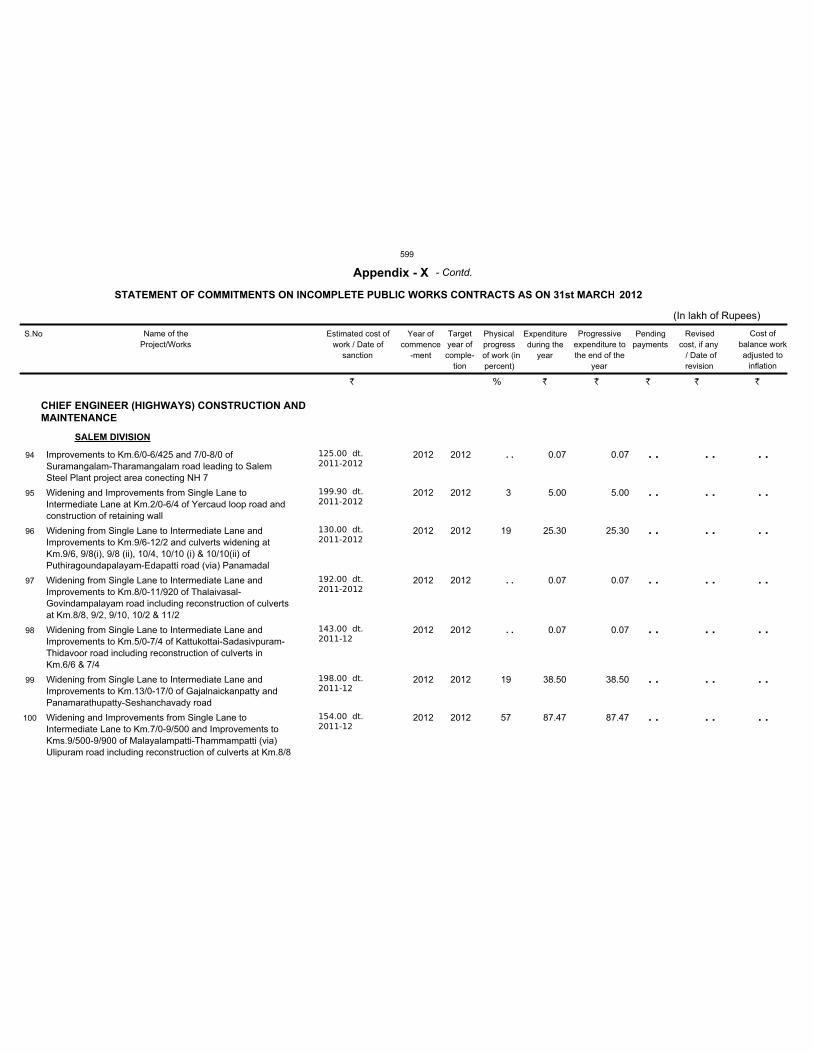
CHIEF ENGINEER (HIGHWAYS) CONSTRUCTION AND
MAINTENANCE
SALEM DIVISION
Improvements to Km.6/0-6/425 and 7/0-8/0 of
Suramangalam-Tharamangalam road leading to Salem
Steel Plant project area conecting NH 7
Widening and Improvements from Single Lane to
Intermediate Lane at Km.2/0-6/4 of Yercaud loop road and
construction of retaining wall
Widening from Single Lane to Intermediate Lane and
Improvements to Km.9/6-12/2 and culverts widening at
Km.9/6, 9/8(i), 9/8 (ii), 10/4, 10/10 (i) & 10/10(ii) of
Puthiragoundapalayam-Edapatti road (via) Panamadal
Widening from Single Lane to Intermediate Lane and
Improvements to Km.8/0-11/920 of Thalaivasal-
Govindampalayam road including reconstruction of culverts
at Km.8/8, 9/2, 9/10, 10/2 & 11/2
Widening from Single Lane to Intermediate Lane and
Improvements to Km.5/0-7/4 of Kattukottai-Sadasivpuram-
Thidavoor road including reconstruction of culverts in
Km.6/6 & 7/4
Widening from Single Lane to Intermediate Lane and
Improvements to Km.13/0-17/0 of Gajalnaickanpatty and
Panamarathupatty-Seshanchavady road
Widening and Improvements from Single Lane to
Intermediate Lane to Km.7/0-9/500 and Improvements to
Kms.9/500-9/900 of Malayalampatti-Thammampatti (via)
Ulipuram road including reconstruction of culverts at Km.8/8
125.00 dt.
2011-2012
199.90 dt.
2011-2012
130.00 dt.
2011-2012
192.00 dt.
2011-2012
143.00 dt.
2011-12
198.00 dt.
2011-12
154.00 dt.
2011-12
2012
2012
2012
2012
2012
2012
2012
2012
2012
2012
2012
2012
2012
2012
0.07
5.00
25.30
0.07
0.07
38.50
87.47
0.07
5.00
25.30
0.07
0.07
38.50
87.47
. .
3
19
. .
. .
19
57
94
95
96
97
98
99
100
S.No Name of the
Project/Works
Estimated cost of
work / Date of
sanction
Year of
commence
-ment
Target
year of
comple-
tion
Physical
progress
of work (in
percent)
Expenditure
during the
year
Progressive
expenditure to
the end of the
year
Pending
payments
Revised
cost, if any
/ Date of
revision
STATEMENT OF COMMITMENTS ON INCOMPLETE PUBLIC WORKS CONTRACTS AS ON 31st MARCH
Appendix - X
(In lakh of Rupees)
2012
Cost of
balance work
adjusted to
inflation
- Contd.
. .
. .
. .
. .
. .
. .
. .
. .
. .
. .
. .
. .
. .
. .
. .
. .
. .
. .
. .
. .
. .
` % ` ` ` ` `
599
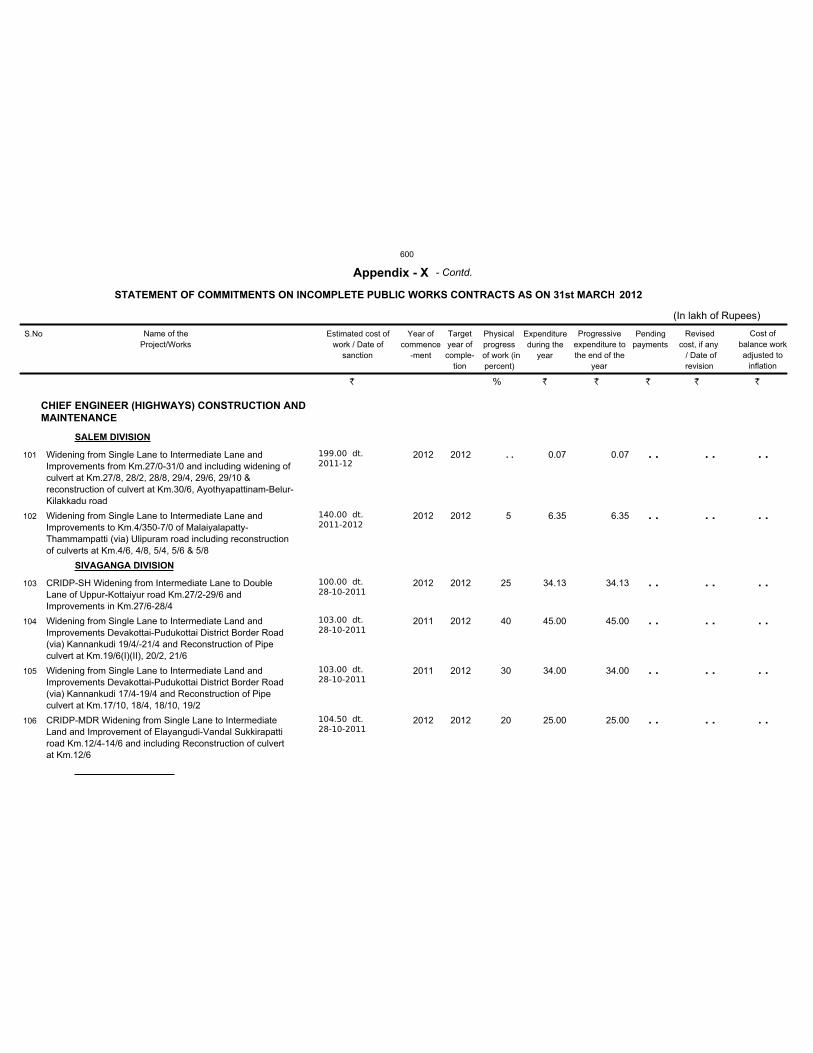
CHIEF ENGINEER (HIGHWAYS) CONSTRUCTION AND
MAINTENANCE
SALEM DIVISION
SIVAGANGA DIVISION
Widening from Single Lane to Intermediate Lane and
Improvements from Km.27/0-31/0 and including widening of
culvert at Km.27/8, 28/2, 28/8, 29/4, 29/6, 29/10 &
reconstruction of culvert at Km.30/6, Ayothyapattinam-Belur-
Kilakkadu road
Widening from Single Lane to Intermediate Lane and
Improvements to Km.4/350-7/0 of Malaiyalapatty-
Thammampatti (via) Ulipuram road including reconstruction
of culverts at Km.4/6, 4/8, 5/4, 5/6 & 5/8
CRIDP-SH Widening from Intermediate Lane to Double
Lane of Uppur-Kottaiyur road Km.27/2-29/6 and
Improvements in Km.27/6-28/4
Widening from Single Lane to Intermediate Land and
Improvements Devakottai-Pudukottai District Border Road
(via) Kannankudi 19/4/-21/4 and Reconstruction of Pipe
culvert at Km.19/6(I)(II), 20/2, 21/6
Widening from Single Lane to Intermediate Land and
Improvements Devakottai-Pudukottai District Border Road
(via) Kannankudi 17/4-19/4 and Reconstruction of Pipe
culvert at Km.17/10, 18/4, 18/10, 19/2
CRIDP-MDR Widening from Single Lane to Intermediate
Land and Improvement of Elayangudi-Vandal Sukkirapatti
road Km.12/4-14/6 and including Reconstruction of culvert
at Km.12/6
199.00 dt.
2011-12
140.00 dt.
2011-2012
100.00 dt.
28-10-2011
103.00 dt.
28-10-2011
103.00 dt.
28-10-2011
104.50 dt.
28-10-2011
2012
2012
2012
2011
2011
2012
2012
2012
2012
2012
2012
2012
0.07
6.35
34.13
45.00
34.00
25.00
0.07
6.35
34.13
45.00
34.00
25.00
. .
5
25
40
30
20
101
102
103
104
105
106
S.No Name of the
Project/Works
Estimated cost of
work / Date of
sanction
Year of
commence
-ment
Target
year of
comple-
tion
Physical
progress
of work (in
percent)
Expenditure
during the
year
Progressive
expenditure to
the end of the
year
Pending
payments
Revised
cost, if any
/ Date of
revision
STATEMENT OF COMMITMENTS ON INCOMPLETE PUBLIC WORKS CONTRACTS AS ON 31st MARCH
Appendix - X
(In lakh of Rupees)
2012
Cost of
balance work
adjusted to
inflation
- Contd.
. .
. .
. .
. .
. .
. .
. .
. .
. .
. .
. .
. .
. .
. .
. .
. .
. .
. .
` % ` ` ` ` `
600

CHIEF ENGINEER (HIGHWAYS) CONSTRUCTION AND
MAINTENANCE
THANJAVUR DIVISION
Formation of By Pass Road for Pattukkottai Town Km.2/8-
4/2 (Pappavelipalayam)
Widening from Single Lane to Intermediate Lane and
Improvements of Km.1/0-4/6 of Thogur-Ayyampettai road
(MD782)
Widening from Single Lane to Intermediate Lane and
Improvements to Thittai-Dharasuram road Km.4/2-7/4
including culvert at Km.4/4 & retaining wall at Km.5/6 (MD
720)
Widening from Single Lane to Intermediate Lane and
Improvements to Thittai-Dharasuram road Km.7/4-9/4
including culvert at Km.8/4 & retaining wall at Km.7/10,
reconstruction of minor bridge at Km.7/8 (MD 720)
Widening from Single Lane to Double Lane and
Improvements to Mannargudi-Orathanadu-Thiruvonam road
Km.25/650-29/0 including pipe culvert at
Km.26/2,26/8,27/2,27/10,28/8 (MD 248)
Widening from Single Lane to Intermediate Lane and
Improvements to Ammapettai-Vaduvur road Km.4/4-7/0
including culvert at Km.4/6, 5/10, 6/2,4,6 & slap culvert at
Km.6/10 (MD 21)
Widening from Single Lane to Intermediate Lane and
Improvements to Thittai-Dharasuram road Km.2/0-4/2
including culvert at Km.2/2,2/6(i), 2/6(ii),3/2,4/2 (MD720)
340.00 dt.
02-08-2010
169.00 dt.
24-10-2011
195.00 dt.
24-10-2011
175.00 dt.
24-10-2011
180.00 dt.
24-10-2011
174.00 dt.
24-10-2011
124.00 dt.
24-10-2011
2012
2011
2011
2011
2011
2011
2011
2012
2012
2012
2012
2012
2012
2012
40.00
110.00
125.00
118.00
102.80
119.00
100.00
40.00
110.00
125.00
118.00
102.80
119.00
100.00
12
65
64
67
57
68
81
107
108
109
110
111
112
113
S.No Name of the
Project/Works
Estimated cost of
work / Date of
sanction
Year of
commence
-ment
Target
year of
comple-
tion
Physical
progress
of work (in
percent)
Expenditure
during the
year
Progressive
expenditure to
the end of the
year
Pending
payments
Revised
cost, if any
/ Date of
revision
STATEMENT OF COMMITMENTS ON INCOMPLETE PUBLIC WORKS CONTRACTS AS ON 31st MARCH
Appendix - X
(In lakh of Rupees)
2012
Cost of
balance work
adjusted to
inflation
- Contd.
. .
. .
. .
. .
. .
. .
. .
. .
. .
. .
. .
. .
. .
. .
. .
. .
. .
. .
. .
. .
. .
` % ` ` ` ` `
601
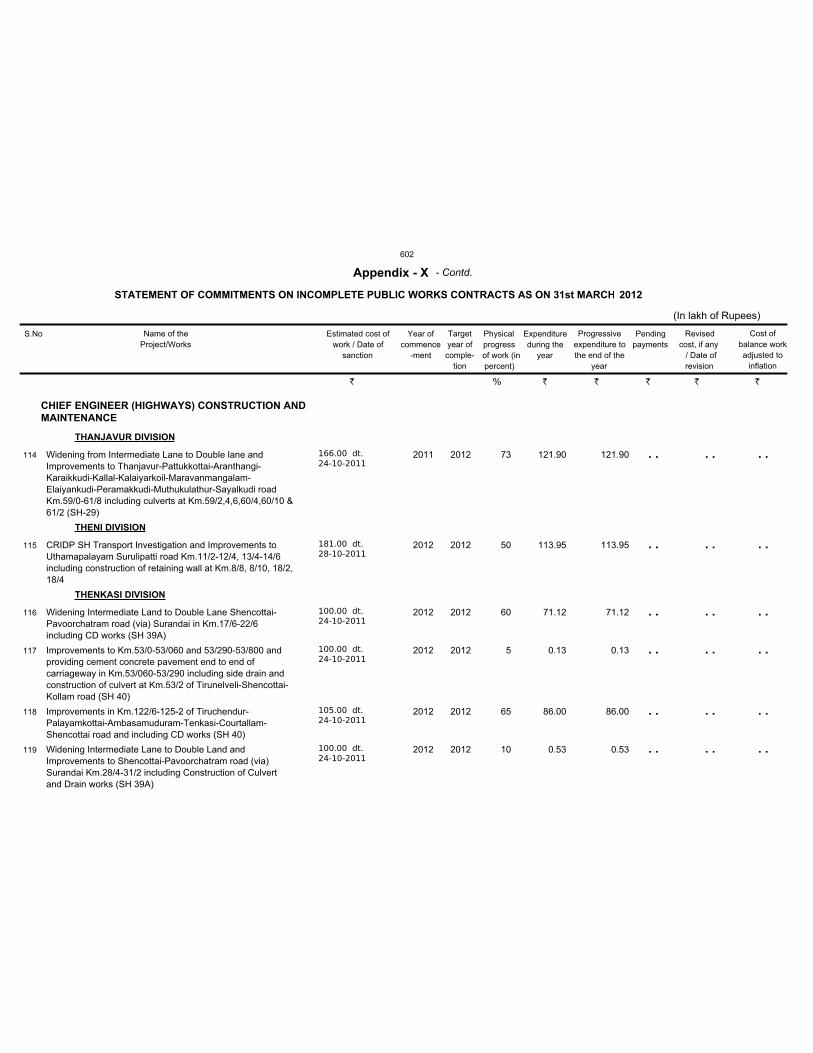
CHIEF ENGINEER (HIGHWAYS) CONSTRUCTION AND
MAINTENANCE
THANJAVUR DIVISION
THENI DIVISION
THENKASI DIVISION
Widening from Intermediate Lane to Double lane and
Improvements to Thanjavur-Pattukkottai-Aranthangi-
Karaikkudi-Kallal-Kalaiyarkoil-Maravanmangalam-
Elaiyankudi-Peramakkudi-Muthukulathur-Sayalkudi road
Km.59/0-61/8 including culverts at Km.59/2,4,6,60/4,60/10 &
61/2 (SH-29)
CRIDP SH Transport Investigation and Improvements to
Uthamapalayam Surulipatti road Km.11/2-12/4, 13/4-14/6
including construction of retaining wall at Km.8/8, 8/10, 18/2,
18/4
Widening Intermediate Land to Double Lane Shencottai-
Pavoorchatram road (via) Surandai in Km.17/6-22/6
including CD works (SH 39A)
Improvements to Km.53/0-53/060 and 53/290-53/800 and
providing cement concrete pavement end to end of
carriageway in Km.53/060-53/290 including side drain and
construction of culvert at Km.53/2 of Tirunelveli-Shencottai-
Kollam road (SH 40)
Improvements in Km.122/6-125-2 of Tiruchendur-
Palayamkottai-Ambasamuduram-Tenkasi-Courtallam-
Shencottai road and including CD works (SH 40)
Widening Intermediate Lane to Double Land and
Improvements to Shencottai-Pavoorchatram road (via)
Surandai Km.28/4-31/2 including Construction of Culvert
and Drain works (SH 39A)
166.00 dt.
24-10-2011
181.00 dt.
28-10-2011
100.00 dt.
24-10-2011
100.00 dt.
24-10-2011
105.00 dt.
24-10-2011
100.00 dt.
24-10-2011
2011
2012
2012
2012
2012
2012
2012
2012
2012
2012
2012
2012
121.90
113.95
71.12
0.13
86.00
0.53
121.90
113.95
71.12
0.13
86.00
0.53
73
50
60
5
65
10
114
115
116
117
118
119
S.No Name of the
Project/Works
Estimated cost of
work / Date of
sanction
Year of
commence
-ment
Target
year of
comple-
tion
Physical
progress
of work (in
percent)
Expenditure
during the
year
Progressive
expenditure to
the end of the
year
Pending
payments
Revised
cost, if any
/ Date of
revision
STATEMENT OF COMMITMENTS ON INCOMPLETE PUBLIC WORKS CONTRACTS AS ON 31st MARCH
Appendix - X
(In lakh of Rupees)
2012
Cost of
balance work
adjusted to
inflation
- Contd.
. .
. .
. .
. .
. .
. .
. .
. .
. .
. .
. .
. .
. .
. .
. .
. .
. .
. .
` % ` ` ` ` `
602
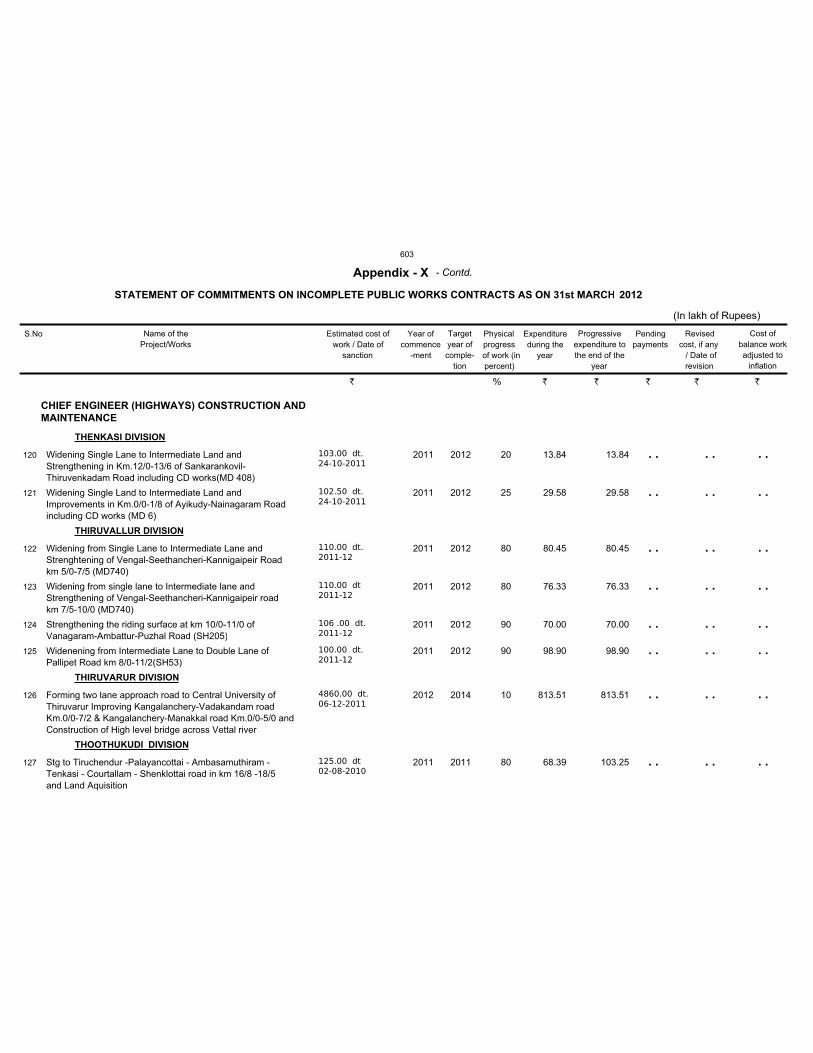
CHIEF ENGINEER (HIGHWAYS) CONSTRUCTION AND
MAINTENANCE
THENKASI DIVISION
THIRUVALLUR DIVISION
THIRUVARUR DIVISION
THOOTHUKUDI DIVISION
Widening Single Lane to Intermediate Land and
Strengthening in Km.12/0-13/6 of Sankarankovil-
Thiruvenkadam Road including CD works(MD 408)
Widening Single Land to Intermediate Land and
Improvements in Km.0/0-1/8 of Ayikudy-Nainagaram Road
including CD works (MD 6)
Widening from Single Lane to Intermediate Lane and
Strenghtening of Vengal-Seethancheri-Kannigaipeir Road
km 5/0-7/5 (MD740)
Widening from single lane to Intermediate lane and
Strengthening of Vengal-Seethancheri-Kannigaipeir road
km 7/5-10/0 (MD740)
Strengthening the riding surface at km 10/0-11/0 of
Vanagaram-Ambattur-Puzhal Road (SH205)
Widenening from Intermediate Lane to Double Lane of
Pallipet Road km 8/0-11/2(SH53)
Forming two lane approach road to Central University of
Thiruvarur Improving Kangalanchery-Vadakandam road
Km.0/0-7/2 & Kangalanchery-Manakkal road Km.0/0-5/0 and
Construction of High level bridge across Vettal river
Stg to Tiruchendur -Palayancottai - Ambasamuthiram -
Tenkasi - Courtallam - Shenklottai road in km 16/8 -18/5
and Land Aquisition
103.00 dt.
24-10-2011
102.50 dt.
24-10-2011
110.00 dt.
2011-12
110.00 dt
2011-12
106 .00 dt.
2011-12
100.00 dt.
2011-12
4860.00 dt.
06-12-2011
125.00 dt
02-08-2010
2011
2011
2011
2011
2011
2011
2012
2011
2012
2012
2012
2012
2012
2012
2014
2011
13.84
29.58
80.45
76.33
70.00
98.90
813.51
68.39
13.84
29.58
80.45
76.33
70.00
98.90
813.51
103.25
20
25
80
80
90
90
10
80
120
121
122
123
124
125
126
127
S.No Name of the
Project/Works
Estimated cost of
work / Date of
sanction
Year of
commence
-ment
Target
year of
comple-
tion
Physical
progress
of work (in
percent)
Expenditure
during the
year
Progressive
expenditure to
the end of the
year
Pending
payments
Revised
cost, if any
/ Date of
revision
STATEMENT OF COMMITMENTS ON INCOMPLETE PUBLIC WORKS CONTRACTS AS ON 31st MARCH
Appendix - X
(In lakh of Rupees)
2012
Cost of
balance work
adjusted to
inflation
- Contd.
. .
. .
. .
. .
. .
. .
. .
. .
. .
. .
. .
. .
. .
. .
. .
. .
. .
. .
. .
. .
. .
. .
. .
. .
` % ` ` ` ` `
603
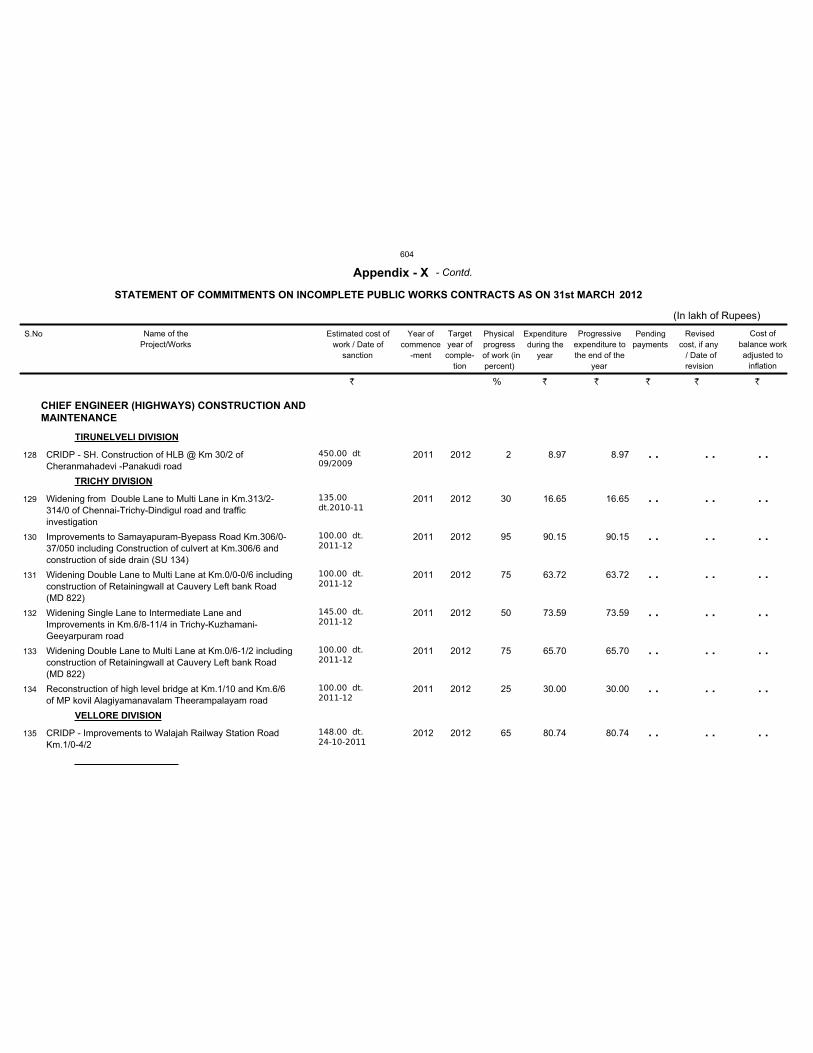
CHIEF ENGINEER (HIGHWAYS) CONSTRUCTION AND
MAINTENANCE
TIRUNELVELI DIVISION
TRICHY DIVISION
VELLORE DIVISION
CRIDP - SH. Construction of HLB @ Km 30/2 of
Cheranmahadevi -Panakudi road
Widening from Double Lane to Multi Lane in Km.313/2-
314/0 of Chennai-Trichy-Dindigul road and traffic
investigation
Improvements to Samayapuram-Byepass Road Km.306/0-
37/050 including Construction of culvert at Km.306/6 and
construction of side drain (SU 134)
Widening Double Lane to Multi Lane at Km.0/0-0/6 including
construction of Retainingwall at Cauvery Left bank Road
(MD 822)
Widening Single Lane to Intermediate Lane and
Improvements in Km.6/8-11/4 in Trichy-Kuzhamani-
Geeyarpuram road
Widening Double Lane to Multi Lane at Km.0/6-1/2 including
construction of Retainingwall at Cauvery Left bank Road
(MD 822)
Reconstruction of high level bridge at Km.1/10 and Km.6/6
of MP kovil Alagiyamanavalam Theerampalayam road
CRIDP - Improvements to Walajah Railway Station Road
Km.1/0-4/2
450.00 dt
09/2009
135.00
dt.2010-11
100.00 dt.
2011-12
100.00 dt.
2011-12
145.00 dt.
2011-12
100.00 dt.
2011-12
100.00 dt.
2011-12
148.00 dt.
24-10-2011
2011
2011
2011
2011
2011
2011
2011
2012
2012
2012
2012
2012
2012
2012
2012
2012
8.97
16.65
90.15
63.72
73.59
65.70
30.00
80.74
8.97
16.65
90.15
63.72
73.59
65.70
30.00
80.74
2
30
95
75
50
75
25
65
128
129
130
131
132
133
134
135
S.No Name of the
Project/Works
Estimated cost of
work / Date of
sanction
Year of
commence
-ment
Target
year of
comple-
tion
Physical
progress
of work (in
percent)
Expenditure
during the
year
Progressive
expenditure to
the end of the
year
Pending
payments
Revised
cost, if any
/ Date of
revision
STATEMENT OF COMMITMENTS ON INCOMPLETE PUBLIC WORKS CONTRACTS AS ON 31st MARCH
Appendix - X
(In lakh of Rupees)
2012
Cost of
balance work
adjusted to
inflation
- Contd.
. .
. .
. .
. .
. .
. .
. .
. .
. .
. .
. .
. .
. .
. .
. .
. .
. .
. .
. .
. .
. .
. .
. .
. .
` % ` ` ` ` `
604
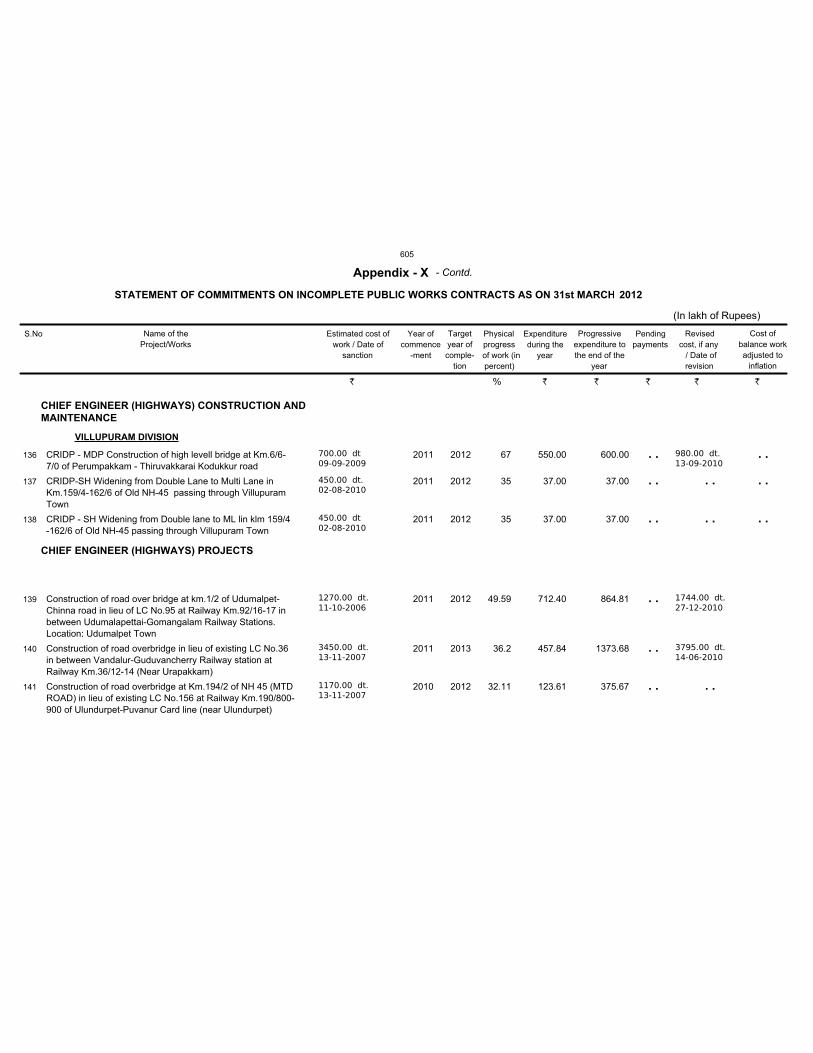
CHIEF ENGINEER (HIGHWAYS) CONSTRUCTION AND
MAINTENANCE
CHIEF ENGINEER (HIGHWAYS) PROJECTS
VILLUPURAM DIVISION
CRIDP - MDP Construction of high levell bridge at Km.6/6-
7/0 of Perumpakkam - Thiruvakkarai Kodukkur road
CRIDP-SH Widening from Double Lane to Multi Lane in
Km.159/4-162/6 of Old NH-45 passing through Villupuram
Town
CRIDP - SH Widening from Double lane to ML lin klm 159/4
-162/6 of Old NH-45 passing through Villupuram Town
Construction of road over bridge at km.1/2 of Udumalpet-
Chinna road in lieu of LC No.95 at Railway Km.92/16-17 in
between Udumalapettai-Gomangalam Railway Stations.
Location: Udumalpet Town
Construction of road overbridge in lieu of existing LC No.36
in between Vandalur-Guduvancherry Railway station at
Railway Km.36/12-14 (Near Urapakkam)
Construction of road overbridge at Km.194/2 of NH 45 (MTD
ROAD) in lieu of existing LC No.156 at Railway Km.190/800-
900 of Ulundurpet-Puvanur Card line (near Ulundurpet)
700.00 dt
09-09-2009
450.00 dt.
02-08-2010
450.00 dt
02-08-2010
1270.00 dt.
11-10-2006
3450.00 dt.
13-11-2007
1170.00 dt.
13-11-2007
2011
2011
2011
2011
2011
2010
2012
2012
2012
2012
2013
2012
980.00 dt.
13-09-2010
1744.00 dt.
27-12-2010
3795.00 dt.
14-06-2010
550.00
37.00
37.00
712.40
457.84
123.61
600.00
37.00
37.00
864.81
1373.68
375.67
67
35
35
49.59
36.2
32.11
136
137
138
139
140
141
S.No Name of the
Project/Works
Estimated cost of
work / Date of
sanction
Year of
commence
-ment
Target
year of
comple-
tion
Physical
progress
of work (in
percent)
Expenditure
during the
year
Progressive
expenditure to
the end of the
year
Pending
payments
Revised
cost, if any
/ Date of
revision
STATEMENT OF COMMITMENTS ON INCOMPLETE PUBLIC WORKS CONTRACTS AS ON 31st MARCH
Appendix - X
(In lakh of Rupees)
2012
Cost of
balance work
adjusted to
inflation
- Contd.
. .
. .
. .
. .
. .
. .
. .
. .
. .
. .
. .
. .
` % ` ` ` ` `
605
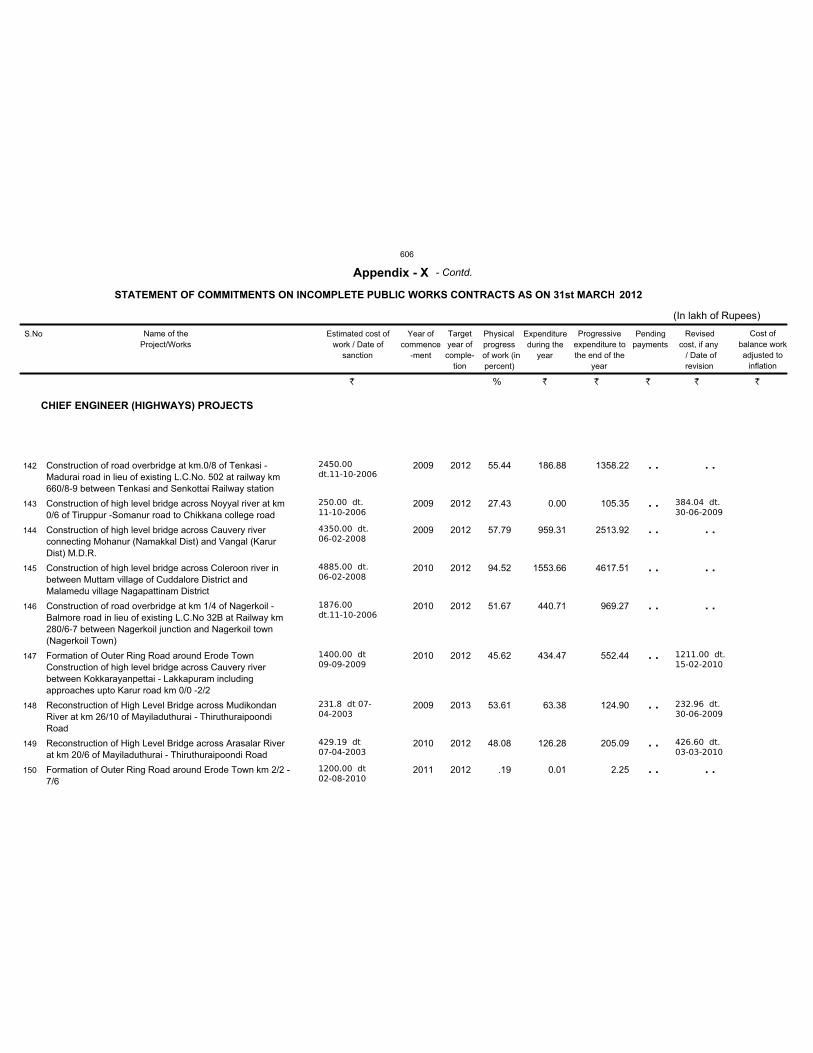
CHIEF ENGINEER (HIGHWAYS) PROJECTS
Construction of road overbridge at km.0/8 of Tenkasi -
Madurai road in lieu of existing L.C.No. 502 at railway km
660/8-9 between Tenkasi and Senkottai Railway station
Construction of high level bridge across Noyyal river at km
0/6 of Tiruppur -Somanur road to Chikkana college road
Construction of high level bridge across Cauvery river
connecting Mohanur (Namakkal Dist) and Vangal (Karur
Dist) M.D.R.
Construction of high level bridge across Coleroon river in
between Muttam village of Cuddalore District and
Malamedu village Nagapattinam District
Construction of road overbridge at km 1/4 of Nagerkoil -
Balmore road in lieu of existing L.C.No 32B at Railway km
280/6-7 between Nagerkoil junction and Nagerkoil town
(Nagerkoil Town)
Formation of Outer Ring Road around Erode Town
Construction of high level bridge across Cauvery river
between Kokkarayanpettai - Lakkapuram including
approaches upto Karur road km 0/0 -2/2
Reconstruction of High Level Bridge across Mudikondan
River at km 26/10 of Mayiladuthurai - Thiruthuraipoondi
Road
Reconstruction of High Level Bridge across Arasalar River
at km 20/6 of Mayiladuthurai - Thiruthuraipoondi Road
Formation of Outer Ring Road around Erode Town km 2/2 -
7/6
2450.00
dt.11-10-2006
250.00 dt.
11-10-2006
4350.00 dt.
06-02-2008
4885.00 dt.
06-02-2008
1876.00
dt.11-10-2006
1400.00 dt
09-09-2009
231.8 dt 07-
04-2003
429.19 dt
07-04-2003
1200.00 dt
02-08-2010
2009
2009
2009
2010
2010
2010
2009
2010
2011
2012
2012
2012
2012
2012
2012
2013
2012
2012
384.04 dt.
30-06-2009
1211.00 dt.
15-02-2010
232.96 dt.
30-06-2009
426.60 dt.
03-03-2010
186.88
0.00
959.31
1553.66
440.71
434.47
63.38
126.28
0.01
1358.22
105.35
2513.92
4617.51
969.27
552.44
124.90
205.09
2.25
55.44
27.43
57.79
94.52
51.67
45.62
53.61
48.08
.19
142
143
144
145
146
147
148
149
150
S.No Name of the
Project/Works
Estimated cost of
work / Date of
sanction
Year of
commence
-ment
Target
year of
comple-
tion
Physical
progress
of work (in
percent)
Expenditure
during the
year
Progressive
expenditure to
the end of the
year
Pending
payments
Revised
cost, if any
/ Date of
revision
STATEMENT OF COMMITMENTS ON INCOMPLETE PUBLIC WORKS CONTRACTS AS ON 31st MARCH
Appendix - X
(In lakh of Rupees)
2012
Cost of
balance work
adjusted to
inflation
- Contd.
. .
. .
. .
. .
. .
. .
. .
. .
. .
. .
. .
. .
. .
. .
` % ` ` ` ` `
606
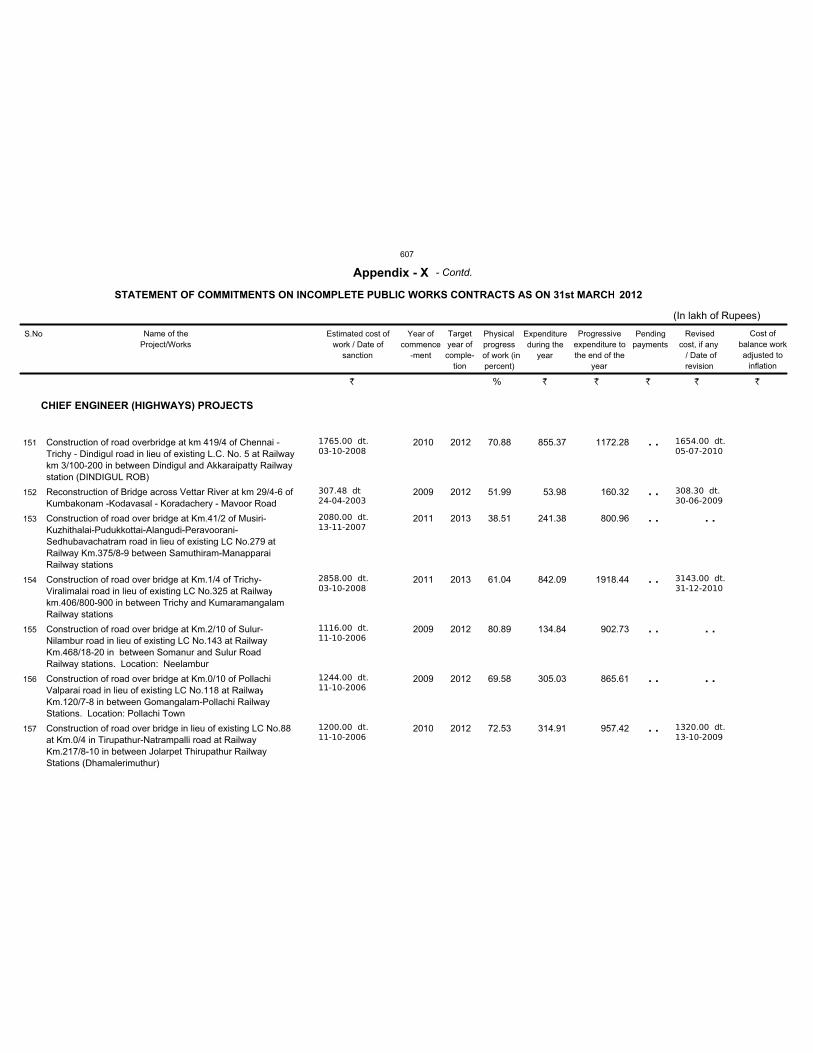
CHIEF ENGINEER (HIGHWAYS) PROJECTS
Construction of road overbridge at km 419/4 of Chennai -
Trichy - Dindigul road in lieu of existing L.C. No. 5 at Railway
km 3/100-200 in between Dindigul and Akkaraipatty Railway
station (DINDIGUL ROB)
Reconstruction of Bridge across Vettar River at km 29/4-6 of
Kumbakonam -Kodavasal - Koradachery - Mavoor Road
Construction of road over bridge at Km.41/2 of Musiri-
Kuzhithalai-Pudukkottai-Alangudi-Peravoorani-
Sedhubavachatram road in lieu of existing LC No.279 at
Railway Km.375/8-9 between Samuthiram-Manapparai
Railway stations
Construction of road over bridge at Km.1/4 of Trichy-
Viralimalai road in lieu of existing LC No.325 at Railway
km.406/800-900 in between Trichy and Kumaramangalam
Railway stations
Construction of road over bridge at Km.2/10 of Sulur-
Nilambur road in lieu of existing LC No.143 at Railway
Km.468/18-20 in between Somanur and Sulur Road
Railway stations. Location: Neelambur
Construction of road over bridge at Km.0/10 of Pollachi
Valparai road in lieu of existing LC No.118 at Railway
Km.120/7-8 in between Gomangalam-Pollachi Railway
Stations. Location: Pollachi Town
Construction of road over bridge in lieu of existing LC No.88
at Km.0/4 in Tirupathur-Natrampalli road at Railway
Km.217/8-10 in between Jolarpet Thirupathur Railway
Stations (Dhamalerimuthur)
1765.00 dt.
03-10-2008
307.48 dt
24-04-2003
2080.00 dt.
13-11-2007
2858.00 dt.
03-10-2008
1116.00 dt.
11-10-2006
1244.00 dt.
11-10-2006
1200.00 dt.
11-10-2006
2010
2009
2011
2011
2009
2009
2010
2012
2012
2013
2013
2012
2012
2012
1654.00 dt.
05-07-2010
308.30 dt.
30-06-2009
3143.00 dt.
31-12-2010
1320.00 dt.
13-10-2009
855.37
53.98
241.38
842.09
134.84
305.03
314.91
1172.28
160.32
800.96
1918.44
902.73
865.61
957.42
70.88
51.99
38.51
61.04
80.89
69.58
72.53
151
152
153
154
155
156
157
S.No Name of the
Project/Works
Estimated cost of
work / Date of
sanction
Year of
commence
-ment
Target
year of
comple-
tion
Physical
progress
of work (in
percent)
Expenditure
during the
year
Progressive
expenditure to
the end of the
year
Pending
payments
Revised
cost, if any
/ Date of
revision
STATEMENT OF COMMITMENTS ON INCOMPLETE PUBLIC WORKS CONTRACTS AS ON 31st MARCH
Appendix - X
(In lakh of Rupees)
2012
Cost of
balance work
adjusted to
inflation
- Contd.
. .
. .
. .
. .
. .
. .
. .
. .
. .
. .
` % ` ` ` ` `
607
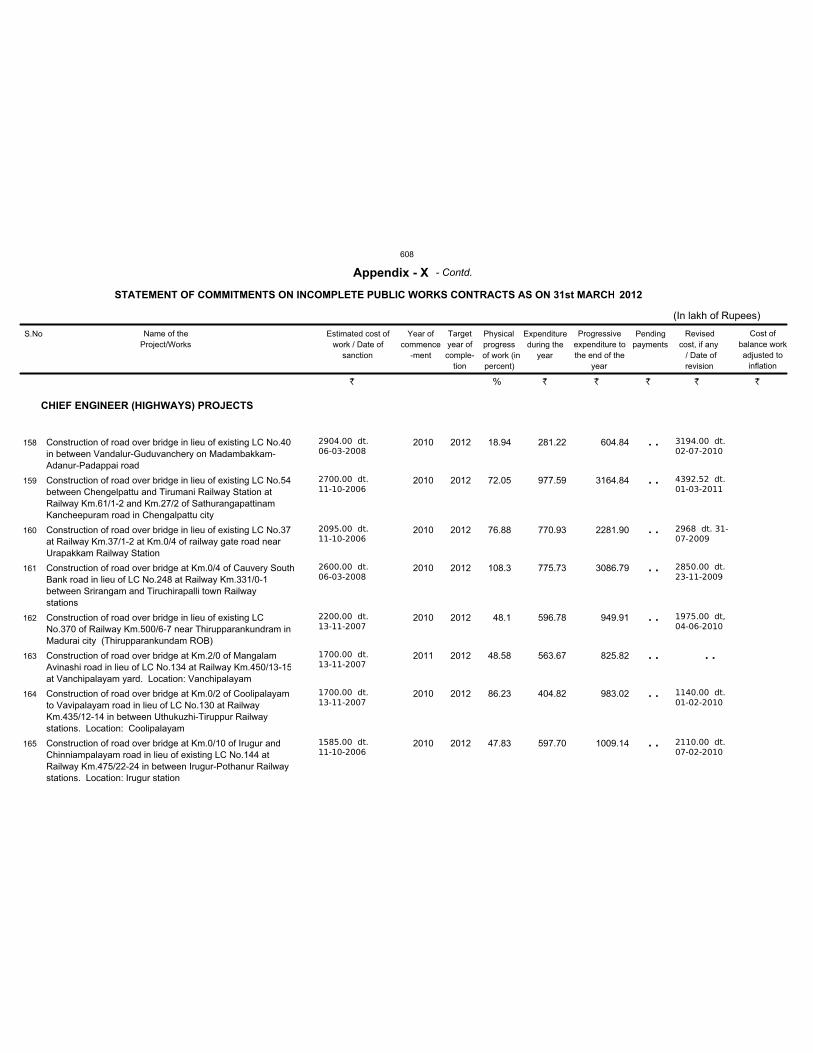
CHIEF ENGINEER (HIGHWAYS) PROJECTS
Construction of road over bridge in lieu of existing LC No.40
in between Vandalur-Guduvanchery on Madambakkam-
Adanur-Padappai road
Construction of road over bridge in lieu of existing LC No.54
between Chengelpattu and Tirumani Railway Station at
Railway Km.61/1-2 and Km.27/2 of Sathurangapattinam
Kancheepuram road in Chengalpattu city
Construction of road over bridge in lieu of existing LC No.37
at Railway Km.37/1-2 at Km.0/4 of railway gate road near
Urapakkam Railway Station
Construction of road over bridge at Km.0/4 of Cauvery South
Bank road in lieu of LC No.248 at Railway Km.331/0-1
between Srirangam and Tiruchirapalli town Railway
stations
Construction of road over bridge in lieu of existing LC
No.370 of Railway Km.500/6-7 near Thirupparankundram in
Madurai city (Thirupparankundam ROB)
Construction of road over bridge at Km.2/0 of Mangalam
Avinashi road in lieu of LC No.134 at Railway Km.450/13-15
at Vanchipalayam yard. Location: Vanchipalayam
Construction of road over bridge at Km.0/2 of Coolipalayam
to Vavipalayam road in lieu of LC No.130 at Railway
Km.435/12-14 in between Uthukuzhi-Tiruppur Railway
stations. Location: Coolipalayam
Construction of road over bridge at Km.0/10 of Irugur and
Chinniampalayam road in lieu of existing LC No.144 at
Railway Km.475/22-24 in between Irugur-Pothanur Railway
stations. Location: Irugur station
2904.00 dt.
06-03-2008
2700.00 dt.
11-10-2006
2095.00 dt.
11-10-2006
2600.00 dt.
06-03-2008
2200.00 dt.
13-11-2007
1700.00 dt.
13-11-2007
1700.00 dt.
13-11-2007
1585.00 dt.
11-10-2006
2010
2010
2010
2010
2010
2011
2010
2010
2012
2012
2012
2012
2012
2012
2012
2012
3194.00 dt.
02-07-2010
4392.52 dt.
01-03-2011
2968 dt. 31-
07-2009
2850.00 dt.
23-11-2009
1975.00 dt,
04-06-2010
1140.00 dt.
01-02-2010
2110.00 dt.
07-02-2010
281.22
977.59
770.93
775.73
596.78
563.67
404.82
597.70
604.84
3164.84
2281.90
3086.79
949.91
825.82
983.02
1009.14
18.94
72.05
76.88
108.3
48.1
48.58
86.23
47.83
158
159
160
161
162
163
164
165
S.No Name of the
Project/Works
Estimated cost of
work / Date of
sanction
Year of
commence
-ment
Target
year of
comple-
tion
Physical
progress
of work (in
percent)
Expenditure
during the
year
Progressive
expenditure to
the end of the
year
Pending
payments
Revised
cost, if any
/ Date of
revision
STATEMENT OF COMMITMENTS ON INCOMPLETE PUBLIC WORKS CONTRACTS AS ON 31st MARCH
Appendix - X
(In lakh of Rupees)
2012
Cost of
balance work
adjusted to
inflation
- Contd.
. .
. .
. .
. .
. .
. .
. .
. .
. .
` % ` ` ` ` `
608
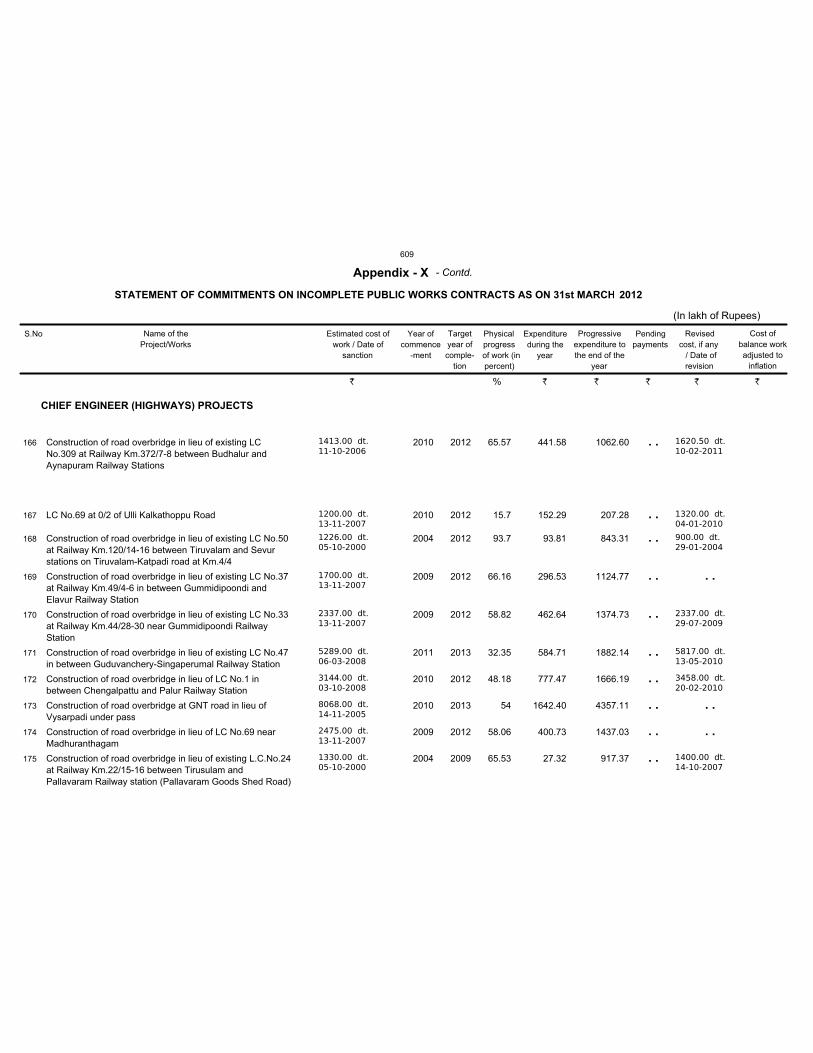
CHIEF ENGINEER (HIGHWAYS) PROJECTS
Construction of road overbridge in lieu of existing LC
No.309 at Railway Km.372/7-8 between Budhalur and
Aynapuram Railway Stations
LC No.69 at 0/2 of Ulli Kalkathoppu Road
Construction of road overbridge in lieu of existing LC No.50
at Railway Km.120/14-16 between Tiruvalam and Sevur
stations on Tiruvalam-Katpadi road at Km.4/4
Construction of road overbridge in lieu of existing LC No.37
at Railway Km.49/4-6 in between Gummidipoondi and
Elavur Railway Station
Construction of road overbridge in lieu of existing LC No.33
at Railway Km.44/28-30 near Gummidipoondi Railway
Station
Construction of road overbridge in lieu of existing LC No.47
in between Guduvanchery-Singaperumal Railway Station
Construction of road overbridge in lieu of LC No.1 in
between Chengalpattu and Palur Railway Station
Construction of road overbridge at GNT road in lieu of
Vysarpadi under pass
Construction of road overbridge in lieu of LC No.69 near
Madhuranthagam
Construction of road overbridge in lieu of existing L.C.No.24
at Railway Km.22/15-16 between Tirusulam and
Pallavaram Railway station (Pallavaram Goods Shed Road)
1413.00 dt.
11-10-2006
1200.00 dt.
13-11-2007
1226.00 dt.
05-10-2000
1700.00 dt.
13-11-2007
2337.00 dt.
13-11-2007
5289.00 dt.
06-03-2008
3144.00 dt.
03-10-2008
8068.00 dt.
14-11-2005
2475.00 dt.
13-11-2007
1330.00 dt.
05-10-2000
2010
2010
2004
2009
2009
2011
2010
2010
2009
2004
2012
2012
2012
2012
2012
2013
2012
2013
2012
2009
1620.50 dt.
10-02-2011
1320.00 dt.
04-01-2010
900.00 dt.
29-01-2004
2337.00 dt.
29-07-2009
5817.00 dt.
13-05-2010
3458.00 dt.
20-02-2010
1400.00 dt.
14-10-2007
441.58
152.29
93.81
296.53
462.64
584.71
777.47
1642.40
400.73
27.32
1062.60
207.28
843.31
1124.77
1374.73
1882.14
1666.19
4357.11
1437.03
917.37
65.57
15.7
93.7
66.16
58.82
32.35
48.18
54
58.06
65.53
166
167
168
169
170
171
172
173
174
175
S.No Name of the
Project/Works
Estimated cost of
work / Date of
sanction
Year of
commence
-ment
Target
year of
comple-
tion
Physical
progress
of work (in
percent)
Expenditure
during the
year
Progressive
expenditure to
the end of the
year
Pending
payments
Revised
cost, if any
/ Date of
revision
STATEMENT OF COMMITMENTS ON INCOMPLETE PUBLIC WORKS CONTRACTS AS ON 31st MARCH
Appendix - X
(In lakh of Rupees)
2012
Cost of
balance work
adjusted to
inflation
- Contd.
. .
. .
. .
. .
. .
. .
. .
. .
. .
. .
. .
. .
. .
` % ` ` ` ` `
609
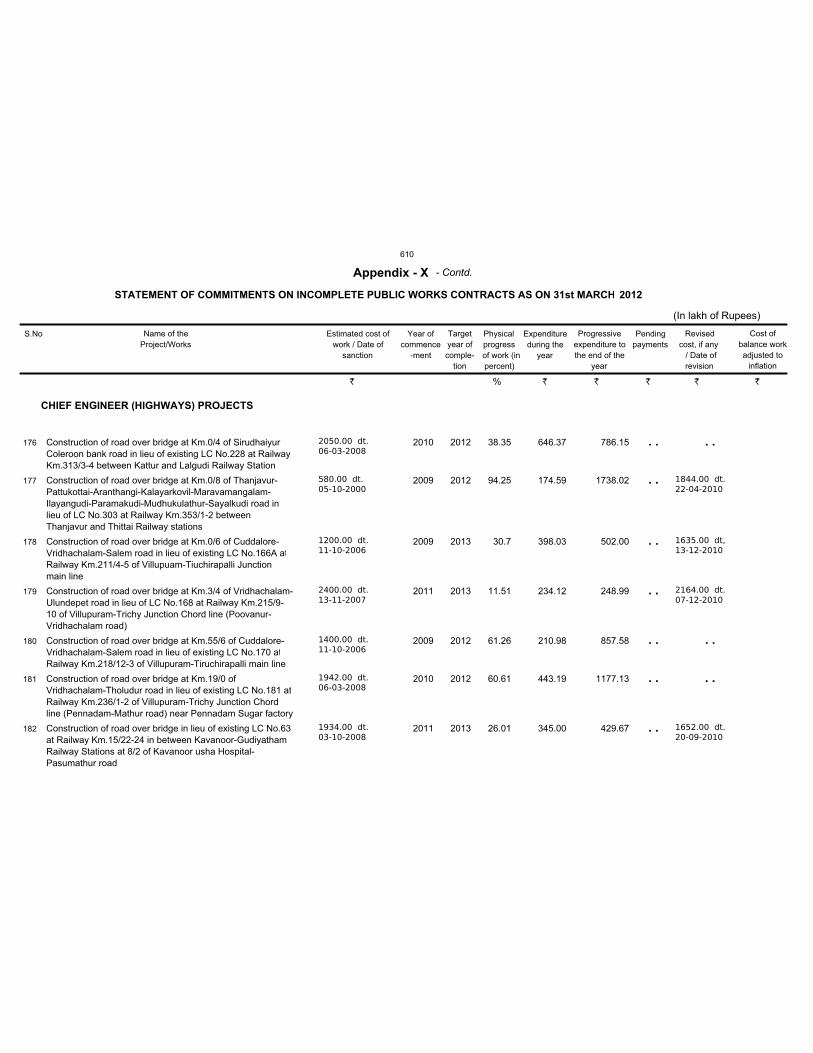
CHIEF ENGINEER (HIGHWAYS) PROJECTS
Construction of road over bridge at Km.0/4 of Sirudhaiyur
Coleroon bank road in lieu of existing LC No.228 at Railway
Km.313/3-4 between Kattur and Lalgudi Railway Station
Construction of road over bridge at Km.0/8 of Thanjavur-
Pattukottai-Aranthangi-Kalayarkovil-Maravamangalam-
Ilayangudi-Paramakudi-Mudhukulathur-Sayalkudi road in
lieu of LC No.303 at Railway Km.353/1-2 between
Thanjavur and Thittai Railway stations
Construction of road over bridge at Km.0/6 of Cuddalore-
Vridhachalam-Salem road in lieu of existing LC No.166A at
Railway Km.211/4-5 of Villupuam-Tiuchirapalli Junction
main line
Construction of road over bridge at Km.3/4 of Vridhachalam-
Ulundepet road in lieu of LC No.168 at Railway Km.215/9-
10 of Villupuram-Trichy Junction Chord line (Poovanur-
Vridhachalam road)
Construction of road over bridge at Km.55/6 of Cuddalore-
Vridhachalam-Salem road in lieu of existing LC No.170 at
Railway Km.218/12-3 of Villupuram-Tiruchirapalli main line
Construction of road over bridge at Km.19/0 of
Vridhachalam-Tholudur road in lieu of existing LC No.181 at
Railway Km.236/1-2 of Villupuram-Trichy Junction Chord
line (Pennadam-Mathur road) near Pennadam Sugar factory
Construction of road over bridge in lieu of existing LC No.63
at Railway Km.15/22-24 in between Kavanoor-Gudiyatham
Railway Stations at 8/2 of Kavanoor usha Hospital-
Pasumathur road
2050.00 dt.
06-03-2008
580.00 dt.
05-10-2000
1200.00 dt.
11-10-2006
2400.00 dt.
13-11-2007
1400.00 dt.
11-10-2006
1942.00 dt.
06-03-2008
1934.00 dt.
03-10-2008
2010
2009
2009
2011
2009
2010
2011
2012
2012
2013
2013
2012
2012
2013
1844.00 dt.
22-04-2010
1635.00 dt,
13-12-2010
2164.00 dt.
07-12-2010
1652.00 dt.
20-09-2010
646.37
174.59
398.03
234.12
210.98
443.19
345.00
786.15
1738.02
502.00
248.99
857.58
1177.13
429.67
38.35
94.25
30.7
11.51
61.26
60.61
26.01
176
177
178
179
180
181
182
S.No Name of the
Project/Works
Estimated cost of
work / Date of
sanction
Year of
commence
-ment
Target
year of
comple-
tion
Physical
progress
of work (in
percent)
Expenditure
during the
year
Progressive
expenditure to
the end of the
year
Pending
payments
Revised
cost, if any
/ Date of
revision
STATEMENT OF COMMITMENTS ON INCOMPLETE PUBLIC WORKS CONTRACTS AS ON 31st MARCH
Appendix - X
(In lakh of Rupees)
2012
Cost of
balance work
adjusted to
inflation
- Contd.
. .
. .
. .
. .
. .
. .
. .
. .
. .
. .
` % ` ` ` ` `
610
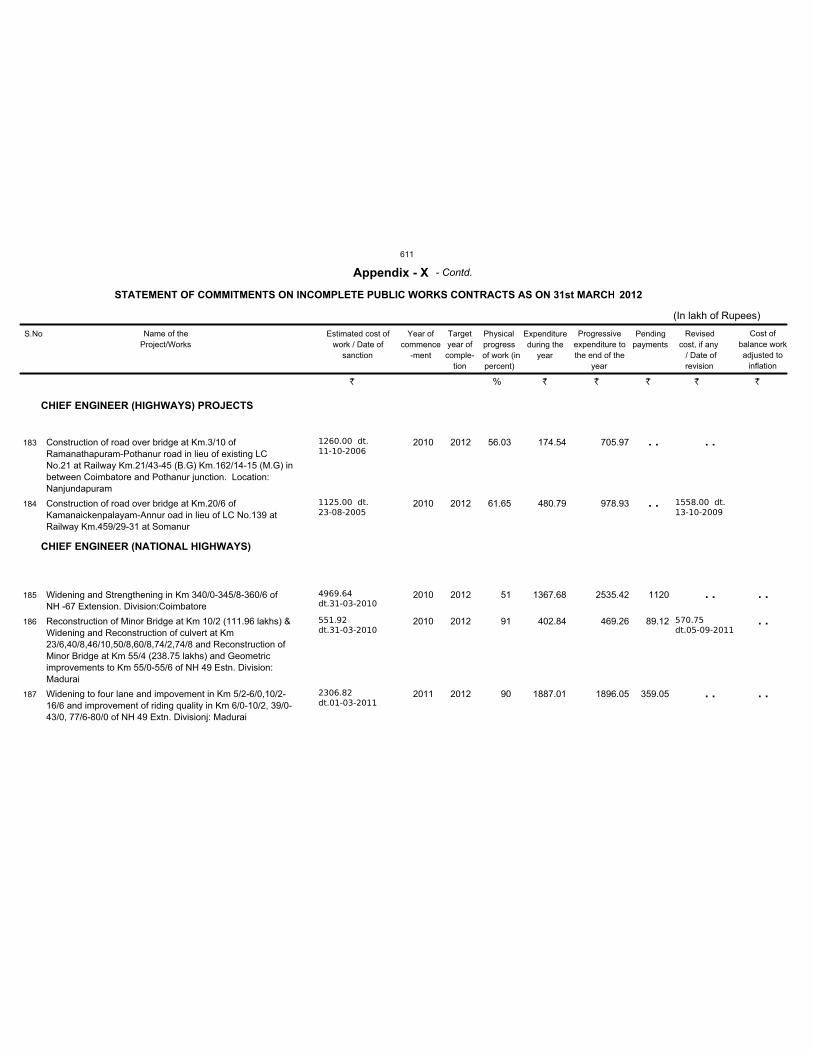
CHIEF ENGINEER (HIGHWAYS) PROJECTS
CHIEF ENGINEER (NATIONAL HIGHWAYS)
Construction of road over bridge at Km.3/10 of
Ramanathapuram-Pothanur road in lieu of existing LC
No.21 at Railway Km.21/43-45 (B.G) Km.162/14-15 (M.G) in
between Coimbatore and Pothanur junction. Location:
Nanjundapuram
Construction of road over bridge at Km.20/6 of
Kamanaickenpalayam-Annur oad in lieu of LC No.139 at
Railway Km.459/29-31 at Somanur
Widening and Strengthening in Km 340/0-345/8-360/6 of
NH -67 Extension. Division:Coimbatore
Reconstruction of Minor Bridge at Km 10/2 (111.96 lakhs) &
Widening and Reconstruction of culvert at Km
23/6,40/8,46/10,50/8,60/8,74/2,74/8 and Reconstruction of
Minor Bridge at Km 55/4 (238.75 lakhs) and Geometric
improvements to Km 55/0-55/6 of NH 49 Estn. Division:
Madurai
Widening to four lane and impovement in Km 5/2-6/0,10/2-
16/6 and improvement of riding quality in Km 6/0-10/2, 39/0-
43/0, 77/6-80/0 of NH 49 Extn. Divisionj: Madurai
1260.00 dt.
11-10-2006
1125.00 dt.
23-08-2005
4969.64
dt.31-03-2010
551.92
dt.31-03-2010
2306.82
dt.01-03-2011
2010
2010
2010
2010
2011
2012
2012
2012
2012
2012
1558.00 dt.
13-10-2009
570.75
dt.05-09-2011
174.54
480.79
1367.68
402.84
1887.01
705.97
978.93
2535.42
469.26
1896.05
56.03
61.65
51
91
90
1120
89.12
359.05
183
184
185
186
187
S.No Name of the
Project/Works
Estimated cost of
work / Date of
sanction
Year of
commence
-ment
Target
year of
comple-
tion
Physical
progress
of work (in
percent)
Expenditure
during the
year
Progressive
expenditure to
the end of the
year
Pending
payments
Revised
cost, if any
/ Date of
revision
STATEMENT OF COMMITMENTS ON INCOMPLETE PUBLIC WORKS CONTRACTS AS ON 31st MARCH
Appendix - X
(In lakh of Rupees)
2012
Cost of
balance work
adjusted to
inflation
- Contd.
. .
. .
. .
. .
. .
. .
. .
. .
` % ` ` ` ` `
611
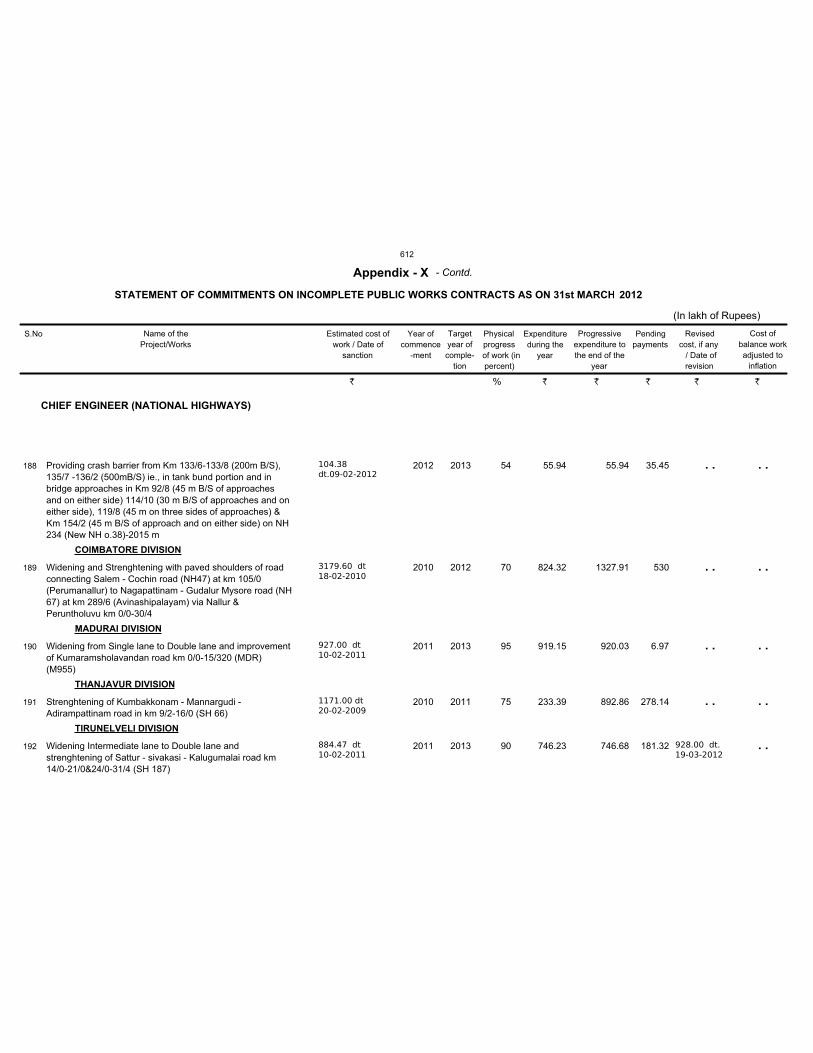
CHIEF ENGINEER (NATIONAL HIGHWAYS)
COIMBATORE DIVISION
MADURAI DIVISION
THANJAVUR DIVISION
TIRUNELVELI DIVISION
Providing crash barrier from Km 133/6-133/8 (200m B/S),
135/7 -136/2 (500mB/S) ie., in tank bund portion and in
bridge approaches in Km 92/8 (45 m B/S of approaches
and on either side) 114/10 (30 m B/S of approaches and on
either side), 119/8 (45 m on three sides of approaches) &
Km 154/2 (45 m B/S of approach and on either side) on NH
234 (New NH o.38)-2015 m
Widening and Strenghtening with paved shoulders of road
connecting Salem - Cochin road (NH47) at km 105/0
(Perumanallur) to Nagapattinam - Gudalur Mysore road (NH
67) at km 289/6 (Avinashipalayam) via Nallur &
Peruntholuvu km 0/0-30/4
Widening from Single lane to Double lane and improvement
of Kumaramsholavandan road km 0/0-15/320 (MDR)
(M955)
Strenghtening of Kumbakkonam - Mannargudi -
Adirampattinam road in km 9/2-16/0 (SH 66)
Widening Intermediate lane to Double lane and
strenghtening of Sattur - sivakasi - Kalugumalai road km
14/0-21/0&24/0-31/4 (SH 187)
104.38
dt.09-02-2012
3179.60 dt
18-02-2010
927.00 dt
10-02-2011
1171.00 dt
20-02-2009
884.47 dt
10-02-2011
2012
2010
2011
2010
2011
2013
2012
2013
2011
2013 928.00 dt.
19-03-2012
55.94
824.32
919.15
233.39
746.23
55.94
1327.91
920.03
892.86
746.68
54
70
95
75
90
35.45
530
6.97
278.14
181.32
188
189
190
191
192
S.No Name of the
Project/Works
Estimated cost of
work / Date of
sanction
Year of
commence
-ment
Target
year of
comple-
tion
Physical
progress
of work (in
percent)
Expenditure
during the
year
Progressive
expenditure to
the end of the
year
Pending
payments
Revised
cost, if any
/ Date of
revision
STATEMENT OF COMMITMENTS ON INCOMPLETE PUBLIC WORKS CONTRACTS AS ON 31st MARCH
Appendix - X
(In lakh of Rupees)
2012
Cost of
balance work
adjusted to
inflation
- Contd.
. .
. .
. .
. .
. .
. .
. .
. .
. .
` % ` ` ` ` `
612
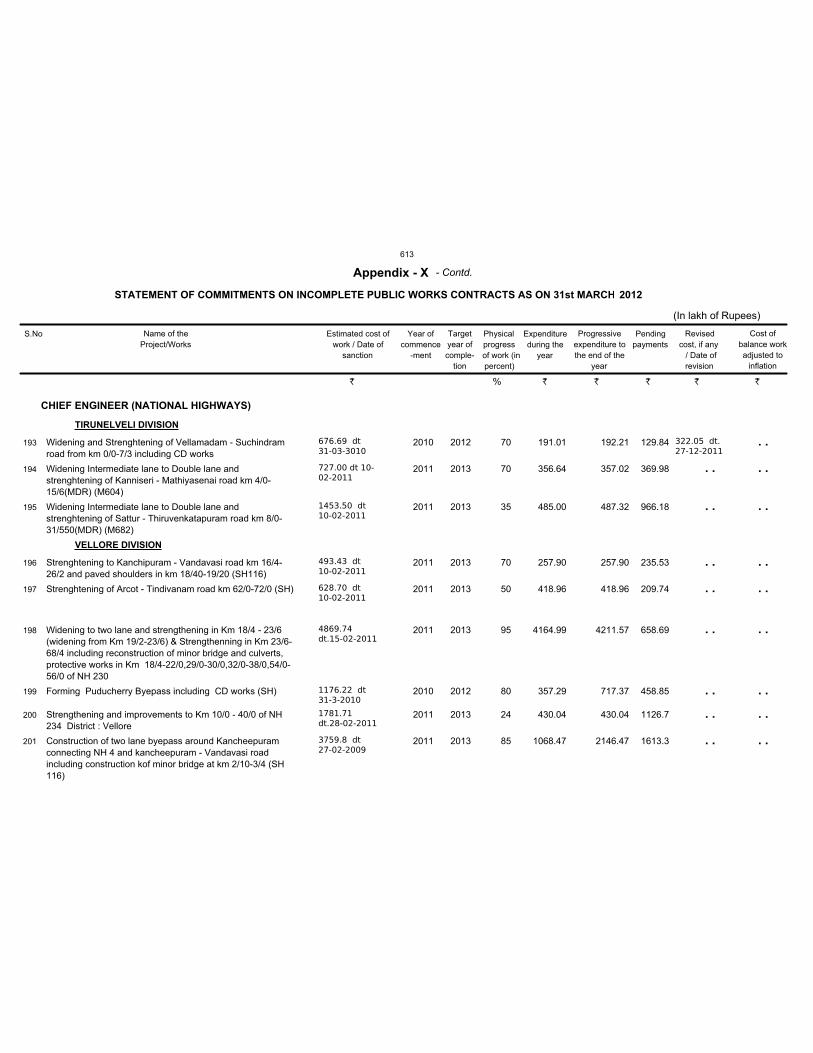
CHIEF ENGINEER (NATIONAL HIGHWAYS)
TIRUNELVELI DIVISION
VELLORE DIVISION
Widening and Strenghtening of Vellamadam - Suchindram
road from km 0/0-7/3 including CD works
Widening Intermediate lane to Double lane and
strenghtening of Kanniseri - Mathiyasenai road km 4/0-
15/6(MDR) (M604)
Widening Intermediate lane to Double lane and
strenghtening of Sattur - Thiruvenkatapuram road km 8/0-
31/550(MDR) (M682)
Strenghtening to Kanchipuram - Vandavasi road km 16/4-
26/2 and paved shoulders in km 18/40-19/20 (SH116)
Strenghtening of Arcot - Tindivanam road km 62/0-72/0 (SH)
Widening to two lane and strengthening in Km 18/4 - 23/6
(widening from Km 19/2-23/6) & Strengthenning in Km 23/6-
68/4 including reconstruction of minor bridge and culverts,
protective works in Km 18/4-22/0,29/0-30/0,32/0-38/0,54/0-
56/0 of NH 230
Forming Puducherry Byepass including CD works (SH)
Strengthening and improvements to Km 10/0 - 40/0 of NH
234 District : Vellore
Construction of two lane byepass around Kancheepuram
connecting NH 4 and kancheepuram - Vandavasi road
including construction kof minor bridge at km 2/10-3/4 (SH
116)
676.69 dt
31-03-3010
727.00 dt 10-
02-2011
1453.50 dt
10-02-2011
493.43 dt
10-02-2011
628.70 dt
10-02-2011
4869.74
dt.15-02-2011
1176.22 dt
31-3-2010
1781.71
dt.28-02-2011
3759.8 dt
27-02-2009
2010
2011
2011
2011
2011
2011
2010
2011
2011
2012
2013
2013
2013
2013
2013
2012
2013
2013
322.05 dt.
27-12-2011191.01
356.64
485.00
257.90
418.96
4164.99
357.29
430.04
1068.47
192.21
357.02
487.32
257.90
418.96
4211.57
717.37
430.04
2146.47
70
70
35
70
50
95
80
24
85
129.84
369.98
966.18
235.53
209.74
658.69
458.85
1126.7
1613.3
193
194
195
196
197
198
199
200
201
S.No Name of the
Project/Works
Estimated cost of
work / Date of
sanction
Year of
commence
-ment
Target
year of
comple-
tion
Physical
progress
of work (in
percent)
Expenditure
during the
year
Progressive
expenditure to
the end of the
year
Pending
payments
Revised
cost, if any
/ Date of
revision
STATEMENT OF COMMITMENTS ON INCOMPLETE PUBLIC WORKS CONTRACTS AS ON 31st MARCH
Appendix - X
(In lakh of Rupees)
2012
Cost of
balance work
adjusted to
inflation
- Contd.
. .
. .
. .
. .
. .
. .
. .
. .
. .
. .
. .
. .
. .
. .
. .
. .
. .
` % ` ` ` ` `
613
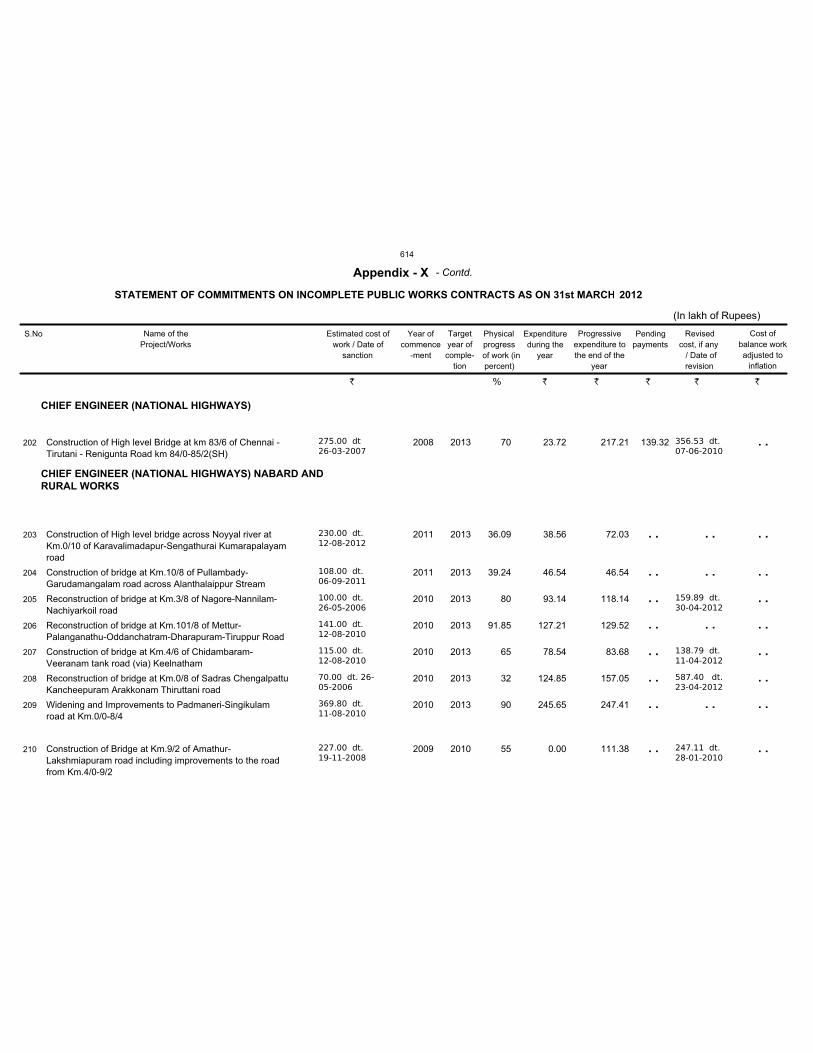
CHIEF ENGINEER (NATIONAL HIGHWAYS)
CHIEF ENGINEER (NATIONAL HIGHWAYS) NABARD AND
RURAL WORKS
Construction of High level Bridge at km 83/6 of Chennai -
Tirutani - Renigunta Road km 84/0-85/2(SH)
Construction of High level bridge across Noyyal river at
Km.0/10 of Karavalimadapur-Sengathurai Kumarapalayam
road
Construction of bridge at Km.10/8 of Pullambady-
Garudamangalam road across Alanthalaippur Stream
Reconstruction of bridge at Km.3/8 of Nagore-Nannilam-
Nachiyarkoil road
Reconstruction of bridge at Km.101/8 of Mettur-
Palanganathu-Oddanchatram-Dharapuram-Tiruppur Road
Construction of bridge at Km.4/6 of Chidambaram-
Veeranam tank road (via) Keelnatham
Reconstruction of bridge at Km.0/8 of Sadras Chengalpattu
Kancheepuram Arakkonam Thiruttani road
Widening and Improvements to Padmaneri-Singikulam
road at Km.0/0-8/4
Construction of Bridge at Km.9/2 of Amathur-
Lakshmiapuram road including improvements to the road
from Km.4/0-9/2
275.00 dt
26-03-2007
230.00 dt.
12-08-2012
108.00 dt.
06-09-2011
100.00 dt.
26-05-2006
141.00 dt.
12-08-2010
115.00 dt.
12-08-2010
70.00 dt. 26-
05-2006
369.80 dt.
11-08-2010
227.00 dt.
19-11-2008
2008
2011
2011
2010
2010
2010
2010
2010
2009
2013
2013
2013
2013
2013
2013
2013
2013
2010
356.53 dt.
07-06-2010
159.89 dt.
30-04-2012
138.79 dt.
11-04-2012
587.40 dt.
23-04-2012
247.11 dt.
28-01-2010
23.72
38.56
46.54
93.14
127.21
78.54
124.85
245.65
0.00
217.21
72.03
46.54
118.14
129.52
83.68
157.05
247.41
111.38
70
36.09
39.24
80
91.85
65
32
90
55
139.32202
203
204
205
206
207
208
209
210
S.No Name of the
Project/Works
Estimated cost of
work / Date of
sanction
Year of
commence
-ment
Target
year of
comple-
tion
Physical
progress
of work (in
percent)
Expenditure
during the
year
Progressive
expenditure to
the end of the
year
Pending
payments
Revised
cost, if any
/ Date of
revision
STATEMENT OF COMMITMENTS ON INCOMPLETE PUBLIC WORKS CONTRACTS AS ON 31st MARCH
Appendix - X
(In lakh of Rupees)
2012
Cost of
balance work
adjusted to
inflation
- Contd.
. .
. .
. .
. .
. .
. .
. .
. .
. .
. .
. .
. .
. .
. .
. .
. .
. .
. .
. .
. .
. .
` % ` ` ` ` `
614
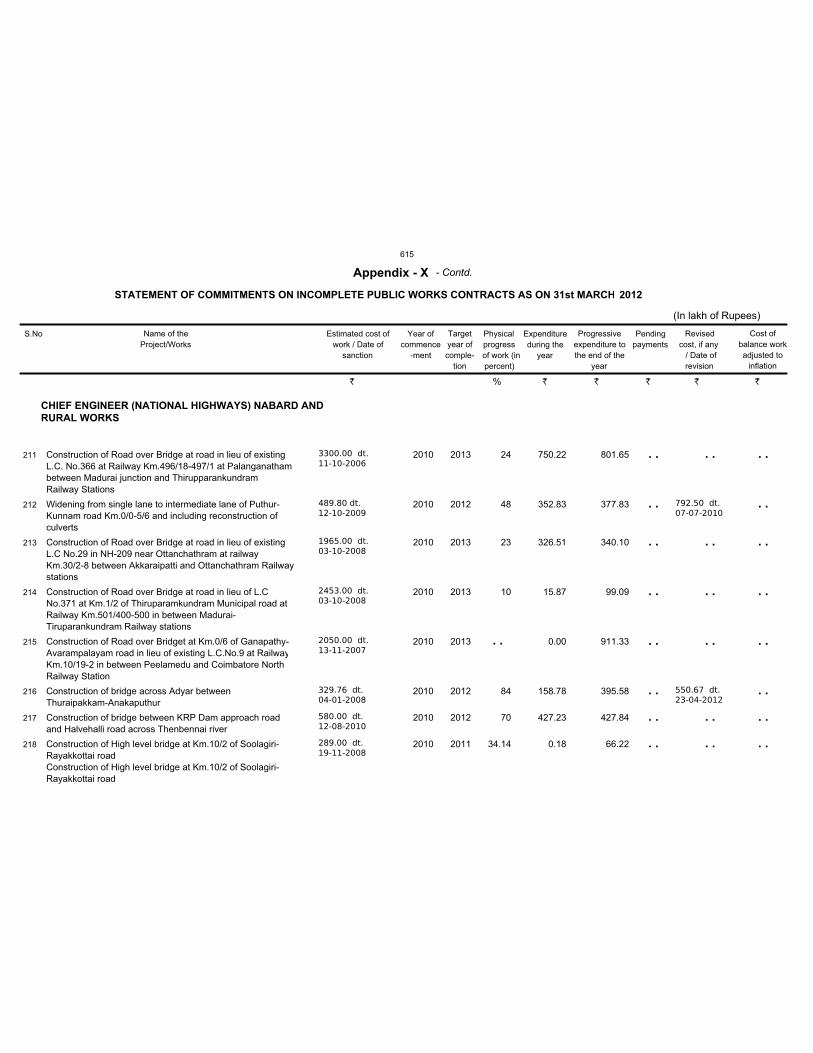
CHIEF ENGINEER (NATIONAL HIGHWAYS) NABARD AND
RURAL WORKS
Construction of Road over Bridge at road in lieu of existing
L.C. No.366 at Railway Km.496/18-497/1 at Palanganatham
between Madurai junction and Thirupparankundram
Railway Stations
Widening from single lane to intermediate lane of Puthur-
Kunnam road Km.0/0-5/6 and including reconstruction of
culverts
Construction of Road over Bridge at road in lieu of existing
L.C No.29 in NH-209 near Ottanchathram at railway
Km.30/2-8 between Akkaraipatti and Ottanchathram Railway
stations
Construction of Road over Bridge at road in lieu of L.C
No.371 at Km.1/2 of Thiruparamkundram Municipal road at
Railway Km.501/400-500 in between Madurai-
Tiruparankundram Railway stations
Construction of Road over Bridget at Km.0/6 of Ganapathy-
Avarampalayam road in lieu of existing L.C.No.9 at Railway
Km.10/19-2 in between Peelamedu and Coimbatore North
Railway Station
Construction of bridge across Adyar between
Thuraipakkam-Anakaputhur
Construction of bridge between KRP Dam approach road
and Halvehalli road across Thenbennai river
Construction of High level bridge at Km.10/2 of Soolagiri-
Rayakkottai road
Construction of High level bridge at Km.10/2 of Soolagiri-
Rayakkottai road
3300.00 dt.
11-10-2006
489.80 dt.
12-10-2009
1965.00 dt.
03-10-2008
2453.00 dt.
03-10-2008
2050.00 dt.
13-11-2007
329.76 dt.
04-01-2008
580.00 dt.
12-08-2010
289.00 dt.
19-11-2008
2010
2010
2010
2010
2010
2010
2010
2010
2013
2012
2013
2013
2013
2012
2012
2011
792.50 dt.
07-07-2010
550.67 dt.
23-04-2012
750.22
352.83
326.51
15.87
0.00
158.78
427.23
0.18
801.65
377.83
340.10
99.09
911.33
395.58
427.84
66.22
24
48
23
10
84
70
34.14
211
212
213
214
215
216
217
218
S.No Name of the
Project/Works
Estimated cost of
work / Date of
sanction
Year of
commence
-ment
Target
year of
comple-
tion
Physical
progress
of work (in
percent)
Expenditure
during the
year
Progressive
expenditure to
the end of the
year
Pending
payments
Revised
cost, if any
/ Date of
revision
STATEMENT OF COMMITMENTS ON INCOMPLETE PUBLIC WORKS CONTRACTS AS ON 31st MARCH
Appendix - X
(In lakh of Rupees)
2012
Cost of
balance work
adjusted to
inflation
- Contd.
. .
. .
. .
. .
. .
. .
. .
. .
. .
. .
. .
. .
. .
. .
. .
. .
. .
. .
. .
. .
. .
. .
. .
` % ` ` ` ` `
615
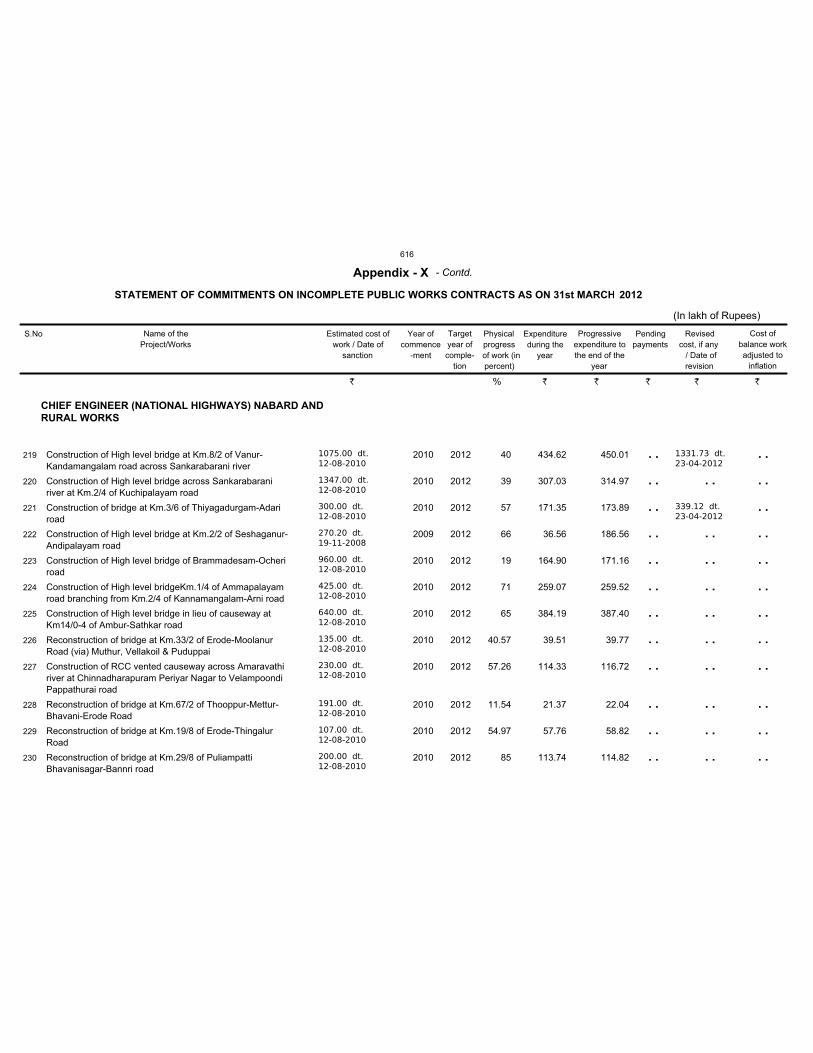
CHIEF ENGINEER (NATIONAL HIGHWAYS) NABARD AND
RURAL WORKS
Construction of High level bridge at Km.8/2 of Vanur-
Kandamangalam road across Sankarabarani river
Construction of High level bridge across Sankarabarani
river at Km.2/4 of Kuchipalayam road
Construction of bridge at Km.3/6 of Thiyagadurgam-Adari
road
Construction of High level bridge at Km.2/2 of Seshaganur-
Andipalayam road
Construction of High level bridge of Brammadesam-Ocheri
road
Construction of High level bridgeKm.1/4 of Ammapalayam
road branching from Km.2/4 of Kannamangalam-Arni road
Construction of High level bridge in lieu of causeway at
Km14/0-4 of Ambur-Sathkar road
Reconstruction of bridge at Km.33/2 of Erode-Moolanur
Road (via) Muthur, Vellakoil & Puduppai
Construction of RCC vented causeway across Amaravathi
river at Chinnadharapuram Periyar Nagar to Velampoondi
Pappathurai road
Reconstruction of bridge at Km.67/2 of Thooppur-Mettur-
Bhavani-Erode Road
Reconstruction of bridge at Km.19/8 of Erode-Thingalur
Road
Reconstruction of bridge at Km.29/8 of Puliampatti
Bhavanisagar-Bannri road
1075.00 dt.
12-08-2010
1347.00 dt.
12-08-2010
300.00 dt.
12-08-2010
270.20 dt.
19-11-2008
960.00 dt.
12-08-2010
425.00 dt.
12-08-2010
640.00 dt.
12-08-2010
135.00 dt.
12-08-2010
230.00 dt.
12-08-2010
191.00 dt.
12-08-2010
107.00 dt.
12-08-2010
200.00 dt.
12-08-2010
2010
2010
2010
2009
2010
2010
2010
2010
2010
2010
2010
2010
2012
2012
2012
2012
2012
2012
2012
2012
2012
2012
2012
2012
1331.73 dt.
23-04-2012
339.12 dt.
23-04-2012
434.62
307.03
171.35
36.56
164.90
259.07
384.19
39.51
114.33
21.37
57.76
113.74
450.01
314.97
173.89
186.56
171.16
259.52
387.40
39.77
116.72
22.04
58.82
114.82
40
39
57
66
19
71
65
40.57
57.26
11.54
54.97
85
219
220
221
222
223
224
225
226
227
228
229
230
S.No Name of the
Project/Works
Estimated cost of
work / Date of
sanction
Year of
commence
-ment
Target
year of
comple-
tion
Physical
progress
of work (in
percent)
Expenditure
during the
year
Progressive
expenditure to
the end of the
year
Pending
payments
Revised
cost, if any
/ Date of
revision
STATEMENT OF COMMITMENTS ON INCOMPLETE PUBLIC WORKS CONTRACTS AS ON 31st MARCH
Appendix - X
(In lakh of Rupees)
2012
Cost of
balance work
adjusted to
inflation
- Contd.
. .
. .
. .
. .
. .
. .
. .
. .
. .
. .
. .
. .
. .
. .
. .
. .
. .
. .
. .
. .
. .
. .
. .
. .
. .
. .
. .
. .
. .
. .
. .
. .
. .
. .
` % ` ` ` ` `
616
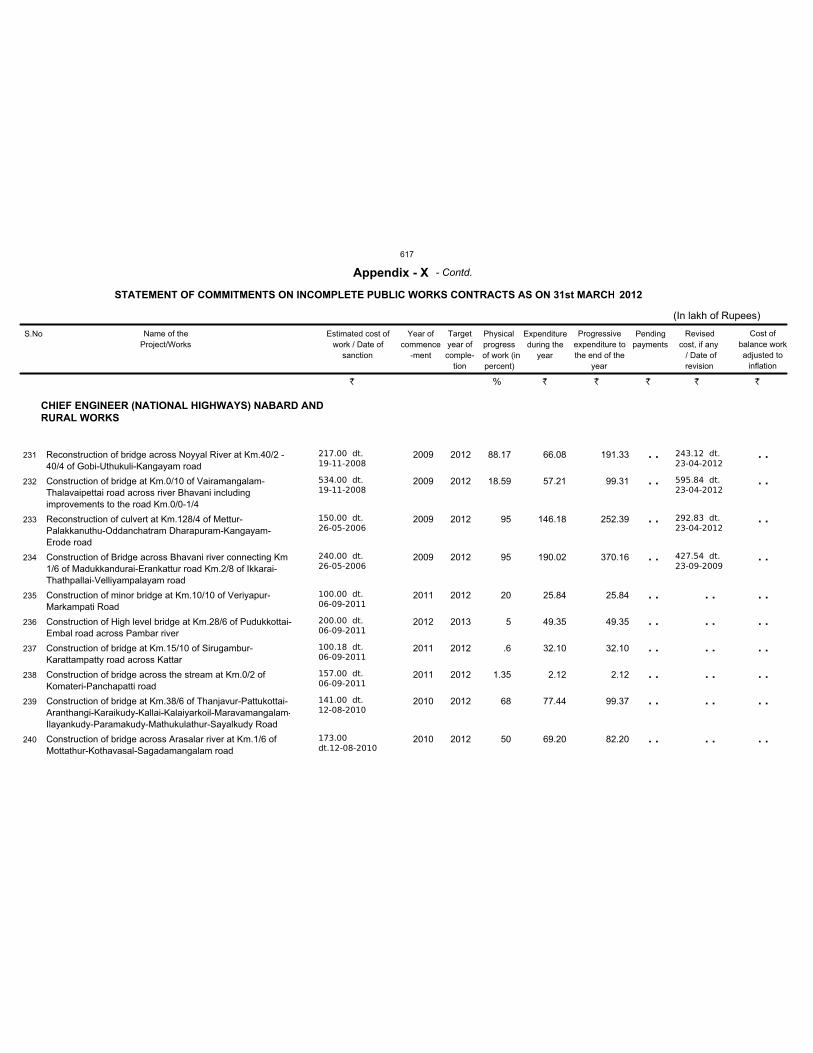
CHIEF ENGINEER (NATIONAL HIGHWAYS) NABARD AND
RURAL WORKS
Reconstruction of bridge across Noyyal River at Km.40/2 -
40/4 of Gobi-Uthukuli-Kangayam road
Construction of bridge at Km.0/10 of Vairamangalam-
Thalavaipettai road across river Bhavani including
improvements to the road Km.0/0-1/4
Reconstruction of culvert at Km.128/4 of Mettur-
Palakkanuthu-Oddanchatram Dharapuram-Kangayam-
Erode road
Construction of Bridge across Bhavani river connecting Km
1/6 of Madukkandurai-Erankattur road Km.2/8 of Ikkarai-
Thathpallai-Velliyampalayam road
Construction of minor bridge at Km.10/10 of Veriyapur-
Markampati Road
Construction of High level bridge at Km.28/6 of Pudukkottai-
Embal road across Pambar river
Construction of bridge at Km.15/10 of Sirugambur-
Karattampatty road across Kattar
Construction of bridge across the stream at Km.0/2 of
Komateri-Panchapatti road
Construction of bridge at Km.38/6 of Thanjavur-Pattukottai-
Aranthangi-Karaikudy-Kallai-Kalaiyarkoil-Maravamangalam-
Ilayankudy-Paramakudy-Mathukulathur-Sayalkudy Road
Construction of bridge across Arasalar river at Km.1/6 of
Mottathur-Kothavasal-Sagadamangalam road
217.00 dt.
19-11-2008
534.00 dt.
19-11-2008
150.00 dt.
26-05-2006
240.00 dt.
26-05-2006
100.00 dt.
06-09-2011
200.00 dt.
06-09-2011
100.18 dt.
06-09-2011
157.00 dt.
06-09-2011
141.00 dt.
12-08-2010
173.00
dt.12-08-2010
2009
2009
2009
2009
2011
2012
2011
2011
2010
2010
2012
2012
2012
2012
2012
2013
2012
2012
2012
2012
243.12 dt.
23-04-2012
595.84 dt.
23-04-2012
292.83 dt.
23-04-2012
427.54 dt.
23-09-2009
66.08
57.21
146.18
190.02
25.84
49.35
32.10
2.12
77.44
69.20
191.33
99.31
252.39
370.16
25.84
49.35
32.10
2.12
99.37
82.20
88.17
18.59
95
95
20
5
.6
1.35
68
50
231
232
233
234
235
236
237
238
239
240
S.No Name of the
Project/Works
Estimated cost of
work / Date of
sanction
Year of
commence
-ment
Target
year of
comple-
tion
Physical
progress
of work (in
percent)
Expenditure
during the
year
Progressive
expenditure to
the end of the
year
Pending
payments
Revised
cost, if any
/ Date of
revision
STATEMENT OF COMMITMENTS ON INCOMPLETE PUBLIC WORKS CONTRACTS AS ON 31st MARCH
Appendix - X
(In lakh of Rupees)
2012
Cost of
balance work
adjusted to
inflation
- Contd.
. .
. .
. .
. .
. .
. .
. .
. .
. .
. .
. .
. .
. .
. .
. .
. .
. .
. .
. .
. .
. .
. .
. .
. .
. .
. .
` % ` ` ` ` `
617
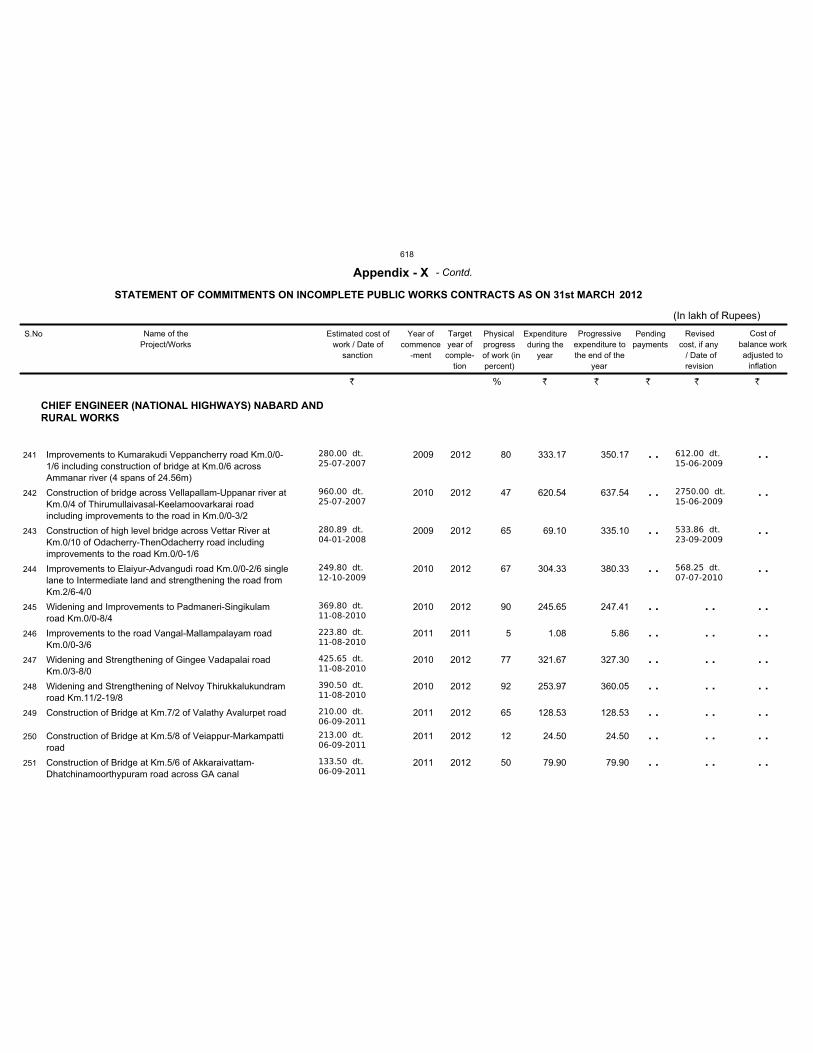
CHIEF ENGINEER (NATIONAL HIGHWAYS) NABARD AND
RURAL WORKS
Improvements to Kumarakudi Veppancherry road Km.0/0-
1/6 including construction of bridge at Km.0/6 across
Ammanar river (4 spans of 24.56m)
Construction of bridge across Vellapallam-Uppanar river at
Km.0/4 of Thirumullaivasal-Keelamoovarkarai road
including improvements to the road in Km.0/0-3/2
Construction of high level bridge across Vettar River at
Km.0/10 of Odacherry-ThenOdacherry road including
improvements to the road Km.0/0-1/6
Improvements to Elaiyur-Advangudi road Km.0/0-2/6 single
lane to Intermediate land and strengthening the road from
Km.2/6-4/0
Widening and Improvements to Padmaneri-Singikulam
road Km.0/0-8/4
Improvements to the road Vangal-Mallampalayam road
Km.0/0-3/6
Widening and Strengthening of Gingee Vadapalai road
Km.0/3-8/0
Widening and Strengthening of Nelvoy Thirukkalukundram
road Km.11/2-19/8
Construction of Bridge at Km.7/2 of Valathy Avalurpet road
Construction of Bridge at Km.5/8 of Veiappur-Markampatti
road
Construction of Bridge at Km.5/6 of Akkaraivattam-
Dhatchinamoorthypuram road across GA canal
280.00 dt.
25-07-2007
960.00 dt.
25-07-2007
280.89 dt.
04-01-2008
249.80 dt.
12-10-2009
369.80 dt.
11-08-2010
223.80 dt.
11-08-2010
425.65 dt.
11-08-2010
390.50 dt.
11-08-2010
210.00 dt.
06-09-2011
213.00 dt.
06-09-2011
133.50 dt.
06-09-2011
2009
2010
2009
2010
2010
2011
2010
2010
2011
2011
2011
2012
2012
2012
2012
2012
2011
2012
2012
2012
2012
2012
612.00 dt.
15-06-2009
2750.00 dt.
15-06-2009
533.86 dt.
23-09-2009
568.25 dt.
07-07-2010
333.17
620.54
69.10
304.33
245.65
1.08
321.67
253.97
128.53
24.50
79.90
350.17
637.54
335.10
380.33
247.41
5.86
327.30
360.05
128.53
24.50
79.90
80
47
65
67
90
5
77
92
65
12
50
241
242
243
244
245
246
247
248
249
250
251
S.No Name of the
Project/Works
Estimated cost of
work / Date of
sanction
Year of
commence
-ment
Target
year of
comple-
tion
Physical
progress
of work (in
percent)
Expenditure
during the
year
Progressive
expenditure to
the end of the
year
Pending
payments
Revised
cost, if any
/ Date of
revision
STATEMENT OF COMMITMENTS ON INCOMPLETE PUBLIC WORKS CONTRACTS AS ON 31st MARCH
Appendix - X
(In lakh of Rupees)
2012
Cost of
balance work
adjusted to
inflation
- Contd.
. .
. .
. .
. .
. .
. .
. .
. .
. .
. .
. .
. .
. .
. .
. .
. .
. .
. .
. .
. .
. .
. .
. .
. .
. .
. .
. .
. .
. .
` % ` ` ` ` `
618
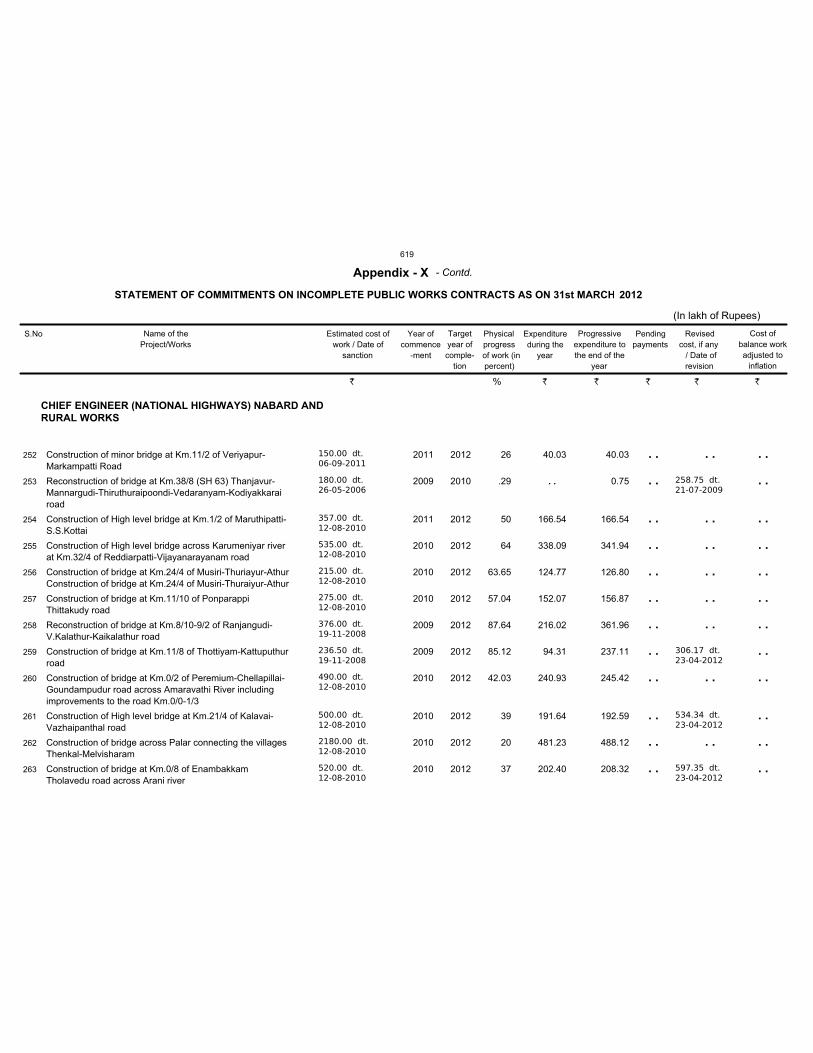
CHIEF ENGINEER (NATIONAL HIGHWAYS) NABARD AND
RURAL WORKS
Construction of minor bridge at Km.11/2 of Veriyapur-
Markampatti Road
Reconstruction of bridge at Km.38/8 (SH 63) Thanjavur-
Mannargudi-Thiruthuraipoondi-Vedaranyam-Kodiyakkarai
road
Construction of High level bridge at Km.1/2 of Maruthipatti-
S.S.Kottai
Construction of High level bridge across Karumeniyar river
at Km.32/4 of Reddiarpatti-Vijayanarayanam road
Construction of bridge at Km.24/4 of Musiri-Thuriayur-Athur
Construction of bridge at Km.24/4 of Musiri-Thuraiyur-Athur
Construction of bridge at Km.11/10 of Ponparappi
Thittakudy road
Reconstruction of bridge at Km.8/10-9/2 of Ranjangudi-
V.Kalathur-Kaikalathur road
Construction of bridge at Km.11/8 of Thottiyam-Kattuputhur
road
Construction of bridge at Km.0/2 of Peremium-Chellapillai-
Goundampudur road across Amaravathi River including
improvements to the road Km.0/0-1/3
Construction of High level bridge at Km.21/4 of Kalavai-
Vazhaipanthal road
Construction of bridge across Palar connecting the villages
Thenkal-Melvisharam
Construction of bridge at Km.0/8 of Enambakkam
Tholavedu road across Arani river
150.00 dt.
06-09-2011
180.00 dt.
26-05-2006
357.00 dt.
12-08-2010
535.00 dt.
12-08-2010
215.00 dt.
12-08-2010
275.00 dt.
12-08-2010
376.00 dt.
19-11-2008
236.50 dt.
19-11-2008
490.00 dt.
12-08-2010
500.00 dt.
12-08-2010
2180.00 dt.
12-08-2010
520.00 dt.
12-08-2010
2011
2009
2011
2010
2010
2010
2009
2009
2010
2010
2010
2010
2012
2010
2012
2012
2012
2012
2012
2012
2012
2012
2012
2012
258.75 dt.
21-07-2009
306.17 dt.
23-04-2012
534.34 dt.
23-04-2012
597.35 dt.
23-04-2012
40.03
. .
166.54
338.09
124.77
152.07
216.02
94.31
240.93
191.64
481.23
202.40
40.03
0.75
166.54
341.94
126.80
156.87
361.96
237.11
245.42
192.59
488.12
208.32
26
.29
50
64
63.65
57.04
87.64
85.12
42.03
39
20
37
252
253
254
255
256
257
258
259
260
261
262
263
S.No Name of the
Project/Works
Estimated cost of
work / Date of
sanction
Year of
commence
-ment
Target
year of
comple-
tion
Physical
progress
of work (in
percent)
Expenditure
during the
year
Progressive
expenditure to
the end of the
year
Pending
payments
Revised
cost, if any
/ Date of
revision
STATEMENT OF COMMITMENTS ON INCOMPLETE PUBLIC WORKS CONTRACTS AS ON 31st MARCH
Appendix - X
(In lakh of Rupees)
2012
Cost of
balance work
adjusted to
inflation
- Contd.
. .
. .
. .
. .
. .
. .
. .
. .
. .
. .
. .
. .
. .
. .
. .
. .
. .
. .
. .
. .
. .
. .
. .
. .
. .
. .
. .
. .
. .
. .
. .
. .
` % ` ` ` ` `
619
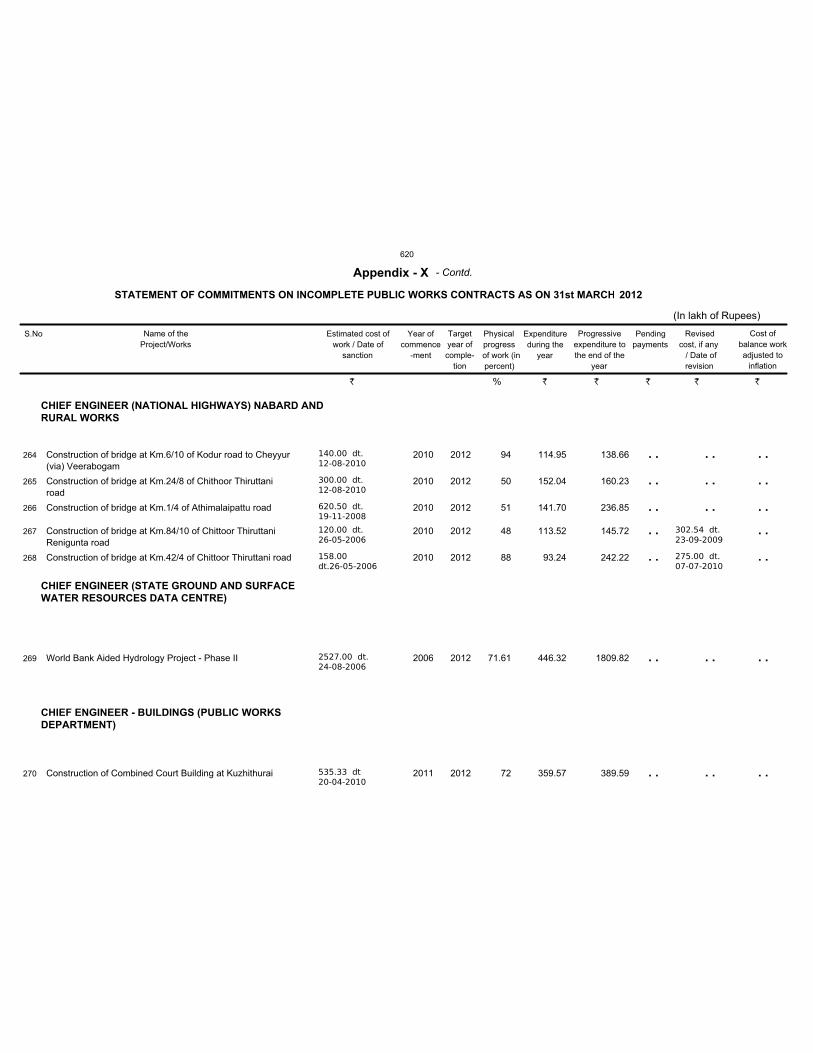
CHIEF ENGINEER (NATIONAL HIGHWAYS) NABARD AND
RURAL WORKS
CHIEF ENGINEER (STATE GROUND AND SURFACE
WATER RESOURCES DATA CENTRE)
CHIEF ENGINEER - BUILDINGS (PUBLIC WORKS
DEPARTMENT)
Construction of bridge at Km.6/10 of Kodur road to Cheyyur
(via) Veerabogam
Construction of bridge at Km.24/8 of Chithoor Thiruttani
road
Construction of bridge at Km.1/4 of Athimalaipattu road
Construction of bridge at Km.84/10 of Chittoor Thiruttani
Renigunta road
Construction of bridge at Km.42/4 of Chittoor Thiruttani road
World Bank Aided Hydrology Project - Phase II
Construction of Combined Court Building at Kuzhithurai
140.00 dt.
12-08-2010
300.00 dt.
12-08-2010
620.50 dt.
19-11-2008
120.00 dt.
26-05-2006
158.00
dt.26-05-2006
2527.00 dt.
24-08-2006
535.33 dt
20-04-2010
2010
2010
2010
2010
2010
2006
2011
2012
2012
2012
2012
2012
2012
2012
302.54 dt.
23-09-2009
275.00 dt.
07-07-2010
114.95
152.04
141.70
113.52
93.24
446.32
359.57
138.66
160.23
236.85
145.72
242.22
1809.82
389.59
94
50
51
48
88
71.61
72
264
265
266
267
268
269
270
S.No Name of the
Project/Works
Estimated cost of
work / Date of
sanction
Year of
commence
-ment
Target
year of
comple-
tion
Physical
progress
of work (in
percent)
Expenditure
during the
year
Progressive
expenditure to
the end of the
year
Pending
payments
Revised
cost, if any
/ Date of
revision
STATEMENT OF COMMITMENTS ON INCOMPLETE PUBLIC WORKS CONTRACTS AS ON 31st MARCH
Appendix - X
(In lakh of Rupees)
2012
Cost of
balance work
adjusted to
inflation
- Contd.
. .
. .
. .
. .
. .
. .
. .
. .
. .
. .
. .
. .
. .
. .
. .
. .
. .
. .
. .
` % ` ` ` ` `
620
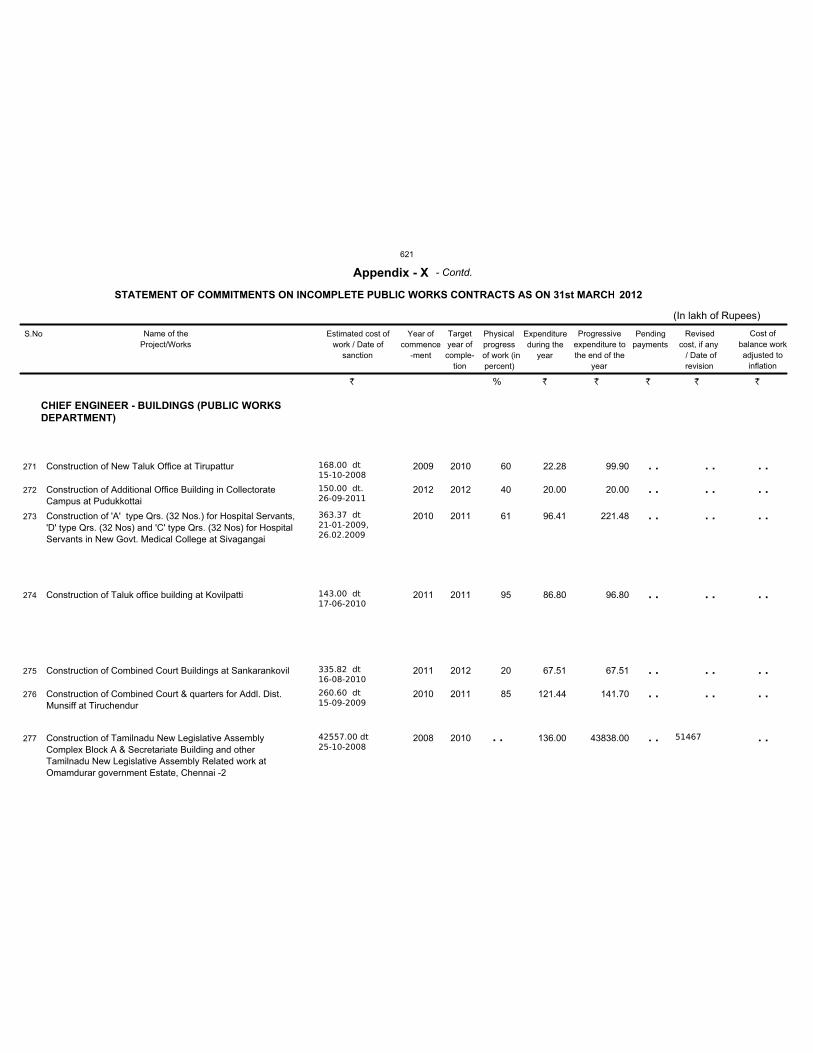
CHIEF ENGINEER - BUILDINGS (PUBLIC WORKS
DEPARTMENT)
Construction of New Taluk Office at Tirupattur
Construction of Additional Office Building in Collectorate
Campus at Pudukkottai
Construction of 'A' type Qrs. (32 Nos.) for Hospital Servants,
'D' type Qrs. (32 Nos) and 'C' type Qrs. (32 Nos) for Hospital
Servants in New Govt. Medical College at Sivagangai
Construction of Taluk office building at Kovilpatti
Construction of Combined Court Buildings at Sankarankovil
Construction of Combined Court & quarters for Addl. Dist.
Munsiff at Tiruchendur
Construction of Tamilnadu New Legislative Assembly
Complex Block A & Secretariate Building and other
Tamilnadu New Legislative Assembly Related work at
Omamdurar government Estate, Chennai -2
168.00 dt
15-10-2008
150.00 dt.
26-09-2011
363.37 dt
21-01-2009,
26.02.2009
143.00 dt
17-06-2010
335.82 dt
16-08-2010
260.60 dt
15-09-2009
42557.00 dt
25-10-2008
2009
2012
2010
2011
2011
2010
2008
2010
2012
2011
2011
2012
2011
2010 51467
22.28
20.00
96.41
86.80
67.51
121.44
136.00
99.90
20.00
221.48
96.80
67.51
141.70
43838.00
60
40
61
95
20
85
271
272
273
274
275
276
277
S.No Name of the
Project/Works
Estimated cost of
work / Date of
sanction
Year of
commence
-ment
Target
year of
comple-
tion
Physical
progress
of work (in
percent)
Expenditure
during the
year
Progressive
expenditure to
the end of the
year
Pending
payments
Revised
cost, if any
/ Date of
revision
STATEMENT OF COMMITMENTS ON INCOMPLETE PUBLIC WORKS CONTRACTS AS ON 31st MARCH
Appendix - X
(In lakh of Rupees)
2012
Cost of
balance work
adjusted to
inflation
- Contd.
. .
. .
. .
. .
. .
. .
. .
. .
. .
. .
. .
. .
. .
. .
. .
. .
. .
. .
. .
. .. .
` % ` ` ` ` `
621
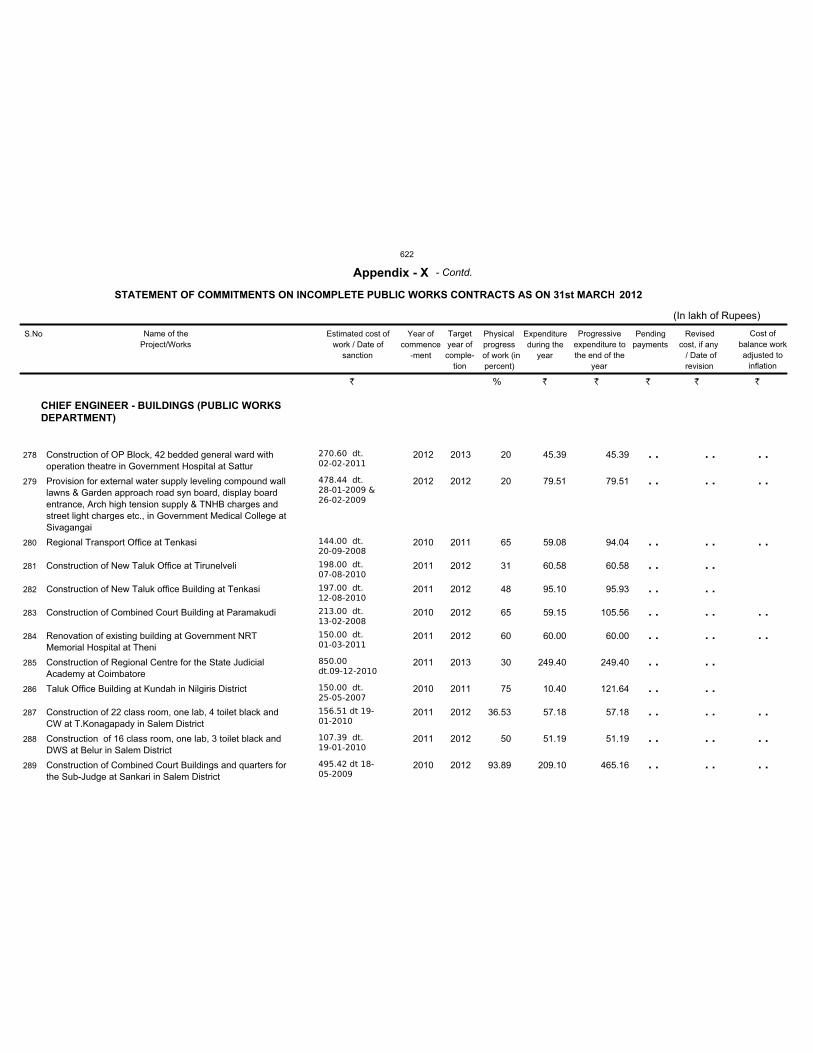
CHIEF ENGINEER - BUILDINGS (PUBLIC WORKS
DEPARTMENT)
Construction of OP Block, 42 bedded general ward with
operation theatre in Government Hospital at Sattur
Provision for external water supply leveling compound wall
lawns & Garden approach road syn board, display board
entrance, Arch high tension supply & TNHB charges and
street light charges etc., in Government Medical College at
Sivagangai
Regional Transport Office at Tenkasi
Construction of New Taluk Office at Tirunelveli
Construction of New Taluk office Building at Tenkasi
Construction of Combined Court Building at Paramakudi
Renovation of existing building at Government NRT
Memorial Hospital at Theni
Construction of Regional Centre for the State Judicial
Academy at Coimbatore
Taluk Office Building at Kundah in Nilgiris District
Construction of 22 class room, one lab, 4 toilet black and
CW at T.Konagapady in Salem District
Construction of 16 class room, one lab, 3 toilet black and
DWS at Belur in Salem District
Construction of Combined Court Buildings and quarters for
the Sub-Judge at Sankari in Salem District
270.60 dt.
02-02-2011
478.44 dt.
28-01-2009 &
26-02-2009
144.00 dt.
20-09-2008
198.00 dt.
07-08-2010
197.00 dt.
12-08-2010
213.00 dt.
13-02-2008
150.00 dt.
01-03-2011
850.00
dt.09-12-2010
150.00 dt.
25-05-2007
156.51 dt 19-
01-2010
107.39 dt.
19-01-2010
495.42 dt 18-
05-2009
2012
2012
2010
2011
2011
2010
2011
2011
2010
2011
2011
2010
2013
2012
2011
2012
2012
2012
2012
2013
2011
2012
2012
2012
45.39
79.51
59.08
60.58
95.10
59.15
60.00
249.40
10.40
57.18
51.19
209.10
45.39
79.51
94.04
60.58
95.93
105.56
60.00
249.40
121.64
57.18
51.19
465.16
20
20
65
31
48
65
60
30
75
36.53
50
93.89
278
279
280
281
282
283
284
285
286
287
288
289
S.No Name of the
Project/Works
Estimated cost of
work / Date of
sanction
Year of
commence
-ment
Target
year of
comple-
tion
Physical
progress
of work (in
percent)
Expenditure
during the
year
Progressive
expenditure to
the end of the
year
Pending
payments
Revised
cost, if any
/ Date of
revision
STATEMENT OF COMMITMENTS ON INCOMPLETE PUBLIC WORKS CONTRACTS AS ON 31st MARCH
Appendix - X
(In lakh of Rupees)
2012
Cost of
balance work
adjusted to
inflation
- Contd.
. .
. .
. .
. .
. .
. .
. .
. .
. .
. .
. .
. .
. .
. .
. .
. .
. .
. .
. .
. .
. .
. .
. .
. .
. .
. .
. .
. .
. .
. .
. .
. .
` % ` ` ` ` `
622
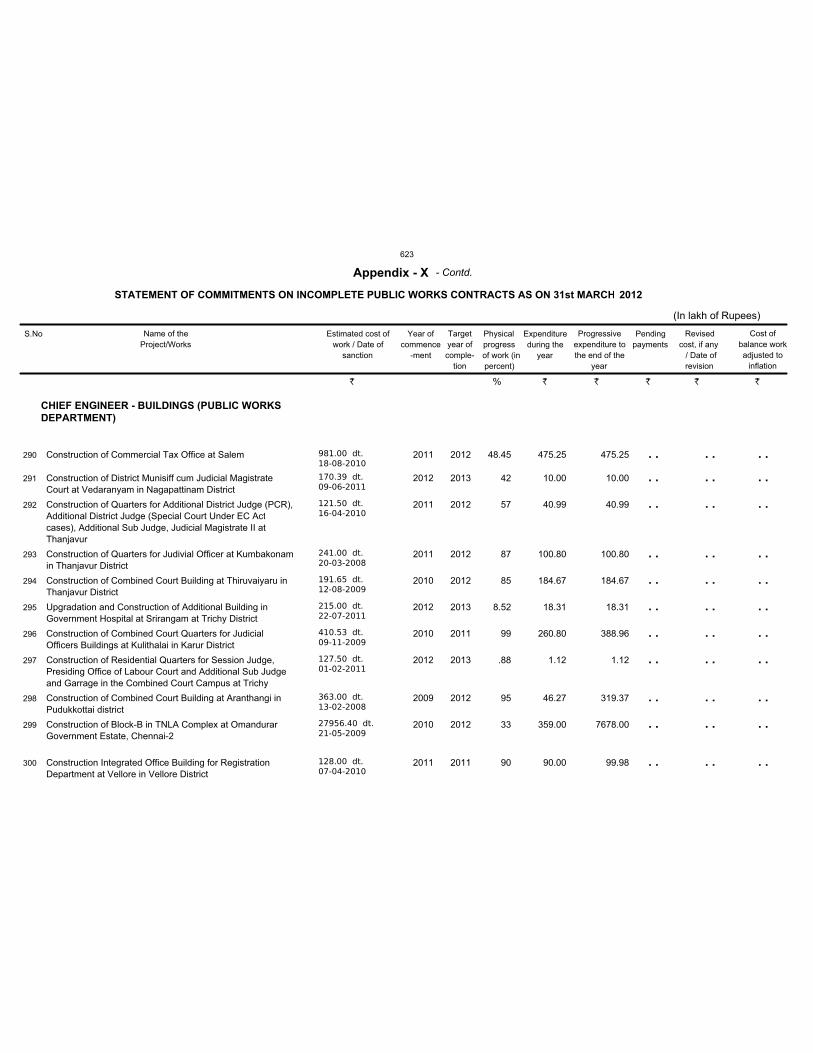
CHIEF ENGINEER - BUILDINGS (PUBLIC WORKS
DEPARTMENT)
Construction of Commercial Tax Office at Salem
Construction of District Munisiff cum Judicial Magistrate
Court at Vedaranyam in Nagapattinam District
Construction of Quarters for Additional District Judge (PCR),
Additional District Judge (Special Court Under EC Act
cases), Additional Sub Judge, Judicial Magistrate II at
Thanjavur
Construction of Quarters for Judivial Officer at Kumbakonam
in Thanjavur District
Construction of Combined Court Building at Thiruvaiyaru in
Thanjavur District
Upgradation and Construction of Additional Building in
Government Hospital at Srirangam at Trichy District
Construction of Combined Court Quarters for Judicial
Officers Buildings at Kulithalai in Karur District
Construction of Residential Quarters for Session Judge,
Presiding Office of Labour Court and Additional Sub Judge
and Garrage in the Combined Court Campus at Trichy
Construction of Combined Court Building at Aranthangi in
Pudukkottai district
Construction of Block-B in TNLA Complex at Omandurar
Government Estate, Chennai-2
Construction Integrated Office Building for Registration
Department at Vellore in Vellore District
981.00 dt.
18-08-2010
170.39 dt.
09-06-2011
121.50 dt.
16-04-2010
241.00 dt.
20-03-2008
191.65 dt.
12-08-2009
215.00 dt.
22-07-2011
410.53 dt.
09-11-2009
127.50 dt.
01-02-2011
363.00 dt.
13-02-2008
27956.40 dt.
21-05-2009
128.00 dt.
07-04-2010
2011
2012
2011
2011
2010
2012
2010
2012
2009
2010
2011
2012
2013
2012
2012
2012
2013
2011
2013
2012
2012
2011
475.25
10.00
40.99
100.80
184.67
18.31
260.80
1.12
46.27
359.00
90.00
475.25
10.00
40.99
100.80
184.67
18.31
388.96
1.12
319.37
7678.00
99.98
48.45
42
57
87
85
8.52
99
.88
95
33
90
290
291
292
293
294
295
296
297
298
299
300
S.No Name of the
Project/Works
Estimated cost of
work / Date of
sanction
Year of
commence
-ment
Target
year of
comple-
tion
Physical
progress
of work (in
percent)
Expenditure
during the
year
Progressive
expenditure to
the end of the
year
Pending
payments
Revised
cost, if any
/ Date of
revision
STATEMENT OF COMMITMENTS ON INCOMPLETE PUBLIC WORKS CONTRACTS AS ON 31st MARCH
Appendix - X
(In lakh of Rupees)
2012
Cost of
balance work
adjusted to
inflation
- Contd.
. .
. .
. .
. .
. .
. .
. .
. .
. .
. .
. .
. .
. .
. .
. .
. .
. .
. .
. .
. .
. .
. .
. .
. .
. .
. .
. .
. .
. .
. .
. .
. .
. .
` % ` ` ` ` `
623
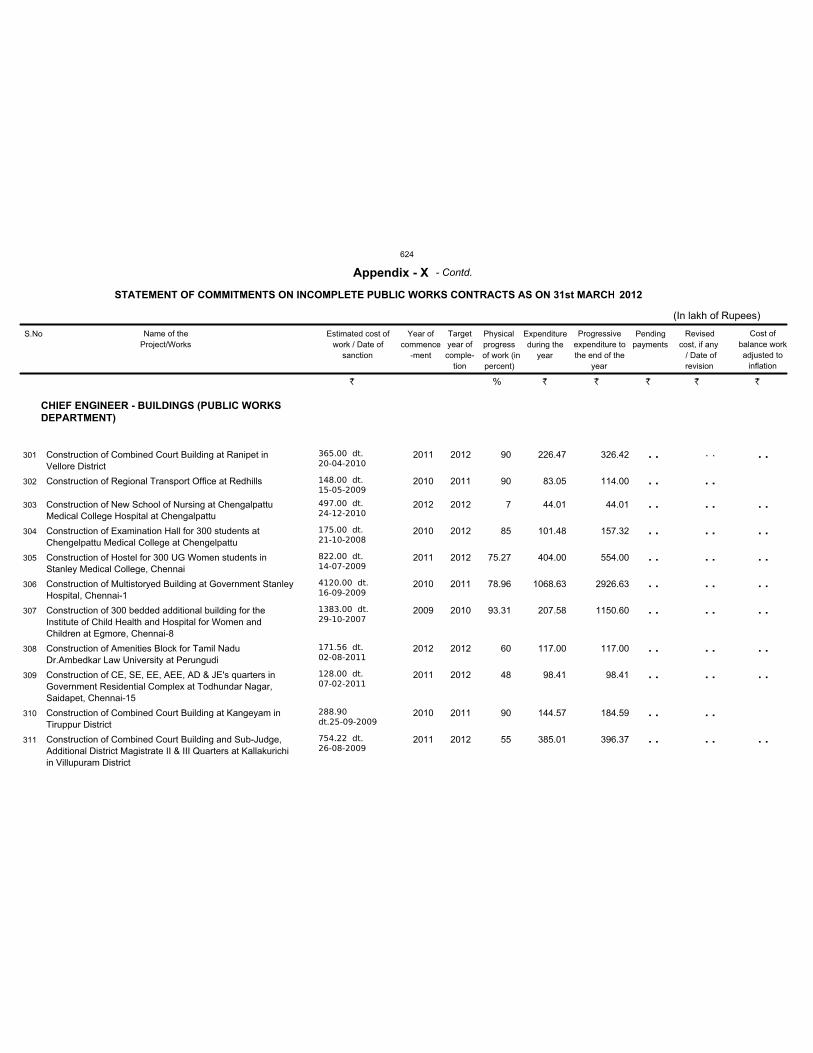
CHIEF ENGINEER - BUILDINGS (PUBLIC WORKS
DEPARTMENT)
Construction of Combined Court Building at Ranipet in
Vellore District
Construction of Regional Transport Office at Redhills
Construction of New School of Nursing at Chengalpattu
Medical College Hospital at Chengalpattu
Construction of Examination Hall for 300 students at
Chengelpattu Medical College at Chengelpattu
Construction of Hostel for 300 UG Women students in
Stanley Medical College, Chennai
Construction of Multistoryed Building at Government Stanley
Hospital, Chennai-1
Construction of 300 bedded additional building for the
Institute of Child Health and Hospital for Women and
Children at Egmore, Chennai-8
Construction of Amenities Block for Tamil Nadu
Dr.Ambedkar Law University at Perungudi
Construction of CE, SE, EE, AEE, AD & JE's quarters in
Government Residential Complex at Todhundar Nagar,
Saidapet, Chennai-15
Construction of Combined Court Building at Kangeyam in
Tiruppur District
Construction of Combined Court Building and Sub-Judge,
Additional District Magistrate II & III Quarters at Kallakurichi
in Villupuram District
365.00 dt.
20-04-2010
148.00 dt.
15-05-2009
497.00 dt.
24-12-2010
175.00 dt.
21-10-2008
822.00 dt.
14-07-2009
4120.00 dt.
16-09-2009
1383.00 dt.
29-10-2007
171.56 dt.
02-08-2011
128.00 dt.
07-02-2011
288.90
dt.25-09-2009
754.22 dt.
26-08-2009
2011
2010
2012
2010
2011
2010
2009
2012
2011
2010
2011
2012
2011
2012
2012
2012
2011
2010
2012
2012
2011
2012
. .226.47
83.05
44.01
101.48
404.00
1068.63
207.58
117.00
98.41
144.57
385.01
326.42
114.00
44.01
157.32
554.00
2926.63
1150.60
117.00
98.41
184.59
396.37
90
90
7
85
75.27
78.96
93.31
60
48
90
55
301
302
303
304
305
306
307
308
309
310
311
S.No Name of the
Project/Works
Estimated cost of
work / Date of
sanction
Year of
commence
-ment
Target
year of
comple-
tion
Physical
progress
of work (in
percent)
Expenditure
during the
year
Progressive
expenditure to
the end of the
year
Pending
payments
Revised
cost, if any
/ Date of
revision
STATEMENT OF COMMITMENTS ON INCOMPLETE PUBLIC WORKS CONTRACTS AS ON 31st MARCH
Appendix - X
(In lakh of Rupees)
2012
Cost of
balance work
adjusted to
inflation
- Contd.
. .
. .
. .
. .
. .
. .
. .
. .
. .
. .
. .
. .
. .
. .
. .
. .
. .
. .
. .
. .
. .
. .
. .
. .
. .
. .
. .
. .
. .
. .
` % ` ` ` ` `
624
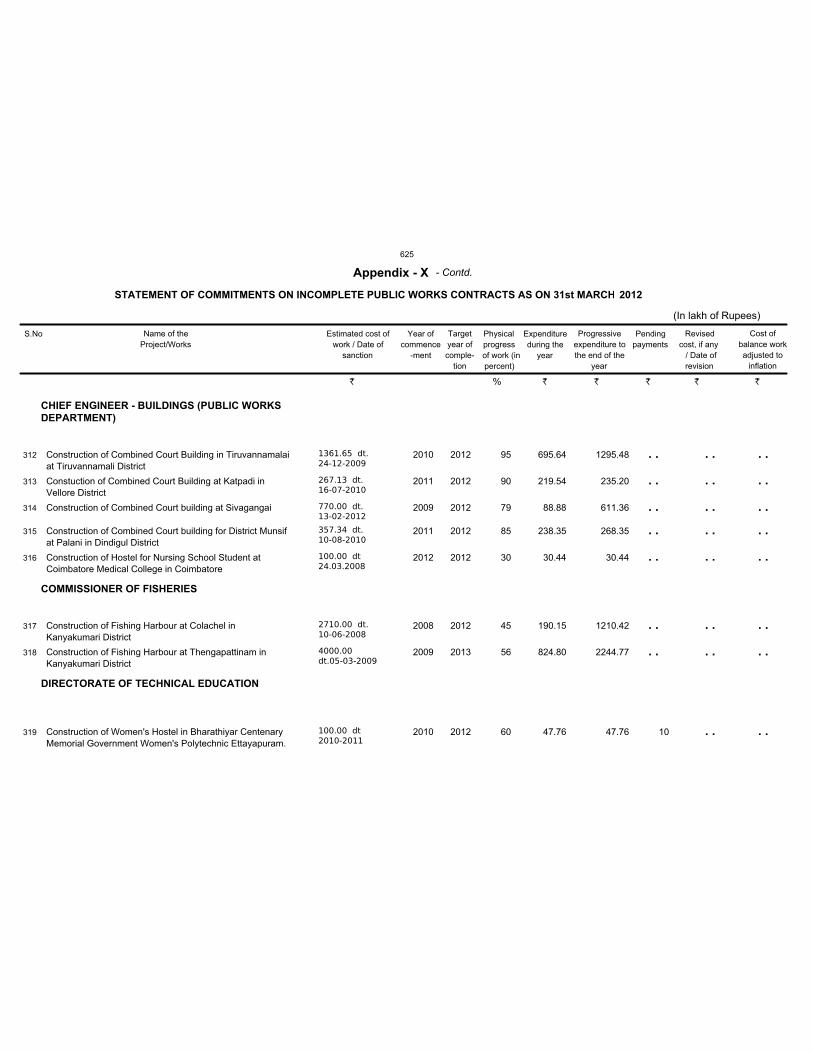
CHIEF ENGINEER - BUILDINGS (PUBLIC WORKS
DEPARTMENT)
COMMISSIONER OF FISHERIES
DIRECTORATE OF TECHNICAL EDUCATION
Construction of Combined Court Building in Tiruvannamalai
at Tiruvannamali District
Constuction of Combined Court Building at Katpadi in
Vellore District
Construction of Combined Court building at Sivagangai
Construction of Combined Court building for District Munsif
at Palani in Dindigul District
Construction of Hostel for Nursing School Student at
Coimbatore Medical College in Coimbatore
Construction of Fishing Harbour at Colachel in
Kanyakumari District
Construction of Fishing Harbour at Thengapattinam in
Kanyakumari District
Construction of Women's Hostel in Bharathiyar Centenary
Memorial Government Women's Polytechnic Ettayapuram.
1361.65 dt.
24-12-2009
267.13 dt.
16-07-2010
770.00 dt.
13-02-2012
357.34 dt.
10-08-2010
100.00 dt
24.03.2008
2710.00 dt.
10-06-2008
4000.00
dt.05-03-2009
100.00 dt
2010-2011
2010
2011
2009
2011
2012
2008
2009
2010
2012
2012
2012
2012
2012
2012
2013
2012
695.64
219.54
88.88
238.35
30.44
190.15
824.80
47.76
1295.48
235.20
611.36
268.35
30.44
1210.42
2244.77
47.76
95
90
79
85
30
45
56
60 10
312
313
314
315
316
317
318
319
S.No Name of the
Project/Works
Estimated cost of
work / Date of
sanction
Year of
commence
-ment
Target
year of
comple-
tion
Physical
progress
of work (in
percent)
Expenditure
during the
year
Progressive
expenditure to
the end of the
year
Pending
payments
Revised
cost, if any
/ Date of
revision
STATEMENT OF COMMITMENTS ON INCOMPLETE PUBLIC WORKS CONTRACTS AS ON 31st MARCH
Appendix - X
(In lakh of Rupees)
2012
Cost of
balance work
adjusted to
inflation
- Contd.
. .
. .
. .
. .
. .
. .
. .
. .
. .
. .
. .
. .
. .
. .
. .
. .
. .
. .
. .
. .
. .
. .
. .
` % ` ` ` ` `
625
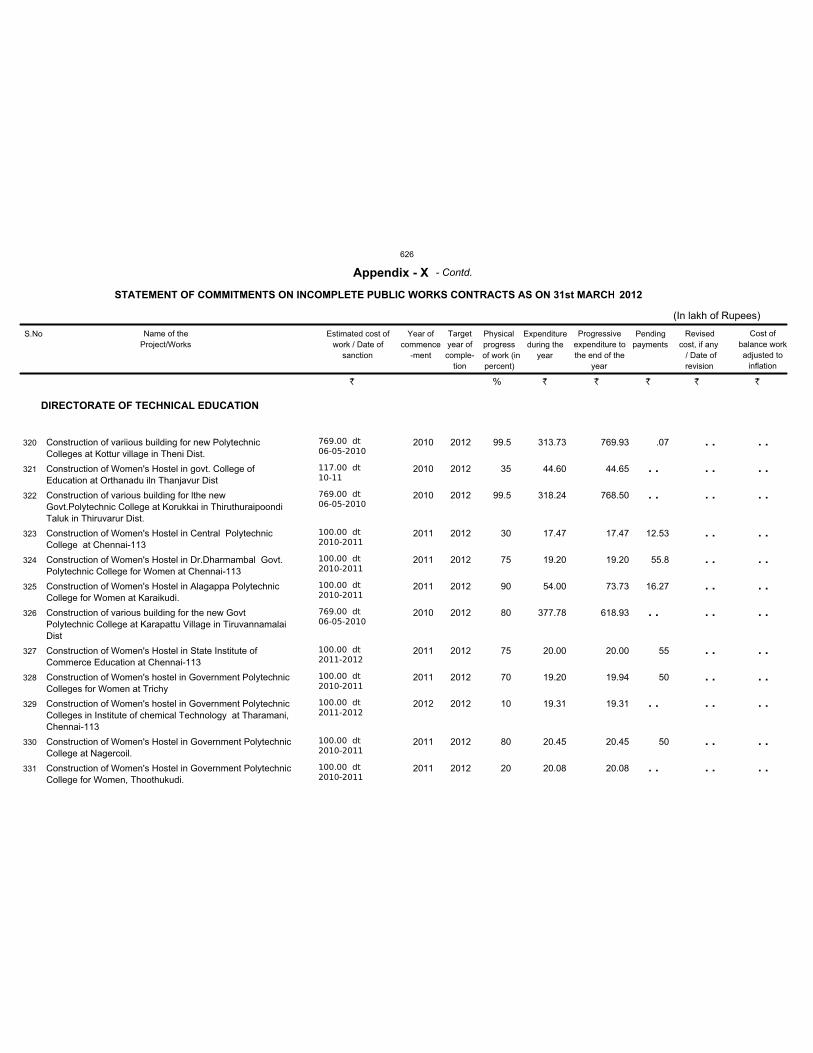
DIRECTORATE OF TECHNICAL EDUCATION
Construction of variious building for new Polytechnic
Colleges at Kottur village in Theni Dist.
Construction of Women's Hostel in govt. College of
Education at Orthanadu iln Thanjavur Dist
Construction of various building for lthe new
Govt.Polytechnic College at Korukkai in Thiruthuraipoondi
Taluk in Thiruvarur Dist.
Construction of Women's Hostel in Central Polytechnic
College at Chennai-113
Construction of Women's Hostel in Dr.Dharmambal Govt.
Polytechnic College for Women at Chennai-113
Construction of Women's Hostel in Alagappa Polytechnic
College for Women at Karaikudi.
Construction of various building for the new Govt
Polytechnic College at Karapattu Village in Tiruvannamalai
Dist
Construction of Women's Hostel in State Institute of
Commerce Education at Chennai-113
Construction of Women's hostel in Government Polytechnic
Colleges for Women at Trichy
Construction of Women's hostel in Government Polytechnic
Colleges in Institute of chemical Technology at Tharamani,
Chennai-113
Construction of Women's Hostel in Government Polytechnic
College at Nagercoil.
Construction of Women's Hostel in Government Polytechnic
College for Women, Thoothukudi.
769.00 dt
06-05-2010
117.00 dt
10-11
769.00 dt
06-05-2010
100.00 dt
2010-2011
100.00 dt
2010-2011
100.00 dt
2010-2011
769.00 dt
06-05-2010
100.00 dt
2011-2012
100.00 dt
2010-2011
100.00 dt
2011-2012
100.00 dt
2010-2011
100.00 dt
2010-2011
2010
2010
2010
2011
2011
2011
2010
2011
2011
2012
2011
2011
2012
2012
2012
2012
2012
2012
2012
2012
2012
2012
2012
2012
313.73
44.60
318.24
17.47
19.20
54.00
377.78
20.00
19.20
19.31
20.45
20.08
769.93
44.65
768.50
17.47
19.20
73.73
618.93
20.00
19.94
19.31
20.45
20.08
99.5
35
99.5
30
75
90
80
75
70
10
80
20
.07
12.53
55.8
16.27
55
50
50
320
321
322
323
324
325
326
327
328
329
330
331
S.No Name of the
Project/Works
Estimated cost of
work / Date of
sanction
Year of
commence
-ment
Target
year of
comple-
tion
Physical
progress
of work (in
percent)
Expenditure
during the
year
Progressive
expenditure to
the end of the
year
Pending
payments
Revised
cost, if any
/ Date of
revision
STATEMENT OF COMMITMENTS ON INCOMPLETE PUBLIC WORKS CONTRACTS AS ON 31st MARCH
Appendix - X
(In lakh of Rupees)
2012
Cost of
balance work
adjusted to
inflation
- Contd.
. .
. .
. .
. .
. .
. .
. .
. .
. .
. .
. .
. .
. .
. .
. .
. .
. .
. .
. .
. .
. .
. .
. .
. .
. .
. .
. .
. .
. .
` % ` ` ` ` `
626
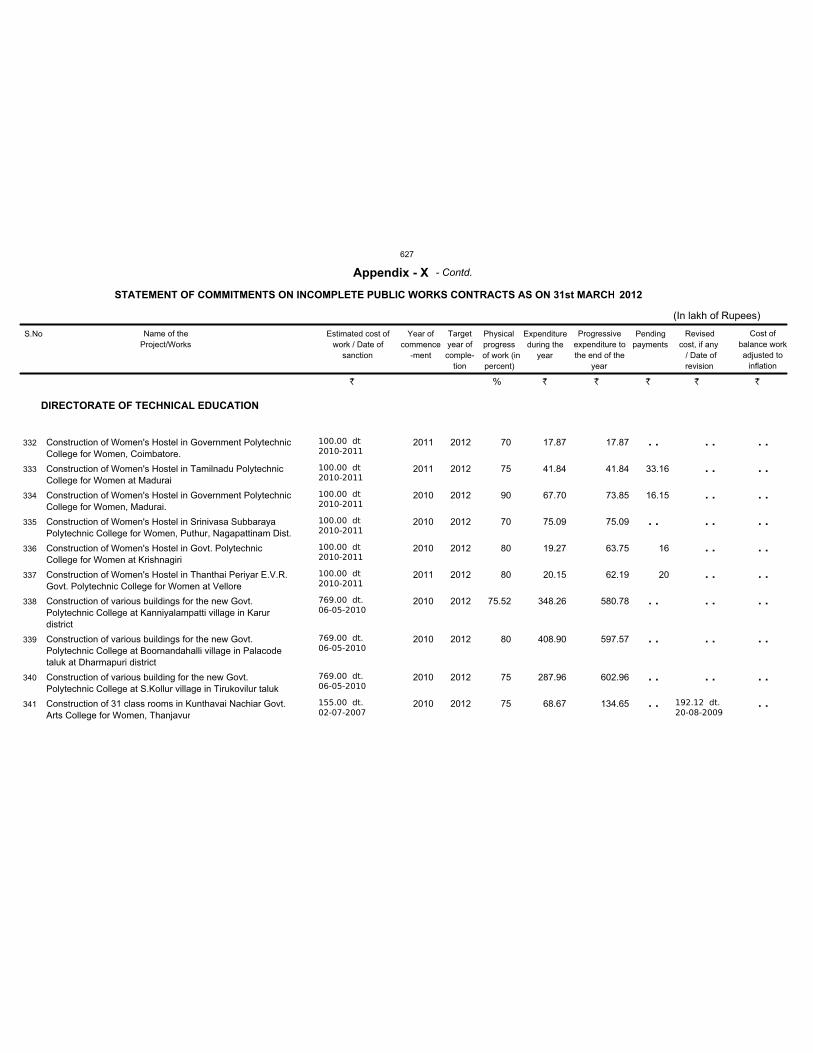
DIRECTORATE OF TECHNICAL EDUCATION
Construction of Women's Hostel in Government Polytechnic
College for Women, Coimbatore.
Construction of Women's Hostel in Tamilnadu Polytechnic
College for Women at Madurai
Construction of Women's Hostel in Government Polytechnic
College for Women, Madurai.
Construction of Women's Hostel in Srinivasa Subbaraya
Polytechnic College for Women, Puthur, Nagapattinam Dist.
Construction of Women's Hostel in Govt. Polytechnic
College for Women at Krishnagiri
Construction of Women's Hostel in Thanthai Periyar E.V.R.
Govt. Polytechnic College for Women at Vellore
Construction of various buildings for the new Govt.
Polytechnic College at Kanniyalampatti village in Karur
district
Construction of various buildings for the new Govt.
Polytechnic College at Boornandahalli village in Palacode
taluk at Dharmapuri district
Construction of various building for the new Govt.
Polytechnic College at S.Kollur village in Tirukovilur taluk
Construction of 31 class rooms in Kunthavai Nachiar Govt.
Arts College for Women, Thanjavur
100.00 dt
2010-2011
100.00 dt
2010-2011
100.00 dt
2010-2011
100.00 dt
2010-2011
100.00 dt
2010-2011
100.00 dt
2010-2011
769.00 dt.
06-05-2010
769.00 dt.
06-05-2010
769.00 dt.
06-05-2010
155.00 dt.
02-07-2007
2011
2011
2010
2010
2010
2011
2010
2010
2010
2010
2012
2012
2012
2012
2012
2012
2012
2012
2012
2012 192.12 dt.
20-08-2009
17.87
41.84
67.70
75.09
19.27
20.15
348.26
408.90
287.96
68.67
17.87
41.84
73.85
75.09
63.75
62.19
580.78
597.57
602.96
134.65
70
75
90
70
80
80
75.52
80
75
75
33.16
16.15
16
20
332
333
334
335
336
337
338
339
340
341
S.No Name of the
Project/Works
Estimated cost of
work / Date of
sanction
Year of
commence
-ment
Target
year of
comple-
tion
Physical
progress
of work (in
percent)
Expenditure
during the
year
Progressive
expenditure to
the end of the
year
Pending
payments
Revised
cost, if any
/ Date of
revision
STATEMENT OF COMMITMENTS ON INCOMPLETE PUBLIC WORKS CONTRACTS AS ON 31st MARCH
Appendix - X
(In lakh of Rupees)
2012
Cost of
balance work
adjusted to
inflation
- Contd.
. .
. .
. .
. .
. .
. .
. .
. .
. .
. .
. .
. .
. .
. .
. .
. .
. .
. .
. .
. .
. .
. .
. .
. .
. .
` % ` ` ` ` `
627
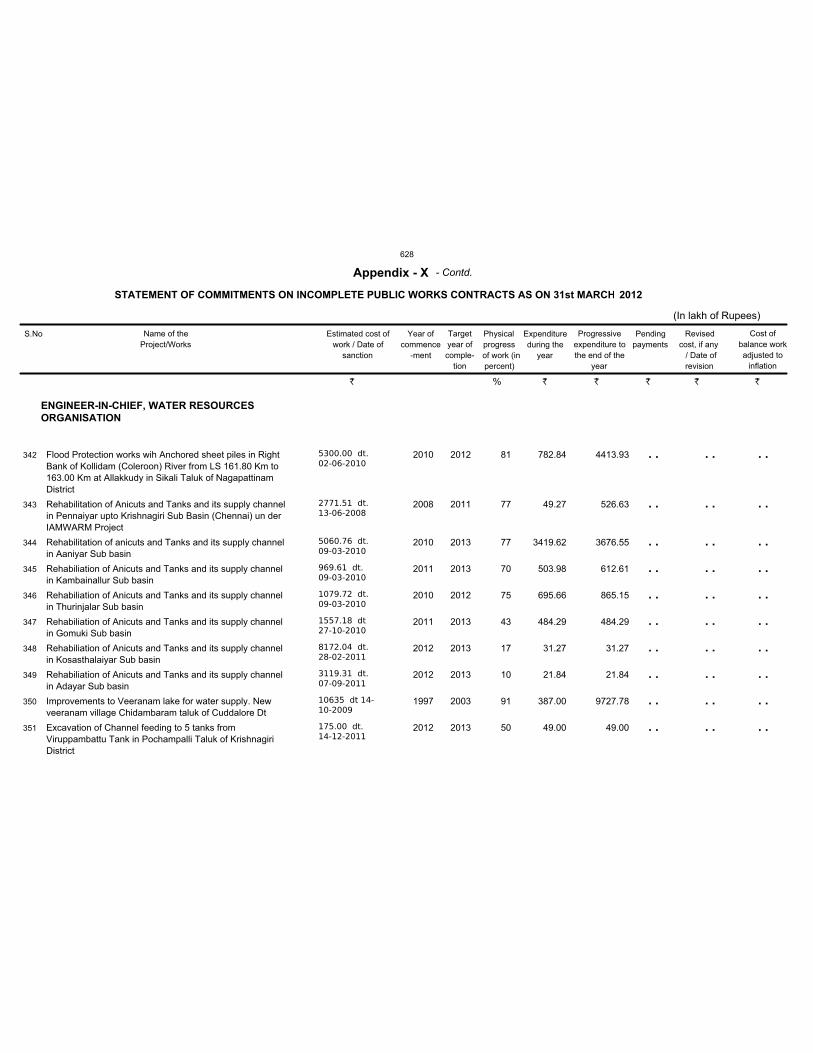
ENGINEER-IN-CHIEF, WATER RESOURCES
ORGANISATION
Flood Protection works wih Anchored sheet piles in Right
Bank of Kollidam (Coleroon) River from LS 161.80 Km to
163.00 Km at Allakkudy in Sikali Taluk of Nagapattinam
District
Rehabilitation of Anicuts and Tanks and its supply channel
in Pennaiyar upto Krishnagiri Sub Basin (Chennai) un der
IAMWARM Project
Rehabilitation of anicuts and Tanks and its supply channel
in Aaniyar Sub basin
Rehabiliation of Anicuts and Tanks and its supply channel
in Kambainallur Sub basin
Rehabiliation of Anicuts and Tanks and its supply channel
in Thurinjalar Sub basin
Rehabiliation of Anicuts and Tanks and its supply channel
in Gomuki Sub basin
Rehabiliation of Anicuts and Tanks and its supply channel
in Kosasthalaiyar Sub basin
Rehabiliation of Anicuts and Tanks and its supply channel
in Adayar Sub basin
Improvements to Veeranam lake for water supply. New
veeranam village Chidambaram taluk of Cuddalore Dt
Excavation of Channel feeding to 5 tanks from
Viruppambattu Tank in Pochampalli Taluk of Krishnagiri
District
5300.00 dt.
02-06-2010
2771.51 dt.
13-06-2008
5060.76 dt.
09-03-2010
969.61 dt.
09-03-2010
1079.72 dt.
09-03-2010
1557.18 dt
27-10-2010
8172.04 dt.
28-02-2011
3119.31 dt.
07-09-2011
10635 dt 14-
10-2009
175.00 dt.
14-12-2011
2010
2008
2010
2011
2010
2011
2012
2012
1997
2012
2012
2011
2013
2013
2012
2013
2013
2013
2003
2013
782.84
49.27
3419.62
503.98
695.66
484.29
31.27
21.84
387.00
49.00
4413.93
526.63
3676.55
612.61
865.15
484.29
31.27
21.84
9727.78
49.00
81
77
77
70
75
43
17
10
91
50
342
343
344
345
346
347
348
349
350
351
S.No Name of the
Project/Works
Estimated cost of
work / Date of
sanction
Year of
commence
-ment
Target
year of
comple-
tion
Physical
progress
of work (in
percent)
Expenditure
during the
year
Progressive
expenditure to
the end of the
year
Pending
payments
Revised
cost, if any
/ Date of
revision
STATEMENT OF COMMITMENTS ON INCOMPLETE PUBLIC WORKS CONTRACTS AS ON 31st MARCH
Appendix - X
(In lakh of Rupees)
2012
Cost of
balance work
adjusted to
inflation
- Contd.
. .
. .
. .
. .
. .
. .
. .
. .
. .
. .
. .
. .
. .
. .
. .
. .
. .
. .
. .
. .
. .
. .
. .
. .
. .
. .
. .
. .
. .
. .
` % ` ` ` ` `
628
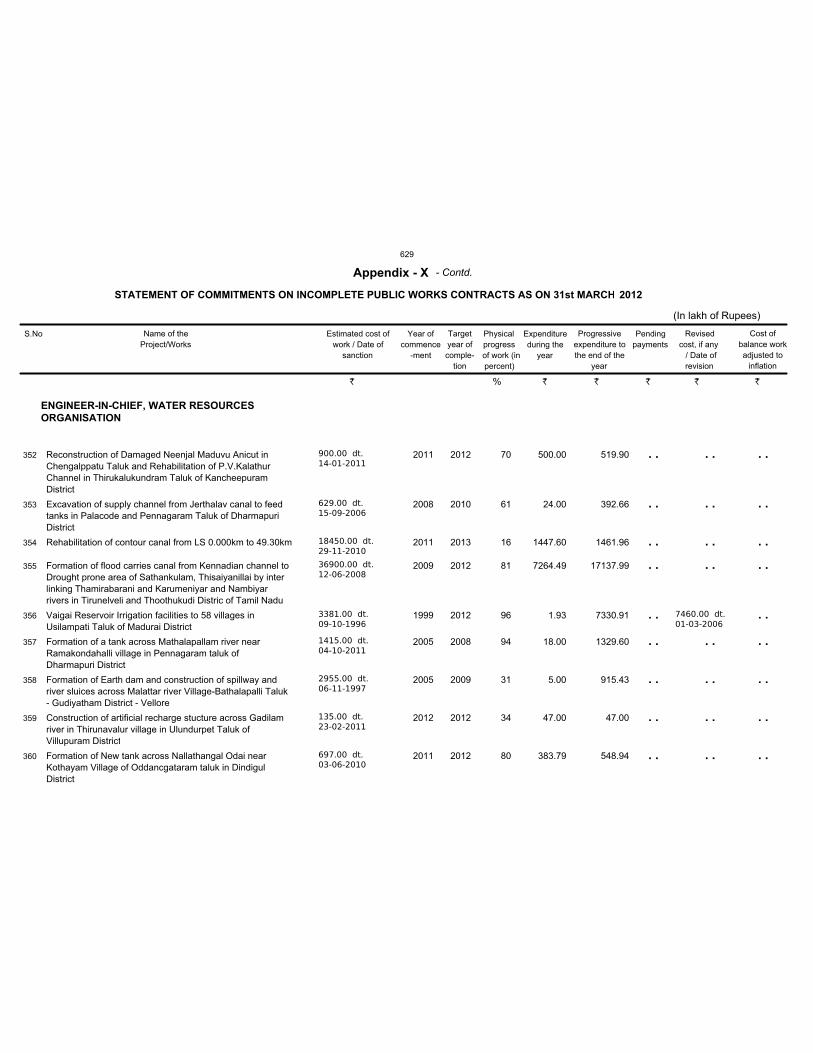
ENGINEER-IN-CHIEF, WATER RESOURCES
ORGANISATION
Reconstruction of Damaged Neenjal Maduvu Anicut in
Chengalppatu Taluk and Rehabilitation of P.V.Kalathur
Channel in Thirukalukundram Taluk of Kancheepuram
District
Excavation of supply channel from Jerthalav canal to feed
tanks in Palacode and Pennagaram Taluk of Dharmapuri
District
Rehabilitation of contour canal from LS 0.000km to 49.30km
Formation of flood carries canal from Kennadian channel to
Drought prone area of Sathankulam, Thisaiyanillai by inter
linking Thamirabarani and Karumeniyar and Nambiyar
rivers in Tirunelveli and Thoothukudi Distric of Tamil Nadu
Vaigai Reservoir Irrigation facilities to 58 villages in
Usilampati Taluk of Madurai District
Formation of a tank across Mathalapallam river near
Ramakondahalli village in Pennagaram taluk of
Dharmapuri District
Formation of Earth dam and construction of spillway and
river sluices across Malattar river Village-Bathalapalli Taluk
- Gudiyatham District - Vellore
Construction of artificial recharge stucture across Gadilam
river in Thirunavalur village in Ulundurpet Taluk of
Villupuram District
Formation of New tank across Nallathangal Odai near
Kothayam Village of Oddancgataram taluk in Dindigul
District
900.00 dt.
14-01-2011
629.00 dt.
15-09-2006
18450.00 dt.
29-11-2010
36900.00 dt.
12-06-2008
3381.00 dt.
09-10-1996
1415.00 dt.
04-10-2011
2955.00 dt.
06-11-1997
135.00 dt.
23-02-2011
697.00 dt.
03-06-2010
2011
2008
2011
2009
1999
2005
2005
2012
2011
2012
2010
2013
2012
2012
2008
2009
2012
2012
7460.00 dt.
01-03-2006
500.00
24.00
1447.60
7264.49
1.93
18.00
5.00
47.00
383.79
519.90
392.66
1461.96
17137.99
7330.91
1329.60
915.43
47.00
548.94
70
61
16
81
96
94
31
34
80
352
353
354
355
356
357
358
359
360
S.No Name of the
Project/Works
Estimated cost of
work / Date of
sanction
Year of
commence
-ment
Target
year of
comple-
tion
Physical
progress
of work (in
percent)
Expenditure
during the
year
Progressive
expenditure to
the end of the
year
Pending
payments
Revised
cost, if any
/ Date of
revision
STATEMENT OF COMMITMENTS ON INCOMPLETE PUBLIC WORKS CONTRACTS AS ON 31st MARCH
Appendix - X
(In lakh of Rupees)
2012
Cost of
balance work
adjusted to
inflation
- Contd.
. .
. .
. .
. .
. .
. .
. .
. .
. .
. .
. .
. .
. .
. .
. .
. .
. .
. .
. .
. .
. .
. .
. .
. .
. .
. .
` % ` ` ` ` `
629
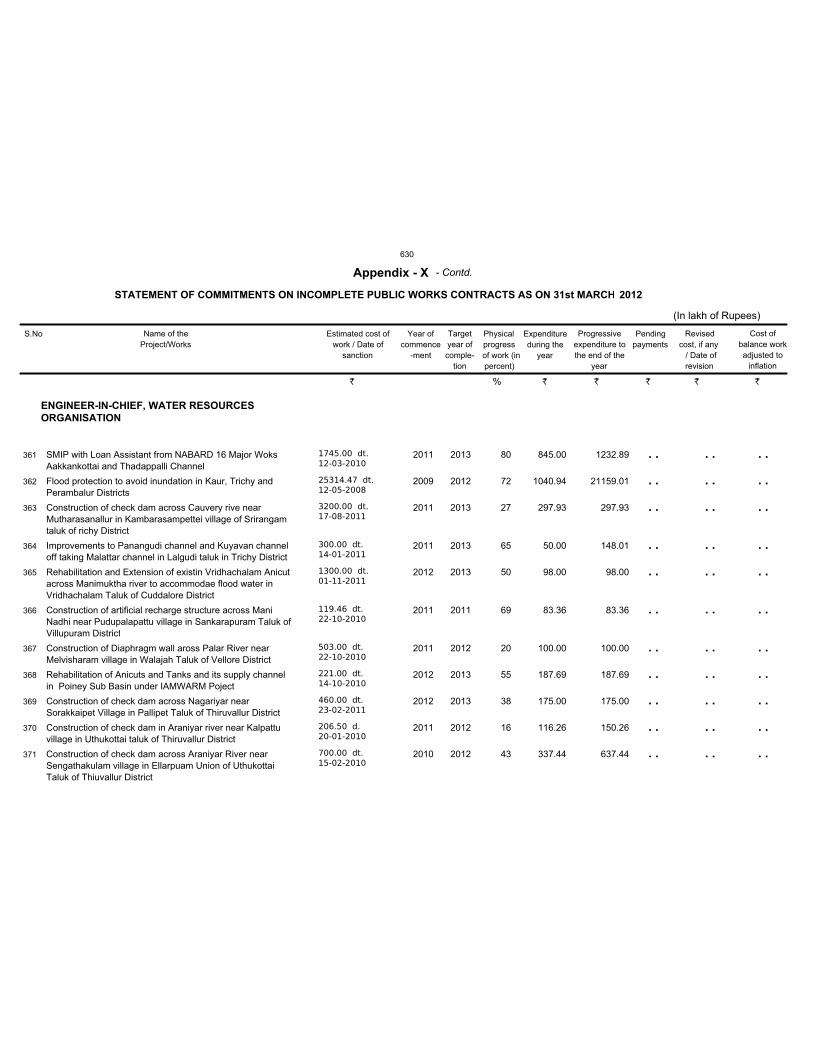
ENGINEER-IN-CHIEF, WATER RESOURCES
ORGANISATION
SMIP with Loan Assistant from NABARD 16 Major Woks
Aakkankottai and Thadappalli Channel
Flood protection to avoid inundation in Kaur, Trichy and
Perambalur Districts
Construction of check dam across Cauvery rive near
Mutharasanallur in Kambarasampettei village of Srirangam
taluk of richy District
Improvements to Panangudi channel and Kuyavan channel
off taking Malattar channel in Lalgudi taluk in Trichy District
Rehabilitation and Extension of existin Vridhachalam Anicut
across Manimuktha river to accommodae flood water in
Vridhachalam Taluk of Cuddalore District
Construction of artificial recharge structure across Mani
Nadhi near Pudupalapattu village in Sankarapuram Taluk of
Villupuram District
Construction of Diaphragm wall aross Palar River near
Melvisharam village in Walajah Taluk of Vellore District
Rehabilitation of Anicuts and Tanks and its supply channel
in Poiney Sub Basin under IAMWARM Poject
Construction of check dam across Nagariyar near
Sorakkaipet Village in Pallipet Taluk of Thiruvallur District
Construction of check dam in Araniyar river near Kalpattu
village in Uthukottai taluk of Thiruvallur District
Construction of check dam across Araniyar River near
Sengathakulam village in Ellarpuam Union of Uthukottai
Taluk of Thiuvallur District
1745.00 dt.
12-03-2010
25314.47 dt.
12-05-2008
3200.00 dt.
17-08-2011
300.00 dt.
14-01-2011
1300.00 dt.
01-11-2011
119.46 dt.
22-10-2010
503.00 dt.
22-10-2010
221.00 dt.
14-10-2010
460.00 dt.
23-02-2011
206.50 d.
20-01-2010
700.00 dt.
15-02-2010
2011
2009
2011
2011
2012
2011
2011
2012
2012
2011
2010
2013
2012
2013
2013
2013
2011
2012
2013
2013
2012
2012
845.00
1040.94
297.93
50.00
98.00
83.36
100.00
187.69
175.00
116.26
337.44
1232.89
21159.01
297.93
148.01
98.00
83.36
100.00
187.69
175.00
150.26
637.44
80
72
27
65
50
69
20
55
38
16
43
361
362
363
364
365
366
367
368
369
370
371
S.No Name of the
Project/Works
Estimated cost of
work / Date of
sanction
Year of
commence
-ment
Target
year of
comple-
tion
Physical
progress
of work (in
percent)
Expenditure
during the
year
Progressive
expenditure to
the end of the
year
Pending
payments
Revised
cost, if any
/ Date of
revision
STATEMENT OF COMMITMENTS ON INCOMPLETE PUBLIC WORKS CONTRACTS AS ON 31st MARCH
Appendix - X
(In lakh of Rupees)
2012
Cost of
balance work
adjusted to
inflation
- Contd.
. .
. .
. .
. .
. .
. .
. .
. .
. .
. .
. .
. .
. .
. .
. .
. .
. .
. .
. .
. .
. .
. .
. .
. .
. .
. .
. .
. .
. .
. .
. .
. .
. .
` % ` ` ` ` `
630
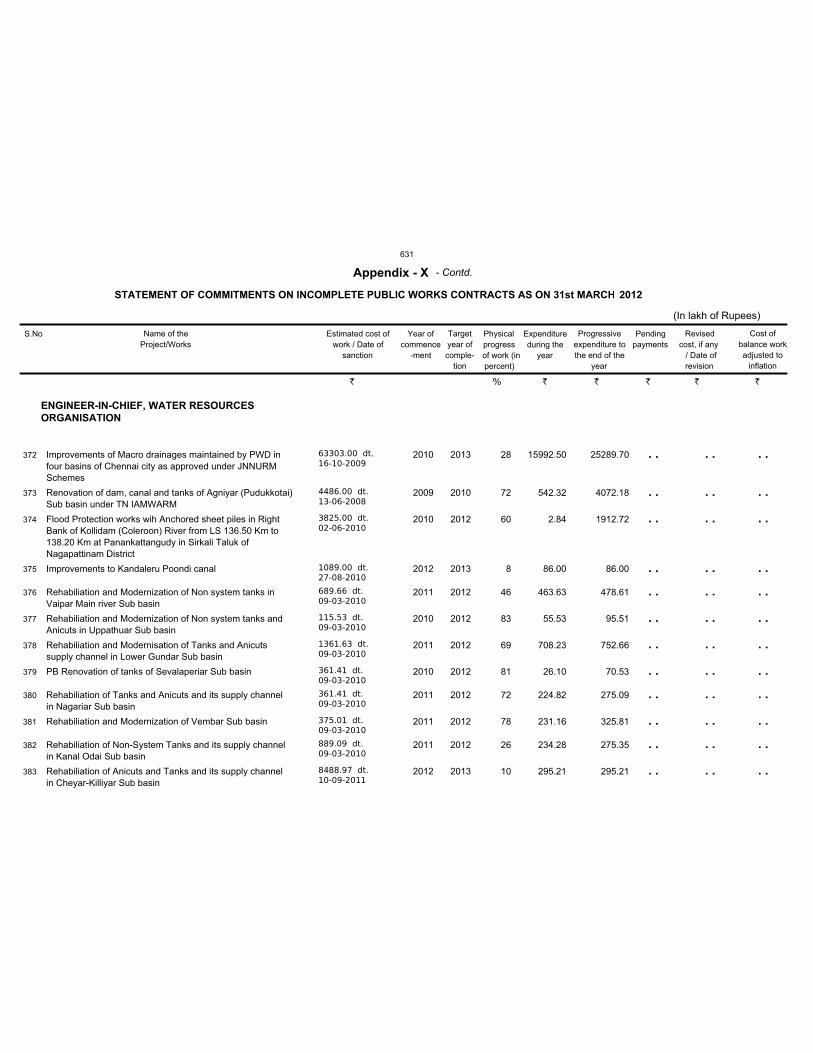
ENGINEER-IN-CHIEF, WATER RESOURCES
ORGANISATION
Improvements of Macro drainages maintained by PWD in
four basins of Chennai city as approved under JNNURM
Schemes
Renovation of dam, canal and tanks of Agniyar (Pudukkotai)
Sub basin under TN IAMWARM
Flood Protection works wih Anchored sheet piles in Right
Bank of Kollidam (Coleroon) River from LS 136.50 Km to
138.20 Km at Panankattangudy in Sirkali Taluk of
Nagapattinam District
Improvements to Kandaleru Poondi canal
Rehabiliation and Modernization of Non system tanks in
Vaipar Main river Sub basin
Rehabiliation and Modernization of Non system tanks and
Anicuts in Uppathuar Sub basin
Rehabiliation and Modernisation of Tanks and Anicuts
supply channel in Lower Gundar Sub basin
PB Renovation of tanks of Sevalaperiar Sub basin
Rehabiliation of Tanks and Anicuts and its supply channel
in Nagariar Sub basin
Rehabiliation and Modernization of Vembar Sub basin
Rehabiliation of Non-System Tanks and its supply channel
in Kanal Odai Sub basin
Rehabiliation of Anicuts and Tanks and its supply channel
in Cheyar-Killiyar Sub basin
63303.00 dt.
16-10-2009
4486.00 dt.
13-06-2008
3825.00 dt.
02-06-2010
1089.00 dt.
27-08-2010
689.66 dt.
09-03-2010
115.53 dt.
09-03-2010
1361.63 dt.
09-03-2010
361.41 dt.
09-03-2010
361.41 dt.
09-03-2010
375.01 dt.
09-03-2010
889.09 dt.
09-03-2010
8488.97 dt.
10-09-2011
2010
2009
2010
2012
2011
2010
2011
2010
2011
2011
2011
2012
2013
2010
2012
2013
2012
2012
2012
2012
2012
2012
2012
2013
15992.50
542.32
2.84
86.00
463.63
55.53
708.23
26.10
224.82
231.16
234.28
295.21
25289.70
4072.18
1912.72
86.00
478.61
95.51
752.66
70.53
275.09
325.81
275.35
295.21
28
72
60
8
46
83
69
81
72
78
26
10
372
373
374
375
376
377
378
379
380
381
382
383
S.No Name of the
Project/Works
Estimated cost of
work / Date of
sanction
Year of
commence
-ment
Target
year of
comple-
tion
Physical
progress
of work (in
percent)
Expenditure
during the
year
Progressive
expenditure to
the end of the
year
Pending
payments
Revised
cost, if any
/ Date of
revision
STATEMENT OF COMMITMENTS ON INCOMPLETE PUBLIC WORKS CONTRACTS AS ON 31st MARCH
Appendix - X
(In lakh of Rupees)
2012
Cost of
balance work
adjusted to
inflation
- Contd.
. .
. .
. .
. .
. .
. .
. .
. .
. .
. .
. .
. .
. .
. .
. .
. .
. .
. .
. .
. .
. .
. .
. .
. .
. .
. .
. .
. .
. .
. .
. .
. .
. .
. .
. .
. .
` % ` ` ` ` `
631
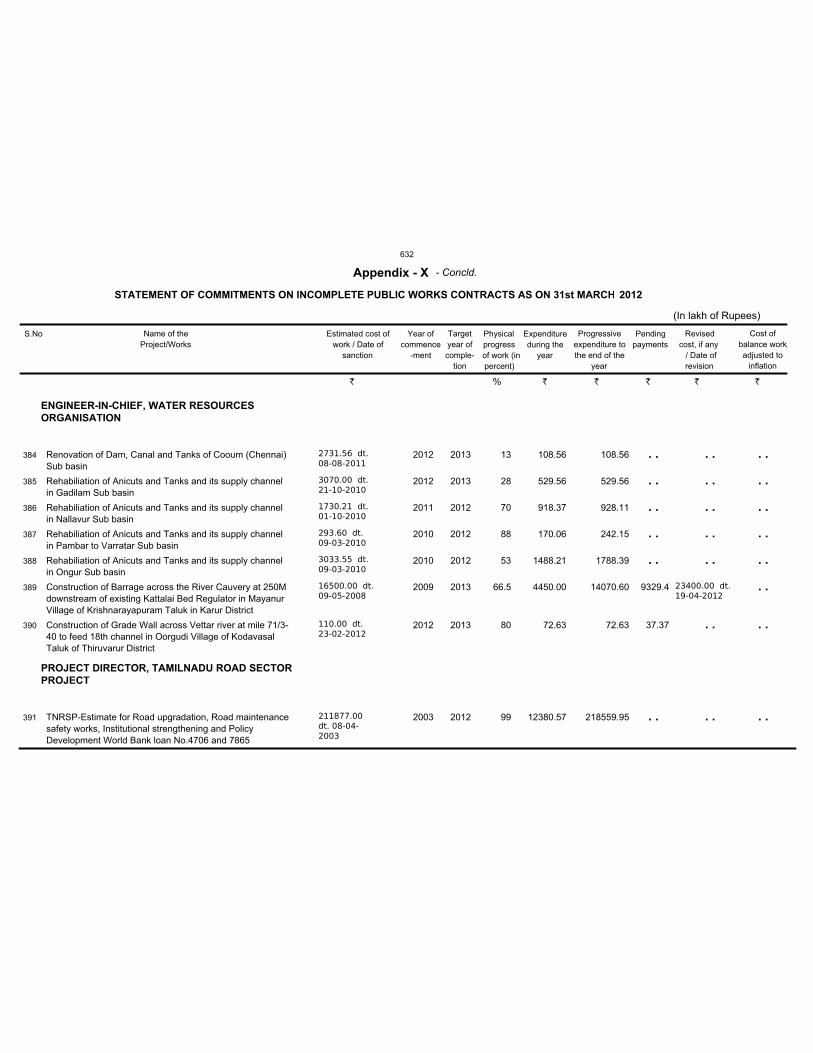
ENGINEER-IN-CHIEF, WATER RESOURCES
ORGANISATION
PROJECT DIRECTOR, TAMILNADU ROAD SECTOR
PROJECT
Renovation of Dam, Canal and Tanks of Cooum (Chennai)
Sub basin
Rehabiliation of Anicuts and Tanks and its supply channel
in Gadilam Sub basin
Rehabiliation of Anicuts and Tanks and its supply channel
in Nallavur Sub basin
Rehabiliation of Anicuts and Tanks and its supply channel
in Pambar to Varratar Sub basin
Rehabiliation of Anicuts and Tanks and its supply channel
in Ongur Sub basin
Construction of Barrage across the River Cauvery at 250M
downstream of existing Kattalai Bed Regulator in Mayanur
Village of Krishnarayapuram Taluk in Karur District
Construction of Grade Wall across Vettar river at mile 71/3-
40 to feed 18th channel in Oorgudi Village of Kodavasal
Taluk of Thiruvarur District
TNRSP-Estimate for Road upgradation, Road maintenance
safety works, Institutional strengthening and Policy
Development World Bank loan No.4706 and 7865
2731.56 dt.
08-08-2011
3070.00 dt.
21-10-2010
1730.21 dt.
01-10-2010
293.60 dt.
09-03-2010
3033.55 dt.
09-03-2010
16500.00 dt.
09-05-2008
110.00 dt.
23-02-2012
211877.00
dt. 08-04-
2003
2012
2012
2011
2010
2010
2009
2012
2003
2013
2013
2012
2012
2012
2013
2013
2012
23400.00 dt.
19-04-2012
108.56
529.56
918.37
170.06
1488.21
4450.00
72.63
12380.57
108.56
529.56
928.11
242.15
1788.39
14070.60
72.63
218559.95
13
28
70
88
53
66.5
80
99
9329.4
37.37
384
385
386
387
388
389
390
391
S.No Name of the
Project/Works
Estimated cost of
work / Date of
sanction
Year of
commence
-ment
Target
year of
comple-
tion
Physical
progress
of work (in
percent)
Expenditure
during the
year
Progressive
expenditure to
the end of the
year
Pending
payments
Revised
cost, if any
/ Date of
revision
STATEMENT OF COMMITMENTS ON INCOMPLETE PUBLIC WORKS CONTRACTS AS ON 31st MARCH
Appendix - X
(In lakh of Rupees)
2012
Cost of
balance work
adjusted to
inflation
- Concld.
. .
. .
. .
. .
. .
. .
. .
. .
. .
. .
. .
. .
. .
. .
. .
. .
. .
. .
. .
. .
. .
` % ` ` ` ` `
632
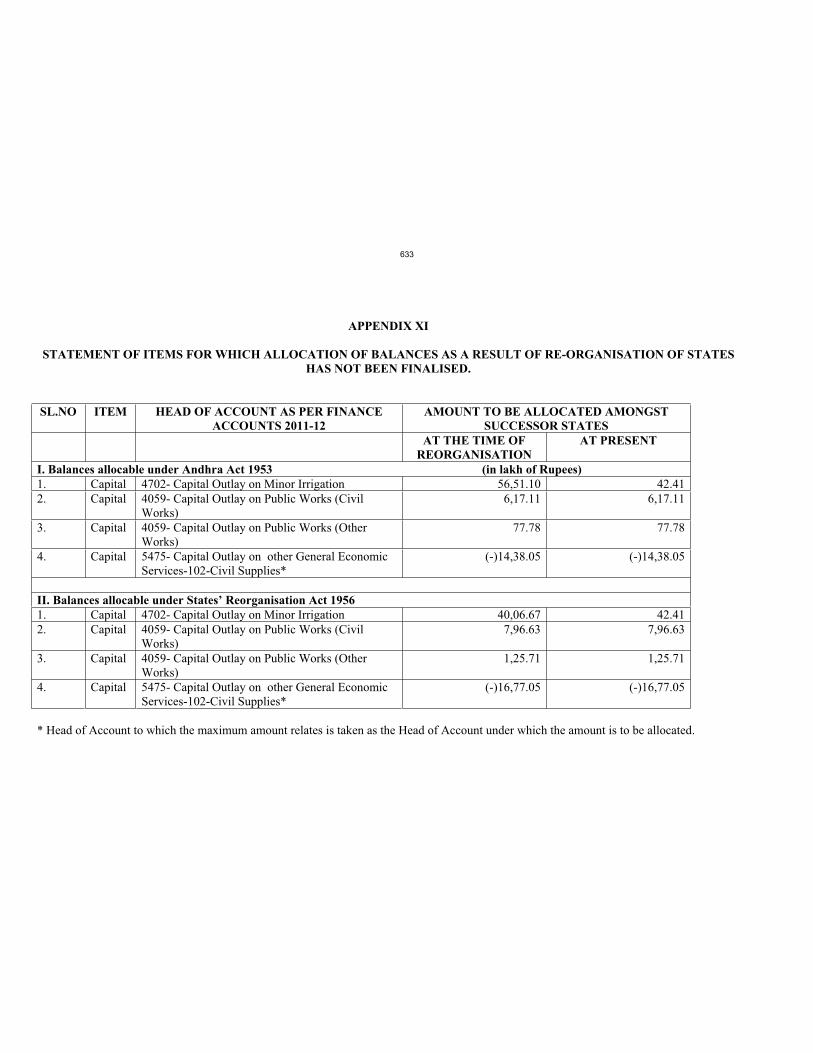
APPENDIX XI
STATEMENT OF ITEMS FOR WHICH ALLOCATION OF BALANCES AS A RESULT OF RE-ORGANISATION OF STATES
HAS NOT BEEN FINALISED.
SL.NO ITEM HEAD OF ACCOUNT AS PER FINANCE
ACCOUNTS 2011-12
AMOUNT TO BE ALLOCATED AMONGST
SUCCESSOR STATES
AT THE TIME OF
REORGANISATION
AT PRESENT
I. Balances allocable under Andhra Act 1953 (in lakh of Rupees)
1. Capital 4702- Capital Outlay on Minor Irrigation 56,51.10 42.41
2. Capital 4059- Capital Outlay on Public Works (Civil
Works)
6,17.11 6,17.11
3. Capital 4059- Capital Outlay on Public Works (Other
Works)
77.78 77.78
4. Capital 5475- Capital Outlay on other General Economic
Services-102-Civil Supplies*
(-)14,38.05 (-)14,38.05
II. Balances allocable under States’ Reorganisation Act 1956
1. Capital 4702- Capital Outlay on Minor Irrigation 40,06.67 42.41
2. Capital 4059- Capital Outlay on Public Works (Civil
Works)
7,96.63 7,96.63
3. Capital 4059- Capital Outlay on Public Works (Other
Works)
1,25.71 1,25.71
4. Capital 5475- Capital Outlay on other General Economic
Services-102-Civil Supplies*
(-)16,77.05 (-)16,77.05
* Head of Account to which the maximum amount relates is taken as the Head of Account under which the amount is to be allocated.
633
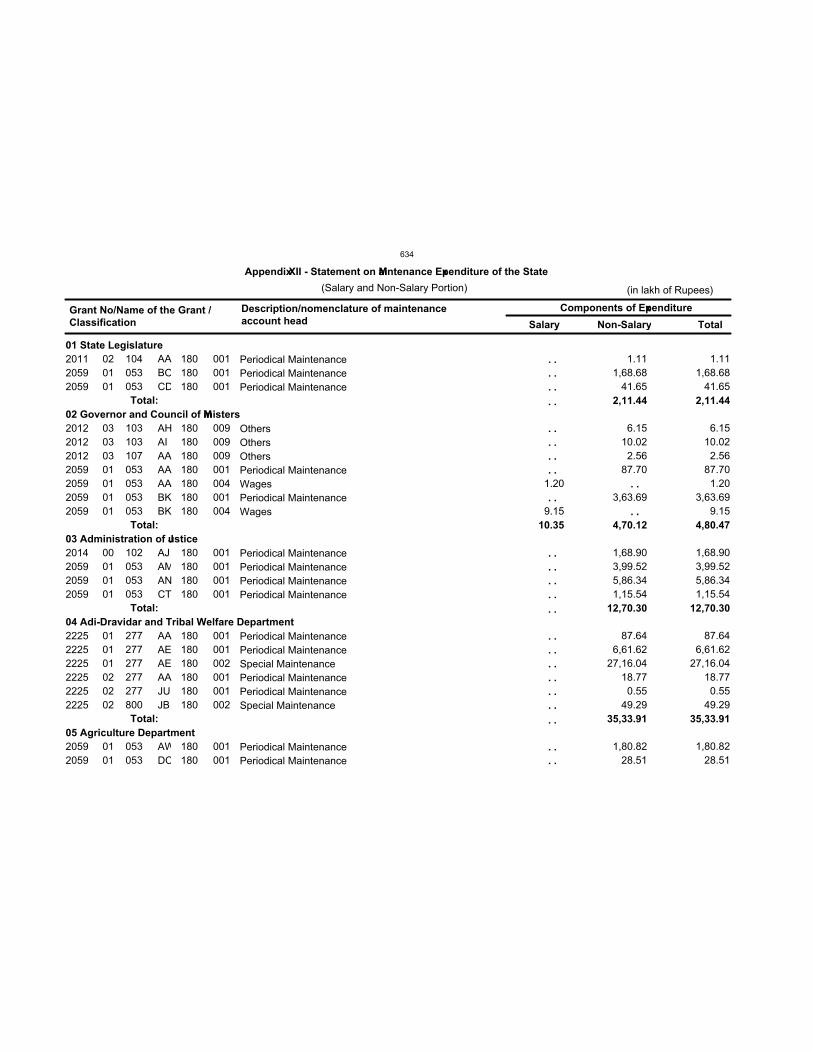
01 State Legislature
02 Governor and Council of Ministers
03 Administration of Justice
04 Adi-Dravidar and Tribal Welfare Department
05 Agriculture Department
10.35
2,11.44
4,70.12
12,70.30
35,33.91
2,11.44
4,80.47
12,70.30
35,33.91
2011
2059
2059
2012
2012
2012
2059
2059
2059
2059
2014
2059
2059
2059
2225
2225
2225
2225
2225
2225
2059
2059
02
01
01
03
03
03
01
01
01
01
00
01
01
01
01
01
01
02
02
02
01
01
104
053
053
103
103
107
053
053
053
053
102
053
053
053
277
277
277
277
277
800
053
053
AA
BO
CD
AH
AI
AA
AA
AA
BK
BK
AJ
AM
AN
CT
AA
AE
AE
AA
JU
JB
AW
DC
180
180
180
180
180
180
180
180
180
180
180
180
180
180
180
180
180
180
180
180
180
180
001
001
001
009
009
009
001
004
001
004
001
001
001
001
001
001
002
001
001
002
001
001
1.20
9.15
1.11
1,68.68
41.65
6.15
10.02
2.56
87.70
3,63.69
1,68.90
3,99.52
5,86.34
1,15.54
87.64
6,61.62
27,16.04
18.77
0.55
49.29
1,80.82
28.51
1.11
1,68.68
41.65
6.15
10.02
2.56
87.70
1.20
3,63.69
9.15
1,68.90
3,99.52
5,86.34
1,15.54
87.64
6,61.62
27,16.04
18.77
0.55
49.29
1,80.82
28.51
Total:
Total:
Total:
Total:
Grant No/Name of the Grant /
Classification
Description/nomenclature of maintenance
account head
Components of Expenditure
Salary Non-Salary Total
Appendix XII - Statement on Maintenance Expenditure of the State
(Salary and Non-Salary Portion) (in lakh of Rupees)
Periodical Maintenance
Periodical Maintenance
Periodical Maintenance
Others
Others
Others
Periodical Maintenance
Wages
Periodical Maintenance
Wages
Periodical Maintenance
Periodical Maintenance
Periodical Maintenance
Periodical Maintenance
Periodical Maintenance
Periodical Maintenance
Special Maintenance
Periodical Maintenance
Periodical Maintenance
Special Maintenance
Periodical Maintenance
Periodical Maintenance
. .
. .
. .
. .
. .
. .
. .
. .
. .
. .
. .
. .
. .
. .
. .
. .
. .
. .
. .
. .
. .
. .
. .
. .
. .
634
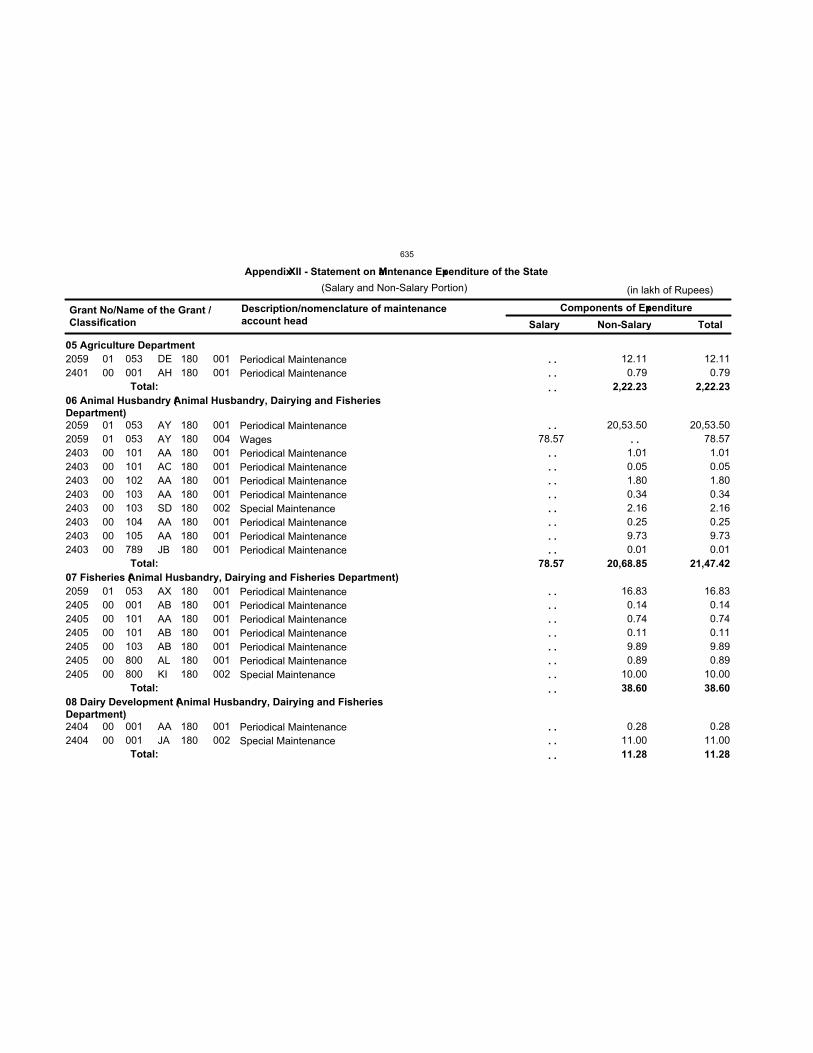
05 Agriculture Department
06 Animal Husbandry (Animal Husbandry, Dairying and Fisheries
Department)
07 Fisheries (Animal Husbandry, Dairying and Fisheries Department)
08 Dairy Development (Animal Husbandry, Dairying and Fisheries
Department)
78.57
2,22.23
20,68.85
38.60
11.28
2,22.23
21,47.42
38.60
11.28
2059
2401
2059
2059
2403
2403
2403
2403
2403
2403
2403
2403
2059
2405
2405
2405
2405
2405
2405
2404
2404
01
00
01
01
00
00
00
00
00
00
00
00
01
00
00
00
00
00
00
00
00
053
001
053
053
101
101
102
103
103
104
105
789
053
001
101
101
103
800
800
001
001
DE
AH
AY
AY
AA
AO
AA
AA
SD
AA
AA
JB
AX
AB
AA
AB
AB
AL
KI
AA
JA
180
180
180
180
180
180
180
180
180
180
180
180
180
180
180
180
180
180
180
180
180
001
001
001
004
001
001
001
001
002
001
001
001
001
001
001
001
001
001
002
001
002
78.57
12.11
0.79
20,53.50
1.01
0.05
1.80
0.34
2.16
0.25
9.73
0.01
16.83
0.14
0.74
0.11
9.89
0.89
10.00
0.28
11.00
12.11
0.79
20,53.50
78.57
1.01
0.05
1.80
0.34
2.16
0.25
9.73
0.01
16.83
0.14
0.74
0.11
9.89
0.89
10.00
0.28
11.00
Total:
Total:
Total:
Total:
Grant No/Name of the Grant /
Classification
Description/nomenclature of maintenance
account head
Components of Expenditure
Salary Non-Salary Total
Appendix XII - Statement on Maintenance Expenditure of the State
(Salary and Non-Salary Portion) (in lakh of Rupees)
Periodical Maintenance
Periodical Maintenance
Periodical Maintenance
Wages
Periodical Maintenance
Periodical Maintenance
Periodical Maintenance
Periodical Maintenance
Special Maintenance
Periodical Maintenance
Periodical Maintenance
Periodical Maintenance
Periodical Maintenance
Periodical Maintenance
Periodical Maintenance
Periodical Maintenance
Periodical Maintenance
Periodical Maintenance
Special Maintenance
Periodical Maintenance
Special Maintenance
. .
. .
. .
. .
. .
. .
. .
. .
. .
. .
. .
. .
. .
. .
. .
. .
. .
. .
. .
. .
. .
. .
. .
. .
635
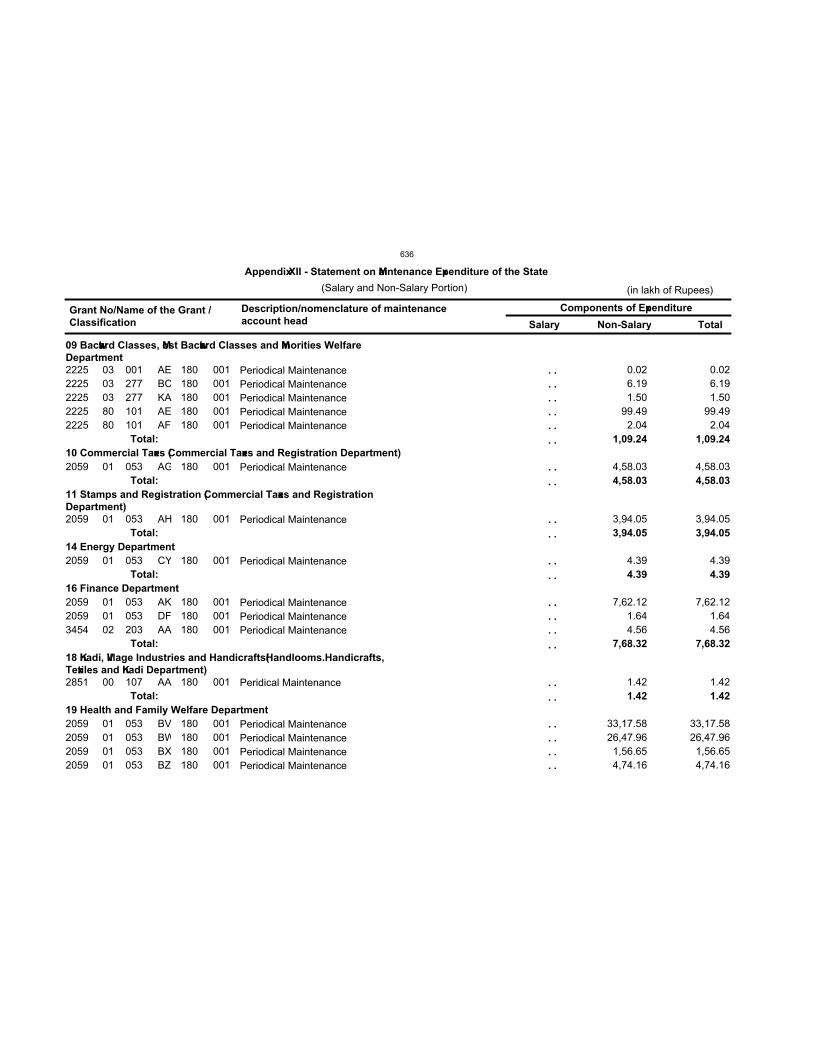
09 Backward Classes, Most Backward Classes and Minorities Welfare
Department
10 Commercial Taxes (Commercial Taxes and Registration Department)
11 Stamps and Registration (Commercial Taxes and Registration
Department)
14 Energy Department
16 Finance Department
18 Khadi, Village Industries and Handicrafts(Handlooms.Handicrafts,
Textiles and Khadi Department)
19 Health and Family Welfare Department
1,09.24
4,58.03
3,94.05
4.39
7,68.32
1.42
1,09.24
4,58.03
3,94.05
4.39
7,68.32
1.42
2225
2225
2225
2225
2225
2059
2059
2059
2059
2059
3454
2851
2059
2059
2059
2059
03
03
03
80
80
01
01
01
01
01
02
00
01
01
01
01
001
277
277
101
101
053
053
053
053
053
203
107
053
053
053
053
AE
BC
KA
AE
AF
AG
AH
CY
AK
DF
AA
AA
BV
BW
BX
BZ
180
180
180
180
180
180
180
180
180
180
180
180
180
180
180
180
001
001
001
001
001
001
001
001
001
001
001
001
001
001
001
001
0.02
6.19
1.50
99.49
2.04
4,58.03
3,94.05
4.39
7,62.12
1.64
4.56
1.42
33,17.58
26,47.96
1,56.65
4,74.16
0.02
6.19
1.50
99.49
2.04
4,58.03
3,94.05
4.39
7,62.12
1.64
4.56
1.42
33,17.58
26,47.96
1,56.65
4,74.16
Total:
Total:
Total:
Total:
Total:
Total:
Grant No/Name of the Grant /
Classification
Description/nomenclature of maintenance
account head
Components of Expenditure
Salary Non-Salary Total
Appendix XII - Statement on Maintenance Expenditure of the State
(Salary and Non-Salary Portion) (in lakh of Rupees)
Periodical Maintenance
Periodical Maintenance
Periodical Maintenance
Periodical Maintenance
Periodical Maintenance
Periodical Maintenance
Periodical Maintenance
Periodical Maintenance
Periodical Maintenance
Periodical Maintenance
Periodical Maintenance
Peridical Maintenance
Periodical Maintenance
Periodical Maintenance
Periodical Maintenance
Periodical Maintenance
. .
. .
. .
. .
. .
. .
. .
. .
. .
. .
. .
. .
. .
. .
. .
. .
. .
. .
. .
. .
. .
. .
636
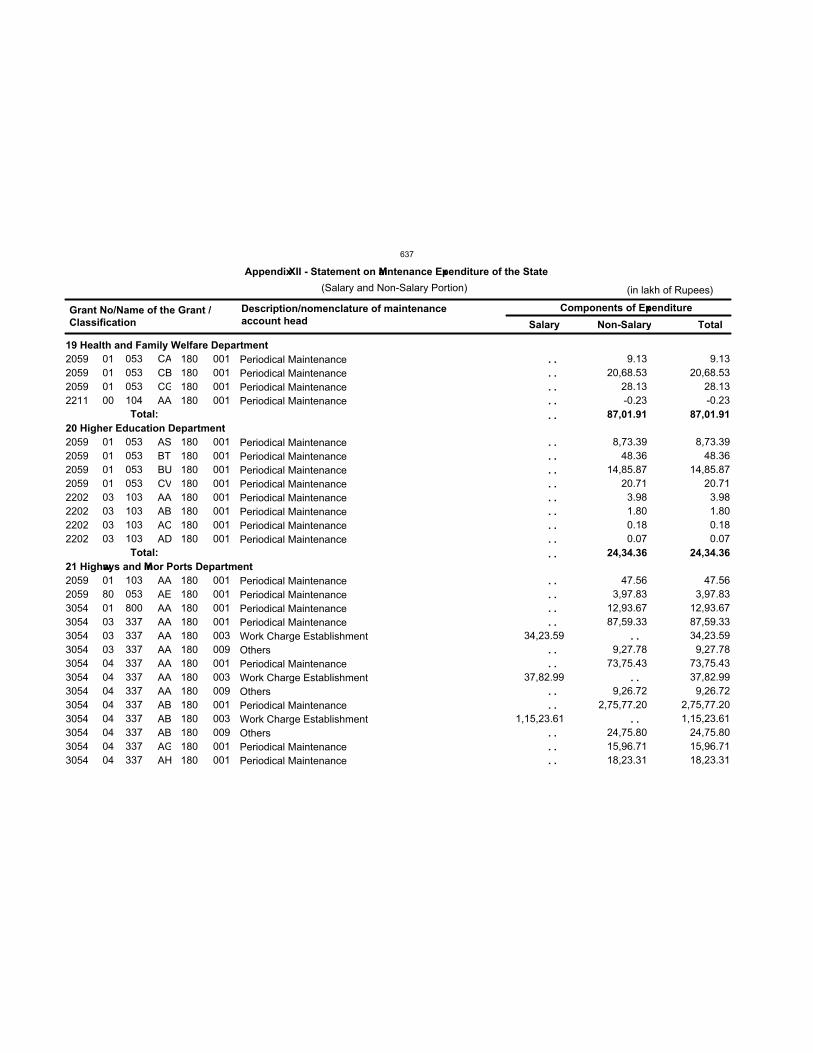
19 Health and Family Welfare Department
20 Higher Education Department
21 Highways and Minor Ports Department
87,01.91
24,34.36
87,01.91
24,34.36
2059
2059
2059
2211
2059
2059
2059
2059
2202
2202
2202
2202
2059
2059
3054
3054
3054
3054
3054
3054
3054
3054
3054
3054
3054
3054
01
01
01
00
01
01
01
01
03
03
03
03
01
80
01
03
03
03
04
04
04
04
04
04
04
04
053
053
053
104
053
053
053
053
103
103
103
103
103
053
800
337
337
337
337
337
337
337
337
337
337
337
CA
CB
CG
AA
AS
BT
BU
CV
AA
AB
AC
AD
AA
AE
AA
AA
AA
AA
AA
AA
AA
AB
AB
AB
AG
AH
180
180
180
180
180
180
180
180
180
180
180
180
180
180
180
180
180
180
180
180
180
180
180
180
180
180
001
001
001
001
001
001
001
001
001
001
001
001
001
001
001
001
003
009
001
003
009
001
003
009
001
001
34,23.59
37,82.99
1,15,23.61
9.13
20,68.53
28.13
-0.23
8,73.39
48.36
14,85.87
20.71
3.98
1.80
0.18
0.07
47.56
3,97.83
12,93.67
87,59.33
9,27.78
73,75.43
9,26.72
2,75,77.20
24,75.80
15,96.71
18,23.31
9.13
20,68.53
28.13
-0.23
8,73.39
48.36
14,85.87
20.71
3.98
1.80
0.18
0.07
47.56
3,97.83
12,93.67
87,59.33
34,23.59
9,27.78
73,75.43
37,82.99
9,26.72
2,75,77.20
1,15,23.61
24,75.80
15,96.71
18,23.31
Total:
Total:
Grant No/Name of the Grant /
Classification
Description/nomenclature of maintenance
account head
Components of Expenditure
Salary Non-Salary Total
Appendix XII - Statement on Maintenance Expenditure of the State
(Salary and Non-Salary Portion) (in lakh of Rupees)
Periodical Maintenance
Periodical Maintenance
Periodical Maintenance
Periodical Maintenance
Periodical Maintenance
Periodical Maintenance
Periodical Maintenance
Periodical Maintenance
Periodical Maintenance
Periodical Maintenance
Periodical Maintenance
Periodical Maintenance
Periodical Maintenance
Periodical Maintenance
Periodical Maintenance
Periodical Maintenance
Work Charge Establishment
Others
Periodical Maintenance
Work Charge Establishment
Others
Periodical Maintenance
Work Charge Establishment
Others
Periodical Maintenance
Periodical Maintenance
. .
. .
. .
. .
. .
. .
. .
. .
. .
. .
. .
. .
. .
. .
. .
. .
. .
. .
. .
. .
. .
. .
. .
. .
. .
. .
. .
. .
637
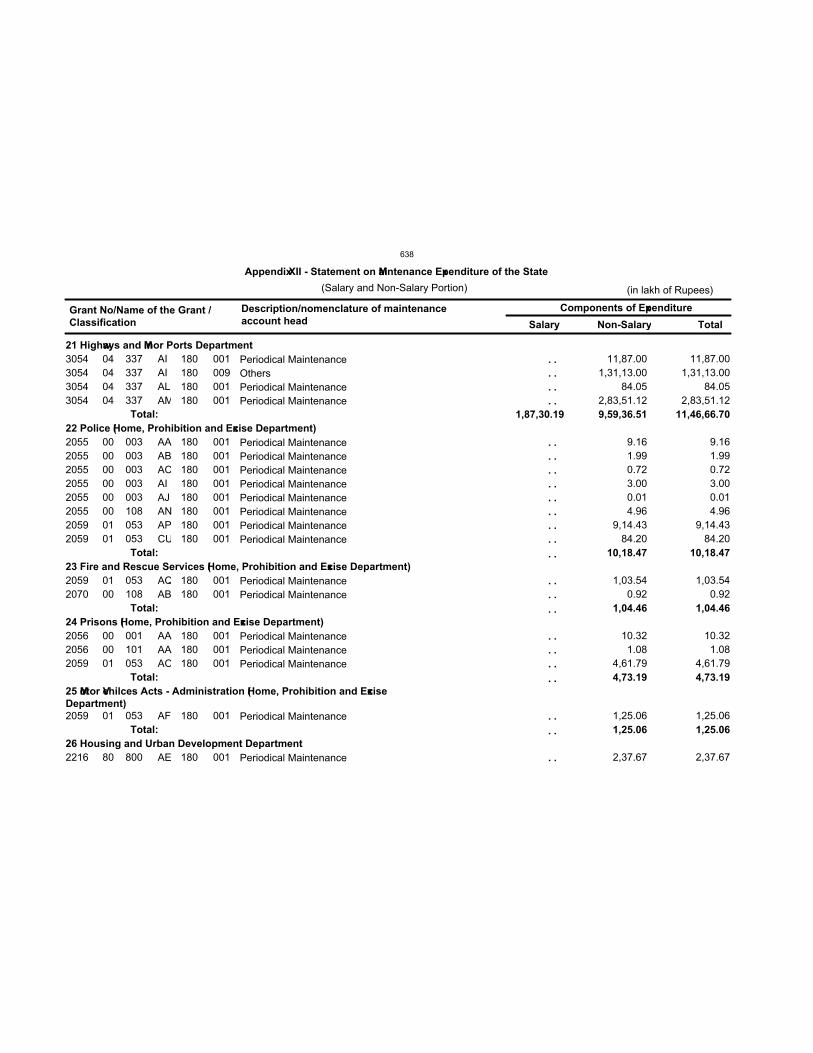
21 Highways and Minor Ports Department
22 Police (Home, Prohibition and Excise Department)
23 Fire and Rescue Services (Home, Prohibition and Excise Department)
24 Prisons (Home, Prohibition and Excise Department)
25 Motor Vehilces Acts - Administration (Home, Prohibition and Excise
Department)
26 Housing and Urban Development Department
1,87,30.19 9,59,36.51
10,18.47
1,04.46
4,73.19
1,25.06
11,46,66.70
10,18.47
1,04.46
4,73.19
1,25.06
3054
3054
3054
3054
2055
2055
2055
2055
2055
2055
2059
2059
2059
2070
2056
2056
2059
2059
2216
04
04
04
04
00
00
00
00
00
00
01
01
01
00
00
00
01
01
80
337
337
337
337
003
003
003
003
003
108
053
053
053
108
001
101
053
053
800
AI
AI
AL
AM
AA
AB
AC
AI
AJ
AN
AP
CU
AQ
AB
AA
AA
AO
AF
AE
180
180
180
180
180
180
180
180
180
180
180
180
180
180
180
180
180
180
180
001
009
001
001
001
001
001
001
001
001
001
001
001
001
001
001
001
001
001
11,87.00
1,31,13.00
84.05
2,83,51.12
9.16
1.99
0.72
3.00
0.01
4.96
9,14.43
84.20
1,03.54
0.92
10.32
1.08
4,61.79
1,25.06
2,37.67
11,87.00
1,31,13.00
84.05
2,83,51.12
9.16
1.99
0.72
3.00
0.01
4.96
9,14.43
84.20
1,03.54
0.92
10.32
1.08
4,61.79
1,25.06
2,37.67
Total:
Total:
Total:
Total:
Total:
Grant No/Name of the Grant /
Classification
Description/nomenclature of maintenance
account head
Components of Expenditure
Salary Non-Salary Total
Appendix XII - Statement on Maintenance Expenditure of the State
(Salary and Non-Salary Portion) (in lakh of Rupees)
Periodical Maintenance
Others
Periodical Maintenance
Periodical Maintenance
Periodical Maintenance
Periodical Maintenance
Periodical Maintenance
Periodical Maintenance
Periodical Maintenance
Periodical Maintenance
Periodical Maintenance
Periodical Maintenance
Periodical Maintenance
Periodical Maintenance
Periodical Maintenance
Periodical Maintenance
Periodical Maintenance
Periodical Maintenance
Periodical Maintenance
. .
. .
. .
. .
. .
. .
. .
. .
. .
. .
. .
. .
. .
. .
. .
. .
. .
. .
. .
. .
. .
. .
. .
638
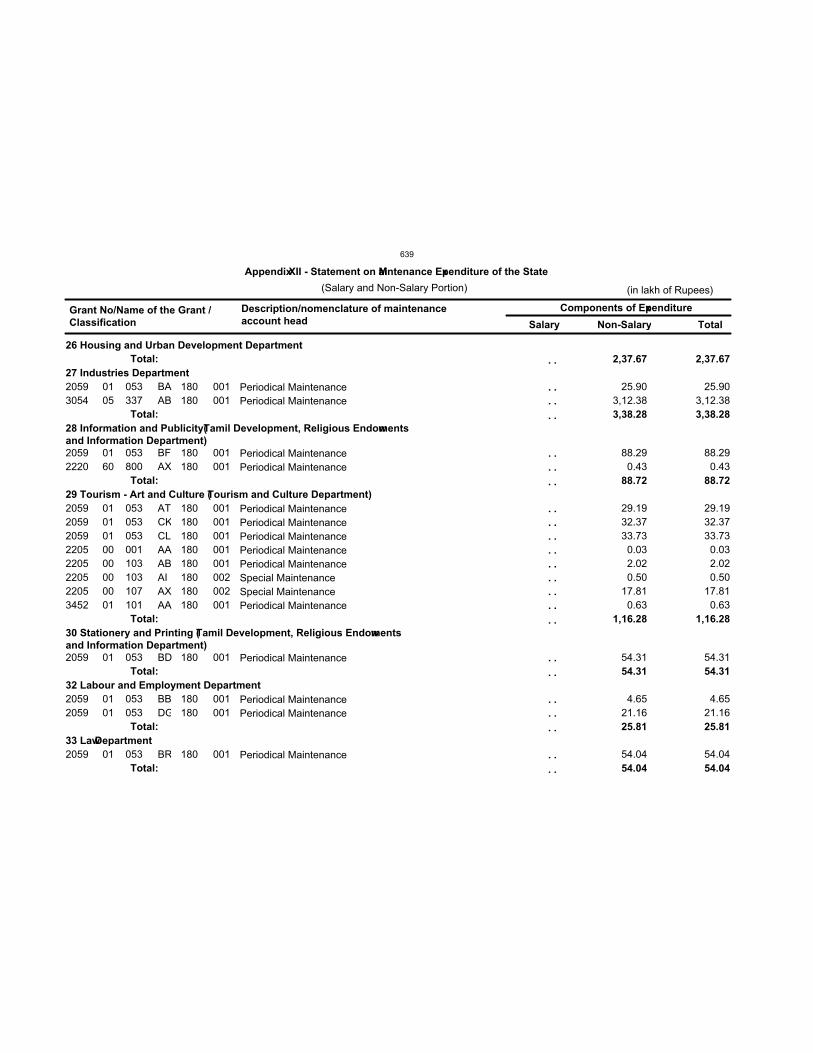
26 Housing and Urban Development Department
27 Industries Department
28 Information and Publicity(Tamil Development, Religious Endowments
and Information Department)
29 Tourism - Art and Culture (Tourism and Culture Department)
30 Stationery and Printing (Tamil Development, Religious Endowments
and Information Department)
32 Labour and Employment Department
33 Law Department
2,37.67
3,38.28
88.72
1,16.28
54.31
25.81
54.04
2,37.67
3,38.28
88.72
1,16.28
54.31
25.81
54.04
2059
3054
2059
2220
2059
2059
2059
2205
2205
2205
2205
3452
2059
2059
2059
2059
01
05
01
60
01
01
01
00
00
00
00
01
01
01
01
01
053
337
053
800
053
053
053
001
103
103
107
101
053
053
053
053
BA
AB
BF
AX
AT
CK
CL
AA
AB
AI
AX
AA
BD
BB
DG
BR
180
180
180
180
180
180
180
180
180
180
180
180
180
180
180
180
001
001
001
001
001
001
001
001
001
002
002
001
001
001
001
001
25.90
3,12.38
88.29
0.43
29.19
32.37
33.73
0.03
2.02
0.50
17.81
0.63
54.31
4.65
21.16
54.04
25.90
3,12.38
88.29
0.43
29.19
32.37
33.73
0.03
2.02
0.50
17.81
0.63
54.31
4.65
21.16
54.04
Total:
Total:
Total:
Total:
Total:
Total:
Total:
Grant No/Name of the Grant /
Classification
Description/nomenclature of maintenance
account head
Components of Expenditure
Salary Non-Salary Total
Appendix XII - Statement on Maintenance Expenditure of the State
(Salary and Non-Salary Portion) (in lakh of Rupees)
Periodical Maintenance
Periodical Maintenance
Periodical Maintenance
Periodical Maintenance
Periodical Maintenance
Periodical Maintenance
Periodical Maintenance
Periodical Maintenance
Periodical Maintenance
Special Maintenance
Special Maintenance
Periodical Maintenance
Periodical Maintenance
Periodical Maintenance
Periodical Maintenance
Periodical Maintenance
. .
. .
. .
. .
. .
. .
. .
. .
. .
. .
. .
. .
. .
. .
. .
. .
. .
. .
. .
. .
. .
. .
. .
639
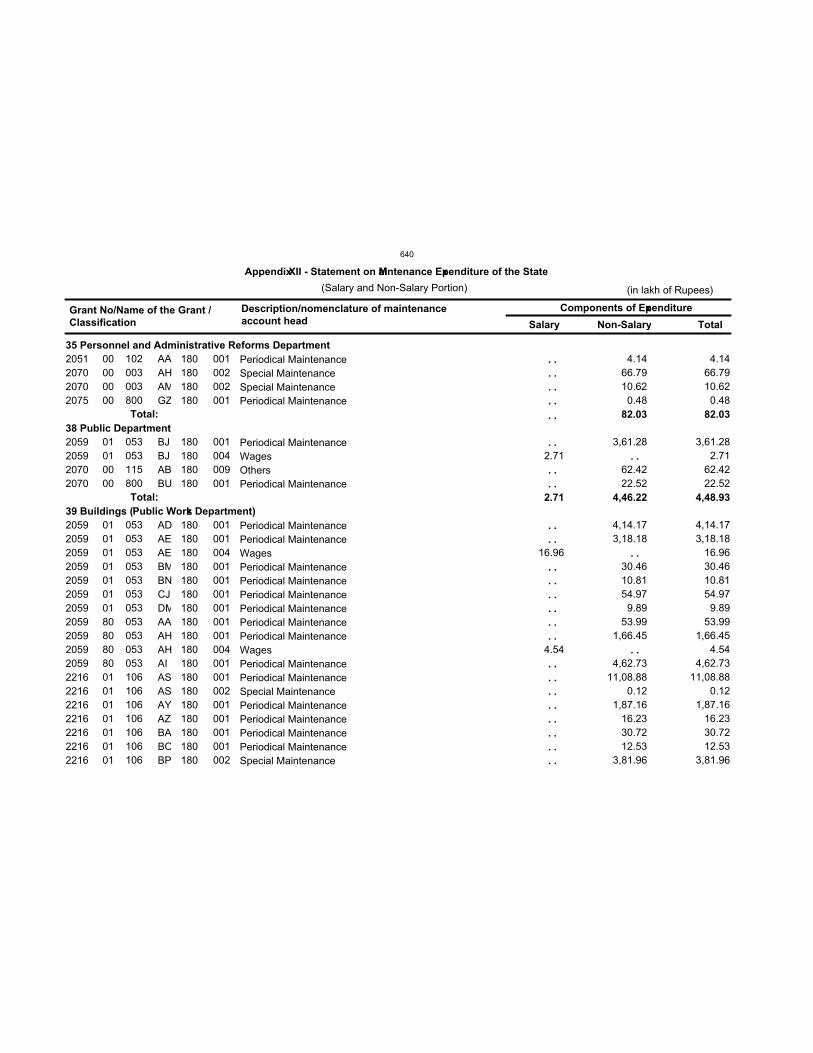
35 Personnel and Administrative Reforms Department
38 Public Department
39 Buildings ( Public Works Department)
2.71
82.03
4,46.22
82.03
4,48.93
2051
2070
2070
2075
2059
2059
2070
2070
2059
2059
2059
2059
2059
2059
2059
2059
2059
2059
2059
2216
2216
2216
2216
2216
2216
2216
00
00
00
00
01
01
00
00
01
01
01
01
01
01
01
80
80
80
80
01
01
01
01
01
01
01
102
003
003
800
053
053
115
800
053
053
053
053
053
053
053
053
053
053
053
106
106
106
106
106
106
106
AA
AH
AM
GZ
BJ
BJ
AB
BU
AD
AE
AE
BM
BN
CJ
DM
AA
AH
AH
AI
AS
AS
AY
AZ
BA
BO
BP
180
180
180
180
180
180
180
180
180
180
180
180
180
180
180
180
180
180
180
180
180
180
180
180
180
180
001
002
002
001
001
004
009
001
001
001
004
001
001
001
001
001
001
004
001
001
002
001
001
001
001
002
2.71
16.96
4.54
4.14
66.79
10.62
0.48
3,61.28
62.42
22.52
4,14.17
3,18.18
30.46
10.81
54.97
9.89
53.99
1,66.45
4,62.73
11,08.88
0.12
1,87.16
16.23
30.72
12.53
3,81.96
4.14
66.79
10.62
0.48
3,61.28
2.71
62.42
22.52
4,14.17
3,18.18
16.96
30.46
10.81
54.97
9.89
53.99
1,66.45
4.54
4,62.73
11,08.88
0.12
1,87.16
16.23
30.72
12.53
3,81.96
Total:
Total:
Grant No/Name of the Grant /
Classification
Description/nomenclature of maintenance
account head
Components of Expenditure
Salary Non-Salary Total
Appendix XII - Statement on Maintenance Expenditure of the State
(Salary and Non-Salary Portion) (in lakh of Rupees)
Periodical Maintenance
Special Maintenance
Special Maintenance
Periodical Maintenance
Periodical Maintenance
Wages
Others
Periodical Maintenance
Periodical Maintenance
Periodical Maintenance
Wages
Periodical Maintenance
Periodical Maintenance
Periodical Maintenance
Periodical Maintenance
Periodical Maintenance
Periodical Maintenance
Wages
Periodical Maintenance
Periodical Maintenance
Special Maintenance
Periodical Maintenance
Periodical Maintenance
Periodical Maintenance
Periodical Maintenance
Special Maintenance
. .
. .
. .
. .
. .
. .
. .
. .
. .
. .
. .
. .
. .
. .
. .
. .
. .
. .
. .
. .
. .
. .
. .
. .
. .
. .
. .
640
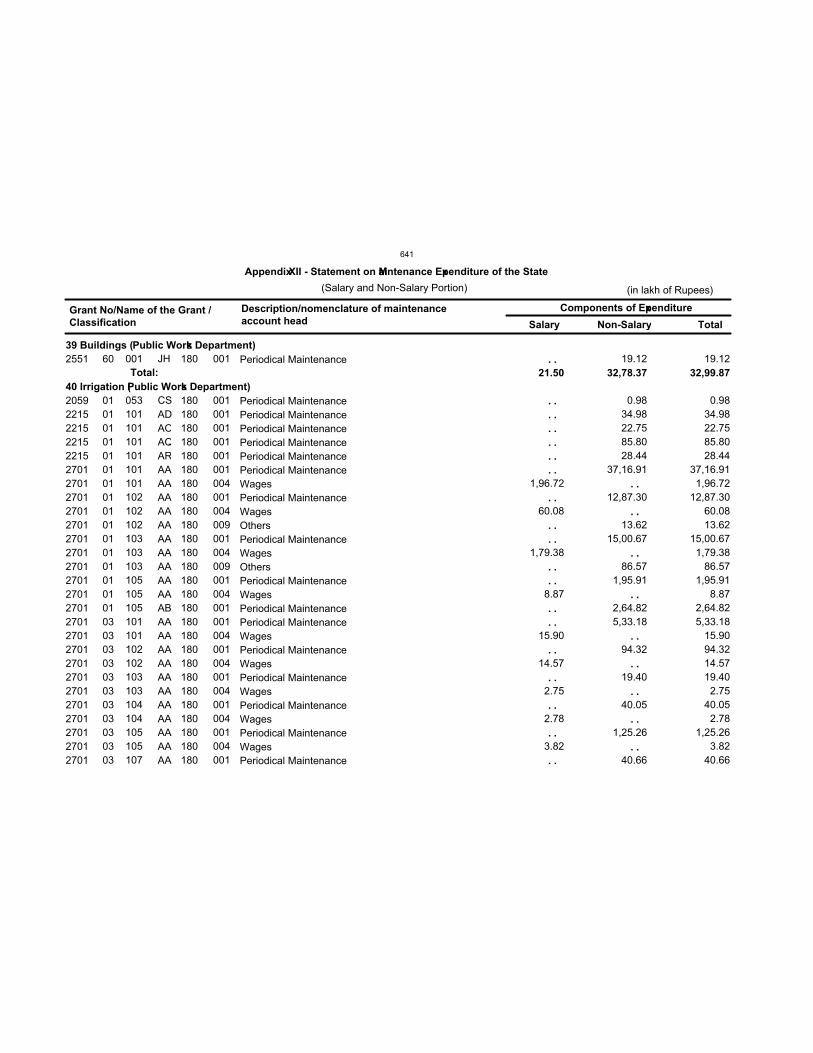
39 Buildings ( Public Works Department)
40 Irrigation (Public Works Department)
21.50 32,78.37 32,99.87
2551
2059
2215
2215
2215
2215
2701
2701
2701
2701
2701
2701
2701
2701
2701
2701
2701
2701
2701
2701
2701
2701
2701
2701
2701
2701
2701
2701
60
01
01
01
01
01
01
01
01
01
01
01
01
01
01
01
01
03
03
03
03
03
03
03
03
03
03
03
001
053
101
101
101
101
101
101
102
102
102
103
103
103
105
105
105
101
101
102
102
103
103
104
104
105
105
107
JH
CS
AD
AO
AQ
AR
AA
AA
AA
AA
AA
AA
AA
AA
AA
AA
AB
AA
AA
AA
AA
AA
AA
AA
AA
AA
AA
AA
180
180
180
180
180
180
180
180
180
180
180
180
180
180
180
180
180
180
180
180
180
180
180
180
180
180
180
180
001
001
001
001
001
001
001
004
001
004
009
001
004
009
001
004
001
001
004
001
004
001
004
001
004
001
004
001
1,96.72
60.08
1,79.38
8.87
15.90
14.57
2.75
2.78
3.82
19.12
0.98
34.98
22.75
85.80
28.44
37,16.91
12,87.30
13.62
15,00.67
86.57
1,95.91
2,64.82
5,33.18
94.32
19.40
40.05
1,25.26
40.66
19.12
0.98
34.98
22.75
85.80
28.44
37,16.91
1,96.72
12,87.30
60.08
13.62
15,00.67
1,79.38
86.57
1,95.91
8.87
2,64.82
5,33.18
15.90
94.32
14.57
19.40
2.75
40.05
2.78
1,25.26
3.82
40.66
Total:
Grant No/Name of the Grant /
Classification
Description/nomenclature of maintenance
account head
Components of Expenditure
Salary Non-Salary Total
Appendix XII - Statement on Maintenance Expenditure of the State
(Salary and Non-Salary Portion) (in lakh of Rupees)
Periodical Maintenance
Periodical Maintenance
Periodical Maintenance
Periodical Maintenance
Periodical Maintenance
Periodical Maintenance
Periodical Maintenance
Wages
Periodical Maintenance
Wages
Others
Periodical Maintenance
Wages
Others
Periodical Maintenance
Wages
Periodical Maintenance
Periodical Maintenance
Wages
Periodical Maintenance
Wages
Periodical Maintenance
Wages
Periodical Maintenance
Wages
Periodical Maintenance
Wages
Periodical Maintenance
. .
. .
. .
. .
. .
. .
. .
. .
. .
. .
. .
. .
. .
. .
. .
. .
. .
. .
. .
. .
. .
. .
. .
. .
. .
. .
. .
. .
641
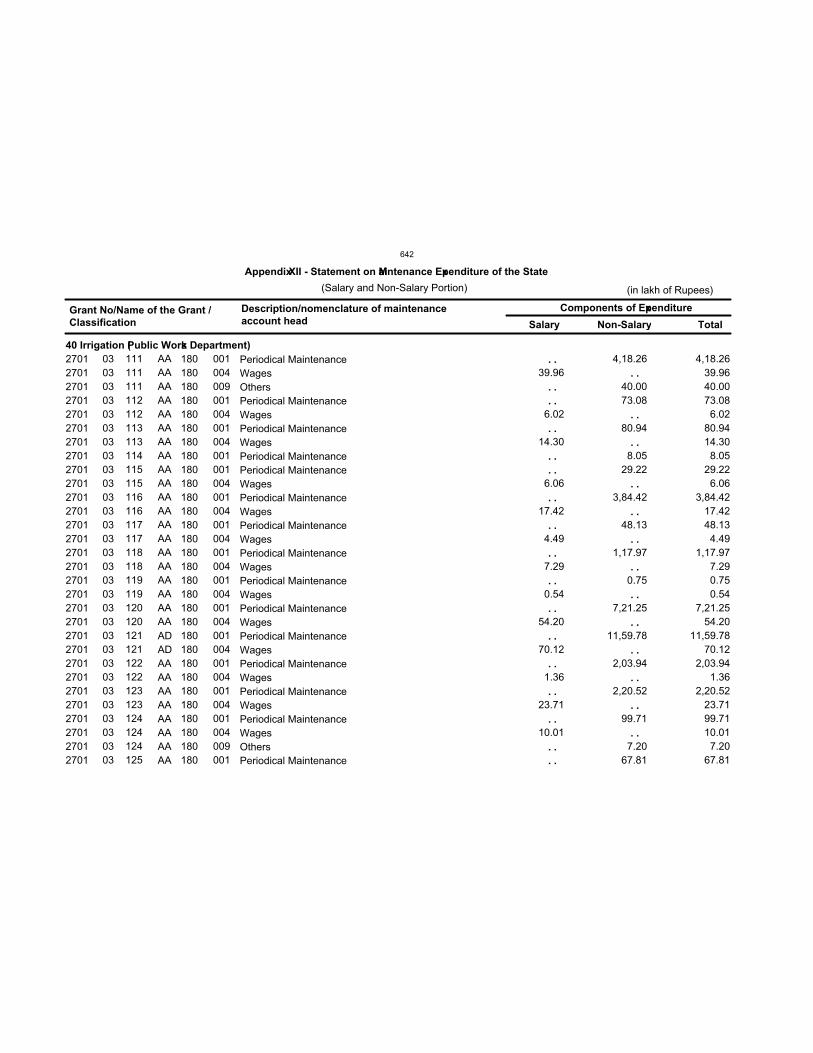
40 Irrigation (Public Works Department)
2701
2701
2701
2701
2701
2701
2701
2701
2701
2701
2701
2701
2701
2701
2701
2701
2701
2701
2701
2701
2701
2701
2701
2701
2701
2701
2701
2701
2701
2701
03
03
03
03
03
03
03
03
03
03
03
03
03
03
03
03
03
03
03
03
03
03
03
03
03
03
03
03
03
03
111
111
111
112
112
113
113
114
115
115
116
116
117
117
118
118
119
119
120
120
121
121
122
122
123
123
124
124
124
125
AA
AA
AA
AA
AA
AA
AA
AA
AA
AA
AA
AA
AA
AA
AA
AA
AA
AA
AA
AA
AD
AD
AA
AA
AA
AA
AA
AA
AA
AA
180
180
180
180
180
180
180
180
180
180
180
180
180
180
180
180
180
180
180
180
180
180
180
180
180
180
180
180
180
180
001
004
009
001
004
001
004
001
001
004
001
004
001
004
001
004
001
004
001
004
001
004
001
004
001
004
001
004
009
001
39.96
6.02
14.30
6.06
17.42
4.49
7.29
0.54
54.20
70.12
1.36
23.71
10.01
4,18.26
40.00
73.08
80.94
8.05
29.22
3,84.42
48.13
1,17.97
0.75
7,21.25
11,59.78
2,03.94
2,20.52
99.71
7.20
67.81
4,18.26
39.96
40.00
73.08
6.02
80.94
14.30
8.05
29.22
6.06
3,84.42
17.42
48.13
4.49
1,17.97
7.29
0.75
0.54
7,21.25
54.20
11,59.78
70.12
2,03.94
1.36
2,20.52
23.71
99.71
10.01
7.20
67.81
Grant No/Name of the Grant /
Classification
Description/nomenclature of maintenance
account head
Components of Expenditure
Salary Non-Salary Total
Appendix XII - Statement on Maintenance Expenditure of the State
(Salary and Non-Salary Portion) (in lakh of Rupees)
Periodical Maintenance
Wages
Others
Periodical Maintenance
Wages
Periodical Maintenance
Wages
Periodical Maintenance
Periodical Maintenance
Wages
Periodical Maintenance
Wages
Periodical Maintenance
Wages
Periodical Maintenance
Wages
Periodical Maintenance
Wages
Periodical Maintenance
Wages
Periodical Maintenance
Wages
Periodical Maintenance
Wages
Periodical Maintenance
Wages
Periodical Maintenance
Wages
Others
Periodical Maintenance
. .
. .
. .
. .
. .
. .
. .
. .
. .
. .
. .
. .
. .
. .
. .
. .
. .
. .
. .
. .
. .
. .
. .
. .
. .
. .
. .
. .
. .
. .
642
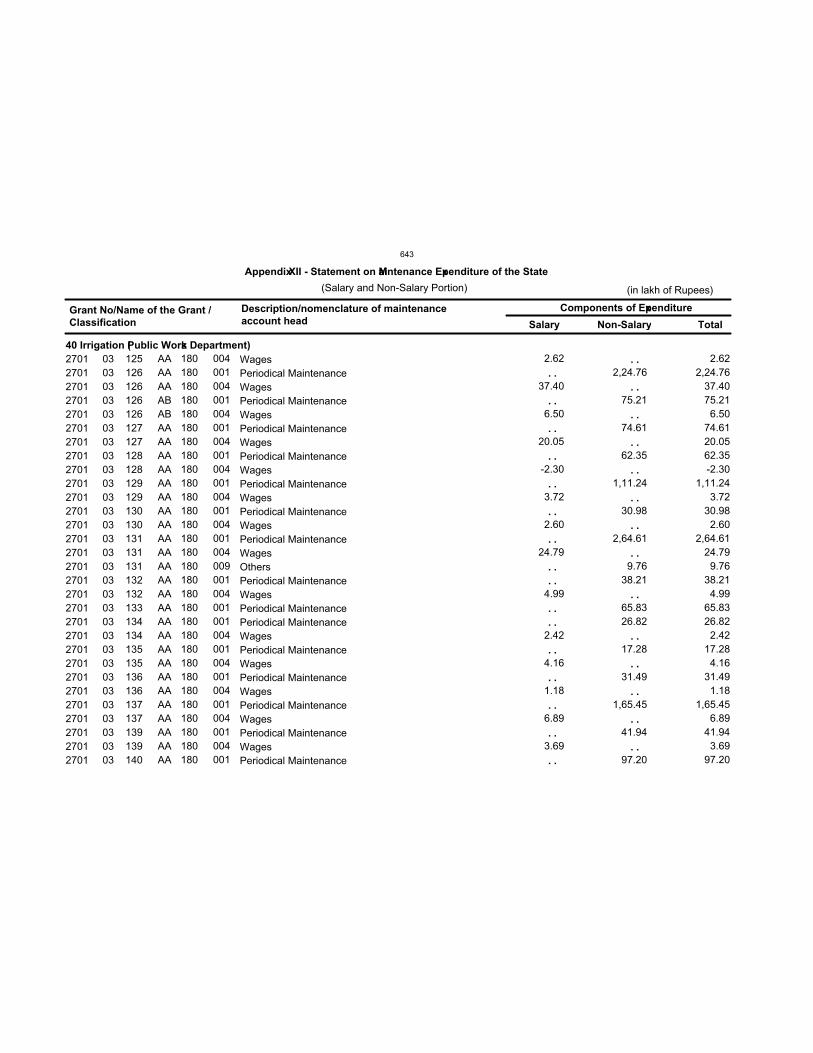
40 Irrigation (Public Works Department)
2701
2701
2701
2701
2701
2701
2701
2701
2701
2701
2701
2701
2701
2701
2701
2701
2701
2701
2701
2701
2701
2701
2701
2701
2701
2701
2701
2701
2701
2701
03
03
03
03
03
03
03
03
03
03
03
03
03
03
03
03
03
03
03
03
03
03
03
03
03
03
03
03
03
03
125
126
126
126
126
127
127
128
128
129
129
130
130
131
131
131
132
132
133
134
134
135
135
136
136
137
137
139
139
140
AA
AA
AA
AB
AB
AA
AA
AA
AA
AA
AA
AA
AA
AA
AA
AA
AA
AA
AA
AA
AA
AA
AA
AA
AA
AA
AA
AA
AA
AA
180
180
180
180
180
180
180
180
180
180
180
180
180
180
180
180
180
180
180
180
180
180
180
180
180
180
180
180
180
180
004
001
004
001
004
001
004
001
004
001
004
001
004
001
004
009
001
004
001
001
004
001
004
001
004
001
004
001
004
001
2.62
37.40
6.50
20.05
-2.30
3.72
2.60
24.79
4.99
2.42
4.16
1.18
6.89
3.69
2,24.76
75.21
74.61
62.35
1,11.24
30.98
2,64.61
9.76
38.21
65.83
26.82
17.28
31.49
1,65.45
41.94
97.20
2.62
2,24.76
37.40
75.21
6.50
74.61
20.05
62.35
-2.30
1,11.24
3.72
30.98
2.60
2,64.61
24.79
9.76
38.21
4.99
65.83
26.82
2.42
17.28
4.16
31.49
1.18
1,65.45
6.89
41.94
3.69
97.20
Grant No/Name of the Grant /
Classification
Description/nomenclature of maintenance
account head
Components of Expenditure
Salary Non-Salary Total
Appendix XII - Statement on Maintenance Expenditure of the State
(Salary and Non-Salary Portion) (in lakh of Rupees)
Wages
Periodical Maintenance
Wages
Periodical Maintenance
Wages
Periodical Maintenance
Wages
Periodical Maintenance
Wages
Periodical Maintenance
Wages
Periodical Maintenance
Wages
Periodical Maintenance
Wages
Others
Periodical Maintenance
Wages
Periodical Maintenance
Periodical Maintenance
Wages
Periodical Maintenance
Wages
Periodical Maintenance
Wages
Periodical Maintenance
Wages
Periodical Maintenance
Wages
Periodical Maintenance
. .
. .
. .
. .
. .
. .
. .
. .
. .
. .
. .
. .
. .
. .
. .
. .
. .
. .
. .
. .
. .
. .
. .
. .
. .
. .
. .
. .
. .
. .
643
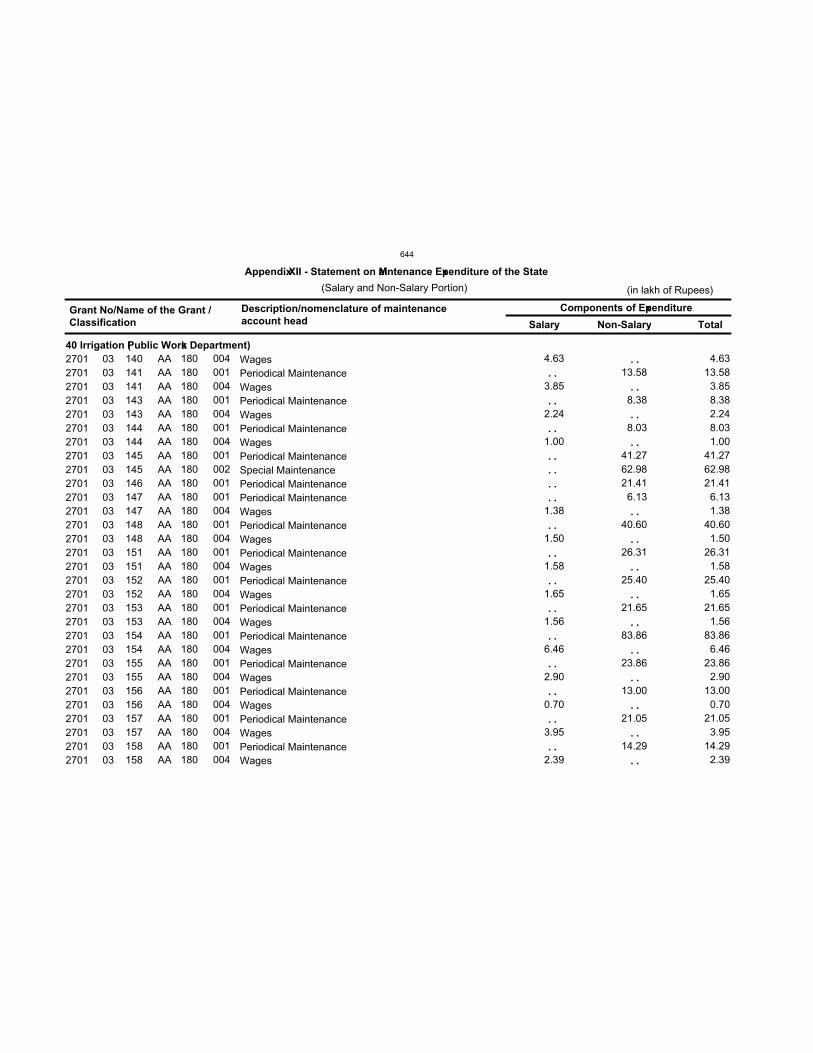
40 Irrigation (Public Works Department)
2701
2701
2701
2701
2701
2701
2701
2701
2701
2701
2701
2701
2701
2701
2701
2701
2701
2701
2701
2701
2701
2701
2701
2701
2701
2701
2701
2701
2701
2701
03
03
03
03
03
03
03
03
03
03
03
03
03
03
03
03
03
03
03
03
03
03
03
03
03
03
03
03
03
03
140
141
141
143
143
144
144
145
145
146
147
147
148
148
151
151
152
152
153
153
154
154
155
155
156
156
157
157
158
158
AA
AA
AA
AA
AA
AA
AA
AA
AA
AA
AA
AA
AA
AA
AA
AA
AA
AA
AA
AA
AA
AA
AA
AA
AA
AA
AA
AA
AA
AA
180
180
180
180
180
180
180
180
180
180
180
180
180
180
180
180
180
180
180
180
180
180
180
180
180
180
180
180
180
180
004
001
004
001
004
001
004
001
002
001
001
004
001
004
001
004
001
004
001
004
001
004
001
004
001
004
001
004
001
004
4.63
3.85
2.24
1.00
1.38
1.50
1.58
1.65
1.56
6.46
2.90
0.70
3.95
2.39
13.58
8.38
8.03
41.27
62.98
21.41
6.13
40.60
26.31
25.40
21.65
83.86
23.86
13.00
21.05
14.29
4.63
13.58
3.85
8.38
2.24
8.03
1.00
41.27
62.98
21.41
6.13
1.38
40.60
1.50
26.31
1.58
25.40
1.65
21.65
1.56
83.86
6.46
23.86
2.90
13.00
0.70
21.05
3.95
14.29
2.39
Grant No/Name of the Grant /
Classification
Description/nomenclature of maintenance
account head
Components of Expenditure
Salary Non-Salary Total
Appendix XII - Statement on Maintenance Expenditure of the State
(Salary and Non-Salary Portion) (in lakh of Rupees)
Wages
Periodical Maintenance
Wages
Periodical Maintenance
Wages
Periodical Maintenance
Wages
Periodical Maintenance
Special Maintenance
Periodical Maintenance
Periodical Maintenance
Wages
Periodical Maintenance
Wages
Periodical Maintenance
Wages
Periodical Maintenance
Wages
Periodical Maintenance
Wages
Periodical Maintenance
Wages
Periodical Maintenance
Wages
Periodical Maintenance
Wages
Periodical Maintenance
Wages
Periodical Maintenance
Wages
. .
. .
. .
. .
. .
. .
. .
. .
. .
. .
. .
. .
. .
. .
. .
. .
. .
. .
. .
. .
. .
. .
. .
. .
. .
. .
. .
. .
. .
. .
644

40 Irrigation (Public Works Department)
2701
2701
2701
2701
2701
2701
2701
2701
2701
2701
2701
2701
2701
2701
2701
2701
2701
2701
2701
2701
2701
2701
2701
2701
2701
2701
2701
2701
2701
2701
03
03
03
03
03
03
03
03
03
03
03
03
03
03
03
03
03
03
03
03
03
03
03
03
03
03
03
03
03
03
159
159
160
161
161
162
162
163
163
164
164
165
165
166
166
167
167
169
169
170
171
172
173
174
174
175
175
176
176
177
AA
AA
AA
AA
AA
AA
AA
AA
AA
AA
AA
AA
AA
AA
AA
AA
AA
AA
AA
AA
AA
AA
AA
AA
AA
AA
AA
AA
AA
AA
180
180
180
180
180
180
180
180
180
180
180
180
180
180
180
180
180
180
180
180
180
180
180
180
180
180
180
180
180
180
001
004
001
001
004
001
004
001
004
001
004
001
004
001
004
001
004
001
004
001
001
001
001
001
004
001
004
001
004
001
3.45
3.45
2.15
1.80
3.80
2.36
2.42
0.58
2.20
1.35
2.74
3.85
13.17
4.77
42.48
26.12
22.97
13.55
6.43
15.54
10.75
15.46
12.93
24.92
12.06
5.14
6.80
16.15
31.76
17.88
13.17
3.45
4.77
42.48
3.45
26.12
2.15
22.97
1.80
13.55
3.80
6.43
2.36
15.54
2.42
10.75
0.58
15.46
2.20
12.93
24.92
12.06
5.14
6.80
1.35
16.15
2.74
31.76
3.85
17.88
Grant No/Name of the Grant /
Classification
Description/nomenclature of maintenance
account head
Components of Expenditure
Salary Non-Salary Total
Appendix XII - Statement on Maintenance Expenditure of the State
(Salary and Non-Salary Portion) (in lakh of Rupees)
Periodical Maintenance
Wages
Periodical Maintenance
Periodical Maintenance
Wages
Periodical Maintenance
Wages
Periodical Maintenance
Wages
Periodical Maintenance
Wages
Periodical Maintenance
Wages
Periodical Maintenance
Wages
Periodical Maintenance
Wages
Periodical Maintenance
Wages
Periodical Maintenance
Periodical Maintenance
Periodical Maintenance
Periodical Maintenance
Periodical Maintenance
Wages
Periodical Maintenance
Wages
Periodical Maintenance
Wages
Periodical Maintenance
. .
. .
. .
. .
. .
. .
. .
. .
. .
. .
. .
. .
. .
. .
. .
. .
. .
. .
. .
. .
. .
. .
. .
. .
. .
. .
. .
. .
. .
. .
645
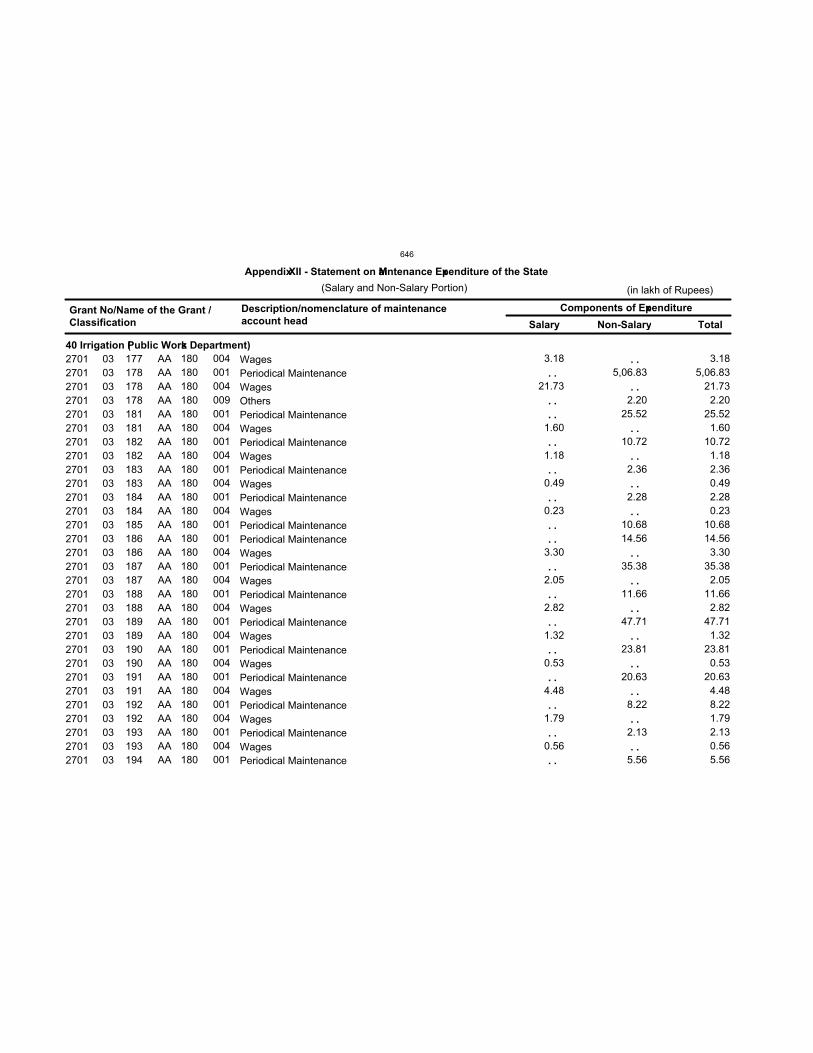
40 Irrigation (Public Works Department)
2701
2701
2701
2701
2701
2701
2701
2701
2701
2701
2701
2701
2701
2701
2701
2701
2701
2701
2701
2701
2701
2701
2701
2701
2701
2701
2701
2701
2701
2701
03
03
03
03
03
03
03
03
03
03
03
03
03
03
03
03
03
03
03
03
03
03
03
03
03
03
03
03
03
03
177
178
178
178
181
181
182
182
183
183
184
184
185
186
186
187
187
188
188
189
189
190
190
191
191
192
192
193
193
194
AA
AA
AA
AA
AA
AA
AA
AA
AA
AA
AA
AA
AA
AA
AA
AA
AA
AA
AA
AA
AA
AA
AA
AA
AA
AA
AA
AA
AA
AA
180
180
180
180
180
180
180
180
180
180
180
180
180
180
180
180
180
180
180
180
180
180
180
180
180
180
180
180
180
180
004
001
004
009
001
004
001
004
001
004
001
004
001
001
004
001
004
001
004
001
004
001
004
001
004
001
004
001
004
001
3.18
21.73
1.60
1.18
0.49
0.23
3.30
2.05
2.82
1.32
0.53
4.48
1.79
0.56
5,06.83
2.20
25.52
10.72
2.36
2.28
10.68
14.56
35.38
11.66
47.71
23.81
20.63
8.22
2.13
5.56
3.18
5,06.83
21.73
2.20
25.52
1.60
10.72
1.18
2.36
0.49
2.28
0.23
10.68
14.56
3.30
35.38
2.05
11.66
2.82
47.71
1.32
23.81
0.53
20.63
4.48
8.22
1.79
2.13
0.56
5.56
Grant No/Name of the Grant /
Classification
Description/nomenclature of maintenance
account head
Components of Expenditure
Salary Non-Salary Total
Appendix XII - Statement on Maintenance Expenditure of the State
(Salary and Non-Salary Portion) (in lakh of Rupees)
Wages
Periodical Maintenance
Wages
Others
Periodical Maintenance
Wages
Periodical Maintenance
Wages
Periodical Maintenance
Wages
Periodical Maintenance
Wages
Periodical Maintenance
Periodical Maintenance
Wages
Periodical Maintenance
Wages
Periodical Maintenance
Wages
Periodical Maintenance
Wages
Periodical Maintenance
Wages
Periodical Maintenance
Wages
Periodical Maintenance
Wages
Periodical Maintenance
Wages
Periodical Maintenance
. .
. .
. .
. .
. .
. .
. .
. .
. .
. .
. .
. .
. .
. .
. .
. .
. .
. .
. .
. .
. .
. .
. .
. .
. .
. .
. .
. .
. .
. .
646
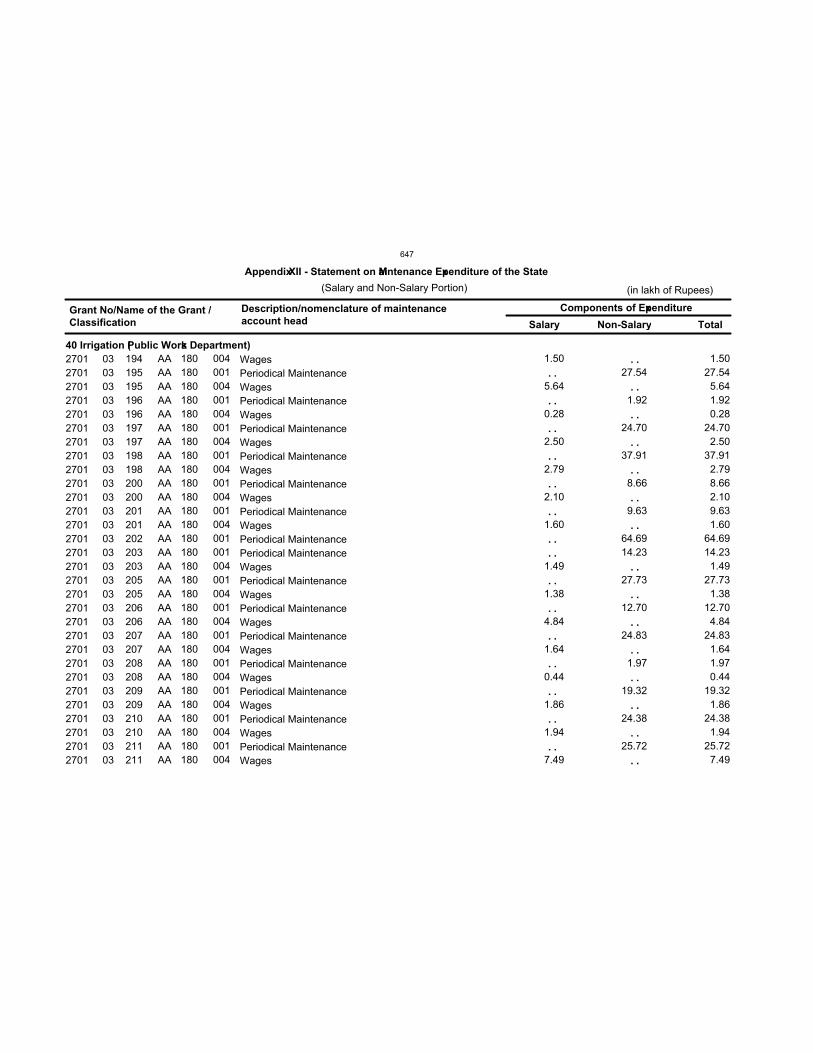
40 Irrigation (Public Works Department)
2701
2701
2701
2701
2701
2701
2701
2701
2701
2701
2701
2701
2701
2701
2701
2701
2701
2701
2701
2701
2701
2701
2701
2701
2701
2701
2701
2701
2701
2701
03
03
03
03
03
03
03
03
03
03
03
03
03
03
03
03
03
03
03
03
03
03
03
03
03
03
03
03
03
03
194
195
195
196
196
197
197
198
198
200
200
201
201
202
203
203
205
205
206
206
207
207
208
208
209
209
210
210
211
211
AA
AA
AA
AA
AA
AA
AA
AA
AA
AA
AA
AA
AA
AA
AA
AA
AA
AA
AA
AA
AA
AA
AA
AA
AA
AA
AA
AA
AA
AA
180
180
180
180
180
180
180
180
180
180
180
180
180
180
180
180
180
180
180
180
180
180
180
180
180
180
180
180
180
180
004
001
004
001
004
001
004
001
004
001
004
001
004
001
001
004
001
004
001
004
001
004
001
004
001
004
001
004
001
004
1.50
5.64
0.28
2.50
2.79
2.10
1.60
1.49
1.38
4.84
1.64
0.44
1.86
1.94
7.49
27.54
1.92
24.70
37.91
8.66
9.63
64.69
14.23
27.73
12.70
24.83
1.97
19.32
24.38
25.72
1.50
27.54
5.64
1.92
0.28
24.70
2.50
37.91
2.79
8.66
2.10
9.63
1.60
64.69
14.23
1.49
27.73
1.38
12.70
4.84
24.83
1.64
1.97
0.44
19.32
1.86
24.38
1.94
25.72
7.49
Grant No/Name of the Grant /
Classification
Description/nomenclature of maintenance
account head
Components of Expenditure
Salary Non-Salary Total
Appendix XII - Statement on Maintenance Expenditure of the State
(Salary and Non-Salary Portion) (in lakh of Rupees)
Wages
Periodical Maintenance
Wages
Periodical Maintenance
Wages
Periodical Maintenance
Wages
Periodical Maintenance
Wages
Periodical Maintenance
Wages
Periodical Maintenance
Wages
Periodical Maintenance
Periodical Maintenance
Wages
Periodical Maintenance
Wages
Periodical Maintenance
Wages
Periodical Maintenance
Wages
Periodical Maintenance
Wages
Periodical Maintenance
Wages
Periodical Maintenance
Wages
Periodical Maintenance
Wages
. .
. .
. .
. .
. .
. .
. .
. .
. .
. .
. .
. .
. .
. .
. .
. .
. .
. .
. .
. .
. .
. .
. .
. .
. .
. .
. .
. .
. .
. .
647
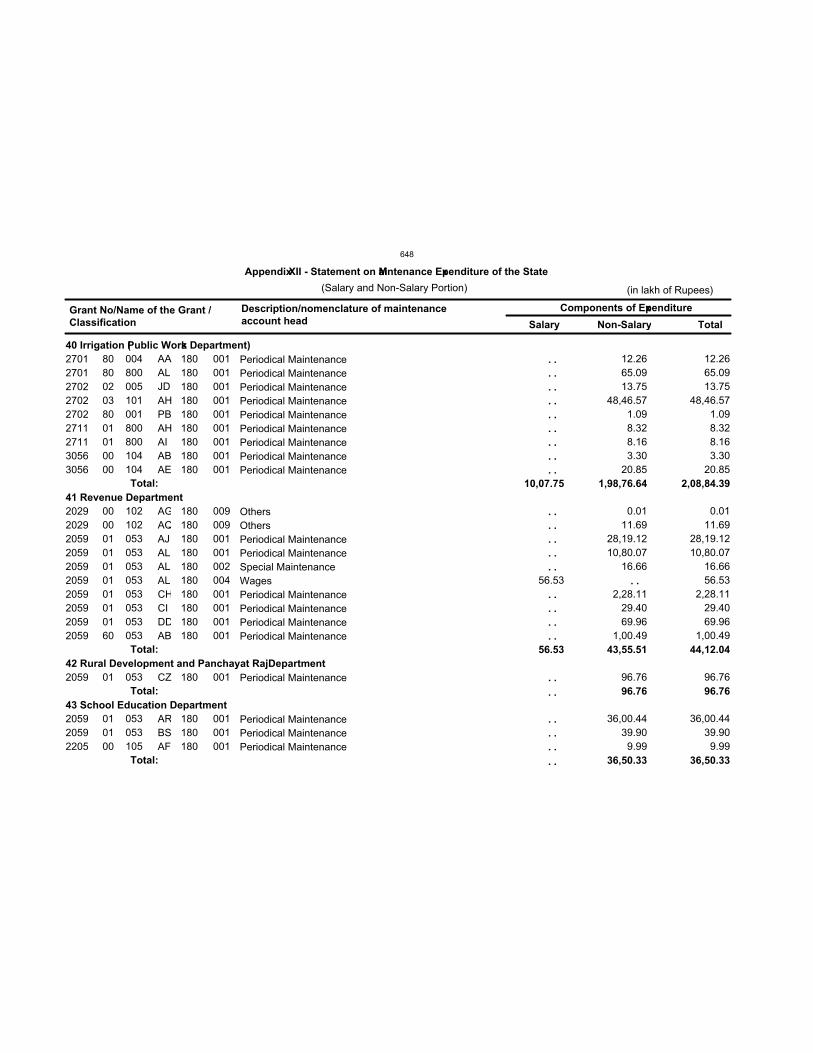
40 Irrigation (Public Works Department)
41 Revenue Department
42 Rural Development and Panchayat Raj Department
43 School Education Department
10,07.75
56.53
1,98,76.64
43,55.51
96.76
36,50.33
2,08,84.39
44,12.04
96.76
36,50.33
2701
2701
2702
2702
2702
2711
2711
3056
3056
2029
2029
2059
2059
2059
2059
2059
2059
2059
2059
2059
2059
2059
2205
80
80
02
03
80
01
01
00
00
00
00
01
01
01
01
01
01
01
60
01
01
01
00
004
800
005
101
001
800
800
104
104
102
102
053
053
053
053
053
053
053
053
053
053
053
105
AA
AL
JD
AH
PB
AH
AI
AB
AE
AG
AQ
AJ
AL
AL
AL
CH
CI
DD
AB
CZ
AR
BS
AF
180
180
180
180
180
180
180
180
180
180
180
180
180
180
180
180
180
180
180
180
180
180
180
001
001
001
001
001
001
001
001
001
009
009
001
001
002
004
001
001
001
001
001
001
001
001
56.53
12.26
65.09
13.75
48,46.57
1.09
8.32
8.16
3.30
20.85
0.01
11.69
28,19.12
10,80.07
16.66
2,28.11
29.40
69.96
1,00.49
96.76
36,00.44
39.90
9.99
12.26
65.09
13.75
48,46.57
1.09
8.32
8.16
3.30
20.85
0.01
11.69
28,19.12
10,80.07
16.66
56.53
2,28.11
29.40
69.96
1,00.49
96.76
36,00.44
39.90
9.99
Total:
Total:
Total:
Total:
Grant No/Name of the Grant /
Classification
Description/nomenclature of maintenance
account head
Components of Expenditure
Salary Non-Salary Total
Appendix XII - Statement on Maintenance Expenditure of the State
(Salary and Non-Salary Portion) (in lakh of Rupees)
Periodical Maintenance
Periodical Maintenance
Periodical Maintenance
Periodical Maintenance
Periodical Maintenance
Periodical Maintenance
Periodical Maintenance
Periodical Maintenance
Periodical Maintenance
Others
Others
Periodical Maintenance
Periodical Maintenance
Special Maintenance
Wages
Periodical Maintenance
Periodical Maintenance
Periodical Maintenance
Periodical Maintenance
Periodical Maintenance
Periodical Maintenance
Periodical Maintenance
Periodical Maintenance
. .
. .
. .
. .
. .
. .
. .
. .
. .
. .
. .
. .
. .
. .
. .
. .
. .
. .
. .
. .
. .
. .
. .
. .
. .
648
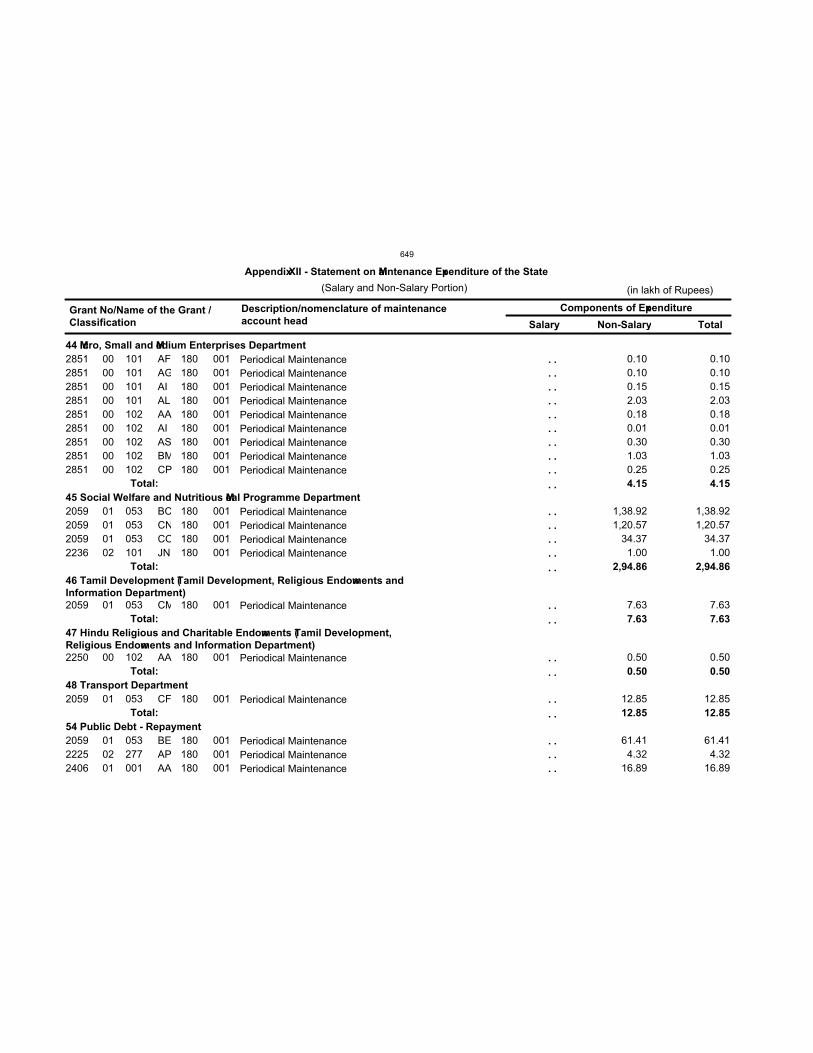
44 Micro, Small and Medium Enterprises Department
45 Social Welfare and Nutritious Meal Programme Department
46 Tamil Development (Tamil Development, Religious Endowments and
Information Department)
47 Hindu Religious and Charitable Endowments (Tamil Development,
Religious Endowments and Information Department)
48 Transport Department
54 Public Debt - Repayment
4.15
2,94.86
7.63
0.50
12.85
4.15
2,94.86
7.63
0.50
12.85
2851
2851
2851
2851
2851
2851
2851
2851
2851
2059
2059
2059
2236
2059
2250
2059
2059
2225
2406
00
00
00
00
00
00
00
00
00
01
01
01
02
01
00
01
01
02
01
101
101
101
101
102
102
102
102
102
053
053
053
101
053
102
053
053
277
001
AF
AG
AI
AL
AA
AI
AS
BM
CP
BC
CN
CO
JN
CM
AA
CF
BE
AP
AA
180
180
180
180
180
180
180
180
180
180
180
180
180
180
180
180
180
180
180
001
001
001
001
001
001
001
001
001
001
001
001
001
001
001
001
001
001
001
0.10
0.10
0.15
2.03
0.18
0.01
0.30
1.03
0.25
1,38.92
1,20.57
34.37
1.00
7.63
0.50
12.85
61.41
4.32
16.89
0.10
0.10
0.15
2.03
0.18
0.01
0.30
1.03
0.25
1,38.92
1,20.57
34.37
1.00
7.63
0.50
12.85
61.41
4.32
16.89
Total:
Total:
Total:
Total:
Total:
Grant No/Name of the Grant /
Classification
Description/nomenclature of maintenance
account head
Components of Expenditure
Salary Non-Salary Total
Appendix XII - Statement on Maintenance Expenditure of the State
(Salary and Non-Salary Portion) (in lakh of Rupees)
Periodical Maintenance
Periodical Maintenance
Periodical Maintenance
Periodical Maintenance
Periodical Maintenance
Periodical Maintenance
Periodical Maintenance
Periodical Maintenance
Periodical Maintenance
Periodical Maintenance
Periodical Maintenance
Periodical Maintenance
Periodical Maintenance
Periodical Maintenance
Periodical Maintenance
Periodical Maintenance
Periodical Maintenance
Periodical Maintenance
Periodical Maintenance
. .
. .
. .
. .
. .
. .
. .
. .
. .
. .
. .
. .
. .
. .
. .
. .
. .
. .
. .
. .
. .
. .
. .
. .
649
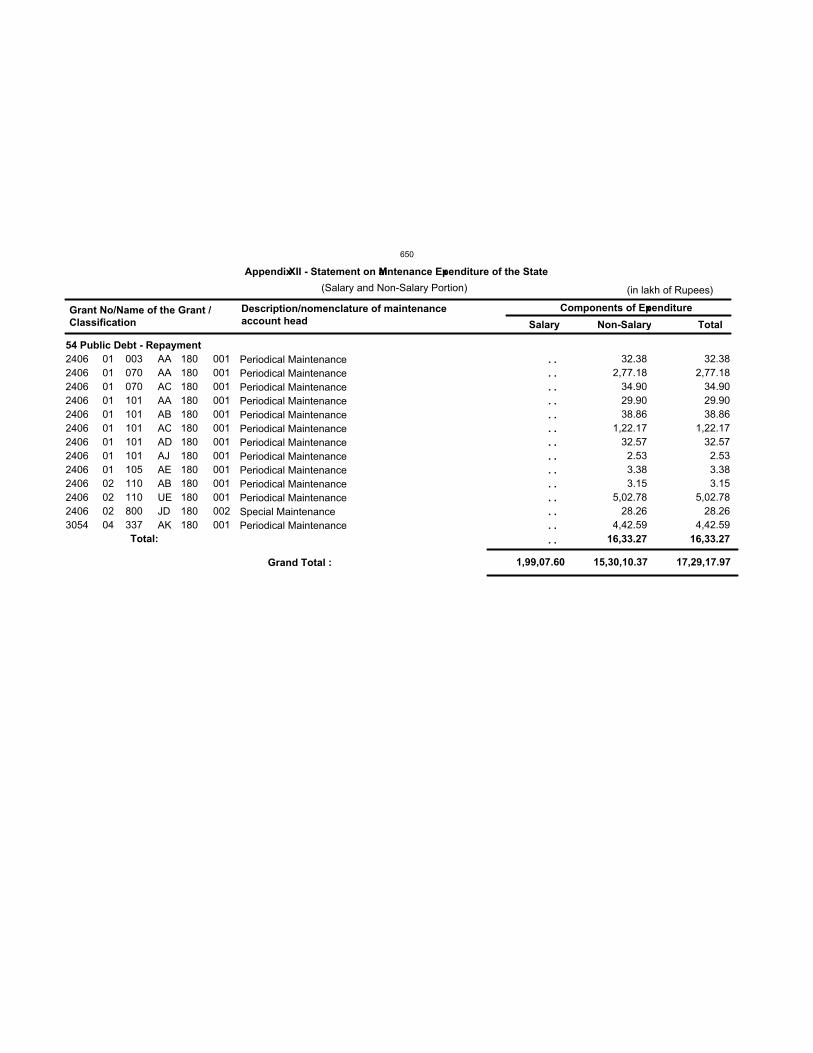
1,99,07.60 15,30,10.37 17,29,17.97
54 Public Debt - Repayment
16,33.27 16,33.27
2406
2406
2406
2406
2406
2406
2406
2406
2406
2406
2406
2406
3054
01
01
01
01
01
01
01
01
01
02
02
02
04
003
070
070
101
101
101
101
101
105
110
110
800
337
AA
AA
AC
AA
AB
AC
AD
AJ
AE
AB
UE
JD
AK
180
180
180
180
180
180
180
180
180
180
180
180
180
001
001
001
001
001
001
001
001
001
001
001
002
001
32.38
2,77.18
34.90
29.90
38.86
1,22.17
32.57
2.53
3.38
3.15
5,02.78
28.26
4,42.59
32.38
2,77.18
34.90
29.90
38.86
1,22.17
32.57
2.53
3.38
3.15
5,02.78
28.26
4,42.59
Total:
Grant No/Name of the Grant /
Classification
Description/nomenclature of maintenance
account head
Components of Expenditure
Salary Non-Salary Total
Appendix XII - Statement on Maintenance Expenditure of the State
(Salary and Non-Salary Portion) (in lakh of Rupees)
Grand Total :
Periodical Maintenance
Periodical Maintenance
Periodical Maintenance
Periodical Maintenance
Periodical Maintenance
Periodical Maintenance
Periodical Maintenance
Periodical Maintenance
Periodical Maintenance
Periodical Maintenance
Periodical Maintenance
Special Maintenance
Periodical Maintenance
. .
. .
. .
. .
. .
. .
. .
. .
. .
. .
. .
. .
. .
. .
650
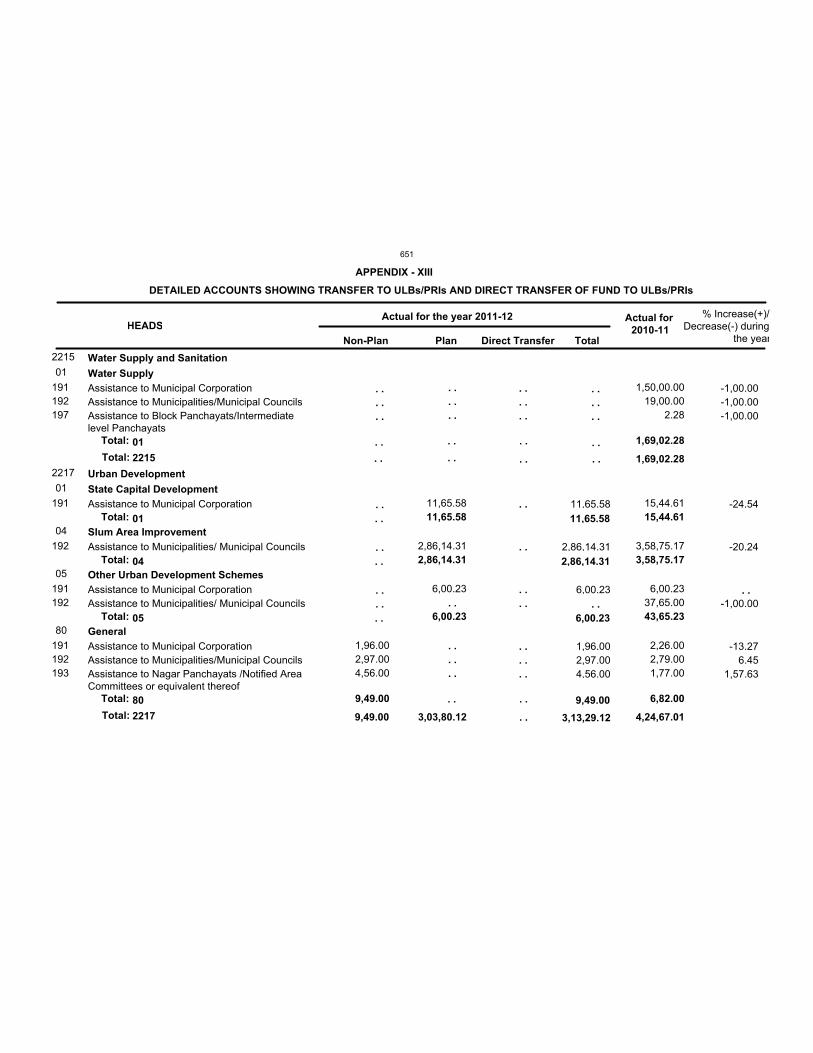
2215
2217
9,49.00 3,03,80.12
1,69,02.28
4,24,67.01
01
01
04
05
80
9,49.00
11,65.58
2,86,14.31
6,00.23
1,69,02.28
15,44.61
3,58,75.17
43,65.23
6,82.00
191
192
197
191
192
191
192
191
192
193
1,96.00
2,97.00
4,56.00
11,65.58
2,86,14.31
6,00.23
1,50,00.00
19,00.00
2.28
15,44.61
3,58,75.17
6,00.23
37,65.00
2,26.00
2,79.00
1,77.00
Total:
Total:
Total:
Total:
Total:
DETAILED ACCOUNTS SHOWING TRANSFER TO ULBs/PRIs AND DIRECT TRANSFER OF FUND TO ULBs/PRIs
HEADSActual for the year 2011-12 Actual for
2010-11
% Increase(+)/Decrease(-) during
the yearNon-Plan Plan Direct Transfer Total
Water Supply and Sanitation
Urban Development
Water Supply
State Capital Development
Slum Area Improvement
Other Urban Development Schemes
General
Assistance to Municipal Corporation
Assistance to Municipalities/Municipal Councils
Assistance to Block Panchayats/Intermediatelevel Panchayats
Assistance to Municipal Corporation
Assistance to Municipalities/ Municipal Councils
Assistance to Municipal Corporation
Assistance to Municipalities/ Municipal Councils
Assistance to Municipal Corporation
Assistance to Municipalities/Municipal Councils
Assistance to Nagar Panchayats /Notified AreaCommittees or equivalent thereof
. .
. .
. .
. .
. .
. .
. .
. .
. .
. .
. .
. .
. .
. .
. .
. .
. .
. .
. .
. .
. . . .
. .
. .
. .
. .
. .
. .
. .
. .
. .
. .
. .
. .
. .
. .
11,65.58
2,86,14.31
6,00.23
1,96.00
2,97.00
4,56.00
11,65.58
2,86,14.31
6,00.23
9,49.00
3,13,29.12
. .
. .
. .
. .
. .
. .
-1,00.00
-1,00.00
-1,00.00
-24.54
-20.24
-1,00.00
-13.27
6.45
1,57.63
. .
APPENDIX - XIII
01
01
04
05
80
Total:
Total:
2215
2217
651
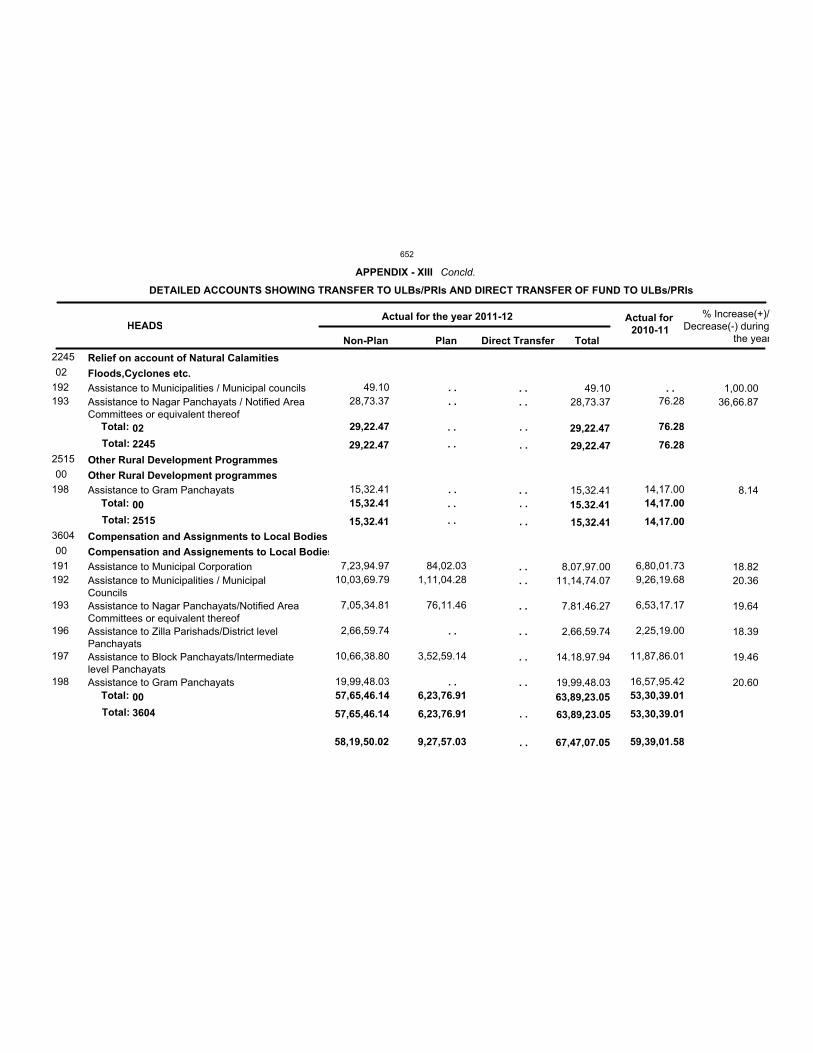
58,19,50.02 9,27,57.03 59,39,01.58
2245
2515
3604
29,22.47
15,32.41
57,65,46.14 6,23,76.91
76.28
14,17.00
53,30,39.01
02
00
00
29,22.47
15,32.41
57,65,46.14 6,23,76.91
76.28
14,17.00
53,30,39.01
192
193
198
191
192
193
196
197
198
49.10
28,73.37
15,32.41
7,23,94.97
10,03,69.79
7,05,34.81
2,66,59.74
10,66,38.80
19,99,48.03
84,02.03
1,11,04.28
76,11.46
3,52,59.14
76.28
14,17.00
6,80,01.73
9,26,19.68
6,53,17.17
2,25,19.00
11,87,86.01
16,57,95.42
Total:
Total:
Total:
DETAILED ACCOUNTS SHOWING TRANSFER TO ULBs/PRIs AND DIRECT TRANSFER OF FUND TO ULBs/PRIs
HEADSActual for the year 2011-12 Actual for
2010-11
% Increase(+)/Decrease(-) during
the yearNon-Plan Plan Direct Transfer Total
Relief on account of Natural Calamities
Other Rural Development Programmes
Compensation and Assignments to Local Bodies
Floods,Cyclones etc.
Other Rural Development programmes
Compensation and Assignements to Local Bodies
Assistance to Municipalities / Municipal councils
Assistance to Nagar Panchayats / Notified AreaCommittees or equivalent thereof
Assistance to Gram Panchayats
Assistance to Municipal Corporation
Assistance to Municipalities / MunicipalCouncils
Assistance to Nagar Panchayats/Notified AreaCommittees or equivalent thereof
Assistance to Zilla Parishads/District levelPanchayats
Assistance to Block Panchayats/Intermediatelevel Panchayats
Assistance to Gram Panchayats
. .
. .
. .
. .
. .
. .
. .
. .
. .
. .
. .
. .
. .
. .
. .
. .
. .
. .
. .
. .
. .
. .
. .
49.10
28,73.37
15,32.41
8,07,97.00
11,14,74.07
7,81,46.27
2,66,59.74
14,18,97.94
19,99,48.03
. .
29,22.47
15,32.41
63,89,23.05
29,22.47
15,32.41
63,89,23.05
67,47,07.05
. . 1,00.00
36,66.87
8.14
18.82
20.36
19.64
18.39
19.46
20.60
APPENDIX - XIII Concld.
02
00
00
Total:
Total:
Total:
2245
2515
3604
652
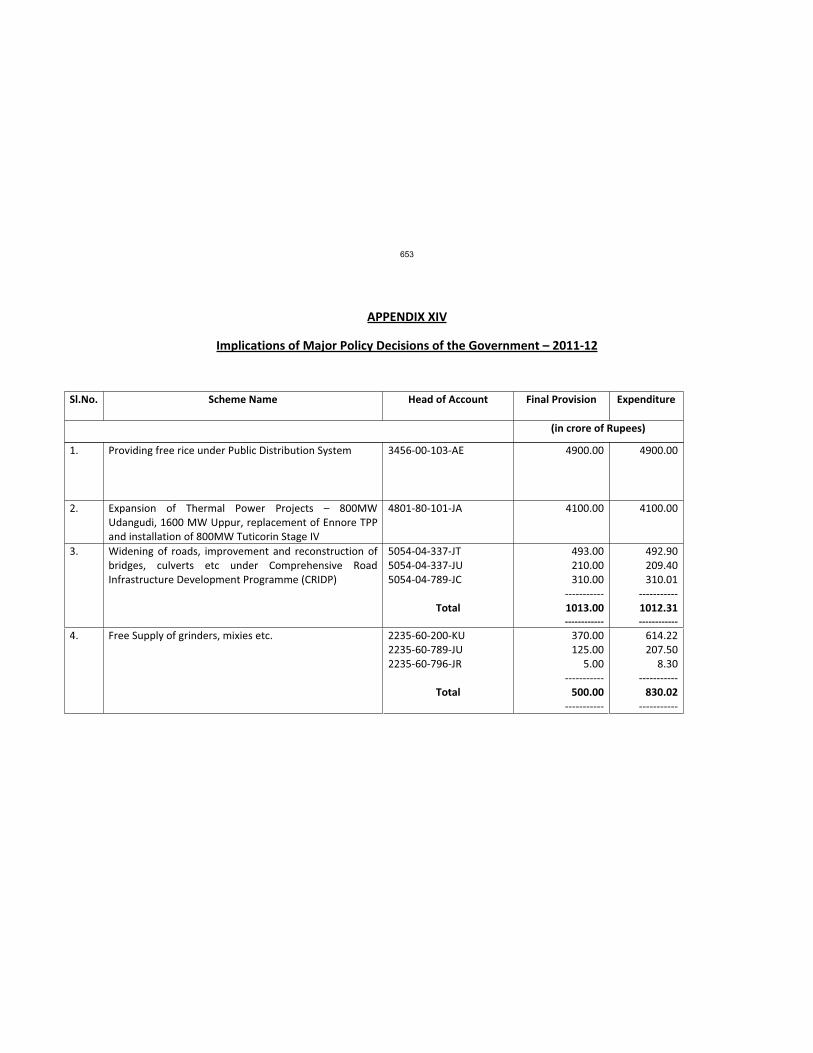
APPENDIX XIV
Implications of Major Policy Decisions of the Government – 2011 12
Sl.No. Scheme Name Head of Account Final Provision Expenditure
(in crore of Rupees)
1. Providing free rice under Public Distribution System 3456 00 103 AE 4900.00 4900.00
2. Expansion of Thermal Power Projects – 800MW
Udangudi, 1600 MW Uppur, replacement of Ennore TPP
and installation of 800MW Tuticorin Stage IV
4801 80 101 JA 4100.00 4100.00
3. Widening of roads, improvement and reconstruction of
bridges, culverts etc under Comprehensive Road
Infrastructure Development Programme (CRIDP)
5054 04 337 JT
5054 04 337 JU
5054 04 789 JC
Total
493.00
210.00
310.00
1013.00
492.90
209.40
310.01
1012.31
4. Free Supply of grinders, mixies etc. 2235 60 200 KU
2235 60 789 JU
2235 60 796 JR
Total
370.00
125.00
5.00
500.00
614.22
207.50
8.30
830.02
653
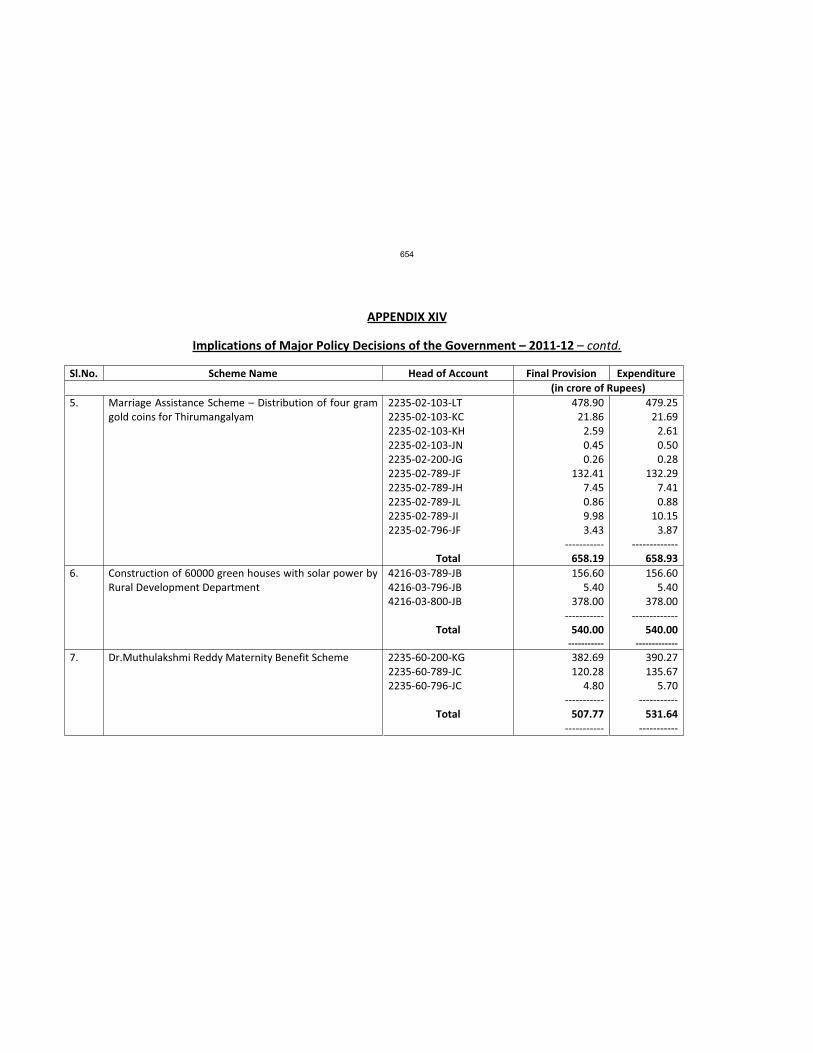
APPENDIX XIV
Implications of Major Policy Decisions of the Government – 2011 12 – contd.
Sl.No. Scheme Name Head of Account Final Provision Expenditure
(in crore of Rupees)
5. Marriage Assistance Scheme – Distribution of four gram
gold coins for Thirumangalyam
2235 02 103 LT
2235 02 103 KC
2235 02 103 KH
2235 02 103 JN
2235 02 200 JG
2235 02 789 JF
2235 02 789 JH
2235 02 789 JL
2235 02 789 JI
2235 02 796 JF
Total
478.90
21.86
2.59
0.45
0.26
132.41
7.45
0.86
9.98
3.43
658.19
479.25
21.69
2.61
0.50
0.28
132.29
7.41
0.88
10.15
3.87
658.93
6. Construction of 60000 green houses with solar power by
Rural Development Department
4216 03 789 JB
4216 03 796 JB
4216 03 800 JB
Total
156.60
5.40
378.00
540.00
156.60
5.40
378.00
540.00
7. Dr.Muthulakshmi Reddy Maternity Benefit Scheme 2235 60 200 KG
2235 60 789 JC
2235 60 796 JC
Total
382.69
120.28
4.80
507.77
390.27
135.67
5.70
531.64
654
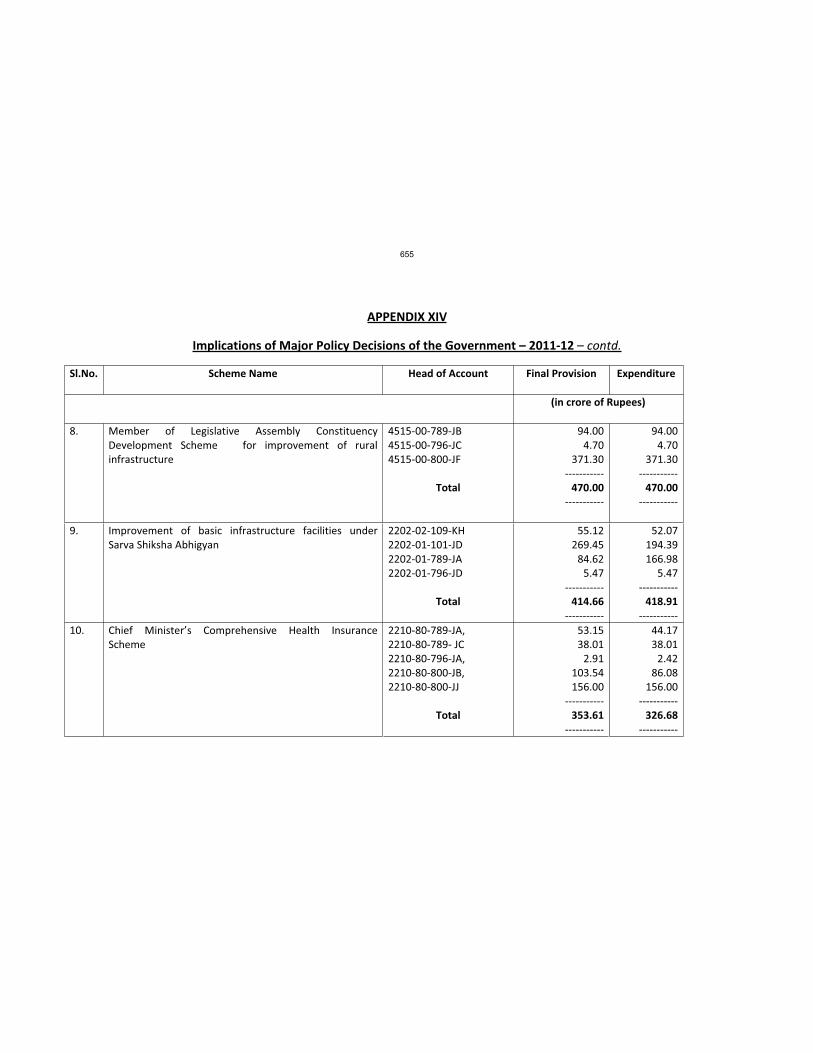
APPENDIX XIV
Implications of Major Policy Decisions of the Government – 2011 12 – contd.
Sl.No. Scheme Name Head of Account Final Provision Expenditure
(in crore of Rupees)
8. Member of Legislative Assembly Constituency
Development Scheme for improvement of rural
infrastructure
4515 00 789 JB
4515 00 796 JC
4515 00 800 JF
Total
94.00
4.70
371.30
470.00
94.00
4.70
371.30
470.00
9. Improvement of basic infrastructure facilities under
Sarva Shiksha Abhigyan
2202 02 109 KH
2202 01 101 JD
2202 01 789 JA
2202 01 796 JD
Total
55.12
269.45
84.62
5.47
414.66
52.07
194.39
166.98
5.47
418.91
10. Chief Minister’s Comprehensive Health Insurance
Scheme
2210 80 789 JA,
2210 80 789 JC
2210 80 796 JA,
2210 80 800 JB,
2210 80 800 JJ
Total
53.15
38.01
2.91
103.54
156.00
353.61
44.17
38.01
2.42
86.08
156.00
326.68
655
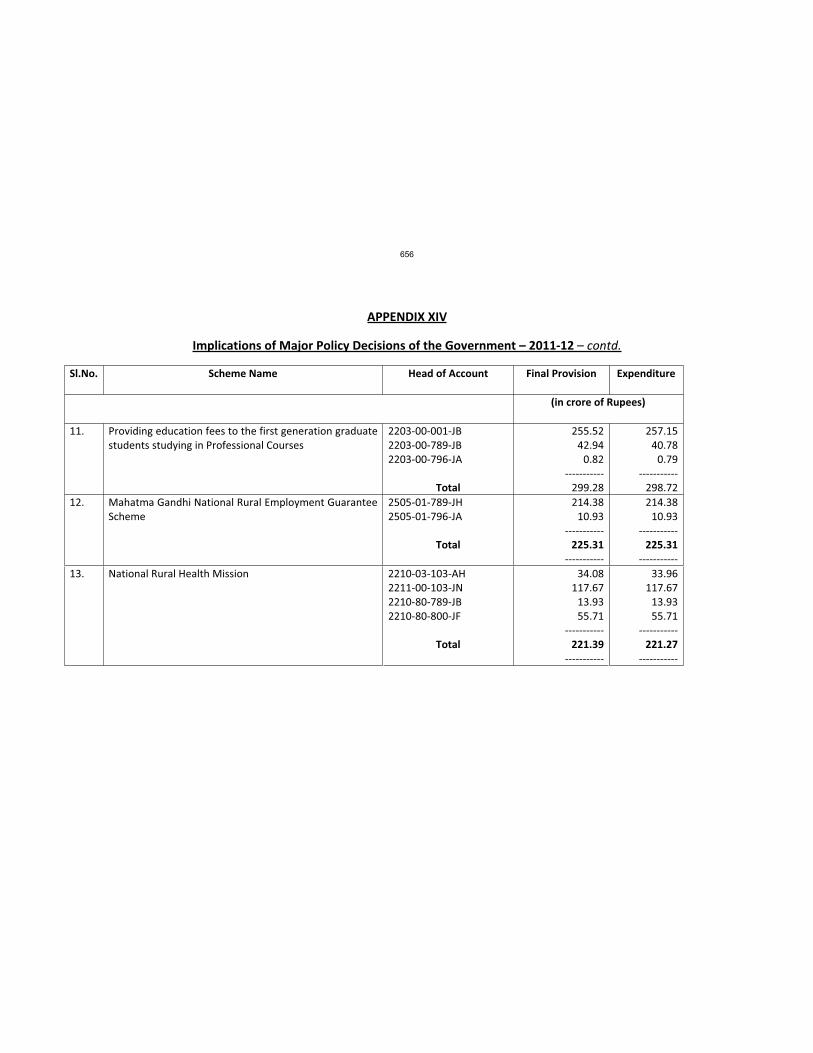
APPENDIX XIV
Implications of Major Policy Decisions of the Government – 2011 12 – contd.
Sl.No. Scheme Name Head of Account Final Provision Expenditure
(in crore of Rupees)
11. Providing education fees to the first generation graduate
students studying in Professional Courses
2203 00 001 JB
2203 00 789 JB
2203 00 796 JA
Total
255.52
42.94
0.82
299.28
257.15
40.78
0.79
298.72
12. Mahatma Gandhi National Rural Employment Guarantee
Scheme
2505 01 789 JH
2505 01 796 JA
Total
214.38
10.93
225.31
214.38
10.93
225.31
13. National Rural Health Mission 2210 03 103 AH
2211 00 103 JN
2210 80 789 JB
2210 80 800 JF
Total
34.08
117.67
13.93
55.71
221.39
33.96
117.67
13.93
55.71
221.27
656
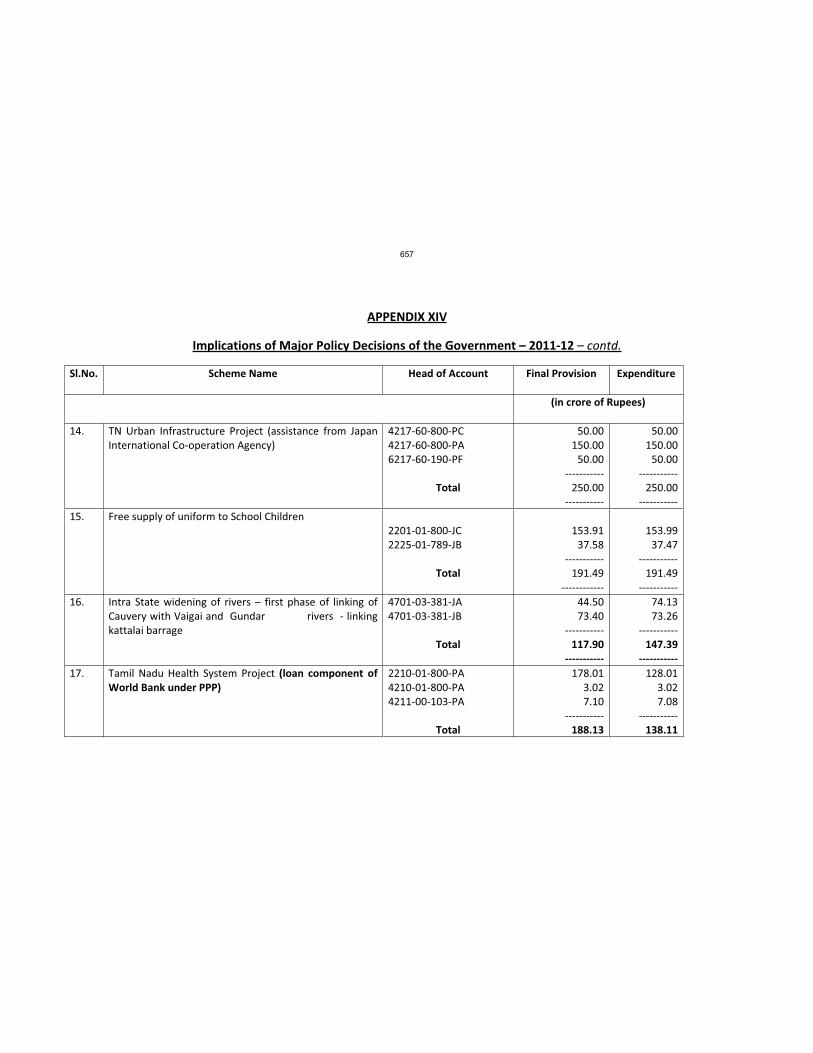
APPENDIX XIV
Implications of Major Policy Decisions of the Government – 2011 12 – contd.
Sl.No. Scheme Name Head of Account Final Provision Expenditure
(in crore of Rupees)
14. TN Urban Infrastructure Project (assistance from Japan
International Co operation Agency)
4217 60 800 PC
4217 60 800 PA
6217 60 190 PF
Total
50.00
150.00
50.00
250.00
50.00
150.00
50.00
250.00
15. Free supply of uniform to School Children
2201 01 800 JC
2225 01 789 JB
Total
153.91
37.58
191.49
153.99
37.47
191.49
16. Intra State widening of rivers – first phase of linking of
Cauvery with Vaigai and Gundar rivers linking
kattalai barrage
4701 03 381 JA
4701 03 381 JB
Total
44.50
73.40
117.90
74.13
73.26
147.39
17. Tamil Nadu Health System Project (loan component of
World Bank under PPP)
2210 01 800 PA
4210 01 800 PA
4211 00 103 PA
Total
178.01
3.02
7.10
188.13
128.01
3.02
7.08
138.11
657
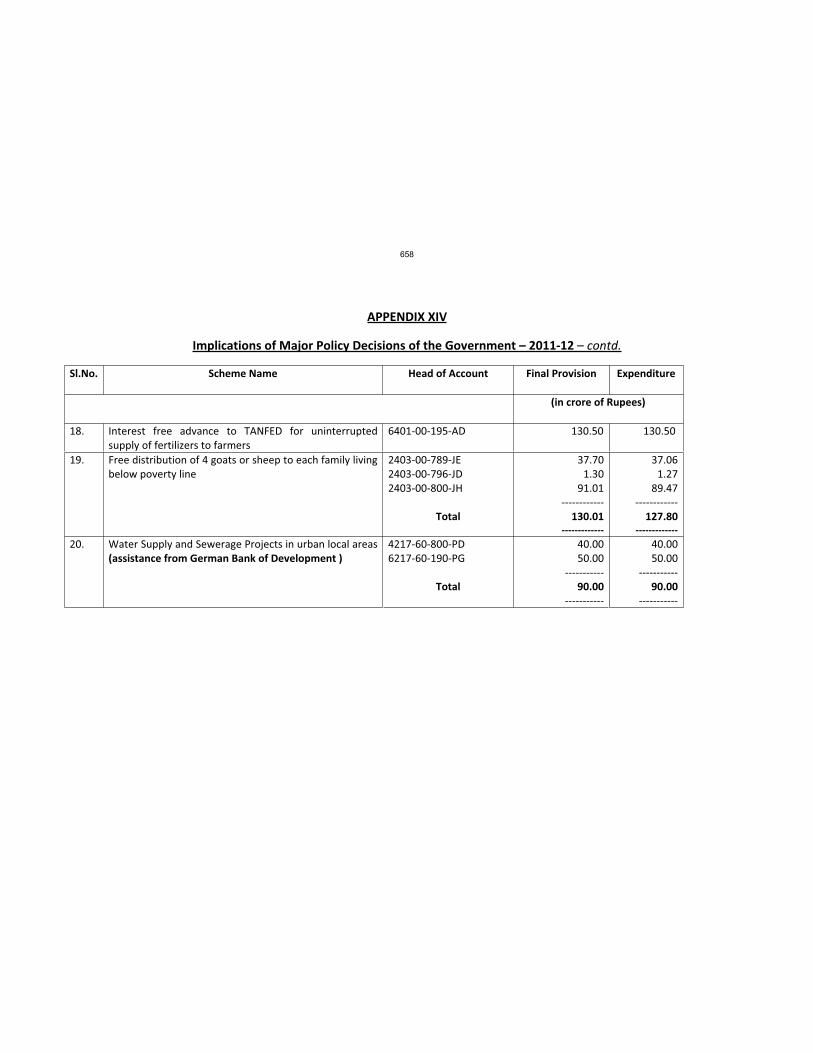
APPENDIX XIV
Implications of Major Policy Decisions of the Government – 2011 12 – contd.
Sl.No. Scheme Name Head of Account Final Provision Expenditure
(in crore of Rupees)
18. Interest free advance to TANFED for uninterrupted
supply of fertilizers to farmers
6401 00 195 AD 130.50 130.50
19. Free distribution of 4 goats or sheep to each family living
below poverty line
2403 00 789 JE
2403 00 796 JD
2403 00 800 JH
Total
37.70
1.30
91.01
130.01
37.06
1.27
89.47
127.80
20. Water Supply and Sewerage Projects in urban local areas
(assistance from German Bank of Development )
4217 60 800 PD
6217 60 190 PG
Total
40.00
50.00
90.00
40.00
50.00
90.00
658
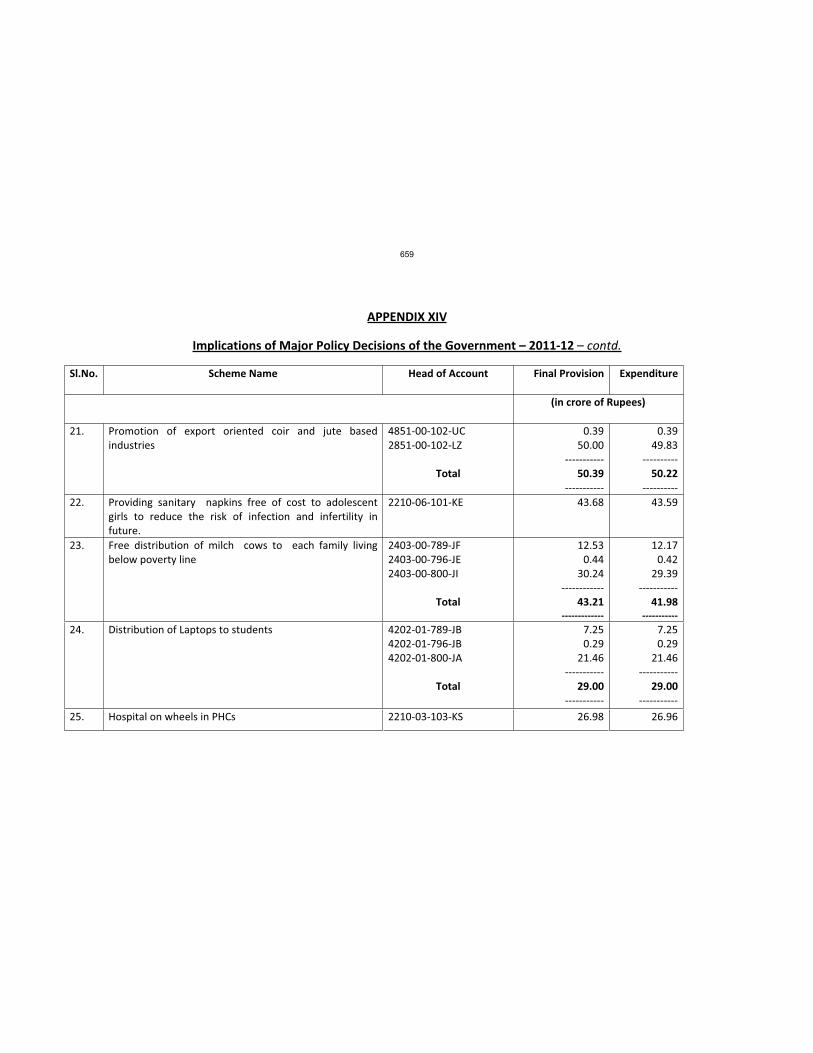
APPENDIX XIV
Implications of Major Policy Decisions of the Government – 2011 12 – contd.
Sl.No. Scheme Name Head of Account Final Provision Expenditure
(in crore of Rupees)
21. Promotion of export oriented coir and jute based
industries
4851 00 102 UC
2851 00 102 LZ
Total
0.39
50.00
50.39
0.39
49.83
50.22
22. Providing sanitary napkins free of cost to adolescent
girls to reduce the risk of infection and infertility in
future.
2210 06 101 KE 43.68 43.59
23. Free distribution of milch cows to each family living
below poverty line
2403 00 789 JF
2403 00 796 JE
2403 00 800 JI
Total
12.53
0.44
30.24
43.21
12.17
0.42
29.39
41.98
24. Distribution of Laptops to students 4202 01 789 JB
4202 01 796 JB
4202 01 800 JA
Total
7.25
0.29
21.46
29.00
7.25
0.29
21.46
29.00
25. Hospital on wheels in PHCs 2210 03 103 KS 26.98 26.96
659
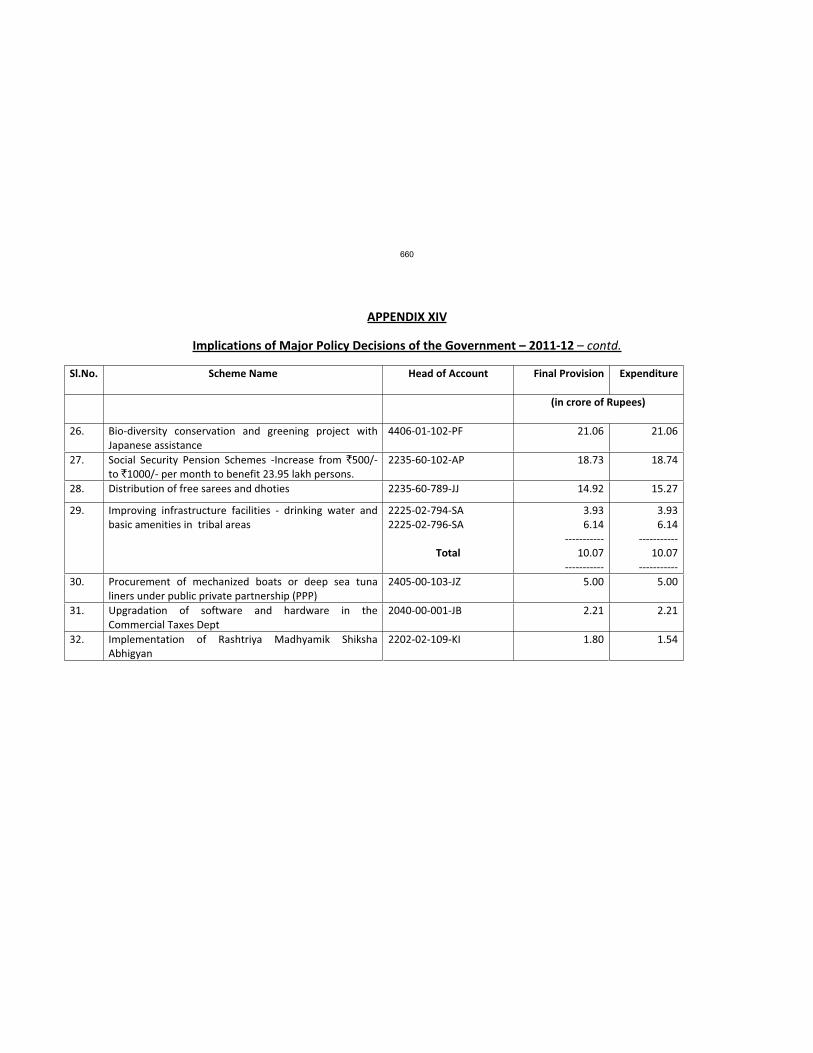
APPENDIX XIV
Implications of Major Policy Decisions of the Government – 2011 12 – contd.
Sl.No. Scheme Name Head of Account Final Provision Expenditure
(in crore of Rupees)
26. Bio diversity conservation and greening project with
Japanese assistance
4406 01 102 PF 21.06 21.06
27. Social Security Pension Schemes Increase from `500/
to `1000/ per month to benefit 23.95 lakh persons.
2235 60 102 AP 18.73 18.74
28. Distribution of free sarees and dhoties 2235 60 789 JJ 14.92 15.27
29. Improving infrastructure facilities drinking water and
basic amenities in tribal areas
2225 02 794 SA
2225 02 796 SA
Total
3.93
6.14
10.07
3.93
6.14
10.07
30. Procurement of mechanized boats or deep sea tuna
liners under public private partnership (PPP)
2405 00 103 JZ 5.00 5.00
31. Upgradation of software and hardware in the
Commercial Taxes Dept
2040 00 001 JB 2.21 2.21
32. Implementation of Rashtriya Madhyamik Shiksha
Abhigyan
2202 02 109 KI 1.80 1.54
660
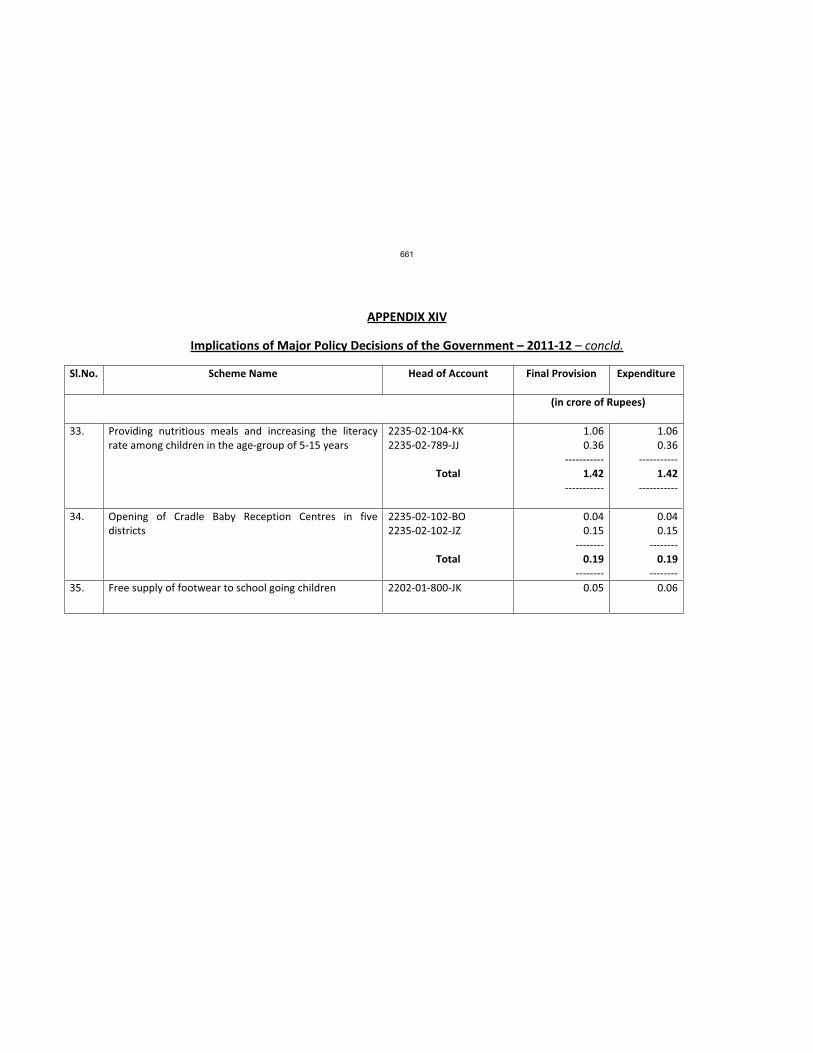
APPENDIX XIV
Implications of Major Policy Decisions of the Government – 2011 12 – concld.
Sl.No. Scheme Name Head of Account Final Provision Expenditure
(in crore of Rupees)
33. Providing nutritious meals and increasing the literacy
rate among children in the age group of 5 15 years
2235 02 104 KK
2235 02 789 JJ
Total
1.06
0.36
1.42
1.06
0.36
1.42
34. Opening of Cradle Baby Reception Centres in five
districts
2235 02 102 BO
2235 02 102 JZ
Total
0.04
0.15
0.19
0.04
0.15
0.19
35. Free supply of footwear to school going children 2202 01 800 JK 0.05 0.06
661


