Embed Size (px)
Citation preview
Volatile Organic Compounds and Particulates asComponents of Diesel Engine Exhaust Gas
HANS SCHULZ,* GILBERTO BANDEIRA DE MELO, and FARID OUSMANOVEngler-Bunte-Institute, University of Karlsruhe, Kaiserstraße 12, 76128 Karlsruhe, Germany
Volatile organic compounds (VOC) and soot particles have been determined in a Diesel’s exhaust gas. A newsampling method allowed the measurement of emissions of organic compounds (C1 to C20) in a gaschromatogram at a detection limit of ca. 0.2 mg/m3. Particles were collected with a filter bed of ceramic particlesand characterized by temperature programmed desorption (TPD) and oxidation (TPO). Engine runs werealways performed at a fixed and constant air to fuel equivalence ratio (l) and with a constant volumetricefficiency, because these parameters strongly influenced the emissions in terms of both composition and orderof magnitude. The effective combustion temperature again strongly governed the nature of the emissions.Model fuels, composed of individual paraffins and aromatics and additions of sulfur compounds and an organicnitrate (for cetane number enhancement) were used. The results contribute to the understanding of the originof specific emissions from Diesel engines. These newly developed methods are recommended for furtherapplication. © 1999 by The Combustion Institute
INTRODUCTION
Volatile organic compounds (VOC) in the ex-haust gas of Diesel engines have attracted muchless attention than similar emissions from Ottoengines [1, 2]. Commonly these emissions areonly measured cumulatively and recorded interms of propane equivalents [3]. However, theycontain reactive compounds which are capableof participating in the formation of photochem-ical smog [4] and even toxic benzene is one of itssignificant constituents. As will be shown below,the air to fuel equivalence ratio (l) dominatesthe magnitude and composition of the emis-sions. This basic dependence is generally recog-nized in this study. In practice the air to fuelratio (by mass) varies between ; 18:1 at highload conditions to ; 150:1 at very low load,corresponding to a range of air to fuel equiva-lence ratios from l 5 1.3 to l 5 11. Thus thecomposition of the exhaust gas from Dieselengines is very variable. The exhaust gas tem-perature (in °C) also changes by at least a factorof 2 between high and low loads. These varia-tions create a challenging task of finding prac-tical solutions for the reduction of harmfulemissions. A further complication arises fromsulfur in the fuel, which disturbs catalytic con-verters and also leads to both sulfuric acid andsulfates adsorbed on the particulates.
Profound knowledge about the nature andthe amount of emissions from Diesel engines,depending on motor-operating parameters (airto fuel equivalence ratio, volumetric efficiency,injection start, ignition delay), fuel composition(paraffins, naphthenes, aromatics, sulfur, addi-tives, boiling range, density, cetane number,nonconventional fuels) and engine design (di-rect injection, prechamber injection, number ofnozzles, injection pressure, turbocharging, etc.)is important for developing systems to treatexhaust gases and for designing cleaner enginesand introducing clean fuels. Additionally, basicknowledge about the nature of emissions andthe parameters and modes of their formation isof interest in relation to legislative activities foremission control.
EXPERIMENTAL
Performance of the Measurements
The measurements were conducted with a one-cylinder engine (BASF, Ludwigshafen) for test-ing cetane numbers. Some of the specificationsof this engine are: displacement volume 850 ml,injection into a swirl chamber and compressionratio 18.2:1. The speed was kept at 1000 rev/minand the beginning of the injection was com-monly at 20° before top dead center. In princi-ple, every engine exhibits its individual emission*Corresponding author.
COMBUSTION AND FLAME 118:179–190 (1999)© 1999 by The Combustion Institute 0010-2180/99/$–see front matterPublished by Elsevier Science Inc. PII S0010-2180(98)00146-1
characteristics. Therefore basic investigationsshould make use of a well-defined referenceengine, like that for determining cetane num-bers. With this engine the speed could be keptconstant, independent of l, and the air charge(volumetric efficiency) controlled. Thus the es-sential parameters for combustion and engineoperation were held at desired values. In par-ticular l and the volumetric efficiency were keptconstant during each measurement.
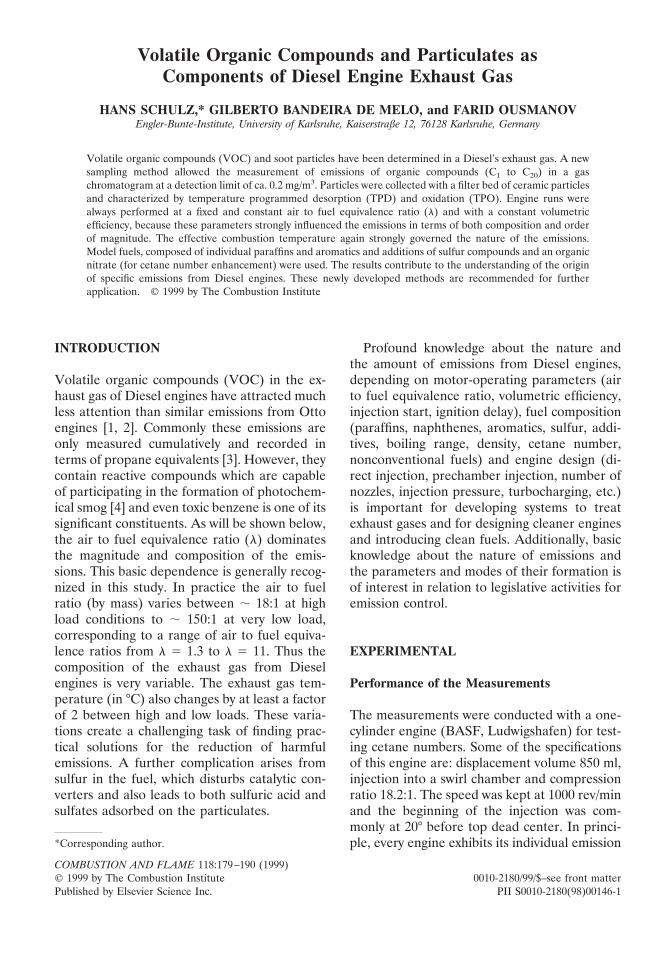
The principal experimental array is shown inFig. 1. Material balances were established bymeasuring the ingoing and outgoing streamsand their compositions. Sampling and on-lineanalyses were performed using three sidestreams. To the first stream a reference stream,consisting of argon and neopentane, was addedand the resulting stream intensively mixed. Alsoin the mixer the average composition fromabout 50 combustion cycles was established toreduce the scatter of the analyses. Samples fromthe gaseous stream behind the mixer were re-covered in ampoules of volume 1–8 ml andstored for subsequent gas chromatography(GC) analysis. By relating to the reference peakof neopentane, the amounts of individual sub-stances of the exhaust gas were obtained di-rectly from the chromatograms. Emissions oforganic compounds are generally presented be-low as a percentage of the carbon of the fuelconsumed. It was fortunate that with this tech-nique [5] the chromatogram of one ampoule
sample yielded all the VOC constituents from C1
to C20. It was possible to store samples in theirampoules for months without any change in com-position. The second side stream was used forcontinuous measurement of the concentrations ofH2O, CO, and CO2 using infrared (IR) absorptionand also of O2 with the paramagnetic technique.
Particulate Sampling and Characterization
From the third side stream particulates wererecovered and weighed later. Fused silica tubescontaining a fixed bed of ceramic particles (diam.0.5–1 mm) obtained by breaking, grinding, andsieving a Diesel exhaust gas filter monolith (De-gussa, Hanau) were used for this purpose. Thesampling temperature was 60°C. After samplingparticulates and weighing, the tube was mountedinto a furnace for temperature programmed de-sorption (TPD), followed by temperature pro-grammed oxidation (TPO). These methods wereused in a quantitative mode. Thus the amounts ofindividual substances adsorbed on the soot andthe amount of soot and its molar hydrogen tocarbon ratio were measured. In contrast withcurrent techniques [6–8], this method providesdetailed data about volatile compounds adsorbedon the particulates and resolves the total weight ofrecovered particulates into that of adsorbedwater, adsorbed organic compounds, and car-bon and hydrogen in the particulates (beforeand after thermal treatment).
Gas Sampling and Analysis
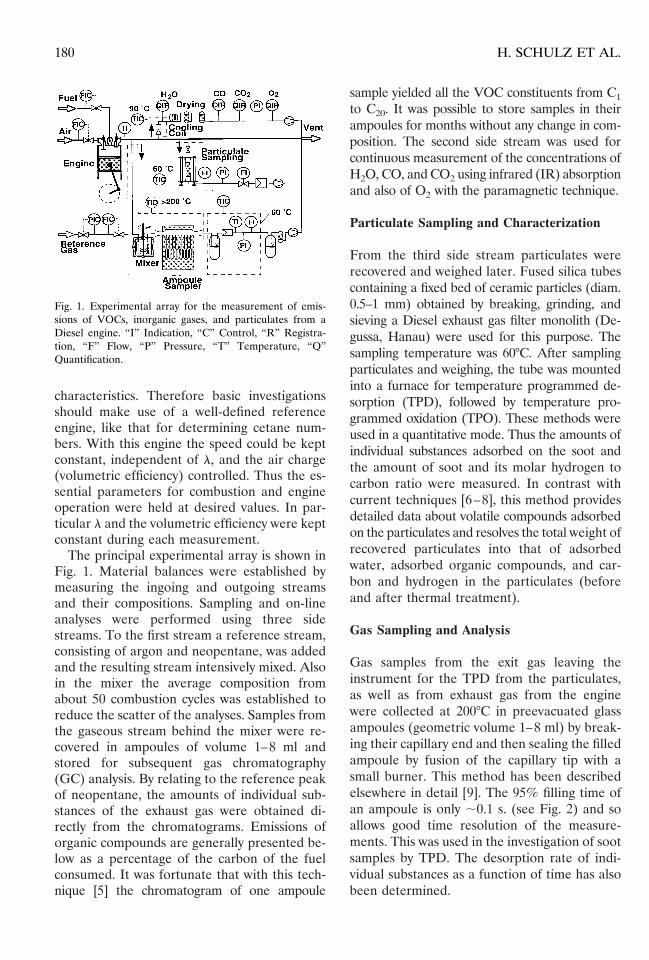
Gas samples from the exit gas leaving theinstrument for the TPD from the particulates,as well as from exhaust gas from the enginewere collected at 200°C in preevacuated glassampoules (geometric volume 1–8 ml) by break-ing their capillary end and then sealing the filledampoule by fusion of the capillary tip with asmall burner. This method has been describedelsewhere in detail [9]. The 95% filling time ofan ampoule is only ;0.1 s. (see Fig. 2) and soallows good time resolution of the measure-ments. This was used in the investigation of sootsamples by TPD. The desorption rate of indi-vidual substances as a function of time has alsobeen determined.
Fig. 1. Experimental array for the measurement of emis-sions of VOCs, inorganic gases, and particulates from aDiesel engine. “I” Indication, “C” Control, “R” Registra-tion, “F” Flow, “P” Pressure, “T” Temperature, “Q”Quantification.
180 H. SCHULZ ET AL.
The method possesses the potential for mea-suring the time dependence of VOC emissionsduring transient episodes of engine tests. Thefavorable characteristics of this method are also:
applicability to a wide molecular weight rangeof VOC components (C1–C20);
storage of the samples without compositionalchanges;
the system is inert, being without losses throughadsorption;
low detection limit without enrichment proce-dures (0.2 mg/m3 for an individual organiccompound).
The method has already been used for studyingthe transient compositions of product streamsfrom the conversion of methanol to hydrocar-bons on zeolite catalysts [11] and from Fischer-Tropsch CO2-hydrogenation [12].
Adapted Gas Chromatography forEmission Measurements
The gas chromatograph (Hewlett Packard 5880)was equipped with the system for introducingsamples from an ampoule, which was put intothe breaking device and heated to 200°C forrevaporization of less volatile compounds. Thenthe ampoule was broken into parts and its
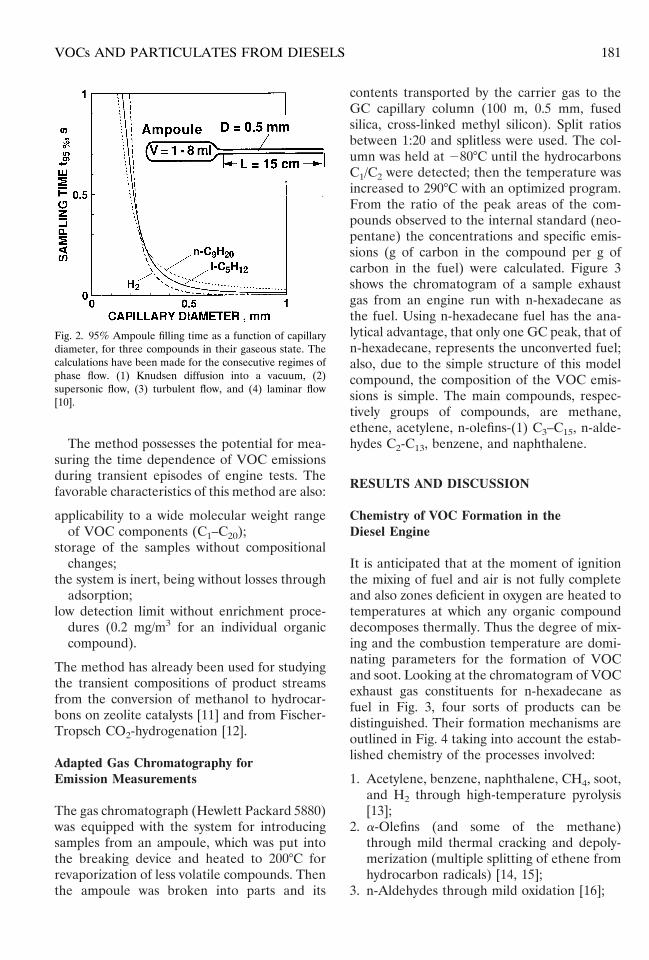
contents transported by the carrier gas to theGC capillary column (100 m, 0.5 mm, fusedsilica, cross-linked methyl silicon). Split ratiosbetween 1:20 and splitless were used. The col-umn was held at 280°C until the hydrocarbonsC1/C2 were detected; then the temperature wasincreased to 290°C with an optimized program.From the ratio of the peak areas of the com-pounds observed to the internal standard (neo-pentane) the concentrations and specific emis-sions (g of carbon in the compound per g ofcarbon in the fuel) were calculated. Figure 3shows the chromatogram of a sample exhaustgas from an engine run with n-hexadecane asthe fuel. Using n-hexadecane fuel has the ana-lytical advantage, that only one GC peak, that ofn-hexadecane, represents the unconverted fuel;also, due to the simple structure of this modelcompound, the composition of the VOC emis-sions is simple. The main compounds, respec-tively groups of compounds, are methane,ethene, acetylene, n-olefins-(1) C3–C15, n-alde-hydes C2-C13, benzene, and naphthalene.
RESULTS AND DISCUSSION
Chemistry of VOC Formation in theDiesel Engine
It is anticipated that at the moment of ignitionthe mixing of fuel and air is not fully completeand also zones deficient in oxygen are heated totemperatures at which any organic compounddecomposes thermally. Thus the degree of mix-ing and the combustion temperature are domi-nating parameters for the formation of VOCand soot. Looking at the chromatogram of VOCexhaust gas constituents for n-hexadecane asfuel in Fig. 3, four sorts of products can bedistinguished. Their formation mechanisms areoutlined in Fig. 4 taking into account the estab-lished chemistry of the processes involved:
1. Acetylene, benzene, naphthalene, CH4, soot,and H2 through high-temperature pyrolysis[13];
2. a-Olefins (and some of the methane)through mild thermal cracking and depoly-merization (multiple splitting of ethene fromhydrocarbon radicals) [14, 15];
3. n-Aldehydes through mild oxidation [16];
Fig. 2. 95% Ampoule filling time as a function of capillarydiameter, for three compounds in their gaseous state. Thecalculations have been made for the consecutive regimes ofphase flow. (1) Knudsen diffusion into a vacuum, (2)supersonic flow, (3) turbulent flow, and (4) laminar flow[10].
181VOCs AND PARTICULATES FROM DIESELS
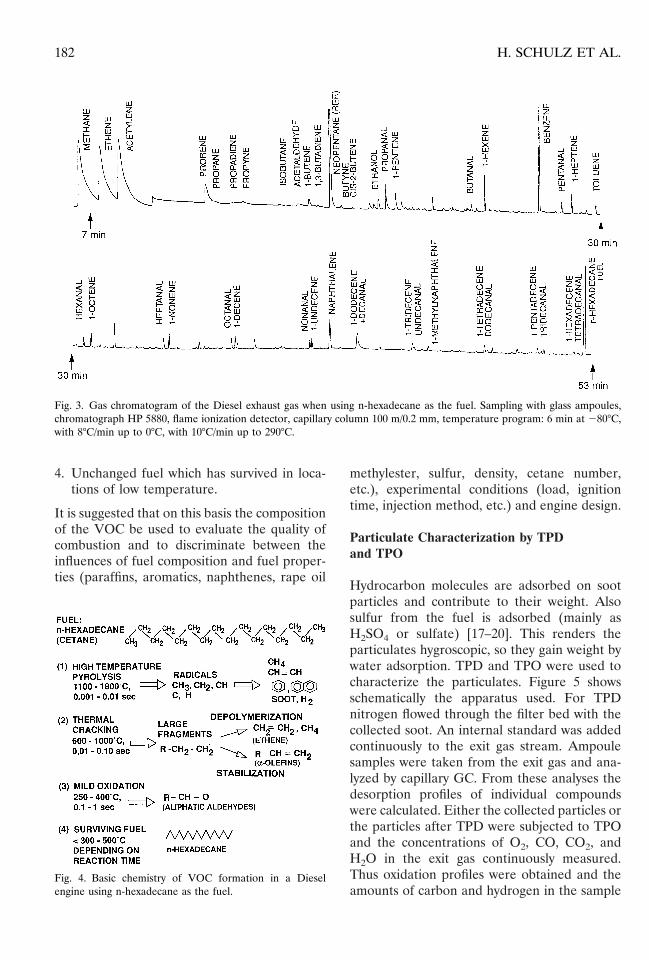
4. Unchanged fuel which has survived in loca-tions of low temperature.
It is suggested that on this basis the compositionof the VOC be used to evaluate the quality ofcombustion and to discriminate between theinfluences of fuel composition and fuel proper-ties (paraffins, aromatics, naphthenes, rape oil
methylester, sulfur, density, cetane number,etc.), experimental conditions (load, ignitiontime, injection method, etc.) and engine design.
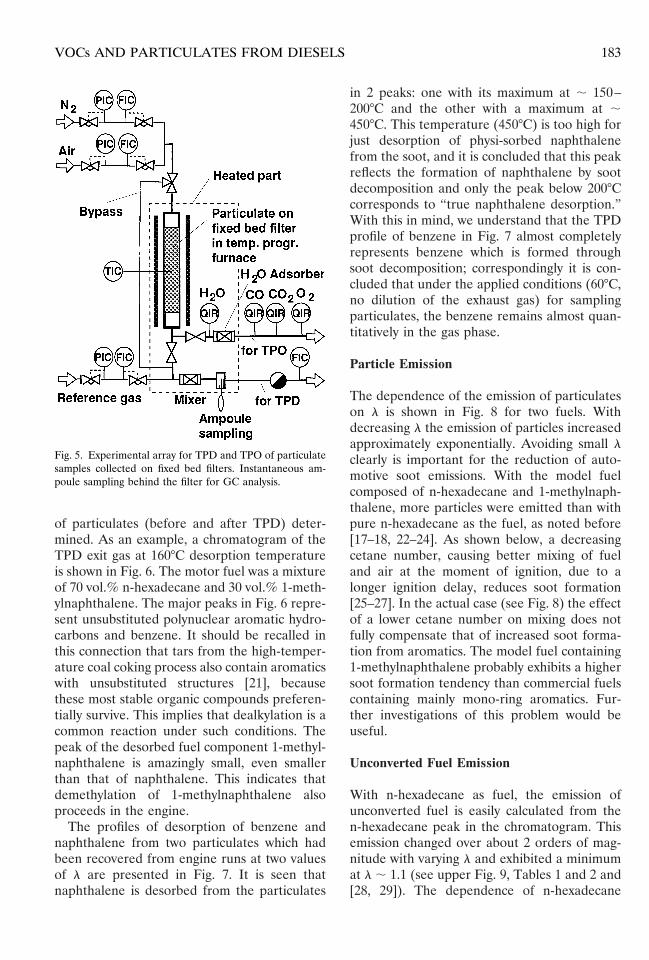
Particulate Characterization by TPDand TPO
Hydrocarbon molecules are adsorbed on sootparticles and contribute to their weight. Alsosulfur from the fuel is adsorbed (mainly asH2SO4 or sulfate) [17–20]. This renders theparticulates hygroscopic, so they gain weight bywater adsorption. TPD and TPO were used tocharacterize the particulates. Figure 5 showsschematically the apparatus used. For TPDnitrogen flowed through the filter bed with thecollected soot. An internal standard was addedcontinuously to the exit gas stream. Ampoulesamples were taken from the exit gas and ana-lyzed by capillary GC. From these analyses thedesorption profiles of individual compoundswere calculated. Either the collected particles orthe particles after TPD were subjected to TPOand the concentrations of O2, CO, CO2, andH2O in the exit gas continuously measured.Thus oxidation profiles were obtained and theamounts of carbon and hydrogen in the sample
Fig. 3. Gas chromatogram of the Diesel exhaust gas when using n-hexadecane as the fuel. Sampling with glass ampoules,chromatograph HP 5880, flame ionization detector, capillary column 100 m/0.2 mm, temperature program: 6 min at 280°C,with 8°C/min up to 0°C, with 10°C/min up to 290°C.
Fig. 4. Basic chemistry of VOC formation in a Dieselengine using n-hexadecane as the fuel.
182 H. SCHULZ ET AL.
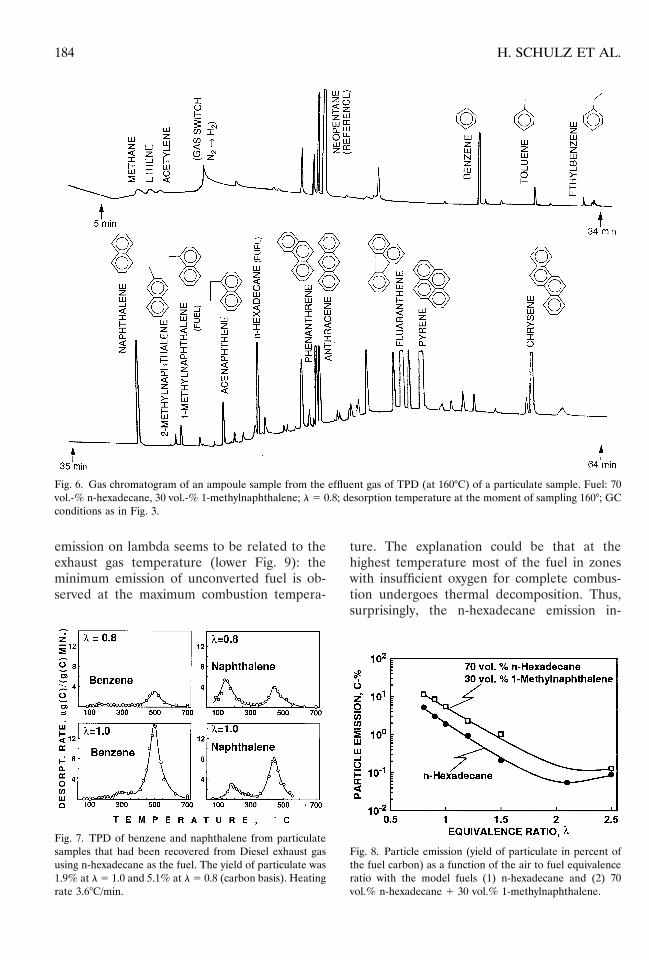
of particulates (before and after TPD) deter-mined. As an example, a chromatogram of theTPD exit gas at 160°C desorption temperatureis shown in Fig. 6. The motor fuel was a mixtureof 70 vol.% n-hexadecane and 30 vol.% 1-meth-ylnaphthalene. The major peaks in Fig. 6 repre-sent unsubstituted polynuclear aromatic hydro-carbons and benzene. It should be recalled inthis connection that tars from the high-temper-ature coal coking process also contain aromaticswith unsubstituted structures [21], becausethese most stable organic compounds preferen-tially survive. This implies that dealkylation is acommon reaction under such conditions. Thepeak of the desorbed fuel component 1-methyl-naphthalene is amazingly small, even smallerthan that of naphthalene. This indicates thatdemethylation of 1-methylnaphthalene alsoproceeds in the engine.
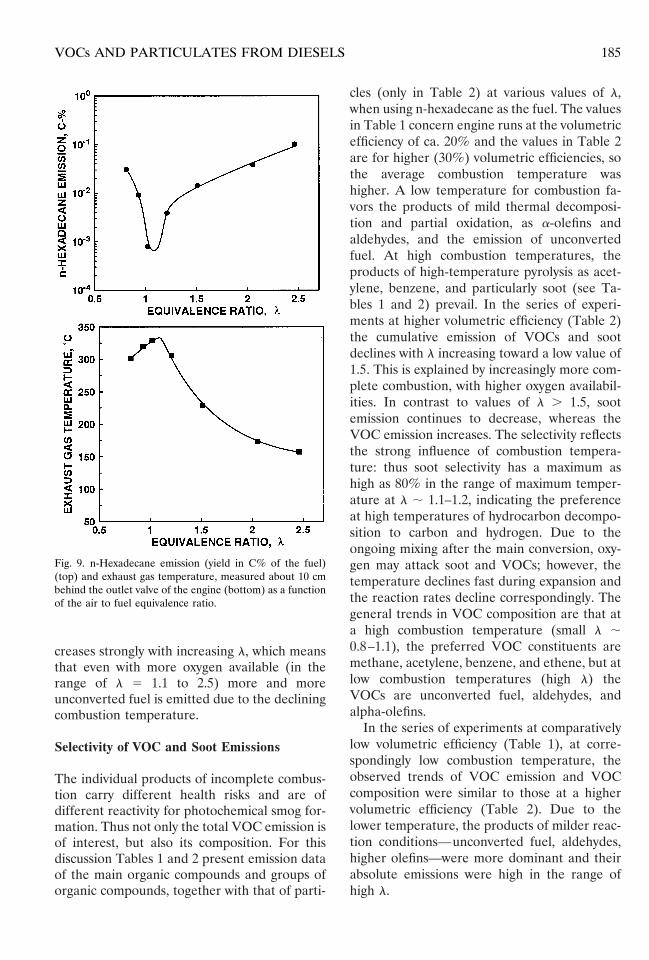
The profiles of desorption of benzene andnaphthalene from two particulates which hadbeen recovered from engine runs at two valuesof l are presented in Fig. 7. It is seen thatnaphthalene is desorbed from the particulates
in 2 peaks: one with its maximum at ; 150–200°C and the other with a maximum at ;450°C. This temperature (450°C) is too high forjust desorption of physi-sorbed naphthalenefrom the soot, and it is concluded that this peakreflects the formation of naphthalene by sootdecomposition and only the peak below 200°Ccorresponds to “true naphthalene desorption.”With this in mind, we understand that the TPDprofile of benzene in Fig. 7 almost completelyrepresents benzene which is formed throughsoot decomposition; correspondingly it is con-cluded that under the applied conditions (60°C,no dilution of the exhaust gas) for samplingparticulates, the benzene remains almost quan-titatively in the gas phase.
Particle Emission
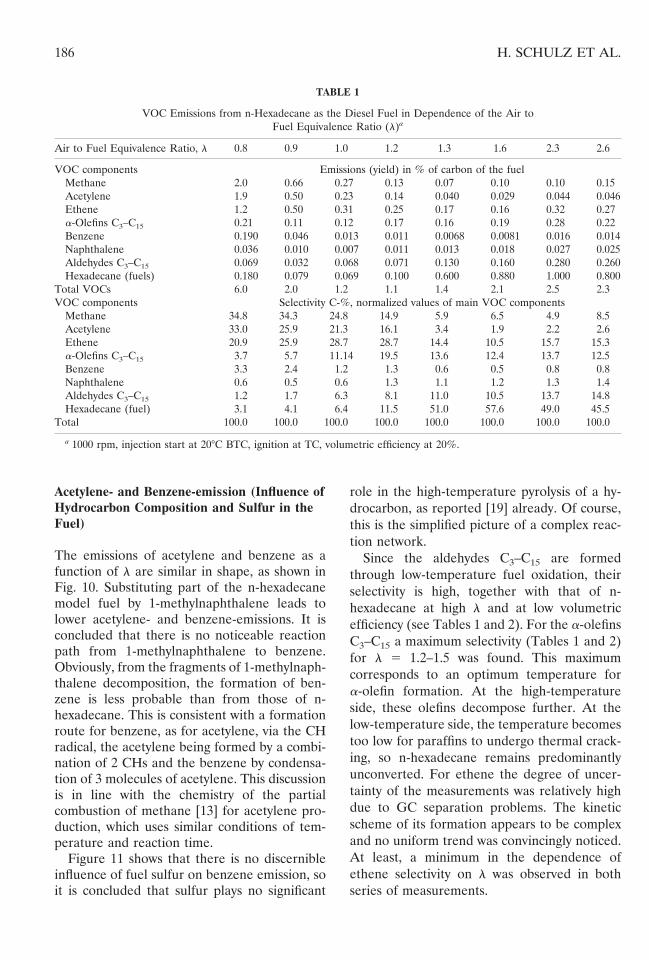
The dependence of the emission of particulateson l is shown in Fig. 8 for two fuels. Withdecreasing l the emission of particles increasedapproximately exponentially. Avoiding small lclearly is important for the reduction of auto-motive soot emissions. With the model fuelcomposed of n-hexadecane and 1-methylnaph-thalene, more particles were emitted than withpure n-hexadecane as the fuel, as noted before[17–18, 22–24]. As shown below, a decreasingcetane number, causing better mixing of fueland air at the moment of ignition, due to alonger ignition delay, reduces soot formation[25–27]. In the actual case (see Fig. 8) the effectof a lower cetane number on mixing does notfully compensate that of increased soot forma-tion from aromatics. The model fuel containing1-methylnaphthalene probably exhibits a highersoot formation tendency than commercial fuelscontaining mainly mono-ring aromatics. Fur-ther investigations of this problem would beuseful.
Unconverted Fuel Emission
With n-hexadecane as fuel, the emission ofunconverted fuel is easily calculated from then-hexadecane peak in the chromatogram. Thisemission changed over about 2 orders of mag-nitude with varying l and exhibited a minimumat l ; 1.1 (see upper Fig. 9, Tables 1 and 2 and[28, 29]). The dependence of n-hexadecane
Fig. 5. Experimental array for TPD and TPO of particulatesamples collected on fixed bed filters. Instantaneous am-poule sampling behind the filter for GC analysis.
183VOCs AND PARTICULATES FROM DIESELS
emission on lambda seems to be related to theexhaust gas temperature (lower Fig. 9): theminimum emission of unconverted fuel is ob-served at the maximum combustion tempera-
ture. The explanation could be that at thehighest temperature most of the fuel in zoneswith insufficient oxygen for complete combus-tion undergoes thermal decomposition. Thus,surprisingly, the n-hexadecane emission in-
Fig. 6. Gas chromatogram of an ampoule sample from the effluent gas of TPD (at 160°C) of a particulate sample. Fuel: 70vol.-% n-hexadecane, 30 vol.-% 1-methylnaphthalene; l 5 0.8; desorption temperature at the moment of sampling 160°; GCconditions as in Fig. 3.
Fig. 7. TPD of benzene and naphthalene from particulatesamples that had been recovered from Diesel exhaust gasusing n-hexadecane as the fuel. The yield of particulate was1.9% at l 5 1.0 and 5.1% at l 5 0.8 (carbon basis). Heatingrate 3.6°C/min.
Fig. 8. Particle emission (yield of particulate in percent ofthe fuel carbon) as a function of the air to fuel equivalenceratio with the model fuels (1) n-hexadecane and (2) 70vol.% n-hexadecane 1 30 vol.% 1-methylnaphthalene.
184 H. SCHULZ ET AL.
creases strongly with increasing l, which meansthat even with more oxygen available (in therange of l 5 1.1 to 2.5) more and moreunconverted fuel is emitted due to the decliningcombustion temperature.
Selectivity of VOC and Soot Emissions
The individual products of incomplete combus-tion carry different health risks and are ofdifferent reactivity for photochemical smog for-mation. Thus not only the total VOC emission isof interest, but also its composition. For thisdiscussion Tables 1 and 2 present emission dataof the main organic compounds and groups oforganic compounds, together with that of parti-
cles (only in Table 2) at various values of l,when using n-hexadecane as the fuel. The valuesin Table 1 concern engine runs at the volumetricefficiency of ca. 20% and the values in Table 2are for higher (30%) volumetric efficiencies, sothe average combustion temperature washigher. A low temperature for combustion fa-vors the products of mild thermal decomposi-tion and partial oxidation, as a-olefins andaldehydes, and the emission of unconvertedfuel. At high combustion temperatures, theproducts of high-temperature pyrolysis as acet-ylene, benzene, and particularly soot (see Ta-bles 1 and 2) prevail. In the series of experi-ments at higher volumetric efficiency (Table 2)the cumulative emission of VOCs and sootdeclines with l increasing toward a low value of1.5. This is explained by increasingly more com-plete combustion, with higher oxygen availabil-ities. In contrast to values of l . 1.5, sootemission continues to decrease, whereas theVOC emission increases. The selectivity reflectsthe strong influence of combustion tempera-ture: thus soot selectivity has a maximum ashigh as 80% in the range of maximum temper-ature at l ; 1.1–1.2, indicating the preferenceat high temperatures of hydrocarbon decompo-sition to carbon and hydrogen. Due to theongoing mixing after the main conversion, oxy-gen may attack soot and VOCs; however, thetemperature declines fast during expansion andthe reaction rates decline correspondingly. Thegeneral trends in VOC composition are that ata high combustion temperature (small l ;0.8–1.1), the preferred VOC constituents aremethane, acetylene, benzene, and ethene, but atlow combustion temperatures (high l) theVOCs are unconverted fuel, aldehydes, andalpha-olefins.
In the series of experiments at comparativelylow volumetric efficiency (Table 1), at corre-spondingly low combustion temperature, theobserved trends of VOC emission and VOCcomposition were similar to those at a highervolumetric efficiency (Table 2). Due to thelower temperature, the products of milder reac-tion conditions—unconverted fuel, aldehydes,higher olefins—were more dominant and theirabsolute emissions were high in the range ofhigh l.
Fig. 9. n-Hexadecane emission (yield in C% of the fuel)(top) and exhaust gas temperature, measured about 10 cmbehind the outlet valve of the engine (bottom) as a functionof the air to fuel equivalence ratio.
185VOCs AND PARTICULATES FROM DIESELS
Acetylene- and Benzene-emission (Influence ofHydrocarbon Composition and Sulfur in theFuel)
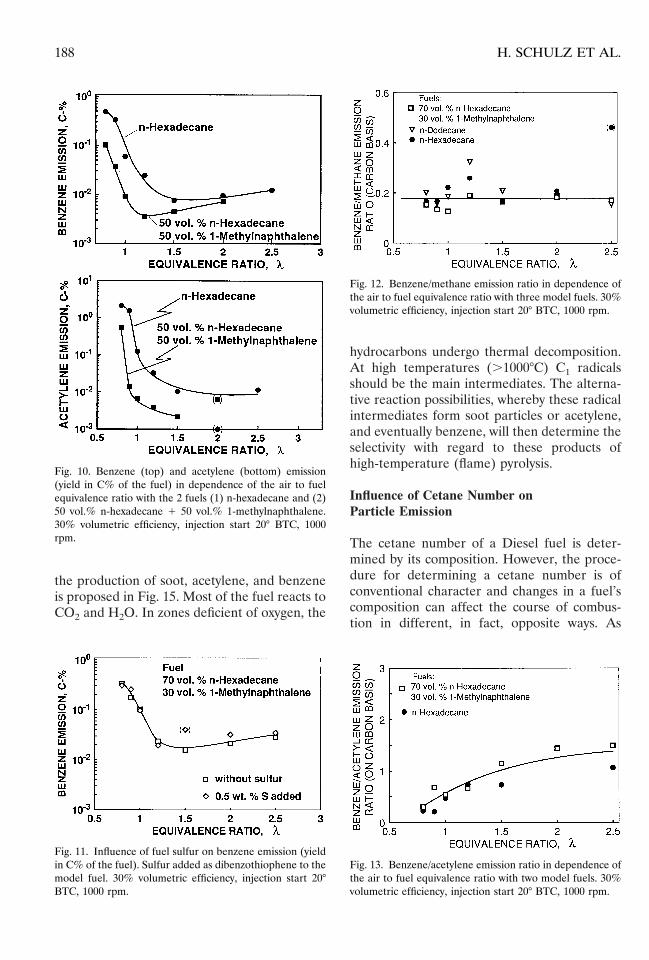
The emissions of acetylene and benzene as afunction of l are similar in shape, as shown inFig. 10. Substituting part of the n-hexadecanemodel fuel by 1-methylnaphthalene leads tolower acetylene- and benzene-emissions. It isconcluded that there is no noticeable reactionpath from 1-methylnaphthalene to benzene.Obviously, from the fragments of 1-methylnaph-thalene decomposition, the formation of ben-zene is less probable than from those of n-hexadecane. This is consistent with a formationroute for benzene, as for acetylene, via the CHradical, the acetylene being formed by a combi-nation of 2 CHs and the benzene by condensa-tion of 3 molecules of acetylene. This discussionis in line with the chemistry of the partialcombustion of methane [13] for acetylene pro-duction, which uses similar conditions of tem-perature and reaction time.
Figure 11 shows that there is no discernibleinfluence of fuel sulfur on benzene emission, soit is concluded that sulfur plays no significant
role in the high-temperature pyrolysis of a hy-drocarbon, as reported [19] already. Of course,this is the simplified picture of a complex reac-tion network.
Since the aldehydes C3–C15 are formedthrough low-temperature fuel oxidation, theirselectivity is high, together with that of n-hexadecane at high l and at low volumetricefficiency (see Tables 1 and 2). For the a-olefinsC3–C15 a maximum selectivity (Tables 1 and 2)for l 5 1.2–1.5 was found. This maximumcorresponds to an optimum temperature fora-olefin formation. At the high-temperatureside, these olefins decompose further. At thelow-temperature side, the temperature becomestoo low for paraffins to undergo thermal crack-ing, so n-hexadecane remains predominantlyunconverted. For ethene the degree of uncer-tainty of the measurements was relatively highdue to GC separation problems. The kineticscheme of its formation appears to be complexand no uniform trend was convincingly noticed.At least, a minimum in the dependence ofethene selectivity on l was observed in bothseries of measurements.
TABLE 1
VOC Emissions from n-Hexadecane as the Diesel Fuel in Dependence of the Air toFuel Equivalence Ratio (l)a
Air to Fuel Equivalence Ratio, l 0.8 0.9 1.0 1.2 1.3 1.6 2.3 2.6
VOC components Emissions (yield) in % of carbon of the fuelMethane 2.0 0.66 0.27 0.13 0.07 0.10 0.10 0.15Acetylene 1.9 0.50 0.23 0.14 0.040 0.029 0.044 0.046Ethene 1.2 0.50 0.31 0.25 0.17 0.16 0.32 0.27a-Olefins C3–C15 0.21 0.11 0.12 0.17 0.16 0.19 0.28 0.22Benzene 0.190 0.046 0.013 0.011 0.0068 0.0081 0.016 0.014Naphthalene 0.036 0.010 0.007 0.011 0.013 0.018 0.027 0.025Aldehydes C3–C15 0.069 0.032 0.068 0.071 0.130 0.160 0.280 0.260Hexadecane (fuels) 0.180 0.079 0.069 0.100 0.600 0.880 1.000 0.800
Total VOCs 6.0 2.0 1.2 1.1 1.4 2.1 2.5 2.3VOC components Selectivity C-%, normalized values of main VOC components
Methane 34.8 34.3 24.8 14.9 5.9 6.5 4.9 8.5Acetylene 33.0 25.9 21.3 16.1 3.4 1.9 2.2 2.6Ethene 20.9 25.9 28.7 28.7 14.4 10.5 15.7 15.3a-Olefins C3–C15 3.7 5.7 11.14 19.5 13.6 12.4 13.7 12.5Benzene 3.3 2.4 1.2 1.3 0.6 0.5 0.8 0.8Naphthalene 0.6 0.5 0.6 1.3 1.1 1.2 1.3 1.4Aldehydes C3–C15 1.2 1.7 6.3 8.1 11.0 10.5 13.7 14.8Hexadecane (fuel) 3.1 4.1 6.4 11.5 51.0 57.6 49.0 45.5
Total 100.0 100.0 100.0 100.0 100.0 100.0 100.0 100.0
a 1000 rpm, injection start at 20°C BTC, ignition at TC, volumetric efficiency at 20%.
186 H. SCHULZ ET AL.
Emission Correlations
Correlations between individual emissions areof interest, indicating mechanistic interrelationsand also for developing models to calculateemissions. It has been shown above that emis-sions are extremely dependent on the air to fuelequivalence ratio, and it was concluded that thedegree of mixing of the fuel and air at themoment of ignition and the combustion temper-ature are dominating parameters. These intrin-sic parameters, however, will depend on a num-ber of experimental variables, including those ofmotor design.
In Fig. 12, the ratio of benzene/methane hasbeen plotted against l for three experiments; analmost horizontal line is obtained. It is con-cluded that methane and benzene are mecha-nistically interlinked and are mainly formed byhigh-temperature pyrolysis. Their molar ratio isnot much affected even by huge changes in“reaction conditions.” The benzene to acetylene
ratio in Fig. 13 increases steadily with l, indi-cating a mechanistic connection between bothcompounds. This increase could be due to themuch higher stability of benzene than acetylene;the secondary reactions of oxidation will bemore probable at higher l.
Figure 14 plots the emission of benzeneagainst that of the particles and shows morebenzene from the paraffinic than the aromaticfuel. It is concluded that the fragments formedby high-temperature pyrolysis from 1-methyl-naphthalene are more deficient in hydrogen andtherefore have a higher tendency to yield soot,rather than benzene, as compared with thefragments from paraffins. It is concluded fromthe shape of the curves that at low particleemissions (high l) the emission of benzene ismore or less constant, independent of sootformation, whereas, at high particle emissions(small l) benzene emission increases with in-creasing soot emission, again indicating somemechanistic connection. A kinetic scheme for
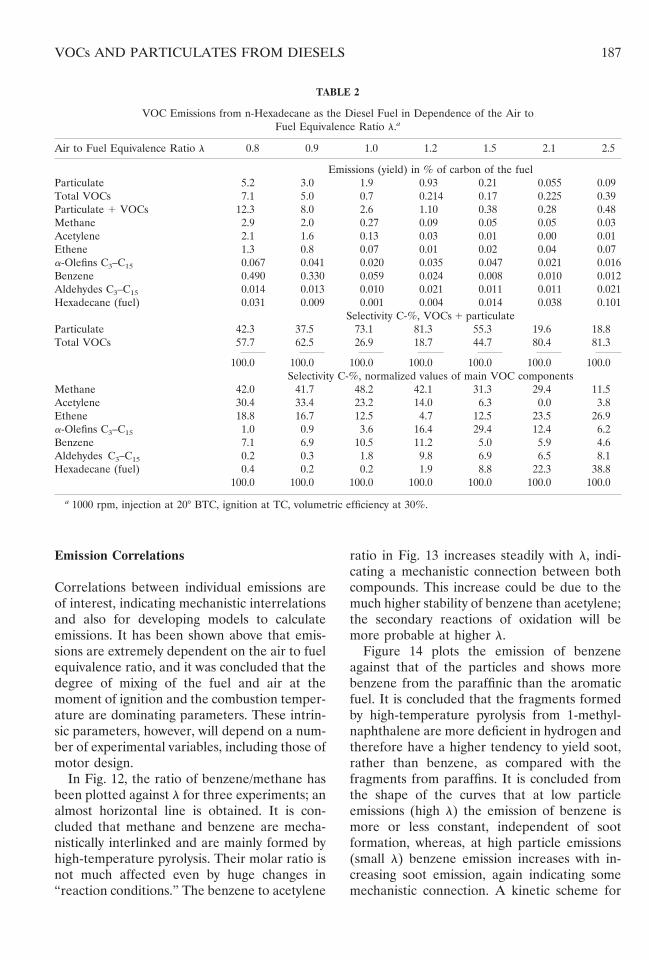
TABLE 2
VOC Emissions from n-Hexadecane as the Diesel Fuel in Dependence of the Air toFuel Equivalence Ratio l.a
Air to Fuel Equivalence Ratio l 0.8 0.9 1.0 1.2 1.5 2.1 2.5
Emissions (yield) in % of carbon of the fuelParticulate 5.2 3.0 1.9 0.93 0.21 0.055 0.09Total VOCs 7.1 5.0 0.7 0.214 0.17 0.225 0.39Particulate 1 VOCs 12.3 8.0 2.6 1.10 0.38 0.28 0.48Methane 2.9 2.0 0.27 0.09 0.05 0.05 0.03Acetylene 2.1 1.6 0.13 0.03 0.01 0.00 0.01Ethene 1.3 0.8 0.07 0.01 0.02 0.04 0.07a-Olefins C3–C15 0.067 0.041 0.020 0.035 0.047 0.021 0.016Benzene 0.490 0.330 0.059 0.024 0.008 0.010 0.012Aldehydes C3–C15 0.014 0.013 0.010 0.021 0.011 0.011 0.021Hexadecane (fuel) 0.031 0.009 0.001 0.004 0.014 0.038 0.101
Selectivity C-%, VOCs 1 particulateParticulate 42.3 37.5 73.1 81.3 55.3 19.6 18.8Total VOCs 57.7 62.5 26.9 18.7 44.7 80.4 81.3
100.0 100.0 100.0 100.0 100.0 100.0 100.0Selectivity C-%, normalized values of main VOC components
Methane 42.0 41.7 48.2 42.1 31.3 29.4 11.5Acetylene 30.4 33.4 23.2 14.0 6.3 0.0 3.8Ethene 18.8 16.7 12.5 4.7 12.5 23.5 26.9a-Olefins C3–C15 1.0 0.9 3.6 16.4 29.4 12.4 6.2Benzene 7.1 6.9 10.5 11.2 5.0 5.9 4.6Aldehydes C3–C15 0.2 0.3 1.8 9.8 6.9 6.5 8.1Hexadecane (fuel) 0.4 0.2 0.2 1.9 8.8 22.3 38.8
100.0 100.0 100.0 100.0 100.0 100.0 100.0
a 1000 rpm, injection at 20° BTC, ignition at TC, volumetric efficiency at 30%.
187VOCs AND PARTICULATES FROM DIESELS
the production of soot, acetylene, and benzeneis proposed in Fig. 15. Most of the fuel reacts toCO2 and H2O. In zones deficient of oxygen, the
hydrocarbons undergo thermal decomposition.At high temperatures (.1000°C) C1 radicalsshould be the main intermediates. The alterna-tive reaction possibilities, whereby these radicalintermediates form soot particles or acetylene,and eventually benzene, will then determine theselectivity with regard to these products ofhigh-temperature (flame) pyrolysis.
Influence of Cetane Number onParticle Emission
The cetane number of a Diesel fuel is deter-mined by its composition. However, the proce-dure for determining a cetane number is ofconventional character and changes in a fuel’scomposition can affect the course of combus-tion in different, in fact, opposite ways. As
Fig. 10. Benzene (top) and acetylene (bottom) emission(yield in C% of the fuel) in dependence of the air to fuelequivalence ratio with the 2 fuels (1) n-hexadecane and (2)50 vol.% n-hexadecane 1 50 vol.% 1-methylnaphthalene.30% volumetric efficiency, injection start 20° BTC, 1000rpm.
Fig. 11. Influence of fuel sulfur on benzene emission (yieldin C% of the fuel). Sulfur added as dibenzothiophene to themodel fuel. 30% volumetric efficiency, injection start 20°BTC, 1000 rpm.
Fig. 12. Benzene/methane emission ratio in dependence ofthe air to fuel equivalence ratio with three model fuels. 30%volumetric efficiency, injection start 20° BTC, 1000 rpm.
Fig. 13. Benzene/acetylene emission ratio in dependence ofthe air to fuel equivalence ratio with two model fuels. 30%volumetric efficiency, injection start 20° BTC, 1000 rpm.
188 H. SCHULZ ET AL.
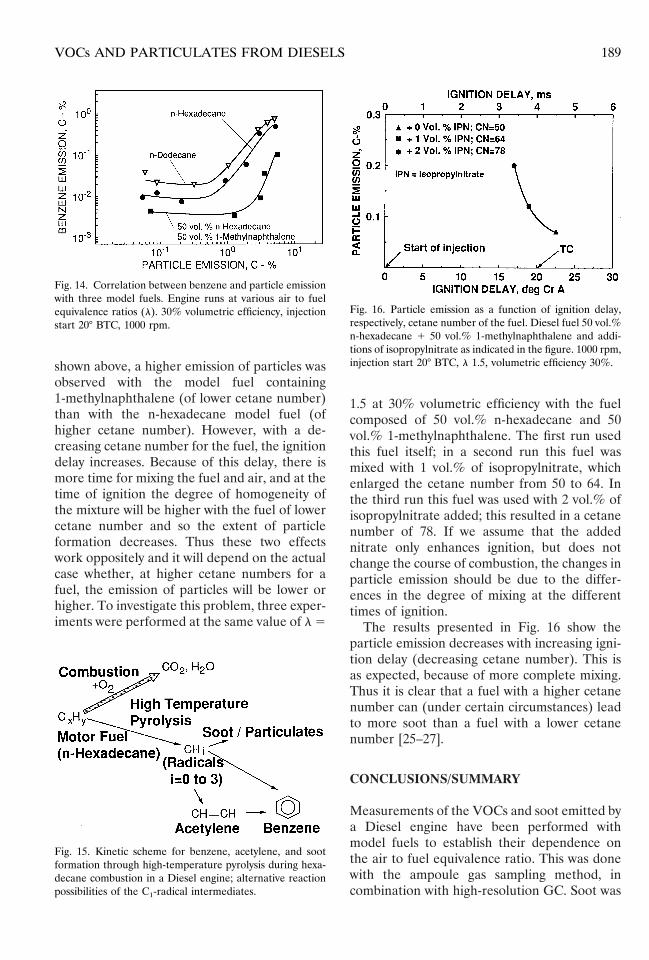
shown above, a higher emission of particles wasobserved with the model fuel containing1-methylnaphthalene (of lower cetane number)than with the n-hexadecane model fuel (ofhigher cetane number). However, with a de-creasing cetane number for the fuel, the ignitiondelay increases. Because of this delay, there ismore time for mixing the fuel and air, and at thetime of ignition the degree of homogeneity ofthe mixture will be higher with the fuel of lowercetane number and so the extent of particleformation decreases. Thus these two effectswork oppositely and it will depend on the actualcase whether, at higher cetane numbers for afuel, the emission of particles will be lower orhigher. To investigate this problem, three exper-iments were performed at the same value of l 5
1.5 at 30% volumetric efficiency with the fuelcomposed of 50 vol.% n-hexadecane and 50vol.% 1-methylnaphthalene. The first run usedthis fuel itself; in a second run this fuel wasmixed with 1 vol.% of isopropylnitrate, whichenlarged the cetane number from 50 to 64. Inthe third run this fuel was used with 2 vol.% ofisopropylnitrate added; this resulted in a cetanenumber of 78. If we assume that the addednitrate only enhances ignition, but does notchange the course of combustion, the changes inparticle emission should be due to the differ-ences in the degree of mixing at the differenttimes of ignition.
The results presented in Fig. 16 show theparticle emission decreases with increasing igni-tion delay (decreasing cetane number). This isas expected, because of more complete mixing.Thus it is clear that a fuel with a higher cetanenumber can (under certain circumstances) leadto more soot than a fuel with a lower cetanenumber [25–27].
CONCLUSIONS/SUMMARY
Measurements of the VOCs and soot emitted bya Diesel engine have been performed withmodel fuels to establish their dependence onthe air to fuel equivalence ratio. This was donewith the ampoule gas sampling method, incombination with high-resolution GC. Soot was
Fig. 14. Correlation between benzene and particle emissionwith three model fuels. Engine runs at various air to fuelequivalence ratios (l). 30% volumetric efficiency, injectionstart 20° BTC, 1000 rpm.
Fig. 15. Kinetic scheme for benzene, acetylene, and sootformation through high-temperature pyrolysis during hexa-decane combustion in a Diesel engine; alternative reactionpossibilities of the C1-radical intermediates.
Fig. 16. Particle emission as a function of ignition delay,respectively, cetane number of the fuel. Diesel fuel 50 vol.%n-hexadecane 1 50 vol.% 1-methylnaphthalene and addi-tions of isopropylnitrate as indicated in the figure. 1000 rpm,injection start 20° BTC, l 1.5, volumetric efficiency 30%.
189VOCs AND PARTICULATES FROM DIESELS
also collected and characterized by TPD andTPO. The results yield insight to the mecha-nisms for forming individual VOCs and parti-cles. They show the shifting of selectivity andalso mechanisms with varying air to fuel equiv-alence ratio, aromaticity of the fuel and alsocetane number, which influences the homoge-neity of the air and fuel mixture at the momentof ignition. Because of its favorable character-istics (simplicity, cheapness, accuracy, capabilityof gaining detailed emission data for VOCs,soot specification for adsorbed compounds andC/H-ratio and the potential for making tran-sient measurements, i.e., engine tests with hightime resolution) the methodology of this work isrecommended for further application.
Diesel particulate filters have been kindly sup-plied by Degussa (Hanau). Financial support hasbeen provided through the “Schwerpunktsfor-schungsprogramm des Landes Baden-Wurttem-berg.” An award of the Konrad Adenauer-Stiftungis gratefully acknowledged.
REFERENCES
1. Schulz, H., Bohringer, W., Kohl, C. P., Rahman, N. M.,and Will, A., Entwicklung und Anwendung der Kapillar-GC-Gesamtprobentechnik fur Gas/Dampf-Vielstoffge-mische, DGMK-Forschungsbericht 320, DGMK,Hamburg, 1984.
2. Heywood, J. B., Prog. Energy Combust. Sci. 1:135(1976).
3. Klingenberg, H., Automobil-Meßtechnik, Band C: Ab-gasmeßtechnik. Springer-Verlag, Berlin-Heidelberg1995.
4. Carter, W. P. L., Pierce, J. A., Luo, D., and Malkina,I. L., Atm. Env. 29:2499 (1995).
5. Sigsby, Jr. J. E., Dropkin, D. L., and Snow, R., Env. Sci.Technol., 24:818 (1990).
6. Hartung, H., Kraft, J., Lies, K., and Schulze, J., MTZ,43:263 (1992).
7. Kraft, J., and Lies, K. -H., SAE 810082 (1981).8. Huth, M. (1992). Dissertation, Universitat Karlsruhe
(TH).9. Schulz, H., and Nehren, S., Erdol und Kohle-Erdgas-
Petrochemie 39:93 (1986).10. Schulz, H., and Beck, K., unpublished.11. Schulz, H., Lau, K., and Claeys, M., Appl. Catal., A:
General 132:29 (1995).12. Schulz, H., Schaub, G., Claeys, M., Riedel, T., and
Walter, S., Stud. Surf. Sci. Catal. 114:159 (1998).13. Fischer, F., Pichler, H., Meyer, K., and Koch, H.,
Brenstoffchemie 9:306 (1928).14. Wu, G., Katsumura, Y., Matsuura, C., Ishigure, K.,
and Kubo, J., Ind. Eng. Chem. Res. 35:4747 (1996).15. Geertsema, A. (1976). Dissertation, Universitat
Karlsruhe (TH).16. Wagner, T., and Wyszynski, M. L., J. Autom. Eng.
210:109 (1996).17. May, H., Hattingen, U., and Croissant, K., 10 Int.
Wiener Motorensymposium, VDI Fortschrittsberichte 12,1989, 122:184.
18. Wall, J. C., and Hekman, S. K., SAE Transactions93:1030 (1984).
19. Baranescu, R. A., SAE 881174 (1988).20. Behn, U., and Heilmann, G. (1990). DGMK-Tagungs-
bericht 9001. Hamburg, p. 377.21. Guillen, M. D., Iglesias, M. J., Dominguez, A., and
Blanco, C. G., Energy Fuels 6:518 (1992).22. Barbella, R., Ciajolo, A., and DAnna, A., 23th Sympo-
sium (International) on Combustion, The CombustionInstitute, Pittsburgh, 1990, p. 1079.
23. Bonffard, R. A., and Beltzer, M., SAE 811191.24. Kagami, M., Akasaka, Y., Date, K., and Maeda, T.,
SAE 841082 (1984).25. Golothan, D. W., SAE 670092. (1967)26. Henein, N. A., Prog. Energy Combust. Sci. 1:165 (1976).27. Barbella, R., Bertoli, C., Ciajolo, A., and DAnna,
Combust. Sci. Technol. 59:183 (1988).28. Kageyama, K., and Kinehara, N., SAE 820181 (1982).29. Bergin, S. P., SAE 831736 (1983).
Received 5 August 1997; revised 18 September 1998; accepted6 October 1998
190 H. SCHULZ ET AL.