Embed Size (px)
Citation preview

Vol. 151 No. 1 January 2022
Research in Computing Science
Series Editorial Board
Editors-in-Chief: Grigori Sidorov, CIC-IPN, Mexico
Gerhard X. Ritter, University of Florida, USA
Jean Serra, Ecole des Mines de Paris, France
Ulises Cortés, UPC, Barcelona, Spain
Associate Editors: Jesús Angulo, Ecole des Mines de Paris, France
Jihad El-Sana, Ben-Gurion Univ. of the Negev, Israel
Alexander Gelbukh, CIC-IPN, Mexico
Ioannis Kakadiaris, University of Houston, USA
Petros Maragos, Nat. Tech. Univ. of Athens, Greece
Julian Padget, University of Bath, UK Mateo Valero, UPC, Barcelona, Spain
Olga Kolesnikova, ESCOM-IPN, Mexico
Rafael Guzmán, Univ. of Guanajuato, Mexico Juan Manuel Torres Moreno, U. of Avignon, France
Editorial Coordination: Susana Navarrete
Research in Computing Science, Año 21, Volumen 151, No. 1, enero de 2022, es una publicación mensual, editada por el Instituto Politécnico Nacional, a través del Centro de Investigación en Computación. Av. Juan
de Dios Bátiz S/N, Esq. Av. Miguel Othon de Mendizábal, Col. Nueva Industrial Vallejo, C.P. 07738, Ciudad
de México, Tel. 57 29 60 00, ext. 56571. https://www.rcs.cic.ipn.mx. Editor responsable: Dr. Grigori Sidorov.
Reserva de Derechos al Uso Exclusivo del Título No. 04-2019-082310242100-203. ISSN: en trámite, ambos
otorgados por el Instituto Politécnico Nacional de Derecho de Autor. Responsable de la última actualización
de este número: el Centro de Investigación en Computación, Dr. Grigori Sidorov, Av. Juan de Dios Bátiz S/N, Esq. Av. Miguel Othon de Mendizábal, Col. Nueva Industrial Vallejo, C.P. 07738. Fecha de última
modificación 01 de enero de 2022.
Las opiniones expresadas por los autores no necesariamente reflejan la postura del editor de la publicación.
Queda estrictamente prohibida la reproducción total o parcial de los contenidos e imágenes de la publicación sin previa autorización del Instituto Politécnico Nacional.
Research in Computing Science, year 21, Volume 151 No. 1, January 2022, is published monthly by the Center for Computing Research of IPN.
The opinions expressed by the authors does not necessarily reflect the editor’s posture.
All rights reserved. No part of this publication may be reproduced, stored in a retrieval system, or transmitted,
in any form or by any means, electronic, mechanical, photocopying, recording or otherwise, without prior
permission of Centre for Computing Research of the IPN.
Volume 151(1)

Intelligent Learning Environments
María Lucía Barrón Estrada
Ramón Zatarain Cabada
María Yasmín Hernández Pérez
Carlos Alberto Reyes García (eds.)
Instituto Politécnico Nacional, Centro de Investigación en Computación
México 2022

ISSN: in process Copyright © Instituto Politécnico Nacional 2022
Formerly ISSNs: 1870-4069, 1665-9899.
Instituto Politécnico Nacional (IPN)
Centro de Investigación en Computación (CIC)
Av. Juan de Dios Bátiz s/n esq. M. Othón de Mendizábal
Unidad Profesional “Adolfo López Mateos”, Zacatenco
07738, México D.F., México
http://www.rcs.cic.ipn.mx
http://www.ipn.mx
http://www.cic.ipn.mx
The editors and the publisher of this journal have made their best effort in
preparing this special issue, but make no warranty of any kind, expressed or
implied, with regard to the information contained in this volume.
All rights reserved. No part of this publication may be reproduced, stored on a
retrieval system or transmitted, in any form or by any means, including
electronic, mechanical, photocopying, recording, or otherwise, without prior
permission of the Instituto Politécnico Nacional, except for personal or
classroom use provided that copies bear the full citation notice provided on the
first page of each paper.
Indexed in LATINDEX, DBLP and Periodica
Electronic edition

Editorial
Virtual learning environments are available around the world every single day. Since
March 2020, we are used to attend virtually many activities and education is not an
exception. The SARS-CoV-2 virus provoked that learning activities migrate to virtual
environments in all educational levels.
On the other side, Artificial Intelligence has impacted many activities and now we
notice that many aspects of our lives have changed due to its non-stopping influence.
In Education, we notice the emergence of new systems and apps that help students to
learn online at their own peace.
Researchers are innovating by mixing theories and technology to provide learning
environments that personalize learning processes for each student.
Researchers have applied several artificial intelligence techniques to develop
educational software systems that students can use to gain knowledge and learn at their
own pace in different virtual or digital environments. All new developments need to be
made known through journals and other forums.
In this volume, our goal is to offer researchers an opportunity to show their work
exploring new ways of applying AI techniques in the development of
educational systems. We present seven research works, in various fields of intelligent
learning systems.
The papers were carefully chosen by the editorial board based on three reviews by
the specialists of the Technical Committee. To select the papers to be published the
reviewers considered the originality, scientific contribution to the field, soundness, and
technical quality of the papers.
Many people participated in preparation of this volume, we appreciate the support
of RedICA (Conacyt Thematic Network in Applied Computational Intelligence)
members that were part of the Technical Committee as well as members of Mexican
Society for Artificial Intelligence (SMIA Sociedad Mexicana de Inteligencia
Artificial). Last, but not least, we thank Centro de Investigación en Computación-
Instituto Politécnico Nacional (CIC-IPN) for their support in preparation and
publication of this volume.
María Lucía Barrón Estrada
Ramón Zatarain Cabada
María Yasmín Hernández Pérez
Carlos Alberto Reyes García
Guest Editors
October 2021
3 Research in Computing Science 151(1), 2022

Table of Contents Page
CARLA 0.9: Now with more Analytics! ...................................................................... 7
Carlos Natanael Lecona-Valdespino, Pablo Isaac Macias-Huerta,
Rafael Cabañas-Rocha, Guillermo Santamaría-Bonfil
Model of Integration of Verbal and Nonverbal Expressions for Credible
Virtual Agents............................................................................................................. 17
Jazmín Guadalupe Ramírez-Medina,
María Lucila Morales-Rodríguez, Nelson Rangel-Valdez
AR Application for Learning Electrical Circuits ........................................................ 25
Aldo Uriarte-Portillo, Luis Marcos Plata-Delgado,
Ramón Zatarain-Cabada, María Lucía Barrón-Estrada,
Rosalío Zatarain-Cabada
Decision Tree-Based Model to Determine Student’s Dropout Factors in a
Mexican Higher Education Institution ........................................................................ 35
María del Pilar Meza Bucio, Gustavo Alfonso Gutiérrez Carreón
Generation of Twitter Information Databases: A Case Study for the
Mobility of People Infected with COVID-19 ............................................................ 43
Alicia Martínez-Rebollar, Pedro Wences-Olguin,
Gilberto Palacios-Gonzalez, Hugo Estrada-Esquivel,
Yasmin Hernandez-Perez
Training Readability Comparators for Academic Texts at Different Levels .............. 51
José Medardo Tapia-Téllez, Aurelio López-López,
Jesús Miguel García-Gorrostieta
A Brief Review of Educational Data Mining to Improve Intelligent
Learning Environments .............................................................................................. 59
Mayra Mendoza, Yasmín Hernández, Javier Ortiz, Alicia Martínez,
Hugo Estrada
5 Research in Computing Science 151(1), 2022

CARLA 0.9: Now with more Analytics!
Carlos Natanael Lecona-Valdespino1, Pablo Isaac Macias-Huerta2,Rafael Cabanas-Rocha2, Guillermo Santamarıa-Bonfil3
1 Universidad Panamericana,Mexico
2 Instituto Politecnico Nacional,Escuela Superior de Computo,
Mexico
3 CONACYT-INEEL,Mexico
[email protected], {pabloisaacmacias,cabanas.rocha.rafael}@gmail.com,[email protected]
Abstract. E-Learning offers new mechanisms for easing interactions withlearning environments. In an earlier work the Conversational Agent based inviRtual reaLity with Analytics (CARLA) was introduced. This is a chatbotthat provides interaction within a virtual reality E-Learning platform throughspoken dialogue. However, its knowledge base was restricted to a local database.To expand it, a search engine is integrated into the chatbot. Furthermore, torecommend new knowledge a recommender system can be employed which isdependable on a semantic similarity measure. Therefore, in this work we improvethe CARLA framework by including a search engine for the dialogue manager,and provide support for recommendations. In particular, the recommender systemis built upon the Normalized Web Distance which allows semantic comparison ofwords and concepts using a large corpus. Results using the Google and Wikipediasearch engines show a high correlation against expert and common knowledgerespondents, emphasizing that the Normalized Web Distance can be employed tosuggest users new knowledge through the chatbot based on topic similarity anduser queries.
Keywords: conversational agent, virtual reality, natural language processing,search engine, recommender system.
1 Introduction
E-learning technologies are of increasing importance in education and Virtual Reality(VR) environments are key in this area [5]. VR provides contextualized knowledge,improves learning through exploration and repetition, and has several degrees offreedom [7]. Furthermore, as Natural Language Processing (NLP) technologies mature,more conversational agents are being adopted within VR E-learning platforms. Thesehave a wide range of applications including (but not restricted to) tutoring, question
7 Research in Computing Science 151(1), 2022pp. 7–15; rec. 2021-07-19; acc. 2021-09-29
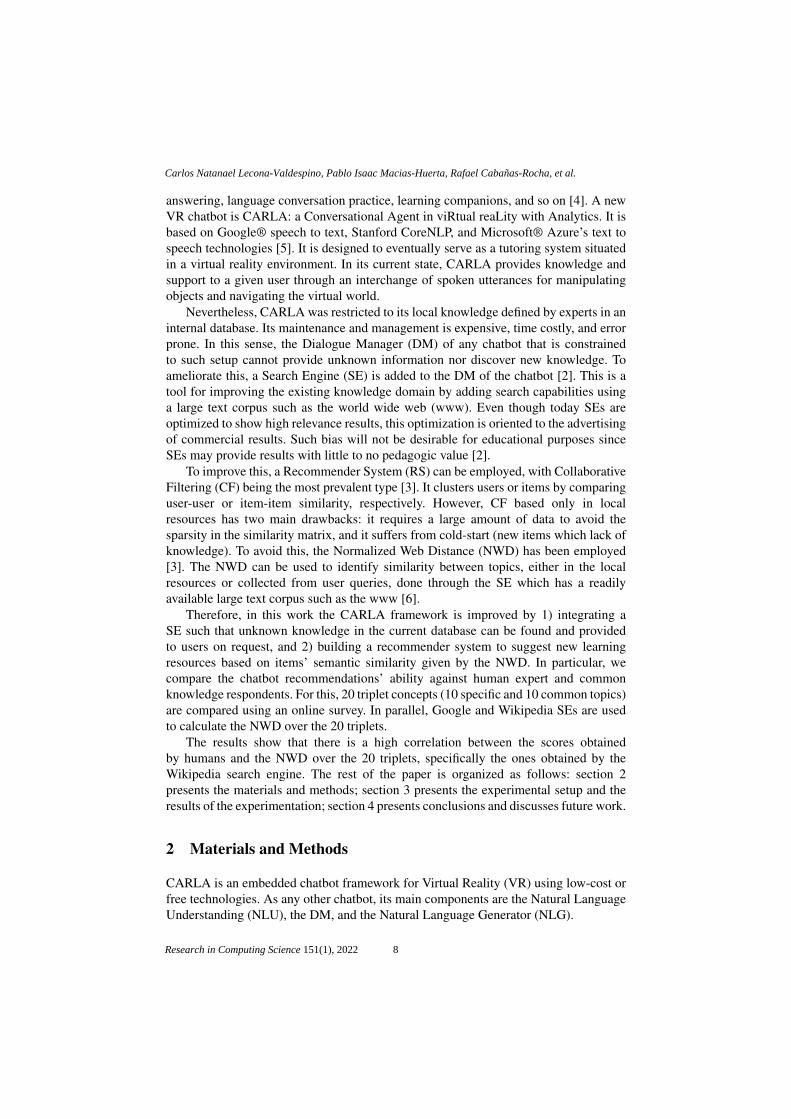
answering, language conversation practice, learning companions, and so on [4]. A newVR chatbot is CARLA: a Conversational Agent in viRtual reaLity with Analytics. It isbased on Google® speech to text, Stanford CoreNLP, and Microsoft® Azure’s text tospeech technologies [5]. It is designed to eventually serve as a tutoring system situatedin a virtual reality environment. In its current state, CARLA provides knowledge andsupport to a given user through an interchange of spoken utterances for manipulatingobjects and navigating the virtual world.
Nevertheless, CARLA was restricted to its local knowledge defined by experts in aninternal database. Its maintenance and management is expensive, time costly, and errorprone. In this sense, the Dialogue Manager (DM) of any chatbot that is constrainedto such setup cannot provide unknown information nor discover new knowledge. Toameliorate this, a Search Engine (SE) is added to the DM of the chatbot [2]. This is atool for improving the existing knowledge domain by adding search capabilities usinga large text corpus such as the world wide web (www). Even though today SEs areoptimized to show high relevance results, this optimization is oriented to the advertisingof commercial results. Such bias will not be desirable for educational purposes sinceSEs may provide results with little to no pedagogic value [2].
To improve this, a Recommender System (RS) can be employed, with CollaborativeFiltering (CF) being the most prevalent type [3]. It clusters users or items by comparinguser-user or item-item similarity, respectively. However, CF based only in localresources has two main drawbacks: it requires a large amount of data to avoid thesparsity in the similarity matrix, and it suffers from cold-start (new items which lack ofknowledge). To avoid this, the Normalized Web Distance (NWD) has been employed[3]. The NWD can be used to identify similarity between topics, either in the localresources or collected from user queries, done through the SE which has a readilyavailable large text corpus such as the www [6].
Therefore, in this work the CARLA framework is improved by 1) integrating aSE such that unknown knowledge in the current database can be found and providedto users on request, and 2) building a recommender system to suggest new learningresources based on items’ semantic similarity given by the NWD. In particular, wecompare the chatbot recommendations’ ability against human expert and commonknowledge respondents. For this, 20 triplet concepts (10 specific and 10 common topics)are compared using an online survey. In parallel, Google and Wikipedia SEs are usedto calculate the NWD over the 20 triplets.
The results show that there is a high correlation between the scores obtainedby humans and the NWD over the 20 triplets, specifically the ones obtained by theWikipedia search engine. The rest of the paper is organized as follows: section 2presents the materials and methods; section 3 presents the experimental setup and theresults of the experimentation; section 4 presents conclusions and discusses future work.
2 Materials and Methods
CARLA is an embedded chatbot framework for Virtual Reality (VR) using low-cost orfree technologies. As any other chatbot, its main components are the Natural LanguageUnderstanding (NLU), the DM, and the Natural Language Generator (NLG).
8
Carlos Natanael Lecona-Valdespino, Pablo Isaac Macias-Huerta, Rafael Cabañas-Rocha, et al.
Research in Computing Science 151(1), 2022
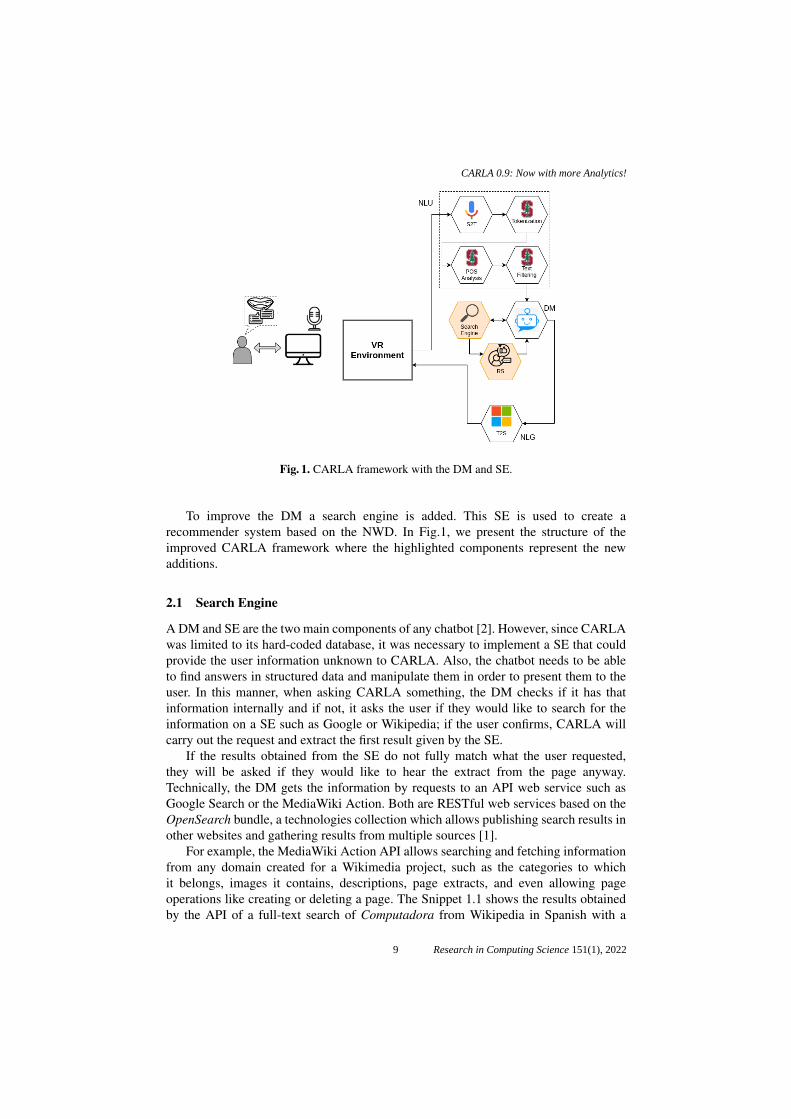
Fig. 1. CARLA framework with the DM and SE.
To improve the DM a search engine is added. This SE is used to create arecommender system based on the NWD. In Fig.1, we present the structure of theimproved CARLA framework where the highlighted components represent the newadditions.
2.1 Search Engine
A DM and SE are the two main components of any chatbot [2]. However, since CARLAwas limited to its hard-coded database, it was necessary to implement a SE that couldprovide the user information unknown to CARLA. Also, the chatbot needs to be ableto find answers in structured data and manipulate them in order to present them to theuser. In this manner, when asking CARLA something, the DM checks if it has thatinformation internally and if not, it asks the user if they would like to search for theinformation on a SE such as Google or Wikipedia; if the user confirms, CARLA willcarry out the request and extract the first result given by the SE.
If the results obtained from the SE do not fully match what the user requested,they will be asked if they would like to hear the extract from the page anyway.Technically, the DM gets the information by requests to an API web service such asGoogle Search or the MediaWiki Action. Both are RESTful web services based on theOpenSearch bundle, a technologies collection which allows publishing search results inother websites and gathering results from multiple sources [1].
For example, the MediaWiki Action API allows searching and fetching informationfrom any domain created for a Wikimedia project, such as the categories to whichit belongs, images it contains, descriptions, page extracts, and even allowing pageoperations like creating or deleting a page. The Snippet 1.1 shows the results obtainedby the API of a full-text search of Computadora from Wikipedia in Spanish with a
9
CARLA 0.9: Now with more Analytics!
Research in Computing Science 151(1), 2022
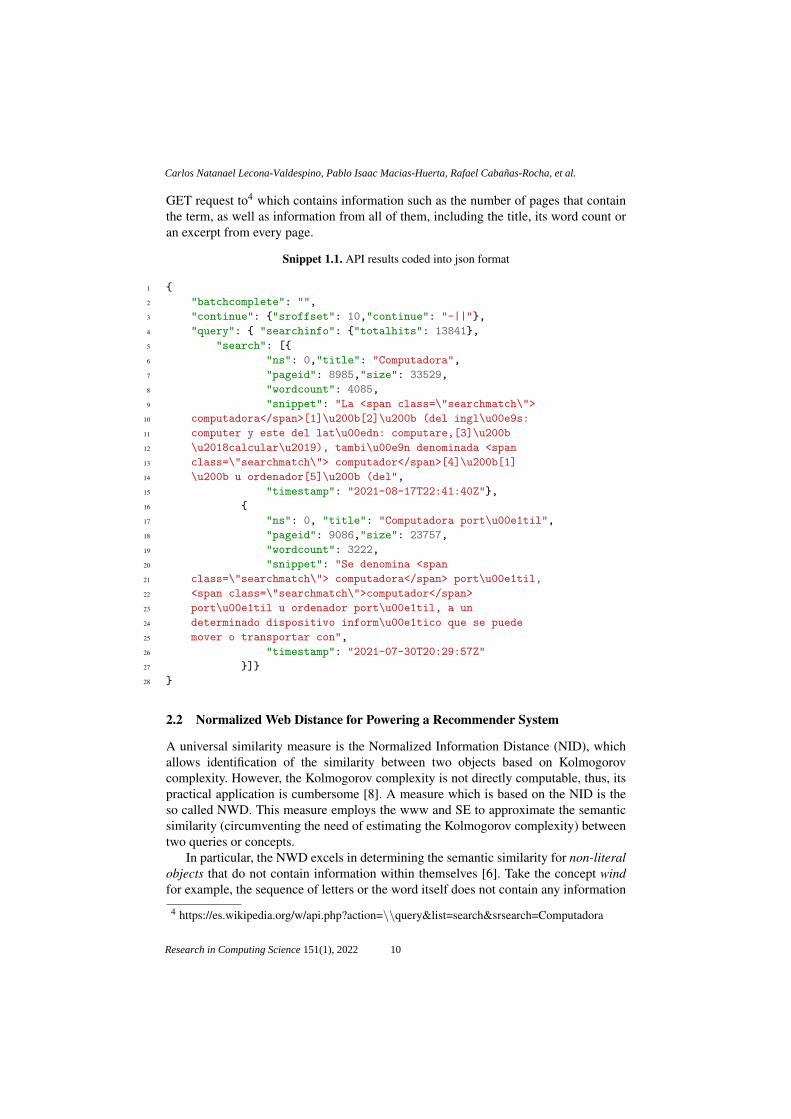
GET request to4 which contains information such as the number of pages that containthe term, as well as information from all of them, including the title, its word count oran excerpt from every page.
Snippet 1.1. API results coded into json format
1 {
2 "batchcomplete": "",
3 "continue": {"sroffset": 10,"continue": "-||"},
4 "query": { "searchinfo": {"totalhits": 13841},
5 "search": [{
6 "ns": 0,"title": "Computadora",
7 "pageid": 8985,"size": 33529,
8 "wordcount": 4085,
9 "snippet": "La <span class=\"searchmatch\">
10 computadora</span>[1]\u200b[2]\u200b (del ingl\u00e9s:
11 computer y este del lat\u00edn: computare,[3]\u200b
12 \u2018calcular\u2019), tambi\u00e9n denominada <span
13 class=\"searchmatch\"> computador</span>[4]\u200b[1]
14 \u200b u ordenador[5]\u200b (del",
15 "timestamp": "2021-08-17T22:41:40Z"},
16 {
17 "ns": 0, "title": "Computadora port\u00e1til",
18 "pageid": 9086,"size": 23757,
19 "wordcount": 3222,
20 "snippet": "Se denomina <span
21 class=\"searchmatch\"> computadora</span> port\u00e1til,
22 <span class=\"searchmatch\">computador</span>
23 port\u00e1til u ordenador port\u00e1til, a un
24 determinado dispositivo inform\u00e1tico que se puede
25 mover o transportar con",
26 "timestamp": "2021-07-30T20:29:57Z"
27 }]}
28 }
2.2 Normalized Web Distance for Powering a Recommender System
A universal similarity measure is the Normalized Information Distance (NID), whichallows identification of the similarity between two objects based on Kolmogorovcomplexity. However, the Kolmogorov complexity is not directly computable, thus, itspractical application is cumbersome [8]. A measure which is based on the NID is theso called NWD. This measure employs the www and SE to approximate the semanticsimilarity (circumventing the need of estimating the Kolmogorov complexity) betweentwo queries or concepts.
In particular, the NWD excels in determining the semantic similarity for non-literalobjects that do not contain information within themselves [6]. Take the concept windfor example, the sequence of letters or the word itself does not contain any information
4 https://es.wikipedia.org/w/api.php?action=\\query&list=search&srsearch=Computadora
10
Carlos Natanael Lecona-Valdespino, Pablo Isaac Macias-Huerta, Rafael Cabañas-Rocha, et al.
Research in Computing Science 151(1), 2022
regarding what wind stands for. Formally, if x and y are two different concepts withinthe set W of all web pages in the www corpus, i.e., x,y ∈ W , then, the NWD betweenthese two is given by
NWD =max{log f (x), log f (y)}− log f (x,y)
logN −min{log f (x), log f (y)}, (1)
where f (x) and f (y) are the number of pages containing term x and y respectively,f (x,y) is the number of pages containing both x and y, and N is a large constantcorresponding to the total number of indexed pages. The NWD is roughly between0 and infinity, obtaining values close to zero for objects which are very similar, and oneor larger for very dissimilar objects. In some cases the NWD can obtain values belowzero if f (x,y) > max{ f (x), f (y)}, or infinite if objects do not appear together on thesame page, but do occur separately.
Also, the NWD is considered a relative similarity measure between two concepts(due to its dependence to the SE) rather than a similarity metric [6]. On the other hand,for a proper usage of the NWD for powering a recommender system, the proper SEneeds to be selected. It is the case that many SEs are optimized for advertisements. If weemploy a biased SE to calculate the NWD, we can hinder new knowledge suggestions toa given user. Therefore, to evaluate this hypothesis we employ Google and Wikipedia asSEs. The first is the most popular SE, whereas the second is a free, multilingual, onlineencyclopedia written mainly by volunteers.
3 Experimentation
In the following, we analyze the level of knowledge agreement between humans andthe NWD using two different SEs. First, we present the details of the survey answeredby human participants. Then, we present the analysis of the results obtained by the twoSEs, and the comparison with the survey results.
3.1 Survey and NWD Calculation
We elaborated a survey5 with triplets of concepts where participants are requested todetermine which of two options is the more closely related to a given concept. In thefirst part of the survey users informed consent and personal data is gathered. The latter isconformed by gender, age group, educational level, and country. It is worth mentioningthat for the educational level we consider the following groups: primary, secondary,high school, undergraduate, and postgraduate.
The survey was responded 130 times by 56% male, 43% female, and 1% did notspecify. Regarding the age group, 50% of the participants were older than 30, 44% werebetween 18 and 29 years old, and only 6% were between 12 and 17 years old.
Regarding the educational level, 38% of the participants were high school students,36% of the participants had some postgraduate degree, 25% were undergraduatestudents, and only 1% were secondary school students. Regarding the nationality of
5 https://forms.gle/sDBZdfVFgRTGiPXc7
11
CARLA 0.9: Now with more Analytics!
Research in Computing Science 151(1), 2022
the participants, 98% were Mexicans, and 2% from other countries. The second part ofthe survey assesses 20 triplets’ (e.g., (A,B,C)) kinship using a Likert scale. This scalepresents a given concept (e.g., A), and asks human participants to assess its similaritywith two others (e.g., B and C), with one of them, for a physical or chemical reason,being more related to the main concept. Some triplets show highly related concepts,while others have concepts with high similarity to one another.
The intention is to determine the level of agreement between users and the NWD.The scale ranges from 0 to 10 (from left to right), and the concepts are presented inopposite sides. In this sense, if the human chooses 0, concept B is the most related toA; if instead human picks 10, concept C is the most related to A. If both concepts B andC are equally similar/dissimilar to A, then, humans need to pick the middle value of thescale (i.e., 5). The triplets are composed by 10 concepts in renewable energy and 10from general domain. For the former, we only consider the answers of participants withsome postgraduate degree given that more advanced knowledge is required; an exampleof this type of triplet is (energıa fotovoltaica, aerogenerador, panel solar) (translated toEnglish: photovoltaic energy, wind turbine, solar panel).
For the latter, the responses of all participants is considered; an example of this typeof similarity assessment is (manzana, pera, libro) (translated to English: apple, pear,book). To determine the similarity assigned by human participants, for each item ofthe survey the mean value of the responses is calculated. On the other hand, given atriplet of concepts we use the NWD and two different SEs, namely Google (NWDG)and Wikipedia (NWDW ), to determine the similarity between the main concept andthe other two. For both cases Eq. 1 is employed to calculate the similarity between theconcepts i.e., NWDG,W (A,B) and NWDG,W (A,C). For each SE two results are obtained,thus, to determine the most related concept the lowest value (i.e., the most semanticallyrelated) is selected.
3.2 Similarity Comparison and its Use for Recommendation
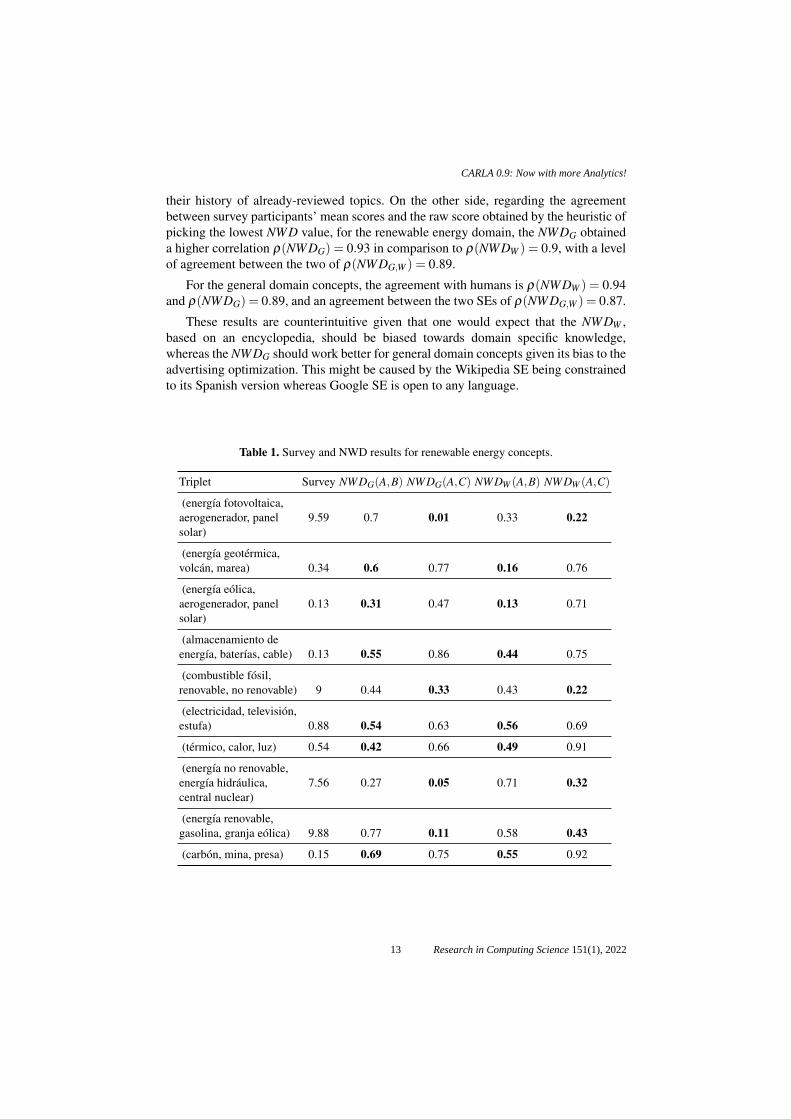
Results about renewable energy and the general domain concepts for the survey andthe NWDG,W are presented in Table 1 and Table 2, respectively. The most semanticallyrelated pair of concepts are highlighted in bold. First, observe that in the case of thesurvey with human participants, and for most of the items, a high polarization is showni.e., tending to just one or the another concept. In contrast, results for the NWDG,W showless polarization. This is very interesting, since humans tend to provide more polarizedanswers, presumably because their knowledge is highly contextualized.
For example, for the last triplet of Table 1 which translates to (coal, mine, dam),humans with specialized knowledge provide a value of 0.15 which depicts a highsimilarity between coal and mine. In contrast, the NWDG achieved a 0.69 and 0.55 forthe NWDW , which highlights similarity but not quite as sharply as human participantsconsidered. Nevertheless, for a given concept and two options, do humans and theNWD agree in picking the most similar concept?
The answer is yes, with a linear correlation of ρ = 0.99 for the renewable energyconcepts and ρ = 0.95 for the general domain concepts, regardless of the SE (with aρ = 1 between the NWDG and NWDW ). These results are encouraging since the NWDcan be used to suggest new, semantically similar concepts or topics to a user given
12
Carlos Natanael Lecona-Valdespino, Pablo Isaac Macias-Huerta, Rafael Cabañas-Rocha, et al.
Research in Computing Science 151(1), 2022
their history of already-reviewed topics. On the other side, regarding the agreementbetween survey participants’ mean scores and the raw score obtained by the heuristic ofpicking the lowest NWD value, for the renewable energy domain, the NWDG obtaineda higher correlation ρ(NWDG) = 0.93 in comparison to ρ(NWDW ) = 0.9, with a levelof agreement between the two of ρ(NWDG,W ) = 0.89.
For the general domain concepts, the agreement with humans is ρ(NWDW ) = 0.94and ρ(NWDG) = 0.89, and an agreement between the two SEs of ρ(NWDG,W ) = 0.87.
These results are counterintuitive given that one would expect that the NWDW ,based on an encyclopedia, should be biased towards domain specific knowledge,whereas the NWDG should work better for general domain concepts given its bias to theadvertising optimization. This might be caused by the Wikipedia SE being constrainedto its Spanish version whereas Google SE is open to any language.
Table 1. Survey and NWD results for renewable energy concepts.
Triplet Survey NWDG(A,B) NWDG(A,C) NWDW (A,B) NWDW (A,C)
(energıa fotovoltaica,aerogenerador, panelsolar)
9.59 0.7 0.01 0.33 0.22
(energıa geotermica,volcan, marea) 0.34 0.6 0.77 0.16 0.76
(energıa eolica,aerogenerador, panelsolar)
0.13 0.31 0.47 0.13 0.71
(almacenamiento deenergıa, baterıas, cable) 0.13 0.55 0.86 0.44 0.75
(combustible fosil,renovable, no renovable) 9 0.44 0.33 0.43 0.22
(electricidad, television,estufa) 0.88 0.54 0.63 0.56 0.69
(termico, calor, luz) 0.54 0.42 0.66 0.49 0.91
(energıa no renovable,energıa hidraulica,central nuclear)
7.56 0.27 0.05 0.71 0.32
(energıa renovable,gasolina, granja eolica) 9.88 0.77 0.11 0.58 0.43
(carbon, mina, presa) 0.15 0.69 0.75 0.55 0.92
13
CARLA 0.9: Now with more Analytics!
Research in Computing Science 151(1), 2022
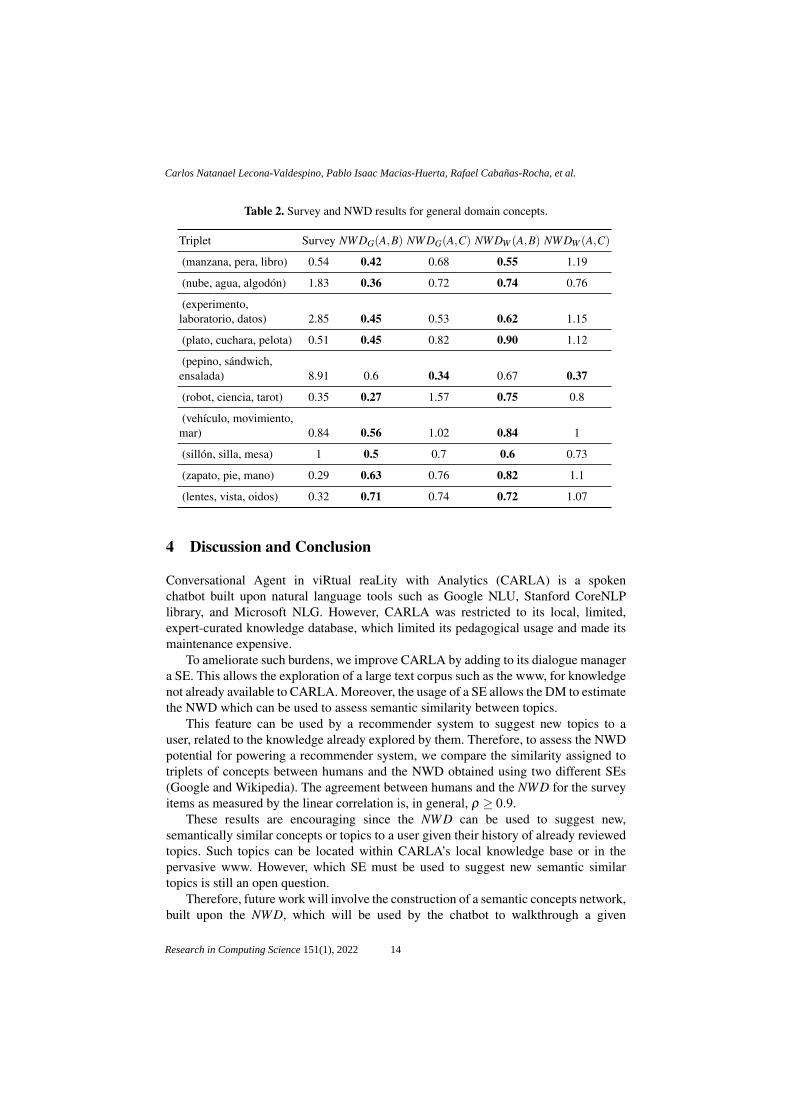
Table 2. Survey and NWD results for general domain concepts.
Triplet Survey NWDG(A,B) NWDG(A,C) NWDW (A,B) NWDW (A,C)
(manzana, pera, libro) 0.54 0.42 0.68 0.55 1.19
(nube, agua, algodon) 1.83 0.36 0.72 0.74 0.76
(experimento,laboratorio, datos) 2.85 0.45 0.53 0.62 1.15
(plato, cuchara, pelota) 0.51 0.45 0.82 0.90 1.12
(pepino, sandwich,ensalada) 8.91 0.6 0.34 0.67 0.37
(robot, ciencia, tarot) 0.35 0.27 1.57 0.75 0.8
(vehıculo, movimiento,mar) 0.84 0.56 1.02 0.84 1
(sillon, silla, mesa) 1 0.5 0.7 0.6 0.73
(zapato, pie, mano) 0.29 0.63 0.76 0.82 1.1
(lentes, vista, oidos) 0.32 0.71 0.74 0.72 1.07
4 Discussion and Conclusion
Conversational Agent in viRtual reaLity with Analytics (CARLA) is a spokenchatbot built upon natural language tools such as Google NLU, Stanford CoreNLPlibrary, and Microsoft NLG. However, CARLA was restricted to its local, limited,expert-curated knowledge database, which limited its pedagogical usage and made itsmaintenance expensive.
To ameliorate such burdens, we improve CARLA by adding to its dialogue managera SE. This allows the exploration of a large text corpus such as the www, for knowledgenot already available to CARLA. Moreover, the usage of a SE allows the DM to estimatethe NWD which can be used to assess semantic similarity between topics.
This feature can be used by a recommender system to suggest new topics to auser, related to the knowledge already explored by them. Therefore, to assess the NWDpotential for powering a recommender system, we compare the similarity assigned totriplets of concepts between humans and the NWD obtained using two different SEs(Google and Wikipedia). The agreement between humans and the NWD for the surveyitems as measured by the linear correlation is, in general, ρ ≥ 0.9.
These results are encouraging since the NWD can be used to suggest new,semantically similar concepts or topics to a user given their history of already reviewedtopics. Such topics can be located within CARLA’s local knowledge base or in thepervasive www. However, which SE must be used to suggest new semantic similartopics is still an open question.
Therefore, future work will involve the construction of a semantic concepts network,built upon the NWD, which will be used by the chatbot to walkthrough a given
14
Carlos Natanael Lecona-Valdespino, Pablo Isaac Macias-Huerta, Rafael Cabañas-Rocha, et al.
Research in Computing Science 151(1), 2022
knowledge area. Then, the users will be requested to evaluate the concepts roadmapusing different SEs.
References
1. Clinton, D.: Spezifikation opensearch 1.1 draft 3 (2007),http://www.opensearch.org/Specifications/OpenSearch/1.1
2. Galitsky, B.: Developing Enterprise Chatbots. Springer International Publishing (2019)3. Huang, T.C.K., Chen, Y.L., Chen, M.C.: A novel recommendation model with Google
similarity. Decision Support Systems 89, 17–27 (2016)4. Kerry, A., Ellis, R., Bull, S.: Conversational agents in e-learning. In: International Conference
on Innovative Techniques and Applications of Artificial Intelligence. pp. 169–182. Springer(2008)
5. Macias-Huerta, P.I., Santamarıa-Bonfil, G., Ibannez, M.: Carla: Conversational agent in virtualreality with analytics. Research in Computing Science 149(12), 15–23 (2020)
6. Santamarıa-Bonfil, G., Dıaz-Rodrıguez, H.D., Arroyo-Figueroa, G., Batres, R.: Knowledgemodelling for ill-defined domains using learning analytics: Lineworkers case. In: InternationalConference on EUropean Transnational Education. pp. 409–418. Springer (2020)
7. Santamarıa-Bonfil, G., Ibanez, M.B., Perez-Ramırez, M., Arroyo-Figueroa, G.,Martınez-Alvarez, F.: Learning analytics for student modeling in virtual reality trainingsystems: Lineworkers case. Computers & Education p. 103871 (2020)
8. Vitanyi, P.M.B., Balbach, F.J., Cilibrasi, R.L., Li, M.: Normalized Information Distance, pp.45–82. Springer US, Boston, MA (2009)
15
CARLA 0.9: Now with more Analytics!
Research in Computing Science 151(1), 2022

Model of Integration of Verbal and NonverbalExpressions for Credible Virtual Agents
Jazmın Guadalupe Ramırez-Medina, Marıa Lucila Morales-Rodrıguez,Nelson Rangel-Valdez
Tecnologico Nacional de Mexico,Instituto Tecnologico de Ciudad Madero,
Mexico
{G20073011, lucila.mr, nelson.rv}@cdmadero.tecnm.mx
Abstract. For the development of a credible virtual agent, it isimportant that this agent has characteristics to create a more immersiveexperience for users and increases the effectiveness of communication.One of these characteristics is the ability to interact through verbaland non-verbal communication. That is why in this work an integrationmodel of dialogue, facial and gestural expressions are proposed, where itis essential to consider the attributes of emotions and personality becausethese directly influence the expressions. This paper proposes the use of anoptimization method named ELECTRE III for the process of selectionof dialogue, facial and gestural expressions, using a corpus characterizedby diverse criteria based on the influence of personality and emotions.
Keywords: virtual agent, verbal expressions, nonverbal expressions,selection, ELECTRE III.
1 Introduction
The moment we enable a face-to-face conversation aspects like verbal andnonverbal language are involved. If we develop a virtual agent that canparticipate in conversations and has the appearance of a human, it would beexpected that it acts like one. For this behaviour to be congruent it is importantthat it communicates through dialogue, also with facial and corporal expressionsas well. For the integration of the different elements that implicate verbal andnonverbal expressions in a virtual agent, it is proposed a selection model basedon an outranking method called ELECTRE III [6]. This will allow us to createa credible virtual agent that can respond to social interactions with a naturalbehavior similar to a human. This way it will be able to make the user immersein the virtual environment and develop a feeling of social presence.
The development of a credible virtual agent involves elements that need tobe considered so that the communication of the agent is coherent and it interactsin a similar way to the human behavior. To accomplish this, it is necessary todevelop a process of integration, in which the following areas are taken into
17 Research in Computing Science 151(1), 2022pp. 17–24; rec. 2021-07-20; acc. 2021-09-29
consideration: face-to-face conversation where language is involved, nonverbalbehavior, emotions and personality, because human behavior is influenced bythese areas [7]. This way the agent will be able to hold a fluent conversationusing dialogue, facial and corporal expressions simultaneously, in a natural wayand accordingly to the presented situations.
2 Related Work
This paper will provide a brief description of the background of projects relatedto credible virtual agents and how these impact the development of this project.
The work of Gratch [7] was one of the first ones where different elementsthat need to be considered to build a credible virtual agent were formalized.For the author, an agent must look and act like a person and at the same time,be able to enable a conversation. The main goal of this work is to develop amodular architecture and interface standards that allow future researchers tostudy each one of the three key areas of virtual human development, whichconsist of: face-to-face conversation, emotions and personality, animation of thehuman figure. All these elements raised by the author will serve as a basis forthe realization of this work.
The work of Rosis [11] and colleagues was to develop an agent that has anatural appearance and behavior, for this very reason a prototype of a talking3D head named “Greta” was designed. To reach this goal a cognitive model waspresented, which was named “mind”, where its beliefs, desires and intentionswere established. This model is used to simulate how the agent reacts to theevents that occur during a conversation. The second model that was intendedto complement the cognitive model, was the “body”. This model has access toa repertoire of signals that the agent can use in its communication process, forexample, the facial expressions, head movement, sight direction, etc. The unionof mind and body modules allows that the different contents of the message areexpressed by the agent.
Greta was designed as a BDI [5] (Beliefs, Desires, Intentions) agent, whosestate of mind integrates a representation of the beliefs and goals that drive thefeeling of emotions and the decision to show or hide them. This characteristicswill allow the user to have the impression of communicating with a person andnot with a computer. As it was mentioned, for an agent to have a naturalappearance, similar to the one of a human being in a face-to-face conversation,it is important to automatically generate the nonverbal expressions from thedialogue.
Because of the nonverbal behavior being affected by the personality, it isimportant to generate expressions that go accordingly with the personality ofthe agent. The work of Ishii [9], shows how the personality can help to improvethe prediction of the nonverbal behavior for the whole body, this is what werefer to head movement, eyes, hands and posture. For the making of this study,verbal and nonverbal information was recollected, personality traits of a humanconversation were recollected as well.
18
Jazmín Guadalupe Ramírez-Medina, María Lucila Morales-Rodríguez, Nelson Rangel-Valdez
Research in Computing Science 151(1), 2022
The model that was used to represent the personality was Big Five [8](approaching, conscience, extroversion, likeability and neuroticism), which is anindicator of personality traits and it is one of the most accepted in academicpsychology. To evaluate the significance of the Big Five model in nonverballanguage, models of behavior generation were implemented with and withoutthe Big Five model. According to this experiment, it was proved that the BigFive model is useful to generate nonverbal expressions. With this work, it ispossible to identify the importance and effect that personality produces in thegeneration of nonverbal expressions.
The work done by Delgado [3] was the development of an agent whichintegrates the element of personality in the process of selection of phrases froma corpus characterized through acts of speech, using the ELECTRE III selectionmethod. Delgado proposes an architecture with five principal components thatare required in a conversational agent: perception, memory and knowledge,behavioral model, answer selection and action. From these modules the authorincorporates the influence of the personality for the selection of phrases from anagent, providing more realism and credibility.
At the same time another work that was analyzed, was the one made by Reyes[10], which goal was the development of a software mechanism that integrates theselection of phrases and nonverbal expressions in assistants and/or video gamesbased on web platforms. This work is based on Delgado [3] for the selection ofphrases and uses the character ”Kathia” as a representation of the developedanimations [12]. This paper proposes a deliberative agent architecture and theanalysis done for their development.
The agent personality influences the process of selecting speech, facialand gestural expression from a characterized corpus while measuring thesimilarity based on outranking relationships and the impact of personality inthe preferences of the user as a measure of expression selection.
3 Theoretical Framework
In this section, it will be presented the theoretical framework of the developmentof a conversational deliberative agent and the role of the personality in theselection process of expressions using the method ELECTRE III.
3.1 Conversational Deliberative Agent
A Conversational Deliberative Agent (CDA) [5] has to emulate human behaviorwithin speech, facial and gestural expressions, so it needs its own traits andreasoning that defines its responses during a conversation. This kind of agentneeds to integrate beliefs, desires and intentions, alongside its perception of theconversation environment to select an expression that responds appropriately tothe context of the conversation. The selection of dialogue, facial and gesturalexpressions in this virtual agent is based in an outranking method calledELECTRE III.
19
Model of Integration of Verbal and Nonverbal Expressions for Credible Virtual Agents
Research in Computing Science 151(1), 2022
3.2 ELECTRE III
The ELECTRE model consists of a family of methods that belongs to the areaof multi-criteria assistance of decision making [6]. The goal of the ELECTRE IIImodel is to order different alternatives in a problem, leading to the generationof diverse criteria. This model allows the incorporation of the imperfection anduncertainty that is always present in a decision-making process while definingthe parameters of preference and indifference [2]. To achieve this is necessary touse a ponderation for the criteria.
Traditional methods of classification come from preference and indifference.In ELECTRE III for every pair of alternatives, there is a measurement ofconcordance and discordance, the goal of the model is to combine these twomeasurements to produce a measurement for the degree of over-classification,in other words, an index of credibility, which validates the process ofdecision-making of choosing one alternative over the other one in a problem [6].For the application of the ELECTRE method, a matrix of performance needs tobe developed [2]. Where each linguistic variable needs to be indicated and alsoneeds to receive a weight of importance.
After establishing the values of these variables, making a matrix thatcompares the values of the alternatives against the criteria that were previouslyestablished for the problem and lastly making a matrix that takes intoconsideration the level of concordance, a decision can be made about whichalternative is the best for solving the problem presented.
3.3 Personality
To take into consideration the personality attributes for the selection of thenonverbal expressions in the agent, the MBTI [1] (Myers-Briggs Type Indicator)model was used. The MBTI is a psychometric test designed to evaluate thepersonality type of people from four dichotomies that are defined as polaropposites in eight categories. Each category is represented by a letter and becauseof this the results are shown in 16 possible combinations of four letters. Basedon these combinations, four big groups can be identified: analysts, diplomats,sentinels and explorers [4].
This paper will only show the description of the characteristics of thepersonality type that was selected for the agent: IFNJ Lawyer-Diplomatic,the people with this profile tend to look for meaning and connection in ideas,relations and material possessions. They want to understand what motivatespeople and they are really perceptive about others. They are conscious andcommitted to their values. They develop a clear vision about what is best toserve the common good, usually organized and decided on the implementingtheir vision [1].
20
Jazmín Guadalupe Ramírez-Medina, María Lucila Morales-Rodríguez, Nelson Rangel-Valdez
Research in Computing Science 151(1), 2022
4 Proposed Architecture for the Integration of theSelection of Verbal and Nonverbal Expressions of aCDA
This paper proposes the architecture presented in Fig. 1 as a means of building aCDA that integrates verbal and nonverbal communication. This architecture isconstituted by five principal components: perception, behavioral model, internalstate of the agent, selection model and animation. All of these components mustexist in a virtual agent to be credible:
– Perception: through this module, the agent will be able to perceive the stateof the dialogue that develops with the user, which means the perception ofall the data of the environment that will serve to characterize said context.
– Behavioral model: this model is in constant change because the emotionsand intentions of the agent are established here.
– Internal state of the agent: in this component, the parameters such aspersonality and motivation are defined, which will be maintained duringthe whole process.
– Model of selection of verbal and nonverbal expressions: this module isintegrated by the management of dialogue and a kinesic model, which areinfluenced by the behavioral model and the internal state of the agent. thiskinesic model has two phases, the first phase is the emotional expression,that as its name indicates is the one that solves the emotional behavior,this first phase will have the responsibility of categorizing and choosing thenonverbal expressions of the agent, which means the gestural, postural andfacial expressions. Subsequently, the second phase is the model of integration,which will have the responsibility of choosing in a definitive manner andcombining the verbal and nonverbal selections to generate the animation.This module is where the contribution of this paper is centered.
– Animation: the last module will have as an input the verbal and nonverbalexpressions previously selected and will be reported to the user.
4.1 Agent Personality
To model the personality expression and identify the facial and corporalexpressions a video analysis of the interactions of the 4 personality type wasdone.For example, was observed that a person with a diplomatic type, is aperson that smiles on a few occasions, which is one of the characteristics ofan introverted person and, according to the personality type description it isa characteristic trait in them, however, in spite of showing seriousness it is anempathetic person that shows caring for others.
Regarding the corporal movements, they were almost null, there was no armmovement, even if there was movement from one side to the other. The videoanalysis of the interaction was used associated with the literature to establishthe characteristic expressions of each of the personality types and thus obtainthe characterization of the corpus according to the personality.
21
Model of Integration of Verbal and Nonverbal Expressions for Credible Virtual Agents
Research in Computing Science 151(1), 2022
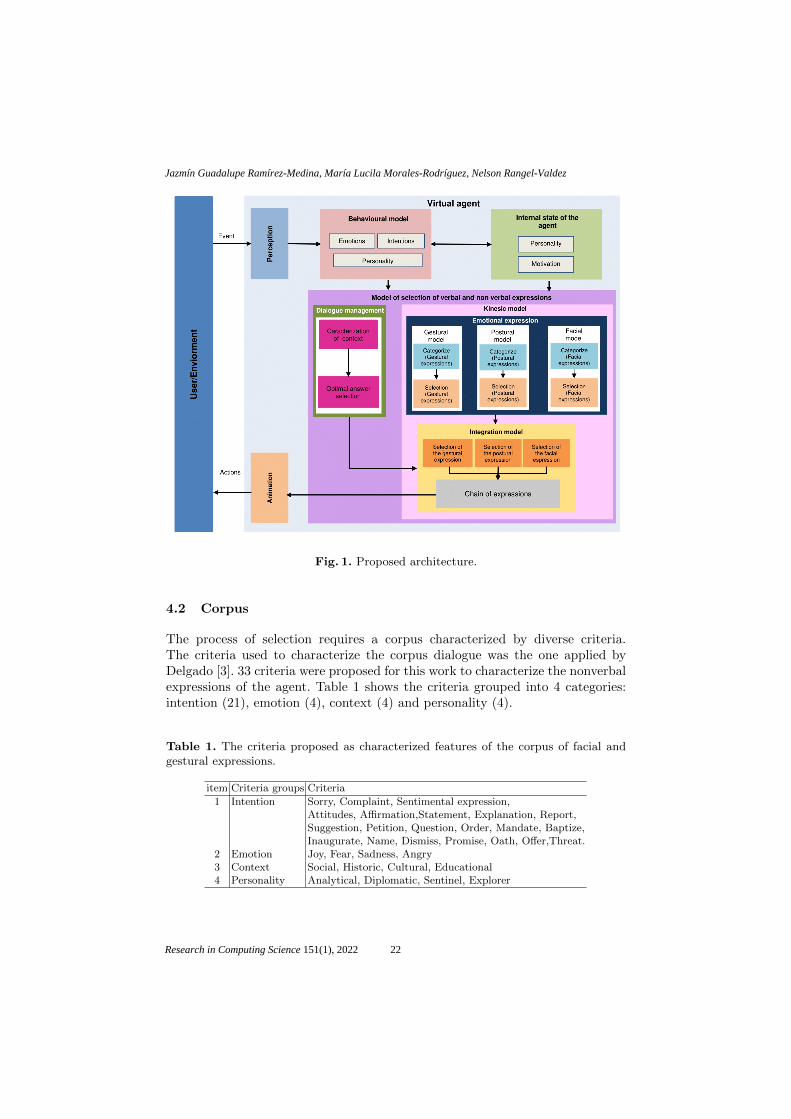
Fig. 1. Proposed architecture.
4.2 Corpus
The process of selection requires a corpus characterized by diverse criteria.The criteria used to characterize the corpus dialogue was the one applied byDelgado [3]. 33 criteria were proposed for this work to characterize the nonverbalexpressions of the agent. Table 1 shows the criteria grouped into 4 categories:intention (21), emotion (4), context (4) and personality (4).
Table 1. The criteria proposed as characterized features of the corpus of facial andgestural expressions.
item Criteria groups Criteria
1 Intention Sorry, Complaint, Sentimental expression,Attitudes, Affirmation,Statement, Explanation, Report,Suggestion, Petition, Question, Order, Mandate, Baptize,Inaugurate, Name, Dismiss, Promise, Oath, Offer,Threat.
2 Emotion Joy, Fear, Sadness, Angry3 Context Social, Historic, Cultural, Educational4 Personality Analytical, Diplomatic, Sentinel, Explorer
22
Jazmín Guadalupe Ramírez-Medina, María Lucila Morales-Rodríguez, Nelson Rangel-Valdez
Research in Computing Science 151(1), 2022
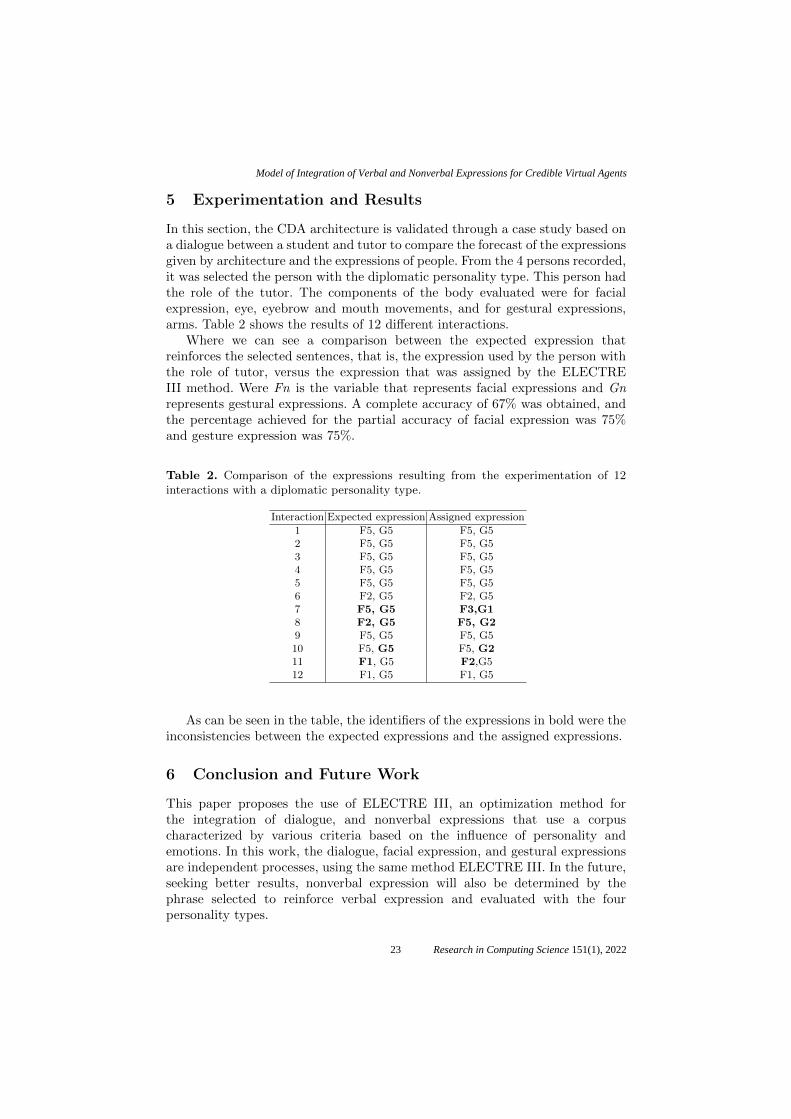
5 Experimentation and Results
In this section, the CDA architecture is validated through a case study based ona dialogue between a student and tutor to compare the forecast of the expressionsgiven by architecture and the expressions of people. From the 4 persons recorded,it was selected the person with the diplomatic personality type. This person hadthe role of the tutor. The components of the body evaluated were for facialexpression, eye, eyebrow and mouth movements, and for gestural expressions,arms. Table 2 shows the results of 12 different interactions.
Where we can see a comparison between the expected expression thatreinforces the selected sentences, that is, the expression used by the person withthe role of tutor, versus the expression that was assigned by the ELECTREIII method. Were Fn is the variable that represents facial expressions and Gnrepresents gestural expressions. A complete accuracy of 67% was obtained, andthe percentage achieved for the partial accuracy of facial expression was 75%and gesture expression was 75%.
Table 2. Comparison of the expressions resulting from the experimentation of 12interactions with a diplomatic personality type.
Interaction Expected expression Assigned expression
1 F5, G5 F5, G52 F5, G5 F5, G53 F5, G5 F5, G54 F5, G5 F5, G55 F5, G5 F5, G56 F2, G5 F2, G57 F5, G5 F3,G18 F2, G5 F5, G29 F5, G5 F5, G510 F5, G5 F5, G211 F1, G5 F2,G512 F1, G5 F1, G5
As can be seen in the table, the identifiers of the expressions in bold were theinconsistencies between the expected expressions and the assigned expressions.
6 Conclusion and Future Work
This paper proposes the use of ELECTRE III, an optimization method forthe integration of dialogue, and nonverbal expressions that use a corpuscharacterized by various criteria based on the influence of personality andemotions. In this work, the dialogue, facial expression, and gestural expressionsare independent processes, using the same method ELECTRE III. In the future,seeking better results, nonverbal expression will also be determined by thephrase selected to reinforce verbal expression and evaluated with the fourpersonality types.
23
Model of Integration of Verbal and Nonverbal Expressions for Credible Virtual Agents
Research in Computing Science 151(1), 2022
Acknowledgments. The authors thanks CONACyT for the support grantedthrough the Scholarship for Postgraduate Studies with CVU 1086661, and theproject of cathedra with number 3058 and basic science 2017-2018 with numberA1-S-11012.
References
1. Analytics Limited, NERIS: Tipos de personalidad (2011),https://www.16personalities.com/es/descripcion-de-los-tipos
2. Cuc, I.: Aplicacion del metodo Electre III en la clasificacion de clusteres deartesanıas. INGE CUC 7(1), 16 (2011)
3. Delgado-Hernandez, X.S., Morales-Rodriguez, M.L., Rangel-Valdez,N., Cruz-Reyes, L., Castro-Rivera, J.: Development of conversationalDeliberative Agents Driven by Personality via Fuzzy OutrankingRelations. International Journal of Fuzzy Systems 22(8), 2720–2734 (2020),http://link.springer.com/10.1007/s40815-020-00817-w
4. Dıaz, J.: MBTI y tipos de personalidad: que, como y por que (2020),https://javierdisan.com/2020/01/22/mbti/
5. Fernandez, C.A.I., Ayestaran, M.G., Cristobal, J.C.G.: Definicion de unametodologıa para el desarrollo de sistemas multiagente. p. 322
6. Gento, A.M., Redondo, A.: Comparacion del metodo ELECTRE III yPROMETHEE II: Aplicacion al caso de un automovil p. 11
7. Gratch, J., Rickel, J., Andre, E., Cassell, J., Petajan, E., Badler, N.: Creatinginteractive virtual humans: some assembly required. IEEE Intelligent Systems17(4), 54–63 (2002), conference Name: IEEE Intelligent Systems
8. G.Y. Lim, A.: Big Five Personality Traits (2020),https://www.simplypsychology.org/big-five-personality.html
9. Ishii, R., Ahuja, C., Nakano, Y.I., Morency, L.P.: Impact of Personality onNonverbal Behavior Generation. In: Proceedings of the 20th ACM InternationalConference on Intelligent Virtual Agents. pp. 1–8. ACM, Virtual Event ScotlandUK (2020), https://dl.acm.org/doi/10.1145/3383652.3423908
10. Reyes Najera, P.D.: Integracion de Motor de Seleccion de Frases basados enSuperacion para Desarrollo de Asistentes Web. Reporte de Residencias, InstitutoTecnologico de Ciudad Madero, Cd. Madero, Tamps. (2020)
11. Rosis, F.d., Pelachaud, C., Poggi, I., Carofiglio, V., Carolis, B.D.: From Greta’smind to her face: modelling the dynamics of affective states in a conversationalembodied agent. International Journal of Human-Computer Studies 59(1-2),81–118 (2003), https://linkinghub.elsevier.com/retrieve/pii/S107158190300020X
12. Villarreal Hernandez, J.A.: Framework para el diseno y animacion de personajesrenderizables en entornos web. Tesis de Licenciatura, Instituto Tecnologico deCiudad Madero, Cd. Madero, Tamps. (2017)
24
Jazmín Guadalupe Ramírez-Medina, María Lucila Morales-Rodríguez, Nelson Rangel-Valdez
Research in Computing Science 151(1), 2022
AR Application for Learning Electrical Circuits
Aldo Uriarte-Portillo, Luis Marcos Plata-Delgado, Ramón Zatarain-Cabada,
María Lucía Barrón-Estrada, Rosalío Zatarain-Cabada
Instituto Tecnológico de Culiacán, Culiacán, Sinaloa,
Mexico
{aldo.up, ramon.zc, lucia.be, rozalio.zc}@culiacan.tecnm.mx,
Abstract. In the learning of the exact sciences, especially those related to
engineering, there has been difficulty in achieving effective learning in the
complex topics that these areas of knowledge include, affecting the motivational
state of the students. Currently, some applications are based on the use of
technology as a learning management tool. However, not all available tools are
being used to better capture students' attention. This work aids with the learning
of the topic "Electric circuits" in first-grade engineering students by promoting
learning, understanding, and application of the benefits that augmented reality
technology provides. In addition to being able to change content to each student's
learning pace, the fuzzy logic technique based on student interaction allows for
content adaptation.
Keywords: augmented reality, fuzzy logic, intelligent learning environments.
1 Introduction
Recently, the use of new technologies aimed at improving the teaching-learning process
of students has been increasing considerably, especially in Science, Technology,
Engineering, and Mathematics (STEM) from preschool to post grade [1]. Every day,
people use mobile devices increasingly often, allowing them to perform various tasks
such as making a video call or making an electronic transaction, with smartphones
having the highest frequency of use [12]. The increment in the demand for the use of a
mobile and the increase in the hardware capacity of the devices has contributed to the
integration of technologies, such as 3D virtual environments, virtual reality, and
augmented reality, which have proven to be effective to promote learning [4].
Augmented reality (AR) is a technology that complements user’s perception of the
real world through a contextual layer of three-dimensional information [2], giving the
user the possibility of real-time interaction with the over posed digital elements,
allowing the user the possibility of visualizing abstract and complex elements, difficult
to imagine. On the other hand, artificial intelligence has impacted various areas, and
education is no exception, whether it is applying computer vision to evaluate tasks or
articles, evaluating students and teachers through adaptive learning methods or
25 Research in Computing Science 151(1), 2022pp. 25–33; rec. 2021-07-20; acc. 2021-09-29
personalized learning approaches, or create interactive learning environments through
facial recognition, virtual laboratories, augmented or virtual reality [13]. The main
contribution of this work is the design and implementation of a learning environment
that, based on AR technology, supports engineering students to complement their
learning process in a complex subject with a high level of abstraction, as it is
electrical circuits.
To achieve this, AR has been combined with a fuzzy logic system, to guide the
student in a personalized way to solve the different exercises that are presented,
superimposing information about the exercise using 3D models to represent the
components of electronic circuits and thereby promote active learning.
This work is organized as follows: Section 2 presents related works on the use of
augmented reality in education and fuzzy logic applied to educational environments; in
section 3 the structure of the learning environment is discussed and explained; section
4 discuss the results obtained from the implementation of the application with students;
and finally, section 5 offers the conclusions and future work.
2 Related Works
This section presents related works within AR focused on STEM learning, and works
that use fuzzy logic focused on learning. In the area of AR focused on the educational
field, studies are aimed at improving the motivation and spatial ability of the student.
Liao [3] designed an assistant system to solve a Rubik's cube using AR, showing
clues and aids in the solution process and examining the effects in terms of student
improvement, and learning concepts of volume and surface of geometric figures.
Rossano [6] designed Geo+, an application aimed to solve geometry problems in
elementary school children, highlighting the ease of use, spatial skills, and the learning
gain of the students.
Hruntova [7] created an application aimed at increasing the efficiency of learning
based on the laws of physics applied in a laboratory, facilitating the training and
cognitive activities of students and improving the quality of the acquisition of
knowledge, promoting interest in a topic and the development of research skills.
Ibáñez [11] presents the acquisition of knowledge of students where the subject of
electromagnetism is evaluated, comparing students who use a Web platform against
students who use a mobile application using augmented reality. In this work, variables
related to the students' learning flow are measured, concluding that the students who
used the AR application had greater user satisfaction, but that there were aspects to
improve in terms of usability in it.
Also, Ibáñez [4] presented a review of the state of the art in AR, reviewing 28
applications to promote STEM learning, classifying them, and making an analysis of
the measurements they take. One conclusion is that the studies of the papers presented
mainly measure affective and cognitive parameters of the students through cross-
sectional experiments and that there is a need to diversify the measures to obtain a
deeper understanding that goes beyond helping to remember facts and content.
26
Aldo Uriarte-Portillo, Luis Marcos Plata-Delgado, Ramón Zatarain-Cabada, et al.
Research in Computing Science 151(1), 2022
On the other hand, there are also works where fuzzy logic models are implemented
to evaluate different aspects of the student in learning systems. Ozdemir [8] propose to
determine the effect of a mobile game on the attitude of engineering students using
fuzzy logic and variations of the same model, concluding that for situations where the
condition is uncertain, fuzzy logic is an effective technique.
Rathore [14] uses a fuzzy inference system to predict student placement in a school
using spreadsheets and Matlab, and choosing fuzzy logic due to a large amount of data
and variables involved, managing to predict and analyze large sets from students.
Gogo [15] develop a model that recommends relevant learning content to students,
using a context-aware approach to obtain student-related data, and then use a fuzzy
logic model to recommend learning content taken from a content database of books,
tutorials, and videos, reducing the time in which a student manages to obtain learning
content according to their level of mastery of a subject.
Karaci [9] proposes an intelligent tutor that uses fuzzy logic to detect errors while
the students take questionnaires, creating a model that allows them to choose the
following questions that will be asked in a personalized way, improving the overall
performance of the students.
3 Structure of the Learning Environment
CircuitAR is a learning tool designed to solve Ohm's law problems, focused on learning
electrical circuits in first-grade engineering students. The tool provides the student 3D
elements that allow visualizing the physical form, description, and composition of the
electrical circuit using batteries and resistors.
For the development of CircuitAR, a methodology for software development with
an iterative and incremental approach was used [16], in which the most important
requirements are developed in a first version of the software, and later versions are
released to meet the other requirements, allowing to take into account the feedback of
the previous versions. The learning environment is made up of a mobile application and
a web application.
3.1 Architecture
CircuitAR is a learning tool using AR developed in Unity 2020 for Android devices,
which implements Vuforia for AR, and Firebase for data persistence. As a complement,
CircuitWeb was developed as a web application, that is responsible for manage all the
information generated by the intervention with the students, as well as for download
the markers. The platform contains 2 main clients: CircuitAR mobile application and
CircuitWeb application. Both applications make requests to Google Firebase, which
offers different services for the development of cloud platforms.
The services used are (1) auth: Registration and authentication of students. (2)
storage: markers storage. (3) Firestore: Document-oriented NoSQL database. It is used
for the storage of the data of the students, exercises, markers, and applied exams. Figure
27
AR Application for Learning Electrical Circuits
Research in Computing Science 151(1), 2022
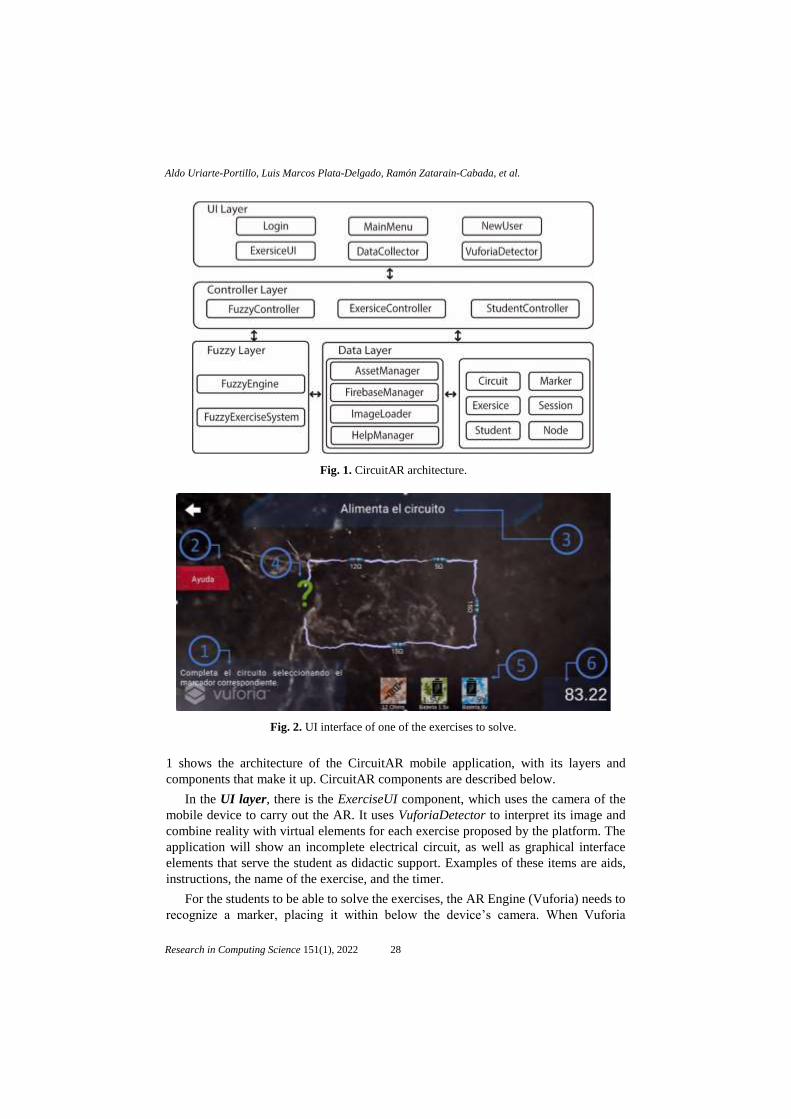
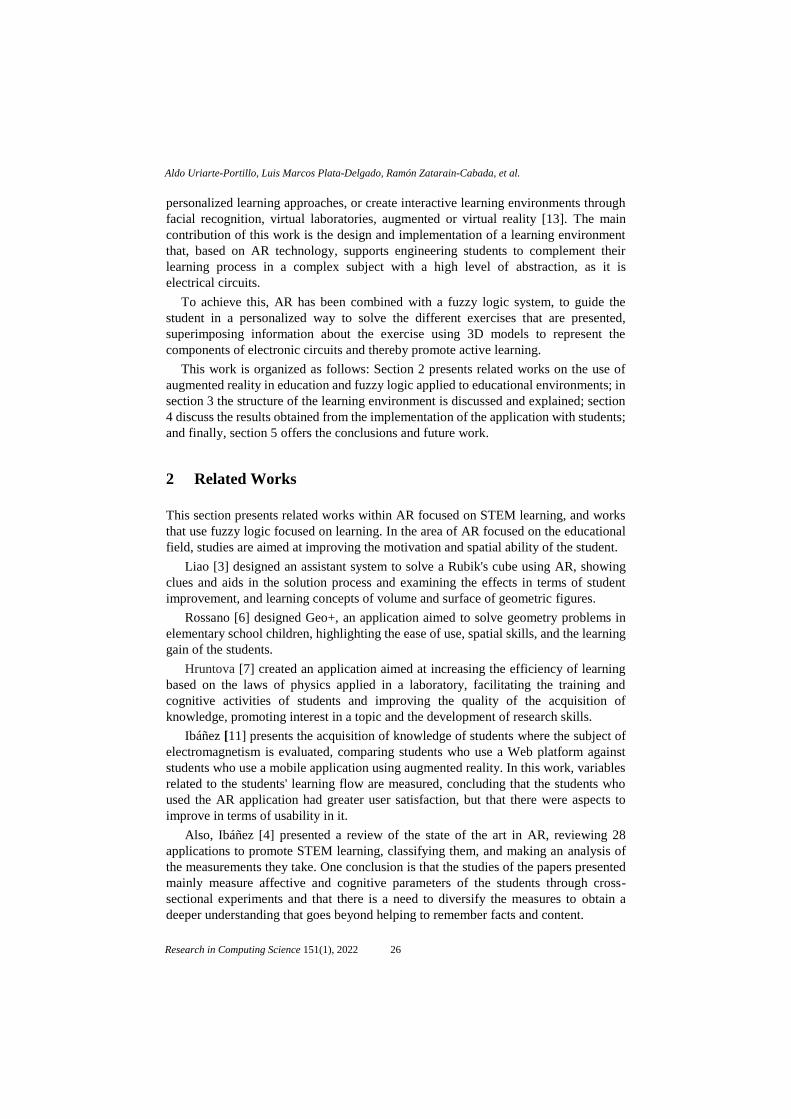
1 shows the architecture of the CircuitAR mobile application, with its layers and
components that make it up. CircuitAR components are described below.
In the UI layer, there is the ExerciseUI component, which uses the camera of the
mobile device to carry out the AR. It uses VuforiaDetector to interpret its image and
combine reality with virtual elements for each exercise proposed by the platform. The
application will show an incomplete electrical circuit, as well as graphical interface
elements that serve the student as didactic support. Examples of these items are aids,
instructions, the name of the exercise, and the timer.
For the students to be able to solve the exercises, the AR Engine (Vuforia) needs to
recognize a marker, placing it within below the device’s camera. When Vuforia
Fig. 1. CircuitAR architecture.
Fig. 2. UI interface of one of the exercises to solve.
28
Aldo Uriarte-Portillo, Luis Marcos Plata-Delgado, Ramón Zatarain-Cabada, et al.
Research in Computing Science 151(1), 2022
recognizes the marker, it superposes the digital elements over it and loads the possible
components to complete the circuit shown.
Each marker is uniquely recognized, which allows the Unity Engine to process
augmented output according to the position of the marker provided by the student [5].
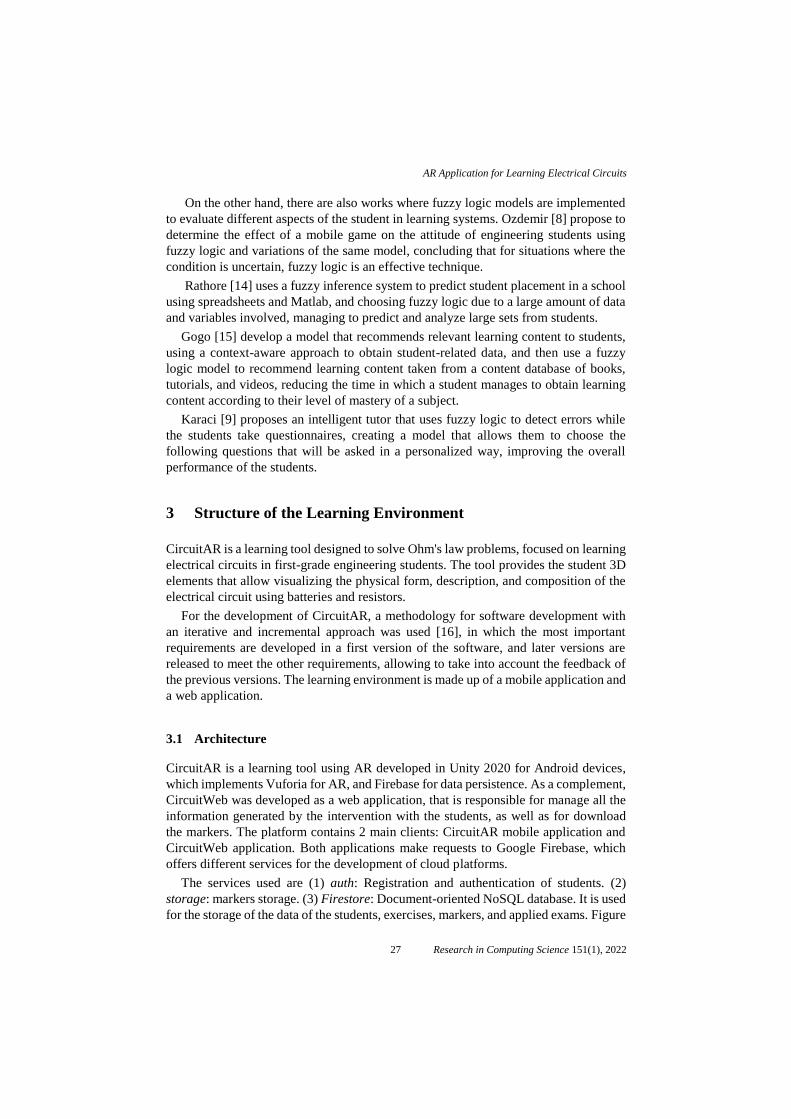
Figure 2 shows the graphical interface of a CircuitAR exercise, where each number
refers to the components to solve the exercise: (1) instructions for solving the exercise;
(2) button to request help; (3) the title of the exercise; (4) marker required, where the
element generated by the markers should be positioned; (5) markers available for
possible response to the exercise; and (6) the timer to solve the current exercise.
The Controller layer contains components that receive requests from the UI layer,
either requesting or sending information. Its function is to coordinate and organize the
logic of the application. This applies to each of the application modules, these being:
student (StudentController), exercises (ExerciseController), and the fuzzy logic
(FuzzyController). The UI layer manages the user’s graphical interfaces through which
the student registers and authenticates in the system. ExerciseUI is the component with
which the student performs the exercises. It relies on VuforiaDetector to be able to carry
out AR and on DataCollector to obtain information about how the student is performing
during the exercises.
The Data layer contains components that perform communication tasks with
Firebase through FirebaseManager, whose function is to manage, store and obtain the
data necessary for the student to complete the exercises. ImageLoader gets the files
hosted on that platform. HelpManager stores and suggest the clues to solve a problem.
All this interaction will occur through objects of the domain component. Within the
fuzzy component, FuzzyExerciseSystem and FuzzyEngine are in charge of taking the
student's performance data and applying the rules of the fuzzy model. The Fuzzy Layer
is described below.
3.2 Fuzzy Logic Model
The Fuzzy layer is responsible to adapt the content of an exercise to be solved according
to the student's performance, a fuzzy logic model was implemented that evaluates the
level of complexity of the following exercise based on the linguistic variables that
correspond to the number of errors made by the student, the aids requested, and the
time necessary to solve the exercise per shift. The FuzzyController subcomponent
selects the exercises that students should perform, based on the recommendations made
by the fuzzy inference machine, and provides relevant feedback to the student.
The fuzzy inference machine adapts the pedagogical model according to the
student's performance, considering the input variables, fuzzy sets, and defined labels.
The result of the inference is a fuzzy output variable called "nextLevel", which
represents the level of difficulty applicable to the next exercise with fuzzy values of
beginner, easy, medium, and hard. Once the linguistic variables are defined, the fuzzy
system applies the fuzzy rules for each set of values of the 3 input variables. Each fuzzy
variable is normalized in a range between 0 and 1. Since there are 4 input variables, 3
of them with 3 possible values and one with 4, 81 rules have been defined, each giving
a corresponding value to the output variable. An example of a fuzzy rule is:
29
AR Application for Learning Electrical Circuits
Research in Computing Science 151(1), 2022
IF prevLevel IS beginner AND errors IS None AND helps IS low AND time IS fast
THEN nextLevel IS easy.
4 The Experiment, Evaluation, and Results
To evaluate the effectiveness of CircuitAR, two aspects were considered: the
functionality of the platform and the intervention with students from the second
semester of the electronic engineering career, from the Technological Institute of
Mazatlán, in a distance mode. Our proposal was adapted to the COVID-19 pandemic's
needs, and we implemented the intervention using a distance learning tool and an online
platform. The following adjustments were made: (1) markers for AR were available on
CircuitWeb, either for printing or viewing from the web; (2) the application was
available for download in Android Google Play1, avoiding distribution and permission
problems in the equipment, as well as increasing the confidence of the students by being
in an environment known to them; (3) pretest and posttest questionnaires are also
available on CircuitWeb platform.
These actions allowed better control of the experiment, thus achieving that the
sessions with the students could be carried out remotely. Similarly, because the pretest
and posttest were accessible through the web platform, students were more motivated
to complete them because they didn't have to leave the application to answer them.
Regarding the functionality of the platform, feedback was received from the students
during the sessions using the tool. For this, observations were collected that allowed us
to improve the learning environment for future iterations of development.
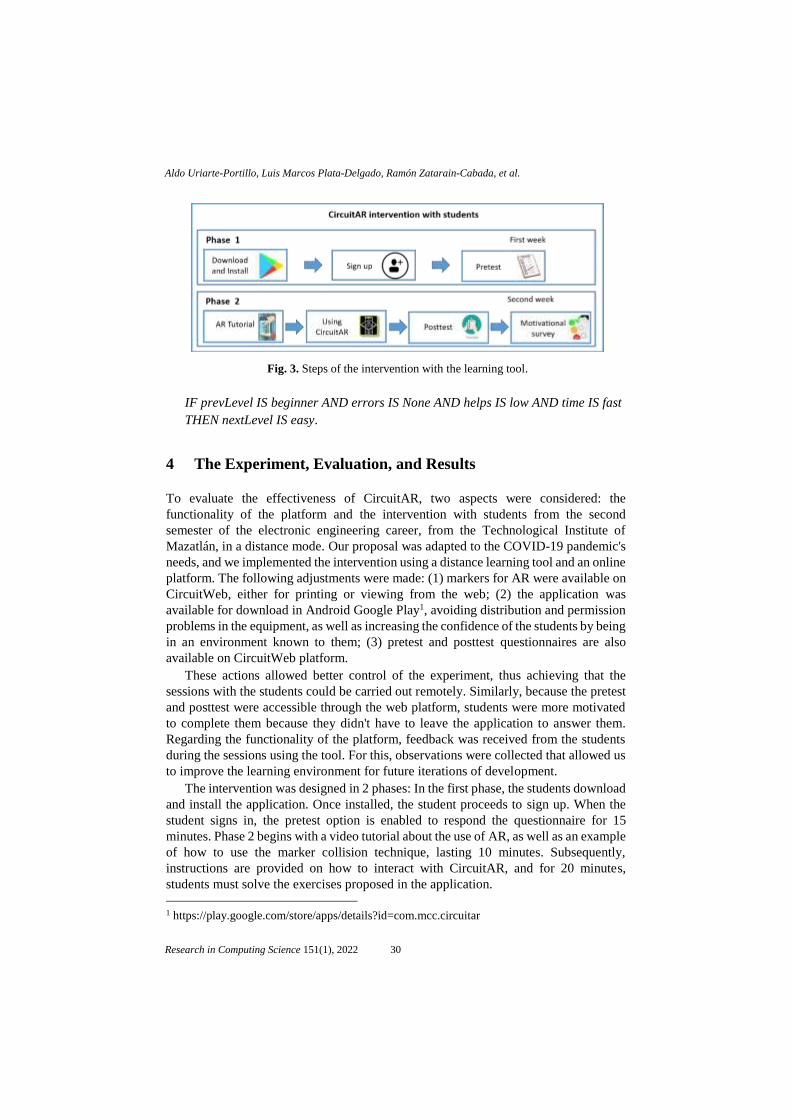
The intervention was designed in 2 phases: In the first phase, the students download
and install the application. Once installed, the student proceeds to sign up. When the
student signs in, the pretest option is enabled to respond the questionnaire for 15
minutes. Phase 2 begins with a video tutorial about the use of AR, as well as an example
of how to use the marker collision technique, lasting 10 minutes. Subsequently,
instructions are provided on how to interact with CircuitAR, and for 20 minutes,
students must solve the exercises proposed in the application.
1 https://play.google.com/store/apps/details?id=com.mcc.circuitar
Fig. 3. Steps of the intervention with the learning tool.
30
Aldo Uriarte-Portillo, Luis Marcos Plata-Delgado, Ramón Zatarain-Cabada, et al.
Research in Computing Science 151(1), 2022
During that time, the research team attends and solves student difficulties with the
handling of the application.
Once the interaction is finished, the student must answer a posttest questionnaire
for 15 minutes, with the same degree of complexity as the pretest.To end the session,
the student must answer a motivational survey, made up of 36 questions with 5 possible
answers in 20 minutes. Figure 3 shows the steps of the intervention with CircuitAR.
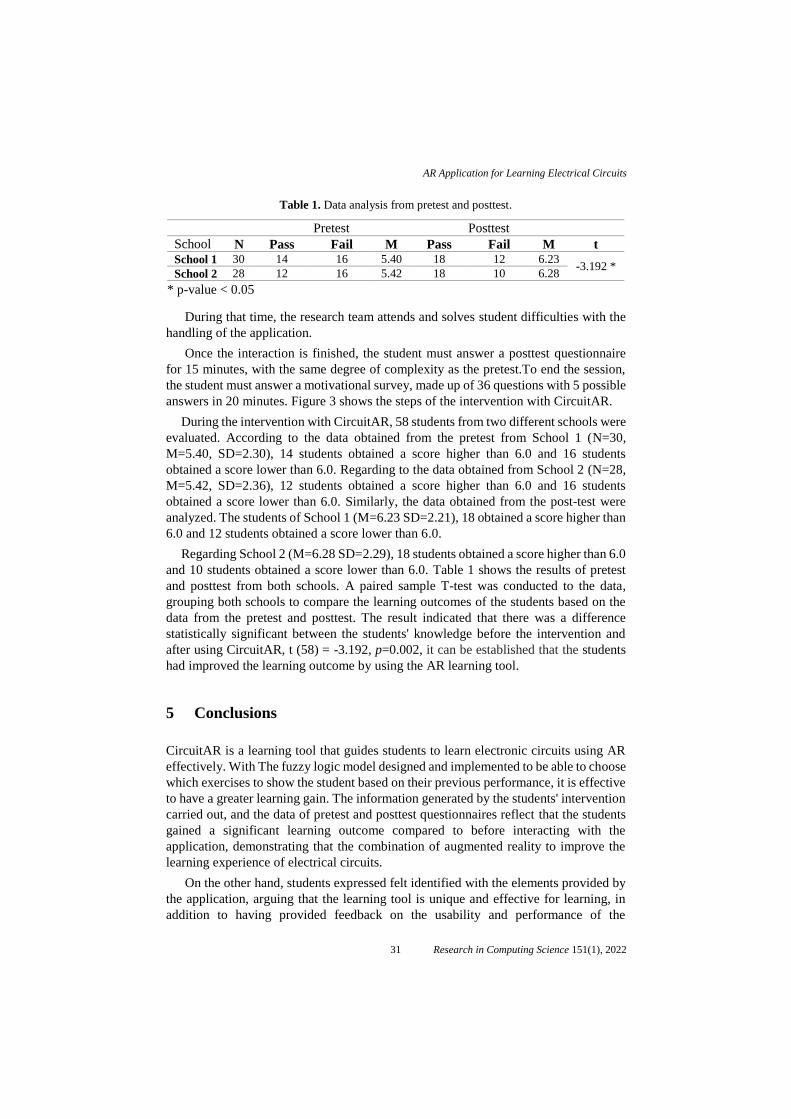
During the intervention with CircuitAR, 58 students from two different schools were
evaluated. According to the data obtained from the pretest from School 1 (N=30,
M=5.40, SD=2.30), 14 students obtained a score higher than 6.0 and 16 students
obtained a score lower than 6.0. Regarding to the data obtained from School 2 (N=28,
M=5.42, SD=2.36), 12 students obtained a score higher than 6.0 and 16 students
obtained a score lower than 6.0. Similarly, the data obtained from the post-test were
analyzed. The students of School 1 (M=6.23 SD=2.21), 18 obtained a score higher than
6.0 and 12 students obtained a score lower than 6.0.
Regarding School 2 (M=6.28 SD=2.29), 18 students obtained a score higher than 6.0
and 10 students obtained a score lower than 6.0. Table 1 shows the results of pretest
and posttest from both schools. A paired sample T-test was conducted to the data,
grouping both schools to compare the learning outcomes of the students based on the
data from the pretest and posttest. The result indicated that there was a difference
statistically significant between the students' knowledge before the intervention and
after using CircuitAR, t (58) = -3.192, p=0.002, it can be established that the students
had improved the learning outcome by using the AR learning tool.
5 Conclusions
CircuitAR is a learning tool that guides students to learn electronic circuits using AR
effectively. With The fuzzy logic model designed and implemented to be able to choose
which exercises to show the student based on their previous performance, it is effective
to have a greater learning gain. The information generated by the students' intervention
carried out, and the data of pretest and posttest questionnaires reflect that the students
gained a significant learning outcome compared to before interacting with the
application, demonstrating that the combination of augmented reality to improve the
learning experience of electrical circuits.
On the other hand, students expressed felt identified with the elements provided by
the application, arguing that the learning tool is unique and effective for learning, in
addition to having provided feedback on the usability and performance of the
Table 1. Data analysis from pretest and posttest.
Pretest Posttest
School N Pass Fail M Pass Fail M t School 1 30 14 16 5.40 18 12 6.23
-3.192 * School 2 28 12 16 5.42 18 10 6.28
* p-value < 0.05
31
AR Application for Learning Electrical Circuits
Research in Computing Science 151(1), 2022
application on different devices, indirectly collaborating to detect and propose possible
solutions to display and performance problems within CircuitAR.
This study had a limited sample size, due to the distance modality and because of
the time in which the intervention was carried out.
For this reason, the size of the sample should be increased and other interventions
with students should be carried out to analyze the impact of the tool in different
contexts. As future work, it is planned to expand the didactic proposal of the platform,
increasing the number of available exercises, and the variety of electrical elements that
students use to improve their learning. Also, integrating new types of exercises apart
from the one proposed in this work, and, integrating a greater degree of feedback during
the intervention with augmented reality exercises, through sound effects
and animations.
References
1. Gonzalez, H. B., Kuenzi, J. J.: Science, technology, engineering, and mathematics (STEM)
education: A primer. Washington, DC: Congressional Research Service, Library of
Congress (2012)
2. Azuma, R. T.: A survey of augmented reality. Presence: Teleoperators & Virtual
Environments, 6(4), pp. 355–385 (1997)
3. Liao, Y. T., Yu, C. H., Wu, C. C.: Learning geometry with augmented reality to enhance
spatial ability. In: 2015 International conference on learning and teaching in computing and
engineering, IEEE, pp. 221–222 (2015)
4. Ibáñez, M. B., Di Serio, Á., Villarán, D., Kloos, C. D.: Experimenting with
electromagnetism using augmented reality: Impact on flow student experience and
educational effectiveness. Computers & Education, 71, pp. 1–13 (2014)
5. Patil, S., Prabhu, C., Neogi, O., Joshi, A. R., Katre, N.: E-learning system using Augmented
Reality. In: 2016 International Conference on Computing Communication Control and
automation (ICCUBEA) (2016)
6. Rossano, V., Lanzilotti, R., Cazzolla, A., Roselli, T.: Augmented Reality to Support
Geometry Learning. IEEE Access, 8, pp. 107772–107780 (2020)
7. Hruntova, T. V., Yechkalo, Y. V., Striuk, A. M., Pikilnyak, A. V.: Augmented reality tools
in physics training at higher technical educational institutions. In: Proceedings of the 1st
International Workshop on Augmented Reality in Education, 2257, pp. 33–40 (2018)
8. Ozdemir, A., Balbal, K. F.: Fuzzy logic based performance analysis of educational mobile
game for engineering students. Computer Applications in Engineering Education, 28(6), pp.
1536–1548 (2020)
9. Karaci, A.: Intelligent tutoring system model based on fuzzy logic and constraint-based
student model. Neural Computing and Applications, 31(8), pp. 3619–3628 (2019)
10. Woolf, B. P.: Building intelligent interactive tutors: Student-centered strategies for
revolutionizing e-learning. Morgan Kaufmann (2010)
11. Deloitte Global Mobile Consumer Survey. May-Jun 2018, May-Jun 2019 (2019)
12. Holmes, W., Bialik, M., Fadel, C.: Artificial intelligence in education. Boston: Center for
Curriculum Redesign (2019)
13. Rathore, R. K., Jayanthi, J.: Student prediction system for placement training using fuzzy
inference system. ICTACT Journal on Soft Computing, 7(3), pp. 1143–1446 (2017)
32
Aldo Uriarte-Portillo, Luis Marcos Plata-Delgado, Ramón Zatarain-Cabada, et al.
Research in Computing Science 151(1), 2022

14. Gogo, K. O., Nderu, L., Mwangi, R. W.: Fuzzy logic based context aware recommender for
smart e-learning content delivery. In: 5th International Conference on Soft Computing &
Machine Intelligence (ICSCMI), pp. 114–118 (2018)
15. Alshamrani, A., Bahattab, A.: A comparison between three SDLC models waterfall model,
spiral model, and Incremental/Iterative model. International Journal of Computer Science
Issues, 12(1), pp. 106 (2015)
33
AR Application for Learning Electrical Circuits
Research in Computing Science 151(1), 2022

Decision Tree-Based Model to Determine Student’s
Dropout Factors in a Mexican Higher
Education Institution
María del Pilar Meza Bucio, Gustavo Gutiérrez-Carreón
Universidad Michoacana de San Nicolas de Hidalgo, Michoacán,
Mexico
{maria.meza,gustavo.gutierrez}@umich.mx
Abstract. The current context in which higher education institutions operating in
Mexico is adverse and multifactorial. In this work, the data obtained from a
survey applied to 1,582 students are analyzed to determine the main factors that
influence school dropout in a pre-COVID19 stage. With this information, an
analysis of the decision tree was developed, detecting the main routes that
influence school dropout. This study can be useful both to the public and to the
instances involved in decision-making, to try to create an environment conducive
to allow students to continue with their university education.
Keywords: learning analytics, higher education, decision making.
1 Introduction
Data analytics is a technique used in many fields of research, one of them is Education,
being very useful for finding patterns in large data sets, and with it optimize and predict
results that allow improving the management and administration of Higher Education
Institutions (HEIs), since it is very useful for the detection and prevention of specific
problems and decisions makes. Higher Education Institutions (HEIs) are in a complex
landscape, where their resources are limited, and situations are changing.
According to a diagnosis of the year 2019 made by the Subsecretaria de Educacion
Superior (SES), the Asociacion Nacional de Universidades e Instituciones de
Educacion Superior (ANUIES), and the Asociacion Mexicana de Organos de Control
y Vigilancia en Instituciones de Educacion Superior, A.C. (AMOCVIES), there are
nine entities in Mexico whose universities have been in economic crisis for several
years: Morelos, Oaxaca, Zacatecas, Chiapas, Estado de Mexico, Tabasco, Michoacan,
Nayarit, and Sinaloa. The magnitude of the accumulated deficit of the nine universities
is equivalent to 71% of their ordinary public subsidy (23,461 million pesos), with a
range ranging from 29% to 190%. Under this unfavorable economic and social
environment, there is a need to detect transversal problems such as school dropout and
the multiple causes that originate it, through various techniques.
35 Research in Computing Science 151(1), 2022pp. 35–41; rec. 2021-07-21; acc. 2021-09-29
One of them could be using learning analytics. Elias [1] mentions that learning
analytics refers to the collection and analysis of data about learners and their
environments to understand and improve learning outcomes.
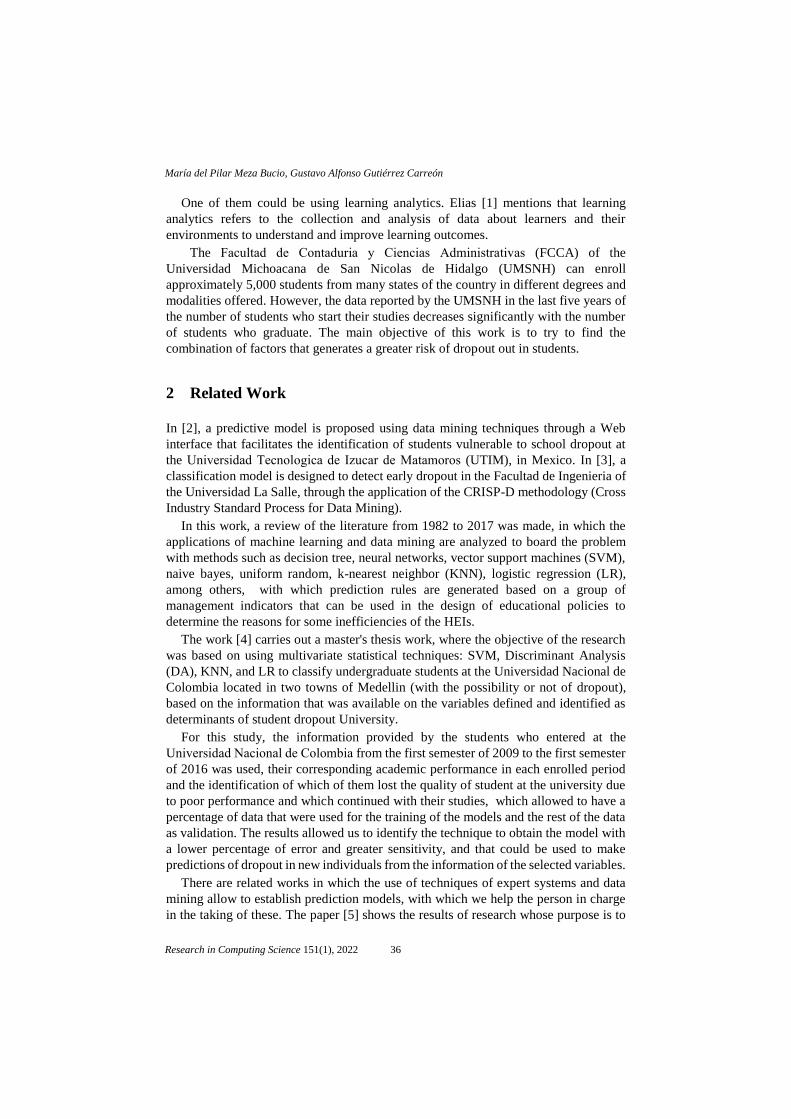
The Facultad de Contaduria y Ciencias Administrativas (FCCA) of the
Universidad Michoacana de San Nicolas de Hidalgo (UMSNH) can enroll
approximately 5,000 students from many states of the country in different degrees and
modalities offered. However, the data reported by the UMSNH in the last five years of
the number of students who start their studies decreases significantly with the number
of students who graduate. The main objective of this work is to try to find the
combination of factors that generates a greater risk of dropout out in students.
2 Related Work
In [2], a predictive model is proposed using data mining techniques through a Web
interface that facilitates the identification of students vulnerable to school dropout at
the Universidad Tecnologica de Izucar de Matamoros (UTIM), in Mexico. In [3], a
classification model is designed to detect early dropout in the Facultad de Ingenieria of
the Universidad La Salle, through the application of the CRISP-D methodology (Cross
Industry Standard Process for Data Mining).
In this work, a review of the literature from 1982 to 2017 was made, in which the
applications of machine learning and data mining are analyzed to board the problem
with methods such as decision tree, neural networks, vector support machines (SVM),
naive bayes, uniform random, k-nearest neighbor (KNN), logistic regression (LR),
among others, with which prediction rules are generated based on a group of
management indicators that can be used in the design of educational policies to
determine the reasons for some inefficiencies of the HEIs.
The work [4] carries out a master's thesis work, where the objective of the research
was based on using multivariate statistical techniques: SVM, Discriminant Analysis
(DA), KNN, and LR to classify undergraduate students at the Universidad Nacional de
Colombia located in two towns of Medellin (with the possibility or not of dropout),
based on the information that was available on the variables defined and identified as
determinants of student dropout University.
For this study, the information provided by the students who entered at the
Universidad Nacional de Colombia from the first semester of 2009 to the first semester
of 2016 was used, their corresponding academic performance in each enrolled period
and the identification of which of them lost the quality of student at the university due
to poor performance and which continued with their studies, which allowed to have a
percentage of data that were used for the training of the models and the rest of the data
as validation. The results allowed us to identify the technique to obtain the model with
a lower percentage of error and greater sensitivity, and that could be used to make
predictions of dropout in new individuals from the information of the selected variables.
There are related works in which the use of techniques of expert systems and data
mining allow to establish prediction models, with which we help the person in charge
in the taking of these. The paper [5] shows the results of research whose purpose is to
36
María del Pilar Meza Bucio, Gustavo Alfonso Gutiérrez Carreón
Research in Computing Science 151(1), 2022

evaluate the technical efficiency of HEIs in Colombia between the years 2011-2013,
through the application of data envelope analysis and data mining techniques.
In [6], a model is proposed to detect possible dropouts in Higher Education in a
public university, where they suggest two proposals for the quantification of dropout:
The first, is established as the proportion of students who graduate in a certain time that
corresponds to the duration of the career; and the second is simply the number of
students who dropout.
To reduce dropout, these investigations propose to improve the mechanisms of early
detection of potential deserters. To elaborate their research, they used some methods:
logistic regression, k-nearest neighbors, decision trees including random forests,
Bayesian networks, neural networks, among others.
3 Method
For this project, variables were chosen that identified each student of the Facultad de
Contaduria y Ciencias Administrativas of the UMSNH, studies previously prepared by
researchers from other universities were taken as a reference, as is the case of the
Universidad Complutense de Madrid, where they carried out a study to determine
academic success/failure, using the techniques of multiple linear regression and logistic
regression [7].
In this part of the work, the variables that are considered to have an impact on the
dropout rate of the students of the bachelor’s Degrees in Facultad de Contaduria y
Ciencias Administrativas of the UMSNH will be described. In addition, the conceptual
model is presented that will allow us to understand the interaction of the variables to
later develop the Data Analysis Model.
[8] Take into consideration making a rigorous separation of the types of dropouts for
their study. The authors explain that student dropout can be understood from two points
of view: temporal and space. As a temporary concept, they identify three types of
dropouts:
1. Premature dropout: when a student leaves a program before been accepted.
2. Early dropout: when the program is abandoned during the first four semesters.
3. Late dropout: understood as abandonment from the fifth semester onwards.
Secondly, as a space concept, reference is made to the fact that a student:
1. Change programs within the same institution.
2. Change educational institutions.
3. Leave the educational system, where there is the possibility of re-entry in the
future, either to the same or to another campus in the country.
For the analysis that will be carried out in this work, the dropout will be taken as a
decision to abandon the academic program, which may become temporary or
definitive. With the data that we have from the Control Escolar of the UMSNH, it is
difficult to track whether the students who have enrolled have temporarily dropped out,
therefore, it must be conceived of dropout in general and therefore a survey will be
applied in which the reasons for dropout will be detected to analyze the data.
37
Decision Tree-Based Model to Determine Student’s Dropout Factors ...
Research in Computing Science 151(1), 2022
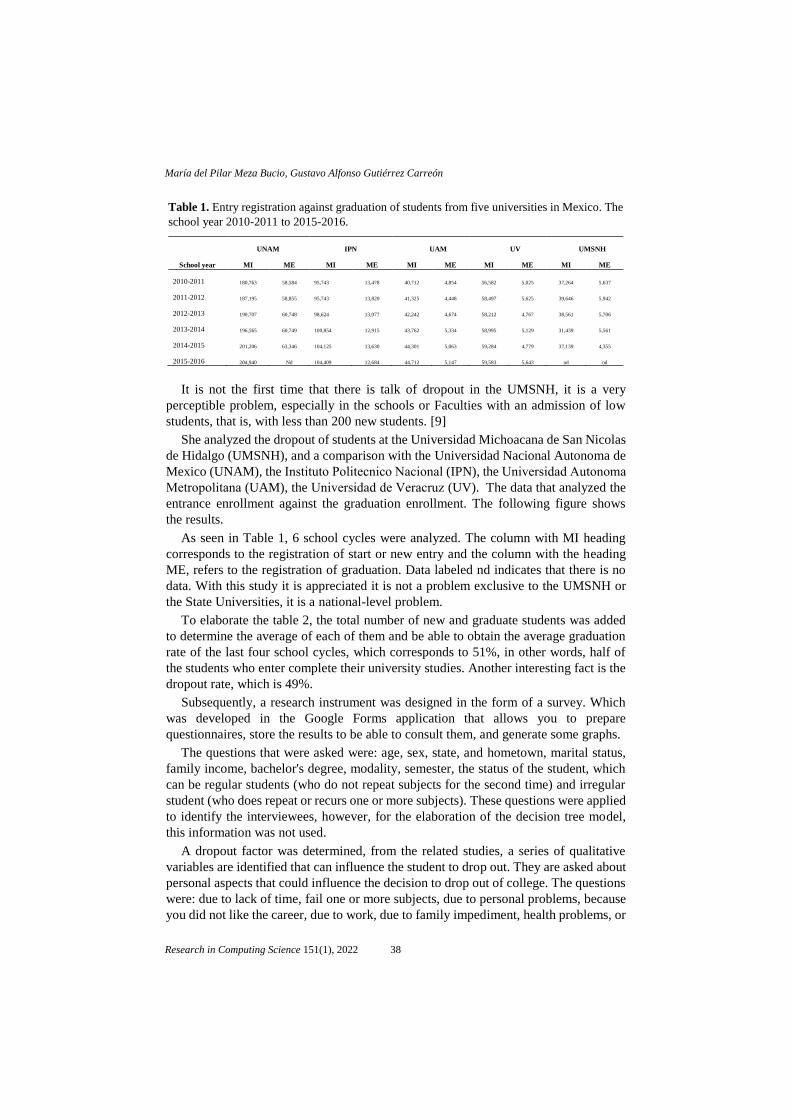
It is not the first time that there is talk of dropout in the UMSNH, it is a very
perceptible problem, especially in the schools or Faculties with an admission of low
students, that is, with less than 200 new students. [9]
She analyzed the dropout of students at the Universidad Michoacana de San Nicolas
de Hidalgo (UMSNH), and a comparison with the Universidad Nacional Autonoma de
Mexico (UNAM), the Instituto Politecnico Nacional (IPN), the Universidad Autonoma
Metropolitana (UAM), the Universidad de Veracruz (UV). The data that analyzed the
entrance enrollment against the graduation enrollment. The following figure shows
the results.
As seen in Table 1, 6 school cycles were analyzed. The column with MI heading
corresponds to the registration of start or new entry and the column with the heading
ME, refers to the registration of graduation. Data labeled nd indicates that there is no
data. With this study it is appreciated it is not a problem exclusive to the UMSNH or
the State Universities, it is a national-level problem.
To elaborate the table 2, the total number of new and graduate students was added
to determine the average of each of them and be able to obtain the average graduation
rate of the last four school cycles, which corresponds to 51%, in other words, half of
the students who enter complete their university studies. Another interesting fact is the
dropout rate, which is 49%.
Subsequently, a research instrument was designed in the form of a survey. Which
was developed in the Google Forms application that allows you to prepare
questionnaires, store the results to be able to consult them, and generate some graphs.
The questions that were asked were: age, sex, state, and hometown, marital status,
family income, bachelor's degree, modality, semester, the status of the student, which
can be regular students (who do not repeat subjects for the second time) and irregular
student (who does repeat or recurs one or more subjects). These questions were applied
to identify the interviewees, however, for the elaboration of the decision tree model,
this information was not used.
A dropout factor was determined, from the related studies, a series of qualitative
variables are identified that can influence the student to drop out. They are asked about
personal aspects that could influence the decision to drop out of college. The questions
were: due to lack of time, fail one or more subjects, due to personal problems, because
you did not like the career, due to work, due to family impediment, health problems, or
Table 1. Entry registration against graduation of students from five universities in Mexico. The
school year 2010-2011 to 2015-2016.
School year
UNAM IPN UAM UV UMSNH
MI ME MI ME MI ME MI ME MI ME
2010-2011 180,763 58,584 95,743 13,478 40,712 4,854 56,582 5,025 37,264 5,637
2011-2012 187,195 58,855 95,743 13,820 41,325 4,448 58,497 5,625 39,646 5,942
2012-2013 190,707 60,748 98,624 13,077 42,242 4,674 58,212 4,767 38,561 5,706
2013-2014 196,565 60,749 100,854 12,915 43,762 5,334 58,995 5,129 31,439 5,561
2014-2015 201,206 63,346 104,125 13,630 44,301 5,063 59,284 4,779 37,139 4,355
2015-2016 204,940 Nd 104,409 12,684 44,712 5,147 59,583 5,643 nd nd
38
María del Pilar Meza Bucio, Gustavo Alfonso Gutiérrez Carreón
Research in Computing Science 151(1), 2022
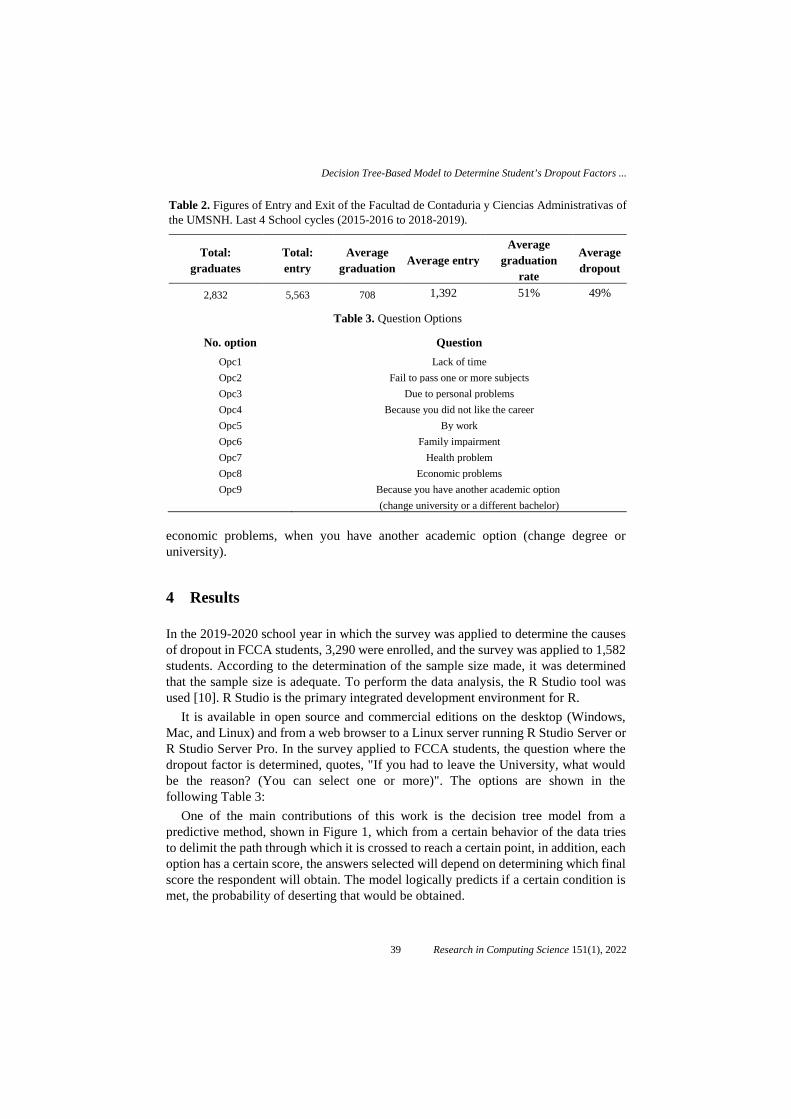
economic problems, when you have another academic option (change degree or
university).
4 Results
In the 2019-2020 school year in which the survey was applied to determine the causes
of dropout in FCCA students, 3,290 were enrolled, and the survey was applied to 1,582
students. According to the determination of the sample size made, it was determined
that the sample size is adequate. To perform the data analysis, the R Studio tool was
used [10]. R Studio is the primary integrated development environment for R.
It is available in open source and commercial editions on the desktop (Windows,
Mac, and Linux) and from a web browser to a Linux server running R Studio Server or
R Studio Server Pro. In the survey applied to FCCA students, the question where the
dropout factor is determined, quotes, "If you had to leave the University, what would
be the reason? (You can select one or more)". The options are shown in the
following Table 3:
One of the main contributions of this work is the decision tree model from a
predictive method, shown in Figure 1, which from a certain behavior of the data tries
to delimit the path through which it is crossed to reach a certain point, in addition, each
option has a certain score, the answers selected will depend on determining which final
score the respondent will obtain. The model logically predicts if a certain condition is
met, the probability of deserting that would be obtained.
Table 2. Figures of Entry and Exit of the Facultad de Contaduria y Ciencias Administrativas of
the UMSNH. Last 4 School cycles (2015-2016 to 2018-2019).
Total:
graduates
Total:
entry
Average
graduation Average entry
Average
graduation
rate
Average
dropout
2,832 5,563 708 1,392 51% 49%
Table 3. Question Options
No. option Question
Opc1 Lack of time
Opc2 Fail to pass one or more subjects
Opc3 Due to personal problems
Opc4 Because you did not like the career
Opc5 By work
Opc6 Family impairment
Opc7 Health problem
Opc8 Economic problems
Opc9 Because you have another academic option
(change university or a different bachelor)
39
Decision Tree-Based Model to Determine Student’s Dropout Factors ...
Research in Computing Science 151(1), 2022
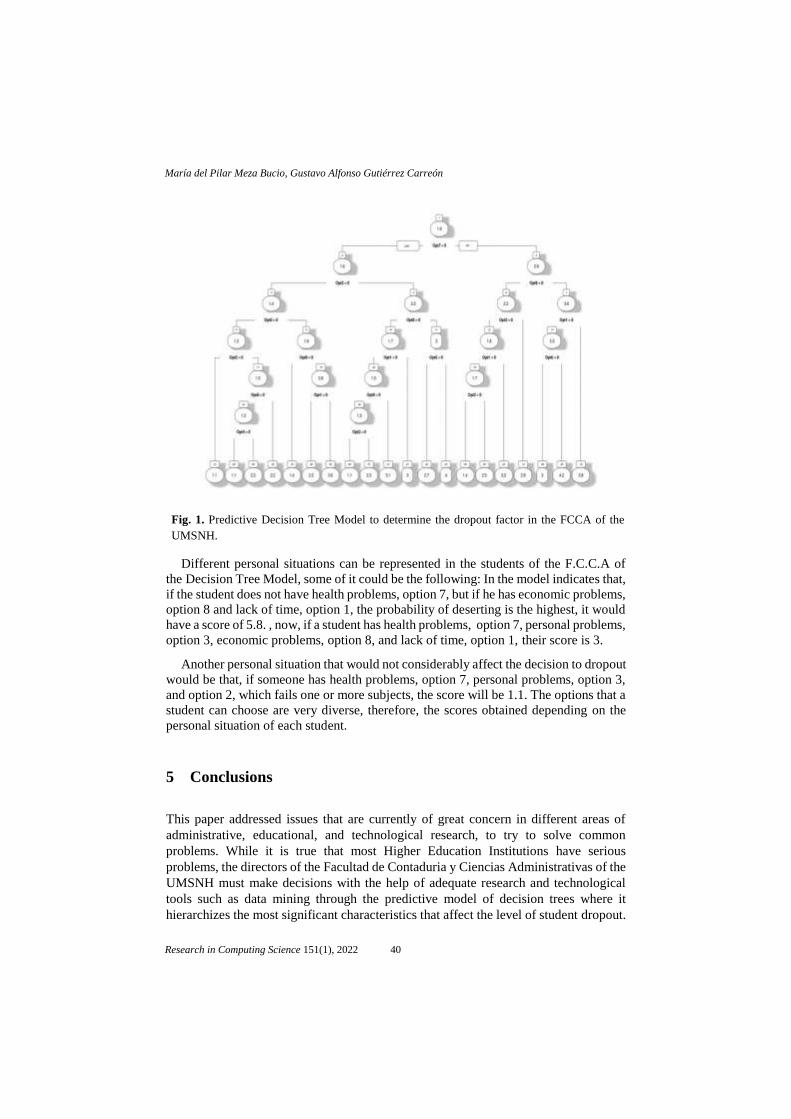
Different personal situations can be represented in the students of the F.C.C.A of
the Decision Tree Model, some of it could be the following: In the model indicates that,
if the student does not have health problems, option 7, but if he has economic problems,
option 8 and lack of time, option 1, the probability of deserting is the highest, it would
have a score of 5.8. , now, if a student has health problems, option 7, personal problems,
option 3, economic problems, option 8, and lack of time, option 1, their score is 3.
Another personal situation that would not considerably affect the decision to dropout
would be that, if someone has health problems, option 7, personal problems, option 3,
and option 2, which fails one or more subjects, the score will be 1.1. The options that a
student can choose are very diverse, therefore, the scores obtained depending on the
personal situation of each student.
5 Conclusions
This paper addressed issues that are currently of great concern in different areas of
administrative, educational, and technological research, to try to solve common
problems. While it is true that most Higher Education Institutions have serious
problems, the directors of the Facultad de Contaduria y Ciencias Administrativas of the
UMSNH must make decisions with the help of adequate research and technological
tools such as data mining through the predictive model of decision trees where it
hierarchizes the most significant characteristics that affect the level of student dropout.
Fig. 1. Predictive Decision Tree Model to determine the dropout factor in the FCCA of the
UMSNH.
40
María del Pilar Meza Bucio, Gustavo Alfonso Gutiérrez Carreón
Research in Computing Science 151(1), 2022
Although funding problems may prevail at the UMSNH, late dropout rates must be
avoided [11] to increase enrollment and decrease their dropout rates, otherwise, there
will be negative consequences, which can impact not only on the aspect of FCCA
enrollment but also on university enrollment and even more on the population
in general.
References
1. Elias, T.: Learning analytics. Learning, pp. 1–22 (2011)
2. Orea, S. V., Vargas, A. S., Alonso, M. G.: Minería de datos: predicción de la deserción
escolar mediante el algoritmo de árboles de decisión y el algoritmo de los k vecinos más
cercanos, 779(73), pp. 33 (2005)
3. Felizzola, H. A., Arias, Y. A. J., Pedroza, F. V., Pastrana, A. M. C.: Modelo de predicción
para la deserción temprana en la Facultad de Ingeniería de la Universidad de la Salle.
Encuentro Internacional de Educación en Ingeniería (2018)
4. Madrid-Echeverry, J. I.: Propuesta de un modelo estadístico para caracterizar y predecir la
deserción estudiantil Universitaria. Escuela de Ingeniería de la Organización (2017)
5. Cadavid, D. V., Mendoza, A. M., Rodríguez, E. C.: Eficiencia en las instituciones de
educación superior públicas colombianas: una aplicación del análisis envolvente de datos.
Civilizar: Ciencias Sociales y Humanas, 16(30), pp. 105–118 (2016)
6. Noboa, C., Ordóñez, M., Magallanes, J.: Statistical Learning to Detect Potential Dropouts
in Higher Education: A Public University Case Study. Learning Analytics for Latin
America, 2231, pp. 12–21 (2018)
7. Jiménez, M. V. G., Izquierdo, J. M. A., Blanco, A. J.: La predicción del rendimiento
académico: regresión lineal versus regresión logística. Psicothema, 12(Su2), pp. 248–525
(2000)
8. Vásquez-Velásquez, J., Castaño-Vélez, E. A., Gallón-Gómez, S. A., Gómez- Portilla, K.:
Determinantes de la deserción estudiantil en la Universidad de Antioquia (2003)
9. Rodriguez, M. G. O.: Deserción de estudiantes de licenciatura de la UMSNH Análisis y
propuesta de solución. Economía y Sociedad, 22(38), pp. 15–32 (2018)
10. Gandrud, C.: Reproducible research with R and R studio. CRC Press (2013)
11. Vélez, E. C., Gómez, S. G., Portilla, K. G., Velásquez, J. V.: Análisis de los factores
asociados a la deserción y graduación estudiantil universitaria. Lecturas de economía, 65,
pp. 9–36 (2006)
41
Decision Tree-Based Model to Determine Student’s Dropout Factors ...
Research in Computing Science 151(1), 2022

Generation of Twitter Information Databases: A Case Study for the Mobility of People Infected with COVID-19
Alicia Martínez-Rebollar, Pedro Wences-Olguin, Gilberto Palacios-Gonzalez, Hugo Estrada-Esquivel, Yasmin Hernandez-Perez
Tecnológico Nacional de México, National Center for Research and Technological Development,
Mexico
{alicia.mr, d15ce096, m20ce067, hugo.ee, yasmin.hp}@cenidet.tecnm.mx
Abstract. Social networks are fundamental tools today for common day life but also for research purposes. The main objective of social network platforms is allowing the users to interact among them using internet. This user interaction generates a significant amount of data daily. However, accessing this information can be quite difficult for inexperienced developers. The objective of this paper is to detail the process for extracting unstructured information from the social network Twitter, and structuring it in a database. which can be used for analysis in data mining processes. This process is presented through a case study that analyzes possible places of contagion of the pandemic disease COVID 19 in Mexico.
Keywords: social networks, twitter extraction, user mobility.
1 Introduction
Social networks generate a large amount of data as result of users interaction. Two goods examples of this big data generation through the social networks are Twitter and Facebook [1]. Several research groups in the world has found the advantages that can be obtained by analyzing the different data generated in social networks within the category of big data [2].
The large amount of data generated by the users’ interaction in social networks has given rise to new disciplinary fields, such as data science, computational social sciences and even other disciplinary initiatives [3].
As an example of the large amount of data produces by social networks, the social network Twitter has more than 300 million users that produce an average of 7,000 tweets per second [4]. In this way, Twitter has become one of the most conducive virtual environments for collecting large volumes of data. However, one of the main issues in the use of big data coming from social networks is the access to the information, which could be complicated for inexperienced developers.
43 Research in Computing Science 151(1), 2022pp. 43–50; rec. 2021-07-22; acc. 2021-09-30

This paper presents the process of extracting unstructured information from the social network Twitter and structuring it to be stored in a database. In order to demonstrate the proposed process, a case study is presented that use Twitter data for the analysis of possible places of contagion of the pandemic disease COVID 19 in Mexico. The paper is organized as follows: Section 2 shows the background and related works. Section 3 presents the description of our proposal. Section 4 details the generation of databases for data mining. Section 5 shows the tests carried out, and finally section 6 shows the conclusions and future work.
2 Background and Related Work
2.1 Social Networks: Twitter
Social networks are defined as web-based services that allow individuals to construct a public or semi-public profile within a bounded system, to articulate a list of other users with whom they share a connection, and also enables the use to view and traverse their list of connections and those made by others within the system [5].
One of the advantages of social networks is the possibility of use the location of user for monitoring the changes that exist in human mobility. The extraction of information from social networks allows exploring a wide range of fields of study, including public health, surveillance, migration, among others [6].
Twitter is a social network to share ideas and information in short messages of up to 280 characters. This social network has 322 million active users, and it is based on the publication and display of user content for followers as well as open publications that can be seen for any Twitter user [4]. Currently, there are two endpoints that can be used to access user tweets: Filtered stream and Search Tweets
2.2 Related Work
This section presents research works focus on obtaining information from the Twitter social network, as well as works related to the mobility of people considering the information obtained from Twitter. Some authors have focused on how to structure the data considering the mentions, retweets and replies that are generated, hashtags used and what resources have been shared, be they images, web pages or other resources [7].
Some other authors apply techniques to obtain the information from the Twitter social network to make an automatic linguistic analysis of the Twitter texts [8]. However, the social network Twitter makes updates that require modifications to the way for accessing the twitter data. Other related works are focused on the use of Twitter data for analyzing mobility of people through the information they publish in the app.
For example, in [9], the authors proposed an approach to analyze and predict the regularities in human mobility. In research work [10], the authors propose the use of Twitter to obtain valuable information on human mobility. Therefore, their objective was to discover the patterns and mobility of Location-Based Social Networks, such as Twitter. In the research work [11], the authors addressed the exploitation of data
44
Alicia Martínez-Rebollar, Pedro Wences-Olguin, Gilberto Palacios-Gonzalez, et al.
Research in Computing Science 151(1), 2022
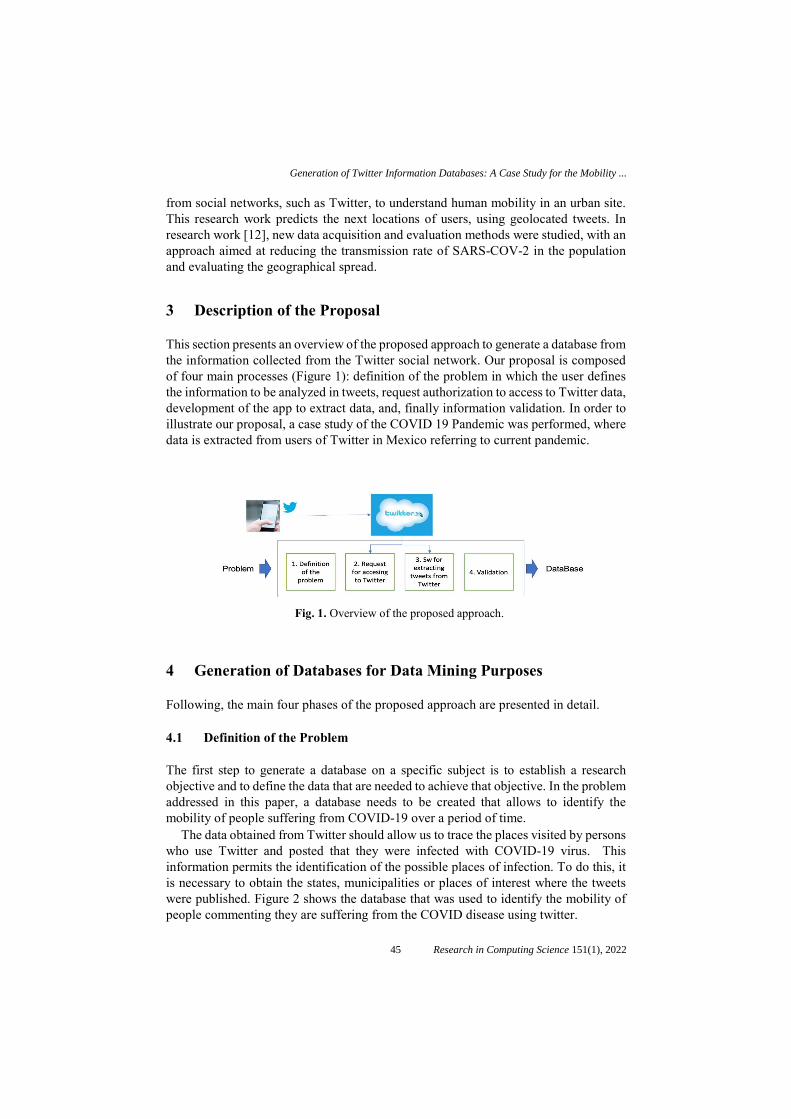
from social networks, such as Twitter, to understand human mobility in an urban site. This research work predicts the next locations of users, using geolocated tweets. In research work [12], new data acquisition and evaluation methods were studied, with an approach aimed at reducing the transmission rate of SARS-COV-2 in the population and evaluating the geographical spread.
3 Description of the Proposal
This section presents an overview of the proposed approach to generate a database from the information collected from the Twitter social network. Our proposal is composed of four main processes (Figure 1): definition of the problem in which the user defines the information to be analyzed in tweets, request authorization to access to Twitter data, development of the app to extract data, and, finally information validation. In order to illustrate our proposal, a case study of the COVID 19 Pandemic was performed, where data is extracted from users of Twitter in Mexico referring to current pandemic.
4 Generation of Databases for Data Mining Purposes
Following, the main four phases of the proposed approach are presented in detail.
4.1 Definition of the Problem
The first step to generate a database on a specific subject is to establish a research objective and to define the data that are needed to achieve that objective. In the problem addressed in this paper, a database needs to be created that allows to identify the mobility of people suffering from COVID-19 over a period of time.
The data obtained from Twitter should allow us to trace the places visited by persons who use Twitter and posted that they were infected with COVID-19 virus. This information permits the identification of the possible places of infection. To do this, it is necessary to obtain the states, municipalities or places of interest where the tweets were published. Figure 2 shows the database that was used to identify the mobility of people commenting they are suffering from the COVID disease using twitter.
Fig. 1. Overview of the proposed approach.
45
Generation of Twitter Information Databases: A Case Study for the Mobility ...
Research in Computing Science 151(1), 2022
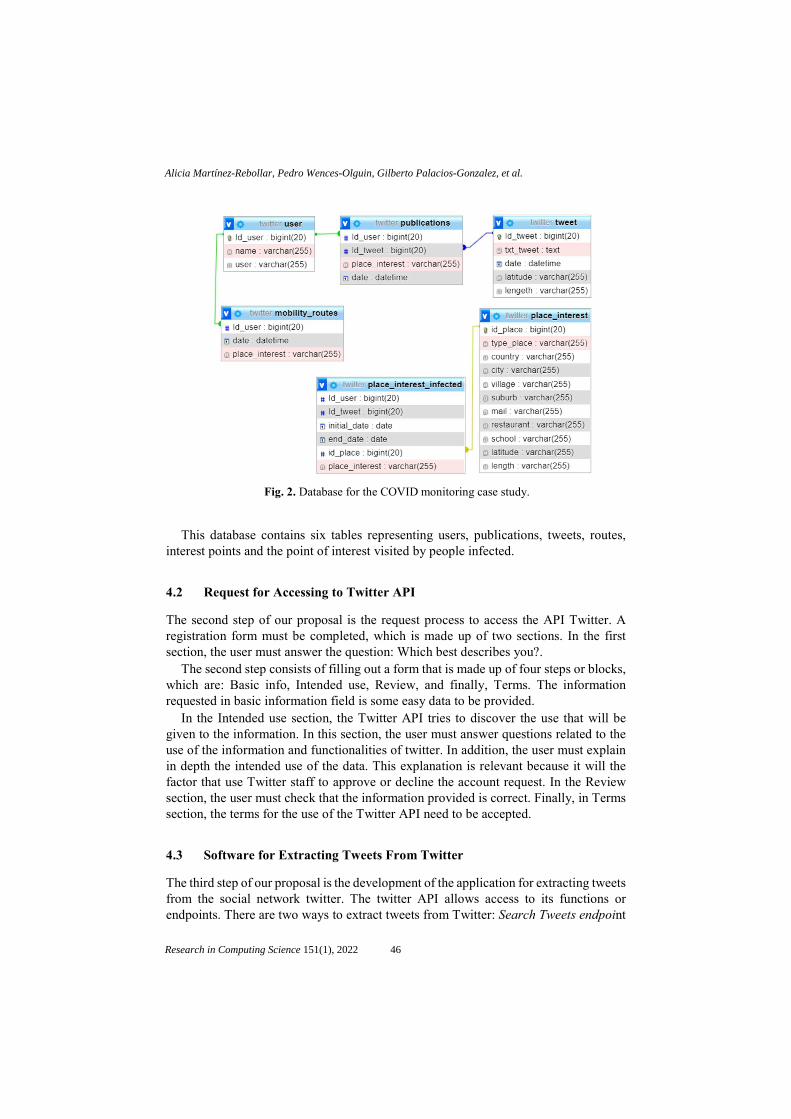
This database contains six tables representing users, publications, tweets, routes, interest points and the point of interest visited by people infected.
4.2 Request for Accessing to Twitter API
The second step of our proposal is the request process to access the API Twitter. A registration form must be completed, which is made up of two sections. In the first section, the user must answer the question: Which best describes you?.
The second step consists of filling out a form that is made up of four steps or blocks, which are: Basic info, Intended use, Review, and finally, Terms. The information requested in basic information field is some easy data to be provided.
In the Intended use section, the Twitter API tries to discover the use that will be given to the information. In this section, the user must answer questions related to the use of the information and functionalities of twitter. In addition, the user must explain in depth the intended use of the data. This explanation is relevant because it will the factor that use Twitter staff to approve or decline the account request. In the Review section, the user must check that the information provided is correct. Finally, in Terms section, the terms for the use of the Twitter API need to be accepted.
4.3 Software for Extracting Tweets From Twitter
The third step of our proposal is the development of the application for extracting tweets from the social network twitter. The twitter API allows access to its functions or endpoints. There are two ways to extract tweets from Twitter: Search Tweets endpoint
Fig. 2. Database for the COVID monitoring case study.
46
Alicia Martínez-Rebollar, Pedro Wences-Olguin, Gilberto Palacios-Gonzalez, et al.
Research in Computing Science 151(1), 2022
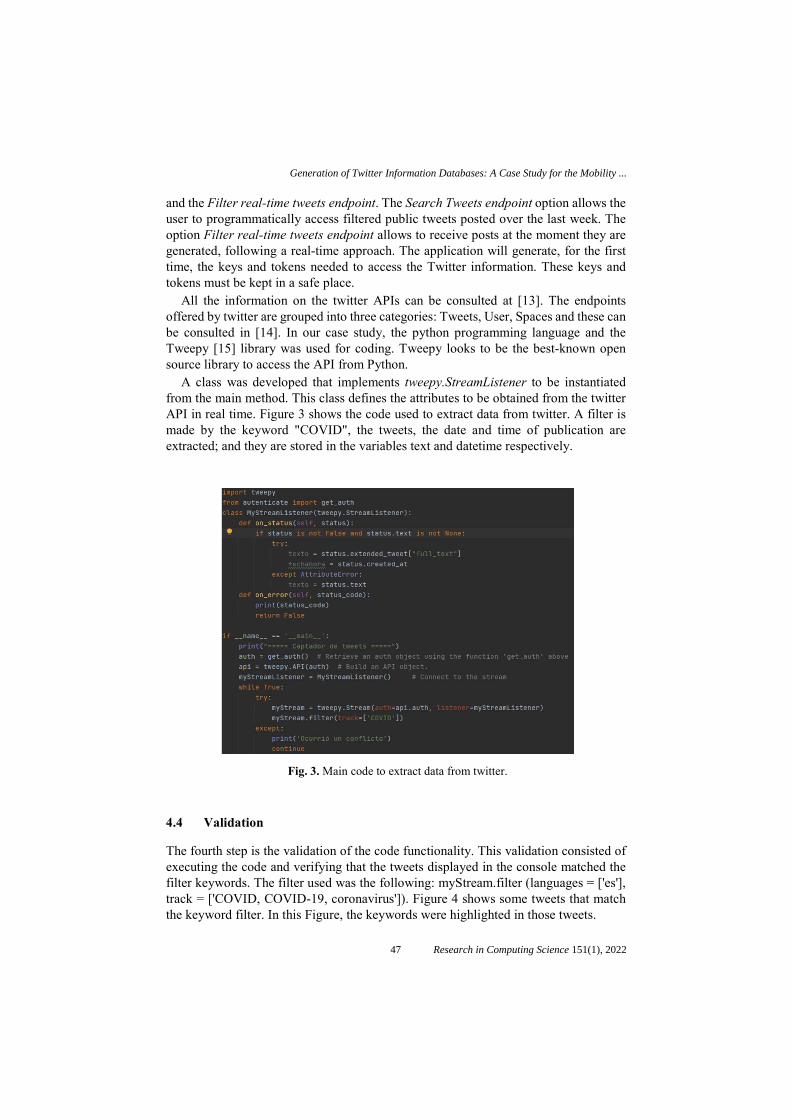
and the Filter real-time tweets endpoint. The Search Tweets endpoint option allows the user to programmatically access filtered public tweets posted over the last week. The option Filter real-time tweets endpoint allows to receive posts at the moment they are generated, following a real-time approach. The application will generate, for the first time, the keys and tokens needed to access the Twitter information. These keys and tokens must be kept in a safe place.
All the information on the twitter APIs can be consulted at [13]. The endpoints offered by twitter are grouped into three categories: Tweets, User, Spaces and these can be consulted in [14]. In our case study, the python programming language and the Tweepy [15] library was used for coding. Tweepy looks to be the best-known open source library to access the API from Python.
A class was developed that implements tweepy.StreamListener to be instantiated from the main method. This class defines the attributes to be obtained from the twitter API in real time. Figure 3 shows the code used to extract data from twitter. A filter is made by the keyword "COVID", the tweets, the date and time of publication are extracted; and they are stored in the variables text and datetime respectively.
4.4 Validation
The fourth step is the validation of the code functionality. This validation consisted of executing the code and verifying that the tweets displayed in the console matched the filter keywords. The filter used was the following: myStream.filter (languages = ['es'], track = ['COVID, COVID-19, coronavirus']). Figure 4 shows some tweets that match the keyword filter. In this Figure, the keywords were highlighted in those tweets.
Fig. 3. Main code to extract data from twitter.
47
Generation of Twitter Information Databases: A Case Study for the Mobility ...
Research in Computing Science 151(1), 2022
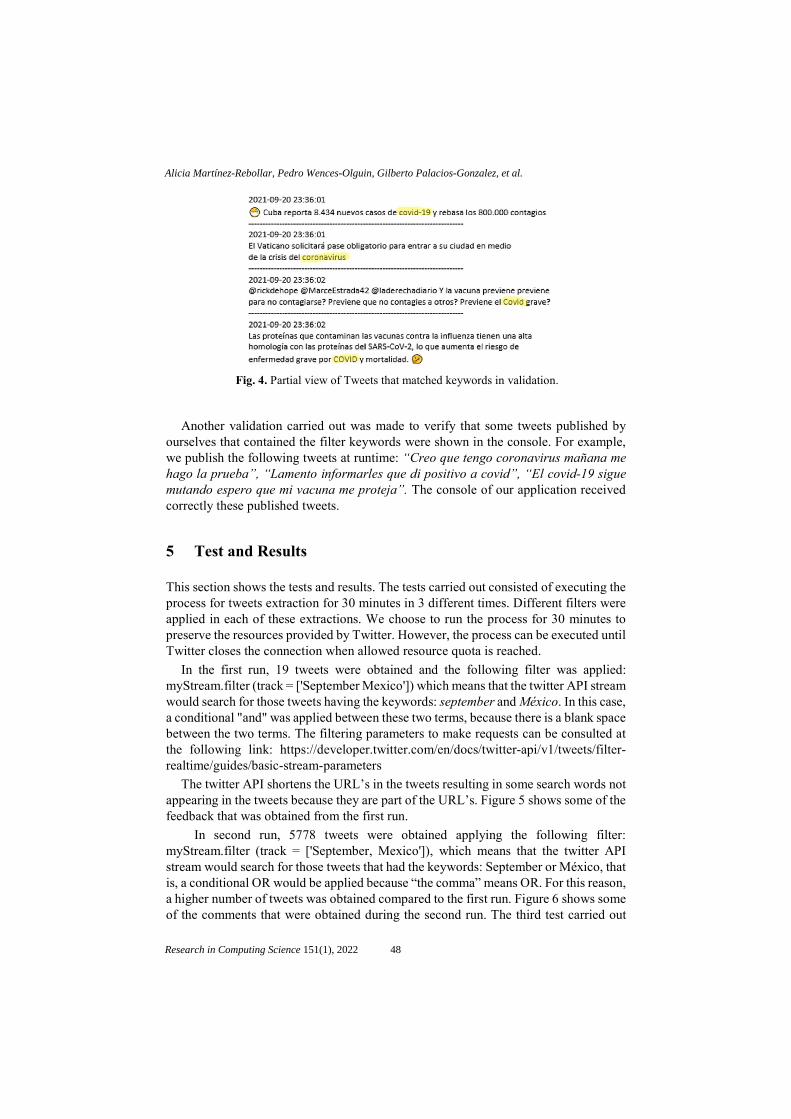
Another validation carried out was made to verify that some tweets published by ourselves that contained the filter keywords were shown in the console. For example, we publish the following tweets at runtime: “Creo que tengo coronavirus mañana me hago la prueba”, “Lamento informarles que di positivo a covid”, “El covid-19 sigue mutando espero que mi vacuna me proteja”. The console of our application received correctly these published tweets.
5 Test and Results
This section shows the tests and results. The tests carried out consisted of executing the process for tweets extraction for 30 minutes in 3 different times. Different filters were applied in each of these extractions. We choose to run the process for 30 minutes to preserve the resources provided by Twitter. However, the process can be executed until Twitter closes the connection when allowed resource quota is reached.
In the first run, 19 tweets were obtained and the following filter was applied: myStream.filter (track = ['September Mexico']) which means that the twitter API stream would search for those tweets having the keywords: september and México. In this case, a conditional "and" was applied between these two terms, because there is a blank space between the two terms. The filtering parameters to make requests can be consulted at the following link: https://developer.twitter.com/en/docs/twitter-api/v1/tweets/filter-realtime/guides/basic-stream-parameters
The twitter API shortens the URL’s in the tweets resulting in some search words not appearing in the tweets because they are part of the URL’s. Figure 5 shows some of the feedback that was obtained from the first run.
In second run, 5778 tweets were obtained applying the following filter: myStream.filter (track = ['September, Mexico']), which means that the twitter API stream would search for those tweets that had the keywords: September or México, that is, a conditional OR would be applied because “the comma” means OR. For this reason, a higher number of tweets was obtained compared to the first run. Figure 6 shows some of the comments that were obtained during the second run. The third test carried out
Fig. 4. Partial view of Tweets that matched keywords in validation.
48
Alicia Martínez-Rebollar, Pedro Wences-Olguin, Gilberto Palacios-Gonzalez, et al.
Research in Computing Science 151(1), 2022
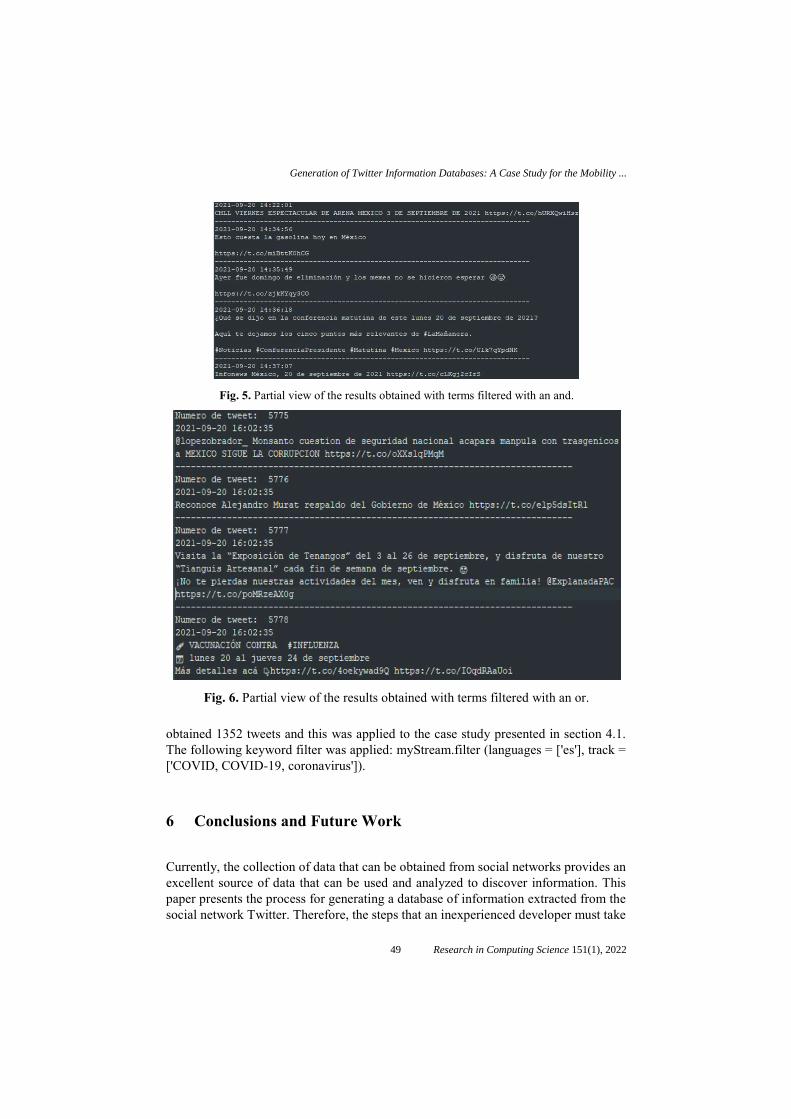
obtained 1352 tweets and this was applied to the case study presented in section 4.1. The following keyword filter was applied: myStream.filter (languages = ['es'], track = ['COVID, COVID-19, coronavirus']).
6 Conclusions and Future Work
Currently, the collection of data that can be obtained from social networks provides an excellent source of data that can be used and analyzed to discover information. This paper presents the process for generating a database of information extracted from the social network Twitter. Therefore, the steps that an inexperienced developer must take
Fig. 5. Partial view of the results obtained with terms filtered with an and.
Fig. 6. Partial view of the results obtained with terms filtered with an or.
49
Generation of Twitter Information Databases: A Case Study for the Mobility ...
Research in Computing Science 151(1), 2022
to carry out the information extraction are discussed. This process will allow her/him to avoid common mistakes when carrying out this extraction process from Twitter.
Each of the steps presented is detailed using a case study. The main challenge in the work presented as future work is to develop a tool that allows us to analyze the mobility patterns that Twitter users have, facing the fact that currently, Twitter has restricted the exact location where a tweet is published for user safety reasons. The next objective of the system will be to produce statistics and draw reliable routes that allow the behavior and interaction of sick people to be analyzed.
References
1. Puyol, J.: Una aproximación a Big Data. Revista de Derecho UNED. (14), pp. 471–503, (2014)
2. Song, X., Shibasaki, R., Jing, N., Xing, X., Li, T., Adachi, R.: DeepMob: Learning Deep Knowledge of Human Emergency Behavior and Mobility from Big and Heterogeneous Data. ACM Transactions on Information Systems, 35, pp. 1–4 (2017)
3. Rocha, M., Elena, M.: Grandes datos, grandes desafíos para las ciencias sociales. Revista Mexicana de Sociología, 80, pp. 2–6 (2018)
4. Statista, https://es.statista.com/estadisticas/636174/numero-de-usuarios- mensuales-activos-de-twitter-en-el-mundo, last accessed 2021/09/20
5. Boyd, D., Ellison, N. B.: Social Network Sites: Definition, History and Scholarship. Journal of Computer-Mediated Communication. Journal of Computer-Mediated Communication, 13, pp. 210–230 (2007)
6. Osorio, J.: Análisis de los patrones espacio-temporales de eventos a partir de datos de Twitter: el caso de la World Pride 2017 en Madrid. Estudios Geográficos, 81, pp. 1–12, (2020)
7. Domingo, M., Minguillón, J.: Modelado, extracción y análisis de información del flujo de datos de Twitter. Universitat Oberta de Catalunya, (2012)
8. Blasco, E.: Aplicación de técnicas de minería de datos en redes sociales/web, Master. Universidad Politécnica de Valencia, (2015)
9. Comito, C., Human Mobility Prediction through Twitter. Procedia Computer Science, 134, pp. 129–136 (2018)
10. Al-Jeri, M.: Towards Human Mobility Detection Scheme for Location-Based Social Network. pp. 1–7, (2019)
11. Comito, C.: Minería de la movilidad humana de los medios sociales para apoyar la informática urbana. pp. 514–521 (2019)
12. Gao, S., Rao, J., Kang, Y., Liang, Y., Kruse, J.: Mapping county-level mobility pattern changes in the United States in response to COVID-19. 12, pp. 16–26 (2020)
13. Twitter API, https://developer.twitter.com/en/docs/twitter-api, last accessed 2021/09/20 14. Twitter API v2, https://documenter.getpostman.com/view/9956214 / T1LMiT5U#4a6cc2e6-
5c99-421a-b1f0-ba9f170dce97, last accessed 2021/09/20 15. Tweepy, http://www.tweepy.org, last accessed 2021/09/20
50
Alicia Martínez-Rebollar, Pedro Wences-Olguin, Gilberto Palacios-Gonzalez, et al.
Research in Computing Science 151(1), 2022
Training Readability Comparators for AcademicTexts at Different Levels
Jose Medardo Tapia-Tellez1, Aurelio Lopez-Lopez1,Jesus Miguel Garcıa-Gorrostieta2
1 Instituto Nacional de Astrofısica Optica y Electronica, Puebla,Mexico
2 Universidad de la Sierra, Sonora,Mexico
{[email protected], allopez}@[email protected]
Abstract. Developing machine learning tools to aid students in theprocess of writing a thesis document is of great interest to students,universities, supervisors and evaluation committees. This article presentsthe construction and evaluation of readability comparators based inSpanish-written thesis documents of four different academic levels:Advanced College Level Technician (ACT), Undergraduate, Masterand Doctoral. Specifically, we provide comparators that can evaluate,between two thesis texts which one is more readable than the other;the thesis sections we focus are: Problem Statement, Results andJustification. The successful completion of these different comparators,as shown in our results, opens the possibility for building a web-basedAPI that analyzes an input thesis draft section and determines whethercorresponds to its academic level or requires further improvement.
1 Introduction
The quest for aiding students in the production of a thesis document is a longtimeproblem that affects universities, thesis supervisors, and committees. Accordingto [1], students in general demand flexible forms and structures of research thatcan explode the extensive use of new technologies. Our aim is to provide thebasis to develop these new technologies, specifically for writers in Spanish.
Computational-linguistic technologies such as word correctors or grammarcheckers have aided students in the production of a thesis document. We nowface a Machine Learning revolution, where tools such as Grammarly3, advertisedas the world’s most accurate online grammar checker, assists students and publicin general in writing documents of any kind. Such tools are very helpful but havesome limitations: first, they were developed for English, and secondly, they arespecifically focused on grammar. We need to develop, first these kind of tools for
3 https://www.grammarly.com
51 Research in Computing Science 151(1), 2022pp. 51–58; rec. 2021-07-22; acc. 2021-09-30
Spanish, and then, we must include deeper linguistic analysis in them. In thiswork, we report the first steps to reach a readability evaluator of thesis.
According to [2], text readability is the sum of all elements in textual materialthat affect a reader’s understanding, reading speed, and level of interest in thematerial. Our aim in this work is to build and contrast machine learning-basedcomparators that are capable to judge between a couple of thesis documentsections, indicating which one is more readable than the other. We tackle thistask through the use of thesis documents of four different academic levels andwe build the comparators based on a previously proposed methodology [9].
The document is organized as follows. Section 2 details related work to ourresearch. Section 3 presents the data-set along with its statistics. Section 4describes the methodology for the comparators and the experiments. Resultsand analysis appear in Section 5, and we conclude in Section 6 with futuredirections.
2 Related Work
To obtain an extensive background on how readability of texts is assessedautomatically we found [3]. They review the state-of-the-art algorithms inautomatic modeling and predicting the reading difficulty of texts, and also listnew challenges and opportunities in the area. In general, studies on this area fallwithin regression and classification, however, one can find research that treatsthis task as a pairwise problem. This paper allowed to point out the not soexplored idea of utilizing comparators as a machine learning tool to evaluatetext readability on documents written in Spanish.
The work of [9] successfully builds a comparator through machine learningthat can judge text readability between two texts. They then utilize thiscomparator to sort a set of texts and present an application which retrievestexts with readability similar to that of a given input text. Here, we employ thiscomparator construction scheme but we implement it for Spanish-written thesesand focus on specific sections.
To build our comparator, a document representation suited for our typeof documents is needed. In [6], they combine lexical, syntactic, and discoursefeatures to produce a highly predictive model of human reader’s judgments oftext readability. This is a work that treats readability prediction as a pairwisepreference learning problem, thus estimating the relative difficulty of pairs ofdocuments instead of assigning a specific level. Through this work, we couldobtain state-of-the-art feature representation for our comparator.
Finally, since our interest is to use the comparators as tools to helpstudents in the process of thesis writing, papers as [7] are pertinent. Theyevaluate the quality of eBooks through text analytics and identify parts thatneed improvement. In [4], they theorize about the generation of an automaticvalidation for a text that contains information pertaining to a medical procedure,and give future approaches on why these tools are viable and important subjectof research.
52
José Medardo Tapia-Téllez, Aurelio López-López, Jesús Miguel García-Gorrostieta
Research in Computing Science 151(1), 2022
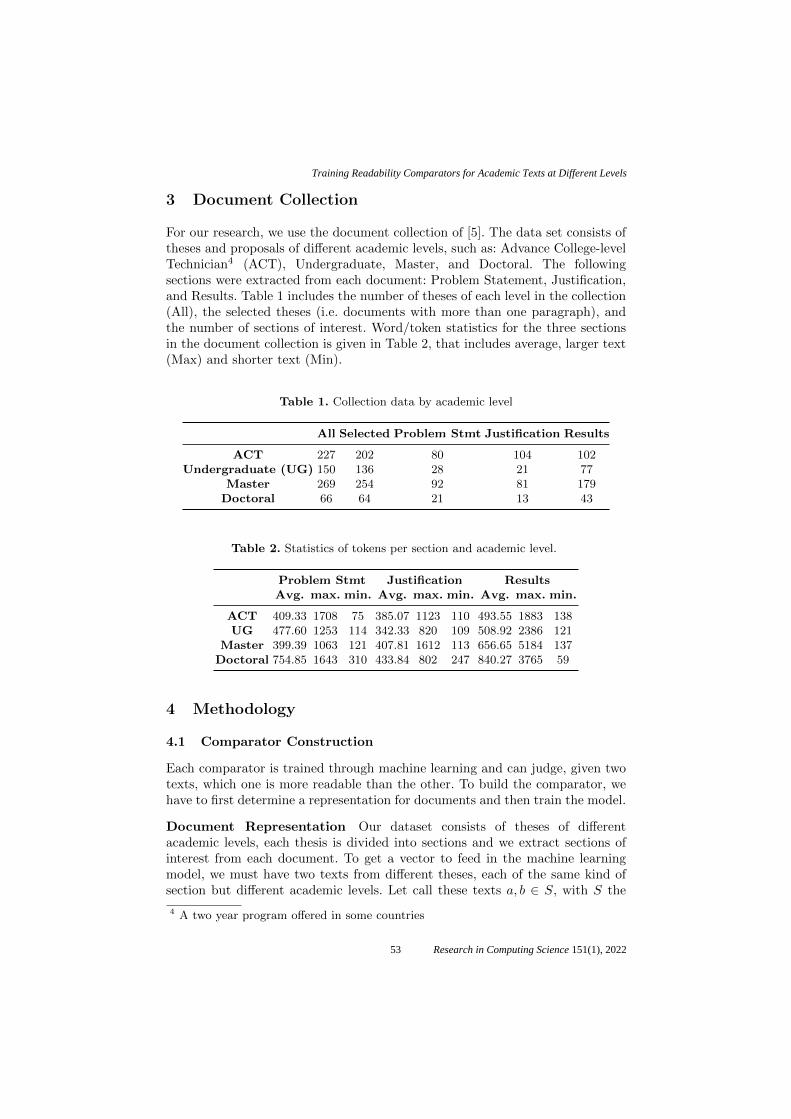
3 Document Collection
For our research, we use the document collection of [5]. The data set consists oftheses and proposals of different academic levels, such as: Advance College-levelTechnician4 (ACT), Undergraduate, Master, and Doctoral. The followingsections were extracted from each document: Problem Statement, Justification,and Results. Table 1 includes the number of theses of each level in the collection(All), the selected theses (i.e. documents with more than one paragraph), andthe number of sections of interest. Word/token statistics for the three sectionsin the document collection is given in Table 2, that includes average, larger text(Max) and shorter text (Min).
Table 1. Collection data by academic level
All Selected Problem Stmt Justification Results
ACT 227 202 80 104 102Undergraduate (UG) 150 136 28 21 77
Master 269 254 92 81 179Doctoral 66 64 21 13 43
Table 2. Statistics of tokens per section and academic level.
Problem Stmt Justification ResultsAvg. max. min. Avg. max. min. Avg. max. min.
ACT 409.33 1708 75 385.07 1123 110 493.55 1883 138UG 477.60 1253 114 342.33 820 109 508.92 2386 121
Master 399.39 1063 121 407.81 1612 113 656.65 5184 137Doctoral 754.85 1643 310 433.84 802 247 840.27 3765 59
4 Methodology
4.1 Comparator Construction
Each comparator is trained through machine learning and can judge, given twotexts, which one is more readable than the other. To build the comparator, wehave to first determine a representation for documents and then train the model.
Document Representation Our dataset consists of theses of differentacademic levels, each thesis is divided into sections and we extract sections ofinterest from each document. To get a vector to feed in the machine learningmodel, we must have two texts from different theses, each of the same kind ofsection but different academic levels. Let call these texts a, b ∈ S, with S the
4 A two year program offered in some countries
53
Training Readability Comparators for Academic Texts at Different Levels
Research in Computing Science 151(1), 2022
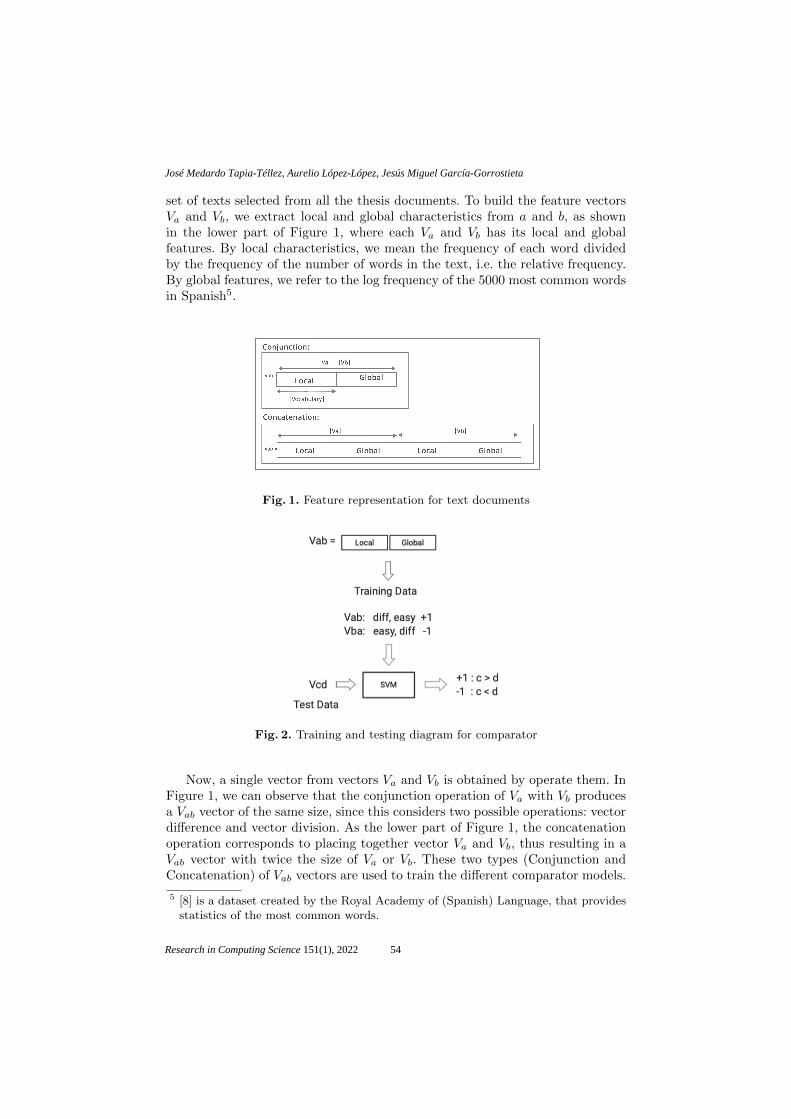
set of texts selected from all the thesis documents. To build the feature vectorsVa and Vb, we extract local and global characteristics from a and b, as shownin the lower part of Figure 1, where each Va and Vb has its local and globalfeatures. By local characteristics, we mean the frequency of each word dividedby the frequency of the number of words in the text, i.e. the relative frequency.By global features, we refer to the log frequency of the 5000 most common wordsin Spanish5.
Fig. 1. Feature representation for text documents
Fig. 2. Training and testing diagram for comparator
Now, a single vector from vectors Va and Vb is obtained by operate them. InFigure 1, we can observe that the conjunction operation of Va with Vb producesa Vab vector of the same size, since this considers two possible operations: vectordifference and vector division. As the lower part of Figure 1, the concatenationoperation corresponds to placing together vector Va and Vb, thus resulting in aVab vector with twice the size of Va or Vb. These two types (Conjunction andConcatenation) of Vab vectors are used to train the different comparator models.
5 [8] is a dataset created by the Royal Academy of (Spanish) Language, that providesstatistics of the most common words.
54
José Medardo Tapia-Téllez, Aurelio López-López, Jesús Miguel García-Gorrostieta
Research in Computing Science 151(1), 2022
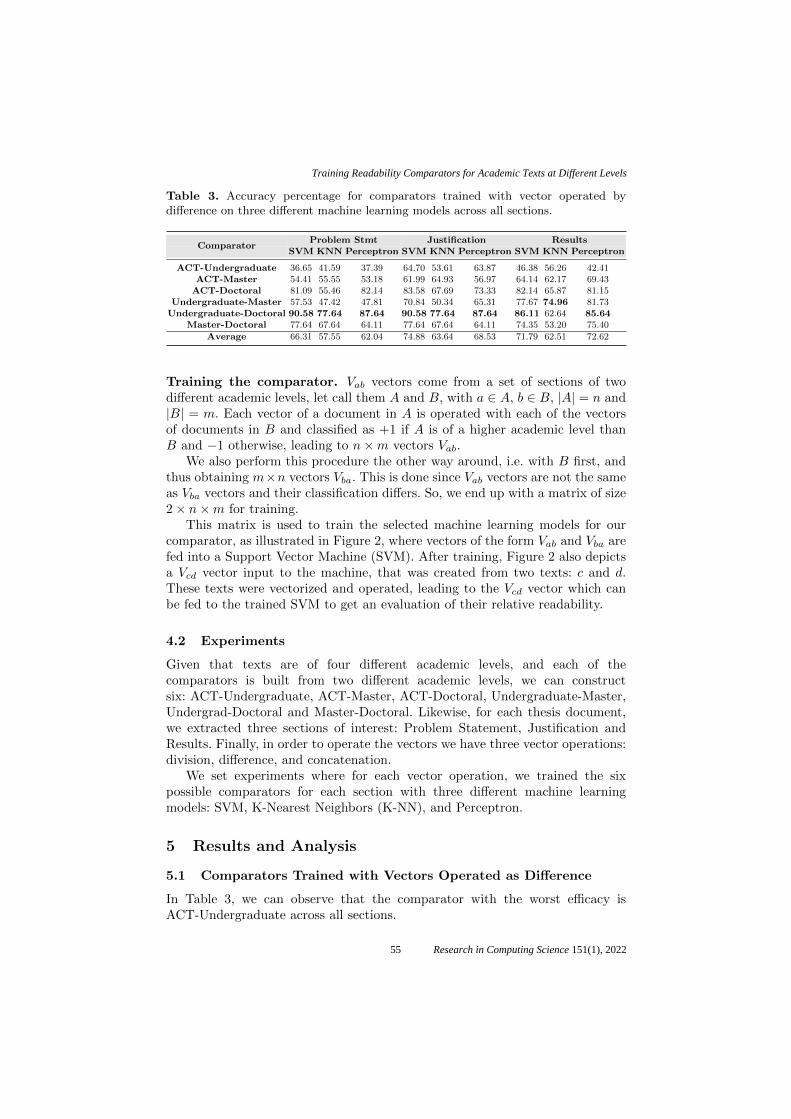
Table 3. Accuracy percentage for comparators trained with vector operated bydifference on three different machine learning models across all sections.
Problem Stmt Justification ResultsComparator
SVM KNN Perceptron SVM KNN Perceptron SVM KNN Perceptron
ACT-Undergraduate 36.65 41.59 37.39 64.70 53.61 63.87 46.38 56.26 42.41ACT-Master 54.41 55.55 53.18 61.99 64.93 56.97 64.14 62.17 69.43
ACT-Doctoral 81.09 55.46 82.14 83.58 67.69 73.33 82.14 65.87 81.15Undergraduate-Master 57.53 47.42 47.81 70.84 50.34 65.31 77.67 74.96 81.73
Undergraduate-Doctoral 90.58 77.64 87.64 90.58 77.64 87.64 86.11 62.64 85.64Master-Doctoral 77.64 67.64 64.11 77.64 67.64 64.11 74.35 53.20 75.40
Average 66.31 57.55 62.04 74.88 63.64 68.53 71.79 62.51 72.62
Training the comparator. Vab vectors come from a set of sections of twodifferent academic levels, let call them A and B, with a ∈ A, b ∈ B, |A| = n and|B| = m. Each vector of a document in A is operated with each of the vectorsof documents in B and classified as +1 if A is of a higher academic level thanB and −1 otherwise, leading to n×m vectors Vab.
We also perform this procedure the other way around, i.e. with B first, andthus obtaining m×n vectors Vba. This is done since Vab vectors are not the sameas Vba vectors and their classification differs. So, we end up with a matrix of size2× n×m for training.
This matrix is used to train the selected machine learning models for ourcomparator, as illustrated in Figure 2, where vectors of the form Vab and Vba arefed into a Support Vector Machine (SVM). After training, Figure 2 also depictsa Vcd vector input to the machine, that was created from two texts: c and d.These texts were vectorized and operated, leading to the Vcd vector which canbe fed to the trained SVM to get an evaluation of their relative readability.
4.2 Experiments
Given that texts are of four different academic levels, and each of thecomparators is built from two different academic levels, we can constructsix: ACT-Undergraduate, ACT-Master, ACT-Doctoral, Undergraduate-Master,Undergrad-Doctoral and Master-Doctoral. Likewise, for each thesis document,we extracted three sections of interest: Problem Statement, Justification andResults. Finally, in order to operate the vectors we have three vector operations:division, difference, and concatenation.
We set experiments where for each vector operation, we trained the sixpossible comparators for each section with three different machine learningmodels: SVM, K-Nearest Neighbors (K-NN), and Perceptron.
5 Results and Analysis
5.1 Comparators Trained with Vectors Operated as Difference
In Table 3, we can observe that the comparator with the worst efficacy isACT-Undergraduate across all sections.
55
Training Readability Comparators for Academic Texts at Different Levels
Research in Computing Science 151(1), 2022
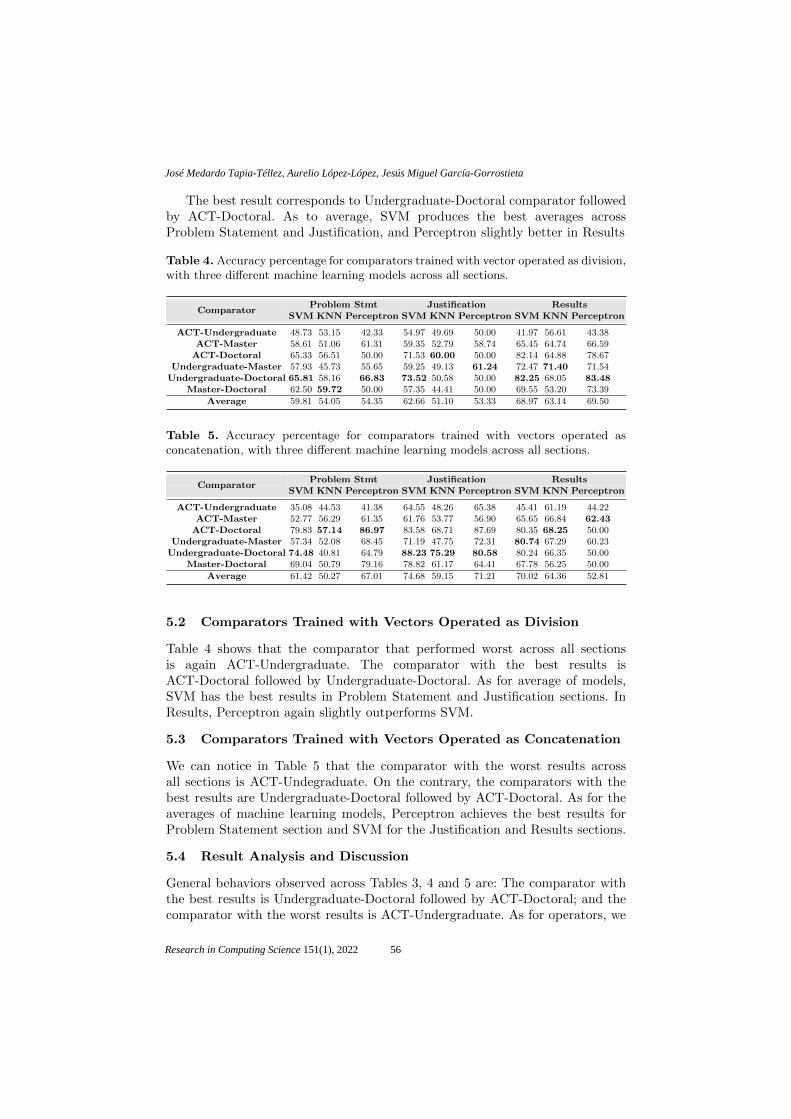
The best result corresponds to Undergraduate-Doctoral comparator followedby ACT-Doctoral. As to average, SVM produces the best averages acrossProblem Statement and Justification, and Perceptron slightly better in Results
Table 4. Accuracy percentage for comparators trained with vector operated as division,with three different machine learning models across all sections.
Problem Stmt Justification ResultsComparator
SVM KNN Perceptron SVM KNN Perceptron SVM KNN Perceptron
ACT-Undergraduate 48.73 53.15 42.33 54.97 49.69 50.00 41.97 56.61 43.38ACT-Master 58.61 51.06 61.31 59.35 52.79 58.74 65.45 64.74 66.59
ACT-Doctoral 65.33 56.51 50.00 71.53 60.00 50.00 82.14 64.88 78.67Undergraduate-Master 57.93 45.73 55.65 59.25 49.13 61.24 72.47 71.40 71.54
Undergraduate-Doctoral 65.81 58.16 66.83 73.52 50.58 50.00 82.25 68.05 83.48Master-Doctoral 62.50 59.72 50.00 57.35 44.41 50.00 69.55 53.20 73.39
Average 59.81 54.05 54.35 62.66 51.10 53.33 68.97 63.14 69.50
Table 5. Accuracy percentage for comparators trained with vectors operated asconcatenation, with three different machine learning models across all sections.
Problem Stmt Justification ResultsComparator
SVM KNN Perceptron SVM KNN Perceptron SVM KNN Perceptron
ACT-Undergraduate 35.08 44.53 41.38 64.55 48.26 65.38 45.41 61.19 44.22ACT-Master 52.77 56.29 61.35 61.76 53.77 56.90 65.65 66.84 62.43
ACT-Doctoral 79.83 57.14 86.97 83.58 68.71 87.69 80.35 68.25 50.00Undergraduate-Master 57.34 52.08 68.45 71.19 47.75 72.31 80.74 67.29 60.23
Undergraduate-Doctoral 74.48 40.81 64.79 88.23 75.29 80.58 80.24 66.35 50.00Master-Doctoral 69.04 50.79 79.16 78.82 61.17 64.41 67.78 56.25 50.00
Average 61.42 50.27 67.01 74.68 59.15 71.21 70.02 64.36 52.81
5.2 Comparators Trained with Vectors Operated as Division
Table 4 shows that the comparator that performed worst across all sectionsis again ACT-Undergraduate. The comparator with the best results isACT-Doctoral followed by Undergraduate-Doctoral. As for average of models,SVM has the best results in Problem Statement and Justification sections. InResults, Perceptron again slightly outperforms SVM.
5.3 Comparators Trained with Vectors Operated as Concatenation
We can notice in Table 5 that the comparator with the worst results acrossall sections is ACT-Undegraduate. On the contrary, the comparators with thebest results are Undergraduate-Doctoral followed by ACT-Doctoral. As for theaverages of machine learning models, Perceptron achieves the best results forProblem Statement section and SVM for the Justification and Results sections.
5.4 Result Analysis and Discussion
General behaviors observed across Tables 3, 4 and 5 are: The comparator withthe best results is Undergraduate-Doctoral followed by ACT-Doctoral; and thecomparator with the worst results is ACT-Undergraduate. As for operators, we
56
José Medardo Tapia-Téllez, Aurelio López-López, Jesús Miguel García-Gorrostieta
Research in Computing Science 151(1), 2022
can observe that difference operator obtains on average the best results; followedby concatenation and lastly division. Based on machine learning models, SVMobtains the best results in two out of three sections, in the three experiments.
Perceptron performs well three times (twice in Results and one in ProblemStatement). K-NN did not compete. So, SVM showed a more consistentperformance. As final remarks, further experimentation with concatenationoperation is not viable since takes too much time, thus we conclude thatthe difference operator is our ideal operator. Based on comparators, a niceobserved feature is that comparators trained with more distant academic levelsobtain higher classification accuracy values, e.g. ACT-Undergraduate is lower onaccuracy results than ACT-Doctoral. This one being an important observation,since it validates our results and provides insight into the learning capabilitiesof our machine learning models.
6 Conclusion
The present work successfully built and evaluated machine learning basedreadability comparators trained with Spanish-written thesis documents of fourdifferent academic levels. These comparators can decide between two differentthesis sections, which one is more readable. In general, results across all sectionsshowed that the best comparator was Undergraduate-Doctoral, the most stablemodel to train them was SVM, and representation with difference operator isboth efficient and lightweight. Based on this information, we can conclude thatthese types of comparators can definitely serve as a base tool, not only to comparereadability between sections of documents, but also to evaluate the academiclevel of the document.
Comparators have limitations, and though we present comparators withgood accuracy level, we have to design a process to employ them to assessnew documents in progress (drafts). So as future work, we plan the creationof evaluators, where we will take a representative document for each academiclevel, and use it to evaluate the level of a draft. We will also explore the possibilityof incorporating a pairwise ranking model as that of [10], that brings deeplearning in our research. Finally, we are interested in deploying our machinelearning-based comparator in a web-based API that, given an input document,estimates its readability level.
Acknowledgments. First author was supported by Conacyt throughscholarship number 1009285. Second and third authors were partially supportedby SNI, Mexico.
References
1. de Anglat, H.D.: Las funciones del tutor de la tesis doctoral en educacion. RevistaMexicana de Investigacion Educativa 16(50), 935–959 (2011)
2. Chall, J.S., Dale, E.: Readability revisited: The new Dale-Chall readability formula.Brookline Books (1995)
57
Training Readability Comparators for Academic Texts at Different Levels
Research in Computing Science 151(1), 2022
3. Collins-Thompson, K.: Computational assessment of text readability: A surveyof current and future research. ITL-International Journal of Applied Linguistics165(2), 97–135 (2014)
4. Glaser, I., Bonczek, G., Landthaler, J., Matthes, F.: Towards computer-aidedanalysis of readability and comprehensibility of patient information in the contextof clinical research projects. In: Proceedings of the Seventeenth InternationalConference on Artificial Intelligence and Law. pp. 260–261 (2019)
5. Gonzalez-Lopez, S., Lopez-Lopez, A.: Coleccion de tesis y propuesta deinvestigacion en tics: un recurso para su analisis y estudio. In: XIII CongresoNacional de Investigacion Educativa. pp. 1–15 (2015)
6. Pitler, E., Nenkova, A.: Revisiting readability: A unified framework for predictingtext quality. In: Proceedings of the 2008 conference on empirical methods in naturallanguage processing. pp. 186–195 (2008)
7. Relan, M., Khurana, S., Singh, V.K.: Qualitative evaluation and improvementsuggestions for ebooks using text analytics algorithms. In: Proceedings of SecondInternational Conference on Eco-friendly Computing and Communication Systems,Solan, India (2013)
8. Sanchez, M.S., Cintas, C.D.: El banco de datos de la rae: Crea y corde. Per Abbat:boletın filologico de actualizacion academica y didactica (2), 137–148 (2007)
9. Tanaka-Ishii, K., Tezuka, S., Terada, H.: Sorting texts by readability.Computational linguistics 36(2), 203–227 (2010)
10. Wang, L., Shen, X., de Melo, G., Weikum, G.: Cross-domain learning for classifyingpropaganda in online contents. arXiv preprint arXiv:2011.06844 (2020)
58
José Medardo Tapia-Téllez, Aurelio López-López, Jesús Miguel García-Gorrostieta
Research in Computing Science 151(1), 2022
A Brief Review of Educational Data Mining to Improve
Intelligent Learning Environments
Mayra Mendoza, Yasmín Hernández, Javier Ortiz, Alicia Martínez,
Hugo Estrada
Tecnológico Nacional de México, Cuernavaca, Morelos,
Mexico
{m21ce017, yasmin.hp, javier.oh,
alicia.mr,hugo.ee}@cenidet.tecnm.mx
Abstract. Learning environments and educational platforms have become
ubiquitous in current education. These systems produce an increasing volume of
data about different aspects of education. The analysis of this data yields useful
knowledge to understand the interrelations and individual states of actors in
education, such as students, pedagogical actions, tutorial decisions, learning
strategies and learning outcomes. These insights can be used in many ways to
improve learning and education, for example, improving intelligent tutoring
systems and intelligent learning environments. We are developing two intelligent
tutoring systems and we are analyzing data from educational contexts to model
the different components of the intelligent tutors through applying several
educational data mining techniques. The initial mining approach is presented
along with a brief review of literature on educational data mining.
Keywords: educational data mining, intelligent tutoring systems, intelligent
learning environments, student modeling.
1 Introduction
Traditionally, education has been one of the favorite fields to prove computational
theories with the aim of supporting the teaching and learning processes; for example,
the artificial intelligence has produced several applications to improve the learning
process through adaptive teaching and tutoring. As a result, there are several educative
platforms such as intelligent tutor systems (ITS), learning management systems (LMS),
e-learning systems, serious and educational games, and massive open online courses
(MOOC), in addition to administrative computer-based systems. These educative
59 Research in Computing Science 151(1), 2022pp. 59–67; rec. 2021-07-22; acc. 2021-09-30
platforms have produced a growing volume of data about the interaction of students
with learning environments, student preferences, student states, tutorial decisions,
tutorial situations, pedagogical strategies, and their impact in learning. The educational
data can help to know the students, to understand different aspects of the interaction of
the students with the systems, and to comprehend the learning process itself, and
therefore to improve the systems and processes.
The Educational Data Mining (EDM) is an emerging discipline, interested in the
development of methods to explore the exceptional data that comes from educational
environments, and concerned in the use of these methods to understand students and
the environments in which they learn [10]. EDM is based on statistical methods and
machine learning algorithms.
There is extensive research to understand educative processes. On the one hand,
researching is interested in knowing which are the characteristics of students with more
impact in learning; for example, emotions, motivation, self-efficacy, among other
characteristics, or to know the context or circumstances where the tutorial/teaching
actions are successful, and therefore to improve the learning environments. On the other
hand, research is also interested in obtaining useful knowledge for teachers,
pedagogists, education managers, researchers in educational psychology and learning
sciences, and other stakeholders to improve their functions. For example, the prediction
of drop-out is a very investigated problem.
We are developing two intelligent learning environments, the first is intended to
teach math to kids from elementary school, and the second one is being designed to
support undergraduate and graduate students to learn mathematical logic. We want to
know which aspects of the learning should be modeled to improve. Therefore, we are
analyzing several educational datasets with EDM techniques. In a first stage, we are
analyzing public datasets, but also, we are planning to gather our own data. Mainly, we
are interested in understanding the impact of psychological constructs in learning, such
as motivation, self-efficacy, and self-regulated learning.
We present a brief review of relevant work on EDM, and we depict a proposal to
apply educational data mining to understand important factors in learning. The paper is
organized as follows: section 2 presents a description of the EDM field; section 3
presents a brief review of literature on educational data mining; section 4 depicts our
approach for applying data mining techniques on educative contexts. Finally, section 5
outlines our conclusions and future work.
2 Educational Data Mining
Nowadays, plenty of data is generated, since almost every aspect of our daily life can
be tore apart in pieces of information. The imperative necessity of solving problems led
to the analysis of the growing data and gave birth to data mining. Data mining is defined
as the process of discovering patterns in data. The process must be automatic or
semiautomatic. The patterns discovered must be meaningful in that they lead to some
advantage [11].
60
Mayra Mendoza, Yasmín Hernández, Javier Ortiz, Alicia Martínez, Hugo Estrada
Research in Computing Science 151(1), 2022
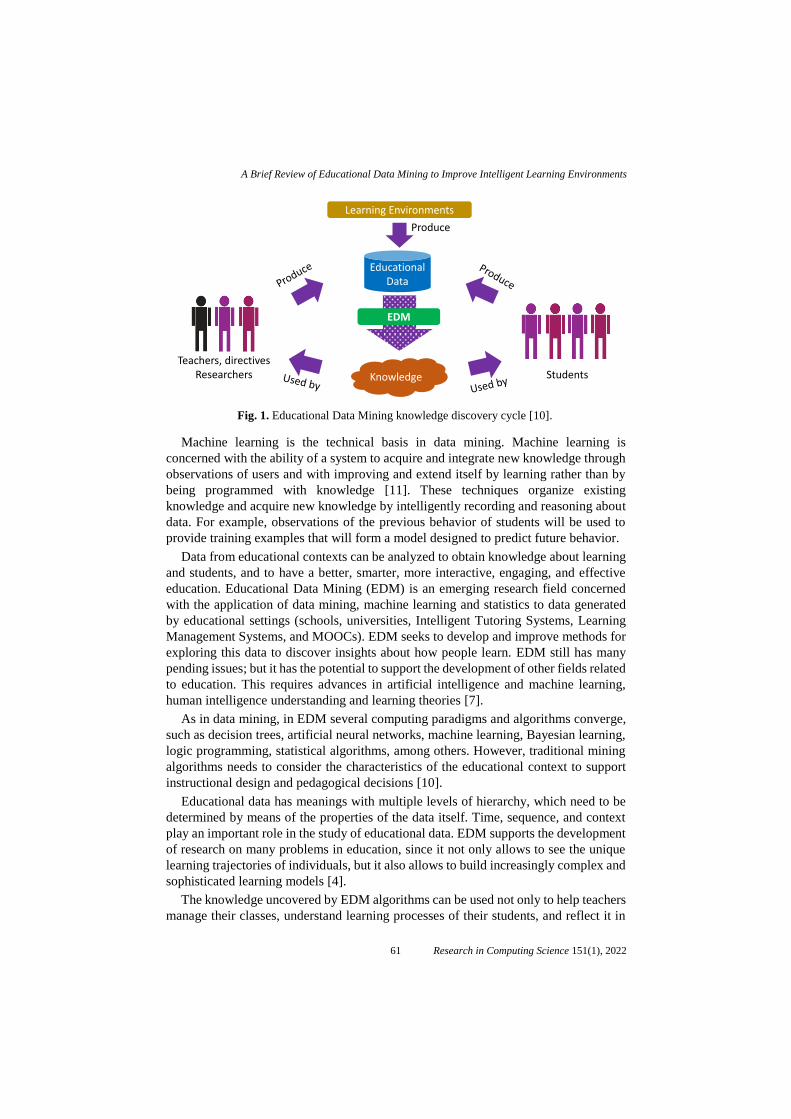
Machine learning is the technical basis in data mining. Machine learning is
concerned with the ability of a system to acquire and integrate new knowledge through
observations of users and with improving and extend itself by learning rather than by
being programmed with knowledge [11]. These techniques organize existing
knowledge and acquire new knowledge by intelligently recording and reasoning about
data. For example, observations of the previous behavior of students will be used to
provide training examples that will form a model designed to predict future behavior.
Data from educational contexts can be analyzed to obtain knowledge about learning
and students, and to have a better, smarter, more interactive, engaging, and effective
education. Educational Data Mining (EDM) is an emerging research field concerned
with the application of data mining, machine learning and statistics to data generated
by educational settings (schools, universities, Intelligent Tutoring Systems, Learning
Management Systems, and MOOCs). EDM seeks to develop and improve methods for
exploring this data to discover insights about how people learn. EDM still has many
pending issues; but it has the potential to support the development of other fields related
to education. This requires advances in artificial intelligence and machine learning,
human intelligence understanding and learning theories [7].
As in data mining, in EDM several computing paradigms and algorithms converge,
such as decision trees, artificial neural networks, machine learning, Bayesian learning,
logic programming, statistical algorithms, among others. However, traditional mining
algorithms needs to consider the characteristics of the educational context to support
instructional design and pedagogical decisions [10].
Educational data has meanings with multiple levels of hierarchy, which need to be
determined by means of the properties of the data itself. Time, sequence, and context
play an important role in the study of educational data. EDM supports the development
of research on many problems in education, since it not only allows to see the unique
learning trajectories of individuals, but it also allows to build increasingly complex and
sophisticated learning models [4].
The knowledge uncovered by EDM algorithms can be used not only to help teachers
manage their classes, understand learning processes of their students, and reflect it in
Fig. 1. Educational Data Mining knowledge discovery cycle [10].
Learning Environments
Teachers, directivesResearchers Students
EducationalData
Knowledge
EDM
Produce
61
A Brief Review of Educational Data Mining to Improve Intelligent Learning Environments
Research in Computing Science 151(1), 2022
their own teaching methods, but also to support reflections of the student about the
situation and give feedback to them [8]. Although one might think that there are only
these two stakeholders in EDM, there are other groups of users, who see EDM from
different points of view, according to their own objectives [10]. For example, education
researchers, universities, course developers, training companies, school supervisors,
school administrators, could also benefit from the knowledge generated by EDM [7].
Fig. 1 shows the interrelationships of educational environments, stakeholders and the
EDM process.
3 Review of Educational Data Mining Research
The improvement of computing has admitted to store and process huge data which
some years ago was impossible. As a result, educational technologies have been
instrumented to collect large amounts of data which in turn is analyzed to understand
the several aspects and interrelations of the educative processes.
Many researchers are interested in the development of early detection of struggling
students. For example, Hung and colleagues [6] propose a novel predictive modeling
method to address the research gaps in existing performance prediction research., their
focus is on:
i) the lack of existing research focused on performance prediction rather than
identifying key performance factors
ii) the lack of common predictors identified for both K-12 and higher
education environments
iii) the misplaced focus on absolute engagement levels rather than relative
engagement levels.
The predictive modeling technique was applied in two datasets, one from higher
education and the other from a K-12 online school with 13,368 students in more than
300 courses. Some experiments were conducted. First, because a student’s engagement
level has been identified as a key predictor in predicting performance, the input
variables will be converted from absolute values to relative values. A K-fold model for
training and validation will be applied to compare accuracy and recall rates between
absolute and relative models.
Authors assume the prediction accuracy can be improved by the relative
transformation. Secondly, because prediction errors are inevitable in the process of
predictive modeling, they propose a two-stage approach by constructing three related
predictive models (the successful model, the at-risk model, and the
coordination model).
Authors assume the dual-stage, three-model approach can further improve the
model’s accuracy and capture more at-risk students during the semester. Finally,
because ensemble and deep learning models will be adopted as the major algorithms,
the surrogate model approach will be applied to reveal the key at-risk predictors. The
results will assist in identifying common at-risk predictors across K-12 and higher
education learning environments [6].
62
Mayra Mendoza, Yasmín Hernández, Javier Ortiz, Alicia Martínez, Hugo Estrada
Research in Computing Science 151(1), 2022
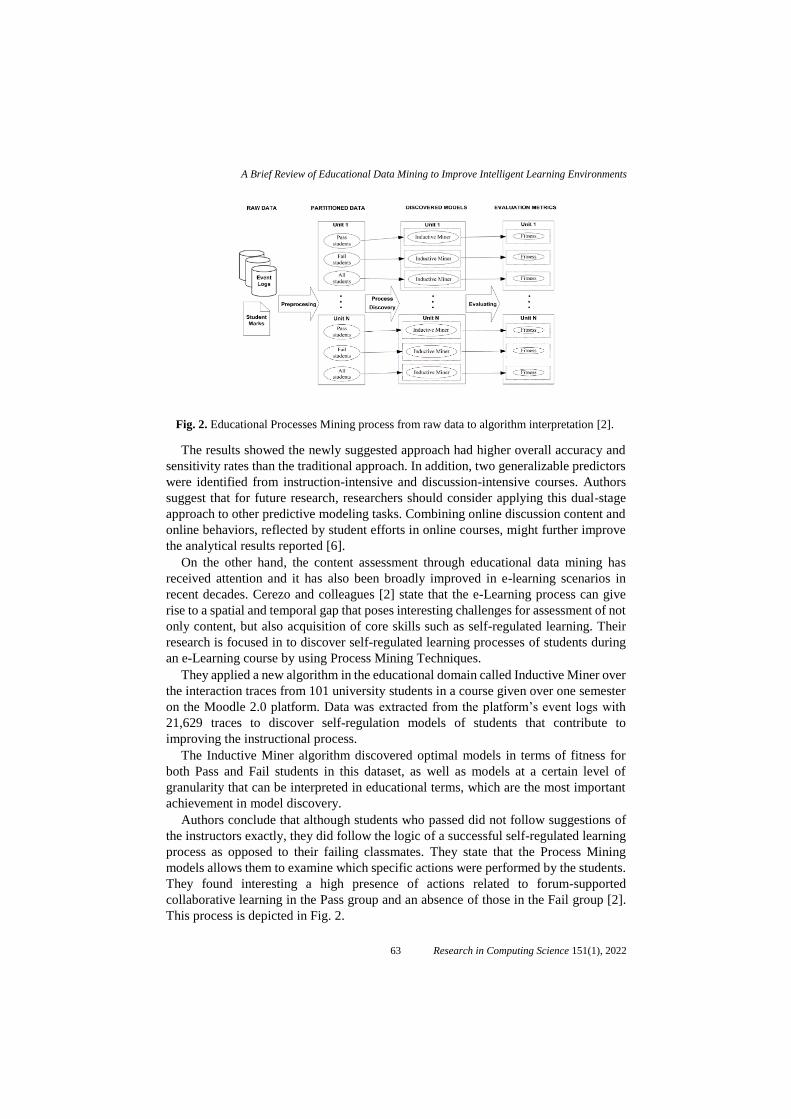
The results showed the newly suggested approach had higher overall accuracy and
sensitivity rates than the traditional approach. In addition, two generalizable predictors
were identified from instruction-intensive and discussion-intensive courses. Authors
suggest that for future research, researchers should consider applying this dual-stage
approach to other predictive modeling tasks. Combining online discussion content and
online behaviors, reflected by student efforts in online courses, might further improve
the analytical results reported [6].
On the other hand, the content assessment through educational data mining has
received attention and it has also been broadly improved in e-learning scenarios in
recent decades. Cerezo and colleagues [2] state that the e-Learning process can give
rise to a spatial and temporal gap that poses interesting challenges for assessment of not
only content, but also acquisition of core skills such as self-regulated learning. Their
research is focused in to discover self-regulated learning processes of students during
an e-Learning course by using Process Mining Techniques.
They applied a new algorithm in the educational domain called Inductive Miner over
the interaction traces from 101 university students in a course given over one semester
on the Moodle 2.0 platform. Data was extracted from the platform’s event logs with
21,629 traces to discover self-regulation models of students that contribute to
improving the instructional process.
The Inductive Miner algorithm discovered optimal models in terms of fitness for
both Pass and Fail students in this dataset, as well as models at a certain level of
granularity that can be interpreted in educational terms, which are the most important
achievement in model discovery.
Authors conclude that although students who passed did not follow suggestions of
the instructors exactly, they did follow the logic of a successful self-regulated learning
process as opposed to their failing classmates. They state that the Process Mining
models allows them to examine which specific actions were performed by the students.
They found interesting a high presence of actions related to forum-supported
collaborative learning in the Pass group and an absence of those in the Fail group [2].
This process is depicted in Fig. 2.
Fig. 2. Educational Processes Mining process from raw data to algorithm interpretation [2].
63
A Brief Review of Educational Data Mining to Improve Intelligent Learning Environments
Research in Computing Science 151(1), 2022
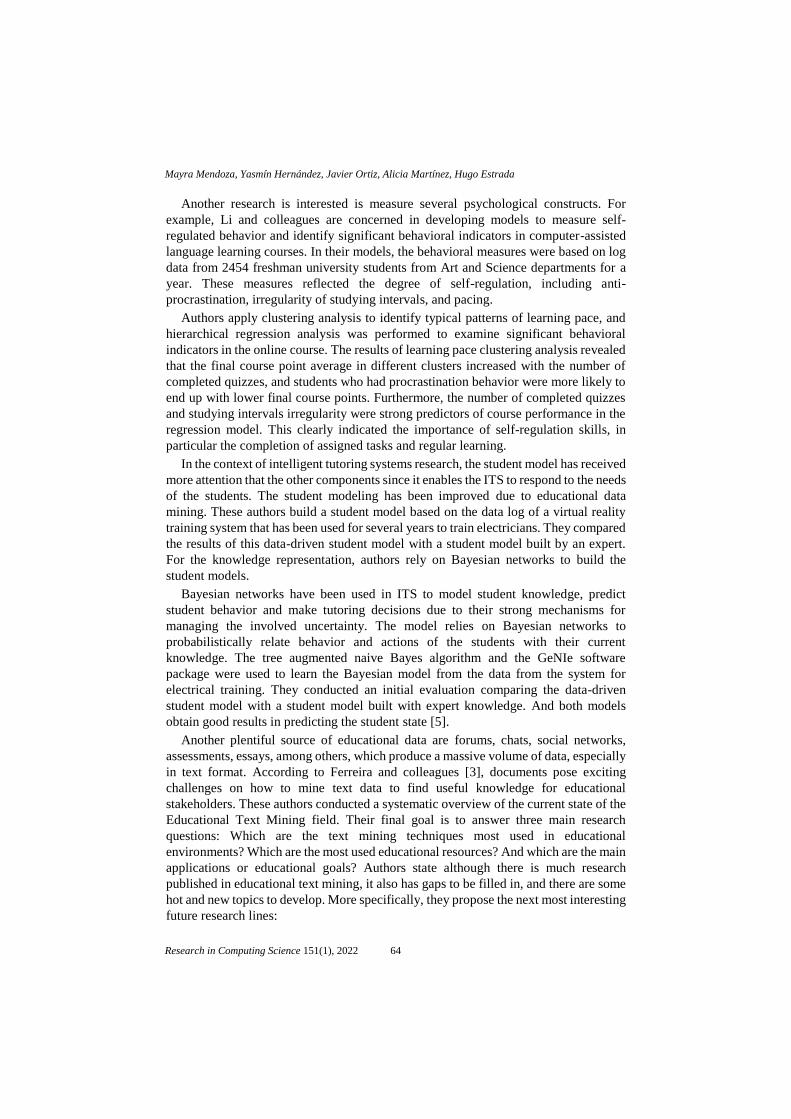
Another research is interested is measure several psychological constructs. For
example, Li and colleagues are concerned in developing models to measure self-
regulated behavior and identify significant behavioral indicators in computer-assisted
language learning courses. In their models, the behavioral measures were based on log
data from 2454 freshman university students from Art and Science departments for a
year. These measures reflected the degree of self-regulation, including anti-
procrastination, irregularity of studying intervals, and pacing.
Authors apply clustering analysis to identify typical patterns of learning pace, and
hierarchical regression analysis was performed to examine significant behavioral
indicators in the online course. The results of learning pace clustering analysis revealed
that the final course point average in different clusters increased with the number of
completed quizzes, and students who had procrastination behavior were more likely to
end up with lower final course points. Furthermore, the number of completed quizzes
and studying intervals irregularity were strong predictors of course performance in the
regression model. This clearly indicated the importance of self-regulation skills, in
particular the completion of assigned tasks and regular learning.
In the context of intelligent tutoring systems research, the student model has received
more attention that the other components since it enables the ITS to respond to the needs
of the students. The student modeling has been improved due to educational data
mining. These authors build a student model based on the data log of a virtual reality
training system that has been used for several years to train electricians. They compared
the results of this data-driven student model with a student model built by an expert.
For the knowledge representation, authors rely on Bayesian networks to build the
student models.
Bayesian networks have been used in ITS to model student knowledge, predict
student behavior and make tutoring decisions due to their strong mechanisms for
managing the involved uncertainty. The model relies on Bayesian networks to
probabilistically relate behavior and actions of the students with their current
knowledge. The tree augmented naive Bayes algorithm and the GeNIe software
package were used to learn the Bayesian model from the data from the system for
electrical training. They conducted an initial evaluation comparing the data-driven
student model with a student model built with expert knowledge. And both models
obtain good results in predicting the student state [5].
Another plentiful source of educational data are forums, chats, social networks,
assessments, essays, among others, which produce a massive volume of data, especially
in text format. According to Ferreira and colleagues [3], documents pose exciting
challenges on how to mine text data to find useful knowledge for educational
stakeholders. These authors conducted a systematic overview of the current state of the
Educational Text Mining field. Their final goal is to answer three main research
questions: Which are the text mining techniques most used in educational
environments? Which are the most used educational resources? And which are the main
applications or educational goals? Authors state although there is much research
published in educational text mining, it also has gaps to be filled in, and there are some
hot and new topics to develop. More specifically, they propose the next most interesting
future research lines:
64
Mayra Mendoza, Yasmín Hernández, Javier Ortiz, Alicia Martínez, Hugo Estrada
Research in Computing Science 151(1), 2022
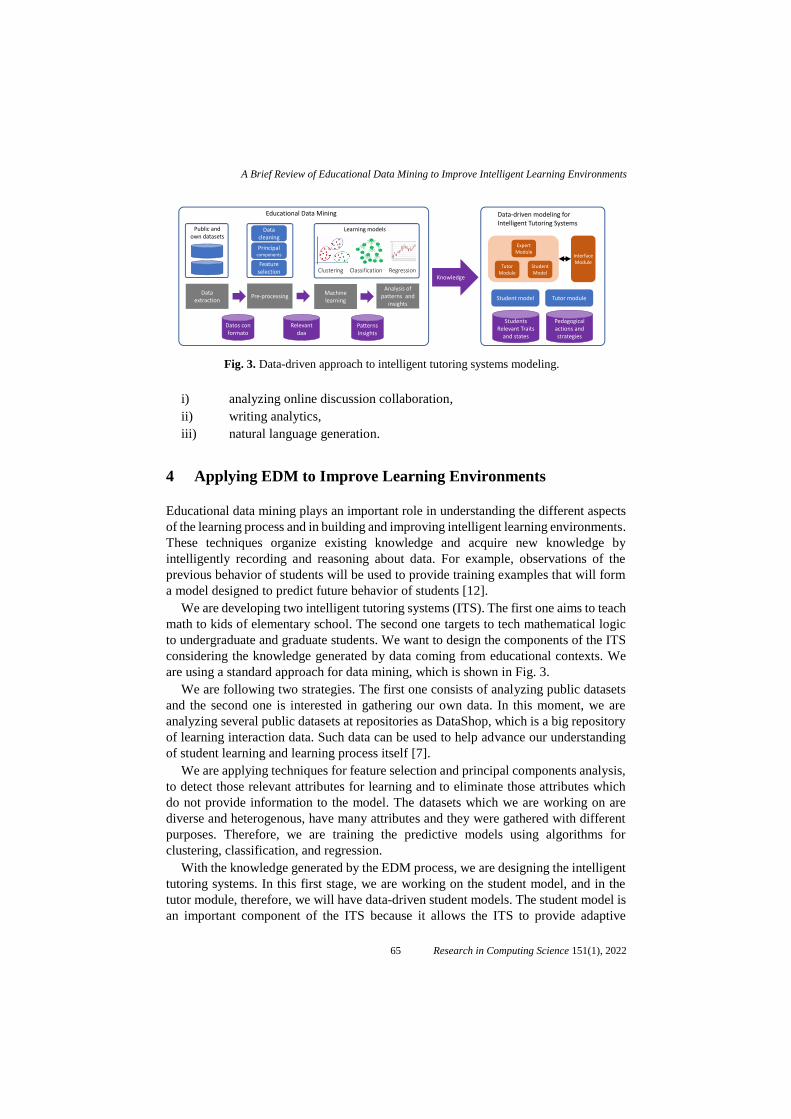
i) analyzing online discussion collaboration,
ii) writing analytics,
iii) natural language generation.
4 Applying EDM to Improve Learning Environments
Educational data mining plays an important role in understanding the different aspects
of the learning process and in building and improving intelligent learning environments.
These techniques organize existing knowledge and acquire new knowledge by
intelligently recording and reasoning about data. For example, observations of the
previous behavior of students will be used to provide training examples that will form
a model designed to predict future behavior of students [12].
We are developing two intelligent tutoring systems (ITS). The first one aims to teach
math to kids of elementary school. The second one targets to tech mathematical logic
to undergraduate and graduate students. We want to design the components of the ITS
considering the knowledge generated by data coming from educational contexts. We
are using a standard approach for data mining, which is shown in Fig. 3.
We are following two strategies. The first one consists of analyzing public datasets
and the second one is interested in gathering our own data. In this moment, we are
analyzing several public datasets at repositories as DataShop, which is a big repository
of learning interaction data. Such data can be used to help advance our understanding
of student learning and learning process itself [7].
We are applying techniques for feature selection and principal components analysis,
to detect those relevant attributes for learning and to eliminate those attributes which
do not provide information to the model. The datasets which we are working on are
diverse and heterogenous, have many attributes and they were gathered with different
purposes. Therefore, we are training the predictive models using algorithms for
clustering, classification, and regression.
With the knowledge generated by the EDM process, we are designing the intelligent
tutoring systems. In this first stage, we are working on the student model, and in the
tutor module, therefore, we will have data-driven student models. The student model is
an important component of the ITS because it allows the ITS to provide adaptive
Fig. 3. Data-driven approach to intelligent tutoring systems modeling.
Machine learning
Relevantdaa
Analysis ofpatterns and
insightsPre-processing
PatternsInsights
Knowledge
v
Learning models
A
F
M
C
J
H
G K
N
B
E
L
I
D
Data extraction
Datos con formato
ClassificationClustering Regression
Public and own datasets
v v
Data cleaning
Principal components
Featureselection
Educational Data Mining Data-driven modeling forIntelligent Tutoring Systems
Student model Tutor module
StudentsRelevant Traits
and states
Pedagogicalactions andstrategies
ExpertModule
StudentModel
TutorModule
InterfaceModule
65
A Brief Review of Educational Data Mining to Improve Intelligent Learning Environments
Research in Computing Science 151(1), 2022
instruction to students; and the tutor module make decisions about the tutorial actions
to be presented to the students based on the student model.
As first steps, we need to identify the relevant attribute in students which have
positive impact in learning. In our previous research, we have identified emotions,
personality, and goals as important players in motivation and learning. But now, we
want to explore other relationships. We are trying to model self-efficacy and self-
regulated learning; therefore, we are working in identifying the indicators of self-
efficacy and self-regulated learning to include them in the student model of the ITS.
Self-efficacy is a personal judgment of how well or poorly a person can cope with a
given situation based on the skills they have and the circumstances they face. Self-
efficacy affects every area of human endeavor. By determining the beliefs a person
holds regarding their power to affect situations, self-efficacy strongly influences both
the power a person actually has to face challenges competently and the choices a person
is most likely to make [1]. Also has been recognized that self-efficacy is a key trait of
self-regulated learners [9]. Self-regulated learning refers to one’s ability to understand
and control one’s learning environment. Self-regulation abilities include goal setting,
self-monitoring, self-instruction, and self-reinforcement [9].
5 Conclusions and Future Work
The ubiquity of computers and mobile devices in classrooms, the distance education
and the learning everywhere produce data every second. Educational data is rich in
insights about the different aspects of students, teachers, learning processes and
learning management. Therefore, machine learning techniques can be used to
understand those aspects, and in turn to design and improve intelligent learning
environments. A goal of educational data mining is having better educational
technologies. This objective requires further advances in artificial intelligence and in
human learning theories. Educational data mining is an emerging discipline that can be
useful towards these aims due to its potential to support the development of fields
related to education.
In this paper, we present a brief review of relevant research in educational data
mining, an also we propose the modeling and designing of intelligent tutoring systems
based on a data-driven approach. The ITS are being built considering the knowledge
produced by the educational data mining techniques. We are analyzing public
educational datasets, but also, we are gathering data by means of a controlled
experiments with an online course and under graduated and graduated students
participating. Despite, this research is in an initial stage, we visualize potential in the
educational data mining techniques based on our previous work in intelligent learning
environments.
References
1. Bandura, A.: Guide for constructing self-efficacy scales. Self-efficacy beliefs Adolesc. pp.
307–337 (2006). https://doi.org/10.1017/CBO9781107415324.004
66
Mayra Mendoza, Yasmín Hernández, Javier Ortiz, Alicia Martínez, Hugo Estrada
Research in Computing Science 151(1), 2022
2. Cerezo, R. et al.: Process mining for self-regulated learning assessment in e-learning. J.
Comput. High. Educ. 32, 1, pp. 74–88 (2020). https://doi.org/10.1007/s12528-019-09225-
y
3. Ferreira-Mello, R. et al.: Text mining in education. Wiley Interdiscip. Rev. Data Min.
Knowl. Discov. 9, 6, (2019). https://doi.org/10.1002/widm.1332
4. Fischer, C. et al.: Mining Big Data in Education: Affordances and Challenges. Rev. Res.
Educ. 44, 1, pp. 130–160 (2020). https://doi.org/10.3102/0091732X20903304
5. Hernández, Y. et al.: Data-driven construction of a student model using bayesian networks
in an electrical domain. In: 16th Mexican International Conference on Artificial
Intelligence, MICAI 2017. pp. 481–490 Springer Verlag (2017).
https://doi.org/10.1007/978-3-319-62428-0_39
6. Hung, J.L. et al.: Improving Predictive Modeling for At-Risk Student Identification: A
Multistage Approach. IEEE Trans. Learn. Technol. 12, 2, pp. 148–157 (2019).
https://doi.org/10.1109/TLT.2019.2911072
7. Koedinger, K.R. et al.: New Potentials for Data-Driven Intelligent Tutoring System
Development and Optimization. AI Mag. 3, pp. 27–41 (2013)
8. Merceron, A. et al.: Learning Analytics: From Big Data to Meaningful Data. J. Learn. Anal.
2, 3, pp. 4–8 (2016). https://doi.org/10.18608/jla.2015.23.2
9. Panadero, E.: A review of self-regulated learning: Six models and four directions for
research. Front. Psychol. 8, APR, 1–28 (2017). https://doi.org/ 10.3389/fpsyg.2017.00422
10. Romero, C., Ventura, S.: Educational data mining and learning analytics: An updated
survey. Wiley Interdiscip. Rev. Data Min. Knowl. Discov. 10, 3, pp. 1–21 (2020).
https://doi.org/10.1002/widm.1355
11. Witten, I.H. et al.: Data Mining: Practical Machine Learning Tools and Techniques.
Morgan Kaufmann, Cambridge (2017)
12. Woolf, B.P.: Student modeling. In: Nkambou, R. et al. (eds.) Studies in Computational
Intelligence. pp. 267–279 Springer (2010). https://doi.org/10.1007/978-3-642-14363-2_13
67
A Brief Review of Educational Data Mining to Improve Intelligent Learning Environments
Research in Computing Science 151(1), 2022


Electronic edition
Available online: http://www.rcs.cic.ipn.mx