Embed Size (px)
Citation preview

This article was published in an Elsevier journal. The attached copyis furnished to the author for non-commercial research and
education use, including for instruction at the author’s institution,sharing with colleagues and providing to institution administration.
Other uses, including reproduction and distribution, or selling orlicensing copies, or posting to personal, institutional or third party
websites are prohibited.
In most cases authors are permitted to post their version of thearticle (e.g. in Word or Tex form) to their personal website orinstitutional repository. Authors requiring further information
regarding Elsevier’s archiving and manuscript policies areencouraged to visit:
http://www.elsevier.com/copyright

Author's personal copy
Visualization of conformational changes of linear short-chain
polyethylenes under shear and elongational flows
J.M. Kim, B.J. Edwards *, D.J. Keffer
Department of Chemical and Biomolecular Engineering, University of Tennessee, Knoxville, TN 37996-2200, United States
Received 30 May 2007; received in revised form 28 August 2007; accepted 4 September 2007
Available online 8 September 2007
Abstract
We have performed nonequilibrium molecular dynamic simulations of the linear short-chain polyethylene liquids C24H50, C50H102, C78H158,
and C128H258 under homogenous shear and elongational flows. We present visualizations of the molecular structure of each of the four liquids under
shear and elongation, and compare them with their equilibrium static structures. These graphics provide a structural understanding of the various
statistical measures that have been used in the literature to characterize the change in chain conformation as a function of strain rate and chain
length. Moreover, these graphics allow a visualization of the inherent chain dynamics and orientation induced by shear and elongational flows. We
discuss the molecular-level mechanisms apparent in the graphics.
# 2007 Elsevier Inc. All rights reserved.
Keywords: Short-chain polyethylenes; Nonequilibrium molecular dynamics; Entanglement network; Rheological properties; Flow-induced structure
1. Introduction
Fluids with internal microstructure possess thermophysical
properties which are functions not only of the local
thermodynamic state (e.g., density and temperature), but also
of the strength of an applied flow field (i.e., strain rate). One
obvious manifestation of this is the fact that polymers are non-
Newtonian fluids, meaning that their viscosities are functions of
strain rate. Of course, the viscosity is actually a function of state
of the internal microstructure, which changes under an imposed
strain. Other properties, such as the heat capacity, have also
recently been shown to be functions of the polymer
microstructure [1,2]. As such, in order to model correctly
polymer processes, one must understand the structure/property
relationships of polymers under various types of flow.
Molecular-level simulations provide an ideal tool for
studying the nonequilibrium structures of polymeric fluids
which are difficult to observe experimentally. This is
particularly true of polymers undergoing steady, elongational
flow at the high elongation rates associated with industrial
processing operations. Under these conditions, there currently
exists no experimental methodology for measuring the
microstructure in this type of flow field. Nonequilibrium
molecular dynamics (NEMD) simulations allow one to model
fluids undergoing homogeneous shear and elongational flows at
arbitrarily high strain rates, in principle.
Much work has been directed at modeling the nonequilibrium
structures of flowing polymer melts, and there are many different
ways to characterize the flow-induced structural changes in
NEMD simulations. One method to characterize changes in
flow-induced structure is to use a coarse-grained approach.
These approaches are of great interest because they hold the
promise of leading to models with fewer degrees of freedom (i.e.,
a reduction in computational resource requirements), which lend
themselves to multiscale modeling efforts. For chain molecules,
the most widely used coarse-grained quantity to describe the
internal structure of a polymer melt is the conformation tensor, c,
which is defined as the second moment of the dyadic product of
the end-to-end chain vector, Rete,
c�hReteRetei; (1)
taken as an ensemble average [3,4]. For the linear, short-chain
polyethylenes studied in this work, C24H50, C50H102, C78H158,
and C128H25, the change in the conformation tensor (or at least
the trace of c) has been previously reported for steady elonga-
tional flow [5–7] and steady shear flow [8].
www.elsevier.com/locate/JMGM
Journal of Molecular Graphics and Modelling 26 (2008) 1046–1056
* Corresponding author. Tel.: +1 865 974 9596.
E-mail address: [email protected] (B.J. Edwards).
1093-3263/$ – see front matter # 2007 Elsevier Inc. All rights reserved.
doi:10.1016/j.jmgm.2007.09.001
Author's personal copy
The conformation tensor, which describes configurational
changes in the polymer microstructure, can also be incorpo-
rated into continuum evolution equations. In this role, the extra
stress tensor is expressed as a function of the conformation
tensor via a one-to-one relationship. Then a macroscopic
evolution equation for the conformation tensor may be
formulated; many such models of polymer viscoelasticity exist
[3,4,9,10]. For example, five models representing different
categories of constitutive equations were compared to
simulation data of n-hexadecane under shear and planar
elongational flow [8]. By comparing these constitutive
equations with NEMD simulations, one can see not only
the molecular-level configurational changes quantified by the
conformation tensor components, but also changes in the stress
tensor that occur in response to the configurational changes in
the microstructure.
One can also generate optical properties from NEMD
simulations, such as the birefringence tensor. For example, the
flow-induced birefringence of model polymer chains has been
studied under shear and elongational flows [11,12]. The
birefringence is a useful property since it is widely used by
experimental rheologists to examine indirectly the internal
microstructure of polymer melts. However, birefringence does
not necessarily scale linearly with either stress or conformation
tensor and, as such, has limitations as a measure of
microstructural changes in the fluid [11,12].
Finally, one can represent the structure of a polymer obtained
via molecular-level simulation by mapping it onto a coarse-
grained entanglement network [7,13–17]. The dynamics of
entanglement networks can potentially be modeled [18] and
computationally evaluated in a fraction of the time required for a
more detailed NEMD simulation. This would allow one to
simulate longer polymer chains than is currently feasible strictly
via NEMD. For example, in this work, the longest chain we
examine is C128H258 due to computational limitations, although
molecular simulations of longer polyethylene chains have been
performed under equilibrium conditions [15,19]. When the
chains become fully extended under an elongational flow field,
as examined herein, much larger simulation boxes are required
to obtain results that are independent of the system size [6].
All of the above measures of polymer configuration, be they
molecular-level or coarse-grained, contribute to the overall
understanding of the relationship between polymer structure
and rheological/thermophysical properties, such as the viscos-
ity and the heat capacity. Each of these measures is also a
statistical average over all polymer chains. However, much
understanding can be achieved through a direct visualization of
the instantaneous configurations of polymeric fluids under-
going shear and elongational flows. In this work, we provide
visualizations of C24H50, C50H102, C78H158, and C128H258,
which span the range from linear alkanes to short-chain, linear
polyethylenes, under steady-state and start-up conditions of
homogenous shear and elongational flows. These graphics are
visual representations of polymer structure as a function of type
and strength of flow field and chain length. They are intended to
complement the aforementioned statistical measures presented
in prior publications [5–8].
2. Simulation methodology
The NVT NEMD simulations were performed using the p-
SLLOD equations of motion [20] with the Nose–Hoover
thermostat [21]. These equations are
qia ¼pia
miaþ qia � ru;
pia ¼ Fia � pia � ru� miaqia � ru � ru� zpia;
(2)
z ¼pz
Q; pz ¼
Xi
Xa
p2ia
mia� DNkBT ; Q ¼ DNkBTt2:
(3)
The pia and qia represent the momentum and position vectors of
atom a of molecule i, respectively. The symbol Fia denotes the
force vector of atom a of molecule i. The mia is the mass of atom
a of molecule i and the ru is the homogeneous velocity
gradient tensor. The Q denotes the inertia mass of the Nose–
Hoover thermostat. The kB and D represent the Boltzmann
constant and the dimensionality of the system, respectively. The
symbols z and pz quantify the response of the Nose–Hoover
counterparts of the position and momentum variables. The N, V,
and T stand for total number of atoms, volume of the system,
and absolute temperature, respectively.
Eq. (2) differs from the SLLOD equations [20,21] only in the
penultimate term on the right side of the bottom equation. In
planar Couette flow (PCF), the only nonzero component of the
velocity gradient tensor isryux ¼ g, where x is the direction of
flow, y is the direction of shear, and g is the shear rate. Hence
the p-SLLOD equations of motion are the same as the SLLOD
equations [20] because the term miaqia � ru � ru vanishes. For
planar elongational flow (PEF), the nonzero components of the
velocity gradient tensor are rxux ¼ e and ryuy ¼ �e, where x
is the direction of extension, y the direction of compression, and
e is the elongational strain rate. For a recent discussion of the
relative merits of the SLLOD and p-SLLOD algorithms, see
Refs. [22–25].
The p-SLLOD equations of motion were integrated with the
Nose–Hoover thermostat using the multiple time scale
reversible reference system propagator algorithm (r-RESPA)
developed by Tuckerman et al. [26]. The long time scale for the
intermolecular interactions was 2.35 fs under PCF and 2.26 fs
under PEF. The short time scale for the intramolecular
interactions was 0.452 fs under PCF and 0.226 fs under PEF,
except for C24H50 under PCF, in which case it was 0.235 fs.
The simulations were performed using the Siepmann–
Karaboni–Smit (SKS) united-atom model for linear alkanes
[27]; however, the rigid bond between adjacent atoms was
substituted with a harmonic potential function to simplify the
numerical integration without sacrificing the pertinent dyna-
mical behavior. The four types of interactions present in this
model are expressed in terms of the Lennard–Jones (LJ)
intermolecular and intramolecular potential function,
VLJðrÞ ¼ 4ei j
��si j
r
�12
��
si j
r
�6�; (4)
J.M. Kim et al. / Journal of Molecular Graphics and Modelling 26 (2008) 1046–1056 1047
Author's personal copy
the bond-stretching harmonic potential,
V strðlÞ ¼1
2kstrðl� leqÞ2; (5)
the bond-bending harmonic potential,
VbenðuÞ ¼1
2kbenðu � ueqÞ2; (6)
and the bond-torsional potential [28],
V torðfÞ ¼X3
m¼0
amðcos fÞm: (7)
In these expressions, rc ¼ 2:5sCH2, eCH2
¼ 47 K, eCH3¼ 114 K,
sCH2¼ sCH3
¼ 3:93 A, leq = 1.54 A, kstr/kB = 452,900 K/A2,
ueq = 1148, kben/kB = 62,500 K/rad2, a0/kB = 1010 K, a1/
kB = 2019 K, a2/kB = 136.4 K, and a3/kB = �3165 K. The intra-
molecular LJ energy was preset at a cut-off distance of 2.5s, and
included only atoms that were separated by more than three
bonds. The parameters eij and sij were estimated according
to Lorentz–Berthelot mixing rules using the expressions
eij = (eiej)1/2, sij = (sisj)
1/2.
Under PCF, the Lees–Edwards boundary condition [21] was
used to perform the simulations. Under PEF, the Kraynik–
Reinelt boundary condition (KRBC) was used [29]. The time
period for the KRBC application, tp, was determined according
to ep ¼ e tp. The Hencky strain value was thus assigned,
ep � 0.9624, and the initial orientation angle of the simulation
box was specified as u0 = 31.7188.To analyze the entanglement networks of the simulated
liquids, the Z-code developed by Kroger [14,16] was applied to
the simulation output data. Details concerning the development
and algorithm of the Z-code can be found in Refs. [14–16].
In general, the simulations were performed at the
temperature of 450 K, except for C24H50, which was performed
at 333 K under both PCF and PEF. The densities of each alkane
were r = 0.7728 g/cm3 for C24H50, r = 0.7426 g/cm3 for
C50H102, r = 0.7640 g/cm3 for C78H158, and r = 0.7754 g/
cm3 for C128H258, at the temperatures indicated above. For PCF,
100 molecules and 2400 interaction sites were used for C24H50,
120 molecules and 6000 interaction sites for C50H102, 160
molecules and 12,480 interaction sites for C78H158, and 256
molecules and 32,768 interaction sites for C128H258. For PEF,
100 molecules and 2400 interaction sites were used for C24H50,
96 molecules and 4800 interaction sites for C50H102, 192
molecules and 14,976 interaction sites for C78H158, and 416
molecules and 53,248 interaction sites for C128H258.
The sizes of the simulation boxes had to be specified very
carefully in order to avoid system–size effects. The box
dimensions for C24H50 at equilibrium, and under PCF and PEF,
were 41.72 A � 41.72 A � 41.72 A in (x, y, z) space. For PCF,
the box dimensions were 93.02 A � 45.00 A � 45.00 A for
C50H102, 130.50 A � 54.00 A � 54.00 A for C78H158, and
212.70 A � 68.00 A � 68.00 A for C128H258. For PEF, the
box dimensions, were 65.45 A � 65.45 A � 35.18 A for
C50H102, 100.50 A � 100.50 A � 45.20 A for C78H158, and
166.00 A � 166.00 A � 58.00 A for C128H258.
Visualizations are presented below for the NVT NEMD
simulations of these liquids under static equilibrium conditions,
under PCF at the dimensionless shear rate, g � � gtref , of 0.8,
and under PEF at the dimensionless elongation rate, e � � etref ,
of 0.2. The reference time, tref, is defined as (ms2/e)1/2, and the
strain rates were rendered dimensionless using s and e.
3. Results and discussion
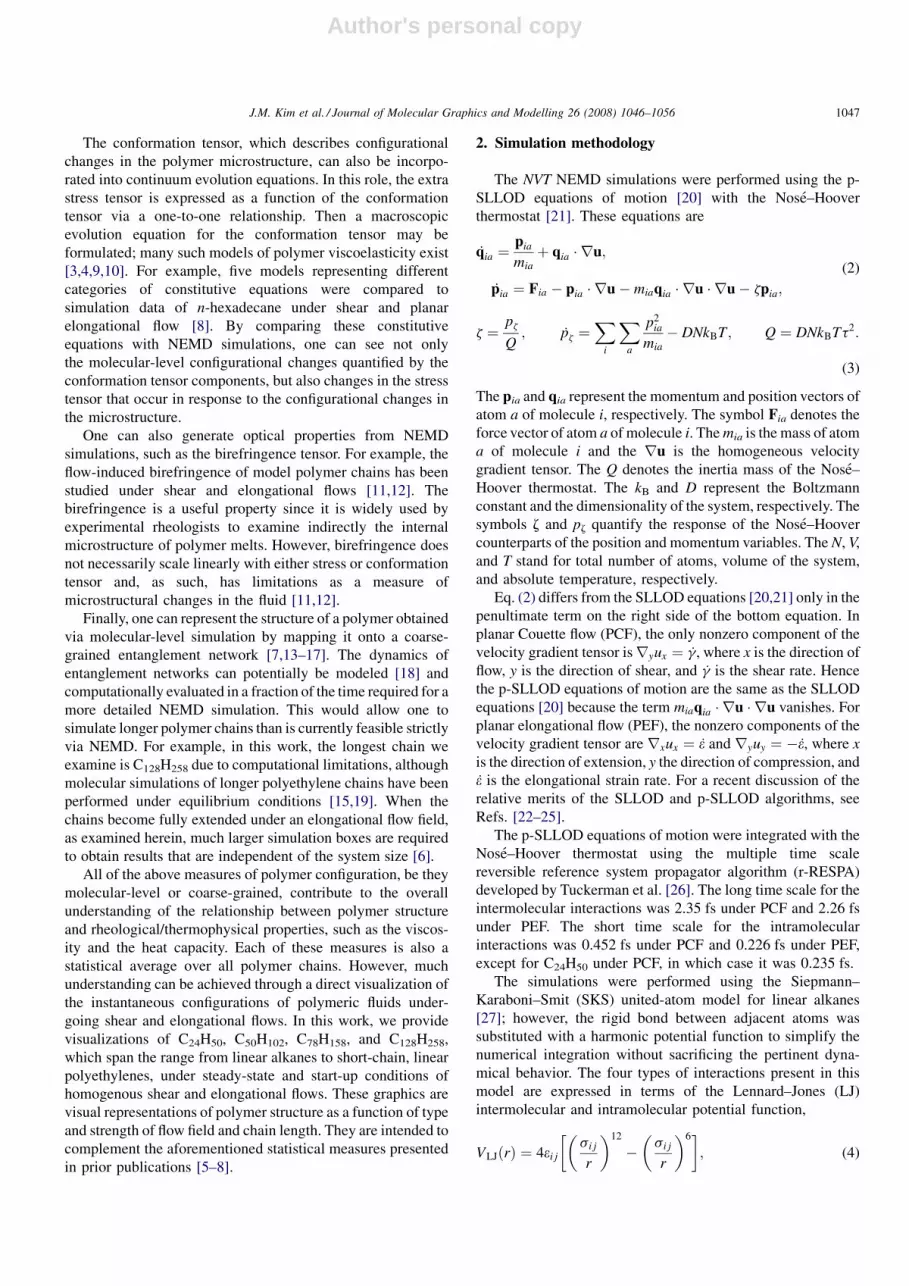
Snapshots of C78H158 under equilibrium, steady-state shear
at a reduced shear rate of 0.8, and steady-state elongational flow
at a reduced strain rate of 0.2 are displayed in Fig. 1. These
Fig. 1. All chains of C78H158 at equilibrium (a), reduced shear rate of 0.8 (b),
and elongation rate of 0.2 (c).
J.M. Kim et al. / Journal of Molecular Graphics and Modelling 26 (2008) 1046–10561048
Author's personal copy
values were so chosen for two reasons. First, they were the
maximum values for each flow type which could be safely
simulated without observing system size effects or thermostat
artifacts. Second, these values correspond to equivalent rates of
deformation, as quantified through use of the second invariant
of the deformation rate tensor for an incompressible fluid, tr
(D�D) [4]. Here, D is the symmetric contribution to the velocity
gradient tensor, so that tr (D�D) for elongational flow at a given
value of e is four times larger than tr (D�D) for shear flow at an
equivalent value of g, i.e., tr ðD � DÞ ¼ g=2 and 2e.In Fig. 1, it is evident that the structure and orientation of
C78H158 is substantially different under the three conditions. In
Figs. 2(c), 3(c), and 4(c), the same snapshots as in Fig. 1 are
displayed rendering all but 10 random chains invisible, so that a
greater degree of clarity is achieved with respect to the
individual molecular structure. In Fig. 2, snapshots of each of
the four liquids (C24H50, C50H102, C78H158, and C128H258) are
displayed at equilibrium. Figs. 3 and 4 display a random 10
chains for the same four fluids under steady-state shear and
steady-state elongation, respectively.
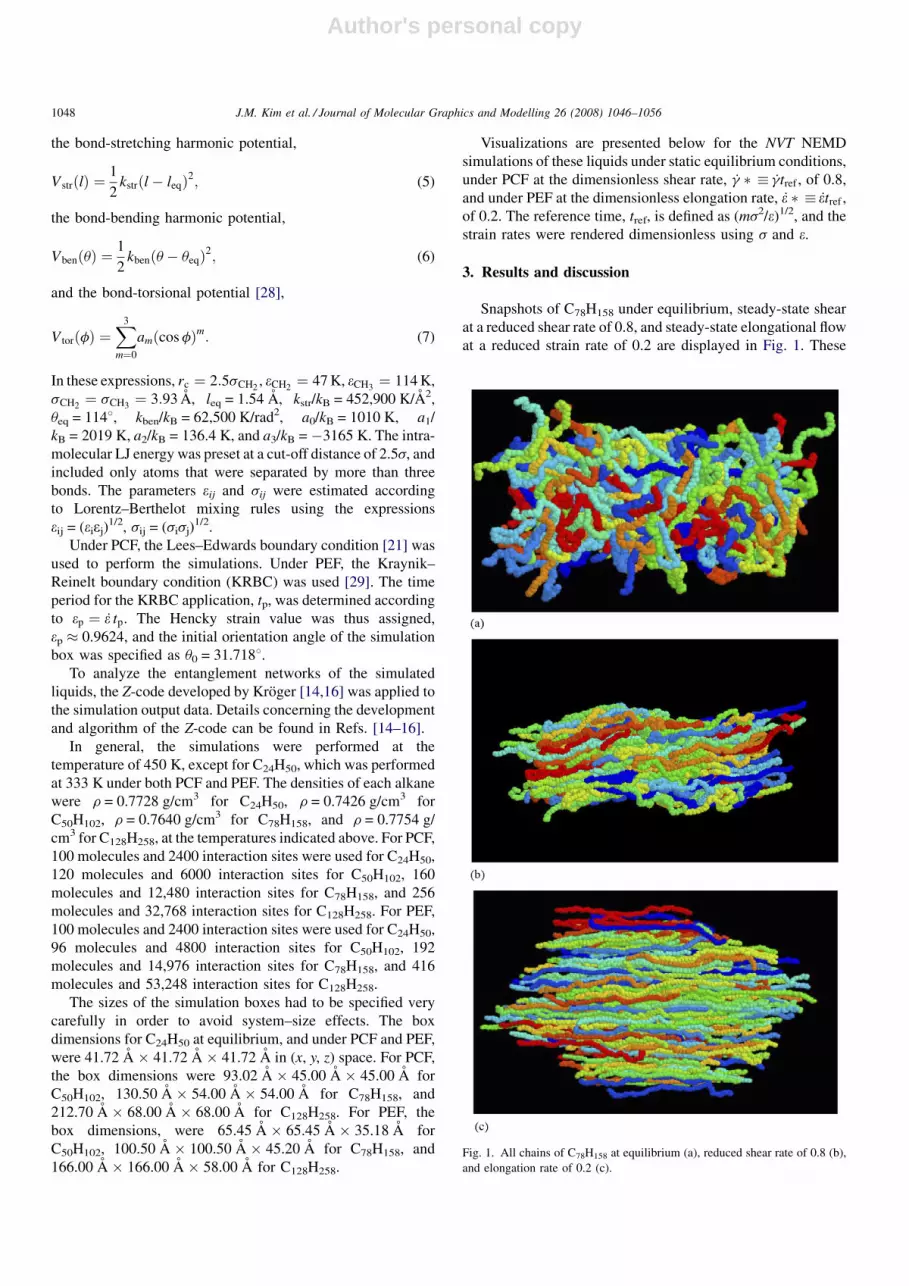
The following trends are evident from Fig. 2. Under
equilibrium conditions (Fig. 2), the chains are randomly
oriented, in terms of an end-to-end vector drawn between the
beads on the chain ends. This vector obeys a well-defined
Gaussian distribution characterizing its magnitude and direc-
tion. The mean-square of the chain end-to-end vector, hR2etei,
quantifies the average conformation of the ensemble of chains.
For example, the quantity hR2etei
1=2of C128H258 under
equilibrium conditions is 50.66 A, whereas the length of the
fully stretched chain in the all-trans-conformation is 164 A [7].
As chain length increases, the magnitude of the root mean
square end-to-end vector, hR2etei
1=2, increases according to the
well-known scaling factor offfiffiffinp
[30,31], n being the number of
bonds in a single chain (see Table 1); however, the orientation
of the chains remains random. Also, although the molecules are
relatively uncoiled at low chain lengths, as the molecular
weight of the compound increases, the chains increasingly
assume random coil conformations. The ratio of hR2etei with
respect to the mean square of the radius of gyration, Rg,
decreases toward the theoretical value of six for long polymer
chains; however, it will not plateau at this value until n � 140
[15]. The Kuhn length, hR2etei
1=2=ffiffiffinp
, which is twice the
persistence length, increases from 4.21 A to 4.50 A as the chain
length increases, indicating a fairly flexible chain.
The orientations and conformations of the chains are
determined by entropic considerations alone. Increasing the
chain length renders accessible many more possible chain
conformations, thus increasing the intrachain entropy. The
Fig. 2. Ten random chains of C24H50 (a), C50H102 (b), C78H158 (c), and C128H258 (d) at equilibrium.
J.M. Kim et al. / Journal of Molecular Graphics and Modelling 26 (2008) 1046–1056 1049

Author's personal copy
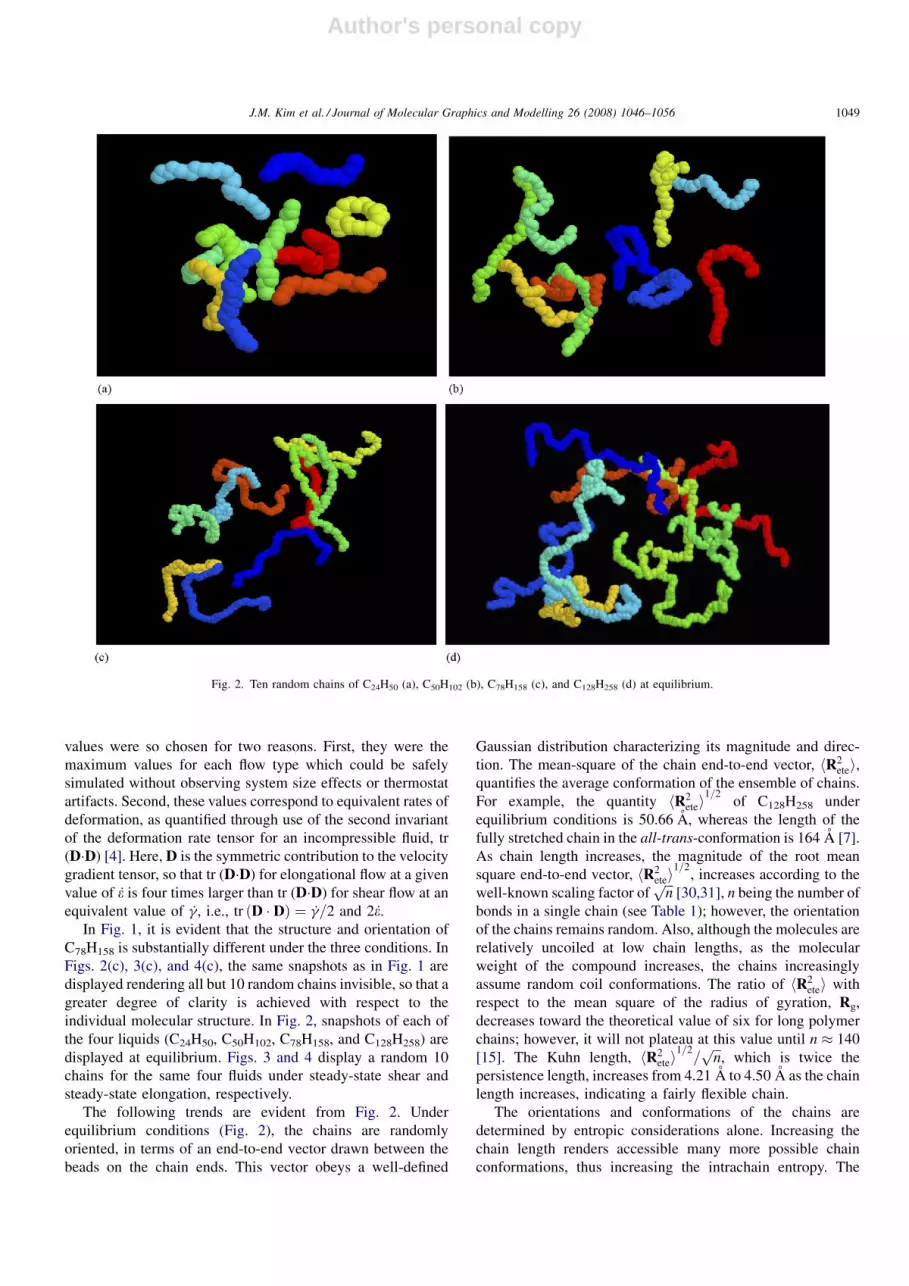
Fig. 3. Ten random chains of C24H50 (a), C50H102 (b), C78H158 (c), and C128H258 (d) at a reduced shear rate of 0.8.
Fig. 4. Ten random chains of C24H50 (a), C50H102 (b), C78H158 (c), and C128H258 (d) at reduced shear rate of 0.2.
J.M. Kim et al. / Journal of Molecular Graphics and Modelling 26 (2008) 1046–10561050
Author's personal copy
entropy increases with increasing chain length according to the
expression [30,31]
S ¼ c� kBb2hR2etei; (8)
where c is an arbitrary constant, b2 = 3/(2nl2), and l represents
the bond length.
The shortest primitive path of the chains, Lpp, is defined as
the contour length of the entanglement network structure
divided by the number of chains in the system [15]. This
network can be visualized as a system of reptation tubes of
diameter app ¼ hR2etei=Lpp. The ‘‘number of entanglements’’,
Zcoil, can be estimated according to
Zcoil ¼L2
pp
hR2etei� 1: (9)
Values of these topological characteristic indicators are
displayed in Table 2 at equilibrium. The least primitive path
displays its minimal value (with respect to an applied flow field)
for all chain lengths, as does the tube diameter. Lpp is generally
greater than or equal to the value of hR2etei
1=2for each chain,
since the end-to-end vector only quantifies the distance between
the chain ends. As the chain length increases, the chains assume
more randomly coiled configurations, and consequently the
difference between these two quantities magnifies, i.e., Lpp
grows faster than hR2etei
1=2. For the shorter chains, the tube
diameter is of the same order as the primitive path length; this is
because of the relatively extended chain configurations, which
are relatively stiff at low values of n. It seems reasonable that
these shorter chain liquids would not form the tortuous, tube
network structures of the longer chain liquids, which have
greater entropic degrees of freedom for configurational
changes. Therefore, the tube diameter decreases relative to
the contour length as the chain length increases. However, the
shorter chain liquids form tube arrays more readily than the
longer chain liquids, since they are relatively more extended
than the longer chains and exhibit fewer entanglements. This
explains why app decreases with diminishing chain length,
whereas the density increases. Zcoil increases steadily with
chain length, as one would intuitively expect, and for long
enough chains this increase is approximately linear [15].
In Fig. 3, we display snapshots of the 10 random chains for
each liquid under steady-state PCF at a reduced shear rate of
0.8. In these figures, flow is in the horizontal direction and the
gradient of velocity is in the vertical direction. By comparing
Fig. 2 with Fig. 3, it is evident that the presence of a strong shear
flow distorts the equilibrium configurations of the chains: there
is a preferential orientation (on average) of the chains with
respect to the flow field, and the chains are more highly
extended. With regard to the chain end-to-end vector
orientation, it is well known under shear flow that the average
orientation decreases from 458 relative to the direction of flow
at low shear rates, to only a few degrees north of the flow
direction at high shear rates [4,5,32]. This high shear rate
behavior is fully depicted in the snapshots of Fig. 3. The
orientation angle is generally a function of the shear rate, and
decreases as shear rate increases [11,33,34]. For these high
strain rates, the preferred orientation angle is very nearly
parallel to the direction of flow. For example the C50H102
displays an ensemble average orientation angle of 58 [11].
The configurations of the individual chains have also been
altered by the shear flow: the molecules are preferentially
stretched in the appropriate direction relative to the direction of
flow (see the preceding paragraph). The longer the chain, the
greater the degree of extension that manifests. On account of
the vorticity of the macroscopic flow field, the molecules tend
to rotate in the clockwise direction, which is also evident in the
figure as some molecules are caught in mid rotation. Still, the
molecules are not on average even nearly fully extended. For
example, the value of hR2etei
1=2of C128H258 under PCF, 81.91 A,
is larger than the equilibrium value of 50.66 A, but much
smaller than that of the fully trans-conformation, 164 A.
These graphics also provide a visual understanding of
polymer shear-thinning behavior under flow. The preferential
alignment of the long chains under flow conditions allows
greater freedom of motion along the flow direction than is
possible in a randomly oriented sample. Thus at low shear rates,
the stress scales linearly with the applied strain rate; however,
as an increasing number of chains orient preferentially nearly
along the flow direction, a relative stress reduction occurs as the
chains are able to glide by each other more freely. In previous
studies [5–7], it was observed that weakened intramolecular
Lennard–Jones interaction energies between chain atoms and
Table 1
Statistical measures of polymer configurations for all four liquids at equilibrium, in PCF, and in PEF
Liquid hR2etei
1=2(A)
equilibrium
hR2etei
1=2(A)
PCF (0.8)
hR2etei
1=2(A)
PEF (0.2)
hR2etei
1=2(A) full
extension
hR2etei=hR2
giequilibrium
Kuhn length
(A) equilibrium
C24H50 20.20 23.13 25.06 29.7 8.44 4.21
C50H102 29.72 35.90 52.92 63.3 7.18 4.25
C78H158 38.63 52.76 87.19 99.4 6.84 4.40
C128H258 50.66 81.91 149.48 164.0 6.60 4.50
Note that all liquids were simulated at 450 K, except for C24H50, which was simulated at 333 K.
Table 2
Topological characteristic quantities at equilibrium for each liquid: contour
length, tube diameter, and number of entanglements [7,15]
Liquid Lpp (A) app (A) Zcoil
C24H50 20.4 16.7 0.04
C50H102 30.2 22.5 0.9
C78H158 41.1 28.2 1.6
C128H258 58.9 35.2 2.5
J.M. Kim et al. / Journal of Molecular Graphics and Modelling 26 (2008) 1046–1056 1051
Author's personal copy
stronger intermolecular LJ energies occurred as a result of the
chain unfolding (reducing the number of interacting intramo-
lecular pairs) and alignment with other chains (increasing the
number of interacting intermolecular pairs).
Ten random chains under an elongational flow of
dimensionless strain rate 0.2 are displayed in Fig. 4. The axis
of extension lies in the horizontal direction, and the axis of
compression lies in the vertical direction. From Fig. 4, it is clear
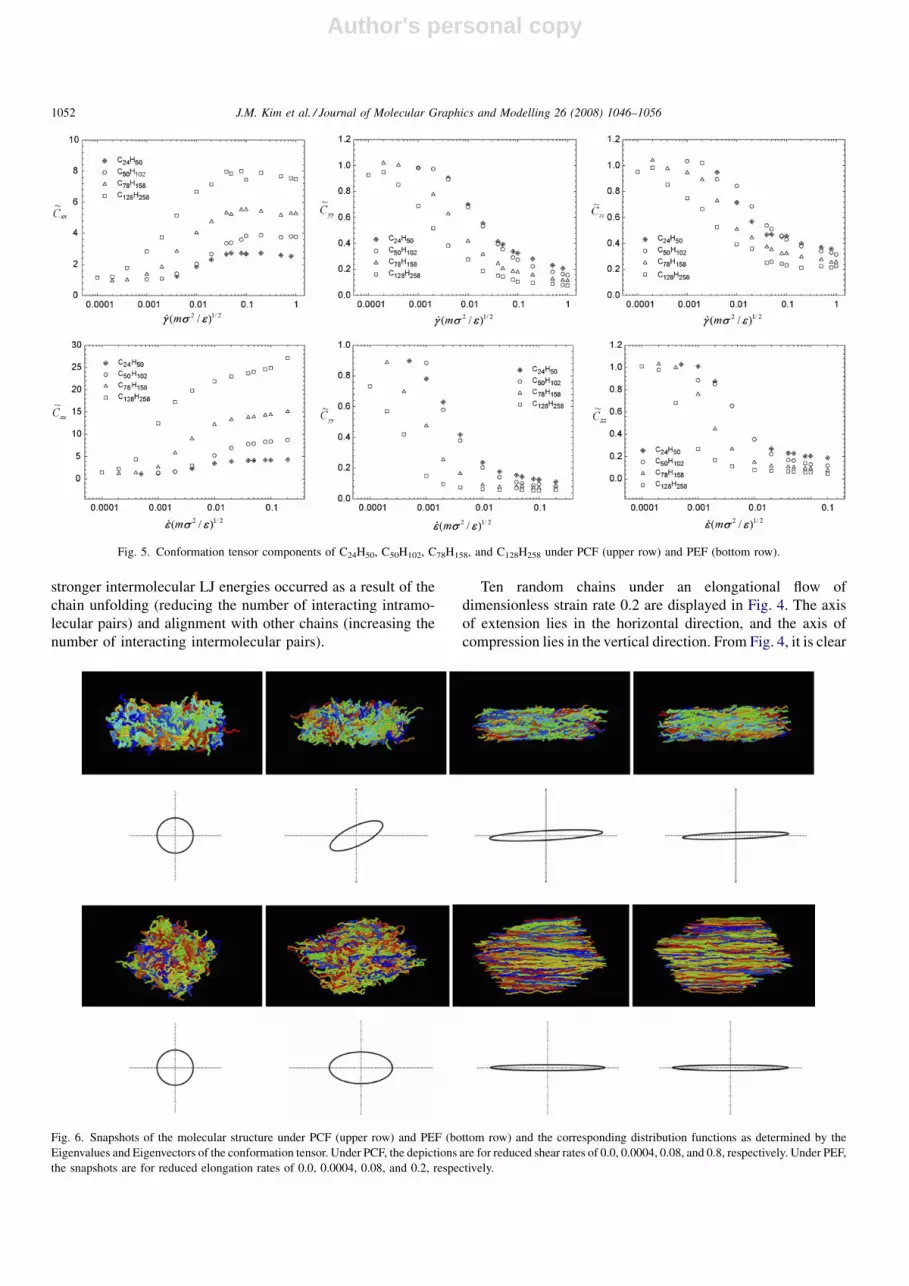
Fig. 5. Conformation tensor components of C24H50, C50H102, C78H158, and C128H258 under PCF (upper row) and PEF (bottom row).
Fig. 6. Snapshots of the molecular structure under PCF (upper row) and PEF (bottom row) and the corresponding distribution functions as determined by the
Eigenvalues and Eigenvectors of the conformation tensor. Under PCF, the depictions are for reduced shear rates of 0.0, 0.0004, 0.08, and 0.8, respectively. Under PEF,
the snapshots are for reduced elongation rates of 0.0, 0.0004, 0.08, and 0.2, respectively.
J.M. Kim et al. / Journal of Molecular Graphics and Modelling 26 (2008) 1046–10561052
Author's personal copy
that the chains of all four liquids align on average with the axis
of extension. However, it is also apparent that the relative
degree of extension of the chains increases dramatically with
chain length. Since elongational flow is vorticity-free, the
rotation of the molecules evident in Fig. 3 is not observed. Also,
the degree of orientation (i.e., the number of molecules near to
the preferred direction) is substantially greater than in the shear
flow, and the preferred direction is always in the direction of
extension. As the chain length increases, the chains become
virtually fully extended: e.g., the value of hR2etei
1=2of C128H258
under PEF, 149.48 A, is larger than that under PCF, 81.91 A,
and approaches that of the fully trans-conformation, 164 A. See
Table 1 for a comparison of various statistical quantities for
equilibrium and under PCF and PEF for all of the simulated
liquids.
Tension-thinning behavior is also observed in these liquids
[6]. Fig. 4 provides qualitative information regarding the
relative stress reduction on account of chain alignment in the
direction of flow. As was the case with shear-thinning behavior,
increasing elongation rate leads to an increase in the number of
chains aligned with respect to the direction of flow, which in
turn results in a decrease of the relative elongational stress.
Even though the quantitative change of the intermolecular and
intramolecular energies is very different between PCF and PEF,
the qualitative change of these energies is very similar, and the
same physical explanations apply to the liquids under PEF.
The average extension of the polyethylene chains can be
quantified through the conformation tensor of Eq. (1). In Fig. 5,
the diagonal components of the dimensionless conformation
tensor are plotted under PCF and PEF as functions of strain rate,
and the trace is directly related to hR2etei. Here x is the flow
direction, y is the gradient or compression direction, and z is the
neutral direction. Under quiescent conditions, this tensor is the
unit tensor. It is evident from these plots that the chains undergo a
dramatic extension in both types of flow at intermediate strain
rates, although the degree of extension under PEF is much more
severe. Note that in both cases, the molecules extend along the
flow direction, and compress along the other two directions
increasingly with increasing strain rate. The snapshots of Figs. 3
and 4 were taken at the highest values of the strain rates in Fig. 5.
The distribution of chain conformations and the preferred
direction of orientation can be quantified using the Eigenvalues
and Eigenvectors of the conformation tensor. In Fig. 6, the
circles and ellipsoids represent the distributions of the chain
extensions and orientations about the flow direction at various
strain rates. For shear flow, the dimensionless shear rates were
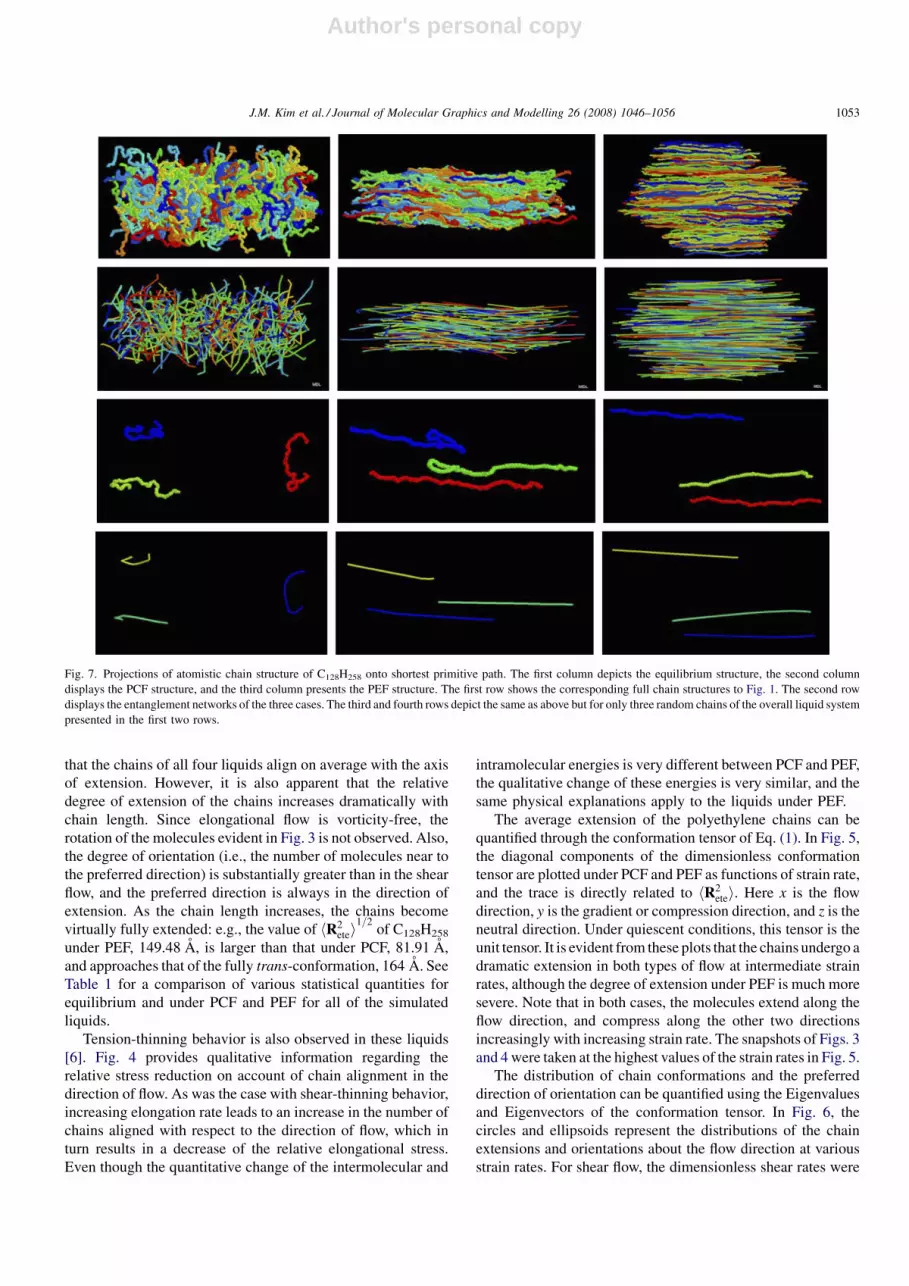
Fig. 7. Projections of atomistic chain structure of C128H258 onto shortest primitive path. The first column depicts the equilibrium structure, the second column
displays the PCF structure, and the third column presents the PEF structure. The first row shows the corresponding full chain structures to Fig. 1. The second row
displays the entanglement networks of the three cases. The third and fourth rows depict the same as above but for only three random chains of the overall liquid system
presented in the first two rows.
J.M. Kim et al. / Journal of Molecular Graphics and Modelling 26 (2008) 1046–1056 1053
Author's personal copy
0.0004, 0.08 and 0.8, and for elongational flow the
dimensionless elongation rates were 0.0004, 0.08 and 0.2
used. The first column in both rows is the equilibrium state. As
expected, at equilibrium all Eigenvalues of the conformation
tensor are identical, implying an isotropic distribution of chain
end-to-end vectors with a well-defined average magnitude.
Under shear flow, the distribution narrows and orients toward
the flow direction as the shear rate is increased. Notice that the
orientation angle decreases with shear rate relative to the
direction of flow. Here, the preferred direction of orientation is
quantified by the Eigenvector of the primary Eigenvalue. Under
PEF, the distribution becomes much narrower than for shear
flow, and always points in the flow direction.
In Fig. 7, we present the entanglement network of the
C128H258 atomistic chains and the shortest primitive path length
at equilibrium (first column), under PCF (second column), and
under PEF (third column). The first row is the full atomistic
chain system structure, as illustrated in previous figures. The
second row presents the full entanglement structure as obtained
from the Z-code of Kroger et al. [13–16]. The third row depicts
a random three chains for easy visualization, and the bottom
row presents the primitive paths for the same three chains. Note
the coarse graining of the atomistic chain with many degrees of
freedom onto a chain composed of the primitive paths between
entanglements bearing much fewer degrees of freedom. At
equilibrium, the primitive path length is relatively large as
compared to hR2etei
1=2, but this difference diminishes as the
chains stretch in response to the imposed flow field [7]. This
behavior is depicted in Fig. 8.
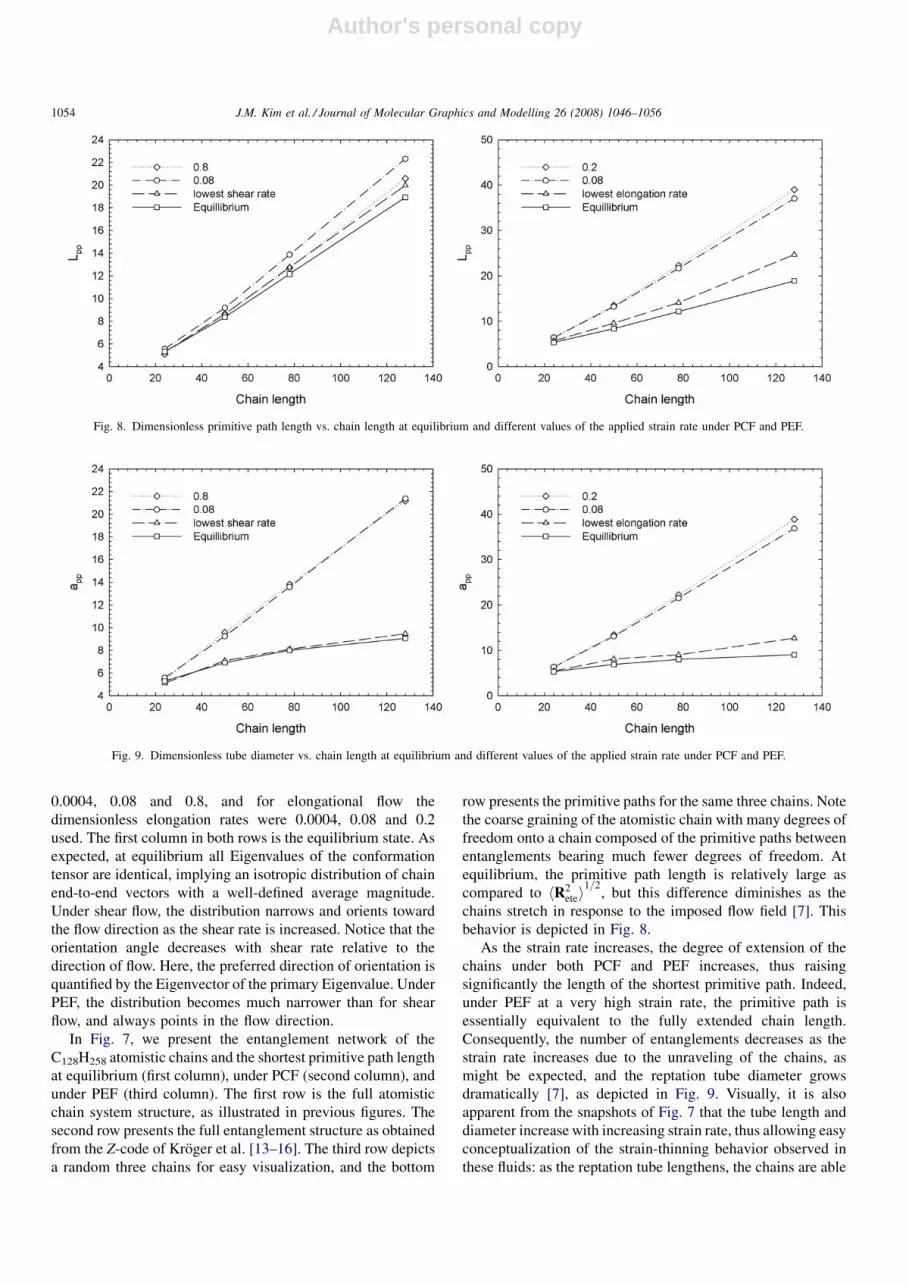
As the strain rate increases, the degree of extension of the
chains under both PCF and PEF increases, thus raising
significantly the length of the shortest primitive path. Indeed,
under PEF at a very high strain rate, the primitive path is
essentially equivalent to the fully extended chain length.
Consequently, the number of entanglements decreases as the
strain rate increases due to the unraveling of the chains, as
might be expected, and the reptation tube diameter grows
dramatically [7], as depicted in Fig. 9. Visually, it is also
apparent from the snapshots of Fig. 7 that the tube length and
diameter increase with increasing strain rate, thus allowing easy
conceptualization of the strain-thinning behavior observed in
these fluids: as the reptation tube lengthens, the chains are able
Fig. 8. Dimensionless primitive path length vs. chain length at equilibrium and different values of the applied strain rate under PCF and PEF.
Fig. 9. Dimensionless tube diameter vs. chain length at equilibrium and different values of the applied strain rate under PCF and PEF.
J.M. Kim et al. / Journal of Molecular Graphics and Modelling 26 (2008) 1046–10561054
Author's personal copy
to move axially with greater freedom, which manifests in lower
relative stress between the atomistic constituents.
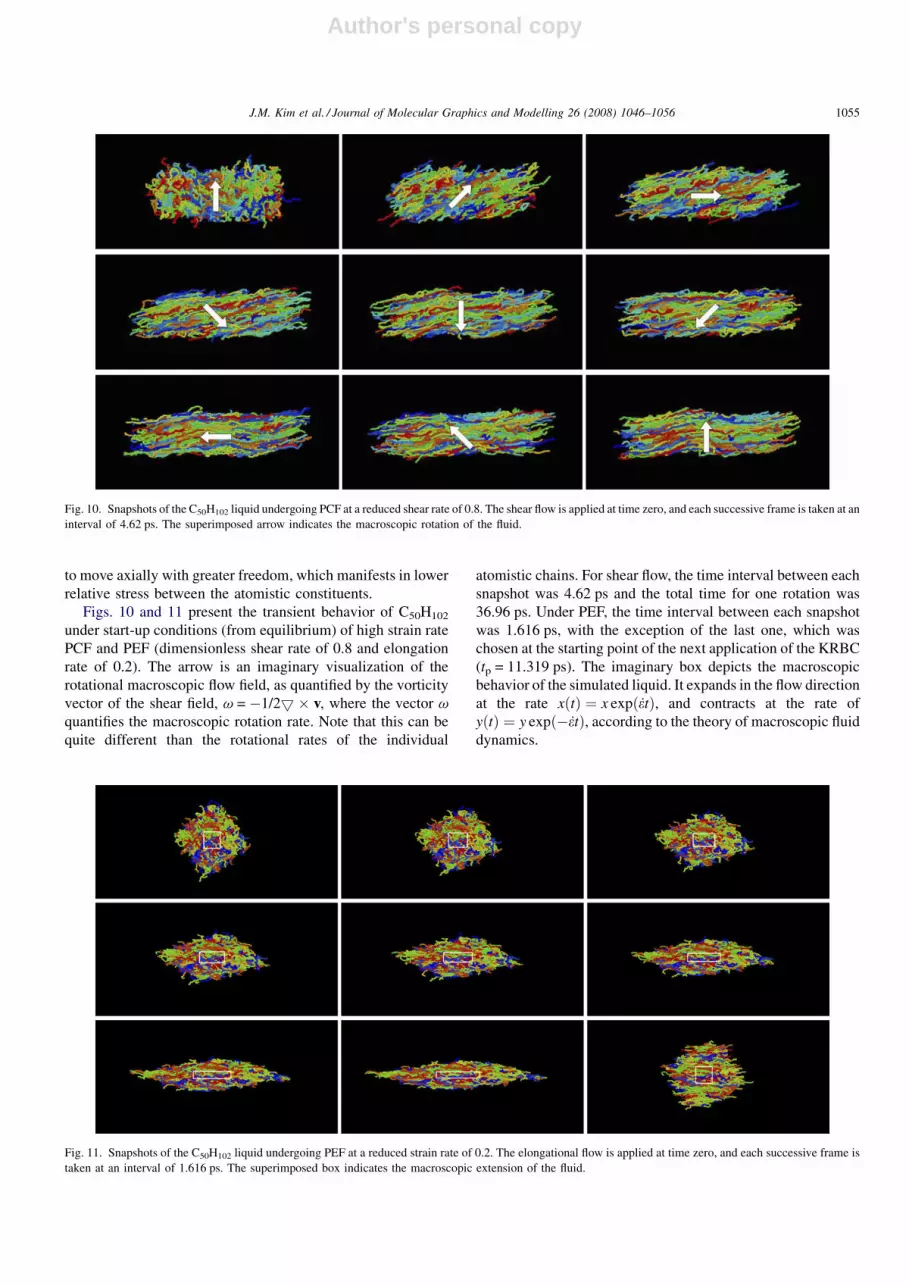
Figs. 10 and 11 present the transient behavior of C50H102
under start-up conditions (from equilibrium) of high strain rate
PCF and PEF (dimensionless shear rate of 0.8 and elongation
rate of 0.2). The arrow is an imaginary visualization of the
rotational macroscopic flow field, as quantified by the vorticity
vector of the shear field, v = �1/25 � v, where the vector v
quantifies the macroscopic rotation rate. Note that this can be
quite different than the rotational rates of the individual
atomistic chains. For shear flow, the time interval between each
snapshot was 4.62 ps and the total time for one rotation was
36.96 ps. Under PEF, the time interval between each snapshot
was 1.616 ps, with the exception of the last one, which was
chosen at the starting point of the next application of the KRBC
(tp = 11.319 ps). The imaginary box depicts the macroscopic
behavior of the simulated liquid. It expands in the flow direction
at the rate xðtÞ ¼ x expðetÞ, and contracts at the rate of
yðtÞ ¼ y expð�etÞ, according to the theory of macroscopic fluid
dynamics.
Fig. 10. Snapshots of the C50H102 liquid undergoing PCF at a reduced shear rate of 0.8. The shear flow is applied at time zero, and each successive frame is taken at an
interval of 4.62 ps. The superimposed arrow indicates the macroscopic rotation of the fluid.
Fig. 11. Snapshots of the C50H102 liquid undergoing PEF at a reduced strain rate of 0.2. The elongational flow is applied at time zero, and each successive frame is
taken at an interval of 1.616 ps. The superimposed box indicates the macroscopic extension of the fluid.
J.M. Kim et al. / Journal of Molecular Graphics and Modelling 26 (2008) 1046–1056 1055
Author's personal copy
4. Conclusion
In this work, we visualized and compared the structures of
C24H50, C50H102, C78H158, and C128H258 at equilibrium, and
under PCF and PEF. The snapshots in this paper provide a visual
basis for the various statistical measures used to describe
polymer orientation and elongation as a function of type of flow,
strain rate, and chain length. At equilibrium, the overall shape of
each chain adopted a random coil configuration.
Under strong shear flow, a partial alignment and extension of
the chains were observed. A dynamical rotation of the chains was
also observed due to the vorticity inherent in PCF. These graphics
support the statistical description of the molecular configurations
as generated from direct measures, such as the conformation
tensor, and indirect measures, such as the birefringence. Under
strong elongational flow, nearly full alignment of the molecules
and extensions approaching the fully trans-configuration are
observed. The visualization of the primitive paths provided a
visual connection between coarse-grained networks and the
highly detailed atomistic models. The ability to simulate longer
chain molecules likely rests in the ability to perform multiscale
simulations that take advantage of both atomistic NEMD
simulations and entanglement network dynamics.
Acknowledgments
This research used resources of the Center for Computa-
tional Sciences at Oak Ridge National Laboratory, which is
supported by the Office of Science of the DOE under Contract
DE-AC05-00OR22725. J.M.K. acknowledges support from the
Don Bogue fellowship at the University of Tennessee.
References
[1] T. Ionescu, D.J. Keffer, V.G. Mavrantzas, B.J. Edwards, Thermodynamic
characterization of polymeric materials subjected to nonisothermal flows:
experiment, theory and simulation, J. Rheol., in press.
[2] M. Dressler, B.J. Edwards, H.C. Ottinger, Macroscopic thermodynamics
of flowing polymeric liquids., Rheol. Acta 38 (1999) 2028–2043.
[3] A.N. Beris, B.J. Edwards, Thermodynamics of Flowing Systems with
Internal Microstructure, Oxford University Press, New York, 1994.
[4] R.B. Bird, O. Hassager, R.C. Armstrong, C.F. Curtiss, 2nd ed., Dynamics
of Polymeric Liquids, vol. 2, John Wiley and Sons, New York, 1987.
[5] C. Baig, B.J. Edwards, D.J. Keffer, H.D. Cochran, Rheological and
structural studies of liquid decane, hexadecane, and tetracosane under
planar elongational flow using nonequilibrium molecular dynamics simu-
lations, J. Chem. Phys. 122 (2005) 184906.
[6] C. Baig, B.J. Edwards, D.J. Keffer, H.D. Cochran, V.A. Harmandaris,
Rheological and structural studies of liquid polyethylenes under planar
elongational flow using nonequilibrium molecular dynamics simulations,
J. Chem. Phys. 124 (2006) 084902.
[7] J.M. Kim, D.J. Keffer, M. Kroger, B.J. Edwards, Rheological and entan-
glement characteristics of linear chain polyethylene liquids in planar
Couette and planar elongational flows, J. Non-Newtonian Fluid Mech.,
in press.
[8] C. Baig, B. Jiang, B.J. Edwards, D.J. Keffer, H.D. Cochran, A comparison
of simple rheological models and simulation data of n-hexadecane under
shear and elongational flow, J. Rheol. 50 (5) (2006) 625–640.
[9] A.N. Beris, B.J. Edwards, Poisson bracket formulation of incompressible
flow equations in continuum mechanics, J. Rheol. 36 (1990) 55–78.
A.N. Beris, B.J. Edwards, Poisson bracket formulation of viscoelastic flow
equations of differential type: a unified approach, J. Rheol. 34 (1990) 503–538.
[11] C. Baig, B.J. Edwards, D.J. Keffer, A molecular dynamics study of the
stress-optical behavior of a linear short-chain polyethylene melt under
shear, Rheol. Acta, in press.
[12] M. Kroger, C. Luap, R. Muller, Polymer melts under uniaxial elongational
flow: stress-optical behavior from experiments and nonequilibrium mole-
cular dynamics computer simulations, Macromolecules 20 (1997) 526–539.
[13] M. Kroger, J. Ramirez, H.C. Ottinger, Projection from an atomistic chain
contour to its primitive path, Polymer 43 (2002) 477–487.
[14] M. Kroger, Shortest multiple disconnected path for the analysis of
entanglements in two- and three-dimensional polymeric systems, Comp.
Phys. Commun. 168 (2005) 209–232.
[15] K. Fonteinopoulou, N.C. Karayiannis, V.G. Mavrantzas, M. Kroger,
Primitive path identification and entanglement statistics in polymer melts:
results from direct topological analysis on atomistic polyethylene models,
Macromolecules 39 (2006) 4207–4216.
[16] M. Kroger, Models for Polymeric and Anisotropic Liquids, Springer-
Verlag, Berlin, 2005.
[17] C. Tzoumanekas, D.N. Theodorou, Topological analysis of linear polymer
melts: a statistical approach, Macromolecules 39 (2006) 4592–4604.
[18] J.D. Schieber, J. Neergaard, S. Gupta, A full-chain, temporary network
model with sliplinks, chain-length fluctuations, chain connectivity and
chain stretching, J. Rheol. 47 (1) (2003) 213–233.
[19] N.C. Karayiannis, A.E. Giannousaki, V.G. Mavrantzas, D.N. Theodorou,
Atomistic Monte Carlo simulation of strictly monodisperse long poly-
ethylene melts through a generalized chain bridging algorithm, J. Chem.
Phys. 117 (2002) 5465–5479.
[20] B.J. Edwards, M. Dressler, A reversible problem in non-equilibrium
thermodynamics: Hamiltonian evolution equations for non-equilibrium
molecular dynamics simulations, J. Non-Newtonian Fluid Mech. 96
(2001) 163–175.
[21] D.J. Evans, G.P. Morriss, Statistical Mechanics of Nonequilibrium
Liquids Theoretical Chemistry Monograph Series, Academic Press,
London, 1990.
[22] C. Baig, B.J. Edwards, D.J. Keffer, H.D. Cochran, A proper approach for
nonequilibrium molecular dynamics simulations of planar elongational
flow, J. Chem. Phys. 122 (2005) 114103.
[23] B.J. Edwards, C. Baig, D.J. Keffer, An examination of the validity of
nonequilibrium molecular-dynamics simulation algorithms for arbitrary
steady-state flows, J. Chem. Phys. 123 (2005) 114106.
[24] B.J. Edwards, C. Baig, D.J. Keffer, Avalidation of the p-SLLOD equations
of motion for homogeneous steady-state flows, J. Chem. Phys. 124 (2006)
194104.
[25] P.J. Daivis, B.J. Todd, A simple, direct derivation and proof of the validity
of the SLLOD equations of motion for generalized homogeneous flows, J.
Chem. Phys. 124 (2006) 194103.
[26] M. Tuckerman, B.J. Berne, G.J. Martyna, Reversible multiple time scale
molecular-dynamics, J. Chem. Phys. 97 (1992) 1990–2001.
[27] J.I. Siepmann, S. Karaborni, B. Smit, Simulating the critical behavior of
complex fluids, Nature 365 (1993) 330–332.
[28] W.L. Jorgensen, J.D. Madura, C.J. Swenson, Optimized intermolecular
potential functions for liquid hydrocarbons, J. Am. Chem. Soc. 106 (1984)
6638–6646.
[29] A.M. Kraynik, D.A. Reinelt, Extensional motions of spatially periodic
lattices, Int. J. Multiphase Flow 18 (1992) 1045–1059.
[30] L.R.G. Treloar, The Physics of Rubber Elasticity, Oxford University
Press, Oxford, 1975.
[31] M. Doi, S.F. Edwards, The Theory of Polymer Dynamics, Oxford
University Press, Oxford, 1986.
[32] G.P. Morriss, P.J. Daivis, D.J. Evans, The rheology of n-alkanes: decane
and eicosane, J. Chem. Phys. 94 (1991) 7420–7433.
[33] S.T. Cui, S.A. Gupta, P.T. Cummings, H.D. Cochran, Molecular dynamics
simulations of the rheology of normal decane, hexadecane, and tetra-
cosane, J. Chem. Phys. Rev. 105 (1996) 1214–1220.
[34] J.D. Moore, S.T. Cui, H.D. Cochran, P.T. Cummings, A molecular
dynamics study of a short-chain polyethylene melt. I. Steady-state shear,
J. Non-Newtonian Fluid Mech. 93 (2000) 83–99.
J.M. Kim et al. / Journal of Molecular Graphics and Modelling 26 (2008) 1046–10561056


![Conformational analysis of dioxa[2.2]orthocyclophanes](https://img.dokumen.tips/doc/110x75/63197d9be9c87e0c091025ba/conformational-analysis-of-dioxa22orthocyclophanes.jpg)


