Embed Size (px)
Citation preview
BÁO CÁO
KINH TẾ VĨ MÔ VIỆT NAM
Quý II - 2015
VIET NAM QUARTERLY
MACROECONOMIC REPORT
Quarter 4 - 2017


Supported by:
Konrad Adenauer Stiftung

2017 VIET NAM MACROECONOMIC REPORT Q4 1
SUMMARY
The world economy in Q4 and in 2017 witnessed a steady growth. The US economy continued to
expand despite the impact of two major hurricanes Harvey and Irma, which led to the Fed’s decision
to hike the interest rates in December. EU’s economy recovered rapidly with the highest growth rate
in recent years, whilst the UK has lost its position as the world’s fifth largest economy. In Asia, Japan
has continued to face labor shortages as well as population decline. The Chinese economy
experienced a slightly lower growth when its government has tried to control the property market
and debt risks. ASEAN economies maintained their impressive growth while BRICS countries also
witnessed signs of economic rebound.
The domestic economy, after an abnormal Q3, continued to be reported with even more impressive
growth rate of 7.65% (yoy), which contributed to the overall growth rate of 6.81% in 2017,
surpassing the National Assembly’s target of 6.7%. Agriculture, forestry and fishery and service
sectors improved greatly compared to previous years. The number of foreign visitors set a record of
nearly 13 million, contributing to the recovery of service sector. The manufacturing witnessed a
tremendous growth of 14.4%, being the driving force of the whole industry sector despite the shrink
of the mining and quarrying sub-sector due to restructuring. All industrial production indicators
grew in Q4.
The number of new jobs and newly established firms increased considerably again in Q4.
CPI remained stable in Q4, only increased by 2.6% (yoy) in December while inflation rate of 2017
was 3.53%, met the target of less than 4% assigned by the National Assembly.
Trade balance saw a surplus of 3 bil. USD in Q4. The trade turnover this year reached 400 bil. USD for
the first time in history. Both export and import turnovers showed impressive growth rate of more
than 20% (yoy). Total trade surplus in 2017 was reported as 2.7 bil. USD.
Korea is replacing China to be the country with highest deficit among trading partners with Vietnam.
Although budget deficit stayed low, it may reflect slow disbursement of public investment. As for
expenditure structure, the expenditure for investment and development still accounted for a small
proportion (21.3%) compared to current expenditure (70.7%).
Consumption continued to improve, growing by 10.9% (yoy,ytd) in Q4. Automobile was the
commodity with the highest growth rate due to a competition in prices between producers and
importers in 2017.
Total investment capital grew steadily by 12.7% (yoy) in Q4. Investment in private sector witnessed
the highest growth rate in both Q4 (17.7%) and the whole year (16.8%) among three sectors of the
economy.
Credit growth rate in 2017 was reported as 18.17%. This rate did not meet the Government’s target
of 21%. Liquidity of the banking system this year stayed plentiful as the SBV injected a large amount
of VND into the economy but not (intentionally) strictly sterilized. Total foreign exchange reserves
reached 51.5 bil. USD by the end of 2017.
In the real estate market, the number of new apartments for sale and transactions increased
significantly in both Hanoi and Ho Chi Minh City. The boom in market supply close to the end of the
year may signal a declining trend in price in the future.
2 2017 VIET NAM MACROECONOMIC REPORT Q4
THE WORLD ECONOMY
Commodity and asset markets
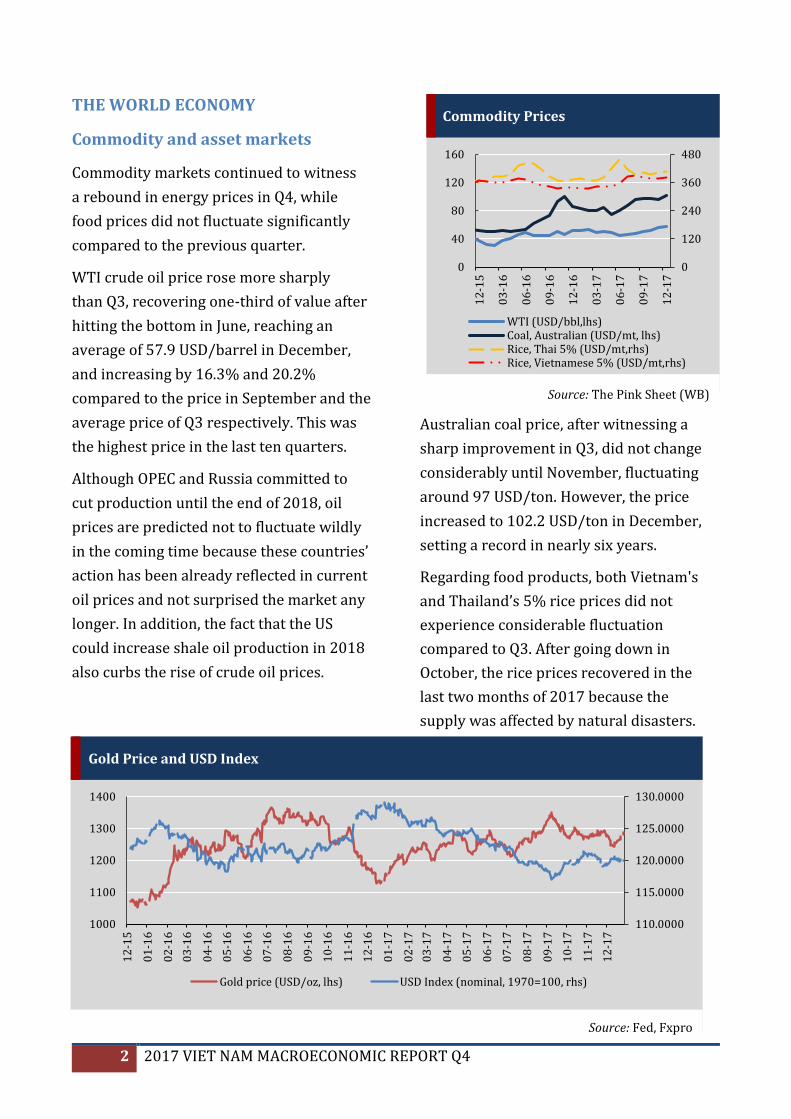
Commodity markets continued to witness
a rebound in energy prices in Q4, while
food prices did not fluctuate significantly
compared to the previous quarter.
WTI crude oil price rose more sharply
than Q3, recovering one-third of value after
hitting the bottom in June, reaching an
average of 57.9 USD/barrel in December,
and increasing by 16.3% and 20.2%
compared to the price in September and the
average price of Q3 respectively. This was
the highest price in the last ten quarters.
Although OPEC and Russia committed to
cut production until the end of 2018, oil
prices are predicted not to fluctuate wildly
in the coming time because these countries’
action has been already reflected in current
oil prices and not surprised the market any
longer. In addition, the fact that the US
could increase shale oil production in 2018
also curbs the rise of crude oil prices.
Australian coal price, after witnessing a
sharp improvement in Q3, did not change
considerably until November, fluctuating
around 97 USD/ton. However, the price
increased to 102.2 USD/ton in December,
setting a record in nearly six years.
Regarding food products, both Vietnam's
and Thailand’s 5% rice prices did not
experience considerable fluctuation
compared to Q3. After going down in
October, the rice prices recovered in the
last two months of 2017 because the
supply was affected by natural disasters.
Commodity Prices
Source: The Pink Sheet (WB)
0
120
240
360
480
0
40
80
120
160
12
-15
03
-16
06
-16
09
-16
12
-16
03
-17
06
-17
09
-17
12
-17
WTI (USD/bbl,lhs)Coal, Australian (USD/mt, lhs)Rice, Thai 5% (USD/mt,rhs)Rice, Vietnamese 5% (USD/mt,rhs)
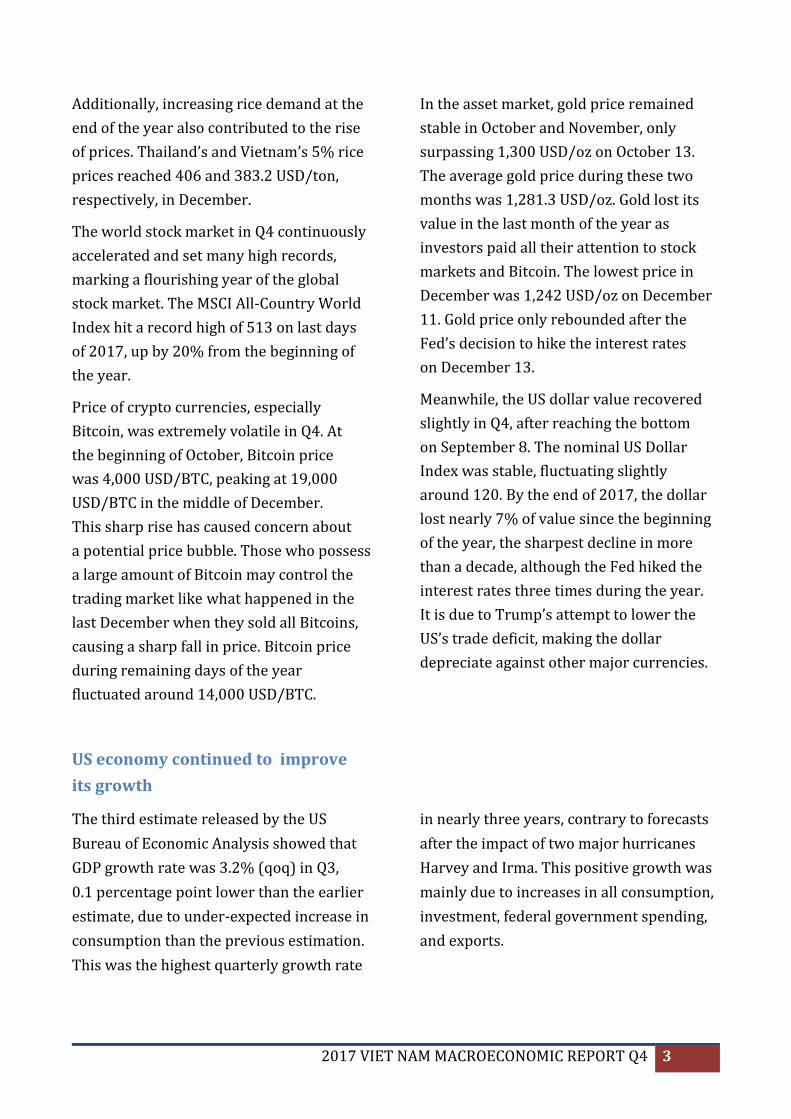
Gold Price and USD Index
Source: Fed, Fxpro
110.0000
115.0000
120.0000
125.0000
130.0000
1000
1100
1200
1300
1400
12
-15
01
-16
02
-16
03
-16
04
-16
05
-16
06
-16
07
-16
08
-16
09
-16
10
-16
11
-16
12
-16
01
-17
02
-17
03
-17
04
-17
05
-17
06
-17
07
-17
08
-17
09
-17
10
-17
11
-17
12
-17
Gold price (USD/oz, lhs) USD Index (nominal, 1970=100, rhs)
2017 VIET NAM MACROECONOMIC REPORT Q4 3
Additionally, increasing rice demand at the
end of the year also contributed to the rise
of prices. Thailand’s and Vietnam’s 5% rice
prices reached 406 and 383.2 USD/ton,
respectively, in December.
The world stock market in Q4 continuously
accelerated and set many high records,
marking a flourishing year of the global
stock market. The MSCI All-Country World
Index hit a record high of 513 on last days
of 2017, up by 20% from the beginning of
the year.
Price of crypto currencies, especially
Bitcoin, was extremely volatile in Q4. At
the beginning of October, Bitcoin price
was 4,000 USD/BTC, peaking at 19,000
USD/BTC in the middle of December.
This sharp rise has caused concern about
a potential price bubble. Those who possess
a large amount of Bitcoin may control the
trading market like what happened in the
last December when they sold all Bitcoins,
causing a sharp fall in price. Bitcoin price
during remaining days of the year
fluctuated around 14,000 USD/BTC.
In the asset market, gold price remained
stable in October and November, only
surpassing 1,300 USD/oz on October 13.
The average gold price during these two
months was 1,281.3 USD/oz. Gold lost its
value in the last month of the year as
investors paid all their attention to stock
markets and Bitcoin. The lowest price in
December was 1,242 USD/oz on December
11. Gold price only rebounded after the
Fed’s decision to hike the interest rates
on December 13.
Meanwhile, the US dollar value recovered
slightly in Q4, after reaching the bottom
on September 8. The nominal US Dollar
Index was stable, fluctuating slightly
around 120. By the end of 2017, the dollar
lost nearly 7% of value since the beginning
of the year, the sharpest decline in more
than a decade, although the Fed hiked the
interest rates three times during the year.
It is due to Trump’s attempt to lower the
US’s trade deficit, making the dollar
depreciate against other major currencies.
US economy continued to improve
its growth
The third estimate released by the US
Bureau of Economic Analysis showed that
GDP growth rate was 3.2% (qoq) in Q3,
0.1 percentage point lower than the earlier
estimate, due to under-expected increase in
consumption than the previous estimation.
This was the highest quarterly growth rate
in nearly three years, contrary to forecasts
after the impact of two major hurricanes
Harvey and Irma. This positive growth was
mainly due to increases in all consumption,
investment, federal government spending,
and exports.
4 2017 VIET NAM MACROECONOMIC REPORT Q4
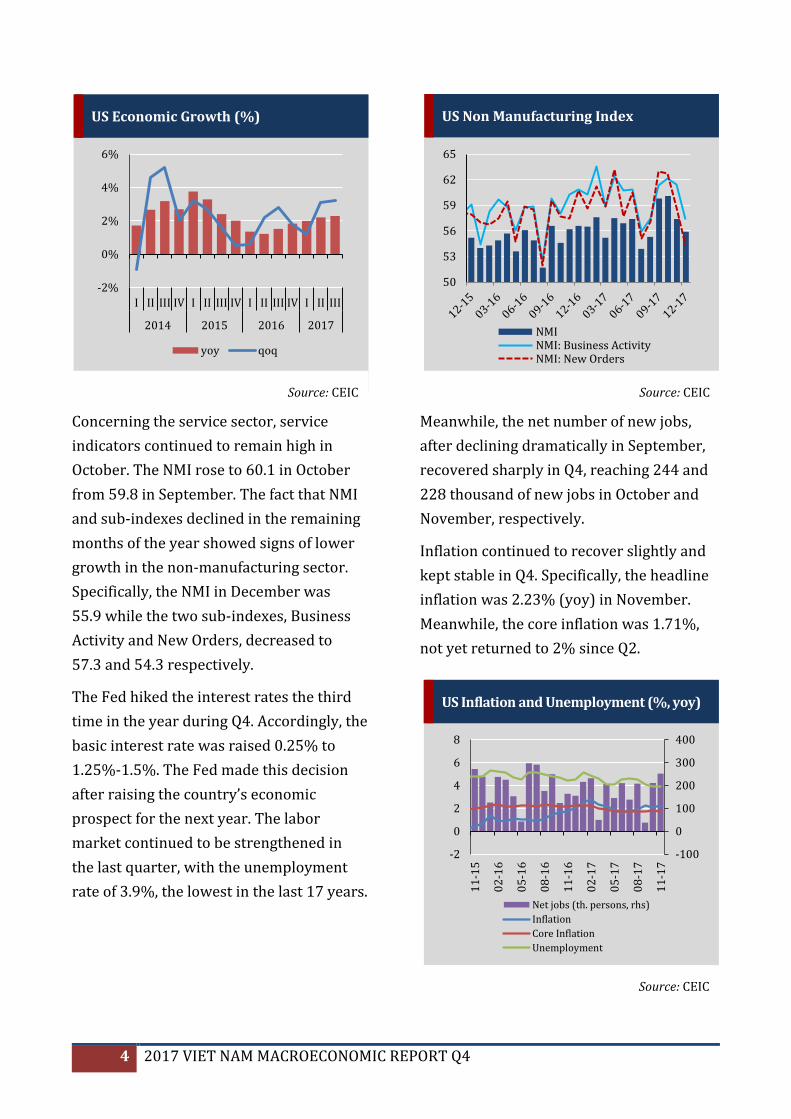
Concerning the service sector, service
indicators continued to remain high in
October. The NMI rose to 60.1 in October
from 59.8 in September. The fact that NMI
and sub-indexes declined in the remaining
months of the year showed signs of lower
growth in the non-manufacturing sector.
Specifically, the NMI in December was
55.9 while the two sub-indexes, Business
Activity and New Orders, decreased to
57.3 and 54.3 respectively.
The Fed hiked the interest rates the third
time in the year during Q4. Accordingly, the
basic interest rate was raised 0.25% to
1.25%-1.5%. The Fed made this decision
after raising the country’s economic
prospect for the next year. The labor
market continued to be strengthened in
the last quarter, with the unemployment
rate of 3.9%, the lowest in the last 17 years.
Meanwhile, the net number of new jobs,
after declining dramatically in September,
recovered sharply in Q4, reaching 244 and
228 thousand of new jobs in October and
November, respectively.
Inflation continued to recover slightly and
kept stable in Q4. Specifically, the headline
inflation was 2.23% (yoy) in November.
Meanwhile, the core inflation was 1.71%,
not yet returned to 2% since Q2.
US Inflation and Unemployment (%, yoy)
Source: CEIC
-100
0
100
200
300
400
-2
0
2
4
6
8
11
-15
02
-16
05
-16
08
-16
11
-16
02
-17
05
-17
08
-17
11
-17
Net jobs (th. persons, rhs)
Inflation
Core Inflation
Unemployment
US Economic Growth (%)
Source: CEIC
-2%
0%
2%
4%
6%
I II III IV I II III IV I II III IV I II III
2014 2015 2016 2017
yoy qoq
US Non Manufacturing Index
Source: CEIC
50
53
56
59
62
65
NMINMI: Business ActivityNMI: New Orders
2017 VIET NAM MACROECONOMIC REPORT Q4 5
Europe continued economic rebound,
the UK economy has lost its economic
position
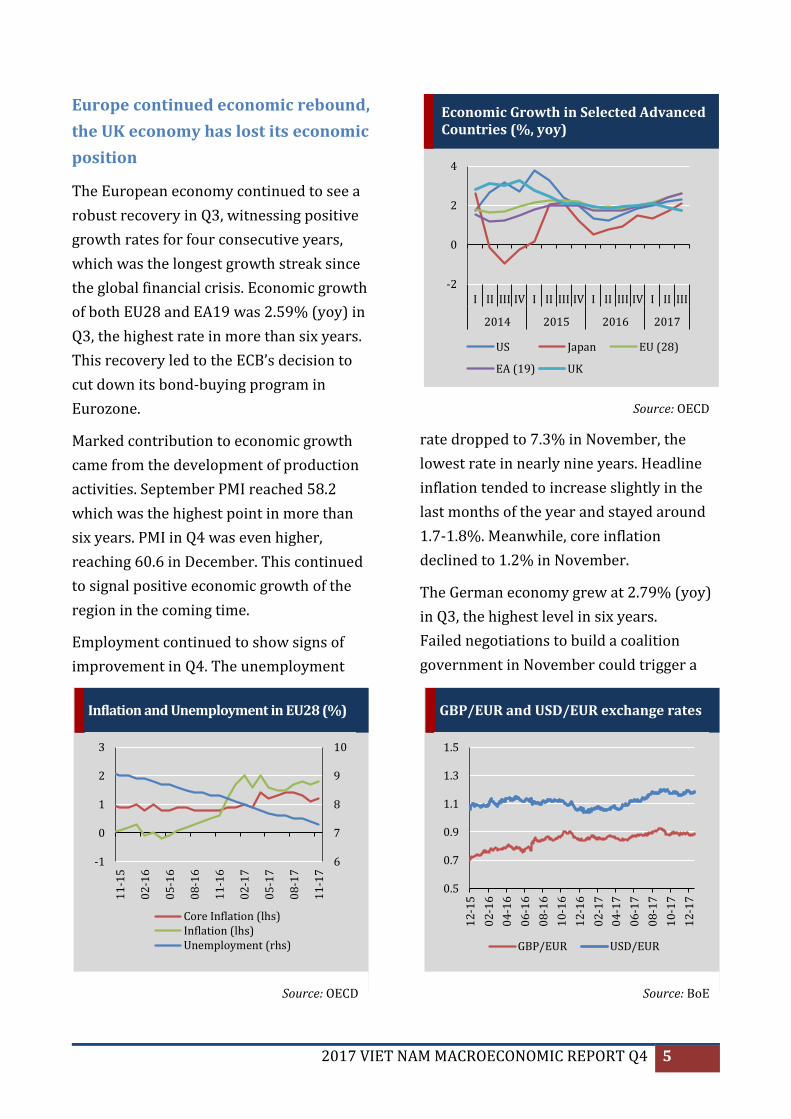
The European economy continued to see a
robust recovery in Q3, witnessing positive
growth rates for four consecutive years,
which was the longest growth streak since
the global financial crisis. Economic growth
of both EU28 and EA19 was 2.59% (yoy) in
Q3, the highest rate in more than six years.
This recovery led to the ECB’s decision to
cut down its bond-buying program in
Eurozone.
Marked contribution to economic growth
came from the development of production
activities. September PMI reached 58.2
which was the highest point in more than
six years. PMI in Q4 was even higher,
reaching 60.6 in December. This continued
to signal positive economic growth of the
region in the coming time.
Employment continued to show signs of
improvement in Q4. The unemployment
rate dropped to 7.3% in November, the
lowest rate in nearly nine years. Headline
inflation tended to increase slightly in the
last months of the year and stayed around
1.7-1.8%. Meanwhile, core inflation
declined to 1.2% in November.
The German economy grew at 2.79% (yoy)
in Q3, the highest level in six years.
Failed negotiations to build a coalition
government in November could trigger a
Economic Growth in Selected Advanced Countries (%, yoy)
Source: OECD
-2
0
2
4
I II III IV I II III IV I II III IV I II III
2014 2015 2016 2017
US Japan EU (28)
EA (19) UK
Inflation and Unemployment in EU28 (%)
Source: OECD
6
7
8
9
10
-1
0
1
2
3
11
-15
02
-16
05
-16
08
-16
11
-16
02
-17
05
-17
08
-17
11
-17
Core Inflation (lhs)Inflation (lhs)Unemployment (rhs)
GBP/EUR and USD/EUR exchange rates
Source: BoE
0.5
0.7
0.9
1.1
1.3
1.5
12
-15
02
-16
04
-16
06
-16
08
-16
10
-16
12
-16
02
-17
04
-17
06
-17
08
-17
10
-17
12
-17
GBP/EUR USD/EUR
6 2017 VIET NAM MACROECONOMIC REPORT Q4
social-political crisis in the largest
European economy in the coming time.
However, the agreement on January 12
may clear up these doubts.
The Spanish economy in Q3 witnessed a
growth rate of 3.14% (yoy). However, the
political crisis between Madrid government
and the autonomous region of Catalonia
since October may slow economic growth
in Q4.
The UK economy continued to face
difficulties. Economic growth was solely
1.75% (yoy), the lowest rate in four years.
The UK has lost its position as the fifth
largest economy in the world to France.
This decline in economic ranking reflects
the UK’s economic recession after Brexit.
In case UK and EU cannot reach a new trade
agreement, British people will face more
difficulties as commodity prices increase.
In the coming time amid uncertainties of
the world, the UK economy is expected to
face many difficulties. In the latest IMF
World Economic Outlook published on
October 24, the IMF kept its forecast for
its economic growth in 2017 and 2018
at 1.7% and 1.5% respectively.
USD/EUR exchange rate in Q4 was more
stable than previous quarters of the year.
At the end of the year, the exchange rate
was at 1.199 USD/EUR, marking one year
the Euro appreciated against the dollar.
In 2018, the ECB will likely implement
tightening monetary policies.
2017 VIET NAM MACROECONOMIC REPORT Q4 7
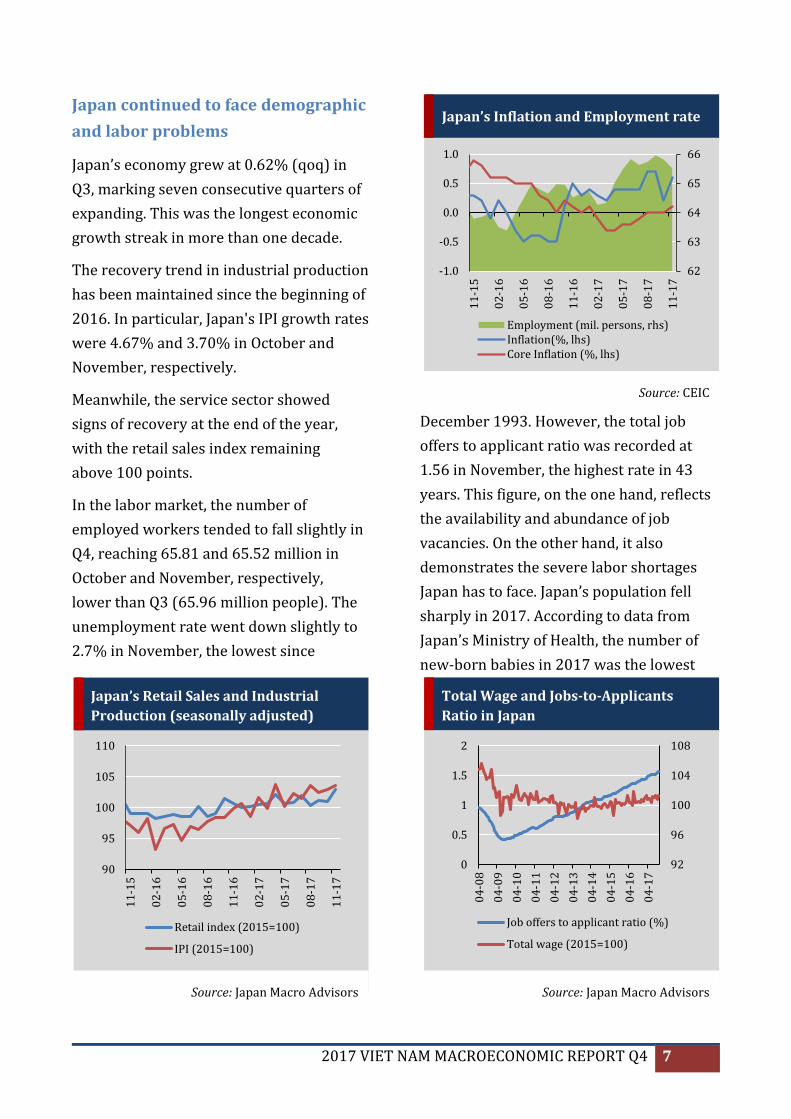
Japan continued to face demographic
and labor problems
Japan’s economy grew at 0.62% (qoq) in
Q3, marking seven consecutive quarters of
expanding. This was the longest economic
growth streak in more than one decade.
The recovery trend in industrial production
has been maintained since the beginning of
2016. In particular, Japan's IPI growth rates
were 4.67% and 3.70% in October and
November, respectively.
Meanwhile, the service sector showed
signs of recovery at the end of the year,
with the retail sales index remaining
above 100 points.
In the labor market, the number of
employed workers tended to fall slightly in
Q4, reaching 65.81 and 65.52 million in
October and November, respectively,
lower than Q3 (65.96 million people). The
unemployment rate went down slightly to
2.7% in November, the lowest since
December 1993. However, the total job
offers to applicant ratio was recorded at
1.56 in November, the highest rate in 43
years. This figure, on the one hand, reflects
the availability and abundance of job
vacancies. On the other hand, it also
demonstrates the severe labor shortages
Japan has to face. Japan’s population fell
sharply in 2017. According to data from
Japan’s Ministry of Health, the number of
new-born babies in 2017 was the lowest
Japan’s Retail Sales and Industrial
Production (seasonally adjusted)
Source: Japan Macro Advisors
90
95
100
105
110
11
-15
02
-16
05
-16
08
-16
11
-16
02
-17
05
-17
08
-17
11
-17
Retail index (2015=100)
IPI (2015=100)
Total Wage and Jobs-to-Applicants
Ratio in Japan
Source: Japan Macro Advisors
92
96
100
104
108
04
-08
04
-09
04
-10
04
-11
04
-12
04
-13
04
-14
04
-15
04
-16
04
-17
0
0.5
1
1.5
2
Job offers to applicant ratio (%)
Total wage (2015=100)
Japan’s Inflation and Employment rate
Source: CEIC
62
63
64
65
66
-1.0
-0.5
0.0
0.5
1.0
11
-15
02
-16
05
-16
08
-16
11
-16
02
-17
05
-17
08
-17
11
-17
Employment (mil. persons, rhs)Inflation(%, lhs)Core Inflation (%, lhs)
8 2017 VIET NAM MACROECONOMIC REPORT Q4
since 1899. The low birth rate combined
with the aging population will be major
challenges for this country in the future
amid increasing labor demand.
Meanwhile, inflation was unpredictable in
the last quarter. Headline inflation, which
remained at 0.7% at the end of Q3, fell back
to 0.2% in October before rebounding in
November. Core inflation, for the first time
since the beginning of the year, kept a
positive value of 0.1% in November. This
will still pose a challenge for the BOJ if it
wants to reach the 2% target by 2019.
One outstanding event in 2017 was the
series of fake data scandals in large
Japanese corporations such as Kobe Steel
and Mitsubishi, etc. These scandals have
damaged public confidence in Japanese
products and also damaged manufacturing
sector of this country.
Chinese economy slightly slowed
Chinese economy grew at 6.8% (yoy) in Q3,
matching analysts’ forecast. The second
largest economy experienced this
slowdown when its government tried to
control the property market and mitigate
debt risks.
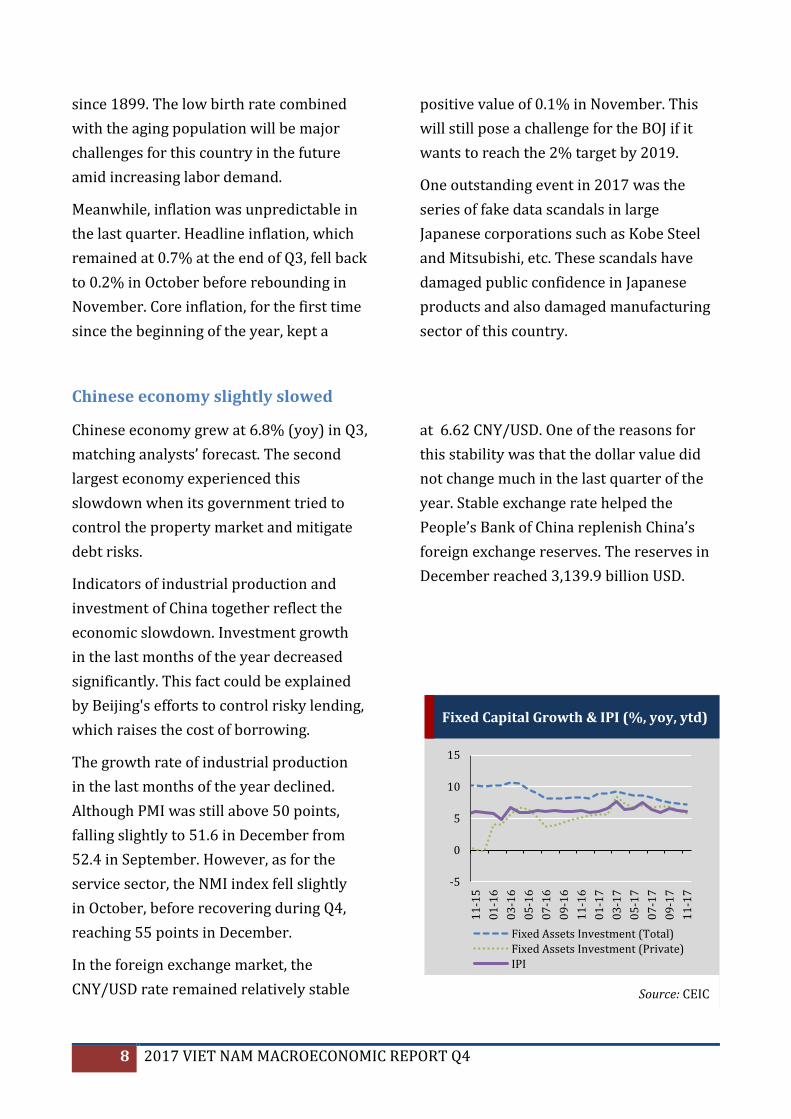
Indicators of industrial production and
investment of China together reflect the
economic slowdown. Investment growth
in the last months of the year decreased
significantly. This fact could be explained
by Beijing's efforts to control risky lending,
which raises the cost of borrowing.
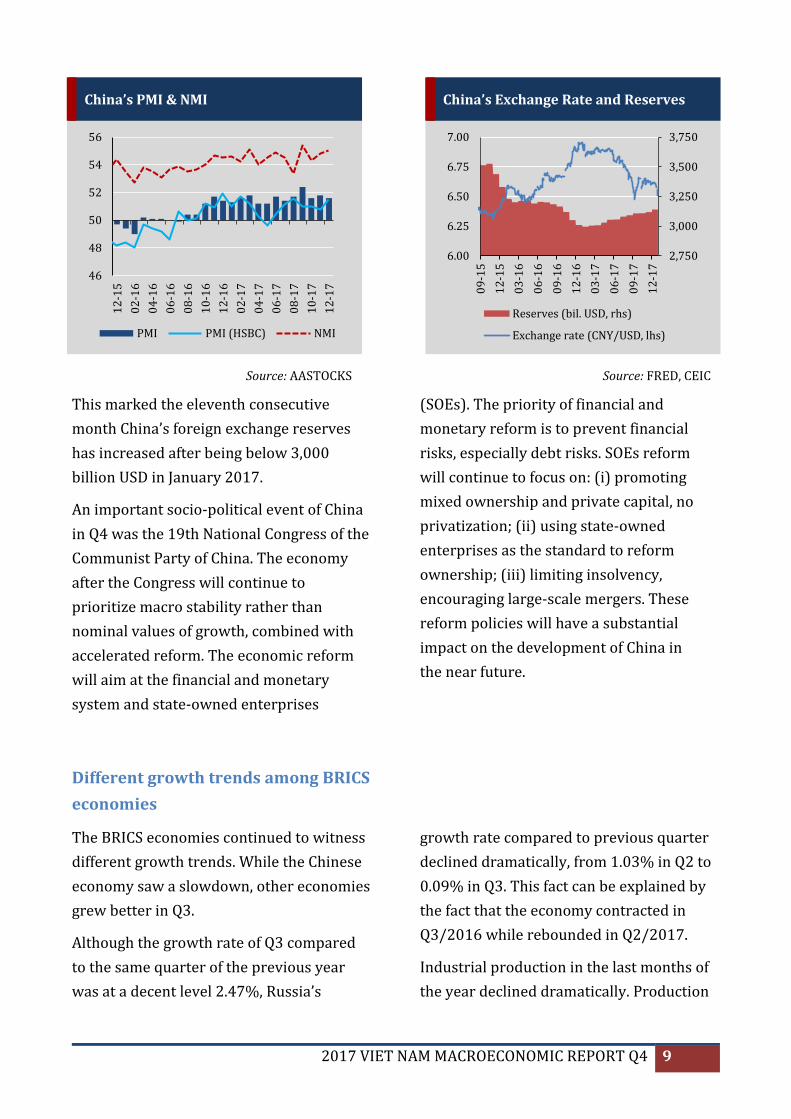
The growth rate of industrial production
in the last months of the year declined.
Although PMI was still above 50 points,
falling slightly to 51.6 in December from
52.4 in September. However, as for the
service sector, the NMI index fell slightly
in October, before recovering during Q4,
reaching 55 points in December.
In the foreign exchange market, the
CNY/USD rate remained relatively stable
at 6.62 CNY/USD. One of the reasons for
this stability was that the dollar value did
not change much in the last quarter of the
year. Stable exchange rate helped the
People’s Bank of China replenish China’s
foreign exchange reserves. The reserves in
December reached 3,139.9 billion USD.
Fixed Capital Growth & IPI (%, yoy, ytd)
Source: CEIC
-5
0
5
10
15
11
-15
01
-16
03
-16
05
-16
07
-16
09
-16
11
-16
01
-17
03
-17
05
-17
07
-17
09
-17
11
-17
Fixed Assets Investment (Total)
Fixed Assets Investment (Private)
IPI
2017 VIET NAM MACROECONOMIC REPORT Q4 9
This marked the eleventh consecutive
month China’s foreign exchange reserves
has increased after being below 3,000
billion USD in January 2017.
An important socio-political event of China
in Q4 was the 19th National Congress of the
Communist Party of China. The economy
after the Congress will continue to
prioritize macro stability rather than
nominal values of growth, combined with
accelerated reform. The economic reform
will aim at the financial and monetary
system and state-owned enterprises
(SOEs). The priority of financial and
monetary reform is to prevent financial
risks, especially debt risks. SOEs reform
will continue to focus on: (i) promoting
mixed ownership and private capital, no
privatization; (ii) using state-owned
enterprises as the standard to reform
ownership; (iii) limiting insolvency,
encouraging large-scale mergers. These
reform policies will have a substantial
impact on the development of China in
the near future.
Different growth trends among BRICS
economies
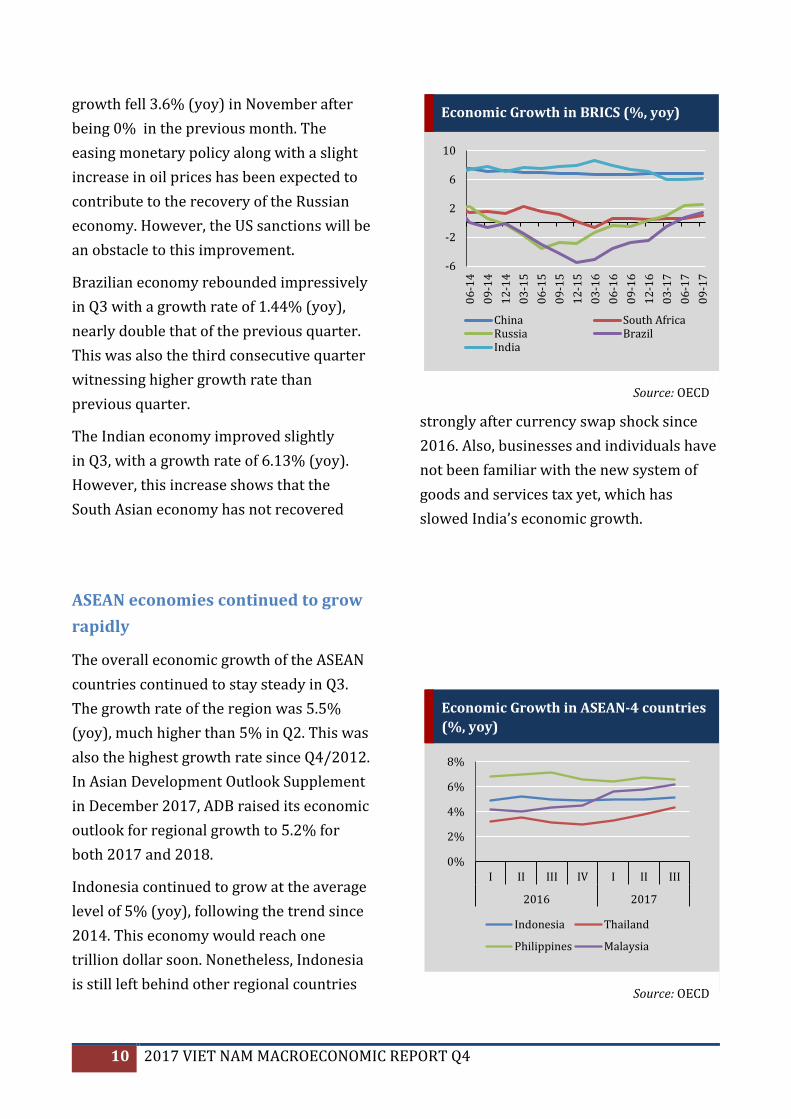
The BRICS economies continued to witness
different growth trends. While the Chinese
economy saw a slowdown, other economies
grew better in Q3.
Although the growth rate of Q3 compared
to the same quarter of the previous year
was at a decent level 2.47%, Russia’s
growth rate compared to previous quarter
declined dramatically, from 1.03% in Q2 to
0.09% in Q3. This fact can be explained by
the fact that the economy contracted in
Q3/2016 while rebounded in Q2/2017.
Industrial production in the last months of
the year declined dramatically. Production
China’s Exchange Rate and Reserves
Source: FRED, CEIC
2,750
3,000
3,250
3,500
3,750
6.00
6.25
6.50
6.75
7.00
09
-15
12
-15
03
-16
06
-16
09
-16
12
-16
03
-17
06
-17
09
-17
12
-17
Reserves (bil. USD, rhs)
Exchange rate (CNY/USD, lhs)
China’s PMI & NMI
Source: AASTOCKS
46
48
50
52
54
56
12
-15
02
-16
04
-16
06
-16
08
-16
10
-16
12
-16
02
-17
04
-17
06
-17
08
-17
10
-17
12
-17
PMI PMI (HSBC) NMI
10 2017 VIET NAM MACROECONOMIC REPORT Q4
growth fell 3.6% (yoy) in November after
being 0% in the previous month. The
easing monetary policy along with a slight
increase in oil prices has been expected to
contribute to the recovery of the Russian
economy. However, the US sanctions will be
an obstacle to this improvement.
Brazilian economy rebounded impressively
in Q3 with a growth rate of 1.44% (yoy),
nearly double that of the previous quarter.
This was also the third consecutive quarter
witnessing higher growth rate than
previous quarter.
The Indian economy improved slightly
in Q3, with a growth rate of 6.13% (yoy).
However, this increase shows that the
South Asian economy has not recovered
strongly after currency swap shock since
2016. Also, businesses and individuals have
not been familiar with the new system of
goods and services tax yet, which has
slowed India’s economic growth.
ASEAN economies continued to grow
rapidly
The overall economic growth of the ASEAN
countries continued to stay steady in Q3.
The growth rate of the region was 5.5%
(yoy), much higher than 5% in Q2. This was
also the highest growth rate since Q4/2012.
In Asian Development Outlook Supplement
in December 2017, ADB raised its economic
outlook for regional growth to 5.2% for
both 2017 and 2018.
Indonesia continued to grow at the average
level of 5% (yoy), following the trend since
2014. This economy would reach one
trillion dollar soon. Nonetheless, Indonesia
is still left behind other regional countries
Economic Growth in BRICS (%, yoy)
Source: OECD
-6
-2
2
6
10
06
-14
09
-14
12
-14
03
-15
06
-15
09
-15
12
-15
03
-16
06
-16
09
-16
12
-16
03
-17
06
-17
09
-17
China South AfricaRussia BrazilIndia
Economic Growth in ASEAN-4 countries
(%, yoy)
Source: OECD
0%
2%
4%
6%
8%
I II III IV I II III
2016 2017
Indonesia Thailand
Philippines Malaysia
2017 VIET NAM MACROECONOMIC REPORT Q4 11
in terms of poverty alleviation,
infrastructure system development, etc.
The Thai economy continued to recover
in Q3. The growth rate was 4.3% (yoy),
the highest in four years. This positive
growth came from increases in all exports,
private consumption expenditures,
government spending, and private
investment.
Myanmar has been expected to be the next
Vietnam after opening the country in recent
years. This country is an attractive
destination for foreign investment after
many decades of isolation. The Rohingya
crisis, however, could prompt the US and
Western countries to consider imposing
sanctions again, which may make this
immature open economy suffer heavily
in the near future.
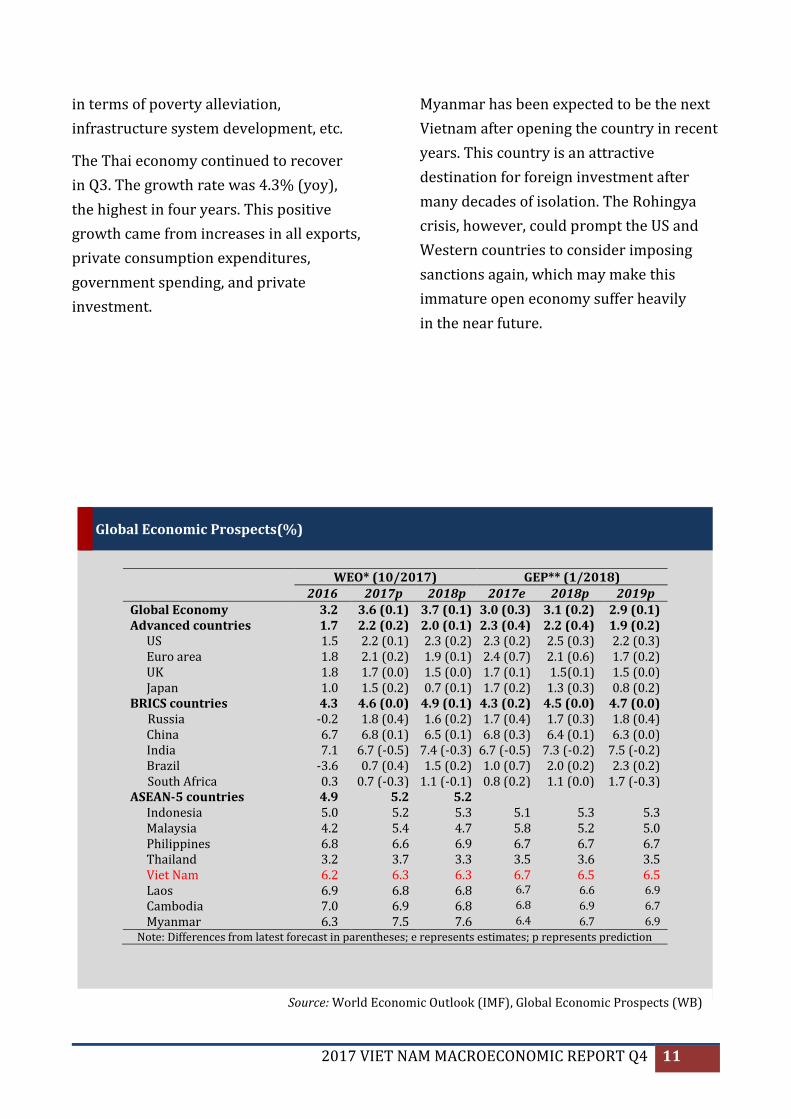
WEO* (10/2017) GEP** (1/2018) 2016 2017p 2018p 2017e 2018p 2019p
Global Economy 3.2 3.6 (0.1) 3.7 (0.1) 3.0 (0.3) 3.1 (0.2) 2.9 (0.1) Advanced countries 1.7 2.2 (0.2) 2.0 (0.1) 2.3 (0.4) 2.2 (0.4) 1.9 (0.2)
US 1.5 2.2 (0.1) 2.3 (0.2) 2.3 (0.2) 2.5 (0.3) 2.2 (0.3) Euro area 1.8 2.1 (0.2) 1.9 (0.1) 2.4 (0.7) 2.1 (0.6) 1.7 (0.2) UK 1.8 1.7 (0.0) 1.5 (0.0) 1.7 (0.1) 1.5(0.1) 1.5 (0.0) Japan 1.0 1.5 (0.2) 0.7 (0.1) 1.7 (0.2) 1.3 (0.3) 0.8 (0.2)
BRICS countries 4.3 4.6 (0.0) 4.9 (0.1) 4.3 (0.2) 4.5 (0.0) 4.7 (0.0) Russia -0.2 1.8 (0.4) 1.6 (0.2) 1.7 (0.4) 1.7 (0.3) 1.8 (0.4)
China 6.7 6.8 (0.1) 6.5 (0.1) 6.8 (0.3) 6.4 (0.1) 6.3 (0.0) India 7.1 6.7 (-0.5) 7.4 (-0.3) 6.7 (-0.5) 7.3 (-0.2) 7.5 (-0.2) Brazil -3.6 0.7 (0.4) 1.5 (0.2) 1.0 (0.7) 2.0 (0.2) 2.3 (0.2)
South Africa 0.3 0.7 (-0.3) 1.1 (-0.1) 0.8 (0.2) 1.1 (0.0) 1.7 (-0.3) ASEAN-5 countries 4.9 5.2 5.2
Indonesia 5.0 5.2 5.3 5.1 5.3 5.3 Malaysia 4.2 5.4 4.7 5.8 5.2 5.0 Philippines 6.8 6.6 6.9 6.7 6.7 6.7 Thailand 3.2 3.7 3.3 3.5 3.6 3.5 Viet Nam 6.2 6.3 6.3 6.7 6.5 6.5 Laos 6.9 6.8 6.8 6.7 6.6 6.9
Cambodia 7.0 6.9 6.8 6.8 6.9 6.7
Myanmar 6.3 7.5 7.6 6.4 6.7 6.9
Note: Differences from latest forecast in parentheses; e represents estimates; p represents prediction
Global Economic Prospects(%)
Source: World Economic Outlook (IMF), Global Economic Prospects (WB)
12 2017 VIET NAM MACROECONOMIC REPORT Q4
THE VIETNAMESE ECONOMY
Growth-Inflation
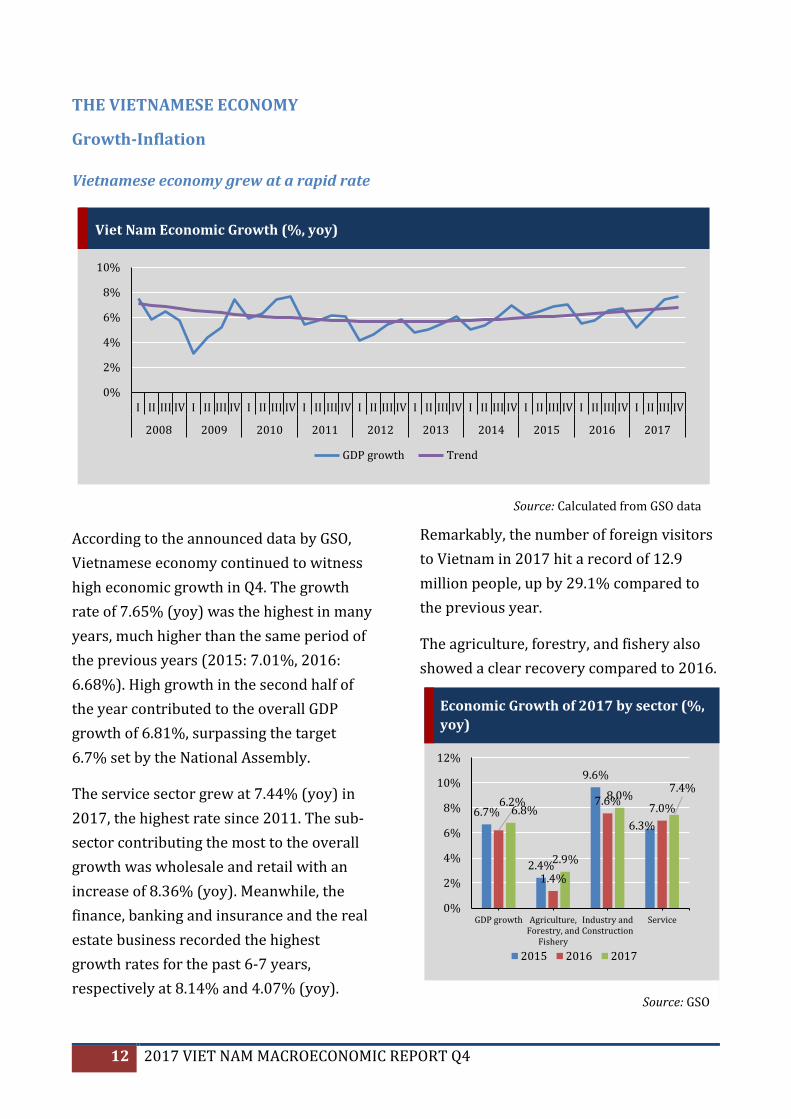
Vietnamese economy grew at a rapid rate
According to the announced data by GSO,
Vietnamese economy continued to witness
high economic growth in Q4. The growth
rate of 7.65% (yoy) was the highest in many
years, much higher than the same period of
the previous years (2015: 7.01%, 2016:
6.68%). High growth in the second half of
the year contributed to the overall GDP
growth of 6.81%, surpassing the target
6.7% set by the National Assembly.
The service sector grew at 7.44% (yoy) in
2017, the highest rate since 2011. The sub-
sector contributing the most to the overall
growth was wholesale and retail with an
increase of 8.36% (yoy). Meanwhile, the
finance, banking and insurance and the real
estate business recorded the highest
growth rates for the past 6-7 years,
respectively at 8.14% and 4.07% (yoy).
Remarkably, the number of foreign visitors
to Vietnam in 2017 hit a record of 12.9
million people, up by 29.1% compared to
the previous year.
The agriculture, forestry, and fishery also
showed a clear recovery compared to 2016.
Viet Nam Economic Growth (%, yoy)
Source: Calculated from GSO data
0%
2%
4%
6%
8%
10%
I II III IV I II III IV I II III IV I II III IV I II III IV I II III IV I II III IV I II III IV I II III IV I II III IV
2008 2009 2010 2011 2012 2013 2014 2015 2016 2017
GDP growth Trend
Economic Growth of 2017 by sector (%,
yoy)
Source: GSO
6.7%
2.4%
9.6%
6.3%
6.2%
1.4%
7.6%7.0%6.8%
2.9%
8.0%7.4%
0%
2%
4%
6%
8%
10%
12%
GDP growth Agriculture,Forestry, and
Fishery
Industry andConstruction
Service
2015 2016 2017
2017 VIET NAM MACROECONOMIC REPORT Q4 13
The growth rate of this sector in 2017
was 2.90%, much higher than in 2016 and
also higher than the growth rate of 2.41%
in 2015. The weather in 2017 was quite
favorable for fishery and forestry, which
witnessed growth rates of 5.54% and
5.14%, respectively. Particularly, 2017
was a good year for the fishery. Raw
pangasius price increased continuously in
the last months of the year, reaching the
highest price in the past 20 years. However,
in a year with a record number of typhoons
and floods, the agriculture sector only grew
by 2.07%.
Meanwhile, the industrial and construction
sector grew at 8.00% (yoy) thanks to two
last accelerating quarters of the year,
surpassing the growth rate of 7.57% in
2016. The manufacturing industry
continued to be the main driving force
of economic growth of this sector with
a very high growth rate of 14.40%. The
mining and quarrying sub-sector continued
to decline by 7.10%, the biggest shrinkage
since 2011, reflecting the restructuring
policies of the Government focusing on
more technology-intensive and added-value
industries.
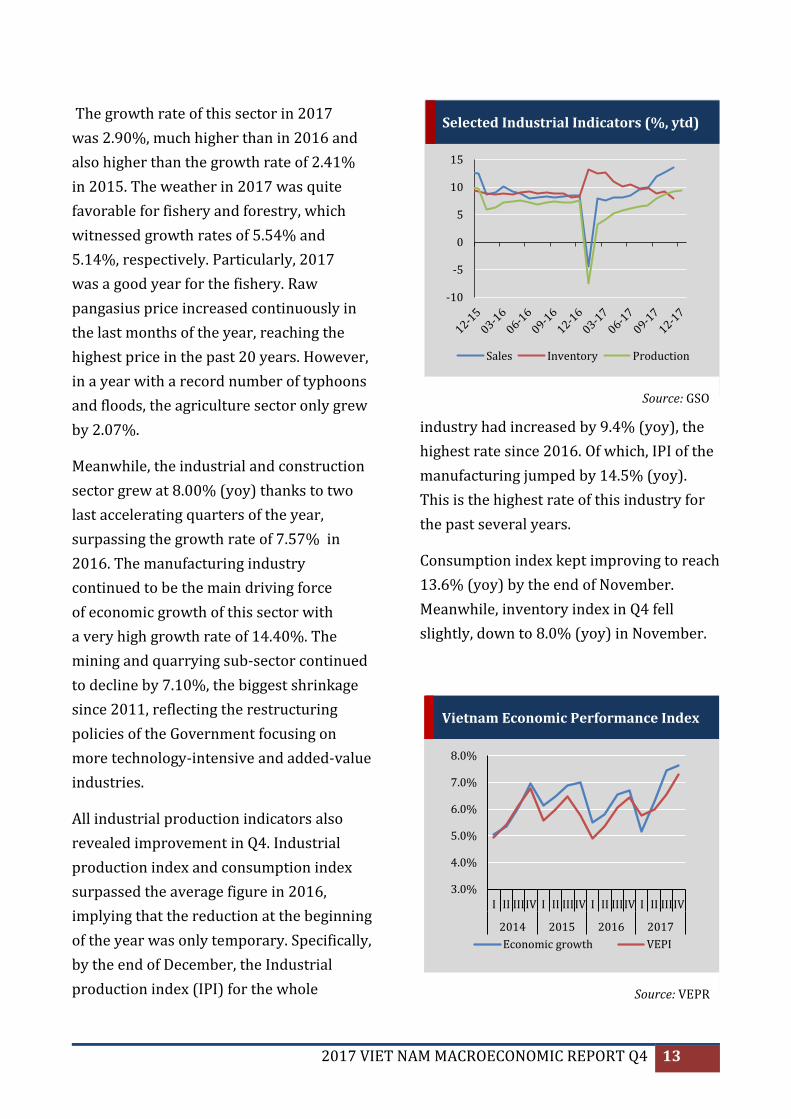
All industrial production indicators also
revealed improvement in Q4. Industrial
production index and consumption index
surpassed the average figure in 2016,
implying that the reduction at the beginning
of the year was only temporary. Specifically,
by the end of December, the Industrial
production index (IPI) for the whole
industry had increased by 9.4% (yoy), the
highest rate since 2016. Of which, IPI of the
manufacturing jumped by 14.5% (yoy).
This is the highest rate of this industry for
the past several years.
Consumption index kept improving to reach
13.6% (yoy) by the end of November.
Meanwhile, inventory index in Q4 fell
slightly, down to 8.0% (yoy) in November.
Vietnam Economic Performance Index
Source: VEPR
3.0%
4.0%
5.0%
6.0%
7.0%
8.0%
I II IIIIV I II IIIIV I II IIIIV I II IIIIV
2014 2015 2016 2017
Economic growth VEPI
Selected Industrial Indicators (%, ytd)
Source: GSO
-10
-5
0
5
10
15
Sales Inventory Production
14 2017 VIET NAM MACROECONOMIC REPORT Q4
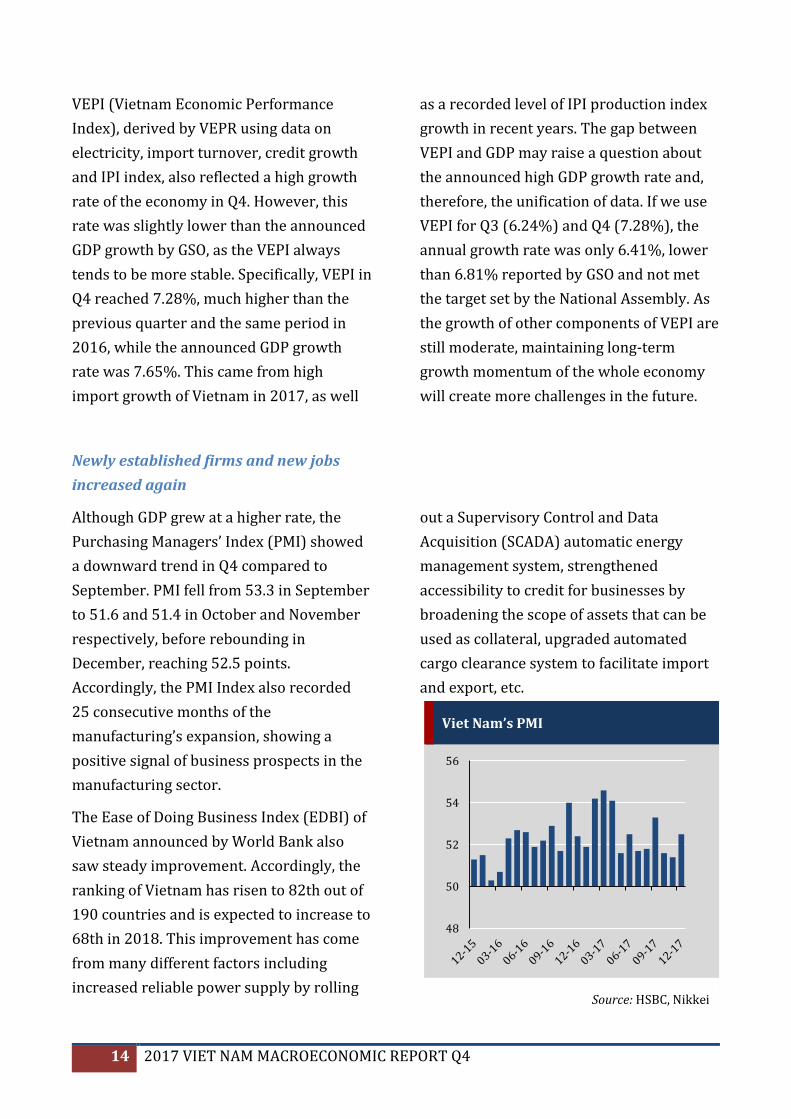
VEPI (Vietnam Economic Performance
Index), derived by VEPR using data on
electricity, import turnover, credit growth
and IPI index, also reflected a high growth
rate of the economy in Q4. However, this
rate was slightly lower than the announced
GDP growth by GSO, as the VEPI always
tends to be more stable. Specifically, VEPI in
Q4 reached 7.28%, much higher than the
previous quarter and the same period in
2016, while the announced GDP growth
rate was 7.65%. This came from high
import growth of Vietnam in 2017, as well
as a recorded level of IPI production index
growth in recent years. The gap between
VEPI and GDP may raise a question about
the announced high GDP growth rate and,
therefore, the unification of data. If we use
VEPI for Q3 (6.24%) and Q4 (7.28%), the
annual growth rate was only 6.41%, lower
than 6.81% reported by GSO and not met
the target set by the National Assembly. As
the growth of other components of VEPI are
still moderate, maintaining long-term
growth momentum of the whole economy
will create more challenges in the future.
Newly established firms and new jobs
increased again
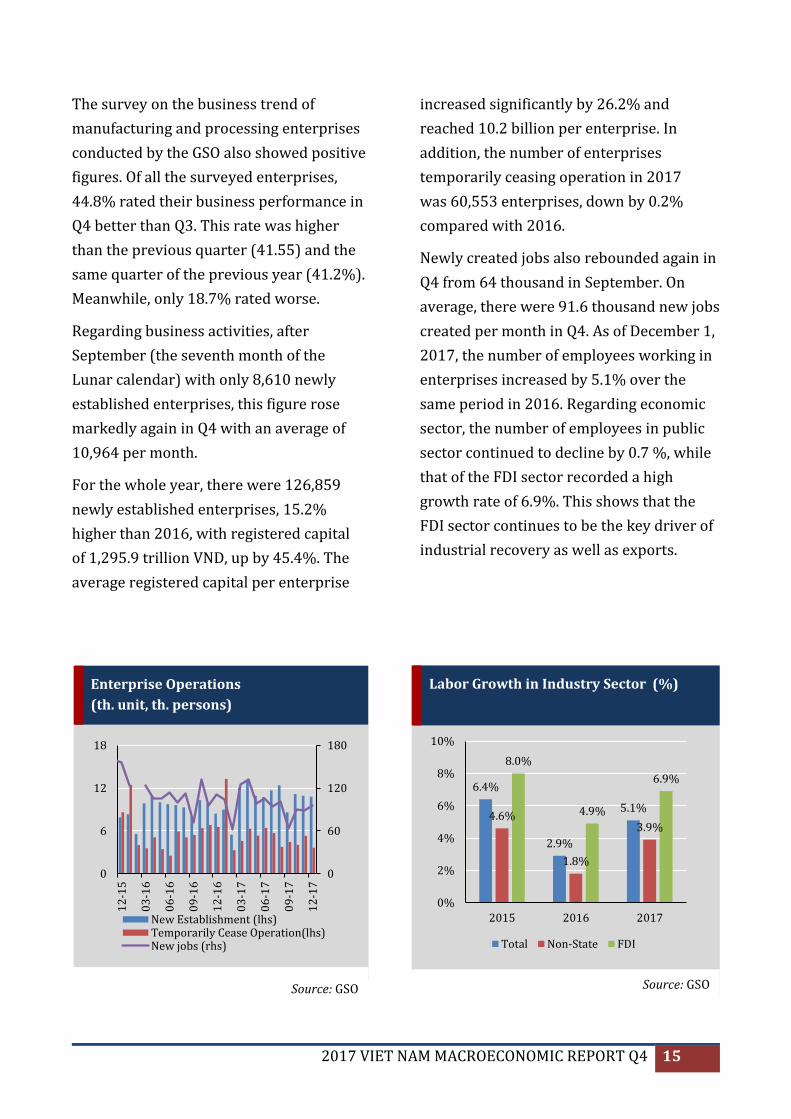
Although GDP grew at a higher rate, the
Purchasing Managers’ Index (PMI) showed
a downward trend in Q4 compared to
September. PMI fell from 53.3 in September
to 51.6 and 51.4 in October and November
respectively, before rebounding in
December, reaching 52.5 points.
Accordingly, the PMI Index also recorded
25 consecutive months of the
manufacturing’s expansion, showing a
positive signal of business prospects in the
manufacturing sector.
The Ease of Doing Business Index (EDBI) of
Vietnam announced by World Bank also
saw steady improvement. Accordingly, the
ranking of Vietnam has risen to 82th out of
190 countries and is expected to increase to
68th in 2018. This improvement has come
from many different factors including
increased reliable power supply by rolling
out a Supervisory Control and Data
Acquisition (SCADA) automatic energy
management system, strengthened
accessibility to credit for businesses by
broadening the scope of assets that can be
used as collateral, upgraded automated
cargo clearance system to facilitate import
and export, etc.
Viet Nam’s PMI
Source: HSBC, Nikkei
48
50
52
54
56
2017 VIET NAM MACROECONOMIC REPORT Q4 15
The survey on the business trend of
manufacturing and processing enterprises
conducted by the GSO also showed positive
figures. Of all the surveyed enterprises,
44.8% rated their business performance in
Q4 better than Q3. This rate was higher
than the previous quarter (41.55) and the
same quarter of the previous year (41.2%).
Meanwhile, only 18.7% rated worse.
Regarding business activities, after
September (the seventh month of the
Lunar calendar) with only 8,610 newly
established enterprises, this figure rose
markedly again in Q4 with an average of
10,964 per month.
For the whole year, there were 126,859
newly established enterprises, 15.2%
higher than 2016, with registered capital
of 1,295.9 trillion VND, up by 45.4%. The
average registered capital per enterprise
increased significantly by 26.2% and
reached 10.2 billion per enterprise. In
addition, the number of enterprises
temporarily ceasing operation in 2017
was 60,553 enterprises, down by 0.2%
compared with 2016.
Newly created jobs also rebounded again in
Q4 from 64 thousand in September. On
average, there were 91.6 thousand new jobs
created per month in Q4. As of December 1,
2017, the number of employees working in
enterprises increased by 5.1% over the
same period in 2016. Regarding economic
sector, the number of employees in public
sector continued to decline by 0.7 %, while
that of the FDI sector recorded a high
growth rate of 6.9%. This shows that the
FDI sector continues to be the key driver of
industrial recovery as well as exports.
Enterprise Operations
(th. unit, th. persons)
Source: GSO
0
60
120
180
0
6
12
18
12
-15
03
-16
06
-16
09
-16
12
-16
03
-17
06
-17
09
-17
12
-17
New Establishment (lhs)Temporarily Cease Operation(lhs)New jobs (rhs)
Labor Growth in Industry Sector (%)
Source: GSO
6.4%
2.9%
5.1%4.6%
1.8%
3.9%
8.0%
4.9%
6.9%
0%
2%
4%
6%
8%
10%
2015 2016 2017
Total Non-State FDI
16 2017 VIET NAM MACROECONOMIC REPORT Q4
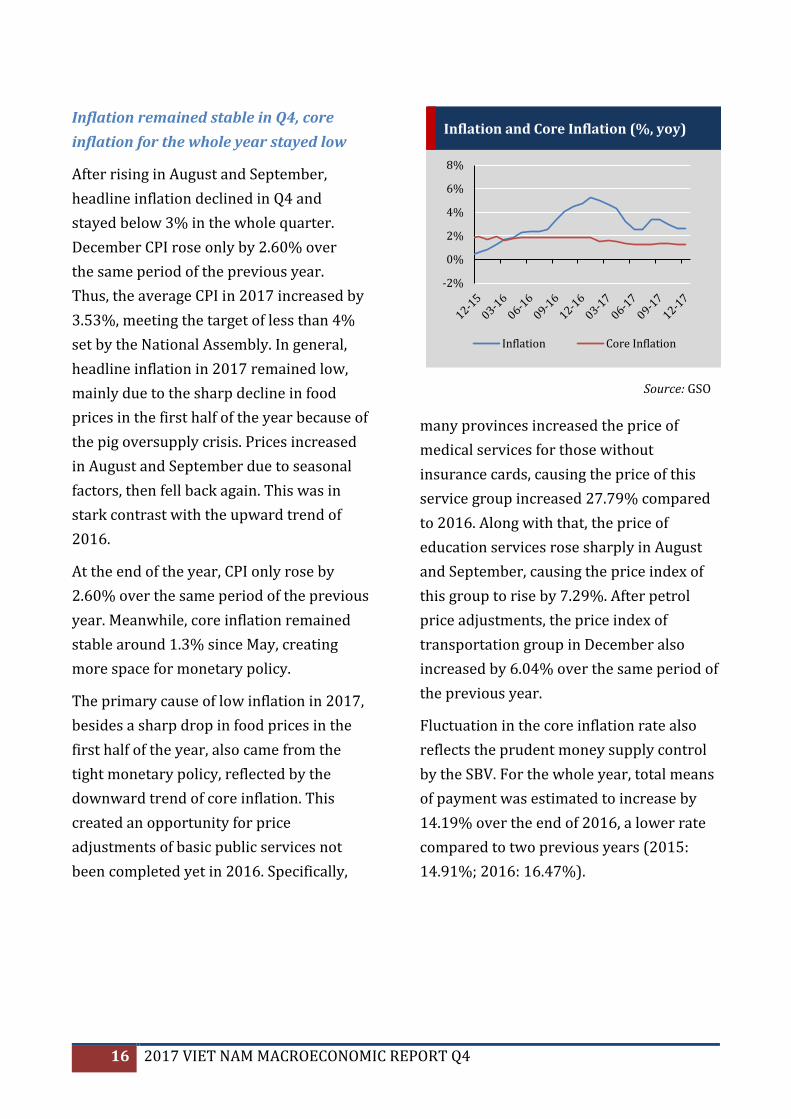
Inflation remained stable in Q4, core
inflation for the whole year stayed low
After rising in August and September,
headline inflation declined in Q4 and
stayed below 3% in the whole quarter.
December CPI rose only by 2.60% over
the same period of the previous year.
Thus, the average CPI in 2017 increased by
3.53%, meeting the target of less than 4%
set by the National Assembly. In general,
headline inflation in 2017 remained low,
mainly due to the sharp decline in food
prices in the first half of the year because of
the pig oversupply crisis. Prices increased
in August and September due to seasonal
factors, then fell back again. This was in
stark contrast with the upward trend of
2016.
At the end of the year, CPI only rose by
2.60% over the same period of the previous
year. Meanwhile, core inflation remained
stable around 1.3% since May, creating
more space for monetary policy.
The primary cause of low inflation in 2017,
besides a sharp drop in food prices in the
first half of the year, also came from the
tight monetary policy, reflected by the
downward trend of core inflation. This
created an opportunity for price
adjustments of basic public services not
been completed yet in 2016. Specifically,
many provinces increased the price of
medical services for those without
insurance cards, causing the price of this
service group increased 27.79% compared
to 2016. Along with that, the price of
education services rose sharply in August
and September, causing the price index of
this group to rise by 7.29%. After petrol
price adjustments, the price index of
transportation group in December also
increased by 6.04% over the same period of
the previous year.
Fluctuation in the core inflation rate also
reflects the prudent money supply control
by the SBV. For the whole year, total means
of payment was estimated to increase by
14.19% over the end of 2016, a lower rate
compared to two previous years (2015:
14.91%; 2016: 16.47%).
Inflation and Core Inflation (%, yoy)
Source: GSO
-2%
0%
2%
4%
6%
8%
Inflation Core Inflation
2017 VIET NAM MACROECONOMIC REPORT Q4 17
Macroeconomic balances
Trade surplus with recorded levels of
import and export turnover
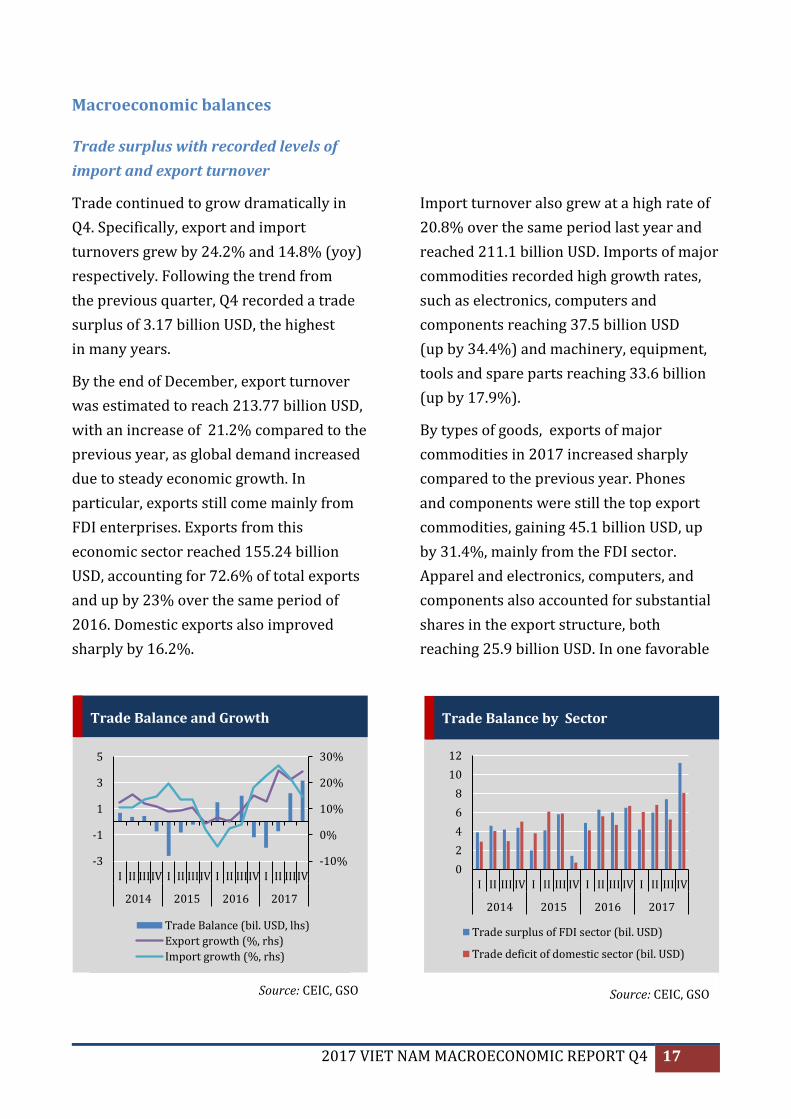
Trade continued to grow dramatically in
Q4. Specifically, export and import
turnovers grew by 24.2% and 14.8% (yoy)
respectively. Following the trend from
the previous quarter, Q4 recorded a trade
surplus of 3.17 billion USD, the highest
in many years.
By the end of December, export turnover
was estimated to reach 213.77 billion USD,
with an increase of 21.2% compared to the
previous year, as global demand increased
due to steady economic growth. In
particular, exports still come mainly from
FDI enterprises. Exports from this
economic sector reached 155.24 billion
USD, accounting for 72.6% of total exports
and up by 23% over the same period of
2016. Domestic exports also improved
sharply by 16.2%.
Import turnover also grew at a high rate of
20.8% over the same period last year and
reached 211.1 billion USD. Imports of major
commodities recorded high growth rates,
such as electronics, computers and
components reaching 37.5 billion USD
(up by 34.4%) and machinery, equipment,
tools and spare parts reaching 33.6 billion
(up by 17.9%).
By types of goods, exports of major
commodities in 2017 increased sharply
compared to the previous year. Phones
and components were still the top export
commodities, gaining 45.1 billion USD, up
by 31.4%, mainly from the FDI sector.
Apparel and electronics, computers, and
components also accounted for substantial
shares in the export structure, both
reaching 25.9 billion USD. In one favorable
Trade Balance and Growth
Source: CEIC, GSO
-10%
0%
10%
20%
30%
-3
-1
1
3
5
I II IIIIV I II IIIIV I II IIIIV I II IIIIV
2014 2015 2016 2017
Trade Balance (bil. USD, lhs)
Export growth (%, rhs)
Import growth (%, rhs)
Trade Balance by Sector
Source: CEIC, GSO
0
2
4
6
8
10
12
I II III IV I II III IV I II III IV I II III IV
2014 2015 2016 2017
Trade surplus of FDI sector (bil. USD)
Trade deficit of domestic sector (bil. USD)
18 2017 VIET NAM MACROECONOMIC REPORT Q4
year for fishery and forestry, these two
sub-sectors also contributed 8.4 and 7.6
billion dollars respectively to total export
turnover.
Meanwhile, imports soared in materials for
manufacturing and processing industry,
reaching 192.9 billion USD, accounting for
91.4% of import turnover. Of which,
imports of machinery, equipment and
spare parts reached 33.6 billion USD (up by
17.9%) while such figures for electronics,
computers and their components, and
phones and their components were 37.5
billion USD (up by 34.4%) and 16.2 billion
USD (up by 53.2%) respectively.
The two last quarters contributed to the
total trade surplus of 2.7 billion USD in
2017. Regarding economic sectors, the FDI
sector recorded a trade surplus of 28.84
billion in 2017, while the domestic sector
suffered a trade deficit of 26.14 billion. This
situation continued to show the
dependence of trade as well as the growth
of the entire economy on the FDI sector and
to raise doubts about long-term prospects
for the quality and sustainability of
Vietnam’s economic growth.
By partners, the US continued to be the
biggest export market of Vietnam with 41.5
billion USD, followed by EU and China with
38.3 and 35.3 billion USD, respectively.
Meanwhile, in terms of imports, although
China was still the largest import market
of Vietnam with 58.5 billion USD (up by
16.9%), South Korea replaced China as the
largest trade deficit partner of Vietnam
with 31.8 billion USD. This continues to
show that FDI inflows from Korea are
growing thanks to FDI enterprises from this
country, especially Samsung, which mainly
import materials from the home country.
The shift of trade deficit from China to
Korea- a country with higher technology
capability- will continue to open
opportunities and challenges for Vietnam in
advancing its technology by adjusting and
applying imported products in the context
of the Industry 4.0.
Exports by Sector
Source: CEIC, GSO
0%
20%
40%
60%
80%
100%
I II III IV I II III IV I II III IV I II III IV
2014 2015 2016 2017
FDI sector Domestic sector
Structure of Budget Revenue in 2017
Source: GSO
Revenue from FDI enterpris
es14.0%
Revenue from
non-state sector15.2%
Revenue from SOEs
17.9%
Environmental
protection tax3.6%
Personal income
tax6.7%
Land use tax
9.5%
Other domestic revenues
12.3%
Oil revenues
4.0%
Revenues from net import-export
activities16.7%
2017 VIET NAM MACROECONOMIC REPORT Q4 19
Budget deficit decreased slightly, but
revenue collection and expenditure
disbursement were behind schedule
According to the National Financial
Supervisory Commission of Vietnam, the
budget deficit in 2017 was 3.5%, the lowest
in the past four years. However, the low
deficit was partly due to the slow
disbursement of public investment.
Divestment from SOEs (such as Sabeco)
also contributed to the low budget deficit.
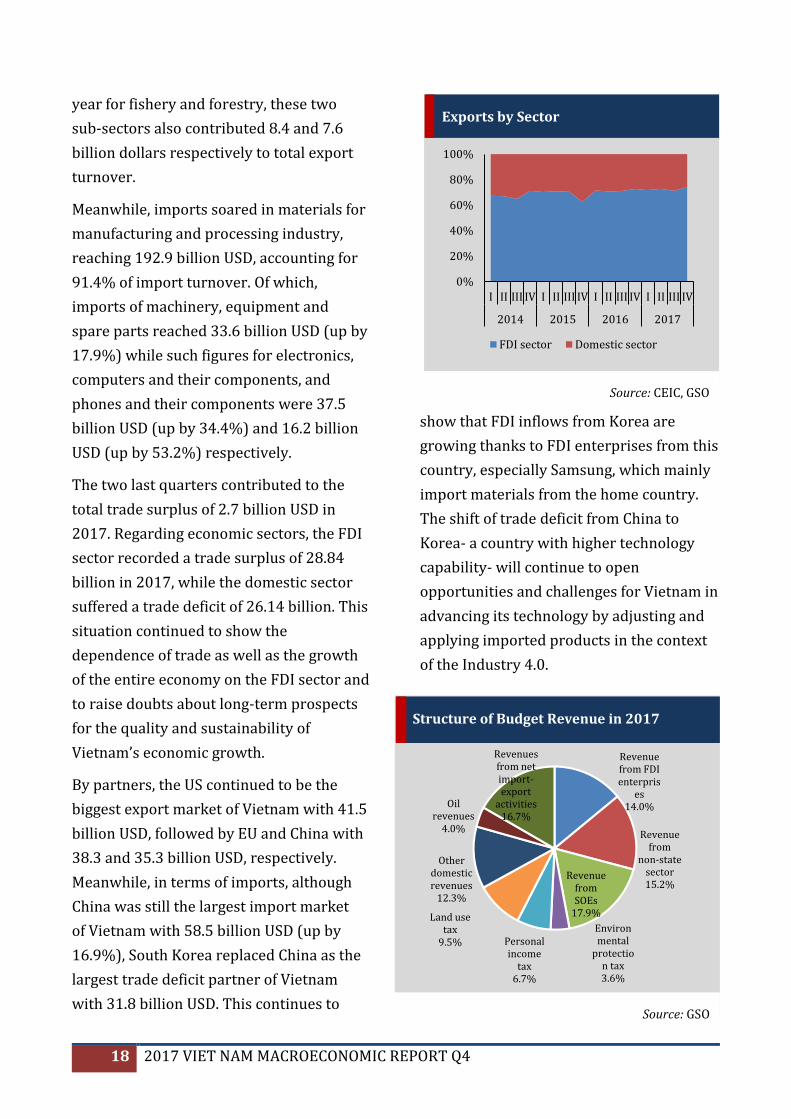
By December 15, 2017, total state budget
revenue was only 1,104 trillion VND, about
91.1% of the plan. Of which, domestic
revenue was 871.1 trillion VND, about 88%
of the plan and accounting for 78.9% of total
revenue. In revenue structure, revenue from
crude oil and trade remained almost
unchanged compared to 2016 (4.0% and
16.7% respectively), much lower than
previous years, due to the impact from the
price of crude oil and other necessities. In
order to raise revenue, the government had
to continue to collect from other revenue
sources, especially from land use tax (9.5%).
In the context of no improvement in
revenue, state budget expenditure has
always been a burden due to the bulky
state apparatus. By December 15, 2017,
total state budget expenditures reached
1,219.5 trillion VND, resulting in the budget
deficit of 115.5 trillion VND. Recurrent
expenditures remained high at 862.6
trillion VND, accounting for 70.7% of total
expenditure. Meanwhile, development
investment was only 259.5 trillion VND,
accounting for 21.3% of total expenditure
and only 72.6% of the plan.
This, on the one hand, showed slow
disbursement of development investment
capital. On the other hand, this situation
continued to reflect the imbalance of total
expenditure as long-term growth resources
such as public investment are much more
limited than short-term needs such as
recurrent expenditure.
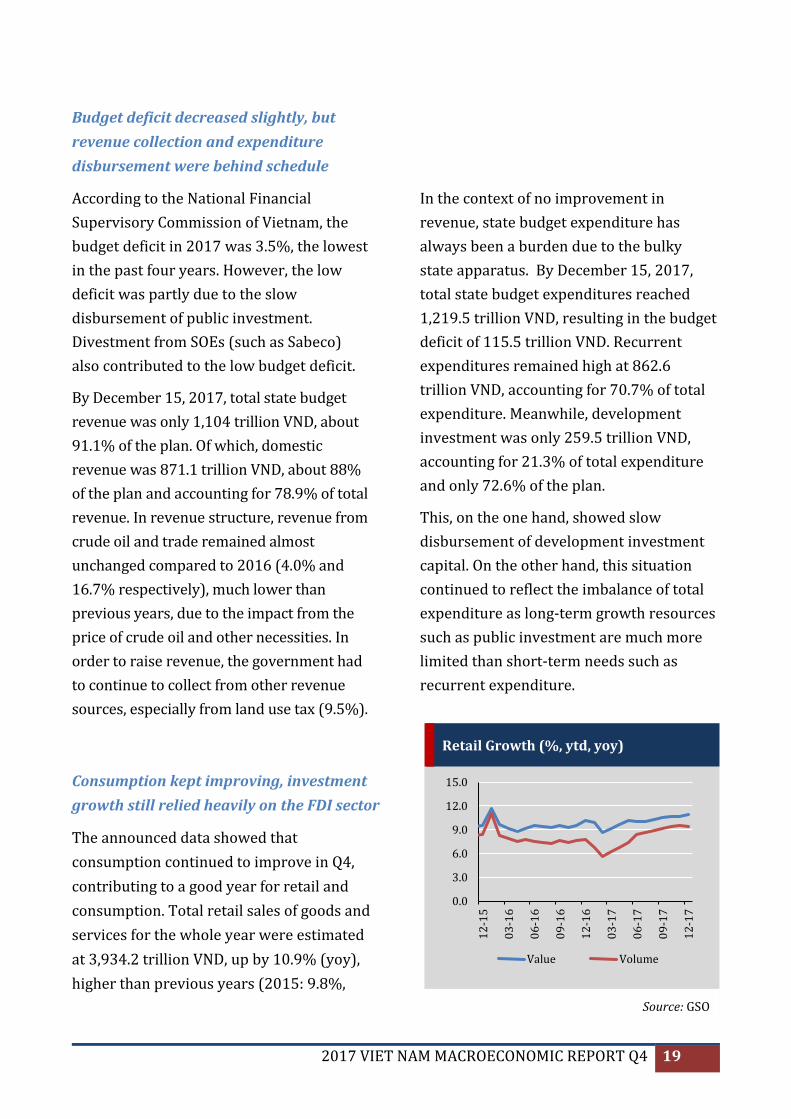
Consumption kept improving, investment
growth still relied heavily on the FDI sector
The announced data showed that
consumption continued to improve in Q4,
contributing to a good year for retail and
consumption. Total retail sales of goods and
services for the whole year were estimated
at 3,934.2 trillion VND, up by 10.9% (yoy),
higher than previous years (2015: 9.8%,
Retail Growth (%, ytd, yoy)
Source: GSO
0.0
3.0
6.0
9.0
12.0
15.0
12
-15
03
-16
06
-16
09
-16
12
-16
03
-17
06
-17
09
-17
12
-17
Value Volume
20 2017 VIET NAM MACROECONOMIC REPORT Q4
2016: 10.1%). In addition, consumption
was substantially enhanced in terms of
quantity with the growth rate of 9.2%
(yoy), excluding price factor. Of which, the
automobile sales had the highest growth
rate (14%) in 2017 due to a competition in
prices between producers and importers.
Precious stones, precious metals (13.2%)
and construction materials (12.8%) also
witnessed high growth rates in the year.
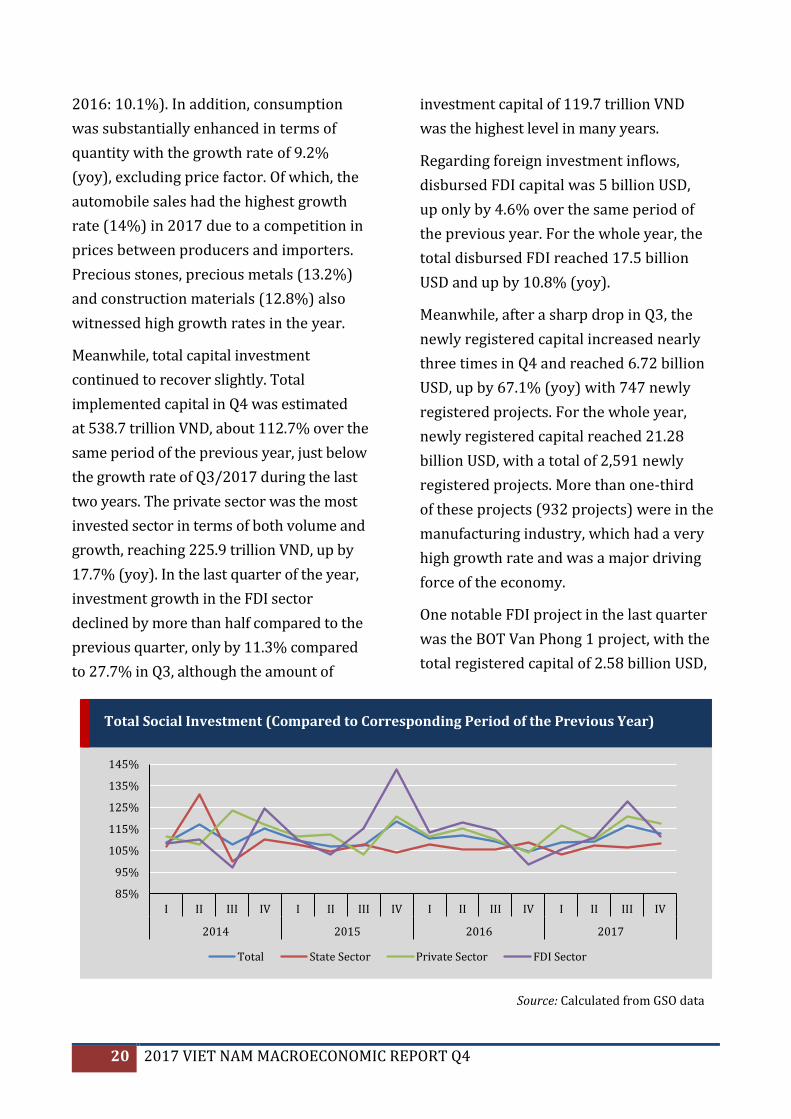
Meanwhile, total capital investment
continued to recover slightly. Total
implemented capital in Q4 was estimated
at 538.7 trillion VND, about 112.7% over the
same period of the previous year, just below
the growth rate of Q3/2017 during the last
two years. The private sector was the most
invested sector in terms of both volume and
growth, reaching 225.9 trillion VND, up by
17.7% (yoy). In the last quarter of the year,
investment growth in the FDI sector
declined by more than half compared to the
previous quarter, only by 11.3% compared
to 27.7% in Q3, although the amount of
investment capital of 119.7 trillion VND
was the highest level in many years.
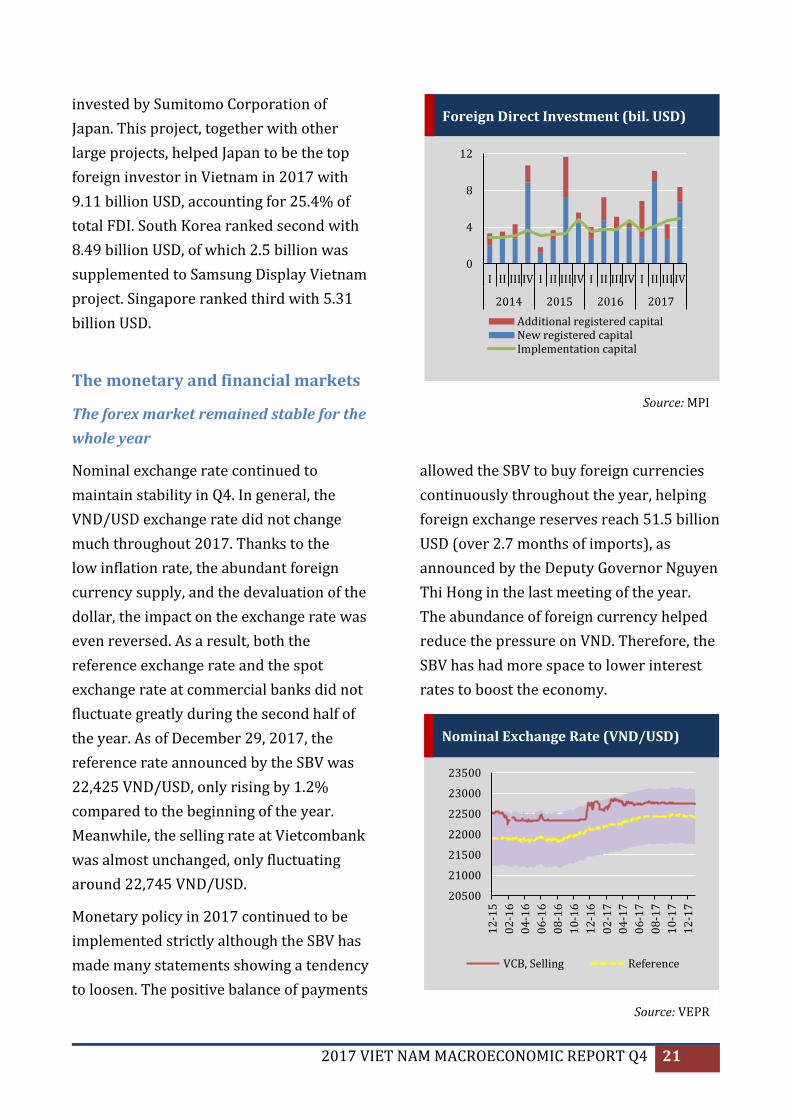
Regarding foreign investment inflows,
disbursed FDI capital was 5 billion USD,
up only by 4.6% over the same period of
the previous year. For the whole year, the
total disbursed FDI reached 17.5 billion
USD and up by 10.8% (yoy).
Meanwhile, after a sharp drop in Q3, the
newly registered capital increased nearly
three times in Q4 and reached 6.72 billion
USD, up by 67.1% (yoy) with 747 newly
registered projects. For the whole year,
newly registered capital reached 21.28
billion USD, with a total of 2,591 newly
registered projects. More than one-third
of these projects (932 projects) were in the
manufacturing industry, which had a very
high growth rate and was a major driving
force of the economy.
One notable FDI project in the last quarter
was the BOT Van Phong 1 project, with the
total registered capital of 2.58 billion USD,
Total Social Investment (Compared to Corresponding Period of the Previous Year)
Source: Calculated from GSO data
85%
95%
105%
115%
125%
135%
145%
I II III IV I II III IV I II III IV I II III IV
2014 2015 2016 2017
Total State Sector Private Sector FDI Sector
2017 VIET NAM MACROECONOMIC REPORT Q4 21
invested by Sumitomo Corporation of
Japan. This project, together with other
large projects, helped Japan to be the top
foreign investor in Vietnam in 2017 with
9.11 billion USD, accounting for 25.4% of
total FDI. South Korea ranked second with
8.49 billion USD, of which 2.5 billion was
supplemented to Samsung Display Vietnam
project. Singapore ranked third with 5.31
billion USD.
The monetary and financial markets
The forex market remained stable for the
whole year
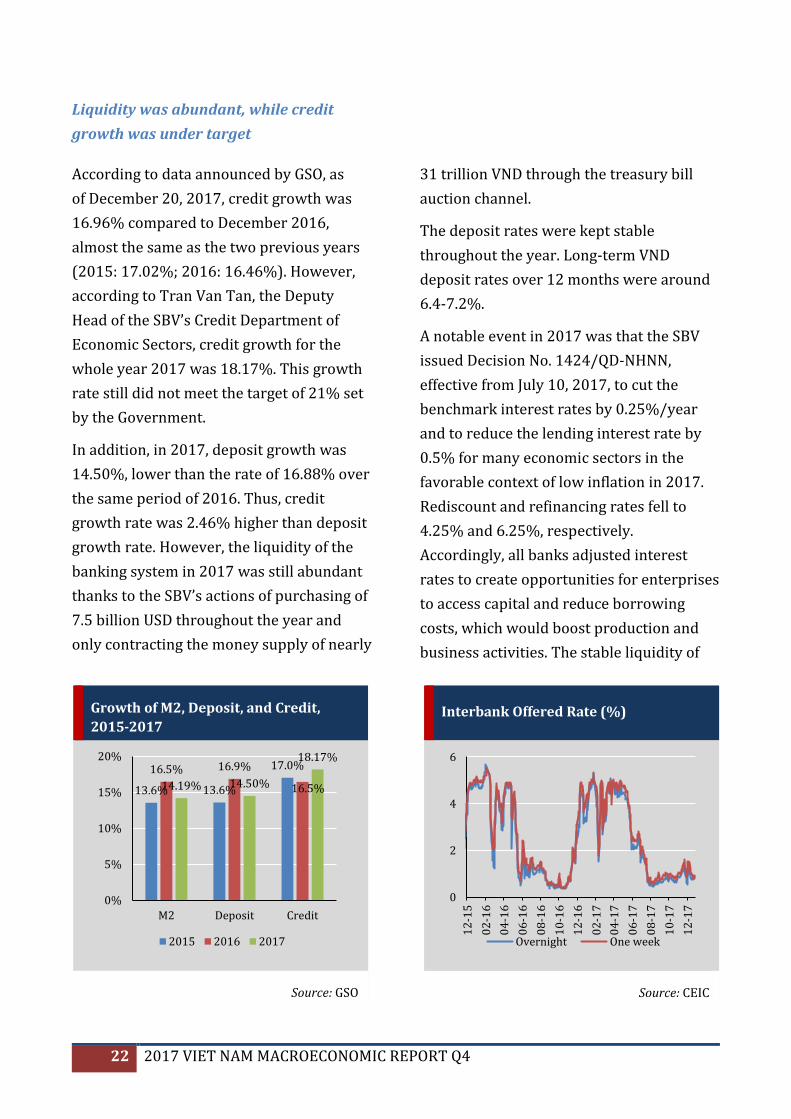
Nominal exchange rate continued to
maintain stability in Q4. In general, the
VND/USD exchange rate did not change
much throughout 2017. Thanks to the
low inflation rate, the abundant foreign
currency supply, and the devaluation of the
dollar, the impact on the exchange rate was
even reversed. As a result, both the
reference exchange rate and the spot
exchange rate at commercial banks did not
fluctuate greatly during the second half of
the year. As of December 29, 2017, the
reference rate announced by the SBV was
22,425 VND/USD, only rising by 1.2%
compared to the beginning of the year.
Meanwhile, the selling rate at Vietcombank
was almost unchanged, only fluctuating
around 22,745 VND/USD.
Monetary policy in 2017 continued to be
implemented strictly although the SBV has
made many statements showing a tendency
to loosen. The positive balance of payments
allowed the SBV to buy foreign currencies
continuously throughout the year, helping
foreign exchange reserves reach 51.5 billion
USD (over 2.7 months of imports), as
announced by the Deputy Governor Nguyen
Thi Hong in the last meeting of the year.
The abundance of foreign currency helped
reduce the pressure on VND. Therefore, the
SBV has had more space to lower interest
rates to boost the economy.
Nominal Exchange Rate (VND/USD)
Source: VEPR
20500
21000
21500
22000
22500
23000
23500
12
-15
02
-16
04
-16
06
-16
08
-16
10
-16
12
-16
02
-17
04
-17
06
-17
08
-17
10
-17
12
-17
VCB, Selling Reference
Foreign Direct Investment (bil. USD)
Source: MPI
0
4
8
12
I II III IV I II III IV I II III IV I II III IV
2014 2015 2016 2017
Additional registered capitalNew registered capitalImplementation capital
22 2017 VIET NAM MACROECONOMIC REPORT Q4
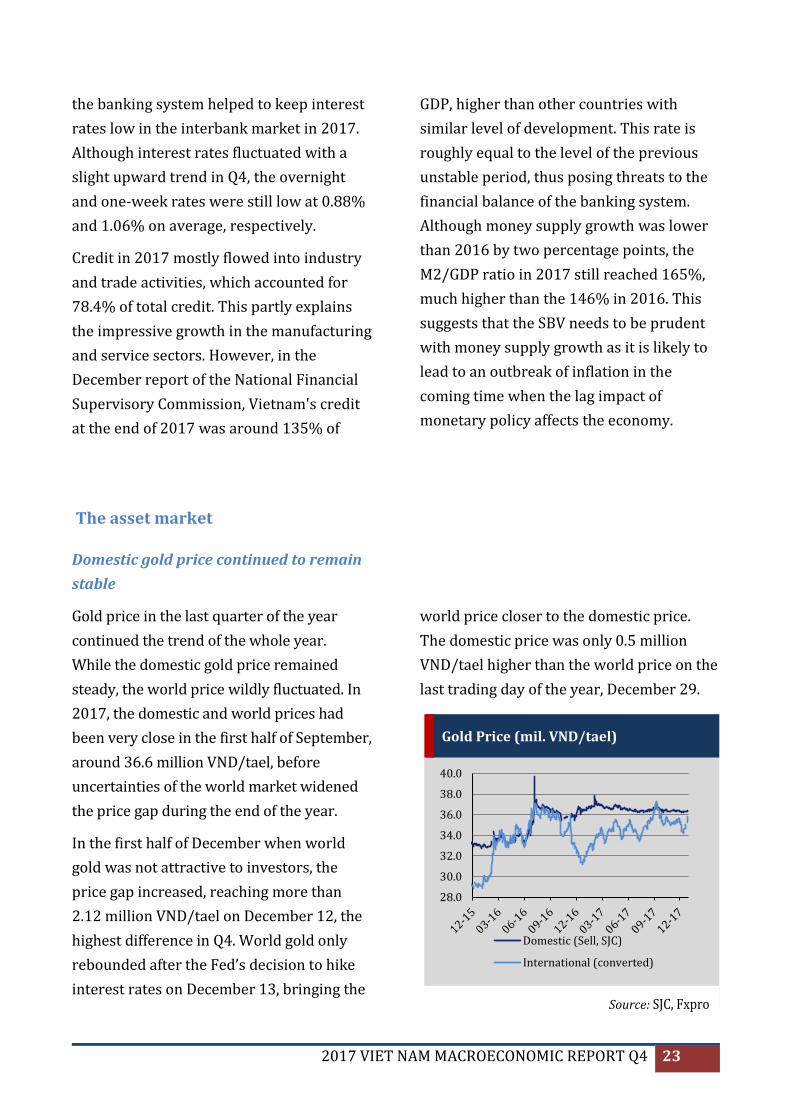
Liquidity was abundant, while credit
growth was under target
According to data announced by GSO, as
of December 20, 2017, credit growth was
16.96% compared to December 2016,
almost the same as the two previous years
(2015: 17.02%; 2016: 16.46%). However,
according to Tran Van Tan, the Deputy
Head of the SBV’s Credit Department of
Economic Sectors, credit growth for the
whole year 2017 was 18.17%. This growth
rate still did not meet the target of 21% set
by the Government.
In addition, in 2017, deposit growth was
14.50%, lower than the rate of 16.88% over
the same period of 2016. Thus, credit
growth rate was 2.46% higher than deposit
growth rate. However, the liquidity of the
banking system in 2017 was still abundant
thanks to the SBV’s actions of purchasing of
7.5 billion USD throughout the year and
only contracting the money supply of nearly
31 trillion VND through the treasury bill
auction channel.
The deposit rates were kept stable
throughout the year. Long-term VND
deposit rates over 12 months were around
6.4-7.2%.
A notable event in 2017 was that the SBV
issued Decision No. 1424/QD-NHNN,
effective from July 10, 2017, to cut the
benchmark interest rates by 0.25%/year
and to reduce the lending interest rate by
0.5% for many economic sectors in the
favorable context of low inflation in 2017.
Rediscount and refinancing rates fell to
4.25% and 6.25%, respectively.
Accordingly, all banks adjusted interest
rates to create opportunities for enterprises
to access capital and reduce borrowing
costs, which would boost production and
business activities. The stable liquidity of
Growth of M2, Deposit, and Credit,
2015-2017
Source: GSO
13.6% 13.6%
17.0%16.5% 16.9%
16.5%14.19% 14.50%
18.17%
0%
5%
10%
15%
20%
M2 Deposit Credit
2015 2016 2017
Interbank Offered Rate (%)
Source: CEIC
0
2
4
6
12
-15
02
-16
04
-16
06
-16
08
-16
10
-16
12
-16
02
-17
04
-17
06
-17
08
-17
10
-17
12
-17
Overnight One week
2017 VIET NAM MACROECONOMIC REPORT Q4 23
the banking system helped to keep interest
rates low in the interbank market in 2017.
Although interest rates fluctuated with a
slight upward trend in Q4, the overnight
and one-week rates were still low at 0.88%
and 1.06% on average, respectively.
Credit in 2017 mostly flowed into industry
and trade activities, which accounted for
78.4% of total credit. This partly explains
the impressive growth in the manufacturing
and service sectors. However, in the
December report of the National Financial
Supervisory Commission, Vietnam's credit
at the end of 2017 was around 135% of
GDP, higher than other countries with
similar level of development. This rate is
roughly equal to the level of the previous
unstable period, thus posing threats to the
financial balance of the banking system.
Although money supply growth was lower
than 2016 by two percentage points, the
M2/GDP ratio in 2017 still reached 165%,
much higher than the 146% in 2016. This
suggests that the SBV needs to be prudent
with money supply growth as it is likely to
lead to an outbreak of inflation in the
coming time when the lag impact of
monetary policy affects the economy.
The asset market
Domestic gold price continued to remain
stable
Gold price in the last quarter of the year
continued the trend of the whole year.
While the domestic gold price remained
steady, the world price wildly fluctuated. In
2017, the domestic and world prices had
been very close in the first half of September,
around 36.6 million VND/tael, before
uncertainties of the world market widened
the price gap during the end of the year.
In the first half of December when world
gold was not attractive to investors, the
price gap increased, reaching more than
2.12 million VND/tael on December 12, the
highest difference in Q4. World gold only
rebounded after the Fed’s decision to hike
interest rates on December 13, bringing the
world price closer to the domestic price.
The domestic price was only 0.5 million
VND/tael higher than the world price on the
last trading day of the year, December 29.
Gold Price (mil. VND/tael)
Source: SJC, Fxpro
28.0
30.0
32.0
34.0
36.0
38.0
40.0
Domestic (Sell, SJC)
International (converted)
24 2017 VIET NAM MACROECONOMIC REPORT Q4
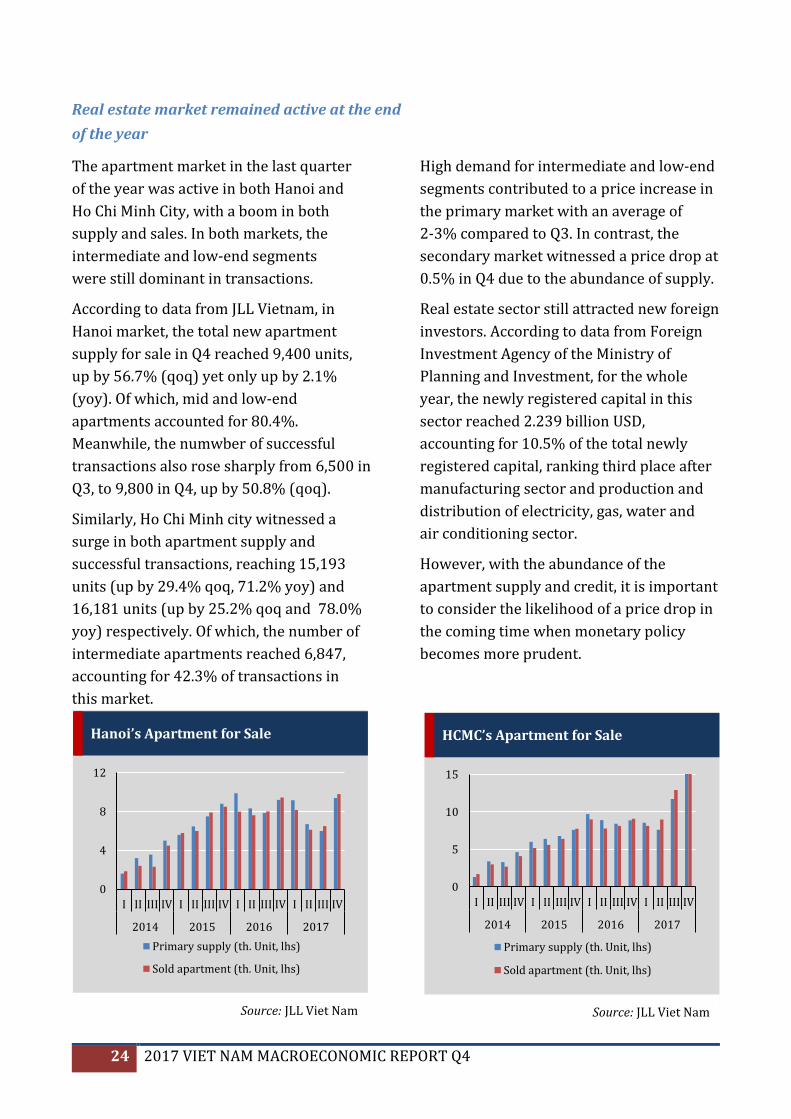
Real estate market remained active at the end
of the year
The apartment market in the last quarter
of the year was active in both Hanoi and
Ho Chi Minh City, with a boom in both
supply and sales. In both markets, the
intermediate and low-end segments
were still dominant in transactions.
According to data from JLL Vietnam, in
Hanoi market, the total new apartment
supply for sale in Q4 reached 9,400 units,
up by 56.7% (qoq) yet only up by 2.1%
(yoy). Of which, mid and low-end
apartments accounted for 80.4%.
Meanwhile, the numwber of successful
transactions also rose sharply from 6,500 in
Q3, to 9,800 in Q4, up by 50.8% (qoq).
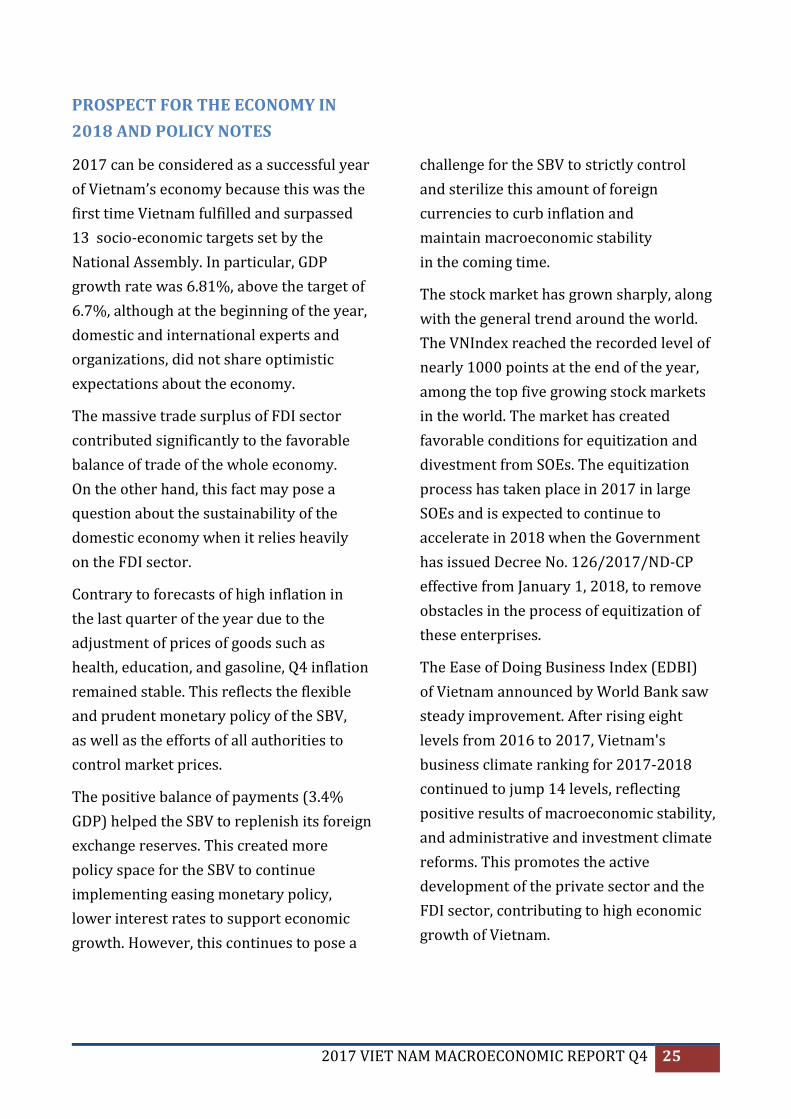
Similarly, Ho Chi Minh city witnessed a
surge in both apartment supply and
successful transactions, reaching 15,193
units (up by 29.4% qoq, 71.2% yoy) and
16,181 units (up by 25.2% qoq and 78.0%
yoy) respectively. Of which, the number of
intermediate apartments reached 6,847,
accounting for 42.3% of transactions in
this market.
High demand for intermediate and low-end
segments contributed to a price increase in
the primary market with an average of
2-3% compared to Q3. In contrast, the
secondary market witnessed a price drop at
0.5% in Q4 due to the abundance of supply.
Real estate sector still attracted new foreign
investors. According to data from Foreign
Investment Agency of the Ministry of
Planning and Investment, for the whole
year, the newly registered capital in this
sector reached 2.239 billion USD,
accounting for 10.5% of the total newly
registered capital, ranking third place after
manufacturing sector and production and
distribution of electricity, gas, water and
air conditioning sector.
However, with the abundance of the
apartment supply and credit, it is important
to consider the likelihood of a price drop in
the coming time when monetary policy
becomes more prudent.
Hanoi’s Apartment for Sale
Source: JLL Viet Nam
0
4
8
12
I II III IV I II III IV I II III IV I II III IV
2014 2015 2016 2017
Primary supply (th. Unit, lhs)
Sold apartment (th. Unit, lhs)
HCMC’s Apartment for Sale
Source: JLL Viet Nam
0
5
10
15
I II III IV I II III IV I II III IV I II III IV
2014 2015 2016 2017
Primary supply (th. Unit, lhs)
Sold apartment (th. Unit, lhs)
2017 VIET NAM MACROECONOMIC REPORT Q4 25
PROSPECT FOR THE ECONOMY IN
2018 AND POLICY NOTES
2017 can be considered as a successful year
of Vietnam’s economy because this was the
first time Vietnam fulfilled and surpassed
13 socio-economic targets set by the
National Assembly. In particular, GDP
growth rate was 6.81%, above the target of
6.7%, although at the beginning of the year,
domestic and international experts and
organizations, did not share optimistic
expectations about the economy.
The massive trade surplus of FDI sector
contributed significantly to the favorable
balance of trade of the whole economy.
On the other hand, this fact may pose a
question about the sustainability of the
domestic economy when it relies heavily
on the FDI sector.
Contrary to forecasts of high inflation in
the last quarter of the year due to the
adjustment of prices of goods such as
health, education, and gasoline, Q4 inflation
remained stable. This reflects the flexible
and prudent monetary policy of the SBV,
as well as the efforts of all authorities to
control market prices.
The positive balance of payments (3.4%
GDP) helped the SBV to replenish its foreign
exchange reserves. This created more
policy space for the SBV to continue
implementing easing monetary policy,
lower interest rates to support economic
growth. However, this continues to pose a
challenge for the SBV to strictly control
and sterilize this amount of foreign
currencies to curb inflation and
maintain macroeconomic stability
in the coming time.
The stock market has grown sharply, along
with the general trend around the world.
The VNIndex reached the recorded level of
nearly 1000 points at the end of the year,
among the top five growing stock markets
in the world. The market has created
favorable conditions for equitization and
divestment from SOEs. The equitization
process has taken place in 2017 in large
SOEs and is expected to continue to
accelerate in 2018 when the Government
has issued Decree No. 126/2017/ND-CP
effective from January 1, 2018, to remove
obstacles in the process of equitization of
these enterprises.
The Ease of Doing Business Index (EDBI)
of Vietnam announced by World Bank saw
steady improvement. After rising eight
levels from 2016 to 2017, Vietnam's
business climate ranking for 2017-2018
continued to jump 14 levels, reflecting
positive results of macroeconomic stability,
and administrative and investment climate
reforms. This promotes the active
development of the private sector and the
FDI sector, contributing to high economic
growth of Vietnam.
26 2017 VIET NAM MACROECONOMIC REPORT Q4
The successful organization of APEC 2017,
as well as the commitment on CPTPP
agreement, opens many opportunities and
challenges for the economy in the future.
Tariff barriers once removed will help
Vietnamese commodities to penetrate more
easily to the CPTPP market. However, in the
opposite direction, foreign commodities
will also flow into Vietnam, creating greater
challenges in improving production
efficiency as well as product quality for
domestic firms.
Macroeconomic stability and institutional
reforms aimed at improving the investment
environment are expected to continue to be
effective and more supportive for business
activities. 2018. However, many inherent
problems of the economy which have not
been resolved thoroughly will remain a
drag on the economy.
Firstly, economic growth still have not come
from increasing labor productivity.
Vietnam’s labor productivity remains low
compared to other countries in the
neighboring region, only 1/14 of
Singapore’s, 1/6 of Malaysia’s and one-third
of Thailand’s. If there are no comprehensive
measures to boost labor productivity in the
near future, in the context of dwindling
away demographic dividend, it is unlikely
that Vietnam will be able to maintain its
current growth momentum. In addition, the
advantage of cheap labor will no longer be
available due to the impact of Industry 4.0.
In the context of depletion of natural
resources, continuous decline in the
production of the mining and quarrying
industry, not-yet breakthroughs in the
manufacturing industry, and vulnerable
agriculture sector from natural disasters
and climate change, the growth pressure for
2018 would be a real challenge.
The 14th National Assembly’s forth session
passed the Resolution No. 48/2017/QH14
and set some key economic development
targets in 2018 as follows:
2018
GDP growth rate (%) 6.5-6.7%
Export turnover growth
(%) 7-8%
Trade deficit/Total export
turnover ratio (%) <3%
CPI (%) 4%
Total social development
investment capital (% GDP) 33-34%
Source: Resolution No. 48/2017/QH14
VEPR research team believe that such
targets in 2018 are achievable in the
current favorable context.
Given this situation, we forecast economic
growth rate and inflation as follows:
Growth- Inflation in 2018 (%, yoy)
Economic
Growth Inflation
Q1 6.02 4.14
Q2 6.41 4.41
Q3 7.08 4.69
Q4 7.27 4.03
2018 6.65
Source: VEPR
Growth-Inflation forecast 2018
2017 VIET NAM MACROECONOMIC REPORT Q4 27
Secondly, high budget deficit and public
debt will continue to be a severe problem
hindering the economy. While public
investment is limited, recurrent
expenditures still remain high, creating a
burden on the state budget. In the context
when international organizations and
foreign donors will no longer provide ODA
preferential loans and only offer loans with
higher interest rates, Vietnam will need to
use more internal resources as driving
forces for growth. The government also
need to take drastic measures to tighten
current expenditures such as policies for
personnel streamlining, restructuring the
apparatus, limiting expenditures for mass
organizations, and divesting and equitizing
SOEs like recently.
Thirdly, the increasing dependence of
Vietnam’s economy on the world economy
and the FDI sector also creates many
uncertainties for the economy, especially in
the context of the world economy in 2018
facing many geopolitical risks and the trade
protectionism of major economies as well
as the rapid change of science and
technology in the world.
Note: Long-term and structural policies will be
discussed in other policy reports of VEPR.

Abbreviations
BoJ Bank of Japan
BoE Bank of England
BSC BIDV Securities Company
CNY Chinese Yuan
ECB European Central Bank
FDI Foreign Direct Investment
FED Federal Reserve
FIE Foreign invested enterprises
FMCG Fast Moving Consumption Goods
GDP Gross Domestic Product
GSO General Statistics Office
HSCB Hong Kong Shanghai Commercial Bank
LHS left hand side
IMF International Monetary Fund
MOLISA Ministry of Labor, Invalid and Social Affairs
MOIT Ministry of Industry and Trade
mom month-on-month
MPI Ministry of Planning and Investment
OECD Organization for Economic Co-operation and Development
PMI Purchasing Manager Index
qoq quarter-on-quarter
RHS right hand side
SBV State Bank of Viet Nam
UN United Nations
USD the United State dollar
VAMC Viet Nam Asset Management Company
VCB Viet Nam Bank of Foreign Trade
VND Vietnamese currency
WB World Bank
yoy year-on-year
ytd year-to-date
Disclosure appendix
Author’s Certification
The following author who are primarily responsible for this report, certify that the opinion on the
subject or issues and/or any other views or forecasts expressed herein accurately reflect their personal
views and that no part of their compensation was, is or will be directly or indirectly related to the
specific recommendations or views contained in this research report: Nguyễn Đức Thành, Vũ Minh
Long, Nguyễn Hoàng Hiệp (VEPR Macroeconomic Research Team).
This document has been prepared and is being distributed by Viet Nam Institute for Economic and
Policy Research (VEPR) and is intended solely for the customers of VEPR and is not for publication to
other persons, whether through the press or other means. Advice in this document is general and
should not be construed as personal advice.
Additional disclosures
This report is dated as January 16, 2018. All data included in this report are dated December 31, 2017
unless otherwise indicated in the report.
VEPR has procedures in place to identify and manage any potential conflicts of interest that arise in
connection with the authors. Any confidential and/or sensitive information is handled in an appropriate
manner. All contributions and exchange please send to: Viet Nam Institute for Economic and Policy
Research, Room 707, E4 Building, 144 Xuan Thuy Street, Cau Giay district, Ha Noi. Email:

MORE WORKING PAPERS
VMM17Q3 Viet Nam Quarterly Macroeconomic Report, Quarter 3 - 2017
VMM17Q2 Viet Nam Quarterly Macroeconomic Report, Quarter 2 - 2017
VMM17Q1 Viet Nam Quarterly Macroeconomic Report, Quarter 1 - 2017
PD-07: Evaluation of the Law on Public Debt Management of Vietnam
and some Policy Implications
PD-06: Minimum Wages in Viet Nam: Preliminary Observations
PD-05: A brief on impacts of Brexit on the World Economy and Vietnamese Economy
WP-18: Development characteristics of SME sector in Vietnam:
Evidence from the Vietnam Enterprise Census 2006-2015
WP-17: The 19th National Congress of the Communist Party of China:
Preparation for a New Era


