Embed Size (px)
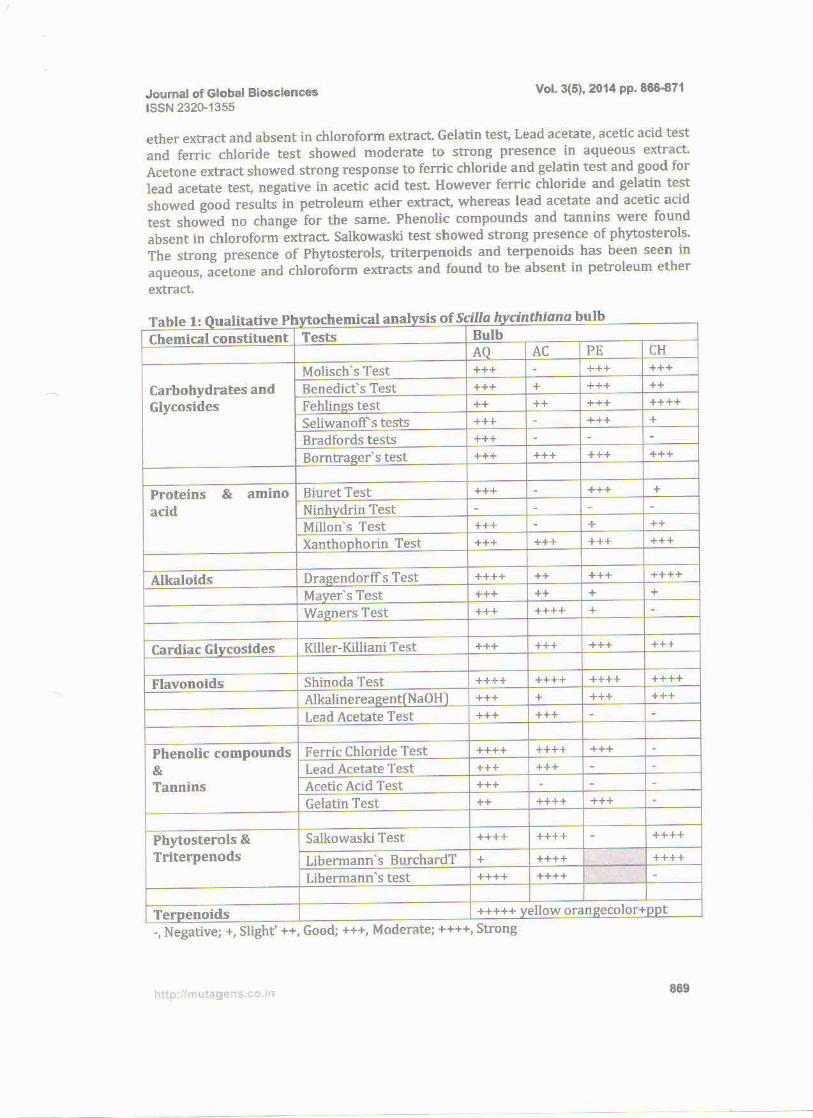
Citation preview

Vidya Bharati Shaikshanik Mandal, Amravati’s
VVIIDDYYAA BBHHAARRAATTII MMAAHHAAVVIIDDYYAALLAAYYAA ,, AAMMRRAAVVAATTII
Affiliated to Sant Gadge Baba Amravati University, Amravati
Re-accredited ‘A’ Grade by NAAC ( CGPA : 3.26 Second Cycle)
CPE Status by UGC-Thrice
Lead College identified by SGBAU, Amravati,
Mentor College under Paramarsha Scheme of UGC
C.K. Naidu Road, Camp, Amravati, Maharashtra State, India, PIN 444602
Phone: 0721-2662740, Fax 0721-2662740,
http://www.vbmv.org
Email: [email protected], [email protected]

SN Title of paper Name of the author/sDepartment of
the teacherName of journal
Year of
publicationISSN number
Link to the recognition in UGC enlistment
of the Journal
1 Phytochemical screening and assessment of
biomolecule compounds in Scilla
hyacinthina Roth. Macbr. bulb
M.U.Ghurde &
S.N.MalodeBotany
Journal of Global
Biosciences2014-15 23201355
Not listed in present UGC approved list as
well as in deleted approved UGC List
2 Cytogenetic Effects of Tilt on Root Tip
Meristem of onion Allium cepa L. Pulate P.V. & Tarar J.L Botany
International Journal of
Plant and Environmental
Science
2014-15 22314490Not listed in present UGC approved list as
well as in deleted approved UGC List
3 Liberalization of Indian Banking and
Regulations, Page No.21-28Dr. S. B. Kadu Commerce
Journal of Research &
Development, Vol. 2014-15 22309578
Not listed in present UGC approved list as
well as in deleted approved UGC List
4 Priority Sector Lending for Agriculture in
India
Dr. S. B. Kadu &
Praneeta DeshmukhCommerce
International Peer Reviewed
Research Journal Special
Issue
2014-15 22789308Not listed in present UGC approved list as
well as in deleted approved UGC List
5 Mahatma Gandhi National Rural
Employment Guarantee Scheme: A Unique
for Indian Rural Women, Page No.82-85
Dr. S. B. Kadu,
Mr.S.K.RoddeCommerce
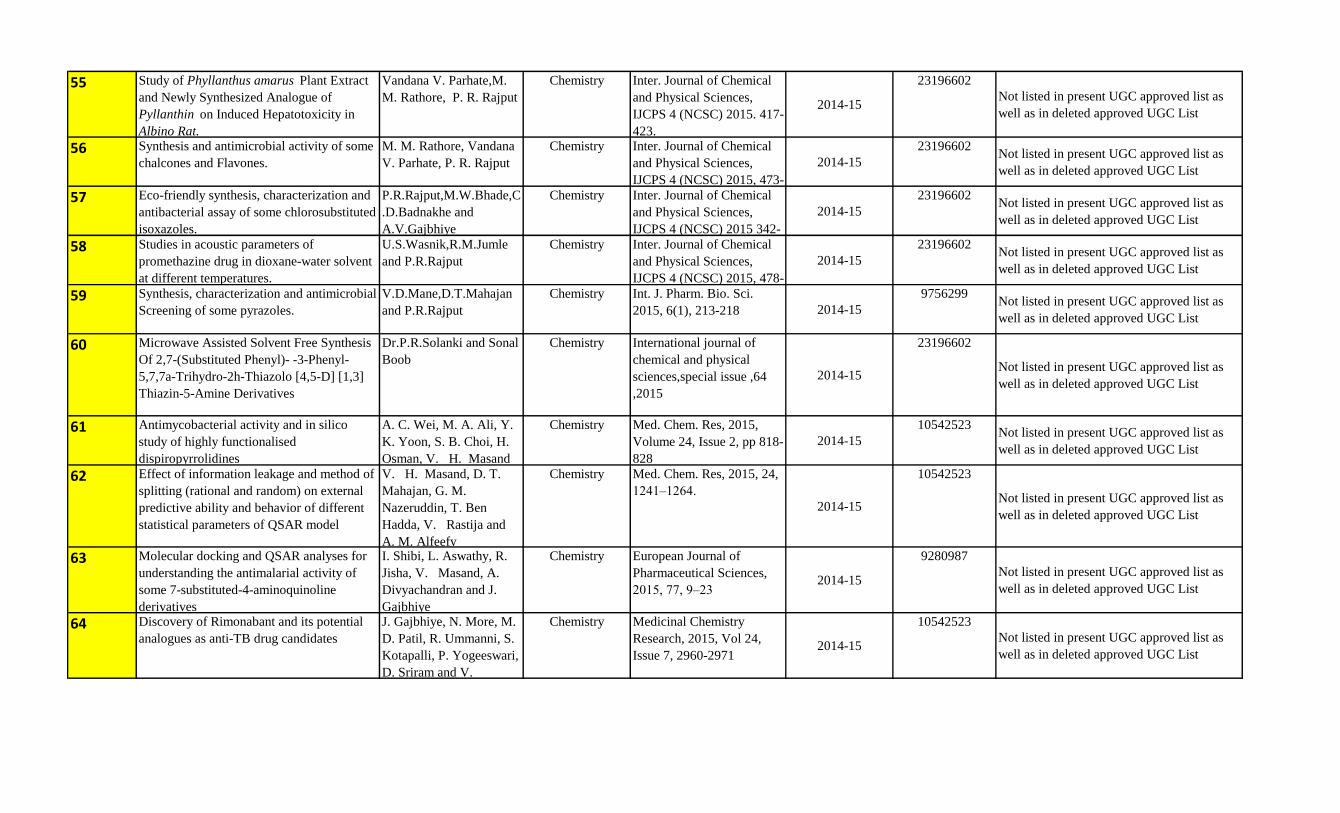
“The Horizon” A Bi-annual
Interdisciplinary Research
Journal, Volume 5, No.2,
2014-15 22294554Not listed in present UGC approved list as
well as in deleted approved UGC List
6 Sensor Technoloies For Sensing The Heart
beatSignal And Their Limitation N.B.Raut Electronics
Journal of the intrument
society of india2014-15
Not listed in present UGC approved list as
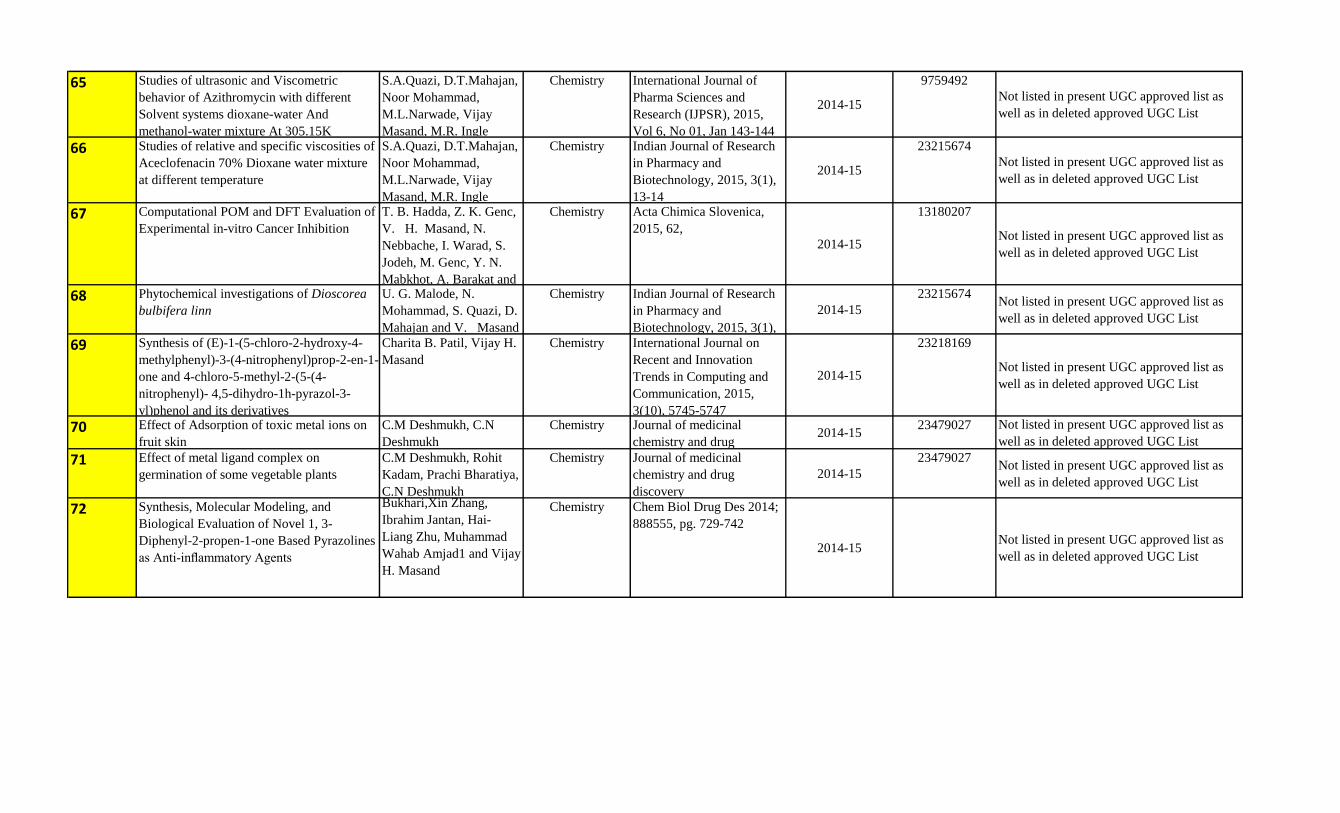
well as in deleted approved UGC List
7 Total Quality Management in Dr. Panjabrao
Deshmukh Agricultural University Library,
Akola Maharashtra A Users' Study
Dr.Vishal R.ShekhawatLibrary and
Information
Sciences
Indian Journal of
Agriculture Library and
Information Services
2014-15 9748776Not listed in present UGC approved list as
well as in deleted approved UGC List
8 Synthesis and characterization of
photoconductive CdS thin Semiconductor
Film by Sillar Method
S. K. Karande , Dr. F. C.
RaghuwanshiPhysics
International Journal of
Basic & Appl. Resech. Spe. 2014-15 22493352 https://www.ugc.ac.in/pdfnews/5283580_U
GC-Cancelled-List.pdf
9 Synthesis and ammonia sensing properties of
Bi2O3nanoparticles
S.D.Kapse, Raghuwanshi
F.C., Kapase V.DPhysics
International Journal of
Basic & Appl. Resech. Spe. 2014-15 22493352
https://www.ugc.ac.in/pdfnews/5283580_U
GC-Cancelled-List.pdf
10 Preparation techniques and applications of
spinel ferrite nanoparticle: An overview
Tatte T.R., Kapase V.D,
Raghuwanshi F.C.Physics
International Journal of
Basic & Appl. Resech. Spe. 2014-15 22493352 https://www.ugc.ac.in/pdfnews/5283580_U
GC-Cancelled-List.pdf
11 Miscibility studies of PVC/PMMA blends
by FTIR analysis and measurements of AC
Electrical conductivity of PVC/PMMA
Blends.
Dakare,A.B.,
G.T.Lamdhade,
F.C.Raghuwanshi
PhysicsInternational Journal of
Basic & Appl. Resech. Spe. 2014-15 22493352 https://www.ugc.ac.in/pdfnews/5283580_U
GC-Cancelled-List.pdf
3.3.2 Number of research papers per teachers in the Journals notified on UGC website during
the Academc Year 2014-15
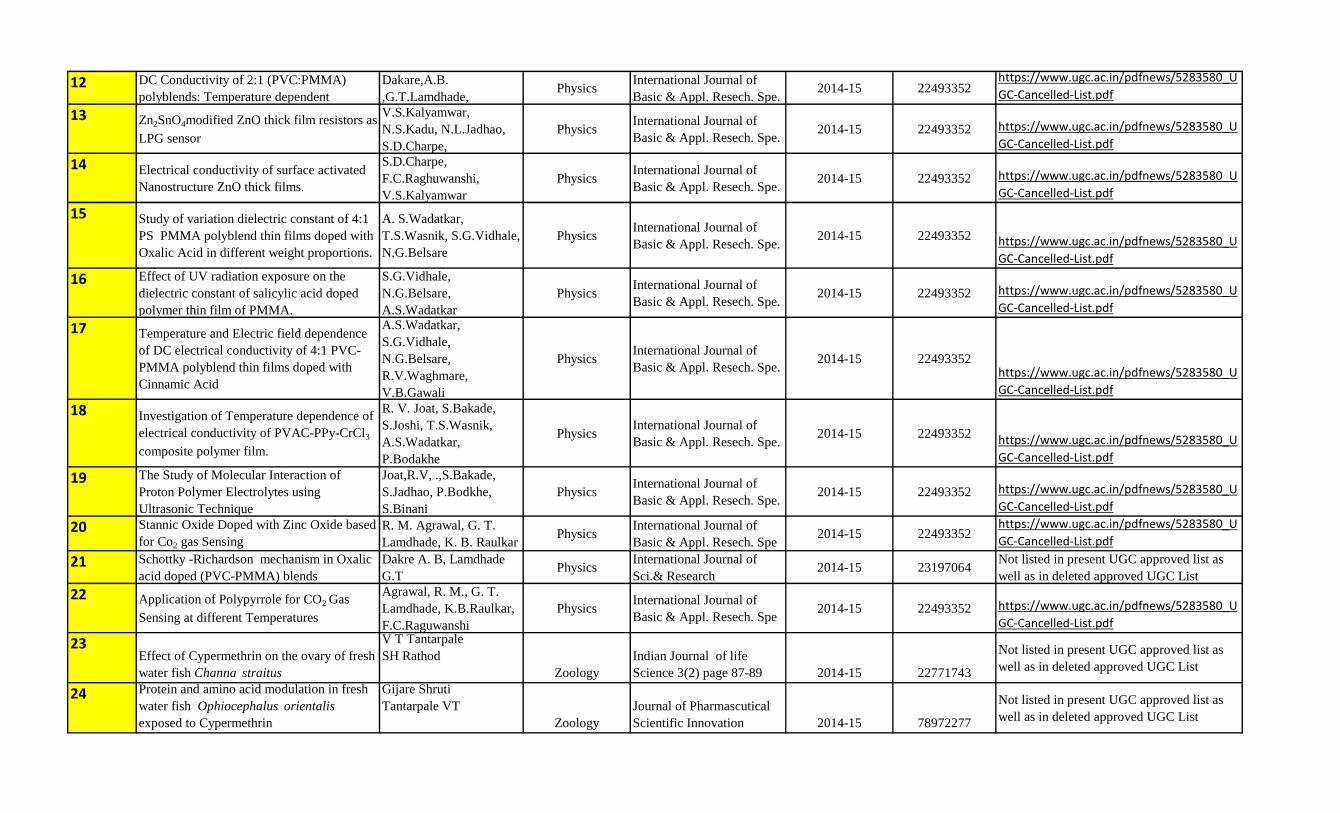
12 DC Conductivity of 2:1 (PVC:PMMA)
polyblends: Temperature dependent
Dakare,A.B.
,G.T.Lamdhade, Physics
International Journal of
Basic & Appl. Resech. Spe. 2014-15 22493352
https://www.ugc.ac.in/pdfnews/5283580_U
GC-Cancelled-List.pdf
13 Zn2SnO4modified ZnO thick film resistors as
LPG sensor
V.S.Kalyamwar,
N.S.Kadu, N.L.Jadhao,
S.D.Charpe,
PhysicsInternational Journal of
Basic & Appl. Resech. Spe. 2014-15 22493352 https://www.ugc.ac.in/pdfnews/5283580_U
GC-Cancelled-List.pdf
14 Electrical conductivity of surface activated
Nanostructure ZnO thick films.
S.D.Charpe,
F.C.Raghuwanshi,
V.S.Kalyamwar
PhysicsInternational Journal of
Basic & Appl. Resech. Spe. 2014-15 22493352 https://www.ugc.ac.in/pdfnews/5283580_U
GC-Cancelled-List.pdf
15 Study of variation dielectric constant of 4:1
PS PMMA polyblend thin films doped with
Oxalic Acid in different weight proportions.
A. S.Wadatkar,
T.S.Wasnik, S.G.Vidhale,
N.G.Belsare
PhysicsInternational Journal of
Basic & Appl. Resech. Spe. 2014-15 22493352 https://www.ugc.ac.in/pdfnews/5283580_U
GC-Cancelled-List.pdf
16 Effect of UV radiation exposure on the
dielectric constant of salicylic acid doped
polymer thin film of PMMA.
S.G.Vidhale,
N.G.Belsare,
A.S.Wadatkar
PhysicsInternational Journal of
Basic & Appl. Resech. Spe. 2014-15 22493352 https://www.ugc.ac.in/pdfnews/5283580_U
GC-Cancelled-List.pdf
17 Temperature and Electric field dependence
of DC electrical conductivity of 4:1 PVC-
PMMA polyblend thin films doped with
Cinnamic Acid
A.S.Wadatkar,
S.G.Vidhale,
N.G.Belsare,
R.V.Waghmare,
V.B.Gawali
PhysicsInternational Journal of
Basic & Appl. Resech. Spe. 2014-15 22493352
https://www.ugc.ac.in/pdfnews/5283580_U
GC-Cancelled-List.pdf
18 Investigation of Temperature dependence of
electrical conductivity of PVAC-PPy-CrCl3
composite polymer film.
R. V. Joat, S.Bakade,
S.Joshi, T.S.Wasnik,
A.S.Wadatkar,
P.Bodakhe
PhysicsInternational Journal of
Basic & Appl. Resech. Spe. 2014-15 22493352 https://www.ugc.ac.in/pdfnews/5283580_U
GC-Cancelled-List.pdf
19 The Study of Molecular Interaction of
Proton Polymer Electrolytes using
Ultrasonic Technique
Joat,R.V, .,S.Bakade,
S.Jadhao, P.Bodkhe,
S.Binani
PhysicsInternational Journal of
Basic & Appl. Resech. Spe.2014-15 22493352 https://www.ugc.ac.in/pdfnews/5283580_U
GC-Cancelled-List.pdf
20 Stannic Oxide Doped with Zinc Oxide based
for Co2 gas Sensing
R. M. Agrawal, G. T.
Lamdhade, K. B. RaulkarPhysics
International Journal of
Basic & Appl. Resech. Spe2014-15 22493352
https://www.ugc.ac.in/pdfnews/5283580_U
GC-Cancelled-List.pdf
21 Schottky -Richardson mechanism in Oxalic
acid doped (PVC-PMMA) blends
Dakre A. B, Lamdhade
G.TPhysics
International Journal of
Sci.& Research 2014-15 23197064
Not listed in present UGC approved list as
well as in deleted approved UGC List
22 Application of Polypyrrole for CO2 Gas
Sensing at different Temperatures
Agrawal, R. M., G. T.
Lamdhade, K.B.Raulkar,
F.C.Raguwanshi
PhysicsInternational Journal of
Basic & Appl. Resech. Spe2014-15 22493352 https://www.ugc.ac.in/pdfnews/5283580_U
GC-Cancelled-List.pdf
23Effect of Cypermethrin on the ovary of fresh
water fish Channa straitus
V T Tantarpale
SH Rathod
Zoology
Indian Journal of life
Science 3(2) page 87-89 2014-15 22771743
Not listed in present UGC approved list as
well as in deleted approved UGC List
24 Protein and amino acid modulation in fresh
water fish Ophiocephalus orientalis
exposed to Cypermethrin
Gijare Shruti
Tantarpale VT
Zoology
Journal of Pharmascutical
Scientific Innovation 2014-15 78972277
Not listed in present UGC approved list as
well as in deleted approved UGC List
25 Effects of Cypermethrin on lipid and
cholesterol contents of fresh water fish
Channa orientalis
Gijare Shruti
Tantarpale VT
Zoology
Indian journal of Sci.
research 2014-15 22501991
Not listed in present UGC approved list as
well as in deleted approved UGC List
26 Morhpometric and meristic variation in fins
of Channa punctatus from fresh water
habitats in Amravati Region.
V.T.Tantarpale, S.H.
Rathod, P.S. Joshi,
S.A.Tantarpale, S.R. Zoology
Indian Journal of Sci.
Research 2014-15 9762876
Not listed in present UGC approved list as
well as in deleted approved UGC List
27 A review of Ophidian studies in Vidarbha
Region (M.S)
Joshi P.S, V.T.Tantarpale
& K.M. Kulkarni Zoology Sci. Research Reporter 2014-15 22492321Not listed in present UGC approved list as
well as in deleted approved UGC List
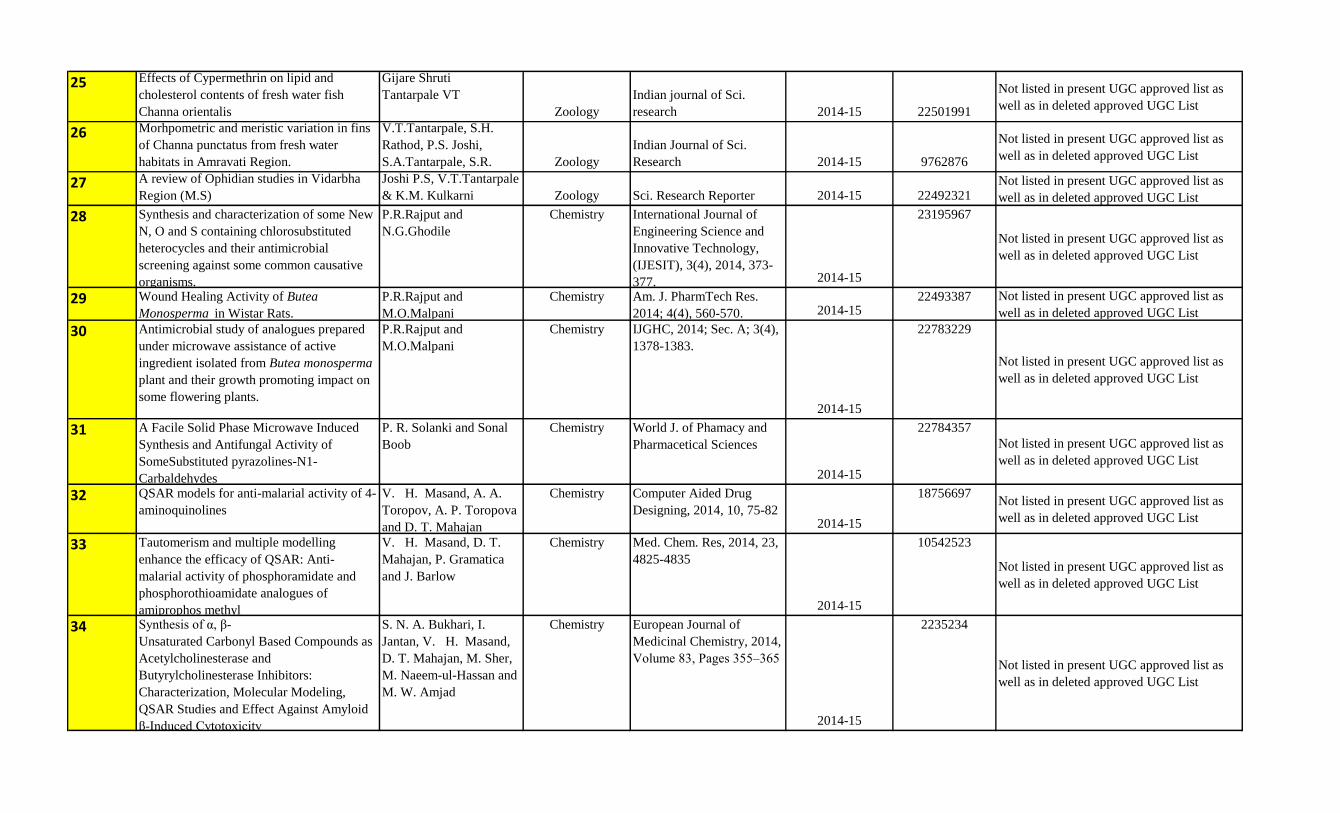
28 Synthesis and characterization of some New
N, O and S containing chlorosubstituted
heterocycles and their antimicrobial
screening against some common causative
organisms.
P.R.Rajput and
N.G.Ghodile
Chemistry International Journal of
Engineering Science and
Innovative Technology,
(IJESIT), 3(4), 2014, 373-
377. 2014-15
23195967
Not listed in present UGC approved list as
well as in deleted approved UGC List
29 Wound Healing Activity of Butea
Monosperma in Wistar Rats.
P.R.Rajput and
M.O.Malpani
Chemistry Am. J. PharmTech Res.
2014; 4(4), 560-570. 2014-1522493387 Not listed in present UGC approved list as
well as in deleted approved UGC List
30 Antimicrobial study of analogues prepared
under microwave assistance of active
ingredient isolated from Butea monosperma
plant and their growth promoting impact on
some flowering plants.
P.R.Rajput and
M.O.Malpani
Chemistry IJGHC, 2014; Sec. A; 3(4),
1378-1383.
2014-15
22783229
Not listed in present UGC approved list as
well as in deleted approved UGC List
31 A Facile Solid Phase Microwave Induced
Synthesis and Antifungal Activity of
SomeSubstituted pyrazolines-N1-
Carbaldehydes
P. R. Solanki and Sonal
Boob
Chemistry World J. of Phamacy and
Pharmacetical Sciences
2014-15
22784357
Not listed in present UGC approved list as
well as in deleted approved UGC List
32 QSAR models for anti-malarial activity of 4-
aminoquinolines
V. H. Masand, A. A.
Toropov, A. P. Toropova
and D. T. Mahajan
Chemistry Computer Aided Drug
Designing, 2014, 10, 75-822014-15
18756697Not listed in present UGC approved list as
well as in deleted approved UGC List
33 Tautomerism and multiple modelling
enhance the efficacy of QSAR: Anti-
malarial activity of phosphoramidate and
phosphorothioamidate analogues of
amiprophos methyl
V. H. Masand, D. T.
Mahajan, P. Gramatica
and J. Barlow
Chemistry Med. Chem. Res, 2014, 23,
4825-4835
2014-15
10542523
Not listed in present UGC approved list as
well as in deleted approved UGC List
34 Synthesis of α, β-
Unsaturated Carbonyl Based Compounds as
Acetylcholinesterase and
Butyrylcholinesterase Inhibitors:
Characterization, Molecular Modeling,
QSAR Studies and Effect Against Amyloid
β-Induced Cytotoxicity
S. N. A. Bukhari, I.
Jantan, V. H. Masand,
D. T. Mahajan, M. Sher,
M. Naeem-ul-Hassan and
M. W. Amjad
Chemistry European Journal of
Medicinal Chemistry, 2014,
Volume 83, Pages 355–365
2014-15
2235234
Not listed in present UGC approved list as
well as in deleted approved UGC List
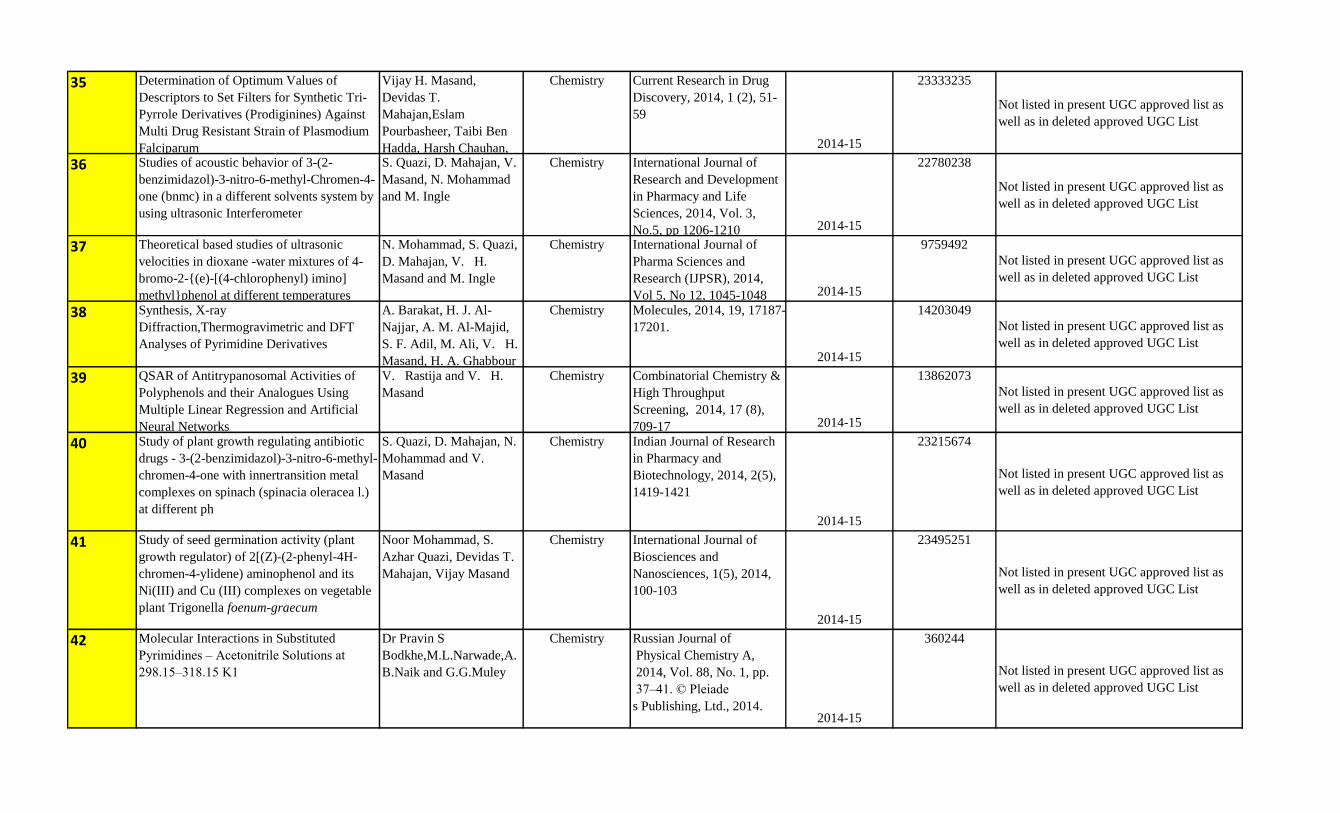
35 Determination of Optimum Values of
Descriptors to Set Filters for Synthetic Tri-
Pyrrole Derivatives (Prodiginines) Against
Multi Drug Resistant Strain of Plasmodium
Falciparum
Vijay H. Masand,
Devidas T.
Mahajan,Eslam
Pourbasheer, Taibi Ben
Hadda, Harsh Chauhan,
Chemistry Current Research in Drug
Discovery, 2014, 1 (2), 51-
59
2014-15
23333235
Not listed in present UGC approved list as
well as in deleted approved UGC List
36 Studies of acoustic behavior of 3-(2-
benzimidazol)-3-nitro-6-methyl-Chromen-4-
one (bnmc) in a different solvents system by
using ultrasonic Interferometer
S. Quazi, D. Mahajan, V.
Masand, N. Mohammad
and M. Ingle
Chemistry International Journal of
Research and Development
in Pharmacy and Life
Sciences, 2014, Vol. 3,
No.5, pp 1206-1210 2014-15
22780238
Not listed in present UGC approved list as
well as in deleted approved UGC List
37 Theoretical based studies of ultrasonic
velocities in dioxane -water mixtures of 4-
bromo-2-{(e)-[(4-chlorophenyl) imino]
methyl}phenol at different temperatures
N. Mohammad, S. Quazi,
D. Mahajan, V. H.
Masand and M. Ingle
Chemistry International Journal of
Pharma Sciences and
Research (IJPSR), 2014,
Vol 5, No 12, 1045-1048 2014-15
9759492
Not listed in present UGC approved list as
well as in deleted approved UGC List
38 Synthesis, X-ray
Diffraction,Thermogravimetric and DFT
Analyses of Pyrimidine Derivatives
A. Barakat, H. J. Al-
Najjar, A. M. Al-Majid,
S. F. Adil, M. Ali, V. H.
Masand, H. A. Ghabbour
Chemistry Molecules, 2014, 19, 17187-
17201.
2014-15
14203049
Not listed in present UGC approved list as
well as in deleted approved UGC List
39 QSAR of Antitrypanosomal Activities of
Polyphenols and their Analogues Using
Multiple Linear Regression and Artificial
Neural Networks
V. Rastija and V. H.
Masand
Chemistry Combinatorial Chemistry &
High Throughput
Screening, 2014, 17 (8),
709-17 2014-15
13862073
Not listed in present UGC approved list as
well as in deleted approved UGC List
40 Study of plant growth regulating antibiotic
drugs - 3-(2-benzimidazol)-3-nitro-6-methyl-
chromen-4-one with innertransition metal
complexes on spinach (spinacia oleracea l.)
at different ph
S. Quazi, D. Mahajan, N.
Mohammad and V.
Masand
Chemistry Indian Journal of Research
in Pharmacy and
Biotechnology, 2014, 2(5),
1419-1421
2014-15
23215674
Not listed in present UGC approved list as
well as in deleted approved UGC List
41 Study of seed germination activity (plant
growth regulator) of 2[(Z)-(2-phenyl-4H-
chromen-4-ylidene) aminophenol and its
Ni(III) and Cu (III) complexes on vegetable
plant Trigonella foenum-graecum
Noor Mohammad, S.
Azhar Quazi, Devidas T.
Mahajan, Vijay Masand
Chemistry International Journal of
Biosciences and
Nanosciences, 1(5), 2014,
100-103
2014-15
23495251
Not listed in present UGC approved list as
well as in deleted approved UGC List
42 Molecular Interactions in Substituted
Pyrimidines – Acetonitrile Solutions at
298.15–318.15 K1
Dr Pravin S
Bodkhe,M.L.Narwade,A.
B.Naik and G.G.Muley
Chemistry Russian Journal of
Physical Chemistry A,
2014, Vol. 88, No. 1, pp.
37–41. © Pleiade
s Publishing, Ltd., 2014.2014-15
360244
Not listed in present UGC approved list as
well as in deleted approved UGC List
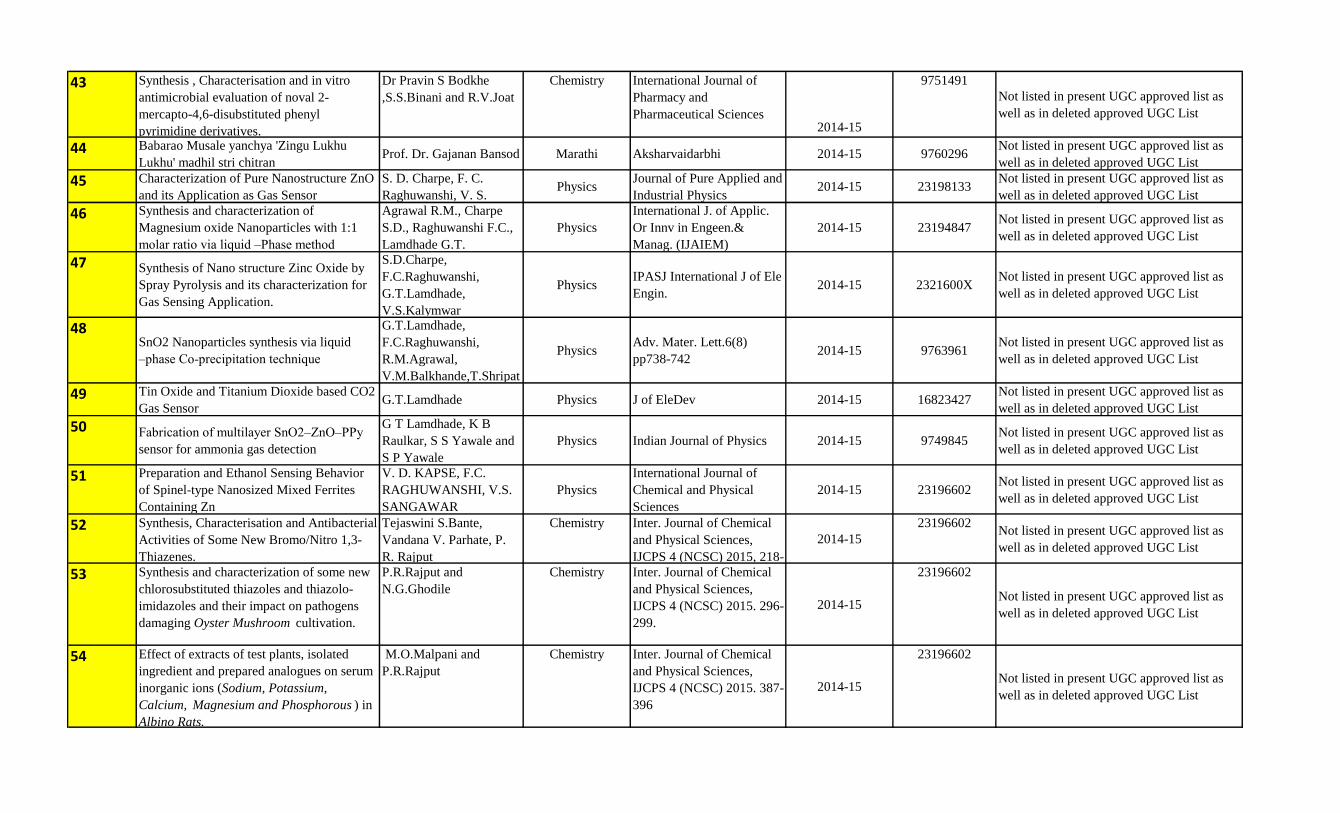
43 Synthesis , Characterisation and in vitro
antimicrobial evaluation of noval 2-
mercapto-4,6-disubstituted phenyl
pyrimidine derivatives.
Dr Pravin S Bodkhe
,S.S.Binani and R.V.Joat
Chemistry International Journal of
Pharmacy and
Pharmaceutical Sciences 2014-15
9751491
Not listed in present UGC approved list as
well as in deleted approved UGC List
44 Babarao Musale yanchya 'Zingu Lukhu
Lukhu' madhil stri chitranProf. Dr. Gajanan Bansod Marathi Aksharvaidarbhi 2014-15 9760296
Not listed in present UGC approved list as
well as in deleted approved UGC List
45 Characterization of Pure Nanostructure ZnO
and its Application as Gas Sensor
S. D. Charpe, F. C.
Raghuwanshi, V. S. Physics
Journal of Pure Applied and
Industrial Physics2014-15 23198133
Not listed in present UGC approved list as
well as in deleted approved UGC List
46 Synthesis and characterization of
Magnesium oxide Nanoparticles with 1:1
molar ratio via liquid –Phase method
Agrawal R.M., Charpe
S.D., Raghuwanshi F.C.,
Lamdhade G.T.
Physics
International J. of Applic.
Or Innv in Engeen.&
Manag. (IJAIEM)
2014-15 23194847Not listed in present UGC approved list as
well as in deleted approved UGC List
47 Synthesis of Nano structure Zinc Oxide by
Spray Pyrolysis and its characterization for
Gas Sensing Application.
S.D.Charpe,
F.C.Raghuwanshi,
G.T.Lamdhade,
V.S.Kalymwar
PhysicsIPASJ International J of Ele
Engin.2014-15 2321600X
Not listed in present UGC approved list as
well as in deleted approved UGC List
48SnO2 Nanoparticles synthesis via liquid
–phase Co-precipitation technique
G.T.Lamdhade,
F.C.Raghuwanshi,
R.M.Agrawal,
V.M.Balkhande,T.Shripat
PhysicsAdv. Mater. Lett.6(8)
pp738-742 2014-15 9763961
Not listed in present UGC approved list as
well as in deleted approved UGC List
49 Tin Oxide and Titanium Dioxide based CO2
Gas SensorG.T.Lamdhade Physics J of EleDev 2014-15 16823427
Not listed in present UGC approved list as
well as in deleted approved UGC List
50 Fabrication of multilayer SnO2–ZnO–PPy
sensor for ammonia gas detection
G T Lamdhade, K B
Raulkar, S S Yawale and
S P Yawale
Physics Indian Journal of Physics 2014-15 9749845Not listed in present UGC approved list as
well as in deleted approved UGC List
51 Preparation and Ethanol Sensing Behavior
of Spinel-type Nanosized Mixed Ferrites
Containing Zn
V. D. KAPSE, F.C.
RAGHUWANSHI, V.S.
SANGAWAR
Physics
International Journal of
Chemical and Physical
Sciences
2014-15 23196602Not listed in present UGC approved list as
well as in deleted approved UGC List
52 Synthesis, Characterisation and Antibacterial
Activities of Some New Bromo/Nitro 1,3-
Thiazenes.
Tejaswini S.Bante,
Vandana V. Parhate, P.
R. Rajput
Chemistry Inter. Journal of Chemical
and Physical Sciences,
IJCPS 4 (NCSC) 2015, 218-
2014-15
23196602Not listed in present UGC approved list as
well as in deleted approved UGC List
53 Synthesis and characterization of some new
chlorosubstituted thiazoles and thiazolo-
imidazoles and their impact on pathogens
damaging Oyster Mushroom cultivation.
P.R.Rajput and
N.G.Ghodile
Chemistry Inter. Journal of Chemical
and Physical Sciences,
IJCPS 4 (NCSC) 2015. 296-
299.
2014-15
23196602
Not listed in present UGC approved list as
well as in deleted approved UGC List
54 Effect of extracts of test plants, isolated
ingredient and prepared analogues on serum
inorganic ions (Sodium, Potassium,
Calcium, Magnesium and Phosphorous ) in
Albino Rats.
M.O.Malpani and
P.R.Rajput
Chemistry Inter. Journal of Chemical
and Physical Sciences,
IJCPS 4 (NCSC) 2015. 387-
396
2014-15
23196602
Not listed in present UGC approved list as
well as in deleted approved UGC List
55 Study of Phyllanthus amarus Plant Extract
and Newly Synthesized Analogue of
Pyllanthin on Induced Hepatotoxicity in
Albino Rat.
Vandana V. Parhate,M.
M. Rathore, P. R. Rajput
Chemistry Inter. Journal of Chemical
and Physical Sciences,
IJCPS 4 (NCSC) 2015. 417-
423.
2014-15
23196602
Not listed in present UGC approved list as
well as in deleted approved UGC List
56 Synthesis and antimicrobial activity of some
chalcones and Flavones.
M. M. Rathore, Vandana
V. Parhate, P. R. Rajput
Chemistry Inter. Journal of Chemical
and Physical Sciences,
IJCPS 4 (NCSC) 2015, 473-
2014-15
23196602Not listed in present UGC approved list as
well as in deleted approved UGC List
57 Eco-friendly synthesis, characterization and
antibacterial assay of some chlorosubstituted
isoxazoles.
P.R.Rajput,M.W.Bhade,C
.D.Badnakhe and
A.V.Gajbhiye
Chemistry Inter. Journal of Chemical
and Physical Sciences,
IJCPS 4 (NCSC) 2015 342-
2014-15
23196602Not listed in present UGC approved list as
well as in deleted approved UGC List
58 Studies in acoustic parameters of
promethazine drug in dioxane-water solvent
at different temperatures.
U.S.Wasnik,R.M.Jumle
and P.R.Rajput
Chemistry Inter. Journal of Chemical
and Physical Sciences,
IJCPS 4 (NCSC) 2015, 478-
2014-15
23196602Not listed in present UGC approved list as
well as in deleted approved UGC List
59 Synthesis, characterization and antimicrobial
Screening of some pyrazoles.
V.D.Mane,D.T.Mahajan
and P.R.Rajput
Chemistry Int. J. Pharm. Bio. Sci.
2015, 6(1), 213-218 2014-15
9756299Not listed in present UGC approved list as
well as in deleted approved UGC List
60 Microwave Assisted Solvent Free Synthesis
Of 2,7-(Substituted Phenyl)- -3-Phenyl-
5,7,7a-Trihydro-2h-Thiazolo [4,5-D] [1,3]
Thiazin-5-Amine Derivatives
Dr.P.R.Solanki and Sonal
Boob
Chemistry International journal of
chemical and physical
sciences,special issue ,64
,2015
2014-15
23196602
Not listed in present UGC approved list as
well as in deleted approved UGC List
61 Antimycobacterial activity and in silico
study of highly functionalised
dispiropyrrolidines
A. C. Wei, M. A. Ali, Y.
K. Yoon, S. B. Choi, H.
Osman, V. H. Masand
Chemistry Med. Chem. Res, 2015,
Volume 24, Issue 2, pp 818-
828
2014-15
10542523Not listed in present UGC approved list as
well as in deleted approved UGC List
62 Effect of information leakage and method of
splitting (rational and random) on external
predictive ability and behavior of different
statistical parameters of QSAR model
V. H. Masand, D. T.
Mahajan, G. M.
Nazeruddin, T. Ben
Hadda, V. Rastija and
A. M. Alfeefy
Chemistry Med. Chem. Res, 2015, 24,
1241–1264.
2014-15
10542523
Not listed in present UGC approved list as
well as in deleted approved UGC List
63 Molecular docking and QSAR analyses for
understanding the antimalarial activity of
some 7-substituted-4-aminoquinoline
derivatives
I. Shibi, L. Aswathy, R.
Jisha, V. Masand, A.
Divyachandran and J.
Gajbhiye
Chemistry European Journal of
Pharmaceutical Sciences,
2015, 77, 9–232014-15
9280987
Not listed in present UGC approved list as
well as in deleted approved UGC List
64 Discovery of Rimonabant and its potential
analogues as anti-TB drug candidates
J. Gajbhiye, N. More, M.
D. Patil, R. Ummanni, S.
Kotapalli, P. Yogeeswari,
D. Sriram and V.
Chemistry Medicinal Chemistry
Research, 2015, Vol 24,
Issue 7, 2960-29712014-15
10542523
Not listed in present UGC approved list as
well as in deleted approved UGC List
65 Studies of ultrasonic and Viscometric
behavior of Azithromycin with different
Solvent systems dioxane-water And
methanol-water mixture At 305.15K
S.A.Quazi, D.T.Mahajan,
Noor Mohammad,
M.L.Narwade, Vijay
Masand, M.R. Ingle
Chemistry International Journal of
Pharma Sciences and
Research (IJPSR), 2015,
Vol 6, No 01, Jan 143-144
2014-15
9759492
Not listed in present UGC approved list as
well as in deleted approved UGC List
66 Studies of relative and specific viscosities of
Aceclofenacin 70% Dioxane water mixture
at different temperature
S.A.Quazi, D.T.Mahajan,
Noor Mohammad,
M.L.Narwade, Vijay
Masand, M.R. Ingle
Chemistry Indian Journal of Research
in Pharmacy and
Biotechnology, 2015, 3(1),
13-14
2014-15
23215674
Not listed in present UGC approved list as
well as in deleted approved UGC List
67 Computational POM and DFT Evaluation of
Experimental in-vitro Cancer Inhibition
T. B. Hadda, Z. K. Genc,
V. H. Masand, N.
Nebbache, I. Warad, S.
Jodeh, M. Genc, Y. N.
Mabkhot, A. Barakat and
Chemistry Acta Chimica Slovenica,
2015, 62,
2014-15
13180207
Not listed in present UGC approved list as
well as in deleted approved UGC List
68 Phytochemical investigations of Dioscorea
bulbifera linn
U. G. Malode, N.
Mohammad, S. Quazi, D.
Mahajan and V. Masand
Chemistry Indian Journal of Research
in Pharmacy and
Biotechnology, 2015, 3(1),
2014-15
23215674Not listed in present UGC approved list as
well as in deleted approved UGC List
69 Synthesis of (E)-1-(5-chloro-2-hydroxy-4-
methylphenyl)-3-(4-nitrophenyl)prop-2-en-1-
one and 4-chloro-5-methyl-2-(5-(4-
nitrophenyl)- 4,5-dihydro-1h-pyrazol-3-
yl)phenol and its derivatives
Charita B. Patil, Vijay H.
Masand
Chemistry International Journal on
Recent and Innovation
Trends in Computing and
Communication, 2015,
3(10), 5745-5747
2014-15
23218169
Not listed in present UGC approved list as
well as in deleted approved UGC List
70 Effect of Adsorption of toxic metal ions on
fruit skin
C.M Deshmukh, C.N
Deshmukh
Chemistry Journal of medicinal
chemistry and drug 2014-15
23479027 Not listed in present UGC approved list as
well as in deleted approved UGC List
71 Effect of metal ligand complex on
germination of some vegetable plants
C.M Deshmukh, Rohit
Kadam, Prachi Bharatiya,
C.N Deshmukh
Chemistry Journal of medicinal
chemistry and drug
discovery
2014-15
23479027Not listed in present UGC approved list as
well as in deleted approved UGC List
72 Synthesis, Molecular Modeling, and
Biological Evaluation of Novel 1, 3-
Diphenyl-2-propen-1-one Based Pyrazolines
as Anti-inflammatory Agents
Syed Nasir Abbas
Bukhari,Xin Zhang,
Ibrahim Jantan, Hai-
Liang Zhu, Muhammad
Wahab Amjad1 and Vijay
H. Masand
Chemistry Chem Biol Drug Des 2014;
888555, pg. 729-742
2014-15Not listed in present UGC approved list as
well as in deleted approved UGC List
© 2014 |IJLSCI www.ijlsci.in 341
215
Cytogenetic effect of Systemic Fungicide Calixin on root meristem
Cells of Allium cepa L.
Pulate PV1 and Tarar JL2*
1Cytognetic Research Lab., P.G. Department of Botany, Vidya Bharati Mahavidyalaya Camp, Amravati 444602,
Maharashtra, India.
2*Department of Botany, Institute of Science, Nagpur 4440010, Maharashtra, India.
*Corresponding author, e-mail: [email protected]
Manuscript details: ABSTRACT
Received: 05 September, 2014
Revised : 25 October, 2014
Revised received: 12 November, 2014
Accepted: 01 December, 2014
Published: 30 December, 2014
Editor: Dr. Arvind Chavhan
Citation this article as:
Pulate PV and Tarar JL (2014)
Cytogenetic effect of Systemic Fungicide
Calixin on root meristem Cells of Allium
cepa L., Int. J. of Life Sciences, 2(4): 341-
345
Acknowledgements:
Authors are thankful to the Director
National Horticultural Research and
Development Foundation (NHRDF)
Chitegaon Phata, Nashik for providing
seed of onion during the course of this
study.
Copyright: © 2014 | Author(s), This is
an open access article under the terms
of the Creative Commons Attribution-
Non-Commercial - No Derivs License,
which permits use and distribution in
any medium, provided the original work
is properly cited, the use is non-
commercial and no modifications or
adaptations are made.
The cytotoxic effect of Calixin, a fungicide was investigated in the mitotic
cell division in root tip cells of Allium cepa L. The seeds of Allium cepa were
treated with different concentrations (0.02%, 0.04%, 0.06% and 0.08%) of
Calixin for 3, 6, 9, 12 h treatment periods. The obtained results indicate
that Calixin had the ability to cause production of a large number of mitotic
abnormalities. These abnormalities appeared in varying degrees
depending on the dose. Various abnormalities on chromosomes like
lagging early anaphase, chromosomal bridges, c-metaphase, sticky
metaphase, multipolarity, fragment, vagrant etc were seen among mitotic
divisions treated with Calixin.
Keywords : Allium cepa, mitotic index, chromosomal aberrations,
cytotoxic effect, fungicides,
INTRODUCTION
Fungicides are most commonly used against diseases of agricultural
crops in many countries of the world. Fungicides produce a diverse
range of products with novel modes of action. The extensive use of
fungicides in plant protection against fungal disease generates long
term residues in food and in the environment (Petit et al., 2008).
Fungicides may also influence to change plant genetic system due to
their mutagenicity and carcinogenicity. Constant use of these chemicals
may result in changing the hereditary constitution of an organism
(Wuu and Grant, 1967, Wuu and Grant, 1982). Cytogenetic studies
have been carried out to detect harmful effects of different pesticides
on different plant species (Rank et al., 2002, Marcano et al., 2004).
Mutation breeding has become increasingly popular in present times as
an effective tool for crop improvement (Siddiqui and Khan, 1999).
RESEARCH ARTICLE
Int. J. of Life Sciences, 2014, Vol. 2(4): 341-345 ISSN: 2320-7817| eISSN: 2320-964X
Pulate and Tarar, 2014
342 Int. J. of Life Sciences, Vol. 2(4) December, 2014
There are several studies aiming to explain and to
understand the effects of fungicides in plant systems.
Rayburn et al., (1993) stated out that amount of
nuclear DNA is decreased by the fungicide, captan and
this fungicide has been mutagenic, carcinogenic and
teratogenic effects on many organisms. Celik (2006)
used two fungicides in his experiment, Derosol and
Korsikol and examined by cytogenetic effects on barley
root tip meristem cells. The effect of these two
fungicides effect on chromosome fragments, bridge,
stickiness and polar deviation is evident.
Tridomorph are systemic fungicidal derivatives which
are systemic and show eradiact action against
powdery mildew of barley. Tridomorph is available
under the commercial name Calixin as 25% E.C
Syngenta and is used extensively in the agricultural
area. The fungicide is also reported to be highly
effective against Ascomycetes such as Mycospaerella
musicola and Erysiphae graminis. It has also shown
direct fungitoxic action against various
phytopathogenic fungi including Botrytis cinerea,
Phomopsis citri, Diplodia hetalensis, Penicillum
digitatum, Cladosporium cucumerinum.
There is no literature available on the cytogenetic
effects of this chemical in the plant systems. The aim of
this study was to investigate the chromosomal
aberration induced by fungicide Calixin in the root tips
of Allium cepa L. and also to determine the relation
between mitotic chromosomal aberrations with
mitotic index.
MATERIAL AND METHODS
Healthy and dry seeds of untreated Allium cepa L var.
N-53 were obtained from National Horticultural
Research and Foundation (NHRDF) Chitegong, Nasik.
Seeds (1,500) were pre-soaked in tap water for 12
hours and then treated with four different
concentrations (0.02%, 0.04%, 0.06%, 0.08% ) of tilt
fungicide for 3, 6, 9 and 12 hours at room temperature
(22+2oC). Conical flasks containing the seeds and
solution were periodically shaken for 2-3 min. during
the treatment. After treatment, the seeds were
thoroughly washed with running tap water to remove
the excess amount of fungicide from the seeds, if any.
One set of seeds was kept untreated to act as control
for comparison. Both the treated and controlled seeds
were transferred to the petri dishes having moist filter
papers for germination. Hundred seeds were used for
each dose and control. The embryonic roots were
reached 1.5 - 2 cm in length (both experimental and
control) were excised and fixed with glacial acetic acid:
ethanol (3:1) solution and kept for 24 hours. After 24
hours the root tips were transferred to 70% ethanol
and stored in a refrigerator. The concentrations were
chosen according to their dose of application in
agricultural field to control different diseases. For
mitotic studies, the root tips were hydrolyzed in 1 (N)
HCl at 600C for 5 minutes, followed by staining with
2% aceto-orcein following the method described by
Sharma and Sharma (1980). After staining,
appropriate squash preparations were made for each
of the treatment and control. Effect of chemical
treatment and control on different chromosome plates
were observed under light microscope. The mitotic
index (MI) was calculated for each treatment as a
number of dividing cells/100 cells. Cytological
abnormalities were also observed and scored.
Abnormalities were photographed using Carl Zeiss
Axiostar Plus microscope mounted with Canon camera
model, Power Shot G12. All experiments were
conducted with five replicates and average results
were taken
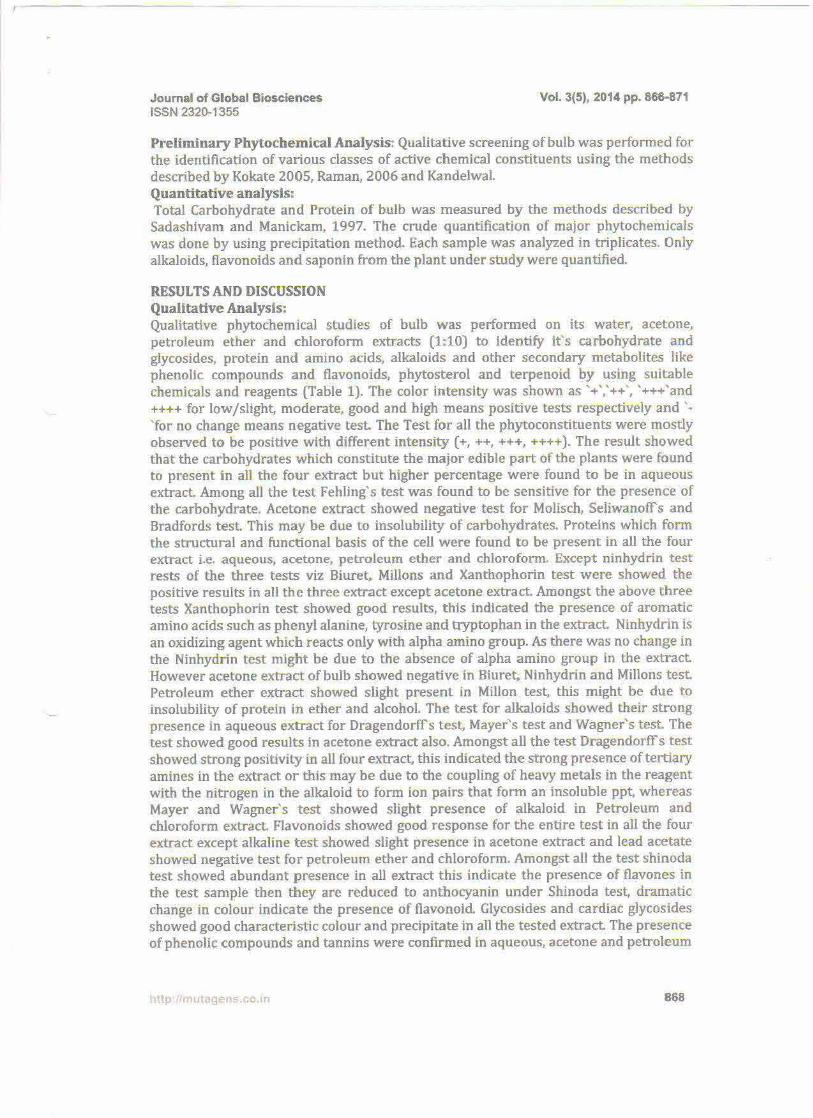
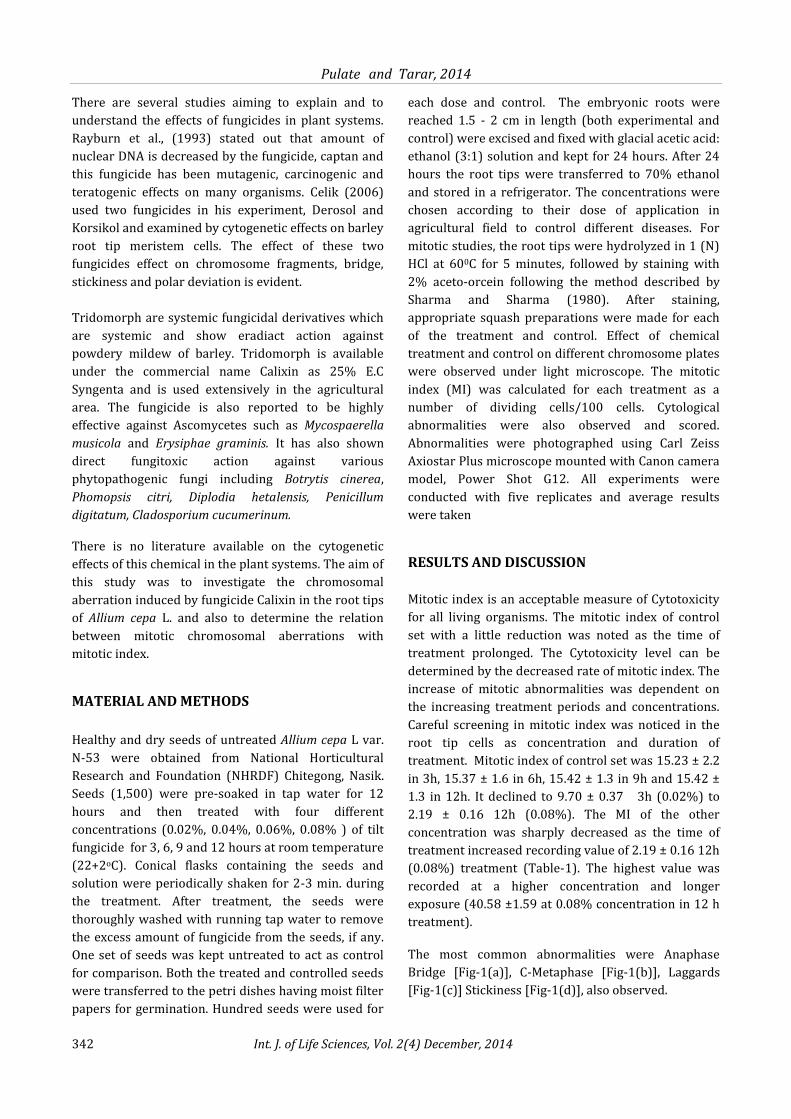
RESULTS AND DISCUSSION
Mitotic index is an acceptable measure of Cytotoxicity
for all living organisms. The mitotic index of control
set with a little reduction was noted as the time of
treatment prolonged. The Cytotoxicity level can be
determined by the decreased rate of mitotic index. The
increase of mitotic abnormalities was dependent on
the increasing treatment periods and concentrations.
Careful screening in mitotic index was noticed in the
root tip cells as concentration and duration of
treatment. Mitotic index of control set was 15.23 ± 2.2
in 3h, 15.37 ± 1.6 in 6h, 15.42 ± 1.3 in 9h and 15.42 ±
1.3 in 12h. It declined to 9.70 ± 0.37 3h (0.02%) to
2.19 ± 0.16 12h (0.08%). The MI of the other
concentration was sharply decreased as the time of
treatment increased recording value of 2.19 ± 0.16 12h
(0.08%) treatment (Table-1). The highest value was
recorded at a higher concentration and longer
exposure (40.58 ±1.59 at 0.08% concentration in 12 h
treatment).
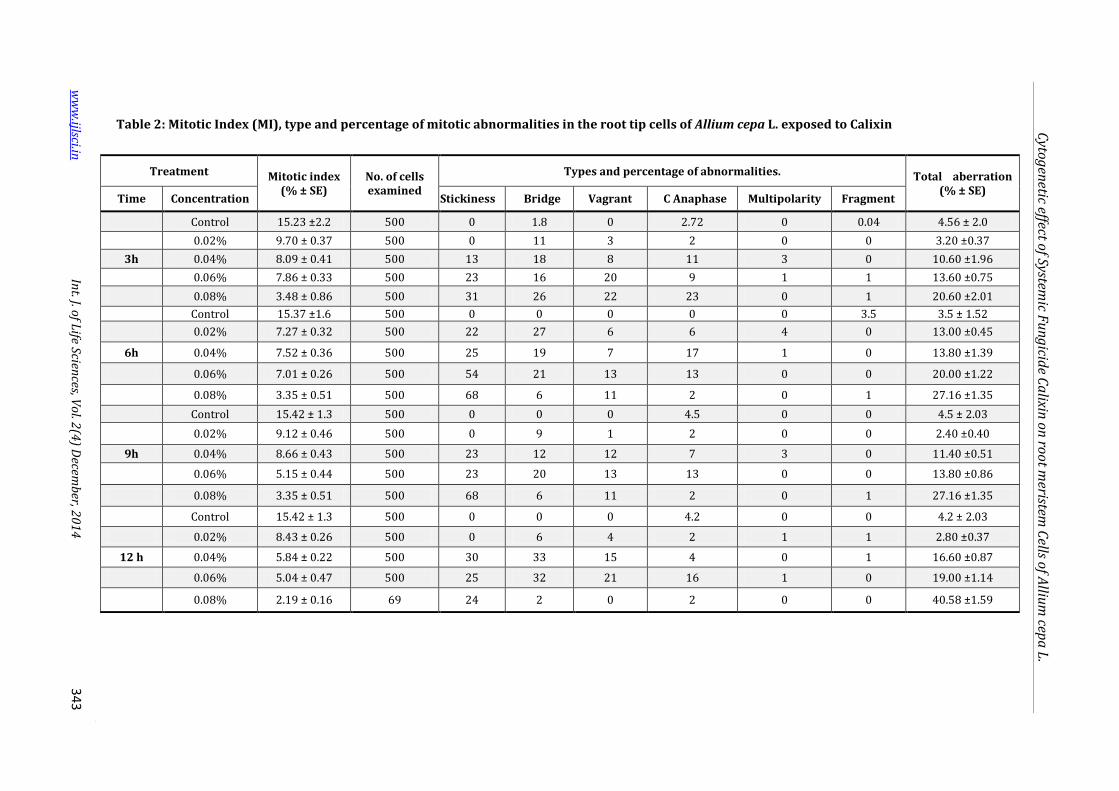
The most common abnormalities were Anaphase
Bridge [Fig-1(a)], C-Metaphase [Fig-1(b)], Laggards
[Fig-1(c)] Stickiness [Fig-1(d)], also observed.
Cytogenetic effect of Systemic Fungicide Calixin on root meristem Cells of Allium cepa L.
www.ijlsci.in Int. J. of Life Sciences, Vol. 2(4) December, 2014 343
Table 2: Mitotic Index (MI), type and percentage of mitotic abnormalities in the root tip cells of Allium cepa L. exposed to Calixin
Treatment Mitotic index (% ± SE)
No. of cells examined
Types and percentage of abnormalities. Total aberration (% ± SE)
Time Concentration Stickiness Bridge Vagrant C Anaphase Multipolarity Fragment
Control 15.23 ±2.2 500 0 1.8 0 2.72 0 0.04 4.56 ± 2.0
0.02% 9.70 ± 0.37 500 0 11 3 2 0 0 3.20 ±0.37
3h 0.04% 8.09 ± 0.41 500 13 18 8 11 3 0 10.60 ±1.96
0.06% 7.86 ± 0.33 500 23 16 20 9 1 1 13.60 ±0.75
0.08% 3.48 ± 0.86 500 31 26 22 23 0 1 20.60 ±2.01
Control 15.37 ±1.6 500 0 0 0 0 0 3.5 3.5 ± 1.52
0.02% 7.27 ± 0.32 500 22 27 6 6 4 0 13.00 ±0.45
6h 0.04% 7.52 ± 0.36 500 25 19 7 17 1 0 13.80 ±1.39
0.06% 7.01 ± 0.26 500 54 21 13 13 0 0 20.00 ±1.22
0.08% 3.35 ± 0.51 500 68 6 11 2 0 1 27.16 ±1.35
Control 15.42 ± 1.3 500 0 0 0 4.5 0 0 4.5 ± 2.03
0.02% 9.12 ± 0.46 500 0 9 1 2 0 0 2.40 ±0.40
9h 0.04% 8.66 ± 0.43 500 23 12 12 7 3 0 11.40 ±0.51
0.06% 5.15 ± 0.44 500 23 20 13 13 0 0 13.80 ±0.86
0.08% 3.35 ± 0.51 500 68 6 11 2 0 1 27.16 ±1.35
Control 15.42 ± 1.3 500 0 0 0 4.2 0 0 4.2 ± 2.03
0.02% 8.43 ± 0.26 500 0 6 4 2 1 1 2.80 ±0.37
12 h 0.04% 5.84 ± 0.22 500 30 33 15 4 0 1 16.60 ±0.87
0.06% 5.04 ± 0.47 500 25 32 21 16 1 0 19.00 ±1.14
0.08% 2.19 ± 0.16 69 24 2 0 2 0 0 40.58 ±1.59
Cyto
gen
etic effect of System
ic Fu
ng
icide C
alixin
on
roo
t meristem
Cells o
f Alliu
m cep
a L
.
ww
w.ijlsci.in
In
t. J. of L
ife Sciences, V
ol. 2
(4) D
ecemb
er, 20
14
3
43
Pulate and Tarar, 2014
344 Int. J. of Life Sciences, Vol. 2(4) December, 2014
(a) (b) (c) (d)
Fig. 1(a) Anaphase bridge (b): C- Metaphase (c): Laggards (d): Sticky Metaphase
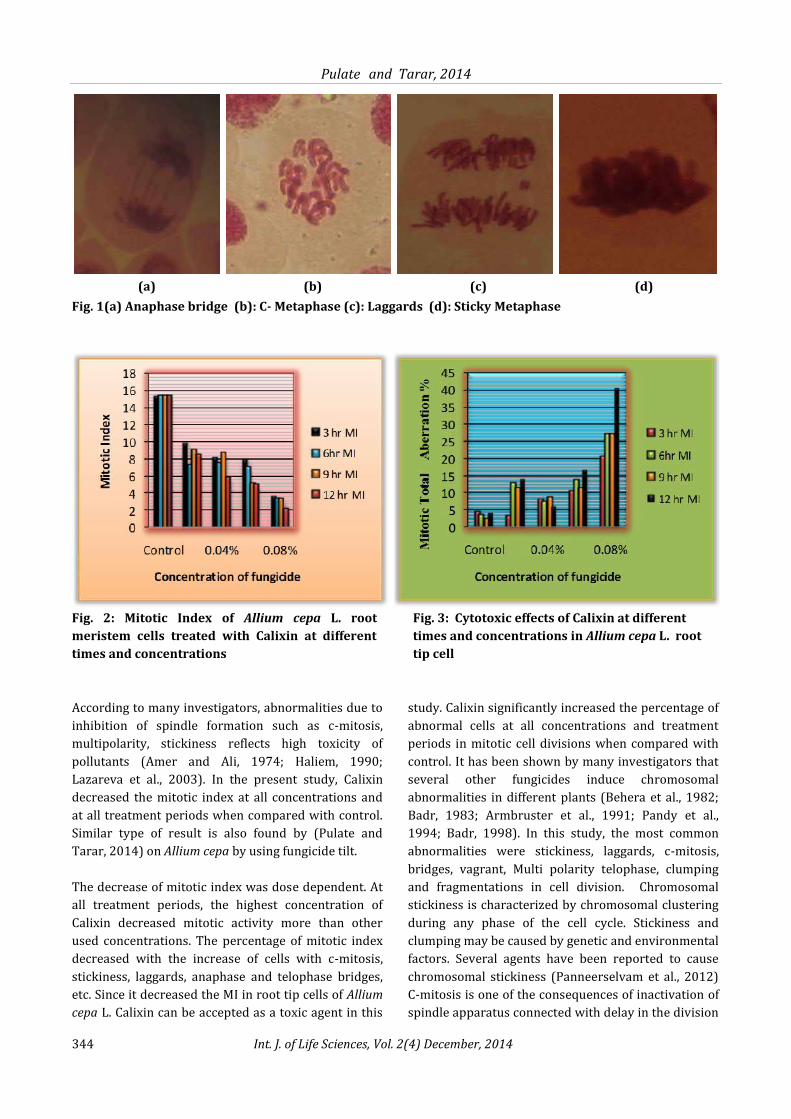
Fig. 2: Mitotic Index of Allium cepa L. root
meristem cells treated with Calixin at different
times and concentrations
Fig. 3: Cytotoxic effects of Calixin at different
times and concentrations in Allium cepa L. root
tip cell
According to many investigators, abnormalities due to
inhibition of spindle formation such as c-mitosis,
multipolarity, stickiness reflects high toxicity of
pollutants (Amer and Ali, 1974; Haliem, 1990;
Lazareva et al., 2003). In the present study, Calixin
decreased the mitotic index at all concentrations and
at all treatment periods when compared with control.
Similar type of result is also found by (Pulate and
Tarar, 2014) on Allium cepa by using fungicide tilt.
The decrease of mitotic index was dose dependent. At
all treatment periods, the highest concentration of
Calixin decreased mitotic activity more than other
used concentrations. The percentage of mitotic index
decreased with the increase of cells with c-mitosis,
stickiness, laggards, anaphase and telophase bridges,
etc. Since it decreased the MI in root tip cells of Allium
cepa L. Calixin can be accepted as a toxic agent in this
study. Calixin significantly increased the percentage of
abnormal cells at all concentrations and treatment
periods in mitotic cell divisions when compared with
control. It has been shown by many investigators that
several other fungicides induce chromosomal
abnormalities in different plants (Behera et al., 1982;
Badr, 1983; Armbruster et al., 1991; Pandy et al.,
1994; Badr, 1998). In this study, the most common
abnormalities were stickiness, laggards, c-mitosis,
bridges, vagrant, Multi polarity telophase, clumping
and fragmentations in cell division. Chromosomal
stickiness is characterized by chromosomal clustering
during any phase of the cell cycle. Stickiness and
clumping may be caused by genetic and environmental
factors. Several agents have been reported to cause
chromosomal stickiness (Panneerselvam et al., 2012)
C-mitosis is one of the consequences of inactivation of
spindle apparatus connected with delay in the division
Cytogenetic effect of Systemic Fungicide Calixin on root meristem Cells of Allium cepa L.
www.ijlsci.in Int. J. of Life Sciences, Vol. 2(4) December, 2014 345
of centromere (Mann, 1977). Sıng (1992) mentioned
that univalent and laggard formation may be due to
the failure of pairing and lagging to the failure of
moving apart. Bridges and fragments are clastogenic
effects, both resulting from chromosomal and
chromatid breaks (Kovalchuk et al., 1998). The
induction of vagrant chromosomes leads to separation
of unequal number of chromosomes in the daughter
nuclei and subsequently formation of daughter cells
with unequal sized or irregularly shaped nuclei at
interphase (ElGhamery et al., 2003).
CONCLUSION
These results indicated that Calixin should be regarded
as a mutagenic agent for plants. Hence, the use of this
fungicide should be under control in agricultural fields.
REFERENCES
Amer SM and Ali EM (1974) Cytological effects of pesticides
vs Effects of some herbicides on Vicia faba. Cytologia,
39: 633-643.
Armbruster BL Molin WT and Bugg MW (1991) Effects of the
herbicide dithiopyr on cell division in wheat root tips.
Pesticide Biochemistry and Physiology, 39(2): 110-120.
Badr A (1983) Mitodepressive and chromotoxic activities of
two herbicides in Allium cepa. Cytologia, 48: 491-497.
Badr AA (1998) Cytogenetic activities of some fungicides.
Cytologia, 53: 633-640.
Behera BN Sahu RK and Sharma CBSR (1982) Cytogenetic
hazards from agricultural chemicals of sequential
screening in the barley progeny test for cytogenetic
activity of some systemic fungicides and a metabolite.
Toxicology Letters 10(2-3): 195-203.
Celik TS (2006) Cytogenetic effects of some fungicides on
Barley root tip meristem cells. Pakistan Journal of
Biological sciences. 9(13): 2508-251.
Elghamery AA Elkholy MA and Elyousser A (2003)
Evaluation of cytological effects of Zn2+ in relation to
germination and root growth of Nigella sativa L. and
Triticum aestivum L. Mutation Research, 537: 2941.
Haliem AS (1990) Cytological effects of the herbicide sencor
on mitosis of Allium cepa. Egyptian Journal of Botany,
33:93-104.
Kovalchuk O Kovalchuk I Arkhipov A Telyuk P Hohn B and
Kovalchuk L (1998) The Allium cepa chromosome
aberration test reliable measures genotoxicity of soils of
inhabited areas in the Ukraine contaminated by the
Chernobyl accident. Mutation Research, 415:47-57.
Lazareva EM Polyakov VY Chentsov YS and Smirnova EA
(2003) Time and cell cycle dependent formation of
heterogeneous tubulin arrays induced by colchicines in
Triticum aestivum root meristem cell. Biology
International, 27:633-646.
Marcano I Carruyo I and Del Campo A (2004) Cytotoxicity
and made of action of maleic hydrazide in root tips of
Allium cepa. Environmental Research, 94:221-226.
Pandy RK Shukla R and Datta S (1994) Chromotoxic effects
of one fungicide (Dithane M-45) and two insecticides
(Aldrex-30 and Metacid-50). Cytologia, 59: 419-422.
Panneerselvam N Palanikumar L and Gopinathan S (2012)
Chromosomal aberrations induced by Glycidol in Allium
cepa L. root meristem cells. International Journal of
Pharma Sciences and Research, 3(2): 300-304.
Petit AN Fontaine F Clément C and Vaillant-Gaveau N (2008)
Photosynthesis limitations of grapevine after treatment
with the fungicide fludioxonil. Journal of Agricultural
and Food Chemistry, 56(15): 6761–6767.
Pulate PV and Tarar JL (2014) Cytogenetic effects of tilt on
root tip meristem of onion Allium cepa L. International
Journal of Plant, Animal and Environmental
Sciences,4(2): 53-57.
Rank J Lopez LC and Nielsen MH (2002) Genotoxicity of
maleic hydrazide, acridine and DEHP in Allium cepa root
cells performed by two different laboratories. Hereditas,
135:13.
Rayburn LA Wayne L and Pedersen L (1993) The fungicide
Dithane M-45 reduce nuclear DNA content in maize
seedling. Pestic. Sci., 37:79-82.
Mann SK (1977) Cytological and genetical effects of dithane
fungicides on Allium cepa. Environmental and
Experimental Botany, 17(1): 7-12.
Sharma AK and Sharma A (1980) Chromosome techniques:
Theory and practice. 3rd edition, Butterworths and Co.
Ltd., London.
Siddiqui BA and Khan S (1999) Breeding in crop plants,
Kalyani Publishers, 20-34.
Singh RN (1992) Chromosomal abnormalities and fertility in
induced autotetraploid Helianthus annuus in Cl and C2
generation. Cytologia, 57: 277-281.
Wuu KD and Grant WF (1982) Chromosome aberration
assays in Allium. A report of the U.S. EPA Gene Tox.
Programme. Mutation Research, 99: 273-291.
Wuu KD and Grant WF (1967) Chromosomal aberrations
induced by pesticides in meiotic cells of barley.
Cytologia, 32(1): 31-41.
© 2014| Published by IJLSCI


Volume 20
MBER
f9
ourn0o
nstrument.u
$
I}
a
rB
(
ttt
I Journal of the instrument society of lndia
R.A.Mishra* and N.B.Raut
Amolakchand Mahavidyalay4Yavatnal4450O 1, IndiaVidyaBhrati Mahavidyalay4Amravati, India
+ E-mail: [email protected]
Abstract
Biomedical instruments are used in large scale for the purpose ofdiagnosis andmedical sciences. Electronic instruments are used in medical science and therefore it isimprove the sensing ofphysiological parameter in biomedical instruments. The designquick recovery heart beat sensor (QRHBS), characteristics of this sensor and itsexisting sensors in similar kind ofbiomcdical instruments is discussed in this papor.
During the tseatment to patient, body ternperature and heart beaS are quite oftena physician for diagnosis ofa patient. The researcher therefore decided to study those senscheart beat measurements. An atiempt has been made by researcher to improve theinstruments by replacing the sensors in existing biomedical instruments. The heart beatexisting sensor like electrode have a problem of interfacing with skin and skin preparatbmeasurements of hesrt beat rate. In order to remove this problem paste-less electrodes may
Many investigators had proposed concepts to measure the body temperature or heatmeasurements in biomedical instruments. They have attempted to design transducers usiogof electronic components such as diode, photo emitters, photo detectors (photo dio&transistors) , field effect devices( FETIIr,IOSFET) , laser based components (,aser-components(strain gauges), inductive components (LVDT/RVDT), capacitive components (crystal and diaphragm type), optical based components( optical fiber), thermal resistaoccthermocouple metal oxides (thermistors), in biomedical instruments. The pmperties of theseare used to measure heart beat rate. The researcher has attempted to use some of theseto develop the hansducors for measurement of heart beat rate. eRHBS sensors areresearcher by overcoming the limitations ofelecronic components.
l.Design technique ofquick recovery heart beat sensor
The quick recovery heart beat sensor (QRHBS) is assembled by usiqgoscillating circuit, LDR & tED. In ilrc time base oscillating circuit, the fiequencysignal depends on series combination ofresistor and capacitor connected to emiu€remitter resistor is replaced by LDR. The resistance of LDR is changed with intensityproperty of LDR is used to change the fircquency of output sweep signals with interd!arrangement of QRHBS is shown in figure-l.
Journal of the instrument society of lndia
Design of quick recoverT heart beat sensor
I Journal of the instrument society of lndia- II
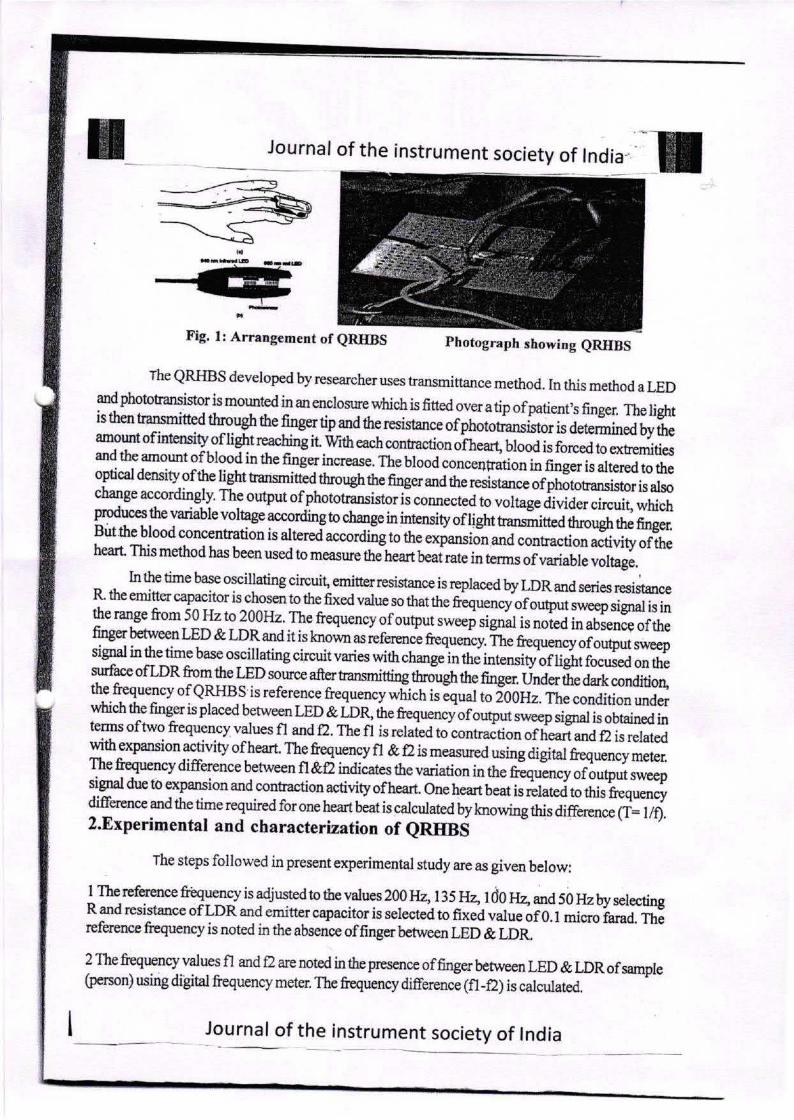
Fig. 1: Arrangement of eRIIBS Photogr.aph showing eRHBS
The QRHBS developed by researcher uses transmittance method. In this method a LEDand phototansistor is mounted in an enclosr:re which is fitted over a tip ofpatient,s finger. The rightis tnen mymmga tlryueh ttre finser tip and ttre resistanc. orpmtot -rirtor is determined by trreamount of interuity of light rcaching it Mth each conaactio,
"ifr."rt, Ul""J;; i;;; ##*and the amount ofblood in the finger increase. The blooJconcenration in finger is artered to theo$cal density ofthe light ransmitted through the finger aoj ttr. ,"rlrturr..
"rprr"i"*.*"". " j*
chape acgordirylv. The ourput of phototrir"irto. iI **."t.a to uort"g" &ria.i "*Ji ilr.r,gpaiq.ue yatatte voltage according to change in intensiry of llght ra,r;;tted ;;ugh,h; d*But .the blood concenftation is altered accordiig to the e*paorio, arrd .onraction activity ofttreheart. This merhod has been used to measure the-heart t*i*nl, *.r-.irJ"ul, ;;;;:."' 'ln the time base oscinating circrrit, emitter resistance is repraced by LDR and series resistanceR the emitter capacitor is chosen to the fixed varue so that trre dquenry of output sweep signal is inthe range from 50 FIz to 200H2. The frequency ofoutput sweep signa rs noted in absence ofthefinger between LED & LDR and it is known * ,"f","n." n.qulnU, il;ffi;;tffi;#,
signal in the time base oscillating circuit varies with changein tn. iot *ity orirgrrii".GJ ""tsuface ofLDR from the LED source after tansmitting through the finger. undo the dark condition,the.frequency of eRHBS is reference frequency wiich is frual to i00Hz. Th;;;Jtil;;;.which the finger is placed between Letl& rtD& the frequencyofouput sweep .ig"r ir .I*rJ,terms oftwo frequency values fl and f2. The fl is reraied toiontraction ofheart and f2 is reratedwith-expansion activity of heart. The tequency fl & o is measured u.irg ag,ra t q"r".y ,rn,The fiequencydifference betw.een fl&O indicatestheru,iutiooiott. Orq;;.yoffi;;,.i psignal due o expansion and contaction activip of heart. o,re treart teat is retatei to ,hi, ;;;;;diference and the time required for one heart beat is calc,lated by knowing tt , airr*.. d=ilil2.Experimental and characterization of eRIIBS
the steps followed in present experimental study are as given below:
]rne.rere.rence Qye]9v is adjusredro thevalues 200H2, tss ur, tdo r4 *a 50 Hzby selectingR and rcsistance ofLDR and emitter capacitor is selected to fixed varuiio. r -,r,o i#a]t'"reference frequency is noted in the absence offinger betw.een LED & LDR.
2 The @uency values fl and D are noted in the presence of finger between LED & LDR of sampre(penon) using digital frequency meter. The tequency diferenci 1fl -o; is calcurated.
Journal of the instrument society of lndia
\
u
Journal of the instr:ument society of lndia
3 The time intensal ofheart beat cycle is calculaed by uking reciprocal ofthis difference'
4 The heart beat rate of sample is calculated by beat to b€at heart beat rate calculation md-heart rate of sample is measured as 60ff'
5 Steps 2 to 5 are repeated for ten samples' The experimental observations have been
th;;i; ;;d.*,o.a"uat trtt n*tt beat rate forten sanples each time'
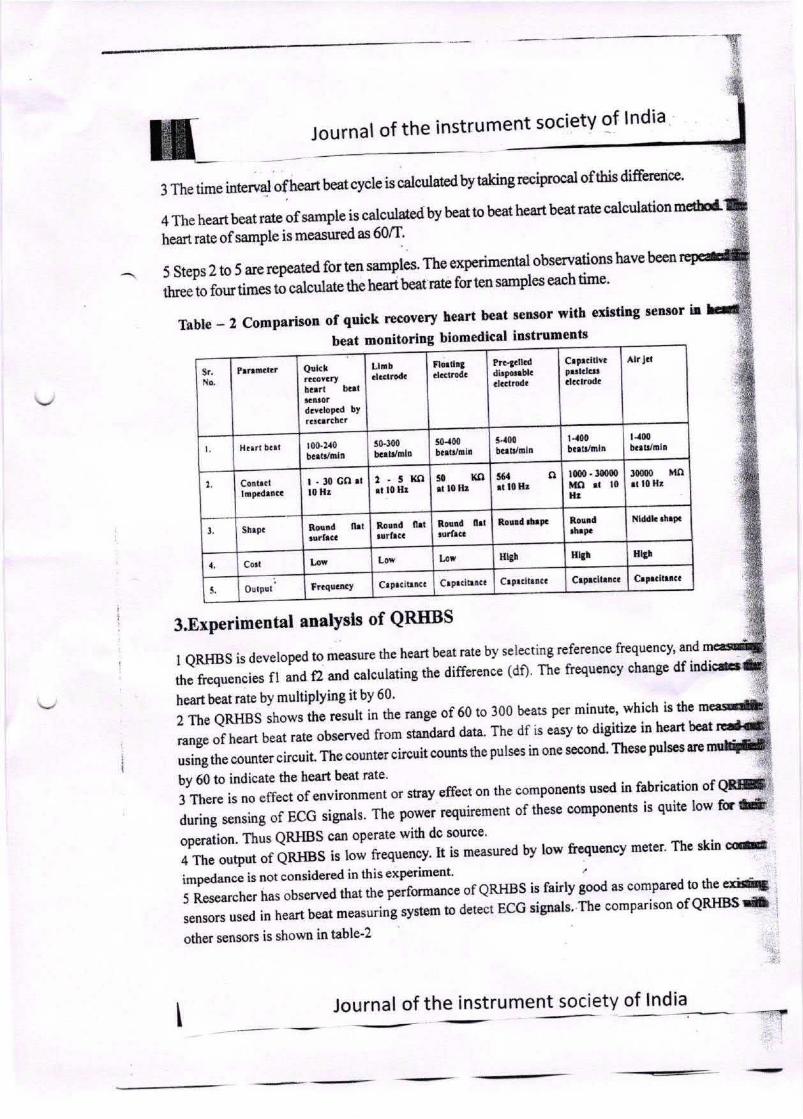
Table - 2 Comparison of quick recovery he'rt bert sensor with
beat monitoring biomedical instruments
Sr, Qulcl
hrrrl ball
d.v.lop.d bY
Llnb Florlll|g Pr.fdl.ddirponhl.al.cttoda
CrptcitlY. AlrJ.l
100-240ba.trtdn
l0'!00b.rlrDh
!0100ba.ldl!ln
5.400bc.trmln
l-400b.rt mh
t{mb.rt ln
Co!t.cl l-!0GO.ll0 Ht
:-5rnrl l0 H.
s6{rtt0ll'
n 10(tr . ,0000iltl .l l0ll2
Shrp. Ro.nd nrl Rollld nlt Round ntl Rou!d fir!. Ro|lndrh.p.
l,llddl. rhrD.
CorlHEN HlSi
5 Oulput Frcquancy Crgacltrna. Crparilrraa Crptdttncr Crpr.llanca Cap.alltiaa
3.Experimental analysls of QRIIBS
I QRIIBS is develoPed to measure the heart beat rate by selecting reference frequency' and
the frequencies fl and O and oalculating the difference (d0 The frequency change df
heart beat rate by multiplying it by 60'
2TheQRHBS shows the result in the range of 60 to 300 beats per minute, which is the
range of heart beat rate observed from standard data. The df is easy to digitize in heart bcat
using the counter circuit. The oounter circuit coun-ts the pulses in one second. Theso pulses are
Journal of the instrument society of lndia
edsting sensor ir
----.e==
-B
t.
7.50 xnrr l0 B,
10000 i.to.r l0 Ht
t.
{.Hl3t j
:rri:,: ,Tff"j;"Y"1H,ll1t luJ,ii o, .n", ur,ct on the components used in fabrication of Qf,*iiduring sensing of ECG sigrals tt't po*o requirement of these c'omponents is quite low fr f"
op.otion. Thus QRHBS can operate with do source'
4 The outPut of QRHBS is to* fr"4ut'"y' It is measued by low frequency meter' The skin cci
impedance is not considered in this experiment'
5 Researcher has oUr.r",a tf'"t tf'" p"iformance of QRHBS is fairly good as compared to the cxfr
sensors used in heart beat measJ*.v*r a detect ECG signals. The comparison of QRHBS -
:
other sensors is shown in table'2
I
Journal of the instrument society of lndia I4. Results
The work was initiated for development ofnew sensors/transducers of heart beat sensing
using time base oscillating circuits. The results ofpresent experimental study are given as under:
I The output power consumption is comparatively low ac the nature of output signal isAC.
2 QRHBS uses LED & LDR arrangement for photo transmittance. The spectral response of LED is ofunique wavelength for red light emission. Infrared LED was selected to give unique spectral response
at 0.94 micrometer with peak bandwidth 0.707 micrometer. LDR is of round surface of 5mm diameter,
which accepts almost all Iight transmitted from finger. This arrangement is sensitive to detect the heart
activity.
3 The QRHBS measures the heart beat rate in the range of60-300 beats/minute. The frequency range
measured for heart beat activity is 2Hzlo 5 Hz.
4 The QRHBS performance is similar to the performance ofelectrodes used in measurement of ECG
signals.
5 Photoconductive cells CdSe has response time of about 10 ms and CdS is 100 ms. CdSe is more
sensitive to change the r€sistance in an ambient temperature. CdS is best photo detector for LED light
illumination.
6 The large response time of Photoconductive cell does not make much more effect in biomedical
applications because the required fiequency range in sensing ofphysiological parameters is less than
100 Hz.
5. CONCLUSIONSThe concept ofQRS is used in designing QRHBS .The study ofvarious concepts of
sensors/transducers used for the measurement of hoart beat rate in biomedical insfuments is canied
out during development ofQRHBS, The limitations ofexisting sensors/transducers are also studied in
their charaoteristics. The QRHBS is desigled with detailed study of characteristics ofquiok recovery
device (QRD as UJT 2646), charactoristics of thermister & LDR. The properties of thermisrcr, LED
& LDR have been used in time based osoillating oircuit to design QRHBS.
The measurement of heart beat rate with QRHBS is done in terms of frequency
difference. This fuquency difference is recorded by digital storage CRO for analysis ofheart beat
rate. The eRHBS is designed by using time base oscillating circuit and photo sensitive compolents
like LED & LDR. The special arrangement is made to detect blood conc€ntration in the part ofbody
with LED & LDR* The direct read out ofheart beat rate is possible in digital form by using counter
circuitThe researcher has developed the QRHBS to measure heart beat rate, The effectiveness
ofthese tansducers is compared vr,ith existing sensorVtransducers such as thermal resistance,
thermocouples, tlrermisters *it l.IfC ma pfC p'ropoties, optical sensors and Llr435 used in biomedical
instumenb.
Journal of the instrumenllegLgtI q! lndia
j instrument society of lndia
The QRHBS is used to measirre the heart beat rate' The effectiveness of QRHN
checked for various samples and observed it is that similar to existing sensors like limb electrodq
electode, pregelled disposable electrode' capacitive paste less electsode, airjet elechode used in
instruments for heart beat measurements' The problem of skin impedance is not much
measurement of heart beat becausc thdre is no direct contact with the body part to detect he3n
in existing sensors. The frequency obtained from heart beat action is quite low. Therefore proper
of heart beat signal is required to detect the heart beat signal at outPut without noise'
In case of QRF{BS probable error is equal to 0.01 Hz. For effective measurement
beat rate by QRHBS the probable error should be minimizpd'
Referencesiit *u*no, lgT8,Clinicalthermalimagingtoday,IEEE'EngMedandBio'19'4'25'
iri Cohen a and N Wadsworth, 1972, Med and Biol Eng' 10' 385'
.cek A and Pedrvcz W, 2006, IEEE Trans on Bio Med Eng' 53(10)' 1972'
io, -","*i"i"r, iooZ, Handbook of biomedical instrumentation by R' S' Khandpur' 2* Ed'
32,66-1t2.Ragheb T and LA Geddas, 1990, Med and Bio Eng and Comp'.182'
nau"t N.s. & Mishra R.A.(2009): The study of some characteristics of sensors used in b
instruments.
Roy O Z, 1980, Med and Eng and Compute, 18,657'
Kanclpur R S, 2003, Electronics Devices and Linear cirouits' l7'
tslt61
t7lt8l
h-
Journal ofthe instrument societY
Journalofthe
i
I
of lndia

Indian l*r:rnal ofAgricultural tibraryand Information Senrices
1',#-i,,..,r.. '*.' {4'tL-.l'
*l;:Sl
,,
t
I,
Tr,I''.{
Association of Agriculrural Librarians arrd Documentalists cf In
*#."
fiists
)'
rotJ
t**
k:di*= J*xrn*l aft .1x {}Jlzri*t
.1gric*llura: Lihr*rY att*, rJ .{.r.,tr:r'ia ri:;r r$' ..15 rli i:l t u r ;z I l.- i h r ;s r i * st.t
1::lbrxilti*n I**ite*::::J l,ir:r' :: rrr.atsJi:ll: r;J" Jr:;Ji* j
1'{}1,l"i:1}..1 : .;L 1.1' * 1)l-{. 1.1: 3},I{ :1} 1i l\S\: {19-+ - B--h
1.
2.
.:.
f *NT*ti?s*niwth a:'rd Dcvehp:c*rrt ::i 8i*i*fir:matirs l:'r
lldia: An *vcrvlex{. &" {*xd;::*! ax* Sxxil {i<:rie "...."..-..'......
}i!5AC*145?: Ile*icr*3 S::p;*rl $;:l*::: a=
Sgri*r:la:r*l l**eali*l: 1r: Sn3I3Sz<l**p tr€rsrl**i*, € f d*..t*1. ,l/kt; ,lre**.K Leerai.un€ru,r- r?'lr'r. i )'r,. " .ja-i^ .-1 tr-*'-.I.Jma ualll{1 -:i*€;:m-. "ff
5e i*r:+m*:ric A:-l atf$s*{ {}rri3' !kie**r' *:*'&;1ncl*gy 3*s..gr{::1.!i:*ra*,rrc: .i *}r:}al -'F*rsp**ti ve
S :(a:*ia*;sa& :sP*;*Y *z:tl S. {::;P<r;;x:leti
a*
1{
5.
"7.
r
q
T*ral Q::*liry 1'la*agex*nt i* 3r. F;xja!=*D*L::::u!i]: .{3***1:urai f nitersi:y Li*rar:'ikr:l=. Xa3:a;xi::ra: i L:*:::' 3lr:35
y;sfu*Z X..l*stt*'n: ;zz:/ {::is*<:li ?. *x};;zl** . }lf i:r:.al i:ej I :: l*rx*lir:* 3i :::*i nati *:': 1::ii*:1:
a,:':..g J*a* :xl A!1i** filr* 3*ea:el:l*s:!t:::*: *l 1Y*:il l1*:.rga!: 4 -r*P*sai
$:::* .**ir* /$:zt*1<;. 5 ,1i. a'*t:tl3*t:cl*ya* :;:;<i
&i:ie ,fti&ra e*r..:* .
Agncultiral 6ne*ir',.:gc \{alrgr:rT ent :) tttni*r *:ap*r**rir: g Farxer*
X. tr{*€tzt: *ttbx. €. 8*;:g;* L;,;*s*:zti *xd8. J*xz:*:; €*xi.....,".
adopLior a-cJ L're of :'Lrarr,ing ar:.:n4Slc€*::s *i Cri:ra l.ir:ivx:lry *l'n g:icr:i:xr* &?*c***l*p: i 5:**y
Rabindr,; R. .VshLoarL
l?rar:r:a*y 3**ea:i*aa! 1:":rtituticr:s' L ibrarie.: i n
?a:::il iiad*: S=ggx:i*::s i*: l*':1:***xact
J. S*lvar<*:si *xd il igre;.:,* {3::l::: '.' '.' '..V:r,::tr'[rr,; \l.tLc ,r tr'\"i!raa.*.t
::
::
*j
:.:
S::zxle3 \'lsd,st 4,.,,,,,? ,;t sB*jize X. l|::?*ri:: - ' .'... ... 5?
li. l:::pae: *i r-R*:*:::*e *a Cha*gi:5 ?:*::ds ir,
t,ilrary an* tibraria:::1i1
S'-:ri,r I \,rnDh' rriur nl
ii. *::*:r:i:a*t* **d **;:triry t1**s*t*x*::: r:i {'*ii:li'-r:rxir::: ;rn*::6 S*i*::t!,;t rl l.Jl:tcai:::r:* tt :t3+t5*..:
a*rl l{:rs=d tLr::l*:rr3 lil*1.€ltlil..',.,-tu A;,ri.i/ r'..i \ '.,4..r
I2. !r:s:i:*:i*na! R*l:r::lii:*ri*l: .{ l:::;< !tr:*y L:}: t.:t::1:':1
R** li,***r*h l;:*li:*:*, {. r::x*li'.r-nn A.':i.o.lUr \..i.ii
rSiT*R:"{:" 8*A3}*dit*r-ia-{tti<f*r. lC treerc*.itr.y::uL*i**r:i3 lilr*ri:c & ?:'*i*.::crIlr*f*sr*r .i*y*:ha::k*r ?*lar5a:::r :la1. Agri.::il*a:r;L:aiYe.:i?tr{.ejeadrar*1e:. }lyd*r*}art * *{t* €}*
S*::*rsfr*L lr**:3i-93P:erident. A.\.LtJl & L'rrve:. q Liire;ran lRctd. r
f{13 t€arya-te Ag:i**l:*ral **iv*r*i.ty1{isar * 1?-< 0l}4 {l{ary*::;}S!;i 3,S. Rg;:*r1**:etary, AA1,=: & {}**:r {a:ha€e\criur.al L.\rar, nf Vele:x:ry (e:crce
l':* i a:': !'*r*ri ;a1y lde:e*r:]: I *:: irut::
}:"ea3::: - ?3.: t:: {U.f.}llr, 1{.X, Slarle;
I roor:*, 1i:Tivc=it3 til;ari*aI Iri"'*rsit3 :.:l .igrie;1:*ral 1::i*::*e:I lharxa* l{a:"::arala}
*:. Axjiv* l{=r*ar ?al*riaA*:isaa*: l-iLrari*;t{CS *sry*:ra *gr1:lrl*rra1 Li*iv*r:i:3lti:at* i?3 {}*4 {Hary**aJ
l3:. U.3.***ha:*cp::ry 1-ib*ri*:tX"ar::a:al* Y*!eri::*:3,A::i*a1 atd fisl*;y 5*iec:e Univ*rsiry'Ye:*rj**r-g C*ll*ae. 3it*t *:85 4t j
S*ri tlra: **jl*fur:::e:i*:r 1y::er::s lll**er a::rd H3€{ :eA*' l-i*laly'l:d ia:: llr:;*i i I ;l A gri*:rltr:r;! li:'**::ch1:lv **11: " :1aX:1:
Xi:ri *.3.5i*g-l*li*r ?c*l::ie::l l.]13:*r'r :l,llra* l
, *a:i;:::ai *airy 8*:*:r*3 lr::i:;te. 1{ar::al
I ll,::r'ar,a * :3?**:II
| S*:*:ig;i*a *xd.r*::3i::5 xrri<€a$ *<z ** *234r**sezi t;;
*r- 1{ }**raaja:le3<1*!{€ilnr-?*:-{ll:i*i, aJaLaS & ! ri:*-lry I-ii:*ri*al'r:l*::nr'lay*:i:**l*xr ?*l* t g* :':* licai* * griell:::r*lI :::i* *r: i l-'e. lLx! ; r:€r* rag*:, ?1y**r**ad * 3{il} t}3*
::**a ilt*.ir!: r**ilii'::all";*t:::: X:li;ile 1r;. l3?*8?fl ?11-15
3*,€ : 7?.€ €*!xs ***:i:c alSlirl:er dz: sa: sl*i* axV
rrr6*:::i5il:ry. t!*t:iti,4' f*r tr*,<rr*,t x*a? :*J ';Fjc**;;*-<grz*zzd *7 <xzi***'
1*€:=*g:*:*
*€
aE*g*=*
3:*,::3€:t
**q:-,
*=**:aa*a*aa**€:,eL:a
=*e
€
:3***=*I::i-i*:*E***=
=?
€€**4
€
€€
€:;=
f i:tra1 R. Sl**a:nra:* a::l* Yaishaii i" {}:iar1l:*t*
aIt*?XAe?
Six** f*rzx:zZirstz /jz* S;::lr a:/ *:ah*rcs?z** :z*s *xtls:abt*tlly prr;vided l**derskip *z llz* xtslitsrs<sJ ls,''cj jx
$z{zlr*rs *f **<sx*z*i; gru*2r,"*rzd *evet*pxe*?. ?r6*r*t;v*r iS kk ;:i*d t* ret*i'z t** gz:rti*ig*ti*x *f *gri*z;l&'.*
;::<igrarid*# xzre* xeerll* z*s*ar*?z *i4 d*v<,;*vx*x, f{x$,?i€s 3v x*t *xfy .r**la{,€ *gri*zslzxrts!::::jeersj**s
*skich *re spr*ad t{r,.tt t&* st,,r€ i, a !}$lax*e{l *oi**' b* fc:kex ;ke*z eb*vc r*c::r:; ?eeepir:g ::rzd p*p*r
x,*r* t* :r*rr:*il; *t?,?{7q€r ,i<ar* t<s s*r** t?t< #srr*s* *f trarzs{*rx*tir:rt *.{ ***z;*r:ti***l f*xxirsg *azl :sgr*
tfftt:tts iai* x*jrr: gi**slxad ;::;*'
Tk* rs-resr*k p*p*sn *!Ns l* brirzg :sb*aZ ZJ$ z*se */ rtsrr;l qz:allSy .xax*g*rzxxt t<**sz!gx*s !* *xenagiT'S
"1*nr*st r,s**tir:J sr$9{2?t.ty5ttfx,* ar:t *<lzze*ti*r',l';*'::i*:i*a:' l?ze li!::'*ries **i*lz p*al aP cxd {s$*?tg€
ka**le*ge m*/*ri*ls ro * fu *e {trl* t* :ru *lA w};*rzev*r xced*d' NtzS*r*Ey it *e**rvzas xx7 $:r :;ll ;}tr;se
x?:* r*qxir* z;slxg t**scryjr:s *xd sx**t?;ly **t:t?ixxiag };irk ,*eir *<sr* **ere*t ziz* li?;r*ry sl.qis {r*q; ?*{?'
lira<.lighz pl*yixg c; sil*rzt r:sl*'
l*dia r.r,rrj&., t: x*w 7s*l!z :r: gl*rv *ed lsrixg /?z* <sx$ r?zird **:ld d*v*l*piztg **ax$? ::&{:& s#JJ r*lix *x
tss"ie,:/tzr* *s iX xtsi;;r s*rrr;i of u*irszz;sl ixt'*'rzz* s lir k*s t* ** z!*tze' *r"' x*' *xly *; Zlze :*V l*v*l *x; rzis*
{}, *€ry jusx,:tur* right frt:x eSz;i*Z;ng thi* rs*zt gener'lti4z, *gr{} *xxuxiry *t*r:z**rs *at clst: daixg iS jx st;&
e w*y t?s*t t**y ar* *SsS*"s* eip* v,;iti'*b**fq; in tlt* ixtJrrz.::i*zz*l *xiirssxm<**' 7&e p<sp*r r*$ests 'r5*
{lz?<< f:l?*z*izzgr., u;ro;*o:uu, :r&j:* *sr*: ll*{ii*il*, *,,s'a.,sivexcss-, '4sttttsrtf' **se$s' t*x''xxit*Zi*st'
***t {axgi*iZi6. Ttz* p*per szinue t<s Fz:t !:?-rh tl* i/*u:iu cf x** :;f Tct<:l Qx*lisy fr{*x*g*tae*t rzterk*sls ir;
iui;s *Z:ze, ,*rult, **;ug z&* sz;t* t'rs4;f<sr *v*:szl! devcl*px<xz'
[}TRODUCTIOT
Xi::*:* *e a::*1*at tixes" ia l:a: }e*a xs:.r*{: *at li*rari** ar: '}*
t*:ttf,3* ::ikx**l*dg* a::d al:* l}':* **x::res
*{ g*rflc rui:ilre. Tleir te:xi:::*1** i: *"ppo*uJ :a b* t}:e }:ea1 *f a *aiversi:y a::d a1** i* &* l*:=. *i s*:tl
aad *rai:r. ?b** xar a1s* a** {}**:,,:*a** cra**J }y;ha Sardx*l 1*ua rtr* xuSh*1"3****- T}:*y *:*d i*
ke*p:.b*ir p:iv*i* lab;; :A. :**dog. fftt ::r.u iui;*xs ari* X.rg33: x*ix*l: rry*:* al;r: ***k l::v*r:' ?i:1:
ihis, are ee.n.3 1* ka:::s &at lilrari*slere i" ;;;; d*ini rh* b**Lal geri*d" ?aal {xali} X::rag=x*ct i*
3*t3:*1 a **a*s," *:U*'* ut**.:*?:*i1 :rea::-aa*:nu.*t** *v*:3*xili*a' cllaiaatiag a::**l*::i*;:r***e:
xi:3 r*qa!re* *bj*rlives. ili*::iili*g :::are =uiaabi*
xays *f t':a**tri*g a-d **a**lli::g *1*ratic::* :* a* t*
a:;i'li:v e d*:ire* r*:elas.
TOI' iL Q ll,.!L iTY 1 1.1X"1{j L }: E I T 11 1}r- F,1: J.l 3L{{} 1}*'S 1{}1I KH
,1ilR1{.1,,1.'i'u R.{L L:r:1'E}tSlTY Ll3*-',{11Y- .1X{}1".1. }1',1}1"1&"1'S1t?RA:
,1 l.3IRS'STL:1]1'
{}3Jgf:'?43 {lr ?xx sTtt}YT1* *bj::etiv*s r:it}* re*ea:ch s:**y x*rc a: i*llaxrir:g:
1. Tc r,:r:d*r::aa* &e ex*::ai*l: r:f ?*:x1 Qa*liry !1a*;:3*:::*::: {?Q*{l ia &grie::i*r*'1 *iv*xi:y li}rxies
in \laharashua
2. T* 3:*dy t!:* r*r€::** *f ?QX i*r til*y s:"rd i:r*rr*a:i*a:*rvi**s'
3, ?* :**y qxality t*:i1:.riqux i:i }r. f::::ja*r** l}e*&t-ulr}: A3riexl:xal ::aiversiry iibrxy i*:
*arlai::all* iibrarY a*{:3gc:xt3:'
A:si*tatt tilra:ia:l Yidyablani L{a}*vi*y*!s"{rareEa:l {X5}'.{:;c{.:{,i*i:* 3rr;**:;*: & itr:;a.l. Dtg'ut;:':*:t ri I-rbre4 & i*i*=ali** 1e i*c**' 1a:::
eadge Faba Ar::ravali Lr::ivexi:y' ixravati {XSi'
::
Ir*li*a J**rtsal t:f .1grie xlr*al zibra;y xx, la!a?*4,,*x srr*ice: }?Jxxe "li tJ.i :t I t
i. ?* id*:::i$ i*:ex*: ,*:*3:**8 aad tl*ir q€a:::y l*r lilrari*:"
i. f* r::*a:se iile *:e$ 3a*saacl:*. :.r:i::g :** *il{er*::: attribr:1es *f ?Q*!'
;f*34 .1:{3 L{3t}TA:t*-fh* pre:*::: .atesta* x<]rlc *3s1"ibrary'.
s*11?:-= F{33C1.3?:*=
1:: *rdcr :r: :ati*f :he qualita:ivt a*d qr.ra:":titalise irl*r:naei*:: r:q:ired fui :hi* :*s*arll plter, 1ie :e:*ar;l*r
s;:l**t** 13* r*:p*:::i*:ts i-e. :1'r* *sers ::f t1':* t):' ?a::rj:bra* l)*slx:;l* Agfic*l:::ral U::iv:::i:3' tibrary'
A :ra:r*:rr* *;nre!*red q:.r*sii*l::':*i:* :.va: d*:ign*:l t* .c1:.e: :h* reqti-:** i*ixm*tl*r wh*r* l'ive p*i:':{
til*a:yp* sealr **: *s::d.
*t$a:1:rT:{}:{{}r:*g Q1jgs?t{}}=3;x"3 1j*8tr i
fle qr:*:ir:r;rair* i; -s:r:1tia!:.y a rkiill*l :ra*slati*n *i **j*::iv* i::l* a c*t r:f qr":e:ri*rs i:'t1:***d :* ir*::.:::*er** !r: :trili=g. 1: i* *',vria1a:: li:: e lq:r*sti*r:: r*q-i:i::g 3t:s11'*ts i:: xiti:'lg'
:is:xi 5"r1;*Y
eLrestir:rxiiirc :*.a; pr*p::re* lr: ir:eur ;,1':: il;:la rel:rlil:g t* &e "I:iers" & t* *b**rn..e a*d recr:i'l th* ae*a1
r*acti*ns i:l th* "'Li:;ers'. al llr. Far:.jahrac D**h*uk1 ,igi**lrura! Univ*3i3 1:brary'
3r. F:13J i 3an* 3 g$l*31 l: K tl,1{l Rtat: LT U a&L S'1iw gXS r"? :- t 3 RA&Y
'l* *:r-:*; tl":* p*ri*rr:a**r; r:l'*r. Fa*jalra* l]*l:x:ll*: igri*rrllxral I::ir*r:i!1 lii:=ry' r:* dtlf*r**: anr:*i:t*:
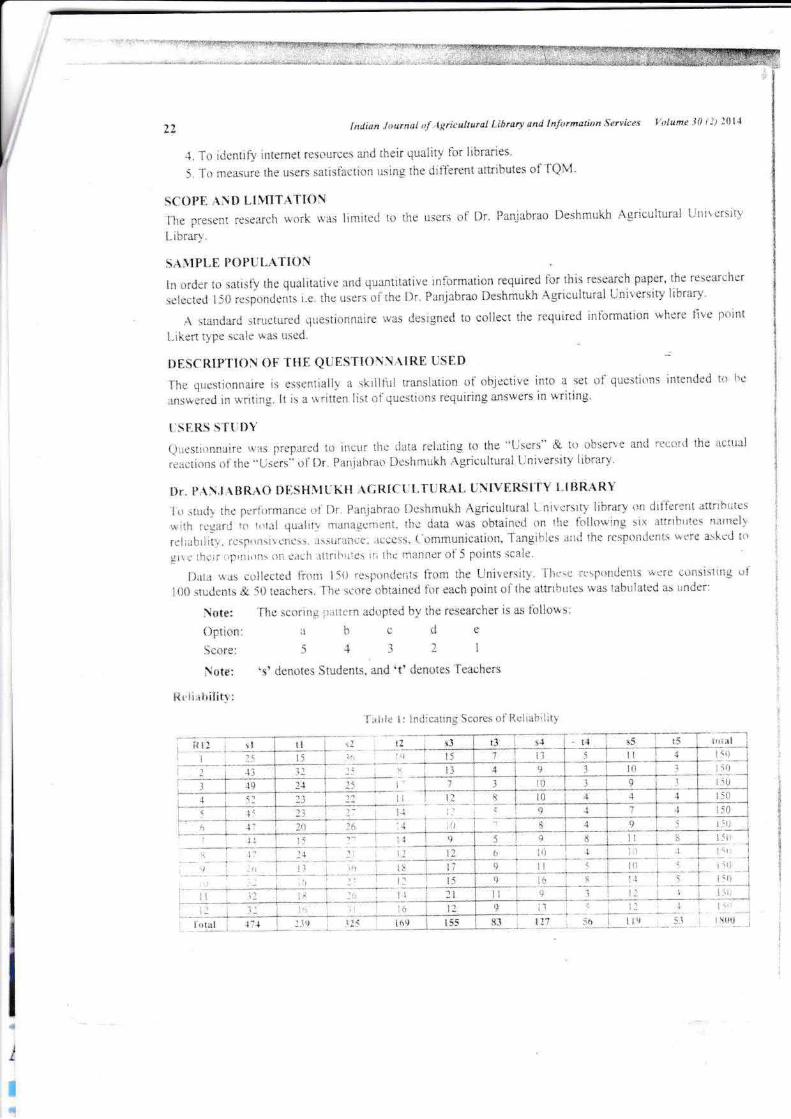
<i:3 r*ga=i i;: :,:lal !xa1:l. *"n=g"**ol, :h* da:a sx *!::air:*:i c{1 a1: *"l1i*i*i::3 ::'t aarl}l;l{:t :':*:::e15'.
rei::1iiiy,,ai-{:::r.rr.1rar. =.:ur=nrr: lf,i*:s. {-'*a:xlu:irati*r:. Ta;rgibl*s acj:.1':e re:p*:Tr1*er: r:*'*r* anle*:l'r
xi:r :!:*;: -t!!a!::*t o* *ath lt:rl1::::: i;; :!* r":a::n*r cl5 p*in;::*ale '
5at* *.a::*11e*::::3 ir*x l5{} r*spr:*de*:* 1?*x:}e ilai:*r:i:y.'fh*r*:r:1:*rle*r*:'}-*ta *r*Litltng *fi*{} *r*dc*:: & 3l} t*ae}:*$. ?l':e :e*ra *b:air*el lor *rcl ?r:i:'tt *i:h* 3a!rt!*,€$ *.*s :ab::iai::* as r**d*r:
i{::t*: Tle se*r!::g r3a:rt* ad*p:e* by tle r*:*xtller i: es i*!1::*"s:
*pti**: :: b * :l e
Sc*re::{3::X::l*: u*'*e*oies Stu<itnts. and 't' dc::*ies ?*aei':*x
l{*:1i::tt:ili}':'f al:i* l: l::d:ea:ia3 S*crea *i !l*1!ai;iliry
:c tle l:3.* *i *r. Pa*j*}r*o **shx*Lh ,{griexlrrr::l i'r:irrrriry
. ar: ;l- ,...--- a.];.,
:li'; I i,;
**_,t{ :
l:ga::,:_. il
- L.a,
*
:li
-*;;;- 4€**T :3*
?3
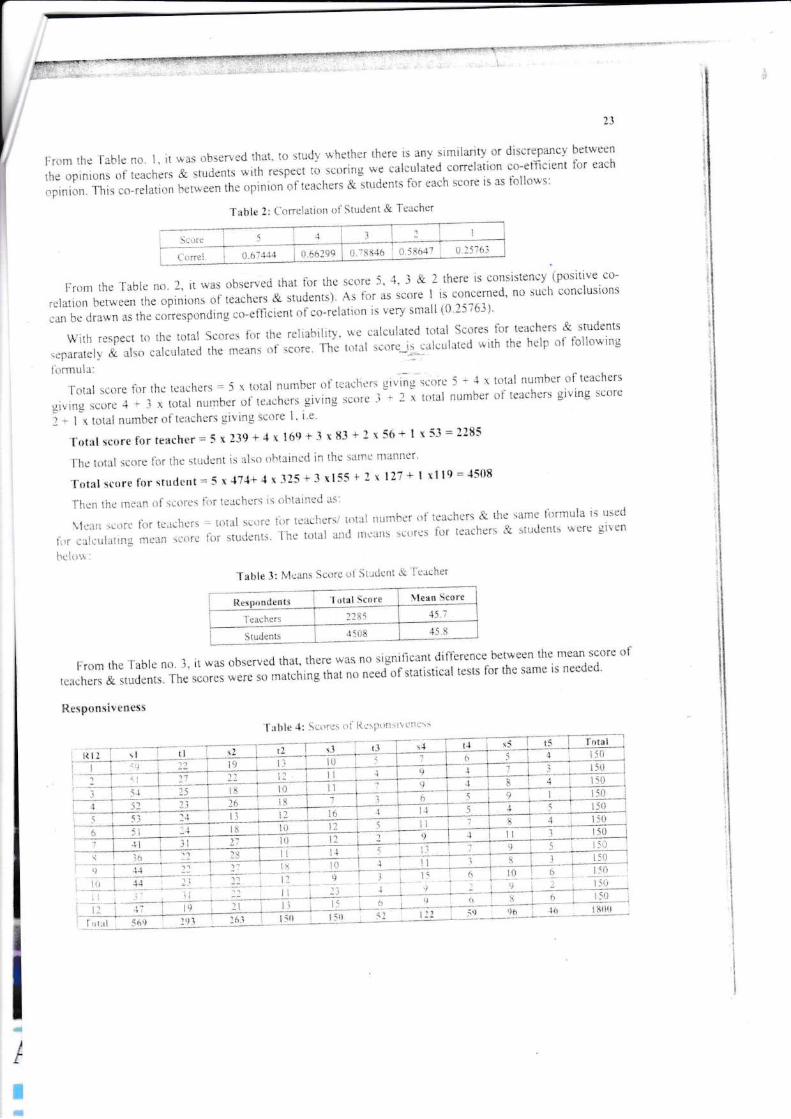
fr*x:le 'l::11* a*. l, i: rv;:: **:crred ia15a. 1* stud; xh*rl*r rl*le is a;13 sixila:iry cr {isl:*pr:r*y }e:x*er:
:1* *pir.:i**; *f a*,ae1*rs & ;ruii*at: *;::: r*p*eiio ,.o.:ng :** la!e-a1ai:i :*rr*la:i*r e*-*l**ie::: ior ea;h
*;ini*n. ?his ec-relari** L*."* il- *pi:':ia:: oi:e**l*:r & :tud**:: f*: e:*i: se*:* is as l"ail**l:
:r5: rs
: {:rnr:i. : *.3:434 a:.1t3i* : *.>5i{?
Frr:*1 :h* ?a}1* **, ?. it w35 *b:;*rve:i tlar lr:r :}:e s**r* :, .i, 3 & 2 :h*:r:: il **alistear:y ip*;ilive **-
r*laii*:: ber:ecr: rl.:e ap;Iir:r::r al teae]:er* * nua*n":. *t f*t * it"'* I ir **::cemed' a* i;ae* **nl1*s1'l&5
ca"r: Le d:a*r as:t'r* **re:3ont::n3 ::r:-efilcie*t:':f e*'r*!alir:t: i: very:rna11 {*'l:l*l}'
*i:1]:xpe*::{::1*a*aal3**re:i*rther*iia}iliry'ilcealexl::te<!:**15**:*sf*r'*ae1*r:&3l3**1:sr*para1*1y & *!:* ru;uolu:** .he i':*;:,:t ol tru.l]*!'r*:al :e*r1i: *a1*i:l;:te:l xitl t*e l:*!p :rf lali*wi:lg
li:r::u1a:
?r:141 xr:re f*r ths laaalcts = 5 r l*tal l*mb*r *l:*a*li*rrgitrng ;*r:re 'l t j x t*lai ::r:r:b*r ai t*'i***:r: .Siving
:ie::re jj- . li :*41 *::xber ::f ::l*f i=rl givi:":g se*r* l ' i e "
11 r:::ni:e: *f leael*r:;:ii;i** re*re i * "1 : !*t:*t : *. ::::a: l::r:':L::r al :ea*?:*rs gi:ilg s:r:re
ff*-'a i rt fntal: I I.\U .
T*t;:1 ri**r*f*r t:a*ber* 3 :?3?+* : 1*?+ 3 :.83 + : x 3t3 1 I 13 * ?t*3
1}*a:rl::l;*r:re*rli'lcstur'i**tis*l:r:lltt*ir:;:dirllcs3n1*11l3{11:tr'
?ar:*l ::*r* ;r..r,€aent* 5 :.1?,4+ { : 315 + 3 =155 + ? : l}? * t xltr* * d5{8
Th*r: the r::a* i.:I:;*r** lar '::a:}':*::;
is *bt;:ir:e* as:
L1*;::'l :*'.:r* lcr l*;:*}t*ll ... :*ial gi:r* lr:r l*a;1..:*::: t*:a1 *u*i:*r *i t*a*}:r= &' :1,:* saxe i!:r=*}* i:; :::ed
li:r.:;l;ui:l:rr.rE:1.:3ar:ierr:e i1::;:txri*::ts' f:-* rurui'"ot: !::**1* =t.tttt ir:r:*al}r*r: &;trlr1*n::; *rre gircn
i:<!ii*:
I:r:m t1.:* ?a*lc r:*. l, it rgu, li:ser,;ed ahal' eh*:e .uaa t1c sig:rifie*r:t d!€:r*** balw**:r tit* :;:ean score ol-
r*ar1.:ers & ::r:d*r:::. **'u"nr*u -F-ere rr ***t,;nJ::,u:I'".*irruaii:ti*al '.'tt F{:!t tte *:"* i: ::**r3ed'
*cs3*:rrivex**r
I
IL
i-
I{
'i:lb1a *: 1tr!a-. i]:
T;:bl* ?: lo:rel*r:::r :rl3t*;l*::t & T*::*her
?s*lc 3: 1l*aR: S':*re *1 5;:**r:l &'l*::;!':*r
'1.:aal aat:.e 11r;iq 1*::re
: :*a*ilar:.?*-:-:*i 31*3e:::5
::3-r "i:.:;:1n: 4:.3
?d {adiatz lt;xzx* *f .4gri<x!:;:**l {i*<zry ::z;2 lxprx*J:::r: 't:r:,&*s ?*l;*xz 3* tr; :€1{
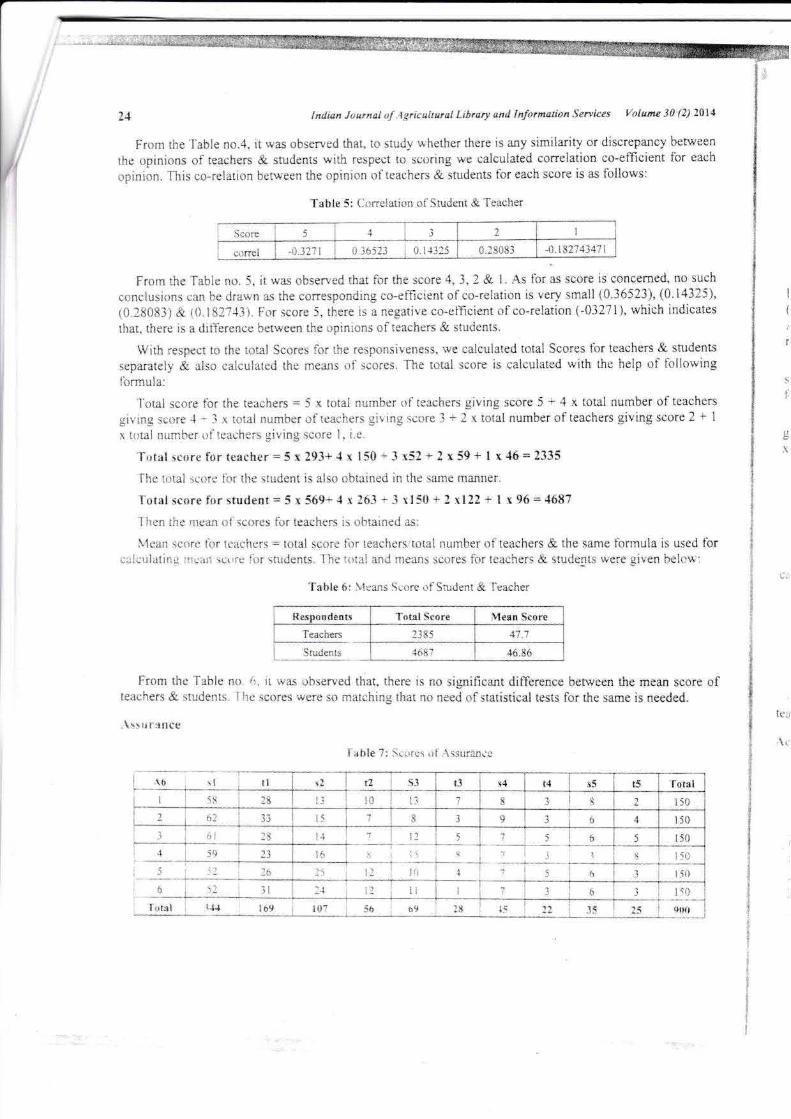
Fr*= a1* ?atr]* x*"4, ia r<35 *bscry** rl':at, t* *:ady iv1:<:i:=r lh=:* is a::t ti::*:*tiay 1r di$*r*panty b€alf**.:h*: r:pir:i*=: *i r*a*?:*x & =*.:**:::s
*itl: r*prci la s*r:ring 1t* **:t::13ae* **ryel*:i*:: e*-***i**t 3r e*:hapi:ti*::. 3i* **-r*la:i;:* **t:r**x t1* *1i:::i*a rl:*ae?:er: & ;:-tj**B f*r *a*i: s**r* i* as {*11*ss:
?alle *: {::rela:i*:: *ilxd**; & I*a*l'r*r
i::::* > ; -: :: :
,.....': .*.::?: *.:*::i *. :3::: *.:*.:,: -:i:-i_:+1*. '
fr*nr: :1:* ?*1k :'r*. 1" i: :*as *bs*"ve* ,trat i*r :tre **:::* 4- :, 2 & i. ,{= &r 3s ;c*rc ir c*nr*m**" r* sue:::
**;:1**i*:':: **:: be *ra*- a* tl* =*r:*:p**ding:*-*l**i*xt *l;*-r*l*ti*:: i* very sratl {*.36i?:}, {*.14:}:}'l*.:E**31 & a*. :33:{:i. F*r s:*:* 5. :1:*e is a r*g*ti"-* :***13*i*::t *f c*-rela**:: a-f3??! }, xhicl iadicat*s
a:€,. t::€,* is * r3ijlere::ee }ea:*ae* *e r:pir':i**s *f :*a*I*r* & tard-**.
!Yi:l': r=ry**: a* ahe 1*!a1 3*::r*: i::r:le r*:p*:rsiv*rl*ss, w* eale r.:lat*d t::;al Sc*rcs l'*r t*a*hers & s*d*:::s:epa:a:ely & ::1:* *aie*1a:*d a3* ;=ea*: r:l ***:*. 3l':e :*tal s**r* i: cal*ula:** xi* ii:e htlp *f l::ll*wi::gl*r;xul:::
T*tal sc*r;: f*: :!:* a*a*h*rs = 3 x {*:ai ::*m}er *i t*actrr*r: givilrg sccre 5 * ,1 x taul nur*bsr ::f te*el*rsgirixg:;si:r*"3-3x:r:1*l ::*rl:**r*f:*acl*r:gi;ixg:e*re3+;x:{}ia:::sr:}*r*ftcaehersgiving:*::re?+1s :::=l nuxb*: i:f:*a:**r:i givi*g sc*re f . i.:.
?atr*l *c*re fur t:a*3*r** x ?93* € : l*3 I 3 x5? * 3 : i9t 1 :{** ?335
Ti*:i:ral re*re i:::r:1* :*d:::1 i: al*<.r *b:air:a* i* rh* s*:11* nia:uta..'Yai:i :esr* f*r
=?::d*al * 5 : 5*?+ 4 : 2S3 * 3 t15€? + 3 :11? * 1 : ?6 = 4*3?
3']':a* :i.:r ;::*a:': *i=*:::*: l:":r aea*}l::x 1* i:!:*il:<:i a::
Slea* rc*r* l*r i::a:h*:; *:*t*l *::*r* l*r t*a:1*r:,'1*aal r:xr:ilr: *ltea*her* & tie sa::ls farrnula ir *s*d ia:*:,:lixl*iir:* :::raa *L.:.* f*l::r:**:":*. l1':* :l::ai a*,3 :**ar:* sr*res f*r:**;h*r: & s:::d*a= x*r* giv** bei*:*':
?abl* *: .11*:r::: I:*::e *iSt=;J*::: &'l***lTL*:
fdi{tt ?*tal I**r* 1l**r:Si:r:rr.l'*::;r*= ::a: e"?;?
1*:**=x ;iar-, ,r{.3t
l'r:r:: the ?a*l* ::r:. r:. i:. rv= r:****'**:*at there i::T* *ig::ifiea::t diJI*rea** be**ecn:i:* r***a:care *i,*a{:1** & *,ud**r:. I1*:**:*: !r€.{: s* ;:":at**"i::s 1*at a* ::**3 *lsx:i=ai*al :e*l* fu::}:c
=arae i: ne*i*d.
,1g>* a*;:a*
l'::*l* l: 1;t;rr;i r.::1,{ls:,::-.:t.1,:
la :l , il q?,* 5: *i;{ a,r 1a 1: l'o:alI <\ . ll 1-': I l* :: : 3 1 a : ::*
3: la I : 1; -1 a 154:
:; :: ! : : : 1r1
"i , I : 3 : :5al
5 4 I lio@' ;-re
i
{
t
tt,
a
.:
rl*l: 1l'a : :*,t : t6? , :*:c9 '::* I ;: !X 1a :: j *t{i
:. 3r:ii*a Jl:::r:t<J:f.'lgr::::l;:::*i L i**ry a:zd lzcliz*rz<zi*r, '53."i.s3 t/cj*tttt 3* #J ?nlr
TL* T::bl* r:*. :{3 =hi}€s
ila! l* =tudy
xh*t1er t}'ier* i* arr3 *imil*r:ry i}r di:.te}anry bclxe*:: t}* *pi::i*a:*l ,*a***x & s::id*::ls rai:tr r*p**x ia rc*ring ealcr:la:ed *cnrlati*a .*-crfr*ian1 i*r eaei *piai**. Thi* e*-
r*la:icl': *eixee* :1':* *pi*i*= *ilea*i:*= & *tt.:*n* lcr <a*3 3**rr 1= ** llll*xt:
T:*irt* ! i: X*r:::ia:i:::: *i 1:::ie*1 & Tea*tr*r
5**r: : n : : l
;;nei 1.8o3ql 0+hS-9 0.f'!9ul , f .::i:+ -t.,il:l
fr*:a ti:* ?ab1e r:o. I l. it nas *1:**'e:1 :hat i*r lle :*c:* 5 & 3 tl*r* i: e**:i:teaey {p*siriv* c*-reiatiq:a
*<tr,".sel th* *pi*i*r:s r:l:*a*i:e::l & stx*ea:sl, For :**r*i, l}el* is a .1rgalive *:*-**i:iea: *f c*-relati**
{-- *.:*53}, xhie* i*di*ai*: t&a.,:}:*r* i* a cJit&rs:':*c bea:v*e:: :}:* *pir':i*r:: *f *a*trers & s:ade**. is i*: x:ea:r 4 & 3 is **::rer::**. ::*:=:i: :***ksir*a *a:: l-.e dra:*x a3 l*c r*rr*=;x::dixg **-e{**i**t *l***:e1ati::::i: ve:y :;nali {f.4**??} & i*,131:4:
trYitir respeet t* :h* :*tal ***r*: i*r tle *.**s3, ** *ale*laaed t*tal S**r*s l*r :*aelex & sxj*ct:sepx*!*!y & al:* ra!*r.:1*:e:l t]':e r={:a*r *l s**re" ** :r::al :c::;r* i: e::i*.rla:** xi:h ihe hel3 *f &l}*xi::gl:rxr:ia:
Totai :er.:re *:r the:eaehr.s * S x rc:al *a:"nb*r *l:*ae&*r: givi:g secr* J *:1 x:*Al *:.r**er*itrathersgivirgs::i:r*€ -]xt**: i:.:r;1bsr*l:*artrer:givla;re*re3+?x.tr:t*l :::aaler*Ite:ch*r:givirg*e*re?+ 1
: t*1a.1 :€xb*r :.:i:ea**<r: givir:g :c*rc l. i.*.
T*lal:;r;rr fi:rt***!<r=3 -: 13?*{ x4?*3 :33+ } x ?1 + I : }3 * l*3d'l'i:* t*tal s:r:r* llr;h* itudent ic alr* *l,lait1eil i:: :lc :a:'.1* {*ac::*..
T{.:lal ::*r* i*r :t=i*:i * 5 s ?39* 4 : 1{3* * 3 x*? * i : ** * : ='t: * l}35
3*:: :l':* :':::::a= ::l=::r:l*> i:: i*aei:e::i i: *b:ai:*:l :::l{e;:r :c*r* l:.lr lea;:i':r:r: = ar:ul :**r* ir:r :*aciersl 1s1*1 *uxhr *{:e::ei:.*rs & :h* :xx: f*xula is :.:scd
ii-:r ;a1*rla:i:':g xea* :e*rc 1'*r ::*r1*r:::. ?1* :*:a! a::* **;ux :**res fu: a*ae*:*= & :;::*eats were givenb*iaw:
1'abl* 1]: 1,1*a::: ner::= ::i Itt**r:i * l*a**r:r
dr*ls j T::ral se*re !1r:*r 5tr:re
?***1x: I -*a :4.::3l*d*1ts i 1t3* :r.:*
Iri;*l:irc I::1:1* ::<:. 11":: *:l,* r:!:serred lhaa. thr*'r* :: :r.' t:5-ri'!ea:':l lii?*:*::cc he:x*ea:i':* =**r: s*t::r* *{:.ii:.:1*.3 & ..lr:**ats. ?1* s*::r** €'*te:* xa::!"tir:ra a*3: r1t: n**4 i;l:tati::i*:l :*r* ii:r th:: lar:e i=::*:d*{.
i :;xxx::irali*:t
'Ia*** i 3: S:::::=* *i er::::r'r*:':i:all*::
frcbexrs*<
{* *.:.ge*r* iis ver3
lVi::etsfalli"ir:'r:u!
T*lgiving.s:::*l
T*t.
?i:e
T*i:7?r*:
l.le*r:ale*1a:
5r*;:;::i:l:e=
fx:rgill
: l::
I
,='!ll;,i
'-.*:;.:i{
:"_.:.:::- ...- -.-:-.
-{
t-
r't . "i 't f ot:l: i 11 I : ; l:li
I r+ I + ' r>n
. h lr ! i*<u
:::;*.***-a.--.**r_-..1r1 nr I :*
1:t
Fr:i:et*c*:** r
27
fr*:x *:e Ta*i* r:*. 13, 1t.:rx *bs€y*d ri:al :* *x33 xl:*:ler tl*:r i* **y si=ila:ity *r:3i**rep*::*y
b*ixees:Le *3iai*n5 ;:f :,:x;}*rs & ::::d:*::t* x!& reeSe*: ? 5e'*:111g x* eai:::la:*d **rr*l€i*- ****flici*:. ibr
aa*1:r *piai*r. *is e*-r*1=:1** be*r*ec rtre *pi::ica *f t*ael*rs & :Xdaa:s f*r eae* rr*re is *s fal!*x::
fr*x ,le ?a31* ::*.13, it :ry*s *3**rv*{ t}a:, :**r* is r::* *igsl**'*:* dj€*=a** **:x**:r t** r:*aa *c'*r*
1*aci.:cx & :lxd*::*. Th*:e*r*: 1:{€tc 5.} ma{;bi::r* *at *c ***d a{s:ati***al t*'*:* i*r ai"r* sarn* ir aee*ed"
?*sg131t=
T*bi* 1*: {:::rel*i*:r *f $:s**:t & ?*a*1ry
Saula l
t,:t=l i:. i,a,i]' : *.:4r?? *.*t?: al.:r-::n: -it.:;4
3r*x :it* ?a*1e :r*. l{, i: xas **s*rve* tla: i*: &e =e*:e
4 & 3 :le:e i* c**sis:er:*3 l3*si:il'* ***rei*:i::a
**lq:*:: :*e *pi::i*a: *i :*a*i:er: & :X.:*elX). 9*r :*cr* l. al*re is * ::*gaXiv* :*-e**i*::' *f e*-rciari*::
{- *.5}n:, x*i*b i::di*al*: tha:, :}cre i* a di€*r*r:** }*3v*a *e ::1i:i*n* *t'*a*}"5 & Xr:**:1l*" '{s i*r as
sccr* 3 & ? i: e*ae*x*d. ::* ruc! **:re1:::i*lts **: be drav:r a* li* **rr**p*n*i-g ;*-ef:ci*:rt *i e*-r*la'i*::
i* v*ry sr::all{3"144?1} & {t'1*J41}
11 i:i: l*sp<*t t* a*:* ta*l 3;*r= ii:r :*e c*r::xu:':iea:i*n, r','c ea1*r:ia:*d t*:a1 Sc::r*s *:r l*::cl:*:: & st*:ielt:
:*px*f*13 * ** ealcr:l*:** :3* r:**:::s ::f :e*r*. ??rc :*fal ::*r* i: e*ll:':la:** xifl :!r* ?r*i3 *f f*1lnxi::3
*r::-:x1a:
T*tal :e*re i*r th* t:*cherS = 5 x l*tai namber cf aeaehers givir:g se*r* '
+ 4 x tr:tal ar::ttler *f teae}l*r:
givi::g:**r*.4*1":.t*aa:**:a!*r*l:ea*t':*=givirrgx*r*3+3x:*:a1 aa*:}*r*f'ea*hc-givi*g*:*rc?*1: :*:a: lt*:**r r:f:aa*:1*x giviag s**r* f . i'e.
?::1sJ r{rre fer texeber * I x 1{* * 4 x *3 * : a:: * ? : 3* + I x 3$ * 1tr??
Thc a{ital :c:r:: {*r:l':e s::**:::: is ak* {}b,air** i:": the sarn* 3:a::r:*t'
T,'1*i *t are {*r *ix**rl * 5 x ?f* + 4 : l€5 "l 3 :*? + ? : $S + 1 r *4 * ?7$3
?i:e*:3* **ar: *i**r*:s fur t*ac?:er* * *b:ai*c* x:
1{e*:: s*:= i*: :*a:h=r: * l*aal =e*:e
*::r t*a:1':s*:c::rl ru:=}*r *l:***l*x & 13* saxe f*r*'r::la ls *s** *ri,alcui*tiag r:1*ar: s.*fe f*r s3d*a:s. Tl:e t*:al *n:1 :::car':s l**r** i*r ?e*:!:er* & slr:*enls xare give:: belav;:
Tablc 1$: X*a* !**rc *f 1*:d*t:: & ?*sci:er
Rlrltnr.s:r Itt1:ll !rlre 11t:r:: Jr:;r
1'*::;**: ! 1li: ::.:a
1l:ti::tl: t:r: :?.al
i:t
Tabl* 1*: I*:rx *l'T*:'gi3l*s
'1 1$ :l I ti 1: e3 t1 ..4 :3 1i t.i.l
I 3? 2* It 1: :* :l 1 tjt * a:u
: :: :* :1 i :: :i : : {i1
_'i .1* t! .> : : : :: : ::l
n r5 :: :: :: :: * :, t : 1:t
.1i -:.: 1; * :: ,: ! -1*
27
:: :.1 t-: :a ': :t: : :l : :a
,:; la i: : 1 :IJ
:! a:
3 J.. :: i: ,< :t =
?a*1* 1* t**24.,.
:a
t:
't:?
::
*€3'1*******€
I*I
ttf3
*€I:,**1I:=**It:t
_l'**a
=g
a:**?
***aa
€*?:a€:
:=:::=i:
.i
I
!N:li*a j:;ar*al ,;!:lgri*xl,:uza3 {"i*r*ry atzd i::}rxa::*x Ss:vi*e; 1?j::*t* -l$ lii 1i}!;i
l&:n:1.:* l:31* aa. li. it rva:; r:b=erve* that. a*:;iu*y x?:ethet tlle.* is aa5:;iraila;i1y a. {:i5etf?a,1ey
bri&*.11 r*e r:pi:'ricr:* *i a;:aci:*r* & ltu**:,: xill: re.sp*;: i* ii!,rrn* *'{ cala.r:al.t c*t?el3:i*a c*ci*:i*::: ftr*3a:1 ,ti.1i{}t:. Tlis e*-r:i::t.?tl }at**{* :h* *3i*1;:l: r:ite::rl:*r: & :t*i1**:* f*: *=;* 3a*a= :3 as i*11:::ar:
'I":titl* t'ar*ia:!o:: &'1'*::***:
*:::9: 0 firl.liji! I rt.5Ygl ',
.IJ,I]J ]:*. :.ilt
fr*rr ltr* T:r*1*::1. 1?. i: *::-* i,l'::e:v** that li:r:1* r*::e 1.4 & 3 ti:e:e i:; ecr:*isa*ney {p*silit* *r:-
;"*latir:* |:e:w*et 1h* r:pi:ri**s rf te:r;h.r; & .iudc*:s]. !:it: li..]tc f . iilcr* i: * negalive c*-ei&eieni *ir:i:-r*lati*:.T {-at.i}i::}, whr;} i::*ir:alfr tka:. tiere i: a drlibr*r:*e **l*e*:"1 t!':,: r:pit':i**: *f tea*}:er: &;::.ld*t1:s' 3::
lrx * tccrr 3 is e**cer::*d, := -=:,.ch a!r**1*a,*!:a t3r b? dr::r*r a': :tr* ;rlrr**pr:r:i1l::g;i:'*ilic'g;ii ,rt 's-:'cl:::!*;: :r ti:r:: s:::atrl i*. i €3lj l.
tr::ait r€sfe*a:* t::r:t:t3: I;r:r*s lr:r;]':* l::.:t*irrlcs. rtr:..r}.*lat;d tctal 3*i::*:,*r laaiL*a: & >a**ar1S
i.ta.3ti:iy & als* *::i,::;ia*d t}:. ::1.:1*t '.:a'3..!..' 'l'h*'".':*l lc*:* i: t*l;*l:l:*tl r'"':tl': ;l':* l:elp *f llil:*i:':g
l, rn';lr.
,.i{;: raaiaa l*r tl':* ie;*1*r:; ' 3 : *tal lu:x*<r ' } r;r.',q.. Jirin:,3ivlng:er:r* 4 i": i a:l=l ::ttr::**:.::':.3*3ta. givi:.:; x:::* .3 t L r a$aa!
{:{}a::: a:lt*b*r *l:ear*r:: givlag sc*r= 1. r"*.
?::*:I s**r* f::r t**c*er * $ x 3?3'. 4 x l?9 *3 "t.1{}* + 3 : ?? + 1
?h* t**: *.*re ,c.:i:e s:=d*:':t is ais*: *i:tei*e* * :i:e sar::* t::;:l::e..
T*tal re::re i*:r :lx{r=t * 5 x *l 1 + * r ::: r .: -:?3{! + 3 : 133 *l1*;: ,l're fi*a:: t:-.ttres i*r t*a*i:err is r:i,-:ain*i a';
11<::,c !*r* lor:***i:ers =':i;i::i s:i:re ii:r:e**l:*rr::*a:ri **it':l':c: *1'e<:;1*rs &:h*::::r:e lora:ui:r i::::cd fur
c*l;:,i.::i-gr:erir::r.]re f::r:ar":**;:::. 11*cr.rla! ;:njr:*:itsi..ires:ira:**;!':=r:&;::;r1***:l*le gi'u*nl":l*-ru:
-la11e l!i: 11c;r:': 1e:.:* ::i'l::.::l:::t & -i'<a;l*:
;*r:rrc 3 I ,l r !**al nur:*ea ai:**ch*rs, i"rx::1k. r:l:eaehert givir:g:e*re 3 l' 1
r ?? * 3*3?
t:t?5*33n?
I::::;: :h* 'fali* ::*. 13, i: **s ':i:r*r:*:.i :i: ,:.
:,1:.:r* & ;:.*a?.3. I'li* 1rr:r*: .;l; it: *::l!t!ri:;=.,',: rix:i ic:.::: ;l! ailr*:;*ri;ri *i 'i::,::i:*:! t=::r i-r
***l*r:'l {3f r*3a :aitt* rlaa':{ r::alc i: **eJ*J.
.4. - - ,..
,l :ar1i :1 ,t :f a: :"tr l* a a: l'na1:
lj J= :: :: l : .1 I :ri
:ll :Y :r) i: :: , :1 : n : ia]
I 11 -13 :l t :; 3 , l ii:
t: +t : a!: * J : j lid :
:J :i .1 t: 3 : 3 r t:lJ
:: :a: 1: :: :- lJ . : 4 ,{*
:: 1t :: :: ; :t :a :r ? :.i{;
'4.:a*1 -::.'all l:: a:? .lrt aa{ lii: 1: :: :?:.1
;.)lJl .,,,{r \l(sn \(,}lL
r*xt]le i;
- €E ln.J
ll,tlc rel*igiviii':*::=stiSr::-3i:'r l:,r:::
llqr-{t,:l :<:
lilrary'.
*
a
l! :a
*
:t4
.!-ii.,Jcnts :-i ll I
::*_*
,l
t:
>ai':€ I
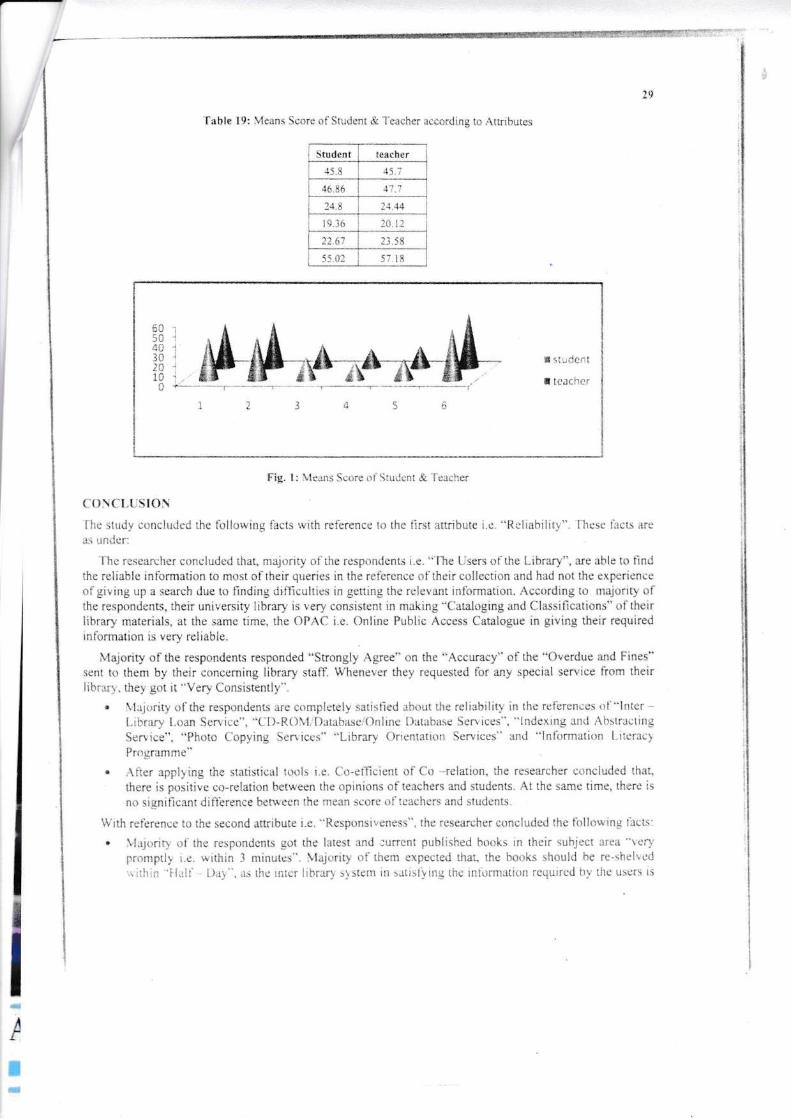
f
TI
I-
;tt
Tall* lll 1'1*ar:s Sec:* *f Xr.:den: & "l'*ae1*r ac.**r*i:":g t+ itrribal*s
:***:a?
t*3
*:1*C*:::
* a;:::l-:*r
:?:4:*
c*-aa..:3r*= f!g- 1: xa:*:'*cr*r.:l1t:ii*:::&T*aeher
["]':e s:*dy *at;luiJr* :]:* *;lli::*ixg la** *iti': refer*':cc t* tl':a ll:*t *ribr:te i.c. "3elia]il!t.r-". 1]*s< lae:: are:. unJcr:
'l"i'::: r*:t*:::!':*r **::eladc<l ti:at, naj*rity oi** resp*::d**t; i.*. "?1* 1i**- r:{:tre Li*rxy", =le 3?:1* ::: li**&e r*lia*l* ir':*nr:*ti** a* r*{:*t *ilk*ir qxerie* ia *r* rei*r*=*e *t :}:eir r*Jl*e:j*:: arr* ?:ad ::r:: the exp+rienrc::f giviag r-:p a :*x:* d*e :* ii::dir:3 diil1e*iti** ir: g**i:':g al':* r*lerar: i::f*:::':ati*:::, &:cr:rding ;* xajcriry *ili* ree3**:le::ts. ti:*ir ;*irersi3 li*r;:ry i: very e*:':si:t*::l i:: r:akl:g "fara1*gi:g a::d flxsi*cati*ns" r:l:i:er;li*r*ry xai*rials, *a at* sas:* ii:=*, *':* *fAC i.*. *::li:r* Fublic A***:* fa:a1::g=* i* giving **i.r t*qti:**i::*:r:r:ari*a i* rery r*liabl*"
l€aj*riry *l *::: r*p*cder:3 :*=p::r*c* "S:r*xgiy Agi**" ** 11* ""Ae*er?*y" :::i ai:e "*v*rd*e ax* 5i**s"3e,':: :* t**::: by *:*it e*xer:.:i*g liL:ary s:alI trY&e::ev*r *ey rcquett** f*r ::ay spe*i*l :ervie* ir*r:r :&*irlilr::"ry. **y g*1 3 "Y*ry' f*:rsi:t*:tly".
n llajr:rit: *:llb* r*:p*::r1en:t a,i:r:x3lel*ly:i*:i=lle* a*<,::":l ** r:li::}iliry i:'t tl::::*lb;*::t:€:.:4"'l.a*t -Lilrary L*ax S*>'ire", *{al-A*11"1}ata}as*{}:rline l}e:*}:=c 5*r*'!cas", "ln**:i::g 3t':d ,1-:tr:ii,lgS*-i*e". "f1*:* {i*3yir:g S*rlic*** "Li*:ary *r:**13*:}* 1*-i**:"' an* "k:l*rxatl;;= Li:*raca
Programme "
" ,111*r a;ply*g :&e :ta:i::!;:1 :**ls i.*. f*-*5;l*r:1 *l {* *r*la:i{:.:, :** r*:e*,'ch*r **::*1xti*d :14t"
tk*r* is p*si;iv* ***r*laii*a *etr:r**:: lie r:pini**: *f aea*l:e* ac*l :i:slc-:s. ,{i ih* same tim;:, th*r* i::r* *ig::iliea::: difrr*::** ***+*== :*e r':*ar s**r*::l:*ac!:ers a=* sl*3*r::.
1tr i:* tci*:::::i:< ir: :1* s*e*:":d altrib:.:te i.*. "R*sp::a:i.r::::*s:;'", :l*: r*:*ar*l*r ****1a*** lh* l*11=r:'n3 tae ts
* 1.1ajl,:"i:y r:i' :** rerS*:rd*::* g*t t1* late*t a::d ;*n*=i 3*1li:*** La*k:; i:: :i':e]r *ulj*c: 3:'*a "t.{y;r*r"::3:i3 i.*. xi:*i:: 3 a:i*xt*:". *i***ry r:l :&e:* *x3**t** ti:al :h* b**1: gl:*r;1:l 1* r*':tel**:i':l:1i- "il;:it'- li*.3". aa ta':* iril*. li*r;ry.1sr*:tr irl rr::::irrl {i1,J in,*n::a:!*:::*r1a::c:3 *y t}r* *s*;:: x
. '.. -*- ' - - -* - ' :iil::':ij::::':': l:.":1-." '
'
l
3* l::&;: "le*:x€i t;f .4gzicx!;x:*l Li*:**g <n* !xtar:r:*3*:: Ss.*.:res ir*Ja:x* 3i {3J 1{} t *
'"Y*ry ef**:iv*". ll:jr:riry i:f th*x a:e *il3 sati:li*ii at*.:t.a€ bekavi*::r*f :he lilrxy;ta1? xiil*pr*vidiag :*ex *iAe s..1iirr *1 .le :a.;:e :i:x*, t}'r*y ar* liiglty sa{i:t'ie{: abcs: the availa*i1iry *frurrert *exsfa?er: :::d periridieals r:* :]':* p*ri*dicals *ispiay :h*iv*s"
* ltaj*ri* *i lhe r*p*::d*::t: are "V*ry Sati*{i*d" a}*:.:t "*.*gi:::ali** *i Li*e:i*, "*araii*::: *f **ak:","e*r:pilati*a *i :ta*li:tg 1i*: ibr !seix", '"3:*::':p: lli::d*ry Ser'*ice:'". "3*l Setrerti*a" *.::d lh*"inr**ri*g *:*r qaeri*:" pr*vi:led t{: a}:er:1 }y:}:r:i: 1i}rary'.
* 3.Ji*r *ppiyi::g a** s*:::a:*ai :**1s i.<, {:r**ei*:::: r:,Ci.}- .e1a**::. irr cr<l*r li: st=*y. ::,*y :*:ilari:,: *rdi:ler=pa::*y bet*€an :L* *pil:*l* :rf t*ar3*rs a:'id s:*rle::x xit* r*e1e*: tr: seorir:3, 11* r*s*xt**re***1;ia* a1a! a3 f*r a: se*r* i: c::**er*ed, **:=*l: e::*rl*si*l,: **.* be *rar:;:: gs ttre e*::*:pr:.r*ir:g***effici*;:t *f ***ret;i:ic:-: is v*ry *r**11. Al rl':* s=x* lix*, ller* i*::* sig*i**ai:: diifere*e* b*arv**:::la xear *care *la*;eh*rs a::d *.ud*n:i.
1:?'ial :**:reaee *f t!':* tl":ird a=:i}*t* i.e. "l:*rlra:::*". :** rtr*$*l':*r e*::rt:.:*ed ll'r* l*11*xi*3 !3*:;: ?ir* b*l':*::*x *i ai:e *i:**er,'ri::g li3:a1v s:ali i: ,":ry ealm *::d **-*per*tiv* x1'rile 3r*virt:ng ehr
rclera::t i*lar:::ati*n **m the :all**:i**r, ,* *:e !:3*x. 3* libra:-r'*tal?a1va;: tak* p*r**::al i*t*r*:tro;i:=::e:el al:: .J3., appr*ael*: ttr*x ilr ;:::y *q*ir:r*:*t. ?!:u*. :::::j*riry *f :!':* r*sp*xd*:r* :r* :*rysa:j:li*d a*c..lt t:':e "qr:ati:y *x*d s*rvi*r*" by ti:*ir iilrary *l t*c sa=* :i::':*- tirey ax famili;:r ivitla}:e Il] 3*L{ l}arebase.Unlire Dau'rase l;.!i.eft.
* iikr xaLi::g :rppli:*ti**: *i:l:ari::ieai :**l*. in *:<3*r:* *:"r*y. ary sin:ita::i:y ;.l: di:*r*par:e3' 3elr***:"1:h* *3i::icns *l t*a*&*ll aa,"1 :*,3e::t= *,it* re:p::et 1i: sr:r':ring, th* r*:ear*l':*r *b:*ne* !t li*:, ilr:c*:e I ar:d ? tl:er* i: = *ega:ir* cr:'*!**i::::l ci ;*-rrla:ir:r: a*d l*r ihe ::*r* 3 axd 3 t1*r* isca*sir,e*e: ip**:tiv* **-rel::lir:r': **:rr*** th* *pir:!*r: i:i:*::;l':*= ;::d:tud*r:ts]. i: *:e s::*xr: ti*jf,ti:ere is l:* sig::iii:aa: *13i:r*ar* **31**:'r tle r::ea* :i:;..:re :,:i {*;:;l:<r; ;::d sta*cr':x.
lr': ah* r*fere::e* *f *e t;l**: =:1r:*;le
i"*. ".1*c*>:". {l':* r:sr::;ft*r +r:xr:l*de* th* i*ljr:lvi;:g facrs:r iJ're er:l*er=ixg li*rary;*ii is ":11..*a;-s'"::vailabi* *1 th* rel*r*a:* de=k. pi':*r::c::;ier r:':g;*i::es
:vail:ble i:: :;xiiiii**: q*a*tity. ?lc re:;tar*l:*r *re!':er :.:b*e*<:i i: tha:, *:a.l*ri:y *i th* re:pr:::3*-xat. n*t :*q::ir*:3 a: rtait ir:: usi*g :** ;r.:r':'rp;..:t*r icri't':ir:al lbr ::;***siltg l:::3C, *r:li:'r;: llax*::s::,["b*r:k:. L- Jr::"rmal:. rar. at ary tix*. 11r;rhi::g 1i1.r: *l:!':e lihrary arc:**venir::t:r rh: majnritS oi:i:* :<:p*::rli:**, a;r* r**y ;.€ i*l r*q:".:ir*;3 t;: *::ii ;;: :.i':* !::r'tg..11i€u*: at llr**i::i*ns {*r1,1t€..
: ;1i1=r r::aki*3 a3pli*a:i*ns *f ;ta:istl;;rl l*.,:l:, ir r:r<!*: t* ri:u,33'. a=3 ;i:=il;:it_v r:r *i*:repar:*: i:*,w*eat** *pini*::: *l:*ar:i:*rs a** s:r:**:':l: rirl: r::p*e: l* s**rir:g" ihe r=s*xel*r *b:*=** i; tlat ii:r***:* I :L*r* i: a *=gn:i:e :* *J11*i*:'r: ::f r*-:e1a:i*r a-,:.:6r::, a'i.:i*l ir:dicat*: al:a1 t}*r* is *diil*r*::ce b*l*cel the r:Siliens ::l aer*h*r= *:":€ ::xd**ts. I*l sccr* I a*{ 4 is **:*ei=*r1= :':;: :ui;l:**:ccl**i*::* car: 3* *ra:*::: :s l*e **r:*r1*:':d!:':g ***elE*i*::r :.:i *c-r*lali** is :;:ry *r:al! a*:l t*r t**::*:* 3 :::* i *r*r* i: :*l::isaa:.:;y i;*sitlr* ;*-r*laii:::': 1**l'**:::l:* *pi*ir:** ci:*x;t*r:i ar:irar*.:t1*:. T?:e rese*::h=r lx:]:*r *}sc:**ri l! i?:::;, *:*re i: -* *ig*ili*a*: **ff*e**i: !et***r: aL* rn*a=sax* *f a*a::lrys *.::d
=:'u;l*r:a:"l: t1:* r:l*re*ce *f :h* *llil att*br:t* i.e . "{ *r:,:lcunlea:i*1'r"" tl':: r::**rcher s:::*lad*d :.i':* li:il*:*;i:rg *cts:n X*ariry *l:tr* r*=pr:rri*r:,: are:::r'::re r:lrh* lircili:i*s:ail:*:vi*e* avaiiall* i::;.i:e lilrary a:id tley
l*alnl :tr**: it: :r:*= *r:- th* "{,lri**:ali:'r:: +i :t':* i-;*:::r-='", Th* r*se*:*h*r &x"*:*r ;:r}:;*x** ;}ra:a:::j*-:y i,.;i li:* r::s1'rr':**::ts g;: "att:.1a: urer x=:r*cl:", :r*:i '".l]-ll{}L.{ !}:t**a":# {,alinr l}atab:xe*:*r *ar:::::.1'- re'*' ea:lly ;i::l r**u!arly. "ll-ir:lr*i::3 :x*dr:ier avaiiall*"'ar* 1*!gixl i* *:**: aa c:<1 ibrary re:;**:**; *fetaiv* I r :::ii : ili*i**rl;.
* *.*er :::akir::g alpli*:i*rr: *i r::;isti*al :**1.q. ic orj*r i* ia*t:" a*: *in:i!*rity *r *i:*r*3a;':cy }*txe**111 ':1l;:j;rrs ::l:*ac!':er: **d *:r:i*r::: xitl r*p*:l l* ser":ri*g, i*r s**:* l. **:* i* a negatirc ;o-*ll:r.:e*: i:l ,:!]..*ta,t,*., i.*. lh*r* j: a rlil?*rexc* !:**l'ec:: *:* r.:ji:ri*ns *l:*el*rs a::d:.;:.trlel*. &= ili:r3t tti:.e ? :*d i i= **:rt*xe*. ** t::;1 t:,:*e 1r.:lir:*: ;;:: 1':* ri:i:xr: x :i':* e::rrerp*r:r**g ;*<f?i*i*=t *i:*-r*iati*r': ti !'*tat :x:li. Fr:r,!':* l**re I *tr J i...-ri ::" ; r;iridilf! ipc*i:ive;*-:*i*t:::1 **t:.v*g;r ii:c::pili::::: r:i l*a*i:;:: 3nql :rt!*€t,tl. ll':* r*ge;rr*;r :l:-1<r r:L:*r;** i: t!:*:. *e:* i= :.:* :;igrri*e::::dil?"er*::::= **ar::** :lr* i::*::*:;*r*;i'a*::*l':";:=::::J =::.:i*;:;-
:t l:
:a
:
:
,
:
:
III,
3
*t*:
€'€
**€
€ta€
**
..
!:": {h* rr:i*re:"::c *i:1":e si:th a*ribute i.i:" "Ta::g131*":tl':* r*::a:*hel corel;ded:1: *il*lvir:g fa*rs
. k{aj*:i:1, *l:!::* res3::::eiert: se "Y*ry Sa:ls*erJ" ab{}ua the "Siliir:g Anal3*:ce::1s". "tr{ai::le::al:ee *lLighti::g a::d ?*mgerarare j;: :3:* Libr:r_:'", *t :}e sx::* tir:e. al1 :3* staiT member: a* r**il at :** at:r:have il:* **g::ir***e t* kr:ep at.:* :e*l:::ai:: "Sr.rifi*ii::':t Sil*r:*e" xithi* ih* eaxp*: pa*i*ularly ia lleli**r,l iall. -3;:
r*sear*her fuxi"l*r *bs*n*d al:aa i:1ajr:riry r:ith* respr:ad*nt* *3:sati.iled:cr*'xtlsrh* "Ad*qr.rat* ard C**:iorr:ble *.e*dix3 R<;*rns". At ai* sttxe tiu':*. mai*i:y rf tl":*lx a:e satirfird
*3r:L:: rh* v:"ri*us racgi*l* l*eilities pr*viel*d r* :}:em by :leir library. ?!r:s. *:ajoriry* of rhem feli
e*xi**a}!e rvl':ile usi-g:iT*s* I**iliti*: ac<!:*rvi**: pr*vid*d l* th*.:: i* pe.:h*i: r*q::iremr:r::s by
:heir 1i**:;*.
r ,{**r *raking applilatir::s *l :;tatis:r*al tcl*ls. i:': {::.ler {c ;:tt*y. an-v :imiiarit-v r:r di:*rep=acy }*tw***:}:* r:;:inio:-:s *l t=ae}:*r: a::d s1r:*:::rts lvi:h le:;p*ct:*:c*ri:':g, F*l **r:re t. thrr* is *:':*g*tlv* ttl*-::-;:i1ici*:':t rI e*-:*l*tial, ibr sx..re f i: ::*n*i:r::ed, n* s*ah r:*:rel*:i**:i c:::: be *rax* as:i:*,-"-r:r:r::sF*l:rii:':1; **-*lfici*r':i ::i e:*:*la:iix i, very sn:al1 and fi:r 1i:* sci:rr* l. ,l ar:l J lh*r* :s
tl.:*sisler:*y {p*:iri;e ec*r*}ati*= Le:.***:": tl.:* *pi:r1*:.:s *l le**hers :nd s*:ii*n:s}. Th*r:: i* n,l
r:g-:llc*ni dil{*rer:c* b*:ra'*e* al':e r::*a:: :e*re *l:*acher* ;r.::d *tuaJ*:1as.
nrrake=a131. ,1gar:+al, J. l';. ai*5ri. Librxi*s i:: Ax*i*:tt 1::*ia- **11":i: lndlan Llbraria:":,{:s::*ia:i*c.
:. llagade. 5.1]. {:a}**}. "1::::1QL:allly L'lanager-*::L Xur::3ai: lli=::iaya i}a*li::atir:n.
3. 131-:::t=::i:ryy=" 3. {:.1}**1. l. 3*:;ear*}r *1et}:r:dr:l:-:gy.lii*ra }e}}i: [x*ei 3**l.s 3:bli:a:i*l.
{l;f*;:*" }. an<i:11r:;h**:se" =.
a 1t}i}j}. ?*tal {ua1i4;11;:a=ge**::t" lr*t Y*:k: 3*f ?xb.
l];i;:,l-1.13.{;l}tl}. fr::alQr:alityh'1:**g*r*r:t.I}eihi:f*:rsr:r:3*u*a:i*r':,{*ia:
l}*pr::*p*. f . t l*?:]" Ferf*rxa:ee Slexssri.s f*r pr:bli* li3rary. 1*::d*a: X.{C&Uf Lad.
{ju:":. A. }1" a:*{}:}. f*::*;:::r**lais::lltatis:i**" K*lka:a: lV*r}* Fr**.
-tt
4.
i.*"
:
:L
I!_
Tr
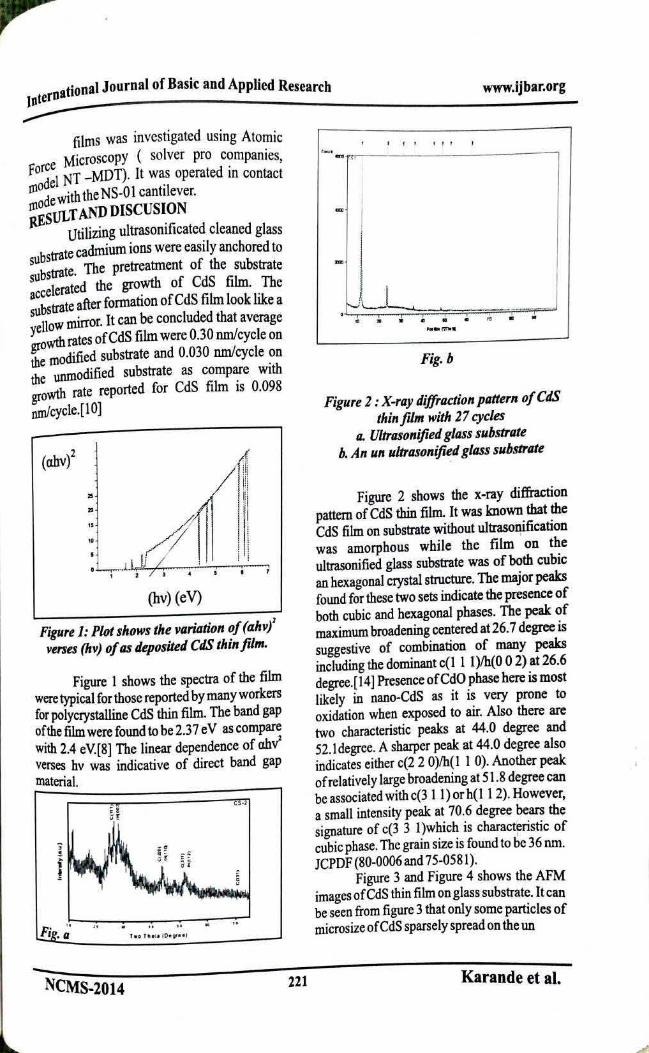
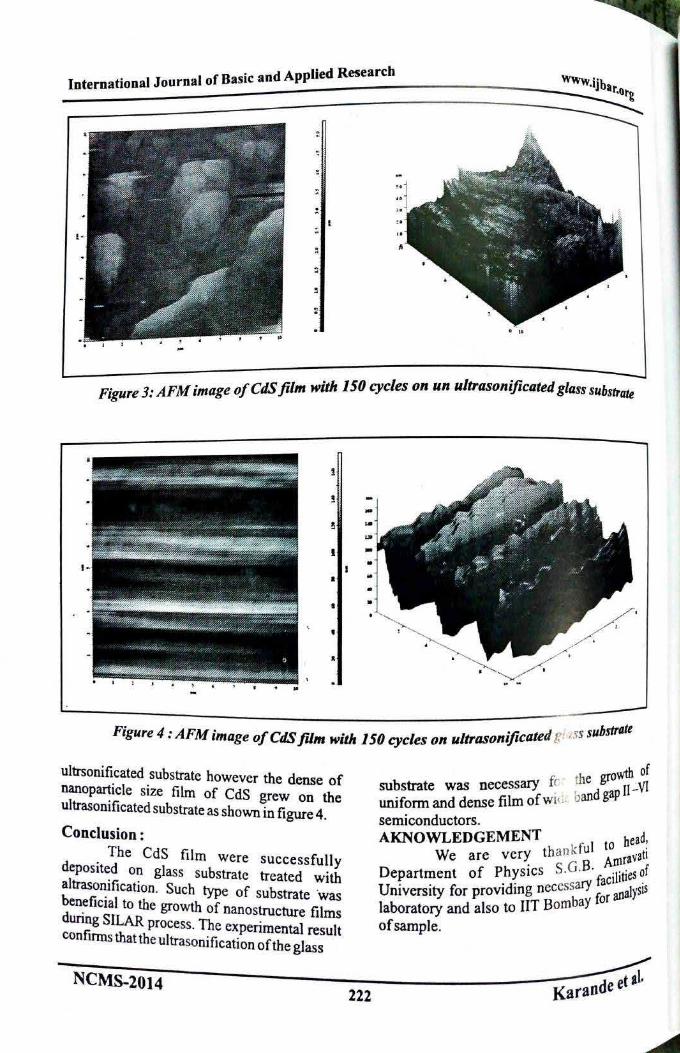
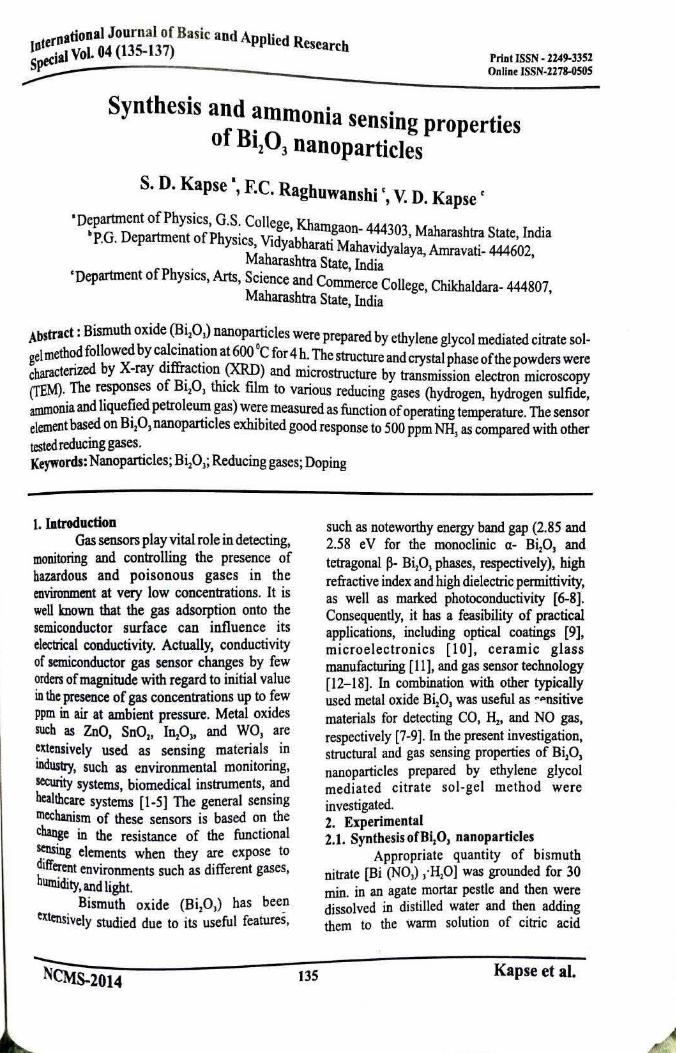
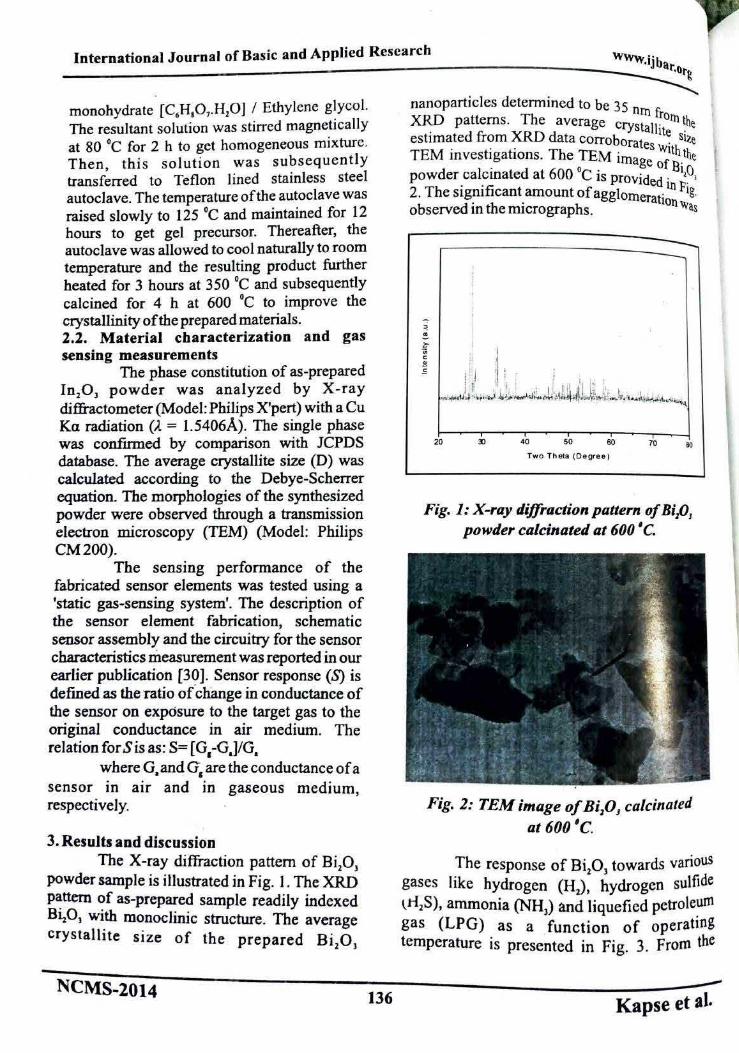
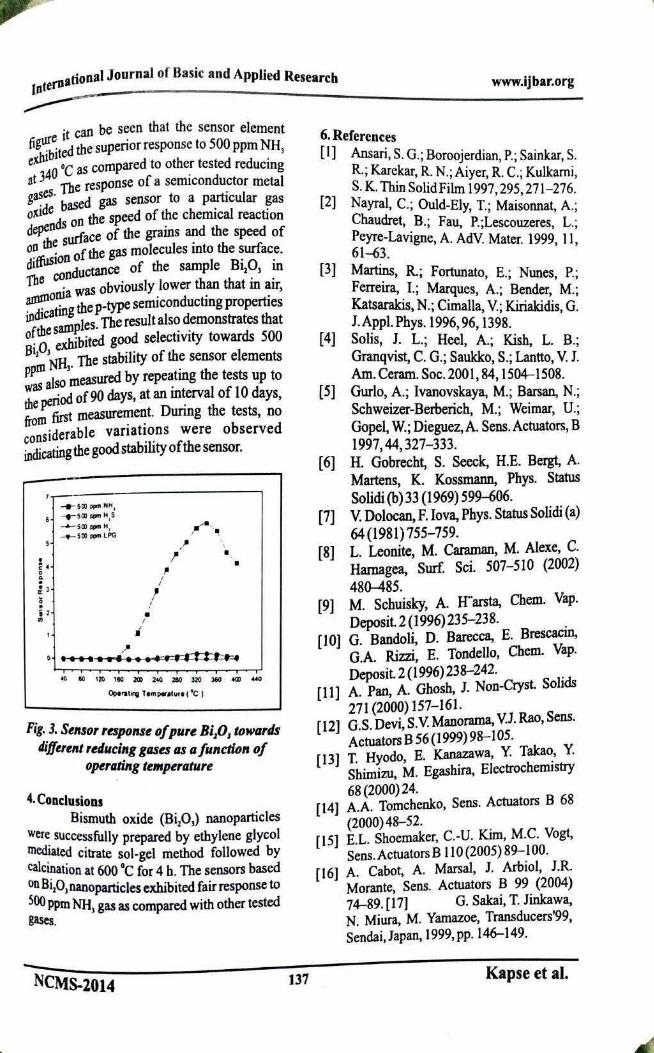
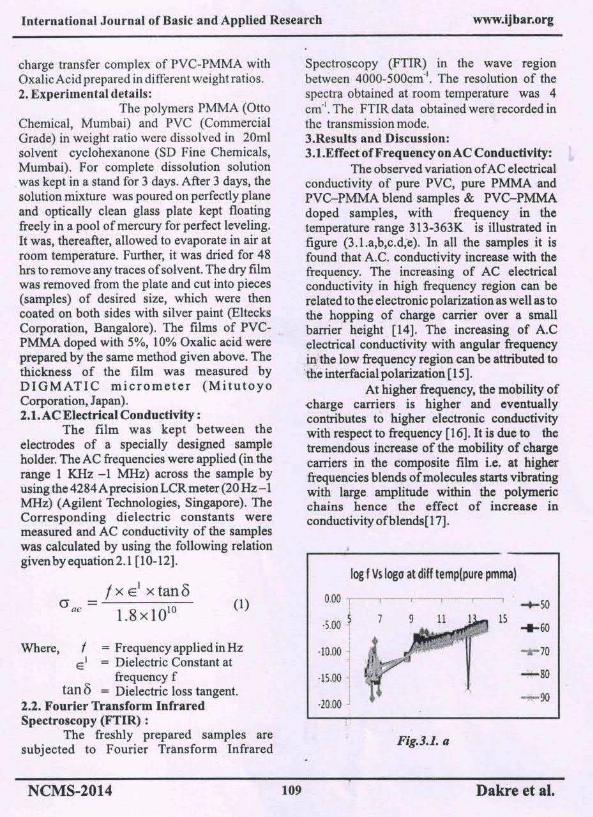
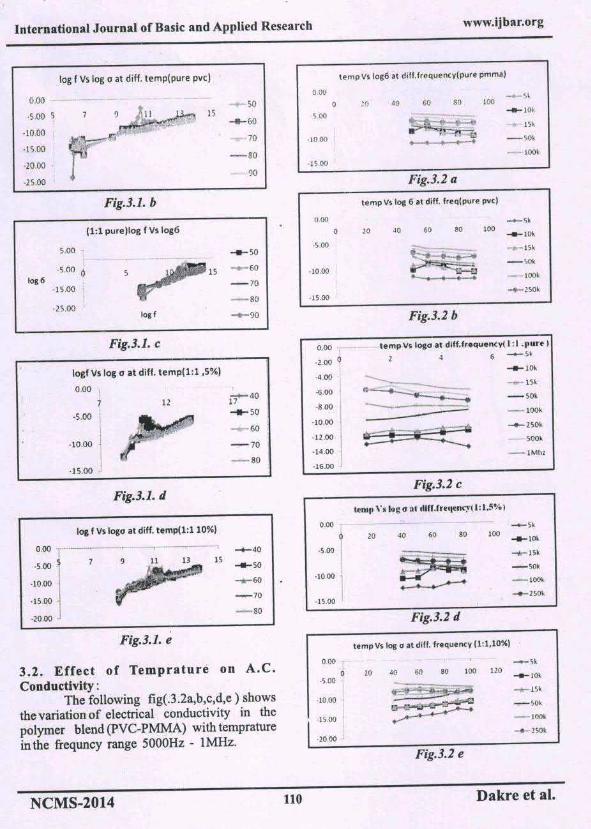
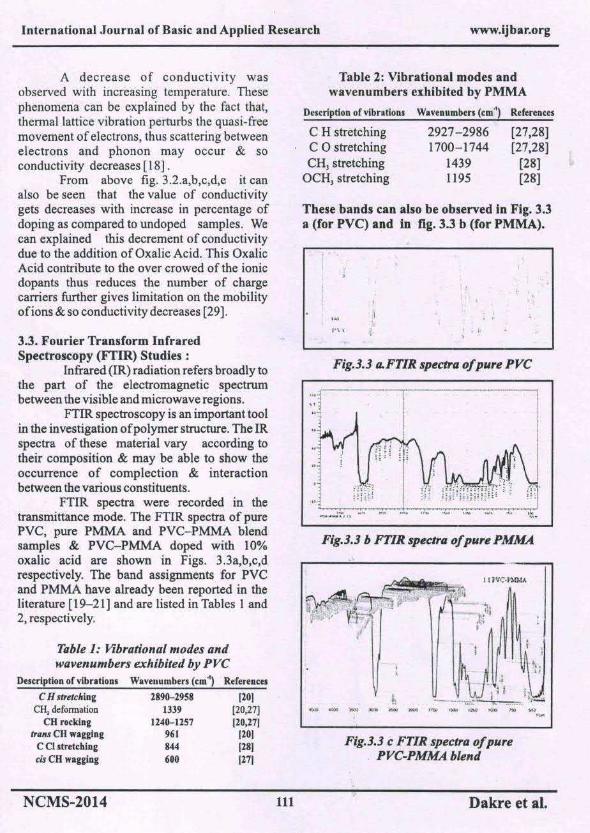
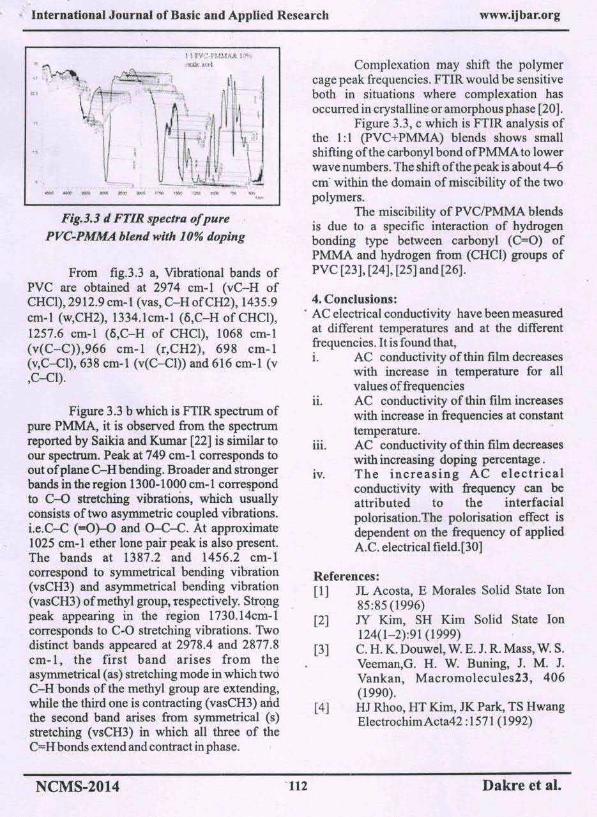
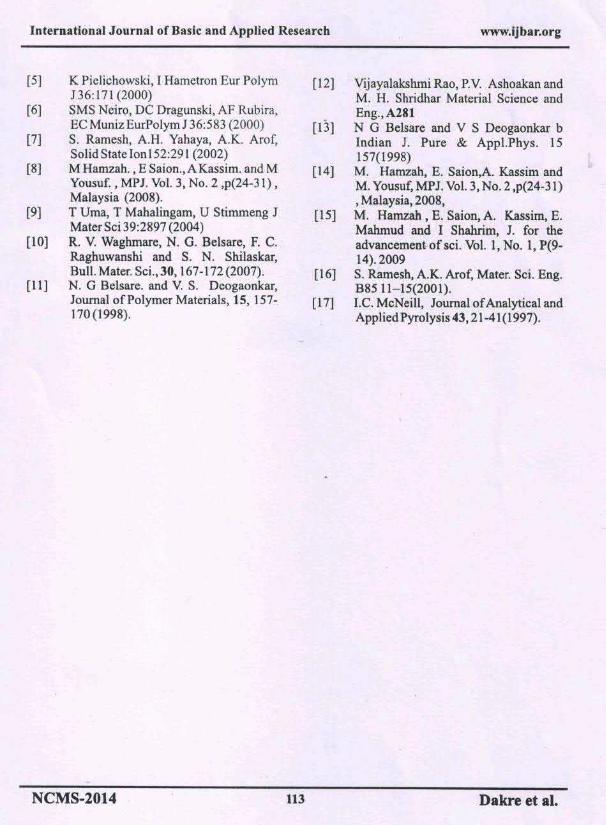
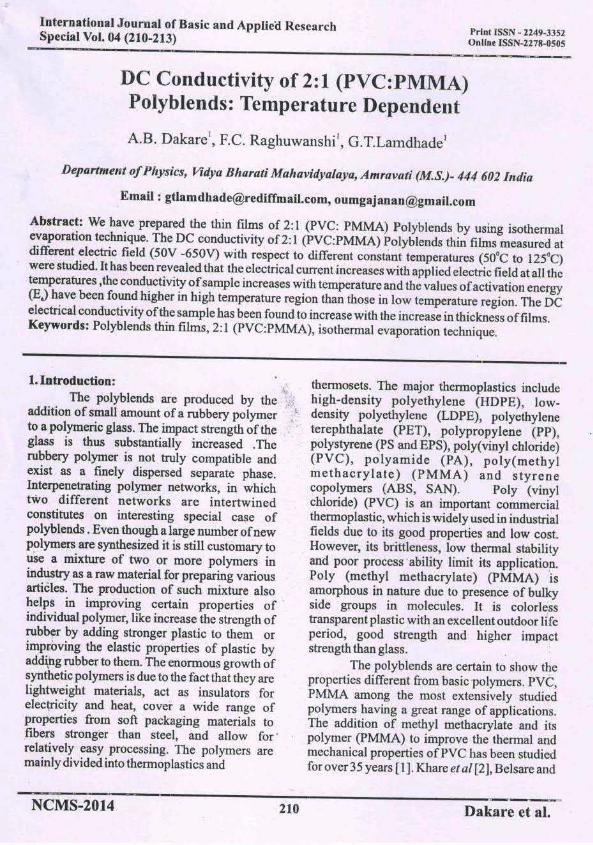
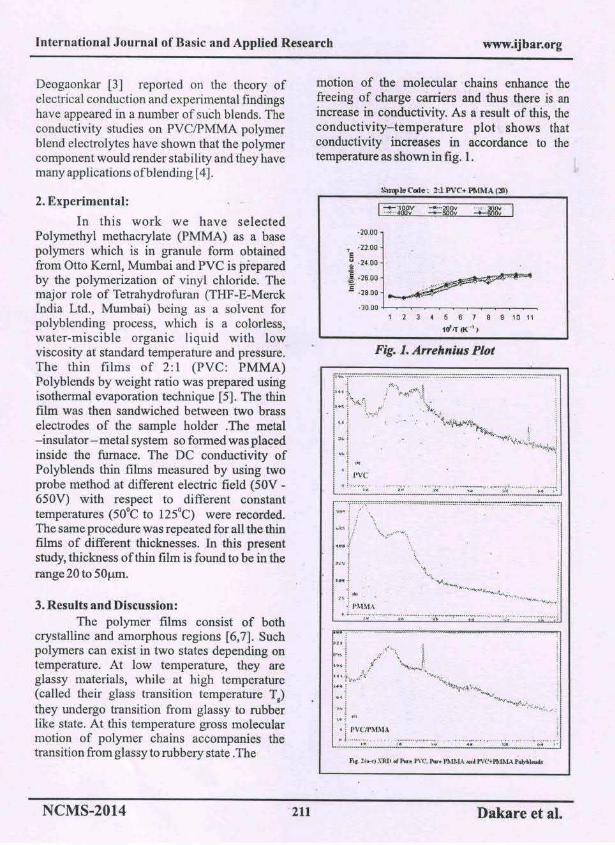
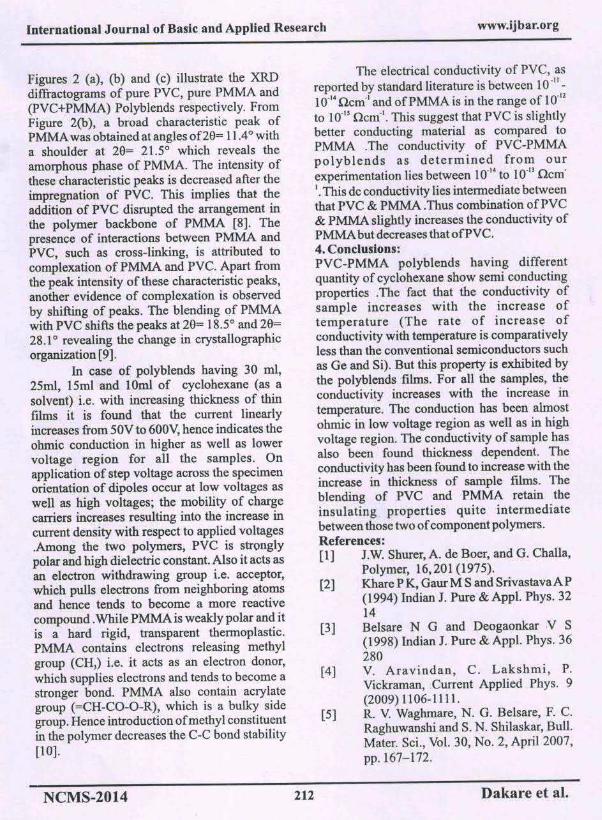
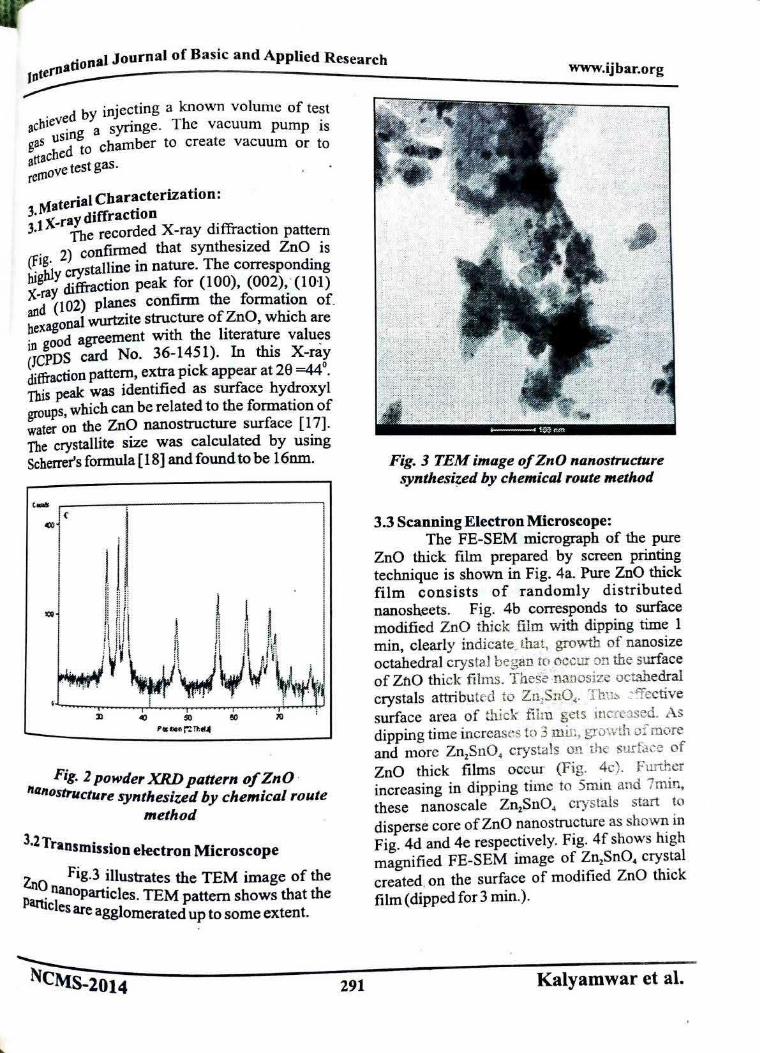
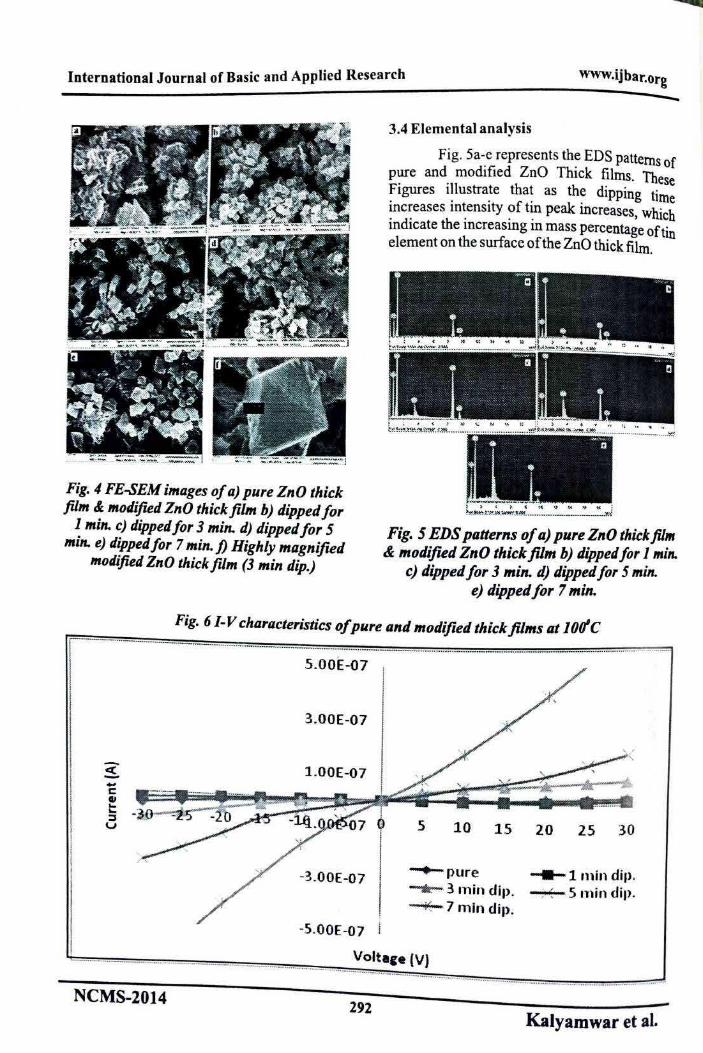
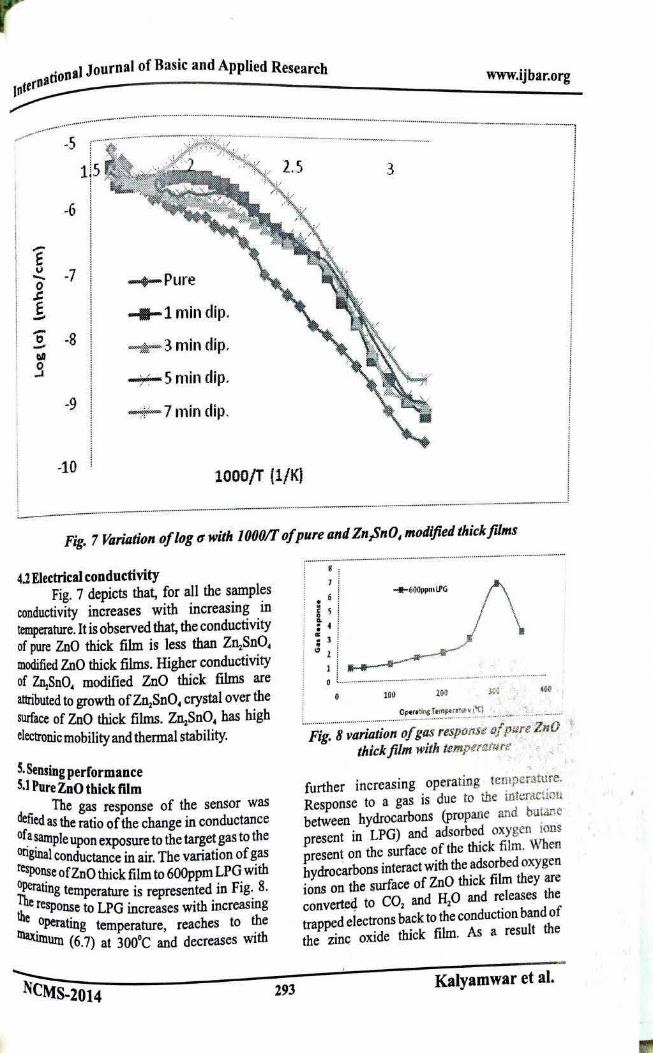
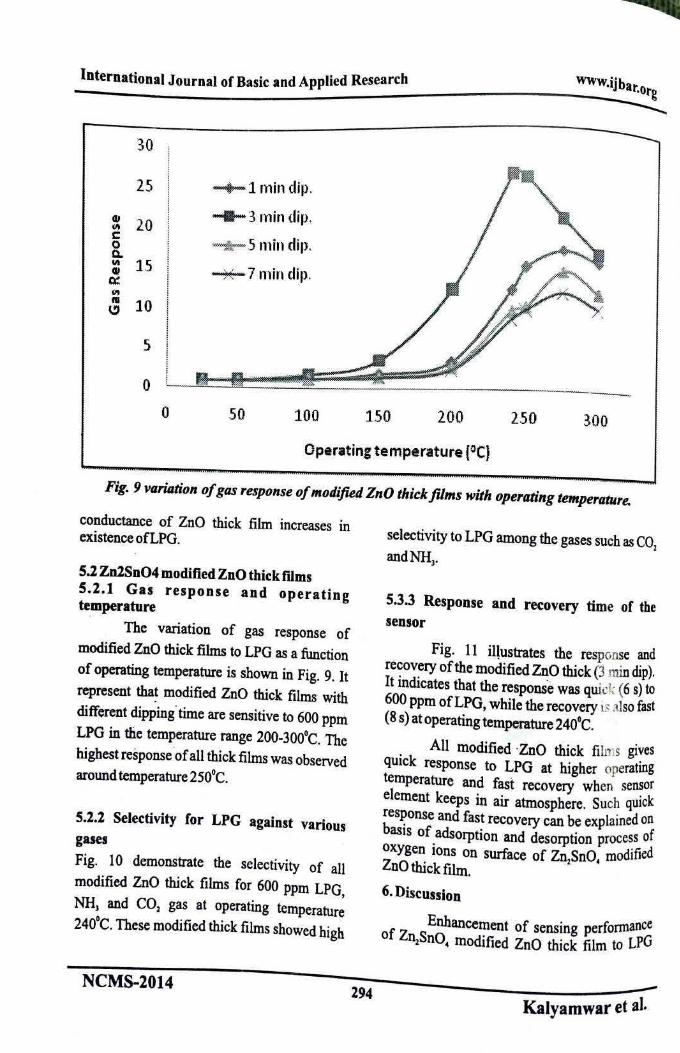
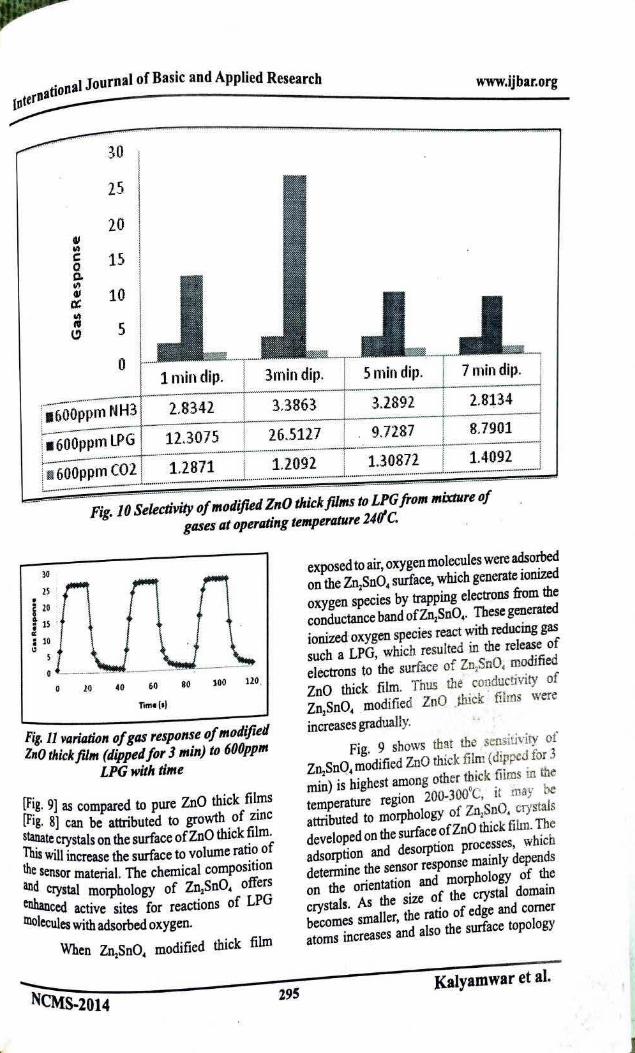
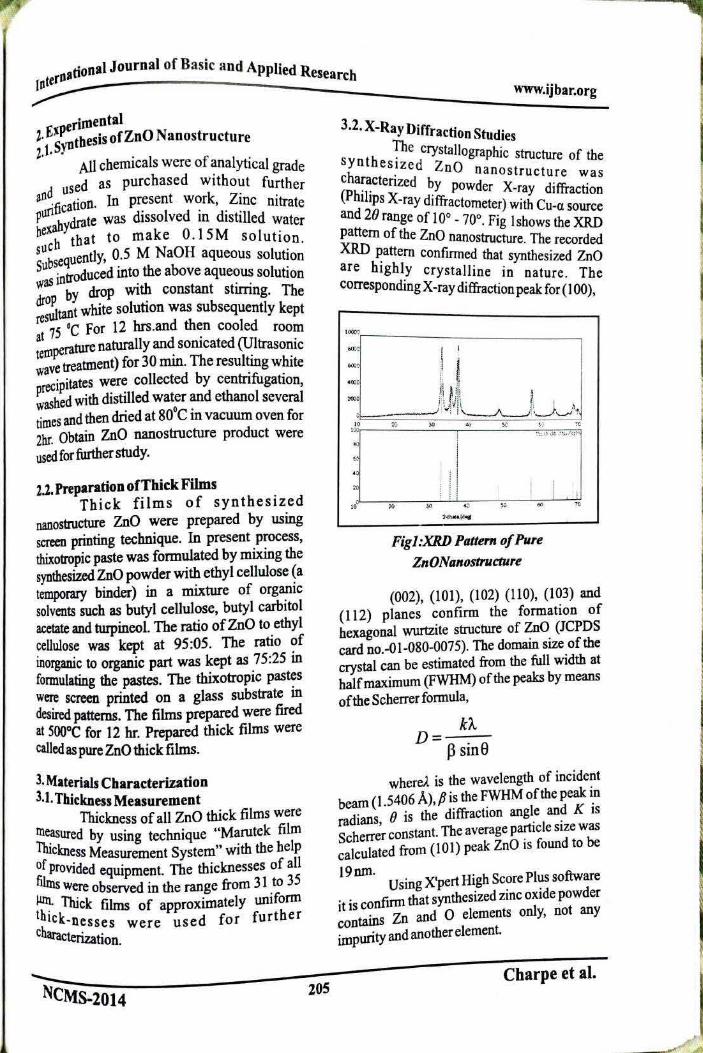
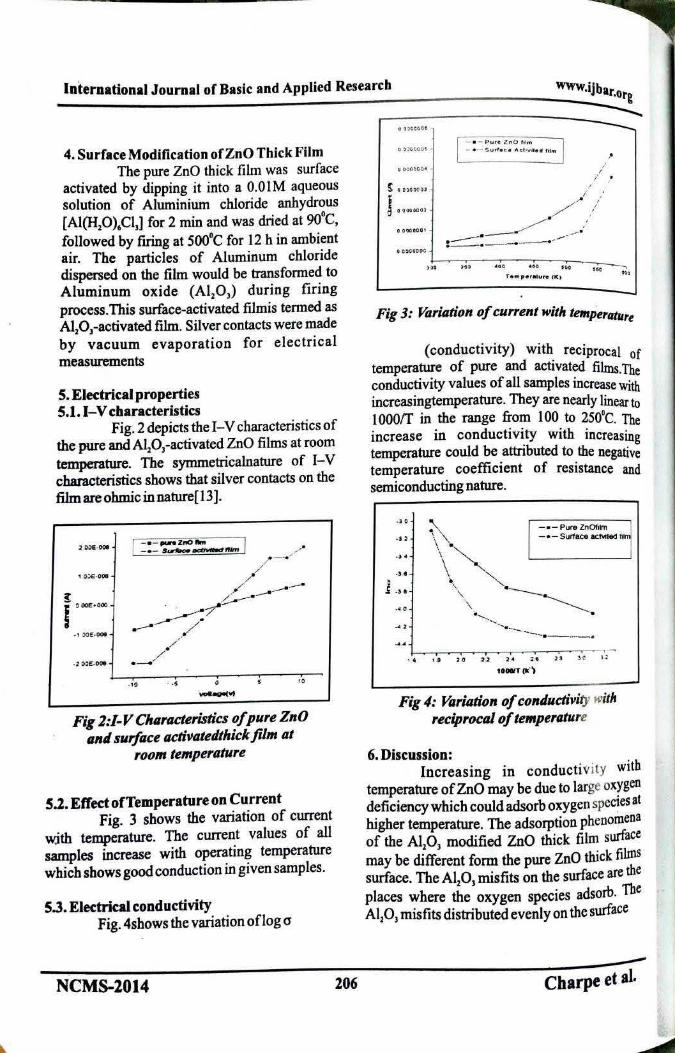
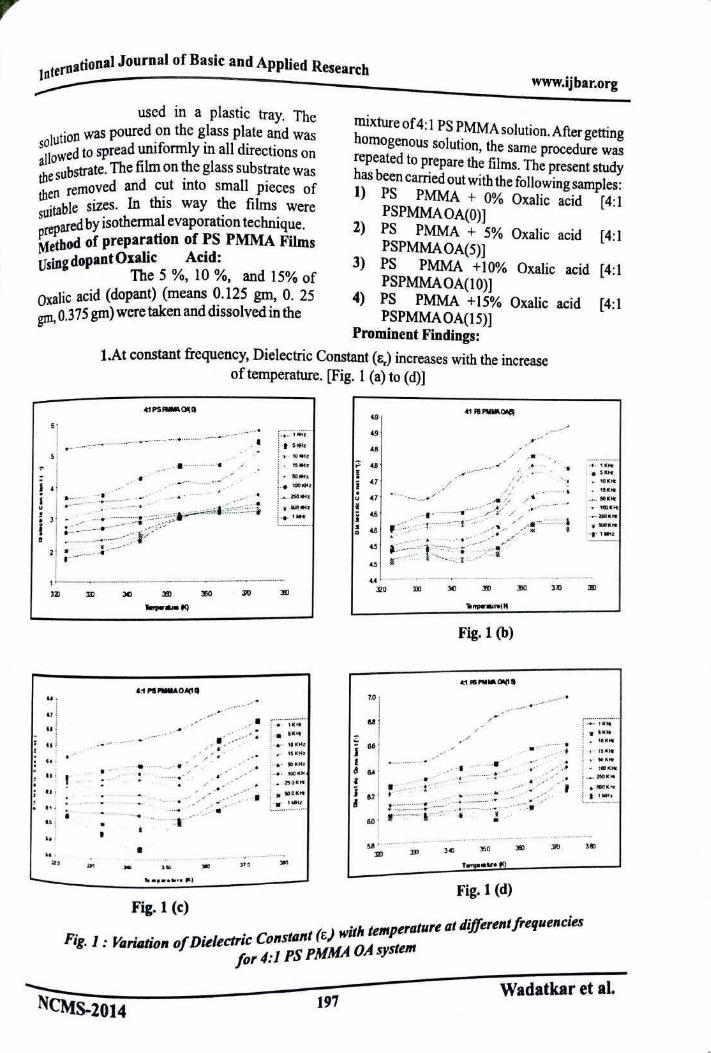
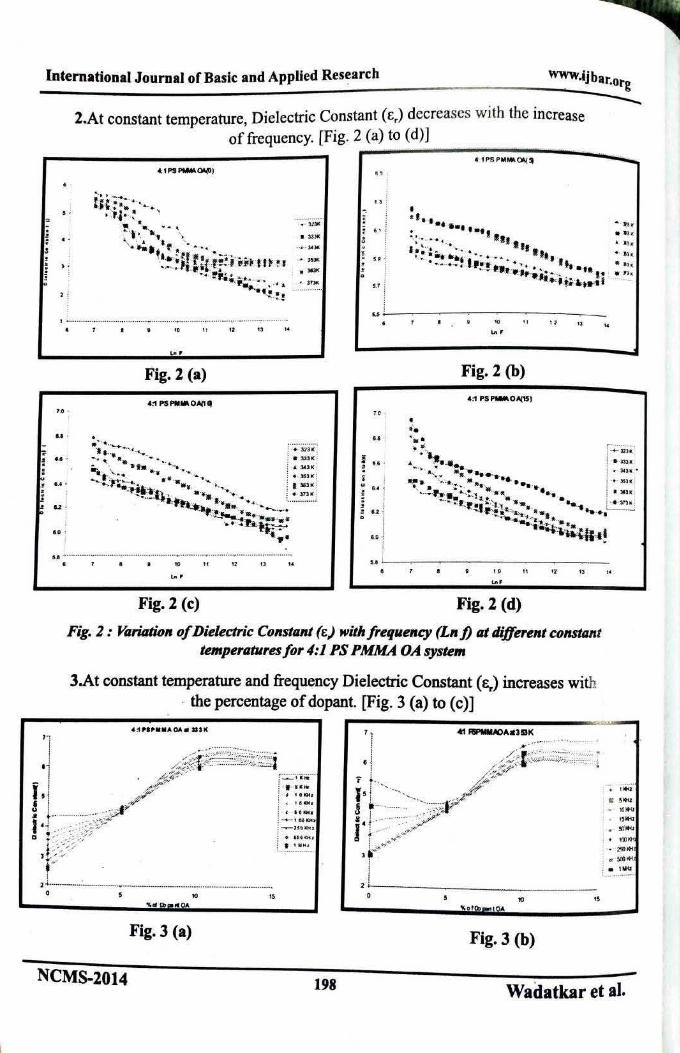
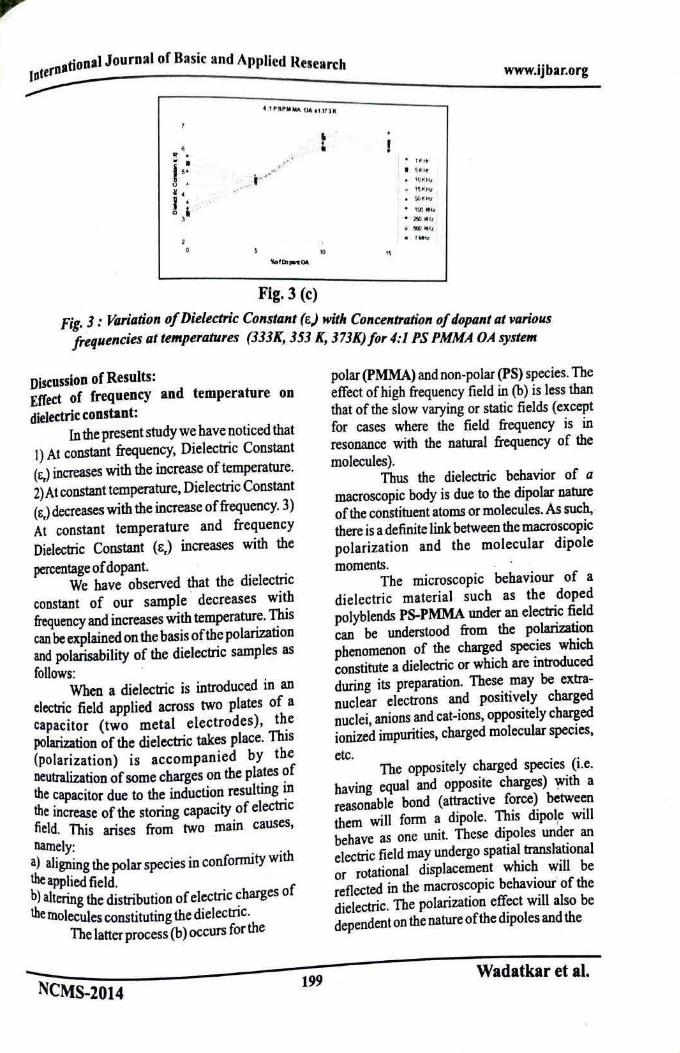
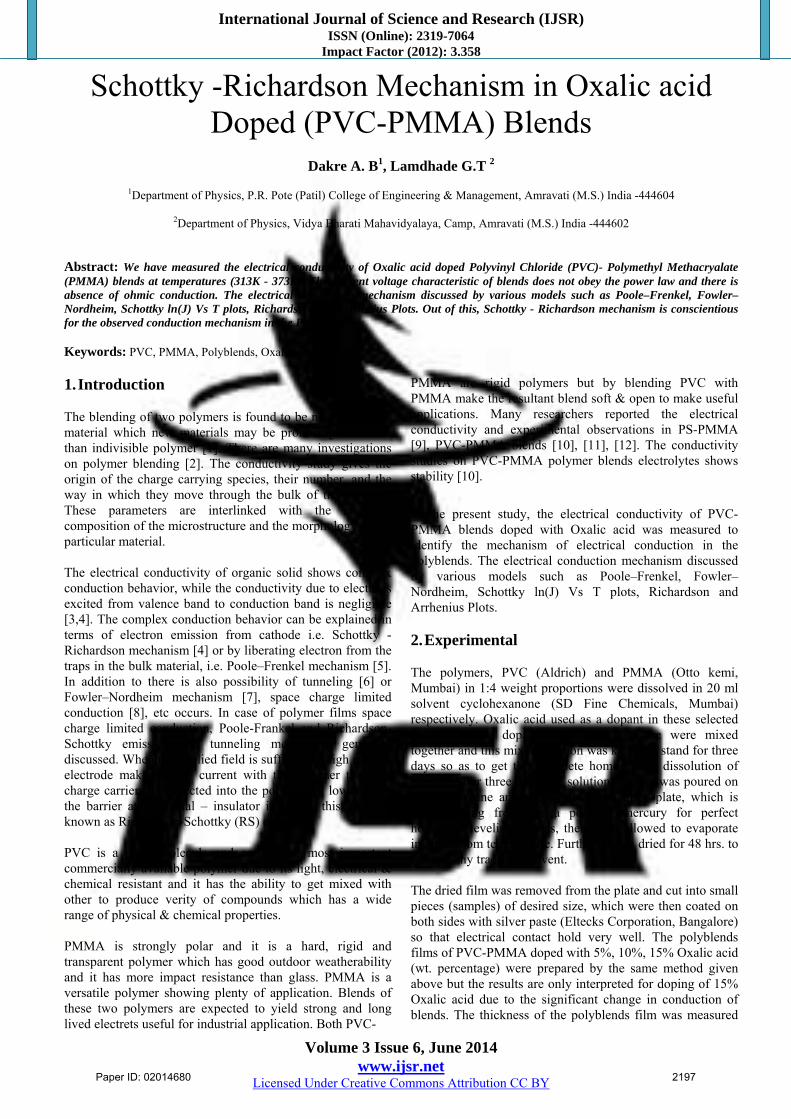
International Journal of Science and Research (IJSR) ISSN (Online): 2319-7064
Impact Factor (2012): 3.358
Volume 3 Issue 6, June 2014 www.ijsr.net
Licensed Under Creative Commons Attribution CC BY
Schottky -Richardson Mechanism in Oxalic acid Doped (PVC-PMMA) Blends
Dakre A. B1, Lamdhade G.T 2
1Department of Physics, P.R. Pote (Patil) College of Engineering & Management, Amravati (M.S.) India -444604
2Department of Physics, Vidya Bharati Mahavidyalaya, Camp, Amravati (M.S.) India -444602 Abstract: We have measured the electrical conductivity of Oxalic acid doped Polyvinyl Chloride (PVC)- Polymethyl Methacryalate (PMMA) blends at temperatures (313K - 373K). The current voltage characteristic of blends does not obey the power law and there is absence of ohmic conduction. The electrical conduction mechanism discussed by various models such as Poole–Frenkel, Fowler–Nordheim, Schottky ln(J) Vs T plots, Richardson and Arrhenius Plots. Out of this, Schottky - Richardson mechanism is conscientious for the observed conduction mechanism in the Polyblends. Keywords: PVC, PMMA, Polyblends, Oxalic Acid 1. Introduction The blending of two polymers is found to be new polymeric material which new materials may be promising candidate than indivisible polymer [1]. There are many investigations on polymer blending [2]. The conductivity study gives the origin of the charge carrying species, their number, and the way in which they move through the bulk of the material. These parameters are interlinked with the chemical composition of the microstructure and the morphology of the particular material. The electrical conductivity of organic solid shows complex conduction behavior, while the conductivity due to electrons excited from valence band to conduction band is negligible [3,4]. The complex conduction behavior can be explained in terms of electron emission from cathode i.e. Schottky -Richardson mechanism [4] or by liberating electron from the traps in the bulk material, i.e. Poole–Frenkel mechanism [5]. In addition to there is also possibility of tunneling [6] or Fowler–Nordheim mechanism [7], space charge limited conduction [8], etc occurs. In case of polymer films space charge limited conduction, Poole-Frankel and Richardson-Schottky emission and tunneling mechanism generally discussed. When the applied field is sufficiently high and the electrode makes ohmic current with the polymer then the charge carriers are injected into the polymer by lowering of the barrier at the metal – insulator interface, this effect is known as Richardson-Schottky (RS) emission. PVC is a polar molecule and one of the most important commercially available polymer due to its light, electrical & chemical resistant and it has the ability to get mixed with other to produce verity of compounds which has a wide range of physical & chemical properties. PMMA is strongly polar and it is a hard, rigid and transparent polymer which has good outdoor weatherability and it has more impact resistance than glass. PMMA is a versatile polymer showing plenty of application. Blends of these two polymers are expected to yield strong and long lived electrets useful for industrial application. Both PVC-
PMMA are rigid polymers but by blending PVC with PMMA make the resultant blend soft & open to make useful applications. Many researchers reported the electrical conductivity and experimental observations in PS-PMMA [9], PVC-PMMA blends [10], [11], [12]. The conductivity studies on PVC-PMMA polymer blends electrolytes shows stability [10].
In the present study, the electrical conductivity of PVC-PMMA blends doped with Oxalic acid was measured to identify the mechanism of electrical conduction in the polyblends. The electrical conduction mechanism discussed by various models such as Poole–Frenkel, Fowler–Nordheim, Schottky ln(J) Vs T plots, Richardson and Arrhenius Plots. 2. Experimental The polymers, PVC (Aldrich) and PMMA (Otto kemi, Mumbai) in 1:4 weight proportions were dissolved in 20 ml solvent cyclohexanone (SD Fine Chemicals, Mumbai) respectively. Oxalic acid used as a dopant in these selected polymers. The dopant & polymer mixture were mixed together and this mixed solution was kept in a stand for three days so as to get the complete homogenous dissolution of blends. After three days, the solution mixture was poured on perfectly plane and chemically clean glass plate, which is kept floating freely in a pool of mercury for perfect horizontal leveling. It was, thereafter, allowed to evaporate in air at room temperature. Further, it was dried for 48 hrs. to remove any traces of solvent. The dried film was removed from the plate and cut into small pieces (samples) of desired size, which were then coated on both sides with silver paste (Eltecks Corporation, Bangalore) so that electrical contact hold very well. The polyblends films of PVC-PMMA doped with 5%, 10%, 15% Oxalic acid (wt. percentage) were prepared by the same method given above but the results are only interpreted for doping of 15% Oxalic acid due to the significant change in conduction of blends. The thickness of the polyblends film was measured
Paper ID: 02014680 2197
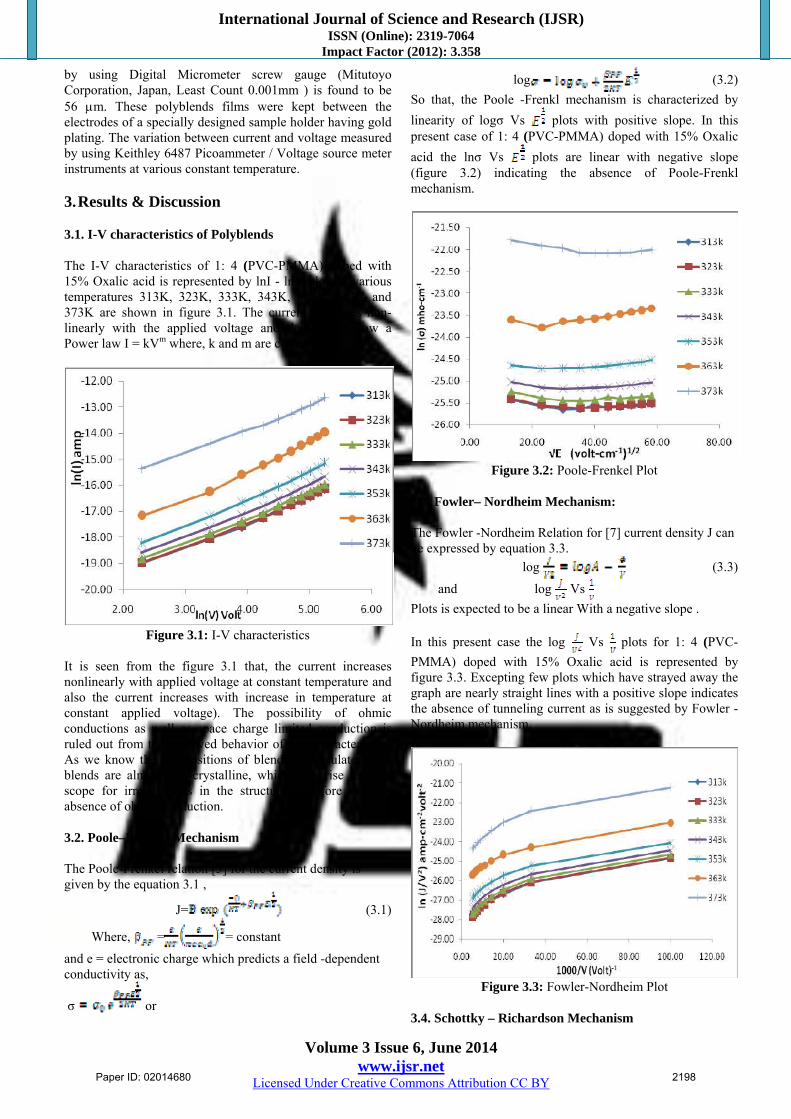
International Journal of Science and Research (IJSR) ISSN (Online): 2319-7064
Impact Factor (2012): 3.358
Volume 3 Issue 6, June 2014 www.ijsr.net
Licensed Under Creative Commons Attribution CC BY
by using Digital Micrometer screw gauge (Mitutoyo Corporation, Japan, Least Count 0.001mm ) is found to be 56 m. These polyblends films were kept between the electrodes of a specially designed sample holder having gold plating. The variation between current and voltage measured by using Keithley 6487 Picoammeter / Voltage source meter instruments at various constant temperature. 3. Results & Discussion 3.1. I-V characteristics of Polyblends The I-V characteristics of 1: 4 (PVC-PMMA) doped with 15% Oxalic acid is represented by lnI - lnV plots at various temperatures 313K, 323K, 333K, 343K, 353K, 363K and 373K are shown in figure 3.1. The current increases non- linearly with the applied voltage and does not follow a Power law I = kVm where, k and m are constant.
Figure 3.1: I-V characteristics
It is seen from the figure 3.1 that, the current increases nonlinearly with applied voltage at constant temperature and also the current increases with increase in temperature at constant applied voltage). The possibility of ohmic conductions as well as space charge limited conduction is ruled out from the observed behavior of I–V characteristics. As we know the compositions of blends are insulators and blends are almost non-crystalline, which give rise to wide scope for irregularities in the structure therefore there is absence of ohmic conduction. 3.2. Poole–Frenkel Mechanism The Poole-Frenkel relation [5] for the current density is given by the equation 3.1 ,
J= (3.1)
Where, = = constant
and e = electronic charge which predicts a field -dependent conductivity as,
σ or
log (3.2)
So that, the Poole -Frenkl mechanism is characterized by
linearity of logσ Vs plots with positive slope. In this present case of 1: 4 (PVC-PMMA) doped with 15% Oxalic
acid the lnσ Vs plots are linear with negative slope (figure 3.2) indicating the absence of Poole-Frenkl mechanism.
Figure 3.2: Poole-Frenkel Plot
3.3. Fowler– Nordheim Mechanism: The Fowler -Nordheim Relation for [7] current density J can be expressed by equation 3.3.
log (3.3)
and log Vs
Plots is expected to be a linear With a negative slope . In this present case the log Vs plots for 1: 4 (PVC-
PMMA) doped with 15% Oxalic acid is represented by figure 3.3. Excepting few plots which have strayed away the graph are nearly straight lines with a positive slope indicates the absence of tunneling current as is suggested by Fowler -Nordheim mechanism.
Figure 3.3: Fowler-Nordheim Plot
3.4. Schottky – Richardson Mechanism
Paper ID: 02014680 2198
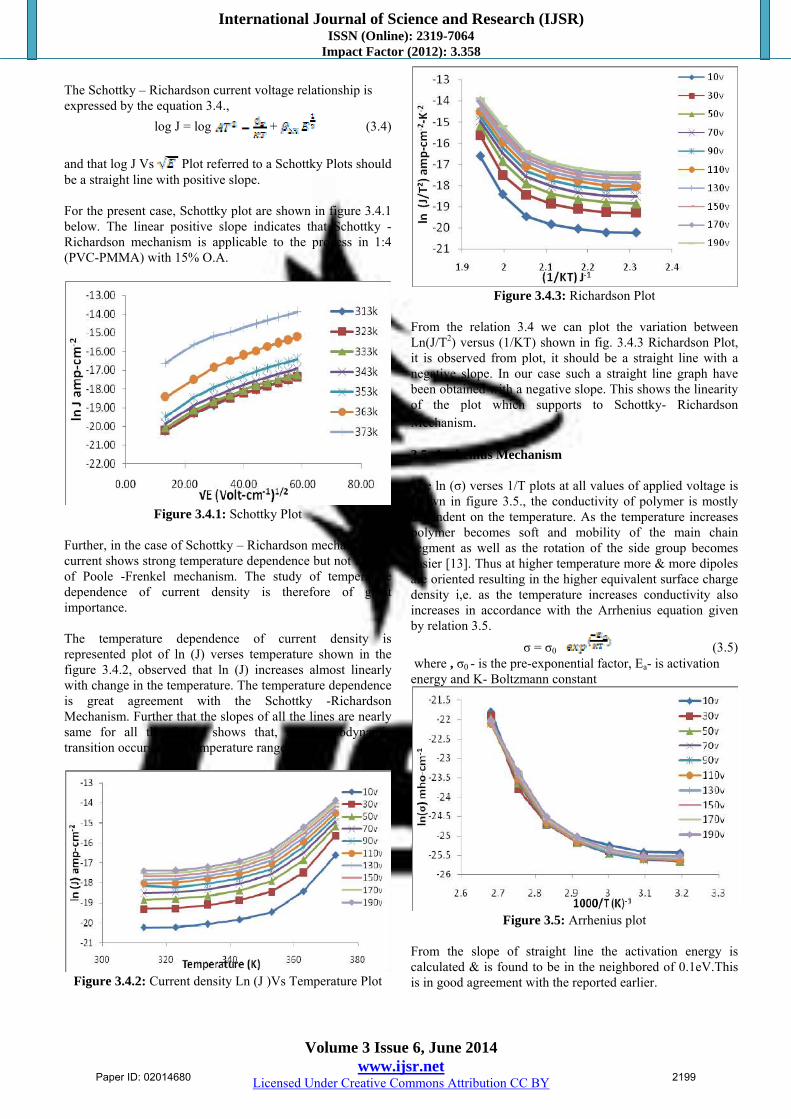
International Journal of Science and Research (IJSR) ISSN (Online): 2319-7064
Impact Factor (2012): 3.358
Volume 3 Issue 6, June 2014 www.ijsr.net
Licensed Under Creative Commons Attribution CC BY
The Schottky – Richardson current voltage relationship is expressed by the equation 3.4.,
log J = log + (3.4)
and that log J Vs Plot referred to a Schottky Plots should be a straight line with positive slope. For the present case, Schottky plot are shown in figure 3.4.1 below. The linear positive slope indicates that Schottky -Richardson mechanism is applicable to the process in 1:4 (PVC-PMMA) with 15% O.A.
Figure 3.4.1: Schottky Plot
Further, in the case of Schottky – Richardson mechanism the current shows strong temperature dependence but not in case of Poole -Frenkel mechanism. The study of temperature dependence of current density is therefore of great importance. The temperature dependence of current density is represented plot of ln (J) verses temperature shown in the figure 3.4.2, observed that ln (J) increases almost linearly with change in the temperature. The temperature dependence is great agreement with the Schottky -Richardson Mechanism. Further that the slopes of all the lines are nearly same for all the fields, shows that, no thermodynamic transition occurs in the temperature range studied.
Figure 3.4.2: Current density Ln (J )Vs Temperature Plot
Figure 3.4.3: Richardson Plot
From the relation 3.4 we can plot the variation between Ln(J/T2) versus (1/KT) shown in fig. 3.4.3 Richardson Plot, it is observed from plot, it should be a straight line with a negative slope. In our case such a straight line graph have been obtained with a negative slope. This shows the linearity of the plot which supports to Schottky- Richardson Mechanism. 3.5. Arrhenius Mechanism The ln (σ) verses 1/T plots at all values of applied voltage is shown in figure 3.5., the conductivity of polymer is mostly dependent on the temperature. As the temperature increases polymer becomes soft and mobility of the main chain segment as well as the rotation of the side group becomes easier [13]. Thus at higher temperature more & more dipoles are oriented resulting in the higher equivalent surface charge density i,e. as the temperature increases conductivity also increases in accordance with the Arrhenius equation given by relation 3.5.
σ = σ0 (3.5) where , σ0 - is the pre-exponential factor, Ea- is activation energy and K- Boltzmann constant
Figure 3.5: Arrhenius plot
From the slope of straight line the activation energy is calculated & is found to be in the neighbored of 0.1eV.This is in good agreement with the reported earlier.
Paper ID: 02014680 2199
International Journal of Science and Research (IJSR) ISSN (Online): 2319-7064
Impact Factor (2012): 3.358
Volume 3 Issue 6, June 2014 www.ijsr.net
Licensed Under Creative Commons Attribution CC BY
4. Conclusions The observed conduction nature at higher fields and temperatures is found to be Richardson-Schottky emission. Due to the formation of charge transfer complex, there exist a link between the dopant molecules and polymer molecules in amorphous region. Schottky and Richardson mechanism of conduction predominates over other mechanism in the doped sample. The applied field seems to be insufficient to liberate electrons from the trapping centers (dopant molecules) showing absence of the Poole–Frenkel mechanism. References [1] Utracki L.A., Polymer Alloys and Blends, Carl Hanser,
Munich, FRG, (1990). [2] Aravindan V., Lakshmi C., Vickraman P., Current
Applied Phys. 9, PP1106-1111 (2009). [3] Khare Pavan and Shrivastav A P, Indian J. Pure Appl.
Phys. 29, pp1410 (1991) [4] Schottky W Z, Phys. 15, pp872 (1914) [5] Frenkel J, Phys. Rev. 54, pp647 (1938) [6] Mann A T, J Appl Phys , 35, pp217 (1964) [7] Fowler R H and Nordheim L, Proc. R. Soc. London 119,
173 (1928) [8] Rose A, Phys. Rev. 97, pp1538 (1955). [9] Belsare N. G., Deogaonkar V. S., Indian J. Pure & Appl.
Phys. 36, pp280 (1998). [10] Rajendran S., Uma T., Electrolytes Mater. Letts, 44,
pp242-247 (2000). [11] Waghmare R. V., Belsare N. G., Raghuwanshi F. C. and
Shilaskar S. N., Bull. Mater. Sci., 30, pp167- 172 (2007).
[12] Belsare N.G, Wadatkar A.S., Joat R.V. Wasnik T.S., Raghuwanshi F.C.,Raulkar K.B. Lamdhade G. T. Journal of Electron Devices, Vol. 11, pp583-587, (2011).
[13] Sangawar V. S., Dhokne R.J., Ubale A.U., Chikhalikar P.S., , Meshram S.D., Bull. Mater. Sci., 30/2 , pp163–166, (2007).
Author Profile
Ms. Archana B. Dakre has received her B.Sc. degree in 1996, M.Sc. degree in 1998 from Sant Gadge Baba Amravati University, Amravati, Maharashtra State, India. Recently she is registered for Ph. D. degree in the Sant Gadge Baba Amravati University, Amrvati.
Presently she is working as Assistant Professor at Department of Physics, P.R. Pote (Patil) College of Engineering & Management, Amravati since last four years and she has also ten years teaching experience in the UG and PG level. She has published two research papers in reputed international journals and two research papers presented in conference. Her current interests of research are synthesis and characterization of Polymers, polyblends, polymer electrolyte and gas sensors etc.
Dr. G. T. Lamdhade has received his B.Sc. and M. Sc. Degrees from Sant Gadge Baba Amravati University, Amravati, Maharashtra State, India. in the years 1996 and 1998 respectively. He obtained his Ph.D. degree in year 2003 from Sant Gadge Baba
Amravati University, Amravati. Currently he is an Associate Professor in the Department of Physics, Vidya Bharati Mahavidyalaya, Amravati. He has fifteen years teaching experience at UG and PG Level classes, currently five students are working for Ph.D. Degree under his guidance and five students have been awarded by M.Phil. Degree under his guidance. He is also supervised fourteen M.Sc. Physics students for completion of dissertation/project. He is working as members on various committees of college administrative and university administrative also. He is working as a editorial board member, review members, referee, expert, members on many international/national journals and he has completed one research project sanctioned by UGC and one major research project is in progress. He has published more than thirty five research papers in reputed international journals and conferences. His current interests of research are in synthesis of metal oxides nanoparticles, Polymers, polyblends, polymer electrolyte, nanocomposites, Humidity sensors etc., characterizations and their applications as chemical gas sensors, thin and thick film sensors etc.
Paper ID: 02014680 2200
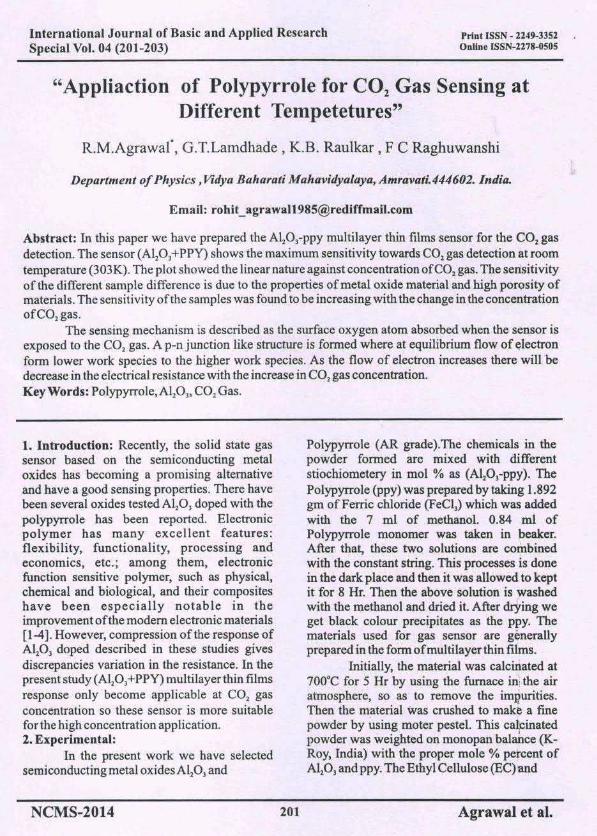
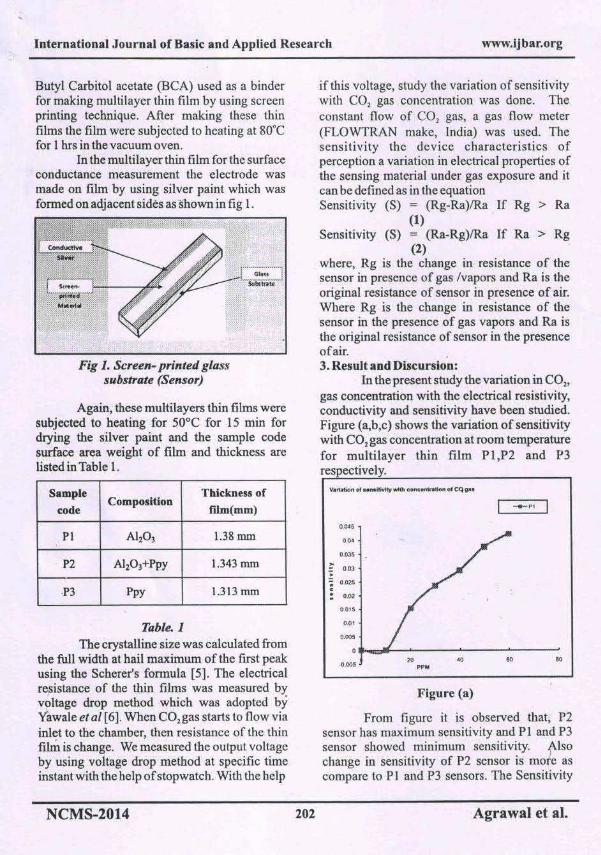
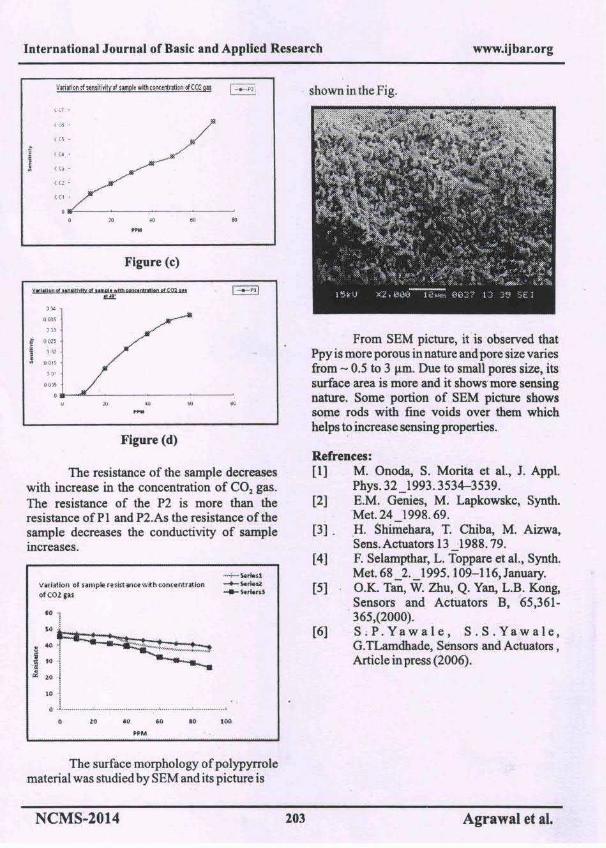
1Corresponding author
hazardous to aquatic fauna.
The experimental fish of were
collected from the local Wadali lake around Amravati
region. They were washed with KMnO solution to avoid
dermal infection the fish were acclimatized to the laboratory
condition for 15 days. During this period fish were fed on
commercially available food .For experimental purpose the
pesticide mixture was prepared by dissolving sufficient
amount of pesticides in 1000 ml of water. A calculated
quantity of stock solution was added to the water in the
experimental aquarium. All fishes of average size that is
(10-13cm) and weight (13-25gm) were used. After
acclimatization of 10-15 days fishes has become divided
into two groups:
GROUPI - Control fishes
GROUPII Experimental treated fishes
Group I fishes was kept in the cypermethrin free
water and served as control and Group II freshwater fishes
were treated to sub lethal concentration of
synthetic parathyroid a cypermethrin. The LC values were
calculated 0.00078 µl/lit at 96 hrs exposure period.
Then after the interval of 24, 48, 72, 96 hours from
each group fish was taken out for the dissection and
dissected out ovary of both controlled and treated fishes of
different time interval. For observed the effect of
cypermethrin an ovary of , after dissection
proceed for the histological slide preparation and slides
observed under the microscope.
MATERIALSAND METHODS
Channa striatus
Channa striatus
Channa striatus
4
50
Pollution is the impairment of the quantity of
some part of the environment of quality and by addition of
harmful impurities. The increased use of insecticides in
agriculture has contributed to the improvement of
agriculture production. However many adverse effects
have been recognized. The mode of action of these
compounds has been subjected to intensive study. Like that
pollutants the domestic sewage is also biggest harmful
substances this sewage accumulates day by day and it is
hazardous to environment not only in rural areas pollution it
posed a threat for the survival of fish and other aquatic
organisms in the estuarine ecosystem but also in urban area.
The sewage is mixed with water sources and caused the,
water quantity and even anesthetic quantity
Use of different pesticides in agriculture to
prevent the crop from pest has increased especially in
developing countries Santhakumar and Balaji, 2000. These
pesticides, even when applied is restricted areas are washed
and carried away by rains and flood to large water bodies
like ponds and river and alter the physiochemical properties
of water which are proved to be highly toxic, not only to
fishes but also to other organisms, Madhav Prasad et al.,
2002. The well documentary effect of pesticides on the
physiology of fish includes its effect on reproductive
organs. Cypermrthrin is a synthetic pyrethroid used widely
to control a variety of insect pest, Crossdland, 1982 state
that low concentration of cypermethrin is toxic to many
species of aquatic organism. Increase use of pesticides not
only helped in controlling insects and pests but also
threaten to environmental contamination specially
EFFECT OF CYPERMETHERIN ON THE OVARY OF FRESHWATER FISHChanna striatus
abP. G. Deppartment of Zoology, Vidya Bharati Mahavidyalaya, Amravati, Maharashtra, India
ABSTRACTNow day's enormous use of pesticides is the issue of increasing in pollution which affects the non targeted organisms.
Animal living in the water are exposed to the pesticides are used in the agriculture field. The present study was carried to measurethe impact of pesticide cypermethrin on the gonad that is ovary of freshwater fish .Alteration of ovary showed thestructural, physiological and morphological changes in freshwater fish . Oocyte showed shrinkage andinterfollicular oedema, as well as yolk of the oocyte cells showed damage and rupture membrane of the oocyte showed stromalhemorrahage was observed.
KEYWORDS :
Channa striatus
Channa striatus
Channa striatus, ovary, cypermetherin, stromal hemorrahage
V. T. TANTARPALE AND S. H. RATHODa1 b
Indian J.L.Sci.3(2) : 87-89, 2014 ISSN : 2277-1743 (Print)ISSN : 2278-7879 (Online)
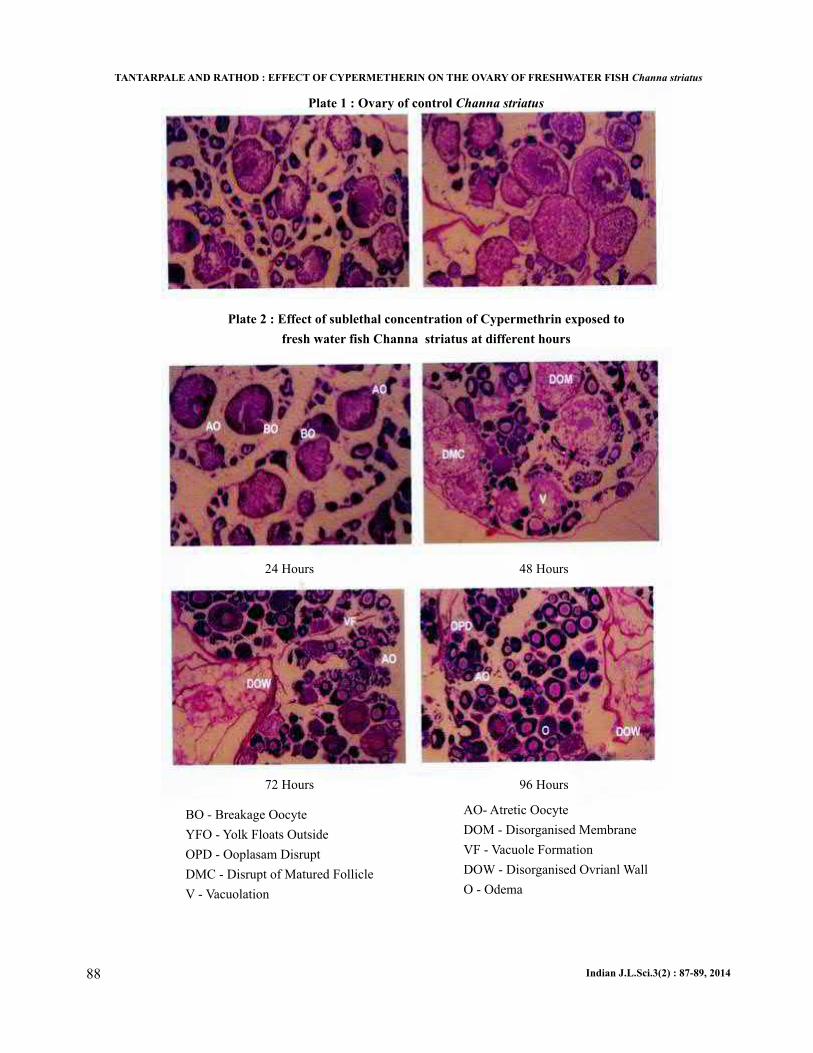
88 Indian J.L.Sci.3(2) : 87-89, 2014
TANTARPALE AND RATHOD : EFFECT OF CYPERMETHERIN ON THE OVARY OF FRESHWATER FISH Channa striatus
Plate 1 : Ovary of control Channa striatus
Plate 2 : Effect of sublethal concentration of Cypermethrin exposed to
fresh water fish Channa striatus at different hours
24 Hours 48 Hours
72 Hours 96 Hours
BO - Breakage Oocyte
YFO - Yolk Floats Outside
OPD - Ooplasam Disrupt
DMC - Disrupt of Matured Follicle
V - Vacuolation
AO- Atretic Oocyte
DOM - Disorganised Membrane
VF - Vacuole Formation
DOW - Disorganised Ovrianl Wall
O - Odema
In the present study indicated that the pesticides
cypermethrin exposed to fresh water fish at
different time duration, Which affected the ovary of fishes,
the disturb, rupture and degenerate ovary as compared to
normal. So concluded that the very lower concentration of
pesticides affect the physiology of fish , due to this it impact
on yielding of the fishes.
Aditya, Ajit Kumar, Sanjiv Chattopadhyay and Shyamal
Mitra, 2002. Effect of mercury and Methyl
parathion on the ovaries of (Ham) J.
Environ Biology : 61-64.
Chandra S., R.N. Ram and I. J. Singh, 2004. First ovarian
maturity and recovery response in common carp,
Cyprinus carpio after exposure to carbofuran J.
Environ. Biol. : 239.
Crossdland N. O., 1982. Aquatic toxicology cypermethrin,
Fate and biological effect in pond experiment.
Aqua. Toxicol : 205-222.
Dutta H.M., 1996. A composite approach for evaluation of
the effect of pesticides on fish, fish morphology,
:249-277.
Ghosh J. and Panchanan Nath, 2005. Seasonal effect of
melathion on ovary and plasma gonodotropin and
vitellogenin levels in intract and pinealectomized
catfish (Linn). India Journ. of exprim Biol. :
224-225.
Jyothi B. and Narayan G., 1999. Toxic effect of carbaryl on
gonads of fresh water fresh J. of
Environ, Biol. : 73-76.
Khillare M., 1992. Effect of ammonium sulphate an oocyte
development of fish (Ham.) Adv.
Biosci. : 75-78.
Lee W. K. and S.W. Yang, 2002. Relationship between
ovarian development and serum levels of gonadal
steroid hormones, and induction of oocyte
maturation and ovulation in the cultured female
Koran spotted seabass lateola brax macutlatus
(Jeom-nong-co.)Aquaculture 207:169-183.
CONCLUSION
REFERENCES
Channa straitus
Laleo rohita
Clarias batrachus
Barbus stigma
23(1)
25(3)
43
20(1)
11
OBSERVATIONSAND RESULTS
DISCUSSION
In the present study freshwater fish
exposed to sub lethal concentration of cypermethrin
showed the structural, physiological and morphological
changes. The treated fish observed flabbyed and
degenerative ovarian follicle. It showed degeneration and
nacrosis in oocytic cells. Also showed shrinkage and
interfollicular oedema in oocyte. The yolk of the oocyte
cells showed damage and rupture membrane of the oocyte.
Stromal hemorrahage were observed as compared to
normal fish ovary. Treated fish ovary showed atretic oocyte,
irregular shaped of oocyte.Also showed floating of contents
due to rupture of cell membrane, so vacuole formed at the
center of the oocyte. The Ovarian follicle rupture, ooplasm
of the ovarian cells was disorganized. The stromal
hemorrhage clearly observed .In this present investigation
the ovary of fresh water fish exposed to
cyermethrin were found to the disrupt, rupture and
degenerate. Primary and secondary growth of oocyte was
highly affected due to pesticide. Accumulated and forms
vacuole. Atretic oocyte membranes of degenerated oocyte
were observed prominently (Plate 1 and 2).
In the present study synthetic pyrethroid a
cypermethrin was treated with fresh water fish
. The Oocyte cell showed histological and
morphological changes. Similar finding were observed by
Dutta (1996) showed low concentration of fenetrothion and
carbaryl arrested the vitallogenic growth of oocytes in
. Also observed in exposed to
sub lethal levels of malathion resulted in significant
reduction in the ovarian weight and affected primary oocyte
and impairment of vitellogenesis; Adityakumar et al., 2002,
Chandra et al., 2004, Ghosh and Nath 2005.
Similar findings by Khillare, 1992 observed
oocyte maturation and arrest of oocyte development in
tertiary yolk stage; Lee and Yang, 2002 observed at the dose
of 100 ppm of sumithion, fragmented ova with abnormal
shape and arrangement were observed in the experimental
fish as compaired to normal. Jyothi and Narayan, 1999
reported the impact sub lethal concentration of carbaryl on
the ovary of arrest of ovarian growth.
Channa
striatus
Channa striatus
Channa
straitus
Channa punctatus G. giruris
,
Clarias batrachus
89Indian J.L.Sci.3(2) : 87-89, 2014
TANTARPALE AND RATHOD : EFFECT OF CYPERMETHERIN ON THE OVARY OF FRESHWATER FISH Channa striatus
Gijare Shruti S et al: Protein and amino acid modulation in fresh water fish Ophiocephalus orientalis
JPSI 3 (4), Jul - Aug 2014 Page 344
Journal of Pharmaceutical and Scientific Innovation www.jpsionline.com
Research Article
PROTEIN AND AMINO ACID MODULATION IN FRESH WATER FISH OPHIOCEPHALUS ORIENTALIS EXPOSED TO CYPERMETHRIN Gijare Shruti S.* and V. T. Tantarpale Vidya Bharati Mahavidyalaya Camp, Amravati, Maharashtra, India *Corresponding Author Email: [email protected] DOI: 10.7897/2277-4572.034169 Published by Moksha Publishing House. Website www.mokshaph.com All rights reserved. Received on: 15/05/14 Revised on: 02/06/14 Accepted on: 05/07/14 ABSTRACT Cypermethrin, a synthetic pyrethroid showed non-target effects on the freshwater fish Ophiocephalus orientalis. The presents study showed the impact of sub lethal concentration (0.0007 µ/lit) of cypermethrin on the concentration of protein and amino acid in two tissues such as liver and muscle of freshwater fish Ophiocephalis orientalis at different time intervals. Decrease in protein level was observed in both tissues liver and muscle. But there was observed increase in amino acid level in both tissues muscle and liver of Ophiocephalus orientalis at different time intervals. Keywords: Cypermethrin, liver, muscle, protein, amino acid. INTRODUCTION Water is main component of the environment which is dynamic entities. It has an effective means of transfer and transport of the waste and other materials. Soil on the other hand is stationary entities, which are indirectly affected by the contaminated water. Toxic waste dumped on a soil may cause harm to the animals and indirectly to human being. The structure and function of lotic ecosystems changed due to pollutants.1 The toxic effect of contaminated water on non target organisms is observed by2,3. One among the environmental problems is the lack of proper management of domestic and industrial wastes which release hazardous chemicals. There is no doubt; these excessive levels of pollutants are causing a lot of damage observed in human and animal health. The organic pollutants may cause declines, deformity and death of autistic life, which in turn cause disease to humans4-6. The aquatic environment is very important because it is a store house of variety of fishery resource. Presently aquatic pollution a serious problem thought out the world. It has been estimated that about 70,000 manmade chemicals are used day to day. These chemical have contributed a lot to the green revolution but their deleterious effects on various ecosystems cannot be ignored7.
MATERIALS AND METHODS The freshwater fish Ophiocephalus orientalis were collected from Wadali lake around Amravati region, India. The fishes were acclimatized at laboratory condition for 1 week. The LC50 value was calculated by probity analysis method8. The LC50 value is 0.0007 µ/lit at 72 h. The acclimatized fishes were exposed to sub lethal concentration for 24 h, 48 h, 72 h and 96 h; simultaneously a control group of healthy fishes were maintained under identical conditions. The fishes were sacrificed at the end of exposure period and liver and muscle were processed for the biochemical estimation. Protein was estimated by the method of Lowry’s9 and amino acid was estimated by the method of Moor and Stein10. RESULT The protein contents in the liver and muscle of the freshwater fish Ophiocephalus orientalis exposed to sublethal concentration of cypermethrin at different time intervals and it showed declined trend as compare to control values. Due to toxic effect of cypermethrin, the process of protein synthesis get altered and an increase in proteolysis activity and possible utilization of its products for metabolic purposes. The amino acid contents in the liver and muscle of the freshwater fish Ophiocephalus orientalis exposed to sublethal concentration of cypermethrin at different time intervals and it showed raised trend as compare to control value. Rised in amino acid level were the result of breakdown of protein for energy and impaired in association of amino acid in protein synthesis.
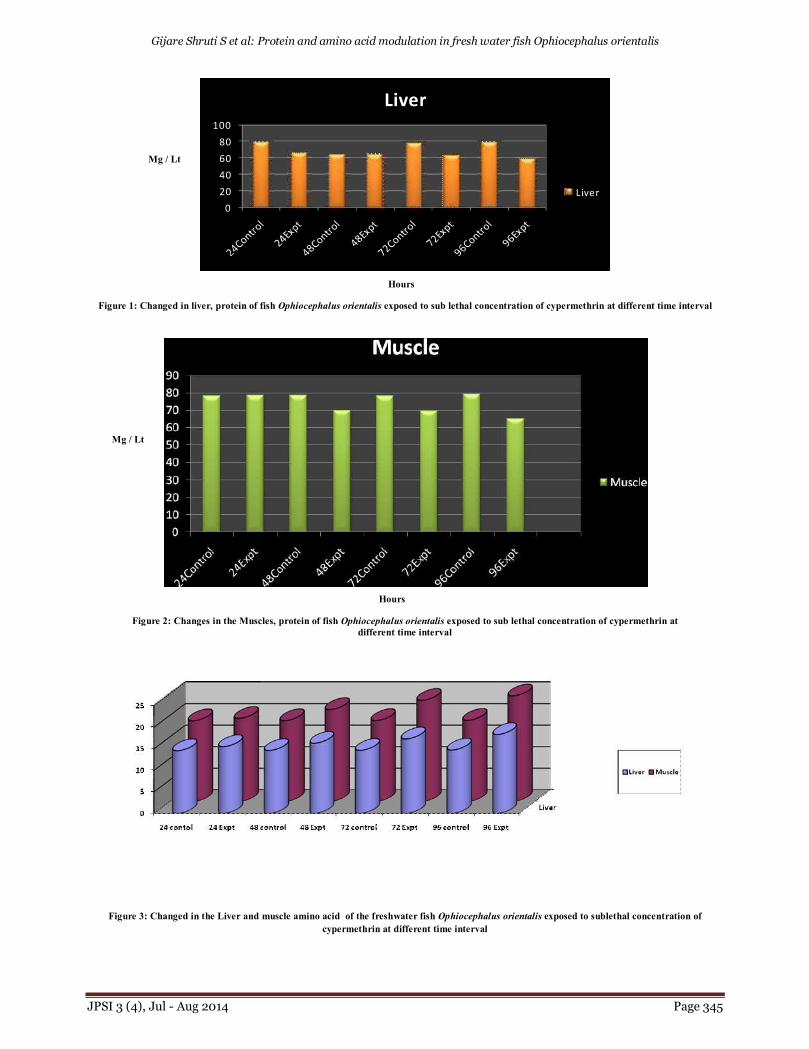
Gijare Shruti S et al: Protein and amino acid modulation in fresh water fish Ophiocephalus orientalis
JPSI 3 (4), Jul - Aug 2014 Page 345
020406080
100
Liver
Liver
Figure 1: Changed in liver, protein of fish Ophiocephalus orientalis exposed to sub lethal concentration of cypermethrin at different time interval
Figure 2: Changes in the Muscles, protein of fish Ophiocephalus orientalis exposed to sub lethal concentration of cypermethrin at different time interval
Figure 3: Changed in the Liver and muscle amino acid of the freshwater fish Ophiocephalus orientalis exposed to sublethal concentration of cypermethrin at different time interval
Hours
Mg / Lt
Hours
Mg / Lt
Gijare Shruti S et al: Protein and amino acid modulation in fresh water fish Ophiocephalus orientalis
JPSI 3 (4), Jul - Aug 2014 Page 346
DISCUSSION In the present study observed that there was significant decrease in total protein of muscle and liver tissues of freshwater fish Ophiocephalus orientalis at different time interval exposed to sublethal concentration of cypermethrin. The similar study is given by the11 on the fresh water fish Channa striatus and found that there was toxic effect of cypermethrin on the liver and muscle protein level it decreases at different exposure period. Also supported by12, observed that there was effect of cypermethrin on protein content of rainbow trout Oncarhynchus mykiss. The depletion of protein fraction in liver, muscle and kidney may have been due to their degradation and possible utilization for metabolic processes. Similar results were also found by13-17. The protein level showed decreased trend in Nile Tilapia, Oreochromis niloticus, in response to the treatment of cypermethrin by18. In Clarias gariepinus exposed to cyhalothrin decreased protein observed by19, in common carp. Cyprinus carpio by20,21; observed the decreased in protein level of due to effect of cypermethrin in freshwater teleost Colisa fasciatus. Also the increase in the amino acid level was observed under the toxic effect of a synthetic pyrethroid, cypermethrin exposed to freshwater fish Ophiocephalus orientalis. Amino acids are considered one of the most reliable techniques for the detection of changes in protein synthesis in cell and therefore, the protein pattern can be used as a criterion for the differentiation between several organs exposed to some pollutants. The similar study was also given by22, on the freshwater fish Cirrhinus mrigala. The toxic effect of cypermethrin also showed increased trend in Cirrihinus mrigala23, observed that there was increase in the amino acid level in the tissues of Labeo rohita and Cirrhinus mrigala exposed to fenvelerate. Similar increase of amino acid in Labeo rohita exposed to endosalfan was observed by24. The freshwater fish Clarias batrachus exposed to cypermethrin, showed increase level of amino acid in muscle and kidney of fish25,26, observed that piscicidal activites of aqueous extract of Euphorbia tirucalli on freshwater fish Chanaa punctatus were altered the level of amino acid.27 reported the effect of cypermethrin on gill, liver and muscle of freshwater fish Tilapia mossambica that increase in amino acid. Similar study was also given by28, observed that the increase in amino acid level in liver of Channa maruius when exposed to dimethoate and monocil. Concluded that protein decreased because of more utilization due to pesticidal stress also which breakdown protein released amino acid in the tissue which was used in prolonged period. REFERENCES 1. Schafer Ralf Bernhard, Thierry Caquet, Katri Siimes, Ralf Mueller,
Laurent Lagadic and Matthias Liess. Effects of pesticides on community structure and ecosystem functions in agricultural streams of three biogeographical regions in Europe. Science of the total environment 2007; 382: 272-285. http://dx.doi.org/10.1016/j.scitotenv.2007.04.040
2. Burger J, F Mol and B Gerowitt. The necessary extent of pesticide use Thought about a key term in German pesticide policy Crop. Prot 2008; 27: 343-351. http://dx.doi.org/10.1016/j.cropro.2007.06.006
3. Mariyona J. Direct and Indirect impacts of integrated pest management on pesticide use. A case of rice agriculture in Javam Indonesia. Pest Manag. Sci 2008; 64: 1069-1073. http://dx.doi.org/10.1002/ps.1602
4. Diana TC and KS Ramulu. Observations of carbohydratelevels in liver and intestine of N. japonicus in relation to Klebsiella species infection. J. Pure and Appl. Microbiol 2009; 3(2): 715-718.
5. Diana TC and KS Ramulu. Changes in the protein content of liver and intestine in relation to Klebsiella infection in Nemipterus japonicus from the coast of Visakhapatnam, India. The Asian. J. of Animal Science 2010; 4(2): 143-145.
6. Rejomon G, Nair M and T Joseph. Trace metal dynamics in fishes from the southwest coast of India. Environ. Monit. Assess 2010; 167(1-4): 243-255. http://dx.doi.org/10.1007/s10661-009-1046-y
7. Hari P and P Neeraja. Ambient ammonia stress on certain metabolic aspects in liver tissue of fish, Cyprinus carpio. The Bioscan 2012; 7(11): 111-113.
8. Finney DJ. Probit Analysis. University Press Cambridge; p. 333.1971. 9. Lowry OH Rosenbrough, NJ Farr AL and RJ Randall. Protein
measurement with folin phenol reagent. J. Biol. Chem 1951; 193: 265-267.
10. Moore S and GN Stein. A Modified rinhyain reagent for the photometric related compounds. J. Biol. Chem 1954; 211: 907-813.
11. Tantarpale SA. Cypermentrin impact on total protein in muscle and liver of the freshwater fish Channa striatus. Sci. Res. Repot 2011; 1(3): 155-158.
12. Atamanalp M, Keles MS Halilorglu HI and MS Aras. The effects of cypermethrin (A synthetic pyrethroid) on some biochemical parameters of (Ca, P, Na, and Tp) of Rainbow trout (Oncorhynchus mykiss). Turk. J. of Biol 2002; 26: 1157-1160.
13. Vutukuru SS. Acute effects of hexavalent chromium on survival oxygen consumption Hematological Parameters and some Biochemical’s profiles of Indian major carp, Labeo rohita. Int. J. Environ Res. Public health 2005; 2(3): 456-462. http://dx.doi.org/10.3390/ijerph2005030010
14. Venktramana GV, Sadhya Rani PN and PS Murthy. Impact of malathion on the Biochemical parameters of gobid fish, Glossogobius giurus (Ham) J. Environ. Biol 2006; 27(1): 119-122.
15. Mamata Kumari. Biochemical changes induced by the pesticides abate in the liver of catfish Heteropneutes fossilis (Bloch). Environ and Eco 2007; 225(4): 1164-1166.
16. Muley DV, Karanijikar DM and SV Maske. Impact of industrial effluents on the biochemical composition of freshwater fish Labeo rohita. J. Environ.Biol 2007; 28 (2): 243-249.
17. Chezhian A, Kabilan N, Kumar St, Senthamilselvan D and K Sivakumari. Impact of common mixed Effluent of spicot industrial Estate on histopathological and biochemical changes in Estuatine fish Lates calcorifer. Curr. Res. J of Biol. Sci 2010; 2(3): 201-209.
18. Korkmaz NEL, Cengiz E Unlu, E Uysal and M Yanar. Cypermethrin- induced histopathological and biochemical changes in Nile tilapia (Oreochromis niloticus) and the protective and recuperative effect of ascorbic acid. Environ, Toxicol. and Pharmacol 2009; 28(2): 198-205. http://dx.doi.org/10.1016/j.etap.2009.04.004
19. Ogueji EO and J Auta. Investigation of Biochemical Effects of Acute Concentrations of Lambda- Cyhalothrin on African Catfish Clarias gariepinus-Teugels. J. of Fisheries Inten 2007; 2(1): 86-90.
20. Dobsikova R, Velisek J, Wlasow T, Gomulka P, Svobodova Z and L Novotny. Effects of cypermethrin on some haematological biochemical and histopathological parameters of common carp (Cyprinus carpio L.). Neuro Endocrinol Lett 2006; 2(27 Suppl.): 91-5.
21. Sing KS, Singh SKS and RP Yadav. Toxicological and biochemical alteration of cypermethrin (Synthetic Pyrethroids) against freshwater teleost Colisa fasciatus at different seasons. World J. Zool 2010; 5(7): 25-32.
22. Neelima PL, Cyril Arun Kumar J, Chandra Sekhara Rao and N Gopala Rao. Impact of cypermethrin 25 % EC on free amino acids and protease activity levels in the freshwater fish Cirrhinus mrigala (HAM). The Bioscan 2011; 6(3): 421-423.
23. Anita ST, K Sobha, K Veeraiah and KS Tilak. Studies on biochemical changes in the tissues of Labeo rohita and Cirrhinus mrigala exposed to fenvelerate technical grade. J. Toxicol. and Envi. Health. Sci 2010; 2(5): 53-62.
24. Sarvanan M Kumar, DV Malarvizhi A and M Ramesh. Bio safety of Azadirachta indicia (A. Juss) leave extracts on certain biochemical parameter of Labeo rohita. J. Bio pesticide 2010; 3(1): 227-231.
25. Begum Ghousia. Cypermethrin-Induced Biochemical perturbation in freshwater fish Clarias batrachus at sub lethal exposure and after released into freshwater. Drug. Chem. Toxicol 2007; 30(1): 55-65. http://dx.doi.org/10.1080/01480540601017686
26. Tiwari S and A Singh. Biochemical stress response in freshwater fish Channa punctatus induced by aqueous extracts of Euporbia tirucalli plant. Chemosphere 2006; 64(1): 36-42. http://dx.doi.org/10.1016/ j.chemosphere.2005.11.049
27. Prashanth, Mahanthinamatha Shankaraiah Hiragond, Ningappa Changond Nikam and Kedari Nanasaheb. The effect of cypermethrin on
Gijare Shruti S et al: Protein and amino acid modulation in fresh water fish Ophiocephalus orientalis
JPSI 3 (4), Jul - Aug 2014 Page 347
different tissues of freshwater fish Tilapia mossambica (Perters). J. of Basic Physiol. Pharmacol 2011; 22(4): 115-119.
28. Prasad BB, KM Singh and M Rani. Dimethoate and monocil toxicity on the concentration of protein and amino acid in the serum and liver of Channa maruleus (Ham). Nat Environ. Pollut. Tech 2002; 1: 147-150.
Source of support: Nil, Conflict of interest: None Declared
How to cite this article: Gijare Shruti S. and V. T. Tantarpale. Protein and amino acid modulation in fresh water fish Ophiocephalus orientalis exposed to Cypermethrin. J Pharm Sci Innov. 2014;3(4):344-347 http://dx.doi.org/10.7897/2277-4572.034169
QUICK RESPONSE CODE
ISSN (Online) : 2277 –4572
Website http://www.jpsionline.com
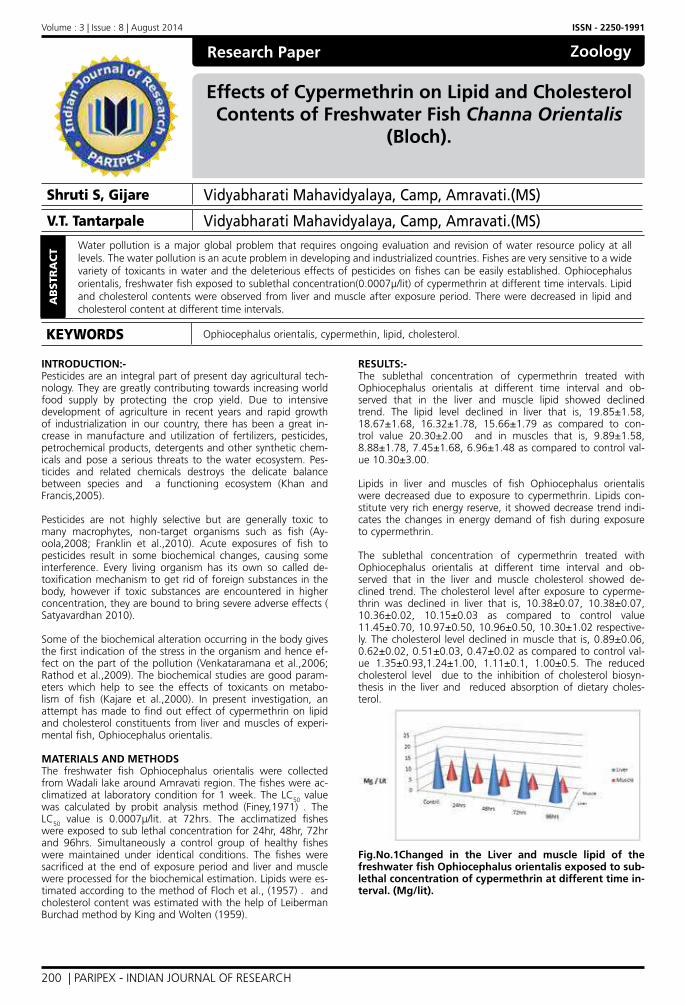
Volume : 3 | Issue : 8 | August 2014 ISSN - 2250-1991
200 | PARIPEX - INDIAN JOURNAL OF RESEARCH
Research Paper
Effects of Cypermethrin on Lipid and Cholesterol Contents of Freshwater Fish Channa Orientalis
(Bloch).
Zoology
Shruti S, Gijare Vidyabharati Mahavidyalaya, Camp, Amravati.(MS)
V.T. Tantarpale Vidyabharati Mahavidyalaya, Camp, Amravati.(MS)
KEYWORDS Ophiocephalus orientalis, cypermethin, lipid, cholesterol.
AB
STR
AC
T Water pollution is a major global problem that requires ongoing evaluation and revision of water resource policy at all levels. The water pollution is an acute problem in developing and industrialized countries. Fishes are very sensitive to a wide variety of toxicants in water and the deleterious effects of pesticides on fishes can be easily established. Ophiocephalus orientalis, freshwater fish exposed to sublethal concentration(0.0007µ/lit) of cypermethrin at different time intervals. Lipid and cholesterol contents were observed from liver and muscle after exposure period. There were decreased in lipid and cholesterol content at different time intervals.
INTRODUCTION:-Pesticides are an integral part of present day agricultural tech-nology. They are greatly contributing towards increasing world food supply by protecting the crop yield. Due to intensive development of agriculture in recent years and rapid growth of industrialization in our country, there has been a great in-crease in manufacture and utilization of fertilizers, pesticides, petrochemical products, detergents and other synthetic chem-icals and pose a serious threats to the water ecosystem. Pes-ticides and related chemicals destroys the delicate balance between species and a functioning ecosystem (Khan and Francis,2005).
Pesticides are not highly selective but are generally toxic to many macrophytes, non-target organisms such as fish (Ay-oola,2008; Franklin et al.,2010). Acute exposures of fish to pesticides result in some biochemical changes, causing some interference. Every living organism has its own so called de-toxification mechanism to get rid of foreign substances in the body, however if toxic substances are encountered in higher concentration, they are bound to bring severe adverse effects ( Satyavardhan 2010).
Some of the biochemical alteration occurring in the body gives the first indication of the stress in the organism and hence ef-fect on the part of the pollution (Venkataramana et al.,2006; Rathod et al.,2009). The biochemical studies are good param-eters which help to see the effects of toxicants on metabo-lism of fish (Kajare et al.,2000). In present investigation, an attempt has made to find out effect of cypermethrin on lipid and cholesterol constituents from liver and muscles of experi-mental fish, Ophiocephalus orientalis.
MATERIALS AND METHODSThe freshwater fish Ophiocephalus orientalis were collected from Wadali lake around Amravati region. The fishes were ac-climatized at laboratory condition for 1 week. The LC50 value was calculated by probit analysis method (Finey,1971) . The LC50 value is 0.0007µ/lit. at 72hrs. The acclimatized fishes were exposed to sub lethal concentration for 24hr, 48hr, 72hr and 96hrs. Simultaneously a control group of healthy fishes were maintained under identical conditions. The fishes were sacrificed at the end of exposure period and liver and muscle were processed for the biochemical estimation. Lipids were es-timated according to the method of Floch et al., (1957) . and cholesterol content was estimated with the help of Leiberman Burchad method by King and Wolten (1959).
RESULTS:-The sublethal concentration of cypermethrin treated with Ophiocephalus orientalis at different time interval and ob-served that in the liver and muscle lipid showed declined trend. The lipid level declined in liver that is, 19.85±1.58, 18.67±1.68, 16.32±1.78, 15.66±1.79 as compared to con-trol value 20.30±2.00 and in muscles that is, 9.89±1.58, 8.88±1.78, 7.45±1.68, 6.96±1.48 as compared to control val-ue 10.30±3.00.
Lipids in liver and muscles of fish Ophiocephalus orientalis were decreased due to exposure to cypermethrin. Lipids con-stitute very rich energy reserve, it showed decrease trend indi-cates the changes in energy demand of fish during exposure to cypermethrin.
The sublethal concentration of cypermethrin treated with Ophiocephalus orientalis at different time interval and ob-served that in the liver and muscle cholesterol showed de-clined trend. The cholesterol level after exposure to cyperme-thrin was declined in liver that is, 10.38±0.07, 10.38±0.07, 10.36±0.02, 10.15±0.03 as compared to control value 11.45±0.70, 10.97±0.50, 10.96±0.50, 10.30±1.02 respective-ly. The cholesterol level declined in muscle that is, 0.89±0.06, 0.62±0.02, 0.51±0.03, 0.47±0.02 as compared to control val-ue 1.35±0.93,1.24±1.00, 1.11±0.1, 1.00±0.5. The reduced cholesterol level due to the inhibition of cholesterol biosyn-thesis in the liver and reduced absorption of dietary choles-terol.
Fig.No.1Changed in the Liver and muscle lipid of the freshwater fish Ophiocephalus orientalis exposed to sub-lethal concentration of cypermethrin at different time in-terval. (Mg/lit).
Volume : 3 | Issue : 8 | August 2014 ISSN - 2250-1991
201 | PARIPEX - INDIAN JOURNAL OF RESEARCH
Fig.No.2 Changed in the Liver and muscle cholesterol of the freshwater fish Ophiocephalus orientalis exposed to sublethal concentration of cypermethrin at different time interval.(Mg/lit). DISCUSSION:-In the present investigation, cypermethrin exposed to fresh-water fish Ophiocephalus orientalis. The level of lipid content decreased in liver and muscle tissues. Lipid plays an important role in energy metabolism and provide energy to metabolic processes. They are also important for cellular and sub-cellular membrane. It is used as energy reservoir, stored and transport-ed in the form of glycerol ester. These decreased in lipid con-tent in tissues suggested that the lipid have been channelized to meet the metabolic demand for extra energy needed to mitigated the toxic stress. Similar finding was given by Patil and Patole,(2012) that the effect of malathion and cyperme-thrin on lipid constituents of freshwater fish Lepidocephalic-chthys guntea. They observed that, the level of lipid content decreased significantly in all treated groups,.
Lipid level decreases significantly because liver is the principle site of detoxification in fishes (Dixith, 2005). Stalin and Das, (2012) were observed the decrease in lipid levels in the liver tissues of Cirrhina mrigala exposed to fenthion.
The level of cholesterol content decreased in liver and mus-cle tissues. The reduced cholesterol level due to the inhibition of cholesterol biosynthesis in the liver and due to reduced ab-sorption of dietary cholesterol. There was also depletion in the lipid content of fish Tilapia mossambica exposed to monocro-tophos reported by Remia et al., (2008).
Ganeshwade (2012), reported that there was decrease in cho-lesterol content in the liver and muscle tissues of freshwater fish Punctius ticto. Due to dimethoate toxicity stress which suppressed lipid metabolism and leads decrease value of cho-lesterol Choudhary and Gaur (2001); Shindhe et al., (2002). Cholesterol is an important normal body constituent used in the structure of cell membrane synthesis of bile acid and syn-thesis of steroid hormones. Significant decrease in cholester-ol content is studied in fish Oreochromis niloticus by Kahtani, (2011).
REFERENCES
Ayoola S.O. (2008): Toxicity of glyphosate herbicide on Nile tilapia (Oreochromis niloticus) juvenile. Afr. J. Agric . Res. Vol.3(12) : pp. 825-834. | Chodhary, A. and Gaur S. (2001): Effect of sodium fluoride on the muscle and liver of a freshwater fish I. J. Aqua. Biol.Vol. 16(2) :pp. 67-68. | Dixit Y.B. (2005): Biochemical changes in the liver of a freshwater teleost, Heteropneustes fossilis (Bloch) exposed to rogor J. Zool Vol.25:pp.51-53. | Finney,D.J. (1971) : Probit Analysis. University Press Cambridge. pp.333. | Folch, J.N. Leer and Sloane, G. Stanley (1957) : Simplified method for isolation and purification of total lipids from animal tissues, J. Bio. Chem 226- 497. | Franklin R.K., H.S.Loo and H.A. Osu.anu, (2010): Incorporation of Bentazone with Exrerohilum rostratum for Controlling Cyperus iria A.M. J. Agri. Biol.Sci., Vol.5: pp.210-214. | Ganeshwade R.M. (2012): Effect of Dimethoate on the level of cholesterol in freshwater Puntius ticto (Ham). Sci. Res. Report. Vol. 2(1) :pp. 26-29. | Kahtani Mohammed A. Al (2011) : Effect of an Insecticide Abamectin on Some Biochemical Characteristics of Tilapia fish (Oreochromis Niloticus) American Journal of Agricultural and Biological Sciences Vol.6(1) : pp.62-68. | Kajare,A., S. Singh and K. Shrivastava (2000): Malathion induced biochemical changes in kidney of freshwater fish Clarias batrachus. J. Ecotoxicol. Environ. Monit. Vol.10, pp. 11-14. | Khan Zaheer M. and Francis C.P. Law (2005): Adverse effects of pesticides and related chemicals on enzyme and hormone systems of fish, amphibians and reptiles. Proc. Pakistan Acad. Sci. Vol. 42(4),pp. 315-323. | Libermann Buchard (1959 ) : Giuen by King E.J. and Wolten I.D.P. micra analysis in method biochemistry, Churchill, London P. 42. | Patil M.U. Dr. Patole S.S. (2012): Effect of Malathion and Cypermethrin on Biochemical Constituents of Freshwater Fish, Lepidocephalichthys guntea (Ham-bach) International Indexed & Referred Research Journal Vol. IV (39). | Patole S.S. Patil M. and Mahajan R.T. (2008): Studies on metabolic changes during intoxication by phytotoxicants in fish Nemacheilus evizardy (Day) int. J. Pharmacol. Bio Sci. Vol.2:pp.63-68. | Rathod , D.S. M.V. Lokhunde and V.S. Shembekar (2009) : Toxic impact of dimethoate on the Biochemical composition of vital tissues of Fish Arias dussumieri. Shodh, Samiksha and Muyankan. Vol. 2, pp. 147-149. | Remia , K.M., S. Loguswamy , K. Logankumar and D. Rajmohan (2008) : Effect of an insecticide (Monocrotophos) on some biochemical constituents of the fish Tilapla massambica poll. Res . Vol.27(3) pp. 529-526. | Satyavardhan, K. (2010): Effect of fenvalerate TM on various tissues of Channa punctatus (Bloch). World Appl. Sci.J. Vol.10, pp 70-74.. | Shinde V.R. Veeresh M.U., and Kulkarni R.S. (2002): Ovarian changes in response to heavy metals exposure to the fish Notoperus notopterus (Pallas) J. Environ.Biol. Vol.23(2): pp.137-141. | Stalin Israel S, Sam Manohar Das. S. (2012): Biochemical changes in certain tissues of Cirrhina mrigala (Hamilaton (Cyprinidae :Cyprniformes ) exposed to fenthion. Inter. J. of Environ. Sci. Vol.2, (3). | Venkataraman G.V. Sandhya P.N. and Murthy P.S. (2006): Impact of malathion on the biochemical parameter of gobiid fish Glossogobius giuris(Ham).J. Envi. Bio. Vol.27(1):pp. 119-122. |
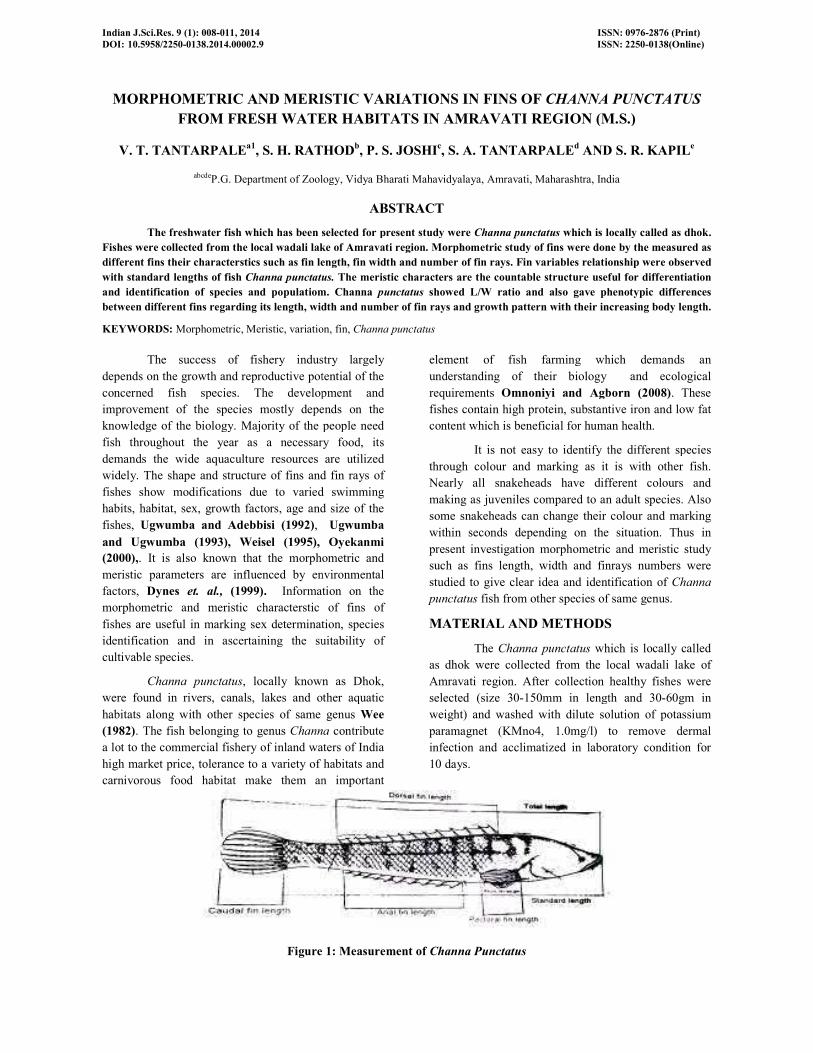
Indian J.Sci.Res. 9 (1): 008-011, 2014
DOI: 10.5958/2250-0138.2014.00002.9
MORPHOMETRIC AND MERISTIC VARIATIONS IN FINS OF
FROM FRESH WATER HABITATS IN AMRAVATI REGION (M.S.)
V. T. TANTARPALEa1, S. H. RATHOD
abcdeP.G. Department of Zoology, Vidya Bharati
The freshwater fish which has been selected for present study
Fishes were collected from the local wadali lake of Amravati region. Morphometric study of fins
different fins their characterstics such as fin length, fin width and number of fin ra
with standard lengths of fish Channa punctatus.
and identification of species and populatiom. Channa
between different fins regarding its length, width and number of fin rays and growth pattern with their increasing body length.
KEYWORDS: Morphometric, Meristic, variation, fin,
The success of fishery industry largely
depends on the growth and reproductive potential of the
concerned fish species. The development and
improvement of the species mostly depends
knowledge of the biology. Majority of the people need
fish throughout the year as a necessary food
demands the wide aquaculture resources are utilized
widely. The shape and structure of fins and fin rays of
fishes show modifications due to varied swimming
habits, habitat, sex, growth factors, age and size of the
fishes, Ugwumba and Adebbisi (1992),
and Ugwumba (1993), Weisel (1995),
(2000),. It is also known that the morphometric and
meristic parameters are influenced by environmental
factors, Dynes et. al., (1999). Information on the
morphometric and meristic characterstic of fins of
fishes are useful in marking sex determination, species
identification and in ascertaining the suitability of
cultivable species.
Channa punctatus, locally known as Dhok
were found in rivers, canals, lakes and other aquatic
habitats along with other species of same genus
(1982). The fish belonging to genus Channa
a lot to the commercial fishery of inland waters of India
high market price, tolerance to a variety of habitat
carnivorous food habitat make them an important
Figure 1: Measurement of
, 2014 ISSN: 0976
ISSN: 2250
MORPHOMETRIC AND MERISTIC VARIATIONS IN FINS OF CHANNA PUNCTATUS
FROM FRESH WATER HABITATS IN AMRAVATI REGION (M.S.)
RATHODb, P. S. JOSHI
c, S. A. TANTARPALE
d AND S. R. KAPIL
Zoology, Vidya Bharati Mahavidyalaya, Amravati, Maharashtra, India
ABSTRACT
The freshwater fish which has been selected for present study were Channa punctatus which is locally called as dhok.
ollected from the local wadali lake of Amravati region. Morphometric study of fins were done by the measured
different fins their characterstics such as fin length, fin width and number of fin rays. Fin variables relationship were
Channa punctatus. The meristic characters are the countable structure useful for differentiation
and identification of species and populatiom. Channa punctatus showed L/W ratio and also gave phenotypic differences
garding its length, width and number of fin rays and growth pattern with their increasing body length.
Morphometric, Meristic, variation, fin, Channa punctatus
The success of fishery industry largely
and reproductive potential of the
concerned fish species. The development and
depends on the
knowledge of the biology. Majority of the people need
the year as a necessary food, its
ture resources are utilized
and fin rays of
fishes show modifications due to varied swimming
habits, habitat, sex, growth factors, age and size of the
, Ugwumba
Oyekanmi
. It is also known that the morphometric and
environmental
Information on the
morphometric and meristic characterstic of fins of
king sex determination, species
ascertaining the suitability of
, locally known as Dhok,
rivers, canals, lakes and other aquatic
ith other species of same genus Wee
Channa contribute
a lot to the commercial fishery of inland waters of India
market price, tolerance to a variety of habitats and
carnivorous food habitat make them an important
element of fish farming which demands an
understanding of their biology and ecological
requirements Omnoniyi and Agborn (2008)
fishes contain high protein, substantive iron and low fat
content which is beneficial for human health.
It is not easy to identify the different species
through colour and marking as it is with other fish.
Nearly all snakeheads have different colours and
making as juveniles compared to an adult species. Also
some snakeheads can change their colour and marking
within seconds depending on the situation
present investigation morphometric and meris
such as fins length, width and finrays numbers
studied to give clear idea and identification of
punctatus fish from other species of same genus.
MATERIAL AND METHODS
The Channa punctatus which is locally called
as dhok were collected from the local wadali lake of
Amravati region. After collection healthy fishes
selected (size 30-150mm in length
weight) and washed with dilute solution of potassium
paramagnet (KMno4, 1.0mg/l) to remove dermal
infection and acclimatized in laboratory condition for
10 days.
Figure 1: Measurement of Channa Punctatus
ISSN: 0976-2876 (Print)
ISSN: 2250-0138(Online)
CHANNA PUNCTATUS
FROM FRESH WATER HABITATS IN AMRAVATI REGION (M.S.)
AND S. R. KAPILe
India
which is locally called as dhok.
were done by the measured as
ys. Fin variables relationship were observed
The meristic characters are the countable structure useful for differentiation
phenotypic differences
garding its length, width and number of fin rays and growth pattern with their increasing body length.
element of fish farming which demands an
understanding of their biology and ecological
Omnoniyi and Agborn (2008). These
fishes contain high protein, substantive iron and low fat
human health.
It is not easy to identify the different species
through colour and marking as it is with other fish.
Nearly all snakeheads have different colours and
making as juveniles compared to an adult species. Also
ds can change their colour and marking
onds depending on the situation. Thus in
morphometric and meristic study
such as fins length, width and finrays numbers were
studied to give clear idea and identification of Channa
fish from other species of same genus.
MATERIAL AND METHODS
which is locally called
ollected from the local wadali lake of
fter collection healthy fishes were
150mm in length and 30-60gm in
weight) and washed with dilute solution of potassium
1.0mg/l) to remove dermal
infection and acclimatized in laboratory condition for
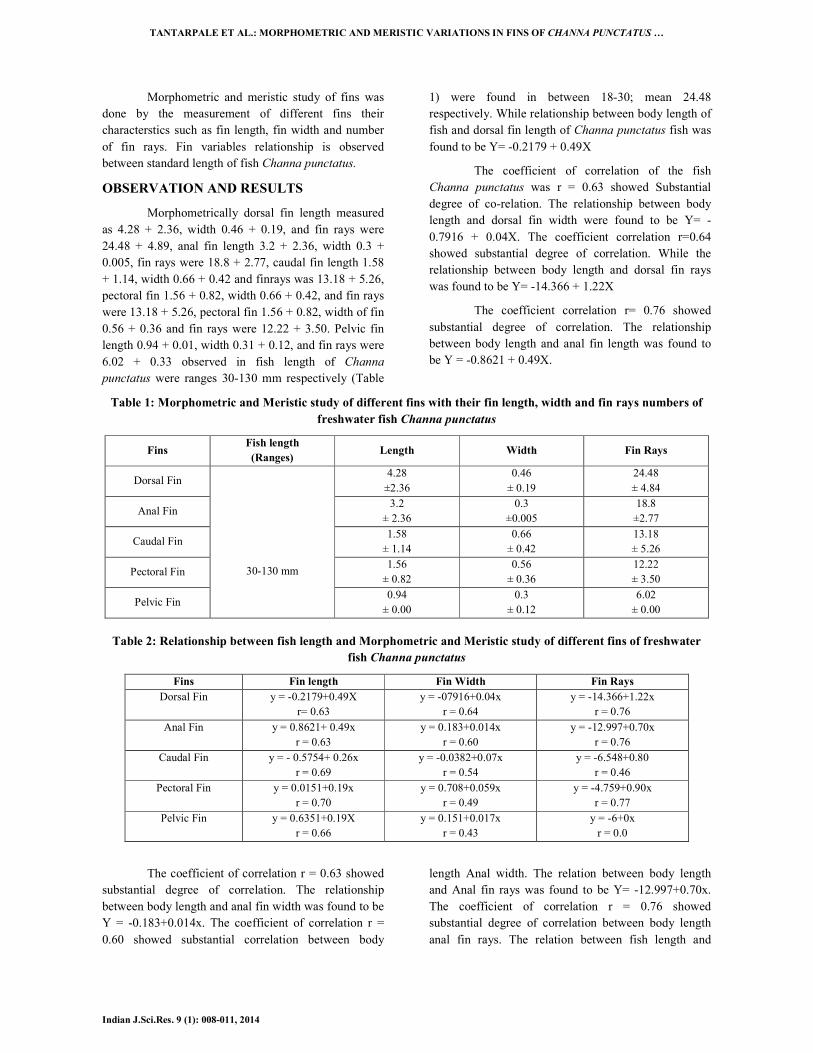
TANTARPALE ET AL.: MORPHOMETRIC AND MERISTIC VARIATIONS IN FINS OF CHANNA PUNCTATUS …
Indian J.Sci.Res. 9 (1): 008-011, 2014
Morphometric and meristic study of fins was
done by the measurement of different fins their
characterstics such as fin length, fin width and number
of fin rays. Fin variables relationship is observed
between standard length of fish Channa punctatus.
OBSERVATION AND RESULTS
Morphometrically dorsal fin length measured
as 4.28 + 2.36, width 0.46 + 0.19, and fin rays were
24.48 + 4.89, anal fin length 3.2 + 2.36, width 0.3 +
0.005, fin rays were 18.8 + 2.77, caudal fin length 1.58
+ 1.14, width 0.66 + 0.42 and finrays was 13.18 + 5.26,
pectoral fin 1.56 + 0.82, width 0.66 + 0.42, and fin rays
were 13.18 + 5.26, pectoral fin 1.56 + 0.82, width of fin
0.56 + 0.36 and fin rays were 12.22 + 3.50. Pelvic fin
length 0.94 + 0.01, width 0.31 + 0.12, and fin rays were
6.02 + 0.33 observed in fish length of Channa
punctatus were ranges 30-130 mm respectively (Table
1) were found in between 18-30; mean 24.48
respectively. While relationship between body length of
fish and dorsal fin length of Channa punctatus fish was
found to be Y= -0.2179 + 0.49X
The coefficient of correlation of the fish
Channa punctatus was r = 0.63 showed Substantial
degree of co-relation. The relationship between body
length and dorsal fin width were found to be Y= -
0.7916 + 0.04X. The coefficient correlation r=0.64
showed substantial degree of correlation. While the
relationship between body length and dorsal fin rays
was found to be Y= -14.366 + 1.22X
The coefficient correlation r= 0.76 showed
substantial degree of correlation. The relationship
between body length and anal fin length was found to
be Y = -0.8621 + 0.49X.
Table 1: Morphometric and Meristic study of different fins with their fin length, width and fin rays numbers of
freshwater fish Channa punctatus
Fins Fish length
(Ranges) Length Width Fin Rays
Dorsal Fin
30-130 mm
4.28
±2.36
0.46
± 0.19
24.48
± 4.84
Anal Fin 3.2
± 2.36
0.3
±0.005
18.8
±2.77
Caudal Fin 1.58
± 1.14
0.66
± 0.42
13.18
± 5.26
Pectoral Fin 1.56
± 0.82
0.56
± 0.36
12.22
± 3.50
Pelvic Fin 0.94
± 0.00
0.3
± 0.12
6.02
± 0.00
Table 2: Relationship between fish length and Morphometric and Meristic study of different fins of freshwater
fish Channa punctatus
Fins Fin length Fin Width Fin Rays
Dorsal Fin y = -0.2179+0.49X
r= 0.63
y = -07916+0.04x
r = 0.64
y = -14.366+1.22x
r = 0.76
Anal Fin y = 0.8621+ 0.49x
r = 0.63
y = 0.183+0.014x
r = 0.60
y = -12.997+0.70x
r = 0.76
Caudal Fin y = - 0.5754+ 0.26x
r = 0.69
y = -0.0382+0.07x
r = 0.54
y = -6.548+0.80
r = 0.46
Pectoral Fin y = 0.0151+0.19x
r = 0.70
y = 0.708+0.059x
r = 0.49
y = -4.759+0.90x
r = 0.77
Pelvic Fin y = 0.6351+0.19X
r = 0.66
y = 0.151+0.017x
r = 0.43
y = -6+0x
r = 0.0
The coefficient of correlation r = 0.63 showed
substantial degree of correlation. The relationship
between body length and anal fin width was found to be
Y = -0.183+0.014x. The coefficient of correlation r =
0.60 showed substantial correlation between body
length Anal width. The relation between body length
and Anal fin rays was found to be Y= -12.997+0.70x.
The coefficient of correlation r = 0.76 showed
substantial degree of correlation between body length
anal fin rays. The relation between fish length and
TANTARPALE ET AL.: MORPHOMETRIC AND MERISTIC VARIATIONS IN FINS OF CHANNA PUNCTATUS …
Indian J.Sci.Res. 9 (1): 008-011, 2014
pectoral fin length was found to be Y= 0.0151+0.19x.
The coefficient of correlation r = 0.70 showed
substantial degree of correlation. The relation between
body length and pectoral fin width of Channa punctatus
was found to be Y = -0.708+0.059x. The coefficient
correlation r = 0.49 showed moderate degree of
correlation. The relation between body length and
pectoral fin rays was found to be Y = -4.759+0.90x.
The coefficient correlation r = 0.77 showed moderate
degree of correlation.
In the relationship between body length of fish
Channa punctatus and different fin length was found
that regression coefficient of dorsal fin length and Anal
fin length was more than caudal fin length, pelvic fin
length and pectoral fin length while coefficient
correlation was near about same that was 0.63, 0.63,
0.69, 0.66, and 0.70 respectively. The relationship
between body length of Channa punctatus fish and
different fin width was found that regression coefficient
of caudal fin width and dorsal fin width was observed
larger as compared to fin width of pectoral fin, pelvic
fin and anal fin. While coefficient correlation in dorsal
fin width and anal fin width was observed more that is
0.64 and 0.60 and coefficient correlation of caudal fin
width, pectoral fin width, pelvic fin width was seen as
0.54, 0.49, and 0.43, respectively. While the
relationship between body length of fish and number of
fin rays of different fins was found that regression
coefficient as dorsal fin rays were more following
pectoral, caudal and anal fin rays. But pelvic fin rays
showed regression coefficient as 0. Same way
coefficient correlation of pelvic fin rays was also found
to be 0.The coefficient correlation of dorsal fin rays,
Anal fin rays, pectoral fin rays and caudal fin rays was
found to be 0.76, 0.76, 0.77, 0.46 respectively; (table
no.2).
The above values showed that increase in body
length; fin length, width and fin rays also changes and
showed increase in them with substantial, moderate
degree of correlation respectively .In case of pelvic fin,
even with increase in body length of the fish Channa
punctatus there is no increase in number of fin rays thus
showed coefficient correlation as r=0.00
DISCUSSION
The present morphometric analysis of different
fins of Channa punctatus showed variation in length,
width and number of fin rays’. It was observed that with
the growth of fish, body length, fin length and fin width
and fin rays number also increase with high degree of
correlation was also shown in fin rays such as 0.76,
0.76, 0.77, 0.46 for dorsal fin, anal fin, pectoral fin and
caudal fin respectively. But pelvic fin showed no
change or increase in number of fin rays r =0.
According to Turan et.al., (2005) and
Omoniyi and Agbon (2008) distinct environmental
structure causes the high morphometric variation and
plasticity which response to differences in
environmental condition such as food abundance and
temperature. Usha (2000) reported that anal, caudal,
pectoral, and pelvic fins of Catla catla were longer than
Cyprinus carpio and Labeo rohita due to its surface
feeding suited ecologically which is rich in vegetation
and species of Clarias gariepinus. They belong to
benthic habitat and have robust bodies and large
pectoral fins which allow them to withstand current on
smaller, smoother substratum. Dynes et.al., (1999)
found that dorsal and pectoral fin lengths of pelagic fish
were shorter than littoral ones in brooke chart, Salvelias
fountinalis. The morphometric study of fins of Channa
punctatus were seen broadly by their location, shape
and size. In Channa punctatus species long dorsal fin,
anal fin, lobed shaped caudal fin, two pectoral fin, two
pelvic fins.and varying number of fin rays were also
noticed.
The increase in size of the fins was
accompanied by branching and segmentation of fin
rays. Such increase was noticed in number of fin rays
once these were formed because a constant number of
rays are characteristic of a particular species, genus or
family (Lagler 1962, Usha and Prakasam 2005). The
sequential development of pectoral fin followed by
caudal and dorsal fins appeared to be related to the
timely uses of these fins as suggested by (Whitehead
1975, Devenport 1993). In the present analysis of fresh
water fish Channa punctatus showed the phenotypic
differences between different fins regarding its length,
width and number of fin rays and growth pattern with
their increasing body length.
REFERENCES
Barlow, G.W. (1961): Causes and significance of
morphological variation in fishering syst.
Zool. 10: 105-117.
Dynes, P. Magnan, L. Bernatchez and M.A. Rodringuez
(1999): Genetic and morphological variation
between two forms of Lacustrine brook charr.
J. Fish. Biol. 54: 955-972.
Devenport, J. (1995): Ventilation of the gills by the
pectoral fins in the long tooth (Anoplogaster
cornutum). How to breath with a full mouth. J.
Fish. Biol., 22(2): 105-111.
TANTARPALE ET AL.: MORPHOMETRIC AND MERISTIC VARIATIONS IN FINS OF CHANNA PUNCTATUS …
Indian J.Sci.Res. 9 (1): 008-011, 2014
Lagler, K., J.E. Bardach and R.R. Miller (1962) :
Ichthyology. Wiley, New York, U.S.A.
Ominiyi I. T. and A. O. Agbon (2008): Morphometric
variation in Sarotherodon melanotheron from
brackish and fresh water habitat in south
wwestern Nigeria. W, Afr. J. Appl. Ecol. 12:
01-05
Turan Cemal, Sukran Yalcin, Funda Turan, Emel Okur
and Ihsan Akyurt (2005): Morphometric
comparision of African catfish, Clarias
gariepinus population in Turkey. Folia Zool.
54 (1-2): 165-172.
Ugwumba A.A. and A.A. Adebisi (1992): Food and
feeding ecology of Sarotherodon
melanotheron in a small fresh water reservoir
in Ibadam, Nigeria. Hydrobiol. 124 (3): 367-
382.
Ugwumba A.O. and A.A. Ugwumba (1993): On the
biology of black jaw tilapia Sarotherodon
melanotheronin a tropical fresh water lake
Niger. J. Res. Rev. Sci. 1: 12-25
Usha. S. (2000): Studies on the fins of carp fishes
(Cyprinus carpio, Labeo rohita, catla catla)
used in polyculture. Doctoral thesis. Univ.
Kerala. India.
Usha, S. and V.R. Prakasam (2005) : Fins of carp fish,
Catla catla in relation to Ecology, Morphology
composition and Development J. Enviroment
Ecology, 23(1) : 106-112.
Weisel, G.F. (1995): Variation in number of fin rays of
two Cyprinid fishes correlated with natural
water temperatures. Ecology 36: 1-6.
Whitehead (1975): How fishes Live. Elsevierphalden,
London, U.K.
Wee, K.L. (1982): Snakeheads-the biology and culture.
In. Recent Advances in Aquaculture (Eds: J. F.
Muir and R.J. Roberts). Croom. Helm Ltd.,
London PP- 179-213.
http://jsrr.net 167 ISSN: 2249-7846 (Online)
Science Research Reporter, 4(2):167-170, (Oct. - 2014) © RUT Printer and Publisher (http://jsrr.net) ISSN: 2249-2321 (Print); ISSN: 2249-7846 (Online) Received: 22-06-2014, Revised: 25-07-2014, Accepted: 09-08-2014e
Full Length Article
A review of ophidian studies in Vidarbha region (M.S.) India
Joshi PS1, Tantarpale VT2 and KM Kulkarni3
1Research Student, Dept. of Zoology, Jijamata Mahavidyalaya, Buldhana (M.S.) India 2Associate Professor, P. G. Dept. of Zoology, Vidya-Bharti Mahavidyalaya, Amravati (M.S.) India
3Former Director of Higher Education, Government of Maharashtra, Pune (M.S.) India Former Vice- Chancellor, S. R. T. M University, Nanded (M.S.) India
ABSTRACT
Through literature survey and current knowledge on the ophidian fauna, this paper deals with a review of ophidian studies in the Vidarbha Region (M.S.) India. A complete bibliography with respect to ophidian taxonomy, distribution, range extension, status reports and conservation is listed. These studies cleared that thirty five ophidian species belonging to six families were common in Vidarbha region in which Colubridae family contributes more number of species.
Key word: Ophidian fauna, Vidarbha Region, Bibliography, Overview.
INTRODUCTION
The biological diversity of the earth and its origins has long been a source of amazement and curiosity. Vidarbha is one of the most diversified Regions in Maharashtra State of India, with respect to biodiversity. Its healthy climate, mountainous terrain, rugged configuration and sudden fall in elevation are phenomenal and have received notable interest that provides favourable environment for ophidian fauna (Joshi and Tantarpale, 2014).
Studies on ophidian fauna of Vidarbha Region comparatively better than amphibian and fishes but has not equaled the progress made on birds and mammalian fauna. Literature survey shows that a few naturalists and scientists have attempted to study this ophidian fauna. The first appreciable study was carried out by D’Abreu (1928), he made a comprehensive collection of snakes for the Central museum, Nagpur, which provides information on reptiles of Vidarbha in general and Amravati in particular.
The scattered but detailed information about ophidian fauna of Vidarbha Region is available in some of the mention studies. Wadatkar (2003) documented 12 ophidian species from
Amravati University Campus. Captain et al. (2005) was reported Elaschitodon westermanni from Wardha district which is adjacent to Amravati District. Nande and Deshmukh (2007) recorded 32 species from Amravati district including Melghat. Harney et al. (2009) and Harney (2011) reported 17 ophidian species from Bhadravati of District Chandrapur. Joshi (2009) studied the diversity and population dynamics of reported 24 species of snakes in Yavatmal district. A preliminary survey of Joshi (2011) reveals occurrence of 22 ophidian species in Buldhana District. Narayanan (2012) gave record of Indian Egg Eater Snake Elaschitodon westermanni from the localities of Shegaon, Dist. Buldhana. Uke et al. (2013) studied eco-diversity, distribution and conservation strategy of Amphiesma stolatum in Nagpur city. Recently Joshi et al. (2013 a) studied the Ecology and behaviour of Coelognathus helena montecolaris. Joshi et al. (2013 b) studied Sexual dimorphism in Xenochrophis piscator in Buldhana District. Gore and Joshi (2013) studied the dicephalic Naja naja from Washim District. Joshi and Tantarpale (2014) studied diversity and population dynamics of 33 ophidian species in Buldhana District of Vidarbha Region (M.S.) India.
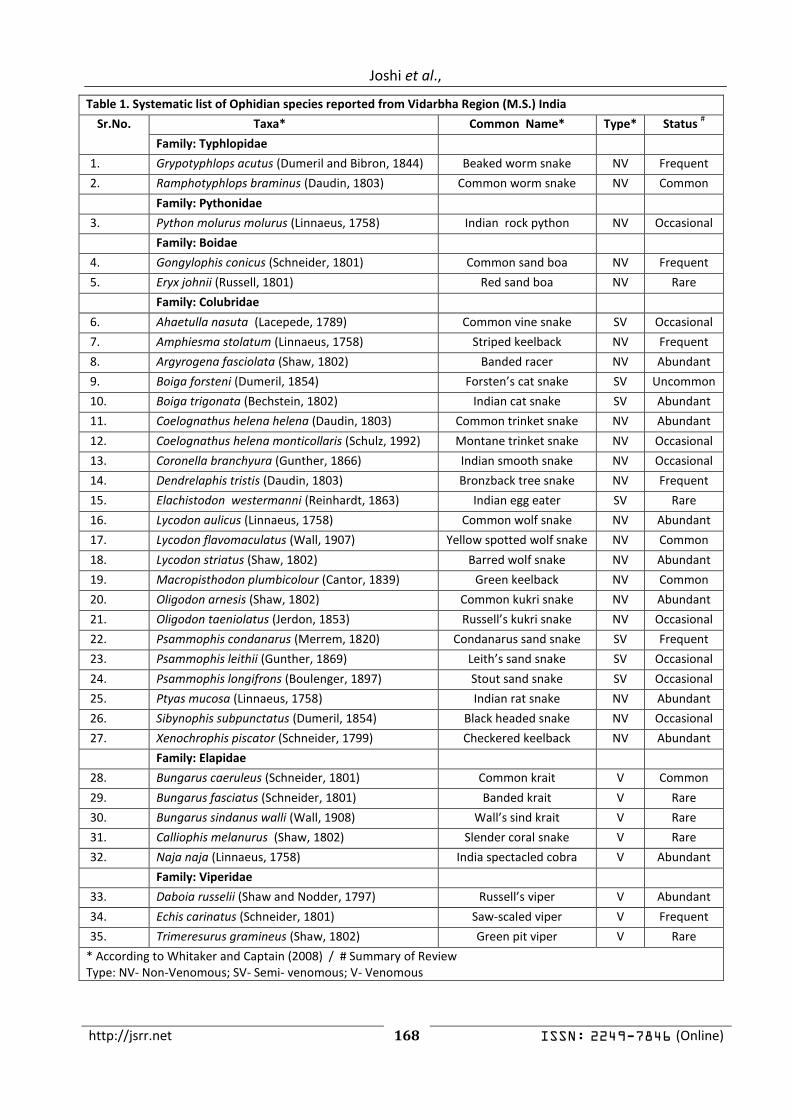
http://jsrr.net 168 ISSN: 2249-7846 (Online)
Joshi et al.,
Table 1. Systematic list of Ophidian species reported from Vidarbha Region (M.S.) India
Sr.No. Taxa* Common Name* Type* Status #
Family: Typhlopidae
1. Grypotyphlops acutus (Dumeril and Bibron, 1844) Beaked worm snake NV Frequent
2. Ramphotyphlops braminus (Daudin, 1803) Common worm snake NV Common
Family: Pythonidae
3. Python molurus molurus (Linnaeus, 1758) Indian rock python NV Occasional
Family: Boidae
4. Gongylophis conicus (Schneider, 1801) Common sand boa NV Frequent
5. Eryx johnii (Russell, 1801) Red sand boa NV Rare
Family: Colubridae
6. Ahaetulla nasuta (Lacepede, 1789) Common vine snake SV Occasional
7. Amphiesma stolatum (Linnaeus, 1758) Striped keelback NV Frequent
8. Argyrogena fasciolata (Shaw, 1802) Banded racer NV Abundant
9. Boiga forsteni (Dumeril, 1854) Forsten’s cat snake SV Uncommon
10. Boiga trigonata (Bechstein, 1802) Indian cat snake SV Abundant
11. Coelognathus helena helena (Daudin, 1803) Common trinket snake NV Abundant
12. Coelognathus helena monticollaris (Schulz, 1992) Montane trinket snake NV Occasional
13. Coronella branchyura (Gunther, 1866) Indian smooth snake NV Occasional
14. Dendrelaphis tristis (Daudin, 1803) Bronzback tree snake NV Frequent
15. Elachistodon westermanni (Reinhardt, 1863) Indian egg eater SV Rare
16. Lycodon aulicus (Linnaeus, 1758) Common wolf snake NV Abundant
17. Lycodon flavomaculatus (Wall, 1907) Yellow spotted wolf snake NV Common
18. Lycodon striatus (Shaw, 1802) Barred wolf snake NV Abundant
19. Macropisthodon plumbicolour (Cantor, 1839) Green keelback NV Common
20. Oligodon arnesis (Shaw, 1802) Common kukri snake NV Abundant
21. Oligodon taeniolatus (Jerdon, 1853) Russell’s kukri snake NV Occasional
22. Psammophis condanarus (Merrem, 1820) Condanarus sand snake SV Frequent
23. Psammophis leithii (Gunther, 1869) Leith’s sand snake SV Occasional
24. Psammophis longifrons (Boulenger, 1897) Stout sand snake SV Occasional
25. Ptyas mucosa (Linnaeus, 1758) Indian rat snake NV Abundant
26. Sibynophis subpunctatus (Dumeril, 1854) Black headed snake NV Occasional
27. Xenochrophis piscator (Schneider, 1799) Checkered keelback NV Abundant
Family: Elapidae
28. Bungarus caeruleus (Schneider, 1801) Common krait V Common
29. Bungarus fasciatus (Schneider, 1801) Banded krait V Rare
30. Bungarus sindanus walli (Wall, 1908) Wall’s sind krait V Rare
31. Calliophis melanurus (Shaw, 1802) Slender coral snake V Rare
32. Naja naja (Linnaeus, 1758) India spectacled cobra V Abundant
Family: Viperidae
33. Daboia russelii (Shaw and Nodder, 1797) Russell’s viper V Abundant
34. Echis carinatus (Schneider, 1801) Saw-scaled viper V Frequent
35. Trimeresurus gramineus (Shaw, 1802) Green pit viper V Rare
* According to Whitaker and Captain (2008) / # Summary of Review Type: NV- Non-Venomous; SV- Semi- venomous; V- Venomous
http://jsrr.net 169 ISSN: 2249-7846 (Online)
Science Research Reporter, 4(2):167-170, (Oct. - 2014) ISSN: 2249-2321(Print)
Conservation and protected areas Vidarbha region has lush green deciduous
forests with large protected areas which are home to variety of flora and fauna. It has approximately 37,251 km2 forest cover. Vidarbha has many popular wildlife sanctuaries and parks viz. Melghat in Amravti, Amba-barwa and Nalganga in Buldhana, Tadoba-Andhari in Chandrapur, Nagzira and Navegaon Bandh in Gondia, etc. These Protected Area networks are managed by Forest departments with the prime objectives to conserve entire biodiversity of Region. But it raises a question; whether the present management practices really supports the conservation of entire biodiversity? It does not because the present management practices and plans of protected areas focus only on mega wildlife projects. The different wildlife and forest conservation acts also provides legislative protection to biodiversity. Present status and threats to ophidian fauna
Snakes are part of our ecosystems and they play a vital role in pest-control. Along with that, they form a vital part of the food chain as a prey as well as a predator. These important animals are always threatened by anthropogenic and environmental factors. The diverse habitats of the Vidarbha Region are rapidly changing due to new irrigation projects and industrialization. Forest areas are being de-notified for implementing development projects such as mining, industry, communication and tourism. This has resulted in alternating climate as well shrinkage, fragmentation, degradation and destruction of natural habitats. Road accidental killing on highways across wildlife refuges are an intrusion and affect the wildlife and its habitats adversely. Misconceptions and fear about snakes are also threatening this important creature of the ecosystem. Species account
The literature survey shows that total 35 ophidian species belonging to six families have been reported from Vidarbha Region (M.S.) India (Table 1). These families are namely Typhlopidae (2 Species), Pythonidae (1 Species), Boidae (2 Species), Colubridae (22 Species), Elapidae (5 Species) and Viperidae (3 Species). Out of these thirty five ophidian species, 8 species are venomous, 7 species are semi venomous, and (20) species are non-venomous. There are, in future, chances of more species being reported because
few pockets and habitats in the Region required extensive exploration.
REFERENCES Captain A, F Tillack, A Gumprechet and P Dandage, 2005. First record of Elachistodon westermanni from Wardha District of Maharashtra, India. Russian J. Herp. 12 (2): 323-324 D’Abreu AE, 1928. Records of the Nagpur museum No.VI. A list of reptiles of the Central Province. Government Press, Nagpur. 1-13 Gore AM and PS Joshi, 2013. Record of dicephalic Naja naja (Lin.1758) from Washim District (M.S.) India. NCEIOR 2013- J. Aqua. Biol. 114-115. Harney NV, Sitre SR, Wadhave NS and PN Nasare, 2009. Biodiversity of snake during monsoon months in Bhadrawati tahsil of Chandrapur district, Maharashtra. J. of Ecol. and Fish., 2(2): 103-106. Harney NV, 2011. Studies on snakes of Bhadravati, District Chandrapur (M.S.) India. Online Intern. Interd. Res. J. 1(1): 12-17. Joshi P, 2009, Studies on the diversity and populattion dynamics of snakes in Yavatmal district of Maharashtra, India. Bios. Biot. Res. Com. 2 (1): 99-105. Joshi PS, 2011. A preliminary survey on snake of Buldhana District, Maharashtra. Gold. Res. Tho. 1(2): 73-74. Joshi PS and VT Tantarpale, 2014. Diversity and population dynamics of ophidian fauna from Buldhana District, Maharashtra (India), Thesis Submitted to S. G. B. Amravati University, Amaravati. 260 pp. Joshi PS, Tantarpale SA, Tantarpale VT and KM Kulkarni, 2013 a. Ecology and behaviour of Coelognathus Helena montecolaris (Schulz 1992) from Buldhana District (M.S.) India. NCEIOR 2013- J. Aqua. Biol. 24-25. Joshi PS, Tantarpale VT and KM Kulkarni, 2013 b. Sexual dimorphism in Xenochrophis piscator (Schneider 1799). AILSPF- 244-246. Nande R and S Deshnukh, 2007. Snakes of Amravti district including melghat, Maharshtra. With important record of the Indian egg-eater, Montane trinket snake and Indian smooth snake. Zoos Print J. 22(2): 2920-2974. Narayanan A, 2012. Records of Indian Egg Eater Snake Elaschitodon westermanni in the localities of Shegaon, Maharashtra, India. Reptiles Rap. 14 (6): 09-12.
http://jsrr.net 170 ISSN: 2249-7846 (Online)
Joshi et al.,
Uke SB, Shende VA and KG Patil, 2013. Eco-diversity, distribution and conservation strategy of Amphiesma stolatum in Nagpur city. Asian J. Biol. and Biotech. 2 (2) 212:001-005.
Wadatkar JS, 2003. Herpetofauna of the Amravati university campus. Maharashtra. Zoos Print J. 19(2): 1381-1382. Whitaker R and A Captain, 2004. Snakes of India. The Field Guide. Draco Books. Chengalpattu, Tamil Nadu. xiv+479 pp, pls, text-figs.
How to Cite this Article: Joshi PS, Tantarpale VT and KM Kulkarni, 2014. A review of ophidian studies in Vidarbha region (M.S.)
India. Science Research Reporter, 4(2):167-170.
ISSN: 2319-5967
ISO 9001:2008 Certified International Journal of Engineering Science and Innovative Technology (IJESIT)
Volume 3, Issue 4, July 2014
373
Abstract—Some new nitrogen, oxygen and sulfur containing heterocyclic systems such as pyrazoles, isoxazoles and
1,3-thiazoles were synthesized via cyclization of 1-(2-hydroxy-3,5-dichlorophenyl)-3’-ethyl-1,3-dione and
1-(2-hydroxy-3,5-dichlorophenyl)-4-bromo-3-ethyl-1,3-dione by using suitable reagents. Structures of the newly
synthesized compounds were established by molecular weight determinations, elemental analysis and spectral data. All the
products were also screened in vitro for their antimicrobial activity against the bacteria P. vulgaris and B. subtilis spp.
and antifungal activity against Aspergillusn niger , Curvularia lunata by disc diffusion method.
Index Terms—Antimicrobial activity, Isoxazoles, Pyrazoles and 1, 3-Thiazoles..
I. INTRODUCTION
The N, O and S containing chlorosubstituted heterocycles viz. pyrazoles, isoxazoles and 1, 3-thiazoles, is an
important class of heterocyclic compounds. These are reported to have a broad spectrum of biological and
medicinal activities, such as Anticonvalsant [1], cytotoxic, herbicidal [2], antiinflammatory [3], antifungal [4],
antimicrobial [5], antioxidant [6] activities.
Pyrazole ring is incorporated into many of the commercially available pharmaceuticals, agrochemicals [7].
Isoxazole derivatives [8] have been in commercial use for many years. Thiazole being an integral part of many
potent biologically active molecules [9] plays an important role as antifungal and antibacterial agent.
In view of the above mentioned findings, we decided to synthesize some new pyrazoles, isoxazoles and 1,3‐ thiazoles and investigate their antimicrobial activities.
II. EXPERIMENTAL
Preparation of 2-hydroxy-3,5-dichloro-4’-ethylchalcone (3a):
To the boiling solution of the 2-hydroxy-3,5-dichloroacetophenone (2b) (0.01 mol) and propanaldehyde (0.01
mol) in ethanol (20ml), 40% solution of NaOH was added gradually. The reaction mixture was stirred
mechanically at room temperature for 1 hr. and kept it at room temperature for 6 to 8 h. followed by decomposition
with ice-cold HCl (1:1). The yellow granules thus obtained were filtered and washed with 10% NaHCO3 solution
and then crystallized from ethanol to obtain compound (3a) m.p.94oC, yield: 75%.
Synthesis and Characterization of Some New N,
O and S Containing Chlorosubstituted
Heterocycles and Their Antimicrobial Screening
against Some Common Causative
Organisms N. G. Ghodile
1* & P. R. Rajput
2
1Department of Chemistry, S.S.S.K.R. Innani MV, Karanja (Lad),
2Department of Chemistry,
Vidya Bharati MV, C. K. Naidu Road, Camp, Amravati-444602.
ISSN: 2319-5967
ISO 9001:2008 Certified International Journal of Engineering Science and Innovative Technology (IJESIT)
Volume 3, Issue 4, July 2014
374
Preparation of Chalconedibromide (3b)
2-Hydroxy-3,5-dichlorophenyl-4’-ethylchalcone (3a) was suspended in bromine-glacial acetic acid reagent. The
reagent was added drop by drop with constant stirring and reaction mixture was kept at room temperature for about
30 minutes. The solid product thus separated was filtered and washed with a little petroleum ether to get the
compound (3b). M.P. 75oC, Yield 82%.
Preparation of 6,8-dicloroflavone (4a).
Compound (3b) was dissolved in ethanol (25ml) containing a little piperidine. To this aqueous KOH solution (25
ml) was added. The reaction mixture was then refluxed for 1 hour, cooled and diluted with water. The product thus
separated was filtered and crystallized from ethanol to get the compound (4a). M.P. 147oC, Yield 60 %.
Preparation of 1-(2-hydroxy-3,5-dichlorophenyl)-3’-ethyl-1,3-dione (5a).
1-Ethyl-6,8-dichloroflavone (4a) was dissolved in ethanol containing a little piperidine. To this aqueous HCl
solution (25 ml) was added. The reaction mixture was then refluxed for 1 hour, cooled and diluted with water. The
product thus separated was filtered and crystallized from ethanol to get the compound (5a). M.P. 110oC, Yield 65
%.
Preparation of 1-(2-hydroxy-3,5-dichlorophenyl)-4-bromo-3-ethyl-1,3-dione (5b).
1-(2-Hydroxy-5-chlorophenyl)-3-ethyl-1,3-dione(5a) was dissolved in ethanol (10 ml) containing a little
piperidine. To this, liquid bromine (0.5 ml) was added and allowed it to stand for 1 hour. It was then diluted and
washed several times with water and finally extracted with ether to get the compound (5b), M.P. 78oC, Yield 60 %.
Preparation of pyrazole 3-(2-hydroxy-3,5-dichlorophenyl)-5 –ethylpyrazole (6a).
1-(2-Hydroxy-3,5-chlorophenyl)-3’-ethyl-1,3-dione (5a) and phenylhydrazine hydrochloride were dissolved in
ethanol (25 ml) containing a little piperidine refluxed for 1.5 hours, cooled and diluted with water and acidified
with conc. HCl. The product thus separated was filtered and crystallized from ethanol to get the compound (6a).
M.P. 167oC, Yield 75 %. Elemental analysis: % C 60.21/ 61.23; % H 4.39/ 5.40; % O 7.75/ 8.16; % Cl 17.86/
18.07; % N 6.82/ 7.14; UV spectrum (dioxane) λmax, 395.0 nm (n―›π*). IR (KBr,): 3600 (-OH stret.), 3038
(Aromatic stret.), 3200 (-NH stret.), 2850 (Ali. C-CH stret.), 1431 (-CH2 bend.), 1304 (-CH3 bend.), 825.57(C-Cl
Stret.), 1H NMR: δ 1.28 (t, 3H, -CH2-CH3), δ 2.05 (q, 2H, -CH2-CH3), δ 6.91 to 8.11 (m, 3H, Ar-H), 11.2 (s, H,
-OH), 4.6 (s, 1H, -NH).
Preparation of isoxazole 3-(2-hydroxy-3,5-dichlorophenyl)-5-ethylisoxazole (6b).
1-(2-Hydroxy-3,5-chlorophenyl)-3’-ethyl-1,3-dione (5a) and hydroxylamine hydrochloride were dissolved in
ethanol (25 ml) contains few drops of piperidine refluxed for 2.5 hours, cooled and diluted with water and acidified
with conc. HCl. The product thus separated was filtered and crystallized from ethanol to get the compound (6a).
M.P. 185oC, Yield 75 %. Elemental analysis: % C 52.00/ 52.02; % H 3.59/ 3.69; % O 15.66/ 15.99 % Cl 23.44/
23.62 % N 4.55/ 4.67; UV spectrum (dioxane) λmax, 402.0 nm (n―›π*). IR (KBr): 3500 (-OH stret.), 3084
(Aromatic stret.), 3359 (-NH stret.), 2861(Ali. C-CH stret.), 1451(-CH2 bending), 1338, (CH3 bending), 819 (C-Cl
Stret.), 1H NMR: δ 1.26 (t, 3H, -CH2-CH3), δ 2.4, (s, 2H, -CH2-CH3), δ 6.67 to 7.83 (m, 3H, Ar-H), 11.3 (s, H,
-OH).
Preparation of 5-(2-hydroxy-3,5-dichlorophenyl)-4’-ethyl-2’-amino-1,3-thiazole (6c).
1-(2-Hydroxy-3,5-chlorophenyl)-2-bromo-3-ethyl-1,3-dione (5b) and thiourea were dissolved in ethanol (25 ml)
contains few drops of piperidine. To this reaction mixture aqueous KOH solution (10ml) was added and refluxed
for 2.5 hours, cooled and diluted with water and acidified with conc. HCl. The product thus separated was filtered
and crystallized from ethanol to get the compound (6a). M.P. 102oC, Yield 64 %. Elemental analysis: %C 46.79/
46.89; %H 2.39/ 2.46; %O 7.75/ 7.82; %Cl 8.56/ 8.65; %N 6.82/ 6.89; %S 7.73/ 7.82.; UV spectrum (dioxane)
λmax, 401.0 nm (n―›π*). IR (KBr): 3500, (-OH stret.), 3038 (Aromatic stret.), 3300 (-NH stret.), 2850 (Ali. C-CH
stret.), 1434 (-CH2 bend.), 1338, (-CH3 bend.) 1022 (C-S stret.), 829.39 (C-Cl Stret.), 1H NMR: δ 2.7 (s, 3H,
-CH3), δ 7-8 (m, 12H, Ar-H), δ 6.2 (s, 1H, -NH), δ 12.5 (s, 2H, Ar-OH), 11.2 (s, H, -OH), 4.7 (s, 1H, -NH).
Preparation of 5-(2-hydroxy-3,5-dichlorophenyl)-4’-ethyl-2’-aminophenyl-1,3-thiazole (6d).
1-(2-Hydroxy-3,5-chlorophenyl)-4’-bromo-3’-ethyl-1,3-dione (5b)and phenylthiourea were dissolved in ethanol
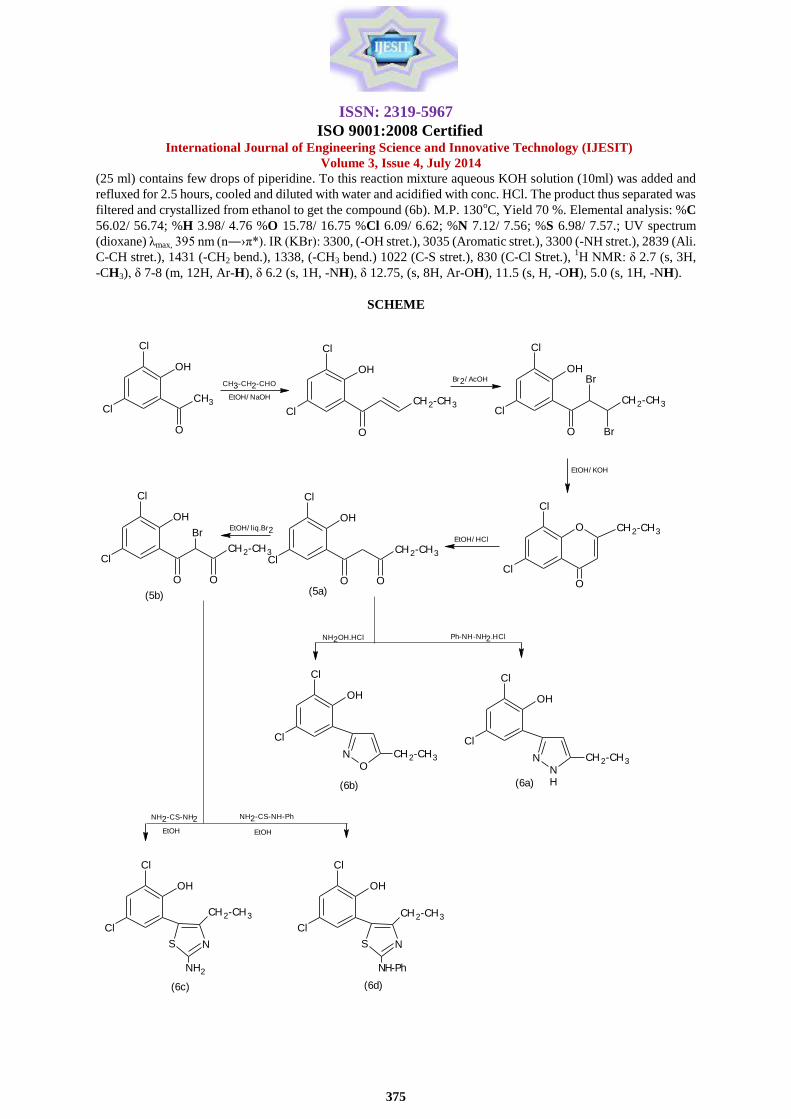
ISSN: 2319-5967
ISO 9001:2008 Certified International Journal of Engineering Science and Innovative Technology (IJESIT)
Volume 3, Issue 4, July 2014
375
(25 ml) contains few drops of piperidine. To this reaction mixture aqueous KOH solution (10ml) was added and
refluxed for 2.5 hours, cooled and diluted with water and acidified with conc. HCl. The product thus separated was
filtered and crystallized from ethanol to get the compound (6b). M.P. 130oC, Yield 70 %. Elemental analysis: %C
56.02/ 56.74; %H 3.98/ 4.76 %O 15.78/ 16.75 %Cl 6.09/ 6.62; %N 7.12/ 7.56; %S 6.98/ 7.57.; UV spectrum
(dioxane) λmax, 395 nm (n―›π*). IR (KBr): 3300, (-OH stret.), 3035 (Aromatic stret.), 3300 (-NH stret.), 2839 (Ali.
C-CH stret.), 1431 (-CH2 bend.), 1338, (-CH3 bend.) 1022 (C-S stret.), 830 (C-Cl Stret.), 1H NMR: δ 2.7 (s, 3H,
-CH3), δ 7-8 (m, 12H, Ar-H), δ 6.2 (s, 1H, -NH), δ 12.75, (s, 8H, Ar-OH), 11.5 (s, H, -OH), 5.0 (s, 1H, -NH).
SCHEME
Cl
Cl
OH
CH3
O
CH3-CH2-CHO
EtOH/ NaOH
Cl
Cl
OH
CH2-CH3
O
Br2/ AcOH
Cl
Cl
OH
O
CH2-CH3
Br
Br
EtOH/ KOH
Cl
Cl
O
O
CH2-CH3EtOH/ HCl
Cl
ClCH2-CH3
OH
O O
Cl
ClCH2-CH3
OH
O O
BrEtOH/ liq.Br2
NNH
Cl
Cl
OH
CH2-CH3N
O
Cl
Cl
OH
CH2-CH3
Cl
Cl
OH
S N
NH2
CH2-CH3
Cl
Cl
OH
S N
NH-Ph
CH2-CH3
Ph-NH-NH2.HClNH2OH.HCl
NH2-CS-NH-PhNH2-CS-NH2
EtOH EtOH
(6a)(6b)
(6c) (6d)
(5a)(5b)
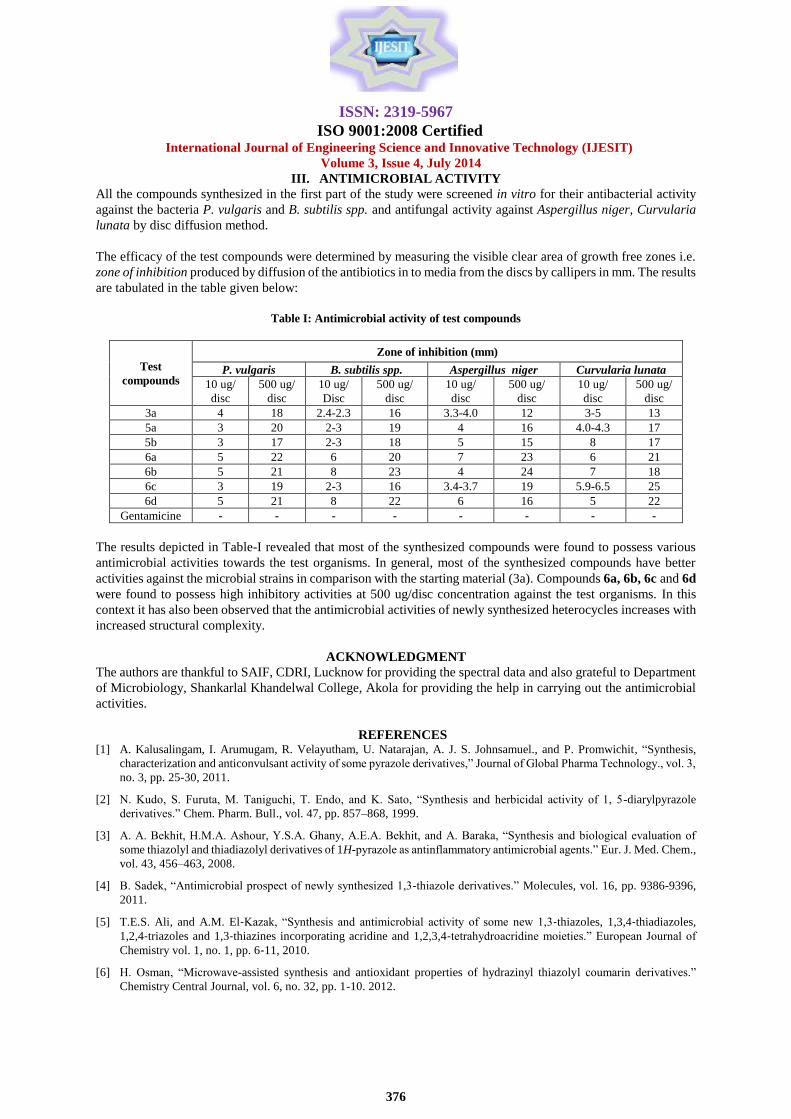
ISSN: 2319-5967
ISO 9001:2008 Certified International Journal of Engineering Science and Innovative Technology (IJESIT)
Volume 3, Issue 4, July 2014
376
III. ANTIMICROBIAL ACTIVITY
All the compounds synthesized in the first part of the study were screened in vitro for their antibacterial activity
against the bacteria P. vulgaris and B. subtilis spp. and antifungal activity against Aspergillus niger, Curvularia
lunata by disc diffusion method.
The efficacy of the test compounds were determined by measuring the visible clear area of growth free zones i.e.
zone of inhibition produced by diffusion of the antibiotics in to media from the discs by callipers in mm. The results
are tabulated in the table given below:
Table I: Antimicrobial activity of test compounds
Test
compounds
Zone of inhibition (mm)
P. vulgaris B. subtilis spp. Aspergillus niger Curvularia lunata
10 ug/
disc
500 ug/
disc
10 ug/
Disc
500 ug/
disc
10 ug/
disc
500 ug/
disc
10 ug/
disc
500 ug/
disc
3a 4 18 2.4-2.3 16 3.3-4.0 12 3-5 13
5a 3 20 2-3 19 4 16 4.0-4.3 17
5b 3 17 2-3 18 5 15 8 17
6a 5 22 6 20 7 23 6 21
6b 5 21 8 23 4 24 7 18
6c 3 19 2-3 16 3.4-3.7 19 5.9-6.5 25
6d 5 21 8 22 6 16 5 22
Gentamicine - - - - - - - -
The results depicted in Table-I revealed that most of the synthesized compounds were found to possess various
antimicrobial activities towards the test organisms. In general, most of the synthesized compounds have better
activities against the microbial strains in comparison with the starting material (3a). Compounds 6a, 6b, 6c and 6d
were found to possess high inhibitory activities at 500 ug/disc concentration against the test organisms. In this
context it has also been observed that the antimicrobial activities of newly synthesized heterocycles increases with
increased structural complexity.
ACKNOWLEDGMENT
The authors are thankful to SAIF, CDRI, Lucknow for providing the spectral data and also grateful to Department
of Microbiology, Shankarlal Khandelwal College, Akola for providing the help in carrying out the antimicrobial
activities.
REFERENCES [1] A. Kalusalingam, I. Arumugam, R. Velayutham, U. Natarajan, A. J. S. Johnsamuel., and P. Promwichit, “Synthesis,
characterization and anticonvulsant activity of some pyrazole derivatives,” Journal of Global Pharma Technology., vol. 3,
no. 3, pp. 25-30, 2011.
[2] N. Kudo, S. Furuta, M. Taniguchi, T. Endo, and K. Sato, “Synthesis and herbicidal activity of 1, 5-diarylpyrazole
derivatives.” Chem. Pharm. Bull., vol. 47, pp. 857–868, 1999.
[3] A. A. Bekhit, H.M.A. Ashour, Y.S.A. Ghany, A.E.A. Bekhit, and A. Baraka, “Synthesis and biological evaluation of
some thiazolyl and thiadiazolyl derivatives of 1H-pyrazole as antinflammatory antimicrobial agents.” Eur. J. Med. Chem.,
vol. 43, 456–463, 2008.
[4] B. Sadek, “Antimicrobial prospect of newly synthesized 1,3-thiazole derivatives.” Molecules, vol. 16, pp. 9386-9396,
2011.
[5] T.E.S. Ali, and A.M. El‐Kazak, “Synthesis and antimicrobial activity of some new 1,3‐thiazoles, 1,3,4‐thiadiazoles,
1,2,4‐triazoles and 1,3‐thiazines incorporating acridine and 1,2,3,4‐tetrahydroacridine moieties.” European Journal of
Chemistry vol. 1, no. 1, pp. 6‐11, 2010.
[6] H. Osman, “Microwave-assisted synthesis and antioxidant properties of hydrazinyl thiazolyl coumarin derivatives.”
Chemistry Central Journal, vol. 6, no. 32, pp. 1-10. 2012.

ISSN: 2319-5967
ISO 9001:2008 Certified International Journal of Engineering Science and Innovative Technology (IJESIT)
Volume 3, Issue 4, July 2014
377
[7] M. A. Salem, H. K. H. Thabet, M. H. Helal, A. S. Abdelaal, and Y. A. Ammar, “Synthesis and pharmacological evaluation
of some Pyrazoles, Thiazolopyrimidine, Triazolopyrimidine, Pyridone and 2-Iminochromene containing naproxenoyl
moiety as NSAIDs,” Chemical Sciences Journal, vol. CSJ-32, pp. 1-12, 2011.
[8] M. Shailaja, A. Manjula, and B.V. Rao, “Synthesis of novel 3, 5-disubstituted-4, 5-dihydroisoxazole and 3, 4,
5-trisubstituted isoxazole and their biological activity.” Indian journal of chemistry, vol.50B, pp. 214-222, 2011.
[9] Heterocyclic Chemistry-II, Five-membered heterocycles, R. R. Gupta, M. Kumar, V. Gupta, Springer publication. ISBN
81-8128-221-3.
RESEARCH ARTICLE Am. J. PharmTech Res. 2014; 4(4) ISSN: 2249-3387
Please cite this article as: Malpani MO et al.,Wound Healing Activity of Butea Monosperma in Wistar
Rats. American Journal of PharmTech Research 2014.
Wound Healing Activity of Butea Monosperma in Wistar Rats
Malpani M. O.1*, Rajput P. R.
2
1. Department of Chemistry, Shankarlal Khandelwal College, Akola,
2.Department of Chemistry, Vidya Bharati Mahavidyalaya, Amravati
ABSTRACT
Wound is a physical injury that causes breakdown in the protective function of the skin and the
loss of continuity of epithelium with or without loss of underlying connective tissues. Proper
healing of wound is essential for the restoration of normalcy in disrupted anatomical continuity
and altered functional status of the skin. Wound healing is a complex and dynamic process of
restoring cellular structures and tissue layers. It can be divided into 3 distinct phases: an immediate
haemostatic phase, an early phase of re-epithelialization, a later phase of dermal repair and
remodelling. The present investigation was undertaken to determine the efficacy of Butea
monosperma leaves aqueous extract, isolated acidic ingredient and its newly synthesized amide
analogue along with silver sulphadiazine as control on burn wound in Wistar albino rats. The
histopathological examinations confirmed that the treated animals showed improved rate of
epithelialization and wound contraction. On comparison among the impact of test compounds; it
was further revealed that, the Butea monosperma leaves aqueous extract and synthesized amide
analogue showed significant wound healing activity than isolated acidic ingredient.
Keywords: Butea monosperma, isolated ingredient, amide analogue, burn wound.
*Corresponding Author Email:[email protected]
Received 19 July 2014, Accepted 28 July 2014
Journal home page: http://www.ajptr.com/
Malpani et. al., Am. J. PharmTech Res. 2014; 4(4) ISSN: 2249-3387
561 www.ajptr.com
INTRODUCTION
The physical injury that results breakdown in the protective function of the skin and the loss of
continuity of epithelium with or without loss of underlying connective tissue is called wound.
Proper healing of wound is essential for the restoration of disrupted anatomical continuity and also
altered functional status of the skin. Wound healing is a complex and fundamental activity of all
damaged body structures. The same principle underlines the healing of cuts, abrasions, ulcers and
areas damaged by chemical attack, invasion by microorganisms or immune reactions. Healing of
the skin damaged by a physical assault may be divided into following three aspects1,
i. An immediate haemostatic phase,
ii. An early phase of re-epithelialization,
iii. A later phase of dermal repair and remodelling.
Research on wound healing agents is one of the developing areas in modern biomedical sciences.
Recently there has been a shift in universal trend from synthetic to herbal medicine, which we can
say ‘Return to Nature’. Medicinal plants have been known for ‘millennia’ and are highly esteemed
all over the world as a rich source of therapeutic agents for treating wounds, cuts and burns. The
herbal drugs are popular for wound healing among rural and urban communities of India. The one
reason for the popularity and acceptability is the belief that all natural products are safe. The
demand for plant-based medicines, health products, pharmaceuticals, food supplements, cosmetics,
etc., are increasing in both developing and developed countries due to the growing recognition that
the natural products are nontoxic, have less side effects and are easily available at affordable
prices2.
In the literature, B. monosperma is ascribed to have many medicinal properties. The flowers and
leaves are reported to possess astringent, diuretic, depurative, aphrodisiac and tonic properties.
They are also effective in leprosy, leucorrhoea and gout. The leaves are also used to cure boils,
pimples and tumorous hemorrhoids and are internally given in flatulent colic, worms and piles.
The leaves are reported to contain alkaloids, protein, fibre and minerals. The bark is useful in
tumors, bleeding piles and ulcers3. Topical administration of an alcoholic bark extract was found to
improve the different phases of wound repair, including collagen synthesis and maturation, wound
contraction and epithelialization4.
The present study was undertaken to explore the efficacy of aqueous extract of Butea monosperma
leaves, isolated acidic ingredient and newly synthesized amide analogue along with silver
sulphadiazine as control on burn wound healing in Wistar albino rats.
Malpani et. al., Am. J. PharmTech Res. 2014; 4(4) ISSN: 2249-3387
www.ajptr.com 562
MATERIALS AND METHODS
Plant material:
The leaves of Butea monosperma plant were collected seasonally from the Melghat region of
Amravati, District of Maharashtra, India. It was authenticated by the taxonomist Dr. S. P. Rothe
with Voucher specimen (ML – 101) and was deposited in the herbarium of Department of Botany,
Shri Shivaji College, Akola.
Extraction and Isolation:
The leaves of Butea monosperma plant were shade dried at room temperature and ground in a
manual mill to get coarse powder. The powder was kept in the airtight polythene bag and stored at
dry place. This powder was extracted with water as a solvent by using soxhlet apparatus. The
extract was concentrated at 40 oC using rotary evaporator. Finally it was dried, crushed and stored
in air tight bottle at 4 oC for further study. The aqueous test extract (100g) was dissolved in
NaHCO3 till there was no effervescence then filter and crude acidic ingredients were re-appeared
from filtrate using 10% HCl.
The crude acidic ingredients (35g) adsorbed on to a silica gel (s d fine 60-120 mesh) and subjected
to column chromatography over silica gel (100-200 mesh) and eluted with n-hexane followed by
petroleum ether-benzene-acetic acid gradient system (20:40:40, 40:20:40, 40:40:20). The fractions
were collected in 100ml conical flasks. The eluted fractions were combined to give major fractions
by comparing their Rf values, when run on TLC Aluminium sheets Silica Gel 60 F254 0.2 mm
thickness with similar solvent systems. The separated components on the silica plate were
visualized in UV light and then to Iodine, methyl red, bromophenol blue, vanillin sulphuric acid.
After developing TLC profile, similar TLC pattern fractions were mixed together to get major
fractions. Total seven fractions were collected (F1-F7). Fraction F-5 was subjected to repeated
chromatographic purification over silica gel using elution with petroleum ether-benzene-acetic
acid (40:40:20) to give compound 1 (100 mg)5&6
.
Characterization of compound 1:
M.P.: 245 °C, Elemental analysis: Found C =49.40,
H = 3.52, O = 47.00, Calculated C = 49.42, H = 3.55, O = 47.02 %. UV spectrum: λmax283 nm
(n *). IR spectrum, ν, cm–1
: 3367.61, 3289.24, 3064.85, 3011.46 (-OH stretching), 3064.85
(Ar-H stretching), 1702.93, 1618.06 (two C=O absorptions), 1600-1450 (aromatic ring), 1300-
1000 (C-O). 1H NMR spectrum (400 MHz):δ ppm 4.801 (3H, s, aromatic C-OH), 7.087-7.221
(2H, s, Ar-H).
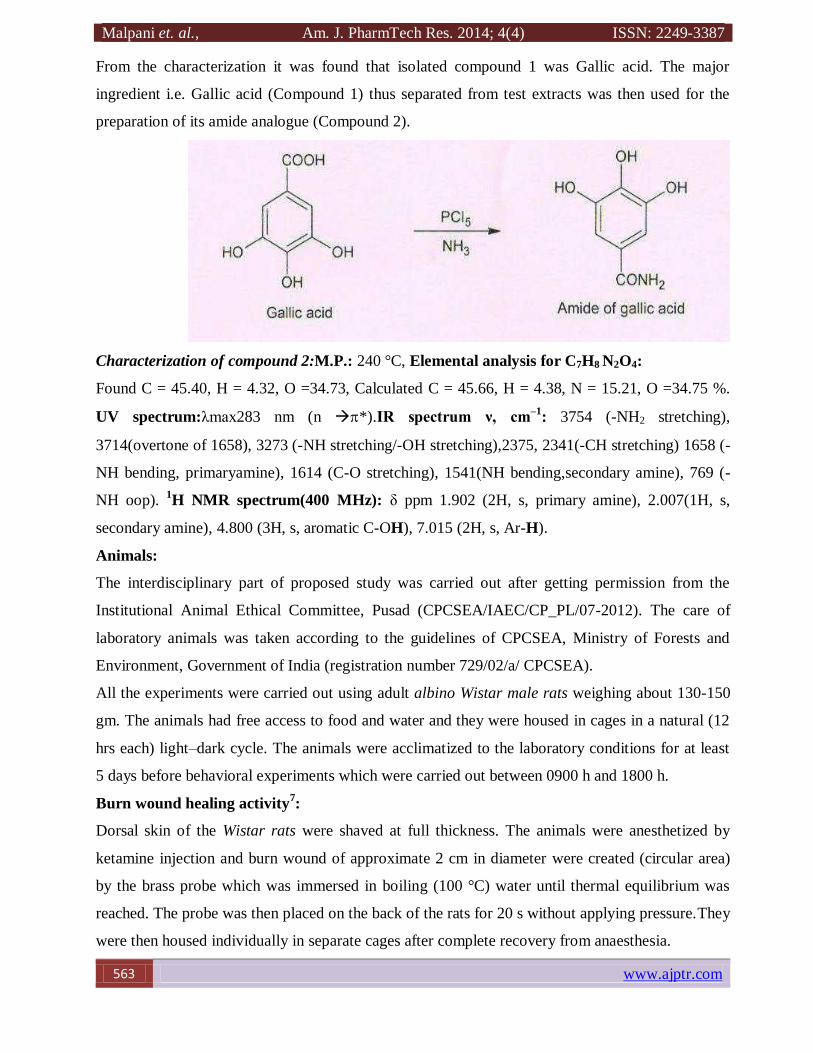
Malpani et. al., Am. J. PharmTech Res. 2014; 4(4) ISSN: 2249-3387
563 www.ajptr.com
From the characterization it was found that isolated compound 1 was Gallic acid. The major
ingredient i.e. Gallic acid (Compound 1) thus separated from test extracts was then used for the
preparation of its amide analogue (Compound 2).
Characterization of compound 2:M.P.: 240 °C, Elemental analysis for C7H8 N2O4:
Found C = 45.40, H = 4.32, O =34.73, Calculated C = 45.66, H = 4.38, N = 15.21, O =34.75 %.
UV spectrum:λmax283 nm (n *).IR spectrum ν, cm–1
: 3754 (-NH2 stretching),
3714(overtone of 1658), 3273 (-NH stretching/-OH stretching),2375, 2341(-CH stretching) 1658 (-
NH bending, primaryamine), 1614 (C-O stretching), 1541(NH bending,secondary amine), 769 (-
NH oop). 1H NMR spectrum(400 MHz): δ ppm 1.902 (2H, s, primary amine), 2.007(1H, s,
secondary amine), 4.800 (3H, s, aromatic C-OH), 7.015 (2H, s, Ar-H).
Animals:
The interdisciplinary part of proposed study was carried out after getting permission from the
Institutional Animal Ethical Committee, Pusad (CPCSEA/IAEC/CP_PL/07-2012). The care of
laboratory animals was taken according to the guidelines of CPCSEA, Ministry of Forests and
Environment, Government of India (registration number 729/02/a/ CPCSEA).
All the experiments were carried out using adult albino Wistar male rats weighing about 130-150
gm. The animals had free access to food and water and they were housed in cages in a natural (12
hrs each) light–dark cycle. The animals were acclimatized to the laboratory conditions for at least
5 days before behavioral experiments which were carried out between 0900 h and 1800 h.
Burn wound healing activity7:
Dorsal skin of the Wistar rats were shaved at full thickness. The animals were anesthetized by
ketamine injection and burn wound of approximate 2 cm in diameter were created (circular area)
by the brass probe which was immersed in boiling (100 °C) water until thermal equilibrium was
reached. The probe was then placed on the back of the rats for 20 s without applying pressure.They
were then housed individually in separate cages after complete recovery from anaesthesia.

Malpani et. al., Am. J. PharmTech Res. 2014; 4(4) ISSN: 2249-3387
www.ajptr.com 564
Rats were randomly divided into five groups of ten animals each:
Control group:
Immediately after burning, burn areas were covered with propylene glycol solution once a day for
20 days.
Standard Silver Sulphadiazine group:
Immediately after burning, burn areas were covered with Silver Sulphadiazine cream once a day
for 20 days.
Crude extract group:
Immediately after burning, burn areas were covered with crude extract of leaves sample which was
prepared in propylene glycol once a day for 20 days.
Isolated acid group:
Immediately after burning, burn areas were covered with isolated acid sample prepared in
propylene glycol, once a day for 20 days.
Prepared analogue group:
Immediately after burning, burn areas were covered with the prepared analogue sample also
prepared in propylene glycol once a day for 20 days.
The wounds were clinically observed in all groups every day. After 10th and 20
th days later, the rats
were sacrificed after being anesthetized.
BIOPHYSICAL PARAMETERS
Measurement of wound contraction:
The animals were inspected daily and the observations of percentage wound closure were made on
10th, 15
th and 20
th post wounding days and the photographs were taken. The wound closure was
monitored by planimetric measurement of the wound area which was achieved by tracing the
wound on a graph paper. The healed area was calculated by subtracting it from the original wound
area (2nd
day). The percentage of wound contraction was determined using the following formula:
Percept wound contraction = Healed area/Total wound area x 100
To apply this equation, the wound margins were traced and measured to calculate the non-healed
area which was then subtracted from the original wound area8.
Measurement of thickness of epithelial:
The thickness of granulation tissues (epithelial) was measured by planimetric measurement of
center of wound9. The thickness of granulation tissue was measured on the isolated burn wound
sample of skin at 10th day and at 20
th day of sacrification of respective group of animals. The
thickness was measured by planimetric, by simply placing the sample of wound area between the
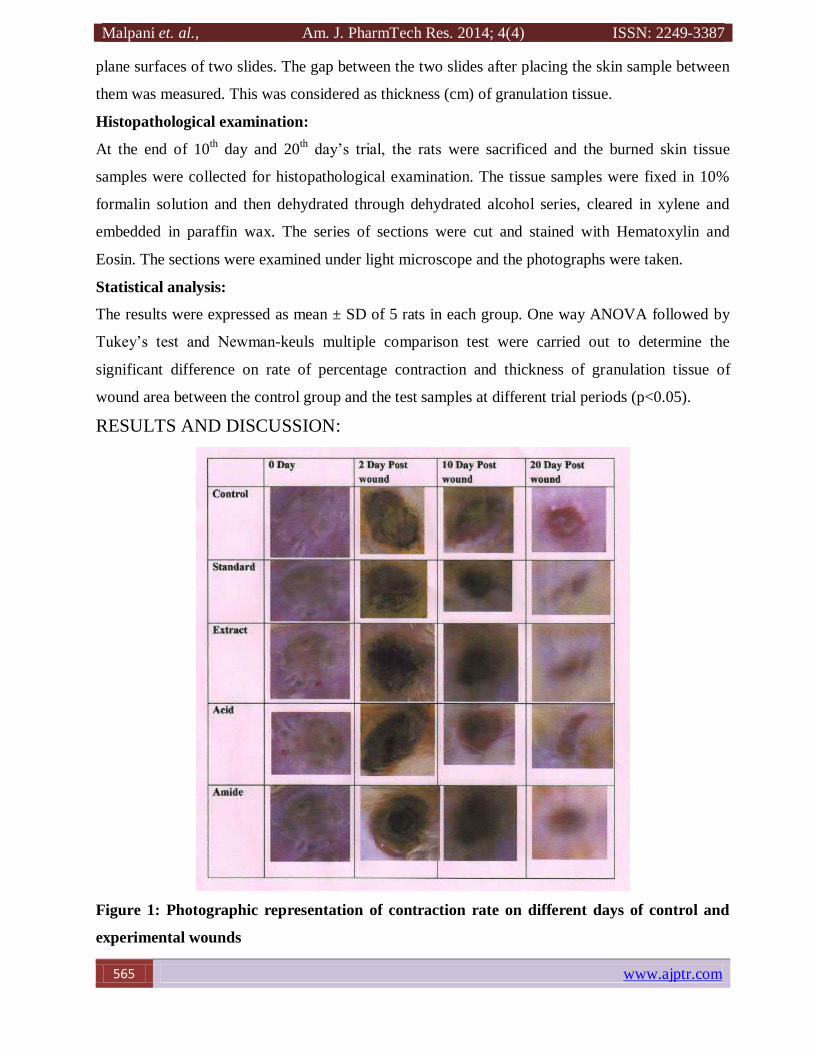
Malpani et. al., Am. J. PharmTech Res. 2014; 4(4) ISSN: 2249-3387
565 www.ajptr.com
plane surfaces of two slides. The gap between the two slides after placing the skin sample between
them was measured. This was considered as thickness (cm) of granulation tissue.
Histopathological examination:
At the end of 10th
day and 20th
day’s trial, the rats were sacrificed and the burned skin tissue
samples were collected for histopathological examination. The tissue samples were fixed in 10%
formalin solution and then dehydrated through dehydrated alcohol series, cleared in xylene and
embedded in paraffin wax. The series of sections were cut and stained with Hematoxylin and
Eosin. The sections were examined under light microscope and the photographs were taken.
Statistical analysis:
The results were expressed as mean ± SD of 5 rats in each group. One way ANOVA followed by
Tukey’s test and Newman-keuls multiple comparison test were carried out to determine the
significant difference on rate of percentage contraction and thickness of granulation tissue of
wound area between the control group and the test samples at different trial periods (p<0.05).
RESULTS AND DISCUSSION:
Figure 1: Photographic representation of contraction rate on different days of control and
experimental wounds
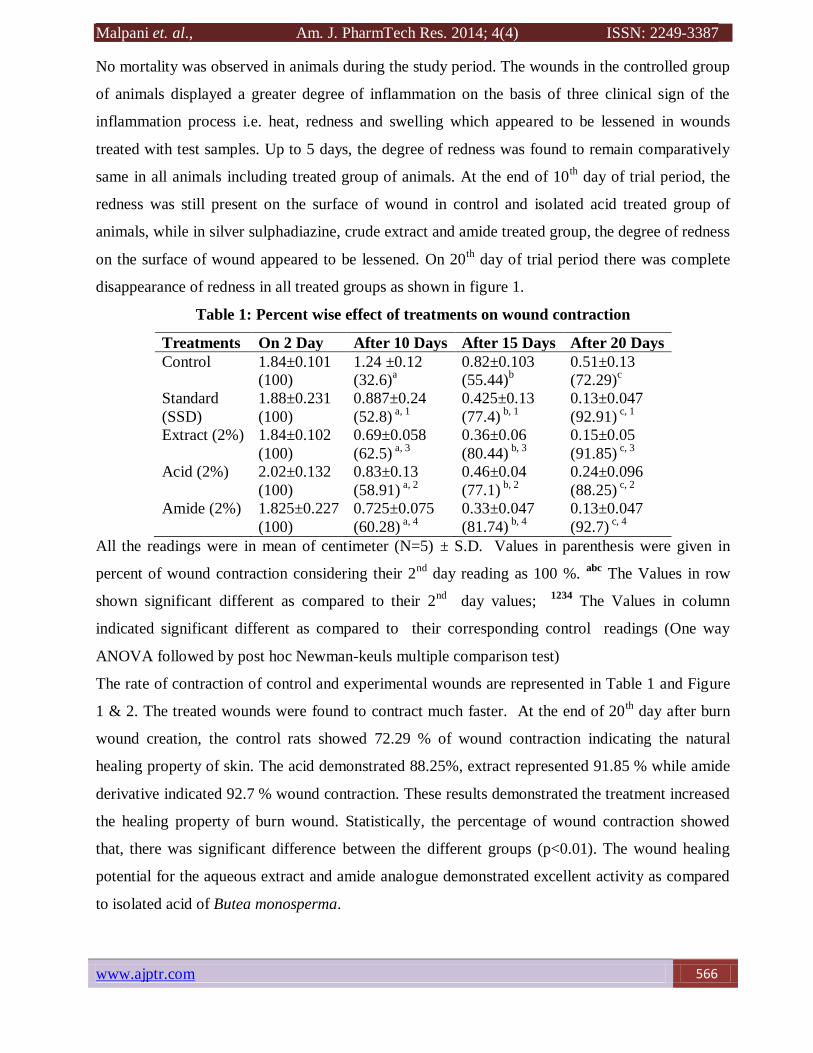
Malpani et. al., Am. J. PharmTech Res. 2014; 4(4) ISSN: 2249-3387
www.ajptr.com 566
No mortality was observed in animals during the study period. The wounds in the controlled group
of animals displayed a greater degree of inflammation on the basis of three clinical sign of the
inflammation process i.e. heat, redness and swelling which appeared to be lessened in wounds
treated with test samples. Up to 5 days, the degree of redness was found to remain comparatively
same in all animals including treated group of animals. At the end of 10th day of trial period, the
redness was still present on the surface of wound in control and isolated acid treated group of
animals, while in silver sulphadiazine, crude extract and amide treated group, the degree of redness
on the surface of wound appeared to be lessened. On 20th
day of trial period there was complete
disappearance of redness in all treated groups as shown in figure 1.
Table 1: Percent wise effect of treatments on wound contraction
Treatments On 2 Day After 10 Days After 15 Days After 20 Days
Control 1.84±0.101
(100)
1.24 ±0.12
(32.6)a
0.82±0.103
(55.44)b
0.51±0.13
(72.29)c
Standard
(SSD)
1.88±0.231
(100)
0.887±0.24
(52.8) a, 1
0.425±0.13
(77.4) b, 1
0.13±0.047
(92.91) c, 1
Extract (2%) 1.84±0.102
(100)
0.69±0.058
(62.5) a, 3
0.36±0.06
(80.44) b, 3
0.15±0.05
(91.85) c, 3
Acid (2%) 2.02±0.132
(100)
0.83±0.13
(58.91) a, 2
0.46±0.04
(77.1) b, 2
0.24±0.096
(88.25) c, 2
Amide (2%) 1.825±0.227
(100)
0.725±0.075
(60.28) a, 4
0.33±0.047
(81.74) b, 4
0.13±0.047
(92.7) c, 4
All the readings were in mean of centimeter (N=5) ± S.D. Values in parenthesis were given in
percent of wound contraction considering their 2nd
day reading as 100 %. abc
The Values in row
shown significant different as compared to their 2nd
day values; 1234
The Values in column
indicated significant different as compared to their corresponding control readings (One way
ANOVA followed by post hoc Newman-keuls multiple comparison test)
The rate of contraction of control and experimental wounds are represented in Table 1 and Figure
1 & 2. The treated wounds were found to contract much faster. At the end of 20th day after burn
wound creation, the control rats showed 72.29 % of wound contraction indicating the natural
healing property of skin. The acid demonstrated 88.25%, extract represented 91.85 % while amide
derivative indicated 92.7 % wound contraction. These results demonstrated the treatment increased
the healing property of burn wound. Statistically, the percentage of wound contraction showed
that, there was significant difference between the different groups (p<0.01). The wound healing
potential for the aqueous extract and amide analogue demonstrated excellent activity as compared
to isolated acid of Butea monosperma.
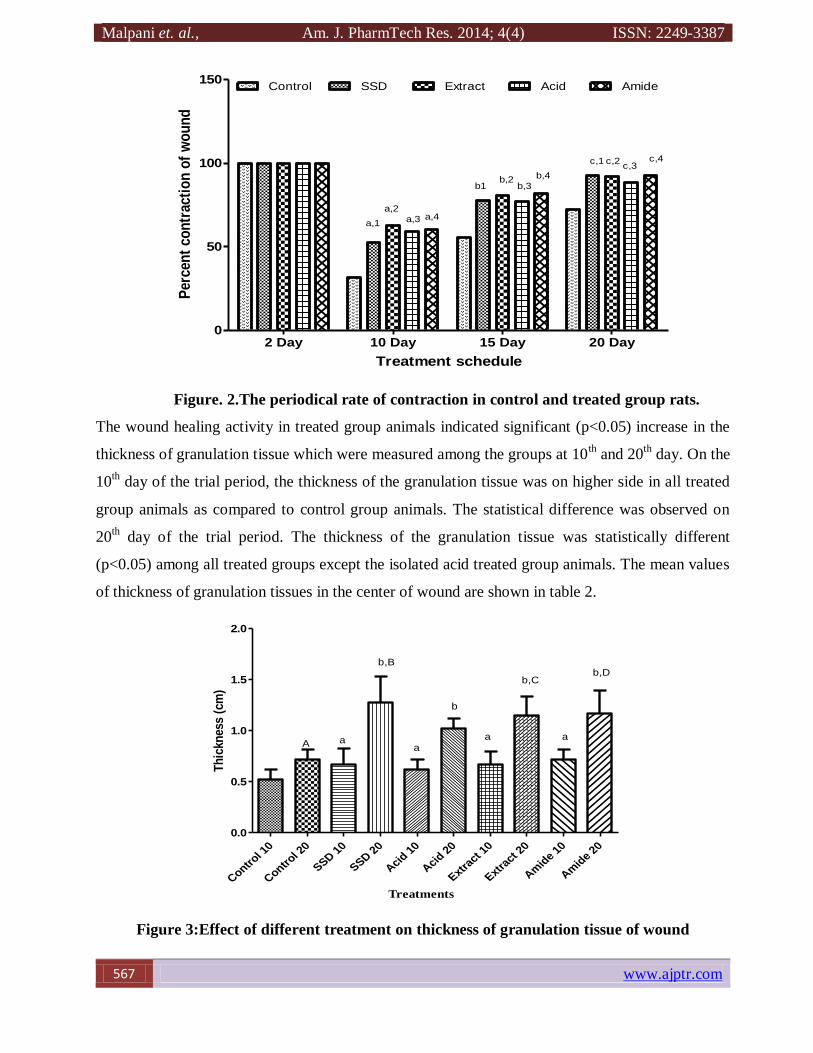
Malpani et. al., Am. J. PharmTech Res. 2014; 4(4) ISSN: 2249-3387
567 www.ajptr.com
2 Day 10 Day 15 Day 20 Day0
50
100
150Control SSD Extract Acid Amide
a,1
b1
c,1
a,2
b,2
c,2
a,3
b,3
c,3
a,4
b,4
c,4
Treatment schedule
Per
cen
t co
ntr
acti
on
of
wo
un
d
Figure. 2.The periodical rate of contraction in control and treated group rats.
The wound healing activity in treated group animals indicated significant (p<0.05) increase in the
thickness of granulation tissue which were measured among the groups at 10th and 20
th day. On the
10th day of the trial period, the thickness of the granulation tissue was on higher side in all treated
group animals as compared to control group animals. The statistical difference was observed on
20th day of the trial period. The thickness of the granulation tissue was statistically different
(p<0.05) among all treated groups except the isolated acid treated group animals. The mean values
of thickness of granulation tissues in the center of wound are shown in table 2.
Contr
ol 10
Contr
ol 20
SSD 1
0
SSD 2
0
Aci
d 10
Aci
d 20
Extra
ct 1
0
Extra
ct 2
0
Am
ide
10
Am
ide
20
0.0
0.5
1.0
1.5
2.0
A aa
a a
b,B
b
b,Cb,D
Treatments
Th
ickn
ess
(cm
)
Figure 3:Effect of different treatment on thickness of granulation tissue of wound
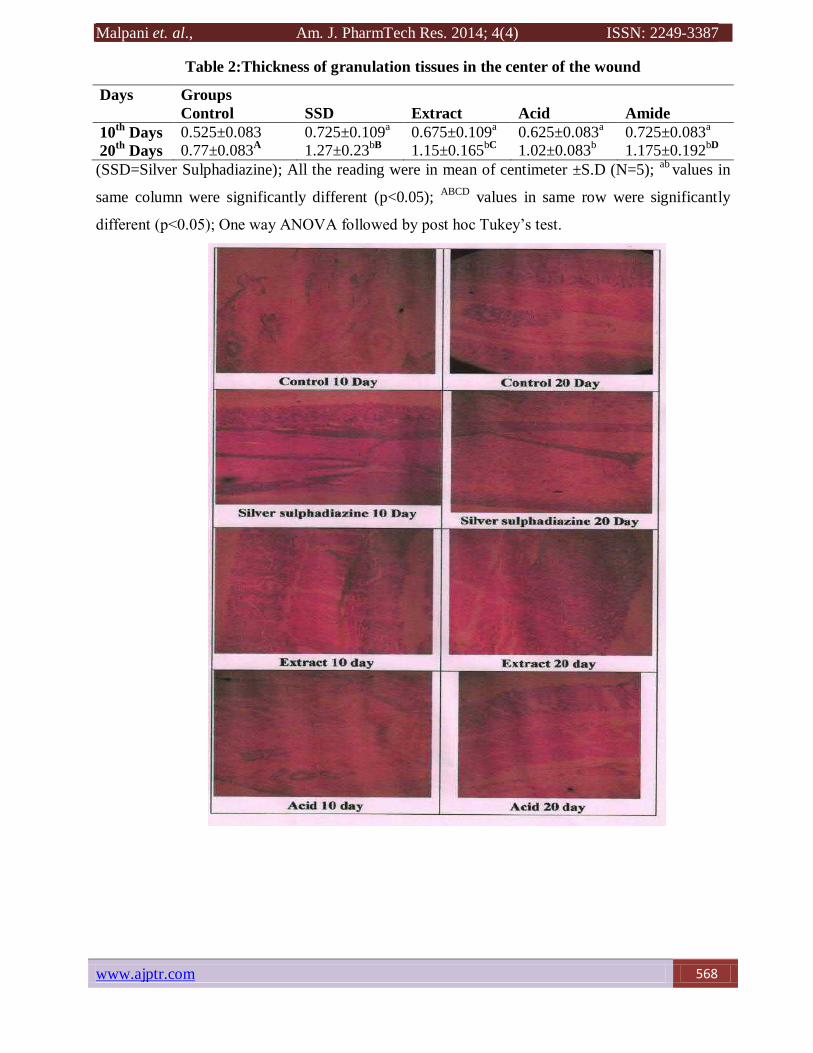
Malpani et. al., Am. J. PharmTech Res. 2014; 4(4) ISSN: 2249-3387
www.ajptr.com 568
Table 2:Thickness of granulation tissues in the center of the wound
Days Groups
Control SSD Extract Acid Amide
10th
Days 0.525±0.083 0.725±0.109a 0.675±0.109
a 0.625±0.083
a 0.725±0.083
a
20th
Days 0.77±0.083A 1.27±0.23
bB 1.15±0.165
bC 1.02±0.083
b 1.175±0.192
bD
(SSD=Silver Sulphadiazine); All the reading were in mean of centimeter ±S.D (N=5); ab
values in
same column were significantly different (p<0.05); ABCD
values in same row were significantly
different (p<0.05); One way ANOVA followed by post hoc Tukey’s test.
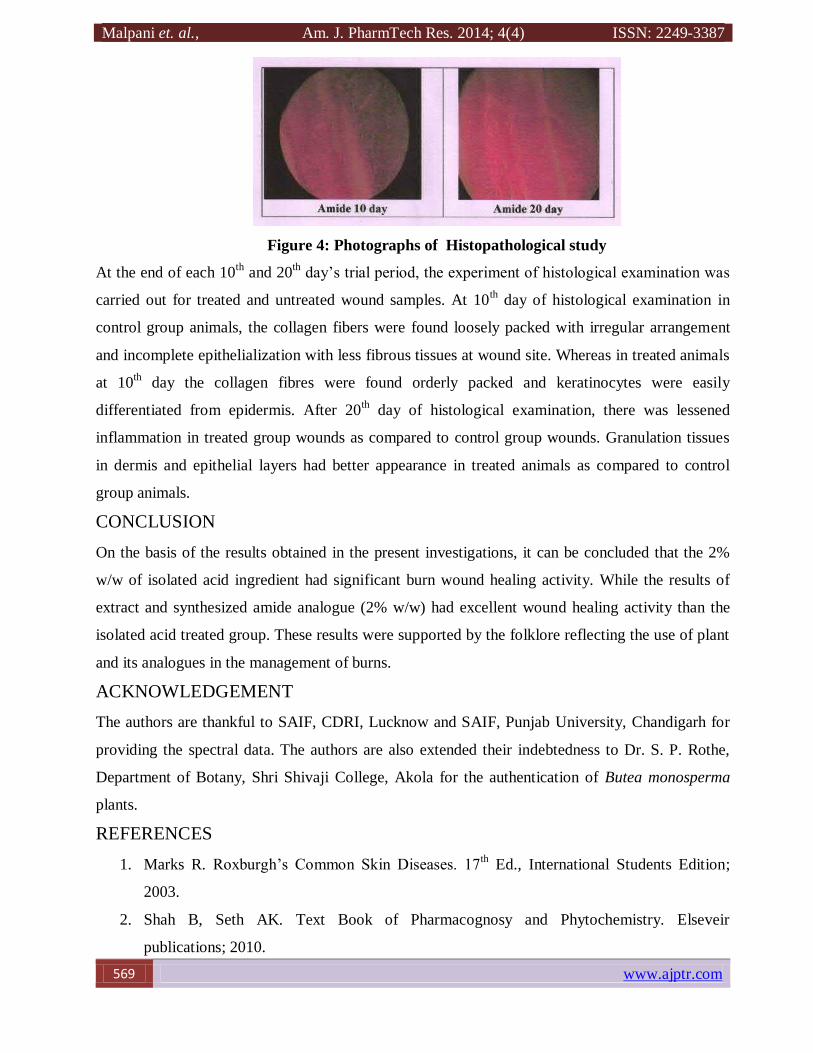
Malpani et. al., Am. J. PharmTech Res. 2014; 4(4) ISSN: 2249-3387
569 www.ajptr.com
Figure 4: Photographs of Histopathological study
At the end of each 10th
and 20th day’s trial period, the experiment of histological examination was
carried out for treated and untreated wound samples. At 10th day of histological examination in
control group animals, the collagen fibers were found loosely packed with irregular arrangement
and incomplete epithelialization with less fibrous tissues at wound site. Whereas in treated animals
at 10th day the collagen fibres were found orderly packed and keratinocytes were easily
differentiated from epidermis. After 20th day of histological examination, there was lessened
inflammation in treated group wounds as compared to control group wounds. Granulation tissues
in dermis and epithelial layers had better appearance in treated animals as compared to control
group animals.
CONCLUSION
On the basis of the results obtained in the present investigations, it can be concluded that the 2%
w/w of isolated acid ingredient had significant burn wound healing activity. While the results of
extract and synthesized amide analogue (2% w/w) had excellent wound healing activity than the
isolated acid treated group. These results were supported by the folklore reflecting the use of plant
and its analogues in the management of burns.
ACKNOWLEDGEMENT
The authors are thankful to SAIF, CDRI, Lucknow and SAIF, Punjab University, Chandigarh for
providing the spectral data. The authors are also extended their indebtedness to Dr. S. P. Rothe,
Department of Botany, Shri Shivaji College, Akola for the authentication of Butea monosperma
plants.
REFERENCES
1. Marks R. Roxburgh’s Common Skin Diseases. 17th Ed., International Students Edition;
2003.
2. Shah B, Seth AK. Text Book of Pharmacognosy and Phytochemistry. Elseveir
publications; 2010.
Malpani et. al., Am. J. PharmTech Res. 2014; 4(4) ISSN: 2249-3387
www.ajptr.com 570
3. The Wealth of India: A Dictionary of Indian Raw materials and Industrial products. First
supplement series Volume 1: A-Ci; National Institute of Science Communication and
Information Resources, CSIR, New Delhi; 2004.
4. Lochin S, Miriyala S, Panchatcharam M. Efficacy of Butea monosperma on dermal wound
healing in rats. The International Journal of Biochemistry & Cell Biology 2005; 37:566-
573.
5. Egon Stahl. Thin-Layer Chromatography. 3rd
Indian Reprint, Springer International
Edition; 2009.
6. Harborne JB.Phytochemical Methods: A guide to modern techniques of plant analysis. 6th
Indian reprint, Springer International Edition; 2010.
7. Nilugal KC, Perumal K, Ugander RE, Chittor A. Evaluation of Wound Healing Activity of
Piper Betle Leaves and Stem Extract in Experimental Wistar Rats. Am. J. Pharm Tech Res.
2014; 4 (3): 443-452.
8. Yaman AS, Durmus S, Ceribasi M, Yaman M. Effects of Nigella sativa and silver
sulfadiazine on burn wound healing in rats. Veterinarni Medicina 2010; 55 (12): 619–624.
9. Somboonwong J, Kankaisre M, Tantisira B, Tantisira MH. Wound healing activities of
different extracts of Centella asiatica in incision and burn wound models: an experimental
animal study. BMC Complementary and Alternative Medicine 2012; 12:103.
10. Karodi R, Jadhav M, Rub R, Bafna A. Evaluation of the wound healing activity of a crude
extract of Rubia cordifolia L. (Indian madder) in mice. International Journal of Applied
Research in Natural Products 2009; 2(2):12-18.
11. Avula M, Sudhakar Babu K, Ravi sankar T, Reddanna P, Latha J. Evaluation of wound
healing properties of bioactive fractions from the extract of Butea monosperma (lam) stem
bark. International Journal of Phytomedicine 2011; 3:41-49.
12. Manoj GS, Murugan K. Wound healing activity of methanolic and aqueous extracts of
plagiochila beddomei Steph. Thallus in rat model. Indian Journal of Experimental Biology
2012; 50: 551-558.
AJPTR is
Peer-reviewed
bimonthly
Rapid publication
Submit your manuscript at: [email protected]
E-ISSN: 2278-3229 IJGHC, September 2014 – November -2014; Sec. A; Vol.3, No.4, 1378-1383.
International Journal of Green and Herbal Chemistry
An International Peer Review E-3 Journal of Sciences
Available online atwww.ijghc.com
Section A: Green Chemistry Research Article CODEN (USA): IJGHAY
1378 IJGHC, September 2014 – November -2014; Sec. A; Vol.3, No.4, 1378-1383.
Antimicrobial study of analogues prepared under
microwave assistance of active ingredient isolated from Buteamonosperma plant and their growth promoting
impact on some flowering plants
M. O. Malpani1*, P. R. Rajput2
Received: 26August 2014; Revised: 8 September2014; Accepted: 12 September 2014
1Department of Chemistry, Shankarlal Khandelwal College, Akola 444-002, 2Department of Chemistry, Vidya Bharati Mahavidyalaya, Amravati 444-602.
Abstract: Buteamonospermais one of the medicinally potential plants found in Melghat region which is frequently used for the eradication of skin diseases. In the present study we have undertaken microwave assisted synthesis the analogues of active ingredient isolated from leaves of Buteamonospermaplant extract and screened for their antibacterial activity against pathogens responsible for skin diseases viz. Streptococcus pyogenes, Nocardiacalcarea, Trichosporoncutaneum, Rhodotorularubra. The synthesized compounds were screened for their growth promoting impacts on some flowering plants viz. Papaverrhoeas, Gladiola tristis, Dianthus chinensis, Candy tuft, Gaillardia, Calendula officinalise.
Key words: Buteamonosperma, microwave assisted synthesis of analogues, skin diseases, Streptococcus pyogenes, Nocardiacalcarea, Trichosporoncutaneum, RhodotorularubraPapaverrhoeas, Gladiola tristis, Dianthus chinensis, Candy tuft, Gaillardia, Calendula officinalise.
INTRODUCTION
The forest of Melghat Tiger reserve is of deciduous nature and has been categorized as “Dry deciduous forest”. The geological formation of the soil largely determines the type of vegetation it is going to support. The most of the area has the soil of trap origin which is rich in minerals and having a high water holding capacity. The soil strata has a remarkable rate of exchangeable
Antimicrobial…. Malpani and Rajput.
1379 IJGHC, September 2014 – November -2014; Sec. A; Vol.3, No.4, 1378-1383.
calcium and pH varying from 6.5 to 7.5 thus supporting the best form of teak and its associate flora.This is the main reason that to make Tectonagrandis (teak) is the most dominant species of Melghat forest. This region is also determined as a unique blend of multiple high hills and deep valleys with terrains and vegetations changing at close intervals.
More than 750 plant species have been enlisted in the Flora of Melghat1. These species belong to 400 genera representing as many as 97 families. There are 91 trees, 109 shrubs, 450 herbs, 38 climbers, 23 sedges and 84 grass species.
In the literature, B. monospermais ascribed to have many medicinal properties such as astringent, diuretic, depurative, aphrodisiac, rubefacient, tonic, and anthelmintic. They are effective in leprosy, leucorrhoea, gout, diarrhoea, puerperal women, elephantiasis, night blindness and other defects of sight, dysentery, phthisis and haemorrhage from stomach and bladder, inflammations, ringworm, ulcers and sore – throats2, 3.
MATERIALS AND METHODS
The leaves of Buteamonosperma plant was collected from the Melghat region of Amravati, District of Maharashtra, India seasonally and authenticated by the taxonomists Dr. S. P. Rothe from the Department of Botany, Shri Shivaji College Akola. Voucher specimen (ML – 101) was deposited in the herbarium of Department of Botany, Shri Shivaji College, Akola.
Chemicals: All the chemicals used in the study were obtained commercially and of analytical grade.
Microorganisms:The microorganisms which were used viz: Streptococcus pyogenes, Nocardiacalcarea, Trichosporoncutaneum, and Rhodotorularubraprocured from National Collection of Industrial Microorganisms (NCIM), National Chemical Laboratory, Pune 411 008.
Experimental: The leaves of Buteamonosperma plant was shade dried at room temperature and ground in a manual mill to get coarse powder. It was kept in the air tight polythene bag and stored at a dry place. The powdered material was extracted with water as a solvent by using soxhlet apparatus. The extract was concentrated for further studies at 40 oC in water bath. The test extract then dried, crushed and stored in air tight bottle for further study. The acidic ingredients present in the extracts were separated by conventional as well as sophisticated chromatographic methods. The major active acidic ingredient i.e. Gallic acid (1a) separated from acidic ingredients was then used for the preparation of analogues under Microwave irradiation.
Synthesis of 3, 4, 5-trihydroxy benzohydrazide (2a): Gallic acid (0.01 mol), methanol (0.03 mol) and hydrazine hydrate (0.02 mol) were mixed and stirred for five minutes. The reaction mixture was exposed to microwave irradiation at low frequency for 45 seconds. The product thus obtained was crystallized by using ethanol.
Synthesis of 5-(4-amino-5-sulfanyl-4H-1, 2, 4-triazole-3-yl) benzene-1, 2, 3-triol (3a):3, 4, 5-Trihydroxy benzohydrazide (II) (0.01 mol), carbon disulphide (0.03 mol), potassium hydroxide (0.02 mol) and hydrazine hydrate (0.03 mol) were mixed together and exposed to microwave irradiation at low frequency for 45 seconds. The yellow colour product thus separated was crystallized by ethanol.
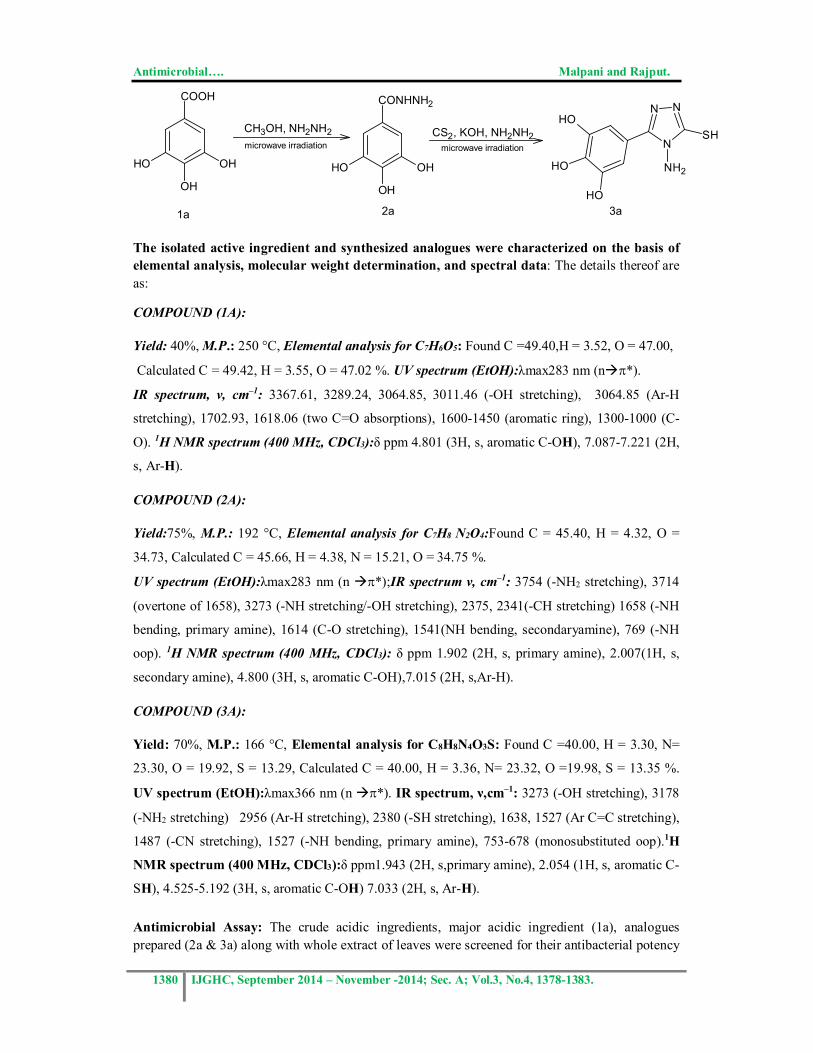
Antimicrobial…. Malpani and Rajput.
1380 IJGHC, September 2014 – November -2014; Sec. A; Vol.3, No.4, 1378-1383.
COOH
OH
OHOH
CH3OH, NH2NH2microwave irradiation
CONHNH2
OH
OHOH
CS2, KOH, NH2NH2microwave irradiation
NN
N
NH2
SHOH
OH
OH1a 2a 3a
The isolated active ingredient and synthesized analogues were characterized on the basis of elemental analysis, molecular weight determination, and spectral data: The details thereof are as:
COMPOUND (1A):
Yield: 40%, M.P.: 250 °C, Elemental analysis for C7H6O5: Found C =49.40,H = 3.52, O = 47.00,
Calculated C = 49.42, H = 3.55, O = 47.02 %. UV spectrum (EtOH):λmax283 nm (n*).
IR spectrum, ν, cm–1: 3367.61, 3289.24, 3064.85, 3011.46 (-OH stretching), 3064.85 (Ar-H
stretching), 1702.93, 1618.06 (two C=O absorptions), 1600-1450 (aromatic ring), 1300-1000 (C-
O). 1H NMR spectrum (400 MHz, CDCl3):δ ppm 4.801 (3H, s, aromatic C-OH), 7.087-7.221 (2H,
s, Ar-H).
COMPOUND (2A):
Yield:75%, M.P.: 192 °C, Elemental analysis for C7H8 N2O4:Found C = 45.40, H = 4.32, O =
34.73, Calculated C = 45.66, H = 4.38, N = 15.21, O = 34.75 %.
UV spectrum (EtOH):λmax283 nm (n *);IR spectrum ν, cm–1: 3754 (-NH2 stretching), 3714
(overtone of 1658), 3273 (-NH stretching/-OH stretching), 2375, 2341(-CH stretching) 1658 (-NH
bending, primary amine), 1614 (C-O stretching), 1541(NH bending, secondaryamine), 769 (-NH
oop). 1H NMR spectrum (400 MHz, CDCl3): δ ppm 1.902 (2H, s, primary amine), 2.007(1H, s,
secondary amine), 4.800 (3H, s, aromatic C-OH),7.015 (2H, s,Ar-H).
COMPOUND (3A):
Yield: 70%, M.P.: 166 °C, Elemental analysis for C8H8N4O3S: Found C =40.00, H = 3.30, N=
23.30, O = 19.92, S = 13.29, Calculated C = 40.00, H = 3.36, N= 23.32, O =19.98, S = 13.35 %.
UV spectrum (EtOH):λmax366 nm (n *). IR spectrum, ν,cm–1: 3273 (-OH stretching), 3178
(-NH2 stretching) 2956 (Ar-H stretching), 2380 (-SH stretching), 1638, 1527 (Ar C=C stretching),
1487 (-CN stretching), 1527 (-NH bending, primary amine), 753-678 (monosubstituted oop).1H
NMR spectrum (400 MHz, CDCl3):δ ppm1.943 (2H, s,primary amine), 2.054 (1H, s, aromatic C-
SH), 4.525-5.192 (3H, s, aromatic C-OH) 7.033 (2H, s, Ar-H).
Antimicrobial Assay: The crude acidic ingredients, major acidic ingredient (1a), analogues prepared (2a & 3a) along with whole extract of leaves were screened for their antibacterial potency
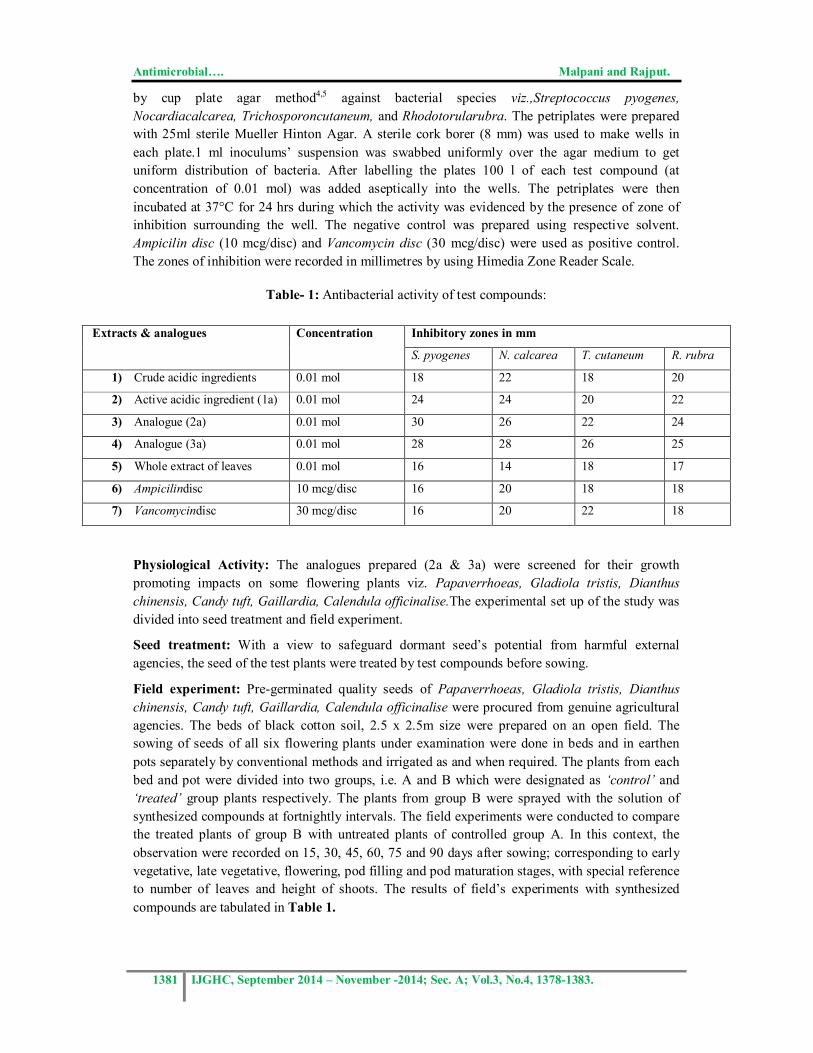
Antimicrobial…. Malpani and Rajput.
1381 IJGHC, September 2014 – November -2014; Sec. A; Vol.3, No.4, 1378-1383.
by cup plate agar method4,5 against bacterial species viz.,Streptococcus pyogenes, Nocardiacalcarea, Trichosporoncutaneum, and Rhodotorularubra. The petriplates were prepared with 25ml sterile Mueller Hinton Agar. A sterile cork borer (8 mm) was used to make wells in each plate.1 ml inoculums’ suspension was swabbed uniformly over the agar medium to get uniform distribution of bacteria. After labelling the plates 100µl of each test compound (at concentration of 0.01 mol) was added aseptically into the wells. The petriplates were then incubated at 37°C for 24 hrs during which the activity was evidenced by the presence of zone of inhibition surrounding the well. The negative control was prepared using respective solvent. Ampicilin disc (10 mcg/disc) and Vancomycin disc (30 mcg/disc) were used as positive control. The zones of inhibition were recorded in millimetres by using Himedia Zone Reader Scale.
Table- 1: Antibacterial activity of test compounds:
Extracts & analogues Concentration Inhibitory zones in mm
S. pyogenes N. calcarea T. cutaneum R. rubra
1) Crude acidic ingredients 0.01 mol 18 22 18 20
2) Active acidic ingredient (1a) 0.01 mol 24 24 20 22
3) Analogue (2a) 0.01 mol 30 26 22 24
4) Analogue (3a) 0.01 mol 28 28 26 25
5) Whole extract of leaves 0.01 mol 16 14 18 17
6) Ampicilindisc 10 mcg/disc 16 20 18 18
7) Vancomycindisc 30 mcg/disc 16 20 22 18
Physiological Activity: The analogues prepared (2a & 3a) were screened for their growth promoting impacts on some flowering plants viz. Papaverrhoeas, Gladiola tristis, Dianthus chinensis, Candy tuft, Gaillardia, Calendula officinalise.The experimental set up of the study was divided into seed treatment and field experiment.
Seed treatment: With a view to safeguard dormant seed’s potential from harmful external agencies, the seed of the test plants were treated by test compounds before sowing.
Field experiment: Pre-germinated quality seeds of Papaverrhoeas, Gladiola tristis, Dianthus chinensis, Candy tuft, Gaillardia, Calendula officinalise were procured from genuine agricultural agencies. The beds of black cotton soil, 2.5 x 2.5m size were prepared on an open field. The sowing of seeds of all six flowering plants under examination were done in beds and in earthen pots separately by conventional methods and irrigated as and when required. The plants from each bed and pot were divided into two groups, i.e. A and B which were designated as ‘control’ and ‘treated’ group plants respectively. The plants from group B were sprayed with the solution of synthesized compounds at fortnightly intervals. The field experiments were conducted to compare the treated plants of group B with untreated plants of controlled group A. In this context, the observation were recorded on 15, 30, 45, 60, 75 and 90 days after sowing; corresponding to early vegetative, late vegetative, flowering, pod filling and pod maturation stages, with special reference to number of leaves and height of shoots. The results of field’s experiments with synthesized compounds are tabulated in Table 1.
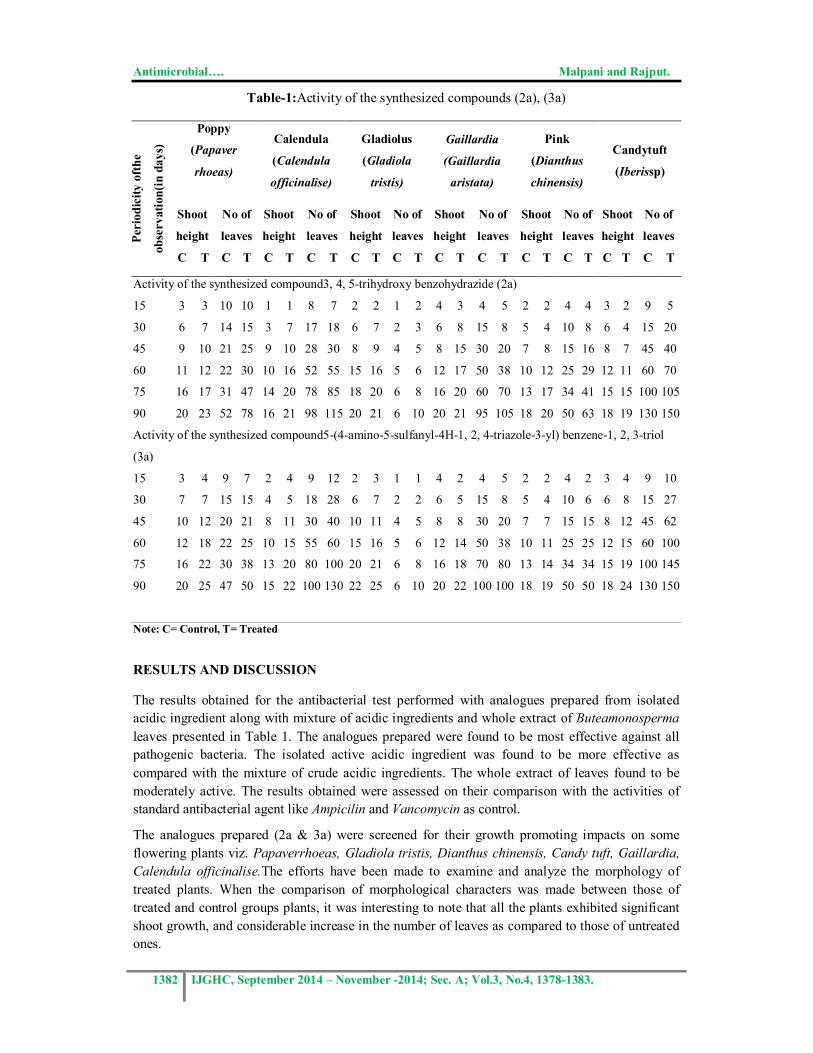
Antimicrobial…. Malpani and Rajput.
1382 IJGHC, September 2014 – November -2014; Sec. A; Vol.3, No.4, 1378-1383.
Table-1:Activity of the synthesized compounds (2a), (3a)
Peri
odic
ity o
fthe
obse
rvat
ion(
in d
ays)
Poppy
(Papaver
rhoeas)
Calendula
(Calendula
officinalise)
Gladiolus
(Gladiola
tristis)
Gaillardia
(Gaillardia
aristata)
Pink
(Dianthus
chinensis)
Candytuft
(Iberissp)
Shoot
height
No of
leaves
Shoot
height
No of
leaves
Shoot
height
No of
leaves
Shoot
height
No of
leaves
Shoot
height
No of
leaves
Shoot
height
No of
leaves
C T C T C T C T C T C T C T C T C T C T C T C T
Activity of the synthesized compound3, 4, 5-trihydroxy benzohydrazide (2a)
15 3 3 10 10 1 1 8 7 2 2 1 2 4 3 4 5 2 2 4 4 3 2 9 5
30 6 7 14 15 3 7 17 18 6 7 2 3 6 8 15 8 5 4 10 8 6 4 15 20
45 9 10 21 25 9 10 28 30 8 9 4 5 8 15 30 20 7 8 15 16 8 7 45 40
60 11 12 22 30 10 16 52 55 15 16 5 6 12 17 50 38 10 12 25 29 12 11 60 70
75 16 17 31 47 14 20 78 85 18 20 6 8 16 20 60 70 13 17 34 41 15 15 100 105
90 20 23 52 78 16 21 98 115 20 21 6 10 20 21 95 105 18 20 50 63 18 19 130 150
Activity of the synthesized compound5-(4-amino-5-sulfanyl-4H-1, 2, 4-triazole-3-yl) benzene-1, 2, 3-triol
(3a)
15 3 4 9 7 2 4 9 12 2 3 1 1 4 2 4 5 2 2 4 2 3 4 9 10
30 7 7 15 15 4 5 18 28 6 7 2 2 6 5 15 8 5 4 10 6 6 8 15 27
45 10 12 20 21 8 11 30 40 10 11 4 5 8 8 30 20 7 7 15 15 8 12 45 62
60 12 18 22 25 10 15 55 60 15 16 5 6 12 14 50 38 10 11 25 25 12 15 60 100
75 16 22 30 38 13 20 80 100 20 21 6 8 16 18 70 80 13 14 34 34 15 19 100 145
90 20 25 47 50 15 22 100 130 22 25 6 10 20 22 100 100 18 19 50 50 18 24 130 150
Note: C= Control, T= Treated
RESULTS AND DISCUSSION
The results obtained for the antibacterial test performed with analogues prepared from isolated acidic ingredient along with mixture of acidic ingredients and whole extract of Buteamonosperma leaves presented in Table 1. The analogues prepared were found to be most effective against all pathogenic bacteria. The isolated active acidic ingredient was found to be more effective as compared with the mixture of crude acidic ingredients. The whole extract of leaves found to be moderately active. The results obtained were assessed on their comparison with the activities of standard antibacterial agent like Ampicilin and Vancomycin as control.
The analogues prepared (2a & 3a) were screened for their growth promoting impacts on some flowering plants viz. Papaverrhoeas, Gladiola tristis, Dianthus chinensis, Candy tuft, Gaillardia, Calendula officinalise.The efforts have been made to examine and analyze the morphology of treated plants. When the comparison of morphological characters was made between those of treated and control groups plants, it was interesting to note that all the plants exhibited significant shoot growth, and considerable increase in the number of leaves as compared to those of untreated ones.
Antimicrobial…. Malpani and Rajput.
1383 IJGHC, September 2014 – November -2014; Sec. A; Vol.3, No.4, 1378-1383.
ACKNOWLEDGEMENT
The authors are thankful to SAIF, CDRI, Lucknow for providing the spectral data. The authors are also thankful to the Dr. S. P. Rothe, Department of Botany, Shri Shivaji College, Akola for the authentification of leaves of Buteamonosperma plants.
REFERENCES
1. Official web site of Melghat Tiger Project, Amravati. 2. The Wealth of India, Raw materials Volume – 2: B; Council of Scientific & Industrial
Research, New Delhi, 1988, pp. 341 – 346. 3. K.R. Kirtikar, B.D. Basu; Indian Medicinal Plants, International Book distributors,
Dehradun, 2005, Vol. I. 4. F. Kavanagh. Analytical microbiology, Part II. Academic Press; New York: 1972.pp.
126. 5. V.D. Mane, P.R. Rajput, et al., phytochemical investigation and antibacterial activity
of various extract of cassia fistula plant:International Journal of Chemistry Research, 2012: 3(1).
6. V.J. Hushare, P.R. Rajput, etal., Synthesis, characterization and physiological activity of some novel isoxazoles: Bioscience, 2012:4(2), 81-85.
7. V.J. Hushare, P.R. Rajput, et.al., Synthesis, characterization of some novel pyrazoles and their growth promoting activity on some flowring plants: International research journal of pharmacy, 2013:4(1), 205-208.
Corresponding author: Dr. M.O.Malpani,
Department of Chemistry, ShankarlalKhandelwal College, Akola [email protected]
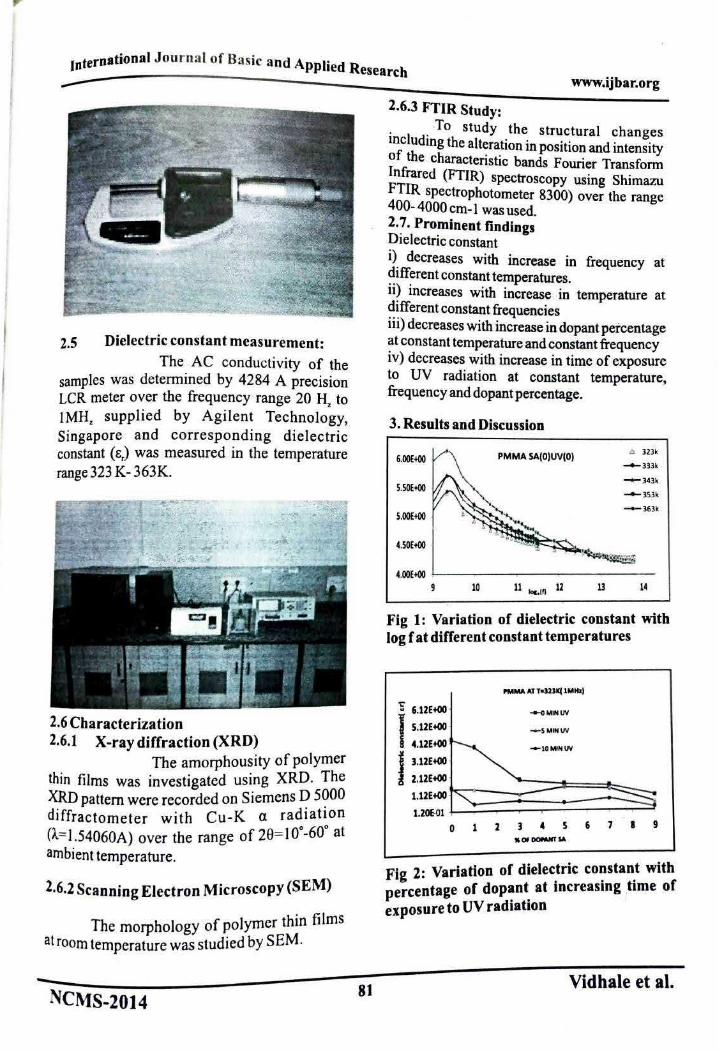
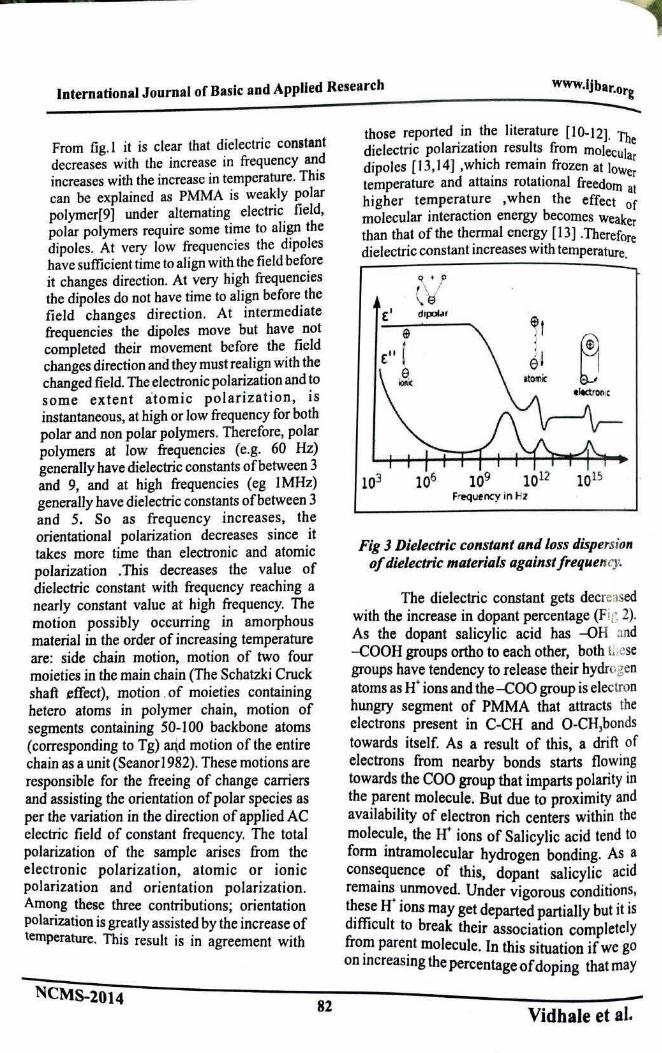
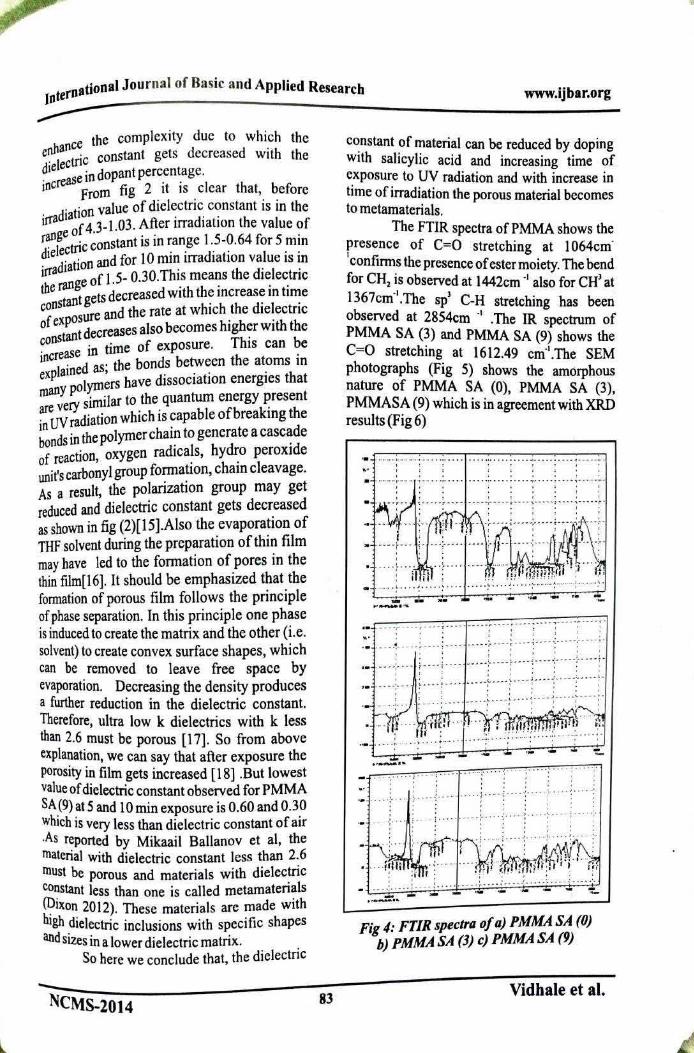
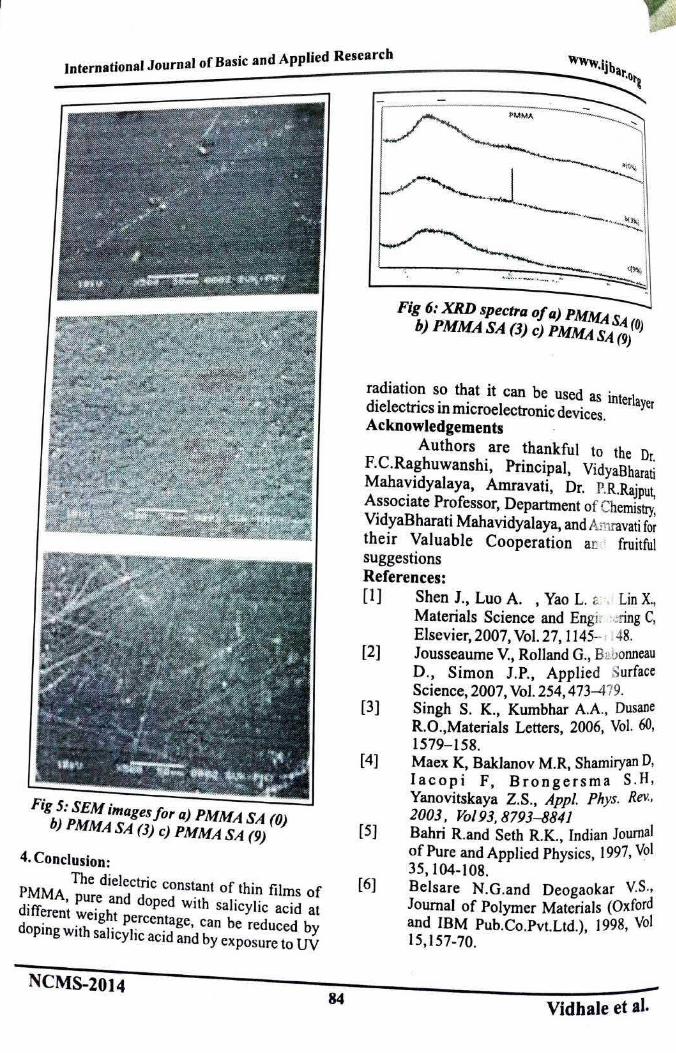
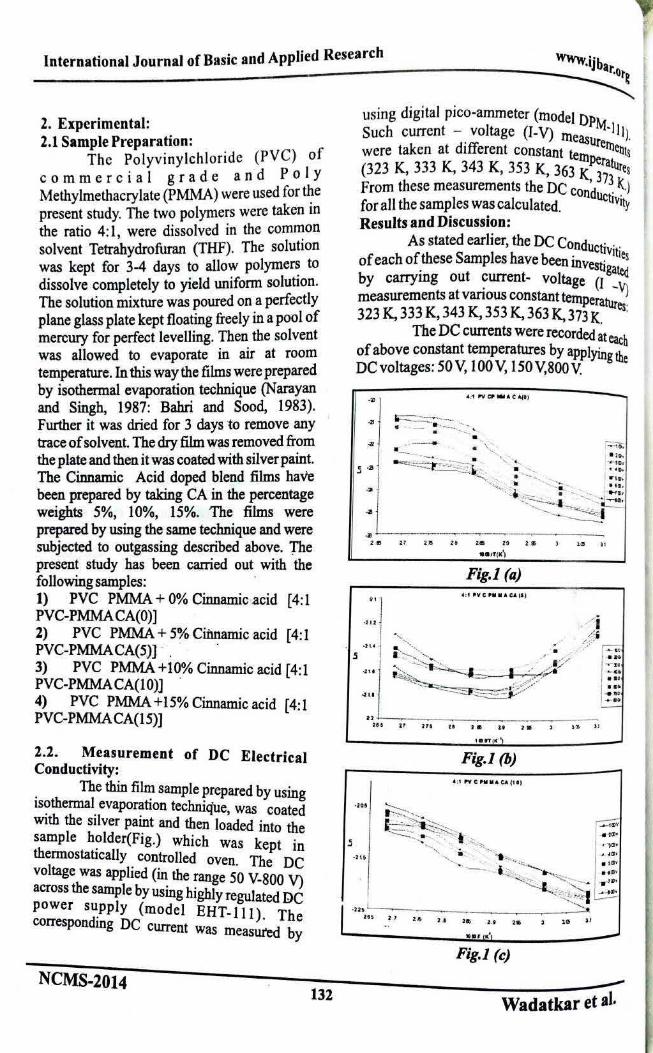
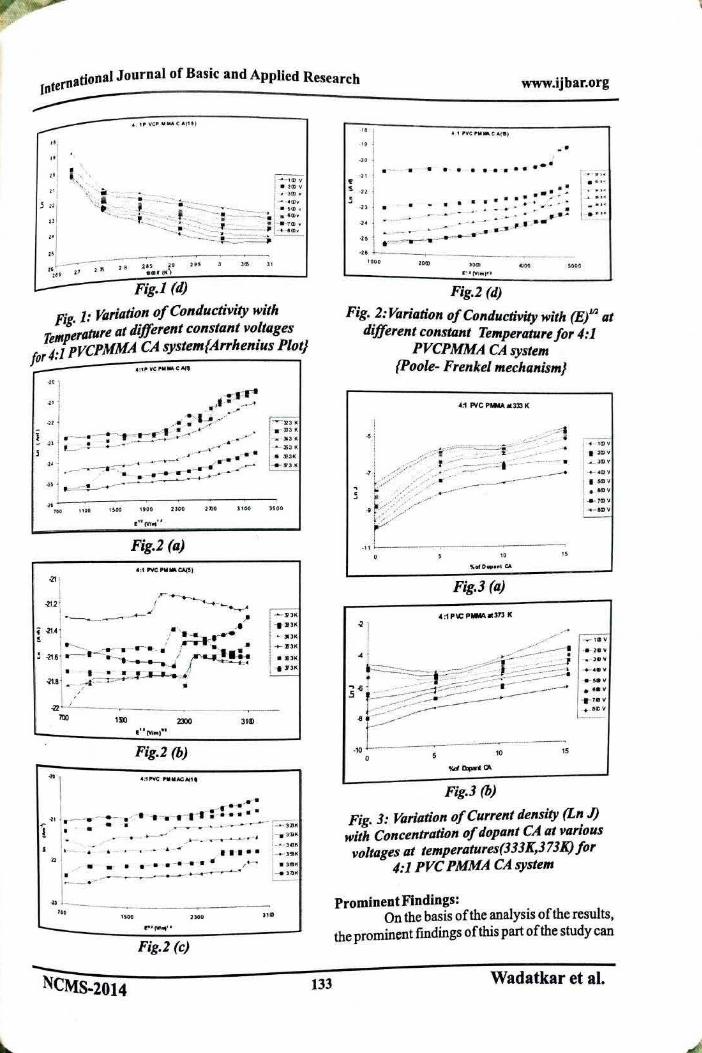
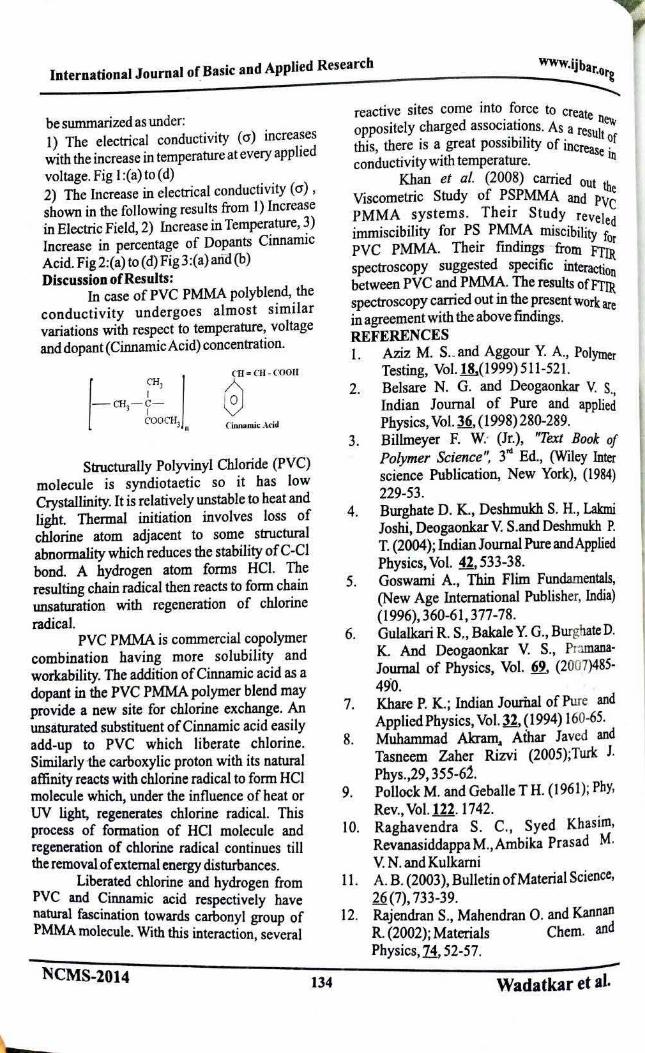
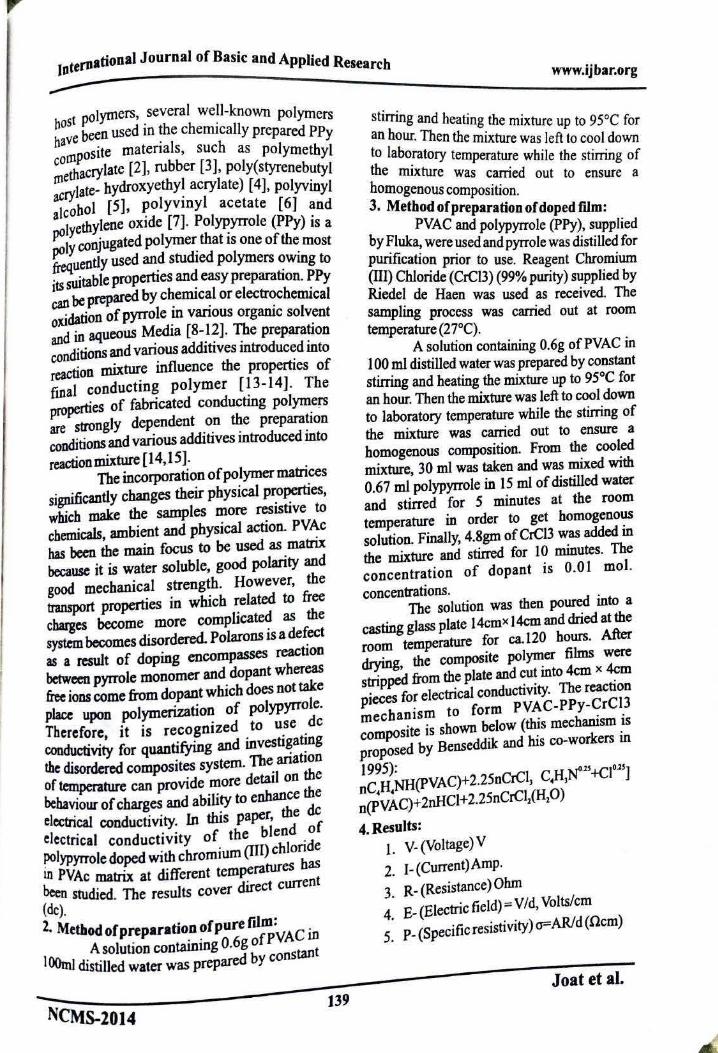
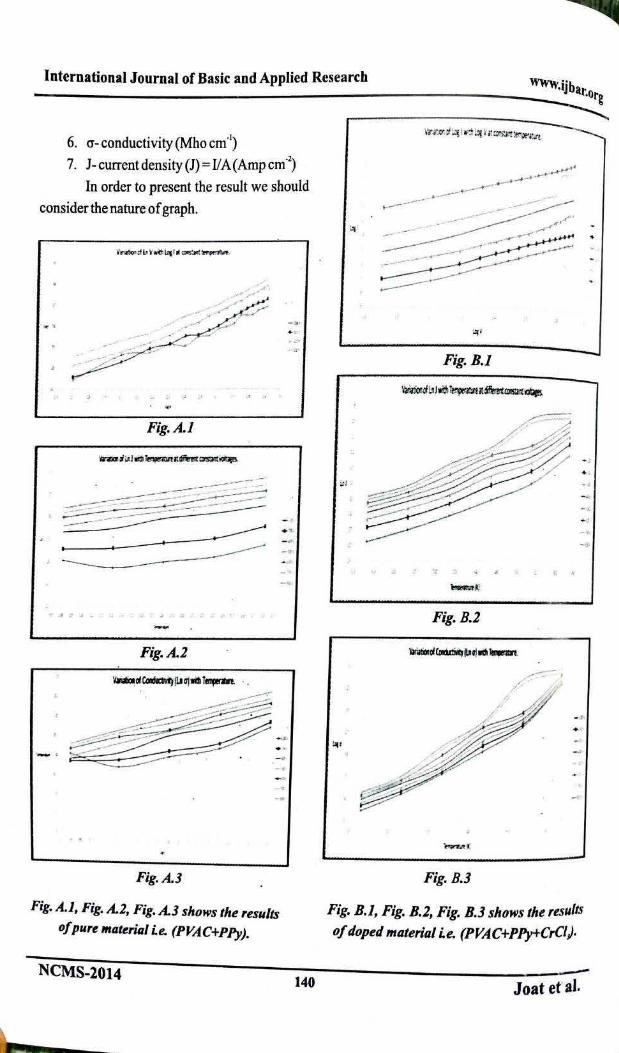
International Journal of Basic and Applied Research Special Vol. 04 (65-68) Print ISSN - 2249-3352
Online ISSN-2278-0S0S
The Study of Molecular Interaction of Proton Polymer Electrolytes Using
Ultrasonic Technique
R. Joat1, S. Bakde1, S. Jadhao1, S. Joshi1, P. Bodkhe2, S. Binani2
:Department of Physics, Vidya Bharati Mahavidyalaya, Amravati. Department of Chemistry, Vidya Bharati Mahavidyalaya, Amravati
ABSTRACT : . The Ultraso~ic velocity, density and viscosity have been measured for aqueous electrolyte solution of ammonmm acetate. The samples were prepared by using different concentration of ammonium acetate doped with polyvinyl alcohol. These experimental data have been used to estimate the physical parameter such as adiabatic compressibility, free path length, internal pressure, relaxation time, acoustic impedance, Gibb's free energy for the aqueous electrolyte solution. The strength of intermolecular interaction between component ofliquid have been successfully investigated by ultrasonic method. KEYWORDS: PVA solution, ultrasonic velocity, Acoustic parameters.
INTRODUCTION Polyvinyl alcohol is a water soluble
polymer. It is used to study the physical parameter of polymer polyvinyl alcohol in solvent distiled water. Ultrasonic is a versatile nondestructive technique and powerful tool for characterization of various acoustic parameters of solution of different concentration (1, 2, 3]. Acoustic parameters provide the information to understand the solute-solvent interaction in proton conducting polymer electrolyte solution (4]. The development of molecular sciences with the help of intermolecular interaction. In this work, we have studied important acoustic parameter like adiabatic compressibility, free length, internal pressure, relaxation time, acoustic impedance, Gibb's free energy of proton conductor PVA solution at different concentration. The ultrasonic velocity and their related acoustic parameters were provides information to understand the molecular interaction in proton conductor polymer blend.
Materials and methods: Polyvinyl alcohol was procurred from
merck and the Aq. Polyvinyl alcohol mixture
NCMS-2014 65
were made with masses weigh by analytical balance. Distilled water was use as a solvent. Similarly the aq. Solution of ammonium.acetate was prepared. As polyvinyl alcohol has remarkably slow rate of dissolution in water at room temperature. Therefore it is warming up with continuous stirring and obtained one phase solution. After cooling solution were 'feighed again and evaporated water in the process of warming up were compensated by adding the distilled water similarly the Aq. solution of ammonium acetate was prepared. As per; weight percentage sample were mixed and prepared the sample of 10%, 20% and 30% concentrated of ammonium acetate with polyvinyl alcohol. In the present study the physical parameter of polymer electrolyte solution were studied by using ultrasonic technique.
Result and Discussion The experimental value ofultrasonic vplocity,
density and viscosity for the binary solution of polyvinyl alcohol and ammonium acetate are given in Graph 1, 2, 3.
Joat et al.
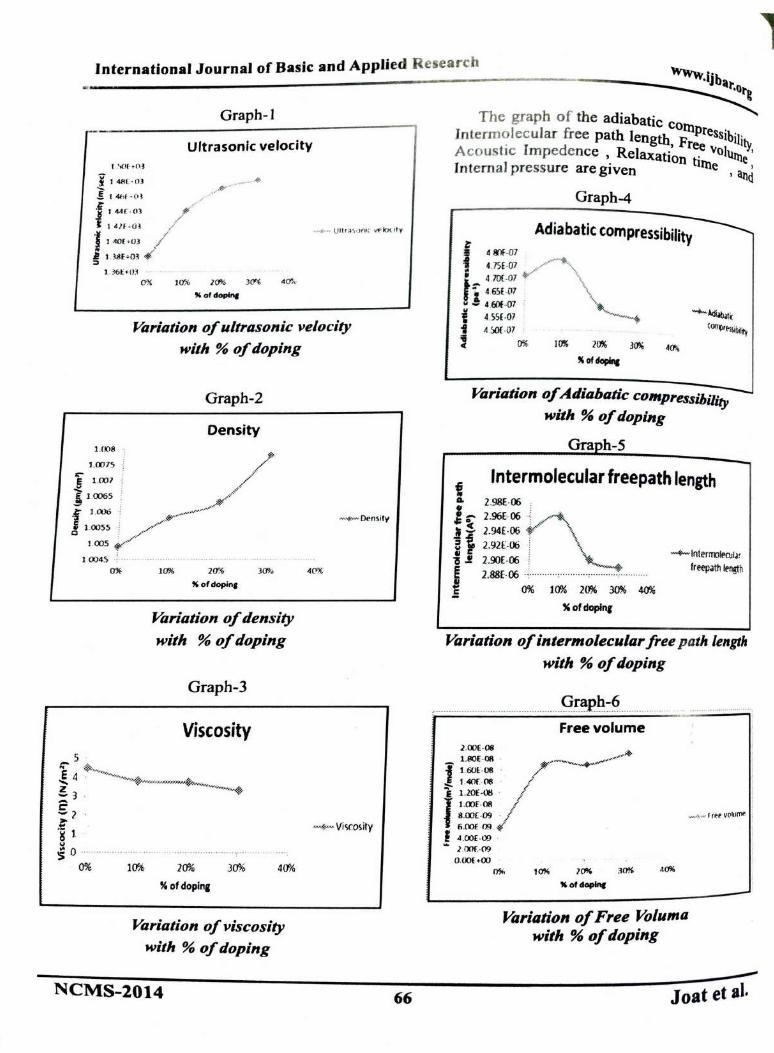
International Journal of Basic and Applied R esearch
Graph-I
Ultrasonfc velocity
l.?-f>E•m 0% l 0% }CJ% 30"' 40"k
"of doplnf
Variation of ultrasonic velocity with % of doping
Graph-2
Density ] .(l()!l
'i.>· l .007S //
( 1ro1 /' 1.:~ v/ __ _,✓/ l 0045 f ....
0% 10% 2<1½, 30%
"of dopin1
Variation of density with % of doping
Graph-3
Viscosity
40%
Variation of viscosity with % of doping
NCMS-2014
m4.'~·Dl.'nsity
4c.>X
,-.+,,, Vi5c:o~ily
66
The graph of the adiabatic c Intermolecular free path length ~lllPressibi!' Acoustic Impedence , Relaxati~n re_e vo1%;' Internal pressure are given tune , ¾d
Graph-4
Adiabatic compressibility
JO% 10%
hfdopinc
-t-Adi~ti: (Ollfir!-S~biity
Variation of Adiabatic compressibility with % of doping
Graoh-5
i Intermolecular freepath length
o. 2.98E-06
1 ::- 2.96[ 06 . ✓""" :; !!,. l .94£-06 ·¥"' \ 8 f, 2.92£-06 i \ . ., r: : \,, ~ ~ 2.90E-06 I ~-+ e 2.88[-06 .;. ............... .. ............ .. ..
J 0% 10% 20% 30% 40¾
" of dopln,
"'4--lntermolt'C\Jl~r freepath length
Variation of intermolecular free path length
with % of doping
.......... ................... ......... ....... .... 9!.~P~~~ ............ ..... .. . Free volume
) .00£..()8
1.!lOE ·OB · . ., ~ ·- __..,..v""" .. j t .60l'•08 · ,)?IP ~ :::- 1.40~-~ · / E 1.20£ -lli · /
l 1.00£·08 / IUXJ(.()9 · / 6 .00E .09 .,,.
f .S .OOE ·OO · ... 1.iXJf.()9
0 .<Xlf.+00
0% 10% 1.~ "°" "of doplnc
Variation of Free Voluma with % of doping
- ~- F rP.P. VC'llllrnt.
Joat et al,
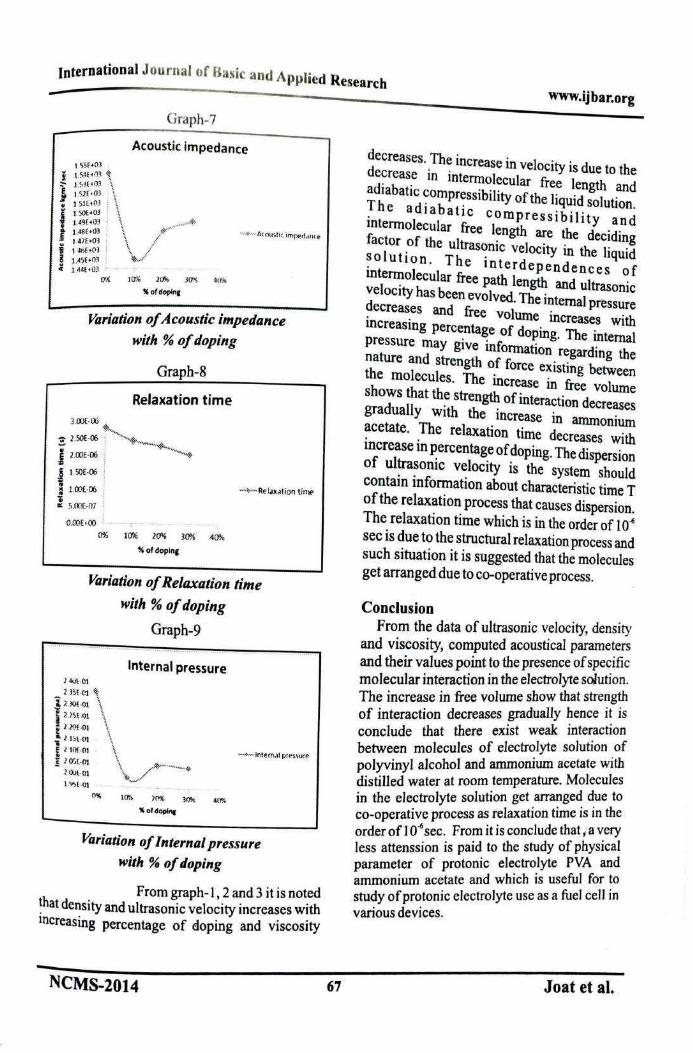
International Journal of Basic and Applied Research
-Graph-7
Acoustic impedance
·····-::-..... -A(OlH,tir. imped.m,-_e
4tJJ,;
Variation of Acoustic impedance
with % of doping
Graph-8
Relaxation time
3.00f-06 i ...._
~ l .SOE-06 ; "''',,1, .. "--,~-~--"""-*· E H XlE-06 :
:ZS : g l 50f-06 j
:ZS :
: 1.00£ -06 • li : a: S.OOE-07 ··
O.OOE +OO :
0% 10% 2~ 30% 40%
¾ofdopln1
Variation of Relaxation time
with % of doping
2 4uHll
2.35£-Ct ~
j i .~ -01 \ I D SE-+ll \ ~ U Of -01 ~
: l .b l -OJ · \
Graph-9
Internal pressure
~ l 10f:-OJ · \
'c l O:i [ -01 \ ~--···~·--~ - 2.Qil -Ct \, / . . •
l.~ l -01 · '«._,-
()'I(, 1()% ] 0% 30% 40%
%oldopb'C
Variation of Internal pressure with % of doping
From graph- I, 2 and 3 it is not_ed that density and ultrasonic velocity increa~es w!th increasing percentage of doping and v1scos1ty
NCMS-2014 67
www.ijbar.org
decreases. The increase in velocity is due to the decrease in intermolecular free length and adiabatic compressibility of the liquid solution. The adiabatic compressibility and intermolecular free length are the deciding factor of the ultrasonic velocity in the liquid solution. The interdependences of intermolecular free path length and ultrasonic velocity has been evolved. The internal pressure decreases and free volume increases with increasing percentage of doping. The internal pressure may give information regarding the nature and strength of force existing between the molecules. The increase in free volume shows that the strength of interaction decreases gradually with the increase in ammonium acetate. The relaxation time decreases with increase in percentage of doping. The dispersion of ultrasonic velocity is the system should contain information about characteristic time T of the relaxation process that causes dispersion. The relaxation time which is in the order of I 0-6 sec is due to the structural relaxation process and such situation it is suggested that the molecules get arranged due to co-operative process.
Conclusion From the data of ultrasonic velocity, density
and viscosity, computed acoustical parame~ers and their values point to the presence of spe~1fic molecular interaction in the electrolyte soiut10n. The increase in free volume show that stre~g~ of interaction decreases gradually ~ence 1~ is conclude that there exist weak mte~action between molecules of electr~lyte solution .:
I . 1 I ohol and ammomum acetate w1 po yvmy a c I I distilled water at room temperature. MJ ~cu ;s in the electrolyte solution get _arr3?ge . _ue ho co-operative process as relaxation time is m t e
d f I 0-6 sec. From it is conclude that t. a ~ery or er o . . d f hys1cal less attenssion 1s paid to the stu Y O P d parameter of protonic electrolyte PVA an ammonium acetate and which is useful for !o study of protonic electrolyte use as a fuel cell m various devices.
Joat et al . .
International Journal of Basic and Applied Research ---------------------------WWW~.ijbar.org
~ References fll Dash UN, Sahu R, Acoustic letters, 17,
(1994), 157. f2J Dash UN, PasupaJak NN, Indian journal
ofchemistry 36A,(l 997), 834. f3J Praharaj MK, Satapathy A, Mishra PR,
Mishra S, Golden Research thought, 2 (8), (2013), 1-10.
f 4J Pankaj K. Singh, S. C. Bhatt J. Appl. Phys. (2010) 1916-9647.
{SJ S. panda, G. C. Mohanty, G. S. Roy, S. Kalia, R. N. Samal Golden Research Thoughts (2013) 2231-5063.
{6] S. panda, G. C. Mohanty, G. S. Roy, S. Kalia, R. N. Samal J. Chemical and Phannaceutical Research 81-89 (2013) 0975-7384
NCMS-2014 68
f7J
(8)
[9)
[10)
(HJ
M. K. Praharaj, Abhiram S R. ~ishra, S. Mishra ~~a~athy, P. Apphed Science Re hives of (2012) 0975-508X. search 837-845
V. D. Bhandakkar Journal of A . Physics 38-48 (2012) 2278-48 PPhed P. Tabhane O p Chi nk 61. ' .. ma ere Dudhe, V. A. Tabhane Pela . ' . M. Library 944-94 7 (2012) 09/~a Research P. Tabhane, 0. P. Chimank!r~O~ Dudhe, V. A. Tabhane J. Che . . M. Phannaceutical Research 3~~al and (2012) 0975-7384. -3056
M. Talukdar, D. Moharatha G S R V. N. Das J Pure and A j- d. . oy, 202-206 (2013). pp te Physics
-Joat et al.
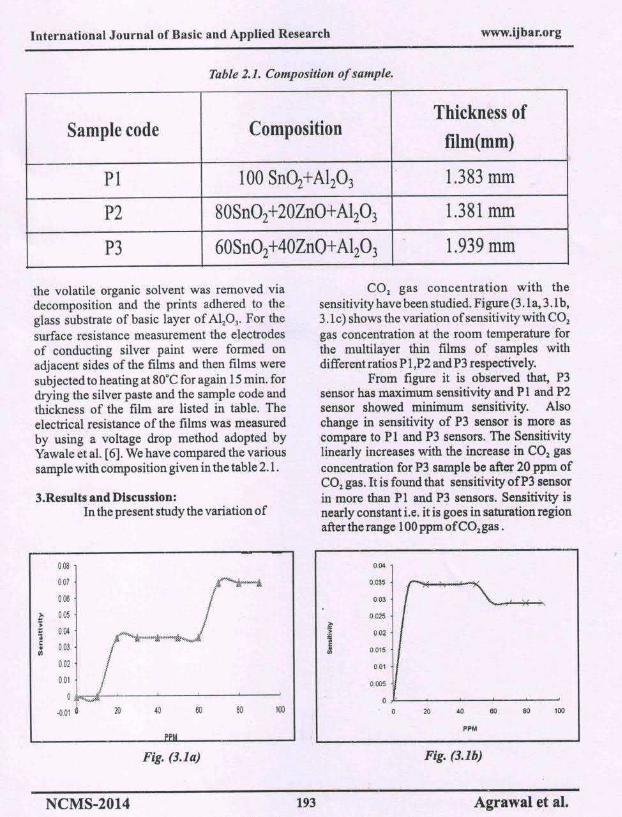
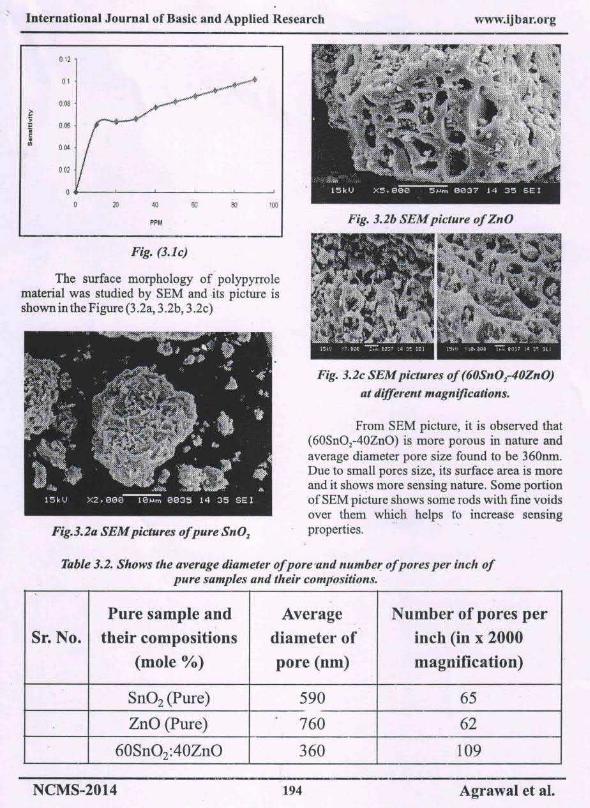
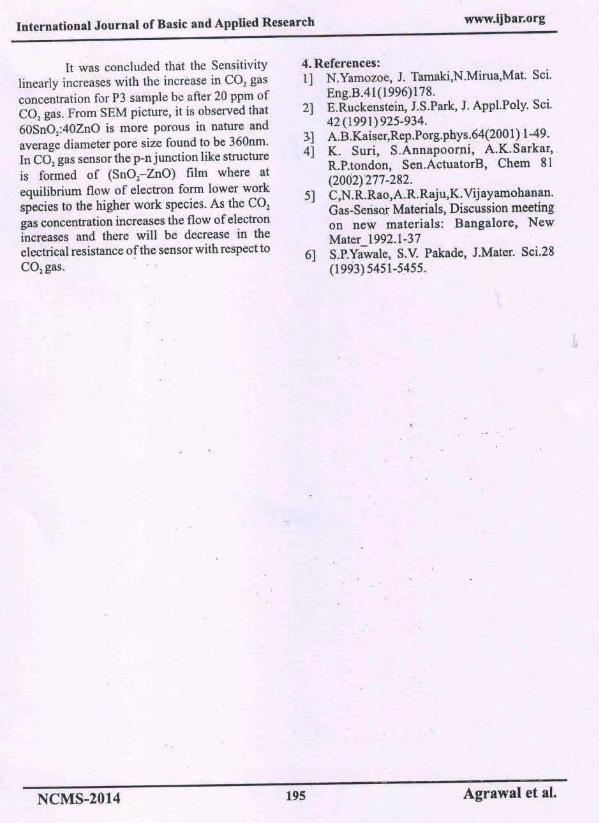
Scanned by CamScanner
Scanned by CamScanner
Scanned by CamScanner
Scanned by CamScanner
Scanned by CamScanner
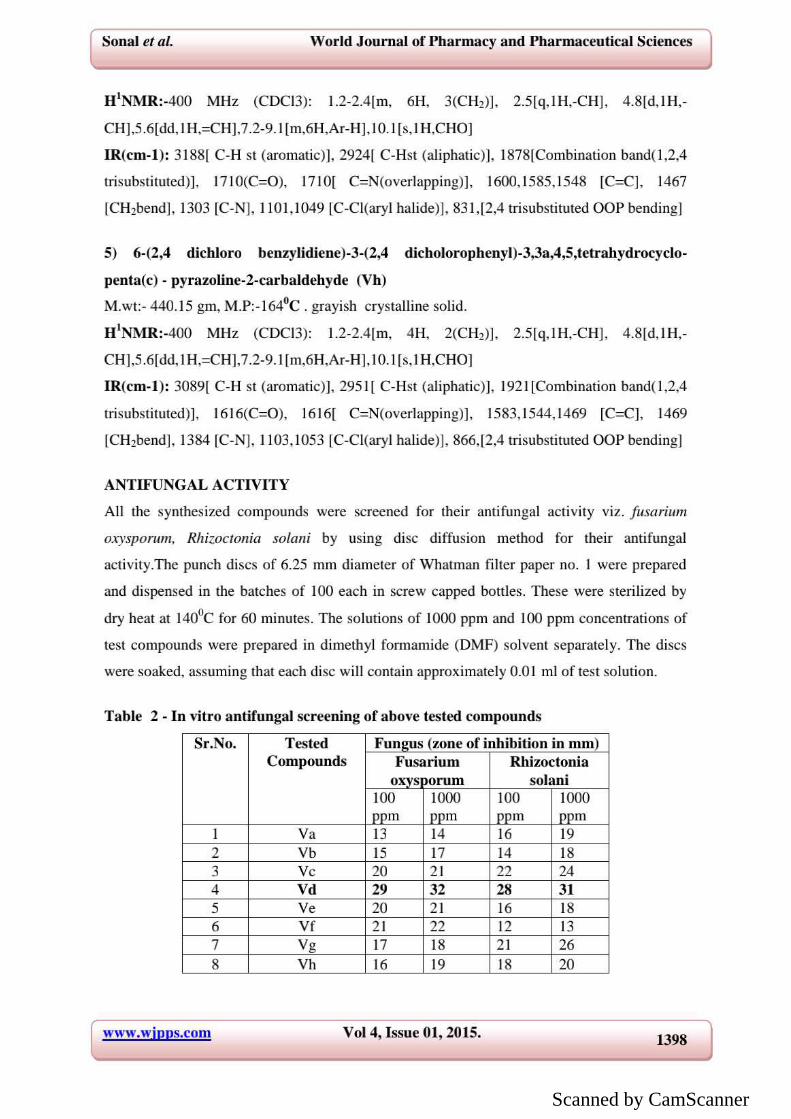
Scanned by CamScanner
Scanned by CamScanner
Send Orders for Reprints to [email protected]
Current Computer-Aided Drug Design, 2014, 10,75-82 75
QSAR Models for Anti-Malarial Activity of 4-Aminoquinolines Vijay H. Masand*,1, Andrey A. Toropov*,2, Alla P. Toropova2 and Devidas T. Mahajan1
1Department of Chemistry, Vidya Bharati College, Camp, Amravati, Maharashtra, 444 602, India 2IRCCS, Istituto di Ricerche Farmacologiche Mario Negri, 20156, Via La Masa 19, Milano, Italy
Abstract: In the present study, predictive quantitative structure – activity relationship (QSAR) models for anti-malarial activity of 4-aminoquinolines have been developed. CORAL, which is freely available on internet (http://www.insilico.eu/coral), has been used as a tool of QSAR analysis to establish statistically robust QSAR model of anti-malarial activity of 4-aminoquinolines. Six random splits into the visible sub-system of the training and invisible sub-system of validation were examined. Statistical qualities for these splits vary, but in all these cases, statistical quality of prediction for anti-malarial activity was quite good. The optimal SMILES-based descriptor was used to derive the single descriptor based QSAR model for a data set of 112 aminoquinolones. All the splits had r2> 0.85 and r2> 0.78 for sub-training and validation sets, respectively. The three parametric multilinear regression (MLR) QSAR model has Q2 = 0.83, R2 = 0.84 and F = 190.39. The anti-malarial activity has strong correlation with presence/absence of nitrogen and oxygen at a topological distance of six.
Keywords: Anti-malarial activity, 4-aminoquinolines, QSAR, optimal descriptor, CORAL software.
1. INTRODUCTION
Malaria, with high occurrence in tropical and sub-tropical regions, is responsible for more than 2 million deaths each year. This vector-borne deadly disease is becoming a major challenge to medicinal chemists due to the emergence of multi drug resistant strains of causative agent in different parts of world. Therefore, search for anti-malarial agents is an important task of modern medicinal chemistry. Different compounds like xanthones, prodiginines, and aminoquinolines have been synthesized and tested to develop new remedies for malaria [1-3]. Aminoquinolines, the quinoline derivatives, which show anti-malarial activity at very low concentration, considerable parasite clearance against wild and multi drug resistant strains of Plasmodium falciparum (P. falciparum) has gained considerable attention [2]. However, search for aminoquinolines with better ADMET (Absorption, Distribution, metabolism, Excretion and Toxicity) and activity profile still persists. Quantitative structure – activity relationships (QSARs) is a modern thriving chemometric technique under the umbrella of computer aided drug design (CADD) that could be a possible tool to select promising compounds against malaria [4-14]. QSAR studies are routinely performed to determine the factors that influence the activity and to predict the activity of a molecule prior to its actual synthesis and biological screening [4-14]. This considerably reduces time, efforts and chemicals, thereby making the process of drug designing
*Address correspondence to these authors at the (Vijay H. Masand) Department of Chemistry, Vidya Bharati College, Camp, Amravati, Maharashtra, 444 602, India; Tel: +91-9403312628; Fax: +91-721-2662740; E-mail: [email protected] and (Andrey A. Toropov) Istituto di Ricerche Farmacologiche Mario Negri, 20156, Via La Masa 19, Milano, Italy; Tel: +39-02-39014595; Fax: +39-02-39014735; E-mail: [email protected]
more cost effective and efficient. In the present study, we performed extensive QSAR analysis to determine the factors that govern the anti-malarial activity of 4-aminoquinolines and to develop highly predictive models. Two different approaches viz. CORAL (Correlation and Logic) [15-34] and GA-MLR QSAR were utilized to develop the models that satisfy OECD principles.
2. MATERIALS AND METHODS
2.1.Dataset
The dataset selected from literature [2], for the present study, comprised of one hundred and twelve 4-aminoquinoline derivatives with a variety of susbstituents at different positions (see Fig. 1). The anti-malarial activity reported as EC50 was converted to pEC50 for smoother statistical calculations using the standard protocol mentioned in the literature [4-8,11,12]. The data set was splitted six times into sub-training, calibration, test, and validation sets. These splits obey the following principles; (i) they are various; and (ii) they are random.
Fig. (1). 4-aminoquinolines used in present study.
1875-6697/14 $58.00+.00 © 2014 Bentham Science Publishers
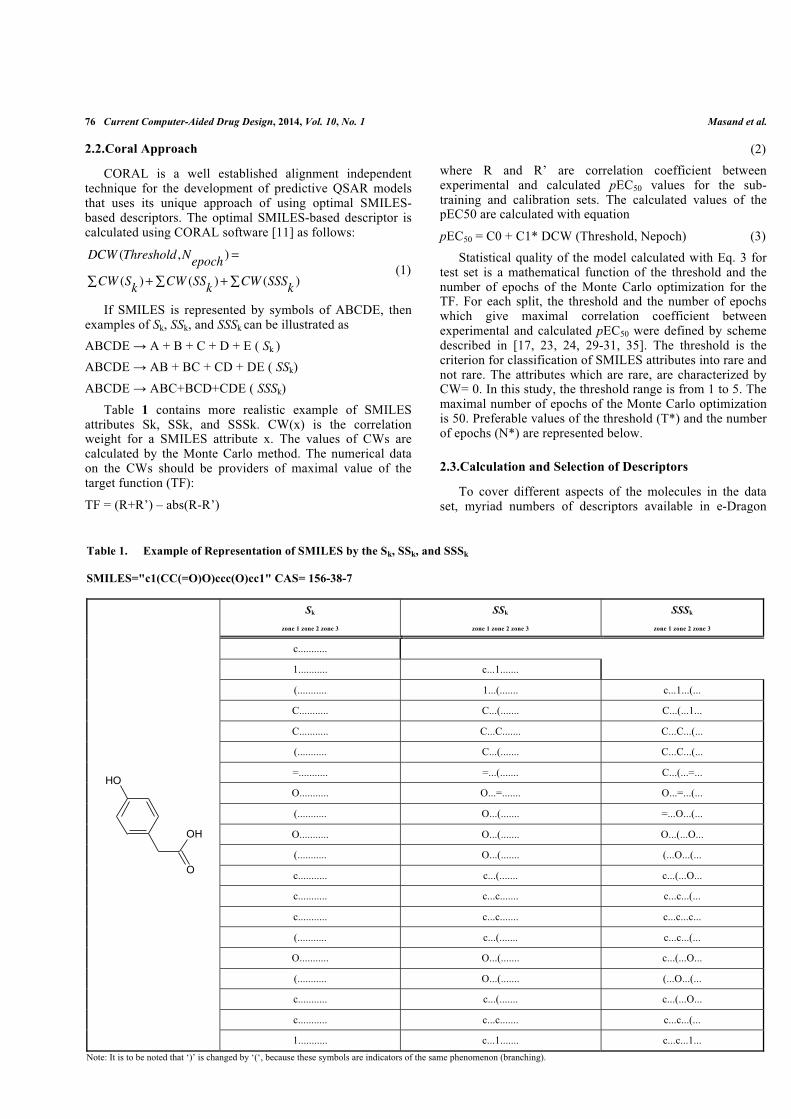
76 Current Computer-Aided Drug Design, 2014, Vol. 10, No. 1 Masand et al.
2.2.Coral Approach
CORAL is a well established alignment independent technique for the development of predictive QSAR models that uses its unique approach of using optimal SMILES-based descriptors. The optimal SMILES-based descriptor is calculated using CORAL software [11] as follows:
DCW (Threshold,Nepoch ) =
CW (Sk∑ )+ CW (SSk∑ )+ CW (SSSk∑ ) (1)
If SMILES is represented by symbols of ABCDE, then examples of Sk, SSk, and SSSk can be illustrated as ABCDE → A + B + C + D + E ( Sk ) ABCDE → AB + BC + CD + DE ( SSk) ABCDE → ABC+BCD+CDE ( SSSk) Table 1 contains more realistic example of SMILES attributes Sk, SSk, and SSSk. CW(x) is the correlation weight for a SMILES attribute x. The values of CWs are calculated by the Monte Carlo method. The numerical data on the CWs should be providers of maximal value of the target function (TF):
TF = (R+R’) – abs(R-R’)
(2) where R and R’ are correlation coefficient between experimental and calculated pEC50 values for the sub-training and calibration sets. The calculated values of the pEC50 are calculated with equation
pEC50 = C0 + C1* DCW (Threshold, Nepoch) (3) Statistical quality of the model calculated with Eq. 3 for test set is a mathematical function of the threshold and the number of epochs of the Monte Carlo optimization for the TF. For each split, the threshold and the number of epochs which give maximal correlation coefficient between experimental and calculated pEC50 were defined by scheme described in [17, 23, 24, 29-31, 35]. The threshold is the criterion for classification of SMILES attributes into rare and not rare. The attributes which are rare, are characterized by CW= 0. In this study, the threshold range is from 1 to 5. The maximal number of epochs of the Monte Carlo optimization is 50. Preferable values of the threshold (T*) and the number of epochs (N*) are represented below.
2.3.Calculation and Selection of Descriptors
To cover different aspects of the molecules in the data set, myriad numbers of descriptors available in e-Dragon
Table 1. Example of Representation of SMILES by the Sk, SSk, and SSSk SMILES="c1(CC(=O)O)ccc(O)cc1" CAS= 156-38-7
O
OH
OH
Sk
zone 1 zone 2 zone 3 SSk
zone 1 zone 2 zone 3
SSSk
zone 1 zone 2 zone 3
c...........
1........... c...1.......
(........... 1...(....... c...1...(...
C........... C...(....... C...(...1...
C........... C...C....... C...C...(...
(........... C...(....... C...C...(...
=........... =...(....... C...(...=...
O........... O...=....... O...=...(...
(........... O...(....... =...O...(...
O........... O...(....... O...(...O...
(........... O...(....... (...O...(...
c........... c...(....... c...(...O...
c........... c...c....... c...c...(...
c........... c...c....... c...c...c...
(........... c...(....... c...c...(...
O........... O...(....... c...(...O...
(........... O...(....... (...O...(...
c........... c...(....... c...(...O...
c........... c...c....... c...c...(...
1........... c...1....... c...c...1... Note: It is to be noted that ‘)’ is changed by ‘(‘, because these symbols are indicators of the same phenomenon (branching).
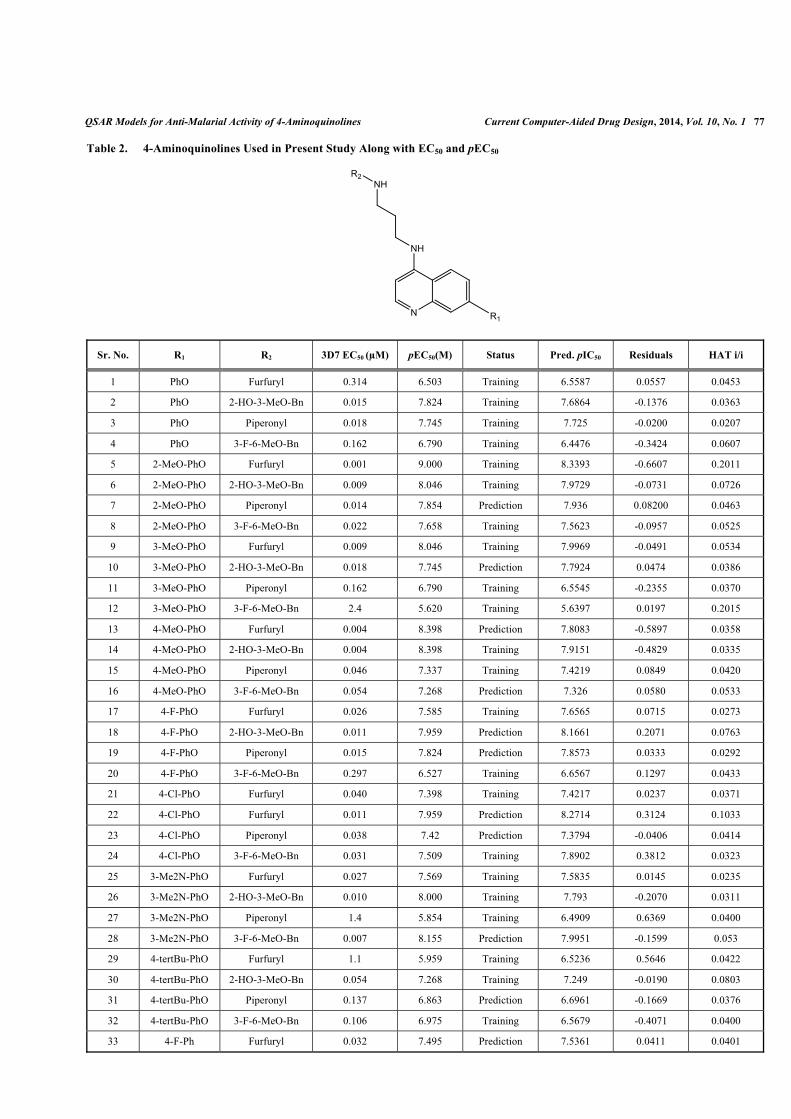
QSAR Models for Anti-Malarial Activity of 4-Aminoquinolines Current Computer-Aided Drug Design, 2014, Vol. 10, No. 1 77
Table 2. 4-Aminoquinolines Used in Present Study Along with EC50 and pEC50
Sr. No. R1 R2 3D7 EC50 (µM) pEC50(M) Status Pred. pIC50 Residuals HAT i/i
1 PhO Furfuryl 0.314 6.503 Training 6.5587 0.0557 0.0453
2 PhO 2-HO-3-MeO-Bn 0.015 7.824 Training 7.6864 -0.1376 0.0363
3 PhO Piperonyl 0.018 7.745 Training 7.725 -0.0200 0.0207
4 PhO 3-F-6-MeO-Bn 0.162 6.790 Training 6.4476 -0.3424 0.0607
5 2-MeO-PhO Furfuryl 0.001 9.000 Training 8.3393 -0.6607 0.2011
6 2-MeO-PhO 2-HO-3-MeO-Bn 0.009 8.046 Training 7.9729 -0.0731 0.0726
7 2-MeO-PhO Piperonyl 0.014 7.854 Prediction 7.936 0.08200 0.0463
8 2-MeO-PhO 3-F-6-MeO-Bn 0.022 7.658 Training 7.5623 -0.0957 0.0525
9 3-MeO-PhO Furfuryl 0.009 8.046 Training 7.9969 -0.0491 0.0534
10 3-MeO-PhO 2-HO-3-MeO-Bn 0.018 7.745 Prediction 7.7924 0.0474 0.0386
11 3-MeO-PhO Piperonyl 0.162 6.790 Training 6.5545 -0.2355 0.0370
12 3-MeO-PhO 3-F-6-MeO-Bn 2.4 5.620 Training 5.6397 0.0197 0.2015
13 4-MeO-PhO Furfuryl 0.004 8.398 Prediction 7.8083 -0.5897 0.0358
14 4-MeO-PhO 2-HO-3-MeO-Bn 0.004 8.398 Training 7.9151 -0.4829 0.0335
15 4-MeO-PhO Piperonyl 0.046 7.337 Training 7.4219 0.0849 0.0420
16 4-MeO-PhO 3-F-6-MeO-Bn 0.054 7.268 Prediction 7.326 0.0580 0.0533
17 4-F-PhO Furfuryl 0.026 7.585 Training 7.6565 0.0715 0.0273
18 4-F-PhO 2-HO-3-MeO-Bn 0.011 7.959 Prediction 8.1661 0.2071 0.0763
19 4-F-PhO Piperonyl 0.015 7.824 Prediction 7.8573 0.0333 0.0292
20 4-F-PhO 3-F-6-MeO-Bn 0.297 6.527 Training 6.6567 0.1297 0.0433
21 4-Cl-PhO Furfuryl 0.040 7.398 Training 7.4217 0.0237 0.0371
22 4-Cl-PhO Furfuryl 0.011 7.959 Prediction 8.2714 0.3124 0.1033
23 4-Cl-PhO Piperonyl 0.038 7.42 Prediction 7.3794 -0.0406 0.0414
24 4-Cl-PhO 3-F-6-MeO-Bn 0.031 7.509 Training 7.8902 0.3812 0.0323
25 3-Me2N-PhO Furfuryl 0.027 7.569 Training 7.5835 0.0145 0.0235
26 3-Me2N-PhO 2-HO-3-MeO-Bn 0.010 8.000 Training 7.793 -0.2070 0.0311
27 3-Me2N-PhO Piperonyl 1.4 5.854 Training 6.4909 0.6369 0.0400
28 3-Me2N-PhO 3-F-6-MeO-Bn 0.007 8.155 Prediction 7.9951 -0.1599 0.053
29 4-tertBu-PhO Furfuryl 1.1 5.959 Training 6.5236 0.5646 0.0422
30 4-tertBu-PhO 2-HO-3-MeO-Bn 0.054 7.268 Training 7.249 -0.0190 0.0803
31 4-tertBu-PhO Piperonyl 0.137 6.863 Prediction 6.6961 -0.1669 0.0376
32 4-tertBu-PhO 3-F-6-MeO-Bn 0.106 6.975 Training 6.5679 -0.4071 0.0400
33 4-F-Ph Furfuryl 0.032 7.495 Prediction 7.5361 0.0411 0.0401
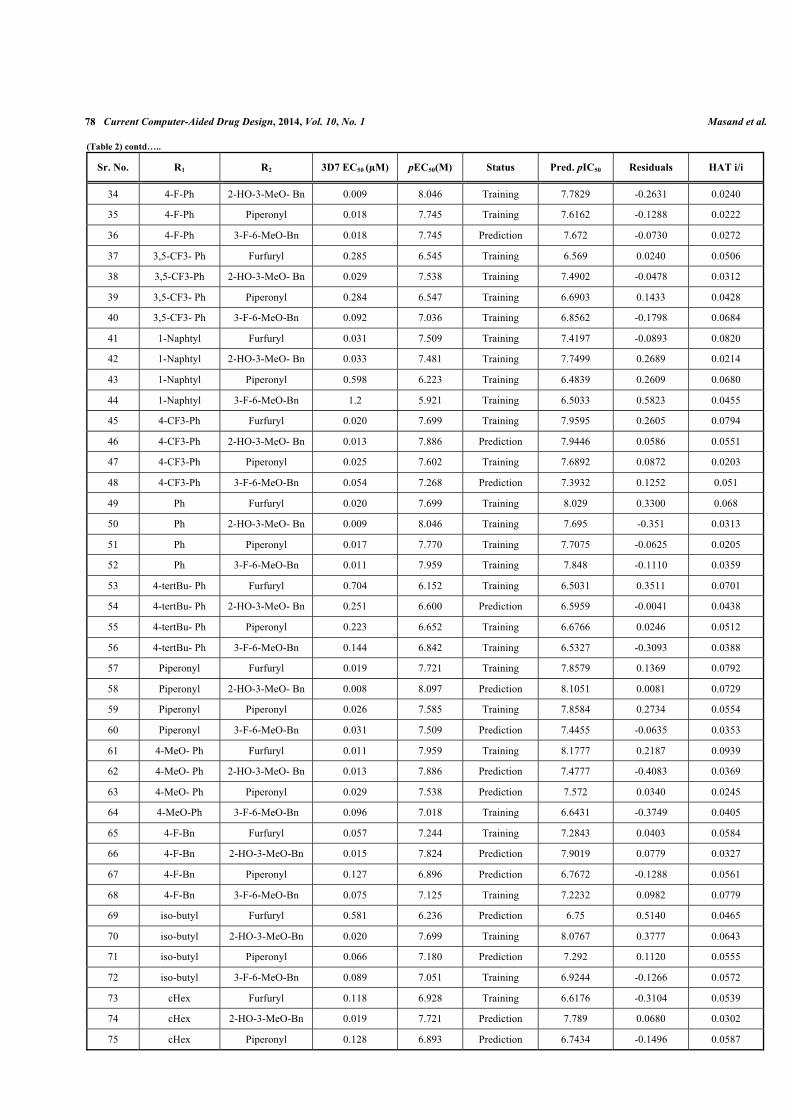
78 Current Computer-Aided Drug Design, 2014, Vol. 10, No. 1 Masand et al.
(Table 2) contd…..
Sr. No. R1 R2 3D7 EC50 (µM) pEC50(M) Status Pred. pIC50 Residuals HAT i/i
34 4-F-Ph 2-HO-3-MeO- Bn 0.009 8.046 Training 7.7829 -0.2631 0.0240
35 4-F-Ph Piperonyl 0.018 7.745 Training 7.6162 -0.1288 0.0222
36 4-F-Ph 3-F-6-MeO-Bn 0.018 7.745 Prediction 7.672 -0.0730 0.0272
37 3,5-CF3- Ph Furfuryl 0.285 6.545 Training 6.569 0.0240 0.0506
38 3,5-CF3-Ph 2-HO-3-MeO- Bn 0.029 7.538 Training 7.4902 -0.0478 0.0312
39 3,5-CF3- Ph Piperonyl 0.284 6.547 Training 6.6903 0.1433 0.0428
40 3,5-CF3- Ph 3-F-6-MeO-Bn 0.092 7.036 Training 6.8562 -0.1798 0.0684
41 1-Naphtyl Furfuryl 0.031 7.509 Training 7.4197 -0.0893 0.0820
42 1-Naphtyl 2-HO-3-MeO- Bn 0.033 7.481 Training 7.7499 0.2689 0.0214
43 1-Naphtyl Piperonyl 0.598 6.223 Training 6.4839 0.2609 0.0680
44 1-Naphtyl 3-F-6-MeO-Bn 1.2 5.921 Training 6.5033 0.5823 0.0455
45 4-CF3-Ph Furfuryl 0.020 7.699 Training 7.9595 0.2605 0.0794
46 4-CF3-Ph 2-HO-3-MeO- Bn 0.013 7.886 Prediction 7.9446 0.0586 0.0551
47 4-CF3-Ph Piperonyl 0.025 7.602 Training 7.6892 0.0872 0.0203
48 4-CF3-Ph 3-F-6-MeO-Bn 0.054 7.268 Prediction 7.3932 0.1252 0.051
49 Ph Furfuryl 0.020 7.699 Training 8.029 0.3300 0.068
50 Ph 2-HO-3-MeO- Bn 0.009 8.046 Training 7.695 -0.351 0.0313
51 Ph Piperonyl 0.017 7.770 Training 7.7075 -0.0625 0.0205
52 Ph 3-F-6-MeO-Bn 0.011 7.959 Training 7.848 -0.1110 0.0359
53 4-tertBu- Ph Furfuryl 0.704 6.152 Training 6.5031 0.3511 0.0701
54 4-tertBu- Ph 2-HO-3-MeO- Bn 0.251 6.600 Prediction 6.5959 -0.0041 0.0438
55 4-tertBu- Ph Piperonyl 0.223 6.652 Training 6.6766 0.0246 0.0512
56 4-tertBu- Ph 3-F-6-MeO-Bn 0.144 6.842 Training 6.5327 -0.3093 0.0388
57 Piperonyl Furfuryl 0.019 7.721 Training 7.8579 0.1369 0.0792
58 Piperonyl 2-HO-3-MeO- Bn 0.008 8.097 Prediction 8.1051 0.0081 0.0729
59 Piperonyl Piperonyl 0.026 7.585 Training 7.8584 0.2734 0.0554
60 Piperonyl 3-F-6-MeO-Bn 0.031 7.509 Prediction 7.4455 -0.0635 0.0353
61 4-MeO- Ph Furfuryl 0.011 7.959 Training 8.1777 0.2187 0.0939
62 4-MeO- Ph 2-HO-3-MeO- Bn 0.013 7.886 Prediction 7.4777 -0.4083 0.0369
63 4-MeO- Ph Piperonyl 0.029 7.538 Prediction 7.572 0.0340 0.0245
64 4-MeO-Ph 3-F-6-MeO-Bn 0.096 7.018 Training 6.6431 -0.3749 0.0405
65 4-F-Bn Furfuryl 0.057 7.244 Training 7.2843 0.0403 0.0584
66 4-F-Bn 2-HO-3-MeO-Bn 0.015 7.824 Prediction 7.9019 0.0779 0.0327
67 4-F-Bn Piperonyl 0.127 6.896 Prediction 6.7672 -0.1288 0.0561
68 4-F-Bn 3-F-6-MeO-Bn 0.075 7.125 Training 7.2232 0.0982 0.0779
69 iso-butyl Furfuryl 0.581 6.236 Prediction 6.75 0.5140 0.0465
70 iso-butyl 2-HO-3-MeO-Bn 0.020 7.699 Training 8.0767 0.3777 0.0643
71 iso-butyl Piperonyl 0.066 7.180 Prediction 7.292 0.1120 0.0555
72 iso-butyl 3-F-6-MeO-Bn 0.089 7.051 Training 6.9244 -0.1266 0.0572
73 cHex Furfuryl 0.118 6.928 Training 6.6176 -0.3104 0.0539
74 cHex 2-HO-3-MeO-Bn 0.019 7.721 Prediction 7.789 0.0680 0.0302
75 cHex Piperonyl 0.128 6.893 Prediction 6.7434 -0.1496 0.0587
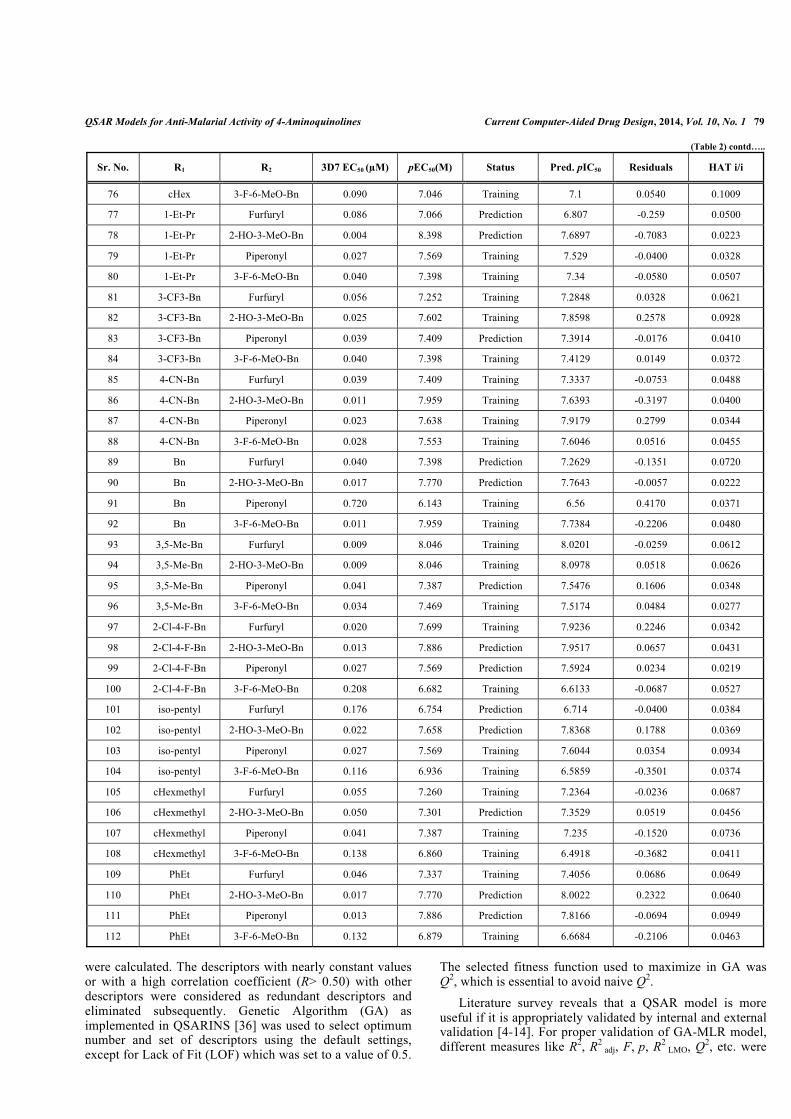
QSAR Models for Anti-Malarial Activity of 4-Aminoquinolines Current Computer-Aided Drug Design, 2014, Vol. 10, No. 1 79
were calculated. The descriptors with nearly constant values or with a high correlation coefficient (R> 0.50) with other descriptors were considered as redundant descriptors and eliminated subsequently. Genetic Algorithm (GA) as implemented in QSARINS [36] was used to select optimum number and set of descriptors using the default settings, except for Lack of Fit (LOF) which was set to a value of 0.5.
The selected fitness function used to maximize in GA was Q2, which is essential to avoid naive Q2. Literature survey reveals that a QSAR model is more useful if it is appropriately validated by internal and external validation [4-14]. For proper validation of GA-MLR model, different measures like R2, R2
adj, F, p, R2 LMO, Q2, etc. were
(Table 2) contd…..
Sr. No. R1 R2 3D7 EC50 (µM) pEC50(M) Status Pred. pIC50 Residuals HAT i/i
76 cHex 3-F-6-MeO-Bn 0.090 7.046 Training 7.1 0.0540 0.1009
77 1-Et-Pr Furfuryl 0.086 7.066 Prediction 6.807 -0.259 0.0500
78 1-Et-Pr 2-HO-3-MeO-Bn 0.004 8.398 Prediction 7.6897 -0.7083 0.0223
79 1-Et-Pr Piperonyl 0.027 7.569 Training 7.529 -0.0400 0.0328
80 1-Et-Pr 3-F-6-MeO-Bn 0.040 7.398 Training 7.34 -0.0580 0.0507
81 3-CF3-Bn Furfuryl 0.056 7.252 Training 7.2848 0.0328 0.0621
82 3-CF3-Bn 2-HO-3-MeO-Bn 0.025 7.602 Training 7.8598 0.2578 0.0928
83 3-CF3-Bn Piperonyl 0.039 7.409 Prediction 7.3914 -0.0176 0.0410
84 3-CF3-Bn 3-F-6-MeO-Bn 0.040 7.398 Training 7.4129 0.0149 0.0372
85 4-CN-Bn Furfuryl 0.039 7.409 Training 7.3337 -0.0753 0.0488
86 4-CN-Bn 2-HO-3-MeO-Bn 0.011 7.959 Training 7.6393 -0.3197 0.0400
87 4-CN-Bn Piperonyl 0.023 7.638 Training 7.9179 0.2799 0.0344
88 4-CN-Bn 3-F-6-MeO-Bn 0.028 7.553 Training 7.6046 0.0516 0.0455
89 Bn Furfuryl 0.040 7.398 Prediction 7.2629 -0.1351 0.0720
90 Bn 2-HO-3-MeO-Bn 0.017 7.770 Prediction 7.7643 -0.0057 0.0222
91 Bn Piperonyl 0.720 6.143 Training 6.56 0.4170 0.0371
92 Bn 3-F-6-MeO-Bn 0.011 7.959 Training 7.7384 -0.2206 0.0480
93 3,5-Me-Bn Furfuryl 0.009 8.046 Training 8.0201 -0.0259 0.0612
94 3,5-Me-Bn 2-HO-3-MeO-Bn 0.009 8.046 Training 8.0978 0.0518 0.0626
95 3,5-Me-Bn Piperonyl 0.041 7.387 Prediction 7.5476 0.1606 0.0348
96 3,5-Me-Bn 3-F-6-MeO-Bn 0.034 7.469 Training 7.5174 0.0484 0.0277
97 2-Cl-4-F-Bn Furfuryl 0.020 7.699 Training 7.9236 0.2246 0.0342
98 2-Cl-4-F-Bn 2-HO-3-MeO-Bn 0.013 7.886 Prediction 7.9517 0.0657 0.0431
99 2-Cl-4-F-Bn Piperonyl 0.027 7.569 Prediction 7.5924 0.0234 0.0219
100 2-Cl-4-F-Bn 3-F-6-MeO-Bn 0.208 6.682 Training 6.6133 -0.0687 0.0527
101 iso-pentyl Furfuryl 0.176 6.754 Prediction 6.714 -0.0400 0.0384
102 iso-pentyl 2-HO-3-MeO-Bn 0.022 7.658 Prediction 7.8368 0.1788 0.0369
103 iso-pentyl Piperonyl 0.027 7.569 Training 7.6044 0.0354 0.0934
104 iso-pentyl 3-F-6-MeO-Bn 0.116 6.936 Training 6.5859 -0.3501 0.0374
105 cHexmethyl Furfuryl 0.055 7.260 Training 7.2364 -0.0236 0.0687
106 cHexmethyl 2-HO-3-MeO-Bn 0.050 7.301 Prediction 7.3529 0.0519 0.0456
107 cHexmethyl Piperonyl 0.041 7.387 Training 7.235 -0.1520 0.0736
108 cHexmethyl 3-F-6-MeO-Bn 0.138 6.860 Training 6.4918 -0.3682 0.0411
109 PhEt Furfuryl 0.046 7.337 Training 7.4056 0.0686 0.0649
110 PhEt 2-HO-3-MeO-Bn 0.017 7.770 Prediction 8.0022 0.2322 0.0640
111 PhEt Piperonyl 0.013 7.886 Prediction 7.8166 -0.0694 0.0949
112 PhEt 3-F-6-MeO-Bn 0.132 6.879 Training 6.6684 -0.2106 0.0463
80 Current Computer-Aided Drug Design, 2014, Vol. 10, No. 1 Masand et al.
calculated to check the robustness of the developed Multi Linear Regression (MLR) equations. In addition, the data set was divided into training and test set for better validation.
3. RESULTS AND DISCUSSION
The CORAL software gave the following models for pEC50 for different splits:
Split 1
pEC50 = 0.0017 (± 0.0843) + 0.1179 (± 0.0013) * DCW(2,56) n=32, r2=0.92, r2
LOO =0.91, s=0.18, F=362 (sub-training set) n=18, r2=0.88, r2
LOO= 0.83, s=0.26 (calibration set) n=24, r2=0.79, r2
LOO= 0.72, s=0.30, Rm2=0.77 (test set)
n=38, r2=0.78, s=0.27 (validation set, CORAL) n=38, r2=0.80, s=0.22 (validation set, GA-MLR)
Split 2
pEC50= 1.1222 (± 0.1225) + 0.1153 (± 0.0022) * DCW(1,87) n=26, r2=0.89, r2
LOO = 0.86, s=0.23, F=190 (sub-training set) n=27, r2=0.89, r2
LOO=0.86, s=0.27 (calibration set) n=20, r2=0.73, r2
LOO= 0.67, s=0.24, Rm2=0.71 (test set)
n=39, r2=0.85, s=0.25 (validation set, CORAL) n=39, r2=0.82, s=0.25 (validation set, GA-MLR)
Split 3
pEC50= 0.0201(± 0.1951) + 0.1459(± 0.0038) * DCW(3,38) n=23, r2=0.88, r2
LOO =0.84, s=0.26, F=152 (sub-training set) n=31, r2=0.87, r2
LOO=0.85, s=0.28 (calibration set) n=36, r2=0.78, r2
LOO= 0.76, s=0.27, Rm2=0.76 (test set)
n=22, r2=0.85, s=0.22 (validation set, CORAL) n=22, r2=0.86, s=0.18 (validation set, GA-MLR)
Split 4
pEC50= -0.0002 (± 0.2056) + 0.1184 (± 0.0033) * DCW(1,61) n=23, r2=0.85, r2
LOO = 0.81, s=0.24, F=121 (sub-training set) n=35, r2=0.85, r2
LOO= 0.83, s=0.27 (calibration set) n=34, r2=0.86, r2
LOO= 0.83, s=0.24, Rm2=0.81 (test set)
n=20, r2=0.89, s= 0.19 (validation set, CORAL) n=20, r2=0.88, s= 0.19 (validation set, GA-MLR)
Split 5
pEC50= 0.0124 (± 0.1549) + 0.1437 (± 0.0029) * DCW(3,66) n=25, r2=0.91, r2
LOO =0.88, s=0.19, F=235 (sub-training set) n=32, r2=0.87, r2
LOO=0.84, s=0.26 (calibration set)
n=27, r2=0.84, r2LOO= 0.81, s=0.22, Rm
2=0.81(test set) n=28, r2=0.83, s=0.25 (validation set, CORAL) n=28, r2=0.88, s=0.20 (validation set, GA-MLR)
Split 6
pEC50= 1.5518 (± 0.1145) + 0.1211 (± 0.0023) * DCW(3,96) n=25, r2=0.91, r2
LOO =0.89, s=0.18, F=245 (sub-training set) n=28, r2=0.91, r2
LOO=0.89, s=0.30 (calibration set) n=39, r2=0.83, r2
LOO= 0.81, s=0.25, Rm2=0.69 (test set)
n=20, r2=0.69, s=0.21 (validation set, CORAL) n=20, r2=0.53, s=0.26 (validation set, GA-MLR) One can see that each split is characterized by various statistical qualities of the prediction. However, in all the cases, the statistical characteristics are quite good. The supplementary materials section contains splits into the training (i.e. the sub-training, calibration and test sets) and validation sets. In addition, the section contains examples of theoretical promising anti-malarial agents. These agents were selected according to their correlation weights: if a SMILES-attribute X has only positive correlation weights in a group of runs of the Monte Carlo optimization then the X should be interpreted as a promoter of increase of the pEC50; if the X has only negative correlation weights then the X should be interpreted as a promoter of decrease of the pEC50[17, 23, 24, 29-31, 35]. For GA-MLR model, the descriptors were selected using first split and validated the model using the same descriptors. The three parametric GA-MLR equation along with statistical parameters and its interpretation in terms of structural features is as follows: pEC50 = C0 + C1RDF040v + C2F06[N-O] + C3Mor13e Ntr = 74, Nex = 38, R2
tr= 0.85, R2adj = 0.84, Q2 = 0.82,
Q2LMO = 0.83, Kxx = 0.23, ΔK = 0.21, RMSEtr = 0.25,
RMSEcv = 0.26, RMSEex = 0.22, S = 0.25, F = 128.52, Q2F1
= 0.83, Q2F2= 0.79, Q2
F3= 0.88, CCCtr = 0.92, CCCcv = 0.90, CCCex = 0.89, MAEtr = 0.19, MAEcv = 0.20, MAEex = 0.14, PRESScv = 5.25, PRESSex = 1.79, R2
LMO = 0.85, The symbols depicted here have usual meaning. The high value of R2, R2
adj, F, R2LMO, Q2, Q2
Fn,Q2LMO, CCCtr and
CCCex confirmed that the model is statistically robust and also possesses high external productivity. The positive coefficient (C1 = 0.092, for split 1) of RDF040v, a 3D descriptor belonging to Radial Distribution Function (RDF), indicates that it plays a positive role in deciding the anti-malarial activity of 4-aminoquinolines, same is true for Mor13e (C3 = 0.234, for split 1), a 3D-descriptor. The RDF selected here is in general used for the explanation of the diffraction patterns obtained in powder X-ray diffraction experiments. RDF descriptors can be used in different tasks to fit the requirements of the information to be represented. These atomic properties enable the discrimination of the atoms of a molecule for almost any property that can be attributed to an atom. RDF040v stands for RDF-4.0/weighted by atomic van der Waal’s volume. The dependence of activity on this descriptor indicates that these molecules adapt a very different conformation during interaction with the receptor, such that the atoms with high
QSAR Models for Anti-Malarial Activity of 4-Aminoquinolines Current Computer-Aided Drug Design, 2014, Vol. 10, No. 1 81
van der Waal’s volume come closer and lie within a distance of 4Ao, though it results in internal repulsion, however, with augmentation in activity [13]. This looks fairly reasonable due to the presence of a good number of single bonds in the molecules. The circle (in Fig. 2) with a diameter of 4Ao has been drawn to represent RDF040v [37]. The radius corresponds to the inner part of the compounds and can be roughly assigned to the Nitrogen atom connected to the quinoline ring. Thus, the activity depends on the presence of heavy atoms at the internal atmosphere of the compounds. The negative coefficient (C2 = -0.926, for split 1) of F06[N-O], a 3D cum indicator variable,points out that the anti-malarial activity has strong correlation with the presence/absence of nitrogen and oxygen at topological distance of six. This observation is supported when the activities of following molecules are compared: 1-4 (EC50 = 0.018 to 0.314µM) with 33-36 (EC50 = 0.009 to 0.032 µM) and with 49-52 (EC50 = 0.009 to 0.020 µM). To elucidate this, we have highlighted (in bold) the topological distance of six between N and O in a molecule in Fig. (2).
Fig. (2). Graphical representation of RDF040v and F06[N-O]. It is a typical approach during the QSAR analysis to divide the available data into single split of training set (compounds which are “visible” during building up a model) and test set (compounds which are “invisible” during building up a model). However, the split has significant influence to the statistical quality of the prediction [38-40]. The split can be "lucky", thereby an approach gives excellent statistics also for external test set; reverse is true if the split is “unlucky”. Under such circumstances, the validation [41-43] of an approach with a group of splits becomes source of robust estimation of the approach. Our computational experiments have shown that there is a significant influence of the split upon predictability of two examined approaches; hence, this influence can take place for cases of other approaches.
CONCLUSIONS
Statistically robust and highly predictive QSAR models (for six random various splits into the training and test sets) for anti-malarial activity have been built up by means of GA-MLR and optimal SMILES-based descriptors (CORAL
software). In three cases (Split 1,Split 3, and Split 5) preferable models have been built by GA-MLR and in three cases (Split 2,Split 4, and Split 6) preferable models have been obtained by optimal descriptors. The models clearify that the topological distance of six between N and O has significant correlation with activity. The anti-malarial activity depends on the presence of heavy atoms in the internal environment of the compounds. Using these models, promising anti-malarial agents could be developed.
CONFLICT OF INTEREST
The authors confirm that this article content has no conflict of interest.
ACKNOWLEDGEMENTS
We are thankful to Gramatica, P., Chirico, N., Papa, E., Cassani, S., Kovarich, S., QSARINS, software for QSAR MLR model development and validation. 2013, QSAR Res. Unit in Environ. Chem. and Ecotox., University of Insubria, Varese, Italy (http://www.qsar.it). Special thanks to Dr. Paola Gramatica for providing the free copy of QSARINS.Sincere thanks to Dr. F.C. raghuwanshi for providing necessary facilities.
SUPPLEMENTARY DATA
Supplementary material is available on the publisher’s web site along with the published article.
REFERENCES
[1] Papireddy, K.; Smilkstein, M.; Kelly, J.X.; Shweta; Salem, S.M.; Alhamadsheh, M.; Haynes, S.W.; Challis, G.L.; Reynolds, K.A. Antimalarial activity of natural and synthetic prodiginines. J. Med. Chem., 2011, 54, 5296-5306.
[2] Hwang, J.Y.; Kawasuji, T.; Lowes, D.J.; Clark, J.A.; Connelly, M.C.; Zhu, F.; Guiguemde, W.A.; Sigal, M.S.; Wilson, E.B.; DeRisi, J.L.; Guy, R.K. Synthesis and evaluation of 7-substituted 4-aminoquinoline analogues for antimalarial activity. J. Med. Chem., 2011, 54, 7084-7093.
[3] M.M.M. Pinto; M.E. Sousa; Nascimento, M.S.J. Xanthone derivatives: new insights in biological activities. Curr. Med. Chem., 2005, 12, 2517-2538.
[4] Jawarkar, R.D.; Masand, V.H.; Patil, K.N.; Mahajan, D.T.; Youssoufi, M.H.; Ben Hadda, T.; Kumbhare, S.L. 3D-QSAR study on coumarin analogues as potent inhibitors of MAO-B using a COMFA approach. Der. Pharma. Chemica., 2010, 2, 302-310.
[5] Mahajan, D.T.; Jawarkar, R.D.; Patil, K.N.; Masand, V.H.; Nazerruddin, G.M. 3D-QSAR studies on xanthone derivatives to understand pharmacological activities as MAO inhibitors. Der. Pharma. Chemica., 2010, 2, 298-308.
[6] Masand, V.H.; Jawarkar, R.D.; Patil, K.N.; Mahajan, D.T.; Ben Hadda, T.; Kurhade, G.H. COMFA analysis and toxicity risk assessment of coumarin analogues as MAO-A Inhibitors: Attempting better insight in drug design. Der. Pharm. Lettre., 2010, 2, 350-357.
[7] Masand, V.H.; Jawarkar, R.D.; Patil, K.N.; Nazerruddin, G.M.; Bajaj, S.O. Correlation potential of Wiener index vis-à-vis molecular refractivity: Antimalarial activity of xanthone derivatives. Organic Chem. Indian J., 2010, 6, 30-38.
[8] Masand, V.H.; Jawarkar, R.D.; Mahajan, D.T.; Ben Hadda, T.; Manikrao, A.M.; Khatale, P.N.; Vyas, J.V. Presuming the probable anti-inflammatory mechanism of ursolic acid: a plant derived pentacyclic triterpenoid, using molecular docking. J. Comput. Method Mol. Des., 2011, 1, 9-13.
[9] Mahajan, D.T.; Masand, V.H.; Patil, K.N.; Ben Hadda, T.; Jawarkar, R.D.; Thakur, S.D.; Rastija, V. CoMSIA and POM
82 Current Computer-Aided Drug Design, 2014, Vol. 10, No. 1 Masand et al.
analyses of anti-malarial activity of synthetic prodiginines. Bioorg. Med. Chem. Lett., 2012, 22, 4827-4835.
[10] Masand, V.H.; Jawarkar, R.D.; Mahajan, D.T.; Hadda, T.B.; Sheikh, J.; Patil, K.N. QSAR and CoMFA studies of biphenyl analogs of the anti-tuberculosis drug (6S)-2-nitro-6-{[4-(trifluoromethoxy) benzyl]oxy}-6,7-dihydro-5H-imidazo[2,1-b][1,3]oxazine(PA-824). Med. Chem. Res., 2012, 21, 2624-2629.
[11] Masand, V.H.; Mahajan, D.T.; Patil, K.N.; Chinchkhede, K.D.; Jawarkar, R.D.; Hadda, T.B.; Alafeefy, A.A.; Shibi, I.G. k-NN, quantum mechanical and field similarity based analysis of xanthone derivatives as α-glucosidase inhibitors. Med. Chem. Res., 2012, 21, 4523-4534.
[12] Mahajan, D.T.; Masand, V.H.; Patil, K.N.; Hadda, T.B.; Rastija, V. Integrating GUSAR and QSAR analyses for antimalarial activity of synthetic prodiginines against multi drug resistant strain. Med. Chem. Res.,2013, 22, 2284-2292.
[13] Masand, V.H.; Mahajan, D.T.; Ben Hadda, T.; Jawarkar, R.D.; Chavan, H.; Bandgar, B.P.; Chauhan, H. Molecular docking and quantitative structure activity relationship (QSAR) analyses of indolylarylsulfones as HIV-1 non-nucleoside reverse transcriptase inhibitors. Med. Chem. Res., 2014, 23, 417-425.
[14] Masand, V.H.; Mahajan, D.T.; Patil, K.N.; Hadda, T.B.; Youssoufi, M.H.; Jawarkar, R.D.; Shibi, I.G. Optimization of antimalarial activity of synthetic prodiginines: QSAR, GUSAR, and CoMFA analyses. Chem. Biol. Drug Des., 2013, 81, 527-536.
[15] Benfenati, E.; Toropov, A.A.; Toropova, A.P.; Manganaro, A.; Gonella Diaza, R. Coral software: QSAR for anticancer agents. Chem. Biol. Drug Des., 2011, 77, 471-476.
[16] Toropov, A.A.; Toropova, A.P.; Lombardo, A.; Roncaglioni, A.; Benfenati, E.; Gini, G. CORAL: building up the model for bioconcentration factor and defining it's applicability domain. Eur. J. Med. Chem., 2011, 46, 1400-1403.
[17] Toropova, A.P.; Toropov, A.A.; Benfenati, E.; Gini, G.; Leszczynska, D.; Leszczynski, J. CORAL: quantitative structure-activity relationship models for estimating toxicity of organic compounds in rats. J. Comput. Chem., 2011, 32, 2727-2733.
[18] Toropova, A.P.; Toropov, A.A.; Benfenati, E.; Gini, G.; Leszczynska, D.; Leszczynski, J. CORAL: QSPR models for solubility of [C60] and [C70] fullerene derivatives. Mol. Divers., 2011, 15, 249-256.
[19] Milekhin, A.; Yeryukov, N.; Toropov, A.; Dmitriev, D.; Sheremet, E.; Zahn, D.R. Raman scattering of InAs/AlAs quantum dot superlattices grown on (001) and (311)B GaAs surfaces. Nanoscale. Res. Lett., 2012, 7, 476.
[20] Stvolinsky, S.; Toropova, K.; Gordeeva, M.; Kazey, V.; Sato, T.; Meguro, K.; Boldyrev, A. Carnosine and its (S)-Trolox derivative protect animals against oxidative stress. Amino Acids, 2012, 43, 165-170.
[21] Tiunova, A.A.; Toropova, K.A.; Konovalova, E.V.; Anokhin, K.V. Effects of systemic administration of histone deacetylase inhibitor on memory formation and immediate early gene expression in chick brain. Bull Exp. Biol. Med., 2012, 153, 742-745.
[22] Toropov, A.A.; Toropova, A.P.; Benfenati, E.; Gini, G.; Leszczynska, D.; Leszczynski, J. Calculation of molecular features with apparent impact on both activity of mutagens and activity of anticancer agents. Anticancer Agents Med. Chem., 2012, 12, 807-817.
[23] Toropov, A.A.; Toropova, A.P.; Benfenati, E.; Gini, G.; Puzyn, T.; Leszczynska, D.; Leszczynski, J. Novel application of the CORAL software to model cytotoxicity of metal oxide nanoparticles to bacteria Escherichia coli. Chemosphere, 2012, 89, 1098-1102.
[24] Toropov, A.A.; Toropova, A.P.; Rasulev, B.F.; Benfenati, E.; Gini, G.; Leszczynska, D.; Leszczynski, J. CORAL: binary classifications (active/inactive) for liver-related adverse effects of drugs. Curr. Drug Saf., 2012, 7, 257-261.
[25] Toropov, A.A.; Toropova, A.P.; Rasulev, B.F.; Benfenati, E.; Gini, G.; Leszczynska, D.; Leszczynski, J. CORAL: QSPR modeling of rate constants of reactions between organic aromatic pollutants and hydroxyl radical. J. Comput. Chem., 2012, 33, 1902-1906.
[26] Toropova, A.P.; Toropov, A.A.; Benfenati, E.; Gini, G. QSAR models for toxicity of organic substances to Daphnia magna built up by using the CORAL freeware. Chem. Biol. Drug. Des., 2012, 79, 332-338.
[27] Toropova, A.P.; Toropov, A.A.; Lombardo, A.; Roncaglioni, A.; Benfenati, E.; Gini, G. Coral: QSAR models for acute toxicity in fathead minnow (Pimephales promelas). J. Comput. Chem., 2012.
[28] Veselinovic, A.M.; Milosavljevic, J.B.; Toropov, A.A.; Nikolic, G.M. SMILES-based QSAR model for arylpiperazines as high-affinity 5-HT(1A) receptor ligands using CORAL. Eur. J. Pharm. Sci., 2012, 48, 532-541.
[29] Toropov, A.A.; Toropova, A.P.; Benfenati, E.; Gini, G.; Leszczynska, D.; Leszczynski, J. CORAL: Classification model for predictions of anti-sarcoma activity. Curr. Top. Med. Chem., 2012, 12, 2741-2744.
[30] Toropov, A.A.; Toropova, A.P.; Benfenati, E.; Gini, G.; Leszczynska, D.; Leszczynski, J. CORAL: QSPR model of water solubility based on local and global SMILES attributes. Chemosphere, 2013, 90, 877-880.
[31] Toropov, A.A.; Toropova, A.P.; Benfenati, E.; Gini, G.; Leszczynska, D.; Leszczynski, J.; De Nucci, G. QSAR models for inhibitors of physiological impact of Escherichia coli that leads to diarrhea. Biochem. Biophys. Res. Commun., 2013, 432, 214-225.
[32] Toropov, A.A.; Toropova, A.P.; Puzyn, T.; Benfenati, E.; Gini, G.; Leszczynska, D.; Leszczynski, J. QSAR as a random event: Modeling of nanoparticles uptake in PaCa2 cancer cells. Chemosphere, 2013, 92, 31-37.
[33] Veselinovic, A.M.; Milosavljevic, J.B.; Toropov, A.A.; Nikolic, G.M. SMILES-based QSAR models for the calcium channel-antagonistic effect of 1,4-dihydropyridines. Arch. Pharm. (Weinheim), 2013, 346, 134-139.
[34] Toropov, A.A.; Rasulev, B.F.; Leszczynski, J. QSAR modeling of acute toxicity for nitrobenzene derivatives towards rats: Comparative analysis by MLRA and optimal descriptors. QSAR Combin. Sci., 2007, 26, 686-693.
[35] Toropov, A.A.; Toropova, A.P.; Benfenati, E.; Gini, G.; Leszczynska, D.; Leszczynski, J. CORAL: classification model for predictions of anti-sarcoma activity. Curr. Top. Med. Chem., 2012, 12, 2741-2744.
[36] Chirico, N.; Papa, E.; Kovarich, S.; Cassani, S.; Gramatica, P. QSARINS, software for QSAR MLR model development and validation. 2012, QSAR Res. Unit in Environ. Chem. and Ecotox., University of Insubria, Varese, Italy. http://www.qsar.it. 2012.
[37] Abreu, R.M.; Ferreira, I.C.; Queiroz, M.J. QSAR model for predicting radical scavenging activity of di(hetero)arylamines derivatives of benzo[b]thiophenes. Eur. J. Med. Chem., 2009, 44, 1952-1958.
[38] Golbraikh, A.; Shen, M.; Xiao, Z.; Xiao, Y.D.; Lee, K.H.; Tropsha, A. Rational selection of training and test sets for the development of validated QSAR models. J. Comput. Aided Mol. Des., 2003, 17, 241-253.
[39] Roy, K.; Mitra, I. On the use of the metric rm(2) as an effective tool for validation of QSAR models in computational drug design and predictive toxicology. Mini Rev. Med. Chem., 2012, 12, 491-504.
[40] Roy, P.P.; Leonard, J.T.; Roy, K. Exploring the impact of size of training sets for the development of predictive QSAR models. Chemo. Intell. Lab. Sys., 2008, 90, 31-42.
[41] Chirico, N.; Gramatica, P. Real external predictivity of qsar models: how to evaluate it? Comparison of different validation criteria and proposal of using the concordance correlation coefficient. J. Chem. Inf. Model, 2011, 51, 2320-2335.
[42] Chirico, N.; Gramatica, P. Real external predictivity of QSAR models. Part 2. New intercomparable thresholds for different validation criteria and the need for scatter plot inspection. J. Chem. Inf. Model., 2012, 52, 2044-2058.
[43] Benigni, R.; Bossa, C. Predictivity and reliability of QSAR models: the case of mutagens and carcinogens. Toxicol. Mech. Meth., 2008, 18, 137-147.
Received: January 6, 2013 Revised: October 22, 2013 Accepted: January 20, 2014
1 23
Medicinal Chemistry Research ISSN 1054-2523Volume 23Number 11 Med Chem Res (2014) 23:4825-4835DOI 10.1007/s00044-014-1043-8
Tautomerism and multiple modellingenhance the efficacy of QSAR: antimalarialactivity of phosphoramidate andphosphorothioamidate analogues ofamiprophos methylVijay H. Masand, Devidas T. Mahajan,Paola Gramatica & James Barlow
1 23
Your article is protected by copyright and all
rights are held exclusively by Springer Science
+Business Media New York. This e-offprint is
for personal use only and shall not be self-
archived in electronic repositories. If you wish
to self-archive your article, please use the
accepted manuscript version for posting on
your own website. You may further deposit
the accepted manuscript version in any
repository, provided it is only made publicly
available 12 months after official publication
or later and provided acknowledgement is
given to the original source of publication
and a link is inserted to the published article
on Springer's website. The link must be
accompanied by the following text: "The final
publication is available at link.springer.com”.

ORIGINAL RESEARCH
Tautomerism and multiple modelling enhance the efficacyof QSAR: antimalarial activity of phosphoramidateand phosphorothioamidate analogues of amiprophos methyl
Vijay H. Masand • Devidas T. Mahajan •
Paola Gramatica • James Barlow
Received: 26 February 2014 / Accepted: 19 May 2014 / Published online: 10 June 2014
� Springer Science+Business Media New York 2014
Abstract In the present study, sixty phosphoramidate and
phosphorothioamidate analogues of amiprophos methyl
(APM) previously reported as potential antimalarial agents
were selected to build GA-MLR QSAR models to deter-
mine the features that govern the antimalarial activity. In
addition, field similarity analysis was performed to deter-
mine the molecular fields that are responsible for the dif-
ference in the activity. The two tautomeric forms, possible
for the molecules in the present study, were considered to
determine the effect of tautomerism on QSAR modelling.
In the present analysis, a simplistic approach was employed
with the assumption that all the molecules either exist in
keto-type tautomeric form or in enol-type form. To get
more results from QSAR analysis, multiple models were
developed. All the models have been thoroughly validated
according to the OECD principles. The best four-
parametric GA-MLR QSAR model is with R2 = 0.787 and
R2ex = 0.806 for the keto form, and R2 = 0.785 and
R2ex = 0.770 for the enol form. In addition, optimum values
for more easily interpretable descriptors like molecular
weight (MW), lipophilicity (ALogP), etc., have been
determined. The analysis reveals that consideration of
tautomerism and multiple models development enhance the
efficiency of QSAR analysis for lead optimization and for
prediction of the activities of as-yet untested molecules.
Keywords Antimalarial activity �Amiprophos methyl analogues � QSAR � Field similarity �Tautomerism
Abbreviations
GA Genetic algorithm
MLR Multiple linear regression
QSAR Quantitative structure–activity analysis
WHO World Health Organization
ADMET Absorption, distribution, metabolism,
excretion and toxicity
OLS Ordinary least square
QSARINS QSAR Insubria
Introduction
The recent WHO report on malaria (http://www.who.int/
malaria/en/2013) clearly indicates that though malaria has
its major presence in undeveloped and developing coun-
tries from Africa, Asia and South America, yet, its ill-
effects are global. This vector-borne disease is responsible
for more than 2 million cases every year (http://www.who.
Electronic supplementary material The online version of thisarticle (doi:10.1007/s00044-014-1043-8) contains supplementarymaterial, which is available to authorized users.
V. H. Masand (&) � D. T. Mahajan
Department of Chemistry, Vidya Bharati College, Camp,
Amravati 444 602, Maharashtra, India
e-mail: [email protected]; [email protected]
P. Gramatica
QSAR Research Unit in Environmental Chemistry and
Ecotoxicology, Department of Theoretical and Applied Sciences,
University of Insubria, Via Dunant 3, 21100 Varese, Italy
J. Barlow
Department of Pharmaceutical & Medicinal Chemistry, Royal
College of Surgeons in Ireland, Stephens Green, Dublin 2,
Ireland
123
Med Chem Res (2014) 23:4825–4835
DOI 10.1007/s00044-014-1043-8
MEDICINALCHEMISTRYRESEARCH
Author's personal copy
int/malaria/en/2013; Mahajan et al., 2012; Masand et al.,
2013c). Recently, many researchers have reported the
emergence of multidrug-resistant strain of Plasmodium
falciparum (P. falciparum), the main etiological agent of
malaria, thereby, making the complete eradication of
malaria a more difficult task. To curb this deadly disease,
established antimalarial classes like artemisinins, amino-
quinolines, etc., and largely unexplored many new com-
pounds such as prodiginines, xanthones, amiprophos
methyl derivatives, etc., have been tested in last decade
(Hwang et al., 2011; Mahajan et al., 2012; Mara et al.,
2011; Mara et al., 2013; Masand et al., 2010b; Masand
et al., 2013c; Ojha and Roy, 2012).
Amiprophos methyl derivatives have received consid-
erable attention in the last decade because of their insec-
ticidal, antimicrobial and herbicidal properties, and ease of
synthesis with the possibility to vary the structure relatively
easy (Mara et al., 2011; Mara et al., 2013). Despite these
advantages and the efforts executed, search for amiprophos
methyl derivatives with high activity and better ADMET
profile still persists.
Computer-assisted drug designing (CADD) has secured
a unique place in modern drug designing because of
quicker, cheaper and result-oriented analysis. Quantitative
structure–activity relationship (QSAR), a thriving branch
of CADD technique, is useful to determine the structural
and pharmacophoric patterns that govern the activity of
congeneric molecules (Scior et al., 2009; Yuriev et al.,
2011). Tautomerism is an import molecular phenomenon
that has significant influence on the different aspects of
molecules, like pKa, LogP, solubility and other properties
(Pospisil et al., 2003a). Recently, a minor tautomer (in
solution) of barbiturate analogue was found to be the
active form in a 1.8 A crystal structure of matrix
metalloproteinase 8. Another example is that of pterin
tautomer bound to the 2.3 A structure of ricin toxin
A-chain (Martin, 2010). Thus, a thermodynamically
favoured tautomeric form in the solution may not be the
‘bioactive tautomeric form’ during the course of mecha-
nism. Moreover, a molecule may interact in different
tautomeric forms with different receptors (Martin, 2009,
2010; Masand et al., 2013a; Oellien et al., 2006; Pospisil
et al., 2003b; Thalheim et al., 2010; Zou et al., 2007).
Herein, we have considered the influence of tautomerism
on QSAR model development and multiple QSAR mod-
elling with the determination of optimum values for some
of the more easily interpretable descriptors for phos-
phoramidate and phosphorothioamidate analogues of
amiprophos methyl. In the present study, we have per-
formed integrated QSAR and field similarity analysis to
determine the structural features that steer the antimalarial
activity of amiprophos methyl derivatives.
Materials and methods
Dataset
The dataset consists of sixty phosphoramidate and phos-
phorothioamidate analogues of amiprophos methyl previ-
ously reported as potential antimalarial agents (Mara et al.,
2011; Mara et al., 2013). The compounds were tested for
inhibitory activity against P. falciparum. The experimental
antimalarial activities reported as IC50 (lM) were converted
to pIC50 (M) for QSAR analysis (Jawarkar et al., 2010;
Mahajan et al., 2010, 2012; Masand et al., 2010a; Masand
et al., 2010b; Masand et al., 2013b; Masand et al., 2012,
2013c). The compounds possess varying substituents at
different positions, cyclic and non-cyclic derivatives and
tautomerism also. For the present analysis, both the tauto-
meric forms were considered. The structures were drawn
using ChemDraw 2008 with default settings followed by
energy optimization with MMFF94 field. The general
structures for both the tautomers are depicted in Table 1
along with the experimental data [IC50 (lM) and pIC50 (M)].
Descriptor calculation and model development
In the present analysis, a simplistic approach was employed
with the assumption that all the molecules exist either in first
tautomeric (keto-type) form or in other (enol-type) form.
Therefore, the first set (Set 1) consists of 60 molecules in
keto-type tautomeric form only, while the second set (Set 2)
consists of 59 molecules but in enol-type of tautomeric form
only. For one of the molecules, 44, M and Y are oxygen and
sulphur, respectively (see Table 1); therefore, enolization
was not possible for it, and hence it was excluded from set 2.
For both the tautomeric forms, a good number of descriptors
were generated for the lowest energy conformer using
e-Dragon followed by the removal of highly collinear
(|R| [ 0.70) and constant ([75 %) descriptors to avoid the
inclusion of multi-collinear and spurious variables in GA-
MLR model, using objective feature selection in QSARINS
v1.2 (Gramatica et al., 2013, 2014). This substantially
decreased the total set of descriptors from 3,224 to 224 and
334 for sets 1 and 2, respectively. The reduced descriptors
pool consists of zero-, one-, two- and three-dimensional
descriptors, charge descriptors and molecular properties.
Subjective feature selection was used to build the statistically
robust OLS QSAR models using genetic algorithm (GA) in
QSARINS. Thorough statistical validation of all the models
for the two sets was performed according to OECD princi-
ples; only models with high internal and external predictiv-
ities were considered (Chavan et al., 2013). To develop
simple and informative QSAR models, the heuristic search
was limited to four variables per model.
4826 Med Chem Res (2014) 23:4825–4835
123
Author's personal copy
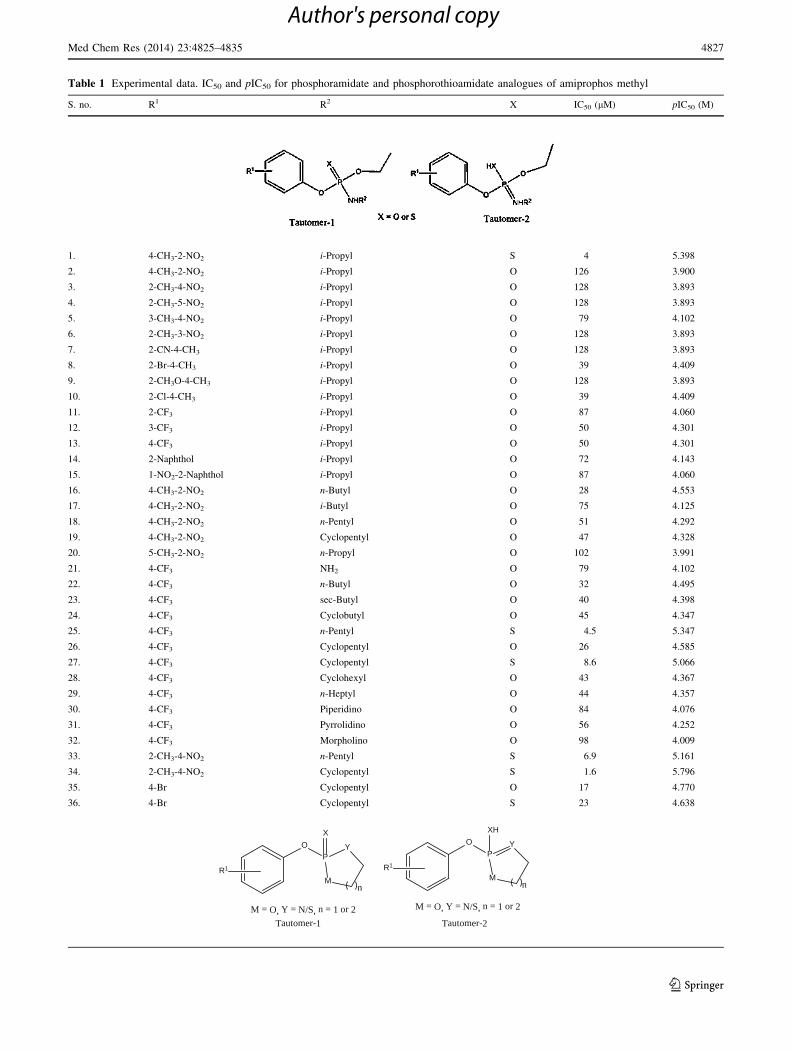
Table 1 Experimental data. IC50 and pIC50 for phosphoramidate and phosphorothioamidate analogues of amiprophos methyl
S. no. R1 R2 X IC50 (lM) pIC50 (M)
1. 4-CH3-2-NO2 i-Propyl S 4 5.398
2. 4-CH3-2-NO2 i-Propyl O 126 3.900
3. 2-CH3-4-NO2 i-Propyl O 128 3.893
4. 2-CH3-5-NO2 i-Propyl O 128 3.893
5. 3-CH3-4-NO2 i-Propyl O 79 4.102
6. 2-CH3-3-NO2 i-Propyl O 128 3.893
7. 2-CN-4-CH3 i-Propyl O 128 3.893
8. 2-Br-4-CH3 i-Propyl O 39 4.409
9. 2-CH3O-4-CH3 i-Propyl O 128 3.893
10. 2-Cl-4-CH3 i-Propyl O 39 4.409
11. 2-CF3 i-Propyl O 87 4.060
12. 3-CF3 i-Propyl O 50 4.301
13. 4-CF3 i-Propyl O 50 4.301
14. 2-Naphthol i-Propyl O 72 4.143
15. 1-NO2-2-Naphthol i-Propyl O 87 4.060
16. 4-CH3-2-NO2 n-Butyl O 28 4.553
17. 4-CH3-2-NO2 i-Butyl O 75 4.125
18. 4-CH3-2-NO2 n-Pentyl O 51 4.292
19. 4-CH3-2-NO2 Cyclopentyl O 47 4.328
20. 5-CH3-2-NO2 n-Propyl O 102 3.991
21. 4-CF3 NH2 O 79 4.102
22. 4-CF3 n-Butyl O 32 4.495
23. 4-CF3 sec-Butyl O 40 4.398
24. 4-CF3 Cyclobutyl O 45 4.347
25. 4-CF3 n-Pentyl S 4.5 5.347
26. 4-CF3 Cyclopentyl O 26 4.585
27. 4-CF3 Cyclopentyl S 8.6 5.066
28. 4-CF3 Cyclohexyl O 43 4.367
29. 4-CF3 n-Heptyl O 44 4.357
30. 4-CF3 Piperidino O 84 4.076
31. 4-CF3 Pyrrolidino O 56 4.252
32. 4-CF3 Morpholino O 98 4.009
33. 2-CH3-4-NO2 n-Pentyl S 6.9 5.161
34. 2-CH3-4-NO2 Cyclopentyl S 1.6 5.796
35. 4-Br Cyclopentyl O 17 4.770
36. 4-Br Cyclopentyl S 23 4.638
R1
O
P
M
Y
n
X
M = O, Y = N/S, n = 1 or 2
R1
O
P
M
Y
n
XH
M = O, Y = N/S, n = 1 or 2
Tautomer-1 Tautomer-2
Med Chem Res (2014) 23:4825–4835 4827
123
Author's personal copy
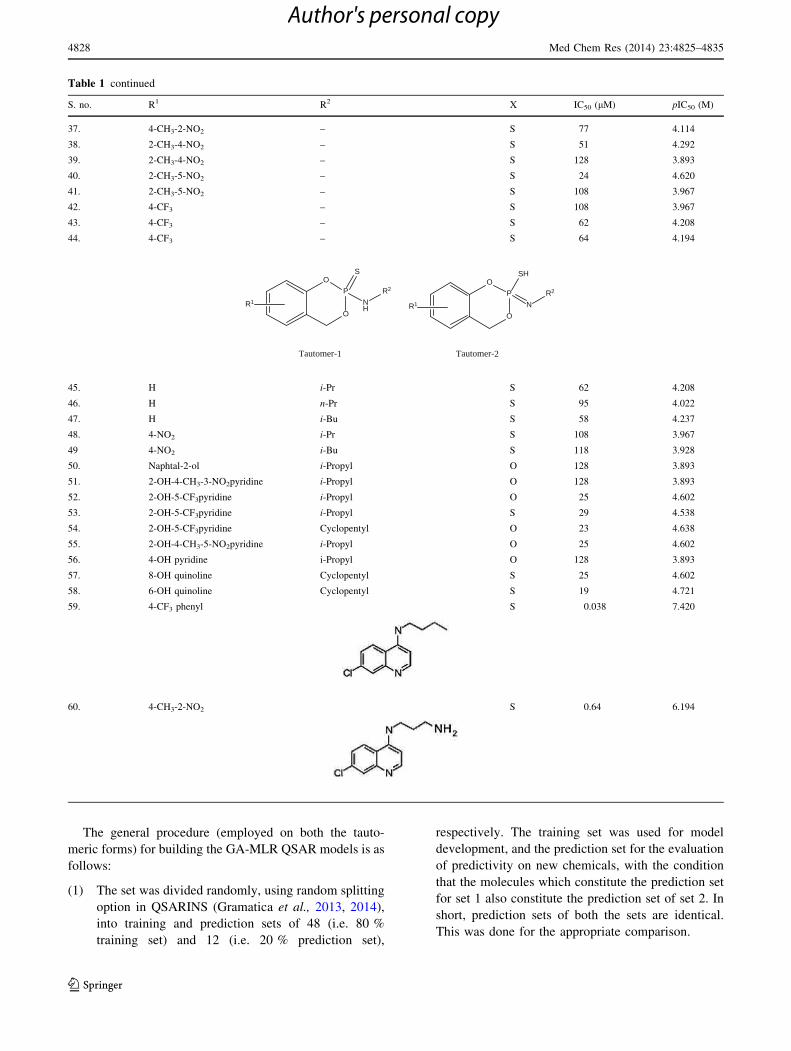
The general procedure (employed on both the tauto-
meric forms) for building the GA-MLR QSAR models is as
follows:
(1) The set was divided randomly, using random splitting
option in QSARINS (Gramatica et al., 2013, 2014),
into training and prediction sets of 48 (i.e. 80 %
training set) and 12 (i.e. 20 % prediction set),
respectively. The training set was used for model
development, and the prediction set for the evaluation
of predictivity on new chemicals, with the condition
that the molecules which constitute the prediction set
for set 1 also constitute the prediction set of set 2. In
short, prediction sets of both the sets are identical.
This was done for the appropriate comparison.
Table 1 continued
S. no. R1 R2 X IC50 (lM) pIC50 (M)
37. 4-CH3-2-NO2 – S 77 4.114
38. 2-CH3-4-NO2 – S 51 4.292
39. 2-CH3-4-NO2 – S 128 3.893
40. 2-CH3-5-NO2 – S 24 4.620
41. 2-CH3-5-NO2 – S 108 3.967
42. 4-CF3 – S 108 3.967
43. 4-CF3 – S 62 4.208
44. 4-CF3 – S 64 4.194
R1
Tautomer-1 Tautomer-2
O
P
OS
NH
R2
R1
O
P
OSH
N
R2
45. H i-Pr S 62 4.208
46. H n-Pr S 95 4.022
47. H i-Bu S 58 4.237
48. 4-NO2 i-Pr S 108 3.967
49 4-NO2 i-Bu S 118 3.928
50. Naphtal-2-ol i-Propyl O 128 3.893
51. 2-OH-4-CH3-3-NO2pyridine i-Propyl O 128 3.893
52. 2-OH-5-CF3pyridine i-Propyl O 25 4.602
53. 2-OH-5-CF3pyridine i-Propyl S 29 4.538
54. 2-OH-5-CF3pyridine Cyclopentyl O 23 4.638
55. 2-OH-4-CH3-5-NO2pyridine i-Propyl O 25 4.602
56. 4-OH pyridine i-Propyl O 128 3.893
57. 8-OH quinoline Cyclopentyl S 25 4.602
58. 6-OH quinoline Cyclopentyl S 19 4.721
59. 4-CF3 phenyl S 0.038 7.420
60. 4-CH3-2-NO2 S 0.64 6.194
4828 Med Chem Res (2014) 23:4825–4835
123
Author's personal copy
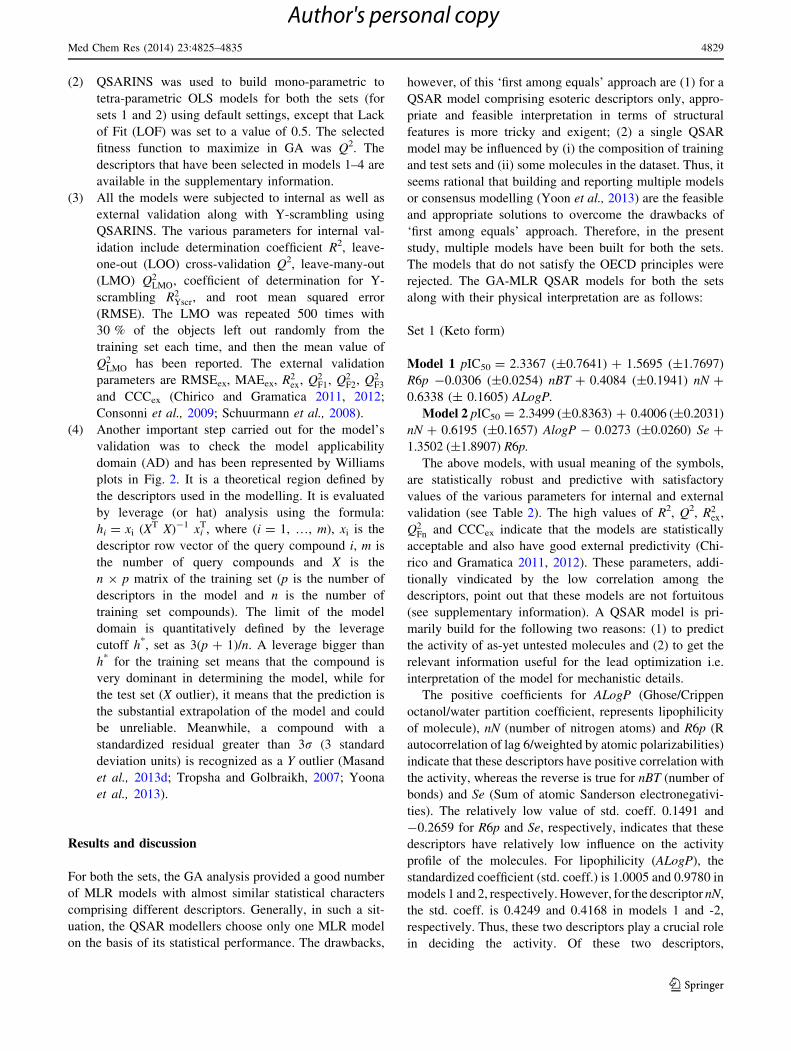
(2) QSARINS was used to build mono-parametric to
tetra-parametric OLS models for both the sets (for
sets 1 and 2) using default settings, except that Lack
of Fit (LOF) was set to a value of 0.5. The selected
fitness function to maximize in GA was Q2. The
descriptors that have been selected in models 1–4 are
available in the supplementary information.
(3) All the models were subjected to internal as well as
external validation along with Y-scrambling using
QSARINS. The various parameters for internal val-
idation include determination coefficient R2, leave-
one-out (LOO) cross-validation Q2, leave-many-out
(LMO) Q2LMO, coefficient of determination for Y-
scrambling R2Yscr, and root mean squared error
(RMSE). The LMO was repeated 500 times with
30 % of the objects left out randomly from the
training set each time, and then the mean value of
Q2LMO has been reported. The external validation
parameters are RMSEex, MAEex, R2ex, Q2
F1, Q2F2, Q2
F3
and CCCex (Chirico and Gramatica 2011, 2012;
Consonni et al., 2009; Schuurmann et al., 2008).
(4) Another important step carried out for the model’s
validation was to check the model applicability
domain (AD) and has been represented by Williams
plots in Fig. 2. It is a theoretical region defined by
the descriptors used in the modelling. It is evaluated
by leverage (or hat) analysis using the formula:
hi = xi (XT X)-1 xiT, where (i = 1, …, m), xi is the
descriptor row vector of the query compound i, m is
the number of query compounds and X is the
n 9 p matrix of the training set (p is the number of
descriptors in the model and n is the number of
training set compounds). The limit of the model
domain is quantitatively defined by the leverage
cutoff h*, set as 3(p ? 1)/n. A leverage bigger than
h* for the training set means that the compound is
very dominant in determining the model, while for
the test set (X outlier), it means that the prediction is
the substantial extrapolation of the model and could
be unreliable. Meanwhile, a compound with a
standardized residual greater than 3r (3 standard
deviation units) is recognized as a Y outlier (Masand
et al., 2013d; Tropsha and Golbraikh, 2007; Yoona
et al., 2013).
Results and discussion
For both the sets, the GA analysis provided a good number
of MLR models with almost similar statistical characters
comprising different descriptors. Generally, in such a sit-
uation, the QSAR modellers choose only one MLR model
on the basis of its statistical performance. The drawbacks,
however, of this ‘first among equals’ approach are (1) for a
QSAR model comprising esoteric descriptors only, appro-
priate and feasible interpretation in terms of structural
features is more tricky and exigent; (2) a single QSAR
model may be influenced by (i) the composition of training
and test sets and (ii) some molecules in the dataset. Thus, it
seems rational that building and reporting multiple models
or consensus modelling (Yoon et al., 2013) are the feasible
and appropriate solutions to overcome the drawbacks of
‘first among equals’ approach. Therefore, in the present
study, multiple models have been built for both the sets.
The models that do not satisfy the OECD principles were
rejected. The GA-MLR QSAR models for both the sets
along with their physical interpretation are as follows:
Set 1 (Keto form)
Model 1 pIC50 = 2.3367 (±0.7641) ? 1.5695 (±1.7697)
R6p -0.0306 (±0.0254) nBT ? 0.4084 (±0.1941) nN ?
0.6338 (± 0.1605) ALogP.
Model 2 pIC50 = 2.3499 (±0.8363) ? 0.4006 (±0.2031)
nN ? 0.6195 (±0.1657) AlogP - 0.0273 (±0.0260) Se ?
1.3502 (±1.8907) R6p.
The above models, with usual meaning of the symbols,
are statistically robust and predictive with satisfactory
values of the various parameters for internal and external
validation (see Table 2). The high values of R2, Q2, R2ex,
Q2Fn and CCCex indicate that the models are statistically
acceptable and also have good external predictivity (Chi-
rico and Gramatica 2011, 2012). These parameters, addi-
tionally vindicated by the low correlation among the
descriptors, point out that these models are not fortuitous
(see supplementary information). A QSAR model is pri-
marily build for the following two reasons: (1) to predict
the activity of as-yet untested molecules and (2) to get the
relevant information useful for the lead optimization i.e.
interpretation of the model for mechanistic details.
The positive coefficients for ALogP (Ghose/Crippen
octanol/water partition coefficient, represents lipophilicity
of molecule), nN (number of nitrogen atoms) and R6p (R
autocorrelation of lag 6/weighted by atomic polarizabilities)
indicate that these descriptors have positive correlation with
the activity, whereas the reverse is true for nBT (number of
bonds) and Se (Sum of atomic Sanderson electronegativi-
ties). The relatively low value of std. coeff. 0.1491 and
-0.2659 for R6p and Se, respectively, indicates that these
descriptors have relatively low influence on the activity
profile of the molecules. For lipophilicity (ALogP), the
standardized coefficient (std. coeff.) is 1.0005 and 0.9780 in
models 1 and 2, respectively. However, for the descriptor nN,
the std. coeff. is 0.4249 and 0.4168 in models 1 and -2,
respectively. Thus, these two descriptors play a crucial role
in deciding the activity. Of these two descriptors,
Med Chem Res (2014) 23:4825–4835 4829
123
Author's personal copy
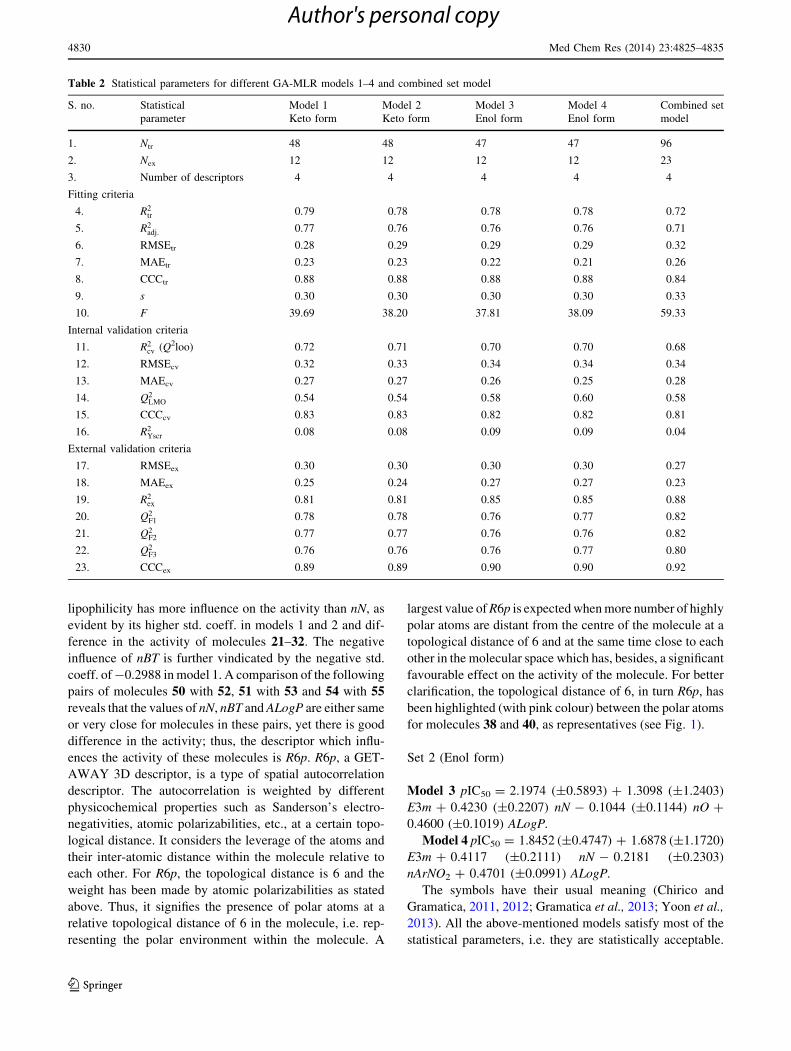
lipophilicity has more influence on the activity than nN, as
evident by its higher std. coeff. in models 1 and 2 and dif-
ference in the activity of molecules 21–32. The negative
influence of nBT is further vindicated by the negative std.
coeff. of -0.2988 in model 1. A comparison of the following
pairs of molecules 50 with 52, 51 with 53 and 54 with 55
reveals that the values of nN, nBT and ALogP are either same
or very close for molecules in these pairs, yet there is good
difference in the activity; thus, the descriptor which influ-
ences the activity of these molecules is R6p. R6p, a GET-
AWAY 3D descriptor, is a type of spatial autocorrelation
descriptor. The autocorrelation is weighted by different
physicochemical properties such as Sanderson’s electro-
negativities, atomic polarizabilities, etc., at a certain topo-
logical distance. It considers the leverage of the atoms and
their inter-atomic distance within the molecule relative to
each other. For R6p, the topological distance is 6 and the
weight has been made by atomic polarizabilities as stated
above. Thus, it signifies the presence of polar atoms at a
relative topological distance of 6 in the molecule, i.e. rep-
resenting the polar environment within the molecule. A
largest value of R6p is expected when more number of highly
polar atoms are distant from the centre of the molecule at a
topological distance of 6 and at the same time close to each
other in the molecular space which has, besides, a significant
favourable effect on the activity of the molecule. For better
clarification, the topological distance of 6, in turn R6p, has
been highlighted (with pink colour) between the polar atoms
for molecules 38 and 40, as representatives (see Fig. 1).
Set 2 (Enol form)
Model 3 pIC50 = 2.1974 (±0.5893) ? 1.3098 (±1.2403)
E3m ? 0.4230 (±0.2207) nN - 0.1044 (±0.1144) nO ?
0.4600 (±0.1019) ALogP.
Model 4 pIC50 = 1.8452 (±0.4747) ? 1.6878 (±1.1720)
E3m ? 0.4117 (±0.2111) nN - 0.2181 (±0.2303)
nArNO2 ? 0.4701 (±0.0991) ALogP.
The symbols have their usual meaning (Chirico and
Gramatica, 2011, 2012; Gramatica et al., 2013; Yoon et al.,
2013). All the above-mentioned models satisfy most of the
statistical parameters, i.e. they are statistically acceptable.
Table 2 Statistical parameters for different GA-MLR models 1–4 and combined set model
S. no. Statistical
parameter
Model 1
Keto form
Model 2
Keto form
Model 3
Enol form
Model 4
Enol form
Combined set
model
1. Ntr 48 48 47 47 96
2. Nex 12 12 12 12 23
3. Number of descriptors 4 4 4 4 4
Fitting criteria
4. R2tr 0.79 0.78 0.78 0.78 0.72
5. R2adj: 0.77 0.76 0.76 0.76 0.71
6. RMSEtr 0.28 0.29 0.29 0.29 0.32
7. MAEtr 0.23 0.23 0.22 0.21 0.26
8. CCCtr 0.88 0.88 0.88 0.88 0.84
9. s 0.30 0.30 0.30 0.30 0.33
10. F 39.69 38.20 37.81 38.09 59.33
Internal validation criteria
11. R2cv (Q2loo) 0.72 0.71 0.70 0.70 0.68
12. RMSEcv 0.32 0.33 0.34 0.34 0.34
13. MAEcv 0.27 0.27 0.26 0.25 0.28
14. Q2LMO 0.54 0.54 0.58 0.60 0.58
15. CCCcv 0.83 0.83 0.82 0.82 0.81
16. R2Yscr 0.08 0.08 0.09 0.09 0.04
External validation criteria
17. RMSEex 0.30 0.30 0.30 0.30 0.27
18. MAEex 0.25 0.24 0.27 0.27 0.23
19. R2ex 0.81 0.81 0.85 0.85 0.88
20. Q2F1 0.78 0.78 0.76 0.77 0.82
21. Q2F2 0.77 0.77 0.76 0.76 0.82
22. Q2F3 0.76 0.76 0.76 0.77 0.80
23. CCCex 0.89 0.89 0.90 0.90 0.92
4830 Med Chem Res (2014) 23:4825–4835
123
Author's personal copy
It is clear that lipophilicity (ALogP) (Std. Coeff. 0.7246
and 0.7405 in models 3 and 4, respectively) has significant
positive role in deciding the activity; the same is acceptable
for nN (Std. Coeff. 0.3848 and 0.3745 in model 3 and 4,
respectively) and E3m (Std. Coeff. 0.1837 and 0.2367 in
model 3 and 4, respectively). However, nO (Std. Coeff.
-0.1762 in model 3) and nArNO2 (Std. Coeff. -0.1762 in
model 4) have negative influence on activity. The predicted
residuals, statistical parameters and correlation matrices for
descriptors used for different GA-MLR models 1–4 have
been listed in tables 3–5 in supplementary information.
A four-parametric QSAR model based on a dataset
comprising both tautomeric forms has also been developed.
Combined set model pIC50 = 2.2298 (±0.3391) ?
0.3463 (±0.1126) nN ? 0.2501 (±0.1349) nS ? 0.3910
(±0.2538) nArX ? 0.4279 (±0.0775) ALogP.
The graphs for correlation, residuals and Y-randomization
have been depicted in Figs. 1 and 2 of supporting information.
Further, the Williams plot has been used to represent the AD of
the models. From Fig. 2, it is evident that some molecules lie
outside the AD of the entire reported model.
It appears that the QSAR models for both the tautomeric
forms are statistically significant and independent of tau-
tomerism. The plausible reasons for negligible influence of
the tautomerism on QSAR models could the insensitivity
of the descriptors in recognization and discrimination of
tautomers. Moreover, tautomerization is a natural, rapid
and dynamic phenomenon, resulting in rapid equilibrium
among the tautomers.
Determination of optimum values of different
descriptors
Even though many QSAR modellers report properly vali-
dated QSAR equations, which are efficient to guide for the
development of novel drugs or modification of existing
drugs, they are not practised due to the following reasons:
(i) complexity in understanding and interpretation of
QSAR equation in terms of structural or pharmacophoric
features; (ii) the accurate and reproducible computation or
estimation of descriptors is either very complex or resource
consuming; (iii) computational facilities/resources like
sophisticated and particular softwares may not be accessi-
ble to organic chemist to compute the reported descriptors
in the QSAR equation; (iv) in addition, some other
descriptors may have good correlation with the activity but
are not included in QSAR equation due to some reasons;
and (v) the organic chemist may not be well skilled or
trained in QSAR.
Therefore, in the present study, we have determined the
optimum values for more easily interpretable different
descriptors to gauge the discovery of novel small molecules
with the specified chemical properties. A very simple yet
effective method to establish the optimal value of any
descriptor is to develop either parabolic (quadratic) or bilinear
equation (Pinto et al., 2005; Abreu et al., 2009). These func-
tions presume that the correlation between the descriptor and
the activity is non-linear in nature with the peak of the curve
representing the optimum value. R, R2, R2adj, F, Spress, SDEP
and s were calculated to check the robustness of the bilinear/
parabolic equations. Though we have compared the activities
of the molecules of the dataset in terms of descriptors like
lipophilicity/hydrophobicity, number of bonds, molecular
weight, etc., for which we have determined the optimum
value, we make it clear that the combined or converse effect of
confounding factors/descriptors do have additional influence
on the activity profile of the compounds. The optimum values
will be the handy tool for medicinal chemists in developing
novel amiprophos methyl analogues with improved antima-
larial activity profile.
0
1
2
3
4
5
O6
P 7
O8
NH
9
S10
11
12
13
N+
14
O15
-O16
50
0
1
2
3
4
5
O6
P 7
O8
HN
9
S10
11
12
13
N+
14
O15
-O16
52
IC50 = 51 µM, R6p = 0.431 IC50 = 24 µM R6p = 0.465
Fig. 1 Physical interpretation of R6p using molecule numbers 50 and 52 as representatives
Med Chem Res (2014) 23:4825–4835 4831
123
Author's personal copy
Fig. 2 Applicability domain representation using Williams plot for models 1–4 and combined set model
4832 Med Chem Res (2014) 23:4825–4835
123
Author's personal copy
Molecular weight (MW)
Model 5 pIC50 = ? 0.0002 (±0.0070) MW ? 0.0117
(±0.0081) Log (b 10MW ? 1) ? 4.0275 (±2.0353).
Ntr = 60, R = 0.808, R2 = 0.6522, R2adj: = 0.634, Q2 =
0.573, s = 0.375, F = 34.997, p\0.0001, SPress = 0.415,
SDEP = 0.408, Log b = -299.441, MW-Optimum =
297.777, Outliers = compound numbers 32 and 46.
Number of carbon atoms (nC)
Model 6 pIC50 = ?0.0763 (±0.0550) nC ? 1.1983
(±0.4840) Log (b 10nC ? 1) ? 3.3909 (±0.6794).
Ntr = 60, R = 0.783, R2 = 0.613, R2adj: = 0.593, s =
0.395, F = 29.607, p \ 0.0001, Q2 = 0.588, SPress =
0.407, SDEP = 0.400, Log b = -20.043, nC-Optimum =
18.875, Outliers = compound numbers 23, 32 and 46.
Lipophilicity (ALogP)
Model 7 pIC50 = ?0.2074 (±0.1638) ALogP ? 0.7029
(±0.3499) Log (b 10ALogP ? 1) ? 3.6044 (±0.4805).
Ntr = 60, R = 0.836, R2 = 0.699, R2adj: = 0.683, s =
0.349, F = 43.270, p \ 0.0001, Q2 = 0.664, SPress =
0.368, SDEP = 0.362, Log b = -4.123, ALogP-Opti-
mum = 3.745, Comment: No outlier.
Sum of atomic polarizabilities (Sp)
Model 8 pIC50 = 0.0186 (±0.0502) Sp ? 0.1706
(±0.0774) Log (b 10 Sp ? 1) ? 3.7687 (±1.2016).
Ntr = 60, R = 0.796, R2 = 0.634, R2adj: = 0.614, s =
0.384, F = 32.298, p \ 0.0001, Q2 = 0.554, SPress =
0.424, SDEP = 0.417, Log b = -26.248, Sp-Opti-
mum = 25.337, Outliers = compound numbers 32 and 46.
In the above models, the symbols have their usual
meanings. A better statistics is possible if the number of
congener compounds in the dataset and also the range of
the biological data are augmented. In many cases, the
acceptable fitting of the equation (R2 [ 0.60), though sta-
tistically not outstanding, indicates that there prevails
optimum value of lipophilicity, molecular weight (MW),
Sum of atomic polarizabilities (Sp) and Number of carbon
atoms (nC).
Fig. 3 Field similarity analysis of Mol id 34 (Most active) and Mol id
3 (least active) 34 (Most active) with side view of Keto form (left) and
enol form (right) (red positive field, blue negative field and yellow
hydrophobic region) 3 (least active) Side view of Keto form (left) and
enol form (right) (Color figure online)
Med Chem Res (2014) 23:4825–4835 4833
123
Author's personal copy
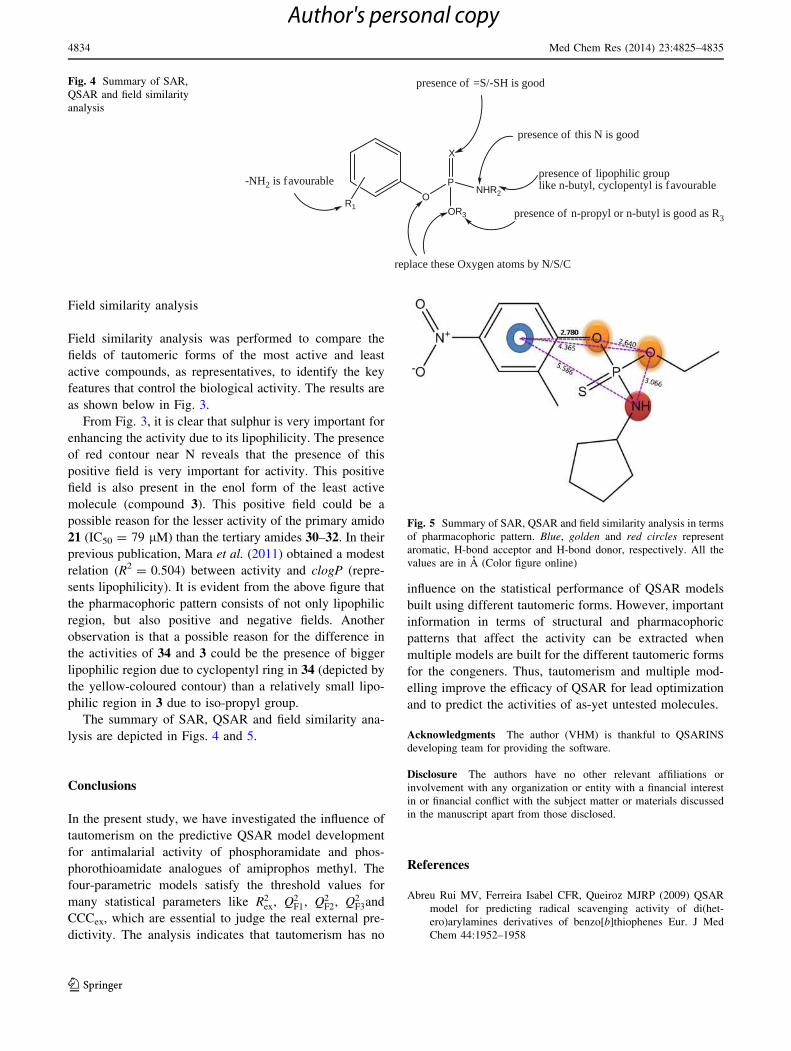
Field similarity analysis
Field similarity analysis was performed to compare the
fields of tautomeric forms of the most active and least
active compounds, as representatives, to identify the key
features that control the biological activity. The results are
as shown below in Fig. 3.
From Fig. 3, it is clear that sulphur is very important for
enhancing the activity due to its lipophilicity. The presence
of red contour near N reveals that the presence of this
positive field is very important for activity. This positive
field is also present in the enol form of the least active
molecule (compound 3). This positive field could be a
possible reason for the lesser activity of the primary amido
21 (IC50 = 79 lM) than the tertiary amides 30–32. In their
previous publication, Mara et al. (2011) obtained a modest
relation (R2 = 0.504) between activity and clogP (repre-
sents lipophilicity). It is evident from the above figure that
the pharmacophoric pattern consists of not only lipophilic
region, but also positive and negative fields. Another
observation is that a possible reason for the difference in
the activities of 34 and 3 could be the presence of bigger
lipophilic region due to cyclopentyl ring in 34 (depicted by
the yellow-coloured contour) than a relatively small lipo-
philic region in 3 due to iso-propyl group.
The summary of SAR, QSAR and field similarity ana-
lysis are depicted in Figs. 4 and 5.
Conclusions
In the present study, we have investigated the influence of
tautomerism on the predictive QSAR model development
for antimalarial activity of phosphoramidate and phos-
phorothioamidate analogues of amiprophos methyl. The
four-parametric models satisfy the threshold values for
many statistical parameters like R2ex, Q2
F1, Q2F2, Q2
F3and
CCCex, which are essential to judge the real external pre-
dictivity. The analysis indicates that tautomerism has no
influence on the statistical performance of QSAR models
built using different tautomeric forms. However, important
information in terms of structural and pharmacophoric
patterns that affect the activity can be extracted when
multiple models are built for the different tautomeric forms
for the congeners. Thus, tautomerism and multiple mod-
elling improve the efficacy of QSAR for lead optimization
and to predict the activities of as-yet untested molecules.
Acknowledgments The author (VHM) is thankful to QSARINS
developing team for providing the software.
Disclosure The authors have no other relevant affiliations or
involvement with any organization or entity with a financial interest
in or financial conflict with the subject matter or materials discussed
in the manuscript apart from those disclosed.
References
Abreu Rui MV, Ferreira Isabel CFR, Queiroz MJRP (2009) QSAR
model for predicting radical scavenging activity of di(het-
ero)arylamines derivatives of benzo[b]thiophenes Eur. J Med
Chem 44:1952–1958
O
PNHR2
OR3
X
R1
presence of =S/-SH is good
replace these Oxygen atoms by N/S/C
presence of lipophilic grouplike n-butyl, cyclopentyl is favourable
presence of n-propyl or n-butyl is good as R3
presence of this N is good
-NH2 is favourable
Fig. 4 Summary of SAR,
QSAR and field similarity
analysis
Fig. 5 Summary of SAR, QSAR and field similarity analysis in terms
of pharmacophoric pattern. Blue, golden and red circles represent
aromatic, H-bond acceptor and H-bond donor, respectively. All the
values are in A (Color figure online)
4834 Med Chem Res (2014) 23:4825–4835
123
Author's personal copy
Chavan HV, Bandgar BP, Adsul LK, Dhakane VD, Bhale PS,
Thakare VN, Masand V (2013) Design, synthesis, characteriza-
tion and anti-inflammatory evaluation of novel pyrazole amal-
gamated flavones. Bioorg Med Chem Lett 23(5):1315–1321
Chirico N, Gramatica P (2011) Real external predictivity of QSAR
models: how to evaluate it? Comparison of different validation
criteria and proposal of using the concordance correlation
coefficient. J Chem Inf Model 51(9):2320–2335
Chirico N, Gramatica P (2012) Real external predictivity of QSAR
models. Part 2. New intercomparable thresholds for different
validation criteria and the need for scatter plot inspection.
J Chem Inf Model 52(8):2044–2058
Consonni V, Ballabio D, Todeschini R (2009) Comments on the
definition of the Q2 parameter for QSAR validation. J Chem Inf
Model 49(7):1669–1678
Gramatica P, Cassani S, Chirico N (2014) QSARINS-chem: insubria
datasets and new QSAR/QSPR models for environmental
pollutants in QSARINS. J Comput Chem 35(13):1036–1044
Gramatica P, Chirico N, Papa E, Cassani S, Kovarich S (2013)
QSARINS: a new software for the development, analysis, and
validation of QSAR MLR models. J Comput Chem
34(24):2121–2132
Hwang JY, Kawasuji T, Lowes DJ, Clark JA, Connelly MC, Zhu F,
Guiguemde WA, Sigal MS, Wilson EB, DeRisi JL, Guy RK
(2011) Synthesis and evaluation of 7-substituted 4-aminoquin-
oline analogues for antimalarial activity. J Med Chem
54(20):7084–7093
Jawarkar RD, Masand VH, Patil KN, Mahajan DT, Youssoufi MH,
Ben Hadda T, Kumbhare SL (2010) 3D-QSAR study on
coumarin analogues as potent inhibitors of MAO-B using a
COMFA approach. Der Pharma Chemica 2(6):302–310
Mahajan DT, Jawarkar RD, Patil KN, Masand VH, Nazerruddin GM
(2010) 3D-QSAR studies on xanthone derivatives to understand
pharmacological activities as MAO inhibitors. Der Pharma
Chemica 2(4):298–308
Mahajan DT, Masand VH, Patil KN, Ben Hadda T, Jawarkar RD,
Thakur SD, Rastija V (2012) CoMSIA and POM analyses of
anti-malarial activity of synthetic prodiginines. Bioorg Med
Chem Lett 22(14):4827–4835
Mara C, Dempsey E, Bell A, Barlow JW (2011) Synthesis and
evaluation of phosphoramidate and phosphorothioamidate ana-
logues of amiprophos methyl as potential antimalarial agents.
Bioorg Med Chem Lett 21(20):6180–6183
Mara C, Dempsey E, Bell A, Barlow JW (2013) Synthesis and evaluation
of phenoxyoxazaphospholidine, phenoxyoxazaphosphinane, and
benzodioxaphosphininamine sulfides and related compounds as
potential anti-malarial agents. Bioorg Med Chem Lett
23(12):3580–3583
Martin YC (2009) Let’s not forget tautomers. J Comput Aided Mol
Des 23(10):693–704
Martin YC (2010) Tautomerism, Hammett sigma, and QSAR.
J Comput Aided Mol Des 24(6–7):613–616
Masand VH, Jawarkar RD, Patil KN, Mahajan DT, Ben Hadda T,
Kurhade GH (2010a) COMFA Analysis and toxicity risk assess-
ment of coumarin analogues as MAO-A inhibitors: attempting
better insight in drug design. Der Pharm Lettre 2(6):350–357
Masand VH, Jawarkar RD, Patil KN, Nazerruddin GM, Bajaj SO
(2010b) Correlation potential of Wiener index vis-a-vis molec-
ular refractivity: antimalarial activity of xanthone derivatives.
Org Chem Indian J 6(1):30–38
Masand VH, Mahajan DT, Patil KN, Chinchkhede KD, Jawarkar RD,
Hadda TB, Alafeefy AA, Shibi IG (2012) k-NN, quantum mechanical
and field similarity based analysis of xanthone derivatives as a-
glucosidase inhibitors. Med Chem Res 21(12):4523–4534
Masand VH, Mahajan DT, Ben Hadda T, Jawarkar RD, Alafeefy AM,
Rastija V, Ali MA (2013a) Does tautomerism influence the
outcome of QSAR modeling? Med Chem Res 23(4):1742–1757
Masand VH, Mahajan DT, Patil KN, Hadda TB, Youssoufi MH,
Jawarkar RD, Shibi IG (2013b) Optimization of antimalarial
activity of synthetic prodiginines: QSAR, GUSAR, and CoMFA
analyses. Chem Biol Drug Des 81(4):527–536
Masand VH, Mahajan DT, Hadda TB, Jawarkar RD, Chavan H,
Bandgar BP, Chauhan H (2013b) Molecular docking and
quantitative structure–activity relationship (QSAR) analyses of
indolylarylsulfones as HIV-1 non-nucleoside reverse transcrip-
tase inhibitors. Med Chem Res 23(1): 417–425
Masand VH, Mahajan DT, Patil KN, Hadda TB, Youssoufi MH,
Jawarkar RD, Shibi IG (2013d) Optimization of antimalarial
activity of synthetic prodiginines: QSAR, GUSAR, and CoMFA
analyses. Chem Biol Drug Des 81(4):527–536
Oellien F, Cramer J, Beyer C, Ihlenfeldt WD, Selzer PM (2006) The
impact of tautomer forms on pharmacophore-based virtual
screening. J Chem Inf Model 46(6):2342–2354
Ojha PK, Roy K (2012) First report on exploring structural require-
ments of 1,2,3,4-tetrahydroacridin-9(10H)-one analogs as anti-
malarials using multiple QSAR approaches: descriptor-based
QSAR, CoMFA-CoMSIA 3D-QSAR, HQSAR and G-QSAR
approaches. Comb Chem High Throughput Screen 16(1):7–21
Pinto MMM, Sousa ME, Nascimento MSJ (2005) Xanthone deriv-
atives: new insights in biological activities. Curr Med Chem
12:2517–2538
Pospisil P, Ballmer P, Scapozza L, Folkers G (2003a) Tautomerism in
computer-aided drug design. J Recept Signal Transduct 23(4):
361–371
Pospisil P, Ballmer P, Scapozza L, Folkers G (2003b) Tautomerism in
computer-aided drug design. J Recept Signal Transduct Res
23(4):361–371
Schuurmann G, Ebert RU, Chen J, Wang B, Kuhne R (2008) External
validation and prediction employing the predictive squared
correlation coefficient test set activity mean vs training set
activity mean. J Chem Inf Model 48(11):2140–2145
Scior T, Medina-Franco JL, Do QT, Martinez-Mayorga K, Yunes Rojas
JA, Bernard P (2009) How to recognize and workaround pitfalls in
QSAR studies: a critical review. Curr Med Chem 16(32):4297–
4313
Thalheim T, Vollmer A, Ebert R-U, Kuhne R, Schuurmann G (2010)
Tautomer identification and tautomer structure generation based
on the InChI code. J Chem Inf Model 50(7):1223–1232
Tropsha A, Golbraikh A (2007) Predictive QSAR modeling work-
flow, model applicability domains, and virtual screening. Curr
Pharm Des 13(34):3494–3504
Yoon YK, Ali MA, Wei AC, Choon TS, Khaw KY, Murugaiyah V,
Osman H, Masand VH (2013) Synthesis, characterization, and
molecular docking analysis of novel benzimidazole derivatives
as cholinesterase inhibitors. Bioorg Chem 49:33–39
Yoona YK, Ali MA, Wei AC, Choon TS, Khaw K-Y, Murugaiyah
V, Osman H, Masand VH (2013) Synthesis, characterization,
and molecular docking analysis of novel benzimidazole
derivatives as cholinesterase inhibitors. Bioorg Chem 49:33–39
Yuriev E, Agostino M, Ramsland PA (2011) Challenges and advances
in computational docking: 2009 in review. J Mol Recognit
24(2):149–164
Zou JW, Luo CC, Zhang HX, Liu HC, Jiang YJ, Yu QS (2007) Three-
dimensional QSAR of HPPD inhibitors, PSA inhibitors, and
anxiolytic agents: effect of tautomerism on the CoMFA models.
J Mol Graph Model 26(2):494–504
Med Chem Res (2014) 23:4825–4835 4835
123
Author's personal copy
Original article
Synthesis of a, b-unsaturated carbonyl based compounds asacetylcholinesterase and butyrylcholinesterase inhibitors:Characterization, molecular modeling, QSAR studies and effect againstamyloid b-induced cytotoxicity
Syed Nasir Abbas Bukhari a, *, Ibrahim Jantan a, *, Vijay H. Masand b, Devidas T. Mahajan b,Muhammad Sher c, M. Naeem-ul-Hassan c, Muhammad Wahab Amjad a
a Drug and Herbal Research Centre, Faculty of Pharmacy, Universiti Kebangsaan Malaysia, Jalan Raja Muda Abdul Aziz, 50300 Kuala Lumpur, Malaysiab Department of Chemistry, Vidya Bharati Mahavidyalaya, Amravati, Maharashtra 444 602, Indiac Department of Chemistry, University of Sargodha, Sargodha 40100, Pakistan
a r t i c l e i n f o
Article history:Received 21 February 2014Received in revised form12 June 2014Accepted 17 June 2014Available online 17 June 2014
Keywords:Alzheimer's diseaseNeuroprotectionOxidative stress4-PiperidoneSynthesis
a b s t r a c t
A series of novel carbonyl compounds was synthesized by a simple, eco-friendly and efficient method.These compounds were screened for anti-oxidant activity, in vitro cytotoxicity and for inhibitory activityfor acetylcholinesterase and butyrylcholinesterase. The effect of these compounds against amyloid b-induced cytotoxicity was also investigated. Among them, compound 14 exhibited strong free radicalscavenging activity (18.39 mM) while six compounds (1, 3, 4, 13, 14, and 19) were found to be the mostprotective against Ab-induced neuronal cell death in PC12 cells. Compounds 4 and 14, containing N-methyl-4-piperidone linker, showed high acetylcholinesterase inhibitory activity as compared to refer-ence drug donepezil. Molecular docking and QSAR (Quantitative StructureeActivity Relationship) studieswere also carried out to determine the structural features that are responsible for the acetylcholines-terase and butyrylcholinesterase inhibitory activity.
© 2014 Elsevier Masson SAS. All rights reserved.
1. Introduction
According to the World Alzheimer Report 2013, Alzheimer'sdisease and other forms of dementia are among the biggest globalpublic health issues facing our generation. Currently, over 35million people around the world live with these conditions andthis number is likely to increase threefold by 2050, to 115 millionpeople [1]. Alzheimer's disease (AD), the most common form ofdementia amongst the aged, is a deadly neurodegenerative dis-ease categorized by the loss of mental abilities and a diversity ofneuropsychiatric symptoms and behavioral disorders [2,3].Neurofibrillary tangles and amyloid b (Ab) plaques are found inthe brain. The cholinergic system is predominantly vulnerable tosynapse loss, particularly in cortical regions related with memoryand executive function [4]. Most treatment approaches to datehave been based on the cholinergic hypothesis which assumes
that memory loss in patients suffering from this disease resultfrom a loss of cholinergic function in brain for cholinergicneurotransmission is specifically affected in patients sufferingfrom Alzheimer's disease.
For the treatment of AD, one of the most common methods isto increase the acetylcholine levels in brain with acetylcholines-terase inhibitors [5]. The best characterized therapeutic effect ofcholinesterase inhibitors (ChE) in Alzheimer disease patients is tomaintain cognitive function for a 1-year period in about 50% of thepatients [6]. Two kinds of cholinesterase enzymes are found in thecentral nervous system; acetylcholinesterase (AChE) and butyr-ylcholinesterase (BuChE). Both enzymes are capable of hydrolyz-ing acetylcholine, but AChE has a 1013-fold higher hydrolyticacetylcholine activity than BuChE, at the similar temperature andpH [7]. In the healthy brain, BuChE is thought to play a trivial rolein regulating brain acetylcholine levels. In the AD brain, BuChEactivity rises while AChE activity remains unchanged or declines.Hence, both enzymes may contribute to regulating acetylcholinelevels and are appropriate therapeutic targets to enhance thecholinergic deficit. The two enzymes vary in location, substratespecificity and kinetics. The most recent studies suggest that
* Corresponding authors.E-mail addresses: [email protected], [email protected]
(S.N.A. Bukhari), [email protected] (I. Jantan).
Contents lists available at ScienceDirect
European Journal of Medicinal Chemistry
journal homepage: http: / /www.elsevier .com/locate/ejmech
http://dx.doi.org/10.1016/j.ejmech.2014.06.0340223-5234/© 2014 Elsevier Masson SAS. All rights reserved.
European Journal of Medicinal Chemistry 83 (2014) 355e365
BuChE might also have a part in the etiology and development ofAD beyond the regulation of synaptic acetylcholine levels.Experimental evidence from the use of agents with improvedselectivity for BuChE and ChE, such as rivastigmine (having dualinhibitory action on both AChE and BuChE), shows that there arepossible therapeutic benefits of inhibiting both AChE and BuChEin AD and associated dementias. The development of specificsmall molecule drugs BuChE inhibitors with the capability toinhibit BuChE together with AChE should lead to better clinicaloutcomes [8].
In our previous studies, we synthesized and screened the seriesof novel chalcone derivatives and curcumin analogues with a, b-carbonyl linkers for their activity against phagocytic chemotaxisand the production of reactive oxygen species (ROS) from zymosanstimulated human phagocytes. On the basis of these findings and athose of other scientists, it was determined that chalcone de-rivatives and curcumin-like compounds bearing a, b-carbonylgroup have a wide diversity of pharmacological activities [9e14].Our latest studies showed that a range of compounds with a a, b-unsaturated moiety are capable of inhibiting both AChE and BuChEand can be possible candidates for the treatment of Alzheimer'sdisease [15,16].
Numerous studies have documented increased protein oxida-tion [17] and reactive oxygen species (ROS) formation [18] in thebrain tissue of AD patients. Ab is considered to be a cause of lipidperoxidation in brain cell membranes that may contribute to neu-rodegeneration [19,20]. Encouraged by these results, we continuedour work in this area, and in the current study we synthesizedthirty novel compounds bearing the a, b-carbonyl moiety and havescreened them for their effects on the AChE/BuChE activities inaddition to amyloid b-induced cytotoxicity in PC12 cells. Lastly,molecular modeling calculations and QSAR studies were performedto understand the structural basis for the biological activity ofcompounds.
2. Results and discussion
2.1. Chemistry
Thirty novel compounds of ten different types were synthe-sized in the current study as reported previously [21,22]. Tosynthesize the desired a, b-unsaturated carbonyl based com-pounds, ClaiseneSchmidt condensation was used [23] betweendifferent ketones and suitable aryl aldehydes at a molar ratio1:2, (twenty one compounds, 1e7; 11e17; 21e27) in the pres-ence of NaOH in ethanol. Some compounds were synthesized inacetic acid in the presence of dry HCl gas. Nine compounds(8e10; 18e20; 28e30) resembling chalcone analogues weresynthesized by same ClaiseneSchmidt condensation using molarratio 1:1 of ketone and aldehyde (Scheme 1). Eight compounds(7, 8, 10, 17, 18, 20, 27, 28) were synthesized using both types ofcatalytic systems comprising NaOH and the dry HCl gas mixture.As compared to NaOH, the catalytic system with HCl gas mixtureproduced compounds more efficiently with a higher yield. Whenusing NaOH, a mixture of numerous unidentified productswas obtained requiring extensive purification by columnchromatography.
All synthesized new compounds were characterized by spec-trophotometric techniques as well as elemental analysis of C, H, andN, and melting points. Carbon nuclear magnetic resonance spectrawere also obtained. For compounds 3,13 and 23, the NH absorptionpeaks were not seen in the 1H NMR spectra of the compounds.Absence of NH absorption peaks is also reported previously byother researchers [24,25].
2.2. Antioxidant activity of a, b-unsaturated carbonyl basedcompounds
The DPPH (1,1-diphenyl-1-picrylhydrazyl) assay was performedto assess the compounds for their antioxidant activity. The data ofthe antioxidant assay is summarized in Table 1. According to thedata, five compounds (1, 3, 4, 14 and 19) were found to possesspotent DPPH radical scavenging activity with IC50 in the range of18.39e22.99 mM. Compound 14, having a N-methyl-4-piperidonelinker and diethoxymethyl substitution at position 4 of aromaticrings, showed the strongest antioxidant activity (18.39 mM), evenmore than the positive control (ascorbic acid; 19.36 mM). Among allthirty compounds, only eleven compounds have poor antioxidantactivities, exhibiting IC50 values greater than 50 mM.
2.3. Cytotoxicity of synthetic compounds in PC12 cells
To investigate the effect of the new compounds on cell viability,the MTT assay was conducted on PC12 cells. The cells were incu-bated with varying concentrations (0.01e100 mM) of the testcompounds for 24 h and under these conditions the a, b-unsatu-rated carbonyl based compounds were nontoxic to PC12 cells at anyof the concentrations tested.
2.4. Neuroprotective effect of synthetic compounds against Ab-induced cell cytotoxicity
The MTT assay was performed to evaluate the effect of novelsynthetic compounds on Ab-induced PC12 cell toxicity. The cellstreated with Ab exhibited significantly reduced cell viability ascompared to control cells (decreased cell viability by 48%). Pre-treatment of cells with the synthetic compounds protected againstAb-induced cell death up to 87%, at a concentration of 100 mM. Sixcompounds (1, 3, 4,13,14, 19) were the most protective against Ab-induced PC12 cell toxicity (Fig. 1). As compared to the positivecontrol selegiline, the protective effect of the synthetic compoundswas significantly higher with compound (14) being the best.Amongst the tested compounds, all those possessing 2-nitro and 4-dimethylamine groups (11e20) had extremely high protective ac-tivities, while a diethoxymethyl group at position 4 of the rings(1e10) lead to significantly less protective activity. The presence ofpyrolidine at position 4 of compounds (21e30) decreased theprotective activity against Ab-induced cytotoxicity. Compoundshaving a 4-piperidone (3, 13) and those possessing N-methyl-4-piperidone (4, 14) linker exhibited somewhat more protection ascompared to all other compounds. These results suggest that a fewof the novel a, b-unsaturated carbonyl based compounds mayreduce cell damage caused by Ab-induced cytotoxicity.
2.5. Acetylcholinesterase and butyrylcholinesterase inhibitionactivity
Evaluation of new compounds for their inhibitory effects onAChE and BChE was done by Ellman's method. The screening ofnovel a, b-unsaturated carbonyl based compounds against AChEand BChE demonstrated that nearly all these were moderate tostrongly active against AChE (Table 1). The compounds were foundto be less active on BChE but most inhibited AChE to various ex-tents. The IC50 values of the compounds 8, 9, 15e18, 21, 22, 25, 26,and 28e30 could not be calculated owing to their weak inhibitionpotency, which did not surpass 50% at the highest concentration(100 mM). In contrast, the compounds 3, 4, 12e14, 23 and 24exhibited IC50 values ranging from 0.042 to 9.52 mM for inhibitionof AChE. In addition, the compounds 3, 4, 13 and 14 showed sub-stantial AChE inhibitory activity below 1 mM, which is similar to
S.N.A. Bukhari et al. / European Journal of Medicinal Chemistry 83 (2014) 355e365356
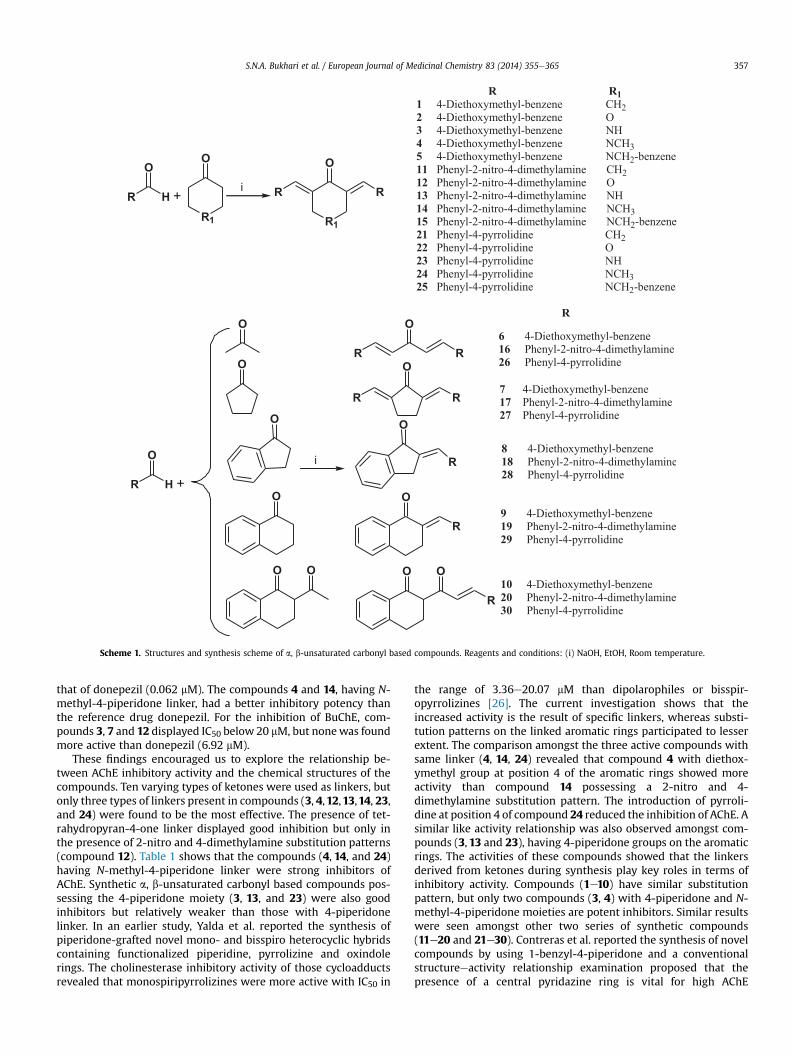
that of donepezil (0.062 mM). The compounds 4 and 14, having N-methyl-4-piperidone linker, had a better inhibitory potency thanthe reference drug donepezil. For the inhibition of BuChE, com-pounds 3, 7 and 12 displayed IC50 below 20 mM, but nonewas foundmore active than donepezil (6.92 mM).
These findings encouraged us to explore the relationship be-tween AChE inhibitory activity and the chemical structures of thecompounds. Ten varying types of ketones were used as linkers, butonly three types of linkers present in compounds (3, 4,12,13,14, 23,and 24) were found to be the most effective. The presence of tet-rahydropyran-4-one linker displayed good inhibition but only inthe presence of 2-nitro and 4-dimethylamine substitution patterns(compound 12). Table 1 shows that the compounds (4, 14, and 24)having N-methyl-4-piperidone linker were strong inhibitors ofAChE. Synthetic a, b-unsaturated carbonyl based compounds pos-sessing the 4-piperidone moiety (3, 13, and 23) were also goodinhibitors but relatively weaker than those with 4-piperidonelinker. In an earlier study, Yalda et al. reported the synthesis ofpiperidone-grafted novel mono- and bisspiro heterocyclic hybridscontaining functionalized piperidine, pyrrolizine and oxindolerings. The cholinesterase inhibitory activity of those cycloadductsrevealed that monospiripyrrolizines were more active with IC50 in
the range of 3.36e20.07 mM than dipolarophiles or bisspir-opyrrolizines [26]. The current investigation shows that theincreased activity is the result of specific linkers, whereas substi-tution patterns on the linked aromatic rings participated to lesserextent. The comparison amongst the three active compounds withsame linker (4, 14, 24) revealed that compound 4 with diethox-ymethyl group at position 4 of the aromatic rings showed moreactivity than compound 14 possessing a 2-nitro and 4-dimethylamine substitution pattern. The introduction of pyrroli-dine at position 4 of compound 24 reduced the inhibition of AChE. Asimilar like activity relationship was also observed amongst com-pounds (3, 13 and 23), having 4-piperidone groups on the aromaticrings. The activities of these compounds showed that the linkersderived from ketones during synthesis play key roles in terms ofinhibitory activity. Compounds (1e10) have similar substitutionpattern, but only two compounds (3, 4) with 4-piperidone and N-methyl-4-piperidone moieties are potent inhibitors. Similar resultswere seen amongst other two series of synthetic compounds(11e20 and 21e30). Contreras et al. reported the synthesis of novelcompounds by using 1-benzyl-4-piperidone and a conventionalstructureeactivity relationship examination proposed that thepresence of a central pyridazine ring is vital for high AChE
Scheme 1. Structures and synthesis scheme of a, b-unsaturated carbonyl based compounds. Reagents and conditions: (i) NaOH, EtOH, Room temperature.
S.N.A. Bukhari et al. / European Journal of Medicinal Chemistry 83 (2014) 355e365 357
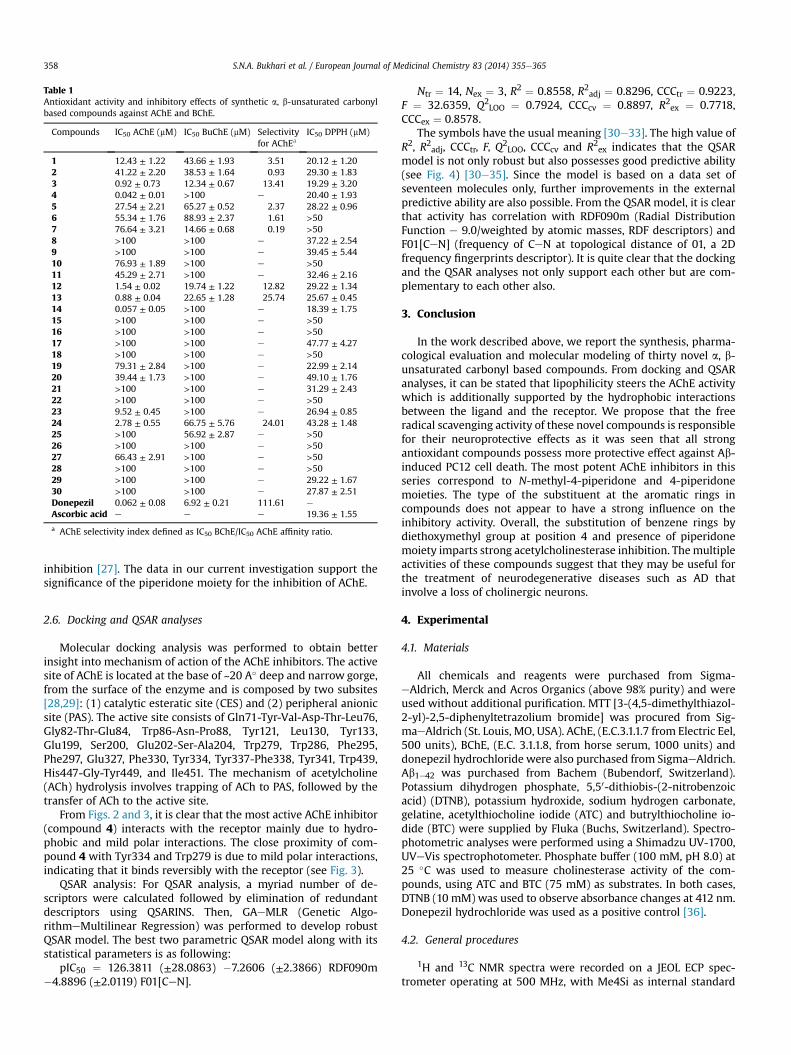
inhibition [27]. The data in our current investigation support thesignificance of the piperidone moiety for the inhibition of AChE.
2.6. Docking and QSAR analyses
Molecular docking analysis was performed to obtain betterinsight into mechanism of action of the AChE inhibitors. The activesite of AChE is located at the base of ~20 A� deep and narrow gorge,from the surface of the enzyme and is composed by two subsites[28,29]: (1) catalytic esteratic site (CES) and (2) peripheral anionicsite (PAS). The active site consists of Gln71-Tyr-Val-Asp-Thr-Leu76,Gly82-Thr-Glu84, Trp86-Asn-Pro88, Tyr121, Leu130, Tyr133,Glu199, Ser200, Glu202-Ser-Ala204, Trp279, Trp286, Phe295,Phe297, Glu327, Phe330, Tyr334, Tyr337-Phe338, Tyr341, Trp439,His447-Gly-Tyr449, and Ile451. The mechanism of acetylcholine(ACh) hydrolysis involves trapping of ACh to PAS, followed by thetransfer of ACh to the active site.
From Figs. 2 and 3, it is clear that the most active AChE inhibitor(compound 4) interacts with the receptor mainly due to hydro-phobic and mild polar interactions. The close proximity of com-pound 4 with Tyr334 and Trp279 is due to mild polar interactions,indicating that it binds reversibly with the receptor (see Fig. 3).
QSAR analysis: For QSAR analysis, a myriad number of de-scriptors were calculated followed by elimination of redundantdescriptors using QSARINS. Then, GAeMLR (Genetic Algo-rithmeMultilinear Regression) was performed to develop robustQSAR model. The best two parametric QSAR model along with itsstatistical parameters is as following:
pIC50 ¼ 126.3811 (±28.0863) �7.2606 (±2.3866) RDF090m�4.8896 (±2.0119) F01[CeN].
Ntr ¼ 14, Nex ¼ 3, R2 ¼ 0.8558, R2adj ¼ 0.8296, CCCtr ¼ 0.9223,F ¼ 32.6359, Q2
LOO ¼ 0.7924, CCCcv ¼ 0.8897, R2ex ¼ 0.7718,CCCex ¼ 0.8578.
The symbols have the usual meaning [30e33]. The high value ofR2, R2adj, CCCtr, F, Q2
LOO, CCCcv and R2ex indicates that the QSARmodel is not only robust but also possesses good predictive ability(see Fig. 4) [30e35]. Since the model is based on a data set ofseventeen molecules only, further improvements in the externalpredictive ability are also possible. From the QSAR model, it is clearthat activity has correlation with RDF090m (Radial DistributionFunction e 9.0/weighted by atomic masses, RDF descriptors) andF01[CeN] (frequency of CeN at topological distance of 01, a 2Dfrequency fingerprints descriptor). It is quite clear that the dockingand the QSAR analyses not only support each other but are com-plementary to each other also.
3. Conclusion
In the work described above, we report the synthesis, pharma-cological evaluation and molecular modeling of thirty novel a, b-unsaturated carbonyl based compounds. From docking and QSARanalyses, it can be stated that lipophilicity steers the AChE activitywhich is additionally supported by the hydrophobic interactionsbetween the ligand and the receptor. We propose that the freeradical scavenging activity of these novel compounds is responsiblefor their neuroprotective effects as it was seen that all strongantioxidant compounds possess more protective effect against Ab-induced PC12 cell death. The most potent AChE inhibitors in thisseries correspond to N-methyl-4-piperidone and 4-piperidonemoieties. The type of the substituent at the aromatic rings incompounds does not appear to have a strong influence on theinhibitory activity. Overall, the substitution of benzene rings bydiethoxymethyl group at position 4 and presence of piperidonemoiety imparts strong acetylcholinesterase inhibition. Themultipleactivities of these compounds suggest that they may be useful forthe treatment of neurodegenerative diseases such as AD thatinvolve a loss of cholinergic neurons.
4. Experimental
4.1. Materials
All chemicals and reagents were purchased from Sigma-eAldrich, Merck and Acros Organics (above 98% purity) and wereused without additional purification. MTT [3-(4,5-dimethylthiazol-2-yl)-2,5-diphenyltetrazolium bromide] was procured from Sig-maeAldrich (St. Louis, MO, USA). AChE, (E.C.3.1.1.7 from Electric Eel,500 units), BChE, (E.C. 3.1.1.8, from horse serum, 1000 units) anddonepezil hydrochloride were also purchased from SigmaeAldrich.Ab1e42 was purchased from Bachem (Bubendorf, Switzerland).Potassium dihydrogen phosphate, 5,50-dithiobis-(2-nitrobenzoicacid) (DTNB), potassium hydroxide, sodium hydrogen carbonate,gelatine, acetylthiocholine iodide (ATC) and butrylthiocholine io-dide (BTC) were supplied by Fluka (Buchs, Switzerland). Spectro-photometric analyses were performed using a Shimadzu UV-1700,UVeVis spectrophotometer. Phosphate buffer (100 mM, pH 8.0) at25 �C was used to measure cholinesterase activity of the com-pounds, using ATC and BTC (75 mM) as substrates. In both cases,DTNB (10 mM) was used to observe absorbance changes at 412 nm.Donepezil hydrochloride was used as a positive control [36].
4.2. General procedures
1H and 13C NMR spectra were recorded on a JEOL ECP spec-trometer operating at 500 MHz, with Me4Si as internal standard
Table 1Antioxidant activity and inhibitory effects of synthetic a, b-unsaturated carbonylbased compounds against AChE and BChE.
Compounds IC50 AChE (mM) IC50 BuChE (mM) Selectivityfor AChEa
IC50 DPPH (mM)
1 12.43 ± 1.22 43.66 ± 1.93 3.51 20.12 ± 1.202 41.22 ± 2.20 38.53 ± 1.64 0.93 29.30 ± 1.833 0.92 ± 0.73 12.34 ± 0.67 13.41 19.29 ± 3.204 0.042 ± 0.01 >100 e 20.40 ± 1.935 27.54 ± 2.21 65.27 ± 0.52 2.37 28.22 ± 0.966 55.34 ± 1.76 88.93 ± 2.37 1.61 >507 76.64 ± 3.21 14.66 ± 0.68 0.19 >508 >100 >100 e 37.22 ± 2.549 >100 >100 e 39.45 ± 5.4410 76.93 ± 1.89 >100 e >5011 45.29 ± 2.71 >100 e 32.46 ± 2.1612 1.54 ± 0.02 19.74 ± 1.22 12.82 29.22 ± 1.3413 0.88 ± 0.04 22.65 ± 1.28 25.74 25.67 ± 0.4514 0.057 ± 0.05 >100 e 18.39 ± 1.7515 >100 >100 e >5016 >100 >100 e >5017 >100 >100 e 47.77 ± 4.2718 >100 >100 e >5019 79.31 ± 2.84 >100 e 22.99 ± 2.1420 39.44 ± 1.73 >100 e 49.10 ± 1.7621 >100 >100 e 31.29 ± 2.4322 >100 >100 e >5023 9.52 ± 0.45 >100 e 26.94 ± 0.8524 2.78 ± 0.55 66.75 ± 5.76 24.01 43.28 ± 1.4825 >100 56.92 ± 2.87 e >5026 >100 >100 e >5027 66.43 ± 2.91 >100 e >5028 >100 >100 e >5029 >100 >100 e 29.22 ± 1.6730 >100 >100 e 27.87 ± 2.51Donepezil 0.062 ± 0.08 6.92 ± 0.21 111.61 e
Ascorbic acid e e e 19.36 ± 1.55
a AChE selectivity index defined as IC50 BChE/IC50 AChE affinity ratio.
S.N.A. Bukhari et al. / European Journal of Medicinal Chemistry 83 (2014) 355e365358
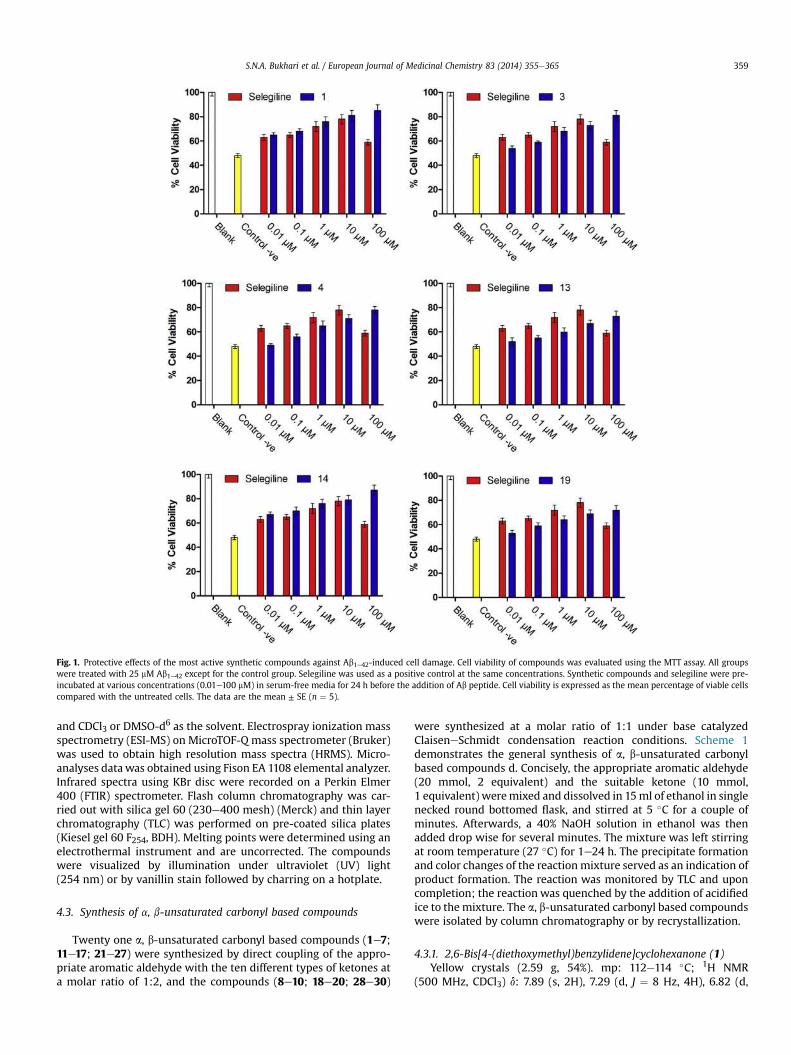
and CDCl3 or DMSO-d6 as the solvent. Electrospray ionization massspectrometry (ESI-MS) on MicroTOF-Q mass spectrometer (Bruker)was used to obtain high resolution mass spectra (HRMS). Micro-analyses datawas obtained using Fison EA 1108 elemental analyzer.Infrared spectra using KBr disc were recorded on a Perkin Elmer400 (FTIR) spectrometer. Flash column chromatography was car-ried out with silica gel 60 (230e400 mesh) (Merck) and thin layerchromatography (TLC) was performed on pre-coated silica plates(Kiesel gel 60 F254, BDH). Melting points were determined using anelectrothermal instrument and are uncorrected. The compoundswere visualized by illumination under ultraviolet (UV) light(254 nm) or by vanillin stain followed by charring on a hotplate.
4.3. Synthesis of a, b-unsaturated carbonyl based compounds
Twenty one a, b-unsaturated carbonyl based compounds (1e7;11e17; 21e27) were synthesized by direct coupling of the appro-priate aromatic aldehyde with the ten different types of ketones ata molar ratio of 1:2, and the compounds (8e10; 18e20; 28e30)
were synthesized at a molar ratio of 1:1 under base catalyzedClaiseneSchmidt condensation reaction conditions. Scheme 1demonstrates the general synthesis of a, b-unsaturated carbonylbased compounds d. Concisely, the appropriate aromatic aldehyde(20 mmol, 2 equivalent) and the suitable ketone (10 mmol,1 equivalent) weremixed and dissolved in 15ml of ethanol in singlenecked round bottomed flask, and stirred at 5 �C for a couple ofminutes. Afterwards, a 40% NaOH solution in ethanol was thenadded drop wise for several minutes. The mixture was left stirringat room temperature (27 �C) for 1e24 h. The precipitate formationand color changes of the reactionmixture served as an indication ofproduct formation. The reaction was monitored by TLC and uponcompletion; the reaction was quenched by the addition of acidifiedice to themixture. The a, b-unsaturated carbonyl based compoundswere isolated by column chromatography or by recrystallization.
4.3.1. 2,6-Bis[4-(diethoxymethyl)benzylidene]cyclohexanone (1)Yellow crystals (2.59 g, 54%). mp: 112e114 �C; 1H NMR
(500 MHz, CDCl3) d: 7.89 (s, 2H), 7.29 (d, J ¼ 8 Hz, 4H), 6.82 (d,
Fig. 1. Protective effects of the most active synthetic compounds against Ab1e42-induced cell damage. Cell viability of compounds was evaluated using the MTT assay. All groupswere treated with 25 mM Ab1e42 except for the control group. Selegiline was used as a positive control at the same concentrations. Synthetic compounds and selegiline were pre-incubated at various concentrations (0.01e100 mM) in serum-free media for 24 h before the addition of Ab peptide. Cell viability is expressed as the mean percentage of viable cellscompared with the untreated cells. The data are the mean ± SE (n ¼ 5).
S.N.A. Bukhari et al. / European Journal of Medicinal Chemistry 83 (2014) 355e365 359
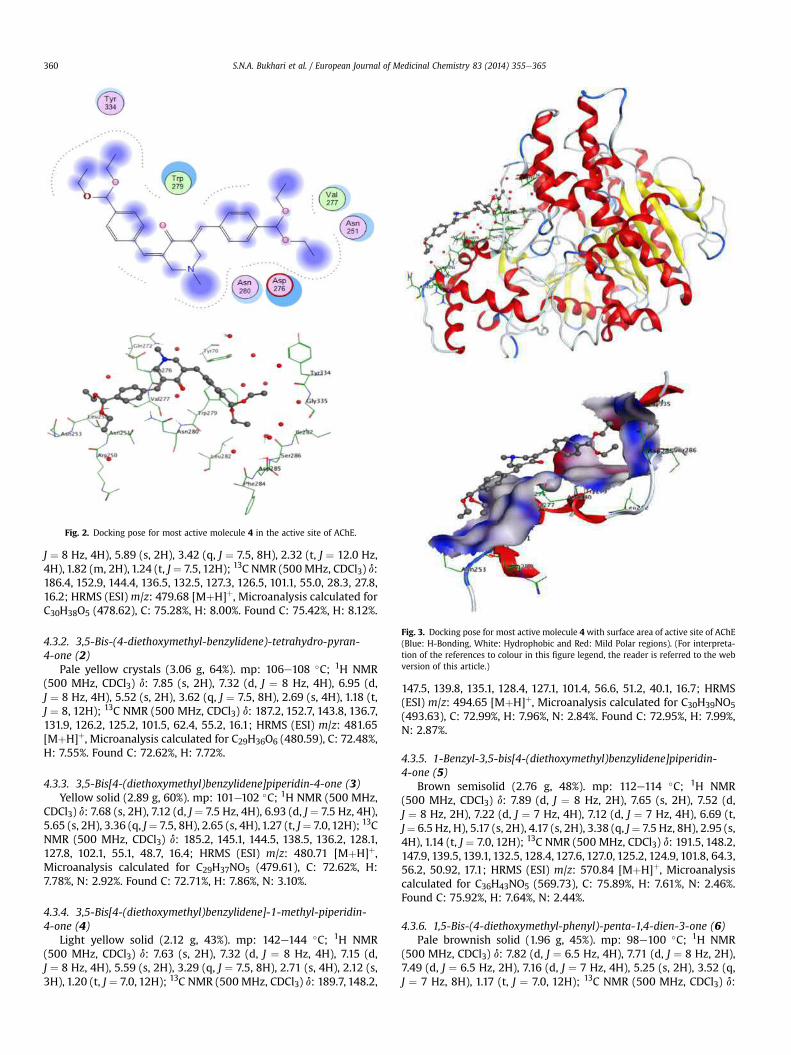
J ¼ 8 Hz, 4H), 5.89 (s, 2H), 3.42 (q, J ¼ 7.5, 8H), 2.32 (t, J ¼ 12.0 Hz,4H), 1.82 (m, 2H), 1.24 (t, J¼ 7.5, 12H); 13C NMR (500 MHz, CDCl3) d:186.4, 152.9, 144.4, 136.5, 132.5, 127.3, 126.5, 101.1, 55.0, 28.3, 27.8,16.2; HRMS (ESI)m/z: 479.68 [MþH]þ, Microanalysis calculated forC30H38O5 (478.62), C: 75.28%, H: 8.00%. Found C: 75.42%, H: 8.12%.
4.3.2. 3,5-Bis-(4-diethoxymethyl-benzylidene)-tetrahydro-pyran-4-one (2)
Pale yellow crystals (3.06 g, 64%). mp: 106e108 �C; 1H NMR(500 MHz, CDCl3) d: 7.85 (s, 2H), 7.32 (d, J ¼ 8 Hz, 4H), 6.95 (d,J ¼ 8 Hz, 4H), 5.52 (s, 2H), 3.62 (q, J ¼ 7.5, 8H), 2.69 (s, 4H), 1.18 (t,J ¼ 8, 12H); 13C NMR (500 MHz, CDCl3) d: 187.2, 152.7, 143.8, 136.7,131.9, 126.2, 125.2, 101.5, 62.4, 55.2, 16.1; HRMS (ESI) m/z: 481.65[MþH]þ, Microanalysis calculated for C29H36O6 (480.59), C: 72.48%,H: 7.55%. Found C: 72.62%, H: 7.72%.
4.3.3. 3,5-Bis[4-(diethoxymethyl)benzylidene]piperidin-4-one (3)Yellow solid (2.89 g, 60%). mp: 101e102 �C; 1H NMR (500 MHz,
CDCl3) d: 7.68 (s, 2H), 7.12 (d, J¼ 7.5 Hz, 4H), 6.93 (d, J¼ 7.5 Hz, 4H),5.65 (s, 2H), 3.36 (q, J¼ 7.5, 8H), 2.65 (s, 4H),1.27 (t, J¼ 7.0,12H); 13CNMR (500 MHz, CDCl3) d: 185.2, 145.1, 144.5, 138.5, 136.2, 128.1,127.8, 102.1, 55.1, 48.7, 16.4; HRMS (ESI) m/z: 480.71 [MþH]þ,Microanalysis calculated for C29H37NO5 (479.61), C: 72.62%, H:7.78%, N: 2.92%. Found C: 72.71%, H: 7.86%, N: 3.10%.
4.3.4. 3,5-Bis[4-(diethoxymethyl)benzylidene]-1-methyl-piperidin-4-one (4)
Light yellow solid (2.12 g, 43%). mp: 142e144 �C; 1H NMR(500 MHz, CDCl3) d: 7.63 (s, 2H), 7.32 (d, J ¼ 8 Hz, 4H), 7.15 (d,J ¼ 8 Hz, 4H), 5.59 (s, 2H), 3.29 (q, J ¼ 7.5, 8H), 2.71 (s, 4H), 2.12 (s,3H), 1.20 (t, J ¼ 7.0, 12H); 13C NMR (500 MHz, CDCl3) d: 189.7, 148.2,
147.5, 139.8, 135.1, 128.4, 127.1, 101.4, 56.6, 51.2, 40.1, 16.7; HRMS(ESI) m/z: 494.65 [MþH]þ, Microanalysis calculated for C30H39NO5(493.63), C: 72.99%, H: 7.96%, N: 2.84%. Found C: 72.95%, H: 7.99%,N: 2.87%.
4.3.5. 1-Benzyl-3,5-bis[4-(diethoxymethyl)benzylidene]piperidin-4-one (5)
Brown semisolid (2.76 g, 48%). mp: 112e114 �C; 1H NMR(500 MHz, CDCl3) d: 7.89 (d, J ¼ 8 Hz, 2H), 7.65 (s, 2H), 7.52 (d,J ¼ 8 Hz, 2H), 7.22 (d, J ¼ 7 Hz, 4H), 7.12 (d, J ¼ 7 Hz, 4H), 6.69 (t,J¼ 6.5 Hz, H), 5.17 (s, 2H), 4.17 (s, 2H), 3.38 (q, J¼ 7.5 Hz, 8H), 2.95 (s,4H), 1.14 (t, J ¼ 7.0, 12H); 13C NMR (500 MHz, CDCl3) d: 191.5, 148.2,147.9, 139.5, 139.1, 132.5, 128.4, 127.6, 127.0, 125.2, 124.9, 101.8, 64.3,56.2, 50.92, 17.1; HRMS (ESI) m/z: 570.84 [MþH]þ, Microanalysiscalculated for C36H43NO5 (569.73), C: 75.89%, H: 7.61%, N: 2.46%.Found C: 75.92%, H: 7.64%, N: 2.44%.
4.3.6. 1,5-Bis-(4-diethoxymethyl-phenyl)-penta-1,4-dien-3-one (6)Pale brownish solid (1.96 g, 45%). mp: 98e100 �C; 1H NMR
(500 MHz, CDCl3) d: 7.82 (d, J ¼ 6.5 Hz, 4H), 7.71 (d, J ¼ 8 Hz, 2H),7.49 (d, J ¼ 6.5 Hz, 2H), 7.16 (d, J ¼ 7 Hz, 4H), 5.25 (s, 2H), 3.52 (q,J ¼ 7 Hz, 8H), 1.17 (t, J ¼ 7.0, 12H); 13C NMR (500 MHz, CDCl3) d:
Fig. 3. Docking pose for most active molecule 4with surface area of active site of AChE(Blue: H-Bonding, White: Hydrophobic and Red: Mild Polar regions). (For interpreta-tion of the references to colour in this figure legend, the reader is referred to the webversion of this article.)
Fig. 2. Docking pose for most active molecule 4 in the active site of AChE.
S.N.A. Bukhari et al. / European Journal of Medicinal Chemistry 83 (2014) 355e365360
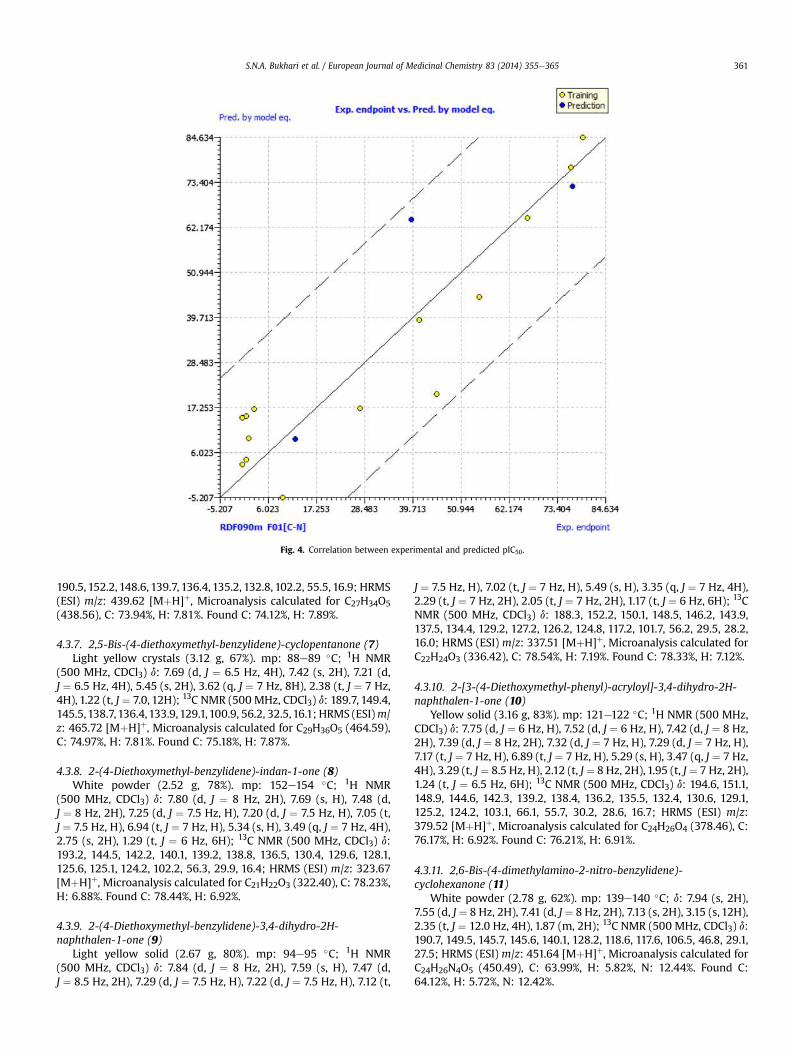
190.5, 152.2, 148.6, 139.7, 136.4, 135.2, 132.8, 102.2, 55.5, 16.9; HRMS(ESI) m/z: 439.62 [MþH]þ, Microanalysis calculated for C27H34O5(438.56), C: 73.94%, H: 7.81%. Found C: 74.12%, H: 7.89%.
4.3.7. 2,5-Bis-(4-diethoxymethyl-benzylidene)-cyclopentanone (7)Light yellow crystals (3.12 g, 67%). mp: 88e89 �C; 1H NMR
(500 MHz, CDCl3) d: 7.69 (d, J ¼ 6.5 Hz, 4H), 7.42 (s, 2H), 7.21 (d,J ¼ 6.5 Hz, 4H), 5.45 (s, 2H), 3.62 (q, J ¼ 7 Hz, 8H), 2.38 (t, J ¼ 7 Hz,4H), 1.22 (t, J ¼ 7.0, 12H); 13C NMR (500 MHz, CDCl3) d: 189.7, 149.4,145.5,138.7,136.4,133.9,129.1,100.9, 56.2, 32.5,16.1; HRMS (ESI)m/z: 465.72 [MþH]þ, Microanalysis calculated for C29H36O5 (464.59),C: 74.97%, H: 7.81%. Found C: 75.18%, H: 7.87%.
4.3.8. 2-(4-Diethoxymethyl-benzylidene)-indan-1-one (8)White powder (2.52 g, 78%). mp: 152e154 �C; 1H NMR
(500 MHz, CDCl3) d: 7.80 (d, J ¼ 8 Hz, 2H), 7.69 (s, H), 7.48 (d,J ¼ 8 Hz, 2H), 7.25 (d, J ¼ 7.5 Hz, H), 7.20 (d, J ¼ 7.5 Hz, H), 7.05 (t,J ¼ 7.5 Hz, H), 6.94 (t, J ¼ 7 Hz, H), 5.34 (s, H), 3.49 (q, J ¼ 7 Hz, 4H),2.75 (s, 2H), 1.29 (t, J ¼ 6 Hz, 6H); 13C NMR (500 MHz, CDCl3) d:193.2, 144.5, 142.2, 140.1, 139.2, 138.8, 136.5, 130.4, 129.6, 128.1,125.6, 125.1, 124.2, 102.2, 56.3, 29.9, 16.4; HRMS (ESI) m/z: 323.67[MþH]þ, Microanalysis calculated for C21H22O3 (322.40), C: 78.23%,H: 6.88%. Found C: 78.44%, H: 6.92%.
4.3.9. 2-(4-Diethoxymethyl-benzylidene)-3,4-dihydro-2H-naphthalen-1-one (9)
Light yellow solid (2.67 g, 80%). mp: 94e95 �C; 1H NMR(500 MHz, CDCl3) d: 7.84 (d, J ¼ 8 Hz, 2H), 7.59 (s, H), 7.47 (d,J ¼ 8.5 Hz, 2H), 7.29 (d, J ¼ 7.5 Hz, H), 7.22 (d, J ¼ 7.5 Hz, H), 7.12 (t,
J ¼ 7.5 Hz, H), 7.02 (t, J ¼ 7 Hz, H), 5.49 (s, H), 3.35 (q, J ¼ 7 Hz, 4H),2.29 (t, J ¼ 7 Hz, 2H), 2.05 (t, J ¼ 7 Hz, 2H), 1.17 (t, J ¼ 6 Hz, 6H); 13CNMR (500 MHz, CDCl3) d: 188.3, 152.2, 150.1, 148.5, 146.2, 143.9,137.5, 134.4, 129.2, 127.2, 126.2, 124.8, 117.2, 101.7, 56.2, 29.5, 28.2,16.0; HRMS (ESI) m/z: 337.51 [MþH]þ, Microanalysis calculated forC22H24O3 (336.42), C: 78.54%, H: 7.19%. Found C: 78.33%, H: 7.12%.
4.3.10. 2-[3-(4-Diethoxymethyl-phenyl)-acryloyl]-3,4-dihydro-2H-naphthalen-1-one (10)
Yellow solid (3.16 g, 83%). mp: 121e122 �C; 1H NMR (500 MHz,CDCl3) d: 7.75 (d, J ¼ 6 Hz, H), 7.52 (d, J ¼ 6 Hz, H), 7.42 (d, J ¼ 8 Hz,2H), 7.39 (d, J ¼ 8 Hz, 2H), 7.32 (d, J ¼ 7 Hz, H), 7.29 (d, J ¼ 7 Hz, H),7.17 (t, J ¼ 7 Hz, H), 6.89 (t, J ¼ 7 Hz, H), 5.29 (s, H), 3.47 (q, J ¼ 7 Hz,4H), 3.29 (t, J¼ 8.5 Hz, H), 2.12 (t, J¼ 8 Hz, 2H), 1.95 (t, J¼ 7 Hz, 2H),1.24 (t, J ¼ 6.5 Hz, 6H); 13C NMR (500 MHz, CDCl3) d: 194.6, 151.1,148.9, 144.6, 142.3, 139.2, 138.4, 136.2, 135.5, 132.4, 130.6, 129.1,125.2, 124.2, 103.1, 66.1, 55.7, 30.2, 28.6, 16.7; HRMS (ESI) m/z:379.52 [MþH]þ, Microanalysis calculated for C24H26O4 (378.46), C:76.17%, H: 6.92%. Found C: 76.21%, H: 6.91%.
4.3.11. 2,6-Bis-(4-dimethylamino-2-nitro-benzylidene)-cyclohexanone (11)
White powder (2.78 g, 62%). mp: 139e140 �C; d: 7.94 (s, 2H),7.55 (d, J¼ 8 Hz, 2H), 7.41 (d, J¼ 8 Hz, 2H), 7.13 (s, 2H), 3.15 (s, 12H),2.35 (t, J ¼ 12.0 Hz, 4H), 1.87 (m, 2H); 13C NMR (500 MHz, CDCl3) d:190.7, 149.5, 145.7, 145.6, 140.1, 128.2, 118.6, 117.6, 106.5, 46.8, 29.1,27.5; HRMS (ESI) m/z: 451.64 [MþH]þ, Microanalysis calculated forC24H26N4O5 (450.49), C: 63.99%, H: 5.82%, N: 12.44%. Found C:64.12%, H: 5.72%, N: 12.42%.
Fig. 4. Correlation between experimental and predicted pIC50.
S.N.A. Bukhari et al. / European Journal of Medicinal Chemistry 83 (2014) 355e365 361
4.3.12. 3,5-Bis[4-(dimethylamino)2-nitro-benzylidene]tetrahydro-pyran-4-one (12)
White powder (2.92 g, 65%). mp: 188e190 �C; 1H NMR(500 MHz, CDCl3) d: 7.89 (s, 2H), 7.46 (d, J ¼ 8 Hz, 2H), 7.14 (d,J ¼ 8 Hz, 2H), 7.05 (s, 2H), 3.13 (s, 12H), 2.93 (s, 4H); 13C NMR(500 MHz, CDCl3) d: 190.5, 149.2, 146.9, 145.1, 139.9, 128.4, 118.9,118.1, 107.8, 65.5, 46.2; HRMS (ESI) m/z: 475.52 [MþNa]þ, Micro-analysis calculated for C23H24N4O6 (452.46), C: 61.05%, H: 5.35%, N:12.38%. Found C: 61.24%, H: 5.59%, N: 12.42%.
4.3.13. 3,5-Bis[4-(dimethylamino)2-nitro-benzylidene]piperidin-4-one (13)
Light yellow solid (2.28 g, 51%). mp: 192e194 �C; 1H NMR(500 MHz, CDCl3) d: 7.82 (s, 2H), 7.72 (d, J ¼ 8 Hz, 2H), 7.21 (d,J ¼ 8 Hz, 2H), 6.92 (s, 2H), 3.17 (s, 12H), 3.13 (s, 4H); 13C NMR(500 MHz, CDCl3) d: 189.4, 149.7, 148.6, 142.5, 140.7, 127.3, 118.8,118.1, 106.5, 49.4, 46.9; HRMS (ESI) m/z: 452.52 [MþH]þ, Micro-analysis calculated for C23H25N5O5 (451.48), C: 61.19%, H: 5.58%, N:15.51%. Found C: 61.42%, H: 5.62%, N: 15.89%.
4.3.14. 3,5-Bis[4-(dimethylamino)2-nitro-benzylidene]-1-methyl-piperidin-4-one (14)
White powder (2.56 g, 55%). mp: 181e182 �C; 1H NMR(500 MHz, CDCl3) d: 7.76 (s, 2H), 7.45 (d, J ¼ 8 Hz, 2H), 7.23 (d,J ¼ 8 Hz, 2H), 7.13 (s, 2H), 3.21 (s, 12H), 3.03 (s, 4H), 2.19 (s, 3H); 13CNMR (500 MHz, CDCl3) d: 187.5, 148.9, 148.2, 143.2, 141.8, 126.7,119.6, 118.9, 106.2, 44.5, 46.1, 38.8; HRMS (ESI)m/z: 466.72 [MþH]þ,Microanalysis calculated for C24H27N5O5 (465.50), C: 61.92%, H:5.85%, N: 15.04%. Found C: 61.99%, H: 5.91%, N: 15.19%.
4.3.15. 1-Benzyl-3,5-bis-(4-dimethylamino-2-nitro-benzylidene)-piperidin-4-one (15)
White crystals (3.22 g, 60%). mp: 165e166 �C; 1H NMR(500 MHz, CDCl3) d: 7.82 (d, J ¼ 8 Hz, 2H), 7.72 (s, 2H), 7.59 (d,J¼ 8 Hz, 2H), 7.32 (d, J¼ 7 Hz, 2H), 7.25 (t, J¼ 7 Hz, 2H), 7.02 (s, 2H),6.92 (t, J¼ 6.5 Hz, H), 4.22 (s, 2H), 3.19 (s,12H), 2.72 (s, 4H); 13C NMR(500 MHz, CDCl3) d: 189.6, 148.9, 147.2, 139.5, 139.0, 131.9, 128.6,126.5, 126.0, 125.3, 124.5, 119.2, 104.9, 64.8, 53.8, 45.9; HRMS (ESI)m/z: 542.65 [MþH]þ, Microanalysis calculated for C30H31N5O5(541.60), C: 66.53%, H: 5.77%, N: 12.93%. Found C: 66.48%, H: 5.79%,N: 12.54%.
4.3.16. 1,5-Bis-(4-dimethylamino-2-nitro-phenyl)-penta-1,4-dien-3-one (16)
Pale yellow solid (2.97 g, 68%). mp: 177e179 �C; 1H NMR(500MHz, CDCl3) d: 7.70 (d, J¼ 6 Hz, 2H), 7.68 (d, J¼ 8 Hz, 2H), 7.44(d, J ¼ 6 Hz, 2H), 7.25 (d, J ¼ 8 Hz, 2H), 7.12 (s, 2H), 3.15 (s, 12H); 13CNMR (500 MHz, CDCl3) d: 187.5, 150.9, 148.6, 144.4, 132.8, 128.1,117.5, 113.8, 107.9, 46.7; HRMS (ESI) m/z: 409.45 [M�H]þ, Micro-analysis calculated for C21H22N4O5 (410.42), C: 61.45%, H: 5.40%, N:13.65%. Found C: 61.48%, H: 5.62%, N: 13.77%.
4.3.17. 2,5-Bis-(4-dimethylamino-2-nitro-benzylidene)-cyclopentanone (17)
White powder (2.41 g, 55%). mp: 156e157 �C; 1H NMR(500 MHz, CDCl3) d: 7.92 (d, J ¼ 6.5 Hz, 2H), 7.88 (d, J ¼ 6 Hz, 2H),7.75 (d, J ¼ 6.5 Hz, 2H), 7.44 (s, 2H), 3.10 (s, 12H), 2.45 (t, J ¼ 7 Hz,4H); 13C NMR (500 MHz, CDCl3) d: 188.9, 153.2, 149.9, 144.2, 143.8,125.8, 118.1, 116.4, 108.3, 46.9, 32.6; HRMS (ESI) m/z: 437.72[MþH]þ, Microanalysis calculated for C23H24N4O5 (436.46), C:63.29%, H: 5.54%, N: 12.84%. Found C: 63.42%, H: 5.48%, N: 12.72%.
4.3.18. 2-(4-Dimethylamino-2-nitro-benzylidene)-indan-1-one(18)
Yellow semisolid (1.95 g, 63%). mp: 169e171 �C; 1H NMR(500MHz, CDCl3) d: 7.56 (d, J¼ 8 Hz, H), 7.48 (s, H), 7.32 (d, J¼ 8 Hz,H), 7.12 (s, H), 6.98 (d, J ¼ 7.5 Hz, H), 6.91 (d, J ¼ 7.5 Hz, H), 6.74 (t,J¼ 7.5 Hz, H), 6.65 (t, J¼ 7 Hz, H), 3.22 (s, 6H), 2.81 (s, 2H); 13C NMR(500 MHz, CDCl3) d: 192.8, 145.6, 142.6, 141.3, 139.8, 138.2, 137.4,130.9, 128.7, 128.0, 125.9, 123.8, 119.5, 117.6, 108.6, 46.8, 28.3; HRMS(ESI)m/z: 309.55 [MþH]þ, Microanalysis calculated for C18H16N2O3(308.33), C: 70.12%, H: 5.23%, N: 9.09%. Found C: 70.18%, H: 5.59%, N:9.18%.
4.3.19. 2-(4-Dimethylamino-2-nitro-benzylidene)-3,4-dihydro-2H-naphthalen-1-one (19)
White powder (2.50 g, 78%). mp: 138e139 �C; 1H NMR(500 MHz, CDCl3) d: 7.82 (d, J ¼ 6.5 Hz, H), 7.57 (s, H), 7.42 (d,J ¼ 6.5 Hz, H), 7.35 (s, H), 7.28 (d, J ¼ 7 Hz, H), 7.20 (d, J ¼ 7 Hz, H),7.19 (t, J¼ 7.5 Hz, H), 6.92 (t, J¼ 8 Hz, H), 3.14 (s, 6H), 2.47 (t, J¼ 7 Hz,2H), 2.14 (t, J¼ 7 Hz, 2H); 13C NMR (500MHz, CDCl3) d: 188.7, 152.8,151.3, 148.9, 146.8, 144.2, 136.8, 134.6, 129.9, 127.6, 126.1, 125.3,124.2, 107.8, 46.2, 29.9, 27.9; HRMS (ESI) m/z: 323.45 [MþH]þ,Microanalysis calculated for C19H18N2O3 (322.36), C: 70.79%, H:5.63%, N: 8.69%. Found C: 71.12%, H: 5.52%, N: 8.72%.
4.3.20. 2-[3-(4-Dimethylamino-2-nitro-phenyl)-acryloyl]-3,4-dihydro-2H-naphthalen-1-one (20)
Pale yellow powder (2.93 g, 80%). mp: 102e103 �C; 1H NMR(500MHz, CDCl3) d: 7.79 (d, J¼ 6.5 Hz, H), 7.62 (d, J¼ 6.5 Hz, H), 7.45(d, J¼ 7.5 Hz, H), 7.32 (s, H), 7.29 (d, J¼ 7.5 Hz, H), 7.21 (d, J¼ 7.5 Hz,H), 7.14 (d, J¼ 7.5 Hz, H), 7.02 (t, J ¼ 7.5 Hz, H), 6.94 (t, J ¼ 7.5 Hz, H),3.45 (t, J ¼ 8.5 Hz, H), 3.10 (s, 6H), 2.22 (t, J ¼ 8 Hz, 2H), 2.15 (t,J ¼ 8 Hz, 2H); 13C NMR (500 MHz, CDCl3) d: 193.8, 152.2, 148.7,145.2, 142.8, 139.6, 137.1, 136.8, 135.6, 131.9, 130.5, 129.4, 124.8,123.5, 116.5, 106.2, 65.8, 46.8, 31.3, 28.7; HRMS (ESI) m/z: 365.55[MþH]þ, Microanalysis calculated for C21H20N2O4 (364.39), C:69.22%, H: 5.53%, N: 7.69%. Found C: 69.34%, H: 5.59%, N: 7.81%.
4.3.21. 2,6-Bis-(4-pyrrolidin-1-yl-benzylidene)-cyclohexanone (21)Brownish powder (3.12 g, 76%). mp: 105e107 �C; 1H NMR
(500 MHz, CDCl3) d: 7.92 (s, 2H), 7.45 (d, J ¼ 8 Hz, 4H), 6.99 (d,J ¼ 8 Hz, 4H), 2.37 (t, J ¼ 10.0 Hz, 4H), 2.10 (m, J ¼ 6.5 Hz, 8H), 1.84(m, J ¼ 5.5, 2H); 13C NMR (500 MHz, CDCl3) d: 188.9, 152.2, 145.2,136.7, 131.9, 127.5, 126.9, 58.1, 28.8, 27.2, 25.6; HRMS (ESI) m/z:413.62 [MþH]þ, Microanalysis calculated for C28H32N2O (412.57), C:81.51%, H: 7.82%, N: 6.79%. Found C: 81.67%, H: 7.99%, N: 6.95%.
4.3.22. 3,5-Bis-(4-pyrrolidin-1-yl-benzylidene)-tetrahydro-pyran-4-one (22)
Light brown solid (2.40 g, 58%). mp: 99e101 �C; 1H NMR(500 MHz, CDCl3) d: 7.81 (s, 2H), 7.37 (d, J ¼ 6.5 Hz, 4H), 7.17 (d,J ¼ 6.5 Hz, 4H), 2.94 (s, 4H), 1.92 (m, J ¼ 6.5 Hz, 8H); 13C NMR(500 MHz, CDCl3) d: 189.0, 150.3, 144.7, 136.8, 130.1, 126.8, 125.6,62.9, 57.1, 25.5; HRMS (ESI) m/z: 415.49 [MþH]þ, Microanalysiscalculated for C27H30N2O2 (414.54), C: 78.23%, H: 7.29%, N: 6.76%.Found C: 78.45%, H: 7.52%, N: 6.72%.
4.3.23. 3,5-Bis-(4-pyrrolidin-1-yl-benzylidene)-piperidin-4-one(23)
Pale yellow powder (2.83 g, 69%). mp: 92e93 �C; 1H NMR(500 MHz, CDCl3) d: 7.72 (s, 2H), 7.17 (d, J ¼ 7.5 Hz, 4H), 6.81 (d,J ¼ 7.5 Hz, 4H), 2.88 (s, 4H), 1.74 (m, J ¼ 6 Hz, 8H); 13C NMR(500 MHz, CDCl3) d: 185.7, 145.9, 143.4, 137.1, 136.5, 128.7, 119.9,56.4, 48.2, 24.9; HRMS (ESI) m/z: 436.62 [MþNa]þ, Microanalysiscalculated for C27H31N3O (413.55), C: 78.42%, H: 7.56%, N: 10.16%.Found C: 78.44%, H: 7.60%, N: 10.25%.
S.N.A. Bukhari et al. / European Journal of Medicinal Chemistry 83 (2014) 355e365362
4.3.24. 1-Methyl-3,5-bis[4-(pyrrolidinyl)benzylidene]piperidin-4-one (24)
Yellow powder (1.99 g, 47%). mp: 122e124 �C; 1H NMR(500 MHz, CDCl3) d: 7.89 (d, J ¼ 8.5 Hz, 4H), 7.65 (s, 2H), 7.52 (d,J ¼ 8.5 Hz, 4H), 2.99 (s, 4H), 2.43 (s, 3H), 1.96 (m, J ¼ 6 Hz, 8H); 13CNMR (500 MHz, CDCl3) d: 190.1, 146.4, 144.7, 141.9, 131.8, 128.2,109.6, 57.4, 56.5, 38.2, 25.5; HRMS (ESI) m/z: 428.71 [MþH]þ,Microanalysis calculated for C28H33N3O (427.58), C: 78.65%, H:7.78%, N: 9.83%. Found C: 78.82%, H: 7.95%, N: 10.12%.
4.3.25. 1-Benzyl-3,5-Bis-(4-pyrrolidin-1-yl-benzylidene)-piperidin-4-one (25)
Light yellow crystals (2.16 g, 43%). mp: 88e89 �C; 1H NMR(500 MHz, CDCl3) d: 7.71 (d, J ¼ 8 Hz, 2H), 7.45 (s, 2H), 7.31 (d,J ¼ 8 Hz, 2H), 7.25 (d, J ¼ 7 Hz, 4H), 7.19 (d, J ¼ 7 Hz, 4H), 6.81 (t,J ¼ 6.5 Hz, H), 4.19 (s, 2H), 2.92 (s, 4H), 1.78 (m, J ¼ 6 Hz, 8H); 13CNMR (500 MHz, CDCl3) d: 192.2, 148.8, 146.3, 138.2, 137.7, 132.7,128.5, 126.2, 125.4, 124.9, 118.9, 65.1, 58.1, 50.2, 25.7; HRMS (ESI)m/z: 504.69 [MþH]þ, Microanalysis calculated for C34H37N3O(503.68), C: 81.08%, H: 7.40%, N: 8.34%. Found C: 81.25%, H: 7.69%, N:8.17%.
4.3.26. 1,5-Bis-(4-pyrrolidin-1-yl-phenyl)-penta-1,4-dien-3-one(26)
Light brownish solid (2.02 g, 54%). mp: 111e113 �C; 1H NMR(500 MHz, CDCl3) d: 7.76 (d, J ¼ 6 Hz, 4H), 7.52 (d, J¼ 6 Hz, 2H), 7.12(d, J ¼ 8 Hz, 2H), 7.05 (d, J ¼ 8 Hz, 4H), 1.85 (m, J ¼ 6 Hz, 8H); 13CNMR (500 MHz, CDCl3) d: 190.0, 151.8, 148.2, 138.2, 136.5, 134.9,131.2, 56.9, 26.6; HRMS (ESI) m/z: 373.82 [MþH]þ, Microanalysiscalculated for C25H28N2O (372.50), C: 80.61%, H: 7.58%, N: 7.52%.Found C: 80.88%, H: 7.74%, N: 7.85%.
4.3.27. 2,5-Bis-(4-pyrrolidin-1-yl-benzylidene)-cyclopentanone(27)
Yellow powder (2.96 g, 74%). mp: 94e95 �C; 1H NMR (500 MHz,CDCl3) d: 7.87 (d, J ¼ 8 Hz, 4H), 7.59 (s, 2H), 7.12 (d, J ¼ 8 Hz, 4H),2.42 (t, J ¼ 7 Hz, 4H), 1.91 (m, J ¼ 6 Hz, 8H); 13C NMR (500 MHz,CDCl3) d: 190.1, 149.5, 145.8, 139.1, 136.8, 134.5, 129.8, 58.1, 32.9,26.2; HRMS (ESI)m/z: 399.51 [MþH]þ, Microanalysis calculated forC27H30N2O (398.54), C: 81.37%, H: 7.59%, N: 7.03%. Found C: 81.42%,H: 7.62%, N: 7.12%.
4.3.28. 2-(4-Pyrrolidin-1-yl-benzylidene)-indan-1-one (28)White powder (1.94 g, 67%). mp: 136e137 �C; 1H NMR
(500 MHz, CDCl3) d: 7.94 (d, J ¼ 8 Hz, 2H), 7.81 (s, H), 7.43 (d,J ¼ 8 Hz, 2H), 7.37 (d, J ¼ 7.5 Hz, H), 7.01 (d, J ¼ 7.5 Hz, H), 6.92 (t,J¼ 7.5 Hz, H), 6.79 (t, J¼ 7 Hz, H), 2.82 (s, 2H), 1.84 (m, J¼ 6 Hz, 4H);13C NMR (500 MHz, CDCl3) d: 192.8, 144.7, 142.9, 141.2, 139.5, 137.9,136.6, 130.8, 129.8, 128.6, 125.2, 124.5, 122.9, 57.7, 28.5, 27.4; HRMS(ESI) m/z: 290.40 [MþH]þ, Microanalysis calculated for C20H19NO(289.37), C: 83.01%, H: 6.62%, N: 4.84%. Found C: 83.25%, H: 6.75%,N: 4.82%.
4.3.29. 2-(4-Pyrrolidin-1-yl-benzylidene)-3,4-dihydro-2H-naphthalen-1-one (29)
Brown solid (2.41 g, 80%). mp: 123e125 �C; 1H NMR (500 MHz,CDCl3) d: 7.76 (d, J ¼ 8 Hz, 2H), 7.52 (s, H), 7.42 (d, J ¼ 8 Hz, 2H), 7.21(d, J ¼ 7.5 Hz, H), 7.15 (d, J ¼ 7.5 Hz, H), 7.02 (t, J ¼ 7.5 Hz, H), 6.99 (t,J ¼ 7 Hz, H), 2.24 (t, J ¼ 7 Hz, 2H), 1.97 (t, J ¼ 7 Hz, 2H), 1.81 (m,J ¼ 6 Hz, 4H); 13C NMR (500 MHz, CDCl3) d: 188.8, 150.5, 149.2,148.7, 147.4, 142.6, 135.1, 132.4, 129.8, 128.9, 125.5, 124.2, 117.5, 58.9,29.7, 27.9, 25.9; HRMS (ESI) m/z: 304.56 [MþH]þ, Microanalysiscalculated for C21H21NO (303.40), C: 83.13%, H: 6.98%, N: 4.62%.Found C: 83.06%, H: 6.91%, N: 4.89%.
4.3.30. 2-[3-(4-Pyrrolidin-1-yl-phenyl)-acryloyl]-3,4-dihydro-2H-naphthalen-1-one (30)
Pale yellow solid (2.52 g, 73%). mp: 118e120 �C; 1H NMR(500MHz, CDCl3) d: 7.70 (d, J¼ 6 Hz, H), 7.48 (d, J¼ 6 Hz, H), 7.33 (d,J¼ 6.5 Hz, 2H), 7.21 (d, J¼ 6.5 Hz, 2H), 7.17 (d, J¼ 6.5 Hz, H), 7.02 (d,J ¼ 6.5 Hz, H), 6.98 (t, J ¼ 6.5 Hz, H), 6.81 (t, J ¼ 6 Hz, H), 3.24 (t,J ¼ 6 Hz, H), 2.29 (t, J ¼ 8 Hz, 2H), 1.98 (t, J ¼ 7 Hz, 2H), 1.94 (m,J¼ 6 Hz, 4H); 13C NMR (500MHz, CDCl3) d: 192.5, 151.8, 149.1, 145.7,142.5, 140.4, 138.7, 136.9, 135.6, 131.9, 130.8, 129.5, 126.1, 119.1, 65.5,58.2, 32.5, 28.7, 25.9; HRMS (ESI) m/z: 346.57 [MþH]þ, Micro-analysis calculated for C23H23NO2 (345.43), C: 79.97%, H: 6.71%, N:4.05%. Found C: 80.19%, H: 6.55%, N: 4.09%.
4.4. DPPH (1,1-diphenyl-2-picrylhydrazyl) assay
The reported DPPH method was applied to assess the scav-enging ability of the compounds [37]. The compounds were testedin the range of 0e25 mg/mL in methanol. To 2.5 ml of compound in5 different concentrations, 1 ml of 0.3 mM DPPH ethanol solutionwas added. Then 1 ml of methanol was added to the solution andallowed to react for 30 min in the dark at room temperature. Thechange in the absorbance was read at 518 nm. The blank wascomprised of 2.5ml of test compound and 1mlmethanol, while themixture of 1 ml DPPH and 2.5 ml of methanol served as negativecontrol. The percentage antioxidant activity was calculated asfollows:
% Inhibition ¼ AA � AB
AB� 100
where: AB: absorption of blank sample, AA: absorption of testsamples. The IC50 value was calculated and compared with that ofascorbic acid as a reference.
4.5. Cell culture
The rat pheochromocytoma (PC12) cell line was purchased fromthe ATCC. The cells were maintained in RPMI-1640 medium con-sisting of 10% heat-inactivated FBS and 1% penicillinestreptomycin.The cells were incubated at 37 �C in a 5% CO2 atmosphere with 95%humidity.
4.6. Cell viability assay
To investigate the cytotoxicity or neuroprotective effects ofsynthetic compounds in PC12 cells, the MTT assay was performed.The cells (1 � 104 cells/well) were seeded in 96-well cell cultureplates and treated with different concentrations of compounds for24 h. The cell viability was expressed as a relative percentageagainst control cultures. To assess the Ab-induced neuroprotectiveactivity, different concentrations of all compounds were individu-ally added to cells for 24 h, before treatment with Ab. The positivecontrol drug selegiline was also evaluated in the same manner forcomparison. 2.0 mg/ml MTT solution was added to each well andincubated for 4 h at 37 �C. The medium was removed and the for-mazan crystals were solubilized in 100 mL dimethyl sulfoxide(DMSO). A microplate reader was used to determine the opticaldensity (excitation at 570 nm, emission at 630 nm) and data areplotted as percent of control.
4.7. AChE and BuChE inhibition assay
To evaluate the potency of compounds to inhibit AChE andBuChE, all compounds were subjected to a slightly modifiedmethod of Ellman's test [38]. The reaction of released thiocholine to
S.N.A. Bukhari et al. / European Journal of Medicinal Chemistry 83 (2014) 355e365 363
give a colored product with a chromogenic reagent 5,5-dithio-bis(2-nitrobenzoic) acid (DTNB) is the basis of the spectrophotometricmethod. The measurements were performed on a 1700 ShimadzuUV-1700, UVeVis spectrophotometer. At a concentration of2.5 units/mL, the enzyme solutions were prepared in gelatin solu-tion (1%). AChE or BChE solution (50 mL) and compound solution(50 mL), prepared in 2% DMSO at a concentration range of10�1e10�6 mM, were added to 3.0 ml phosphate buffer (pH 8 ± 0.1)andwere incubated at 25 �C for 5min. DTNB (50 mL) and ATC (10 mL)were added to the enzyme-inhibitor mixture to start the reaction.For 10 min, the production of the yellow anion was recorded at412 nm. Serving as a control, an identical solution of the enzymewithout the inhibitor was processed using the same protocol. Theblank reading consisted of 3.0 ml buffer, 50 mL 2% DMSO, 50 mLDTNB and 10 mL substrate. All the processes were assayed in trip-licate. The percentage inhibition rate was calculated by thefollowing equation:
% Inhibition ¼ AC � AI
AC� 100
where AI is the absorbance in the presence of the inhibitor, AC is theabsorbance of the control and AB is the absorbance of blank. Bothvalues were corrected with blank-reading value. The data wasexpressed as Mean ± SD.
4.8. Molecular docking and QSAR analysis
For docking, the molecules were drawn using ACD Chemsketch12 freeware followed by energy optimization using MMFF94 forcefield in TINKER [32]. The protein was first subjected to energyminimization, protonation followed by detection of site detection.The receptor and the drug candidates were optimized before actualdocking followed by docking in MOE using the standard procedurefound in the manual of software. The molecules were docked in theactive site using ‘force field’ as a refinement technique with defaultsettings in MOE [29]. All of the newly synthesized molecules weredocked in the active site of AChE (pdb-1GQR, X-rayresolution ¼ 2.20 A�). For the sake of convenience and comparison,as a representative, we report the docking poses for the most activecompound of the series. For QSAR analysis, e-Dragon was used tocalculate myriad number of descriptors, followed by randomsplitting of data set into training set (80%) and test set (20%).QSARINS v1.2 was used to eliminate redundant descriptors and forbuilding GAeMLR (Genetic AlgorithmeMultilinear regression)model [31,32].
Acknowledgments
SNAB thanks University Kebangsaan Malaysia for post-doctoralcontract and highly obliged to Professor Dr. David Schubert, Headof cellular neurobiology laboratory, Salk Institute (USA), for hiskind suggestions and reading the manuscript. VHM is thankful toDr. Paola Gramatica, Italy for providing evaluation copy of QSAR-INS and to NCL, Pune for allowing to perform the computationalwork. Authors gratefully acknowledge the generous supportprovided by the University Kebangsaan Malaysia (UKM-DLP-2013-013).
Appendix A. Supplementary data
Supplementary data related to this article can be found at http://dx.doi.org/10.1016/j.ejmech.2014.06.034.
References
[1] World Alzheimer Report 2013, Alzheimer's Disease International, 2013, p. 1.[2] D.K. Lahiri, M.R. Farlow, N.H. Greig, K. Sambamurti, Current drug targets for
Alzheimer's disease treatment, Drug Dev. Res. 56 (2002) 267e281.[3] J.L. Cummings, Alzheimer's disease, N. Engl. J. Med. 351 (2004) 56e67.[4] J.A. Bailey, D.K. Lahiri, A novel effect of rivastigmine on pre-synaptic proteins
and neuronal viability in a neurodegeneration model of fetal rat primarycortical cultures and its implication in Alzheimer's disease, J. Neurochem. 112(2010) 843e853.
[5] A. Enz, R. Amstutz, H. Boddeke, G. Gmelin, J. Malanowski, Brain selective in-hibition of acetylcholinesterase: a novel approach to therapy for Alzheimer'sdisease, Prog. Brain Res. 98 (1993) 431e438.
[6] E. Giacobini, Cholinesterase inhibitors: new roles and therapeutic alternatives,Pharmacol. Res. 50 (2004) 433e440.
[7] P.J. Houghton, Y. Ren, M.-J. Howes, Acetylcholinesterase inhibitors from plantsand fungi, Nat. Prod. Rep. 23 (2006) 181e199.
[8] N.H. Greig, T. Utsuki, Q.-S. Yu, X. Zhu, H.W. Holloway, T. Perry, B. Lee,D.K. Ingram, D.K. Lahiri, A new therapeutic target in Alzheimer's diseasetreatment: attention to butyrylcholinesterase, Curr. Med. Res. Opin. 17 (2001)159e165.
[9] J. Lal, S.K. Gupta, D. Thavaselvam, D.D. Agarwal, Design, synthesis, synergisticantimicrobial activity and cytotoxicity of 4-aryl substituted 3,4-dihydropyrimidinones of curcumin, Bioorg. Med. Chem. Lett. 22 (2012)2872e2876.
[10] A.M.Magerramov,M.M. Kurbanova, R.T. Abdinbekova, I.A. Rzaeva, V.M. Farzaliev,M.A. Allakhverdiev, Synthesis and antioxidative properties of some 3,4-dihydropyrimidin-2(1H)ones (-thiones), Russ. J. Appl. Chem. 79 (2006) 787e790.
[11] R. Feng, Y. Lu, L.L. Bowman, Y. Qian, V. Castranova, M. Ding, Inhibition ofactivator protein-1, NF-kB, and MAPKs and induction of phase 2 detoxifyingenzyme activity by chlorogenic acid, J. Biol. Chem. 280 (2005) 27888e27895.
[12] S.N.A. Bukhari, Y. Tajuddin, V.J. Benedict, K.W. Lam, I. Jantan, J. Jalil, M. Jasamai,Synthesis and evaluation of chalcone derivatives as inhibitors of neutrophils'chemotaxis, phagocytosis and production of reactive oxygen species, Chem.Biol. Drug Des. 83 (2014) 198e206.
[13] S.N. Bukhari, I. Jantan, M. Jasamai, Anti-inflammatory trends of 1, 3-diphenyl-2-propen-1-one derivatives, Mini Rev. Med. Chem. 13 (2013) 87e94.
[14] S.N. Bukhari, M. Jasamai, I. Jantan, Synthesis and biological evaluation of chal-cone derivatives (mini review), Mini Rev. Med. Chem. 12 (2012) 1394e1403.
[15] S. Bag, S. Ghosh, R. Tulsan, A. Sood, W. Zhou, C. Schifone, M. Foster, H. LeVineIii, B. T€or€ok, M. T€or€ok, Design, synthesis and biological activity of multifunc-tional a,b-unsaturated carbonyl scaffolds for Alzheimer's disease, Bioorg. Med.Chem. Lett. 23 (2013) 2614e2618.
[16] D. Silva, M. Chioua, A. Samadi, P. Agostinho, P. Garç~ao, R. Lajarín-Cuesta, C. delos Ríos, I. Iriepa, I. Moraleda, L. Gonzalez-Lafuente, E. Mendes, C. P�erez,M.I. Rodríguez-Franco, J. Marco-Contelles, M. Carmo Carreiras, Synthesis,pharmacological assessment, and molecular modeling of acetylcholinesterase/butyrylcholinesterase inhibitors: effect against amyloid-b-induced neurotox-icity, ACS Chem. Neurosci. 4 (2013) 547e565.
[17] R. Sultana, M. Perluigi, D.A. Butterfield, Oxidatively modified proteins inAlzheimer's disease (AD), mild cognitive impairment and animal models ofAD: role of Abeta in pathogenesis, Acta Neuropathol. 118 (2009) 131e150.
[18] X. Zhu, B. Su, X. Wang, M.A. Smith, G. Perry, Causes of oxidative stress inAlzheimer disease, Experientia 64 (2007) 2202e2210.
[19] R.J. Mark, M.A. Lovell, W.R. Markesbery, K. Uchida, M.P. Mattson, A role for 4-hydroxynonenal, an aldehydic product of lipid peroxidation, in disruption ofion homeostasis and neuronal death induced by amyloid b-peptide,J. Neurochem. 68 (1997) 255e264.
[20] D.A. Butterfield, K. Hensley, M. Harris, M. Mattson, J. Carney, b-Amyloidpeptide free radical fragments initiate synaptosomal lipoperoxidation in asequence-specific fashion: implications to Alzheimer's disease, Biochem.Biophys. Res. Commun. 200 (1994) 710e715.
[21] S.N. Bukhari, I. Jantan, O.U. Tan, M. Sher, N.U. Hassan, H.L. Qin, Biological ac-tivity and molecular docking studies of curcumin related alpha, beta-unsaturated carbonyl based synthetic compounds as anticancer agents andmushroom tyrosinase inhibitors, J. Agric. Food Chem. (2014), http://dx.doi.org/10.1021/jf501145b.
[22] S.N.A. Bukhari, G. Lauro, I. Jantan, G. Bifulco, M.W. Amjad, Pharmacologicalevaluation and docking studies of a, b-unsaturated carbonyl based syntheticcompounds as inhibitors of secretory phospholipase A2, cyclooxygenases,lipoxygenase and proinflammatory cytokines, Bioorg. Med. Chem. (2014),http://dx.doi.org/10.1016/j.bmc.2014.05.052.
[23] J.R. Dimmock, M.P. Padmanilayam, R.N. Puthucode, A.J. Nazarali,N.L. Motaganahalli, G.A. Zello, J.W. Quail, E.O. Oloo, H.-B. Kraatz, J.S. Prisciak,T.M. Allen, C.L. Santos, J. Balzarini, E. De Clercq, E.K. Manavathu,A conformational and structureeactivity relationship study of cytotoxic 3,5-bis(arylidene)-4-piperidones and related n-acryloyl analogues, J. Med.Chem. 44 (2001) 586e593.
[24] U. Das, M. Kawase, H. Sakagami, A. Ideo, J. Shimada, J. Moln�ar, Z. Bar�ath,Z. Bata, J.R. Dimmock, 3-(3,4,5-Trimethoxyphenyl)-1-oxo-2-propene: a novelpharmacophore displaying potent multidrug resistance reversal and selectivecytotoxicity, Bioorg. Med. Chem. 15 (2007) 3373e3380.
[25] U. Das, J. Alcorn, A. Shrivastav, R.K. Sharma, E. De Clercq, J. Balzarini,J.R. Dimmock, Design, synthesis and cytotoxic properties of novel 1-[4-(2-
S.N.A. Bukhari et al. / European Journal of Medicinal Chemistry 83 (2014) 355e365364
alkylaminoethoxy)phenylcarbonyl]-3,5-bis(arylidene)-4-piperidones andrelated compounds, Eur. J. Med. Chem. 42 (2007) 71e80.
[26] Y. Kia, H. Osman, R.S. Kumar, V. Murugaiyah, A. Basiri, S. Perumal, H.A. Wahab,C.S. Bing, Synthesis and discovery of novel piperidone-grafted mono- and bis-spirooxindole-hexahydropyrrolizines as potent cholinesterase inhibitors,Bioorg. Med. Chem. 21 (2013) 1696e1707.
[27] J.-M. Contreras, Y.M. Rival, S. Chayer, J.-J. Bourguignon, C.G. Wermuth, Ami-nopyridazines as acetylcholinesterase inhibitors, J. Med. Chem. 42 (1999)730e741.
[28] K.K. Roy, A. Dixit, A.K. Saxena, An investigation of structurally diverse car-bamates for acetylcholinesterase (AChE) inhibition using 3D-QSAR analysis,J. Mol. Gr. Model. 27 (2008) 197e208.
[29] Y.K. Yoon, M.A. Ali, A.C. Wei, T.S. Choon, K.-Y. Khaw, V. Murugaiyah, H. Osman,V.H. Masand, Synthesis, characterization, and molecular docking analysis ofnovel benzimidazole derivatives as cholinesterase inhibitors, Bioorg. Chem. 49(2013) 33e39.
[30] D. Mahajan, V. Masand, K. Patil, T. Hadda, V. Rastija, Integrating GUSAR andQSAR analyses for antimalarial activity of synthetic prodiginines against multidrug resistant strain, Med. Chem. Res. 22 (2013) 2284e2292.
[31] V.H. Masand, D.T. Mahajan, K.N. Patil, T.B. Hadda, M.H. Youssoufi,R.D. Jawarkar, I.G. Shibi, Optimization of antimalarial activity of syntheticprodiginines: QSAR, GUSAR, and CoMFA analyses, Chem. Biol. Drug Des. 81(2013) 527e536.
[32] V. Masand, D. Mahajan, T. Hadda, R. Jawarkar, H. Chavan, B.P. Bandgar,H. Chauhan, Molecular docking and quantitative structureeactivity relation-ship (QSAR) analyses of indolylarylsulfones as HIV-1 non-nucleoside reversetranscriptase inhibitors, Med. Chem. Res. 23 (2014) 417e425.
[33] D.T. Mahajan, V.H. Masand, K.N. Patil, T. Ben Hadda, R.D. Jawarkar, S.D. Thakur,V. Rastija, CoMSIA and POM analyses of anti-malarial activity of syntheticprodiginines, Bioorg. Med. Chem. Lett. 22 (2012) 4827e4835.
[34] P. Gramatica, On the development and validation of QSAR models, MethodsMol. Biol. 930 (2013) 499e526.
[35] P. Gramatica, N. Chirico, E. Papa, S. Cassani, S. Kovarich, QSARINS: a newsoftware for the development, analysis, and validation of QSAR MLR models,J. Comput. Chem. 34 (2013) 2121e2132.
[36] G.L. Ellman, K.D. Courtney, V. Andres jr, R.M. Featherstone, A new and rapidcolorimetric determination of acetylcholinesterase activity, Biochem. Phar-macol. 7 (1961) 88e95.
[37] C.W. Choi, S.C. Kim, S.S. Hwang, B.K. Choi, H.J. Ahn, M.Y. Lee, S.H. Park,S.K. Kim, Antioxidant activity and free radical scavenging capacity betweenKorean medicinal plants and flavonoids by assay-guided comparison, PlantSci. 163 (2002) 1161e1168.
[38] N.S. Perry, P.J. Houghton, A. Theobald, P. Jenner, E.K. Perry, In-vitro inhibitionof human erythrocyte acetylcholinesterase by salvia lavandulaefolia essentialoil and constituent terpenes, J. Pharm. Pharmacol. 52 (2000) 895e902.
S.N.A. Bukhari et al. / European Journal of Medicinal Chemistry 83 (2014) 355e365 365
© 2014 The Vijay H. Masand, Devidas T. Mahajan, Eslam Pourbasheer, Taibi Ben Hadda, Harsh Chauhan, J.M. Gajbhiye and A.M. Alafeefy. This open access article is distributed under a Creative Commons Attribution (CC-BY) 3.0 license.
Current Research in Drug Discovery
Original Research Paper
Determination of Optimum Values of Descriptors to Set
Filters for Synthetic Tri-Pyrrole Derivatives (Prodiginines)
Against Multi Drug Resistant Strain of Plasmodium
Falciparum
1Vijay H. Masand,
1Devidas T. Mahajan,
2Eslam Pourbasheer,
3Taibi Ben Hadda,
4Harsh Chauhan,
5J.M. Gajbhiye and
6A.M. Alafeefy
1Department of Chemistry, Vidya Bharati College, Camp, Amravati, Maharashtra, India 2Department of Chemistry, Faculty of Science, University of Qom, Qom, Iran 3Laboratoire Chimie des Matériaux, Université Mohammed Premier, Oujda-60000, Morocco 4Creighton University, Omaha, NE, USA 5Division of Organic Chemistry, CSIR-National Chemical Laboratory, Pune 411008, India 6Department of Pharmaceutical Chemistry, Kind Saud University, Alkharj, Saudi Arabia
Article history
Received: 06-11-2014
Revised: 15-11-2014
Accepted: 31-12-2014
Corresponding Author:
Vijay H. Masand
Department of Chemistry,
Vidya Bharati College, Camp,
Amravati, Maharashtra, India Email: [email protected]
Abstract: In the present study, we have carried out extensive non-linear Quantitative-Structure Activity Relationship (QSAR) analysis to correlate in vitro anti-malarial activity against multi drug resistant strain of Plasmodium falciparum. Forty-three synthetic prodiginines with different structural features were used for their potential antimalarial activity. Linear, bilinear, biexponential and parabolic equations were developed. These equations were compared to determine the optimum values of descriptors for very useful and easily interpretable descriptors. The optimum values of these descriptors could be helpful in finding and optimizing a good lead compound. Obtained correlations reveal that various factors like lipophilicity, molecular weight and number of bonds have non-linear relation with the anti-malarial activity.
Keywords: Prodiginines, Anti-Malarial Activity, Optimum/Desirability
Values, Hybrid Inverse-QSAR
Introduction
Malaria, a dreadful vector-borne protozoal disease is responsible for more than two million deaths every year (WHO, 2012; http://www.who.int/malaria/en/). Developing a potent antimalarial compound is still a major challenge for the medicinal chemists (Biamonte et al., 2013). The situation is worsening with the rapid spread of multi drug resistant strains of causative agent (Biamonte et al., 2013; Mahajan et al., 2012; 2013; Mara et al., 2013; Masand et al., 2013b; Murugesan et al., 2013; Ojha and Roy, 2012; Papireddy et al., 2011). Therefore, there is essential need to curb this deadly disease either by modifying the existing marketed drugs or developing new therapeutic molecules. Different compounds like xanthones, artemisinins, prodiginines have been synthesized and tested to develop new potential remedies for malaria (Biamonte et al., 2013; Mahajan et al., 2012; 2013; Mara et al., 2013; Masand et al., 2013b; Murugesan et al., 2013; Ojha and Roy, 2012; Papireddy et al., 2011).
Prodiginines (Mahajan et al., 2012; 2013; Masand et al.,
2013b; Papireddy et al., 2011), the oligopyrrole derivatives
with a characteristic conjugated system, are promising anti-
malarial agents (Fig. 1). These compounds have the ability
to inhibit Plasmodium falciparum (P. falciparum) at very
low concentrations. They show marked clearance of the
protozoa parasite and can be effectively administered orally.
Despite these advantages, search for a potent prodiginines
with good Absorption, Distribution, Metabolism, Excretion
and Toxicity (ADMET) profile and improved ease of
synthesis has resulted in limited success (Mahajan et al.,
2012; 2013; Masand et al., 2013b; Papireddy et al.,
2011). The progress can be expedited using the
contemporary method of drug designing like QSAR,
Molecular docking and Pharmacophore modelling. Of the
above mentioned methods, QSAR is an established
technique with good success in last few decades and is
utilized in our research (Huang et al., 2011; Myint et al.,
2010; Scior et al., 2009; Tropsha, 2010).
Vijay H. Masand et al. / Current Research in Drug Discovery 2014, 1 (2): 51.59
DOI: 10.3844/crddsp.2014.51.59
52
Fig. 1. Synthetic prodiginines used in present study
A typical QSAR study involves establishment of
correlation between structure and activity (Mahajan et al.,
2012; 2013; Masand et al., 2012a; Masand et al., 2013a;
2012b; 2013b; Rastija et al., 2013). Different characteristics
or attributes of chemical structure are expressed in terms of
numerical entities termed as molecular descriptors (also
known as parameters or features). One or more molecular
descriptors are used to build statistically robust linear
regression equation. A properly validated QSAR equation is
considered more useful if it is derived using descriptors that
represent maximum useful information with minimum
overlap and are interpretable in terms of structural features
(Chirico and Gramatica, 2011; 2012a; Chirico et al., 2012b;
Gramatica, 2013; Gramatica et al., 2012; Gramatica et al.,
2013; Martin et al., 2012; Mitra et al., 2010; Roy et al.,
2012; Saha et al., 2012; Tropsha, 2010). Unfortunately,
limited number of validated QSAR equations with the
ability to guide for the development of new drugs or
modification of existing drugs are utilized, due to the
following reasons (Chirico and Gramatica, 2011; 2012a;
Chirico et al., 2012b; Doweyko, 2008; Gramatica, 2013;
Gramatica et al., 2012; Gramatica et al., 2013; Martin et al.,
2012; Mitra et al., 2010; Roy et al., 2012; Saha et al., 2012;
Tropsha, 2010) (i) Difficulty in interpretation of QSAR
equation in terms of structural features; (ii) The calculation
or estimation of descriptors is very complex or resource
consuming; (iii) computational facilities/resources like
advanced and specific softwares may not be available to
organic chemist to calculate descriptors that are mentioned
in QSAR equation. (iv) The organic chemist may not be
well skilled or trained in QSAR; (v) In addition, important
descriptors having good correlation with activity might get
missed in QSAR equations due to some reasons. To overcome the difficulties, many researchers use
inverse-QSAR (i-QSAR). In i-QSAR, the molecules are optimised using a set of physico-chemical properties or theoretical descriptors, which are obtained or derived using
a well known marketed drug as ‘reference’ (Brown et al., 2006; Faulon et al., 2005). This approach has certain limitations like (i) proper selection of drug is an exigent and tricky process (ii) the drug should have similarity in structural or shape with the molecules of data set in hand (iii) For some diseases, no marketed drugs are available whereas for some diseases, a lot of marketed drugs are available. (iv) The physico-chemical properties or theoretical descriptors which are associated with one chemo-type of drug may not be possible to calculate or estimate for other chemo-type of molecule. (iv) The physico-chemical properties or theoretical descriptors associated with one chemo-type of drug may not be possible to calculate or estimate for other chemo-type molecules. After determining the values of different descriptors, the problem then lies in constructing a viable molecule from these descriptors. This is the real limiting factor of most inverse-QSAR methods, because most of the descriptors are not reversible.
A good solution is to determine the optimum value
of useful and information rich descriptors, during the
QSAR equation development. The most striking
advantage in determining optimal values of different
descriptors is that the ‘most active’ compound in the
given data set may or may not fit to optimum values of
all the descriptors. This optimization is not based on
single ‘reference’ drug as in i-QSAR. In this case a data
set is used to derive a set of physico-chemical properties
or theoretical descriptors to optimize the molecules.
Thereby, increasing the chances of finding better
alternatives to visible ‘most active’ and potential
compounds outside the present data set. This approach
can be viewed as ‘Hybrid-inverse QSAR’. It could
significantly accelerate the discovery of novel small
molecules with specified chemical properties.
Literature survey reveals (Buchwald et al., 2014;
Gidskehaug et al., 2008; Hansch et al., 2004; Jager et al.,
2009; Kubinyi, 2002) that a well established method to
determine the optimum value of any descriptor is to
derive non-linear equation, especially bilinear or
biexponential or parabolic equation. These functions
assume that the relationship between descriptor and
the activity is non-linear with the vertex of curve
representing the optimum value.
In our previous work, we successfully performed CoMSIA, GUSAR and QSAR analyses for antimalarial activity of synthetic prodiginines. The objectives of the present study are (i) to determine optimum value of easily interpretable descriptors used in the QSAR equation (ii) to determine optimum value of some other useful descriptors having good correlation with activity but not included in the reported QSAR equations and (iii) to compare the performance and ability of linear, parabolic, bilinear and biexponential QSAR models to determine the optimum values of descriptors.
Vijay H. Masand et al. / Current Research in Drug Discovery 2014, 1 (2): 51.59
DOI: 10.3844/crddsp.2014.51.59
53
Methodology
Data Set
The experimental in vitro Inhibitory Concentrations
(IC50) expressed in nanomolar units of forty three
synthetic prodiginines against the Chloroquine (CQ)
resistant strain Dd2 are selected from a recent
publication (Papireddy et al., 2011). The data set
includes prodiginines with different substituents like
varying length of alkyl chain, substituents at different
positions of benzene ring etc. Table 1, provides the
experimental data. The values were converted into the
logarithm units, (-log 10 IC50 = pIC50) for molecular
modelling purpose.
The structures were drawn using ACD Chemsketch
12 freeware and were converted into 3D structures. This
was followed by geometry optimization using a molecular
mechanics method implemented in the program VegaZZ,
using Gasteiger partial charges and Tripos force field
(Mahajan et al., 2012; 2013; Masand et al., 2013b). The
optimized structures (β-isomer) were uploaded onto the e-
DRAGON server to calculate myriad number of 1D-, 2D-
and 3D- molecular descriptors (Fig. 2). Before QSAR
model development, descriptors with constant or nearly
constant (for 80% molecules) values were discarded.
Genetic Algorithm (GA) available in QSARINS (Chirico
and Gramatica, 2011; 2012a; Chirico et al., 2012b;
Gramatica et al., 2013; Chirico and Gramatica, 2011;
2012a; Chirico et al., 2012b; Gramatica et al., 2013) was
used to select optimum number and set of descriptors to
build statistically sound multi linear regression equation.
Matlab and BuildQSAR were used to build bilinear,
biexponential and parabolic equations. In addition,
Microsoft excel was used for different statistical functions.
A good number of statistical parameters like R, R2,
R2
adj, S and F were calculated along with R2
cv (R2
LOO)
for internal validation and to check the robustness of
the model.
Fig. 2. Tautomeric forms of synthetic prodiginines (β-isomer) used in present study

Vijay H. Masand et al. / Current Research in Drug Discovery 2014, 1 (2): 51.59
DOI: 10.3844/crddsp.2014.51.59
54
Table 1. Different synthetic prodiginines along with experimental data IC50 (nM) and pIC50
S. No. R1 R2 R3 IC50(nM) Dd2 pIC50 expt.
1 2-pyrolyl n-C4H9 H 1590.0 5.799
2 2-pyrolyl n-C6H13 H 450.0 6.347
3 2-pyrolyl n-C8H17 H 130.0 6.886
4 2-pyrolyl n-C16H33 H 400.0 6.398
5 2-pyrolyl H CH2CH(CH3)2 230.0 6.638
6 2-pyrolyl H n-C4H9 18.0 7.745
7 2-pyrolyl H n-C6H13 7.0 8.155
8 2-pyrolyl H n-C8H17 1.8 8.745
9 2-pyrolyl H n-C10H21 10.0 8.000a
10 2-pyrolyl H C6H5CH2 86.0 7.066
11 2-pyrolyl H 4-OCH3C6H4CH2 156.0 6.807
12 2-pyrolyl H 4-ClC6H4CH2 81.0 7.092
13 2-pyrolyl H 4-BrC6H4CH2 108.0 6.967
14 2-pyrolyl CH3 CH3 8130.0 5.090
15 2-pyrolyl n-C6H13 n-C3H7 4.0 8.398
16 2-pyrolyl n-C8H17 n-C3H7 2.7 8.569
17 2-pyrolyl n-C3H7 1.3 8.886
18 2-pyrolyl n-C6H13 n-C6H13 1.1 8.959
19 2-pyrolyl n-C7H15 n-C6H13 1.2 8.921
20 2-pyrolyl n-C6H13 n-C8H17 2.0 8.699
21 2-pyrolyl n-C7H15 n-C8H17 2.9 8.538
22 2-pyrolyl n-C8H17 n-C8H17 129.0 6.889
23 2-pyrolyl 3.5 8.456
24 2-pyrolyl C2H5 4-ClC6H4CH2 6.2 8.208
25 2-pyrolyl n-C3H7 4-ClC6H4CH2 2.6 8.585
26 2-pyrolyl n-C6H13 4-ClC6H4CH2 1.8 8.745
27 2-pyrolyl n-C7H15 4-ClC6H4CH2 2.2 8.658
28 2-pyrolyl n-C8H17 4-ClC6H4CH2 12.0 7.921
29 2-pyrolyl 4-ClC6H4CH2 2.9 8.538
30 2-pyrolyl n-C6H13 4-FC6H4CH2 0.9 9.046
31 2-pyrolyl n-C8H17 4-FC6H4CH2 1.2 8.921
32 2-pyrolyl n-C6H13 4-BrC6H4CH2 2.8 8.553
33 2-pyrolyl n-C8H17 4-BrC6H4CH2 2.9 8.538
34 2-pyrolyl 4-ClC6H4CH2 4-ClC6H4CH2 4.8 8.319
35 2-pyrolyl 4-FC6H4CH2 4-FC6H4CH2 5.7 8.244
36 2-pyrolyl 4-BrC6H4CH2 4-BrC6H4CH2 11.0 7.959
37 2-pyrolyl 4-FC6H4CH2 4-ClC6H4CH2 6.1 8.215
38 2-pyrolyl 4-BrC6H4CH2 4-ClC6H4CH2 7.7 8.114
39 2-pyrolyl 4-BrC6H4CH2 4-FC6H4CH2 5.1 8.292
40 2-pyrolyl 2,4-Cl2C6H3CH2 2,4-Cl2C6H3CH2 11.0 7.959
41 2-pyrolyl 2,4-F2C6H3CH2 2,4-F2C6H3CH2 18.3 7.738
42 2-pyrolyl 3-FC6H4CH2 3-FC6H4CH2 6.7 8.174
43 2-pyrolyl 2-ClC6H4CH2 2-ClC6H4CH2 4.9 8.310
Results and Discussion
In the present study, we derived and compared the
linear, biexponential, bilinear (two equations) and
parabolic equations. These equations are listed in Table 2
and 3. The equations provide useful correlation between
activity and many easily interpretable useful descriptors
like Sv (Sum of atomic van der Waal’s volumes), Sp
(Sum of atomic polarizabilities), X1v (first order valence
connectivity index, to represent the steric factor),
ALOGP (Ghose-Crippen Octanol-water coefficient) and
nAT (number of atoms).
The linear model cannot be used for the
determination of optimum value of any descriptor. The
general form of the parabolic, bilinear Equation 1
(proposed by Kubinyi), bilinear Equation 2 and
biexponential model is as following: Y = aX + bX
2 + c (1)
Y = aX + b log(cX + 1) + d (2) Y = aX + b Log(β 10
X + 1) + c (3)
Y = -b (log((e
(-c(x-a)/b))+(e
(e(x-a)/b)))) + d (4)
Vijay H. Masand et al. / Current Research in Drug Discovery 2014, 1 (2): 51.59
DOI: 10.3844/crddsp.2014.51.59
55
Comparison of Different Models
For some descriptors viz. nAT, Sv, Sp and ALOGP,
non-linear models are either superior or equivalent to the
linear model. Whereas, for rest of the descriptors, the
fitting of the non-linear models is better than the linear
model. This indicates that the relation between the activity
and the selected descriptors is non-linear in nature. In
other words, non-linear model can better explain the
variation of activity. Among non-linear models, bilinear
Equation 1 (based on Kubinyi formula) fits better than the
rest, with biexponential models being least fit in nature for
many descriptors. None of the model satisfies the
recommended threshold value (>0.85) of CCC, though for
some models, it is close to it. In the above models, the symbols have their usual
meanings. Increasing the number of congeneric compounds in the data set as well as the range of biological data might result in better statistical fitting.
In many cases, the substantial fitting of the equation
(R2>0.60), though not outstanding, is satisfactory. This
proves that there prevails the optimum value of
lipophilicity, number of atoms, number of bonds and X1v
(to represent steric factor). Thus, the selected descriptors,
for which the optimum values are determined, represent
the overall descriptor space.
A comparison of values of descriptors for four most
active (highlighted as bold and italic) and four least
active (highlighted as bold and italic) compounds justify
the importance of optimum values of descriptors (Table
3). The value for selected descriptors for four most
active molecules selected as representatives are close to
optimum values whereas reverse is true for the four least
active molecules. Thus, the optimum values of these
descriptors could be helpful in finding a good “lead
prodiginine” for anti-malarial activity.
Interestingly, the values of descriptors for the ‘most
active’ compound 30 in the present data set are close to
optimum values of many descriptors. However, it does
not match with the optimum values of all the descriptors.
This confirms that the appropriate lead/drug optimization
using only most active or single drug as ‘reference’
is not a perfect method. Table 2. Different linear and non-linear equations along with their statistical parameters
Statistical Bilinear Bilinear Descriptor parameter Linear Parabolic Equation 1 Equation 2 Biexponential
nAT R2 0.242 0.685 0.640 0.664 0.242 R2
adj 0.224 0.669 0.612 0.638 0.162 RMSE 0.800 0.516 0.565 0.533 0.800 SSE 27.517 11.442 13.073 12.211 27.517 F 13.099 43.465 23.105 25.349 3.035 CCC 0.389 0.813 0.781 0.796 0.390 nBT R2 0.267 0.676 0.657 0.654 0.713 R2
adj 0.249 0.660 0.631 0.628 0.683 RMSE 0.786 0.523 0.565 0.540 0.492 SSE 26.613 11.758 12.443 12.548 10.407 F 14.935 41.756 24.933 24.354 23.629 CCC 0.421 0.807 0.793 0.790 0.833 Sv R2 0.331 0.633 0.673 0.612 0.331 R2
adj 0.314 0.614 0.648 0.582 0.260 RMSE 0.752 0.557 0.551 0.573 0.752 SSE 24.302 13.339 11.857 14.093 24.302 F 20.254 34.438 26.808 20.279 4.693 CCC 0.497 0.775 0.805 0.758 0.497 Sp R2 0.320 0.647 0.679 0.624 0.320 R2
adj 0.304 0.629 0.654 0.596 0.249 RMSE 0.758 0.546 0.547 0.563 0.758 SSE 24.679 12.819 11.652 13.639 24.679 F 19.317 36.648 27.508 21.377 4.475 CCC 0.485 0.786 0.809 0.767 0.485 X1v R2 0.329 0.625 0.641 0.605 NC R2
adj 0.313 0.607 0.614 0.574 NC RMSE 0.752 0.562 0.578 0.578 NC SSE 24.336 13.601 13.022 14.351 NC F 20.169 33.388 23.245 19.717 NC CCC 0.496 0.769 0.782 0.753 NC ALOGP R2 0.323 0.683 0.711 0.650 0.232 R2
adj 0.307 0.667 0.688 0.623 0.151 RMSE 0.756 0.517 0.519 0.543 0.805 SSE 24.573 11.506 10.511 12.701 27.875 F 19.579 43.112 31.906 23.576 9.349 CCC 0.488 0.812 0.831 0.786 0.065
SSE- Sum of Squared Errors, RMSE-Root Mean Square Error, CCC- Concordance Correlation Coefficient
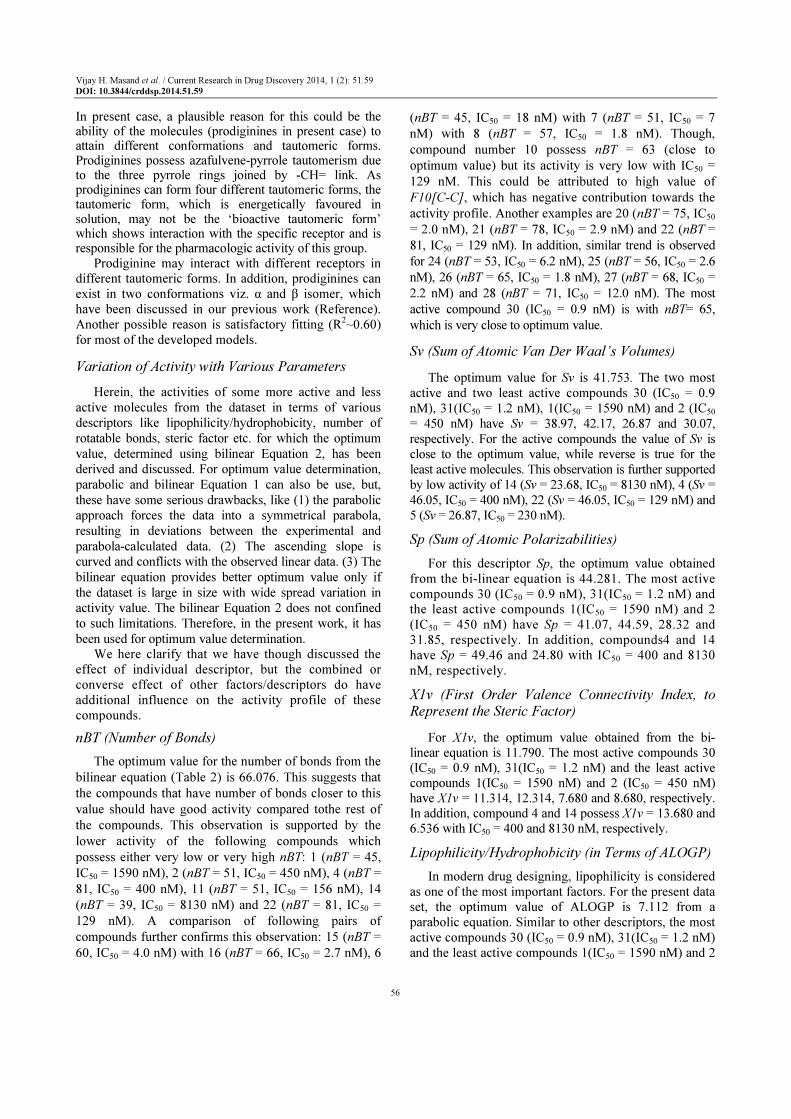
Vijay H. Masand et al. / Current Research in Drug Discovery 2014, 1 (2): 51.59
DOI: 10.3844/crddsp.2014.51.59
56
In present case, a plausible reason for this could be the ability of the molecules (prodiginines in present case) to attain different conformations and tautomeric forms. Prodiginines possess azafulvene-pyrrole tautomerism due to the three pyrrole rings joined by -CH= link. As prodiginines can form four different tautomeric forms, the tautomeric form, which is energetically favoured in solution, may not be the ‘bioactive tautomeric form’ which shows interaction with the specific receptor and is responsible for the pharmacologic activity of this group.
Prodiginine may interact with different receptors in
different tautomeric forms. In addition, prodiginines can
exist in two conformations viz. α and β isomer, which
have been discussed in our previous work (Reference).
Another possible reason is satisfactory fitting (R2~0.60)
for most of the developed models.
Variation of Activity with Various Parameters
Herein, the activities of some more active and less
active molecules from the dataset in terms of various
descriptors like lipophilicity/hydrophobicity, number of
rotatable bonds, steric factor etc. for which the optimum
value, determined using bilinear Equation 2, has been
derived and discussed. For optimum value determination,
parabolic and bilinear Equation 1 can also be use, but,
these have some serious drawbacks, like (1) the parabolic
approach forces the data into a symmetrical parabola,
resulting in deviations between the experimental and
parabola-calculated data. (2) The ascending slope is
curved and conflicts with the observed linear data. (3) The
bilinear equation provides better optimum value only if
the dataset is large in size with wide spread variation in
activity value. The bilinear Equation 2 does not confined
to such limitations. Therefore, in the present work, it has
been used for optimum value determination.
We here clarify that we have though discussed the
effect of individual descriptor, but the combined or
converse effect of other factors/descriptors do have
additional influence on the activity profile of these
compounds.
nBT (Number of Bonds)
The optimum value for the number of bonds from the
bilinear equation (Table 2) is 66.076. This suggests that
the compounds that have number of bonds closer to this
value should have good activity compared tothe rest of
the compounds. This observation is supported by the
lower activity of the following compounds which
possess either very low or very high nBT: 1 (nBT = 45,
IC50 = 1590 nM), 2 (nBT = 51, IC50 = 450 nM), 4 (nBT =
81, IC50 = 400 nM), 11 (nBT = 51, IC50 = 156 nM), 14
(nBT = 39, IC50 = 8130 nM) and 22 (nBT = 81, IC50 =
129 nM). A comparison of following pairs of
compounds further confirms this observation: 15 (nBT =
60, IC50 = 4.0 nM) with 16 (nBT = 66, IC50 = 2.7 nM), 6
(nBT = 45, IC50 = 18 nM) with 7 (nBT = 51, IC50 = 7
nM) with 8 (nBT = 57, IC50 = 1.8 nM). Though,
compound number 10 possess nBT = 63 (close to
optimum value) but its activity is very low with IC50 =
129 nM. This could be attributed to high value of
F10[C-C], which has negative contribution towards the
activity profile. Another examples are 20 (nBT = 75, IC50
= 2.0 nM), 21 (nBT = 78, IC50 = 2.9 nM) and 22 (nBT =
81, IC50 = 129 nM). In addition, similar trend is observed
for 24 (nBT = 53, IC50 = 6.2 nM), 25 (nBT = 56, IC50 = 2.6
nM), 26 (nBT = 65, IC50 = 1.8 nM), 27 (nBT = 68, IC50 =
2.2 nM) and 28 (nBT = 71, IC50 = 12.0 nM). The most
active compound 30 (IC50 = 0.9 nM) is with nBT= 65,
which is very close to optimum value.
Sv (Sum of Atomic Van Der Waal’s Volumes)
The optimum value for Sv is 41.753. The two most
active and two least active compounds 30 (IC50 = 0.9
nM), 31(IC50 = 1.2 nM), 1(IC50 = 1590 nM) and 2 (IC50
= 450 nM) have Sv = 38.97, 42.17, 26.87 and 30.07,
respectively. For the active compounds the value of Sv is
close to the optimum value, while reverse is true for the
least active molecules. This observation is further supported
by low activity of 14 (Sv = 23.68, IC50 = 8130 nM), 4 (Sv =
46.05, IC50 = 400 nM), 22 (Sv = 46.05, IC50 = 129 nM) and
5 (Sv = 26.87, IC50 = 230 nM).
Sp (Sum of Atomic Polarizabilities)
For this descriptor Sp, the optimum value obtained
from the bi-linear equation is 44.281. The most active
compounds 30 (IC50 = 0.9 nM), 31(IC50 = 1.2 nM) and
the least active compounds 1(IC50 = 1590 nM) and 2
(IC50 = 450 nM) have Sp = 41.07, 44.59, 28.32 and
31.85, respectively. In addition, compounds4 and 14
have Sp = 49.46 and 24.80 with IC50 = 400 and 8130
nM, respectively.
X1v (First Order Valence Connectivity Index, to Represent the Steric Factor)
For X1v, the optimum value obtained from the bi-
linear equation is 11.790. The most active compounds 30
(IC50 = 0.9 nM), 31(IC50 = 1.2 nM) and the least active
compounds 1(IC50 = 1590 nM) and 2 (IC50 = 450 nM)
have X1v = 11.314, 12.314, 7.680 and 8.680, respectively.
In addition, compound 4 and 14 possess X1v = 13.680 and
6.536 with IC50 = 400 and 8130 nM, respectively.
Lipophilicity/Hydrophobicity (in Terms of ALOGP)
In modern drug designing, lipophilicity is considered
as one of the most important factors. For the present data
set, the optimum value of ALOGP is 7.112 from a
parabolic equation. Similar to other descriptors, the most
active compounds 30 (IC50 = 0.9 nM), 31(IC50 = 1.2 nM)
and the least active compounds 1(IC50 = 1590 nM) and 2
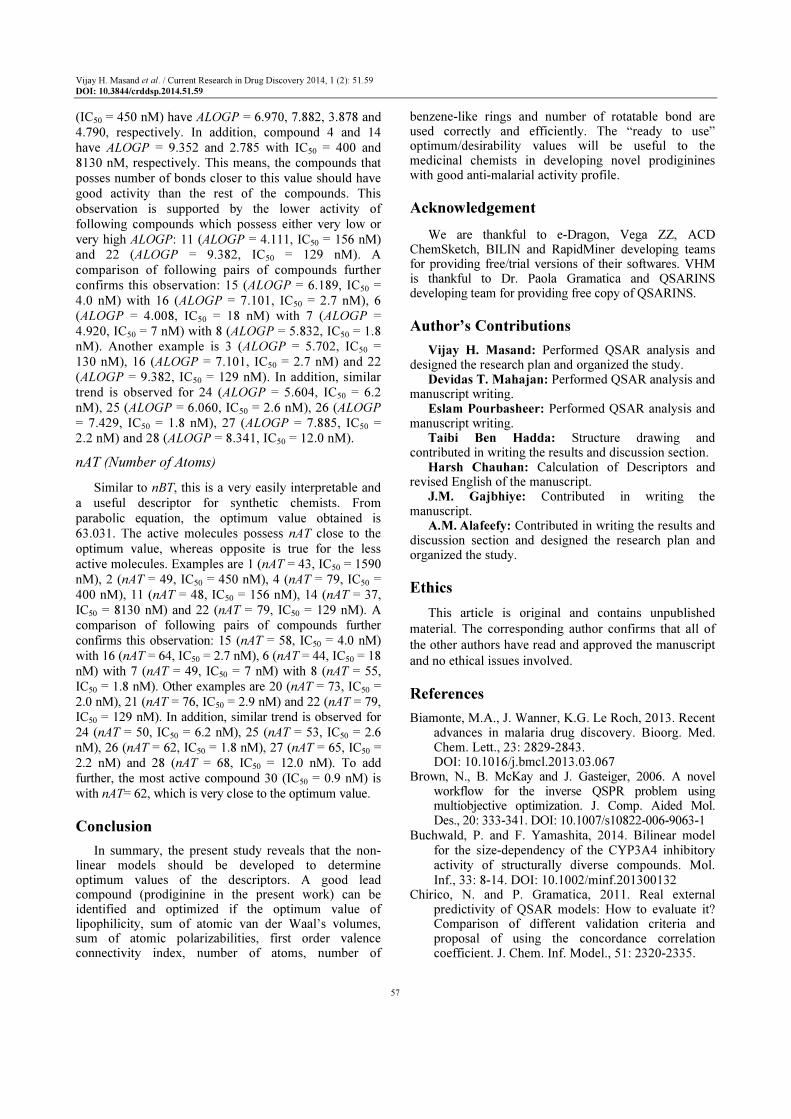
Vijay H. Masand et al. / Current Research in Drug Discovery 2014, 1 (2): 51.59
DOI: 10.3844/crddsp.2014.51.59
57
(IC50 = 450 nM) have ALOGP = 6.970, 7.882, 3.878 and
4.790, respectively. In addition, compound 4 and 14
have ALOGP = 9.352 and 2.785 with IC50 = 400 and
8130 nM, respectively. This means, the compounds that
posses number of bonds closer to this value should have
good activity than the rest of the compounds. This
observation is supported by the lower activity of
following compounds which possess either very low or
very high ALOGP: 11 (ALOGP = 4.111, IC50 = 156 nM)
and 22 (ALOGP = 9.382, IC50 = 129 nM). A
comparison of following pairs of compounds further
confirms this observation: 15 (ALOGP = 6.189, IC50 =
4.0 nM) with 16 (ALOGP = 7.101, IC50 = 2.7 nM), 6
(ALOGP = 4.008, IC50 = 18 nM) with 7 (ALOGP =
4.920, IC50 = 7 nM) with 8 (ALOGP = 5.832, IC50 = 1.8
nM). Another example is 3 (ALOGP = 5.702, IC50 =
130 nM), 16 (ALOGP = 7.101, IC50 = 2.7 nM) and 22
(ALOGP = 9.382, IC50 = 129 nM). In addition, similar
trend is observed for 24 (ALOGP = 5.604, IC50 = 6.2
nM), 25 (ALOGP = 6.060, IC50 = 2.6 nM), 26 (ALOGP
= 7.429, IC50 = 1.8 nM), 27 (ALOGP = 7.885, IC50 =
2.2 nM) and 28 (ALOGP = 8.341, IC50 = 12.0 nM).
nAT (Number of Atoms)
Similar to nBT, this is a very easily interpretable and
a useful descriptor for synthetic chemists. From
parabolic equation, the optimum value obtained is
63.031. The active molecules possess nAT close to the
optimum value, whereas opposite is true for the less
active molecules. Examples are 1 (nAT = 43, IC50 = 1590
nM), 2 (nAT = 49, IC50 = 450 nM), 4 (nAT = 79, IC50 =
400 nM), 11 (nAT = 48, IC50 = 156 nM), 14 (nAT = 37,
IC50 = 8130 nM) and 22 (nAT = 79, IC50 = 129 nM). A
comparison of following pairs of compounds further
confirms this observation: 15 (nAT = 58, IC50 = 4.0 nM)
with 16 (nAT = 64, IC50 = 2.7 nM), 6 (nAT = 44, IC50 = 18
nM) with 7 (nAT = 49, IC50 = 7 nM) with 8 (nAT = 55,
IC50 = 1.8 nM). Other examples are 20 (nAT = 73, IC50 =
2.0 nM), 21 (nAT = 76, IC50 = 2.9 nM) and 22 (nAT = 79,
IC50 = 129 nM). In addition, similar trend is observed for
24 (nAT = 50, IC50 = 6.2 nM), 25 (nAT = 53, IC50 = 2.6
nM), 26 (nAT = 62, IC50 = 1.8 nM), 27 (nAT = 65, IC50 =
2.2 nM) and 28 (nAT = 68, IC50 = 12.0 nM). To add
further, the most active compound 30 (IC50 = 0.9 nM) is
with nAT= 62, which is very close to the optimum value.
Conclusion
In summary, the present study reveals that the non-linear models should be developed to determine optimum values of the descriptors. A good lead compound (prodiginine in the present work) can be identified and optimized if the optimum value of lipophilicity, sum of atomic van der Waal’s volumes, sum of atomic polarizabilities, first order valence connectivity index, number of atoms, number of
benzene-like rings and number of rotatable bond are used correctly and efficiently. The “ready to use” optimum/desirability values will be useful to the medicinal chemists in developing novel prodiginines with good anti-malarial activity profile.
Acknowledgement
We are thankful to e-Dragon, Vega ZZ, ACD ChemSketch, BILIN and RapidMiner developing teams for providing free/trial versions of their softwares. VHM is thankful to Dr. Paola Gramatica and QSARINS developing team for providing free copy of QSARINS.
Author’s Contributions
Vijay H. Masand: Performed QSAR analysis and designed the research plan and organized the study.
Devidas T. Mahajan: Performed QSAR analysis and manuscript writing.
Eslam Pourbasheer: Performed QSAR analysis and manuscript writing.
Taibi Ben Hadda: Structure drawing and contributed in writing the results and discussion section.
Harsh Chauhan: Calculation of Descriptors and revised English of the manuscript.
J.M. Gajbhiye: Contributed in writing the manuscript.
A.M. Alafeefy: Contributed in writing the results and discussion section and designed the research plan and organized the study.
Ethics
This article is original and contains unpublished
material. The corresponding author confirms that all of
the other authors have read and approved the manuscript
and no ethical issues involved.
References
Biamonte, M.A., J. Wanner, K.G. Le Roch, 2013. Recent advances in malaria drug discovery. Bioorg. Med. Chem. Lett., 23: 2829-2843.
DOI: 10.1016/j.bmcl.2013.03.067 Brown, N., B. McKay and J. Gasteiger, 2006. A novel
workflow for the inverse QSPR problem using multiobjective optimization. J. Comp. Aided Mol. Des., 20: 333-341. DOI: 10.1007/s10822-006-9063-1
Buchwald, P. and F. Yamashita, 2014. Bilinear model for the size-dependency of the CYP3A4 inhibitory activity of structurally diverse compounds. Mol. Inf., 33: 8-14. DOI: 10.1002/minf.201300132
Chirico, N. and P. Gramatica, 2011. Real external predictivity of QSAR models: How to evaluate it? Comparison of different validation criteria and proposal of using the concordance correlation coefficient. J. Chem. Inf. Model., 51: 2320-2335.

Vijay H. Masand et al. / Current Research in Drug Discovery 2014, 1 (2): 51.59
DOI: 10.3844/crddsp.2014.51.59
58
Chirico, N. and P. Gramatica, 2012a. Real external
predictivity of QSAR models. Part 2. New
intercomparable thresholds for different validation
criteria and the need for scatter plot inspection. J.
Chem. Inf. Model., 52: 2044-2058.
Chirico, N., E. Papa, S. Kovarich, S. Cassani and P.
Gramatica, 2012b. QSARINS, software for QSAR
MLR model development and validation. University
of Insubria, Varese, Italy.
Doweyko, A.M., 2008. QSAR: Dead or alive? J.
Comput. Aided Mol. Des., 22: 81-89.
DOI: 10.1007/s10822-007-9162-7
Faulon, J.L., W. Brown and S. Martin, 2005. Reverse
engineering chemical structures from molecular
descriptors: How many solutions? J. Comp. Aided
Mol. Des., 19: 637-650.
DOI: 10.1007/s10822-005-9007-1
Gidskehaug, L., E. Anderssen and B.K. Alsberg, 2008.
Cross model validation and optimisation of bilinear
regression models. Chemo. Intell. Lab. Syst., 93:
1-10. DOI: 10.1016/j.chemolab.2008.01.005
Gramatica, P., 2013. On the development and validation of
QSAR models. Methods Mol. Biol., 930: 499-526.
DOI: 10.1007/978-1-62703-059-5_21
Gramatica, P., N. Chirico, E. Papa, S. Cassani and S.
Kovarich, 2013. QSARINS: A new software for the
development, analysis and validation of QSAR
MLR models. J. Comput. Chem., 34: 2121-2132.
DOI: 10.1002/jcc.23361
Gramatica, P., S. Cassani, P.P. Roy, S. Kovarich and
C.W. Yap et al., 2012. QSAR modeling is not “Push
a Button and Find a Correlation”: A case study of
toxicity of (Benzo-)triazoles on Algae. Mol. Inf., 31:
817-835. DOI: 10.1002/minf.201200075
Hansch, C., A. Leo, S.B. Mekapati and A. Kurup, 2004.
QSAR and ADME. Bioorg. Med. Chem. Lett., 12:
3391-3400.
DOI: 10.1016/j.bmc.2003.11.037
Huang, J. and X. Fan, 2011. Why QSAR fails: An
empirical evaluation using conventional
computational approach. Mol. Pharm., 8: 600-608.
DOI: 10.1021/mp100423u
Jager, T. and S.A.L.M. Kooijman, 2009. A biology-
based approach for Quantitative Structure-Activity
Relationships (QSARs) in ecotoxicity.
Ecotoxicology, 18: 187-196.
DOI: 10.1007/s10646-008-0271-4
Kubinyi, H., 2002. From narcosis to hyperspace: The
history of QSAR. Quant. Struct. Act. Rel., 21:
348-356.
DOI: 10.1002/1521-3838(200210)21:4<348::AID-
QSAR348>3.0.CO;2-D
Mahajan, D.T., V.H. Masand, K.N. Patil, T. Ben Hadda and R.D. Jawarkar et al., 2012. CoMSIA and POM analyses of anti-malarial activity of synthetic prodiginines. Bioorg. Med. Chem. Lett., 22: 4827-4835. DOI: 10.1016/j.bmcl.2012.05.115
Mahajan, D.T., V.H. Masand, K.N. Patil, T.B. Hadda and V. Rastija, 2013. Integrating GUSAR and QSAR analyses for antimalarial activity of synthetic prodiginines against multi drug resistant strain. Med. Chem. Res., 22: 2284-2292.
DOI: 10.1007/s00044-012-0223-7 Mara, C., E. Dempsey, A. Bell and J.W. Barlow, 2013.
Synthesis and evaluation of phenoxyoxazaphospholidine, phenoxyoxazaphosphinane and benzodioxaphosphininamine sulfides and related compounds as potential anti-malarial agents. Bioorg. Med. Chem. Lett., 23: 3580-3583.
DOI: 10.1016/j.bmcl.2013.04.026 Martin, T.M., P. Harten, D.M. Young, E.N. Muratov and
A. Golbraikh et al., 2012. Does rational selection of training and test sets improve the outcome of QSAR modeling? J. Chem. Inf. Model., 52: 2570-2578.
Masand, V.H., D.T. Mahajan, K.N. Patil, K.D. Chinchkhede and R.D. Jawarkar et al., 2012b. k-NN, quantum mechanical and field similarity based analysis of xanthone derivatives as α-glucosidase inhibitors. Med. Chem. Res., 21: 4523-4534.
DOI: 10.1007/s00044-012-9995-z Masand, V.H., D.T. Mahajan, K.N. Patil, T.B. Hadda
and M.H. Youssoufi et al., 2013b. Optimization of antimalarial activity of synthetic prodiginines: QSAR, GUSAR and CoMFA analyses. Chem. Biol. Drug. Des., 81: 527-536.
DOI: 10.1111/cbdd.12099 Masand, V.H., D.T. Mahajan, T. Ben Hadda, R.D.
Jawarkar and H. Chavan, 2013a. Molecular Docking and Quantitative Structure Activity Relationship (QSAR) analyses of indolylarylsulfones as HIV-1 non-nucleoside reverse transcriptase inhibitors. Med. Chem. Res. DOI: 10.1007/s00044-013-0647-8
Masand, V.H., R.D. Jawarkar, D.T. Mahajan, T.B. Hadda and J. Sheikh et al., 2012a. QSAR and CoMFA studies of biphenyl analogs of the anti-tuberculosis drug (6S)-2-nitro-6-{[4-(trifluoromethoxy)benzyl]oxy}-6,7-dihydro-5H-imidazo [2,1-b][1,3]oxazine (PA-824). Med. Chem. Res., 21: 2624-2629.
DOI: 10.1007/s00044-011-9787-x Mitra, I., P.P. Roy, S. Kar, P.K. Ojha and K. Roy, 2010.
On further application of 2
mr as a metric for
validation of QSAR models. J. Chemomem., 24: 22-33. DOI: 10.1002/cem.1268
Murugesan, D., A. Mital, M. Kaiser, D.M. Shackleford and J. Morizzi et al., 2013. Discovery and structure-activity relationships of pyrrolone antimalarials. J. Med. Chem., 56: 2975-2990.
DOI: 10.1021/jm400009c
Vijay H. Masand et al. / Current Research in Drug Discovery 2014, 1 (2): 51.59
DOI: 10.3844/crddsp.2014.51.59
59
Myint, K.Z. and X.Q. Xie, 2010. Recent advances in fragment-based QSAR and multi-dimensional QSAR methods. Int. J. Mol. Sci., 11: 3846-3866. DOI: 10.3390/ijms11103846
Ojha, P.K. and K. Roy, 2012. First report on exploring structural requirements of 1,2,3,4- Tetrahydroacridin-9(10H)-one analogs as antimalarials using multiple QSAR approaches: Descriptor-based QSAR, CoMFA-CoMSIA 3DQSAR, HQSAR and G-QSAR approaches.
Comb. Chem. High Throughput Screen, 16: 7-21. Papireddy, K., M. Smilkstein, J.X. Kelly S.M. Salem and
M. Alhamadsheh et al., 2011. Antimalarial activity
of natural and synthetic prodiginines. J. Med.
Chem., 54: 5296-5306.
DOI: 10.1021/jm200543y
Rastija, V., S. Nikolic and V.H. Masand, 2013.
Quantitative relationships between structure and
lipophilicity of naturally occurring polyphenols.
Acta Chim. Slov., 60: 781-789.
Roy, K. and I. Mitra, 2012. On the use of the metric rm 2
as an effective tool for validation of QSAR models
in computational drug design and predictive
toxicology. Mini. Rev. Med. Chem., 12: 491-504. DOI: 10.2174/138955712800493861
Saha, A. and K. Roy, 2012. In silico modeling for
prediction of drug-induced adverse reactions and
environmental hazards using QSAR tools. Curr.
Drug Saf., 7: 255-256. DOI: 10.2174/157488612804096560 Scior, T., J.L. Medina-Franco, Q.T. Do, K. Martinez-
Mayorga and J.A. Yunes Rojas et al., 2009. How to
recognize and workaround pitfalls in QSAR studies:
A critical review. Curr. Med. Chem., 16: 4297-4313.
DOI: 10.2174/092986709789578213
Tropsha, A., 2010. Best practices for QSAR model
development, validation and exploitation. Mol.
Inform., 29: 476-488. DOI: 10.1002/minf.201000061
©SRDE Group, All Rights Reserved. Int. J. Res. Dev. Pharm. L. Sci. 1206
International Journal of Research and Development in Pharmacy and Life Sciences Available online at http//www.ijrdpl.com
August - September, 2014, Vol. 3, No.5, pp 1206-1210 ISSN: 2278-0238
Research Article
STUDIES OF ACOUSTIC BEHAVIOR OF 3-(2-BENZIMIDAZOL)-3-NITRO-6-METHYL-
CHROMEN-4-ONE (BNMC) IN A DIFFERENT SOLVENTS SYSTEM BY USING ULTRASONIC
INTERFEROMETER
S.A.Quazi1, D.T.Mahajan2, Vijay Masand3, Noor Mohammad4, M.R. Ingle5
(Received: May 03, 2014; Accepted: July 29, 2014)
ABSTRACT
By using various acoustic parameters ultrasonic velocity of3-(2-benzimidazol)-3-nitro-6-methyl-chromen-4 one (BNMC) in different solvent mixtures has been investigated to understand the effect of (BNMC) in interaction with water and organic solvent. Keywords: Apparent molal adiabatic compressibility, Hydration numbers, 3-(2-benzimidazol)-3-nitro-6-methyl-chromen-4-one(BNMC),dioxane-water mixture, Interferometer. INTRODUCTION
Vibrational waves of frequency above hearing range of
normal ear are referred as Ultrasonic waves. All waves of
frequencies more than 20 KHz are Ultrasonic waves. The
waves are being used for detected of flaws of materials,
mechanical cleaning of surface etc,in the field of technology.
In medicinal science too, the waves are being used to detect
cancer tumors, bone fractures, cardiology etc. In present day
applications of Ultrasonic are emerging in the field of
forensic sciences, space research and in wars.Studies of
stability constants and thermodynamically parameters (∆H,
∆G, ∆S) of inner transition metal ions complexes with
substituted chromoneschiff bases 70% dioxane – water
solvent1.Studies of some acoustic parameters of cu (No3)2 in
water-dioxane mixture at 298.150k by physico -chemical
method2.Adiabatic molal Compressibility and apparent
molal volumes of many electrolytes in mixed organic solvent
are found out earlier3-8. Recently some co-workers have
investigated acoustic parameters of some binary liquids
mixture at different temperatures 9-15.Narwade et
a16have studied the adiabatic compressibility and apparent
molar volume of substitute pyrazoles in water-dioxane
mixture.Deosarkar17have investigated the
adiabaticcompressibility, apparent molar compressibility and
other parameters of pyrazoles in aqueous acetone-mixture.
Hydration numbers are calculated using partial molal volume
and adiabatic compressibility data.Pawar18have studied
the apparent molal adiabatic compressibility andhydration
numbers of some peptides. Khobragadeet al19have
investigated apparent molal compressibility for isoxazoline
1. Department of chemistry, VidyaBhartiMahavidyalaya, Camp, Amravati (M.S) India
2. Department of chemistry, Govt.Vidarbha Institute of Sci. and Humanities, Amravati (M.S) India
3. Department of chemistry, G.S college, Khamgaon
*Corresponding Author: Email: [email protected]
Quazi S. A. et. al., August - September, 2014, 3(5), 1206-1210
©SRDE Group, All Rights Reserved. Int. J. Res. Dev. Pharm. L. Sci. 1207
in 70% dioxane-water mixture.This paper is in continuation
to our research work on ultrasonic investigation of adiabatic
molalcompressibilities and apparent molal volume of 3-(2-
benzimidazol)-3-nitro-6-methyl-chromen-4-one(BNMC),
dioxane- water mixture.
EXPERIMENTAL SECTION
Instruments
Pyknometer:
Pyknometer (Borosil make) are used in the present
investigation for measuring the densities. Pyknometer were
standardized by the standard procedure20.
Balance
Weighing was made on MechanikiZaktadyPrecyzyjnej
Gdansk balance, made in Poland (±0.001 gm).
Ultrasonic Interferometer:
An ultrasonic interferometer MX-3 model (Mittal Enterprises,
Delhi) having frequency 2MHz and accuracy ±0.03% was
used for the measurement of ultrasonic velocity in solutions.
Thermostat
A special thermostatic arrangement was done for density
and ultrasonic velocity measurements. Elite Thermostatic
water bath was used, in which continuous stirring of water
was carried out with the help of electric stirrer and
temperature variation was maintain within ±0.10C.
Solvents and chemicals
All chemicals are analytical reagent (AR) grade with were
obtained from SdFine chemicals, India which is used as such
without further purification. Water used in the experiment
was demonized, distilled and degassed prior to making
solutions. The cell of ultrasonic interferometer was filled fully
with the solution and needle of ammeter was adjusted in the
range of 20 to 60 with the help of “Adj” knob. It was
warmed for 10 minutes so that the range should remain
steady. Micrometer reading was noted. Screw was moved
anticlockwise to get the maximum deflections of needle. To
movement of screw was co untied to gate 5 deflection. After
retuning back to its original position, Micrometer screw was
noted. The difference between these two readings gave the
distance travelled by screw for getting five maxima. From
this distance required though which micrometer screw should
move for one maximum was calculated by dividing it by 5.
Same procedure repeated many times. The apparent molal
volume (Φv) and apparent molar adiabatic compressibility
(Φ K(s)) of (BNMC) in solution are determined from density
(dS) and adiabatic compressibility (βs) of solution calculated
by using following equations.
Φ K(s) = (( sdo- ods)〖10〗^3)/(m×ds×do) + sM/ds
…………… (1)
Table – 1 Ultrasonic Velocity in Distilled Water; Ultrasonic Frequency = 2 MHZ; Temp. 27± 0.1°C
Sr. No. Number of rotation of Screw
Micrometer Reading (mm)
Difference between Reading (mm)
Distance traveled by Screw for one maxima [(D)mm]
Ultrasonic Velocity [(U)msec-
1]
1 5 25.15 0.392 1649
2 10 23.17 1.86 0.393 1645
3 15 21.21 1.8 0.393 1645
4 20 19.25 1.84 0.392 1641
5 25 17.34 1.83 0.391 1637
6 30 15.32 1.82 0.3905 1633
Quazi S. A. et. al., August - September, 2014, 3(5), 1206-1210
©SRDE Group, All Rights Reserved. Int. J. Res. Dev. Pharm. L. Sci. 1208
Table - 2 Ultrasonic Velocity In 20% of ethanol-water, acetone-water & Dioxane-water mixtures
System - (BNMC) Ultrasonic Frequency = 2 MHz
Temp. 27± 0.1°C Molality =0.0091
Ultrasonic Velocity In 20% Ethanol-Water Mixture
Sr. No.
Number of
rotation of
Screw
Micrometer
Reading (mm)
Difference
between
Reading
(mm)
Distance traveled by
Screw for one
maxima [(D)mm]
Ultrasonic
Velocity
[(U)msec-1]
1
5
22.75
0.3840
1650
2
10
21.50
1.96
0.3825
1645
3
15
21.20
1.92
0.3878
1635
4
20
18.90
1.90
0.3844
1630
5
25
17.85
1.87
0.3851
1627
6
30
17.20
1.84
0.3867
1622
Average 0.3850 1634
Ultrasonic Velocity In 20% Acetone- Water Mixture
1
5
27.15
0.3750
1540
2
10
26.90
1.98
0.3720
1535
3
15
25.21
1.94
0.3770
1535
4
20
23.95
1.92
0.3740
1531
5
25
22.34
1.90
0.3750
1527
6
30
21.30
1.87
0.3760
1523
Average 0.3748 1531
Quazi S. A. et. al., August - September, 2014, 3(5), 1206-1210
©SRDE Group, All Rights Reserved. Int. J. Res. Dev. Pharm. L. Sci. 1209
Contd.
Ultrasonic Velocity In 20% Ethanol-Water Mixture
Number of
rotation of
Screw
Micrometer
Reading (mm)
Difference
between
Reading
(mm)
Distance traveled by
Screw for one
maxima [(D)mm]
Ultrasonic
Velocity
[(U)msec-1]
Ultrasonic Velocity In 20% Dioxane- Water Mixture
1
5
26.10
0.3950
1544
2
10
25.90
1.99
0.3920
1552
3
15
24.25
1.97
0.3970
1536
4
20
22.91
1.96
0.3940
1539
5
25
21.30
1.93
0.3950
1528
7
30
20.35
1.89
0.3960
1526
Average 0.3944 1537.5
Table 3 Φ K(s) &Φ v values along with other parameters in 20% of ethanol-water, acetone-water &dioxane-water mixtures of
ligand (BMNC) Ultrasonic frequency: 2MHz Temp 27+0.10C
Parameters
Solvent percentage (v/v) 20
Ethanol-Water Dioxane- Water Acetone- Water Molality 0.0091 0.0091 0.0091 D0 0.4680 0.4623 0.4666 d0 1.0651 0.0398 0.0365 U0 1570.0 1592.0 1559.0 B0 46.5551 44.8001 48.6050 DS 0.4850 0.4948 0.4632 dS 1.0743 1.0203 1.0091 Us msec-1 1610.0 1657.0 1582.0 βs ×108 44.30 40.91 48.23
βs ds×108 47.5213 45.6740 45.8760
βs d0×108 45.2543 43.4876 49.5678
ΦK(s) ×104 0.8932 -26.4237 49.76521 Φv 540.87 2457.32 7321.10
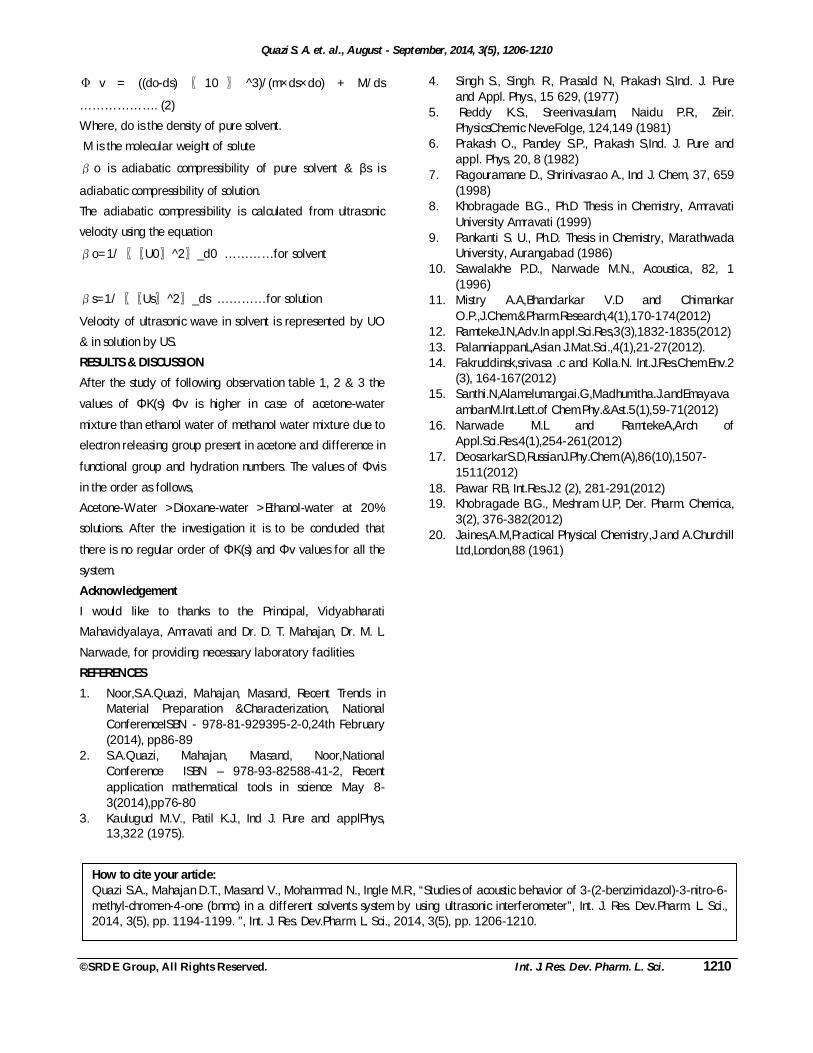
Quazi S. A. et. al., August - September, 2014, 3(5), 1206-1210
©SRDE Group, All Rights Reserved. Int. J. Res. Dev. Pharm. L. Sci. 1210
Φ v = ((do-ds) 〖 10 〗 ^3)/(m×ds×do) + M/ds
………………. (2)
Where, do is the density of pure solvent.
M is the molecular weight of solute
βo is adiabatic compressibility of pure solvent & βs is
adiabatic compressibility of solution.
The adiabatic compressibility is calculated from ultrasonic
velocity using the equation
βo=1/〖〖U0〗^2〗_d0 …………for solvent
βs=1/〖〖Us〗^2〗_ds …………for solution
Velocity of ultrasonic wave in solvent is represented by UO
& in solution by US.
RESULTS & DISCUSSION
After the study of following observation table 1, 2 & 3 the
values of ΦK(s) Φv is higher in case of acetone-water
mixture than ethanol water of methanol water mixture due to
electron releasing group present in acetone and difference in
functional group and hydration numbers. The values of Φvis
in the order as follows,
Acetone-Water >Dioxane-water >Ethanol-water at 20%
solutions. After the investigation it is to be concluded that
there is no regular order of ΦK(s) and Φv values for all the
system.
Acknowledgement
I would like to thanks to the Principal, Vidyabharati
Mahavidyalaya, Amravati and Dr. D. T. Mahajan, Dr. M. L.
Narwade, for providing necessary laboratory facilities.
REFERENCES
1. Noor,S.A.Quazi, Mahajan, Masand, Recent Trends in Material Preparation &Characterization, National ConferenceISBN - 978-81-929395-2-0,24th February (2014), pp86-89
2. S.A.Quazi, Mahajan, Masand, Noor,National Conference ISBN – 978-93-82588-41-2, Recent application mathematical tools in science May 8-3(2014),pp76-80
3. Kaulugud M.V., Patil K.J., Ind J. Pure and applPhys, 13,322 (1975).
4. Singh S., Singh. R., Prasald N, Prakash S,Ind. J. Pure and Appl. Phys., 15 629, (1977)
5. Reddy K.S., Sreenivasulam, Naidu P.R., Zeir. PhysicsChemic NeveFolge, 124,149 (1981)
6. Prakash O., Pandey S.P., Prakash S,Ind. J. Pure and appl. Phys, 20, 8 (1982)
7. Ragouramane D., Shrinivasrao A., Ind J. Chem, 37, 659 (1998)
8. Khobragade B.G., Ph.D Thesis in Chemistry, Amravati University Amravati (1999)
9. Pankanti S. U., Ph.D. Thesis in Chemistry, Marathwada University, Aurangabad (1986)
10. Sawalakhe P.D., Narwade M.N., Acoustica, 82, 1 (1996)
11. Mistry A.A,Bhandarkar V.D and Chimankar O.P.,J.Chem.&Pharm.Research,4(1),170-174(2012)
12. RamtekeJ.N,Adv.In appl.Sci.Res,3(3),1832-1835(2012) 13. PalanniappanL,Asian J.Mat.Sci.,4(1),21-27(2012). 14. Fakruddinsk,srivasa .c and Kolla.N. Int.J.Res.Chem.Env.2
(3), 164-167(2012) 15. Santhi.N,Alamelumangai.G,Madhumitha.J.andEmayava
ambanM.Int.Lett.of Chem.Phy.&Ast.5(1),59-71(2012) 16. Narwade M.L and RamtekeA,Arch of
Appl.Sci.Res.4(1),254-261(2012) 17. DeosarkarS.D,RussianJ.Phy.Chem.(A),86(10),1507-
1511(2012) 18. Pawar R.B, Int.Res.J.2 (2), 281-291(2012) 19. Khobragade B.G., Meshram U.P, Der. Pharm. Chemica,
3(2), 376-382(2012) 20. Jaines,A.M,Practical Physical Chemistry,J and A.Churchill
Ltd,London,88 (1961)
How to cite your article: Quazi S.A., Mahajan D.T., Masand V., Mohammad N., Ingle M.R., “Studies of acoustic behavior of 3-(2-benzimidazol)-3-nitro-6-methyl-chromen-4-one (bnmc) in a different solvents system by using ultrasonic interferometer”, Int. J. Res. Dev.Pharm. L. Sci., 2014, 3(5), pp. 1194-1199. ”, Int. J. Res. Dev.Pharm. L. Sci., 2014, 3(5), pp. 1206-1210.
Theoretical based studies of ultrasonic velocities in dioxane -water mixtures of 4-
bromo-2-{(e)-[(4-chlorophenyl) imino] methyl}phenol at different temperatures
Noor Mohammad1, S.A.Quazi2, D.T.Mahajan2, Vijay.H.Masand2, M.R.Ingle3 1)Department of Chemistry, Govt.Vidarbha Institute of Sci. and Humanities, Amravati (M.S) India
2)Department of Chemistry, Vidya Bharti Mahavidyalaya, Amravati (M.S.) India 3)Department of Chemistry, G.S.College, Khamgaon(M.S) India
ABSTRACT
Ultrasonic velocity examined from Nomoto’s relation, Van Dael ideal mixing relation, impedance relation, Rao’s specific velocity relation and Junjie’s theory has been compared in the mixtures of 4-bromo-2-{(e)-[(4-chlorophenyl)imino]methyl}phenol as a common component with different percentage of dioxane- water mixture at 305.15, 310.15, 315.15 and 320.15 K . A good agreement has been justified between experimental and theoretical ultrasonic velocities.U2
exp/U2mix has also been evaluated for non-ideality in the mixtures. The
relative applicability of above theories to the present systems has been compared and discussed. The results are highlighted on the basis of molecular interactions occurring in these liquid mixtures. Key words: Ultrasonic velocity, 4-bromo-2-{(e)-[(4-chlorophenyl) imino] methyl} phenol, dioxane- water mixture.
INTRODUCTION
Acoustics parameter like ultrasonic dealing with sound above the audible range and frequencies are higher than 20,000 Hz and their wavelengths are small. The results was showed in terms of molecular interactions, ultrasonic investigations on liquid mixtures and compared the experimental results of ultrasonic velocity with theoretical relations of Nomoto 1, Van dael and Vangeel 2,impedence relation 3, Rao’s specific velocity 4 and Junjie 5 carried out by some scholars6-10.Ultrasonic velocities in dioxane- water mixtures of 4-bromo-2-{(e)-[(4-chlorophenyl)imino]methyl}phenol(L) by using the above theoretical relations are compared with the experimental values of ultrasonic velocities at different temperatures 305.15, 310.15and 315.15 K and study the molecular interaction from the deviation in the values of U2
exp/U2mix on the basis of earlier studies. Studies of
acoustic behavior of 3-(2-benzimidazol)-3-nitro-6-methylchromen-4-one (BNMC) in a different solvents system by using ultrasonic interferometer11.
EXPERIMENTAL PROCEDURE
All chemicals are analytical reagent (AR) grade with were obtained from Sd Fine chemicals, India which is used as such without further purification. After literature survey 12,13the purity of samples was checked. The mixtures were prepared of required proportions by Job’s method of continuous variation. Weighing was made on Mechaniki Zaktady Precyzyjnej Gdansk Balance, made in Poland (± 0.001 gm). The speed of sound waves was obtained by using variable path, single crystal interferometer (Mittal Enterprises, Model MX-3) with accuracy of ± 0.03% and frequency 1 MHz A special thermostatic arrangement was done for density and ultrasonic velocity measurements. Elite thermostatic water bath was used; in which continuous stirring of water was carried out with the help of electric stirrer and temperature variation was maintained within ± 0.1°C.
THEOROTICAL RELATION FOR ULTRASONIC VELOCITY
1. Nomoto relation
UN = [(x1R1+x2R2) / (x1V1+x2V2)] 3……………………..1 Where, R- molar sound velocity x1and x2 - mole fractions of liquid mixture V- is molar volume. 2. Van Dael and Vangeel relation
Umix = [(x1/M1U21 + x2/M2U2
2) (x1M1+x2M2)]-1/2……………..2 Where, Umix- mixing ultrasonic velocity in liquid mixture U1 and U2 -ultrasonic velocities of individual compounds.
Noor Mohammad et al./ International Journal of Pharma Sciences and Research (IJPSR)
ISSN : 0975-9492 Vol 5 No 12 Dec 2014 1045
3. Impedance relation
UImp = �xiZi /��xi�i…………………….3 Where,xi - mole fraction,
�i - density of the mixture Zi -acoustic impedance
4. Rao’s velocity
UR= (�xi ri �i)3 …………………………..4 Where, xi - mole fraction Ui -ultrasonic velocity, �i - density of the mixture
ri -Rao’s specific sound velocity = U1/3i /�i
Zi -acoustic impedance 5. Jungie equation
UJ = (x1M1/�1 + x2M2/�2)/ [{x1M1+x2M2}1/2 x {x1M1/�1U21+x2M2/�2U2
2}]1/2…5 Where, M1, M2 - molecular weights of constituent components, �������������������������1 and �2 -densities of constituent components.
RESULTS AND DISCUSSION
Comparative study of theoretical values of ultrasonic velocities and which obtained experimentally in the present liquid mixtures is explained the nature of interaction between the component molecules in the mixture. Theoretical study is useful in building the comprehensive theoretical model for the liquid mixtures. The theoretical values of ultrasonic velocities calculated by using the above all equations i.e. 1-5. and the experimental values for mixtures at different temperatures of 305.15, 310.15 and315.15 K are given in below table. From table it is clear that the theoretical values of ultrasonic velocity calculated by using various theories show deviation from experimental values. Due to the limitations and approximation of these theories are responsible for the deviations of theoretical values from experimental values. In Nomoto’s theory, it is supposed that the volume does not change on mixing. On mixing of liquids, the interaction between the molecules of liquids takes place due to the presence of various factors such as dispersive forces, charge transfer, hydrogen bonding, dipole-dipole and dipole-induced dipole interactions. The deviations of experimental values from theoretical values calculated using van Dael and Vangeel equation might be due to the compressibility of the component liquids in the present mixtures. The deviations of experimental values and calculated values from impedance relation and Rao’s relation simply non-additively of acoustic impedance and Rao’s velocity in the liquid mixtures. In case of Junjie’s relation large deviations are observed.It is reveals that, the observed deviation of theoretical values of velocity from the experimental values shows that there are molecular interactions takes place. On rising the temperature, the ultrasonic velocity values decrease in the liquid mixtures. Theoretical results of ultrasonic velocities in liquid mixtures are showed, it is observed that out of all five theories Nomoto’s theory gives best results followed by Impedance dependence relation in all the systems studied.
Noor Mohammad et al./ International Journal of Pharma Sciences and Research (IJPSR)
ISSN : 0975-9492 Vol 5 No 12 Dec 2014 1046
Table-A : Experimental and theoretical values of velocities (m.s-1) in L + water- dioxane system at 305.15K
X1 Uexp UN Umix UImp UR UJ 0.0000 1585.27 1585.27 1585.27 1585.27 1585.27 1559.10
0.0889 1600.01 1592.02 1590.08 1591.61 1591.26 1561.95
0.1799 1609.48 1598.79 1595.24 1598.05 1597.42 1564.88
0.2733 1615.80 1605.58 1600.79 1604.60 1603.76 1567.89
0.3691 1625.27 1612.39 1606.75
1611.26 1610.28 1570.98
0.4673 1631.59 1619.23 1613.17 1618.03
1616.98 1574.16
0.5682 1634.22 1626.08
1620.08 1624.92 1623.89 1577.41
0.6718 1637.90 1632.95 1627.54 1631.93
1631.01 1580.75
0.7783 1644.22 1639.84 1635.59 1639.06 1638.34
1584.17
0.8877
1650.54 1646.76 1644.28 1646.31 1645.90 1587.68
1.0002 1653.69 1653.69 1653.69
1653.69 1653.69 1591.29
Table-B: Experimental and theoretical values of velocities (m.s-1) in L + Water- dioxane system at 310.15 K
X1 Uexp UN Umix UImp UR UJ
0.0000 1465.27 1565.27 1465.27 1465.27 1465.27 1439.10
0.0889 1580.08 1572.09 1570.15 1571.68 1571.34 1542.02
0.1799 1589.59 1578.88 1575.36 1578.15 1577.54 1544.98
0.2733 1575.87 1565.65 1560.84 1564.67 1563.83 1527.97
0.3691 1605.34 1592.41 1596.75
1591.28 1590.30 1550.98
0.4673 1611.59 1599.25 1593.17 1598.05
1596.98 1554.19
0.5682 1614.24 1606.08
1600.10 1604.92 1603.89 1557.43
0.6718 1617.90 1612.97 1617.56 1611.95
1611.04 1560.78
0.7783 1624.24 1619.84 1615.63 1619.08 1618.34
1564.19
0.8877
1630.56 1626.78 1624.29 1626.31 1625.92 1567.70
1.0002 1633.69 1633.69 1633.68
1633.70 1633.69 1571.31
Noor Mohammad et al./ International Journal of Pharma Sciences and Research (IJPSR)
ISSN : 0975-9492 Vol 5 No 12 Dec 2014 1047
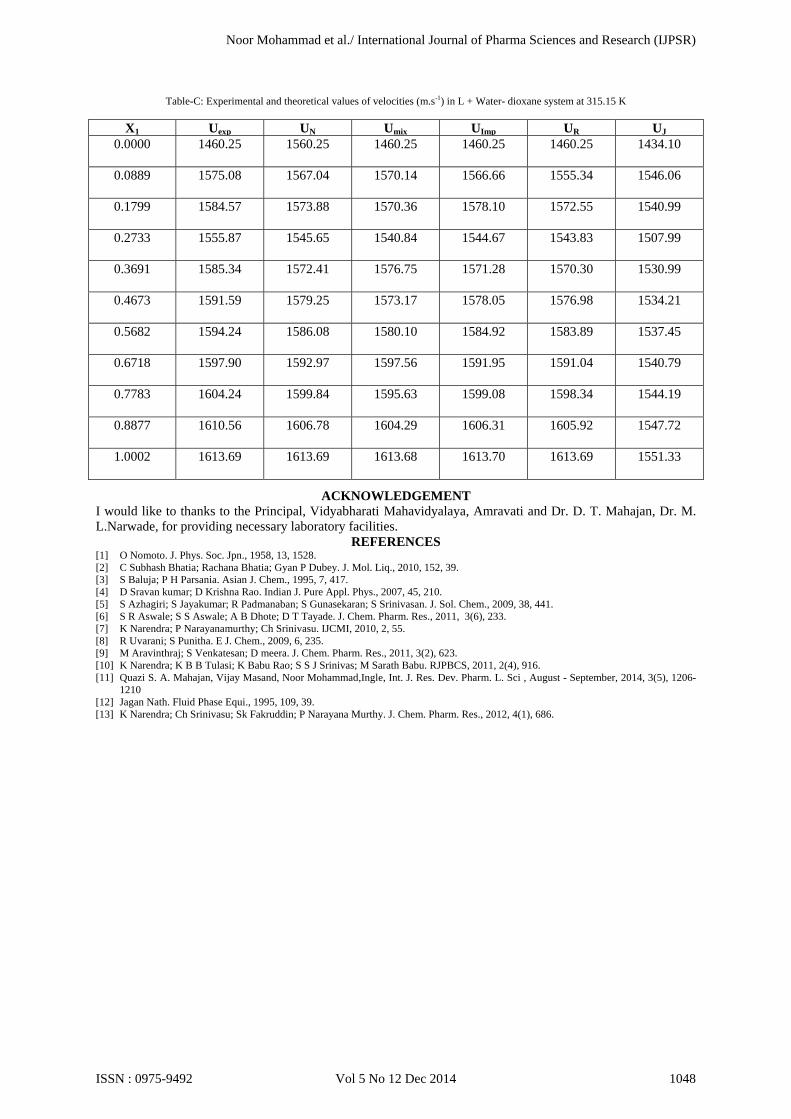
Table-C: Experimental and theoretical values of velocities (m.s-1) in L + Water- dioxane system at 315.15 K
X1 Uexp UN Umix UImp UR UJ 0.0000 1460.25 1560.25 1460.25 1460.25 1460.25 1434.10
0.0889 1575.08 1567.04 1570.14 1566.66 1555.34 1546.06
0.1799 1584.57 1573.88 1570.36 1578.10 1572.55 1540.99
0.2733 1555.87 1545.65 1540.84 1544.67 1543.83 1507.99
0.3691 1585.34 1572.41 1576.75
1571.28 1570.30 1530.99
0.4673 1591.59 1579.25 1573.17 1578.05
1576.98 1534.21
0.5682 1594.24 1586.08
1580.10 1584.92 1583.89 1537.45
0.6718 1597.90 1592.97 1597.56 1591.95
1591.04 1540.79
0.7783 1604.24 1599.84 1595.63 1599.08 1598.34
1544.19
0.8877
1610.56 1606.78 1604.29 1606.31 1605.92 1547.72
1.0002 1613.69 1613.69 1613.68
1613.70 1613.69 1551.33
ACKNOWLEDGEMENT I would like to thanks to the Principal, Vidyabharati Mahavidyalaya, Amravati and Dr. D. T. Mahajan, Dr. M. L.Narwade, for providing necessary laboratory facilities.
REFERENCES [1] O Nomoto. J. Phys. Soc. Jpn., 1958, 13, 1528. [2] C Subhash Bhatia; Rachana Bhatia; Gyan P Dubey. J. Mol. Liq., 2010, 152, 39. [3] S Baluja; P H Parsania. Asian J. Chem., 1995, 7, 417. [4] D Sravan kumar; D Krishna Rao. Indian J. Pure Appl. Phys., 2007, 45, 210. [5] S Azhagiri; S Jayakumar; R Padmanaban; S Gunasekaran; S Srinivasan. J. Sol. Chem., 2009, 38, 441. [6] S R Aswale; S S Aswale; A B Dhote; D T Tayade. J. Chem. Pharm. Res., 2011, 3(6), 233. [7] K Narendra; P Narayanamurthy; Ch Srinivasu. IJCMI, 2010, 2, 55. [8] R Uvarani; S Punitha. E J. Chem., 2009, 6, 235. [9] M Aravinthraj; S Venkatesan; D meera. J. Chem. Pharm. Res., 2011, 3(2), 623. [10] K Narendra; K B B Tulasi; K Babu Rao; S S J Srinivas; M Sarath Babu. RJPBCS, 2011, 2(4), 916. [11] Quazi S. A. Mahajan, Vijay Masand, Noor Mohammad,Ingle, Int. J. Res. Dev. Pharm. L. Sci , August - September, 2014, 3(5), 1206-
1210 [12] Jagan Nath. Fluid Phase Equi., 1995, 109, 39. [13] K Narendra; Ch Srinivasu; Sk Fakruddin; P Narayana Murthy. J. Chem. Pharm. Res., 2012, 4(1), 686.
Noor Mohammad et al./ International Journal of Pharma Sciences and Research (IJPSR)
ISSN : 0975-9492 Vol 5 No 12 Dec 2014 1048
Molecules 2014, 19, 17187-17201; doi:10.3390/molecules191117187
molecules ISSN 1420-3049
www.mdpi.com/journal/molecules
Article
Synthesis, X-ray Diffraction, Thermogravimetric and DFT
Analyses of Pyrimidine Derivatives
Assem Barakat 1,2,†,*, Hany J. Al-Najjar 1,†, Abdullah M. Al-Majid 1,†, Syed F. Adil 1,†,
Mohamed Ali 3,†, Vijay H. Masand 4,†, Hazem A Ghabbour 5,† and Hoong-Kun Fun 5,6,†
1 Department of Chemistry, College of Science, King Saud University, P.O. Box 2455,
Riyadh 11451, Saudi Arabia 2 Department of Chemistry, Faculty of Science, Alexandria University, P.O. Box 426, Ibrahimia,
Alexandria 21321, Egypt 3 Petrochemical Research Chair, Department of Chemistry, College of Science,
King Saud University, B.O. 2455, Riaydh 11451, Saudi Arabia 4 Department of Chemistry, Vidya Bharati College, Amravati, Maharashtra 444602, India 5 Department of Pharmaceutical Chemistry, College of Pharmacy, King Saud University,
P.O. Box 2457, Riyadh 11451, Saudi Arabia 6 X-ray Crystallography Unit, School of Physics, Universiti Sains Malaysia, 11800 USM,
Penang, Malaysia
† These authors contributed equally to this work.
* Author to whom correspondence should be addressed; E-Mail: [email protected];
Tel.: +96-6146-75884; Fax: +96-6146-75992.
External Editor: Derek J. McPhee
Received: 25 September 2014; in revised form: 16 October 2014 / Accepted: 17 October 2014 /
Published: 24 October 2014
Abstract: An eco-benign synthesis of pyrimidine derivatives 2a,b containing different
functional groups with different electronic character starting from nitroalkenes 1a and 2b
has been described. The structures for 1a and 2a,b have been characterized by single crystal
X-ray diffraction analysis. The thermal data of the molecules pointed towards important
structural aspects of their stability. The mechanism of their thermal decomposition is
discussed. The thermodynamic parameters of the dissociation steps were evaluated and
discussed. DFT calculations reveal that the compound 1a possesses a high calculated dipole
moment value (8.28 D) which indicates its high reactivity towards its surrounding molecules.
OPEN ACCESS
Molecules 2014, 19 17188
Keywords: pyrimidine; X-ray; DFT; TGA; FT-IR
1. Introduction
Pyrimidine and its derivatives, which are important N-heterocyclic molecules, have received the
consideration of researchers due to their significant biological and pharmaceutical properties. Pyrimidine
and its derivatives have immense importance as antibiotics, and as crucial parts of many vitamins, and
coenzymes. Indeed, some of them are the basic constituents of DNA and RNA, and play an important role
in the constitutional properties of nucleic acids. Pyrimidine-derived biomolecules have received much
attention from spectroscopists, drug, clinical, and industrial researchers because of their therapeutic
importance [1–9]. Barbiturates (barbituric acid derivatives) are a class of central nervous system
depressants, [10] utilized as sedatives, sleeping agents, hypnotics, anxiolytics, anticonvulsants, and
anesthetics [7]. In addition, they have additional pharmacological activities as antioxidant anxiolitics,
analeptics, anti-AIDA, immunomodulatory, anticancer agents and in other psychiatric disorders, and
possess effects on motor and sensory functions [11–15] For example, phenobarbital, a 5-alkylated
barbituric acid, was reported to exhibit sedative and hypnotic properties, and most importantly is an
anticonvulsant [16].
In continuation of our research program [17–23], in the present work, the structures of some
pyrimidine derivatives were characterized for the first time by single-crystal crystallography and TGA
studies. DFT calculations were undertaken to study the optimized molecular structural parameters,
vibrational frequencies, thermodynamic parameters, total dipole moment and HOMO-LUMO energy
gap for the synthesized molecules using B3LYP/6-311G(d,p) basis set. The findings of these
spectroscopic and theoretical studies are reported herein.
2. Results and Discussion
2.1. Synthesis of the Pyrimidine Derivatives
Green chemistry is being increasingly exploited as a powerful tool for the generation of privileged
medicinal scaffolds and fine chemicals due to its numerous advantages, such as providing high
enantio- and regioselectivity and more environmentally friendliness.
Recently, research groups have become involved in using green chemistry as a synthetic tool for
the generation of valuable scaffolds to achieve new biological knowledge. The chemistry used in this
paper involves an aqueous diethylamine catalyzed Michael addition of 1,3-dimethylbarbituric acid to
nitro-olefins at room temperature for less than 1 h [16] (Scheme 1).
2.2. X-ray Crystal Structures
The structures of 1a and 2a,b were confirmed by single crystal X-ray analysis (Figure 1).
Tables 1–7 display the crystal data and main geometrical parameters of the compounds.
X-ray analysis was performed using a Bruker Apex II D8 Venture diffractometer (Bruker AXS
GmbH, Karlsruhe, Germany). The data were processed with SAINT and corrected for absorption using
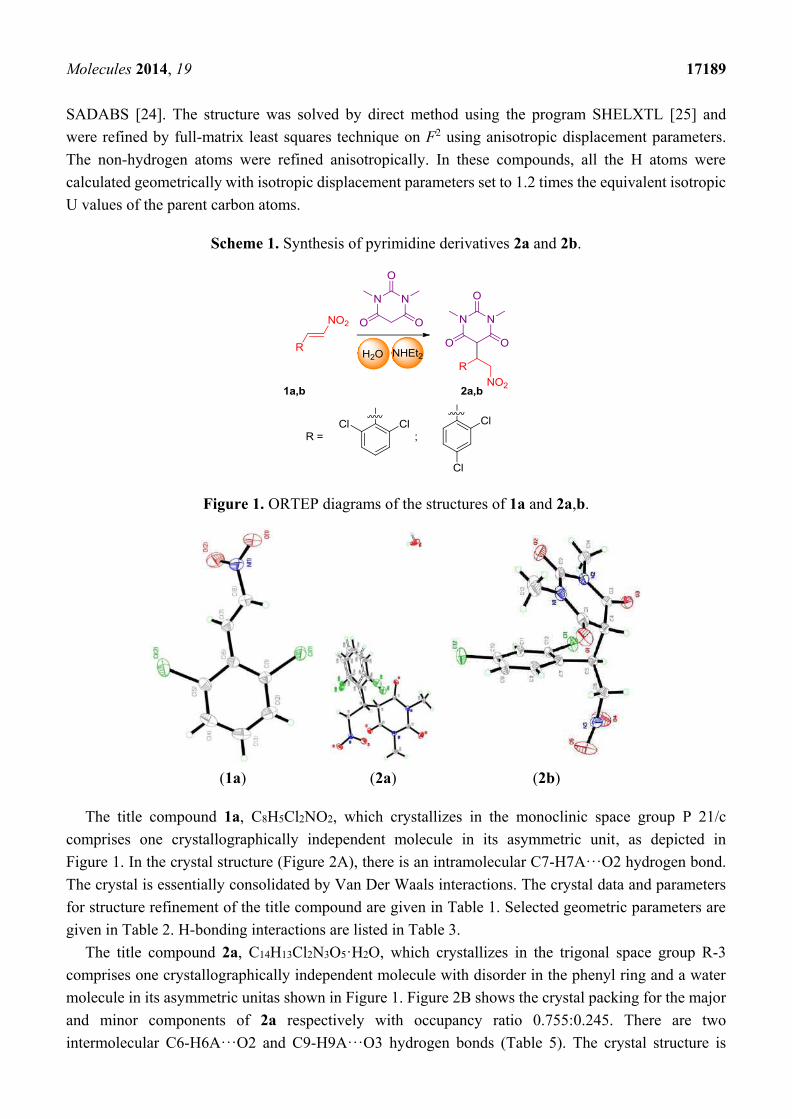
Molecules 2014, 19 17189
SADABS [24]. The structure was solved by direct method using the program SHELXTL [25] and
were refined by full-matrix least squares technique on F2 using anisotropic displacement parameters.
The non-hydrogen atoms were refined anisotropically. In these compounds, all the H atoms were
calculated geometrically with isotropic displacement parameters set to 1.2 times the equivalent isotropic
U values of the parent carbon atoms.
Scheme 1. Synthesis of pyrimidine derivatives 2a and 2b.
Figure 1. ORTEP diagrams of the structures of 1a and 2a,b.
(1a) (2a) (2b)
The title compound 1a, C8H5Cl2NO2, which crystallizes in the monoclinic space group P 21/c
comprises one crystallographically independent molecule in its asymmetric unit, as depicted in
Figure 1. In the crystal structure (Figure 2A), there is an intramolecular C7-H7A···O2 hydrogen bond.
The crystal is essentially consolidated by Van Der Waals interactions. The crystal data and parameters
for structure refinement of the title compound are given in Table 1. Selected geometric parameters are
given in Table 2. H-bonding interactions are listed in Table 3.
The title compound 2a, C14H13Cl2N3O5·H2O, which crystallizes in the trigonal space group R-3
comprises one crystallographically independent molecule with disorder in the phenyl ring and a water
molecule in its asymmetric unitas shown in Figure 1. Figure 2B shows the crystal packing for the major
and minor components of 2a respectively with occupancy ratio 0.755:0.245. There are two
intermolecular C6-H6A···O2 and C9-H9A···O3 hydrogen bonds (Table 5). The crystal structure is
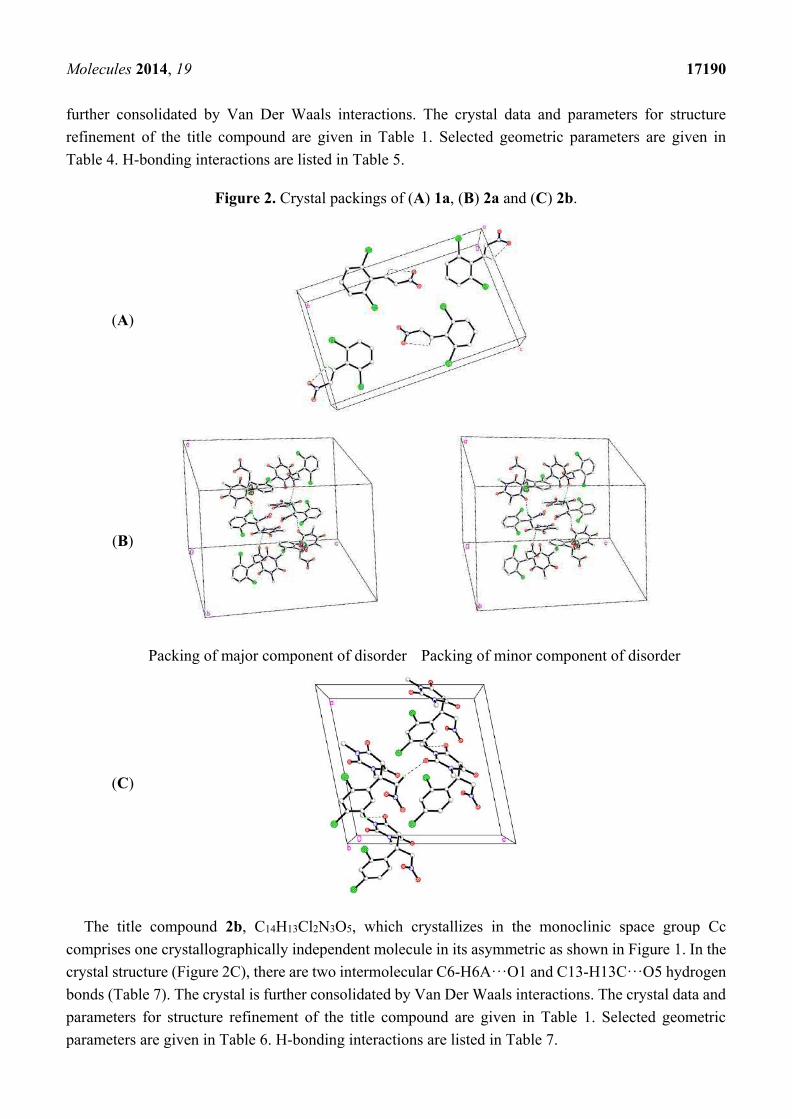
Molecules 2014, 19 17190
further consolidated by Van Der Waals interactions. The crystal data and parameters for structure
refinement of the title compound are given in Table 1. Selected geometric parameters are given in
Table 4. H-bonding interactions are listed in Table 5.
Figure 2. Crystal packings of (A) 1a, (B) 2a and (C) 2b.
(A)
(B)
Packing of major component of disorder Packing of minor component of disorder
(C)
The title compound 2b, C14H13Cl2N3O5, which crystallizes in the monoclinic space group Cc
comprises one crystallographically independent molecule in its asymmetric as shown in Figure 1. In the
crystal structure (Figure 2C), there are two intermolecular C6-H6A···O1 and C13-H13C···O5 hydrogen
bonds (Table 7). The crystal is further consolidated by Van Der Waals interactions. The crystal data and
parameters for structure refinement of the title compound are given in Table 1. Selected geometric
parameters are given in Table 6. H-bonding interactions are listed in Table 7.
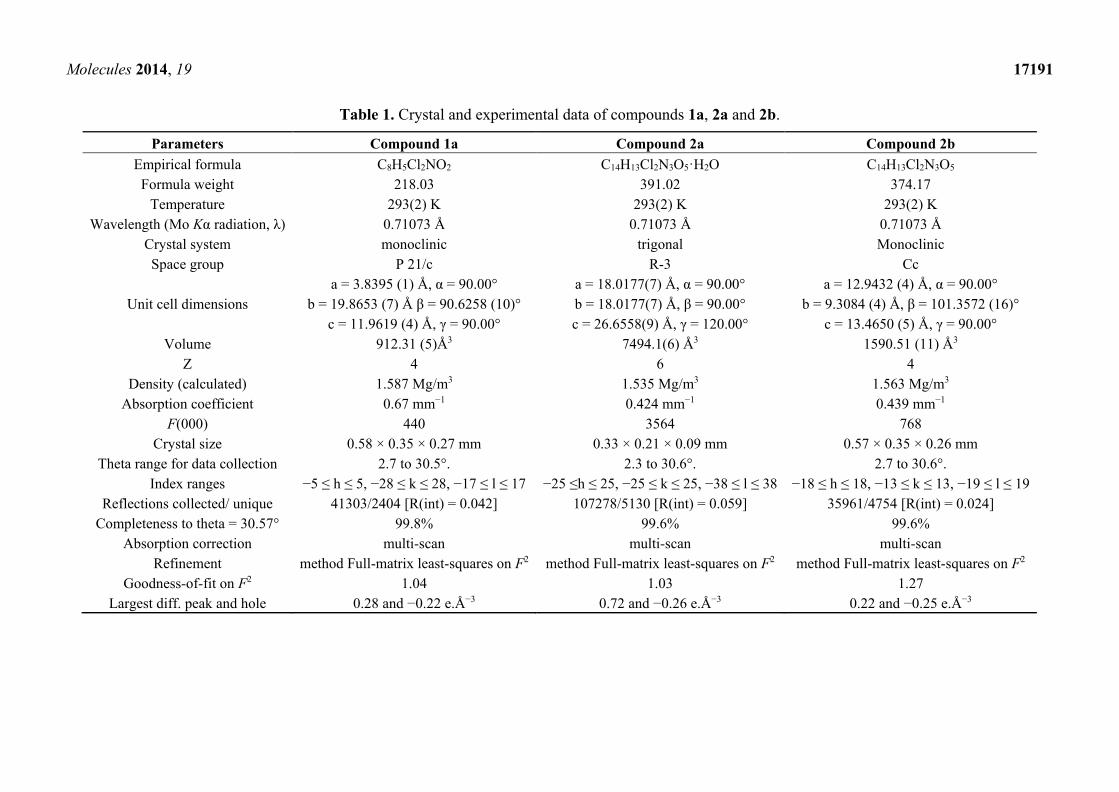
Molecules 2014, 19 17191
Table 1. Crystal and experimental data of compounds 1a, 2a and 2b.
Parameters Compound 1a Compound 2a Compound 2b
Empirical formula C8H5Cl2NO2 C14H13Cl2N3O5·H2O C14H13Cl2N3O5
Formula weight 218.03 391.02 374.17
Temperature 293(2) K 293(2) K 293(2) K
Wavelength (Mo Kα radiation, λ) 0.71073 Å 0.71073 Å 0.71073 Å
Crystal system monoclinic trigonal Monoclinic
Space group P 21/c R-3 Cc
Unit cell dimensions
a = 3.8395 (1) Å, α = 90.00°
b = 19.8653 (7) Å β = 90.6258 (10)°
c = 11.9619 (4) Å, γ = 90.00°
a = 18.0177(7) Å, α = 90.00°
b = 18.0177(7) Å, β = 90.00°
c = 26.6558(9) Å, γ = 120.00°
a = 12.9432 (4) Å, α = 90.00°
b = 9.3084 (4) Å, β = 101.3572 (16)°
c = 13.4650 (5) Å, γ = 90.00°
Volume 912.31 (5)Å3 7494.1(6) Å3 1590.51 (11) Å3
Z 4 6 4
Density (calculated) 1.587 Mg/m3 1.535 Mg/m3 1.563 Mg/m3
Absorption coefficient 0.67 mm−1 0.424 mm−1 0.439 mm−1
F(000) 440 3564 768
Crystal size 0.58 × 0.35 × 0.27 mm 0.33 × 0.21 × 0.09 mm 0.57 × 0.35 × 0.26 mm
Theta range for data collection 2.7 to 30.5°. 2.3 to 30.6°. 2.7 to 30.6°.
Index ranges −5 ≤ h ≤ 5, −28 ≤ k ≤ 28, −17 ≤ l ≤ 17 −25 ≤h ≤ 25, −25 ≤ k ≤ 25, −38 ≤ l ≤ 38 −18 ≤ h ≤ 18, −13 ≤ k ≤ 13, −19 ≤ l ≤ 19
Reflections collected/ unique 41303/2404 [R(int) = 0.042] 107278/5130 [R(int) = 0.059] 35961/4754 [R(int) = 0.024]
Completeness to theta = 30.57° 99.8% 99.6% 99.6%
Absorption correction multi-scan multi-scan multi-scan
Refinement method Full-matrix least-squares on F2 method Full-matrix least-squares on F2 method Full-matrix least-squares on F2
Goodness-of-fit on F2 1.04 1.03 1.27
Largest diff. peak and hole 0.28 and −0.22 e.Å−3 0.72 and −0.26 e.Å−3 0.22 and −0.25 e.Å−3
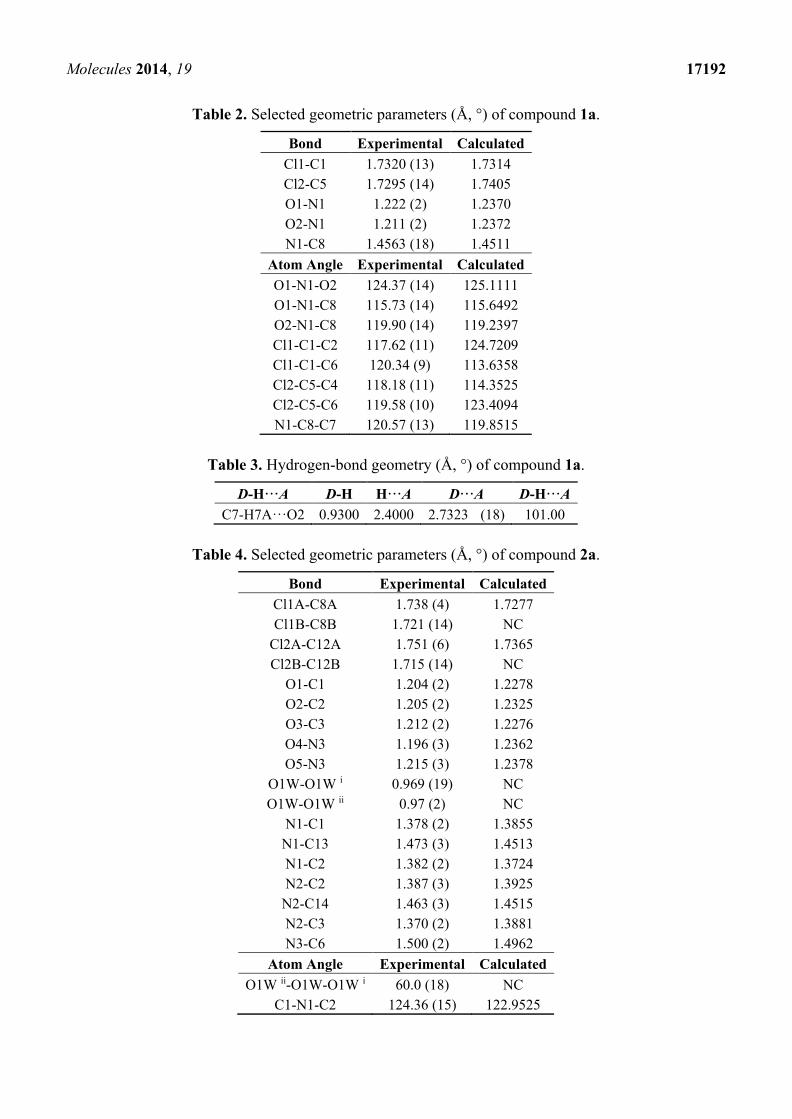
Molecules 2014, 19 17192
Table 2. Selected geometric parameters (Å, °) of compound 1a.
Bond Experimental Calculated
Cl1-C1 1.7320 (13) 1.7314
Cl2-C5 1.7295 (14) 1.7405
O1-N1 1.222 (2) 1.2370
O2-N1 1.211 (2) 1.2372
N1-C8 1.4563 (18) 1.4511
Atom Angle Experimental Calculated
O1-N1-O2 124.37 (14) 125.1111
O1-N1-C8 115.73 (14) 115.6492
O2-N1-C8 119.90 (14) 119.2397
Cl1-C1-C2 117.62 (11) 124.7209
Cl1-C1-C6 120.34 (9) 113.6358
Cl2-C5-C4 118.18 (11) 114.3525
Cl2-C5-C6 119.58 (10) 123.4094
N1-C8-C7 120.57 (13) 119.8515
Table 3. Hydrogen-bond geometry (Å, °) of compound 1a.
D-H···A D-H H···A D···A D-H···A
C7-H7A···O2 0.9300 2.4000 2.7323 (18) 101.00
Table 4. Selected geometric parameters (Å, °) of compound 2a.
Bond Experimental Calculated
Cl1A-C8A 1.738 (4) 1.7277
Cl1B-C8B 1.721 (14) NC
Cl2A-C12A 1.751 (6) 1.7365
Cl2B-C12B 1.715 (14) NC
O1-C1 1.204 (2) 1.2278
O2-C2 1.205 (2) 1.2325
O3-C3 1.212 (2) 1.2276
O4-N3 1.196 (3) 1.2362
O5-N3 1.215 (3) 1.2378
O1W-O1W i 0.969 (19) NC
O1W-O1W ii 0.97 (2) NC
N1-C1 1.378 (2) 1.3855
N1-C13 1.473 (3) 1.4513
N1-C2 1.382 (2) 1.3724
N2-C2 1.387 (3) 1.3925
N2-C14 1.463 (3) 1.4515
N2-C3 1.370 (2) 1.3881
N3-C6 1.500 (2) 1.4962
Atom Angle Experimental Calculated
O1W ii-O1W-O1W i 60.0 (18) NC
C1-N1-C2 124.36 (15) 122.9525
Molecules 2014, 19 17193
Table 4. Cont.
Atom Angle Experimental Calculated
C2-N1-C13 117.61 (15) 117.6313
C1-N1-C13 117.39 (15) 117.0595
C2-N2-C3 124.74 (15) 123.0628
C3-N2-C14 117.62 (17) 116.9594
C2-N2-C14 117.50 (16) 117.4505
O4-N3-C6 121.03 (18) 117.2445
O4-N3-O5 123.45 (19) 125.7819
O5-N3-C6 115.53 (16) 116.9697
O1-C1-N1 121.69 (16) 123.7575
O1-C1-C4 121.91 (15) 122.9936
N1-C1-C4 116.24 (15) 113.2488
O2-C2-N2 120.68 (18) 123.3871
N1-C2-N2 117.42 (14) 116.2983
O2-C2-N1 121.9 (2) 121.7454
O3-C3-C4 121.55 (15) 123.7560
O3-C3-N2 121.13 (15) 121.7802
N2-C3-C4 117.24 (14) 112.8565
N3-C6-C5 112.43 (14) 111.9825
Cl1A-C8A-C7A 119.7 (3) 124.0885
Cl1A-C8A-C9A 117.4 (3) 114.4806
Cl1B-C8B-C9B 116.7 (10) NC
Cl1B-C8B-C7B 121.7 (9) NC
Cl2A-C12A-C7A 120.8 (3) 122.7008
Cl2A-C12A-C11A 114.7 (4) 115.2511
Cl2B-C12B-C7B 122.5 (8) NC
Cl2B-C12B-C11B 114.4 (10) NC
Symmetry codes: (i) –x + y + 1, −x + 1, z; (ii) –y + 1, x − y, z. NC: Not calculated.
Table 5. Hydrogen-bond geometry (Å, °) of compound 2a.
D-H···A D-H H···A D···A D-H···A
O1W-H2W1···O1W iii 0.9100 2.1000 2.859 (6) 140.00
O1W-H2W1···O1W iv 0.9100 1.8500 2.689 (6) 152.00
O1W-H2W1···O1W v 0.9100 2.0500 2.689 (7) 125.00
C5-H5A···O4 0.9800 2.2700 2.741 (3) 108.00
C6-H6A···O1 vi 0.9700 2.5300 3.337 (3) 141.00
C6-H6B···Cl2A 0.9700 2.6800 3.125 (4) 109.00
C6-H6B···O3 0.9700 2.5800 2.979 (2) 105.00
C13-H13A···O2 0.9600 2.2900 2.716 (3) 106.00
C13-H13C···O5 vii 0.9600 2.5100 3.425 (3) 159.00
C14-H14B···O2 0.9600 2.2400 2.690 (4) 108.00
Symmetry codes: (iii) −x + 4/3, −y + 2/3, −z + 2/3; (iv) y + 1/3, −x + y + 2/3, −z + 2/3; (v) x − y + 1/3, x − 1/3,
−z + 2/3; (vi) y − 1/3, −x + y + 1/3, −z + 4/3; (vii) −x + y, −x, z.
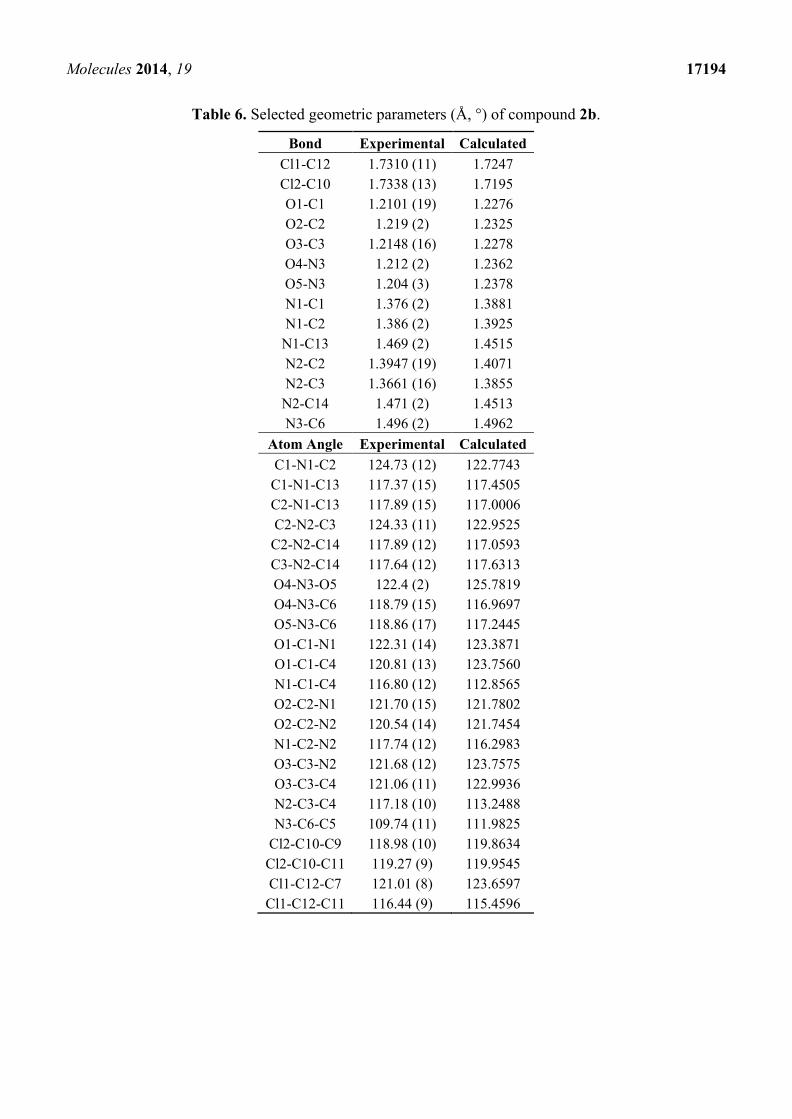
Molecules 2014, 19 17194
Table 6. Selected geometric parameters (Å, °) of compound 2b.
Bond Experimental Calculated
Cl1-C12 1.7310 (11) 1.7247
Cl2-C10 1.7338 (13) 1.7195
O1-C1 1.2101 (19) 1.2276
O2-C2 1.219 (2) 1.2325
O3-C3 1.2148 (16) 1.2278
O4-N3 1.212 (2) 1.2362
O5-N3 1.204 (3) 1.2378
N1-C1 1.376 (2) 1.3881
N1-C2 1.386 (2) 1.3925
N1-C13 1.469 (2) 1.4515
N2-C2 1.3947 (19) 1.4071
N2-C3 1.3661 (16) 1.3855
N2-C14 1.471 (2) 1.4513
N3-C6 1.496 (2) 1.4962
Atom Angle Experimental Calculated
C1-N1-C2 124.73 (12) 122.7743
C1-N1-C13 117.37 (15) 117.4505
C2-N1-C13 117.89 (15) 117.0006
C2-N2-C3 124.33 (11) 122.9525
C2-N2-C14 117.89 (12) 117.0593
C3-N2-C14 117.64 (12) 117.6313
O4-N3-O5 122.4 (2) 125.7819
O4-N3-C6 118.79 (15) 116.9697
O5-N3-C6 118.86 (17) 117.2445
O1-C1-N1 122.31 (14) 123.3871
O1-C1-C4 120.81 (13) 123.7560
N1-C1-C4 116.80 (12) 112.8565
O2-C2-N1 121.70 (15) 121.7802
O2-C2-N2 120.54 (14) 121.7454
N1-C2-N2 117.74 (12) 116.2983
O3-C3-N2 121.68 (12) 123.7575
O3-C3-C4 121.06 (11) 122.9936
N2-C3-C4 117.18 (10) 113.2488
N3-C6-C5 109.74 (11) 111.9825
Cl2-C10-C9 118.98 (10) 119.8634
Cl2-C10-C11 119.27 (9) 119.9545
Cl1-C12-C7 121.01 (8) 123.6597
Cl1-C12-C11 116.44 (9) 115.4596
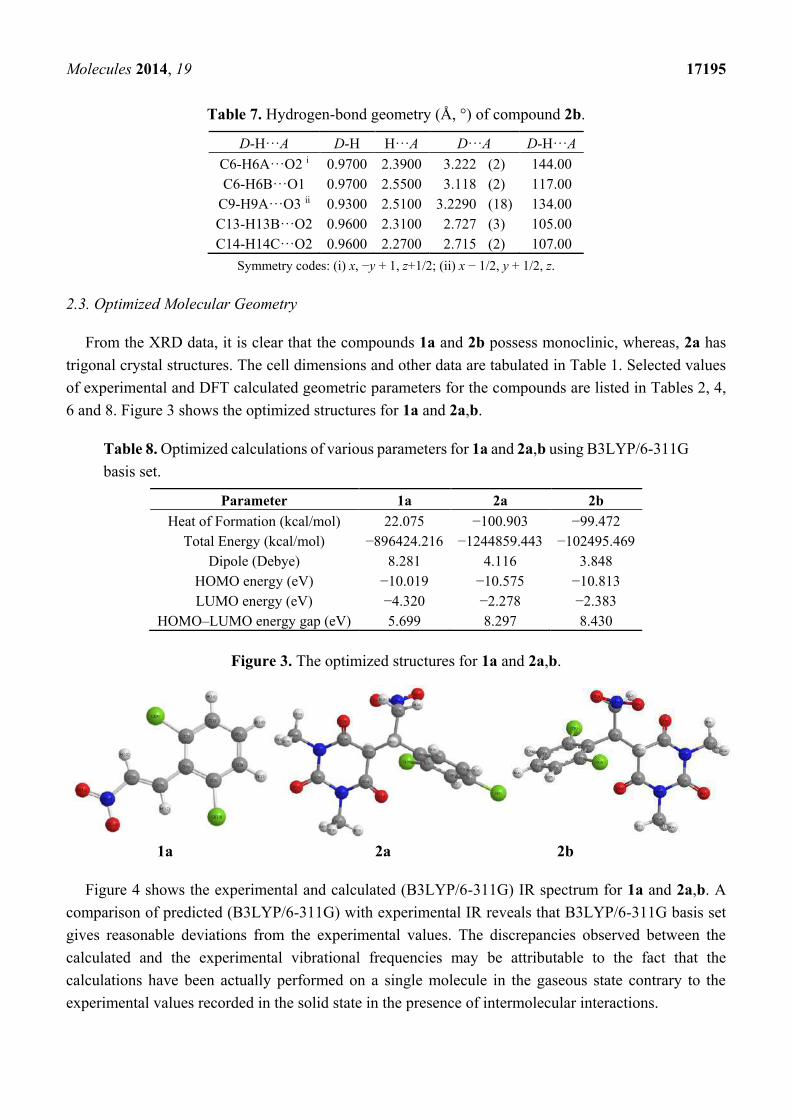
Molecules 2014, 19 17195
Table 7. Hydrogen-bond geometry (Å, °) of compound 2b.
D-H···A D-H H···A D···A D-H···A
C6-H6A···O2 i 0.9700 2.3900 3.222 (2) 144.00
C6-H6B···O1 0.9700 2.5500 3.118 (2) 117.00
C9-H9A···O3 ii 0.9300 2.5100 3.2290 (18) 134.00
C13-H13B···O2 0.9600 2.3100 2.727 (3) 105.00
C14-H14C···O2 0.9600 2.2700 2.715 (2) 107.00
Symmetry codes: (i) x, −y + 1, z+1/2; (ii) x − 1/2, y + 1/2, z.
2.3. Optimized Molecular Geometry
From the XRD data, it is clear that the compounds 1a and 2b possess monoclinic, whereas, 2a has
trigonal crystal structures. The cell dimensions and other data are tabulated in Table 1. Selected values
of experimental and DFT calculated geometric parameters for the compounds are listed in Tables 2, 4,
6 and 8. Figure 3 shows the optimized structures for 1a and 2a,b.
Table 8. Optimized calculations of various parameters for 1a and 2a,b using B3LYP/6-311G
basis set.
Parameter 1a 2a 2b
Heat of Formation (kcal/mol) 22.075 −100.903 −99.472
Total Energy (kcal/mol) −896424.216 −1244859.443 −102495.469
Dipole (Debye) 8.281 4.116 3.848
HOMO energy (eV) −10.019 −10.575 −10.813
LUMO energy (eV) −4.320 −2.278 −2.383
HOMO–LUMO energy gap (eV) 5.699 8.297 8.430
Figure 3. The optimized structures for 1a and 2a,b.
1a 2a 2b
Figure 4 shows the experimental and calculated (B3LYP/6-311G) IR spectrum for 1a and 2a,b. A
comparison of predicted (B3LYP/6-311G) with experimental IR reveals that B3LYP/6-311G basis set
gives reasonable deviations from the experimental values. The discrepancies observed between the
calculated and the experimental vibrational frequencies may be attributable to the fact that the
calculations have been actually performed on a single molecule in the gaseous state contrary to the
experimental values recorded in the solid state in the presence of intermolecular interactions.
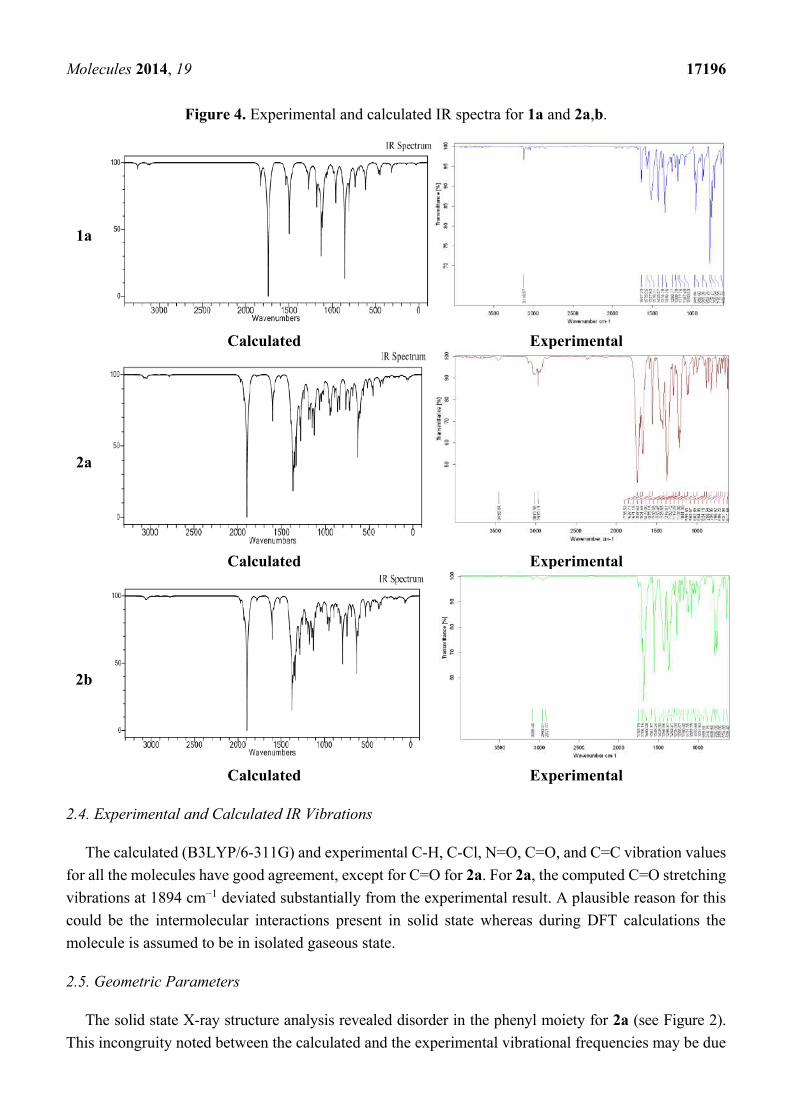
Molecules 2014, 19 17196
Figure 4. Experimental and calculated IR spectra for 1a and 2a,b.
1a
Calculated Experimental
2a
Calculated Experimental
2b
Calculated Experimental
2.4. Experimental and Calculated IR Vibrations
The calculated (B3LYP/6-311G) and experimental C-H, C-Cl, N=O, C=O, and C=C vibration values
for all the molecules have good agreement, except for C=O for 2a. For 2a, the computed C=O stretching
vibrations at 1894 cm−1 deviated substantially from the experimental result. A plausible reason for this
could be the intermolecular interactions present in solid state whereas during DFT calculations the
molecule is assumed to be in isolated gaseous state.
2.5. Geometric Parameters
The solid state X-ray structure analysis revealed disorder in the phenyl moiety for 2a (see Figure 2).
This incongruity noted between the calculated and the experimental vibrational frequencies may be due
Molecules 2014, 19 17197
to the fact that the calculations have been actually performed on a single molecule in the gaseous state
contrary to the experimental values recorded in the solid state. In DFT calculations, bond lengths and
angles have been reported only for the major component of the phenyl moiety of 2a (designated by the
suffix “A”). The selected calculated and experimental geometric parameters for 1a and 2a,b have been
tabulated in Tables 2, 4 and 6.
2.6. Thermal Gravimetric Analysis (TGA)
The synthesized novel compounds were subjected to thermogravimetric analysis (TGA) to evaluate
their thermal stability and degradation patterns (Table 9) and the TGA and DTG patterns are shown in
Figure 5. All samples were subjected to analysis in a nitrogen atmosphere in the temperature range from
30 °C to 800 °C with a heating ramp rate of 10 °C per min. It was observed that the different nitrostyrene
derivatives displayed different thermal stabilities and degradation patterns. The pyrolysis processes of
the materials are characterized by single-stage degradation, with an exception of 2a, which displays
two-stage degradation. Interestingly, it was detected that upon the incorporation of the barbituric acid
ring into the styrene, the resulting molecule was slightly more thermally stable than its precursor. The
weight loss pattern of all the compounds was found to be different at different intervals with 1a,b
displaying a weight loss of 70% and 98% respectively at 200 °C, but at the same temperature the weight
loss percentage for the barbituric acid derivatives 2a,b were found to be 48% and 18 % respectively.
When a comparison of thermal degradation pattern between 1a and 2a was made it was found that 1a
undergoes single stage degradation with decomposition range of 100–190 °C (90 °C), while 2a displays
two stage degradation with decomposition taking place in the range of 105–195 °C (90 °C) and
200–275 °C (75 °C). The degradation temperature range of 1b and 2b was found to take place at a
162–262 °C (100 °C) and 125–230 °C (105 °C), respectively. The peak temperature of 2b (220.02 °C)
was higher than that of 1b (199.38 °C), while the decomposition intensity of 1b was found to be high
with 2.35 wt %/°C compared to 1.99 wt %/°C 2b. This behaviour can be attributed to the presence of
barbituric acid. However, when the temperature was increased further all the compounds followed
similar weight loss patterns with varying percentages of residue at the final temperature of 800 °C. From
the residual weight values obtained at ~800 °C it can be concluded that there is no significant thermal
stability among any of the four compounds tested, however it can be said that thermal stability of the
barbituric acid derivative of the styrene molecule is slightly improved compared to that of its precursor.
The weight loss percentage at different temperatures is mentioned in the table below and a comparative
graphical representation of the compounds is given in Figure 5. A detailed study into the thermal behaviour
of the synthesized compounds shall be carried out the thermal kinetics will be reported separately.
Table 9. Weight loss percentage at different temperatures for 1a,b and 2a,b.
Temperature Weight Loss (%)
1a 2a 1b 2b
100 0.33 0.63 1.42 0.44
200 70.85 48.06 98.37 18.45
300 98.72 91.07 98.46 84.73
Molecules 2014, 19 17198
Table 9. Cont.
Temperature Weight Loss (%)
1a 2a 1b 2b
400 98.98 93.95 98.40 88.19
500 99.11 95.67 98.29 92.93
600 99.56 96.47 98.08 96.10
700 99.77 97.14 97.87 98.52
800 99.66 97.47 97.55 99.81
Figure 5. TGA and DTG curves of the synthesized compounds.
3. Experimental Section
3.1. General
All the chemicals were purchased from Aldrich (Riedstraße, Germany), Sigma-Aldrich (St. Louis,
MO, USA), Fluka (Buchs, Switzerland), and used without further purification, unless otherwise stated.
The structure of 1a was confirmed by X-ray crystal structure analysis (Bruker AXS GmbH,
Karlsruhe, Germany). The crystallographic data for 1a (CCDC-992700), 2a (CCDC-992327) and
2b (CCDC-992701) have been submitted to the Cambridge Crystallographic Data Centre
(www.ccdc.cam.ac.uk/data_request/cif). Compound 1a was prepared from 2,6-dicholorobenzaldehyde
and nitromethane as white crystals according to the reported procedure [16]. Colorless block-shaped
100 200 300 400 500 600 700 800
0
20
40
60
80
100
-2
-1
0
1
2
Temperature( C)
TGA
(wt.
%)
DTG
(wt.
%/
C)
145.04 C1.13 wt% / C
249.49 C0.86 wt% / C
100 200 300 400 500 600 700 800
0
20
40
60
80
100
-1
0
1
2
3
Temperature( C)
TGA
(wt.
%)
DTG
(wt.
%/
C)
220.02 C1.99 wt%/ C
100 200 300 400 500 600 700 800
0
20
40
60
80
100
-1
0
1
2
3
4
Temperature( C)
TGA
(wt.
%)
DTG
(wt.
%/
C)
174.5 C3.23 wt%/ C
100 200 300 400 500 600 700 800
0
20
40
60
80
100
-1
0
1
2
3
Temperature( C)
TGA
(wt.
%)
DTG
(wt.
%/
C)
199.38 C2.35 wt%/ C
1a 2a
1b 2b
Molecules 2014, 19 17199
crystals of the compound suitable for X-ray analysis were formed in isopropanol/heptane at room
temperature after 3 days.
3.2. 5-(1-(2,6-Dichlorophenyl)-2-nitroethyl)-1,3-dimethylpyrimidine-2,4,6(1H,3H,5H)-trione (2a)
According to the reported procedure [16], 2a was prepared from 1,3-dimethylbarbituric acid (1a) and
(E)-2,6-dichloro-1-(2-nitrovinyl)benzene (1a) as white crystals. Colorless block-shaped crystals of the
compound suitable for X-ray analysis were formed in CHCl3/Et2O at room temperature after 2 days.
3.3. 5-(1-(2,4-Dichlorophenyl)-2-nitroethyl)-1,3-dimethylpyrimidine-2,4,6(1H,3H,5H)-trione (2b)
According to the reported procedure [16], 2b was prepared from 1,3-dimethylbarbituric acid and
(E)-2,4-dichloro-1-(2-nitrovinyl)benzene (1a) as yellow crystals. Colorless block-shaped crystals of the
compound suitable for X-ray analysis were formed in DCM/Pet. ether at room temperature after 1 day.
3.4. DFT Calculations
The DFT calculations were performed using the GAMESS package. The input geometry of the
synthesized molecules were optimized without imposing any external constraint on the potential energy
surfaces generated by the B3LYP/6-311G(d,p) basis set for C, O, N and H atoms. The resulting
optimized geometry was used as an input for vibrational frequencies calculations, with inclusion of
polarization functions to handle the polar bonds such as N=O, C=O, etc.
4. Conclusions
In a summary, pyrimidine derivatives 2a,b were prepared starting from nitroalkenes 1a,b using an
eco-benign method. The structures for 1a and 2a,b have been characterized by their single crystal X-ray
diffraction analysis. DFT/TGA/IR analyses were performed and discussed.
Supplementary Materials
Supplementary materials can be accessed at: http://www.mdpi.com/1420-3049/19/10/17187/s1.
Acknowledgments
The authors extend their appreciation to the Deanship of Scientific Research at King Saud University
for funding the work through the research group project Number RGP-VPP-257.
Author Contributions
Hany J. Al-Najjar and Mohamed Ali carried out the experimental part; Syed F. Adil carried out
thermo-analysis; Vijay H. Masand carried out computational studies; Hazem A Ghabbour and
Hoong-Kun Fun carried out X-ray part; Abdullah M. Al-Majid helped in the results and discussion and
writing the manuscript; Assem Barakat: proposed the subject and designed the study. All the authors
read and approved the final manuscript.
Molecules 2014, 19 17200
Conflicts of Interest
The authors declare no conflict of interest.
References
1. Rastogi, V.K.; Mittal, H.P.; Sharma, Y.C.; Sharma, S.N. Spectroscopy of Biological Molecules;
Hester, R.E., Girling, R.B., Eds.; Royal Society of Chemistry: London, UK, 1991; pp. 403–404.
2. Bandekar, J.; Zundel, G. Normal coordinate analysis treatment on uracil in solid state.
Spectrochim. Acta A 1983, 39, 343–355.
3. Aruna, S.; Shanmugam, G. Vibrational assignments of six-membered heterocyclic compounds: Normal
vibrations of 6-amino uracil and 6-amino 2-thio uracil. Spectrochim. Acta A 1985, 41, 531–536.
4. Portalone, G.; Ballirano, P.; Maras, A. The crystal structure of 3-methyluracil from X-ray powder
diffraction data. J. Mol. Struct. 2002, 608, 35–39.
5. Grosmaire, L.; Delabre, J.L. Vibrational spectra of 6-methyluracil, 6-methyl-2-thiouracil and their
deuterated analogues. J. Mol. Struct. 2012, 1011, 42–49.
6. Yaniv, M.; Folk, W.R. The nucleotide sequences of the two glutamine transfer ribonucleic acids
from Escherichia coli. J. Biol. Chem. 1975, 250, 3243–3253.
7. Amir, M.; Javed, S.A.; Kumar, H. Pyrimidine as antiinflammatory agent: A review. Indian J.
Pharm. Sci. 2007, 69, 337–343.
8. Çırak Ç.; Sert, Y.; Ucun, F. Experimental and computational study on molecular structure and
vibrational analysis of a modified biomolecule: 5-Bromo-2'-deoxyuridine. Spectrochim. Acta A
2012, 92, 406–414.
9. Demirbaş N, Ugurluoglu R, Demirbaş A Synthesis of 3-alkyl(aryl)-4-alkylidenamino-4,5-dihydro-
1H-1,2,4-triazol-5-ones and 3-alkyl-4-alkylamino-4,5-dihydro-1H-1,2,4-triazol-5-ones as antitumor
agents. Bioorg. Med. Chem. 2002, 10, 3717–3723.
10. Elinson, M.N.; Vereshchagin, A.N.; Stepanov, N.O.; Zaimovskaya, T.A.; Merkulova, V.M.;
Nikishin, G.I. The first example of the cascade assembly of a spirocyclopropane structure:
Direct transformation of benzylidenemalononitriles and N,N-dialkylbarbituric acids into substituted
2-aryl-4,6,8-trioxo-5,7-diazaspiro[2.5]octane-1,1-dicarbonitriles. Tetrahedron Lett. 2010, 51, 428–431.
11. Barakat, A.; Al-Majid, A.M.; Al-Najjar, H.J.; Mabkhot ,Y.N.; Javaid, S.; Yousuf, S.; Choudhary, M.I.
Zwitterionic pyrimidinium adducts as antioxidants with therapeutic potential as nitric oxide
scavenger. Eur. J. Med. Chem. 2014, 84, 146–154.
12. Ray, R.; Krishna, S.H.; Sharma, J.D.; Limaye, S.N. Variations in the Physico-Chemical Parameters
of Some 5a and 5b Substituted Barbiturate Derivatives. Asian J. Chem. 2007, 19, 2497–2501.
13. Brunton, L.L.; Lazo, J.S.; Lazo, P.; Keith, L. Goodman & Gilman’s The Pharmacological Basis of
Therapeutics, 11th ed.; McGraw-Hill: New York, NY, USA, 2006.
14. Fillaut, J.L.; de Los Rios, I.; Masi, D.; Romerosa, A.; Zanobini, F.; Peruzzini, M. Synthesis and
Structural Characterization of (Carbene)ruthenium Complexes Binding Nucleobases. Eur. J.
Inorg. Chem. 2002, 935–942.
Molecules 2014, 19 17201
15. Temiz-Arpaci, O.; Ozdemir, A.; Yalcin, I.; Yildiz, I.; Aki-Sener, E.; Altanlar, N. Synthesis and
antimicrobial activity of some 5-[2-(morpholin-4-yl)acetamido] and/or 5-[2-(4-substituted
piperazin-1-yl)acetamido]-2-(p-substituted phenyl)benzoxazoles. Arch. Pharm. 2005, 338, 105–111.
16. Kwan, P.; Brodie, M.J. Phenobarbital for the treatment of epilepsy in the 21st century: A critical
review. Epilepsia 2004, 45, 1141–1149.
17. Al-Najjar, H.J.; Barakat, A.; Al-Majid, A.M.; Mabkhot, Y.N.; Weber, M.; Ghabbour, H.A.; Fun, H.-K.
A greener and efficient approach to Michael addition of barbituric acid to nitroalkene in aqueous
diethylamine mediu. Molecules 2014, 19, 1150–1162.
18. Al-Majid, A.M.; Barakat, A.; Al-Najjar, H.J.; Mabkhot, Y.N.; Ghabbour, H.A.; Fun, H-K. Tandem
Aldol-Michael reactions in aqueous diethylamine medium: A greener and efficient approach to
bis-pyrimidine derivatives. Int. J. Mol. Sci. 2013, 14, 23762–23773.
19. Barakat, A.; Al-Majid, A.M.; Al-Ghamdi, A.M.; Mabkhot, Y.N.; Siddiqui, M.R.; Ghabbour, H.A.;
Fun, H-K. Tandem Aldol-Michael reactions in aqueous diethylamine medium: A greener and efficient
approach to dimedone-barbituric acid derivatives. Chem. Cent. J. 2014, 8, doi:10.1186/1752-153X-8-9.
20. Barakat, A.; Al-Majid, A.M.; Al-Najjar, H.J.; Mabkhot, Y.N.; Ghabbour, H.A.; Fun, H-K. An
efficient and green procedure for synthesis of rhodanine derivatives by Aldol-thia-Michael protocol
using aqueous diethylamine. RSC Adv. 2014, 4, 4909–4916.
21. Barakat, A.; Al Majid, A.M.A.; Islam, M.S.; Al-Othman, Z.A. Highly enantioselective
Friedel-Crafts alkylations of indoles with α,β-unsaturated ketones under Cu(II)-simple
oxazoline-imidazoline catalysts. Tetrahedron 2013, 69, 5185–5192.
22. Al-Majid, A.M.; Islam, M.S. Barakat, A.; Elkahatany, N.; Yousuf, S.S.; Choudhary, M.I. Tandem
Knoevenagel-Michael reactions in aqueous diethylamine medium: A greener and efficient approach
to bis-Dimedone derivatives. Arab. J. Chem. 2014, doi:10.1016/j.arabjc.2014.04.008.
23. Islam, M.S.; Al-Majid, A.M.A.; Al-Othman, Z.A.; Barakat, A. Highly Enantioselective
Friedel-Crafts Alkylation of Indole with electron deficient trans-β-Nitroalkenes under simple
Zn(II)-Oxazoline-Imidazoline Catalysts. Tetrahedron: Asymmetry 2014, 25, 245–251.
24. Bruker, APEX2, SAINT and SADABS; Bruker AXS Inc.: Madison, WI, USA, 2009.
25. Sheldrick, G.M. A short history of SHELX. Acta Crystallogr. 2008, A64, 112–122.
Sample Availability: Samples of the compounds 1a,b and 2a,b are available from the authors.
© 2014 by the authors; licensee MDPI, Basel, Switzerland. This article is an open access article
distributed under the terms and conditions of the Creative Commons Attribution license
(http://creativecommons.org/licenses/by/4.0/).
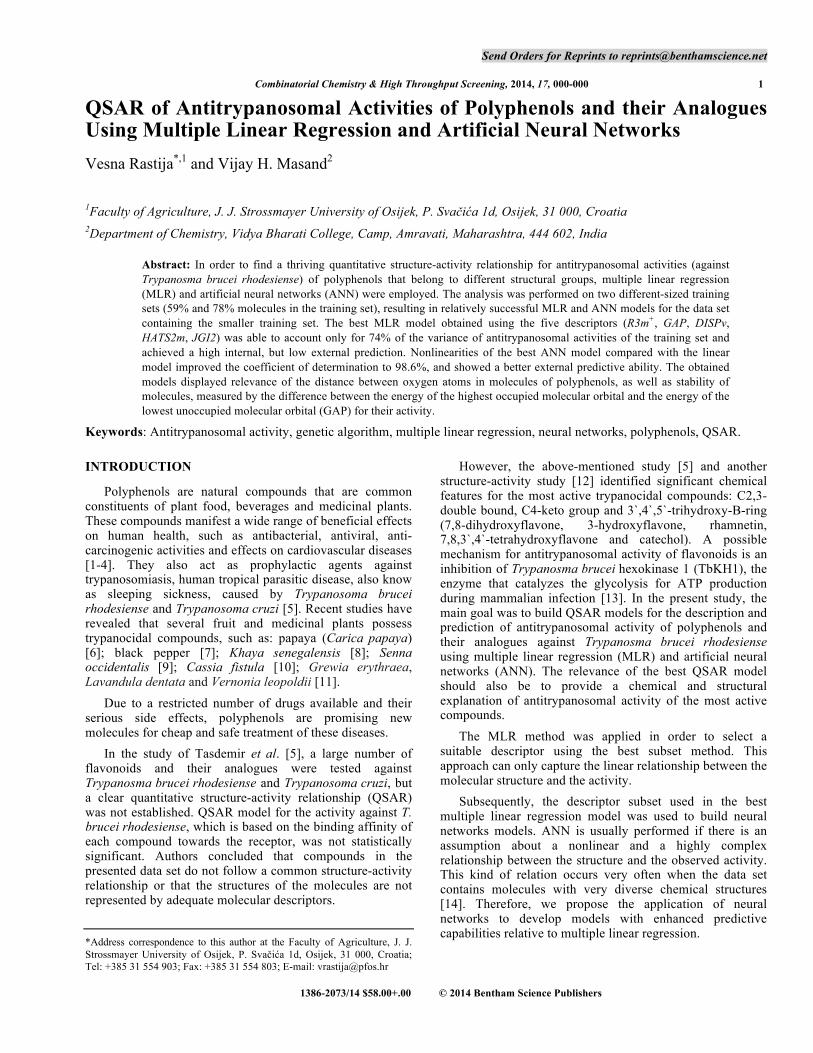
Send Orders for Reprints to [email protected]
Combinatorial Chemistry & High Throughput Screening, 2014, 17, 000-000 1
1386-2073/14 $58.00+.00 © 2014 Bentham Science Publishers
QSAR of Antitrypanosomal Activities of Polyphenols and their Analogues Using Multiple Linear Regression and Artificial Neural Networks Vesna Rastija*,1 and Vijay H. Masand2
1Faculty of Agriculture, J. J. Strossmayer University of Osijek, P. Svačića 1d, Osijek, 31 000, Croatia 2Department of Chemistry, Vidya Bharati College, Camp, Amravati, Maharashtra, 444 602, India
Abstract: In order to find a thriving quantitative structure-activity relationship for antitrypanosomal activities (against Trypanosma brucei rhodesiense) of polyphenols that belong to different structural groups, multiple linear regression (MLR) and artificial neural networks (ANN) were employed. The analysis was performed on two different-sized training sets (59% and 78% molecules in the training set), resulting in relatively successful MLR and ANN models for the data set containing the smaller training set. The best MLR model obtained using the five descriptors (R3m+, GAP, DISPv, HATS2m, JGI2) was able to account only for 74% of the variance of antitrypanosomal activities of the training set and achieved a high internal, but low external prediction. Nonlinearities of the best ANN model compared with the linear model improved the coefficient of determination to 98.6%, and showed a better external predictive ability. The obtained models displayed relevance of the distance between oxygen atoms in molecules of polyphenols, as well as stability of molecules, measured by the difference between the energy of the highest occupied molecular orbital and the energy of the lowest unoccupied molecular orbital (GAP) for their activity.
Keywords: Antitrypanosomal activity, genetic algorithm, multiple linear regression, neural networks, polyphenols, QSAR.
INTRODUCTION
Polyphenols are natural compounds that are common constituents of plant food, beverages and medicinal plants. These compounds manifest a wide range of beneficial effects on human health, such as antibacterial, antiviral, anti-carcinogenic activities and effects on cardiovascular diseases [1-4]. They also act as prophylactic agents against trypanosomiasis, human tropical parasitic disease, also know as sleeping sickness, caused by Trypanosoma brucei rhodesiense and Trypanosoma cruzi [5]. Recent studies have revealed that several fruit and medicinal plants possess trypanocidal compounds, such as: papaya (Carica papaya) [6]; black pepper [7]; Khaya senegalensis [8]; Senna occidentalis [9]; Cassia fistula [10]; Grewia erythraea, Lavandula dentata and Vernonia leopoldii [11]. Due to a restricted number of drugs available and their serious side effects, polyphenols are promising new molecules for cheap and safe treatment of these diseases. In the study of Tasdemir et al. [5], a large number of flavonoids and their analogues were tested against Trypanosma brucei rhodesiense and Trypanosoma cruzi, but a clear quantitative structure-activity relationship (QSAR) was not established. QSAR model for the activity against T. brucei rhodesiense, which is based on the binding affinity of each compound towards the receptor, was not statistically significant. Authors concluded that compounds in the presented data set do not follow a common structure-activity relationship or that the structures of the molecules are not represented by adequate molecular descriptors.
*Address correspondence to this author at the Faculty of Agriculture, J. J. Strossmayer University of Osijek, P. Svačića 1d, Osijek, 31 000, Croatia; Tel: +385 31 554 903; Fax: +385 31 554 803; E-mail: [email protected]
However, the above-mentioned study [5] and another structure-activity study [12] identified significant chemical features for the most active trypanocidal compounds: C2,3-double bound, C4-keto group and 3`,4`,5`-trihydroxy-B-ring (7,8-dihydroxyflavone, 3-hydroxyflavone, rhamnetin, 7,8,3`,4`-tetrahydroxyflavone and catechol). A possible mechanism for antitrypanosomal activity of flavonoids is an inhibition of Trypanosma brucei hexokinase 1 (TbKH1), the enzyme that catalyzes the glycolysis for ATP production during mammalian infection [13]. In the present study, the main goal was to build QSAR models for the description and prediction of antitrypanosomal activity of polyphenols and their analogues against Trypanosma brucei rhodesiense using multiple linear regression (MLR) and artificial neural networks (ANN). The relevance of the best QSAR model should also be to provide a chemical and structural explanation of antitrypanosomal activity of the most active compounds. The MLR method was applied in order to select a suitable descriptor using the best subset method. This approach can only capture the linear relationship between the molecular structure and the activity. Subsequently, the descriptor subset used in the best multiple linear regression model was used to build neural networks models. ANN is usually performed if there is an assumption about a nonlinear and a highly complex relationship between the structure and the observed activity. This kind of relation occurs very often when the data set contains molecules with very diverse chemical structures [14]. Therefore, we propose the application of neural networks to develop models with enhanced predictive capabilities relative to multiple linear regression.
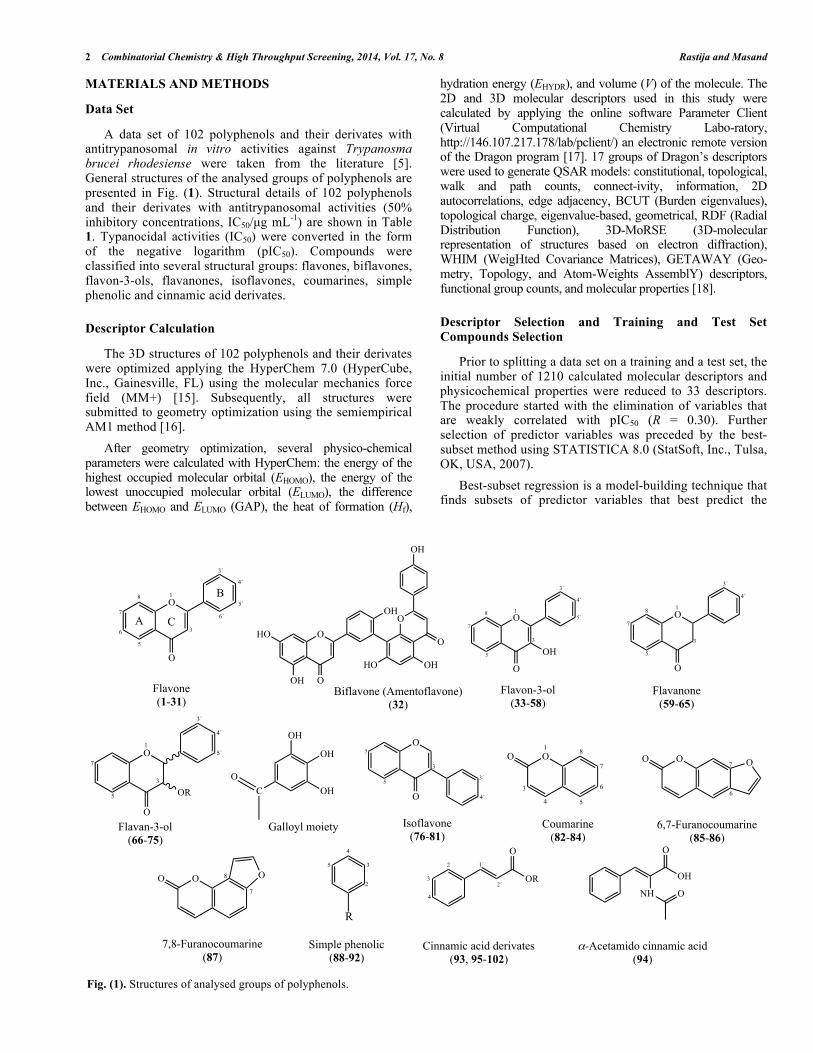
2 Combinatorial Chemistry & High Throughput Screening, 2014, Vol. 17, No. 8 Rastija and Masand
MATERIALS AND METHODS
Data Set
A data set of 102 polyphenols and their derivates with antitrypanosomal in vitro activities against Trypanosma brucei rhodesiense were taken from the literature [5]. General structures of the analysed groups of polyphenols are presented in Fig. (1). Structural details of 102 polyphenols and their derivates with antitrypanosomal activities (50% inhibitory concentrations, IC50/µg mL-1) are shown in Table 1. Typanocidal activities (IC50) were converted in the form of the negative logarithm (pIC50). Compounds were classified into several structural groups: flavones, biflavones, flavon-3-ols, flavanones, isoflavones, coumarines, simple phenolic and cinnamic acid derivates.
Descriptor Calculation
The 3D structures of 102 polyphenols and their derivates were optimized applying the HyperChem 7.0 (HyperCube, Inc., Gainesville, FL) using the molecular mechanics force field (MM+) [15]. Subsequently, all structures were submitted to geometry optimization using the semiempirical AM1 method [16]. After geometry optimization, several physico-chemical parameters were calculated with HyperChem: the energy of the highest occupied molecular orbital (EHOMO), the energy of the lowest unoccupied molecular orbital (ELUMO), the difference between EHOMO and ELUMO (GAP), the heat of formation (Hf),
hydration energy (EHYDR), and volume (V) of the molecule. The 2D and 3D molecular descriptors used in this study were calculated by applying the online software Parameter Client (Virtual Computational Chemistry Labo-ratory, http://146.107.217.178/lab/pclient/) an electronic remote version of the Dragon program [17]. 17 groups of Dragon’s descriptors were used to generate QSAR models: constitutional, topological, walk and path counts, connect-ivity, information, 2D autocorrelations, edge adjacency, BCUT (Burden eigenvalues), topological charge, eigenvalue-based, geometrical, RDF (Radial Distribution Function), 3D-MoRSE (3D-molecular representation of structures based on electron diffraction), WHIM (WeigHted Covariance Matrices), GETAWAY (Geo-metry, Topology, and Atom-Weights AssemblY) descriptors, functional group counts, and molecular properties [18].
Descriptor Selection and Training and Test Set Compounds Selection
Prior to splitting a data set on a training and a test set, the initial number of 1210 calculated molecular descriptors and physicochemical properties were reduced to 33 descriptors. The procedure started with the elimination of variables that are weakly correlated with pIC50 (R = 0.30). Further selection of predictor variables was preceded by the best-subset method using STATISTICA 8.0 (StatSoft, Inc., Tulsa, OK, USA, 2007). Best-subset regression is a model-building technique that finds subsets of predictor variables that best predict the
Fig. (1). Structures of analysed groups of polyphenols.
O
O
A
B
C
1
3
4´
5
6
7
8
3´
5´
6´
Flavone(1-31)
O
O
HO
OH
OH
HO
O
O
OH
OH
Biflavone (Amentoflavone)(32)
O
O
OH
1
3´
3
4´
5
5´7
8
Flavon-3-ol(33-58)
O
O
1
3´
3
4´
5
7
8
Flavanone(59-65)
O
O
OR
1
3´
3
4´
5
5´7
Flavan-3-ol(66-75)
OH
OH
OHC
Galloyl moiety
O
O
3´
3
4´
5
7
Isoflavone(76-81)
OO1
3
4 5
6
7
8
Coumarine(82-84)
OO
6
7 O
6,7-Furanocoumarine(85-86)
OO O7
8
7,8-Furanocoumarine(87)
2
3
4
5
R
Simple phenolic(88-92)
O
OR
4
2
3
1´
Cinnamic acid derivates(93, 95-102)
O
OH
NH O2´
α-Acetamido cinnamic acid(94)
O
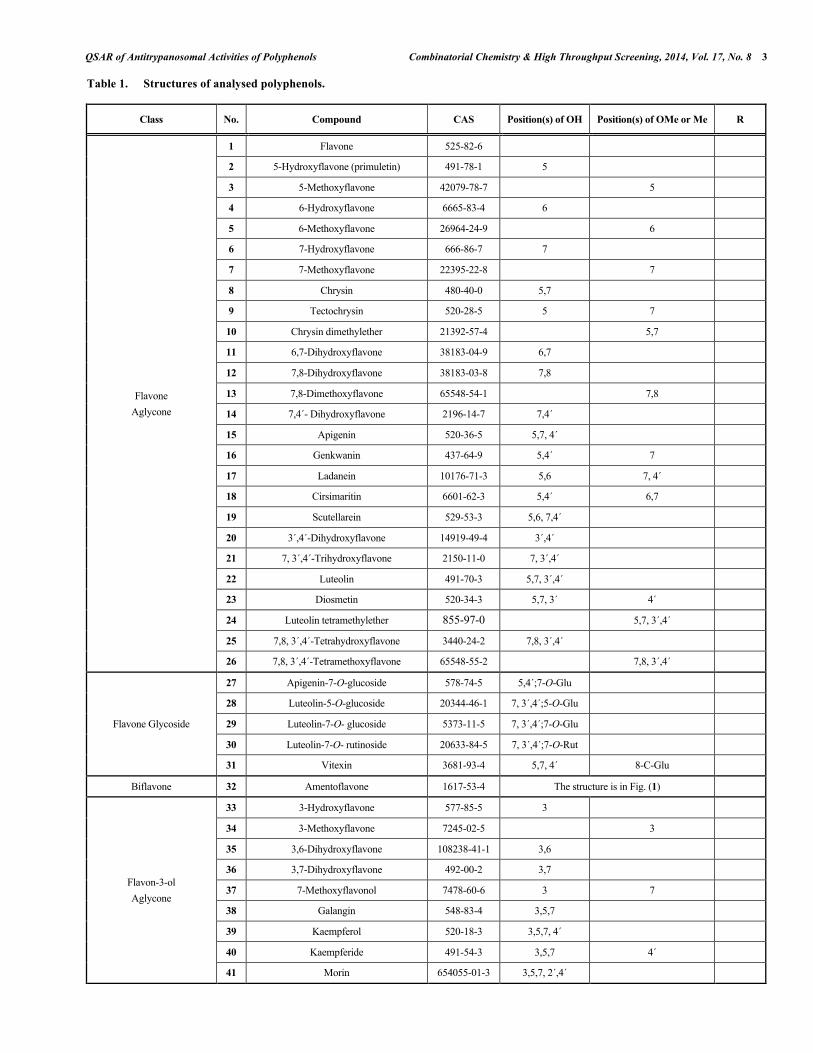
QSAR of Antitrypanosomal Activities of Polyphenols Combinatorial Chemistry & High Throughput Screening, 2014, Vol. 17, No. 8 3
Table 1. Structures of analysed polyphenols.
Class No. Compound CAS Position(s) of OH Position(s) of OMe or Me R
Flavone Aglycone
1 Flavone 525-82-6
2 5-Hydroxyflavone (primuletin) 491-78-1 5
3 5-Methoxyflavone 42079-78-7 5
4 6-Hydroxyflavone 6665-83-4 6
5 6-Methoxyflavone 26964-24-9 6
6 7-Hydroxyflavone 666-86-7 7
7 7-Methoxyflavone 22395-22-8 7
8 Chrysin 480-40-0 5,7
9 Tectochrysin 520-28-5 5 7
10 Chrysin dimethylether 21392-57-4 5,7
11 6,7-Dihydroxyflavone 38183-04-9 6,7
12 7,8-Dihydroxyflavone 38183-03-8 7,8
13 7,8-Dimethoxyflavone 65548-54-1 7,8
14 7,4´- Dihydroxyflavone 2196-14-7 7,4´
15 Apigenin 520-36-5 5,7, 4´
16 Genkwanin 437-64-9 5,4´ 7
17 Ladanein 10176-71-3 5,6 7, 4´
18 Cirsimaritin 6601-62-3 5,4´ 6,7
19 Scutellarein 529-53-3 5,6, 7,4´
20 3´,4´-Dihydroxyflavone 14919-49-4 3´,4´
21 7, 3´,4´-Trihydroxyflavone 2150-11-0 7, 3´,4´
22 Luteolin 491-70-3 5,7, 3´,4´
23 Diosmetin 520-34-3 5,7, 3´ 4´
24 Luteolin tetramethylether 855-97-0 5,7, 3´,4´
25 7,8, 3´,4´-Tetrahydroxyflavone 3440-24-2 7,8, 3´,4´
26 7,8, 3´,4´-Tetramethoxyflavone 65548-55-2 7,8, 3´,4´
Flavone Glycoside
27 Apigenin-7-O-glucoside 578-74-5 5,4´;7-O-Glu
28 Luteolin-5-O-glucoside 20344-46-1 7, 3´,4´;5-O-Glu
29 Luteolin-7-O- glucoside 5373-11-5 7, 3´,4´;7-O-Glu
30 Luteolin-7-O- rutinoside 20633-84-5 7, 3´,4´;7-O-Rut
31 Vitexin 3681-93-4 5,7, 4´ 8-C-Glu
Biflavone 32 Amentoflavone 1617-53-4 The structure is in Fig. (1)
Flavon-3-ol Aglycone
33 3-Hydroxyflavone 577-85-5 3
34 3-Methoxyflavone 7245-02-5 3
35 3,6-Dihydroxyflavone 108238-41-1 3,6
36 3,7-Dihydroxyflavone 492-00-2 3,7
37 7-Methoxyflavonol 7478-60-6 3 7
38 Galangin 548-83-4 3,5,7
39 Kaempferol 520-18-3 3,5,7, 4´
40 Kaempferide 491-54-3 3,5,7 4´
41 Morin 654055-01-3 3,5,7, 2´,4´
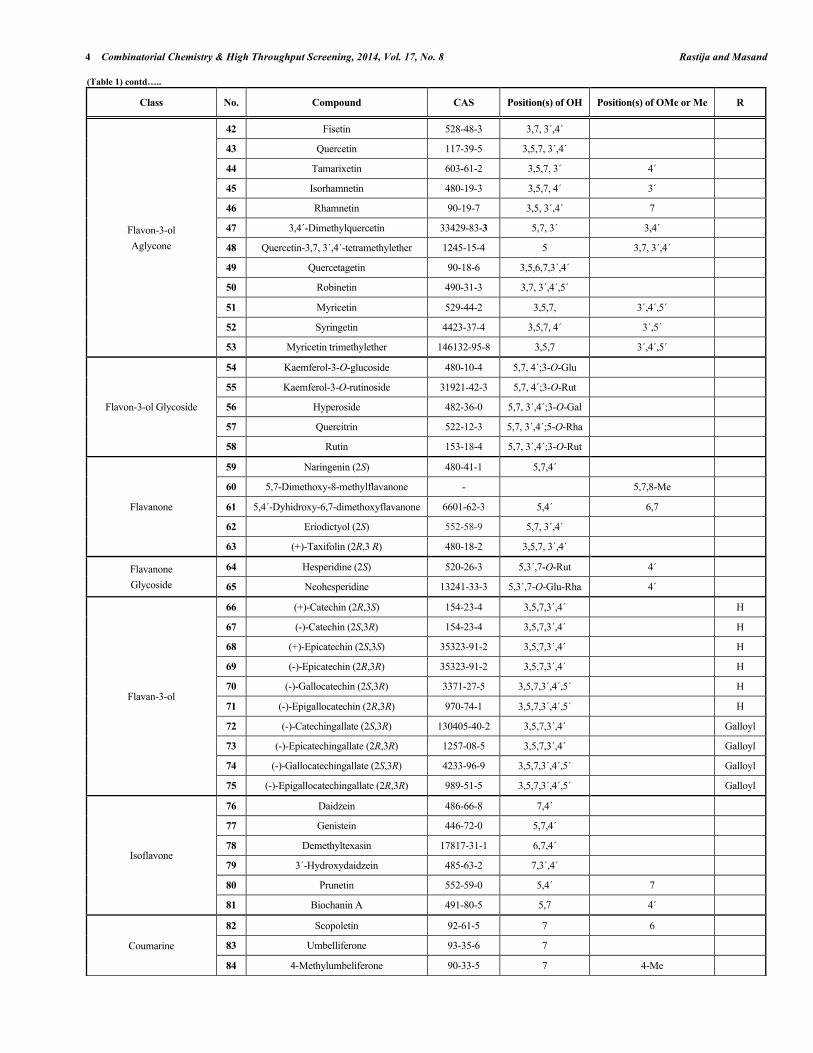
4 Combinatorial Chemistry & High Throughput Screening, 2014, Vol. 17, No. 8 Rastija and Masand
(Table 1) contd…..
Class No. Compound CAS Position(s) of OH Position(s) of OMe or Me R
Flavon-3-ol Aglycone
42 Fisetin 528-48-3 3,7, 3´,4´
43 Quercetin 117-39-5 3,5,7, 3´,4´
44 Tamarixetin 603-61-2 3,5,7, 3´ 4´
45 Isorhamnetin 480-19-3 3,5,7, 4´ 3´
46 Rhamnetin 90-19-7 3,5, 3´,4´ 7
47 3,4´-Dimethylquercetin 33429-83-3 5,7, 3´ 3,4´
48 Quercetin-3,7, 3´,4´-tetramethylether 1245-15-4 5 3,7, 3´,4´
49 Quercetagetin 90-18-6 3,5,6,7,3´,4´
50 Robinetin 490-31-3 3,7, 3´,4´,5´
51 Myricetin 529-44-2 3,5,7, 3´,4´,5´
52 Syringetin 4423-37-4 3,5,7, 4´ 3´,5´
53 Myricetin trimethylether 146132-95-8 3,5,7 3´,4´,5´
Flavon-3-ol Glycoside
54 Kaemferol-3-O-glucoside 480-10-4 5,7, 4´;3-O-Glu
55 Kaemferol-3-O-rutinoside 31921-42-3 5,7, 4´;3-O-Rut
56 Hyperoside 482-36-0 5,7, 3´,4´;3-O-Gal
57 Quercitrin 522-12-3 5,7, 3´,4´;5-O-Rha
58 Rutin 153-18-4 5,7, 3´,4´;3-O-Rut
Flavanone
59 Naringenin (2S) 480-41-1 5,7,4´
60 5,7-Dimethoxy-8-methylflavanone - 5,7,8-Me
61 5,4´-Dyhidroxy-6,7-dimethoxyflavanone 6601-62-3 5,4´ 6,7
62 Eriodictyol (2S) 552-58-9 5,7, 3´,4´
63 (+)-Taxifolin (2R,3 R) 480-18-2 3,5,7, 3´,4´
Flavanone Glycoside
64 Hesperidine (2S) 520-26-3 5,3´,7-O-Rut 4´
65 Neohesperidine 13241-33-3 5,3´,7-O-Glu-Rha 4´
Flavan-3-ol
66 (+)-Catechin (2R,3S) 154-23-4 3,5,7,3´,4´ H
67 (-)-Catechin (2S,3R) 154-23-4 3,5,7,3´,4´ H
68 (+)-Epicatechin (2S,3S) 35323-91-2 3,5,7,3´,4´ H
69 (-)-Epicatechin (2R,3R) 35323-91-2 3,5,7,3´,4´ H
70 (-)-Gallocatechin (2S,3R) 3371-27-5 3,5,7,3´,4´,5´ H
71 (-)-Epigallocatechin (2R,3R) 970-74-1 3,5,7,3´,4´,5´ H
72 (-)-Catechingallate (2S,3R) 130405-40-2 3,5,7,3´,4´ Galloyl
73 (-)-Epicatechingallate (2R,3R) 1257-08-5 3,5,7,3´,4´ Galloyl
74 (-)-Gallocatechingallate (2S,3R) 4233-96-9 3,5,7,3´,4´,5´ Galloyl
75 (-)-Epigallocatechingallate (2R,3R) 989-51-5 3,5,7,3´,4´,5´ Galloyl
Isoflavone
76 Daidzein 486-66-8 7,4´
77 Genistein 446-72-0 5,7,4´
78 Demethyltexasin 17817-31-1 6,7,4´
79 3´-Hydroxydaidzein 485-63-2 7,3´,4´
80 Prunetin 552-59-0 5,4´ 7
81 Biochanin A 491-80-5 5,7 4´
Coumarine
82 Scopoletin 92-61-5 7 6
83 Umbelliferone 93-35-6 7
84 4-Methylumbeliferone 90-33-5 7 4-Me
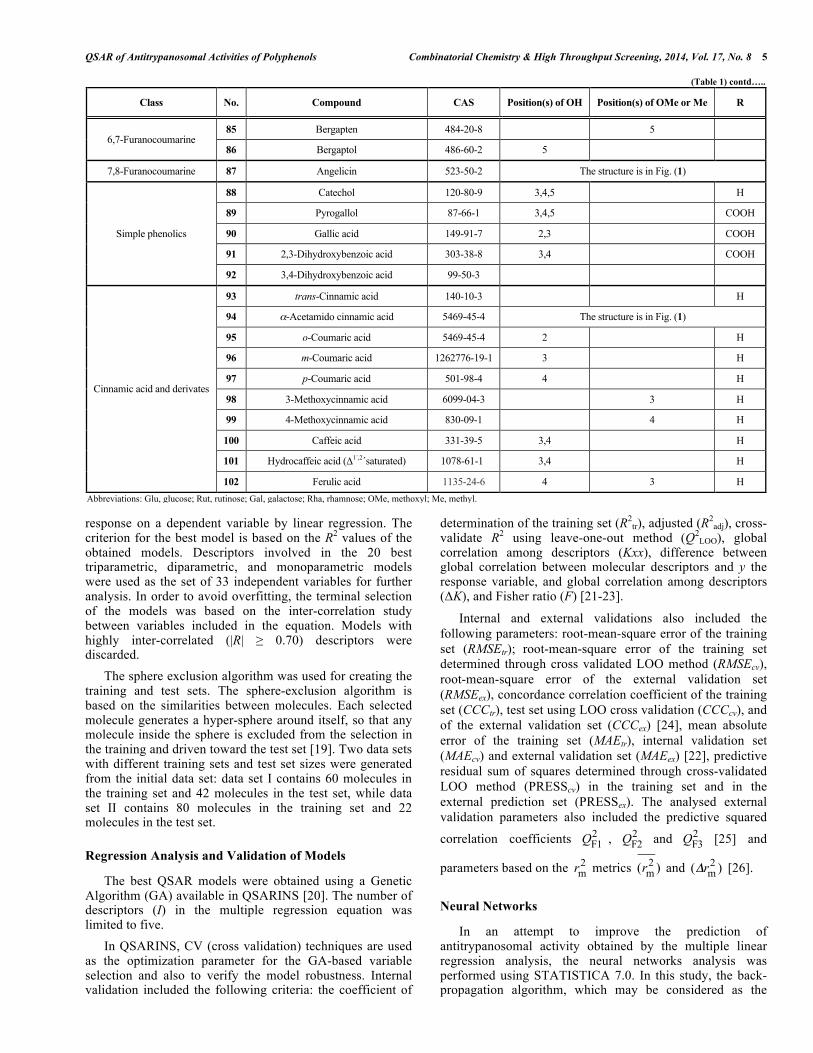
QSAR of Antitrypanosomal Activities of Polyphenols Combinatorial Chemistry & High Throughput Screening, 2014, Vol. 17, No. 8 5
response on a dependent variable by linear regression. The criterion for the best model is based on the R2 values of the obtained models. Descriptors involved in the 20 best triparametric, diparametric, and monoparametric models were used as the set of 33 independent variables for further analysis. In order to avoid overfitting, the terminal selection of the models was based on the inter-correlation study between variables included in the equation. Models with highly inter-correlated (|R| ≥ 0.70) descriptors were discarded. The sphere exclusion algorithm was used for creating the training and test sets. The sphere-exclusion algorithm is based on the similarities between molecules. Each selected molecule generates a hyper-sphere around itself, so that any molecule inside the sphere is excluded from the selection in the training and driven toward the test set [19]. Two data sets with different training sets and test set sizes were generated from the initial data set: data set I contains 60 molecules in the training set and 42 molecules in the test set, while data set II contains 80 molecules in the training set and 22 molecules in the test set.
Regression Analysis and Validation of Models
The best QSAR models were obtained using a Genetic Algorithm (GA) available in QSARINS [20]. The number of descriptors (I) in the multiple regression equation was limited to five. In QSARINS, CV (cross validation) techniques are used as the optimization parameter for the GA-based variable selection and also to verify the model robustness. Internal validation included the following criteria: the coefficient of
determination of the training set (R2tr), adjusted (R2
adj), cross-validate R2 using leave-one-out method (Q2
LOO), global correlation among descriptors (Kxx), difference between global correlation between molecular descriptors and y the response variable, and global correlation among descriptors (ΔK), and Fisher ratio (F) [21-23].
Internal and external validations also included the following parameters: root-mean-square error of the training set (RMSEtr); root-mean-square error of the training set determined through cross validated LOO method (RMSEcv), root-mean-square error of the external validation set (RMSEex), concordance correlation coefficient of the training set (CCCtr), test set using LOO cross validation (CCCcv), and of the external validation set (CCCex) [24], mean absolute error of the training set (MAEtr), internal validation set (MAEcv) and external validation set (MAEex) [22], predictive residual sum of squares determined through cross-validated LOO method (PRESScv) in the training set and in the external prediction set (PRESSex). The analysed external validation parameters also included the predictive squared
correlation coefficients QF12 , QF2
2 and QF3
2 [25] and
parameters based on the rm2 metrics (rm
2 ) and (Δrm2 ) [26].
Neural Networks
In an attempt to improve the prediction of antitrypanosomal activity obtained by the multiple linear regression analysis, the neural networks analysis was performed using STATISTICA 7.0. In this study, the back-propagation algorithm, which may be considered as the
(Table 1) contd…..
Class No. Compound CAS Position(s) of OH Position(s) of OMe or Me R
6,7-Furanocoumarine 85 Bergapten 484-20-8 5
86 Bergaptol 486-60-2 5
7,8-Furanocoumarine 87 Angelicin 523-50-2 The structure is in Fig. (1)
Simple phenolics
88 Catechol 120-80-9 3,4,5 H
89 Pyrogallol 87-66-1 3,4,5 COOH
90 Gallic acid 149-91-7 2,3 COOH
91 2,3-Dihydroxybenzoic acid 303-38-8 3,4 COOH
92 3,4-Dihydroxybenzoic acid 99-50-3
Cinnamic acid and derivates
93 trans-Cinnamic acid 140-10-3 H
94 α-Acetamido cinnamic acid 5469-45-4 The structure is in Fig. (1)
95 o-Coumaric acid 5469-45-4 2 H
96 m-Coumaric acid 1262776-19-1 3 H
97 p-Coumaric acid 501-98-4 4 H
98 3-Methoxycinnamic acid 6099-04-3 3 H
99 4-Methoxycinnamic acid 830-09-1 4 H
100 Caffeic acid 331-39-5 3,4 H
101 Hydrocaffeic acid (∆1´,2´saturated) 1078-61-16 3,4 H
102 Ferulic acid 1135-24-6 4 3 H Abbreviations: Glu, glucose; Rut, rutinose; Gal, galactose; Rha, rhamnose; OMe, methoxyl; Me, methyl.
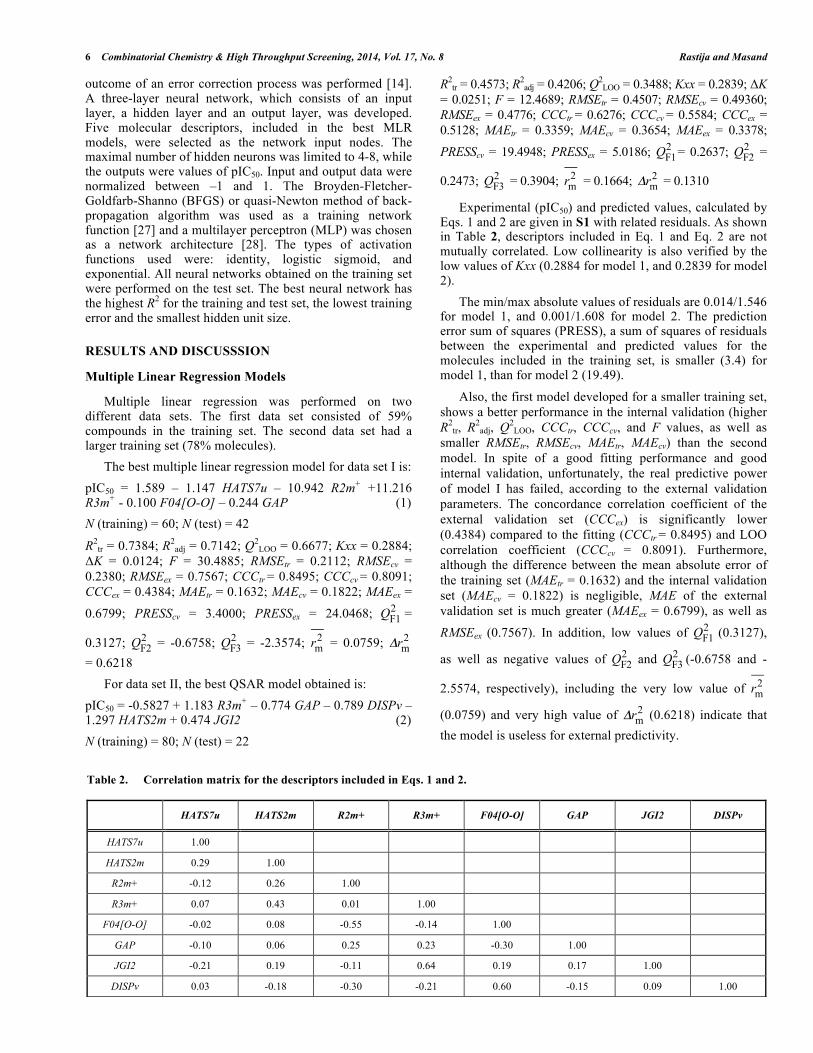
6 Combinatorial Chemistry & High Throughput Screening, 2014, Vol. 17, No. 8 Rastija and Masand
outcome of an error correction process was performed [14]. A three-layer neural network, which consists of an input layer, a hidden layer and an output layer, was developed. Five molecular descriptors, included in the best MLR models, were selected as the network input nodes. The maximal number of hidden neurons was limited to 4-8, while the outputs were values of pIC50. Input and output data were normalized between –1 and 1. The Broyden-Fletcher-Goldfarb-Shanno (BFGS) or quasi-Newton method of back-propagation algorithm was used as a training network function [27] and a multilayer perceptron (MLP) was chosen as a network architecture [28]. The types of activation functions used were: identity, logistic sigmoid, and exponential. All neural networks obtained on the training set were performed on the test set. The best neural network has the highest R2 for the training and test set, the lowest training error and the smallest hidden unit size.
RESULTS AND DISCUSSSION
Multiple Linear Regression Models
Multiple linear regression was performed on two different data sets. The first data set consisted of 59% compounds in the training set. The second data set had a larger training set (78% molecules). The best multiple linear regression model for data set I is: pIC50 = 1.589 – 1.147 HATS7u – 10.942 R2m+ +11.216 R3m+ - 0.100 F04[O-O] – 0.244 GAP (1) N (training) = 60; N (test) = 42
R2tr = 0.7384; R2
adj = 0.7142; Q2LOO = 0.6677; Kxx = 0.2884;
ΔK = 0.0124; F = 30.4885; RMSEtr = 0.2112; RMSEcv = 0.2380; RMSEex = 0.7567; CCCtr = 0.8495; CCCcv = 0.8091; CCCex = 0.4384; MAEtr = 0.1632; MAEcv = 0.1822; MAEex =
0.6799; PRESScv = 3.4000; PRESSex = 24.0468; QF12 =
0.3127; QF22 = -0.6758; QF3
2 = -2.3574; rm2 = 0.0759; Δrm
2 = 0.6218 For data set II, the best QSAR model obtained is: pIC50 = -0.5827 + 1.183 R3m+ – 0.774 GAP – 0.789 DISPv – 1.297 HATS2m + 0.474 JGI2 (2) N (training) = 80; N (test) = 22
R2tr = 0.4573; R2
adj = 0.4206; Q2LOO = 0.3488; Kxx = 0.2839; ΔK
= 0.0251; F = 12.4689; RMSEtr = 0.4507; RMSEcv = 0.49360; RMSEex = 0.4776; CCCtr = 0.6276; CCCcv = 0.5584; CCCex = 0.5128; MAEtr = 0.3359; MAEcv = 0.3654; MAEex = 0.3378;
PRESScv = 19.4948; PRESSex = 5.0186; QF12 = 0.2637; QF2
2 =
0.2473; QF32 = 0.3904; rm
2 = 0.1664; Δrm2 = 0.1310
Experimental (pIC50) and predicted values, calculated by Eqs. 1 and 2 are given in S1 with related residuals. As shown in Table 2, descriptors included in Eq. 1 and Eq. 2 are not mutually correlated. Low collinearity is also verified by the low values of Kxx (0.2884 for model 1, and 0.2839 for model 2). The min/max absolute values of residuals are 0.014/1.546 for model 1, and 0.001/1.608 for model 2. The prediction error sum of squares (PRESS), a sum of squares of residuals between the experimental and predicted values for the molecules included in the training set, is smaller (3.4) for model 1, than for model 2 (19.49).
Also, the first model developed for a smaller training set, shows a better performance in the internal validation (higher R2
tr, R2adj, Q2
LOO, CCCtr, CCCcv, and F values, as well as smaller RMSEtr, RMSEcv, MAEtr, MAEcv) than the second model. In spite of a good fitting performance and good internal validation, unfortunately, the real predictive power of model I has failed, according to the external validation parameters. The concordance correlation coefficient of the external validation set (CCCex) is significantly lower (0.4384) compared to the fitting (CCCtr = 0.8495) and LOO correlation coefficient (CCCcv = 0.8091). Furthermore, although the difference between the mean absolute error of the training set (MAEtr = 0.1632) and the internal validation set (MAEcv = 0.1822) is negligible, MAE of the external validation set is much greater (MAEex = 0.6799), as well as
RMSEex (0.7567). In addition, low values of QF12 (0.3127),
as well as negative values of QF22 and QF3
2 (-0.6758 and -
2.5574, respectively), including the very low value of rm2
(0.0759) and very high value of Δrm2 (0.6218) indicate that
the model is useless for external predictivity.
Table 2. Correlation matrix for the descriptors included in Eqs. 1 and 2.
HATS7u HATS2m R2m+ R3m+ F04[O-O] GAP JGI2 DISPv
HATS7u 1.00
HATS2m 0.29 1.00
R2m+ -0.12 0.26 1.00
R3m+ 0.07 0.43 0.01 1.00
F04[O-O] -0.02 0.08 -0.55 -0.14 1.00
GAP -0.10 0.06 0.25 0.23 -0.30 1.00
JGI2 -0.21 0.19 -0.11 0.64 0.19 0.17 1.00
DISPv 0.03 -0.18 -0.30 -0.21 0.60 -0.15 0.09 1.00
QSAR of Antitrypanosomal Activities of Polyphenols Combinatorial Chemistry & High Throughput Screening, 2014, Vol. 17, No. 8 7
The quality of the internal validation for the second model, which is developed for the 80 compounds in the training sets, is not acceptable considering the low values of R2
tr, R2adj, Q2
LOO, CCCtr, CCCcv, and F, as well as high values of RMSEtr, RMSEcv, MAEtr, MAEcv. However, the quality of external validation of model 2 is more acceptable than for model 1. Values of RMSEtr, RMSEcv, RMSEex have approximately equal values (0.4507, 0.49360, 0.4776, respectively, as well as MAEtr, MAEcv, MAEex (0.3359, 0.3654, 0.3378, respectively). Although values obtained for
parameters QF12 , and QF3
2 are not even close to the threshold
(0.70), they are higher than for model 1. The value of rm2 is
unacceptably low (0.1664) since that parameter may attain a
maximum value of 1. On the other hand, Δrm2 has an
acceptable value lower than 0.2 (0.131). However, a reduced size of the test set, compared to model 1, may be the potential reason for better external validation results. Considering the fact that both models do not satisfy criteria of the internal and external validation to be “predictive” QSAR models [21], we may conclude that the linear relationship between the antitrypanosomal activity and the structures of observed polyphenols does not exist. A possible reason for this occurrence lies in the great diversity of the chemical structure of molecules. Therefore, a complex nonlinear relationship between structures and observed activities of polyphenols was examined by neural networks using descriptors involved in the best MLR equations. The majority of descriptors involved in models 1 and 2 belong to the GETAWAY group of descriptors. Two of them, HATS7u and HATS2m leverage-weighted autocorrelation indices, unweighted and weighted by atomic masses [29], respectively, exert a negative influence on pIC50. Thus, the enhanced values of the descriptor HATS2m, or heavier atoms than carbon or hydrogen (oxygen atoms) located at topological distance 2, affect the lower antitrypanosomal activity. Therefore, compounds with two oxygen atoms at topological distance 2 possess higher HATS2m values, e.g. coumarines and furanocoumarines because of their 2-pyrone structure, as well as flavonoid glucosides as a result of O-glycosidic bond. Other two GETAWAY descriptors (R2m+, R3m+) are autocorrelation R-GETAWAY descriptors that are based on the influence/distance matrix R. Descriptors R2m+ and R3m+ represent a maximal contribution to the autocorrelation at topological distance 2 and 3, respectively. As in the case with HATS2m, the negative coefficient of R2m+ implies that oxygen atoms at topological distance 2 affect the reduction of antitrypanosomal activity. On the other hand, higher values of R3m+ are favourable for the exhibition of inhibitory activity of polyphenols. The given descriptor reflects the relevance of the catechol functional group for higher trypanocidal activities at the A and B ring of flavonoids, as in 7,8,3´,4´-tetrahydroxyflavone (25) (pIC50 = 0.301) and 3´,4´-dihydroxyflavone (20) (pIC50 = -0.0041). An equal effect is exhibited by two OH groups at C-7 and C-8 of flavones, as in the most active compound, 7,8-dihydroxyflavone (12) (pIC50 = 1.167), or two OH groups at C-6 and C-7 of 6,7-dihydroxyflavone (11) (pIC50 = -0.279).
Eq. 2 also reveals that higher values of 2nd order mean topological charge index (JGI2) enhance the activity. Negative signs of the other three descriptors in Eqs. 1 and 2 (DISPv, F04[O-O], GAP) indicate that higher values of those descriptors are unfavourable for the activity. DISPv is a geometrical descriptor weighted by atomic van der Waals volumes. F04[O-O] is a 2D frequency fingerprint descriptor, which corresponds to the frequency of occurrence of two oxygen atoms at topological distance 4. This occurrence is most evident for glycosides, which are, at the same time, the most inactive compounds. Another descriptor that negatively affects the antitrypanosomal activity is the quantum-chemical descriptor, energy gap (GAP), the measure of the molecular stability [30]. A large HOMO-LUMO gap implies high stability for the molecules in the sense of its lower reactivity, which is proved by the negative coefficient of this descriptor in Eqs. 1 and 2.
Neural Networks Models
In order to find a nonlinear relationship between antitrypanosomal activity and polyphenols, and possibly improve the prediction, the neural networks (NN) models were obtained using five descriptors appearing in MLR models 1 and 2. Neural networks were performed on the same training and test set as the MLR analysis. The best network for data set I (N (training) = 60; N (test) = 42) (NN I) was obtained with five inputs (HATS7u, R2m+, R3m+, F04[O-O], GAP). The networks consist of six hidden units while the outputs were pIC50 values. The neuron hidden activation function was logistic, while the output activation was identity. The correlation coefficients of networks (5-6-1) are: R2
train = 0.986, training error = 0.000961, R2test = 0.758
For data set II (N (training) = 80; N (test) = 22), the best neural network (NN II) was obtained with the five descriptors (R3m+, GAP, DISPv, HATS2m, JGI2). The architecture of the obtained network is 5-5-1 (5 inputs, 5 hidden units and 1 output). The hidden activation function was logistic, while the output function was exponential function. The correlation coefficients of networks are: R2
train = 0.913, training error = 0.003251, R2test = 0.673
Prediction results for both neural networks are presented in the Supplementary data (S1). The plot of the observed versus calculated pIC50 for the training set of compounds derived by NN I is shown in Fig. (2), and for the test set in Fig. (3). Comparing the results of both networks, it is evident that NN created for data set I has better statistical parameters than NN for data set II, as well as in case of MLR models. Therefore, the correlation coefficients of NN I are higher than of NN II, while the training error and difference between R2
train and R2test is smaller. Moreover, ANN applied
to the same data set shows a better predictive ability than MLR. Thus, the NN I model is able to account for 98.6% of the variance of antitrypanosomal activity of the training set, while model 1 obtained by MLR accounts only for 73.84%. However, better statistical results of model 1 and NN I compared with the results of model 2 and NN II indicate that pIC50 significantly correlated with the five descriptors
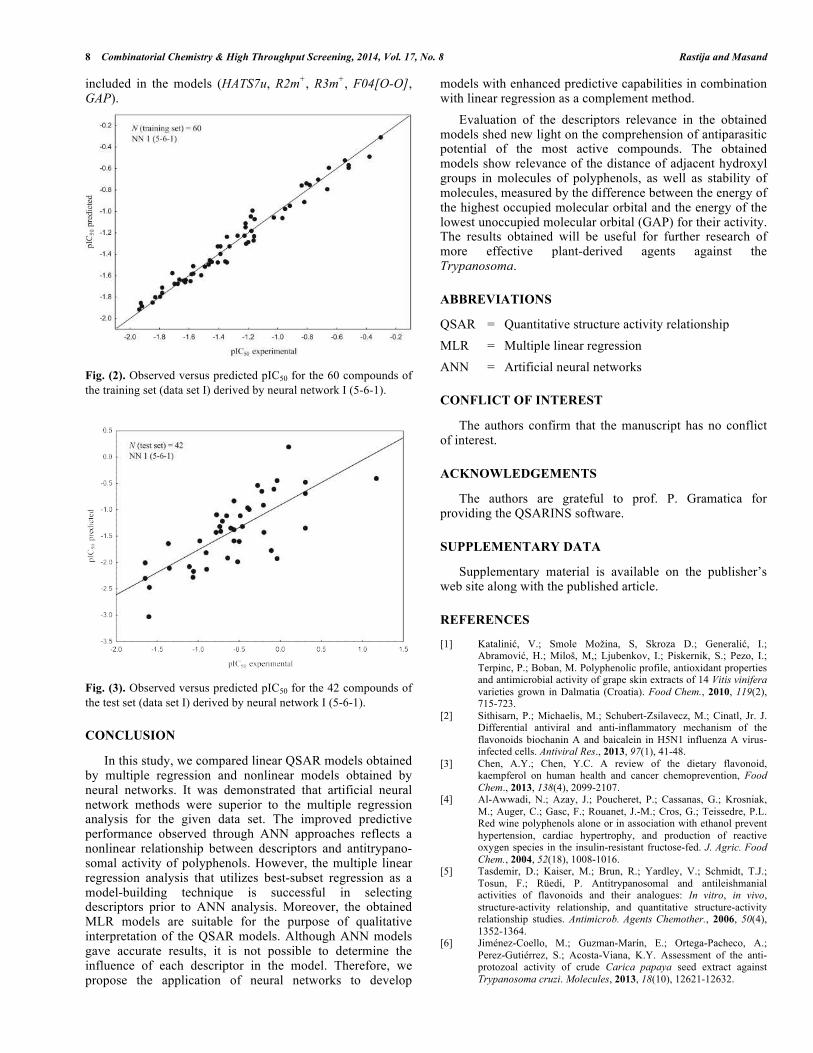
8 Combinatorial Chemistry & High Throughput Screening, 2014, Vol. 17, No. 8 Rastija and Masand
included in the models (HATS7u, R2m+, R3m+, F04[O-O], GAP). Fig. (2). Observed versus predicted pIC50 for the 60 compounds of the training set (data set I) derived by neural network I (5-6-1).
Fig. (3). Observed versus predicted pIC50 for the 42 compounds of the test set (data set I) derived by neural network I (5-6-1).
CONCLUSION
In this study, we compared linear QSAR models obtained by multiple regression and nonlinear models obtained by neural networks. It was demonstrated that artificial neural network methods were superior to the multiple regression analysis for the given data set. The improved predictive performance observed through ANN approaches reflects a nonlinear relationship between descriptors and antitrypano-somal activity of polyphenols. However, the multiple linear regression analysis that utilizes best-subset regression as a model-building technique is successful in selecting descriptors prior to ANN analysis. Moreover, the obtained MLR models are suitable for the purpose of qualitative interpretation of the QSAR models. Although ANN models gave accurate results, it is not possible to determine the influence of each descriptor in the model. Therefore, we propose the application of neural networks to develop
models with enhanced predictive capabilities in combination with linear regression as a complement method. Evaluation of the descriptors relevance in the obtained models shed new light on the comprehension of antiparasitic potential of the most active compounds. The obtained models show relevance of the distance of adjacent hydroxyl groups in molecules of polyphenols, as well as stability of molecules, measured by the difference between the energy of the highest occupied molecular orbital and the energy of the lowest unoccupied molecular orbital (GAP) for their activity. The results obtained will be useful for further research of more effective plant-derived agents against the Trypanosoma.
ABBREVIATIONS
QSAR = Quantitative structure activity relationship MLR = Multiple linear regression ANN = Artificial neural networks
CONFLICT OF INTEREST
The authors confirm that the manuscript has no conflict of interest.
ACKNOWLEDGEMENTS
The authors are grateful to prof. P. Gramatica for providing the QSARINS software.
SUPPLEMENTARY DATA
Supplementary material is available on the publisher’s web site along with the published article.
REFERENCES
[1] Katalinić, V.; Smole Možina, S, Skroza D.; Generalić, I.; Abramović, H.; Miloš, M,; Ljubenkov, I.; Piskernik, S.; Pezo, I.; Terpinc, P.; Boban, M. Polyphenolic profile, antioxidant properties and antimicrobial activity of grape skin extracts of 14 Vitis vinifera varieties grown in Dalmatia (Croatia). Food Chem., 2010, 119(2), 715-723.
[2] Sithisarn, P.; Michaelis, M.; Schubert-Zsilavecz, M.; Cinatl, Jr. J. Differential antiviral and anti-inflammatory mechanism of the flavonoids biochanin A and baicalein in H5N1 influenza A virus-infected cells. Antiviral Res., 2013, 97(1), 41-48.
[3] Chen, A.Y.; Chen, Y.C. A review of the dietary flavonoid, kaempferol on human health and cancer chemoprevention, Food Chem., 2013, 138(4), 2099-2107.
[4] Al-Awwadi, N.; Azay, J.; Poucheret, P.; Cassanas, G.; Krosniak, M.; Auger, C.; Gasc, F.; Rouanet, J.-M.; Cros, G.; Teissedre, P.L. Red wine polyphenols alone or in association with ethanol prevent hypertension, cardiac hypertrophy, and production of reactive oxygen species in the insulin-resistant fructose-fed. J. Agric. Food Chem., 2004, 52(18), 1008-1016.
[5] Tasdemir, D.; Kaiser, M.; Brun, R.; Yardley, V.; Schmidt, T.J.; Tosun, F.; Rüedi, P. Antitrypanosomal and antileishmanial activities of flavonoids and their analogues: In vitro, in vivo, structure-activity relationship, and quantitative structure-activity relationship studies. Antimicrob. Agents Chemother., 2006, 50(4), 1352-1364.
[6] Jiménez-Coello, M.; Guzman-Marín, E.; Ortega-Pacheco, A.; Perez-Gutiérrez, S.; Acosta-Viana, K.Y. Assessment of the anti-protozoal activity of crude Carica papaya seed extract against Trypanosoma cruzi. Molecules, 2013, 18(10), 12621-12632.
QSAR of Antitrypanosomal Activities of Polyphenols Combinatorial Chemistry & High Throughput Screening, 2014, Vol. 17, No. 8 9
[7] Shaba, P.; Pandey, N.N.; Sharma, O.P.; Singh, R.K. Anti-trypanosomal activity of Piper nigrum L. (black pepper) against Trypanosoma evansi. J. Vet. Adv., 2012, 2(4), 161-167.
[8] Shaba, P.; Pandey, N.N.; Sharma, O.P.; Rao, J.R.; Mishra, A.K.; Singh, R.K. Antitrypanosomal activity of methanolic extract of Khaya senegalensis tree bark against Trypanosoma evansi. Int. J. Food Agr. Vet. Sc., 2011, 1(1), 21-26.
[9] Ibrahim, M.A.; Aliyu, A.B.; Sallau, A.B.; Yunusu, I.; Umar, T.S. Senna occidentalis leaf extract possesses antitrypanosomal activity and ameliorates the trypanosome-induced anemia and organ damage. Pharmacognosy Res., 2010, 2(3), 175-180.
[10] Sartorelli, P.; Carvalho, C.S.; Reimão, J.Q.; Ferreira, M.J.P.; Tempone, A.G. Antiparasitic activity of biochanin A, an isolated isoflavone from fruits of Cassia fistula (Leguminosae). Parasitol. Res., 2009, 10(2), 311-314.
[11] Al-Musayeib, N.M.; Mothana, R.A.; Matheeussen, A.; Cos, P.; Maes, L. In vitro antiplasmodial, antileishmanial and antitrypanosomal activities of selected medicinal plants used in the traditional Arabian Peninsular region. BMC Complement Altern Med. 2012, 12, 49-49.
[12] Scotti, L.; Ferreira, E.I.; da Silva, M.S.; Scotti, M.T. Chemometric studies on natural products as potential inhibitors of the NADH oxidase from Trypanosoma cruzi using the VolSurf approach. Molecules, 2010, 15(10), 7363-7377.
[13] Dodson, H.C.; Lyda, T.A.; Chambers, J.W.; Morris, M.T.; Christensen, K.A.; Morris, J.C. Quercetin, a fluorescent bioflavonoid, inhibits Trypanosoma brucei hexokinase 1. Exp. Parasitol., 2011, 127(2), 423-428.
[14] Niculescu, S.P. Artificial neural networks and genetic algorithms in QSAR. J. Mol. Struct. (Theochem), 2003, 622(1-2), 71-83.
[15] Hocquet. A.; Langgård, M. An evaluation of the MM+ force field. 1998, J. Mol. Model, 4(3), 94-112.
[16] Dewar, M.J.S.; Zoebisch, E.G.; Healy, E.F.; Stewart, J.J.P. AM1: A new general purpose quantum mechanical model. J. Am. Chem. Soc., 1985, 107(13), 3902-3909.
[17] Tetko, I.V.; Gasteiger, J.; Todeschini, R.; Mauri, A.; Livingstone, D.; Ertl, P.; Palyulin, V.A.; Radchenko, E.V.; Zefirov, N.S.; Makarenko, A.S.; Tanchuk, V.Y.; Prokopenko, V.V. Virtual computational chemistry laboratory – design and description. J. Comput. Aided Mol. Des., 2005, 19(6), 453-463.
[18] Todeschini, R.; Consonni, V. Handbook of molecular descriptors, Wiley-VCH: Weinheim, 2000.
[19] Hudson, B.D.; Hyde, R.M.; Rahr, E.; Wood, J. Parameter based methods for compound selection from chemical database. Quantitative Structure-Activity Relationships, 1996, 15(4), 285-289.
[20] Gramatica, P.; Chirico, N.; Papa, N.; Cassani, S.; Kovarich, S. QSARINS: A new software for the development, analysis, and validation of QSAR MLR models. J. Comput. Chem., 2013, 34(24), 2121-2132.
[21] Gramatica, P. Principles of QSAR models validation: internal and external. QSAR Comb. Sci., 2007, 26(5), 694-701.
[22] Tropsha, A. Best practices for QSAR model development, validation, and exploitation. Molecular Informatics 2010, 29(6-7), 476-488.
[23] Todeschini, R.; Consonni, V.; Maiocchi, A. The K correlation index: theory development and its application in chemometrics. Chemom. Intell. Lab. Syst., 1999, 46(1), 13-29.
[24] Chirico, N.; Gramatica, P. Real external predictivity of QSAR models: how to evaluate it? Comparison of different validation criteria and proposal of using the concordance correlation coefficient. J. Chem. Inf. Model, 2011, 51(9), 2320-2335.
[25] Schüürmann, G.; Ebert, R.; Chen, J.; Wang, B.; Kühne, R. External validation and prediction employing the predictive squared correlation coefficients test set activity mean vs training set activity mean, J. Chem. Inf. Model, 2008, 48(11), 2140–2145.
[26] Ojha, P.K.; Mitra, I.; Das, R.N.; Roy, K. Further exploring rm2
metrics for validation of QSPR models dataset. Chemom. Intell. Lab. Syst., 2011, 107(1), 194-205.
[27] Anastasiadis, A.D.; Magoulas, G.D.; Vrahatis, M.N. New globally convergent training scheme based on the resilient propagation algorithm. Neurocomputing, 2005, 64, 253-270.
[28] Rumelhart, D.E.; McClelland, J. Parallel distributed processing; MIT Press: Cambridge, 1986, Vol. 1, pp. 305-314.
[29] Consonni, V.; Todeschini, R.; Pavan, M. Structure/response correlations and similarity/diversity analysis by GETAWAY descriptors. 1. Theory of the novel 3D molecular descriptors. J. Chem. Inf. Comput. Sci., 2002, 42(3), 682-692.
[30] Zhou, Z.; Parr, R.G. New measures of aromaticity: absolute hardness and relative hardness. J. Am. Chem. Soc., 1989, 111(19), 7371-7379.
Received: March 28, 2014 Revised: July 2, 2014 Accepted: July 23, 2014
S.A.Quazi et.al Indian Journal of Research in Pharmacy and Biotechnology ISSN: 2321-5674(Print) ISSN: 2320 – 3471(Online)
IJRPB 2(5) www.ijrpb.com September-October 2014 Page 1419
Study of plant growth regulating antibiotic drugs - 3-(2-benzimidazol)-3-nitro-6-
methyl-chromen-4-one with innertransition metal complexes on spinach
(spinacia oleracea l.) at different ph
S.A.Quazi1*
, D.T.Mahajan2, Noor Mohammad
3, Vijay Masand
4
Department of chemistry, VidyaBhartiMahavidyalaya, Camp, Amravati (M.S) India
Department of chemistry, Govt.Vidarbha Institute of Sci. and Humanities, Amravati (M.S) India
*Corresponding author: E.Mail:[email protected]
ABSTRACT
Antibiotic drugs - 3-(2-benzimidazol)-3-nitro-6-methyl chromen-4-one (Chromone derivatives)
with inner transition metal complexes at different pH on plant growth of spinach were studied. Plant growth
was decided by measurement of different growth parameters.
Keywords: plant growth, germination, antibiotic drugs, metal complexes.
INTRODUCTION
Chromone derivatives having great attention
for their applications, plants make plant growth
regulators, often called phytohormones, to regulate
growth, development, and responses to stimuli. Each of
these small organic molecules has pleiotropic effects.
The balance between them shifts constantly. Changes
in phytohormone levels result in gene activation shifts.
In tissue culture the concentration of growth regulators
in the medium must be optimized and may change
according to the desired result. Cytokines promote
shoot formation, but need auxins as well to promote
mitosis. We offer the naturally occurring hormones as
well as potent synthetic substitutes. We also offer
antagonists, useful as tools for investigating hormonal
mechanisms of action. These compounds exhibit a
wide spectrum of biological activities including
antimicrobial (Goker, 2005; Nawort, 2006),
antibacterial (Harborne, 2000; Guz, 2001), antitumor
(Yakut, 2004), antifungal (Ali, 2008; Ali 2007, Uher,
1994), anti-allergic (Ohata, 1991), antiviral (Desideri,
2003), anti-inflammatory (Jerzy, 1995) and anticancer
(Denis, 1999) activities. Plant growth regulating
activities of various organic ligands and their transition
metal ion complexes for various plants were studied by
many workers (AB Patil, 2007; Adams, 2009;
Meshram, 2011; SKumar, 2010; Magar, 2011; Mane,
2010). Germination is an economical and simple
method for improving the nutritive value and several
studies have reported (King, 1981; Frias, 1995; Honke,
1998) higher levels of nutrients and lower levels of
antinutrients in sprouts compared to the ingeminated
seeds. studies of acoustic behavior of 3-(2-
benzimidazol)-3-nitro-6-methylchromen-4-one (bnmc)
in a different solvents system by using
ultrasonicinterferometer(Quazi, 2014).Studies
ofstability constants and thermodynamically
parameters (ΔH,ΔG, ΔS) of inner transition metal ions
complexes with substituted chromone Schiff bases
70% dioxane – water(Noor, 2014). Studies of some
acoustic parameters of cu (No3)2 inwater-dioxane
mixture at 298.150k by physico -chemical method
(Quazi, 2014).
3-(2-benzimidazol)-3-nitro-6-methyl chromen-
4-one (Chromone derivatives) with inner transition
metal complexes. Spinach have rich source of vit-A,
vit-C, vit-E, vit-K, Mg, Mn, Foliate, Betaine, Fe, vit-
B12, Ca, K, vit-B6, Folic acid, Cu,Protein, P, Zn,
Niacin, Se and omega 3 fatty acids since no work is
reported on the biological applications of metal
complexes with chromone derivatives, present work is
carried out with metal complexes of Ce (III) and
Sm(III) with 3-(2-benzimidazol)-3-nitro-6-methyl
chromen-4-one to study the effect of these complexes
on germination, survival, seedling height action
spinach plant.
MATERIALS AND METHODS
All metal nitrates available from Sigma
Aldrich Chem. Co., U.S.A. Metal nitrate was prepared
in triply distill water and concentration was estimated
by standard method. Solutions of Ce (III) and Sm (III)
metal nitrates of 0.01 mol/dm3 concentration were
prepared by adding accurate amounts of metal salts in
distilled water. The solution of 3-(2-benzimidazol)-3-
nitro-6-methyl chromen-4-one of 0.01
mol/dm3concentration was prepared in distilled water.
The biological applications were studied at pH 4.5, 7.5
and 9.0 at 0.1 mol/dm3 ionic strength of KNO3
solution.
The basic requirement for this experiment was
soil fertilized soil, which collected from agricultural
land. Stones and other hard material removed from it.
It was then grind and filtered. Two parts of this finely
powdered soil was mixed with one part of filtered pink
stone sand. This soil was then filled in two wooden
trays having compartments of equal size. The soil in
the tray was moistened with water. Sowing of seeds
was done in this soil after one hour.Spinacia oleracea
S.A.Quazi et.al Indian Journal of Research in Pharmacy and Biotechnology ISSN: 2321-5674(Print) ISSN: 2320 – 3471(Online)
IJRPB 2(5) www.ijrpb.com September-October 2014 Page 1420
(spinach) are selected, healthy seeds of spinach
[Spinacia oleracea L.] of equal size were selected for
same germination were taken and thoroughly washed
using doubly distilled water. 100 seeds from these
healthy seeds of equal size immersed in tested solution
of pH 4.5, 7.5 and 9.0. These seeds soaked were taken
out of each solution. The seeds were sowed in the
wooden trays in a row. Effect of the ligand, metal ion,
complex solution on growth of plants was studied at
different pH 4.5, 7.5 and 9.0 the seeds being immersed
in the solution at about 6 hours. A controlled set was
similarly run using double distilled water. Plant growth
is decided on the basis of measured average value of
parameters such as percentage of germinations,
survival, seedling height, shoot length, root length and
leaf area of young leaves compared with control
system. The germination and Survival was noted after
4 and 10 days. After noting the survival of the plants,
they were taken out of the soil. The seedling height
(root length/shoot length) and leaf area (width &
length) of young leaf of survived plants were
measured. Table 1, 2 and 3 represents the average
values of growth parameters.
Table.1.Effect of ligand, metal ion and complex on Germination, Survival, seeding height etc. on Spinacia
oleracea (L.) at 4.5 pH
Table.2.Effect of ligand, metal ion and complex on Germination, Survival, seeding height etc. on Spinacia
oleracea (L.) at 7.5 pH
Parameters
Effect Order of plant Growth
regulators
Control Ligand Metal-Complex
L>complex>metal>control
Ce(III) Sm(III)
%germination after 4 days 54.00 68.00 58.00 57.00
% survival after10days 68.00 84.00 78.00 76.00
Seedling height (cm) 2.40 2.48 2.43 2.41
Root length (cm) 4.05 4.12 4.08 4.07
Shoot length (cm) 4.32 4.55 4.51 4.42
Root/Shoot ratio 0.9372 0.9049 0.9040 0.9100
Width length of young leaf (cm) 0.9652 0.9699 0.9642 0.9594
Table.3.Effect of ligand, metal ion and complex on Germination, Survival, seeding height etc. on Spinacia
oleracea (L.) at 9.0 pH
Parameters
Effect Order of plant Growth regulators
Control Ligand Metal-Complex
L>complex>metal>control
Ce (III) Sm (III)
%germination after 4 days 51.00 66.00 54.00 52.00
% survival after10days 66.00 82.00 76.00 74.00
Seedling height (cm) 2.30 2.45 2.40 2.39
Root length (cm) 4.03 4.10 4.08 4.05
Shoot length (cm) 4.30 4.50 4.45 4.42
Root/Shoot ratio 0.9369 0.9106 0.9164 0.9158
Width length of young leaf (cm) 0.9607 0.9684 0.9606 0.9558
Parameters Effect Order of plant Growth
regulators
Control Ligand Metal-Complex L>complex>metal>control
Ce (III) Sm (III)
%germination after 4 days 55.00 71.00 63.00 58.00
% survival after10days 71.00 86.00 79.00 77.00
Seedling height (cm) 2.41 2.50 2.47 2.43
Root length (cm) 4.07 4.14 4.09 4.07
Shoot length (cm) 4.35 4.59 4.53 4.50
Root/Shoot ratio 0.9353 0.9011 0.9000 0.9059
Width length of young leaf
(cm)
0.9729 0.9737 0.9230 0.9640
S.A.Quazi et.al Indian Journal of Research in Pharmacy and Biotechnology ISSN: 2321-5674(Print) ISSN: 2320 – 3471(Online)
IJRPB 2(5) www.ijrpb.com September-October 2014 Page 1421
RESULTS AND DISCUSSION
The parameter of plant growth was considered
on the basis of percentage of germination, survival,
seedling height, soot length, root length, root/shoot
ratio, and thickness of young leaf. The average values
of these parameters are reported in Table (2).Seed
Germination is one of the main feature of plant
physiology. It was cleared from table 1, 2 & 3 that, the
percent germination in all the treatments showed
increase than that of control (distilled water).
The seedling height (root length/shoot length)
and leaf area (width & length) of young leaf of plants
were measured. The average values of these
parameters are showed in table 1, 2 & 3. In the present
investigation, effect of the ligand, complex and metal
ion on percentage seed germination, root length, shoot
length (root /shoot ratio) and seedling height etc. have
been studied. The ligand-L has found high value for all
these parameters at different pH. Thus, at pH 4.5, 7.5
and 9.0 Ligand (L) can functions as plant growth
regulators. The percent germination in all the
treatments showed increase than that of control
(distilled water). The root and shoot lengths differ. It
clearly show in the Table 1, 2 & 3, the average root
length in ligand, complex, Ce (III) at all pH increases
over control and complex of Sm (III) with L showed
decrease in shoot length but increase as compared to
control. It is also examined that Root/ Shoot ratio is
decrease in complex (Sm (III)-L) and ligand, but it is
increases for control.
ACKNOWLEDGEMENT
I would like to thanks to the Principal,
Vidyabharati Mahavidyalaya, Amravati and Dr. D. T.
Mahajan, Dr. M. L.Narwade, for providing necessary
laboratory facilities.
REFERENCES
AB Patil, Ph. D. Thesis, Chemistry, S. G. B, Amravati
University, INDIA, 2007.
Ali, Phosphorous, Sulfur, and Silicon, 182(8), 2007,
1717-1726.
Ali; S.A. Ghfaar; H.M. El-Shaaer; F.I. Hanafy and
A.Z. El-Fauomy, Turk. J. Chem., 2008, 32(3), 365-
374.
AV Mane, RR Sankpal, LA Mane, MS Ambawade, J.
Chem. Pharm. Res., 2010, 2 (5), 206-215.
BK Magar, AS Kirdant, VA Shelke, SG Shankarwar
and T K Chondhekar, J. Chem. Pharm. Res., 2011,
3(5),11 , 6-123.
CM Adams, Orient. J. Chem., 2009, 25 (2), 459-460.
Guz; F.R. Stermitz; J.B. Johnson; T.D. Beeson; S.
Willen; J.F. Hastang and K. Lewis, J. Med. Chem.,
2001, 44(2), 261-268.
H. Goker; D.W. Boykin and S. Yildiz, Bioorg. Med.
Chem., 2005, 13(5), 1707-1714.
J Frias; M Prodanov; I Sierra; C Vidal-Valerie. Journal
of Food Protection., 1995, 58, 692–695.
J Honke; H Kozłowska; C Vidal-Valverde; J Frias; R
Go. Recki Zeitschrift f €ur Lebensmittel-
Untersuchungund -Forschung A., 1998, 206, 279–283.
J.B. Harborne and C.A. Williams, Photochemistry,
2000, 55(6), 481-504.
K. Jerzy and Z. Teodor, Chem. Abstr., 1995, 123,
339629.
L. Denis; M.S. Morton and K. Griffith, Eur. Urol.,
1999, 35(5-6), 377-387.
M. J. Nawort; E. Nawrot and J. Graczyk, Eur. J. Med.
Chem., 2006, 41(11), 1301-1309.
M. Ohata; K. Watanabe; K. Kumata; K. Hisamichi; S.
Suzuki and H. Ito, Annu. Rep. Tohoku Coll. Pharm.,
1991, 38, 35.
M. Uher;V. Konecny and O. Rajniakova, Chem. Pap.,
1994, 48(4), 282-284.
N. Desideri; P. Mastromarino and C. Conti, Antiviral
Chem. And Chemotherapy, Chem.Abstr., 2003, 14(4),
195-203.
Noor,S.A.Quazi, Mahajan, Masand, Recent Trends in
Material Preparation & Characterization , National
Conference ISBN - 978-81-929395-2-0,24th February
2014, pp86-89
RD King; P Perwastien. J. of Food Science., 1987, 52,
106–108.
S Kumar, A Kumar Singh, J. Chem. Pharm. Res.,
2010, 2(6), 118-124.
S.A.Quazi, Mahajan, Masand, Noor Mohammad,M.R.
Ingle., August - September, 2014, Vol. 3, No.5, pp
1206-1210.,ISSN: 2278-0238
S.A.Quazi, Mahajan, Masand,
Noor,NationalConference ISBN – 978-93-82588-41-2,
Recent application mathematical tools in science May
8- 3,2014,pp76-80
UP Meshram, BG Khobragade, ML Narwade, VB
Khobragade, Der Pharma Chemica, 2011, 3 (2), 376-
382.
100 www.ijbsans.com Int.J.Biosci.Nanosci.Vol,1(5),2014
Study of seed germination activity (plant growth regulator) of 2[(Z)-(2-phenyl-4H-
chromen-4-ylidene) aminophenol and its Ni (III) and Cu (III) complexes on vegetable
plant Trigonella foenum-graecum
Noor Mohammad1, S. Azhar Quazi
2, Devidas t. mahajan
2, Vijay Masand
2
1Department of Chemistry, Govt.Vidarbha Institute of Sci. and Humanities, Amravati (M.S) India
2Department of Chemistry, Vidya Bharti Mahavidyalaya, Camp, Amravati (M.S) India
*Corresponding author: [email protected]
Received: 29 Aug 2014; Revised: 20 Sep 2014 / Accepted: 31 Sep 2014
Abstract
The seed germination activity of 2-[(Z)-(2-phenyl-4H-chromen-4-
ylidene)aminophenol and its Ni(III) and Cu (III) complexes on Trigonella
foenum-graecum (Methi) have been studied at pH 4.5 and 9.5 in order to justify
whether this ligand and its ternary complexes of can be used as seed germination
activity by measurement of parameters like percentage of germination, survival,
seedling height, soot length, root length, root/soot ratio and width of young leaf.
The average values of these parameters have been used to make a justification
about seed germination activity of ligand and its ternary complexes.
Keyword: Seed germination, Ligand metal, Soot length, Root length, Root/Soot ratio.
INTRODUCTION
Plants are autotrophic in nature, they
produce their own food. But we are
completely and absolutely dependent on
plants for the necessities of life. A plant-
based diet – mainly on vegetables, fruits and
whole grains – has become one of the most
important guidelines for lowering the risk of
human diseases. Therefore, need to improve
the nutritive value of the final products of
vegetables plant. So that it is necessary to do
agricultural research is the production of new
and better qualities and varieties of crop
plants, the improvement of plant growth,
protection against insects, diseases and
weeds, the control of soil fertility. Chromone
have immersed biological properties reported
(Noor Mohammad, 2014). Plant growth
regulating activity of complexes of transition
metal ions reported by different co-workers,
(Sharma et al., 1981; Patil, 2009; Thakare,
2007 ; Adams and Bernays, 1978;
Meshram et al., 2011 ; Singh, et al., 2011 ;
Mane et al., 2010). Germination is an
economical and simple method for improving
the nutritive value of plants studies has
reported, King- Ramteke, et al [9-12]. As we
move among several economical plants,
Trigonella (Methi) is selected as a plant
system because this plant is in ideal system to
study the germination and growth pattern.
Further, economical importance of this plant
is highlighted by its wide use for the
vegetable purposes. The seed germination
activity of 2-[(Z)-(2-phenyl-4H-chromen-4-
ylidene) aminophenol and its Ni (III) and Cu
(III) complexes on Trigonella foenum-
graecum (Methi) is still lacking. So that the
present work is carried out to study the plant
International Journal of Biosciences and Nanosciences
Volume 1 (5), 2014, pp. 100-103.
ISSN-2349-5251
Original Article
101 www.ijbsans.com Int.J.Biosci.Nanosci.Vol,1(5),2014
growth regulating activity of this ligand and
its complexes on methi plant.
EXPERIMENTAL SECTION
Solutions of Ni (III) and Cu (III) metal
nitrates of 0.01 mol/dm3 concentration were
prepared by adding accurate amounts of
metal salts in distilled water. The solution of
2- [(Z)-(2-phenyl - 4H- chromen -4 -ylidene)
aminophenol ligand of 0.01 mol/dm3
concentration was prepared in distilled water.
The biological applications were studied at
pH 4.5 and 9.5 and at 0.1mol/dm3 ionic
strength of KNO3 solution. Fertilized soil was
collected from agricultural land. Stones and
other materials were sorted out and discarded.
Two parts of this finely powdered soil was
mixed with one part of filtered pink-stone-
sand. This soil was filled in wooden trays
having compartments of equal size. The soil
in the tray was moistened with water. Sowing
of seeds was done in this soil after one hour.
Healthy seeds of Methi of equal size
were selected. 600 seeds were soaked in
water and kept in refrigerator for 6 hours.
From these, healthy seeds of equal size were
chosen out of which 50 seeds each were
soaked in distilled water, ligand solution, and
ternary complex solution with Ni (III) and Cu
(III) of pH 4.5 and 9.50 for 6 hours. The pH
of test solutions was maintained using
ELICO-pH meter-L1-10 (accuracy ±0.05
units). The seeds soaked were taken out of
each solution and washed with distilled
water. The seeds were sowed in the wooden
trays in a row. Effect of ternary complexes of
Ni (III) and Cu (III) studied at different pH
(5.0 and 8.00), the seeds being immersed in
experimental solution for 6 hours.
Germination and survival were noted after12
days and 14 days respectively. By noting
survival of the plants after 12 days, they were
taken out of the soil. The seedling height,
shoot length, root length, root/shoot ratio, and
thickness (width length) of young leaf of
survived plant were measured.
RESULTS AND DISCUSSION Seed germination or plant growth was
justified on the basis of parameters such as
percentage of germination, survival, seedling
height, shoot length, root length, root/shoot
ratio, and thickness of young leaf. The
average values of these parameters are shown
in Table. The root/shoot ratio is one of the
measures of overall health of the plants and it
was determined .root/shoot ratio dry weight
for roots/dry weight for top of plant. The dry
weight was measured by keeping 50 fresh
plantlets in oven first at 70°C and later at
100°C to obtain a constant weight. It can be
seen from Table that there is change in the
root: shoot ratio over control (water) which
shows change in overall growth of the plant.
In this presentation the root: shoot ratio has
increased for both Ni(III) and Cu (III)
complex at pH 4.5 and 9.5 as compared to
control treatment, this increase is a sign of a
healthier plant compared to other treatments.
Increase in this ratio came from greater
root size and not from a decrease in shoot
weight. Vigor index was determined using
equation Vigour index % germination (root
length in mm),(shoot length in mm). The
higher value of vigor index at pH 4.5 and 9.5
are shown for the treatment of Cu (III)
complex solutions. The vigor index values for
various treatments are increased compared to
control.
The order of plant growth regulators
found at different pH is shown below: At pH
4.5 and 9.5, Cu (III)-Ligand complex solution
> Ni (III)-Ligand complex solution > Ligand
> Control (water).The Cu (III) - of 2-[(Z)-(2-
phenyl-4H-chromen-4-ylidene) aminophenol
complex solution is proposed as a plant
growth regulator at pH 9.50 for Trigonella
foenum-graecum (Methi) plant.
ACKNOWLEDGEMENT
I would like to thanks to the Principal,
Vidyabharati Mahavidyalaya, Amravati and
Dr. D. T. Mahajan, Dr. M. L.Narwade, for
providing necessary laboratory facilities.
102 www.ijbsans.com Int.J.Biosci.Nanosci.Vol,1(5),2014
Table: Effect of ligand and its complexes with Ni (III) and Cu (III) on growth parameters
of Methi plant (I=0.1 mol/dm3 KNO3)
Parameters Effect of following solutions on different growth parameters
Control Ligand Ni (III)-Ligand
complex
Cu (III)-Ligand
complex
pH 4.5
Germination
seed number
50 50 50 50
% Germination
after 12days
61 66 79 72
% Survival
after 14 days
71 77 84 95
Seedling height
(cm)
6.6 6.9 7.4 8.0
Root length
(cm)
2.2 2.5 3.2 3.2
Shoot length
(cm)
4.7 5.0 5.7 6.1
Root/shoot 0.35 0.45 0.57 0.63
Vigor index 4022 4747 6786 6463
Width of young
leaf (cm)
0.5 0.6 0.7 0.7
pH 9.5
Germination
seed number
50 50 50 50
% Germination
after 12days
62 61 68 76
% Survival
after 14 days
73 79 83 90
Seedling height
(cm)
7.8 8.0 8.3 8.4
Root length
(cm)
2.7 3.1 3.5 3.8
Shoot length
(cm)
4.7 5.1 5.8 6.2
Root/shoot 0.49 0.54 0.65 0.70
Vigor index 4333 4742 6032 7278
Width of young
leaf (cm)
0.6 0.4 0.7 0.8
103 www.ijbsans.com Int.J.Biosci.Nanosci.Vol,1(5),2014
REFERENCES
Noor Mohammad Ph.D. Thesis, Chemistry,
2014, S. G. B. Amravati University, (MS)
India.
Sharma, R.C, Tripathi, S.P and Khann, S and
RS Sharma. Curr. Sci., 1981, 50, 748-750.
Patiln, AB, Orient. J. Chem., 2009, 25(2), 459-
460.
Thakare, V.J, Ph.D. Thesis, Chemistry, 2007,
S. G. B. Amravati University, (MS) India.
Adams, C.M and Bernays, E.A. Entomol. Exp.
Appl., 1978, 23, 101-109.
Meshram, U.P, Khobragade, B.G, Narwade,
M.L, and Khobragade, V.B. Der Pharma
Chemica, 2011, 3(2), 376-382.
Singh, V.P.,Yashovardhan and Bhati, S.K. Int.
J. ChemTech Res., 2011, 3 (2), 892-900.
Mane, A.V., Sankpal, R.R., Mane, L.A and
Ambawade, M.S. J. Chem. Pharm. Res.,
2010, 2(5), 206-215.
King, R.D and P. Perwastien, J. of Food
Science. 1987, 52, 106–108.
Frias, J and M. Prodanov and I. Sierra and C.
Vidal-Valerie, Journal of Food Protection.
1995, 58, 692–695.
Honke, J and H. Kozłowska and C.Vidal-
Valverd and J. Frias, R Go, Recki Zeitschrift
f €ur Lebensmittel- Untersuchung und -
Forschung A., 1998, 206, 279–283.
Ramteke, A and M. L. Narwade and P. D.
Shirgave, Journal of Chemical and
Pharmaceutical Research, 2012, 4(4):1889
1894.
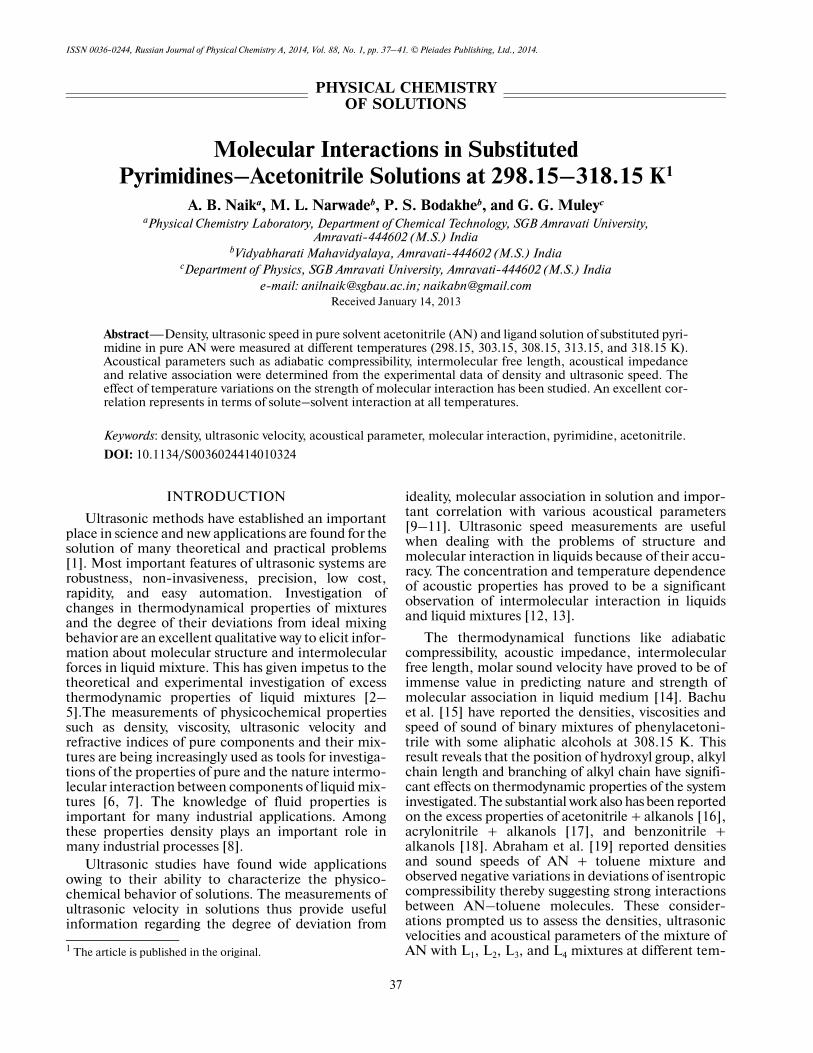
ISSN 0036�0244, Russian Journal of Physical Chemistry A, 2014, Vol. 88, No. 1, pp. 37–41. © Pleiades Publishing, Ltd., 2014.
37
1 INTRODUCTION
Ultrasonic methods have established an importantplace in science and new applications are found for thesolution of many theoretical and practical problems[1]. Most important features of ultrasonic systems arerobustness, non�invasiveness, precision, low cost,rapidity, and easy automation. Investigation ofchanges in thermodynamical properties of mixturesand the degree of their deviations from ideal mixingbehavior are an excellent qualitative way to elicit infor�mation about molecular structure and intermolecularforces in liquid mixture. This has given impetus to thetheoretical and experimental investigation of excessthermodynamic properties of liquid mixtures [2–5].The measurements of physicochemical propertiessuch as density, viscosity, ultrasonic velocity andrefractive indices of pure components and their mix�tures are being increasingly used as tools for investiga�tions of the properties of pure and the nature intermo�lecular interaction between components of liquid mix�tures [6, 7]. The knowledge of fluid properties isimportant for many industrial applications. Amongthese properties density plays an important role inmany industrial processes [8].
Ultrasonic studies have found wide applicationsowing to their ability to characterize the physico�chemical behavior of solutions. The measurements ofultrasonic velocity in solutions thus provide usefulinformation regarding the degree of deviation from
1 The article is published in the original.
ideality, molecular association in solution and impor�tant correlation with various acoustical parameters[9–11]. Ultrasonic speed measurements are usefulwhen dealing with the problems of structure andmolecular interaction in liquids because of their accu�racy. The concentration and temperature dependenceof acoustic properties has proved to be a significantobservation of intermolecular interaction in liquidsand liquid mixtures [12, 13].
The thermodynamical functions like adiabaticcompressibility, acoustic impedance, intermolecularfree length, molar sound velocity have proved to be ofimmense value in predicting nature and strength ofmolecular association in liquid medium [14]. Bachuet al. [15] have reported the densities, viscosities andspeed of sound of binary mixtures of phenylacetoni�trile with some aliphatic alcohols at 308.15 K. Thisresult reveals that the position of hydroxyl group, alkylchain length and branching of alkyl chain have signifi�cant effects on thermodynamic properties of the systeminvestigated. The substantial work also has been reportedon the excess properties of acetonitrile + alkanols [16],acrylonitrile + alkanols [17], and benzonitrile +alkanols [18]. Abraham et al. [19] reported densitiesand sound speeds of AN + toluene mixture andobserved negative variations in deviations of isentropiccompressibility thereby suggesting strong interactionsbetween AN–toluene molecules. These consider�ations prompted us to assess the densities, ultrasonicvelocities and acoustical parameters of the mixture ofAN with L1, L2, L3, and L4 mixtures at different tem�
Molecular Interactions in SubstitutedPyrimidines–Acetonitrile Solutions at 298.15–318.15 K1
A. B. Naika, M. L. Narwadeb, P. S. Bodakheb, and G. G. Muleyc
aPhysical Chemistry Laboratory, Department of Chemical Technology, SGB Amravati University,Amravati�444602 (M.S.) India
bVidyabharati Mahavidyalaya, Amravati�444602 (M.S.) IndiacDepartment of Physics, SGB Amravati University, Amravati�444602 (M.S.) India
e�mail: [email protected]; [email protected] January 14, 2013
Abstract—Density, ultrasonic speed in pure solvent acetonitrile (AN) and ligand solution of substituted pyri�midine in pure AN were measured at different temperatures (298.15, 303.15, 308.15, 313.15, and 318.15 K).Acoustical parameters such as adiabatic compressibility, intermolecular free length, acoustical impedanceand relative association were determined from the experimental data of density and ultrasonic speed. Theeffect of temperature variations on the strength of molecular interaction has been studied. An excellent cor�relation represents in terms of solute–solvent interaction at all temperatures.
Keywords: density, ultrasonic velocity, acoustical parameter, molecular interaction, pyrimidine, acetonitrile.
DOI: 10.1134/S0036024414010324
PHYSICAL CHEMISTRYOF SOLUTIONS
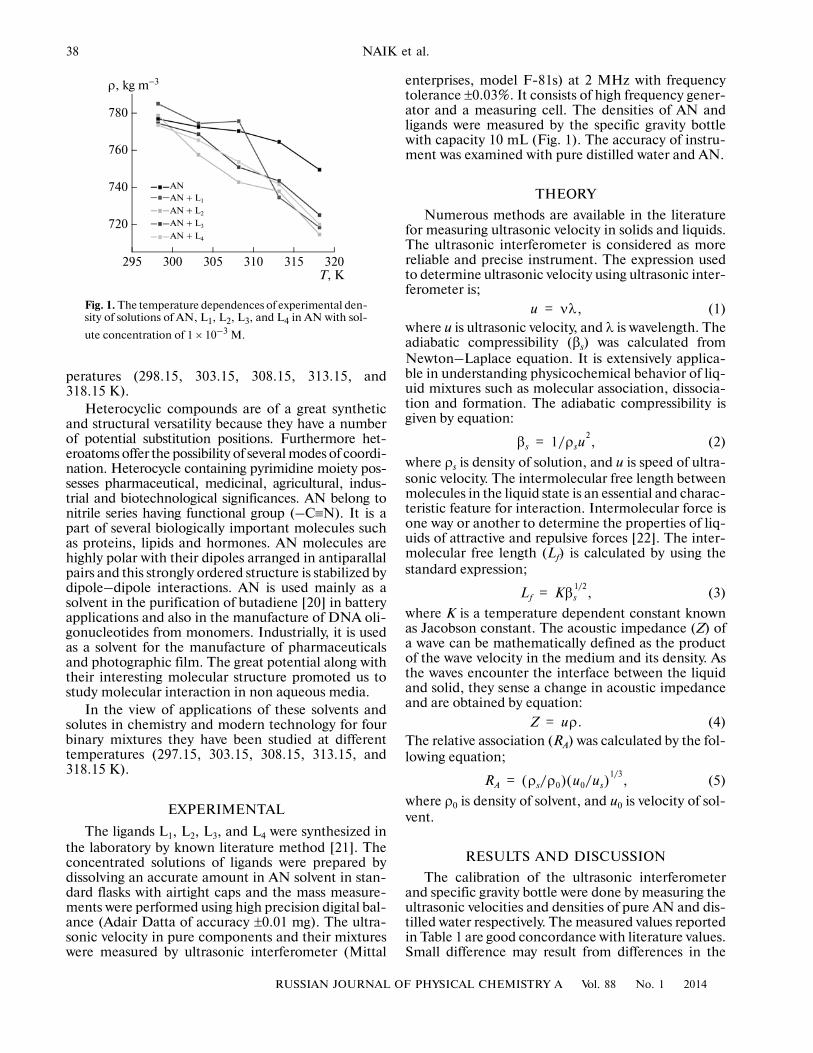
38
RUSSIAN JOURNAL OF PHYSICAL CHEMISTRY A Vol. 88 No. 1 2014
NAIK et al.
peratures (298.15, 303.15, 308.15, 313.15, and318.15 K).
Heterocyclic compounds are of a great syntheticand structural versatility because they have a numberof potential substitution positions. Furthermore het�eroatoms offer the possibility of several modes of coordi�nation. Heterocycle containing pyrimidine moiety pos�sesses pharmaceutical, medicinal, agricultural, indus�trial and biotechnological significances. AN belong tonitrile series having functional group (–C≡N). It is apart of several biologically important molecules suchas proteins, lipids and hormones. AN molecules arehighly polar with their dipoles arranged in antiparallalpairs and this strongly ordered structure is stabilized bydipole–dipole interactions. AN is used mainly as asolvent in the purification of butadiene [20] in batteryapplications and also in the manufacture of DNA oli�gonucleotides from monomers. Industrially, it is usedas a solvent for the manufacture of pharmaceuticalsand photographic film. The great potential along withtheir interesting molecular structure promoted us tostudy molecular interaction in non aqueous media.
In the view of applications of these solvents andsolutes in chemistry and modern technology for fourbinary mixtures they have been studied at differenttemperatures (297.15, 303.15, 308.15, 313.15, and318.15 K).
EXPERIMENTAL
The ligands L1, L2, L3, and L4 were synthesized inthe laboratory by known literature method [21]. Theconcentrated solutions of ligands were prepared bydissolving an accurate amount in AN solvent in stan�dard flasks with airtight caps and the mass measure�ments were performed using high precision digital bal�ance (Adair Datta of accuracy ±0.01 mg). The ultra�sonic velocity in pure components and their mixtureswere measured by ultrasonic interferometer (Mittal
enterprises, model F�81s) at 2 MHz with frequencytolerance ±0.03%. It consists of high frequency gener�ator and a measuring cell. The densities of AN andligands were measured by the specific gravity bottlewith capacity 10 mL (Fig. 1). The accuracy of instru�ment was examined with pure distilled water and AN.
THEORY
Numerous methods are available in the literaturefor measuring ultrasonic velocity in solids and liquids.The ultrasonic interferometer is considered as morereliable and precise instrument. The expression usedto determine ultrasonic velocity using ultrasonic inter�ferometer is;
(1)where u is ultrasonic velocity, and λ is wavelength. Theadiabatic compressibility (βs) was calculated fromNewton–Laplace equation. It is extensively applica�ble in understanding physicochemical behavior of liq�uid mixtures such as molecular association, dissocia�tion and formation. The adiabatic compressibility isgiven by equation:
(2)
where ρs is density of solution, and u is speed of ultra�sonic velocity. The intermolecular free length betweenmolecules in the liquid state is an essential and charac�teristic feature for interaction. Intermolecular force isone way or another to determine the properties of liq�uids of attractive and repulsive forces [22]. The inter�molecular free length (Lf) is calculated by using thestandard expression;
(3)
where K is a temperature dependent constant knownas Jacobson constant. The acoustic impedance (Z) ofa wave can be mathematically defined as the productof the wave velocity in the medium and its density. Asthe waves encounter the interface between the liquidand solid, they sense a change in acoustic impedanceand are obtained by equation:
(4)The relative association (RA) was calculated by the fol�lowing equation;
(5)
where ρ0 is density of solvent, and u0 is velocity of sol�vent.
RESULTS AND DISCUSSION
The calibration of the ultrasonic interferometerand specific gravity bottle were done by measuring theultrasonic velocities and densities of pure AN and dis�tilled water respectively. The measured values reportedin Table 1 are good concordance with literature values.Small difference may result from differences in the
u νλ,=
βs 1/ρsu2,=
Lf Kβs1/2
,=
Z uρ.=
RA ρs/ρ0( ) u0/us( )1/3
,=
780
320315310305300295T, K
760
740
720
ρ, kg m−3
ANAN + L1
AN + L2
AN + L3
AN + L4
Fig. 1. The temperature dependences of experimental den�sity of solutions of AN, L1, L2, L3, and L4 in AN with sol�
ute concentration of 1 × 10⎯3 M.
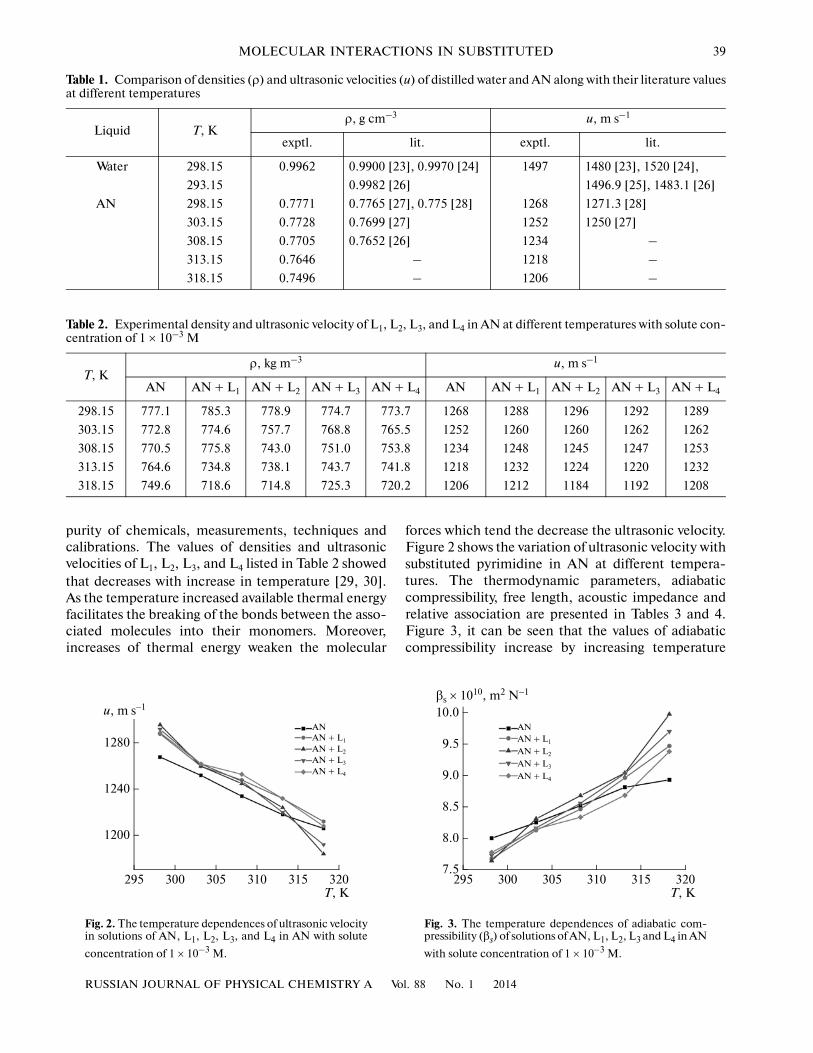
RUSSIAN JOURNAL OF PHYSICAL CHEMISTRY A Vol. 88 No. 1 2014
MOLECULAR INTERACTIONS IN SUBSTITUTED 39
purity of chemicals, measurements, techniques andcalibrations. The values of densities and ultrasonicvelocities of L1, L2, L3, and L4 listed in Table 2 showedthat decreases with increase in temperature [29, 30].As the temperature increased available thermal energyfacilitates the breaking of the bonds between the asso�ciated molecules into their monomers. Moreover,increases of thermal energy weaken the molecular
forces which tend the decrease the ultrasonic velocity.Figure 2 shows the variation of ultrasonic velocity withsubstituted pyrimidine in AN at different tempera�tures. The thermodynamic parameters, adiabaticcompressibility, free length, acoustic impedance andrelative association are presented in Tables 3 and 4.Figure 3, it can be seen that the values of adiabaticcompressibility increase by increasing temperature
Table 1. Comparison of densities (ρ) and ultrasonic velocities (u) of distilled water and AN along with their literature valuesat different temperatures
Liquid T, Kρ, g cm–3 u, m s–1
exptl. lit. exptl. lit.
Water 298.15 0.9962 0.9900 [23], 0.9970 [24] 1497 1480 [23], 1520 [24],
293.15 0.9982 [26] 1496.9 [25], 1483.1 [26]
AN 298.15 0.7771 0.7765 [27], 0.775 [28] 1268 1271.3 [28]
303.15 0.7728 0.7699 [27] 1252 1250 [27]
308.15 0.7705 0.7652 [26] 1234 –
313.15 0.7646 – 1218 –
318.15 0.7496 – 1206 –
Table 2. Experimental density and ultrasonic velocity of L1, L2, L3, and L4 in AN at different temperatures with solute con�centration of 1 × 10⁻³ M
T, Kρ, kg m–3 u, m s–1
AN AN + L1 AN + L2 AN + L3 AN + L4 AN AN + L1 AN + L2 AN + L3 AN + L4
298.15 777.1 785.3 778.9 774.7 773.7 1268 1288 1296 1292 1289
303.15 772.8 774.6 757.7 768.8 765.5 1252 1260 1260 1262 1262
308.15 770.5 775.8 743.0 751.0 753.8 1234 1248 1245 1247 1253
313.15 764.6 734.8 738.1 743.7 741.8 1218 1232 1224 1220 1232
318.15 749.6 718.6 714.8 725.3 720.2 1206 1212 1184 1192 1208
1280
320315310305300295T, K
1240
1200
u, m s−1
ANAN + L1
AN + L2
AN + L3
AN + L4
Fig. 2. The temperature dependences of ultrasonic velocityin solutions of AN, L1, L2, L3, and L4 in AN with solute
concentration of 1 × 10⎯3 M.
10.0
320315310305300295T, K
9.5
8.5
8.0
βs × 1010, m2 N−1
ANAN + L1
AN + L2
AN + L3
AN + L4
7.5
9.0
Fig. 3. The temperature dependences of adiabatic com�pressibility (βs) of solutions of AN, L1, L2, L3 and L4 in AN
with solute concentration of 1 × 10⎯3 M.
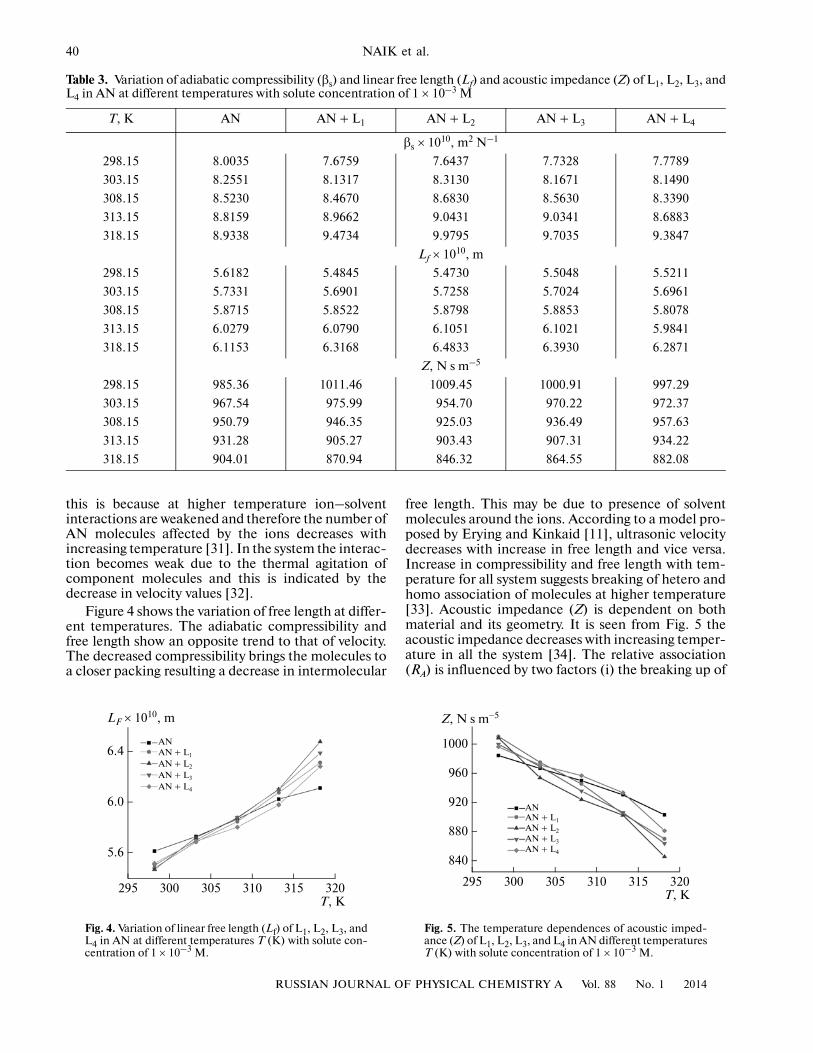
40
RUSSIAN JOURNAL OF PHYSICAL CHEMISTRY A Vol. 88 No. 1 2014
NAIK et al.
this is because at higher temperature ion–solventinteractions are weakened and therefore the number ofAN molecules affected by the ions decreases withincreasing temperature [31]. In the system the interac�tion becomes weak due to the thermal agitation ofcomponent molecules and this is indicated by thedecrease in velocity values [32].
Figure 4 shows the variation of free length at differ�ent temperatures. The adiabatic compressibility andfree length show an opposite trend to that of velocity.The decreased compressibility brings the molecules toa closer packing resulting a decrease in intermolecular
free length. This may be due to presence of solventmolecules around the ions. According to a model pro�posed by Erying and Kinkaid [11], ultrasonic velocitydecreases with increase in free length and vice versa.Increase in compressibility and free length with tem�perature for all system suggests breaking of hetero andhomo association of molecules at higher temperature[33]. Acoustic impedance (Z) is dependent on bothmaterial and its geometry. It is seen from Fig. 5 theacoustic impedance decreases with increasing temper�ature in all the system [34]. The relative association(RA) is influenced by two factors (i) the breaking up of
Table 3. Variation of adiabatic compressibility (βs) and linear free length (Lf) and acoustic impedance (Z) of L1, L2, L3, andL4 in AN at different temperatures with solute concentration of 1 × 10⁻³ M
T, K AN AN + L1 AN + L2 AN + L3 AN + L4
βs × 1010, m2 N–1
298.15 8.0035 7.6759 7.6437 7.7328 7.7789
303.15 8.2551 8.1317 8.3130 8.1671 8.1490
308.15 8.5230 8.4670 8.6830 8.5630 8.3390
313.15 8.8159 8.9662 9.0431 9.0341 8.6883
318.15 8.9338 9.4734 9.9795 9.7035 9.3847
Lf × 1010, m
298.15 5.6182 5.4845 5.4730 5.5048 5.5211
303.15 5.7331 5.6901 5.7258 5.7024 5.6961
308.15 5.8715 5.8522 5.8798 5.8853 5.8078
313.15 6.0279 6.0790 6.1051 6.1021 5.9841
318.15 6.1153 6.3168 6.4833 6.3930 6.2871
Z, N s m–5
298.15 985.36 1011.46 1009.45 1000.91 997.29
303.15 967.54 975.99 954.70 970.22 972.37
308.15 950.79 946.35 925.03 936.49 957.63
313.15 931.28 905.27 903.43 907.31 934.22
318.15 904.01 870.94 846.32 864.55 882.08
320315310305300295T, K
6.0
5.6
LF × 1010, m
ANAN + L1
AN + L2
AN + L3
AN + L4
6.4
Fig. 4. Variation of linear free length (Lf) of L1, L2, L3, andL4 in AN at different temperatures T (K) with solute con�centration of 1 × 10⁻³ M.
320315310305300295T, K
1000
920
880
Z, N s m−5
ANAN + L1
AN + L2
AN + L3
AN + L4
840
960
Fig. 5. The temperature dependences of acoustic imped�ance (Z) of L1, L2, L3, and L4 in AN different temperaturesT (K) with solute concentration of 1 × 10⁻³ M.
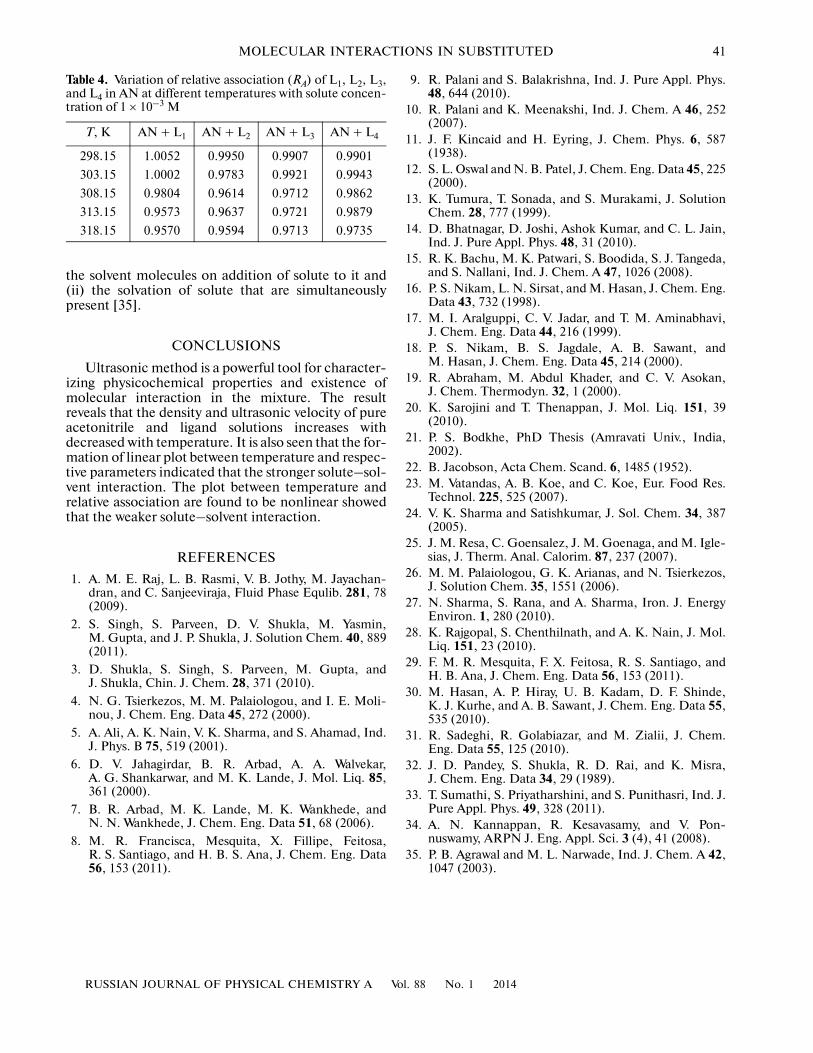
RUSSIAN JOURNAL OF PHYSICAL CHEMISTRY A Vol. 88 No. 1 2014
MOLECULAR INTERACTIONS IN SUBSTITUTED 41
the solvent molecules on addition of solute to it and(ii) the solvation of solute that are simultaneouslypresent [35].
CONCLUSIONS
Ultrasonic method is a powerful tool for character�izing physicochemical properties and existence ofmolecular interaction in the mixture. The resultreveals that the density and ultrasonic velocity of pureacetonitrile and ligand solutions increases withdecreased with temperature. It is also seen that the for�mation of linear plot between temperature and respec�tive parameters indicated that the stronger solute–sol�vent interaction. The plot between temperature andrelative association are found to be nonlinear showedthat the weaker solute–solvent interaction.
REFERENCES
1. A. M. E. Raj, L. B. Rasmi, V. B. Jothy, M. Jayachan�dran, and C. Sanjeeviraja, Fluid Phase Equlib. 281, 78(2009).
2. S. Singh, S. Parveen, D. V. Shukla, M. Yasmin,M. Gupta, and J. P. Shukla, J. Solution Chem. 40, 889(2011).
3. D. Shukla, S. Singh, S. Parveen, M. Gupta, andJ. Shukla, Chin. J. Chem. 28, 371 (2010).
4. N. G. Tsierkezos, M. M. Palaiologou, and I. E. Moli�nou, J. Chem. Eng. Data 45, 272 (2000).
5. A. Ali, A. K. Nain, V. K. Sharma, and S. Ahamad, Ind.J. Phys. B 75, 519 (2001).
6. D. V. Jahagirdar, B. R. Arbad, A. A. Walvekar,A. G. Shankarwar, and M. K. Lande, J. Mol. Liq. 85,361 (2000).
7. B. R. Arbad, M. K. Lande, M. K. Wankhede, andN. N. Wankhede, J. Chem. Eng. Data 51, 68 (2006).
8. M. R. Francisca, Mesquita, X. Fillipe, Feitosa,R. S. Santiago, and H. B. S. Ana, J. Chem. Eng. Data56, 153 (2011).
9. R. Palani and S. Balakrishna, Ind. J. Pure Appl. Phys.48, 644 (2010).
10. R. Palani and K. Meenakshi, Ind. J. Chem. A 46, 252(2007).
11. J. F. Kincaid and H. Eyring, J. Chem. Phys. 6, 587(1938).
12. S. L. Oswal and N. B. Patel, J. Chem. Eng. Data 45, 225(2000).
13. K. Tumura, T. Sonada, and S. Murakami, J. SolutionChem. 28, 777 (1999).
14. D. Bhatnagar, D. Joshi, Ashok Kumar, and C. L. Jain,Ind. J. Pure Appl. Phys. 48, 31 (2010).
15. R. K. Bachu, M. K. Patwari, S. Boodida, S. J. Tangeda,and S. Nallani, Ind. J. Chem. A 47, 1026 (2008).
16. P. S. Nikam, L. N. Sirsat, and M. Hasan, J. Chem. Eng.Data 43, 732 (1998).
17. M. I. Aralguppi, C. V. Jadar, and T. M. Aminabhavi,J. Chem. Eng. Data 44, 216 (1999).
18. P. S. Nikam, B. S. Jagdale, A. B. Sawant, andM. Hasan, J. Chem. Eng. Data 45, 214 (2000).
19. R. Abraham, M. Abdul Khader, and C. V. Asokan,J. Chem. Thermodyn. 32, 1 (2000).
20. K. Sarojini and T. Thenappan, J. Mol. Liq. 151, 39(2010).
21. P. S. Bodkhe, PhD Thesis (Amravati Univ., India,2002).
22. B. Jacobson, Acta Chem. Scand. 6, 1485 (1952).23. M. Vatandas, A. B. Koe, and C. Koe, Eur. Food Res.
Technol. 225, 525 (2007).24. V. K. Sharma and Satishkumar, J. Sol. Chem. 34, 387
(2005).25. J. M. Resa, C. Goensalez, J. M. Goenaga, and M. Igle�
sias, J. Therm. Anal. Calorim. 87, 237 (2007).26. M. M. Palaiologou, G. K. Arianas, and N. Tsierkezos,
J. Solution Chem. 35, 1551 (2006).27. N. Sharma, S. Rana, and A. Sharma, Iron. J. Energy
Environ. 1, 280 (2010).28. K. Rajgopal, S. Chenthilnath, and A. K. Nain, J. Mol.
Liq. 151, 23 (2010).29. F. M. R. Mesquita, F. X. Feitosa, R. S. Santiago, and
H. B. Ana, J. Chem. Eng. Data 56, 153 (2011).30. M. Hasan, A. P. Hiray, U. B. Kadam, D. F. Shinde,
K. J. Kurhe, and A. B. Sawant, J. Chem. Eng. Data 55,535 (2010).
31. R. Sadeghi, R. Golabiazar, and M. Zialii, J. Chem.Eng. Data 55, 125 (2010).
32. J. D. Pandey, S. Shukla, R. D. Rai, and K. Misra,J. Chem. Eng. Data 34, 29 (1989).
33. T. Sumathi, S. Priyatharshini, and S. Punithasri, Ind. J.Pure Appl. Phys. 49, 328 (2011).
34. A. N. Kannappan, R. Kesavasamy, and V. Pon�nuswamy, ARPN J. Eng. Appl. Sci. 3 (4), 41 (2008).
35. P. B. Agrawal and M. L. Narwade, Ind. J. Chem. A 42,1047 (2003).
Table 4. Variation of relative association (RA) of L1, L2, L3,and L4 in AN at different temperatures with solute concen�tration of 1 × 10⁻³ M
T, K AN + L1 AN + L2 AN + L3 AN + L4
298.15 1.0052 0.9950 0.9907 0.9901
303.15 1.0002 0.9783 0.9921 0.9943
308.15 0.9804 0.9614 0.9712 0.9862
313.15 0.9573 0.9637 0.9721 0.9879
318.15 0.9570 0.9594 0.9713 0.9735
Research Article
SYNTHESIS, CHARACTERIZATION AND IN VITRO ANTIMICROBIAL EVALUATION OF NOVEL 2-MERCAPTO-4,6-DISUBSTITUTED PHENYL PYRIMIDINE DERIVATIVES
SHRADHA. S. BINANI*, P. S. BODKE, R.V.JOAT1.
Department of chemistry, 1Department of Physics, Vidyabharati Mahavidyalaya, Amravati 444602. Email: [email protected]
Received: 13 Nov 2013, Revised and Accepted: 04 Dec 2013
ABSTRACT
Objective: Synthesis and antimicrobial evaluation of a novel 2-mercapto-4,6-disubstituted phenyl pyrimidine derivatives.
Methods: A series of novel 2-mercapto-4,6-disubstituted phenyl pyrimidine derivatives(5a-d) were synthesized by refluxing 1-(2’hydroxy aryl)-3-(substituted aryl) prop-1,3-dione(4a-d) with thiourea in DMF solvent and obtained in good yield. 1-(2’-hydroxy aryl)-3-(substituted aryl) prop-1,3-dione(4a-d) were obtained by BVT rearrangement in pyridine medium from corresponding 2-benzoyloxy acetophenone (3a-d). The newly synthesized compounds are characterized by IR, H1NMR mass spectral studies and elemental analysis. These compounds were also screened for their In-vitro antibacterial and antifungal activities.
Results and conclusion: Preliminary results reveal that some of the synthesized compounds are showing promising antibacterial and antifungal activity.
Keywords: 2-mercapto-4,6-disubstituted pyrimidines, prop-1,3-dione, thiourea, antibacterial, antifungal activity.
INTRODUCTION
Recent decades have witnessed an exponential growth in the applications of heterocyclic compounds containing nitrogen, oxygen and sulphur due to their wide range of pharmacological activities. Pyrimidine based heterocyclic compounds are of interest as potential bioactive molecules and exhibit analgesic, (1)antihypertensive(2), antipyretic(3), antiviral(4) and anti-inflammatory(5) activities. These are also associated with nucleic acid, antibiotic, antimalarial, anticancer drugs(6).Many of the pyrimidine derivatives are reported to possess potential CNS depressant properties(7).
R1 -Cl, -OCH3
Fig. 1: Experimental scheme for the synthesis of 2-mercapto- 4,6-disubstituted phenyl pyrimidines (5a-d)
There are few reports concerning with pyrimidine ring containing mercapto groups (8).The mercapto derivatives have been shown to exhibit cytotoxic activity (9) and various derivatives of mercapto fused with pyrimidine ring were synthesized and evaluated for antibacterial, antifungal activities in our laboratory (10, 11).hence it was thought of interest to synthesize new derivatives of mercapto pyrimidines by simple method and investigate them for biological and pharmacological activities.
From the above facts it was contemplated to synthesize a novel series of 2-mercapto-4,6-disubstituted phenyl pyrimidines. The final synthesized compounds were screened for their in-vitro antibacterial,antifungal activities.
The key starting materials 2-benzoyloxy acetophenone (3a-d) were prepared by condensation of 5-chloro-2-hydroxy-4-methyl acetophenone (1) in pyridine medium using appropriate aromatic acids(3-OCH3 benzoic acid/4-OCH3 benzoic acid/Para chloro benzoic acid/2,4-dichloro benzoic acid)(2)in presence of POCl3.1-(2’-hydroxy aryl)-3-(substituted aryl) prop-1,3-dione(4a-d) were obtained by BVT(12) of corresponding 2-benzoyloxy acetophenone as per known procedures. A mixture of diketone and thiourea in DMF solvent was refluxed to yield the title compounds 2-mercapto-4,6-disubstituted phenyl pyrimidines(5a-d).The synthetic strategies adopted to obtain the target compounds are depicted as Scheme-01.
MATERIAL AND METHODS
The IR spectrum is recorded by using Alpha Bruker IR spectrometer using a thin film on KBr pellets and frequencies are expressed in cm-
1.The H1NMR spectra were recorded on bruker advance ii 400 MHz NMR spectrometer. All spectra were obtained in CDCl3 and DMSO d6 as a solvent. Chemical shifts values are reported as values in ppm relative to TMS as internal standard. Mass spectra were recorded on ESI. Melting point were determined by open capillary method and are uncorrected. All the synthesized compounds were purified by recrystallization. Elemental analysis was also performed. Purity of the compound was checked by TLC.
Synthesis
A mixture of diketone (0.01 mole) and thiourea (0.01 mole) in DMF(50 ml) solvent was refluxed on water bath at 75-90 0C for 1hr and mixture was cooled and pour in ice cold aqueous solution. The solid separated was washed with water and crystallized from aq. alcohol to give mercapto pyrimidines. The progress of the reaction was monitored by TLC (benzene: chloroform 8:2).The physical data is as follows.
R1
R1
CH3
CH3
Cl
Cl
COOH
POCl3
pyridine/
R1
BVT
C
O O
C
OH
CH2
O C
O
C
O
CH3
CH3
Cl
O
C
OH
Cl
CH3
SHN
NOH
CH3
R1
C
S
NH2H2N DMF
Pyridine
(1)
(2)
(3a-d)
(4a-d)
(5a-d)
International Journal of Pharmacy and Pharmaceutical Sciences
ISSN- 0975-1491 Vol 6, Issue 1, 2014
AAccaaddeemmiicc SScciieenncceess
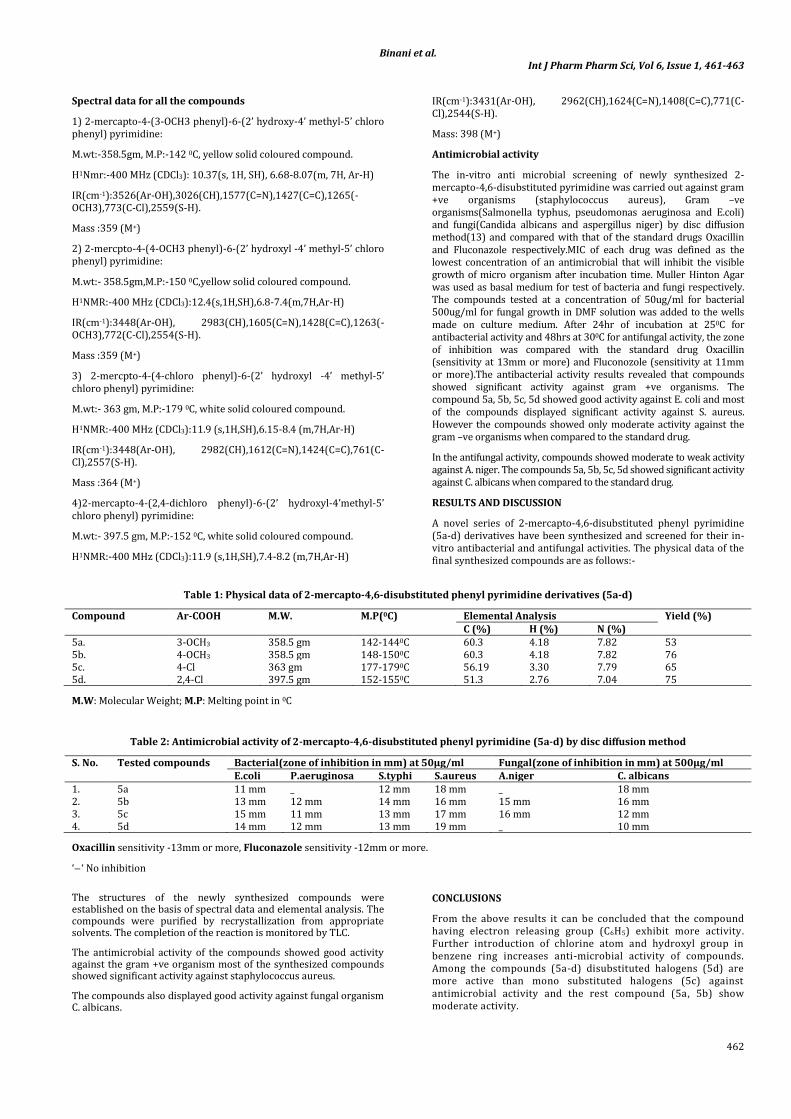
Binani et al. Int J Pharm Pharm Sci, Vol 6, Issue 1, 461-463
462
Spectral data for all the compounds
1) 2-mercapto-4-(3-OCH3 phenyl)-6-(2’ hydroxy-4’ methyl-5’ chloro phenyl) pyrimidine:
M.wt:-358.5gm, M.P:-142 0C, yellow solid coloured compound.
H1Nmr:-400 MHz (CDCl3): 10.37(s, 1H, SH), 6.68-8.07(m, 7H, Ar-H)
IR(cm-1):3526(Ar-OH),3026(CH),1577(C=N),1427(C=C),1265(-OCH3),773(C-Cl),2559(S-H).
Mass :359 (M+)
2) 2-mercpto-4-(4-OCH3 phenyl)-6-(2’ hydroxyl -4’ methyl-5’ chloro phenyl) pyrimidine:
M.wt:- 358.5gm,M.P:-150 0C,yellow solid coloured compound.
H1NMR:-400 MHz (CDCl3):12.4(s,1H,SH),6.8-7.4(m,7H,Ar-H)
IR(cm-1):3448(Ar-OH), 2983(CH),1605(C=N),1428(C=C),1263(-OCH3),772(C-Cl),2554(S-H).
Mass :359 (M+)
3) 2-mercpto-4-(4-chloro phenyl)-6-(2’ hydroxyl -4’ methyl-5’ chloro phenyl) pyrimidine:
M.wt:- 363 gm, M.P:-179 0C, white solid coloured compound.
H1NMR:-400 MHz (CDCl3):11.9 (s,1H,SH),6.15-8.4 (m,7H,Ar-H)
IR(cm-1):3448(Ar-OH), 2982(CH),1612(C=N),1424(C=C),761(C-Cl),2557(S-H).
Mass :364 (M+)
4)2-mercapto-4-(2,4-dichloro phenyl)-6-(2’ hydroxyl-4’methyl-5’ chloro phenyl) pyrimidine:
M.wt:- 397.5 gm, M.P:-152 0C, white solid coloured compound.
H1NMR:-400 MHz (CDCl3):11.9 (s,1H,SH),7.4-8.2 (m,7H,Ar-H)
IR(cm-1):3431(Ar-OH), 2962(CH),1624(C=N),1408(C=C),771(C-Cl),2544(S-H).
Mass: 398 (M+)
Antimicrobial activity
The in-vitro anti microbial screening of newly synthesized 2-mercapto-4,6-disubstituted pyrimidine was carried out against gram +ve organisms (staphylococcus aureus), Gram –ve organisms(Salmonella typhus, pseudomonas aeruginosa and E.coli) and fungi(Candida albicans and aspergillus niger) by disc diffusion method(13) and compared with that of the standard drugs Oxacillin and Fluconazole respectively.MIC of each drug was defined as the lowest concentration of an antimicrobial that will inhibit the visible growth of micro organism after incubation time. Muller Hinton Agar was used as basal medium for test of bacteria and fungi respectively. The compounds tested at a concentration of 50ug/ml for bacterial 500ug/ml for fungal growth in DMF solution was added to the wells made on culture medium. After 24hr of incubation at 250C for antibacterial activity and 48hrs at 300C for antifungal activity, the zone of inhibition was compared with the standard drug Oxacillin (sensitivity at 13mm or more) and Fluconozole (sensitivity at 11mm or more).The antibacterial activity results revealed that compounds showed significant activity against gram +ve organisms. The compound 5a, 5b, 5c, 5d showed good activity against E. coli and most of the compounds displayed significant activity against S. aureus. However the compounds showed only moderate activity against the gram –ve organisms when compared to the standard drug.
In the antifungal activity, compounds showed moderate to weak activity against A. niger. The compounds 5a, 5b, 5c, 5d showed significant activity against C. albicans when compared to the standard drug.
RESULTS AND DISCUSSION
A novel series of 2-mercapto-4,6-disubstituted phenyl pyrimidine (5a-d) derivatives have been synthesized and screened for their in-vitro antibacterial and antifungal activities. The physical data of the final synthesized compounds are as follows:-
Table 1: Physical data of 2-mercapto-4,6-disubstituted phenyl pyrimidine derivatives (5a-d)
Compound Ar-COOH M.W. M.P(0C) Elemental Analysis Yield (%) C (%) H (%) N (%)
5a. 3-OCH3 358.5 gm 142-1440C 60.3 4.18 7.82 53 5b. 4-OCH3 358.5 gm 148-1500C 60.3 4.18 7.82 76 5c. 4-Cl 363 gm 177-1790C 56.19 3.30 7.79 65 5d. 2,4-Cl 397.5 gm 152-1550C 51.3 2.76 7.04 75
M.W: Molecular Weight; M.P: Melting point in 0C
Table 2: Antimicrobial activity of 2-mercapto-4,6-disubstituted phenyl pyrimidine (5a-d) by disc diffusion method
S. No. Tested compounds Bacterial(zone of inhibition in mm) at 50µg/ml Fungal(zone of inhibition in mm) at 500µg/ml E.coli P.aeruginosa S.typhi S.aureus A.niger C. albicans
1. 5a 11 mm _ 12 mm 18 mm _ 18 mm 2. 5b 13 mm 12 mm 14 mm 16 mm 15 mm 16 mm 3. 5c 15 mm 11 mm 13 mm 17 mm 16 mm 12 mm 4. 5d 14 mm 12 mm 13 mm 19 mm _ 10 mm
Oxacillin sensitivity -13mm or more, Fluconazole sensitivity -12mm or more.
‘ ‘ No inhibition
The structures of the newly synthesized compounds were established on the basis of spectral data and elemental analysis. The compounds were purified by recrystallization from appropriate solvents. The completion of the reaction is monitored by TLC.
The antimicrobial activity of the compounds showed good activity against the gram +ve organism most of the synthesized compounds showed significant activity against staphylococcus aureus.
The compounds also displayed good activity against fungal organism C. albicans.
CONCLUSIONS
From the above results it can be concluded that the compound having electron releasing group (C6H5) exhibit more activity. Further introduction of chlorine atom and hydroxyl group in benzene ring increases anti-microbial activity of compounds. Among the compounds (5a-d) disubstituted halogens (5d) are more active than mono substituted halogens (5c) against antimicrobial activity and the rest compound (5a, 5b) show moderate activity.
Binani et al. Int J Pharm Pharm Sci, Vol 6, Issue 1, 461-463
463
ACKNOWLEDGEMENT
The author is thankful to Department of Science and Technology, New Delhi for availing the finance assistance (Inspire Scholarship) for this research work. The authors are grateful to SAIF, Punjab University, India, for recording the NMR spectra.
REFERENCES
1. Anshu chaudhary, pramod Kumar Sharma, prabhakar verma, Nitin Kumar, Rupesh dudhe.Microwave assisted synthesis of novel pyrimidine derivatives and investigation of their analgesic and ulcerogenic activity. Medicinal chemistry research 2012; 21(11):3629-45.
2. Sekiya T, Hiranuma H, Hata S, Mizogami S, Hanazuka M, Yamada S. Synthesis and hypertensive activity of 4-amino-2-(4-cinnamoylpiperazino)-6,7-dimethoxyquinazoline derivatives. J.Med chem.1983 26(3):411-6.
3. Makino H, Kuzuna S, Naka T, Saijo T, Maki Y. Anti-inflammatory, analgesic, and antipyretic activities of methyl 7-butyl-4, 5, 6, 7-tetrahydro-3-methylamino-4, 6-dioxo-5-propyl-2H-pyrazol o [3, 4-d] pyrimidine-2-carboxylate (AA-2379), a novel non-acidic agent. Agents Actions. 1988 Dec; 25(3-4):385-93.
4. Ajitha.M, Rajnarayana K. Synthesis and evaluation of new-3-substituted – [3, 4-dihydropyrimidinones-Indolin-2-ones for cytotoxic activity. Int J pharmacy and pharmaceutical Sciences. 2011;3(4):89-93.
5. M Amir, SA Javed, Harish Kumar Pyrimidine as anti-inflammatory agent: A review 2007; 69(3): 337-343.
6. V.N.Ingle, S.T.Kharche and U.G.Upadhyay. Synthesis of some new 4-0-(-β-D-glucopyranosyloxy)-4,6–diaryl –tetra hydro
pyrimidine -2-thianes and their biological activities. Indian journal of chemistry. 2004, pp 2027-2031.
7. Abdellatif M. Salaheldin and Ligia M.Rodrigues. Synthesis of some novel pyrazolo [3, 4-d] pyrimidine derivatives. Arikvoc 2007; 16: 92-100.
8. M.P.V.Boarland and J. F. W. McOmie. Pyrimidine part III.The ultra-violet adsorption spectra of some polysubstituted pyrimidines. J. Chem. Soc., 1952, 3722-3728
9. Xanthopoulou MN, Hadjikakou SK, Hadjiliadis N, Schumann M, Jurkschat K, Michaelides A, Skoulika S, Bakas T, Binolis J, Karkabounas S, Charalabopoulos K.Synthesis,structural characterization and in vitro cytoxicity of organotin (IV) derivatives of heterocyclic thioamides,2-mercaptobenzothiazole,5-chloro-2-mercaptobenzothiazole,3-methyl-2-mercaptobenzothiazole and 2-mercaptonicotinic acid. J Inorg Biochem. 2003 Aug 1; 96(2-3):425-34.
10. MN Kumaraswamy, DA Prathima Mathias, C Chandrashekhar, VP Vaidya. Synthesis and pharmacological evaluation of 2-mercapto-4-substituted-naphtho [2, 1-b] furo [3, 2-d] pyrimidines, Indian journal of pharmaceutical sciences. 2006 ; 68 (6): 731-736
11. Gertrude B. Elion, Elizabeth Burgi, George H. Hitchings. Studies on Condensed Pyrimidine Systems.IX. The Synthesis of some 6-Substituted Purines J. Am. Chem. Soc., 1952, 74 (2): 411–414
12. George A. Kraus, Brian S. Fulton, Soon Hyung Wood. Aliphatic acyl transfer in the Baker-Venkataraman reaction J. Org. Chem., 1984, 49 (17): 3212–3214
13. Murray P.R, Baron E.J, Pfaller M.A, Tenover F.C, Yolken R, American Society for Microbiology, Washington DC, 1995, 1342-1349.
Scanned by CamScanner
Scanned by CamScanner
Scanned by CamScanner
Scanned by CamScanner
ISSN 0976-5727 (Print) ISSN 2319-8133 (Online
Journal of Pure Applied and Industrial Physics, Vol. 5(2), 47-56, February 2015 (An International Research Journal), www.physics-journal.org
February, 2015 | Journal of Pure Applied and Industrial Physics | www.physics-journal.org
Characterization of Pure Nanostructure ZnO and its Application as Gas Sensor
S. D. Charpe1, F. C. Raghuwanshi2 and V. S. Kalymwar3
1Department of Physics, Vidya Bharati Mahavidyalaya, Amravati, INDIA.
[email protected] 2The Principal,
Department of Physics, Vidya Bharati Mahavidyalaya, Amravati, INDIA.
3Department of Physics, Bharatiya Mahavidyalaya, Amravati, INDIA.
(Received on: February 8, 2015)
ABSTRACT
The ZnO nanostructures have been synthesized and studied as the sensing
element for the detection of H2S gas. The ZnO nanostructures were synthesized by Sol-gel method followed by sonication. By using screen printing method, thick films of synthesized ZnO nanostructure were deposited on glass substrate. Gas sensing properties of ZnO nanostructure thick films were studied for low concentration H2Sgas at different temperature. ZnO nanostructure synthesized by this method can be used as a promising material for semiconductor gas sensor to detect gas like H2S at room temperature with high sensitivity and selectivity.
Keywords: Nanostructure ZnO, Characterization; UV, FTIR,XRD, TEM, SEM and H2S Sensor.
1. INTRODUCTION Sensor science and engineering is relevant to virtually all aspects of life including safety, security, surveillance, monitoring, and awareness in general. Owing to recent consciousness in environmental pollution, there is a growing need for reliable and inexpensive gas sensors and monitoring systems for industrial process and production areas. The modern industrial monitoring is based on the capability of measuring and controlling physical and chemical parameters such as temperature, pressure and chemical composition. Hence, the development of specific and efficient sensors is a necessity. Recently, sensors has
48 S. D. Charpe, et al., J. Pure Appl. & Ind. Phys. Vol.5 (2), 47-56 (2015)
February, 2015 | Journal of Pure Applied and Industrial Physics | www.physics-journal.org
been using for a variety of purposes such as detection of smoke, radiation, hazardous gases. This demand has been created by an increasing concern for pollution monitoring and improved safety in various environments, both industrial and domestic. In addition, these sensors could have an important role in the intelligent automatic control of a large number of processes, ranging from microwave cooking to the efficient combustion of motor engines1. Sensors are also central to medicines being used for diagnostics, monitoring, critical care, and public health.
Gas sensors play an important role in our everyday life in which we gather information, process it and perform some task. Yet, the successful application of a sensor is determined by its performance, cost and reliability. Recent technological developments both in the knowledge of the sensing principles and enabling technologies have led to the design of superior sensors with linear outputs. These sensors, which analyze or identify atmospheric gases, are useful in many fields of human activity including detection of toxic and explosive gases inside mines, gas leak inside residences and the control of atmospheric pollution. Aside from other applications, gas sensors are heavily used in areas like environmental monitoring, biotechnology, chemical analysis, and on-line detection of products. Thus, sensors open a wide range of applications from home to factory floor. They were first developed in Japan for devices such as gas leak alarms and measuring instruments. In addition, gas sensors make a major impact on many other different applications in areas like automotive industries, oil industries etc.
Nanostructured materials such as ZnO, SnO2, and WO3 have shown good electrical properties2-13. Among these nanostructure-semiconducting materials, ZnO has been studied extensively for electrical application and gas sensing. Due to its versatility and multifunctionality creates attention in the research field related to its electrical applicationsand gas sensing. A wide number of synthesis techniques also been developed by which ZnO can be grown in different nanoscale forms. Efforts were made to synthesize ZnO nanostructure with innovative morphology by Sol-gel method. The synthesized ZnO shows good electrical conductivity. In the present work, the efforts are made to study Characterizationand gas sensing of low cost (ZnO).
H2S is a toxic gas produced from the coal, oil and natural gas industries. In order to enhance the sensitivity and selectivity of H2S, many attempts were made to synthesized nanostructure ZnO with different morphologies14-18. 2. EXPERIMENTAL 2.1. Synthesis of ZnO Nanostructure
All chemicals were of analytical grade and used as purchased without further purification. In present work, Zinc nitrate hexahydrate was dissolved in distilled water such that to make 0.15 M solution. Subsequently, 0.5 M NaOH aqueous solutionswere introduced into the above aqueous solution drop by drop with constant stirring. The resultant white solution was subsequently kept at 75 0C For 12 hrs and then cooled room temperature
S. D. Charpe, et al., J. Pure Appl. & Ind. Phys. Vol.5 (2), 47-56 (2015) 49
February, 2015 | Journal of Pure Applied and Industrial Physics | www.physics-journal.org
naturally and sonicated (Ultrasonic wave treatment) for 30 min. The resulting white precipitates were collected by centrifugation, washed with distilled water and ethanol several times and then dried at 800C in vacuum oven for 2hr. Obtain ZnO nanostructure product were used for further study. 2.2. Preparation of Thick Films
Thick films of synthesized nanostructure ZnO were prepared by using screen printing technique. In present process, thixotropic paste was formulated by mixing the synthesized ZnO powder with ethyl cellulose (a temporary binder) in a mixture of organic solvents such as butylcellulose, butyl carbitol acetate and turpineol. The ratio of ZnO to ethyl cellulose was kept at 95:05. The ratio of inorganic to organic part was kept as 75:25 in formulating the pastes. The thixotropic pastes were screen printed on a glass substrate in desired patterns. The films pre-pared were fired at 500°C for 12 hr. Prepared thick films were called as pure ZnO thick films. 3. MATERIALS CHARACTERIZATION 3.1. Thickness Measurement
Thickness of all ZnO thick films were measured by using technique “Marutek film Thickness Measurement System” with the help of provided equipment. The thicknesses of all films were observed in the range from 35 µm. Thick films of approximately uniform thick-nesses were used for further characterization. 3.2 UV-visible absorption spectrum UV-visible absorption spectroscopyis widely used tool for checking the opticalproperties of nanosized particles. Figure 3.2 shows the UV-visible absorption spectrum of ZnO nanoparticles calcined at temperature 800oC for 6 Hrs. From the spectrum four peaks are observed at 362nm, 318nm, 344nm and 296nm, out of this at 318 nm wavelength has been found maximum absorption, if we calculate band gap for this wavelength it is 3.30eV, which is very close to the band gap of ZnO 1s–1s electron transition (3.37eV)19. 3.3 FTIR analysis
FTIR analysis spectrum shown in figure 3.6, indicating significant absorption peaks at wave numbers 4350, 4200, 3900, 3850, 1700, 1550 and 600, 510 cm-1. The absorption band at 600 and 510 cm-1 is obtained due existence of Zn-O bond stretching vibration20. The peaks at 1700 and 1550 cm-1 shows H-O-H bending vibration due to the adsorption of moisture, when FTIR sample disks were prepared in an open air atmosphere. The remaining peaks between 4350 to 3850 cm-1 are corresponding to O-H stretching vibrations21.
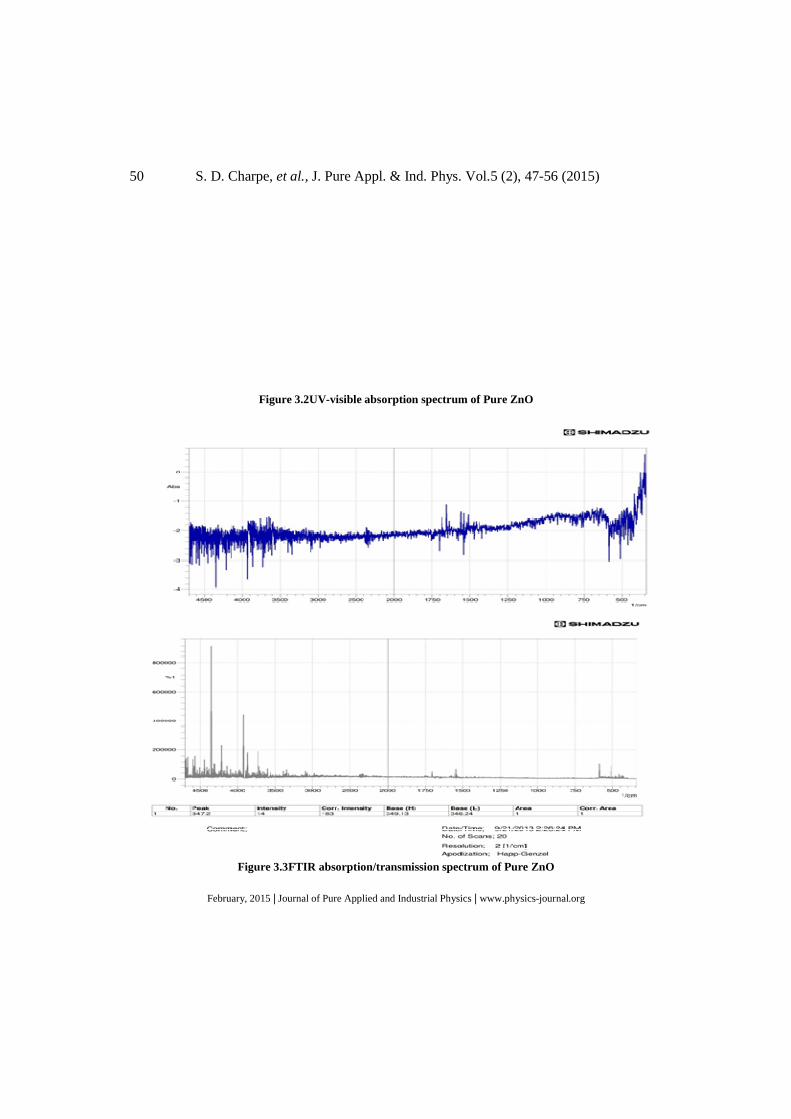
50 S. D. Charpe, et al., J. Pure Appl. & Ind. Phys. Vol.5 (2), 47-56 (2015)
February, 2015 | Journal of Pure Applied and Industrial Physics | www.physics-journal.org
Figure 3.2UV-visible absorption spectrum of Pure ZnO
Figure 3.3FTIR absorption/transmission spectrum of Pure ZnO
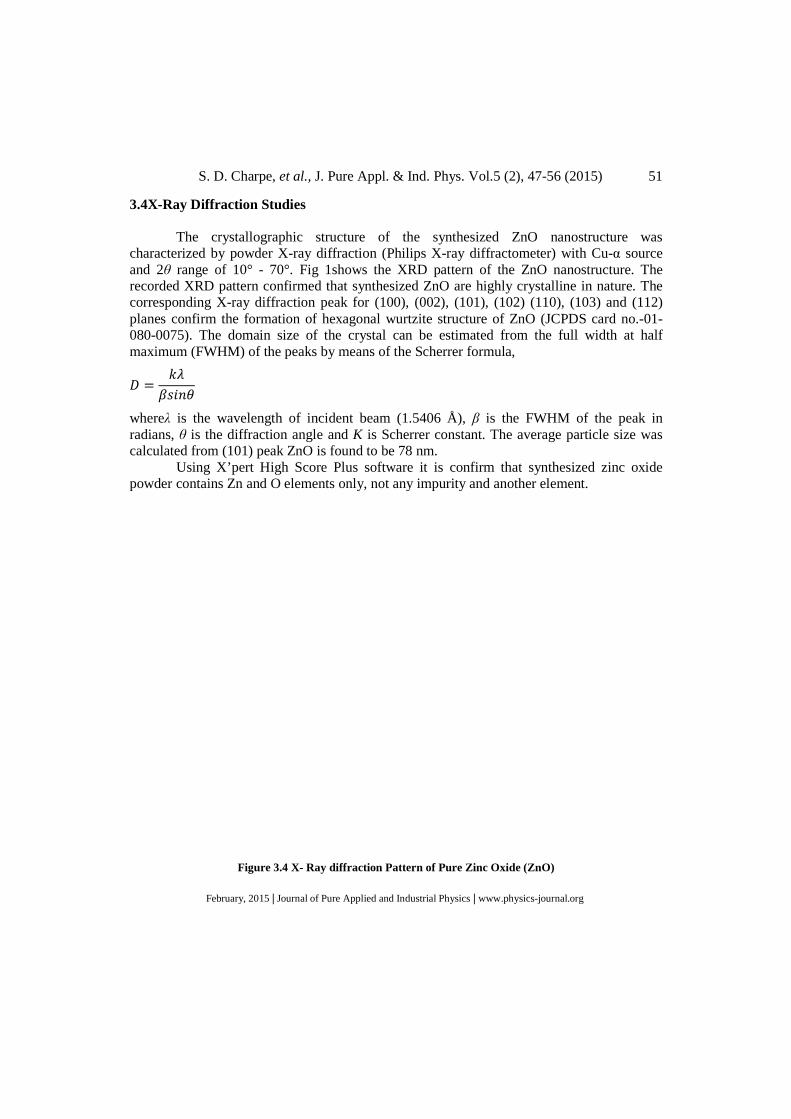
S. D. Charpe, et al., J. Pure Appl. & Ind. Phys. Vol.5 (2), 47-56 (2015) 51
February, 2015 | Journal of Pure Applied and Industrial Physics | www.physics-journal.org
3.4X-Ray Diffraction Studies
The crystallographic structure of the synthesized ZnO nanostructure was characterized by powder X-ray diffraction (Philips X-ray diffractometer) with Cu-α source and 2θ range of 10° - 70°. Fig 1shows the XRD pattern of the ZnO nanostructure. The recorded XRD pattern confirmed that synthesized ZnO are highly crystalline in nature. The corresponding X-ray diffraction peak for (100), (002), (101), (102) (110), (103) and (112) planes confirm the formation of hexagonal wurtzite structure of ZnO (JCPDS card no.-01-080-0075). The domain size of the crystal can be estimated from the full width at half maximum (FWHM) of the peaks by means of the Scherrer formula,
� ���
����
whereλ is the wavelength of incident beam (1.5406 Å), β is the FWHM of the peak in radians, θ is the diffraction angle and K is Scherrer constant. The average particle size was calculated from (101) peak ZnO is found to be 78 nm.
Using X’pert High Score Plus software it is confirm that synthesized zinc oxide powder contains Zn and O elements only, not any impurity and another element.
Figure 3.4 X- Ray diffraction Pattern of Pure Zinc Oxide (ZnO)
52 S. D. Charpe, et al., J. Pure Appl. & Ind. Phys. Vol.5 (2), 47-56 (2015)
February, 2015 | Journal of Pure Applied and Industrial Physics | www.physics-journal.org
3.5 Transmission electron microscope Figure 3.5shows transmission electron microscope image of ZnO nanostructure
synthesized by Sol-gel method. It is clearly seen from the TEM image that the ZnO powders consist of large number of nanosphere which were cumulated to form superior size crystal.
Fig 3.5 (a) Fig 3.5 (b)
3.6 Scanning Electron Microscopic Study
Figure 3.6 shows typical SEM images of the pure ZnO thick film prepared by screen printing technique. The ZnO synthesized by the Sol- gel method consist of randomly distributed nanosphere as shown in Figure 3.6(a),(b) Due to such a deposition of nanosphere, surface to volume ratio of the ZnO may be increase.
Fig 3.6 (a) Fig 3.6 (b)
S. D. Charpe, et al., J. Pure Appl. & Ind. Phys. Vol.5 (2), 47-56 (2015) 53
February, 2015 | Journal of Pure Applied and Industrial Physics | www.physics-journal.org
4. ELECTRICAL PROPERTIES 4.1. I–V characteristics
Figure 4.1depicts the I–V characteristics of the pure ZnO films at room temperature. The symmetrical nature of I–V characteristics shows that silver contacts on the film are ohmic in nature22.
Figure 4.1 I-V Characteristics of Pure ZnO Thick Films
Figure 4.2 A.C. Conductivity of Pure ZnO Thick Film
54 S. D. Charpe, et al., J. Pure Appl. & Ind. Phys. Vol.5 (2), 47-56 (2015)
February, 2015 | Journal of Pure Applied and Industrial Physics | www.physics-journal.org
4.2 For Measurement of A.C. Conductivity
A.C. electrical conductivity of the thick films was measured by using Agilent 4284A LRC meter. Variation of electrical conductivity with the frequency was observed in the frequency range 100- 1MHz at room temperature.
The A.C. conductivity of pure ZnO thick films measured in the frequency range of 100Hz to 1MHz at room temperature. The experimental data reveal that ac conductivity increases with frequency (Figure 4.2)Variation of A.C. conductivity with frequency can be explained with the help of barrier hopping mode23. 4.3 Gas Sensing Properties
The gas response of the sensor was defied as the ratio of the change in conductance of a sample upon exposure to the target gas to the original conductance in air. Figure 4.3shows the gas responses of ZnO thick films to H2S at operating temperature. This high response of ZnO thick film to H2S may be due to the interaction of ZnO with H2S, forming ZnS24. ZnS exhibits higher electronic conductivity as compared to pure ZnO.
Figure 4.3 sensitivity of gas from mixture of gases
Figure 4.3also indicates the pure ZnO have maximum gas response to low concentration H2S. The higher response ZnO nanostructure upon exposure to H2S may be attributed to the decrease in con- centration of oxygen adsorbents (O2-
ad) and a resulting increase in concentration of electron.
The gas response was mainly dependent upon two factors. The first was the amount of active sites for oxygen and the reducing gases on the surface of the sensor materials. It is seen form TEM images Figure 3.6 (a),(b).The surfaces pure ZnO contain more active sites. This could explain why the response of pure ZnO thick films was higher than other thick films.
S. D. Charpe, et al., J. Pure Appl. & Ind. Phys. Vol.5 (2), 47-56 (2015) 55
February, 2015 | Journal of Pure Applied and Industrial Physics | www.physics-journal.org
5. CONCLUSION
In summary, sensors were fabricated with ZnO nanostructures, which were synthesized by a sol-gel method followed by sonication, and their gas sensing properties were measured. The results demonstrated that pure ZnO is very sensitive to low concentration H2S. Such nanomaterials with innovative structure can be used for gas sensors to monitor hazards gas like H2S. ACKNOWLEDGEMENT
I would like to thanks UGC and Dr. F.C. Raghuwanshi, my guide and supervisor for his excellent guidance, competent advice, admirable support and persistent encouragement through the course of my research work, without which the successful completion of this work would not have been possible REFERENCES 1. L. Morawska, , Z. Ristovski, E.R. Jayaratne, D.U. Keogh, X. Ling, Atmospheric
Environment, Volume 42, Issue 35, pp. 8113–8138 (November 2008). 2. S. Pizzini, N. Butta, D. Narducci, M. Palladina, J. Electrochem. Soc., 136, (7), 48 (1945). 3. H.W. Ryu, B.S. Park, A.A. Sheikh, W.S. Lee, K.J. Hong, Y.J. Seo, D.C. Shin, J.S. Park,
G.P. Choi, Sensors and Actuators B, 96, pp.717-722 (2003). 4. S.T. Shishiyanu, T.S. Shishiyanu, 0.1. Lupan, Sensors and Actuators B, 107, pp.379-386
(2005). 5. Can Li,Shunping Zhang, Mulin Hu, Changesheng Xie, Sensors and Actuators B,
153,pp.415-420 (2011). 6. M.C.Carotta, A.Cervi,v.di.Natale, Sensors and Actuators B, 137,pp.164-169 (2009). 7. M.Hubner, N.Barsan, U.Weimar, Sensors and Actuators B, 151,pp.103-106 (2010). 8. M. Hubner, D. Koziej, M. Bauer, M.D. Rossell, Angewandte Chemie-International
Edition 50, (12), pp. 2841-2844 (2011). 9. Z. A. Ansari, Taegyung G. Ko, and Jae-Hee Oh, IEEE Sensor Journal, 5, (5), pp. 817-
824 (2005). 10. G. Neri, A. Bonavita, G. Rizzo, S. Galvagno, N. Pinna, M. Niederberger, S. Capone, P.
Siciliano, Sensor and Actuators B, 122,pp.564-571 (2007). 11. M.D. Antonik, J.E. Schneider, E.L. Wittman, K. Snow, J.F. Vetelino, R.J. Lad, Thin
Solid Films, 256, pp.247-252 (1995). 12. V. Khatko, E. Llobet, X. Vilanova, J. Brezmes, J. Hubalek, K. Malysz, X. Correig,
Sensor and Actuators B, 45, pp.111-112 (2005). 13. W. Belkacem, A. Labidi, J. Guerin, N. Mliki, K. Aguir, Sensor and Actuators B, 132 (1),
pp.196-201(2008). 14. T. Brousse and D. M. Schleich, Sensors and Actuators B: Chemical, Vol. 31, No. 1-2,
pp. 77-79 (1996).
56 S. D. Charpe, et al., J. Pure Appl. & Ind. Phys. Vol.5 (2), 47-56 (2015)
February, 2015 | Journal of Pure Applied and Industrial Physics | www.physics-journal.org
15. A. P. Chatterjee, P. Mitra and A. K. Mukhopadhyay, Journal of Materials Science, Vol. 34, No. 17, pp. 4225-4231 (1999).
16. L. Liao, H. B. Lu, J. C. Li, H. He, D. F. Wang, D. J. Fu, C. Liu and W. F. Zhang, The Journal of Physical Chemistry C, Vol. 111, No. 5, pp. 1900-1903 (2007).
17. S. S. Badadhe and I. S. Mulla, “CO2 Gas Sensitive Indium-Doped ZnO Thin Films: Preparation and Characterization,” Sensors and Actuators B: Chemical, Vol. 143, No. 1, pp. 164-170 (2009).
18. Z. T. Liu, T. X. Fan, D. Zhang, X. L. Gong and J. Q. Xu, “Hierarchically Porous ZnO with High Sensitivity and Selectivity to CO2 Derived from Biotemplates,” Sensors and Actuators B: Chemical, Vol. 136, No. 2, pp. 499-509 (2009).
19. Hsieh P.T., Chen Y.C., Kao K.S., Lee M.S., Cheng C.C., Journal of the European Ceramic Society, Vol. 27, 13-15, pp. 3815-3818 (2007).
20. Wang J.,Gao L., Inorg. Chem. Commun. 6, pp.877–881 (2003). 21. Hong R Y, Li J H, Chen L L, Liu D Q, Li H Z, Zheng Y and Ding J, Powder
Technology, 189(3), pp.426-432 (2009). 22. G. H. Jain, M.S. Wagh, Sensors and Actuators B 12, pp. 233-239 (2007). 23. K. Lal, S. K. Chattopadhyay, A. K. Meikap, S. K. Chatterjee , Czechoslovak Journal of
Physics, Vol. 53,No. 3 (2003). 24. D. Wang, X. F. Chu and M. L. Gong, Nanotechnology, Vol. 18, No. 18, (2007).
International Journal of Application or Innovation in Engineering & Management (IJAIEM) Web Site: www.ijaiem.org Email: [email protected]
Volume 4, Issue 2, February 2015 ISSN 2319 - 4847
Volume 4, Issue 2, February 2015 Page 141
ABSTRACT Magnesium nitrate and Sodium hydroxide are used as a starting material for the preparation of nanoparticles of Magnesium oxide (MgO) via liquid phase method. The XRD analysis shows that nanocrystalline size of MgO remarkably with the 1:1 molar ratio. The respective average crystalline size is found to be 25.91nm. The resistance of MgO nanoparticles is temperature dependent and decreases exponentially (from 1011 to 107 ). The activation energy of the MgO nanoparticles is found to be 0.49eV or 48.196 KJ/mol by using Arrhenius plot. The I/V characteristics of MgO nanoparticles is found to be linear in nature and obey the Ohms law in the operating temperature range (50-350 OC). Keywords: [Mg(NO2)(H2O)6] , (NaOH), Ethanol, Activation Energy
1. INTRODUCTION Now-a-days one dimensional nanomaterial such as nanowires, nanorods, nanofibers of various metal oxides materials has been growing an interest due to their potential applications in various functional devices and their fundamental scientific interest [1-4]. The synthesis of nanomaterials can be broadly categories; Liquid-phase, Gas-phase and Vapour-phase . Under liquid phase the techniques used for synthesis are: co-precipitation, sol-gel processing, micro-emulsions, hydrothermal /solvo-thermal , microwave , sono-chemical , Template and biomimetic . The MgO has a good additive properties in heavy fuel oil because of high oil dispersion ability and large specific surface area and also bactericidal performance in the aqueous environments due to the formation of super oxide [5-7]. As the Magnesium hydroxide is eco-friendly, non toxic, thermally stable flame retardant and suppressing fumes under fire conditions. There are various kinds of techniques which are used to synthesize the MgO nano-particles by using different methods such as pulse laser deposition (PLD) [8], Laser ablation [9], hydrothermal method [10], sol-gel method [10-11], thermal decomposition of hydroxide or carbonate [12-13] etc. Out of above all the synthesis technique, sol-gel method has synthesis and large scale production of MgO nanoparticles [14]. The nanosize oxide particles with narrow size distribution can be prepared by using various techniques as given above. The oxide particle size and morphology can be controlled by various parameters such as preparation conditions as the pH, temperature of precipitation, different molar concentration or ionic strength, and different calcinations temperature or time [15]. In the present study is to synthesize and structural characterisation of MgO nanoparticles by using liquid phase method with large surface area in short reaction time at room temperature and this method is the simplest, cost effective, eco-friendly method. It is also probed for its effect on nanocrystalline size structure via XRD studies and also reported I/V characteristics, the activation energy of MgO nanoparticles.
2. EXPERIMENTAL 2.1 Synthesis of MgO Nanoparticles The synthesis of MgO nanoparticles is divided into various steps, such as mixing, stirring, filtering, drying and calcination [16]. Finally by the calcinating the powder at 400 oC for 3 h, the MgO is obtained in the nanoparticles form, the flow chart of procedure is as shown in figure 1.
Synthesis and Characterization of Magnesium oxide Nanoparticles with 1:1 molar ratio via
Liquid-Phase Method
Agrawal R.M., Charpe S.D., Raghuwanshi F.C. and *Lamdhade G.T.
Department of Physics, Vidya Bharati Mahavidyalaya, CK Naidu Road, Camp, Amravati Maharshtra State- 444602 India
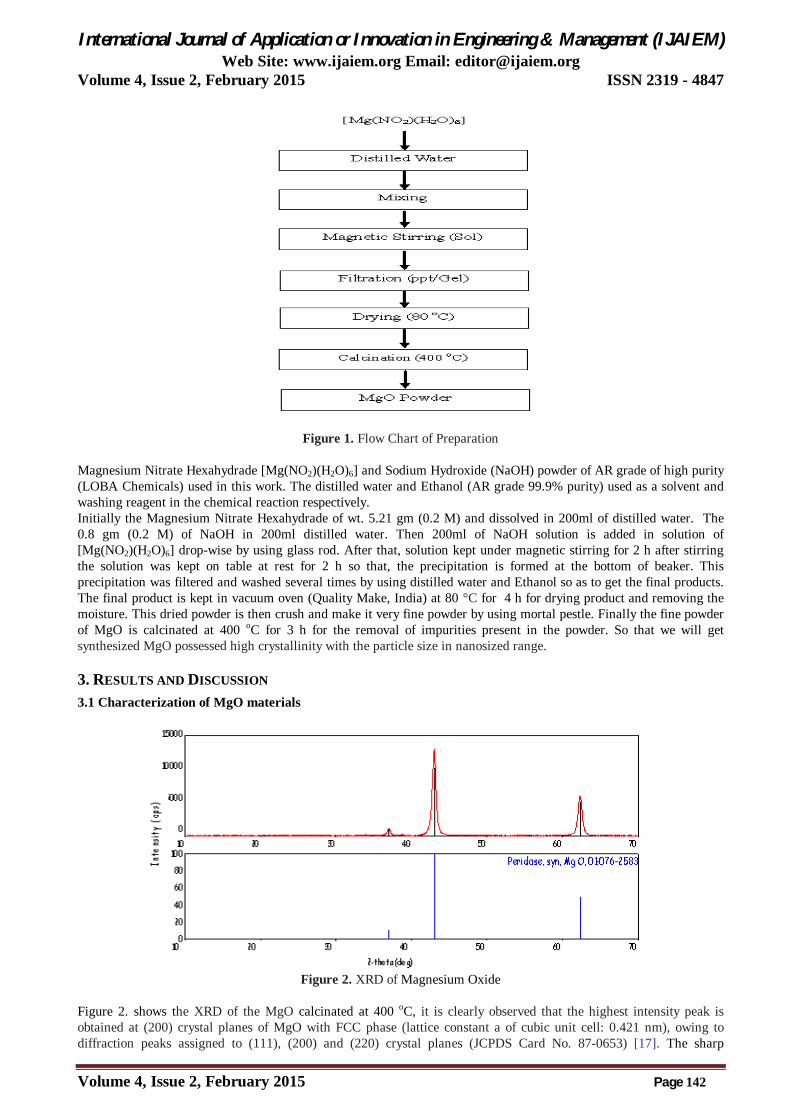
International Journal of Application or Innovation in Engineering & Management (IJAIEM) Web Site: www.ijaiem.org Email: [email protected]
Volume 4, Issue 2, February 2015 ISSN 2319 - 4847
Volume 4, Issue 2, February 2015 Page 142
Figure 1. Flow Chart of Preparation
Magnesium Nitrate Hexahydrade [Mg(NO2)(H2O)6] and Sodium Hydroxide (NaOH) powder of AR grade of high purity (LOBA Chemicals) used in this work. The distilled water and Ethanol (AR grade 99.9% purity) used as a solvent and washing reagent in the chemical reaction respectively. Initially the Magnesium Nitrate Hexahydrade of wt. 5.21 gm (0.2 M) and dissolved in 200ml of distilled water. The 0.8 gm (0.2 M) of NaOH in 200ml distilled water. Then 200ml of NaOH solution is added in solution of [Mg(NO2)(H2O)6] drop-wise by using glass rod. After that, solution kept under magnetic stirring for 2 h after stirring the solution was kept on table at rest for 2 h so that, the precipitation is formed at the bottom of beaker. This precipitation was filtered and washed several times by using distilled water and Ethanol so as to get the final products. The final product is kept in vacuum oven (Quality Make, India) at 80 °C for 4 h for drying product and removing the moisture. This dried powder is then crush and make it very fine powder by using mortal pestle. Finally the fine powder of MgO is calcinated at 400 oC for 3 h for the removal of impurities present in the powder. So that we will get synthesized MgO possessed high crystallinity with the particle size in nanosized range.
3. RESULTS AND DISCUSSION 3.1 Characterization of MgO materials
Figure 2. XRD of Magnesium Oxide
Figure 2. shows the XRD of the MgO calcinated at 400 oC, it is clearly observed that the highest intensity peak is obtained at (200) crystal planes of MgO with FCC phase (lattice constant a of cubic unit cell: 0.421 nm), owing to diffraction peaks assigned to (111), (200) and (220) crystal planes (JCPDS Card No. 87-0653) [17]. The sharp
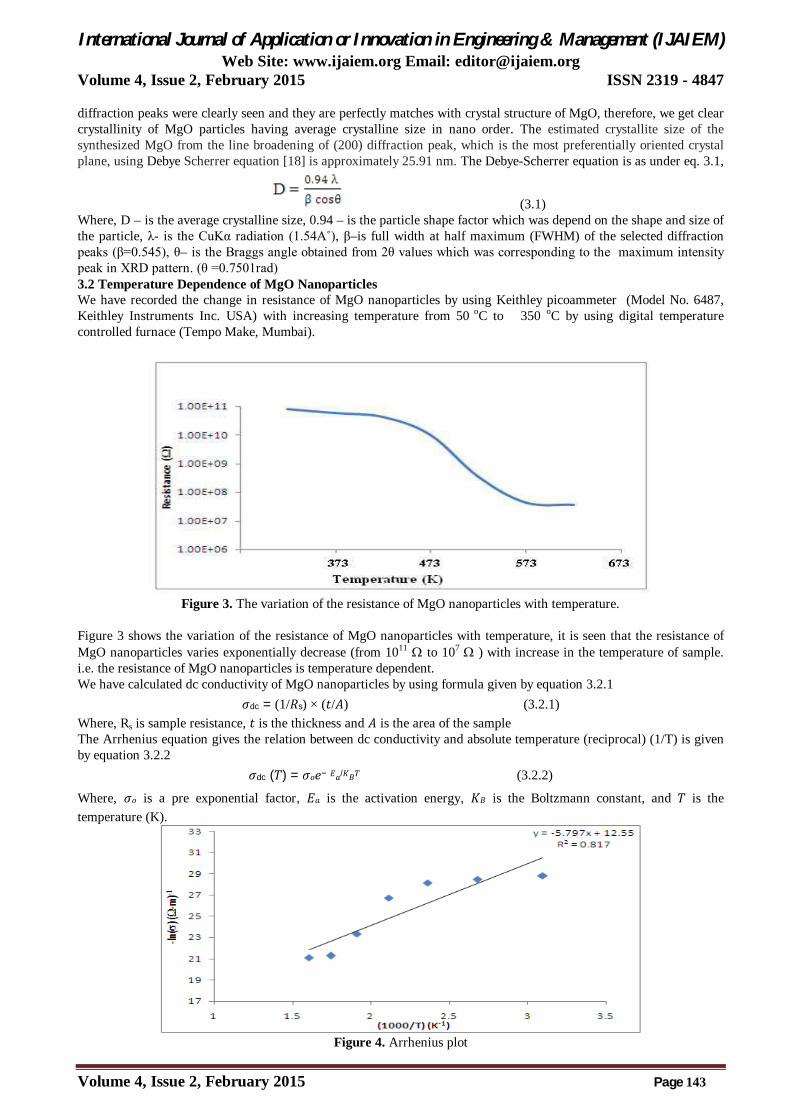
International Journal of Application or Innovation in Engineering & Management (IJAIEM) Web Site: www.ijaiem.org Email: [email protected]
Volume 4, Issue 2, February 2015 ISSN 2319 - 4847
Volume 4, Issue 2, February 2015 Page 143
diffraction peaks were clearly seen and they are perfectly matches with crystal structure of MgO, therefore, we get clear crystallinity of MgO particles having average crystalline size in nano order. The estimated crystallite size of the synthesized MgO from the line broadening of (200) diffraction peak, which is the most preferentially oriented crystal plane, using Debye Scherrer equation [18] is approximately 25.91 nm. The Debye-Scherrer equation is as under eq. 3.1,
(3.1) Where, D – is the average crystalline size, 0.94 – is the particle shape factor which was depend on the shape and size of the particle, λ- is the CuKα radiation (1.54A˚), β–is full width at half maximum (FWHM) of the selected diffraction peaks (β=0.545), θ– is the Braggs angle obtained from 2θ values which was corresponding to the maximum intensity peak in XRD pattern. (θ =0.7501rad) 3.2 Temperature Dependence of MgO Nanoparticles We have recorded the change in resistance of MgO nanoparticles by using Keithley picoammeter (Model No. 6487, Keithley Instruments Inc. USA) with increasing temperature from 50 oC to 350 oC by using digital temperature controlled furnace (Tempo Make, Mumbai).
Figure 3. The variation of the resistance of MgO nanoparticles with temperature.
Figure 3 shows the variation of the resistance of MgO nanoparticles with temperature, it is seen that the resistance of MgO nanoparticles varies exponentially decrease (from 1011 to 107 ) with increase in the temperature of sample. i.e. the resistance of MgO nanoparticles is temperature dependent. We have calculated dc conductivity of MgO nanoparticles by using formula given by equation 3.2.1
(3.2.1) (ܣ/ݐ) × dc = (1/s)ߪWhere, Rs is sample resistance, ݐ is the thickness and ܣ is the area of the sample The Arrhenius equation gives the relation between dc conductivity and absolute temperature (reciprocal) (1/T) is given by equation 3.2.2
−ߪ = () dcߪ (3.2.2) ܤܭ/ܧWhere, ߪ is a pre exponential factor, ܧ is the activation energy, ܤܭ is the Boltzmann constant, and is the temperature (K).
Figure 4. Arrhenius plot
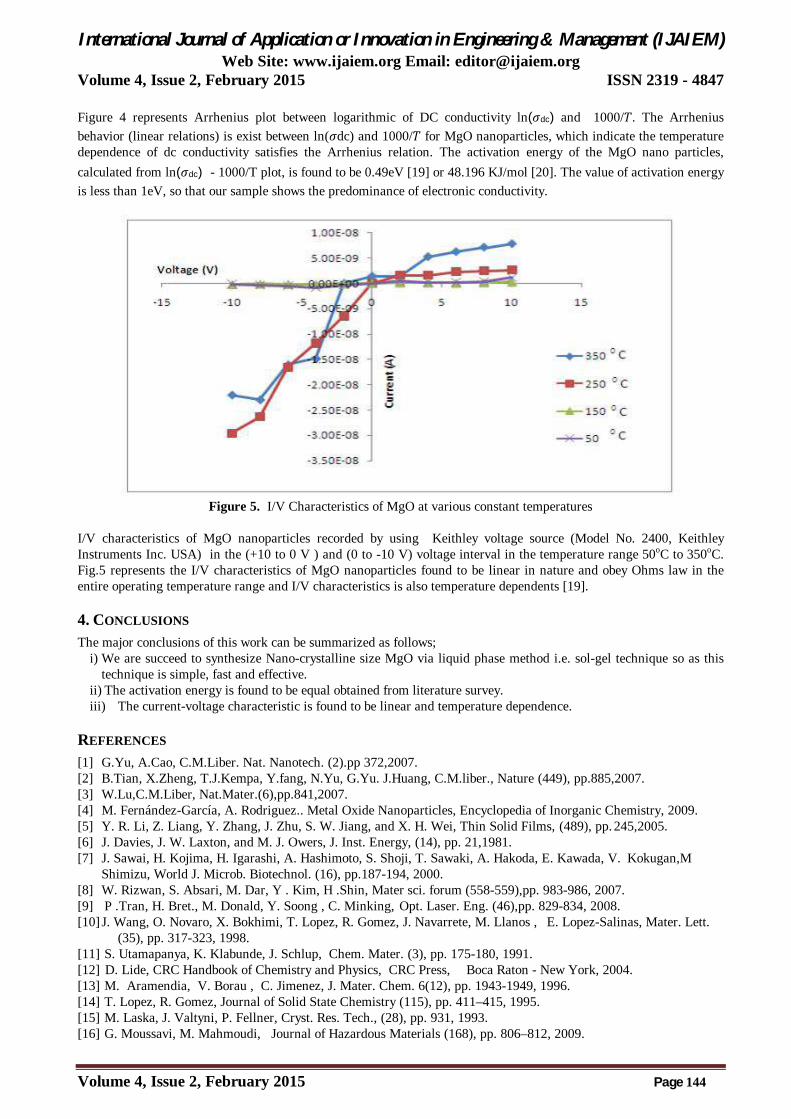
International Journal of Application or Innovation in Engineering & Management (IJAIEM) Web Site: www.ijaiem.org Email: [email protected]
Volume 4, Issue 2, February 2015 ISSN 2319 - 4847
Volume 4, Issue 2, February 2015 Page 144
Figure 4 represents Arrhenius plot between logarithmic of DC conductivity ln(ߪdc) and 1000/. The Arrhenius behavior (linear relations) is exist between ln(ߪdc) and 1000/ for MgO nanoparticles, which indicate the temperature dependence of dc conductivity satisfies the Arrhenius relation. The activation energy of the MgO nano particles, calculated from ln(ߪdc) - 1000/T plot, is found to be 0.49eV [19] or 48.196 KJ/mol [20]. The value of activation energy is less than 1eV, so that our sample shows the predominance of electronic conductivity.
Figure 5. I/V Characteristics of MgO at various constant temperatures
I/V characteristics of MgO nanoparticles recorded by using Keithley voltage source (Model No. 2400, Keithley Instruments Inc. USA) in the (+10 to 0 V ) and (0 to -10 V) voltage interval in the temperature range 50oC to 350oC. Fig.5 represents the I/V characteristics of MgO nanoparticles found to be linear in nature and obey Ohms law in the entire operating temperature range and I/V characteristics is also temperature dependents [19].
4. CONCLUSIONS The major conclusions of this work can be summarized as follows;
i) We are succeed to synthesize Nano-crystalline size MgO via liquid phase method i.e. sol-gel technique so as this technique is simple, fast and effective.
ii) The activation energy is found to be equal obtained from literature survey. iii) The current-voltage characteristic is found to be linear and temperature dependence.
REFERENCES [1] G.Yu, A.Cao, C.M.Liber. Nat. Nanotech. (2).pp 372,2007. [2] B.Tian, X.Zheng, T.J.Kempa, Y.fang, N.Yu, G.Yu. J.Huang, C.M.liber., Nature (449), pp.885,2007. [3] W.Lu,C.M.Liber, Nat.Mater.(6),pp.841,2007. [4] M. Fernández-García, A. Rodriguez.. Metal Oxide Nanoparticles, Encyclopedia of Inorganic Chemistry, 2009. [5] Y. R. Li, Z. Liang, Y. Zhang, J. Zhu, S. W. Jiang, and X. H. Wei, Thin Solid Films, (489), pp. 245,2005. [6] J. Davies, J. W. Laxton, and M. J. Owers, J. Inst. Energy, (14), pp. 21,1981. [7] J. Sawai, H. Kojima, H. Igarashi, A. Hashimoto, S. Shoji, T. Sawaki, A. Hakoda, E. Kawada, V. Kokugan,M
Shimizu, World J. Microb. Biotechnol. (16), pp.187-194, 2000. [8] W. Rizwan, S. Absari, M. Dar, Y . Kim, H .Shin, Mater sci. forum (558-559),pp. 983-986, 2007. [9] P .Tran, H. Bret., M. Donald, Y. Soong , C. Minking, Opt. Laser. Eng. (46),pp. 829-834, 2008. [10] J. Wang, O. Novaro, X. Bokhimi, T. Lopez, R. Gomez, J. Navarrete, M. Llanos , E. Lopez-Salinas, Mater. Lett.
(35), pp. 317-323, 1998. [11] S. Utamapanya, K. Klabunde, J. Schlup, Chem. Mater. (3), pp. 175-180, 1991. [12] D. Lide, CRC Handbook of Chemistry and Physics, CRC Press, Boca Raton - New York, 2004. [13] M. Aramendia, V. Borau , C. Jimenez, J. Mater. Chem. 6(12), pp. 1943-1949, 1996. [14] T. Lopez, R. Gomez, Journal of Solid State Chemistry (115), pp. 411–415, 1995. [15] M. Laska, J. Valtyni, P. Fellner, Cryst. Res. Tech., (28), pp. 931, 1993. [16] G. Moussavi, M. Mahmoudi, Journal of Hazardous Materials (168), pp. 806–812, 2009.
International Journal of Application or Innovation in Engineering & Management (IJAIEM) Web Site: www.ijaiem.org Email: [email protected]
Volume 4, Issue 2, February 2015 ISSN 2319 - 4847
Volume 4, Issue 2, February 2015 Page 145
[17] V. Smith, X-ray Powder Data File, American Society for Testing Materials, 1960. [18] B. Cullity, Elements of X-ray Diffraction. Massachusetts, Addison-Wesley Publication Company, 1978. [19] N. Kilincl, L. Arda, S. Ozturk, Z. Ozturk, Cryst. Res. Technol. 45, (5), pp. 529 – 538, 2010. [20] T. Jeffrey, M. Simone, P. Ivan, J. Am. Ceram. Soc., 97 (1), pp. 275– 282,2014.
IPASJ International Journal of Electrical Engineering (IIJEE) Web Site: http://www.ipasj.org/IIJEE/IIJEE.htm
A Publisher for Research Motivation........ Email: [email protected] Volume 3, Issue 2, February 2015 ISSN 2321-600X
Volume 3, Issue 2, February 2015 Page 12
ABSTRACT Thin film of Zinc Oxide (ZnO) nanostructure has been deposited on glass substrate by using spray pyrolysis method. This method can be used as a promising material for semiconductor gas sensor to detect gas like H2S at above room temperature with high sensitivity and selectivity. Characterizations of Zinc Oxide (ZnO) using UV, FTIR, XRD, SEM, EDS has been done. Keywords: ZnO, Spray Pyrolysis, XRD, SEM, EDS and H2S Sensor.
1. INTRODUCTION Metal oxide is a very important material which exhibits electric, magnetic and structural ordering has attracted great interest in the past few years resulting in concurrent applications like gas sensors, microelectronics, optoelectronic devices and solar cells. These materials offer a wide opportunity for possible applications spintronic devices and sensors where both structural and electricproperties giving enough opportunity for manipulating devices. These nanocrystalline materials have interesting physical and chemical properties prepared using new man-made routes for the production of special nanoparticles which have new applications in material science and nanotechnology. Zinc Oxide (ZnO) has been extensively studied for various applications in sensing, acoustic wave resonator, acoustic optic modulator [1], [2]. The origin of various applications the lies in its crystal structure, in which the oxygen atoms and zinc atoms are tetrahedral, bonded. In such a non-Centro symmetric structure, the center of positive charge and negative charge can be displaced due to external pressure induced lattice distortion. In fact, among the tetrahedrally bonded semiconductors, ZnO has the highest wide band gap semiconductor with a band gap ~3.3 eV at room temperaturewhich provides a large electro-mechanical coupling. This property of ZnO nanostructures was also investigated for their potential applications in nano systems [3]. Pure and doped ZnO thin films have been deposited using various techniques such as Liquid-phase synthesis [4]-[6]and secondly by using liquid or vapor precursorssuch as Chemical Vapour Synthesis [7], Spray Pyrolysis [8], [9], Laser Pyrolysis [10], Flame Spray Pyrolysis [11].Spray pyrolysis (SP) technique is a very easy, low cost, safe, and non-vacuum system of deposition for preparing transparent conducting oxides as compared with the other techniques. The other advantage of the Spray pyrolysis technique is that it can be adapted easily for production of large area uniform film coatings. The aim of this work is to study the structural, and gas sensing properties of Pure ZnO thin film.
2.EXPERIMENTAL DETAILS Synthesis of NanostructureZnO by using Spray Pyrolysis All substrates were thoroughly cleaned by the following sequence: cleaned by labolene detergent and then rinsed with double-distilled (DD) water; then boiled with dilute chromic acid for 15 minutes and thoroughly rinsed with DD water; after that, ultrasonicated for 10min in acetone and then in methanol, and finally all substrates were dried in an oven. Zinc acetate dehydrate [Zn (CH3COO)22H2O], sodium hydroxide (NaOH) pallet and ethanol used for the sprayed pure ZnO thin films were analytical reagent grade (99.5 %purity, Sigma Aldrich). The spray pyrolysis experimental set-up and the details of the procedure for the pure ZnO thin films deposition have been described elsewhere [12]. 0.1M zinc acetate was dissolved in 25 ml of de-ionized water then mixed with ethanol in the ratio 1:3 and stirred for 10 minutes using a magnetic stirrer. Similarly, 1 M sodium hydroxide solution was also prepared. The NaOH solution was slowly added from a burette held vertically with zinc acetate dehydrate solution until the pH value reached 7. Cleaned glass slides were used as substrates to form pure ZnO films. The prepared solution was sprayed on glass substrates, kept at 5000C temperatures.
Synthesis of Nano structure Zinc Oxide by Spray Pyrolysis and itsCharacterizationfor
Gas Sensing Application
S.D.Charpe1*, F.C. Raghuwanshi2*, G.T. Lamdhade *, V.S. Kalymwar†
* Department of Physics, Vidya Bharati Mahavidyalaya, Amravati, India.
† Department of Physics, Bharatiya Mahavidyalaya, Amravati, India.
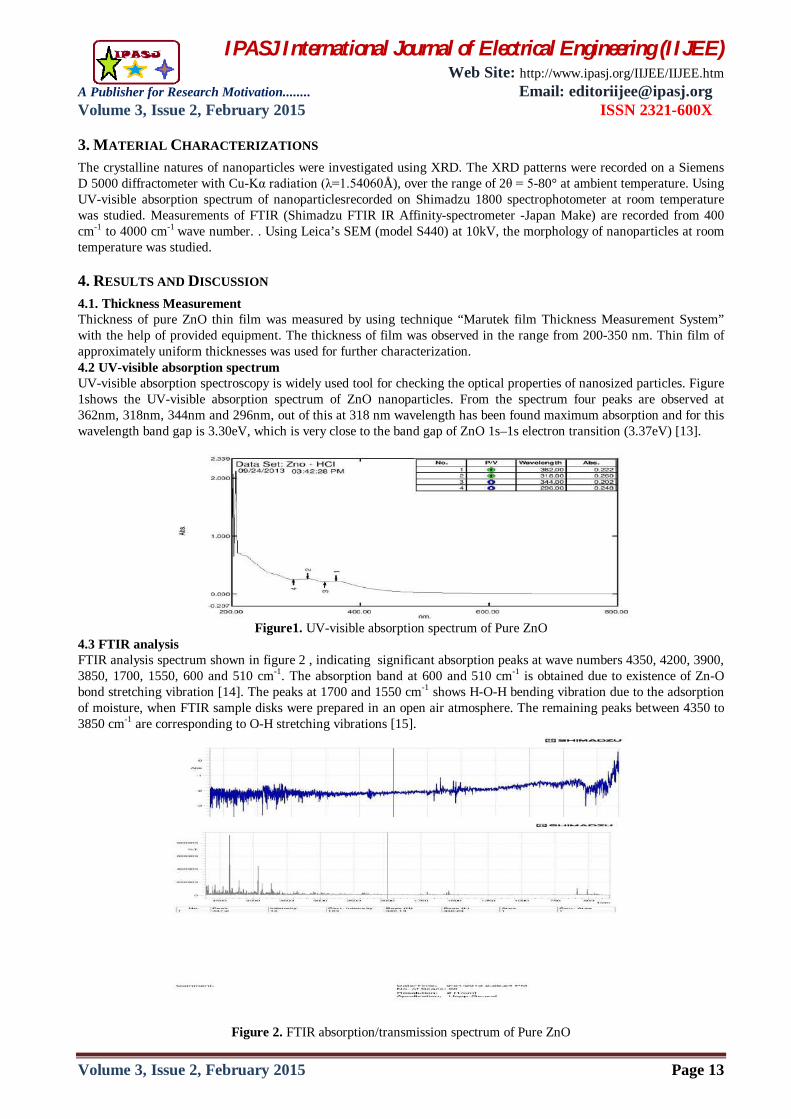
IPASJ International Journal of Electrical Engineering (IIJEE) Web Site: http://www.ipasj.org/IIJEE/IIJEE.htm
A Publisher for Research Motivation........ Email: [email protected] Volume 3, Issue 2, February 2015 ISSN 2321-600X
Volume 3, Issue 2, February 2015 Page 13
3. MATERIAL CHARACTERIZATIONS The crystalline natures of nanoparticles were investigated using XRD. The XRD patterns were recorded on a Siemens D 5000 diffractometer with Cu-Kα radiation (λ=1.54060Å), over the range of 2θ = 5-80° at ambient temperature. Using UV-visible absorption spectrum of nanoparticlesrecorded on Shimadzu 1800 spectrophotometer at room temperature was studied. Measurements of FTIR (Shimadzu FTIR IR Affinity-spectrometer -Japan Make) are recorded from 400 cm-1 to 4000 cm-1 wave number. . Using Leica’s SEM (model S440) at 10kV, the morphology of nanoparticles at room temperature was studied.
4. RESULTS AND DISCUSSION 4.1. Thickness Measurement Thickness of pure ZnO thin film was measured by using technique “Marutek film Thickness Measurement System” with the help of provided equipment. The thickness of film was observed in the range from 200-350 nm. Thin film of approximately uniform thicknesses was used for further characterization. 4.2 UV-visible absorption spectrum UV-visible absorption spectroscopy is widely used tool for checking the optical properties of nanosized particles. Figure 1shows the UV-visible absorption spectrum of ZnO nanoparticles. From the spectrum four peaks are observed at 362nm, 318nm, 344nm and 296nm, out of this at 318 nm wavelength has been found maximum absorption and for this wavelength band gap is 3.30eV, which is very close to the band gap of ZnO 1s–1s electron transition (3.37eV) [13].
Figure1. UV-visible absorption spectrum of Pure ZnO
4.3 FTIR analysis FTIR analysis spectrum shown in figure 2 , indicating significant absorption peaks at wave numbers 4350, 4200, 3900, 3850, 1700, 1550, 600 and 510 cm-1. The absorption band at 600 and 510 cm-1 is obtained due to existence of Zn-O bond stretching vibration [14]. The peaks at 1700 and 1550 cm-1 shows H-O-H bending vibration due to the adsorption of moisture, when FTIR sample disks were prepared in an open air atmosphere. The remaining peaks between 4350 to 3850 cm-1 are corresponding to O-H stretching vibrations [15].
Figure 2. FTIR absorption/transmission spectrum of Pure ZnO
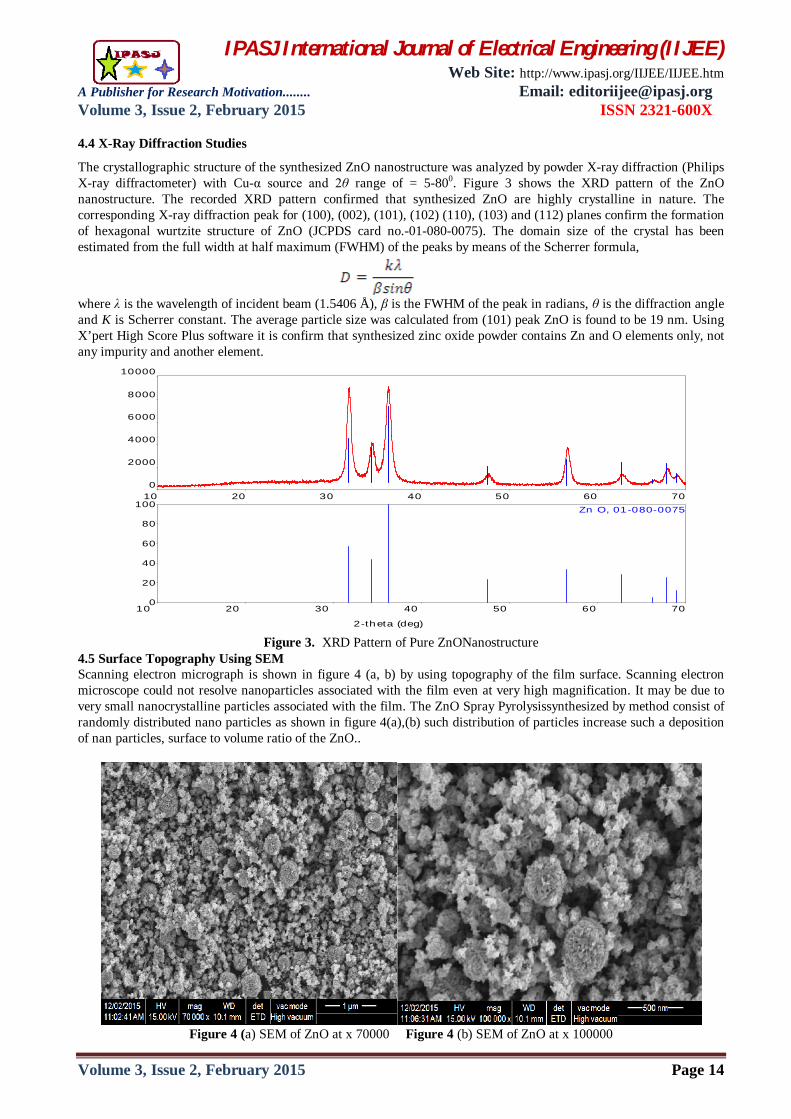
IPASJ International Journal of Electrical Engineering (IIJEE) Web Site: http://www.ipasj.org/IIJEE/IIJEE.htm
A Publisher for Research Motivation........ Email: [email protected] Volume 3, Issue 2, February 2015 ISSN 2321-600X
Volume 3, Issue 2, February 2015 Page 14
4.4 X-Ray Diffraction Studies
The crystallographic structure of the synthesized ZnO nanostructure was analyzed by powder X-ray diffraction (Philips X-ray diffractometer) with Cu-α source and 2θ range of = 5-800. Figure 3 shows the XRD pattern of the ZnO nanostructure. The recorded XRD pattern confirmed that synthesized ZnO are highly crystalline in nature. The corresponding X-ray diffraction peak for (100), (002), (101), (102) (110), (103) and (112) planes confirm the formation of hexagonal wurtzite structure of ZnO (JCPDS card no.-01-080-0075). The domain size of the crystal has been estimated from the full width at half maximum (FWHM) of the peaks by means of the Scherrer formula,
where λ is the wavelength of incident beam (1.5406 Å), β is the FWHM of the peak in radians, θ is the diffraction angle and K is Scherrer constant. The average particle size was calculated from (101) peak ZnO is found to be 19 nm. Using X’pert High Score Plus software it is confirm that synthesized zinc oxide powder contains Zn and O elements only, not any impurity and another element.
10 20 30 40 50 60 70 0
2000
4000
6000
8000
10000
10 20 30 40 50 60 70 0
20
40
60
80
100Zn O, 01-080-0075
2-theta (deg) Figure 3. XRD Pattern of Pure ZnONanostructure
4.5 Surface Topography Using SEM Scanning electron micrograph is shown in figure 4 (a, b) by using topography of the film surface. Scanning electron microscope could not resolve nanoparticles associated with the film even at very high magnification. It may be due to very small nanocrystalline particles associated with the film. The ZnO Spray Pyrolysissynthesized by method consist of randomly distributed nano particles as shown in figure 4(a),(b) such distribution of particles increase such a deposition of nan particles, surface to volume ratio of the ZnO..
Figure 4 (a) SEM of ZnO at x 70000 Figure 4 (b) SEM of ZnO at x 100000
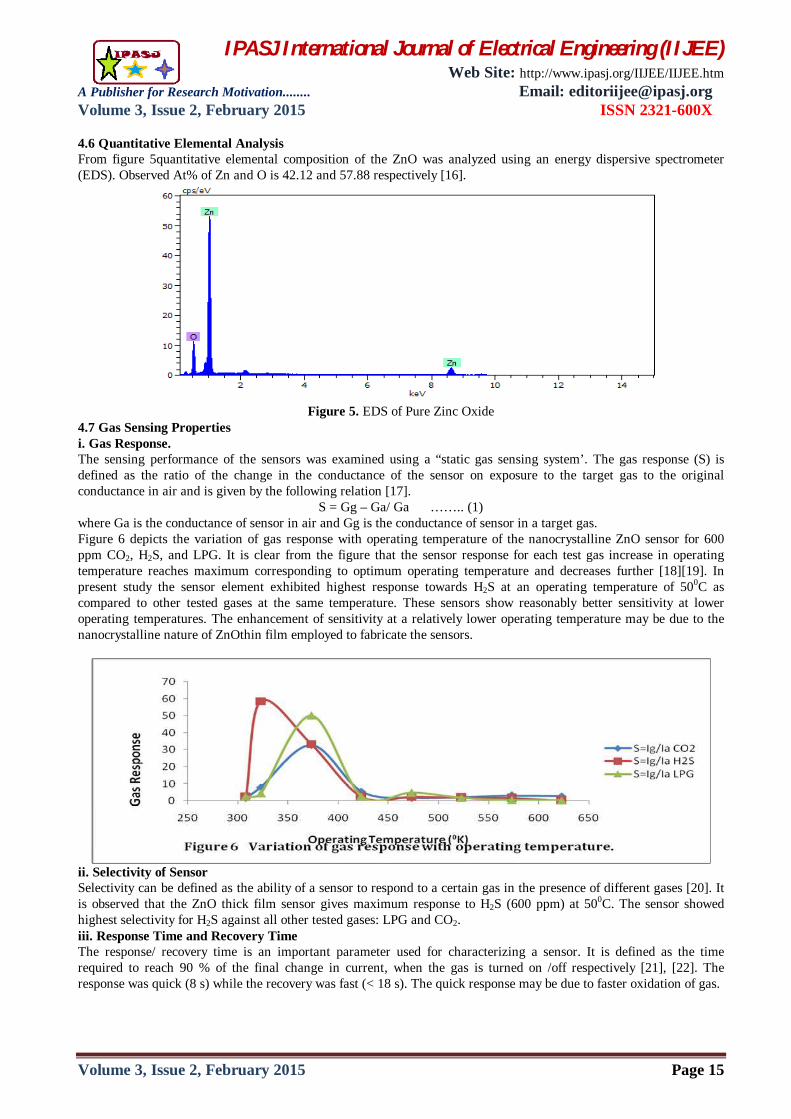
IPASJ International Journal of Electrical Engineering (IIJEE) Web Site: http://www.ipasj.org/IIJEE/IIJEE.htm
A Publisher for Research Motivation........ Email: [email protected] Volume 3, Issue 2, February 2015 ISSN 2321-600X
Volume 3, Issue 2, February 2015 Page 15
4.6 Quantitative Elemental Analysis From figure 5quantitative elemental composition of the ZnO was analyzed using an energy dispersive spectrometer (EDS). Observed At% of Zn and O is 42.12 and 57.88 respectively [16].
Figure 5. EDS of Pure Zinc Oxide
4.7 Gas Sensing Properties i. Gas Response. The sensing performance of the sensors was examined using a “static gas sensing system’. The gas response (S) is defined as the ratio of the change in the conductance of the sensor on exposure to the target gas to the original conductance in air and is given by the following relation [17].
S = Gg – Ga/ Ga …….. (1) where Ga is the conductance of sensor in air and Gg is the conductance of sensor in a target gas. Figure 6 depicts the variation of gas response with operating temperature of the nanocrystalline ZnO sensor for 600 ppm CO2, H2S, and LPG. It is clear from the figure that the sensor response for each test gas increase in operating temperature reaches maximum corresponding to optimum operating temperature and decreases further [18][19]. In present study the sensor element exhibited highest response towards H2S at an operating temperature of 500C as compared to other tested gases at the same temperature. These sensors show reasonably better sensitivity at lower operating temperatures. The enhancement of sensitivity at a relatively lower operating temperature may be due to the nanocrystalline nature of ZnOthin film employed to fabricate the sensors.
ii. Selectivity of Sensor Selectivity can be defined as the ability of a sensor to respond to a certain gas in the presence of different gases [20]. It is observed that the ZnO thick film sensor gives maximum response to H2S (600 ppm) at 500C. The sensor showed highest selectivity for H2S against all other tested gases: LPG and CO2. iii. Response Time and Recovery Time The response/ recovery time is an important parameter used for characterizing a sensor. It is defined as the time required to reach 90 % of the final change in current, when the gas is turned on /off respectively [21], [22]. The response was quick (8 s) while the recovery was fast (< 18 s). The quick response may be due to faster oxidation of gas.
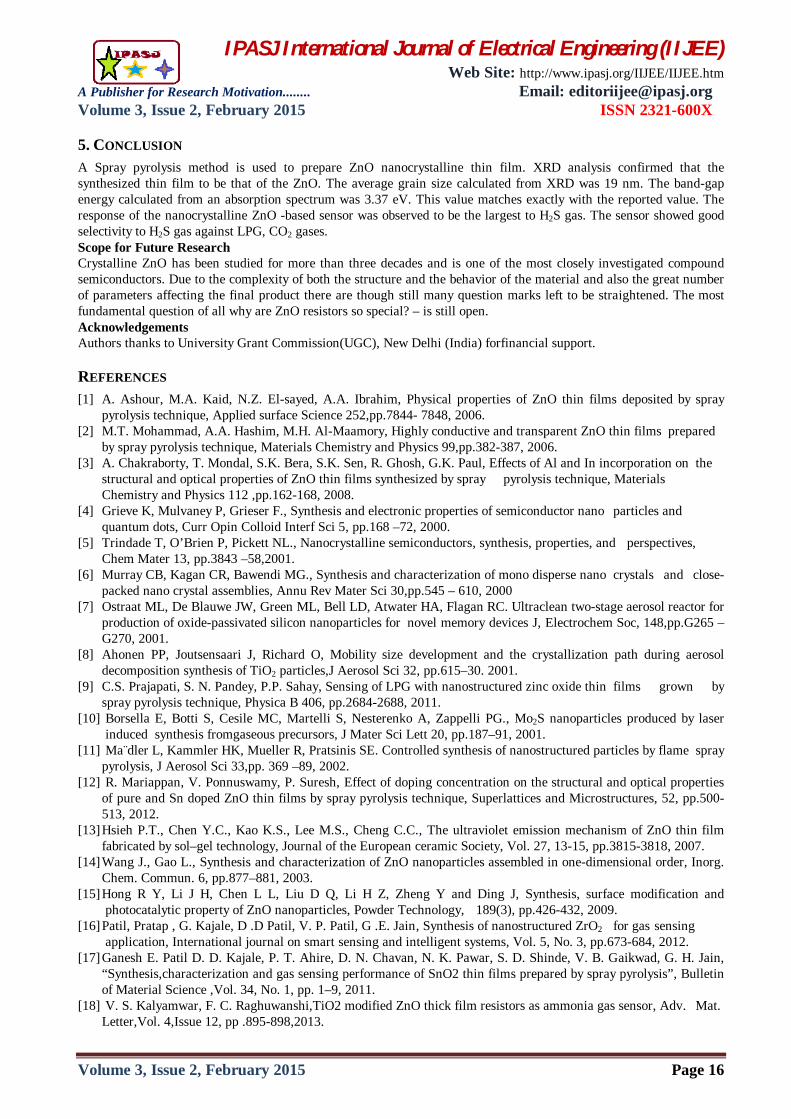
IPASJ International Journal of Electrical Engineering (IIJEE) Web Site: http://www.ipasj.org/IIJEE/IIJEE.htm
A Publisher for Research Motivation........ Email: [email protected] Volume 3, Issue 2, February 2015 ISSN 2321-600X
Volume 3, Issue 2, February 2015 Page 16
5. CONCLUSION A Spray pyrolysis method is used to prepare ZnO nanocrystalline thin film. XRD analysis confirmed that the synthesized thin film to be that of the ZnO. The average grain size calculated from XRD was 19 nm. The band-gap energy calculated from an absorption spectrum was 3.37 eV. This value matches exactly with the reported value. The response of the nanocrystalline ZnO -based sensor was observed to be the largest to H2S gas. The sensor showed good selectivity to H2S gas against LPG, CO2 gases. Scope for Future Research Crystalline ZnO has been studied for more than three decades and is one of the most closely investigated compound semiconductors. Due to the complexity of both the structure and the behavior of the material and also the great number of parameters affecting the final product there are though still many question marks left to be straightened. The most fundamental question of all why are ZnO resistors so special? – is still open. Acknowledgements Authors thanks to University Grant Commission(UGC), New Delhi (India) forfinancial support.
REFERENCES [1] A. Ashour, M.A. Kaid, N.Z. El-sayed, A.A. Ibrahim, Physical properties of ZnO thin films deposited by spray
pyrolysis technique, Applied surface Science 252,pp.7844- 7848, 2006. [2] M.T. Mohammad, A.A. Hashim, M.H. Al-Maamory, Highly conductive and transparent ZnO thin films prepared
by spray pyrolysis technique, Materials Chemistry and Physics 99,pp.382-387, 2006. [3] A. Chakraborty, T. Mondal, S.K. Bera, S.K. Sen, R. Ghosh, G.K. Paul, Effects of Al and In incorporation on the
structural and optical properties of ZnO thin films synthesized by spray pyrolysis technique, Materials Chemistry and Physics 112 ,pp.162-168, 2008.
[4] Grieve K, Mulvaney P, Grieser F., Synthesis and electronic properties of semiconductor nano particles and quantum dots, Curr Opin Colloid Interf Sci 5, pp.168 –72, 2000.
[5] Trindade T, O’Brien P, Pickett NL., Nanocrystalline semiconductors, synthesis, properties, and perspectives, Chem Mater 13, pp.3843 –58,2001.
[6] Murray CB, Kagan CR, Bawendi MG., Synthesis and characterization of mono disperse nano crystals and close-packed nano crystal assemblies, Annu Rev Mater Sci 30,pp.545 – 610, 2000
[7] Ostraat ML, De Blauwe JW, Green ML, Bell LD, Atwater HA, Flagan RC. Ultraclean two-stage aerosol reactor for production of oxide-passivated silicon nanoparticles for novel memory devices J, Electrochem Soc, 148,pp.G265 –G270, 2001.
[8] Ahonen PP, Joutsensaari J, Richard O, Mobility size development and the crystallization path during aerosol decomposition synthesis of TiO2 particles,J Aerosol Sci 32, pp.615–30. 2001.
[9] C.S. Prajapati, S. N. Pandey, P.P. Sahay, Sensing of LPG with nanostructured zinc oxide thin films grown by spray pyrolysis technique, Physica B 406, pp.2684-2688, 2011.
[10] Borsella E, Botti S, Cesile MC, Martelli S, Nesterenko A, Zappelli PG., Mo2S nanoparticles produced by laser induced synthesis fromgaseous precursors, J Mater Sci Lett 20, pp.187–91, 2001.
[11] Ma¨dler L, Kammler HK, Mueller R, Pratsinis SE. Controlled synthesis of nanostructured particles by flame spray pyrolysis, J Aerosol Sci 33,pp. 369 –89, 2002.
[12] R. Mariappan, V. Ponnuswamy, P. Suresh, Effect of doping concentration on the structural and optical properties of pure and Sn doped ZnO thin films by spray pyrolysis technique, Superlattices and Microstructures, 52, pp.500-513, 2012.
[13] Hsieh P.T., Chen Y.C., Kao K.S., Lee M.S., Cheng C.C., The ultraviolet emission mechanism of ZnO thin film fabricated by sol–gel technology, Journal of the European ceramic Society, Vol. 27, 13-15, pp.3815-3818, 2007.
[14] Wang J., Gao L., Synthesis and characterization of ZnO nanoparticles assembled in one-dimensional order, Inorg. Chem. Commun. 6, pp.877–881, 2003.
[15] Hong R Y, Li J H, Chen L L, Liu D Q, Li H Z, Zheng Y and Ding J, Synthesis, surface modification and photocatalytic property of ZnO nanoparticles, Powder Technology, 189(3), pp.426-432, 2009.
[16] Patil, Pratap , G. Kajale, D .D Patil, V. P. Patil, G .E. Jain, Synthesis of nanostructured ZrO2 for gas sensing application, International journal on smart sensing and intelligent systems, Vol. 5, No. 3, pp.673-684, 2012.
[17] Ganesh E. Patil D. D. Kajale, P. T. Ahire, D. N. Chavan, N. K. Pawar, S. D. Shinde, V. B. Gaikwad, G. H. Jain, “Synthesis,characterization and gas sensing performance of SnO2 thin films prepared by spray pyrolysis”, Bulletin of Material Science ,Vol. 34, No. 1, pp. 1–9, 2011.
[18] V. S. Kalyamwar, F. C. Raghuwanshi,TiO2 modified ZnO thick film resistors as ammonia gas sensor, Adv. Mat. Letter,Vol. 4,Issue 12, pp .895-898,2013.
IPASJ International Journal of Electrical Engineering (IIJEE) Web Site: http://www.ipasj.org/IIJEE/IIJEE.htm
A Publisher for Research Motivation........ Email: [email protected] Volume 3, Issue 2, February 2015 ISSN 2321-600X
Volume 3, Issue 2, February 2015 Page 17
[19] F.C. Raghuwanshi, N.G. Belsare,G.T. Lamdhade, International Journal of Advanced Engineering Technology, Vol. II,Issue IV, pp. 226-230, Oct- Dec 2011.
[20] S. D. Shinde, G. E. Patil, D. D. Kajale, V. B. Gaikwad and G. H. Jain, Synthesis of ZnO nanorods by spray pyrolysis for H2S gas sensor, Journal of Alloys and Compounds, Vol. 528, pp.109-114, 2012.
[21] Ganesh E. Patil, D. D. Kajale, V. B. Gaikwad, N. K. Pawar and G. H. Jain, “Properties and Gas Sensing Mechanism Study of CTO Thin Films as Ethanol Sensor”, Sensors &Transducers Journal, Vol. 137, Issue2, pp. 47-58, 2012.
[22] Patil, P. G., Kajale, D. D., Patil, V. P., Patil, G. E., & Jain, G. H., Synthesis Of Nanostructured ZnO for Gas Sensing, 5(3), pp.673–684, 2012.
AUTHOR
Mr. Sushil Charpe post graduated in physics from Vidya Bharati Mahavidyalaya Amravati which isaffiliated to S.G.B.A.U. Amravati. He is Ph.D. student at this University, studying structural and gassensing properties of metal oxide Nano materials for applications in gas-sensor devices. Dr. F. C. Raghuwanshi received his Ph.D. in Physics from Rashtrasant Tukadoji Maharaj Nagpur University, presently working as a Principal of Vidya Bharati Mahavidyalaya, Amravati and Deanof Faculty of Science in S.G.B.A.U. Amravati. His field of interest is solid state ionics andsemiconductor metal oxide gas sensor.
Research Article Adv. Mater. Lett. 2015, 6(8), 738-742 Advanced Materials Letters
Adv. Mater. Lett. 2015, 6(8), 738-742 Copyright © 2015 VBRI Press
www.amlett.com, www.vbripress.com/aml, DOI: 10.5185/amlett.2015.5877 Published online by the VBRI Press in 2015
SnO2 nanoparticles synthesis via liquid-phase co-precipitation technique
G. T. Lamdhade1*
, F. C. Raghuwanshi1, R. M. Agrawal
1, V. M. Balkhande
1, T. Shripathi
2
1Department of Physics, Vidya Bharati Mahavidyalaya Camp, C.K. Naidu Road, Amravati, Maharashtra 444602, India
2ESCA Lab and Molecular Spectroscopy Lab, UGC-DAE Consortium for Scientific Research, University Campus, Khandwa
Road, Indore, Madhya Pradesh 452001, India *Corresponding author. Tel: (+91) 9404518185; E-mail: [email protected]
Received: 28 February 2015, Revised: 25 March 2015 and Accepted: 29 March 2015
ABSTRACT
The samples have been prepared in the form of pellets of SnO2 nanoparticles and synthesized via the liquid-phase co-precipitation technique. The ac electrical conductivity of samples is found to be frequency dependent. The dielectric constant increases with temperature and decreases with frequency of applied field. The semiconducting behavior of SnO2 nanoparticles have been studied from I-V characteristics. The characterization of samples has been studied by XRD, FESEM, UV-spectra and TG-DTA plot. Copyright © 2015 VBRI Press.
Keywords: SnO2 nanoparticles; liquid-phase synthesis; ac conductivity; dielectric constant; dielectric loss.
Introduction
Stannic oxide (SnO2) is a wideband gap n-type
semiconductor exhibiting rutile structure [1]. SnO2 is applicable to the large number of field such as sensors, humidity sensors, optoelectronic devices, transparent
electrodes, Li-ion batteries, etc [2-6]. Single SnO2 nanowire have been synthesized by thermal
evaporation method and its I-V characteristics show semiconducting behavior , these nanowires would be a promising candidate for gas sensing applications due to its
structural and electrical properties [7]. Nanocrystalline composites of Zinc oxide and Tin oxide synthesize by using chemical route and the sensing response characteristics for NO2 gas has been studied and compared with corresponding results obtained for pure SnO2 and ZnO thin
film based sensor structure [8]. Thick film resistors of nano-phase SnO2 powder have been prepared by using screen printing method and their surfaces were modified by dip coating in platinum chloride solution different time periods. The sensors were found to be extremely stable and
repeatable [9]. Tin oxide quantum dots have been synthesized by solution-combustion method and there is
formation of a rutile SnO₂ phase with a tetragonal lattice
structure. The origin of the blue emission in the SnO₂ quantum dots is studied with reference to the energy band
diagram [10]. The properties of nanostructure material can be oriented
as per requirements can be achieve by using the various experimental process for synthesis of nanoparticles such as chemical precipitation, sol–gel, hydrothermal, microwave
technique, spray pyrolysis, CVD, etc [11, 12].
Bueno et al. [13] investigated the AC electrical properties of tin oxide found that the two time constants with different activation energies, one at low frequencies and the other at high frequencies. AC transport properties of nanocrystalline tin oxide were studied by Sahay et al.
[14, 15], show that it is frequency dependent and obey the power law. The AC electrical conductivity of nanocrystalline tin oxide is found to be frequency dependent at a temperature of 200 °C and the result are interpreted in terms of the random potential barrier model
[16]. As per the literature survey, there is less attention towards AC electrical, dielectric properties of nanocrystalline tin oxide as compared to DC conductivities
mechanism [17]. This paper is devoted to effective method for the synthesis of nanocrystalline tin oxide using liquid phase co-precipitation method and AC electrical, dielectric measurements in the temperature range (313-473 K) were carried out in the frequency range (20 Hz - 1 MHz) , I-V characteristics, crystallographic structural (X-RD), morphological behavior (FESEM) and UV-vis absorbance spectrum are reported.
Experimental
Materials
All the chemicals used in this present work were of GR grade purchased from Sd-fine chemicals, India having purity 99.99% except conducting silver paint purchased from Sigma Aldrich Chemical, USA. Stannous chloride dehydrates (SnCl2.2H2O), ammonia solution and deionised water were used during reaction. The conducting silver paint is used to form electrodes during the experimental work.
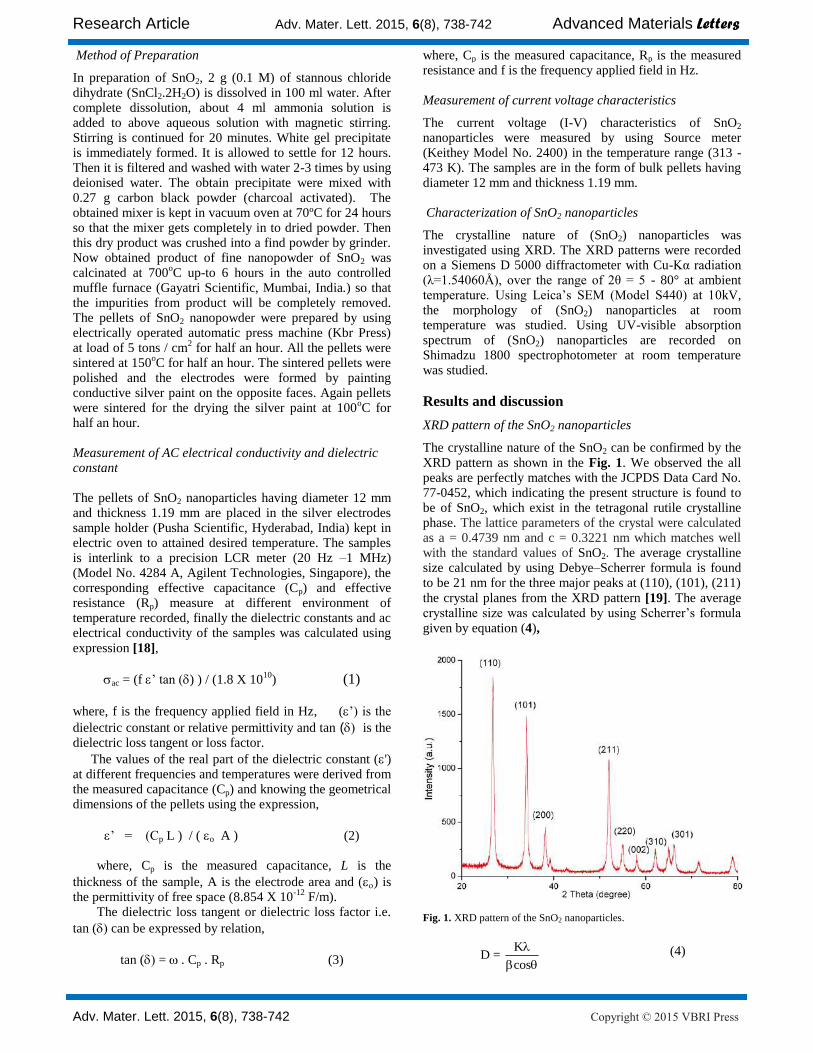
Research Article Adv. Mater. Lett. 2015, 6(8), 738-742 Advanced Materials Letters
Adv. Mater. Lett. 2015, 6(8), 738-742 Copyright © 2015 VBRI Press
Method of Preparation
In preparation of SnO2, 2 g (0.1 M) of stannous chloride dihydrate (SnCl2.2H2O) is dissolved in 100 ml water. After complete dissolution, about 4 ml ammonia solution is added to above aqueous solution with magnetic stirring. Stirring is continued for 20 minutes. White gel precipitate is immediately formed. It is allowed to settle for 12 hours. Then it is filtered and washed with water 2-3 times by using deionised water. The obtain precipitate were mixed with 0.27 g carbon black powder (charcoal activated). The obtained mixer is kept in vacuum oven at 70ºC for 24 hours so that the mixer gets completely in to dried powder. Then this dry product was crushed into a find powder by grinder. Now obtained product of fine nanopowder of SnO2 was calcinated at 700
oC up-to 6 hours in the auto controlled
muffle furnace (Gayatri Scientific, Mumbai, India.) so that the impurities from product will be completely removed. The pellets of SnO2 nanopowder were prepared by using electrically operated automatic press machine (Kbr Press) at load of 5 tons / cm
2 for half an hour. All the pellets were
sintered at 150oC for half an hour. The sintered pellets were
polished and the electrodes were formed by painting conductive silver paint on the opposite faces. Again pellets were sintered for the drying the silver paint at 100
oC for
half an hour. Measurement of AC electrical conductivity and dielectric constant The pellets of SnO2 nanoparticles having diameter 12 mm and thickness 1.19 mm are placed in the silver electrodes sample holder (Pusha Scientific, Hyderabad, India) kept in electric oven to attained desired temperature. The samples is interlink to a precision LCR meter (20 Hz –1 MHz) (Model No. 4284 A, Agilent Technologies, Singapore), the corresponding effective capacitance (Cp) and effective resistance (Rp) measure at different environment of temperature recorded, finally the dielectric constants and ac electrical conductivity of the samples was calculated using
expression [18],
ac = (f ’ tan () ) / (1.8 X 10¹⁰
) (1)
where, f is the frequency applied field in Hz, (’) is the
dielectric constant or relative permittivity and tan ( is the dielectric loss tangent or loss factor.
The values of the real part of the dielectric constant (') at different frequencies and temperatures were derived from the measured capacitance (Cp) and knowing the geometrical dimensions of the pellets using the expression,
’ = (Cp L ) / ( o A ) (2)
where, Cp is the measured capacitance, L is the
thickness of the sample, A is the electrode area and () is the permittivity of free space (8.854 X 10
-12 F/m).
The dielectric loss tangent or dielectric loss factor i.e.
tan ( can be expressed by relation,
tan ( = . Cp . Rp (3)
where, Cp is the measured capacitance, Rp is the measured resistance and f is the frequency applied field in Hz.
Measurement of current voltage characteristics
The current voltage (I-V) characteristics of SnO2 nanoparticles were measured by using Source meter (Keithey Model No. 2400) in the temperature range (313 - 473 K). The samples are in the form of bulk pellets having diameter 12 mm and thickness 1.19 mm.
Characterization of SnO2 nanoparticles
The crystalline nature of (SnO2) nanoparticles was investigated using XRD. The XRD patterns were recorded on a Siemens D 5000 diffractometer with Cu-Kα radiation (λ=1.54060Å), over the range of 2θ = 5 - 80° at ambient temperature. Using Leica’s SEM (Model S440) at 10kV, the morphology of (SnO2) nanoparticles at room temperature was studied. Using UV-visible absorption spectrum of (SnO2) nanoparticles are recorded on Shimadzu 1800 spectrophotometer at room temperature was studied.
Results and discussion
XRD pattern of the SnO2 nanoparticles
The crystalline nature of the SnO2 can be confirmed by the
XRD pattern as shown in the Fig. 1. We observed the all peaks are perfectly matches with the JCPDS Data Card No. 77-0452, which indicating the present structure is found to be of SnO2, which exist in the tetragonal rutile crystalline phase. The lattice parameters of the crystal were calculated as a = 0.4739 nm and c = 0.3221 nm which matches well with the standard values of SnO2. The average crystalline size calculated by using Debye–Scherrer formula is found to be 21 nm for the three major peaks at (110), (101), (211)
the crystal planes from the XRD pattern [19]. The average crystalline size was calculated by using Scherrer’s formula
given by equation (4),
Fig. 1. XRD pattern of the SnO2 nanoparticles.
KD =
cos
(4)
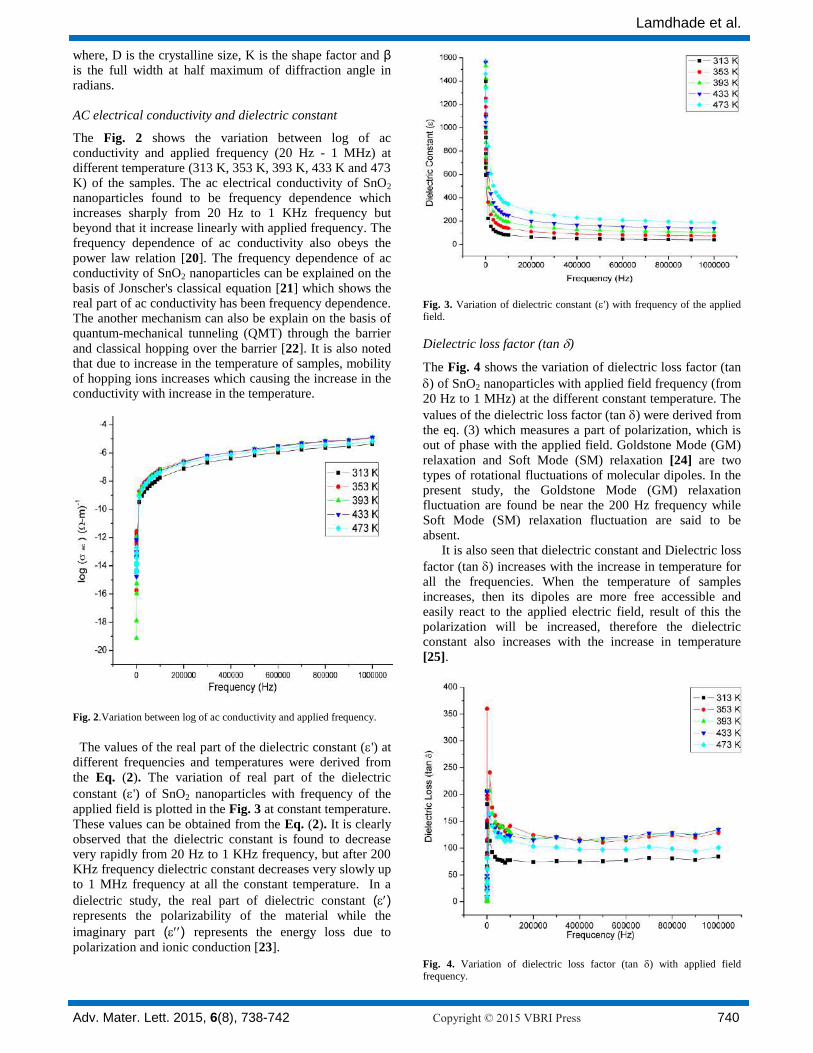
Lamdhade et al.
Adv. Mater. Lett. 2015, 6(8), 738-742 Copyright © 2015 VBRI Press 740
where, D is the crystalline size, K is the shape factor and β is the full width at half maximum of diffraction angle in radians.
AC electrical conductivity and dielectric constant
The Fig. 2 shows the variation between log of ac conductivity and applied frequency (20 Hz - 1 MHz) at different temperature (313 K, 353 K, 393 K, 433 K and 473 K) of the samples. The ac electrical conductivity of SnO2 nanoparticles found to be frequency dependence which increases sharply from 20 Hz to 1 KHz frequency but beyond that it increase linearly with applied frequency. The frequency dependence of ac conductivity also obeys the
power law relation [20]. The frequency dependence of ac conductivity of SnO2 nanoparticles can be explained on the
basis of Jonscher's classical equation [21] which shows the real part of ac conductivity has been frequency dependence. The another mechanism can also be explain on the basis of quantum-mechanical tunneling (QMT) through the barrier
and classical hopping over the barrier [22]. It is also noted that due to increase in the temperature of samples, mobility of hopping ions increases which causing the increase in the conductivity with increase in the temperature.
Fig. 2.Variation between log of ac conductivity and applied frequency.
The values of the real part of the dielectric constant (') at different frequencies and temperatures were derived from
the Eq. (2). The variation of real part of the dielectric
constant (') of SnO2 nanoparticles with frequency of the
applied field is plotted in the Fig. 3 at constant temperature.
These values can be obtained from the Eq. (2). It is clearly observed that the dielectric constant is found to decrease very rapidly from 20 Hz to 1 KHz frequency, but after 200 KHz frequency dielectric constant decreases very slowly up to 1 MHz frequency at all the constant temperature. In a
dielectric study, the real part of dielectric constant () represents the polarizability of the material while the
imaginary part () represents the energy loss due to
polarization and ionic conduction [23].
Fig. 3. Variation of dielectric constant (') with frequency of the applied field.
Dielectric loss factor (tan )
The Fig. 4 shows the variation of dielectric loss factor (tan
) of SnO2 nanoparticles with applied field frequency (from 20 Hz to 1 MHz) at the different constant temperature. The
values of the dielectric loss factor (tan ) were derived from the eq. (3) which measures a part of polarization, which is out of phase with the applied field. Goldstone Mode (GM)
relaxation and Soft Mode (SM) relaxation [24] are two types of rotational fluctuations of molecular dipoles. In the present study, the Goldstone Mode (GM) relaxation fluctuation are found be near the 200 Hz frequency while Soft Mode (SM) relaxation fluctuation are said to be absent.
It is also seen that dielectric constant and Dielectric loss
factor (tan ) increases with the increase in temperature for all the frequencies. When the temperature of samples increases, then its dipoles are more free accessible and easily react to the applied electric field, result of this the polarization will be increased, therefore the dielectric constant also increases with the increase in temperature
[25].
Fig. 4. Variation of dielectric loss factor (tan ) with applied field frequency.
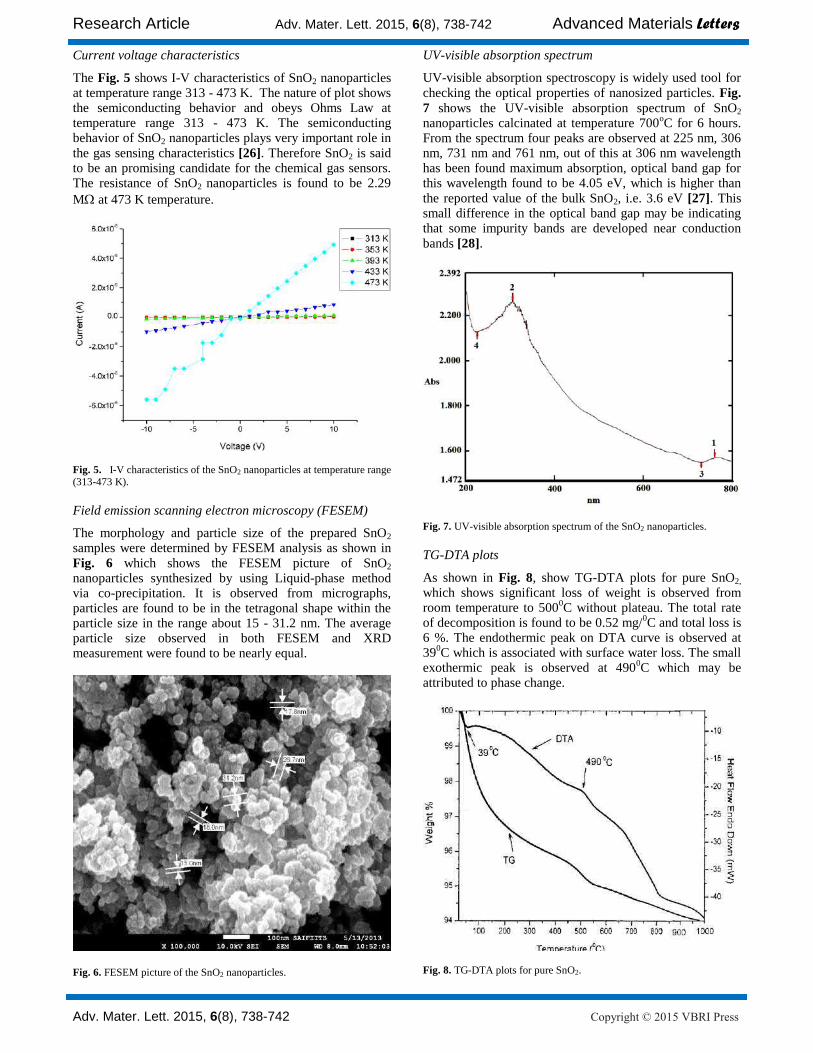
Research Article Adv. Mater. Lett. 2015, 6(8), 738-742 Advanced Materials Letters
Adv. Mater. Lett. 2015, 6(8), 738-742 Copyright © 2015 VBRI Press
Current voltage characteristics
The Fig. 5 shows I-V characteristics of SnO2 nanoparticles at temperature range 313 - 473 K. The nature of plot shows the semiconducting behavior and obeys Ohms Law at temperature range 313 - 473 K. The semiconducting behavior of SnO2 nanoparticles plays very important role in
the gas sensing characteristics [26]. Therefore SnO2 is said to be an promising candidate for the chemical gas sensors. The resistance of SnO2 nanoparticles is found to be 2.29
M at 473 K temperature.
Fig. 5. I-V characteristics of the SnO2 nanoparticles at temperature range (313-473 K). Field emission scanning electron microscopy (FESEM)
The morphology and particle size of the prepared SnO2 samples were determined by FESEM analysis as shown in
Fig. 6 which shows the FESEM picture of SnO2 nanoparticles synthesized by using Liquid-phase method via co-precipitation. It is observed from micrographs, particles are found to be in the tetragonal shape within the particle size in the range about 15 - 31.2 nm. The average particle size observed in both FESEM and XRD measurement were found to be nearly equal.
Fig. 6. FESEM picture of the SnO2 nanoparticles.
UV-visible absorption spectrum
UV-visible absorption spectroscopy is widely used tool for
checking the optical properties of nanosized particles. Fig.
7 shows the UV-visible absorption spectrum of SnO2 nanoparticles calcinated at temperature 700
oC for 6 hours.
From the spectrum four peaks are observed at 225 nm, 306 nm, 731 nm and 761 nm, out of this at 306 nm wavelength has been found maximum absorption, optical band gap for this wavelength found to be 4.05 eV, which is higher than
the reported value of the bulk SnO2, i.e. 3.6 eV [27]. This small difference in the optical band gap may be indicating that some impurity bands are developed near conduction
bands [28].
Fig. 7. UV-visible absorption spectrum of the SnO2 nanoparticles.
TG-DTA plots
As shown in Fig. 8, show TG-DTA plots for pure SnO2,
which shows significant loss of weight is observed from room temperature to 500
0C without plateau. The total rate
of decomposition is found to be 0.52 mg/0C and total loss is
6 %. The endothermic peak on DTA curve is observed at 39
0C which is associated with surface water loss. The small
exothermic peak is observed at 4900C which may be
attributed to phase change.
Fig. 8. TG-DTA plots for pure SnO2.
Lamdhade et al.
Adv. Mater. Lett. 2015, 6(8), 738-742 Copyright © 2015 VBRI Press 742
From TG-DTA curves, upto 1000C, loss of weight is
due to loss of water contents in the sample. Weight loss is
in the range 0.5 to 4%. Onwards 1000C upto 800
0C, the
weight loss observed upto 12 %. During this temperature range the samples are found to be stable. After 800
0C, a
sudden weight loss observed upto 6% which is due to transformation of
43OSnSnO during heating of the
powder sample [29].
Conclusion
Preparation of SnO2 nanostructures by using liquid-phase co-precipitation method is fast and easy. The ac electrical conductivity and dielectric constant has been frequency dependent. Tetragonal rutile crystalline phase, morphology of SnO2 has been identified by XRD and FESEM
respectively. The optical band gap is found to be 4.05eV.
The significant loss of weight is observed from room temperature to 500
0C without plateau.
Acknowledgements Authors are very much thankful to the Principal and Head Department of Physics both from Vidya Bharati Mahavidyalaya, Amravati for providing necessary laboratories facilities and also thankful to SAIF, Indian Institute of Technology, Bombay, Powai, Mumbai for providing the characterization of samples.
Reference
1. Rockenberger, J.; Felde, U.; M. Tischer, L.; Troger, M.; Haase, H.;
Weller; J. Chem. Phys., 2000, 112, 4296.
DOI: 10.1063/1.480975
2. Seiyama, T.; Kato A.; Fujiishi, K.; Nagatani, M.; Anal. Chem., 1962, 34, 1502.
DOI: 10.1021/ac60191a001 3. Shukla, S.K.; Mishra, A.K.; Arotiba, O.A.; Mamba, B.B.; Enzymes
Microb. Technol. 2014, 66, 48.
DOI: 10.1016/j.enzmictec.2014.08.003 4. Zhang, J.; Gao, L.J.; Solid State Chem. 2004, 177, 1425.
DOI: 10.1016/j.jssc.2003.11.024
5. Wang, Y.; Lee, J.Y.; J. Phys. Chem. B 2004, 108, 13589.
DOI: 10.1021/jp048454w
6. Bhagwat. M.; Shah, P.; Ramaswamy, V.; Mater. Lett. 2003, 57, 1604.
DOI: 10.1016/s0167-577x(02)01040-6
7. Johari A.; Bhatnagar, M.C.; Rana, V.; Adv. Mat. Lett. 2012, 3(6), 515.
DOI: 10.5185/amlett.2012.icnano.251 8. Sonker, R.K.; Sharma, A.; Shahabuddin, Md.; Tomar, M.; Gupta, V.;
Adv. Mat. Lett. 2013, 4(3), 196.
DOI: 10.5185/amlett.2012.7390
9. Garje, A.D.; Sadakale S.N.; Adv. Mat. Lett. 2013, 4(1), 58.
DOI: 10.5185/amlett.2013.icnano.228 10. Kumar, V.; Kumar, V.; Som, S.; Neethling, J.H.; Lee, M.;
Ntwaeaborwa, O.M.; Swart, H.C.; Nanotechnology. 2014, 25(13), 135701.
DOI: 10.1088/0957-4484/25/13/135701
11. Ristic, M.; Ivanda, M.; Popovic, S.; Music, S.; J. Non-Cryst. Solids,
2002, 303, 270.
DOI: 10.1016/s0022-3093(02)00944-4
12. Liu, Y.; Koep, E.; Liu, M.; Chem. Mater. 2005, 17, 3997.
DOI: 10.1021/cm050451o 13. Bueno, P. R .; Pianaro, S.A.; Pereira, E.C.; Bulhoes, L.O.S.; Longo,
E.; Varela, J.A.; J. Appl.Phys., 1998, 84, 3700.
DOI: 10.1063/1.368587 14. Sahay, P.P.; Mishra, R.K.; Pandey, S.N.; Jha, S.; Shamsuddin, M.;
Ceramics Int. 2012, 38(2) , 1281.
DOI: 10.1016/j.ceramint.2011.08.062 15. Sahay, P. P.; Mishra, R.K.; Pandey, S.N.; Jha, S.; Shamsuddin, M.;
Current Appl. Phys.2013, 13(3), 479.
DOI: 10.1016/j.cap.2012.09.010
16. Chizhov, A.; Rumyantseva, M.; Gaskov, A.; Inorg. Mat. 2013,
49(10), 1000.
DOI: 10.1134/s0020168513100014
17. Ni, J.; Zhao, X.; Zheng, X.; Zhao, J.; Liu, B. ; Acta Mater. 2009, 57, 278.
DOI: 10.1016/j.actamat.2008.09.013 18. Vijayalakshmi, R.; Ashokan, P.V.; Shridhar, M.H. ; Mat. Sci. Eng. A
2000, 281, 213.
DOI: 10.1016/s0921-5093(99)00723-6
19. Cullity, B.D.; Elements of X-ray diffraction (Addison-Wesley), 1970,
102.
DOI: 10.1119/1.1934486
20. Butcher, P.N.; Morys, P.L.; J. Phys. C, Solid State Phys., 1973, 6, 2147.
DOI: 10.1088/0022-3719/6/13/014 21. Ce-Wen, N.; Holten, S.; Birringer, R.; Haibin, G. ; Kliem, H.; Gleiter,
H.; Phys. stat. sol. 1997, (a) 164 No.1 , R1-R2.
DOI: 10.1002/1521-396x(199711)164:13.0.co;2-#
22. Elliot, S.R.; Adv. Phys. 1987, 36, 135. 23. Saltas, V.; Vallianatos, F.; Soupios, P.; Makris, J.P.; Triantis, D.; J.
Hazard. Mater. , 2007, 142, 520.
DOI: 10.1016/j.jhazmat.2006.08.051 24. Singh, D.P.; Gupta, S.K.; Pandey, A.C.; Manohar, R.; Adv. Mat. Lett.
, 2013, 4(7), 556.
DOI: 10.5185/amlett.2012.11463.
25. Frohlick, H.; Theory of Dielectrics; Oxford University press, 1956. 26. Johari A.; Rana V.; Bhatnagar M. C.; Nanomater; nanotechnol.,
2011, 1(2) ,49.
DOI: 10.1109/inec.2011.5991739 27. Fang, L.M.; Zu, X.T.; Li, Z.J.; Zhu, S.; Liu, C.M.; Wang, L.M.; Gao,
F.; J. Mater. Sci: Mater. Electron, 2008, 19 , 868.
DOI: 10.1007/s10854-007-9543-7
28. Terrier, C.; Chatelon, J.P.; Roger, J.A.; Thin Solid Films, 1997, 295, 95.
DOI: 10.1016/s0040-6090(96)09324-8 29. Madhusudhana Reddy, M.H.; Jawalekar, S.R; Chandorkar A.N.; Thin
solid films, 1989, 169, 117.
DOI: 10.1016/s0040-6090(89)80010-0
TIN OXIDE AND TITANIUM DIOXIDE BASED CO2 GAS SENSOR
Gajanan Trymbakappa Lamdhade
Department of Physics, Vidya Bharati Mahavidyalaya, CK Naidu Road, Camp, Amravati Maharashtra State 444 602, INDIA
[email protected], [email protected]
Received 19-02-2015, online 30-05-2015
ABSTRACT
The influence of CO2 gas concentration on the transport properties of SnO2-10Al2O3-10TiO2 oxide thick films has been
studied. From the X-RD spectra the average crystallite size of the samples is found to be of the order of 10.80 nm to 56.05 nm and
shows polycrystalline and granular nature. For a fixed concentration of gas the sensitivity decreases with increase in temperature,
but increases with increasing concentration of CO2 gas. Transient response of the samples was studied. The resistance of all the
samples increases by increasing the concentration of CO2 gas, due to oxidization process on the surface of the material.
Keywords: Metal oxide thin films, electrical conductivity, transient response, CO2 gas Sensor.
I. INTRODUCTION
The hetero-structure mechanism and the amorphous nature of the samples are important for the sensing devices. Ceramic
and amorphous materials may be the best sensors for sensing the present gases. Most of the research workers have studied the
electrical resistance of the material in presence of CO2 gas environment. Today multi–functioning sensors are available in the
market but now there is a need to develop the best sensor for sensing the single gas only. The semiconductor metal oxide materials
are generally used in the form of wafer (thin pellet) or film (thin or thick) deposited on a substrate (glass, silica, silicon, alumina,
steatite etc.). Gas sensors in the form of thin or thick films seems to be more promising detectors over the pellet form, because they
are potentially of low cost, rugged and have low consumption of electric power and more active surface area.
A sensor array comprising of three chemical gas sensors was evaluated to predict the concentrations of O2, CO and CO2 in a
gas stream at 600oC [1]. The sensors in the array included a resistance-based 2% CuO/10% La2O3/TiO2 material and yttrium
stabilized zirconium (YSZ) sensor with a metal/metal oxide internal reference electrode and a lithium phosphate-based sensor.
Electrochemical impedance spectroscopy (EIS) was used to study the electrical properties of heat treated electrochemical gas
sensors [2]. In the present paper solid solution of metal oxides SnO2-10TiO2-10Al2O3 in the form of thick films is selected. The pure
TiO2 and Al2O3 are mixed with SnO2 for the improvement of temperature characteristic and stability respectively.
II. EXPERIMENTAL DETAILS
The thick films of tin oxide (SnO2), titanium oxide (TiO2) and alumina (Al2O3) were prepared by screen-printing technique
on chemically clean optically plane glass substrate. The X-ray diffraction (XRD, Rigaku X-ray diffractometer, Japan) analyses of
thick films was conducted using Cu K radiation to determine the different phases and the grain size. The crystallite size was
calculated from the full width at half maximum of the first peak using the Scherrer’s formula [3].
The thickness of the sensor films was measured by Digimatic Outside Micrometer (Series-293, Japan) having a resolution
of ±0.001mm and found to be 7.45, 40.09 and 73.34 m for (SnO2-10TiO2-10Al2O3) solid solution, pure SnO2 and pure TiO2
sensors respectively. The resistance of the sensor was measured by voltage drop method adopted by Yawale et al [4, 5]. By knowing
sensor resistance the sensitivity was calculated.
III. RESULTS AND DISCUSSION:
Tin oxide (SnO2) is a wide energy gap n-type semiconductor. It is used as sensor because of its chemical and mechanical
stability. The fig.1 shows the XRD spectra of (SnO2-10TiO2-10Al2O3) solid solution and shows polycrystalline and granular nature
of the selected oxides. From fig. 1 it is observed that XRD spectra contains 10–15 peaks which are due to SnO2 and TiO2. The (h, k,
l) values are obtained by using 2 and d-values. Tin dioxide has one stable state called as rutile. Anatase phase of TiO2 changes to
rutile when heated above temperature 500 oC along with SnO2 and Al2O3 [6, 7]. So the structure of TiO2 and SnO2 is same. The
lattice parameter values obtained for SnO2 and TiO2 are a = b = 4.7382 oA and c = 3.1871 °A with c/a ratio of 0.6726 and a =
4.5933 °A and c = 2.9595 °A with c/a ratio of 0.6442, respectively. These values are in agreement with the values reported in
references [8, 9]. The rutile phase is stable and because of the same structure of SnO2 and TiO2, the space group and atom location
sites changes the Ti4+
by Sn4+
metallic cation. Similarly the Al2O3 which is added as stabilizer to SnO2–TiO2 material, forms
hexagonal phase with a = 4.758 °A and c = 12.925 A°. These phases are playing very important role for sensing the CO2 gas [10,
11].
Journal of Electron Devices, Vol. 21, 2015, pp. 1849-1853
© JED [ISSN: 1682 -3427 ]
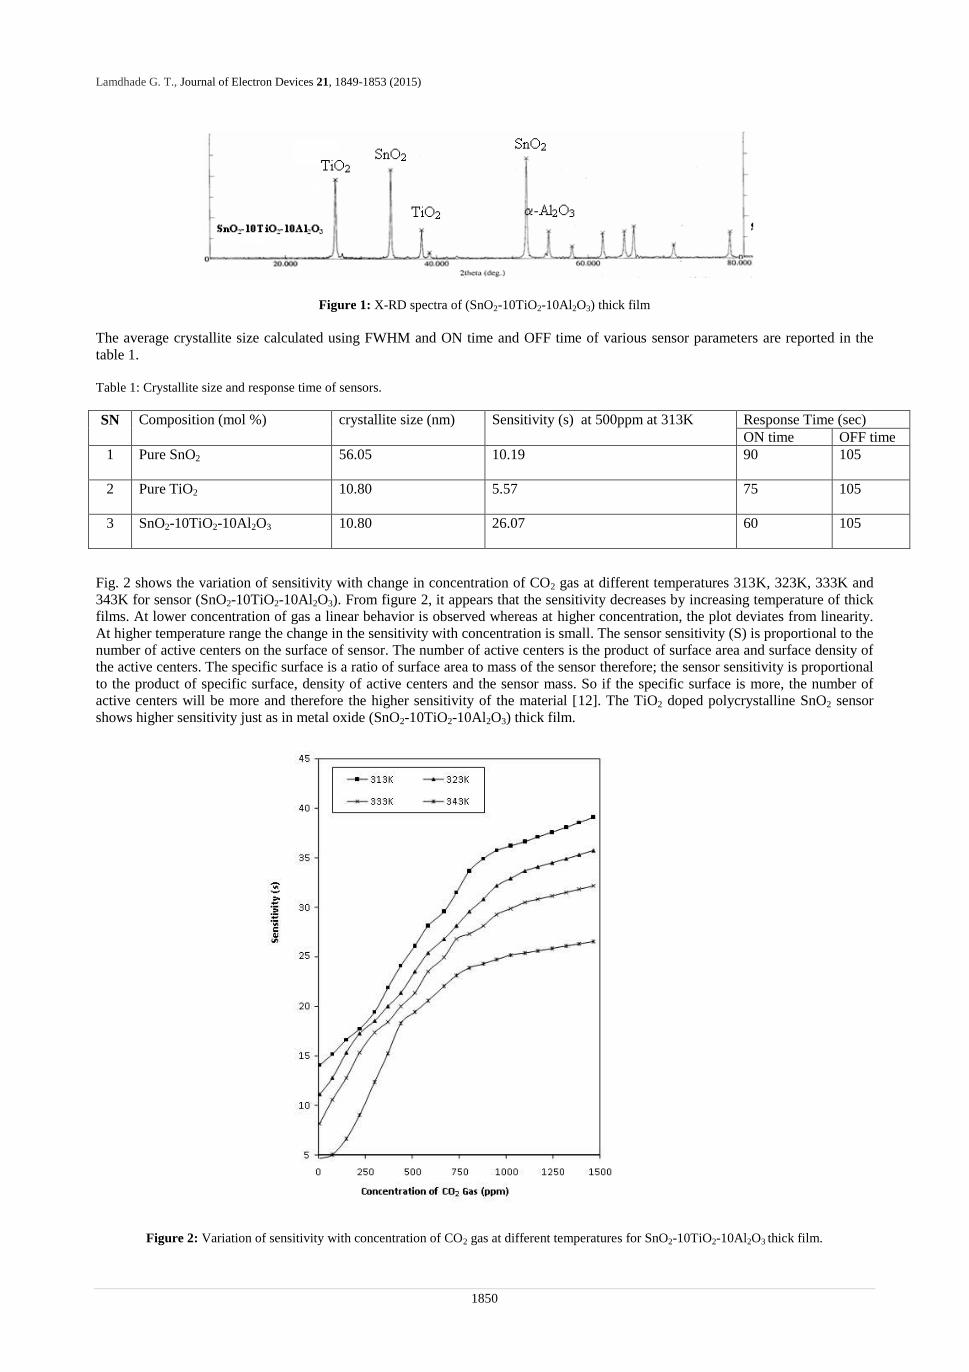
Lamdhade G. T., Journal of Electron Devices 21, 1849-1853 (2015)
1850
Figure 1: X-RD spectra of (SnO2-10TiO2-10Al2O3) thick film
The average crystallite size calculated using FWHM and ON time and OFF time of various sensor parameters are reported in the
table 1.
Table 1: Crystallite size and response time of sensors.
SN Composition (mol %) crystallite size (nm) Sensitivity (s) at 500ppm at 313K Response Time (sec)
ON time OFF time
1 Pure SnO2 56.05 10.19 90 105
2 Pure TiO2 10.80 5.57 75 105
3 SnO2-10TiO2-10Al2O3 10.80 26.07 60 105
Fig. 2 shows the variation of sensitivity with change in concentration of CO2 gas at different temperatures 313K, 323K, 333K and
343K for sensor (SnO2-10TiO2-10Al2O3). From figure 2, it appears that the sensitivity decreases by increasing temperature of thick
films. At lower concentration of gas a linear behavior is observed whereas at higher concentration, the plot deviates from linearity.
At higher temperature range the change in the sensitivity with concentration is small. The sensor sensitivity (S) is proportional to the
number of active centers on the surface of sensor. The number of active centers is the product of surface area and surface density of
the active centers. The specific surface is a ratio of surface area to mass of the sensor therefore; the sensor sensitivity is proportional
to the product of specific surface, density of active centers and the sensor mass. So if the specific surface is more, the number of
active centers will be more and therefore the higher sensitivity of the material [12]. The TiO2 doped polycrystalline SnO2 sensor
shows higher sensitivity just as in metal oxide (SnO2-10TiO2-10Al2O3) thick film.
Figure 2: Variation of sensitivity with concentration of CO2 gas at different temperatures for SnO2-10TiO2-10Al2O3 thick film.
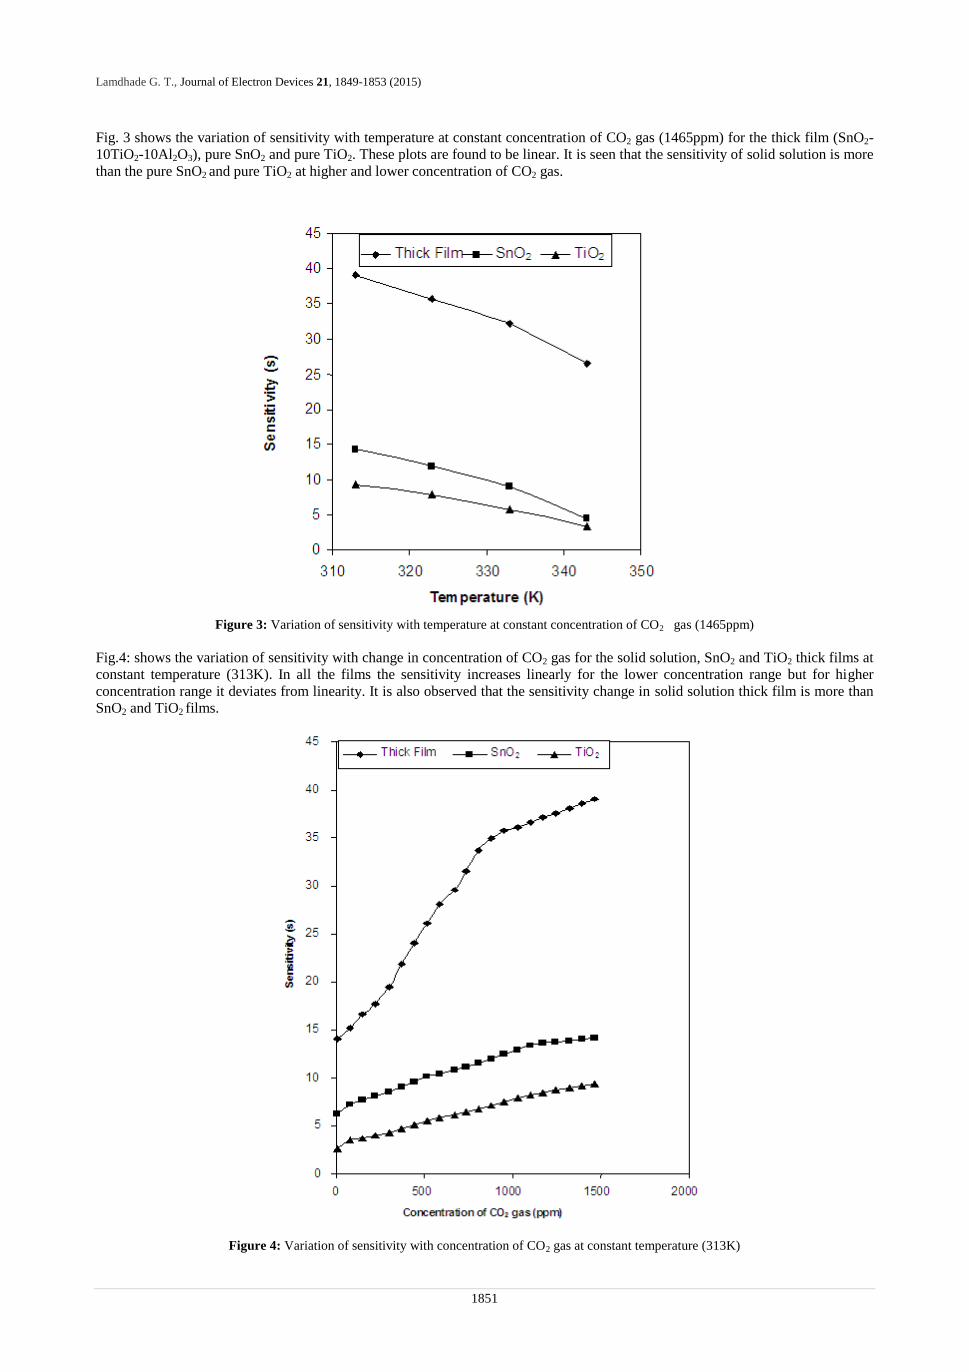
Lamdhade G. T., Journal of Electron Devices 21, 1849-1853 (2015)
1851
Fig. 3 shows the variation of sensitivity with temperature at constant concentration of CO2 gas (1465ppm) for the thick film (SnO2-
10TiO2-10Al2O3), pure SnO2 and pure TiO2. These plots are found to be linear. It is seen that the sensitivity of solid solution is more
than the pure SnO2 and pure TiO2 at higher and lower concentration of CO2 gas.
Figure 3: Variation of sensitivity with temperature at constant concentration of CO2 gas (1465ppm)
Fig.4: shows the variation of sensitivity with change in concentration of CO2 gas for the solid solution, SnO2 and TiO2 thick films at
constant temperature (313K). In all the films the sensitivity increases linearly for the lower concentration range but for higher
concentration range it deviates from linearity. It is also observed that the sensitivity change in solid solution thick film is more than
SnO2 and TiO2 films.
Figure 4: Variation of sensitivity with concentration of CO2 gas at constant temperature (313K)
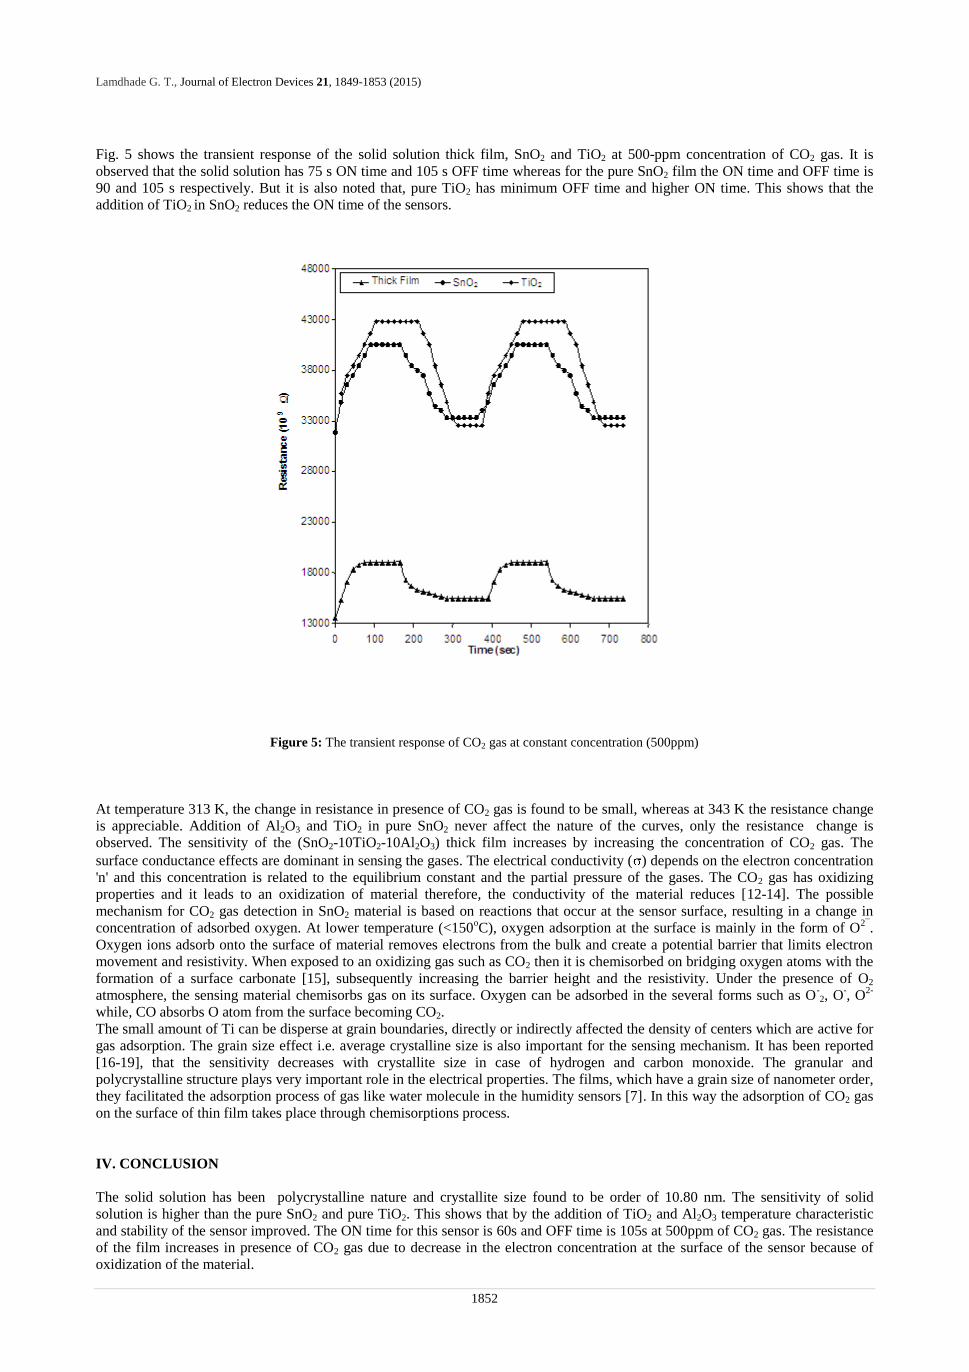
Lamdhade G. T., Journal of Electron Devices 21, 1849-1853 (2015)
1852
Fig. 5 shows the transient response of the solid solution thick film, SnO2 and TiO2 at 500-ppm concentration of CO2 gas. It is
observed that the solid solution has 75 s ON time and 105 s OFF time whereas for the pure SnO2 film the ON time and OFF time is
90 and 105 s respectively. But it is also noted that, pure TiO2 has minimum OFF time and higher ON time. This shows that the
addition of TiO2 in SnO2 reduces the ON time of the sensors.
Figure 5: The transient response of CO2 gas at constant concentration (500ppm)
At temperature 313 K, the change in resistance in presence of CO2 gas is found to be small, whereas at 343 K the resistance change
is appreciable. Addition of Al2O3 and TiO2 in pure SnO2 never affect the nature of the curves, only the resistance change is
observed. The sensitivity of the (SnO2-10TiO2-10Al2O3) thick film increases by increasing the concentration of CO2 gas. The
surface conductance effects are dominant in sensing the gases. The electrical conductivity ( ) depends on the electron concentration
'n' and this concentration is related to the equilibrium constant and the partial pressure of the gases. The CO2 gas has oxidizing
properties and it leads to an oxidization of material therefore, the conductivity of the material reduces [12-14].. The possible
mechanism for CO2 gas detection in SnO2 material is based on reactions that occur at the sensor surface, resulting in a change in
concentration of adsorbed oxygen. At lower temperature (<150oC), oxygen adsorption at the surface is mainly in the form of O
2¯.
Oxygen ions adsorb onto the surface of material removes electrons from the bulk and create a potential barrier that limits electron
movement and resistivity. When exposed to an oxidizing gas such as CO2 then it is chemisorbed on bridging oxygen atoms with the
formation of a surface carbonate [15], subsequently increasing the barrier height and the resistivity. Under the presence of O2
atmosphere, the sensing material chemisorbs gas on its surface. Oxygen can be adsorbed in the several forms such as O-2, O
-, O
2-
while, CO absorbs O atom from the surface becoming CO2.
The small amount of Ti can be disperse at grain boundaries, directly or indirectly affected the density of centers which are active for
gas adsorption. The grain size effect i.e. average crystalline size is also important for the sensing mechanism. It has been reported
[16-19], that the sensitivity decreases with crystallite size in case of hydrogen and carbon monoxide. The granular and
polycrystalline structure plays very important role in the electrical properties. The films, which have a grain size of nanometer order,
they facilitated the adsorption process of gas like water molecule in the humidity sensors [7]. In this way the adsorption of CO2 gas
on the surface of thin film takes place through chemisorptions process.
IV. CONCLUSION
The solid solution has been polycrystalline nature and crystallite size found to be order of 10.80 nm. The sensitivity of solid
solution is higher than the pure SnO2 and pure TiO2. This shows that by the addition of TiO2 and Al2O3 temperature characteristic
and stability of the sensor improved. The ON time for this sensor is 60s and OFF time is 105s at 500ppm of CO2 gas. The resistance
of the film increases in presence of CO2 gas due to decrease in the electron concentration at the surface of the sensor because of
oxidization of the material.
Lamdhade G. T., Journal of Electron Devices 21, 1849-1853 (2015)
1853
References
[1] Zhang B. Pengbei, Lee C.Chonghoon, Verweij C. Henk, A.Sheikh, C. Akbar, Hunter D. Gary, K. Prabir, A.Dutta, "High
temperature sensor array for simultaneous determination of O2, CO, and CO2 with kernel ridge regression data analysis",
Sensors and Actuators B, 123, 950-963 (2007).
[2] M. Wierzbicka, P. Pasierb, M. Rekas, "CO2 sensor studied by impedance spectroscopy", Physica B, 387, 302-312 (2007).
[3] B. D. Cullity, "Elements of X-Ray Diffraction", Addison-Wesley Publishing Company Inc., London (1978).
[4] G. T. Lamdhade, S. S. Yawale, S. P. Yawale, "Tin oxide and zinc oxide based doped humidity sensors", Sensors and Actuators
A, 135, 388-393 (2007).
[5] S. P. Yawale, S. V. Pakade, "D.C. conductivity and hopping mechanism in Bi2O3-B2O3 glasses", J. Mater. Sci. 28, 5451-5455
(1993).
[6] Seng-Lu ,Yang, Wu Jenn-Ming, "ZrO2–TiO2 ceramic humidity sensors", J. Mater. Sci., 26, 631-636 (1991).
[7] Radecka Marta, Zokrzewska Katavzyna, Rekas Mieczyslaw, "SnO2-TiO2 solid solutions for gas sensors", Sensors and
Actuators B, 47, 194-204 (1998).
[8] A. Dieguez, "Structural analysis for the improvement of SnO2 based gas sensor", Ph.D. Thesis, Universitat de Barcelona,
Barcelona, (1999).
[9] J. Robertson, "Defect levels of SnO2", Phys. Rev. B, 30 3520–3522 (1984).
[10] K. D. Schierbaum, S. Vaihinger, W. Gopel, H. H. Van Den, V. Lekkert, B. Kloeck, N.F. Rooij, "Prototype structure for
systematic investigations of thin-film gas sensors", Sensors and Actuators B, 1, 171-175 (1990).
[11] H. Nanto, T. Morita , H. Habara , K. Kondo, Y. Douguchi, T. Minami, "Properties and sensor performance of zinc oxide
thin films", Sensors and Actuators B, 35, 384-387 (1996).
[12] Marc J. Madou. and Roy S. Morrison, "Chemical Sensing with Solid State Devices", Academic Press Inc., London, (1989).
[13] Waghuley S.A., Yenorkar S.M., Yawale S.S., Yawale S.P., "Application of chemically synthesized conducting polymer-
polypyrrole as a carbon dioxide gas sensor", Sensors and Actuators B, 128 366-373 (2008).
[14] Waghuley S.A. , Yenorkar S.M., Yawale S.S., Yawale S.P., "SnO2/PPy Screen-Printed Multilayer CO2 Gas Sensor",
Sensors and Transducers, 79, 1180-1185 (2007).
[15] Matthias Batzill, U. Diebold, "The surface and materials science of tin oxide", Progress in Surface Science, 79, 47-154
(2005).
[16] Yamazoe Noboru, "New approaches for improving semiconductor gas sensors", Sensors and Actuators B, 5, 7-19 (1991).
[17] R.M. Agrawal, "H2S sensing properties of metal oxide (SnO2-CuO-TiO2) thin films at room temperature", Journal of
Electron Devices, 12, 730-733 (2012).
[18] AK Yewale, KB Raulkar, AS Wadatkar, GT Lamdhade, "Application of metal oxide thick film as a NH3 gas sensor",
Journal of Electron Devices, 11, 544-550 (2011).
[19] GT Lamdhade, KB Raulkar, SS Yawale, SP Yawale, "Fabrication of multilayer SnO2–ZnO–PPy sensor for ammonia gas
detection", Indian Journal of Physics, (2015) 1-6, (DOI 10.1007/s12648-015-0676-x).
1 23
Indian Journal of Physics ISSN 0973-1458 Indian J PhysDOI 10.1007/s12648-015-0676-x
Fabrication of multilayer SnO2–ZnO–PPysensor for ammonia gas detection
G. T. Lamdhade, K. B. Raulkar,S. S. Yawale & S. P. Yawale
1 23
Your article is protected by copyright and
all rights are held exclusively by Indian
Association for the Cultivation of Science.
This e-offprint is for personal use only
and shall not be self-archived in electronic
repositories. If you wish to self-archive your
article, please use the accepted manuscript
version for posting on your own website. You
may further deposit the accepted manuscript
version in any repository, provided it is only
made publicly available 12 months after
official publication or later and provided
acknowledgement is given to the original
source of publication and a link is inserted
to the published article on Springer's
website. The link must be accompanied by
the following text: "The final publication is
available at link.springer.com”.
ORIGINAL PAPER
Fabrication of multilayer SnO2–ZnO–PPy sensor for ammonia gasdetection
G T Lamdhade1*, K B Raulkar1, S S Yawale2 and S P Yawale2
1Department of Physics, Vidya Bharati Mahavidyalaya, Amravati 444 602, Maharashtra, India
2Department of Physics, Government Vidarbha Institute of Science and Humanities, Amravati 444 604, Maharashtra, India
Received: 07 November 2014 / Accepted: 18 February 2015
Abstract: The sensitivity of SnO2–ZnO composites in multilayer with PPy and Al2O3 has been studied. Composites of
SnO2–ZnO have been prepared and multilayer sensor has been fabricated using screen printing technique with Al2O3 as
substrate on glass plate and PPy in multilayer with SnO2–ZnO. The morphologies of composites of SnO2–ZnO and PPy
have been studied by scanning electron microscopy and crystallite size by X-ray diffraction. Sensitivity has been found to
be more for 70SnO2:30ZnO/PPy/Al2O3 multilayer sensor, which is supported by scanning electron microscopy and X-ray
diffraction studies. It has been found that with the increase in concentration of NH3 gas, the response of multilayer sensor
increases.
Keywords: Multilayer; SnO2–ZnO; Gas sensor
PACS No.: 07.07.Df
1. Introduction
Gas sensors based on semiconductor metal oxides are the
most investigated devices. They have attracted the attention
of many researchers due to their low cost, ease of fabrication,
simplicity of use and large number of detectable gases [1].
Most of the companies provide metal oxide-based gas sensors
due to their applications ranging from detection of com-
bustible or toxic gas to air intake control in automobile and
glucose biosensors [2]. Tin oxide (SnO2) is the most used
sensing material among commercially sensor devices for
toxic gas detection [3]. It is well known that the sensing
properties of SnO2-based materials depend on their chemical
and physical characteristics, which are strongly dependent on
the preparation conditions, dopant and grain size. This im-
plies that the synthesis of the sensing materials is a key step in
the preparation of high-performance metal oxide semicon-
ductor (MOS) gas sensors. SnO2 powders and films can be
prepared by a variety of methods [4–7]. DC-electrical resis-
tance of SnO2 doped with ZnO and TiO2 sensors is measured
in the presence of humidity. SnO2–5Al2O3 and ZnO–5Al2O3
sensors are found to be good sensing materials for humidity.
Due to various applications in organic light-emitting
diodes (OLEDs) [8], lithography [9], electrode material
[10], electromagnetic shielding [11] and sensing [12, 13],
conducting polymers have attracted considerable interest.
Sensors constructed from conducting polymers such as
polypyrrole, polyhexylthiophene, polymethylthiophene,
polyethylene and polyaniline have been investigated [14–
19] to study their potential applications in detecting gases,
like nitrogen dioxide, carbon monoxide, carbon dioxide,
ammonia and hydrogen besides moisture and a number of
organic volatile compounds [20].
The present paper mainly deals with the preparation of
NH3 gas sensor in multilayer pattern with SnO2 doped as
ZnO and polypyrrole layer. It is found that SnO2–ZnO
system in multilayer with polypyrrole shows sensitivity to
70 ppm of ammonia gas concentration even at room
temperature.
2. Experimental details
Powder polypyrrole was prepared from 4.290 (high) weight
ratio of pyrrole (Py) monomer and oxidant (FeCl3). During*Corresponding author, E-mail: [email protected];
Indian J Phys
DOI 10.1007/s12648-015-0676-x
� 2015 IACS
Author's personal copy
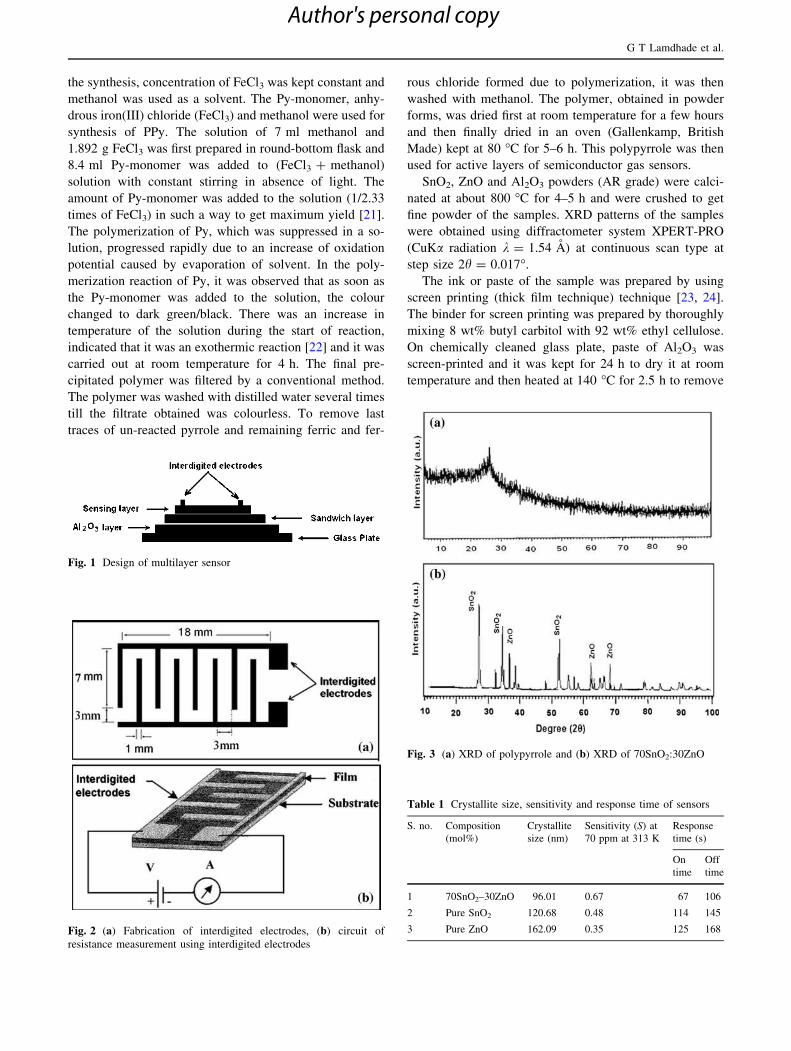
the synthesis, concentration of FeCl3 was kept constant and
methanol was used as a solvent. The Py-monomer, anhy-
drous iron(III) chloride (FeCl3) and methanol were used for
synthesis of PPy. The solution of 7 ml methanol and
1.892 g FeCl3 was first prepared in round-bottom flask and
8.4 ml Py-monomer was added to (FeCl3 ? methanol)
solution with constant stirring in absence of light. The
amount of Py-monomer was added to the solution (1/2.33
times of FeCl3) in such a way to get maximum yield [21].
The polymerization of Py, which was suppressed in a so-
lution, progressed rapidly due to an increase of oxidation
potential caused by evaporation of solvent. In the poly-
merization reaction of Py, it was observed that as soon as
the Py-monomer was added to the solution, the colour
changed to dark green/black. There was an increase in
temperature of the solution during the start of reaction,
indicated that it was an exothermic reaction [22] and it was
carried out at room temperature for 4 h. The final pre-
cipitated polymer was filtered by a conventional method.
The polymer was washed with distilled water several times
till the filtrate obtained was colourless. To remove last
traces of un-reacted pyrrole and remaining ferric and fer-
rous chloride formed due to polymerization, it was then
washed with methanol. The polymer, obtained in powder
forms, was dried first at room temperature for a few hours
and then finally dried in an oven (Gallenkamp, British
Made) kept at 80 �C for 5–6 h. This polypyrrole was then
used for active layers of semiconductor gas sensors.
SnO2, ZnO and Al2O3 powders (AR grade) were calci-
nated at about 800 �C for 4–5 h and were crushed to get
fine powder of the samples. XRD patterns of the samples
were obtained using diffractometer system XPERT-PRO
(CuKa radiation k = 1.54 A) at continuous scan type at
step size 2h = 0.017�.The ink or paste of the sample was prepared by using
screen printing (thick film technique) technique [23, 24].
The binder for screen printing was prepared by thoroughly
mixing 8 wt% butyl carbitol with 92 wt% ethyl cellulose.
On chemically cleaned glass plate, paste of Al2O3 was
screen-printed and it was kept for 24 h to dry it at room
temperature and then heated at 140 �C for 2.5 h to remove
Fig. 1 Design of multilayer sensor
Fig. 2 (a) Fabrication of interdigited electrodes, (b) circuit of
resistance measurement using interdigited electrodes
Fig. 3 (a) XRD of polypyrrole and (b) XRD of 70SnO2:30ZnO
Table 1 Crystallite size, sensitivity and response time of sensors
S. no. Composition
(mol%)
Crystallite
size (nm)
Sensitivity (S) at
70 ppm at 313 K
Response
time (s)
On
time
Off
time
1 70SnO2–30ZnO 96.01 0.67 67 106
2 Pure SnO2 120.68 0.48 114 145
3 Pure ZnO 162.09 0.35 125 168
G T Lamdhade et al.
Author's personal copy
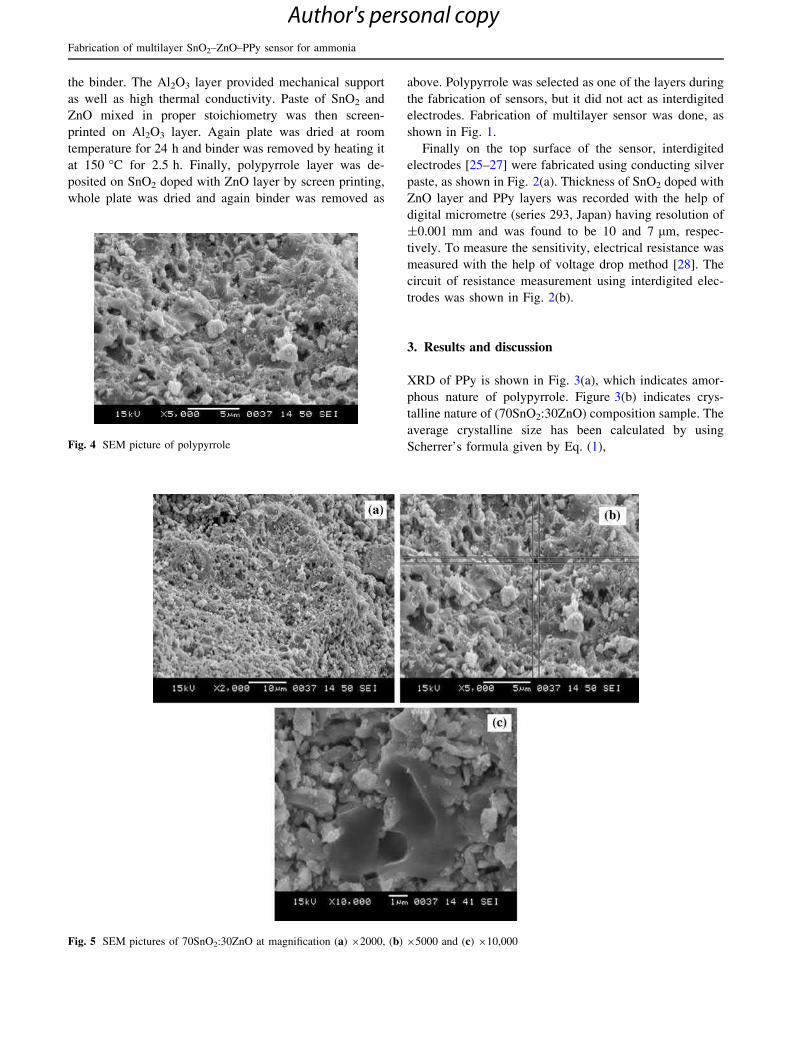
the binder. The Al2O3 layer provided mechanical support
as well as high thermal conductivity. Paste of SnO2 and
ZnO mixed in proper stoichiometry was then screen-
printed on Al2O3 layer. Again plate was dried at room
temperature for 24 h and binder was removed by heating it
at 150 �C for 2.5 h. Finally, polypyrrole layer was de-
posited on SnO2 doped with ZnO layer by screen printing,
whole plate was dried and again binder was removed as
above. Polypyrrole was selected as one of the layers during
the fabrication of sensors, but it did not act as interdigited
electrodes. Fabrication of multilayer sensor was done, as
shown in Fig. 1.
Finally on the top surface of the sensor, interdigited
electrodes [25–27] were fabricated using conducting silver
paste, as shown in Fig. 2(a). Thickness of SnO2 doped with
ZnO layer and PPy layers was recorded with the help of
digital micrometre (series 293, Japan) having resolution of
±0.001 mm and was found to be 10 and 7 lm, respec-
tively. To measure the sensitivity, electrical resistance was
measured with the help of voltage drop method [28]. The
circuit of resistance measurement using interdigited elec-
trodes was shown in Fig. 2(b).
3. Results and discussion
XRD of PPy is shown in Fig. 3(a), which indicates amor-
phous nature of polypyrrole. Figure 3(b) indicates crys-
talline nature of (70SnO2:30ZnO) composition sample. The
average crystalline size has been calculated by using
Scherrer’s formula given by Eq. (1),Fig. 4 SEM picture of polypyrrole
Fig. 5 SEM pictures of 70SnO2:30ZnO at magnification (a) 92000, (b) 95000 and (c) 910,000
Fabrication of multilayer SnO2–ZnO–PPy sensor for ammonia
Author's personal copy
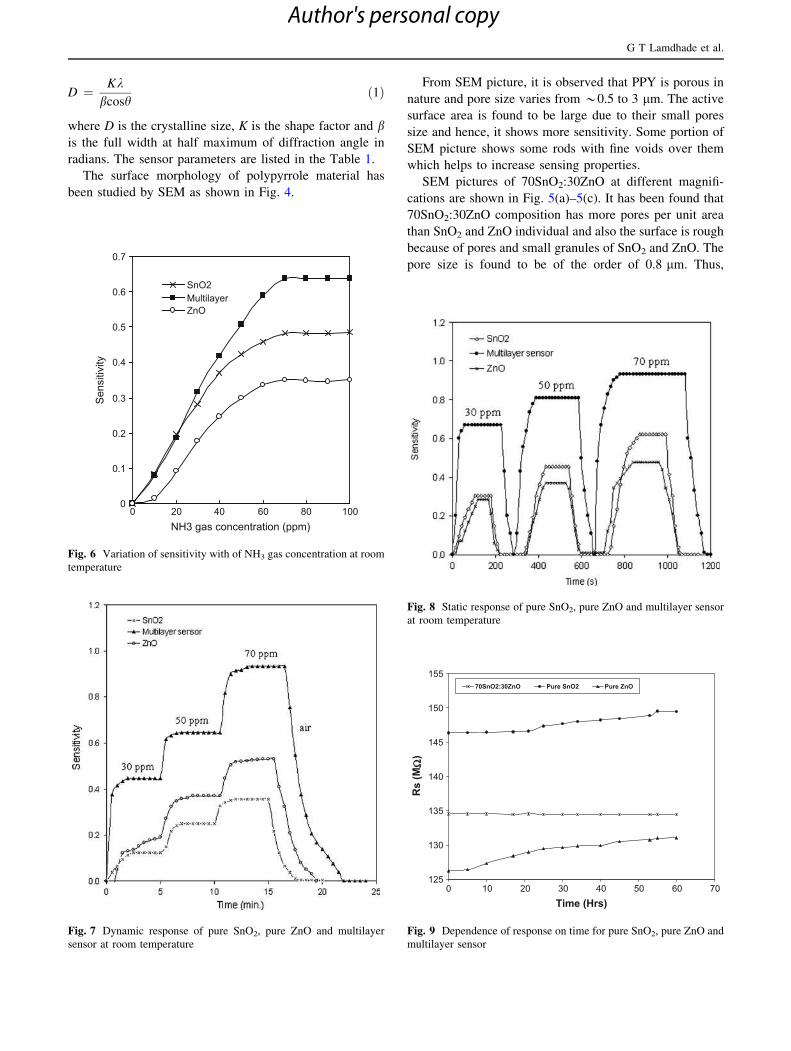
D ¼ Kkbcosh
ð1Þ
where D is the crystalline size, K is the shape factor and bis the full width at half maximum of diffraction angle in
radians. The sensor parameters are listed in the Table 1.
The surface morphology of polypyrrole material has
been studied by SEM as shown in Fig. 4.
From SEM picture, it is observed that PPY is porous in
nature and pore size varies from *0.5 to 3 lm. The active
surface area is found to be large due to their small pores
size and hence, it shows more sensitivity. Some portion of
SEM picture shows some rods with fine voids over them
which helps to increase sensing properties.
SEM pictures of 70SnO2:30ZnO at different magnifi-
cations are shown in Fig. 5(a)–5(c). It has been found that
70SnO2:30ZnO composition has more pores per unit area
than SnO2 and ZnO individual and also the surface is rough
because of pores and small granules of SnO2 and ZnO. The
pore size is found to be of the order of 0.8 lm. Thus,
0
0.1
0.2
0.3
0.4
0.5
0.6
0.7
0 20 40 60 80 100NH3 gas concentration (ppm)
Sen
sitiv
ity
SnO2MultilayerZnO
Fig. 6 Variation of sensitivity with of NH3 gas concentration at room
temperature
Fig. 7 Dynamic response of pure SnO2, pure ZnO and multilayer
sensor at room temperature
Fig. 8 Static response of pure SnO2, pure ZnO and multilayer sensor
at room temperature
125
130
135
140
145
150
155
0 10 20 30 40 50 60 70
Time (Hrs)
Rs
(MΩ
)
70SnO2:30ZnO Pure SnO2 Pure ZnO
Fig. 9 Dependence of response on time for pure SnO2, pure ZnO and
multilayer sensor
G T Lamdhade et al.
Author's personal copy
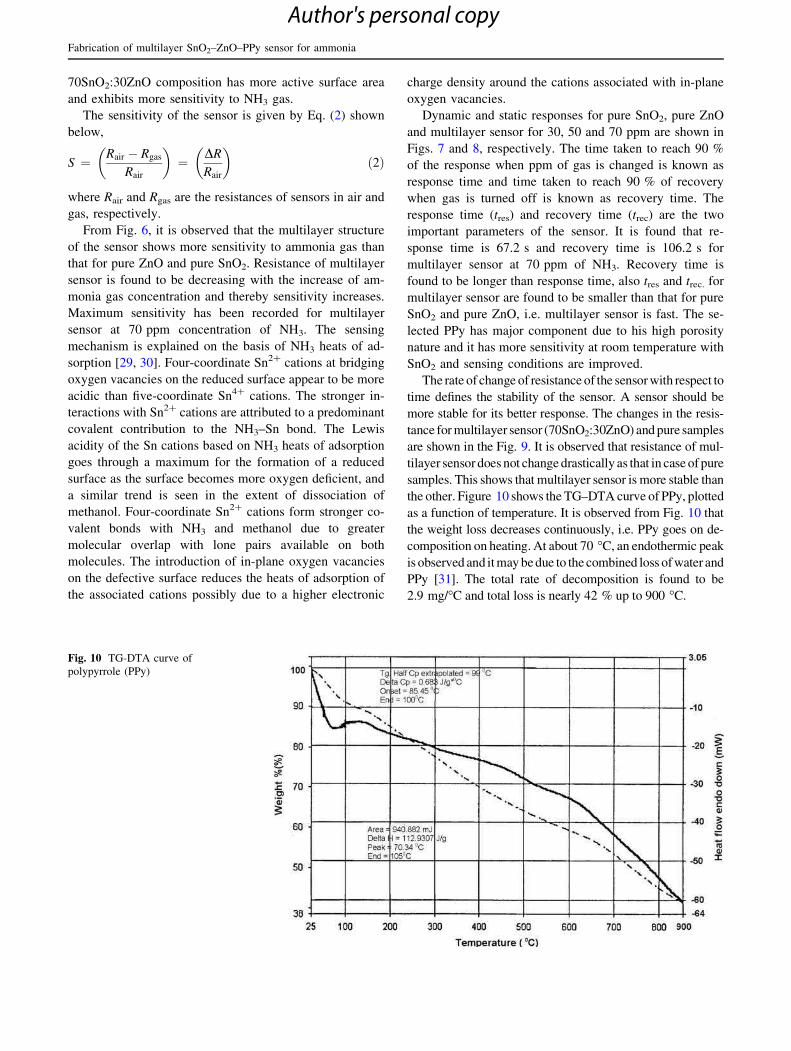
70SnO2:30ZnO composition has more active surface area
and exhibits more sensitivity to NH3 gas.
The sensitivity of the sensor is given by Eq. (2) shown
below,
S ¼ Rair � Rgas
Rair
� �¼ DR
Rair
� �ð2Þ
where Rair and Rgas are the resistances of sensors in air and
gas, respectively.
From Fig. 6, it is observed that the multilayer structure
of the sensor shows more sensitivity to ammonia gas than
that for pure ZnO and pure SnO2. Resistance of multilayer
sensor is found to be decreasing with the increase of am-
monia gas concentration and thereby sensitivity increases.
Maximum sensitivity has been recorded for multilayer
sensor at 70 ppm concentration of NH3. The sensing
mechanism is explained on the basis of NH3 heats of ad-
sorption [29, 30]. Four-coordinate Sn2? cations at bridging
oxygen vacancies on the reduced surface appear to be more
acidic than five-coordinate Sn4? cations. The stronger in-
teractions with Sn2? cations are attributed to a predominant
covalent contribution to the NH3–Sn bond. The Lewis
acidity of the Sn cations based on NH3 heats of adsorption
goes through a maximum for the formation of a reduced
surface as the surface becomes more oxygen deficient, and
a similar trend is seen in the extent of dissociation of
methanol. Four-coordinate Sn2? cations form stronger co-
valent bonds with NH3 and methanol due to greater
molecular overlap with lone pairs available on both
molecules. The introduction of in-plane oxygen vacancies
on the defective surface reduces the heats of adsorption of
the associated cations possibly due to a higher electronic
charge density around the cations associated with in-plane
oxygen vacancies.
Dynamic and static responses for pure SnO2, pure ZnO
and multilayer sensor for 30, 50 and 70 ppm are shown in
Figs. 7 and 8, respectively. The time taken to reach 90 %
of the response when ppm of gas is changed is known as
response time and time taken to reach 90 % of recovery
when gas is turned off is known as recovery time. The
response time (tres) and recovery time (trec) are the two
important parameters of the sensor. It is found that re-
sponse time is 67.2 s and recovery time is 106.2 s for
multilayer sensor at 70 ppm of NH3. Recovery time is
found to be longer than response time, also tres and trec. for
multilayer sensor are found to be smaller than that for pure
SnO2 and pure ZnO, i.e. multilayer sensor is fast. The se-
lected PPy has major component due to his high porosity
nature and it has more sensitivity at room temperature with
SnO2 and sensing conditions are improved.
The rate of change of resistance of the sensor with respect to
time defines the stability of the sensor. A sensor should be
more stable for its better response. The changes in the resis-
tance for multilayer sensor (70SnO2:30ZnO) and pure samples
are shown in the Fig. 9. It is observed that resistance of mul-
tilayer sensor does not change drastically as that in case of pure
samples. This shows that multilayer sensor is more stable than
the other. Figure 10 shows the TG–DTA curve of PPy, plotted
as a function of temperature. It is observed from Fig. 10 that
the weight loss decreases continuously, i.e. PPy goes on de-
composition on heating. At about 70 �C, an endothermic peak
is observed and it may be due to the combined loss of water and
PPy [31]. The total rate of decomposition is found to be
2.9 mg/�C and total loss is nearly 42 % up to 900 �C.
Fig. 10 TG-DTA curve of
polypyrrole (PPy)
Fabrication of multilayer SnO2–ZnO–PPy sensor for ammonia
Author's personal copy
4. Conclusions
From XRD and SEM analysis, it is concluded that the
crystallite size of 70SnO2:30ZnO multilayer is smaller and
it is more porus and hence has greater surface area and
therefore shows greater response to ammonia gas.
70SnO2:30ZnO multilayer sensor shows better stability
than pure samples and dynamic response is also fast.
Acknowledgments Financial support from the University Grants
Commission, New Delhi (File No. 42-823/2013 (SR) dated March 14,
2014), under Major Research Project (Physics) for this work is
gratefully acknowledged by S P Yawale. Authors are also very much
thankful to the Director and Head Department of Physics of
Government Vidarbha Institute of Science and Humanities, Amravati,
for providing necessary laboratories facilities.
References
[1] P T Moselicy Solid state gas sensor. Meas. Sci. Technol. 8 223
(1997)
[2] S P Yawale, S S Yawale and G T Lamdhade Sens. Actuators
A 135 388 (2007)
[3] Z Han, N Guo, F Li, W Zhang, H Zhao and Y Qian Mater. Lett.
48 99 (2001)
[4] K C Song and J H Kim Powder Technol. 107 268 (2000)
[5] C H Shek, JK L Lai and G M Lin Nanostruct. Mater. 11 887
(1999)
[6] D Briand, M Labeau, J F Currie and G Delabouglise Sens. Ac-
tuators B 48 395 (1998)
[7] N. Pinna and M Niederberger Angew. Chem. Int. Ed. 47 5292
(2008)
[8] J W Schultze and H Karabulut Electrochim. Acta 50 1739
(2005)
[9] T Asmus and G K Wolf Nucl. Instr. Meth. Phy. Res. B. 166 732
(2000)
[10] M Mastragostino, C Arbizzani and F Soavi Solid State Ionics
148 493 (2002)
[11] S K Dhawan, N Singh and D Rodrigues Sci. Technol. Adv.
Mater. 4 105 (2003)
[12] S Koul, R Chandra and S K Dhawan Sens. Actuators B 75, 151
(2001)
[13] S Jain, S Chakane, A B Samui, V N Krishnamurthy and S V
Bhoraskar Sens. Actuators B 96 124 (2003)
[14] Y Joon-Boo, B Hyung-Gi, S Myung-Suk and H Jeung-Soo Sens.
Actuators B 108 305 (2005)
[15] R Gangopadhay and A De Sens. Actuators B 77 326 (2001)
[16] M E H Amrani, R M Dowdeswell, P A Payne and K C Persaud
Sens. Actuators B 44 512 (1997)
[17] C Jouve, D Jullien and B Remaki Sens. Actuators B 28 75 (1995)
[18] S Dogan, U Akbulut, T Yalcin, S Suzer and L Toppare Synth.
Metal 60 27 (1993)
[19] M K Ram, O Yavuz and M Aldissi Synth. Metal 151 77 (2005)
[20] S A Waghuley, S M Yenorkar, S S Yawale and S P Yawale
Sens. Actuators B 128 366 (2008)
[21] S Machida, S Miyata and A Techagumpuch Synth. Metals 31311 (1989)
[22] S H Hahn PhD Thesis University of Tubingen (2002)
[23] T Ishihara, K Kometani, Y Mizuhara and Y Takita J. Am.
Ceram. Soc. 75 3 (1992)
[24] C A Harper Inorg. Chem. Acta 34 175 (1979)
[25] Y Shimizu and M Egashira MRS Bull. 24 18 (1999)
[26] V Jayaram New Materials (India: Narosa Publishing House)
(eds.) S K Joshi, T Tsurata, C N R Rao and S Nagakura (1992)
[27] A Salomonsson PhD Thesis University of Linkopings (2005)
[28] S P Yawale and S V Pakade J. Mater. Sci. 28 5451 (1993)
[29] J Y Ouyang and Y F Li Polymer 38 27 (1997)
[30] W M Abee and D F Cox Surf. Sci. 77 520 (2002)
[31] H P Wong, B C Dave, F Lenoux, J Harreld, B Dunn and L F
Nazar J. Mater. Chem. 8 1019 (1998)
G T Lamdhade et al.
Author's personal copy
IJCPS Vol. 4, No. 1, Jan-Feb 2015 ISSN:2319-6602 www.ijcps.org International Journal of Chemical and Physical Sciences
Preparation and Ethanol Sensing Behavior of Spinel-type Nanosized Mixed Ferrites Containing Zn
V. D. KAPSE, F.C. RAGHUWANSHI, V.S. SANGAWAR -121-
Preparation and Ethanol Sensing Behavior of Spinel-type Nanosized Mixed Ferrites Containing Zn
V. D. KAPSE 1, ∗, F.C. RAGHUWANSHI 2, V.S. SANGAWAR 3
1 Department of Physics, Arts, Science and Commerce College, Chikhaldara 444807, Maharashtra, India
2 Department of Physics, Vidyabharati Mahavidyalaya, Amravati 444602, Maharashtra, India 3 Department of Physics, Government Vidarbha Institute of Science & Humanities, Amravati
444604, Maharashtra, India, Corresponding author: [email protected]
Abstract
Nanocrystalline Ni1-xZnxFe2O4 (x = 0, 0.2, 0.3 and 0.4) mixed ferrite with cubic spinel structure was successfully prepared by the citrated sol-gel method followed by calcinations at 600 0C. Characterization of the materials was performed by XRD. Indirect-heating sensors using as-prepared powders of mixed ferrite as sensitive materials were fabricated on an alumina tube with Au electrodes and Platinum wires. The gas response of Ni1-xZnxFe2O4 based thick film sensor to C2H5OH, was measured. Ni0.6Zn0.4Fe2O4 based thick film sensor showed better response to ethanol gas at 300 0C as compared with other tested reducing gases. The observed gas sensing potential is explained by using the reducer nature of the gaseous species that react on the surface of the heated semi-conducting mixed oxide. The sensor exhibited a fast response and a good recovery.
Keywords: X-ray diffraction; Mixed ferrites; Gas sensor; Sensor response.
1. Introduction
Metal oxides based semiconductor gas sensors are commonly used in the monitoring of toxic
pollutants and can provide the necessary sensitivity, selectivity and stability required by such systems [1].
Gas-sensing properties of semiconducting materials based on SnO2, ZnO, WO3, TiO2, In2O3, Fe2O3,
mixed oxides, ferrites and complex metal oxides have been extensively studied to detect explosive,
inflammable, toxic and hazardous gases. In the last decade there is growing interest to investigate the gas
sensing properties of ferrites [2-4]. NiFe2O4 (AB2O4) is a well-known inverse spinel with all Ni2+ ions on
the B-sites and Fe3+ ions equally distributed between A and B-sites [5]. NiFe2O4 exhibit high sensitivity
for the reducing gases like chlorine and liquefied petroleum gas [6, 7]. However, to our knowledge the
ethanol gas-sensing properties of NiFe2O4 and Zn doped NiFe2O4 are still not so widely available.
The gas sensing mechanism involves surface reaction of the oxide surface with the test gas [8].
The ability to control the surface of the nanocrystals by adopting different synthesis routes has opened-up
a new dimension to modify material for specific property applications. Also, nano sized materials, which
have high surface activity due to their small particle size and enormous surface area, can increase the
IJCPS Vol. 4, No. 1, Jan-Feb 2015 ISSN:2319-6602 www.ijcps.org International Journal of Chemical and Physical Sciences
Preparation and Ethanol Sensing Behavior of Spinel-type Nanosized Mixed Ferrites Containing Zn
V. D. KAPSE, F.C. RAGHUWANSHI, V.S. SANGAWAR -122-
efficiency of the chemical sensor [9, 10]. There are several routes to obtain nanosized ferrites such as
hydrothermal synthesis, sol–gel, microemulsion techniques, etc.
The aim of the present investigation is to prepare nanocrystalline Zn modified Ni ferrite by
citrated sol-gel method with a low calcination temperature involving low cost metal nitrates as raw
materials and characterize them for ethanol gas sensing.
2. Experimental details
The stoichiometric molar amounts of Ferric nitrate [Fe(NO3)3.9H2O], Nickel nitrate
[Ni(NO3)2.6H2O], Zinc nitrate [Zn(NO3)2.6H2O] and citric acid monohydrate [C6H8O7.H2O] were
weighed and mixed with ethylene glycol. The prepared mixture was stirred magnetically at 80 0C for 2 h.
A transparent solution was obtained after 2 h. Then, this solution was consequently transferred to Teflon-
lined stainless steel autoclave. The temperature of the autoclave was raised slowly to 125 0C and
maintained for 10 h to get gel precursor. Afterward, the autoclave was allowed to cool naturally to room
temperature and the resulting product further heated for 3 h at 350 0C in muffle furnace and then milled to
a fine powder. The obtained powder was then calcined at 600 for 5 h 0C to improve the crystallinity of the
prepared materials. Fig. 1 shows the flowchart to prepare nanosized Ni1-xZnxFe2O4 powder samples.
Figure 1. Flow chart for synthesis of Ni1-xZnxFe2O4 powders
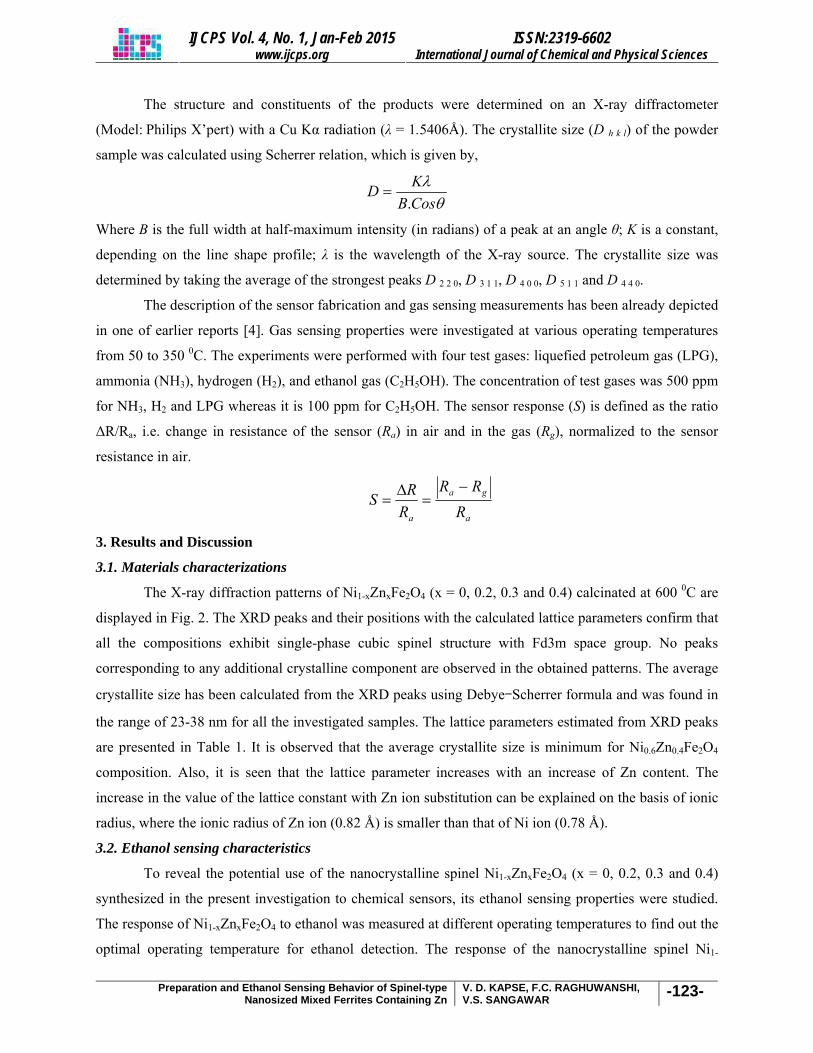
IJCPS Vol. 4, No. 1, Jan-Feb 2015 ISSN:2319-6602 www.ijcps.org International Journal of Chemical and Physical Sciences
Preparation and Ethanol Sensing Behavior of Spinel-type Nanosized Mixed Ferrites Containing Zn
V. D. KAPSE, F.C. RAGHUWANSHI, V.S. SANGAWAR -123-
The structure and constituents of the products were determined on an X-ray diffractometer
(Model: Philips X’pert) with a Cu Kα radiation (λ = 1.5406Å). The crystallite size (D h k l) of the powder
sample was calculated using Scherrer relation, which is given by,
θλ
CosBKD
.=
Where B is the full width at half-maximum intensity (in radians) of a peak at an angle θ; K is a constant,
depending on the line shape profile; λ is the wavelength of the X-ray source. The crystallite size was
determined by taking the average of the strongest peaks D 2 2 0, D 3 1 1, D 4 0 0, D 5 1 1 and D 4 4 0.
The description of the sensor fabrication and gas sensing measurements has been already depicted
in one of earlier reports [4]. Gas sensing properties were investigated at various operating temperatures
from 50 to 350 0C. The experiments were performed with four test gases: liquefied petroleum gas (LPG),
ammonia (NH3), hydrogen (H2), and ethanol gas (C2H5OH). The concentration of test gases was 500 ppm
for NH3, H2 and LPG whereas it is 100 ppm for C2H5OH. The sensor response (S) is defined as the ratio
ΔR/Ra, i.e. change in resistance of the sensor (Ra) in air and in the gas (Rg), normalized to the sensor
resistance in air.
a
ga
a RRR
RRS
−=
Δ=
3. Results and Discussion
3.1. Materials characterizations
The X-ray diffraction patterns of Ni1-xZnxFe2O4 (x = 0, 0.2, 0.3 and 0.4) calcinated at 600 0C are
displayed in Fig. 2. The XRD peaks and their positions with the calculated lattice parameters confirm that
all the compositions exhibit single-phase cubic spinel structure with Fd3m space group. No peaks
corresponding to any additional crystalline component are observed in the obtained patterns. The average
crystallite size has been calculated from the XRD peaks using Debye–Scherrer formula and was found in
the range of 23-38 nm for all the investigated samples. The lattice parameters estimated from XRD peaks
are presented in Table 1. It is observed that the average crystallite size is minimum for Ni0.6Zn0.4Fe2O4
composition. Also, it is seen that the lattice parameter increases with an increase of Zn content. The
increase in the value of the lattice constant with Zn ion substitution can be explained on the basis of ionic
radius, where the ionic radius of Zn ion (0.82 Å) is smaller than that of Ni ion (0.78 Å).
3.2. Ethanol sensing characteristics
To reveal the potential use of the nanocrystalline spinel Ni1-xZnxFe2O4 (x = 0, 0.2, 0.3 and 0.4)
synthesized in the present investigation to chemical sensors, its ethanol sensing properties were studied.
The response of Ni1-xZnxFe2O4 to ethanol was measured at different operating temperatures to find out the
optimal operating temperature for ethanol detection. The response of the nanocrystalline spinel Ni1-
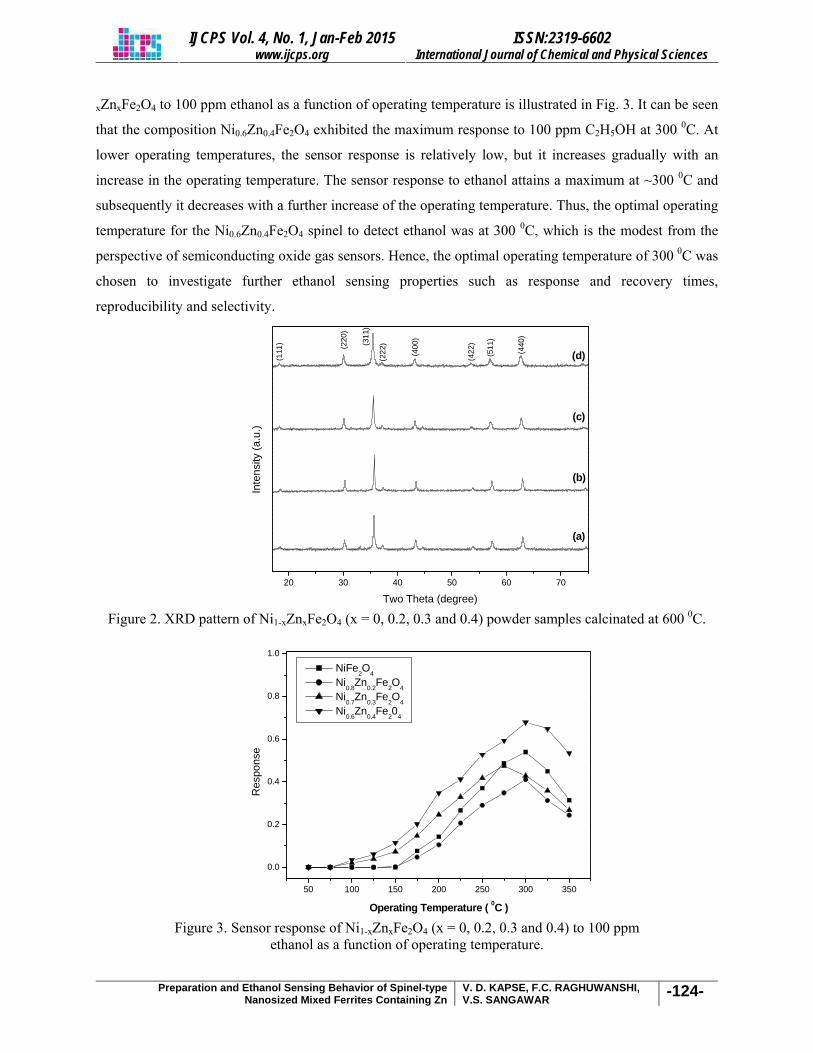
IJCPS Vol. 4, No. 1, Jan-Feb 2015 ISSN:2319-6602 www.ijcps.org International Journal of Chemical and Physical Sciences
Preparation and Ethanol Sensing Behavior of Spinel-type Nanosized Mixed Ferrites Containing Zn
V. D. KAPSE, F.C. RAGHUWANSHI, V.S. SANGAWAR -124-
xZnxFe2O4 to 100 ppm ethanol as a function of operating temperature is illustrated in Fig. 3. It can be seen
that the composition Ni0.6Zn0.4Fe2O4 exhibited the maximum response to 100 ppm C2H5OH at 300 0C. At
lower operating temperatures, the sensor response is relatively low, but it increases gradually with an
increase in the operating temperature. The sensor response to ethanol attains a maximum at ~300 0C and
subsequently it decreases with a further increase of the operating temperature. Thus, the optimal operating
temperature for the Ni0.6Zn0.4Fe2O4 spinel to detect ethanol was at 300 0C, which is the modest from the
perspective of semiconducting oxide gas sensors. Hence, the optimal operating temperature of 300 0C was
chosen to investigate further ethanol sensing properties such as response and recovery times,
reproducibility and selectivity.
20 30 40 50 60 70
(a)
Inte
nsity
(a.u
.)
Two Theta (degree)
(b)
(c)
(d)(440
)
(511
)
(422
)
(400
)
(222
)(311
)
(220
)
(111
)
Figure 2. XRD pattern of Ni1-xZnxFe2O4 (x = 0, 0.2, 0.3 and 0.4) powder samples calcinated at 600 0C.
50 100 150 200 250 300 350
0.0
0.2
0.4
0.6
0.8
1.0
Res
pons
e
Operating Temperature ( 0C )
NiFe2O4 Ni0.8Zn0.2Fe2O4 Ni0.7Zn0.3Fe2O4 Ni0.6Zn0.4Fe204
Figure 3. Sensor response of Ni1-xZnxFe2O4 (x = 0, 0.2, 0.3 and 0.4) to 100 ppm
ethanol as a function of operating temperature.
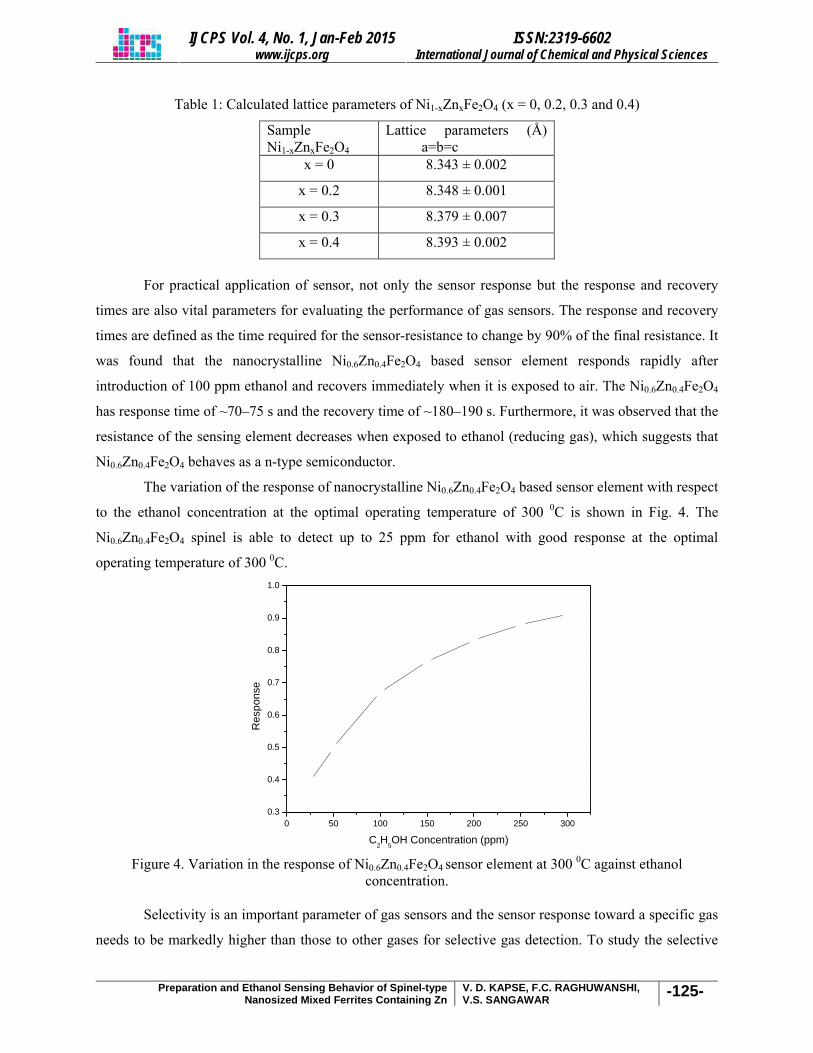
IJCPS Vol. 4, No. 1, Jan-Feb 2015 ISSN:2319-6602 www.ijcps.org International Journal of Chemical and Physical Sciences
Preparation and Ethanol Sensing Behavior of Spinel-type Nanosized Mixed Ferrites Containing Zn
V. D. KAPSE, F.C. RAGHUWANSHI, V.S. SANGAWAR -125-
Table 1: Calculated lattice parameters of Ni1-xZnxFe2O4 (x = 0, 0.2, 0.3 and 0.4)
Sample Ni1-xZnxFe2O4
Lattice parameters (Å) a=b=c
x = 0 8.343 ± 0.002
x = 0.2 8.348 ± 0.001
x = 0.3 8.379 ± 0.007
x = 0.4 8.393 ± 0.002
For practical application of sensor, not only the sensor response but the response and recovery
times are also vital parameters for evaluating the performance of gas sensors. The response and recovery
times are defined as the time required for the sensor-resistance to change by 90% of the final resistance. It
was found that the nanocrystalline Ni0.6Zn0.4Fe2O4 based sensor element responds rapidly after
introduction of 100 ppm ethanol and recovers immediately when it is exposed to air. The Ni0.6Zn0.4Fe2O4
has response time of ~70–75 s and the recovery time of ~180–190 s. Furthermore, it was observed that the
resistance of the sensing element decreases when exposed to ethanol (reducing gas), which suggests that
Ni0.6Zn0.4Fe2O4 behaves as a n-type semiconductor.
The variation of the response of nanocrystalline Ni0.6Zn0.4Fe2O4 based sensor element with respect
to the ethanol concentration at the optimal operating temperature of 300 0C is shown in Fig. 4. The
Ni0.6Zn0.4Fe2O4 spinel is able to detect up to 25 ppm for ethanol with good response at the optimal
operating temperature of 300 0C.
0 50 100 150 200 250 3000.3
0.4
0.5
0.6
0.7
0.8
0.9
1.0
Res
pons
e
C2H5OH Concentration (ppm)
Figure 4. Variation in the response of Ni0.6Zn0.4Fe2O4 sensor element at 300 0C against ethanol concentration.
Selectivity is an important parameter of gas sensors and the sensor response toward a specific gas
needs to be markedly higher than those to other gases for selective gas detection. To study the selective
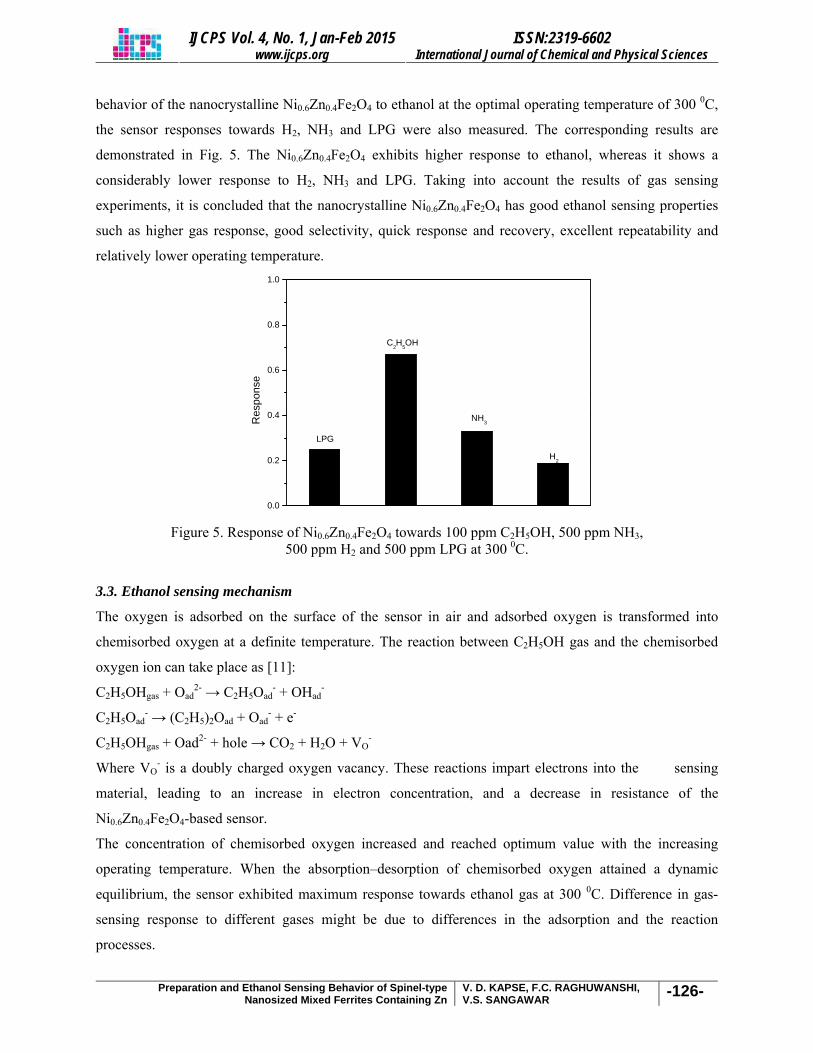
IJCPS Vol. 4, No. 1, Jan-Feb 2015 ISSN:2319-6602 www.ijcps.org International Journal of Chemical and Physical Sciences
Preparation and Ethanol Sensing Behavior of Spinel-type Nanosized Mixed Ferrites Containing Zn
V. D. KAPSE, F.C. RAGHUWANSHI, V.S. SANGAWAR -126-
behavior of the nanocrystalline Ni0.6Zn0.4Fe2O4 to ethanol at the optimal operating temperature of 300 0C,
the sensor responses towards H2, NH3 and LPG were also measured. The corresponding results are
demonstrated in Fig. 5. The Ni0.6Zn0.4Fe2O4 exhibits higher response to ethanol, whereas it shows a
considerably lower response to H2, NH3 and LPG. Taking into account the results of gas sensing
experiments, it is concluded that the nanocrystalline Ni0.6Zn0.4Fe2O4 has good ethanol sensing properties
such as higher gas response, good selectivity, quick response and recovery, excellent repeatability and
relatively lower operating temperature.
0.0
0.2
0.4
0.6
0.8
1.0
H2
NH3
C2H5OH
LPG
Res
pons
e
Figure 5. Response of Ni0.6Zn0.4Fe2O4 towards 100 ppm C2H5OH, 500 ppm NH3,
500 ppm H2 and 500 ppm LPG at 300 0C.
3.3. Ethanol sensing mechanism
The oxygen is adsorbed on the surface of the sensor in air and adsorbed oxygen is transformed into
chemisorbed oxygen at a definite temperature. The reaction between C2H5OH gas and the chemisorbed
oxygen ion can take place as [11]:
C2H5OHgas + Oad2- → C2H5Oad
- + OHad-
C2H5Oad- → (C2H5)2Oad + Oad
- + e-
C2H5OHgas + Oad2- + hole → CO2 + H2O + VO-
Where VO- is a doubly charged oxygen vacancy. These reactions impart electrons into the sensing
material, leading to an increase in electron concentration, and a decrease in resistance of the
Ni0.6Zn0.4Fe2O4-based sensor.
The concentration of chemisorbed oxygen increased and reached optimum value with the increasing
operating temperature. When the absorption–desorption of chemisorbed oxygen attained a dynamic
equilibrium, the sensor exhibited maximum response towards ethanol gas at 300 0C. Difference in gas-
sensing response to different gases might be due to differences in the adsorption and the reaction
processes.
IJCPS Vol. 4, No. 1, Jan-Feb 2015 ISSN:2319-6602 www.ijcps.org International Journal of Chemical and Physical Sciences
Preparation and Ethanol Sensing Behavior of Spinel-type Nanosized Mixed Ferrites Containing Zn
V. D. KAPSE, F.C. RAGHUWANSHI, V.S. SANGAWAR -127-
4. Conclusions
In conclusion, Ni1-xZnxFe2O4 (x = 0, 0.2, 0.3 and 0.4) mixed ferrite powder samples with cubic
spinel structure were successfully synthesized by citrate sol-gel route. The response of Ni0.6Zn0.4Fe2O4
based sensor element to 100 ppm ethanol was found maximum at an optimal operating temperature 300 0C. The response time was ~70–75 s and the recovery time was found to be ~180–190 s. Furthermore,
Ni0.6Zn0.4Fe2O4 sensor exhibited good selectivity to C2H5OH when operating at 300 0C. This means that
Ni0.6Zn0.4Fe2O4 sensor can be a good candidate for practical application in detecting C2H5OH because of
the good characteristics mentioned.
Acknowledgement
VDK gratefully acknowledges the financial assistance from the University Grants Commission
(U.G.C.), New Delhi, India through the Minor Research Project No. F. 47-762/13(WRO).
References [1] R.D. McMichael, R.D. Shull, L.J. Swartzendruber, L.H. Bennett, R.E.Watson, J. Magn. Magn. Mater.,
1992, 111, 29-33.
[2] C.V. Gopal Reddy, S.V. Manorama, V.J. Rao, J. Mater. Sci. Lett., 2000, 9, 775-778.
[3] Y.-L. Liu, Z.-M. Liu, Y.Yang, H.F.Yang, G.-L. Shen, R.-Q.Yu, Sens. Actuators B, 2005, 107, 600-604.
[4] V. D. Kapse, S. A. Ghosh, F. C. Raghuwanshi and S. D. Kapse, Mater. Chem. Phys., 2009, 113, 638–
644.
[5] C.N. Chinnasamy, A. Narayanasamy, N. Ponpandian, K. Chattopadhyay, K. Shinoda, B. Jeyadevan,
Phys. Rev. B, 2001, 63, 184108–184116.
[6] R.C.V. Gopal, S.V. Manorama, V.J. Rao, Sensor. Actuat. B 1999, 55, 90–95.
[7] L. Satyanarayana, R.K. Madhusudan, S.V. Manorama. Mater. Chem. Phys., 2003, 82, 21–26.
[8] M.J. Madou, S.R. Morrison, Chemical Sensing in Solid State Devices, Academic Press, San Diago, 1989.
[9] K.N.P. Kumar, K. Keizer, A.J. Burggraaf, T. Okubo, H. Nagamoto, S. Morooka, Nature, 1992, 358, 48-
51.
[10] G. Sberveglieri, L.E. Depero, M. Ferroni, V. Guidi, G. Martinelli, P. Nelli, C. Perego, L. Sangletti, Adv.
Mater., 1996, 8, 334-337.
[11] Z.P. Sun, L. Liu, D.Z. Jia, W.Y. Pan, Sens. Actuators B, 2007, 125, 144-148.
International Journal of Chemical and Physical Sciences, ISSN:2319-6602 IJCPS Vol. 4 Special Issue – NCSC Jan-2015
www.ijcps.org
Synthesis, Charecterisation and Antibacterial Activities of Some New Bromo/Nitro 1,3-Thiazenes
TEJASWINI S.BANTE, V. V. PARHATE AND P.R.RAJPUT
-218 -
Synthesis, Charecterisation and Antibacterial Activities of Some New Bromo/Nitro 1,3-Thiazenes
TEJASWINI S.BANTE, V. V. PARHATE AND P.R.RAJPUT
Department of Chemistry, VidyabhartiMahavidyalaya, Amravati. (MS) 444602.India
Corresponding author: [email protected]
Abstract
1,3-thiazines were prepared by refluxing the mixture of 2-hydroxy-3-bromo/nitro -5-chlorochalcone and diphenylthiourea in alcohol and aq.KOH medium. The newly synthesized 1,3-thiazenes were characterized on the basis of elemental analysis and spectroscopic data of IR,NMR. The melting points were taken in an open capillary tube. All compounds have been evaluated for their in vitro growth of inhibitory activity against Escherichia coli, Staphylococcus aureaus, Bacillus subtilis and Phaseolusargenosa. Keywords: 1, 3-Thiazines, Antibacterial Activity, pathogenic bacteria.
Introduction
Thiazine is a six membered heterocyclic compound which contains two hetero atoms (N and S) placed at
1,3 positions. 1,3-thiazines have a very broad spectrum of fungicides, insecticides, growth promoting
hormonal effect etc. Thiazines are very useful units in the fields of medicinal and pharmaceutical
chemistry and have been reported to exhibit a variety of biological activities1-2.The reaction of thiourea
with α,β-unsaturated ketones results in 1, 3 thiazines3-4 .Some chloro-substituted-1, 3-thiazines have been
reported for antimicrobial activity5
Thiazine reported to exhibit antitubercular, antibacterial used as cannabinoid receptor against6 1,3-thiazine
derivatives and their evaluation as potential antimycobacterial agents7.The synthesis of 2,4-dihydro-1H-
benzo[d] [1,3] thiazines via silver catalyzed addition-cyclization reactions are reported8. Synthesize of
new chromene base heterocyclic like thiazine from 2-Amino-5-hydroxy-4-phenyl-7-methyl-4H[1-
chromeno-3-carbonitrile which may show a good biological activity9.Some 1,3-thiazines are reported for
its antimicrobial activity.10
Experimental
The synthesis of 1,3-thiazines from 3-bromo-5-chlorochalcone and 3-nitro-5-chlorochalcone on treatment
with diphenylthiourea in presence of alcoholic KOH. The melting points of these compounds were
recorded on ‘Tempo’ melting point apparatus and are uncorrected. The carbon, nitrogen, sulphur and
hydrogen analysis was carried out on ‘Carlo Ebra 1106’ analyzer. The IR spectra were recorded on
‘Perkin-Elmer Infra Red spectrophotometer. The PMR spectra were recorded on DRX 300 spectrometer
in CDCl3. Purity of the compound was tested by TLC. The study were treated for their antibacterial
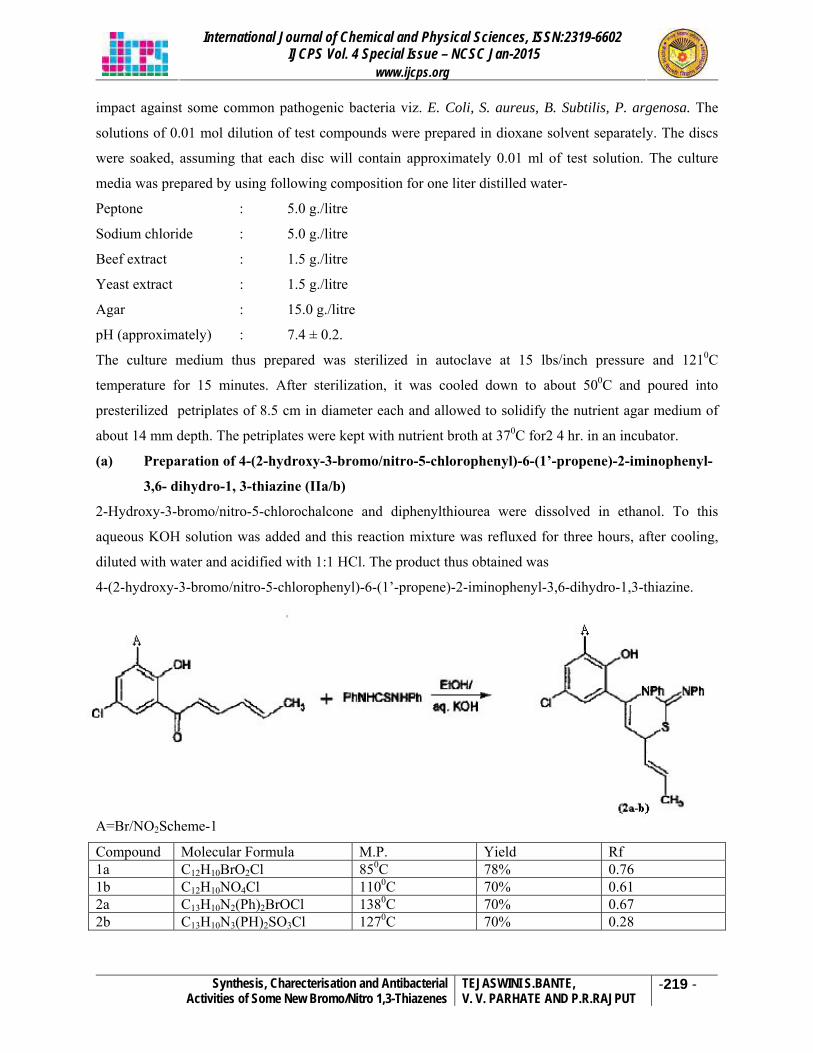
International Journal of Chemical and Physical Sciences, ISSN:2319-6602 IJCPS Vol. 4 Special Issue – NCSC Jan-2015
www.ijcps.org
Synthesis, Charecterisation and Antibacterial Activities of Some New Bromo/Nitro 1,3-Thiazenes
TEJASWINI S.BANTE, V. V. PARHATE AND P.R.RAJPUT
-219 -
impact against some common pathogenic bacteria viz. E. Coli, S. aureus, B. Subtilis, P. argenosa. The
solutions of 0.01 mol dilution of test compounds were prepared in dioxane solvent separately. The discs
were soaked, assuming that each disc will contain approximately 0.01 ml of test solution. The culture
media was prepared by using following composition for one liter distilled water-
Peptone : 5.0 g./litre
Sodium chloride : 5.0 g./litre
Beef extract : 1.5 g./litre
Yeast extract : 1.5 g./litre
Agar : 15.0 g./litre
pH (approximately) : 7.4 ± 0.2.
The culture medium thus prepared was sterilized in autoclave at 15 lbs/inch pressure and 1210C
temperature for 15 minutes. After sterilization, it was cooled down to about 500C and poured into
presterilized petriplates of 8.5 cm in diameter each and allowed to solidify the nutrient agar medium of
about 14 mm depth. The petriplates were kept with nutrient broth at 370C for2 4 hr. in an incubator.
(a) Preparation of 4-(2-hydroxy-3-bromo/nitro-5-chlorophenyl)-6-(1’-propene)-2-iminophenyl-
3,6- dihydro-1, 3-thiazine (IIa/b)
2-Hydroxy-3-bromo/nitro-5-chlorochalcone and diphenylthiourea were dissolved in ethanol. To this
aqueous KOH solution was added and this reaction mixture was refluxed for three hours, after cooling,
diluted with water and acidified with 1:1 HCl. The product thus obtained was
4-(2-hydroxy-3-bromo/nitro-5-chlorophenyl)-6-(1’-propene)-2-iminophenyl-3,6-dihydro-1,3-thiazine.
A=Br/NO2Scheme-1
Compound Molecular Formula M.P. Yield Rf 1a C12H10BrO2Cl 850C 78% 0.76 1b C12H10NO4Cl 1100C 70% 0.61 2a C13H10N2(Ph)2BrOCl 1380C 70% 0.67 2b C13H10N3(PH)2SO3Cl 1270C 70% 0.28
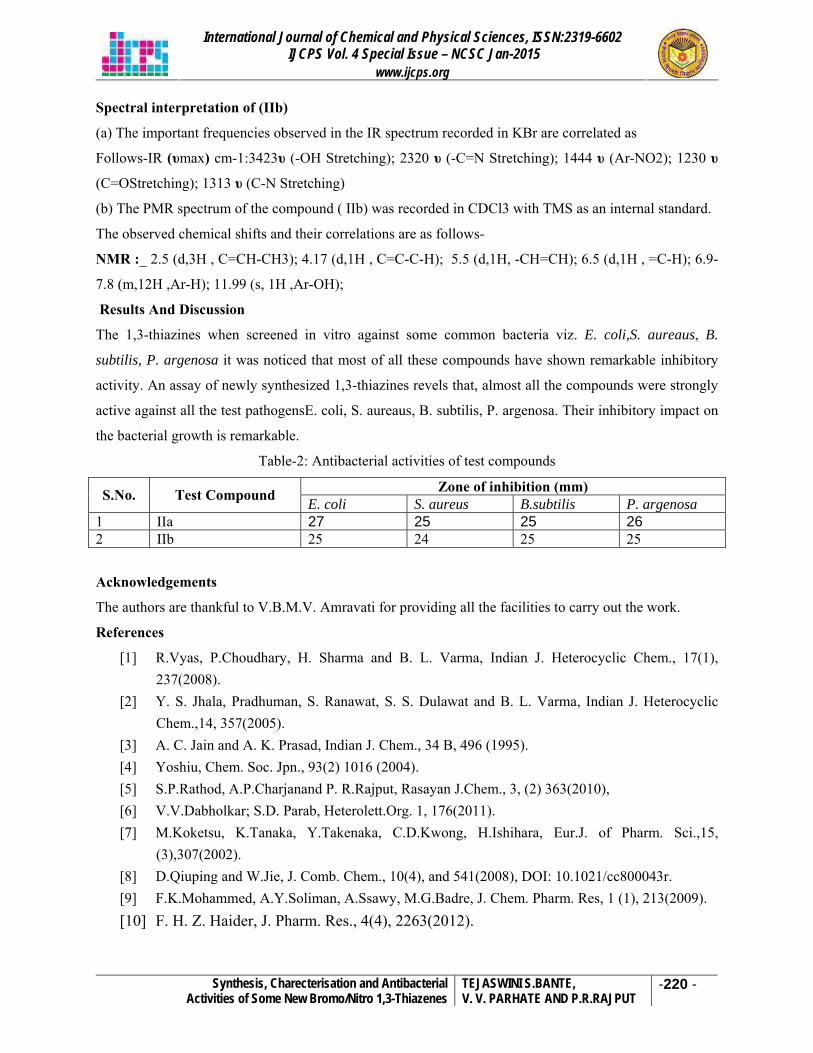
International Journal of Chemical and Physical Sciences, ISSN:2319-6602 IJCPS Vol. 4 Special Issue – NCSC Jan-2015
www.ijcps.org
Synthesis, Charecterisation and Antibacterial Activities of Some New Bromo/Nitro 1,3-Thiazenes
TEJASWINI S.BANTE, V. V. PARHATE AND P.R.RAJPUT
-220 -
Spectral interpretation of (IIb)
(a) The important frequencies observed in the IR spectrum recorded in KBr are correlated as
Follows-IR (υmax) cm-1:3423υ (-OH Stretching); 2320 υ (-C=N Stretching); 1444 υ (Ar-NO2); 1230 υ
(C=OStretching); 1313 υ (C-N Stretching)
(b) The PMR spectrum of the compound ( IIb) was recorded in CDCl3 with TMS as an internal standard.
The observed chemical shifts and their correlations are as follows-
NMR :_ 2.5 (d,3H , C=CH-CH3); 4.17 (d,1H , C=C-C-H); 5.5 (d,1H, -CH=CH); 6.5 (d,1H , =C-H); 6.9-
7.8 (m,12H ,Ar-H); 11.99 (s, 1H ,Ar-OH);
Results And Discussion
The 1,3-thiazines when screened in vitro against some common bacteria viz. E. coli,S. aureaus, B.
subtilis, P. argenosa it was noticed that most of all these compounds have shown remarkable inhibitory
activity. An assay of newly synthesized 1,3-thiazines revels that, almost all the compounds were strongly
active against all the test pathogensE. coli, S. aureaus, B. subtilis, P. argenosa. Their inhibitory impact on
the bacterial growth is remarkable.
Table-2: Antibacterial activities of test compounds
Zone of inhibition (mm) S.No. Test Compound E. coli S. aureus B.subtilis P. argenosa 1 IIa 27 25 25 26 2 IIb 25 24 25 25
Acknowledgements
The authors are thankful to V.B.M.V. Amravati for providing all the facilities to carry out the work.
References
[1] R.Vyas, P.Choudhary, H. Sharma and B. L. Varma, Indian J. Heterocyclic Chem., 17(1), 237(2008).
[2] Y. S. Jhala, Pradhuman, S. Ranawat, S. S. Dulawat and B. L. Varma, Indian J. Heterocyclic Chem.,14, 357(2005).
[3] A. C. Jain and A. K. Prasad, Indian J. Chem., 34 B, 496 (1995). [4] Yoshiu, Chem. Soc. Jpn., 93(2) 1016 (2004). [5] S.P.Rathod, A.P.Charjanand P. R.Rajput, Rasayan J.Chem., 3, (2) 363(2010), [6] V.V.Dabholkar; S.D. Parab, Heterolett.Org. 1, 176(2011). [7] M.Koketsu, K.Tanaka, Y.Takenaka, C.D.Kwong, H.Ishihara, Eur.J. of Pharm. Sci.,15,
(3),307(2002). [8] D.Qiuping and W.Jie, J. Comb. Chem., 10(4), and 541(2008), DOI: 10.1021/cc800043r. [9] F.K.Mohammed, A.Y.Soliman, A.Ssawy, M.G.Badre, J. Chem. Pharm. Res, 1 (1), 213(2009). [10] F. H. Z. Haider, J. Pharm. Res., 4(4), 2263(2012).
International Journal of Chemical and Physical Sciences, ISSN:2319-6602 IJCPS Vol. 4 Special Issue – NCSC Jan-2015
www.ijcps.org
Synthesis and Characterization of Some New Chlorosubstituted Thiazoles and Thiazolo-Imidazoles and their Impact on Pathogens
Damaging Oyster Mushroom Cultivation
N. G. GHODILE AND P. R. RAJPUT
-296 -
Synthesis and Characterization of Some New Chlorosubstituted Thiazoles and Thiazolo-Imidazoles and their Impact on Pathogens
Damaging Oyster Mushroom Cultivation
N. G. GHODILE AND P. R. RAJPUT
Department of Chemistry, S.S.S.K.R. Innani Mahavidyalaya, Karanja (Lad), Washim. Department of Chemistry, Vidya Bharati Mahavidyalaya, Amravati, India. 444 602
Corresponding author: [email protected]
Abstract
The mushroom growers in and around Vidarbha region of Central India have been engaged in the cultivation of one of the edible and highly profiTable varieties of mushroom crop ie. Oyster mushroom spp. But now a days farmers of this region facing the most alarming problem related to the susceptibility of this variety that easily falls prey to the pathogenic attack. As a result of this the efforts and investment that farmers put in the cultivation of this crop would not commensurate with the yield. Literature survey reveals that the paucity of data in the field of protection of mushroom cultivation from the attack of causative organism, creates a considerable amount of scope to undertake a systematic research of synthesis of some eco-friendly heterocycles and study of their curative impact on edible mushroom varieties with special reference to Oyster mushroom spp. In this context, in the present study, we have synthesized some new chlorosubstituted thiazoles and thiazolo-imidazole from chlorosubstituted diketones, chromones and chromanones in benign solvents. The newly synthesized titled compounds were screened for their antipathogenic activities against the causative organisms responsible for the damage of mushroom cultivation in the tropical belt of Vidarbha region. It was encouraging to note that the titled compounds not only inhibit the growth of all the pathogens under examination (C. verticillatum, G. deliquescene, Cladobotryum apiculatum, Velricillium fungicola, Gliocladium vireus, Sibirina fungicola, P. agarici, Arthrobotrys pleuroli and Pseudomonas stulzeri.) to a considerable extent but also exerted a positive impact on the phytotic growth of the test variety of mushroom. Key words: chlorosubstituted thiazoles, thiazolo-imidazoles, diketones, chromones and chromanones, Oyster mushroom crop pathogens like C. verticillatum, G. deliquescene, C. apiculatum, V. fungicola, G. vireus, S. fungicola, P. agarici. A. pleuroli, P. stulzeri.
Introduction:
Pleurotus commonly called as Oyster mushroom is one of the most widely eaten mushrooms1 appreciated
for its culinary properties2. Oyster spp. can be successfully cultivated at temperatures of around 30°C and
hence it is becoming increasingly popular in both tropical and sub-tropical countries. Being a tropical
country, India has been bestowed with bountiful crops. In India, the cultivation of this variety of
mushroom is picking up at an alarmingly high rate due to ease of its cultivation.
International Journal of Chemical and Physical Sciences, ISSN:2319-6602 IJCPS Vol. 4 Special Issue – NCSC Jan-2015
www.ijcps.org
Synthesis and Characterization of Some New Chlorosubstituted Thiazoles and Thiazolo-Imidazoles and their Impact on Pathogens
Damaging Oyster Mushroom Cultivation
N. G. GHODILE AND P. R. RAJPUT
-297 -
After Agaricus spp. (Button mushrooms), Pleurotus species are the second most populer mushrooms
growing in India. Though cultivation of Oyster mushroom in Vidarbha region is increasing gradualy but
the major constraint in its speedy popularization is the susceptibility of this crop towards pathogenic
attack. As a consequence, initial investment incurred on the cultivation of Oyster mushroom crop could
not be recovered. The pathogens inhibit the growth of mushrooms and hinders the production of fruiting
bodies. The disease and pasts happen to be devastating and perpeturate easily from one season to another.
Shah and Nasreen reported3 that some growers hardly use the fungicides for the treatment of this havoc of
disease. They often found fungicidal treatment as non-economical. Chitra4 et al reported that the 60%
concentration of potassium humate influence the mushroom growth as well as nutritional value and
recommended to use this for the increase of production.
Literature survey reveals that, nitrogen and oxygen containing chlorosubstituted heterocycles such as
pyrazolines, pyrazoles, isoxazolines, and isoxazoles were found to be very useful in controlling the
diseases in the field of agriculture. This series of compounds reported to have antibacterial5, antifungal6,
analgesic7, anesthetic8 and antinflammatory activities.
The present study has been carried out to develop ecofriendly and economically viable management of
mushroom crop disease by synthesizing some new chlorosubstituted thiazoles and thiazolo-imidazoles
from chlorosubstituted diketones, chromones and chromanones and applying them to inhibit the growth
of causative organisms.
Experimental:
The synthetic route for obtaining the final products is presented in scheme I. 1-(2-Hydroxy-5-
chlorophenyl)-3-phenyl-1,3-propanedione (1a) was suspended in bromine-glacial acetic acid reagent to
get the compound 1-(2-hydroxy-5-chlorophenyl)-2-bromo-3-phenyl-1,3-propanedione (2a). The
bromosubstituted-1,3-propanedione (2a) refluxed with thiourea for about 2.5 hrs. using aqueous KOH
solution and ethanol as a solvent. Finally on acidification with conc. HCl yield the product substituted
thiazole (3a).
The reaction of substituted thiazole(3a) with 2-bromo-1-(2-chloro-5-hydroxy phenyl) ethanone in
absolute ethanol lead to the formation of substituted α- amino ketone (4a) which on treatment with KSCN
in glacial acetic acid for 4 hrs. gave substituted thiazolo-imidazole (5a). which on acetylation give its
acetyl derivative (6a).
Melting points of all the synthesized compounds were determined in open capillaries and are uncorrected.
The homogeneity of all compounds was checked by TLC using benzene-CCl4 as developing solvent. IR
spectra were recorded on Perkin-Elmer 1000 spectrophotometer in KBr. The 1H NMR spectra were
recorded on Bruker advance II 400 NMR spectrophotometer using TMS as an internal standard and
chemical shifts are expressed in δ (ppm).
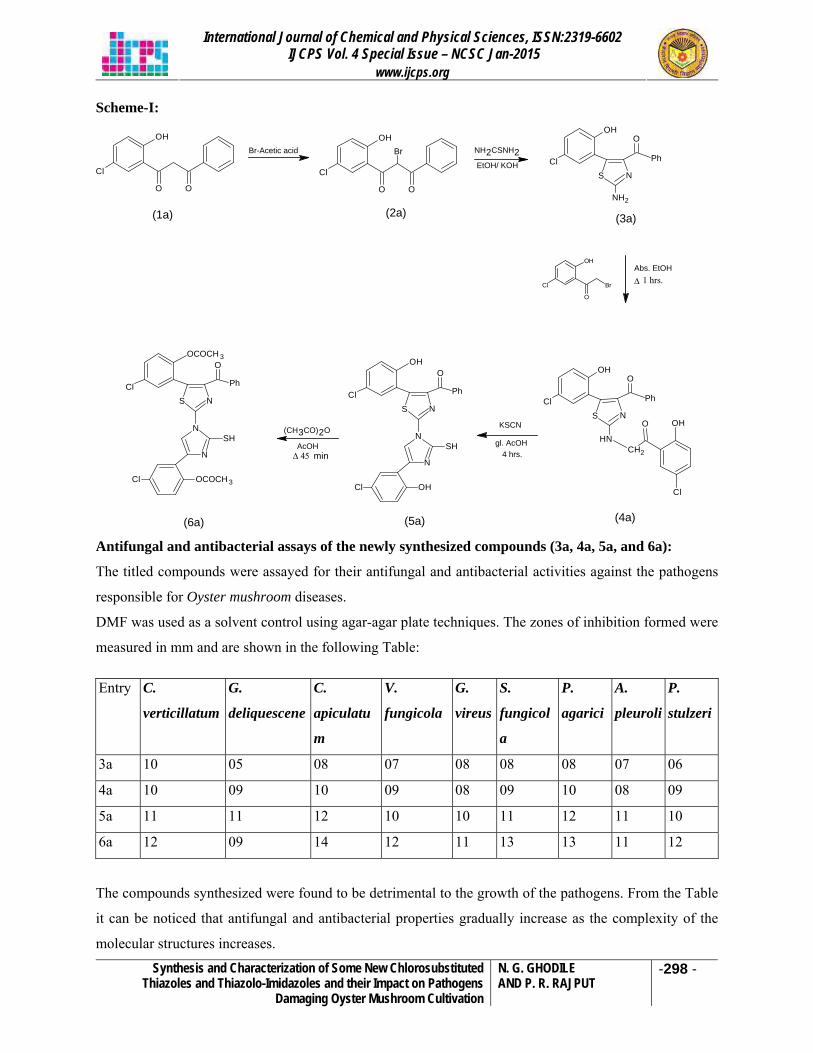
International Journal of Chemical and Physical Sciences, ISSN:2319-6602 IJCPS Vol. 4 Special Issue – NCSC Jan-2015
www.ijcps.org
Synthesis and Characterization of Some New Chlorosubstituted Thiazoles and Thiazolo-Imidazoles and their Impact on Pathogens
Damaging Oyster Mushroom Cultivation
N. G. GHODILE AND P. R. RAJPUT
-298 -
Scheme-I:
O O
OH
Cl
O O
OH
Cl
Br NH2CSNH2EtOH/ KOH
Br-Acetic acid
S N
Ph
OOH
Cl
NH2
Abs. EtOHΔ 1 hrs.
OH
Cl Br
O
S N
Ph
OOH
Cl
NHCH2
O OH
Cl
gl. AcOH
KSCN
4 hrs.
OH
ClS N
O
Ph
N
N
SH
OHCl
OCOCH 3
ClS N
O
Ph
N
N
SH
OCOCH 3Cl
(CH3CO)2O
AcOHΔ 45 min
(1a) (2a) (3a)
(4a)(5a)(6a) Antifungal and antibacterial assays of the newly synthesized compounds (3a, 4a, 5a, and 6a):
The titled compounds were assayed for their antifungal and antibacterial activities against the pathogens
responsible for Oyster mushroom diseases.
DMF was used as a solvent control using agar-agar plate techniques. The zones of inhibition formed were
measured in mm and are shown in the following Table:
The compounds synthesized were found to be detrimental to the growth of the pathogens. From the Table
it can be noticed that antifungal and antibacterial properties gradually increase as the complexity of the
molecular structures increases.
Entry C.
verticillatum
G.
deliquescene
C.
apiculatu
m
V.
fungicola
G.
vireus
S.
fungicol
a
P.
agarici
A.
pleuroli
P.
stulzeri
3a 10 05 08 07 08 08 08 07 06
4a 10 09 10 09 08 09 10 08 09
5a 11 11 12 10 10 11 12 11 10
6a 12 09 14 12 11 13 13 11 12
International Journal of Chemical and Physical Sciences, ISSN:2319-6602 IJCPS Vol. 4 Special Issue – NCSC Jan-2015
www.ijcps.org
Synthesis and Characterization of Some New Chlorosubstituted Thiazoles and Thiazolo-Imidazoles and their Impact on Pathogens
Damaging Oyster Mushroom Cultivation
N. G. GHODILE AND P. R. RAJPUT
-299 -
References:
[1]. Shah S., Nasreen S. and Munshi N.A., International Journal of botany, 7(3), 2011, 209-215.
[2]. Baysal, E., Peker H., Yalinkilic M.K. and Temiz A., Bioresour. Technol., 89, 2003, 95-97.
[3]. Shah S. and S. Nasreen, Int. J. Plant Pathol., 2, 2011, 81-88.
[4]. Prakash. P, Samundeeswari. R, Vivek. C and Chitra D.A, World Journal of Science and
Technology 1(7), 2011, 28-31.
[5]. Hans N. Swiss Patent, 592103, 1977, Chem. Abstra., 88, 1978, 22886.
[6]. Borthakur S. K., Boruah P. and Goswami B. N., J. Chemical Research, 128, 2007, 127.
[7]. Narayan B., Raj Vijaya K.K., Ashalata, B.V. and Sucheta N.K., Indian J. Chem. 45B, 2006,
1704.
[8]. Altintes H, and Birteksoz S., Indian J. Chem. 44B, 2005, 585.
International Journal of Chemical and Physical Sciences, ISSN:2319-6602 IJCPS Vol. 4 Special Issue – NCSC Jan-2015
www.ijcps.org
Effect of Extracts of Test Plants, Isolated Ingredient and Prepared Analogues on Serum Inorganic Ions (Sodium, Potassium, Calcium,
Magnesium and Phosphorous) in Albino Rats
M. O. MALPANI, P. R. RAJPUT
- 387 -
Effect of Extracts of Test Plants, Isolated Ingredient and Prepared Analogues on Serum Inorganic Ions (Sodium, Potassium, Calcium,
Magnesium and Phosphorous) in Albino Rats
M. O. MALPANI 1*, P. R. RAJPUT 2
1Department of Chemistry, Shankarlal Khandelwal College, Akola, 444-002 2Department of Chemistry, Vidya Bharati Mahavidyalaya, Amravati 444 - 602.
Corresponding author: [email protected]
Abstract
Medicinal plants are of great value in the field of treatment and cure of diseases. Over the years, scientific research has expanded our knowledge of the chemical effects and composition of the active constituents, which determine the medicinal properties of the plants. It has now been universally accepted fact that the plant drugs and remedies are far safer than that of synthetic medicines for curing the complex diseases like cancer and AIDS. Melghat region is a rich source of medicinal flora. Near about 772 naturalized species found in Melghat region which are used for the cure of various diseases. Butea monosperma, Cassia fistula, Ceasalpinina bonduc, Cassine glauca, and Cassia absus, plants are found in Melghat region. All these plants are frequently used for the eradication of various diseases. In case of serum inorganic ions, the four cations, Na+, K+, Mg2+ and Ca2+, are widely distributed in all living organisms. These cations play a tremendous variety of roles such as in the transmission of nerves impulses, in muscle contraction, and as enzyme activators and structural factors. In the present study we have undertaken this task to explore the impact of test plants whole extracts; some isolated ingredients and prepared analogues on serum composition of test animals with special reference to inorganic ions. Keywords: Test plants, isolated ingredient, prepared analogue, serum inorganic ions.
Introduction
Primarily it may be stated that cutaneous lesions are due to influences of source outside the body or which
exist or arise within the body. To the former class may be assigned such as depend on temperature and
climate, such as are due to traumatism of various kind, such as result from various parasitic invasions, etc.
this is in reality but a limited class, on other hand, the etiological factors which arise within the body itself
are very numerous. The external causes like excessive heat direct exposure to the Sun may exhibit undue
activity of the sudoriferous gland and result in the production of sudamina or Sunburn. The excessive
cold may result in absolute, congelation of exposed portion of the integument. On the other hand internal
causes of skin diseases, however, are far more frequently in operation. In this class we may place those
affections of the skin which are due to pre-existing lesions of some part of the nervous system. The
nervous system acts as a medium for the transmission of some internal irritation to the surface, thus, the
gastric irritation resulting from the ingestion of shell-fish may manifest itself on the skin till another
International Journal of Chemical and Physical Sciences, ISSN:2319-6602 IJCPS Vol. 4 Special Issue – NCSC Jan-2015
www.ijcps.org
Effect of Extracts of Test Plants, Isolated Ingredient and Prepared Analogues on Serum Inorganic Ions (Sodium, Potassium, Calcium,
Magnesium and Phosphorous) in Albino Rats
M. O. MALPANI, P. R. RAJPUT
- 388 -
internal cause of cutaneous lesions is found in ill nutrition or imperfect assimilation. Finally we may have
external lesions resulting from the accumulation in the blood of certain infectious material. Sometimes
such materials may be generated within the body itself through imperfections in the digestive,
assimilative or excretory functions.
In order that nutrition may be healthily carried on in any part there must be a proper state of the blood, a
proper condition and behaviour of the tissues to be nourished and a right exercise of the controlling
influence exerted by the nerves. These three must work harmoniously together. The theoretical origin,
therefore, of diseased changes in the skin may be especially in the blood and here the skin affection is
only symptomatic.
The four cations, Na+, K+, Mg2+ and Ca2+, are widely distributed in all living organisms These cations
play a tremendous variety of roles such as in the transmission of nerves impulses, in muscle contraction,
and as enzyme activators and structural factors. The extra- and intracellular concentrations of Na+, K+,
Mg2+ are very different (the values for Ca2+ being quite similar). This observation raises the questions
about the establishment, maintenance and distribution of dissymmetry1-4.
In the present study we have undertaken this task to explore the impact of test plants whole extracts, some
isolated ingredients and prepared analogues on serum composition of test animals with special reference
to inorganic ions.
Materials And Methods
Plant material: The test plant materials of Butea monosperma, Cassia fistula, Ceasalpinina bonduc,
Cassine glauca, and Cassia absus, plants were collected seasonally from the Melghat region of Amravati,
District of Maharashtra, India. They were authenticated by the taxonomist Dr. S. P. Rothe with Voucher
specimens (ML – 101, ML – 102, ML – 103, ML – 104, ML – 105) and were deposited in the herbarium
of Department of Botany, Shri Shivaji College, Akola.
Extraction and Isolation: The test plant materials of Butea monosperma, Cassia fistula, Ceasalpinina
bonduc, Cassine glauca, and Cassia absus, plants were shade dried at room temperature and ground in a
manual mill to get coarse powder. The powders were kept in the airtight polythene bags and stored at dry
place. These powders were extracted with water as a solvent by using soxhlet apparatus. The extracts
were concentrated at 40 oC using rotary evaporator. Finally it was dried, crushed and stored in air tight
bottle at 4 oC for further study. Again by using thin layer and column chromatography techniques, we
have isolated the acidic ingredient from Butea monosperma test plant extracts and from the
characterization it was found that isolated compound 1 was Gallic acid. The Gallic acid (Compound 1)
thus separated from test extracts of Butea monosperma plant was then used for the preparation of its
amide analogue (Compound 2) and ester analogue (Compound 3).
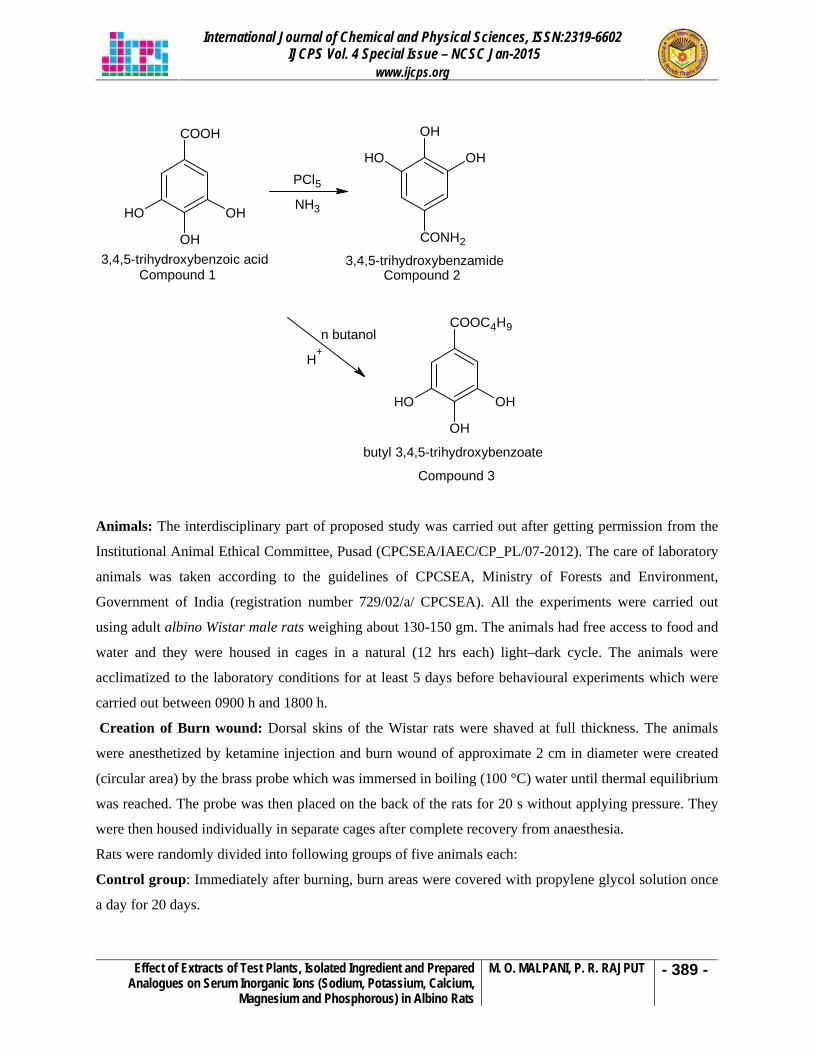
International Journal of Chemical and Physical Sciences, ISSN:2319-6602 IJCPS Vol. 4 Special Issue – NCSC Jan-2015
www.ijcps.org
Effect of Extracts of Test Plants, Isolated Ingredient and Prepared Analogues on Serum Inorganic Ions (Sodium, Potassium, Calcium,
Magnesium and Phosphorous) in Albino Rats
M. O. MALPANI, P. R. RAJPUT
- 389 -
COOH
OH
OHOH
3,4,5-trihydroxybenzoic acid
PCl5NH3
OHOH
OH
CONH2
3,4,5-trihydroxybenzamideCompound 1 Compound 2
COOC4H9
OH
OHOH
butyl 3,4,5-trihydroxybenzoate
Compound 3
n butanol
H+
Animals: The interdisciplinary part of proposed study was carried out after getting permission from the
Institutional Animal Ethical Committee, Pusad (CPCSEA/IAEC/CP_PL/07-2012). The care of laboratory
animals was taken according to the guidelines of CPCSEA, Ministry of Forests and Environment,
Government of India (registration number 729/02/a/ CPCSEA). All the experiments were carried out
using adult albino Wistar male rats weighing about 130-150 gm. The animals had free access to food and
water and they were housed in cages in a natural (12 hrs each) light–dark cycle. The animals were
acclimatized to the laboratory conditions for at least 5 days before behavioural experiments which were
carried out between 0900 h and 1800 h.
Creation of Burn wound: Dorsal skins of the Wistar rats were shaved at full thickness. The animals
were anesthetized by ketamine injection and burn wound of approximate 2 cm in diameter were created
(circular area) by the brass probe which was immersed in boiling (100 °C) water until thermal equilibrium
was reached. The probe was then placed on the back of the rats for 20 s without applying pressure. They
were then housed individually in separate cages after complete recovery from anaesthesia.
Rats were randomly divided into following groups of five animals each:
Control group: Immediately after burning, burn areas were covered with propylene glycol solution once
a day for 20 days.
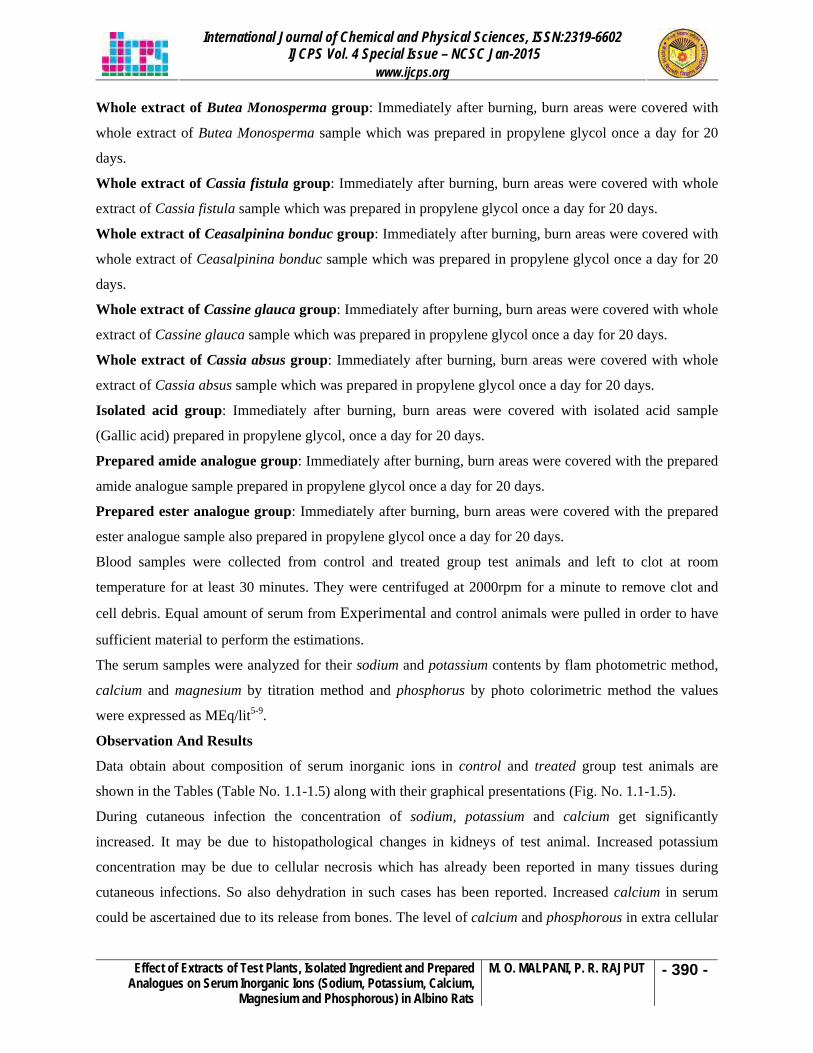
International Journal of Chemical and Physical Sciences, ISSN:2319-6602 IJCPS Vol. 4 Special Issue – NCSC Jan-2015
www.ijcps.org
Effect of Extracts of Test Plants, Isolated Ingredient and Prepared Analogues on Serum Inorganic Ions (Sodium, Potassium, Calcium,
Magnesium and Phosphorous) in Albino Rats
M. O. MALPANI, P. R. RAJPUT
- 390 -
Whole extract of Butea Monosperma group: Immediately after burning, burn areas were covered with
whole extract of Butea Monosperma sample which was prepared in propylene glycol once a day for 20
days.
Whole extract of Cassia fistula group: Immediately after burning, burn areas were covered with whole
extract of Cassia fistula sample which was prepared in propylene glycol once a day for 20 days.
Whole extract of Ceasalpinina bonduc group: Immediately after burning, burn areas were covered with
whole extract of Ceasalpinina bonduc sample which was prepared in propylene glycol once a day for 20
days.
Whole extract of Cassine glauca group: Immediately after burning, burn areas were covered with whole
extract of Cassine glauca sample which was prepared in propylene glycol once a day for 20 days.
Whole extract of Cassia absus group: Immediately after burning, burn areas were covered with whole
extract of Cassia absus sample which was prepared in propylene glycol once a day for 20 days.
Isolated acid group: Immediately after burning, burn areas were covered with isolated acid sample
(Gallic acid) prepared in propylene glycol, once a day for 20 days.
Prepared amide analogue group: Immediately after burning, burn areas were covered with the prepared
amide analogue sample prepared in propylene glycol once a day for 20 days.
Prepared ester analogue group: Immediately after burning, burn areas were covered with the prepared
ester analogue sample also prepared in propylene glycol once a day for 20 days.
Blood samples were collected from control and treated group test animals and left to clot at room
temperature for at least 30 minutes. They were centrifuged at 2000rpm for a minute to remove clot and
cell debris. Equal amount of serum from Experimental and control animals were pulled in order to have
sufficient material to perform the estimations.
The serum samples were analyzed for their sodium and potassium contents by flam photometric method,
calcium and magnesium by titration method and phosphorus by photo colorimetric method the values
were expressed as MEq/lit5-9.
Observation And Results
Data obtain about composition of serum inorganic ions in control and treated group test animals are
shown in the Tables (Table No. 1.1-1.5) along with their graphical presentations (Fig. No. 1.1-1.5).
During cutaneous infection the concentration of sodium, potassium and calcium get significantly
increased. It may be due to histopathological changes in kidneys of test animal. Increased potassium
concentration may be due to cellular necrosis which has already been reported in many tissues during
cutaneous infections. So also dehydration in such cases has been reported. Increased calcium in serum
could be ascertained due to its release from bones. The level of calcium and phosphorous in extra cellular
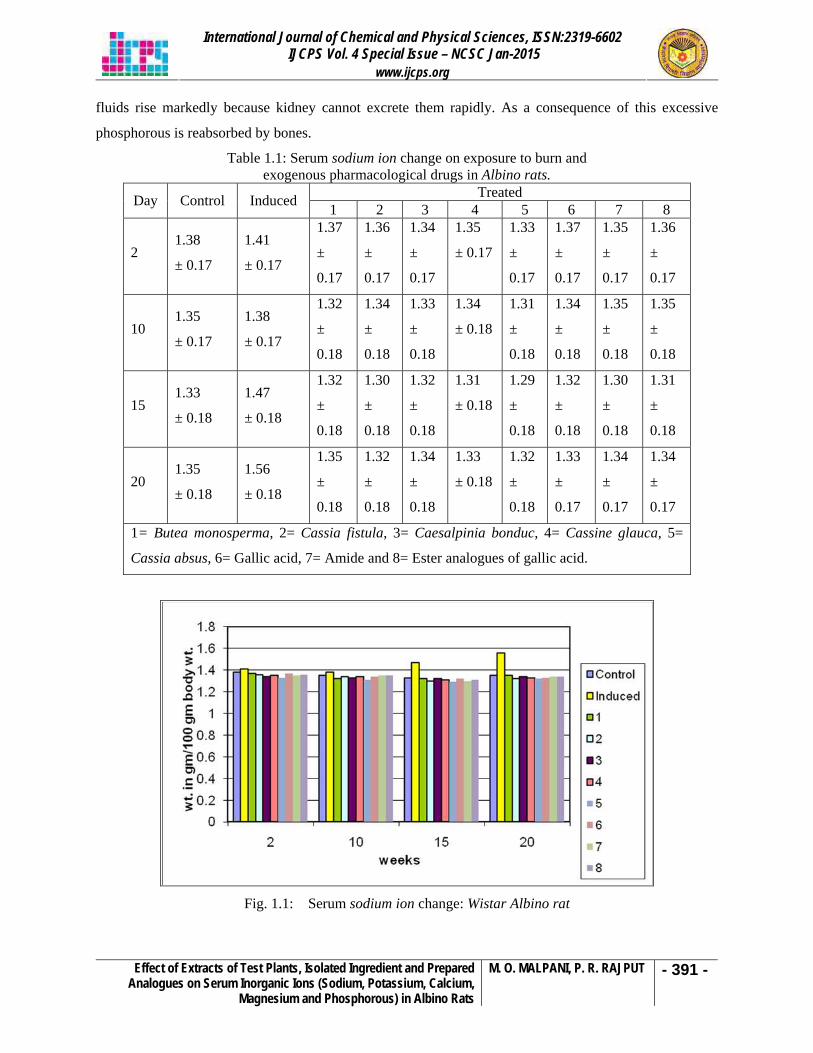
International Journal of Chemical and Physical Sciences, ISSN:2319-6602 IJCPS Vol. 4 Special Issue – NCSC Jan-2015
www.ijcps.org
Effect of Extracts of Test Plants, Isolated Ingredient and Prepared Analogues on Serum Inorganic Ions (Sodium, Potassium, Calcium,
Magnesium and Phosphorous) in Albino Rats
M. O. MALPANI, P. R. RAJPUT
- 391 -
fluids rise markedly because kidney cannot excrete them rapidly. As a consequence of this excessive
phosphorous is reabsorbed by bones.
Table 1.1: Serum sodium ion change on exposure to burn and exogenous pharmacological drugs in Albino rats.
Treated Day Control Induced 1 2 3 4 5 6 7 8
2 1.38
± 0.17
1.41
± 0.17
1.37
±
0.17
1.36
±
0.17
1.34
±
0.17
1.35
± 0.17
1.33
±
0.17
1.37
±
0.17
1.35
±
0.17
1.36
±
0.17
10 1.35
± 0.17
1.38
± 0.17
1.32
±
0.18
1.34
±
0.18
1.33
±
0.18
1.34
± 0.18
1.31
±
0.18
1.34
±
0.18
1.35
±
0.18
1.35
±
0.18
15 1.33
± 0.18
1.47
± 0.18
1.32
±
0.18
1.30
±
0.18
1.32
±
0.18
1.31
± 0.18
1.29
±
0.18
1.32
±
0.18
1.30
±
0.18
1.31
±
0.18
20 1.35
± 0.18
1.56
± 0.18
1.35
±
0.18
1.32
±
0.18
1.34
±
0.18
1.33
± 0.18
1.32
±
0.18
1.33
±
0.17
1.34
±
0.17
1.34
±
0.17
1= Butea monosperma, 2= Cassia fistula, 3= Caesalpinia bonduc, 4= Cassine glauca, 5=
Cassia absus, 6= Gallic acid, 7= Amide and 8= Ester analogues of gallic acid.
Fig. 1.1: Serum sodium ion change: Wistar Albino rat
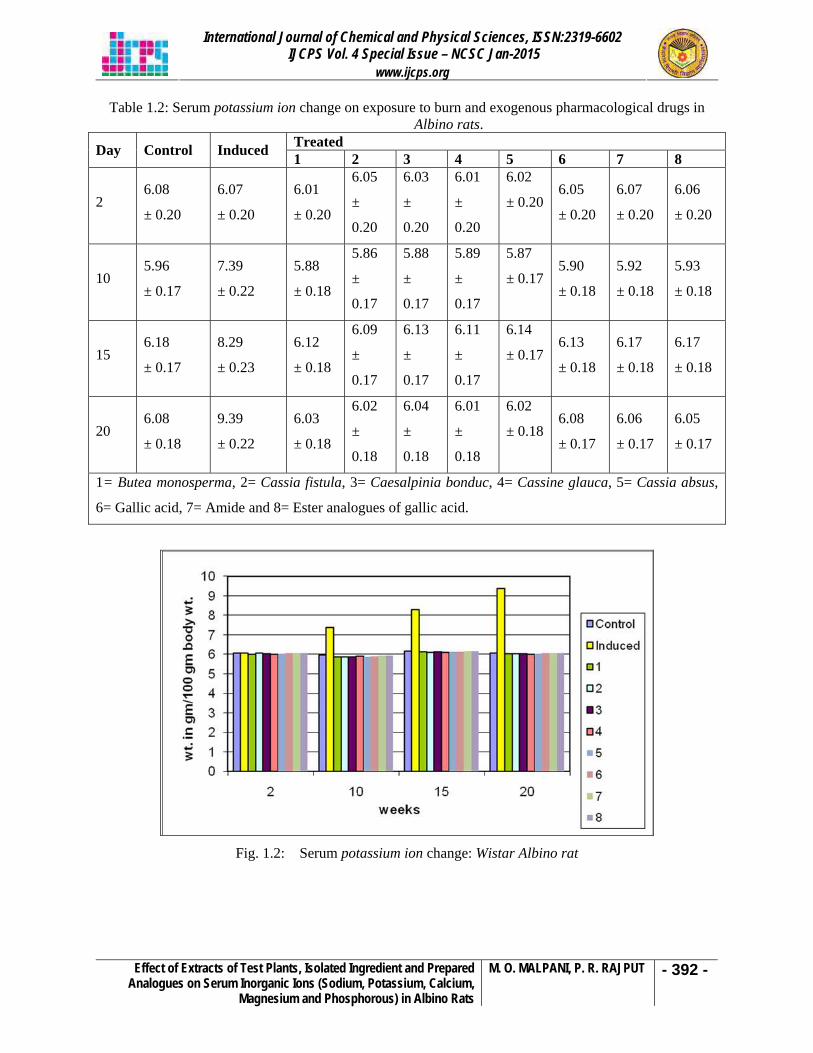
International Journal of Chemical and Physical Sciences, ISSN:2319-6602 IJCPS Vol. 4 Special Issue – NCSC Jan-2015
www.ijcps.org
Effect of Extracts of Test Plants, Isolated Ingredient and Prepared Analogues on Serum Inorganic Ions (Sodium, Potassium, Calcium,
Magnesium and Phosphorous) in Albino Rats
M. O. MALPANI, P. R. RAJPUT
- 392 -
Table 1.2: Serum potassium ion change on exposure to burn and exogenous pharmacological drugs in Albino rats.
Treated Day Control Induced 1 2 3 4 5 6 7 8
2 6.08
± 0.20
6.07
± 0.20
6.01
± 0.20
6.05
±
0.20
6.03
±
0.20
6.01
±
0.20
6.02
± 0.20 6.05
± 0.20
6.07
± 0.20
6.06
± 0.20
10 5.96
± 0.17
7.39
± 0.22
5.88
± 0.18
5.86
±
0.17
5.88
±
0.17
5.89
±
0.17
5.87
± 0.17 5.90
± 0.18
5.92
± 0.18
5.93
± 0.18
15 6.18
± 0.17
8.29
± 0.23
6.12
± 0.18
6.09
±
0.17
6.13
±
0.17
6.11
±
0.17
6.14
± 0.17 6.13
± 0.18
6.17
± 0.18
6.17
± 0.18
20 6.08
± 0.18
9.39
± 0.22
6.03
± 0.18
6.02
±
0.18
6.04
±
0.18
6.01
±
0.18
6.02
± 0.18 6.08
± 0.17
6.06
± 0.17
6.05
± 0.17
1= Butea monosperma, 2= Cassia fistula, 3= Caesalpinia bonduc, 4= Cassine glauca, 5= Cassia absus,
6= Gallic acid, 7= Amide and 8= Ester analogues of gallic acid.
Fig. 1.2: Serum potassium ion change: Wistar Albino rat
International Journal of Chemical and Physical Sciences, ISSN:2319-6602 IJCPS Vol. 4 Special Issue – NCSC Jan-2015
www.ijcps.org
Effect of Extracts of Test Plants, Isolated Ingredient and Prepared Analogues on Serum Inorganic Ions (Sodium, Potassium, Calcium,
Magnesium and Phosphorous) in Albino Rats
M. O. MALPANI, P. R. RAJPUT
- 393 -
Table 1.3: Serum calcium ion change on exposure to burn and exogenous pharmacological drugs in Albino rats. Treated Day Control Induced 1 2 3 4 5 6 7 8
2 6.5
± 0.21
8.9
± 0.18
6.0
± 0.21
5.9
± 0.21
6.3
± 0.21
6.1
± 0.21
6.3
± 0.21
6.4
± 0.21
6.3
± 0.21
6.3
± 0.21
10 6.0
± 0.21
8.36
± 0.20
5.8
± 0.34
5.8
± 0.34
5.9
± 0.34
5.7
± 0.34
5.8
± 0.34
5.7
± 0.34
5.9
± 0.34
5.9
± 0.34
15 6.4
± 0.39
9.20
± 0.37
6.0
± 0.38
6.2
± 0.38
6.0
± 0.38
6.1
± 0.38
6.1
± 0.38
6.3
± 0.34
6.2
± 0.38
6.2
± 0.38
20 6.1
± 0.20
9.42
± 0.29
5.8
± 0.34
5.9
± 0.34
5.8
± 0.34
6.0
± 0.34
5.8
± 0.34
5.9
± 0.34
6.0
± 0.34
6.0
± 0.34
1= Butea monosperma, 2= Cassia fistula, 3= Caesalpinia bonduc, 4= Cassine glauca, 5= Cassia absus,
6= Gallic acid, 7= Amide and 8= Ester analogues of gallic acid.
Fig. 1.3: Serum calcium ion change: Wistar Albino rat
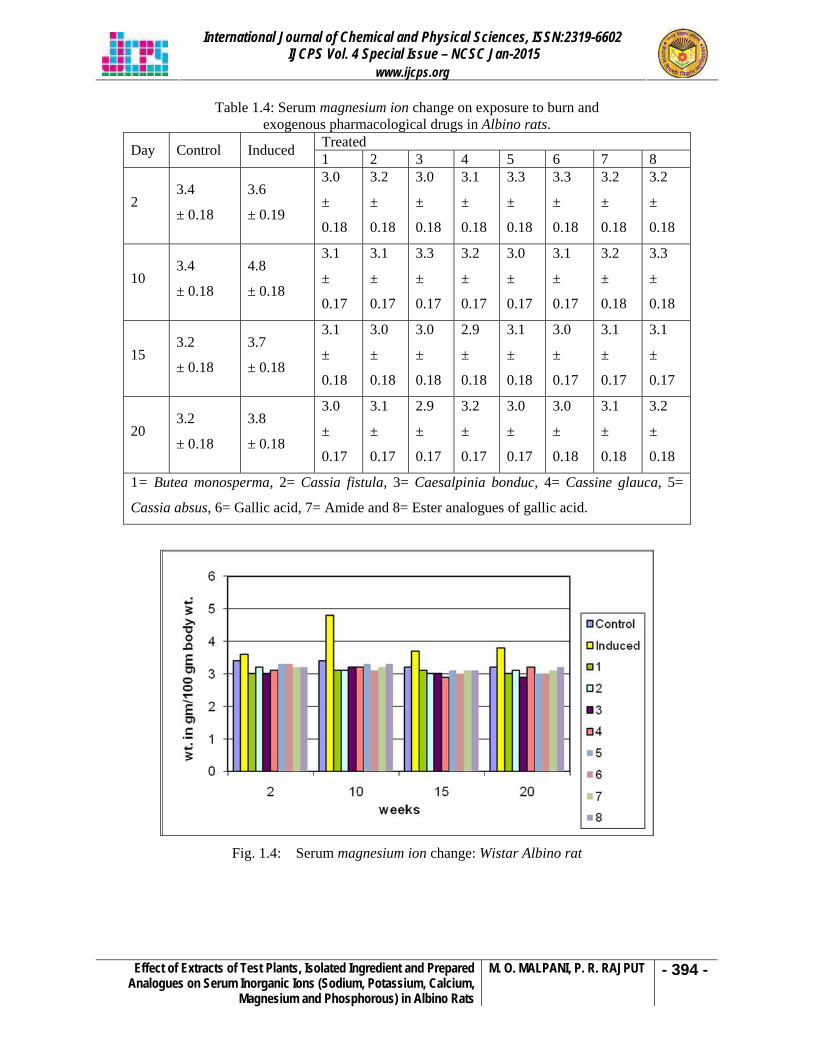
International Journal of Chemical and Physical Sciences, ISSN:2319-6602 IJCPS Vol. 4 Special Issue – NCSC Jan-2015
www.ijcps.org
Effect of Extracts of Test Plants, Isolated Ingredient and Prepared Analogues on Serum Inorganic Ions (Sodium, Potassium, Calcium,
Magnesium and Phosphorous) in Albino Rats
M. O. MALPANI, P. R. RAJPUT
- 394 -
Table 1.4: Serum magnesium ion change on exposure to burn and exogenous pharmacological drugs in Albino rats.
Treated Day Control Induced 1 2 3 4 5 6 7 8
2 3.4
± 0.18
3.6
± 0.19
3.0
±
0.18
3.2
±
0.18
3.0
±
0.18
3.1
±
0.18
3.3
±
0.18
3.3
±
0.18
3.2
±
0.18
3.2
±
0.18
10 3.4
± 0.18
4.8
± 0.18
3.1
±
0.17
3.1
±
0.17
3.3
±
0.17
3.2
±
0.17
3.0
±
0.17
3.1
±
0.17
3.2
±
0.18
3.3
±
0.18
15 3.2
± 0.18
3.7
± 0.18
3.1
±
0.18
3.0
±
0.18
3.0
±
0.18
2.9
±
0.18
3.1
±
0.18
3.0
±
0.17
3.1
±
0.17
3.1
±
0.17
20 3.2
± 0.18
3.8
± 0.18
3.0
±
0.17
3.1
±
0.17
2.9
±
0.17
3.2
±
0.17
3.0
±
0.17
3.0
±
0.18
3.1
±
0.18
3.2
±
0.18
1= Butea monosperma, 2= Cassia fistula, 3= Caesalpinia bonduc, 4= Cassine glauca, 5=
Cassia absus, 6= Gallic acid, 7= Amide and 8= Ester analogues of gallic acid.
Fig. 1.4: Serum magnesium ion change: Wistar Albino rat
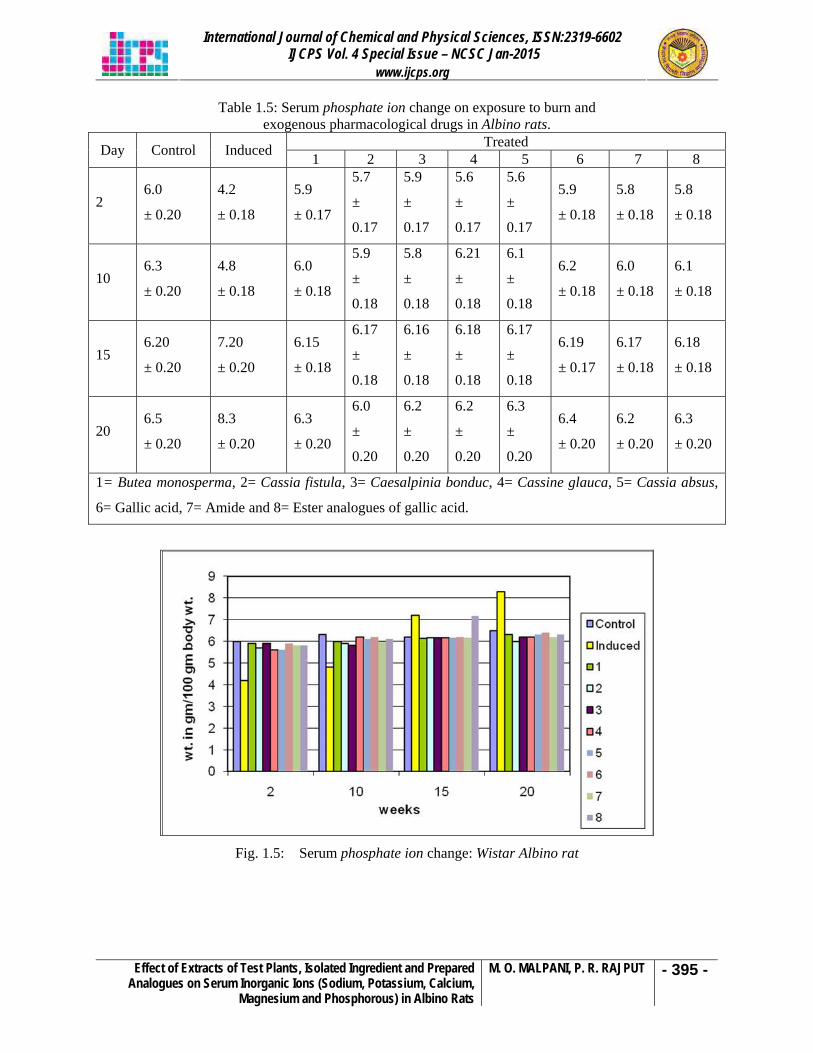
International Journal of Chemical and Physical Sciences, ISSN:2319-6602 IJCPS Vol. 4 Special Issue – NCSC Jan-2015
www.ijcps.org
Effect of Extracts of Test Plants, Isolated Ingredient and Prepared Analogues on Serum Inorganic Ions (Sodium, Potassium, Calcium,
Magnesium and Phosphorous) in Albino Rats
M. O. MALPANI, P. R. RAJPUT
- 395 -
Table 1.5: Serum phosphate ion change on exposure to burn and exogenous pharmacological drugs in Albino rats.
Treated Day Control Induced 1 2 3 4 5 6 7 8
2 6.0
± 0.20
4.2
± 0.18
5.9
± 0.17
5.7
±
0.17
5.9
±
0.17
5.6
±
0.17
5.6
±
0.17
5.9
± 0.18
5.8
± 0.18
5.8
± 0.18
10 6.3
± 0.20
4.8
± 0.18
6.0
± 0.18
5.9
±
0.18
5.8
±
0.18
6.21
±
0.18
6.1
±
0.18
6.2
± 0.18
6.0
± 0.18
6.1
± 0.18
15 6.20
± 0.20
7.20
± 0.20
6.15
± 0.18
6.17
±
0.18
6.16
±
0.18
6.18
±
0.18
6.17
±
0.18
6.19
± 0.17
6.17
± 0.18
6.18
± 0.18
20 6.5
± 0.20
8.3
± 0.20
6.3
± 0.20
6.0
±
0.20
6.2
±
0.20
6.2
±
0.20
6.3
±
0.20
6.4
± 0.20
6.2
± 0.20
6.3
± 0.20
1= Butea monosperma, 2= Cassia fistula, 3= Caesalpinia bonduc, 4= Cassine glauca, 5= Cassia absus,
6= Gallic acid, 7= Amide and 8= Ester analogues of gallic acid.
Fig. 1.5: Serum phosphate ion change: Wistar Albino rat
International Journal of Chemical and Physical Sciences, ISSN:2319-6602 IJCPS Vol. 4 Special Issue – NCSC Jan-2015
www.ijcps.org
Effect of Extracts of Test Plants, Isolated Ingredient and Prepared Analogues on Serum Inorganic Ions (Sodium, Potassium, Calcium,
Magnesium and Phosphorous) in Albino Rats
M. O. MALPANI, P. R. RAJPUT
- 396 -
Conclusion:
Cutaneous infections adversely influence the ion exchange permeability of the skin. This leads to creating
barriers in the supply of vital materials (ingredients) to the infected sites resulting into the deterioration of
the natural composition and also the texture of the skin. Since the infected part of the skin becomes more
susceptible to bacterial infections, the proportion of metal ions present in serum gets abnormally altered.
From the above data it was very obvious that the concentration of the sodium, potassium, calcium,
magnesium and phosphate ions for treated animals restored almost to the state of normalcy. It has also
been revealed that isolated ingredients of the plant extracts and their chemical analogues are more
effective in restoring the normalcy of the skin as compared whole plant extracts. However the author
would like to mention that further extensive and systematic study in this field can lead to revealing many
more life saving properties and potentials of these herbal preparations.
Acknowledgement
The authors are thankful to SAIF, CDRI, Lucknow and SAIF, Punjab University, Chandigarh for
providing the spectral data. The authors are also extended their indebtedness to Dr. S. P. Rothe,
Department of Botany, Shri Shivaji College, Akola for the authentication of Butea monosperma plants.
References
[1]. I. Bertini, H. B. Gray, S. J. Lippard and J. S. Valentine, Bioinorganic Chemistry, Viva Books Pvt.
Lmt., 1998.
[2]. R. J. P. Williams, Calcium in Biological Systems, Cambridge University Press, 1976.
[3]. J. David Rawn, Biochemistry, first Indian reprint, Panima Publishing Corporation, New Delhi /
Bangalore, 2004.
[4]. G. P. Talwar, L. M. Srivastava, Textbook of Biochemistry and Human biology, third ed.,
Prentice-Hall of India, New Delhi, 2002.
[5]. Temkitthawon, P., Viyoch, J., Limpeanchob, N., et al., 2008. Screening for phosphodiesterase
inhibitory activity of Thai medicinal plants. Journal of Ethnopharmacology 119, 214–217.
[6]. Ansari, T.M., Ikram, N., Khalid, N., et al., 2004. Essential trace metal (Zinc, Manganese, Copper
and Iron) levels in plants of medicinal importance, J. Biol. Sci. 4(2), 95-99.
[7]. Duggal, A. K., Yadav, P, Agarwal, A. K., Rewan, B. B, 2006. Clinical Approach to Altered
Serum Sodium levels. JIACM 7(2), 91-103.
[8]. Noordzij, M., Boeschoten, E. W., Bos., W. J., et al., 2007. Disturbed mineral metabolism is
associated with muscle and skin complaints in a prospective cohort of dialysis patients. Nephrol
Dial Transplant 22, 2944–2949.
[9]. Alan B. G. Lansdown, 1995. Physiological and toxicological changes in the skin resulting from
the action and interaction of metal ions, Critical Reviews in Toxicology 25(5), 397-4
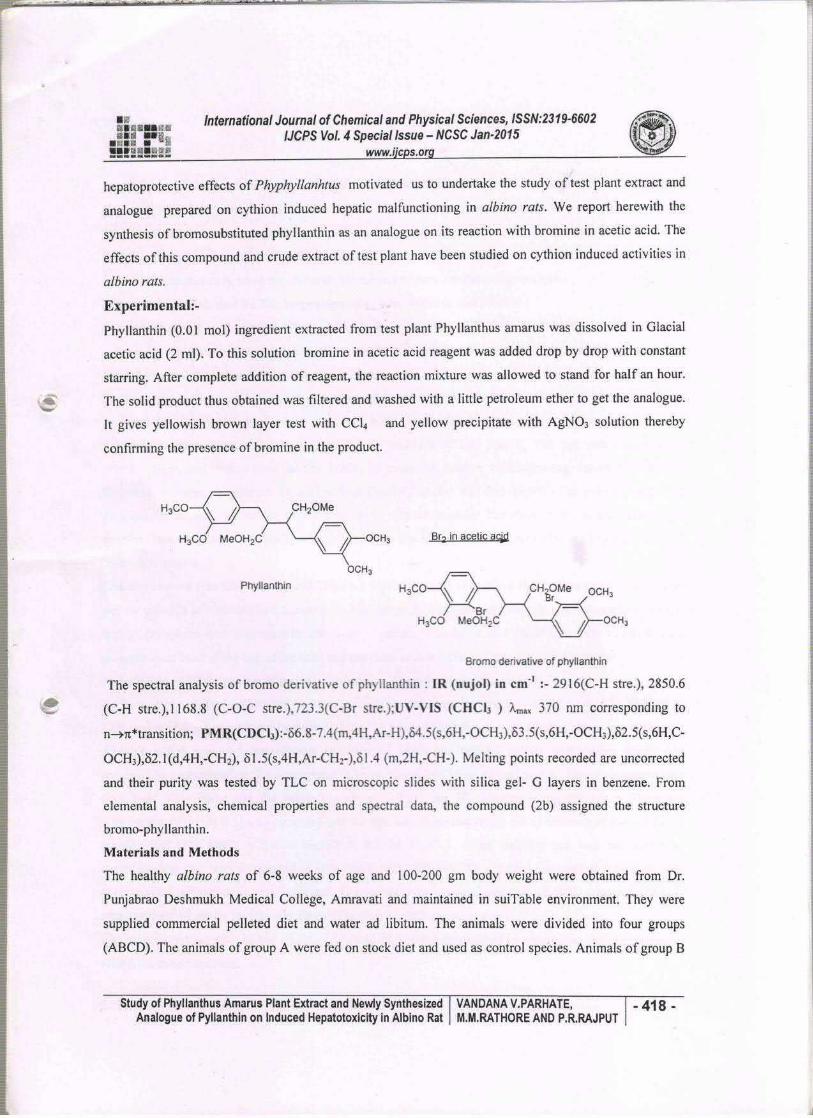
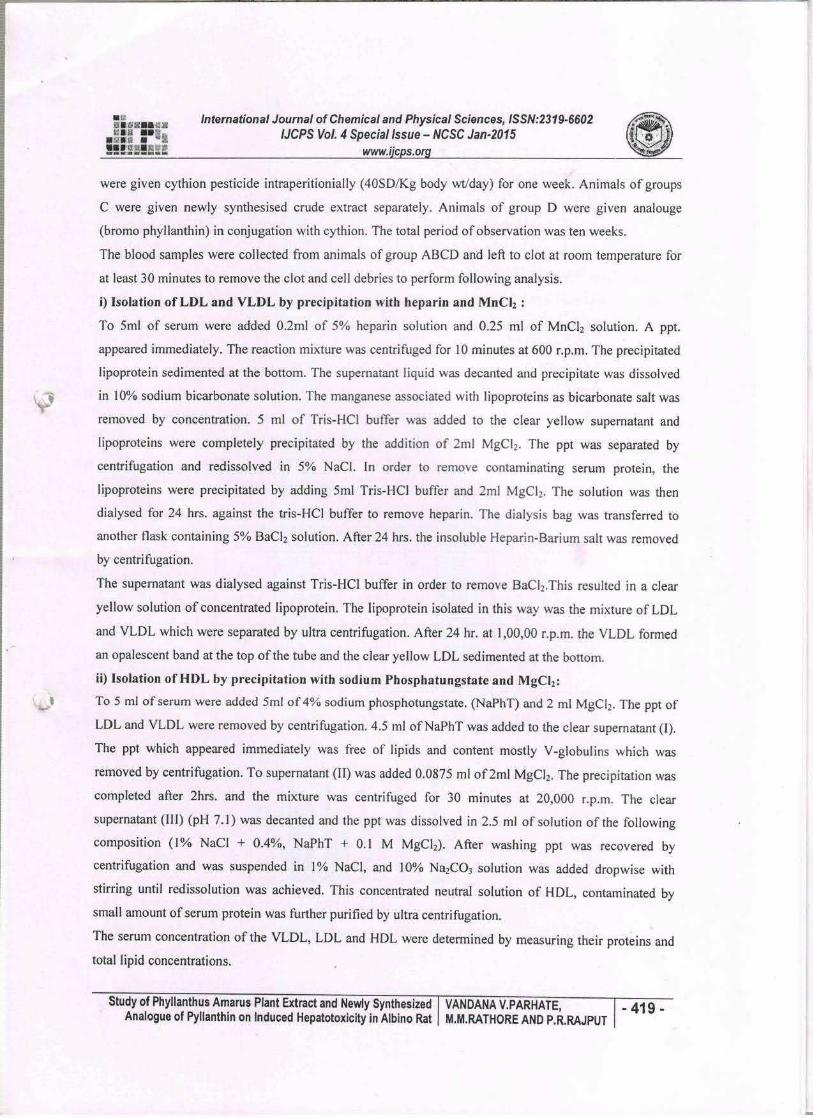
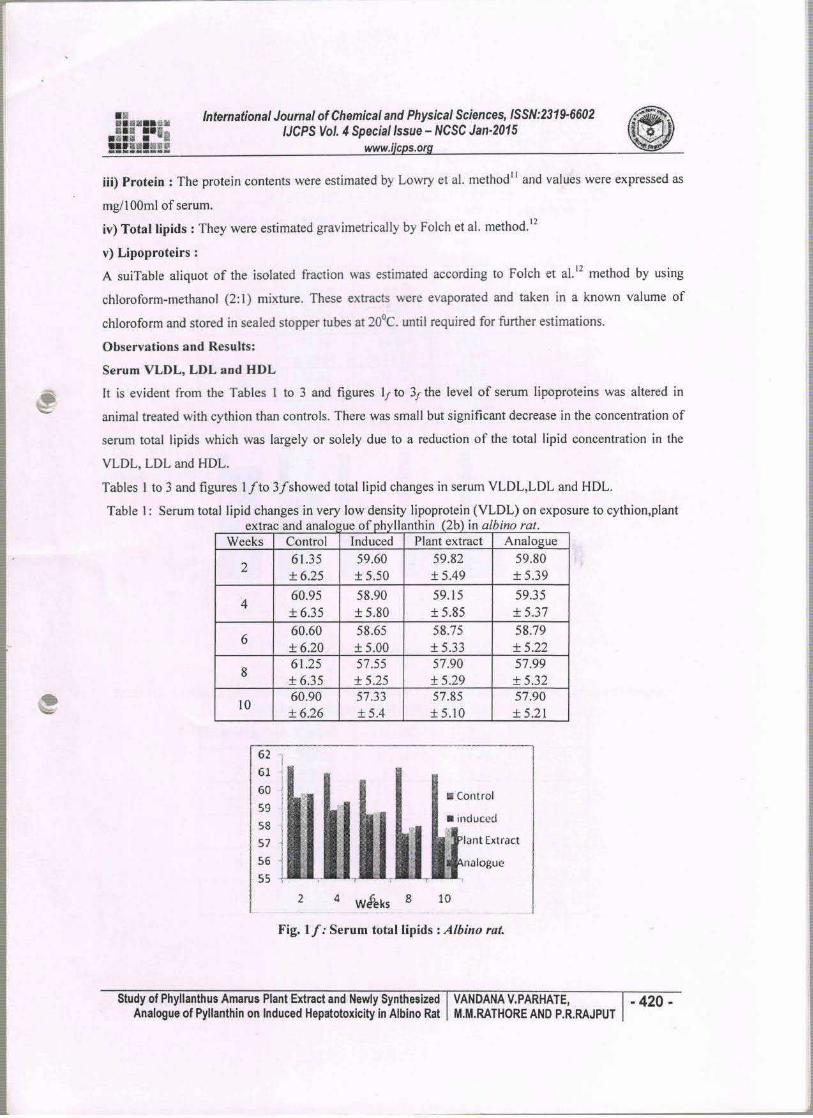
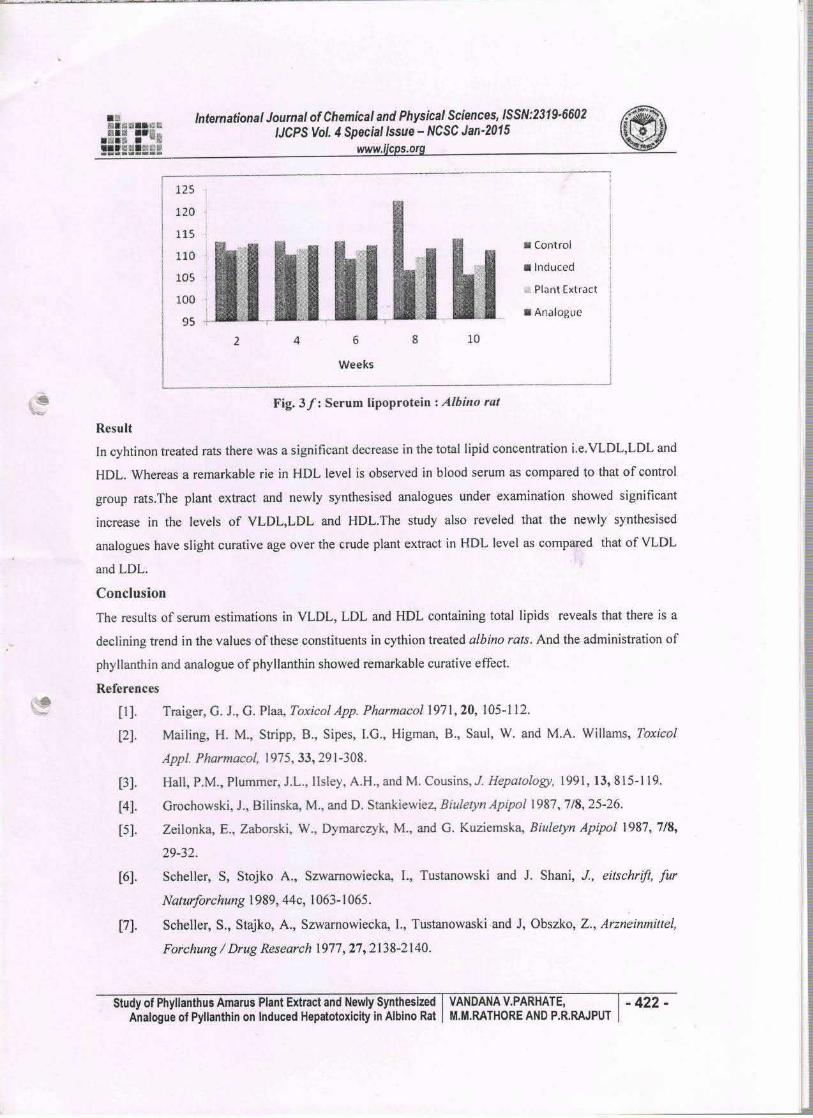
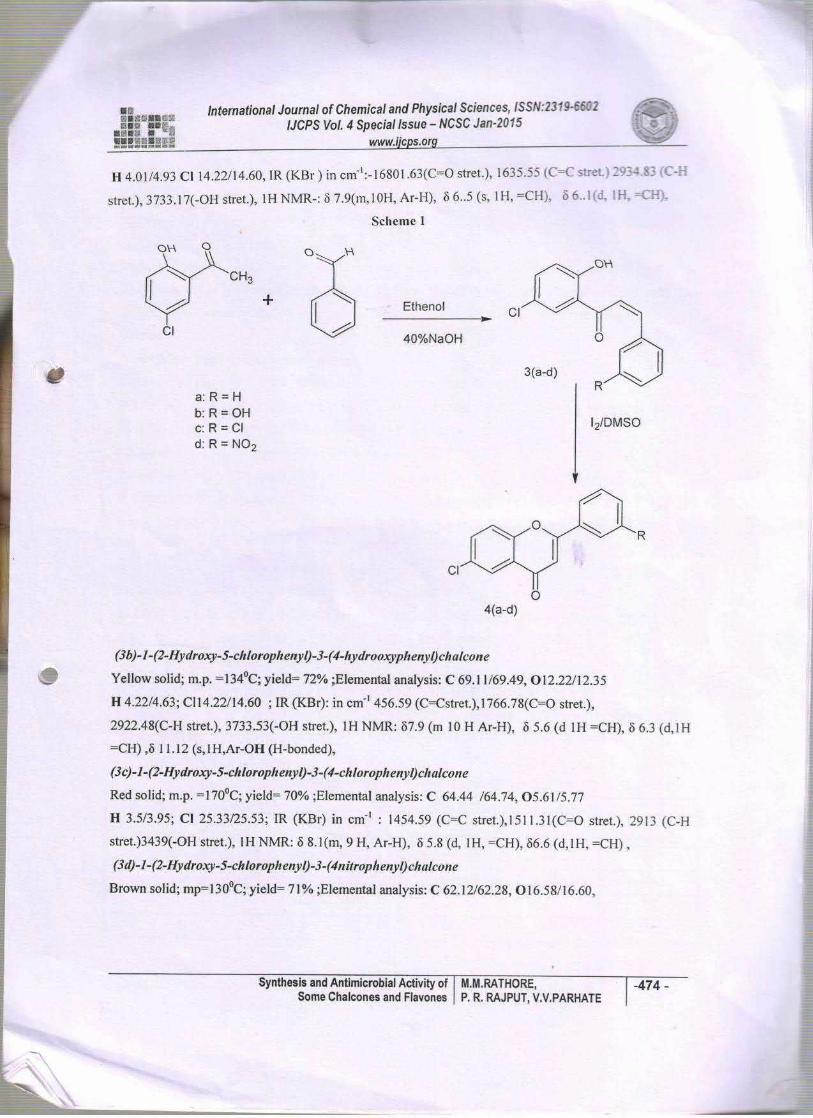
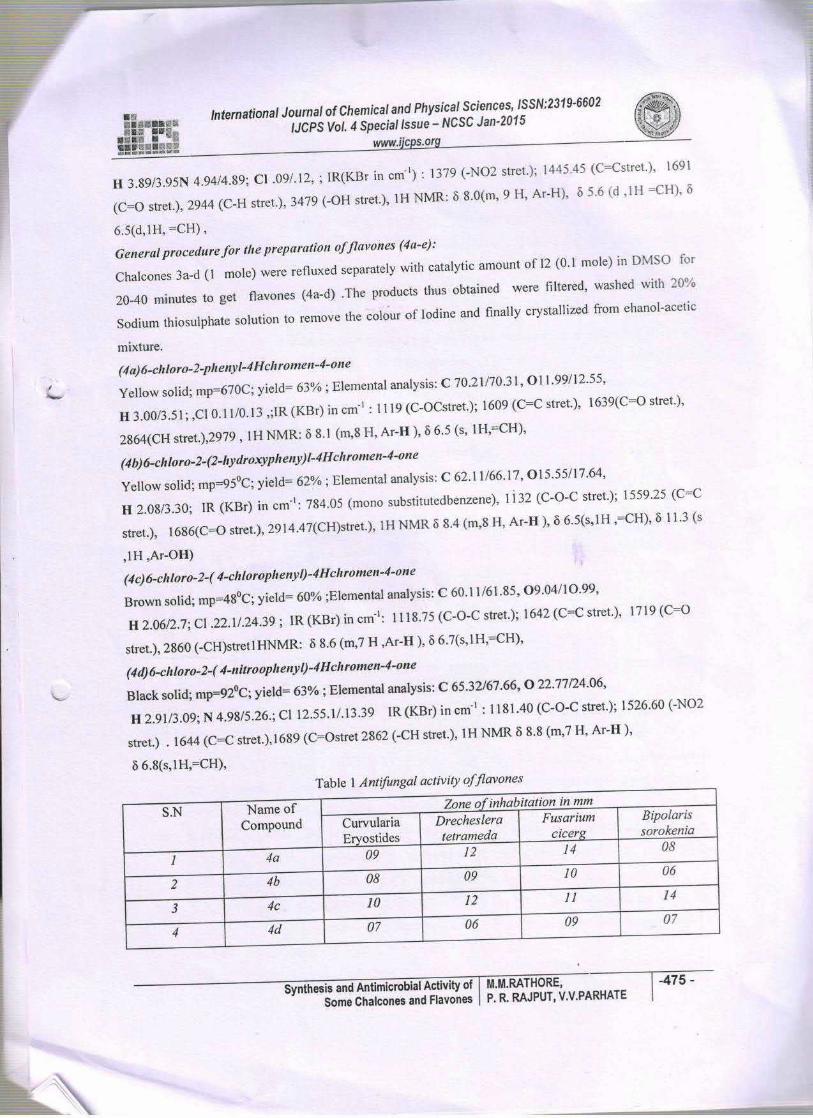
International Journal of Chemical and Physical Sciences, ISSN:2319-6602 IJCPS Vol. 4 Special Issue – NCSC Jan-2015
www.ijcps.org
Ecofriendly Synthesis, Characterization and Antibacterial Assay of Some Chlorosubstituted Isoxazoles
P.R. RAJPUT, M.W.BHADE, C.D.BADNAKHE, A.V.GAJBHIYE
-342 -
Ecofriendly Synthesis, Characterization and Antibacterial Assay of Some Chlorosubstituted Isoxazoles
P. R. RAJPUT1, M. W. BHADE2, C. D. BADNAKHE3, A. V. GAJBHIYE4
1 Department of Chemistry, Vidyabharati Mahavidyalaya, Camp Amravati
2 Department of Chemistry, Amolakchand Mahavidyalaya, Yavatmal 3 Department of Chemistry, Dr. Manorama & Prof. H.S. Pundkar Arts,
Commerce & Science College, Balapur 4. Department of Chemistry, MGV’s A.S.C. College, Nampur
Corresponding author: [email protected]
Abstract
The concept of green chemistry is now widely adopted to meet the scientific challenges in order to protect the human health and environment. Nowadays researchers are working extensively to synthesize new compounds using ecofriendly solvents and other conditions. Literature survey reveals that isoxazoles are very useful units in the fields of medicinal, pharmaceutical and agriculture. Isoxazoles have been reported to exhibit a broad spectrum of biological activities. In this regard, in the present study, we have undertaken synthesis and characterization of new chlorosubstitutedisoxazole derivatives by the action of chlorosubstituted flavones, which were prepared from chalcones in a ecofriendly single step, with hydroxylamine hydrochloride in good yields. The newly synthesized compounds are screened against some bacteria with special reference to study antipathogenic activities. Keywords: Chlorosubstitutedisoxazoles, flavones, chalcones, antibacterial assay, antipathogenic activities.
Introduction
Literature survey shows that the chlorosubstituted heterocycles1 have antifungal2, antimicrobial3,
antitubercular4, antiviral5, and antibacterial6 activity. Taking into account the widespread applications of
chlorosubstituted heterocycles such as pyrazoles, thiazoles, isoxazoles7 in the fields of pharmaceutical,
medicine and agriculture, it was thought interesting to synthesize some new chlrosubstituted isoxazoles
and study their impact on plant pathogens especially bacteria. The isoxazoles are the compounds having
five membered ring containing both oxygen & nitrogen atoms in the 1,2 positions. It has been observed
that flavones are the best starting compounds for the preparation of isoxazole derivatives. These flavones
are prepared from chalcones in a ecofriendly single step.
Experimental
Scheme-I
Preparation of 2,4-dichloro phenyl acetate(1a): 2,4-dichlorophenol (10gm) was mixed with acetic
anhydride (12ml) and anhydrous sodium acetate (1gm). The mixture was refluxed for about an hour. The
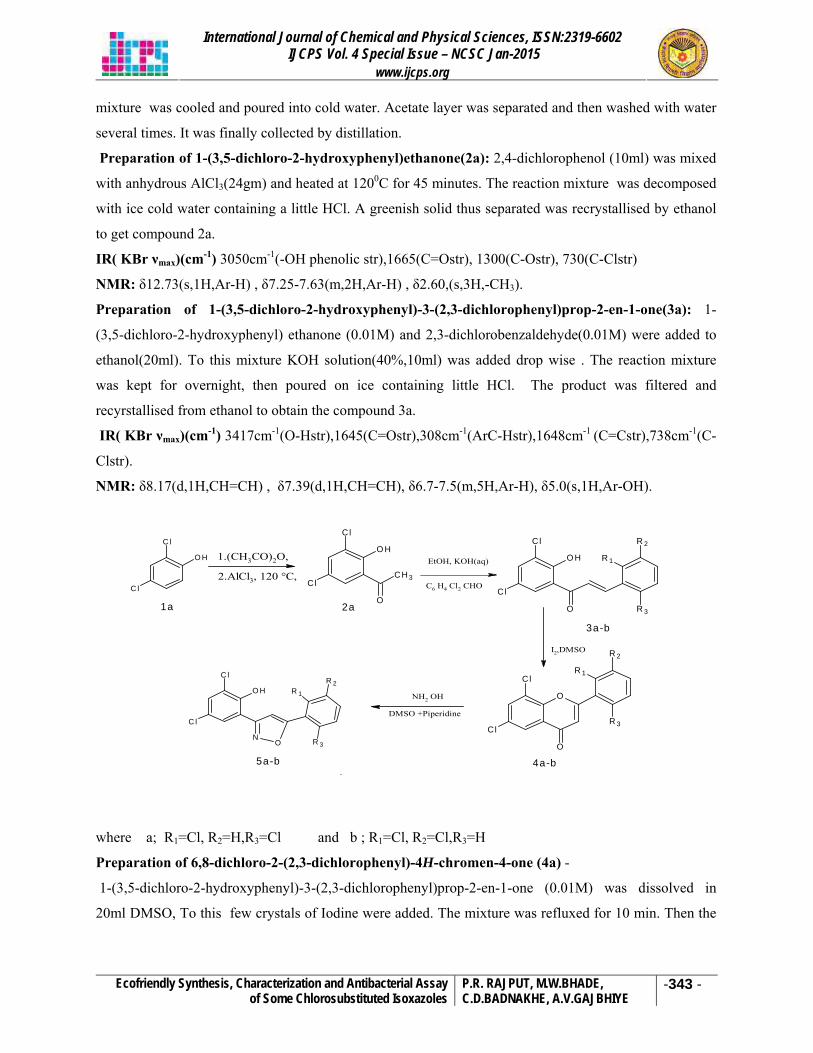
International Journal of Chemical and Physical Sciences, ISSN:2319-6602 IJCPS Vol. 4 Special Issue – NCSC Jan-2015
www.ijcps.org
Ecofriendly Synthesis, Characterization and Antibacterial Assay of Some Chlorosubstituted Isoxazoles
P.R. RAJPUT, M.W.BHADE, C.D.BADNAKHE, A.V.GAJBHIYE
-343 -
mixture was cooled and poured into cold water. Acetate layer was separated and then washed with water
several times. It was finally collected by distillation.
Preparation of 1-(3,5-dichloro-2-hydroxyphenyl)ethanone(2a): 2,4-dichlorophenol (10ml) was mixed
with anhydrous AlCl3(24gm) and heated at 1200C for 45 minutes. The reaction mixture was decomposed
with ice cold water containing a little HCl. A greenish solid thus separated was recrystallised by ethanol
to get compound 2a.
IR( KBr νmax)(cm-1) 3050cm-1(-OH phenolic str),1665(C=Ostr), 1300(C-Ostr), 730(C-Clstr)
NMR: δ12.73(s,1H,Ar-H) , δ7.25-7.63(m,2H,Ar-H) , δ2.60,(s,3H,-CH3).
Preparation of 1-(3,5-dichloro-2-hydroxyphenyl)-3-(2,3-dichlorophenyl)prop-2-en-1-one(3a): 1-
(3,5-dichloro-2-hydroxyphenyl) ethanone (0.01M) and 2,3-dichlorobenzaldehyde(0.01M) were added to
ethanol(20ml). To this mixture KOH solution(40%,10ml) was added drop wise . The reaction mixture
was kept for overnight, then poured on ice containing little HCl. The product was filtered and
recyrstallised from ethanol to obtain the compound 3a.
IR( KBr νmax)(cm-1) 3417cm-1(O-Hstr),1645(C=Ostr),308cm-1(ArC-Hstr),1648cm-1 (C=Cstr),738cm-1(C-
Clstr).
NMR: δ8.17(d,1H,CH=CH) , δ7.39(d,1H,CH=CH), δ6.7-7.5(m,5H,Ar-H), δ5.0(s,1H,Ar-OH).
1.(CH3CO)2O,
2.AlCl3, 120 °C,
Cl
O H
Cl
O
CH 3
2a
EtOH, KOH(aq)
C6 H4 Cl2 CHOCl
C l
O H
O
R 1
R 3
R 2
Cl
C l
O
O
R 1
R 2
R 3
I2,DMSO
C l
C l
O H
NO
R 1
R 2
R 3
NH2 OH
DMSO +Piperidine
5a-b
1a
C l
C l
O H
3a-b
4a-b
where a; R1=Cl, R2=H,R3=Cl and b ; R1=Cl, R2=Cl,R3=H
Preparation of 6,8-dichloro-2-(2,3-dichlorophenyl)-4H-chromen-4-one (4a) -
1-(3,5-dichloro-2-hydroxyphenyl)-3-(2,3-dichlorophenyl)prop-2-en-1-one (0.01M) was dissolved in
20ml DMSO, To this few crystals of Iodine were added. The mixture was refluxed for 10 min. Then the
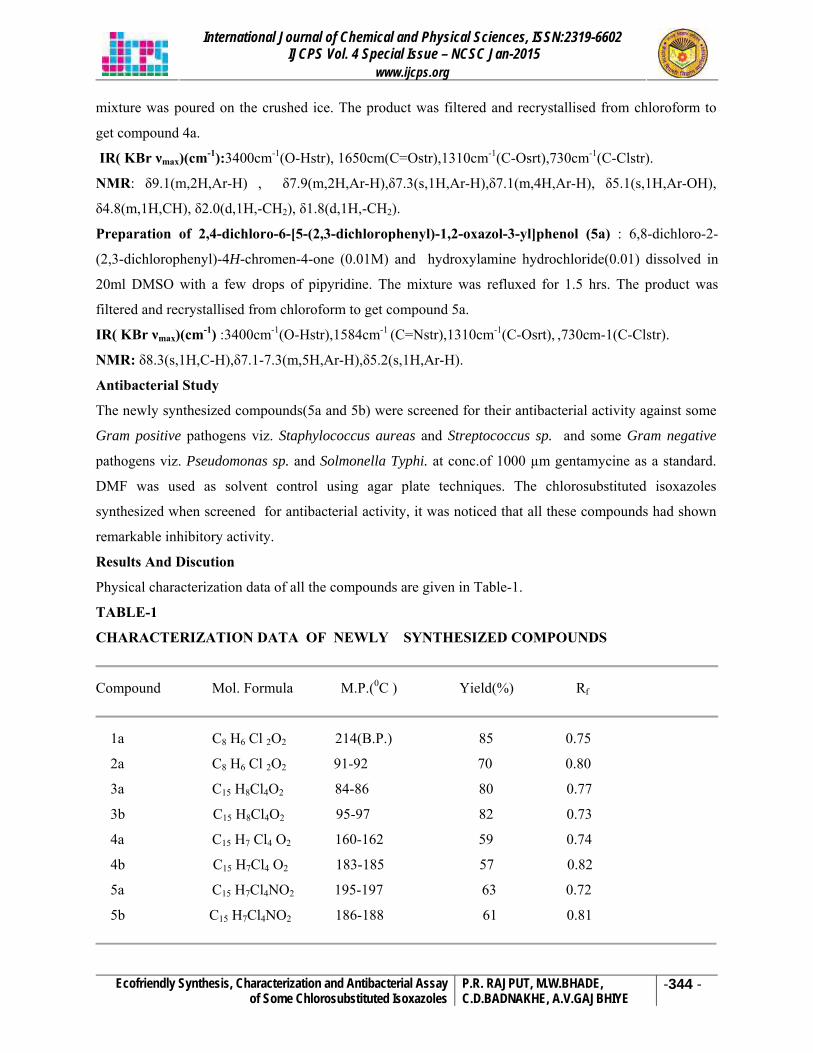
International Journal of Chemical and Physical Sciences, ISSN:2319-6602 IJCPS Vol. 4 Special Issue – NCSC Jan-2015
www.ijcps.org
Ecofriendly Synthesis, Characterization and Antibacterial Assay of Some Chlorosubstituted Isoxazoles
P.R. RAJPUT, M.W.BHADE, C.D.BADNAKHE, A.V.GAJBHIYE
-344 -
mixture was poured on the crushed ice. The product was filtered and recrystallised from chloroform to
get compound 4a.
IR( KBr νmax)(cm-1):3400cm-1(O-Hstr), 1650cm(C=Ostr),1310cm-1(C-Osrt),730cm-1(C-Clstr).
NMR: δ9.1(m,2H,Ar-H) , δ7.9(m,2H,Ar-H),δ7.3(s,1H,Ar-H),δ7.1(m,4H,Ar-H), δ5.1(s,1H,Ar-OH),
δ4.8(m,1H,CH), δ2.0(d,1H,-CH2), δ1.8(d,1H,-CH2).
Preparation of 2,4-dichloro-6-[5-(2,3-dichlorophenyl)-1,2-oxazol-3-yl]phenol (5a) : 6,8-dichloro-2-
(2,3-dichlorophenyl)-4H-chromen-4-one (0.01M) and hydroxylamine hydrochloride(0.01) dissolved in
20ml DMSO with a few drops of pipyridine. The mixture was refluxed for 1.5 hrs. The product was
filtered and recrystallised from chloroform to get compound 5a.
IR( KBr νmax)(cm-1) :3400cm-1(O-Hstr),1584cm-1 (C=Nstr),1310cm-1(C-Osrt), ,730cm-1(C-Clstr).
NMR: δ8.3(s,1H,C-H),δ7.1-7.3(m,5H,Ar-H),δ5.2(s,1H,Ar-H).
Antibacterial Study
The newly synthesized compounds(5a and 5b) were screened for their antibacterial activity against some
Gram positive pathogens viz. Staphylococcus aureas and Streptococcus sp. and some Gram negative
pathogens viz. Pseudomonas sp. and Solmonella Typhi. at conc.of 1000 µm gentamycine as a standard.
DMF was used as solvent control using agar plate techniques. The chlorosubstituted isoxazoles
synthesized when screened for antibacterial activity, it was noticed that all these compounds had shown
remarkable inhibitory activity.
Results And Discution
Physical characterization data of all the compounds are given in Table-1.
TABLE-1
CHARACTERIZATION DATA OF NEWLY SYNTHESIZED COMPOUNDS
Compound Mol. Formula M.P.(0C ) Yield(%) Rf
1a C8 H6 Cl 2O2 214(B.P.) 85 0.75
2a C8 H6 Cl 2O2 91-92 70 0.80
3a C15 H8Cl4O2 84-86 80 0.77
3b C15 H8Cl4O2 95-97 82 0.73
4a C15 H7 Cl4 O2 160-162 59 0.74
4b C15 H7Cl4 O2 183-185 57 0.82
5a C15 H7Cl4NO2 195-197 63 0.72
5b C15 H7Cl4NO2 186-188 61 0.81
International Journal of Chemical and Physical Sciences, ISSN:2319-6602 IJCPS Vol. 4 Special Issue – NCSC Jan-2015
www.ijcps.org
Ecofriendly Synthesis, Characterization and Antibacterial Assay of Some Chlorosubstituted Isoxazoles
P.R. RAJPUT, M.W.BHADE, C.D.BADNAKHE, A.V.GAJBHIYE
-345 -
The synthetic routes which furnished the target compounds are shown below along with their IR and
NMR data. The newly synthesized compounds (5a and 5b) were found to be active against test
pathogens. A further detailed study in the light of Medical sciences is advised.
Acknowledgements
The authors are thankful to Amolakchand Mahavidyalaya, Yavatmal and Vidyabharati Mahavidyalaya,
Amravati for providing all the facilities to carry out synthetic work and Punjab University Chandigarh for
providing spectral data, Shri Shankarlal Khandelwal College ,Akola for providing help in carrying out
the antibacterial activities.
References
[1]. Vinata V. Mulwad, Bhushan P Langi and Atul C Chaskar, Acta Polo. Pharma.Drug Research,
68(1),39-47,(2011).
[2]. D. D. Guy, P. M. Carabates, (Sterling Drug Inc.) U.S. 4,268,678 (C1. 548-247;
C07D261/08), 19 May (1981), Appl. 72,134, 04 Sep (1979); 4 pp; Chem. Abstr., 1981,
95,203923n
[3]. M. T. Shreenivas, B. E. Kumara Swamy, J. G. Manjunatha, Umesh Chandra, G. R.Srinivasa and
B. S. Sherigara Der Pharma Chemica, 2011, 3 (6),224-234
[4]. Caradonna, C.and Stein,M.L.,Farmoco. Edn. Sci, 15, (1960), 674
[5]. Stelger, N., Chem Abstr., 45 (1951), 10259.
[6]. Okuda, T., Kitamura, J. and azika, Proc. Gifu. Coll. Pharm., K.A.,No.5 (1955), 208.
[7]. B Veeraswamy, C.Kurumurthy, G Santosh Kumar, P Sambsiva Rao, Kavya Thelekkal,
Srigiridhar Kotamraju and B Narsaiah, Indian J. Chemistry, 51B,( 2012), 1369-75.
International Journal of Chemical and Physical Sciences, ISSN:2319-6602 IJCPS Vol. 4 Special Issue – NCSC Jan-2015
www.ijcps.org
Studies in Acoustic Parameters of Promethazine Drug in Dioxane-Water Solvent at Different Temperatures
U.S. WASNIK, R.M.JUMLE, P.R. RAJPUT
-478 -
Studies in Acoustic Parameters of Promethazine Drug in Dioxane-Water Solvent at Different Temperatures
U.S. WASNIK1, R.M.JUMLE2 AND P.R. RAJPUT3
1-Department of Chemistry, Arts Science and Commerce College, Chikhaldara Dist : Amravati (M.S.)
2-Department of Chemistry , Shivaji College, AkotDist : Akola (M.S.) India 3-Department of Chemistry, VBMV, Amravati (M.S.) India
Corresponding author: [email protected]
Abstract Measurements of ultrasonic velocity have been carried out for Promethazine hudrochloride (PM) at three different temperatures. Viscosities and densities of present system have been measured at 303K, 308K & 313K. From this data various acoustic parameters such as apparent molar compressibility (φk ), apparent molar volume (φv ), adiabatic compressibility (βs), specific acoustic impendence (Z), intermolecular free length (Lf ), molar compressibility (W) & relative association (RA) have been determined. From these derived parameters limiting apparent molal volume (φ0
v ), limiting apparent molal compressibility (φ0
k ) and Experimental slopes (S0V&S0
K) have calculated by using Massons equation. The viscosity data are analysed using Jones – Dole equation. The results are interpreted on the basis of solute-solvent and solute-solute interactions. Keywords: Promethazine hydrochloride, acoustic parameters.
Introduction
The studies on volumetric, ultrasonic and viscometric properties of liquid mixtures and their dependence
on composition and temperature are of importance in many fields of applied research and find
applications in many important chemical, textile, leather, industrial and biological process. Ultrasonic
waves provide valuable information about the molecular interaction in pure liquids, aqueous solutions,
liquid mixtures and also provide valuable information about the structure of solids1-4.
Ultrasonic velocity measurements have been successfully employed to detect and assess weak and strong
molecular interactions, present in binary liquid mixtures 5, 6. Ultrasonic studies have found wide
applications owing to their ability to characterize the physico-chemical behaviour of solutions. The excess
properties have been claimed to be an aid in the characterization of the molecular interactions that are
present in solutions and liquid mixtures. This is achieved through elevation of ideal quantities. In recent
years, considerable efforts have been given for the elevation of ideal and excess thermodynamic
quantities of binary and ternary liquid mixtures 7, 8.The study of molecular interaction in the liquid
mixtures is of considerable in the elucidation of the structural properties of the molecules.
The nature and degree of molecular interactions in different solutions depend upon the nature of the
medium, the structure of the solute molecule and also the extent of solvation taking place in solution.For
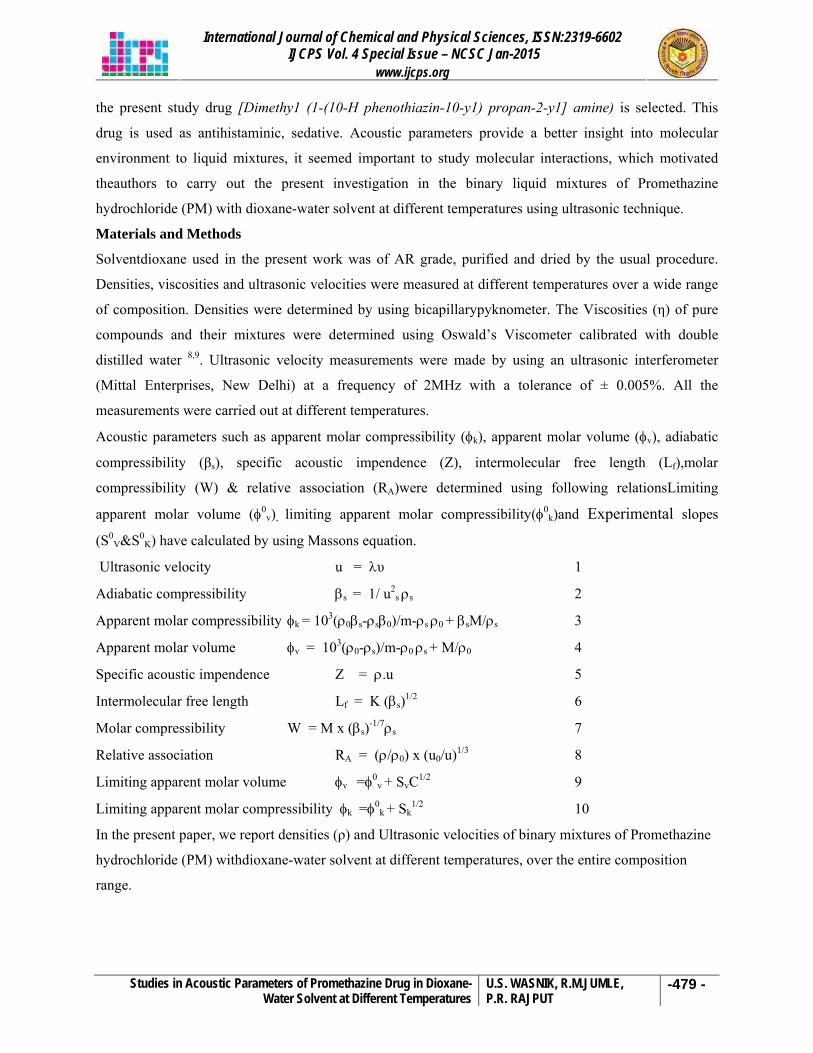
International Journal of Chemical and Physical Sciences, ISSN:2319-6602 IJCPS Vol. 4 Special Issue – NCSC Jan-2015
www.ijcps.org
Studies in Acoustic Parameters of Promethazine Drug in Dioxane-Water Solvent at Different Temperatures
U.S. WASNIK, R.M.JUMLE, P.R. RAJPUT
-479 -
the present study drug [Dimethy1 (1-(10-H phenothiazin-10-y1) propan-2-y1] amine) is selected. This
drug is used as antihistaminic, sedative. Acoustic parameters provide a better insight into molecular
environment to liquid mixtures, it seemed important to study molecular interactions, which motivated
theauthors to carry out the present investigation in the binary liquid mixtures of Promethazine
hydrochloride (PM) with dioxane-water solvent at different temperatures using ultrasonic technique.
Materials and Methods
Solventdioxane used in the present work was of AR grade, purified and dried by the usual procedure.
Densities, viscosities and ultrasonic velocities were measured at different temperatures over a wide range
of composition. Densities were determined by using bicapillarypyknometer. The Viscosities (η) of pure
compounds and their mixtures were determined using Oswald’s Viscometer calibrated with double
distilled water 8,9. Ultrasonic velocity measurements were made by using an ultrasonic interferometer
(Mittal Enterprises, New Delhi) at a frequency of 2MHz with a tolerance of ± 0.005%. All the
measurements were carried out at different temperatures.
Acoustic parameters such as apparent molar compressibility (φk), apparent molar volume (φv), adiabatic
compressibility (βs), specific acoustic impendence (Z), intermolecular free length (Lf),molar
compressibility (W) & relative association (RA)were determined using following relationsLimiting
apparent molar volume (φ0v), limiting apparent molar compressibility(φ0
k)and Experimental slopes
(S0V&S0
K) have calculated by using Massons equation.
Ultrasonic velocity u = λυ 1
Adiabatic compressibility βs = 1/ u2s ρs 2
Apparent molar compressibility φk = 103(ρ0βs-ρsβ0)/m-ρs ρ0 + βsM/ρs 3
Apparent molar volume φv = 103(ρ0-ρs)/m-ρ0 ρs + M/ρ0 4
Specific acoustic impendence Z = ρ.u 5
Intermolecular free length Lf = K (βs)1/2 6
Molar compressibility W = M x (βs)-1/7ρs 7
Relative association RA = (ρ/ρ0) x (u0/u)1/3 8
Limiting apparent molar volume φv =φ0v + SvC1/2 9
Limiting apparent molar compressibility φk =φ0k + Sk
1/2 10
In the present paper, we report densities (ρ) and Ultrasonic velocities of binary mixtures of Promethazine
hydrochloride (PM) withdioxane-water solvent at different temperatures, over the entire composition
range.
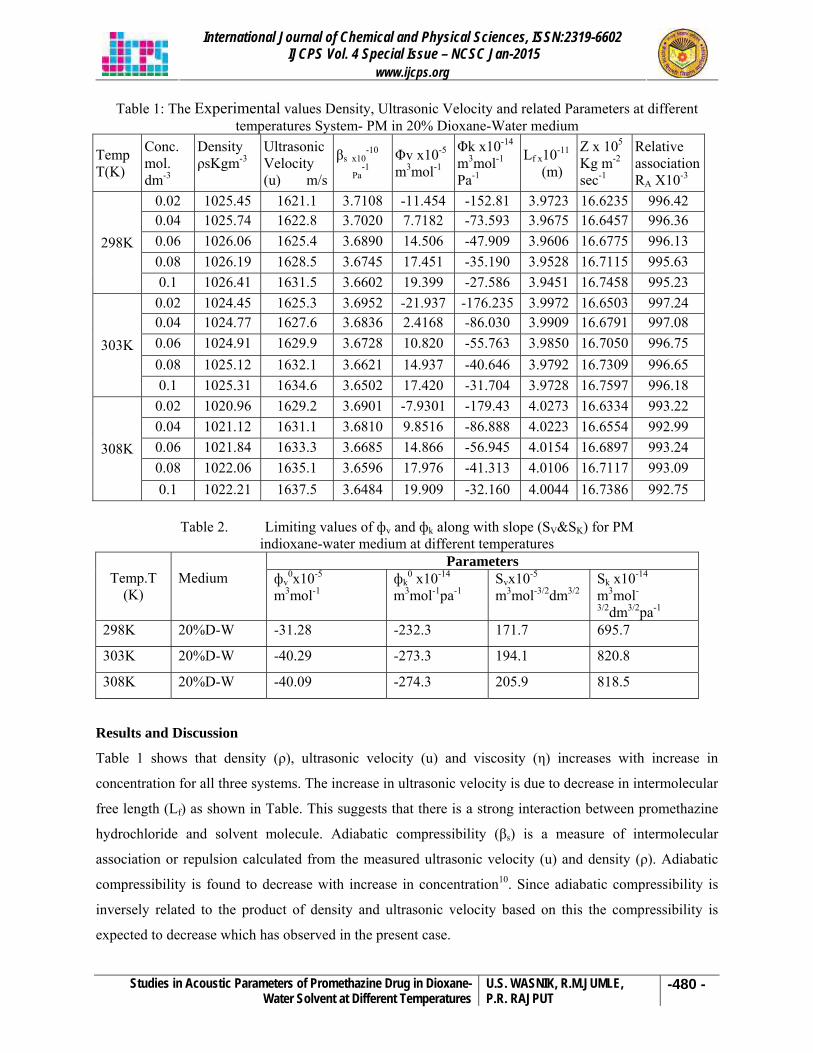
International Journal of Chemical and Physical Sciences, ISSN:2319-6602 IJCPS Vol. 4 Special Issue – NCSC Jan-2015
www.ijcps.org
Studies in Acoustic Parameters of Promethazine Drug in Dioxane-Water Solvent at Different Temperatures
U.S. WASNIK, R.M.JUMLE, P.R. RAJPUT
-480 -
Table 1: The Experimental values Density, Ultrasonic Velocity and related Parameters at different temperatures System- PM in 20% Dioxane-Water medium
Temp T(K)
Conc. mol. dm-3
Density ρsKgm-3
Ultrasonic Velocity (u) m/s
βs x10-10
Pa-1
Φv x10-5 m3mol-1
Φk x10-14 m3mol-1
Pa-1
Lf x10-11
(m)
Z x 105 Kg m-2
sec-1
Relative associationRA X10-3
0.02 1025.45 1621.1 3.7108 -11.454 -152.81 3.9723 16.6235 996.42 0.04 1025.74 1622.8 3.7020 7.7182 -73.593 3.9675 16.6457 996.36 0.06 1026.06 1625.4 3.6890 14.506 -47.909 3.9606 16.6775 996.13 0.08 1026.19 1628.5 3.6745 17.451 -35.190 3.9528 16.7115 995.63
298K
0.1 1026.41 1631.5 3.6602 19.399 -27.586 3.9451 16.7458 995.23 0.02 1024.45 1625.3 3.6952 -21.937 -176.235 3.9972 16.6503 997.24 0.04 1024.77 1627.6 3.6836 2.4168 -86.030 3.9909 16.6791 997.08 0.06 1024.91 1629.9 3.6728 10.820 -55.763 3.9850 16.7050 996.75 0.08 1025.12 1632.1 3.6621 14.937 -40.646 3.9792 16.7309 996.65
303K
0.1 1025.31 1634.6 3.6502 17.420 -31.704 3.9728 16.7597 996.18 0.02 1020.96 1629.2 3.6901 -7.9301 -179.43 4.0273 16.6334 993.22 0.04 1021.12 1631.1 3.6810 9.8516 -86.888 4.0223 16.6554 992.99 0.06 1021.84 1633.3 3.6685 14.866 -56.945 4.0154 16.6897 993.24 0.08 1022.06 1635.1 3.6596 17.976 -41.313 4.0106 16.7117 993.09
308K
0.1 1022.21 1637.5 3.6484 19.909 -32.160 4.0044 16.7386 992.75
Table 2. Limiting values of фv and фk along with slope (SV&SK) for PM indioxane-water medium at different temperatures
Parameters Temp.T
(K)
Medium фv
0x10-5
m3mol-1 фk
0 x10-14 m3mol-1pa-1
Svx10-5 m3mol-3/2dm3/2
Sk x10-14 m3mol-
3/2dm3/2pa-1 298K 20%D-W -31.28 -232.3 171.7 695.7
303K 20%D-W -40.29 -273.3 194.1 820.8
308K 20%D-W -40.09 -274.3 205.9 818.5
Results and Discussion
Table 1 shows that density (ρ), ultrasonic velocity (u) and viscosity (η) increases with increase in
concentration for all three systems. The increase in ultrasonic velocity is due to decrease in intermolecular
free length (Lf) as shown in Table. This suggests that there is a strong interaction between promethazine
hydrochloride and solvent molecule. Adiabatic compressibility (βs) is a measure of intermolecular
association or repulsion calculated from the measured ultrasonic velocity (u) and density (ρ). Adiabatic
compressibility is found to decrease with increase in concentration10. Since adiabatic compressibility is
inversely related to the product of density and ultrasonic velocity based on this the compressibility is
expected to decrease which has observed in the present case.
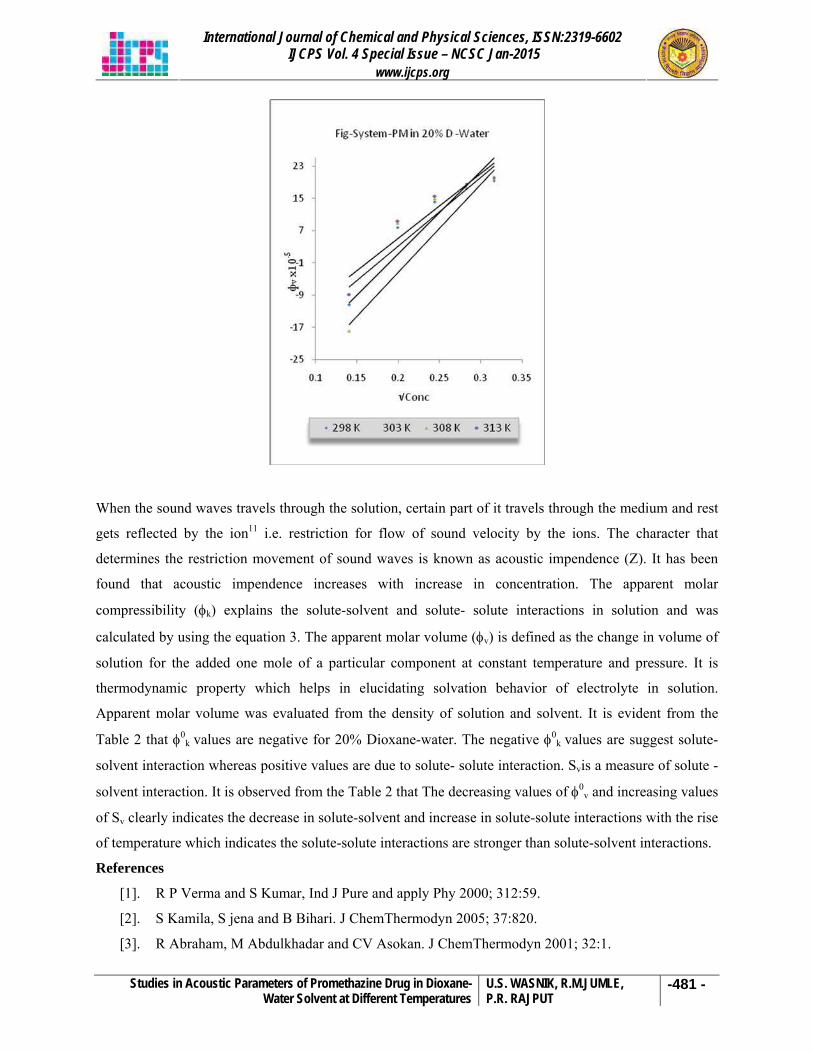
International Journal of Chemical and Physical Sciences, ISSN:2319-6602 IJCPS Vol. 4 Special Issue – NCSC Jan-2015
www.ijcps.org
Studies in Acoustic Parameters of Promethazine Drug in Dioxane-Water Solvent at Different Temperatures
U.S. WASNIK, R.M.JUMLE, P.R. RAJPUT
-481 -
When the sound waves travels through the solution, certain part of it travels through the medium and rest
gets reflected by the ion11 i.e. restriction for flow of sound velocity by the ions. The character that
determines the restriction movement of sound waves is known as acoustic impendence (Z). It has been
found that acoustic impendence increases with increase in concentration. The apparent molar
compressibility (φk) explains the solute-solvent and solute- solute interactions in solution and was
calculated by using the equation 3. The apparent molar volume (φv) is defined as the change in volume of
solution for the added one mole of a particular component at constant temperature and pressure. It is
thermodynamic property which helps in elucidating solvation behavior of electrolyte in solution.
Apparent molar volume was evaluated from the density of solution and solvent. It is evident from the
Table 2 that φ0k values are negative for 20% Dioxane-water. The negative φ0
k values are suggest solute-
solvent interaction whereas positive values are due to solute- solute interaction. Svis a measure of solute -
solvent interaction. It is observed from the Table 2 that The decreasing values of φ0v and increasing values
of Sv clearly indicates the decrease in solute-solvent and increase in solute-solute interactions with the rise
of temperature which indicates the solute-solute interactions are stronger than solute-solvent interactions.
References
[1]. R P Verma and S Kumar, Ind J Pure and apply Phy 2000; 312:59.
[2]. S Kamila, S jena and B Bihari. J ChemThermodyn 2005; 37:820.
[3]. R Abraham, M Abdulkhadar and CV Asokan. J ChemThermodyn 2001; 32:1.
International Journal of Chemical and Physical Sciences, ISSN:2319-6602 IJCPS Vol. 4 Special Issue – NCSC Jan-2015
www.ijcps.org
Studies in Acoustic Parameters of Promethazine Drug in Dioxane-Water Solvent at Different Temperatures
U.S. WASNIK, R.M.JUMLE, P.R. RAJPUT
-482 -
[4]. S Mukharjee, C Basu and US Ghosh. J Non-Cryst Solids.1992; 144:159.
[5]. Kannappan V and Jaya SanthiR Indian J pure &applPhy 2005;43, 750.
[6]. Kannappan V, Xavier Jesu Raja and JayasanthiR Indian J pure &apply 2003;41,690.
[7]. Jayakumar S, Karunanithi N, Kannappan V andGunasekaran S Asian Chem Lett1999;3, 224.
[8]. YonzhanLuo and Robert L Bldwin J MolBiology 1998; 49, 279.
[9]. Kannappan V and Jaya Santhi R Indian J pure & apply 2005; 43,167.
[10]. Owen B.B and Kronick P K, J Phys Chem,1961; 65:81.
[11]. Sumathi T & Uma Maheshwari, Indian J Pure and Applied phys., 2009; 47:782

Internationally indexed journalInternationally indexed journalInternationally indexed journalInternationally indexed journal Indexed in Chemical Abstract Services (USA), Index coppernicus, Ulrichs Directory of Periodicals, Google scholar, CABI ,DOAJ , PSOAR, EBSCO , Open J gate , Proquest , SCOPUS , EMBASE ,etc.
.
..
Rapid and Easy PublishingRapid and Easy PublishingRapid and Easy PublishingRapid and Easy Publishing The “International Journal of Pharma and Bio Sciences” (IJPBS) is an international journal in English published quarterly. The aim of IJPBS is to publish peer reviewed research and review articles rapidly
without delay in the developing field of pharmaceutical and biological sciences
www.ijpbs.net
Indexed in Elsevier Bibliographic Database
(Scopus and EMBASE)
SCImago Journal Rank 0.288
Impact factor 2.958*
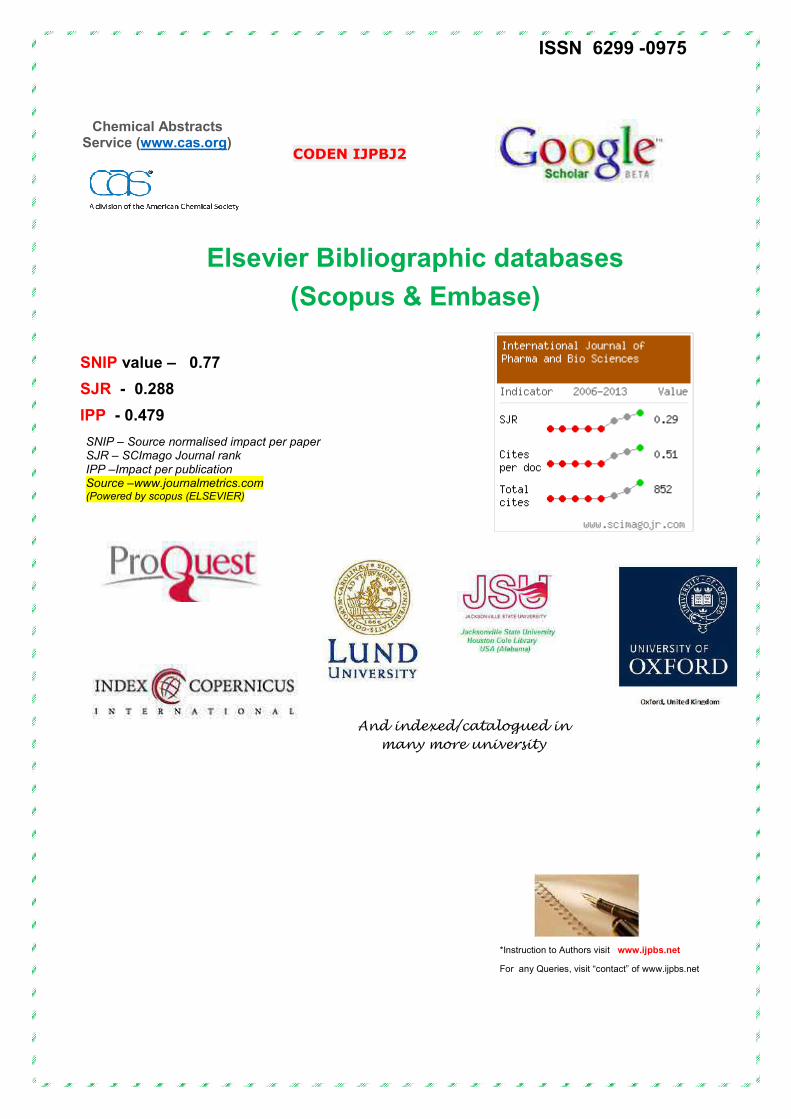
Elsevier B
Chemical Abstracts Service (www.cas.org)
SNIP value – 0.77
SJR - 0.288
IPP - 0.479
SNIP – Source normalised impact per paSJR – SCImago Journal rank IPP –Impact per publication Source –www.journalmetrics.com (Powered by scopus (ELSEVIER)
ISSN 6
Elsevier Bibliographic database
(Scopus & Embase)
CODEN IJPBJ2
ct per paper
And indexed/catalogued in many more university
*Instruction to Author
For any Queries, vis
ISSN 6299 -0975
ic databases
d in
Authors visit www.ijpbs.net
Queries, visit “contact” of www.ijpbs.net
Int J Pharm Bio Sci 2015 Jan; 6(1): (P) 213 - 218
This article can be downloaded from www.ijpbs.net
P - 213
Research Article Medicinal chemistry
International Journal of Pharma and Bio Sciences ISSN
0975-6299
SYNTHESIS, CHARACTERIZATION AND ANTIMICROBIAL
SCREENING OF SOME PYRAZOLES.
V. D. MANE*1, D. T. MAHAJAN2 AND P. R. RAJPUT2
1Department of Chemistry, S. K. College, Akola, India.
2Department of Chemistry, Vidyabharti Mahavidyalaya Amravati, India.
ABSTRACT
In the present study the pyrazole have been synthesized by the reaction of chalcone dibromide with phenyl hydrazine hydrochloride to afford the yellow solids of pyrazoles. The synthesized compounds have been confirmed by their chemical, analytical and spectral study and these synthesized compounds have been screened for their antimicrobial activity against some kharip plant pathogens viz Xanthomonas Campestris, Alternari Macrospora, Fusarium Spp.Pseudomonas syringae. KEYWORDS:Pyrazole, chalconedibromide, antimicrobial activity, plant pathogen, chalcone.
*Corresponding author
V. D. MANE
Department of Chemistry, S. K. College, Akola, India.
Int J Pharm Bio Sci 2015 Jan; 6(1): (P) 213 - 218
This article can be downloaded from www.ijpbs.net
P - 214
INTRODUCTION
The great majority of the known compounds with two hetero atoms in the five membered ring are aromatic and can be derived formally from pyrrole by the replacement of one of the methine (-CH=) by a nitrogen atom in case of pyrazole. As early as 1884 Knorr discovered the antipyretic action of pyrazole derivatives in the man, knorr named the compound antipyrine. This stimulated interest in pyrazole chemistry a number of pharmaceuticals and dyestuffs contain the pyrazole ring1. The literature survey shows that pyrazole and its derivatives are an important class of compounds and attracted vide spread attention due to their pharmacological properties, being reported to have a large spectrum of biological effects2, especially analgesic3 and anti-inflammatory4, antibacterial5, antiparasitic6, antiamoebic7, antifungal8 and antiaggregating9, properties.
MATERIALS AND METHODS
Preparation of 2-hydroxy 3, 5-dichloroacetophenone (2a) 2-hydroxy 3, 5-dichloroacetate (50 ml) was mixed with anhydrous AlCl3 (120 gm) and heated at 120oC for 45 minutes on the parafine oil bath. The reaction mixture was decomposed by taking ice cold water containing a few amount of HCl acid and allowing the solution to fall drop by drop into cold water with constant stirring . A greenish white solid of compound (2a) was obtained. Preparation of 2-hydroxy-3, 5-dichlorophenyl-4-p-chlorochalcone (3a, 3b) 2-Hydroxy-3,5-dichloroacetophenone(2a) (0.01mol) and p-chlorobenzaldehyde and p, m-dichlorobenzaldehyde (0.01mol), were dissolved in ethanol (25ml). after that in this solution the 40% 30 ml NaOH solution is added drop wise with constant stirring getting the saffron color solid kept it overnight after that
acidify this solid by 50% HCL solution, affords a yellow solid was filtered, washed with sodium bicarbonate (10%) followed by water. The crude product was crystallized from ethanol acetic acid. Synthesis of 2-hydroxy 3, 5-dichlorophenylchalconedibromide (6a, 6b) 2-hydroxy 3, 5-dichlorophenyl chalcone (3a) and chalcone (3b) (0.01 mol 3.26, 3.65gm respectively) was dissolved in bromine -acetic acid reagent (25%, w/v) (6.4 ml). The reagent was added drop wise with constant stirring. After complete addition of reagent, the reaction mixture was kept at room temperature for about 30 minutes. The solid product thus separated was filtered and washed with a little petroleum ether to get the compound (6a) and (6b). Synthesis of 2-hydroxy-3, 5-dichlorophenyl pyrazole (7a, 7b) A mixture of chalconedibromide (6a) and (6b) (0.01 mol, 4.84 and 5.18 gm, respectively) and Ph.NH.NH2.HCl (0.02 mol, 2.78gm) was refluxed in ethanol (20 ml) and piperidine (1ml) for about 3.5 hours. After cooling the reaction mixture was acidified with dil. HCl (1:1). The solid product separated was filtered, washed with sodium bicarbonate solution (5 %) and water. The product was finally crystallized from ethanol-acetic acid mixture to get the compound (7a) and (7b). Characterization of the compounds Melting points of all synthesized compounds were determined in open capillaries and are uncorrected. IR spectra were recorded on Perkin-Elmer 1000 Spectrophotometer in KBr. NMR spectra were recorded on Bruker advance 400 NMR spectrometer using TMS as internal standard and chemical shift were expressed in δ ppm.
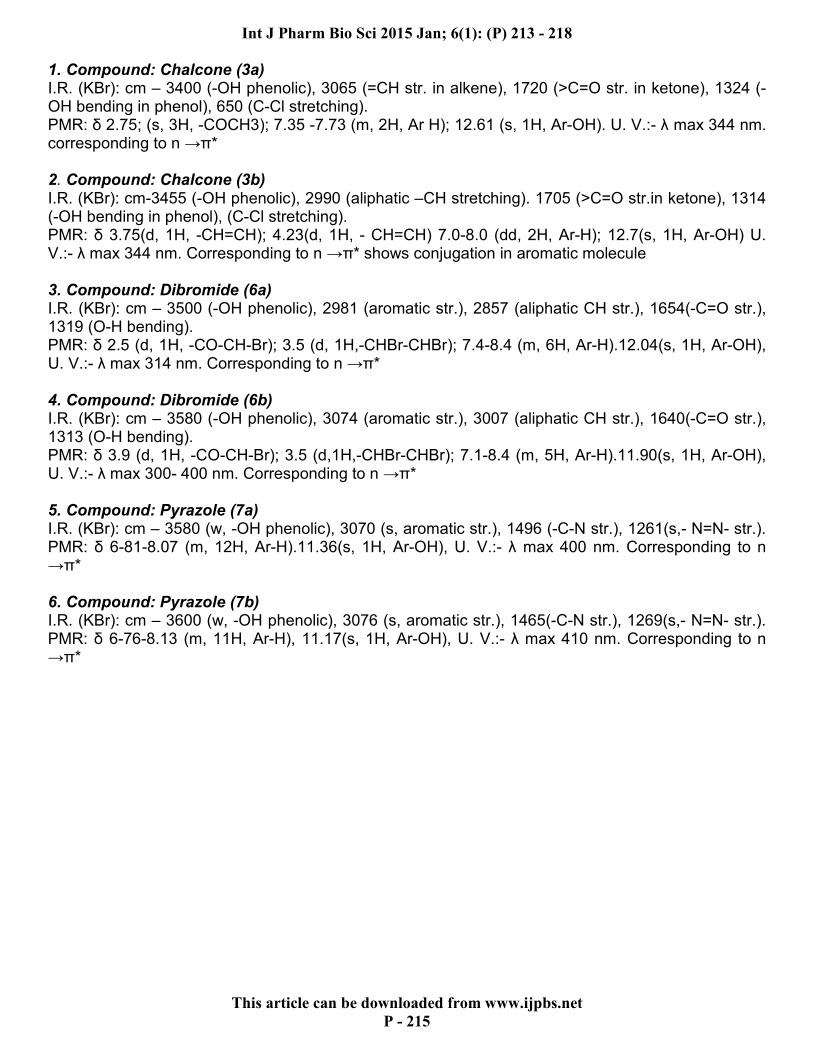
Int J Pharm Bio Sci 2015 Jan; 6(1): (P) 213 - 218
This article can be downloaded from www.ijpbs.net
P - 215
1. Compound: Chalcone (3a) I.R. (KBr): cm – 3400 (-OH phenolic), 3065 (=CH str. in alkene), 1720 (>C=O str. in ketone), 1324 (-OH bending in phenol), 650 (C-Cl stretching). PMR: δ 2.75; (s, 3H, -COCH3); 7.35 -7.73 (m, 2H, Ar H); 12.61 (s, 1H, Ar-OH). U. V.:- λ max 344 nm. corresponding to n →π* 2. Compound: Chalcone (3b) I.R. (KBr): cm-3455 (-OH phenolic), 2990 (aliphatic –CH stretching). 1705 (>C=O str.in ketone), 1314 (-OH bending in phenol), (C-Cl stretching). PMR: δ 3.75(d, 1H, -CH=CH); 4.23(d, 1H, - CH=CH) 7.0-8.0 (dd, 2H, Ar-H); 12.7(s, 1H, Ar-OH) U. V.:- λ max 344 nm. Corresponding to n →π* shows conjugation in aromatic molecule 3. Compound: Dibromide (6a) I.R. (KBr): cm – 3500 (-OH phenolic), 2981 (aromatic str.), 2857 (aliphatic CH str.), 1654(-C=O str.), 1319 (O-H bending). PMR: δ 2.5 (d, 1H, -CO-CH-Br); 3.5 (d, 1H,-CHBr-CHBr); 7.4-8.4 (m, 6H, Ar-H).12.04(s, 1H, Ar-OH), U. V.:- λ max 314 nm. Corresponding to n →π* 4. Compound: Dibromide (6b) I.R. (KBr): cm – 3580 (-OH phenolic), 3074 (aromatic str.), 3007 (aliphatic CH str.), 1640(-C=O str.), 1313 (O-H bending). PMR: δ 3.9 (d, 1H, -CO-CH-Br); 3.5 (d,1H,-CHBr-CHBr); 7.1-8.4 (m, 5H, Ar-H).11.90(s, 1H, Ar-OH), U. V.:- λ max 300- 400 nm. Corresponding to n →π* 5. Compound: Pyrazole (7a) I.R. (KBr): cm – 3580 (w, -OH phenolic), 3070 (s, aromatic str.), 1496 (-C-N str.), 1261(s,- N=N- str.). PMR: δ 6-81-8.07 (m, 12H, Ar-H).11.36(s, 1H, Ar-OH), U. V.:- λ max 400 nm. Corresponding to n →π* 6. Compound: Pyrazole (7b) I.R. (KBr): cm – 3600 (w, -OH phenolic), 3076 (s, aromatic str.), 1465(-C-N str.), 1269(s,- N=N- str.). PMR: δ 6-76-8.13 (m, 11H, Ar-H), 11.17(s, 1H, Ar-OH), U. V.:- λ max 410 nm. Corresponding to n →π*
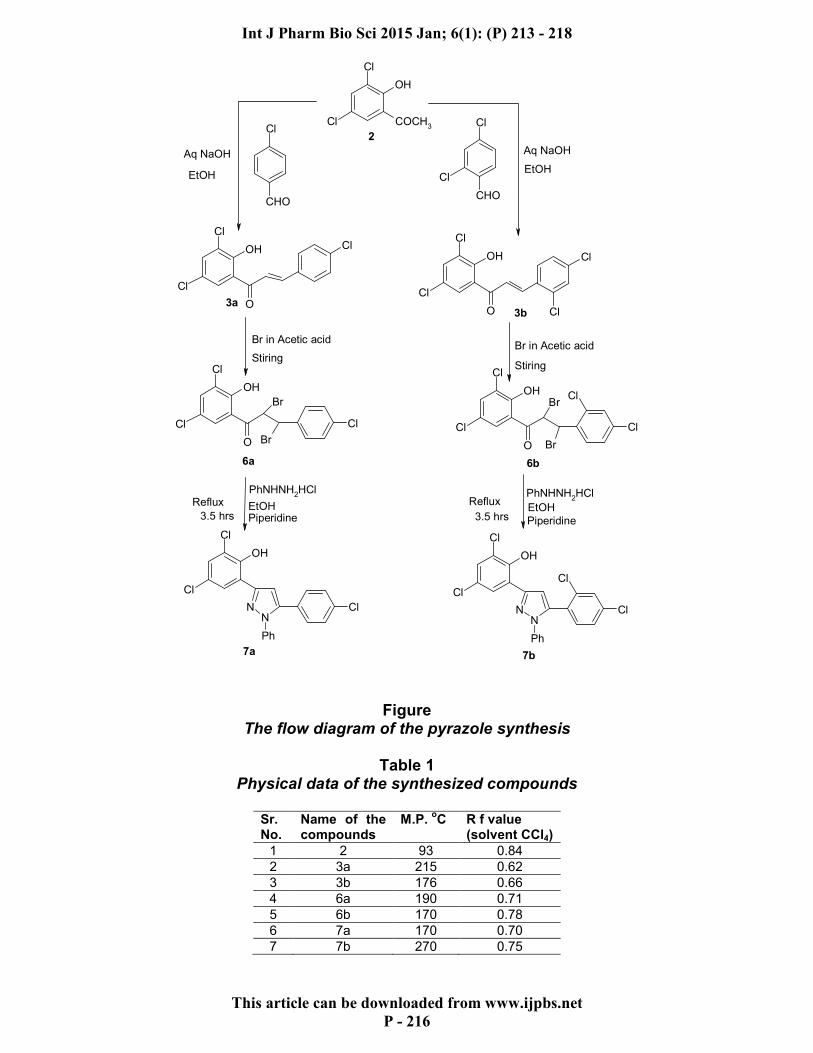
Int J Pharm Bio Sci 2015 Jan; 6(1): (P) 213 - 218
This article can be downloaded from www.ijpbs.net
P - 216
Cl
Cl
OH
O
Br
Cl
Cl
Cl
Cl
OH
COCH3 Cl
Cl
CHO
Cl
CHO
Aq NaOH
EtOH
Aq NaOH
EtOH
Cl
Cl
OH
O
Cl
Br
Cl
Cl
OH
O
ClCl
Cl
OH
O
Cl
Cl
Br in Acetic acidBr in Acetic acid
StiringStiring
PhNHNH2HCl PhNHNH
2HCl
EtOH EtOHPiperidine Piperidine
Reflux Reflux
Cl
Cl
OH
Cl
Cl
OH
NN Cl
Ph
NN Cl
Cl
Ph
Br Br
2
3a
6a 6b
3.5 hrs 3.5 hrs
7a 7b
3b
Figure The flow diagram of the pyrazole synthesis
Table 1
Physical data of the synthesized compounds
Sr. No.
Name of the compounds
M.P. oC R f value
(solvent CCl4)
1 2 93 0.84
2 3a 215 0.62
3 3b 176 0.66
4 6a 190 0.71
5 6b 170 0.78
6 7a 170 0.70
7 7b 270 0.75
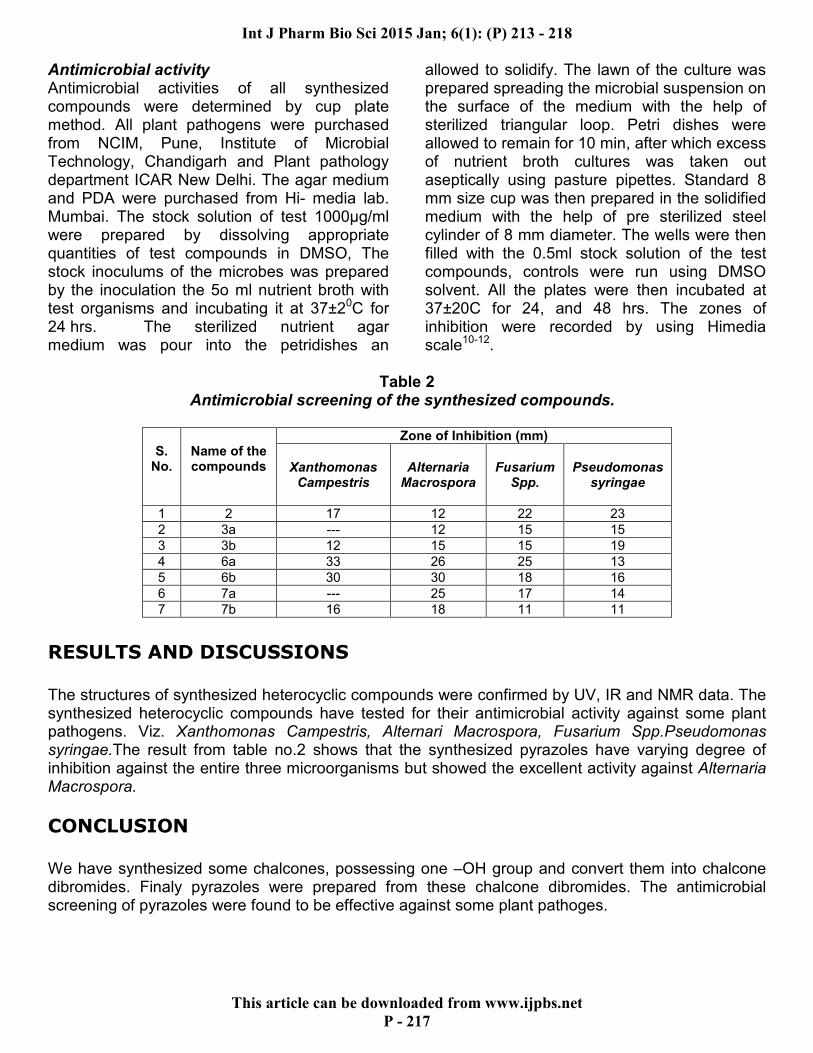
Int J Pharm Bio Sci 2015 Jan; 6(1): (P) 213 - 218
This article can be downloaded from www.ijpbs.net
P - 217
Antimicrobial activity Antimicrobial activities of all synthesized compounds were determined by cup plate method. All plant pathogens were purchased from NCIM, Pune, Institute of Microbial Technology, Chandigarh and Plant pathology department ICAR New Delhi. The agar medium and PDA were purchased from Hi- media lab. Mumbai. The stock solution of test 1000µg/ml were prepared by dissolving appropriate quantities of test compounds in DMSO, The stock inoculums of the microbes was prepared by the inoculation the 5o ml nutrient broth with test organisms and incubating it at 37±20C for 24 hrs. The sterilized nutrient agar medium was pour into the petridishes an
allowed to solidify. The lawn of the culture was prepared spreading the microbial suspension on the surface of the medium with the help of sterilized triangular loop. Petri dishes were allowed to remain for 10 min, after which excess of nutrient broth cultures was taken out aseptically using pasture pipettes. Standard 8 mm size cup was then prepared in the solidified medium with the help of pre sterilized steel cylinder of 8 mm diameter. The wells were then filled with the 0.5ml stock solution of the test compounds, controls were run using DMSO solvent. All the plates were then incubated at 37±20C for 24, and 48 hrs. The zones of inhibition were recorded by using Himedia scale10-12.
Table 2
Antimicrobial screening of the synthesized compounds.
S.
No.
Name of the compounds
Zone of Inhibition (mm)
Xanthomonas
Campestris
Alternaria
Macrospora
Fusarium
Spp.
Pseudomonas
syringae
1 2 17 12 22 23
2 3a --- 12 15 15
3 3b 12 15 15 19
4 6a 33 26 25 13
5 6b 30 30 18 16
6 7a --- 25 17 14
7 7b 16 18 11 11
RESULTS AND DISCUSSIONS
The structures of synthesized heterocyclic compounds were confirmed by UV, IR and NMR data. The synthesized heterocyclic compounds have tested for their antimicrobial activity against some plant pathogens. Viz. Xanthomonas Campestris, Alternari Macrospora, Fusarium Spp.Pseudomonas syringae.The result from table no.2 shows that the synthesized pyrazoles have varying degree of inhibition against the entire three microorganisms but showed the excellent activity against Alternaria Macrospora.
CONCLUSION
We have synthesized some chalcones, possessing one –OH group and convert them into chalcone dibromides. Finaly pyrazoles were prepared from these chalcone dibromides. The antimicrobial screening of pyrazoles were found to be effective against some plant pathoges.
Int J Pharm Bio Sci 2015 Jan; 6(1): (P) 213 - 218
This article can be downloaded from www.ijpbs.net
P - 218
ACKNOWLEDGMENT Authors are thankful to the Principle Dr. F. C. Raghuwanshi Vidyabharti mahavidyalaya Amravati, for providing the necessary facilities. Dr. D. D. Bhokare, Dr. A. R. Deshpande, Dept. of microbiology for helping in antimicrobial activity and Dr. P. S. Pande Dept of Chemistry for their valuable guidance.
REFERENCES
1. Bansal R. K, Heterocyclic Chemistry, 4th
edition.New age international publishers, New Delhi, 443, (2005).
2. Cheng C.C., Edward F., Elslager L. M., Werbel W. R., Leopold III, Synthesis and antineoplastic activity of 3-(2-chloroethyl)-3,4-dihydro-4-oxopyrazole [5 1-d] -1, 2, 3, 5- tetrazine-8-carboxamide and rerlated compounds: J Med Chem, 12, (545), (1969).
3. Kedar R. M, Vidhale N. N, Chincholkar M. M ,Synthesis of new heterocycles and their antimicrobial activity: Orient J Chem, 13, 143, (1997).
4. Sahu S. K., Banarjee M., Samantray A., Behera, C. and Azam M. A., Synthesis, analgesic, Anti-inflammatory and antimicrobial Activities of Some Novel Pyrazoline derivatives: Trop J Pharm Res, 7, 2, (2008).
5. Lee K. Y., Kimand J. M., Kim J. N., synthesis of heterocyclic compounds by using the Baylis-Hillman adducts: Tetrahedron Lett., 44, 6737,( 2003).
6. Singh A., Rathod S., Berad B. N., Patil S. D., Doshi, Synthesis and structural studies of some mixed ligand transition metal complexes of histidine and adenine or guanine: A. J. Orient J Chem.,16, 315, ( 2000).
7. Abidand M., Azam A., Synthesis, characterization and antiamoebic activity of 1-(thiazolo[4,5-b]quinoxaline-2-yl)-3-phenyl-2-pyrazoline derivatives: Biorg Med Chem Lett., 16, (10), 2812,( 2006).
8. Yan Li, Zang, H. Q, Liu J, Yang X. P, Liu Z. J, Stereoselective synthesis and antifungal activity of E-α-( methoxyimina) benzeneacetate derivatives containing 1, 3, 5- substituted pyrazole ring: J. Agric. Food. Chem, 54, (10), 3636-3640, (2006)
9. Lee K. Y., Kim J. M, Regioselective synthesis of 1, 2, 3, 5- tetrasubstituted pyrazoles from baylis-Hillman adducts. Tetrahedron Lett., 44, 6737, ( 2003).
10. Li JX, Xub B, Chai Q, Liu ZX, Zhao APand Chan LB., Antihypertansive Effect of Total Flavonoid fraction of Astragalus complanatus in Hypertensive Rats: Chin. J. Physiol., 48, 101-106,(2005).
11. Inoue T, Sugimoto Y, Masuda H and Kamei C., Antiallergic Effect of Flavonoid Glycosides obtained from Mentha piperita L.: Biol. Pharm. Bull,.25: 256-259, (2002).
12. Malpani M. O. and Rajput P.R., Phytochemical screening ,characterization and in vitro antimicrobial activity of beutea monosperma flower, leaves and gum: methanolic and aquous extract. Int. J. Pharm. Bio. Sci., 4, (2): 427 – 430, 2013.
International Journal of Chemical and Physical Sciences, ISSN:2319-6602 IJCPS Vol. 4 Special Issue – NCSC Jan-2015
www.ijcps.org
Microwave Assisted Solvent Free Synthesis of 2,7-(Substituted Phenyl)- 3-Phenyl-5,7,7A-Trihydro-2H-Thiazolo [4,5-D] [1,3]
Thiazin-5-Amine Derivatives
SONAL D.BOOB AND P.R. SOLANKI
-227 -
Microwave Assisted Solvent Free Synthesis of 2,7-(Substituted Phenyl)- 3-Phenyl-5,7,7A-Trihydro-2H-Thiazolo [4,5-D] [1,3]
Thiazin-5-Amine Derivatives
SONAL D.BOOB AND P.R. SOLANKI
Vidyabharti Mahavidyalaya, Camp Amravati, (MS) India 444601 Corresponding author: [email protected]
Abstract
Synthesis of Novel 2,7-(substituted phenyl)- -3-phenyl-5,7,7a-trihydro-2H-thiazolo [4,5-d] [1,3] thiazin-5-amine(Va-Vh) by condensation of 2-(substituted phenyl)-3-phenyl thiazolidin-4-one (IVa-IVh) with excess of aromatic aldehyde and thiourea dissolved in polar solvent. In vitro assay of newly synthesized compound were carried out to test antifungal activity by disc diffusion method against Fusarium oxysporum and Rhizoctonia solani. All synthesized compounds were characterized by UV.IR, 1HNMR, 13C NMR, spectral and elemental analysis. Keywords- Thiazolidione, Thiazolo-Thiazine, Antifungal Activity
Introduction-:
Chemistry nowadays is at fore front of the development of clean production processes and products.
Chemistry is no doubt determinant to understand and protect our environment, as the world’s future is
strongly dependant on the chemical processes adopted. Chemistry plays an integral part of our lives.
Sustainability, eco-friendly and green chemistry are new principles that are guiding the development of
next generation of products and processes1,2. “Green chemistry is considered an essential piece of a
comprehensive program to protect human health and the environment.” In its essence green chemistry3-8
is a science based non-regulatory and economically driven approach to achieving the goals of
environmental protection and sustainable development. Thiazoles are a familiar group of heterocyclic
compounds possessing wide variety of biological activities, and their usefulness as medicines are well
established. Thiazole nucleus is also an integral part of all the available penicillin’s, which have
revolutionized the therapy of bacterial diseases9 . Thiazoles have attracted continuing interest because of
their varied biologicalactivities10 , which have found applications in the treatment of allergies11,
hypertension12, inflammation13, schizophrenia14microbial infections15-16, HIV infections17, hypnotics 18and
for the treatment of pain19 . They have been also used asfibrinogen receptor antagonists with
antithrombotic activity 20and as new inhibitors of bacterial DNA gyrase B 21. Aldo Andreani reported the
synthesis and antitubercular activity of imidazo(2,1-b) thiazoles, Raghav Mishra, Synthesized and studied
antimicrobial evaluation of some novel thiazole –pyrazoline derivatives. This has been prompted us to
synthesize fused thiazo-thiazine derivatives.
International Journal of Chemical and Physical Sciences, ISSN:2319-6602 IJCPS Vol. 4 Special Issue – NCSC Jan-2015
www.ijcps.org
Microwave Assisted Solvent Free Synthesis of 2,7-(Substituted Phenyl)- 3-Phenyl-5,7,7A-Trihydro-2H-Thiazolo [4,5-D] [1,3]
Thiazin-5-Amine Derivatives
SONAL D.BOOB AND P.R. SOLANKI
-228 -
Material and methods-:All chemicals used were of analytical grade. All the synthesized compounds
have been characterized on the basis of chemical properties, elemental and spectral analysis. The melting
points were measured in a open glass capillary and are uncorrected .IR spectra in KBr were recorded on
instrument Perkin Elmer - Spectrum RX-IFTIR. 1H-NMR spectra were recorded on FT NMR
Spectrometer model Advance-II (Bruker) Its 1H frequency is 400 MHz. 13C the frequency is 100 MHz.
(CDCl3 and DMSO-d6) using TMS as an internal standard All reactions were monitored by TLC using
silica gel 60-f-254plates. All reactions were carried out in scientific microwave oven (Scientific
microwave system model RG31lL1,700w, 2450MHz).satisfactory C,H,N analysis were carried out for
most of the compounds on Thermo Scientific (FLASH 2000) CHN Elemental Analyzer at RSIC, Punjab
university, Chandigarh
Synthesis Of 2,7-(Substituted Phenyl)- -3-Phenyl-5,7,7a-Trihydro-2h-Thiazolo [4,5-D] [1,3]
Thiazin-5-Amine(Va-h)
The reaction is completed in following two steps.
1)Synthesis of 2-(substituted phenyl)-3-phenylthiazolidin-4-one(IVa-IVh)-:A neat rection technology
for one pot synthesis of the starting material 2-(substituted phenyl)-3-phenylthiazolidin)-4-one by
condensation of aromatic aldehyde(0.01M), aniline(0.01M), and thioglycolic acid(0.01M). carried out
under scientific microwave oven. The irradiation time is 1-1.5 min. The reaction mixture was cooled at
room temperature and poured in ice-cold water. The product thus separated out was filtered and
crystallized from ethanol to get fine crystals of 2-(substituted phenyl)-3-phenylthiazolidin-4-one . (IVa-
IVh).
II) Synthesis of 2,7-(substituted phenyl)-3-phenyl-5,7,7a-trihydro-2H-thiazolo [4,5-d] [1,3] thiazin-5
–amine(Va-Vh)-:The synthesis of Novel 2,7-(substituted phenyl)- -3-phenyl-5,7,7a-trihydro-2H-thiazolo
[4,5-d] [1,3] thiazin-5-amine(Va-Vh) by condensation of 2-(substituted phenyl)-3-phenyl thiazolidin-4-
one.(0.01M) (IVa-IVh) with excess of aromatic aldehyde and thiourea dissolved in polar solvent under
microwave mode (1.5 min) followed by filtration, washing with water and recrystallize from ethanol to
get the product
Mechanism
Thiazolidione are the potential synthons in the synthesis of heterocyclic compounds. It is noteworthy that
the reactivity of thiazolidione is due to inductive effect of carbonyl group. Thiourea is a weak base ,the
reason is that the lone pair of electrons on nitrogen are removed in the formation of ∏- molecular orbital.
In this mechanism the first step concern with Knoevengel condensation of thiozalidione and aldehyde
through carbonium ion intermediate in situ results in the formation of α-β unsaturated ketone and second
step involve nucleophilic addition of thiourea followed by cyclodehydration to lead target molecule.
International Journal of Chemical and Physical Sciences, ISSN:2319-6602 IJCPS Vol. 4 Special Issue – NCSC Jan-2015
www.ijcps.org
Microwave Assisted Solvent Free Synthesis of 2,7-(Substituted Phenyl)- 3-Phenyl-5,7,7A-Trihydro-2H-Thiazolo [4,5-D] [1,3]
Thiazin-5-Amine Derivatives
SONAL D.BOOB AND P.R. SOLANKI
-229 -
SCHEME – I Experimental scheme for the synthesis of2,7-(substituted phenyl)-3-phenyl-5,7,7a-trihydro-2H-thiazolo [4,5-d] [1,3] thiazin-5 –amine(Va-Vh) (IVa-h)
International Journal of Chemical and Physical Sciences, ISSN:2319-6602 IJCPS Vol. 4 Special Issue – NCSC Jan-2015
www.ijcps.org
Microwave Assisted Solvent Free Synthesis of 2,7-(Substituted Phenyl)- 3-Phenyl-5,7,7A-Trihydro-2H-Thiazolo [4,5-D] [1,3]
Thiazin-5-Amine Derivatives
SONAL D.BOOB AND P.R. SOLANKI
-230 -
Table I: Physical data of of2,7-(substituted phenyl)-3-phenyl-5,7,7a-trihydro -2H-thiazolo [4,5-d] [1,3] thiazin-5 –amine(Va-Vh
Compound (Va-Vh)
R R1 R2 Molecular Formula
Melting Point
a -C6H5 -C6H4Cl C6H3Cl2 C23H18Cl3N3S2 2650C
b -C6H5 -C6H4OH C6H4Br C23H20BrN3OS2 2700C
c -C6H5 -C6H4Br C6H3Cl2 C23H18BrCl2N3S2 2840C
d -C6H5 -C6H4-OCH3 C6H4Br C24H22BrN3OS2 2640C
e -C6H5 -C6H4Cl -C6H5 C23H20ClN3S2 2740C
f -C6H5 -C6H5 -C6H3Cl2 C23H19Cl2N3S2 2830C
g -C6H5 -C6H4Br -C6H5 C23H20BrN3S2 2540C
h -C6H5 -C6H5 -C6H5 C23H21N3S2 2630C
Spectral data
1)2-(4-bromophenyl)- 7-(2,4-dichlorphenyl)3-phenyl-5,7,7a-trihydro-2H-thiazolo [4,5-d] [1,3]
thiazin-5 –amine(V c)
M.wt:-551.35 gm, M.P:-2840C, brownish crystalline solid IR(cm-1): 3303(-NH2) ,3058[ C-H st
(aromatic)], 2900[ C-Hst (aliphatic)], 1693(C=N), 1618 (N-H bend), 1597 [C=C], 1490 [C-N], 1100 [C-
Cl(aryl halide)], 692[N-H wagging] ;1HNMR:-400 MHz (CDCl3): 3.3[(s,1H,-CH(W-
coupling)],3.5(d,2H,NH2) ,3.6[(S,1H, ,-CH(W-coupling)], 3.8(d,1H,-CH ,J3-15.7Hz) ,3.9(d,1H,-CH ,J3-
15.7Hz)6.4-8.0(m,12H,Ar-H);13CNMR-100 MHz. (CDCl3 and DMSO-d6) 63.48(C-N,62.79(-
CH),32.71(CH)121.07(CNH2),127.97,170.36,130.97,131.35,126.47,137.17,147.7,125.46,128.22,121.37,
139.54,128.67,131.55,137.42,188.74(C=N) calculated %C= 50.10 %N=7.62 %S =11.63 %
Br=14.49 % Cl=3.29 % H= 12.86 observed %C= 50.02 %N= 7.12 %S =11.06 % Br=
14.11 % Cl =2.45 % H=12.21
2) 2-(methoxyphenyl)-7-(4-bromophenyl)3-phenyl-5,7,7a-trihydro-2H-thiazolo [4,5-d] [1,3] thiazin-5 –amine(V d)
M.wt:-511.04 gm, M.P:-2640C, brownish crystalline solid IR(cm-1): 3400(-NH assym) ,3258 (NH
sym),3058[ C-H st (aromatic)], 2940[ C-Hst (aliphatic)], 1723(C=N), 1600 (N-H bend), 1625 [C=C],
1444 [C-N], 1067 [C-Br(aryl halide)], 960[N-H wagging] ;1HNMR:-400 MHz (CDCl3):
1.28(s,3H,OCH3), 3.6[(s,1H,-CH(W-coupling)],3.37(Br,2H,NH2) ,3.7[(d,1H, ,-CH(W-coupling)],
4.2(d,1H,-CH ,J3-7.2Hz) ,4.3(d,1H,-CH ,J3-7.2Hz),7.0-7.7(m,12H,Ar-H);13CNMR-100
MHz.(CDCl3andDMSOd6)63.22(CN),61.29(OCH3),43.14(CH)113.86(CNH2),13.8(CH)
,130.18,128.62,131.99,159.16,138.74,119.23,128.75,123.34,138.83,131.46,131.65,123.52(Ar-
CH),167.03(C=N) calculated %C= 56.25 %N=8.20 %S =12.51 % Br=15.59 % O=3.12 % H=
4.33 observed %C= 56.12 %N= 7.98 %S =12.01 % Br= 15.21 % O =2.94 % H=4.33
International Journal of Chemical and Physical Sciences, ISSN:2319-6602 IJCPS Vol. 4 Special Issue – NCSC Jan-2015
www.ijcps.org
Microwave Assisted Solvent Free Synthesis of 2,7-(Substituted Phenyl)- 3-Phenyl-5,7,7A-Trihydro-2H-Thiazolo [4,5-D] [1,3]
Thiazin-5-Amine Derivatives
SONAL D.BOOB AND P.R. SOLANKI
-231 -
Antifungal Activity-: All the synthesized compounds were screened for their antifungal activity viz.
fusarium oxysporum, Rhizoctonia solani by using disc diffusion method for their antifungal activity.The
punch discs of 6.25 mm diameter of Whatman filter paper no. 1 were prepared and dispensed in the
batches of 100 each in screw capped bottles. These were sterilized by dry heat at 1400C for 60 minutes.
The solutions of 1000 ppm and 100 ppm concentrations of test compounds were prepared in dimethyl
formamide (DMF) solvent separately. The discs were soaked, assuming that each disc will contain
approximately 0.01 ml of test solution
Table 2 - In vitro antifungal screening of above tested compounds
Fungus (zone of inhibition in mm)
Fusarium
oxysporum
Rhizoctonia solani
Sr.No. Tested
Compo
unds
100
ppm
1000
ppm
100ppm 1000pp
m
1 Va 6 7 - 12
2 Vb 15 17 14 18
3 Vc 32 34 31 34
4 Vd 26 28 18 20
5 Ve 20 21 16 18
6 Vf 11 12 9 11
7 Vg 17 18 21 26
8 Vh 9 13 8 10
The observations show that activity of compound Vc is maximum against both the fungi . Almost all the
compounds were active against all the test pathogens. The compound 5c is the most dominant among all
the test compounds. Their inhibitory impact on the bacterial growth is remarkable.
Conclusion
This was an attempt to synthesize biologically potential heterocyclic moiety in solvent free reaction
condition that leads to considerable saving in the reaction time and energetically profiTable. The solvent
free condition contributes to saving in cost, time and diminishes the waste disposal problem and
environmental pollution this work may bring research fraternity towards sustainable development.
Acknowledgement
The authors are thankful to the Principal, Vidyabharati Mahavidyalaya, Amravati, Dr. F.C.Raghuwanshi
and Director, SAIF, Punjab University, India, for providing spectral data of the compounds.
International Journal of Chemical and Physical Sciences, ISSN:2319-6602 IJCPS Vol. 4 Special Issue – NCSC Jan-2015
www.ijcps.org
Microwave Assisted Solvent Free Synthesis of 2,7-(Substituted Phenyl)- 3-Phenyl-5,7,7A-Trihydro-2H-Thiazolo [4,5-D] [1,3]
Thiazin-5-Amine Derivatives
SONAL D.BOOB AND P.R. SOLANKI
-232 -
References-
[1]. F. Smith, B. Cousins, J. Bozic and W. Flora, Anal-chim-Acta, 177, 243,6,1985. [2]. J.A. Hesek and R.C. Wilson, Anal. Chem,. 46,1160,1974 [3]. R.A. Nadkarni, Anal. Chem., 56,2233,1984 [4]. M. Bacci, M.Bini, A.Checcucci, A.Ignesti, L. Millanta, N. Rubino and R. Vanni, J.
Chem. Soc. Faraday Trans.,1, 77, 1503, 1981 [5]. R.S. Verma, Green Chem., 1,43,1999 [6]. L. Perreux, A. Loupy, Tetrahedron 57,9199,2001 [7]. D. Mathe, Synthesis, 1213, 1998 [8]. R.S. Verma, D. Kumar, Synth. Commun., 29,1333,1999 [9]. S. Onca, M. Punar, H. Erakosy, Chemotherapy 50 (2004) 98e100. [10]. S.J. Kashyap, V.K. Garg, P.K. Sharma, N. Kumar, R. Dudhe, J.K. Gupta, Med.Chem.
Res. 21 (2012) 2123e2132. [11]. K.D. Hargrave, F.K. Hess, J.T. Oliver, J. Med. Chem. 26 (1983) 1158e1163. [12]. W.C. Patt, H.W. Hamilton, M.D. Taylor, M.J. Ryan, D.G. Taylor Jr., C.J.C. Connolly,
A.M. Doherty, S.R. Klutchko, I. Sircar, B.A. Steinbaugh, B.L. Batley, C.A. Painchaud, S.T. Rapundalo, B.M. Michniewicz, S.C.J. Olso, J. Med. Chem. 35 (1992) 2562e2572.
[13]. R.N. Sharma, F.P. Xavier, K.K. Vasu, S.C. Chaturvedi, S.S. Pancholi, J. Enzym. Inhib.Med. Chem. 24 (2009) 890e897.
[14]. J.C. Jaen, L.D. Wise, B.W. Caprathe, H. Tecle, S. Bergmeier, C.C. Humblet, T.G. Heffner, L.T. Meltzner, T.A. Pugsley, J. Med. Chem. 33 (1990) 311e317.
[15]. K. Omar, A. Geronikoki, P. Zoumpoulakis, C. Camoutsis, M. Sokovic, A. Ciric, J. Glamoclija, Bioorg. Med. Chem. 18 (2010) 426e432.
[16]. K. Liaras, A. Geronikoki, J. Glamoclija, A. Ciric, M. Sokovic, Bioorg. Med. Chem. 9 (2011) 3135e3140.
[17]. F.W. Bell, A.S. Cantrell, M. Hogberg, S.R. Jaskunas, N.G. Johansson, C.L. Jordon, [18]. M.D. Kinnick, P. Lind, J.M. Morin Jr., R. Noreen, B. Oberg, J.A. Palkowitz, [19]. C.A. Parrish, P. Pranc, C. Sahlberg, R.J. Ternansky, R.T. Vasileff, L. Vrang, [20]. S.J. West, H. Zhang, X.X. Zhou, J. Med. Chem. 38 (1995) 4929e4936. [21]. N. Ergenc, G. Capan, N.S. Gunay, S. Ozkirimli, M. Gungor, S. Ozbey, E. Kendi, [22]. Arch. Pharm. Pharm. Med. Chem. 332 (1999) 343e347. [23]. J.S. Carter, S. Kramer, J.J. Talley, T. Penning, P. Collins, M.J. Graneto, K. Seibert, [24]. C. Koboldt, J.Masferrer, B. Zweifel, Bioorg.Med. Chem. Lett. 9 (1999) 1171e1174. [25]. A. Badorc, M.F. Bordes, P. De Cointet, P. Savi, A. Bernat, A. Lale, M. Petitou, [26]. J.P. Maffrand, J.M. Herbert, J. Med. Chem. 40 (1997) 3393e3401. [27]. J. Rudolph, H. Theis, R. Hanke, R. Endermann, L. Johannsen, F.U. Geschke,J. Med.
Chem. 44 (2001) 619e626
ORIGINAL RESEARCH
Antimycobacterial activity and in silico study of highlyfunctionalised dispiropyrrolidines
Ang Chee Wei • Mohamed Ashraf Ali • Yeong Keng Yoon •
Sy Bing Choi • Hasnah Osman • Vijay H. Masand •
Tan Soo Choon
Received: 10 February 2014 / Accepted: 9 July 2014 / Published online: 24 July 2014
� Springer Science+Business Media New York 2014
Abstract Two series of novel and highly functionalised
dispiropyrrolidines were synthesized using 1,3-dipolar
cycloaddition reaction. The synthesized compounds were
screened for their antimycobacterial activity against
M. tuberculosis H37Rv using the Promega reagent BacTiter-
GloTM Microbial Cell Viability (BTG). Molecular docking
analysis was carried out for the active compounds against
the target enzyme enoyl-ACP reductase (InhA) to under-
stand the possible binding mode. Of the 24 novel synthe-
sized compounds, seven dispiropyrrolidines revealed
inhibition with EC50 \25 lM. Compound 5b 70-(4-chloro-
phenyl)-50,60,70,7a0-tetrahydrodispiro[indan-2,50-pyrrolo
[1,2-c]-[1,3]thiazole-60,200-indan]-1,3,100-trione was found
to be the most active with EC50 of 10.52 lM, and was
2.2-fold more active than cycloserine. The docking result
revealed that 5b had good affinity with the catalytic residues
in InhA, forming hydrophobic and mild polar interactions
with the important amino acids in the active site.
Keywords Dispiropyrrolidines � 1,3-Dipolar
cycloaddition � Antimycobacterial � Enoyl-ACP-reductase �Molecular docking
Introduction
Tuberculosis (TB) is an airborne disease caused by various
strains of mycobacterium, typically Mycobacterium
tuberculosis. According to the World Health Organization,
one-third of the world’s population harbors a latent form of
TB which is asymptomatic and 10 % of those infected
people will develop active TB in their lifetime (Introduc-
tion 2008). Despite half of a century of anti-TB chemo-
therapy, TB still remains the leading infectious disease,
especially in the third world countries (Zhang, 2005; Lawn
and Zumla, 2011). In 2012, the total number of TB cases
worldwide was approximately 8.6 million, causing
1.3 million deaths. India and China alone had accounted
for 26 and 12 % of the global burden, respectively (WHO,
2013). The pandemic of AIDS and the emergence of drug-
resistant strains in recent years have further complicated
this situation (Chiang et al., 2010; Pawlowski et al., 2012).
Therefore, it is of utmost importance to discover a new
drug candidate to combat this disease.
Electronic supplementary material The online version of thisarticle (doi:10.1007/s00044-014-1181-z) contains supplementarymaterial, which is available to authorized users.
A. C. Wei (&) � M. A. Ali � Y. K. Yoon � T. S. Choon
Institute for Research in Molecular Medicine, Universiti Sains
Malaysia, 11800 Minden, Penang, Malaysia
e-mail: [email protected]
M. A. Ali
New Drug Discovery Research, Department of Medicinal
Chemistry, Alwar Pharmacy College, Alwar 301030, Rajasthan,
India
M. A. Ali
New Drug Discovery Research, Department of Medicinal
Chemistry, Sunrise University, Alwar 301030, Rajasthan, India
S. B. Choi
School of Industrial Technology, Universiti Sains Malaysia,
11800 Minden, Penang, Malaysia
H. Osman
School of Chemical Sciences, Universiti Sains Malaysia,
11800 Minden, Penang, Malaysia
V. H. Masand
Department of Chemistry, Vidya Bharati College,
Amravati 444 602, Maharashtra, India
123
Med Chem Res (2015) 24:818–828
DOI 10.1007/s00044-014-1181-z
MEDICINALCHEMISTRYRESEARCH
The current front line TB treatment regimen relies
mostly on isoniazid (INH), one of the most effective anti-
TB agents that was discovered in 1950s (Mitchison, 2000).
INH is a prodrug that requires activation step by KatG, the
mycobacterial catalase-peroxidase enzyme, to form a tight
INH-NAD covalent adduct (Zhang et al., 1992; Timmins
and Deretic, 2006). This active adduct inhibits the bio-
synthesis of mycolic acids by targeting InhA, the enoyl
acyl carrier protein (ACP) reductase in type II fatty acid
biosynthesis pathway (Banerjee et al., 1994). Recent
studies on drug-resistant strains suggest that the predomi-
nant mechanism of INH resistance arises from the muta-
tions in KatG (Musser et al., 1996; Cade et al., 2010).
Therefore, compounds that can inhibit the ultimate target
of INH by by-passing the KatG activation would have great
potential for combating ING-resistant as well as other
drug-resistant TB (Kuo et al., 2003).
Pyrrolidines have drawn considerable attention lately
due to their highly pronounced biological activities
(Crooks and Rosenberg, 1978; Bellina and Rossi, 2006;
Stylianakis et al., 2003). They make the central skeleton of
many natural products, such as Tryprostatin A, (Usui et al.,
1998), elacomine (Pellegrini et al., 1996), and broussone-
tine H (Brimble et al., 2003). Construction of the substi-
tuted pyrrolidines with spiro moiety was achieved through
1,3-dipolar cycloaddition. This reaction, also known as the
Huisgen cycloaddition, is a classical method to build var-
ious highly substituted five-membered heterocycles (Tsuge
and Kanemasa, 1989). Our previous studies have utilized
the chemistry of this cycloaddition between azomethine
ylides with cyclic ketones to form different series of
dispiropyrrolidines (Wei et al., 2012b, 2013). Since the
previous results shown promising antimycobacterial
activity, herein our group further investigated the potential
of a new series of dispiropyrrolidines using in vitro and in
silico studies.
Materials and methods
Chemistry
All the chemicals and reagents were purchased from
Sigma-Aldrich Chemical Co. and E.Merck (Germany).
Thin layer chromatography (TLC) was performed on pre-
coated silica gel aluminum plates (Kieselgel 60, 254,
E. Merck, Germany). 1H and 13C NMR were performed on
Bruker Avance 300 (1H: 300 MHz, 13C: 75 MHz) spec-
trometer in CDCl3, using TMS as internal standard. Mass
spectra were recorded on Varian 320-MS TQ LC/MS using
ESI. Elemental analyses were performed on Perkin Elmer
2400 Series II CHN Elemental Analyzer. X-ray structural
analysis was carried out using Bruker SMART APEXII
CCD area-detector diffractometer.
General procedure for synthesis of 2-[(E)-1-(substituted
aryl) methylidene]-1-indanone
An equimolar mixture of 1-indanone and various aromatic
aldehydes was dissolved in ethanol (10 mL), and 30 % of
sodium hydroxide solution (5 mL) was added and stirred at
room temperature for 4 h. The mixture was then poured into
crushed ice and neutralized with concentrated HCl. The
precipitated solid was filtered, washed with water, and re-
crystallized from methanol to reveal the titled compounds.
Synthesis of substituted dispiropyrrolidine analogs (5a–5j
and 6a–6j)
A mixture of substituted 2-[(E)-1-arylmethylidene]-1-
indanone (0.001 mol), ninhydrin or acenaphthenequinone
(0.001 mol), and thiazolidine-4-carboxylic acid (0.002
mol) (1:1:2) was dissolved in methanol (10 mL) and
refluxed for 4–8 h. After completion of the reaction as
evident from TLC, the mixture was poured into iced water
(50 mL). The precipitated solid was filtered, washed with
water, and purified by either recrystallization or silica gel
column chromatography to give the desired products.
70-Phenyl-50,60,70,7a0-tetrahydrodispiro[indan-2,50-pyrrolo
[1,2-c]-[1,3]thiazole-60,200-indan]-1,3,100-trione (5a) 1H
NMR (CDCl3) dH: 3.09 (d, 1H, J = 18.5 Hz, H-300), 3.12
(t, J = 5.5 Hz, 1H, H-10), 3.42 (t, J = 9.5 Hz, 1H, H-10), 3.67
(d, J = 7.0 Hz, 1H, H-30), 3.91 (d, J = 17.5 Hz, 1H,
H-300), 4.08 (d, J = 7.0 Hz, 1H, H-30), 4.51 (d, J = 9.0 Hz,
1H, H-70), 4.70–4.74 (m, 1H, H-7a0), 7.09–8.02 (m, 13H,
Ar–H); 13C NMR (CDCl3) dC: 30.9 (CH2, C-300), 36.3
(CH2, C-10), 50.9 (CH, C-70), 51.8 (CH2, C-200), 71.5 (CH2,
C-30), 73.2 (CH, C-7a0), 81.5 (C, C-50), 122.5 (CH, Ar),
123.9 (CH, Ar), 126.1 (CH, Ar), 126.3 (CH, Ar), 126.4
(CH, Ar), 127.5 (CH, Ar), 128.8 (CH, Ar), 129.1 (CH, Ar),
129.2 (CH, Ar), 133.5 (CH, Ar), 133.6 (CH, Ar), 135.6
(CH, Ar), 135.7 (CH, Ar), 135.9 (C, Ar), 140.1 (C, Ar),
140.4 (C, Ar), 140.7 (C, Ar), 152.5 (C, Ar), 197.6 (C, C=
O), 199.8 (C, C=O), 201.6 (C, C=O). ESI–MS: m/z 452
(M?H)?. Anal. calcd. C28H21NO3S: C, 74.48; H, 4.69; N,
3.10. Found: C, 74.49; H, 4.75; N, 3.06.
70-(4-Chlorophenyl)-50,60,70,7a0-tetrahydrodispiro[indan-
2,50-pyrrolo[1,2-c]-[1,3]thiazole-60,200-indan]-1,3,100-tri-
one (5b) 1H NMR (CDCl3) dH: 3.07 (d, 1H, J = 18.5 Hz,
H-300), 3.11 (t, J = 5.0 Hz, 1H, H-10), 3.41 (t, J = 9.5 Hz,
1H, H-10), 3.65 (d, J = 7.5 Hz, 1H, H-30), 3.91 (d, J = 17.5
Hz, 1H, H-300), 4.07 (d, J = 7.5 Hz, 1H, H-30), 4.52
Med Chem Res (2015) 24:818–828 819
123
(d, J = 9.0 Hz, 1H, H-70), 4.70–4.73 (m, 1H, H-7a0),7.08–8.01 (m, 12H, Ar–H); 13C NMR (CDCl3) dC: 30.9
(CH2, C-300), 36.2 (CH2, C-10), 50.8 (CH, C-70), 51.8 (C,
C-200), 71.5 (CH2, C-30), 73.1 (CH, C-7a0), 81.5 (C, C-50),122.5 (CH, Ar), 123.1 (CH, Ar), 123.5 (CH, Ar), 126.5
(CH, Ar), 127.5 (CH, Ar), 128.6 (CH, Ar), 128.8 (CH, Ar),
130.0 (CH, Ar), 130.0 (CH, Ar), 133.5 (CH, Ar), 133.7
(CH, Ar), 135.6 (C, Ar), 135.7 (CH, Ar), 135.7 (C, Ar),
136.7 (C, Ar), 140.4 (C, Ar), 140.7 (C, Ar), 152.5 (C, Ar),
197.6 (C, C=O), 199.8 (C, C=O), 201.5 (C, C=O). ESI–
MS: m/z 486 (M?H)?. Anal. calcd. C28H20ClNO3S: C, 69.
20; H, 4.15; N, 2.88. Found: C, 69.26; H, 4.20; N, 2.79.
70-(4-Bromophenyl)-50,60,70,7a0-tetrahydrodispiro[indan-
2,50-pyrrolo[1,2-c]-[1,3]thiazole-60,200-indan]-1,3,100-tri-
one (5c) 1H NMR (CDCl3) dH: 3.06 (d, 1H, J = 18.5
Hz, H-300), 3.11 (t, J = 5.0 Hz, 1H, H-10), 3.42 (t, J = 9.5
Hz, 1H, H-10), 3.60 (d, J = 7.5 Hz, 1H, H-30), 3.91 (d,
J = 17.5 Hz, 1H, H-300), 4.06 (d, J = 7.5 Hz, 1H, H-30),4.52 (d, J = 9.5 Hz, 1H, H-70), 4.69–4.73 (m, 1H, H-7a0),7.09–8.01 (m, 12H, Ar–H); 13C NMR (CDCl3) dC: 30.9
(CH2, C-300), 36.2 (CH2, C-10), 50.8 (CH, C-70), 51.8 (C,
C-200), 71.6 (CH2, C-30), 76.8 (CH, C7a0), 81.5 (C, C-50),119.6 (C, Ar), 122.5 (CH, Ar), 126.5 (CH, Ar), 127.5 (CH,
Ar), 128.6 (CH, Ar), 128.8 (CH, Ar), 130.3 (CH, Ar), 130.
4 (CH, Ar), 130.4 (CH, Ar), 130.6 (CH, Ar), 133.5 (CH,
Ar), 133.7 (CH, Ar), 135.7 (CH, Ar), 136.7 (C, Ar), 139.9
(C, Ar), 140.4 (C, Ar), 140.7 (C, Ar), 152.5 (C, Ar), 197.6
(C, C=O), 199.8 (C, C=O), 201.5 (C, C=O). ESI–MS: m/z
531 (M?H)?. Anal. calcd. C28H20BrNO3S: C, 63.40; H,
3.80; N, 2.64. Found: C, 63.31; H, 3.82; N, 2.60.
70-(4-Trifluoromethylphenyl)-50,60,70,7a0-tetrahydrodispiro
[indan-2,50-pyrrolo[1,2-c]-[1,3]thiazole-60,200-indan]-1,3,100-trione (5d) 1H NMR (CDCl3) dH: 3.05 (d, 1H, J = 18.0
Hz, H-300), 3.12 (t, J = 5.0 Hz, 1H, H-10), 3.42 (t, J = 9.5
Hz, 1H, H-10), 3.60 (d, J = 7.5 Hz, 1H, H-30), 3.91 (d,
J = 17.5 Hz, 1H, H-300), 4.06 (d, J = 7.5 Hz, 1H, H-30),4.52 (d, J = 9.5 Hz, 1H, H-70), 4.69–4.74 (m, 1H, H-7a0),7.07–8.01 (m, 12H, Ar–H); 13C NMR (CDCl3) dC: 30.9
(CH2, C-300), 36.2 (CH2, C-10), 50.8 (CH, C-70), 51.9 (C,
C-200), 71.5 (CH2, C-30), 76.8 (CH, C-7a0), 81.5 (C, C-50),122.5 (CH, Ar), 123.2 (CF3, Ar), 123.7 (CH, Ar), 123.9
(CH, Ar), 125.1 (C, Ar), 126.5 (CH, Ar), 127.5 (CH, Ar),
127.6 (CH, Ar), 128.8 (CH, Ar), 129.1 (CH, Ar), 129.1
(CH, Ar), 133.5 (CH, Ar), 133.6 (CH, Ar), 135.7 (CH,
Ar), 136.7 (C, Ar), 140.4 (C, Ar), 140.7 (C, Ar), 144.1 (C,
Ar), 152.6 (C, Ar), 197.6 (C, C=O), 199.9 (C, C=O), 201.5
(C, C=O). ESI–MS: m/z 520 (M?H)?. Anal. calcd.
C29H20F3NO3S: C, 67.04; H, 3.88; N, 2.70. Found: C,
67.01; H, 3.82; N, 2.66.
70-(4-Trifluoromethoxylphenyl)-50,60,70,7a0-tetrahydrodi-
spiro[indan-2,50-pyrrolo[1,2-c]-[1,3]thiazole-60,200-indan]-
1,3,100-trione (5e) 1H NMR (CDCl3) dH: 3.06 (d, 1H, J =
17.9 Hz, H-300), 3.10 (t, J = 5.2 Hz, 1H, H-10), 3.40 (t,
J = 9.8 Hz, 1H, H-10), 3.65 (d, J = 7.6 Hz, 1H, H-30),3.88 (d, J = 17.5 Hz, 1H, H-300), 4.05 (d, J = 7.6 Hz, 1H,
H-30), 4.51 (d, J = 9.0 Hz, 1H, H-70), 4.69–4.74 (m, 1H,
H-7a0), 7.01–8.00 (m, 12H, Ar–H); 13C NMR (CDCl3) dC:
30.9 (CH2, C-300), 36.2 (CH2, C-10), 50.8 (CH, C-70), 51.9 (C,
C-200), 71.5 (CH2, C-30), 76.8 (CH, C-7a0), 81.5 (C, C-50),114.2 (CH, Ar), 114.3 (CH, Ar), 122.1 (CH, Ar), 122.1 (CH,
Ar), 122.5 (CH, Ar), 126.6 (CH, Ar), 127.5 (OCF3, Ar), 128.9
(CH, Ar), 129.4 (CH, Ar), 129.5 (CH, Ar), 133.5 (CH, Ar),
133.6 (CH, Ar), 135.2 (C, Ar), 135.7 (CH, Ar), 136.5 (C, Ar),
140.4 (C, Ar), 140.7 (C, Ar), 146.1 (C, Ar), 152.5 (C, Ar),
197.6 (C, C=O), 199.9 (C, C=O), 201.5 (C, C=O). ESI–MS:
m/z 536 (M?H)?. Anal. calcd. C29H20F3NO4S: C, 65.04; H,
3.76; N, 2.62. Found: C, 65.07; H, 3.81; N, 2.60.
70-(3-Nitrophenyl)-50,60,70,7a0-tetrahydrodispiro[indan-
2,50-pyrrolo[1,2-c]-[1,3]thiazole-60,200-indan]-1,3,100-trione
(5f) 1H NMR (CDCl3) dH: 3.07 (d, 1H, J = 18.5 Hz,
H-300), 3.11 (t, J = 5.5 Hz, 1H, H-10), 3.41 (t, J = 9.5 Hz,
1H, H-10), 3.65 (d, J = 7.5 Hz, 1H, H-30), 3.91 (d, J = 17.5
Hz, 1H, H-300), 4.07 (d, J = 7.5 Hz, 1H, H-30), 4.52 (d,
J = 9.0 Hz, 1H, H-70), 4.70–4.73 (m, 1H, H-7a0), 7.06–8.11
(m, 12H, Ar–H); 13C NMR (CDCl3) dC: 30.1 (CH2, C-300),36.2 (CH2, C-10), 50.9 (CH, C-70), 51.8 (C, C-200), 71.5
(CH2, C-30), 76.5 (CH, C-7a0), 81.5 (C, C-50), 117.9 (CH,
Ar), 122.5 (CH, Ar), 122.6 (CH, Ar), 123.1 (CH, Ar), 123.2
(CH, Ar), 126.5 (CH, Ar), 127.5 (CH, Ar), 128.8 (CH, Ar),
133.5 (CH, Ar), 133.7 (CH, Ar), 135.7 (CH, Ar), 135.7
(CH, Ar), 136.2 (C, Ar), 140.4 (C, Ar), 140.7 (C, Ar), 141.5
(C, Ar), 146.7 (C, Ar), 152.5 (C, Ar), 197.6 (C, C=O), 199.8
(C, C=O), 201.5 (C, C=O). ESI–MS: m/z 497 (M?H)?.
Anal. calcd. C28H20N2O5S: C, 67.73; H, 4.06; N, 5.64.
Found: C, 67.76; H, 4.10; N, 5.69.
70-(4-Methoxyphenyl)-50,60,70,7a0-tetrahydrodispiro[indan-
2,50-pyrrolo[1,2-c]-[1,3]thiazole-60,200-indan]-1,3,100-trione
(5g) 1H NMR (CDCl3) dH: 3.07 (d, 1H, J = 18.5 Hz,
H-300), 3.11 (t, J = 5.5 Hz, 1H, H-10), 3.41 (t, J = 9.5 Hz,
1H, H-10), 3.65 (d, J = 7.5 Hz, 1H, H-30), 3.69 (s, 3H,
OCH3), 3.91 (d, J = 17.5 Hz, 1H, H-300), 4.07 (d, J = 7.5
Hz, 1H, H-30), 4.52 (d, J = 9.0 Hz, 1H, H-70), 4.70–4.73
(m, 1H, H-7a0), 6.67–8.00 (m, 12H, aromatic); 13C NMR
(CDCl3) dC: 30.9 (CH2, C-300), 36.2 (CH2, C-10), 50.9 (CH,
C-70), 51.9 (C, C-200), 54.3 (CH3, OCH3), 71.8, (CH2, C-30),73.4 (CH, C-7a0), 81.7 (C, C-50), 112.2 (CH, Ar), 112.3
(CH, Ar), 122.5 (CH, Ar), 123.7 (CH, Ar), 126.4 (CH, Ar),
127.5 (CH, Ar), 128.9 (CH, Ar), 129.4 (CH, Ar), 129.4
(CH, Ar), 133.5 (CH, Ar), 133.7 (CH, Ar), 135.6 (C, Ar),
820 Med Chem Res (2015) 24:818–828
123
135.7 (CH, Ar), 136.0 (C, Ar), 140.4 (C, Ar), 140.7 (C, Ar),
152.5 (C, Ar), 156.7 (C, Ar), 197.6 (C, C=O), 199.8 (C, C=
O) 201.5 (C, C=O). ESI–MS: m/z 482 (M?H)?. Anal.
calcd. C29H23NO4S: C, 72.33; H, 4.81; N, 2.91. Found: C,
72.36; H, 4.81; N, 2.95.
70-(4-Benzo[d][1,3]dioxole)-50,60,70,7a0-tetrahydrodispiro
[indan-2,50-pyrrolo[1,2-c]-[1,3]thiazole-60,200-indan]-1,3,100-trione (5h) 1H NMR (CDCl3) dH: 3.04–3.07 (m, 1H,
H-10), 3.09 (d, J = 18.0 Hz, 1H, H-300), 3.43 (t, J = 9.0
Hz, 1H, H-10), 3.67–3.71 (m, 2H, H-30, H-300), 4.07 (d, J =
7.5 Hz, 1H, H-30), 4.53 (d, J = 8.5 Hz, 1H, H-70), 4.79–
4.84 (m, 1H, H-7a0), 5.95 (s, 2H, CH2), 7.05–8.00 (m, 11H,
H–Ar); 13C NMR (CDCl3) dC: 32.1 (CH2, C-300), 36.2
(CH2, C-10), 50.9 (CH, C-70), 51.8 (C, C-200), 71.2 (CH2,
C-30), 73.6 (CH, C-7a0), 81.5 (C, C-50), 101.4 (CH2,
OCH2O), 109.3 (CH, Ar), 119.2 (CH, Ar), 121.2 (CH, Ar),
122.5 (CH, Ar), 123.0 (CH, Ar), 123.1 (CH, Ar), 126.5
(CH, Ar), 127.5 (CH, Ar), 134.9 (C, Ar), 135.2 (CH, Ar),
135.2 (CH, Ar), 135.7 (CH, Ar), 136.7 (C, Ar), 140.5 (C,
Ar), 140.7 (C, Ar), 145.7 (C, Ar), 147.0 (C, Ar), 153.1 (C,
Ar), 197.9 (C, C=O), 199.2 (C, C=O), 201.5 (C, C=O).
ESI–MS: m/z 496 (M?H)?. Anal. calcd. C29H21NO5S: C,
70.29; H, 4.27; N, 2.83. Found: C, 70.41; H, 4.31; N, 2.85.
70-(4-(Dimethylamino)phenyl)-50,60,70,7a0-tetrahydrodispi-
ro[indan-2,50-pyrrolo[1,2-c]-[1,3]thiazole-60,200-indan]-
1,3,100-trione (5i) 1H NMR (CDCl3) dH: 2.90 (s, 6H),
3.07 (d, 1H, J = 18.0 Hz, H-300), 3.09 (t, J = 5.5 Hz, 1H,
H-10), 3.43 (t, J = 9.5 Hz, 1H, H-10), 3.67 (d, J = 7.5 Hz,
1H, H-30), 3.91 (d, J = 17.5 Hz, 1H, H-300), 4.07 (d, J = 7.5
Hz, 1H, H-30), 4.53 (d, J = 8.5 Hz, 1H, H-70), 4.84–4.90 (m,
1H, H-7a0), 6.62–8.19 (m, 12H, H–Ar); 13C NMR (CDCl3)
dC: 31.9 (CH2, C-300), 36.2 (CH2, C-10), 40.2 (CH3,
N(CH3)2), 40.4 (CH3, N(CH3)2), 50.9 (CH, C-70), 51.8 (C,
C-200), 71.2 (CH2, C-30), 73.1 (CH, C-7a0), 81.5 (C, C-50),111.9 (CH, Ar), 112.1 (CH, Ar), 123.0 (CH, Ar), 123.4 (CH,
Ar), 123.6 (CH, Ar), 126.5 (CH, Ar), 127.5 (CH, Ar), 130.2
(CH, Ar), 130.3 (CH, Ar), 131.2 (C, Ar), 135.4 (CH, Ar),
135.5 (CH, Ar), 135.7 (CH, Ar), 136.7 (C, Ar), 140.5 (C,
Ar), 140.7 (C, Ar), 147.5 (C, Ar), 152.9 (C, Ar), 197.9 (C,
C=O), 199.7 (C, C=O), 201.5 (C, C=O). ESI–MS: m/z 495
(M?H)?. Anal. calcd. C30H26N2O3S: C, 72.85; H, 5.30; N,
5.66. Found: C, 72.97; H, 5.31; N, 5.65.
70-(4-(Morpholine-1-yl)phenyl)-50,60,70,7a0-tetrahydrodi-
spiro[indan-2,50-pyrrolo[1,2-c]-[1,3]thiazole-60,200-indan]-
1,3,100-trione (5j) 1H NMR (CDCl3) dH: 3.05 (d, 1H, J =
17.5 Hz, H-300), 3.10 (t, J = 5.5 Hz, 1H, H-10), 3.12 (t,
J = 9.0 Hz, 4H, CH2), 3.43 (t, J = 9.5 Hz, 1H, H-10), 3.67
(d, J = 7.5 Hz, 1H, H-30), 3.87 (t, J = 9.0 Hz, 4H, CH2),
3.90 (d, J = 17.5 Hz, 1H, H-300), 4.07 (d, J = 7.5 Hz, 1H,
H-30), 4.53 (d, J = 8.5 Hz, 1H, H-70), 4.79–4.82 (m, 1H,
H-7a0), 6.69–8.19 (m, 12H, H–Ar); 13C NMR (CDCl3) dC:
31.9 (CH2, C-300), 36.3 (CH2, C-10), 49.2 (CH2, NCH2), 49.3
(CH2, NCH2), 50.9 (CH, C-70), 51.8 (C, C-200), 69.5 (CH2,
OCH2), 69.5 (CH2, OCH2), 71.2 (CH2, C-30), 73.1 (CH,
C-7a0), 81.5 (C, C-50), 116.7 (CH, Ar), 116.9 (CH, Ar),
123.0 (CH, Ar), 123.5 (CH, Ar), 124.1 (CH, Ar), 126.1
(CH, Ar), 127.0 (CH, Ar), 130.0 (CH, Ar), 130.1 (CH, Ar),
131.2 (C, Ar), 135.4 (CH, Ar), 135.5 (CH, Ar), 135.7 (CH,
Ar), 136.7 (C, Ar), 140.6 (C, Ar), 140.7 (C, Ar), 146.1 (C,
Ar), 152.9 (C, Ar), 197.9 (C, C=O), 199.7 (C, C=O), 201.5
(C, C=O). ESI–MS: m/z 537 (M?H)?. Anal. calcd.
C32H28N2O4S: C, 71.62; H, 5.26; N, 5.22. Found: C, 71.70;
H, 5.31; N, 5.25.
70-(2,5-Dimethoxylphenyl)-50,60,70,7a0-tetrahydrodispiro[in-
dan-2,50-pyrrolo[1,2-c]-[1,3]thiazole-60,200-indan]-1,3,100-trione (5k) 1H NMR (CDCl3) dH: 3.04–3.07 (m, 1H,
H-10), 3.21 (d, J = 17.5 Hz, 1H, H-300), 3.38 (s, 3H,
OCH3), 3.45 (t, J = 9.5 Hz, 1H, H-10), 3.64–3.70 (m, 2H,
H-30), 3.70 (s, 3H, OCH3), 4.08 (d, J = 7.5 Hz, 1H, H-300),4.69 (d, J = 8.5 Hz, 1H, H-70), 4.81–4.86 (m, 1H, H-7a0),7.00–8.13 (m, 11H, Ar–H); 13C NMR (CDCl3) dC: 32.1
(CH2, C-300), 36.6 (CH2, C-10), 49.4 (CH, C-70), 50.9 (C,
C-200), 54.5 (CH3, OCH3), 55.8 (CH3, OCH3), 71.5 (CH2,
C-30), 73.0 (CH, C-7a0), 80.2 (C, C-50), 110.1 (CH, Ar),
112.5 (CH, Ar), 115.8 (CH, Ar), 122.9 (CH, Ar), 123.0
(CH, Ar), 123.0 (CH, Ar), 124.2 (CH, Ar), 125.9 (C, Ar),
126.8 (CH, Ar), 134.8 (CH, Ar), 135.2 (CH, Ar), 135.9
(CH, Ar), 136.8 (C, Ar), 140.5 (C, Ar), 142.6 (C, Ar), 151.5
(C, Ar), 152.0 (C, Ar), 153.1 (C, Ar), 197.9 (C, C=O), 199.0
(C, C=O), 200.9 (C, C=O). ESI–MS: m/z 512 (M?H)?.
Anal. calcd. C30H25NO5S: C, 70.43; H, 4.93; N, 2.74.
Found: C, 70.49; H, 5.01; N, 2.77.
70-(4-(Piperidin-1-yl)phenyl)-50,60,70,7a0-tetrahydrodispiro
[indan-2,50-pyrrolo[1,2-c]-[1,3]thiazole-60,200-indan]-1,3,100-trione (5l) 1H NMR (CDCl3): 1.52–1.63 (m, 6H, CH2),
2.67 (t, J = 9.0 Hz, 4H, CH2), 3.07 (d, 1H, J = 18.5 Hz,
H-300), 3.11 (t, J = 5.0 Hz, 1H, H-10), 3.43 (t, J = 9.0 Hz,
1H, H-10), 3.67 (d, J = 7.5 Hz, 1H, H-30), 3.91 (d, J = 17.5
Hz, 1H, H-30),4.03 (d, J = 7.5 Hz, 1H, H-300), 4.51 (d, J =
9.5 Hz, 1H, H-70), 4.69–4.73 (m, 1H, H-7a0), 7.08–8.01 (m,
12H, Ar–H); 13C NMR (CDCl3) dC: 23.9 (CH2), 24.4
(CH2), 24.6 (CH2), 32.1 (CH2, C-300), 36.7 (CH2, C-10),49.3 (CH, C-70), 50.4 (CH2, NCH2), 50.9 (CH2, NCH2), 52.9
(C, C-200), 71.4 (CH2, C-30), 73.0 (CH, C-7a0), 80.3 (C,
C-50), 112.7 (CH, Ar), 112.8 (CH, Ar), 122.9 (CH, Ar),
123.0 (CH, Ar), 123.0 (CH, Ar), 124.3 (CH, Ar), 126.5
(CH, Ar), 128.4 (CH, Ar), 129.0 (CH, Ar), 130.7 (C, Ar),
134.1 (CH, Ar), 134.7 (CH, Ar), 135.4 (CH, Ar), 136.8 (C,
Ar), 140.5 (C, Ar), 141.7 (C, Ar), 149.1 (C, Ar), 152.9 (C,
Ar), 197.9 (C, C=O), 199.0 (C, C=O), 200.9 (C, C=O).
ESI–MS: m/z 535 (M?H)?. Anal. calcd. C33H30N2O3S:
Med Chem Res (2015) 24:818–828 821
123
C, 74.13; H, 5.66; N, 5.24. Found: C, 74.16; H, 5.72;
N, 5.25.
70-Phenyl-10,30,50,60,70,7a0-hexahydrodispiro[acenaphthyl-
ene-1,50-pyrrolo-[1,2-c]thiazole-60,200-indane]-2,100(1H)-
dione (6a) 1H NMR (CDCl3) dH: 2.91 (d, J = 16.5 Hz,
1H, H-300), 3.13 (dd, J = 11.4, 3.0 Hz, 1H, H-10), 3.34–
3.37 (m, 1H, H-10), 3.67 (d, J = 10.2 Hz, 1H, H-30), 4.03
(d, J = 16.6 Hz, 1H, H-300), 4.06 (d, J = 10.2 Hz, 1H,
H-30), 4.27 (d, J = 10.6 Hz, 1H, H-70), 4.73–4.76 (m, 1H,
H-7a0), 6.75–8.10 (m, 15H, H–Ar); 13C NMR (CDCl3) dC:
32.0 (CH2, C-300), 36.5 (CH2, C-10), 53.0 (CH, C-70), 53.9
(CH2, C-30), 71.4 (CH, C-7a0), 71.9 (C, C-200), 83.0 (C,
C-50), 120.9 (CH, Ar), 123.1 (CH, Ar), 125.1 (CH, Ar),
125.9 (CH, Ar), 126.3 (CH, Ar), 126.4 (CH, Ar), 126.5
(CH, Ar), 126.6 (CH, Ar), 127.7 (CH, Ar), 127.9 (CH, Ar),
128.0 (CH, Ar), 128.2 (C, Ar), 128.4 (CH, Ar), 130.6 (CH,
Ar), 131.5 (CH, Ar), 132.1 (C, Ar), 134.1 (C, Ar), 134.9
(CH, Ar), 136.7 (C, Ar), 137.9 (C, Ar), 142.0 (C, Ar), 151.2
(C, Ar), 202.4 (C, C=O), 204.3 (C, C=O). ESI–MS: m/z
474 (M?H)?. Anal. calcd. C31H23NO2S: C, 78.62; H, 4.90;
N, 2.96. Found: C, 78.66; H, 4.89; N, 2.91.
70-(4-Chlorophenyl)-10,30,50,60,70,7a0-hexahydrodispiro[ace-
naphthylene-1,50-pyrrolo-[1,2-c]thiazole-60,200-indane]-2,100
(1H)-dione (6b) 1H NMR (CDCl3) dH: 3.01 (d, J = 16.5
Hz, 1H, H-300), 3.08 (dd, J = 11.4, 3.0 Hz, 1H, H-10),3.34–3.37 (m, 1H, H-10), 3.67 (d, J = 10.2 Hz, 1H, H-30),4.03 (d, J = 16.6 Hz, 1H, H-300), 4.06 (d, J = 10.2 Hz, 1H,
H-30), 4.27 (d, J = 10.6 Hz, 1H, H-70), 4.73–4.76 (m, 1H,
H-7a0), 6.84–8.12 (m, 14H, H–Ar); 13C NMR (75 MHz,
CDCl3): 13C NMR (CDCl3) dC: 31.9 (CH2, C-300), 36.1
(CH2, C-10), 52.1 (CH, C-70), 53.9 (CH2, C-30), 71.4 (CH,
C-7a0), 71.9 (C, C-200), 83.0 (C, C-50), 122.5 (CH, Ar),
123.0 (CH, Ar), 123.4 (CH, Ar), 123.5 (CH, Ar), 123.5
(CH, Ar), 123.9 (CH, Ar), 124.9 (CH, Ar), 126.2 (CH, Ar),
127.1 (CH, Ar), 127.7 (CH, Ar), 130.0 (CH, Ar), 130.1 (C,
Ar), 130.6 (CH, Ar), 131.3 (CH, Ar), 132.7 (CH, Ar), 133.6
(C, Ar), 135.4 (C, Ar), 135.6 (C, Ar), 135.7 (C, Ar), 136.7
(C, Ar), 141.0 (C, Ar), 152.0 (C, Ar), 202.4 (C, C=O),
204.3 (C, C=O). ESI–MS: m/z 508 (M?H)?. Anal. calcd.
C31H22ClNO2S: C, 73.29; H, 4.36; N, 2.76. Found: C,
73.26; H, 4.41; N, 2.72.
70-(4-Bromophenyl)-10,30,50,60,70,7a0-hexahydrodispiro[ace-
naphthylene-1,50-pyrrolo-[1,2-c]thiazole-60,200-indane]-2,100
(1H)-dione (6c) 1H NMR (CDCl3) dH: 2.88 (d, J =
16.5 Hz, 1H, H-300), 3.08 (dd, J = 11.5, 3.0 Hz, 1H, H-10),3.30–3.34 (m, 1H, H-10), 3.67 (d, J = 9.9 Hz, 1H, H-30),4.00 (d, J = 16.7 Hz, 1H, H-300), 4.05 (d, J = 10.0 Hz, 1H,
H-30), 4.28 (d, J = 10.5 Hz, 1H, H-70), 4.88–4.90 (m, 1H,
H-7a0), 6.79–8.30 (m, 14H, H–Ar); 13C NMR (CDCl3) dC:
31.5 (CH2, C-300), 36.2 (CH2, C-10), 52.6 (CH, C-70), 53.6
(CH2, C-30), 70.9 (CH, C-7a0), 71.3 (C, C-200), 82.7 (C,
C-50), 120.5 (CH, Ar), 121.5 (C, Ar), 122.8 (CH, Ar), 123.4
(CH, Ar), 123.9 (C, Ar), 125.7 (CH, Ar), 125.7 (CH, Ar),
126.3 (CH, Ar), 127.3 (CH, Ar), 127.6 (CH, Ar), 128.2
(CH, Ar), 130.4 (C, Ar), 131.0 (CH, Ar), 131.2 (CH, Ar),
131.8 (CH, Ar), 131.9 (CH, Ar), 133.5 (C, Ar), 134.8 (CH,
Ar), 135.3 (C, Ar), 136.1 (C, Ar), 140.5 (C, Ar), 151.2 (C,
Ar), 202.1 (C, C=O), 204.2 (C, C=O). ESI–MS: m/z 553
(M?H)?. Anal. calcd. C31H22BrNO2S: C, 67.39; H, 4.01;
N, 2.54. Found: C, 67.36; H, 4.05; N, 2.55.
70-(4-Trifluoromethylphenyl)-10,30,50,60,70,7a0-hexahydrodi-
spiro[acenaphthylene-1,50-pyrrolo-[1,2-c]thiazole-60,200-indane]-2,100(1H)-dione (6d) 1H NMR (CDCl3) dH: 2.89
(d, 1H, J = 16.6 Hz, H-10), 3.10 (dd, J = 11.4, 3.0 Hz,
1H, H-300), 3.31–3.35 (m, 1H, H-10), 3.67 (d, J = 10.0 Hz,
1H, H-300), 4.00 (d, J = 16.6 Hz, 1H, H-30), 4.06 (d, J =
10.0 Hz, 1H, H-30), 4.33 (d, J = 10.6 Hz, 1H, H-70),4.87–4.95 (m, 1H, H-7a0), 7.01–8.30 (m, 14H, H–Ar); 13C
NMR (CDCl3) dC: 32.0 (CH2, C-300), 36.5 (CH2, C-10), 53.2
(CH, C-70), 53.9 (CH2, C-30), 71.4 (CH, C-7a0), 71.8 (C,
C-200), 82.7 (C, C-50), 123.5 (CH, Ar), 123.7 (C, CF3),
124.1 (CH, Ar), 126.0 (CH, Ar), 126.2 (CH, Ar), 126.7
(CH, Ar), 127.1 (C, Ar), 127.7 (CH, Ar), 127.9 (CH, Ar),
128.1 (CH, Ar), 128.5 (CH, Ar), 128.6 (CH, Ar), 130.6 (C,
Ar), 131.0 (C, Ar), 132.3 (CH, Ar), 133.5 (CH, Ar), 133.7
(CH, Ar), 133.9 (C, Ar), 135.4 (CH, Ar), 136.4 (C, Ar),
141.0 (C, Ar), 144.2 (C, Ar), 151.3 (C, Ar), 202.4 (C, C=
O), 204.4 (C, C=O). ESI–MS: m/z 542 (M?H)?. Anal.
calcd. C32H22F3NO2S: C, 70.97; H, 4.09; N, 2.59. Found:
C, 71.00; H, 4.10; N, 2.55.
70-(4-Trifluoromethoxyphenyl)-10,30,50,60,70,7a0-hexahydro-
dispiro[acenaphthylene-1,50-pyrrolo-[1,2-c]thiazole-60,200-indane]-2,100(1H)-dione (6e) 1H NMR (CDCl3) dH: 2.88
(d, 1H, J = 16.6 Hz, H-300), 3.10 (dd, J = 11.4, 3.0 Hz,
1H, H-10), 3.32–3.35 (m, 1H, H-10), 3.67 (d, J =
10.0 Hz, 1H, H-30), 4.00 (d, J = 16.6 Hz, 1H, H-300),4.06 (d, J = 10.0 Hz, 1H, H-30), 4.32 (d, J = 10.4 Hz,
1H, H-70), 4.87–4.95 (m, 1H, H-7a0), 6.79–8.30 (m,
14H, H–Ar); 13C NMR (CDCl3) dC: 32.1 (CH2, C-300),36.6 (CH2, C-10), 53.2 (CH, C-70), 53.9 (CH2, C-30),71.4 (CH, C-7a0), 71.8 (C, C-200), 82.5 (C, C-50), 114.2
(CH, Ar). 114.3 (CH, Ar), 123.5 (CH, Ar), 124.1 (CH,
Ar), 126.0 (CH, Ar), 126.2 (CH, Ar), 126.7 (CH, Ar),
127.9 (CH, Ar), 127.9 (CH, Ar), 128.5 (CH, Ar), 128.9
(C, OCF3), 129.4 (CH, Ar), 129.5 (CH, Ar), 130.6 (C,
Ar), 131.0 (C, Ar), 132.3 (CH, Ar), 133.5 (C, Ar), 135.4
(C, Ar), 135.7 (CH, Ar), 136.4 (C, Ar), 141.0 (C, Ar),
146.7 (C, Ar), 151.2 (C, Ar), 202.4 (C, C=O), 204.4 (C,
C=O). ESI–MS: m/z 558 (M?H)?. Anal. calcd.
C32H22F3NO3S: C, 68.93; H, 3.98; N, 2.51. Found: C,
68.91; H, 4.03; N, 2.53.
822 Med Chem Res (2015) 24:818–828
123
70-(3-Nitrophenyl)-10,30,50,60,70,7a0-hexahydrodispiro[ace-
naphthylene-1,50-pyrrolo-[1,2-c]thiazole-60,200-indane]-2,100
(1H)-dione (6f) 1H NMR (CDCl3) dH: 2.83 (d, 1H, J =
16.8 Hz, H-10), 3.11 (dd, J = 11.4, 3.3 Hz, 1H, H-300),3.34–3.40 (m, 1H, H-10), 3.71 (d, J = 9.6 Hz, 1H, H-300),4.01–4.08 (m, 2H, H-30), 4.43 (d, J = 10.5 Hz, 1H, H-70),4.96–5.02 (m, 1H, H-7a0), 6.82–8.31 (m, 14H, H–Ar); 13C
NMR (CDCl3) dC: 32.1 (CH2, C-300), 36.5 (CH2, C-10), 53.1
(CH, C-70), 53.8 (CH2, C-30), 71.4 (CH, C-7a0), 71.8 (C,
C-200), 82.8 (C, C-50), 121.0 (CH, Ar), 123.0 (CH, Ar),
123.4 (CH, Ar), 124.6 (CH, Ar), 126.0 (CH, Ar), 126.2
(CH, Ar), 126.7 (CH, Ar), 127.9 (CH, Ar), 128.0 (CH, Ar),
128.6 (CH, Ar), 130.1 (C, Ar), 130.8 (C, Ar), 131.3 (CH,
Ar), 132.4 (CH, Ar), 133.6 (C, Ar), 135.3 (CH, Ar), 136.3
(C, Ar), 136.6 (C, Ar), 139.1 (CH, Ar), 141.0 (C, Ar), 148.8
(C, Ar), 151.2 (C, Ar), 202.4 (C, C=O), 204.4 (C, C=O).
ESI–MS: m/z 519 (M?H)?. Anal. calcd. C31H22N2O4S: C,
71.80; H, 4.28; N, 5.40. Found: C, 71.76; H, 4.32; N, 5.41.
70-(4-Methoxyphenyl)-10,30,50,60,70,7a0-hexahydrodispiro
[acenaphthylene-1,50-pyrrolo-[1,2-c]thiazole-60,200-indane]-
2,100(1H)-dione (6g) 1H NMR (CDCl3) dH: 3.03 (d, 1H,
J = 16.8 Hz, H-10), 3.11 (dd, J = 11.4, 3.3 Hz, 1H, H-300),3.34–3.36 (m, 1H, H-10), 3.69 (s, 3H, OCH3), 3.71 (d, J =
9.6 Hz, 1H, H-300), 4.01–4.08 (m, 2H, H-30), 4.26 (d, J =
10.5 Hz, 1H, H-70), 4.86–4.93 (m, 1H, H-7a0), 6.82–8.31
(m, 14H, H–Ar); 13C NMR (CDCl3) dC: 31.9 (CH2, C-300),36.6 (CH2, C-10), 51.9 (CH, C-70), 54.0 (CH2, C-30), 55.1
(C, OCH3) 71.1 (CH, C-7a0), 71.7 (C, C-200), 83.0 (C, C-50),112.2 (CH, Ar), 112.6 (CH, Ar), 120.9 (CH, Ar), 123.0
(CH, Ar), 123.5 (CH, Ar), 125.7 (CH, Ar), 126.0 (CH, Ar),
126.4 (CH, Ar), 126.7 (CH, Ar), 127.9 (CH, Ar), 129.9
(CH, Ar), 130.1 (CH, Ar), 130.7 (CH, Ar), 131.0 (CH, Ar),
131.9 (C, Ar), 132.1 (C, Ar), 133.9 (C, Ar), 135.4 (C, Ar),
136.3 (C, Ar), 140.4 (C, Ar), 151.5 (C, Ar), 151.9 (C, Ar),
202.4 (C, C=O), 204.5 (C, C=O). ESI–MS: m/z 504
(M?H)?. Anal. calcd. C32H25NO3S: C, 76.32; H, 5.00; N,
2.78. Found: C, 76.21; H, 5.03; N, 2.79.
70-(4-Benzo[d][1,3]dioxole)-10,30,50,60,70,7a0-hexahydrodi-
spiro[acenaphthylene-1,50-pyrrolo-[1,2-c]thiazole-60,200-indane]-2,100(1H)-dione (6h) 1H NMR (CDCl3) dH: 3.04
(d, J = 16.8 Hz, 1H, H-300), 3.13 (dd, J = 11.5, 2.8 Hz,
1H, H-10), 3.32–3.35 (m, 1H, H-10), 3.64 (d, J = 10.2 Hz,
1H, H-30), 4.04 (d, J = 16.6 Hz, 1H, H-300), 4.09 (d, J =
10.2 Hz, 1H, H-30), 4.26 (d, J = 10.6 Hz, 1H, H-70),4.83–4.87 (m, 1H, H-7a0), 5.95 (s, 2H, CH2), 6.80–8.29 (m,
13H, H–Ar); 13C NMR (CDCl3) dC: 31.9 (CH2, C-300), 36.6
(CH2, C-10), 52.6 (CH, C-70), 54.1 (CH2, C-30), 71.4 (CH,
C-7a0), 71.7 (C, C-200), 83.1 (C, C-50), 101.4 (CH2,
OCH2O), 109.3 (CH, Ar), 119.2 (CH, Ar), 120.3 (CH, Ar),
121.0 (CH, Ar), 122.6 (CH, Ar), 123.4 (CH, Ar), 125.5
(CH, Ar), 125.9 (CH, Ar), 126.4 (CH, Ar), 128.1 (CH, Ar),
130.2 (CH, Ar), 130.3 (CH, Ar), 131.8 (C, Ar), 132.8 (CH,
Ar), 133.7 (C, Ar), 134.5 (C, Ar), 134.9 (C, Ar), 136.3 (C,
Ar), 140.4 (C, Ar), 145.7 (C, Ar), 147.0 (C, Ar), 151.8 (C,
Ar), 202.4 (C, C=O), 204.5 (C, C=O). ESI–MS: m/z 518
(M?H)?. Anal. calcd. C32H23NO4S: C, 74.26; H, 4.48; N,
2.71. Found: C, 74.23; H, 4.53; N, 2.74.
70-(4-(Dimethylamino)phenyl)-10,30,50,60,70,7a0-hexahydro-
dispiro[acenaphthylene-1,50-pyrrolo-[1,2-c]thiazole-60,200-indane]-2,100(1H)-dione (6i) 1H NMR (CDCl3) dH: 2.87
(s, 6H), 3.04 (d, J = 16.8 Hz, 1H, H-300), 3.13 (dd, J =
11.5, 2.8 Hz, 1H, H-10), 3.32–3.35 (m, 1H, H-10), 3.64 (d,
J = 10.2 Hz, 1H, H-30), 4.04 (d, J = 16.6 Hz, 1H, H-300),4.09 (d, J = 10.2 Hz, 1H, H-30), 4.26 (d, J = 10.6 Hz, 1H,
H-70), 4.87–4.91 (m, 1H, H-7a0), 6.60–8.36 (m, 14H,
H–Ar); 13C NMR (CDCl3) dC: 31.3 (CH2, C-300) 36.6 (CH2,
C-10), 40.1 (CH3, N(CH3)2), 40.4 (CH3, N(CH3)2), 52.6
(CH, C-70), 54.1 (CH2, C-30), 71.1 (CH, C-7a0), 71.7 (C,
C-200), 83.1 (C, C-50), 111.9 (CH, Ar), 112.4 (CH, Ar),
120.3 (CH, Ar), 122.6 (CH, Ar), 123.4 (CH, Ar), 125.5
(CH, Ar), 125.9 (CH, Ar), 126.4 (CH, Ar), 127.0 (CH, Ar),
127.4 (CH, Ar), 128.1 (CH, Ar), 130.2 (CH, Ar), 130.3
(CH, Ar), 131.1 (C, Ar), 131.8 (C, Ar), 132.8 (CH, Ar),
133.7 (C, Ar), 134.5 (C, Ar), 136.3 (C, Ar), 140.4 (C, Ar),
149.6 (C, Ar), 151.8 (C, Ar), 202.3 (C, C=O), 204.5 (C, C=
O). ESI–MS: m/z 517 (M?H)?. Anal. calcd. C33H28N2
O2S: C, 76.72; H, 5.46; N, 5.42. Found: C, 76.66; H, 5.49;
N, 5.41.
70-(4-(Morpholine-1-yl)phenyl)-10,30,50,60,70,7a0-hexahyd-
rodispiro[acenaphthylene-1,50-pyrrolo-[1,2-c]thiazole-60,200-indane]-2,100(1H)-dione (6j) 1H NMR (CDCl3) dH: 3.
05 (d, 1H, J = 16.6 Hz, H-300), 3.10 (dd, J = 11.5, 2.8 Hz,
1H, H-10), 3.15 (t, J = 9.0 Hz, 4H, CH2), 3.32–3.35 (m,
1H, H-10), 3.67 (d, J = 10.5 Hz, 1H, H-30), 3.87 (t, J =
9.0 Hz, 4H, CH2), 4.01 (d, J = 16.6 Hz, 1H, H-300),4.07 (d, J = 10.0 Hz, 1H, H-30), 4.26 (d, J = 10.6 Hz, 1H,
H-70), 4.82–4.90 (m, 1H, H-7a0), 6.69–8.21 (m, 14H,
H–Ar); 13C NMR (CDCl3) dC: 31.6 (CH2, C-300), 36.9 (CH2,
C-10), 49.7 (CH2, NCH2), 49.9 (CH2, NCH2), 53.1 (CH, C-70),54.4 (CH2, C-30), 69.4 (CH2, OCH2), 69.6 (CH2, OCH2), 71.2
(CH, C-7a0), 72.0 (C, C-200), 82.9 (C, C-50), 116.7 (CH, Ar),
116.9 (CH, Ar), 120.7 (CH, Ar), 123.1 (CH, Ar), 125.9 (CH,
Ar), 126.3 (CH, Ar), 126.3 (CH, Ar), 126.7 (CH, Ar), 127.3
(CH, Ar), 127.4 (CH, Ar), 127.8 (CH, Ar), 128.5 (CH, Ar),
130.5 (CH, Ar), 130.7 (C, Ar), 131.5 (C, Ar), 132.2 (CH, Ar),
134.1 (C, Ar), 134.9 (C, Ar), 136.7 (C, Ar), 141.9 (C, Ar), 151.5
(C, Ar), 151.9 (C, Ar), 202.4 (C, C=O), 204.4 (C, C=O). ESI–
MS: m/z 559 (M?H)?. Anal. calcd. C35H30N2O3S: C, 75.24;
H, 5.41; N, 5.01. Found: C, 75.35; H, 5.49; N, 4.97.
Med Chem Res (2015) 24:818–828 823
123
70-(2,5-Dimethoxyphenyl)-10,30,50,60,70,7a0-hexahydrodispiro
[acenaphthylene-1,50-pyrrolo-[1,2-c]thiazole-60,200-indane]-
2,100(1H)-dione (6k) 1H NMR (CDCl3) dH: 3.04 (d, J =
16.6 Hz, 1H, H-300), 3.12 (dd, J = 11.5, 2.8 Hz, 1H, H-10),3.33–3.35 (m, 1H, H-10), 3.38 (s, 3H, OCH3), 3.65 (d, J =
10.2 Hz, 1H, H-30), 3.70 (s, 3H, OCH3), 4.04 (d, J = 16.6
Hz, 1H, H-300), 4.09 (d, J = 10.2 Hz, 1H, H-30), 4.26 (d,
J = 10.6 Hz, 1H, H-70), 4.86–4.90 (m, 1H, H-7a0), 6.90–8.
20 (m, 13H, H–Ar); 13C NMR (CDCl3) dC: 31.4 (CH2,
C-300), 36.6 (CH2, C-10), 51.9 (CH, C-70), 54.1 (CH2, C-30),54.5 (CH3, OCH3), 55.8 (CH3, OCH3), 71.1 (CH, C-7a0),71.7 (C, C-200), 83.0 (C, C-50), 110.2 (CH, Ar), 112.6 (CH,
Ar), 115.8 (CH, Ar), 120.9 (CH, Ar), 123.0 (CH, Ar), 123.5
(CH, Ar), 125.7 (CH, Ar), 126.0 (CH, Ar), 126.4 (CH, Ar),
126.7 (CH, Ar), 127.9 (CH, Ar), 130.2 (CH, Ar), 130.7
(C, Ar), 131.0 (C, Ar), 131.9 (CH, Ar), 133.9 (C, Ar), 135.4
(C, Ar), 136.3 (C, Ar), 140.4 (C, Ar), 151.5 (C, Ar), 151.9
(C, Ar), 152.0 (C, Ar), 202.3 (C, C=O), 204.5 (C, C=O).
ESI–MS: m/z 534 (M?H)?. Anal. calcd. C33H27NO4S: C,
74.27; H, 5.10; N, 2.62. Found: C, 74.16; H, 5.13; N, 2.61.
70-(4-(Piperidin-1-yl)phenyl)-10,30,50,60,70,7a0-hexahydrodi-
spiro[acenaphthylene-1,50-pyrrolo-[1,2-c]thiazole-60,200-indane]-2,100(1H)-dione (6l) 1H NMR (CDCl3) dH:
1.54–1.66 (m, 6H, CH2), 2.83–3.16 (m, 6H, H-300), 3.32–
3.39 (m, 1H, H-10), 3.66 (d, J = 9.9 Hz, 1H, H-300), 4.08–4.19
(m, 2H, H-30), 4.28 (d, J = 10.5 Hz, 1H, H-70), 4.88–4.93
(m, 1H, H-7a0), 6.79–8.38 (m, 14H, H–Ar); 13C NMR
(CDCl3) dC: 23.9 (CH2), 24.4 (CH2), 24.6 (CH2), 31.7 (CH2,
C-300), 36.9 (CH2, C-10), 50.4 (CH2, NCH2), 50.9 (CH2,
NCH2), 53.1 (CH, C-70), 54.4 (CH2, C-30), 71.4 (CH, C-7a0),72.0 (C, C-200), 82.9 (C, C-50), 116.4 (CH, Ar), 116.7 (CH,
Ar), 120.7 (CH, Ar), 123.1 (CH, Ar), 125.9 (CH, Ar), 126.3
(CH, Ar), 126.3 (CH, Ar), 126.7 (CH, Ar), 127.3 (CH, Ar),
127.4 (CH, Ar), 127.8 (CH, Ar), 128.5 (CH, Ar), 130.5 (CH,
Ar), 130.7 (C, Ar), 131.5 (C, Ar), 132.2 (CH, Ar), 134.1 (C,
Ar), 134.9 (C, Ar), 136.7 (C, Ar), 141.9 (C, Ar), 151.5 (C, Ar),
152.1 (C, Ar), 202.4 (C, C=O), 204.4 (C, C=O). ESI–MS: m/z
557 (M?H)?. Anal. calcd. C36H32N2O2S: C, 77.67; H, 5.79;
N, 5.03. Found: C, 77.50; H, 5.83; N, 5.09.
Biological evaluation
All the synthesized compounds 5a–5l and 6a–6l were tested
for their antimycobacterial activity in vitro against
M. tuberculosis H37RV (MTB-H37Rv) using a modified high
throughput screen assay (Collins and Franzblau, 1997), and
the end-point detection was assessed by the Promega reagent
BacTiter-GloTM Microbial Cell Viability (BTG). Com-
pounds screened in dose response were tested in ten twofold
dilutions from 100 lM to 0.195 lM. Three standard drugs
(isoniazid, ethambutol, and cycloserine) were used as ref-
erences for the assay. Concurrent with the activity screening,
cytotoxicity test was also performed in VERO cells at con-
centrations of 62.5 lg/mL. After 72 h of exposure, viability
was assessed on the basis of cellular conversion of MTT into
a formazan product using the Promega CellTiter 96 nonra-
dioactive cell proliferation assay.
Molecular docking studies
To investigate the binding interactions of the target com-
pounds, docking studies were performed on the lead
compound 5b against M. tuberculosis enoyl reductase,
InhA (PDB ID: 2H7M, Resolution = 1.62 A). Two dif-
ferent programs, Autodock 4.2 and Glide 5.7 were used in
order to identify the proper docking protocol. The receptor
and drug candidates were structurally optimized prior to
the actual docking simulation. Control dock of InhA was
performed against the bounded ligand, and the root mean
square deviation (RMSD) between the crystal geometry
and the docked pose was investigated. Since Glide pose
showed a lower rmsd value (rmsd = 0.228 A) compared to
Autodock (rmsd = 1.929 A), Glide XP protocol was used
for the rest of the studies to dock the target compounds.
Results and discussion
2-[(E)-1-(substituted aryl) methylidene]-1-indanones were
synthesized by Claisen-Schmidt condensation according to
the literature method (Ali et al., 2009), followed by syn-
thesis of dispiropyrrolidines via 1,3-dipolar cycloaddition
of azomethine ylides generated in situ from the decarb-
oxylative condensation of ninhydrin or acenaphthenequi-
none and thiazolidine-4-carboxylic acid with appropriate
dipolarophiles, 2-[(E)-1-arylmethylidene]-1-indanones
(Schemes 1, 2). Purity of the newly synthesized dispiro-
pyrrolidines was checked using NMR, CHN, and mass
spectrometry. All the analytical and spectral data showed that
the synthesized compounds were in full agreement with the
proposed structures. The regio and stereochemical
outcome of the cycloaddition reaction of compounds 5a (Wei
et al., 2011) was ascertained by single crystal X-ray analysis
(Figs. 1, 2). The molecular structure was stabilized by the
intramolecular C–H���O and C–H���N hydrogen bonds.
BacTiter-GloTM Microbial Cell Viability was used to screen
the activity of the newly synthesized compounds. This method
was based on the measurement of ATP content as an indicator of
the metabolically active cells. The luminescence signal gener-
ated by luciferase reaction was proportional to the amount of
viable cells present (Yuroff et al., 2008). From the 24 new
compounds, six of them showed better activity than cycloserine.
Compound 5b 70-(4-chlorophenyl)-50,60,70,7a0-tetrahydrodispi-
ro[indan-2,50-pyrrolo[1,2-c]-[1,3]thiazole-60,200-indan]-1,3,100-trione was found to be the most active with EC50 of 10.52 lM.
824 Med Chem Res (2015) 24:818–828
123
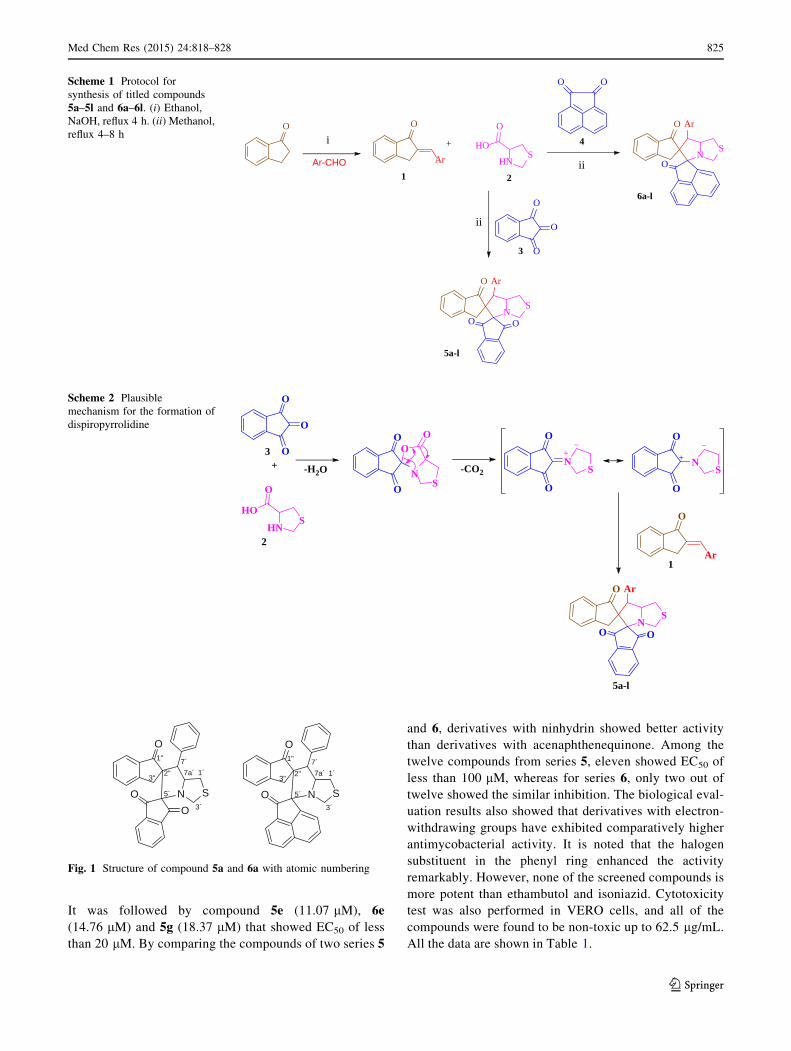
It was followed by compound 5e (11.07 lM), 6e
(14.76 lM) and 5g (18.37 lM) that showed EC50 of less
than 20 lM. By comparing the compounds of two series 5
and 6, derivatives with ninhydrin showed better activity
than derivatives with acenaphthenequinone. Among the
twelve compounds from series 5, eleven showed EC50 of
less than 100 lM, whereas for series 6, only two out of
twelve showed the similar inhibition. The biological eval-
uation results also showed that derivatives with electron-
withdrawing groups have exhibited comparatively higher
antimycobacterial activity. It is noted that the halogen
substituent in the phenyl ring enhanced the activity
remarkably. However, none of the screened compounds is
more potent than ethambutol and isoniazid. Cytotoxicity
test was also performed in VERO cells, and all of the
compounds were found to be non-toxic up to 62.5 lg/mL.
All the data are shown in Table 1.
O O
Ar
O
O
O
+i
ii
ii
HNS
HO
O
5a-l
N
O
OO
Ar
S
O O
6a-l
N
O
O
Ar
S
1 2
3
4
Ar-CHO
Scheme 1 Protocol for
synthesis of titled compounds
5a–5l and 6a–6l. (i) Ethanol,
NaOH, reflux 4 h. (ii) Methanol,
reflux 4–8 h
O
O+
O
-H2O
3
HNS
HO
O
2
-CO2
O
O
NS
O
O
NS
O
Ar1
5a-l
N
O
OO
Ar
S
O
O
N
O
S
O
Scheme 2 Plausible
mechanism for the formation of
dispiropyrrolidine
O
O
O
N S
1´
3´
7´
7a´
1"
3"2"
5´
O
O N S
1´
3´
7´
7a´
1"
3"2"
5´
Fig. 1 Structure of compound 5a and 6a with atomic numbering
Med Chem Res (2015) 24:818–828 825
123
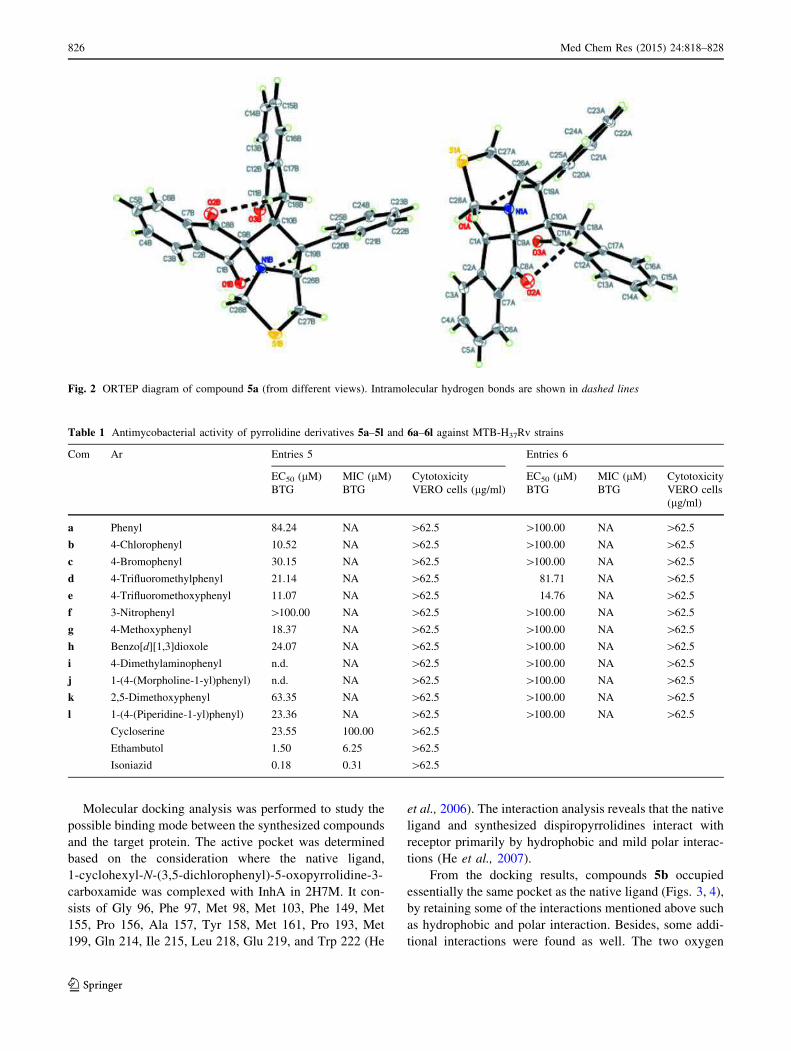
Molecular docking analysis was performed to study the
possible binding mode between the synthesized compounds
and the target protein. The active pocket was determined
based on the consideration where the native ligand,
1-cyclohexyl-N-(3,5-dichlorophenyl)-5-oxopyrrolidine-3-
carboxamide was complexed with InhA in 2H7M. It con-
sists of Gly 96, Phe 97, Met 98, Met 103, Phe 149, Met
155, Pro 156, Ala 157, Tyr 158, Met 161, Pro 193, Met
199, Gln 214, Ile 215, Leu 218, Glu 219, and Trp 222 (He
et al., 2006). The interaction analysis reveals that the native
ligand and synthesized dispiropyrrolidines interact with
receptor primarily by hydrophobic and mild polar interac-
tions (He et al., 2007).
From the docking results, compounds 5b occupied
essentially the same pocket as the native ligand (Figs. 3, 4),
by retaining some of the interactions mentioned above such
as hydrophobic and polar interaction. Besides, some addi-
tional interactions were found as well. The two oxygen
Fig. 2 ORTEP diagram of compound 5a (from different views). Intramolecular hydrogen bonds are shown in dashed lines
Table 1 Antimycobacterial activity of pyrrolidine derivatives 5a–5l and 6a–6l against MTB-H37Rv strains
Com Ar Entries 5 Entries 6
EC50 (lM)
BTG
MIC (lM)
BTG
Cytotoxicity
VERO cells (lg/ml)
EC50 (lM)
BTG
MIC (lM)
BTG
Cytotoxicity
VERO cells
(lg/ml)
a Phenyl 84.24 NA [62.5 [100.00 NA [62.5
b 4-Chlorophenyl 10.52 NA [62.5 [100.00 NA [62.5
c 4-Bromophenyl 30.15 NA [62.5 [100.00 NA [62.5
d 4-Trifluoromethylphenyl 21.14 NA [62.5 81.71 NA [62.5
e 4-Trifluoromethoxyphenyl 11.07 NA [62.5 14.76 NA [62.5
f 3-Nitrophenyl [100.00 NA [62.5 [100.00 NA [62.5
g 4-Methoxyphenyl 18.37 NA [62.5 [100.00 NA [62.5
h Benzo[d][1,3]dioxole 24.07 NA [62.5 [100.00 NA [62.5
i 4-Dimethylaminophenyl n.d. NA [62.5 [100.00 NA [62.5
j 1-(4-(Morpholine-1-yl)phenyl) n.d. NA [62.5 [100.00 NA [62.5
k 2,5-Dimethoxyphenyl 63.35 NA [62.5 [100.00 NA [62.5
l 1-(4-(Piperidine-1-yl)phenyl) 23.36 NA [62.5 [100.00 NA [62.5
Cycloserine 23.55 100.00 [62.5
Ethambutol 1.50 6.25 [62.5
Isoniazid 0.18 0.31 [62.5
826 Med Chem Res (2015) 24:818–828
123
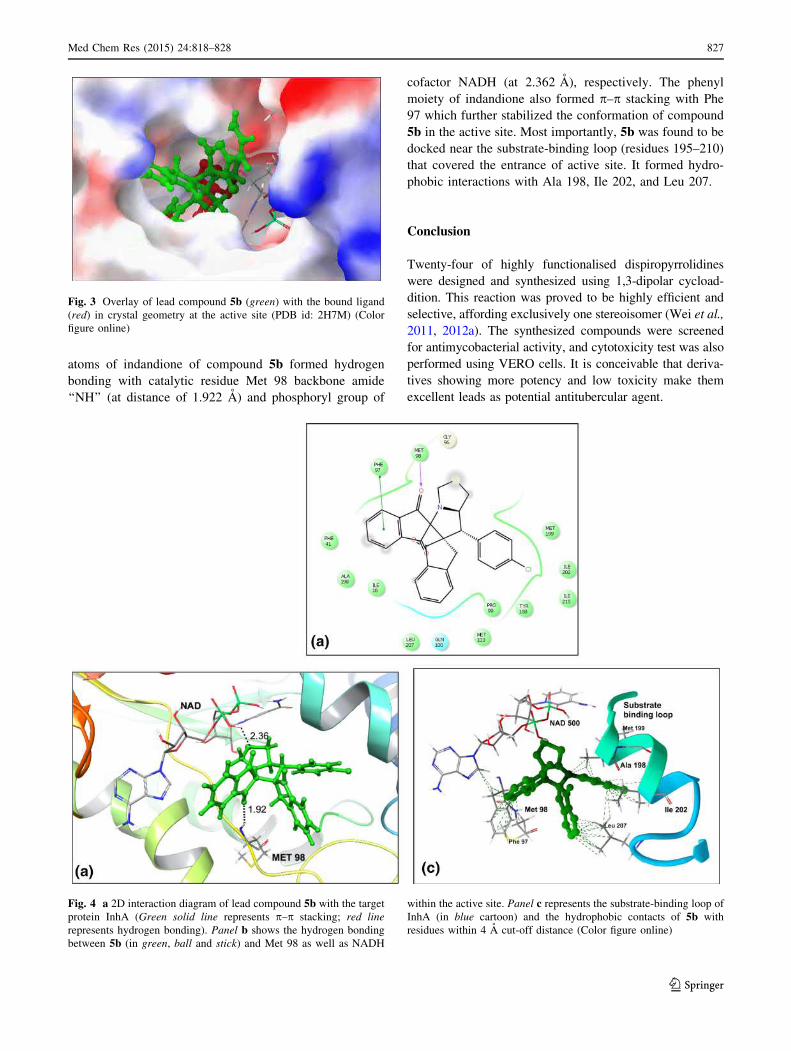
atoms of indandione of compound 5b formed hydrogen
bonding with catalytic residue Met 98 backbone amide
‘‘NH’’ (at distance of 1.922 A) and phosphoryl group of
cofactor NADH (at 2.362 A), respectively. The phenyl
moiety of indandione also formed p–p stacking with Phe
97 which further stabilized the conformation of compound
5b in the active site. Most importantly, 5b was found to be
docked near the substrate-binding loop (residues 195–210)
that covered the entrance of active site. It formed hydro-
phobic interactions with Ala 198, Ile 202, and Leu 207.
Conclusion
Twenty-four of highly functionalised dispiropyrrolidines
were designed and synthesized using 1,3-dipolar cycload-
dition. This reaction was proved to be highly efficient and
selective, affording exclusively one stereoisomer (Wei et al.,
2011, 2012a). The synthesized compounds were screened
for antimycobacterial activity, and cytotoxicity test was also
performed using VERO cells. It is conceivable that deriva-
tives showing more potency and low toxicity make them
excellent leads as potential antitubercular agent.
Fig. 3 Overlay of lead compound 5b (green) with the bound ligand
(red) in crystal geometry at the active site (PDB id: 2H7M) (Color
figure online)
Fig. 4 a 2D interaction diagram of lead compound 5b with the target
protein InhA (Green solid line represents p–p stacking; red line
represents hydrogen bonding). Panel b shows the hydrogen bonding
between 5b (in green, ball and stick) and Met 98 as well as NADH
within the active site. Panel c represents the substrate-binding loop of
InhA (in blue cartoon) and the hydrophobic contacts of 5b with
residues within 4 A cut-off distance (Color figure online)
Med Chem Res (2015) 24:818–828 827
123
Molecular docking results reveal that the binding mode
of the most active compound, 5b is similar with pyrrolidine
carboxamides, the known direct InhA inhibitor. It is
encouraging to see that dispiropyrrolidines display poten-
tial as direct InhA inhibitor as it is docked near the sub-
strate-binding loop. Further modification on the novel
scaffolds is ongoing in our laboratory to exhibit better
potency than standard drugs.
Acknowledgments The authors wish to express their thanks to
Pharmacogenetic and Novel Therapeutic Research, Institute for
Research in Molecular Medicine, Universiti of Sains Malaysia, Pen-
ang for the research facilities. This work was supported by National
Institutes of Health and the National Institute of Allergy and Infec-
tious Diseases, Contract No. HHSN272201100012I for the biological
evaluation. The funding of this project was through Research Grant
No. RUC (1001/PSK/8620012) and RU 1001/PKIMIA/811221.
Conflict of interest The authors confirm that this article content has
no conflicts of interest.
References
Ali MA, Samy JG, Manogaran E, Sellappan V, Hasan MZ, Ahsan MJ,
Pandian S, ShaharYar M (2009) Synthesis and antimycobacterial
evaluation of novel 5,6-dimethoxy-1-oxo-2,5-dihydro-1H-2-in-
denyl-5,4-substituted phenyl methanone analogues. Bioorg Med
Chem Lett 19(24):7000–7002
Banerjee A, Dubnau E, Quemard A, Balasubramanian V, Um KS,
Wilson T, Collins D, de Lisle G, Jacobs WR Jr (1994) inhA, a
gene encoding a target for isoniazid and ethionamide in
Mycobacterium tuberculosis. Science 263(5144):227–230
Bellina F, Rossi R (2006) Synthesis and biological activity of pyrrole,
pyrroline and pyrrolidine derivatives with two aryl groups on
adjacent positions. Tetrahedron 62(31):7213–7256
Brimble MA, Park JH, Taylor CM (2003) Synthesis of the spiroacetal
fragment of broussonetine H. Tetrahedron 59(31):5861–5868
Cade CE, Dlouhy AC, Medzihradszky KF, Salas-Castillo SP, Ghiladi
RA (2010) Isoniazid-resistance conferring mutations in Myco-
bacterium tuberculosis KatG: catalase, peroxidase, and INH-
NADH adduct formation activities. Protein Sci 19(3):458–474
Chiang C-Y, Centis R, Migliori GB (2010) Drug-resistant tubercu-
losis: past, present, future. Respirology 15(3):413–432
Collins L, Franzblau SG (1997) Microplate alamar blue assay versus
BACTEC 460 system for high-throughput screening of com-
pounds against Mycobacterium tuberculosis and Mycobacterium
avium. Antimicrob Agents Chemother 41(5):1004–1009
Crooks PA, Rosenberg HE (1978) Synthesis of spiro[tetralin-2,20-pyrrolidine] and spiro[indan-2,20-pyrrolidine] derivatives as
potential analgesics. J Med Chem 21(6):585–587
He X, Alian A, Stroud R, Ortiz de Montellano PR (2006) Pyrrolidine
carboxamides as a novel class of inhibitors of enoyl acyl carrier
protein reductase from Mycobacterium tuberculosis. J Med
Chem 49(21):6308–6323
He X, Alian A, Ortiz de Montellano PR (2007) Inhibition of the
Mycobacterium tuberculosis enoyl acyl carrier protein reductase
InhA by arylamides. Bioorg Med Chem 15(21):6649–6658
Introduction (2008). Tuberculosis 88 (2):85–86
Kuo MR, Morbidoni HR, Alland D, Sneddon SF, Gourlie BB,
Staveski MM, Leonard M, Gregory JS, Janjigian AD, Yee C,
Musser JM, Kreiswirth B, Iwamoto H, Perozzo R, Jacobs WR,
Sacchettini JC, Fidock DA (2003) Targeting tuberculosis and
malaria through inhibition of enoyl reductase: compound activity
and structural data. J Biol Chem 278(23):20851–20859
Lawn SD, Zumla AI (2011) Tuberculosis. Lancet 378(9785):57–72
Mitchison DA (2000) Role of individual drugs in the chemotherapy of
tuberculosis. Int J Tuberc Lung Dis 4(9):796–806
Musser JM, Kapur V, Williams DL, Kreiswirth BN, van Soolingen D,
van Embden JDA (1996) Characterization of the catalase-
peroxidase gene (katG) and inhA locus in isoniazid-resistant and
-susceptible strains of Mycobacterium tuberculosis by automated
DNA sequencing: restricted array of mutations associated with
drug resistance. J Infect Dis 173(1):196–202
Pawlowski A, Jansson M, Skold M, Rottenberg ME, Kallenius G
(2012) Tuberculosis and HIV co-infection. PLoS Pathog 8(2):
e1002464
Pellegrini C, Weber M, Borschberg H-J (1996) Total synthesis of (?)-
elacomine and (-)-isoelacomine, two hitherto unnamed oxin-
dole alkaloids from Elaeagnus commutata. Helv Chim Acta
79(1):151–168
Stylianakis I, Kolocouris A, Kolocouris N, Fytas G, Foscolos GB,
Padalko E, Neyts J, De Clercq E (2003) Spiro[pyrrolidine-2,20-adamantanes]: synthesis, anti-influenza virus activity and con-
formational properties. Bioorg Med Chem Lett 13(10):
1699–1703
Timmins GS, Deretic V (2006) Mechanisms of action of isoniazid.
Mol Microbiol 62(5):1220–1227
Tsuge O, Kanemasa S (1989) Recent advances in azomethine ylide
chemistry. In: Alan RK (ed) Advances in heterocyclic chemistry,
vol 45. Academic Press, New York, pp 231–349
Usui T, Kondoh M, Cui CB, Mayumi T, Osada H (1998) Tryprostatin
A, a specific and novel inhibitor of microtubule assembly.
Biochem J 333(3):543–548
Wei AC, Ali MA, Choon TS, Quah CK, Fun H-K (2011) 70-Phenyl-
50,60,70,7a0-tetrahydrodipiro[indan-2,50-pyrrolo[1,2-c][1,3]thia-
zole-60,200-indan]-1,3,100-trione. Acta Crystallographica Sec-
tion E 67(12):o3218–o3219
Wei AC, Ali MA, Choon TS, Arshad S, Razak IA (2012a) 70-Phenyl-
10,30,50,60,70,7a0-hexahydrodipiro[acenaphthylene-1,50-pyrrolo
[1,2-c]thiazole-60,200-indane]-2,100(1H)-dione. Acta Crystallogr
Sect E 68(4):o1265–o1266
Wei AC, Ali MA, Yoon YK, Ismail R, Choon TS, Kumar RS,
Arumugam N, Almansour AI, Osman H (2012b) Antimycobac-
terial activity: a facile three-component [3 ? 2]-cycloaddition
for the regioselective synthesis of highly functionalised dispiro-
pyrrolidines. Bioorg Med Chem Lett 22(15):4930–4933
Wei AC, Ali MA, Yoon YK, Ismail R, Choon TS, Kumar RS (2013)
A facile three-component [3 ? 2]-cycloaddition for the regio-
selective synthesis of highly functionalised dispiropyrrolidines
acting as antimycobacterial agents. Bioorg Med Chem Lett
23(5):1383–1386
WHO (2013) Global tuberculosis report
Yuroff A, Fan F, Butler B, Collins M (2008) Application of the
BacTiter-GloTM assay for rapid enumeration and screening of
antimicrobial compounds for mycobacterium avium complex
bacteria. Promega Notes 98:8–10
Zhang Y (2005) The magic bullets and tuberculosis drug targets.
Annu Rev Pharmacol Toxicol 45:529–564
Zhang Y, Heym B, Allen B, Young D, Cole S (1992) The catalase-
peroxidase gene and isoniazid resistance of Mycobacterium
tuberculosis. Nature 358(6387):591–593
828 Med Chem Res (2015) 24:818–828
123
1 23
Medicinal Chemistry Research ISSN 1054-2523Volume 24Number 3 Med Chem Res (2015) 24:1241-1264DOI 10.1007/s00044-014-1193-8
Effect of information leakage and methodof splitting (rational and random) onexternal predictive ability and behavior ofdifferent statistical parameters of QSARmodelVijay H. Masand, Devidas T. Mahajan,Gulam M. Nazeruddin, Taibi BenHadda, Vesna Rastija & AhmedM. Alfeefy

1 23
Your article is protected by copyright and all
rights are held exclusively by Springer Science
+Business Media New York. This e-offprint is
for personal use only and shall not be self-
archived in electronic repositories. If you wish
to self-archive your article, please use the
accepted manuscript version for posting on
your own website. You may further deposit
the accepted manuscript version in any
repository, provided it is only made publicly
available 12 months after official publication
or later and provided acknowledgement is
given to the original source of publication
and a link is inserted to the published article
on Springer's website. The link must be
accompanied by the following text: "The final
publication is available at link.springer.com”.
ORIGINAL RESEARCH
Effect of information leakage and method of splitting (rationaland random) on external predictive ability and behaviorof different statistical parameters of QSAR model
Vijay H. Masand • Devidas T. Mahajan • Gulam M. Nazeruddin •
Taibi Ben Hadda • Vesna Rastija • Ahmed M. Alfeefy
Received: 22 May 2014 / Accepted: 15 July 2014 / Published online: 12 August 2014
� Springer Science+Business Media New York 2014
Abstract Quantitative Structure–Activity Relationship
not only provides guidelines regarding structural features
responsible for biological activity but it can be used also
for prediction of desired activity prior to synthesis of
untested chemicals. Therefore, an appropriate validation of
any QSAR is of utmost importance to judge its external
predictive ability. Generally, internal and external valida-
tions (preferred by many) are used in the absence of a true
external dataset. The model developed using external
method may not be reliable as it may not capture all
essential features required for the particular SAR due to
omission of some compounds, especially for small datasets.
In external validation, the splitting is done either rationally
or in random manner before descriptor selection. In the
present study, rational splitting of dataset was performed
using a novel method and its effect on statistical parameters
was analyzed. The analysis reveals that the predictive
ability of a QSAR model is sensitive toward (1) the method
of splitting and (2) distribution of the training and the
prediction sets. In addition, purposeful selection can be
used to influence the statistical parameters; therefore,
external validation based on single split is insufficient to
guarantee the true predictive ability of a QSAR model.
Besides, it appears that the selection of descriptors prior to
splitting (information leakage) has little role to play in
deciding external predictivity of the model. The present
study reveals that as many as possible statistical parameters
should be examined along with boot-strapping instead of
single external validation.
Keywords QSAR � External validation �Statistical parameters � Splitting methods � Predictivity
Introduction
Under the umbrella of modern drug designing, Computer
Assisted Drug Designing (CADD) is the method of choice
due to faster, cheaper, and result-oriented analysis (Kub-
inyi, 2002; Van Drie, 2007; Yuriev et al., 2011). Over the
years, CADD has matured with the advent of new tech-
niques, algorithms, and software programs. Quantitative
Structure–Activity Relationship (QSAR), molecular dock-
ing, pharmacophore modeling, etc. are thriving techniques
from the tenant of CADD. Of these, QSAR has gained
much attention because of its applicability in risk assess-
ment, toxicity prediction, and regulatory decisions apart
from drug discovery and lead optimization. Further
Electronic supplementary material The online version of thisarticle (doi:10.1007/s00044-014-1193-8) contains supplementarymaterial, which is available to authorized users.
V. H. Masand (&) � D. T. Mahajan
Department of Chemistry, Vidya Bharati College, Camp,
Amravati, Maharashtra, India
e-mail: [email protected]; [email protected]
G. M. Nazeruddin
Department of Chemistry, Poona College, Pune, Maharashtra,
India
T. B. Hadda
Laboratoire Chimie des Materiaux, Universite Mohammed
Premier, 60000 Oujda, Morocco
V. Rastija
Department of Chemistry, Faculty of Agriculture, Josip Juraj
Strossmayer University of P. Svacica 1d, Osijek, Croatia
A. M. Alfeefy
Department of Pharmaceutical Chemistry, College of Pharmacy,
Salman Bin Abdulaziz University, P.O. Box 173, Alkharj 11942,
Saudi Arabia
123
Med Chem Res (2015) 24:1241–1264
DOI 10.1007/s00044-014-1193-8
MEDICINALCHEMISTRYRESEARCH
Author's personal copy
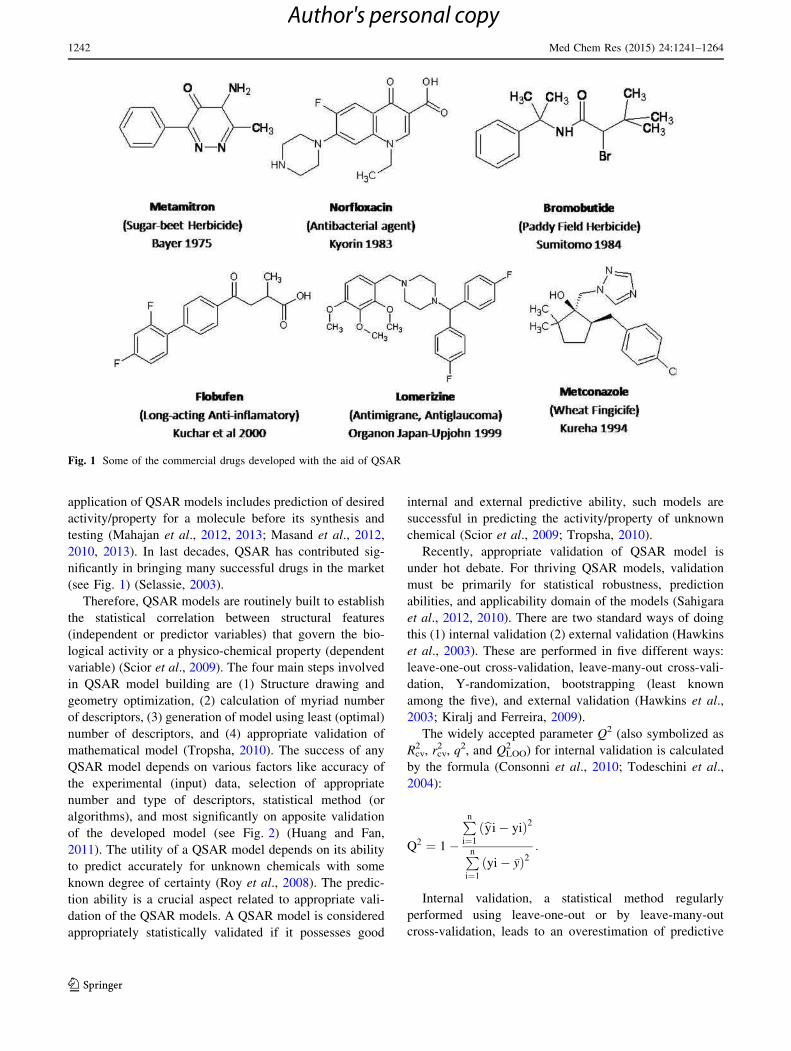
application of QSAR models includes prediction of desired
activity/property for a molecule before its synthesis and
testing (Mahajan et al., 2012, 2013; Masand et al., 2012,
2010, 2013). In last decades, QSAR has contributed sig-
nificantly in bringing many successful drugs in the market
(see Fig. 1) (Selassie, 2003).
Therefore, QSAR models are routinely built to establish
the statistical correlation between structural features
(independent or predictor variables) that govern the bio-
logical activity or a physico-chemical property (dependent
variable) (Scior et al., 2009). The four main steps involved
in QSAR model building are (1) Structure drawing and
geometry optimization, (2) calculation of myriad number
of descriptors, (3) generation of model using least (optimal)
number of descriptors, and (4) appropriate validation of
mathematical model (Tropsha, 2010). The success of any
QSAR model depends on various factors like accuracy of
the experimental (input) data, selection of appropriate
number and type of descriptors, statistical method (or
algorithms), and most significantly on apposite validation
of the developed model (see Fig. 2) (Huang and Fan,
2011). The utility of a QSAR model depends on its ability
to predict accurately for unknown chemicals with some
known degree of certainty (Roy et al., 2008). The predic-
tion ability is a crucial aspect related to appropriate vali-
dation of the QSAR models. A QSAR model is considered
appropriately statistically validated if it possesses good
internal and external predictive ability, such models are
successful in predicting the activity/property of unknown
chemical (Scior et al., 2009; Tropsha, 2010).
Recently, appropriate validation of QSAR model is
under hot debate. For thriving QSAR models, validation
must be primarily for statistical robustness, prediction
abilities, and applicability domain of the models (Sahigara
et al., 2012, 2010). There are two standard ways of doing
this (1) internal validation (2) external validation (Hawkins
et al., 2003). These are performed in five different ways:
leave-one-out cross-validation, leave-many-out cross-vali-
dation, Y-randomization, bootstrapping (least known
among the five), and external validation (Hawkins et al.,
2003; Kiralj and Ferreira, 2009).
The widely accepted parameter Q2 (also symbolized as
Rcv2 , rcv
2 , q2, and QLOO2 ) for internal validation is calculated
by the formula (Consonni et al., 2010; Todeschini et al.,
2004):
Q2 ¼ 1 �
Pn
i¼1
ðbyi � yiÞ2
Pn
i¼1
ðyi � �yÞ2:
Internal validation, a statistical method regularly
performed using leave-one-out or by leave-many-out
cross-validation, leads to an overestimation of predictive
Fig. 1 Some of the commercial drugs developed with the aid of QSAR
1242 Med Chem Res (2015) 24:1241–1264
123
Author's personal copy
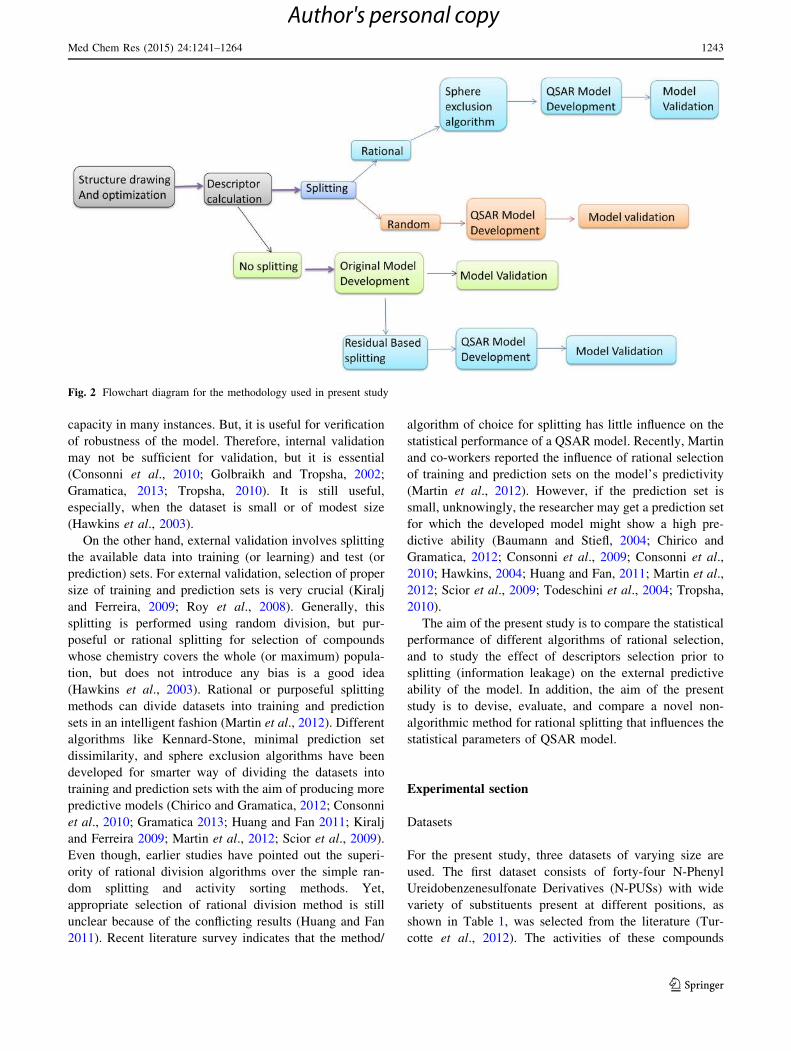
capacity in many instances. But, it is useful for verification
of robustness of the model. Therefore, internal validation
may not be sufficient for validation, but it is essential
(Consonni et al., 2010; Golbraikh and Tropsha, 2002;
Gramatica, 2013; Tropsha, 2010). It is still useful,
especially, when the dataset is small or of modest size
(Hawkins et al., 2003).
On the other hand, external validation involves splitting
the available data into training (or learning) and test (or
prediction) sets. For external validation, selection of proper
size of training and prediction sets is very crucial (Kiralj
and Ferreira, 2009; Roy et al., 2008). Generally, this
splitting is performed using random division, but pur-
poseful or rational splitting for selection of compounds
whose chemistry covers the whole (or maximum) popula-
tion, but does not introduce any bias is a good idea
(Hawkins et al., 2003). Rational or purposeful splitting
methods can divide datasets into training and prediction
sets in an intelligent fashion (Martin et al., 2012). Different
algorithms like Kennard-Stone, minimal prediction set
dissimilarity, and sphere exclusion algorithms have been
developed for smarter way of dividing the datasets into
training and prediction sets with the aim of producing more
predictive models (Chirico and Gramatica, 2012; Consonni
et al., 2010; Gramatica 2013; Huang and Fan 2011; Kiralj
and Ferreira 2009; Martin et al., 2012; Scior et al., 2009).
Even though, earlier studies have pointed out the superi-
ority of rational division algorithms over the simple ran-
dom splitting and activity sorting methods. Yet,
appropriate selection of rational division method is still
unclear because of the conflicting results (Huang and Fan
2011). Recent literature survey indicates that the method/
algorithm of choice for splitting has little influence on the
statistical performance of a QSAR model. Recently, Martin
and co-workers reported the influence of rational selection
of training and prediction sets on the model’s predictivity
(Martin et al., 2012). However, if the prediction set is
small, unknowingly, the researcher may get a prediction set
for which the developed model might show a high pre-
dictive ability (Baumann and Stiefl, 2004; Chirico and
Gramatica, 2012; Consonni et al., 2009; Consonni et al.,
2010; Hawkins, 2004; Huang and Fan, 2011; Martin et al.,
2012; Scior et al., 2009; Todeschini et al., 2004; Tropsha,
2010).
The aim of the present study is to compare the statistical
performance of different algorithms of rational selection,
and to study the effect of descriptors selection prior to
splitting (information leakage) on the external predictive
ability of the model. In addition, the aim of the present
study is to devise, evaluate, and compare a novel non-
algorithmic method for rational splitting that influences the
statistical parameters of QSAR model.
Experimental section
Datasets
For the present study, three datasets of varying size are
used. The first dataset consists of forty-four N-Phenyl
Ureidobenzenesulfonate Derivatives (N-PUSs) with wide
variety of substituents present at different positions, as
shown in Table 1, was selected from the literature (Tur-
cotte et al., 2012). The activities of these compounds
Fig. 2 Flowchart diagram for the methodology used in present study
Med Chem Res (2015) 24:1241–1264 1243
123
Author's personal copy
Table 1 Substituted N-Phenyl Ureidobenzenesulfonate derivatives along with -logIC50 (pIC50) and descriptor values
S. no. X R1 R2 pIC50 (M)
(HT-29)
F07
[C–N]
F05
[C–C]
Mor29e Mor03m RDF095v
1 O 4-OH 4-CEU 5.824 1 12 0.728 -3.81 1.503
2 O 2-Me 3-CEU 4.481 2 13 0.04 -5.025 5.266
3 O 2-CH2-CH3 3-CEU 5.367 2 14 0.283 -5.342 3.314
4 O 2-(CH2)2-CH3 3-CEU 4.824 2 16 0.04 -4.293 5.093
5 O 4-OH 3-CEU 3.921 2 12 0.408 -4.627 4.138
6 O 2-CH2-CH3 4-CEU 4.770 1 14 0.246 -2.51 1.679
7 O 2-(CH2)2-CH3 4-CEU 5.602 1 16 0.249 -4.542 3.791
8 NH 2-Me 3-CEU 4.149 2 13 0.044 -5.776 5.265
9 NH 2-CH2-CH3 3-CEU 4.319 2 14 0.003 -4.2 3.792
10 NH 2-(CH2)2-CH3 3-CEU 4.824 2 16 -0.015 -5.66 6.562
11 NH 2-Me 4-CEU 4.260 2 13 -0.056 -4.842 4.379
12 NH 2-CH2-CH3 4-CEU 4.398 2 14 -0.199 -4.036 3.316
13 NH 2-(CH2)2-CH3 4-CEU 4.678 2 16 -0.109 -5.379 4.276
14 O 2-Me 3-CPU 4.678 2 13 -0.099 -4.91 4.18
15 O 2-CH2-CH3 3-CPU 4.638 2 14 0.057 -5.709 3.351
16 O 2-(CH2)2-CH3 3-CPU 4.854 2 16 0.09 -4.777 5.737
17 O 4-OH 3-CPU 4.292 2 12 0.371 -3.81 3.557
18 O 2-Me 4-CPU 4.585 1 13 0.026 -3.933 2.952
19 O 2-CH2-CH3 4-CPU 4.824 1 14 0.1 -4.001 2.835
20 O 2-(CH2)2-CH3 4-CPU 4.886 1 16 -0.033 -4.132 4.372
21 O 4-OH 4-CPU 4.301 1 12 0.137 -3.322 2.426
22 NH 2-Me 3-CPU 4.377 2 13 0.144 -4.557 4.698
23 NH 2-CH2-CH3 3-CPU 4.018 2 14 -0.233 -5.079 4.639
24 NH 2-(CH2)2-CH3 3-CPU 4.824 2 16 -0.265 -5.077 5.298
25 NH 2-Me 4-CPU 4.194 2 13 -0.247 -2.874 2.342
26 NH 2-(CH2)2-CH3 4-CPU 4.585 2 16 -0.199 -5.308 4.241
27 O 2-Me 4-CEU 5.328 1 13 0.182 -4.774 3.14
28 O 2-Me 3-EU 4.357 2 13 0.048 -3.826 3.679
29 O 2-CH2-CH3 3-EU 4.481 2 14 0.123 -3.92 3.658
30 O 2-(CH2)2-CH3 3-EU 4.602 2 16 0.064 -4.152 5.884
31 O 4-OH 3-EU 4.125 2 12 0.245 -3.361 3.747
32 O 2-Me 4-EU 4.921 1 13 0.226 -3.517 2.458
33 O 2-CH2-CH3 4-EU 4.921 1 14 0.289 -3.603 2.334
34 O 2-(CH2)2-CH3 4-EU 5.620 1 16 0.179 -3.78 3.85
35 O 4-OH 4-EU 4.921 1 12 0.275 -2.822 2.042
36 O 3-Me 4-CEU 5.143 1 12 0.179 -5.158 2.729
37 NH 2-Me 3-EU 3.991 2 13 0.114 -4.003 5.481
38 NH 2-CH2-CH3 3-EU 4.824 2 14 -0.077 -3.948 3.99
39 NH 2-(CH2)2-CH3 3-EU 4.387 2 16 -0.121 -3.772 4.862
40 NH 2-CH2-CH3 4-EU 4.066 2 14 -0.106 -3.638 2.681
41 NH 2-(CH2)2-CH3 4-EU 4.495 2 16 -0.179 -3.383 3.517
42 O 4-Me 4-CEU 4.523 1 12 0.411 -2.191 3.995
43 O 4-OMe 4-CEU 4.745 1 13 0.579 -3.646 2.832
44 O 4-N(Me)2 4-CEU 4.409 2 14 0.274 -3.852 5.562
CEU 2-chloroethylurea, CPU 3-chloropropylurea, EU ethylurea
1244 Med Chem Res (2015) 24:1241–1264
123
Author's personal copy
reported as IC50 (lM) against HT-29 colon carcinoma cells
were converted to pIC50 (M). These derivatives of N-PUS,
their corresponding -logIC50 (pIC50) values along with the
values of descriptor are presented in Table 1.
The second data consists of one hundred and twelve
4-aminoquinoline derivatives (Hwang et al., 2011) with a
variety of substituents at different positions (see Table 2).
The anti-malarial activity tested against chloroquine (CQ)
sensitive (3D7) strain of P. falciparum reported as EC50
(lM) values were converted to pEC50 (M) for smoother
statistical calculations. These derivatives of 4-aminoquin-
olines, their corresponding -logEC50 (pEC50) values and
values of descriptor are presented in Table 2.
The third dataset, which is a subset of the dataset 2,
comprises cytotoxicity data of one hundred 4-aminoquin-
olines (Hwang et al., 2011) tested against HepG2 cell lines
(see Table 3). For convenience, EC50 (lM) values were
converted to pEC50 (M).
Calculation and selection of descriptors
The structures were drawn using Chemsketch 12 freeware,
optimized using MMFF94 force field in TINKER, and then
subjected to calculation of a large number of descriptors
using e-Dragon, and PowerMV. Objective feature selection
was performed to eliminate highly correlated and constant
variables using QSARINS v1.2 and RapidMiner 5.0.
Redundant descriptors were identified and eliminated using
objective feature selection (Chirico and Gramatica, 2012;
Gramatica, 2013; Mahajan et al., 2013; Masand et al.,
2012, 2010, 2013). The procedure reported in the literature
was employed for objective feature selection (Chirico and
Gramatica 2012; Gramatica, 2013; Mahajan et al., 2013;
Masand et al., 2012, 2010, 2013). As a general rule, con-
stant for [80 % molecules, low-variance and correlated
(|R| C 0.6) descriptors were excluded prior to modeling.
Methodology
The general procedure of external validation involves
selection of descriptor on the basis of training set after
splitting. It is well established that a QSAR model well
predicts for a prediction molecule that is structurally very
similar to the training set molecules because the descriptor
(hence, the model) has captured common features of the
training set molecules and is proficient to detect them in the
new molecule (Consonni et al., 2009, 2010; Huang and
Fan, 2011; Schuurmann et al., 2008; Todeschini et al.,
2004), reverse is true for a new molecule which has very
little in common with the training set data. That is, the
confidence in its prediction should be low. Recently, Roy
et al. proposed a new approach to overcome this critical
issue, in which they used undivided dataset for selection of
variables and performed internal validation (LOO cross-
validation) in two different ways to ensure external pre-
dictivity of the developed model (Mitra et al., 2010). In the
present work, descriptor selection was performed for the
whole data set prior to splitting (information leakage) to
determine the effect of selection of descriptors on external
predictivity and behavior of different statistical parameters
of the model. Genetic Algorithm (GA) available in QSA-
RINS v1.2 was employed for the selection of optimum
number and the set of descriptors applying the default
settings (Chirico and Gramatica, 2011, 2012). Though, this
step contravenes the basic rule that prediction set com-
pounds should be excluded from the model development
procedure, that is, they should be unknown to the devel-
oped model. But, this ensures that the selected descriptors
capture the essential features that control the biological
activity. In addition, it allows determining the effect of
early descriptor selection (that is, prior to splitting or
information leakage) on external predictivity of the mod-
els. Ferreira and Kiralj have termed such models as
‘Auxiliary models’ (Kiralj and Ferreira, 2009).
In QSARINS (Gramatica et al., 2014, 2013), CV (cross-
validation) techniques are used as the optimization
parameter (fitness function) for GA-based variable selec-
tion and also to verify model robustness and to avoid naıve
Q2 (Chirico and Gramatica, 2011, (2012). The novel
methodology for splitting (first time reported in this work,
termed as residual-based method (RBM)) begins with the
creation of an original model on the basis of undivided
dataset followed by splitting of dataset into training and
prediction sets on the basis of sign of residuals (difference
between the actual and predicted value by original model)
for each sample. In short, for the whole undivided dataset,
a statistically robust GA-MLR model (Original Model) was
built. For some molecules, this original model resulted in
positive residuals and negative for the rest. Now, for the
novel methodology of splitting i.e., RBM, the whole
dataset was divided rationally into training and prediction
sets on the basis of sign of the residuals (obtained in the
original model with the condition that the bigger set as
training set). A GA-MLR QSAR model was built for the
training and the prediction sets created by RBM method.
For comparison purpose, the whole dataset was again
divided randomly (random splitting model, termed as
RSM) and rationally (using sphere exclusion model,
termed a SEM method) into the training and the prediction
sets with number of compounds similar to training and
prediction sets as in RBM, that is, during these various
splitting, the number of molecules in training and predic-
tion set is identical in RBM, RSM, and SEM. A molecule
in the training set of one method (RBM or RSM or SEM)
may or may not be in the training set of other method
(RBM or RSM or SEM). The identical data split with
Med Chem Res (2015) 24:1241–1264 1245
123
Author's personal copy
Table 2 4-aminoquinolines used in present study along with pEC50 and descriptors
Sr. no. R1 R2 pEC50 (M) Mor13e RDF040v F06 [N–O]
1 PhO Furfuryl 5.620 -0.218 7.086 2
2 PhO 2-HO-3-MeO-Bn 5.854 -0.81 7.784 1
3 PhO Piperonyl 5.921 -1.085 8.62 1
4 PhO 3-F-6-MeO-Bn 5.959 -0.506 7.366 1
5 2-MeO-PhO Furfuryl 6.143 -0.729 8.331 1
6 2-MeO-PhO 2-HO-3-MeO-Bn 6.152 -1.446 9.537 1
7 2-MeO-PhO Piperonyl 6.223 -1.455 9.351 1
8 2-MeO-PhO 3-F-6-MeO-Bn 6.236 -0.523 9.875 1
9 3-MeO-PhO Furfuryl 6.503 -0.319 7.272 1
10 3-MeO-PhO 2-HO-3-MeO-Bn 6.527 -0.748 9.432 1
11 3-MeO-PhO Piperonyl 6.545 -1.079 9.32 1
12 3-MeO-PhO 3-F-6-MeO-Bn 6.547 -0.64 9.523 1
13 4-MeO-PhO Furfuryl 6.600 -0.245 7.489 1
14 4-MeO-PhO 2-HO-3-MeO-Bn 6.652 -0.838 9.878 1
15 4-MeO-PhO Piperonyl 6.682 -1.017 9.645 1
16 4-MeO-PhO 3-F-6-MeO-Bn 6.754 -0.392 9.149 1
17 4-F-PhO Furfuryl 6.790 -0.428 6.34 1
18 4-F-PhO 2-HO-3-MeO-Bn 6.790 -0.651 8.072 1
19 4-F-PhO Piperonyl 6.842 -0.842 8.321 1
20 4-F-PhO 3-F-6-MeO-Bn 6.860 -0.691 7.491 1
21 4-Cl-PhO Furfuryl 6.863 -0.252 8.598 1
22 4-Cl-PhO Furfuryl 6.879 -0.778 9.636 1
23 4-Cl-PhO Piperonyl 6.893 -0.749 10.379 1
24 4-Cl-PhO 3-F-6-MeO-Bn 6.896 -0.636 10.35 1
25 3-Me2 N-PhO Furfuryl 6.928 -0.024 7.162 1
26 3-Me2 N-PhO 2-HO-3-MeO-Bn 6.936 -0.727 8.607 1
27 3-Me2 N-PhO Piperonyl 6.975 -0.858 8.745 1
28 3-Me2 N-PhO 3-F-6-MeO-Bn 7.018 -0.212 7.919 1
29 4-tertBu-PhO Furfuryl 7.036 0.559 8.276 1
30 4-tertBu-PhO 2-HO-3-MeO-Bn 7.046 1.005 9.795 1
31 4-tertBu-PhO Piperonyl 7.051 0.206 9.918 1
32 4-tertBu-PhO 3-F-6-MeO-Bn 7.066 -0.375 10.119 1
33 4-F-Ph Furfuryl 7.125 -0.585 5.107 0
34 4-F-Ph 2-HO-3-MeO-Bn 7.180 -0.77 6.327 0
35 4-F-Ph Piperonyl 7.244 -0.931 6.653 0
36 4-F-Ph 3-F-6-MeO-Bn 7.252 -1.058 6.982 0
37 3,5-CF3-Ph Furfuryl 7.260 -0.722 5.599 0
38 3,5-CF3-Ph 2-HO-3-MeO-Bn 7.268 -0.92 7.079 0
39 3,5-CF3-Ph Piperonyl 7.268 -1.35 7.336 0
40 3,5-CF3-Ph 3-F-6-MeO-Bn 7.268 -0.935 7.85 0
41 1-Naphtyl Furfuryl 7.301 -0.703 6.82 0
42 1-Naphtyl 2-HO-3-MeO-Bn 7.337 -0.761 7.719 0
43 1-Naphtyl Piperonyl 7.337 -1.118 8.451 0
44 1-Naphtyl 3-F-6-MeO-Bn 7.387 -0.556 8.566 0
45 4-CF3-Ph Furfuryl 7.387 -0.594 5.258 0
46 4-CF3-Ph 2-HO-3-MeO-Bn 7.398 -0.331 6.622 0
47 4-CF3-Ph Piperonyl 7.398 -0.877 7.122 0
48 4-CF3-Ph 3-F-6-MeO-Bn 7.398 -0.562 7.114 0
1246 Med Chem Res (2015) 24:1241–1264
123
Author's personal copy
Table 2 continued
Sr. no. R1 R2 pEC50 (M) Mor13e RDF040v F06 [N–O]
49 Ph Furfuryl 7.398 -0.449 5.193 0
50 Ph 2-HO-3-MeO-Bn 7.409 -0.4 6.467 0
51 Ph Piperonyl 7.409 -0.754 6.74 0
52 Ph 3-F-6-MeO-Bn 7.420 -0.588 6.815 0
53 4-tertBu-Ph Furfuryl 7.469 -0.104 7.086 0
54 4-tertBu-Ph 2-HO-3-MeO-Bn 7.481 0.348 8.467 0
55 4-tertBu-Ph Piperonyl 7.495 -0.658 8.7 0
56 4-tertBu-Ph 3-F-6-MeO-Bn 7.509 0.472 9.679 0
57 Piperonyl Furfuryl 7.509 0.326 4.927 0
58 Piperonyl 2-HO-3-MeO-Bn 7.509 -0.592 7.546 0
59 Piperonyl Piperonyl 7.538 -0.501 7.801 0
60 Piperonyl 3-F-6-MeO-Bn 7.538 -0.268 8.098 0
61 4-MeO-Ph Furfuryl 7.553 0.539 6.398 0
62 4-MeO-Ph 2-HO-3-MeO-Bn 7.569 -0.221 8.104 0
63 4-MeO-Ph Piperonyl 7.569 -0.536 8.312 0
64 4-MeO-Ph 3-F-6-MeO-Bn 7.569 -0.071 7.819 0
65 4-F-Bn Furfuryl 7.569 0.959 5.326 0
66 4-F-Bn 2-HO-3-MeO-Bn 7.585 -0.233 8.929 0
67 4-F-Bn Piperonyl 7.585 -0.067 10.705 0
68 4-F-Bn 3-F-6-MeO-Bn 7.602 0.219 8.134 0
69 iso-butyl Furfuryl 7.602 1.507 6.712 0
70 iso-butyl 2-HO-3-MeO-Bn 7.638 0.808 9.125 0
71 iso-butyl Piperonyl 7.658 0.497 6.044 0
72 iso-butyl 3-F-6-MeO-Bn 7.658 0.112 10.014 0
73 cHex Furfuryl 7.699 1.544 7.704 0
74 cHex 2-HO-3-MeO-Bn 7.699 0.438 11.277 0
75 cHex Piperonyl 7.699 0.752 10.997 0
76 cHex 3-F-6-MeO-Bn 7.699 0.756 9.319 0
77 1-Et-Pr Furfuryl 7.721 1.399 6.966 0
78 1-Et-Pr 2-HO-3-MeO-Bn 7.721 0.074 9.59 0
79 1-Et-Pr Piperonyl 7.745 0.193 8.59 0
80 1-Et-Pr 3-F-6-MeO-Bn 7.745 0.864 7.615 0
81 3-CF3-Bn Furfuryl 7.745 0.117 7.599 0
82 3-CF3-Bn 2-HO-3-MeO-Bn 7.745 -0.196 9.004 0
83 3-CF3-Bn Piperonyl 7.770 0.261 8.227 0
84 3-CF3-Bn 3-F-6-MeO-Bn 7.770 0.413 8.458 0
85 4-CN-Bn Furfuryl 7.770 1.409 8.512 0
86 4-CN-Bn 2-HO-3-MeO-Bn 7.824 -0.322 9.482 0
87 4-CN-Bn Piperonyl 7.824 0.399 9.507 0
88 4-CN-Bn 3-F-6-MeO-Bn 7.824 0.776 9.032 0
89 Bn Furfuryl 7.854 1.122 8.522 0
90 Bn 2-HO-3-MeO-Bn 7.886 0.25 10.837 0
91 Bn Piperonyl 7.886 -0.019 6.437 0
92 Bn 3-F-6-MeO-Bn 7.886 0.494 10.293 0
93 3,5-Me-Bn Furfuryl 7.886 1.444 6.402 0
94 3,5-Me-Bn 2-HO-3-MeO-Bn 7.959 1.194 10.845 0
95 3,5-Me-Bn Piperonyl 7.959 1.419 11.419 0
96 3,5-Me-Bn 3-F-6-MeO-Bn 7.959 0.887 8.162 0
Med Chem Res (2015) 24:1241–1264 1247
123
Author's personal copy
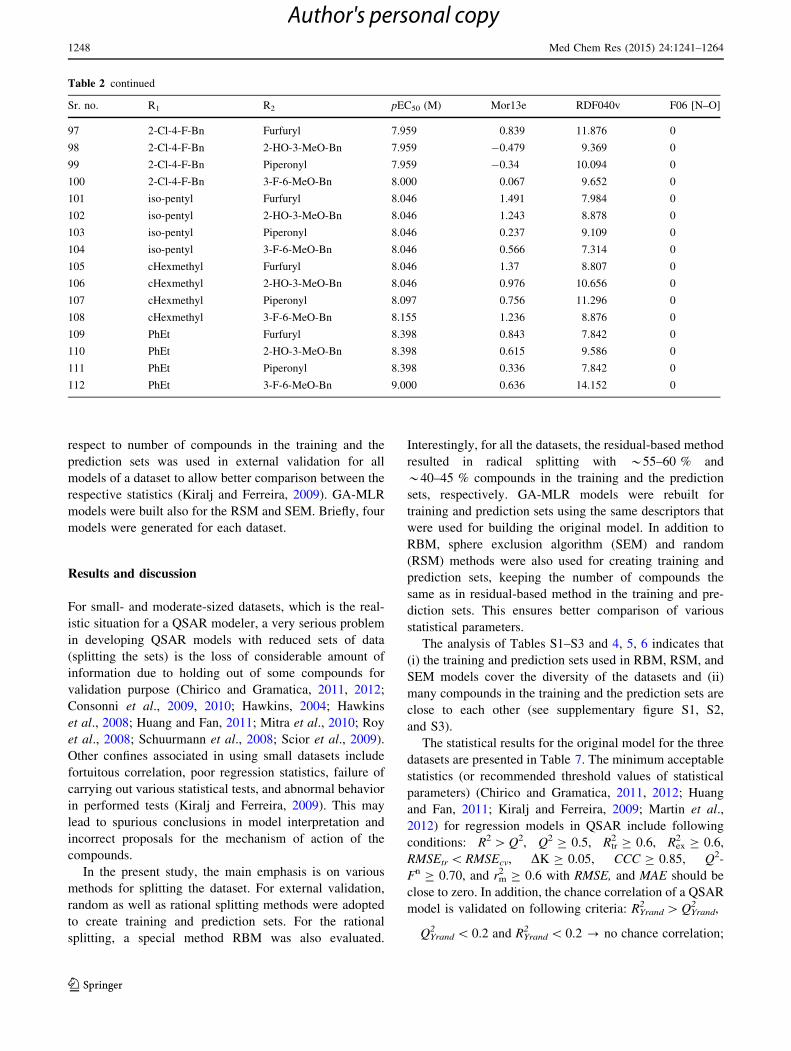
respect to number of compounds in the training and the
prediction sets was used in external validation for all
models of a dataset to allow better comparison between the
respective statistics (Kiralj and Ferreira, 2009). GA-MLR
models were built also for the RSM and SEM. Briefly, four
models were generated for each dataset.
Results and discussion
For small- and moderate-sized datasets, which is the real-
istic situation for a QSAR modeler, a very serious problem
in developing QSAR models with reduced sets of data
(splitting the sets) is the loss of considerable amount of
information due to holding out of some compounds for
validation purpose (Chirico and Gramatica, 2011, 2012;
Consonni et al., 2009, 2010; Hawkins, 2004; Hawkins
et al., 2008; Huang and Fan, 2011; Mitra et al., 2010; Roy
et al., 2008; Schuurmann et al., 2008; Scior et al., 2009).
Other confines associated in using small datasets include
fortuitous correlation, poor regression statistics, failure of
carrying out various statistical tests, and abnormal behavior
in performed tests (Kiralj and Ferreira, 2009). This may
lead to spurious conclusions in model interpretation and
incorrect proposals for the mechanism of action of the
compounds.
In the present study, the main emphasis is on various
methods for splitting the dataset. For external validation,
random as well as rational splitting methods were adopted
to create training and prediction sets. For the rational
splitting, a special method RBM was also evaluated.
Interestingly, for all the datasets, the residual-based method
resulted in radical splitting with *55–60 % and
*40–45 % compounds in the training and the prediction
sets, respectively. GA-MLR models were rebuilt for
training and prediction sets using the same descriptors that
were used for building the original model. In addition to
RBM, sphere exclusion algorithm (SEM) and random
(RSM) methods were also used for creating training and
prediction sets, keeping the number of compounds the
same as in residual-based method in the training and pre-
diction sets. This ensures better comparison of various
statistical parameters.
The analysis of Tables S1–S3 and 4, 5, 6 indicates that
(i) the training and prediction sets used in RBM, RSM, and
SEM models cover the diversity of the datasets and (ii)
many compounds in the training and the prediction sets are
close to each other (see supplementary figure S1, S2,
and S3).
The statistical results for the original model for the three
datasets are presented in Table 7. The minimum acceptable
statistics (or recommended threshold values of statistical
parameters) (Chirico and Gramatica, 2011, 2012; Huang
and Fan, 2011; Kiralj and Ferreira, 2009; Martin et al.,
2012) for regression models in QSAR include following
conditions: R2 [ Q2, Q2 C 0.5, Rtr2 C 0.6, Rex
2 C 0.6,
RMSEtr \ RMSEcv, DK C 0.05, CCC C 0.85, Q2-
Fn C 0.70, and rm2 C 0.6 with RMSE, and MAE should be
close to zero. In addition, the chance correlation of a QSAR
model is validated on following criteria: RYrand2 [ QYrand
2 ,
QYrand2 \ 0.2 and RYrand
2 \ 0.2 ? no chance correlation;
Table 2 continued
Sr. no. R1 R2 pEC50 (M) Mor13e RDF040v F06 [N–O]
97 2-Cl-4-F-Bn Furfuryl 7.959 0.839 11.876 0
98 2-Cl-4-F-Bn 2-HO-3-MeO-Bn 7.959 -0.479 9.369 0
99 2-Cl-4-F-Bn Piperonyl 7.959 -0.34 10.094 0
100 2-Cl-4-F-Bn 3-F-6-MeO-Bn 8.000 0.067 9.652 0
101 iso-pentyl Furfuryl 8.046 1.491 7.984 0
102 iso-pentyl 2-HO-3-MeO-Bn 8.046 1.243 8.878 0
103 iso-pentyl Piperonyl 8.046 0.237 9.109 0
104 iso-pentyl 3-F-6-MeO-Bn 8.046 0.566 7.314 0
105 cHexmethyl Furfuryl 8.046 1.37 8.807 0
106 cHexmethyl 2-HO-3-MeO-Bn 8.046 0.976 10.656 0
107 cHexmethyl Piperonyl 8.097 0.756 11.296 0
108 cHexmethyl 3-F-6-MeO-Bn 8.155 1.236 8.876 0
109 PhEt Furfuryl 8.398 0.843 7.842 0
110 PhEt 2-HO-3-MeO-Bn 8.398 0.615 9.586 0
111 PhEt Piperonyl 8.398 0.336 7.842 0
112 PhEt 3-F-6-MeO-Bn 9.000 0.636 14.152 0
1248 Med Chem Res (2015) 24:1241–1264
123
Author's personal copy
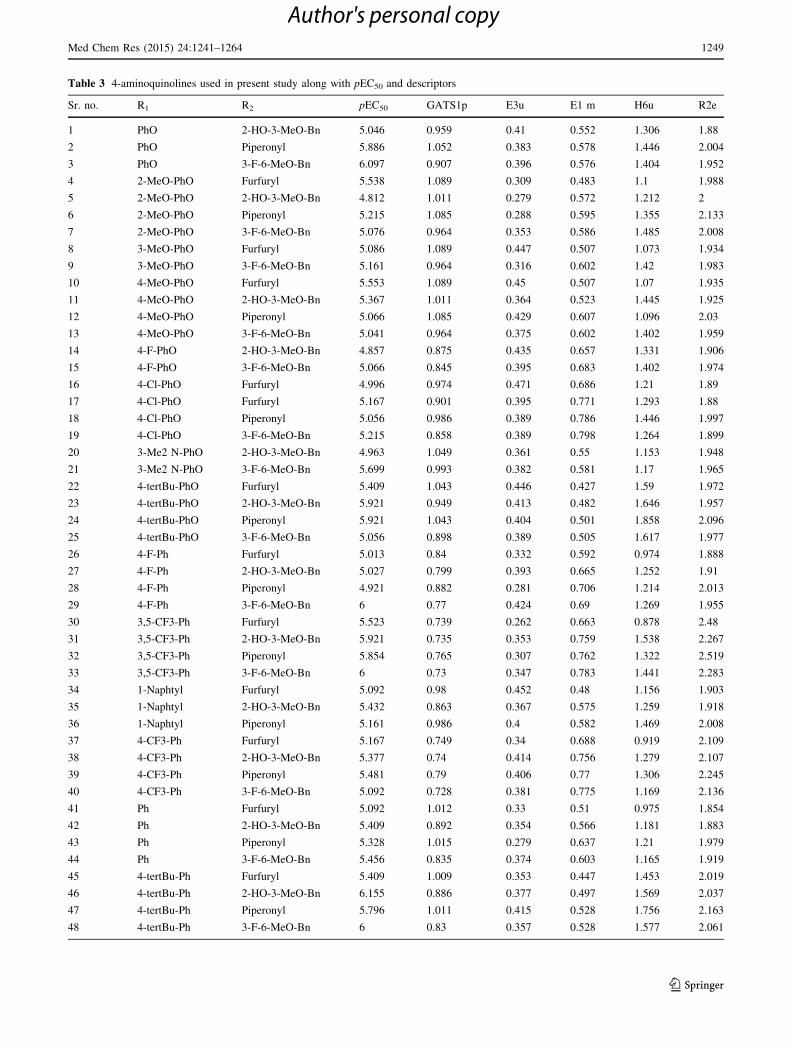
Table 3 4-aminoquinolines used in present study along with pEC50 and descriptors
Sr. no. R1 R2 pEC50 GATS1p E3u E1 m H6u R2e
1 PhO 2-HO-3-MeO-Bn 5.046 0.959 0.41 0.552 1.306 1.88
2 PhO Piperonyl 5.886 1.052 0.383 0.578 1.446 2.004
3 PhO 3-F-6-MeO-Bn 6.097 0.907 0.396 0.576 1.404 1.952
4 2-MeO-PhO Furfuryl 5.538 1.089 0.309 0.483 1.1 1.988
5 2-MeO-PhO 2-HO-3-MeO-Bn 4.812 1.011 0.279 0.572 1.212 2
6 2-MeO-PhO Piperonyl 5.215 1.085 0.288 0.595 1.355 2.133
7 2-MeO-PhO 3-F-6-MeO-Bn 5.076 0.964 0.353 0.586 1.485 2.008
8 3-MeO-PhO Furfuryl 5.086 1.089 0.447 0.507 1.073 1.934
9 3-MeO-PhO 3-F-6-MeO-Bn 5.161 0.964 0.316 0.602 1.42 1.983
10 4-MeO-PhO Furfuryl 5.553 1.089 0.45 0.507 1.07 1.935
11 4-MeO-PhO 2-HO-3-MeO-Bn 5.367 1.011 0.364 0.523 1.445 1.925
12 4-MeO-PhO Piperonyl 5.066 1.085 0.429 0.607 1.096 2.03
13 4-MeO-PhO 3-F-6-MeO-Bn 5.041 0.964 0.375 0.602 1.402 1.959
14 4-F-PhO 2-HO-3-MeO-Bn 4.857 0.875 0.435 0.657 1.331 1.906
15 4-F-PhO 3-F-6-MeO-Bn 5.066 0.845 0.395 0.683 1.402 1.974
16 4-Cl-PhO Furfuryl 4.996 0.974 0.471 0.686 1.21 1.89
17 4-Cl-PhO Furfuryl 5.167 0.901 0.395 0.771 1.293 1.88
18 4-Cl-PhO Piperonyl 5.056 0.986 0.389 0.786 1.446 1.997
19 4-Cl-PhO 3-F-6-MeO-Bn 5.215 0.858 0.389 0.798 1.264 1.899
20 3-Me2 N-PhO 2-HO-3-MeO-Bn 4.963 1.049 0.361 0.55 1.153 1.948
21 3-Me2 N-PhO 3-F-6-MeO-Bn 5.699 0.993 0.382 0.581 1.17 1.965
22 4-tertBu-PhO Furfuryl 5.409 1.043 0.446 0.427 1.59 1.972
23 4-tertBu-PhO 2-HO-3-MeO-Bn 5.921 0.949 0.413 0.482 1.646 1.957
24 4-tertBu-PhO Piperonyl 5.921 1.043 0.404 0.501 1.858 2.096
25 4-tertBu-PhO 3-F-6-MeO-Bn 5.056 0.898 0.389 0.505 1.617 1.977
26 4-F-Ph Furfuryl 5.013 0.84 0.332 0.592 0.974 1.888
27 4-F-Ph 2-HO-3-MeO-Bn 5.027 0.799 0.393 0.665 1.252 1.91
28 4-F-Ph Piperonyl 4.921 0.882 0.281 0.706 1.214 2.013
29 4-F-Ph 3-F-6-MeO-Bn 6 0.77 0.424 0.69 1.269 1.955
30 3,5-CF3-Ph Furfuryl 5.523 0.739 0.262 0.663 0.878 2.48
31 3,5-CF3-Ph 2-HO-3-MeO-Bn 5.921 0.735 0.353 0.759 1.538 2.267
32 3,5-CF3-Ph Piperonyl 5.854 0.765 0.307 0.762 1.322 2.519
33 3,5-CF3-Ph 3-F-6-MeO-Bn 6 0.73 0.347 0.783 1.441 2.283
34 1-Naphtyl Furfuryl 5.092 0.98 0.452 0.48 1.156 1.903
35 1-Naphtyl 2-HO-3-MeO-Bn 5.432 0.863 0.367 0.575 1.259 1.918
36 1-Naphtyl Piperonyl 5.161 0.986 0.4 0.582 1.469 2.008
37 4-CF3-Ph Furfuryl 5.167 0.749 0.34 0.688 0.919 2.109
38 4-CF3-Ph 2-HO-3-MeO-Bn 5.377 0.74 0.414 0.756 1.279 2.107
39 4-CF3-Ph Piperonyl 5.481 0.79 0.406 0.77 1.306 2.245
40 4-CF3-Ph 3-F-6-MeO-Bn 5.092 0.728 0.381 0.775 1.169 2.136
41 Ph Furfuryl 5.092 1.012 0.33 0.51 0.975 1.854
42 Ph 2-HO-3-MeO-Bn 5.409 0.892 0.354 0.566 1.181 1.883
43 Ph Piperonyl 5.328 1.015 0.279 0.637 1.21 1.979
44 Ph 3-F-6-MeO-Bn 5.456 0.835 0.374 0.603 1.165 1.919
45 4-tertBu-Ph Furfuryl 5.409 1.009 0.353 0.447 1.453 2.019
46 4-tertBu-Ph 2-HO-3-MeO-Bn 6.155 0.886 0.377 0.497 1.569 2.037
47 4-tertBu-Ph Piperonyl 5.796 1.011 0.415 0.528 1.756 2.163
48 4-tertBu-Ph 3-F-6-MeO-Bn 6 0.83 0.357 0.528 1.577 2.061
Med Chem Res (2015) 24:1241–1264 1249
123
Author's personal copy
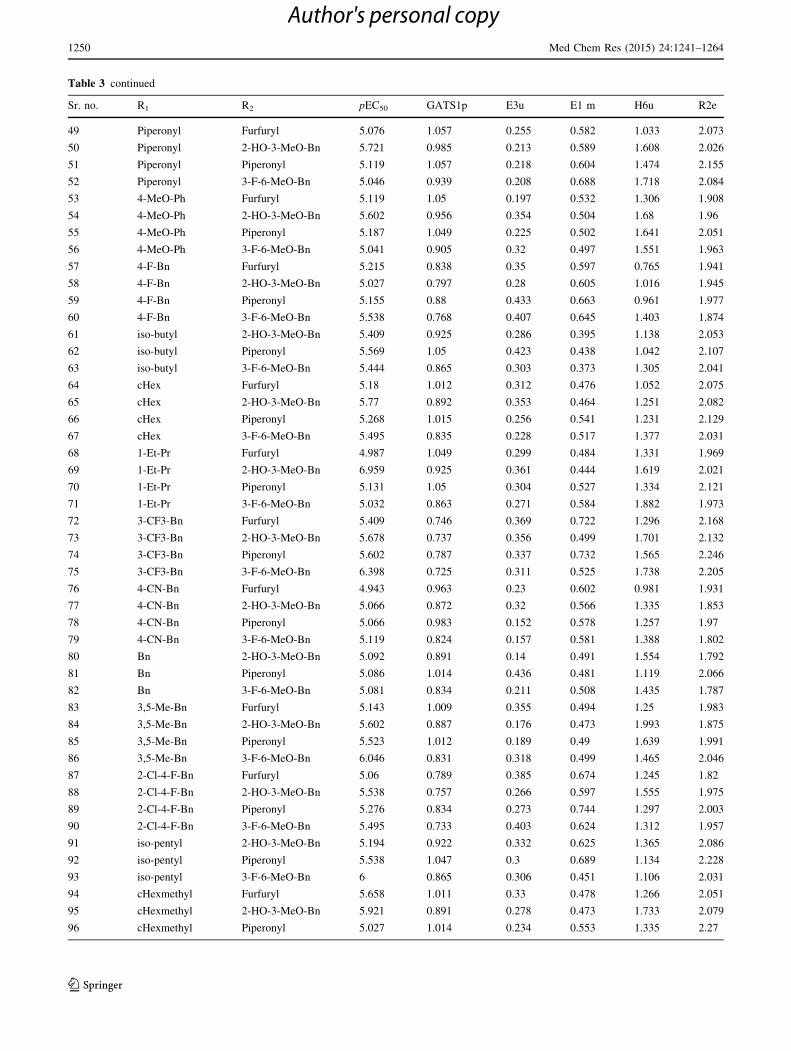
Table 3 continued
Sr. no. R1 R2 pEC50 GATS1p E3u E1 m H6u R2e
49 Piperonyl Furfuryl 5.076 1.057 0.255 0.582 1.033 2.073
50 Piperonyl 2-HO-3-MeO-Bn 5.721 0.985 0.213 0.589 1.608 2.026
51 Piperonyl Piperonyl 5.119 1.057 0.218 0.604 1.474 2.155
52 Piperonyl 3-F-6-MeO-Bn 5.046 0.939 0.208 0.688 1.718 2.084
53 4-MeO-Ph Furfuryl 5.119 1.05 0.197 0.532 1.306 1.908
54 4-MeO-Ph 2-HO-3-MeO-Bn 5.602 0.956 0.354 0.504 1.68 1.96
55 4-MeO-Ph Piperonyl 5.187 1.049 0.225 0.502 1.641 2.051
56 4-MeO-Ph 3-F-6-MeO-Bn 5.041 0.905 0.32 0.497 1.551 1.963
57 4-F-Bn Furfuryl 5.215 0.838 0.35 0.597 0.765 1.941
58 4-F-Bn 2-HO-3-MeO-Bn 5.027 0.797 0.28 0.605 1.016 1.945
59 4-F-Bn Piperonyl 5.155 0.88 0.433 0.663 0.961 1.977
60 4-F-Bn 3-F-6-MeO-Bn 5.538 0.768 0.407 0.645 1.403 1.874
61 iso-butyl 2-HO-3-MeO-Bn 5.409 0.925 0.286 0.395 1.138 2.053
62 iso-butyl Piperonyl 5.569 1.05 0.423 0.438 1.042 2.107
63 iso-butyl 3-F-6-MeO-Bn 5.444 0.865 0.303 0.373 1.305 2.041
64 cHex Furfuryl 5.18 1.012 0.312 0.476 1.052 2.075
65 cHex 2-HO-3-MeO-Bn 5.77 0.892 0.353 0.464 1.251 2.082
66 cHex Piperonyl 5.268 1.015 0.256 0.541 1.231 2.129
67 cHex 3-F-6-MeO-Bn 5.495 0.835 0.228 0.517 1.377 2.031
68 1-Et-Pr Furfuryl 4.987 1.049 0.299 0.484 1.331 1.969
69 1-Et-Pr 2-HO-3-MeO-Bn 6.959 0.925 0.361 0.444 1.619 2.021
70 1-Et-Pr Piperonyl 5.131 1.05 0.304 0.527 1.334 2.121
71 1-Et-Pr 3-F-6-MeO-Bn 5.032 0.863 0.271 0.584 1.882 1.973
72 3-CF3-Bn Furfuryl 5.409 0.746 0.369 0.722 1.296 2.168
73 3-CF3-Bn 2-HO-3-MeO-Bn 5.678 0.737 0.356 0.499 1.701 2.132
74 3-CF3-Bn Piperonyl 5.602 0.787 0.337 0.732 1.565 2.246
75 3-CF3-Bn 3-F-6-MeO-Bn 6.398 0.725 0.311 0.525 1.738 2.205
76 4-CN-Bn Furfuryl 4.943 0.963 0.23 0.602 0.981 1.931
77 4-CN-Bn 2-HO-3-MeO-Bn 5.066 0.872 0.32 0.566 1.335 1.853
78 4-CN-Bn Piperonyl 5.066 0.983 0.152 0.578 1.257 1.97
79 4-CN-Bn 3-F-6-MeO-Bn 5.119 0.824 0.157 0.581 1.388 1.802
80 Bn 2-HO-3-MeO-Bn 5.092 0.891 0.14 0.491 1.554 1.792
81 Bn Piperonyl 5.086 1.014 0.436 0.481 1.119 2.066
82 Bn 3-F-6-MeO-Bn 5.081 0.834 0.211 0.508 1.435 1.787
83 3,5-Me-Bn Furfuryl 5.143 1.009 0.355 0.494 1.25 1.983
84 3,5-Me-Bn 2-HO-3-MeO-Bn 5.602 0.887 0.176 0.473 1.993 1.875
85 3,5-Me-Bn Piperonyl 5.523 1.012 0.189 0.49 1.639 1.991
86 3,5-Me-Bn 3-F-6-MeO-Bn 6.046 0.831 0.318 0.499 1.465 2.046
87 2-Cl-4-F-Bn Furfuryl 5.06 0.789 0.385 0.674 1.245 1.82
88 2-Cl-4-F-Bn 2-HO-3-MeO-Bn 5.538 0.757 0.266 0.597 1.555 1.975
89 2-Cl-4-F-Bn Piperonyl 5.276 0.834 0.273 0.744 1.297 2.003
90 2-Cl-4-F-Bn 3-F-6-MeO-Bn 5.495 0.733 0.403 0.624 1.312 1.957
91 iso-pentyl 2-HO-3-MeO-Bn 5.194 0.922 0.332 0.625 1.365 2.086
92 iso-pentyl Piperonyl 5.538 1.047 0.3 0.689 1.134 2.228
93 iso-pentyl 3-F-6-MeO-Bn 6 0.865 0.306 0.451 1.106 2.031
94 cHexmethyl Furfuryl 5.658 1.011 0.33 0.478 1.266 2.051
95 cHexmethyl 2-HO-3-MeO-Bn 5.921 0.891 0.278 0.473 1.733 2.079
96 cHexmethyl Piperonyl 5.027 1.014 0.234 0.553 1.335 2.27
1250 Med Chem Res (2015) 24:1241–1264
123
Author's personal copy
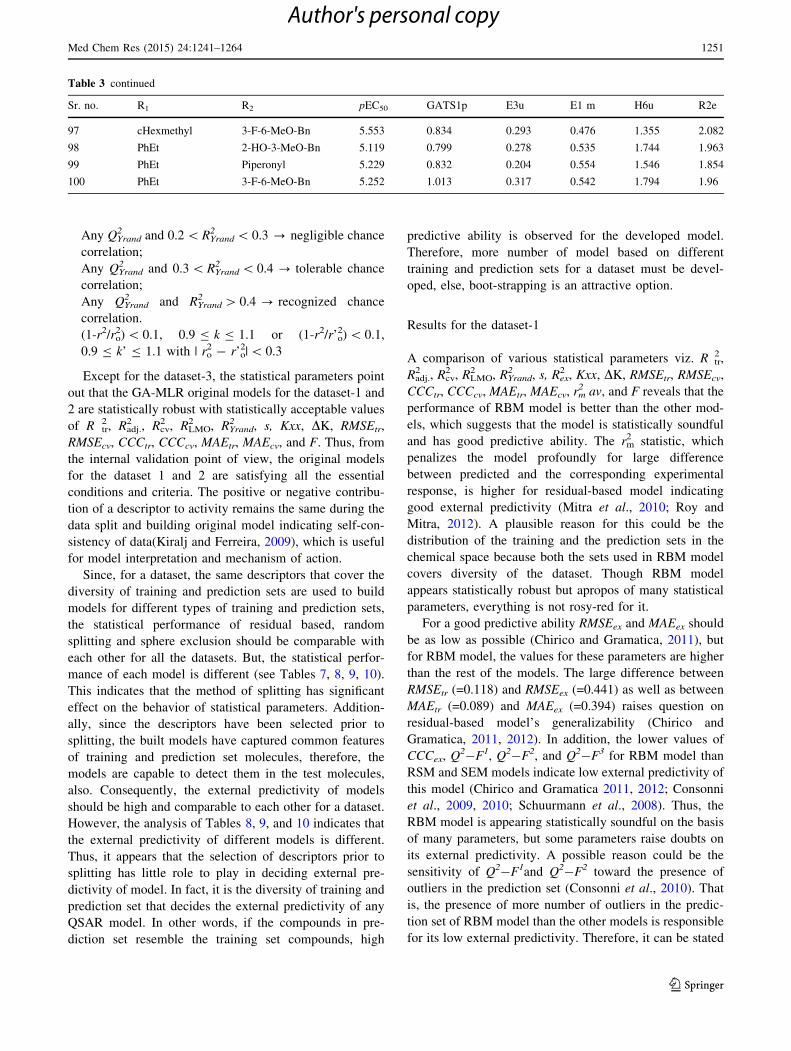
Any QYrand2 and 0.2 \ RYrand
2 \ 0.3 ? negligible chance
correlation;
Any QYrand2 and 0.3 \ RYrand
2 \ 0.4 ? tolerable chance
correlation;
Any QYrand2 and RYrand
2 [ 0.4 ? recognized chance
correlation.
(1-r2/ro2) \ 0.1, 0.9 B k B 1.1 or (1-r2/r’o
2) \ 0.1,
0.9 B k’ B 1.1 with | ro2 - r’o
2| \ 0.3
Except for the dataset-3, the statistical parameters point
out that the GA-MLR original models for the dataset-1 and
2 are statistically robust with statistically acceptable values
of R tr2 , Radj.
2 , Rcv2 , RLMO
2 , RYrand2 , s, Kxx, DK, RMSEtr,
RMSEcv, CCCtr, CCCcv, MAEtr, MAEcv, and F. Thus, from
the internal validation point of view, the original models
for the dataset 1 and 2 are satisfying all the essential
conditions and criteria. The positive or negative contribu-
tion of a descriptor to activity remains the same during the
data split and building original model indicating self-con-
sistency of data(Kiralj and Ferreira, 2009), which is useful
for model interpretation and mechanism of action.
Since, for a dataset, the same descriptors that cover the
diversity of training and prediction sets are used to build
models for different types of training and prediction sets,
the statistical performance of residual based, random
splitting and sphere exclusion should be comparable with
each other for all the datasets. But, the statistical perfor-
mance of each model is different (see Tables 7, 8, 9, 10).
This indicates that the method of splitting has significant
effect on the behavior of statistical parameters. Addition-
ally, since the descriptors have been selected prior to
splitting, the built models have captured common features
of training and prediction set molecules, therefore, the
models are capable to detect them in the test molecules,
also. Consequently, the external predictivity of models
should be high and comparable to each other for a dataset.
However, the analysis of Tables 8, 9, and 10 indicates that
the external predictivity of different models is different.
Thus, it appears that the selection of descriptors prior to
splitting has little role to play in deciding external pre-
dictivity of model. In fact, it is the diversity of training and
prediction set that decides the external predictivity of any
QSAR model. In other words, if the compounds in pre-
diction set resemble the training set compounds, high
predictive ability is observed for the developed model.
Therefore, more number of model based on different
training and prediction sets for a dataset must be devel-
oped, else, boot-strapping is an attractive option.
Results for the dataset-1
A comparison of various statistical parameters viz. R tr2 ,
Radj.2 , Rcv
2 , RLMO2 , RYrand
2 , s, Rex2 , Kxx, DK, RMSEtr, RMSEcv,
CCCtr, CCCcv, MAEtr, MAEcv, rm2 av, and F reveals that the
performance of RBM model is better than the other mod-
els, which suggests that the model is statistically soundful
and has good predictive ability. The rm2 statistic, which
penalizes the model profoundly for large difference
between predicted and the corresponding experimental
response, is higher for residual-based model indicating
good external predictivity (Mitra et al., 2010; Roy and
Mitra, 2012). A plausible reason for this could be the
distribution of the training and the prediction sets in the
chemical space because both the sets used in RBM model
covers diversity of the dataset. Though RBM model
appears statistically robust but apropos of many statistical
parameters, everything is not rosy-red for it.
For a good predictive ability RMSEex and MAEex should
be as low as possible (Chirico and Gramatica, 2011), but
for RBM model, the values for these parameters are higher
than the rest of the models. The large difference between
RMSEtr (=0.118) and RMSEex (=0.441) as well as between
MAEtr (=0.089) and MAEex (=0.394) raises question on
residual-based model’s generalizability (Chirico and
Gramatica, 2011, 2012). In addition, the lower values of
CCCex, Q2-F1, Q2-F2, and Q2-F3 for RBM model than
RSM and SEM models indicate low external predictivity of
this model (Chirico and Gramatica 2011, 2012; Consonni
et al., 2009, 2010; Schuurmann et al., 2008). Thus, the
RBM model is appearing statistically soundful on the basis
of many parameters, but some parameters raise doubts on
its external predictivity. A possible reason could be the
sensitivity of Q2-F1and Q2-F2 toward the presence of
outliers in the prediction set (Consonni et al., 2010). That
is, the presence of more number of outliers in the predic-
tion set of RBM model than the other models is responsible
for its low external predictivity. Therefore, it can be stated
Table 3 continued
Sr. no. R1 R2 pEC50 GATS1p E3u E1 m H6u R2e
97 cHexmethyl 3-F-6-MeO-Bn 5.553 0.834 0.293 0.476 1.355 2.082
98 PhEt 2-HO-3-MeO-Bn 5.119 0.799 0.278 0.535 1.744 1.963
99 PhEt Piperonyl 5.229 0.832 0.204 0.554 1.546 1.854
100 PhEt 3-F-6-MeO-Bn 5.252 1.013 0.317 0.542 1.794 1.96
Med Chem Res (2015) 24:1241–1264 1251
123
Author's personal copy
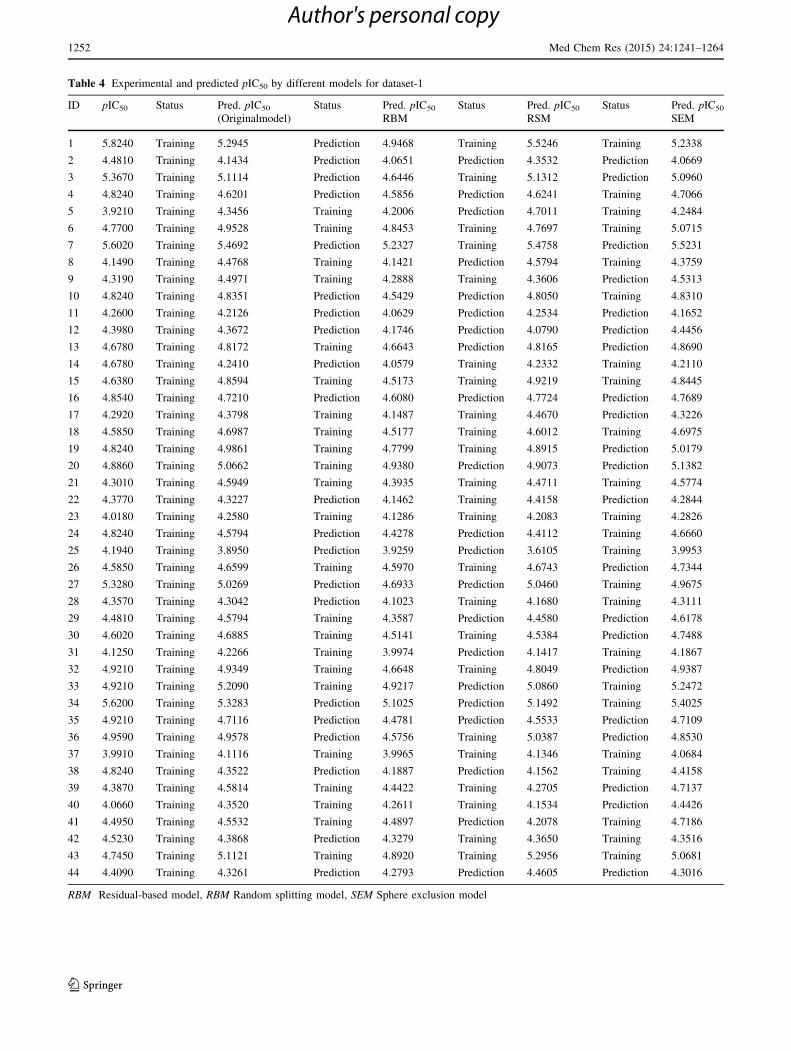
Table 4 Experimental and predicted pIC50 by different models for dataset-1
ID pIC50 Status Pred. pIC50
(Originalmodel)
Status Pred. pIC50
RBM
Status Pred. pIC50
RSM
Status Pred. pIC50
SEM
1 5.8240 Training 5.2945 Prediction 4.9468 Training 5.5246 Training 5.2338
2 4.4810 Training 4.1434 Prediction 4.0651 Prediction 4.3532 Prediction 4.0669
3 5.3670 Training 5.1114 Prediction 4.6446 Training 5.1312 Prediction 5.0960
4 4.8240 Training 4.6201 Prediction 4.5856 Prediction 4.6241 Training 4.7066
5 3.9210 Training 4.3456 Training 4.2006 Prediction 4.7011 Training 4.2484
6 4.7700 Training 4.9528 Training 4.8453 Training 4.7697 Training 5.0715
7 5.6020 Training 5.4692 Prediction 5.2327 Training 5.4758 Prediction 5.5231
8 4.1490 Training 4.4768 Training 4.1421 Prediction 4.5794 Training 4.3759
9 4.3190 Training 4.4971 Training 4.2888 Training 4.3606 Prediction 4.5313
10 4.8240 Training 4.8351 Prediction 4.5429 Prediction 4.8050 Training 4.8310
11 4.2600 Training 4.2126 Prediction 4.0629 Prediction 4.2534 Prediction 4.1652
12 4.3980 Training 4.3672 Prediction 4.1746 Prediction 4.0790 Prediction 4.4456
13 4.6780 Training 4.8172 Training 4.6643 Prediction 4.8165 Prediction 4.8690
14 4.6780 Training 4.2410 Prediction 4.0579 Training 4.2332 Training 4.2110
15 4.6380 Training 4.8594 Training 4.5173 Training 4.9219 Training 4.8445
16 4.8540 Training 4.7210 Prediction 4.6080 Prediction 4.7724 Prediction 4.7689
17 4.2920 Training 4.3798 Training 4.1487 Training 4.4670 Prediction 4.3226
18 4.5850 Training 4.6987 Training 4.5177 Training 4.6012 Training 4.6975
19 4.8240 Training 4.9861 Training 4.7799 Training 4.8915 Prediction 5.0179
20 4.8860 Training 5.0662 Training 4.9380 Prediction 4.9073 Prediction 5.1382
21 4.3010 Training 4.5949 Training 4.3935 Training 4.4711 Training 4.5774
22 4.3770 Training 4.3227 Prediction 4.1462 Training 4.4158 Prediction 4.2844
23 4.0180 Training 4.2580 Training 4.1286 Training 4.2083 Training 4.2826
24 4.8240 Training 4.5794 Prediction 4.4278 Prediction 4.4112 Training 4.6660
25 4.1940 Training 3.8950 Prediction 3.9259 Prediction 3.6105 Training 3.9953
26 4.5850 Training 4.6599 Training 4.5970 Training 4.6743 Prediction 4.7344
27 5.3280 Training 5.0269 Prediction 4.6933 Prediction 5.0460 Training 4.9675
28 4.3570 Training 4.3042 Prediction 4.1023 Training 4.1680 Training 4.3111
29 4.4810 Training 4.5794 Training 4.3587 Prediction 4.4580 Prediction 4.6178
30 4.6020 Training 4.6885 Training 4.5141 Training 4.5384 Prediction 4.7488
31 4.1250 Training 4.2266 Training 3.9974 Prediction 4.1417 Training 4.1867
32 4.9210 Training 4.9349 Training 4.6648 Training 4.8049 Prediction 4.9387
33 4.9210 Training 5.2090 Training 4.9217 Prediction 5.0860 Training 5.2472
34 5.6200 Training 5.3283 Prediction 5.1025 Prediction 5.1492 Training 5.4025
35 4.9210 Training 4.7116 Prediction 4.4781 Prediction 4.5533 Prediction 4.7109
36 4.9590 Training 4.9578 Prediction 4.5756 Training 5.0387 Prediction 4.8530
37 3.9910 Training 4.1116 Training 3.9965 Training 4.1346 Training 4.0684
38 4.8240 Training 4.3522 Prediction 4.1887 Prediction 4.1562 Training 4.4158
39 4.3870 Training 4.5814 Training 4.4422 Training 4.2705 Prediction 4.7137
40 4.0660 Training 4.3520 Training 4.2611 Training 4.1534 Prediction 4.4426
41 4.4950 Training 4.5532 Training 4.4897 Prediction 4.2078 Training 4.7186
42 4.5230 Training 4.3868 Prediction 4.3279 Training 4.3650 Training 4.3516
43 4.7450 Training 5.1121 Training 4.8920 Training 5.2956 Training 5.0681
44 4.4090 Training 4.3261 Prediction 4.2793 Prediction 4.4605 Prediction 4.3016
RBM Residual-based model, RBM Random splitting model, SEM Sphere exclusion model
1252 Med Chem Res (2015) 24:1241–1264
123
Author's personal copy
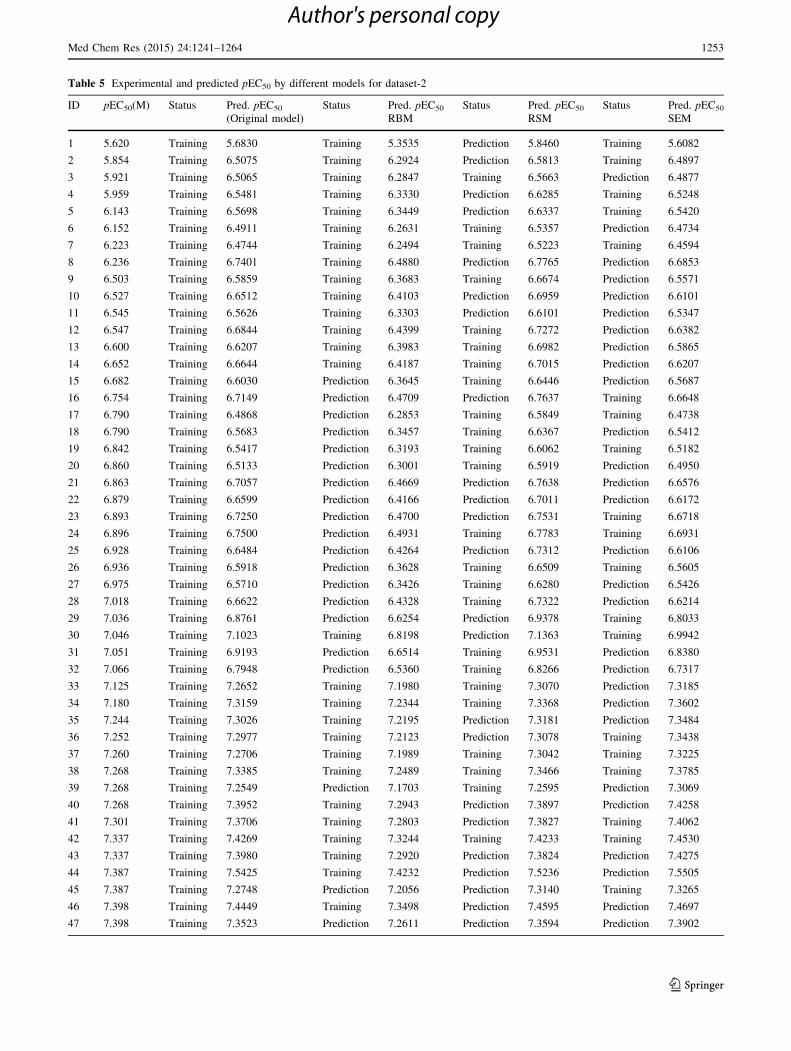
Table 5 Experimental and predicted pEC50 by different models for dataset-2
ID pEC50(M) Status Pred. pEC50
(Original model)
Status Pred. pEC50
RBM
Status Pred. pEC50
RSM
Status Pred. pEC50
SEM
1 5.620 Training 5.6830 Training 5.3535 Prediction 5.8460 Training 5.6082
2 5.854 Training 6.5075 Training 6.2924 Prediction 6.5813 Training 6.4897
3 5.921 Training 6.5065 Training 6.2847 Training 6.5663 Prediction 6.4877
4 5.959 Training 6.5481 Training 6.3330 Prediction 6.6285 Training 6.5248
5 6.143 Training 6.5698 Training 6.3449 Prediction 6.6337 Training 6.5420
6 6.152 Training 6.4911 Training 6.2631 Training 6.5357 Prediction 6.4734
7 6.223 Training 6.4744 Training 6.2494 Training 6.5223 Training 6.4594
8 6.236 Training 6.7401 Training 6.4880 Prediction 6.7765 Prediction 6.6853
9 6.503 Training 6.5859 Training 6.3683 Training 6.6674 Prediction 6.5571
10 6.527 Training 6.6512 Training 6.4103 Prediction 6.6959 Prediction 6.6101
11 6.545 Training 6.5626 Training 6.3303 Prediction 6.6101 Prediction 6.5347
12 6.547 Training 6.6844 Training 6.4399 Training 6.7272 Prediction 6.6382
13 6.600 Training 6.6207 Training 6.3983 Training 6.6982 Prediction 6.5865
14 6.652 Training 6.6644 Training 6.4187 Training 6.7015 Prediction 6.6207
15 6.682 Training 6.6030 Prediction 6.3645 Training 6.6446 Prediction 6.5687
16 6.754 Training 6.7149 Prediction 6.4709 Prediction 6.7637 Training 6.6648
17 6.790 Training 6.4868 Prediction 6.2853 Training 6.5849 Training 6.4738
18 6.790 Training 6.5683 Prediction 6.3457 Training 6.6367 Prediction 6.5412
19 6.842 Training 6.5417 Prediction 6.3193 Training 6.6062 Training 6.5182
20 6.860 Training 6.5133 Prediction 6.3001 Training 6.5919 Prediction 6.4950
21 6.863 Training 6.7057 Prediction 6.4669 Prediction 6.7638 Prediction 6.6576
22 6.879 Training 6.6599 Prediction 6.4166 Prediction 6.7011 Prediction 6.6172
23 6.893 Training 6.7250 Prediction 6.4700 Prediction 6.7531 Training 6.6718
24 6.896 Training 6.7500 Prediction 6.4931 Training 6.7783 Training 6.6931
25 6.928 Training 6.6484 Prediction 6.4264 Prediction 6.7312 Prediction 6.6106
26 6.936 Training 6.5918 Prediction 6.3628 Training 6.6509 Training 6.5605
27 6.975 Training 6.5710 Prediction 6.3426 Training 6.6280 Prediction 6.5426
28 7.018 Training 6.6622 Prediction 6.4328 Training 6.7322 Prediction 6.6214
29 7.036 Training 6.8761 Prediction 6.6254 Prediction 6.9378 Training 6.8033
30 7.046 Training 7.1023 Training 6.8198 Prediction 7.1363 Training 6.9942
31 7.051 Training 6.9193 Prediction 6.6514 Training 6.9531 Prediction 6.8380
32 7.066 Training 6.7948 Prediction 6.5360 Training 6.8266 Prediction 6.7317
33 7.125 Training 7.2652 Training 7.1980 Training 7.3070 Prediction 7.3185
34 7.180 Training 7.3159 Training 7.2344 Training 7.3368 Prediction 7.3602
35 7.244 Training 7.3026 Training 7.2195 Prediction 7.3181 Prediction 7.3484
36 7.252 Training 7.2977 Training 7.2123 Prediction 7.3078 Training 7.3438
37 7.260 Training 7.2706 Training 7.1989 Training 7.3042 Training 7.3225
38 7.268 Training 7.3385 Training 7.2489 Training 7.3466 Training 7.3785
39 7.268 Training 7.2549 Prediction 7.1703 Training 7.2595 Prediction 7.3069
40 7.268 Training 7.3952 Training 7.2943 Prediction 7.3897 Prediction 7.4258
41 7.301 Training 7.3706 Training 7.2803 Prediction 7.3827 Training 7.4062
42 7.337 Training 7.4269 Training 7.3244 Training 7.4233 Training 7.4530
43 7.337 Training 7.3980 Training 7.2920 Prediction 7.3824 Prediction 7.4275
44 7.387 Training 7.5425 Training 7.4232 Prediction 7.5236 Prediction 7.5505
45 7.387 Training 7.2748 Prediction 7.2056 Prediction 7.3140 Training 7.3265
46 7.398 Training 7.4449 Training 7.3498 Prediction 7.4595 Prediction 7.4697
47 7.398 Training 7.3523 Prediction 7.2611 Prediction 7.3594 Prediction 7.3902
Med Chem Res (2015) 24:1241–1264 1253
123
Author's personal copy
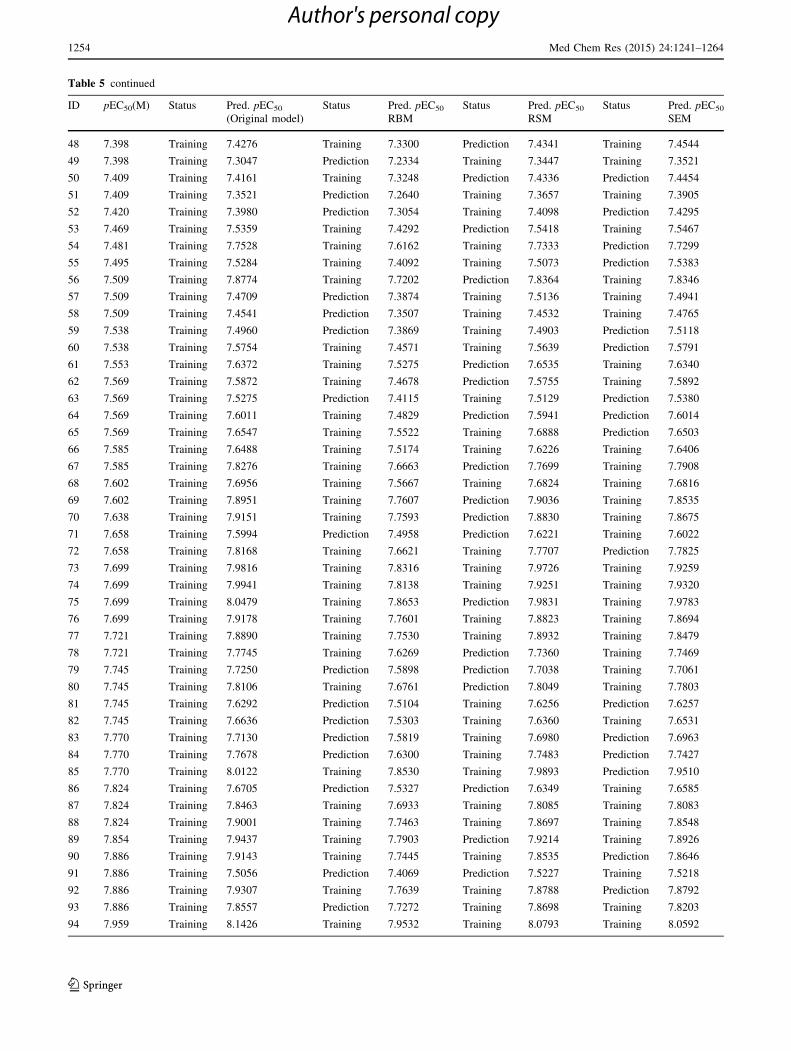
Table 5 continued
ID pEC50(M) Status Pred. pEC50
(Original model)
Status Pred. pEC50
RBM
Status Pred. pEC50
RSM
Status Pred. pEC50
SEM
48 7.398 Training 7.4276 Training 7.3300 Prediction 7.4341 Training 7.4544
49 7.398 Training 7.3047 Prediction 7.2334 Training 7.3447 Training 7.3521
50 7.409 Training 7.4161 Training 7.3248 Prediction 7.4336 Prediction 7.4454
51 7.409 Training 7.3521 Prediction 7.2640 Training 7.3657 Training 7.3905
52 7.420 Training 7.3980 Prediction 7.3054 Training 7.4098 Prediction 7.4295
53 7.469 Training 7.5359 Training 7.4292 Prediction 7.5418 Training 7.5467
54 7.481 Training 7.7528 Training 7.6162 Training 7.7333 Prediction 7.7299
55 7.495 Training 7.5284 Training 7.4092 Training 7.5073 Prediction 7.5383
56 7.509 Training 7.8774 Training 7.7202 Prediction 7.8364 Training 7.8346
57 7.509 Training 7.4709 Prediction 7.3874 Training 7.5136 Training 7.4941
58 7.509 Training 7.4541 Prediction 7.3507 Training 7.4532 Training 7.4765
59 7.538 Training 7.4960 Prediction 7.3869 Training 7.4903 Prediction 7.5118
60 7.538 Training 7.5754 Training 7.4571 Training 7.5639 Prediction 7.5791
61 7.553 Training 7.6372 Training 7.5275 Prediction 7.6535 Training 7.6340
62 7.569 Training 7.5872 Training 7.4678 Prediction 7.5755 Training 7.5892
63 7.569 Training 7.5275 Prediction 7.4115 Training 7.5129 Prediction 7.5380
64 7.569 Training 7.6011 Training 7.4829 Prediction 7.5941 Prediction 7.6014
65 7.569 Training 7.6547 Training 7.5522 Training 7.6888 Prediction 7.6503
66 7.585 Training 7.6488 Training 7.5174 Training 7.6226 Training 7.6406
67 7.585 Training 7.8276 Training 7.6663 Prediction 7.7699 Training 7.7908
68 7.602 Training 7.6956 Training 7.5667 Training 7.6824 Training 7.6816
69 7.602 Training 7.8951 Training 7.7607 Prediction 7.9036 Training 7.8535
70 7.638 Training 7.9151 Training 7.7593 Prediction 7.8830 Training 7.8675
71 7.658 Training 7.5994 Prediction 7.4958 Prediction 7.6221 Training 7.6022
72 7.658 Training 7.8168 Training 7.6621 Training 7.7707 Prediction 7.7825
73 7.699 Training 7.9816 Training 7.8316 Training 7.9726 Training 7.9259
74 7.699 Training 7.9941 Training 7.8138 Training 7.9251 Training 7.9320
75 7.699 Training 8.0479 Training 7.8653 Prediction 7.9831 Training 7.9783
76 7.699 Training 7.9178 Training 7.7601 Training 7.8823 Training 7.8694
77 7.721 Training 7.8890 Training 7.7530 Training 7.8932 Training 7.8479
78 7.721 Training 7.7745 Training 7.6269 Prediction 7.7360 Training 7.7469
79 7.745 Training 7.7250 Prediction 7.5898 Prediction 7.7038 Training 7.7061
80 7.745 Training 7.8106 Training 7.6761 Prediction 7.8049 Training 7.7803
81 7.745 Training 7.6292 Prediction 7.5104 Training 7.6256 Prediction 7.6257
82 7.745 Training 7.6636 Prediction 7.5303 Training 7.6360 Training 7.6531
83 7.770 Training 7.7130 Prediction 7.5819 Training 7.6980 Prediction 7.6963
84 7.770 Training 7.7678 Prediction 7.6300 Training 7.7483 Prediction 7.7427
85 7.770 Training 8.0122 Training 7.8530 Training 7.9893 Prediction 7.9510
86 7.824 Training 7.6705 Prediction 7.5327 Prediction 7.6349 Training 7.6585
87 7.824 Training 7.8463 Training 7.6933 Training 7.8085 Training 7.8083
88 7.824 Training 7.9001 Training 7.7463 Training 7.8697 Training 7.8548
89 7.854 Training 7.9437 Training 7.7903 Prediction 7.9214 Training 7.8926
90 7.886 Training 7.9143 Training 7.7445 Training 7.8535 Prediction 7.8646
91 7.886 Training 7.5056 Prediction 7.4069 Prediction 7.5227 Training 7.5218
92 7.886 Training 7.9307 Training 7.7639 Training 7.8788 Prediction 7.8792
93 7.886 Training 7.8557 Prediction 7.7272 Training 7.8698 Training 7.8203
94 7.959 Training 8.1426 Training 7.9532 Training 8.0793 Training 8.0592
1254 Med Chem Res (2015) 24:1241–1264
123
Author's personal copy
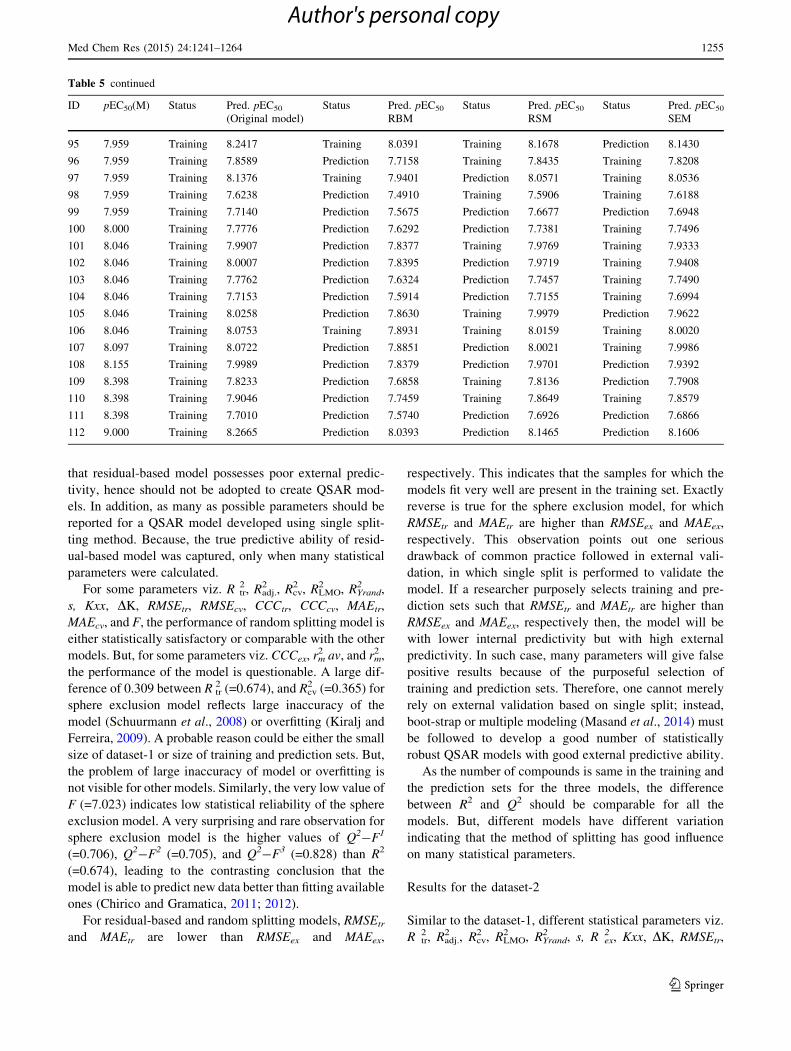
that residual-based model possesses poor external predic-
tivity, hence should not be adopted to create QSAR mod-
els. In addition, as many as possible parameters should be
reported for a QSAR model developed using single split-
ting method. Because, the true predictive ability of resid-
ual-based model was captured, only when many statistical
parameters were calculated.
For some parameters viz. R tr2 , Radj.
2 , Rcv2 , RLMO
2 , RYrand2 ,
s, Kxx, DK, RMSEtr, RMSEcv, CCCtr, CCCcv, MAEtr,
MAEcv, and F, the performance of random splitting model is
either statistically satisfactory or comparable with the other
models. But, for some parameters viz. CCCex, rm2 av, and rm
2 ,
the performance of the model is questionable. A large dif-
ference of 0.309 between R tr2 (=0.674), and Rcv
2 (=0.365) for
sphere exclusion model reflects large inaccuracy of the
model (Schuurmann et al., 2008) or overfitting (Kiralj and
Ferreira, 2009). A probable reason could be either the small
size of dataset-1 or size of training and prediction sets. But,
the problem of large inaccuracy of model or overfitting is
not visible for other models. Similarly, the very low value of
F (=7.023) indicates low statistical reliability of the sphere
exclusion model. A very surprising and rare observation for
sphere exclusion model is the higher values of Q2-F1
(=0.706), Q2-F2 (=0.705), and Q2-F3 (=0.828) than R2
(=0.674), leading to the contrasting conclusion that the
model is able to predict new data better than fitting available
ones (Chirico and Gramatica, 2011; 2012).
For residual-based and random splitting models, RMSEtr
and MAEtr are lower than RMSEex and MAEex,
respectively. This indicates that the samples for which the
models fit very well are present in the training set. Exactly
reverse is true for the sphere exclusion model, for which
RMSEtr and MAEtr are higher than RMSEex and MAEex,
respectively. This observation points out one serious
drawback of common practice followed in external vali-
dation, in which single split is performed to validate the
model. If a researcher purposely selects training and pre-
diction sets such that RMSEtr and MAEtr are higher than
RMSEex and MAEex, respectively then, the model will be
with lower internal predictivity but with high external
predictivity. In such case, many parameters will give false
positive results because of the purposeful selection of
training and prediction sets. Therefore, one cannot merely
rely on external validation based on single split; instead,
boot-strap or multiple modeling (Masand et al., 2014) must
be followed to develop a good number of statistically
robust QSAR models with good external predictive ability.
As the number of compounds is same in the training and
the prediction sets for the three models, the difference
between R2 and Q2 should be comparable for all the
models. But, different models have different variation
indicating that the method of splitting has good influence
on many statistical parameters.
Results for the dataset-2
Similar to the dataset-1, different statistical parameters viz.
R tr2 , Radj.
2 , Rcv2 , RLMO
2 , RYrand2 , s, R ex
2 , Kxx, DK, RMSEtr,
Table 5 continued
ID pEC50(M) Status Pred. pEC50
(Original model)
Status Pred. pEC50
RBM
Status Pred. pEC50
RSM
Status Pred. pEC50
SEM
95 7.959 Training 8.2417 Training 8.0391 Training 8.1678 Prediction 8.1430
96 7.959 Training 7.8589 Prediction 7.7158 Training 7.8435 Training 7.8208
97 7.959 Training 8.1376 Training 7.9401 Prediction 8.0571 Training 8.0536
98 7.959 Training 7.6238 Prediction 7.4910 Training 7.5906 Training 7.6188
99 7.959 Training 7.7140 Prediction 7.5675 Prediction 7.6677 Prediction 7.6948
100 8.000 Training 7.7776 Prediction 7.6292 Prediction 7.7381 Training 7.7496
101 8.046 Training 7.9907 Prediction 7.8377 Training 7.9769 Training 7.9333
102 8.046 Training 8.0007 Prediction 7.8395 Prediction 7.9719 Training 7.9408
103 8.046 Training 7.7762 Prediction 7.6324 Prediction 7.7457 Training 7.7490
104 8.046 Training 7.7153 Prediction 7.5914 Prediction 7.7155 Training 7.6994
105 8.046 Training 8.0258 Prediction 7.8630 Training 7.9979 Prediction 7.9622
106 8.046 Training 8.0753 Training 7.8931 Training 8.0159 Training 8.0020
107 8.097 Training 8.0722 Prediction 7.8851 Prediction 8.0021 Training 7.9986
108 8.155 Training 7.9989 Prediction 7.8379 Prediction 7.9701 Prediction 7.9392
109 8.398 Training 7.8233 Prediction 7.6858 Training 7.8136 Prediction 7.7908
110 8.398 Training 7.9046 Prediction 7.7459 Training 7.8649 Training 7.8579
111 8.398 Training 7.7010 Prediction 7.5740 Prediction 7.6926 Prediction 7.6866
112 9.000 Training 8.2665 Prediction 8.0393 Prediction 8.1465 Prediction 8.1606
Med Chem Res (2015) 24:1241–1264 1255
123
Author's personal copy
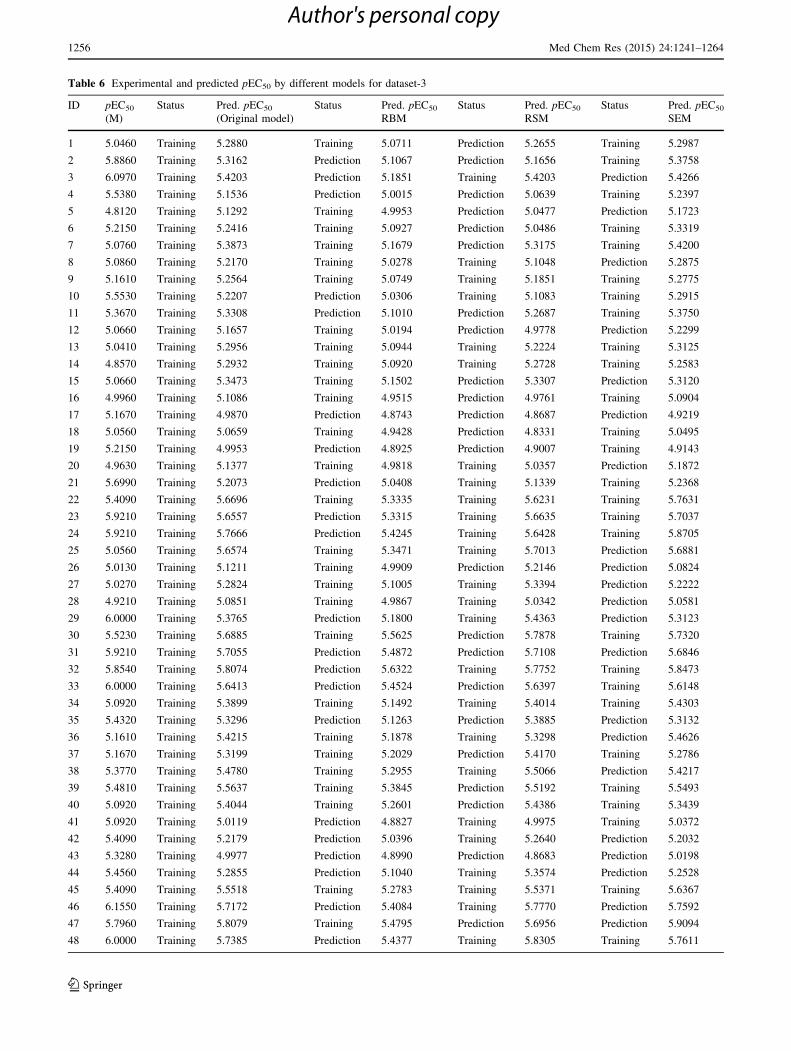
Table 6 Experimental and predicted pEC50 by different models for dataset-3
ID pEC50
(M)
Status Pred. pEC50
(Original model)
Status Pred. pEC50
RBM
Status Pred. pEC50
RSM
Status Pred. pEC50
SEM
1 5.0460 Training 5.2880 Training 5.0711 Prediction 5.2655 Training 5.2987
2 5.8860 Training 5.3162 Prediction 5.1067 Prediction 5.1656 Training 5.3758
3 6.0970 Training 5.4203 Prediction 5.1851 Training 5.4203 Prediction 5.4266
4 5.5380 Training 5.1536 Prediction 5.0015 Prediction 5.0639 Training 5.2397
5 4.8120 Training 5.1292 Training 4.9953 Prediction 5.0477 Prediction 5.1723
6 5.2150 Training 5.2416 Training 5.0927 Prediction 5.0486 Training 5.3319
7 5.0760 Training 5.3873 Training 5.1679 Prediction 5.3175 Training 5.4200
8 5.0860 Training 5.2170 Training 5.0278 Training 5.1048 Prediction 5.2875
9 5.1610 Training 5.2564 Training 5.0749 Training 5.1851 Training 5.2775
10 5.5530 Training 5.2207 Prediction 5.0306 Training 5.1083 Training 5.2915
11 5.3670 Training 5.3308 Prediction 5.1010 Prediction 5.2687 Training 5.3750
12 5.0660 Training 5.1657 Training 5.0194 Prediction 4.9778 Prediction 5.2299
13 5.0410 Training 5.2956 Training 5.0944 Training 5.2224 Training 5.3125
14 4.8570 Training 5.2932 Training 5.0920 Training 5.2728 Training 5.2583
15 5.0660 Training 5.3473 Training 5.1502 Prediction 5.3307 Prediction 5.3120
16 4.9960 Training 5.1086 Training 4.9515 Prediction 4.9761 Training 5.0904
17 5.1670 Training 4.9870 Prediction 4.8743 Prediction 4.8687 Prediction 4.9219
18 5.0560 Training 5.0659 Training 4.9428 Prediction 4.8331 Training 5.0495
19 5.2150 Training 4.9953 Prediction 4.8925 Prediction 4.9007 Training 4.9143
20 4.9630 Training 5.1377 Training 4.9818 Training 5.0357 Prediction 5.1872
21 5.6990 Training 5.2073 Prediction 5.0408 Training 5.1339 Training 5.2368
22 5.4090 Training 5.6696 Training 5.3335 Training 5.6231 Training 5.7631
23 5.9210 Training 5.6557 Prediction 5.3315 Training 5.6635 Training 5.7037
24 5.9210 Training 5.7666 Prediction 5.4245 Training 5.6428 Training 5.8705
25 5.0560 Training 5.6574 Training 5.3471 Training 5.7013 Prediction 5.6881
26 5.0130 Training 5.1211 Training 4.9909 Prediction 5.2146 Prediction 5.0824
27 5.0270 Training 5.2824 Training 5.1005 Training 5.3394 Prediction 5.2222
28 4.9210 Training 5.0851 Training 4.9867 Training 5.0342 Prediction 5.0581
29 6.0000 Training 5.3765 Prediction 5.1800 Training 5.4363 Prediction 5.3123
30 5.5230 Training 5.6885 Training 5.5625 Prediction 5.7878 Training 5.7320
31 5.9210 Training 5.7055 Prediction 5.4872 Prediction 5.7108 Prediction 5.6846
32 5.8540 Training 5.8074 Prediction 5.6322 Training 5.7752 Training 5.8473
33 6.0000 Training 5.6413 Prediction 5.4524 Prediction 5.6397 Training 5.6148
34 5.0920 Training 5.3899 Training 5.1492 Training 5.4014 Training 5.4303
35 5.4320 Training 5.3296 Prediction 5.1263 Prediction 5.3885 Prediction 5.3132
36 5.1610 Training 5.4215 Training 5.1878 Training 5.3298 Prediction 5.4626
37 5.1670 Training 5.3199 Training 5.2029 Prediction 5.4170 Training 5.2786
38 5.3770 Training 5.4780 Training 5.2955 Training 5.5066 Prediction 5.4217
39 5.4810 Training 5.5637 Training 5.3845 Prediction 5.5192 Training 5.5493
40 5.0920 Training 5.4044 Training 5.2601 Prediction 5.4386 Training 5.3439
41 5.0920 Training 5.0119 Prediction 4.8827 Training 4.9975 Training 5.0372
42 5.4090 Training 5.2179 Prediction 5.0396 Training 5.2640 Prediction 5.2032
43 5.3280 Training 4.9977 Prediction 4.8990 Prediction 4.8683 Prediction 5.0198
44 5.4560 Training 5.2855 Prediction 5.1040 Training 5.3574 Prediction 5.2528
45 5.4090 Training 5.5518 Training 5.2783 Training 5.5371 Training 5.6367
46 6.1550 Training 5.7172 Prediction 5.4084 Training 5.7770 Prediction 5.7592
47 5.7960 Training 5.8079 Training 5.4795 Prediction 5.6956 Prediction 5.9094
48 6.0000 Training 5.7385 Prediction 5.4377 Training 5.8305 Training 5.7611
1256 Med Chem Res (2015) 24:1241–1264
123
Author's personal copy
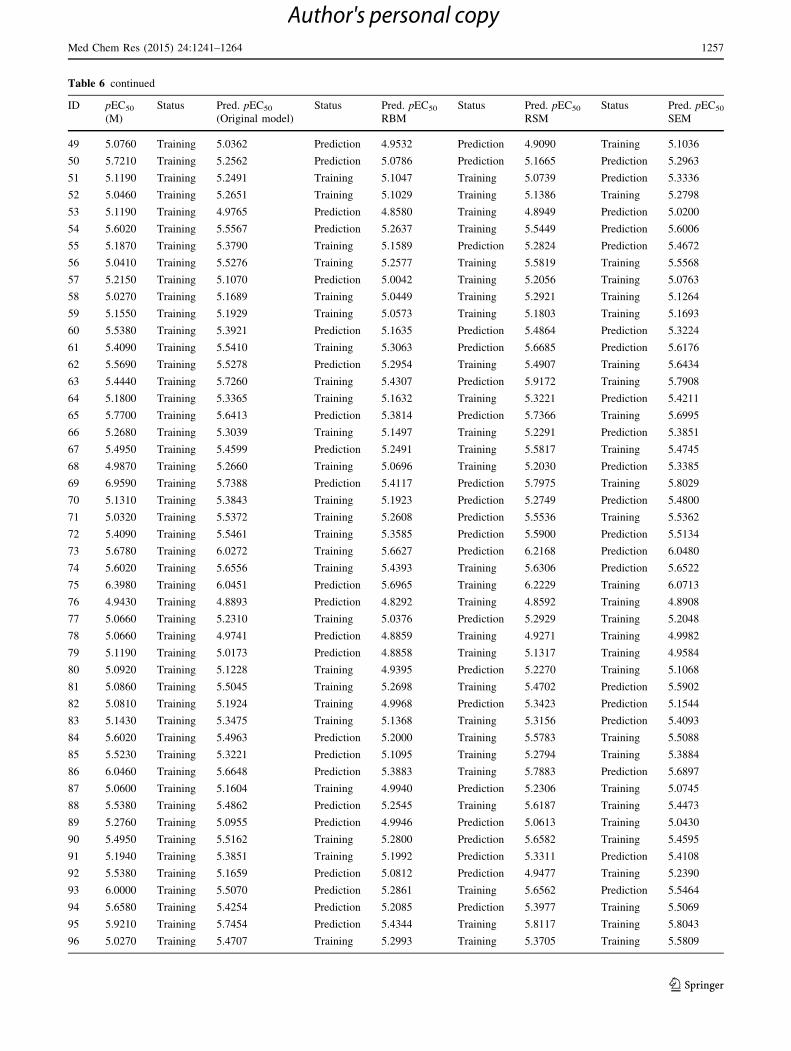
Table 6 continued
ID pEC50
(M)
Status Pred. pEC50
(Original model)
Status Pred. pEC50
RBM
Status Pred. pEC50
RSM
Status Pred. pEC50
SEM
49 5.0760 Training 5.0362 Prediction 4.9532 Prediction 4.9090 Training 5.1036
50 5.7210 Training 5.2562 Prediction 5.0786 Prediction 5.1665 Prediction 5.2963
51 5.1190 Training 5.2491 Training 5.1047 Training 5.0739 Prediction 5.3336
52 5.0460 Training 5.2651 Training 5.1029 Training 5.1386 Training 5.2798
53 5.1190 Training 4.9765 Prediction 4.8580 Training 4.8949 Prediction 5.0200
54 5.6020 Training 5.5567 Prediction 5.2637 Training 5.5449 Prediction 5.6006
55 5.1870 Training 5.3790 Training 5.1589 Prediction 5.2824 Prediction 5.4672
56 5.0410 Training 5.5276 Training 5.2577 Training 5.5819 Training 5.5568
57 5.2150 Training 5.1070 Prediction 5.0042 Training 5.2056 Training 5.0763
58 5.0270 Training 5.1689 Training 5.0449 Training 5.2921 Training 5.1264
59 5.1550 Training 5.1929 Training 5.0573 Training 5.1803 Training 5.1693
60 5.5380 Training 5.3921 Prediction 5.1635 Prediction 5.4864 Prediction 5.3224
61 5.4090 Training 5.5410 Training 5.3063 Prediction 5.6685 Prediction 5.6176
62 5.5690 Training 5.5278 Prediction 5.2954 Training 5.4907 Training 5.6434
63 5.4440 Training 5.7260 Training 5.4307 Prediction 5.9172 Training 5.7908
64 5.1800 Training 5.3365 Training 5.1632 Training 5.3221 Prediction 5.4211
65 5.7700 Training 5.6413 Prediction 5.3814 Prediction 5.7366 Training 5.6995
66 5.2680 Training 5.3039 Training 5.1497 Training 5.2291 Prediction 5.3851
67 5.4950 Training 5.4599 Prediction 5.2491 Training 5.5817 Training 5.4745
68 4.9870 Training 5.2660 Training 5.0696 Training 5.2030 Prediction 5.3385
69 6.9590 Training 5.7388 Prediction 5.4117 Prediction 5.7975 Training 5.8029
70 5.1310 Training 5.3843 Training 5.1923 Prediction 5.2749 Prediction 5.4800
71 5.0320 Training 5.5372 Training 5.2608 Prediction 5.5536 Training 5.5362
72 5.4090 Training 5.5461 Training 5.3585 Prediction 5.5900 Prediction 5.5134
73 5.6780 Training 6.0272 Training 5.6627 Prediction 6.2168 Prediction 6.0480
74 5.6020 Training 5.6556 Training 5.4393 Training 5.6306 Prediction 5.6522
75 6.3980 Training 6.0451 Prediction 5.6965 Training 6.2229 Training 6.0713
76 4.9430 Training 4.8893 Prediction 4.8292 Training 4.8592 Training 4.8908
77 5.0660 Training 5.2310 Training 5.0376 Prediction 5.2929 Training 5.2048
78 5.0660 Training 4.9741 Prediction 4.8859 Training 4.9271 Training 4.9982
79 5.1190 Training 5.0173 Prediction 4.8858 Training 5.1317 Training 4.9584
80 5.0920 Training 5.1228 Training 4.9395 Prediction 5.2270 Training 5.1068
81 5.0860 Training 5.5045 Training 5.2698 Training 5.4702 Prediction 5.5902
82 5.0810 Training 5.1924 Training 4.9968 Prediction 5.3423 Prediction 5.1544
83 5.1430 Training 5.3475 Training 5.1368 Training 5.3156 Prediction 5.4093
84 5.6020 Training 5.4963 Prediction 5.2000 Training 5.5783 Training 5.5088
85 5.5230 Training 5.3221 Prediction 5.1095 Training 5.2794 Training 5.3884
86 6.0460 Training 5.6648 Prediction 5.3883 Training 5.7883 Prediction 5.6897
87 5.0600 Training 5.1604 Training 4.9940 Prediction 5.2306 Training 5.0745
88 5.5380 Training 5.4862 Prediction 5.2545 Training 5.6187 Training 5.4473
89 5.2760 Training 5.0955 Prediction 4.9946 Prediction 5.0613 Training 5.0430
90 5.4950 Training 5.5162 Training 5.2800 Prediction 5.6582 Training 5.4595
91 5.1940 Training 5.3851 Training 5.1992 Prediction 5.3311 Prediction 5.4108
92 5.5380 Training 5.1659 Prediction 5.0812 Prediction 4.9477 Training 5.2390
93 6.0000 Training 5.5070 Prediction 5.2861 Training 5.6562 Prediction 5.5464
94 5.6580 Training 5.4254 Prediction 5.2085 Prediction 5.3977 Training 5.5069
95 5.9210 Training 5.7454 Prediction 5.4344 Training 5.8117 Training 5.8043
96 5.0270 Training 5.4707 Training 5.2993 Training 5.3705 Training 5.5809
Med Chem Res (2015) 24:1241–1264 1257
123
Author's personal copy
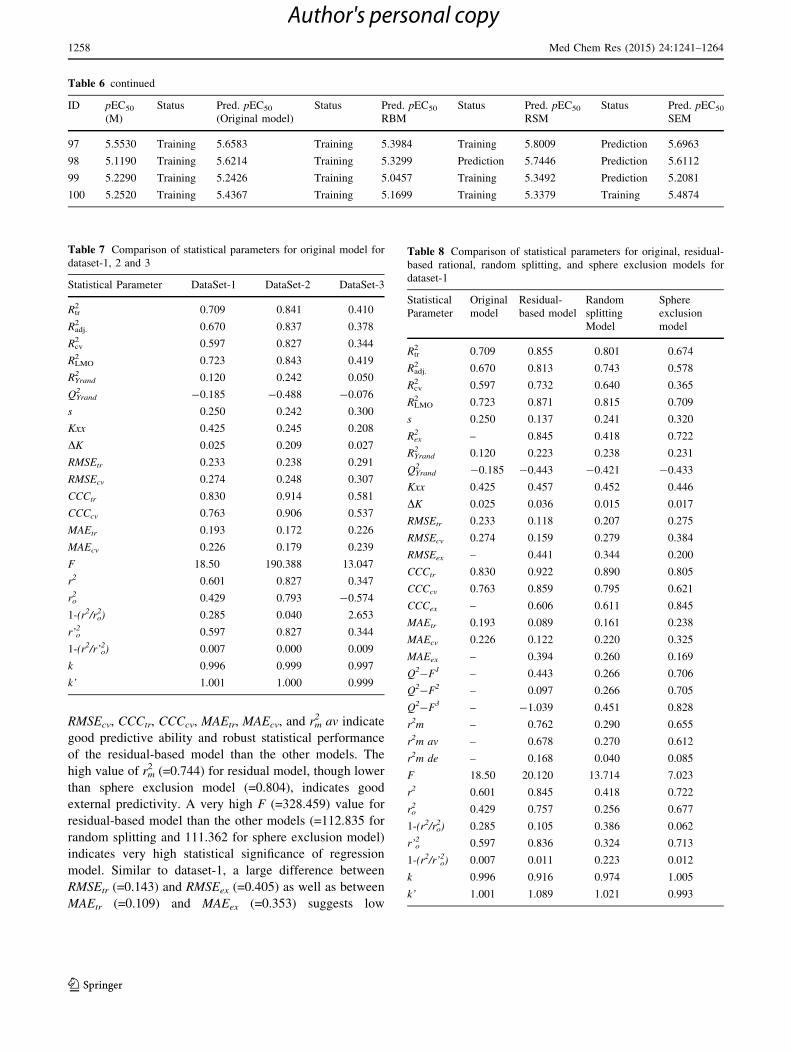
RMSEcv, CCCtr, CCCcv, MAEtr, MAEcv, and rm2 av indicate
good predictive ability and robust statistical performance
of the residual-based model than the other models. The
high value of rm2 (=0.744) for residual model, though lower
than sphere exclusion model (=0.804), indicates good
external predictivity. A very high F (=328.459) value for
residual-based model than the other models (=112.835 for
random splitting and 111.362 for sphere exclusion model)
indicates very high statistical significance of regression
model. Similar to dataset-1, a large difference between
RMSEtr (=0.143) and RMSEex (=0.405) as well as between
MAEtr (=0.109) and MAEex (=0.353) suggests low
Table 6 continued
ID pEC50
(M)
Status Pred. pEC50
(Original model)
Status Pred. pEC50
RBM
Status Pred. pEC50
RSM
Status Pred. pEC50
SEM
97 5.5530 Training 5.6583 Training 5.3984 Training 5.8009 Prediction 5.6963
98 5.1190 Training 5.6214 Training 5.3299 Prediction 5.7446 Prediction 5.6112
99 5.2290 Training 5.2426 Training 5.0457 Training 5.3492 Prediction 5.2081
100 5.2520 Training 5.4367 Training 5.1699 Training 5.3379 Training 5.4874
Table 7 Comparison of statistical parameters for original model for
dataset-1, 2 and 3
Statistical Parameter DataSet-1 DataSet-2 DataSet-3
Rtr2 0.709 0.841 0.410
Radj.2 0.670 0.837 0.378
Rcv2 0.597 0.827 0.344
RLMO2 0.723 0.843 0.419
RYrand2 0.120 0.242 0.050
QYrand2 -0.185 -0.488 -0.076
s 0.250 0.242 0.300
Kxx 0.425 0.245 0.208
DK 0.025 0.209 0.027
RMSEtr 0.233 0.238 0.291
RMSEcv 0.274 0.248 0.307
CCCtr 0.830 0.914 0.581
CCCcv 0.763 0.906 0.537
MAEtr 0.193 0.172 0.226
MAEcv 0.226 0.179 0.239
F 18.50 190.388 13.047
r2 0.601 0.827 0.347
ro2 0.429 0.793 -0.574
1-(r2/ro2) 0.285 0.040 2.653
r’o2 0.597 0.827 0.344
1-(r2/r’o2) 0.007 0.000 0.009
k 0.996 0.999 0.997
k’ 1.001 1.000 0.999
Table 8 Comparison of statistical parameters for original, residual-
based rational, random splitting, and sphere exclusion models for
dataset-1
Statistical
Parameter
Original
model
Residual-
based model
Random
splitting
Model
Sphere
exclusion
model
Rtr2 0.709 0.855 0.801 0.674
Radj.2 0.670 0.813 0.743 0.578
Rcv2 0.597 0.732 0.640 0.365
RLMO2 0.723 0.871 0.815 0.709
s 0.250 0.137 0.241 0.320
Rex2 – 0.845 0.418 0.722
RYrand2 0.120 0.223 0.238 0.231
QYrand2 -0.185 -0.443 -0.421 -0.433
Kxx 0.425 0.457 0.452 0.446
DK 0.025 0.036 0.015 0.017
RMSEtr 0.233 0.118 0.207 0.275
RMSEcv 0.274 0.159 0.279 0.384
RMSEex – 0.441 0.344 0.200
CCCtr 0.830 0.922 0.890 0.805
CCCcv 0.763 0.859 0.795 0.621
CCCex – 0.606 0.611 0.845
MAEtr 0.193 0.089 0.161 0.238
MAEcv 0.226 0.122 0.220 0.325
MAEex – 0.394 0.260 0.169
Q2-F1 – 0.443 0.266 0.706
Q2-F2 – 0.097 0.266 0.705
Q2-F3 – -1.039 0.451 0.828
r2m – 0.762 0.290 0.655
r2m av – 0.678 0.270 0.612
r2m de – 0.168 0.040 0.085
F 18.50 20.120 13.714 7.023
r2 0.601 0.845 0.418 0.722
ro2 0.429 0.757 0.256 0.677
1-(r2/ro2) 0.285 0.105 0.386 0.062
r’o2 0.597 0.836 0.324 0.713
1-(r2/r’o2) 0.007 0.011 0.223 0.012
k 0.996 0.916 0.974 1.005
k’ 1.001 1.089 1.021 0.993
1258 Med Chem Res (2015) 24:1241–1264
123
Author's personal copy
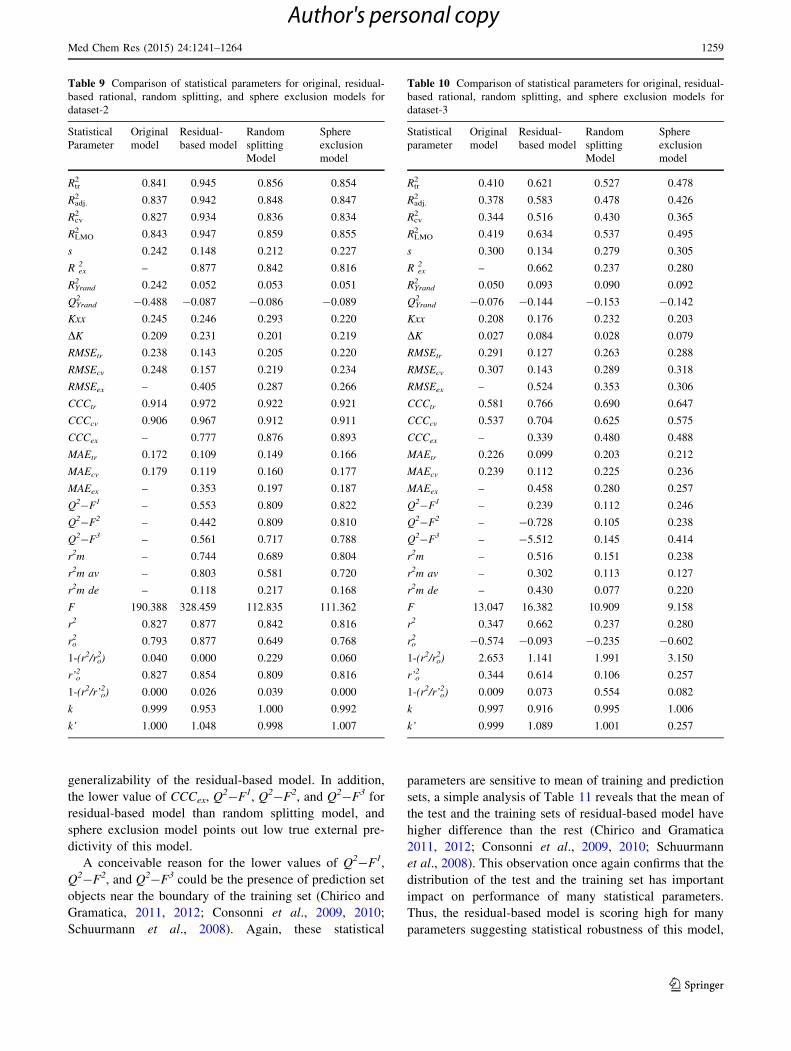
generalizability of the residual-based model. In addition,
the lower value of CCCex, Q2-F1, Q2-F2, and Q2-F3 for
residual-based model than random splitting model, and
sphere exclusion model points out low true external pre-
dictivity of this model.
A conceivable reason for the lower values of Q2-F1,
Q2-F2, and Q2-F3 could be the presence of prediction set
objects near the boundary of the training set (Chirico and
Gramatica, 2011, 2012; Consonni et al., 2009, 2010;
Schuurmann et al., 2008). Again, these statistical
parameters are sensitive to mean of training and prediction
sets, a simple analysis of Table 11 reveals that the mean of
the test and the training sets of residual-based model have
higher difference than the rest (Chirico and Gramatica
2011, 2012; Consonni et al., 2009, 2010; Schuurmann
et al., 2008). This observation once again confirms that the
distribution of the test and the training set has important
impact on performance of many statistical parameters.
Thus, the residual-based model is scoring high for many
parameters suggesting statistical robustness of this model,
Table 9 Comparison of statistical parameters for original, residual-
based rational, random splitting, and sphere exclusion models for
dataset-2
Statistical
Parameter
Original
model
Residual-
based model
Random
splitting
Model
Sphere
exclusion
model
Rtr2 0.841 0.945 0.856 0.854
Radj.2 0.837 0.942 0.848 0.847
Rcv2 0.827 0.934 0.836 0.834
RLMO2 0.843 0.947 0.859 0.855
s 0.242 0.148 0.212 0.227
R ex2 – 0.877 0.842 0.816
RYrand2 0.242 0.052 0.053 0.051
QYrand2 -0.488 -0.087 -0.086 -0.089
Kxx 0.245 0.246 0.293 0.220
DK 0.209 0.231 0.201 0.219
RMSEtr 0.238 0.143 0.205 0.220
RMSEcv 0.248 0.157 0.219 0.234
RMSEex – 0.405 0.287 0.266
CCCtr 0.914 0.972 0.922 0.921
CCCcv 0.906 0.967 0.912 0.911
CCCex – 0.777 0.876 0.893
MAEtr 0.172 0.109 0.149 0.166
MAEcv 0.179 0.119 0.160 0.177
MAEex – 0.353 0.197 0.187
Q2-F1 – 0.553 0.809 0.822
Q2-F2 – 0.442 0.809 0.810
Q2-F3 – 0.561 0.717 0.788
r2m – 0.744 0.689 0.804
r2m av – 0.803 0.581 0.720
r2m de – 0.118 0.217 0.168
F 190.388 328.459 112.835 111.362
r2 0.827 0.877 0.842 0.816
ro2 0.793 0.877 0.649 0.768
1-(r2/ro2) 0.040 0.000 0.229 0.060
r’o2 0.827 0.854 0.809 0.816
1-(r2/r’o2) 0.000 0.026 0.039 0.000
k 0.999 0.953 1.000 0.992
k’ 1.000 1.048 0.998 1.007
Table 10 Comparison of statistical parameters for original, residual-
based rational, random splitting, and sphere exclusion models for
dataset-3
Statistical
parameter
Original
model
Residual-
based model
Random
splitting
Model
Sphere
exclusion
model
Rtr2 0.410 0.621 0.527 0.478
Radj.2 0.378 0.583 0.478 0.426
Rcv2 0.344 0.516 0.430 0.365
RLMO2 0.419 0.634 0.537 0.495
s 0.300 0.134 0.279 0.305
R ex2 – 0.662 0.237 0.280
RYrand2 0.050 0.093 0.090 0.092
QYrand2 -0.076 -0.144 -0.153 -0.142
Kxx 0.208 0.176 0.232 0.203
DK 0.027 0.084 0.028 0.079
RMSEtr 0.291 0.127 0.263 0.288
RMSEcv 0.307 0.143 0.289 0.318
RMSEex – 0.524 0.353 0.306
CCCtr 0.581 0.766 0.690 0.647
CCCcv 0.537 0.704 0.625 0.575
CCCex – 0.339 0.480 0.488
MAEtr 0.226 0.099 0.203 0.212
MAEcv 0.239 0.112 0.225 0.236
MAEex – 0.458 0.280 0.257
Q2-F1 – 0.239 0.112 0.246
Q2-F2 – -0.728 0.105 0.238
Q2-F3 – -5.512 0.145 0.414
r2m – 0.516 0.151 0.238
r2m av – 0.302 0.113 0.127
r2m de – 0.430 0.077 0.220
F 13.047 16.382 10.909 9.158
r2 0.347 0.662 0.237 0.280
ro2 -0.574 -0.093 -0.235 -0.602
1-(r2/ro2) 2.653 1.141 1.991 3.150
r’o2 0.344 0.614 0.106 0.257
1-(r2/r’o2) 0.009 0.073 0.554 0.082
k 0.997 0.916 0.995 1.006
k’ 0.999 1.089 1.001 0.257
Med Chem Res (2015) 24:1241–1264 1259
123
Author's personal copy
but some parameters raise doubts on its external
predictivity.
Results for the dataset-3
Various statistical parameters viz. R tr2 , Radj.
2 , Rcv2 , RLMO
2 ,
RYrand2 , s, R ex
2 , Kxx, DK, RMSEtr, RMSEcv, CCCtr, CCCcv,
MAEtr, MAEcv, rm2 av, and F (see Table 10) indicate low
predictive ability and poor statistical performance of all the
models. But, a closer inspection of various models indi-
cates that the performance of residual-based model is better
than the other models. Some of the statistical parameters
like R tr2 , RLMO
2 , s, R ex2 , RMSEtr, RMSEcv, MAEtr, and
MAEcv are with acceptable values. However, the model
possesses low internal and external predictivity. As stated
earlier, it is not a useful model at all for the prediction and
pattern recognition. The Q2-F2 and Q2-F3 are negative
which indicates that the model is useless for external
predictivity.
Comparison of performance of splitting methodologies
and statistical behavior of statistical parameters
In the present analysis, information leakage was purposely
performed for RBM. The descriptors were selected using
the whole dataset, therefore, due to the information leak-
age, the selected descriptors must have captured the com-
mon structural features that influence the activity, and
consequently, after splitting in any pattern/composition, the
performance of RBM model for the all the datasets must be
superior than SEM and RSM with respect to internal and
external cross-validation parameters, i.e., must show high
level of external predictivity with high validation score.
Surprisingly, for RBM model, various validation parame-
ters do not show expected behavior and values for all the
datasets.
The random splitting models, for all the datasets, have
varying performance; this could be due to the fact that
during splitting the training or prediction set may not be
covering the diversity of the whole dataset or the com-
pounds are not close to each other. Repeating the random
splitting several times is a good solution to arrive at best
random splitting (Huang and Fan, 2011; Kiralj and Ferre-
ira, 2009). Yet, as pointed out in a recent study, a QSAR
model with high external predictivity for one prediction set
does not necessarily indicate high accuracy for another
external set (Huang and Fan, 2011). Therefore, precautions
must be taken in using single random splitting.
Since, the performance of the RBM, RSM, and SEM
models is varying, but by luck or due to rational splitting,
the researcher may arrive at the training and prediction sets
that indicate high external predictive ability, such situation,
though, leads to a statistically robust but a misguiding
QSAR model as observed in RBM. An easy and handy
solution to this problem is to develop a model using
undivided dataset and compare its performance with the
other models. Herein, in all the datasets, the performance
of original model, though not better than residual based and
sphere exclusion models, is still statistically satisfactory. It
is expected that a model developed with no prediction set
will be most accurate and possess the highest coverage for
external evaluation set. But, a recent study reports exactly
opposite results in certain situations (Martin et al., 2012).
Therefore, we recommend and accentuate reporting of a
statistically robust QSAR model that is developed using
undivided whole dataset and same set of descriptors, which
were selected and used in splitting-based model. Then,
such a model tells the true effect of inclusion of compounds
in the dataset. That is, it is useful in understanding the
effect of increase/decrease in size of dataset as well as for
capturing less privileged yet useful structural features that
govern the activity.
A higher value of Rtr2 for residual-based model in all
the datasets than the rest of the models indicates a better
fitting or explanation of variance (see Tables 8–10).
Similar trend for Rex2 for residual-based model for dif-
ferent datasets confers as if the residual based splitting is
better method of splitting. Therefore, a QSAR modeler
may consider the residual-based model superior than
others. This apparent superiority can be attributed to the
purposeful selection of the training and the prediction
sets, that is, the method of splitting has significant impact
on many statistical parameters. Moreover, a careful
comparison of residual values for all the models (see
Fig. 3) reveals that the difference between the experi-
mental and predicted in many instances is large in case of
residual-based model than the others. But, during the
calculation of various statistical parameters either sum or
average is used. Therefore, the statistical parameters are
unable to recognize this serious pitfall. In fact, a QSAR
model based on splitting method with an unusually robust
training set Rtr2 of 0.8 or greater than Rtr
2 of undivided set
Table 11 Mean of experimental pIC50 for prediction and training
sets of various models for datasets 1–3
DataSet Set Original Residual-
based
model
Random
splitting
Model
Sphere
exclusion
model
1 Prediction – 4.8308 4.6389 4.6509
Training 4.6397 4.4652 4.6404 4.6295
2 Prediction – 7.5342 7.3803 7.3017
Training 7.3867 7.2633 7.3921 7.4577
3 Prediction – 5.6296 5.3598 5.3570
Training 5.3778 5.1799 5.3925 5.3941
1260 Med Chem Res (2015) 24:1241–1264
123
Author's personal copy
For Data set-1
3.5
4
4.5
5
5.5
6
0 5 10 15 20 25 30 35 40 45
OM pIC50
RBM pIC50
RSM pIC50
SEM pIC50
pIC50
For Data set-2
5
5.5
6
6.5
7
7.5
8
8.5
9
-5 15 35 55 75 95 115
OM pIC50RBM pIC50RSM pIC50SEM pIC50pIC50
For Data set-3
4.5
5
5.5
6
6.5
7
0 10 20 30 40 50 60 70 80 90 100
OM pIC50
RBM pIC50
RSM pIC50
SEM pIC50
pIC50
Fig. 3 Difference between
experimental and predicted
pIC50 by various models for
dataset-1, 2, and 3 (X-axis:
Compound number and Y-axis:
pIC50/pEC50; X-axis: Serial
number of compound, Y-axis:
pIC50 value)
Med Chem Res (2015) 24:1241–1264 1261
123
Author's personal copy
should be viewed with suspicion. Some parameters like
CCCex, Q2-F1, Q2-F2, Q2-F3, and rm2 are more suc-
cessful in identifying this crucial aspect. This can be
ascribed to the method of calculation of these parameters
(Chirico and Gramatica, 2011, 2012); (Consonni et al.,
2009, 2010; Schuurmann et al., 2008).
Q2 � F1 ¼ 1 �
Pnext
i¼1
ðbyi � yiÞ2
Pnext
i¼1
ðyi � �ytrÞ2
Q2 � F3 ¼ 1 �
Pnext
i¼1
ðbyi � yiÞ2=next
Pntr
i¼1
ðyi � �ytrÞ2=ntr
Q2 � F2 ¼ 1 �
Pnext
i¼1
ðbyi � yiÞ2
Pnext
i¼1
ðyi � �yextÞ2
r2m ¼ r2ð1 �
ffiffiffiffiffiffiffiffiffiffiffiffiffir2 þ r2
o
qÞ
:
Thus, rm2 considers agreement between the actual and the
predicted values as an essential factor to establish the true
predictivity (Mitra et al., 2010; Roy and Mitra, 2012).
Thence, the statistical parameters viz. CCCex, Q2-F1, Q2-
F2, Q2-F3, and rm2 reflect the factual performance of model
regarding true external predictivity of a QSAR model.
Therefore, these parameters should be used as criteria for
selection of a consensus model, as in QSARINS v1.2. In
QSARINS v1.2, MAEtr, MAEex, RMSEtr, RMSEex, CCCtr,
CCCex, Q2-F1, Q2-F2, Q2-F3, and some other
parameters are used to find a consensus model.
In agreement with the previous reports, the trend of
lower CCC with higher RMSE value is true for all the
datasets (Chirico and Gramatica, 2011, 2012). However,
the claim that the smaller the dataset size, the better the
performances of rm2 -EyPx and CCC compared to the
other external validation measures was not observed for
any of the dataset (Chirico and Gramatica, 2011, 2012).
The similar values of Q2-F1and Q2-F2 for random
splitting model for dataset 1 and 2 can be attributed to
the fact that these parameters depend on agreement
between the mean of the training and the prediction set
values (Consonni et al., 2009, 2010). For dataset 1 and
2, the mean of test and training sets values is very close
to each other (see Table 11). A good difference between
the mean of the undivided set and the training set values
of the residual-based model for all the datasets indicates
that the prediction set was not selected properly. Such a
noticeable difference is absent in case of other models.
This again indicates that residual-based method of
splitting cannot be functionalised for splitting the data-
set for external validation.
Since the whole dataset is involved in descriptor selec-
tion and model development, another point view toward the
present approach is to consider it as a methodology to
develop a model with good external predictivity using
advantages of internal validation method. A model with
good internal predictivity may or may not be good at
external predictivity (Chirico and Gramatica, 2011, 2012;
Consonni et al., 2009, 2010; Gramatica 2013, Schuurmann
et al., 2008). In the present analysis, sphere exclusion
model with higher values of Q2-F3, CCCex, and lower
values of RMSEex, MAEex indicate good external predic-
tivity of model.
Consonni et al. argued that increasing the mean of
training set values increases Q2 artificially (Consonni et al.,
2009). From Table 11, it is observed that the mean of the
training set values for the random (for dataset- 1 and 2) and
the sphere exclusion models (for dataset-1) is very close to
mean of undivided set values; therefore, the value of Q2 for
these models should be close to Q2 of the original model.
However, for random splitting model, Q2 = 0.640 for
dataset-1, and Q2 = 0.836 for dataset-2 are higher than that
of the original model (Q2 = 0.597). In addition, lower
Q2 = 0.365 for sphere exclusion model for dataset-1 than
Q2 = 0.597 for original model conflicts the finding of
Consonni et al. The mean of the training set for residual
model (=4.4652) is lower than mean of training set of
undivided set (=4.6397). Therefore, for the sphere exclu-
sion model, Q2 should be lower than the Q2 for original
model, but the results are exactly opposite. Therefore,
further studies are required to understand the effect of
mean of training set on Q2.
Conclusions
In conclusion, external validation based on single splitting is
neither perfect nor absolutely accurate method of QSAR
model validation as the statistical parameters can be influ-
enced easily due to the biased and purposeful selection of the
training and prediction sets. Moreover, the predictive ability
of a QSAR model is sensitive toward the method of splitting
and its manipulation is feasible. Thus, it is still insufficient to
guarantee the true predictability of a QSAR model. The true
external predictivity of any QSAR model cannot be decided
on the basis of one or two parameters, that is, as many as
possible statistical parameters should be calculated to judge
the external predictivity. A good number of statistical
parameters need to be calculated and presented to identify
the true external predictivity of any QSAR model. We
1262 Med Chem Res (2015) 24:1241–1264
123
Author's personal copy
suggest and emphasize reporting of at least one statistically
robust QSAR model that is developed using undivided whole
dataset with appropriate cross validation.
In the present study, we presented a novel method for
splitting the dataset for external validation. The residual
method, though, generates statistically robust model but
with low external predictivity. Further studies are in pro-
gress for the improvement of this method.
Acknowledgments We are thankful to QSARINS and RapidMiner
developing teams for providing the evaluation and free versions of the
softwares. One of the authors (VHM) is thankful to Dr. Paola
Gramatica, Italy for providing QSARINS v1.2 and later versions.
References
Baumann K, Stiefl N (2004) Validation tools for variable subset
regression. J Comput Aided Mol Des 18(7–9):549–562
Chirico N, Gramatica P (2011) Real external predictivity of qsar
models: how to evaluate it? comparison of different validation
criteria and proposal of using the concordance correlation
coefficient. J Chem Inf Model 51(9):2320–2335
Chirico N, Gramatica P (2012) Real external predictivity of QSAR
models. Part 2. New intercomparable thresholds for different
validation criteria and the need for scatter plot inspection.
J Chem Inf Model 52(8):2044–2058
Consonni V, Ballabio D, Todeschini R (2009) Comments on the
definition of the Q2 parameter for QSAR validation. J Chem Inf
Model 49(7):1669–1678
Consonni V, Ballabio D, Todeschini R (2010) Evaluation of model
predictive ability by external validation techniques. J Chemomet
24:194–201
Golbraikh A, Tropsha A (2002) Beware of q2! J Mol Graph Model
20(4):269–276
Gramatica P (2013) On the development and validation of QSAR
models. Methods Mol Biol 930:499–526
Gramatica P, Chirico N, Papa E, Cassani S, Kovarich S (2013) QSARINS:
a new software for the development, analysis, and validation of
QSAR MLR models. J Comput Chem 34(24):2121–2132
Gramatica P, Cassani S, Chirico N (2014) QSARINS-chem: insubria
datasets and new QSAR/QSPR models for environmental
pollutants in QSARINS. J Comput Chem 35(13):1036–1044
Hawkins DM (2004) The problem of overfitting. J Chem Inf Comput
Sci 44(1):1–12
Hawkins DM, Basak SC, Mills D (2003) Assessing model fit by cross-
validation. J Chem Inf Comput Sci 43:579–586
Hawkins DM, Kraker JJ, Basak SC, Mills D (2008) QSPR checking
and validation: a case study with hydroxy radical reaction rate
constant. SAR QSAR Environ Res 19(5–6):525–539
Huang J, Fan X (2011) Why QSAR fails: an empirical evaluation using
conventional computational approach. Mol Pharm 8(2):600–608
Hwang JY, Kawasuji T, Lowes DJ, Clark JA, Connelly MC, Zhu F,
Guiguemde WA, Sigal MS, Wilson EB, DeRisi JL, Guy RK
(2011) Synthesis and evaluation of 7-substituted 4-aminoquin-
oline analogues for antimalarial activity. J Med Chem 54(20):
7084–7093
Kiralj R, Ferreira MMC (2009) Basic validation procedures for
regression models in QSAR and QSPR studies: theory and
application. J Braz Chem Soc 20:770–787
Kubinyi H (2002) From narcosis to hyperspace: the history of QSAR.
Quant Struct Act Relat 21:348–356
Mahajan DT, Masand VH, Patil KN, Ben Hadda T, Jawarkar RD,
Thakur SD, Rastija V (2012) CoMSIA and POM analyses of
anti-malarial activity of synthetic prodiginines. Bioorg Med
Chem Lett 22(14):4827–4835
Mahajan DT, Masand VH, Patil KN, Hadda TB, Rastija V (2013)
Integrating GUSAR and QSAR analyses for antimalarial activity
of synthetic prodiginines against multi drug resistant strain. Med
Chem Res 22:2284–2292
Martin TM, Harten P, Young DM, Muratov EN, Golbraikh A, Zhu H,
Tropsha A (2012) Does rational selection of training and test sets
improve the outcome of QSAR modeling? J Chem Inf Model
52(10):2570–2578
Masand VH, Jawarkar RD, Patil KN, Nazerruddin GM, Bajaj SO
(2010) Correlation potential of Wiener index and molecular
refractivity vis-a‘-vis Antimalarial activity of xanthone deriva-
tives. Org Chem 6(1):30–38
Masand VH, Jawarkar RD, Mahajan DT, Hadda TB, Sheikh J, Patil
KN (2012) QSAR and CoMFA studies of biphenyl analogs of
the anti-tuberculosis drug (6S)-2-nitro-6-{[4-(trifluoromethoxy)
benzyl]oxy}-6,7-dihydro-5H-imidazo[2,1-b][1,3]oxazine(PA-
824). Med Chem Res 21:2624–2629
Masand VH, Mahajan DT, Patil KN, Hadda TB, Youssoufi MH,
Jawarkar RD, Shibi IG (2013) Optimization of antimalarial
activity of synthetic prodiginines: QSAR, GUSAR, and CoMFA
analyses. Chem Biol Drug Des 81(4):527–536
Masand VH, Mahajan DT, Gramatica P, Barlow J (2014) Tautom-
erism and multiple modelling enhance the efficacy of QSAR:
antimalarial activity of phosphoramidate and phosphorothioam-
idate analogues of amiprophos methyl. Med Chem Res
Mitra I, Roy PP, Kar S, Ojha PK, Roy K (2010) On further application
of r m2 as a metric for validation of QSAR models. J Chemomet
24(1):22–33
Roy K, Mitra I (2012) On the use of the metric rm(2) as an effective
tool for validation of QSAR models in computational drug design
and predictive toxicology. Mini Rev Med Chem 12(6):491–504
Roy K, Roy PP, Leonard JT (2008) Exploring the impact of size of
training sets for the development of predictive QSAR models.
Chemomet Intel Lab Sys 90:31–42
Sahigara F, Mansouri K, Ballabio D, Mauri A, Consonni V,
Todeschini R (2012) Comparison of different approaches to
define the applicability domain of QSAR models. Molecules
17(5):4791–4810
Schuurmann G, Ebert RU, Chen J, Wang B, Kuhne R (2008) External
validation and prediction employing the predictive squared
correlation coefficient test set activity mean vs training set
activity mean. J Chem Inf Model 48(11):2140–2145
Scior T, Medina-Franco JL, Do QT, Martinez-Mayorga K, Yunes
Rojas JA, Bernard P (2009) How to recognize and workaround
pitfalls in QSAR studies: a critical review. Curr Med Chem
16(32):4297–4313
Selassie CD (2003) History of Quantitative Structure-Activity
Relationships. In Burger’s Medicinal Chemistry and Drug
Discovery, 6 ed.; Abraham, D. J., Ed. JohnWiley&Sons, Inc.:
2003; Vol. 1
Sushko I, Novotarskyi S, Korner R, Pandey AK, Cherkasov A, Li J,
Gramatica P, Hansen K, Schroeter T, Muller KR, Xi L, Liu H,
Yao X, Oberg T, Hormozdiari F, Dao P, Sahinalp C, Todeschini
R, Polishchuk P, Artemenko A, Kuz’min V, Martin TM, Young
DM, Fourches D, Muratov E, Tropsha A, Baskin I, Horvath D,
Marcou G, Muller C, Varnek A, Prokopenko VV, Tetko IV
(2010) Applicability domains for classification problems: bench-
marking of distance to models for Ames mutagenicity set.
J Chem Inf Model 50(12):2094–2111
Todeschini R, Consonni V, Mauri A, Pavan M (2004) Detecting
‘‘bad’’ regression models: multicriteria fitness functions in
regression analysis. Anal Chim Acta 515(1):199–208
Med Chem Res (2015) 24:1241–1264 1263
123
Author's personal copy

Tropsha A (2010) Best practices for QSAR model development,
validation, and exploitation. Mol Inform 29:476–488
Turcotte V, Fortin S, Vevey F, Coulombe Y, Lacroix J, Cote MF,
Masson JY, R CG (2012) Synthesis, biological evaluation, and
structure-activity relationships of novel substituted N-phenyl
ureidobenzenesulfonate derivatives blocking cell cycle progres-
sion in S-phase and inducing DNA double-strand breaks. J Med
Chem 55(13):6194–6208
Van Drie JH (2007) Computer-aided drug design: the next 20 years.
J Comput Aided Mol Des 21(10–11):591–601
Yuriev E, Agostino M, Ramsland PA (2011) Challenges and advances
in computational docking: 2009 in review. J Mol Recognit
24(2):149–164
1264 Med Chem Res (2015) 24:1241–1264
123
Author's personal copy
Molecular docking and QSAR analyses for understanding theantimalarial activity of some 7-substituted-4-aminoquinolinederivatives
I.G. Shibi a,⇑, L. Aswathy a, R.S. Jisha a, V.H. Masand b, A. Divyachandran a, J.M. Gajbhiye c
aDepartment of Chemistry, Sree Narayana College, Chempazhanthy, Kerala, IndiabDepartment of Chemistry, Vidya Bharati College, Camp, Amravati, Maharashtra, IndiacDivision of Organic Chemistry, CSIR-National Chemical Laboratory, Pune, India
a r t i c l e i n f o
Article history:Received 12 March 2015Received in revised form 2 May 2015Accepted 21 May 2015Available online 22 May 2015
Chemical compounds:N-(furan-2-ylmethyl)-N0-(7-phenoxyquinolin-4-yl)propane-1,3-diamine(PubChem CID: 56593944)N-[(5-fluoro-2-methoxy-phenyl)methyl]-N0-[7-(3-methoxyphenoxy)-4-quinolyl]propane-1,3-diamine (PubChem CID: 56595146)2-[[3-[[7-(4-chlorophenoxy)-4-quinolyl]amino]propylamino]methyl]-6-methoxy-phenol (PubChem CID: 56593662)N-(1,3-benzodioxol-4-ylmethyl)-N0-[7-(4-tert-butylphenoxy)-4-quinolyl]propane-1,3-diamine (PubChem CID: 56593819)N-(2-furylmethyl)-N0-(7-isopentyl-4-quinolyl)propane-1,3-diamine (PubChem CID56593939)(2H-1,3-benzodioxol-4-ylmethyl)(3-{[7-(2-phenylethyl)quinolin-4-yl]amino}propyl)amine (PubChem CID: 56594874)N-(1,3-benzodioxol-4-ylmethyl)-N0-(7-phenethyl-4-quinolyl)propane-1,3-diamine(PubChem CID: 56594623)
Keywords:MalariaPlasmodium falciparum2D-QSARCoMFACoMSIAMolecular docking
a b s t r a c t
The quinoline moiety is one of the widely studied scaffolds for generating derivatives with various phar-macophoric groups due to its potential antimalarial activities. In the present study, a series of7-substituted-4-aminoquinoline derivatives were selected to understand their antimalarial propertiescomputationally by molecular modeling techniques including 2D QSAR, comparative molecular fieldanalysis (CoMFA), comparative molecular similarity indices analysis (CoMSIA) and molecular docking.The 2D-QSAR model built with four descriptors selected by genetic algorithm technique and CoMFAmodel showed satisfactory statistical results (Q2 = 0.540, R2
ncv = 0.881, F value = 157.09). A reliableCoMSIA model out of the fourteen different combinations has a Q2 value of 0.638. The molecular dockingstudies of the compounds for 1CET as the protein target revealed that ten compounds showed maximuminteractions with the binding site of the protein. The present study highlights the unique binding signaturesof the ligands within the active site groove of the target and it explains the subtle differences in their EC50
values and their mechanism of inhibition.� 2015 Elsevier B.V. All rights reserved.
http://dx.doi.org/10.1016/j.ejps.2015.05.0250928-0987/� 2015 Elsevier B.V. All rights reserved.
⇑ Corresponding author at: PG & Research Department of Chemistry, SreeNarayana College, Chempazhanthy, Thiruvananthapuram 695 587, Kerala, India.
E-mail address: [email protected] (I.G. Shibi).
European Journal of Pharmaceutical Sciences 77 (2015) 9–23
Contents lists available at ScienceDirect
European Journal of Pharmaceutical Sciences
journal homepage: www.elsevier .com/ locate/e jps
1. Introduction
Malaria is a severe and infectious disease caused mainly byPlasmodium falciparum (P. falciparum) (White et al., 2014). About207 million cases and 627,000 deaths are reported annually,mainly in African sub-Saharan countries (Sonin et al., 2013).Recent reports show that P. falciparum has become resistant toall chemotherapeutic agents that are currently in use (O’Brienet al., 2011). Consequently World Health Organization (WHO)has recommended the use of Artemisinin-based combination ther-apy (ACT) for the treatment of P. falciparum related uncomplicatedand severe malarial infection. But it has been reported that parasiteshows resistance to Artemisinin, compounding an urgent require-ment for additional therapeutic agents targeting Plasmodium para-sites (Kyaw et al., 2013).
The quinoline moiety has attracted much consideration ofmedicinal chemists, as it is one of the imperative pharmacophoresaccountable for imparting antimalarial action (Boechat et al., 2014;Videnovic et al., 2014; Mishra et al., 2014). Quinoline based drugsexert antimalarial activity by interfering with hemoglobin (Hb)degradation in the parasitic food vacuole. One of the waste prod-ucts of the parasite’s hemoglobin diet is ferriprotoporphyrin IX(FP); a toxic iron-containing molecule (O’Neill et al., 1998). Theparasite detoxifies this molecule by means of a crystallization reac-tion that converts FP into non-toxic hemozoin or malaria pigmentwhile the globin is hydrolyzed into individual amino acids (Ridley,1996). The most accepted hypothesis is that antimalarial drugsform a complex with FP that inhibits the formation of hemozoinand result in an accumulation of toxic molecules in the parasite,which eventually kills it (Dorn et al., 1998).
In drug discovery process Quantitative Structure–ActivityRelationships (QSAR) have great importance (Pourbasheer et al.,2013; Pourbasheer et al., 2010; Riahi et al., 2008, 2009).Molecular descriptors can be 2D as well as 3D. The 3D-QSAR mod-els can be employed for the identification of regions in space whichcorrelate with the biological activities (Du et al., 2012). The 3DQSAR models can be generated using Comparative MolecularField Analysis (CoMFA) (Cramer et al., 1988) and the ComparativeMolecular Similarity Indices Analysis (CoMSIA) (Klebe et al., 1994).CoMFA works out the steric and electrostatic fields surroundingthe molecules and correlates the differences in these fields withbiological activity. CoMSIA works out three more moleculardescriptors than CoMFA: hydrophobic fields, H-bond donor fieldsand H-bond acceptor fields.
In the present work, the application of CoMFA, CoMSIA methodsand molecular docking studies have been employed to generatequantitative models, to predict and determine the pharmacophoricfeatures that govern the activity of 7-substituted 4-aminoquinolineanalogs synthesized by Hwang et al. with antimalarial activityagainst the chloroquine (CQ) – resistant Plasmodium strains(Hwang et al., 2011), and to specify regions in space where interac-tive fields might enhance their activity. QSAR studies of these com-pounds have already been carried out by Masand et al. (2014). Theobjective of their study was to determine the factors that influencethe activity of the selected compounds and generate QSAR modelsto predict the activity of molecules prior to actual synthesis andbiological screening. They used GA-MLR and optimalSMILES-based descriptors to build QSAR models. The models eluci-date that anti-malarial activity has high correlation with the topo-logical distance of six between N and O. Also the models predictedthat, the antimalarial activity depends on the presence of heavyatoms in the internal environment of the compounds. We haveused Plasmodium lactate dehydrogenase (pLDH) in our in silicostudies as it is an important enzyme of glycolysis and is essentialfor energy production in the Plasmodia. Moreover, Plasmodia lack
functional Krebs cycle during some erythrocytic stages (LangUnnasch and Murphy, 1998). Lactate dehydrogenase (LDH) is anessential enzyme that catalyses the interconversion of pyruvateand lactate with concomitant conversion of NADH and NAD+
(Wiwanitkit, 2007). The parasite lactate dehydrogenase is a tetra-meric enzyme containing 316 amino acids and present in all fourhuman parasitic Plasmodium species. It is known that pLDH hasnotable structural and kinetic properties making it different frommammalian and bacterial LDH. The predictive ability of the gener-ated model was tested by an external validation technique using22 test set compounds. The obtained model was further used togenerate contour maps for explaining the interaction of the com-pounds and to study SAR. Molecular docking studies were carriedout to understand the important structural features required forbinding at the active sites of the protein 1CET (Read et al., 1999).
2. Materials and methods
A series of 112 analogs of 7-substituted-4-aminoquinoline weretaken to perform the present study. Table 1 describes the struc-tures and EC50 values of the data set. The three-dimensional chem-ical structures of the compounds were drawn by ChemDraw(version 64-1.5.3). The optimization of the cleaned compoundswas done through MOE (MOE Version 2007.09, ChemicalComputing Group, Inc.).
2.1. 2D-QSAR modeling and dataset
EC50 (lM) data was converted to pEC50 (M) for all the QSARanalyses.
pEC50 ¼ � log EC50 ð1Þ
2.1.1. Descriptor calculationA total of 251 descriptors were calculated which included 2D
and 3D molecular descriptors (Lin, 2000). 2D descriptors whichdescribe notation and terminology, physical properties, subdividedsurface areas, atom counts and bond counts, Kier & Hall connectiv-ity and Kappa shape indices, adjacency and distance, matrix, phar-macophore features and partial charges. 3D descriptors areclassified into internal 3D descriptors (i3D) and external 3Ddescriptors (�3D) which describe potential energy, surface area,volume and shape and conformation-dependent charge. Afterobjective feature selection filtering, finally a total of 37 descriptorswere selected to build the 2D-QSAR model.
2.2. 3D-QSAR method
For the development of 3D-QSAR models the complete set ofthese compounds (112 compounds) were divided into a trainingset (90 compounds) to generate the models and a test set (22 com-pounds) to evaluate the predictive ability of the resulting models.The steric and electrostatic CoMFA potential fields were performedusing Open3DQSAR (Tosco and Balle, 2011). MOE 2007.09 wasused to explore the results and graphical visualization. TheCoMSIA method was performed with the same parameters usedin CoMFA analysis so as to evaluate the similarity indices amongthe compounds.
2.2.1. Partial least-squares analysisThe predictive ability of the 3D-QSAR models is assessed by
applying partial least squares (PLS) analysis (Bush and Nachbar,1993) as well as the leave-one-out (LOO) (Wold et al., 1984)cross-validation method. In the cross-validation analysis, LOOmethod was used, in which one compound was removed from
10 I.G. Shibi et al. / European Journal of Pharmaceutical Sciences 77 (2015) 9–23
Table 1Structures and antimalarial activities values of a series of 7-substituted-4-aminoquinline analogs.
N
NH
NHR1
R2
Compounds R1 R2 EC50 (lM) pEC50 (M)
1 Furfuryl PhO 0.314 6.50312a 2-HO-3-MeO-Bn PhO 0.015 7.82393 Piperonyl PhO 0.018 7.74474a 3-F-6-MeO-Bn PhO 0.162 6.79055 Furfuryl 2-MeO-PhO 0.092 9.00006 2-HO-3-MeO-Bn 2-MeO-PhO 0.001 8.04587 Piperonyl 2-MeO-PhO 0.009 7.85398 3-F-6-MeO-Bn 2-MeO-PhO 0.009 7.65769 Furfuryl 3-MeO-PhO 0.014 8.045810 2-HO-3-MeO-Bn 3-MeO-PhO 0.022 7.744711 Piperonyl 3-MeO-PhO 0.023 6.790512 3-F-6-MeO-Bn 3-MeO-PhO 0.009 5.619813 Furfuryl 4-MeO-PhO 0.018 8.397914 2-HO-3-MeO-Bn 4-MeO-PhO 0.162 8.397915a Piperonyl 4-MeO-PhO 2.400 7.337216 3-F-6-MeO-Bn 4-MeO-PhO 0.004 7.267617 Furfuryl 4-F-PhO 0.004 7.585018 2-HO-3-MeO-Bn 4-F-PhO 0.046 7.958619 Piperonyl 4-F-PhO 0.054 7.823920 3-F-6-MeO-Bn 4-F-PhO 0.026 6.527221 Furfuryl 4-Cl-PhO 0.011 7.397922a 2-HO-3-MeO-Bn 4-Cl-PhO 0.015 7.958623 Piperonyl 4-Cl-PhO 0.297 7.420224a 3-F-6-MeO-Bn 4-Cl-PhO 0.040 7.508625 Furfuryl 3-Me2N-PhO 0.011 7.568626 2-HO-3-MeO-Bn 3-Me2N-PhO 0.038 8.000027 Piperonyl 3-Me2N-PhO 0.031 5.853928a 3-F-6-MeO-Bn 3-Me2N-PhO 0.027 8.154929 Furfuryl 4-tertBu-PhO 0.010 5.958630 2-HO-3-MeO-Bn 4-tertBu-PhO 1.400 7.267631 Piperonyl 4-tertBu-PhO 0.007 6.863332 3-F-6-MeO-Bn 4-tertBu-PhO 1.100 6.974733 Furfuryl 4-F-Ph 0.054 7.494934 2-HO-3-MeO-Bn 4-F-Ph 0.137 8.045835 Piperonyl 4-F-Ph 0.106 7.744736 3-F-6-MeO-Bn 4-F-Ph 0.032 7.744737 Furfuryl 4-F-Bn 0.096 7.244138 2-HO-3-MeO-Bn 4-F-Bn 0.057 7.823939 Piperonyl 4-F-Bn 0.015 6.896240a 3-F-6-MeO-Bn 4-F-Bn 0.127 7.124941 Furfuryl iso-pentyl 0.176 6.754542 2-HO-3-MeO-Bn iso-pentyl 0.022 7.657643 Piperonyl iso-pentyl 0.027 7.568644 3-F-6-MeO-Bn iso-pentyl 0.116 6.935545 Furfuryl cHexmethyl 0.055 7.259646 2-HO-3-MeO-Bn cHexmethyl 0.050 7.301047 Piperonyl cHexmethyl 0.041 7.387248 3-F-6-MeO-Bn cHexmethyl 0.138 6.860149 Furfuryl PhEt 0.046 7.337250 2-HO-3-MeO-Bn PhEt 0.017 7.769651a Piperonyl PhEt 0.013 7.886152 3-F-6-MeO-Bn PhEt 0.132 6.879453a Furfuryl iso-butyl 0.075 6.235854 2-HO-3-MeO-Bn iso-butyl 0.581 7.699055 Piperonyl iso-butyl 0.020 7.180556 3-F-6-MeO-Bn iso-butyl 0.066 7.050657 Furfuryl cHex 0.089 6.928158a 2-HO-3-MeO-Bn cHex 0.118 7.721259a Piperonyl cHex 0.019 6.892860 3-F-6-MeO-Bn cHex 0.128 7.045861 Furfuryl 1-Et-Pr 0.090 7.065562 2-HO-3-MeO-Bn 1-Et-Pr 0.086 8.397963a Piperonyl 1-Et-Pr 0.004 7.5686
(continued on next page)
I.G. Shibi et al. / European Journal of Pharmaceutical Sciences 77 (2015) 9–23 11
the data set and its activity was predicted using the model derivedfrom the rest of the data set (Podlogar and Ferguson, 2000). Theoptimum number of components (ONC) and the highestcross-validated coefficient Q2 were determined using thecross-validation method on the basis of the first minimumcross-validated standard error of prediction. The finalnon-cross-validated model was developed using ONC by producingthe standard error of the estimate (SEE), the non-cross-validatedcorrelation coefficient (R2
ncv) and the F-test value.Also, the CoMFA and CoMSIA models were assessed by predict-
ing the activity of 22 external test set compounds. The predictiveR2 (R2
pred) of test set compounds is computed using the followingequation.
R2pred ¼ ðSD� PRESSÞ
SDð2Þ
where SD is the sum of the squared deviations between the biolog-ical activity of compounds in the test set and the mean biologicalactivity of the same, and the predictive sum of squares (PRESS) is
the sum of the squared deviations between predicted and actualactivity values of test set compounds. The model is said to behealthy and predictive if the statistical parameters R2ncv > 0.6,R2pred > 0.5, and Q2 > 0.6. (Afantitis et al., 2009; Golbraikh andTropsha, 2002).
To further validate the predictive ability of the constructedmodels, the following equation was used (Rännar et al., 1994):
R2mðoverallÞ ¼ R2 � ð1�
ffiffiffiffiffiffiffiffiffiffiffiffiffiffiffiffiR2 � R2
0
qÞ ð3Þ
where R2 is squared correlation coefficient between observed andpredicted pEC50 values of 112 analogs of7-substituted-4-aminoquinoline and R2
0 is squared correlation coef-ficient with intercept set to zero. The parameter determineswhether the range of predicted activity values for the whole datasetis really close to the observed activity or not. The value of R2m(overall)
should be greater than 0.5 for a satisfactory model.
Table 1 (continued)
Compounds R1 R2 EC50 (lM) pEC50 (M)
64a 3-F-6-MeO-Bn 1-Et-Pr 0.027 7.397965 Furfuryl 3,5-CF3-Ph 0.009 6.545266 2-HO-3-MeO-Bn 3,5-CF3- Ph 0.018 7.537667 Piperonyl 3,5-CF3-Ph 0.018 6.546768 3-F-6-MeO-Bn 3,5-CF3-Ph 0.285 7.036269 Furfuryl 1-Naphtyl 0.029 7.508670 2-HO-3-MeO-Bn 1-Naphtyl 0.284 7.481571 Piperonyl 1-Naphtyl 0.031 6.223372a 3-F-6-MeO-Bn 1-Naphtyl 0.033 5.920873 Furfuryl 4-CF3-Ph 0.598 7.699074 2-HO-3-MeO-Bn 4-CF3-Ph 1.200 7.886175 Piperonyl 4-CF3-Ph 0.020 7.602176a 3-F-6-MeO-Bn 4-CF3-Ph 0.013 7.267677 Furfuryl Ph 0.025 7.699078a 2-HO-3-MeO-Bn Ph 0.054 8.045879 Piperonyl Ph 0.020 7.769680 3-F-6-MeO-Bn Ph 0.017 7.958681 Furfuryl 4-tertBu-Ph 0.011 6.152482a 2-HO-3-MeO-Bn 4-tertBu-Ph 0.704 6.600383 Piperonyl 4-tertBu-Ph 0.251 6.651784 3-F-6-MeO-Bn 4-tertBu-Ph 0.223 6.841685 Furfuryl Piperonyl 0.144 7.721286 2-HO-3-MeO-Bn Piperonyl 0.019 8.096987 Piperonyl Piperonyl 0.008 7.585088 3-F-6-MeO-Bn Piperonyl 0.026 7.508689 Furfuryl 4-MeO-Ph 0.031 7.958690 2-HO-3-MeO-Bn 4-MeO-Ph 0.011 7.886191 Piperonyl 4-MeO-Ph 0.013 7.537692a 3-F-6-MeO-Bn 4-MeO-Ph 0.029 7.017793 Furfuryl 3-CF3-Bn 0.040 7.251894a 2-HO-3-MeO-Bn 3-CF3-Bn 0.056 7.602195 Piperonyl 3-CF3-Bn 0.025 7.408996 3-F-6-MeO-Bn 3-CF3-Bn 0.039 7.397997 Furfuryl 4-CN-Bn 0.040 7.408998 2-HO-3-MeO-Bn 4-CN-Bn 0.039 7.958699 Piperonyl 4-CN-Bn 0.011 7.6383100 3-F-6-MeO-Bn 4-CN-Bn 0.028 7.5528101 Furfuryl Bn 0.040 7.3979102a 2-HO-3-MeO-Bn Bn 0.017 7.7696103 Piperonyl Bn 0.720 6.1427104 3-F-6-MeO-Bn Bn 0.011 7.9586105 Furfuryl 3,5-Me-Bn 0.009 8.0458106 2-HO-3-MeO-Bn 3,5-Me-Bn 0.009 8.0458107 Piperonyl 3,5-Me-Bn 0.041 7.3872108a 3-F-6-MeO-Bn 3,5-Me-Bn 0.034 7.4685109a Furfuryl 2-Cl-4-F-Bn 0.020 7.6990110 2-HO-3-MeO-Bn 2-Cl-4-F-Bn 0.013 7.8861111 Piperonyl 2-Cl-4-F-Bn 0.027 7.5686112 3-F-6-MeO-Bn 2-Cl-4-F-Bn 0.208 6.6819
a Test set compounds.
12 I.G. Shibi et al. / European Journal of Pharmaceutical Sciences 77 (2015) 9–23
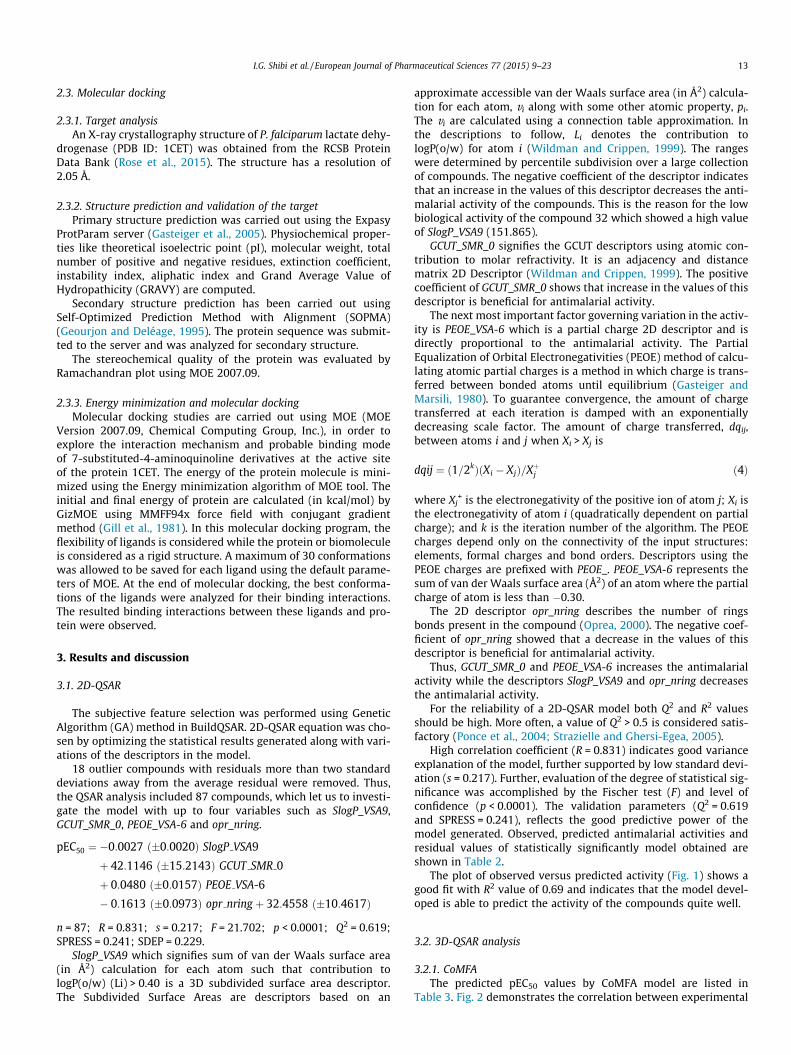
2.3. Molecular docking
2.3.1. Target analysisAn X-ray crystallography structure of P. falciparum lactate dehy-
drogenase (PDB ID: 1CET) was obtained from the RCSB ProteinData Bank (Rose et al., 2015). The structure has a resolution of2.05 Å.
2.3.2. Structure prediction and validation of the targetPrimary structure prediction was carried out using the Expasy
ProtParam server (Gasteiger et al., 2005). Physiochemical proper-ties like theoretical isoelectric point (pI), molecular weight, totalnumber of positive and negative residues, extinction coefficient,instability index, aliphatic index and Grand Average Value ofHydropathicity (GRAVY) are computed.
Secondary structure prediction has been carried out usingSelf-Optimized Prediction Method with Alignment (SOPMA)(Geourjon and Deléage, 1995). The protein sequence was submit-ted to the server and was analyzed for secondary structure.
The stereochemical quality of the protein was evaluated byRamachandran plot using MOE 2007.09.
2.3.3. Energy minimization and molecular dockingMolecular docking studies are carried out using MOE (MOE
Version 2007.09, Chemical Computing Group, Inc.), in order toexplore the interaction mechanism and probable binding modeof 7-substituted-4-aminoquinoline derivatives at the active siteof the protein 1CET. The energy of the protein molecule is mini-mized using the Energy minimization algorithm of MOE tool. Theinitial and final energy of protein are calculated (in kcal/mol) byGizMOE using MMFF94x force field with conjugant gradientmethod (Gill et al., 1981). In this molecular docking program, theflexibility of ligands is considered while the protein or biomoleculeis considered as a rigid structure. A maximum of 30 conformationswas allowed to be saved for each ligand using the default parame-ters of MOE. At the end of molecular docking, the best conforma-tions of the ligands were analyzed for their binding interactions.The resulted binding interactions between these ligands and pro-tein were observed.
3. Results and discussion
3.1. 2D-QSAR
The subjective feature selection was performed using GeneticAlgorithm (GA) method in BuildQSAR. 2D-QSAR equation was cho-sen by optimizing the statistical results generated along with vari-ations of the descriptors in the model.
18 outlier compounds with residuals more than two standarddeviations away from the average residual were removed. Thus,the QSAR analysis included 87 compounds, which let us to investi-gate the model with up to four variables such as SlogP_VSA9,GCUT_SMR_0, PEOE_VSA-6 and opr_nring.
pEC50 ¼ �0:0027 ð�0:0020Þ SlogP VSA9
þ 42:1146 ð�15:2143Þ GCUT SMR 0
þ 0:0480 ð�0:0157Þ PEOE VSA-6
� 0:1613 ð�0:0973Þ opr nring þ 32:4558 ð�10:4617Þ
n = 87; R = 0.831; s = 0.217; F = 21.702; p < 0.0001; Q2 = 0.619;SPRESS = 0.241; SDEP = 0.229.
SlogP_VSA9 which signifies sum of van der Waals surface area(in Å2) calculation for each atom such that contribution tologP(o/w) (Li) > 0.40 is a 3D subdivided surface area descriptor.The Subdivided Surface Areas are descriptors based on an
approximate accessible van der Waals surface area (in Å2) calcula-tion for each atom, vi along with some other atomic property, pi.The vi are calculated using a connection table approximation. Inthe descriptions to follow, Li denotes the contribution tologP(o/w) for atom i (Wildman and Crippen, 1999). The rangeswere determined by percentile subdivision over a large collectionof compounds. The negative coefficient of the descriptor indicatesthat an increase in the values of this descriptor decreases the anti-malarial activity of the compounds. This is the reason for the lowbiological activity of the compound 32 which showed a high valueof SlogP_VSA9 (151.865).
GCUT_SMR_0 signifies the GCUT descriptors using atomic con-tribution to molar refractivity. It is an adjacency and distancematrix 2D Descriptor (Wildman and Crippen, 1999). The positivecoefficient of GCUT_SMR_0 shows that increase in the values of thisdescriptor is beneficial for antimalarial activity.
The next most important factor governing variation in the activ-ity is PEOE_VSA-6 which is a partial charge 2D descriptor and isdirectly proportional to the antimalarial activity. The PartialEqualization of Orbital Electronegativities (PEOE) method of calcu-lating atomic partial charges is a method in which charge is trans-ferred between bonded atoms until equilibrium (Gasteiger andMarsili, 1980). To guarantee convergence, the amount of chargetransferred at each iteration is damped with an exponentiallydecreasing scale factor. The amount of charge transferred, dqij,between atoms i and j when Xi > Xj is
dqij ¼ ð1=2kÞðXi � XjÞ=Xþj ð4Þ
where Xj+ is the electronegativity of the positive ion of atom j; Xi is
the electronegativity of atom i (quadratically dependent on partialcharge); and k is the iteration number of the algorithm. The PEOEcharges depend only on the connectivity of the input structures:elements, formal charges and bond orders. Descriptors using thePEOE charges are prefixed with PEOE_. PEOE_VSA-6 represents thesum of van der Waals surface area (Å2) of an atom where the partialcharge of atom is less than �0.30.
The 2D descriptor opr_nring describes the number of ringsbonds present in the compound (Oprea, 2000). The negative coef-ficient of opr_nring showed that a decrease in the values of thisdescriptor is beneficial for antimalarial activity.
Thus, GCUT_SMR_0 and PEOE_VSA-6 increases the antimalarialactivity while the descriptors SlogP_VSA9 and opr_nring decreasesthe antimalarial activity.
For the reliability of a 2D-QSAR model both Q2 and R2 valuesshould be high. More often, a value of Q2 > 0.5 is considered satis-factory (Ponce et al., 2004; Strazielle and Ghersi-Egea, 2005).
High correlation coefficient (R = 0.831) indicates good varianceexplanation of the model, further supported by low standard devi-ation (s = 0.217). Further, evaluation of the degree of statistical sig-nificance was accomplished by the Fischer test (F) and level ofconfidence (p < 0.0001). The validation parameters (Q2 = 0.619and SPRESS = 0.241), reflects the good predictive power of themodel generated. Observed, predicted antimalarial activities andresidual values of statistically significantly model obtained areshown in Table 2.
The plot of observed versus predicted activity (Fig. 1) shows agood fit with R2 value of 0.69 and indicates that the model devel-oped is able to predict the activity of the compounds quite well.
3.2. 3D-QSAR analysis
3.2.1. CoMFAThe predicted pEC50 values by CoMFA model are listed in
Table 3. Fig. 2 demonstrates the correlation between experimental
I.G. Shibi et al. / European Journal of Pharmaceutical Sciences 77 (2015) 9–23 13
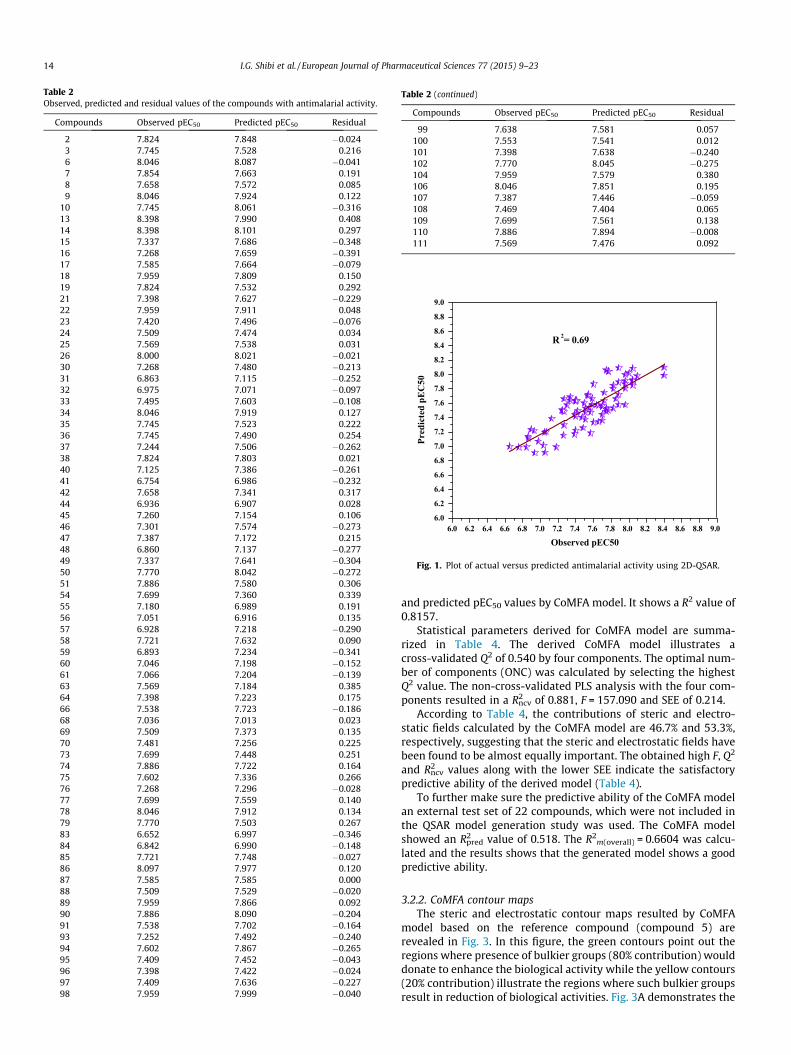
and predicted pEC50 values by CoMFA model. It shows a R2 value of0.8157.
Statistical parameters derived for CoMFA model are summa-rized in Table 4. The derived CoMFA model illustrates across-validated Q2 of 0.540 by four components. The optimal num-ber of components (ONC) was calculated by selecting the highestQ2 value. The non-cross-validated PLS analysis with the four com-ponents resulted in a R2
ncv of 0.881, F = 157.090 and SEE of 0.214.According to Table 4, the contributions of steric and electro-
static fields calculated by the CoMFA model are 46.7% and 53.3%,respectively, suggesting that the steric and electrostatic fields havebeen found to be almost equally important. The obtained high F, Q2
and R2ncv values along with the lower SEE indicate the satisfactory
predictive ability of the derived model (Table 4).To further make sure the predictive ability of the CoMFA model
an external test set of 22 compounds, which were not included inthe QSAR model generation study was used. The CoMFA modelshowed an R2
pred value of 0.518. The R2m(overall) = 0.6604 was calcu-lated and the results shows that the generated model shows a goodpredictive ability.
3.2.2. CoMFA contour mapsThe steric and electrostatic contour maps resulted by CoMFA
model based on the reference compound (compound 5) arerevealed in Fig. 3. In this figure, the green contours point out theregions where presence of bulkier groups (80% contribution) woulddonate to enhance the biological activity while the yellow contours(20% contribution) illustrate the regions where such bulkier groupsresult in reduction of biological activities. Fig. 3A demonstrates the
Table 2Observed, predicted and residual values of the compounds with antimalarial activity.
Compounds Observed pEC50 Predicted pEC50 Residual
2 7.824 7.848 �0.0243 7.745 7.528 0.2166 8.046 8.087 �0.0417 7.854 7.663 0.1918 7.658 7.572 0.0859 8.046 7.924 0.122
10 7.745 8.061 �0.31613 8.398 7.990 0.40814 8.398 8.101 0.29715 7.337 7.686 �0.34816 7.268 7.659 �0.39117 7.585 7.664 �0.07918 7.959 7.809 0.15019 7.824 7.532 0.29221 7.398 7.627 �0.22922 7.959 7.911 0.04823 7.420 7.496 �0.07624 7.509 7.474 0.03425 7.569 7.538 0.03126 8.000 8.021 �0.02130 7.268 7.480 �0.21331 6.863 7.115 �0.25232 6.975 7.071 �0.09733 7.495 7.603 �0.10834 8.046 7.919 0.12735 7.745 7.523 0.22236 7.745 7.490 0.25437 7.244 7.506 �0.26238 7.824 7.803 0.02140 7.125 7.386 �0.26141 6.754 6.986 �0.23242 7.658 7.341 0.31744 6.936 6.907 0.02845 7.260 7.154 0.10646 7.301 7.574 �0.27347 7.387 7.172 0.21548 6.860 7.137 �0.27749 7.337 7.641 �0.30450 7.770 8.042 �0.27251 7.886 7.580 0.30654 7.699 7.360 0.33955 7.180 6.989 0.19156 7.051 6.916 0.13557 6.928 7.218 �0.29058 7.721 7.632 0.09059 6.893 7.234 �0.34160 7.046 7.198 �0.15261 7.066 7.204 �0.13963 7.569 7.184 0.38564 7.398 7.223 0.17566 7.538 7.723 �0.18668 7.036 7.013 0.02369 7.509 7.373 0.13570 7.481 7.256 0.22573 7.699 7.448 0.25174 7.886 7.722 0.16475 7.602 7.336 0.26676 7.268 7.296 �0.02877 7.699 7.559 0.14078 8.046 7.912 0.13479 7.770 7.503 0.26783 6.652 6.997 �0.34684 6.842 6.990 �0.14885 7.721 7.748 �0.02786 8.097 7.977 0.12087 7.585 7.585 0.00088 7.509 7.529 �0.02089 7.959 7.866 0.09290 7.886 8.090 �0.20491 7.538 7.702 �0.16493 7.252 7.492 �0.24094 7.602 7.867 �0.26595 7.409 7.452 �0.04396 7.398 7.422 �0.02497 7.409 7.636 �0.22798 7.959 7.999 �0.040
Table 2 (continued)
Compounds Observed pEC50 Predicted pEC50 Residual
99 7.638 7.581 0.057100 7.553 7.541 0.012101 7.398 7.638 �0.240102 7.770 8.045 �0.275104 7.959 7.579 0.380106 8.046 7.851 0.195107 7.387 7.446 �0.059108 7.469 7.404 0.065109 7.699 7.561 0.138110 7.886 7.894 �0.008111 7.569 7.476 0.092
6.0 6.2 6.4 6.6 6.8 7.0 7.2 7.4 7.6 7.8 8.0 8.2 8.4 8.6 8.8 9.06.0
6.2
6.4
6.6
6.8
7.0
7.2
7.4
7.6
7.8
8.0
8.2
8.4
8.6
8.8
9.0
Pred
icte
d pE
C50
Observed pEC50
R 2= 0.69
Fig. 1. Plot of actual versus predicted antimalarial activity using 2D-QSAR.
14 I.G. Shibi et al. / European Journal of Pharmaceutical Sciences 77 (2015) 9–23
steric field effects. The CoMFA electrostatic contour maps (Fig. 3B)are represented by red1 and blue contours. The red contours (20%contribution) demonstrate the regions where electron-rich (elec-tronegative) groups result in increase of biological activity whereasthe blue contours (80% contribution) indicate the regions wherepresence of positive charge (or decreased negative charge) groupwould result in an increase of biological activity.
The steric contours of the CoMFA display a large green contournear R1 region demonstrating the favorable effect of bulky groupsin raising the biological activities of the compounds. According toTable 1, this can be explained by comparing the activities of com-pounds 61 and 62 where bulk groups (–2-HO-3-MeO-Bn >–Furfuryl) at R1 substituent would result in lower EC50 values of0.004 and 0.086, respectively. Same type of behavior is observedbetween compounds 25 and 26. The compound 26 has higher inhi-bitory activity (pEC50 = 8.00) and bulky characteristics thancompound 25 (pEC50 = 7.57). Using the bulky substituents(–2-HO-3-MeO-Bn > –Furfuryl) R1 would lead to increase ofpEC50 values in the compounds: 86 (having –2-HO-3-MeO-Bngroup with pEC50 = 8.10) and 85 (having –Furfuryl group withpEC50 = 7.72). This effect can also be observed between compounds34 and 35 where their higher activities can be related to the pres-ence of –Piperonyl and –2-HO-3-MeO-Bn substituents, in which byincreasing the bulky behavior of substituent (–Piperonyl <–2-HO-3-MeO-Bn) the inhibitory activities would be increased(7.74 < 8.04). As the bulkiness of the groups decreases in the order2-HO-3-MeO-Bn > 3-F-6-MeO-Bn > Piperonyl > Furfuryl, the bio-logical activity of the compounds decreases in the order 78(8.04) > 80 (7.95) > 79 (7.77) > 77 (7.70), respectively. The stericcontours of the CoMFA display a tiny green contour near the R2region. This can be explained by comparing the order of activitiesof compounds 14 and 78. The compound 14 possesses –4-MeO-PhO substituent in contrast to the compound 78 whichhas only a Ph substituent at the same position and hence showshigher inhibitory activity (8.40 > 8.04). A comparison betweencompounds 28 and 80 reveals that compound 28 possesses3-F-6-MeO-Bn group and displays higher inhibitory activity(pEC50 = 8.15) than compound 80 which contains a phenyl sub-stituent as R2 (pEC50 = 7.96). As it can be seen from Fig. 3A, thesteric contours map shows a small yellow contour at the R1 sub-stituent region which exemplifies the unfavorable effect of bulkygroups in some series of compounds. As shown by the pEC50 val-ues, using bulky groups such as –3-F-6-MeO-Bn (compound 12with pEC50 = 5.62) in contrast to –Furfuryl (compound 9 withpEC50 = 8.04) would result in decrease of activities. This fact canalso be described by comparing compounds 72 (having3-F-6-MeO-Bn as R1) with 69 (having Furfuryl group as R1).Replacing the R1 substituent with a bulkier group would resultin decreasing of the pEC50 values (5.92 < 7.40).
Fig. 3B which represents the electrostatic contour plot has ablue contour near R2 group and a small blue contour in the bottomof R1 group. The small blue contour at the bottom of R1 group canbe explained by comparing compounds 13 and 16 where replacingof 3-F-6-MeO-Bn in place of furfuryl is found to increase the nega-tive charge behavior of this substituent. Consequently, the pEC50
values would be decreased (7.26 < 8.40). This blue contour mapclearly explains why compound 9 showed higher inhibitory activ-ities (8.04) than compound 10 (7.74). The blue contours at the R2substituent can be understood by comparing compounds 62 (hav-ing –1-Et-Pr group with pEC50 = 8.40) and 78 (having –Ph groupwith pEC50 = 8.04) where using the positive charge group as R2would lead to increasing the inhibitory activities. This fact is also
observed among compounds 105, 89 and 73 where increasingthe negative charge properties (–4-CF3-Ph > –4-MeO-Ph > 3,5-Me-Bn) would result in decrease of inhibitory activities(7.70 < 7.96 < 8.05), respectively. The blue contours observed nearR2 substituent can be described considering compounds 106 and94; whereas, positive charge features increased (3,5-Me-Bn> –3-CF3-Bn), the inhibitory activities (8.05 > 7.60) are alsoincreased. The increasing biological activity can also be observedamong compounds 75, 35, 79 and 51 where increasing the positivecharge properties (4-CF3 < –Ph < 4-F-Ph < –Ph < –PhEt) wouldresult in increase of inhibitory activities (7.60 < 7.74 < 7.77 < 7.87),respectively. Fig. 3B demonstrated small red contours near theR2 substituent. The red contours can be explained by comparingcompounds 34 and 50 where using the negative charge groups(–4-F-Ph > PhEt) would result in higher biological activities(8.05 > 7.77), respectively. The small red contour at the bottom ofR1 group can be explained by comparing compounds 13 and 16where replacing 3-F-6-MeO-Bn in place of –furfuryl wouldincrease the negative charge behavior of this substituent, and con-sequently, the pEC50 values would be increased (compound 13;pEC50 = 7.26 < compound 16; pEC50 = 8.40). The red contour mapclearly explains that why compound 78 showed higher inhibitoryactivities (8.05) than compound 77 (7.70).
3.2.3. CoMSIAIn addition to steric (S) and electrostatic (E) fields calculated by
the CoMFA approach, hydrophobic (H), hydrogen-bond donor (D)and hydrogen-bond acceptor (A) fields can be derived using theCoMSIA method (Klebe et al., 1994). Different combinations offields are combined to generate a total of 14 CoMSIA models. Thestatistical results of the constructed CoMSIA models are summa-rized in Table 5.
Fig. 4 demonstrates the correlation between experimental andpredicted pEC50 values by CoMSIA model 12. It shows a R2 valueof 0.8701.
The donor and acceptor fields produced the lowest Q2 and R2ncv,
whereas the combined steric and electrostatic fields gave good Q2
and R2ncv values. Although Q2 for the CoMSIA model 8 show highR2ncv value the R2ncv is slightly lower. The CoMSIA model 4 gave fineQ2 and R2ncv values but CoMSIA model 12, however, the combinationof hydrophobic field provided more information and better values.Thus according to Table 5, the constructed CoMSIA model 12 withsteric, hydrophobic, H-bond donor and H-bond acceptor fields couldprovide high statistical values for Q2 (0.638) and R2ncv (0.946) valueswith the 10 optimum components. The statistical parameters calcu-lated by CoMSIA model 12 indicate the satisfactory F value of138.972 with the less SEE value of 0.149. The steric (S), hydrophobic(H) H-bond donor (D) and H-bond acceptor (A) field descriptor con-tributions were 23.1%, 44.6%, 21.5% and 10.8%, respectively.
The CoMSIA model showed an R2pred value of 0.521. The
R2m(overall) = 0.760 was calculated and the results shows that the gen-erated model shows a good predictive ability.
3.2.4. CoMSIA contour mapsThe contour plots of the CoMSIA model-12 are presented in
Fig. 5 which illustrates the steric, hydrophobic, H-bond acceptorand H-bond donor fields using the most active compound 5.
As shown in Fig. 5A, the steric field displayed a large yellowcontour in the region of the R2 substituent and a large green con-tour around the R1 substituent. The yellow contour around the R2substituent can be understood by comparing the compounds 51(having PhEt group with pEC50 = 7.89) and 107 (having3,5-Me-Bn group with pEC50 = 7.39) where the presence of bulkiersize group would result in decrease of pEC50 values. This effect canbe explained further by considering compounds 77 (having Phenylgroup with pEC50 = 7.70) and 81 (having 4-tertBu-Ph group with
1 For interpretation of color in Figs. 3 and 5, the reader is referred to the webversion of this article.
I.G. Shibi et al. / European Journal of Pharmaceutical Sciences 77 (2015) 9–23 15
Table 3Experimental activity and predicted activity of the compounds based on 3D-QSAR analysis (CoMFA and CoMSIA).
Compounds Actual pEC50 (M) Predicted pEC50 (M) Residual CoMFA Predicted pEC50 (M) Residual CoMSIACoMFA CoMSIA
1 6.5031 6.681 �0.1779 6.595 �0.22792a 7.8239 7.376 0.4479 7.393 0.34193 7.7447 7.654 0.0907 7.622 0.11974a 6.7905 7.580 �0.7895 7.242 �0.28055 9.0000 8.554 0.4460 8.956 0.10906 8.0458 7.884 0.1618 8.155 �0.00327 7.8539 7.957 �0.1031 8.084 �0.27218 7.6576 7.755 �0.0974 7.651 �0.03849 8.0458 7.853 0.1928 7.848 0.196810 7.7447 7.954 �0.2093 7.624 0.074711 6.7905 7.253 �0.4625 7.041 �0.377512 5.6198 5.311 0.3088 5.532 0.081813 8.3979 8.272 0.1259 8.429 �0.015114 8.3979 8.466 �0.0681 8.373 0.008915a 7.3372 7.802 �0.4648 7.469 0.098216 7.2676 7.278 �0.0104 7.090 0.239617 7.5850 7.648 �0.0630 7.757 �0.102018 7.9586 7.782 0.1766 7.973 �0.101419 7.8239 7.428 0.3959 7.439 0.469920 6.5272 6.929 �0.4018 6.993 �0.455821 7.3979 7.255 0.1429 7.382 0.030922a 7.9586 7.802 0.1566 7.966 0.118623 7.4202 7.432 �0.0118 7.475 �0.013824a 7.5086 7.223 0.2856 7.260 0.328625 7.5686 7.901 �0.3324 7.511 �0.007426 8.0000 8.059 �0.0590 8.036 0.006027 5.8539 5.690 0.1639 5.743 0.089928a 8.1549 7.829 0.3259 7.438 0.773929 5.9586 5.825 0.1336 6.059 0.007630 7.2676 7.417 �0.1494 7.279 �0.077431 6.8633 6.739 0.1243 6.865 �0.021732 6.9747 6.698 0.2767 6.910 0.048733 7.4949 7.745 �0.2501 7.668 �0.274134 8.0458 8.177 �0.1312 8.161 �0.129235 7.7447 7.763 �0.0183 7.792 0.070736 7.7447 7.460 0.2847 7.496 0.224737 7.2441 7.486 �0.2419 7.447 �0.176938 7.8239 7.661 0.1629 7.727 0.017939 6.8962 7.086 �0.1898 6.803 �0.109840a 7.1249 7.390 �0.2651 7.113 �0.178141 6.7545 7.012 �0.2575 6.749 �0.002542 7.6576 7.267 0.3906 7.599 0.001643 7.5686 7.176 0.3926 7.436 0.239644 6.9355 6.910 0.0255 7.055 �0.140545 7.2596 7.091 0.1686 7.184 0.002646 7.3010 7.252 0.0490 7.247 �0.093047 7.3872 7.345 0.0422 7.353 �0.021848 6.8601 6.885 �0.0249 6.903 �0.219949 7.3372 7.455 �0.1178 7.237 0.134250 7.7696 7.815 �0.0454 7.820 �0.039451a 7.8861 7.216 0.6701 6.794 0.783152 6.8794 7.109 �0.2296 6.809 0.051453a 6.2358 6.585 �0.3492 6.702 �0.627254 7.6990 7.629 0.0700 7.748 �0.130055 7.1805 7.291 �0.1105 7.249 �0.054556 7.0506 7.394 �0.3434 7.065 0.004657 6.9281 7.124 �0.1959 7.016 0.035158a 7.7212 7.076 0.6452 7.225 0.487259a 6.8928 7.010 �0.1172 6.995 �0.033260 7.0458 6.995 0.0508 7.004 �0.034261 7.0655 7.182 �0.1165 7.013 0.158562 8.3979 7.998 0.3999 8.340 0.042963a 7.5686 7.341 0.2276 7.307 0.576664a 7.3979 7.721 �0.3231 7.786 �0.065165 6.5452 6.502 0.0432 6.478 �0.000866 7.5376 7.419 0.1186 7.483 0.008667 6.5467 6.828 �0.2813 6.628 �0.035368 7.0362 7.115 �0.0788 7.077 0.024269 7.5086 7.468 0.0406 7.541 0.022670 7.4815 7.314 0.1675 7.507 0.022571 6.2233 6.329 �0.1057 6.299 0.034372a 5.9208 5.866 0.0548 6.017 �0.043273 7.6990 7.918 �0.2190 7.852 �0.0430
16 I.G. Shibi et al. / European Journal of Pharmaceutical Sciences 77 (2015) 9–23
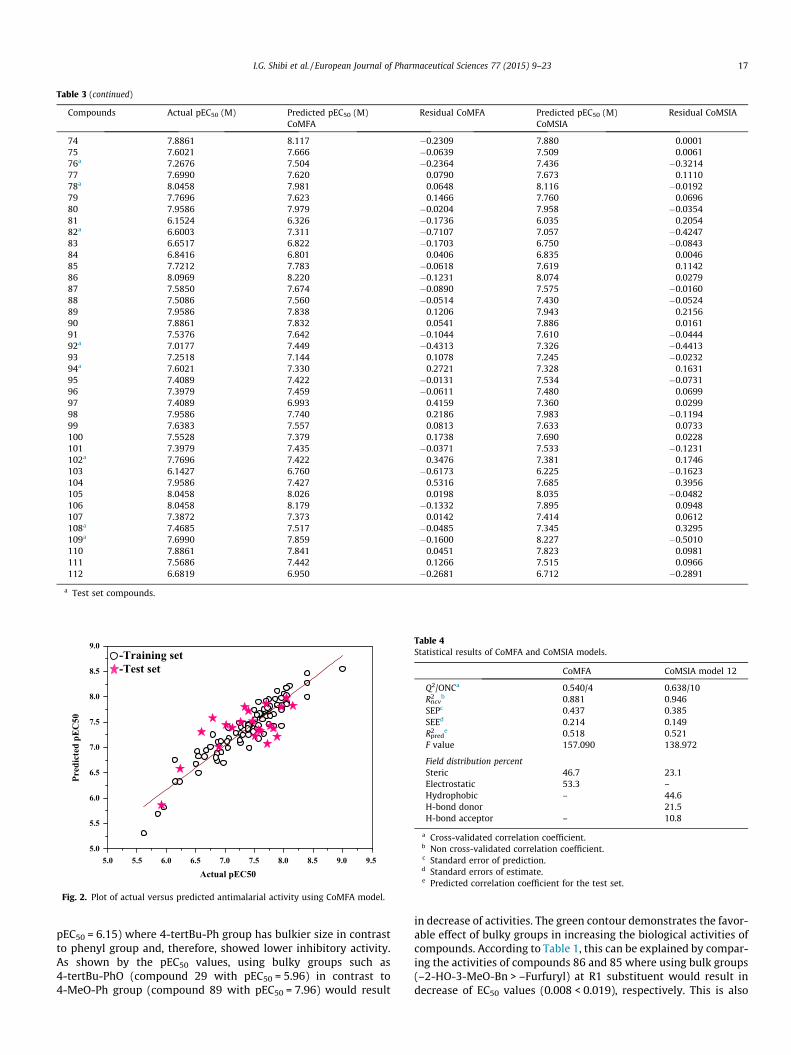
pEC50 = 6.15) where 4-tertBu-Ph group has bulkier size in contrastto phenyl group and, therefore, showed lower inhibitory activity.As shown by the pEC50 values, using bulky groups such as4-tertBu-PhO (compound 29 with pEC50 = 5.96) in contrast to4-MeO-Ph group (compound 89 with pEC50 = 7.96) would result
in decrease of activities. The green contour demonstrates the favor-able effect of bulky groups in increasing the biological activities ofcompounds. According to Table 1, this can be explained by compar-ing the activities of compounds 86 and 85 where using bulk groups(–2-HO-3-MeO-Bn > –Furfuryl) at R1 substituent would result indecrease of EC50 values (0.008 < 0.019), respectively. This is also
Table 3 (continued)
Compounds Actual pEC50 (M) Predicted pEC50 (M) Residual CoMFA Predicted pEC50 (M) Residual CoMSIACoMFA CoMSIA
74 7.8861 8.117 �0.2309 7.880 0.000175 7.6021 7.666 �0.0639 7.509 0.006176a 7.2676 7.504 �0.2364 7.436 �0.321477 7.6990 7.620 0.0790 7.673 0.111078a 8.0458 7.981 0.0648 8.116 �0.019279 7.7696 7.623 0.1466 7.760 0.069680 7.9586 7.979 �0.0204 7.958 �0.035481 6.1524 6.326 �0.1736 6.035 0.205482a 6.6003 7.311 �0.7107 7.057 �0.424783 6.6517 6.822 �0.1703 6.750 �0.084384 6.8416 6.801 0.0406 6.835 0.004685 7.7212 7.783 �0.0618 7.619 0.114286 8.0969 8.220 �0.1231 8.074 0.027987 7.5850 7.674 �0.0890 7.575 �0.016088 7.5086 7.560 �0.0514 7.430 �0.052489 7.9586 7.838 0.1206 7.943 0.215690 7.8861 7.832 0.0541 7.886 0.016191 7.5376 7.642 �0.1044 7.610 �0.044492a 7.0177 7.449 �0.4313 7.326 �0.441393 7.2518 7.144 0.1078 7.245 �0.023294a 7.6021 7.330 0.2721 7.328 0.163195 7.4089 7.422 �0.0131 7.534 �0.073196 7.3979 7.459 �0.0611 7.480 0.069997 7.4089 6.993 0.4159 7.360 0.029998 7.9586 7.740 0.2186 7.983 �0.119499 7.6383 7.557 0.0813 7.633 0.0733100 7.5528 7.379 0.1738 7.690 0.0228101 7.3979 7.435 �0.0371 7.533 �0.1231102a 7.7696 7.422 0.3476 7.381 0.1746103 6.1427 6.760 �0.6173 6.225 �0.1623104 7.9586 7.427 0.5316 7.685 0.3956105 8.0458 8.026 0.0198 8.035 �0.0482106 8.0458 8.179 �0.1332 7.895 0.0948107 7.3872 7.373 0.0142 7.414 0.0612108a 7.4685 7.517 �0.0485 7.345 0.3295109a 7.6990 7.859 �0.1600 8.227 �0.5010110 7.8861 7.841 0.0451 7.823 0.0981111 7.5686 7.442 0.1266 7.515 0.0966112 6.6819 6.950 �0.2681 6.712 �0.2891
a Test set compounds.
-Training set -Test set
5.0 5.5 6.0 6.5 7.0 7.5 8.0 8.5 9.0 9.55.0
5.5
6.0
6.5
7.0
7.5
8.0
8.5
9.0
Actual pEC50
Pred
icte
d pE
C50
Fig. 2. Plot of actual versus predicted antimalarial activity using CoMFA model.
Table 4Statistical results of CoMFA and CoMSIA models.
CoMFA CoMSIA model 12
Q2/ONCa 0.540/4 0.638/10R2ncv
b 0.881 0.946SEPc 0.437 0.385SEEd 0.214 0.149R2pred
e 0.518 0.521F value 157.090 138.972
Field distribution percentSteric 46.7 23.1Electrostatic 53.3 –Hydrophobic – 44.6H-bond donor 21.5H-bond acceptor – 10.8
a Cross-validated correlation coefficient.b Non cross-validated correlation coefficient.c Standard error of prediction.d Standard errors of estimate.e Predicted correlation coefficient for the test set.
I.G. Shibi et al. / European Journal of Pharmaceutical Sciences 77 (2015) 9–23 17
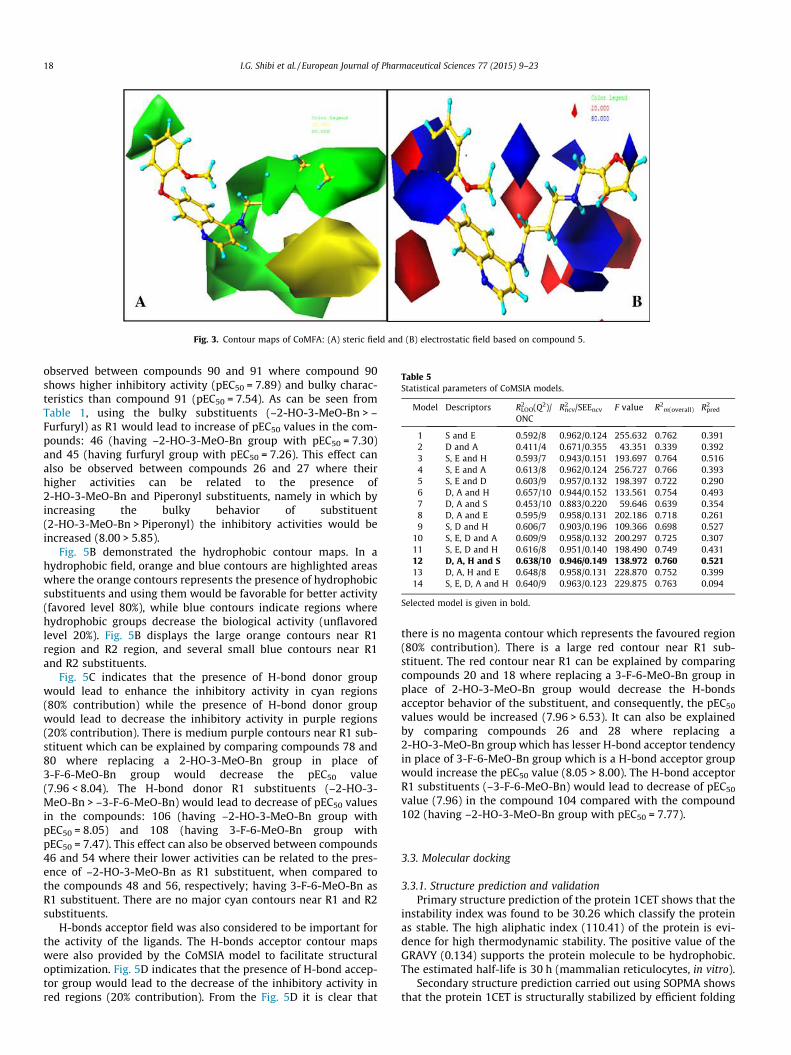
observed between compounds 90 and 91 where compound 90shows higher inhibitory activity (pEC50 = 7.89) and bulky charac-teristics than compound 91 (pEC50 = 7.54). As can be seen fromTable 1, using the bulky substituents (–2-HO-3-MeO-Bn > –Furfuryl) as R1 would lead to increase of pEC50 values in the com-pounds: 46 (having –2-HO-3-MeO-Bn group with pEC50 = 7.30)and 45 (having furfuryl group with pEC50 = 7.26). This effect canalso be observed between compounds 26 and 27 where theirhigher activities can be related to the presence of2-HO-3-MeO-Bn and Piperonyl substituents, namely in which byincreasing the bulky behavior of substituent(2-HO-3-MeO-Bn > Piperonyl) the inhibitory activities would beincreased (8.00 > 5.85).
Fig. 5B demonstrated the hydrophobic contour maps. In ahydrophobic field, orange and blue contours are highlighted areaswhere the orange contours represents the presence of hydrophobicsubstituents and using them would be favorable for better activity(favored level 80%), while blue contours indicate regions wherehydrophobic groups decrease the biological activity (unflavoredlevel 20%). Fig. 5B displays the large orange contours near R1region and R2 region, and several small blue contours near R1and R2 substituents.
Fig. 5C indicates that the presence of H-bond donor groupwould lead to enhance the inhibitory activity in cyan regions(80% contribution) while the presence of H-bond donor groupwould lead to decrease the inhibitory activity in purple regions(20% contribution). There is medium purple contours near R1 sub-stituent which can be explained by comparing compounds 78 and80 where replacing a 2-HO-3-MeO-Bn group in place of3-F-6-MeO-Bn group would decrease the pEC50 value(7.96 < 8.04). The H-bond donor R1 substituents (–2-HO-3-MeO-Bn > –3-F-6-MeO-Bn) would lead to decrease of pEC50 valuesin the compounds: 106 (having –2-HO-3-MeO-Bn group withpEC50 = 8.05) and 108 (having 3-F-6-MeO-Bn group withpEC50 = 7.47). This effect can also be observed between compounds46 and 54 where their lower activities can be related to the pres-ence of –2-HO-3-MeO-Bn as R1 substituent, when compared tothe compounds 48 and 56, respectively; having 3-F-6-MeO-Bn asR1 substituent. There are no major cyan contours near R1 and R2substituents.
H-bonds acceptor field was also considered to be important forthe activity of the ligands. The H-bonds acceptor contour mapswere also provided by the CoMSIA model to facilitate structuraloptimization. Fig. 5D indicates that the presence of H-bond accep-tor group would lead to the decrease of the inhibitory activity inred regions (20% contribution). From the Fig. 5D it is clear that
there is no magenta contour which represents the favoured region(80% contribution). There is a large red contour near R1 sub-stituent. The red contour near R1 can be explained by comparingcompounds 20 and 18 where replacing a 3-F-6-MeO-Bn group inplace of 2-HO-3-MeO-Bn group would decrease the H-bondsacceptor behavior of the substituent, and consequently, the pEC50
values would be increased (7.96 > 6.53). It can also be explainedby comparing compounds 26 and 28 where replacing a2-HO-3-MeO-Bn group which has lesser H-bond acceptor tendencyin place of 3-F-6-MeO-Bn group which is a H-bond acceptor groupwould increase the pEC50 value (8.05 > 8.00). The H-bond acceptorR1 substituents (–3-F-6-MeO-Bn) would lead to decrease of pEC50
value (7.96) in the compound 104 compared with the compound102 (having –2-HO-3-MeO-Bn group with pEC50 = 7.77).
3.3. Molecular docking
3.3.1. Structure prediction and validationPrimary structure prediction of the protein 1CET shows that the
instability index was found to be 30.26 which classify the proteinas stable. The high aliphatic index (110.41) of the protein is evi-dence for high thermodynamic stability. The positive value of theGRAVY (0.134) supports the protein molecule to be hydrophobic.The estimated half-life is 30 h (mammalian reticulocytes, in vitro).
Secondary structure prediction carried out using SOPMA showsthat the protein 1CET is structurally stabilized by efficient folding
Fig. 3. Contour maps of CoMFA: (A) steric field and (B) electrostatic field based on compound 5.
Table 5Statistical parameters of CoMSIA models.
Model Descriptors R2LOO(Q2)/
ONCR2ncv/SEEncv F value R2m(overall) R2pred
1 S and E 0.592/8 0.962/0.124 255.632 0.762 0.3912 D and A 0.411/4 0.671/0.355 43.351 0.339 0.3923 S, E and H 0.593/7 0.943/0.151 193.697 0.764 0.5164 S, E and A 0.613/8 0.962/0.124 256.727 0.766 0.3935 S, E and D 0.603/9 0.957/0.132 198.397 0.722 0.2906 D, A and H 0.657/10 0.944/0.152 133.561 0.754 0.4937 D, A and S 0.453/10 0.883/0.220 59.646 0.639 0.3548 D, A and E 0.595/9 0.958/0.131 202.186 0.718 0.2619 S, D and H 0.606/7 0.903/0.196 109.366 0.698 0.527
10 S, E, D and A 0.609/9 0.958/0.132 200.297 0.725 0.30711 S, E, D and H 0.616/8 0.951/0.140 198.490 0.749 0.43112 D, A, H and S 0.638/10 0.946/0.149 138.972 0.760 0.52113 D, A, H and E 0.648/8 0.958/0.131 228.870 0.752 0.39914 S, E, D, A and H 0.640/9 0.963/0.123 229.875 0.763 0.094
Selected model is given in bold.
18 I.G. Shibi et al. / European Journal of Pharmaceutical Sciences 77 (2015) 9–23
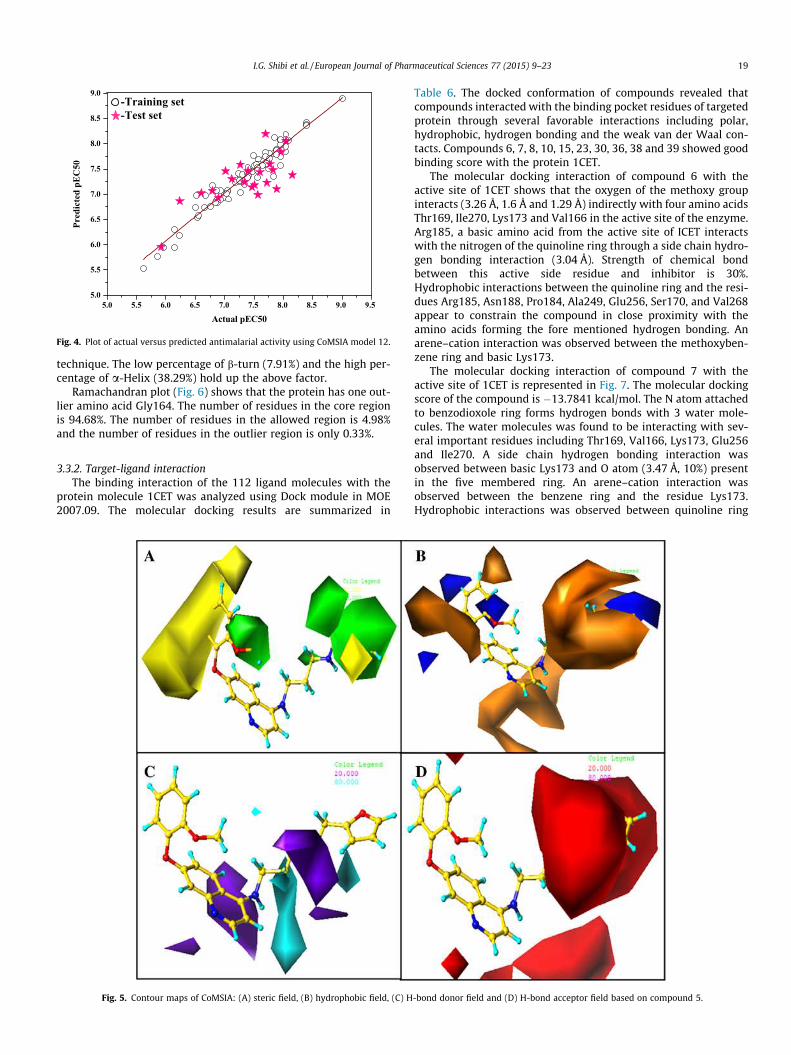
technique. The low percentage of b-turn (7.91%) and the high per-centage of a-Helix (38.29%) hold up the above factor.
Ramachandran plot (Fig. 6) shows that the protein has one out-lier amino acid Gly164. The number of residues in the core regionis 94.68%. The number of residues in the allowed region is 4.98%and the number of residues in the outlier region is only 0.33%.
3.3.2. Target-ligand interactionThe binding interaction of the 112 ligand molecules with the
protein molecule 1CET was analyzed using Dock module in MOE2007.09. The molecular docking results are summarized in
Table 6. The docked conformation of compounds revealed thatcompounds interacted with the binding pocket residues of targetedprotein through several favorable interactions including polar,hydrophobic, hydrogen bonding and the weak van der Waal con-tacts. Compounds 6, 7, 8, 10, 15, 23, 30, 36, 38 and 39 showed goodbinding score with the protein 1CET.
The molecular docking interaction of compound 6 with theactive site of 1CET shows that the oxygen of the methoxy groupinteracts (3.26 Å, 1.6 Å and 1.29 Å) indirectly with four amino acidsThr169, Ile270, Lys173 and Val166 in the active site of the enzyme.Arg185, a basic amino acid from the active site of ICET interactswith the nitrogen of the quinoline ring through a side chain hydro-gen bonding interaction (3.04 Å). Strength of chemical bondbetween this active side residue and inhibitor is 30%.Hydrophobic interactions between the quinoline ring and the resi-dues Arg185, Asn188, Pro184, Ala249, Glu256, Ser170, and Val268appear to constrain the compound in close proximity with theamino acids forming the fore mentioned hydrogen bonding. Anarene–cation interaction was observed between the methoxyben-zene ring and basic Lys173.
The molecular docking interaction of compound 7 with theactive site of 1CET is represented in Fig. 7. The molecular dockingscore of the compound is �13.7841 kcal/mol. The N atom attachedto benzodioxole ring forms hydrogen bonds with 3 water mole-cules. The water molecules was found to be interacting with sev-eral important residues including Thr169, Val166, Lys173, Glu256and Ile270. A side chain hydrogen bonding interaction wasobserved between basic Lys173 and O atom (3.47 Å, 10%) presentin the five membered ring. An arene–cation interaction wasobserved between the benzene ring and the residue Lys173.Hydrophobic interactions was observed between quinoline ring
-Training set -Test set
5.0 5.5 6.0 6.5 7.0 7.5 8.0 8.5 9.0 9.55.0
5.5
6.0
6.5
7.0
7.5
8.0
8.5
9.0
Pred
icte
d pE
C50
Actual pEC50
Fig. 4. Plot of actual versus predicted antimalarial activity using CoMSIA model 12.
Fig. 5. Contour maps of CoMSIA: (A) steric field, (B) hydrophobic field, (C) H-bond donor field and (D) H-bond acceptor field based on compound 5.
I.G. Shibi et al. / European Journal of Pharmaceutical Sciences 77 (2015) 9–23 19
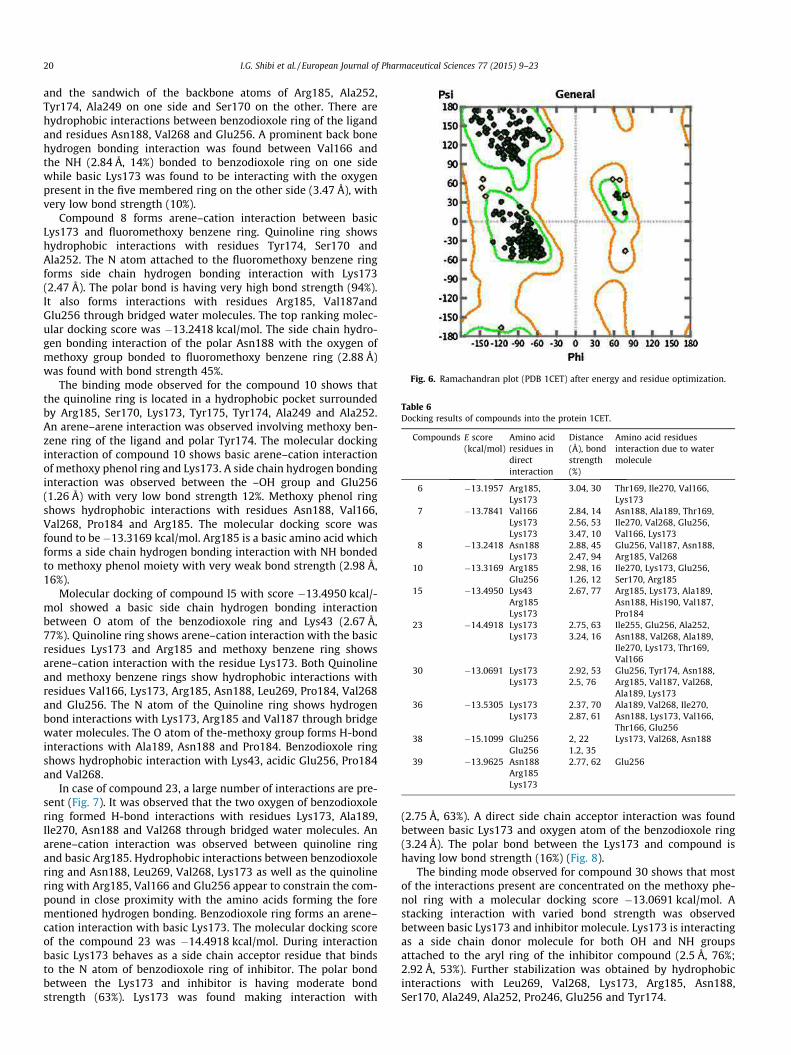
and the sandwich of the backbone atoms of Arg185, Ala252,Tyr174, Ala249 on one side and Ser170 on the other. There arehydrophobic interactions between benzodioxole ring of the ligandand residues Asn188, Val268 and Glu256. A prominent back bonehydrogen bonding interaction was found between Val166 andthe NH (2.84 Å, 14%) bonded to benzodioxole ring on one sidewhile basic Lys173 was found to be interacting with the oxygenpresent in the five membered ring on the other side (3.47 Å), withvery low bond strength (10%).
Compound 8 forms arene–cation interaction between basicLys173 and fluoromethoxy benzene ring. Quinoline ring showshydrophobic interactions with residues Tyr174, Ser170 andAla252. The N atom attached to the fluoromethoxy benzene ringforms side chain hydrogen bonding interaction with Lys173(2.47 Å). The polar bond is having very high bond strength (94%).It also forms interactions with residues Arg185, Val187andGlu256 through bridged water molecules. The top ranking molec-ular docking score was �13.2418 kcal/mol. The side chain hydro-gen bonding interaction of the polar Asn188 with the oxygen ofmethoxy group bonded to fluoromethoxy benzene ring (2.88 Å)was found with bond strength 45%.
The binding mode observed for the compound 10 shows thatthe quinoline ring is located in a hydrophobic pocket surroundedby Arg185, Ser170, Lys173, Tyr175, Tyr174, Ala249 and Ala252.An arene–arene interaction was observed involving methoxy ben-zene ring of the ligand and polar Tyr174. The molecular dockinginteraction of compound 10 shows basic arene–cation interactionof methoxy phenol ring and Lys173. A side chain hydrogen bondinginteraction was observed between the –OH group and Glu256(1.26 Å) with very low bond strength 12%. Methoxy phenol ringshows hydrophobic interactions with residues Asn188, Val166,Val268, Pro184 and Arg185. The molecular docking score wasfound to be �13.3169 kcal/mol. Arg185 is a basic amino acid whichforms a side chain hydrogen bonding interaction with NH bondedto methoxy phenol moiety with very weak bond strength (2.98 Å,16%).
Molecular docking of compound l5 with score �13.4950 kcal/-mol showed a basic side chain hydrogen bonding interactionbetween O atom of the benzodioxole ring and Lys43 (2.67 Å,77%). Quinoline ring shows arene–cation interaction with the basicresidues Lys173 and Arg185 and methoxy benzene ring showsarene–cation interaction with the residue Lys173. Both Quinolineand methoxy benzene rings show hydrophobic interactions withresidues Val166, Lys173, Arg185, Asn188, Leu269, Pro184, Val268and Glu256. The N atom of the Quinoline ring shows hydrogenbond interactions with Lys173, Arg185 and Val187 through bridgewater molecules. The O atom of the-methoxy group forms H-bondinteractions with Ala189, Asn188 and Pro184. Benzodioxole ringshows hydrophobic interaction with Lys43, acidic Glu256, Pro184and Val268.
In case of compound 23, a large number of interactions are pre-sent (Fig. 7). It was observed that the two oxygen of benzodioxolering formed H-bond interactions with residues Lys173, Ala189,Ile270, Asn188 and Val268 through bridged water molecules. Anarene–cation interaction was observed between quinoline ringand basic Arg185. Hydrophobic interactions between benzodioxolering and Asn188, Leu269, Val268, Lys173 as well as the quinolinering with Arg185, Val166 and Glu256 appear to constrain the com-pound in close proximity with the amino acids forming the forementioned hydrogen bonding. Benzodioxole ring forms an arene–cation interaction with basic Lys173. The molecular docking scoreof the compound 23 was �14.4918 kcal/mol. During interactionbasic Lys173 behaves as a side chain acceptor residue that bindsto the N atom of benzodioxole ring of inhibitor. The polar bondbetween the Lys173 and inhibitor is having moderate bondstrength (63%). Lys173 was found making interaction with
(2.75 Å, 63%). A direct side chain acceptor interaction was foundbetween basic Lys173 and oxygen atom of the benzodioxole ring(3.24 Å). The polar bond between the Lys173 and compound ishaving low bond strength (16%) (Fig. 8).
The binding mode observed for compound 30 shows that mostof the interactions present are concentrated on the methoxy phe-nol ring with a molecular docking score �13.0691 kcal/mol. Astacking interaction with varied bond strength was observedbetween basic Lys173 and inhibitor molecule. Lys173 is interactingas a side chain donor molecule for both OH and NH groupsattached to the aryl ring of the inhibitor compound (2.5 Å, 76%;2.92 Å, 53%). Further stabilization was obtained by hydrophobicinteractions with Leu269, Val268, Lys173, Arg185, Asn188,Ser170, Ala249, Ala252, Pro246, Glu256 and Tyr174.
Fig. 6. Ramachandran plot (PDB 1CET) after energy and residue optimization.
Table 6Docking results of compounds into the protein 1CET.
Compounds E score(kcal/mol)
Amino acidresidues indirectinteraction
Distance(Å), bondstrength(%)
Amino acid residuesinteraction due to watermolecule
6 �13.1957 Arg185,Lys173
3.04, 30 Thr169, Ile270, Val166,Lys173
7 �13.7841 Val166 2.84, 14 Asn188, Ala189, Thr169,Ile270, Val268, Glu256,Val166, Lys173
Lys173 2.56, 53Lys173 3.47, 10
8 �13.2418 Asn188 2.88, 45 Glu256, Val187, Asn188,Arg185, Val268Lys173 2.47, 94
10 �13.3169 Arg185 2.98, 16 Ile270, Lys173, Glu256,Ser170, Arg185Glu256 1.26, 12
15 �13.4950 Lys43 2.67, 77 Arg185, Lys173, Ala189,Asn188, His190, Val187,Pro184
Arg185Lys173
23 �14.4918 Lys173 2.75, 63 Ile255, Glu256, Ala252,Asn188, Val268, Ala189,Ile270, Lys173, Thr169,Val166
Lys173 3.24, 16
30 �13.0691 Lys173 2.92, 53 Glu256, Tyr174, Asn188,Arg185, Val187, Val268,Ala189, Lys173
Lys173 2.5, 76
36 �13.5305 Lys173 2.37, 70 Ala189, Val268, Ile270,Asn188, Lys173, Val166,Thr166, Glu256
Lys173 2.87, 61
38 �15.1099 Glu256 2, 22 Lys173, Val268, Asn188Glu256 1.2, 35
39 �13.9625 Asn188 2.77, 62 Glu256Arg185Lys173
20 I.G. Shibi et al. / European Journal of Pharmaceutical Sciences 77 (2015) 9–23
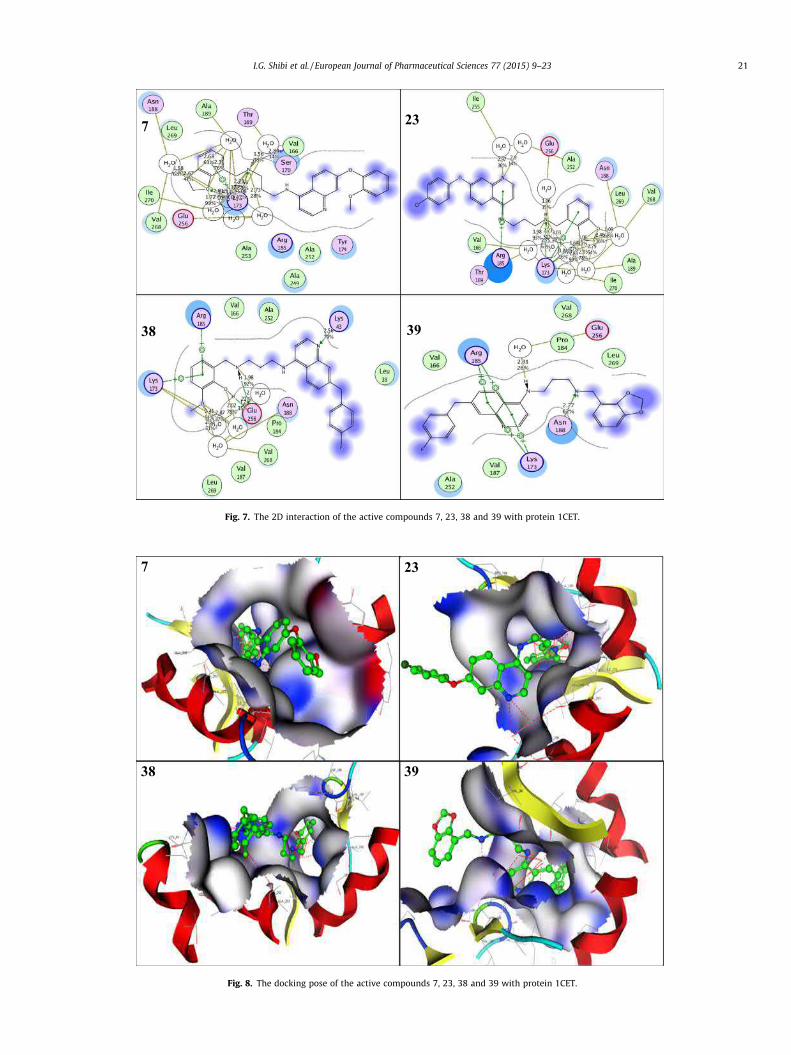
7
38
23
39
Fig. 7. The 2D interaction of the active compounds 7, 23, 38 and 39 with protein 1CET.
7 23
3938
Fig. 8. The docking pose of the active compounds 7, 23, 38 and 39 with protein 1CET.
I.G. Shibi et al. / European Journal of Pharmaceutical Sciences 77 (2015) 9–23 21
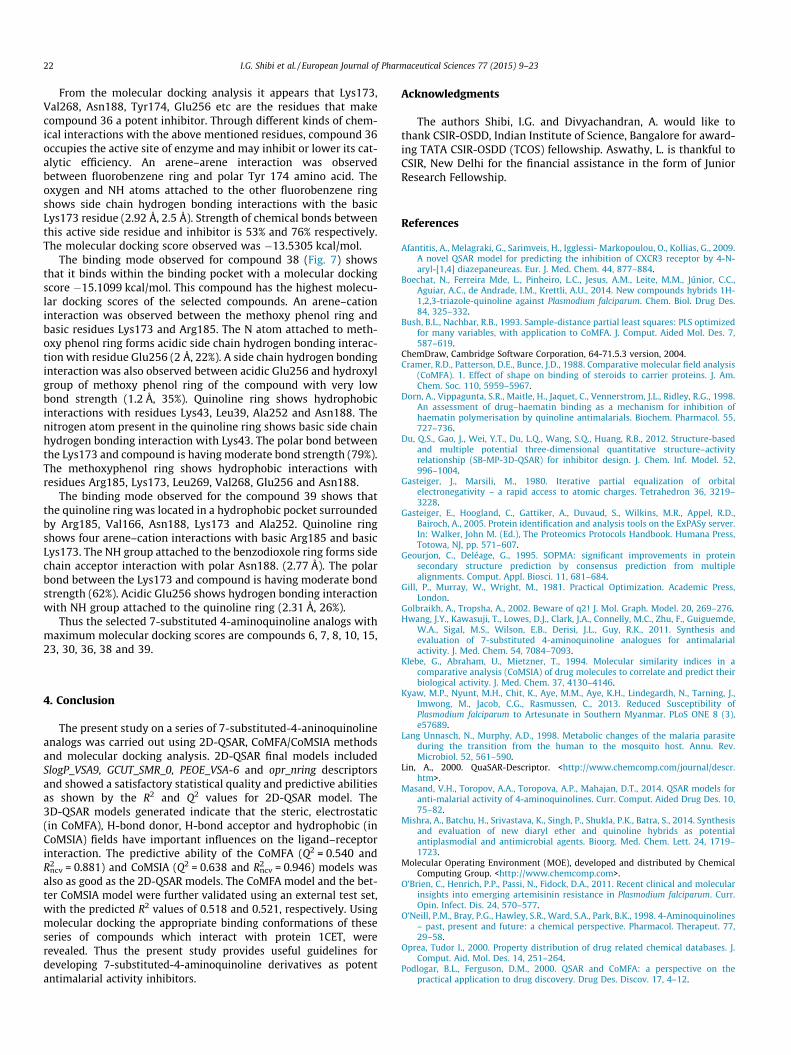
From the molecular docking analysis it appears that Lys173,Val268, Asn188, Tyr174, Glu256 etc are the residues that makecompound 36 a potent inhibitor. Through different kinds of chem-ical interactions with the above mentioned residues, compound 36occupies the active site of enzyme and may inhibit or lower its cat-alytic efficiency. An arene–arene interaction was observedbetween fluorobenzene ring and polar Tyr 174 amino acid. Theoxygen and NH atoms attached to the other fluorobenzene ringshows side chain hydrogen bonding interactions with the basicLys173 residue (2.92 Å, 2.5 Å). Strength of chemical bonds betweenthis active side residue and inhibitor is 53% and 76% respectively.The molecular docking score observed was �13.5305 kcal/mol.
The binding mode observed for compound 38 (Fig. 7) showsthat it binds within the binding pocket with a molecular dockingscore �15.1099 kcal/mol. This compound has the highest molecu-lar docking scores of the selected compounds. An arene–cationinteraction was observed between the methoxy phenol ring andbasic residues Lys173 and Arg185. The N atom attached to meth-oxy phenol ring forms acidic side chain hydrogen bonding interac-tion with residue Glu256 (2 Å, 22%). A side chain hydrogen bondinginteraction was also observed between acidic Glu256 and hydroxylgroup of methoxy phenol ring of the compound with very lowbond strength (1.2 Å, 35%). Quinoline ring shows hydrophobicinteractions with residues Lys43, Leu39, Ala252 and Asn188. Thenitrogen atom present in the quinoline ring shows basic side chainhydrogen bonding interaction with Lys43. The polar bond betweenthe Lys173 and compound is having moderate bond strength (79%).The methoxyphenol ring shows hydrophobic interactions withresidues Arg185, Lys173, Leu269, Val268, Glu256 and Asn188.
The binding mode observed for the compound 39 shows thatthe quinoline ring was located in a hydrophobic pocket surroundedby Arg185, Val166, Asn188, Lys173 and Ala252. Quinoline ringshows four arene–cation interactions with basic Arg185 and basicLys173. The NH group attached to the benzodioxole ring forms sidechain acceptor interaction with polar Asn188. (2.77 Å). The polarbond between the Lys173 and compound is having moderate bondstrength (62%). Acidic Glu256 shows hydrogen bonding interactionwith NH group attached to the quinoline ring (2.31 Å, 26%).
Thus the selected 7-substituted 4-aminoquinoline analogs withmaximum molecular docking scores are compounds 6, 7, 8, 10, 15,23, 30, 36, 38 and 39.
4. Conclusion
The present study on a series of 7-substituted-4-aninoquinolineanalogs was carried out using 2D-QSAR, CoMFA/CoMSIA methodsand molecular docking analysis. 2D-QSAR final models includedSlogP_VSA9, GCUT_SMR_0, PEOE_VSA-6 and opr_nring descriptorsand showed a satisfactory statistical quality and predictive abilitiesas shown by the R2 and Q2 values for 2D-QSAR model. The3D-QSAR models generated indicate that the steric, electrostatic(in CoMFA), H-bond donor, H-bond acceptor and hydrophobic (inCoMSIA) fields have important influences on the ligand–receptorinteraction. The predictive ability of the CoMFA (Q2 = 0.540 andR2ncv = 0.881) and CoMSIA (Q2 = 0.638 and R2ncv = 0.946) models was
also as good as the 2D-QSAR models. The CoMFA model and the bet-ter CoMSIA model were further validated using an external test set,with the predicted R2 values of 0.518 and 0.521, respectively. Usingmolecular docking the appropriate binding conformations of theseseries of compounds which interact with protein 1CET, wererevealed. Thus the present study provides useful guidelines fordeveloping 7-substituted-4-aminoquinoline derivatives as potentantimalarial activity inhibitors.
Acknowledgments
The authors Shibi, I.G. and Divyachandran, A. would like tothank CSIR-OSDD, Indian Institute of Science, Bangalore for award-ing TATA CSIR-OSDD (TCOS) fellowship. Aswathy, L. is thankful toCSIR, New Delhi for the financial assistance in the form of JuniorResearch Fellowship.
References
Afantitis, A., Melagraki, G., Sarimveis, H., Igglessi- Markopoulou, O., Kollias, G., 2009.A novel QSAR model for predicting the inhibition of CXCR3 receptor by 4-N-aryl-[1,4] diazepaneureas. Eur. J. Med. Chem. 44, 877–884.
Boechat, N., Ferreira Mde, L., Pinheiro, L.C., Jesus, A.M., Leite, M.M., Júnior, C.C.,Aguiar, A.C., de Andrade, I.M., Krettli, A.U., 2014. New compounds hybrids 1H-1,2,3-triazole-quinoline against Plasmodium falciparum. Chem. Biol. Drug Des.84, 325–332.
Bush, B.L., Nachbar, R.B., 1993. Sample-distance partial least squares: PLS optimizedfor many variables, with application to CoMFA. J. Comput. Aided Mol. Des. 7,587–619.
ChemDraw, Cambridge Software Corporation, 64-71.5.3 version, 2004.Cramer, R.D., Patterson, D.E., Bunce, J.D., 1988. Comparative molecular field analysis
(CoMFA). 1. Effect of shape on binding of steroids to carrier proteins. J. Am.Chem. Soc. 110, 5959–5967.
Dorn, A., Vippagunta, S.R., Maitle, H., Jaquet, C., Vennerstrom, J.L., Ridley, R.G., 1998.An assessment of drug–haematin binding as a mechanism for inhibition ofhaematin polymerisation by quinoline antimalarials. Biochem. Pharmacol. 55,727–736.
Du, Q.S., Gao, J., Wei, Y.T., Du, L.Q., Wang, S.Q., Huang, R.B., 2012. Structure-basedand multiple potential three-dimensional quantitative structure–activityrelationship (SB-MP-3D-QSAR) for inhibitor design. J. Chem. Inf. Model. 52,996–1004.
Gasteiger, J., Marsili, M., 1980. Iterative partial equalization of orbitalelectronegativity – a rapid access to atomic charges. Tetrahedron 36, 3219–3228.
Gasteiger, E., Hoogland, C., Gattiker, A., Duvaud, S., Wilkins, M.R., Appel, R.D.,Bairoch, A., 2005. Protein identification and analysis tools on the ExPASy server.In: Walker, John M. (Ed.), The Proteomics Protocols Handbook. Humana Press,Totowa, NJ, pp. 571–607.
Geourjon, C., Deléage, G., 1995. SOPMA: significant improvements in proteinsecondary structure prediction by consensus prediction from multiplealignments. Comput. Appl. Biosci. 11, 681–684.
Gill, P., Murray, W., Wright, M., 1981. Practical Optimization. Academic Press,London.
Golbraikh, A., Tropsha, A., 2002. Beware of q2! J. Mol. Graph. Model. 20, 269–276.Hwang, J.Y., Kawasuji, T., Lowes, D.J., Clark, J.A., Connelly, M.C., Zhu, F., Guiguemde,
W.A., Sigal, M.S., Wilson, E.B., Derisi, J.L., Guy, R.K., 2011. Synthesis andevaluation of 7-substituted 4-aminoquinoline analogues for antimalarialactivity. J. Med. Chem. 54, 7084–7093.
Klebe, G., Abraham, U., Mietzner, T., 1994. Molecular similarity indices in acomparative analysis (CoMSIA) of drug molecules to correlate and predict theirbiological activity. J. Med. Chem. 37, 4130–4146.
Kyaw, M.P., Nyunt, M.H., Chit, K., Aye, M.M., Aye, K.H., Lindegardh, N., Tarning, J.,Imwong, M., Jacob, C.G., Rasmussen, C., 2013. Reduced Susceptibility ofPlasmodium falciparum to Artesunate in Southern Myanmar. PLoS ONE 8 (3),e57689.
Lang Unnasch, N., Murphy, A.D., 1998. Metabolic changes of the malaria parasiteduring the transition from the human to the mosquito host. Annu. Rev.Microbiol. 52, 561–590.
Lin, A., 2000. QuaSAR-Descriptor. <http://www.chemcomp.com/journal/descr.htm>.
Masand, V.H., Toropov, A.A., Toropova, A.P., Mahajan, D.T., 2014. QSAR models foranti-malarial activity of 4-aminoquinolines. Curr. Comput. Aided Drug Des. 10,75–82.
Mishra, A., Batchu, H., Srivastava, K., Singh, P., Shukla, P.K., Batra, S., 2014. Synthesisand evaluation of new diaryl ether and quinoline hybrids as potentialantiplasmodial and antimicrobial agents. Bioorg. Med. Chem. Lett. 24, 1719–1723.
Molecular Operating Environment (MOE), developed and distributed by ChemicalComputing Group. <http://www.chemcomp.com>.
O’Brien, C., Henrich, P.P., Passi, N., Fidock, D.A., 2011. Recent clinical and molecularinsights into emerging artemisinin resistance in Plasmodium falciparum. Curr.Opin. Infect. Dis. 24, 570–577.
O’Neill, P.M., Bray, P.G., Hawley, S.R., Ward, S.A., Park, B.K., 1998. 4-Aminoquinolines– past, present and future: a chemical perspective. Pharmacol. Therapeut. 77,29–58.
Oprea, Tudor I., 2000. Property distribution of drug related chemical databases. J.Comput. Aid. Mol. Des. 14, 251–264.
Podlogar, B.L., Ferguson, D.M., 2000. QSAR and CoMFA: a perspective on thepractical application to drug discovery. Drug Des. Discov. 17, 4–12.
22 I.G. Shibi et al. / European Journal of Pharmaceutical Sciences 77 (2015) 9–23
Ponce, Y.M., Garit, J.A., Torrens, F., Zaldivar, V.R., Castro, E.A., 2004. Atom, atom-type,and total linear indices of the ‘‘molecular pseudograph’s atom adjacencymatrix’’: application to QSPR/QSAR studies of organic compounds. Molecules 9,1100–1123.
Pourbasheer, E., Riahi, S., Ganjali, M.R., Norouzi, P., 2010. QSAR study onmelanocortin-4 receptors by support vector machine. Eur. J. Med. Chem. 45,1087–1093.
Pourbasheer, E., Aalizadeh, R., Ganjali, M., Norouzi, P., 2013. QSAR study of a1b4integrin inhibitors by GA-MLR and GA-SVM methods. Struct. Chem. 25, 355–370.
Rännar, S., Lindgren, F., Geladi, P., Wold, S.A., 1994. PLS kernel algorithm for datasets with many variables and fewer objects. Part 1: theory and algorithm. J.Chemom. 8, 111–125.
Read, J.A., Wilkinson, K.W., Tranter, R., Sessions, R.B., Brady, R.L., 1999. Chloroquinebinds in the cofactor binding site of Plasmodium falciparum lactatedehydrogenase. J. Biol. Chem. 274, 10213–10218.
Riahi, S., Ganjali, M., Pourbasheer, E., Norouzi, P., 2008. QSRR study of GC retentionindices of essential-oil compounds by multiple linear regression with a geneticalgorithm. Chroma 67, 917–922.
Riahi, S., Pourbasheer, E., Ganjali, M.R., Norouzi, P., 2009. Investigation of differentlinear and nonlinear chemometric methods for modeling of retention index ofessential oil components: concerns to support vector machine. J. Hazard. Mater.166, 853–859.
Ridley, R.G., 1996. Hemozoin formation in malaria parasites: is there ahaempolymerase? Trends Microbiol. 4, 253–254.
Rose, P.W., Prlic, A., Bi, C., Bluhm, W.F., Christie, C.H., Dutta, S., Green, R.K., Goodsell,D.S., Westbrook, J.D., Woo, J., Young, J., Zardecki, C., Berman, H.M., Bourne, P.E.,
Burley, 2015. The RCSB Protein Data Bank: views of structural biology for basicand applied research and education. Nucleic Acids Res. 43 (Database issue),D345–D356.
Sonin, D.L., Wakatsuki, T., Routhu, K.V., Harmann, L.M., Petersen, M., Meyer, J.,Strande, J.L., 2013. Protease-activated receptor 1 inhibition by SCH79797attenuates left ventricular remodeling and profibrotic activities of cardiacfibroblasts. J. Cardiovasc. Pharmacol. Ther. 18, 460–475.
Strazielle, N., Ghersi-Egea, J.F., 2005. Factors affecting delivery of antiviral drugs tothe brain. Rev. Med. Virol. 15, 105–133.
Tosco, P., Balle, T., 2011. Open3DQSAR: a new open-source software aimed at high-throughput chemometric analysis of molecular interaction fields. J. Mol. Model.17, 201–208.
Videnovic, M., Opsenica, D.M., Burnett, J.C., Gomba, L., Nuss, J.E., Selakovic, Z.,Konstantinovic, J., Krstic, M., Segan, S., Zlatovic, M., Sciotti, R.J., Bavari, S., Solaja,B.A., 2014. Second generation steroidal 4-aminoquinolines are potent, dual-target inhibitors of the botulinum neurotoxin serotype A metalloprotease and P.falciparum malaria. J. Med. Chem. 57, 4134–4153.
White, N.J., Pukrittayakamee, S., Hien, T.T., Faiz, M.A., Mokuolu, O.A., Dondorp, A.M.,2014. Malaria. Lancet 383, 723–735.
Wildman, S.A., Crippen, G.M., 1999. Prediction of physiochemical parameters byatomic contributions. J. Chem. Inf. Comput. Sci. 39, 868–873.
Wiwanitkit, V., 2007. Plasmodium and host lactate dehydrogenasemolecular functionand biological pathways: implication for antimalarial drug discovery. Chem.Biol. Drug Des. 69 (4), 280–283.
Wold, S., Ruhe, A., Wold, H., Dunn, I.W., 1984. The collinearity problem in linearregression. The partial least squares (PLS) approach to generalized inverses. J.Sci. Stat. Comp. 5, 735–743.
I.G. Shibi et al. / European Journal of Pharmaceutical Sciences 77 (2015) 9–23 23
ORIGINAL RESEARCH
Discovery of Rimonabant and its potential analogues as anti-TBdrug candidates
J. M. Gajbhiye • N. A. More • Manoj D. Patil • R. Ummanni •
S. S. Kotapalli • P. Yogeeswari • D. Sriram • V. H. Masand
Received: 25 September 2014 / Accepted: 19 February 2015
� Springer Science+Business Media New York 2015
Abstract Rimonabant and its analogues have been syn-
thesized in moderate to good yields using a simple syn-
thetic route. All the newly synthesized compounds were
subjected to in vitro screening against M. tuberculosis and
M. smegmatis. The most potent analogue JMG-14 exhibits
MIC value of 3.13 compared to 3.25 and 50 lg/ml for
ethambutol and pyrazinamide, respectively. The molecular
docking reveals that pyrazole ring, number and position of
halogen atoms play a crucial role in deciding interactions
with MTCYP-121. These findings open up a new avenue in
the search of potent anti-TB drugs with rimonabant and its
novel analogue JMG-14 as lead molecules.
Graphical Abstract
Keywords Rimonabant � Diaryl pyrazoles �Tuberculosis � Mycobacterium tuberculosis � H37Rv �MTCYP-121
Introduction
Tuberculosis (TB) is among the deadly diseases afflicting
mankind, and it still remains a major public health burden in
many developing countries (Corbett et al., 2003). Ap-
proximately one-third of the world’s population is still under
the ill influence of TB. In 2011, nearly 9 million people
around the world suffered from TB (WHO 2013), with 1.4
million deaths worldwide. Recent reports reveal that every
year 0.2 million from 0.7 million HIV patients die due to TB,
J. M. Gajbhiye (&) � N. A. More � M. D. Patil
Division of Organic Chemistry, CSIR-National Chemical
Laboratory, Pune 411008, India
e-mail: [email protected]
R. Ummanni � S. S. Kotapalli
Centre for Chemical Biology, Indian Institute of Chemical
Technology, Hyderabad 500607, India
P. Yogeeswari � D. Sriram
Tuberculosis Drug Discovery Laboratory, Pharmacy Group,
Birla Institute of Technology and Science, Pilani, Hyderabad
Campus, Hyderabad 500078, India
V. H. Masand
Department of Chemistry, VidyaBharati College, Camp,
Amravati 444602, India
123
Med Chem Res
DOI 10.1007/s00044-015-1346-4
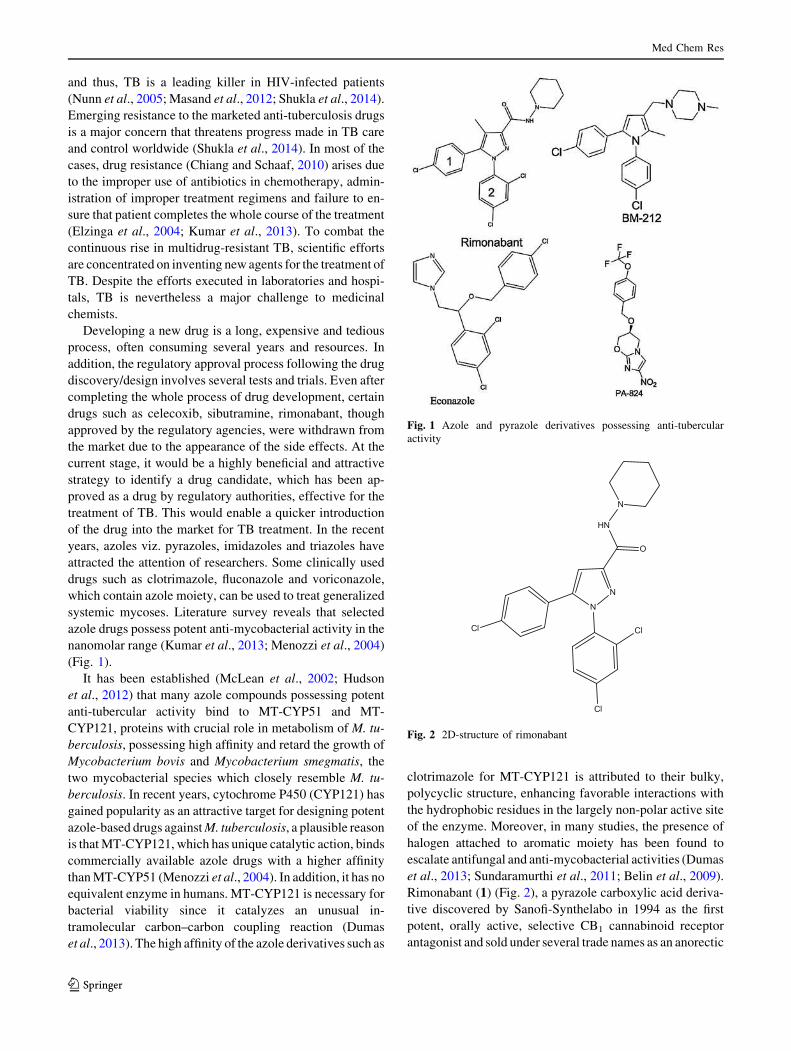
and thus, TB is a leading killer in HIV-infected patients
(Nunn et al., 2005; Masand et al., 2012; Shukla et al., 2014).
Emerging resistance to the marketed anti-tuberculosis drugs
is a major concern that threatens progress made in TB care
and control worldwide (Shukla et al., 2014). In most of the
cases, drug resistance (Chiang and Schaaf, 2010) arises due
to the improper use of antibiotics in chemotherapy, admin-
istration of improper treatment regimens and failure to en-
sure that patient completes the whole course of the treatment
(Elzinga et al., 2004; Kumar et al., 2013). To combat the
continuous rise in multidrug-resistant TB, scientific efforts
are concentrated on inventing new agents for the treatment of
TB. Despite the efforts executed in laboratories and hospi-
tals, TB is nevertheless a major challenge to medicinal
chemists.
Developing a new drug is a long, expensive and tedious
process, often consuming several years and resources. In
addition, the regulatory approval process following the drug
discovery/design involves several tests and trials. Even after
completing the whole process of drug development, certain
drugs such as celecoxib, sibutramine, rimonabant, though
approved by the regulatory agencies, were withdrawn from
the market due to the appearance of the side effects. At the
current stage, it would be a highly beneficial and attractive
strategy to identify a drug candidate, which has been ap-
proved as a drug by regulatory authorities, effective for the
treatment of TB. This would enable a quicker introduction
of the drug into the market for TB treatment. In the recent
years, azoles viz. pyrazoles, imidazoles and triazoles have
attracted the attention of researchers. Some clinically used
drugs such as clotrimazole, fluconazole and voriconazole,
which contain azole moiety, can be used to treat generalized
systemic mycoses. Literature survey reveals that selected
azole drugs possess potent anti-mycobacterial activity in the
nanomolar range (Kumar et al., 2013; Menozzi et al., 2004)
(Fig. 1).
It has been established (McLean et al., 2002; Hudson
et al., 2012) that many azole compounds possessing potent
anti-tubercular activity bind to MT-CYP51 and MT-
CYP121, proteins with crucial role in metabolism of M. tu-
berculosis, possessing high affinity and retard the growth of
Mycobacterium bovis and Mycobacterium smegmatis, the
two mycobacterial species which closely resemble M. tu-
berculosis. In recent years, cytochrome P450 (CYP121) has
gained popularity as an attractive target for designing potent
azole-based drugs against M. tuberculosis, a plausible reason
is that MT-CYP121, which has unique catalytic action, binds
commercially available azole drugs with a higher affinity
than MT-CYP51 (Menozzi et al., 2004). In addition, it has no
equivalent enzyme in humans. MT-CYP121 is necessary for
bacterial viability since it catalyzes an unusual in-
tramolecular carbon–carbon coupling reaction (Dumas
et al., 2013). The high affinity of the azole derivatives such as
clotrimazole for MT-CYP121 is attributed to their bulky,
polycyclic structure, enhancing favorable interactions with
the hydrophobic residues in the largely non-polar active site
of the enzyme. Moreover, in many studies, the presence of
halogen attached to aromatic moiety has been found to
escalate antifungal and anti-mycobacterial activities (Dumas
et al., 2013; Sundaramurthi et al., 2011; Belin et al., 2009).
Rimonabant (1) (Fig. 2), a pyrazole carboxylic acid deriva-
tive discovered by Sanofi-Synthelabo in 1994 as the first
potent, orally active, selective CB1 cannabinoid receptor
antagonist and sold under several trade names as an anorectic
Fig. 1 Azole and pyrazole derivatives possessing anti-tubercular
activity
N
N
O
HN
N
Cl
ClCl
Fig. 2 2D-structure of rimonabant
Med Chem Res
123
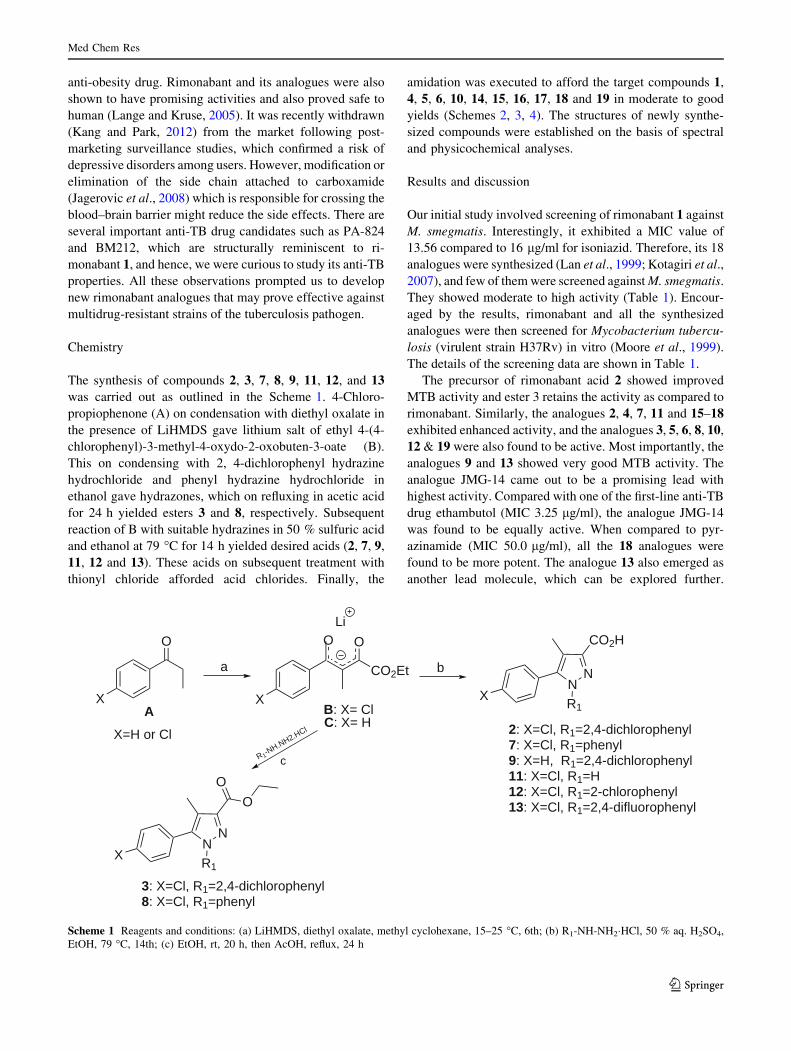
anti-obesity drug. Rimonabant and its analogues were also
shown to have promising activities and also proved safe to
human (Lange and Kruse, 2005). It was recently withdrawn
(Kang and Park, 2012) from the market following post-
marketing surveillance studies, which confirmed a risk of
depressive disorders among users. However, modification or
elimination of the side chain attached to carboxamide
(Jagerovic et al., 2008) which is responsible for crossing the
blood–brain barrier might reduce the side effects. There are
several important anti-TB drug candidates such as PA-824
and BM212, which are structurally reminiscent to ri-
monabant 1, and hence, we were curious to study its anti-TB
properties. All these observations prompted us to develop
new rimonabant analogues that may prove effective against
multidrug-resistant strains of the tuberculosis pathogen.
Chemistry
The synthesis of compounds 2, 3, 7, 8, 9, 11, 12, and 13
was carried out as outlined in the Scheme 1. 4-Chloro-
propiophenone (A) on condensation with diethyl oxalate in
the presence of LiHMDS gave lithium salt of ethyl 4-(4-
chlorophenyl)-3-methyl-4-oxydo-2-oxobuten-3-oate (B).
This on condensing with 2, 4-dichlorophenyl hydrazine
hydrochloride and phenyl hydrazine hydrochloride in
ethanol gave hydrazones, which on refluxing in acetic acid
for 24 h yielded esters 3 and 8, respectively. Subsequent
reaction of B with suitable hydrazines in 50 % sulfuric acid
and ethanol at 79 �C for 14 h yielded desired acids (2, 7, 9,
11, 12 and 13). These acids on subsequent treatment with
thionyl chloride afforded acid chlorides. Finally, the
amidation was executed to afford the target compounds 1,
4, 5, 6, 10, 14, 15, 16, 17, 18 and 19 in moderate to good
yields (Schemes 2, 3, 4). The structures of newly synthe-
sized compounds were established on the basis of spectral
and physicochemical analyses.
Results and discussion
Our initial study involved screening of rimonabant 1 against
M. smegmatis. Interestingly, it exhibited a MIC value of
13.56 compared to 16 lg/ml for isoniazid. Therefore, its 18
analogues were synthesized (Lan et al., 1999; Kotagiri et al.,
2007), and few of them were screened against M. smegmatis.
They showed moderate to high activity (Table 1). Encour-
aged by the results, rimonabant and all the synthesized
analogues were then screened for Mycobacterium tubercu-
losis (virulent strain H37Rv) in vitro (Moore et al., 1999).
The details of the screening data are shown in Table 1.
The precursor of rimonabant acid 2 showed improved
MTB activity and ester 3 retains the activity as compared to
rimonabant. Similarly, the analogues 2, 4, 7, 11 and 15–18
exhibited enhanced activity, and the analogues 3, 5, 6, 8, 10,
12 & 19 were also found to be active. Most importantly, the
analogues 9 and 13 showed very good MTB activity. The
analogue JMG-14 came out to be a promising lead with
highest activity. Compared with one of the first-line anti-TB
drug ethambutol (MIC 3.25 lg/ml), the analogue JMG-14
was found to be equally active. When compared to pyr-
azinamide (MIC 50.0 lg/ml), all the 18 analogues were
found to be more potent. The analogue 13 also emerged as
another lead molecule, which can be explored further.
X
O
a b NN
CO2H
R1X
A
NNR1
X
O
O
2: X=Cl, R1=2,4-dichlorophenyl7: X=Cl, R1=phenyl9: X=H, R1=2,4-dichlorophenyl11: X=Cl, R1=H12: X=Cl, R1=2-chlorophenyl13: X=Cl, R1=2,4-difluorophenyl
3: X=Cl, R1=2,4-dichlorophenyl8: X=Cl, R1=phenyl
X=H or Cl
X
CO2Et
OOLi
B: X= ClC: X= H
R1-NH.NH2.HCl
c
Scheme 1 Reagents and conditions: (a) LiHMDS, diethyl oxalate, methyl cyclohexane, 15–25 �C, 6th; (b) R1-NH-NH2�HCl, 50 % aq. H2SO4,
EtOH, 79 �C, 14th; (c) EtOH, rt, 20 h, then AcOH, reflux, 24 h
Med Chem Res
123
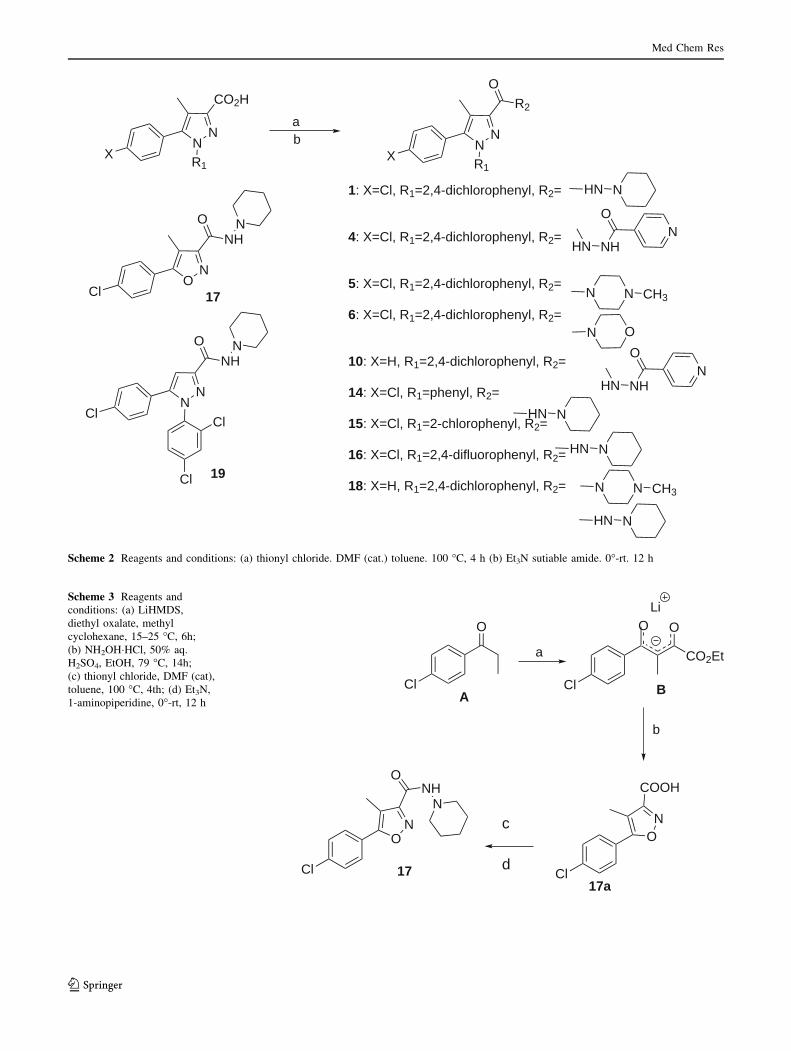
NN
CO2H
R1X
ab N
NR1
X
NHN
O
R2
1: X=Cl, R1=2,4-dichlorophenyl, R2=
4: X=Cl, R1=2,4-dichlorophenyl, R2=
5: X=Cl, R1=2,4-dichlorophenyl, R2=
6: X=Cl, R1=2,4-dichlorophenyl, R2=
10: X=H, R1=2,4-dichlorophenyl, R2=
14: X=Cl, R1=phenyl, R2=
15: X=Cl, R1=2-chlorophenyl, R2=
16: X=Cl, R1=2,4-difluorophenyl, R2=
18: X=H, R1=2,4-dichlorophenyl, R2=
NNH
O
HN
N N CH3
N O
NHN
NNH
O
HN
NHN
N N CH3
NHN
NO
Cl
O
NHN
17
NN
Cl
O
NHN
Cl
Cl 19
Scheme 2 Reagents and conditions: (a) thionyl chloride. DMF (cat.) toluene. 100 �C, 4 h (b) Et3N sutiable amide. 0�-rt. 12 h
Cl
ON
COOH
Cl
ON
N
ONH
c
d1717a
Cl
O
a
ACl
CO2Et
OOLi
B
b
Scheme 3 Reagents and
conditions: (a) LiHMDS,
diethyl oxalate, methyl
cyclohexane, 15–25 �C, 6h;
(b) NH2OH�HCl, 50% aq.
H2SO4, EtOH, 79 �C, 14h;
(c) thionyl chloride, DMF (cat),
toluene, 100 �C, 4th; (d) Et3N,
1-aminopiperidine, 0�-rt, 12 h
Med Chem Res
123
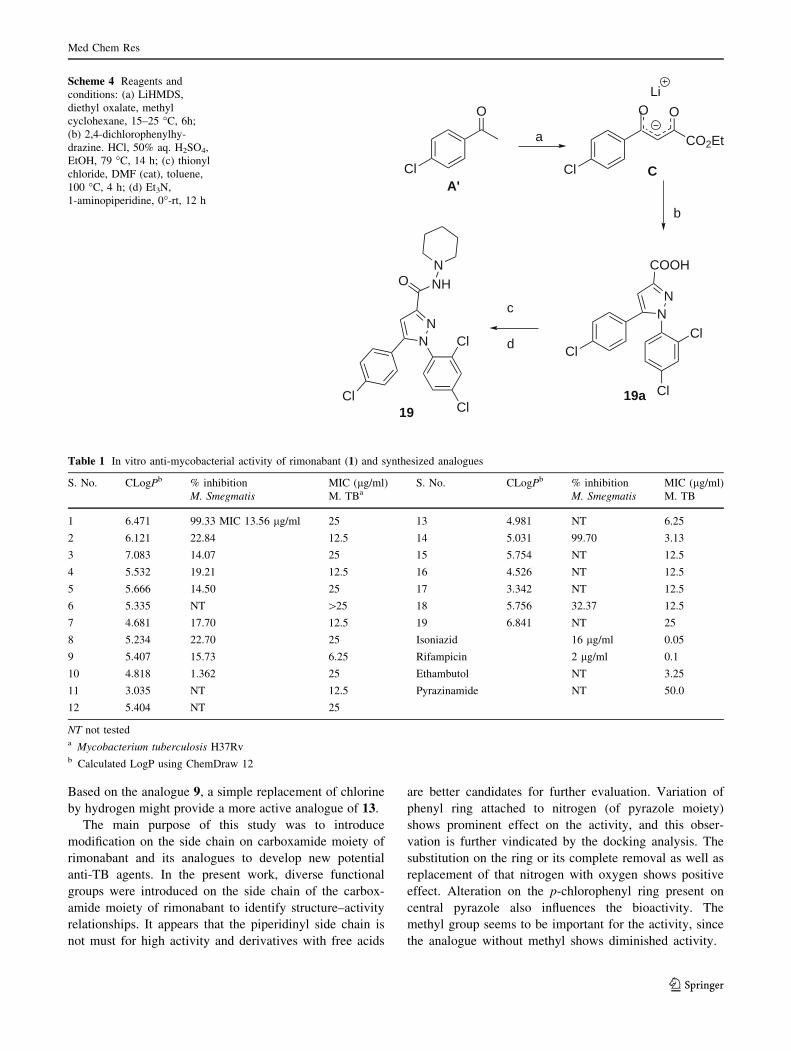
Based on the analogue 9, a simple replacement of chlorine
by hydrogen might provide a more active analogue of 13.
The main purpose of this study was to introduce
modification on the side chain on carboxamide moiety of
rimonabant and its analogues to develop new potential
anti-TB agents. In the present work, diverse functional
groups were introduced on the side chain of the carbox-
amide moiety of rimonabant to identify structure–activity
relationships. It appears that the piperidinyl side chain is
not must for high activity and derivatives with free acids
are better candidates for further evaluation. Variation of
phenyl ring attached to nitrogen (of pyrazole moiety)
shows prominent effect on the activity, and this obser-
vation is further vindicated by the docking analysis. The
substitution on the ring or its complete removal as well as
replacement of that nitrogen with oxygen shows positive
effect. Alteration on the p-chlorophenyl ring present on
central pyrazole also influences the bioactivity. The
methyl group seems to be important for the activity, since
the analogue without methyl shows diminished activity.
Cl
NN
COOH
c
d
1919a
Cl
ClCl
NN
Cl
Cl
O NHN
Cl
O
a
Cl
CO2Et
OOLi
b
CA'
Scheme 4 Reagents and
conditions: (a) LiHMDS,
diethyl oxalate, methyl
cyclohexane, 15–25 �C, 6h;
(b) 2,4-dichlorophenylhy-
drazine. HCl, 50% aq. H2SO4,
EtOH, 79 �C, 14 h; (c) thionyl
chloride, DMF (cat), toluene,
100 �C, 4 h; (d) Et3N,
1-aminopiperidine, 0�-rt, 12 h
Table 1 In vitro anti-mycobacterial activity of rimonabant (1) and synthesized analogues
S. No. CLogPb % inhibition
M. Smegmatis
MIC (lg/ml)
M. TBaS. No. CLogPb % inhibition
M. Smegmatis
MIC (lg/ml)
M. TB
1 6.471 99.33 MIC 13.56 lg/ml 25 13 4.981 NT 6.25
2 6.121 22.84 12.5 14 5.031 99.70 3.13
3 7.083 14.07 25 15 5.754 NT 12.5
4 5.532 19.21 12.5 16 4.526 NT 12.5
5 5.666 14.50 25 17 3.342 NT 12.5
6 5.335 NT [25 18 5.756 32.37 12.5
7 4.681 17.70 12.5 19 6.841 NT 25
8 5.234 22.70 25 Isoniazid 16 lg/ml 0.05
9 5.407 15.73 6.25 Rifampicin 2 lg/ml 0.1
10 4.818 1.362 25 Ethambutol NT 3.25
11 3.035 NT 12.5 Pyrazinamide NT 50.0
12 5.404 NT 25
NT not testeda Mycobacterium tuberculosis H37Rvb Calculated LogP using ChemDraw 12
Med Chem Res
123
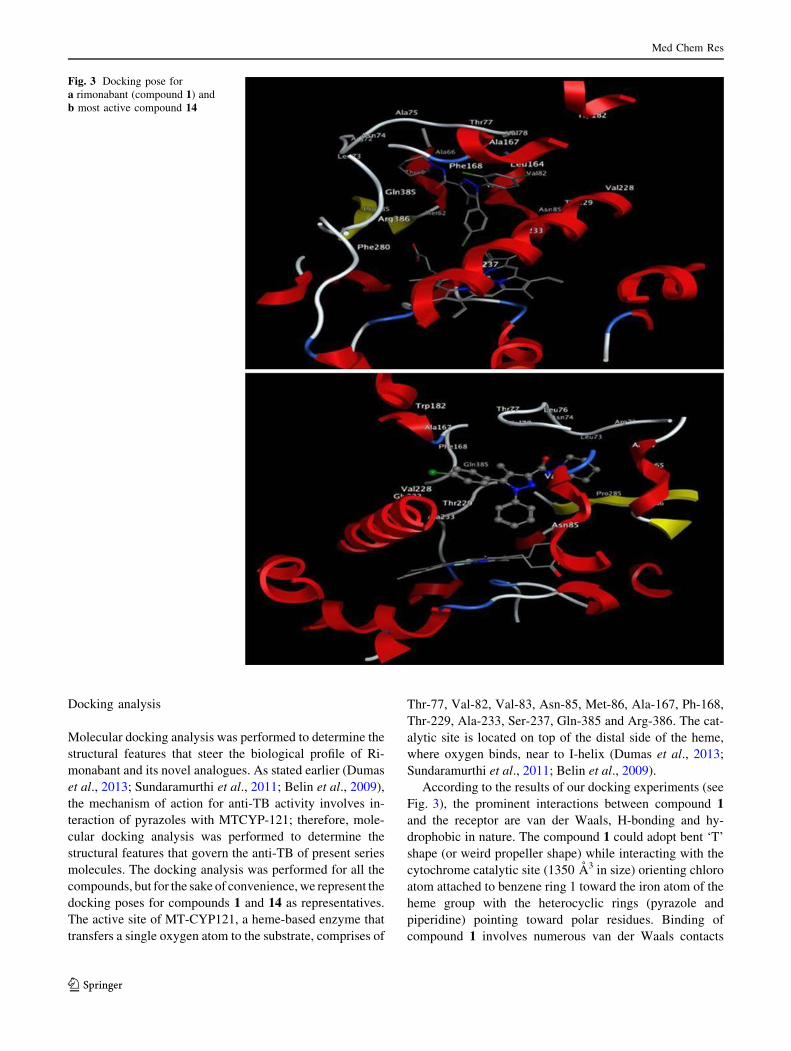
Docking analysis
Molecular docking analysis was performed to determine the
structural features that steer the biological profile of Ri-
monabant and its novel analogues. As stated earlier (Dumas
et al., 2013; Sundaramurthi et al., 2011; Belin et al., 2009),
the mechanism of action for anti-TB activity involves in-
teraction of pyrazoles with MTCYP-121; therefore, mole-
cular docking analysis was performed to determine the
structural features that govern the anti-TB of present series
molecules. The docking analysis was performed for all the
compounds, but for the sake of convenience, we represent the
docking poses for compounds 1 and 14 as representatives.
The active site of MT-CYP121, a heme-based enzyme that
transfers a single oxygen atom to the substrate, comprises of
Thr-77, Val-82, Val-83, Asn-85, Met-86, Ala-167, Ph-168,
Thr-229, Ala-233, Ser-237, Gln-385 and Arg-386. The cat-
alytic site is located on top of the distal side of the heme,
where oxygen binds, near to I-helix (Dumas et al., 2013;
Sundaramurthi et al., 2011; Belin et al., 2009).
According to the results of our docking experiments (see
Fig. 3), the prominent interactions between compound 1
and the receptor are van der Waals, H-bonding and hy-
drophobic in nature. The compound 1 could adopt bent ‘T’
shape (or weird propeller shape) while interacting with the
cytochrome catalytic site (1350 A3 in size) orienting chloro
atom attached to benzene ring 1 toward the iron atom of the
heme group with the heterocyclic rings (pyrazole and
piperidine) pointing toward polar residues. Binding of
compound 1 involves numerous van der Waals contacts
Fig. 3 Docking pose for
a rimonabant (compound 1) and
b most active compound 14
Med Chem Res
123
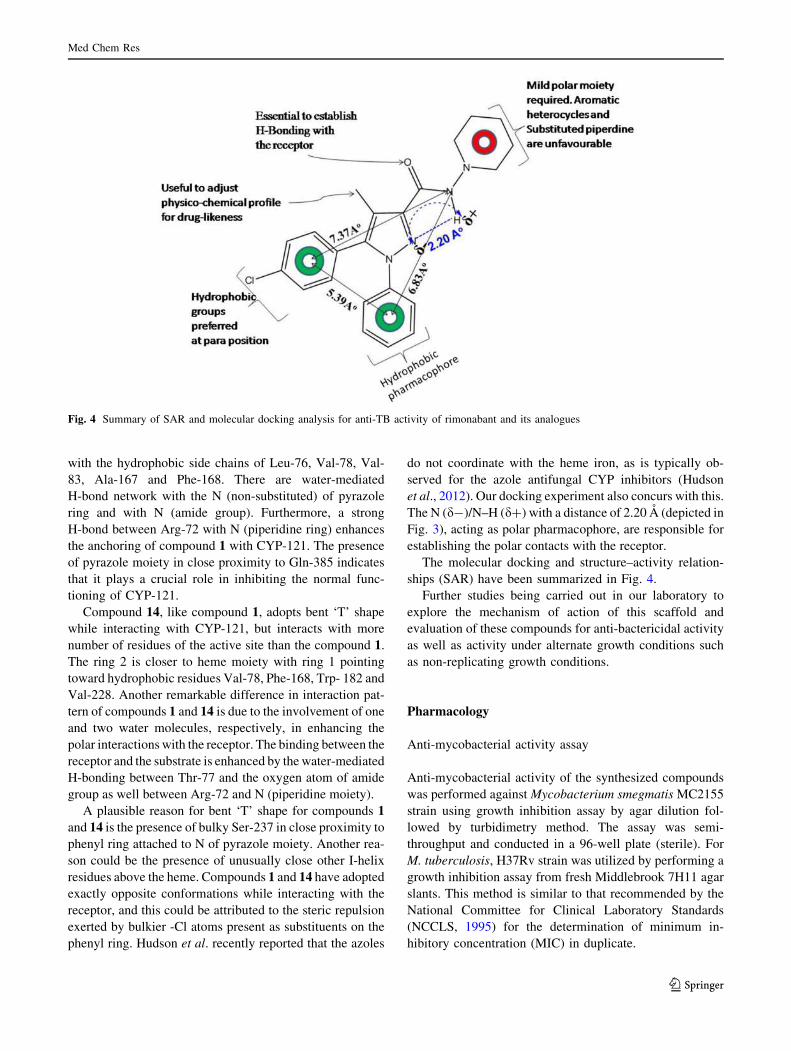
with the hydrophobic side chains of Leu-76, Val-78, Val-
83, Ala-167 and Phe-168. There are water-mediated
H-bond network with the N (non-substituted) of pyrazole
ring and with N (amide group). Furthermore, a strong
H-bond between Arg-72 with N (piperidine ring) enhances
the anchoring of compound 1 with CYP-121. The presence
of pyrazole moiety in close proximity to Gln-385 indicates
that it plays a crucial role in inhibiting the normal func-
tioning of CYP-121.
Compound 14, like compound 1, adopts bent ‘T’ shape
while interacting with CYP-121, but interacts with more
number of residues of the active site than the compound 1.
The ring 2 is closer to heme moiety with ring 1 pointing
toward hydrophobic residues Val-78, Phe-168, Trp- 182 and
Val-228. Another remarkable difference in interaction pat-
tern of compounds 1 and 14 is due to the involvement of one
and two water molecules, respectively, in enhancing the
polar interactions with the receptor. The binding between the
receptor and the substrate is enhanced by the water-mediated
H-bonding between Thr-77 and the oxygen atom of amide
group as well between Arg-72 and N (piperidine moiety).
A plausible reason for bent ‘T’ shape for compounds 1
and 14 is the presence of bulky Ser-237 in close proximity to
phenyl ring attached to N of pyrazole moiety. Another rea-
son could be the presence of unusually close other I-helix
residues above the heme. Compounds 1 and 14 have adopted
exactly opposite conformations while interacting with the
receptor, and this could be attributed to the steric repulsion
exerted by bulkier -Cl atoms present as substituents on the
phenyl ring. Hudson et al. recently reported that the azoles
do not coordinate with the heme iron, as is typically ob-
served for the azole antifungal CYP inhibitors (Hudson
et al., 2012). Our docking experiment also concurs with this.
The N (d-)/N–H (d?) with a distance of 2.20 A (depicted in
Fig. 3), acting as polar pharmacophore, are responsible for
establishing the polar contacts with the receptor.
The molecular docking and structure–activity relation-
ships (SAR) have been summarized in Fig. 4.
Further studies being carried out in our laboratory to
explore the mechanism of action of this scaffold and
evaluation of these compounds for anti-bactericidal activity
as well as activity under alternate growth conditions such
as non-replicating growth conditions.
Pharmacology
Anti-mycobacterial activity assay
Anti-mycobacterial activity of the synthesized compounds
was performed against Mycobacterium smegmatis MC2155
strain using growth inhibition assay by agar dilution fol-
lowed by turbidimetry method. The assay was semi-
throughput and conducted in a 96-well plate (sterile). For
M. tuberculosis, H37Rv strain was utilized by performing a
growth inhibition assay from fresh Middlebrook 7H11 agar
slants. This method is similar to that recommended by the
National Committee for Clinical Laboratory Standards
(NCCLS, 1995) for the determination of minimum in-
hibitory concentration (MIC) in duplicate.
Fig. 4 Summary of SAR and molecular docking analysis for anti-TB activity of rimonabant and its analogues
Med Chem Res
123
Conclusion
For the first time, it has been shown that rimonabant could
be a lead molecule for finding more potent anti-TB drug
candidates. In the present work, JMG-14 is the most potent
analogue of rimonabant, emerging as a suitable lead
molecule, which can be further optimized using the SAR
and molecular docking analyses. Currently, research work
is in progress on the development of more rational ana-
logues and their anti-TB.
Experimental
Chemistry
All the reagents and the solvents were used as received
from commercial sources unless and otherwise stated. All
the experiments were carried out under an atmosphere of
nitrogen in round-bottom flask. Pre-coated plates (silica gel
60 PF254, 0.25 mm or 0.5 mm) were utilized for thin-layer
chromatography (TLC). Column chromatographic purifi-
cations were carried out on flash silica gel (100–200 mesh)
using either petroleum ether and ethyl acetate or dichlor-
omethane and methanol as eluents. Melting points (mp) are
uncorrected and were measured on an electrothermal
melting point apparatus. The IR spectra were recorded on
an FT-IR spectrometer. The 1H and 13C NMR spectra were
recorded on 200/400/500 MHz and 50/100/125 MHz NMR
spectrometer, respectively, in CDCl3/DMSO-d6. Mass
spectra were taken on LC–MS (ESI) mass spectrometer.
HRMS were scanned at NCL, Pune.
Preparation of Lithium salt of Ethyl 4-(4-chlorophenyl)-3-
methyl-4-oxydo-2-oxobuten-3-oate (B) Methylcyclohex-
ane (30 ml) and lithium hexamethyldisilazane (30 ml,
31.7 mmol) were introduced in a round-bottom flask under
nitrogen atmosphere and cooled to 15–25 �C. A solution of
4-chloropropiophenone (A, 5.0 g, 29.65 mmol) in
methylcyclohexane (12.5 ml) was slowly added with con-
tinuous stirring for 2.5 h. To this reaction mixture, diethyl
oxalate (4.78 g, 32.6 mmol) was added with stirring. The
reaction progress was monitored by TLC; the solid ob-
tained was filtered, washed with methylcyclohexane
(30 ml) and dried under vacuum (30 min) to afford the
lithium salt (Kotagiri et al., 2007) (Cream yellow solid,
5.7 g, 71.9 %).
Preparation of ethyl 5-(4-Chlorophenyl)-1-(2,4-dichlor-
ophenyl)-4-methyl-1H-pyrazole-3-carboxylate (3) To a
continuously stirring solution of lithium salt B (1.0 g,
3.64 mmol) in 15 ml of ethanol was added 2,4-dichlor-
ophenyl hydrazine hydrochloride (0.777 g, 3.64 mmol) at
room temperature. The shaking was carried for 20 h till
precipitate was obtained. The precipitate so obtained was
filtered and washed with ethanol (10 ml) and dried under
vacuum to give a pale yellow solid (1.1 g), which was
dissolved in acetic acid (10 ml) and refluxed for 24 h. On
completion of the reaction (TLC), the reaction mixture was
poured into cold water (20 ml) and then extracted with
ethyl acetate (3 9 15 ml). The combined extracts were
washed with water, saturated sodium bicarbonate solution,
brine and then dried under vacuum to give the crude
product. It was then purified by column chromatography on
silica gel using ethyl acetate/petroleum ether (1:9) as elu-
tion system to give the ester 3 (Kotagiri et al., 2007),
(670 mg, 45 %,) pale yellow solid.mp 128–129 �C;1H
NMR (CDCl3, 200 MHz): d 7.39 (d, J = 2.02 Hz, 1H),
7.34 (d, J = 1.37 Hz, 1H), 7.33–7.28 (m, 3H), 7.08 (d,
J = 8.59 Hz, 2H), 4.51–4.41 (q, J = 7.08 Hz, 2H), 2.34 (s,
3H), 1.43 (t, J = 7.08 Hz, 3H); 13C NMR (CDCl3,
100 MHz): d 162.7, 142.9, 136.0, 135.9, 135.0, 133.0,
130.9, 130.7, 130.1, 128.9, 127.7, 127.0, 119.1, 60.9, 14.4,
and 9.6.HRMS-ESI (m/z) Calcd. C19H15O2N2Cl3 ? H)?:
409.0272 found: 409.0265.
Preparation of 1-(5-(4-Chlorophenyl)-4-methyl-1-phenyl-
1H-pyrazol-3-yl)propan-1-one (8) Synthesis of 8 was ac-
complished according to the procedure applied for 3. Pale
orange solid; 595 mg, 48 %; mp 121–123 �C; 1H NMR
(CDCl3, 400 MHz): d 7.31–7.36 (m, 5H), 7.24–7.27 (m, 2H),
7.10 (d, J = 8.6 Hz, 2H), 4.48 (q, J = 14.14 Hz, 2H), 2.33
(s, 3H), 1.46 (t, J = 7.07 Hz, 3H); 13C NMR (CDCl3,
100 MHz): d 163.0, 142.3, 140.9, 139.3, 134.7, 131.3, 128.9,
128.0, 127.9, 127.0, 125.4, 120.0, 60.8, 14.4, 9.7; HRMS-
ESI (m/z) Calcd. C19H17O2N2ClNa: 363.0871 found:
363.0868.
Preparation of 5-(4-Chlorophenyl)-1-(2,4-dichlorophenyl)-
4-methyl-1H-pyrazole-3-carboxylic acid (2) A mixture of
lithium salt of ethyl 4-(4-chlorophenyl)-3-methyl-4-oxydo-
2-oxobuten-3-oate (B, 1.0 g, 3.6 mmol), ethanol (25 ml),
2,4-dichlorophenyl hydrazine hydrochloride (0.777 g,
3.6 mmol), and 50 % sulfuric acid (10 ml) was refluxed for
6 h. After the reaction was complete (TLC), ethanol was
removed under reduced pressure, and again, a second in-
stallment of 50 % sulfuric acid (20 ml) was added, fol-
lowed by refluxing for 8 h. The reaction mixture was
cooled to room temperature (35 �C) and was poured onto
crushed ice, stirred for 15 min, filtered and washed with
water (20 ml). The wet solid so obtained was stirred with
water (30 ml), and the pH was adjusted to [10 with 20 %
dil. NaOH. This aqueous layer was washed with petroleum
ether. The aqueous layer was separated, cooled to 0 �C, and
pH was adjusted to 2.0 by concentrated hydrochloric acid.
Solid so obtained was filtered, washed with water (100 ml)
and dried to afford 2 (Kotagiri et al., 2007), (0.923 mg,
65 %), Off white solid, mp 208–209 �C; 1H NMR (CDCl3,
Med Chem Res
123
400 MHz): d 7.44–7.41 (m, 1H), 7.35 (d, J = 1.89 Hz,
1H), 7.33–7.28 (m, 3H), 7.09 (d, J = 8.47 Hz, 2H), 2.36 (s,
3H); 13C NMR (CDCl3, 100 MHz): d 166.4, 143.3, 136.2,
135.6, 135.1, 133.5, 130.8, 130.5, 129.8, 128.9, 127.8,
127.7, 126.7, 119.6, 9.6; HRMS-ESI (m/z) Calcd.
C17H11O2N2Cl3Na: 402.9778 found: 402.9781.
Preparation of 5-(4-Chlorophenyl)-4-methyl-1-phenyl-1H-
pyrazole-3-carboxylic acid (7) Compound 7 was synthe-
sized by the procedure applied for 2. Pale brown solid:
719 mg, 58 %; mp 203–204 �C; 1H NMR (CDCl3,
200 MHz): d 7.46 (s, 1H), 7.32–7.38 (m, 5H), 7.30–7.20
(m, 2H), 7.13 (d, J = 6.36 Hz, 2H), 2.35 (s,3H); 13C NMR
(CDCl3, 400 MHz): d 165.9, 141.3, 140.9, 139.0, 134.9,
131.3, 129.0, 128.2, 127.6, 125.4, 125.1, 120.5, 9.6;
HRMS-ESI (m/z) Calcd. C17H13O2N2ClNa: 335.0571
found: 335.0566.
Preparation of 1-(2,4-dichlorophenyl)-4-methyl-5-phenyl-
1H-pyrazole-3-carboxylic acid (9) Compound 9 was
synthesized by the procedure applied to 2. Cream solid:
865 mg, 59 %; mp 188–189 �C; 1H NMR (CDCl3,
400 MHz): d 7.46 (s, 1H), 7.16–7.27 (m, 5H), 7.08 (s, 2H),
6.02 (s, 1H), 2.17 (s, 3H); 13C NMR (CDCl3, 100 MHz): d167.2, 145.6, 136.0, 135.1, 132.2, 131.2, 130.8, 129.6, 129.1,
128.5, 128.3, 128.2, 127.8, 118.0, 9.7; HRMS-ESI (m/z)
Calcd. C17H12O2N2Cl2Na: 369.0168 found: 369.0164.
Preparation of 5-(4-chlorophenyl)-4-methyl-1H-pyrazole-
3-carboxylic acid (11) Compound 11 was synthesized by
the procedure applied to 2. Cream solid; 387 mg, 45 %; mp
288–290 �C; 1H NMR (DMSO-d6, 500 MHz): d 13.54 (s,
1H), 7.89, (d, J = 8.24 Hz, 2H), 7.77 (d, J = 8.24 Hz,
2H), 2.61 (s, 3H); 13C NMR (DMSO-d6, 125 MHz): d162.4, 132.7, 130.9, 129.4, 128.9, 128.5, 117.0, 60.5, 9.9;
HRMS-ESI (m/z) Calcd. C11H9O2N2ClNa: 259.0245
found: 259.0243.
Preparation of 1-(2-chlorophenyl)-5-(4-chlorophenyl)-4-
methyl-1H-pyrazole-3-carboxylic acid (12) Compound
12 was synthesized by the procedure applied to 2. Pale
yellow solid: 656 mg, 52 %; mp 204–206 �C; 1H NMR
(CDCl3, 200 MHz): d 7.33–7.42 (m, 4H), 7.26 (d,
J = 6.41 Hz, 2H), 7.04 (d, J = 7.79 Hz, 2 H), 2.32 (s,
3H);13C NMR (CDCl3, 100 MHz): d 165.6, 143.3, 141.7,
136.9, 134.9, 131.9, 130.9, 130.3, 130.0, 129.8, 128.8
127.5, 126.9, 119.4, 9.6; HRMS-ESI (m/z) Calcd.
C17H12O2N2Cl2Na: 369.0168 found: 369.0168.
Preparation of 5-(4-chlorophenyl)-1-(2,4-difluorophenyl)-
4-methyl-1H-pyrazole-3-carboxylic acid (13) Compound
13 was synthesized by the procedure applied to 2. Pale brown
solid; 781 mg, 62 %; mp 196–198 �C; 1H NMR (CDCl3,
500 MHz): d 9.31 (bs, 1H), 7.44 (s, 1H), 7.27 (d,
J = 8.46 Hz, 2H), 7.03 (d, J = 8.46 Hz, 2H), 6.87 (s, 1H),
6.72 (s, 1H), 2.25 (s, 3H); 13C NMR (CDCl3, 125 MHz): d161.7, 157.5, 155.5, 143.1, 135.0, 130.7, 130.0, 128.9, 127.0,
123.7, 119.5, 112.1, 111.9, 104.8, 9.6; HRMS-ESI (m/z)
Calcd. C17H11O2N2ClF2Na: 371.0369 found: 371.0369.
Procedure for the synthesis of 5-(4-Chlorophenyl)-1-(2,4-
dichlorophenyl)-4-methyl-N-(piperidin-1-yl)-1H-pyrazole-
3-carboxamide 1 To a stirred solution of 2 (382 mg;
1.0 mmol) in toluene (10 ml), one drop of dimethyl for-
mamide was added. The reaction mixture was cooled to
0 �C and thionyl chloride (140 mg: 1.2 mmol) in 2 ml
toluene was added dropwise for the period of 2 min at the
same temperature. The reaction mixture was allowed to
attain room temperature and heated at 100 �C for 4 h.
Excess of thionyl chloride and toluene was distilled off
under reduced pressure. In another flask under nitrogen
atmosphere was introduced 1-aminopiperidine (100 mg;
1.0 mmol) and triethyl amine (101 mg; 1.0 mmol) in
5.0 ml dichloromethane. The flask was cooled to 0 �C. To
this was added a cooled solution of acid chloride dropwise
at the same temperature. The resulting reaction mixture
was allowed to attain room temperature, and then, it was
stirred for 12 h. After completion of the reaction (mon-
itored by TLC), the reaction mixture was diluted with
water (10 ml) and organic layer was separated, washed
with water (2 9 5 ml) and brine solution (5 ml), dried over
Na2SO4 and concentrated in vacuo. The residue was puri-
fied by column chromatography over silica gel (ethyl ac-
etate/petroleum ether 1:9 (v/v)) afforded pure product.
White solid: 292 mg, 63 %; mp 182–183 �C;1H NMR
(CDCl3, 400 MHz): d 7.63 (s,1H), 7.41–7.36 (m, 1H),
7.30–7.26 (m, 3H), 7.04 (d, J = 8.28 Hz, 2H), 2.93–2.78
(m, 4H), 2.35 (s, 3H), 1.78–1.70 (m, 4H), 1.48–1.37 (m,
2H);13C NMR (CDCl3, 100 MHz): d 159.9, 144.4, 142.9,
136.0, 135.9, 134.9, 132.9, 130.8, 130.6, 130.3, 128.9,
127.9, 127.2, 118.2, 57.0, 25.4, 23.3, 9.3; HRMS-ESI (m/z)
Calcd. C22H22ON3Cl3 ? H)?: 463.0854 found:463.0853.
N0-(5-(4-chlorophenyl)-1-(2,4-dichlorophenyl)-4-methyl-
1H-pyrazole-3-carbonyl) isonicotinohydrazide (4) Com-
pound 4 was synthesized according to the procedure ap-
plied to 1. Off white solid: 499 mg, 59 %; mp 237–239 �C;1H NMR (CDCl3, 400 MHz): d 10.33 (s,1H), 9.44 (s, 1H),
8.71 (s, 1H), 7.74 (s, 2H), 7.41 (s, 1H), 7.30–7.32 (m, 5H),
7.05 (d, J = 8.53 Hz, 2H), 2.17 (s, 3H); 13C NMR (CDCl3,
100 MHz): d 163.5, 161.2, 150.2, 143.3, 142.4, 136.2,
135.6, 135.2, 132.7, 130.7, 130.5, 130.3, 128.9, 128.8,
127.9, 126.7, 118.4, 30.9, 9.2; HRMS-ESI (m/z) C23H16-
O2N5Cl3 ? H)?: Calcd. 500.0442 found: 500.0443.
(5-(4-chlorophenyl)-1-(2,4-dichlorophenyl)-4-methyl-1H-
pyrazol-3-yl)(4-methylpiperazin-1-yl) methanone (5) Com-
pound 5 was synthesized according to the procedure ap-
plied to 1. Brown solid; 306 mg, 50 %; mp 111–113 �C;
Med Chem Res
123
1H NMR (CDCl3, 400 MHz): d 7.48 (s, 1H), 7.31–7.34 (m,
3H), 7.20 (d, J = 8.54 Hz, 1H), 7.10 (d, J = 8.28 Hz, 2H),
3.99–3.80 (m, 4H), 2.61–2.45 (m, 4H), 2.37 (s, 3H), 2.24
(s, 3H); 13C NMR (CDCl3, 100 MHz): d 163.2, 146.4,
141.9, 135.9, 135.7, 134.8, 133.0, 130.6, 128.9, 127.8,
127.3, 116.8, 55.5, 54.7, 47.1, 45.9, 41.9, 9.0; HRMS-ESI
(m/z) C22H21ON4Cl3 ? H) ? :Calcd. 463.0854 found:
463.0862.
(5-(4-chlorophenyl)-1-(2,4-dichlorophenyl)-4-methyl-1H-
pyrazol-3-yl) (morpholino) methanone (6) Compound 6
was synthesized according to the procedure applied to 1.
Cream yellow solid: 590 mg, 63 %; mp 170–172 �C;1H
NMR (CDCl3, 500 MHz): d 7.47 (d, J = 2 Hz, 1H), 7.33 (d,
J = 8.54 Hz, 2H), 7.27–7.30 (m, 1H), 7.19 (d, J = 8.55 Hz,
1H), 7.09 (d, J = 8.54 Hz, 2H), 3.85–3.92 (m, 4H),
3.75–3.83 (m, 4H), 2.25 (s, 3H); 13C NMR (CDCl3,
125 MHz): d 163.2, 146.0, 142.1, 135.9, 135.8, 134.9, 133.0,
130.6, 130.5, 130.3, 128.9, 127.8, 127.3, 117.2, 67.3, 66.9,
47.8, 42.6, 9.1; HRMS-ESI (m/z) C21H18O2N3Cl3Na:Calcd.
472.0357 found: 472.0355.
N0-(1-(2,4-dichlorophenyl)-4-methyl-5-phenyl-1H-pyrazole-
3-carbonyl)isonicotinohydrazide (10) Compound 10 was
synthesized according to the procedure applied to 1. White
solid: 273 mg, 68 %; mp 167–168 �C; 1H NMR (CDCl3,
400 MHz): d 10.28 (bs, 1H), 9.43 (s, 1H), 8.71 (bs, 1H),
7.75 (s, 1H), 7.41 (d, J = 1.47, 2H), 7.28–7.34 (m, 5H),
7.14 (d, J = 4.40, 2H), 7.01–7.04 (m, 1H) 2.33 (s,3H); 13C
NMR (CDCl3, 100 MHz): d 163.4, 161.2, 150.3, 144.4,
142.3, 138.8, 135.9, 135.8, 132.8, 130.5, 130.2, 129.5,
128.9, 128.6, 128.2, 127.8, 121.2, 118.3, 9.3; HRMS-ESI
(m/z) C23H17O2N5Cl2 ? H)?: Calcd. 466.0832 found:
463.0830.
5-(4-chlorophenyl)-4-methyl-1-phenyl-N-(piperidin-1-yl)-
1H-pyrazole-3-carboxamide (14) Compound 14 was
synthesized according to the procedure applied to 1. White
solid; 580 mg, 65 %; mp 201–202 �C; 1H NMR (CDCl3,
400 MHz): d 7.77 (bs, 1H), 7.33 (d, J = 7.27 Hz, 5H),
7.21 (d, J = 7.78 Hz, 2H), 7.08 (d, J = 8.28 Hz, 2H),
2.98–2.79 (m, 4H), 2.35 (s, 3H), 1.85–1.68 (m, 4H),
1.52–1.38 (m, 2H); 13C NMR (CDCl3, 100 MHz): d 160.1,
143.5, 140.9, 139.3, 134.6, 131.2, 129.0, 128.9, 128.0,
127.9, 125.0, 119.1, 57.1, 25.4, 23.3, 9.3; HRMS-ESI (m/z)
C22H23ON4Cl ? H)?: Calcd. 395.1633 found: 395.1631.
1-(2-chlorophenyl)-5-(4-chlorophenyl)-4-methyl-N-(piperid-
in-1-yl)-1H-pyrazole-3-carboxamide (15) Compound 15
was synthesized according to the procedure applied to 1.
Yellow solid: 207 mg, 42 %; mp 248–250 �C; 1H NMR
(CDCl3, 200 MHz): d 7.69 (bs, 1H), 7.37–7.30 (m,
1H),7.29–7.24 (m, 2H), 7.23–7.15 (m, 3H), 6.98 (d,
J = 8.71 Hz, 2H), 2.95–2.72 (m, 4H), 2.30 (s,3H),
1.78–1.61 (m, 4H), 1.45–1.29 (m, 2H); 13C NMR (CDCl3,
100 MHz): d 160.3, 143.4, 141.1, 136.5, 135.0, 131.5,
130.9, 130.8, 130.3, 129.8, 128.8, 127.7, 126.6, 118.3,
55.7, 23.8, 21.1, 9.2; HRMS-ESI (m/z) C22H22ON4-
Cl2 ? H)?: Calcd. 429.1243 found: 429.1246.
(5-(4-chlorophenyl)-1-(2,4-difluorophenyl)-4-methyl-1H-pyra-
zol-3-yl)(4-methylpiperazin-1-yl) methanone (16) Com-
pound 16 was synthesized according to the procedure
applied to 1. White solid; 518 mg, 84 %; mp 174–176 �C;1H NMR (CDCl3, 200 MHz): d 7.30–7.24 (m, 1H),
7.24–7.20 (m, 2H), 7.06–6.96 (m, 2H), 6.91–6.69 (m, 2H),
3.91–3.63 (m, 4H), 2.56–2.34 (m, 4H), 2.29 (s, 3H), 2.12
(s, 3H); 13C NMR (CDCl3, 50 MHz): d 163.2, 146.6,
141.9, 134.8, 130.5, 129.7, 128.8, 127.4, 124.1, 116.8,
112.1, 111.6, 105.0, 104.5, 55.5, 54.7, 47.0, 45.9, 41.8, 8.9;
HRMS-ESI (m/z) C22H21ON4ClF2 ? H)?: Calcd.
431.1445 found: 431.1447.
5-(4-chlorophenyl)-4-methyl-N-(piperidin-1-yl) isoxazole-
3-carboxamide (17) Compound 17 was synthesized ac-
cording to the procedure applied to 1. White solid: 240 mg,
45 %; mp 103–104 �C; 1H NMR (CDCl3, 500 MHz): d7.63–7.64 (d, J = 8.24 Hz, 1H), 7.57–7.58 (d,
J = 8.24 Hz, 1H), 7.47–7.49 (d, J = 8.24 Hz, 2H),
2.99–2.81 (m, 4H), 2.45 (s, 3H), 1.85–1.71 (m, 4H),
1.53–1.41 (m, 2H); 13C NMR (CDCl3, 125 MHz): d 165.8,
163.0, 157.3, 156.4, 136.1, 129.2, 126.0, 111.7, 56.9, 25.2,
23.1, 8.3; HRMS-ESI (m/z) C16H18O2N3Cl ? H)?: Calcd.
320.1160 found: 320.1161.
1-(2,4-dichlorophenyl)-4-methyl-5-phenyl-N-(piperidin-1-
yl)-1H-pyrazole-3-carboxamide (18) Compound 18 was
synthesized according to the procedure applied to 1. Pale
brown solid: 288 mg, 61 %; mp 172–173 �C; 1H NMR
(CDCl3, 400 MHz): d 7.72 (s, 1H), 7.41 (s, 1H), 7.27–7.32
(m, 5H), 7.11 (s, 2H), 3.05–2.75 (m, 4H), 2.38 (s, 3H),
1.91–1.65 (m, 4H), 1.54–1.34 (m, 2H); 13C NMR (CDCl3,
100 MHz): d 160.1, 144.2, 144.0, 136.1, 135.7, 133.0,
130.6, 130.2, 129.5, 128.6, 128.6, 128.4, 127.7, 117.9,
57.0, 25.3, 23.2, 9.3; HRMS-ESI (m/z) C22H22ON4-
Cl2 ? H)?: Calcd. 429.1243 found: 429.1244.
5-(4-chlorophenyl)-1-(2,4-dichlorophenyl)-N-(piperidin-1-yl)-
1H-pyrazole-3-carboxamide (19) Compound 19 was syn-
thesized from the corresponding acid according to the
procedure applied to 1. Cream solid: 199 mg, 53 %; mp
139–140 �C; 1H NMR (CDCl3, 400 MHz): d 7.61 (d,
J = 2.29 Hz, 1H), 7.57 (s, 1H), 7.55 (d, J = 2.29 Hz, 1H),
7.53 (d, J = 1.83 Hz, 1H), 7.42 (d, J = 9.15 Hz, 2H), 7.26
(d, 2H), 7.23 (s, 1H), 3.35–3.19 (m, 4H), 2.01–1.95 (m,
4H), 1.70–1.59 (m, 2H); 13C NMR (CDCl3, 100 MHz): d158.8, 146.8, 145.6, 136.3, 135.7, 135.1, 132.8, 130.5,
130.4, 129.1, 129.0, 128.2, 127.3, 107.5, 56.8, 24.9, 22.7;
HRMS-ESI (m/z) C21H19ON4Cl3 ? H)?: Calcd. 449.0697
found: 449.0701.
Med Chem Res
123
Anti-mycobacterial activity assay (Abreu et al., 2012;
Stigliani et al., 2012; Handoko et al., 2012; Tiwari
et al., 2012; NCCLS, 1995)
Isolated single colonies of M. smegmatis MC2155 (ATCC
14468) grown on 7H10 agar plate were developed over-
night in Middlebrook 7H9 medium (0.47 % Middlebrook
7H9 broth base, 10 % ADS, 0.2 % glycerol and 0.1 %
Tween 80) to mid-exponential phase at 37 �C. When the
OD of this culture reached approximately 0.8, a secondary
culture was inoculated in 5 ml Middlebrook 7H9 medium.
The secondary culture was incubated overnight and al-
lowed to grow at 37 �C to early log phase (OD600 & 0.3).
For the anti-mycobacterial assay, 98 ll of 1:1000-folds
dilution of the secondary culture was dispensed into
96-well microtiter plate per well along with 2 ll of test
compound in triplicate, and 240 ll of sterile water was
added to each well of the peripheral rows of 96-well plate
to minimize media evaporation during assay incubation.
The final concentration of the test compound in each well
was 30 lM. Bacterial growth was assessed after 32 h of
incubation by measuring turbidity at 600 nm OD600 values
using TECAN Infinite 200 PROTM (Tecan Instruments,
Switzerland). Depending upon the percentage of growth,
the percentage of inhibition was calculated at a standard
concentration of 30 lM. Isoniazid and rifampicin were
included in every assay plate as positive controls of growth
inhibition using stock solutions of INH (10 mg/ml,
HiMedia) and rifampicin (10 mg/ml, HiMedia) to achieve
the final concentration of 16 lg/ml for INH and 2 lg/ml
for rifampicin. Additional controls DMSO (solvent without
compound) and medium without inoculums were included
in all the assay plates avoiding intra-assay variability. The
results were analyzed as the percentage of growth
inhibition.
MIC Assay (Abreu et al., 2012; Stigliani et al., 2012;
Handoko et al., 2012; Tiwari et al., 2012; NCCLS,
1995)
After the compounds were screened for percentage inhibi-
tion, the promising compounds were further screened to
obtain the MIC values. Minimum inhibitory concentration
(MIC) is the concentration of compound which inhibits the
90 % growth of bacteria under optimum conditions. The
growth inhibition assays were carried out in the same ana-
logy as explained above using various concentrations of the
test compounds prepared by serial dilutions 100, 50, 25, 12.5
and 6.25 lM to obtain the final concentrations of 46.37,
23.18, 11.59, 5.79 and 2.89 lg/ml, respectively. From the
rate of inhibition bacterial growth, the ascertained MIC of the
compound was calculated. The MIC value of the test com-
pound 1 (rimonabant) is 13.56 lg/ml (29.24 lM ± 1.47).
In vitro anti-mycobacterial activity against M. tubercu-
losis H37Rv (MTB) (Abreu et al., 2012; Stigliani et al.,
2012; Handoko et al., 2012; Tiwari et al., 2012; NCCLS,
1995).
MTB H37Rv strain was obtained from National Institute
for Research in Tuberculosis (NIRT), Chennai. Tenfold
serial dilutions of each test compound were prepared and
incorporated into Middlebrook 7H11 agar medium with
OADC growth supplement. Inoculation of M. tuberculosis
H37Rv ATCC 27294 (MTB) was prepared from fresh
Middlebrook 7H11 slants with OADC growth supplement
and was adjusted to 1 mg/ml (wet weight) in Tween 80
(0.05 %) saline diluted to 10–2 to achieve a concentration
of *107 cfu/ml (culture forming units). Then, a bacterial
suspension of 5 ll was spotted in 7H11 agar tubes having
tenfold serial dilutions of compounds per ml. Cultures were
then incubated at 37 �C for 4 weeks. The MIC values of
the synthesized compounds along with the standard drugs
for comparison are tabulated in Table 1.
Experimental methodology for molecular docking
analysis
For molecular docking, the structures were drawn using
ChemDraw 12 followed by MMFF94 optimization using
the default settings. The crystallographic coordinates of
CYP121 (pdb id: 2IJ7) from M. tuberculosis were obtained
from protein data bank (www.rcsb.org). For CYP121 of M.
tuberculosis, we opted for pdb-2IJ7 for docking, because it
has been crystallized with fairly good resolution (1.90 A)
with fluconazole as a ligand. For docking analysis, the
standard procedure mentioned in literature (Abreu et al.,
2012; Stigliani et al., 2012; Handoko et al., 2012; Tiwari
et al., 2012; Masand et al., 2013) was followed using
AutoDock 4.2, running under Linux Ubuntu 12.04.
Acknowledgments JMG gratefully acknowledges CSIR-OSDD,
CSIR-ORIGIN and DST-SERB, for the financial support.
References
Abreu RM, Froufe HJ, Queiroz MJ, Ferreira IC (2012) Selective
flexibility of side-chain residues improves VEGFR-2 docking
score using AutoDock Vina. Chem Biol Drug Des 79(4):530–534
Belin P, Le Du MH, Fielding A, Lequin O, Jacquet M, Charbonnier
JB, Lecoq A, Thai R, Courcon M, Masson C, Dugavet R,
Pernodet JL, Gondry M (2009) Identification and structural basis
of the reaction catalyzed by CYP121, an essential cytochrome
P450 in Mycobacterium tuberculosis. Proc Natl Acad Sci USA
106(18):7426–7431
Chiang CY, Schaaf HS (2010) Management of drug-resistant
tuberculosis. Int J Tuberc LungDis 14:672–682
Corbett EL, Watt CJ, Walker N, Maher D, Williams BG, Raviglione
MC, Dye C (2003) The growing burden of tuberculosis: global
Med Chem Res
123
trends and interactions with the HIV epidemic. Arch Intern Med
163(9):1009–1021
Dumas VG, Defelipe LA, Petruk AA, Turjanski AG, Marti MA
(2013) QM/MM study of the C–C coupling reaction mechanism
of CYP121, an essential cytochrome p450 of mycobacterium
tuberculosis. Proteins 82(6):1004–1021
Elzinga G, Raviglione MC, Maher D (2004) Scale up: meeting targets
in global tuberculosis control. Lancet 363(9411):814–819
Handoko SD, Ouyang X, Su CT, Kwoh CK, Ong YS (2012)
QuickVina: accelerating AutoDock Vina using gradient-based
heuristics for global optimization. IEEE/ACM Trans Comput
Biol Bioinform. 9(5):1266–1272
Hudson SA, McLean KJ, Surade S, Yang Y-Q, Leys D, Ciulli A,
Munro AW, Abell C (2012) Application of fragment screening
and merging to the discovery of inhibitors of the mycobacterium
tuberculosis cytochrome P450 CYP121. Angew Chem Int Ed
51(37):9311–9316
Jagerovic N, Fernandez-Fernandez C, Goya P (2008) CB1 cannabi-
noid antagonists: structure-activity relationships and potential
therapeutic applications. Curr Top Med Chem 8(3):205–230
Kang JG, Park CY (2012) Anti-obesity drugs: a review about their
effects and safety. Diabetes Metab J 36(1):13–25
Kotagiri VK, Suthrapu S, Mukunda Reddy J, Prasad Rao C,
Bollugoddu V, Bhattacharya A, Bandichor R (2007) An
improved synthesis of rimonabant: anti-obesity drug. Org Proc
Res Dev 11:910–912
Kumar V, Kaur K, Gupta GK, Sharma AK (2013) Pyrazole containing
natural products: synthetic preview and biological significance.
Eur J Med Chem 69:735–753
Lan R, Liu Q, Fan P, Lin S, Fernando SR, McCallion D, Pertwee R,
Makriyannis A (1999) Structure-activity relationships of pyra-
zole derivatives as cannabinoid receptor antagonists. J Med
Chem 42(4):769–776
Lange JH, Kruse CG (2005) Keynote review: medicinal chemistry
strategies to CB1 cannabinoid receptor antagonists. Drug Discov
Today 10(10):693–702
Masand VH, Jawarkar RD, Mahajan DT, Hadda TB, Sheikh J, Patil
KN (2012) QSAR and CoMFA studies of biphenyl analogs of
the anti-tuberculosis drug (6S)-2-nitro-6-{[4-(trifluoromethoxy)
benzyl]oxy}-6,7-dihydro-5H-imidazo[2,1-b][1,3]oxazine(PA-
824). Med Chem Res 21:2624–2629
Masand VH, Mahajan DT, Hadda TB, Jawarkar RD, Chavan H,
Bandgar BP, Chauhan H (2013) Molecular docking and
quantitative structure–activity relationship (QSAR) analyses of
indolylarylsulfones as HIV-1 non-nucleoside reverse transcrip-
tase inhibitors. Med Chem Res 23(1):417–425
McLean KJ, Marshall KR, Richmond A, Hunter IS, Fowler K, Kieser
T, Gurcha SS, Besra GS, Munro AW (2002) Azole antifungals
are potent inhibitors of cytochrome P450 mono-oxygenases and
bacterial growth in mycobacteria and streptomycetes. Microbi-
ology 148:2937–2949
Menozzi G, Merello L, Fossa P, Schenone S, Ranise A, Mosti L,
Bondavalli F, Loddo R, Murgioni C, Mascia V, La Colla P,
Tamburini E (2004) Synthesis, antimicrobial activity and
molecular modeling studies of halogenated 4-[1H-imidazol-1-
yl(phenyl)methyl]-1,5-diphenyl-1H-pyrazoles. Bioorg Med
Chem 12(20):5465–5483
Moore AV, Kirk SM, Callister SM, Mazurek GH, Schell RF (1999)
Safe determination of susceptibility of Mycobacterium tubercu-
losis to antimycobacterial agents by flow cytometry. J. Clin
Microbio 37(3):479–483
NCCLS-National Committee for Clinical Laboratory Standards
(1995) Antimycobacterial susceptibility testing for Mycobac-
terium tuberculosis proposed standard M24-T. Villanova, PA
Nunn P, Williams B, Floyd K, Dye C, Elzinga G, Raviglione M
(2005) Tuberculosis control in the era of HIV. Nature Rev
Immunol 5(10):819–826
Shukla D, Mesfin YM, Hailemariam D, Biadglign S, Kibret KT
(2014) Association between HIV/AIDS and multi-drug resis-
tance tuberculosis: a systematic review and meta-analysis. PLoS
ONE 9(1):e82235
Stigliani JL, Bernardes-Genisson V, Bernadou J, Pratviel G (2012)
Cross-docking study on InhA inhibitors: a combination of
Autodock Vina and PM6-DH2 simulations to retrieve bio-active
conformations. Org Bio-Mol Chem 10(31):6341–6349
Sundaramurthi JC, Kumar S, Silambuchelvi K, Hanna LE (2011)
Molecular docking of azole drugs and their analogs on CYP121
of mycobacterium tuberculosis. Bioinformation 7(3):130–133
Tiwari A, Saxena S, Pant AB, Srivastava P (2012) Protein-ligand
interaction studies of retinol-binding protein 3 with herbal
molecules using AutoDock for the management of Eales’
disease. J Ocul Biol Dis Infor 5(2):40–43
www.who.int/topics/tuberculosis/en/, Global Tuberculosis Report
2013, in, 2013
www.who.int/topics/tuberculosis/en/, Tuberculosis prevalence sur-
veys: a handbook, in, 2011
Med Chem Res
123
STUDIES OF ULTRASONIC AND VISCOMETRIC BEHAVIOR OF
AZITHROMYCIN WITH DIFFERENT SOLVENT SYSTEMS DIOXANE-WATER
AND METHANOL-WATER MIXTURE AT 305.15 K
S.A.Quazi1, D.T.Mahajan1, Noor Mohammad2, M.L.Narwade1, Vijay Masand1, M.R. Ingle3
1Department of Chemistry VidyaBharti Mahavidyalaya, Camp, Amravati (M.S) India. 2Department of Chemistry Govt.Vidarbha Institute of Sci. and Humanities, Amravati (M.S) India.
3Department of Chemistry G.S College, Khamgaon (M.S.) India.
ABSTRACT
Antibiotic drug Azithromycin is mainly used for treatments of infectious disease caused by bacteria such as respiratory,skin,ear and sexually transmitted diseases such great importance of azithromycine in human life the densities, ultrasonic velocities and viscosities of azithromycine have been evaluated in different concentrations in 70% dioxane-water and 70% methanol-water mixtures at 305.15 K. Experimental data of sound velocities and densities of solutions in 70% dioxane-water helps to determine the various acoustical parameters such as adiabatic compressibility, apparent molal volumes, intermolecular free length, specific acoustic impedance, relative association etc. for evaluating the molecular interactions present in different solutions were studied.
Keywords: Azithromycin drug, dioxane water and viscometric measurements.
INTRODUCTION
In the fields of medicinal, industrial, biochemistry etc the study of molecular interactions between solutes molecule and solvent media has got great importance. It also helps the study of solute solvent and solvent-solvent interactions can by the measurement of relative viscosity and ultrasonic velocity of an electrolyte in solutions1-3. Many workers have presented the viscosity in different concentrations of ligand solutions in various solvents4-13.The apparent and partial molar volumes of electrolyte solutions very important parameter for eluciding the ion-ions, ion-solvent and solute-solvent interactions in solution.
EXPERIMENTAL SECTION
The chemicals used were of AR grade and were purified by standard methods. Requisite amount of chemicals weighing was done by using electronic balance.By using the Pyknometers the densities of solutions were determined, which was standardized by the standard procedure. Ostwald’s Viscometer was used for measurements of viscosity which was kept in elite thermostatic water bath (±0.1°C). The ultrasonic velocity of solution and solvent was determined by using single crystal interferometer (Mittal Enterprises, Model F-81) with accuracy of ± 0.03% and 2 MHz frequency.
RESULTS AND DISCUSSION
Acoustic parameters, densities and relative viscosities have been determined for all the solutions and were calculated by using different equations14 and are presented in the following Table -I. After observing the table, the relative viscosity increases with increase in the concentration of solute that means increasing solute-solvent interactions, same results evaluated by different workers15-19.
S.A.Quazi et al. / International Journal of Pharma Sciences and Research (IJPSR)
ISSN : 0975-9492 Vol 6 No 01 Jan 2015 143
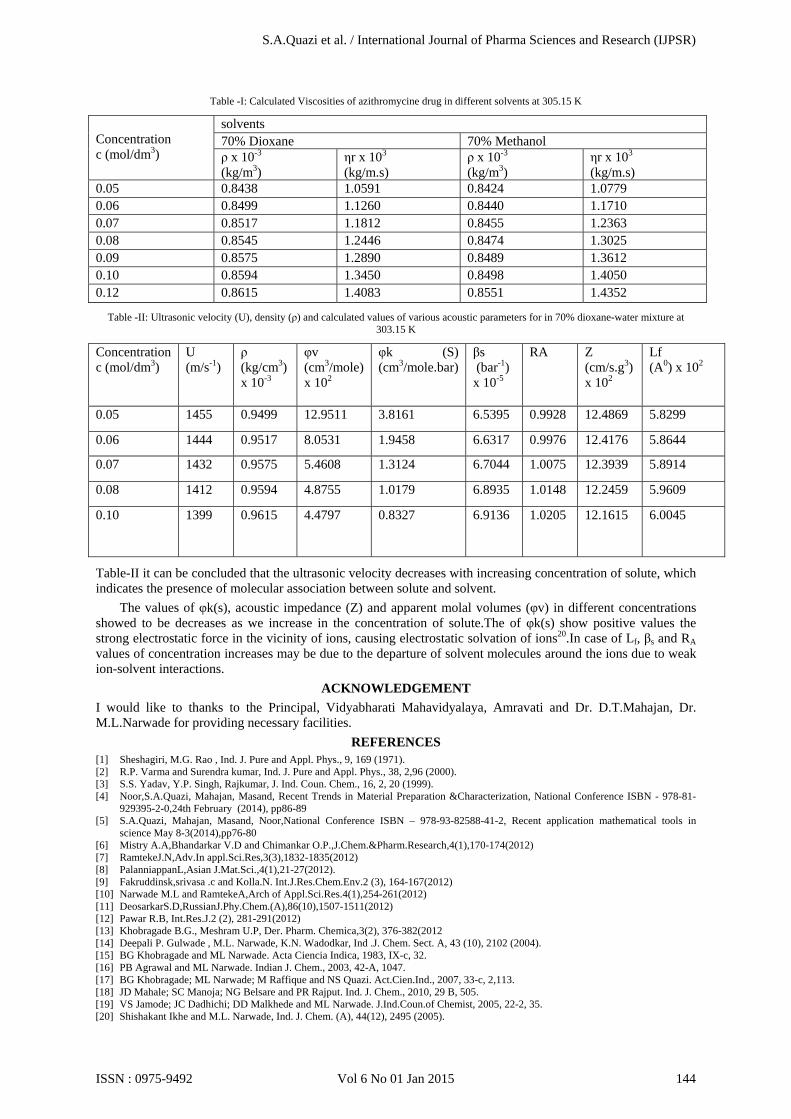
Table -I: Calculated Viscosities of azithromycine drug in different solvents at 305.15 K
Concentration c (mol/dm3)
solvents 70% Dioxane 70% Methanol ρ x 10-3 (kg/m3)
ηr x 103 (kg/m.s)
ρ x 10-3 (kg/m3)
ηr x 103 (kg/m.s)
0.05 0.8438 1.0591 0.8424 1.0779 0.06 0.8499 1.1260 0.8440 1.1710 0.07 0.8517 1.1812 0.8455 1.2363 0.08 0.8545 1.2446 0.8474 1.3025 0.09 0.8575 1.2890 0.8489 1.3612 0.10 0.8594 1.3450 0.8498 1.4050 0.12 0.8615 1.4083 0.8551 1.4352
Table -II: Ultrasonic velocity (U), density (ρ) and calculated values of various acoustic parameters for in 70% dioxane-water mixture at 303.15 K
Concentration c (mol/dm3)
U (m/s-1)
ρ (kg/cm3) x 10-3
φv (cm3/mole) x 102
φk (S) (cm3/mole.bar)
βs (bar-1) x 10-5
RA Z (cm/s.g3) x 102
Lf (A0) x 102
0.05 1455 0.9499 12.9511 3.8161 6.5395 0.9928 12.4869 5.8299
0.06 1444 0.9517 8.0531 1.9458 6.6317 0.9976 12.4176 5.8644
0.07 1432 0.9575 5.4608 1.3124 6.7044 1.0075 12.3939 5.8914
0.08 1412 0.9594 4.8755 1.0179 6.8935 1.0148 12.2459 5.9609
0.10 1399 0.9615 4.4797 0.8327 6.9136 1.0205 12.1615
6.0045
Table-II it can be concluded that the ultrasonic velocity decreases with increasing concentration of solute, which indicates the presence of molecular association between solute and solvent.
The values of φk(s), acoustic impedance (Z) and apparent molal volumes (φv) in different concentrations showed to be decreases as we increase in the concentration of solute.The of φk(s) show positive values the strong electrostatic force in the vicinity of ions, causing electrostatic solvation of ions20.In case of Lf, βs and RA values of concentration increases may be due to the departure of solvent molecules around the ions due to weak ion-solvent interactions.
ACKNOWLEDGEMENT
I would like to thanks to the Principal, Vidyabharati Mahavidyalaya, Amravati and Dr. D.T.Mahajan, Dr. M.L.Narwade for providing necessary facilities.
REFERENCES [1] Sheshagiri, M.G. Rao , Ind. J. Pure and Appl. Phys., 9, 169 (1971). [2] R.P. Varma and Surendra kumar, Ind. J. Pure and Appl. Phys., 38, 2,96 (2000). [3] S.S. Yadav, Y.P. Singh, Rajkumar, J. Ind. Coun. Chem., 16, 2, 20 (1999). [4] Noor,S.A.Quazi, Mahajan, Masand, Recent Trends in Material Preparation &Characterization, National Conference ISBN - 978-81-
929395-2-0,24th February (2014), pp86-89 [5] S.A.Quazi, Mahajan, Masand, Noor,National Conference ISBN – 978-93-82588-41-2, Recent application mathematical tools in
science May 8-3(2014),pp76-80 [6] Mistry A.A,Bhandarkar V.D and Chimankar O.P.,J.Chem.&Pharm.Research,4(1),170-174(2012) [7] RamtekeJ.N,Adv.In appl.Sci.Res,3(3),1832-1835(2012) [8] PalanniappanL,Asian J.Mat.Sci.,4(1),21-27(2012). [9] Fakruddinsk,srivasa .c and Kolla.N. Int.J.Res.Chem.Env.2 (3), 164-167(2012) [10] Narwade M.L and RamtekeA,Arch of Appl.Sci.Res.4(1),254-261(2012) [11] DeosarkarS.D,RussianJ.Phy.Chem.(A),86(10),1507-1511(2012) [12] Pawar R.B, Int.Res.J.2 (2), 281-291(2012) [13] Khobragade B.G., Meshram U.P, Der. Pharm. Chemica,3(2), 376-382(2012 [14] Deepali P. Gulwade , M.L. Narwade, K.N. Wadodkar, Ind .J. Chem. Sect. A, 43 (10), 2102 (2004). [15] BG Khobragade and ML Narwade. Acta Ciencia Indica, 1983, IX-c, 32. [16] PB Agrawal and ML Narwade. Indian J. Chem., 2003, 42-A, 1047. [17] BG Khobragade; ML Narwade; M Raffique and NS Quazi. Act.Cien.Ind., 2007, 33-c, 2,113. [18] JD Mahale; SC Manoja; NG Belsare and PR Rajput. Ind. J. Chem., 2010, 29 B, 505. [19] VS Jamode; JC Dadhichi; DD Malkhede and ML Narwade. J.Ind.Coun.of Chemist, 2005, 22-2, 35. [20] Shishakant Ikhe and M.L. Narwade, Ind. J. Chem. (A), 44(12), 2495 (2005).
S.A.Quazi et al. / International Journal of Pharma Sciences and Research (IJPSR)
ISSN : 0975-9492 Vol 6 No 01 Jan 2015 144
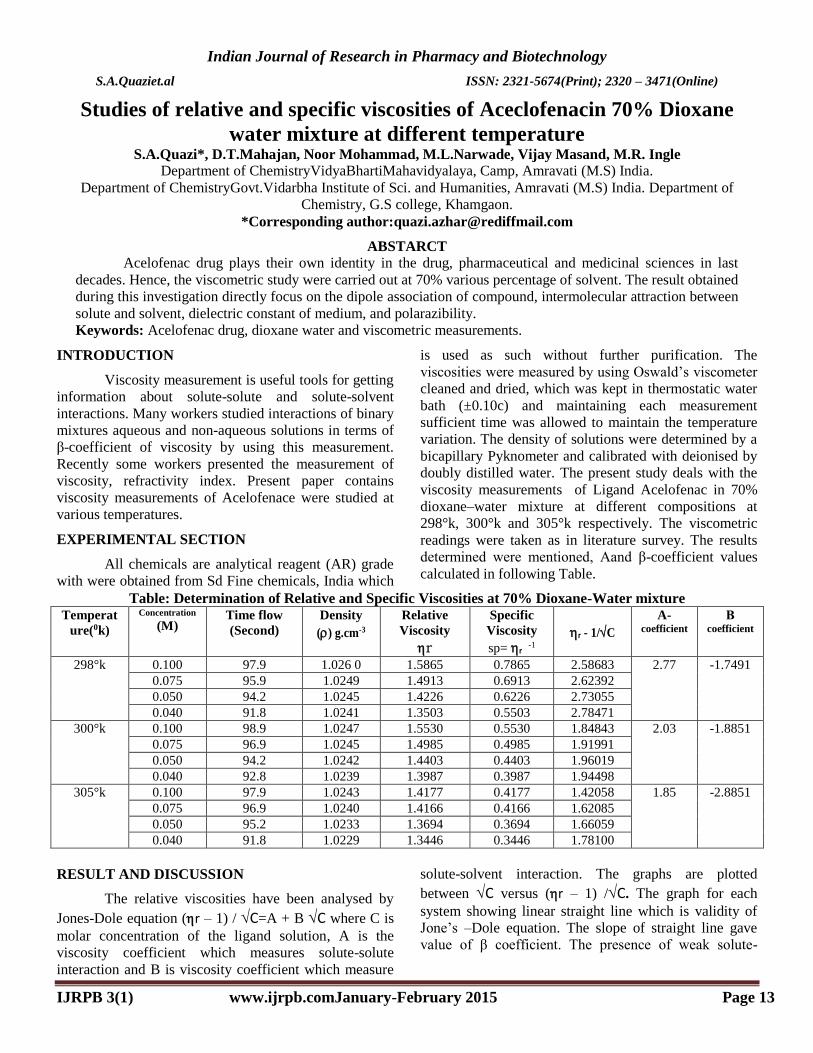
Indian Journal of Research in Pharmacy and Biotechnology
S.A.Quaziet.al ISSN: 2321-5674(Print); 2320 – 3471(Online)
IJRPB 3(1) www.ijrpb.comJanuary-February 2015 Page 13
Studies of relative and specific viscosities of Aceclofenacin 70% Dioxane
water mixture at different temperature S.A.Quazi*, D.T.Mahajan, Noor Mohammad, M.L.Narwade, Vijay Masand, M.R. Ingle
Department of ChemistryVidyaBhartiMahavidyalaya, Camp, Amravati (M.S) India.
Department of ChemistryGovt.Vidarbha Institute of Sci. and Humanities, Amravati (M.S) India. Department of
Chemistry, G.S college, Khamgaon.
*Corresponding author:[email protected]
ABSTARCT
Acelofenac drug plays their own identity in the drug, pharmaceutical and medicinal sciences in last
decades. Hence, the viscometric study were carried out at 70% various percentage of solvent. The result obtained
during this investigation directly focus on the dipole association of compound, intermolecular attraction between
solute and solvent, dielectric constant of medium, and polarazibility.
Keywords: Acelofenac drug, dioxane water and viscometric measurements.
INTRODUCTION
Viscosity measurement is useful tools for getting
information about solute-solute and solute-solvent
interactions. Many workers studied interactions of binary
mixtures aqueous and non-aqueous solutions in terms of
β-coefficient of viscosity by using this measurement.
Recently some workers presented the measurement of
viscosity, refractivity index. Present paper contains
viscosity measurements of Acelofenace were studied at
various temperatures.
EXPERIMENTAL SECTION
All chemicals are analytical reagent (AR) grade
with were obtained from Sd Fine chemicals, India which
is used as such without further purification. The
viscosities were measured by using Oswald’s viscometer
cleaned and dried, which was kept in thermostatic water
bath (±0.10c) and maintaining each measurement
sufficient time was allowed to maintain the temperature
variation. The density of solutions were determined by a
bicapillary Pyknometer and calibrated with deionised by
doubly distilled water. The present study deals with the
viscosity measurements of Ligand Acelofenac in 70%
dioxane–water mixture at different compositions at
298°k, 300°k and 305°k respectively. The viscometric
readings were taken as in literature survey. The results
determined were mentioned, Aand β-coefficient values
calculated in following Table.
Table: Determination of Relative and Specific Viscosities at 70% Dioxane-Water mixture Temperat
ure(0k)
Concentration
(M) Time flow
(Second)
Density
() g.cm-3
Relative
Viscosity
r
Specific
Viscosity
sp= r -1
r - 1/C
A- coefficient
Β coefficient
298°k 0.100 97.9 1.026 0 1.5865 0.7865 2.58683 2.77 -1.7491
0.075 95.9 1.0249 1.4913 0.6913 2.62392
0.050 94.2 1.0245 1.4226 0.6226 2.73055
0.040 91.8 1.0241 1.3503 0.5503 2.78471
300°k 0.100 98.9 1.0247 1.5530 0.5530 1.84843 2.03 -1.8851
0.075 96.9 1.0245 1.4985 0.4985 1.91991
0.050 94.2 1.0242 1.4403 0.4403 1.96019
0.040 92.8 1.0239 1.3987 0.3987 1.94498
305°k 0.100 97.9 1.0243 1.4177 0.4177 1.42058 1.85 -2.8851
0.075 96.9 1.0240 1.4166 0.4166 1.62085
0.050 95.2 1.0233 1.3694 0.3694 1.66059
0.040 91.8 1.0229 1.3446 0.3446 1.78100
RESULT AND DISCUSSION
The relative viscosities have been analysed by
Jones-Dole equation (r – 1) / C=A + B C where C is
molar concentration of the ligand solution, A is the
viscosity coefficient which measures solute-solute
interaction and B is viscosity coefficient which measure
solute-solvent interaction. The graphs are plotted
between C versus (r – 1) /C. The graph for each
system showing linear straight line which is validity of
Jone’s –Dole equation. The slope of straight line gave
value of β coefficient. The presence of weak solute-
Indian Journal of Research in Pharmacy and Biotechnology
S.A.Quaziet.al ISSN: 2321-5674(Print); 2320 – 3471(Online)
IJRPB 3(1) www.ijrpb.comJanuary-February 2015 Page 14
solvent interaction may be due to strong hydrogen
bonding.
CONCLUSION
From the results, it is observed that, the
concentration of ligand is directly proportional to density
and relative viscosity for ligand at temperature 298°k,
300°k and 305°k for 70% dioxane-water mixture. This
may be due to the weak solvation effect which shows
weak molecule interaction. The A and β-coefficient
values are negative indicating a weak solute-solvent
interaction which is good for interactions in between the
drug and the drug receptors indicate good drug activity
and effect which in favors of pharmacokinetics and
pharmacodynamics activity. The density and relative
viscosity for ligand is inversely proportional to
temperature of solution which shows weak the molecular
interactions.
It indicates that when the temperature of dioxane
water increases, weak solute-solvent interactions i.e.
interaction of ligand (drugs) and dioxane increases,
which may be stabilize the drug activity. From this it can
be concluded that the drug absorption, drug transmission
and drug effect of ligand is more effective at higher
temperature of dioxane water.
ACKNOWLEDGEMENT
I would like to thanks to the Principal, Vidya
Bharati Mahavidyalaya, Amravati and Dr. D.T.Mahajan,
Dr. M.L.Narwade for providing necessary facilities.
REFERENCE BG Khobragade; ML Narwade, M Raffique and NS
Quazi, Act.Cien.Ind., 2007, 2(33), 113
C.Y. Huang, Job Plot Method in Enzymology, 87, 1982,
509.
F. Karia, S. Baluja, Asian J. Chem., 12 (2), 2000, 593.
JD Mahale; SC Manoja; NG Belsare and PR Rajput, Ind.
J. Chem., 2010, 29, 505.
Jones G., and Doles M., J. Am. Chem. Soc., 51, 1929,
500-503.
Jones, G. and Dole, M, J. Am. Chem. Soc., 51, 1929,
2950.
Maccarthy, Patrick, Z.D. Hillz, J. Chemical Education,
63 (3), 1986, 162.
P. Job, Amnali di chimica Application, 9 (10), 1928. 113.
Patil K.J., Manwatkar S.M., Dondge S.S., J.Ind.
Chem.Soc, 4, 1994, 33.
PB Agrawal and ML Narwade, Indian J. Chem., 2003,
42-A, 1047.
R.K. Wadi, V. Kakkar, J. Ind. Chem. Soc., 39 (6), 2000,
598.
VS Jamode, JC Dadhichi, DD Malkhede and ML
Narwade, J.Ind.Coun.of Chemist, 35, 2005, 22-2.
679Acta Chim. Slov. 2015, 62, 679–688
Hadda et al.: Computational POM and DFT Evaluation ...
Scientific paper
Computational POM and DFT Evaluation of Experimental in-vitro Cancer Inhibition
of Staurosporine-Ruthenium(II) Complexes: the Power Force of Organometallics in Drug Design
Taibi Ben Hadda,1,* Zuhal K. Genc,2,* Vijay H. Masand,3 Nadia Nebbache,4
Ismail Warad,5 Shehdeh Jodeh,5 Murat Genc,6 Yahia N. Mabkhot,7
Assem Barakat7 and Hector Salgado-Zamora8
1 Laboratoire Chimie Matériaux, FSO, Université Mohamed Premier, Oujda 60000, Morocco
2 Faculty of Engineering, Department of Metallurgy and Materials Engineering, Adiyaman University, 02040, Adiyaman, Turkey
3 Department of Chemistry, Vidya Bharati College, Camp, Amravati, Maharashtra, India
4 Laboratoire de chimie appliquée, Université de Biskra, B.P. 145, RP. 07000 Biskra, Algérie
5 Department of Chemistry, Faculty of Science,Taibah University, Al-Madinah Al-Munawarah, 30002, Saudi Arabia
6 Department of Chemistry, Faculty of Science and Arts, Adiyaman University, 02040 Adiyaman, Turkey
7 Department of Chemistry, College of Science, King Saud University, P. O. Box 2455, Riyadh-11451, Saudi Arabia
8 Departamento de Química Orgánica, Escuela Nacional de Ciencias Biológicas, Instituto Politécnico Nacional, Mexico, DF 11340, Mexico
* Corresponding author: E-mail: [email protected], [email protected]: +212 0666134178; Fax: +212 0536500603
Received: 14-01-2015
AbstractA computational Petra/Osiris/Molinspiration/DFT(POM/DFT) based model has been developed for the identification of
physico-chemical parameters governing the bioactivity of ruthenium-staurosporine complexes 2–4 containing an antitu-
moral-kinase (TK) pharmacophore sites. The four compounds 1–4 analyzed here were previously screened for their antitu-
mor activity, compounds 2 and 4 are neutral, whereas analogue compound 3 is a monocation with ruthenium(II) centre.
The highest anti- antitumor activity was obtained for compounds 3 and 4, which exhibited low IC50 values (0.45 and 8 nM,
respectively), superior to staurosporine derivative (pyridocarbazole ligand 1, 150 · 103 nM). The IC50 of 3 (0.45 nM), repre-
sents 20,000 fold increased activity as compared to staurosporine derivative 1. The increase of bioactivity could be attribu-
ted to the existence of pi-charge transfer from metal-staurosporine to its (COδ-–NHδ+) antitumor pharmacophore site.
Keywords: Cancer-Kinase (CK), antitumor agents, ruthenium-staurosporine complexes, DFT, Petra/Osiris/Molinspira-
tion (POM) analyses.
1. IntroductionStaurosporine derivatives (Figure 1) have been tho-
roughly studied in organic and inorganic chemistry. So-me of these compounds have been semi-synthesized for
industrial, biological, and medicinal aims. Moreover, thestaurosporine derivatives are regarded as excellentagents not only for their affinity to complex the kinaseenzymes1 but also to form stable bioactive and selectivecomplexes with the ions of ruthenium(II).2 These com-
DOI: 10.17344/acsi.2015.1357
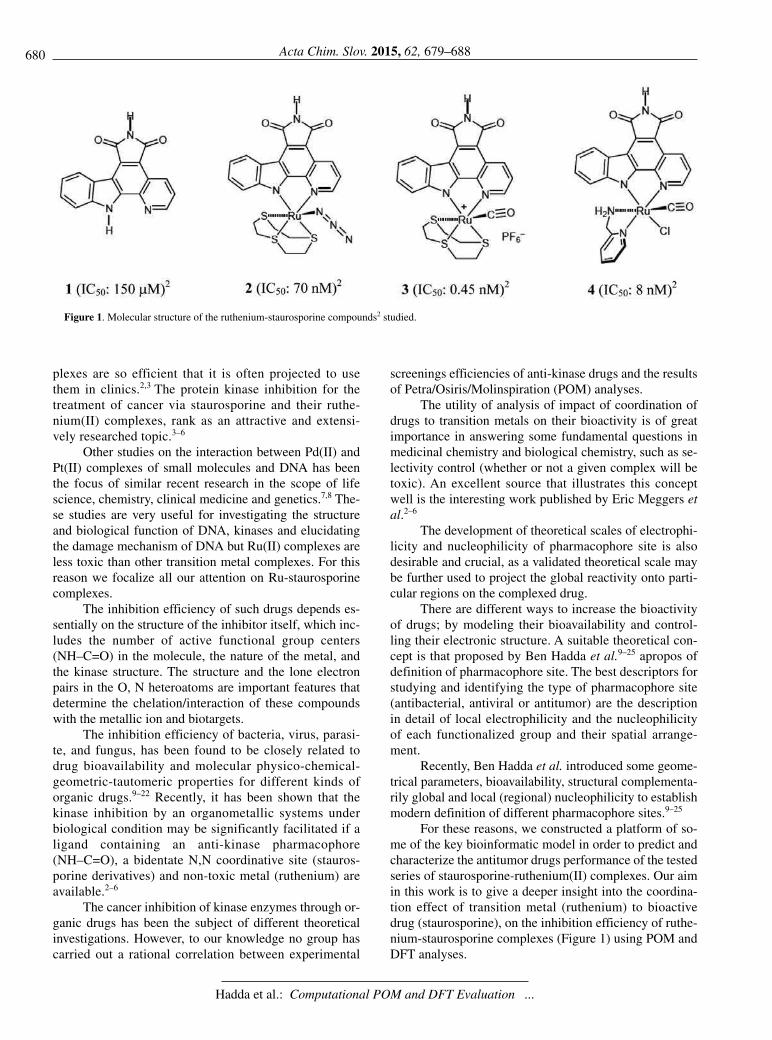
680 Acta Chim. Slov. 2015, 62, 679–688
Hadda et al.: Computational POM and DFT Evaluation ...
plexes are so efficient that it is often projected to usethem in clinics.2,3 The protein kinase inhibition for thetreatment of cancer via staurosporine and their ruthe-nium(II) complexes, rank as an attractive and extensi-vely researched topic.3–6
Other studies on the interaction between Pd(II) andPt(II) complexes of small molecules and DNA has beenthe focus of similar recent research in the scope of lifescience, chemistry, clinical medicine and genetics.7,8 The-se studies are very useful for investigating the structureand biological function of DNA, kinases and elucidatingthe damage mechanism of DNA but Ru(II) complexes areless toxic than other transition metal complexes. For thisreason we focalize all our attention on Ru-staurosporinecomplexes.
The inhibition efficiency of such drugs depends es-sentially on the structure of the inhibitor itself, which inc-ludes the number of active functional group centers(NH–C=O) in the molecule, the nature of the metal, andthe kinase structure. The structure and the lone electronpairs in the O, N heteroatoms are important features thatdetermine the chelation/interaction of these compoundswith the metallic ion and biotargets.
The inhibition efficiency of bacteria, virus, parasi-te, and fungus, has been found to be closely related todrug bioavailability and molecular physico-chemical-geometric-tautomeric properties for different kinds oforganic drugs.9–22 Recently, it has been shown that thekinase inhibition by an organometallic systems underbiological condition may be significantly facilitated if aligand containing an anti-kinase pharmacophore(NH–C=O), a bidentate N,N coordinative site (stauros-porine derivatives) and non-toxic metal (ruthenium) areavailable.2–6
The cancer inhibition of kinase enzymes through or-ganic drugs has been the subject of different theoreticalinvestigations. However, to our knowledge no group hascarried out a rational correlation between experimental
screenings efficiencies of anti-kinase drugs and the resultsof Petra/Osiris/Molinspiration (POM) analyses.
The utility of analysis of impact of coordination ofdrugs to transition metals on their bioactivity is of greatimportance in answering some fundamental questions inmedicinal chemistry and biological chemistry, such as se-lectivity control (whether or not a given complex will betoxic). An excellent source that illustrates this conceptwell is the interesting work published by Eric Meggers etal.2–6
The development of theoretical scales of electrophi-licity and nucleophilicity of pharmacophore site is alsodesirable and crucial, as a validated theoretical scale maybe further used to project the global reactivity onto parti-cular regions on the complexed drug.
There are different ways to increase the bioactivityof drugs; by modeling their bioavailability and control-ling their electronic structure. A suitable theoretical con-cept is that proposed by Ben Hadda et al.9–25 apropos ofdefinition of pharmacophore site. The best descriptors forstudying and identifying the type of pharmacophore site(antibacterial, antiviral or antitumor) are the descriptionin detail of local electrophilicity and the nucleophilicityof each functionalized group and their spatial arrange-ment.
Recently, Ben Hadda et al. introduced some geome-trical parameters, bioavailability, structural complementa-rily global and local (regional) nucleophilicity to establishmodern definition of different pharmacophore sites.9–25
For these reasons, we constructed a platform of so-me of the key bioinformatic model in order to predict andcharacterize the antitumor drugs performance of the testedseries of staurosporine-ruthenium(II) complexes. Our aimin this work is to give a deeper insight into the coordina-tion effect of transition metal (ruthenium) to bioactivedrug (staurosporine), on the inhibition efficiency of ruthe-nium-staurosporine complexes (Figure 1) using POM andDFT analyses.
Figure 1. Molecular structure of the ruthenium-staurosporine compounds2 studied.
681Acta Chim. Slov. 2015, 62, 679–688
Hadda et al.: Computational POM and DFT Evaluation ...
2. Experimental
2. 1. DFT MethodThe molecular modeling was performed using Gaus-
sian 09 program package for calculations. In the presentwork, the calculations have been carried out at(DFT/B3LYP) method with 6-31+G(d,p) basis set. Electroncorrelations were included using Becke3-Lee-Yang-Parr(B3LYP) procedure.26 This contains Becke’s gradient exc-hange corrections, Lee, Yang and Parr correlation functio-nal and/or Vosko, Wilk and Nusair correlation functional.27
2. 2. POM Analyses
One of the practical problems associated to thesynthetic drugs is the existence of various side effects. Fora molecule to be a potential drug, besides having a goodbiological activity, it must have good pharmacokineticproperties in biological systems. To access the pharmaco-kinetic profile of the synthesized molecules, we used wellestablished in silico tools such as Osiris, Petra and Mo-linspiration, which have been validated with almost 7000drug molecules available on the market.
3. Results and Discussion
3. 1. POM Analyses of Compounds 1–5The analysis of theoretical toxicity risks for the stau-
rosporine (STR) and its organic derivative 1 using the Osi-ris program showed that compound 1 and probably therest of series 2–4 (Figure 2) are less toxic than standardclinical drugs (camptothecins) and can be used as thera-peutic agents. From the data evaluated in Table 1, allstructures are supposed to be non-mutagenic when runthrough the mutagenicity assessment of coordinated sys-tem and, as far as irritating and reproductive effects areconcerned, all the compounds are at low risk comparablewith standard drugs used. The hydrophilicity character ofeach compound has been expressed in terms of the cLogPvalue. It has been established that the absorption or per-meation is greatly affected by the hydrophilicity (value ofcLogP). Accordingly, when cLogP is higher than 5, theabsorption or permeation decreases. On this basis, most ofcompounds 1–4 have cLogP values within the acceptablecriteria and are active at different IC50 because anothercrucial parameter should be taken in consideration. Thisdoes not concern the geometrical conformation of phar-
Figure 2. Series of Ru-staurosporine complexes with anti-tumoral pharmacophore site.
Table 1. Osiris calculations of toxicity risks of staurosporine (STR) and its derivative (1).
Compd. MW Toxicity Risks[[a]] Osiris calculations[[b]]
MUT TUM IRRI REP cLogP Sol DL DS1 287 +++ --- +++ +++ 2.41 –4.72 2.28 0.42
STR 466 +++ +++ +++ +++ 4.44 –6.77 5.28 0.37
Higly toxic: (---), Slightly toxic: (+), Not toxic (+++). [a] MUT: Mutagenic, TUM: Tumorigenic, IRRIT: Irritant, RE: Reproductive effective. [b] Sol: Solubility, DL: Druglikness, DS: Drug-Score. STR : Staurosporine.
682 Acta Chim. Slov. 2015, 62, 679–688
Hadda et al.: Computational POM and DFT Evaluation ...
macophore because it is fixed for all compounds 1–4. Theabsorption, distribution characteristics and bioactivity we-re proved to be dependent on the geometrical parameterand the aqueous solubility of each compound. Conse-quently, the bad absorption of tested staurosporine-ruthe-
nium(II) complexes 2–4 could presumably be due to theirlow solubility.28,29 Further, Table 2 shows drug-likeness ofcompounds 1–4, not in the comparable zone with standarddrugs used. We have calculated overall drug-score (DS)for compounds 1–4 and compared with that of standard
Table 2. Molinspiration calculations of staurosporine derivative (1) and its complexes (2–4).
Compd.Molinspiration calculations [[a]] Drug-likeness [[b]]
TPSA NONH NV VOL GPCRL ICM KI NRL PI EI1 79 2 0 236 0.01 0.02 0.96 .48 0.21 0.56
2 109 1 1 428 0.12 0.15 0.33 –0.56 –0.02 0.42
3 76 1 1 480 0.00 0.28 0.11 0.64 0.08 0.14
4 96 3 1 394 0.04 0.18 0.25 0.70 0.25 0.28
STR 69 2 0 410 0.37 0.23 1.50 –0.18 0.35 0.86
[a] TPSA: Total molecular polar surface area; NONH: number of OH---N or O---NH interaction, NV: number of violation of five Lipinsky rules
[50, 51]; VOL: volume. [b] GPCRL: GPCR ligand; ICM: Ion channel modulator; KI: Kinase inhibitor; NRL: Nuclear receptor ligand; PI: Protea-
se inhibitor; EI: Enzyme inhibitor. STR : Staurosporine.
Figure 3. Optimized geometrical structure of compounds 1–4.
683Acta Chim. Slov. 2015, 62, 679–688
Hadda et al.: Computational POM and DFT Evaluation ...
drug (STR). The DS combines drug-likeness, cLogP, logS, molecular weight, and toxicity risks, in one handy valuethat may be used to judge the compound’s overall poten-tial to qualify for a drug. The reported compounds 2–4showed low to moderate DS as compared with standarddrug used STR (Table 1).
Incidentally, it is our opinion that DS and DL are notquite reliable since the values depend upon the programused. For this reason, supplementary DFT calculationswill clarify this query.
3. 2. Frontier Molecular Orbitals
Highest occupied molecular orbital (HOMO) andlowest unoccupied molecular orbital (LUMO) are themost important orbitals to characterize the chemical reac-
tivity,30,31 optical properties32 and biological activity.33
The energy gap between HOMO and LUMO is obtainedby first optimization of structures 1–4 (Figure 3) as illu-strated in Figure 4.
HOMO, HOMO–1, LUMO and LUMO+1 ener-gies were calculated at B3LYP/6-311+G(d,p) andLANL2DZ theory level in order to understand influenceof the structural properties of the Staurosporine and itscomplexes that are summarized in Table 3. As can beseen from Figures 4–7, for compound 1, HOMO ismainly delocalized on the aromatic ring and heteroa-toms except pyrrole carbonyl oxygen; however LUMOis mainly delocalized on the indole ring and heteroa-toms. For compound 2; the HOMO electrons are mainlydelocalized on the Ru(II) and azido group, LUMO elec-trons are delocalized on the Staurosporine ring. For
Figure 4. HOMO and LUMO molecular orbitals of the staurosporine derivative N,N-ligand (1) using the 6-311+G(d,p) method.
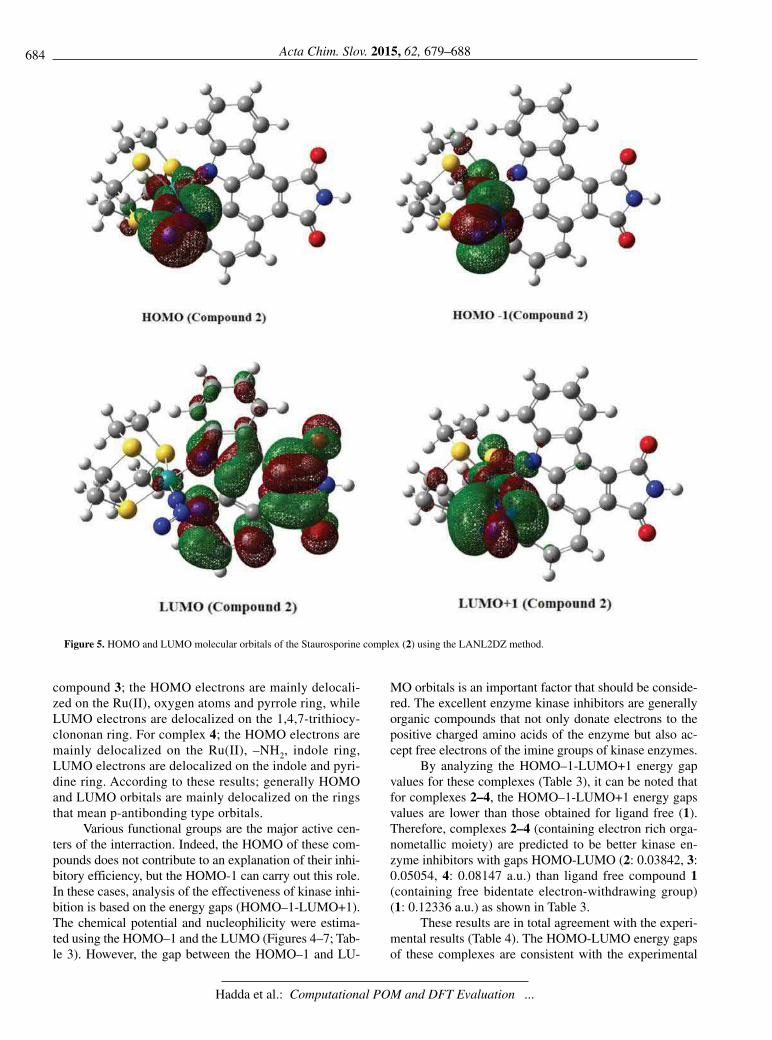
compound 3; the HOMO electrons are mainly delocali-zed on the Ru(II), oxygen atoms and pyrrole ring, whileLUMO electrons are delocalized on the 1,4,7-trithiocy-clononan ring. For complex 4; the HOMO electrons aremainly delocalized on the Ru(II), –NH2, indole ring,LUMO electrons are delocalized on the indole and pyri-dine ring. According to these results; generally HOMOand LUMO orbitals are mainly delocalized on the ringsthat mean p-antibonding type orbitals.
Various functional groups are the major active cen-ters of the interraction. Indeed, the HOMO of these com-pounds does not contribute to an explanation of their inhi-bitory efficiency, but the HOMO-1 can carry out this role.In these cases, analysis of the effectiveness of kinase inhi-bition is based on the energy gaps (HOMO–1-LUMO+1).The chemical potential and nucleophilicity were estima-ted using the HOMO–1 and the LUMO (Figures 4–7; Tab-le 3). However, the gap between the HOMO–1 and LU-
MO orbitals is an important factor that should be conside-red. The excellent enzyme kinase inhibitors are generallyorganic compounds that not only donate electrons to thepositive charged amino acids of the enzyme but also ac-cept free electrons of the imine groups of kinase enzymes.
By analyzing the HOMO–1-LUMO+1 energy gapvalues for these complexes (Table 3), it can be noted thatfor complexes 2–4, the HOMO–1-LUMO+1 energy gapsvalues are lower than those obtained for ligand free (1).Therefore, complexes 2–4 (containing electron rich orga-nometallic moiety) are predicted to be better kinase en-zyme inhibitors with gaps HOMO-LUMO (2: 0.03842, 3:0.05054, 4: 0.08147 a.u.) than ligand free compound 1(containing free bidentate electron-withdrawing group)(1: 0.12336 a.u.) as shown in Table 3.
These results are in total agreement with the experi-mental results (Table 4). The HOMO-LUMO energy gapsof these complexes are consistent with the experimental
684 Acta Chim. Slov. 2015, 62, 679–688
Hadda et al.: Computational POM and DFT Evaluation ...
Figure 5. HOMO and LUMO molecular orbitals of the Staurosporine complex (2) using the LANL2DZ method.
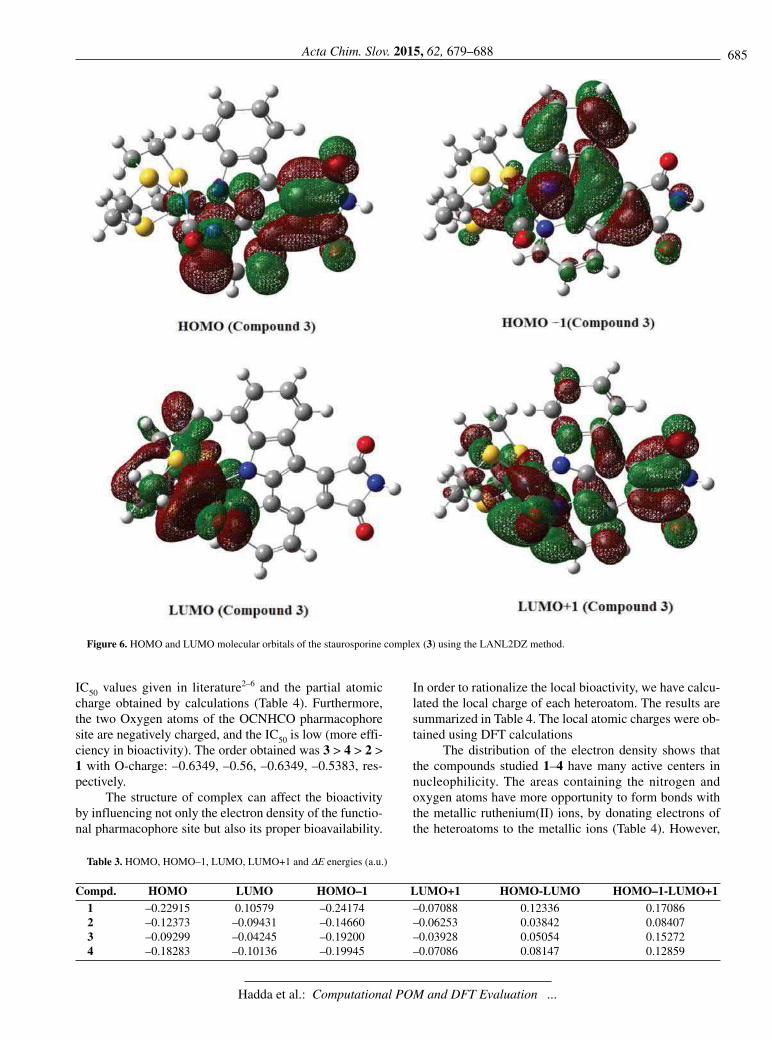
685Acta Chim. Slov. 2015, 62, 679–688
Hadda et al.: Computational POM and DFT Evaluation ...
Figure 6. HOMO and LUMO molecular orbitals of the staurosporine complex (3) using the LANL2DZ method.
IC50 values given in literature2–6 and the partial atomiccharge obtained by calculations (Table 4). Furthermore,the two Oxygen atoms of the OCNHCO pharmacophoresite are negatively charged, and the IC50 is low (more effi-ciency in bioactivity). The order obtained was 3 > 4 > 2 >1 with O-charge: –0.6349, –0.56, –0.6349, –0.5383, res-pectively.
The structure of complex can affect the bioactivityby influencing not only the electron density of the functio-nal pharmacophore site but also its proper bioavailability.
In order to rationalize the local bioactivity, we have calcu-lated the local charge of each heteroatom. The results aresummarized in Table 4. The local atomic charges were ob-tained using DFT calculations
The distribution of the electron density shows thatthe compounds studied 1–4 have many active centers innucleophilicity. The areas containing the nitrogen andoxygen atoms have more opportunity to form bonds withthe metallic ruthenium(II) ions, by donating electrons ofthe heteroatoms to the metallic ions (Table 4). However,
Table 3. HOMO, HOMO–1, LUMO, LUMO+1 and ΔE energies (a.u.)
Compd. HOMO LUMO HOMO–1 LUMO+1 HOMO-LUMO HOMO–1-LUMO+11 –0.22915 0.10579 –0.24174 –0.07088 0.12336 0.17086
2 –0.12373 –0.09431 –0.14660 –0.06253 0.03842 0.08407
3 –0.09299 –0.04245 –0.19200 –0.03928 0.05054 0.15272
4 –0.18283 –0.10136 –0.19945 –0.07086 0.08147 0.12859
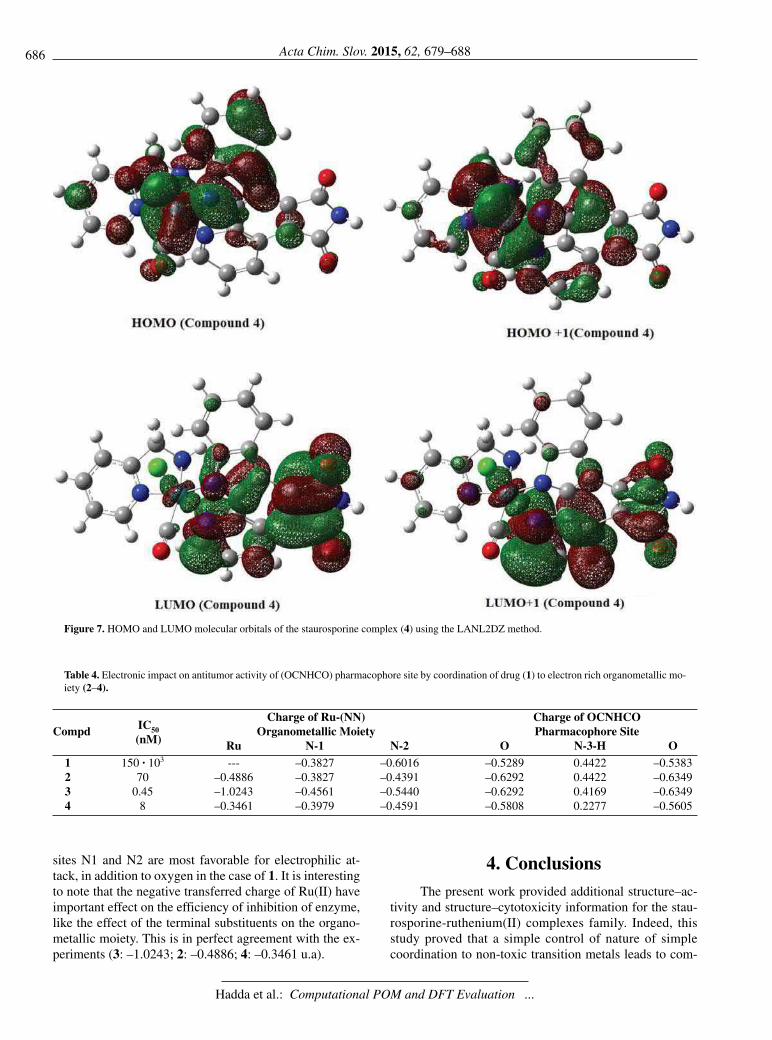
686 Acta Chim. Slov. 2015, 62, 679–688
Hadda et al.: Computational POM and DFT Evaluation ...
sites N1 and N2 are most favorable for electrophilic at-tack, in addition to oxygen in the case of 1. It is interestingto note that the negative transferred charge of Ru(II) haveimportant effect on the efficiency of inhibition of enzyme,like the effect of the terminal substituents on the organo-metallic moiety. This is in perfect agreement with the ex-periments (3: –1.0243; 2: –0.4886; 4: –0.3461 u.a).
4. ConclusionsThe present work provided additional structure–ac-
tivity and structure–cytotoxicity information for the stau-rosporine-ruthenium(II) complexes family. Indeed, thisstudy proved that a simple control of nature of simplecoordination to non-toxic transition metals leads to com-
Figure 7. HOMO and LUMO molecular orbitals of the staurosporine complex (4) using the LANL2DZ method.
Table 4. Electronic impact on antitumor activity of (OCNHCO) pharmacophore site by coordination of drug (1) to electron rich organometallic mo-
iety (2–4).
IC50
Charge of Ru-(NN) Charge of OCNHCOCompd
(nM)Organometallic Moiety Pharmacophore Site
Ru N-1 N-2 O N-3-H O1 150 · 103 --- –0.3827 –0.6016 –0.5289 0.4422 –0.5383
2 70 –0.4886 –0.3827 –0.4391 –0.6292 0.4422 –0.6349
3 0.45 –1.0243 –0.4561 –0.5440 –0.6292 0.4169 –0.6349
4 8 –0.3461 –0.3979 –0.4591 –0.5808 0.2277 –0.5605
687Acta Chim. Slov. 2015, 62, 679–688
Hadda et al.: Computational POM and DFT Evaluation ...
pounds with high activities and reduced cytotoxicities ofstaurosporine as parent and clinical standard drug.
Tumor inhibition of kinase through staurosporineligand and its complexes was elucidated by means ofdensity functional theory (DFT)-derived reactivity inde-xes. The DFT calculated parameters and experimentalcancer inhibition efficiency (IC50) indicate that their in-hibition effect is closely related to the frontier orbitalenergies, polarizability, electronic chemical potentialand global nucleophilicity. The quantum chemistry cal-culations were performed at the B3LYP/6-31G(d) level.The theoretical results predicted by using DFT-basedreactivity indexes, are in good agreement with experi-mental outcomes.
In comparing the percentages of inhibition effi-ciency (IC50) of the studied compounds with the theore-tical results, we note that their inhibitory effects are clo-sely related to HOMO–1, HOMO–1-LUMO+1 gap, andthe partial negative charge of Oxygen atoms of pharma-cophore site. These parameters were calculated by theDFT method. The bioactivity decreases when HOMO–1increases, and when the HOMO-1-LUMO+1 gap de-creases. Therefore, complexes 2–4 are better kinase inhi-bitors (presence of donor organometallic moiety on theligand-Ru) than free ligand 1 (presence of withdrawingnitrogen bidente groups on the staurosporine derivativering’s). The DFT calculations indicate that it is not con-venient to consider only a single parameter (partial char-ges). However, several parameters were considered tocharacterize the inhibitory activity of the molecules, inparticularly bioavailability (cLogP). The partial atomiccharges of the series of complexes were discussed in asimple but precise manner.
5. Acknowledgements
The authors would like to extend their sincere appre-ciation to the Deanship of Scientific Research at kingSaud University for its funding this Research group N°(RG-007-1435-1436).
6. References
1. A. Huwe, R. Mazitschek, A. Giannis, Angew. Chem. Int. Ed.2003, 42, 2122–2138.
http://dx.doi.org/10.1002/anie.200200540
2. E. Meggers, G. E. Atilla-Gokcumen, H. Bregman, J. Maksi-
moska, S. P. Mulcahy, N. Pagano, D. S. Williams, Synlett2007, 8, 1177–1189.
http://dx.doi.org/10.1055/s-2007-973893
3. E. Meggers, Curr. Opin. Chem. Biol. 2007, 11, 287–292.
http://dx.doi.org/10.1016/j.cbpa.2007.05.013
4. J. E. Debreczeni, A. N. Bullock, G. E. Atilla, D. S. Williams,
H. Bregman, S. Knapp, E. Meggers, Angew, Chem. Int. Ed.
2006, 45, 1580–1585.
http://dx.doi.org/10.1002/anie.200503468
5. H. Bregman, D.S. Williams, G. E. Atilla, P. J. Carroll, E.
Meggers, J. Am. Chem. Soc. 2004, 126, 13594–13595.
http://dx.doi.org/10.1021/ja046049c
6. S. P. Mulcahy, P. J. Carroll, E. Meggers, Tetrahedron Lett.2006, 47, 8877–8880.
http://dx.doi.org/10.1016/j.tetlet.2006.10.054
7. N. Stojanovi}, D. Urankar, A. Brozovi}, A. Ambriovi}-Ristov,
M. Osmak, J. Ko{mrlj. Acta Chim. Slov. 2013, 60, 368– 374.
8. M. Saeidifar, H. Mansouri-Torshizi, Y. Palizdar, M. Eslami-
Moghaddam, A. Divsalar, A. A. Saboury, Acta Chim. Slov.2014, 61, 126–136.
9. J. Sheikh, K. Hatzade, A. Bader, U. Shaheen, T. Sander, T.
Ben Hadda, Med. Chem. Res. 2014, 23, 243–251.
http://dx.doi.org/10.1007/s00044-013-0621-5
10. T. Ben Hadda, S. Srivastava, B. Das, H. Salgado-Zamora, U.
Shaheen, A. Bader, M. M. Naseer, Med. Chem. Res. 2014,
23, 995–103. http://dx.doi.org/10.1007/s00044-013-0707-0
11. T. Ben Hadda, M. A. Ali, V. Masand, S. Gharby, T. Fergoug,
I. Warad, Med. Chem. Res. 2013, 22, 1438–1449.
http://dx.doi.org/10.1007/s00044-012-0143-6
12. T. Ben Hadda, T. Fergoug, I. Warad, Res. Chem. Intermed.
2013, 39, 1963–1971.
http://dx.doi.org/10.1007/s11164-012-0729-0
13. J. Fathi, V. Masand, R. Jawarkar, R. Mouhoub, T. Ben Had-
da, J. Comput. Method. Mol. Design 2011, 1, 57–68.
14. A. Jarrahpour, J. Fathi, M. Mimouni, T. Ben Hadda, J.
Sheikh, Z. H. Chohan, A. Parvez, Med. Chem. Res. 2012, 21,
1984–1990. http://dx.doi.org/10.1007/s00044-011-9723-0
15. A. Parvez, M. Jyotsna, M. H. Youssoufi, T. Ben Hadda, Phosp-horus, Sulfur, Silicon Relat. Elem. 2010, 185, 1500– 1510.
http://dx.doi.org/10.1080/10426500903095556
16. Z. H. Chohan, S. H. Sumrra, M. H. Youssoufi, T. Ben Hadda,
Eur. J. Med. Chem. 2010, 45, 2739–2747.
http://dx.doi.org/10.1016/j.ejmech.2010.02.053
17. Z. H. Chohan, M. H. Youssoufi, A. Jarrahpour, T. Ben Had-
da, Eur. J. Med. Chem. 2010, 45, 1189–1199.
http://dx.doi.org/10.1016/j.ejmech.2009.11.029
18. A. Jarrahpour, M. Motamedifar, M. Zarei1, M. H. Youssoufi,
M. Mimouni, Z. H. Chohan, T. Ben Hadda, Phosphorus, Sul-fur, Silicon Relat. Elem. 2010, 185 491–497.
http://dx.doi.org/10.1080/10426500902953953
19. A. Parvez, M. Jyotsna, M. H. Youssoufi, T. Ben Hadda,
Phosphorus, Sulfur, Silicon Relat. Elem. 2010, 185, 1500–
1510. http://dx.doi.org/10.1080/10426500903095556
20. B. Bennani, A. Kerbal, M. Daoudi, B. Filali Baba, G. Al Ho-
uari, A. F. Jalbout, M. Mimouni, M. Benazza, G. Demailly,
M. Akkurt, S. Ö. Yildirim, T. Ben Hadda, Arkivoc 2007, 16,
19–40. http://dx.doi.org/10.3998/ark.5550190.0008.g03
21. J. Sheikh, A. Parvez, V. Ingle, H. Juneja, R. Dongre, Z. H.
Chohan, M. H. Youssoufi, T. Ben Hadda, Eur. J. Med. Chem.2011, 46, 1390–1399.
http://dx.doi.org/10.1016/j.ejmech.2011.01.068
22. Z. H. Chohan, S. H. Sumrra, M. H. Youssoufi, T. Ben Hadda,
J. Coord. Chem. 2010, 63, 3981–3998.
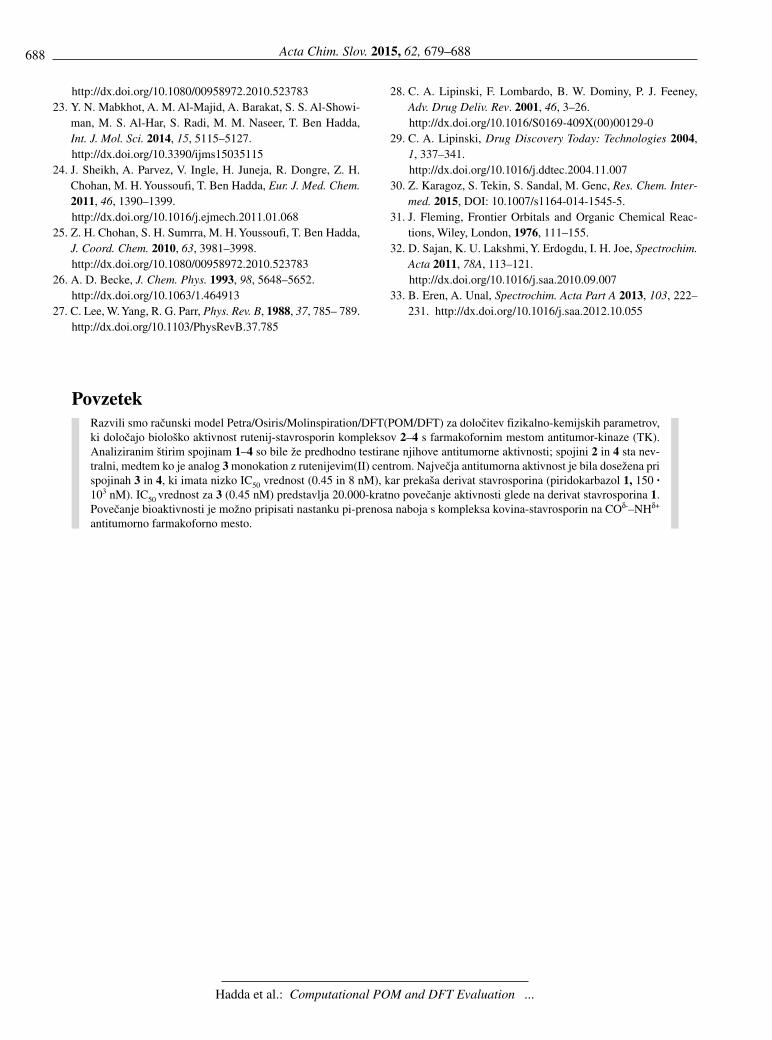
688 Acta Chim. Slov. 2015, 62, 679–688
Hadda et al.: Computational POM and DFT Evaluation ...
http://dx.doi.org/10.1080/00958972.2010.523783
23. Y. N. Mabkhot, A. M. Al-Majid, A. Barakat, S. S. Al-Showi-
man, M. S. Al-Har, S. Radi, M. M. Naseer, T. Ben Hadda,
Int. J. Mol. Sci. 2014, 15, 5115–5127.
http://dx.doi.org/10.3390/ijms15035115
24. J. Sheikh, A. Parvez, V. Ingle, H. Juneja, R. Dongre, Z. H.
Chohan, M. H. Youssoufi, T. Ben Hadda, Eur. J. Med. Chem.2011, 46, 1390–1399.
http://dx.doi.org/10.1016/j.ejmech.2011.01.068
25. Z. H. Chohan, S. H. Sumrra, M. H. Youssoufi, T. Ben Hadda,
J. Coord. Chem. 2010, 63, 3981–3998.
http://dx.doi.org/10.1080/00958972.2010.523783
26. A. D. Becke, J. Chem. Phys. 1993, 98, 5648–5652.
http://dx.doi.org/10.1063/1.464913
27. C. Lee, W. Yang, R. G. Parr, Phys. Rev. B, 1988, 37, 785– 789.
http://dx.doi.org/10.1103/PhysRevB.37.785
28. C. A. Lipinski, F. Lombardo, B. W. Dominy, P. J. Feeney,
Adv. Drug Deliv. Rev. 2001, 46, 3–26.
http://dx.doi.org/10.1016/S0169-409X(00)00129-0
29. C. A. Lipinski, Drug Discovery Today: Technologies 2004,
1, 337–341.
http://dx.doi.org/10.1016/j.ddtec.2004.11.007
30. Z. Karagoz, S. Tekin, S. Sandal, M. Genc, Res. Chem. Inter-med. 2015, DOI: 10.1007/s1164-014-1545-5.
31. J. Fleming, Frontier Orbitals and Organic Chemical Reac-
tions, Wiley, London, 1976, 111–155.
32. D. Sajan, K. U. Lakshmi, Y. Erdogdu, I. H. Joe, Spectrochim.Acta 2011, 78A, 113–121.
http://dx.doi.org/10.1016/j.saa.2010.09.007
33. B. Eren, A. Unal, Spectrochim. Acta Part A 2013, 103, 222–
231. http://dx.doi.org/10.1016/j.saa.2012.10.055
PovzetekRazvili smo ra~unski model Petra/Osiris/Molinspiration/DFT(POM/DFT) za dolo~itev fizikalno-kemijskih parametrov,
ki dolo~ajo biolo{ko aktivnost rutenij-stavrosporin kompleksov 2–4 s farmakofornim mestom antitumor-kinaze (TK).
Analiziranim {tirim spojinam 1–4 so bile `e predhodno testirane njihove antitumorne aktivnosti; spojini 2 in 4 sta nev-
tralni, medtem ko je analog 3 monokation z rutenijevim(II) centrom. Najve~ja antitumorna aktivnost je bila dose`ena pri
spojinah 3 in 4, ki imata nizko IC50 vrednost (0.45 in 8 nM), kar preka{a derivat stavrosporina (piridokarbazol 1, 150 ·103 nM). IC50 vrednost za 3 (0.45 nM) predstavlja 20.000-kratno pove~anje aktivnosti glede na derivat stavrosporina 1.
Pove~anje bioaktivnosti je mo`no pripisati nastanku pi-prenosa naboja s kompleksa kovina-stavrosporin na COδ-–NHδ+
antitumorno farmakoforno mesto.
Indian Journal of Research in Pharmacy and Biotechnology
Ujwala G.Malode et.al ISSN: 2321-5674(Print); 2320 – 3471(Online)
IJRPB 3(1) www.ijrpb.com January-February 2015 Page 20
Phytochemical investigations of Dioscorea bulbifera linn Ujwala G.Malode1, Noor Mohammad2, S.A.Quazi3*, D.T.Mahajan3, Vijay Masand3 1Department of Chemistry, Jagdamba Mahavidyalaya, Achalpur, Amravati (M.S) India
2Department of Chemistry, Govt.Vidarbha Institute of Sci. and Humanities, Amravati (M.S) India 3Department of Chemistry, VidyaBharti Mahavidyalaya, Camp Amravati (M.S) India
Corresponding author: E.mail:[email protected]
ABSTRACT
Dioscorea bulbifera Linn. Belonging to family Dioscoreaceae is cultivated in Maharashtra on a small
scale for its edible tubers. The Plant is perennial, large climber, producing bulbils at the base of its leaves. Whole
plant is medicinal being anthelmintic, aphrodisiac, diuretic and tonic. It is also used in diabetes, gonorrhea,
helminthiasis and leprosy. Extract of tuber and leaves was subjected to chemical tests for the presence of
phytochemical classes like carbohydrates ,proteins, amino acids, fats, oils, steroids, glycosides, alkaloids , tannins
and phenolics. Due to presence of carbohydrate, proteins, amino acids, fats and starch tubers become edible.
Medicinal property of the plant is due to the presence of secondary metabolites such as alkaloids, glycosides and
tannins.
Key words: Tuber, Dioscorea, bulbil, Glycoside.
INTRODUCTION
The Plant is found commonly in India. In
Maharashtra it is cultivated on a small scale in Warud and
parts of Achalpur tahasils. It is a perennial large climber,
Tubers very large roundish,white from inside, Stem 4
angled, Leaves opposite, broadly ovate 6-15 x 4-10 cm,
base cordate, acute. The bulbils grow at the base of its
leaves. Flowers greenish white. Capsules of 2
semicircular, flat lobes, seeds winged all round.Plant is
anthelmintic, aphrodisiac. Cooling, diuertic, sweet and
tonic. It is also used in diabetes, gonorrhoea, helminthiasis
and leprosy (Ahmad, 2012). Bulbils are more important
food product. It is used in the treatment of rheumatis
arthritis (Kokate, 2003). The tubers are edible sweet,
cooling, aphrodisiac, tonic, diuretic and anthelmintic
haemorrhoids, diabetes. They are also used in heart
disease (Prajapati, 2003). Phytochemical analysis and
Enzyme Inhibition Assay of Aerva javanica for Ulcer
(Abdul Wajid Khan, 2012). Strawberry polyphenols
attenuate ethanol-induced gastric lesions in rats by
activation of antioxidant enzymes and attenuation of
MDA increase (Alvarez-Suarez, 2011). Protective effect
of Calamintha officinalis Moench leaves against alcohol-
induced gastric mucosa injury in rats (Monforte, 2012).
Macroscopic, histologic and phytochemical analysis
(Emam, 1999). Phytochemical studies on the herb Aerva
javanica growing in Egypt (Garg, 1980). Aervanone, a
new flavanone from Aerva persica. Antiplasmodial
activity of some medicinal plants used in sudanese folk-
medicine (El-Hadi, 2010). Antihyperglycaemic activity of
ethanol extract of Aerva javanica leaves in alloxan-
induced diabetic mice (Srinivas, 2009). Chemical
Constituents of Aerva javanica (Khan, 1982). Secondary
transport as an efficient membrane transport
mechanism for plant secondary metabolites (Kazufumi
Yazaki, 2008).
MATERIALS AND METHODS
The plant parts tubers and leaves were dried in a
shed under normal environmental conditions for about one
week. These dried parts were broken into small pieces
with the help of the cutter and grinded to a coarse powder.
Coarsely grinded plant parts were extracted in Soxhlet
Apparatus successively with different solvents such as
Acetone, Benzene, Chloroform, Ethyl alcohol, Petroleum
Ether and Distilled water. The extracts obtained were
concentrated and dried. The plant extract was subjected to
chemical tests for the presence of phytochemical classes
like carbohydrates, proteins, amino acids, fats and oils,
steroids, glycosides, alkaloids, tannins and phenolics.
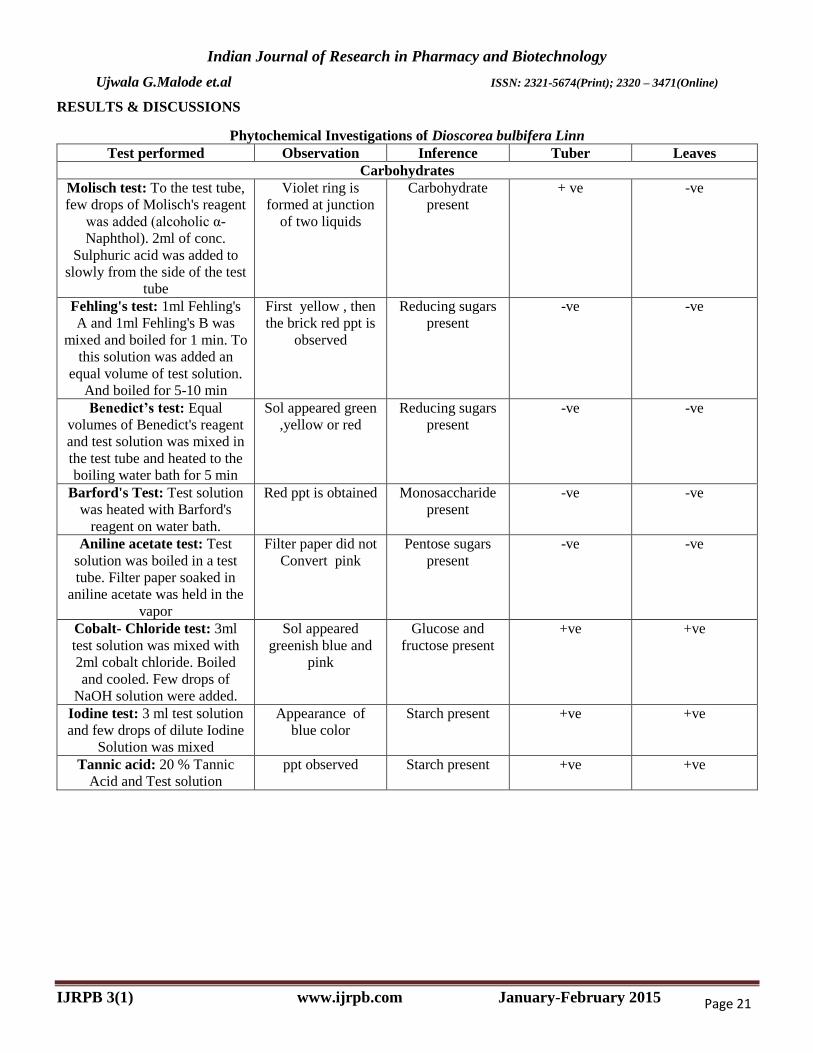
Indian Journal of Research in Pharmacy and Biotechnology
Ujwala G.Malode et.al ISSN: 2321-5674(Print); 2320 – 3471(Online)
IJRPB 3(1) www.ijrpb.com January-February 2015 Page 11
RESULTS & DISCUSSIONS
Phytochemical Investigations of Dioscorea bulbifera Linn
Test performed Observation Inference Tuber Leaves
Carbohydrates
Molisch test: To the test tube,
few drops of Molisch's reagent
was added (alcoholic α-
Naphthol). 2ml of conc.
Sulphuric acid was added to
slowly from the side of the test
tube
Violet ring is
formed at junction
of two liquids
Carbohydrate
present
+ ve -ve
Fehling's test: 1ml Fehling's
A and 1ml Fehling's B was
mixed and boiled for 1 min. To
this solution was added an
equal volume of test solution.
And boiled for 5-10 min
First yellow , then
the brick red ppt is
observed
Reducing sugars
present
-ve -ve
Benedict’s test: Equal
volumes of Benedict's reagent
and test solution was mixed in
the test tube and heated to the
boiling water bath for 5 min
Sol appeared green
,yellow or red
Reducing sugars
present
-ve -ve
Barford's Test: Test solution
was heated with Barford's
reagent on water bath.
Red ppt is obtained Monosaccharide
present
-ve -ve
Aniline acetate test: Test
solution was boiled in a test
tube. Filter paper soaked in
aniline acetate was held in the
vapor
Filter paper did not
Convert pink
Pentose sugars
present
-ve -ve
Cobalt- Chloride test: 3ml
test solution was mixed with
2ml cobalt chloride. Boiled
and cooled. Few drops of
NaOH solution were added.
Sol appeared
greenish blue and
pink
Glucose and
fructose present
+ve +ve
Iodine test: 3 ml test solution
and few drops of dilute Iodine
Solution was mixed
Appearance of
blue color
Starch present +ve +ve
Tannic acid: 20 % Tannic
Acid and Test solution
ppt observed Starch present +ve +ve
Page 21
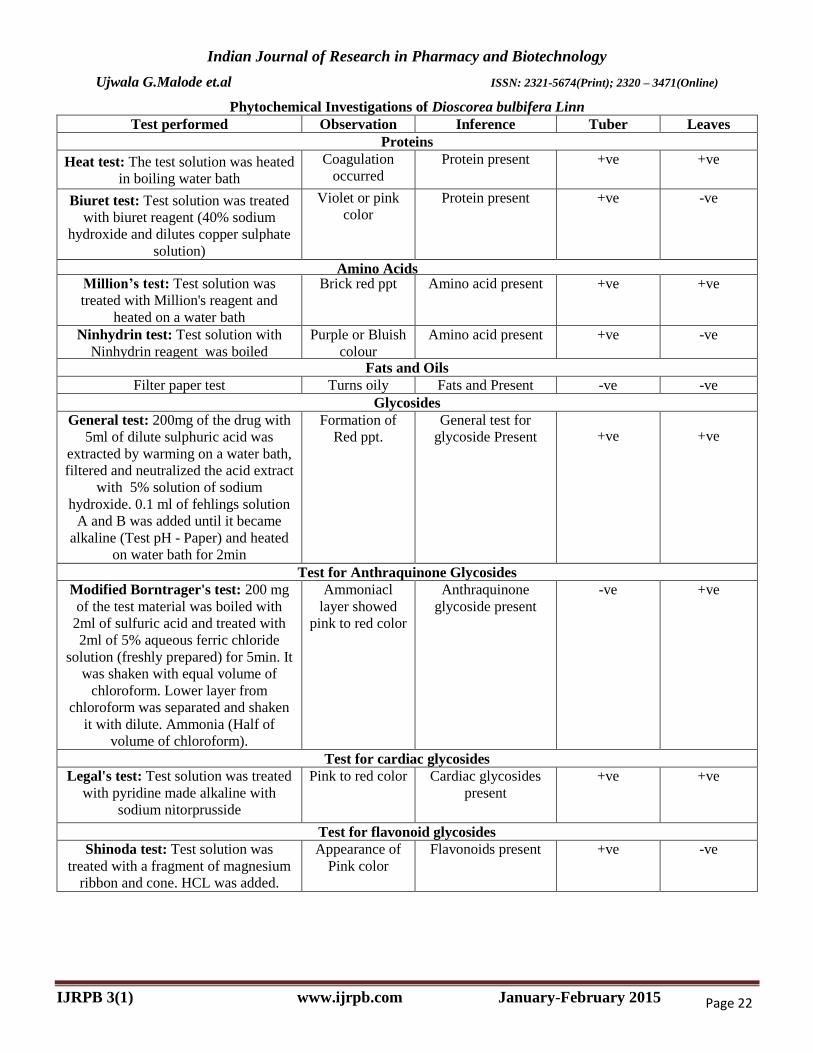
Indian Journal of Research in Pharmacy and Biotechnology
Ujwala G.Malode et.al ISSN: 2321-5674(Print); 2320 – 3471(Online)
IJRPB 3(1) www.ijrpb.com January-February 2015 Page 12
Phytochemical Investigations of Dioscorea bulbifera Linn
Test performed Observation Inference Tuber Leaves
Proteins
Heat test: The test solution was heated
in boiling water bath
Coagulation
occurred
Protein present +ve +ve
Biuret test: Test solution was treated
with biuret reagent (40% sodium
hydroxide and dilutes copper sulphate
solution)
Violet or pink
color
Protein present +ve -ve
Amino Acids Million’s test: Test solution was
treated with Million's reagent and
heated on a water bath
Brick red ppt Amino acid present +ve +ve
Ninhydrin test: Test solution with
Ninhydrin reagent was boiled
Purple or Bluish
colour
Amino acid present +ve -ve
Fats and Oils
Filter paper test Turns oily Fats and Present -ve -ve
Glycosides
General test: 200mg of the drug with
5ml of dilute sulphuric acid was
extracted by warming on a water bath,
filtered and neutralized the acid extract
with 5% solution of sodium
hydroxide. 0.1 ml of fehlings solution
A and B was added until it became
alkaline (Test pH - Paper) and heated
on water bath for 2min
Formation of
Red ppt.
General test for
glycoside Present +ve +ve
Test for Anthraquinone Glycosides
Modified Borntrager's test: 200 mg
of the test material was boiled with
2ml of sulfuric acid and treated with
2ml of 5% aqueous ferric chloride
solution (freshly prepared) for 5min. It
was shaken with equal volume of
chloroform. Lower layer from
chloroform was separated and shaken
it with dilute. Ammonia (Half of
volume of chloroform).
Ammoniacl
layer showed
pink to red color
Anthraquinone
glycoside present
-ve +ve
Test for cardiac glycosides
Legal's test: Test solution was treated
with pyridine made alkaline with
sodium nitorprusside
Pink to red color Cardiac glycosides
present
+ve +ve
Test for flavonoid glycosides
Shinoda test: Test solution was
treated with a fragment of magnesium
ribbon and cone. HCL was added.
Appearance of
Pink color
Flavonoids present +ve -ve
Page 22
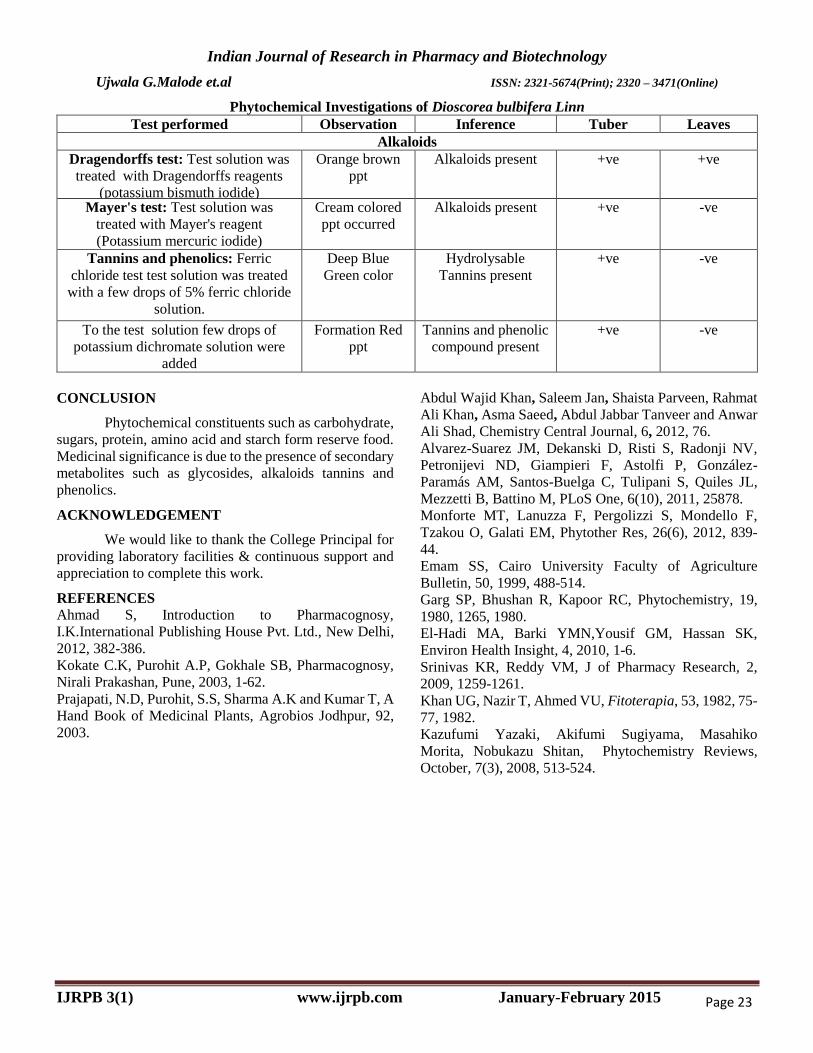
Indian Journal of Research in Pharmacy and Biotechnology
Ujwala G.Malode et.al ISSN: 2321-5674(Print); 2320 – 3471(Online)
IJRPB 3(1) www.ijrpb.com January-February 2015 Page 13
Phytochemical Investigations of Dioscorea bulbifera Linn
Test performed Observation Inference Tuber Leaves
Alkaloids
Dragendorffs test: Test solution was
treated with Dragendorffs reagents
(potassium bismuth iodide)
Orange brown
ppt
Alkaloids present +ve +ve
Mayer's test: Test solution was
treated with Mayer's reagent
(Potassium mercuric iodide)
Cream colored
ppt occurred
Alkaloids present +ve -ve
Tannins and phenolics: Ferric
chloride test test solution was treated
with a few drops of 5% ferric chloride
solution.
Deep Blue
Green color
Hydrolysable
Tannins present
+ve -ve
To the test solution few drops of
potassium dichromate solution were
added
Formation Red
ppt
Tannins and phenolic
compound present
+ve -ve
CONCLUSION
Phytochemical constituents such as carbohydrate,
sugars, protein, amino acid and starch form reserve food.
Medicinal significance is due to the presence of secondary
metabolites such as glycosides, alkaloids tannins and
phenolics.
ACKNOWLEDGEMENT
We would like to thank the College Principal for
providing laboratory facilities & continuous support and
appreciation to complete this work.
REFERENCES
Ahmad S, Introduction to Pharmacognosy,
I.K.International Publishing House Pvt. Ltd., New Delhi,
2012, 382-386.
Kokate C.K, Purohit A.P, Gokhale SB, Pharmacognosy,
Nirali Prakashan, Pune, 2003, 1-62.
Prajapati, N.D, Purohit, S.S, Sharma A.K and Kumar T, A
Hand Book of Medicinal Plants, Agrobios Jodhpur, 92,
2003.
Abdul Wajid Khan, Saleem Jan, Shaista Parveen, Rahmat
Ali Khan, Asma Saeed, Abdul Jabbar Tanveer and Anwar
Ali Shad, Chemistry Central Journal, 6, 2012, 76.
Alvarez-Suarez JM, Dekanski D, Risti S, Radonji NV,
Petronijevi ND, Giampieri F, Astolfi P, González-
Paramás AM, Santos-Buelga C, Tulipani S, Quiles JL,
Mezzetti B, Battino M, PLoS One, 6(10), 2011, 25878.
Monforte MT, Lanuzza F, Pergolizzi S, Mondello F,
Tzakou O, Galati EM, Phytother Res, 26(6), 2012, 839-
44.
Emam SS, Cairo University Faculty of Agriculture
Bulletin, 50, 1999, 488-514.
Garg SP, Bhushan R, Kapoor RC, Phytochemistry, 19,
1980, 1265, 1980.
El-Hadi MA, Barki YMN,Yousif GM, Hassan SK,
Environ Health Insight, 4, 2010, 1-6.
Srinivas KR, Reddy VM, J of Pharmacy Research, 2,
2009, 1259-1261.
Khan UG, Nazir T, Ahmed VU, Fitoterapia, 53, 1982, 75-
77, 1982.
Kazufumi Yazaki, Akifumi Sugiyama, Masahiko
Morita, Nobukazu Shitan, Phytochemistry Reviews,
October, 7(3), 2008, 513-524.
Page 23
International Journal on Recent and Innovation Trends in Computing and Communication ISSN: 2321-8169 Volume: 3 Issue: 5 279 – 281
_______________________________________________________________________________________________
279 IJRITCC | May 2015, Available @ http://www.ijritcc.org
_______________________________________________________________________________________
Synthesis of (E)-1-(5-chloro-2-hydroxy-4-methylphenyl)-3-(4-
nitrophenyl)prop-2-en-1-one and 4-chloro-5-methyl-2-(5-(4-nitrophenyl)-
4,5-dihydro-1h-pyrazol-3-yl)phenol and its derivatives
Charita B. Patil*1
Department of Chemistry, L.A.D. College of Women, Nagpur,
Maharashtra, India
Vijay H. Masand2
Department of Chemistry, Vidya Bharati Mahavidyalaya,
Amravati, Maharashtra, India- 444 602
Abstract— In the present work, a simple and efficient protocol was followed to synthesize pyrazoline derivatives. The synthetic
protocol commences with acetylation of appropriately substituted phenol 1a, followed by Fries migration to afford substituted
acetophenone 2a. The product 2a was then condensed with properly substituted benzaldehyde to provide corresponding chalcone
3a. The chalcone 3a was then subjected to treatment with hydrazine hydrate to furnish 1H-pyrazoline 4a and its derivatives 4b-d
following acetylation, benzoylation and nitrosoation in moderate to high yields. The structures of the intermediate 1a, 2a, 3a, and
pyrazolines 4a-d were established using chemical reactivity, elemental and spectral analyses.
Keywords- nitro-Chalcone, Pyrazoline, synthesis, IR, PMR
__________________________________________________*****_________________________________________________
I. INTRODUCTION
The synthesis of heterocyclic molecules has enriched the
understanding and knowledge of reactivity and chemistry of
catalysts, reagents, reaction intermediates, medicines and
toxicants [1-4]. Heterocyclic molecules bearing two or more
heteroatoms are key compounds in medicinal, agriculture and
other fields for synthesis of variety of compounds with diverse
applications and desired toxicity/activity. Nirogen
heterocycles viz. pyrazoles, imidazoles, etc. have gained the
prime attention and reverence of researchers due to their
therapeutic properties like anti-bacterial, anti-fungal, anti-
inflammatory, etc., a few to mention [5-12, 14]. Recently,
Bandgar etal highlighted the various methods of synthesis and
applications of pyrazoline derivatives as anti-inflammatory
and anti-oxidants [13].
From the literature survey [1-7], it has been found that nitro
substituted chalcones have never been employed for the
synthesis of respective pyrazolines using reported method.
Therefore, in the present work, the synthesis of pyrazolines
has been accomplished following a simple yet very efficient
route. The emphasis in the present work is on developing
synthetic protocol for easily scalable and competent route for
pyrazolines.
II. EXPERIMENTAL SECTION
All the chemicals were of analytical grade and used as
supplied. The m.p. were recorded in an open capillary and are
uncorrected. The FT-IR spectra were recorded on Agilent
Spectrophotometer and reported in cm-1
. The PMR were
recorded in DMSO-d6 using TMS as an internal standard and
reported in ppm. Synthesis of chalcone 3a [1-8]: Appropriately substituted
acetophenone 2a (0.01 mol) and nitrobenzaldehyde (0.012
mol) were dissolved in ethanol (20 ml), then the mixture was
brought to boiling. To this hot solution, NaOH (0.03 mol) was
added with constant stirring and solution was kept overnight.
The sodium salt obtained was decomposed by aq. HCl (1:1) in
cold condition. The yellow solid obtained was filtered, washed
with NaHCO3 (2%) and then with water. The product was
crystallized from ethanol to get yellow crystal of (E)-1-(5-
chloro-2-hydroxy-4-methylphenyl)-3-(4-nitrophenyl)prop-2-
en-1-one 3a. Yield: 80%, m.p.: 250oC. FT-IR (cm
-1): 3750.21
(presence of free –OH group), 1642.64 (-CO- in conjugation
with -C=C-), 1574.25 (-C=C- moiety), 1514.23 and 1340.40
(asymmetric and symmetric stretch for aromatic -NO2),
1050.29 (aromatic C-Cl stretch), 841.41, 788.23 and 731.47
(presence of substituted benzene ring). PMR (δ): 12.37
(phenolic -OH), 1.23 (-CH3), 2.53 and 2.38 (-CH = CH-),
6.93-8.35 (multiplet, aromatic CH)
Synthesis of pyrazoline 4a [1-8]: The chalcone 3a (0.01 mol)
and hydrazine hydrate (0.012 mol) in 20 ml ethanol was
refluxed for 2 hr, and the mixture was then concentrated. On
cooling, the resulting solid was filtered, and crystallized from
ethanol. Yield: 80%, m.p.: 220-225oC. FT-IR (cm
-1): 3753.20
(free –OH group), 3330.27 (-NH (2o amine)), 3078.79
(aromatic C-H stretch), 1594.24 (-C=N- of pyrazoline),
1514.53 and 1340.86 (aromatic -NO2), 1442.21 (-CH2- of
pyrazoline ring), 1067. 31 (aromatic C-Cl stretch), 849.83,
753.46, and 729.16 (substituted benzene ring). PMR (δ): 10.93
(phenolic –OH), 2.29 (-CH3), 2.53 (-CH2), 6.86 (-NH) 7.21-
8.23 (multiplet, aromatic CH).
Synthesis of 4b-d pyrazoline derivatives [4-9]:
Synthesis of 4b: A mixture of 4a (0.01 mol) and acetic acid
(10 ml) was refluxed for 2 hr. On cooling, the resulting solid
was filtered, and crystallized from ethanol. Pale yellow solid.
Yield: 75%, m.p.: 239oC.
Synthesis of 4c: An equimolar mixture of 4a (0.01 mol) and
benzoyl chloride was dissolved in dry pyridine (10 ml) and
stirred at room temperature for 1 hr. The reaction mixture was
treated with cold dil HCl (2N). The resulting solid was
filtered, washed with water, cold NaOH (2N) and again with
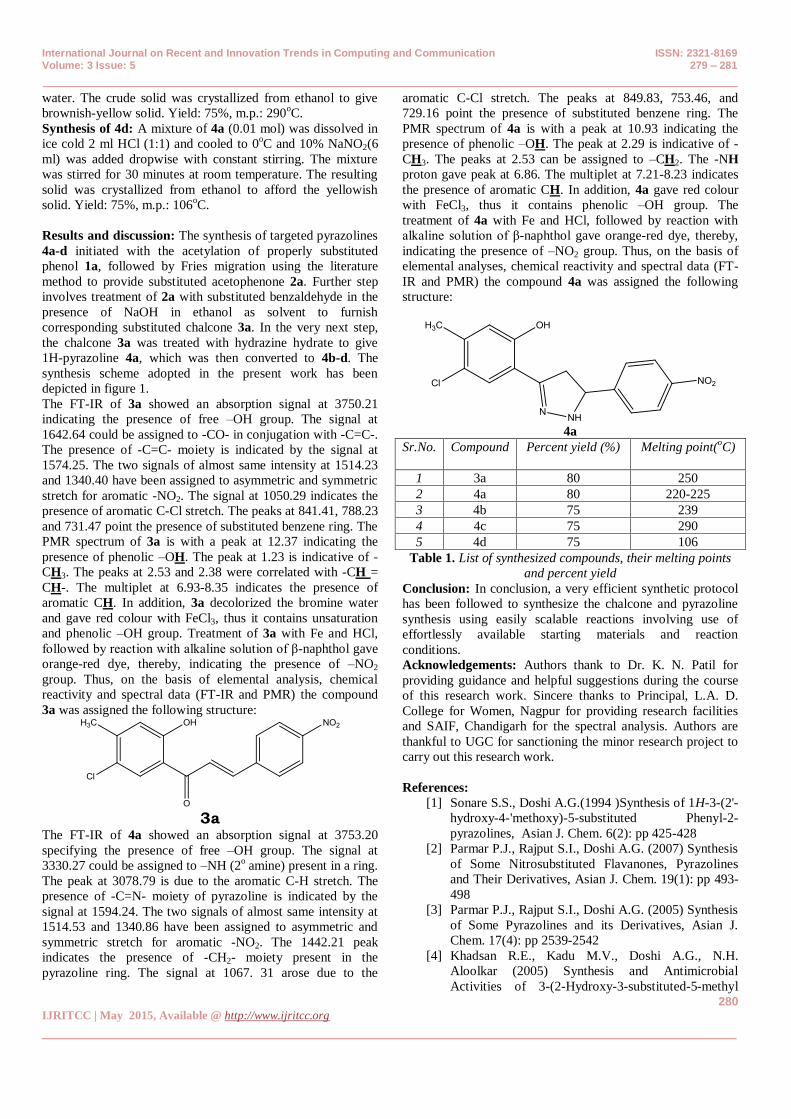
International Journal on Recent and Innovation Trends in Computing and Communication ISSN: 2321-8169 Volume: 3 Issue: 5 279 – 281
_______________________________________________________________________________________________
280 IJRITCC | May 2015, Available @ http://www.ijritcc.org
_______________________________________________________________________________________
water. The crude solid was crystallized from ethanol to give
brownish-yellow solid. Yield: 75%, m.p.: 290oC.
Synthesis of 4d: A mixture of 4a (0.01 mol) was dissolved in
ice cold 2 ml HCl (1:1) and cooled to 0oC and 10% NaNO2(6
ml) was added dropwise with constant stirring. The mixture
was stirred for 30 minutes at room temperature. The resulting
solid was crystallized from ethanol to afford the yellowish
solid. Yield: 75%, m.p.: 106oC.
Results and discussion: The synthesis of targeted pyrazolines
4a-d initiated with the acetylation of properly substituted
phenol 1a, followed by Fries migration using the literature
method to provide substituted acetophenone 2a. Further step
involves treatment of 2a with substituted benzaldehyde in the
presence of NaOH in ethanol as solvent to furnish
corresponding substituted chalcone 3a. In the very next step,
the chalcone 3a was treated with hydrazine hydrate to give
1H-pyrazoline 4a, which was then converted to 4b-d. The
synthesis scheme adopted in the present work has been
depicted in figure 1.
The FT-IR of 3a showed an absorption signal at 3750.21
indicating the presence of free –OH group. The signal at
1642.64 could be assigned to -CO- in conjugation with -C=C-.
The presence of -C=C- moiety is indicated by the signal at
1574.25. The two signals of almost same intensity at 1514.23
and 1340.40 have been assigned to asymmetric and symmetric
stretch for aromatic -NO2. The signal at 1050.29 indicates the
presence of aromatic C-Cl stretch. The peaks at 841.41, 788.23
and 731.47 point the presence of substituted benzene ring. The
PMR spectrum of 3a is with a peak at 12.37 indicating the
presence of phenolic –OH. The peak at 1.23 is indicative of -
CH3. The peaks at 2.53 and 2.38 were correlated with -CH =
CH-. The multiplet at 6.93-8.35 indicates the presence of
aromatic CH. In addition, 3a decolorized the bromine water
and gave red colour with FeCl3, thus it contains unsaturation
and phenolic –OH group. Treatment of 3a with Fe and HCl,
followed by reaction with alkaline solution of β-naphthol gave
orange-red dye, thereby, indicating the presence of –NO2
group. Thus, on the basis of elemental analysis, chemical
reactivity and spectral data (FT-IR and PMR) the compound
3a was assigned the following structure:
3a
The FT-IR of 4a showed an absorption signal at 3753.20
specifying the presence of free –OH group. The signal at
3330.27 could be assigned to –NH (2o amine) present in a ring.
The peak at 3078.79 is due to the aromatic C-H stretch. The
presence of -C=N- moiety of pyrazoline is indicated by the
signal at 1594.24. The two signals of almost same intensity at
1514.53 and 1340.86 have been assigned to asymmetric and
symmetric stretch for aromatic -NO2. The 1442.21 peak
indicates the presence of -CH2- moiety present in the
pyrazoline ring. The signal at 1067. 31 arose due to the
aromatic C-Cl stretch. The peaks at 849.83, 753.46, and
729.16 point the presence of substituted benzene ring. The
PMR spectrum of 4a is with a peak at 10.93 indicating the
presence of phenolic –OH. The peak at 2.29 is indicative of -
CH3. The peaks at 2.53 can be assigned to –CH2. The -NH
proton gave peak at 6.86. The multiplet at 7.21-8.23 indicates
the presence of aromatic CH. In addition, 4a gave red colour
with FeCl3, thus it contains phenolic –OH group. The
treatment of 4a with Fe and HCl, followed by reaction with
alkaline solution of β-naphthol gave orange-red dye, thereby,
indicating the presence of –NO2 group. Thus, on the basis of
elemental analyses, chemical reactivity and spectral data (FT-
IR and PMR) the compound 4a was assigned the following
structure:
4a
Sr.No. Compound Percent yield (%) Melting point(oC)
1 3a 80 250
2 4a 80 220-225
3 4b 75 239
4 4c 75 290
5 4d 75 106
Table 1. List of synthesized compounds, their melting points
and percent yield
Conclusion: In conclusion, a very efficient synthetic protocol
has been followed to synthesize the chalcone and pyrazoline
synthesis using easily scalable reactions involving use of
effortlessly available starting materials and reaction
conditions.
Acknowledgements: Authors thank to Dr. K. N. Patil for
providing guidance and helpful suggestions during the course
of this research work. Sincere thanks to Principal, L.A. D.
College for Women, Nagpur for providing research facilities
and SAIF, Chandigarh for the spectral analysis. Authors are
thankful to UGC for sanctioning the minor research project to
carry out this research work.
References:
[1] Sonare S.S., Doshi A.G.(1994 )Synthesis of 1H-3-(2'-
hydroxy-4-'methoxy)-5-substituted Phenyl-2-
pyrazolines, Asian J. Chem. 6(2): pp 425-428
[2] Parmar P.J., Rajput S.I., Doshi A.G. (2007) Synthesis
of Some Nitrosubstituted Flavanones, Pyrazolines
and Their Derivatives, Asian J. Chem. 19(1): pp 493-
498
[3] Parmar P.J., Rajput S.I., Doshi A.G. (2005) Synthesis
of Some Pyrazolines and its Derivatives, Asian J.
Chem. 17(4): pp 2539-2542
[4] Khadsan R.E., Kadu M.V., Doshi A.G., N.H.
Aloolkar (2005) Synthesis and Antimicrobial
Activities of 3-(2-Hydroxy-3-substituted-5-methyl
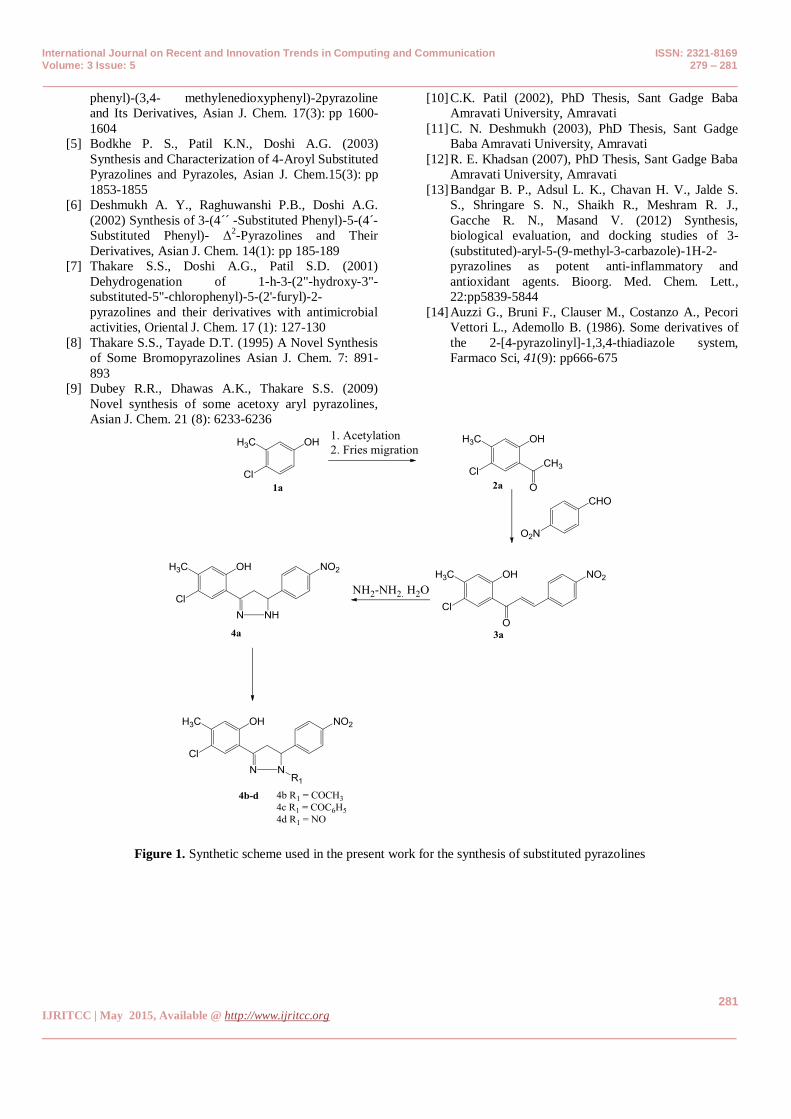
International Journal on Recent and Innovation Trends in Computing and Communication ISSN: 2321-8169 Volume: 3 Issue: 5 279 – 281
_______________________________________________________________________________________________
281 IJRITCC | May 2015, Available @ http://www.ijritcc.org
_______________________________________________________________________________________
phenyl)-(3,4- methylenedioxyphenyl)-2pyrazoline
and Its Derivatives, Asian J. Chem. 17(3): pp 1600-
1604
[5] Bodkhe P. S., Patil K.N., Doshi A.G. (2003)
Synthesis and Characterization of 4-Aroyl Substituted
Pyrazolines and Pyrazoles, Asian J. Chem.15(3): pp
1853-1855
[6] Deshmukh A. Y., Raghuwanshi P.B., Doshi A.G.
(2002) Synthesis of 3-(4´´ -Substituted Phenyl)-5-(4´-
Substituted Phenyl)- Δ2-Pyrazolines and Their
Derivatives, Asian J. Chem. 14(1): pp 185-189
[7] Thakare S.S., Doshi A.G., Patil S.D. (2001)
Dehydrogenation of 1-h-3-(2"-hydroxy-3"-
substituted-5"-chlorophenyl)-5-(2'-furyl)-2-
pyrazolines and their derivatives with antimicrobial
activities, Oriental J. Chem. 17 (1): 127-130
[8] Thakare S.S., Tayade D.T. (1995) A Novel Synthesis
of Some Bromopyrazolines Asian J. Chem. 7: 891-
893
[9] Dubey R.R., Dhawas A.K., Thakare S.S. (2009)
Novel synthesis of some acetoxy aryl pyrazolines,
Asian J. Chem. 21 (8): 6233-6236
[10] C.K. Patil (2002), PhD Thesis, Sant Gadge Baba
Amravati University, Amravati
[11] C. N. Deshmukh (2003), PhD Thesis, Sant Gadge
Baba Amravati University, Amravati
[12] R. E. Khadsan (2007), PhD Thesis, Sant Gadge Baba
Amravati University, Amravati
[13] Bandgar B. P., Adsul L. K., Chavan H. V., Jalde S.
S., Shringare S. N., Shaikh R., Meshram R. J.,
Gacche R. N., Masand V. (2012) Synthesis,
biological evaluation, and docking studies of 3-
(substituted)-aryl-5-(9-methyl-3-carbazole)-1H-2-
pyrazolines as potent anti-inflammatory and
antioxidant agents. Bioorg. Med. Chem. Lett.,
22:pp5839-5844
[14] Auzzi G., Bruni F., Clauser M., Costanzo A., Pecori
Vettori L., Ademollo B. (1986). Some derivatives of
the 2-[4-pyrazolinyl]-1,3,4-thiadiazole system,
Farmaco Sci, 41(9): pp666-675
Figure 1. Synthetic scheme used in the present work for the synthesis of substituted pyrazolines
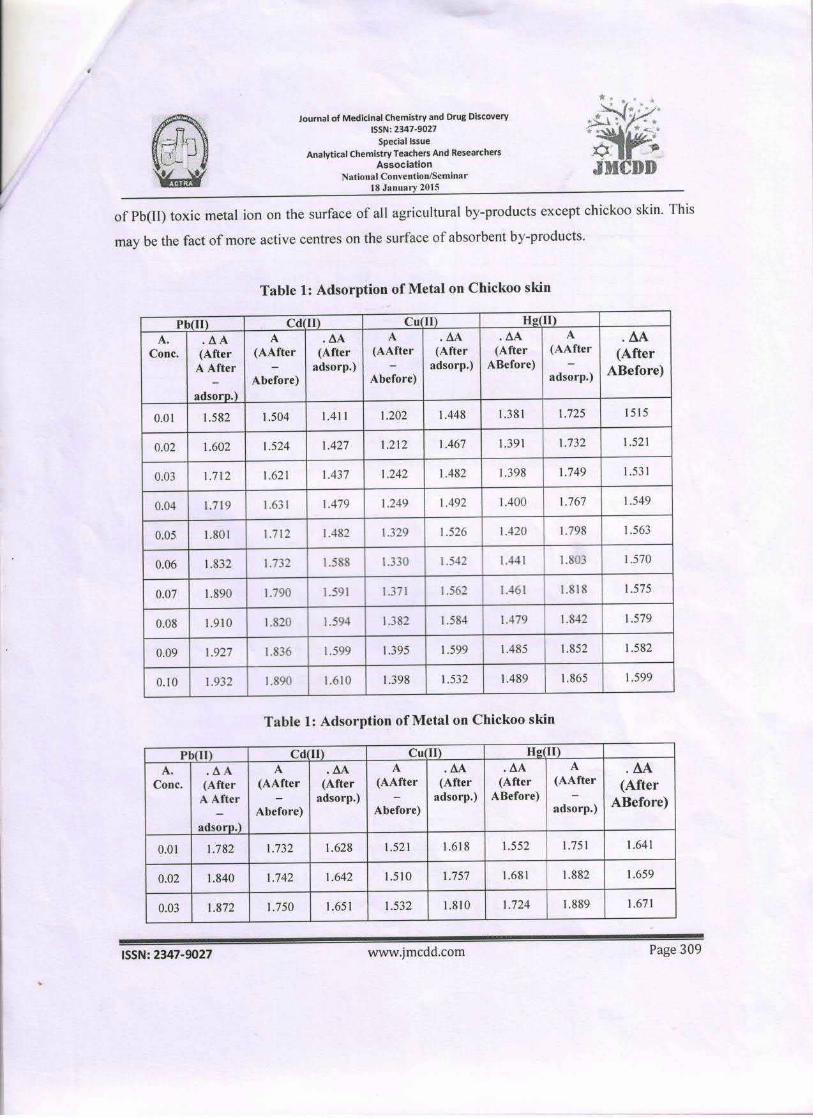
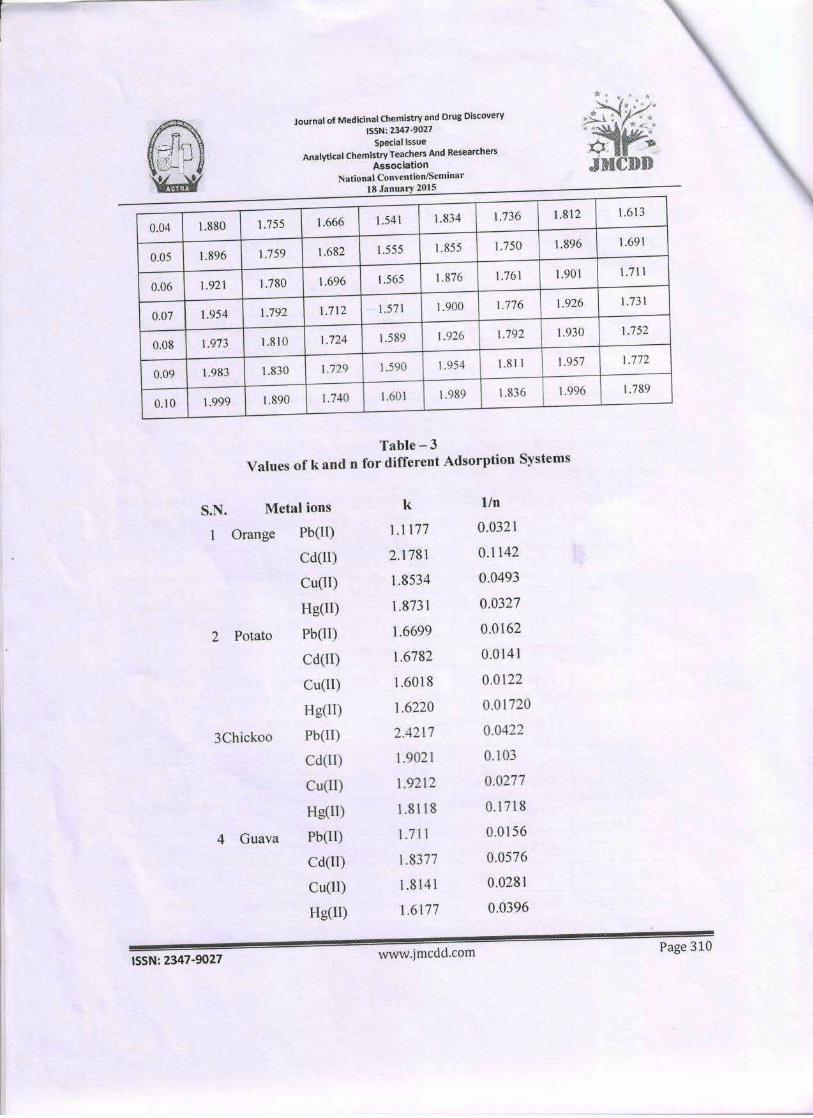
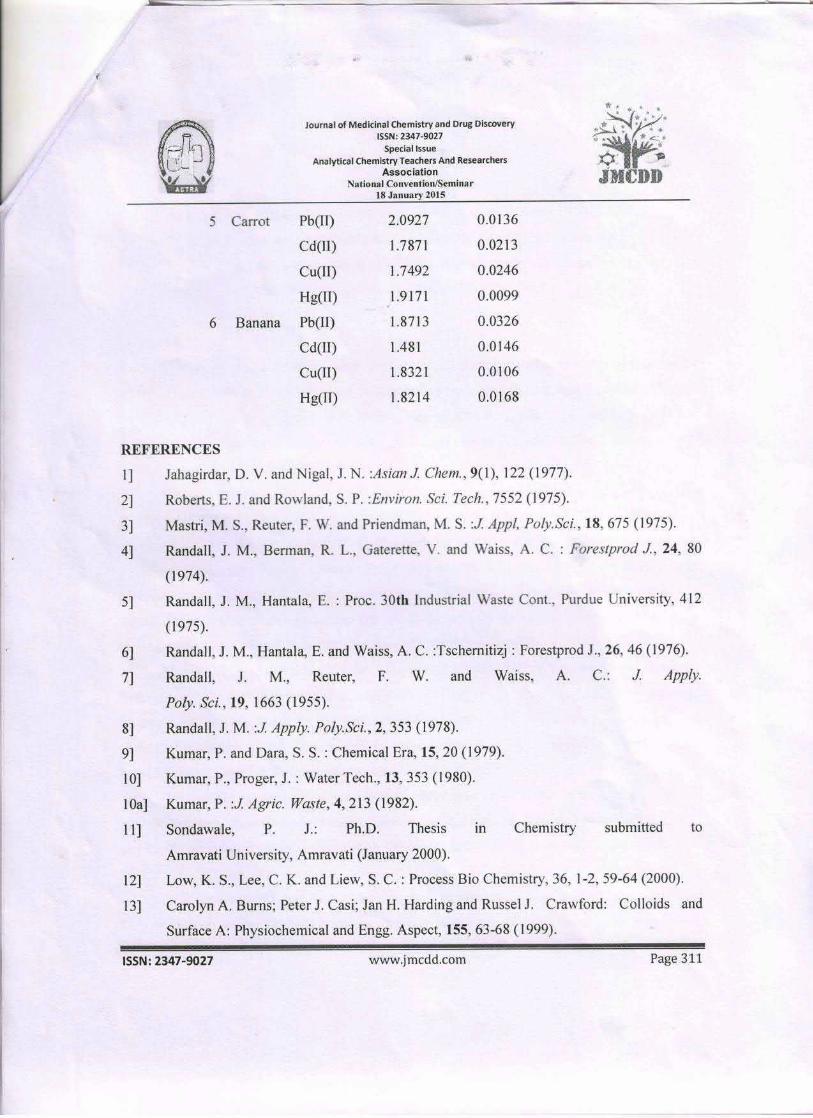
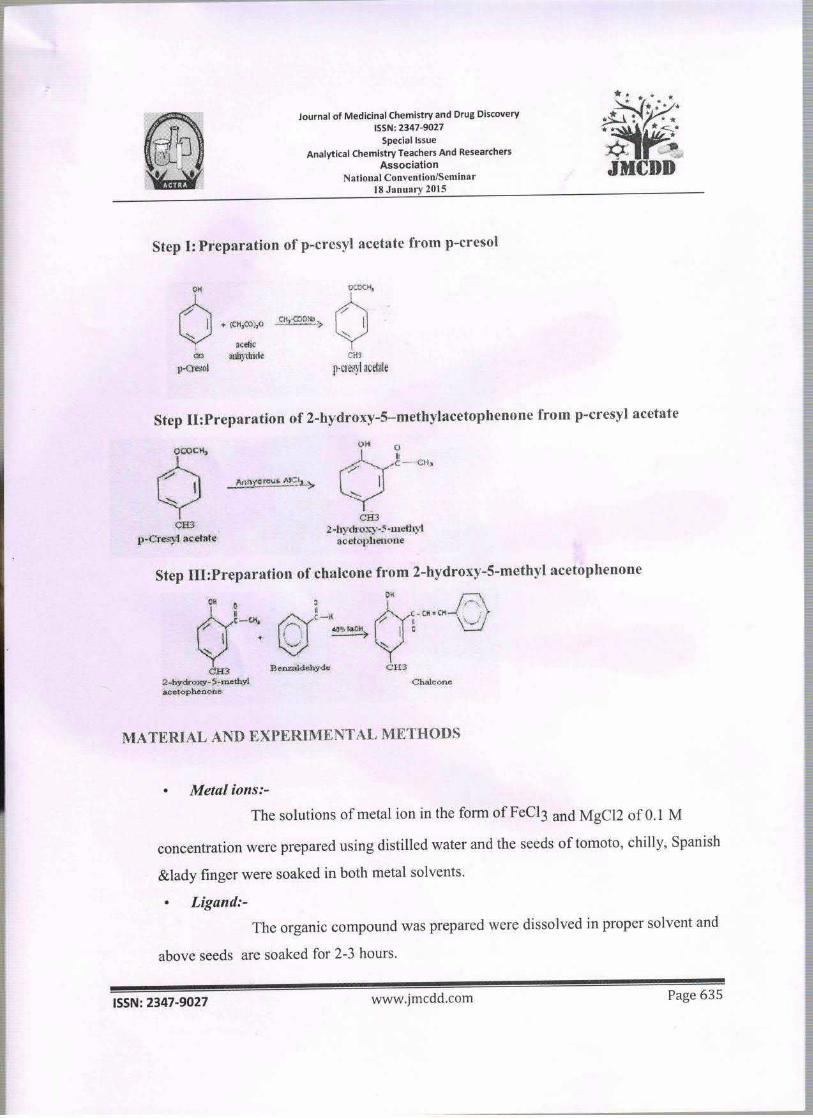
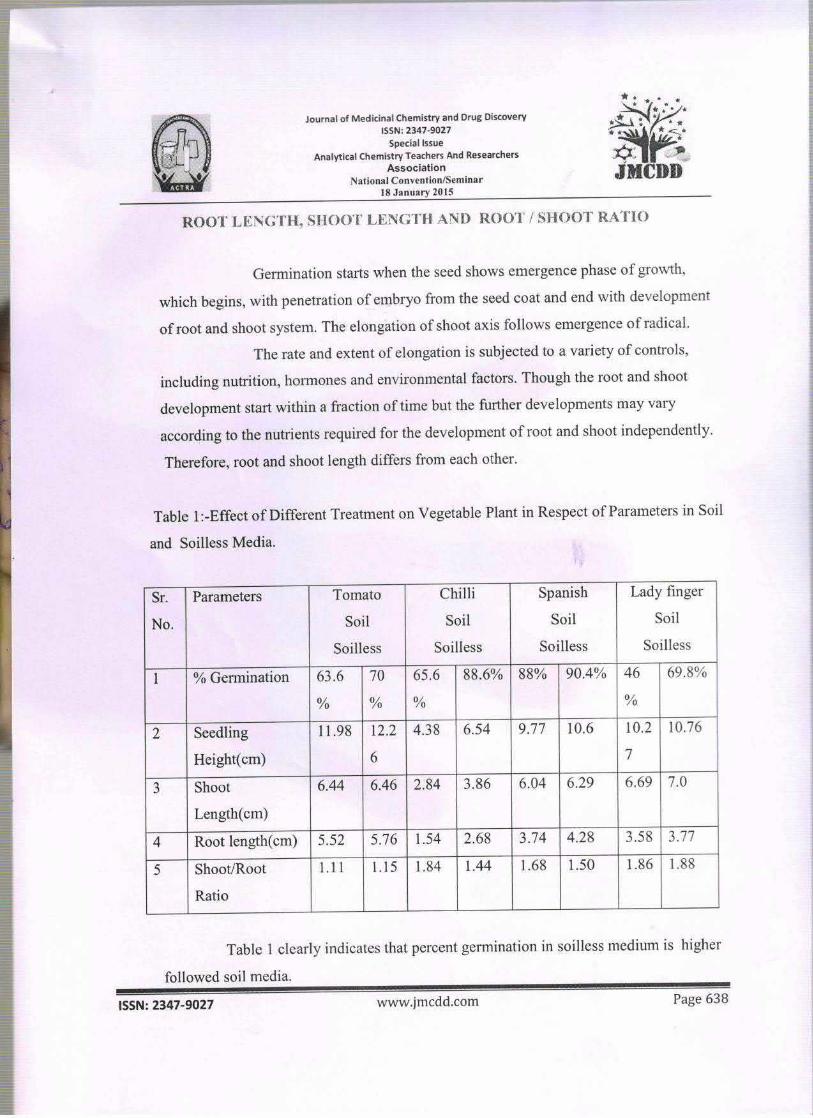
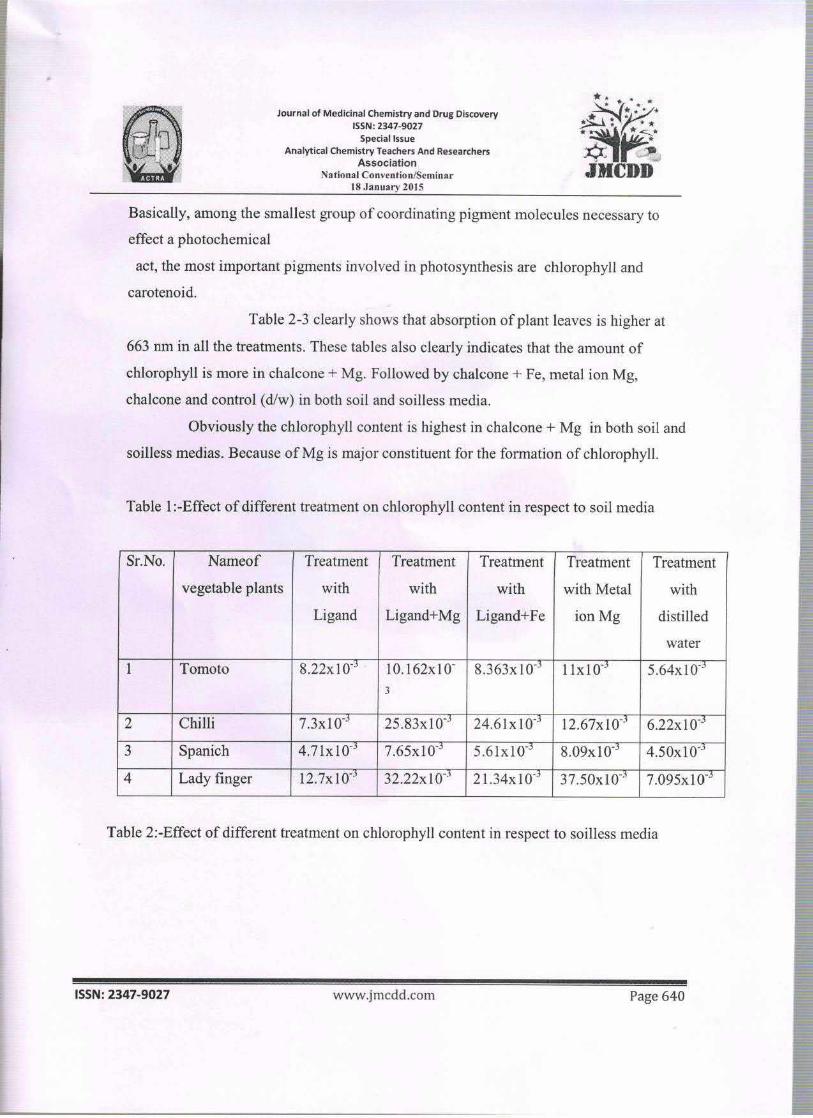
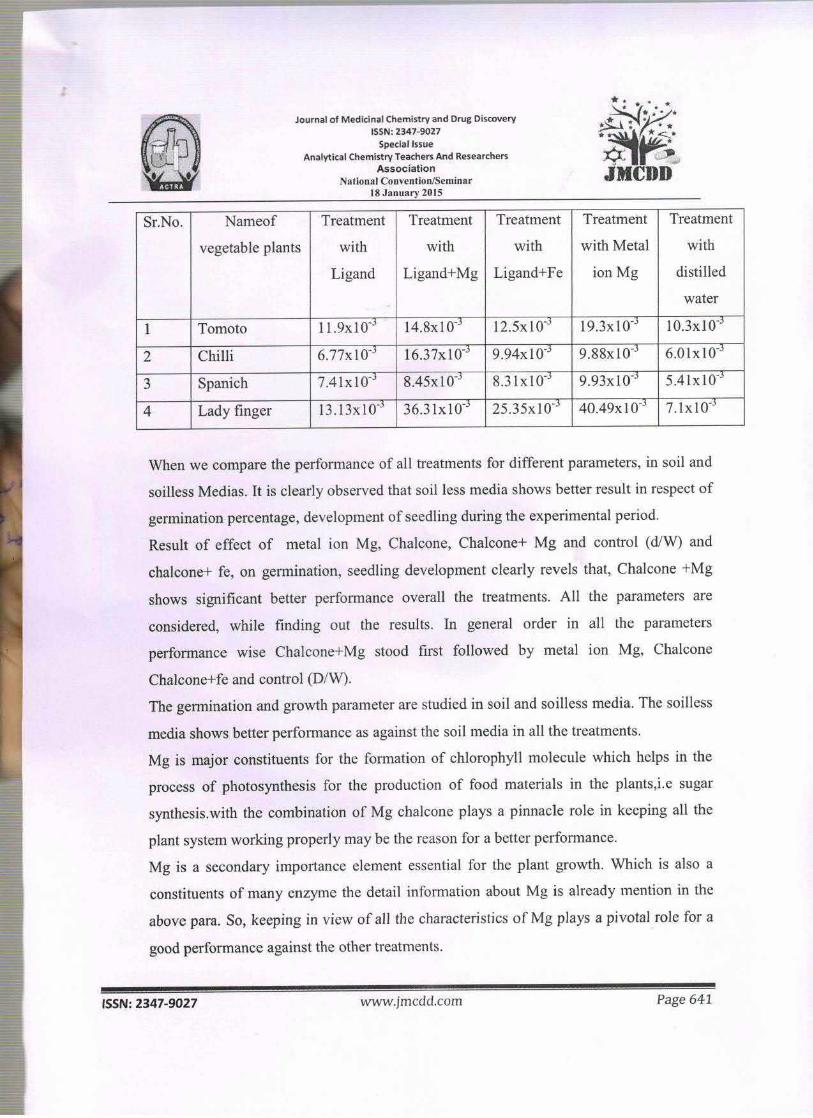
Synthesis, Molecular Modeling, and BiologicalEvaluation of Novel 1, 3-Diphenyl-2-propen-1-oneBased Pyrazolines as Anti-inflammatory Agents
Syed Nasir Abbas Bukhari1,*, Xin Zhang2,Ibrahim Jantan1, Hai-Liang Zhu2,*,Muhammad Wahab Amjad1 andVijay H. Masand3
1Drug and Herbal Research Centre, Faculty of Pharmacy,Universiti Kebangsaan Malaysia, Jalan Raja Muda AbdulAziz, 50300 Kuala Lumpur, Malaysia2Institute of Functional Biomolecules, State Key Laboratoryof Pharmaceutical Biotechnology, Nanjing University,Nanjing 210093, China3Department of Chemistry, Vidya Bharati Mahavidyalaya,Amravati, Maharashtra 444 602, India*Corresponding authors: Syed Nasir Abbas Bukhari,[email protected], [email protected]; Hai-LiangZhu, [email protected]
A novel series of 1,3-diphenyl-2-propen-1-one (chal-cone) derivatives was synthesized by a simple, eco-friendly, and efficient Claisen–Schmidt condensationreaction and used as precursors for the synthesis ofnew pyrazoline derivatives. All the synthesized com-pounds were screened for anti-inflammatory relatedactivities such as inhibition of phospholipase A2
(PLA2), cyclooxygenases (COX-1 and COX-2), IL-6, andTNF-a. The results of the above studies show that thecompounds synthesized are effective inhibitors ofabove pro-inflammatory enzymes and cytokines. Over-all, the results of the studies reveal that the pyrazolineswith chlorophenyl substitution (1b–6b) seem to beimportant for inhibition of enzymes and cytokines.Molecular docking experiments were performed toclarify the molecular aspects of the observed COX-inhibitory activities of the investigated compounds.
Key words: arachidonic acid, chalcones, Claisen–Schmidtcondensation, flavonoids, lipopolysaccharides
Received 9 July 2014, revised 25 September 2014 andaccepted for publication 15 October 2014
Phospholipases A2 (PLA2) are main enzymes that areresponsible for catalyzing the hydrolysis of the ester bondat the sn-2 position of glycerophospholipids. Resultingproducts of this hydrolysis include fatty-acids such as ara-chidonic acid (AA); enzymatically, this AA is further metab-olized into potent pro-inflammatory mediators known as
eicosanoids (prostaglandins, leukotrienes, and thrombox-anes). Further, lyso-phospholipids are metabolized byPAF-acetyltransferase producing platelet activating factor(PAF) which is another pro-inflammatory mediator. Control-ling or suppressing the production of the lipid mediators isone of the therapeutic strategies owing to the associationand the diversity of pathological processes and involve-ment of lipid mediators in such processes (1).
Biotransformation of arachidonic acid into prostaglandins(PGs) and thromboxanes, which are ultimately responsiblefor several physiological and pathophysiological responses,is catalyzed by the cyclooxygenase isozymes (COX-1 andCOX-2) (2,3). The COX-1 isozyme is responsible for thehomeostatic functions such as renal blood flow regulation,initiation of labor pain, protection of the gastric mucosa,and importantly platelet aggregation. Recently, investiga-tions have indicated a possible involvement of the COX-1in angiogenesis thus justifying the development of newCOX-1 inhibitors (4,5), while the COX-2 isozyme is involvedin the production of inflammatory PGs, which is responsi-ble for inducing pain, swelling, and fever (6–8). Other thaninduction of peripheral inflammation, COX-2 isozymeexpression is also upregulated in several human cancersincluding lung, colon, prostate, gastric, hepatocellular,breast, and esophageal carcinomas (9,10).
Pro-inflammation, a widespread unwanted phenomenon,is associated with a variety of diseases including but notlimited to, carcinomas and cardiovascular diseases (11–13). IL-6 and TNF-a are pro-inflammatory cytokines, whichare involved in the pathogenesis of various inflammatorydisorders such as endotoxemia and/or toxic shock syn-drome, rheumatoid arthritis (RA), osteoarthritis, inflamma-tory bowel disease, and psoriasis (14–22). These cytokinesplay important and widespread vital roles for maintainingthe normal cell physiology other than their pro-inflamma-tory duties. For instance, activation of T cells and otherinflammatory cells, secretion of cytokines (such as IL-1,IL-6 and IL-10), and apoptosis induction can be triggeredby TNF-a. Nonetheless, an over-expression of TNF-a andIL-6 could lead to the development of various inflammatorydisorders and other human diseases. Numerous clinicaltrials for RA management have shown that targeted inhibi-tion of cytokines, specifically TNF-a, is beneficial. Given all
ª 2014 John Wiley & Sons A/S. doi: 10.1111/cbdd.12457 1
Chem Biol Drug Des 2014
Research Article
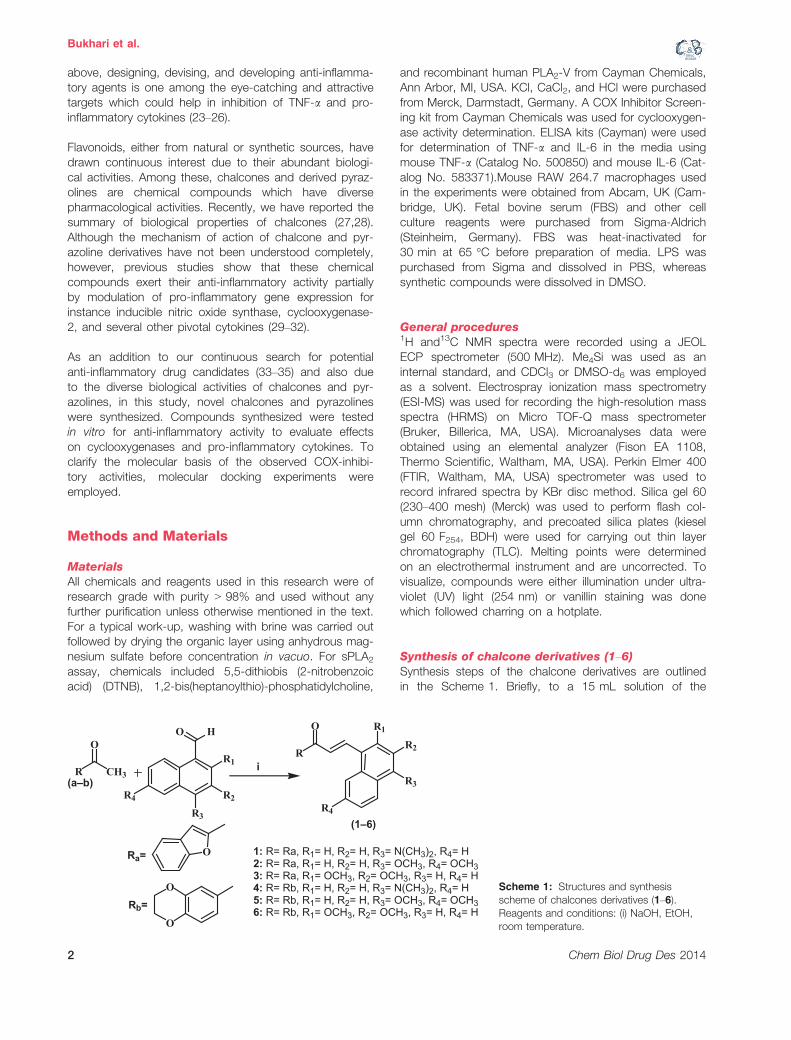
above, designing, devising, and developing anti-inflamma-tory agents is one among the eye-catching and attractivetargets which could help in inhibition of TNF-a and pro-inflammatory cytokines (23–26).
Flavonoids, either from natural or synthetic sources, havedrawn continuous interest due to their abundant biologi-cal activities. Among these, chalcones and derived pyraz-olines are chemical compounds which have diversepharmacological activities. Recently, we have reported thesummary of biological properties of chalcones (27,28).Although the mechanism of action of chalcone and pyr-azoline derivatives have not been understood completely,however, previous studies show that these chemicalcompounds exert their anti-inflammatory activity partiallyby modulation of pro-inflammatory gene expression forinstance inducible nitric oxide synthase, cyclooxygenase-2, and several other pivotal cytokines (29–32).
As an addition to our continuous search for potentialanti-inflammatory drug candidates (33–35) and also dueto the diverse biological activities of chalcones and pyr-azolines, in this study, novel chalcones and pyrazolineswere synthesized. Compounds synthesized were testedin vitro for anti-inflammatory activity to evaluate effectson cyclooxygenases and pro-inflammatory cytokines. Toclarify the molecular basis of the observed COX-inhibi-tory activities, molecular docking experiments wereemployed.
Methods and Materials
MaterialsAll chemicals and reagents used in this research were ofresearch grade with purity > 98% and used without anyfurther purification unless otherwise mentioned in the text.For a typical work-up, washing with brine was carried outfollowed by drying the organic layer using anhydrous mag-nesium sulfate before concentration in vacuo. For sPLA2
assay, chemicals included 5,5-dithiobis (2-nitrobenzoicacid) (DTNB), 1,2-bis(heptanoylthio)-phosphatidylcholine,
and recombinant human PLA2-V from Cayman Chemicals,Ann Arbor, MI, USA. KCl, CaCl2, and HCl were purchasedfrom Merck, Darmstadt, Germany. A COX Inhibitor Screen-ing kit from Cayman Chemicals was used for cyclooxygen-ase activity determination. ELISA kits (Cayman) were usedfor determination of TNF-a and IL-6 in the media usingmouse TNF-a (Catalog No. 500850) and mouse IL-6 (Cat-alog No. 583371).Mouse RAW 264.7 macrophages usedin the experiments were obtained from Abcam, UK (Cam-bridge, UK). Fetal bovine serum (FBS) and other cellculture reagents were purchased from Sigma-Aldrich(Steinheim, Germany). FBS was heat-inactivated for30 min at 65 °C before preparation of media. LPS waspurchased from Sigma and dissolved in PBS, whereassynthetic compounds were dissolved in DMSO.
General procedures1H and13C NMR spectra were recorded using a JEOLECP spectrometer (500 MHz). Me4Si was used as aninternal standard, and CDCl3 or DMSO-d6 was employedas a solvent. Electrospray ionization mass spectrometry(ESI-MS) was used for recording the high-resolution massspectra (HRMS) on Micro TOF-Q mass spectrometer(Bruker, Billerica, MA, USA). Microanalyses data wereobtained using an elemental analyzer (Fison EA 1108,Thermo Scientific, Waltham, MA, USA). Perkin Elmer 400(FTIR, Waltham, MA, USA) spectrometer was used torecord infrared spectra by KBr disc method. Silica gel 60(230–400 mesh) (Merck) was used to perform flash col-umn chromatography, and precoated silica plates (kieselgel 60 F254, BDH) were used for carrying out thin layerchromatography (TLC). Melting points were determinedon an electrothermal instrument and are uncorrected. Tovisualize, compounds were either illumination under ultra-violet (UV) light (254 nm) or vanillin staining was donewhich followed charring on a hotplate.
Synthesis of chalcone derivatives (1–6)Synthesis steps of the chalcone derivatives are outlinedin the Scheme 1. Briefly, to a 15 mL solution of the
O
O
CH3
O
O
O H
R3
R1
R2R4
R
R
O
R3
R1R2
R4
Ra=
(1–6)
Rb=
(a–b)
1: R= Ra, R1= H, R2= H, R3= N(CH3)2, R4= H2: R= Ra, R1= H, R2= H, R3= OCH3, R4= OCH33: R= Ra, R1= OCH3, R2= OCH3, R3= H, R4= H4: R= Rb, R1= H, R2= H, R3= N(CH3)2, R4= H5: R= Rb, R1= H, R2= H, R3= OCH3, R4= OCH36: R= Rb, R1= OCH3, R2= OCH3, R3= H, R4= H
i
Scheme 1: Structures and synthesisscheme of chalcones derivatives (1–6).Reagents and conditions: (i) NaOH, EtOH,room temperature.
2 Chem Biol Drug Des 2014
Bukhari et al.
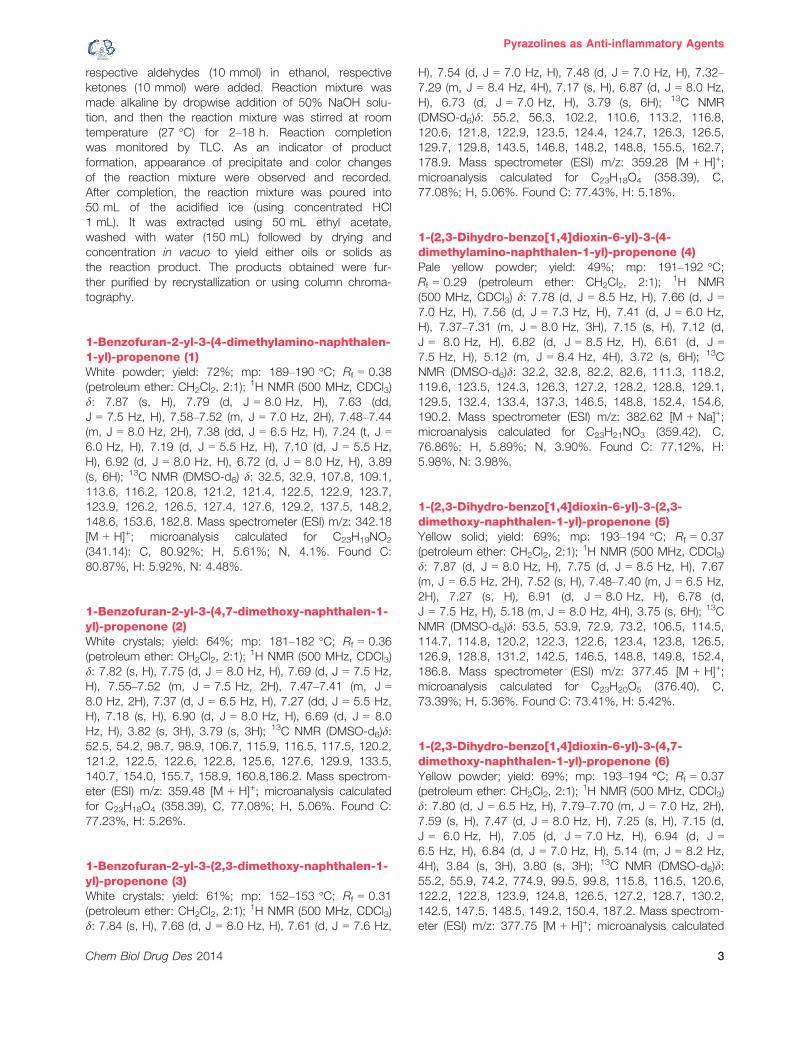
respective aldehydes (10 mmol) in ethanol, respectiveketones (10 mmol) were added. Reaction mixture wasmade alkaline by dropwise addition of 50% NaOH solu-tion, and then the reaction mixture was stirred at roomtemperature (27 °C) for 2–18 h. Reaction completionwas monitored by TLC. As an indicator of productformation, appearance of precipitate and color changesof the reaction mixture were observed and recorded.After completion, the reaction mixture was poured into50 mL of the acidified ice (using concentrated HCl1 mL). It was extracted using 50 mL ethyl acetate,washed with water (150 mL) followed by drying andconcentration in vacuo to yield either oils or solids asthe reaction product. The products obtained were fur-ther purified by recrystallization or using column chroma-tography.
1-Benzofuran-2-yl-3-(4-dimethylamino-naphthalen-1-yl)-propenone (1)White powder; yield: 72%; mp: 189–190 °C; Rf = 0.38(petroleum ether: CH2Cl2, 2:1);
1H NMR (500 MHz, CDCl3)d: 7.87 (s, H), 7.79 (d, J = 8.0 Hz, H), 7.63 (dd,J = 7.5 Hz, H), 7.58–7.52 (m, J = 7.0 Hz, 2H), 7.48–7.44(m, J = 8.0 Hz, 2H), 7.38 (dd, J = 6.5 Hz, H), 7.24 (t, J =6.0 Hz, H), 7.19 (d, J = 5.5 Hz, H), 7.10 (d, J = 5.5 Hz,H), 6.92 (d, J = 8.0 Hz, H), 6.72 (d, J = 8.0 Hz, H), 3.89(s, 6H); 13C NMR (DMSO-d6) d: 32.5, 32.9, 107.8, 109.1,113.6, 116.2, 120.8, 121.2, 121.4, 122.5, 122.9, 123.7,123.9, 126.2, 126.5, 127.4, 127.6, 129.2, 137.5, 148.2,148.6, 153.6, 182.8. Mass spectrometer (ESI) m/z: 342.18[M + H]+; microanalysis calculated for C23H19NO2
(341.14): C, 80.92%; H, 5.61%; N, 4.1%. Found C:80.87%, H: 5.92%, N: 4.48%.
1-Benzofuran-2-yl-3-(4,7-dimethoxy-naphthalen-1-yl)-propenone (2)White crystals; yield: 64%; mp: 181–182 °C; Rf = 0.36(petroleum ether: CH2Cl2, 2:1);
1H NMR (500 MHz, CDCl3)d: 7.82 (s, H), 7.75 (d, J = 8.0 Hz, H), 7.69 (d, J = 7.5 Hz,H), 7.55–7.52 (m, J = 7.5 Hz, 2H), 7.47–7.41 (m, J =8.0 Hz, 2H), 7.37 (d, J = 6.5 Hz, H), 7.27 (dd, J = 5.5 Hz,H), 7.18 (s, H), 6.90 (d, J = 8.0 Hz, H), 6.69 (d, J = 8.0Hz, H), 3.82 (s, 3H), 3.79 (s, 3H); 13C NMR (DMSO-d6)d:52.5, 54.2, 98.7, 98.9, 106.7, 115.9, 116.5, 117.5, 120.2,121.2, 122.5, 122.6, 122.8, 125.6, 127.6, 129.9, 133.5,140.7, 154.0, 155.7, 158.9, 160.8,186.2. Mass spectrom-eter (ESI) m/z: 359.48 [M + H]+; microanalysis calculatedfor C23H18O4 (358.39), C, 77.08%; H, 5.06%. Found C:77.23%, H: 5.26%.
1-Benzofuran-2-yl-3-(2,3-dimethoxy-naphthalen-1-yl)-propenone (3)White crystals; yield: 61%; mp: 152–153 °C; Rf = 0.31(petroleum ether: CH2Cl2, 2:1);
1H NMR (500 MHz, CDCl3)d: 7.84 (s, H), 7.68 (d, J = 8.0 Hz, H), 7.61 (d, J = 7.6 Hz,
H), 7.54 (d, J = 7.0 Hz, H), 7.48 (d, J = 7.0 Hz, H), 7.32–7.29 (m, J = 8.4 Hz, 4H), 7.17 (s, H), 6.87 (d, J = 8.0 Hz,H), 6.73 (d, J = 7.0 Hz, H), 3.79 (s, 6H); 13C NMR(DMSO-d6)d: 55.2, 56.3, 102.2, 110.6, 113.2, 116.8,120.6, 121.8, 122.9, 123.5, 124.4, 124.7, 126.3, 126.5,129.7, 129.8, 143.5, 146.8, 148.2, 148.8, 155.5, 162.7,178.9. Mass spectrometer (ESI) m/z: 359.28 [M + H]+;microanalysis calculated for C23H18O4 (358.39), C,77.08%; H, 5.06%. Found C: 77.43%, H: 5.18%.
1-(2,3-Dihydro-benzo[1,4]dioxin-6-yl)-3-(4-dimethylamino-naphthalen-1-yl)-propenone (4)Pale yellow powder; yield: 49%; mp: 191–192 °C;Rf = 0.29 (petroleum ether: CH2Cl2, 2:1); 1H NMR(500 MHz, CDCl3) d: 7.78 (d, J = 8.5 Hz, H), 7.66 (d, J =7.0 Hz, H), 7.56 (d, J = 7.3 Hz, H), 7.41 (d, J = 6.0 Hz,H), 7.37–7.31 (m, J = 8.0 Hz, 3H), 7.15 (s, H), 7.12 (d,J = 8.0 Hz, H), 6.82 (d, J = 8.5 Hz, H), 6.61 (d, J =7.5 Hz, H), 5.12 (m, J = 8.4 Hz, 4H), 3.72 (s, 6H); 13CNMR (DMSO-d6)d: 32.2, 32.8, 82.2, 82.6, 111.3, 118.2,119.6, 123.5, 124.3, 126.3, 127.2, 128.2, 128.8, 129.1,129.5, 132.4, 133.4, 137.3, 146.5, 148.8, 152.4, 154.6,190.2. Mass spectrometer (ESI) m/z: 382.62 [M + Na]+;microanalysis calculated for C23H21NO3 (359.42), C,76.86%; H, 5.89%; N, 3.90%. Found C: 77.12%, H:5.98%, N: 3.98%.
1-(2,3-Dihydro-benzo[1,4]dioxin-6-yl)-3-(2,3-dimethoxy-naphthalen-1-yl)-propenone (5)Yellow solid; yield: 69%; mp: 193–194 °C; Rf = 0.37(petroleum ether: CH2Cl2, 2:1);
1H NMR (500 MHz, CDCl3)d: 7.87 (d, J = 8.0 Hz, H), 7.75 (d, J = 8.5 Hz, H), 7.67(m, J = 6.5 Hz, 2H), 7.52 (s, H), 7.48–7.40 (m, J = 6.5 Hz,2H), 7.27 (s, H), 6.91 (d, J = 8.0 Hz, H), 6.78 (d,J = 7.5 Hz, H), 5.18 (m, J = 8.0 Hz, 4H), 3.75 (s, 6H); 13CNMR (DMSO-d6)d: 53.5, 53.9, 72.9, 73.2, 106.5, 114.5,114.7, 114.8, 120.2, 122.3, 122.6, 123.4, 123.8, 126.5,126.9, 128.8, 131.2, 142.5, 146.5, 148.8, 149.8, 152.4,186.8. Mass spectrometer (ESI) m/z: 377.45 [M + H]+;microanalysis calculated for C23H20O5 (376.40), C,73.39%; H, 5.36%. Found C: 73.41%, H: 5.42%.
1-(2,3-Dihydro-benzo[1,4]dioxin-6-yl)-3-(4,7-dimethoxy-naphthalen-1-yl)-propenone (6)Yellow powder; yield: 69%; mp: 193–194 °C; Rf = 0.37(petroleum ether: CH2Cl2, 2:1);
1H NMR (500 MHz, CDCl3)d: 7.80 (d, J = 6.5 Hz, H), 7.79–7.70 (m, J = 7.0 Hz, 2H),7.59 (s, H), 7.47 (d, J = 8.0 Hz, H), 7.25 (s, H), 7.15 (d,J = 6.0 Hz, H), 7.05 (d, J = 7.0 Hz, H), 6.94 (d, J =6.5 Hz, H), 6.84 (d, J = 7.0 Hz, H), 5.14 (m, J = 8.2 Hz,4H), 3.84 (s, 3H), 3.80 (s, 3H); 13C NMR (DMSO-d6)d:55.2, 55.9, 74.2, 774.9, 99.5, 99.8, 115.8, 116.5, 120.6,122.2, 122.8, 123.9, 124.8, 126.5, 127.2, 128.7, 130.2,142.5, 147.5, 148.5, 149.2, 150.4, 187.2. Mass spectrom-eter (ESI) m/z: 377.75 [M + H]+; microanalysis calculated
Chem Biol Drug Des 2014 3
Pyrazolines as Anti-inflammatory Agents
for C23H20O5 (376.40), C, 73.39%; H, 5.36%. Found C:73.29%, H: 5.39%.
Synthesis of disubstituted-4,5-dihydro-pyrazole-1-carbothioamides (1a–6a)For a typical synthesis, 5 mmol NaOH solution in 1 mLwas added to a mixture of 10 mmol chalcones (1–6) and10 mmol thiosemicarbazide in 50 mL of ethanol underreflux for 10–18 h (Scheme 2). After designated time peri-ods, reaction mixture was transferred onto crushed iceand the solid obtained as a result was filtered, followed bydrying, recrystallization from dimethylformamide (DMF) orpurification by column chromatography.
3-Benzofuran-2-yl-5-(4-dimethylamino-naphthalen-1-yl)-4,5-dihydro-pyrazole-1-carbothioic acidamide (1a)White powder; yield: 42%; mp: 229–230 °C; Rf = 0.48(petroleum ether: CH2Cl2, 2:1);
1H NMR (500 MHz, CDCl3)d: 8.80 (s, D2O exchangeable, 2H, NH2), 7.78–7.30 (m,J = 8.0 Hz, 10H), 7.19 (s, 1H), 5.52–5.47 (dd, J = 12.0 Hz,1H), 4.21–4.13 (dd, J = 12.0 Hz, 1H), 3.87 (s, 6H), 3.45–3.29 (dd, J = 17.5 Hz, 1H). Mass spectrometer (ESI) m/z:415.62 [M + H]+; microanalysis calculated for C24H22N4OS(414.52), C, 69.54%; H, 5.35%; N, 13.52%; S, 7.74%.Found C: 69.63%, H: 5.29%, N: 13.61%, S: 7.79%.
3-Benzofuran-2-yl-5-(4,7-dimethoxy-naphthalen-1-yl)-4,5-dihydro-pyrazole-1-carbothioic acid amide(2a)White powder; yield: 39%; mp: 234–236 °C; Rf = 0.43(petroleum ether: CH2Cl2, 2:1);
1H NMR (500 MHz, CDCl3)d: 8.87 (s, D2O exchangeable, 2H, NH2), 7.89–7.29 (m,J = 8.0 Hz, 8H), 7.16 (s, 1H), 6.92 (d, J = 8.0 Hz, 1H),5.57–5.50 (dd, J = 11.5 Hz, 1H), 4.22–4.19 (dd, J =11.5 Hz, 1H), 3.85 (s, 6H), 3.47-3.34 (dd, J = 17.5 Hz,1H). Mass spectrometer (ESI) m/z: 432.52 [M + H]+;microanalysis calculated for C24H21N3O3S (431.51), C,66.80%; H, 4.91%; N, 9.74%; S, 7.43%. Found C:66.97%, H: 4.98%, N: 9.73%, S: 7.41%.
3-Benzofuran-2-yl-5-(2,3-dimethoxy-naphthalen-1-yl)-4,5-dihydro-pyrazole-1-carbothioic acid amide(3a)White solid; yield: 51%; mp: 218–220 °C; Rf = 0.48(petroleum ether: CH2Cl2, 2:1); 1H NMR (500 MHz,CDCl3) d: 8.81 (s, D2O exchangeable, 2H, NH2), 7.73–7.51 (m, J = 8.0 Hz, 9H), 7.19 (s, 1H), 5.48–5.42 (dd,J = 11.5 Hz, 1H), 4.20–4.16 (dd, J = 11.5 Hz, 1H), 3.87(s, 6H), 3.41–3.35 (dd, J = 16.5 Hz, 1H). Mass spec-trometer (ESI) m/z: 432.64 [M + H]+; microanalysis calcu-lated for C24H21N3O3S (431.51), C, 66.80%; H, 4.91%;N, 9.74%; S, 7.43%. Found C: 66.85%, H: 4.98%, N:9.85%, S: 7.48%.
3-(2,3-Dihydro-benzo[1,4]dioxin-6-yl)-5-(4-dimethylamino-naphthalen-1-yl)-4,5-dihydro-pyrazole-1-carbothioic acid amide (4a)Pale yellow crystals; yield: 49%; mp: 201–202 °C; Rf = 0.38(petroleum ether: CH2Cl2, 2:1);
1H NMR (500 MHz, CDCl3)d: 8.94 (s, D2O exchangeable, 2H, NH2), 7.82–7.47 (m,J = 6.5 Hz, 8H), 7.12 (s, 1H), 5.42–5.32 (dd, J = 12.0 Hz,1H), 5.12 (m, J = 8.0 Hz, 4H), 4.22–4.15 (dd, J = 12.0 Hz,1H), 3.80 (s, 6H), 3.24–3.12 (dd, J = 16.0 Hz, 1H). Massspectrometer (ESI) m/z: 455.64 [M + Na]+; microanalysiscalculated for C24H24N4O2S (432.54), C, 66.64%; H,5.59%; N, 12.95%; S, 7.41%. Found C: 66.68%, H: 5.56%,N: 12.99%, S: 7.43%.
3-(2,3-Dihydro-benzo[1,4]dioxin-6-yl)-5-(2,3-dimethoxy-naphthalen-1-yl)-4,5-dihydro-pyrazole-1-carbothioic acid amide (5a)White powder; yield: 47%; mp: 222–224 °C; Rf = 0.41(petroleum ether: CH2Cl2, 2:1);
1H NMR (500 MHz, CDCl3)d: 8.90 (s, D2O exchangeable, 2H, NH2), 7.77–7.52 (m,J = 8.0 Hz, 7H), 7.22 (s, 1H), 5.38–5.30 (dd, J = 12.5 Hz,1H), 5.17 (m, J = 8.0 Hz, 4H), 4.25–4.12 (dd, J = 12.5 Hz,1H), 3.92 (s, 6H), 3.32–3.29 (dd, J = 17.0 Hz, 1H). Massspectrometer (ESI) m/z: 450.48 [M + H]+; microanalysis cal-culated for C24H23N3O4S (449.52), C, 64.13%; H, 5.16%;N, 9.35%; S, 7.13%. Found C: 64.18%, H: 5.19%, N:9.49%, S: 7.19%.
R
O
R3
R1R2
R4(1–6)
H3N NH
SNH2
R
N N
S NH2
R1R2
R3
R4
(1a–6a)1: R= Ra, R1= H, R2= H, R3= N(CH3)2, R4= H2: R= Ra, R1= H, R2= H, R3= OCH3, R4= OCH33: R= Ra, R1= OCH3, R2= OCH3, R3= H, R4= H4: R= Rb, R1= H, R2= H, R3= N(CH3)2, R4= H5: R= Rb, R1= H, R2= H, R3= OCH3, R4= OCH36: R= Rb, R1= OCH3, R2= OCH3, R3= H, R4= H
i
Scheme 2: Synthesis of pyrazolinederivatives (1a–6a). Reagents andconditions: (i) NaOH, EtOH, roomtemperature.
4 Chem Biol Drug Des 2014
Bukhari et al.
3-(2,3-Dihydro-benzo[1,4]dioxin-6-yl)-5-(4,7-dimethoxy-naphthalen-1-yl)-4,5-dihydro-pyrazole-1-carbothioic acid amide (6a)White solid; yield: 32%; mp: 227–229 °C; Rf = 0.43 (petro-leum ether: CH2Cl2, 2:1); 1H NMR (500 MHz, CDCl3) d:8.92 (s, D2O exchangeable, 2H, NH2), 7.72–7.48 (m,J = 8.0 Hz, 7H), 7.28 (s, 1H), 5.44–5.28 (dd, J = 12.0 Hz,1H), 5.09 (m, J = 8.0 Hz, 4H), 4.29–4.14 (dd, J = 12.0Hz, 1H), 3.85 (s, 6H), 3.24–3.17 (dd, J = 19.0 Hz, 1H).Mass spectrometer (ESI) m/z: 450.74 [M + H]+; microanal-ysis calculated for C24H23N3O4S (449.52), C, 64.13%; H,5.16%; N, 9.35%; S, 7.13%. Found C: 64.15%, H:5.09%, N: 9.62%, S: 7.19%.
Synthesis of 4-chlorophenylsemicarbazide (7)For synthesizing pyrazolines (1b–6b), phenylsemicar-bazide with chloro substitution were synthesized by dis-solving 4-chlorophenylisocyanate (10 mmol) in diethylether followed by drop wise addition of hydrazine(10 mmol) and stirring for 15 min (Scheme 3). Theobtained 4-chlorophenylsemicarbazide was filtered, dried,and washed with petroleum ether to get the intermedi-ate product.
Synthesis of trisubstituted-4,5-dihydro-pyrazole-1-carboxamides (1b–6b)10 mmol chalcone (1–6) was dissolved in ethanol (10 mL)followed by addition of 4-chlorophenylsemicarbazide (7) for
synthesis of trisubstituted-4, 5-dihydro-pyrazole-1-carbox-amides (Scheme 4). Following this, 5 mmol NaOH in 1 mLwater was added. After the reaction completion (monitoredby TLC), the reaction mixture was poured onto ice and theprecipitate was filtered, dried, and crystallized using suit-able solvent.
3-Benzofuran-2-yl-5-(4-dimethylamino-naphthalen-1-yl)-4,5-dihydro-pyrazole-1-carboxylic acid(4-chloro-phenyl)-amide (1b)White solid; yield: 42%; mp: 167–169 °C; Rf = 0.22 (petro-leum ether: CH2Cl2, 2:1);
1H NMR (500 MHz, CDCl3) d: 8.91(s, NH), 7.75–7.17 (m, J = 8.0 Hz, 14H), 7.09 (s, 1H), 5.42–5.34 (dd, J = 12.0 Hz, 1H), 4.18–4.12 (dd, J = 12.0 Hz,1H), 3.82 (s, 6H), 3.22-3.16 (dd, J = 17.5 Hz, 1H). Massspectrometer (ESI) m/z: 510.13 [M + H]+; microanalysis cal-culated for C30H25ClN4O2 (509.00), C, 70.79%; H, 4.95%;N, 11.01%. Found C: 70.83%, H: 4.98%, N: 10.98%.
3-Benzofuran-2-yl-5-(4,7-dimethoxy-naphthalen-1-yl)-4,5-dihydro-pyrazole-1-carboxylic acid(4-chloro-phenyl)-amide (2b)White powder; yield: 61%; mp: 211–213 °C; Rf = 0.29(petroleum ether: CH2Cl2, 2:1);
1H NMR (500 MHz, CDCl3)d: 8.92 (s, NH), 7.71–7.17 (m, J = 8.5 Hz, 12H), 7.05(s, 1H), 6.95 (d, J = 7.0 Hz, 1H), 5.27–5.12 (dd,J = 10.5 Hz, 1H), 4.17–4.10 (dd, J = 10.5 Hz, 1H), 3.78 (s,6H), 3.42–3.28 (dd, J = 18.0 Hz, 1H). Mass spectrometer
Cl
HNN
Cl
C
H2N NH2
O
NHNH2
Chlorophenyl isocyanate
O
(7)
+i
Scheme 3: Synthesis of4-chlorophenylsemicarbazide (7). Reagentsand conditions: (i) NaOH, EtOH, roomtemperature.
HN
O
NH
Cl
NH2 R NN
O
NH
R1
R2
R3
R4
Cl
R
O
R3
R1R2
R4(1–6)
(1b–6b)
(7)
1: R= Ra, R1= H, R2= H, R3= N(CH3)2, R4= H2: R= Ra, R1= H, R2= H, R3= OCH3, R4= OCH33: R= Ra, R1= OCH3, R2= OCH3, R3= H, R4= H4: R= Rb, R1= H, R2= H, R3= N(CH3)2, R4= H5: R= Rb, R1= H, R2= H, R3= OCH3, R4= OCH36: R= Rb, R1= OCH3, R2= OCH3, R3= H, R4= H
i
Scheme 4: Synthesis of pyrazolinederivatives (1b–6b). Reagents andconditions: (i) NaOH, EtOH, roomtemperature.
Chem Biol Drug Des 2014 5
Pyrazolines as Anti-inflammatory Agents
(ESI) m/z: 548.97 [M + Na]+; microanalysis calculated forC30H24ClN3O4 (525.98), C, 68.50%; H, 4.60%; N, 7.99%.Found C: 68.52%, H: 4.63%, N: 7.97%.
3-Benzofuran-2-yl-5-(2,3-dimethoxy-naphthalen-1-yl)-4,5-dihydro-pyrazole-1-carboxylic acid(4-chloro-phenyl)-amide (3b)White powder; yield: 37%; mp: 191–193 °C; Rf = 0.26(petroleum ether: CH2Cl2, 2:1);
1H NMR (500 MHz, CDCl3)d: 8.94 (s, NH), 7.81–7.34 (m, J = 8.5 Hz, 13H), 7.13 (s,1H), 5.52–5.37 (dd, J = 11.0 Hz, 1H), 4.24–4.11 (dd,J = 11.0 Hz, 1H), 3.80 (s, 6H), 3.38–3.16 (dd,J = 17.0 Hz, 1H). Mass spectrometer (ESI) m/z: 527.11[M + H]+; microanalysis calculated for C30H24ClN3O4
(525.98), C, 68.50%; H, 4.60%; N, 7.99%. Found C:68.48%, H: 4.62%, N: 7.94%.
3-(2,3-Dihydro-benzo[1,4]dioxin-6-yl)-5-(4-dimethylamino-naphthalen-1-yl)-4,5-dihydro-pyrazole-1-carboxylic acid (4-chloro-phenyl)-amide(4b)Yellow powder; yield: 42%; mp: 167–168 °C; Rf = 0.21(petroleum ether: CH2Cl2, 2:1); 1H NMR (500 MHz,CDCl3) d: 8.94 (s, NH), 7.80–7.27 (m, J = 8.0 Hz, 12H),7.15 (s, 1H), 5.36–5.27 (dd, J = 12.5 Hz, 1H), 5.11(m, J = 8.0 Hz, 4H), 4.28–4.16 (dd, J = 12.5 Hz, 1H),3.86 (s, 6H), 3.33–3.19 (dd, J = 16.0 Hz, 1H). Massspectrometer (ESI) m/z: 528.05 [M + H]+; microanalysiscalculated for C30H27ClN4O3 (527.01), C, 68.37%; H,5.16%; N, 10.63%. Found C: 68.39%, H: 5.14%, N:10.68%.
3-(2,3-Dihydro-benzo[1,4]dioxin-6-yl)-5-(2,3-dimethoxy-naphthalen-1-yl)-4,5-dihydro-pyrazole-1-carboxylic acid (4-chloro-phenyl)-amide(5b)White powder; yield: 38%; mp: 189–91 °C; Rf = 0.23(petroleum ether: CH2Cl2, 2:1);
1H NMR (500 MHz, CDCl3)d: 8.91 (s, NH), 7.73–7.30 (m, J = 8.0 Hz, 11H), 7.17 (s,1H), 5.49–5.41 (dd, J = 11.0 Hz, 1H), 5.15 (m,J = 8.5 Hz, 4H), 4.28-4.09 (dd, J = 11.0 Hz, 1H), 3.88 (s,6H), 3.39-3.24 (dd, J = 17.5 Hz, 1H). Mass spectrometer(ESI) m/z: 545.12 [M + H]+; microanalysis calculated forC30H26ClN3O5 (544.00), C, 66.24%; H, 4.82%; N, 7.72%.Found C: 66.28%, H: 4.88%, N: 7.71%.
3-(2,3-Dihydro-benzo[1,4]dioxin-6-yl)-5-(4,7-dimethoxy-naphthalen-1-yl)-4,5-dihydro-pyrazole-1-carboxylic acid (4-chloro-phenyl)-amide(6b)White powder; yield: 51%; mp: 227–229 °C; Rf = 0.31(petroleum ether: CH2Cl2, 2:1);
1H NMR (500 MHz, CDCl3)d: 8.97 (s, NH), 7.92–7.38 (m, J = 8.0 Hz, 11H), 7.11 (s,1H), 5.42–5.27 (dd, J = 12.5 Hz, 1H), 5.12 (m,
J = 8.5 Hz, 4H), 4.28–4.24 (dd, J = 12.5 Hz, 1H), 3.81 (s,6H), 3.21–3.17 (dd, J = 17.5 Hz, 1H). Mass spectrometer(ESI) m/z: 544.97 [M + H]+; microanalysis calculated forC30H26ClN3O5 (544.00), C, 66.24%; H, 4.82%; N, 7.72%.Found C: 66.27%, H: 4.88%, N: 7.91%.
Secretory phospholipase A2-V (sPLA2-V) activityassayHuman recombinant sPLA2-V was used as an enzymesource. Based on the Ellman’s method (36), activity ofsPLA2 enzyme was determined by a photometric assay.Briefly, sn-2ester bond of the substrate 1,2-bis(hepta-noylthio)-glycerophosphocholine was hydrolyzed by PLA2-V followed by the exposure of free thiols. These thiolsactivated the conversion of DTNB (5,5–dithio-bis-(2-nitro-benzoic acid) to 2-nitro-5-thiobenzoic acid, which wasphotometrically detected at 405 nm. After this, the assayproceeded in an aqueous buffer solution (pH 7.5)containing KCl (94 mM), CaCl2 (9 mM), Tris (24 mM), andTriton-X 100 (280 BM). Before the assay was started,substrate and PLA2-V was resuspended in assay bufferwhereas DTNB was dissolved in an aqueous solution ofTris-HCl (pH 8) yielding an enzyme and DTNB concen-trations of 100 ng/mL and 87 BM, respectively. 96-wellmicro titre plates containing substrate solution, DTNB,and the respective test substance were used to carryout assays at room temperature. For obtaining positivecontrol, values substrate was added to plates withenzyme only. DMSO was used as a negative control, asit was inactive at the tested concentration in the assay(1.7% v/v).
Cyclooxygenase assayCOX Inhibitor Screening kit (Catalog No 560131) fromCayman Chemicals was used to determine the effects ofthe test compounds on COX-1 and COX-2 by quantifyingprostaglandin E2 (PGE2). 100 mM Tris–HCl buffer, pH 8.0containing 1 lM heme and COX-1 (ovine) or COX-2(human recombinant), which was preincubated for 10 minin a water bath at 37 °C was used for reaction mixturepreparation. Addition of 10 lL arachidonic acid to thereaction mixture (final concentration 100 lM) was used toinitiate reaction. After 2 min reaction was stopped by addi-tion of 1 M HCl. PGE2 in the reaction mixture was deter-mined using ELISA method. 100 mM potassium phosphatebuffer (pH 7.4) was used to dilute the DMSO stock solu-tions of the test compounds to the desired concentration.This reaction mixture was transferred to a 96-well platethat was precoated with a mouse anti-rabbit IgG. Tracerprostaglandin acetylcholine esterase and primary antibody(mouse anti PGE2) were also added to the plates followedby overnight incubation at room temperature. After over-night incubation, reaction mixtures were pipetted out andthe wells were washed with 10 mM potassium phosphatebuffer containing 0.05% Tween 20. After washing, 200 lLof Ellman’s reagent was added to each well and the plates
6 Chem Biol Drug Des 2014
Bukhari et al.
were incubated at room temperature protected from lightfor 60 min or until the control wells yielded an OD = 0.3–0.8 at 412 nm. PGE2standard curve was generated usingsame plate and later used to quantify the PGE2 levelsproduced in the presence of test samples. Results of theassay were expressed as a percentage relative to a control(solvent treated samples). All the measurements wererecorded in triplicate, and values were generally within10%.
Cell treatment and ELISA assay for TNF-a and IL-6Mouse RAW 264.7 macrophages were propagated andmaintained in DMEM media, which was supplementedwith 10% FBS, 100 U/mL penicillin, and 100 lg/mL strep-tomycin at 37 °C in 5% CO2 environment. As discussedearlier, cells were pretreated with synthetic compounds orvehicle control for 2 h followed by treatment with LPS(0.5 lg/mL) for 22 h. After completion of the treatmentperiod, the culture media and cells were collected sepa-rately. Culture media from the previous step was centri-fuged for 10 min at 105 9 g. Supernatant followingcentrifugation was stored at �80 °C until use. On theother hand, cells were washed with PBS, harvested, andlysed with cell lysis buffer (Tris–HCl 20 mM, NP40 1%,NaCl 150 mM, EDTA 2 mM, Na3VO4 200 mM, SDS 0.1%,NaF 20 mM). The cell mix in lysis buffer was shaken vigor-ously for 10 min at 0 °C. After lysis step, mixture was cen-trifuged at 15 000 9 g for 30 min at 4 °C, the totalprotein content was determined by Bio-Rad (Hercules,CA, USA) protein assay reagents. For expressing results,
inflammatory factors in the media were normalized to thetotal protein content present in the viable cells.
Molecular modeling detailsAutomated docking studies were carried out using Discov-ery Studio (version 3.5, Accelrys, San Diego, CA, USA) asimplemented through the graphical user interface DS-CDocker protocol. The three-dimensional structures of theaforementioned compounds were constructed using Chem.3D ultra 11.0 software [Chemical Structure Drawing Stan-dard; Cambridge Soft Corporation, Cambridge, MA, USA],then they were energetically minimized using MOPAC with100 iterations and minimum RMS gradient of 0.10. The Ga-steiger–H€uckel charges of ligands were assigned. The crys-tal structures of COX-1 and COX-2 (PDB code: 1EQG and3Q7D, respectively) complex were retrieved from the RCSBProtein Data Bank (http://www.rcsb.org/pdb/home/home.do). These pdb contain the drug bound to the receptor. Allbound water and ligands were eliminated from the proteinand the polar hydrogens, and the Kollman-united chargeswere added to the proteins.
Statistical analysisAll the experiments were conducted thrice and data repre-sented as the mean � standard error of mean (SEM).Graph Pad Prism 5 software was used for calculating theIC50 values. One-way analysis of variance (ANOVA) for multi-ple comparisons was used for analyzing data wherep < 0.05 was considered to be statistically significant.
Table 1: Inhibition of secretoryphospholipase A2-V (sPLA2-V), COX-1 andCOX-2 activities by synthetic compoundsand their Cox-1(PDB code:1EQG) and Cox-2(PDB code: 3Q7D) docking score
CompoundsPLA2-VIC50 (lM)
COX-1IC50 (lM)
COX-2IC50 (lM)
Binding enegryDGb
COX-1 COX-2
1 45.22 � 2.61 9.27 � 1.51 25.53 � 2.22 �37.89621 �29.47322 27.83 � 1.42 14.99 � 0.15 19.14 � 1.52 �37.2338 �35.86703 12.72 � 1.29 12.46 � 0.08 12.24 � 0.42 �33.8103 �42.76984 32.21 � 1.91 7.06 � 0.34 24.48 � 1.72 �33.0058 �30.52455 22.78 � 2.21 11.14 � 1.68 18.48 � 1.91 �29.9782 �36.52636 19.10 � 2.73 8.22 � 0.89 12.45 � 1.40 �39.4566 �42.55231a 35.44 � 3.92 4.53 � 0.12 14.55 � 1.78 �38.4338 �40.45542a 21.13 � 1.75 7.22 � 2.77 12.32 � 1.89 �38.0386 �42.68653a 9.17 � 1.02 8.06 � 0.27 10.28 � 1.61 �39.8495 �44.72984a 22.24 � 0.13 1.12 � 0.55 13.17 � 1.99 �46.6357 �41.83455a 19.17 � 3.42 3.42 � 0.32 17.79 � 2.06 �40.9794 �37.21436a 7.12 � 1.54 2.82 � 0.22 12.55 � 0.28 �40.8135 �42.45121b 22.19 � 1.82 1.87 � 0.51 9.10 � 1.12 �50.7175 �45.92352b 14.55 � 1.52 2.14 � 0.24 11.07 � 1.67 �40.3426 �43.93783b 8.46 � 2.20 0.99 � 0.05 5.02 � 2.35 �52.2044 �49.98904b 17.16 � 1.76 0.44 � 0.25 9.72 � 2.45 �52.3508 �45.28125b 17.32 � 0.14 1.17 � 0.65 12.32 � 1.89 �50.7175 �42.68906b 5.12 � 0.55 0.94 � 0.85 11.95 � 1.35 �48.2068 �43.0565Dexamethasone 0.62 � 0.09 – – – –Indomethacina – 0.22 � 0.05 3.44 � 0.27 – –
NDGA, Nordihydroguaiaretic acid.Values are the mean � SD; n = 3.a30 lM concentration.b(kcal/mol).
Chem Biol Drug Des 2014 7
Pyrazolines as Anti-inflammatory Agents
Results and Discussion
ChemistrySynthesis of all the compounds was carried out as out-lined in Schemes 1–4. Claisen–Schmidt condensationreaction was employed to prepare chalcones (1–6) whereequimolar aldehydes and ketones were reacted in thepresence of a base. Whereas chalcones (1–6) and thiose-micarbazide were refluxed in the presence of alkalinemedium to get pyrazolines (1a–6a). Compounds (1b–6b)were also synthesized by a similar reaction by refluxingchalcones (1–6) with N-(4-chlorophenyl) semicarbazide (7)in alkaline medium. Column chromatography and crystalli-zation techniques were used for the purification of all syn-thesized compounds. Thin layer chromatography (TLC)was used to check the purity of the compounds routinelyusing precoated silica plates. Analytical techniques includ-ing IR, 1H NMR, 13C NMR, MS, and elemental analysiswere used to confirm synthesis of the all the new com-pounds.
Inhibition of secretory phospholipase A2-VOne among the important strategies to prevent inflamma-tion is the inhibition of PLA2. Table 1 lists the resultsobtained for all synthesized compounds for their inhibitorypotential against sPLA2 at concentrations of 1.25–20 lg/mL using an in vitro enzymatic photometric assay basedon Ellman’s method (36). In this assay, dexamethasonewas used as positive control. Curcumins, chalcone deriva-tives (compounds bearing a, b-unsaturated carbonylgroup) and other compounds which bear a pyrazoline moi-ety decrease sPLA2 activities as shown by a number ofstudies carried out previously on the sPLA2 isoform activi-ties which also show that more than 70% homology was
seen among various isoforms of PLA2 enzymes (37–39).As represented in Figure 1, a strong dose dependent inhi-bition of sPLA2-V was shown by compounds 3, 3a, 6a,2b, 3b, and 6b. IC50 values for all the compounds were inthe range of 5.12–14.55 lM. Among all the compounds, apyrazoline derivative 6b showed strongest inhibition ofsPLA2-V with IC50 5.12 lM.
Inhibition of COX-1 and COX-2COX1 and COX2 are two isoforms of cyclooxygenase. Onemechanism for anti-inflammatory action is the inhibition ofthe enzymes COX-1 and COX-2. The inhibitory activities ofchalcone and pyrazoline derivatives on the cyclooxygenasewas evaluated using the COX-inhibitor screening assay kit invitro (37). All the compounds were tested at a concentrationof 40 lg/mL for both isoforms of, that is, COX-1 and COX-2. Calculated IC50 values are exhibited in the Table 1.Results indicate that the newly synthesized compoundshave an affinity towards COX-1. Results show that six com-pounds (4a, 1b, 3b, 4b, 5b, and 6b) exhibited strong inhibi-tion of COX-1 activity ranging from 82.76 to 94.44%.Indomethacin was a positive control. It was observed thatmajority of compounds show a better COX-1 inhibitoryactivity with IC50 values ranging from 0.44 to 3.42 lM. Simi-lar to sPLA2 inhibitory activity, strongest COX-1 inhibitionwas shown by a pyrazoline derivative 4b.
In previously carried out studies, a selective COX-1 inhibitorshowed an equipotent inhibition of PG formation in aninflammatory exudate to the COX-2 selective inhibitorcelecoxib. However, this selective COX-1 inhibitor was inef-fective in reducing increased PG levels in the cerebrospinalfluid, where non-selective COX-1/COX-2 inhibition turnedout to be more effective in reducing signs of inflammation
Figure 1: Concentration dependentinhibitory effects of chalcones andpyrazolines on activity of secretoryphospholipase A2-V. Graph represents the% inhibition by most active compounds atdifferent concentrations. The data shown arean average of three independent experimentand values are mean � SD.
8 Chem Biol Drug Des 2014
Bukhari et al.
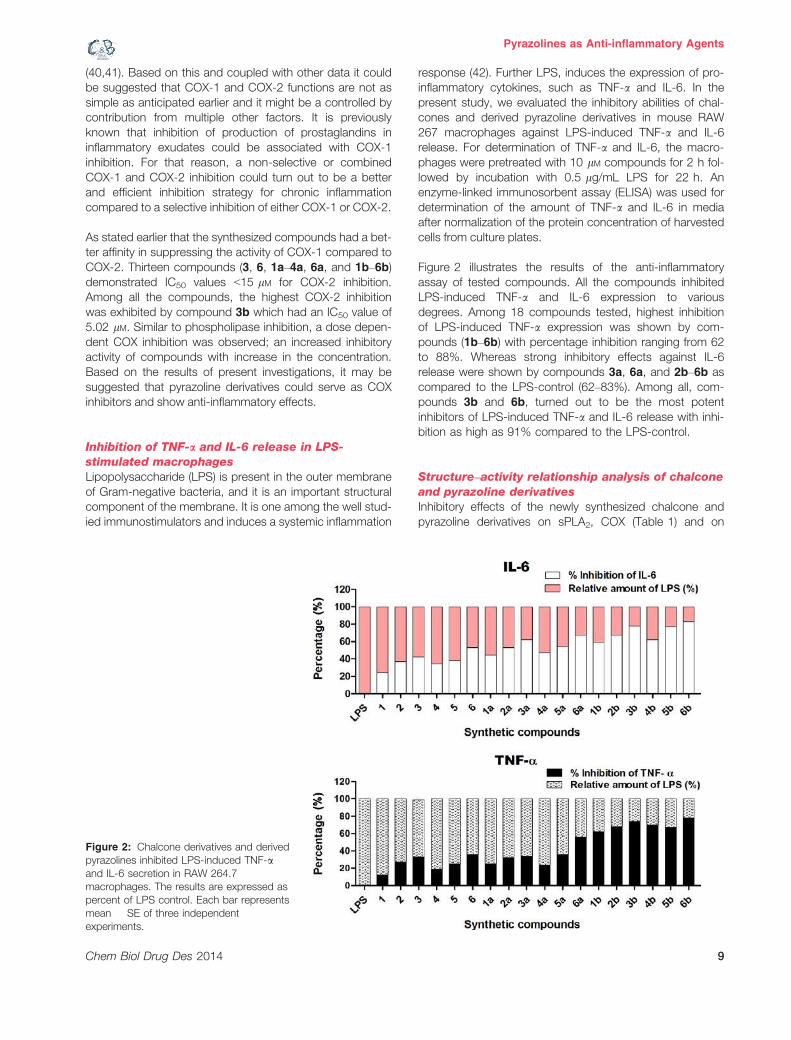
(40,41). Based on this and coupled with other data it couldbe suggested that COX-1 and COX-2 functions are not assimple as anticipated earlier and it might be a controlled bycontribution from multiple other factors. It is previouslyknown that inhibition of production of prostaglandins ininflammatory exudates could be associated with COX-1inhibition. For that reason, a non-selective or combinedCOX-1 and COX-2 inhibition could turn out to be a betterand efficient inhibition strategy for chronic inflammationcompared to a selective inhibition of either COX-1 or COX-2.
As stated earlier that the synthesized compounds had a bet-ter affinity in suppressing the activity of COX-1 compared toCOX-2. Thirteen compounds (3, 6, 1a–4a, 6a, and 1b–6b)demonstrated IC50 values <15 lM for COX-2 inhibition.Among all the compounds, the highest COX-2 inhibitionwas exhibited by compound 3b which had an IC50 value of5.02 lM. Similar to phospholipase inhibition, a dose depen-dent COX inhibition was observed; an increased inhibitoryactivity of compounds with increase in the concentration.Based on the results of present investigations, it may besuggested that pyrazoline derivatives could serve as COXinhibitors and show anti-inflammatory effects.
Inhibition of TNF-a and IL-6 release in LPS-stimulated macrophagesLipopolysaccharide (LPS) is present in the outer membraneof Gram-negative bacteria, and it is an important structuralcomponent of the membrane. It is one among the well stud-ied immunostimulators and induces a systemic inflammation
response (42). Further LPS, induces the expression of pro-inflammatory cytokines, such as TNF-a and IL-6. In thepresent study, we evaluated the inhibitory abilities of chal-cones and derived pyrazoline derivatives in mouse RAW267 macrophages against LPS-induced TNF-a and IL-6release. For determination of TNF-a and IL-6, the macro-phages were pretreated with 10 lM compounds for 2 h fol-lowed by incubation with 0.5 lg/mL LPS for 22 h. Anenzyme-linked immunosorbent assay (ELISA) was used fordetermination of the amount of TNF-a and IL-6 in mediaafter normalization of the protein concentration of harvestedcells from culture plates.
Figure 2 illustrates the results of the anti-inflammatoryassay of tested compounds. All the compounds inhibitedLPS-induced TNF-a and IL-6 expression to variousdegrees. Among 18 compounds tested, highest inhibitionof LPS-induced TNF-a expression was shown by com-pounds (1b–6b) with percentage inhibition ranging from 62to 88%. Whereas strong inhibitory effects against IL-6release were shown by compounds 3a, 6a, and 2b–6b ascompared to the LPS-control (62–83%). Among all, com-pounds 3b and 6b, turned out to be the most potentinhibitors of LPS-induced TNF-a and IL-6 release with inhi-bition as high as 91% compared to the LPS-control.
Structure–activity relationship analysis of chalconeand pyrazoline derivativesInhibitory effects of the newly synthesized chalcone andpyrazoline derivatives on sPLA2, COX (Table 1) and on
Figure 2: Chalcone derivatives and derivedpyrazolines inhibited LPS-induced TNF-aand IL-6 secretion in RAW 264.7macrophages. The results are expressed aspercent of LPS control. Each bar representsmean � SE of three independentexperiments.
Chem Biol Drug Des 2014 9
Pyrazolines as Anti-inflammatory Agents
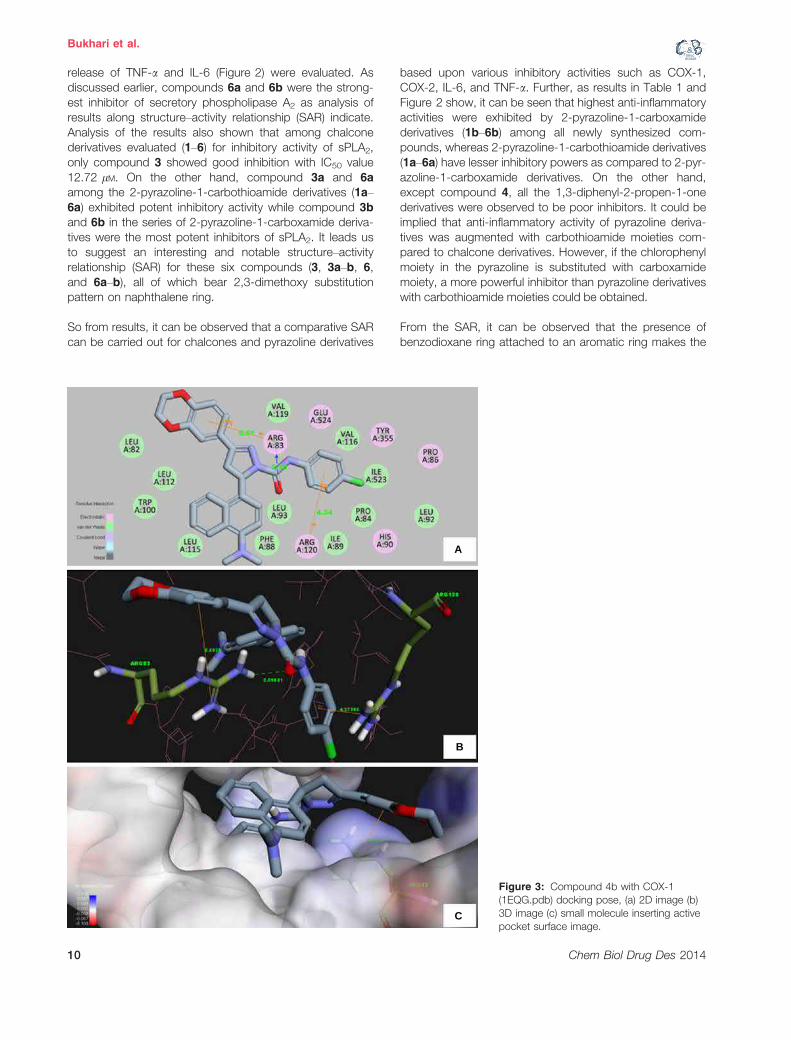
release of TNF-a and IL-6 (Figure 2) were evaluated. Asdiscussed earlier, compounds 6a and 6b were the strong-est inhibitor of secretory phospholipase A2 as analysis ofresults along structure–activity relationship (SAR) indicate.Analysis of the results also shown that among chalconederivatives evaluated (1–6) for inhibitory activity of sPLA2,only compound 3 showed good inhibition with IC50 value12.72 lM. On the other hand, compound 3a and 6a
among the 2-pyrazoline-1-carbothioamide derivatives (1a–6a) exhibited potent inhibitory activity while compound 3b
and 6b in the series of 2-pyrazoline-1-carboxamide deriva-tives were the most potent inhibitors of sPLA2. It leads usto suggest an interesting and notable structure–activityrelationship (SAR) for these six compounds (3, 3a–b, 6,and 6a–b), all of which bear 2,3-dimethoxy substitutionpattern on naphthalene ring.
So from results, it can be observed that a comparative SARcan be carried out for chalcones and pyrazoline derivatives
based upon various inhibitory activities such as COX-1,COX-2, IL-6, and TNF-a. Further, as results in Table 1 andFigure 2 show, it can be seen that highest anti-inflammatoryactivities were exhibited by 2-pyrazoline-1-carboxamidederivatives (1b–6b) among all newly synthesized com-pounds, whereas 2-pyrazoline-1-carbothioamide derivatives(1a–6a) have lesser inhibitory powers as compared to 2-pyr-azoline-1-carboxamide derivatives. On the other hand,except compound 4, all the 1,3-diphenyl-2-propen-1-onederivatives were observed to be poor inhibitors. It could beimplied that anti-inflammatory activity of pyrazoline deriva-tives was augmented with carbothioamide moieties com-pared to chalcone derivatives. However, if the chlorophenylmoiety in the pyrazoline is substituted with carboxamidemoiety, a more powerful inhibitor than pyrazoline derivativeswith carbothioamide moieties could be obtained.
From the SAR, it can be observed that the presence ofbenzodioxane ring attached to an aromatic ring makes the
A
B
C
Figure 3: Compound 4b with COX-1(1EQG.pdb) docking pose, (a) 2D image (b)3D image (c) small molecule inserting activepocket surface image.
10 Chem Biol Drug Des 2014
Bukhari et al.
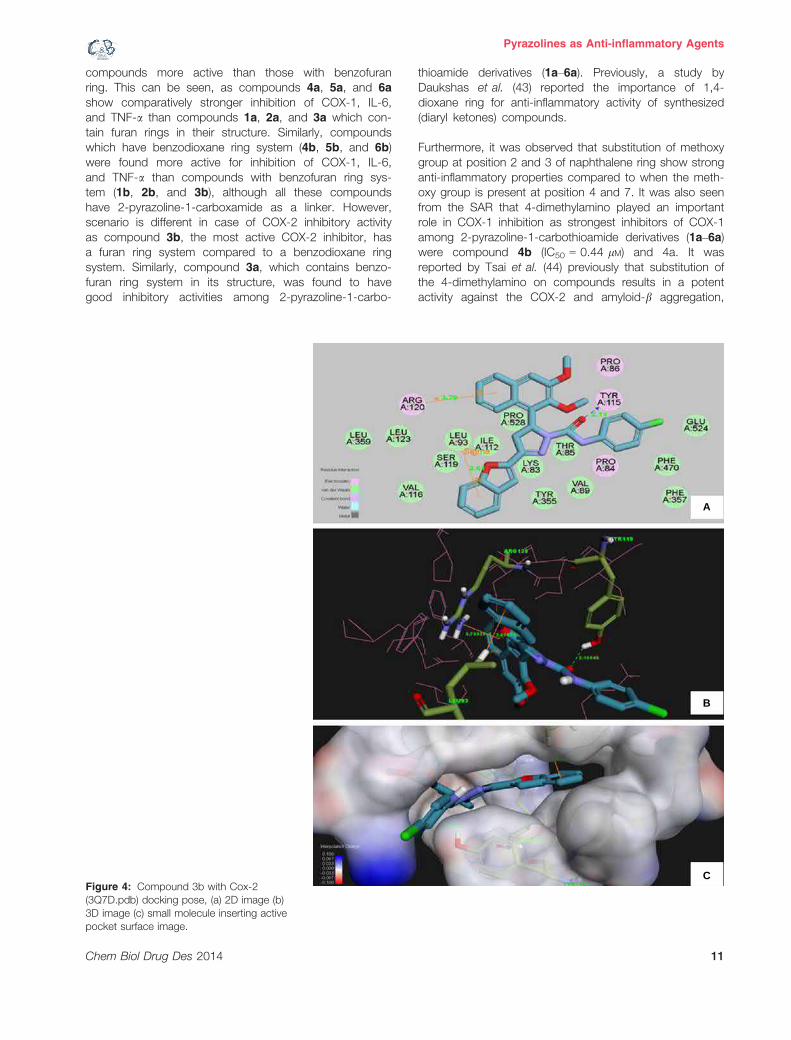
compounds more active than those with benzofuranring. This can be seen, as compounds 4a, 5a, and 6a
show comparatively stronger inhibition of COX-1, IL-6,and TNF-a than compounds 1a, 2a, and 3a which con-tain furan rings in their structure. Similarly, compoundswhich have benzodioxane ring system (4b, 5b, and 6b)were found more active for inhibition of COX-1, IL-6,and TNF-a than compounds with benzofuran ring sys-tem (1b, 2b, and 3b), although all these compoundshave 2-pyrazoline-1-carboxamide as a linker. However,scenario is different in case of COX-2 inhibitory activityas compound 3b, the most active COX-2 inhibitor, hasa furan ring system compared to a benzodioxane ringsystem. Similarly, compound 3a, which contains benzo-furan ring system in its structure, was found to havegood inhibitory activities among 2-pyrazoline-1-carbo-
thioamide derivatives (1a–6a). Previously, a study byDaukshas et al. (43) reported the importance of 1,4-dioxane ring for anti-inflammatory activity of synthesized(diaryl ketones) compounds.
Furthermore, it was observed that substitution of methoxygroup at position 2 and 3 of naphthalene ring show stronganti-inflammatory properties compared to when the meth-oxy group is present at position 4 and 7. It was also seenfrom the SAR that 4-dimethylamino played an importantrole in COX-1 inhibition as strongest inhibitors of COX-1among 2-pyrazoline-1-carbothioamide derivatives (1a–6a)were compound 4b (IC50 = 0.44 lM) and 4a. It wasreported by Tsai et al. (44) previously that substitution ofthe 4-dimethylamino on compounds results in a potentactivity against the COX-2 and amyloid-b aggregation,
A
B
CFigure 4: Compound 3b with Cox-2(3Q7D.pdb) docking pose, (a) 2D image (b)3D image (c) small molecule inserting activepocket surface image.
Chem Biol Drug Des 2014 11
Pyrazolines as Anti-inflammatory Agents
which is one of the mediators of neuro-inflammation inAlzheimer’s disease.
An interesting finding among the all studies performed wasthe synergistic effect of some of compounds as one ofpyrazoline derivative (3b) showed the strong inhibition ofCOX-1, COX-2, sPLA2, and pro-inflammatory cytokines.Such kind of compounds can be very ideal candidates forthe development of anti-inflammatory agents, so furtherresearch on other parameters is required to understandthe mechanisms involved in the role of such compounds.
Docking studiesDocking analysis was performed for all the compounds, forthe sake of convenience, docking analysis for 4b and 3b, asrepresentatives, are reported. The binding energy of allcompounds is listed in Table 1. Of the compounds studied,compound 4b was nicely bound into the active site of Cox-2 with minimum binding energy (DGb = �52.3508 kcal/mol)and compound 3b was bound into the active site of Cox-2with binding energy DGb = �49.9890 kcal/mol. Compound4b was evaluated by molecular docking based on the bind-ing model of the COX-1 complex structure (1EQG.pdb) (45).As shown in the Figure 3A,B, the 2D- and 3D images of thebinding mode between compound 4b and the target proteinwere clearly demonstrated. Figure 3C shows the small mol-ecule was well inserted into the active pocket of the COX-1protein. The binding mode of the most potent compound4b in the active pocket could be stabilized by several molec-ular interactions (Figure 3A,B) discussed as follows. Thecompound 4b adopts bent ‘T’ shape in the active site ofCOX-1 with prominent interactions with polar ARG83, andARG120. With rest of the residues from active site, the inter-actions are van der Waals forces and hydrophobic in nature.One Cation–Pi interaction with the length of 5.5075 �A wasdisplayed between the benzdioxan ring of compound 4b
and the N atom of ARG83. Another Cation–Pi interactioncan also be observed between the aniline ring of compound4b and the N atom of ARG120 with the length of4.37385 �A. In addition to the two Pi–Pi interactions, onehydrogen bond was also formed between the backboneamino groups of ARG83 and carbonyl O atom of compound4b with the length of 2.09531 �A. This H-bonding between-C=O and ARG83 indicates that this group is vital for inter-action with the receptor.
Molecular docking analysis for compound 3b with COX-2complex structure (3Q7D.pdb) (45) revealed the structuralfeatures that steer its inflammatory activity. As shown inthe Figure 4, the 2D- and 3D images of the binding modebetween compound 3b and the target protein clearly dem-onstrated that it fits well into the active pocket of theCOX-2 protein.
The binding of the most potent compound 3b in the activepocket is due to different types of molecular interactions(Figure 4) discussed as follows. One Cation–Pi interaction
with the length of 3.79326 �A was displayed between thebenzene ring of compound 3b and the N atom of polarARG120. The benzene ring of compound 3b and the Natom of LEU93 presented another Cation–Pi interactionwith the length of 2.60531 �A. Similar to compound 4b, inaddition to the two Cation–Pi interactions, one hydrogenbond was also formed between the backbone aminogroups of TYR115 and carbonyl O atom of compound 3b
with the length of 2.10546 �A, signifying the importance ofcarbonyl group in deciding the interaction with the recep-tor. In addition, van der Waals forces and hydrophobicinteractions enhance the interaction between the com-pound 3b and the receptor.
In COX-2, the binding site is long, slender with the hydro-phobic channel extending from the membrane-bindingregion of the protein. A second cavity branched off fromthe main channel that lead to the cyclooxygenase activesite is observed in COX-2. A similar pocket also exists inCOX-1, but it is small and less accessible due to the pres-ence of bulkier isoleucine at position number 523. There-fore, a possible reason for the greater bending of 4b in theactive site of COX-1 compared to lesser bending of 3b inthe active site of COX-2 is relatively smaller size of activesite of COX-1 than COX-2 (46).
Conclusions
In summary, a novel series of chalcones and chalcone-based pyrazolines was synthesized and assessed for theirpotential inhibitory activities against the sPLA2-V, COX-1,COX-2 and release of pro-inflammatory cytokines includingIL-6 and TNF-a. It was shown that trisubstituted-4,5-dihy-dro-pyrazole-1-carboxamide series with pyrazoline moietywas the most potent enzyme and cytokine inhibitors. Anti-inflammatory properties of these chalcones and pyrazolinederivatives as shown by the inhibition of enzymes andcytokines add further to the knowledge base of anti-inflammatory compounds. A number of the newly synthe-sized molecules in the present investigation could be fur-ther optimized and explored as lead molecules fordeveloping novel and effective anti-inflammatory agents.Further studies which give insights into toxicity and in vivo
anti-inflammatory activities are in progress for furtherunderstanding.
Acknowledgments
This work was supported by the Research Incentive Fundof Universiti Kebangsaan Malaysia (Grant No: UKM-DLP-2013-013).
Conflict of Interest
The authors declare no competing financial interest.
12 Chem Biol Drug Des 2014
Bukhari et al.
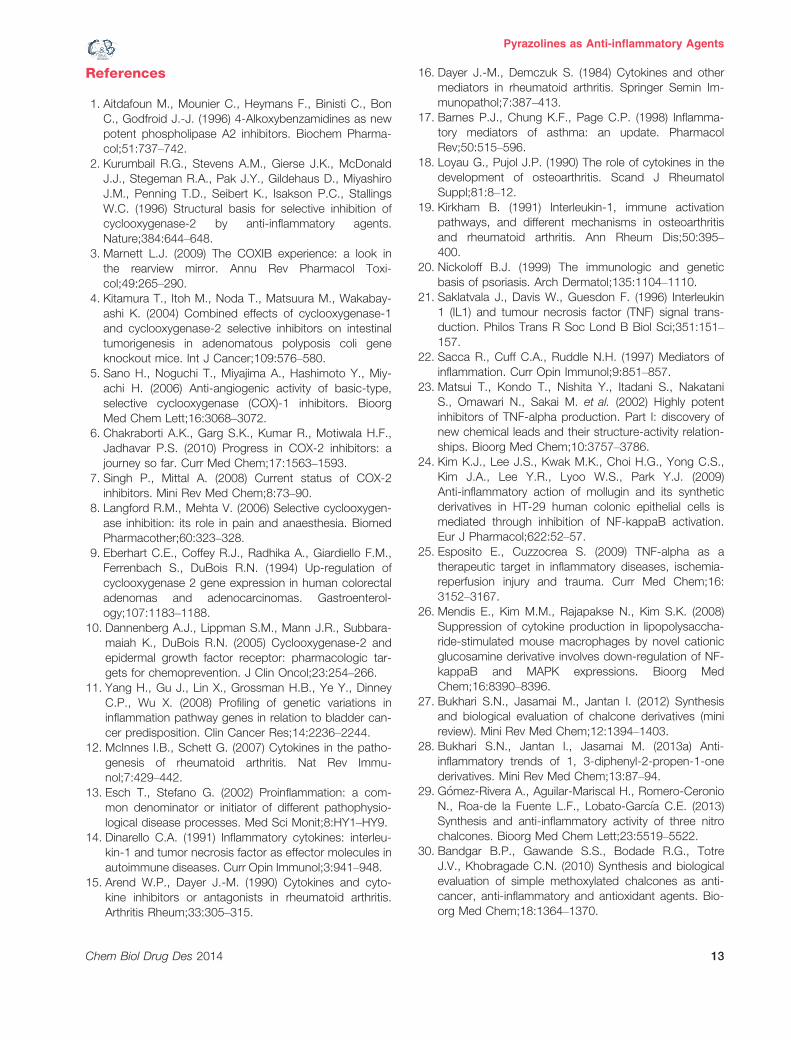
References
1. Aitdafoun M., Mounier C., Heymans F., Binisti C., BonC., Godfroid J.-J. (1996) 4-Alkoxybenzamidines as newpotent phospholipase A2 inhibitors. Biochem Pharma-col;51:737–742.
2. Kurumbail R.G., Stevens A.M., Gierse J.K., McDonaldJ.J., Stegeman R.A., Pak J.Y., Gildehaus D., MiyashiroJ.M., Penning T.D., Seibert K., Isakson P.C., StallingsW.C. (1996) Structural basis for selective inhibition ofcyclooxygenase-2 by anti-inflammatory agents.Nature;384:644–648.
3. Marnett L.J. (2009) The COXIB experience: a look inthe rearview mirror. Annu Rev Pharmacol Toxi-col;49:265–290.
4. Kitamura T., Itoh M., Noda T., Matsuura M., Wakabay-ashi K. (2004) Combined effects of cyclooxygenase-1and cyclooxygenase-2 selective inhibitors on intestinaltumorigenesis in adenomatous polyposis coli geneknockout mice. Int J Cancer;109:576–580.
5. Sano H., Noguchi T., Miyajima A., Hashimoto Y., Miy-achi H. (2006) Anti-angiogenic activity of basic-type,selective cyclooxygenase (COX)-1 inhibitors. BioorgMed Chem Lett;16:3068–3072.
6. Chakraborti A.K., Garg S.K., Kumar R., Motiwala H.F.,Jadhavar P.S. (2010) Progress in COX-2 inhibitors: ajourney so far. Curr Med Chem;17:1563–1593.
7. Singh P., Mittal A. (2008) Current status of COX-2inhibitors. Mini Rev Med Chem;8:73–90.
8. Langford R.M., Mehta V. (2006) Selective cyclooxygen-ase inhibition: its role in pain and anaesthesia. BiomedPharmacother;60:323–328.
9. Eberhart C.E., Coffey R.J., Radhika A., Giardiello F.M.,Ferrenbach S., DuBois R.N. (1994) Up-regulation ofcyclooxygenase 2 gene expression in human colorectaladenomas and adenocarcinomas. Gastroenterol-ogy;107:1183–1188.
10. Dannenberg A.J., Lippman S.M., Mann J.R., Subbara-maiah K., DuBois R.N. (2005) Cyclooxygenase-2 andepidermal growth factor receptor: pharmacologic tar-gets for chemoprevention. J Clin Oncol;23:254–266.
11. Yang H., Gu J., Lin X., Grossman H.B., Ye Y., DinneyC.P., Wu X. (2008) Profiling of genetic variations ininflammation pathway genes in relation to bladder can-cer predisposition. Clin Cancer Res;14:2236–2244.
12. McInnes I.B., Schett G. (2007) Cytokines in the patho-genesis of rheumatoid arthritis. Nat Rev Immu-nol;7:429–442.
13. Esch T., Stefano G. (2002) Proinflammation: a com-mon denominator or initiator of different pathophysio-logical disease processes. Med Sci Monit;8:HY1–HY9.
14. Dinarello C.A. (1991) Inflammatory cytokines: interleu-kin-1 and tumor necrosis factor as effector molecules inautoimmune diseases. Curr Opin Immunol;3:941–948.
15. Arend W.P., Dayer J.-M. (1990) Cytokines and cyto-kine inhibitors or antagonists in rheumatoid arthritis.Arthritis Rheum;33:305–315.
16. Dayer J.-M., Demczuk S. (1984) Cytokines and othermediators in rheumatoid arthritis. Springer Semin Im-munopathol;7:387–413.
17. Barnes P.J., Chung K.F., Page C.P. (1998) Inflamma-tory mediators of asthma: an update. PharmacolRev;50:515–596.
18. Loyau G., Pujol J.P. (1990) The role of cytokines in thedevelopment of osteoarthritis. Scand J RheumatolSuppl;81:8–12.
19. Kirkham B. (1991) Interleukin-1, immune activationpathways, and different mechanisms in osteoarthritisand rheumatoid arthritis. Ann Rheum Dis;50:395–400.
20. Nickoloff B.J. (1999) The immunologic and geneticbasis of psoriasis. Arch Dermatol;135:1104–1110.
21. Saklatvala J., Davis W., Guesdon F. (1996) Interleukin1 (IL1) and tumour necrosis factor (TNF) signal trans-duction. Philos Trans R Soc Lond B Biol Sci;351:151–157.
22. Sacca R., Cuff C.A., Ruddle N.H. (1997) Mediators ofinflammation. Curr Opin Immunol;9:851–857.
23. Matsui T., Kondo T., Nishita Y., Itadani S., NakataniS., Omawari N., Sakai M. et al. (2002) Highly potentinhibitors of TNF-alpha production. Part I: discovery ofnew chemical leads and their structure-activity relation-ships. Bioorg Med Chem;10:3757–3786.
24. Kim K.J., Lee J.S., Kwak M.K., Choi H.G., Yong C.S.,Kim J.A., Lee Y.R., Lyoo W.S., Park Y.J. (2009)Anti-inflammatory action of mollugin and its syntheticderivatives in HT-29 human colonic epithelial cells ismediated through inhibition of NF-kappaB activation.Eur J Pharmacol;622:52–57.
25. Esposito E., Cuzzocrea S. (2009) TNF-alpha as atherapeutic target in inflammatory diseases, ischemia-reperfusion injury and trauma. Curr Med Chem;16:3152–3167.
26. Mendis E., Kim M.M., Rajapakse N., Kim S.K. (2008)Suppression of cytokine production in lipopolysaccha-ride-stimulated mouse macrophages by novel cationicglucosamine derivative involves down-regulation of NF-kappaB and MAPK expressions. Bioorg MedChem;16:8390–8396.
27. Bukhari S.N., Jasamai M., Jantan I. (2012) Synthesisand biological evaluation of chalcone derivatives (minireview). Mini Rev Med Chem;12:1394–1403.
28. Bukhari S.N., Jantan I., Jasamai M. (2013a) Anti-inflammatory trends of 1, 3-diphenyl-2-propen-1-onederivatives. Mini Rev Med Chem;13:87–94.
29. G�omez-Rivera A., Aguilar-Mariscal H., Romero-CeronioN., Roa-de la Fuente L.F., Lobato-Garc�ıa C.E. (2013)Synthesis and anti-inflammatory activity of three nitrochalcones. Bioorg Med Chem Lett;23:5519–5522.
30. Bandgar B.P., Gawande S.S., Bodade R.G., TotreJ.V., Khobragade C.N. (2010) Synthesis and biologicalevaluation of simple methoxylated chalcones as anti-cancer, anti-inflammatory and antioxidant agents. Bio-org Med Chem;18:1364–1370.
Chem Biol Drug Des 2014 13
Pyrazolines as Anti-inflammatory Agents
31. Kil J.S., Son Y., Cheong Y.K., Kim N.H., Jeong H.J.,Kwon J.W., Lee E.J., Kwon T.O., Chung H.T., PaeH.O. (2012) Okanin, a chalcone found in the genus Bi-dens, and 3-penten-2-one inhibit inducible nitric oxidesynthase expression via heme oxygenase-1 inductionin RAW264.7 macrophages activated with lipopolysac-charide. J Clin Biochem Nutr;50:53–58.
32. Ramesh B., Sumana T. (2010) Synthesis and anti-inflammatory activity of pyrazolines. J Chem;7:514–516.
33. Bukhari S.N.A., Tajuddin Y., Benedict V.J., Lam K.W.,Jantan I., Jalil J., Jasamai M. (2014) Synthesis and eval-uation of chalcone derivatives as inhibitors of neutroph-ils’ chemotaxis, phagocytosis and production of reactiveoxygen species. Chem Biol Drug Des;83:198–206.
34. Ahmad W., Kumolosasi E., Jantan I., Bukhari S.N.,Jasamai M. (2014) Effects of novel diarylpentanoidanalogues of curcumin on secretory phospholipaseA, cyclooxygenases, lipoxygenase and microsomalprostaglandin E synthase-1. Chem Biol Drug Des;83:670–681.
35. Bukhari S.N., Jantan I., Wai L.K., Lajis N.H., Abbas F.,Jasamai M. (2013b) Synthesis and effects of pyrazo-lines and isoxazoles on the phagocytic chemotaxisand release of reactive oxygen species by zymosanstimulated human neutrophils. Med Chem;9:1091–1098.
36. Ellman G.L., Courtney K.D., Andres V. Jr, FeatherstoneR.M. (1961) A new and rapid colorimetric determina-tion of acetylcholinesterase activity. Biochem Pharma-col;7:88–95.
37. Blobaum A.L., Marnett L.J. (2007) Structural and func-tional basis of cyclooxygenase inhibition. J MedChem;50:1425–1441.
38. Kim H.P., Son K.H., Chang H.W., Kang S.S. (2004)Anti-inflammatory plant flavonoids and cellular actionmechanisms. J Pharmacol Sci;96:229–245.
39. Wang Y., Xu W., Shao H., Xie Y., Wang J. (2011)Design and synthesis of novel pyrazole-based Lp-PLA2 inhibitors. Chin J Chem;29:2039–2048.
40. Seibert K., Zhang Y., Leahy K., Hauser S., MasferrerJ., Perkins W., Lee L., Isakson P. (1994) Pharmacolog-ical and biochemical demonstration of the role ofcyclooxygenase 2 in inflammation and pain. Proc NatlAcad Sci USA;91:12013–12017.
41. Willingale H.L., Gardiner N.J., McLymont N., Giblett S.,Grubb B.D. (1997) Prostanoids synthesized by cyclo-oxygenase isoforms in rat spinal cord and their contri-bution to the development of neuronal hyperexcitability.Br J Pharmacol;122:1593–1604.
42. Stoll L.L., Denning G.M., Weintraub N.L. (2006) Endo-toxin, TLR4 signaling and vascular inflammation:potential therapeutic targets in cardiovascular disease.Curr Pharm Des;12:4229–4245.
43. Daukshas V.K., Gaidyalis P.G., Udrenaite �E.B., Pyatr-auskas O.Y., Brukshtus A.B. (1985) Synthesis andantiinflammatory activity of 6-acylsubstituted benzo-1,4-dioxanes and dihydrobenzopyrans. Pharm ChemJ;19:611–614.
44. Tsai W.-J., Shiao Y.-J., Lin S.-J., Chiou W.-F., LinL.-C., Yang T.-H., Teng C.-M., Wu T.-S., Yang L.-M.(2006) Selective COX-2 inhibitors. Part 1: synthesisand biological evaluation of phenylazobenzenesulfona-mides. Bioorg Med Chem Lett;16:4440–4443.
45. Selinsky B.S., Gupta K., Sharkey C.T., Loll P.J. (2001)Structural analysis of NSAID binding by prostaglandinH2 synthase: time-dependent and time-independentinhibitors elicit identical enzyme conformations. Bio-chemistry;40:5172–5180.
46. Chavan H.V., Bandgar B.P., Adsul L.K., Dhakane V.D.,Bhale P.S., Thakare V.N., Masand V. (2013) Design,synthesis, characterization and anti-inflammatory evalu-ation of novel pyrazole amalgamated flavones. BioorgMed Chem Lett;23:1315–1321.
14 Chem Biol Drug Des 2014
Bukhari et al.


