Embed Size (px)
Citation preview
Vibrational Spectra of Anhydrous and Monohydrated Caffeine and Theophylline Moleculesand Crystals
Perla B. Balbuena,* Wendy Blocker, Rachel M. Dudek, Fredy A. Cabrales-Navarro, andPussana HirunsitDepartment of Chemical Engineering, Texas A&M UniVersity, College Station, Texas 77843
ReceiVed: June 22, 2008; ReVised Manuscript ReceiVed: August 29, 2008
Density functional theory and classical molecular dynamics simulations are used to investigate the vibrationalspectra of caffeine and theophylline anhydrous and monohydrate molecules and those of their crystallineanhydrous and monohydrated states, with emphasis in the terahertz region of the spectra. To better understandthe influence of water in the monohydrate crystal spectra, we analyze the vibrational spectra of water monomer,dimer, tetramer, and pentamer, and also those of liquid water at two different temperatures. In small waterclusters, we observe the progressive addition of translational and librational modes to the terahertz region ofthe spectra. The water spectra predicted by rigid and flexible water models is examined with classical moleculardynamics, and the respective peaks, especially in the terahertz region, are compared with those found in thesmall clusters. Similar analysis done for caffeine and theophylline monohydrate molecules using densityfunctional theory clearly shows the presence of water modes in the librational states and in the water stretchingregion. Molecular dynamics of caffeine and theophylline anhydrous and monohydrate crystals reveal theinfluence of vibrations from the molecule-molecule (caffeine or theophylline) crystal stacks and those fromthe water-molecule interactions found in the monohydrate molecules and new modes from molecule-molecule,water-molecule, and water-water hydrogen bonding interactions arising from collective effects in the crystalstructure. Findings illustrate challenges of terahertz technology for the detection of specific substances incondensed phases.
1. IntroductionThe technology of terahertz pulsed spectroscopy (TPS) is
currently being developed to image tissues for the purpose ofdetecting skin cancer1 and is expected to be extensively usefulin sensors and biomedical applications where detection ofindividual chemical compounds or intermolecular interactionsis crucial. This technology is good for imaging because it isnonionizing and sample nondestructive and by its nature excitesvibrational frequencies arising due to van der Waals interactionsand hydrogen bonds, making it an excellent technology fordetecting water.1 Terahertz radiation’s ability to excite inter-molecular modes in water also makes it a good candidate tomonitor pharmaceutical purity. It also has recently beendemonstrated to be a useful technique for the investigation ofsolid state properties in pharmaceutical materials,2-5 whereestablishing the structure of a compound, particularly in its solidstate, is an important factor to understand related physicochem-ical properties. Commonly these compounds can exist indifferent polymorph and hydrated forms.6,7 The existence ofthese various conformers or pseudopolymorphs depends on amultitude of factors, from temperature and humidity to theprocess by which the compound is synthesized.6,8 The presenceof water in a molecular drug sample (often due to water beingthe solvent of crystallization) can cause it to adopt a completelydifferent crystal structure (known as a pseudopolymorph) thanthat of the desired anhydrous structure.7 As a consequence,physicochemical properties such as density, solubility, meltingpoint, thermal conductivity, chemical and physical stability, andbioactivity may differ from the anhydrates.1,7 These properties
determine the effectiveness of a drug and its performance andcould have impact at therapeutic, manufacturing, commercial,and legal levels.7,9
At present, there are thought to be three distinct classes ofhydrate crystal structures, according to the distribution of waterwithin the crystal lattice, channel, isolated-site, and ion-boundhydrates, each exhibiting different solid-state phase-transforma-tion mechanisms.3,10 These mechanisms and consequencesthereof are currently not well understood,3 and molecularmodeling techniques can help elucidating the various structuresand the phase-transformation mechanisms. Advantages of mo-lecular modeling techniques as characterization tools to comple-ment and guide experiments include a greater flexibility toinvestigate complicated geometries such as those present inbiological molecules for comparison with experimental data andthe possibility of obtaining theoretical predictions to interpretand describe spectroscopic data. Density functional theory (DFT)is commonly used to predict gas-phase spectra of isolatedmolecules, dimers, and clusters. In condensed phases, due tothe complexity involved in periodic DFT modeling in largesystems involving macromolecules, this remains a difficultproblem.3 Classical molecular dynamics (MD) simulation11 isa complementary powerful tool where information about thevibrational spectra including intermolecular modes can beobtained by analysis of the Fourier transform of the velocityautocorrelation function. Although limited by the approximationsof the effective force fields utilized to describe the intermolecularinteractions, this technique is particularly useful for analysis ofthe terahertz domain, which is important for detection of specificmolecules present in mixtures in condensed phases.
* To whom correspondence should be addressed. E-mail: [email protected].
J. Phys. Chem. A 2008, 112, 10210–1021910210
10.1021/jp805499m CCC: $40.75 2008 American Chemical SocietyPublished on Web 09/25/2008
In this work, DFT and classical MD methods have beenapplied to generate vibrational spectra of water, caffeine(C8H10N4O2), and theophylline (C7H8N4O2). We studied anhy-drous �-caffeine, caffeine monohydrate, anhydrous theophylline,and monohydrated theophylline. We have selected caffeine andtheophylline, which are commonly used as medicines, as modelmolecules to investigate the effect of water in their vibrationalspectra, both as isolated molecules and in the crystallized state.Calculated spectra are subsequently analyzed to identify vibra-tional modes and to investigate structural differences and intra-and intermolecular interactions that are responsible for variationsin the positions of the calculated modes. The two differenttheoretical approaches utilized to determine the structures andvibrational spectra are complementary, and the ab initio analysisin small clusters greatly helps to elucidate the contributions toobserved vibrational modes in condensed phases.
2. Methodology
Structures and molecular spectra of water monomer, dimer,tetramer, and pentamer structures were investigated using densityfunctional theory (DFT) with Becke-3 (B3) and Perdew-Wang91 (PW91) functionals12,13 and the 6-311G, 6-311G(d,p), and6-311G(d,p)++ basis sets. For caffeine and theophylline, theB3PW91/6-311G(d,p) method and basis set were used. Coor-dinates for the hydrated forms of caffeine were imported fromthe Cambridge Crystallographic database, reference code CAF-INE01. The �-caffeine unit cell was only firmly established asof 2007, by Lehmann and Stowasser.14 The structure wasconstructed and optimized in Cerius2,15 based on representationsof the cell given in ref 14. The structures for both anhydroustheophylline and the monohydrate were initially from theCambridge Structural Database, BAPLOT01 and THEOPH01,respectively. These structures were optimized using DFT. Allthe ab initio calculations were done using the Gaussian 0316
program.MD simulations, which can describe larger systems incor-
porating collective as well as pressure and temperature effectswere performed using DL_POLY 2.18.17 The simulated systemsinclude (1) water at 298.15 K at a density of 0.995 g/cm3 and374 K at a density of 0.95 g/cm3 (both densities were obtainedfrom coexistence data presented by Guissani and Guillot),18 (2)a �-phase anhydrous caffeine and a caffeine monohydrate, bothof approximate density of 1.43 g/cm3, and (3) anhydrous andmonohydrate theophylline. The NVT ensemble with Evansthermostat19 was used for water, and the NVT ensemble withHoover-Nose thermostat20 was used for caffeine and theophyl-line. The Dreiding force field21 was applied to represent theintra- and intermolecular interactions of caffeine and theophyl-line. Water was represented by the simple point charge extended(SPC/E) model,22 where the bonds and bending angle are rigidand intermolecular forces are described by Lennard-Jones (LJ)and Coulombic terms, and also by flexible models. We followthe flexible water model introduced by Ferguson,23 whichcontains bond stretching and angle bending terms and LJ andCoulombic terms for nonbonded interactions. We have testedtwo forms of the flexible model: one containing harmonic termsfor both bonds and angles and another that includes a quadraticand a cubic term for bond stretching and a quadratic term forangle bending. Periodic boundary conditions in the three spatialdirections were employed in all cases. The total simulation timewas 300 ps, and the equilibration time was set at 200 ps. Longersimulations (1 ns) for the two forms of the caffeine crystalyielded negligible variations in the calculated spectra withrespect to the shorter simulations. The time step was 0.001 ps.
Fourier transforms of the velocity autocorrelation functionsrepresenting the vibrational spectra were computed and analyzedafter the simulations were completed.
3. Results and Discussion
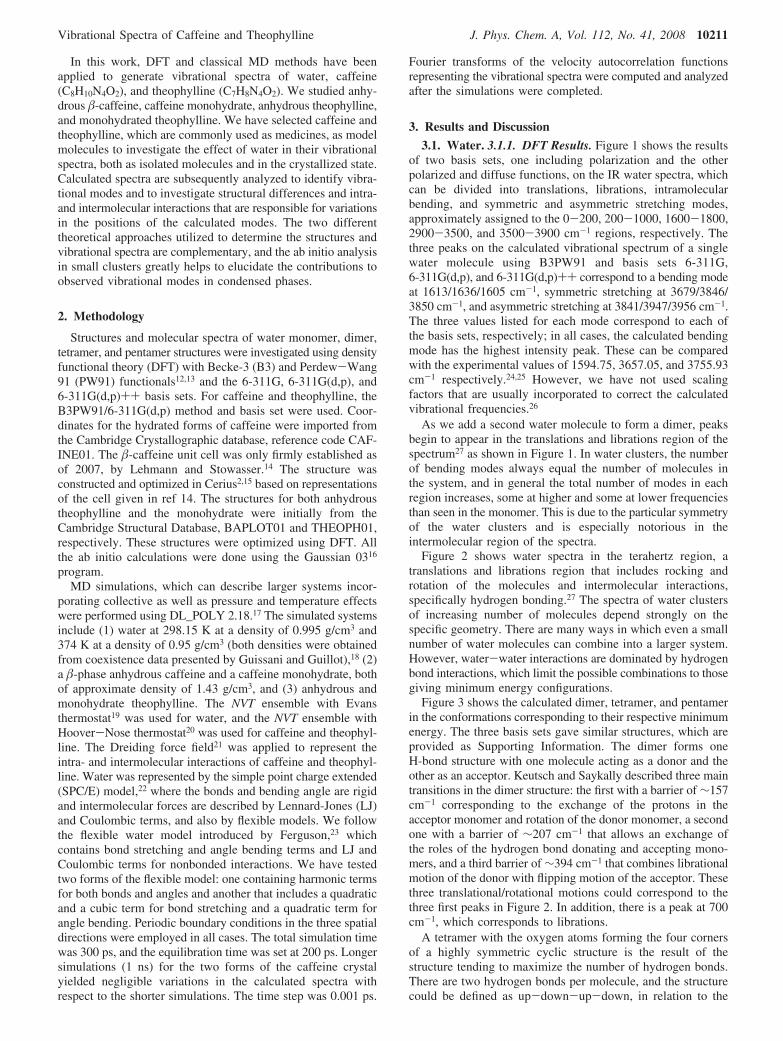
3.1. Water. 3.1.1. DFT Results. Figure 1 shows the resultsof two basis sets, one including polarization and the otherpolarized and diffuse functions, on the IR water spectra, whichcan be divided into translations, librations, intramolecularbending, and symmetric and asymmetric stretching modes,approximately assigned to the 0-200, 200-1000, 1600-1800,2900-3500, and 3500-3900 cm-1 regions, respectively. Thethree peaks on the calculated vibrational spectrum of a singlewater molecule using B3PW91 and basis sets 6-311G,6-311G(d,p), and 6-311G(d,p)++ correspond to a bending modeat 1613/1636/1605 cm-1, symmetric stretching at 3679/3846/3850 cm-1, and asymmetric stretching at 3841/3947/3956 cm-1.The three values listed for each mode correspond to each ofthe basis sets, respectively; in all cases, the calculated bendingmode has the highest intensity peak. These can be comparedwith the experimental values of 1594.75, 3657.05, and 3755.93cm-1 respectively.24,25 However, we have not used scalingfactors that are usually incorporated to correct the calculatedvibrational frequencies.26
As we add a second water molecule to form a dimer, peaksbegin to appear in the translations and librations region of thespectrum27 as shown in Figure 1. In water clusters, the numberof bending modes always equal the number of molecules inthe system, and in general the total number of modes in eachregion increases, some at higher and some at lower frequenciesthan seen in the monomer. This is due to the particular symmetryof the water clusters and is especially notorious in theintermolecular region of the spectra.
Figure 2 shows water spectra in the terahertz region, atranslations and librations region that includes rocking androtation of the molecules and intermolecular interactions,specifically hydrogen bonding.27 The spectra of water clustersof increasing number of molecules depend strongly on thespecific geometry. There are many ways in which even a smallnumber of water molecules can combine into a larger system.However, water-water interactions are dominated by hydrogenbond interactions, which limit the possible combinations to thosegiving minimum energy configurations.
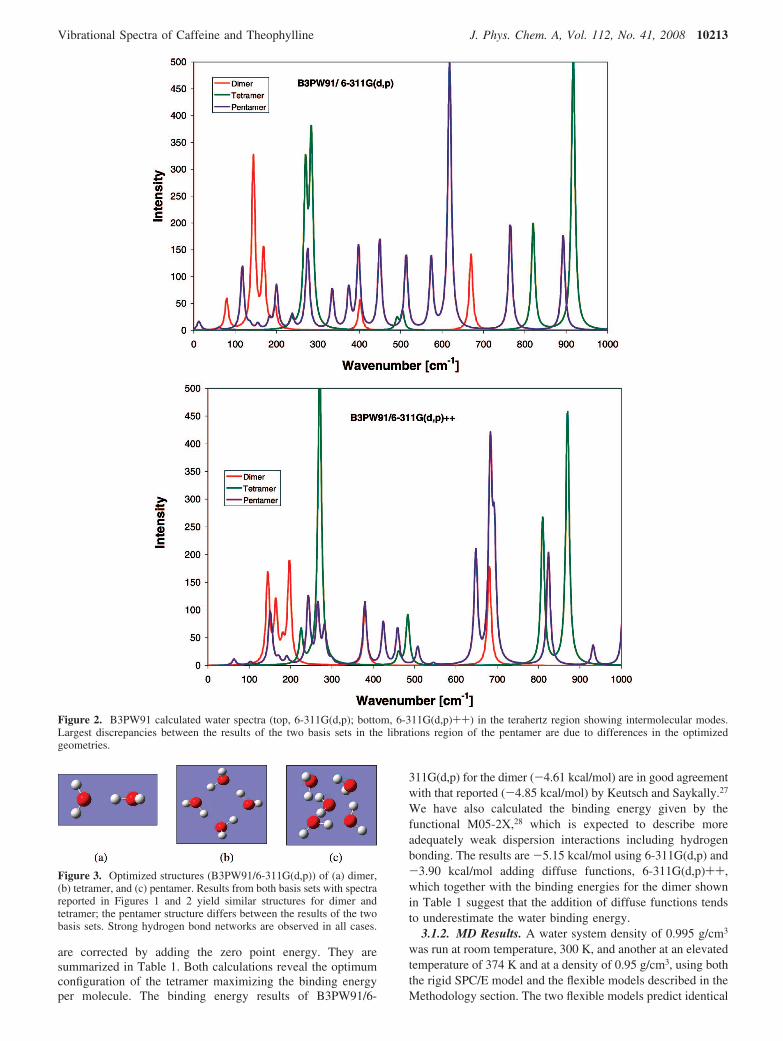
Figure 3 shows the calculated dimer, tetramer, and pentamerin the conformations corresponding to their respective minimumenergy. The three basis sets gave similar structures, which areprovided as Supporting Information. The dimer forms oneH-bond structure with one molecule acting as a donor and theother as an acceptor. Keutsch and Saykally described three maintransitions in the dimer structure: the first with a barrier of ∼157cm-1 corresponding to the exchange of the protons in theacceptor monomer and rotation of the donor monomer, a secondone with a barrier of ∼207 cm-1 that allows an exchange ofthe roles of the hydrogen bond donating and accepting mono-mers, and a third barrier of ∼394 cm-1 that combines librationalmotion of the donor with flipping motion of the acceptor. Thesethree translational/rotational motions could correspond to thethree first peaks in Figure 2. In addition, there is a peak at 700cm-1, which corresponds to librations.
A tetramer with the oxygen atoms forming the four cornersof a highly symmetric cyclic structure is the result of thestructure tending to maximize the number of hydrogen bonds.There are two hydrogen bonds per molecule, and the structurecould be defined as up-down-up-down, in relation to the
Vibrational Spectra of Caffeine and Theophylline J. Phys. Chem. A, Vol. 112, No. 41, 2008 10211
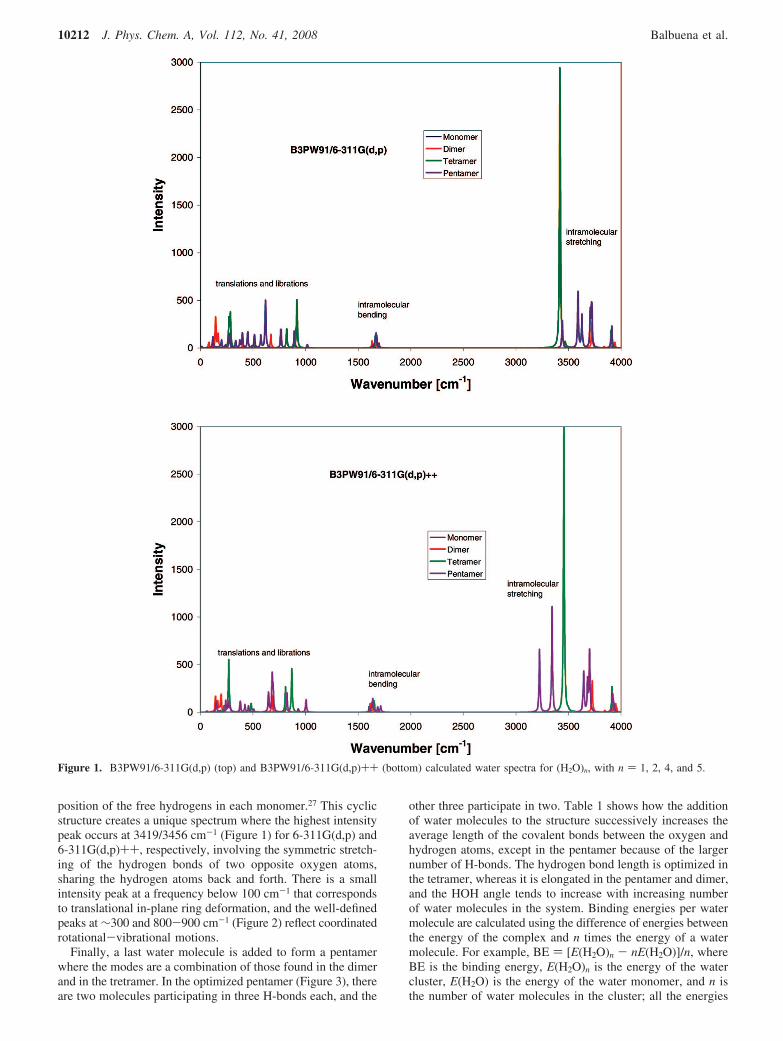
position of the free hydrogens in each monomer.27 This cyclicstructure creates a unique spectrum where the highest intensitypeak occurs at 3419/3456 cm-1 (Figure 1) for 6-311G(d,p) and6-311G(d,p)++, respectively, involving the symmetric stretch-ing of the hydrogen bonds of two opposite oxygen atoms,sharing the hydrogen atoms back and forth. There is a smallintensity peak at a frequency below 100 cm-1 that correspondsto translational in-plane ring deformation, and the well-definedpeaks at ∼300 and 800-900 cm-1 (Figure 2) reflect coordinatedrotational-vibrational motions.
Finally, a last water molecule is added to form a pentamerwhere the modes are a combination of those found in the dimerand in the tretramer. In the optimized pentamer (Figure 3), thereare two molecules participating in three H-bonds each, and the
other three participate in two. Table 1 shows how the additionof water molecules to the structure successively increases theaverage length of the covalent bonds between the oxygen andhydrogen atoms, except in the pentamer because of the largernumber of H-bonds. The hydrogen bond length is optimized inthe tetramer, whereas it is elongated in the pentamer and dimer,and the HOH angle tends to increase with increasing numberof water molecules in the system. Binding energies per watermolecule are calculated using the difference of energies betweenthe energy of the complex and n times the energy of a watermolecule. For example, BE ) [E(H2O)n - nE(H2O)]/n, whereBE is the binding energy, E(H2O)n is the energy of the watercluster, E(H2O) is the energy of the water monomer, and n isthe number of water molecules in the cluster; all the energies
Figure 1. B3PW91/6-311G(d,p) (top) and B3PW91/6-311G(d,p)++ (bottom) calculated water spectra for (H2O)n, with n ) 1, 2, 4, and 5.
10212 J. Phys. Chem. A, Vol. 112, No. 41, 2008 Balbuena et al.
are corrected by adding the zero point energy. They aresummarized in Table 1. Both calculations reveal the optimumconfiguration of the tetramer maximizing the binding energyper molecule. The binding energy results of B3PW91/6-
311G(d,p) for the dimer (-4.61 kcal/mol) are in good agreementwith that reported (-4.85 kcal/mol) by Keutsch and Saykally.27
We have also calculated the binding energy given by thefunctional M05-2X,28 which is expected to describe moreadequately weak dispersion interactions including hydrogenbonding. The results are -5.15 kcal/mol using 6-311G(d,p) and-3.90 kcal/mol adding diffuse functions, 6-311G(d,p)++,which together with the binding energies for the dimer shownin Table 1 suggest that the addition of diffuse functions tendsto underestimate the water binding energy.
3.1.2. MD Results. A water system density of 0.995 g/cm3
was run at room temperature, 300 K, and another at an elevatedtemperature of 374 K and at a density of 0.95 g/cm3, using boththe rigid SPC/E model and the flexible models described in theMethodology section. The two flexible models predict identical
Figure 2. B3PW91 calculated water spectra (top, 6-311G(d,p); bottom, 6-311G(d,p)++) in the terahertz region showing intermolecular modes.Largest discrepancies between the results of the two basis sets in the librations region of the pentamer are due to differences in the optimizedgeometries.
Figure 3. Optimized structures (B3PW91/6-311G(d,p)) of (a) dimer,(b) tetramer, and (c) pentamer. Results from both basis sets with spectrareported in Figures 1 and 2 yield similar structures for dimer andtetramer; the pentamer structure differs between the results of the twobasis sets. Strong hydrogen bond networks are observed in all cases.
Vibrational Spectra of Caffeine and Theophylline J. Phys. Chem. A, Vol. 112, No. 41, 2008 10213
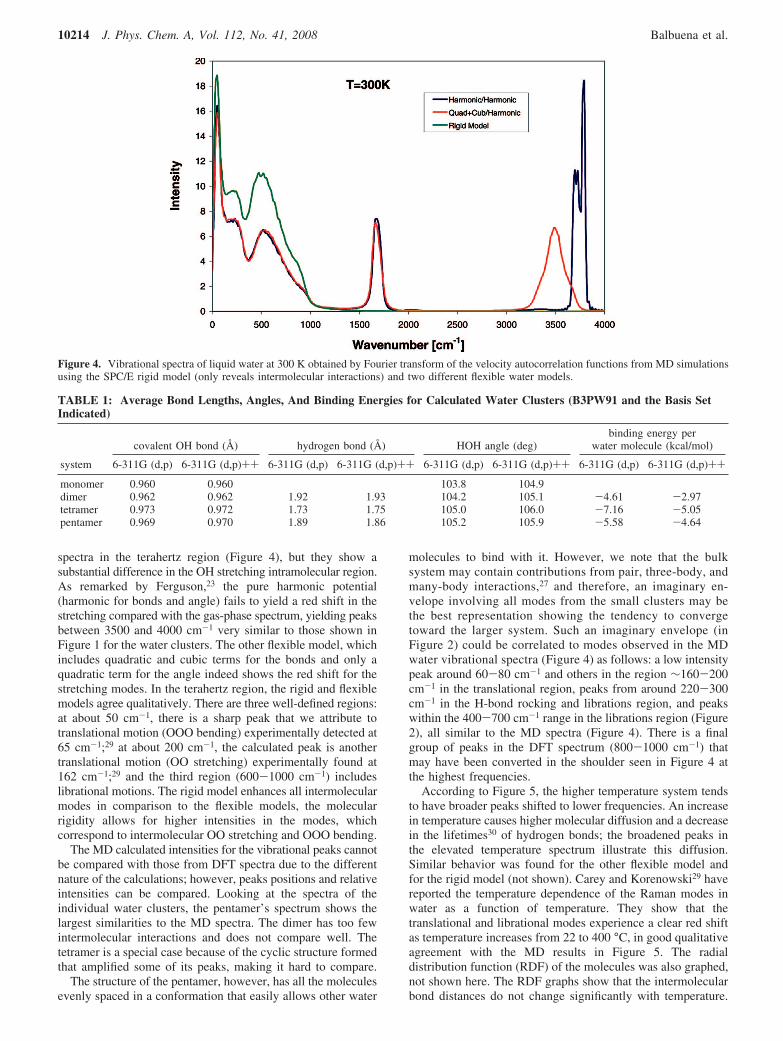
spectra in the terahertz region (Figure 4), but they show asubstantial difference in the OH stretching intramolecular region.As remarked by Ferguson,23 the pure harmonic potential(harmonic for bonds and angle) fails to yield a red shift in thestretching compared with the gas-phase spectrum, yielding peaksbetween 3500 and 4000 cm-1 very similar to those shown inFigure 1 for the water clusters. The other flexible model, whichincludes quadratic and cubic terms for the bonds and only aquadratic term for the angle indeed shows the red shift for thestretching modes. In the terahertz region, the rigid and flexiblemodels agree qualitatively. There are three well-defined regions:at about 50 cm-1, there is a sharp peak that we attribute totranslational motion (OOO bending) experimentally detected at65 cm-1;29 at about 200 cm-1, the calculated peak is anothertranslational motion (OO stretching) experimentally found at162 cm-1;29 and the third region (600-1000 cm-1) includeslibrational motions. The rigid model enhances all intermolecularmodes in comparison to the flexible models, the molecularrigidity allows for higher intensities in the modes, whichcorrespond to intermolecular OO stretching and OOO bending.
The MD calculated intensities for the vibrational peaks cannotbe compared with those from DFT spectra due to the differentnature of the calculations; however, peaks positions and relativeintensities can be compared. Looking at the spectra of theindividual water clusters, the pentamer’s spectrum shows thelargest similarities to the MD spectra. The dimer has too fewintermolecular interactions and does not compare well. Thetetramer is a special case because of the cyclic structure formedthat amplified some of its peaks, making it hard to compare.
The structure of the pentamer, however, has all the moleculesevenly spaced in a conformation that easily allows other water
molecules to bind with it. However, we note that the bulksystem may contain contributions from pair, three-body, andmany-body interactions,27 and therefore, an imaginary en-velope involving all modes from the small clusters may bethe best representation showing the tendency to convergetoward the larger system. Such an imaginary envelope (inFigure 2) could be correlated to modes observed in the MDwater vibrational spectra (Figure 4) as follows: a low intensitypeak around 60-80 cm-1 and others in the region ∼160-200cm-1 in the translational region, peaks from around 220-300cm-1 in the H-bond rocking and librations region, and peakswithin the 400-700 cm-1 range in the librations region (Figure2), all similar to the MD spectra (Figure 4). There is a finalgroup of peaks in the DFT spectrum (800-1000 cm-1) thatmay have been converted in the shoulder seen in Figure 4 atthe highest frequencies.
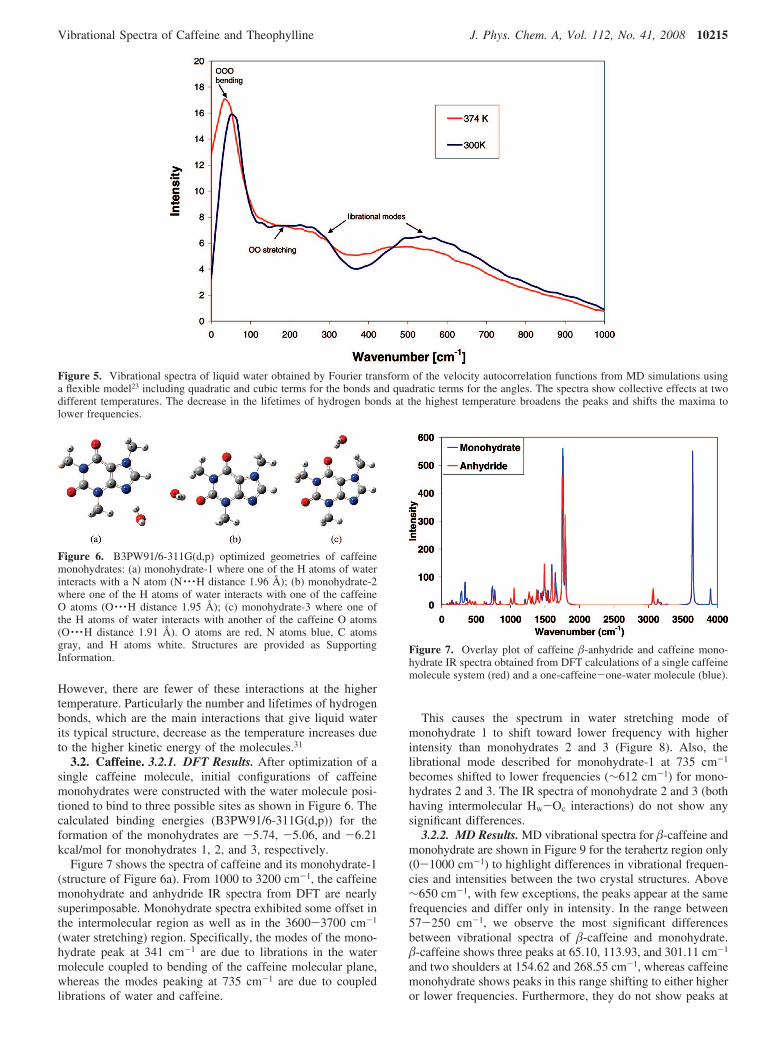
According to Figure 5, the higher temperature system tendsto have broader peaks shifted to lower frequencies. An increasein temperature causes higher molecular diffusion and a decreasein the lifetimes30 of hydrogen bonds; the broadened peaks inthe elevated temperature spectrum illustrate this diffusion.Similar behavior was found for the other flexible model andfor the rigid model (not shown). Carey and Korenowski29 havereported the temperature dependence of the Raman modes inwater as a function of temperature. They show that thetranslational and librational modes experience a clear red shiftas temperature increases from 22 to 400 °C, in good qualitativeagreement with the MD results in Figure 5. The radialdistribution function (RDF) of the molecules was also graphed,not shown here. The RDF graphs show that the intermolecularbond distances do not change significantly with temperature.
Figure 4. Vibrational spectra of liquid water at 300 K obtained by Fourier transform of the velocity autocorrelation functions from MD simulationsusing the SPC/E rigid model (only reveals intermolecular interactions) and two different flexible water models.
TABLE 1: Average Bond Lengths, Angles, And Binding Energies for Calculated Water Clusters (B3PW91 and the Basis SetIndicated)
covalent OH bond (Å) hydrogen bond (Å) HOH angle (deg)binding energy per
water molecule (kcal/mol)
system 6-311G (d,p) 6-311G (d,p)++ 6-311G (d,p) 6-311G (d,p)++ 6-311G (d,p) 6-311G (d,p)++ 6-311G (d,p) 6-311G (d,p)++
monomer 0.960 0.960 103.8 104.9dimer 0.962 0.962 1.92 1.93 104.2 105.1 -4.61 -2.97tetramer 0.973 0.972 1.73 1.75 105.0 106.0 -7.16 -5.05pentamer 0.969 0.970 1.89 1.86 105.2 105.9 -5.58 -4.64
10214 J. Phys. Chem. A, Vol. 112, No. 41, 2008 Balbuena et al.
However, there are fewer of these interactions at the highertemperature. Particularly the number and lifetimes of hydrogenbonds, which are the main interactions that give liquid waterits typical structure, decrease as the temperature increases dueto the higher kinetic energy of the molecules.31
3.2. Caffeine. 3.2.1. DFT Results. After optimization of asingle caffeine molecule, initial configurations of caffeinemonohydrates were constructed with the water molecule posi-tioned to bind to three possible sites as shown in Figure 6. Thecalculated binding energies (B3PW91/6-311G(d,p)) for theformation of the monohydrates are -5.74, -5.06, and -6.21kcal/mol for monohydrates 1, 2, and 3, respectively.
Figure 7 shows the spectra of caffeine and its monohydrate-1(structure of Figure 6a). From 1000 to 3200 cm-1, the caffeinemonohydrate and anhydride IR spectra from DFT are nearlysuperimposable. Monohydrate spectra exhibited some offset inthe intermolecular region as well as in the 3600-3700 cm-1
(water stretching) region. Specifically, the modes of the mono-hydrate peak at 341 cm-1 are due to librations in the watermolecule coupled to bending of the caffeine molecular plane,whereas the modes peaking at 735 cm-1 are due to coupledlibrations of water and caffeine.
This causes the spectrum in water stretching mode ofmonohydrate 1 to shift toward lower frequency with higherintensity than monohydrates 2 and 3 (Figure 8). Also, thelibrational mode described for monohydrate-1 at 735 cm-1
becomes shifted to lower frequencies (∼612 cm-1) for mono-hydrates 2 and 3. The IR spectra of monohydrate 2 and 3 (bothhaving intermolecular Hw-Oc interactions) do not show anysignificant differences.
3.2.2. MD Results. MD vibrational spectra for �-caffeine andmonohydrate are shown in Figure 9 for the terahertz region only(0-1000 cm-1) to highlight differences in vibrational frequen-cies and intensities between the two crystal structures. Above∼650 cm-1, with few exceptions, the peaks appear at the samefrequencies and differ only in intensity. In the range between57-250 cm-1, we observe the most significant differencesbetween vibrational spectra of �-caffeine and monohydrate.�-caffeine shows three peaks at 65.10, 113.93, and 301.11 cm-1
and two shoulders at 154.62 and 268.55 cm-1, whereas caffeinemonohydrate shows peaks in this range shifting to either higheror lower frequencies. Furthermore, they do not show peaks at
Figure 5. Vibrational spectra of liquid water obtained by Fourier transform of the velocity autocorrelation functions from MD simulations usinga flexible model23 including quadratic and cubic terms for the bonds and quadratic terms for the angles. The spectra show collective effects at twodifferent temperatures. The decrease in the lifetimes of hydrogen bonds at the highest temperature broadens the peaks and shifts the maxima tolower frequencies.
Figure 6. B3PW91/6-311G(d,p) optimized geometries of caffeinemonohydrates: (a) monohydrate-1 where one of the H atoms of waterinteracts with a N atom (N · · ·H distance 1.96 Å); (b) monohydrate-2where one of the H atoms of water interacts with one of the caffeineO atoms (O · · ·H distance 1.95 Å); (c) monohydrate-3 where one ofthe H atoms of water interacts with another of the caffeine O atoms(O · · ·H distance 1.91 Å). O atoms are red, N atoms blue, C atomsgray, and H atoms white. Structures are provided as SupportingInformation.
Figure 7. Overlay plot of caffeine �-anhydride and caffeine mono-hydrate IR spectra obtained from DFT calculations of a single caffeinemolecule system (red) and a one-caffeine-one-water molecule (blue).
Vibrational Spectra of Caffeine and Theophylline J. Phys. Chem. A, Vol. 112, No. 41, 2008 10215
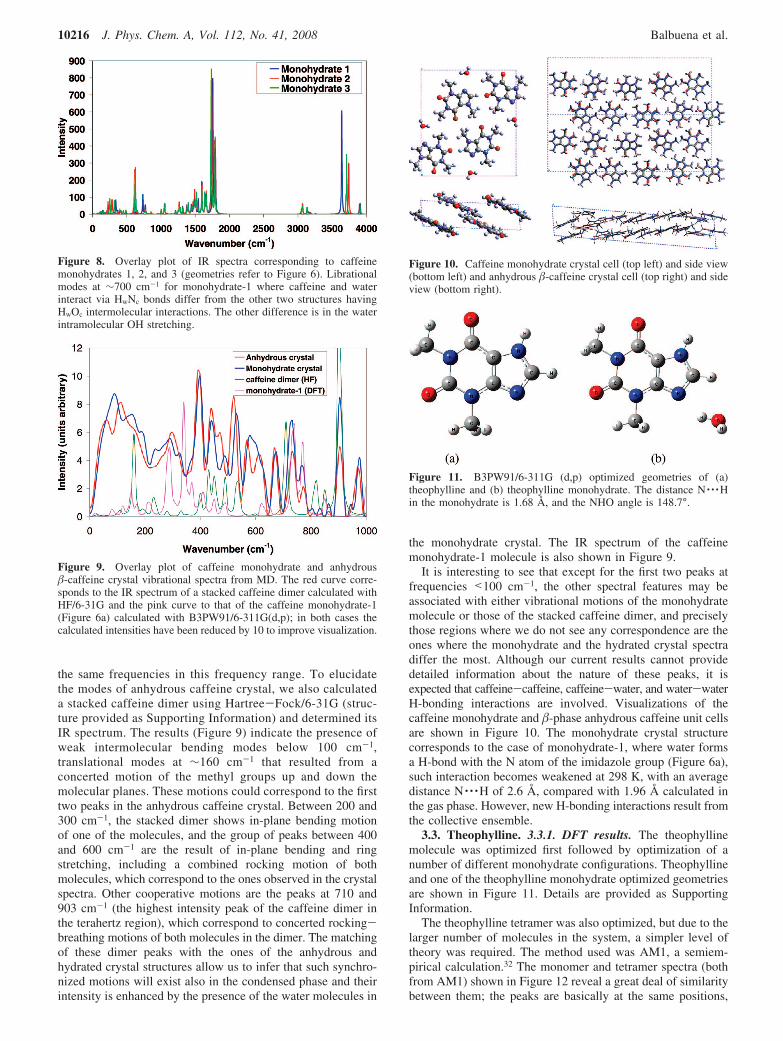
the same frequencies in this frequency range. To elucidatethe modes of anhydrous caffeine crystal, we also calculateda stacked caffeine dimer using Hartree-Fock/6-31G (struc-ture provided as Supporting Information) and determined itsIR spectrum. The results (Figure 9) indicate the presence ofweak intermolecular bending modes below 100 cm-1,translational modes at ∼160 cm-1 that resulted from aconcerted motion of the methyl groups up and down themolecular planes. These motions could correspond to the firsttwo peaks in the anhydrous caffeine crystal. Between 200 and300 cm-1, the stacked dimer shows in-plane bending motionof one of the molecules, and the group of peaks between 400and 600 cm-1 are the result of in-plane bending and ringstretching, including a combined rocking motion of bothmolecules, which correspond to the ones observed in the crystalspectra. Other cooperative motions are the peaks at 710 and903 cm-1 (the highest intensity peak of the caffeine dimer inthe terahertz region), which correspond to concerted rocking-breathing motions of both molecules in the dimer. The matchingof these dimer peaks with the ones of the anhydrous andhydrated crystal structures allow us to infer that such synchro-nized motions will exist also in the condensed phase and theirintensity is enhanced by the presence of the water molecules in
the monohydrate crystal. The IR spectrum of the caffeinemonohydrate-1 molecule is also shown in Figure 9.
It is interesting to see that except for the first two peaks atfrequencies <100 cm-1, the other spectral features may beassociated with either vibrational motions of the monohydratemolecule or those of the stacked caffeine dimer, and preciselythose regions where we do not see any correspondence are theones where the monohydrate and the hydrated crystal spectradiffer the most. Although our current results cannot providedetailed information about the nature of these peaks, it isexpected that caffeine-caffeine, caffeine-water, and water-waterH-bonding interactions are involved. Visualizations of thecaffeine monohydrate and �-phase anhydrous caffeine unit cellsare shown in Figure 10. The monohydrate crystal structurecorresponds to the case of monohydrate-1, where water formsa H-bond with the N atom of the imidazole group (Figure 6a),such interaction becomes weakened at 298 K, with an averagedistance N · · ·H of 2.6 Å, compared with 1.96 Å calculated inthe gas phase. However, new H-bonding interactions result fromthe collective ensemble.
3.3. Theophylline. 3.3.1. DFT results. The theophyllinemolecule was optimized first followed by optimization of anumber of different monohydrate configurations. Theophyllineand one of the theophylline monohydrate optimized geometriesare shown in Figure 11. Details are provided as SupportingInformation.
The theophylline tetramer was also optimized, but due to thelarger number of molecules in the system, a simpler level oftheory was required. The method used was AM1, a semiem-pirical calculation.32 The monomer and tetramer spectra (bothfrom AM1) shown in Figure 12 reveal a great deal of similaritybetween them; the peaks are basically at the same positions,
Figure 8. Overlay plot of IR spectra corresponding to caffeinemonohydrates 1, 2, and 3 (geometries refer to Figure 6). Librationalmodes at ∼700 cm-1 for monohydrate-1 where caffeine and waterinteract via HwNc bonds differ from the other two structures havingHwOc intermolecular interactions. The other difference is in the waterintramolecular OH stretching.
Figure 9. Overlay plot of caffeine monohydrate and anhydrous�-caffeine crystal vibrational spectra from MD. The red curve corre-sponds to the IR spectrum of a stacked caffeine dimer calculated withHF/6-31G and the pink curve to that of the caffeine monohydrate-1(Figure 6a) calculated with B3PW91/6-311G(d,p); in both cases thecalculated intensities have been reduced by 10 to improve visualization.
Figure 10. Caffeine monohydrate crystal cell (top left) and side view(bottom left) and anhydrous �-caffeine crystal cell (top right) and sideview (bottom right).
Figure 11. B3PW91/6-311G (d,p) optimized geometries of (a)theophylline and (b) theophylline monohydrate. The distance N · · ·Hin the monohydrate is 1.68 Å, and the NHO angle is 148.7°.
10216 J. Phys. Chem. A, Vol. 112, No. 41, 2008 Balbuena et al.
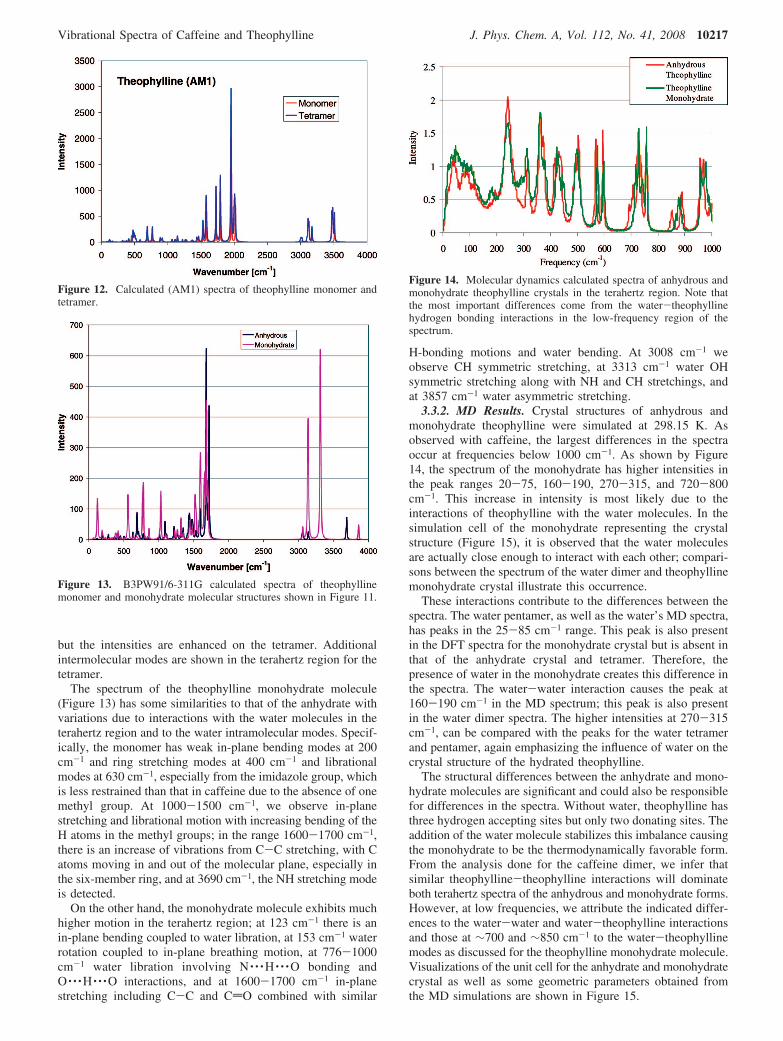
but the intensities are enhanced on the tetramer. Additionalintermolecular modes are shown in the terahertz region for thetetramer.
The spectrum of the theophylline monohydrate molecule(Figure 13) has some similarities to that of the anhydrate withvariations due to interactions with the water molecules in theterahertz region and to the water intramolecular modes. Specif-ically, the monomer has weak in-plane bending modes at 200cm-1 and ring stretching modes at 400 cm-1 and librationalmodes at 630 cm-1, especially from the imidazole group, whichis less restrained than that in caffeine due to the absence of onemethyl group. At 1000-1500 cm-1, we observe in-planestretching and librational motion with increasing bending of theH atoms in the methyl groups; in the range 1600-1700 cm-1,there is an increase of vibrations from C-C stretching, with Catoms moving in and out of the molecular plane, especially inthe six-member ring, and at 3690 cm-1, the NH stretching modeis detected.
On the other hand, the monohydrate molecule exhibits muchhigher motion in the terahertz region; at 123 cm-1 there is anin-plane bending coupled to water libration, at 153 cm-1 waterrotation coupled to in-plane breathing motion, at 776-1000cm-1 water libration involving N · · ·H · · ·O bonding andO · · ·H · · ·O interactions, and at 1600-1700 cm-1 in-planestretching including C-C and CdO combined with similar
H-bonding motions and water bending. At 3008 cm-1 weobserve CH symmetric stretching, at 3313 cm-1 water OHsymmetric stretching along with NH and CH stretchings, andat 3857 cm-1 water asymmetric stretching.
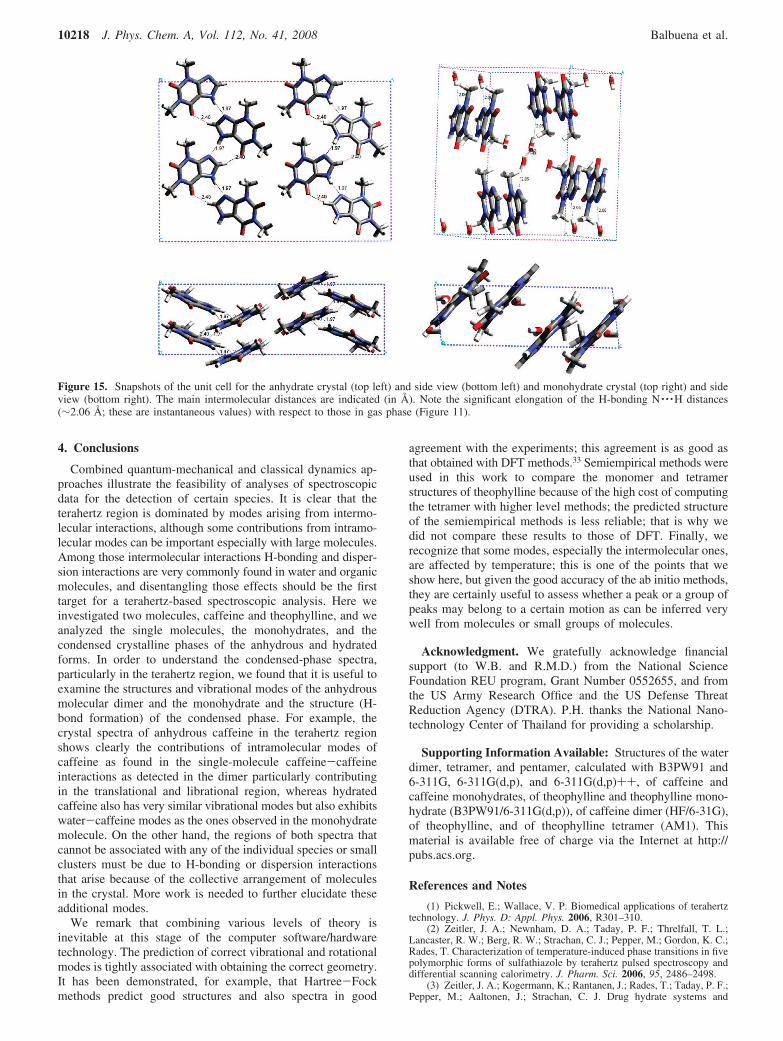
3.3.2. MD Results. Crystal structures of anhydrous andmonohydrate theophylline were simulated at 298.15 K. Asobserved with caffeine, the largest differences in the spectraoccur at frequencies below 1000 cm-1. As shown by Figure14, the spectrum of the monohydrate has higher intensities inthe peak ranges 20-75, 160-190, 270-315, and 720-800cm-1. This increase in intensity is most likely due to theinteractions of theophylline with the water molecules. In thesimulation cell of the monohydrate representing the crystalstructure (Figure 15), it is observed that the water moleculesare actually close enough to interact with each other; compari-sons between the spectrum of the water dimer and theophyllinemonohydrate crystal illustrate this occurrence.
These interactions contribute to the differences between thespectra. The water pentamer, as well as the water’s MD spectra,has peaks in the 25-85 cm-1 range. This peak is also presentin the DFT spectra for the monohydrate crystal but is absent inthat of the anhydrate crystal and tetramer. Therefore, thepresence of water in the monohydrate creates this difference inthe spectra. The water-water interaction causes the peak at160-190 cm-1 in the MD spectrum; this peak is also presentin the water dimer spectra. The higher intensities at 270-315cm-1, can be compared with the peaks for the water tetramerand pentamer, again emphasizing the influence of water on thecrystal structure of the hydrated theophylline.
The structural differences between the anhydrate and mono-hydrate molecules are significant and could also be responsiblefor differences in the spectra. Without water, theophylline hasthree hydrogen accepting sites but only two donating sites. Theaddition of the water molecule stabilizes this imbalance causingthe monohydrate to be the thermodynamically favorable form.From the analysis done for the caffeine dimer, we infer thatsimilar theophylline-theophylline interactions will dominateboth terahertz spectra of the anhydrous and monohydrate forms.However, at low frequencies, we attribute the indicated differ-ences to the water-water and water-theophylline interactionsand those at ∼700 and ∼850 cm-1 to the water-theophyllinemodes as discussed for the theophylline monohydrate molecule.Visualizations of the unit cell for the anhydrate and monohydratecrystal as well as some geometric parameters obtained fromthe MD simulations are shown in Figure 15.
Figure 12. Calculated (AM1) spectra of theophylline monomer andtetramer.
Figure 13. B3PW91/6-311G calculated spectra of theophyllinemonomer and monohydrate molecular structures shown in Figure 11.
Figure 14. Molecular dynamics calculated spectra of anhydrous andmonohydrate theophylline crystals in the terahertz region. Note thatthe most important differences come from the water-theophyllinehydrogen bonding interactions in the low-frequency region of thespectrum.
Vibrational Spectra of Caffeine and Theophylline J. Phys. Chem. A, Vol. 112, No. 41, 2008 10217
4. Conclusions
Combined quantum-mechanical and classical dynamics ap-proaches illustrate the feasibility of analyses of spectroscopicdata for the detection of certain species. It is clear that theterahertz region is dominated by modes arising from intermo-lecular interactions, although some contributions from intramo-lecular modes can be important especially with large molecules.Among those intermolecular interactions H-bonding and disper-sion interactions are very commonly found in water and organicmolecules, and disentangling those effects should be the firsttarget for a terahertz-based spectroscopic analysis. Here weinvestigated two molecules, caffeine and theophylline, and weanalyzed the single molecules, the monohydrates, and thecondensed crystalline phases of the anhydrous and hydratedforms. In order to understand the condensed-phase spectra,particularly in the terahertz region, we found that it is useful toexamine the structures and vibrational modes of the anhydrousmolecular dimer and the monohydrate and the structure (H-bond formation) of the condensed phase. For example, thecrystal spectra of anhydrous caffeine in the terahertz regionshows clearly the contributions of intramolecular modes ofcaffeine as found in the single-molecule caffeine-caffeineinteractions as detected in the dimer particularly contributingin the translational and librational region, whereas hydratedcaffeine also has very similar vibrational modes but also exhibitswater-caffeine modes as the ones observed in the monohydratemolecule. On the other hand, the regions of both spectra thatcannot be associated with any of the individual species or smallclusters must be due to H-bonding or dispersion interactionsthat arise because of the collective arrangement of moleculesin the crystal. More work is needed to further elucidate theseadditional modes.
We remark that combining various levels of theory isinevitable at this stage of the computer software/hardwaretechnology. The prediction of correct vibrational and rotationalmodes is tightly associated with obtaining the correct geometry.It has been demonstrated, for example, that Hartree-Fockmethods predict good structures and also spectra in good
agreement with the experiments; this agreement is as good asthat obtained with DFT methods.33 Semiempirical methods wereused in this work to compare the monomer and tetramerstructures of theophylline because of the high cost of computingthe tetramer with higher level methods; the predicted structureof the semiempirical methods is less reliable; that is why wedid not compare these results to those of DFT. Finally, werecognize that some modes, especially the intermolecular ones,are affected by temperature; this is one of the points that weshow here, but given the good accuracy of the ab initio methods,they are certainly useful to assess whether a peak or a group ofpeaks may belong to a certain motion as can be inferred verywell from molecules or small groups of molecules.
Acknowledgment. We gratefully acknowledge financialsupport (to W.B. and R.M.D.) from the National ScienceFoundation REU program, Grant Number 0552655, and fromthe US Army Research Office and the US Defense ThreatReduction Agency (DTRA). P.H. thanks the National Nano-technology Center of Thailand for providing a scholarship.
Supporting Information Available: Structures of the waterdimer, tetramer, and pentamer, calculated with B3PW91 and6-311G, 6-311G(d,p), and 6-311G(d,p)++, of caffeine andcaffeine monohydrates, of theophylline and theophylline mono-hydrate (B3PW91/6-311G(d,p)), of caffeine dimer (HF/6-31G),of theophylline, and of theophylline tetramer (AM1). Thismaterial is available free of charge via the Internet at http://pubs.acs.org.
References and Notes
(1) Pickwell, E.; Wallace, V. P. Biomedical applications of terahertztechnology. J. Phys. D: Appl. Phys. 2006, R301–310.
(2) Zeitler, J. A.; Newnham, D. A.; Taday, P. F.; Threlfall, T. L.;Lancaster, R. W.; Berg, R. W.; Strachan, C. J.; Pepper, M.; Gordon, K. C.;Rades, T. Characterization of temperature-induced phase transitions in fivepolymorphic forms of sulfathiazole by terahertz pulsed spectroscopy anddifferential scanning calorimetry. J. Pharm. Sci. 2006, 95, 2486–2498.
(3) Zeitler, J. A.; Kogermann, K.; Rantanen, J.; Rades, T.; Taday, P. F.;Pepper, M.; Aaltonen, J.; Strachan, C. J. Drug hydrate systems and
Figure 15. Snapshots of the unit cell for the anhydrate crystal (top left) and side view (bottom left) and monohydrate crystal (top right) and sideview (bottom right). The main intermolecular distances are indicated (in Å). Note the significant elongation of the H-bonding N · · ·H distances(∼2.06 Å; these are instantaneous values) with respect to those in gas phase (Figure 11).
10218 J. Phys. Chem. A, Vol. 112, No. 41, 2008 Balbuena et al.
dehydration processes studied by terahertz pulsed spectroscopy. Int.J. Pharm. 2007, 334, 78–84.
(4) Taday, P. F.; Bradley, I. V.; Arnone, D. D.; Pepper, M. Usingterahertz pulse spectroscopy to study the crystalline structure of a drug: Acase study of the polymorphs of ranitidine hydrochloride. J. Pharm. Sci.2003, 92, 831–838.
(5) Strachan, C. J.; Rades, T.; Newnham, D. A.; Gordon, K. C.; Pepper,M.; Taday, P. F. Using terahertz pulsed spectroscopy to study crystallinityof pharmaceutical materials. Chem. Phys. Lett. 2004, 390, 20–24.
(6) Threlfall, T. L. Analysis of organic polymorphssa review. Analyst1995, 120, 2435–2460.
(7) Liu, H.-B.; Chen, Y.; Zhang, X. C. Characterization of anhydrousand hydrated pharmaceutical materials with THz time-domain spectroscopy.J. Pharm. Sci. 2007, 96, 927–934.
(8) Airaksinen, S.; Karjalainen, M.; Shevchenko, A.; Westermarck, S.;Leppanen, E.; Rantanen, J.; Yliruusi, J. Role of water in the physical stabilityof solid dosage formulations. J. Pharm. Sci. 2005, 94, 2147–2165.
(9) Byrn, S.; Pfeiffer, R.; Ganey, M.; Hoiberg, C.; Poochikian, G.Pharmaceutical Solids: A Strategic Approach to Regulatory Considerations.Pharm. Res. 1995, 12, 945–954.
(10) Morris, K. R. Polymorphism in Pharmaceutical Solids; MarcelDekker Inc.: New York, 1999.
(11) Allen, M. P.; Tildesley, D. J. Computer Simulation of Liquids;Oxford University Press: Oxford, U.K., 1990.
(12) Perdew, J. P. Unified theory of exchange and correlation beyondthe local density approximation. In Electronic Structure of Solids; Ziesche,P., Eschrig, H., Eds; Akademie Verlag: Berlin, 1991.
(13) Perdew, J. P.; Wang, Y. Accurate and simple analytic representationof the electron-gas correlation energy. Phys. ReV. B 1992, 45, 13244–13249.
(14) Lehmann, Christian, W.; Stowasser, F. The crystal structure ofanhydrous �-caffeine as determined from X-ray powder-diffraction data.Chem.sEur. J. 2007, 13, 2908–2911.
(15) Molecular Simulations, I. CERIUS 2; San Diego, CA, 1997.(16) Frisch, M. J.; Trucks, G. W.; Schlegel, H. B.; Scuseria, G. E.; Robb,
M. A.; Cheeseman, J. R.; Montgomery, J. A., Jr.; Vreven, T.; Kudin, K. N.;Burant, J. C.; Millam, J. M.; Iyengar, S. S.; Tomasi, J.; Barone, V.;Mennucci, B.; Cossi, M.; Scalmani, G.; Rega, N.; Petersson, G. A.;Nakatsuji, H.; Hada, M.; Ehara, M.; Toyota, K.; Fukuda, R.; Hasegawa, J.;Ishida, M.; Nakajima, T.; Honda, Y.; Kitao, O.; Nakai, H.; Klene, M.; Li,X.; Knox, J. E.; Hratchian, H. P.; Cross, J. B.; Bakken, V.; Adamo, C.;Jaramillo, J.; Gomperts, R.; Stratmann, R. E.; Yazyev, O.; Austin, A. J.;Cammi, R.; Pomelli, C.; Ochterski, J. W.; Ayala, P. Y.; Morokuma, K.;Voth, G. A.; Salvador, P.; Dannenberg, J. J.; Zakrzewski, G.; Dapprich,S.; Daniels, A. D.; Strain, M. C.; Farkas, O.; Malick, D. K.; Rabuck, A. D.;Raghavachari, K.; Foresman, J. B.; Ortiz, J. V.; Cui, Q.; Baboul, A. G.;Clifford, S.; Cioslowski, J.; Stefanov, B. B.; Liu, G.; Liashenko, A.; Piskorz,P.; Komaromi, I.; Martin, R. L.; Fox, D. J.; Keith, T.; Al-Laham, M. A.;Peng, C. Y.; Nanayakkara, A.; Challacombe, M.; Gill, P. M. W.; Johnson,
B.; Chen, W.; Wong, M. W.; Gonzalez, C.; Pople, J. A. Gaussian 03,Revision C.02; Gaussian, Inc.: Wallingford, CT, 2004.
(17) Smith, W.; Forester, T. R. DL_POLY_2.0: A general-purposeparallel molecular dynamics simulation package. J. Mol. Graphics 1996,14, 136–141.
(18) Guissani, Y.; Guillot, B. A computer-simulation study of the liquid-vapor coexistence curve of water. J. Chem. Phys. 1993, 98, 8221–8235.
(19) Evans, D. J.; Morriss, G. P. The isothermal/isobaric moleculardynamics ensemble. Phys. Lett. 1983, 98A, 433–436.
(20) Hoover, W. Canonical dynamics: Equilibrium phase-space distribu-tions. Phys. ReV. A 1985, 31, 1695.
(21) Mayo, S. L.; Olafson, B. D.; Goddard, W. A. Dreiding: A genericforce field for molecular simulations. J. Phys. Chem. 1990, 94, 8897–8909.
(22) Berendsen, H. J. C.; Grigera, J. R.; Straatsma, T. P. The missingterm in effective pair potentials. J. Phys. Chem. 1987, 91, 6269–6271.
(23) Ferguson, D. M. Parameterization and evaluation of a flexible modelof water. J. Comput. Chem. 1995, 16, 501–511.
(24) Bernath, P. F. The spectroscopy of water vapour: Experiment, theoryand applications. Phys. Chem. Chem. Phys. 2002, 4, 1501–1509.
(25) Lemus, R. Vibrational excitations in H2O in the framework of alocal model. J. Mol. Spectrosc. 2004, 225, 73–92.
(26) Scott, A. P.; Radom, L. Harmonic vibrational frequencies: Anevaluation of Hartree-Fock, Moller-Plesset, quadratic configurationinteraction, density functional theory, and semiempirical scale factors. J.Phys. Chem. 1996, 100, 16502–16513.
(27) Keutsch, F. N.; Saykally, R. J. Water clusters: Untangling themysteries of the liquid, one molecule at a time. Proc. Natl. Acad. Sci. U.S.A.2001, 98, 10533–10540.
(28) Zhao, Y.; Schultz, N. E.; Truhlar, D. G. Design of densityfunctionals by combining the method of constraint satisfaction withparametrization for thermochemistry, thermochemical kinetics, and non-covalent interactions. J. Chem. Theory Comput. 2006, 2, 364–382.
(29) Carey, D. M.; Korenowski, G. M. Measurement of the Ramanspectrum of liquid water. J. Chem. Phys. 1998, 108, 2669–2675.
(30) Flanagin, L. W.; Balbuena, P. B.; Johnston, K. P.; Rossky, P. J.Temperature and density effects on an SN2 reaction in supercritical water.J. Phys. Chem. 1995, 99, 5196–5205.
(31) Balbuena, P. B.; Johnston, K. P.; Rossky, P. J. Molecular dynamicssimulation of electrolyte solutions in ambient and supercritical water I. Ionsolvation. J. Phys. Chem. 1996, 100, 2706–2715.
(32) Dewar, M. J. S.; Zoebisch, E. G.; Healy, E. F. AM1: A generalpurpose quantum mechanical molecular model. J. Am. Chem. Soc. 1985,107, 3902–3909.
(33) Hehre, W. J.; Radom, L.; Schleyer, P. v. R.; Pople, J. A. Ab InitioMolecular Orbital Theory; John Wiley & Sons: New York, 1986.
JP805499M
Vibrational Spectra of Caffeine and Theophylline J. Phys. Chem. A, Vol. 112, No. 41, 2008 10219


