Embed Size (px)
Citation preview
Vehicles and mobility
1
Shantanu GuptaCentre for Science and Environment
Meeting: Clean air action plan for Jaipur region: Building enhanced
multi-sector Strategies
December 23, 2020
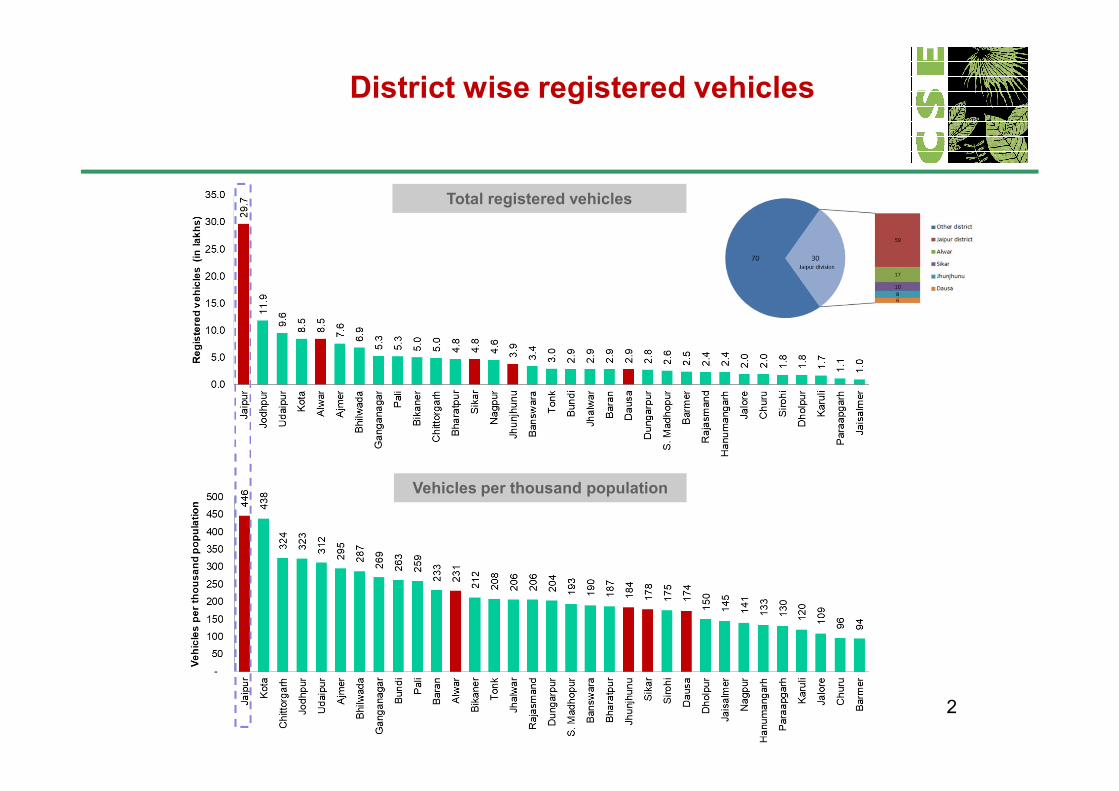
District wise registered vehicles
Total registered vehicles
2
Vehicles per thousand population
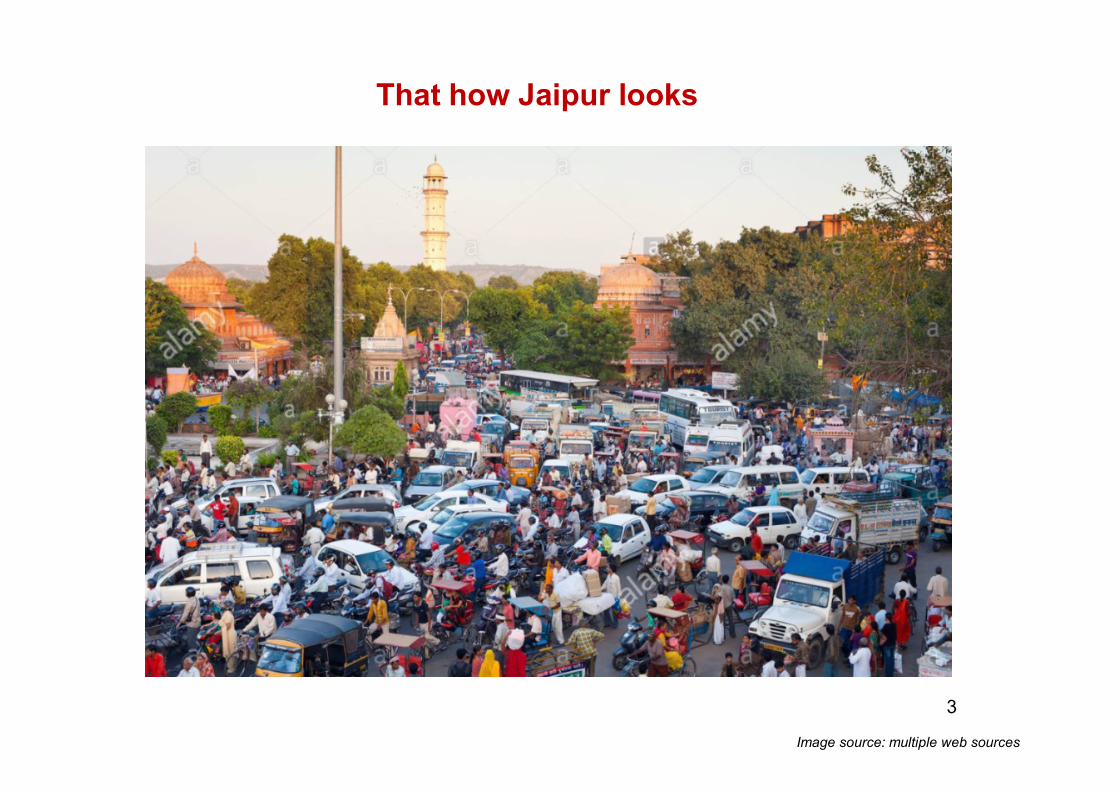
That how Jaipur looks
3
Image source: multiple web sources
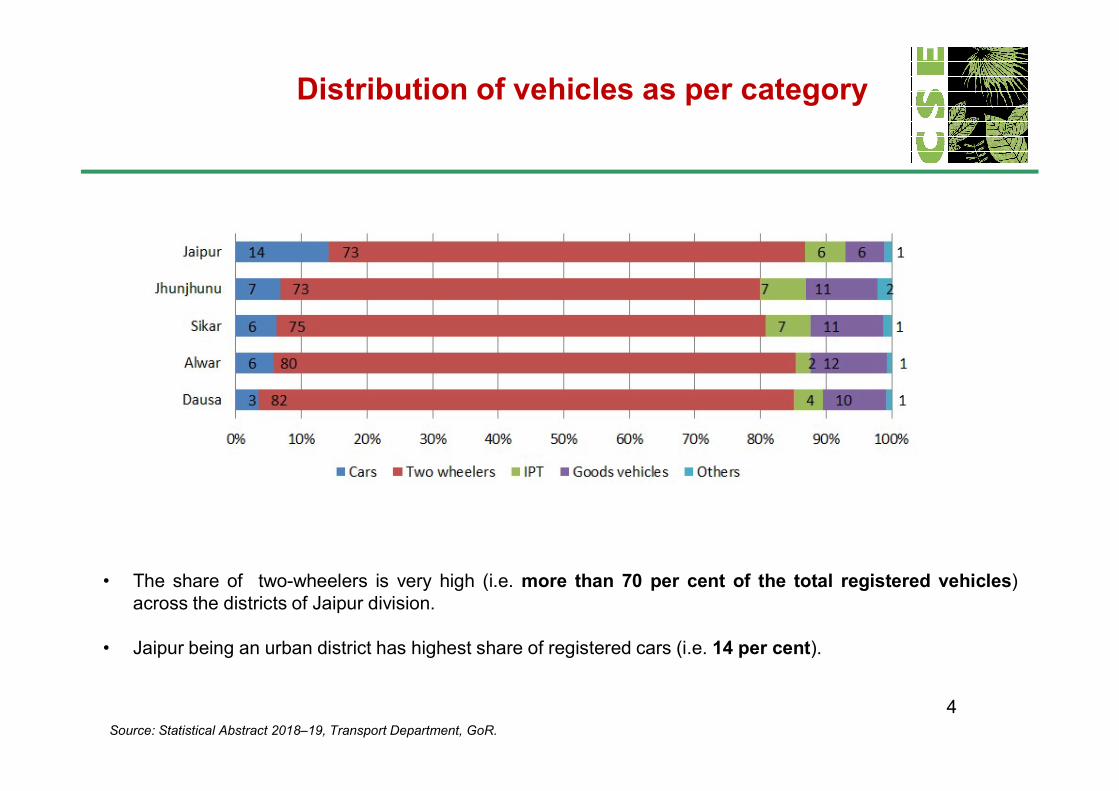
Distribution of vehicles as per category
4
• The share of two-wheelers is very high (i.e. more than 70 per cent of the total registered vehicles)across the districts of Jaipur division.
• Jaipur being an urban district has highest share of registered cars (i.e. 14 per cent).
Source: Statistical Abstract 2018–19, Transport Department, GoR.
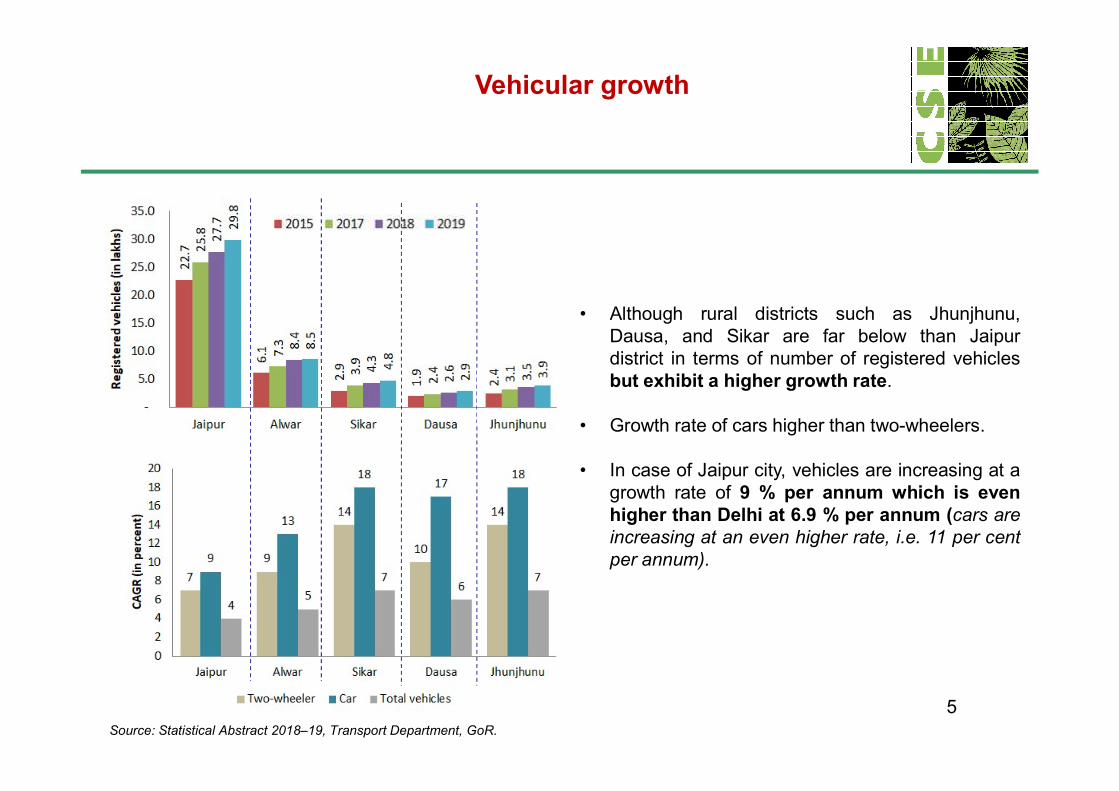
Vehicular growth
• Although rural districts such as Jhunjhunu,Dausa, and Sikar are far below than Jaipurdistrict in terms of number of registered vehiclesbut exhibit a higher growth rate.
5
• Growth rate of cars higher than two-wheelers.
• In case of Jaipur city, vehicles are increasing at agrowth rate of 9 % per annum which is evenhigher than Delhi at 6.9 % per annum (cars areincreasing at an even higher rate, i.e. 11 per centper annum).
Source: Statistical Abstract 2018–19, Transport Department, GoR.
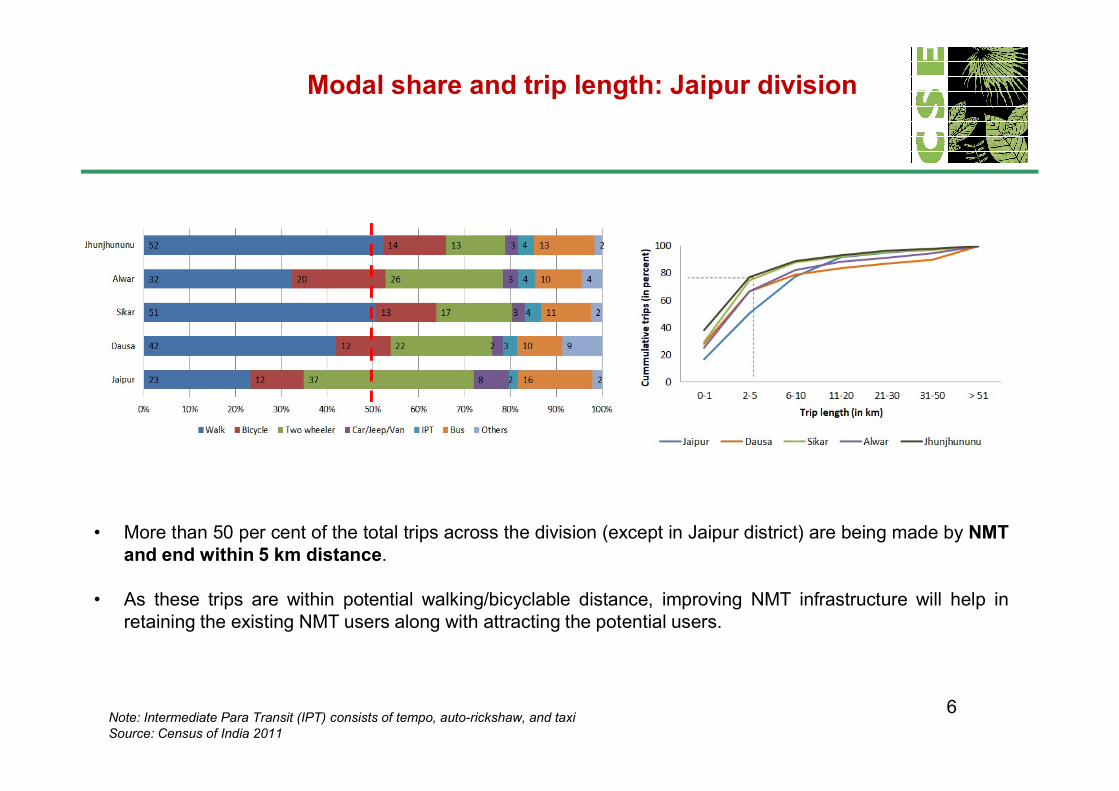
Modal share and trip length: Jaipur division
6Note: Intermediate Para Transit (IPT) consists of tempo, auto-rickshaw, and taxi Source: Census of India 2011
• More than 50 per cent of the total trips across the division (except in Jaipur district) are being made by NMTand end within 5 km distance.
• As these trips are within potential walking/bicyclable distance, improving NMT infrastructure will help inretaining the existing NMT users along with attracting the potential users.
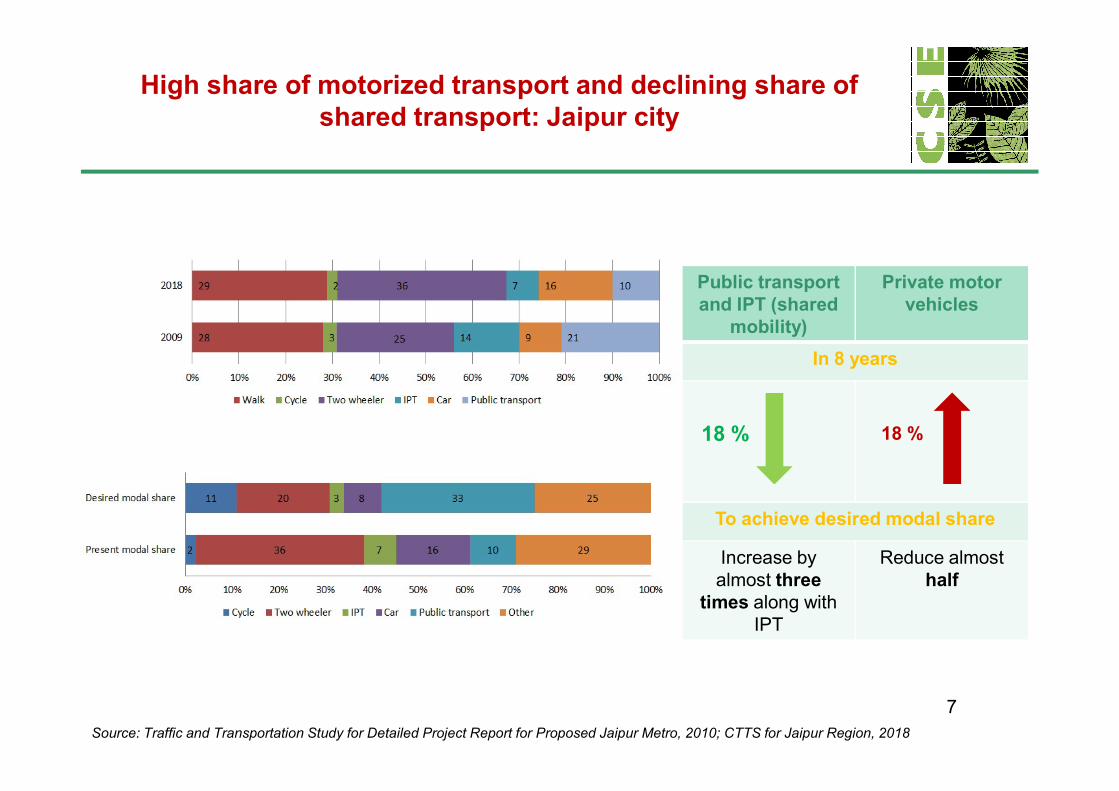
High share of motorized transport and declining share of shared transport: Jaipur city
Public transportand IPT (shared
mobility)
Private motorvehicles
In 8 years
7Source: Traffic and Transportation Study for Detailed Project Report for Proposed Jaipur Metro, 2010; CTTS for Jaipur Region, 2018
To achieve desired modal share
Increase by almost three
times along with IPT
Reduce almost half
18 % 18 %
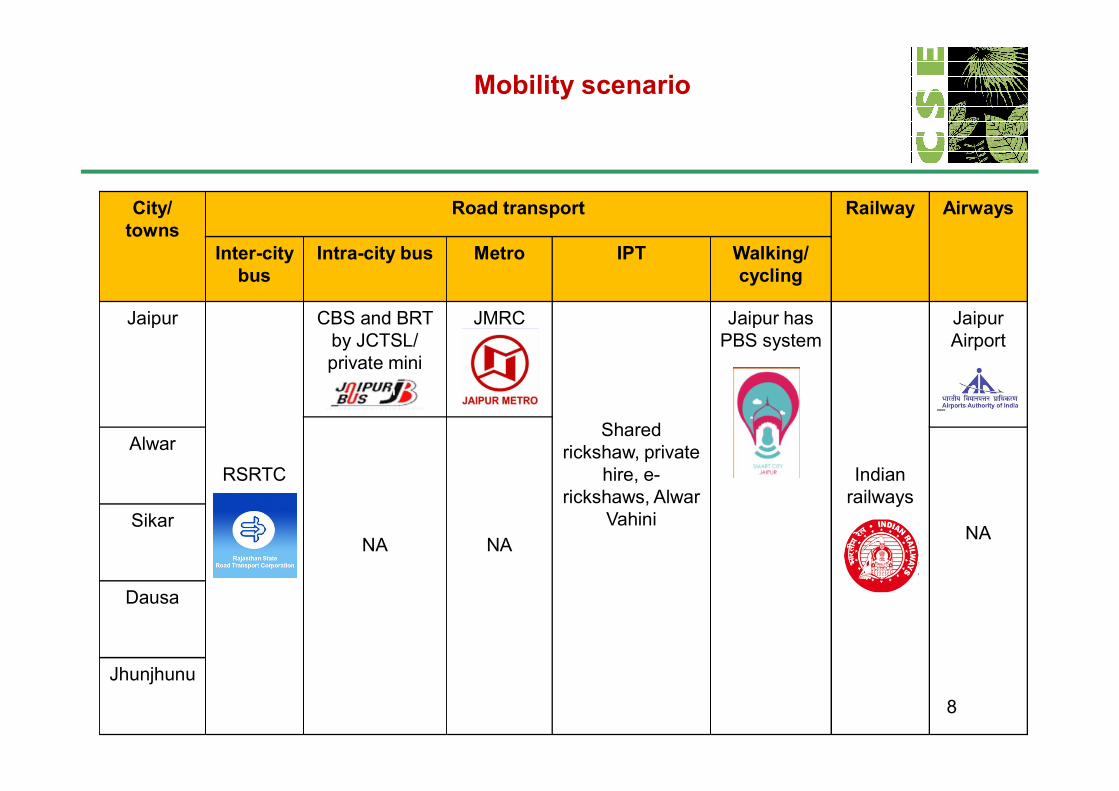
Mobility scenario
City/ towns
Road transport Railway Airways
Inter-citybus
Intra-city bus Metro IPT Walking/cycling
Jaipur CBS and BRT by JCTSL/ private mini
buses
JMRC Jaipur has PBS system
Jaipur Airport
8
RSRTC
buses
Shared rickshaw, private
hire, e-rickshaws, Alwar
Vahini
Indianrailways
NA NA
Alwar
NASikar
Dausa
Jhunjhunu
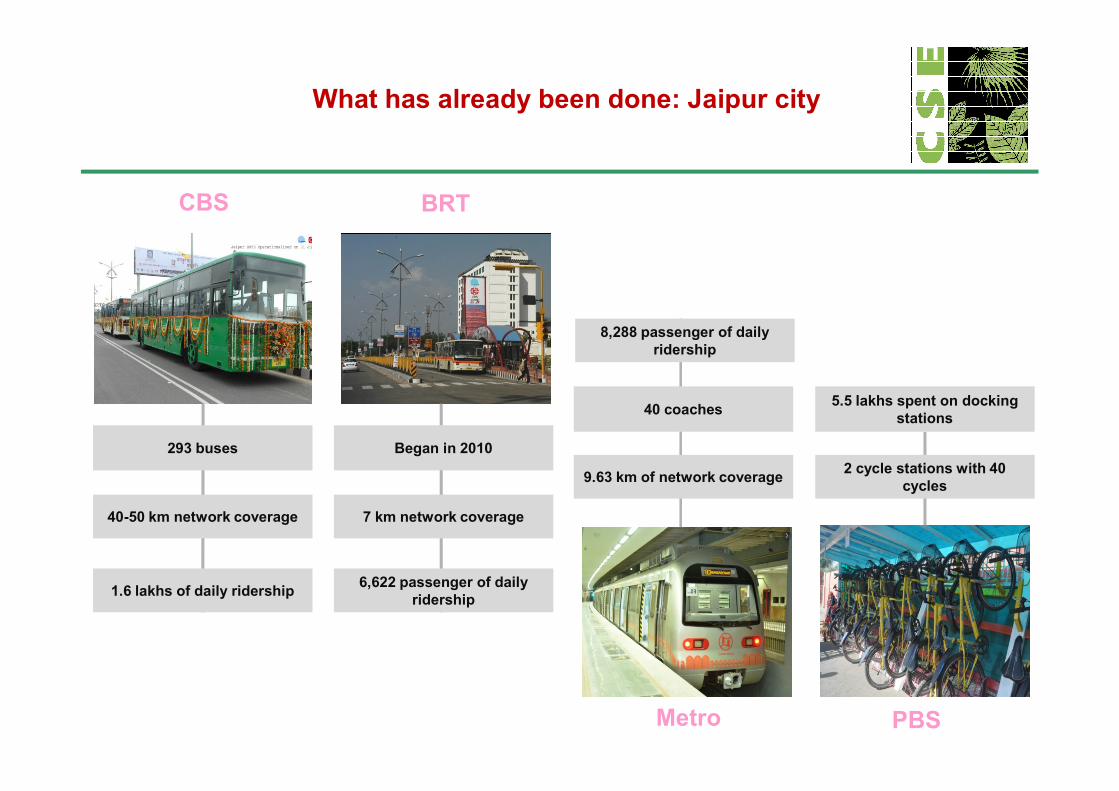
What has already been done: Jaipur city
8,288 passenger of daily ridership
5.5 lakhs spent on docking
CBS BRT
9
293 buses
40-50 km network coverage
1.6 lakhs of daily ridership
Began in 2010
7 km network coverage
6,622 passenger of daily ridership
40 coaches
9.63 km of network coverage
5.5 lakhs spent on docking stations
2 cycle stations with 40 cycles
Metro PBS
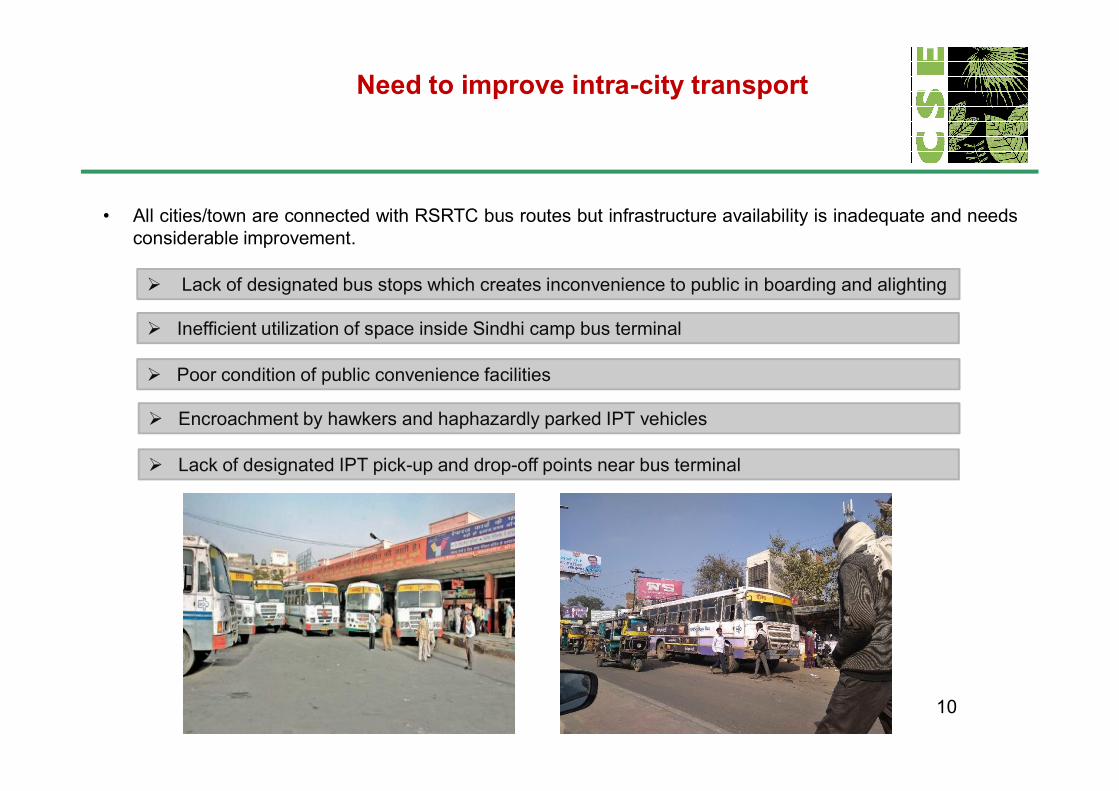
Need to improve intra-city transport
• All cities/town are connected with RSRTC bus routes but infrastructure availability is inadequate and needsconsiderable improvement.
Inefficient utilization of space inside Sindhi camp bus terminal
Poor condition of public convenience facilities
Lack of designated bus stops which creates inconvenience to public in boarding and alighting
10
Encroachment by hawkers and haphazardly parked IPT vehicles
Lack of designated IPT pick-up and drop-off points near bus terminal
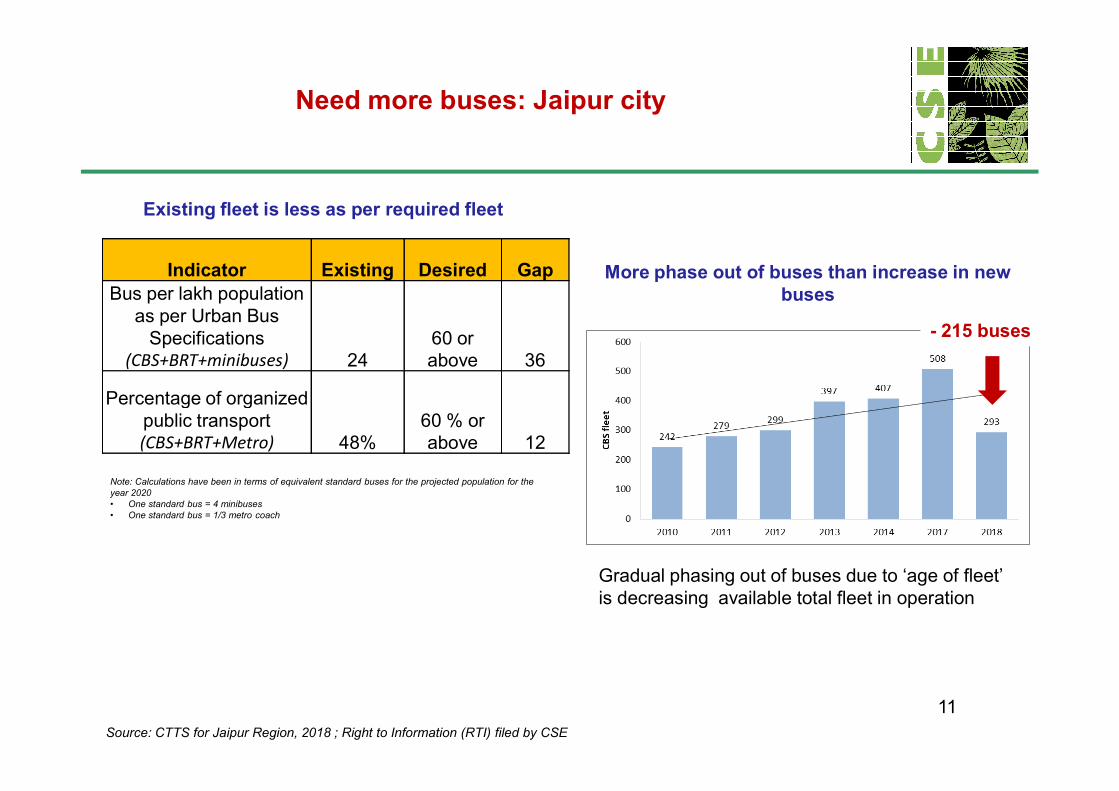
Indicator Existing Desired GapBus per lakh population
as per Urban Bus Specifications
(CBS+BRT+minibuses) 2460 or above 36
Percentage of organized
Existing fleet is less as per required fleet
- 215 buses
More phase out of buses than increase in new buses
Need more buses: Jaipur city
11
Note: Calculations have been in terms of equivalent standard buses for the projected population for the year 2020 • One standard bus = 4 minibuses• One standard bus = 1/3 metro coach
Percentage of organized public transport(CBS+BRT+Metro) 48%
60 % or above 12
Gradual phasing out of buses due to ‘age of fleet’ is decreasing available total fleet in operation
Source: CTTS for Jaipur Region, 2018 ; Right to Information (RTI) filed by CSE
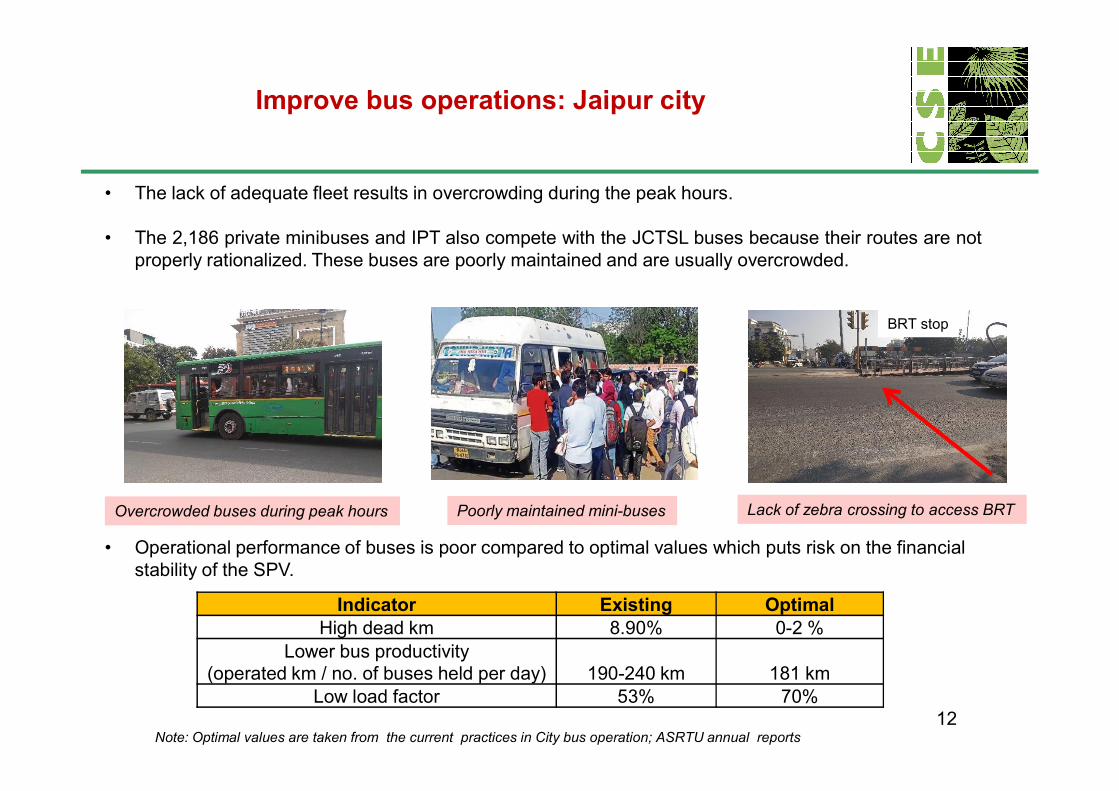
• The lack of adequate fleet results in overcrowding during the peak hours.
• The 2,186 private minibuses and IPT also compete with the JCTSL buses because their routes are notproperly rationalized. These buses are poorly maintained and are usually overcrowded.
BRT stop
Improve bus operations: Jaipur city
12
Indicator Existing OptimalHigh dead km 8.90% 0-2 %
Lower bus productivity (operated km / no. of buses held per day) 190-240 km 181 km
Low load factor 53% 70%
Note: Optimal values are taken from the current practices in City bus operation; ASRTU annual reports
• Operational performance of buses is poor compared to optimal values which puts risk on the financial stability of the SPV.
Overcrowded buses during peak hours Poorly maintained mini-buses Lack of zebra crossing to access BRT
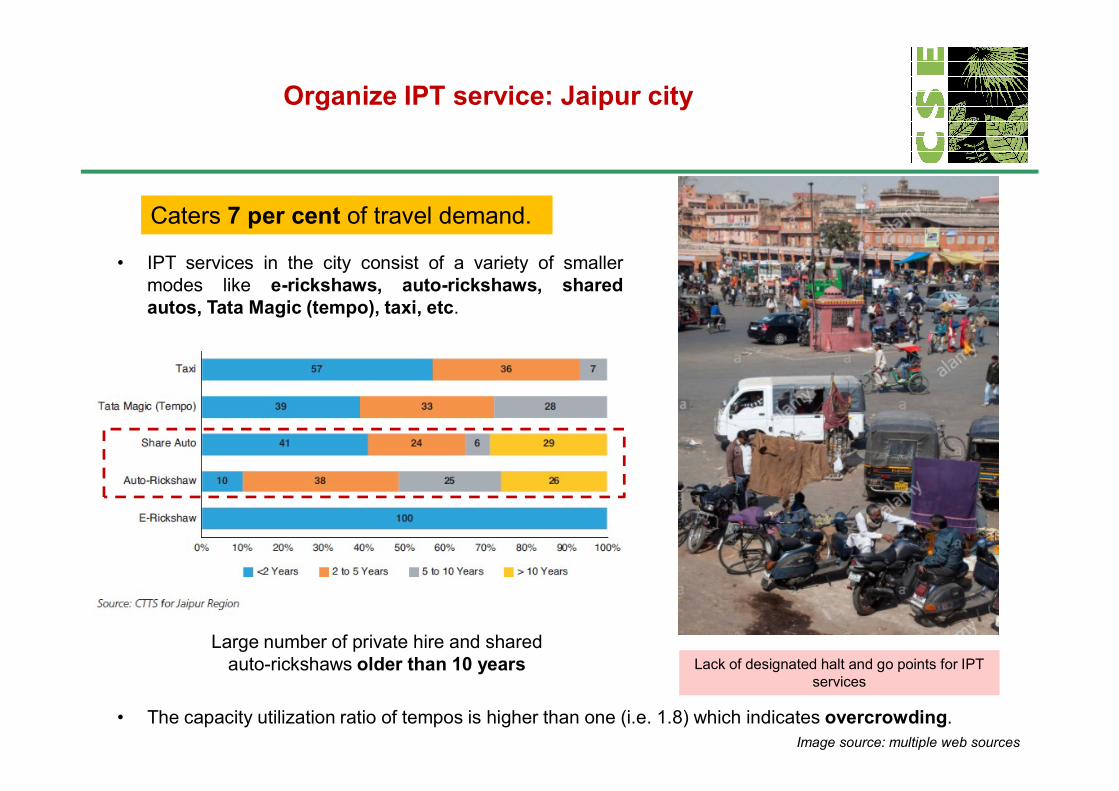
Organize IPT service: Jaipur city
• IPT services in the city consist of a variety of smallermodes like e-rickshaws, auto-rickshaws, sharedautos, Tata Magic (tempo), taxi, etc.
Caters 7 per cent of travel demand.
Large number of private hire and shared auto-rickshaws older than 10 years Lack of designated halt and go points for IPT
services
• The capacity utilization ratio of tempos is higher than one (i.e. 1.8) which indicates overcrowding.Image source: multiple web sources
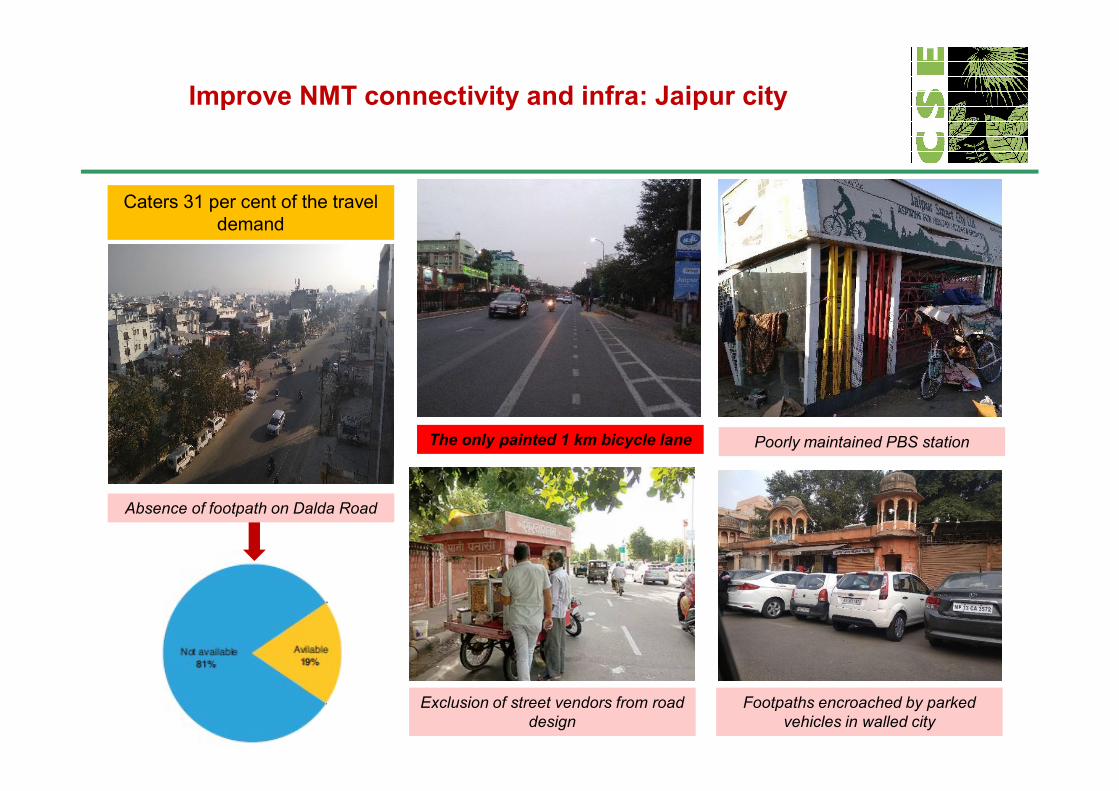
Improve NMT connectivity and infra: Jaipur city
Caters 31 per cent of the travel demand
14
Absence of footpath on Dalda Road
The only painted 1 km bicycle lane Poorly maintained PBS station
Exclusion of street vendors from road design
Footpaths encroached by parked vehicles in walled city
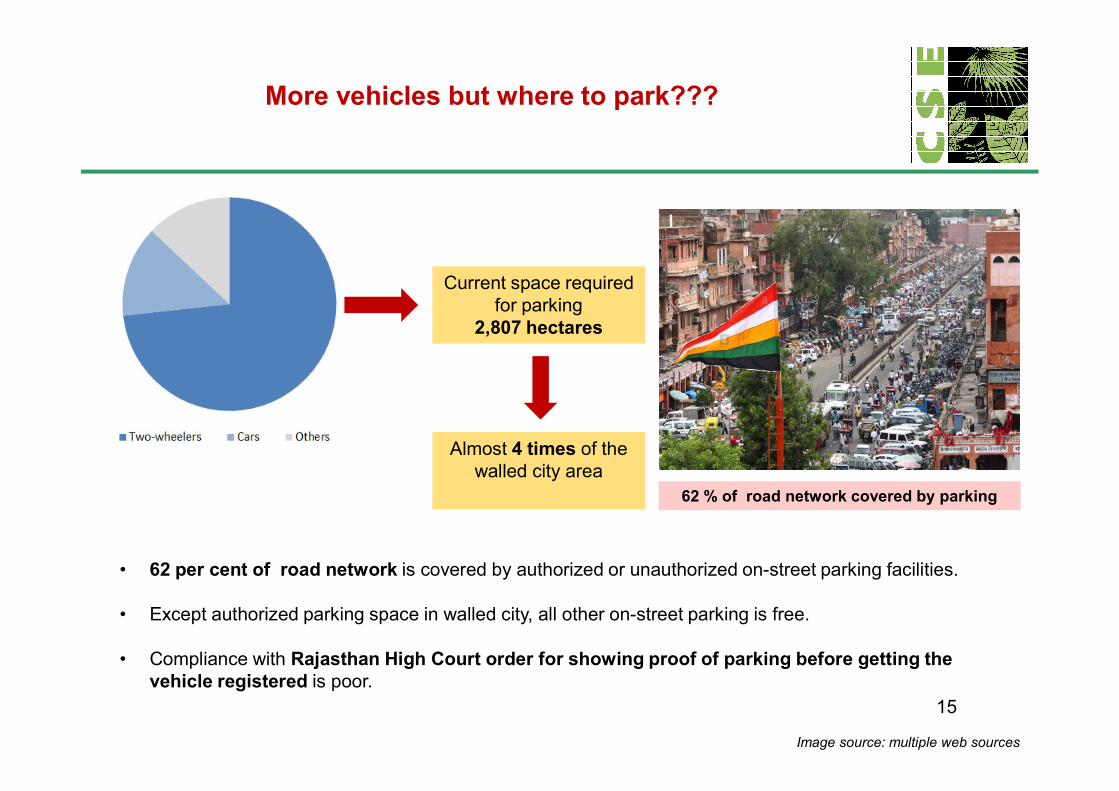
More vehicles but where to park???
Current space required for parking
2,807 hectares
15
• 62 per cent of road network is covered by authorized or unauthorized on-street parking facilities.
• Except authorized parking space in walled city, all other on-street parking is free.
• Compliance with Rajasthan High Court order for showing proof of parking before getting the vehicle registered is poor.
62 % of road network covered by parking
Image source: multiple web sources
Almost 4 times of the walled city area
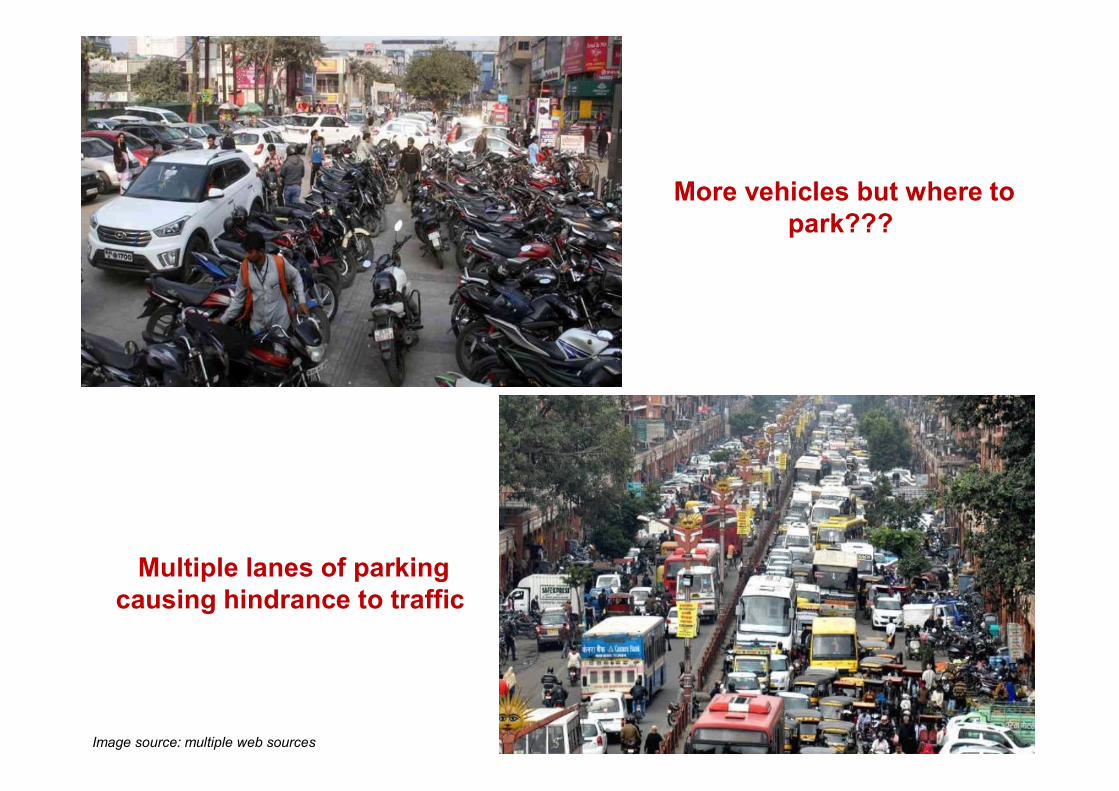
More vehicles but where to park???
16
Multiple lanes of parking causing hindrance to traffic
Image source: multiple web sources
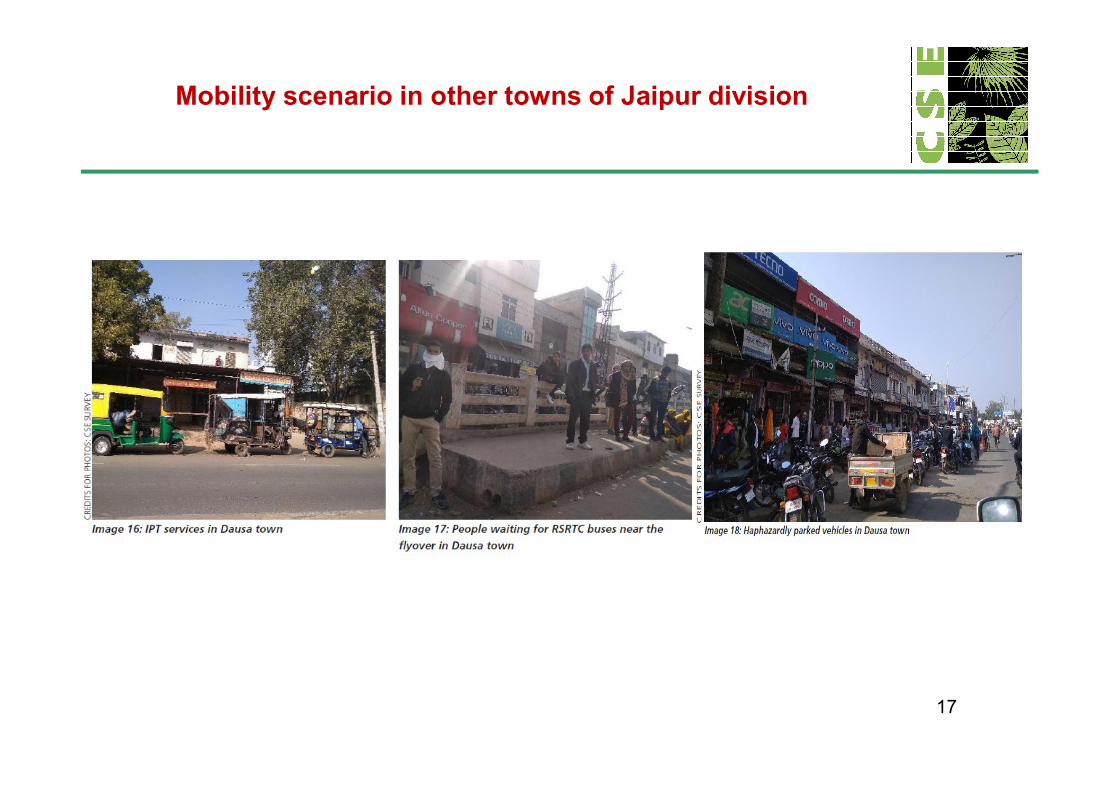
Mobility scenario in other towns of Jaipur division
17
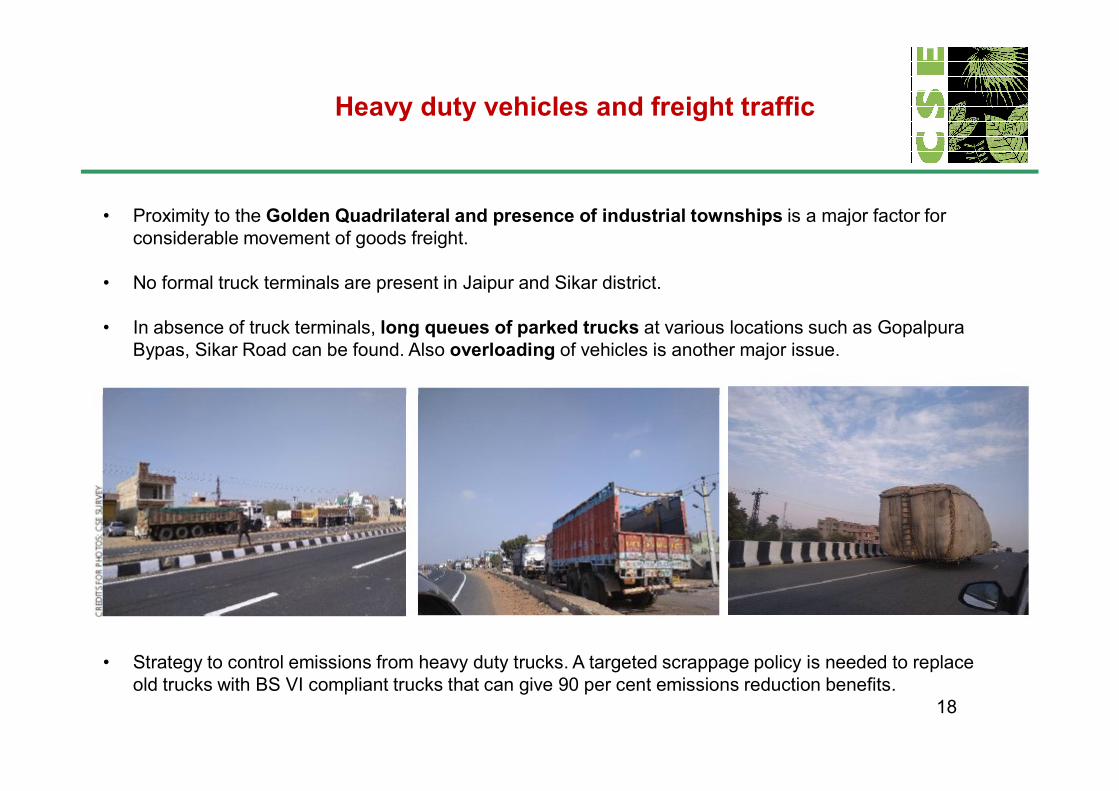
Heavy duty vehicles and freight traffic
• Proximity to the Golden Quadrilateral and presence of industrial townships is a major factor for considerable movement of goods freight.
• No formal truck terminals are present in Jaipur and Sikar district.
• In absence of truck terminals, long queues of parked trucks at various locations such as GopalpuraBypas, Sikar Road can be found. Also overloading of vehicles is another major issue.
18
• Strategy to control emissions from heavy duty trucks. A targeted scrappage policy is needed to replace old trucks with BS VI compliant trucks that can give 90 per cent emissions reduction benefits.
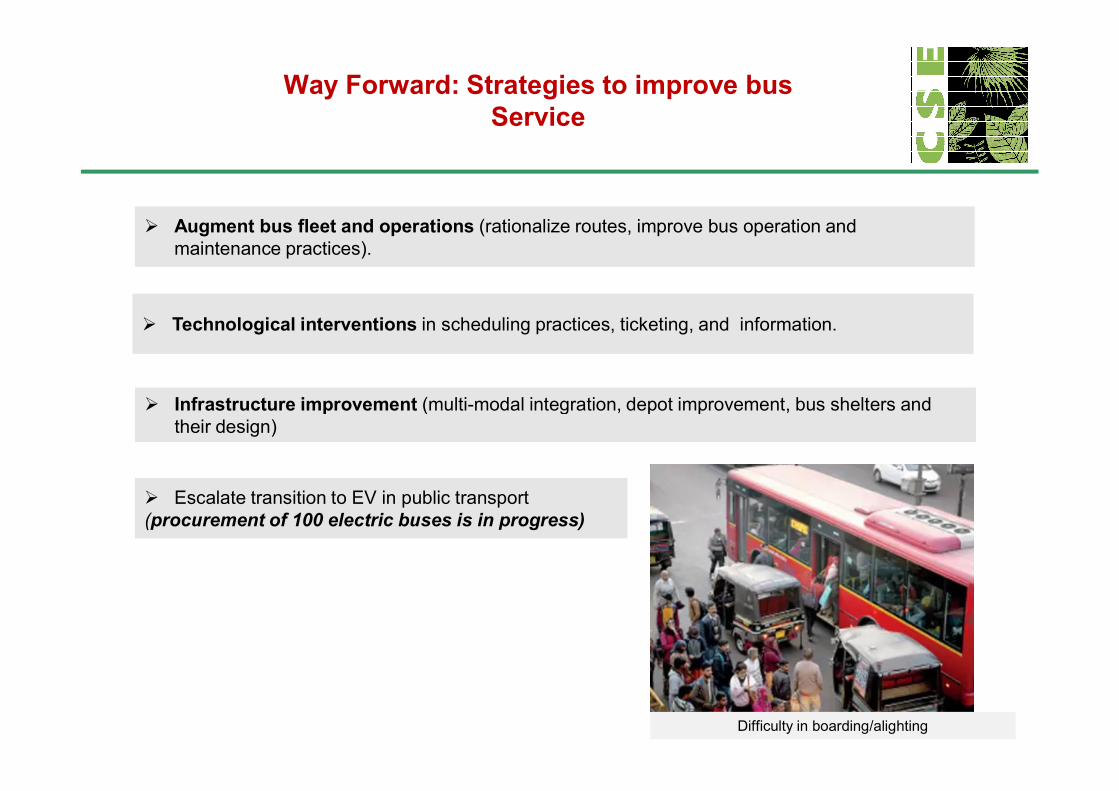
Way Forward: Strategies to improve bus Service
Augment bus fleet and operations (rationalize routes, improve bus operation and maintenance practices).
Infrastructure improvement (multi-modal integration, depot improvement, bus shelters and
Technological interventions in scheduling practices, ticketing, and information.
19
Infrastructure improvement (multi-modal integration, depot improvement, bus shelters and their design)
Escalate transition to EV in public transport (procurement of 100 electric buses is in progress)
Difficulty in boarding/alighting
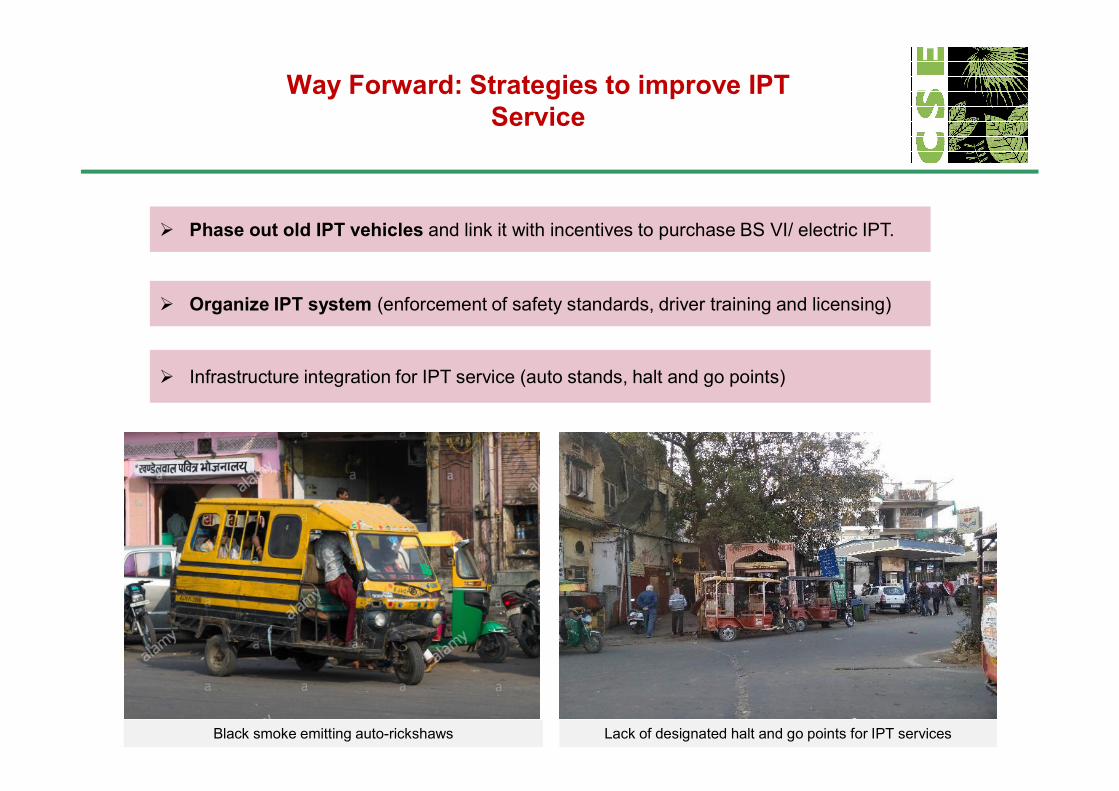
Way Forward: Strategies to improve IPT Service
Organize IPT system (enforcement of safety standards, driver training and licensing)
Infrastructure integration for IPT service (auto stands, halt and go points)
Phase out old IPT vehicles and link it with incentives to purchase BS VI/ electric IPT.
20Lack of designated halt and go points for IPT services Black smoke emitting auto-rickshaws
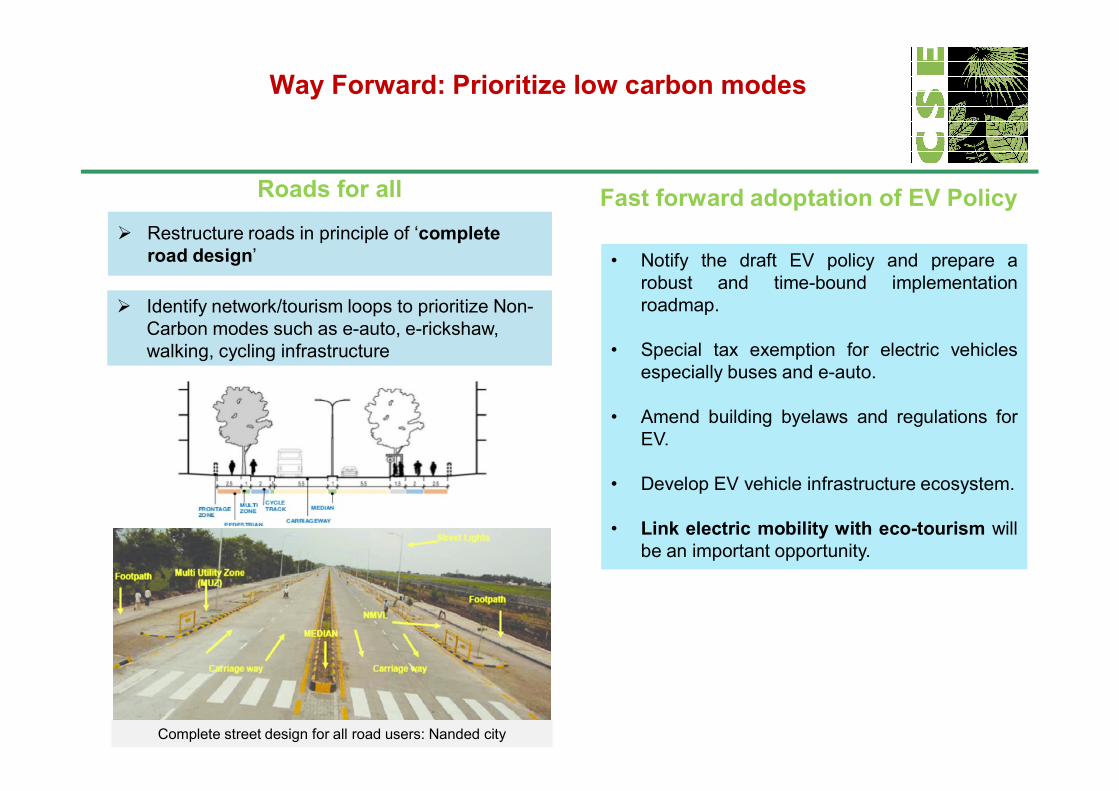
Way Forward: Prioritize low carbon modes
Identify network/tourism loops to prioritize Non-Carbon modes such as e-auto, e-rickshaw, walking, cycling infrastructure
Restructure roads in principle of ‘complete road design’ • Notify the draft EV policy and prepare a
robust and time-bound implementationroadmap.
• Special tax exemption for electric vehiclesespecially buses and e-auto.
Fast forward adoptation of EV PolicyRoads for all
• Amend building byelaws and regulations forEV.
• Develop EV vehicle infrastructure ecosystem.
• Link electric mobility with eco-tourism willbe an important opportunity.
Complete street design for all road users: Nanded city
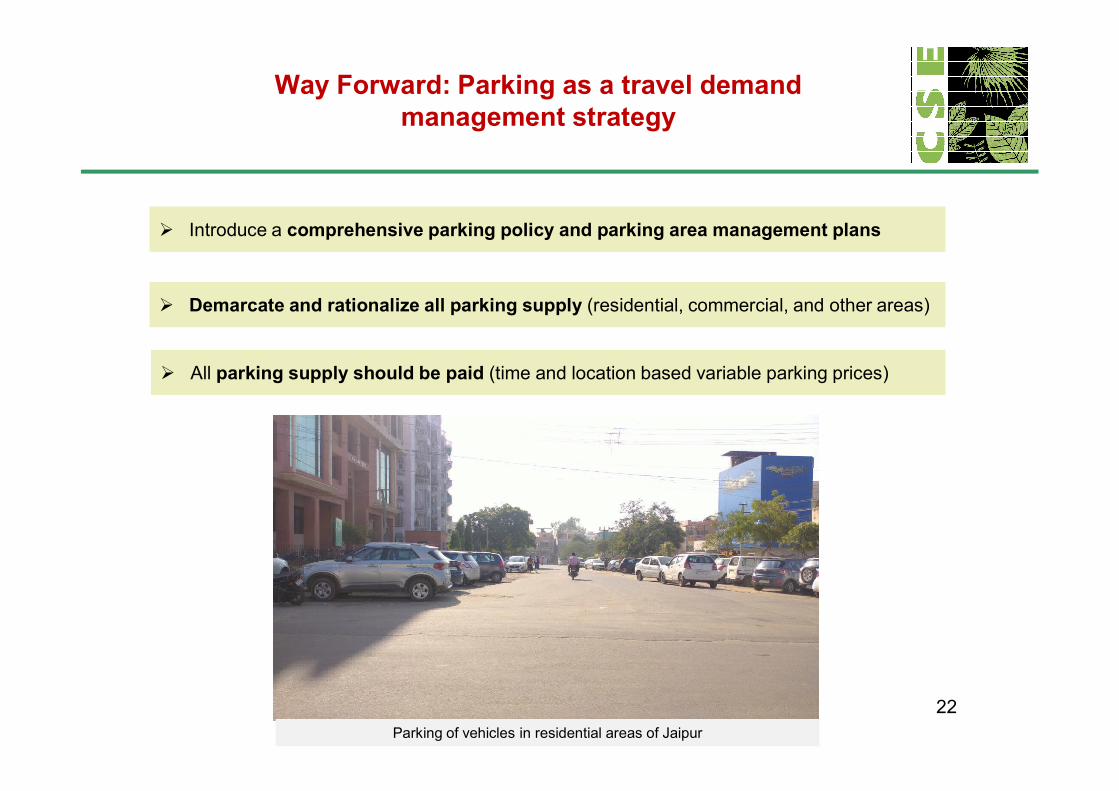
Way Forward: Parking as a travel demand management strategy
Introduce a comprehensive parking policy and parking area management plans
Demarcate and rationalize all parking supply (residential, commercial, and other areas)
All parking supply should be paid (time and location based variable parking prices)
22Parking of vehicles in residential areas of Jaipur

THANK YOU
23


