Embed Size (px)
Citation preview

Utility of multispectral imaging in automated quantitativescoring of immunohistochemistry
Christopher Fiore1,2, Dyane Bailey1,2, Niamh Conlon3, Xiaoqiu Wu1,2, Neil Martin4,Michelangelo Fiorentino1,2,5, Stephen Finn1,2,3, Katja Fall6,7, Swen-Olof Andersson7, OveAndren7, Massimo Loda1,2, and Richard Flavin1,2,3
1Center for Molecular Oncologic Pathology, Dana Farber Cancer Institute, Boston,Massachusetts, USA 2Brigham and Women’s Hospital, Harvard Medical School, Boston,Massachusetts, USA 3Department of Pathology, Trinity College, Dublin, Ireland 4Department ofRadiation Oncology, Harvard Radiation Oncology Program, Boston, Massachusetts, USA5Pathology Unit, Addarii Institute, S Orsola-Malpighi Hospital, Bologna, Italy 6School of Healthand Medical Sciences, Örebro University, Örebro, Sweden 7Harvard School of Public Health,Boston, MA, USA 8Department of Urology, Örebro University Hospital, Örebro, Sweden
AbstractBackground—Automated scanning devices and image analysis software provide a means toovercome the limitations of manual semiquantitative scoring of immunohistochemistry. Commondrawbacks to automated imaging systems include an inability to classify tissue type and aninability to segregate cytoplasmic and nuclear staining.
Methods—Immunohistochemistry for the membranous marker α-catenin, the cytoplasmicmarker stathmin and the nuclear marker Ki-67 was performed on tissue microarrays (TMA) ofarchival formalin-fixed paraffin-embedded tissue comprising 471 (α-catenin and stathmin) and511 (Ki-67) cases of prostate adenocarcinoma. These TMA were quantitatively analysed usingtwo commercially available automated image analysers, the Ariol SL-50 system and the Nuancesystem from CRi. Both systems use brightfield microscopy for automated, unbiased andstandardised quantification of immunohistochemistry, while the Nuance system has spectraldeconvolution capabilities.
Results—Overall concordance between scores from both systems was excellent (r=0.90; 0.83–0.95). The software associated with the multispectral imager allowed accurate automatedclassification of tissue type into epithelial glandular structures and stroma, and a single-stepsegmentation of staining into cytoplasmic or nuclear compartments allowing independentevaluation of these areas. The Nuance system, however, was not able to distinguish reliablybetween tumour and non-tumour tissue. In addition, variance in the labour and time required foranalysis between the two systems was also noted.
Conclusion—Despite limitations, this study suggests some beneficial role for the use of amultispectral imaging system in automated analysis of immunohistochemistry.
Correspondence to: Dr Richard Flavin, Department of Pathology, St James’s Hospital, James’s Street, Dublin 8, Ireland;[email protected].
Contributors CF collected and analysed data and wrote the paper; DB and XW performed the experiments; SF, MF, NC, NM, SOA,OA and KF collected and analysed data; ML and RF conceived the idea for the paper, provided guidance and helped write the paper.ML and RF are joint senior authors.
Competing interests None.
Provenance and peer review Not commissioned; externally peer reviewed.
NIH Public AccessAuthor ManuscriptJ Clin Pathol. Author manuscript; available in PMC 2012 September 10.
Published in final edited form as:J Clin Pathol. 2012 June ; 65(6): 496–502. doi:10.1136/jclinpath-2012-200734.
NIH
-PA Author Manuscript
NIH
-PA Author Manuscript
NIH
-PA Author Manuscript

Over the years, identifying tissue biomarkers has been the focus of a large body of researchto help classify cancers for diagnostic, prognostic and therapeutic purposes. This ability tosubclassify cancers is dependent on the means of quantifying the amount of biomarkerpresent in tissue. Immunohistochemistry is a technique frequently used to visualise proteinpresent in tissue. Traditionally, histopathologists have scored immunohistochemistrymanually; however, this can be labour and time intensive, semiquantitative and subject toobserver bias. Comparisons of scoring methods by different pathologists have shownrelatively accurate reproducibility of scores for the intensity of staining but a pronouncedlack of reliability for the extent of staining.1 Tissue microarrays (TMA) allowimmunohistochemical analysis of large numbers of tumour samples in a high-throughputmanner. Potentially up to 400 tissue cores representing more than 130 tumours in triplicatecan be placed onto one TMA block. While this allows for increased speed of analysis, it isstill inefficient when scored semiquantitatively by pathologists. In addition, it can also bedifficult to set an appropriate quantitative scale that can be accurately followed by theobserver.2 As such, automated scanning devices and image analysis software coupled withTMA may provide a means to overcome such limitations.3
Various methods of automated scoring of immunohistochemistry have proved to be aneffective substitute for manual scoring. The Ariol SL-50 system (Genetix, San Jose,California, USA) is a widely used platform for automated immunohistochemicalanalysis.2, 4, 5 Quantitative scores using this system show very good correlation withsemiquantitative manual scores in both small and large study cohorts, with comparablepatient outcome data generated from both systems of analysis.4–6 Furthermore, these andother studies have indicated that automated quantitative systems are an excellent substitutefor manual semiquantitative scoring by a pathologist.5, 7–9 Of importance, automationreduces the labour and time required to score immunohistochemically, and can also produceimprovements in scoring such as the reproducibility and reliability of the score for the totalarea of staining.1, 4 Indeed, automated systems may help lead to a standardised system ofimmunohistochemical scoring and reduce the dependence of scores on arbitrarythresholds.10
However, computational image analysis is not without problems. Tumour tissue may bequite heterogenous morphologically, comprising both epithelial and stromal compartments;this can be difficult to analyse consistently using existing computer software programs.Some tumours, such as prostatic adenocarcinoma, can cause special problems with analysisdue to the infiltrative nature of malignant glands among normal epithelial tissue andprostatic intra-epithelial neoplasia coexisting adjacent to invasive adenocarcinoma. Themajor limitation of some automated systems is an inability to classify the tissue typeautomatically. This necessitates manually marking tumour areas for analysis for each coreon a TMA. The software programs are also imperfect at segmenting tissue into nuclear andcytoplasmic areas, especially when there is strong intense immunohistochemical staining.Furthermore, there may be problems with colour pattern recognition. The AQUA system, afluorescence-based system with subcellular compartmentalisation capabilities, haspreviously been used to quantify biomarkers such as α-methylacyl coenzyme A racemaseand epidermal growth factor receptor specifically in tumours, but it typically requires theprocess of masking using other biomarkers, and may not work in all situations.2, 11 Inaddition and importantly, cytokeratins mask both normal and neoplastic epithelial tissues,without the capability of differentiating between these compartments. Software that couldautomate the process of tumour classification and improve tissue segmentation forquantitative scoring would mean significant progress for the analysis ofimmunohistochemistry. The commercially available Nuance system from CRi (Woburn,Massachusetts, USA) could potentially help fill this gap, as its multispectral capabilitieshave the ability to separate visual components to demarcate different cellular components.12
Fiore et al. Page 2
J Clin Pathol. Author manuscript; available in PMC 2012 September 10.
NIH
-PA Author Manuscript
NIH
-PA Author Manuscript
NIH
-PA Author Manuscript
In this study we show that automated quantitative analysis of immunohistochemistry onTMA using the Nuance system produces comparable results to the Ariol system.Furthermore, we demonstrate both the added advantages of a multispectral imager for suchimage analysis and also the potential shortcomings of such a system.
METHODSCase selection
As proof of principle we focused on cases of prostatic adenocarcinoma as these cancers tendto exhibit heterogeneity in terms of morphology. These samples were obtained from theSwedish Watchful Waiting Cohort, which consists of samples from a population-basedcohort of men with localised prostate cancer diagnosed incidentally by transurethralresection of the prostate for symptomatic benign prostatic hyperplasia, as previouslydescribed.13, 14 While these samples were collected and immunohistochemically stainedprimarily for parallel studies, we have used them to compare the image analysis systems as aproof of principle. A total of 571 and 411 cases was represented on five and six TMA fortwo cohorts, respectively (tables 1 and 2).
ImmunohistochemistryFour-micrometre sections of each TMA were cut and mounted on glass slides. For antigenunmasking, heat-mediated antigen retrieval was performed on deparaffinised sections bymicrowaving in citrate buffer (10 mmol/l sodium citrate buffer; pH 6.0) before incubationwith primary antibodies. Membranous marker α-catenin (mouse monoclonal; 25B1; Abcam,Cambridge, MA), cytoplasmic marker stathmin (rabbit polyclonal; Cell Signalling, Danvers,MA) and nuclear marker Ki-67 (rabbit polyclonal; Vectorlab, Burlingame, CA) proteinlevels were examined using dilutions of 1:200, 1:50 and 1:2000, respectively (figure 1). α-Catenin binds to β-catenin, links the E-cadherin complex to the actin cytoskeleton, andstabilises E-cadherin at the adherens junction.15, 16 In addition to its role in cell–celladhesion, α-catenin is also implicated in the regulation of cell proliferation.17–20 Themicrotubule-associated protein stathmin has been implicated as a putative marker of PI3Kpathway activation.21–23 Haematoxylin was used as a counterstain and diaminobenzadinewas used for the immunohistochemical stain. Antibody staining was performed using astreptavidin–horseradish peroxidase system (catalogue nos HK340-9K and HK330-9K;Biogenex, San Ramon, California, USA).
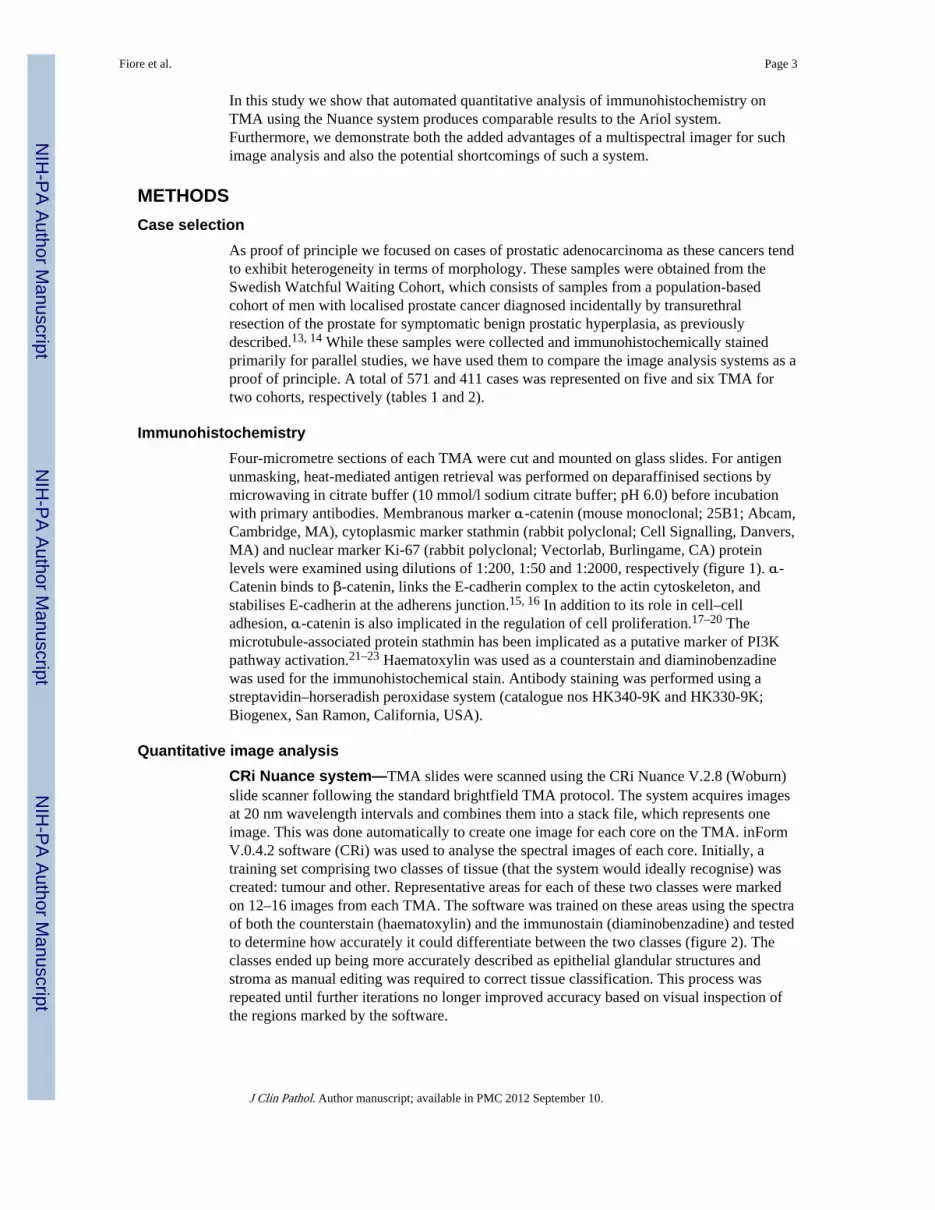
Quantitative image analysisCRi Nuance system—TMA slides were scanned using the CRi Nuance V.2.8 (Woburn)slide scanner following the standard brightfield TMA protocol. The system acquires imagesat 20 nm wavelength intervals and combines them into a stack file, which represents oneimage. This was done automatically to create one image for each core on the TMA. inFormV.0.4.2 software (CRi) was used to analyse the spectral images of each core. Initially, atraining set comprising two classes of tissue (that the system would ideally recognise) wascreated: tumour and other. Representative areas for each of these two classes were markedon 12–16 images from each TMA. The software was trained on these areas using the spectraof both the counterstain (haematoxylin) and the immunostain (diaminobenzadine) and testedto determine how accurately it could differentiate between the two classes (figure 2). Theclasses ended up being more accurately described as epithelial glandular structures andstroma as manual editing was required to correct tissue classification. This process wasrepeated until further iterations no longer improved accuracy based on visual inspection ofthe regions marked by the software.
Fiore et al. Page 3
J Clin Pathol. Author manuscript; available in PMC 2012 September 10.
NIH
-PA Author Manuscript
NIH
-PA Author Manuscript
NIH
-PA Author Manuscript

Histological images were then analysed using the nuclear or cytoplasmic algorithmdepending on the antibody. The multi-spectral imaging capabilities of the Nuance slidescanner allow the software to isolate or segment the nuclei using the unmixed spectra of thenuclear counterstain and the diaminobenzadine immunohistochemical stain used in additionfor a nuclear biomarker (figure 3). In turn, cytoplasm was found based on the non-nucleartumour area. The final score was based on the percentage of the cytoplasmic or nucleartumour area that was positively stained. A random sample of 30 cores per antibody(corresponding to 5.3% and 7.3% of the tissue cores in each cohort, respectively) werereviewed by study participants (CF, RF, MF) to ensure that assigned scores wereappropriate. Cores that were difficult to classify (due to technical artifacts such as folds inthe tissue, air bubbles, cores overlapping or due to difficulty in morphological classification)were either eliminated from the analysis or manually edited in order to categorise the tissueappropriately.
Ariol SL-50 system—Corresponding TMA were then scanned and quantitatively scoredusing the Ariol SL-50 system (Genetix). Scores were generated using the MultiStain assay,providing areas of staining per cell (Area_score), intensity of staining (Intensity_score), anda combination of the two to produce a logarithmic score with an approximately normaldistribution (Combination_score). Cytoplasmic and membranous staining was assumed to beproportional to the amount of staining in the whole cell, as these stains showed little non-specific intracellular staining. A Nuclear_score was also calculated based on the percentageof haematoxylin-stained nuclei recognised by the Ariol that were positive fordiaminobenzadine staining. Areas of tumour were manually identified with masking of thestroma and normal/benign glands from image analysis.
Time/labour analysisStudy participant (CF) estimated labour and computer time to scan and analyse the entireSwedish Watchful Waiting II Cohort corresponding to 1200 TMA cores for each stain.
Semiquantitative analysisAlthough human assessment of immunohistochemistry has its limitations it remains the goldstandard, so as proof of principle α-catenin was scored semiquantitatively, to allow forthree-way comparison of manually generated scores with those generated by the automatedimage analysis systems. One pathologist (NC, blinded to the original diagnosis) scored thesections independently. A modified visual semiquantification method was used using a one-score system for immunointensity as staining for α-catenin was homogenous. The semi-quantification for immunointensity was scored on a scale of: 0, negative; 1, weak; 2, strong.Scores from all cores from one case were averaged.
Statistical analysisCorrelation between inForm and Ariol scores and manual semiquantitative scores werecalculated using Spearman’s correlation coefficient with R V.2.7.0 (R Foundation forStatistical Computing, Vienna, Austria).
RESULTSMasking
The inForm software identified the tumour regions of the tissue with a high degree ofaccuracy (figure 3). There was, however, a number of cores that required manual editing ofthe tissue classification mask due to poor tissue quality, benign glands mixing withmalignant glands (figure 3), or simple mislabelling by the algorithm. These accounted for
Fiore et al. Page 4
J Clin Pathol. Author manuscript; available in PMC 2012 September 10.
NIH
-PA Author Manuscript
NIH
-PA Author Manuscript
NIH
-PA Author Manuscript

10.7% of α-catenin cores (data not shown). Manual editing of the cores was able to correcttissue classification for all downstream analysis. Nuclear and cytoplasmic classification bythe inForm software was also found to be accurate for the vast majority of cores analysed(figure 3).
Quantitative image analysisThe raw image analysis data are presented in figure 4. The correlation between inForm andAriol scores was dependent on the immunohistochemical stain and was high overall (table3). The overall correlation between the ranks of the cores using the inForm scores and theAriol scores for all stains was 0.877 (Spearman’s rank correlation; p<0.001).
Semiquantitative analysisConcordance between manual semiquantitative scores generated for α-catenin andquantitative scores generated by the CRi and Ariol systems was 0.591 (p<0.0001) and 0.589(p<0.0001), respectively (Spearman’s rank correlation; figure 5).
Time/labour analysisTwo and a half hours of human time and 15 h of computer time was required to scan andanalyse the Swedish Watchful Waiting II Cohort for each stain using the CRi Nuancesystem; 7.5 h of human time and 7.5 h of computer time was required to scan and analyseeach stain of the same cohort using the Ariol SL-50 system.
DISCUSSIONThe Ariol SL-50 system is an established tool for quantitatively scoringimmunohistochemistry on TMA.24–26 Here we show a strong concordance between scoresgenerated for cytoplasmic and nuclear immunohistochemistry from both the CRi Nuance V.2.8 scanner and the Ariol SL-50 system, illustrating the utility of the Nuance imager andinForm software for quantitatively scoring immunohistochemistry. Ki67 is the only stainthat did not have a correlation value above 0.9. It remains to be seen whether this representsa strong improvement or a drawback of the CRi system, as a very high concordance with theAriol does not necessarily represent total biological accuracy. The high correlation valuesseen for α-catenin for all three scores from the Ariol highlights the ability of the binningscore to reflect differences in intensity as well as the percentage of staining, simplifying thescoring of different stains. Furthermore, the good correlation between semiquantitativemanual scoring and the Ariol/CRi scores suggests that both systems perform equally well atrecapitulating human assessment.
The Nuance system has been used previously for multispectral imaging ofimmunohistochemistry on archival formalin-fixed, paraffin-embedded TMA specimens inorder to help distinguish cell types and to quantify tissue biomarkers.27–29 The inFormsoftware allows for the subclassification of tissues and stratification of cells into nuclear andcytoplasmic compartments in a single step. Other groups have used similar automatedmethods involving intensity thresholds to quantify staining with software from CRi.29
Indeed, inForm offers improvements in a number of areas over RGB (red, green, blue)systems such as the Ariol (box 1), probably reflecting the multispectral imaging capabilitiesof the Nuance scanner. For brightfield applications, the system collects images along thevisible light spectrum at a specified number of intervals (usually every 5–20 nm ofwavelength). It then compiles them into an image file, referred to as a cube, in which everypixel has a spectra associated with it. Spectra representing different chromogens areestablished and can be ‘unmixed’ so as to visualise their contributions to the image. Thisallows for specific colour recognition without the difficulty in deciphering between similar
Fiore et al. Page 5
J Clin Pathol. Author manuscript; available in PMC 2012 September 10.
NIH
-PA Author Manuscript
NIH
-PA Author Manuscript
NIH
-PA Author Manuscript

and overlapping chromogens.3 A similar approach is utilised for fluorescence-basedapproaches such as quantum dots.30 While we were unable to quantify any improvements inclassification, the unmixing of chromogens appears to remove background noise,contributing to a more accurate score. Furthermore, the ability to segment nuclear areas withunmixed chromogen spectra (even when diaminobenzadine masks some of the nuclearcounterstain) ensures that nuclear staining is not interrogated as cytoplasmic staining. Thereare, however, a number of disadvantages to the current CRi system. The major limitingfactor is the length of time required to scan individual slides: it takes approximately 30 s percore to scan (an average TMA contained 300–400 cores) following a set-up time ofapproximately 15–30 min per TMA. In addition, a batch process to analyse the entirety ofthe image set can take approximately 1 min for every five cores. In contrast, the Ariolsystem takes approximately 15 s to scan a core following a similar set-up time. Batchprocessing on the Ariol takes approximately 1 min per four to five cores. Ultimately, thisincreased time by the CRi system requires little to no human involvement, and the ability ofinForm to classify the tissue automatically can help relieve human labour considerably.
Box 1
List of advantages and disadvantages of the InForm software (CRi) incomparison with the Ariol SL-50 system
inForm advantages
• Specific colour recognition.
• Machine learning classification of stroma from epithelial tissue in prostate.
• Cell by cell information.
inForm disadvantages
• Lengthy scans.
• Difficulty with prostatic adenocarcinoma classification.
• Difficulty with variability in tissue appearance within a cohort.
In our study, as the number of TMA slides was relatively small, the time factor was not anoverwhelming issue; it may, however, become an issue for study sets containing largenumbers of slides on whole tissue sections. Another drawback of the current inFormsoftware is the inability to distinguish between tumour and benign epithelial glandularelements (it can, however, distinguish between stromal regions and tumour areas).Therefore, during the classification of cores that contain a heterogeneous mix of tissue, thesoftware may mark both tumour and benign prostate as tumour on automated classification,and thus require manual editing of the file to demarcate tumour regions. In this study, thenumber of cores that required editing varied based on the heterogeneity of cores in aparticular cohort and on the staining characteristics of both benign and malignant tissue. Theheterogeneity of tissue samples in different cohorts can cause other problems in the analysis.inForm uses ‘projects’ to help classify different tissues and to organise the analysis ofimages (it allows up to 16 images per training set per project); this usually equates with oneproject per immunostain and cohort. In some cohorts there is large variability in theappearance of the tissue, making it difficult for inForm to account for every general tissueappearance. This can lead to a number of cores being misclassified. Splitting up the cohortinto smaller projects can help with classification in these scenarios; this will lead toadditional set-up time and potentially could lead to scoring bias. Notably for both systems,pathologist input to delineate tumour and normal tissue is essential. While Ariol requiresmasking on each core to identify tumour, the inForm system can automatically identify
Fiore et al. Page 6
J Clin Pathol. Author manuscript; available in PMC 2012 September 10.
NIH
-PA Author Manuscript
NIH
-PA Author Manuscript
NIH
-PA Author Manuscript

glandular tissue that must then be differentiated from tumour manually. We show thatwhether performed manually for each core as with Ariol or following the recognition ofepithelial tissue as with inForm, high concordance rates between scores from the twodifferent systems and with semiquantitative manual scoring can be maintained.
In conclusion, this study suggests a beneficial role for the use of a multispectral imagingsystem in the automated analysis of immunohistochemistry, and highlights both the inherentadvantages and shortcomings of the system when compared with traditional automated andsemiquantitative analysis systems.
AcknowledgmentsThe authors would like to thank Edward Stack for his help in assembling images.
Funding ML is supported by the Prostate Cancer Foundation, the National Cancer Institute (RO1CA131945,PO1CA89021 and P50 CA90381), the Linda and Arthur Gelb Center for Translational Research and a gift fromNuclea Biomarkers to the Jimmy Fund and the Loda laboratory. ML is also the recipient of a grant from the DanaFarber Cancer Institute–Novartis Drug Development Program.
References1. Jaraj SJ, Camparo P, Boyle H, et al. Intra- and interobserver reproducibility of interpretation of
immunohistochemical stains of prostate cancer. Virchows Arch. 2009; 455:375–81. [PubMed:19760433]
2. Rubin MA, Zerkowski MP, Camp RL, et al. Quantitative determination of expression of the prostatecancer protein alpha-methylacyl-CoA racemase using automated quantitative analysis (AQUA): anovel paradigm for automated and continuous biomarker measurements. Am J Pathol. 2004;164:831–40. [PubMed: 14982837]
3. Taylor CR, Levenson RM. Quantification of immunohistochemistry – issues concerning methods,utility and semiquantitative assessment II. Histopathology. 2006; 49:411–24. [PubMed: 16978205]
4. Turbin DA, Leung S, Cheang MC, et al. Automated quantitative analysis of estrogen receptorexpression in breast carcinoma does not differ from expert pathologist scoring: a tissue microarraystudy of 3,484 cases. Breast Cancer Res Treat. 2008; 110:417–26. [PubMed: 17912629]
5. Gokhale S, Rosen D, Sneige N, et al. Assessment of two automated imaging systems in evaluatingestrogen receptor status in breast carcinoma. Appl Immunohistochem Mol Morphol. 2007; 15:451–5. [PubMed: 18091390]
6. Faratian D, Kay C, Robson T, et al. Automated image analysis for high-throughput quantitativedetection of ER and PR expression levels in large-scale clinical studies: the TEAM TrialExperience. Histopathology. 2009; 55:587–93. [PubMed: 19912364]
7. Sanders TH, Stokes TH, Moffitt RA, et al. Development of an automatic quantification method forcancer tissue microarray study. Conf Proc IEEE Eng Med Biol Soc. 2009; 2009:3665–8. [PubMed:19964806]
8. Masmoudi H, Hewitt SM, Petrick N, et al. Automated quantitative assessment of HER-2/neuimmunohistochemical expression in breast cancer. IEEE Trans Med Imaging. 2009; 28:916–25.[PubMed: 19164073]
9. Mulrane L, Rexhepaj E, Penney S, et al. Automated image analysis in histopathology: a valuabletool in medical diagnostics. Expert Rev Mol Diagn. 2008; 8:707–25. [PubMed: 18999923]
10. Walker RA. Quantification of immunohistochemistry – issues concerning methods, utility andsemiquantitative assessment I. Histopathology. 2006; 49:406–10. [PubMed: 16978204]
11. Psyrri A, Yu Z, Weinberger PM, et al. Quantitative determination of nuclear and cytoplasmicepidermal growth factor receptor expression in oropharyngeal squamous cell cancer by usingautomated quantitative analysis. Clin Cancer Res. 2005; 11:5856–62. [PubMed: 16115926]
12. Levenson RM, Fornari A, Loda M. Multispectral imaging and pathology: seeing and doing more.Expert Opin Med Diagn. 2008; 2:1067–81.
Fiore et al. Page 7
J Clin Pathol. Author manuscript; available in PMC 2012 September 10.
NIH
-PA Author Manuscript
NIH
-PA Author Manuscript
NIH
-PA Author Manuscript

13. Andrén O, Fall K, Franzén L, et al. How well does the Gleason score predict prostate cancer death?A 20-year followup of a population based cohort in Sweden. J Urol. 2006; 175:1337–40.[PubMed: 16515993]
14. Johansson JE, Andrén O, Andersson SO, et al. Natural history of early, localized prostate cancer.JAMA. 2004; 291:2713–19. [PubMed: 15187052]
15. Kobielak A, Fuchs E. Alpha-catenin: at the junction of intercellular adhesion and actin dynamics.Nat Rev Mol Cell Biol. 2004; 5:614–25. [PubMed: 15366705]
16. Scott JA, Yap AS. Cinderella no longer: alpha-catenin steps out of cadherin’s shadow. J Cell Sci.2006; 119:4599–605. [PubMed: 17093264]
17. Bullions LC, Notterman DA, Chung LS, et al. Expression of wild-type alpha-catenin protein incells with a mutant alpha-catenin gene restores both growth regulation and tumor suppressoractivities. Mol Cell Biol. 1997; 17:4501–8. [PubMed: 9234707]
18. Ewing CM, Ru N, Morton RA, et al. Chromosome 5 suppresses tumorigenicity of PC3 prostatecancer cells: correlation with re-expression of alpha-catenin and restoration of E-cadherinfunction. Cancer Res. 1995; 55:4813–17. [PubMed: 7585512]
19. Watabe M, Nagafuchi A, Tsukita S, et al. Induction of polarized cell–cell association andretardation of growth by activation of the E-cadherin-catenin adhesion system in a dispersedcarcinoma line. J Cell Biol. 1994; 127:247–56. [PubMed: 7929567]
20. Matsubara S, Ozawa M. Expression of alpha-catenin in alpha-catenin-deficient cells results in areduced proliferation in three-dimensional multicellular spheroids but not in two-dimensionalmonolayer cultures. Oncogene. 2004; 23:2694–702. [PubMed: 14755240]
21. Stolarov J, Chang K, Reiner A, et al. Design of a retroviral-mediated ecdysone-inducible systemand its application to the expression profiling of the PTEN tumor suppressor. Proc Natl Acad SciU S A. 2001; 98:13043–8. [PubMed: 11687610]
22. Yu YP, Landsittel D, Jing L, et al. Gene expression alterations in prostate cancer predicting tumoraggression and preceding development of malignancy. J Clin Oncol. 2004; 22:2790–9. [PubMed:15254046]
23. Saal LH, Johansson P, Holm K, et al. Poor prognosis in carcinoma is associated with a geneexpression signature of aberrant PTEN tumor suppressor pathway activity. Proc Natl Acad Sci U SA. 2007; 104:7564–9. [PubMed: 17452630]
24. Fiorentino M, Zadra G, Palescandolo E, et al. Overexpression of fatty acid synthase is associatedwith palmitoylation of Wnt1 and cytoplasmic stabilization of beta-catenin in prostate cancer. LabInvest. 2008; 88:1340–8. [PubMed: 18838960]
25. Kleiner HE, Krishnan P, Tubbs J, et al. Tissue microarray analysis of eIF4E and its downstreameffector proteins in human breast cancer. J Exp Clin Cancer Res. 2009; 28:5. [PubMed: 19134194]
26. Turashvili G, Leung S, Turbin D, et al. Inter-observer reproducibility of HER2immunohistochemical assessment and concordance with fluorescent in situ hybridization (FISH):pathologist assessment compared to quantitative image analysis. BMC cancer. 2009; 9:165.[PubMed: 19476653]
27. Xu X, Gimotty PA, Guerry D, et al. Lymphatic invasion revealed by multispectral imaging iscommon in primary melanomas and associates with prognosis. Hum Pathol. 2008; 39:901–9.[PubMed: 18440591]
28. O’Donnell RK, Feldman M, Mick R, et al. Immunohistochemical method identifieslymphovascular invasion in a majority of oral squamous cell carcinomas and discriminatesbetween blood and lymphatic vessel invasion. J Histochem Cytochem. 2008; 56:803–10.[PubMed: 18505934]
29. Mansoor I, Zalles C, Zahid F, et al. Fine-needle aspiration of follicular adenoma versus parathyroidadenoma: the utility of multispectral imaging in differentiating lesions with subtlecytomorphologic differences. Cancer. 2008; 114:22–6. [PubMed: 18085636]
30. Snyder EL, Sandstrom DJ, Law K, et al. c-Jun amplification and overexpression are oncogenic inliposarcoma but not always sufficient to inhibit the adipocytic differentiation programme. J Pathol.2009; 218:292–300. [PubMed: 19449367]
Fiore et al. Page 8
J Clin Pathol. Author manuscript; available in PMC 2012 September 10.
NIH
-PA Author Manuscript
NIH
-PA Author Manuscript
NIH
-PA Author Manuscript

Take-home messages
• The Nuance system from CRi allows for automated analysis ofimmunohistochemistry using multispectral imaging.
• The scores from the Nuance system and Ariol system are highly correlated, butdifferences in specific instances could point to functional biology and/ordrawbacks in the individual systems.
• There are many factors to consider when choosing an automated scoring system,such as time, labour, reliability and simplicity.
Fiore et al. Page 9
J Clin Pathol. Author manuscript; available in PMC 2012 September 10.
NIH
-PA Author Manuscript
NIH
-PA Author Manuscript
NIH
-PA Author Manuscript

Figure 1.Immunohistochemical staining (×20) of prostate adenocarcinoma for membranous markerα-catenin (A), nuclear marker Ki-67 (B) and cytoplasmic marker stathmin (C).
Fiore et al. Page 10
J Clin Pathol. Author manuscript; available in PMC 2012 September 10.
NIH
-PA Author Manuscript
NIH
-PA Author Manuscript
NIH
-PA Author Manuscript
Figure 2.Tissue segmentation: comparison of a raw image (left) with one with tissue classificationusing inForm (right) for immunohistochemically stained tissue for α-catenin (A) andstathmin (B).
Fiore et al. Page 11
J Clin Pathol. Author manuscript; available in PMC 2012 September 10.
NIH
-PA Author Manuscript
NIH
-PA Author Manuscript
NIH
-PA Author Manuscript

Figure 3.Cell segmentation: inForm classified the nuclei of tissue stained with nuclear marker Ki67—raw image (A) with the classified image (B). The nuclear classification is outlined.
Fiore et al. Page 12
J Clin Pathol. Author manuscript; available in PMC 2012 September 10.
NIH
-PA Author Manuscript
NIH
-PA Author Manuscript
NIH
-PA Author Manuscript

Figure 4.Concordance between immunohistochemical scores generated for each tissue sample byquantitative image analysis using the CRi system and the Ariol system, shown as dotplotsfor α-catenin (A), stathmin (B) and Ki67 (C). For Ki67, both distributions show a strongclustering at the low end of the spectrum, and a low number of cases with high scores. Basedon this, the samples with a score in the 80% percentile were calculated, and found to overlapwith a rate of 0.6824 (those cases positive in one that are also positive in the other: 116/170).The overlap is 0.6486 for the averaged samples (48/74).
Fiore et al. Page 13
J Clin Pathol. Author manuscript; available in PMC 2012 September 10.
NIH
-PA Author Manuscript
NIH
-PA Author Manuscript
NIH
-PA Author Manuscript

Figure 5.Concordance between immunohistchemical scores generated for Ki67-stained tissue usingthe CRi system and semiquantitative scores by a pathologist, shown as a dotplot. Theconcordance between the two scores is good (Spearman’s rank correlation 0.591).
Fiore et al. Page 14
J Clin Pathol. Author manuscript; available in PMC 2012 September 10.
NIH
-PA Author Manuscript
NIH
-PA Author Manuscript
NIH
-PA Author Manuscript

NIH
-PA Author Manuscript
NIH
-PA Author Manuscript
NIH
-PA Author Manuscript
Fiore et al. Page 15
Table 1
Study cohort characteristics (Swedish Watchful Waiting Cohort I: stained for stathmin and Ki67)
No of patients 571
Mean age, years
Age at diagnosis 73.08 (51–91)
Gleason score n (%)
4 9 (1.6)
5 14 (2.5)
6 224 (39.2)
7 203 (35.6)
8 53 (9.3)
9 59 (10.3)
10 9 (1.6)
% Chips with cancer
<5 191 (33.5)
5–25 240 (42.0)
26–50 63 (11.0)
>50 77 (13.5)
t-Stage
T1a 191 (33.5)
T1b 380 (66.6)
Cause of death
PC death 102 (17.9)
Non-PC death 346 (60.6)
Still alive 73 (12.8)
PC, prostate cancer.
J Clin Pathol. Author manuscript; available in PMC 2012 September 10.

NIH
-PA Author Manuscript
NIH
-PA Author Manuscript
NIH
-PA Author Manuscript
Fiore et al. Page 16
Table 2
Study cohort characteristics (Swedish Watchful Waiting Cohort II: stained for α-catenin)
No of patients 411
Mean age, years
Age at diagnosis 73.93 (51–91)
Gleason score n (%)
4 5 (1.6)
5 14 (2.5)
6 104 (39.2)
7 185 (35.6)
8 47 (9.3)
9 53 (10.3)
10 3 (1.6)
% Chips with cancer
<5 74 (18.0)
5–25 197 (47.9)
26–50 63 (15.3)
>50 77 (18.7)
t-Stage
T1a 74 (18.0)
T1b 337 (82.0)
Cause of death
PC death 72 (17.5)
Non-PC death 272 (66.2)
Still alive 67 (16.3)
PC, prostate cancer.
J Clin Pathol. Author manuscript; available in PMC 2012 September 10.

NIH
-PA Author Manuscript
NIH
-PA Author Manuscript
NIH
-PA Author Manuscript
Fiore et al. Page 17
Tabl
e 3
Spea
rman
cor
rela
tion
coef
fici
ents
bet
wee
n in
Form
bin
ning
sco
res
and
Ari
ol s
core
s (m
ean
inte
nsity
, are
a an
d co
mbi
natio
n sc
ore)
Coh
ort
Imm
unoh
isto
chem
ical
sta
inD
ata
NIn
tens
ity
scor
eA
rea/
nucl
ear
scor
eC
ombi
nati
on s
core
Swed
ish
IIα
-cat
enin
Sam
ples
542
0.83
0.92
90.
932
Swed
ish
IIα
-cat
enin
Tum
our
core
s11
230.
821
0.95
30.
954
Swed
ish
IK
i-67
Sam
ples
371
0.49
0.67
20.
672
Swed
ish
IK
i-67
Tum
our
core
s85
10.
424
0.65
90.
657
Swed
ish
ISt
athm
inSa
mpl
es23
80.
461
0.93
40.
933
Swed
ish
ISt
athm
inT
umou
r co
res
583
0.43
70.
929
0.92
8
Not
e: s
ampl
e da
ta w
ere
gene
rate
d by
taki
ng th
e m
ean
scor
e fr
om a
ll th
ree
core
s fo
r ea
ch s
ampl
e.
All
corr
elat
ion
valu
es w
ere
sign
ific
ant w
ith a
p v
alue
<2.
2×10
−16
.
J Clin Pathol. Author manuscript; available in PMC 2012 September 10.