Embed Size (px)
Citation preview
Using the GCE Data Toolbox to automate
environmental data processing and produce EML-described data packages for the EDI repository
Wade Sheldon
Georgia Coastal Ecosystems LTER
Background
The GCE Data Toolbox is unique in several ways
Software optimized for LTER-scale, end-to-end environmental Data Management
Rare example of LTER site-developed CI released as community tool
Multiple modes of operation – automated workflows to PI/student use
Unusually long history – 18 years of production use and development
Webinar Overview
Short history of motivation and development process
Walk-through of key features for data processing, Q/C, publishing
Implementation and support resources
Quick demo of importing, checking, publishing as EML data package
Motivation
Georgia Coastal Ecosystems LTER started in 2000
Large data collection effort planned (cruises, sensors, lab analyses, marsh surveys, …)
Minimal IM staff (0.75 FTE for ALL IT/IM support)
Needed to standardize and automate tabular data processing, quality control, documentation
No ready-to-use software for LTER data management
Lots of great papers and reports, no tools to download
Relational databases emerging – site-specific, complex, require network
Developed custom data management framework in MATLAB
Benefits
Experienced using MATLAB for automating data processing, GUIs
Broadly used at GCE – better code-reuse potential than database/web solution
Cross platform code and data (Windows, Mac, Linux)
Good scalability
Costs
Commercial licensed source, limiting distribution (but often site-licensed)
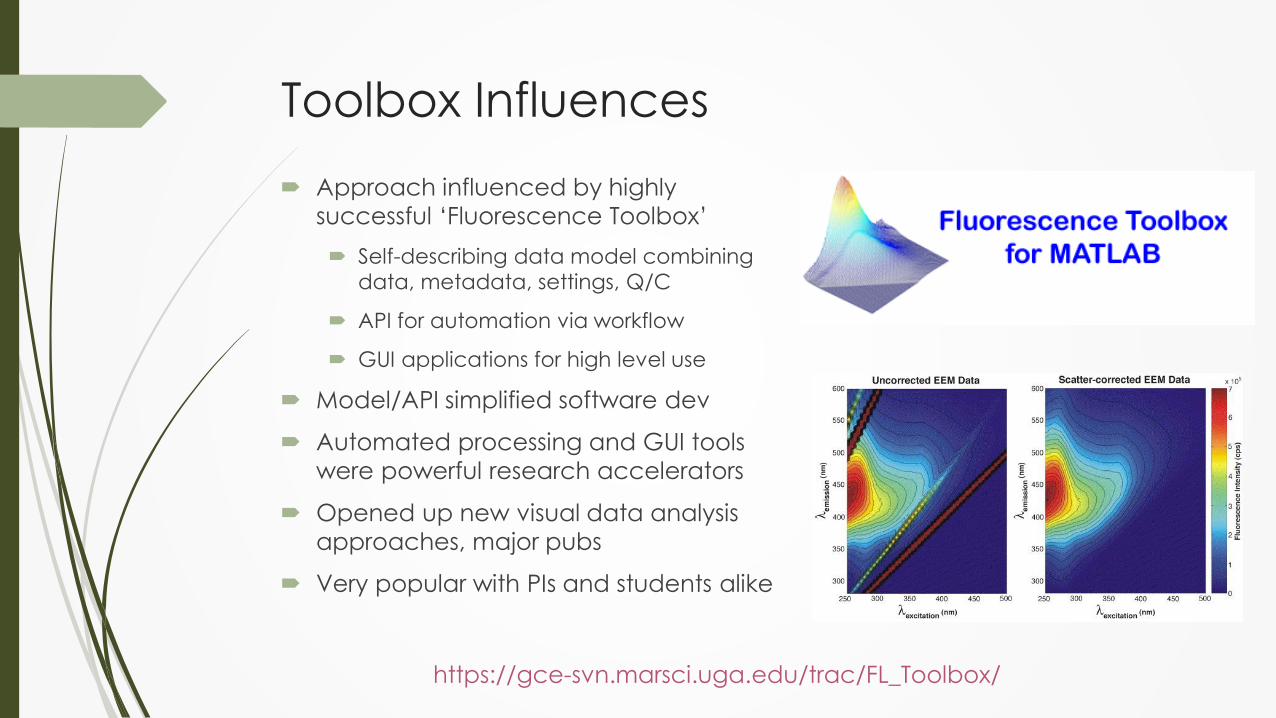
Toolbox Influences
Approach influenced by highly
successful ‘Fluorescence Toolbox’
Self-describing data model combining
data, metadata, settings, Q/C
API for automation via workflow
GUI applications for high level use
Model/API simplified software dev
Automated processing and GUI tools
were powerful research accelerators
Opened up new visual data analysis
approaches, major pubs
Very popular with PIs and students alike
https://gce-svn.marsci.uga.edu/trac/FL_Toolbox/
Toolbox Development
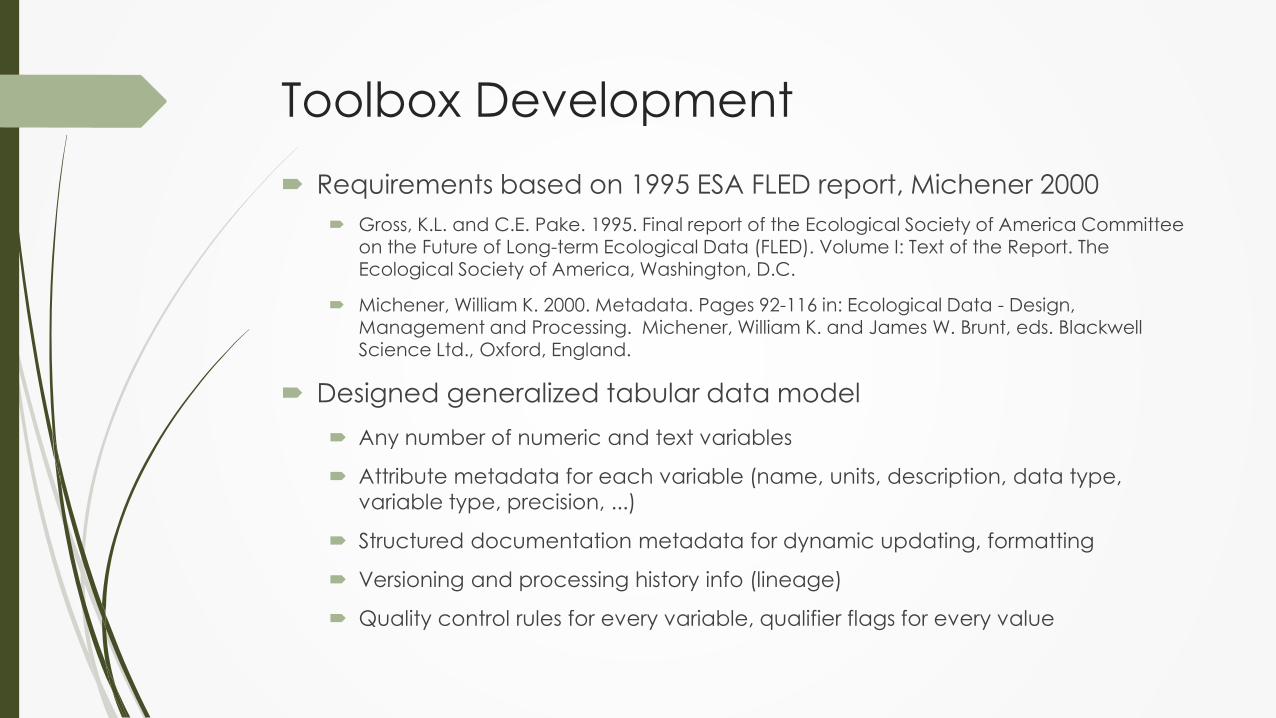
Requirements based on 1995 ESA FLED report, Michener 2000
Gross, K.L. and C.E. Pake. 1995. Final report of the Ecological Society of America Committee on the Future of Long-term Ecological Data (FLED). Volume I: Text of the Report. The Ecological Society of America, Washington, D.C.
Michener, William K. 2000. Metadata. Pages 92-116 in: Ecological Data - Design, Management and Processing. Michener, William K. and James W. Brunt, eds. Blackwell Science Ltd., Oxford, England.
Designed generalized tabular data model
Any number of numeric and text variables
Attribute metadata for each variable (name, units, description, data type,
variable type, precision, ...)
Structured documentation metadata for dynamic updating, formatting
Versioning and processing history info (lineage)
Quality control rules for every variable, qualifier flags for every value
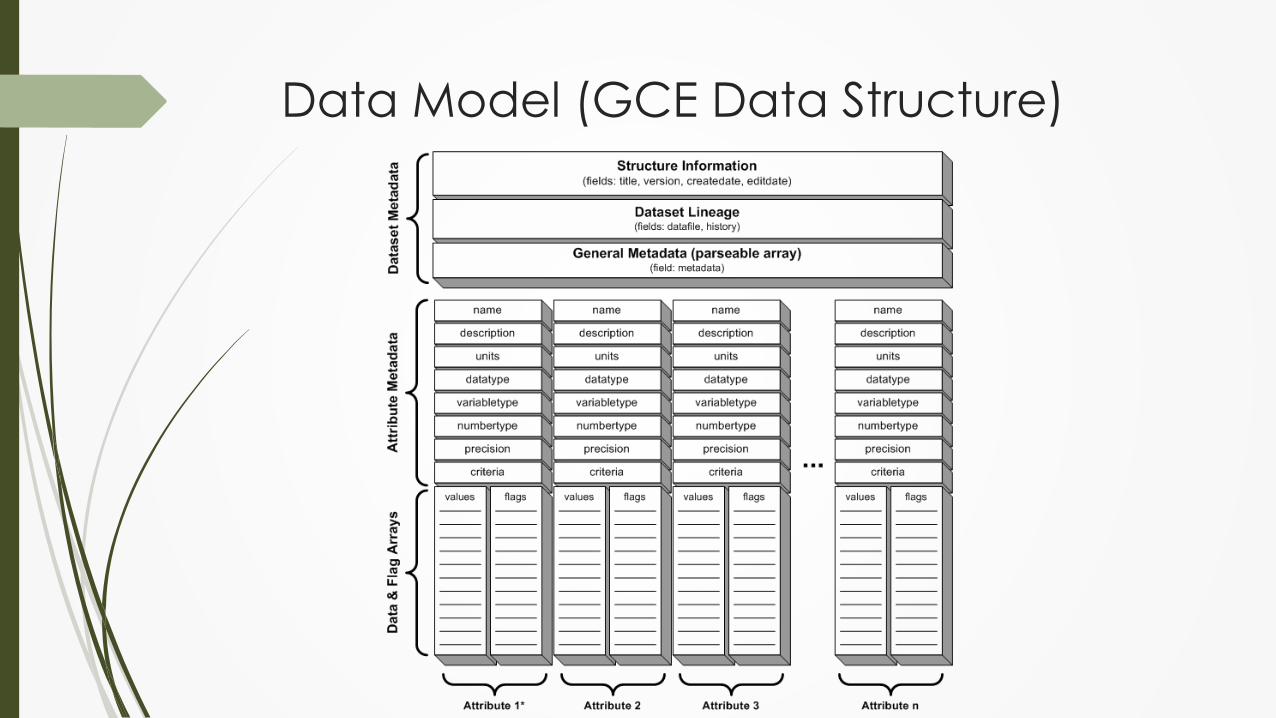
Data Model (GCE Data Structure)
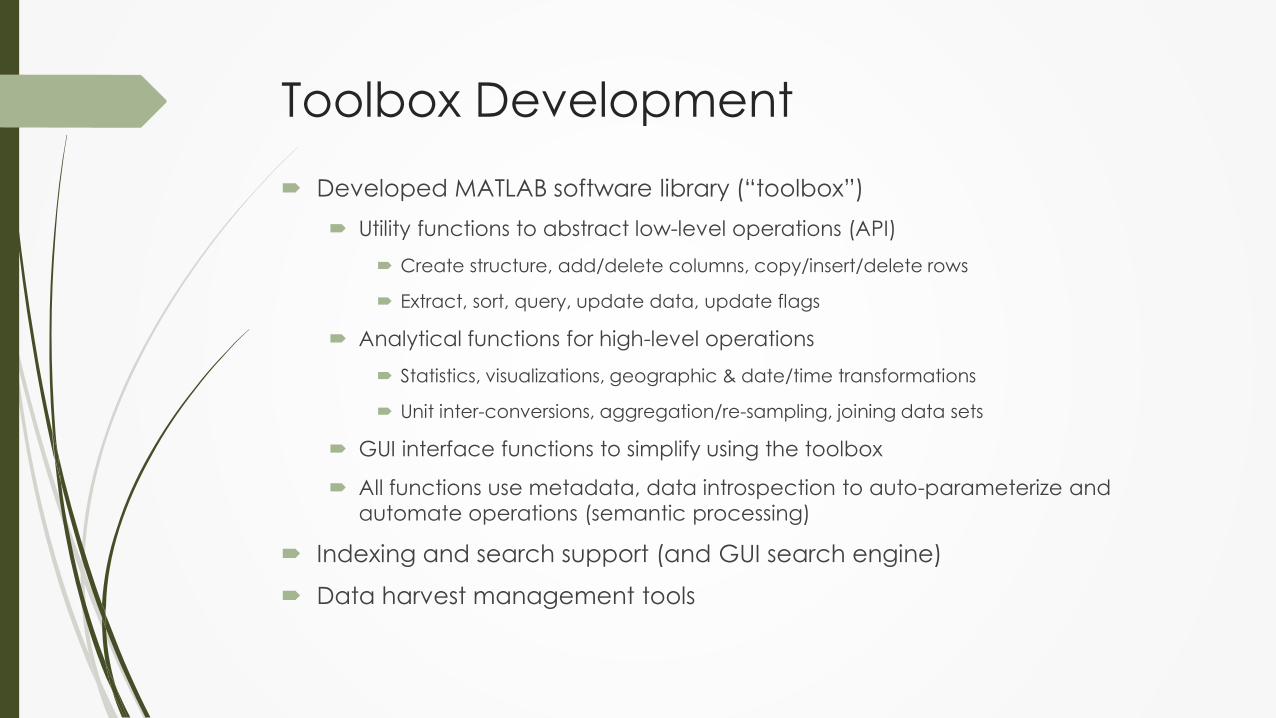
Toolbox Development
Developed MATLAB software library (“toolbox”)
Utility functions to abstract low-level operations (API)
Create structure, add/delete columns, copy/insert/delete rows
Extract, sort, query, update data, update flags
Analytical functions for high-level operations
Statistics, visualizations, geographic & date/time transformations
Unit inter-conversions, aggregation/re-sampling, joining data sets
GUI interface functions to simplify using the toolbox
All functions use metadata, data introspection to auto-parameterize and
automate operations (semantic processing)
Indexing and search support (and GUI search engine)
Data harvest management tools
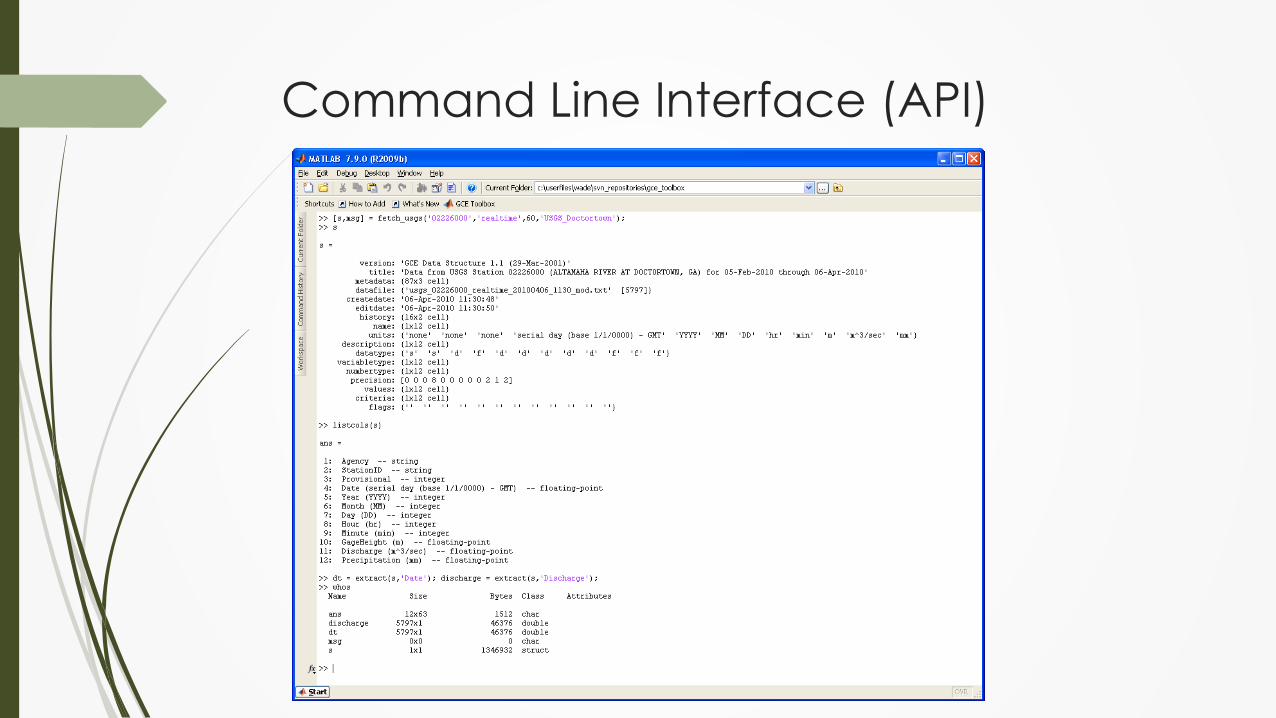
Command Line Interface (API)
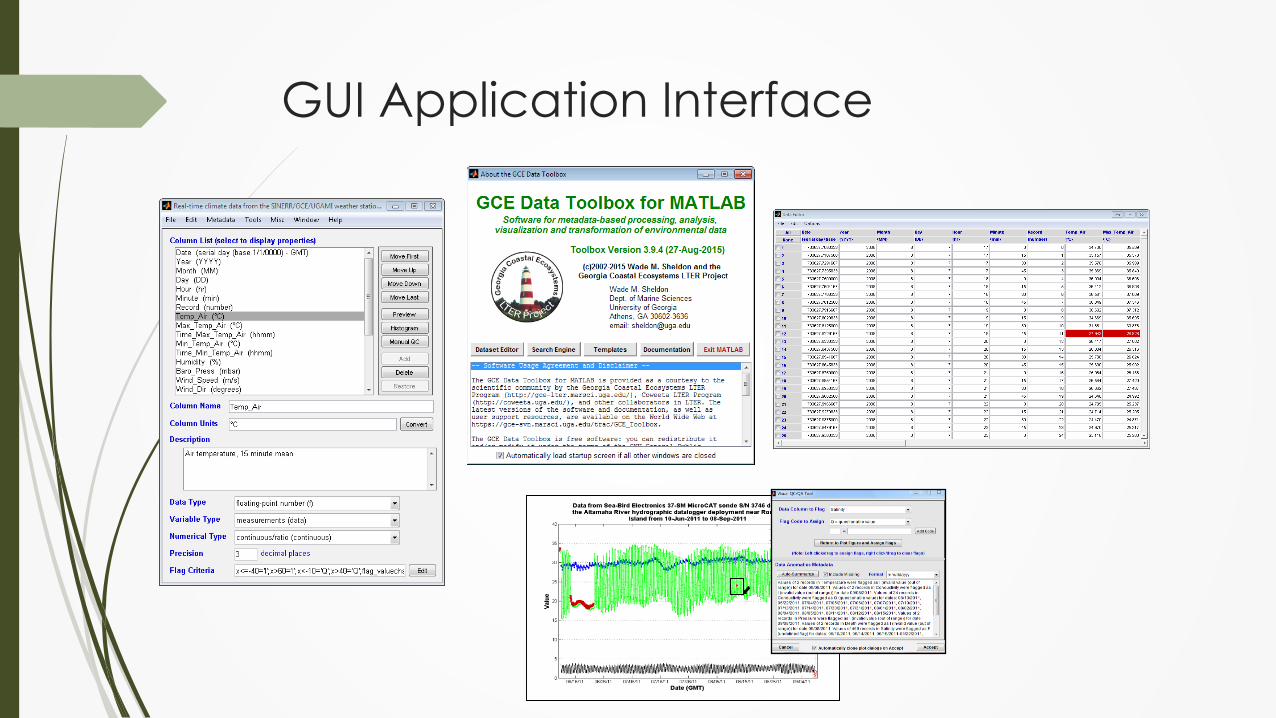
GUI Application Interface
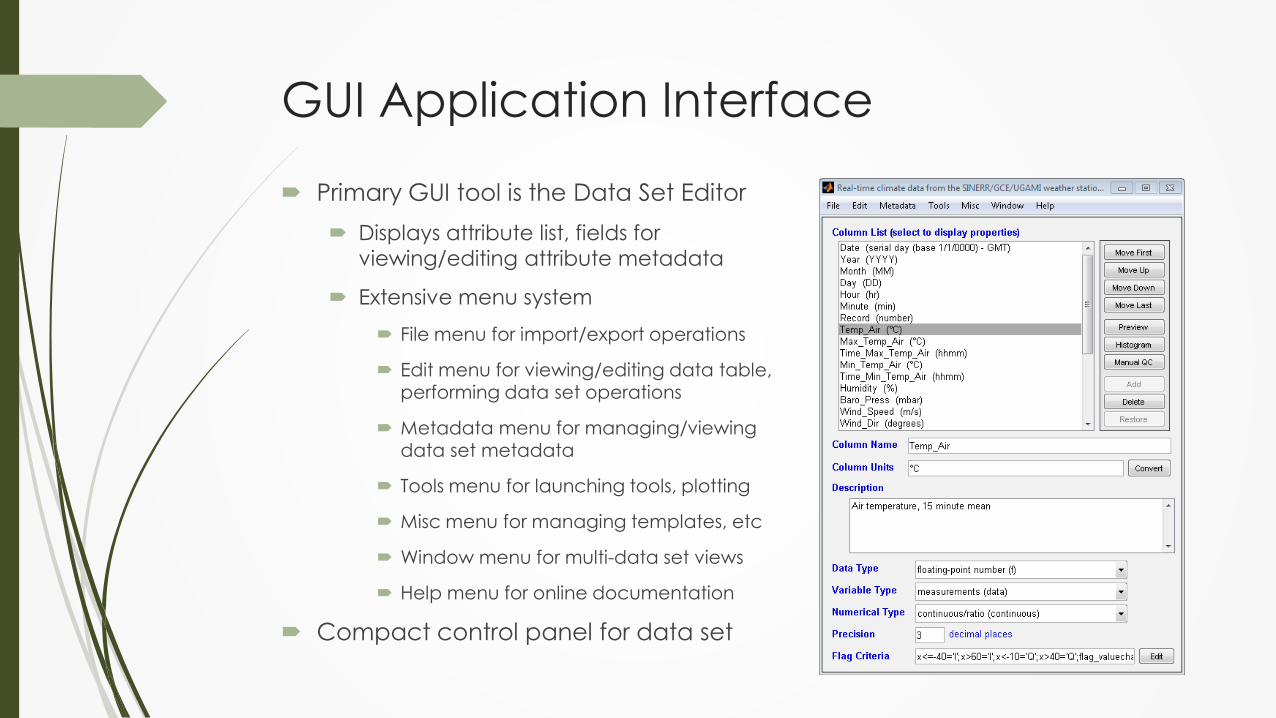
GUI Application Interface
Primary GUI tool is the Data Set Editor
Displays attribute list, fields for
viewing/editing attribute metadata
Extensive menu system
File menu for import/export operations
Edit menu for viewing/editing data table, performing data set operations
Metadata menu for managing/viewing data set metadata
Tools menu for launching tools, plotting
Misc menu for managing templates, etc
Window menu for multi-data set views
Help menu for online documentation
Compact control panel for data set
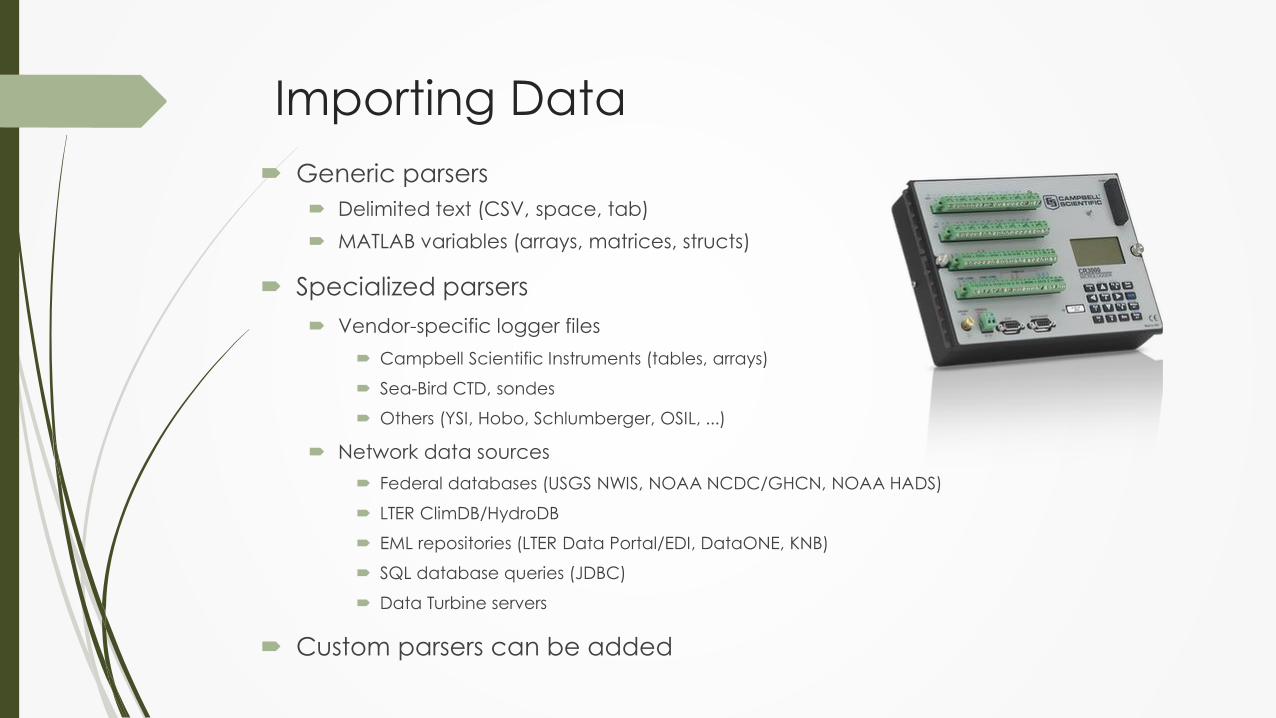
Generic parsers
Delimited text (CSV, space, tab)
MATLAB variables (arrays, matrices, structs)
Specialized parsers
Vendor-specific logger files
Campbell Scientific Instruments (tables, arrays)
Sea-Bird CTD, sondes
Others (YSI, Hobo, Schlumberger, OSIL, ...)
Network data sources
Federal databases (USGS NWIS, NOAA NCDC/GHCN, NOAA HADS)
LTER ClimDB/HydroDB
EML repositories (LTER Data Portal/EDI, DataONE, KNB)
SQL database queries (JDBC)
Data Turbine servers
Custom parsers can be added
Importing Data
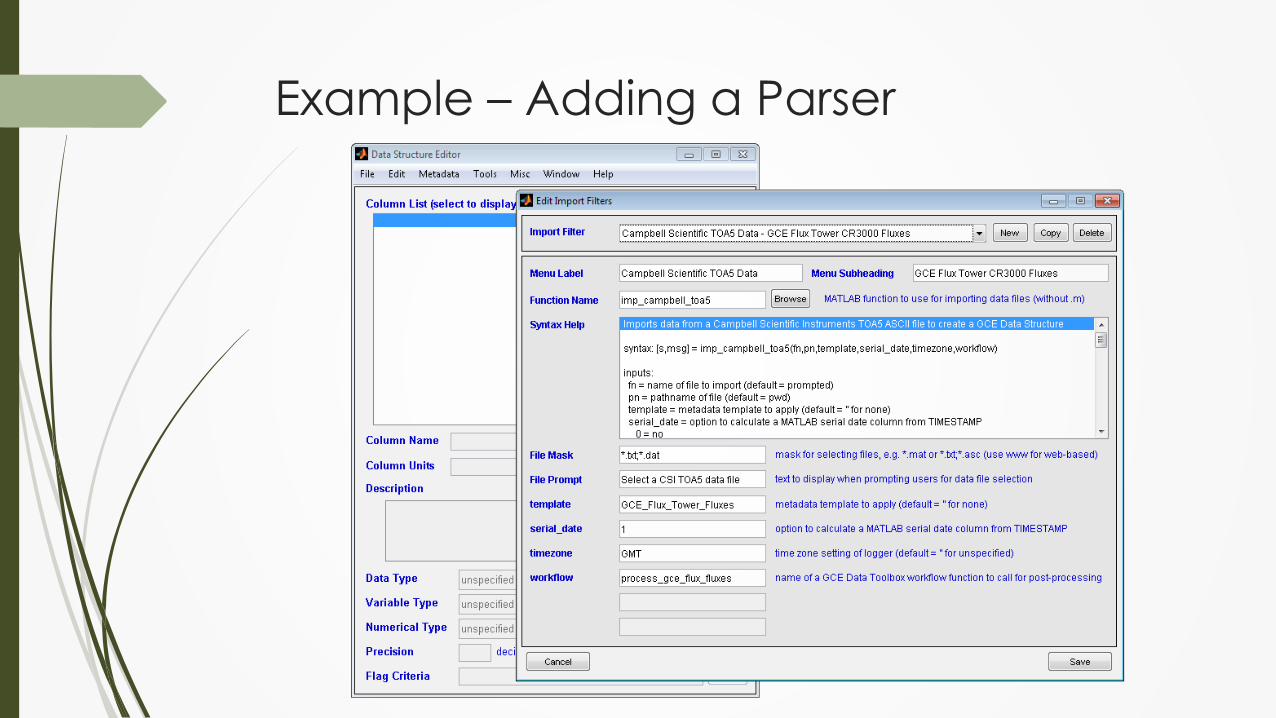
Example – Adding a Parser
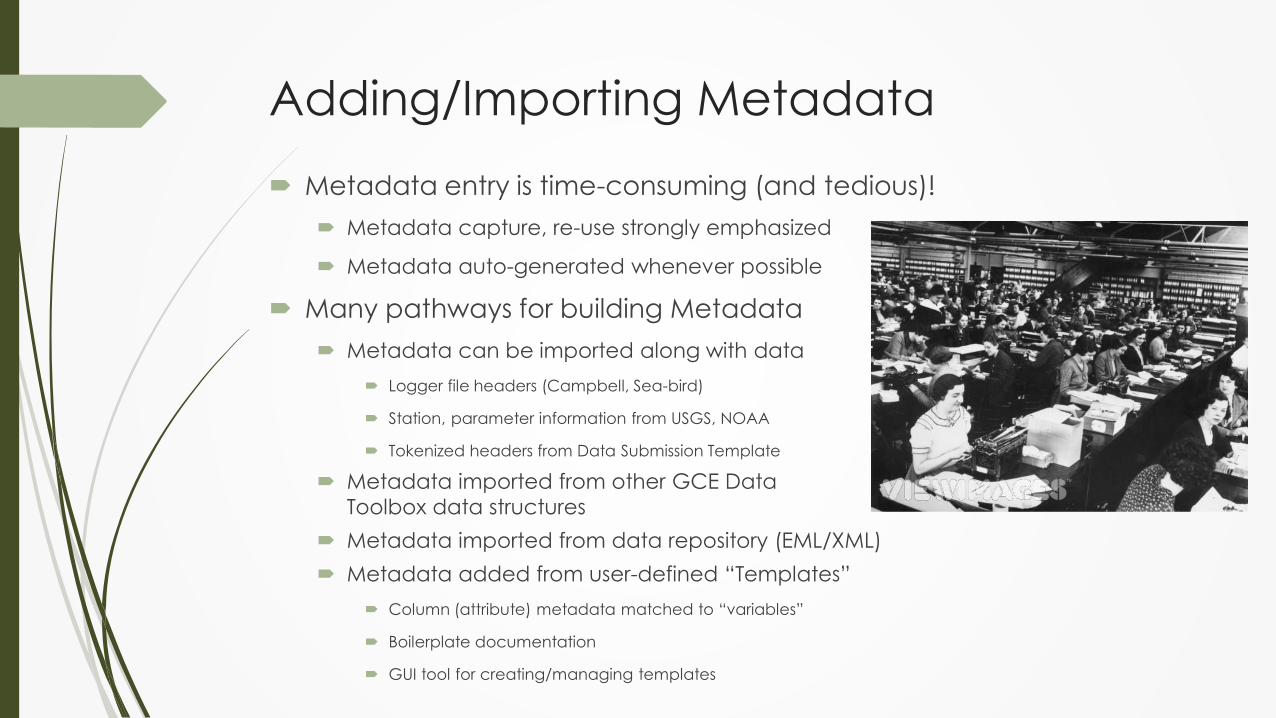
Metadata entry is time-consuming (and tedious)!
Metadata capture, re-use strongly emphasized
Metadata auto-generated whenever possible
Many pathways for building Metadata
Metadata can be imported along with data
Logger file headers (Campbell, Sea-bird)
Station, parameter information from USGS, NOAA
Tokenized headers from Data Submission Template
Metadata imported from other GCE Data
Toolbox data structures
Metadata imported from data repository (EML/XML)
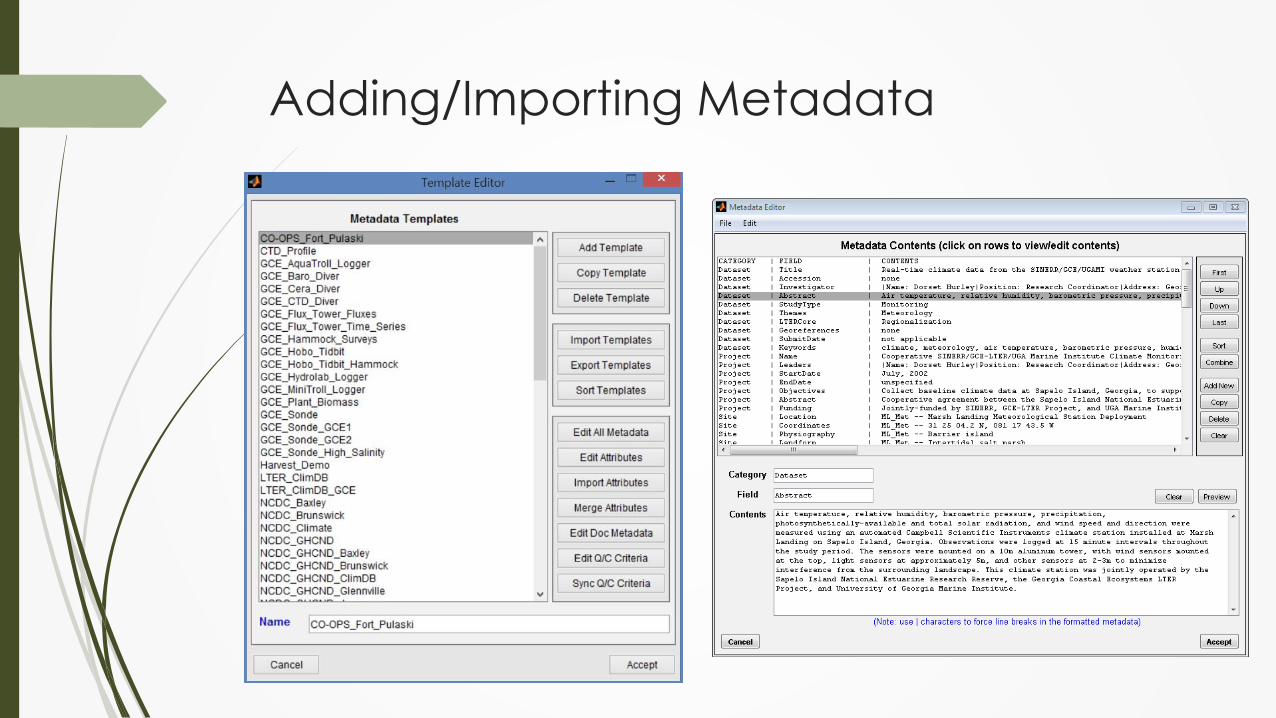
Metadata added from user-defined “Templates”
Column (attribute) metadata matched to “variables”
Boilerplate documentation
GUI tool for creating/managing templates
Adding/Importing Metadata
Adding/Importing Metadata
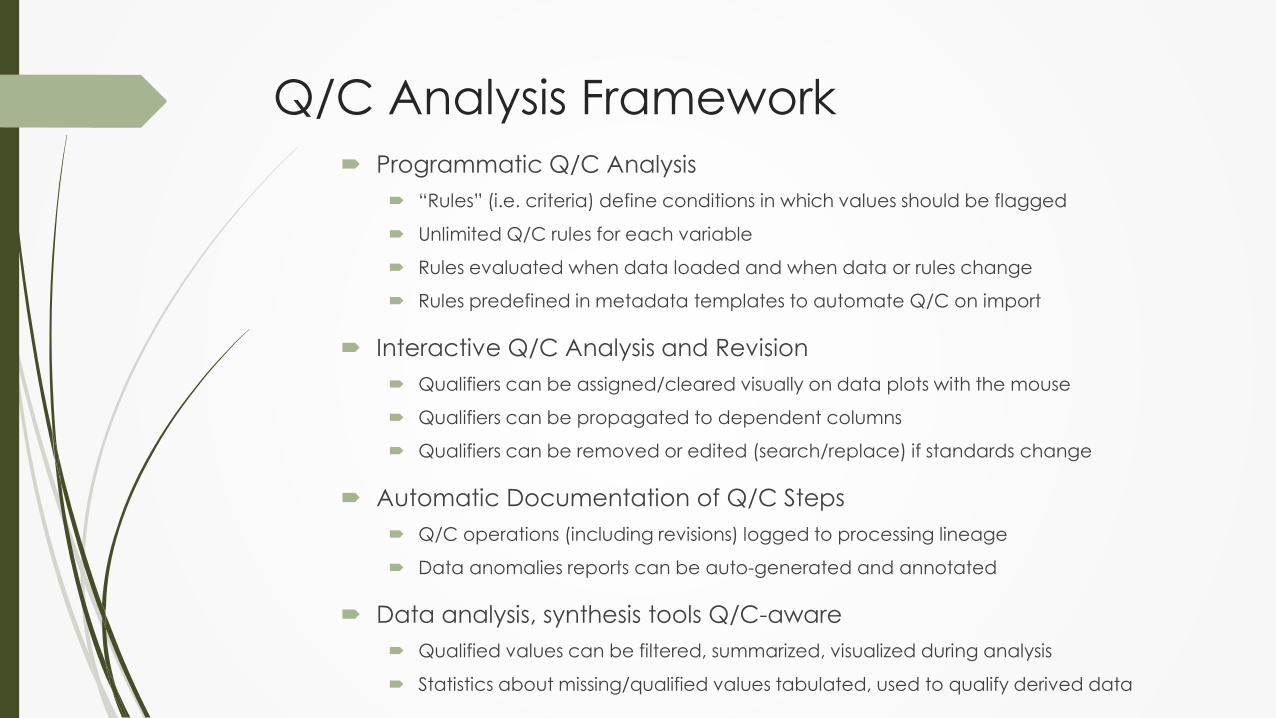
Programmatic Q/C Analysis
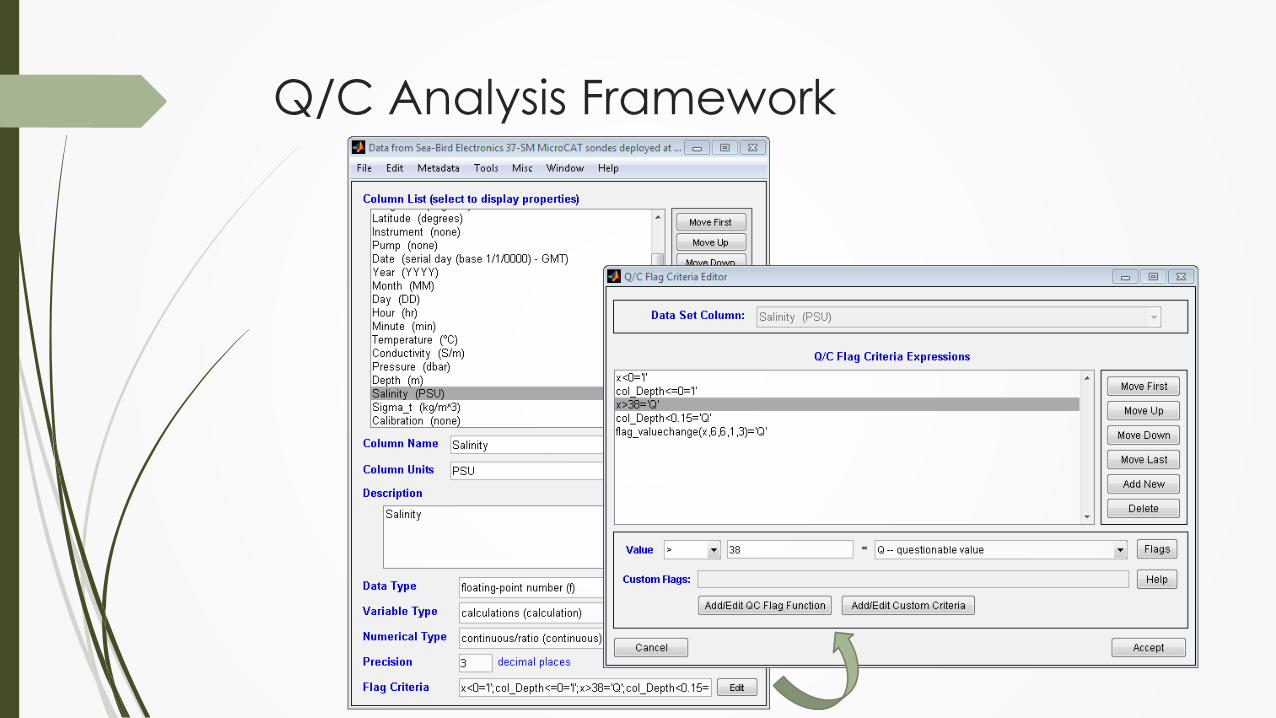
“Rules” (i.e. criteria) define conditions in which values should be flagged
Unlimited Q/C rules for each variable
Rules evaluated when data loaded and when data or rules change
Rules predefined in metadata templates to automate Q/C on import
Interactive Q/C Analysis and Revision
Qualifiers can be assigned/cleared visually on data plots with the mouse
Qualifiers can be propagated to dependent columns
Qualifiers can be removed or edited (search/replace) if standards change
Automatic Documentation of Q/C Steps
Q/C operations (including revisions) logged to processing lineage
Data anomalies reports can be auto-generated and annotated
Data analysis, synthesis tools Q/C-aware
Qualified values can be filtered, summarized, visualized during analysis
Statistics about missing/qualified values tabulated, used to qualify derived data
Q/C Analysis Framework
Q/C Analysis Framework
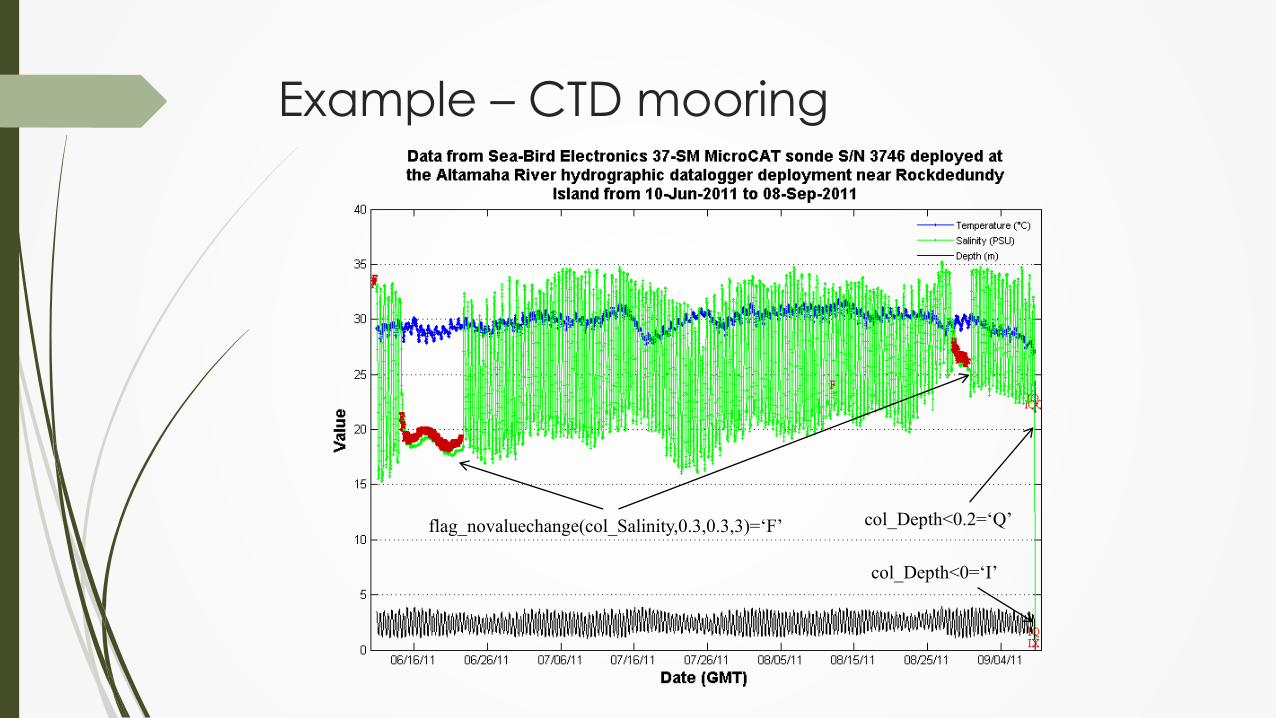
Example – CTD mooring
flag_novaluechange(col_Salinity,0.3,0.3,3)=‘F’
col_Depth<0=‘I’
col_Depth<0.2=‘Q’
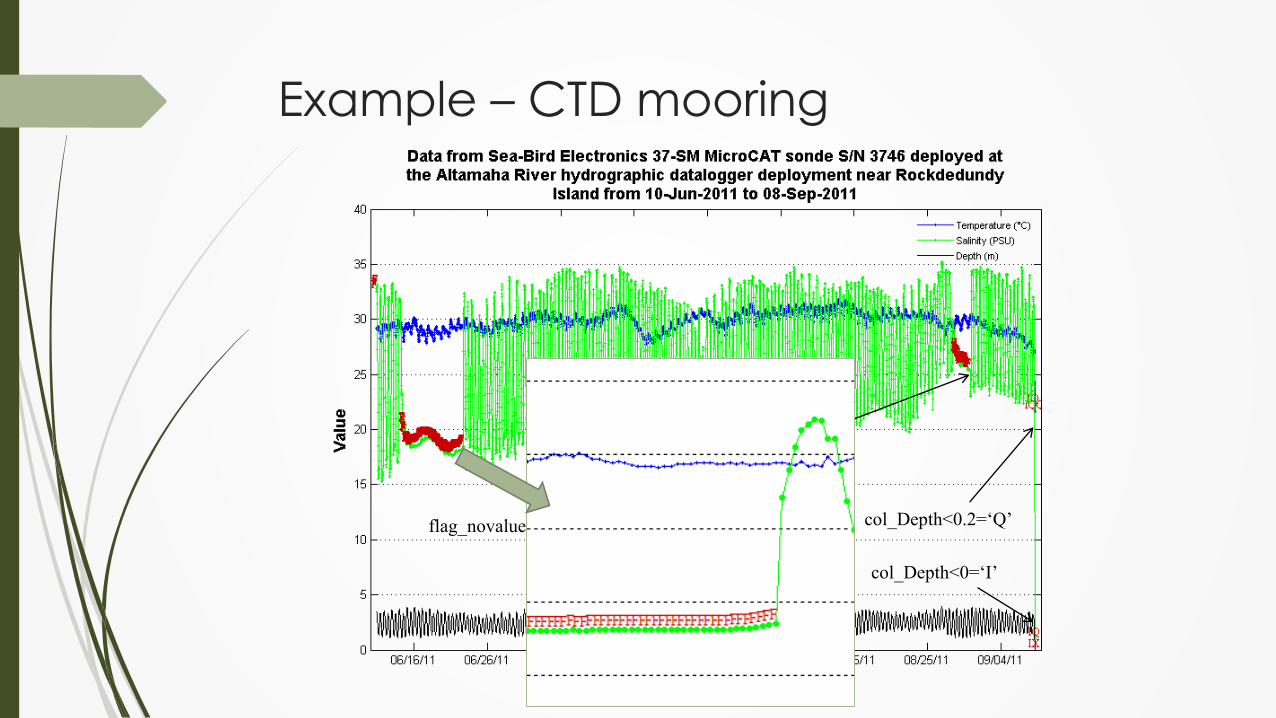
Example – CTD mooring
flag_novaluechange(col_Salinity,0.3,0.3,3)=‘F’
col_Depth<0=‘I’
col_Depth<0.2=‘Q’
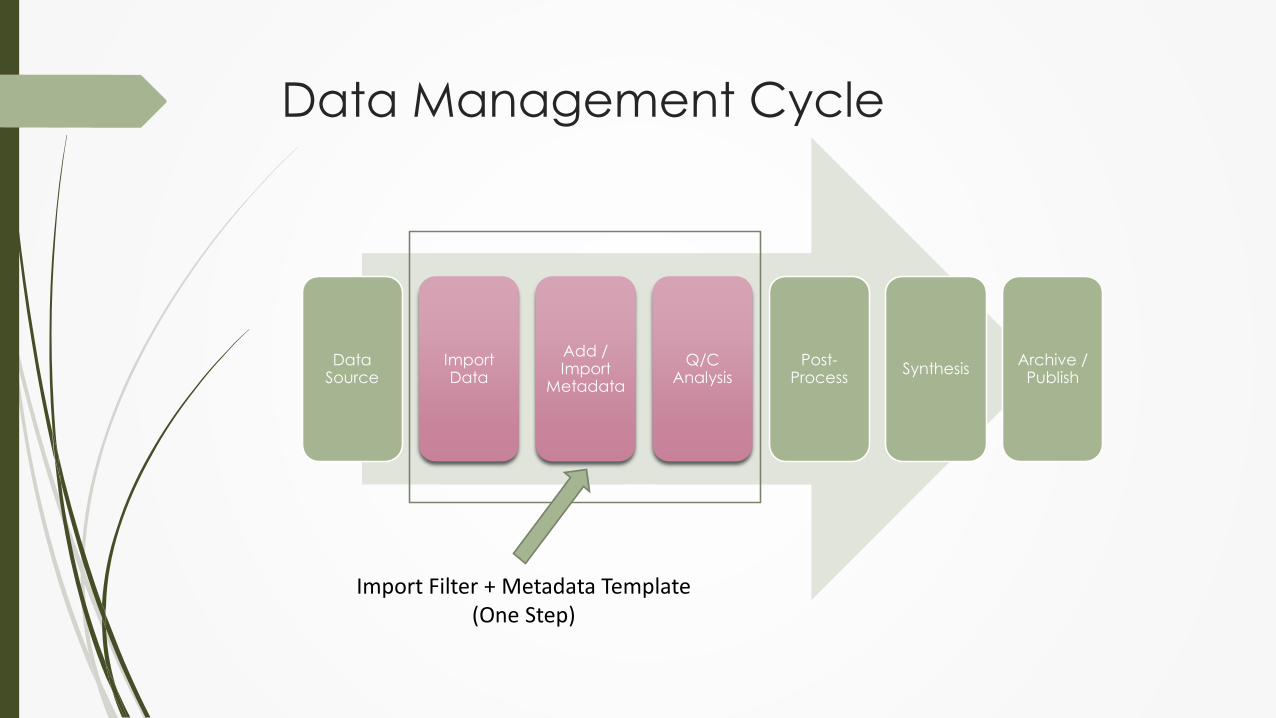
Data Management Cycle
Data Source
Import Data
Add / Import
Metadata
Q/C Analysis
Post-Process
SynthesisArchive /
Publish
Import Filter + Metadata Template(One Step)
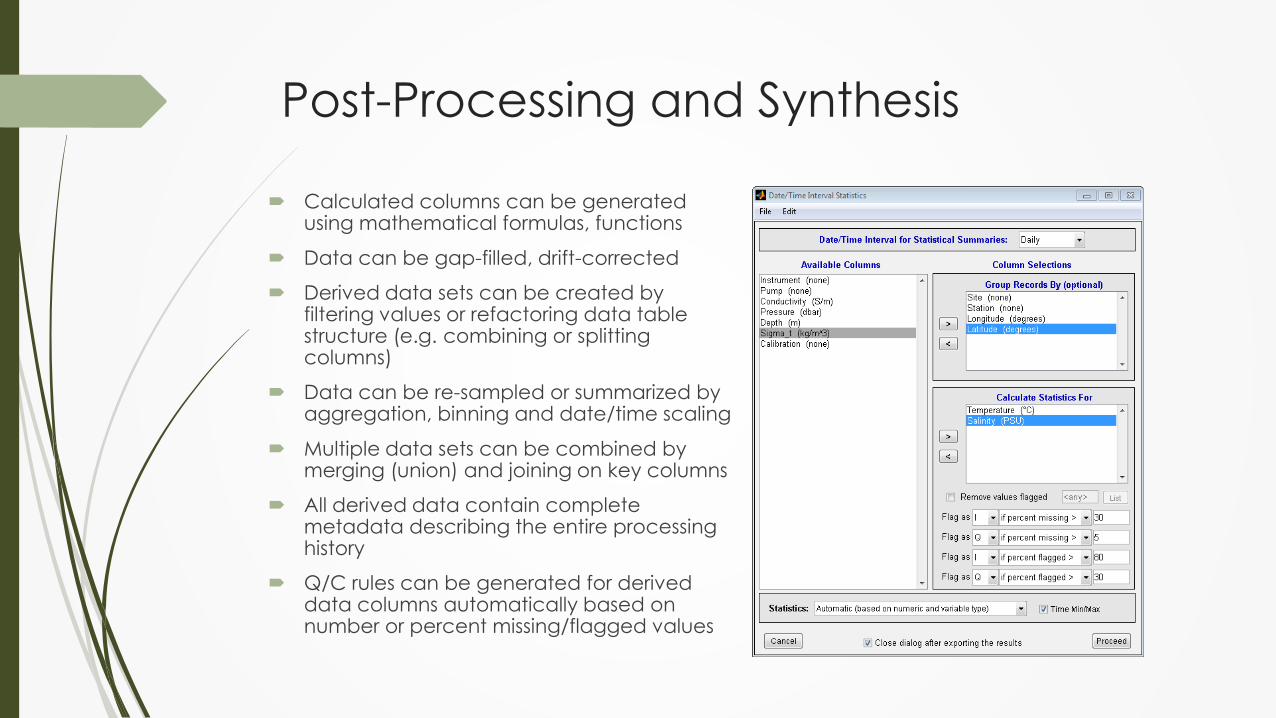
Calculated columns can be generated using mathematical formulas, functions
Data can be gap-filled, drift-corrected
Derived data sets can be created by filtering values or refactoring data table structure (e.g. combining or splitting columns)
Data can be re-sampled or summarized by aggregation, binning and date/time scaling
Multiple data sets can be combined by merging (union) and joining on key columns
All derived data contain complete metadata describing the entire processing history
Q/C rules can be generated for derived data columns automatically based on number or percent missing/flagged values
Post-Processing and Synthesis
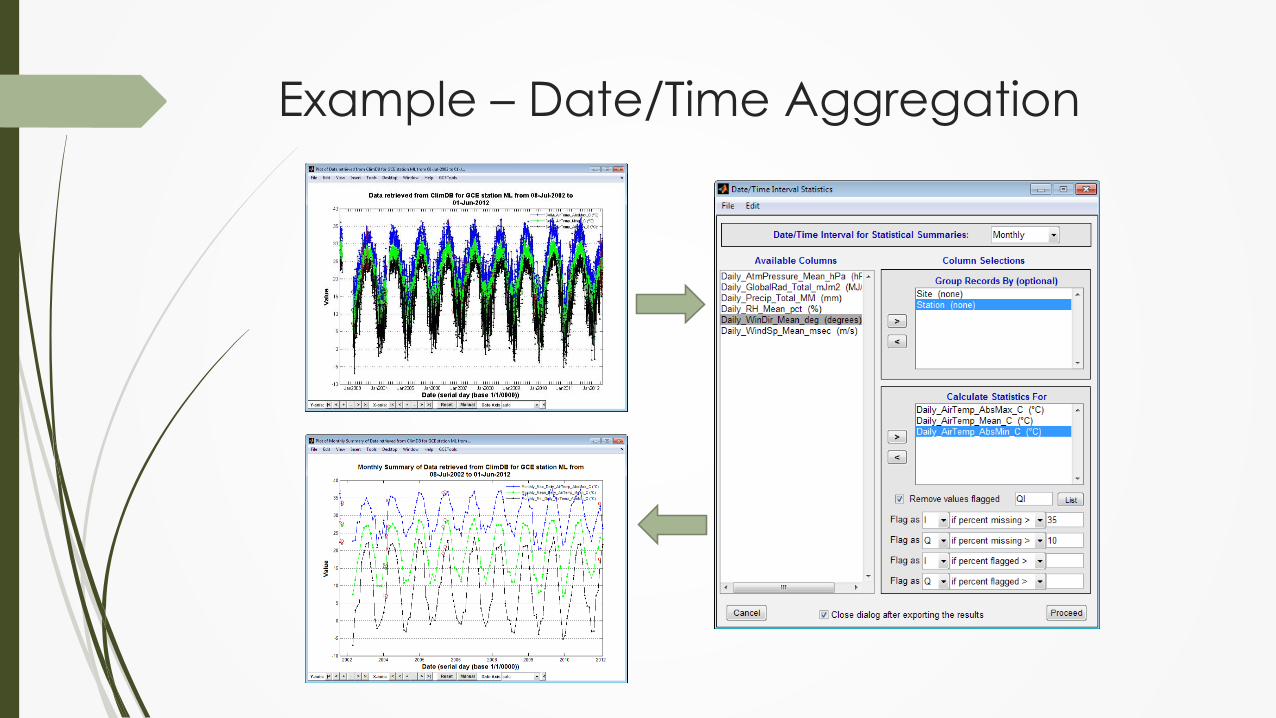
Example – Date/Time Aggregation
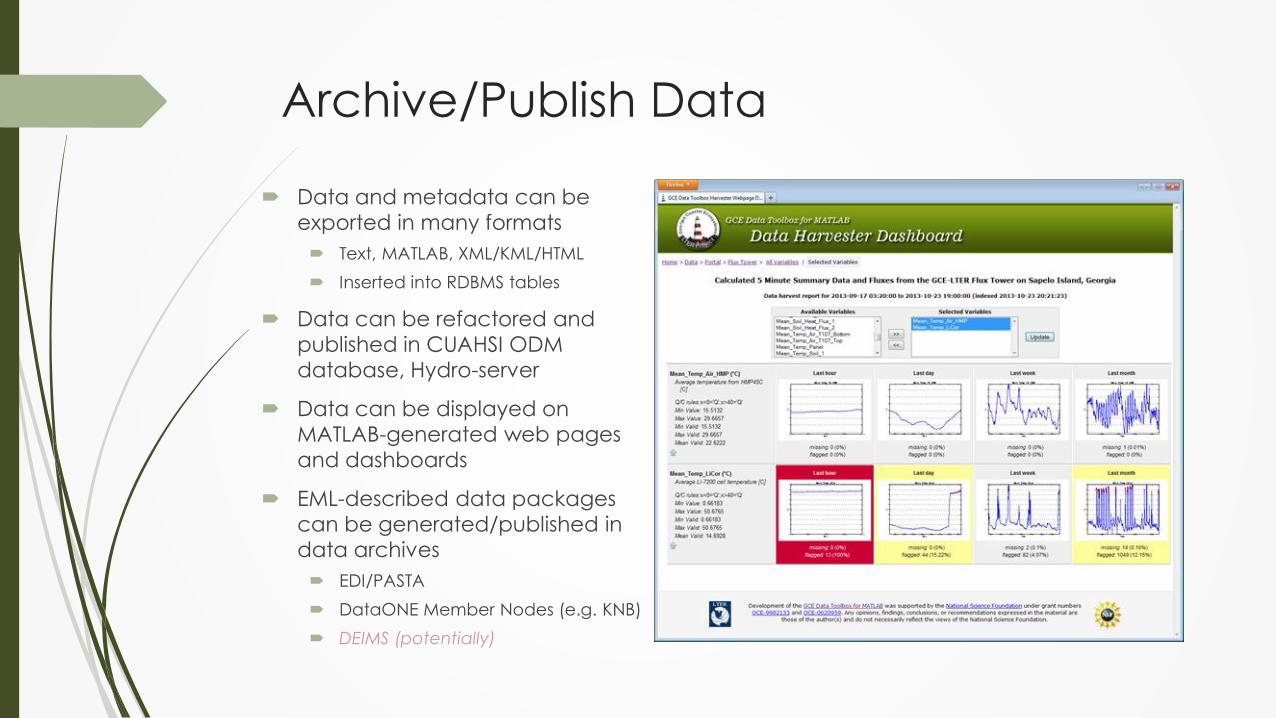
Data and metadata can be
exported in many formats
Text, MATLAB, XML/KML/HTML
Inserted into RDBMS tables
Data can be refactored and
published in CUAHSI ODM
database, Hydro-server
Data can be displayed on
MATLAB-generated web pages
and dashboards
EML-described data packages
can be generated/published in
data archives
EDI/PASTA
DataONE Member Nodes (e.g. KNB)
DEIMS (potentially)
Archive/Publish Data
Archive/Publish Data
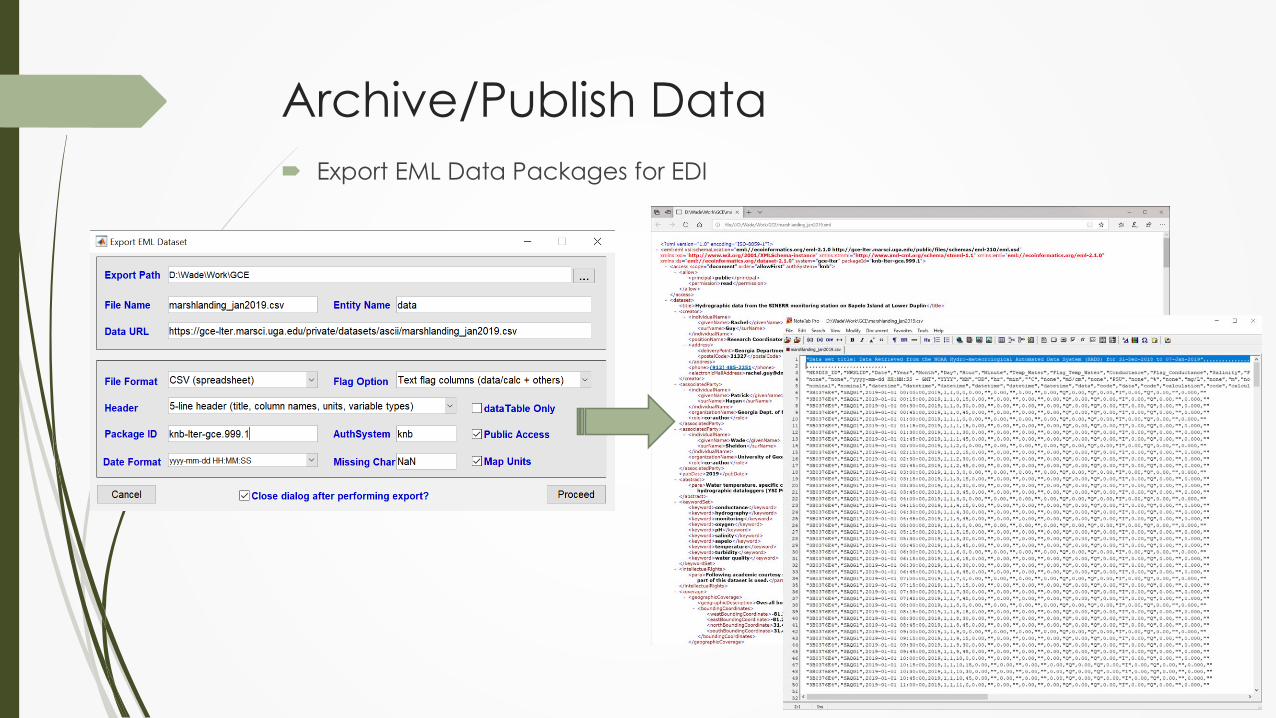
Export EML Data Packages for EDI
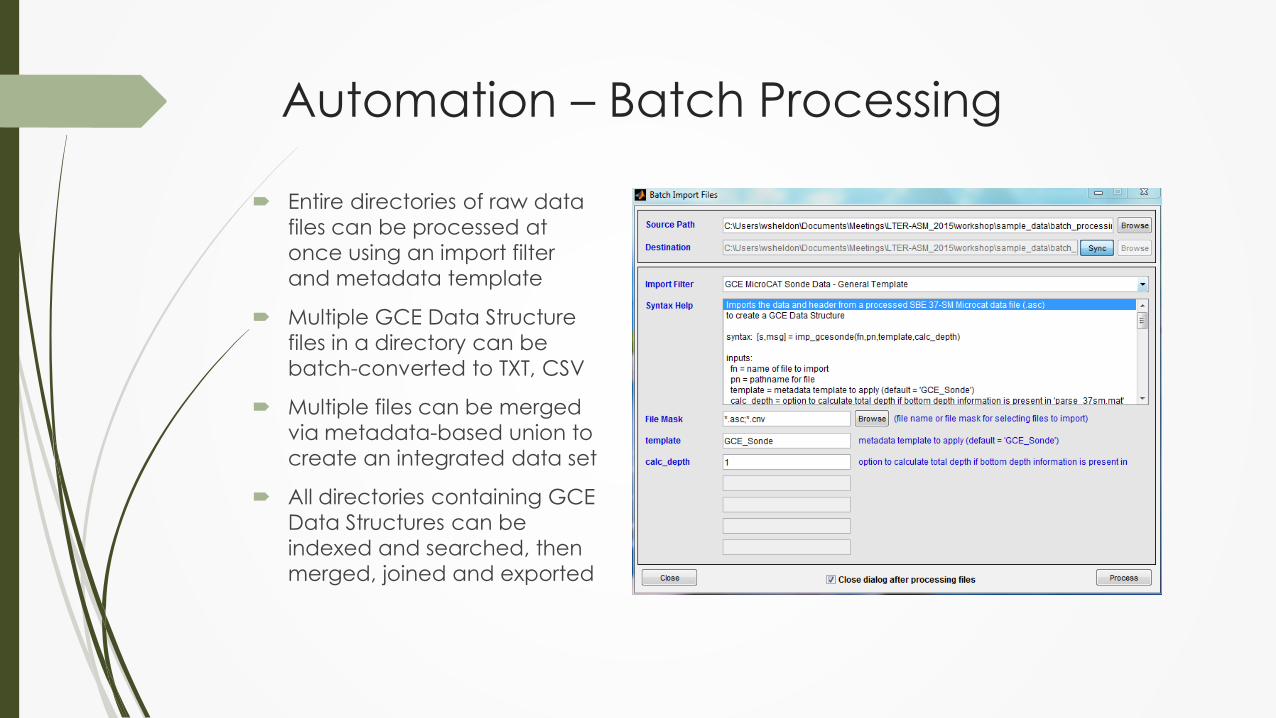
Entire directories of raw data
files can be processed at
once using an import filter
and metadata template
Multiple GCE Data Structure
files in a directory can be
batch-converted to TXT, CSV
Multiple files can be merged
via metadata-based union to
create an integrated data set
All directories containing GCE
Data Structures can be
indexed and searched, then
merged, joined and exported
Automation – Batch Processing
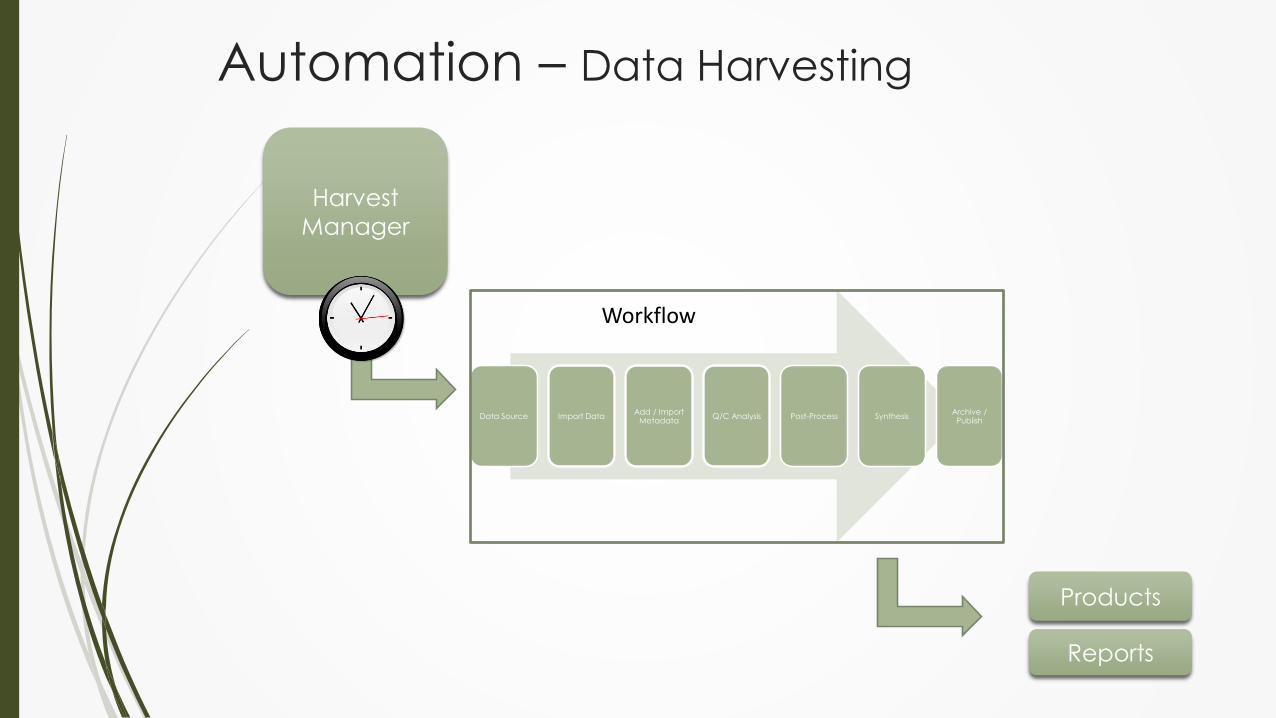
Automation – Data Harvesting
Harvest
Manager
Data Source Import DataAdd / Import
MetadataQ/C Analysis Post-Process Synthesis
Archive / Publish
Workflow
Products
Reports
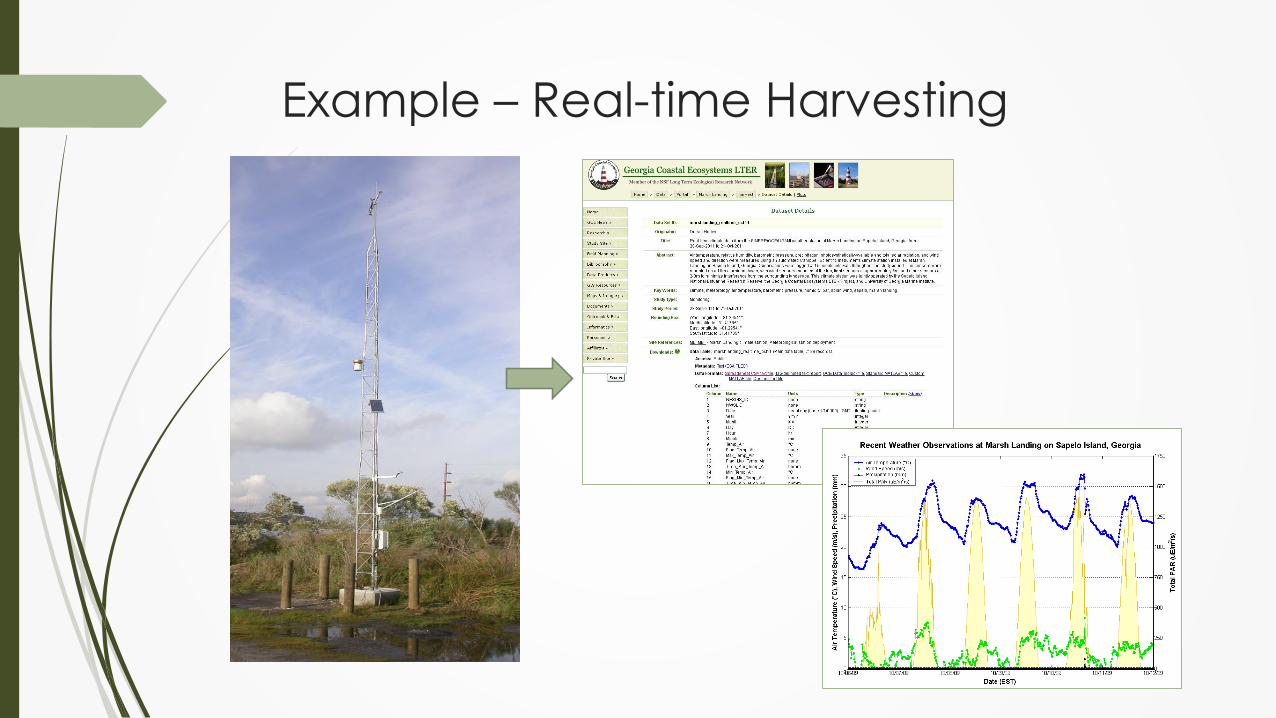
Example – Real-time Harvesting
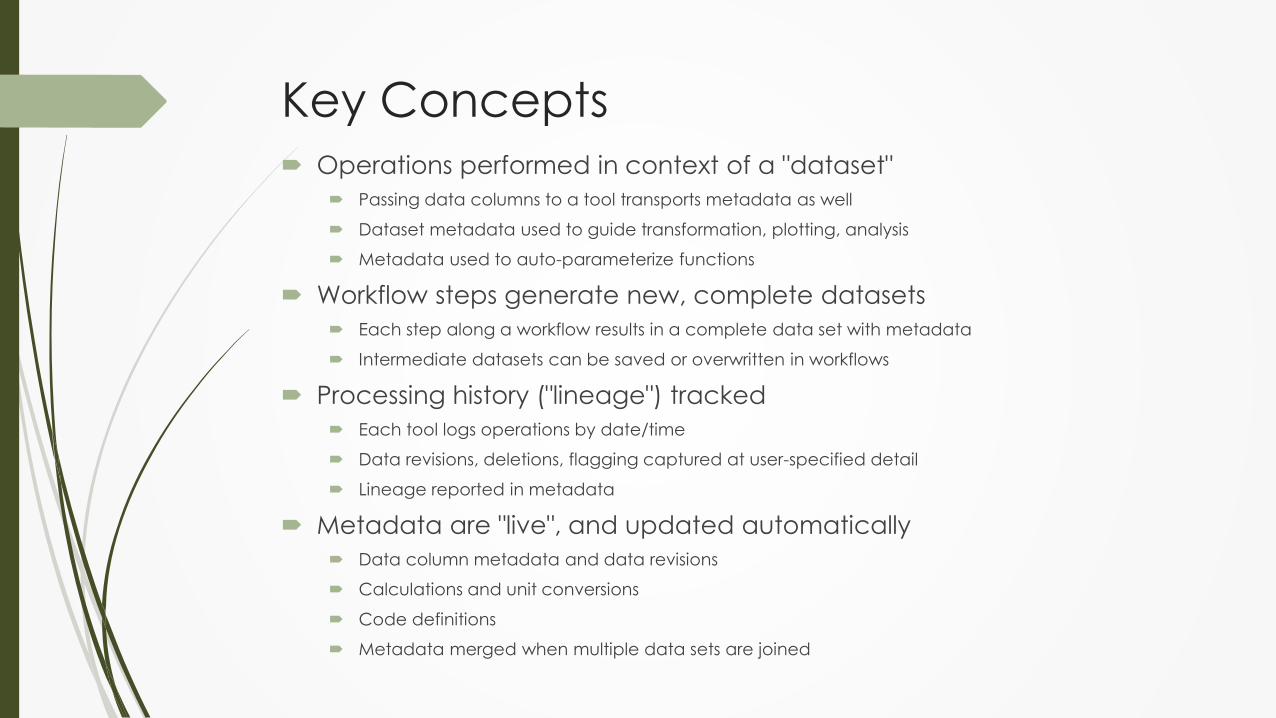
Key Concepts Operations performed in context of a "dataset"
Passing data columns to a tool transports metadata as well
Dataset metadata used to guide transformation, plotting, analysis
Metadata used to auto-parameterize functions
Workflow steps generate new, complete datasets
Each step along a workflow results in a complete data set with metadata
Intermediate datasets can be saved or overwritten in workflows
Processing history ("lineage") tracked
Each tool logs operations by date/time
Data revisions, deletions, flagging captured at user-specified detail
Lineage reported in metadata
Metadata are "live", and updated automatically
Data column metadata and data revisions
Calculations and unit conversions
Code definitions
Metadata merged when multiple data sets are joined
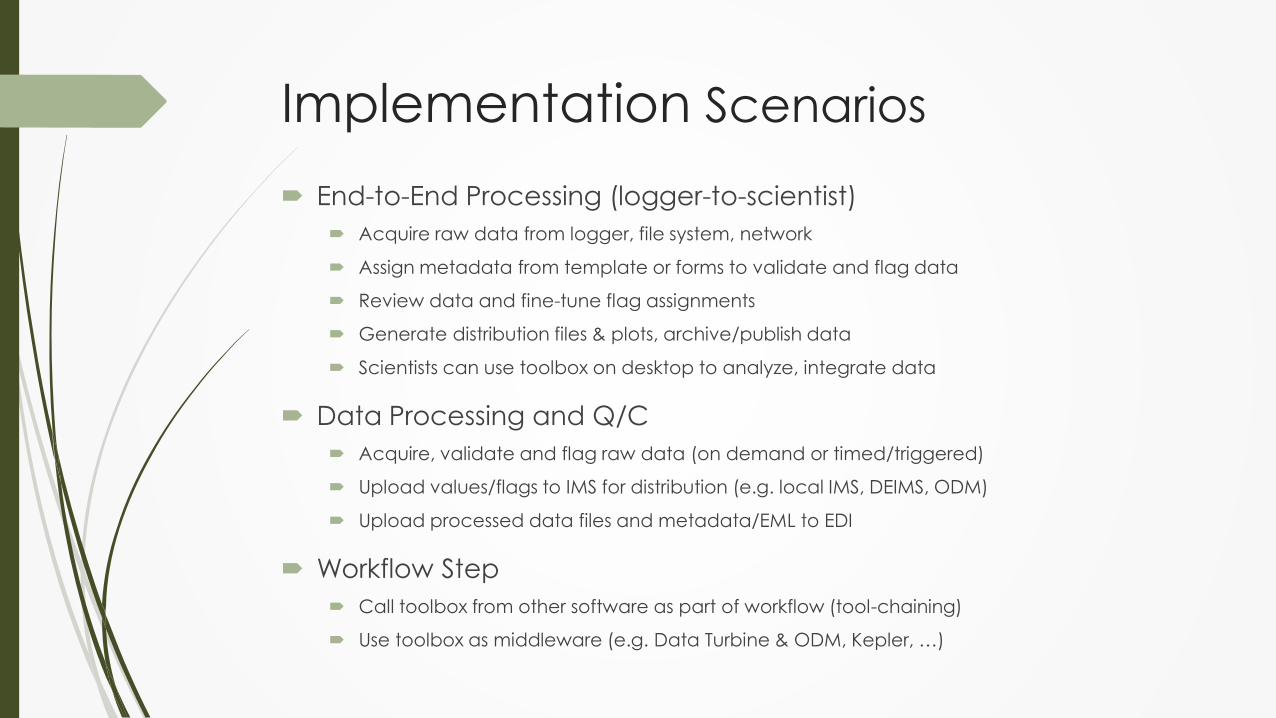
Implementation Scenarios
End-to-End Processing (logger-to-scientist)
Acquire raw data from logger, file system, network
Assign metadata from template or forms to validate and flag data
Review data and fine-tune flag assignments
Generate distribution files & plots, archive/publish data
Scientists can use toolbox on desktop to analyze, integrate data
Data Processing and Q/C
Acquire, validate and flag raw data (on demand or timed/triggered)
Upload values/flags to IMS for distribution (e.g. local IMS, DEIMS, ODM)
Upload processed data files and metadata/EML to EDI
Workflow Step
Call toolbox from other software as part of workflow (tool-chaining)
Use toolbox as middleware (e.g. Data Turbine & ODM, Kepler, …)
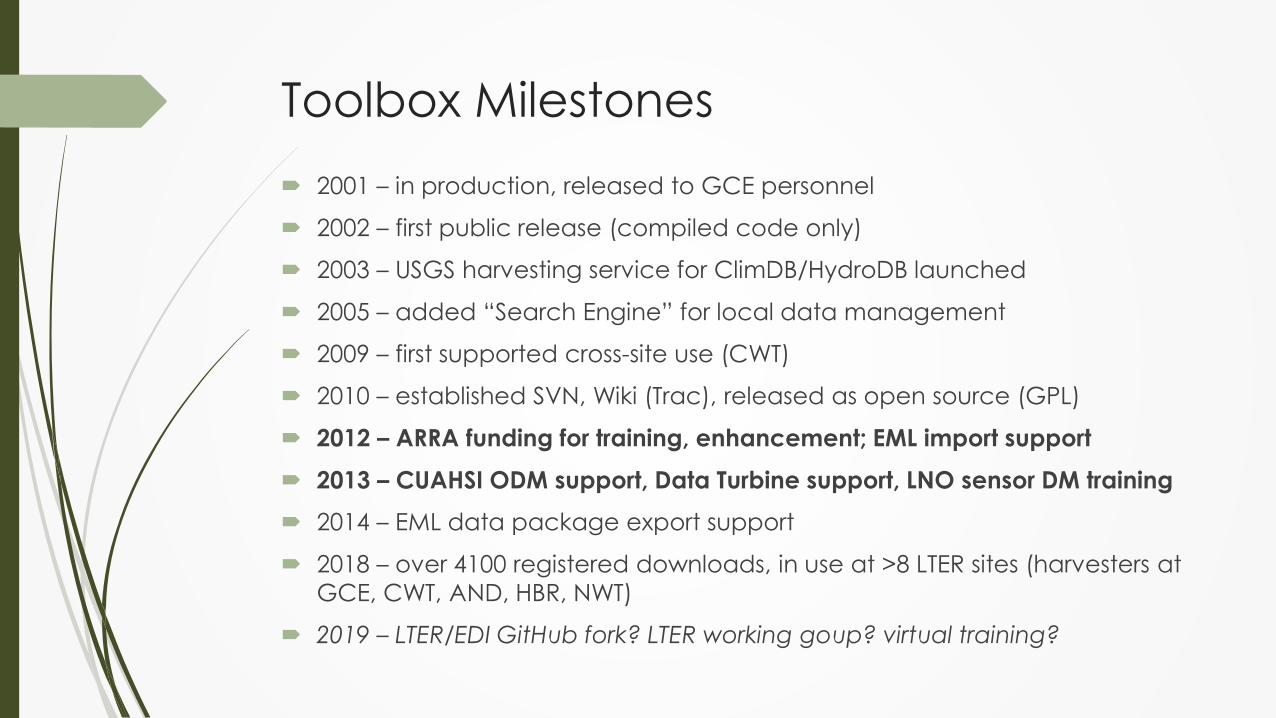
Toolbox Milestones
2001 – in production, released to GCE personnel
2002 – first public release (compiled code only)
2003 – USGS harvesting service for ClimDB/HydroDB launched
2005 – added “Search Engine” for local data management
2009 – first supported cross-site use (CWT)
2010 – established SVN, Wiki (Trac), released as open source (GPL)
2012 – ARRA funding for training, enhancement; EML import support
2013 – CUAHSI ODM support, Data Turbine support, LNO sensor DM training
2014 – EML data package export support
2018 – over 4100 registered downloads, in use at >8 LTER sites (harvesters at
GCE, CWT, AND, HBR, NWT)
2019 – LTER/EDI GitHub fork? LTER working goup? virtual training?
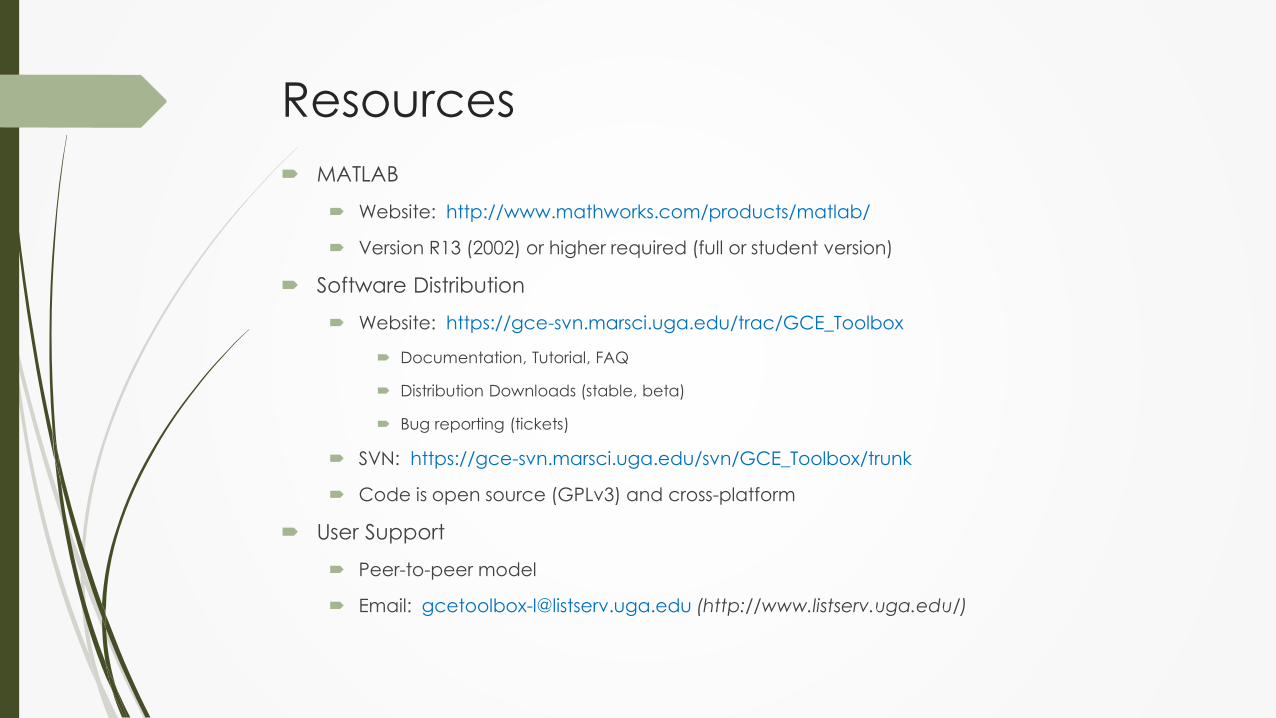
Resources
MATLAB
Website: http://www.mathworks.com/products/matlab/
Version R13 (2002) or higher required (full or student version)
Software Distribution
Website: https://gce-svn.marsci.uga.edu/trac/GCE_Toolbox
Documentation, Tutorial, FAQ
Distribution Downloads (stable, beta)
Bug reporting (tickets)
SVN: https://gce-svn.marsci.uga.edu/svn/GCE_Toolbox/trunk
Code is open source (GPLv3) and cross-platform
User Support
Peer-to-peer model
Email: [email protected] (http://www.listserv.uga.edu/)


