Embed Size (px)
Citation preview

1
Using ArcView in Managed Care
By Jim Banta
Presented at the 15th Annual ESRI International User Conference, San Diego, CA. July 1997.
As a result of the California State Department of Mental Health's move toward managed care,
San Bernardino County Department of Behavioral Health is responsible for creating and
maintaining a network of mental health providers which will ensure access to mental health
services for approximately 370,00 Medi-Cal eligibles throughout the geographically largest
county in the continental United States (20,062 square miles). By combining and mapping a
variety of data, the Department is better able to meet State mandates and allocate resources. This
information comes from a variety of sources, such as Departmental billing records, Medi-Cal
Fee-For-Service claims provided by the State Department of Mental Health and census data.
INTRODUCTION
San Bernardino is the fifth largest California County in terms of population. Most of its 1.5
million residents are concentrated in the valley region at the south-west corner of the county,
while a little more than 20% of the population is spread throughout desert and mountain
communities and unincorporated areas. The Department of Behavioral Health provides mental
health services to more than 16,000 individuals per year using its own facilities as well as
contract agencies. This does not include substance abuse treatment.
The County Department, along with all other public mental health departments throughout the
State of California, is several years into the process of becoming a capitated managed care plan,
responsible for ensuring mental health services to low-income individuals with specified
diagnoses and medical necessity. The major steps of this process are seen in Figure 1.
One can see county departments becoming increasingly involved with private, Fee-For-Service
providers such as Psychiatrists and Psychologists. Prior to Phase I, county departments received
payment from the State Department of Mental Health (DMH) for providing services to Medi-Cal
clients. Meanwhile, private or Fee-For-Service providers were paid through the State Department
of Health Services (DHS). During consolidation DHS assumes less and less responsibility for
mental health services. When consolidation is finished, all Medi-Cal money for mental health
providers will be distributed by DMH via capitated contracts or block grants to each county
department.
In Phase I, departments were mandated to contract with all private hospitals within their county
that had historically seen Medi-Cal clients. Figure 2 shows the hospitals within the county which
provided mental health inpatient services to Medi-Cal patients during any portion of 1995 or
1996. Not shown are hospitals outside of the county which provided inpatient services to San
Bernardino County Medi-Cal beneficiaries.

2
During the planning of Phase II, maps have become useful as planning tools. As departments
implement Phase II and move into Phase III, it is possible for maps and a Geographic
Information System to become even more important as planning tools and perhaps even as a
critical business tool.
USING ARCVIEW
There are limited applications of GIS by county departments in the management and functioning
of public mental health systems. A major limitation is access to relevant, affordable and
mappable data. For example, at the client level - decisions are governed by clinical issues, most
of which have a limited geographical component (unless looking at distances to available
treatment and residential facilities). At the administrative level - in addition to clinical issues;
legislative, bureaucratic and political concerns predominate, with interest in maps being
primarily for presentation purposes. However, ArcView is powerful at:
Presenting relationships among clinics.
Presenting client characteristics.
Presenting demographic characteristics of interest to mental health planning.
Although there can be overlap among these categories, especially since each of these three items
could be shown as themes on the same map, there are also different uses for each of these
categories.
I. Presenting relationships among clinics
As part of its Medicaid waiver request, the State of California must prove to the Health Care
Financing Administration (HCFA) that the implementation of Phase II will not restrict access to
services by Medi-Cal clients previously seen only by private providers. In response, the State is
mandating that counties show that access to services will be ensured. For example, one guideline
for the annual quality work plan "requires mechanisms to ensure the capacity of services
delivery," the first step being describing "the current number, types and geographic distribution
of mental health services within its delivery system". The next two maps created with ArcView
3.0a, are a start towards that requirement, by showing the Department's current facilities.
As can be seen in figures 3 and 4 the Department currently has contract providers in outlying
desert and mountain communities. Looking at the detail map in figure 4, one can see that most
cities in the urbanized southwest corner already have at least one Departmental provider.
County departments have received data files from the State DHS paid claims database to aid in
the planning process. Although I have analyzed the files using such relational databases as,
R:BASE by Microrim (Bellevue,Washington) and Microsoft Access (Redmond, Washington), it
is not possible to reliably map FFS service sites or client information using that data.
In addition to showing the location of clinics for internal use or for such documents as annual
reports, maps may also be used for site selection. A simple example is Figure 5, which shows
existing clinics and a recently proposed new clinic site.

3
II. Presenting client characteristics
More than 13,000 clients seen in Fiscal Year 1994-95 were able to be geocoded, although in a
few cases the address of the primary clinic was used since there was absolutely no address in the
computer system. Other limitations of this data include the mobility of some clients and
uncertainty about the accuracy of self-reported data. However, this data can be used in a number
of ways, although confidentiality requirements do place restrictions on what can be presented
publicly. An example is Figure 6, which shows clients of the clinic mentioned in Figure 5. This
map only shows clients within neighboring communities, there were a clients that lived further
away. However, it is clear that the majority of clients were within a few miles of either site.
Gaining a better understanding of clients, particularly the more than 10,000 San Bernardino
County Medi-Cal clients served by nearly 700 FFS mental health providers in Fiscal Year 1995-
96, is important to making sure the most appropriate services are delivered. For example, if a
large number of clients living in the same community were found to be using excessive inpatient
services, the Department may provide clients in that area with more case management and
outpatient services.
III. Presenting demographic characteristics of interest to mental health planning
Social and demographic characteristics appear to be related in general ways to the prevalence of
mental disorders. This has allowed for needs assessments to be conducted from census data using
such variables as poverty, population density, age distribution and ethnicity. My supervisor
conducted such a needs assessment using 1980 census data (before the days of ArcView) and
identified a high need community that later did receive a clinic.
ArcView's immediate usefulness is its ability to help departments respond to State managed care
mandates revolving around needs assessment and cultural competency. This includes comparing
ethnicity and age of clients with both total county population and the Medi-Cal population. One
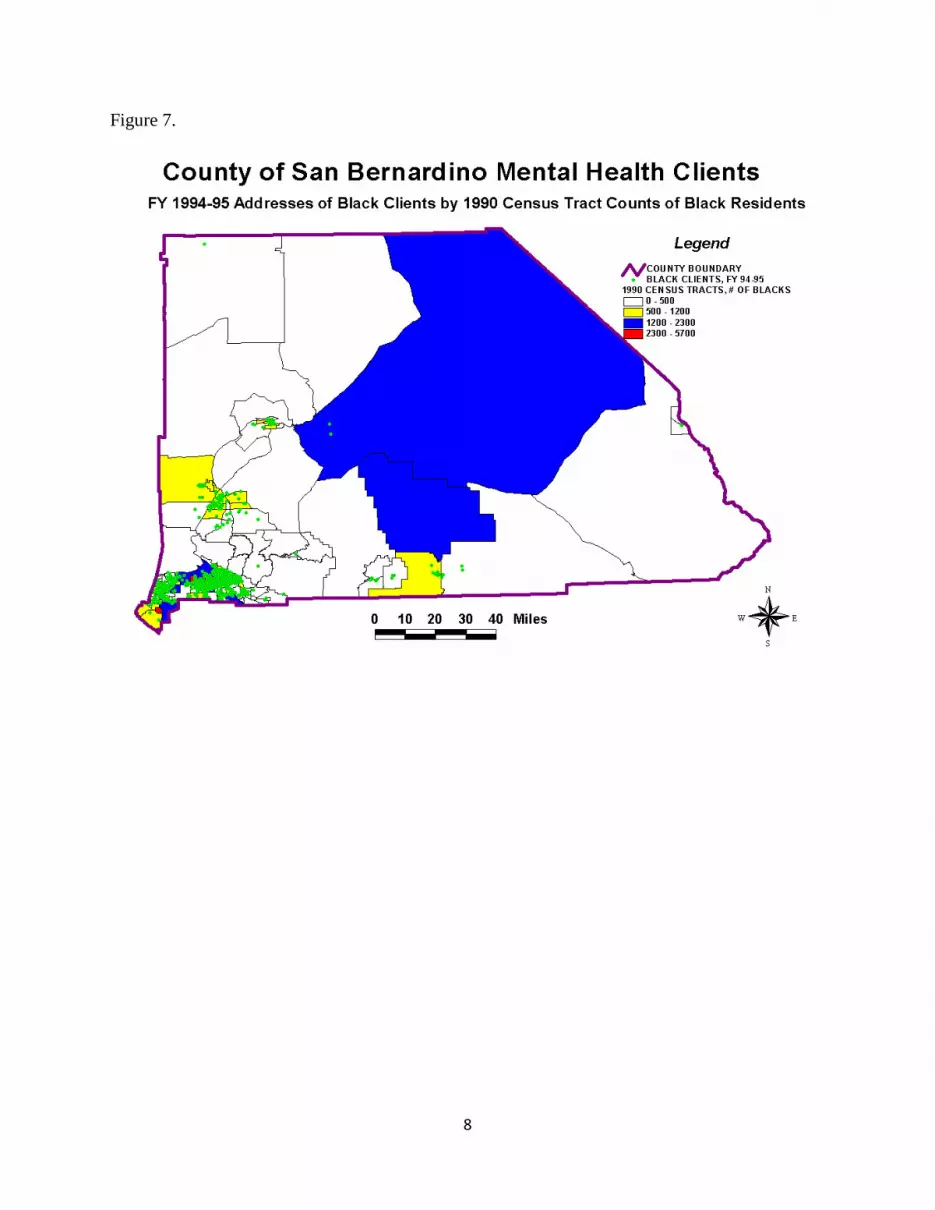
example of this is Figure 7, which shades census tracts based on the number of individuals
identified as "Black" reported in the 1990 census data files. Printed over the demographic data
are the geocoded addresses for clients seen in Fiscal Year 1994-95 which were identified as
"Black" in the Department's centralized data system. It appears at first glance that clients
identified as "Black" in parts of the desert may not be served by the Department in proportion to
the number of identified in the 1990 Census as "Black". This is a good example of the dangers
of uncritically accepting maps at face value.
There are at least a couple reasons to be skeptical of this map. For example, although "Black"
individuals make up 8% of the county's population, they accounted for nearly 17% of the
Department's admissions during Fiscal Year 1995-96. Also, nearly 3,000 clients were not able to
be geocoded. It is known that clients in the desert and mountain areas were less likely to be
geocoded successfully than clients having a street address within the major cities. When these
two factors are considered, one can see that further analysis is needed to prove the "obvious" fact
that individuals living in parts of the desert areas of San Bernardino County who are identified as
"Black" are less likely to receive mental health services. If this were indeed found to be true, it
would obviously be of concern to the Department.

4
Although these types of maps are fairly easy to create, it is critical that readers understand the
data limitations before reaching a final conclusion. This is especially true in the health and social
services communities which are undergoing many changes.
CONCLUSION
Though currently of limited usefulness at the individual client level, ArcView can perform
several tasks for public mental health departments within a managed care environment. These
tasks include presenting relationships among clinics or other service sites, such as hospitals and
residential facilities; presenting client characteristics; and presenting demographic characteristics
of interest. These tasks can be performed for internal planning/evaluation, to meet mandated
reporting requirements; and for external presentations such as annual reports and public
meetings. As more extensive mental health data is gathered in a format which can be mapped,
ArcView can contribute to the more efficient and effective operation of public mental health
departments.
ACKNOWLEDGMENTS
Technical assistance was provided by the San Bernardino County Geographic Information
Management System (GIMS) Division.
REFERENCES
California Department of Mental Health, "Data for Phase II Consolidation Planning," letter from
Statistics and Data Analysis Section, April 9, 1997
California Department of Mental Health, "The Spring 97 Medi-Cal Consolidation Phase II
Workshop, Southern Region," April 10, 1997
California Medi-Cal Specialty Mental Health Consolidation Part II Program Subcommittee,
"Proposed Quality Management Standards," 3/12/97 draft
Center for Mental Health Services. Mental Health, United States, 1996. Manderscheid, R.W.,
and Sonnenschein, M.A., eds. DHHS Pub. No. (SMA)96-3098. Washington D.C.: Supt. Of
Docs., U.S. Govt. Print. Off., 1996.
Jim Banta
Managed Care Research Analyst
San Bernardino County Department of Behavioral Health
700 E. Gilbert St, Bldg. # 5
San Bernardino, California 92415-0920
Telephone:(909) 387-7030
Fax: (909) 386-8563

5
Figure 1.
Figure 2.

6
Figure 3.
Figure 4.

7
Figure 5.
Figure 6.