Embed Size (px)
Citation preview

HELPING PEOPLE PROGRESS BEYOND ASSISTANCE
2O17 FISCAL YEAR
AGENCY FINANCIAL REPORT

(Preceding page) Monjuara Begum is thriving as a farmer in Bangladesh after training from USAID. She raises cows, goats, and ducks; grows vegetables and fruit; and shares what she has learned with her community. Meet Monjuara at stories.usaid.gov. PHOTO: MORGANA WINGARD FOR USAID
i
ABOUT THIS REPORT
• Accountability of Tax Dollars Act (ATDA) of 2002 – expands auditing requirement for financial statements to non-CFO Act agencies;
• Government Performance and Results Act (GPRA) Modernization Act (GPRAMA) of 2010 – requires quarterly performance reviews of federal policy and management priorities;
• Improper Payments Information Act (IPIA) of 2002, as amended by Improper Payments Elimination and Recovery Act (IPERA) of 2010 and the Improper Payments Elimination and Recovery Improvement Act (IPERIA) of 2012 – requires agencies to improve efforts to reduce and recover improper payments and requires federal agencies to expand their efforts to identify, recover, and prevent improper payments;
• Fraud Reduction and Data Analytics Act of 2015 – requires agencies to submit to Congress as part of the annual financial report of the agency a report on the agency’s progress in improving federal agency financial and administrative controls and procedures to assess and mitigate fraud risks, and to improve federal agency’s development and use of data analytics for the purpose of identifying, preventing, and responding to fraud, including improper payments;
• Grants Oversight and New Efficiency (GONE) Act of 2016 – requires agencies to report on federal grant and cooperative agreement awards which have not yet been closed out and for which the period of performance, including extensions, elapsed for more than two years. On August 15, 2016, OMB issued Management Procedures Memo MPM-2016-04, implementing guidance for the GONE Act that includes a high-level public reporting component through the AFR.
In lieu of a combined PAR, USAID elects to produce an AFR with a primary focus on financial results and a high-level discussion of performance results, along with an Annual Performance Report (APR) which details strategic goals and performance results. The FY 2017 APR will be submitted to OMB in March 2018. Both reports will be available at https://www.usaid.gov/results-and-data/performance-reporting.
The U.S. Agency for International Development (USAID) Agency Financial Report (AFR) for fiscal year (FY) 2017 provides an overview of the Agency’s performance and financial information. The AFR demonstrates to Congress, the President, and the public USAID’s commitment to its mission and accountability for the resources entrusted to it. This report is available on USAID’s website at https://www.usaid.gov/results-and-data/progress-data/agency-financial-report and includes information that satisfies the reporting requirements contained in the following legislation:
• Inspector General Act of 1978 [Amended] – requires information on management actions in response to the Office of Inspector General (OIG) audits;
• Federal Managers’ Financial Integrity Act (FMFIA) of 1982 – requires ongoing evaluations of, and reports on, the adequacy of internal accounting systems and administrative controls, not just controls over financial reporting, but also controls over program areas;
• Chief Financial Officers (CFO) Act of 1990 – requires better financial accounting and reporting;
• Government Management Reform Act (GMRA) of 1994 – requires annual audited agency-level financial statements, as well as an annual audit of government-wide consolidated financial statements;
• Federal Financial Management Improvement Act (FFMIA) of 1996 – requires an assessment of an agency’s financial management systems for adherence to government-wide requirements to ensure accurate, reliable, and timely financial management information;
• Reports Consolidation Act of 2000 – permits agencies to prepare a combined Performance and Accountability Report (PAR). During FY 2007 and FY 2008, the Office of Management and Budget (OMB) conducted a pilot in which agencies were permitted to produce an alternative to the consolidated PAR, which USAID has done since FY 2007;
USAID FY 2017 AGENCY FINANCIAL REPORT | MANAGEMENT’S DISCUSSION AND ANALYSIS
USAID AT A GLANCE
WHO USAID IS
• An independent Federal Government agency.
• Receives overall foreign policy guidance from the Secretary of State.
• Headquartered in Washington, D.C.
• U.S. Government’s lead agency for development, and is an essential component of American foreign policy and national security.
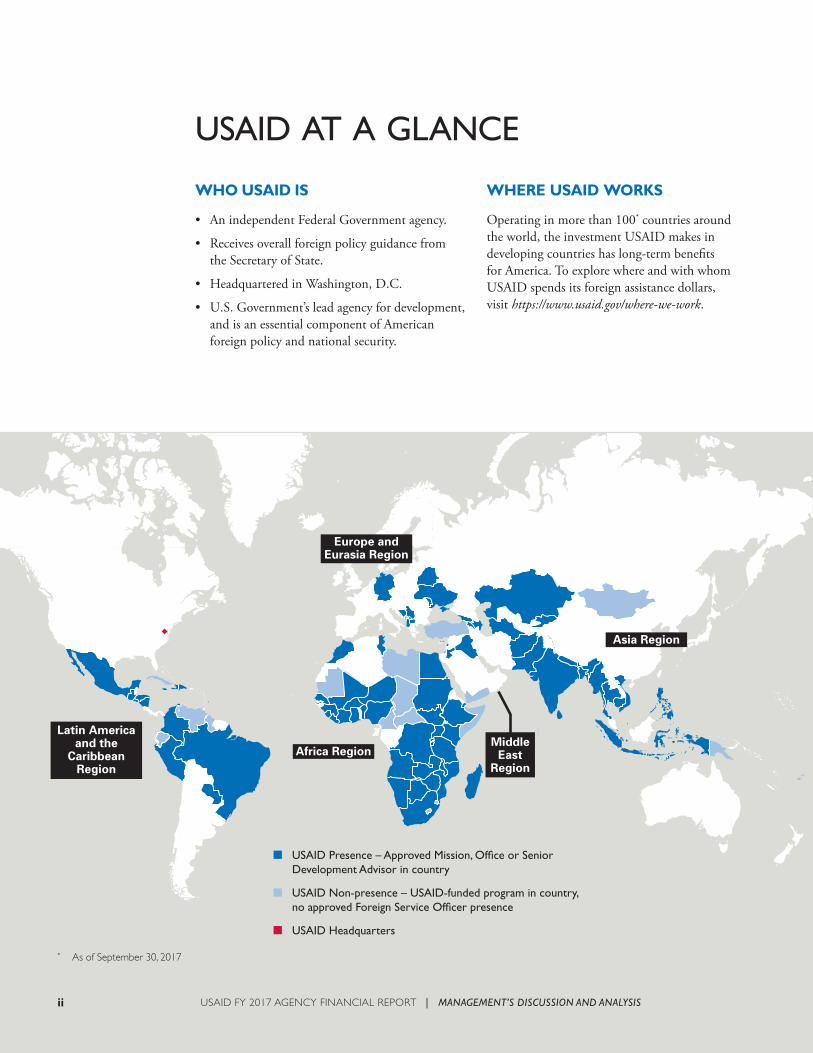
Operating in more than 100* countries around the world, the investment USAID makes in developing countries has long-term benefits for America. To explore where and with whom USAID spends its foreign assistance dollars, visit https://www.usaid.gov/where-we-work.
WHERE USAID WORKS
USAID FY 2017 AGENCY FINANCIAL REPORT | MANAGEMENT’S DISCUSSION AND ANALYSISii
* As of September 30, 2017
iii
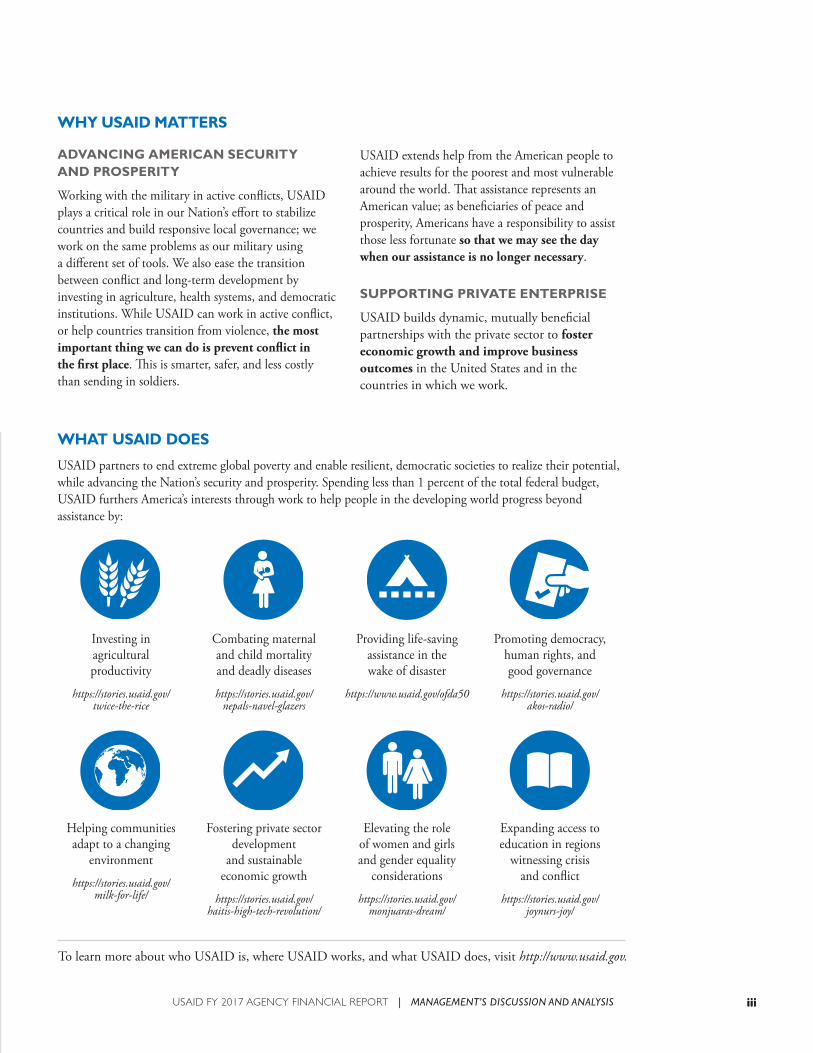
Investing in agricultural productivity
https://stories.usaid.gov/twice-the-rice
Combating maternal and child mortality and deadly diseases
https://stories.usaid.gov/nepals-navel-glazers
Providing life-saving assistance in the wake of disaster
https://www.usaid.gov/ofda50
Promoting democracy, human rights, and good governance
https://stories.usaid.gov/akos-radio/
Helping communities adapt to a changing
environment
https://stories.usaid.gov/milk-for-life/
Fostering private sector development
and sustainable economic growth
https://stories.usaid.gov/haitis-high-tech-revolution/
Elevating the role of women and girls and gender equality
considerations
https://stories.usaid.gov/monjuaras-dream/
Expanding access to education in regions
witnessing crisis and conflict
https://stories.usaid.gov/joynurs-joy/
To learn more about who USAID is, where USAID works, and what USAID does, visit http://www.usaid.gov.
USAID partners to end extreme global poverty and enable resilient, democratic societies to realize their potential, while advancing the Nation’s security and prosperity. Spending less than 1 percent of the total federal budget, USAID furthers America’s interests through work to help people in the developing world progress beyond assistance by:
WHAT USAID DOES
WHY USAID MATTERS
USAID FY 2017 AGENCY FINANCIAL REPORT | MANAGEMENT’S DISCUSSION AND ANALYSIS iii
ADVANCING AMERICAN SECURITY AND PROSPERITY
Working with the military in active conflicts, USAID plays a critical role in our Nation’s effort to stabilize countries and build responsive local governance; we work on the same problems as our military using a different set of tools. We also ease the transition between conflict and long-term development by investing in agriculture, health systems, and democratic institutions. While USAID can work in active conflict, or help countries transition from violence, the most important thing we can do is prevent conflict in the first place. This is smarter, safer, and less costly than sending in soldiers.
USAID extends help from the American people to achieve results for the poorest and most vulnerable around the world. That assistance represents an American value; as beneficiaries of peace and prosperity, Americans have a responsibility to assist those less fortunate so that we may see the day when our assistance is no longer necessary.
SUPPORTING PRIVATE ENTERPRISE
USAID builds dynamic, mutually beneficial partnerships with the private sector to foster economic growth and improve business outcomes in the United States and in the countries in which we work.
TABLE OF CONTENTS
vi A MESSAGE FROM THE ADMINISTRATOR
A brief message from the Agency Head highlighting the Agency’s vision and an assessment of the reliability and completeness of financial and performance data in the report.
MANAGEMENT’S DISCUSSION AND ANALYSIS
1 MANAGEMENT’S DISCUSSION AND ANALYSIS (MD&A)
The MD&A provides an overview of the Agency’s financial and performance results. It summarizes the Agency’s mission, activities, program and financial performance, systems, controls, legal compliance, and financial position.
3 Mission and Organizational Structure
6 Program Performance Overview
26 Looking Forward
28 Analysis of Financial Statements
32 Limitations of the Financial Statements
33 Analysis of Entity’s Systems, Controls, and Legal Compliance
33 Management Assurances
37 Goals and Supporting Financial System Strategies
40 Other Management Information, Initiatives, and Issues
FINANCIAL SECTION
53 FINANCIAL SECTION
55 A Message from the Chief Financial Officer
57 Independent Auditor’s Report
77 Financial Statements and Notes
123 Required Supplementary Information
iv USAID FY 2017 AGENCY FINANCIAL REPORT
v
OTHER INFORMATION
129 OTHER INFORMATION
131 Office of Inspector General’s Statement of Most Serious Management and Performance Challenges for USAID
150 Summary of Financial Statement Audit and Management Assurances
152 Payment Integrity
157 Fraud Reduction Report
160 Reduce the Footprint
161 Grants Oversight and New Efficiency (GONE) Act Reporting
of Unclosed Grant and Cooperative Agreement Awards
APPENDICES
163 APPENDICES
165 Appendix A. Summary of FMFIA Definitions and Reporting
166 Appendix B. Programs Assessed for Improper Payments for FY 2017
167 Appendix C. Revised Program Structure for FY 2017
168 Appendix D. Abbreviations and Acronyms
USAID FY 2017 AGENCY FINANCIAL REPORT
This report is available at: https://www.usaid.gov/results-and-data/progress-data/agency-financial-report.
A MESSAGE FROM THE ADMINISTRATOR
This is the vision toward which we are working. For USAID to succeed, we must constantly improve. We should be better today than we were yesterday.
The actions and goals described in this Agency Financial Report (AFR) are critical to that effort. We worked with the Office of Inspector General to ensure the financial and summary performance data included in this report are complete, reliable, and accurate. This AFR shares how we are becoming more effective and efficient, including steps we are taking to be more responsive to the Department of the Treasury and our interagency partners. It describes how we are strengthening country capacity, and becoming more outcome driven. And it shares how we are strengthening our monitoring– and–evaluation systems to improve oversight and accountability. By taking these steps, I believe that USAID is helping to move us closer to the day when foreign assistance is no longer needed.
Mark A. GreenUSAID AdministratorNovember 15, 2017
HELPING PEOPLE PROGRESS BEYOND ASSISTANCE
Mark A. Green
The day I arrived at USAID, I described our mission like this: the purpose of foreign assistance should be ending its need to exist. I believe that each of our programs should look forward to the day when it can end, and, around the world, we should measure our work by how far each investment moves us closer to that day.
Each country must lead its own development journey, so I believe USAID should prioritize tools and reforms that build a country’s capacity to take on its own challenges. Every human being, every family, every community, and every country wants the self-dignity of providing for itself and being self-reliant.
In the area of humanitarian assistance, we will always stand with people when disaster strikes or crises emerge, because that is who we are as Americans. As the world’s leader in humanitarian assistance, we will also call on others to do their part.
As responsible stewards of taxpayer dollars, we will work relentlessly to ensure our partners deliver assistance as effectively as possible, and because we believe that the truest sense of compassion comes with helping others to help themselves. As we respond to immediate needs, we will also look for ways to build partner resilience against future crises.
vi USAID FY 2017 AGENCY FINANCIAL REPORT | A MESSAGE FROM THE ADMINISTRATOR
MANAGEMENT’S DISCUSSION AND ANALYSIS

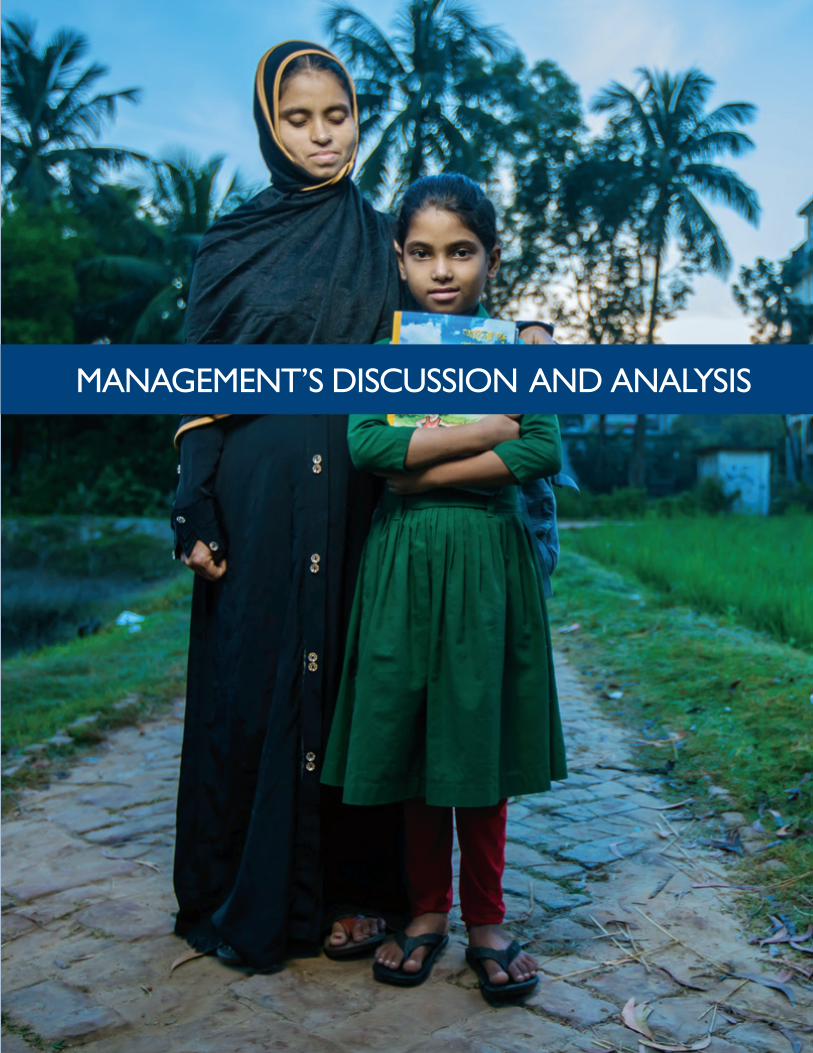
(Preceding page) Joynur’s mother encourages her daughter to be enthusiastic about learning. USAID is training teachers in Bangladesh to emphasize reading with comprehension and installing reading corners in classrooms to provide access to books. Meet Joynur at stories.usaid.gov. PHOTO: MORGANA WINGARD FOR USAID
(Above) Isobel Báez on route to a youth center in the Dominican Republic. The USAID program provides a safety net for at-risk youth ages 11 to 24 and helps prevent crime. Meet Isobel at stories.usaid.gov. PHOTO: THOMAS CRISTOFOLETTI FOR USAID
3
MISSION AND ORGANIZATIONAL STRUCTURE
MISSION STATEMENT
We partner to end extreme poverty and to promote resilient, democratic societies while advancing our security and prosperity.*
USAID has elected to produce an Agency Financial Report (AFR) and Annual Performance Report (APR) as an alternative to the consolidated Performance and Accountability Report (PAR). The Agency will submit its FY 2017 APR to the Office of Management and Budget in March 2018; and will post it on the Agency’s website at http://www.usaid.gov/results-and-data/progress-data/annual-performance-report.
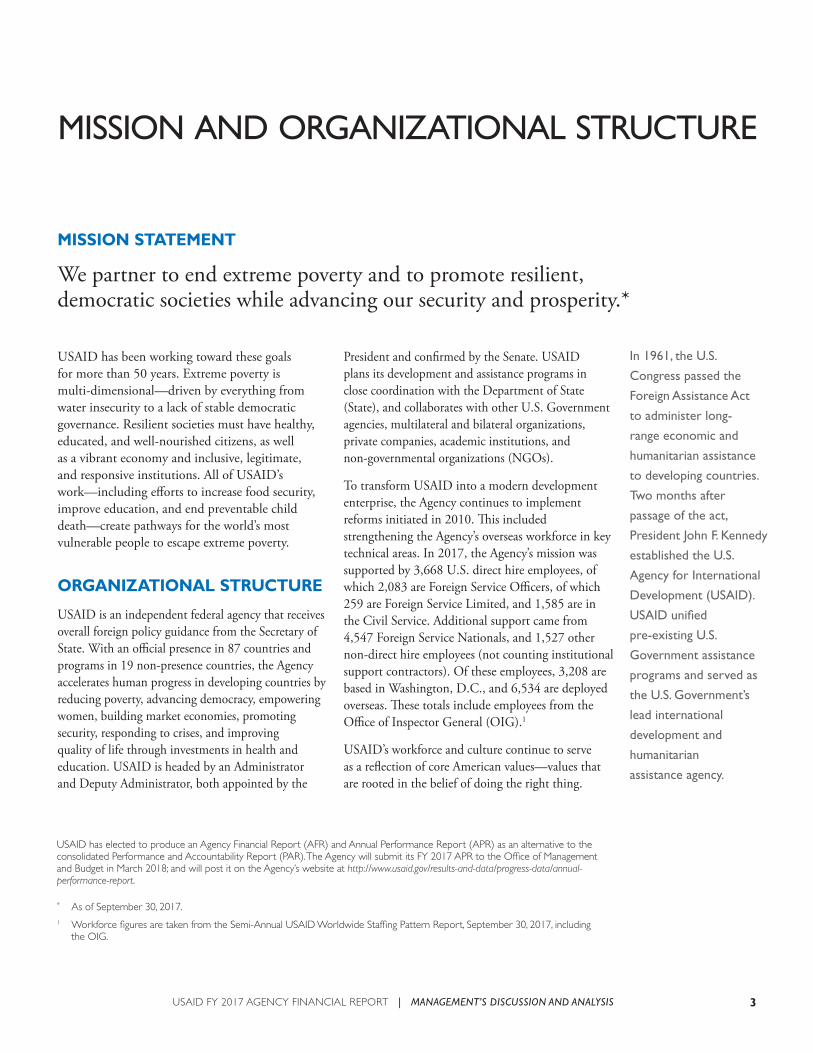
USAID has been working toward these goals for more than 50 years. Extreme poverty is multi-dimensional—driven by everything from water insecurity to a lack of stable democratic governance. Resilient societies must have healthy, educated, and well-nourished citizens, as well as a vibrant economy and inclusive, legitimate, and responsive institutions. All of USAID’s work—including efforts to increase food security, improve education, and end preventable child death—create pathways for the world’s most vulnerable people to escape extreme poverty.
ORGANIZATIONAL STRUCTURE
USAID is an independent federal agency that receives overall foreign policy guidance from the Secretary of State. With an official presence in 87 countries and programs in 19 non-presence countries, the Agency accelerates human progress in developing countries by reducing poverty, advancing democracy, empowering women, building market economies, promoting security, responding to crises, and improving quality of life through investments in health and education. USAID is headed by an Administrator and Deputy Administrator, both appointed by the
President and confirmed by the Senate. USAID plans its development and assistance programs in close coordination with the Department of State (State), and collaborates with other U.S. Government agencies, multilateral and bilateral organizations, private companies, academic institutions, and non-governmental organizations (NGOs).
To transform USAID into a modern development enterprise, the Agency continues to implement reforms initiated in 2010. This included strengthening the Agency’s overseas workforce in key technical areas. In 2017, the Agency’s mission was supported by 3,668 U.S. direct hire employees, of which 2,083 are Foreign Service Officers, of which 259 are Foreign Service Limited, and 1,585 are in the Civil Service. Additional support came from 4,547 Foreign Service Nationals, and 1,527 other non-direct hire employees (not counting institutional support contractors). Of these employees, 3,208 are based in Washington, D.C., and 6,534 are deployed overseas. These totals include employees from the Office of Inspector General (OIG).1
USAID’s workforce and culture continue to serve as a reflection of core American values—values that are rooted in the belief of doing the right thing.
In 1961, the U.S.
Congress passed the
Foreign Assistance Act
to administer long-
range economic and
humanitarian assistance
to developing countries.
Two months after
passage of the act,
President John F. Kennedy
established the U.S.
Agency for International
Development (USAID).
USAID unified
pre-existing U.S.
Government assistance
programs and served as
the U.S. Government’s
lead international
development and
humanitarian
assistance agency.
1 Workforce figures are taken from the Semi-Annual USAID Worldwide Staffing Pattern Report, September 30, 2017, including the OIG.
* As of September 30, 2017.
USAID FY 2017 AGENCY FINANCIAL REPORT | MANAGEMENT’S DISCUSSION AND ANALYSIS
There is no escaping
our obligations: our
moral obligations as a
wise leader and good
neighbor in the inter-
dependent community
of free nations—our
economic obligations
as the wealthiest
people in a world of
largely poor people,
as a nation no longer
dependent upon the
loans from abroad
that once helped us
develop our own
economy—and
our political
obligations as the
single largest counter
to the adversaries
of freedom.
– John F. Kennedy
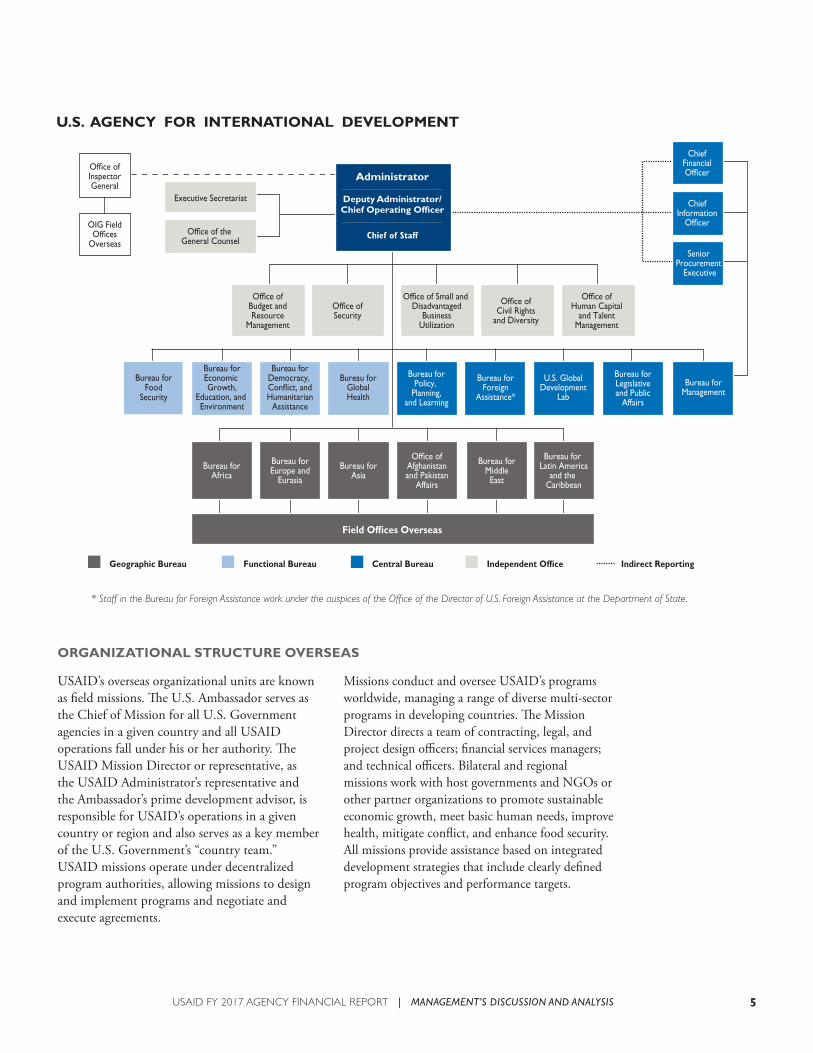
ORGANIZATIONAL STRUCTURE IN WASHINGTON
In Washington, D.C., USAID’s geographic, functional, and central bureaus are responsible for coordinating the Agency’s activities and supporting implementation of programs overseas. Independent offices support crosscutting or more limited services. The geographic bureaus are Africa, Asia, Middle East, Latin America and the Caribbean, Europe and Eurasia, and the Office of Afghanistan and Pakistan Affairs.
There are four functional bureaus that support the geographic bureaus and offices:
• Bureau for Food Security (BFS), which provides expertise in agricultural productivity and addressing hunger and malnutrition;
• Bureau for Economic Growth, Education, and Environment (E3), which provides expertise in economic growth, trade opportunities, technology, education, and environment/natural resource management;
• Bureau for Democracy, Conflict, and Humanitarian Assistance (DCHA), which provides expertise in democracy and governance, conflict management and mitigation, and humanitarian assistance;
• Bureau for Global Health (GH), which provides expertise in global health challenges, such as maternal and child health and HIV/AIDS.
Central bureaus and offices include:
• Bureau for Policy, Planning, and Learning (PPL), which oversees all program, policy, and develop-ment and promotes a learning environment;
• Bureau for Foreign Assistance (FA), which provides strategic planning, regional coor-dination, and program budget formulation in coordination with PPL and the Office of Budget and Resource Management (BRM);
• U.S. Global Development Lab (Lab), which provides expertise in the application of science, technology, innovation, and partnerships to extend the Agency’s development impact in helping to end extreme poverty;
• Bureau for Legislative and Public Affairs (LPA), which manages the Agency’s legislative engage-ments, strategic communications, and outreach efforts to promote understanding of USAID’s mission and programs;
• Bureau for Management (M), which administers centralized support services for the Agency’s worldwide operations.
In addition to these central bureaus, USAID has seven independent offices that are responsible for discrete Agency functions that include legal, budget, diversity programs, security, and partnerships. These offices are: (1) the Office of the Executive Secretariat, (2) the Office of the General Counsel, (3) the Office of Budget and Resource Management, (4) the Office of Security, (5) the Office of Small and Disadvantaged Business and Utilization, (6) the Office of Civil Rights and Diversity, and (7) the Office of Human Capital and Talent Management (HCTM), which oversees the planning, development, management, and administration of human capital for the Agency.
The OIG is independent and separate from the Office of the Administrator. The OIG reviews the integrity of Agency operations through audits, appraisals, investigations, and inspections.
Finally, the Chief Financial Officer, Chief Information Officer, and Senior Procurement Executive report directly to the Assistant Administrator in the Bureau for Management (M/AA) and may indirectly report to the Administrator. The Chief Financial Officers Act of 1990, Chief Information Officer Act of 1996, and the Federal Acquisition Reform Act (FARA) of 1996 mandated the establishment of these positions. The intention was to elevate these positions, to establish clear accountability, and to improve the Federal Government’s financial and information management activities.
USAID FY 2017 AGENCY FINANCIAL REPORT | MANAGEMENT’S DISCUSSION AND ANALYSIS4
5
ORGANIZATIONAL STRUCTURE OVERSEAS
Missions conduct and oversee USAID’s programs worldwide, managing a range of diverse multi-sector programs in developing countries. The Mission Director directs a team of contracting, legal, and project design officers; financial services managers; and technical officers. Bilateral and regional missions work with host governments and NGOs or other partner organizations to promote sustainable economic growth, meet basic human needs, improve health, mitigate conflict, and enhance food security. All missions provide assistance based on integrated development strategies that include clearly defined program objectives and performance targets.
USAID’s overseas organizational units are known as field missions. The U.S. Ambassador serves as the Chief of Mission for all U.S. Government agencies in a given country and all USAID operations fall under his or her authority. The USAID Mission Director or representative, as the USAID Administrator’s representative and the Ambassador’s prime development advisor, is responsible for USAID’s operations in a given country or region and also serves as a key member of the U.S. Government’s “country team.” USAID missions operate under decentralized program authorities, allowing missions to design and implement programs and negotiate and execute agreements.
USAID FY 2017 AGENCY FINANCIAL REPORT | MANAGEMENT’S DISCUSSION AND ANALYSIS
As the U.S. Government’s principal leader, coordinator, and provider of international development and humanitarian assistance, USAID advances national security and economic prosperity, while demonstrating American values and goodwill abroad. Agency investments save lives, foster inclusive economic growth, reduce poverty, and strengthen democratic governance while helping other countries progress beyond needing USAID’s assistance.
To help the Agency determine how well it is meeting its goals, and maximizing its relevance and value as a lead development organization, USAID assesses its performance across three key areas: delivering results on a meaningful scale through a strengthened USAID; promoting high-impact partnerships and local ownership that enables countries to sustain development processes and outcomes; and identifying and scaling up innovative, breakthrough solutions to intractable development challenges.
1. DELIVER RESULTS ON A MEANINGFUL SCALE THROUGH A STRENGTHENED USAID
To maximize USAID’s impact with every development dollar, the Agency is pursuing a more strategic, focused, and results-oriented approach. The purpose of foreign assistance should be to end its need to exist. The effectiveness of the Agency’s work should be measured by how far each investment moves it closer to that day. The Agency continues to strengthen the impact of its investments by:
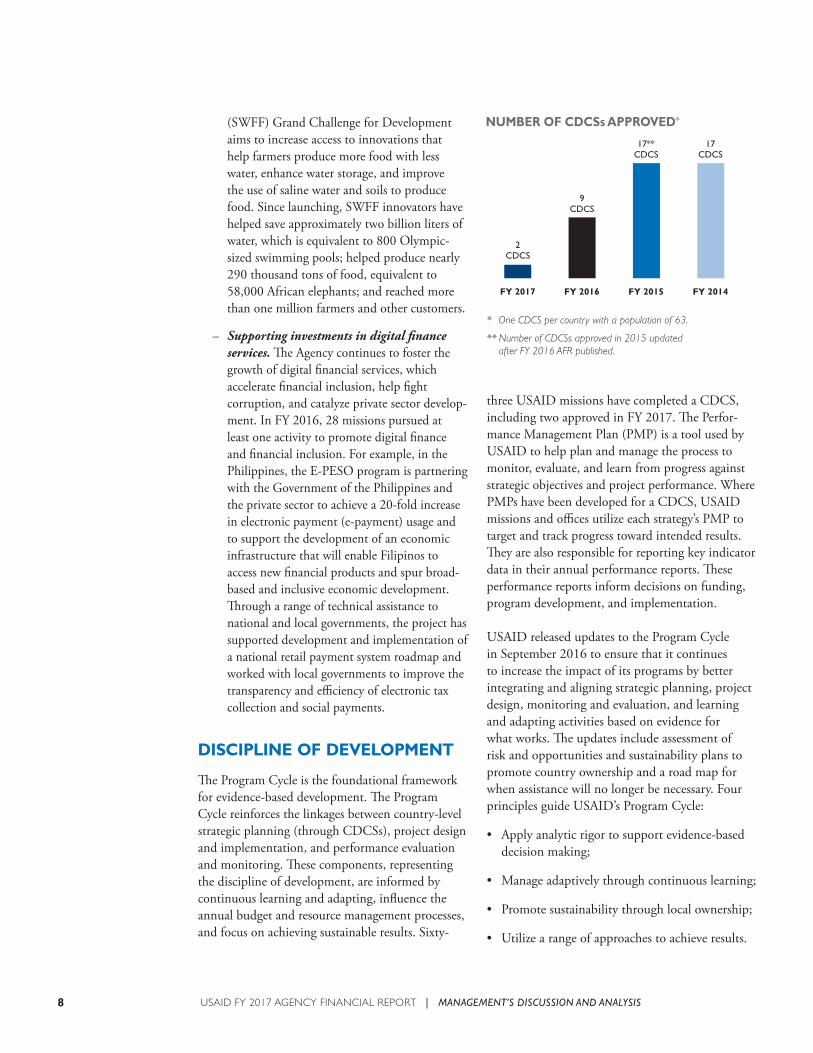
• Designing country and sector development strategies and projects to better align U.S. Government resources with the priorities of its partner countries. USAID operating units have completed 63 out of 63 Country Development Cooperation Strategies (CDCSs), including two approved
in FY 2017—representing the majority of USAID missions—and published them on USAID.gov (https://www.usaid.gov/results-and-data/planning/country-strategies-cdcs).
• Evaluating projects for what works and what does not. In 2011, USAID implemented an Evaluation Policy that has been called a “model for other federal agencies” by the Evaluation Policy Task Force of the American Evaluation Association. In FY 2016, USAID operating units completed 138 external evaluations, bringing the total number to over 1 thousand since the Agency established the Evaluation Policy. USAID evaluation reports are available to the public online at the Development Experience Clearinghouse (DEC) (https://dec.usaid.gov/dec/home/Default.aspx).
• Investing in Agency staff by introducing new ways to strengthen and grow the best talent. USAID’s Mentoring Program enhanced the professional development of more than 1,100 staff over FY 2016, increasing by 22 percent from FY 2015. Since the program’s inception, the number of participants in the mentoring program has increased by more than 73 percent. Leadership support for mentoring has helped the Agency improve teamwork, program management, and performance.
1. PROMOTE SUSTAINABLE DEVELOPMENT THROUGH HIGH-IMPACT PARTNERSHIPS AND LOCAL OWNERSHIP
To achieve long-term, sustainable development, USAID collaborates with and supports government institutions, private sector partners, and civil society organizations that serve as engines of growth and progress for their own nations. The Agency is developing the capabilities of its partners to direct their own development by:
2
PROGRAM PERFORMANCE OVERVIEW
1
USAID FY 2017 AGENCY FINANCIAL REPORT | MANAGEMENT’S DISCUSSION AND ANALYSIS6
7
• Promoting local ownership by investing directly in partner governments and civil society organizations where the capacity exists, and strengthening it where there are gaps. Since 2010, USAID has tripled the percentage of funding obligated through local govern-ments, civil society partners, and local private sector actors. Overall, the Agency obligated 15.9 percent of funding to local actors in FY 2016 (22.5 percent, including cash transfers and qualifying trust funds). These local solutions investments have demonstrated evidence of progress, local resourcing, and sustained results.
• Encouraging direct engagement of staff with local actors and systems. The percentage of field staff who engaged with a local partner was 58.5 percent in FY 2016. A high percentage of USAID mission staff continue to work closely with local partners overseas—whether host country governments, regional entities, or local non-governmental organizations or commercial firms—to increase the success and sustainability of interventions. Missions have learned that direct engagement yields results and are using a broad range of approaches, including:
– direct training to build in-country capacity (financial, procurement, reporting);
– joint program development and monitoring;
– policy advice and improved coordination by placing advisors inside national and regional government agencies.
• Forging public-private partnerships with new and existing partners that leverage new resources and expertise to expand the reach and impact of the Agency’s work. In FY 2016, USAID missions leveraged commitments of $484 million in private sector resources for new Global Development Alliances (GDAs), i.e., partnerships with at least 1:1 cost sharing. Since 2001, USAID has built more than 1,800 partnerships with the private sector involving more than 3,900 unique partner organizations, expecting to leverage more than $38 billion in non-U.S. government funds. These partnerships not only make budgets go farther, they also bring the unique expertise and assets of the private sector such as efficiency and effectiveness.
• Improving lending to new and emerging markets through the Development Credit Authority (DCA). USAID’s DCA credit guarantee portfolio grew significantly in 2016, bringing the total credit mobilized since the beginning of the program to nearly $5.0 billion. Compared to a portfolio of less than $2.0 billion mobilized from 1999 through 2010, it shows significant growth in both size and importance of the DCA in the last several years. In FY 2016 alone, USAID mobilized $892 million in private capital through the DCA, which is close to half the size of the total portfolio from the combined first 12 years of the program, through 56 new guarantees signed with 55 financial partners across 27 countries.
3. IDENTIFY AND SCALE UP INNOVATIVE, BREAKTHROUGH SOLUTIONS TO INTRACTABLE DEVELOPMENT CHALLENGES
• USAID fosters a culture of innovation and uses its convening power to test and scale breakthrough innovations to solve development challenges faster and cheaper. The U.S. Global Development Lab (Lab) seeks to increase the application of science, technology, innovation, and partnerships to achieve, sustain, and extend the Agency’s development impact. The Lab sources, tests, and delivers proven solutions—from expanding the reach of mobile banking to teaching children to read in their local language. The Agency sustains and extends its development impact by:
– Encouraging innovation to improve lives. USAID brings new perspectives to long-standing development challenges through flagship innovation initiatives. More than 16 thousand people have applied for innovation grants, 75 percent of whom have never received USAID funding, and approximately 25 percent of Grand Challenge grantees are from developing countries. In FY 2016, the Lab supported 13 high-potential innovations, which have significant beneficiary reach, sustainable financing, and rigorous evidence of impact. For example, the Securing Water for Food
3
USAID FY 2017 AGENCY FINANCIAL REPORT | MANAGEMENT’S DISCUSSION AND ANALYSIS
(SWFF) Grand Challenge for Development aims to increase access to innovations that help farmers produce more food with less water, enhance water storage, and improve the use of saline water and soils to produce food. Since launching, SWFF innovators have helped save approximately two billion liters of water, which is equivalent to 800 Olympic-sized swimming pools; helped produce nearly 290 thousand tons of food, equivalent to 58,000 African elephants; and reached more than one million farmers and other customers.
– Supporting investments in digital finance services. The Agency continues to foster the growth of digital financial services, which accelerate financial inclusion, help fight corruption, and catalyze private sector develop-ment. In FY 2016, 28 missions pursued at least one activity to promote digital finance and financial inclusion. For example, in the Philippines, the E-PESO program is partnering with the Government of the Philippines and the private sector to achieve a 20-fold increase in electronic payment (e-payment) usage and to support the development of an economic infrastructure that will enable Filipinos to access new financial products and spur broad-based and inclusive economic development. Through a range of technical assistance to national and local governments, the project has supported development and implementation of a national retail payment system roadmap and worked with local governments to improve the transparency and efficiency of electronic tax collection and social payments.
DISCIPLINE OF DEVELOPMENT
The Program Cycle is the foundational framework for evidence-based development. The Program Cycle reinforces the linkages between country-level strategic planning (through CDCSs), project design and implementation, and performance evaluation and monitoring. These components, representing the discipline of development, are informed by continuous learning and adapting, influence the annual budget and resource management processes, and focus on achieving sustainable results. Sixty-
three USAID missions have completed a CDCS, including two approved in FY 2017. The Perfor-mance Management Plan (PMP) is a tool used by USAID to help plan and manage the process to monitor, evaluate, and learn from progress against strategic objectives and project performance. Where PMPs have been developed for a CDCS, USAID missions and offices utilize each strategy’s PMP to target and track progress toward intended results. They are also responsible for reporting key indicator data in their annual performance reports. These performance reports inform decisions on funding, program development, and implementation.
USAID released updates to the Program Cycle in September 2016 to ensure that it continues to increase the impact of its programs by better integrating and aligning strategic planning, project design, monitoring and evaluation, and learning and adapting activities based on evidence for what works. The updates include assessment of risk and opportunities and sustainability plans to promote country ownership and a road map for when assistance will no longer be necessary. Four principles guide USAID’s Program Cycle:
• Apply analytic rigor to support evidence-based decision making;
• Manage adaptively through continuous learning;
• Promote sustainability through local ownership;
• Utilize a range of approaches to achieve results.
USAID FY 2017 AGENCY FINANCIAL REPORT | MANAGEMENT’S DISCUSSION AND ANALYSIS8
9
QUALITY OF MONITORING AND EVALUATION
As part of the Program Cycle, USAID’s monitoring and evaluation requirements help the Agency build a body of evidence from which to learn and adapt, as well as increase the quality and transparency of that evidence.
In 2016, USAID published a study titled Evaluation Utilization at USAID, which found that at several stages during the USAID Program Cycle, evaluation use was evident, strong, and compared well to those of other U.S. Government agencies. At the country level, 59 percent of approved strategies referenced USAID evaluations, and 71 percent of respondents reported using evaluations to design or modify a USAID project or activity. The study also found the most common changes were actions that refocus ongoing activities. Findings from the study helped inform revisions to USAID’s Automated Directive Service (ADS) Chapter 201, which discusses USAID’s policy on the Program Cycle and emphasizes using and learning from evaluations and other evidence in decision making. To promote internal and external learning from evaluations, USAID requires evaluations (with limited exceptions) to be made publicly available on USAID’s DEC at https://dec.usaid.gov.
USAID is also building staff and partner capacity to generate and use quality evidence for decision making and improving program effectiveness. USAID’s capacity building approach focuses on four main areas of work: developing classroom and online training courses, creating tools and guidance to support staff in implementing Program Cycle procedures, direct technical assistance to USAID missions and offices on Program Cycle processes, and facilitating peer-to-peer learning by hosting communities of practice. For example:
• USAID has developed a sophisticated training curriculum with a set of online and classroom courses ranging from introductory to more advanced content and targeted to specific staff roles to build capacity in Program Cycle processes. Courses include: Introduction to the Program Cycle; Project and Activity Design and
Implementation; Performance Monitoring and Evaluation; and Better Development through Collaborating, Learning, and Adapting.
• As of July 2017, USAID has trained more than 2,600 staff in program evaluation and monitoring since 2011.
• USAID provides templates, checklists, guidance documents and other tools that support staff in planning, designing, managing, and learning from monitoring and evaluation. USAID toolkits for good practice in evaluation (https://usaidlearninglab.org/evaluation) , monitoring (https://usaidlearninglab.org/content/monitoring-toolkit), and learning (https://usaidlearninglab.org/cla-toolkit) have been published on USAID’s Learning Lab website (https://usaidlearninglab.org/).
PERFORMANCE INDICATORS AND TRENDS
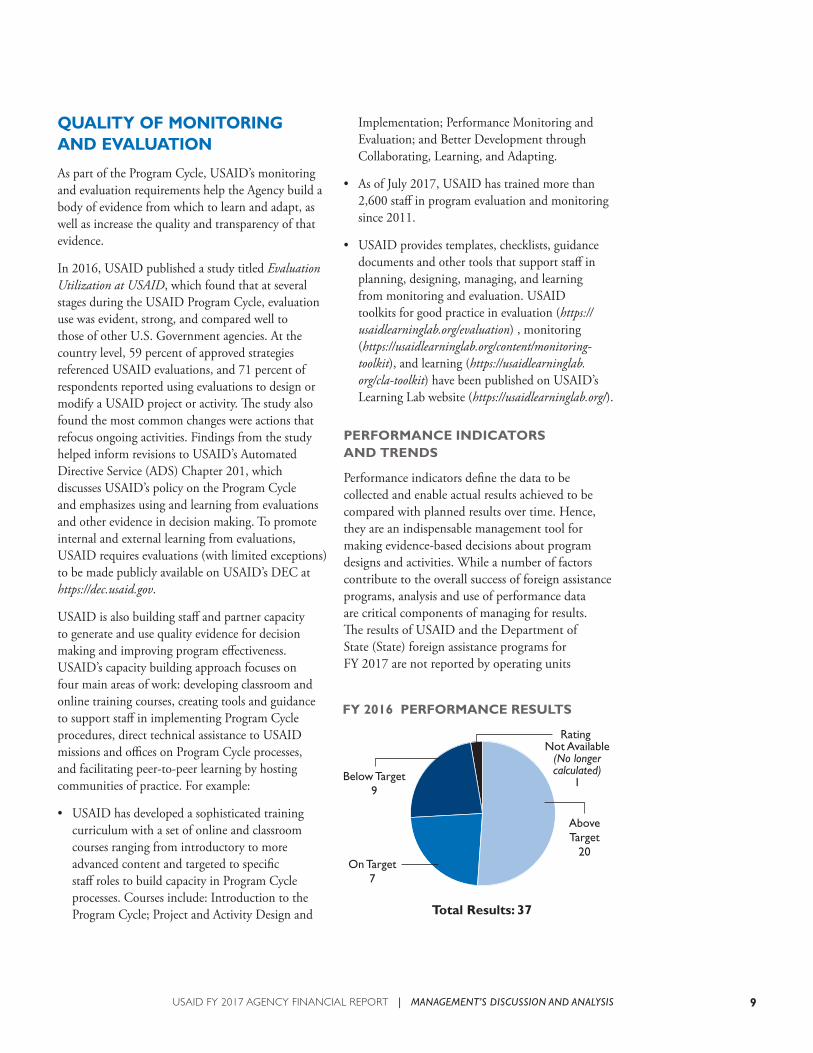
Performance indicators define the data to be collected and enable actual results achieved to be compared with planned results over time. Hence, they are an indispensable management tool for making evidence-based decisions about program designs and activities. While a number of factors contribute to the overall success of foreign assistance programs, analysis and use of performance data are critical components of managing for results. The results of USAID and the Department of State (State) foreign assistance programs for FY 2017 are not reported by operating units
USAID FY 2017 AGENCY FINANCIAL REPORT | MANAGEMENT’S DISCUSSION AND ANALYSIS
strengthen democratic governance, and help avert crises worldwide. USAID continues striving to achieve development results, confront threats to national security and global stability, demonstrate American leadership, and ensure the effectiveness and accountability of its programs to the American taxpayer.
Operationally, USAID and State implement this directive by working cooperatively to pursue U.S. national security objectives abroad. They do this through diplomacy and foreign assistance programs that are implemented by both agencies. One vehicle for this engagement is the National Security Strategy. A draft of the new National Security Strategy, which will have implications for USAID programs in Africa, is currently underway.
Additionally, as of the end of FY 2017, USAID and State are currently developing the FY 2018 – FY 2022 Joint Strategic Plan (JSP). This effort coincides with State’s and USAID’s reform efforts, pursuant to Office of Management and Budget (OMB) Memo 17-22, currently underway at both agencies. An overview of the new JSP will outline the policy priorities that will facilitate the development of State and USAID strategies, and will align with the President’s Management Agenda. This will involve updating the strategic objectives, goals, and targets from the FY 2014 –2017 JSP, and may include modifying, adding and/or removing current indicators. The FY 2017 Agency Financial Report will serve as the final year for conveying accomplishments under the FY 2014 – FY 2017 JSP.
USAID’s and State’s joint strategic goals support the U.S. Government’s overall efforts to shape and sustain a peaceful, prosperous, just, and democratic world. These goals foster conditions for stability and progress for the benefit of the American people and people everywhere. USAID and State have reiterated their commitment to joint planning to implement foreign policy initiatives and invest effectively in foreign assistance programs.
The Government Performance and Results Act (GPRA) of 2003 require agencies to develop strategic plans. Since 2004, USAID and State have created joint strategic goals and objectives, Agency Priority
until December 2017, after the required publication date of USAID’s Agency Financial Report (AFR). Accordingly, the most recent performance data contained in this report are for FY 20162, with baseline and trend data included when available.
In assessing performance, it is important to underscore the challenges faced by USAID’s assistance programs. In spite of a variety of obstacles, most USAID strategic goals met or exceeded their targets in FY 2016.
DATA QUALITY
Data are only useful for decision making if they are of high quality and provide the groundwork for informed decisions. As indicated in USAID’s ADS Chapter 201, USAID missions and operating units are required to follow standard processes to ensure data quality. A Performance Indicator Reference Sheet (PIRS) is the primary document USAID uses to ensure data quality and consistency. A PIRS must be developed for each performance indicator as it: (1) defines the indicator’s meaning, use, and the method of data collection; and (2) specifies where the data are sourced and identifies any limitations of the data. A Data Quality Assessment (DQA) is the process by which USAID assesses the validity, integrity, precision, reliability, and timeliness of performance indicator data. All data reported externally from a mission or operating unit must go through the DQA process. USAID obtains performance data from three sources: (1) primary (data collected by USAID or where collection is funded by USAID), (2) secondary (data compiled by USAID implementing partners but collected from other sources), and (3) third-party (data from other government agencies or other international organizations, e.g., World Bank or the United Nations).
STRATEGIC GOALS AND RESULTS
Development plays an indispensable role, alongside diplomacy and defense, in advancing U.S. national security and economic interests. USAID’s programs save lives, promote inclusive economic growth,
2 Annual targets are set before results of the previous year are calculated. Targets are included in the Performance Plan and Report (PPR) two years in advance. For example, targets for FY 2016 were set in the PPR of FY 2014.
USAID FY 2017 AGENCY FINANCIAL REPORT | MANAGEMENT’S DISCUSSION AND ANALYSIS10
11
Goals (APGs), and performance goals that reflect State’s and USAID’s global reach and impact as part of the USAID-State Joint Strategic Plan (http://www.usaid.gov/documents/1868/usaid-and-department-state-joint-strategic-plan).
Also per GPRAMA, USAID and State publicly reported, on a quarterly basis, the progress of the APGs (https://obamaadministration.archives.performance.gov/). The five APGs for FY 2016 – FY 2017 were in the following areas: Food Security
(USAID), Global Health (USAID), Climate Change (USAID and State), Consular Service Delivery (State), and Outreach to U.S. Businesses (State). Results for each of these APGs are included in the applicable Strategic Goal update sections in this report and on performance.gov. Reporting on these APGs was suspended in early 2017 due to a change in priorities from the new administration. As of the end of FY 2017, USAID and State are currently developing new APGs.
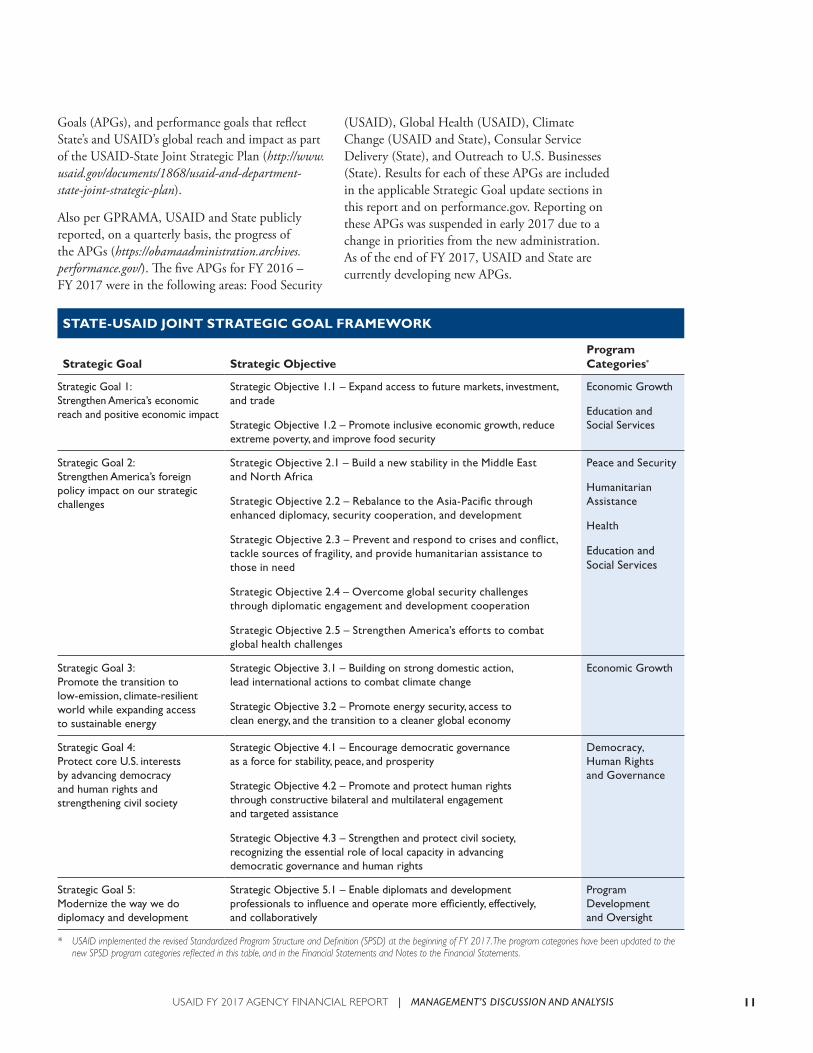
STATE-USAID JOINT STRATEGIC GOAL FRAMEWORK
Strategic Goal Strategic ObjectiveProgram Categories*
Strategic Goal 1: Strengthen America’s economic reach and positive economic impact
Strategic Objective 1.1 – Expand access to future markets, investment, and trade
Strategic Objective 1.2 – Promote inclusive economic growth, reduce extreme poverty, and improve food security
Economic Growth
Education and Social Services
Strategic Goal 2: Strengthen America’s foreign policy impact on our strategic challenges
Strategic Objective 2.1 – Build a new stability in the Middle East and North Africa
Strategic Objective 2.2 – Rebalance to the Asia-Pacific through enhanced diplomacy, security cooperation, and development
Strategic Objective 2.3 – Prevent and respond to crises and conflict, tackle sources of fragility, and provide humanitarian assistance to those in need
Strategic Objective 2.4 – Overcome global security challenges through diplomatic engagement and development cooperation
Strategic Objective 2.5 – Strengthen America’s efforts to combat global health challenges
Peace and Security
Humanitarian Assistance
Health
Education and Social Services
Strategic Goal 3: Promote the transition to low-emission, climate-resilient world while expanding access to sustainable energy
Strategic Objective 3.1 – Building on strong domestic action, lead international actions to combat climate change
Strategic Objective 3.2 – Promote energy security, access to clean energy, and the transition to a cleaner global economy
Economic Growth
Strategic Goal 4: Protect core U.S. interests by advancing democracy and human rights and strengthening civil society
Strategic Objective 4.1 – Encourage democratic governance as a force for stability, peace, and prosperity
Strategic Objective 4.2 – Promote and protect human rights through constructive bilateral and multilateral engagement and targeted assistance
Strategic Objective 4.3 – Strengthen and protect civil society, recognizing the essential role of local capacity in advancing democratic governance and human rights
Democracy, Human Rights and Governance
Strategic Goal 5: Modernize the way we do diplomacy and development
Strategic Objective 5.1 – Enable diplomats and development professionals to influence and operate more efficiently, effectively, and collaboratively
Program Development and Oversight
* USAID implemented the revised Standardized Program Structure and Definition (SPSD) at the beginning of FY 2017. The program categories have been updated to the new SPSD program categories reflected in this table, and in the Financial Statements and Notes to the Financial Statements.
USAID FY 2017 AGENCY FINANCIAL REPORT | MANAGEMENT’S DISCUSSION AND ANALYSIS
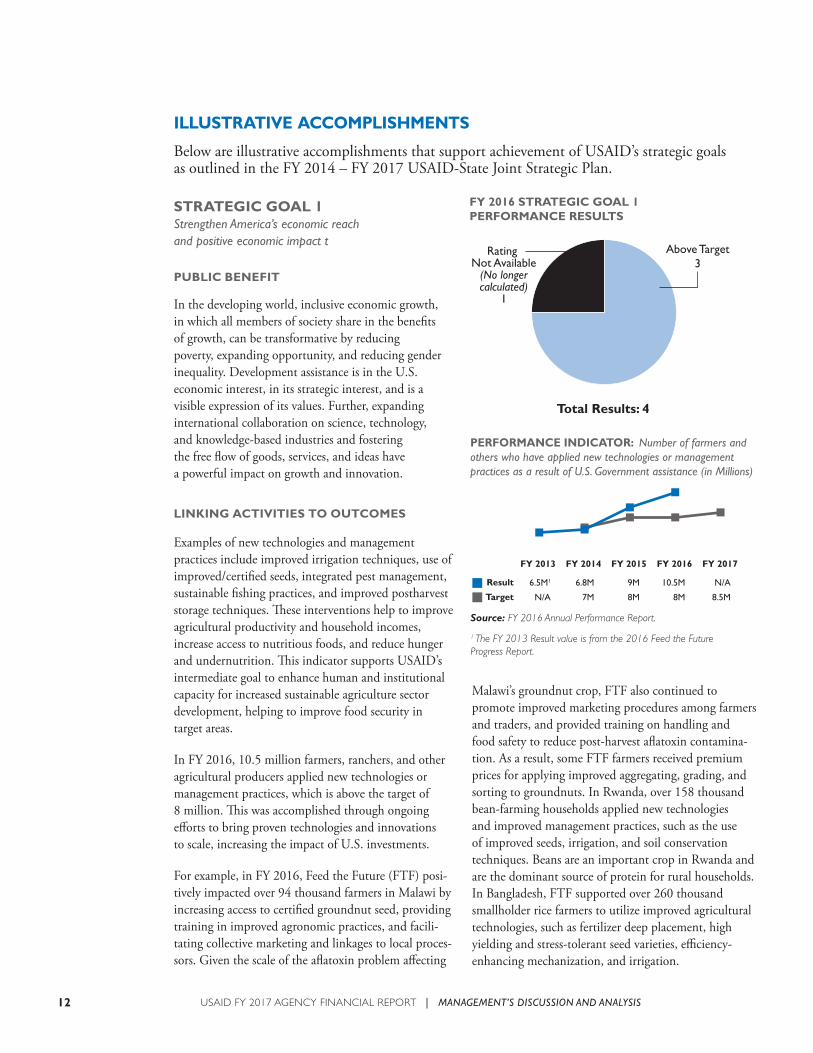
ILLUSTRATIVE ACCOMPLISHMENTS
Below are illustrative accomplishments that support achievement of USAID’s strategic goals as outlined in the FY 2014 – FY 2017 USAID-State Joint Strategic Plan.
STRATEGIC GOAL 1Strengthen America’s economic reach and positive economic impact t
PUBLIC BENEFIT
In the developing world, inclusive economic growth, in which all members of society share in the benefits of growth, can be transformative by reducing poverty, expanding opportunity, and reducing gender inequality. Development assistance is in the U.S. economic interest, in its strategic interest, and is a visible expression of its values. Further, expanding international collaboration on science, technology, and knowledge-based industries and fostering the free flow of goods, services, and ideas have a powerful impact on growth and innovation.
LINKING ACTIVITIES TO OUTCOMES
Examples of new technologies and management practices include improved irrigation techniques, use of improved/certified seeds, integrated pest management, sustainable fishing practices, and improved postharvest storage techniques. These interventions help to improve agricultural productivity and household incomes, increase access to nutritious foods, and reduce hunger and undernutrition. This indicator supports USAID’s intermediate goal to enhance human and institutional capacity for increased sustainable agriculture sector development, helping to improve food security in target areas.
In FY 2016, 10.5 million farmers, ranchers, and other agricultural producers applied new technologies or management practices, which is above the target of 8 million. This was accomplished through ongoing efforts to bring proven technologies and innovations to scale, increasing the impact of U.S. investments.
For example, in FY 2016, Feed the Future (FTF) posi-tively impacted over 94 thousand farmers in Malawi by increasing access to certified groundnut seed, providing training in improved agronomic practices, and facili-tating collective marketing and linkages to local proces-sors. Given the scale of the aflatoxin problem affecting
Malawi’s groundnut crop, FTF also continued to promote improved marketing procedures among farmers and traders, and provided training on handling and food safety to reduce post-harvest aflatoxin contamina-tion. As a result, some FTF farmers received premium prices for applying improved aggregating, grading, and sorting to groundnuts. In Rwanda, over 158 thousand bean-farming households applied new technologies and improved management practices, such as the use of improved seeds, irrigation, and soil conservation techniques. Beans are an important crop in Rwanda and are the dominant source of protein for rural households. In Bangladesh, FTF supported over 260 thousand smallholder rice farmers to utilize improved agricultural technologies, such as fertilizer deep placement, high yielding and stress-tolerant seed varieties, efficiency-enhancing mechanization, and irrigation.
USAID FY 2017 AGENCY FINANCIAL REPORT | MANAGEMENT’S DISCUSSION AND ANALYSIS12

13
April 2017—Living in southern rural Vietnam, Ho Thi Thanh My dreamed of a way to make money for her family. She bought fruits and vegetables from local households and then sold them in markets. Though she worked hard, her inventory was dependent on the season and output of her suppliers. At times, she had nothing to sell. Most days she only earned $2-$3 per day.
“My business was difficult but I had no idea what to do and how to do things differently to improve my income. I felt trapped,” said My.
After joining a savings-led microfinance program for women supported by USAID’s Mekong Vitality Expanded Alliance in September 2015, she went on to receive advanced business training, where she learned about consumer psychology, including how to attract and better serve customers.
Following the training, My switched from selling agricultural products to selling breakfast foods. She used what she learned to select a good place to sell food, ensure food safety and hygiene, and display her products in the best way. She now gets up early in the morning to cook sticky rice for sale in the market.
While her profits were small initially, with the support of her group members, My has built a large customer base, selling a large quantity of sticky rice every day. With a smartphone provided by the project, she also accessed business lessons and took a loan from her savings group to expand her business. She now includes stewed corn and Vietnamese pancakes for sale in the morning and different kinds of sticky rice at night.
With these new products, My’s income has increased threefold and has improved her family’s life. “I have frequent customers who are my group members, my neighbors, and my relatives,”
she says smiling. “They call me any time when they have parties, weddings, etc., asking me to cook sticky rice for them. They have helped me earn more money.”
Since 2014, the Mekong Vitality Expanded Alliance has partnered with the private sector to provide women entrepreneurs over $1.2 million in microfinance loans and access to smartphones to take business training courses. In 2016, 15 percent of loan beneficiaries started a new business and 54 percent expanded their existing business, 77 percent of whom use the USAID smartphone technology to support business operations.
WOMEN EXPAND BUSINESSES IN VIETNAM WITH LOANS AND PHONES
Learning how to attract and serve customers triples profits
“I had no idea what to do and how to do things differently to improve my income. I felt trapped.”
USAID’s Mekong Vitality Expanded Alliance expands business opportunities by providing training in consumer psychology and customer service. PHOTO: ESPEN FAUGSTAD
USAID FY 2017 AGENCY FINANCIAL REPORT | MANAGEMENT’S DISCUSSION AND ANALYSIS
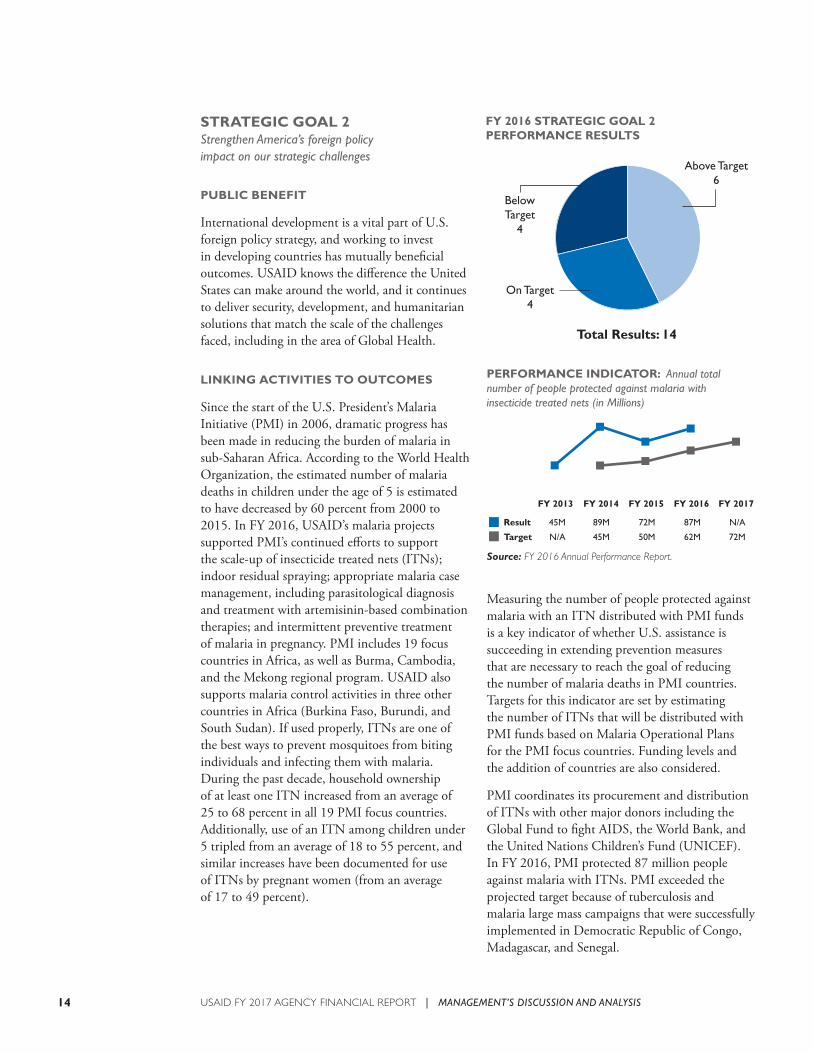
STRATEGIC GOAL 2Strengthen America’s foreign policy impact on our strategic challenges
PUBLIC BENEFIT
International development is a vital part of U.S. foreign policy strategy, and working to invest in developing countries has mutually beneficial outcomes. USAID knows the difference the United States can make around the world, and it continues to deliver security, development, and humanitarian solutions that match the scale of the challenges faced, including in the area of Global Health.
LINKING ACTIVITIES TO OUTCOMES
Since the start of the U.S. President’s Malaria Initiative (PMI) in 2006, dramatic progress has been made in reducing the burden of malaria in sub-Saharan Africa. According to the World Health Organization, the estimated number of malaria deaths in children under the age of 5 is estimated to have decreased by 60 percent from 2000 to 2015. In FY 2016, USAID’s malaria projects supported PMI’s continued efforts to support the scale-up of insecticide treated nets (ITNs); indoor residual spraying; appropriate malaria case management, including parasitological diagnosis and treatment with artemisinin-based combination therapies; and intermittent preventive treatment of malaria in pregnancy. PMI includes 19 focus countries in Africa, as well as Burma, Cambodia, and the Mekong regional program. USAID also supports malaria control activities in three other countries in Africa (Burkina Faso, Burundi, and South Sudan). If used properly, ITNs are one of the best ways to prevent mosquitoes from biting individuals and infecting them with malaria. During the past decade, household ownership of at least one ITN increased from an average of 25 to 68 percent in all 19 PMI focus countries. Additionally, use of an ITN among children under 5 tripled from an average of 18 to 55 percent, and similar increases have been documented for use of ITNs by pregnant women (from an average of 17 to 49 percent).
Measuring the number of people protected against malaria with an ITN distributed with PMI funds is a key indicator of whether U.S. assistance is succeeding in extending prevention measures that are necessary to reach the goal of reducing the number of malaria deaths in PMI countries. Targets for this indicator are set by estimating the number of ITNs that will be distributed with PMI funds based on Malaria Operational Plans for the PMI focus countries. Funding levels and the addition of countries are also considered.
PMI coordinates its procurement and distribution of ITNs with other major donors including the Global Fund to fight AIDS, the World Bank, and the United Nations Children’s Fund (UNICEF). In FY 2016, PMI protected 87 million people against malaria with ITNs. PMI exceeded the projected target because of tuberculosis and malaria large mass campaigns that were successfully implemented in Democratic Republic of Congo, Madagascar, and Senegal.
USAID FY 2017 AGENCY FINANCIAL REPORT | MANAGEMENT’S DISCUSSION AND ANALYSIS14
15
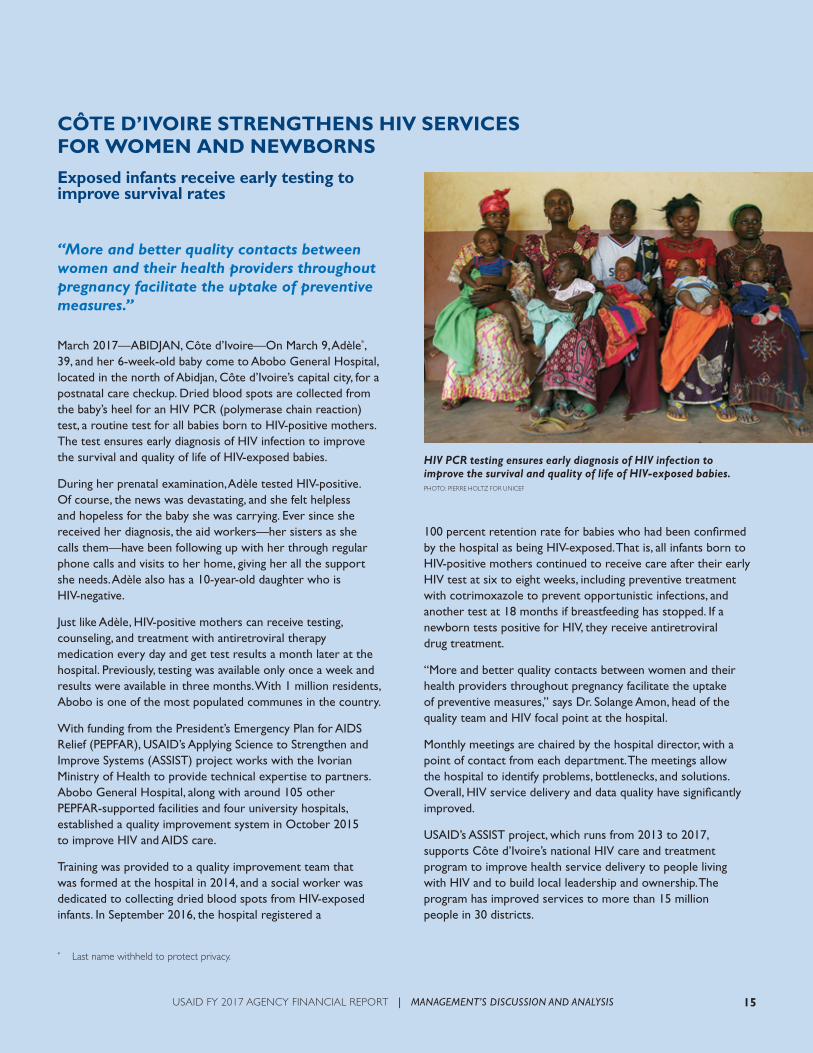
March 2017—ABIDJAN, Côte d’Ivoire—On March 9, Adèle*, 39, and her 6-week-old baby come to Abobo General Hospital, located in the north of Abidjan, Côte d’Ivoire’s capital city, for a postnatal care checkup. Dried blood spots are collected from the baby’s heel for an HIV PCR (polymerase chain reaction) test, a routine test for all babies born to HIV-positive mothers. The test ensures early diagnosis of HIV infection to improve the survival and quality of life of HIV-exposed babies.
During her prenatal examination, Adèle tested HIV-positive. Of course, the news was devastating, and she felt helpless and hopeless for the baby she was carrying. Ever since she received her diagnosis, the aid workers—her sisters as she calls them—have been following up with her through regular phone calls and visits to her home, giving her all the support she needs. Adèle also has a 10-year-old daughter who is HIV-negative.
Just like Adèle, HIV-positive mothers can receive testing, counseling, and treatment with antiretroviral therapy medication every day and get test results a month later at the hospital. Previously, testing was available only once a week and results were available in three months. With 1 million residents, Abobo is one of the most populated communes in the country.
With funding from the President’s Emergency Plan for AIDS Relief (PEPFAR), USAID’s Applying Science to Strengthen and Improve Systems (ASSIST) project works with the Ivorian Ministry of Health to provide technical expertise to partners. Abobo General Hospital, along with around 105 other PEPFAR-supported facilities and four university hospitals, established a quality improvement system in October 2015 to improve HIV and AIDS care.
Training was provided to a quality improvement team that was formed at the hospital in 2014, and a social worker was dedicated to collecting dried blood spots from HIV-exposed infants. In September 2016, the hospital registered a
100 percent retention rate for babies who had been confirmed by the hospital as being HIV-exposed. That is, all infants born to HIV-positive mothers continued to receive care after their early HIV test at six to eight weeks, including preventive treatment with cotrimoxazole to prevent opportunistic infections, and another test at 18 months if breastfeeding has stopped. If a newborn tests positive for HIV, they receive antiretroviral drug treatment.
“More and better quality contacts between women and their health providers throughout pregnancy facilitate the uptake of preventive measures,” says Dr. Solange Amon, head of the quality team and HIV focal point at the hospital.
Monthly meetings are chaired by the hospital director, with a point of contact from each department. The meetings allow the hospital to identify problems, bottlenecks, and solutions. Overall, HIV service delivery and data quality have significantly improved.
USAID’s ASSIST project, which runs from 2013 to 2017, supports Côte d’Ivoire’s national HIV care and treatment program to improve health service delivery to people living with HIV and to build local leadership and ownership. The program has improved services to more than 15 million people in 30 districts.
CÔTE D’IVOIRE STRENGTHENS HIV SERVICES FOR WOMEN AND NEWBORNS
Exposed infants receive early testing to improve survival rates
“More and better quality contacts between women and their health providers throughout pregnancy facilitate the uptake of preventive measures.”
HIV PCR testing ensures early diagnosis of HIV infection to improve the survival and quality of life of HIV-exposed babies. PHOTO: PIERRE HOLTZ FOR UNICEF
* Last name withheld to protect privacy.
USAID FY 2017 AGENCY FINANCIAL REPORT | MANAGEMENT’S DISCUSSION AND ANALYSIS
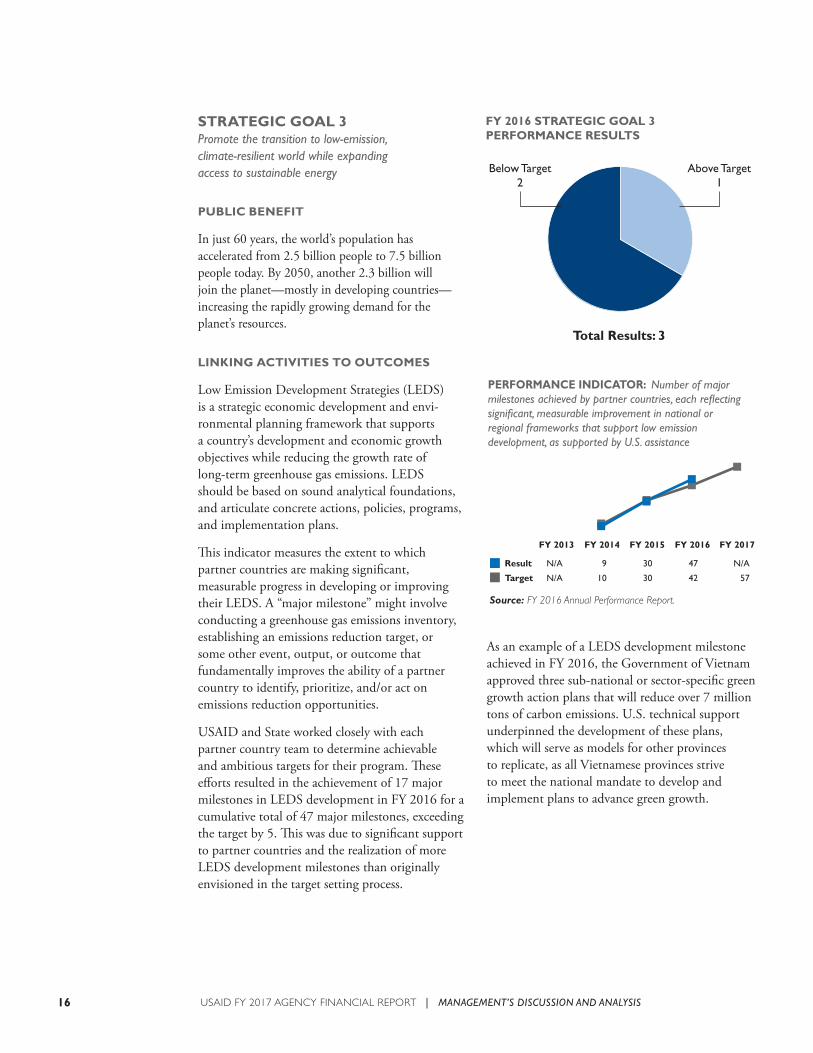
As an example of a LEDS development milestone achieved in FY 2016, the Government of Vietnam approved three sub-national or sector-specific green growth action plans that will reduce over 7 million tons of carbon emissions. U.S. technical support underpinned the development of these plans, which will serve as models for other provinces to replicate, as all Vietnamese provinces strive to meet the national mandate to develop and implement plans to advance green growth.
STRATEGIC GOAL 3Promote the transition to low-emission, climate-resilient world while expanding access to sustainable energy
PUBLIC BENEFIT
In just 60 years, the world’s population has accelerated from 2.5 billion people to 7.5 billion people today. By 2050, another 2.3 billion will join the planet—mostly in developing countries—increasing the rapidly growing demand for the planet’s resources.
LINKING ACTIVITIES TO OUTCOMES
Low Emission Development Strategies (LEDS) is a strategic economic development and envi-ronmental planning framework that supports a country’s development and economic growth objectives while reducing the growth rate of long-term greenhouse gas emissions. LEDS should be based on sound analytical foundations, and articulate concrete actions, policies, programs, and implementation plans.
This indicator measures the extent to which partner countries are making significant, measurable progress in developing or improving their LEDS. A “major milestone” might involve conducting a greenhouse gas emissions inventory, establishing an emissions reduction target, or some other event, output, or outcome that fundamentally improves the ability of a partner country to identify, prioritize, and/or act on emissions reduction opportunities.
USAID and State worked closely with each partner country team to determine achievable and ambitious targets for their program. These efforts resulted in the achievement of 17 major milestones in LEDS development in FY 2016 for a cumulative total of 47 major milestones, exceeding the target by 5. This was due to significant support to partner countries and the realization of more LEDS development milestones than originally envisioned in the target setting process.
USAID FY 2017 AGENCY FINANCIAL REPORT | MANAGEMENT’S DISCUSSION AND ANALYSIS16

17
March 2017—The poor state of several apartment buildings in Tesanj, an otherwise picturesque town in the Tuzla canton of Bosnia and Herzegovina, left residents uncomfortable and cold. They grew accustomed to shabby-looking homes with leaky roofs and inadequate insulation.
Home did not feel as “homey” when apartment owners like Abzia Hasanovic were cold. “Before, I had to wear a coat in my flat,” she said.
With the support of USAID, Habitat for Humanity brought together people from the community and the public and private sectors to provide a better home for Hasanovic. The Residential Energy Efficiency for Low-Income Households project began in August 2012 as a way to promote collaboration between municipalities, financing institutions, construction and maintenance companies, and homeowners while introducing innovative financing solutions to leverage public and private funding. The project works directly with individual homeowners or homeowner associations.
The project facilitated new partnerships and empowered the local community to join forces in a dilemma that might have otherwise been left for Hasanovic to handle on her own. Thanks to training on energy efficiency, residents in Hasanovic’s neighborhood started to brainstorm concrete steps that could improve their homes, save money, and earn money back by selling unused energy to the utility.
After the training, homeowners took action. Together, they met with the entrepreneurial president of the homeowner’s association, joining forces to secure subsidies from the municipality and a loan from the local bank to improve the energy efficiency of apartments. They then used their new skills to contract and manage the construction with private sector companies.
The residents’ hard work paid off and their reward has been a substantial improvement to their quality of life. The professionally insulated walls and dry roofs lend a new sense
of security and warmth. Locals in Tesanj have already started to enjoy the benefits of energy efficiency intervention. They are saving on electricity bills, paying 20 percent less in 2016 than they paid in 2015, enabling them to open up rooms that were previously closed to conserve heat. The project also increases energy security, allowing residents to learn about the sources of energy powering their homes and ensure all proper parties are in place to continue providing the necessary services.
Residents of Hasanovic’s apartment building agree that this work brings both practical improvements and hope for the future. The project was inspired by an earlier USAID-funded project on residential energy efficiency in Macedonia. In Armenia, the project targets similarly vulnerable housing sectors and reduces the impact of escalating energy prices for families. Apartment residents no longer return to a chilled complex in the evening, and with a newly renovated home, Hasanovic, and others like her across the region, can finally rest easy.
More than 50 families in Bosnia and Herzegovina and 20 buildings in Armenia have benefited from the project as well as 400 households in Macedonia. The project is scheduled
to be extended until 2019 and reopened in Macedonia.
BOSNIANS UPGRADE HOMES TO WARM UP AND CONSERVE ENERGY
Collaboration brings financing, technical solutions to neglected buildings
“Before, I had to wear a coat in my flat.”
In Bosnia and Herzegovina, support from USAID helped residents secure subsidies and loans to improve the energy efficiency of apartments. PHOTO: ROB CAMPBELL
USAID FY 2017 AGENCY FINANCIAL REPORT | MANAGEMENT’S DISCUSSION AND ANALYSIS
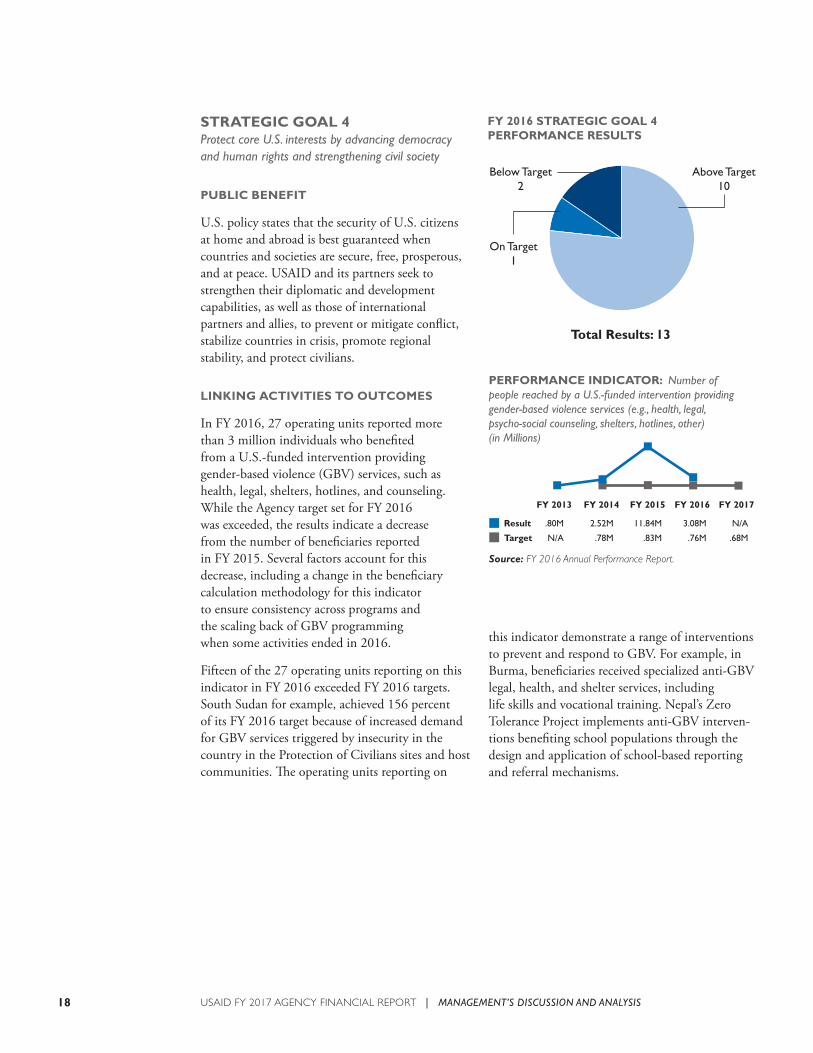
this indicator demonstrate a range of interventions to prevent and respond to GBV. For example, in Burma, beneficiaries received specialized anti-GBV legal, health, and shelter services, including life skills and vocational training. Nepal’s Zero Tolerance Project implements anti-GBV interven-tions benefiting school populations through the design and application of school-based reporting and referral mechanisms.
STRATEGIC GOAL 4 Protect core U.S. interests by advancing democracy and human rights and strengthening civil society
PUBLIC BENEFIT
U.S. policy states that the security of U.S. citizens at home and abroad is best guaranteed when countries and societies are secure, free, prosperous, and at peace. USAID and its partners seek to strengthen their diplomatic and development capabilities, as well as those of international partners and allies, to prevent or mitigate conflict, stabilize countries in crisis, promote regional stability, and protect civilians.
LINKING ACTIVITIES TO OUTCOMES
In FY 2016, 27 operating units reported more than 3 million individuals who benefited from a U.S.-funded intervention providing gender-based violence (GBV) services, such as health, legal, shelters, hotlines, and counseling. While the Agency target set for FY 2016 was exceeded, the results indicate a decrease from the number of beneficiaries reported in FY 2015. Several factors account for this decrease, including a change in the beneficiary calculation methodology for this indicator to ensure consistency across programs and the scaling back of GBV programming when some activities ended in 2016.
Fifteen of the 27 operating units reporting on this indicator in FY 2016 exceeded FY 2016 targets. South Sudan for example, achieved 156 percent of its FY 2016 target because of increased demand for GBV services triggered by insecurity in the country in the Protection of Civilians sites and host communities. The operating units reporting on
USAID FY 2017 AGENCY FINANCIAL REPORT | MANAGEMENT’S DISCUSSION AND ANALYSIS18
19
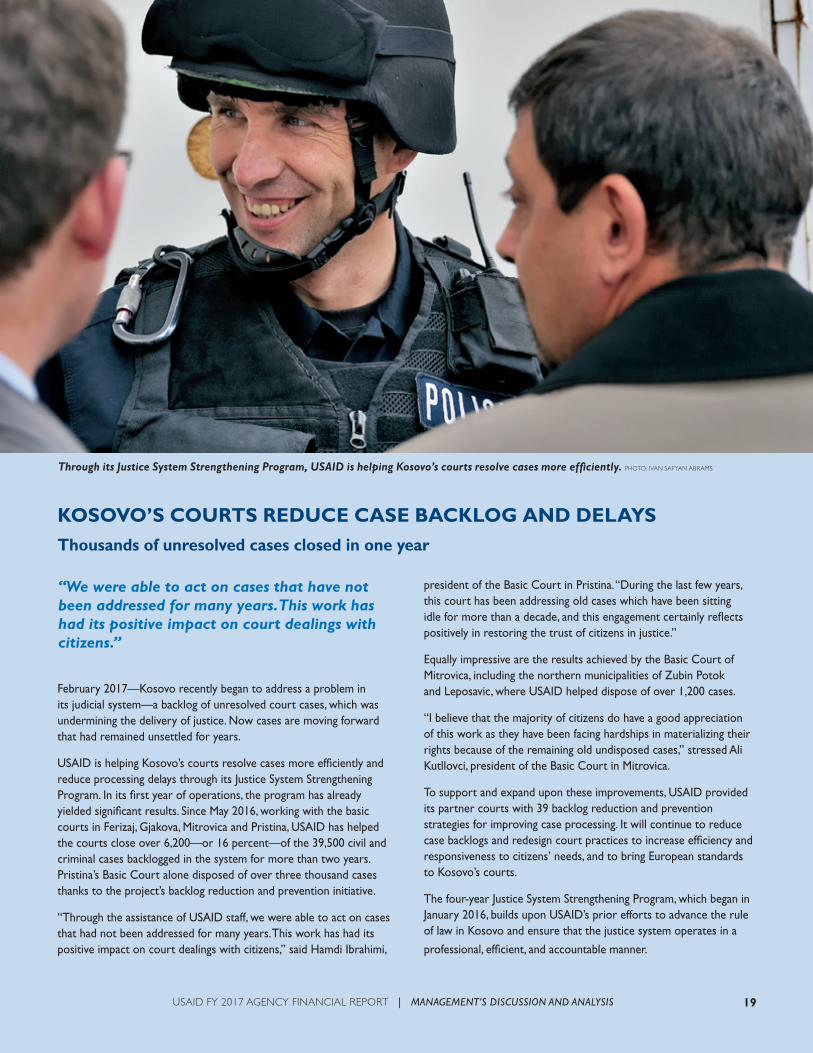
February 2017—Kosovo recently began to address a problem in its judicial system—a backlog of unresolved court cases, which was undermining the delivery of justice. Now cases are moving forward that had remained unsettled for years.
USAID is helping Kosovo’s courts resolve cases more efficiently and reduce processing delays through its Justice System Strengthening Program. In its first year of operations, the program has already yielded significant results. Since May 2016, working with the basic courts in Ferizaj, Gjakova, Mitrovica and Pristina, USAID has helped the courts close over 6,200—or 16 percent—of the 39,500 civil and criminal cases backlogged in the system for more than two years. Pristina’s Basic Court alone disposed of over three thousand cases thanks to the project’s backlog reduction and prevention initiative.
“Through the assistance of USAID staff, we were able to act on cases that had not been addressed for many years. This work has had its positive impact on court dealings with citizens,” said Hamdi Ibrahimi,
president of the Basic Court in Pristina. “During the last few years, this court has been addressing old cases which have been sitting idle for more than a decade, and this engagement certainly reflects positively in restoring the trust of citizens in justice.”
Equally impressive are the results achieved by the Basic Court of Mitrovica, including the northern municipalities of Zubin Potok and Leposavic, where USAID helped dispose of over 1,200 cases.
“I believe that the majority of citizens do have a good appreciation of this work as they have been facing hardships in materializing their rights because of the remaining old undisposed cases,” stressed Ali Kutllovci, president of the Basic Court in Mitrovica.
To support and expand upon these improvements, USAID provided its partner courts with 39 backlog reduction and prevention strategies for improving case processing. It will continue to reduce case backlogs and redesign court practices to increase efficiency and responsiveness to citizens’ needs, and to bring European standards to Kosovo’s courts.
The four-year Justice System Strengthening Program, which began in January 2016, builds upon USAID’s prior efforts to advance the rule of law in Kosovo and ensure that the justice system operates in a
professional, efficient, and accountable manner.
KOSOVO’S COURTS REDUCE CASE BACKLOG AND DELAYSThousands of unresolved cases closed in one year
“We were able to act on cases that have not been addressed for many years. This work has had its positive impact on court dealings with citizens.”
Through its Justice System Strengthening Program, USAID is helping Kosovo’s courts resolve cases more efficiently. PHOTO: IVAN SAFYAN ABRAMS
USAID FY 2017 AGENCY FINANCIAL REPORT | MANAGEMENT’S DISCUSSION AND ANALYSIS
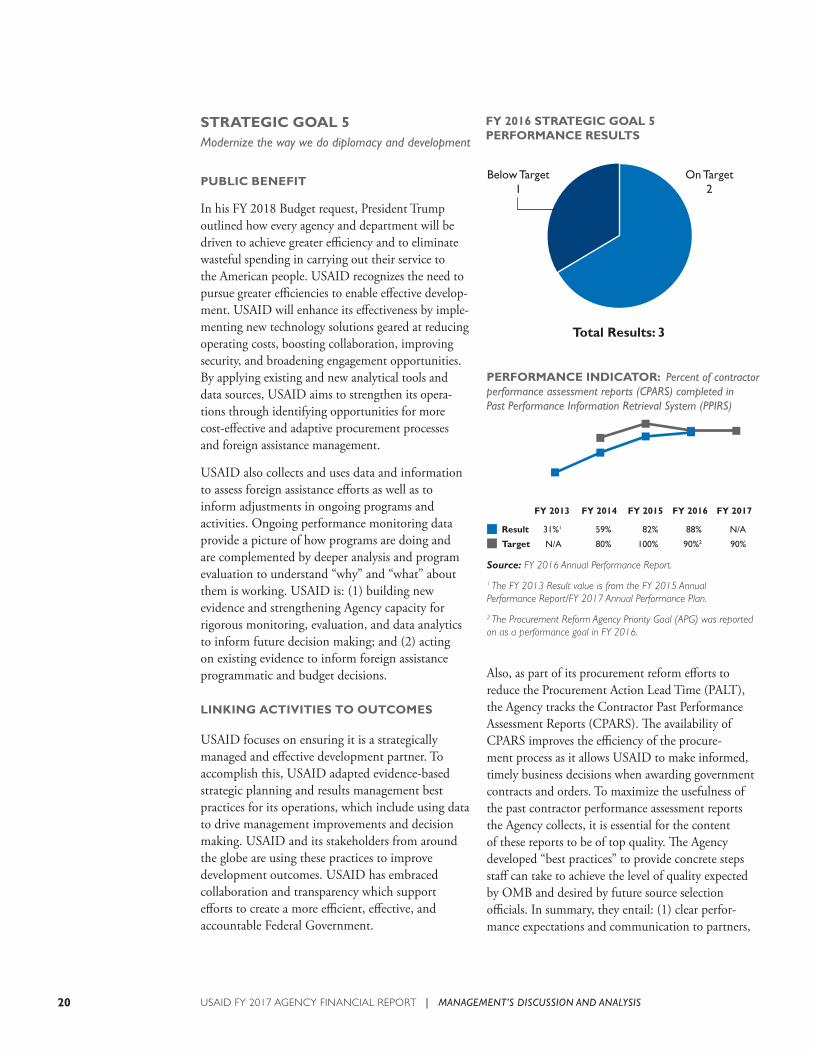
STRATEGIC GOAL 5Modernize the way we do diplomacy and development
PUBLIC BENEFIT
In his FY 2018 Budget request, President Trump outlined how every agency and department will be driven to achieve greater efficiency and to eliminate wasteful spending in carrying out their service to the American people. USAID recognizes the need to pursue greater efficiencies to enable effective develop-ment. USAID will enhance its effectiveness by imple-menting new technology solutions geared at reducing operating costs, boosting collaboration, improving security, and broadening engagement opportunities. By applying existing and new analytical tools and data sources, USAID aims to strengthen its opera-tions through identifying opportunities for more cost-effective and adaptive procurement processes and foreign assistance management.
USAID also collects and uses data and information to assess foreign assistance efforts as well as to inform adjustments in ongoing programs and activities. Ongoing performance monitoring data provide a picture of how programs are doing and are complemented by deeper analysis and program evaluation to understand “why” and “what” about them is working. USAID is: (1) building new evidence and strengthening Agency capacity for rigorous monitoring, evaluation, and data analytics to inform future decision making; and (2) acting on existing evidence to inform foreign assistance programmatic and budget decisions.
LINKING ACTIVITIES TO OUTCOMES
USAID focuses on ensuring it is a strategically managed and effective development partner. To accomplish this, USAID adapted evidence-based strategic planning and results management best practices for its operations, which include using data to drive management improvements and decision making. USAID and its stakeholders from around the globe are using these practices to improve development outcomes. USAID has embraced collaboration and transparency which support efforts to create a more efficient, effective, and accountable Federal Government.
Also, as part of its procurement reform efforts to reduce the Procurement Action Lead Time (PALT), the Agency tracks the Contractor Past Performance Assessment Reports (CPARS). The availability of CPARS improves the efficiency of the procure-ment process as it allows USAID to make informed, timely business decisions when awarding government contracts and orders. To maximize the usefulness of the past contractor performance assessment reports the Agency collects, it is essential for the content of these reports to be of top quality. The Agency developed “best practices” to provide concrete steps staff can take to achieve the level of quality expected by OMB and desired by future source selection officials. In summary, they entail: (1) clear perfor-mance expectations and communication to partners,
USAID FY 2017 AGENCY FINANCIAL REPORT | MANAGEMENT’S DISCUSSION AND ANALYSIS20
21
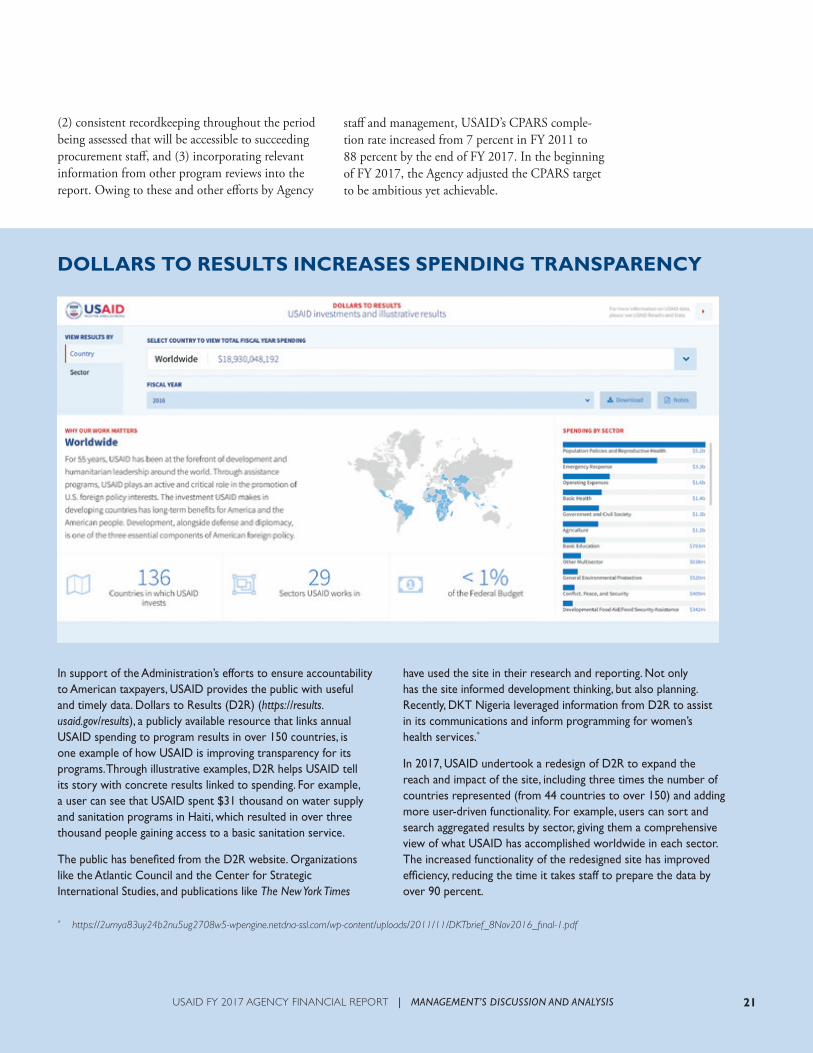
In support of the Administration’s efforts to ensure accountability to American taxpayers, USAID provides the public with useful and timely data. Dollars to Results (D2R) (https://results.usaid.gov/results), a publicly available resource that links annual USAID spending to program results in over 150 countries, is one example of how USAID is improving transparency for its programs. Through illustrative examples, D2R helps USAID tell its story with concrete results linked to spending. For example, a user can see that USAID spent $31 thousand on water supply and sanitation programs in Haiti, which resulted in over three thousand people gaining access to a basic sanitation service.
The public has benefited from the D2R website. Organizations like the Atlantic Council and the Center for Strategic International Studies, and publications like The New York Times
have used the site in their research and reporting. Not only has the site informed development thinking, but also planning. Recently, DKT Nigeria leveraged information from D2R to assist in its communications and inform programming for women’s health services.*
In 2017, USAID undertook a redesign of D2R to expand the reach and impact of the site, including three times the number of countries represented (from 44 countries to over 150) and adding more user-driven functionality. For example, users can sort and search aggregated results by sector, giving them a comprehensive view of what USAID has accomplished worldwide in each sector. The increased functionality of the redesigned site has improved efficiency, reducing the time it takes staff to prepare the data by over 90 percent.
DOLLARS TO RESULTS INCREASES SPENDING TRANSPARENCY
(2) consistent recordkeeping throughout the period being assessed that will be accessible to succeeding procurement staff, and (3) incorporating relevant information from other program reviews into the report. Owing to these and other efforts by Agency
staff and management, USAID’s CPARS comple-tion rate increased from 7 percent in FY 2011 to 88 percent by the end of FY 2017. In the beginning of FY 2017, the Agency adjusted the CPARS target to be ambitious yet achievable.
* https://2umya83uy24b2nu5ug2708w5-wpengine.netdna-ssl.com/wp-content/uploads/2011/11/DKTbrief_8Nov2016_final-1.pdf
USAID FY 2017 AGENCY FINANCIAL REPORT | MANAGEMENT’S DISCUSSION AND ANALYSIS
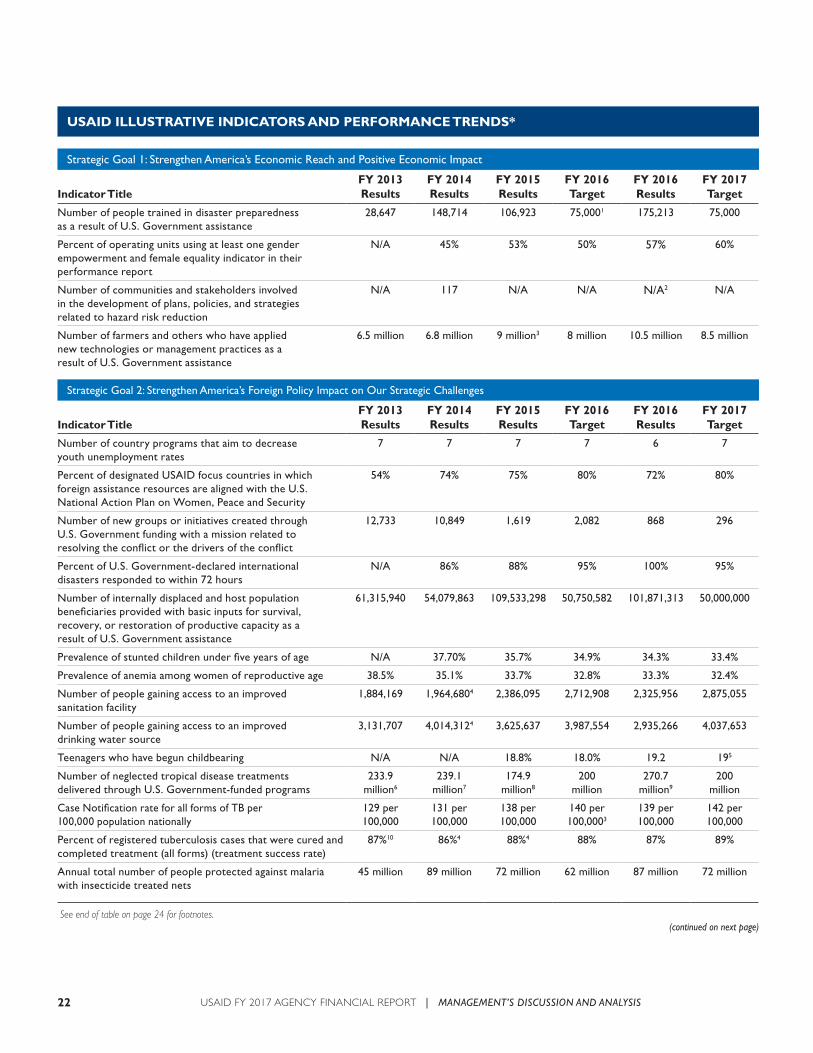
USAID ILLUSTRATIVE INDICATORS AND PERFORMANCE TRENDS*
Strategic Goal 1: Strengthen America’s Economic Reach and Positive Economic Impact
Indicator TitleFY 2013 Results
FY 2014 Results
FY 2015 Results
FY 2016 Target
FY 2016 Results
FY 2017 Target
Number of people trained in disaster preparedness as a result of U.S. Government assistance
28,647 148,714 106,923 75,0001 175,213 75,000
Percent of operating units using at least one gender empowerment and female equality indicator in their performance report
N/A 45% 53% 50% 57% 60%
Number of communities and stakeholders involved in the development of plans, policies, and strategies related to hazard risk reduction
N/A 117 N/A N/A N/A2 N/A
Number of farmers and others who have applied new technologies or management practices as a result of U.S. Government assistance
6.5 million 6.8 million 9 million3 8 million 10.5 million 8.5 million
Strategic Goal 2: Strengthen America’s Foreign Policy Impact on Our Strategic Challenges
Indicator TitleFY 2013 Results
FY 2014 Results
FY 2015 Results
FY 2016 Target
FY 2016 Results
FY 2017 Target
Number of country programs that aim to decrease youth unemployment rates
7 7 7 7 6 7
Percent of designated USAID focus countries in which foreign assistance resources are aligned with the U.S. National Action Plan on Women, Peace and Security
54% 74% 75% 80% 72% 80%
Number of new groups or initiatives created through U.S. Government funding with a mission related to resolving the conflict or the drivers of the conflict
12,733 10,849 1,619 2,082 868 296
Percent of U.S. Government-declared international disasters responded to within 72 hours
N/A 86% 88% 95% 100% 95%
Number of internally displaced and host population beneficiaries provided with basic inputs for survival, recovery, or restoration of productive capacity as a result of U.S. Government assistance
61,315,940 54,079,863 109,533,298 50,750,582 101,871,313 50,000,000
Prevalence of stunted children under five years of age N/A 37.70% 35.7% 34.9% 34.3% 33.4%
Prevalence of anemia among women of reproductive age 38.5% 35.1% 33.7% 32.8% 33.3% 32.4%
Number of people gaining access to an improved sanitation facility
1,884,169 1,964,6804 2,386,095 2,712,908 2,325,956 2,875,055
Number of people gaining access to an improved drinking water source
3,131,707 4,014,3124 3,625,637 3,987,554 2,935,266 4,037,653
Teenagers who have begun childbearing N/A N/A 18.8% 18.0% 19.2 195
Number of neglected tropical disease treatments delivered through U.S. Government-funded programs
233.9 million6
239.1 million7
174.9 million8
200 million
270.7 million9
200 million
Case Notification rate for all forms of TB per 100,000 population nationally
129 per 100,000
131 per 100,000
138 per 100,000
140 per 100,0003
139 per 100,000
142 per 100,000
Percent of registered tuberculosis cases that were cured and completed treatment (all forms) (treatment success rate)
87%10 86%4 88%4 88% 87% 89%
Annual total number of people protected against malaria with insecticide treated nets
45 million 89 million 72 million 62 million 87 million 72 million
See end of table on page 24 for footnotes.(continued on next page)
USAID FY 2017 AGENCY FINANCIAL REPORT | MANAGEMENT’S DISCUSSION AND ANALYSIS22
23
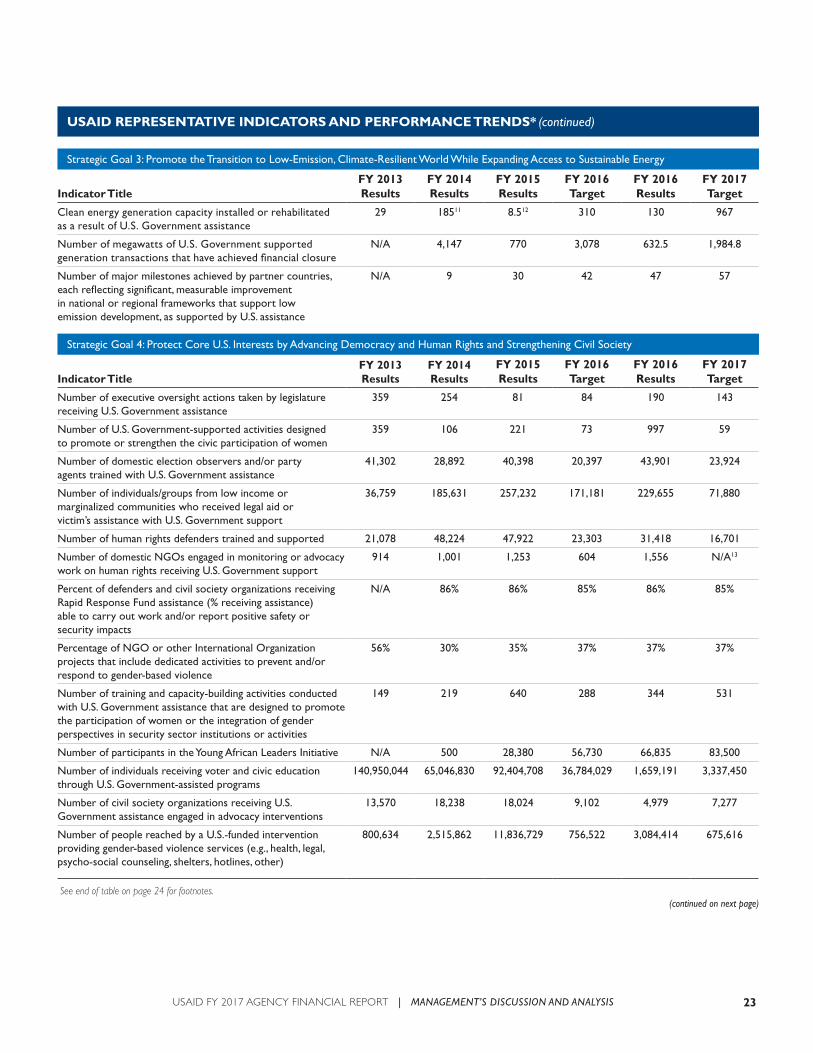
USAID REPRESENTATIVE INDICATORS AND PERFORMANCE TRENDS* (continued)
Strategic Goal 3: Promote the Transition to Low-Emission, Climate-Resilient World While Expanding Access to Sustainable Energy
Indicator TitleFY 2013 Results
FY 2014 Results
FY 2015 Results
FY 2016 Target
FY 2016 Results
FY 2017 Target
Clean energy generation capacity installed or rehabilitated as a result of U.S. Government assistance
29 18511 8.512 310 130 967
Number of megawatts of U.S. Government supported generation transactions that have achieved financial closure
N/A 4,147 770 3,078 632.5 1,984.8
Number of major milestones achieved by partner countries, each reflecting significant, measurable improvement in national or regional frameworks that support low emission development, as supported by U.S. assistance
N/A 9 30 42 47 57
Strategic Goal 4: Protect Core U.S. Interests by Advancing Democracy and Human Rights and Strengthening Civil Society
Indicator TitleFY 2013 Results
FY 2014 Results
FY 2015 Results
FY 2016 Target
FY 2016 Results
FY 2017 Target
Number of executive oversight actions taken by legislature receiving U.S. Government assistance
359 254 81 84 190 143
Number of U.S. Government-supported activities designed to promote or strengthen the civic participation of women
359 106 221 73 997 59
Number of domestic election observers and/or party agents trained with U.S. Government assistance
41,302 28,892 40,398 20,397 43,901 23,924
Number of individuals/groups from low income or marginalized communities who received legal aid or victim’s assistance with U.S. Government support
36,759 185,631 257,232 171,181 229,655 71,880
Number of human rights defenders trained and supported 21,078 48,224 47,922 23,303 31,418 16,701
Number of domestic NGOs engaged in monitoring or advocacy work on human rights receiving U.S. Government support
914 1,001 1,253 604 1,556 N/A13
Percent of defenders and civil society organizations receiving Rapid Response Fund assistance (% receiving assistance) able to carry out work and/or report positive safety or security impacts
N/A 86% 86% 85% 86% 85%
Percentage of NGO or other International Organization projects that include dedicated activities to prevent and/or respond to gender-based violence
56% 30% 35% 37% 37% 37%
Number of training and capacity-building activities conducted with U.S. Government assistance that are designed to promote the participation of women or the integration of gender perspectives in security sector institutions or activities
149 219 640 288 344 531
Number of participants in the Young African Leaders Initiative N/A 500 28,380 56,730 66,835 83,500
Number of individuals receiving voter and civic education through U.S. Government-assisted programs
140,950,044 65,046,830 92,404,708 36,784,029 1,659,191 3,337,450
Number of civil society organizations receiving U.S. Government assistance engaged in advocacy interventions
13,570 18,238 18,024 9,102 4,979 7,277
Number of people reached by a U.S.-funded intervention providing gender-based violence services (e.g., health, legal, psycho-social counseling, shelters, hotlines, other)
800,634 2,515,862 11,836,729 756,522 3,084,414 675,616
See end of table on page 24 for footnotes.(continued on next page)
USAID FY 2017 AGENCY FINANCIAL REPORT | MANAGEMENT’S DISCUSSION AND ANALYSIS
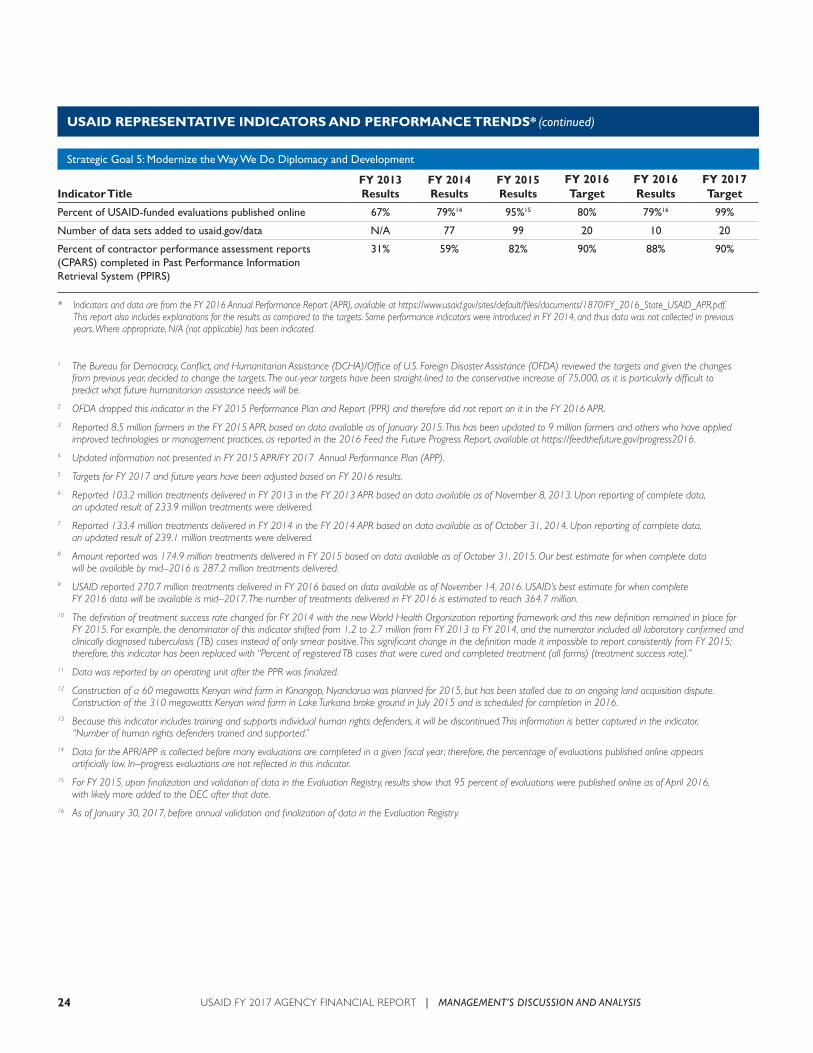
USAID REPRESENTATIVE INDICATORS AND PERFORMANCE TRENDS* (continued)
Strategic Goal 5: Modernize the Way We Do Diplomacy and Development
Indicator TitleFY 2013 Results
FY 2014 Results
FY 2015 Results
FY 2016 Target
FY 2016 Results
FY 2017 Target
Percent of USAID-funded evaluations published online 67% 79%14 95%15 80% 79%16 99%
Number of data sets added to usaid.gov/data N/A 77 99 20 10 20
Percent of contractor performance assessment reports (CPARS) completed in Past Performance Information Retrieval System (PPIRS)
31% 59% 82% 90% 88% 90%
* Indicators and data are from the FY 2016 Annual Performance Report (APR), available at https://www.usaid.gov/sites/default/files/documents/1870/FY_2016_State_USAID_APR.pdf.
This report also includes explanations for the results as compared to the targets. Some performance indicators were introduced in FY 2014, and thus data was not collected in previous years. Where appropriate, N/A (not applicable) has been indicated.
1 The Bureau for Democracy, Conflict, and Humanitarian Assistance (DCHA)/Office of U.S. Foreign Disaster Assistance (OFDA) reviewed the targets and given the changes from previous year, decided to change the targets. The out-year targets have been straight-lined to the conservative increase of 75,000, as it is particularly difficult to predict what future humanitarian assistance needs will be.
2 OFDA dropped this indicator in the FY 2015 Performance Plan and Report (PPR) and therefore did not report on it in the FY 2016 APR. 3 Reported 8.5 million farmers in the FY 2015 APR, based on data available as of January 2015. This has been updated to 9 million farmers and others who have applied
improved technologies or management practices, as reported in the 2016 Feed the Future Progress Report, available at https://feedthefuture.gov/progress2016. 4 Updated information not presented in FY 2015 APR/FY 2017 Annual Performance Plan (APP).5 Targets for FY 2017 and future years have been adjusted based on FY 2016 results. 6 Reported 103.2 million treatments delivered in FY 2013 in the FY 2013 APR based on data available as of November 8, 2013. Upon reporting of complete data,
an updated result of 233.9 million treatments were delivered. 7 Reported 133.4 million treatments delivered in FY 2014 in the FY 2014 APR based on data available as of October 31, 2014. Upon reporting of complete data,
an updated result of 239.1 million treatments were delivered. 8 Amount reported was 174.9 million treatments delivered in FY 2015 based on data available as of October 31, 2015. Our best estimate for when complete data
will be available by mid- ‐2016 is 287.2 million treatments delivered. 9 USAID reported 270.7 million treatments delivered in FY 2016 based on data available as of November 14, 2016. USAID’s best estimate for when complete
FY 2016 data will be available is mid- ‐2017. The number of treatments delivered in FY 2016 is estimated to reach 364.7 million. 10 The definition of treatment success rate changed for FY 2014 with the new World Health Organization reporting framework and this new definition remained in place for
FY 2015. For example, the denominator of this indicator shifted from 1.2 to 2.7 million from FY 2013 to FY 2014, and the numerator included all laboratory confirmed and clinically diagnosed tuberculosis (TB) cases instead of only smear positive. This significant change in the definition made it impossible to report consistently from FY 2015; therefore, this indicator has been replaced with “Percent of registered TB cases that were cured and completed treatment (all forms) (treatment success rate).”
11 Data was reported by an operating unit after the PPR was finalized. 12 Construction of a 60 megawatts Kenyan wind farm in Kinangop, Nyandarua was planned for 2015, but has been stalled due to an ongoing land acquisition dispute.
Construction of the 310 megawatts Kenyan wind farm in Lake Turkana broke ground in July 2015 and is scheduled for completion in 2016.13 Because this indicator includes training and supports individual human rights defenders, it will be discontinued. This information is better captured in the indicator,
“Number of human rights defenders trained and supported.” 14 Data for the APR/APP is collected before many evaluations are completed in a given fiscal year; therefore, the percentage of evaluations published online appears
artificially low. In- ‐progress evaluations are not reflected in this indicator. 15 For FY 2015, upon finalization and validation of data in the Evaluation Registry, results show that 95 percent of evaluations were published online as of April 2016,
with likely more added to the DEC after that date. 16 As of January 30, 2017, before annual validation and finalization of data in the Evaluation Registry.
USAID FY 2017 AGENCY FINANCIAL REPORT | MANAGEMENT’S DISCUSSION AND ANALYSIS24
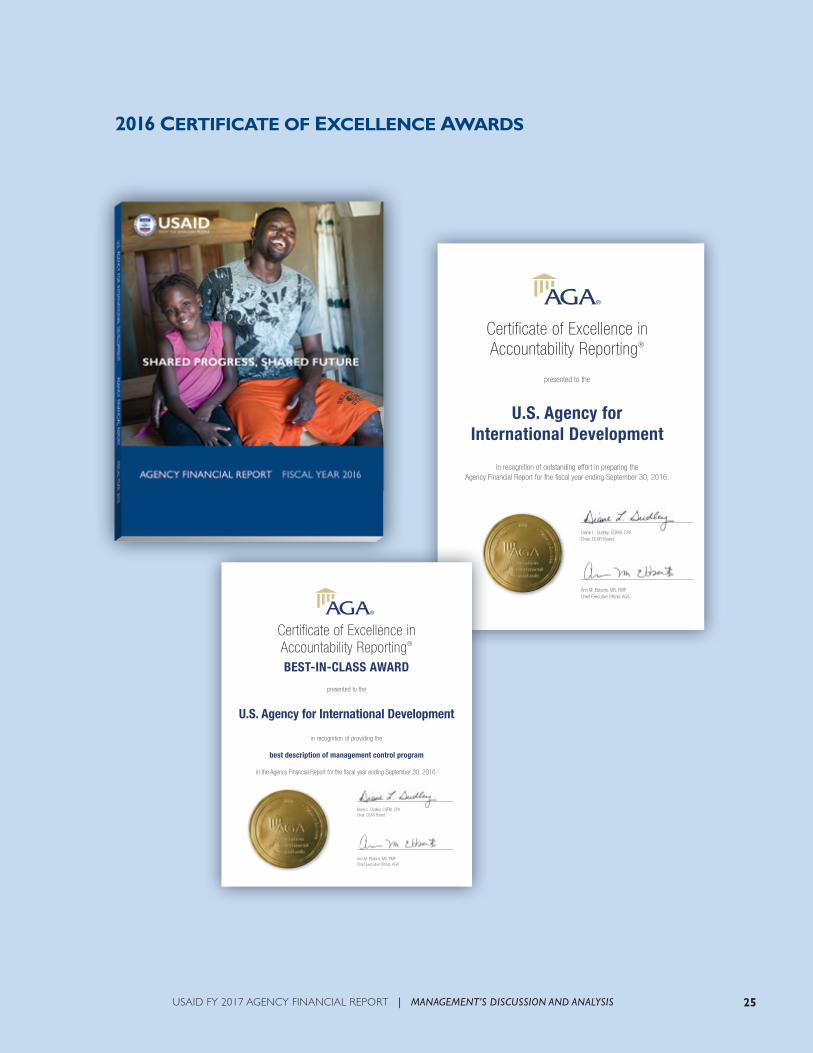
25
Certificate of Excellence inAccountability Reporting®
presented to the
in recognition of outstanding effort in preparing the Agency Financial Report for the fiscal year ending September 30, 2016.
®
Ann M. Ebberts, MS, PMPChief Executive Officer, AGA
Diane L. Dudley, CGFM, CPA Chair, CEAR Board
U.S. Agency for International Development
2016 CertifiCate of exCellenCe awards
Certificate of Excellence inAccountability Reporting®
BEST-IN-CLASS AWARD
®
Ann M. Ebberts, MS, PMPChief Executive Officer, AGA
Diane L. Dudley, CGFM, CPA Chair, CEAR Board
presented to the
in recognition of providing the
in the Agency Financial Report for the fiscal year ending September 30, 2016.
U.S. Agency for International Development
best description of management control program
USAID FY 2017 AGENCY FINANCIAL REPORT | MANAGEMENT’S DISCUSSION AND ANALYSIS
LOOKING FORWARD
REFINING FOREIGN ASSISTANCE ARCHITECTURE
USAID is one of more than 20 federal agencies that delivers foreign assistance. In concert with the Department of State (State), we have embarked upon a redesign initiative to examine how we can structure our processes and resources to better achieve our respective missions. USAID has an exceptionally strong foundation on which to build. Our workforce is mission-centered and resolute— a theme that resonated in the joint State-USAID listening survey completed in FY 2017. USAID is a federal leader in ensuring strategic alignment. At our strategic core is our determined pursuit of results. Yet the need to reconcile interagency priorities and leverage comparative advantage while advancing development outcomes requires significant collaboration and leadership. Planning and implementing revisions to the foreign assistance framework will bring significant changes to manage, but we hope these reforms will strengthen our core capabilities to empower people and countries. As we continue our transformational process, we will hone our approaches while maintaining our focus on doing the right things well.
INCREASINGLY COMPLEX OPERATING ENVIRONMENT
USAID implements programs worldwide in very remote areas and conflict zones. Due to logistical realities, and for the safety of our personnel and partners, we cannot immediately access all parts of the globe. Yet, to meet our commitment to the world’s most vulnerable people and the American taxpayer, we must leverage our reach where practical. In the coming year, USAID will
AGENCY IMPACT
A critical mission unifies USAID: we partner to end extreme poverty and promote resilient, democratic societies while advancing our security and prosperity. The challenges we confront are complex, with intertwining roots in food insecurity, illiteracy, ill-health, disempowerment, marginalization, vulnerability, and both man-made and natural disasters. Therefore, USAID seeks multi-dimensional solutions that target both the symptoms of and pathways out of poverty. USAID’s work directly enhances American, as well as global, security and prosperity. The United States is safer and stronger when fewer people face destitution, when our trade partners flourish, when nations can withstand crises, and when societies are freer, more democratic, and more inclusive, protecting the rights of all citizens.
USAID strives to maintain the excellence that makes us the world’s premiere development agency. We will continue to prioritize sustainability and emphasize balanced partner engagement. We hope to spur innovation and competition, reduce administrative costs, and foster a culture of idea-sharing that facilitates progress toward self-reliance and self-sufficiency.
IDENTIFYING CHALLENGES
Going forward, USAID will continue to demonstrate American values and goodwill abroad, making investments that advance national security and economic prosperity. By demonstrating our commitment to continuous improvement, we learn, adapt, and grow.
Angelique M. Crumbly
USAID FY 2017 AGENCY FINANCIAL REPORT | MANAGEMENT’S DISCUSSION AND ANALYSIS26
27
continue to develop our capacity to work more strategically and effectively in the world’s most challenging contexts. We are developing assess-ment approaches, leadership training, and design methodologies targeted to non-permissive environ-ments. We will maintain efforts to optimize our overseas footprint. We will expand technological solutions to extend our reach virtually and we will continue to strengthen local partners, and enhance our toolkit to do so, with the aim of cultivating a new cadre of development leaders.
CYBERSECURITY THREATS
With interconnectedness comes risk exposure. Through its global presence, USAID has a large potential cyberattack surface. USAID continues to prioritize the security of its information technology (IT) investments. We will maintain the efforts that, this year, earned an “A+” grade on the federal IT Acquisition Reform scorecard. Furthermore, USAID is building the Development Information Solution, an integrated portfolio management system to link budget and the program cycle with streamlined data management. We have also deployed trainings for all Agency staff on information security and data privacy. Moving forward, USAID will continue its recognized federal leadership in delivering a modern IT infrastructure.
ENHANCING ACCOUNTABILITY
Like many others, USAID is asked consistently to do more with less. Effective stewardship of taxpayer funding is a hallmark of USAID, yet we must redouble our efforts. To meet this mandate, USAID will pursue greater operating efficiencies
and accountability for results—both from ourselves and from our implementing partners. We have identified and proposed for elimination duplicative processes and reports. We are seeking delegations of authority where necessary. We are targeting our reform efforts to buttress government-wide initiatives, such as the pursuit of best-in-class and managed contracts. We will continue to strive to reduce cycle times and streamline processes. Moving forward, USAID will explore how we can improve our program management, design, and monitoring capabilities so that programs have the resources needed to achieve objectives and remediate problems when necessary. In these efforts, robust, data-driven reviews will continue to guide implementation.
LOOKING TO THE FUTURE
Ultimately, USAID’s goal is for our assistance to no longer be needed. As we work toward ever-greater partnership with other development partners, our host countries, and beneficiaries, we confront these challenges with realism and maintain our focus on delivering on our mission effectively and efficiently.
Angelique M. CrumblyPerformance Improvement Officer
USAID FY 2017 AGENCY FINANCIAL REPORT | MANAGEMENT’S DISCUSSION AND ANALYSIS
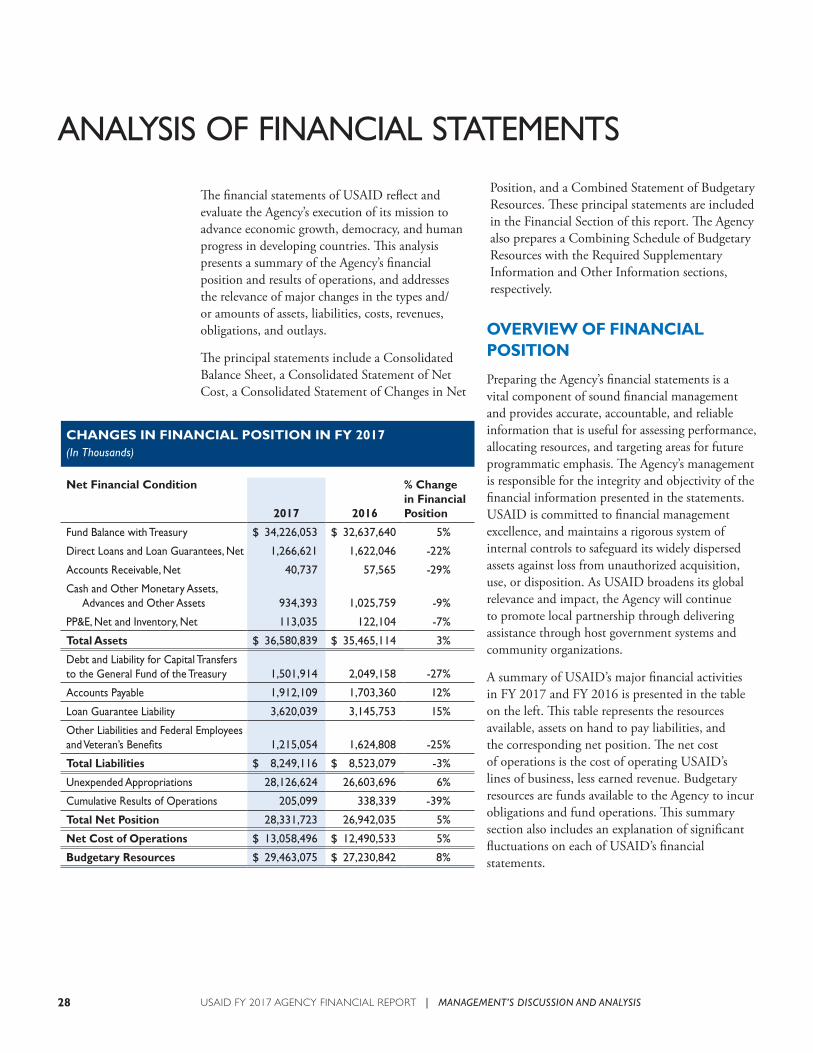
ANALYSIS OF FINANCIAL STATEMENTS
The financial statements of USAID reflect and evaluate the Agency’s execution of its mission to advance economic growth, democracy, and human progress in developing countries. This analysis presents a summary of the Agency’s financial position and results of operations, and addresses the relevance of major changes in the types and/or amounts of assets, liabilities, costs, revenues, obligations, and outlays.
The principal statements include a Consolidated Balance Sheet, a Consolidated Statement of Net Cost, a Consolidated Statement of Changes in Net
Position, and a Combined Statement of Budgetary Resources. These principal statements are included in the Financial Section of this report. The Agency also prepares a Combining Schedule of Budgetary Resources with the Required Supplementary Information and Other Information sections, respectively.
CHANGES IN FINANCIAL POSITION IN FY 2017(In Thousands)
Net Financial Condition
2017 2016
% Change in Financial Position
Fund Balance with Treasury $ 34,226,053 $ 32,637,640 5%
Direct Loans and Loan Guarantees, Net 1,266,621 1,622,046 -22%
Accounts Receivable, Net 40,737 57,565 -29%
Cash and Other Monetary Assets, Advances and Other Assets 934,393 1,025,759 -9%
PP&E, Net and Inventory, Net 113,035 122,104 -7%
Total Assets $ 36,580,839 $ 35,465,114 3%
Debt and Liability for Capital Transfers to the General Fund of the Treasury 1,501,914 2,049,158 -27%
Accounts Payable 1,912,109 1,703,360 12%
Loan Guarantee Liability 3,620,039 3,145,753 15%
Other Liabilities and Federal Employees and Veteran’s Benefits 1,215,054 1,624,808 -25%
Total Liabilities $ 8,249,116 $ 8,523,079 -3%
Unexpended Appropriations 28,126,624 26,603,696 6%
Cumulative Results of Operations 205,099 338,339 -39%
Total Net Position 28,331,723 26,942,035 5%
Net Cost of Operations $ 13,058,496 $ 12,490,533 5%
Budgetary Resources $ 29,463,075 $ 27,230,842 8%
OVERVIEW OF FINANCIAL POSITION
Preparing the Agency’s financial statements is a vital component of sound financial management and provides accurate, accountable, and reliable information that is useful for assessing performance, allocating resources, and targeting areas for future programmatic emphasis. The Agency’s management is responsible for the integrity and objectivity of the financial information presented in the statements. USAID is committed to financial management excellence, and maintains a rigorous system of internal controls to safeguard its widely dispersed assets against loss from unauthorized acquisition, use, or disposition. As USAID broadens its global relevance and impact, the Agency will continue to promote local partnership through delivering assistance through host government systems and community organizations.
A summary of USAID’s major financial activities in FY 2017 and FY 2016 is presented in the table on the left. This table represents the resources available, assets on hand to pay liabilities, and the corresponding net position. The net cost of operations is the cost of operating USAID’s lines of business, less earned revenue. Budgetary resources are funds available to the Agency to incur obligations and fund operations. This summary section also includes an explanation of significant fluctuations on each of USAID’s financial statements.
USAID FY 2017 AGENCY FINANCIAL REPORT | MANAGEMENT’S DISCUSSION AND ANALYSIS28
29
BALANCE SHEET SUMMARY
ASSETS – WHAT WE OWN AND MANAGE
Total assets were $36.6 billion as of September 30, 2017. This represents an increase of $1.1 billion over the FY 2016 total of $35.5 billion. The most significant assets are the Fund Balance with Treasury and Direct Loans and Loan Guarantees (Net), which represent 94 percent and 3 percent of total USAID’s assets, respectively, as of September 30, 2017. The Fund Balance with Treasury consists of cash appropriated to USAID by Congress or transferred from other federal agencies and held in U.S. Department of the Treasury’s (Treasury) accounts that are accessible by the Agency to pay the Agency’s obligations incurred.
LIABILITIES – WHAT WE OWE
The Consolidated Balance Sheet reflects total liabilities of $8.2 billion, of which $5.1 billion, or 62 percent, is comprised of Debt and Liabilities for Capital Transfers to the General Fund of the Treasury and Loan Guarantee Liability. These liabilities represent funds borrowed from Treasury to carry out the Agency’s Federal Credit Reform program activities and net liquidating account equity. Loan Guarantee Liability accounts increased by $474.3 million between the two fiscal years, which represents an increase of almost 15 percent. This was driven by new loan guarantees with the Middle East Northern Africa (MENA) program.
ENDING NET POSITION – WHAT WE HAVE DONE OVER TIME
Net Position represents the Agency’s equity, which includes the cumulative net earnings and unexpended authority granted by Congress. USAID’s Net Position is shown on the Consolidated Balance Sheet and the Consolidated Statement of Changes in Net Position. The reported Net Position balance as of September 30, 2017, was $28.3 billion, which is an increase of $1.4 billion, or 5 percent, over the $26.9 billion reported for FY 2016. The majority of this increase was related to additional appropriations received within the International Development Assistance program.
RESULTS (NET COST) OF OPERATIONS
NET COSTS
The results of operations are reported in the Consoli-dated Statement of Net Cost and the Consolidated Statement of Changes in Net Position. The Consoli-dated Statement of Net Cost represents the cost (net of earned revenues) of operating the Agency’s foreign assistance programs. The Department of State (State) and USAID use the Standardized Program Structure and Definition (SPSD) system to categorize their programs. In FY 2017, the SPSD was updated to contain the following seven categories of foreign assistance programs:
• Democracy, Human Rights and Governance (DR) – support the establishment, consolida-tion, and protection of democratic institutions, processes, and values in countries to advance freedom.
• Economic Growth (EG) – strive to generate rapid, sustained, and broad-based economic growth.
• Education and Social Services (ES) – aid nations through effective and accountable investments in education and social services to establish sustainable improvements in the well-being and productivity of their populations.
• Humanitarian Assistance (HA) – provide assistance to countries on the basis of need according to principles of universality, impartiality, and human dignity to save lives, alleviate suffering, and minimize the economic costs of conflict, disasters, and displacement.
• Health (HL) – contribute to improvements in the health of people; especially women, children, and other vulnerable populations in countries globally.
• Program Development and Oversight (PO) – provide program management, accounting, and tracking for costs to assist U.S. foreign assistance objectives.
• Peace and Security (PS) – help countries establish the conditions and capacity for achieving peace, security, stability, and response against arising threats to national or international security and stability.
USAID FY 2017 AGENCY FINANCIAL REPORT | MANAGEMENT’S DISCUSSION AND ANALYSIS
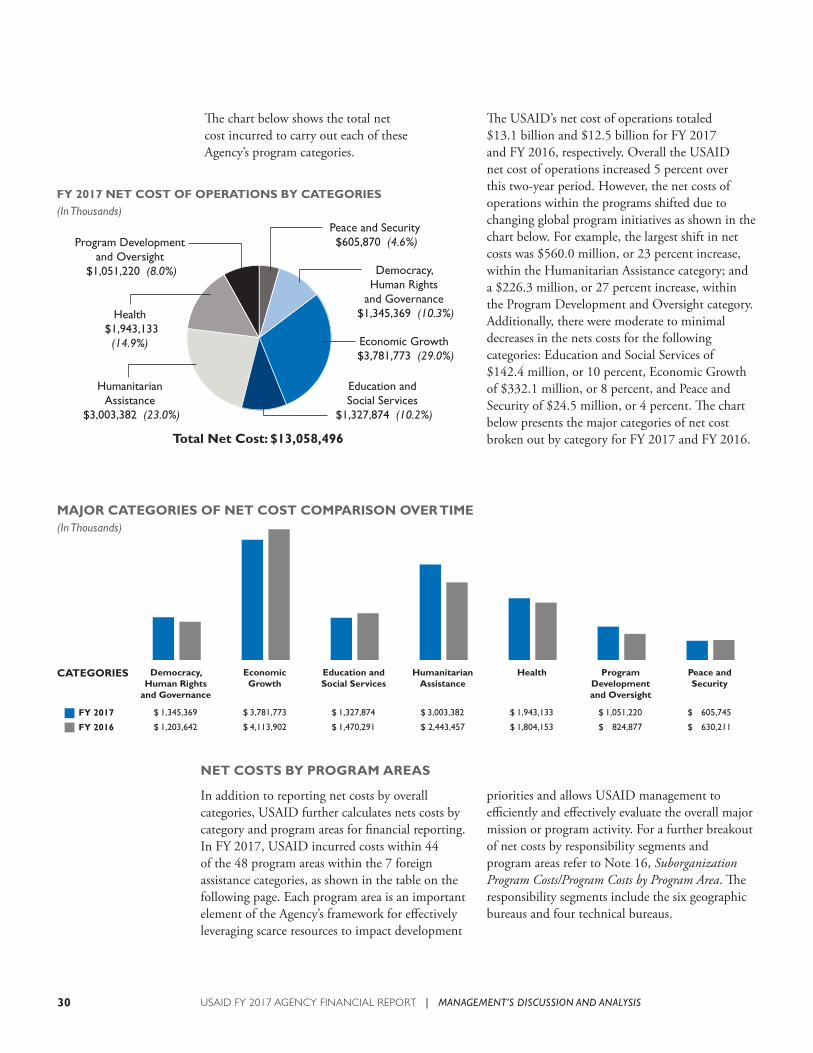
The chart below shows the total net cost incurred to carry out each of these Agency’s program categories.
priorities and allows USAID management to efficiently and effectively evaluate the overall major mission or program activity. For a further breakout of net costs by responsibility segments and program areas refer to Note 16, Suborganization Program Costs/Program Costs by Program Area. The responsibility segments include the six geographic bureaus and four technical bureaus.
The USAID’s net cost of operations totaled $13.1 billion and $12.5 billion for FY 2017 and FY 2016, respectively. Overall the USAID net cost of operations increased 5 percent over this two-year period. However, the net costs of operations within the programs shifted due to changing global program initiatives as shown in the chart below. For example, the largest shift in net costs was $560.0 million, or 23 percent increase, within the Humanitarian Assistance category; and a $226.3 million, or 27 percent increase, within the Program Development and Oversight category. Additionally, there were moderate to minimal decreases in the nets costs for the following categories: Education and Social Services of $142.4 million, or 10 percent, Economic Growth of $332.1 million, or 8 percent, and Peace and Security of $24.5 million, or 4 percent. The chart below presents the major categories of net cost broken out by category for FY 2017 and FY 2016.
NET COSTS BY PROGRAM AREAS
In addition to reporting net costs by overall categories, USAID further calculates nets costs by category and program areas for financial reporting. In FY 2017, USAID incurred costs within 44 of the 48 program areas within the 7 foreign assistance categories, as shown in the table on the following page. Each program area is an important element of the Agency’s framework for effectively leveraging scarce resources to impact development
USAID FY 2017 AGENCY FINANCIAL REPORT | MANAGEMENT’S DISCUSSION AND ANALYSIS30
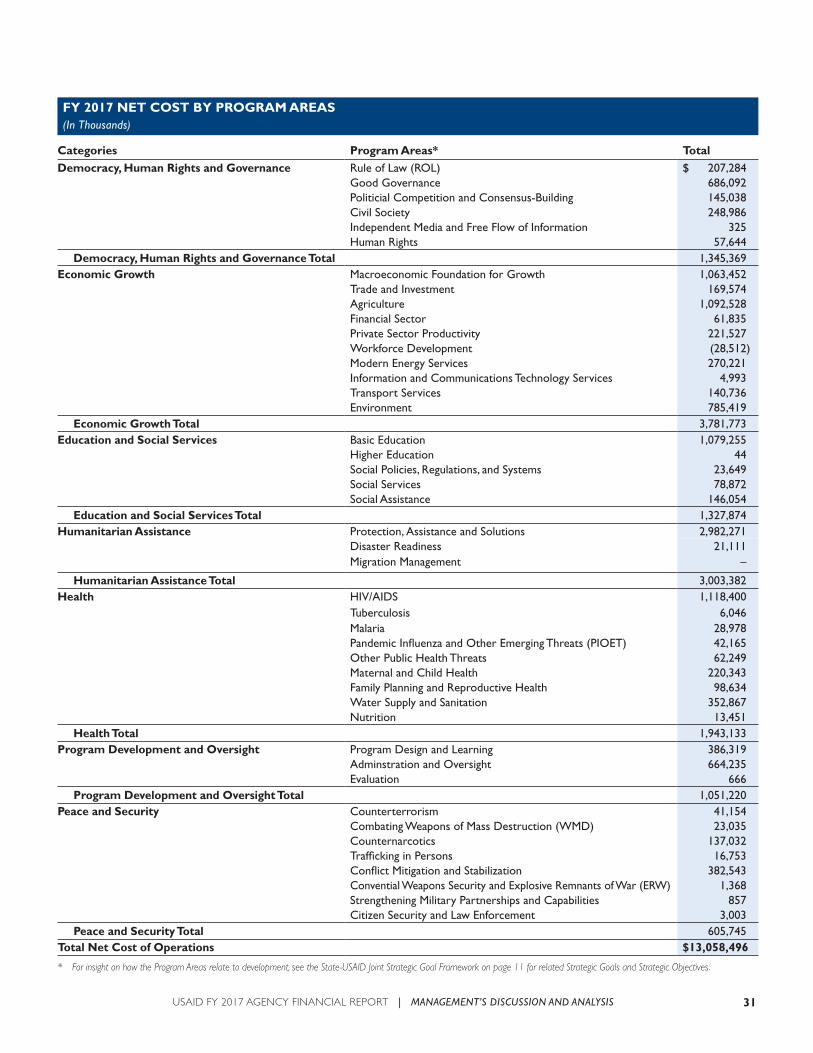
31
FY 2017 NET COST BY PROGRAM AREAS(In Thousands)
Categories Program Areas* TotalDemocracy, Human Rights and Governance Rule of Law (ROL) $ 207,284
Good Governance 686,092 Politicial Competition and Consensus-Building 145,038 Civil Society 248,986 Independent Media and Free Flow of Information 325 Human Rights 57,644
Democracy, Human Rights and Governance Total 1,345,369 Economic Growth Macroeconomic Foundation for Growth 1,063,452
Trade and Investment 169,574 Agriculture 1,092,528 Financial Sector 61,835 Private Sector Productivity 221,527 Workforce Development (28,512)Modern Energy Services 270,221 Information and Communications Technology Services 4,993 Transport Services 140,736 Environment 785,419
Economic Growth Total 3,781,773 Education and Social Services Basic Education 1,079,255
Higher Education 44 Social Policies, Regulations, and Systems 23,649 Social Services 78,872 Social Assistance 146,054
Education and Social Services Total 1,327,874 Humanitarian Assistance Protection, Assistance and Solutions 2,982,271
Disaster Readiness 21,111 Migration Management –
Humanitarian Assistance Total 3,003,382 Health HIV/AIDS 1,118,400
Tuberculosis 6,046 Malaria 28,978 Pandemic Influenza and Other Emerging Threats (PIOET) 42,165 Other Public Health Threats 62,249 Maternal and Child Health 220,343 Family Planning and Reproductive Health 98,634 Water Supply and Sanitation 352,867 Nutrition 13,451
Health Total 1,943,133 Program Development and Oversight Program Design and Learning 386,319
Adminstration and Oversight 664,235 Evaluation 666
Program Development and Oversight Total 1,051,220 Peace and Security Counterterrorism 41,154
Combating Weapons of Mass Destruction (WMD) 23,035 Counternarcotics 137,032 Trafficking in Persons 16,753 Conflict Mitigation and Stabilization 382,543 Convential Weapons Security and Explosive Remnants of War (ERW) 1,368 Strengthening Military Partnerships and Capabilities 857 Citizen Security and Law Enforcement 3,003
Peace and Security Total 605,745 Total Net Cost of Operations $ 13,058,496
* For insight on how the Program Areas relate to development, see the State-USAID Joint Strategic Goal Framework on page 11 for related Strategic Goals and Strategic Objectives.
USAID FY 2017 AGENCY FINANCIAL REPORT | MANAGEMENT’S DISCUSSION AND ANALYSIS
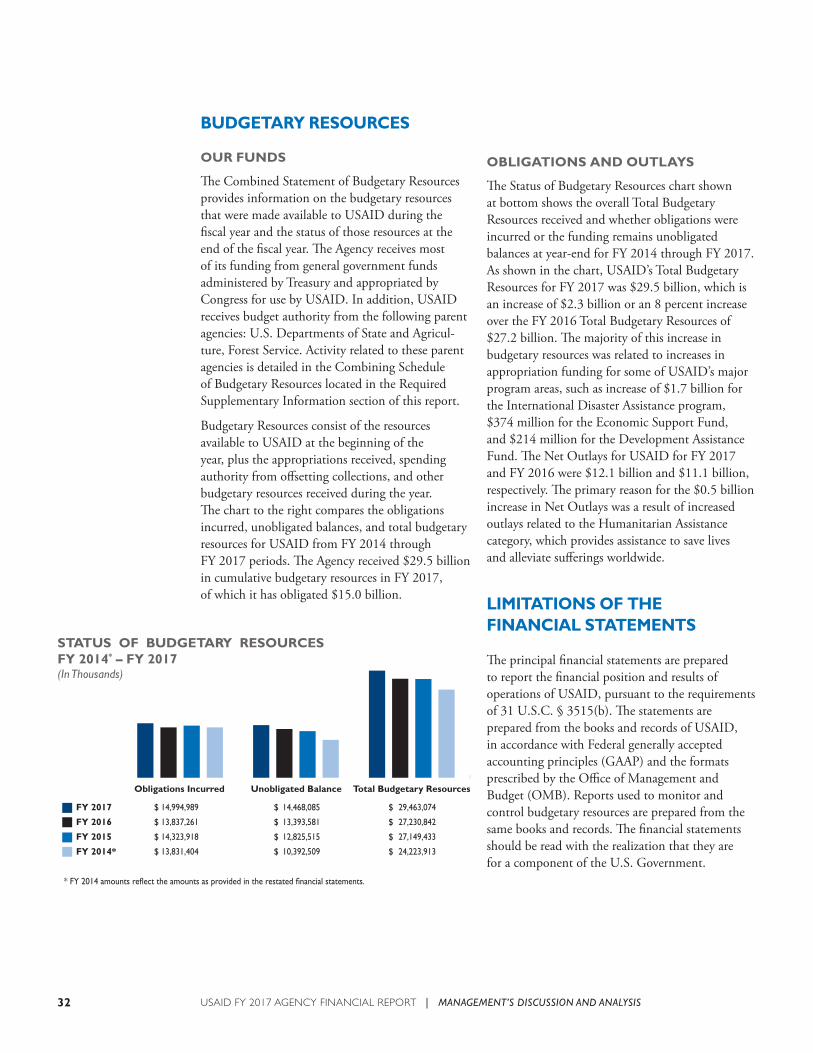
BUDGETARY RESOURCES
OUR FUNDS
The Combined Statement of Budgetary Resources provides information on the budgetary resources that were made available to USAID during the fiscal year and the status of those resources at the end of the fiscal year. The Agency receives most of its funding from general government funds administered by Treasury and appropriated by Congress for use by USAID. In addition, USAID receives budget authority from the following parent agencies: U.S. Departments of State and Agricul-ture, Forest Service. Activity related to these parent agencies is detailed in the Combining Schedule of Budgetary Resources located in the Required Supplementary Information section of this report.
Budgetary Resources consist of the resources available to USAID at the beginning of the year, plus the appropriations received, spending authority from offsetting collections, and other budgetary resources received during the year. The chart to the right compares the obligations incurred, unobligated balances, and total budgetary resources for USAID from FY 2014 through FY 2017 periods. The Agency received $29.5 billion in cumulative budgetary resources in FY 2017, of which it has obligated $15.0 billion.
OBLIGATIONS AND OUTLAYS
The Status of Budgetary Resources chart shown at bottom shows the overall Total Budgetary Resources received and whether obligations were incurred or the funding remains unobligated balances at year-end for FY 2014 through FY 2017. As shown in the chart, USAID’s Total Budgetary Resources for FY 2017 was $29.5 billion, which is an increase of $2.3 billion or an 8 percent increase over the FY 2016 Total Budgetary Resources of $27.2 billion. The majority of this increase in budgetary resources was related to increases in appropriation funding for some of USAID’s major program areas, such as increase of $1.7 billion for the International Disaster Assistance program, $374 million for the Economic Support Fund, and $214 million for the Development Assistance Fund. The Net Outlays for USAID for FY 2017 and FY 2016 were $12.1 billion and $11.1 billion, respectively. The primary reason for the $0.5 billion increase in Net Outlays was a result of increased outlays related to the Humanitarian Assistance category, which provides assistance to save lives and alleviate sufferings worldwide.
LIMITATIONS OF THE FINANCIAL STATEMENTS
The principal financial statements are prepared to report the financial position and results of operations of USAID, pursuant to the requirements of 31 U.S.C. § 3515(b). The statements are prepared from the books and records of USAID, in accordance with Federal generally accepted accounting principles (GAAP) and the formats prescribed by the Office of Management and Budget (OMB). Reports used to monitor and control budgetary resources are prepared from the same books and records. The financial statements should be read with the realization that they are for a component of the U.S. Government.
USAID FY 2017 AGENCY FINANCIAL REPORT | MANAGEMENT’S DISCUSSION AND ANALYSIS32
33
MANAGEMENT ASSURANCES
The Agency’s internal control policy is comprehen-sive and requires all USAID managers to establish cost-effective systems of internal control to ensure U.S. Government activities are managed effectively, efficiently, economically, and with integrity. All levels of management are responsible for ensuring adequate controls over USAID operations.
The Federal Managers’ Financial Integrity Act (FMFIA) requires agencies to establish internal control and financial systems that provide reasonable assurance that the following objectives are achieved:
• effectiveness and efficiency of operations;
• compliance with applicable laws and regulations;
• reliability of reporting for internal and external use.
ANALYSIS OF ENTITY’S SYSTEMS, CONTROLS, AND LEGAL COMPLIANCE
Based on an Agency evaluation, the Agency head is required to provide an annual Statement of Assurance (see below) on whether the Agency has met this requirement. The Office of Management and Budget (OMB) Circular A-123, Management’s Responsibility for Enterprise Risk Management and Internal Control, implements the FMFIA and defines management’s responsibility for internal control and risk management. In addition, the Agency has provided a Summary of Financial Statement Audits and Management Assurances as required by OMB Circular A-136, Financial Reporting Requirements, revised, in the Other Information section of this report.
USAID STATEMENT OF ASSURANCE
The Agency’s management is responsible for managing risks and maintaining effective internal control to meet the objectives of Sections 2 and 4 of the Federal Managers’ Financial Integrity Act. The Agency conducted its assessment of risk and internal control in accordance with OMB Circular No. A-123, Management’s Responsibility for Enterprise Risk Management and Internal Control. Based on the results of the assessment, the Agency can provide reasonable assurance that internal control over operations, reporting, and compliance were operating effectively as of September 30, 2017, except for the following
existing material weakness reported: USAID did not reconcile its Fund Balance with Treasury account with the U.S. Department of the Treasury, and resolve reconciling items in a timely manner (Exhibit A).
Mark A. GreenAdministrator November 15, 2017
USAID FY 2017 AGENCY FINANCIAL REPORT | MANAGEMENT’S DISCUSSION AND ANALYSIS
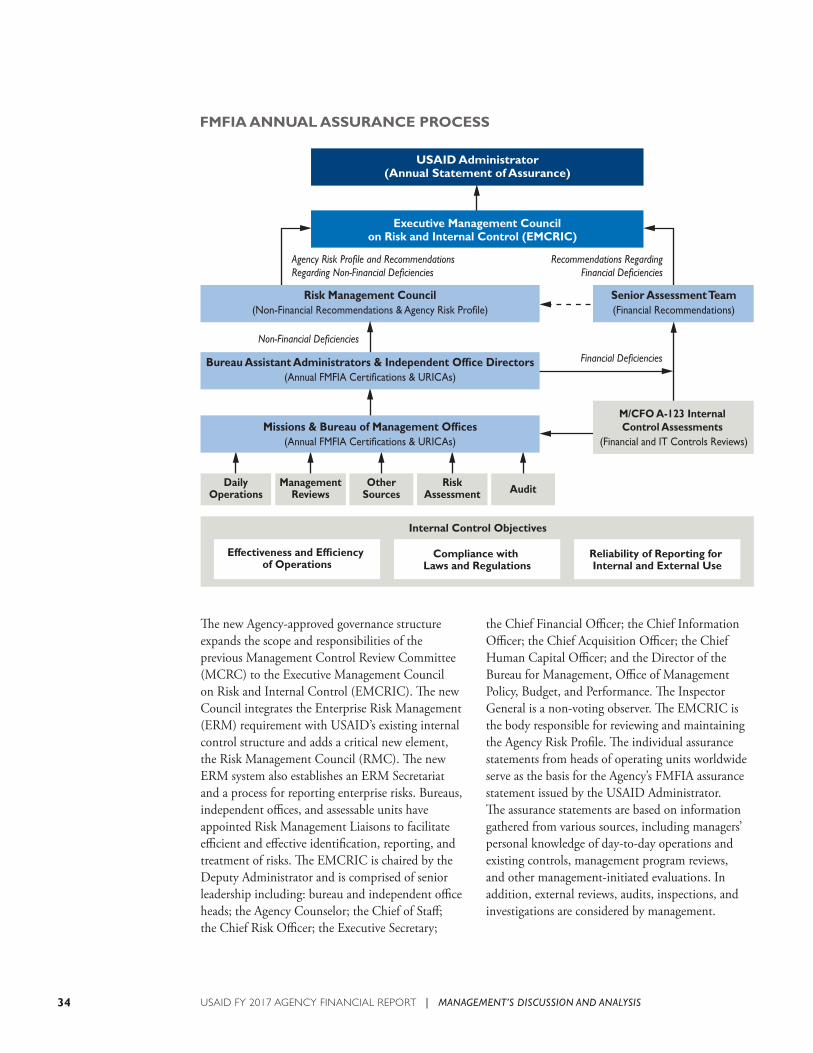
The new Agency-approved governance structure expands the scope and responsibilities of the previous Management Control Review Committee (MCRC) to the Executive Management Council on Risk and Internal Control (EMCRIC). The new Council integrates the Enterprise Risk Management (ERM) requirement with USAID’s existing internal control structure and adds a critical new element, the Risk Management Council (RMC). The new ERM system also establishes an ERM Secretariat and a process for reporting enterprise risks. Bureaus, independent offices, and assessable units have appointed Risk Management Liaisons to facilitate efficient and effective identification, reporting, and treatment of risks. The EMCRIC is chaired by the Deputy Administrator and is comprised of senior leadership including: bureau and independent office heads; the Agency Counselor; the Chief of Staff; the Chief Risk Officer; the Executive Secretary;
the Chief Financial Officer; the Chief Information Officer; the Chief Acquisition Officer; the Chief Human Capital Officer; and the Director of the Bureau for Management, Office of Management Policy, Budget, and Performance. The Inspector General is a non-voting observer. The EMCRIC is the body responsible for reviewing and maintaining the Agency Risk Profile. The individual assurance statements from heads of operating units worldwide serve as the basis for the Agency’s FMFIA assurance statement issued by the USAID Administrator. The assurance statements are based on information gathered from various sources, including managers’ personal knowledge of day-to-day operations and existing controls, management program reviews, and other management-initiated evaluations. In addition, external reviews, audits, inspections, and investigations are considered by management.
USAID FY 2017 AGENCY FINANCIAL REPORT | MANAGEMENT’S DISCUSSION AND ANALYSIS34
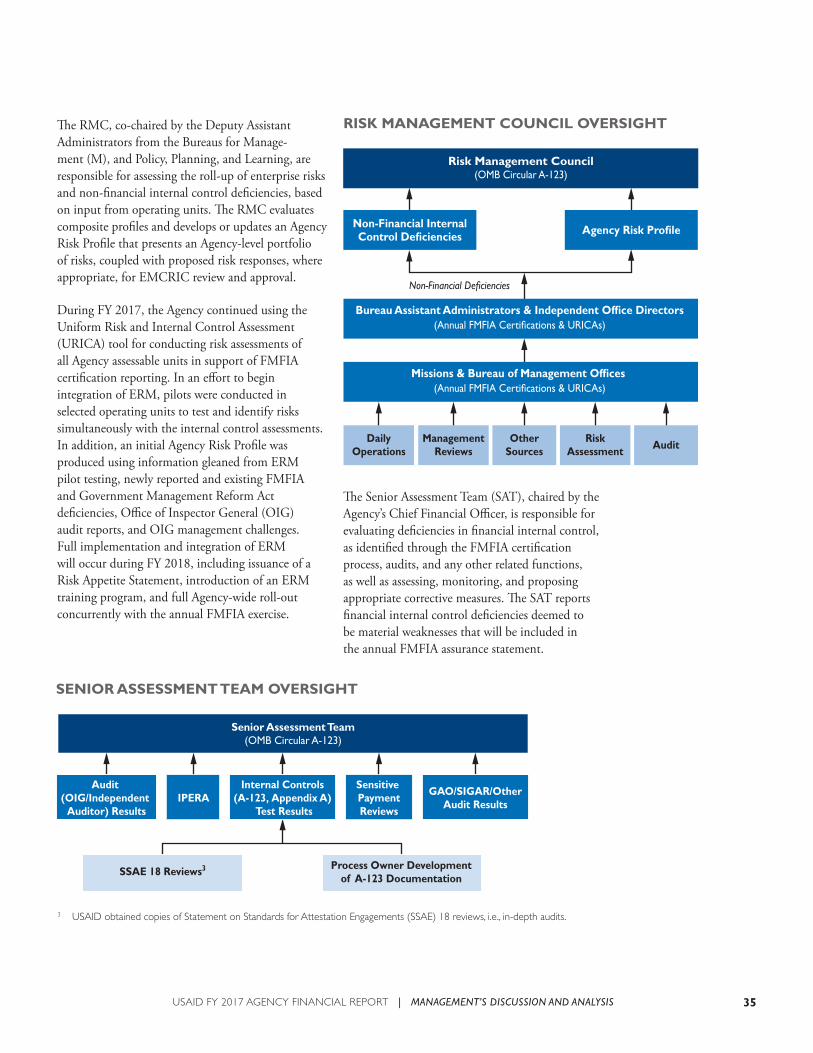
35
3 USAID obtained copies of Statement on Standards for Attestation Engagements (SSAE) 18 reviews, i.e., in-depth audits.
The RMC, co-chaired by the Deputy Assistant Administrators from the Bureaus for Manage-ment (M), and Policy, Planning, and Learning, are responsible for assessing the roll-up of enterprise risks and non-financial internal control deficiencies, based on input from operating units. The RMC evaluates composite profiles and develops or updates an Agency Risk Profile that presents an Agency-level portfolio of risks, coupled with proposed risk responses, where appropriate, for EMCRIC review and approval.
During FY 2017, the Agency continued using the Uniform Risk and Internal Control Assessment (URICA) tool for conducting risk assessments of all Agency assessable units in support of FMFIA certification reporting. In an effort to begin integration of ERM, pilots were conducted in selected operating units to test and identify risks simultaneously with the internal control assessments. In addition, an initial Agency Risk Profile was produced using information gleaned from ERM pilot testing, newly reported and existing FMFIA and Government Management Reform Act deficiencies, Office of Inspector General (OIG) audit reports, and OIG management challenges. Full implementation and integration of ERM will occur during FY 2018, including issuance of a Risk Appetite Statement, introduction of an ERM training program, and full Agency-wide roll-out concurrently with the annual FMFIA exercise.
The Senior Assessment Team (SAT), chaired by the Agency’s Chief Financial Officer, is responsible for evaluating deficiencies in financial internal control, as identified through the FMFIA certification process, audits, and any other related functions, as well as assessing, monitoring, and proposing appropriate corrective measures. The SAT reports financial internal control deficiencies deemed to be material weaknesses that will be included in the annual FMFIA assurance statement.
USAID FY 2017 AGENCY FINANCIAL REPORT | MANAGEMENT’S DISCUSSION AND ANALYSIS
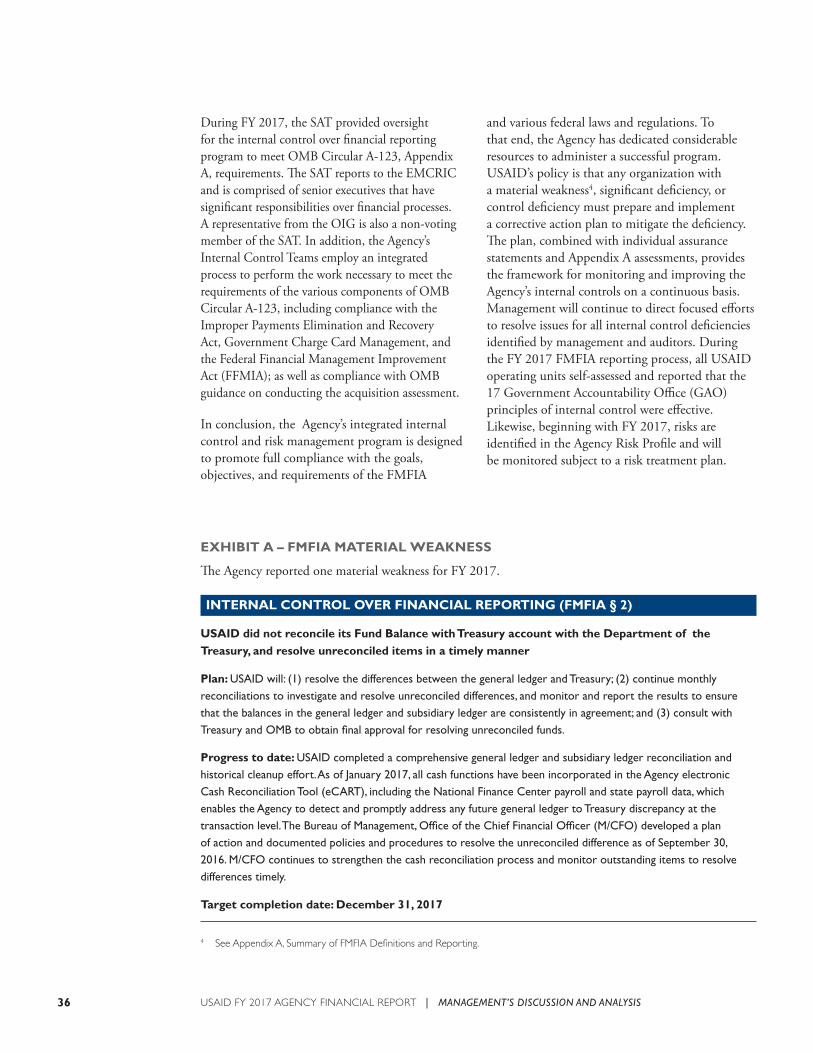
During FY 2017, the SAT provided oversight for the internal control over financial reporting program to meet OMB Circular A-123, Appendix A, requirements. The SAT reports to the EMCRIC and is comprised of senior executives that have significant responsibilities over financial processes. A representative from the OIG is also a non-voting member of the SAT. In addition, the Agency’s Internal Control Teams employ an integrated process to perform the work necessary to meet the requirements of the various components of OMB Circular A-123, including compliance with the Improper Payments Elimination and Recovery Act, Government Charge Card Management, and the Federal Financial Management Improvement Act (FFMIA); as well as compliance with OMB guidance on conducting the acquisition assessment.
In conclusion, the Agency’s integrated internal control and risk management program is designed to promote full compliance with the goals, objectives, and requirements of the FMFIA
4 See Appendix A, Summary of FMFIA Definitions and Reporting.
and various federal laws and regulations. To that end, the Agency has dedicated considerable resources to administer a successful program. USAID’s policy is that any organization with a material weakness4, significant deficiency, or control deficiency must prepare and implement a corrective action plan to mitigate the deficiency. The plan, combined with individual assurance statements and Appendix A assessments, provides the framework for monitoring and improving the Agency’s internal controls on a continuous basis. Management will continue to direct focused efforts to resolve issues for all internal control deficiencies identified by management and auditors. During the FY 2017 FMFIA reporting process, all USAID operating units self-assessed and reported that the 17 Government Accountability Office (GAO) principles of internal control were effective. Likewise, beginning with FY 2017, risks are identified in the Agency Risk Profile and will be monitored subject to a risk treatment plan.
EXHIBIT A – FMFIA MATERIAL WEAKNESS
The Agency reported one material weakness for FY 2017.
INTERNAL CONTROL OVER FINANCIAL REPORTING (FMFIA § 2)
USAID did not reconcile its Fund Balance with Treasury account with the Department of the Treasury, and resolve unreconciled items in a timely manner
Plan: USAID will: (1) resolve the differences between the general ledger and Treasury; (2) continue monthly reconciliations to investigate and resolve unreconciled differences, and monitor and report the results to ensure that the balances in the general ledger and subsidiary ledger are consistently in agreement; and (3) consult with Treasury and OMB to obtain final approval for resolving unreconciled funds.
Progress to date: USAID completed a comprehensive general ledger and subsidiary ledger reconciliation and historical cleanup effort. As of January 2017, all cash functions have been incorporated in the Agency electronic Cash Reconciliation Tool (eCART), including the National Finance Center payroll and state payroll data, which enables the Agency to detect and promptly address any future general ledger to Treasury discrepancy at the transaction level. The Bureau of Management, Office of the Chief Financial Officer (M/CFO) developed a plan of action and documented policies and procedures to resolve the unreconciled difference as of September 30, 2016. M/CFO continues to strengthen the cash reconciliation process and monitor outstanding items to resolve differences timely.
Target completion date: December 31, 2017
USAID FY 2017 AGENCY FINANCIAL REPORT | MANAGEMENT’S DISCUSSION AND ANALYSIS36
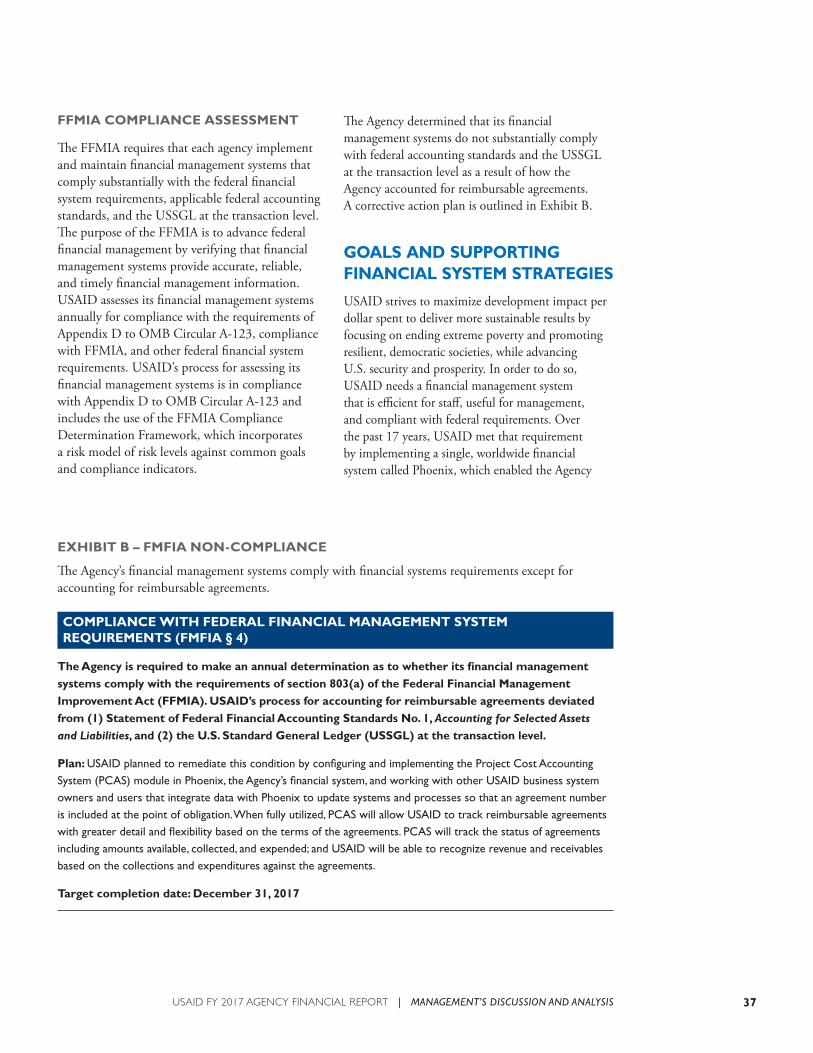
37
FFMIA COMPLIANCE ASSESSMENT
The FFMIA requires that each agency implement and maintain financial management systems that comply substantially with the federal financial system requirements, applicable federal accounting standards, and the USSGL at the transaction level. The purpose of the FFMIA is to advance federal financial management by verifying that financial management systems provide accurate, reliable, and timely financial management information. USAID assesses its financial management systems annually for compliance with the requirements of Appendix D to OMB Circular A-123, compliance with FFMIA, and other federal financial system requirements. USAID’s process for assessing its financial management systems is in compliance with Appendix D to OMB Circular A-123 and includes the use of the FFMIA Compliance Determination Framework, which incorporates a risk model of risk levels against common goals and compliance indicators.
EXHIBIT B – FMFIA NON-COMPLIANCE
The Agency’s financial management systems comply with financial systems requirements except for accounting for reimbursable agreements.
COMPLIANCE WITH FEDERAL FINANCIAL MANAGEMENT SYSTEM REQUIREMENTS (FMFIA § 4)
The Agency is required to make an annual determination as to whether its financial management systems comply with the requirements of section 803(a) of the Federal Financial Management Improvement Act (FFMIA). USAID’s process for accounting for reimbursable agreements deviated from (1) Statement of Federal Financial Accounting Standards No. 1, Accounting for Selected Assets and Liabilities, and (2) the U.S. Standard General Ledger (USSGL) at the transaction level.
Plan: USAID planned to remediate this condition by configuring and implementing the Project Cost Accounting System (PCAS) module in Phoenix, the Agency’s financial system, and working with other USAID business system owners and users that integrate data with Phoenix to update systems and processes so that an agreement number is included at the point of obligation. When fully utilized, PCAS will allow USAID to track reimbursable agreements with greater detail and flexibility based on the terms of the agreements. PCAS will track the status of agreements including amounts available, collected, and expended; and USAID will be able to recognize revenue and receivables based on the collections and expenditures against the agreements.
Target completion date: December 31, 2017
The Agency determined that its financial management systems do not substantially comply with federal accounting standards and the USSGL at the transaction level as a result of how the Agency accounted for reimbursable agreements. A corrective action plan is outlined in Exhibit B.
GOALS AND SUPPORTING FINANCIAL SYSTEM STRATEGIES
USAID strives to maximize development impact per dollar spent to deliver more sustainable results by focusing on ending extreme poverty and promoting resilient, democratic societies, while advancing U.S. security and prosperity. In order to do so, USAID needs a financial management system that is efficient for staff, useful for management, and compliant with federal requirements. Over the past 17 years, USAID met that requirement by implementing a single, worldwide financial system called Phoenix, which enabled the Agency
USAID FY 2017 AGENCY FINANCIAL REPORT | MANAGEMENT’S DISCUSSION AND ANALYSIS
to produce auditable financial statements. More recently, USAID has shifted the way it administers assistance—channeling funding to local governments and organizations, and streamlining the procurement process—and so the financial systems strategy must also evolve. Maintaining and building upon a strong financial system framework better enables USAID to be effective, efficient, accountable, and agile in providing international development and humanitarian assistance, and strengthening management processes that deliver employee-centric and cost-effective services. Publishing foreign assistance budget and spending data on the public Foreign Assistance Dashboard helps stakeholders understand how U.S. taxpayer funds are used to achieve international development results. USAID provides transactional detail to the Foreign Assistance Dashboard that represents each financial record in Phoenix that has been processed in a given time period for program work with implementing partners and other administrative expenses. USAID’s financial management operational efficiency will enable the Agency to focus its resources where they achieve the most impact and in direct support of the Administration’s focus; not only on the dollars spent, but on the results achieved. This requires new technologies and enhanced data analysis.
As the Federal Government undertakes new strategies and initiatives to improve financial management, USAID is updating its systems and processes accordingly, as funding permits. The Agency will continue to reflect standard business processes and meet user and federal requirements, as well as follow guidance from OMB and the Department of the Treasury (Treasury), to strengthen both financial and IT management practices. The Agency is conducting an analysis to streamline the accruals process that would support more than two thousand users who are responsible for entering and providing accruals information and to further integrate information from the Global Acquisition and Assistance System (GLAAS), the Agency’s procurement system, in order to improve assignments of awards, increase the transparency of the accruals process, and strengthen the quality of pipeline reports. In addition, the Agency has implemented PCAS and integrated it with Phoenix, which will improve USAID’s ability to track interagency agreements and reimbursable
activities, and allow it to address prior audit findings. The Agency plans to invest in financial data and reporting support by upgrading its reporting database and the supporting infrastructure. This will position the Agency to continue implementing mandates established by the Digital Accountability and Transparency Act of 2014 (DATA Act). Throughout FY 2017, the Agency prepared to implement the DATA Act by testing the submission of data via Treasury’s Broker and successfully submitting USAID data, which were certified by the Chief Financial Officer, in May 2017. In FY 2016, State introduced a revised Standardized Program Structure and Definition (SPSD), a set of codes that categorizes foreign assistance spending. The Agency implemented the revised SPSD in Phoenix at the beginning of FY 2017, as well as updated Phoenix Accounting Templates, released updated SPSD Program Areas and Elements, and restricted the codes and budget levels that can be used for program-funded actions to align with the new codes and hierarchy. This implementation provides stakeholders and the public increased transparency into federal spending. In addition, the financial reporting modernization’s data-centric approach increases transparency and adheres to new data standards such as those set forth by the Federal Information Technology Reform Act (FITARA) and OMB Memorandum M-15-12, Increasing Transparency of Federal Spending by Making Federal Spending Data Accessible, Searchable, and Reliable, which sets the requirement to continue compliance with the reporting requirements in the Federal Funding Accountability and Transparency Act (FFATA) and the DATA Act.
FINANCIAL MANAGEMENT SYSTEMS FRAMEWORK
The Phoenix financial system is the accounting system of record for the Agency and the core of USAID’s financial management systems framework. Phoenix enables Agency staff to analyze, manage, and report on foreign assistance funds. Phoenix interfaces with other Agency systems and tools in order to align financial management with other business processes. Based on available resources and Agency priorities, USAID makes incremental investments to automate and streamline financial management processes.
USAID FY 2017 AGENCY FINANCIAL REPORT | MANAGEMENT’S DISCUSSION AND ANALYSIS38
39
USAID will continue to make improvements to financial management processes so that they are more efficient and take advantage of shared services, when possible. A recent upgrade to the Phoenix system provided the Agency the technical ability to implement the Invoice Processing Platform (IPP), a Web-based system that efficiently manages government invoicing from purchase order through payment notifications and centralizes all invoice transaction data and documents. Implementation of the IPP capability will automate vendor invoicing and payments and should reduce transactional costs, improve accuracy of payment and accounting data, and help USAID comply with new federal accounting and IT standards, many driven by Treasury with a vision of all-electronic invoicing by the end of FY 2018.
The Phoenix and GLAAS Financial Integration demonstrates the Agency’s commitment to help streamline and standardize business processes. While GLAAS supports the Agency’s acquisition and assistance management activities, Phoenix validates funds and processes GLAAS requests and awards as Phoenix commitments and obligations in real-time. Throughout FY 2017, the Agency has been preparing for the GLAAS 4.3 upgrade, which will enhance assistance functionality and is scheduled for release in FY 2018. GLAAS also piloted new FedConnect functionality, which will serve as a portal between USAID and potential partners, aiding the communication and proposal/application process and allowing for the electronic submission of proposals/applications.
Financial management processes were made more efficient with enhancements of the Mission Project Pipeline Reporting (MAPPR) tool that allows users to add mission-defined metadata to financial information; i.e., office, bilateral agreement, or activity, at the level missions need to better manage their portfolios more quickly and conduct pipeline reporting. In FY 2017, upgraded versions of MAPPR were released to include new reference tables where field missions can manage their own lists of applicable values, a renamed activity field that auto-populates from GLAAS and overwrites any manually selected value if the activity is linked to a GLAAS award, and a new accounting lines report that shows all obligation accounting lines frozen as of the end of the prior month. Another enhancement included new functionality that simplifies the tool for missions that might be overwhelmed by the amount of choices available or that want to tailor their deployment to what meets their needs.
USAID successfully implemented the Auto-Deobligation application in 2015, which leverages functionality in the current Phoenix Viewer reporting tool to streamline the deobligation process. The application has been successful across bureaus in Washington, D.C. and in the missions in ensuring Agency funds are available for reuse, and it now includes the functionality to deobligate micro-purchases.
USAID FY 2017 AGENCY FINANCIAL REPORT | MANAGEMENT’S DISCUSSION AND ANALYSIS
Management excellence in development is the foundation on which USAID’s ability to deliver results is built. Upon this “One M” platform, the pillars of the new Administration’s commitment to reform are anchored. USAID organized this section around the themes of: effectiveness of Agency systems and programs, efficiency demanded by taxpayers, economic growth powered by accessible government data and transparency, and an overall strengthening of the federal workforce.
EFFECTIVENESS
As the world’s foremost development entity, USAID relies heavily on its information technology (IT) systems to effectively administer its programs and safeguard sensitive information. USAID also improves its effectiveness by focusing on the areas of customer service, rulemaking, and the reduction of burdensome reporting requirements.
CYBERSECURITY
USAID has a vast attack surface—operating in more than 100 countries, over 12 thousand users accessing its network, including hundreds of foreign nationals, and about 35 thousand devices connected to the USAID global network, etc.—representing potential entry points for internal and external adversaries. Overall, the Agency’s Bureau for Management, Office of the Chief Information Officer detects and mitigates more than 200 thousand malware and intrusion events each month.
USAID faces a wide array of cyber threats and cybersecurity is a critical priority. Through its cyber work over the last few years, USAID has laid an important foundation for working closely with the Office of Management and Budget (OMB), the Department of Homeland Security (DHS), the federal Chief Information Officers Council, and
other federal organizations to protect its networks, systems, and information from unauthorized access or disruption while continually providing essential services and protecting privacy.
USAID is also strengthening its overall cybersecurity capabilities, such as implementing the DHS’s Continuous Diagnostics and Mitigation program to provide the capabilities and tools that identify cybersecurity risks on an ongoing basis, prioritize these risks based upon potential impacts, and enable its cybersecurity personnel to mitigate the most significant problems first.
USAID was one of 10 Chief Financial Officer (CFO) Act agencies to recently receive the highest possible overall cybersecurity risk management rating of “Managing Risk” from OMB and DHS. This designation signifies that the Agency has instituted required information security policies, procedures, and tools, and is able to actively manage its cybersecurity risk. This assessment of the Agency’s cybersecurity program using the National Institute of Standards and Technology Cybersecurity Framework was a requirement of presidential Executive Order 13800, Strengthening the Cybersecurity of Federal Networks and Critical Infrastructure, issued in May 2017.
FEDERAL INFORMATION TECHNOLOGY ACQUISITION REFORM ACT
Enacted in 2014, the Federal Information Technology Acquisition Reform Act (FITARA) promotes effectiveness and cost-efficiency of IT in support of the Federal Government’s mission. As a result of the continued efforts in implementing FITARA, USAID became the first CFO Act agency to receive an “A+” rating for its FITARA scorecard, which the House Committee on Oversight and Government Reform issued in June 2017. The
OTHER MANAGEMENT INFORMATION, INITIATIVES, AND ISSUES
USAID FY 2017 AGENCY FINANCIAL REPORT | MANAGEMENT’S DISCUSSION AND ANALYSIS40
41
rating reflects USAID’s accomplishments in a number of critical areas, including data center optimization, incremental development, and transparency and risk management.
USAID recognizes there are still challenges to overcome in achieving the objectives established in FITARA. For example, USAID must continue to improve visibility of IT investments across the Agency, further strengthen oversight of all IT investments by the Chief Information Officer, and make additional efforts to optimize the Agency IT portfolio.
DEVELOPMENT INFORMATION SOLUTION
USAID’s work requires an integrated portfolio management system, used in every mission and bureau, which captures the Agency’s data and facilitates evidence-based decisions in real time. The proliferation of systems and lack of data integration place a high management burden on USAID staff, which impacts the Agency’s mission and effectiveness in managing development resources. The Development Information Solution (DIS) will be an Agency-wide portfolio management system integrating data across systems and program cycle functions (i.e., budget, performance management, strategic planning).
The main goals for the DIS are: (1) enable Agency reforms and policy implementation, including FITARA and Federal Information Security Modernization Act compliance, (2) facilitate better data analysis and management of resources, and (3) streamline standard reporting and portfolio management tasks. When completed, the DIS will be the only system users need to execute portfolio management tasks.
In October 2016, USAID awarded a contract to build the first work stream on Performance Manage-ment. Agency subject matter experts have supplied critical support, helping refine the high-level business requirements into detailed user stories, and ensuring the system is appropriate for all missions and bureaus. In August 2017, the new Administra-tion designated the DIS a high-priority project for the Agency. Therefore, USAID is accelerating the
timeline for the remaining work streams (Budget, Project Management, and Portfolio Viewer and Reporting).
CUSTOMER SERVICE
USAID collects data to continuously improve customer service and enhance its capacity to efficiently and effectively deliver on its mission. USAID administers an annual survey to all staff to solicit feedback about its support services. The 2017 Management Support Services Customer Survey gathered input on 13 operating units providing management services to Agency staff. Responses indicate 76 percent of those utilizing services have their overall needs met, a 14 percentage point increase from the 2016 survey. In 2017, USAID also identified process improvements with actionable suggestions for each operating unit. In addition, for the first time, the Agency created a dashboard to visualize transparently the survey data, making it available for Agency-wide use.
Based on the results from previous years’ surveys, the operating units have been taking concrete steps to improve customer satisfaction and increase the efficiency and effectiveness of management operations. A prime illustration of this is the Bureau for Legislative and Public Affairs conducting a series of informational presentations to keep the Agency better informed on legislative and public affairs issues in FY 2017. In addition to the launch of last year’s Service Central for Human Resources (HR) and IT assistance, the Office of the General Counsel launched a knowledge management system that allows attorneys to efficiently share information and seek feedback with one another on legal issues.
Additionally, USAID remains actively engaged with its external partners. USAID organizes regular outreach events for organizations that work with or are interested in partnering with the Agency. One of the regular outreach events is an “Ask the Procurement Executive” conference call (https://www.usaid.gov/partnerships/ask-the-executive). The purpose of this call is to answer partners’ questions about specific funding opportunities and working with USAID beyond the Business Forecast. These events are well attended, with nearly 250 partners participated in the July 2017 call.
USAID FY 2017 AGENCY FINANCIAL REPORT | MANAGEMENT’S DISCUSSION AND ANALYSIS
REDUCING THE REPORTING BURDEN
USAID staff maintain robust workloads given the need to satisfy growing mission requirements. As such and consistent with the President’s Management Agenda, USAID examines every opportunity to minimize the Agency’s administrative burden in order to maximize effectiveness while achieving development objectives. USAID is legislatively required to submit recommendations to OMB on how it can reduce its reporting burden for congressional reports, per the Government Performance and Results Act and Modernization Act of 2010. In addition to this legislative requirement, the Agency remains committed to streamlining its overall reporting burden to improve its overall efficiency and effectiveness, including those that are legislatively required or mandated by oversight entities (e.g., OMB or the Government Accountability Office. In 2017, the Agency had an external reporting burden of 219 reports, and has identified 88 opportunities to eliminate, consolidate, or further streamline existing reporting requirements. If these recommendations are implemented, the end result will be a more than 30 percent reduction in USAID’s existing reporting burden.
AGENCY RULEMAKING
USAID is dedicated to promoting public engagement, and the rulemaking process is an integral part of that effort. Agency rulemaking is designed to foster public and customer engagement. As required, USAID gives notice to the public that it is considering a specific regulatory change that will alter the rights and interests of outside parties before the rule takes effect. Once USAID publishes the rule in the Federal Register, the public can comment on the proposed rule and provide feedback to the Agency.
In 2017, USAID continues its commitment to transparency with partners/stakeholders via the Rulemaking and eRulemaking processes and engagement. USAID currently has nine regulatory actions identified in the fall 2017 Unified Semi-Annual Agenda of Regulations—four proposed rules, four final rules, and one completed action. One proposed rule is significant and the others are defined as non-substantive. Three of the four final
rules and the completed action are all deregulatory. (https://www.reginfo.gov/public/do/eAgendaMain)
USAID’s rulemaking program is in compliance with the principles and requirements of presidential Executive Order on regulatory reform, Executive Order 13771, “Reducing Regulations and Controlling Regulatory Costs,” issued in January 2017.
EFFICIENCY
USAID works in more than 100 countries and partners with a variety of different types of organizations to achieve its mission. USAID awards the majority of its funds competitively through acquisition and assistance (A&A) instruments. USAID continues to relentlessly pursue efficiencies including in the areas of Procurement, Category Management (CM), and Benchmarking.
ENHANCED ACCOUNTABILITY IN ACQUISITIONS AND ASSISTANCE
USAID’s A&A portfolio represents the greatest share of the Agency’s annual spending. USAID designs, competes, and awards a complex array of A&A instruments annually in support of the Agency’s mission. (See Automated Directive Service (ADS) 300, https://www.usaid.gov/sites/default/files/documents/1868/300.pdf). For the past four years, the Agency’s most senior leadership has reviewed major A&A awards to ensure that they fulfill specific requirements. Through these reviews the Agency aligns resources with priorities, sharpens the focus on results, emphasizes the use of small business and in-country organizations, as well as leverages innovations and builds on past experiences. The review process continues to be a valuable tool for focusing attention on the scope of awards, their impact, and the value for money invested.
PROCUREMENT REFORM
To better fulfill its mission, USAID made a critical shift in the way it administers foreign assistance by placing a greater emphasis on leveraging private capital; channeling funding to local governments and organizations that have the in-country
USAID FY 2017 AGENCY FINANCIAL REPORT | MANAGEMENT’S DISCUSSION AND ANALYSIS42
43
series. During FY 2017, the topics included: Construction Contracting, Oral Interviews, Digital Money, PALT Best Practices, the Importance of Data Quality, and A&A reporting. In addition, the A&A Lab conducts workshops on innovative approaches to A&A including: Broad Agency Announcements, Co-creation, and Adaptive Management techniques. Such approaches help spur procurement competition to reach unique and small community partners. They also ensure the Agency is able to react quickly with agile mechanisms in response to an ever-changing operating environment and humanitarian emergencies. In addition, the A&A Lab has established an A&A Expert Help Desk staffed by USAID volunteers around the world and a Business Manager’s Toolkit.
Given USAID relies on procurement tools to implement programs around the world, it is critical the Agency’s A&A processes operate efficiently to achieve its development objectives. In FY 2017, USAID continued to take steps to reduce PALT on awards over $10 million. The Agency focused its efforts on developing a tracking process with each bureau and mission to ensure internal transparency on procurement processes, and to identify delays. USAID is creating a user-friendly and cost effective method to increase the use of milestone plans in its existing A&A planning system. USAID established a cross-functional team to ensure that the new method: (1) continues to streamline milestone planning, (2) increases tracking and reporting capability, (3) integrates milestone requirements into other Agency enterprise systems, (4) allows contracting and assistance officers to customize milestone plans for particular procurements, and (5) serves as an Agency-level management tool. Along with the May 2017 community of practice conference call on PALT, the Agency released a PALT Best Practices Guide and one-pager.
In FY 2017, USAID has continued its goal of “end-to-end paperless contracting” with a four-fold approach: (1) pilot FedConnect, (2) enhance expedited electronic document filing with the Agency Secure Image and Storage Tracking System (ASIST), (3) pilot use of digital signatures, and (4) use online collaboration tools.
knowledge and expertise to create sustainable, positive change; and expanding its partner base. USAID also focused on streamlining the procurement process and institutionalizing reforms.
USAID utilizes a Web-based A&A Plan system to capture planned actions. The tool provides USAID with a holistic view, capturing actions from 147 operating units. The Agency combines this with financial data to create a clearer picture of the Agency’s business mechanisms. USAID can then engage operating units and direct resources where needed. The system also provides a variety of dashboards and reports, customized to its users, helping USAID to effectively manage its awards. USAID added functionality to the A&A planning system to track mission concurrence in accordance with the revised ADS 201 policy (https://www.usaid.gov/ads/policy/200/201man) to ensure mission directors have overall visibility of activities operating under their purview. Since its launch in FY 2015, users have shown positive increased usage by entering over 13,700 planned actions into the system. In January 2017, the Agency launched a “live feed” of its Business Forecast, improving upon the previous practice of producing a quarterly forecast. USAID pulls the forecast directly from the Agency’s A&A Plan every 24 hours, providing more accurate and timely information to partners. This feature enables potential partners to plan and organize before the Agency posts a solicitation on Grants.gov or FBO.gov. This timely forecast information can help improve Procurement Action Lead Time (PALT) when the Agency receives better proposals or applications from partners.
USAID created the A&A Lab as a result of a mandate by OMB to address Agency-specific mandates to bolster innovation while also developing and enhancing the A&A workforce. USAID has utilized the A&A Lab to connect A&A staff worldwide to advance the Agency’s mission through workforce development, and for the testing and scaling of innovations that spur competition and establish new partnerships. In FY 2017, the Agency piloted an A&A Mentoring Program which is set for a formal rollout in fall 2018. The A&A Lab has hosted a series of community of practice conference calls, webinars, and a topical speaker
USAID FY 2017 AGENCY FINANCIAL REPORT | MANAGEMENT’S DISCUSSION AND ANALYSIS
First, FedConnect is a government-wide A&A portal that allows for the automation of electronic submission of proposals and applications from the Agency’s implementing partners. Second, ASIST has successfully passed tests with FedConnect to automatically link proposals with the Agency’s electronic files. This is another step to automate the A&A process. Following the completion of the pilot, it is USAID’s intention to deploy FedConnect Agency-wide. The Agency will establish timelines for the launch of FedConnect upon completion of the pilot program. Third, USAID has been testing digital signatures with proper security protocols to expedite award approvals. The Agency successfully completed digital signature testing in Washington, D.C. for internal documents as of June 2017, and testing in the field is currently underway. Last, using online collaboration tools has allowed faster and easier development and review for technical evaluations and other documents. All of the approaches detailed above are designed to automate the A&A process and have also assisted in the streamlining of PALT.
CATEGORY MANAGEMENT
Category Management (CM) is an approach the Federal Government is applying to buy smarter and more like a single enterprise. CM enables the government to eliminate redundancies, increase efficiency, and deliver more value and savings from the acquisition programs. During FY 2017, USAID began its involvement in the CM initiative that both the General Services Administration (GSA) and OMB lead.
USAID has been engaged in identifying, assessing, and reporting on its portfolio of acquisition contracts. USAID assessed how its contracts were applicable to the federal-wide CM “tiered” system and determined which contracts met the requirements for Best-in-Class (BIC) solutions. Contracts designated BIC can be used by multiple agencies and meet the following five OMB criteria:
1. Rigorous requirements, definitions, and planning processes;
2. Appropriate pricing strategies;
3. Data-driven demand management strategies;
4. Category and performance management practices;
5. Independently validated reviews.
USAID reported that in FY 2016, 58 percent of its acquisition dollars were categorized as Spend Under Management, meaning that percentage met defined criteria for management maturity and data sharing.
USAID is engaged and committed to the Federal Government’s CM efforts. The Agency has been an active participant in the Office of Federal Procurement Policy’s initial set of federal-wide coordination meetings that supported the USAID roll-out of CM. USAID hosted a GSA/OMB sponsored CM-specific training for its Bureau for Management, Office of Acquisition and Assistance (M/OAA) staff in FY 2017. The CM training was designed to increase the familiarity of CM and the supporting tools (Acquisition Gateway) available for staff in support of CM implementation. USAID will continue to train its M/OAA and program staff during FY 2018 in the benefits and proper application of CM and will assess the Next Generation of Package Delivery BIC solution for its Agency-wide adoption and implementation. USAID anticipates there will be additional “roll-outs” of other CM and BIC solutions for consideration and adoption in FY 2018 and beyond.
BENCHMARK AND IMPROVE MISSION SUPPORT OPERATIONS
Cost and quality benchmarks of mission support operations give Agency decision makers better data to compare options and allocate resources as efficiently as possible. Mission support operations cover the areas of contracting, financial management, human capital, real property, and IT. USAID continues to make progress on the cost, quality, and customer satisfaction metrics, including moving toward low-cost, high-quality IT and contracting.
USAID remained one of the top five performing CFO Act agencies for the rate at which it generates multiple proposals for competitive acquisitions. Less than 6 percent of competitive acquisitions received one bid or were sole sourced in FY 2016,
USAID FY 2017 AGENCY FINANCIAL REPORT | MANAGEMENT’S DISCUSSION AND ANALYSIS44
45
significantly lower than the government-wide average of 14.33 percent. In addition, USAID’s contracting function ranked first out of the 24 CFO Act agencies in customers’ perception of it as a strategic partner.
In FY 2016, USAID halved the percentage it spends on financial management per full-time employee as it relates to the total organizational full-time employee spend, from 10 percent to 4.4 percent. USAID continued the downward trend in terms of cost per vendor invoice, lowering this metric from $120.40 in FY 2014 to $38.49 in FY 2016. The Agency’s systems costs per user ranked first among CFO Act agencies with adjusted Agency obligations under $2 billion. Additionally, USAID’s financial management function placed first among the 24 CFO Act agencies in terms of both overall customer satisfaction and being viewed as an integral strategic partner.
USAID lowered its Human Resources Information Technology (HRIT) cost per employee serviced by an impressive 36 percent, earning a third place ranking in that category among CFO Act agencies. USAID also dramatically reduced its recruiting and hiring cost per external position filled, from $17,940 in FY 2015 to under $3 thousand in FY 2016, an 84 percent cost savings. Even though USAID’s HR function continues to lag behind in being viewed as a strategic partner by its customers, the Agency increased this score and its Human Capital satisfaction score each by 39 percent over FY 2015.
The Agency’s strongest customer satisfaction benchmarking results come in the IT realm. USAID ranked first overall, as well as in IT equipment and IT help desk when compared to other CFO Act agencies. In terms of cost savings, USAID decreased the cost per desktop end user, e-mail inbox, and help desk ticket by over 10 percent each from FY 2015, placing it in the top 10 in each category. A help desk abandonment rate of less than 2 percent was also good enough for a fourth place ranking among all CFO Act agencies.
USAID maintained its first place space efficiency ranking with 180.33 square feet per person, lowering that figure 5 percent from FY 2015. The government-wide average for space efficiency is nearly 266 square feet per person.
CONFERENCE MANAGEMENT
OMB Memorandum M-12-12, Promoting Efficient Spending to Support Agency Operations, (https://www.whitehouse.gov/sites/default/files/omb/memoranda/2012/m-12-12.pdf), requires that federal agencies ensure that conference expenses are appropriate, necessary, and managed in a way that minimizes expenses to taxpayers. In response, USAID has implemented comprehensive policies and other controls to mitigate the risk of inappropriate spending on conferences (See ADS 580, https://www.usaid.gov/sites/default/files/documents/1868/580.pdf). Senior-level review of conference expenditures resulted in reduced overall costs for five out of 29 conferences totaling $238,327, saving the Agency and taxpayers an average of $47,665 per event.
COST SAVINGS
Reducing administrative costs is a key priority for USAID. The Agency is committed to achieving cost savings by constantly improving the efficiency and effectiveness of its operations. As a result of these ongoing efforts, USAID achieved approximately $6.4 million in FY 2017 cost savings. USAID accomplished these cost savings primarily through the effective management of its real estate overseas including the renegotiation of its lease of the mission office in Kazakhstan and disposal of excess property. In addition, the Agency improved the efficiency of printing and the management of travel authorizations. USAID will continue to pursue reductions to administrative costs with a focus on improving Agency operations.
ENTERPRISE RISK MANAGEMENT
USAID implements its responsibility for Enterprise Risk Management (ERM) by building on a strong foundation and practice of risk management. Agency staff regularly assess and mitigate a wide variety of risks in order to ensure good stewardship of taxpayer funds and achievement of development and humanitarian assistance program goals. USAID staff also apply internal controls as continuous, operations-level safeguards. These ensure the Agency uses funds properly and supports the achievement of USAID program objectives.
USAID FY 2017 AGENCY FINANCIAL REPORT | MANAGEMENT’S DISCUSSION AND ANALYSIS
In FY 2017, USAID advanced ERM in significant ways, improving governance, policy, and procedure to strengthen the management of risks across operating units and enhance integration of risk considerations in ongoing planning and management activities. These improvements resulted from USAID’s internal culture of continuous process improvement and in response to external directives from the OMB in the revised Circular A-123 (https://www.whitehouse.gov/sites/default/files/omb/memoranda/2016/m-16-17.pdf).
In FY 2017, USAID approved an initial Agency Risk Profile, ERM governance structure, and initial Implementation Plan. The Agency revised the charter of its Management Control Review Committee (MCRC), formerly charged solely with reviewing internal controls, and reconstituted it as the Executive Management Council on Risk and Internal Control (EMCRIC). The new governance structure expands the scope and responsibilities of the former MCRC to integrate ERM with USAID’s current internal control structure, and adds a critical new component by establishing the Risk Management Council (RMC) under the EMCRIC. The RMC assesses the roll-up of enterprise risks and non-financial internal controls in order to make recommendations to the EMCRIC. The Agency has also established an ERM Secretariat to support the RMC and a process for ERM risk reporting that utilizes bureau and independent office Risk Management Liaisons to facilitate top-down and bottom-up information flows. Establishing a Chief Risk Officer will be a component of the Agency’s Redesign in FY 2018.
ECONOMIC GROWTH
USAID’s commitment to making its program-matic and operational data more publicly accessible promotes transparency to foster innovation and support economic growth.
OPEN DATA
USAID continues to refine its approach to making Federal Government data discoverable, accessible, and usable to the American taxpayer and the broader international development community. Readily available data supports the Agency’s effort to design and implement programs based on solid
evidence. Sharing data in the highly decentralized, international environment in which USAID operates reduces duplicative data collection efforts while increasing the ability of the Agency to learn from previous work.
During FY 2017, USAID staff and implementing partners submitted more than 250 new datasets to the Development Data Library (DDL), the Agency’s central digital data repository, in accor-dance with the Agency’s Development Data Policy (https://www.usaid.gov/ads/policy/500/579). Data submissions averaged approximately six to seven datasets per week over the course of the year. USAID has worked to curate these datasets in its repository to ensure that these data are preserved, accessible, and made usable over the long-term.
USAID remains committed to enhancing the accessibility and value of data submissions while protecting the privacy and security of all individuals, including participants in USAID programs. This commitment prompted the Agency to temporarily pause the release of datasets submitted to the DDL in early FY 2017, while Agency data privacy and security experts worked together to enhance various protection measures. This included issuing a Request for Information to explore some industry solutions to data privacy risk assessment and disclosure mitigation. By mid-FY 2017, the Agency again began publishing data at an increasing pace.
USAID is anticipating the launch of a new DDL platform in FY 2018 that will greatly enhance the accessibility and usability of Agency data. While the Agency initially planned this launch for FY 2017, USAID is devoting more time to developing addi-tional requirements requested by Agency staff and partners. This operational delay has also allowed the Agency to direct more resources to meeting federal security requirements such as FedRAMP certification, integrating with other Agency systems, and adopting criteria observed by trusted digital repositories. As the launch of the DDL approaches, USAID will embark on change management efforts to familiarize implementing partners and staff with the new platform. Partners will have increased control over the submission and presentation of their data through the new DDL, including the ability to create visualizations of their data to share
USAID FY 2017 AGENCY FINANCIAL REPORT | MANAGEMENT’S DISCUSSION AND ANALYSIS46
47
key lessons with potential users. USAID operating unit staff will also have increased capabilities to guide partners in data collection, submission, and curation and publication procedures.
OPEN GOVERNMENT
In the realm of foreign assistance, transparency is essential for promoting accountability to both recipients abroad and American taxpayers at home. USAID, in partnership with the Department of State (State), Office of U.S. Foreign Assistance Resources (F), leads the effort to ensure greater transparency of U.S. Government foreign assistance funding through ForeignAssistance.gov (https://foreignassistance.gov/). This website allows stakeholders, both internal and external, the ability to search and visualize expanded, timely information about what, where, how, and with whom USAID spends development dollars. USAID fulfills the obligation from the Open Government Plan v4.0 (https://www.usaid.gov/sites/default/files/documents/1868/USAID_OpenGovPlan2016.pdf) and disseminates up-to-date information in a common, open format. Publishing data on ForeignAssistance.gov is also a significant component in USAID’s International Aid Transparency Initiative (IATI) Cost Management Plan (https://www.usaid.gov/sites/default/files/documents/1870/IATI%20Cost%20Management%20Plan_u_14July2015.pdf). Published in July 2015, the plan provides a detailed roadmap on how USAID will share more data about its work. Since the publication of the plan, USAID has added or improved upon 22 IATI fields in its quarterly reporting, as well as institutionalized the data review process prior to publication. State and USAID are working together to explore the possibility of IATI files being used to satisfy in-country reporting requirements to Aid Information Management Systems. USAID successfully completed a pilot program effort in Bangladesh in spring 2017, and is exploring expanding the process to other countries.
USAID’s Program Cycle policy requires that unstructured, qualitative data remain available through the Development Experience Clearinghouse (DEC) (https://dec.usaid.gov) within
three months of completion. The DEC contains more than 238 thousand documents, 11 thousand of which are evaluations. Of the approximately 159 internal and external project evaluations completed in FY 2016, 79 percent were available online in the DEC as of January 2017. Evidence from these evaluations is used to make mid-course corrections and inform future project design.
Powered by an underlying database of all U.S. foreign assistance funding from over 70 U.S. Government departments, agencies, and offices, Foreign Aid Explorer (https://explorer.usaid.gov/) presents the multi-dimensional picture of U.S. foreign assistance through a highly visual and inter-active website. Additionally, in FY 2017, USAID redesigned an updated, more comprehensive Dollars to Results (D2R) website (https://results.usaid.gov/) to display data about USAID’s impact around the world by linking foreign assistance spending and illustrative results by fiscal year. Currently, D2R displays FY 2014 through FY 2016 disbursement and results data for over 150 countries, more than three times the countries included in previous years. To make USAID information more accessible to the public, D2R displays results with reader friendly explanations and allows users to download data in a machine readable format.
USAID is committed to integrating the principles of open government into sustainable develop-ment. For example, as part of the U.S. Govern-ment commitment to the Global Partnership for Sustainable Data, USAID will provide financial support to the Global Open Data for Agriculture and Nutrition (GODAN) (http://www.godan.info/) secretariat to expand its work in promoting the opening of agriculture and nutrition datasets. The Agency will support implementation of surveys on agricultural production, productivity, and socio-economic variables that support the Global Food Security Act Core Agricultural and Rural Data Surveys (CARDS) project. The project supports methodological research aimed at improving the core set of country household data, and training and dissemination activities to improve usability of these data in policy-making.
USAID FY 2017 AGENCY FINANCIAL REPORT | MANAGEMENT’S DISCUSSION AND ANALYSIS
Additionally, USAID’s mission in Colombia led two data analysis events promoting USAID open government efforts. Data Jam Desarrollo Rural 2017 was a crowd-sourcing activity held in late April 2017 to promote using open data for innovative ideas to address common social issues. The mission coordinated with the Government of Colombia Information Technologies and Communications Ministry to support this 48-hour marathon event. Over 120 people in 30 teams analyzed 80 open datasets to address the rural development-focused problems presented to them with hopes of generating ideas for more effective public policy development to tackle challenges common to the region. The mission also hosted a Data Journalism workshop, teaching the 23 attending journalists how to use effective analysis of available data to develop stories as well as how to visualize and share data through infographics and interactive presentations. Both events galvanized more authenticated datasets, making them available for public use and furthering the mission’s efforts to bring the projects and ideas born of the exercises to fruition.
STRENGTHENING THE FEDERAL WORKFORCE
USAID is committed to making its workforce accountable and more effective. A focus on perfor-mance management and employee engagement drives a thoughtful effort to reshape the Agency’s workforce to more optimally meet mission objectives.
PERFORMANCE MANAGEMENT
In FY 2016, USAID released its five-year HR Transformation Strategy and Action Plan (2016–2021) (http://pdf.usaid.gov/pdf_docs/PBAAE486.pdf) which seeks to establish strong core HR capabilities that exceed the expectations of customers. Funda-mentally, improving the way USAID supports HR and talent management is central to advancing the Agency’s mission, particularly given its increas-ingly complex operating environments. The three major pillars of the transformation are HR opera-tions, workforce preparedness, and organizational culture and wellness. During the first year of
implementation, the strategy prioritizes efficient, effective, and customer-focused HR operations to improve customer service, clarify roles and responsibilities, and clean up HR data. The HR Transformation will ensure workforce preparedness by providing the knowledge, skills, abilities, and attributes necessary to meet the Agency’s mission for today and the future. Finally, the founda-tional pillar of HR Transformation, organizational culture and wellness, will build a stronger culture of accountability where people demonstrate high levels of ownership to think and act in the manner necessary to achieve organizational results. During FY 2017, USAID continued to make progress with HR Transformation. Among the many initiatives: (1) reinstituting the Student Loan Repayment Program, (2) establishing a Community of Stake-holders working on a redesign of the Foreign Service Assignments process, and (3) establishing a working group for workforce planning and analytics.
Of particular significance is the work that has been done by the Community of Stakeholders on the redesign of the Foreign Service Performance and Promotion process. The redesign streamlines the process and is estimated to result in a savings of 53 thousand man-hours per year. The Foreign Service Performance process is distinct from, yet aligned with, the promotion process. The overarching results of this reform include: (1) strengthened performance management culture, (2) streamlined processes, and (3) greater accountability. Most components of the new employee performance and development process have been negotiated with the American Foreign Service Association The last remaining element to be negotiated is the streamlined process that holds Foreign Service Officers accountable for improving performance deficiencies and removing those who cannot meet USAID’s high standards of performance. Proposed changes to the promotion process will greatly increase the quality of the information provided to promotion boards and the fairness and transparency of the review process. The final elements will be negotiated once the pilot test of the proposed new promotion process is completed. The Administrator intends the new process will go into effect on April 1, 2018.
USAID FY 2017 AGENCY FINANCIAL REPORT | MANAGEMENT’S DISCUSSION AND ANALYSIS48
49
Efforts are also underway on the redesign of the Civil Service performance management process where interviews, focus groups, and a survey to guide the Civil Service redesign efforts have already been conducted. A current assessment with recommended actions will be released in the first quarter of FY 2018. In addition, an automated performance management system will be implemented to provide additional time savings and enhance accountability for Foreign Service, Civil Service, Senior Executive Service, Senior Level, and Scientific Technical employees. These efforts are fully aligned with USAID’s comprehensive plan to maximize employee performance, a plan drafted in response to the March 2017 presidential Executive Order on a Comprehensive Plan for Reorganizing the Executive Branch.
EMPLOYEE ENGAGEMENT
USAID’s focus on employee engagement leverages data from the Federal Employee Viewpoint Survey (https://www.fedview.opm.gov/). USAID values an inclusive work environment, one where the Agency learns from every member of its team and fosters his or her active engagement. USAID recognizes the relationship between employee engagement and mission performance, and made action planning mandatory for all bureaus and missions in FY 2017. The Agency continues to improve its Employee Engagement Index score through these and other efforts, increasing it by 8 percentage points in a three-year period, from 64 percent in 2014 to 72 percent in 2017.
FEDERAL REAL PROPERTY INITIATIVE
USAID holds leasehold and freehold interest in real property assets overseas and domestically. For overseas assets, the Agency works with State’s Bureau of Overseas Building Operations (OBO) to transact and manage real property. Domestically, USAID’s primary partner is the GSA. The Agency manages 1,552 overseas assets5 as of December 31, 2016,
the latest reporting period for the Federal Real Property Profile, including 173 owned assets of which 55 have reversionary interests as trust-funded properties. The plant replacement value for owned assets is $210 million.6 There are 1,379 leases with annual rent payments totaling $60 million for 2016. These leases include facilities such as office buildings, warehouses, housing units, guard booths, and secure parking areas. The overseas portfolio is managed by the Bureau for Management’s Office of Management Services’ Overseas Management Division, with oversight from USAID’s Senior Real Property Officer and in collaboration with OBO.
In the United States, USAID maintains six occupancy agreements with the GSA and one direct lease with a private landlord. Domestic office and warehouse space is included in the baseline measurements for the Reduce the Footprint initiative. Under the baseline requirements, USAID reports on usable square feet for office and warehouse space in the Washington, D.C. area. The administration of occupancy agreements and leases, as well as the facilities and building operations management is the responsibility of the Bureau for Management’s Office of Management Services’ Headquarters Management Division under the oversight of the Senior Real Property Officer and in coordination with the GSA.
USAID manages the real property portfolio in accordance with a series of mandated references including legislative authority, regulatory guidance, policies, and Executive Orders. These include but are not limited to the Foreign Assistance Act; Title 41 of the Code of Federal Regulation; the Foreign Affairs Manual; the Agency Directive System; and Executive Order 13327, Federal Real Property Asset Management. Accordingly, USAID seeks to maintain an efficient and effective real property portfolio. Per the requirements of Executive Order 13327, the Agency reports through the FRPP database all owned, leased, and otherwise managed federal real property assets within and outside the United States, including improvements on federal land, in coordination with the GSA and OMB.
5 This figure includes land parcels.6 This figure does not include real property leases and is not used for financial reporting purposes.
USAID FY 2017 AGENCY FINANCIAL REPORT | MANAGEMENT’S DISCUSSION AND ANALYSIS
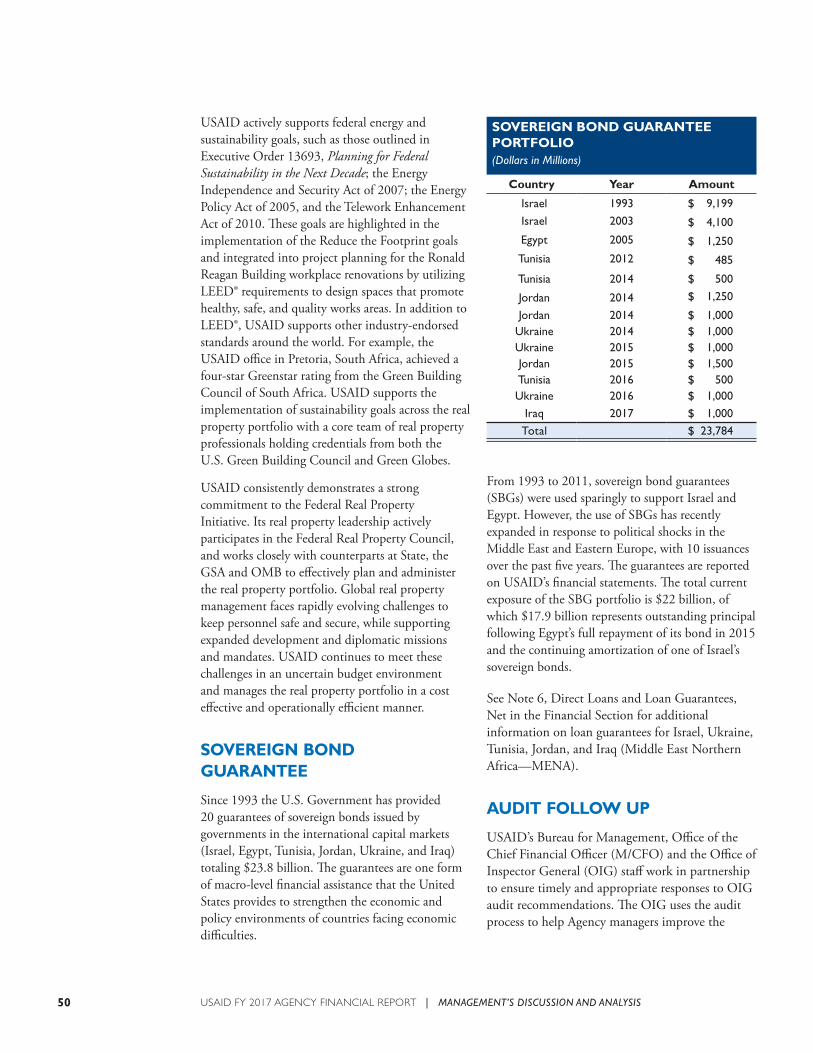
USAID actively supports federal energy and sustainability goals, such as those outlined in Executive Order 13693, Planning for Federal Sustainability in the Next Decade; the Energy Independence and Security Act of 2007; the Energy Policy Act of 2005, and the Telework Enhancement Act of 2010. These goals are highlighted in the implementation of the Reduce the Footprint goals and integrated into project planning for the Ronald Reagan Building workplace renovations by utilizing LEED® requirements to design spaces that promote healthy, safe, and quality works areas. In addition to LEED®, USAID supports other industry-endorsed standards around the world. For example, the USAID office in Pretoria, South Africa, achieved a four-star Greenstar rating from the Green Building Council of South Africa. USAID supports the implementation of sustainability goals across the real property portfolio with a core team of real property professionals holding credentials from both the U.S. Green Building Council and Green Globes.
USAID consistently demonstrates a strong commitment to the Federal Real Property Initiative. Its real property leadership actively participates in the Federal Real Property Council, and works closely with counterparts at State, the GSA and OMB to effectively plan and administer the real property portfolio. Global real property management faces rapidly evolving challenges to keep personnel safe and secure, while supporting expanded development and diplomatic missions and mandates. USAID continues to meet these challenges in an uncertain budget environment and manages the real property portfolio in a cost effective and operationally efficient manner.
SOVEREIGN BOND GUARANTEE
Since 1993 the U.S. Government has provided 20 guarantees of sovereign bonds issued by governments in the international capital markets (Israel, Egypt, Tunisia, Jordan, Ukraine, and Iraq) totaling $23.8 billion. The guarantees are one form of macro-level financial assistance that the United States provides to strengthen the economic and policy environments of countries facing economic difficulties.
From 1993 to 2011, sovereign bond guarantees (SBGs) were used sparingly to support Israel and Egypt. However, the use of SBGs has recently expanded in response to political shocks in the Middle East and Eastern Europe, with 10 issuances over the past five years. The guarantees are reported on USAID’s financial statements. The total current exposure of the SBG portfolio is $22 billion, of which $17.9 billion represents outstanding principal following Egypt’s full repayment of its bond in 2015 and the continuing amortization of one of Israel’s sovereign bonds.
SOVEREIGN BOND GUARANTEE PORTFOLIO (Dollars in Millions)
Country Year Amount
Israel 1993 $ 9,199
Israel 2003 $ 4,100
Egypt 2005 $ 1,250
Tunisia 2012 $ 485
Tunisia 2014 $ 500
Jordan 2014 $ 1,250
Jordan 2014 $ 1,000Ukraine 2014 $ 1,000Ukraine 2015 $ 1,000Jordan 2015 $ 1,500Tunisia 2016 $ 500Ukraine 2016 $ 1,000
Iraq 2017 $ 1,000
Total $ 23,784
See Note 6, Direct Loans and Loan Guarantees, Net in the Financial Section for additional information on loan guarantees for Israel, Ukraine, Tunisia, Jordan, and Iraq (Middle East Northern Africa—MENA).
AUDIT FOLLOW UP
USAID’s Bureau for Management, Office of the Chief Financial Officer (M/CFO) and the Office of Inspector General (OIG) staff work in partnership to ensure timely and appropriate responses to OIG audit recommendations. The OIG uses the audit process to help Agency managers improve the
USAID FY 2017 AGENCY FINANCIAL REPORT | MANAGEMENT’S DISCUSSION AND ANALYSIS50
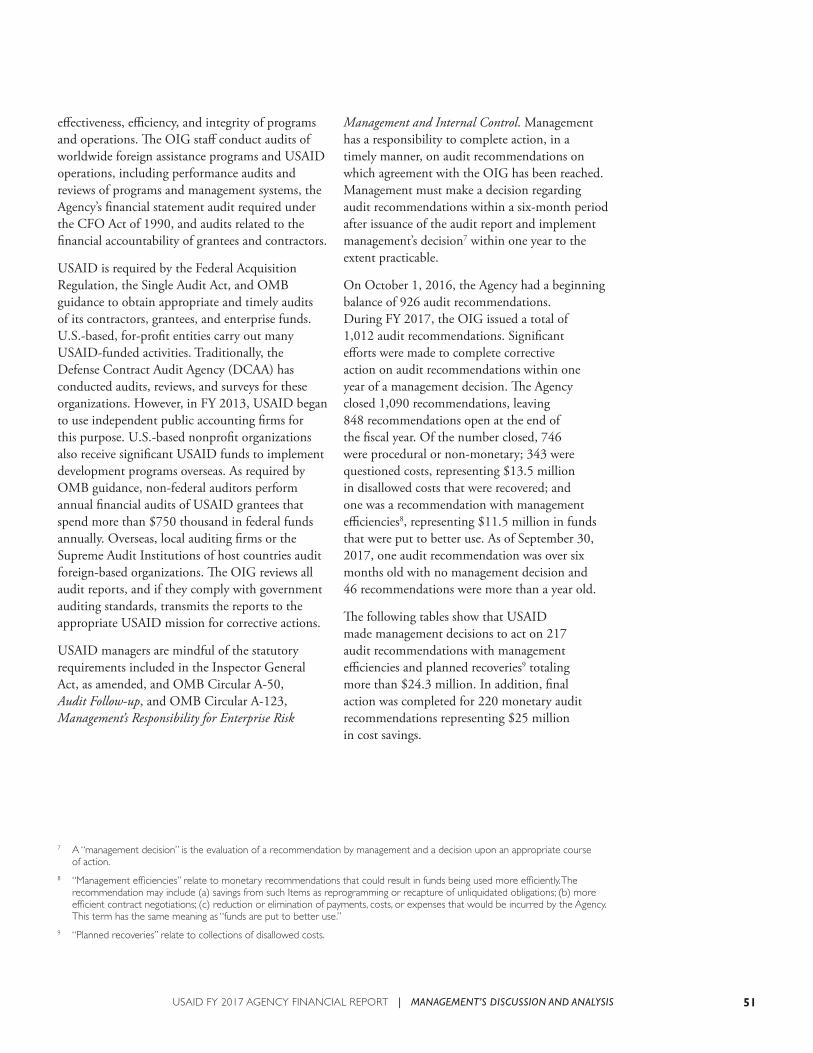
51
effectiveness, efficiency, and integrity of programs and operations. The OIG staff conduct audits of worldwide foreign assistance programs and USAID operations, including performance audits and reviews of programs and management systems, the Agency’s financial statement audit required under the CFO Act of 1990, and audits related to the financial accountability of grantees and contractors.
USAID is required by the Federal Acquisition Regulation, the Single Audit Act, and OMB guidance to obtain appropriate and timely audits of its contractors, grantees, and enterprise funds. U.S.-based, for-profit entities carry out many USAID-funded activities. Traditionally, the Defense Contract Audit Agency (DCAA) has conducted audits, reviews, and surveys for these organizations. However, in FY 2013, USAID began to use independent public accounting firms for this purpose. U.S.-based nonprofit organizations also receive significant USAID funds to implement development programs overseas. As required by OMB guidance, non-federal auditors perform annual financial audits of USAID grantees that spend more than $750 thousand in federal funds annually. Overseas, local auditing firms or the Supreme Audit Institutions of host countries audit foreign-based organizations. The OIG reviews all audit reports, and if they comply with government auditing standards, transmits the reports to the appropriate USAID mission for corrective actions.
USAID managers are mindful of the statutory requirements included in the Inspector General Act, as amended, and OMB Circular A-50, Audit Follow-up, and OMB Circular A-123, Management’s Responsibility for Enterprise Risk
Management and Internal Control. Management has a responsibility to complete action, in a timely manner, on audit recommendations on which agreement with the OIG has been reached. Management must make a decision regarding audit recommendations within a six-month period after issuance of the audit report and implement management’s decision7 within one year to the extent practicable.
On October 1, 2016, the Agency had a beginning balance of 926 audit recommendations. During FY 2017, the OIG issued a total of 1,012 audit recommendations. Significant efforts were made to complete corrective action on audit recommendations within one year of a management decision. The Agency closed 1,090 recommendations, leaving 848 recommendations open at the end of the fiscal year. Of the number closed, 746 were procedural or non-monetary; 343 were questioned costs, representing $13.5 million in disallowed costs that were recovered; and one was a recommendation with management efficiencies8, representing $11.5 million in funds that were put to better use. As of September 30, 2017, one audit recommendation was over six months old with no management decision and 46 recommendations were more than a year old.
The following tables show that USAID made management decisions to act on 217 audit recommendations with management efficiencies and planned recoveries9 totaling more than $24.3 million. In addition, final action was completed for 220 monetary audit recommendations representing $25 million in cost savings.
7 A “management decision” is the evaluation of a recommendation by management and a decision upon an appropriate course of action.
8 “Management efficiencies” relate to monetary recommendations that could result in funds being used more efficiently. The recommendation may include (a) savings from such Items as reprogramming or recapture of unliquidated obligations; (b) more efficient contract negotiations; (c) reduction or elimination of payments, costs, or expenses that would be incurred by the Agency. This term has the same meaning as “funds are put to better use.”
9 “Planned recoveries” relate to collections of disallowed costs.
USAID FY 2017 AGENCY FINANCIAL REPORT | MANAGEMENT’S DISCUSSION AND ANALYSIS
10 “Ending Balance 9/30/2017” equals “Total management decisions made” minus “Total final actions.”11 A single audit recommendation may involve multiple recovery types (collections/offset, other recovery, write-offs).
MANAGEMENT ACTION ON RECOMMENDATIONS THAT FUNDS BE PUT TO BETTER USE
Recommendations Dollar Value ($000)
Management decisions:Beginning balance 10/1/2016 1 $ 16
Management decisions during the fiscal year 1 11,532
Total management decisions made 2 11,548
Final actions:Recommendations implemented 1 11,532Recommendations not implemented – –
Total final actions 1 11,532
Ending Balance 9/30/201710 1 $ 16
MANAGEMENT ACTION ON AUDIT RECOMMENDATIONS WITH DISALLOWED COSTS
Recommendations Dollar Value ($000)
Management decisions:Beginning balance 10/1/2016 215 $ 36,822
Management decisions during the fiscal year 216 12,771
Total management decisions made 431 49,593
Final actions:
Collections/Offsets – 13,049
Other Recovery – 39
Write-offs – 442
Total final actions11 219 13,530
Ending Balance 9/30/201710 212 $ 36,063
Note: The data in these tables do not include procedural (non-monetary) audit recommendations.
USAID FY 2017 AGENCY FINANCIAL REPORT | MANAGEMENT’S DISCUSSION AND ANALYSIS52

FINANCIAL SECTION

(Preceding page) Jamaica’s Ruben Robinson is a community activist and “violence interrupter” who works to prevent criminal activity. USAID helped develop this community-based policing program. Meet Ruben at stories.usaid.gov. PHOTO: THOMAS CRISTOFOLETTI FOR USAID
(Above) Luis Edgardo Cruz Diaz searched for acceptance in the wrong places before a USAID program helped him change direction. He left a gang, returned to school, and became a respectful son and sibling. Meet Luis at stories.usaid.gov. PHOTO: THOMAS CRISTOFOLETTI FOR USAID
55USAID FY 2017 AGENCY FINANCIAL REPORT | A MESSAGE FROM THE CHIEF FINANCIAL OFFICER
Specifically, we implemented improved processes to account for reimbursable agreements, including launching a modification to our core financial accounting system to better track these agreements. In addition, we continued efforts to reconcile intragovernmental transactions (IGTs) and have a quality control procedure in place to ensure IGT differences remain at the lowest possible. As a result, USAID is ranked 8th best out of 35 agencies tracked by Treasury for IGT differences. With respect to Property, Plant and Equipment (PP&E) reporting, we have implemented a memorandum of understanding, finalized standard operating procedures, and instituted a quality control process to improve reporting and accounting. Through dedicated and diligent efforts, we were able to close the financial deficiency regarding investigating and resolving potential funds control violations (FCV) by reviewing and closing 100 percent of the backlogged cases, as well as establishing and implementing revised policies and procedures and dedicating resources to the investigation of potential FCV cases. Additional information regarding identified deficiencies and corrective actions can be found in the Management’s Discussion and Analysis (MD&A) section of this report.
The Agency remains vigilant in its efforts to reduce payment errors by focusing on identifying, reporting, and recovering overpayments. In March 2015, the Office of Management and Budget (OMB) granted improper payment reporting relief to USAID based on having a minimum of two consecutive years of improper payments below the thresholds set by the Improper Payments Elimination and Recovery Act (IPERA) of 2010. This relief places USAID programs on a three-year cycle of risk assessment. The next planned reporting will be in the FY 2018 AFR.
A MESSAGE FROM THE CHIEF FINANCIAL OFFICER
It is my privilege to present the U.S. Agency for International Development (USAID) Fiscal Year (FY) 2017 Agency Financial Report (AFR). The AFR provides us an opportunity to share with the American public our commitment to sound financial stewardship over the funds entrusted to the Agency to carry out its mission. It is our goal to present the Agency’s use of resources, operating performance, financial stewardship, and assessment of risks in a clear and effective manner. By doing so, we hope to continue to build upon the recognition we have received for the last two years from the Association of Government Accountants’ Certificate of Excellence in Accountability Reporting.
We are pleased that in FY 2017 USAID sustained an unmodified audit opinion, as determined by our Office of Inspector General (OIG). Our Agency has worked diligently to eliminate our material weakness finding related to Fund Balance with the U.S. Department of the Treasury (Treasury). We completed a comprehensive reconciliation and data cleanup effort and instituted a monthly reconciliation process to effectively identify and address any new discrepancies. All cash functions have been incorporated into our worldwide Web-based cash reconciliation tool, which allows the Agency to detect and promptly address discrepancies between USAID and Treasury. Finally, we developed a plan of action and consulted with our stakeholders to identify a one-time adjustment to eliminate the remainder of the difference. In the interest of exercising due diligence over this issue and ensuring the accuracy of the adjustment, we elected to extend our anticipated closure date for this issue to the end of calendar year 2017.
In addition, USAID dedicated resources toward continuing efforts to build and maintain a strong and sustainable internal control posture.
Reginald W. Mitchell
56 USAID FY 2017 AGENCY FINANCIAL REPORT | A MESSAGE FROM THE CHIEF FINANCIAL OFFICER
Nonetheless, the Agency continues to perform risk assessments annually to identify programs susceptible to significant improper payments by monitoring and testing controls.
Over the last year, USAID took significant steps to integrate Enterprise Risk Management (ERM) into our systems for internal control as required by OMB Circular A-123, Management’s Responsibility for Enterprise Risk Management and Internal Control. Specifically, we established an Executive Management Council on Risk and Internal Control and updated internal policies and procedures to include ERM provisions. Agency leadership has approved and communicated USAID’s overall ERM strategy and approach, including an initial Agency risk profile and a risk appetite document to serve as a guidepost for the identification, assessment, and treatment of the Agency’s key enterprise risks.
In order to provide our stakeholders and the American public increased transparency of federal spending, the Agency worked throughout FY 2017 to implement the Digital Accountability and Transparency Act of 2014 (DATA Act) by testing and successfully submitting USAID spending data. In addition, USAID’s financial accounting system implemented the revised Standardized Program Structure and Definition (SPSD), a set of codes that categorize foreign assistance spending.
The Office of the Chief Financial Officer continues to play a strong supporting role in the Agency’s Local Solutions initiative, which seeks to strengthen partner country public financial management capacity and improve aid effectiveness and sustainability. We are working with the Government Accountability Office and the International Monetary Fund (IMF) to provide expertise, collaboration, and training to assist recipient nations in developing their financial and auditing capabilities. In the last year, USAID, in partnership with the IMF, has held a Public Financial Management Concepts course in Bangkok and supported the development of online training.
Finally, I want to thank our staff for the diligent work performed in FY 2017 to mitigate weaknesses, implement new requirements, and partner creatively and strategically. In FY 2018, we will work closely with our auditors and remain dedicated to holding ourselves and the Agency to the highest financial management standards. USAID affirms its commitment to promoting effective risk management and resolving any impediments to producing fairly represented financial statements today and in the future.
Reginald W. MitchellChief Financial OfficerNovember 15, 2017
FINANCIAL SECTION
INDEPENDENT AUDITOR’S REPORT

58 USAID FY 2017 AGENCY FINANCIAL REPORT | FINANCIAL SECTION
(Preceding page) Fish farming has been the key to Ruma Begum’s success. USAID offered training to her and others in her Bangladesh community to start and grow aquaculture enterprises. Meet Ruma at stories.usaid.gov. PHOTO: MORGANA WINGARD FOR USAID
(Above) Christela Lindor sells locally grown vegetables and fruits to market shoppers in Haiti. Through the Kore Lavi program, USAID works to increase food production and encourage better nutrition. More than 525 thousand Haitians have benefitted. Meet Christela at stories.usaid.gov. PHOTO: ELLIE VAN HOUTTE FOR USAID
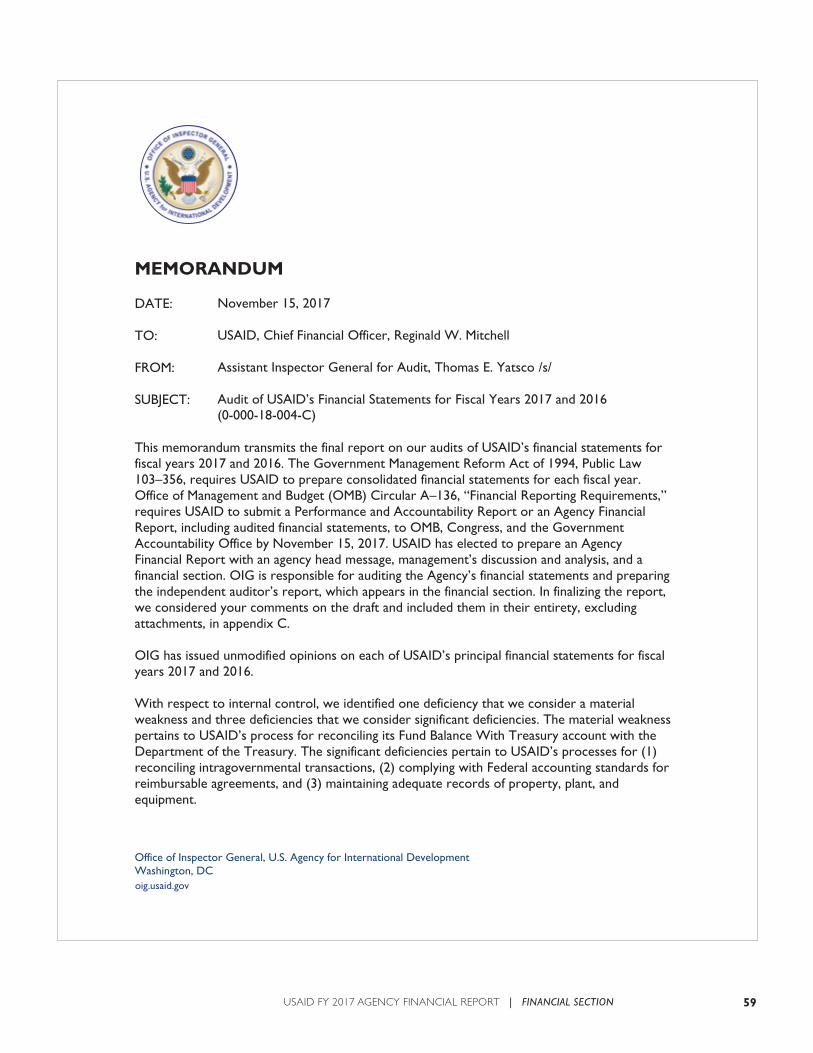
59USAID FY 2017 AGENCY FINANCIAL REPORT | FINANCIAL SECTION
Office of Inspector General, U.S. Agency for International Development Washington, DC oig.usaid.gov
MEMORANDUM
DATE:
TO:
FROM:
SUBJECT:
November 15, 2017
USAID, Chief Financial Officer, Reginald W. Mitchell
Assistant Inspector General for Audit, Thomas E. Yatsco /s/
Audit of USAID’s Financial Statements for Fiscal Years 2017 and 2016 (0-000-18-004-C)
This memorandum transmits the final report on our audits of USAID’s financial statements for fiscal years 2017 and 2016. The Government Management Reform Act of 1994, Public Law 103–356, requires USAID to prepare consolidated financial statements for each fiscal year. Office of Management and Budget (OMB) Circular A–136, “Financial Reporting Requirements,” requires USAID to submit a Performance and Accountability Report or an Agency Financial Report, including audited financial statements, to OMB, Congress, and the Government Accountability Office by November 15, 2017. USAID has elected to prepare an Agency Financial Report with an agency head message, management’s discussion and analysis, and a financial section. OIG is responsible for auditing the Agency’s financial statements and preparing the independent auditor’s report, which appears in the financial section. In finalizing the report, we considered your comments on the draft and included them in their entirety, excluding attachments, in appendix C.
OIG has issued unmodified opinions on each of USAID’s principal financial statements for fiscal years 2017 and 2016.
With respect to internal control, we identified one deficiency that we consider a material weakness and three deficiencies that we consider significant deficiencies. The material weakness pertains to USAID’s process for reconciling its Fund Balance With Treasury account with the Department of the Treasury. The significant deficiencies pertain to USAID’s processes for (1) reconciling intragovernmental transactions, (2) complying with Federal accounting standards for reimbursable agreements, and (3) maintaining adequate records of property, plant, and equipment.
oig.usaid.gov
60 USAID FY 2017 AGENCY FINANCIAL REPORT | FINANCIAL SECTION
Regarding compliance, in doing tests required under section 803(a) of the Federal Financial Management Improvement Act of 1996 (FFMIA), Public Law 104-208, we found no instances of substantial noncompliance with Federal financial management system requirements, but one each with Federal accounting standards and the U.S. Standard General Ledger at the transaction level.
The report contains three recommendations to improve USAID’s internal control. After reviewing information you provided in response to the draft report, we consider the recommendations resolved but open pending completion of planned activities.
For these recommendations please provide evidence of final action to the Audit Performance and Compliance Division.
We appreciate the assistance you and your staff extended to us during these audits.
61USAID FY 2017 AGENCY FINANCIAL REPORT | FINANCIAL SECTION
Office of Inspector General, U.S. Agency for International Development
INDEPENDENT AUDITOR’S REPORT
REPORT ON THE FINANCIAL STATEMENTS We have audited the accompanying consolidated financial statements of USAID, which comprise the consolidated balance sheets as of September 30, 2017 and 2016, and the related consolidated statements of net cost, consolidated statements of changes in net position, and combined statements of budgetary resources for the years then ended, and the related notes to the financial statements.
MANAGEMENT’S RESPONSIBILITY FOR THE FINANCIAL STATEMENTS Management is responsible for the preparation and fair presentation of these financial statements in accordance with accounting principles generally accepted in the United States of America; this includes the design, implementation, and maintenance of internal control relevant to the preparation and fair presentation of consolidated financial statements that are free from material misstatement, whether due to fraud or error.
AUDITOR’S RESPONSIBILITY Our responsibility is to express an opinion on these consolidated financial statements based on our audits. We conducted our audits in accordance with auditing standards generally accepted in the United States of America; generally accepted government auditing standards issued by the Comptroller General of the United States; and OMB Bulletin 17-03, “Audit Requirements for Federal Financial Statements.” Those standards and OMB Bulletin No. 17-03 require that we plan and perform the audit to obtain reasonable assurance about whether the consolidated financial statements are free from material misstatement.
An audit involves performing procedures to obtain audit evidence about the amounts and disclosures in the consolidated financial statements. The procedures selected depend on the auditor’s judgment, including the assessment of the risk of material misstatement of the consolidated financial statements, whether due to fraud or error. In making those risk assessments, the auditor considers internal control relevant to the agency’s preparation and fair presentation of the consolidated financial statements in order to design audit procedures that are appropriate in the circumstances, but not for the purpose of expressing an opinion on the effectiveness of the agency’s internal control. Accordingly, we express no such opinion. An audit also includes evaluating the appropriateness of accounting policies used and the reasonableness of significant accounting estimates made by management, as well as evaluating the overall presentation of the consolidated financial statements.
We believe that the audit evidence we have obtained is sufficient and appropriate to provide a basis for our audit opinion.
62 USAID FY 2017 AGENCY FINANCIAL REPORT | FINANCIAL SECTION
Office of Inspector General, U.S. Agency for International Development
OPINION In our opinion, the consolidated financial statements referred to above present fairly, in all material respects, the financial position of USAID as of September 30, 2017 and 2016, and its net costs, changes in net position, and budgetary resources for the years then ended in accordance with U.S. generally accepted accounting principles.
OTHER MATTERS
Required Supplementary Information U.S. generally accepted accounting principles require that the information in the Management’s Discussion and Analysis and Required Supplementary Information sections be presented to supplement the basic consolidated financial statements. Such information, although not a part of the basic consolidated financial statements, is required by the Federal Accounting Standards Advisory Board who considers it to be an essential part of financial reporting for placing the basic consolidated financial statements in an appropriate operational, economic, or historical context. We have applied certain limited procedures to the required supplementary information in accordance with auditing standards generally accepted in the United States of America, which consisted of inquiries of management about the methods of preparing the information, and comparing the information for consistency with management’s responses to our inquiries, the basic consolidated financial statements, and other knowledge we obtained during our audits of the basic consolidated financial statements. We do not express an opinion or provide any assurance on the information because the limited procedures do not provide us with sufficient evidence to express an opinion or provide any assurance.
Other Information Our audits were conducted to form an opinion on the basic consolidated financial statements as a whole. The information in the About This Report section, the USAID At A Glance section, the Message from the Administrator, the Message from the Chief Financial Officer, the Other Information section, and the appendixes in the Agency Financial Report are presented for the purpose of additional analysis and are not a required part of the basic consolidated financial statements. Such information was not subjected to the auditing procedures applied in the audit of the basic consolidated financial statements; accordingly, we do not express an opinion or provide any assurance on it.
Other Reporting Required by “Government Auditing Standards” In accordance with “Government Auditing Standards,” we have also issued reports dated November 15, 2017, on our consideration of USAID’s internal control over financial reporting and our tests of its compliance with certain provisions of laws, regulations, contracts, and grant agreements. These reports are an integral part of an audit performed in accordance with “Government Auditing Standards” and should be read in conjunction with this report.
USAID Office of Inspector General /s/ November 15, 2017
63USAID FY 2017 AGENCY FINANCIAL REPORT | FINANCIAL SECTION
Office of Inspector General, U.S. Agency for International Development
REPORT ON INTERNAL CONTROL
We have audited the accompanying consolidated financial statements of USAID, which comprise the consolidated balance sheets as of September 30, 2017 and 2016, and the related consolidated statements of net cost, consolidated statements of changes in net position, and combined statements of budgetary resources for the years then ended, and the related notes to the financial statements, and have issued our report thereon, dated November 15, 2017.
INTERNAL CONTROL OVER FINANCIAL REPORTING In planning and performing our audits of USAID’s financial statements for the fiscal years ended September 30, 2017 and 2016, we considered USAID’s internal control over financial reporting by obtaining an understanding of USAID’s system of internal control, determining whether internal controls had been placed in operation, assessing control risk, and testing controls to determine which auditing procedures to use for expressing our opinion on the financial statements. We limited our internal control testing to those controls necessary to achieve the objectives described in OMB Bulletin 17-03. We did not test all internal controls relevant to operating objectives as broadly defined by the Federal Managers’ Financial Integrity Act of 1982 (FMFIA), Public Law 97-225, such as those controls relevant to ensuring efficient operations. The objective of our audit was not to provide an opinion on internal control. Accordingly, we do not express an opinion on it.
Our consideration of internal control was for the limited purpose described in the preceding paragraph and was not designed to identify all deficiencies in internal control that might be material weaknesses or significant deficiencies. Therefore, material weaknesses and significant deficiencies may exist that were not identified.
A deficiency in internal control exists when the design or operation of a control does not allow management or employees, in the normal course of performing their assigned functions, to prevent, or detect and correct, misstatements on a timely basis. A material weakness is a deficiency or a combination of deficiencies in internal control that presents a reasonable possibility that a material misstatement of the entity’s financial statements will not be prevented, or detected and corrected, on a timely basis. We identified one deficiency in internal control that we consider a material weakness, as defined above, relating to USAID’s reconciliation of its Fund Balance With Treasury account.
A significant deficiency is a deficiency or a combination of deficiencies in internal control that is less severe than a material weakness, yet important enough to merit attention by those charged with governance. We identified significant deficiencies in internal control related to three of USAID’s financial management processes:
Reconciling intragovernmental transactions.
Complying with Federal accounting standards for reimbursable agreements.
64 USAID FY 2017 AGENCY FINANCIAL REPORT | FINANCIAL SECTION
Office of Inspector General, U.S. Agency for International Development
Maintaining adequate records of property, plant, and equipment.
We also noted other matters involving internal control over financial reporting that we will report to USAID’s management in a separate letter.
MATERIAL WEAKNESS
USAID Did Not Reconcile Its Fund Balance With Treasury Account with the Department of the Treasury and Resolve Unreconciled Items in a Timely Manner (Repeat Finding) Although USAID made progress reconciling its Fund Balance With Treasury (FBWT) account with the fund balance reported by the Department of the Treasury (Treasury), the Agency still has large unreconciled differences related to legacy items that have not been resolved. As of September 30, 2017, these differences totaled approximately $214 million. Table 1 illustrates the differences for the past 6 fiscal years.
Table 1. USAID’s FBWT Differences (millions)
Fiscal Year Net Difference Absolute Value
2012 114 127
2013 121 1,915
2014 154 2,011
2015 198a 528
2016 195 356
2017 214 263 a The amount reported on the fiscal year 2015 USAID Agency Financial Report finding was understated and has been updated.
These differences persist because USAID did not reconcile the FBWT account with Treasury’s fund balance each month and research and resolve those differences in a timely manner. USAID adjusted its FBWT account to agree with Treasury’s fund balance without adequately researching the differences. The difference between USAID’s general ledger and the amount reported by Treasury is $214 million, of which $83 million is due to outstanding unreconciled items and $131 million cannot be explained. The agency identified 13,747 transactions with a net worth of $83 million as outstanding unreconciled items. Six percent ($5.1 million net) of these transactions have been outstanding for more than three months and up to one year. An additional 2 percent ($1.4 million net) have been outstanding for more than one year.
Recognizing the importance of maintaining account balances consistent with Treasury’s, USAID’s management started a comprehensive review of its FBWT records in fiscal
65USAID FY 2017 AGENCY FINANCIAL REPORT | FINANCIAL SECTION
Office of Inspector General, U.S. Agency for International Development
year 2014 to ascertain the reasons for the differences and take corrective action. It determined that the account balances in the subsidiary ledger were more accurate than those in the general ledger and undertook a reconciliation of the two records. In February 2015, the difference between the subsidiary and general ledgers was approximately $445 million. However, as of September 30, 2017, that difference was reduced to approximately $1.6 million (net), $11.8 million (absolute), which is a significant reduction. USAID also made improvements to its web-based automated cash reconciliation system, eCART, by integrating third party transactions and automating the submission of appropriation reclassification to Treasury.
USAID management consulted with the Treasury and the Office of Management and Budget (OMB) to resolve these unexplained differences and submitted a plan for their approval. However, the plan has not yet been approved by OMB and the differences remain unresolved. The Agency anticipates that the differences will be resolved by the end of the first quarter of fiscal year 2018.
Fund Balance With Treasury, Reconciliation Procedures, a Supplement to the Treasury Financial Manual, Volume I, part 2-5100, section IV, states, “Federal agencies must reconcile their USSGL (U.S. Government Standard General Ledger) account 1010 and any related subaccounts with the GWA (Government-wide Accounting) Account Statement on a monthly basis (at minimum).”1 The manual also states that the subsidiary report balances should agree with the general ledger and federal agencies should not permit prior-month differences to remain outstanding for more than 3 months.
We are not making a recommendation regarding the $131 million difference because the Office of Chief Financial Officer is currently working with the OMB and the US Treasury to clear this unexplained difference. However, we recommend:
Recommendation 1. The Office of the Chief Financial Officer continue to investigate the $83 million differences between the Agency’s Fund Balance With Treasury Account and Treasury fund balance to identify the root cause and, if appropriate, modify its business process to mitigate future occurrences.
Recommendation 2. The Office of the Chief Financial Officer enhance its policies and procedures to ensure the subsidiary and general ledgers are completely reconciled and the causes of the differences are corrected.
SIGNIFICANT DEFICIENCIES
Intragovernmental Transactions Remain Unreconciled (Repeat Finding) As of September 30, 2017, USAID had $488 million in unreconciled intragovernmental transactions, according to Treasury. Of that amount, USAID was required to reconcile and confirm $455 million in accordance with OMB Circular A-136, “Financial Reporting Requirements,” and Treasury’s “Intragovernmental Transactions Guide.” Although
1 Fund Balance With Treasury, Reconciliation Procedures, A Supplement to Treasury Financial Manual Volume 1, part 2, chapter 5100, section IV.A, March 2012, p. 2.
66 USAID FY 2017 AGENCY FINANCIAL REPORT | FINANCIAL SECTION
Office of Inspector General, U.S. Agency for International Development
USAID has increased its efforts to resolve unreconciled amounts, the remaining differences are still significant.
USAID continually researches intragovernmental transactions to improve its reconciliation process and eliminate the differences. These current efforts are likely to resolve timing differences, created when agencies record transactions in different periods. However, other differences such as those caused by accounting errors will require a special effort and commitment of resources by USAID and its trading partners to resolve. Treasury’s guide suggests that agencies work together to estimate accruals and record corresponding entries to ensure that they agree and that long-term accounting policy differences can be eliminated.
In fiscal year 2013, Treasury developed scorecards to track and correct these differences. The scorecards rank each agency by its contribution to Government-wide differences. At the end of fiscal year 2016, USAID had differences amounting to $540 million and ranked as the 16th largest contributor out of 140. According to the scorecard for the end of the third quarter of fiscal year 2017, USAID’s differences had decreased to $479 million, making the Agency the 18th largest contributor.
We reported a similar finding in previous audits, last year’s being the most recent, and recognize that resolution of these differences requires continuing coordination with other Federal agencies.2 Therefore, we are not making a recommendation, but we will continue to monitor USAID’s progress in fiscal year 2018.
USAID Did Not Comply With Federal Standards in Accounting for Reimbursable Agreements (Repeat Finding) USAID continues to have difficulty accounting for reimbursable agreements in accordance with Statements of Federal Financial Accounting Standards (Federal Generally Accepted Accounting Principles, known as Federal GAAP).3 In prior years OIG reported that the way USAID accounted for transactions under reimbursable agreements did not comply with Federal GAAP in three respects:
USAID received cash advances from agencies with which it has reimbursable agreements (“trading partners”) and recorded them as receipts of cash and earned revenue although the revenue had not yet been earned. Federal GAAP requires that a liability (deferred revenue) be recorded until the services required by the agreement have been rendered.
USAID recorded all reimbursable agreements as unfilled customer orders without advances even though it received cash advances for most agreements. This approach deviated from the United States Standard General Ledger (USSGL), which provides a
2 “Audit of USAID's Financial Statements for Fiscal Years 2016 and 2015” (0-000-17-001-C), November 15, 2016.
3 Reimbursable agreements are contracts between two agencies that allow one to do work for the other and be reimbursed. For example, the State Department might contract with USAID to implement a vaccination campaign. USAID would run the campaign, and the State Department would reimburse USAID for the drugs and the costs of administering them.
67USAID FY 2017 AGENCY FINANCIAL REPORT | FINANCIAL SECTION
Office of Inspector General, U.S. Agency for International Development
uniform chart of accounts and technical guidance for standardizing Federal agency accounting.
USAID could not track incurred expenses or recognized revenue to specific reimbursable agreements because, according to agency officials, its accounting system did not have this functionality. To compensate for this deficiency, USAID recorded quarterly adjustments in its general ledger before preparing financial statements to accurately reflect the financial status and results of its reimbursable agreements. For fiscal year 2017, USAID recorded adjustments of approximately $508 million.
These types of noncompliance recurred in fiscal year 2017 because USAID did not complete the reconfiguration of its financial management system to account for reimbursable agreements in accordance with Federal GAAP and did not have a complete inventory of reimbursable agreements. As a result, USAID was unable to properly account for reimbursable agreement activities and provide reliable information from Phoenix4 to the agency’s decision makers. For example, USAID is unable to determine how much the agency has earned but not collected.
In accordance with the Statement of Federal Financial Accounting Standards No. 1, “Accounting for Selected Assets and Liabilities,” paragraph 85, states:
Federal entities may receive advances and prepayments from other entities for goods to be delivered or services to be performed. Before revenues are earned, the current portion of the advances and prepayments should be recorded as other current liabilities. After the revenue is earned…the entity should record the appropriate amount as a revenue or financing source and should reduce the liability accordingly.
In the beginning of fiscal year 2018, USAID activated the project cost accounting system (PCAS), a subsystem of its financial accounting system. According to USAID’s management, when fully utilized, PCAS will allow USAID to track reimbursable agreements with greater detail and flexibility by the terms of the agreements and the types of services being rendered. PCAS will track the status of agreements including amounts available, collected, and expended, allowing USAID to recognize revenue and receivables under the agreements. However, this system has not yet been tested. Therefore, we will not make any recommendation but will monitor the implementation during fiscal year 2018.
USAID Did Not Maintain Adequate Records of Property, Plant, and Equipment (Repeat Finding) USAID’s controls to ensure correct and on-time recording of the acquisition and disposal of depreciable assets—property, plant, and equipment (PP&E)—were not effective. Specifically, missions did not follow established procedures for the acquisition and disposition of vehicles and other equipment.
4 USAID’s financial system.
68 USAID FY 2017 AGENCY FINANCIAL REPORT | FINANCIAL SECTION
Office of Inspector General, U.S. Agency for International Development
USAID’s overseas missions are expected to use the vehicle management information system (VMIS) to record vehicle transactions. When an overseas mission acquires or disposes of a vehicle, the mission must make an entry in VMIS within 5 days and send supporting documentation to the Overseas Management Division (OMD) of the Bureau for Management’s Office of Management Services in Washington, DC.5 The Office of the Chief Financial Officer (CFO) issues a quarterly data call to the missions for changes to PP&E and requires them to certify their responses. However, the OMD and CFO records we reviewed showed that missions did not comply with these requirements.
Missions made no entries in VMIS for 3 of the 17 vehicles marked as disposed in the fiscal year 2017 quarterly data calls and did not send documentation to OMD. Six of the 17 vehicles reported as disposed of in the data call did not have approved authorization for disposal. Another vehicle was disposed of and entered into VMIS, but was not identified as disposed of in the fiscal year 2017 quarterly data calls. Six other vehicles were identified as disposed of in the quarterly data calls, but personnel from the CFO’s office made no change in USAID’s subsidiary ledger. One vehicle was incorrectly marked as disposed in VMIS due to a similar plate and vehicle identification number (VIN) of another vehicle. In another case, a mission marked one vehicle as disposed in their quarterly data call when the vehicle was transferred to another mission. The receiving mission reported the vehicle as a new acquisition, which caused an overstatement of assets by $111,918 in the CFO’s subsidiary ledger. In the fourth quarter of fiscal year 2017, personnel of the office of the CFO recorded an adjusting journal entry to update its general ledger for equipment that was acquired between 1993 and 2016, but never accounted for. The entry included 55 items with a current net book value of $2,535,893.
Moreover, reviews of data provided from the CFO’s office and of inventory and records at 10 selected missions showed that missions sent inaccurate PP&E data not limited to vehicles. For example:
One mission disposed of a forklift, but the disposal was not reported in thequarterly data call.
One mission understated the cost of a new vehicle by $2,333 on a quarterly datacall.
One mission reported a vehicle costing $30,500 twice on the quarterly data call.
One mission did not report 20 nonexpendable items, such as computer servers andcopiers that cost $204,976 and were sold at auction, on the quarterly data call.
One mission disposed of a generator originally costing $35,122 with no documenteddisposal authorization.
The CFO’s PP&E subsidiary ledger contained five duplicate vehicle records acrossfour missions overstating the USAID’s asset balance by $115,614.
5 Department of State, “Foreign Affairs Manual,” 14FAM437.1b, “Accountability, Use, and Maintenance Records,” August 3, 2015.
69USAID FY 2017 AGENCY FINANCIAL REPORT | FINANCIAL SECTION
Office of Inspector General, U.S. Agency for International Development
Mission personnel are neglecting to adhere to guidance. They are not verifying information before approving and reporting it to the CFO. Reasons for noncompliance include a misunderstanding of the State Department’s role—it runs motor pools and manages the vehicles for selected missions, but they remain on USAID’s books—and mission-specific (sometimes outdated) ways of recording transactions for assets other than vehicles. Making mission controllers responsible for verifying quarterly information would improve the likelihood of compliance and increase accuracy. Furthermore, the CFO’s office does not reconcile the PP&E subsidiary ledger with VMIS to ensure the accuracy of their records and resolve any differences between the CFO’s capital asset records and OMD’s equipment records.
“Standards for Internal Control in the Federal Government” states that management should design control activities so that all transactions are completely and accurately recorded.6 Not verifying the accuracy of information on assets increases the risk that account misstatements will not be detected. In the above cases, not verifying data caused the vehicle inventory report and the capitalized asset depreciation report to be inaccurate. Therefore, we recommend:
Recommendation 3. The Office of the Chief Financial Officer implement a quality assurance program to validate the quarterly information that missions submit, and ensure that there are no differences between vehicle management information system and the Chief Financial Officer’s records.
THE AGENCY’S RESPONSE TO AUDIT FINDINGS The Agency’s responses to our findings and recommendations appear in appendix C. The Agency’s responses were not subjected to the procedures applied in the audit of the consolidated financial statements; accordingly, we express no opinion on the responses.
PURPOSE OF THIS REPORT The purpose of this report is solely to describe the scope of our testing of internal control over financial reporting and the results of that testing, and not to provide an opinion on the effectiveness of USAID’s internal control over financial reporting. Accordingly, this report is not suitable for any other purpose.
USAID Office of Inspector General /s/ November 15, 2017
6 U.S. Government Accountability Office (GAO-14-704G), September 2014.
70 USAID FY 2017 AGENCY FINANCIAL REPORT | FINANCIAL SECTION
Office of Inspector General, U.S. Agency for International Development
REPORT ON COMPLIANCE WITH APPLICABLE PROVISIONS OF LAWS, REGULATIONS, CONTRACTS, AND GRANT AGREEMENTS
We have audited the accompanying consolidated financial statements of USAID, which comprise the consolidated balance sheets as of September 30, 2017 and 2016, and the related consolidated statements of net cost, consolidated statements of changes in net position, and combined statements of budgetary resources for the years then ended, and the related notes to the financial statements, and have issued our report thereon, dated November 15, 2017.
The management of USAID is responsible for complying with laws, regulations, contracts, and grant agreements applicable to USAID. As part of obtaining reasonable assurance about whether USAID’s financial statements are free of material misstatement, we performed tests of USAID’s compliance with certain provisions of laws and regulations, noncompliance with which could have a direct and material effect on the determination of financial statement amounts and with certain other laws and regulations specified in OMB Bulletin 17-03, including the requirements referred to in section 803(a) of the Federal Financial Management Improvement Act of 1996 (FFMIA). We limited our tests of compliance to these provisions and did not test compliance with all laws and regulations applicable to USAID.
Our tests did not disclose instances of noncompliance that were reportable under “Government Auditing Standards” and OMB Bulletin 17-03. Our objective was not to provide an opinion on compliance with laws, regulations, contracts, and grant agreements; accordingly, we do not express such an opinion.
COMPLIANCE WITH THE FEDERAL FINANCIAL MANAGEMENT IMPROVEMENT ACT OF 1996 Under FFMIA, we are required to report on whether USAID’s financial management systems substantially comply with Federal financial management system requirements, applicable Federal accounting standards, and the USSGL at the transaction level. To meet this requirement, we performed tests of compliance with each of the three FFMIA section 803(a), Public Law 104-208, Title VIII (31 U.S.C. 3512 note), requirements. We observed two exceptions that we considered substantial noncompliance with FFMIA. Specifically, we noted noncompliance in accounting for reimbursable agreements, which deviated from the Statement of Federal Financial Accounting Standards No. 1, “Accounting for Selected Assets and Liabilities,” and the USSGL at the transaction level.
In the beginning of fiscal year 2018, the CFO’s office, which is responsible for the noncompliance, activated the Project Cost Accounting System (PCAS), a subsystem of its financial accounting system. When fully utilized, PCAS will allow USAID to track reimbursable agreements with greater detail and flexibility based on the terms of the agreements and the types of services being rendered. PCAS will track the status of agreements including amounts collected, expended, and available, and USAID will be
71USAID FY 2017 AGENCY FINANCIAL REPORT | FINANCIAL SECTION
Office of Inspector General, U.S. Agency for International Development
able to recognize revenue and receivables based on the collections and expenditures under the agreements.
In our report on internal control, we identified the following areas for improvement in several financial system processes:
Reconciling its fund balance with the U.S. Treasury.
Reconciling intragovernmental transactions.
Complying with Federal accounting standards for reimbursable agreements.
Maintaining adequate records of property, plant, and equipment.
PURPOSE OF THIS REPORT The purpose of this report is solely to describe the scope of our testing of compliance with applicable provisions of laws, regulations, contracts, and grant agreements and the results of that testing, and not to provide an opinion on the effectiveness of USAID’s compliance with applicable provisions of laws, regulations, contracts, and grant agreements. Accordingly, this report is not suitable for any other purpose.
USAID Office of Inspector General /s/ November 15, 2017
72 USAID FY 2017 AGENCY FINANCIAL REPORT | FINANCIAL SECTION
Office of Inspector General, U.S. Agency for International Development
APPENDIX C. MANAGEMENT COMMENTS
Chief Financial Officer
November 15, 2017
MEMORANDUM
TO: Thomas E. Yatsco, Assistant Inspector General for Audit
FROM: Reginald W. Mitchell /s/
SUBJECT: Management Response to Draft Independent Auditor’s Report on USAID’s Financial Statements for Fiscal Years 2017 and 2016 (0-000-18-004-C)
Thank you for your draft report on the Audit of USAID’s Financial Statements for Fiscal Years 2017 and 2016 and for the professionalism exhibited by your staff throughout this process.
Fiscal Year (FY) 2017 was a significant year for federal financial management at USAID. We are pleased that the USAID Inspector General will issue an unmodified opinion on the Agency’s principal financial statements. The acknowledgments of the Agency’s improvements in financial systems and processes throughout the report are appreciated.
The following are management’s comments regarding the audit findings:
Material Weakness: USAID Did Not Reconcile Its Fund Balance With Treasury Account With the Department of the Treasury and Resolve Unreconciled Items in a Timely Manner (Repeat Finding)
Recommendation 1: The Office of the Chief Financial Officer continue to investigate the $83 million differences between the Agency’s Fund Balance With Treasury Account and Treasury fund balance to identify the root cause and, if appropriate, modify its business processes to mitigate future occurrences.
73USAID FY 2017 AGENCY FINANCIAL REPORT | FINANCIAL SECTION
Office of Inspector General, U.S. Agency for International Development
Management Decision: Management accepts this recommendation. The Office of the Chief Financial Officer will document the nature of the differences between the Agency’s Fund Balance with Treasury Account and Treasury fund balance to assess the root cause and modify its business processes to prevent future occurrences.
Target Completion Date: December 31, 2017
Recommendation 2: We recommend that the Office of the Chief Financial Officer enhances its policies and procedures to ensure the subsidiary and general ledgers are completely reconciled and the causes of the differences are corrected.
Management Decision: Management accepts this recommendation. The Office of the Chief Financial Officer will update its policies and procedures to require the documentation of General Ledger (GL) to Subsidiary Ledger (SL) discrepancies to assess the root cause and modify its business processes to mitigate future occurrences.
Target Completion Date: December 31, 2017
Significant Deficiency: Intragovernmental Transactions Remain Unreconciled (Repeat Finding)
Management acknowledges this finding. To further address the Intragovernmental reconciliation issue, the Office of the Chief Financial Officer will continue to reconcile the differences with our trading partners on a monthly basis. We will also continue to review Intragovernmental Payment and Collections (IPAC) on a regular basis to ensure transactions are coded correctly, as well as monitor buy/sell transactions.
Significant Deficiency: USAID Did Not Comply With Federal Standards in Accounting for Reimbursable Agreements (Repeat Finding)
Management acknowledges this finding. During FY 2017, the Office of the Chief Financial Officer worked with stakeholders to develop new reimbursable agreement processes and to configure and implement the Project Cost Accounting System (PCAS) module in the Agency’s accounting system (Phoenix). Going forward, beginning in FY 2018, the Agency uses PCAS to track new reimbursable agreements. The greater detail and flexibility of this module allows USAID to monitor and report on the status of new agreements, including amounts available, collected, and expended, as well as to recognize revenue and receivables based upon the status of the agreements. The successful implementation of PCAS will allow the Agency to be FFMIA and FASAB compliant with regards to tracking our reimbursable agreements at the transactional level. For those agreements established prior to PCAS implementation, current processes will be used until those agreements are closed.
Target Completion Date: December 31, 2017
74 USAID FY 2017 AGENCY FINANCIAL REPORT | FINANCIAL SECTION
Office of Inspector General, U.S. Agency for International Development
Significant Deficiency: USAID Did Not Maintain Adequate Records of Property, Plant and Equipment (Repeat Finding)
Recommendation 3: We recommend that the Office of the Chief Financial Officer implement a quality assurance program to validate the quarterly information that missions submit, and ensure that there are no differences between VMIS and the CFO’s records.
Management Decision: Management acknowledges this finding. During FY 2017, management implemented a corrective action plan which consisted of a signed Memorandum of Understanding (MOU) between both Management/Management Services (M/MS) and M/CFO. This MOU enhanced the Property, Plant and Equipment (PPE) quality assurance framework. M/MS and M/CFO conducted quarterly meetings to coordinate efforts on upcoming PPE quarterly data calls subsequently disseminating updated guidance on reporting of PPE and capital assets. We will continue with these quarterly meetings and update guidance as necessary to ensure the accuracy of PP&E records.
Target Completion Date: March 31, 2018
75USAID FY 2017 AGENCY FINANCIAL REPORT | FINANCIAL SECTION
Office of Inspector General, U.S. Agency for International Development
APPENDIX D. STATUS OF PRIOR YEAR FINDINGS AND RECOMMENDATIONS
OMB Circular A–50, “Audit Follow-up,” states that a management decision on audit recommendations shall be made within 6 months after a final report is issued. Corrective action should proceed as rapidly as possible.
STATUS OF 2016 FINDINGS AND RECOMMENDATIONS Recommendation1. We recommend that the Office of the Chief Financial Officer resolve all unexplained differences between USAID’s Fund Balance With Treasury account and the Department of the Treasury by December 31, 2016, and institutionalize the monthly reconciliation of the Fund Balance With Treasury account.
Status: The target completion date is December 31, 2017.
Recommendation 2. We recommend that the Office of the Chief Financial Officer implement a quality assurance program to validate the quarterly information that missions submit.
Status: This recommendation was closed on September 29, 2017.
Recommendation 3. We recommend that the Office of the Chief Financial Officer implement a plan to immediately investigate all potential funds control violations reported as of September 30, 2016, and resolve them by June 30, 2017.
Status: This recommendation was closed on August 30, 2017.
Recommendation 4. We recommend that the Office of the Chief Financial Officer enhance its policies and procedures to evaluate potential funds control violations so that they are investigated and resolved promptly.
Status: This recommendation was closed on August 30, 2017.
STATUS OF 2014 FINDINGS AND RECOMMENDATIONS Recommendation 2. We recommend that USAID’s Office of the Chief Financial Officer consult with the U.S. Treasury to obtain advice and approval for resolving unreconciled funds.
Status: The target completion date is December 31, 2017.
Recommendation 7. We recommend that USAID’s Office of the Chief Financial Officer reconfigure its financial management system to account for reimbursable agreements in accordance with Federal Generally Accepted Accounting Principles, and in consultation with appropriate stakeholders, develop and implement improved processes to account for reimbursable agreements.
76 USAID FY 2017 AGENCY FINANCIAL REPORT | FINANCIAL SECTION
Office of Inspector General, U.S. Agency for International Development
Status: The target completion date is December 31, 2017.
STATUS OF 2012 FINDINGS AND RECOMMENDATIONS Recommendation 1. We recommend that the Chief Financial Officer verify that all differences between USAID and the Department of the Treasury are researched and resolved in a timely manner in accordance with Treasury financial manual reconciliation procedures.
Status: The target completion date is December 31, 2017.
STATUS OF 2004 FINDINGS AND RECOMMENDATIONS In the fiscal year 2004 audit report, OIG recommended that USAID’s Chief Financial Officer direct the Financial Management Office to conduct quarterly intragovernmental reconciliations of activity and balances with its trading partners in accordance with the requirements of the “Federal Intragovernmental Transactions Accounting Policies Guide,” issued by the Department of the Treasury’s Financial Management Service.
Status: OIG has made no subsequent recommendations because USAID has reduced the differences significantly and is continuously researching intragovernmental activity and developing new tools to improve its reconciliation process to eliminate the differences.
FINANCIAL SECTION
FINANCIAL STATEMENTS AND NOTES

78 USAID FY 2017 AGENCY FINANCIAL REPORT | FINANCIAL SECTION
(Preceding page) Doaa Mohamed Bakr, left, launched a duck farming business after winning a USAID-sponsored competition at her high school in Egypt. USAID encourages entrepreneurship to boost economic growth and youth employment. Meet Doaa at stories.usaid.gov. PHOTO: THOMAS CRISTOFOLETTI FOR USAID
(Above) Sisters Najlae and Rajae Lakchar trained to be auto mechanics in Morocco as part of a USAID-backed internship. Meet them at stories.usaid.gov. PHOTO: BOBBY NEPTUNE FOR USAID
79USAID FY 2017 AGENCY FINANCIAL REPORT | FINANCIAL SECTION
The Principal Financial Statements have been prepared to report the financial position and results of USAID’s operations. The statements have been prepared from the books and records of the Agency in accordance with formats prescribed by the Office of Management and Budget (OMB) in OMB Circular A-136, Financial Reporting Requirements. The statements are produced in addition to other financial reports prepared by the Agency, in accordance with OMB and U.S. Department of the Treasury (Treasury) directives to monitor and control the status and use of budgetary resources, which are prepared from the same books and records. Subject to Appropriation Law, the Agency has no authority to pay liabilities not covered by budgetary resources. Liquidation of such liabilities requires enactment of a corresponding appropriation. The principal financial statements include comparative data for FY 2016 has been included. USAID’s principal financial statements, footnotes, and other information for FY 2017 and FY 2016 consist of the following:
The Consolidated Balance Sheet presents those resources owned or managed by USAID that are available to provide current and future economic benefits (assets); amounts owed by USAID that will require payments from those resources or future resources (liabilities); and residual amounts retained by USAID, comprising the difference between future economic benefits and future payments (net position).
The Consolidated Statement of Net Cost presents the net cost of USAID operations, which are comprised of the gross costs incurred by USAID less any exchange revenue earned from USAID activities. Due to the geographic and organizational complexity of USAID’s operations, the classification of gross cost and exchange revenues by major program and sub-organization is presented in
Note 16, Schedule of Costs by Standardized Program Structure and Definition (SPSD).
The Consolidated Statement of Changes in Net Position presents the change in USAID’s net position resulting from the net cost of USAID operations, budgetary financing sources other than exchange revenues, and other financing sources for the years ended September 30, 2017 and 2016. The components are separately displayed in two sections, namely Cumulative Results of Operations and Unexpended Appropriations.
The Combined Statement of Budgetary Resources, which presents the spending authority or budgetary resources available to USAID, the use or status of these resources at year-end, the change in obligated balance, and outlays of budgetary resources for the years ended September 30, 2017 and 2016. Information in this statement is reported on the budgetary basis of accounting.
The Notes to Principal Financial Statements are an integral part of the financial statements. They provide explanatory information or additional detail to help readers understand, interpret, and use the data presented. Comparative FY 2016 note data has been included.
HISTORY OF USAID’S FINANCIAL STATEMENTS
In accordance with the Government Manage-ment Reform Act (GMRA) of 1994, USAID has prepared consolidated fiscal year-end financial statements since FY 1996. The USAID Office of Inspector General (OIG) is required to audit these statements, related internal controls, and Agency compliance with applicable laws and regulations. From FY 1996 through FY 2000, the OIG was unable to express an opinion on USAID’s financial
INTRODUCTION TO PRINCIPAL FINANCIAL STATEMENTS
80 USAID FY 2017 AGENCY FINANCIAL REPORT | FINANCIAL SECTION
statements because the Agency’s financial manage-ment systems could not produce complete, reliable, timely, and consistent financial information.
In FY 2001, the OIG was able to express qualified opinions on three of the then five principal financial statements of the Agency, while continuing to issue a disclaimer of opinion on the remaining two statements. In FY 2002, the OIG expressed unqualified opinions on four of the then five principal financial statements and a qualified opinion on the fifth. This marked the first time since enactment of the GMRA that USAID received an opinion on all of its financial statements. The Agency continued to receive unqualified opinions on its principal financial statements until FY 2012, when an accounting
error resulted in the first qualified opinion in nine years. USAID successfully executed corrective measures and regained an unmodified audit opinion on both the FY 2013 and FY 2012 principal financial statements. The OIG did not express an opinion on the FY 2014 financial statements, but rendered an unmodified opinion on the comparative FY 2015 and FY 2014 (Restated) principal financial statements. USAID received an unmodified opinion on the FY 2016 financial statements. The OIG rendered an unmodified opinion on the FY 2017 principal financial statements. The Agency remains committed to employing the systems, resources, and strategies necessary to ensure production of timely and accurate financial reports.
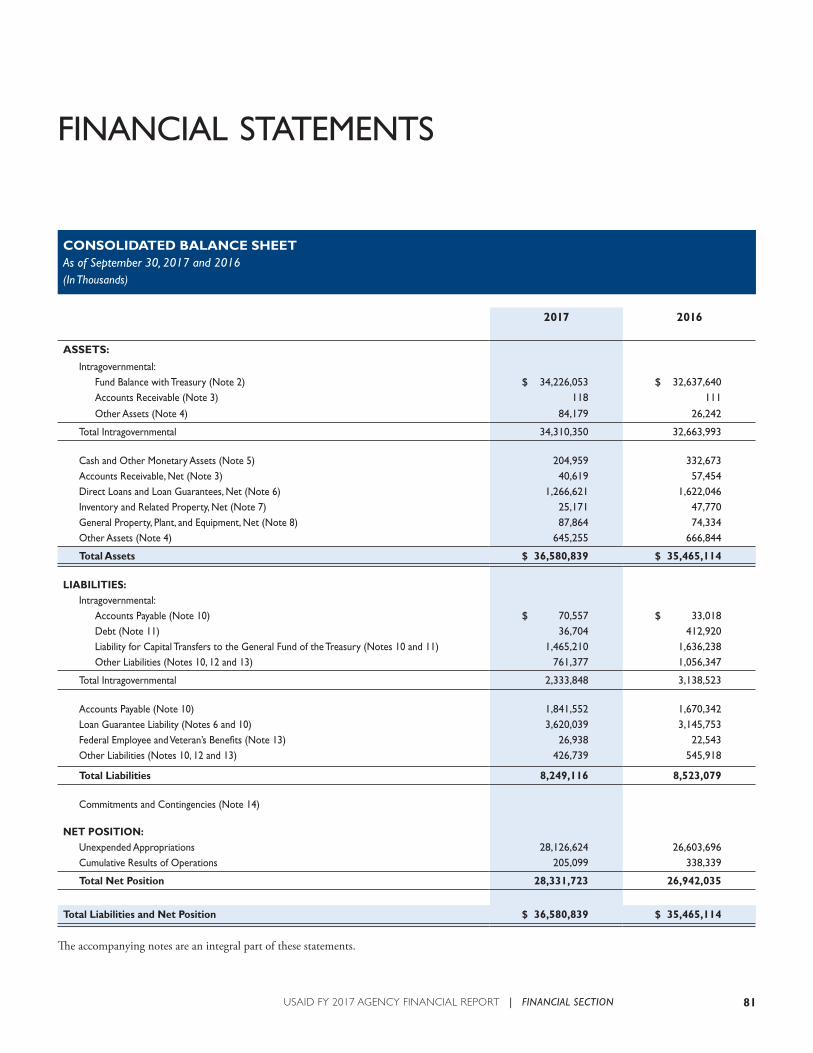
81USAID FY 2017 AGENCY FINANCIAL REPORT | FINANCIAL SECTION
CONSOLIDATED BALANCE SHEETAs of September 30, 2017 and 2016(In Thousands)
2017 2016
ASSETS:
Intragovernmental: Fund Balance with Treasury (Note 2) $ 34,226,053 $ 32,637,640 Accounts Receivable (Note 3) 118 111
Other Assets (Note 4) 84,179 26,242
Total Intragovernmental 34,310,350 32,663,993
Cash and Other Monetary Assets (Note 5) 204,959 332,673 Accounts Receivable, Net (Note 3) 40,619 57,454 Direct Loans and Loan Guarantees, Net (Note 6) 1,266,621 1,622,046 Inventory and Related Property, Net (Note 7) 25,171 47,770 General Property, Plant, and Equipment, Net (Note 8) 87,864 74,334 Other Assets (Note 4) 645,255 666,844
Total Assets $ 36,580,839 $ 35,465,114
LIABILITIES: Intragovernmental: Accounts Payable (Note 10) $ 70,557 $ 33,018 Debt (Note 11) 36,704 412,920 Liability for Capital Transfers to the General Fund of the Treasury (Notes 10 and 11) 1,465,210 1,636,238 Other Liabilities (Notes 10, 12 and 13) 761,377 1,056,347
Total Intragovernmental 2,333,848 3,138,523
Accounts Payable (Note 10) 1,841,552 1,670,342 Loan Guarantee Liability (Notes 6 and 10) 3,620,039 3,145,753 Federal Employee and Veteran’s Benefits (Note 13) 26,938 22,543 Other Liabilities (Notes 10, 12 and 13) 426,739 545,918
Total Liabilities 8,249,116 8,523,079
Commitments and Contingencies (Note 14)
NET POSITION: Unexpended Appropriations 28,126,624 26,603,696 Cumulative Results of Operations 205,099 338,339
Total Net Position 28,331,723 26,942,035
Total Liabilities and Net Position $ 36,580,839 $ 35,465,114
The accompanying notes are an integral part of these statements.
FINANCIAL STATEMENTS
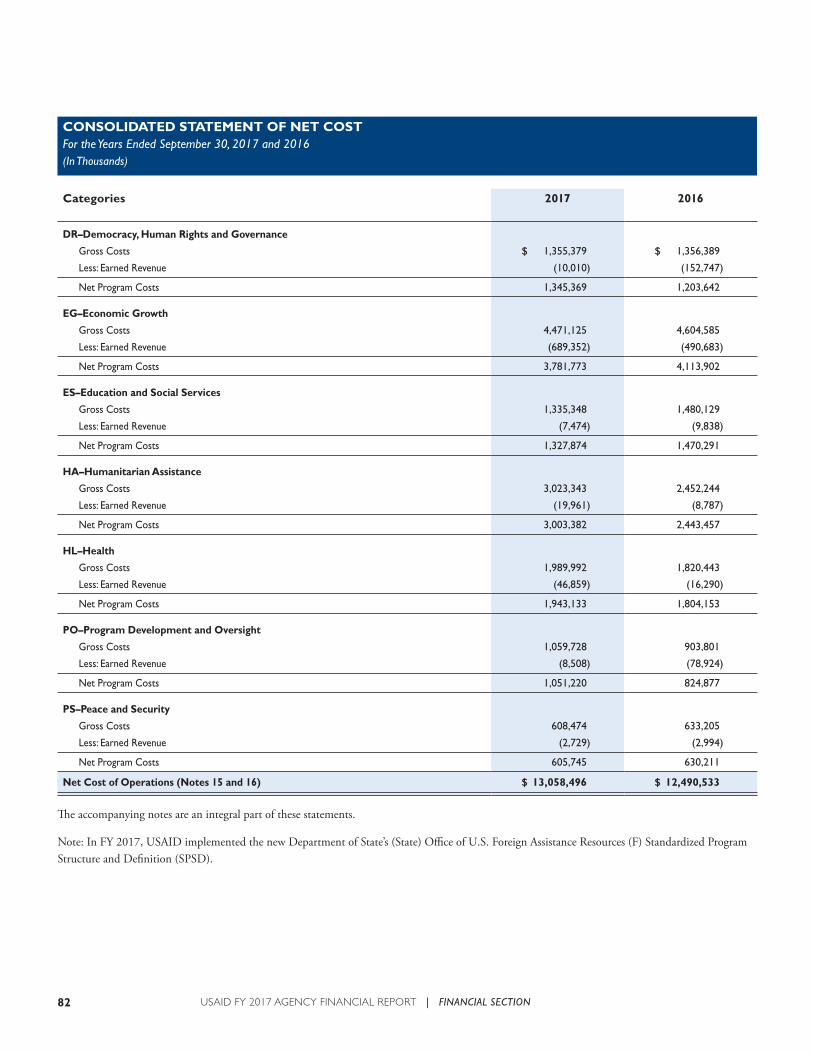
82 USAID FY 2017 AGENCY FINANCIAL REPORT | FINANCIAL SECTION
CONSOLIDATED STATEMENT OF NET COSTFor the Years Ended September 30, 2017 and 2016(In Thousands)
Categories 2017 2016
DR–Democracy, Human Rights and Governance
Gross Costs $ 1,355,379 $ 1,356,389
Less: Earned Revenue (10,010) (152,747)
Net Program Costs 1,345,369 1,203,642
EG–Economic Growth
Gross Costs 4,471,125 4,604,585
Less: Earned Revenue (689,352) (490,683)
Net Program Costs 3,781,773 4,113,902
ES–Education and Social Services
Gross Costs 1,335,348 1,480,129
Less: Earned Revenue (7,474) (9,838)
Net Program Costs 1,327,874 1,470,291
HA–Humanitarian Assistance
Gross Costs 3,023,343 2,452,244
Less: Earned Revenue (19,961) (8,787)
Net Program Costs 3,003,382 2,443,457
HL–Health
Gross Costs 1,989,992 1,820,443
Less: Earned Revenue (46,859) (16,290)
Net Program Costs 1,943,133 1,804,153
PO–Program Development and Oversight
Gross Costs 1,059,728 903,801
Less: Earned Revenue (8,508) (78,924)
Net Program Costs 1,051,220 824,877
PS–Peace and Security
Gross Costs 608,474 633,205
Less: Earned Revenue (2,729) (2,994)
Net Program Costs 605,745 630,211
Net Cost of Operations (Notes 15 and 16) $ 13,058,496 $ 12,490,533
The accompanying notes are an integral part of these statements.
Note: In FY 2017, USAID implemented the new Department of State’s (State) Office of U.S. Foreign Assistance Resources (F) Standardized Program Structure and Definition (SPSD).
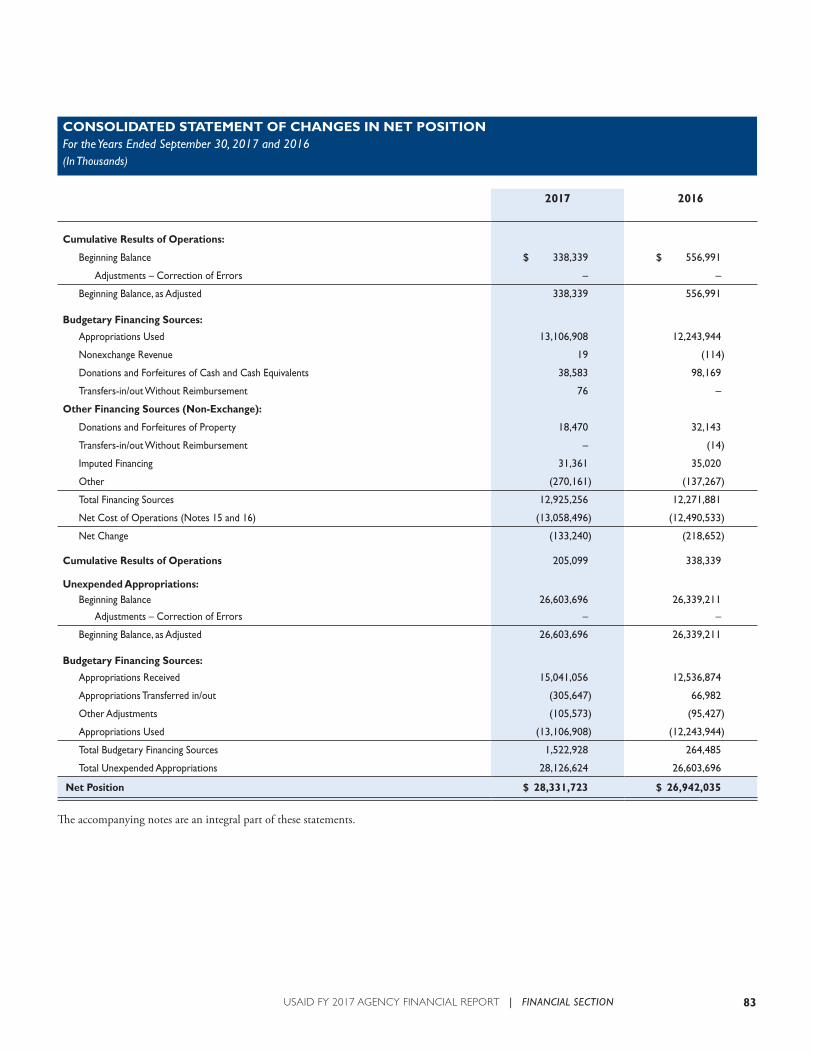
83USAID FY 2017 AGENCY FINANCIAL REPORT | FINANCIAL SECTION
CONSOLIDATED STATEMENT OF CHANGES IN NET POSITIONFor the Years Ended September 30, 2017 and 2016(In Thousands)
2017 2016
Cumulative Results of Operations:
Beginning Balance $ 338,339 $ 556,991
Adjustments – Correction of Errors – –
Beginning Balance, as Adjusted 338,339 556,991
Budgetary Financing Sources:
Appropriations Used 13,106,908 12,243,944
Nonexchange Revenue 19 (114)
Donations and Forfeitures of Cash and Cash Equivalents 38,583 98,169
Transfers-in/out Without Reimbursement 76 –
Other Financing Sources (Non-Exchange):
Donations and Forfeitures of Property 18,470 32,143
Transfers-in/out Without Reimbursement – (14)
Imputed Financing 31,361 35,020
Other (270,161) (137,267)
Total Financing Sources 12,925,256 12,271,881
Net Cost of Operations (Notes 15 and 16) (13,058,496) (12,490,533)
Net Change (133,240) (218,652)
Cumulative Results of Operations 205,099 338,339
Unexpended Appropriations: Beginning Balance 26,603,696 26,339,211
Adjustments – Correction of Errors – –
Beginning Balance, as Adjusted 26,603,696 26,339,211
Budgetary Financing Sources:
Appropriations Received 15,041,056 12,536,874
Appropriations Transferred in/out (305,647) 66,982
Other Adjustments (105,573) (95,427)
Appropriations Used (13,106,908) (12,243,944)
Total Budgetary Financing Sources 1,522,928 264,485
Total Unexpended Appropriations 28,126,624 26,603,696
Net Position $ 28,331,723 $ 26,942,035
The accompanying notes are an integral part of these statements.
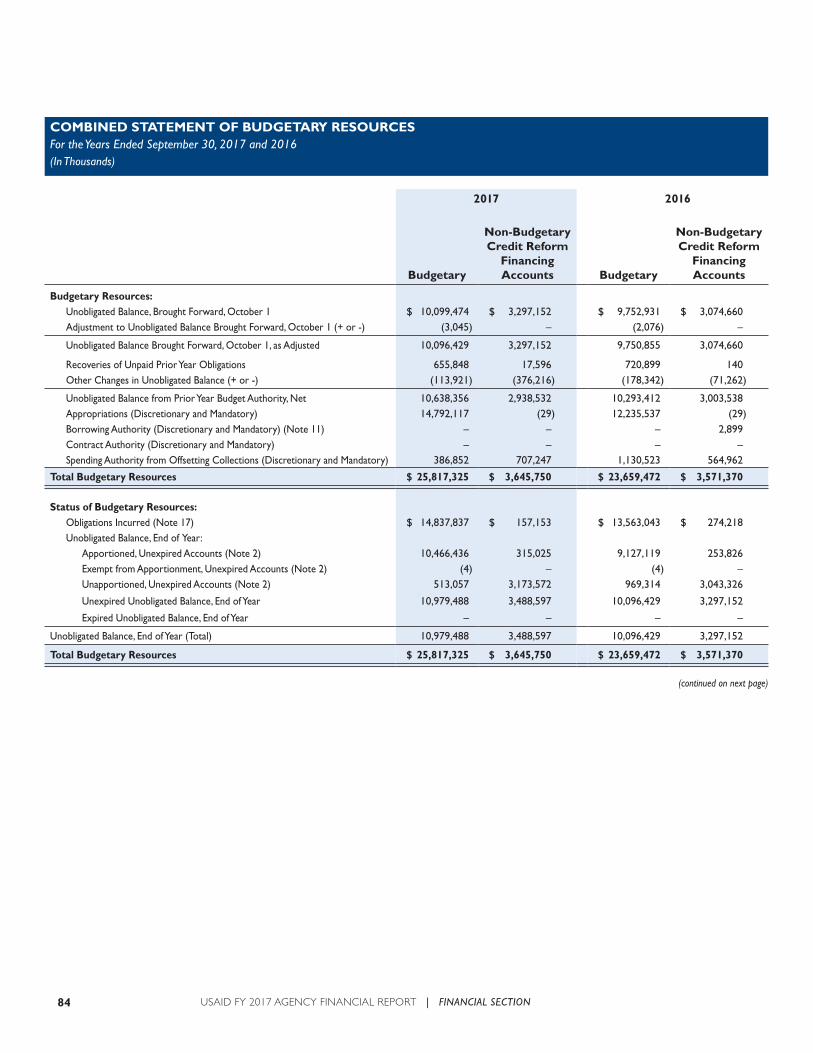
84 USAID FY 2017 AGENCY FINANCIAL REPORT | FINANCIAL SECTION
COMBINED STATEMENT OF BUDGETARY RESOURCESFor the Years Ended September 30, 2017 and 2016(In Thousands)
2017 2016
Budgetary
Non-Budgetary Credit Reform
Financing Accounts Budgetary
Non-Budgetary Credit Reform
Financing Accounts
Budgetary Resources: Unobligated Balance, Brought Forward, October 1 $ 10,099,474 $ 3,297,152 $ 9,752,931 $ 3,074,660 Adjustment to Unobligated Balance Brought Forward, October 1 (+ or -) (3,045) – (2,076) –
Unobligated Balance Brought Forward, October 1, as Adjusted 10,096,429 3,297,152 9,750,855 3,074,660
Recoveries of Unpaid Prior Year Obligations 655,848 17,596 720,899 140 Other Changes in Unobligated Balance (+ or -) (113,921) (376,216) (178,342) (71,262)
Unobligated Balance from Prior Year Budget Authority, Net 10,638,356 2,938,532 10,293,412 3,003,538 Appropriations (Discretionary and Mandatory) 14,792,117 (29) 12,235,537 (29) Borrowing Authority (Discretionary and Mandatory) (Note 11) – – – 2,899 Contract Authority (Discretionary and Mandatory) – – – – Spending Authority from Offsetting Collections (Discretionary and Mandatory) 386,852 707,247 1,130,523 564,962
Total Budgetary Resources $ 25,817,325 $ 3,645,750 $ 23,659,472 $ 3,571,370
Status of Budgetary Resources: Obligations Incurred (Note 17) $ 14,837,837 $ 157,153 $ 13,563,043 $ 274,218 Unobligated Balance, End of Year:
Apportioned, Unexpired Accounts (Note 2) 10,466,436 315,025 9,127,119 253,826 Exempt from Apportionment, Unexpired Accounts (Note 2) (4) – (4) – Unapportioned, Unexpired Accounts (Note 2) 513,057 3,173,572 969,314 3,043,326
Unexpired Unobligated Balance, End of Year 10,979,488 3,488,597 10,096,429 3,297,152
Expired Unobligated Balance, End of Year – – – –
Unobligated Balance, End of Year (Total) 10,979,488 3,488,597 10,096,429 3,297,152
Total Budgetary Resources $ 25,817,325 $ 3,645,750 $ 23,659,472 $ 3,571,370
(continued on next page)
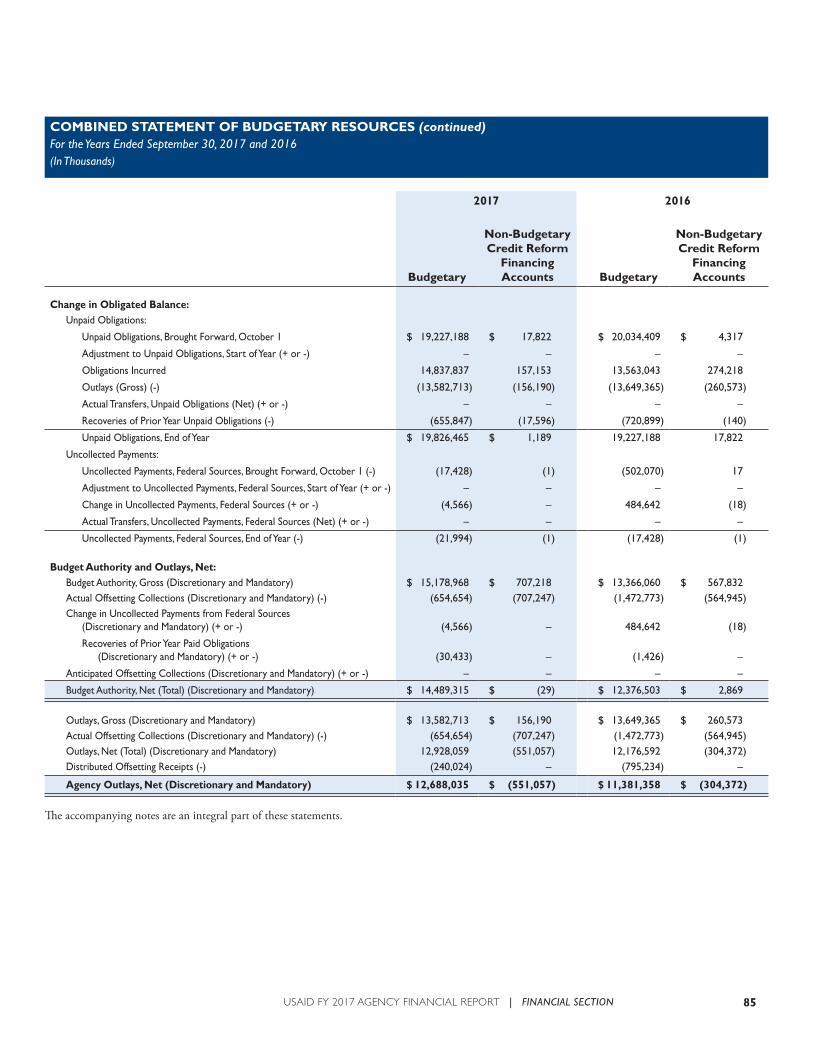
85USAID FY 2017 AGENCY FINANCIAL REPORT | FINANCIAL SECTION
COMBINED STATEMENT OF BUDGETARY RESOURCES (continued)For the Years Ended September 30, 2017 and 2016(In Thousands)
2017 2016
Budgetary
Non-Budgetary Credit Reform
Financing Accounts Budgetary
Non-Budgetary Credit Reform
Financing Accounts
Change in Obligated Balance: Unpaid Obligations:
Unpaid Obligations, Brought Forward, October 1 $ 19,227,188 $ 17,822 $ 20,034,409 $ 4,317
Adjustment to Unpaid Obligations, Start of Year (+ or -) – – – –
Obligations Incurred 14,837,837 157,153 13,563,043 274,218
Outlays (Gross) (-) (13,582,713) (156,190) (13,649,365) (260,573)
Actual Transfers, Unpaid Obligations (Net) (+ or -) – – – –
Recoveries of Prior Year Unpaid Obligations (-) (655,847) (17,596) (720,899) (140)
Unpaid Obligations, End of Year $ 19,826,465 $ 1,189 19,227,188 17,822
Uncollected Payments:
Uncollected Payments, Federal Sources, Brought Forward, October 1 (-) (17,428) (1) (502,070) 17
Adjustment to Uncollected Payments, Federal Sources, Start of Year (+ or -) – – – –
Change in Uncollected Payments, Federal Sources (+ or -) (4,566) – 484,642 (18)
Actual Transfers, Uncollected Payments, Federal Sources (Net) (+ or -) – – – –
Uncollected Payments, Federal Sources, End of Year (-) (21,994) (1) (17,428) (1)
Budget Authority and Outlays, Net:Budget Authority, Gross (Discretionary and Mandatory) $ 15,178,968 $ 707,218 $ 13,366,060 $ 567,832Actual Offsetting Collections (Discretionary and Mandatory) (-) (654,654) (707,247) (1,472,773) (564,945)Change in Uncollected Payments from Federal Sources
(Discretionary and Mandatory) (+ or -) (4,566) – 484,642 (18)
Recoveries of Prior Year Paid Obligations (Discretionary and Mandatory) (+ or -) (30,433) – (1,426) –
Anticipated Offsetting Collections (Discretionary and Mandatory) (+ or -) – – – –
Budget Authority, Net (Total) (Discretionary and Mandatory) $ 14,489,315 $ (29) $ 12,376,503 $ 2,869
Outlays, Gross (Discretionary and Mandatory) $ 13,582,713 $ 156,190 $ 13,649,365 $ 260,573Actual Offsetting Collections (Discretionary and Mandatory) (-) (654,654) (707,247) (1,472,773) (564,945)Outlays, Net (Total) (Discretionary and Mandatory) 12,928,059 (551,057) 12,176,592 (304,372)Distributed Offsetting Receipts (-) (240,024) – (795,234) –
Agency Outlays, Net (Discretionary and Mandatory) $ 12,688,035 $ (551,057) $ 11,381,358 $ (304,372)
The accompanying notes are an integral part of these statements.
86 USAID FY 2017 AGENCY FINANCIAL REPORT | FINANCIAL SECTION
NOTES TO THE FINANCIAL STATEMENTS
NOTE 1. SUMMARY OF SIGNIFICANT ACCOUNTING POLICIES
Economic Support Fund; Development Assistance; International Disaster Assistance; Global Health and Child Survival; Complex Crisis Fund; Transi-tion Initiatives; and Direct and Guaranteed Loan Programs. This classification is consistent with the budget of the United States.
Assistance for Europe, Eurasia, and Central Asia
Funds appropriated under this heading are considered to be economic assistance under the Foreign Assistance Act of 1961.
This account provides funds for a program of assis-tance to the independent states that emerged from the former Soviet Union. These funds support the U.S. foreign policy goals of consolidating improved U.S. security; building a lasting partnership with the new independent states; and providing mutual access to markets, resources, and expertise.
Civilian Stabilization Initiative
This fund provides support for the necessary expenses needed to establish, support, maintain, mobilize, and deploy a civilian response corps in coordination with the USAID. This fund is also used for related reconstruction and stabilization assistance to prevent or respond to conflict or civil strife in foreign countries or regions, or to enable transition from such unstable conditions.
Capital Investment Fund
This fund provides for the necessary expenses of overseas construction and related costs, and for procurement and enhancement of information technology and related capital investments. Specifically, this fund provides
A. BASIS OF PRESENTATION
The accompanying principal financial statements report USAID’s financial position and results of operations. The statements have been prepared using USAID’s books and records in accordance with Agency accounting policies, the most signifi-cant of which are summarized in this note. The statements are presented in accordance with the guidance and requirements of the Office of Management and Budget (OMB) Circular A-136, Financial Reporting Requirements.
USAID accounting policies follow generally accepted accounting principles for the Federal government, as established by the Federal Accounting Standards Advisory Board (FASAB). The FASAB has been recognized by the American Institute of Certified Public Accountants (AICPA) as the official accounting standard setting authority for the Federal government. These standards have been agreed to by the Director of the OMB, the Secretary of the Treasury, and the Comptroller General.
B. REPORTING ENTITY
Established in 1961 by President John F. Kennedy, USAID is the independent U.S. Government agency that provides economic development and humanitarian assistance to advance United States economic and political interests overseas.
PROGRAM FUNDS
The principal statements present the financial activity of various programs and accounts managed by USAID. The programs include Assistance for Europe, Eurasia, and Central Asia; Civilian Stabilization Initiative; Capital Investment Fund;
87USAID FY 2017 AGENCY FINANCIAL REPORT | FINANCIAL SECTION
assistance in supporting the Global Acquisition and Assistance System (GLAAS).
Economic Support Fund
The Economic Support Fund supports U.S. foreign policy objectives by providing economic assistance to allies and countries in transition to democracy. Programs funded through this account promote stability and U.S. security interests in strategic regions of the world.
Development Assistance
This program provides economic resources to developing countries with the aim of bringing the benefits of development to the poor. The program promotes broad-based, self-sustaining economic growth and opportunity, and supports initia-tives intended to stabilize population growth, protect the environment and foster increased democratic participation in developing countries. The program is concentrated in those areas in which the United States has special expertise and which promise the greatest opportunity for the poor to better their lives.
International Disaster Assistance
Funds for the International Disaster Assistance Program provide relief, rehabilitation, and reconstruction assistance to foreign countries struck by disasters such as famines, floods, hurricanes and earthquakes. The program also provides assistance in disaster preparedness, prevention and mitigation; and providing emergency commodities and services for immediate healthcare and nutrition. Additionally, this fund supports the capability to provide timely emergency response to disasters worldwide.
Global Health and Child Survival
This fund provides economic resources to developing countries in support of programs to improve infant and child nutrition, with the aim of reducing infant and child mortality rates; to reduce HIV transmis-sion and the impact of the HIV/AIDS pandemic in developing countries; to reduce the threat of infec-tious diseases of major public health importance such as polio, malaria or tuberculosis; and to expand access to quality basic education for girls and women.
Complex Crisis Fund
This fund provides for necessary expenses under of the Foreign Assistance Act of 1961 to support programs and activities around prevention of, or response to emerging or unforeseen complex crises overseas.
Transition Initiatives
This fund provides for humanitarian programs that provide post conflict assistance to victims of both natural and man-made disasters. The program supports U.S. foreign policy objectives by helping local partners advance peace and democracy in priority countries in crisis. Seizing critical windows of opportunity, the Office of Transition Initiatives works on the ground to provide fast, flexible, short-term assistance targeted at key political transition and stabilization needs.
Direct and Guaranteed Loans
• Direct Loan Program
These loans are authorized under the Foreign Assistance Act of 1961, various predecessor agency programs, and other foreign assistance legislation. Direct Loans are issued in both U.S. dollars and the currency of the borrower. Foreign currency loans made “with maintenance of value” places the risk of currency devaluation on the borrower, and are recorded in equivalent U.S. dollars. Loans made “without mainte-nance of value” place the risk of devaluation on the U.S. Government, and are recorded in the foreign currency of the borrower.
• Urban and Environmental Program
The Urban and Environmental (UE) Program extends guaranties to U.S. private investors who make loans to developing countries, to assist them in formulating and executing sound housing and community development policies that meet the needs of lower income groups.
• Micro and Small Enterprise Development Program
The Micro and Small Enterprise Development (MSED) Program was established to support private sector activities in developing countries
88 USAID FY 2017 AGENCY FINANCIAL REPORT | FINANCIAL SECTION
by providing direct loans and loan guarantees to local micro and small enterprises. Although the MSED program is still active, most of USAID’s new loan guarantee activity is managed through the Development Credit Authority (DCA) Program.
• Development Credit Authority
The first obligations for USAID’s DCA were made in FY 1999. The DCA allows missions and other offices to use loans and loan guar-antees to achieve their development objectives when it can be shown that (1) the project generates enough revenue to cover the debt service including USAID fees, (2) there is at least 50 percent risk-sharing by a private-sector institution, and (3) the DCA guarantee addresses a financial market failure in-country and does not “crowd-out” private sector lending. The DCA can be used in any sector and by any USAID operating unit whose project meets the DCA criteria. DCA projects are approved by the Agency Credit Review Board and the Chief Financial Officer.
• Israel Loan Guarantee Program
Congress authorized the Israel Loan Guarantee Program in Section 226 of the Foreign Assis-tance Act to support the costs for immigrants resettling to Israel from the former Soviet Union, Ethiopia, and other countries. Under the program, the U.S. Government guaranteed the repayment of up to $10.5 billion in notes issued. Borrowing was completed under the program during FY 2005.
• Loan Guarantees to Middle East Northern Africa (MENA) Program
The Loan Guarantee authority for the MENA Program was initially established under Title III of the Department of State, Foreign Operations, and Related Programs Appropriations Act, 2012, Division I of Pub. L. No. 112-74, earmarked to provide support for the Republic of Tunisia. In FY 2014, this program was expanded to include Jordan and renamed the MENA Loan Guarantee Program. Under this program, the U. S. Government
issues guarantees with respect to the payment obligations of MENA for notes. In January 2017, Iraq under a guarantee (the “Guarantee”) issued pursuant to (i) Section 7034(o)(1) of the Department of State, Foreign Operations, and Related Programs Appropriations Act, 2016 (Div. K, Pub. L. No. 114-113); (ii) Section 205(a) of the Further Continuing and Security Assistance Appropriations Act, 2017 (Pub. L. No. 114-254); and (iii) the regulations of USAID codified at 22 C.F.R. 241 (2017) (the “Guarantee Terms and Conditions”), was added to the MENA Loan Guarantee Program. Under this program, the U.S. Government guarantees total repayment of $6.24 billion in notes issued to date.
• Ukraine Loan Guarantee Program
The Loan Guarantee Program for Ukraine was established in accordance with Title III of the Department of State, Foreign Opera-tions, and Related Programs Appropriations Act, 2014 (division K of Pub. L. No. 113-76). In FY 2016, a new $1.0 billion note with a $290 million subsidy cost was issued under the Ukraine program resulting in an overall total of $3 billion in notes issued to date. The Ukraine Loan Program is intended to help Ukraine meet its near-term social spending needs and insulate vulnerable Ukrainians from the impact of necessary economic adjustments.
FUND TYPES
The principal statements include the accounts of all funds under USAID’s control. Most of the fund accounts relate to general fund appropriations. USAID also has special funds, revolving funds, trust funds, deposit funds, a capital investment fund, receipt accounts, and budget clearing accounts.
General fund appropriations and the special funds are used to record financial transactions under Congressional appropriations or other authorization to spend general revenue.
Revolving funds are established by law to finance a continuing cycle of operations, with receipts derived from such operations usually available
89USAID FY 2017 AGENCY FINANCIAL REPORT | FINANCIAL SECTION
in their entirety for use by the fund without further action by Congress.
Trust funds are credited with receipts generated by the terms of the underlying trust agreement or statute. At the point of collection, these receipts may be available or unavailable, depending upon statutory spending authority.
Deposit funds are established for (1) amounts received for which USAID is acting as a fiscal agent or custodian, (2) unidentified remittances, (3) monies withheld from payments for goods or services received, and (4) monies held awaiting distribution on the basis of legal determination.
The capital investment fund contains no-year (non-expiring) funds to provide the Agency with greater flexibility to manage investments in technology systems and facility construction that’s allowed under the annual appropriation for operating expenses.
C. BASIS OF ACCOUNTING
Transactions are recorded on both an accrual and budgetary basis. Under the accrual basis, revenues are recognized when earned and expenses are recognized when a liability is incurred, without regard to receipt or payment of cash. Budgetary accounting facilitates compliance with legal constraints on, and controls of, the use of federal funds. The accompanying Balance Sheet, Statement of Net Cost, and Statement of Changes in Net Position have been prepared on an accrual basis. The Statement of Budgetary Resources has been prepared in accordance with budgetary accounting rules.
D. BUDGETS AND BUDGETARY ACCOUNTING
The components of USAID’s budgetary resources include current budgetary authority (that is, appropriations and borrowing authority) and unobligated balances remaining from multiyear and no-year budget authority received in prior years. Budget authority is the authorization provided by law to enter into financial obligations that result in immediate or future outlays of federal funds. Budgetary resources also include reimbursement
and other income (that is, spending authority from offsetting collections credited to an appropriation or fund account) and adjustments (that is, recoveries of prior year obligations).
Unobligated balances associated with appropriations that expire at the end of the fiscal year remain available for obligation adjustments, but not new obligations, for five years until that account is canceled. When accounts are canceled amounts are not available for obligations or expenditure for any purpose and are returned to Treasury.
The “Consolidated Appropriations Act” signed into law as Pub. L. No.112-74 provides to USAID extended authority to obligate funds. USAID’s appropriations have consistently provided essentially similar authority, commonly known as “7011”. Under this authority, funds shall remain available for obligation for an extended period if such funds are initially obligated within their initial period of availability.
E. REVENUES AND OTHER FINANCING SOURCES
USAID receives the majority of its funding through congressional appropriations—annual, multiyear, and no-year (non-expiring) appropriations—that may be used within statutory limits. Appropriations are recognized as a financing source (i.e., Appropriations Used) on the Statement of Changes in Net Position at the time the related program or administrative expenses are incurred. Appropriations expended for capitalized property and equipment are not recognized as expenses. In addition to funds warranted directly to USAID, the agency also receives allocation transfers from the Department of Agriculture Commodity Credit Corporation, the Executive Office of the President, the Department of State, and Millennium Challenge Corporation.
Additional financing sources for USAID’s various credit programs and trust funds include amounts obtained through collection of guaranty fees, interest income on rescheduled loans, penalty interest on delinquent balances, permanent indefinite borrowing authority from the U.S. Treasury, proceeds from the sale of overseas real property acquired by
90 USAID FY 2017 AGENCY FINANCIAL REPORT | FINANCIAL SECTION
USAID, and advances from foreign governments and international organizations.
Revenues are recognized as financing sources to the extent that they are received by USAID from other agencies, other governments and the public. Imputed revenues are reported in the financial statements to offset imputed costs. Amounts received from other Federal agencies under reimbursable agreements are recognized as revenue as related expenditures are incurred.
F. FUND BALANCE WITH TREASURY
Cash receipts and disbursements are processed by the U.S. Treasury. The fund balances with Treasury are primarily appropriated funds that are available to pay current liabilities and finance authorized purchase commitments, but they also include revolving, deposit, and trust funds.
G. FOREIGN CURRENCY
The Direct Loan Program maintains foreign currency funds, which are used to disburse loans in certain countries. Those balances are reported at the U.S. dollar equivalents using the exchange rates prescribed by the U.S. Treasury. A gain or loss on currency conversion is recognized for any change in valuation of foreign currencies at year-end. Additionally, some USAID host countries contribute funds for the overhead operation of the host mission and the execution of USAID programs. These funds are held in trust and reported in U.S. dollar equivalents on the Balance Sheet and Statement of Net Costs.
H. ACCOUNTS RECEIVABLE
Accounts receivable consist of amounts due mainly from foreign governments but also from other Federal agencies and private organizations. USAID regards amounts due from other Federal agencies as 100 percent collectible. The Agency establishes an allowance for uncollectible accounts receivable from the public for non-loan or revenue generating sources based on a historical analysis of collectability.
I. DIRECT LOANS AND LOAN GUARANTEES
Loans are accounted for as receivables after funds have been disbursed. For loans obligated before October 1, 1991 (the pre-credit reform period), loan principal, interest, and penalties receivable are reduced by an allowance for estimated uncollectible amounts. The allowance is estimated based on a net present value method prescribed by OMB that takes into account country risk and projected cash flows.
For loans obligated on or after October 1, 1991, the loans receivable are reduced by an allowance equal to the net present value of the cost to the United States Government of making the loan. This cost, known as “subsidy”, takes into account all cash inflows and outflows associated with the loan, including the interest rate differential between the loans and Treasury borrowing, the estimated delinquencies and defaults net of recoveries, and offsets from fees and other estimated cash flows. This allowance is re-estimated when necessary and changes reflected in the operating statement.
Loans have been made in both U.S. dollars and foreign currencies. Loans extended in foreign currencies can be with or without “Maintenance of Value” (MOV). Foreign currency exchange gain or loss is recognized on those loans extended without MOV, and reflected in the net credit programs receivable balance.
Credit program receivables also include origination and annual fees on outstanding guarantees, interest on rescheduled loans and late charges. Claims receivables (subrogated and rescheduled) are due from foreign governments as a result of defaults for pre-1992 guaranteed loans. Receivables are stated net of an allowance for uncollectible accounts that is determined using an OMB approved net present value default methodology.
While estimates of uncollectible loans and interest are made using methods prescribed by OMB, the final determination as to whether a loan is collectible is also affected by actions of other federal government agencies.
91USAID FY 2017 AGENCY FINANCIAL REPORT | FINANCIAL SECTION
J. ADVANCES
Funds disbursed before expenditures are incurred are recorded as advances. Most advances consist of funds disbursed under letters of credit to contrac-tors and grantees. The advances are liquidated and recorded as expenses upon receipt of expenditure reports from the recipients.
K. INVENTORY AND RELATED PROPERTY
USAID’s inventory and related property are comprised of life essential materials and supplies. The Agency has materials and supplies in reserve for foreign disaster assistance stored at strategic sites around the world. These include tents, disaster kits, field packs, and water purification units.
Agency supplies held in reserve for future use are items not readily available in the market, or for which there is more than a remote chance that the supplies will be needed, but not in the normal course of operations. Their valuation is based on cost and they are not considered “held for sale.” USAID has no supplies categorizable as excess, obsolete, or unserviceable operating materials and supplies.
L. PROPERTY, PLANT AND EQUIPMENT
USAID capitalizes all property, plant and equipment that have an acquisition cost of $25,000 or greater and a useful life of two years or more. Acquisitions that do not meet these criteria are recorded as operating expenses. Assets are capitalized at historical cost, depending on when the asset was put into production and depreciated using the straight-line method (mid-year and mid-quarter). Real property is depreciated over 20 years, nonexpendable personal property is depreciated over three to five years, and capital leases are depreciated according to the terms of the lease. The Agency uses land, buildings, and equipment that are provided by the General Services Administration. Internal use software that has development costs of $300,000 or greater is capitalized. Deferred maintenance amounts
are immaterial with respect to the financial statements. In addition, certain USAID assets are held by government contractors. Under provisions of the Federal Acquisition Regulation (FAR), the contractors are responsible for the control and accountability of the assets in their possession, which are immaterial in nature. These government-owned, contractor-held assets are included within the balances reported in USAID’s financial statements.
M. LIABILITIES
Liabilities represent the amount of monies or other resources that are likely to be paid by USAID as the result of transactions or events that have already occurred. However, no liability can be paid by the Agency without an appropriation or borrowing authority. Liabilities for which an appropriation has not been enacted are therefore classified as Liabilities Not Covered by Budgetary Resources (unfunded liabilities), and there is no certainty that the appropriations will be enacted. As a sovereign entity, the Federal Government can abrogate the payment of all liabilities other than for contracts.
N. LIABILITIES FOR LOAN GUARANTEES
The Credit Reform Act (CRA) of 1990, which became effective on October 1, 1991, significantly changed the manner in which USAID finances the activities of loan programs. The main purpose of the CRA was to more accurately measure the cost of Federal credit programs and to place the cost of such programs on a budgetary basis equivalent to other Federal spending. Consequently, commencing in FY 1992, USAID can only make new loans or guarantees with an appropriation available to fund the cost of making the loan or guarantee. This cost is known as “subsidy.”
For USAID’s loan guarantee programs, when guarantee commitments are made, an obligation for subsidy cost is recorded in the program account. This cost is based on the net present value of the estimated net cash outflows to be paid by the program as a result of the loan guarantees, except
92 USAID FY 2017 AGENCY FINANCIAL REPORT | FINANCIAL SECTION
for administrative costs, less the net present value of all cash inflows to be generated from those guarantees. When the loans are disbursed, the subsidy cost is disbursed from the program account to a financing account.
For loan guarantees made before the CRA (pre-1992), the liability for loan guarantees represents an unfunded liability. The amount of unfunded liabilities also represents a future funding requirement for USAID. The liability is calculated using a reserve methodology that is similar to the OMB- prescribed method for post-1991 loan guarantees.
O. ANNUAL, SICK, AND OTHER LEAVE
Annual leave is accrued as it is earned and the accrual is reduced as leave is taken. Each year, the balance in the accrued annual leave account is adjusted to reflect current pay rates. To the extent that current or prior year appropriations are not available to fund annual leave earned but not taken, funding will be obtained from future financing sources. Sick leave and other types of leave are expensed as taken.
P. RETIREMENT PLANS AND POST EMPLOYMENT BENEFITS
USAID recognizes its share of the cost of providing future pension benefits to eligible employees over the period of time the employees provide the related services. The pension expense recognized in the financial statements equals the current service cost for USAID employees for the accounting period less the amount contributed by the employees. The measurement of the service cost requires the use of an actuarial cost method and assumptions. The Office of Personnel Management (OPM) administers these benefits and provides the factors that USAID applies to calculate the cost. The excess of the pension expense over the amount contributed by USAID and employees represents the amount being financed directly through the Civil Service Retirement System and the Federal Employees Retirement System administered by OPM. This cost is considered imputed cost to USAID.
USAID recognizes a current period expense for the future cost of post retirement health benefits and life insurance for its employees while they are still working. USAID accounts for and reports this expense in its financial statements in a manner similar to that used for pensions, with the exception that employees and USAID do not make contributions to fund these future benefits.
Q. COMMITMENTS AND CONTINGENCIES
A contingency is an existing condition, situation or set of circumstances involving uncertainty as to possible gain or loss to USAID. The uncertainty will ultimately be resolved when one or more future events occur or fail to occur. For pending, threatened or potential litigation, a liability is recognized when a past transaction or event has occurred, a future outflow or other sacrifice of resources is likely, and the related future outflow or sacrifice of resources is measurable. For other litigations, a contingent liability is recognized when similar events occur except that the future outflow or other sacrifice of resources is more likely than not.
R. NET POSITION
Net position is the residual difference between assets and liabilities. It is composed of unexpended appropriations and cumulative results of operations.
• Unexpended appropriations are the portion of the appropriations represented by undelivered orders and unobligated balances.
• Cumulative results of operations are also part of net position. This account reflects the net differ-ence between expenses and losses and financing sources, including appropriations, revenues and gains, since the inception of the activity.
S. NON-ENTITY ASSETS
Non-entity fund balances are amounts in deposit fund accounts. These include such items as: funds received from outside sources where the government acts as fiscal agent, monies the government has withheld awaiting distribution
93USAID FY 2017 AGENCY FINANCIAL REPORT | FINANCIAL SECTION
based on legal determination, and unidentified remittances credited as suspense items outside the budget. For USAID, non-entity assets are minimal in amount, and are composed solely of accounts receivable, net of allowances.
T. AGENCY COSTS
USAID costs of operations are comprised of program and operating expenses. USAID/Washington program and Mission related expenses by category are obtained directly from Phoenix, the Agency general ledger. A cost allocation model is used to distribute operating expenses, including Management Bureau, Global Development Alliance, Trust Funds and Support Offices costs to specific goals. Expenses related to Credit Reform and Revolving Funds are directly applied to specific agency goals based on their categories.
U. PARENT/CHILD REPORTING
USAID is a party to allocation transfers with other federal agencies as both a transferring (parent) entity and receiving (child) entity. Allocation transfers are legal delegations by one department of its ability to obligate budget authority and outlay funds to another department. A separate fund account (allocation account) is created in the U.S. Treasury as a subset of the parent fund account for tracking and reporting purposes. All allocation transfers of balances are credited to this account,
and subsequent obligations and outlays incurred by the child entity are also charged to this allocation account as they execute the delegated activity on behalf of the parent entity. Generally, all financial activity related to these allocation transfers (e.g., budget authority, obligations, outlays) is reported in the financial statements of the parent entity, from which the underlying legislative authority, appropriations, and budget apportionments are derived. Per OMB guidance, child transfer activities are to be included and parent transfer activities are to be excluded in trial balances. Exceptions to this general rule affecting USAID include the Executive Office of the President, for whom USAID is the child in the allocation transfer but, per OMB guidance, will report all activity relative to these allocation transfers in USAID’s financial statements. In addition to these funds, USAID allocates funds as the parent to:
• Department of Agriculture, Forest Service
• Department of State
USAID receives allocation transfers as the child from:
• Department of State
• Executive Office of the President
• Millennium Challenge Corporation
• Department of Agriculture, Commodity Credit Corporation
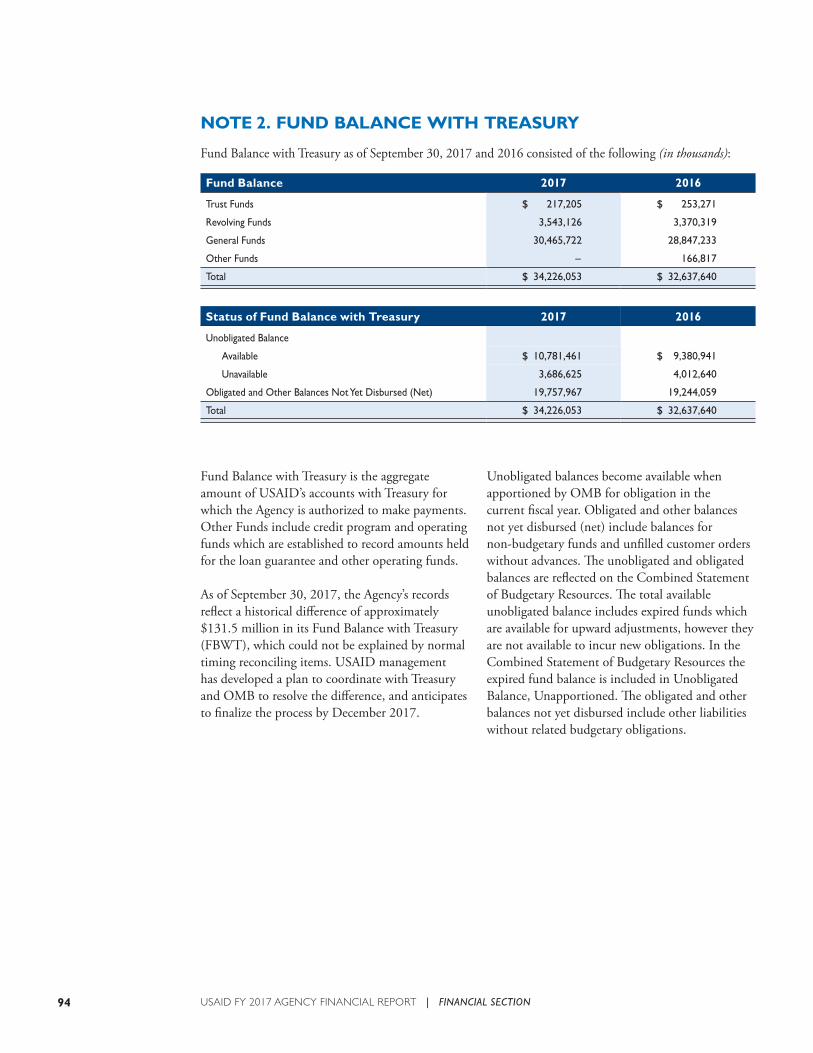
94 USAID FY 2017 AGENCY FINANCIAL REPORT | FINANCIAL SECTION
Fund Balance with Treasury is the aggregate amount of USAID’s accounts with Treasury for which the Agency is authorized to make payments. Other Funds include credit program and operating funds which are established to record amounts held for the loan guarantee and other operating funds.
As of September 30, 2017, the Agency’s records reflect a historical difference of approximately $131.5 million in its Fund Balance with Treasury (FBWT), which could not be explained by normal timing reconciling items. USAID management has developed a plan to coordinate with Treasury and OMB to resolve the difference, and anticipates to finalize the process by December 2017.
Unobligated balances become available when apportioned by OMB for obligation in the current fiscal year. Obligated and other balances not yet disbursed (net) include balances for non-budgetary funds and unfilled customer orders without advances. The unobligated and obligated balances are reflected on the Combined Statement of Budgetary Resources. The total available unobligated balance includes expired funds which are available for upward adjustments, however they are not available to incur new obligations. In the Combined Statement of Budgetary Resources the expired fund balance is included in Unobligated Balance, Unapportioned. The obligated and other balances not yet disbursed include other liabilities without related budgetary obligations.
NOTE 2. FUND BALANCE WITH TREASURY
Fund Balance with Treasury as of September 30, 2017 and 2016 consisted of the following (in thousands):
Fund Balance 2017 2016
Trust Funds $ 217,205 $ 253,271
Revolving Funds 3,543,126 3,370,319
General Funds 30,465,722 28,847,233
Other Funds – 166,817
Total $ 34,226,053 $ 32,637,640
Status of Fund Balance with Treasury 2017 2016
Unobligated Balance
Available $ 10,781,461 $ 9,380,941
Unavailable 3,686,625 4,012,640
Obligated and Other Balances Not Yet Disbursed (Net) 19,757,967 19,244,059
Total $ 34,226,053 $ 32,637,640
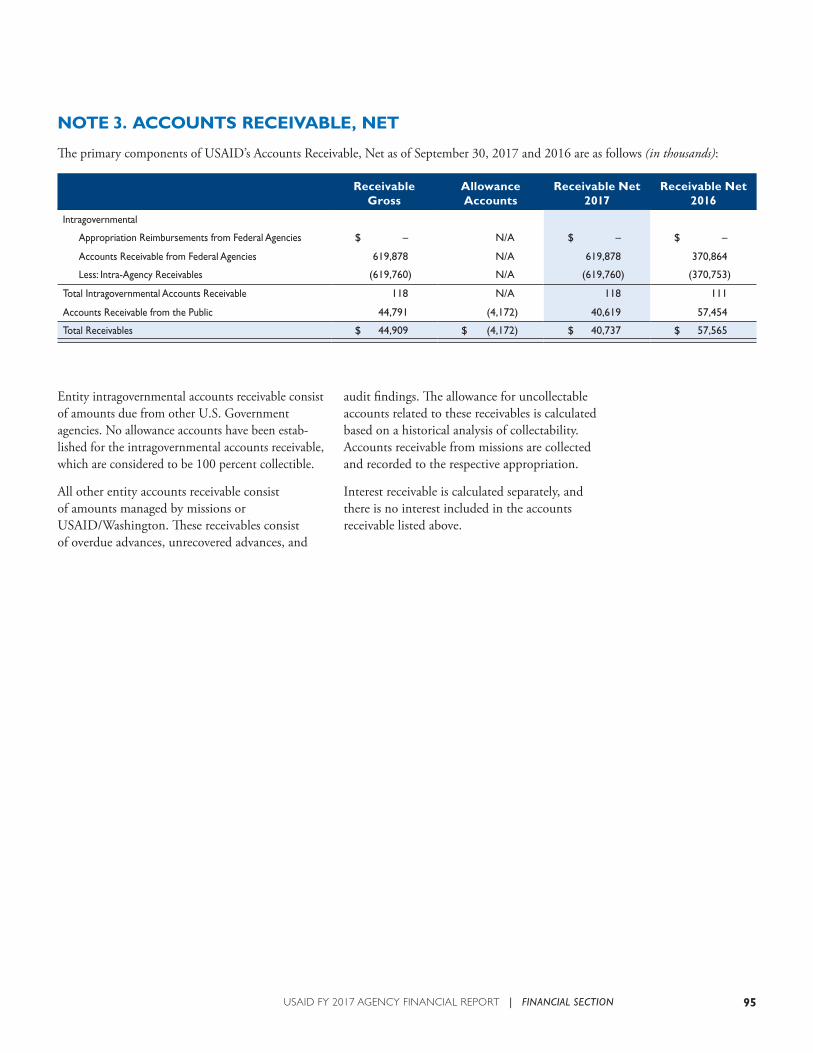
95USAID FY 2017 AGENCY FINANCIAL REPORT | FINANCIAL SECTION
NOTE 3. ACCOUNTS RECEIVABLE, NET
The primary components of USAID’s Accounts Receivable, Net as of September 30, 2017 and 2016 are as follows (in thousands):
Receivable Gross
Allowance Accounts
Receivable Net 2017
Receivable Net 2016
Intragovernmental
Appropriation Reimbursements from Federal Agencies $ – N/A $ – $ –
Accounts Receivable from Federal Agencies 619,878 N/A 619,878 370,864
Less: Intra-Agency Receivables (619,760) N/A (619,760) (370,753)
Total Intragovernmental Accounts Receivable 118 N/A 118 111
Accounts Receivable from the Public 44,791 (4,172) 40,619 57,454
Total Receivables $ 44,909 $ (4,172) $ 40,737 $ 57,565
Entity intragovernmental accounts receivable consist of amounts due from other U.S. Government agencies. No allowance accounts have been estab-lished for the intragovernmental accounts receivable, which are considered to be 100 percent collectible.
All other entity accounts receivable consist of amounts managed by missions or USAID/Washington. These receivables consist of overdue advances, unrecovered advances, and
audit findings. The allowance for uncollectable accounts related to these receivables is calculated based on a historical analysis of collectability. Accounts receivable from missions are collected and recorded to the respective appropriation.
Interest receivable is calculated separately, and there is no interest included in the accounts receivable listed above.
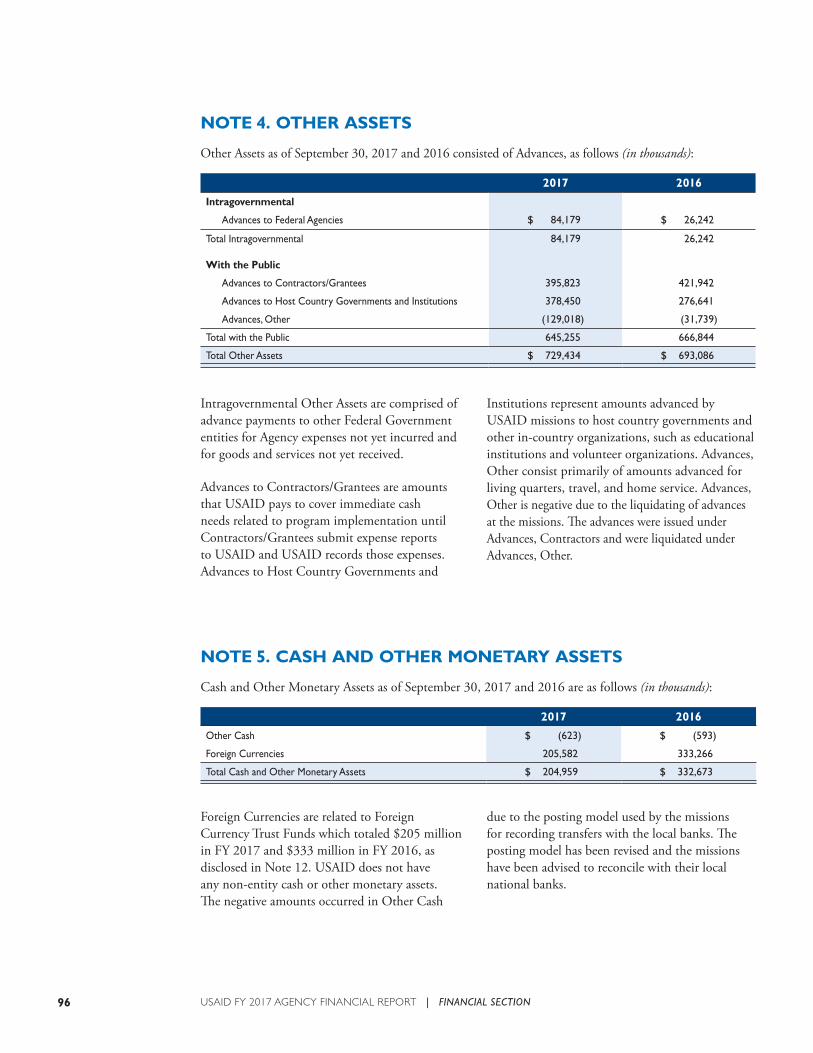
96 USAID FY 2017 AGENCY FINANCIAL REPORT | FINANCIAL SECTION
Intragovernmental Other Assets are comprised of advance payments to other Federal Government entities for Agency expenses not yet incurred and for goods and services not yet received.
Advances to Contractors/Grantees are amounts that USAID pays to cover immediate cash needs related to program implementation until Contractors/Grantees submit expense reports to USAID and USAID records those expenses. Advances to Host Country Governments and
Institutions represent amounts advanced by USAID missions to host country governments and other in-country organizations, such as educational institutions and volunteer organizations. Advances, Other consist primarily of amounts advanced for living quarters, travel, and home service. Advances, Other is negative due to the liquidating of advances at the missions. The advances were issued under Advances, Contractors and were liquidated under Advances, Other.
Foreign Currencies are related to Foreign Currency Trust Funds which totaled $205 million in FY 2017 and $333 million in FY 2016, as disclosed in Note 12. USAID does not have any non-entity cash or other monetary assets. The negative amounts occurred in Other Cash
due to the posting model used by the missions for recording transfers with the local banks. The posting model has been revised and the missions have been advised to reconcile with their local national banks.
NOTE 4. OTHER ASSETS
Other Assets as of September 30, 2017 and 2016 consisted of Advances, as follows (in thousands):
2017 2016
Intragovernmental
Advances to Federal Agencies $ 84,179 $ 26,242
Total Intragovernmental 84,179 26,242
With the Public
Advances to Contractors/Grantees 395,823 421,942
Advances to Host Country Governments and Institutions 378,450 276,641
Advances, Other (129,018) (31,739)
Total with the Public 645,255 666,844
Total Other Assets $ 729,434 $ 693,086
NOTE 5. CASH AND OTHER MONETARY ASSETS
Cash and Other Monetary Assets as of September 30, 2017 and 2016 are as follows (in thousands):
2017 2016
Other Cash $ (623) $ (593)
Foreign Currencies 205,582 333,266
Total Cash and Other Monetary Assets $ 204,959 $ 332,673
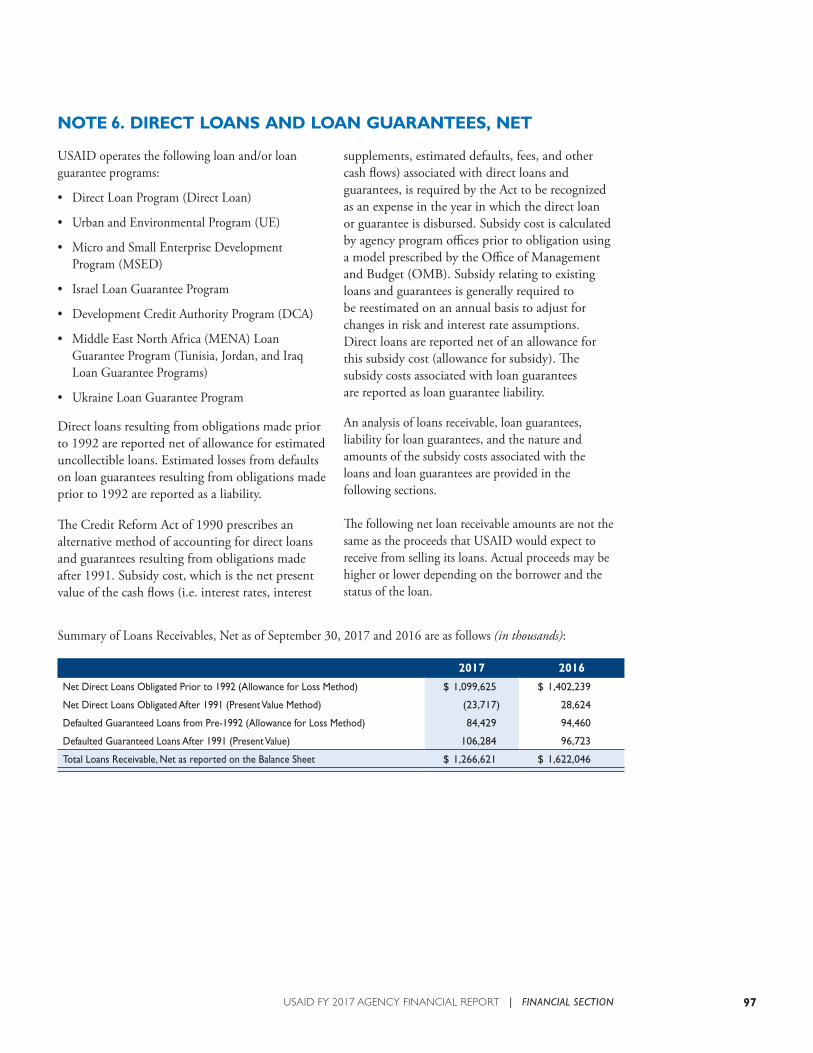
97USAID FY 2017 AGENCY FINANCIAL REPORT | FINANCIAL SECTION
NOTE 6. DIRECT LOANS AND LOAN GUARANTEES, NET
USAID operates the following loan and/or loan guarantee programs:
• Direct Loan Program (Direct Loan)
• Urban and Environmental Program (UE)
• Micro and Small Enterprise Development Program (MSED)
• Israel Loan Guarantee Program
• Development Credit Authority Program (DCA)
• Middle East North Africa (MENA) Loan Guarantee Program (Tunisia, Jordan, and Iraq Loan Guarantee Programs)
• Ukraine Loan Guarantee Program
Direct loans resulting from obligations made prior to 1992 are reported net of allowance for estimated uncollectible loans. Estimated losses from defaults on loan guarantees resulting from obligations made prior to 1992 are reported as a liability.
The Credit Reform Act of 1990 prescribes an alternative method of accounting for direct loans and guarantees resulting from obligations made after 1991. Subsidy cost, which is the net present value of the cash flows (i.e. interest rates, interest
supplements, estimated defaults, fees, and other cash flows) associated with direct loans and guarantees, is required by the Act to be recognized as an expense in the year in which the direct loan or guarantee is disbursed. Subsidy cost is calculated by agency program offices prior to obligation using a model prescribed by the Office of Management and Budget (OMB). Subsidy relating to existing loans and guarantees is generally required to be reestimated on an annual basis to adjust for changes in risk and interest rate assumptions. Direct loans are reported net of an allowance for this subsidy cost (allowance for subsidy). The subsidy costs associated with loan guarantees are reported as loan guarantee liability.
An analysis of loans receivable, loan guarantees, liability for loan guarantees, and the nature and amounts of the subsidy costs associated with the loans and loan guarantees are provided in the following sections. The following net loan receivable amounts are not the same as the proceeds that USAID would expect to receive from selling its loans. Actual proceeds may be higher or lower depending on the borrower and the status of the loan.
Summary of Loans Receivables, Net as of September 30, 2017 and 2016 are as follows (in thousands):
2017 2016
Net Direct Loans Obligated Prior to 1992 (Allowance for Loss Method) $ 1,099,625 $ 1,402,239
Net Direct Loans Obligated After 1991 (Present Value Method) (23,717) 28,624
Defaulted Guaranteed Loans from Pre-1992 (Allowance for Loss Method) 84,429 94,460
Defaulted Guaranteed Loans After 1991 (Present Value) 106,284 96,723
Total Loans Receivable, Net as reported on the Balance Sheet $ 1,266,621 $ 1,622,046
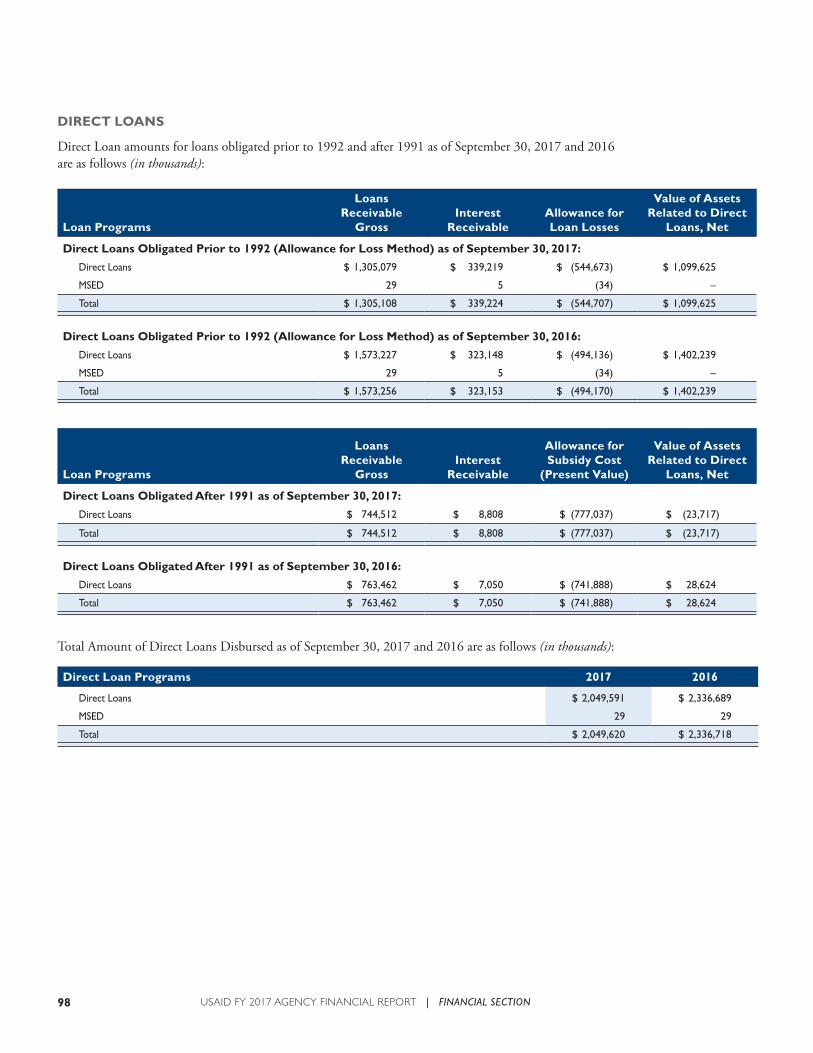
98 USAID FY 2017 AGENCY FINANCIAL REPORT | FINANCIAL SECTION
DIRECT LOANS
Direct Loan amounts for loans obligated prior to 1992 and after 1991 as of September 30, 2017 and 2016 are as follows (in thousands):
Loan Programs
Loans Receivable
GrossInterest
ReceivableAllowance for Loan Losses
Value of Assets Related to Direct
Loans, Net
Direct Loans Obligated Prior to 1992 (Allowance for Loss Method) as of September 30, 2017:
Direct Loans $ 1,305,079 $ 339,219 $ (544,673) $ 1,099,625
MSED 29 5 (34) –
Total $ 1,305,108 $ 339,224 $ (544,707) $ 1,099,625
Direct Loans Obligated Prior to 1992 (Allowance for Loss Method) as of September 30, 2016:
Direct Loans $ 1,573,227 $ 323,148 $ (494,136) $ 1,402,239
MSED 29 5 (34) –
Total $ 1,573,256 $ 323,153 $ (494,170) $ 1,402,239
Loan Programs
Loans Receivable
GrossInterest
Receivable
Allowance for Subsidy Cost
(Present Value)
Value of Assets Related to Direct
Loans, Net
Direct Loans Obligated After 1991 as of September 30, 2017:
Direct Loans $ 744,512 $ 8,808 $ (777,037) $ (23,717)
Total $ 744,512 $ 8,808 $ (777,037) $ (23,717)
Direct Loans Obligated After 1991 as of September 30, 2016:
Direct Loans $ 763,462 $ 7,050 $ (741,888) $ 28,624
Total $ 763,462 $ 7,050 $ (741,888) $ 28,624
Total Amount of Direct Loans Disbursed as of September 30, 2017 and 2016 are as follows (in thousands):
Direct Loan Programs 2017 2016
Direct Loans $ 2,049,591 $ 2,336,689
MSED 29 29
Total $ 2,049,620 $ 2,336,718
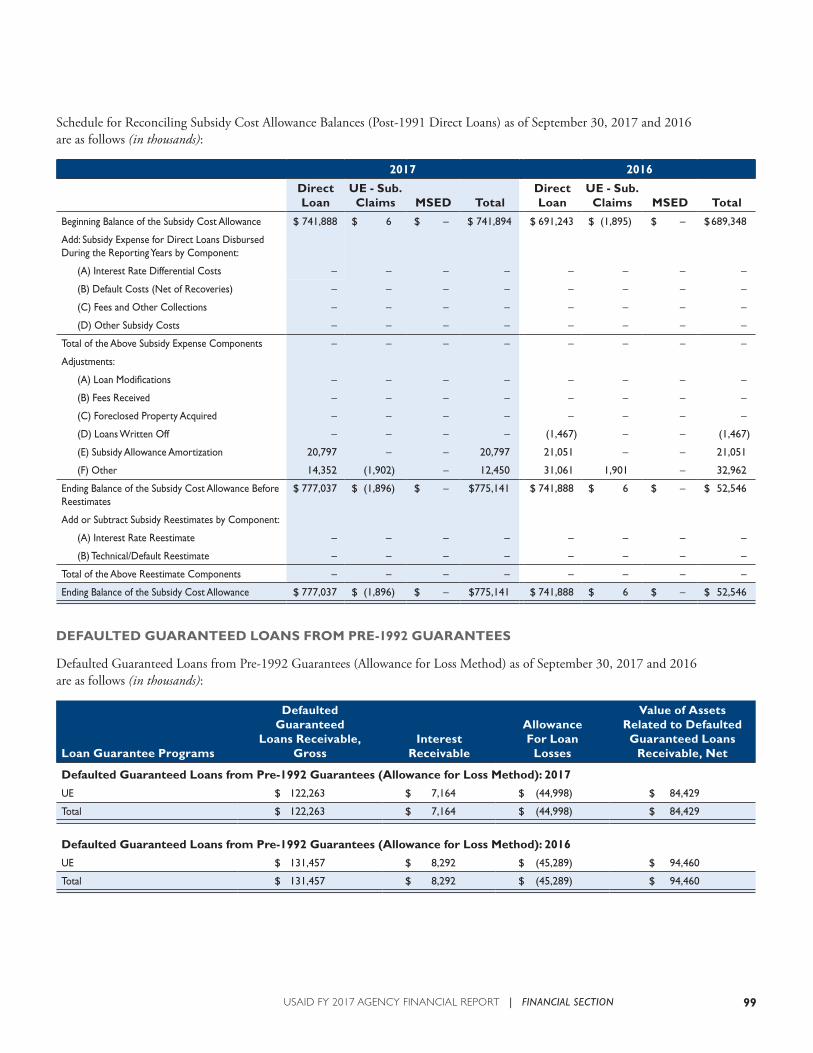
99USAID FY 2017 AGENCY FINANCIAL REPORT | FINANCIAL SECTION
Schedule for Reconciling Subsidy Cost Allowance Balances (Post-1991 Direct Loans) as of September 30, 2017 and 2016 are as follows (in thousands):
2017 2016
Direct Loan
UE - Sub. Claims MSED Total
Direct Loan
UE - Sub. Claims MSED Total
Beginning Balance of the Subsidy Cost Allowance $ 741,888 $ 6 $ – $ 741,894 $ 691,243 $ (1,895) $ – $ 689,348
Add: Subsidy Expense for Direct Loans Disbursed During the Reporting Years by Component:
(A) Interest Rate Differential Costs – – – – – – – –
(B) Default Costs (Net of Recoveries) – – – – – – – –
(C) Fees and Other Collections – – – – – – – –
(D) Other Subsidy Costs – – – – – – – –
Total of the Above Subsidy Expense Components – – – – – – – –
Adjustments:
(A) Loan Modifications – – – – – – – –
(B) Fees Received – – – – – – – –
(C) Foreclosed Property Acquired – – – – – – – –
(D) Loans Written Off – – – – (1,467) – – (1,467)
(E) Subsidy Allowance Amortization 20,797 – – 20,797 21,051 – – 21,051
(F) Other 14,352 (1,902) – 12,450 31,061 1,901 – 32,962
Ending Balance of the Subsidy Cost Allowance Before Reestimates
$ 777,037 $ (1,896) $ – $775,141 $ 741,888 $ 6 $ – $ 52,546
Add or Subtract Subsidy Reestimates by Component:
(A) Interest Rate Reestimate – – – – – – – –
(B) Technical/Default Reestimate – – – – – – – –
Total of the Above Reestimate Components – – – – – – – –
Ending Balance of the Subsidy Cost Allowance $ 777,037 $ (1,896) $ – $775,141 $ 741,888 $ 6 $ – $ 52,546
DEFAULTED GUARANTEED LOANS FROM PRE-1992 GUARANTEES
Defaulted Guaranteed Loans from Pre-1992 Guarantees (Allowance for Loss Method) as of September 30, 2017 and 2016 are as follows (in thousands):
Loan Guarantee Programs
Defaulted Guaranteed
Loans Receivable,Gross
InterestReceivable
AllowanceFor Loan
Losses
Value of Assets Related to DefaultedGuaranteed Loans
Receivable, Net
Defaulted Guaranteed Loans from Pre-1992 Guarantees (Allowance for Loss Method): 2017
UE $ 122,263 $ 7,164 $ (44,998) $ 84,429
Total $ 122,263 $ 7,164 $ (44,998) $ 84,429
Defaulted Guaranteed Loans from Pre-1992 Guarantees (Allowance for Loss Method): 2016
UE $ 131,457 $ 8,292 $ (45,289) $ 94,460
Total $ 131,457 $ 8,292 $ (45,289) $ 94,460
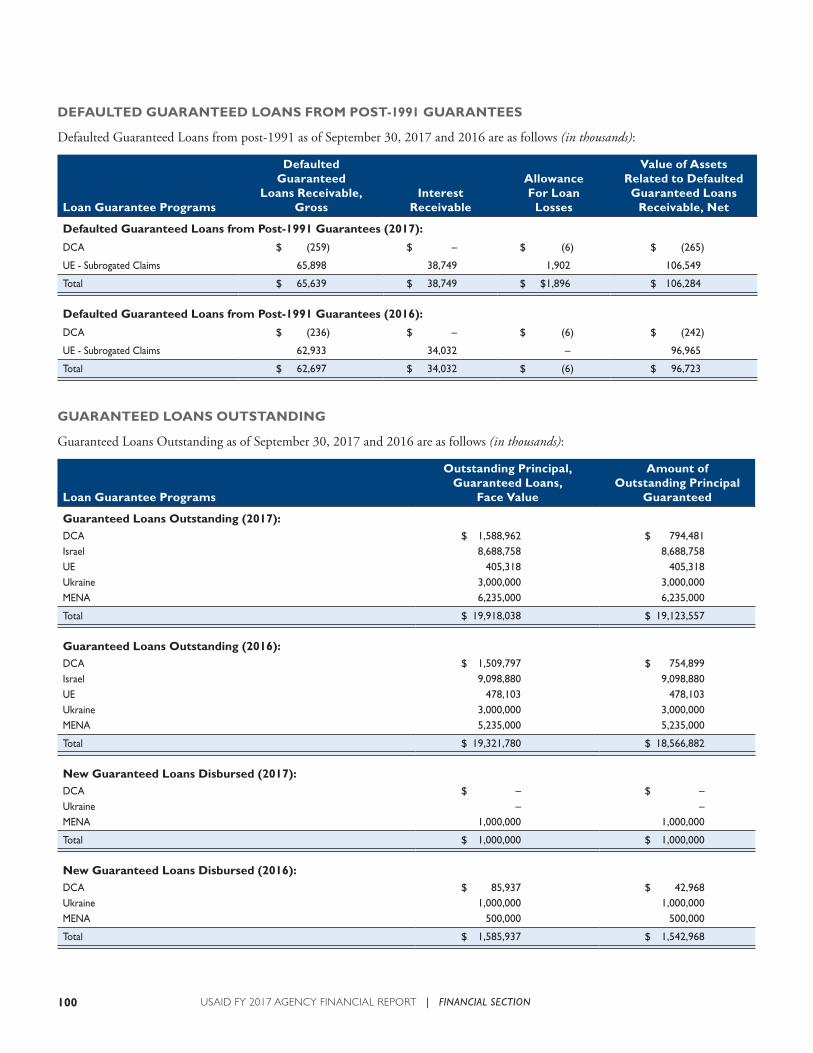
100 USAID FY 2017 AGENCY FINANCIAL REPORT | FINANCIAL SECTION
DEFAULTED GUARANTEED LOANS FROM POST-1991 GUARANTEES
Defaulted Guaranteed Loans from post-1991 as of September 30, 2017 and 2016 are as follows (in thousands):
Loan Guarantee Programs
Defaulted Guaranteed
Loans Receivable,Gross
InterestReceivable
AllowanceFor Loan
Losses
Value of Assets Related to DefaultedGuaranteed Loans
Receivable, Net
Defaulted Guaranteed Loans from Post-1991 Guarantees (2017):
DCA $ (259) $ – $ (6) $ (265)
UE - Subrogated Claims 65,898 38,749 1,902 106,549
Total $ 65,639 $ 38,749 $ $1,896 $ 106,284
Defaulted Guaranteed Loans from Post-1991 Guarantees (2016):
DCA $ (236) $ – $ (6) $ (242)
UE - Subrogated Claims 62,933 34,032 – 96,965
Total $ 62,697 $ 34,032 $ (6) $ 96,723
GUARANTEED LOANS OUTSTANDING
Guaranteed Loans Outstanding as of September 30, 2017 and 2016 are as follows (in thousands):
Loan Guarantee Programs
Outstanding Principal,Guaranteed Loans,
Face Value
Amount of Outstanding Principal
Guaranteed
Guaranteed Loans Outstanding (2017):DCA $ 1,588,962 $ 794,481 Israel 8,688,758 8,688,758 UE 405,318 405,318 Ukraine 3,000,000 3,000,000 MENA 6,235,000 6,235,000
Total $ 19,918,038 $ 19,123,557
Guaranteed Loans Outstanding (2016):DCA $ 1,509,797 $ 754,899 Israel 9,098,880 9,098,880 UE 478,103 478,103 Ukraine 3,000,000 3,000,000 MENA 5,235,000 5,235,000
Total $ 19,321,780 $ 18,566,882
New Guaranteed Loans Disbursed (2017):DCA $ – $ –Ukraine – –MENA 1,000,000 1,000,000
Total $ 1,000,000 $ 1,000,000
New Guaranteed Loans Disbursed (2016):DCA $ 85,937 $ 42,968Ukraine 1,000,000 1,000,000MENA 500,000 500,000
Total $ 1,585,937 $ 1,542,968
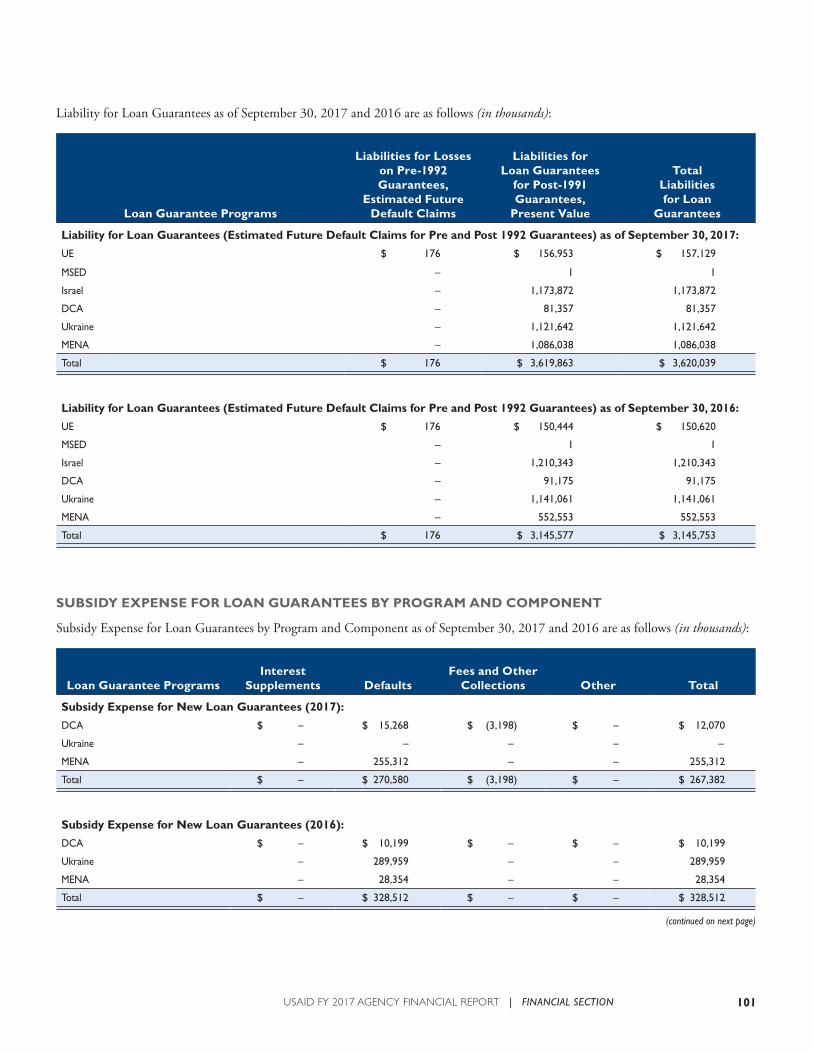
101USAID FY 2017 AGENCY FINANCIAL REPORT | FINANCIAL SECTION
Liability for Loan Guarantees as of September 30, 2017 and 2016 are as follows (in thousands):
Loan Guarantee Programs
Liabilities for Losses on Pre-1992Guarantees,
Estimated Future Default Claims
Liabilities for Loan Guarantees
for Post-1991Guarantees,
Present Value
Total Liabilitiesfor Loan
Guarantees
Liability for Loan Guarantees (Estimated Future Default Claims for Pre and Post 1992 Guarantees) as of September 30, 2017:
UE $ 176 $ 156,953 $ 157,129
MSED – 1 1
Israel – 1,173,872 1,173,872
DCA – 81,357 81,357
Ukraine – 1,121,642 1,121,642
MENA – 1,086,038 1,086,038
Total $ 176 $ 3,619,863 $ 3,620,039
Liability for Loan Guarantees (Estimated Future Default Claims for Pre and Post 1992 Guarantees) as of September 30, 2016:
UE $ 176 $ 150,444 $ 150,620
MSED – 1 1
Israel – 1,210,343 1,210,343
DCA – 91,175 91,175
Ukraine – 1,141,061 1,141,061
MENA – 552,553 552,553
Total $ 176 $ 3,145,577 $ 3,145,753
SUBSIDY EXPENSE FOR LOAN GUARANTEES BY PROGRAM AND COMPONENT
Subsidy Expense for Loan Guarantees by Program and Component as of September 30, 2017 and 2016 are as follows (in thousands):
Loan Guarantee ProgramsInterest
Supplements DefaultsFees and Other
Collections Other Total
Subsidy Expense for New Loan Guarantees (2017):
DCA $ – $ 15,268 $ (3,198) $ – $ 12,070
Ukraine – – – – –
MENA – 255,312 – – 255,312
Total $ – $ 270,580 $ (3,198) $ – $ 267,382
Subsidy Expense for New Loan Guarantees (2016):
DCA $ – $ 10,199 $ – $ – $ 10,199
Ukraine – 289,959 – – 289,959
MENA – 28,354 – – 28,354
Total $ – $ 328,512 $ – $ – $ 328,512
(continued on next page)
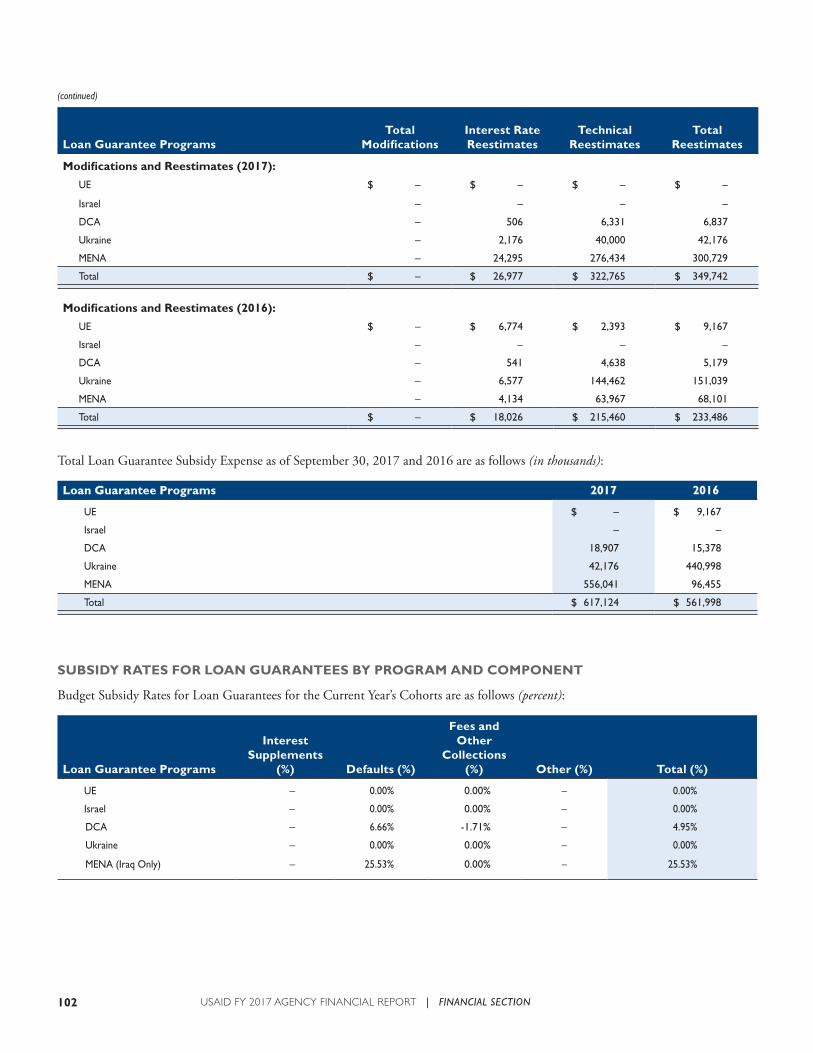
102 USAID FY 2017 AGENCY FINANCIAL REPORT | FINANCIAL SECTION
(continued)
Loan Guarantee ProgramsTotal
ModificationsInterest Rate Reestimates
Technical Reestimates
Total Reestimates
Modifications and Reestimates (2017):
UE $ – $ – $ – $ –
Israel – – – –
DCA – 506 6,331 6,837
Ukraine – 2,176 40,000 42,176
MENA – 24,295 276,434 300,729
Total $ – $ 26,977 $ 322,765 $ 349,742
Modifications and Reestimates (2016):
UE $ – $ 6,774 $ 2,393 $ 9,167
Israel – – – –
DCA – 541 4,638 5,179
Ukraine – 6,577 144,462 151,039
MENA – 4,134 63,967 68,101
Total $ – $ 18,026 $ 215,460 $ 233,486
Total Loan Guarantee Subsidy Expense as of September 30, 2017 and 2016 are as follows (in thousands):
Loan Guarantee Programs 2017 2016
UE $ – $ 9,167
Israel – –
DCA 18,907 15,378
Ukraine 42,176 440,998
MENA 556,041 96,455
Total $ 617,124 $ 561,998
SUBSIDY RATES FOR LOAN GUARANTEES BY PROGRAM AND COMPONENT
Budget Subsidy Rates for Loan Guarantees for the Current Year’s Cohorts are as follows (percent):
Loan Guarantee Programs
Interest Supplements
(%) Defaults (%)
Fees and Other
Collections (%) Other (%) Total (%)
UE – 0.00% 0.00% – 0.00%
Israel – 0.00% 0.00% – 0.00%
DCA – 6.66% -1.71% – 4.95%
Ukraine – 0.00% 0.00% – 0.00%
MENA (Iraq Only) – 25.53% 0.00% – 25.53%
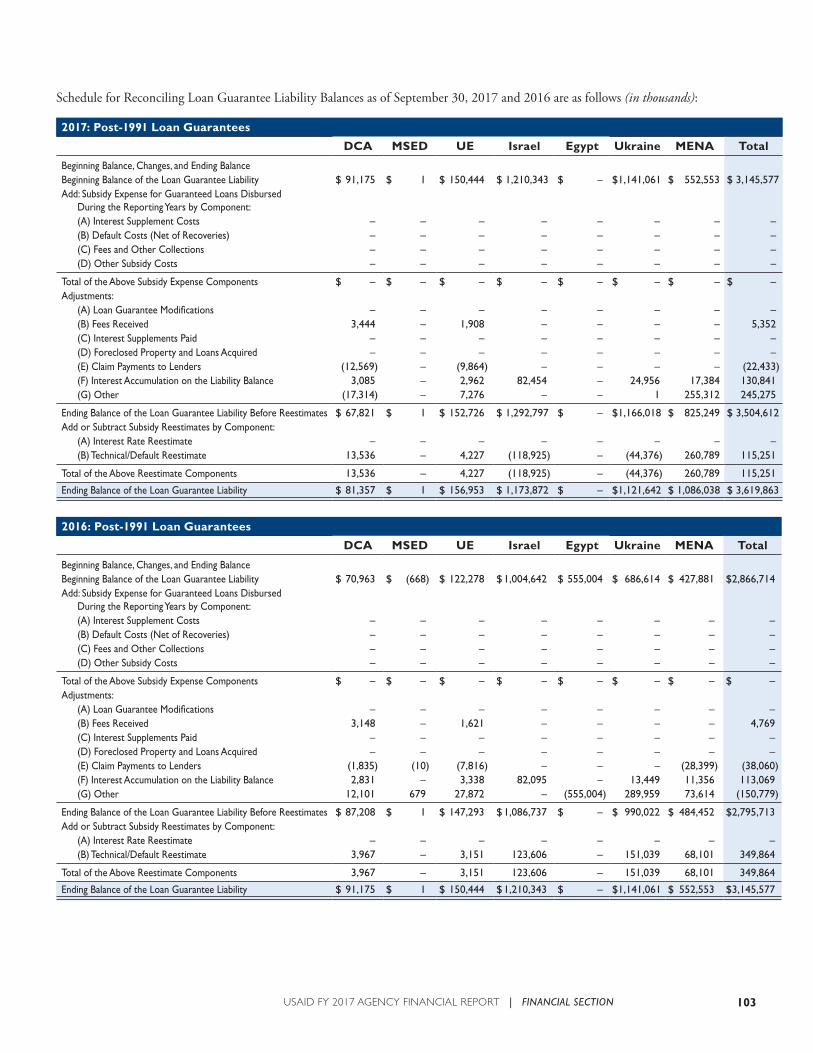
103USAID FY 2017 AGENCY FINANCIAL REPORT | FINANCIAL SECTION
Schedule for Reconciling Loan Guarantee Liability Balances as of September 30, 2017 and 2016 are as follows (in thousands):
2017: Post-1991 Loan Guarantees
DCA MSED UE Israel Egypt Ukraine MENA Total
Beginning Balance, Changes, and Ending BalanceBeginning Balance of the Loan Guarantee Liability $ 91,175 $ 1 $ 150,444 $ 1,210,343 $ – $ 1,141,061 $ 552,553 $ 3,145,577 Add: Subsidy Expense for Guaranteed Loans Disbursed
During the Reporting Years by Component: (A) Interest Supplement Costs – – – – – – – – (B) Default Costs (Net of Recoveries) – – – – – – – – (C) Fees and Other Collections – – – – – – – – (D) Other Subsidy Costs – – – – – – – –
Total of the Above Subsidy Expense Components $ – $ – $ – $ – $ – $ – $ – $ –Adjustments: (A) Loan Guarantee Modifications – – – – – – – – (B) Fees Received 3,444 – 1,908 – – – – 5,352 (C) Interest Supplements Paid – – – – – – – – (D) Foreclosed Property and Loans Acquired – – – – – – – – (E) Claim Payments to Lenders (12,569) – (9,864) – – – – (22,433) (F) Interest Accumulation on the Liability Balance 3,085 – 2,962 82,454 – 24,956 17,384 130,841 (G) Other (17,314) – 7,276 – – 1 255,312 245,275
Ending Balance of the Loan Guarantee Liability Before Reestimates $ 67,821 $ 1 $ 152,726 $ 1,292,797 $ – $ 1,166,018 $ 825,249 $ 3,504,612 Add or Subtract Subsidy Reestimates by Component: (A) Interest Rate Reestimate – – – – – – – – (B) Technical/Default Reestimate 13,536 – 4,227 (118,925) – (44,376) 260,789 115,251
Total of the Above Reestimate Components 13,536 – 4,227 (118,925) – (44,376) 260,789 115,251
Ending Balance of the Loan Guarantee Liability $ 81,357 $ 1 $ 156,953 $ 1,173,872 $ – $ 1,121,642 $ 1,086,038 $ 3,619,863
2016: Post-1991 Loan Guarantees
DCA MSED UE Israel Egypt Ukraine MENA Total
Beginning Balance, Changes, and Ending BalanceBeginning Balance of the Loan Guarantee Liability $ 70,963 $ (668) $ 122,278 $ 1,004,642 $ 555,004 $ 686,614 $ 427,881 $ 2,866,714Add: Subsidy Expense for Guaranteed Loans Disbursed
During the Reporting Years by Component: (A) Interest Supplement Costs – – – – – – – – (B) Default Costs (Net of Recoveries) – – – – – – – – (C) Fees and Other Collections – – – – – – – – (D) Other Subsidy Costs – – – – – – – –
Total of the Above Subsidy Expense Components $ – $ – $ – $ – $ – $ – $ – $ –Adjustments: (A) Loan Guarantee Modifications – – – – – – – – (B) Fees Received 3,148 – 1,621 – – – – 4,769 (C) Interest Supplements Paid – – – – – – – – (D) Foreclosed Property and Loans Acquired – – – – – – – – (E) Claim Payments to Lenders (1,835) (10) (7,816) – – – (28,399) (38,060) (F) Interest Accumulation on the Liability Balance 2,831 – 3,338 82,095 – 13,449 11,356 113,069 (G) Other 12,101 679 27,872 – (555,004) 289,959 73,614 (150,779)
Ending Balance of the Loan Guarantee Liability Before Reestimates $ 87,208 $ 1 $ 147,293 $ 1,086,737 $ – $ 990,022 $ 484,452 $2,795,713Add or Subtract Subsidy Reestimates by Component: (A) Interest Rate Reestimate – – – – – – – – (B) Technical/Default Reestimate 3,967 – 3,151 123,606 – 151,039 68,101 349,864
Total of the Above Reestimate Components 3,967 – 3,151 123,606 – 151,039 68,101 349,864
Ending Balance of the Loan Guarantee Liability $ 91,175 $ 1 $ 150,444 $ 1,210,343 $ – $ 1,141,061 $ 552,553 $ 3,145,577
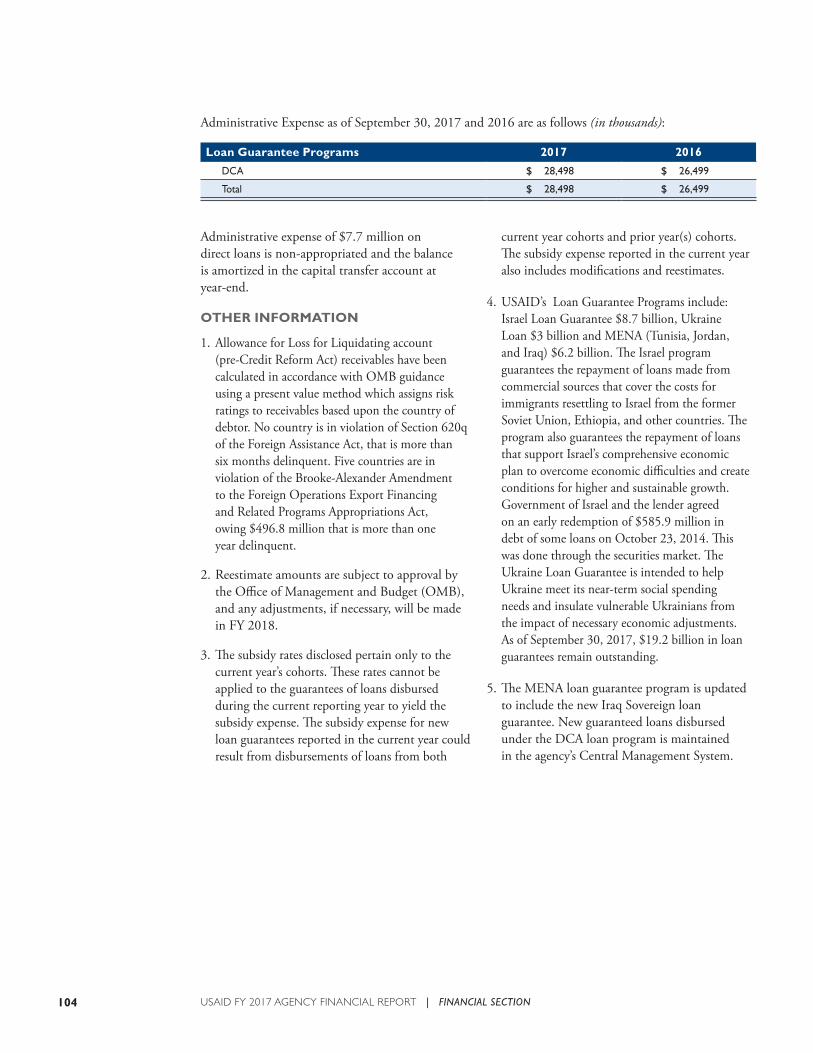
104 USAID FY 2017 AGENCY FINANCIAL REPORT | FINANCIAL SECTION
Administrative Expense as of September 30, 2017 and 2016 are as follows (in thousands):
Loan Guarantee Programs 2017 2016
DCA $ 28,498 $ 26,499
Total $ 28,498 $ 26,499
Administrative expense of $7.7 million on direct loans is non-appropriated and the balance is amortized in the capital transfer account at year-end.
OTHER INFORMATION
1. Allowance for Loss for Liquidating account (pre-Credit Reform Act) receivables have been calculated in accordance with OMB guidance using a present value method which assigns risk ratings to receivables based upon the country of debtor. No country is in violation of Section 620q of the Foreign Assistance Act, that is more than six months delinquent. Five countries are in violation of the Brooke-Alexander Amendment to the Foreign Operations Export Financing and Related Programs Appropriations Act, owing $496.8 million that is more than one year delinquent.
2. Reestimate amounts are subject to approval by the Office of Management and Budget (OMB), and any adjustments, if necessary, will be made in FY 2018.
3. The subsidy rates disclosed pertain only to the current year’s cohorts. These rates cannot be applied to the guarantees of loans disbursed during the current reporting year to yield the subsidy expense. The subsidy expense for new loan guarantees reported in the current year could result from disbursements of loans from both
current year cohorts and prior year(s) cohorts. The subsidy expense reported in the current year also includes modifications and reestimates.
4. USAID’s Loan Guarantee Programs include: Israel Loan Guarantee $8.7 billion, Ukraine Loan $3 billion and MENA (Tunisia, Jordan, and Iraq) $6.2 billion. The Israel program guarantees the repayment of loans made from commercial sources that cover the costs for immigrants resettling to Israel from the former Soviet Union, Ethiopia, and other countries. The program also guarantees the repayment of loans that support Israel’s comprehensive economic plan to overcome economic difficulties and create conditions for higher and sustainable growth. Government of Israel and the lender agreed on an early redemption of $585.9 million in debt of some loans on October 23, 2014. This was done through the securities market. The Ukraine Loan Guarantee is intended to help Ukraine meet its near-term social spending needs and insulate vulnerable Ukrainians from the impact of necessary economic adjustments. As of September 30, 2017, $19.2 billion in loan guarantees remain outstanding.
5. The MENA loan guarantee program is updated to include the new Iraq Sovereign loan guarantee. New guaranteed loans disbursed under the DCA loan program is maintained in the agency’s Central Management System.
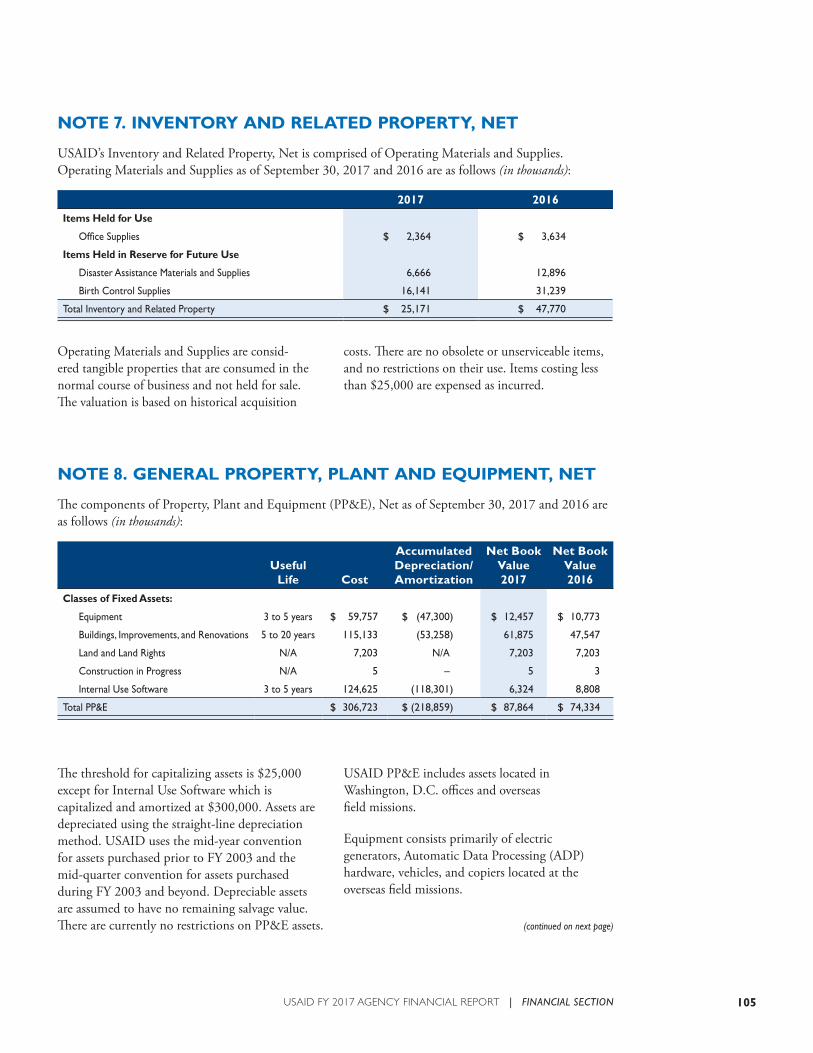
105USAID FY 2017 AGENCY FINANCIAL REPORT | FINANCIAL SECTION
NOTE 7. INVENTORY AND RELATED PROPERTY, NET
USAID’s Inventory and Related Property, Net is comprised of Operating Materials and Supplies. Operating Materials and Supplies as of September 30, 2017 and 2016 are as follows (in thousands):
2017 2016
Items Held for Use
Office Supplies $ 2,364 $ 3,634
Items Held in Reserve for Future Use
Disaster Assistance Materials and Supplies 6,666 12,896
Birth Control Supplies 16,141 31,239
Total Inventory and Related Property $ 25,171 $ 47,770
Operating Materials and Supplies are consid-ered tangible properties that are consumed in the normal course of business and not held for sale. The valuation is based on historical acquisition
costs. There are no obsolete or unserviceable items, and no restrictions on their use. Items costing less than $25,000 are expensed as incurred.
NOTE 8. GENERAL PROPERTY, PLANT AND EQUIPMENT, NET
The components of Property, Plant and Equipment (PP&E), Net as of September 30, 2017 and 2016 are as follows (in thousands):
Useful Life Cost
Accumulated Depreciation/ Amortization
Net BookValue2017
Net Book Value2016
Classes of Fixed Assets:
Equipment 3 to 5 years $ 59,757 $ (47,300) $ 12,457 $ 10,773
Buildings, Improvements, and Renovations 5 to 20 years 115,133 (53,258) 61,875 47,547
Land and Land Rights N/A 7,203 N/A 7,203 7,203
Construction in Progress N/A 5 – 5 3
Internal Use Software 3 to 5 years 124,625 (118,301) 6,324 8,808
Total PP&E $ 306,723 $ (218,859) $ 87,864 $ 74,334
The threshold for capitalizing assets is $25,000 except for Internal Use Software which is capitalized and amortized at $300,000. Assets are depreciated using the straight-line depreciation method. USAID uses the mid-year convention for assets purchased prior to FY 2003 and the mid-quarter convention for assets purchased during FY 2003 and beyond. Depreciable assets are assumed to have no remaining salvage value. There are currently no restrictions on PP&E assets.
USAID PP&E includes assets located in Washington, D.C. offices and overseas field missions.
Equipment consists primarily of electric generators, Automatic Data Processing (ADP) hardware, vehicles, and copiers located at the overseas field missions.
(continued on next page)
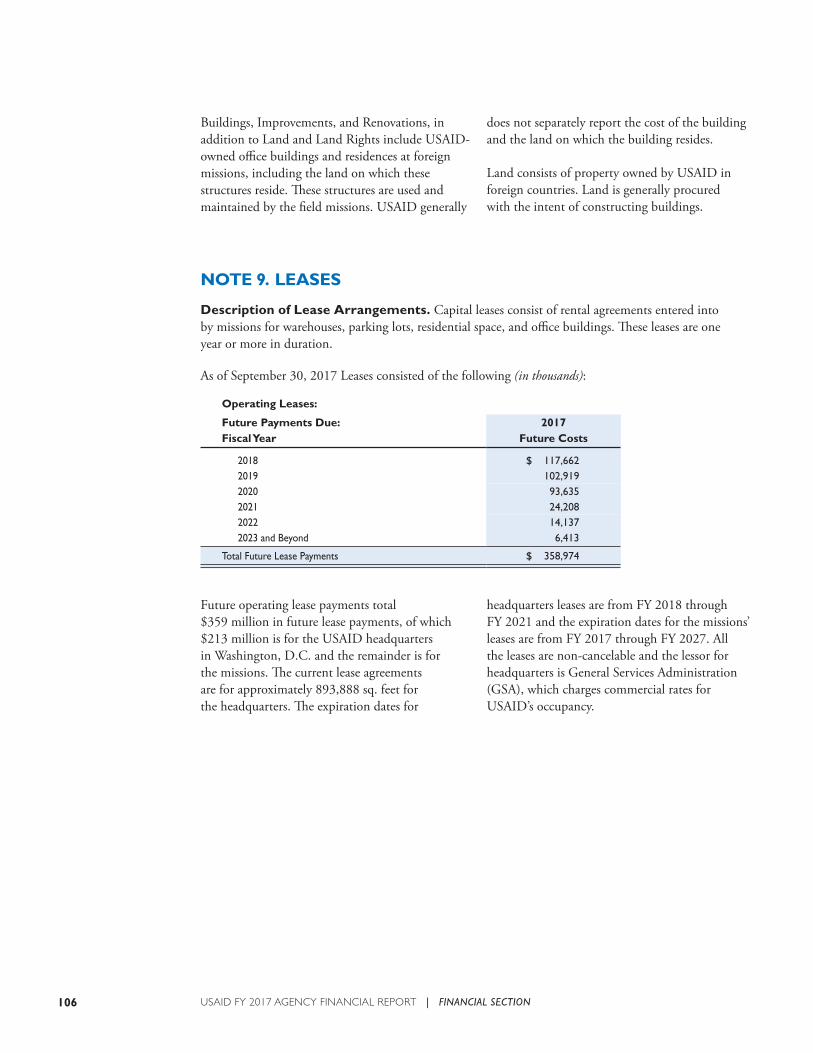
106 USAID FY 2017 AGENCY FINANCIAL REPORT | FINANCIAL SECTION
NOTE 9. LEASES
Description of Lease Arrangements. Capital leases consist of rental agreements entered into by missions for warehouses, parking lots, residential space, and office buildings. These leases are one year or more in duration.
As of September 30, 2017 Leases consisted of the following (in thousands):
Operating Leases:
Future Payments Due: 2017 Fiscal Year Future Costs
2018 $ 117,6622019 102,9192020 93,635 2021 24,208 2022 14,137 2023 and Beyond 6,413
Total Future Lease Payments $ 358,974
Future operating lease payments total $359 million in future lease payments, of which $213 million is for the USAID headquarters in Washington, D.C. and the remainder is for the missions. The current lease agreements are for approximately 893,888 sq. feet for the headquarters. The expiration dates for
headquarters leases are from FY 2018 through FY 2021 and the expiration dates for the missions’ leases are from FY 2017 through FY 2027. All the leases are non-cancelable and the lessor for headquarters is General Services Administration (GSA), which charges commercial rates for USAID’s occupancy.
Buildings, Improvements, and Renovations, in addition to Land and Land Rights include USAID-owned office buildings and residences at foreign missions, including the land on which these structures reside. These structures are used and maintained by the field missions. USAID generally
does not separately report the cost of the building and the land on which the building resides.
Land consists of property owned by USAID in foreign countries. Land is generally procured with the intent of constructing buildings.
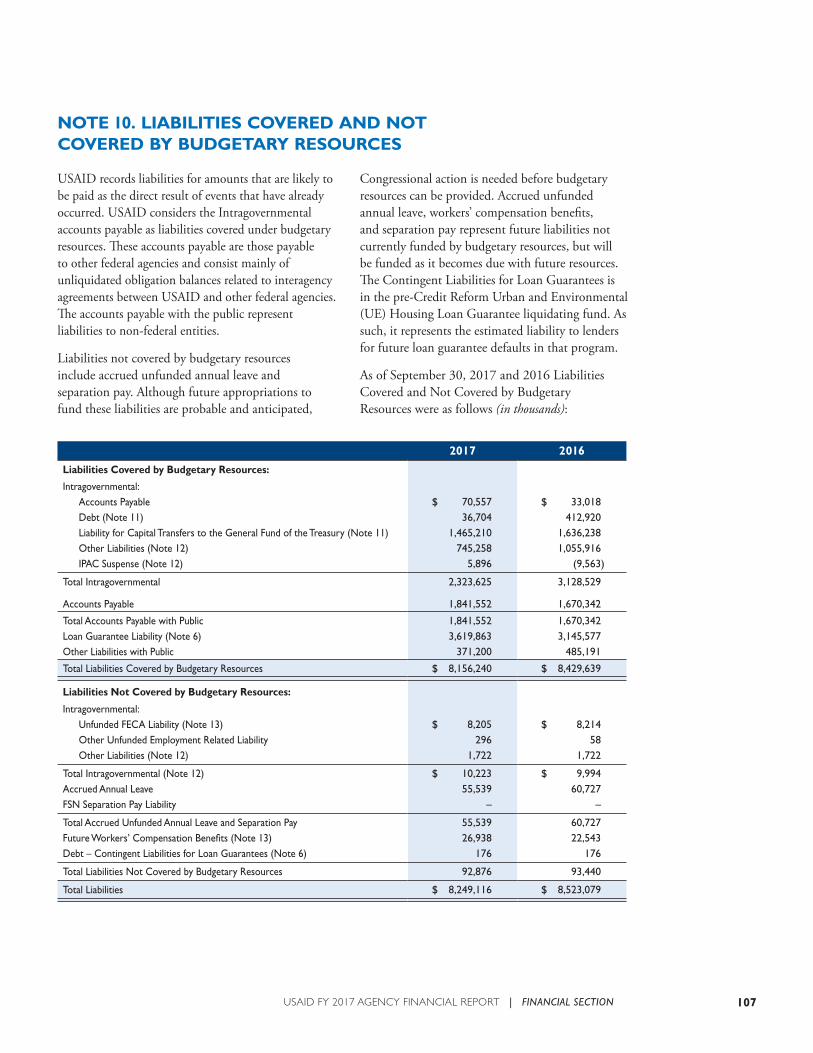
107USAID FY 2017 AGENCY FINANCIAL REPORT | FINANCIAL SECTION
USAID records liabilities for amounts that are likely to be paid as the direct result of events that have already occurred. USAID considers the Intragovernmental accounts payable as liabilities covered under budgetary resources. These accounts payable are those payable to other federal agencies and consist mainly of unliquidated obligation balances related to interagency agreements between USAID and other federal agencies. The accounts payable with the public represent liabilities to non-federal entities.
Liabilities not covered by budgetary resources include accrued unfunded annual leave and separation pay. Although future appropriations to fund these liabilities are probable and anticipated,
Congressional action is needed before budgetary resources can be provided. Accrued unfunded annual leave, workers’ compensation benefits, and separation pay represent future liabilities not currently funded by budgetary resources, but will be funded as it becomes due with future resources. The Contingent Liabilities for Loan Guarantees is in the pre-Credit Reform Urban and Environmental (UE) Housing Loan Guarantee liquidating fund. As such, it represents the estimated liability to lenders for future loan guarantee defaults in that program.
As of September 30, 2017 and 2016 Liabilities Covered and Not Covered by Budgetary Resources were as follows (in thousands):
2017 2016
Liabilities Covered by Budgetary Resources:
Intragovernmental: Accounts Payable $ 70,557 $ 33,018 Debt (Note 11) 36,704 412,920 Liability for Capital Transfers to the General Fund of the Treasury (Note 11) 1,465,210 1,636,238 Other Liabilities (Note 12) 745,258 1,055,916 IPAC Suspense (Note 12) 5,896 (9,563)
Total Intragovernmental 2,323,625 3,128,529
Accounts Payable 1,841,552 1,670,342
Total Accounts Payable with Public 1,841,552 1,670,342Loan Guarantee Liability (Note 6) 3,619,863 3,145,577Other Liabilities with Public 371,200 485,191
Total Liabilities Covered by Budgetary Resources $ 8,156,240 $ 8,429,639
Liabilities Not Covered by Budgetary Resources:
Intragovernmental:Unfunded FECA Liability (Note 13) $ 8,205 $ 8,214Other Unfunded Employment Related Liability 296 58Other Liabilities (Note 12) 1,722 1,722
Total Intragovernmental (Note 12) $ 10,223 $ 9,994Accrued Annual Leave 55,539 60,727FSN Separation Pay Liability – –
Total Accrued Unfunded Annual Leave and Separation Pay 55,539 60,727Future Workers’ Compensation Benefits (Note 13) 26,938 22,543Debt – Contingent Liabilities for Loan Guarantees (Note 6) 176 176
Total Liabilities Not Covered by Budgetary Resources 92,876 93,440
Total Liabilities $ 8,249,116 $ 8,523,079
NOTE 10. LIABILITIES COVERED AND NOT COVERED BY BUDGETARY RESOURCES
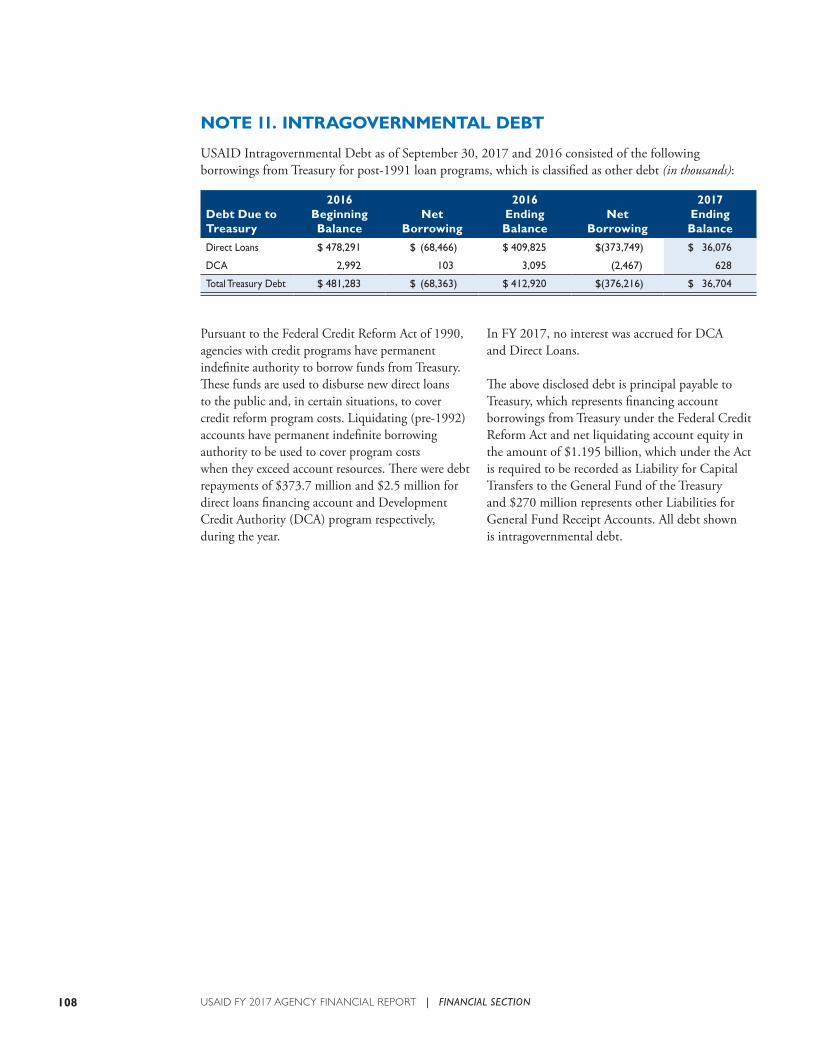
108 USAID FY 2017 AGENCY FINANCIAL REPORT | FINANCIAL SECTION
NOTE 11. INTRAGOVERNMENTAL DEBT
USAID Intragovernmental Debt as of September 30, 2017 and 2016 consisted of the following borrowings from Treasury for post-1991 loan programs, which is classified as other debt (in thousands):
Debt Due to Treasury
2016 Beginning Balance
NetBorrowing
2016 EndingBalance
NetBorrowing
2017 EndingBalance
Direct Loans $ 478,291 $ (68,466) $ 409,825 $ (373,749) $ 36,076
DCA 2,992 103 3,095 (2,467) 628
Total Treasury Debt $ 481,283 $ (68,363) $ 412,920 $ (376,216) $ 36,704
Pursuant to the Federal Credit Reform Act of 1990, agencies with credit programs have permanent indefinite authority to borrow funds from Treasury. These funds are used to disburse new direct loans to the public and, in certain situations, to cover credit reform program costs. Liquidating (pre-1992) accounts have permanent indefinite borrowing authority to be used to cover program costs when they exceed account resources. There were debt repayments of $373.7 million and $2.5 million for direct loans financing account and Development Credit Authority (DCA) program respectively, during the year.
In FY 2017, no interest was accrued for DCA and Direct Loans.
The above disclosed debt is principal payable to Treasury, which represents financing account borrowings from Treasury under the Federal Credit Reform Act and net liquidating account equity in the amount of $1.195 billion, which under the Act is required to be recorded as Liability for Capital Transfers to the General Fund of the Treasury and $270 million represents other Liabilities for General Fund Receipt Accounts. All debt shown is intragovernmental debt.
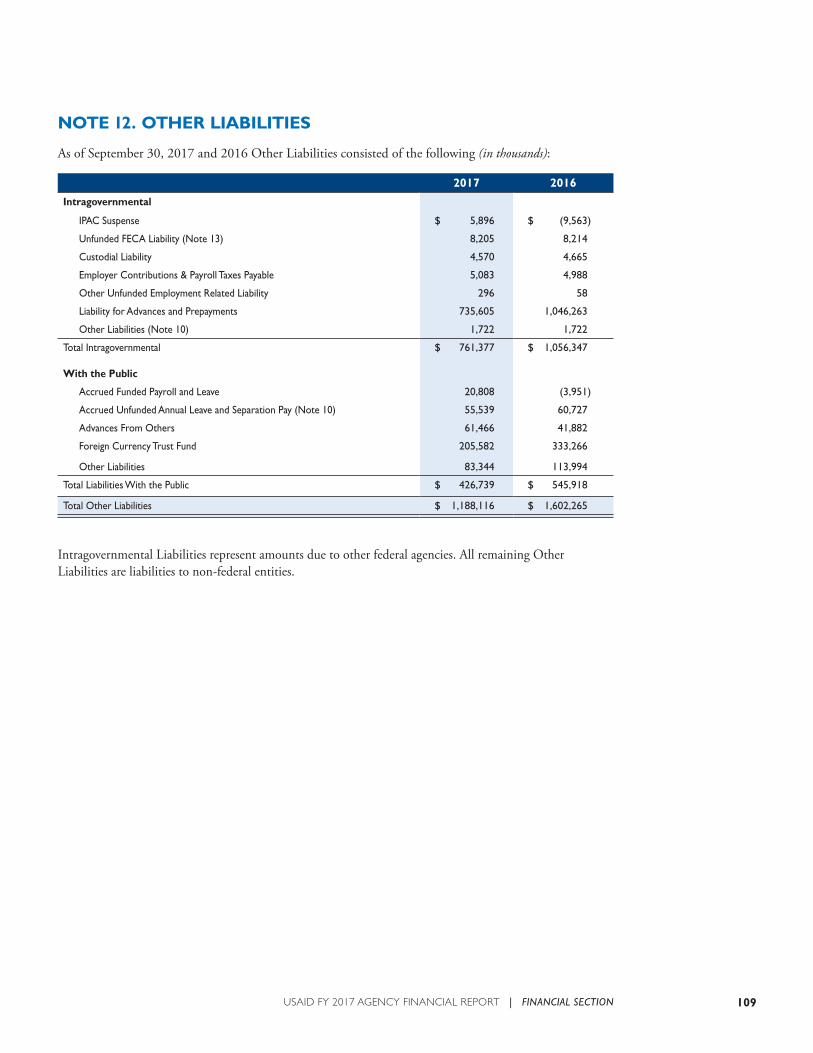
109USAID FY 2017 AGENCY FINANCIAL REPORT | FINANCIAL SECTION
NOTE 12. OTHER LIABILITIES
As of September 30, 2017 and 2016 Other Liabilities consisted of the following (in thousands):
2017 2016
Intragovernmental
IPAC Suspense $ 5,896 $ (9,563)
Unfunded FECA Liability (Note 13) 8,205 8,214
Custodial Liability 4,570 4,665
Employer Contributions & Payroll Taxes Payable 5,083 4,988
Other Unfunded Employment Related Liability 296 58
Liability for Advances and Prepayments 735,605 1,046,263
Other Liabilities (Note 10) 1,722 1,722
Total Intragovernmental $ 761,377 $ 1,056,347
With the Public
Accrued Funded Payroll and Leave 20,808 (3,951)
Accrued Unfunded Annual Leave and Separation Pay (Note 10) 55,539 60,727
Advances From Others 61,466 41,882
Foreign Currency Trust Fund 205,582 333,266
Other Liabilities 83,344 113,994
Total Liabilities With the Public $ 426,739 $ 545,918
Total Other Liabilities $ 1,188,116 $ 1,602,265
Intragovernmental Liabilities represent amounts due to other federal agencies. All remaining Other Liabilities are liabilities to non-federal entities.
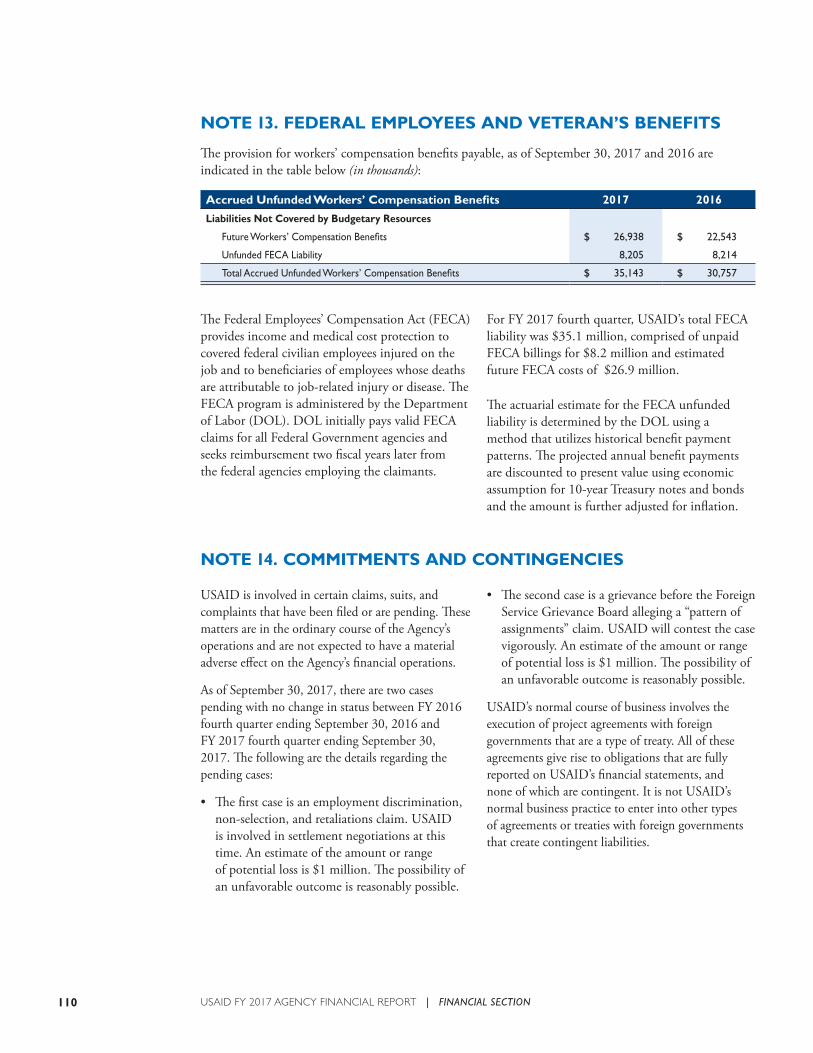
110 USAID FY 2017 AGENCY FINANCIAL REPORT | FINANCIAL SECTION
NOTE 13. FEDERAL EMPLOYEES AND VETERAN’S BENEFITS
The provision for workers’ compensation benefits payable, as of September 30, 2017 and 2016 are indicated in the table below (in thousands):
Accrued Unfunded Workers’ Compensation Benefits 2017 2016
Liabilities Not Covered by Budgetary Resources
Future Workers’ Compensation Benefits $ 26,938 $ 22,543
Unfunded FECA Liability 8,205 8,214
Total Accrued Unfunded Workers’ Compensation Benefits $ 35,143 $ 30,757
NOTE 14. COMMITMENTS AND CONTINGENCIES
The Federal Employees’ Compensation Act (FECA) provides income and medical cost protection to covered federal civilian employees injured on the job and to beneficiaries of employees whose deaths are attributable to job-related injury or disease. The FECA program is administered by the Department of Labor (DOL). DOL initially pays valid FECA claims for all Federal Government agencies and seeks reimbursement two fiscal years later from the federal agencies employing the claimants.
• The second case is a grievance before the Foreign Service Grievance Board alleging a “pattern of assignments” claim. USAID will contest the case vigorously. An estimate of the amount or range of potential loss is $1 million. The possibility of an unfavorable outcome is reasonably possible.
USAID’s normal course of business involves the execution of project agreements with foreign governments that are a type of treaty. All of these agreements give rise to obligations that are fully reported on USAID’s financial statements, and none of which are contingent. It is not USAID’s normal business practice to enter into other types of agreements or treaties with foreign governments that create contingent liabilities.
USAID is involved in certain claims, suits, and complaints that have been filed or are pending. These matters are in the ordinary course of the Agency’s operations and are not expected to have a material adverse effect on the Agency’s financial operations.
As of September 30, 2017, there are two cases pending with no change in status between FY 2016 fourth quarter ending September 30, 2016 and FY 2017 fourth quarter ending September 30, 2017. The following are the details regarding the pending cases:
• The first case is an employment discrimination, non-selection, and retaliations claim. USAID is involved in settlement negotiations at this time. An estimate of the amount or range of potential loss is $1 million. The possibility of an unfavorable outcome is reasonably possible.
For FY 2017 fourth quarter, USAID’s total FECA liability was $35.1 million, comprised of unpaid FECA billings for $8.2 million and estimated future FECA costs of $26.9 million.
The actuarial estimate for the FECA unfunded liability is determined by the DOL using a method that utilizes historical benefit payment patterns. The projected annual benefit payments are discounted to present value using economic assumption for 10-year Treasury notes and bonds and the amount is further adjusted for inflation.
111USAID FY 2017 AGENCY FINANCIAL REPORT | FINANCIAL SECTION
NOTE 15. SCHEDULE OF COSTS AND EARNED REVENUE
The Consolidated Statement of Net Cost reports the Agency’s gross costs less earned revenues to arrive at net cost of operations by Program Categories and Responsibility Segments, as of September 30, 2017. These categories are consistent with the new State-USAID Standardized Program Structure and Definition (SPSD).
The format of the Consolidated Statement of Net Cost is also consistent with OMB Circular A-136 guidance.
Note 15 shows the value of exchange transactions between USAID and other federal entities as well as non-federal entities. These are also categorized within the Agency by Program Categories, Responsibility Segments and Program Areas are defined in Note 16.
Intragovernmental Costs and Earned Revenue sources relate to transactions between USAID and other federal entities. Public costs and earned revenues on the other hand relate to transactions between USAID and non-federal entities. Program Costs and Earned Revenue by Responsibility Segment for the years ended September 30, 2017 and 2016 are indicated in the table on the following pages (in thousands):
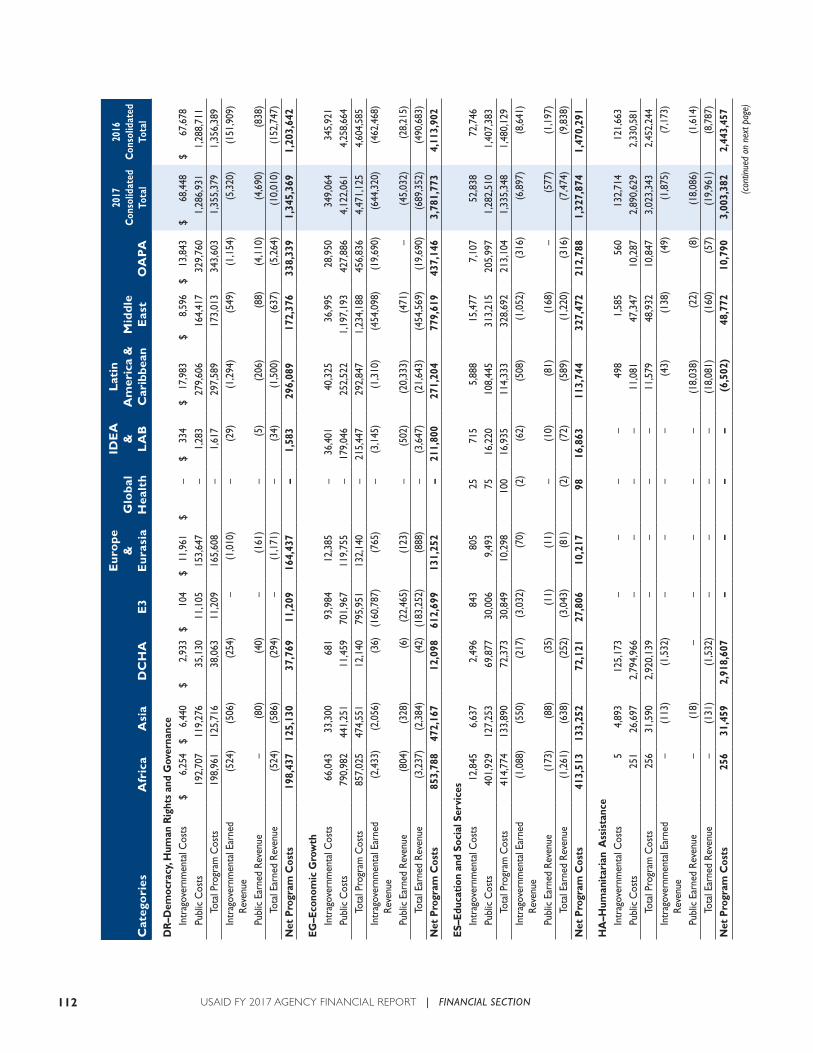
112 USAID FY 2017 AGENCY FINANCIAL REPORT | FINANCIAL SECTION
Cat
ego
ries
Afr
ica
Asi
a D
CH
AE
3
Eu
rop
e &
E
ura
sia
Glo
bal
Hea
lth
IDE
A
&
LA
B
Lat
in
Am
eric
a &
Car
ibbe
anM
idd
le
Eas
tO
AP
A
2017
C
onso
lidat
edTo
tal
2016
C
onso
lidat
edTo
tal
DR
–Dem
ocra
cy, H
uman
Rig
hts
and
Gov
erna
nce
Intr
agov
ernm
enta
l Cos
ts$
6,25
4$
6,44
0$
2,93
3$
104
$ 11
,961
$ –
$ 33
4$
17,9
83$
8,59
6$
13,8
43$
68,4
48$
67,6
78
Publ
ic C
osts
192,
707
119,
276
35,1
3011
,105
153,
647
–
1,28
327
9,60
616
4,41
732
9,76
01,
286,
931
1,28
8,71
1To
tal P
rogr
am C
osts
198,
961
125,
716
38,0
6311
,209
165,
608
–
1,61
729
7,58
917
3,01
334
3,60
31,
355,
379
1,35
6,38
9In
trag
over
nmen
tal E
arne
d Re
venu
e
(524
)
(506
)
(254
)
–
(1,0
10)
–
(2
9)
(1,2
94)
(5
49)
(1
,154
)
(5,3
20)
(1
51,9
09)
Publ
ic E
arne
d Re
venu
e
–
(80)
(4
0)
–
(161
)
–
(5)
(2
06)
(8
8)
(4,1
10)
(4
,690
)
(838
)To
tal E
arne
d Re
venu
e
(524
)
(586
)
(294
)
–
(1,1
71)
–
(3
4)
(1,5
00)
(6
37)
(5
,264
)
(10,
010)
(1
52,7
47)
Net
Pro
gram
Cos
ts19
8,43
712
5,13
037
,769
11,2
0916
4,43
7
–1,
583
296,
089
172,
376
338,
339
1,34
5,36
91,
203,
642
EG–E
cono
mic
Gro
wth
Intr
agov
ernm
enta
l Cos
ts66
,043
33,3
0068
193
,984
12,3
85
–36
,401
40,3
2536
,995
28,9
5034
9,06
434
5,92
1
Publ
ic C
osts
790,
982
441,
251
11,4
5970
1,96
711
9,75
5
–17
9,04
625
2,52
21,
197,
193
427,
886
4,12
2,06
14,
258,
664
Tota
l Pro
gram
Cos
ts85
7,02
547
4,55
112
,140
795,
951
132,
140
–
215,
447
292,
847
1,23
4,18
845
6,83
64,
471,
125
4,60
4,58
5
Intr
agov
ernm
enta
l Ear
ned
Reve
nue
(2
,433
)
(2,0
56)
(3
6) (
160,
787)
(7
65)
–
(3
,145
)
(1,3
10)
(4
54,0
98)
(1
9,69
0)
(644
,320
)
(462
,468
)
Publ
ic E
arne
d Re
venu
e
(804
)
(328
)
(6)
(2
2,46
5)
(123
)
–
(502
)
(20,
333)
(4
71)
–
(4
5,03
2)
(28,
215)
Tota
l Ear
ned
Reve
nue
(3
,237
)
(2,3
84)
(4
2) (
183,
252)
(8
88)
–
(3
,647
)
(21,
643)
(4
54,5
69)
(1
9,69
0)
(689
,352
)
(490
,683
)
Net
Pro
gram
Cos
ts85
3,78
847
2,16
712
,098
612,
699
131,
252
–
211,
800
271,
204
779,
619
437,
146
3,78
1,77
34,
113,
902
ES–E
duca
tion
and
Soc
ial S
ervi
ces
Intr
agov
ernm
enta
l Cos
ts12
,845
6,63
72,
496
843
805
2571
55,
888
15,4
777,
107
52,8
3872
,746
Publ
ic C
osts
401,
929
127,
253
69,8
7730
,006
9,49
375
16,2
2010
8,44
531
3,21
520
5,99
71,
282,
510
1,40
7,38
3To
tal P
rogr
am C
osts
414,
774
133,
890
72,3
7330
,849
10,2
9810
016
,935
114,
333
328,
692
213,
104
1,33
5,34
81,
480,
129
Intr
agov
ernm
enta
l Ear
ned
Reve
nue
(1
,088
)
(550
)
(217
)
(3,0
32)
(7
0)
(2)
(6
2)
(508
)
(1,0
52)
(3
16)
(6
,897
)
(8,6
41)
Publ
ic E
arne
d Re
venu
e
(173
)
(88)
(3
5)
(11)
(1
1)
–
(10)
(8
1)
(168
)
–
(577
)
(1,1
97)
Tota
l Ear
ned
Reve
nue
(1
,261
)
(638
)
(252
)
(3,0
43)
(8
1)
(2)
(7
2)
(589
)
(1,2
20)
(3
16)
(7
,474
)
(9,8
38)
Net
Pro
gram
Cos
ts41
3,51
313
3,25
272
,121
27,8
0610
,217
9816
,863
113,
744
327,
472
212,
788
1,32
7,87
41,
470,
291
HA
–Hum
anit
aria
n A
ssis
tanc
eIn
trag
over
nmen
tal C
osts
54,
893
125,
173
–
–
–
–
498
1,58
556
013
2,71
412
1,66
3
Publ
ic C
osts
251
26,6
972,
794,
966
–
–
–
–
11,0
8147
,347
10,2
872,
890,
629
2,33
0,58
1
Tota
l Pro
gram
Cos
ts25
631
,590
2,92
0,13
9
–
–
–
–11
,579
48,9
3210
,847
3,02
3,34
32,
452,
244
Intr
agov
ernm
enta
l Ear
ned
Reve
nue
–
(1
13)
(1
,532
)
–
–
–
–
(43)
(1
38)
(4
9)
(1,8
75)
(7
,173
)
Publ
ic E
arne
d Re
venu
e
–
(18)
–
–
–
–
–
(1
8,03
8)
(22)
(8
)
(18,
086)
(1
,614
)
Tota
l Ear
ned
Reve
nue
–
(1
31)
(1
,532
)
–
–
–
–
(18,
081)
(1
60)
(5
7)
(19,
961)
(8
,787
)
Net
Pro
gram
Cos
ts25
631
,459
2,91
8,60
7
–
–
–
–
(6,5
02)
48,7
7210
,790
3,00
3,38
22,
443,
457
(con
tinue
d on
nex
t pag
e)
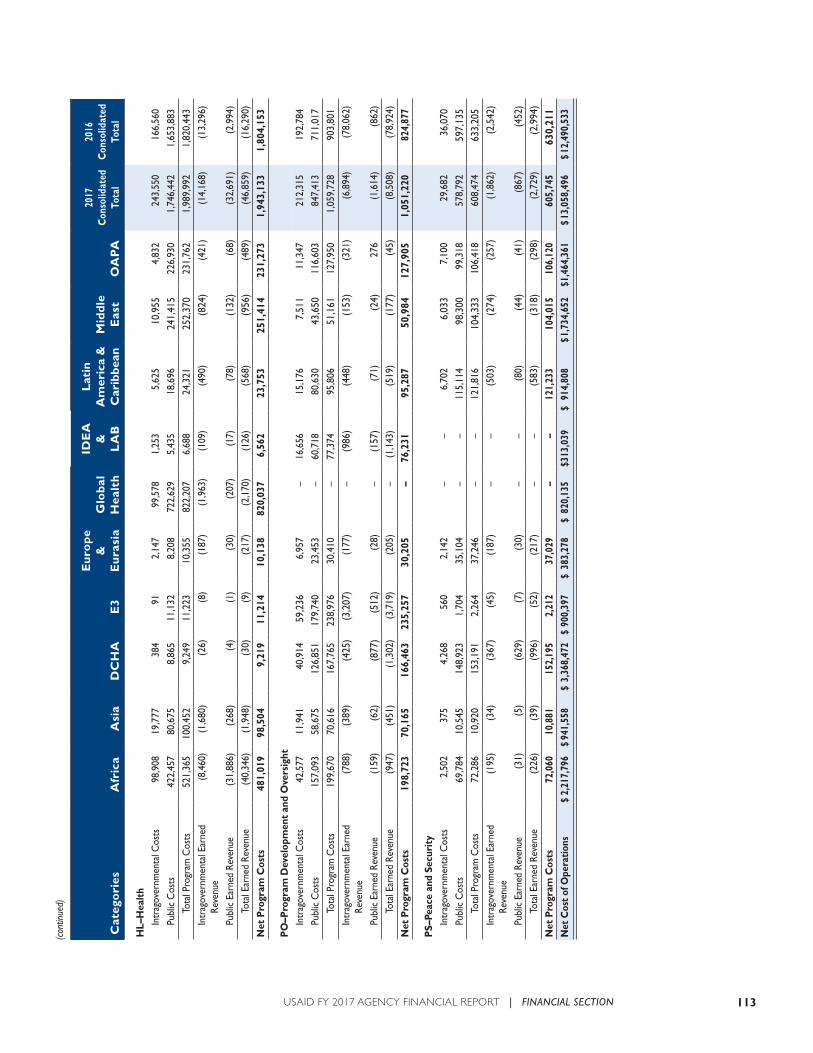
113USAID FY 2017 AGENCY FINANCIAL REPORT | FINANCIAL SECTION
(con
tinue
d)
Cat
ego
ries
Afr
ica
Asi
a D
CH
AE
3
Eu
rop
e &
E
ura
sia
Glo
bal
Hea
lth
IDE
A
&
LA
B
Lat
in
Am
eric
a &
Car
ibbe
anM
idd
le
Eas
tO
AP
A
2017
C
onso
lidat
edTo
tal
2016
C
onso
lidat
edTo
tal
HL–
Hea
lth
Intr
agov
ernm
enta
l Cos
ts98
,908
19,7
7738
491
2,14
799
,578
1,25
35,
625
10,9
554,
832
243,
550
166,
560
Publ
ic C
osts
422,
457
80,6
758,
865
11,1
328,
208
722,
629
5,43
518
,696
241,
415
226,
930
1,74
6,44
21,
653,
883
Tota
l Pro
gram
Cos
ts52
1,36
510
0,45
29,
249
11,2
2310
,355
822,
207
6,68
824
,321
252,
370
231,
762
1,98
9,99
21,
820,
443
Intr
agov
ernm
enta
l Ear
ned
Reve
nue
(8
,460
)
(1,6
80)
(2
6)
(8)
(1
87)
(1
,963
)
(109
)
(490
)
(824
)
(421
)
(14,
168)
(1
3,29
6)
Publ
ic E
arne
d Re
venu
e
(31,
886)
(2
68)
(4
)
(1)
(3
0)
(207
)
(17)
(7
8)
(132
)
(68)
(3
2,69
1)
(2,9
94)
Tota
l Ear
ned
Reve
nue
(4
0,34
6)
(1,9
48)
(3
0)
(9)
(2
17)
(2
,170
)
(126
)
(568
)
(956
)
(489
)
(46,
859)
(1
6,29
0)
Net
Pro
gram
Cos
ts48
1,01
998
,504
9,21
911
,214
10,1
3882
0,03
76,
562
23,7
5325
1,41
423
1,27
31,
943,
133
1,80
4,15
3
PO
–Pro
gram
Dev
elop
men
t an
d O
vers
ight
In
trag
over
nmen
tal C
osts
42,5
7711
,941
40,9
1459
,236
6,95
7
–16
,656
15,1
767,
511
11,3
4721
2,31
519
2,78
4
Publ
ic C
osts
157,
093
58,6
7512
6,85
117
9,74
023
,453
–
60,7
1880
,630
43,6
5011
6,60
384
7,41
371
1,01
7
Tota
l Pro
gram
Cos
ts19
9,67
070
,616
167,
765
238,
976
30,4
10
–77
,374
95,8
0651
,161
127,
950
1,05
9,72
890
3,80
1
Intr
agov
ernm
enta
l Ear
ned
Reve
nue
(7
88)
(3
89)
(4
25)
(3
,207
)
(177
)
–
(986
)
(448
)
(153
)
(321
)
(6,8
94)
(7
8,06
2)
Publ
ic E
arne
d Re
venu
e
(159
)
(62)
(8
77)
(5
12)
(2
8)
–
(157
)
(71)
(2
4)27
6
(1,6
14)
(8
62)
Tota
l Ear
ned
Reve
nue
(9
47)
(4
51)
(1
,302
)
(3,7
19)
(2
05)
–
(1
,143
)
(519
)
(177
)
(45)
(8
,508
)
(78,
924)
Net
Pro
gram
Cos
ts19
8,72
370
,165
166,
463
235,
257
30,2
05
–76
,231
95,2
8750
,984
127,
905
1,05
1,22
082
4,87
7
PS–
Peac
e an
d Se
curi
ty
Intr
agov
ernm
enta
l Cos
ts2,
502
375
4,26
856
02,
142
–
–
6,70
26,
033
7,10
029
,682
36,0
70Pu
blic
Cos
ts69
,784
10,5
4514
8,92
31,
704
35,1
04
–
–11
5,11
498
,300
99,3
1857
8,79
259
7,13
5To
tal P
rogr
am C
osts
72,2
8610
,920
153,
191
2,26
437
,246
–
–
121,
816
104,
333
106,
418
608,
474
633,
205
Intr
agov
ernm
enta
l Ear
ned
Reve
nue
(1
95)
(3
4)
(367
)
(45)
(1
87)
–
–
(5
03)
(2
74)
(2
57)
(1
,862
)
(2,5
42)
Publ
ic E
arne
d Re
venu
e
(31)
(5
)
(629
)
(7)
(3
0)
–
–
(80)
(4
4)
(41)
(8
67)
(4
52)
Tota
l Ear
ned
Reve
nue
(2
26)
(3
9)
(996
)
(52)
(2
17)
–
–
(5
83)
(3
18)
(2
98)
(2
,729
)
(2,9
94)
Net
Pro
gram
Cos
ts72
,060
10,8
8115
2,19
52,
212
37,0
29
–
–12
1,23
310
4,01
510
6,12
060
5,74
563
0,21
1N
et C
ost o
f Ope
ratio
ns$
2,21
7,79
6$
941,
558
$ 3,
368,
472
$ 90
0,39
7$
383,
278
$ 82
0,13
5$ 3
13,0
39$
914,
808
$ 1,7
34,6
52$ 1
,464
,361
$ 13,
058,
496
$ 12,
490,
533
114 USAID FY 2017 AGENCY FINANCIAL REPORT | FINANCIAL SECTION
NOTE 16. SCHEDULE OF COST BY STANDARDIZED PROGRAM STRUCTURE AND DEFINITION (SPSD)
The Schedule of Costs by Responsibility Segment categorizes costs and revenues by Program Categories, Program Areas, which is consistent with the new State-USAID SPSD and Responsibility Segment.
A responsibility segment is the component that carries out a mission or major line of activity, and whose managers report directly to top manage-ment. The geographic and technical bureaus of USAID meet the criteria for responsibility segments. These bureaus directly support the Agency goals while the remaining bureaus and offices support the operations of these bureaus. To report the full cost of program outputs, the cost of support bureaus and offices are allocated to the outputs of the geographic and technical bureaus. Intra-agency eliminations are allocated to Program Areas to reflect total costs.
In the FY 2017 fourth quarter Consolidated Statement of Net Cost, major responsibility segments are (i) the Geographic Bureaus and (ii) the Technical Bureaus. The six Geographic Bureaus are: Africa; Asia; Europe and Eurasia; Latin America and the Caribbean; the Middle East; and the Office of Afghanistan and Pakistan Affairs (OAPA). The four Technical Bureaus are Democracy, Conflict and Humanitarian Assistance (DCHA); Economic Growth, Education and the Environment (E3); Global Health; and Innovation and Development Alliances (IDEA) & U.S. Global Development Lab (LAB). Note that receiving organizations IDEA and LAB have been merged as IDEA & LAB for Statement of Net Cost reporting purposes.
Schedule of Costs by SPSD for the years ended September 30, 2017 and 2016 are indicated in the table on the following pages (in thousands):
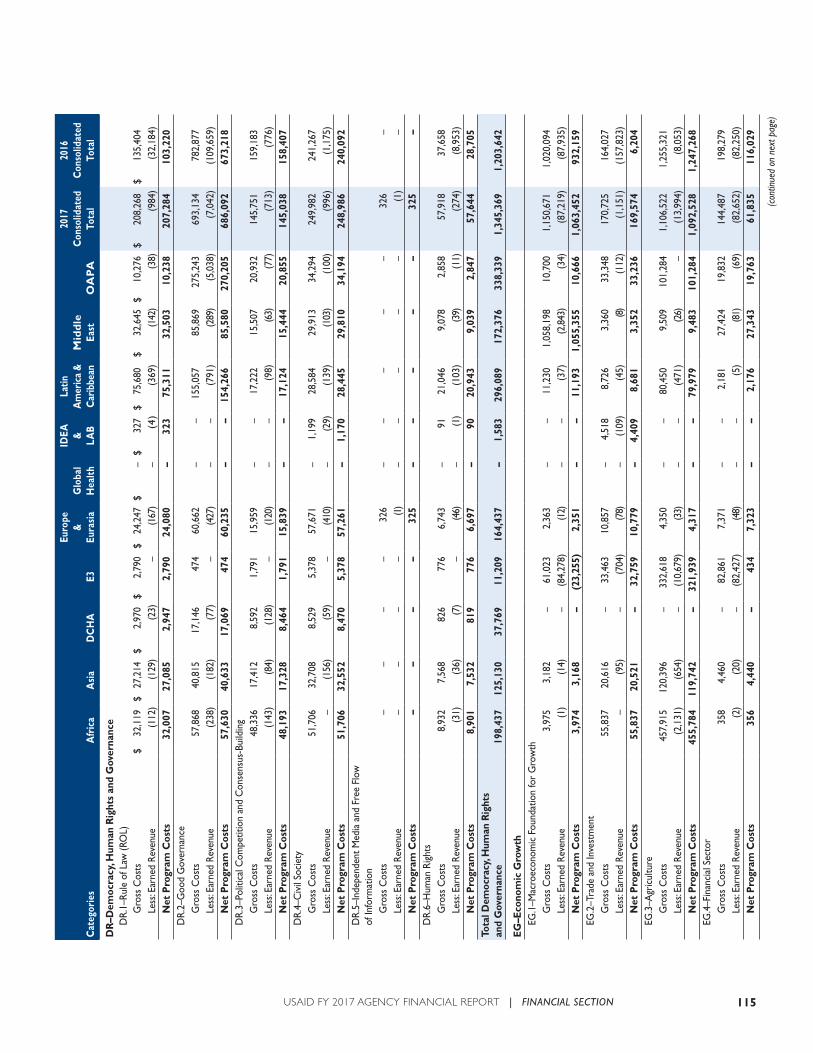
115USAID FY 2017 AGENCY FINANCIAL REPORT | FINANCIAL SECTION
Cat
egor
ies
Afr
ica
Asi
a D
CH
AE3
Euro
pe
&
Eura
sia
Glo
bal
Hea
lth
IDEA
&
LA
B
Latin
A
mer
ica
&C
arib
bean
Mid
dle
Ea
stO
AP
A
2017
C
onso
lidat
edTo
tal
2016
C
onso
lidat
edTo
tal
DR
–Dem
ocra
cy, H
uman
Rig
hts
and
Gov
erna
nce
D
R.1–
Rule
of L
aw (R
OL)
Gro
ss C
osts
$ 32
,119
$ 27
,214
$ 2,
970
$ 2,
790
$ 24
,247
$ –
$ 32
7$
75,6
80$
32,6
45$
10,2
76$
208,
268
$ 13
5,40
4
Le
ss: E
arne
d Re
venu
e
(112
)
(129
)
(23)
–
(1
67)
–
(4
)
(369
)
(142
)
(38)
(9
84)
(3
2,18
4)
N
et P
rogr
am C
osts
32,0
0727
,085
2,94
72,
790
24,0
80
–32
375
,311
32,5
0310
,238
207,
284
103,
220
DR.
2–G
ood
Gov
erna
nce
Gro
ss C
osts
57,8
6840
,815
17,1
4647
460
,662
–
–
155,
057
85,8
6927
5,24
369
3,13
478
2,87
7
Le
ss: E
arne
d Re
venu
e
(238
)
(182
)
(77)
–
(4
27)
–
–
(7
91)
(2
89)
(5
,038
)
(7,0
42)
(1
09,6
59)
Net
Pro
gram
Cos
ts57
,630
40,6
3317
,069
474
60,2
35
–
–15
4,26
685
,580
270,
205
686,
092
673,
218
DR.
3–Po
litic
al C
ompe
titio
n an
d C
onse
nsus
-Bui
ldin
g
G
ross
Cos
ts48
,336
17,4
128,
592
1,79
115
,959
–
–
17,2
2215
,507
20,9
3214
5,75
115
9,18
3
Le
ss: E
arne
d Re
venu
e
(143
)
(84)
(1
28)
–
(1
20)
–
–
(9
8)
(63)
(7
7)
(713
)
(776
)
N
et P
rogr
am C
osts
48,1
9317
,328
8,46
41,
791
15,8
39
–
–17
,124
15,4
4420
,855
145,
038
158,
407
DR.
4–C
ivil
Soci
ety
Gro
ss C
osts
51,7
0632
,708
8,52
95,
378
57,6
71
–1,
199
28,5
8429
,913
34,2
9424
9,98
224
1,26
7
Le
ss: E
arne
d Re
venu
e
–
(156
)
(59)
–
(4
10)
–
(2
9)
(139
)
(103
)
(100
)
(996
)
(1,1
75)
Net
Pro
gram
Cos
ts51
,706
32,5
528,
470
5,37
857
,261
–
1,17
028
,445
29,8
1034
,194
248,
986
240,
092
DR.
5–In
depe
nden
t Med
ia a
nd F
ree
Flow
of
Info
rmat
ion
Gro
ss C
osts
–
–
–
–
326
–
–
–
–
–
326
–
Less
: Ear
ned
Reve
nue
–
–
–
–
(1
)
–
–
–
–
–
(1)
–
Net
Pro
gram
Cos
ts
–
–
–
–32
5
–
–
–
–
–32
5
–D
R.6–
Hum
an R
ight
s
G
ross
Cos
ts8,
932
7,56
882
677
66,
743
–
9121
,046
9,07
82,
858
57,9
1837
,658
Less
: Ear
ned
Reve
nue
(3
1)
(36)
(7
)
–
(46)
–
(1
)
(103
)
(39)
(1
1)
(274
)
(8,9
53)
Net
Pro
gram
Cos
ts8,
901
7,53
281
977
66,
697
–
9020
,943
9,03
92,
847
57,6
4428
,705
Tota
l Dem
ocra
cy, H
uman
Rig
hts
and
Gov
erna
nce
198,
437
125,
130
37,7
6911
,209
164,
437
–
1,58
329
6,08
917
2,37
633
8,33
91,
345,
369
1,20
3,64
2
EG–E
cono
mic
Gro
wth
EG.1
–Mac
roec
onom
ic F
ound
atio
n fo
r G
row
th
G
ross
Cos
ts3,
975
3,18
2
–61
,023
2,36
3
–
–11
,230
1,05
8,19
810
,700
1,15
0,67
11,
020,
094
Less
: Ear
ned
Reve
nue
(1
)
(14)
–
(8
4,27
8)
(12)
–
–
(3
7)
(2,8
43)
(3
4)
(87,
219)
(8
7,93
5)
N
et P
rogr
am C
osts
3,97
43,
168
–
(2
3,25
5)2,
351
–
–
11,1
931,
055,
355
10,6
661,
063,
452
932,
159
EG.2
–Tra
de a
nd In
vest
men
t
G
ross
Cos
ts55
,837
20,6
16
–33
,463
10,8
57
–4,
518
8,72
63,
360
33,3
4817
0,72
516
4,02
7
Le
ss: E
arne
d Re
venu
e
–
(95)
–
(7
04)
(7
8)
–
(109
)
(45)
(8
)
(112
)
(1,1
51)
(1
57,8
23)
Net
Pro
gram
Cos
ts55
,837
20,5
21
–32
,759
10,7
79
–4,
409
8,68
13,
352
33,2
3616
9,57
46,
204
EG.3
–Agr
icul
ture
Gro
ss C
osts
457,
915
120,
396
–
332,
618
4,35
0
–
–80
,450
9,50
910
1,28
41,
106,
522
1,25
5,32
1
Le
ss: E
arne
d Re
venu
e
(2,1
31)
(6
54)
–
(1
0,67
9)
(33)
–
–
(4
71)
(2
6)
–
(13,
994)
(8
,053
)
N
et P
rogr
am C
osts
455,
784
119,
742
–
321,
939
4,31
7
–
–79
,979
9,48
310
1,28
41,
092,
528
1,24
7,26
8EG
.4–F
inan
cial
Sec
tor
Gro
ss C
osts
358
4,46
0
–82
,861
7,37
1
–
–2,
181
27,4
2419
,832
144,
487
198,
279
Less
: Ear
ned
Reve
nue
(2
)
(20)
–
(8
2,42
7)
(48)
–
–
(5
)
(81)
(6
9)
(82,
652)
(8
2,25
0)
N
et P
rogr
am C
osts
356
4,44
0
–43
47,
323
–
–
2,17
627
,343
19,7
6361
,835
116,
029
(con
tinue
d on
nex
t pag
e)
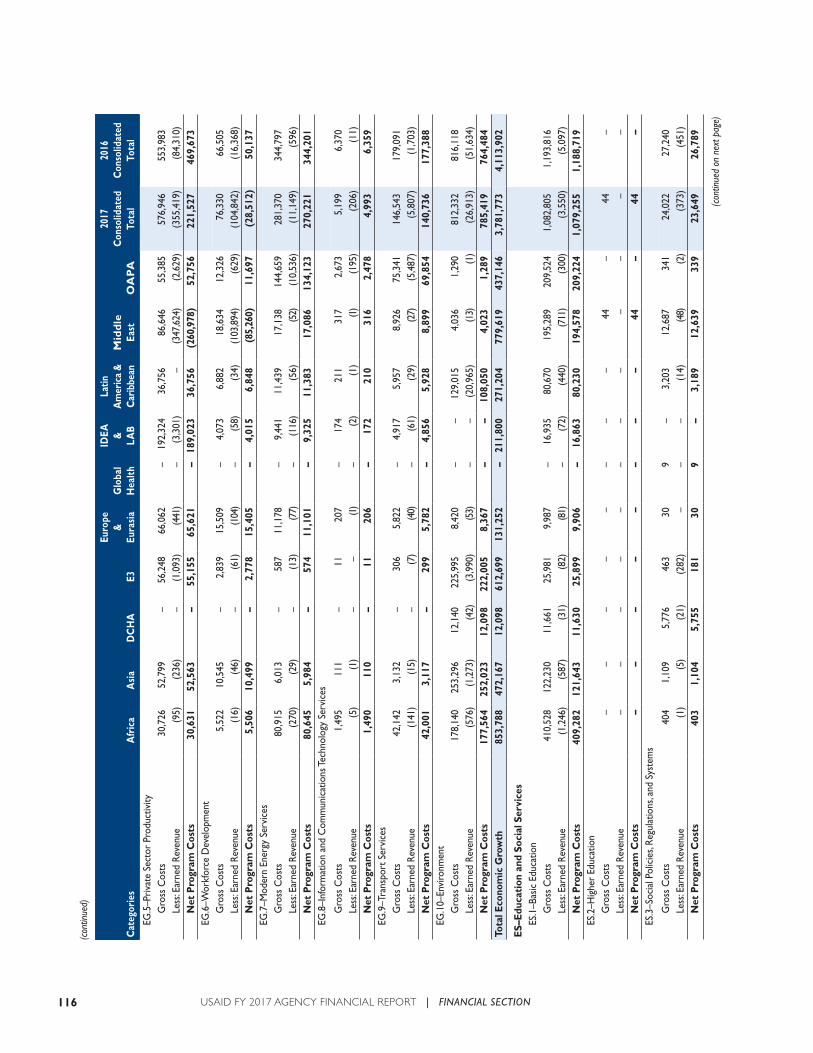
116 USAID FY 2017 AGENCY FINANCIAL REPORT | FINANCIAL SECTION
NOT UPDATED
(con
tinue
d)
Cat
egor
ies
Afr
ica
Asi
a D
CH
AE3
Euro
pe
&
Eura
sia
Glo
bal
Hea
lth
IDEA
&
LA
B
Latin
A
mer
ica
&C
arib
bean
Mid
dle
Ea
stO
AP
A
2017
C
onso
lidat
edTo
tal
2016
C
onso
lidat
edTo
tal
EG.5
–Priv
ate
Sect
or P
rodu
ctiv
ity
G
ross
Cos
ts30
,726
52,7
99
–56
,248
66,0
62
–19
2,32
436
,756
86,6
4655
,385
576,
946
553,
983
Less
: Ear
ned
Reve
nue
(9
5)
(236
)
–
(1,0
93)
(4
41)
–
(3
,301
)
–
(347
,624
)
(2,6
29)
(3
55,4
19)
(8
4,31
0)
N
et P
rogr
am C
osts
30,6
3152
,563
–
55,1
5565
,621
–
189,
023
36,7
56
(260
,978
)52
,756
221,
527
469,
673
EG.6
–Wor
kfor
ce D
evel
opm
ent
Gro
ss C
osts
5,52
210
,545
–
2,83
915
,509
–
4,07
36,
882
18,6
3412
,326
76,3
3066
,505
Less
: Ear
ned
Reve
nue
(1
6)
(46)
–
(6
1)
(104
)
–
(58)
(3
4)
(103
,894
)
(629
)
(104
,842
)
(16,
368)
Net
Pro
gram
Cos
ts5,
506
10,4
99
–2,
778
15,4
05
–4,
015
6,84
8
(85,
260)
11,6
97
(28,
512)
50,1
37EG
.7–M
oder
n En
ergy
Ser
vice
s
G
ross
Cos
ts80
,915
6,01
3
–58
711
,178
–
9,44
111
,439
17,1
3814
4,65
928
1,37
034
4,79
7
Le
ss: E
arne
d Re
venu
e
(270
)
(29)
–
(1
3)
(77)
–
(1
16)
(5
6)
(52)
(1
0,53
6)
(11,
149)
(5
96)
Net
Pro
gram
Cos
ts80
,645
5,98
4
–57
411
,101
–
9,32
511
,383
17,0
8613
4,12
327
0,22
134
4,20
1EG
.8–I
nfor
mat
ion
and
Com
mun
icat
ions
Tech
nolo
gy S
ervi
ces
Gro
ss C
osts
1,49
511
1
–11
207
–
174
211
317
2,67
35,
199
6,37
0
Le
ss: E
arne
d Re
venu
e
(5)
(1
)
–
–
(1)
–
(2
)
(1)
(1
)
(195
)
(206
)
(11)
Net
Pro
gram
Cos
ts1,
490
110
–
1120
6
–17
221
031
62,
478
4,99
36,
359
EG.9
–Tra
nspo
rt S
ervi
ces
Gro
ss C
osts
42,1
423,
132
–
306
5,82
2
–4,
917
5,95
78,
926
75,3
4114
6,54
317
9,09
1
Le
ss: E
arne
d Re
venu
e
(141
)
(15)
–
(7
)
(40)
–
(6
1)
(29)
(2
7)
(5,4
87)
(5
,807
)
(1,7
03)
Net
Pro
gram
Cos
ts42
,001
3,11
7
–29
95,
782
–
4,85
65,
928
8,89
969
,854
140,
736
177,
388
EG.1
0–En
viro
nmen
t
G
ross
Cos
ts17
8,14
025
3,29
612
,140
225,
995
8,42
0
–
–12
9,01
54,
036
1,29
081
2,33
281
6,11
8
Le
ss: E
arne
d Re
venu
e
(576
)
(1,2
73)
(4
2)
(3,9
90)
(5
3)
–
–
(20,
965)
(1
3)
(1)
(2
6,91
3)
(51,
634)
Net
Pro
gram
Cos
ts17
7,56
425
2,02
312
,098
222,
005
8,36
7
–
–10
8,05
04,
023
1,28
978
5,41
976
4,48
4To
tal E
cono
mic
Gro
wth
853,
788
472,
167
12,0
9861
2,69
913
1,25
2
–21
1,80
027
1,20
477
9,61
943
7,14
63,
781,
773
4,11
3,90
2
ES–E
duca
tion
and
Soc
ial S
ervi
ces
ES.1
–Bas
ic E
duca
tion
Gro
ss C
osts
410,
528
122,
230
11,6
6125
,981
9,98
7
–16
,935
80,6
7019
5,28
920
9,52
41,
082,
805
1,19
3,81
6
Le
ss: E
arne
d Re
venu
e
(1,2
46)
(5
87)
(3
1)
(82)
(8
1)
–
(72)
(4
40)
(7
11)
(3
00)
(3
,550
)
(5,0
97)
Net
Pro
gram
Cos
ts40
9,28
212
1,64
311
,630
25,8
999,
906
–
16,8
6380
,230
194,
578
209,
224
1,07
9,25
51,
188,
719
ES.2
–Hig
her
Educ
atio
n
G
ross
Cos
ts
–
–
–
–
–
–
–
–44
–
44
–
Le
ss: E
arne
d Re
venu
e
–
–
–
–
–
–
–
–
–
–
–
–
N
et P
rogr
am C
osts
–
–
–
–
–
–
–
–
44
–44
–
ES.3
–Soc
ial P
olic
ies,
Regu
latio
ns, a
nd S
yste
ms
Gro
ss C
osts
404
1,10
95,
776
463
309
–
3,20
312
,687
341
24,0
2227
,240
Less
: Ear
ned
Reve
nue
(1
)
(5)
(2
1)
(282
)
–
–
–
(14)
(4
8)
(2)
(3
73)
(4
51)
Net
Pro
gram
Cos
ts40
31,
104
5,75
518
130
9
–3,
189
12,6
3933
923
,649
26,7
89
(con
tinue
d on
nex
t pag
e)
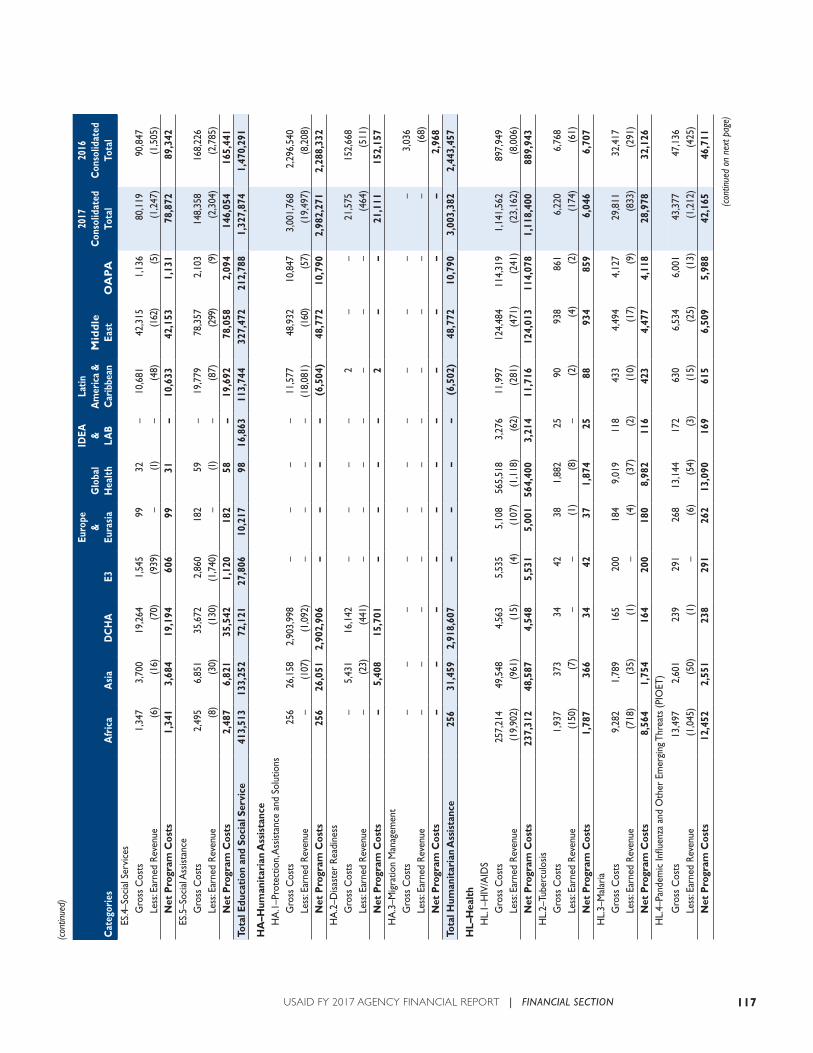
117USAID FY 2017 AGENCY FINANCIAL REPORT | FINANCIAL SECTION
(con
tinue
d)
Cat
egor
ies
Afr
ica
Asi
a D
CH
AE3
Euro
pe
&
Eura
sia
Glo
bal
Hea
lth
IDEA
&
LA
B
Latin
A
mer
ica
&C
arib
bean
Mid
dle
Ea
stO
AP
A
2017
C
onso
lidat
edTo
tal
2016
C
onso
lidat
edTo
tal
ES.4
–Soc
ial S
ervi
ces
Gro
ss C
osts
1,34
73,
700
19,2
641,
545
9932
–
10,6
8142
,315
1,13
680
,119
90,8
47
Le
ss: E
arne
d Re
venu
e
(6)
(1
6)
(70)
(9
39)
–
(1
)
–
(48)
(1
62)
(5
)
(1,2
47)
(1
,505
)
N
et P
rogr
am C
osts
1,34
13,
684
19,1
9460
699
31
–10
,633
42,1
531,
131
78,8
7289
,342
ES.5
–Soc
ial A
ssist
ance
Gro
ss C
osts
2,49
56,
851
35,6
722,
860
182
59
–19
,779
78,3
572,
103
148,
358
168,
226
Less
: Ear
ned
Reve
nue
(8
)
(30)
(1
30)
(1
,740
)
–
(1)
–
(8
7)
(299
)
(9)
(2
,304
)
(2,7
85)
Net
Pro
gram
Cos
ts2,
487
6,82
135
,542
1,12
018
258
–
19,6
9278
,058
2,09
414
6,05
416
5,44
1To
tal E
duca
tion
and
Soc
ial S
ervi
ce41
3,51
313
3,25
272
,121
27,8
0610
,217
9816
,863
113,
744
327,
472
212,
788
1,32
7,87
41,
470,
291
HA
–Hum
anit
aria
n A
ssis
tanc
eH
A.1
–Pro
tect
ion,
Ass
istan
ce a
nd S
olut
ions
Gro
ss C
osts
256
26,1
582,
903,
998
–
–
–
–
11,5
7748
,932
10,8
473,
001,
768
2,29
6,54
0
Le
ss: E
arne
d Re
venu
e
–
(107
)
(1,0
92)
–
–
–
–
(1
8,08
1)
(160
)
(57)
(1
9,49
7)
(8,2
08)
Net
Pro
gram
Cos
ts25
626
,051
2,90
2,90
6
–
–
–
–
(6,5
04)
48,7
7210
,790
2,98
2,27
12,
288,
332
HA
.2–D
isast
er R
eadi
ness
Gro
ss C
osts
–
5,43
116
,142
–
–
–
–
2
–
–21
,575
152,
668
Less
: Ear
ned
Reve
nue
–
(2
3)
(441
)
–
–
–
–
–
–
–
(464
)
(511
)
N
et P
rogr
am C
osts
–
5,40
815
,701
–
–
–
–
2
–
–21
,111
152,
157
HA
.3–M
igra
tion
Man
agem
ent
Gro
ss C
osts
–
–
–
–
–
–
–
–
–
–
–
3,03
6
Le
ss: E
arne
d Re
venu
e
–
–
–
–
–
–
–
–
–
–
–
(68)
Net
Pro
gram
Cos
ts
–
–
–
–
–
–
–
–
–
–
–2,
968
Tota
l Hum
anit
aria
n A
ssis
tanc
e25
631
,459
2,91
8,60
7
–
–
–
–
(6,5
02)
48,7
7210
,790
3,00
3,38
22,
443,
457
HL–
Hea
lth
HL.
1–H
IV/A
IDS
Gro
ss C
osts
257,
214
49,5
484,
563
5,53
55,
108
565,
518
3,27
611
,997
124,
484
114,
319
1,14
1,56
289
7,94
9
Le
ss: E
arne
d Re
venu
e
(19,
902)
(9
61)
(1
5)
(4)
(1
07)
(1
,118
)
(62)
(2
81)
(4
71)
(2
41)
(2
3,16
2)
(8,0
06)
Net
Pro
gram
Cos
ts23
7,31
248
,587
4,54
85,
531
5,00
156
4,40
03,
214
11,7
1612
4,01
311
4,07
81,
118,
400
889,
943
HL.
2–Tu
berc
ulos
is
G
ross
Cos
ts1,
937
373
3442
381,
882
2590
938
861
6,22
06,
768
Less
: Ear
ned
Reve
nue
(1
50)
(7
)
–
–
(1)
(8
)
–
(2)
(4
)
(2)
(1
74)
(6
1)
N
et P
rogr
am C
osts
1,78
736
634
4237
1,87
425
8893
485
96,
046
6,70
7H
L.3–
Mal
aria
Gro
ss C
osts
9,28
21,
789
165
200
184
9,01
911
843
34,
494
4,12
729
,811
32,4
17
Le
ss: E
arne
d Re
venu
e
(718
)
(35)
(1
)
–
(4)
(3
7)
(2)
(1
0)
(17)
(9
)
(833
)
(291
)
N
et P
rogr
am C
osts
8,56
41,
754
164
200
180
8,98
211
642
34,
477
4,11
828
,978
32,1
26H
L.4–
Pand
emic
Influ
enza
and
Oth
er E
mer
ging
Thr
eats
(PIO
ET)
Gro
ss C
osts
13,4
972,
601
239
291
268
13,1
4417
263
06,
534
6,00
143
,377
47,1
36
Le
ss: E
arne
d Re
venu
e
(1,0
45)
(5
0)
(1)
–
(6
)
(54)
(3
)
(15)
(2
5)
(13)
(1
,212
)
(425
)
N
et P
rogr
am C
osts
12,4
522,
551
238
291
262
13,0
9016
961
56,
509
5,98
842
,165
46,7
11
(con
tinue
d on
nex
t pag
e)
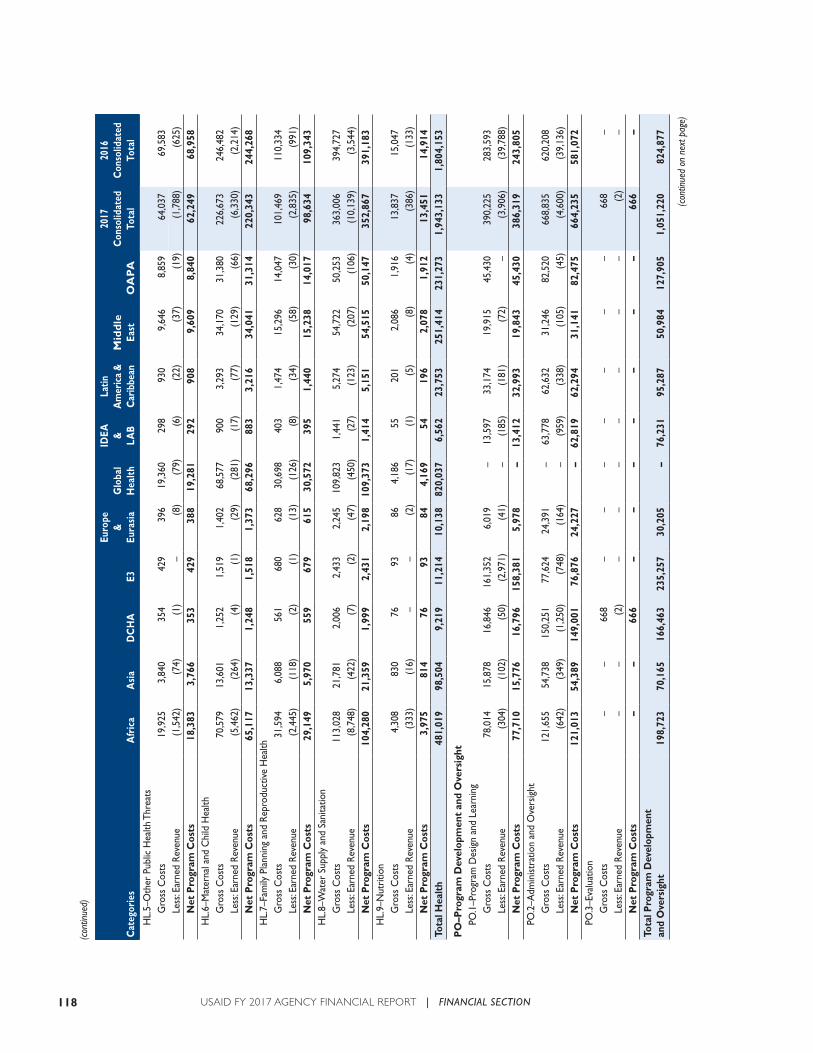
118 USAID FY 2017 AGENCY FINANCIAL REPORT | FINANCIAL SECTION
(con
tinue
d)
Cat
egor
ies
Afr
ica
Asi
a D
CH
AE3
Euro
pe
&
Eura
sia
Glo
bal
Hea
lth
IDEA
&
LA
B
Latin
A
mer
ica
&C
arib
bean
Mid
dle
Ea
stO
AP
A
2017
C
onso
lidat
edTo
tal
2016
C
onso
lidat
edTo
tal
HL.
5–O
ther
Pub
lic H
ealth
Thr
eats
Gro
ss C
osts
19,9
253,
840
354
429
396
19,3
6029
893
09,
646
8,85
964
,037
69,5
83
Le
ss: E
arne
d Re
venu
e
(1,5
42)
(7
4)
(1)
–
(8
)
(79)
(6
)
(22)
(3
7)
(19)
(1
,788
)
(625
)
N
et P
rogr
am C
osts
18,3
833,
766
353
429
388
19,2
8129
290
89,
609
8,84
062
,249
68,9
58H
L.6–
Mat
erna
l and
Chi
ld H
ealth
Gro
ss C
osts
70,5
7913
,601
1,25
21,
519
1,40
268
,577
900
3,29
334
,170
31,3
8022
6,67
324
6,48
2
Le
ss: E
arne
d Re
venu
e
(5,4
62)
(2
64)
(4
)
(1)
(2
9)
(281
)
(17)
(7
7)
(129
)
(66)
(6
,330
)
(2,2
14)
Net
Pro
gram
Cos
ts65
,117
13,3
371,
248
1,51
81,
373
68,2
9688
33,
216
34,0
4131
,314
220,
343
244,
268
HL.
7–Fa
mily
Pla
nnin
g an
d Re
prod
uctiv
e H
ealth
Gro
ss C
osts
31,5
946,
088
561
680
628
30,6
9840
31,
474
15,2
9614
,047
101,
469
110,
334
Less
: Ear
ned
Reve
nue
(2
,445
)
(118
)
(2)
(1
)
(13)
(1
26)
(8
)
(34)
(5
8)
(30)
(2
,835
)
(991
)
N
et P
rogr
am C
osts
29,1
495,
970
559
679
615
30,5
7239
51,
440
15,2
3814
,017
98,6
3410
9,34
3H
L.8–
Wat
er S
uppl
y an
d Sa
nita
tion
Gro
ss C
osts
113,
028
21,7
812,
006
2,43
32,
245
109,
823
1,44
15,
274
54,7
2250
,253
363,
006
394,
727
Less
: Ear
ned
Reve
nue
(8
,748
)
(422
)
(7)
(2
)
(47)
(4
50)
(2
7)
(123
)
(207
)
(106
)
(10,
139)
(3
,544
)
N
et P
rogr
am C
osts
104,
280
21,3
591,
999
2,43
12,
198
109,
373
1,41
45,
151
54,5
1550
,147
352,
867
391,
183
HL.
9–N
utrit
ion
Gro
ss C
osts
4,30
883
076
9386
4,18
655
201
2,08
61,
916
13,8
3715
,047
Less
: Ear
ned
Reve
nue
(3
33)
(1
6)
–
–
(2)
(1
7)
(1)
(5
)
(8)
(4
)
(386
)
(133
)
N
et P
rogr
am C
osts
3,97
581
476
9384
4,16
954
196
2,07
81,
912
13,4
5114
,914
Tota
l Hea
lth
481,
019
98,5
049,
219
11,2
1410
,138
820,
037
6,56
223
,753
251,
414
231,
273
1,94
3,13
31,
804,
153
PO
–Pro
gram
Dev
elop
men
t an
d O
vers
ight
PO.1
–Pro
gram
Des
ign
and
Lear
ning
Gro
ss C
osts
78,0
1415
,878
16,8
4616
1,35
26,
019
–
13,5
9733
,174
19,9
1545
,430
390,
225
283,
593
Less
: Ear
ned
Reve
nue
(3
04)
(1
02)
(5
0)
(2,9
71)
(4
1)
–
(185
)
(181
)
(72)
–
(3
,906
)
(39,
788)
Net
Pro
gram
Cos
ts77
,710
15,7
7616
,796
158,
381
5,97
8
–13
,412
32,9
9319
,843
45,4
3038
6,31
924
3,80
5PO
.2–A
dmin
istra
tion
and
Ove
rsig
ht
G
ross
Cos
ts12
1,65
554
,738
150,
251
77,6
2424
,391
–
63,7
7862
,632
31,2
4682
,520
668,
835
620,
208
Less
: Ear
ned
Reve
nue
(6
42)
(3
49)
(1
,250
)
(748
)
(164
)
–
(959
)
(338
)
(105
)
(45)
(4
,600
)
(39,
136)
Net
Pro
gram
Cos
ts12
1,01
354
,389
149,
001
76,8
7624
,227
–
62,8
1962
,294
31,1
4182
,475
664,
235
581,
072
PO.3
–Eva
luat
ion
Gro
ss C
osts
–
–
668
–
–
–
–
–
–
–
668
–
Less
: Ear
ned
Reve
nue
–
–
(2
)
–
–
–
–
–
–
–
(2)
–
Net
Pro
gram
Cos
ts
–
–66
6
–
–
–
–
–
–
–66
6
–To
tal P
rogr
am D
evel
opm
ent
and
Ove
rsig
ht19
8,72
370
,165
166,
463
235,
257
30,2
05
–76
,231
95,2
8750
,984
127,
905
1,05
1,22
082
4,87
7
(con
tinue
d on
nex
t pag
e)
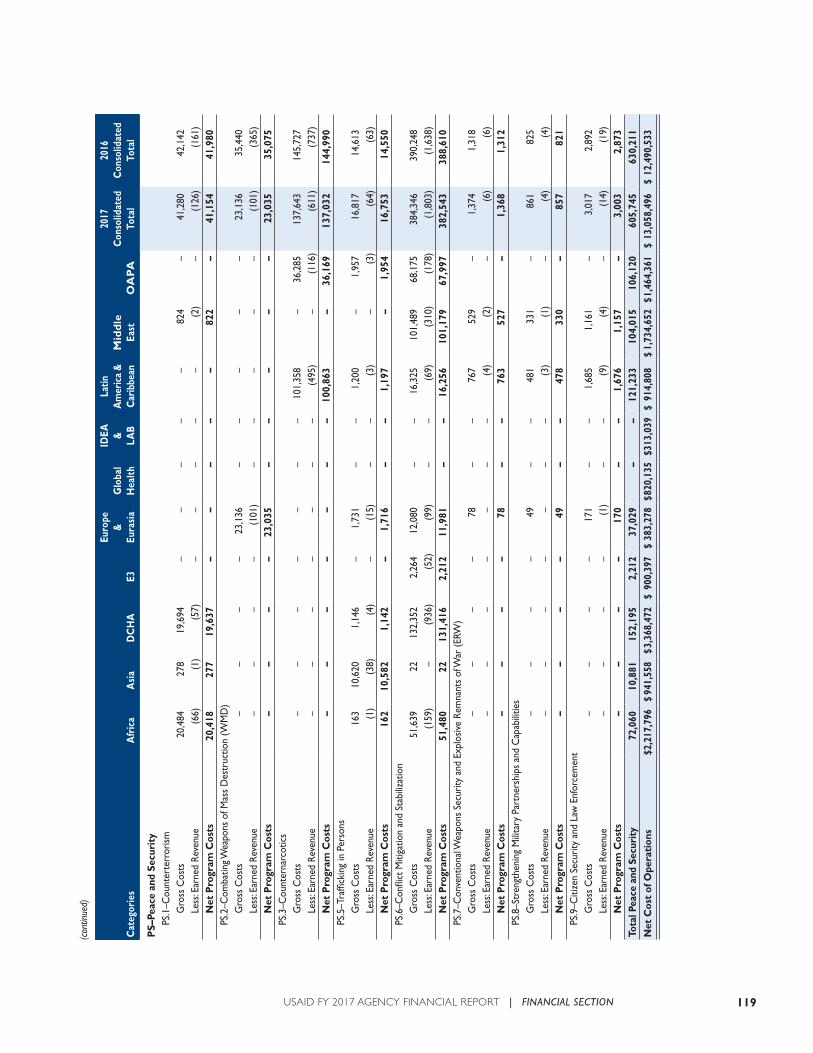
119USAID FY 2017 AGENCY FINANCIAL REPORT | FINANCIAL SECTION
(con
tinue
d)
Cat
egor
ies
Afr
ica
Asi
a D
CH
AE3
Euro
pe
&
Eura
sia
Glo
bal
Hea
lth
IDEA
&
LA
B
Latin
A
mer
ica
&C
arib
bean
Mid
dle
Ea
stO
AP
A
2017
C
onso
lidat
edTo
tal
2016
C
onso
lidat
edTo
tal
PS–
Peac
e an
d Se
curi
tyPS
.1–C
ount
erte
rror
ism
G
ross
Cos
ts20
,484
278
19,6
94
–
–
–
–
–82
4
–41
,280
42,1
42
Le
ss: E
arne
d Re
venu
e
(66)
(1
)
(57)
–
–
–
–
–
(2
)
–
(126
)
(161
)
N
et P
rogr
am C
osts
20,4
1827
719
,637
–
–
–
–
–
822
–
41,1
5441
,980
PS.2
–Com
batin
g Wea
pons
of M
ass
Des
truc
tion
(WM
D)
Gro
ss C
osts
–
–
–
–
23,1
36
–
–
–
–
–23
,136
35,4
40
Le
ss: E
arne
d Re
venu
e
–
–
–
–
(101
)
–
–
–
–
–
(101
)
(365
)
N
et P
rogr
am C
osts
–
–
–
–
23,0
35
–
–
–
–
–23
,035
35,0
75PS
.3–C
ount
erna
rcot
ics
Gro
ss C
osts
–
–
–
–
–
–
–
101,
358
–
36,2
8513
7,64
314
5,72
7
Le
ss: E
arne
d Re
venu
e
–
–
–
–
–
–
–
(495
)
–
(116
)
(611
)
(737
)
N
et P
rogr
am C
osts
–
–
–
–
–
–
–
100,
863
–
36,1
6913
7,03
214
4,99
0PS
.5–T
raffi
ckin
g in
Per
sons
Gro
ss C
osts
163
10,6
201,
146
–
1,73
1
–
–1,
200
–
1,95
716
,817
14,6
13
Le
ss: E
arne
d Re
venu
e
(1)
(3
8)
(4)
–
(1
5)
–
–
(3)
–
(3
)
(64)
(6
3)
N
et P
rogr
am C
osts
162
10,5
821,
142
–
1,71
6
–
–1,
197
–
1,95
416
,753
14,5
50PS
.6–C
onfli
ct M
itiga
tion
and
Stab
iliza
tion
Gro
ss C
osts
51,6
3922
132,
352
2,26
412
,080
–
–
16,3
2510
1,48
968
,175
384,
346
390,
248
Less
: Ear
ned
Reve
nue
(1
59)
–
(9
36)
(5
2)
(99)
–
–
(6
9)
(310
)
(178
)
(1,8
03)
(1
,638
)
N
et P
rogr
am C
osts
51,4
8022
131,
416
2,21
211
,981
–
–
16,2
5610
1,17
967
,997
382,
543
388,
610
PS.7
–Con
vent
iona
l Wea
pons
Sec
urity
and
Exp
losiv
e Re
mna
nts
of W
ar (E
RW)
Gro
ss C
osts
–
–
–
–
78
–
–76
752
9
–1,
374
1,31
8
Le
ss: E
arne
d Re
venu
e
–
–
–
–
–
–
–
(4)
(2
)
–
(6)
(6
)
N
et P
rogr
am C
osts
–
–
–
–
78
–
–76
352
7
–1,
368
1,31
2PS
.8–S
tren
gthe
ning
Mili
tary
Par
tner
ship
s an
d C
apab
ilitie
s
G
ross
Cos
ts
–
–
–
–49
–
–
481
331
–
861
825
Less
: Ear
ned
Reve
nue
–
–
–
–
–
–
–
(3
)
(1)
–
(4
)
(4)
Net
Pro
gram
Cos
ts
–
–
–
–49
–
–
478
330
–
857
821
PS.9
–Citi
zen
Secu
rity
and
Law
Enf
orce
men
t
G
ross
Cos
ts
–
–
–
–17
1
–
–1,
685
1,16
1
–3,
017
2,89
2
Le
ss: E
arne
d Re
venu
e
–
–
–
–
(1)
–
–
(9
)
(4)
–
(1
4)
(19)
Net
Pro
gram
Cos
ts
–
–
–
–17
0
–
–1,
676
1,15
7
–3,
003
2,87
3To
tal P
eace
and
Sec
urit
y72
,060
10,8
8115
2,19
52,
212
37,0
29
–
–12
1,23
310
4,01
510
6,12
060
5,74
563
0,21
1N
et C
ost
of O
pera
tion
s$ 2
,217
,796
$ 94
1,55
8$ 3
,368
,472
$ 90
0,39
7$
383,
278
$ 820
,135
$ 313
,039
$ 91
4,80
8$
1,73
4,65
2$ 1
,464
,361
$ 13
,058
,496
$ 12
,490
,533
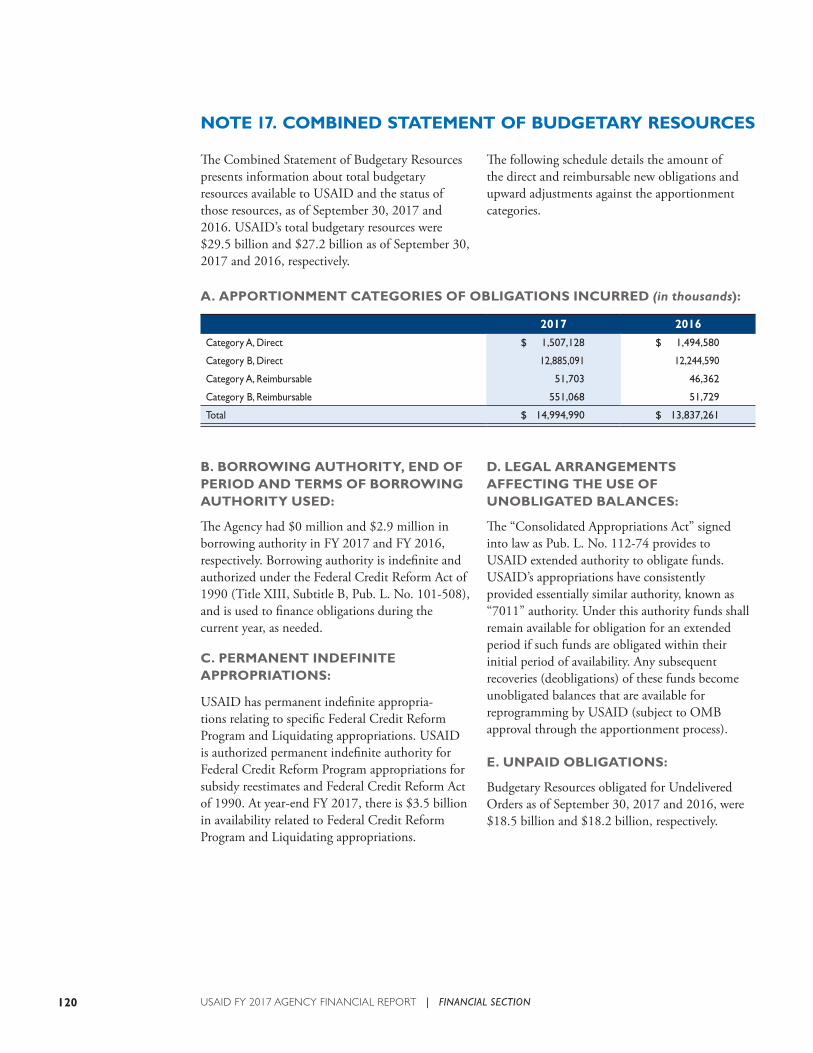
120 USAID FY 2017 AGENCY FINANCIAL REPORT | FINANCIAL SECTION
NOTE 17. COMBINED STATEMENT OF BUDGETARY RESOURCES
The Combined Statement of Budgetary Resources presents information about total budgetary resources available to USAID and the status of those resources, as of September 30, 2017 and 2016. USAID’s total budgetary resources were $29.5 billion and $27.2 billion as of September 30, 2017 and 2016, respectively.
The following schedule details the amount of the direct and reimbursable new obligations and upward adjustments against the apportionment categories.
A. APPORTIONMENT CATEGORIES OF OBLIGATIONS INCURRED (in thousands):
2017 2016
Category A, Direct $ 1,507,128 $ 1,494,580
Category B, Direct 12,885,091 12,244,590
Category A, Reimbursable 51,703 46,362
Category B, Reimbursable 551,068 51,729
Total $ 14,994,990 $ 13,837,261
B. BORROWING AUTHORITY, END OF PERIOD AND TERMS OF BORROWING AUTHORITY USED:
The Agency had $0 million and $2.9 million in borrowing authority in FY 2017 and FY 2016, respectively. Borrowing authority is indefinite and authorized under the Federal Credit Reform Act of 1990 (Title XIII, Subtitle B, Pub. L. No. 101-508), and is used to finance obligations during the current year, as needed.
C. PERMANENT INDEFINITE APPROPRIATIONS:
USAID has permanent indefinite appropria-tions relating to specific Federal Credit Reform Program and Liquidating appropriations. USAID is authorized permanent indefinite authority for Federal Credit Reform Program appropriations for subsidy reestimates and Federal Credit Reform Act of 1990. At year-end FY 2017, there is $3.5 billion in availability related to Federal Credit Reform Program and Liquidating appropriations.
D. LEGAL ARRANGEMENTS AFFECTING THE USE OF UNOBLIGATED BALANCES:
The “Consolidated Appropriations Act” signed into law as Pub. L. No. 112-74 provides to USAID extended authority to obligate funds. USAID’s appropriations have consistently provided essentially similar authority, known as “7011” authority. Under this authority funds shall remain available for obligation for an extended period if such funds are obligated within their initial period of availability. Any subsequent recoveries (deobligations) of these funds become unobligated balances that are available for reprogramming by USAID (subject to OMB approval through the apportionment process).
E. UNPAID OBLIGATIONS:
Budgetary Resources obligated for Undelivered Orders as of September 30, 2017 and 2016, were $18.5 billion and $18.2 billion, respectively.
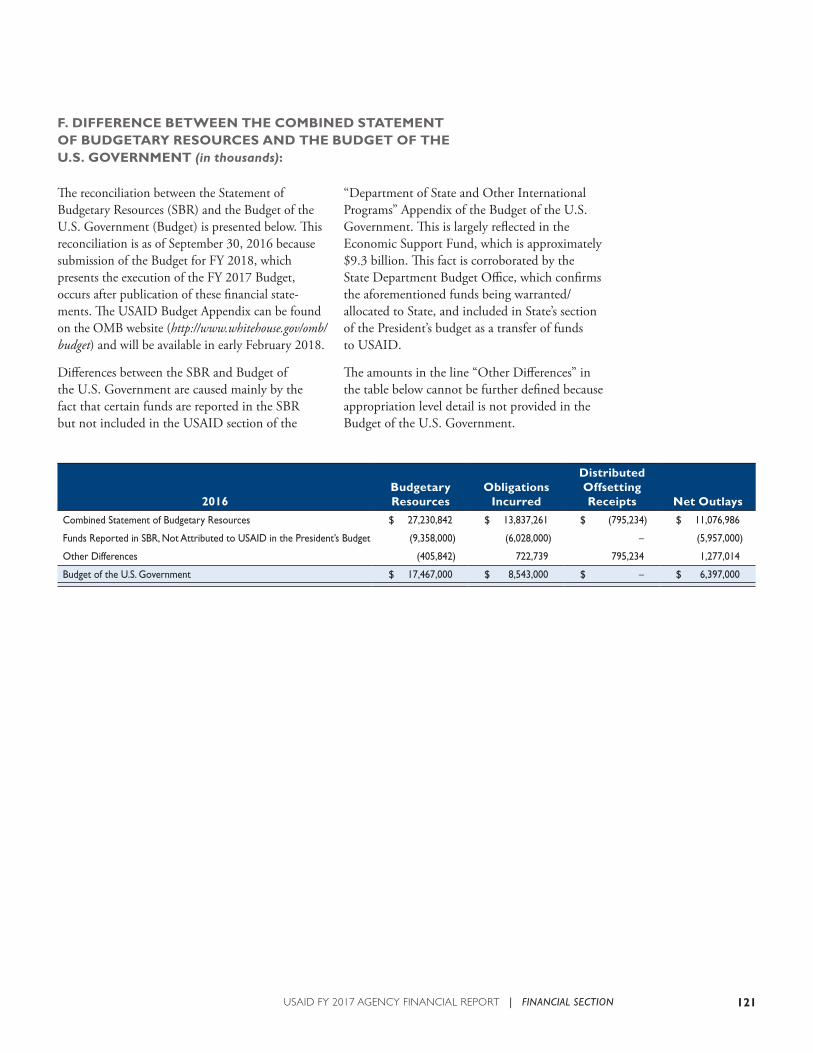
121USAID FY 2017 AGENCY FINANCIAL REPORT | FINANCIAL SECTION
2016Budgetary Resources
Obligations Incurred
Distributed Offsetting Receipts Net Outlays
Combined Statement of Budgetary Resources $ 27,230,842 $ 13,837,261 $ (795,234) $ 11,076,986
Funds Reported in SBR, Not Attributed to USAID in the President’s Budget (9,358,000) (6,028,000) – (5,957,000)
Other Differences (405,842) 722,739 795,234 1,277,014
Budget of the U.S. Government $ 17,467,000 $ 8,543,000 $ – $ 6,397,000
F. DIFFERENCE BETWEEN THE COMBINED STATEMENT OF BUDGETARY RESOURCES AND THE BUDGET OF THE U.S. GOVERNMENT (in thousands):
“Department of State and Other International Programs” Appendix of the Budget of the U.S. Government. This is largely reflected in the Economic Support Fund, which is approximately $9.3 billion. This fact is corroborated by the State Department Budget Office, which confirms the aforementioned funds being warranted/allocated to State, and included in State’s section of the President’s budget as a transfer of funds to USAID.
The amounts in the line “Other Differences” in the table below cannot be further defined because appropriation level detail is not provided in the Budget of the U.S. Government.
The reconciliation between the Statement of Budgetary Resources (SBR) and the Budget of the U.S. Government (Budget) is presented below. This reconciliation is as of September 30, 2016 because submission of the Budget for FY 2018, which presents the execution of the FY 2017 Budget, occurs after publication of these financial state-ments. The USAID Budget Appendix can be found on the OMB website (http://www.whitehouse.gov/omb/budget) and will be available in early February 2018.
Differences between the SBR and Budget of the U.S. Government are caused mainly by the fact that certain funds are reported in the SBR but not included in the USAID section of the
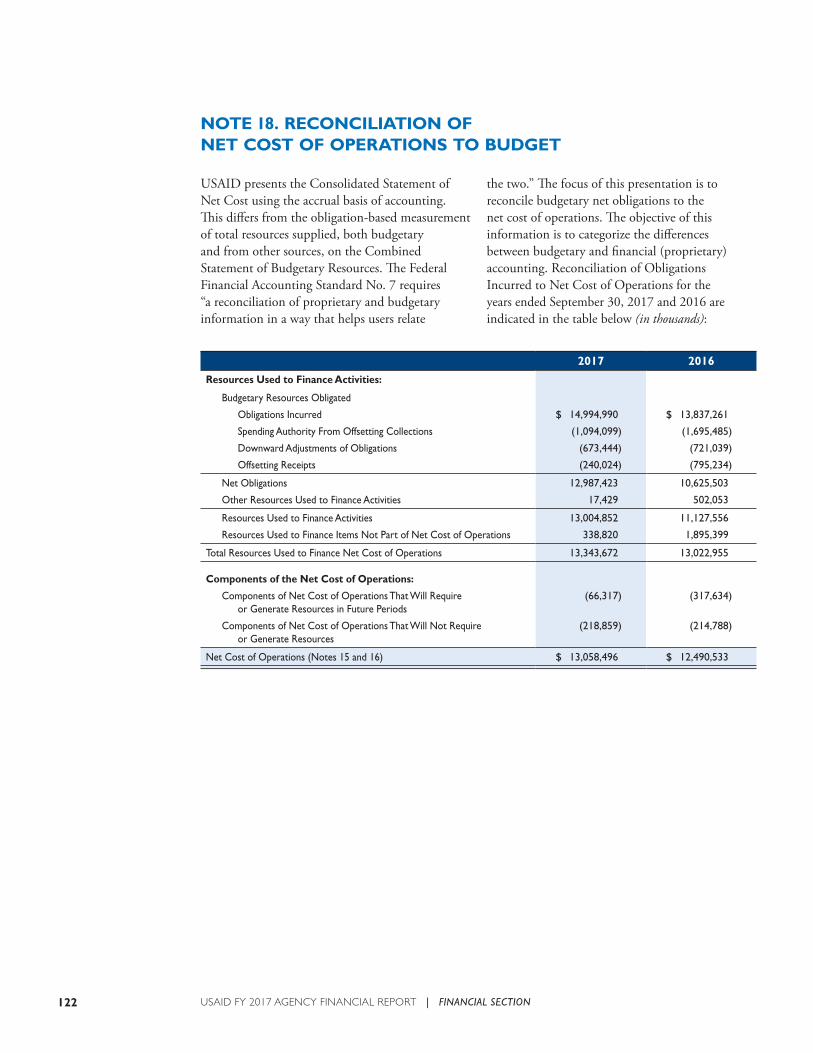
122 USAID FY 2017 AGENCY FINANCIAL REPORT | FINANCIAL SECTION
NOTE 18. RECONCILIATION OF NET COST OF OPERATIONS TO BUDGET
USAID presents the Consolidated Statement of Net Cost using the accrual basis of accounting. This differs from the obligation-based measurement of total resources supplied, both budgetary and from other sources, on the Combined Statement of Budgetary Resources. The Federal Financial Accounting Standard No. 7 requires “a reconciliation of proprietary and budgetary information in a way that helps users relate
2017 2016
Resources Used to Finance Activities:
Budgetary Resources Obligated
Obligations Incurred $ 14,994,990 $ 13,837,261
Spending Authority From Offsetting Collections (1,094,099) (1,695,485)
Downward Adjustments of Obligations (673,444) (721,039)
Offsetting Receipts (240,024) (795,234)
Net Obligations 12,987,423 10,625,503
Other Resources Used to Finance Activities 17,429 502,053
Resources Used to Finance Activities 13,004,852 11,127,556
Resources Used to Finance Items Not Part of Net Cost of Operations 338,820 1,895,399
Total Resources Used to Finance Net Cost of Operations 13,343,672 13,022,955
Components of the Net Cost of Operations:
Components of Net Cost of Operations That Will Require or Generate Resources in Future Periods
(66,317) (317,634)
Components of Net Cost of Operations That Will Not Require or Generate Resources
(218,859) (214,788)
Net Cost of Operations (Notes 15 and 16) $ 13,058,496 $ 12,490,533
the two.” The focus of this presentation is to reconcile budgetary net obligations to the net cost of operations. The objective of this information is to categorize the differences between budgetary and financial (proprietary) accounting. Reconciliation of Obligations Incurred to Net Cost of Operations for the years ended September 30, 2017 and 2016 are indicated in the table below (in thousands):
FINANCIAL SECTION
REQUIRED SUPPLEMENTARY INFORMATION

124 USAID FY 2017 AGENCY FINANCIAL REPORT | FINANCIAL SECTION
(Preceding page) Wilfred Charles is a Malawi farmer and pastor who built an irrigation system to bring water to his drought-starved community. The village is now thriving thanks to the USAID-funded project. Meet Wilfred at stories.usaid.gov. PHOTO: MORGANA WINGARD FOR USAID
(Above) Food aid recipients in West Bank and Gaza receive electronic food vouchers instead of direct food assistance. This allows families like Neimat Faqih’s to purchase locally produced food at nearby shops. Meet Neimat at stories.usaid.gov. PHOTO: BOBBY NEPTUNE FOR USAID
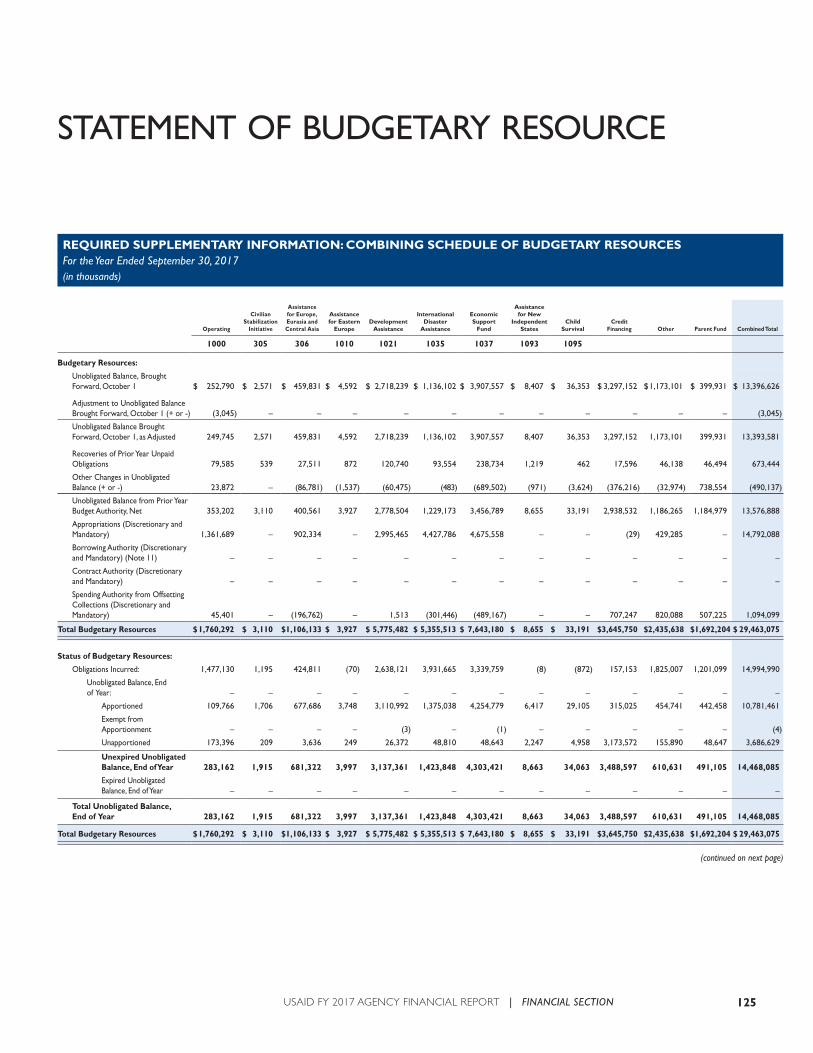
125USAID FY 2017 AGENCY FINANCIAL REPORT | FINANCIAL SECTION
STATEMENT OF BUDGETARY RESOURCE
REQUIRED SUPPLEMENTARY INFORMATION: COMBINING SCHEDULE OF BUDGETARY RESOURCESFor the Year Ended September 30, 2017(in thousands)
Operating
Civilian Stabilization
Initiative
Assistance for Europe, Eurasia and Central Asia
Assistance for Eastern
EuropeDevelopment
Assistance
International Disaster
Assistance
Economic Support
Fund
Assistance for New
Independent States
Child Survival
Credit Financing Other Parent Fund Combined Total
1000 305 306 1010 1021 1035 1037 1093 1095
Budgetary Resources:
Unobligated Balance, Brought Forward, October 1 $ 252,790 $ 2,571 $ 459,831 $ 4,592 $ 2,718,239 $ 1,136,102 $ 3,907,557 $ 8,407 $ 36,353 $ 3,297,152 $ 1,173,101 $ 399,931 $ 13,396,626
Adjustment to Unobligated Balance Brought Forward, October 1 (+ or -) (3,045) – – – – – – – – – – – (3,045)
Unobligated Balance Brought Forward, October 1, as Adjusted 249,745 2,571 459,831 4,592 2,718,239 1,136,102 3,907,557 8,407 36,353 3,297,152 1,173,101 399,931 13,393,581
Recoveries of Prior Year Unpaid Obligations 79,585 539 27,511 872 120,740 93,554 238,734 1,219 462 17,596 46,138 46,494 673,444
Other Changes in Unobligated Balance (+ or -) 23,872 – (86,781) (1,537) (60,475) (483) (689,502) (971) (3,624) (376,216) (32,974) 738,554 (490,137)
Unobligated Balance from Prior Year Budget Authority, Net 353,202 3,110 400,561 3,927 2,778,504 1,229,173 3,456,789 8,655 33,191 2,938,532 1,186,265 1,184,979 13,576,888
Appropriations (Discretionary and Mandatory) 1,361,689 – 902,334 – 2,995,465 4,427,786 4,675,558 – – (29) 429,285 – 14,792,088
Borrowing Authority (Discretionary and Mandatory) (Note 11) – – – – – – – – – – – – –
Contract Authority (Discretionary and Mandatory) – – – – – – – – – – – – –
Spending Authority from Offsetting Collections (Discretionary and Mandatory) 45,401 – (196,762) – 1,513 (301,446) (489,167) – – 707,247 820,088 507,225 1,094,099
Total Budgetary Resources $ 1,760,292 $ 3,110 $ 1,106,133 $ 3,927 $ 5,775,482 $ 5,355,513 $ 7,643,180 $ 8,655 $ 33,191 $ 3,645,750 $ 2,435,638 $ 1,692,204 $ 29,463,075
Status of Budgetary Resources:
Obligations Incurred: 1,477,130 1,195 424,811 (70) 2,638,121 3,931,665 3,339,759 (8) (872) 157,153 1,825,007 1,201,099 14,994,990
Unobligated Balance, End of Year: – – – – – – – – – – – – –
Apportioned 109,766 1,706 677,686 3,748 3,110,992 1,375,038 4,254,779 6,417 29,105 315,025 454,741 442,458 10,781,461
Exempt from Apportionment – – – – (3) – (1) – – – – – (4)
Unapportioned 173,396 209 3,636 249 26,372 48,810 48,643 2,247 4,958 3,173,572 155,890 48,647 3,686,629
Unexpired Unobligated Balance, End of Year 283,162 1,915 681,322 3,997 3,137,361 1,423,848 4,303,421 8,663 34,063 3,488,597 610,631 491,105 14,468,085
Expired Unobligated Balance, End of Year – – – – – – – – – – – – –
Total Unobligated Balance, End of Year 283,162 1,915 681,322 3,997 3,137,361 1,423,848 4,303,421 8,663 34,063 3,488,597 610,631 491,105 14,468,085
Total Budgetary Resources $ 1,760,292 $ 3,110 $ 1,106,133 $ 3,927 $ 5,775,482 $ 5,355,513 $ 7,643,180 $ 8,655 $ 33,191 $ 3,645,750 $ 2,435,638 $ 1,692,204 $ 29,463,075
(continued on next page)
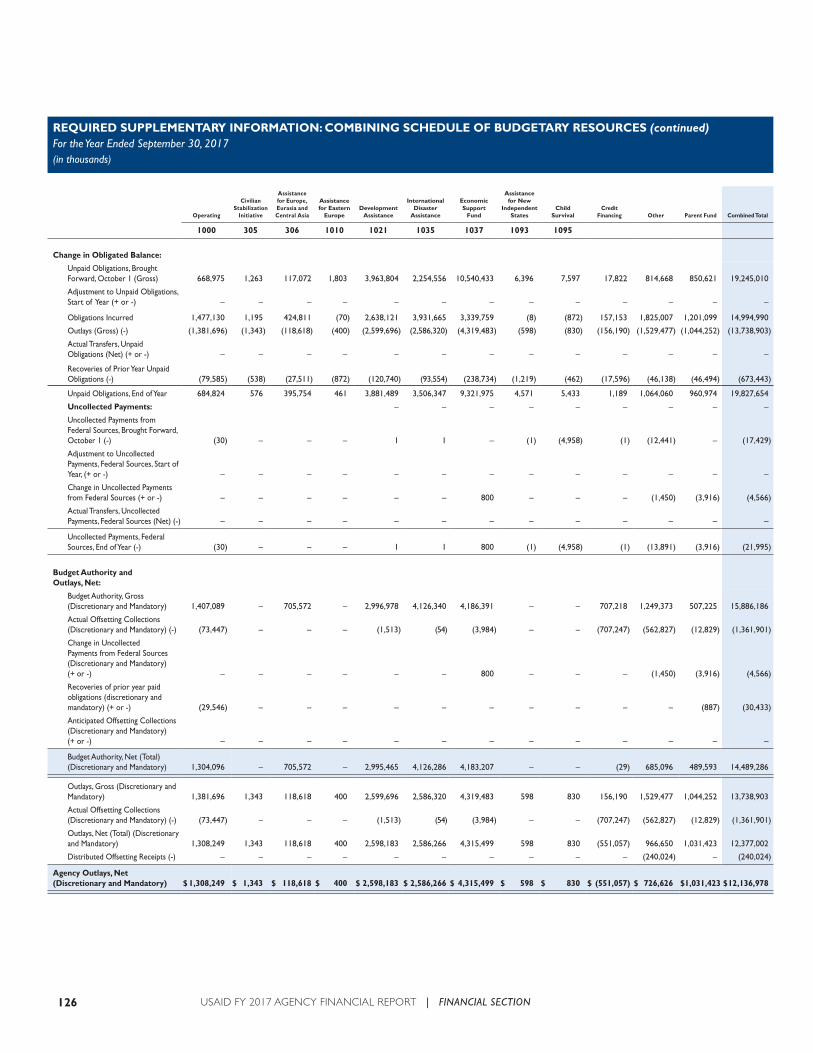
126 USAID FY 2017 AGENCY FINANCIAL REPORT | FINANCIAL SECTION
REQUIRED SUPPLEMENTARY INFORMATION: COMBINING SCHEDULE OF BUDGETARY RESOURCES (continued)For the Year Ended September 30, 2017(in thousands)
Operating
Civilian Stabilization
Initiative
Assistance for Europe, Eurasia and Central Asia
Assistance for Eastern
EuropeDevelopment
Assistance
International Disaster
Assistance
Economic Support
Fund
Assistance for New
Independent States
Child Survival
Credit Financing Other Parent Fund Combined Total
1000 305 306 1010 1021 1035 1037 1093 1095
Change in Obligated Balance:
Unpaid Obligations, Brought Forward, October 1 (Gross) 668,975 1,263 117,072 1,803 3,963,804 2,254,556 10,540,433 6,396 7,597 17,822 814,668 850,621 19,245,010
Adjustment to Unpaid Obligations, Start of Year (+ or -) – – – – – – – – – – – – –
Obligations Incurred 1,477,130 1,195 424,811 (70) 2,638,121 3,931,665 3,339,759 (8) (872) 157,153 1,825,007 1,201,099 14,994,990
Outlays (Gross) (-) (1,381,696) (1,343) (118,618) (400) (2,599,696) (2,586,320) (4,319,483) (598) (830) (156,190) (1,529,477) (1,044,252) (13,738,903)
Actual Transfers, Unpaid Obligations (Net) (+ or -) – – – – – – – – – – – – –
Recoveries of Prior Year Unpaid Obligations (-) (79,585) (538) (27,511) (872) (120,740) (93,554) (238,734) (1,219) (462) (17,596) (46,138) (46,494) (673,443)
Unpaid Obligations, End of Year 684,824 576 395,754 461 3,881,489 3,506,347 9,321,975 4,571 5,433 1,189 1,064,060 960,974 19,827,654
Uncollected Payments: – – – – – – – – –
Uncollected Payments from Federal Sources, Brought Forward, October 1 (-) (30) – – – 1 1 – (1) (4,958) (1) (12,441) – (17,429)
Adjustment to Uncollected Payments, Federal Sources, Start of Year, (+ or -) – – – – – – – – – – – – –
Change in Uncollected Payments from Federal Sources (+ or -) – – – – – – 800 – – – (1,450) (3,916) (4,566)
Actual Transfers, Uncollected Payments, Federal Sources (Net) (-) – – – – – – – – – – – – –
Uncollected Payments, Federal Sources, End of Year (-) (30) – – – 1 1 800 (1) (4,958) (1) (13,891) (3,916) (21,995)
Budget Authority and Outlays, Net:
Budget Authority, Gross (Discretionary and Mandatory) 1,407,089 – 705,572 – 2,996,978 4,126,340 4,186,391 – – 707,218 1,249,373 507,225 15,886,186
Actual Offsetting Collections (Discretionary and Mandatory) (-) (73,447) – – – (1,513) (54) (3,984) – – (707,247) (562,827) (12,829) (1,361,901)
Change in Uncollected Payments from Federal Sources (Discretionary and Mandatory) (+ or -) – – – – – – 800 – – – (1,450) (3,916) (4,566)
Recoveries of prior year paid obligations (discretionary and mandatory) (+ or -) (29,546) – – – – – – – – – – (887) (30,433)
Anticipated Offsetting Collections (Discretionary and Mandatory) (+ or -) – – – – – – – – – – – – –
Budget Authority, Net (Total) (Discretionary and Mandatory) 1,304,096 – 705,572 – 2,995,465 4,126,286 4,183,207 – – (29) 685,096 489,593 14,489,286
Outlays, Gross (Discretionary and Mandatory) 1,381,696 1,343 118,618 400 2,599,696 2,586,320 4,319,483 598 830 156,190 1,529,477 1,044,252 13,738,903
Actual Offsetting Collections (Discretionary and Mandatory) (-) (73,447) – – – (1,513) (54) (3,984) – – (707,247) (562,827) (12,829) (1,361,901)
Outlays, Net (Total) (Discretionary and Mandatory) 1,308,249 1,343 118,618 400 2,598,183 2,586,266 4,315,499 598 830 (551,057) 966,650 1,031,423 12,377,002
Distributed Offsetting Receipts (-) – – – – – – – – – – (240,024) – (240,024)
Agency Outlays, Net (Discretionary and Mandatory) $ 1,308,249 $ 1,343 $ 118,618 $ 400 $ 2,598,183 $ 2,586,266 $ 4,315,499 $ 598 $ 830 $ (551,057) $ 726,626 $ 1,031,423 $ 12,136,978
127USAID FY 2017 AGENCY FINANCIAL REPORT | FINANCIAL SECTION
MAJOR FUNDS
Operating Funds
1000 Operating Expenses of USAID
Program Funds
1010 Assistance for Eastern Europe
1021 Development Assistance
1035 International Disaster Assistance
1037 Economic Support Fund
1093 Assistance for the N.I.S. of the Former Soviet Union
1095 Child Survival and Disease Programs Funds
CREDIT FINANCING FUNDS
4119 Israel Guarantee Financing Fund
4137 Direct Loan Financing Fund
4266 DCA Financing Fund
4343 MSED Guarantee Financing Fund
4344 UE Financing Fund
4345 Ukraine Guarantees Financing Fund
4491 Egypt Guarantee Financing Fund
4493 Loan Guarantees to Middle East Northern Africa (MENA) – Financing Account
CREDIT PROGRAM FUNDS
0301 Israel Program Fund
0304 Egypt Program Fund
0400 MSED Program Fund
0401 UE Program Fund
0402 Ukraine Program Fund
0409 Loan Guarantees to Middle East Northern Africa (MENA) – Program Account
1264 DCA Program Fund
5318 Israel Program Fund – Administrative Expense
CREDIT LIQUIDATING FUNDS
4103 Economic Assistance Loans – Liquidating Fund
4340 UE Guarantee Liquidating Fund
4341 MSED Direct Loan Liquidating Fund
OTHER FUNDS
Operating Funds
0300 Capital Investment Fund (CIF)
0306 Assistance for Europe, Eurasia, and Central Asia
1007 Operating Expenses of USAID Inspector General
1036 Foreign Service Retirement and Disability Fund
1099 Fines, Penalties and Forfeitures – N.O.E.
1435 Miscellaneous Interest Collections
3220 Miscellaneous Recoveries
OTHER FUNDS (continued)
Program Funds
0305 Civilian Stabilization Initiative
1012 Sahel Development Program
1014 Development Fund for Africa
1015 Complex Crisis Fund
1023 Food and Nutrition Development Assistance
1024 Population and Planning & Health, Development Assistance
1025 Education and Human Resources, Development Assistance
1027 Transition Initiatives
1028 Global Fund to Fight HIV/AIDS
1029 Tsunami Relief and Reconstruction Fund
1033 HIV/AIDS Working Capital
1038 Central American Reconciliation Assistance
1040 Sub-Saharan Africa Disaster Assistance
1096 Iraq Relief Fund
1500 Demobilization and Transition Fund
Trust Funds
8342 Foreign National Employees Separation Liability Fund
8502 Technical Assistance – U.S. Dollars Advance from Foreign Governments
8824 Gifts and Donations
Revolving Funds
4175 Property Management Fund
4513 Working Capital Fund
4590 Acquisition of Property, Revolving Fund
ALLOCATIONS TO OTHER AGENCIES
1010 Assistance for Eastern Europe
1021 Development Assistance
1035 International Disaster Assistance
1037 Economic Support Fund
1093 Assistance for the N.I.S. of the Former Soviet Union
1095 Child Survival and Disease Program Funds
ALLOCATIONS FROM OTHER AGENCIES
0113 Diplomatic and Consular Programs, State
1030 Global HIV/AIDS Initiative – Carryover
1031 Global Health/Child Survival and HIV/AIDS
1121 Democracy Fund
1154 Andean Counterdrug Initiative (ACI)
2278 Commodity Credit Corporation
2750 Millennium Challenge Corporation
4336 Commodity Credit Corporation

128 USAID FY 2017 AGENCY FINANCIAL REPORT | FINANCIAL SECTION
OTHER INFORMATION
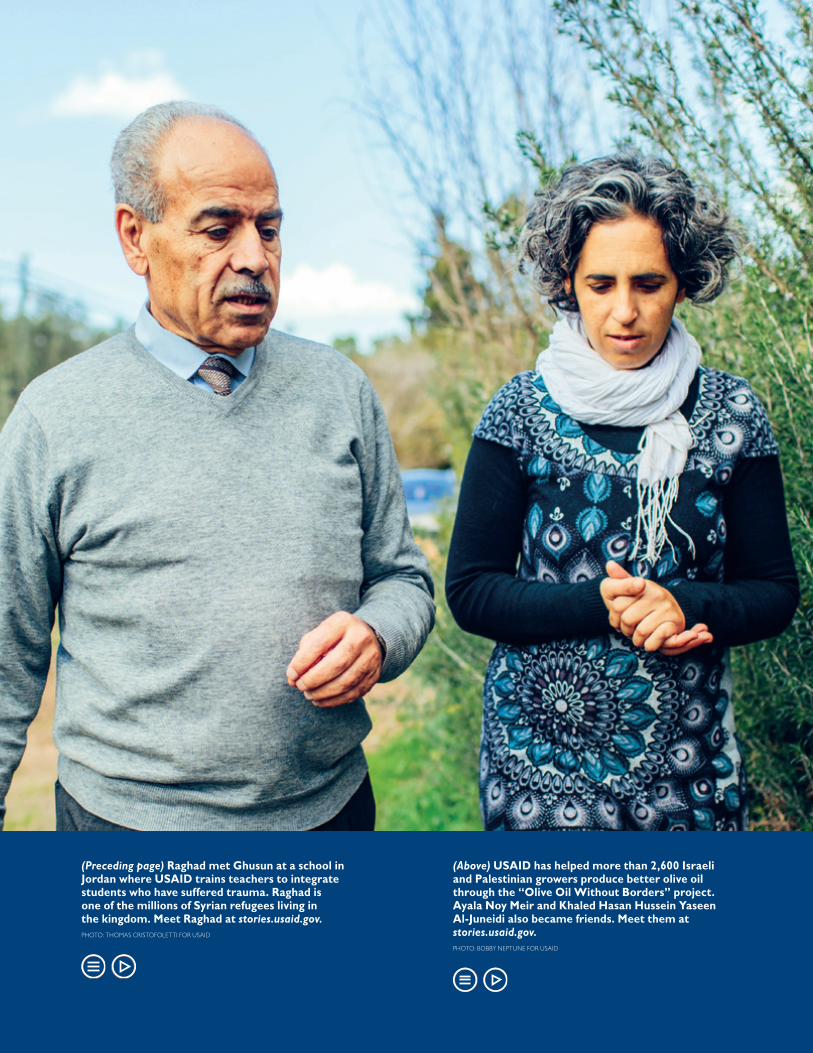
130 USAID FY 2017 AGENCY FINANCIAL REPORT | FINANCIAL SECTION
(Preceding page) Raghad met Ghusun at a school in Jordan where USAID trains teachers to integrate students who have suffered trauma. Raghad is one of the millions of Syrian refugees living in the kingdom. Meet Raghad at stories.usaid.gov. PHOTO: THOMAS CRISTOFOLETTI FOR USAID
(Above) USAID has helped more than 2,600 Israeli and Palestinian growers produce better olive oil through the “Olive Oil Without Borders” project. Ayala Noy Meir and Khaled Hasan Hussein Yaseen Al-Juneidi also became friends. Meet them at stories.usaid.gov. PHOTO: BOBBY NEPTUNE FOR USAID
131USAID FY 2017 AGENCY FINANCIAL REPORT | OTHER INFORMATION
OFFICE OF INSPECTOR GENERAL’S STATEMENT OF MOST SERIOUS MANAGEMENT AND PERFORMANCE CHALLENGES FOR USAID
According to USAID’s Inspector General, the top management challenges facing the Agency are in the following four areas:
• Improving Program Planning and Monitoring
• Reconciling Interagency Priorities and Functions to More Efficiently and Effectively Advance International Development
• Strengthening Country Ownership and Local Capacity to Promote Sustainability of U.S.-Funded Development
• Meeting Governmentwide Financial and Information Management and Security Requirements
USAID aggressively pursues corrective actions for all significant challenges, whether identified by the Office of Inspector General (OIG), Government Accountability Office (GAO), or other sources.
The following pages addressing top manage-ment challenges for USAID are from the entire Top Management Challenges Fiscal Year 2018 report, which is available on the OIG USAID website (oig.usaid.gov) at https://oig.usaid.gov/otherplansandreports?field_report_type_value= Major+Management+Challenges&field_ organization_value=All.
132 USAID FY 2017 AGENCY FINANCIAL REPORT | OTHER INFORMATION
USAID provides humanitarian assistance to people in areas besieged by natural disaster, health crisis, or armed conflict, while supporting the U.S. commitment to help countries confront chronic conditions such as hunger, child and maternal mortality, illiteracy, and gender inequality. The work of the Millennium Challenge Corporation (MCC) complements USAID’s mission by investing in countries committed to poverty reduction through policies for sound economic growth. USAID and MCC—together with the U.S. African Development Foundation (USADF), the Inter-American Foundation (IAF), and the Overseas Private Investment Corporation (OPIC)—managed over $30 billion in budgetary resources in fiscal year 2016 to advance economic growth and democracy around the world, which promotes U.S. national security interests.
To help ensure the U.S. Government achieves maximum return on these investments, OIG provides independent oversight of USAID, MCC, USADF, IAF, and OPIC.1 As part of this oversight, the Reports Consolidation Act of 2000 (Public Law 106–531) requires applicable Federal agencies to include in their performance and accountability reports a statement by their Inspector General summarizing the agencies’ most daunting challenges and the progress made in managing them.
From our recent audits and investigations, we identified four top management challenges for fiscal year 2018: 2
• Improving program planning and monitoring. USAID policy calls for rigorous planning, design, monitoring, and evaluation to better ensure that foreign assistance programs have the resources needed to achieve objectives and to identify and address fraud and other
1 OIG also provides oversight of overseas contingency operations as part of lead inspector general initiatives (described in section 8L of the Inspector General Act, as amended).
2 Our recent work identified a challenge for MCC related to strengthening local capacity and increasing sustainability in the activities it funds, discussed on pages 13 and 14. No serious challenges were identified for USADF or IAF.
Ann Calvaresi Barr Inspector General
Message From the Inspector General
133USAID FY 2017 AGENCY FINANCIAL REPORT | OTHER INFORMATION
risks. However, effectively putting these policies into effect continues to be a challenge, particularly in overseas contingency operations and the nonpermissive environments USAID frequently works in.3
• Reconciling interagency priorities and functions to more efficiently and effectively advance international development. Providing foreign assistance through multiple U.S. Government agencies has presented significant challenges for USAID in achieving its core development mission. Coordinating with the State Department, which leads multiagency responses to political and security crises, has complicated USAID’s project planning and execution. Despite broad interagency guidance on State’s role in these environments, key USAID staff remain unclear as to how to manage and respond to additional layers of review, changing priorities, and competing short- and long-term priorities.
• Strengthening country ownership and local capacity to promote sustainability of U.S.-funded development. To sustain development after U.S. involvement ends, USAID calls for investing in communities that have a stake in continuing activities and services, building the skills of local stakeholders, and ensuring public- or private-sector participation and financial backing. While USAID policies require assessments of country capacity and the risks in providing direct assistance to a sovereign state, the policies lack the clarity needed to ensure rigorous assessments.
• Meeting Governmentwide financial and information management and security requirements. The Federal Government established strict financial and information management requirements to promote effective stewardship of Government resources. Despite noteworthy actions to better ensure compliance, USAID is still unable to meet all of these requirements.
In addition to meeting the requirements of the Reports Consolidation Act, this document will help inform our work and frame our dialogues with Congress, the new administration, and other stakeholders about their priorities for effective stewardship of U.S. funds dedicated to foreign aid and development.
OIG remains committed to conducting thorough and timely audits and investigations of USAID programs and management—as well as those of MCC, USADF, IAF, and OPIC—and when appropriate, recommending actions to help address the challenges we identify.
If you would like to discuss or have any questions about USAID’s top management challenges for fiscal year 2018, please contact me at 202-712-1150.
3 Work in nonpermissive and contingency environments includes overseas contingency operations, which integrate the efforts of the Departments of Defense and State, USAID, and other partners to respond to conflicts and emergencies.
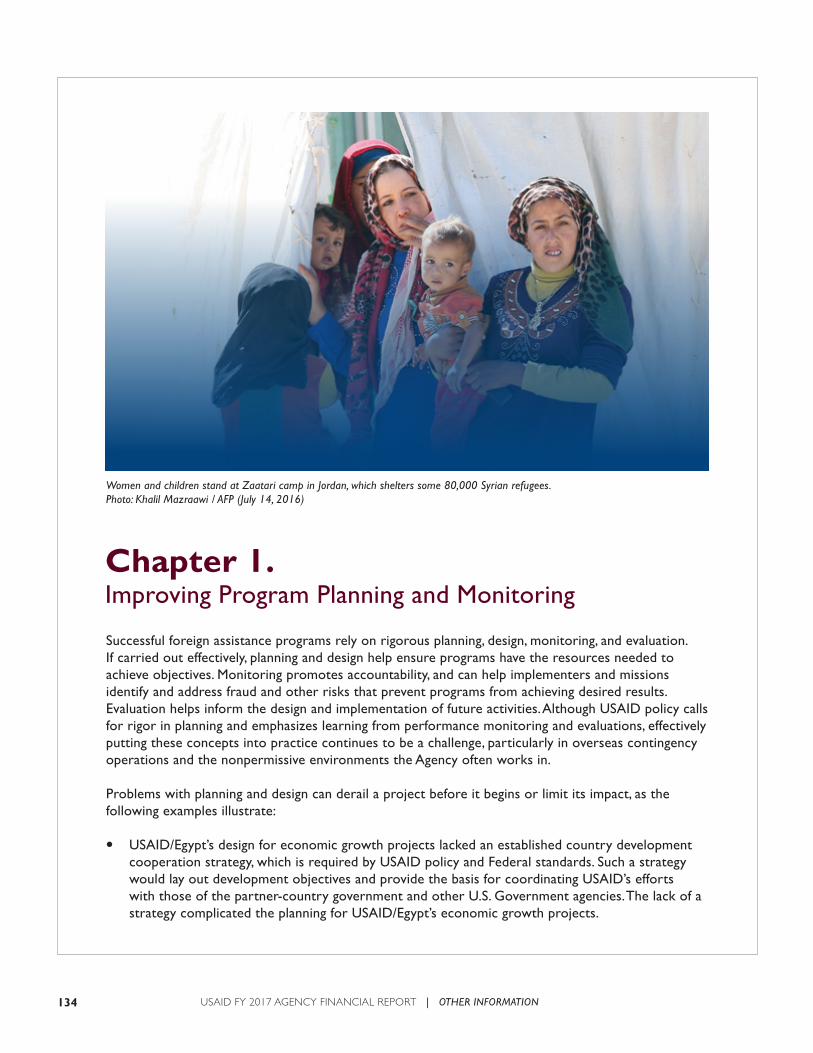
134 USAID FY 2017 AGENCY FINANCIAL REPORT | OTHER INFORMATION
Chapter 1. Improving Program Planning and Monitoring
Successful foreign assistance programs rely on rigorous planning, design, monitoring, and evaluation. If carried out effectively, planning and design help ensure programs have the resources needed to achieve objectives. Monitoring promotes accountability, and can help implementers and missions identify and address fraud and other risks that prevent programs from achieving desired results. Evaluation helps inform the design and implementation of future activities. Although USAID policy calls for rigor in planning and emphasizes learning from performance monitoring and evaluations, effectively putting these concepts into practice continues to be a challenge, particularly in overseas contingency operations and the nonpermissive environments the Agency often works in.
Problems with planning and design can derail a project before it begins or limit its impact, as the following examples illustrate:
• USAID/Egypt’s design for economic growth projects lacked an established country development cooperation strategy, which is required by USAID policy and Federal standards. Such a strategy would lay out development objectives and provide the basis for coordinating USAID’s efforts with those of the partner-country government and other U.S. Government agencies. The lack of a strategy complicated the planning for USAID/Egypt’s economic growth projects.
Women and children stand at Zaatari camp in Jordan, which shelters some 80,000 Syrian refugees. Photo: Khalil Mazraawi / AFP (July 14, 2016)
135USAID FY 2017 AGENCY FINANCIAL REPORT | OTHER INFORMATION
• After planning activities under its $50 million Community Engagement Project that would focus on the problems faced by Syrian refugees and their hosts, USAID/Jordan changed the project to reflect that Syrian refugee surges were just one of several stressors creating challenges in Jordanian communities. USAID’s frequent changes to the project’s focus and approach undermined monitoring, as they stretched project resources, muddled project goals, and prevented the mission from formally establishing useful performance measures and definitions of success.
• In Lebanon, USAID’s $41 million Quality Instruction Towards Access and Basic Education Improvement Project lacked clear goals and metrics. Planning and communication lapses led to project delays, in part because USAID had to cancel two of its main activities in favor of providing services requested by the Lebanese Ministry of Education. USAID and the Ministry agreed to adjust the project’s initial approach, but did not develop operational plans for the new activities, creating the risk of developing solutions that are unsustainable or underutilized. Without fully developed plans, the changes to the project may reduce its effectiveness at alleviating strains on the Lebanese public school system and improving access for Syrian refugee students.
Persistent weaknesses in monitoring and evaluation—particularly related to data collection and reporting—can increase the risk of projects not achieving their goals, as these examples illustrate:
• USAID lacked an overall monitoring and evaluation plan to align activities and performance indicators for the Afghanistan Reconstruction Trust Fund (ARTF) with the mission’s strategy and development objectives. Despite the U.S. Government’s significant contribution—$2.9 billion from ARTF’s establishment in 2002 through March 2017—USAID reported results from only one activity between 2013 and 2015, which accounted for just 9 percent of U.S. ARTF contributions. In addition, mission staff did not carry out essential responsibilities for monitoring and reporting ARTF’s progress. Specifically, USAID—the largest ARTF donor—has not conducted a formal evaluation of ARTF activities to determine overall performance and justify further funding to constituents. USAID/Afghanistan staff stated that Agency policy on awards to public international organizations (PIO) such as the World Bank condones a hands-off approach to oversight.
• The Regional Development Mission for Asia did not have monitoring tools in place to measure the reported results for a $27 million project intended to support regional economic integration under the Asia-Pacific Economic Cooperation (APEC), an activity that USAID manages for the State Department. Specifically, the project lacked an approved monitoring and evaluation plan for the first 19 months, and staff did not follow the plan in collecting data on 6 of the project’s 11 indicators; data either lacked adequate support or were collected using means other than those laid out in the plan. Because of insufficient monitoring by USAID, the project’s reported results were not reliable, impeding the Agency’s ability to evaluate impact.
• USAID missions in Egypt, Jordan, and the West Bank and Gaza did not adequately develop or use internal controls—policies, procedures, systems, or other tools—to ensure quality data, monitoring, or evaluation. Even when such tools were in place, program management and oversight were not always adequate due to weaknesses such as staffing shortages, insufficient employee training, and managers’ lack of enforcement, as well as to continually shifting budgets and priorities. More than two-thirds of the 21 performance audits that we conducted between fiscal years 2011 and 2013 on activities at these missions found unreliable data.
136 USAID FY 2017 AGENCY FINANCIAL REPORT | OTHER INFORMATION
Some actions have been taken to improve the monitoring and evaluation weaknesses we identified. For example, mission officials in Afghanistan recently issued a revised order, requiring staff to capture PIO award information in the mission’s database for monitoring and reporting. In response to our recommendations, USAID also plans to review its policies on monitoring and evaluating PIOs. A review that results in effective policies would better position USAID to determine progress toward achieving its long-term development objectives in Afghanistan. We have an ongoing audit to examine the risk assessments USAID offices conduct before awarding funds to PIOs, as well as their risk management strategies.
Effective and timely implementation of such actions is critical to protect USAID funds from fraud, waste, and abuse. Our investigations continue to demonstrate that weak internal controls create opportunities for unprincipled contractors, grantees, and other implementers to exploit these vulnerabilities for personal gain—a concern emphasized in our fiscal year 2017 Top Management Challenges report. Highlights of relevant work follow:
• Our investigations related to cross-border programs in Syria revealed widespread fraud—including procurement fraud, product substitution, bid-rigging, and kickback schemes—which points to poor internal controls on the part of implementers and a lack of adequate monitoring by USAID. Where insecurity and hostility run high, programs are especially vulnerable to exploitation and fraud.
• In working to dismantle organized crime groups that seek to profit from humanitarian commodities—one of our investigative priorities—we have investigated individuals and syndicates in Africa that steal, transport, and resell commodities supplied under the President’s Malaria Initiative, such as bed nets and antimalarial pharmaceuticals. Investigations have resulted in a number of arrests and seizures of stolen and counterfeit commodities.
• Relying on prime implementers and their subcontractors to monitor projects and report fraud can be problematic. In some cases, major USAID implementers have failed to promptly notify USAID or OIG of potential fraud or corruption. This has led to critical programmatic disruptions, such as the suspension of approximately $239 million worth of Syria-related programming by USAID last year after serious fraud was uncovered. In June 2017, we advised the Office of Global Health of the risks in relying heavily on implementers to monitor the Agency’s $9.5 billion Global Health Supply Chain Procurement and Supply Management Project—the largest contract awarded in USAID history.
In addition to aggressively investigating allegations, OIG provides fraud awareness training and has published a fraud awareness handbook. Our ongoing and planned audits and investigations cover a broad range of high-risk, high-dollar programs and projects. We have recently initiated an audit of USAID’s healthcare commodities and supply chain management, and an audit examining what corrective actions one Syria-response implementer has taken to remedy internal control weaknesses identified during OIG investigations.
USAID has also stepped up efforts to improve monitoring. Notably, the Agency had trained more than 2,600 staff in performance monitoring and evaluation as of July 2017, and USAID’s Bureau of Policy, Planning and Learning provided courses for training technical and program officers in project and activity design. The bureau also began reviewing skills for effective project management to update core program cycle training courses. Finally, the Agency updated its policy for program design and management in September 2016. However, until these actions translate into improvements, effective program planning and monitoring will remain a significant management challenge.
137USAID FY 2017 AGENCY FINANCIAL REPORT | OTHER INFORMATION
In addition, USAID’s planning requirements, including project approval documents, have been geared to achieving long-term, sustainable development results rather than the short-term objectives of many programs in nonpermissive environments. For example, USAID/Afghanistan’s Stabilization Unit—not its program office—developed plans for ARTF in early 2012 when some 90,000 U.S. troops were in Afghanistan trying to help stabilize the country. Although USAID policy requires missions to prepare a detailed plan telling how each project will contribute to the mission’s development strategy, the Stabilization Unit did not do so. Specifically, its plan did not describe how contributions to several categories of ARTF helped achieve USAID’s objectives. USAID continued to rely on this outmoded planning document until October 2016—nearly 5 five years after it formally adopted updated planning processes. Mission officials said that the inability to meet USAID’s planning requirements showed the difficulty of applying peacetime rules in a fluid, conflict setting.
To overcome the challenges of working in nonpermissive and contingency environments, USAID recently revised its planning policy and developed a nonpermissive environment framework and action plan to encourage missions to “manage adaptively.” The action plan established workgroups focused on building Agency capacity and developing and sharing resources in areas such as monitoring, evaluation, and learning. According to USAID, these actions will “strengthen the ability of USAID missions and staff to understand and assess the impact of nonpermissive conditions.” Although these are important steps, sustained reinforcement will be necessary if tools such as remote and tiered monitoring—the reliance on multiple sources to monitor projects where security restrictions prevent USAID personnel from accessing program sites—and flexible procurements are to be implemented effectively in nonpermissive environments.
Related OIG Products
• “USAID Planning and Monitoring Gaps Weaken Accountability for Results Through the Afghanistan Reconstruction Trust Fund,” 8-306-17-004-P, August 16, 2017.
• “USAID Needs Better Monitoring and Focus To Promote and Sustain Economic Integration Under Its APEC Contract,” 5-486-17-001-P, June 13, 2017.
• “Global Health Advisory on Internal Control Concerns,” June 7, 2017. • “Shift in USAID Education Activities May Diminish Efforts To Alleviate Strains on Lebanese Public
Schools,” 8-268-17-003-P, May 18, 2017.• “Mission’s Changing Focus and Approach Made It Difficult To Measure Success of the Jordan
Community Engagement Project,” 8-298-17-002-P, March 23, 2017.• “Working in Politically Sensitive Countries With Limited Resources Stymied Monitoring and
Evaluation Efforts of Selected Middle East Missions,” 8-000-16-003-P, September 30, 2016. • “Fraud Investigations Expose Weaknesses in Syria Humanitarian Aid Programs,” Statement of the
Honorable Ann Calvaresi Barr, Inspector General, U.S. Agency for International Development, Before the Committee on Foreign Affairs, Subcommittee on the Middle East and North Africa, United States House of Representatives, July 14, 2016.
• “Fraud Prevention and Implementing Partners,” A Pocket Guide for the Middle East Crisis Humanitarian Response, June 1, 2016.
• “Review of USAID/Egypt’s Adherence to Policy, Standards, and Best Practices in Designing Economic Growth Projects,” 8-263-16-002-S, February 12, 2016.
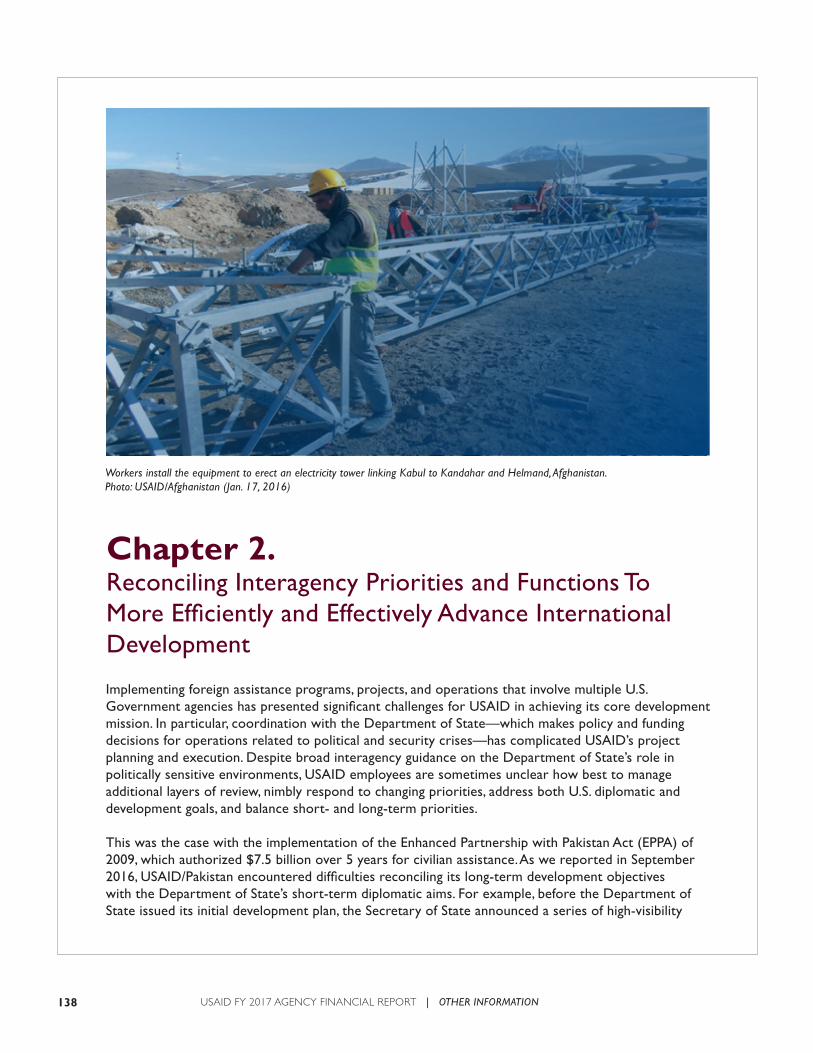
138 USAID FY 2017 AGENCY FINANCIAL REPORT | OTHER INFORMATION
Chapter 2. Reconciling Interagency Priorities and Functions To More Efficiently and Effectively Advance International Development
Implementing foreign assistance programs, projects, and operations that involve multiple U.S. Government agencies has presented significant challenges for USAID in achieving its core development mission. In particular, coordination with the Department of State—which makes policy and funding decisions for operations related to political and security crises—has complicated USAID’s project planning and execution. Despite broad interagency guidance on the Department of State’s role in politically sensitive environments, USAID employees are sometimes unclear how best to manage additional layers of review, nimbly respond to changing priorities, address both U.S. diplomatic and development goals, and balance short- and long-term priorities.
This was the case with the implementation of the Enhanced Partnership with Pakistan Act (EPPA) of 2009, which authorized $7.5 billion over 5 years for civilian assistance. As we reported in September 2016, USAID/Pakistan encountered difficulties reconciling its long-term development objectives with the Department of State’s short-term diplomatic aims. For example, before the Department of State issued its initial development plan, the Secretary of State announced a series of high-visibility
Workers install the equipment to erect an electricity tower linking Kabul to Kandahar and Helmand, Afghanistan. Photo: USAID/Afghanistan (Jan. 17, 2016)
139USAID FY 2017 AGENCY FINANCIAL REPORT | OTHER INFORMATION
infrastructure projects, including dams and irrigation systems, that would provide tangible examples of the United States’ support for Pakistan. USAID was made responsible for implementing these large infrastructure projects with minimal planning years before it identified its own development goals for EPPA. Almost 4 years into the effort, the mission implemented a formal strategy linking the Department of State’s energy activities to a USAID development goal—increasing sustainable energy supplied to the economy—but State’s energy priority took precedence over other development priorities, such as health, education, and economic growth.
Addressing overarching U.S. Government priorities can complicate USAID’s efforts to manage and safeguard international development funds, as the following examples demonstrate:
• In August 2017, we reported that USAID contributed nearly $300 million to various projects in Afghanistan through ARTF without documenting the rationale for the amounts or the timing for four out of five projects we reviewed, calling into question whether they represented the best use of USAID funds. One mission official stated that contributing to ARTF was the best and easiest way to meet the U.S. commitment to provide 50 percent of its assistance to the Afghan Government on budget,1 which was driven by a number of diplomatic and military considerations in Afghanistan.
• USAID’s Regional Development Mission for Asia implemented the APEC Technical Assistance to Advance Regional Integration Project for more than 31 months for the Department of State without a formal interagency agreement. The lack of an interagency agreement defining roles and responsibilities created vulnerabilities in project management and oversight.
USAID recognizes that coordinating its development priorities with those of other agencies, particularly in politically sensitive environments, is an ongoing challenge. To help ensure USAID’s development efforts are part of broader U.S. foreign policy, the Agency has begun working with the Department of State and other agencies to reconcile priorities. For example, in response to a recommendation we made in our EPPA report—that USAID institute an interagency forum so its development goals are taken into account in countries where Department of State is the lead—the USAID Administrator engaged Department of State leadership to discuss how to reconcile any conflicting interests at the beginning of planning and programming, and to help USAID and State simultaneously pursue their respective objectives.
The Agency also revised its programming guidance to address USAID’s roles and responsibilities when working with Department of State and other U.S. Government agencies. The guidance outlines expectations for missions to collaborate with and leverage the resources of partners, including U.S. Government agencies, country governments, civil society organizations, the private sector, multilateral organizations, and other donors, to maximize the impact of USAID’s assistance, prioritize where it has a comparative advantage, and rationalize resource allocations. The guidance, which was issued in September 2016, also adds requirements related to documenting the specific contributions of donors, including those from the Department of State and other U.S. Government agencies. Effective implementation of the guidance will be critical to addressing the challenge of clearly defining roles and responsibilities.
1 “On-budget” is defined as support given either directly to the Afghan Government or through contributions to multidonor trust funds that international organizations disburse to the Afghan Government. ARTF is a multidonor trust fund.
140 USAID FY 2017 AGENCY FINANCIAL REPORT | OTHER INFORMATION
In addition to revising its programming policy to address roles and responsibilities, USAID participates in the Interagency Policy Coordinating Committee focused on fragile states and stabilization, along with the Departments of State and Defense and other Federal agencies. In June 2017, Department of State and USAID began reviewing interagency efforts in areas liberated from extremist organizations to develop guidance and best practices for optimizing U.S. foreign assistance resources dedicated to stabilization efforts in complex environments. However, until the review is completed and the committee’s findings are incorporated into policy and procedure, USAID will continue to be challenged to advance its mission in these environments.
The administration’s call for a leaner Federal Government2—particularly as it relates to potential agency restructurings—adds a layer of complexity to USAID efforts to address interagency cooperation challenges. Under the Office of Management and Budget’s (OMB) guidance, certain executive branch departments and agencies must develop a comprehensive reform plan that includes an analytical framework aligning activities with the agency’s mission and role and the performance of its individual functions. This task is particularly complex for USAID given its worldwide mission to promote resilient, democratic societies and advance U.S. security and prosperity by providing foreign aid and development through diverse partners.
Anticipating these challenges, we posed a number of questions in a June 2017 advisory for USAID to consider as it develops its reform framework and plans. We asked USAID to consider how it might do the following:
• Benefit from instituting interagency forums.
• Forge partnerships with other U.S. agencies to implement projects outside USAID’s core development activities.
• Further capitalize on shared agency support services.
• Use program and activity data from other Federal agencies and development organizations to identify duplication of efforts and better coordinate U.S. investments.
• Engage with Congress and the administration on USAID’s authority and capability to fully implement priority development programs.
• Work with other U.S. agencies to outline and deliberate on the advantages of doing parallel work abroad.
USAID and the Department of State are working on a redesign initiative based on a 2017 survey commissioned by the Secretary of State to gather input from Department of State and USAID employees on how to improve the efficiency, effectiveness, performance, and accountability of the agencies and to determine how the two can structure their processes, workforce, and technology to better achieve their core missions of development and diplomacy. The survey identified areas for improvement as well as areas of duplication and overlap, and resulted in redesign recommendations in five key focus areas:
2 Office of Management and Budget (OMB) Memorandum M-17-22, “Comprehensive Plan for Reforming the Federal Government and Reducing the Federal Civilian Workforce,” April 12, 2017, provides guidance for agencies to implement the President’s March 13, 2017, Reorganization Executive Order.
141USAID FY 2017 AGENCY FINANCIAL REPORT | OTHER INFORMATION
• Foreign Assistance. Analyze current foreign assistance policies and programs at the Department of State and USAID to develop a future vision, ensuring alignment with national priorities.
• Overseas Alignment and Approach. Assess key diplomatic activities and identify required platforms, including assessing the balance between Washington and the field.
• Human Capital. Identify ways to promote an agile and empowered workforce as part of an overarching talent map.
• Management Support. Identify opportunities to streamline administrative support functions at the bureau and agency levels to support frontline effectiveness.
• Information Technology Platform Planning. Increase the use of new technology and streamline duplicative systems and processes.
The joint initiative—in conjunction with other USAID actions—has the potential to address the challenge of reconciling interagency functions and priorities. However, given the complexity of the types of reforms OMB is calling for, it will be an ongoing challenge turning reforms into actionable initiatives and working with stakeholders, particularly in areas where agencies do not have full authority to act.
Related OIG Products
• “USAID Planning and Monitoring Gaps Weaken Accountability for Results Through the Afghanistan Reconstruction Trust Fund,” 8-306-17-004-P, August 16, 2017.
• “Key Considerations for Developing USAID’s Comprehensive Plan on Reforming and Reducing the Federal Workforce,” Advisory Notice for USAID Management, June 21, 2017.
• “USAID Needs Better Monitoring and Focus To Promote and Sustain Economic Integration Under Its APEC Contract,” 5-486-17-001-P, June 13, 2017.
• “Competing Priorities Have Complicated USAID/Pakistan’s Efforts To Achieve Long-Term Development Under EPPA,” G-391-16-003-P, September 8, 2016.
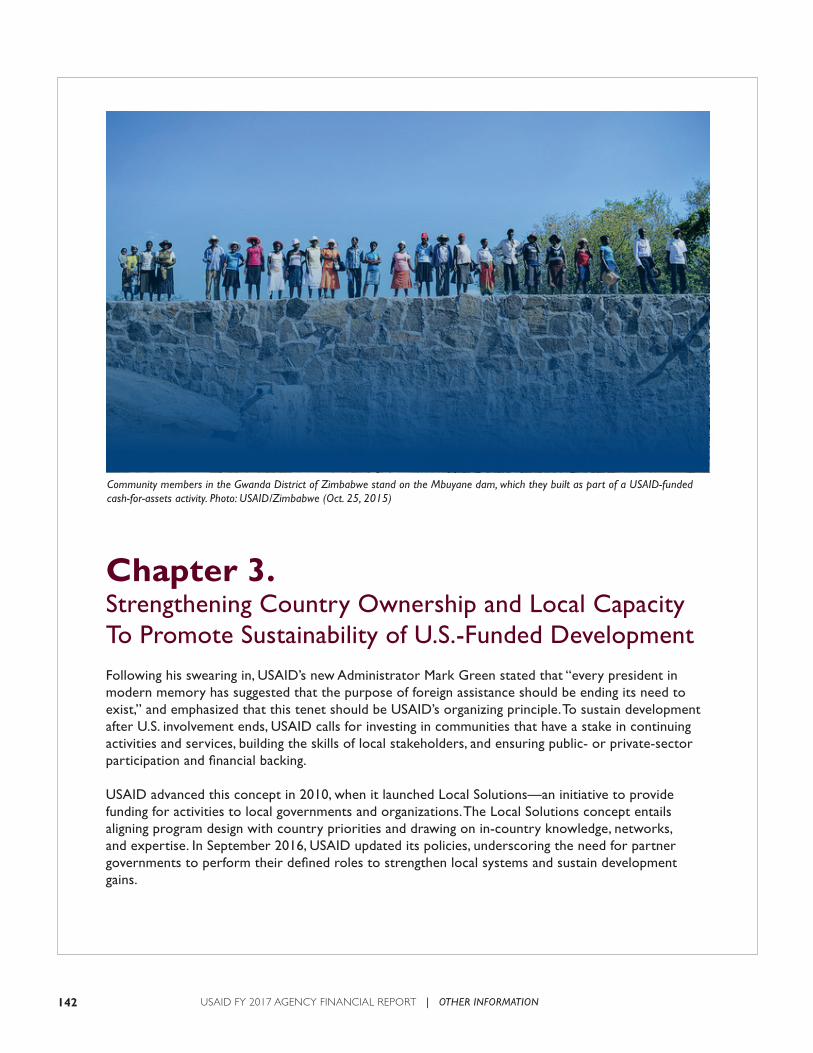
142 USAID FY 2017 AGENCY FINANCIAL REPORT | OTHER INFORMATION
Chapter 3. Strengthening Country Ownership and Local Capacity To Promote Sustainability of U.S.-Funded DevelopmentFollowing his swearing in, USAID’s new Administrator Mark Green stated that “every president in modern memory has suggested that the purpose of foreign assistance should be ending its need to exist,” and emphasized that this tenet should be USAID’s organizing principle. To sustain development after U.S. involvement ends, USAID calls for investing in communities that have a stake in continuing activities and services, building the skills of local stakeholders, and ensuring public- or private-sector participation and financial backing.
USAID advanced this concept in 2010, when it launched Local Solutions—an initiative to provide funding for activities to local governments and organizations. The Local Solutions concept entails aligning program design with country priorities and drawing on in-country knowledge, networks, and expertise. In September 2016, USAID updated its policies, underscoring the need for partner governments to perform their defined roles to strengthen local systems and sustain development gains.
Community members in the Gwanda District of Zimbabwe stand on the Mbuyane dam, which they built as part of a USAID-funded cash-for-assets activity. Photo: USAID/Zimbabwe (Oct. 25, 2015)
143USAID FY 2017 AGENCY FINANCIAL REPORT | OTHER INFORMATION
USAID’s initiatives to strengthen country ownership and capacity have been informed by global compacts that call for country ownership, inclusive partnerships, and delivering results—notably, the 2008 Accra Agenda and the 2011 Busan Partnership. The Accra Agenda calls for wider country participation in formulating policy, stronger country leadership on aid coordination, and more use of country systems for aid delivery; the Busan Partnership additionally calls for increased transparency and accountability.
Providing direct assistance to sovereign states, especially those with a history of weak democratic accountability, has a number of inherent risks. To minimize fiduciary risk, USAID calls for assessing country capacity to manage and be accountable for donor funds before providing assistance. While the Agency has policies on assessing and mitigating risk, its Local Solutions effort lacks clarity on how it measures sustainability and local ownership. As the Government Accountability Office (GAO) reported in April 2014, USAID measures the success of its Local Solutions initiative primarily by the amount of funding it has given to local entities, not by what they have done with the funds.1 In a review of programs having a Local Solutions component, the Agency acknowledged that “clear results related to sustainability and local ownership were ambiguous, and often not explicitly addressed.”2
We are currently auditing USAID’s Local Solutions efforts worldwide to determine whether USAID is achieving its three Local Solutions goals—strengthening local capacity, enhancing and promoting country ownership, and increasing sustainability—and implementing risk mitigation procedures for vetting and selecting government ministries, local nongovernmental organizations, and local for-profit firms to implement USAID-funded programs.
USAID has also been challenged to build sustainability into development programs that do not have a Local Solutions element. For example, a health services project in Haiti lacked a plan to transfer responsibility for paying the salaries of health workers at 80 health-care facilities from USAID to other sources after the project ended. According to the contract, the mission expected the country’s health ministry to assume some of these costs, but the Haitian Government could not take them on. To be viable, the project would need other donors. Similarly, 5 of 19 USAID-funded road construction projects in the West Bank and Gaza showed signs of deterioration, raising questions about their sustainability. A mission-commissioned study found that because of competing budget priorities, the Palestinian Authority did not allocate funds from fuel-tax revenue to support road maintenance. Finally, the contractor responsible for implementing USAID grants supporting renewable energy and electrification projects in rural communities in Colombia did not complete required sustainability plans, do cost estimates for operations and maintenance, or evaluate grantees’ technical and institutional abilities to achieve results and safeguard USAID assets.
While cost sharing can encourage local commitment to project sustainability, its use has been problematic in some locations.3 For example, in 6 of 13 awards made by the Azerbaijan, Belarus, and Ukraine missions that we reviewed, cost-sharing requirements did not effectively align with program goals. These missions could have benefited from additional guidance and training on using cost sharing.
1 “USAID Has Increased Funding to Partner-Country Organizations but Could Better Track Progress,” GAO-14-355, April 16, 2014.
2 “Closing the Loop on Learning, A Review of Local Solutions Evaluation Reports,” Social Solutions International Inc., December 2016.
3 USAID’s Automated Directives System (ADS) defines “cost share” as the resources “a recipient contributes to the total cost of an agreement” (ADS 303.3.10, effective June 18, 2012).
144 USAID FY 2017 AGENCY FINANCIAL REPORT | OTHER INFORMATION
Our investigations of local implementers in Cambodia, Nigeria, Pakistan, and the Philippines pointed to weak corporate governance, which poses a risk to long-term impact and sustainability. Most cases involved allegations of inappropriate or fraudulent actions taken by senior or key staff. We also found that local implementers typically failed to disclose fraud to the Agency or OIG.
The Agency is taking actions to promote sustainability, assess and mitigate risk, and build accountability, and recently updated its guidance to support these measures.4 Notably, the Agency completed or began the following efforts:
• Revised its program cycle guidance to further strengthen planning and implementation that promote sustainability in projects and activities.
• Began developing new training and tools to help staff implement the new guidance.
• Began developing indicators to track local ownership and identify effective practices for sustained results throughout USAID’s development program cycle.
The Agency is also working through external partnerships with the International Organization for Supreme Audit Institutions and GAO to enhance the oversight capabilities of audit organizations in developing countries.
To help ensure these actions are effectively implemented and have their intended effect, we will continue to monitor USAID’s efforts to strengthen local capacity, enhance and promote country ownership, and increase sustainability.
The Millennium Challenge Corporation (MCC) also faces a challenge related to strengthening local capacity and increasing sustainability. MCC awards large, 5-year grants or compacts to countries with sound policies that promote poverty reduction through sustainable economic growth. When a country is awarded a compact, it sets up a local, accountable entity to manage and oversee all aspects of implementation. This model, which centers on country ownership, entails risks like those USAID has with Local Solutions.
For example, the capacity of some accountable entities to manage activities is limited. This was the case with a $19.3 million MCC-funded construction project in Morocco. An OIG investigation uncovered a product substitution and false billing scheme facilitated by the supervisory engineering firm that Morocco’s accountable entity hired to oversee construction. A survey of the project sites also revealed construction defects and safety hazards due to poor workmanship and materials—defects that neither the supervisory engineer nor Morocco’s accountable entity reported. MCC asked the Government of Morocco to remediate the quality and safety issues, which will require an estimated $4.1 million.
4 In September 2016, USAID issued updated policy (ADS 201) and guidance to integrate and elevate sustainability and local ownership. The policy on government-to-government assistance (ADS 220) was issued in July 2014.
145USAID FY 2017 AGENCY FINANCIAL REPORT | OTHER INFORMATION
Risks related to sustainability planning and monitoring also exist in MCC’s projects. Our audit of the Philippines Revenue Administration Reform Project found that two information systems critical to modernizing tax collection were implemented without clear goals, schedules, or sustainability measures, making it difficult for the Philippine Government to manage and sustain the systems. In response to our recommendations, MCC finalized new policy and guidelines to assess sustainability in project design and require reporting on sustainability during project implementation.
We will continue to monitor how these changes in policy are implemented in future compacts. We also have an ongoing audit to determine if MCC has sufficient policies, procedures, and guidance to meet sustainability goals for road infrastructure projects and whether MCC tracks and assesses activities to improve their sustainability.
In determining our oversight priorities, we consider such risks, and our 2017-2018 plan includes audits of infrastructure project planning, monitoring, and sustainability, while our investigative efforts will continue to focus on detecting, deterring, and neutralizing fraud and corruption in infrastructure projects.
Related OIG Products
• “USAID/Colombia’s Clean Energy Program Faced Delays in Achieving Intended Results, 1-514-17-002-P,” May 5, 2017.
• “Revenue Administration Reform Project in the Philippines Would Have Benefited From Consolidating Its Sustainability Efforts,” M-000-17-004-C, February 15, 2017.
• “USAID Top Management Challenges and OIG Initiatives,” Statement of the Honorable Ann Calvaresi Barr Before the Senate Committee on Foreign Relations, Subcommittee on State Department and USAID Management, International Operations and Bilateral International Development,” December 8, 2016.
• “USAID/Haiti Needs To Improve Oversight of the Quality Health Services for Haiti Central and South Project To Better Ensure Sustainability,” 1-521-16-006-P, July 6, 2016.
• “USAID/Azerbaijan, Belarus, Ukraine, and Other Offices Would Benefit From Additional Guidance and Training on Using Cost Sharing,” 8-000-16-002-P, July 5, 2016.
• “Audit of USAID/West Bank and Gaza Construction Programs,” 8-294-16-001-P, February 22, 2016.
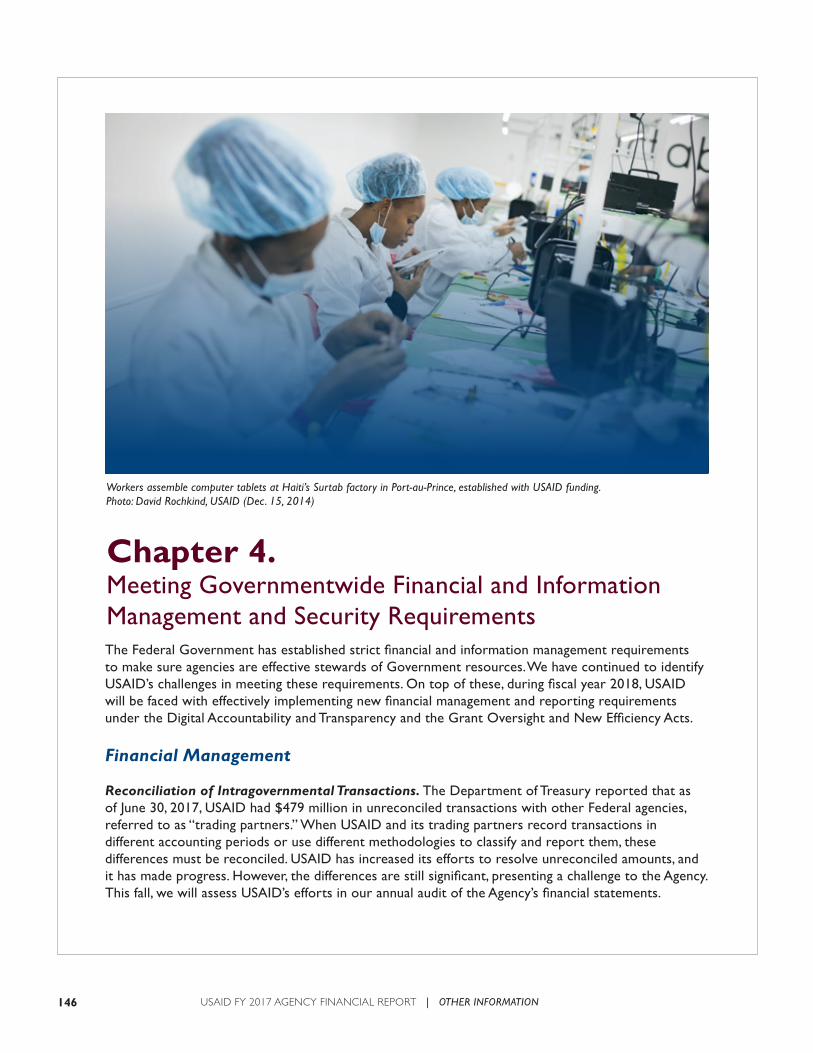
146 USAID FY 2017 AGENCY FINANCIAL REPORT | OTHER INFORMATION
Chapter 4. Meeting Governmentwide Financial and Information Management and Security RequirementsThe Federal Government has established strict financial and information management requirements to make sure agencies are effective stewards of Government resources. We have continued to identify USAID’s challenges in meeting these requirements. On top of these, during fiscal year 2018, USAID will be faced with effectively implementing new financial management and reporting requirements under the Digital Accountability and Transparency and the Grant Oversight and New Efficiency Acts.
Financial Management
Reconciliation of Intragovernmental Transactions. The Department of Treasury reported that as of June 30, 2017, USAID had $479 million in unreconciled transactions with other Federal agencies, referred to as “trading partners.” When USAID and its trading partners record transactions in different accounting periods or use different methodologies to classify and report them, these differences must be reconciled. USAID has increased its efforts to resolve unreconciled amounts, and it has made progress. However, the differences are still significant, presenting a challenge to the Agency. This fall, we will assess USAID’s efforts in our annual audit of the Agency’s financial statements.
Workers assemble computer tablets at Haiti’s Surtab factory in Port-au-Prince, established with USAID funding. Photo: David Rochkind, USAID (Dec. 15, 2014)
147USAID FY 2017 AGENCY FINANCIAL REPORT | OTHER INFORMATION
Reconciliation of the Fund Balance With Treasury. Our audit of USAID’s financial statements for fiscal years 2016 and 2015 identified a material weakness related to the Agency’s Fund Balance with Treasury (FBWT) reconciliations. This weakness indicates that a material misstatement of the Agency’s financial statements may not be prevented or readily detected. USAID has made progress reconciling its FBWT account, but large unreconciled differences remain. In the past, USAID did not reconcile the FBWT account with Treasury’s fund balance each month or research and resolve any identified differences in a timely manner. Instead, USAID adjusted its FBWT account to agree with Treasury’s fund balance. As of September 30, 2016, the net difference between USAID’s general ledger and the amount in Treasury’s records was approximately $195 million, of which $141 million was unexplained. This difference accumulated because of ongoing problems with a legacy system and data migration, and the lack of an integrated system to control reconciliations performed by missions around the world. USAID reported it that had developed a plan to work with Treasury and OMB to resolve the difference by December 2016. However, as of September 2017, the difference had not been resolved. Until these actions are fully implemented and the impacts assessed in our future financial statement audits, reconciliation will remain a management challenge.
Information Management and Security
Federal Information Technology Acquisition Reform Act (FITARA). FITARA was enacted in December 2014 to reform and streamline the Government’s information technology acquisitions, including strengthening chief information officers’ accountability for their agencies’ IT costs, schedules, performance, and security. We are conducting an audit of USAID’s and MCC’s compliance with FITARA requirements. According to USAID’s baseline implementation plan, most FITARA requirements will not be met until September 30, 2018. Until the plan is implemented, USAID will face a challenge with complying with FITARA requirements.
Privacy Act of 1974. Our 2014 audit of USAID’s privacy program for information technology resulted in 34 recommendations for the Agency to address weaknesses and risks related to potential noncompliance with major privacy laws, including the Privacy Act of 1974, as amended. Most significantly, USAID needs to determine and allocate the resources needed for the program. USAID has made progress in addressing these weaknesses by taking final action on 32 of the 34 recommendations, downgrading this area from a significant deficiency to a control deficiency, which it plans to correct by December 2017. Despite progress, until USAID determines and allocates the resources needed for the program, this management challenge will persist.
Executive Order 13526, Classified National Security Information. Executive Order 13526, signed in 2009, established a uniform system for classifying, safeguarding, and declassifying national security information. In September 2016, we reported that USAID’s classification policy did not meet the order’s requirements, having found persistent and systemic noncompliance related to program management and administration. We also reported that not all of the 11 recommendations we made in 2014 were implemented effectively. Given the depth, sensitivity, and persistence of the weaknesses we found in operations, reporting, and compliance, we considered the noncompliance a significant internal control deficiency. Despite these weaknesses, our review did not find instances of persistent misclassification of derivatively classified information, and USAID’s one originally classified document was properly classified.
148 USAID FY 2017 AGENCY FINANCIAL REPORT | OTHER INFORMATION
In response to our 2016 recommendation, USAID’s Office of Security implemented a corrective action plan in 2017. We reported the noncompliance as a challenge last year, but acknowledge USAID’s progress in addressing it. Continued management attention to implementation in the decentralized security environment at USAID will be critical to achieving sustained effectiveness of recent corrective actions and preventing compliance with the executive order from recurring as a top management challenge.
Related OIG Products
• “Audit of USAID’s Financial Statements for Fiscal Years 2016 and 2015,” 0-000-17-001-C, November 15, 2016.
• “USAID’s Implementation of Executive Order 13526, Classified National Security Information, Needs Significant Improvement,” 9-000-16-001-P, September 30, 2016.
• “Audit of USAID’s Implementation of Key Components of a Privacy Program for Its Information Technology Systems,” A-000-15-001-P, October 10, 2015.
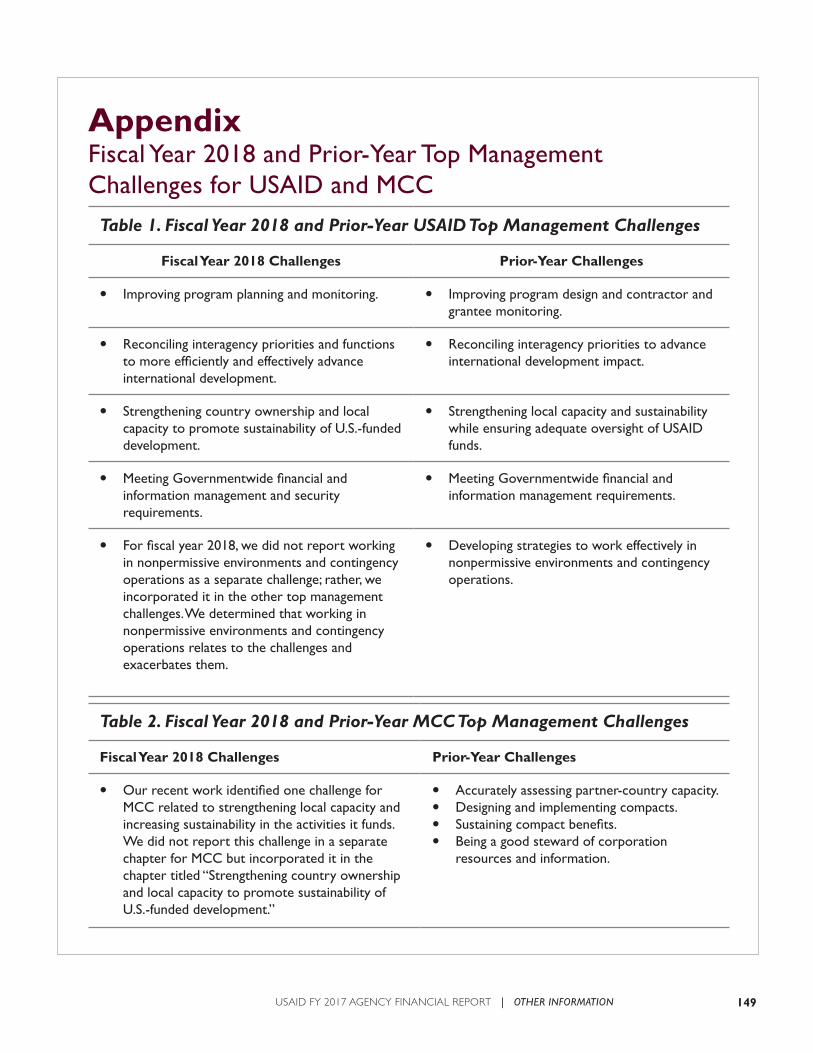
149USAID FY 2017 AGENCY FINANCIAL REPORT | OTHER INFORMATION
Appendix Fiscal Year 2018 and Prior-Year Top Management Challenges for USAID and MCC
Table 1. Fiscal Year 2018 and Prior-Year USAID Top Management Challenges
Fiscal Year 2018 Challenges Prior-Year Challenges
• Improving program planning and monitoring. • Improving program design and contractor and grantee monitoring.
• Reconciling interagency priorities and functions to more efficiently and effectively advance international development.
• Reconciling interagency priorities to advance international development impact.
• Strengthening country ownership and local capacity to promote sustainability of U.S.-funded development.
• Strengthening local capacity and sustainability while ensuring adequate oversight of USAID funds.
• Meeting Governmentwide financial and information management and security requirements.
• Meeting Governmentwide financial and information management requirements.
• For fiscal year 2018, we did not report working in nonpermissive environments and contingency operations as a separate challenge; rather, we incorporated it in the other top management challenges. We determined that working in nonpermissive environments and contingency operations relates to the challenges and exacerbates them.
• Developing strategies to work effectively in nonpermissive environments and contingency operations.
Table 2. Fiscal Year 2018 and Prior-Year MCC Top Management Challenges
Fiscal Year 2018 Challenges Prior-Year Challenges
• Our recent work identified one challenge for MCC related to strengthening local capacity and increasing sustainability in the activities it funds. We did not report this challenge in a separate chapter for MCC but incorporated it in the chapter titled “Strengthening country ownership and local capacity to promote sustainability of U.S.-funded development.”
• Accurately assessing partner-country capacity.• Designing and implementing compacts.• Sustaining compact benefits.• Being a good steward of corporation
resources and information.
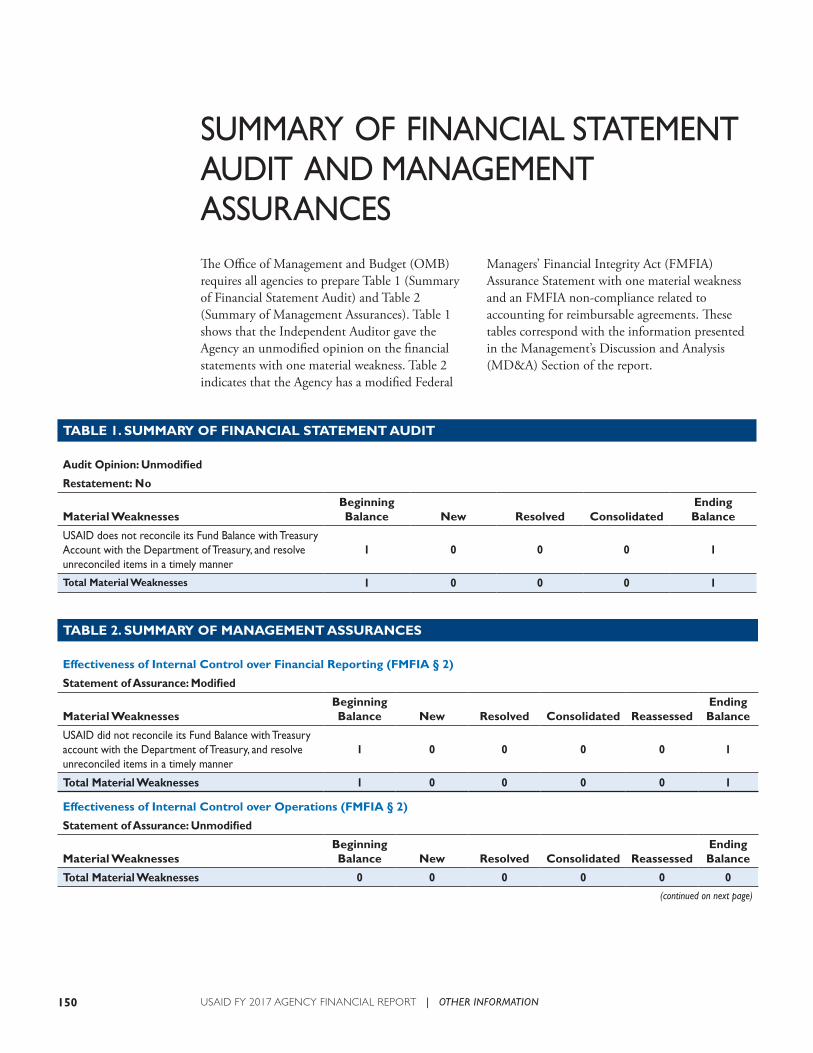
150 USAID FY 2017 AGENCY FINANCIAL REPORT | OTHER INFORMATION
SUMMARY OF FINANCIAL STATEMENT AUDIT AND MANAGEMENT ASSURANCESThe Office of Management and Budget (OMB) requires all agencies to prepare Table 1 (Summary of Financial Statement Audit) and Table 2 (Summary of Management Assurances). Table 1 shows that the Independent Auditor gave the Agency an unmodified opinion on the financial statements with one material weakness. Table 2 indicates that the Agency has a modified Federal
Managers’ Financial Integrity Act (FMFIA) Assurance Statement with one material weakness and an FMFIA non-compliance related to accounting for reimbursable agreements. These tables correspond with the information presented in the Management’s Discussion and Analysis (MD&A) Section of the report.
TABLE 1. SUMMARY OF FINANCIAL STATEMENT AUDIT
Audit Opinion: Unmodified
Restatement: No
Material WeaknessesBeginning Balance New Resolved Consolidated
Ending Balance
USAID does not reconcile its Fund Balance with Treasury Account with the Department of Treasury, and resolve unreconciled items in a timely manner
1 0 0 0 1
Total Material Weaknesses 1 0 0 0 1
TABLE 2. SUMMARY OF MANAGEMENT ASSURANCES
Effectiveness of Internal Control over Financial Reporting (FMFIA § 2)
Statement of Assurance: Modified
Material WeaknessesBeginning Balance New Resolved Consolidated Reassessed
Ending Balance
USAID did not reconcile its Fund Balance with Treasury account with the Department of Treasury, and resolve unreconciled items in a timely manner
1 0 0 0 0 1
Total Material Weaknesses 1 0 0 0 0 1
Effectiveness of Internal Control over Operations (FMFIA § 2)
Statement of Assurance: Unmodified
Material WeaknessesBeginning Balance New Resolved Consolidated Reassessed
Ending Balance
Total Material Weaknesses 0 0 0 0 0 0
(continued on next page)
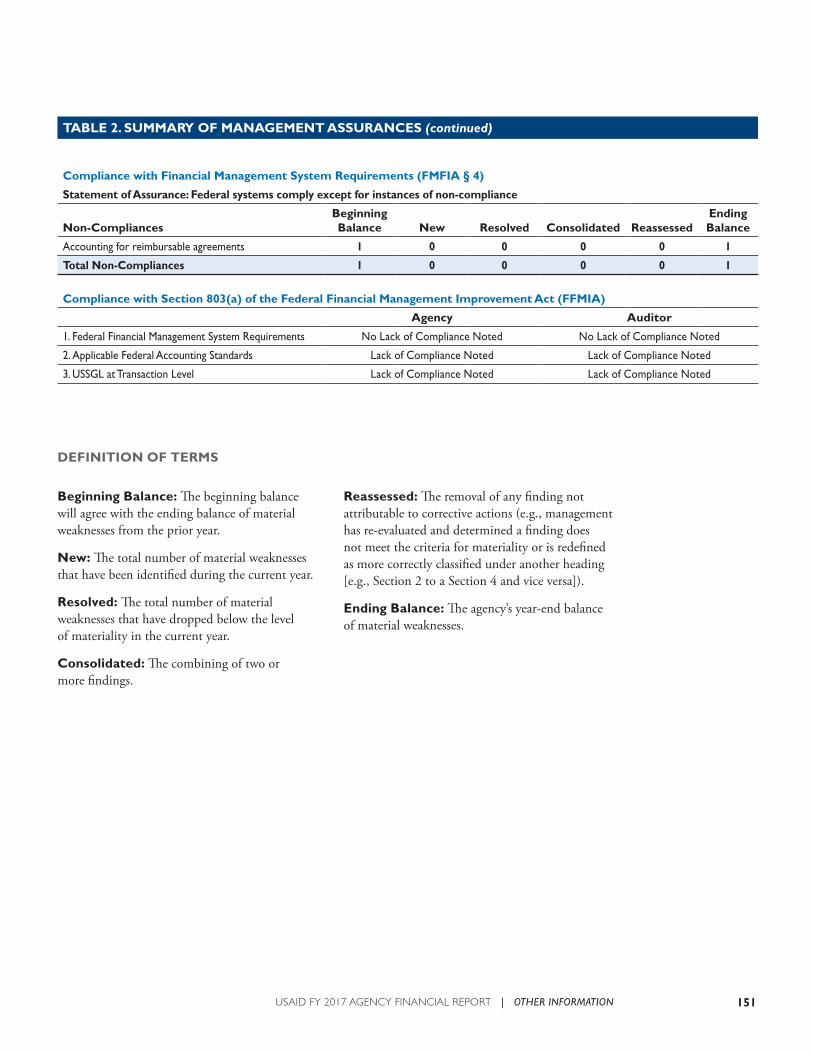
151USAID FY 2017 AGENCY FINANCIAL REPORT | OTHER INFORMATION
TABLE 2. SUMMARY OF MANAGEMENT ASSURANCES (continued)
Compliance with Financial Management System Requirements (FMFIA § 4)
Statement of Assurance: Federal systems comply except for instances of non-compliance
Non-CompliancesBeginning Balance New Resolved Consolidated Reassessed
Ending Balance
Accounting for reimbursable agreements 1 0 0 0 0 1
Total Non-Compliances 1 0 0 0 0 1
Compliance with Section 803(a) of the Federal Financial Management Improvement Act (FFMIA)
Agency Auditor
1. Federal Financial Management System Requirements No Lack of Compliance Noted No Lack of Compliance Noted
2. Applicable Federal Accounting Standards Lack of Compliance Noted Lack of Compliance Noted
3. USSGL at Transaction Level Lack of Compliance Noted Lack of Compliance Noted
DEFINITION OF TERMS
Beginning Balance: The beginning balance will agree with the ending balance of material weaknesses from the prior year.
New: The total number of material weaknesses that have been identified during the current year.
Resolved: The total number of material weaknesses that have dropped below the level of materiality in the current year.
Consolidated: The combining of two or more findings.
Reassessed: The removal of any finding not attributable to corrective actions (e.g., management has re-evaluated and determined a finding does not meet the criteria for materiality or is redefined as more correctly classified under another heading [e.g., Section 2 to a Section 4 and vice versa]).
Ending Balance: The agency’s year-end balance of material weaknesses.
152 USAID FY 2017 AGENCY FINANCIAL REPORT | OTHER INFORMATION
PAYMENT INTEGRITY
The Improper Payments Information Act (IPIA) of 2002, Public Law (Pub. L.) No. 107-300, as amended, requires agencies to annually review their programs to identify those susceptible to significant improper payments, as well as to conduct payment recapture programs. On July 22, 2010, the Improper Payments Elimination and Recovery Act (IPERA, Pub. L. No. 111-204) was enacted, which amended the IPIA and repealed the Recovery Auditing Act (Section 831 of the 2002 Defense Authorization Act, Pub. L. No. 107-107). In January 2013, the Improper Payments Elimination and Recovery Improvement Act (IPERIA) of 2012, Pub. L. No. 112-248, further amended IPIA. All remaining references in this disclosure to the term IPIA will mean IPIA as amended by IPERA and IPERIA. Most significantly, IPERIA expanded the term “payment” to refer to all payments except intragovernmental transactions. It also codified the Office of Management and Budget’s (OMB) ongoing efforts to develop and enhance the U.S. Government’s Do Not Pay Initiative (DNP), which included the creation of a centralized DNP list for agencies to access prior to disbursing payments. USAID defines its programs and activities in alignment with the manner of funding received through appropriations, as further subdivided into funding for global operations. See Appendix B in this document for a list of USAID programs.
USAID is dedicated to reducing fraud, waste, and abuse by adequately reviewing and reporting programs susceptible to improper payments under IPIA and OMB Circular A-123, Appendix C, Requirements for Effective Estimation and Remedia-tion of Improper Payments. USAID took signifi-cant steps to reduce or eliminate the Agency’s improper payments through comprehensive annual internal control reviews and substantive testing of payments. USAID requires staff associated with payments to complete improper payments training, exercise the highest degree of quality control in the payment process, and be held accountable for improper payments.
Appendix C requires all federal agencies to determine if the risk of improper payments is significant and to provide statistically valid annual estimates of improper payments. An improper payment is defined as any payment that should not have been made or that was made in an incorrect amount under statutory, contractual, administrative, or other legally applicable requirements. Incorrect amounts are overpayments or underpayments that are made to eligible recipients (including inappropriate denials of payment or service, any payment that does not account for credit for applicable discounts, payments that are for the incorrect amount, and duplicate payments). An improper payment also includes any payment that was made to an ineligible recipient or for an ineligible good or service, or payments for goods or services not received (except for such payments authorized by law).
I. RISK ASSESSMENT
In March 2015, OMB granted USAID relief from reporting beginning with the FY 2015 Agency Financial Report (AFR), meaning the Agency is on a three-year risk assessment cycle. The reporting relief was based upon USAID having reported a minimum of two consecutive years of improper payments below the thresholds set by IPERA and an assertion by USAID’s Office of Inspector General (OIG) that it concurs with this request for relief. USAID will report the results of its risk assessment when it resumes the three-year cycle (i.e., FY 2018). This reporting relief is contingent upon no significant legislative or programmatic changes occurring, as well as no significant funding increases or any change that would result in substantial program impact.
USAID maintains improper payment reporting readiness and expertise by continuing to perform risk assessments annually in order to identify programs susceptible to significant improper payments. In the event a program is susceptible to significant improper payments, USAID will revert
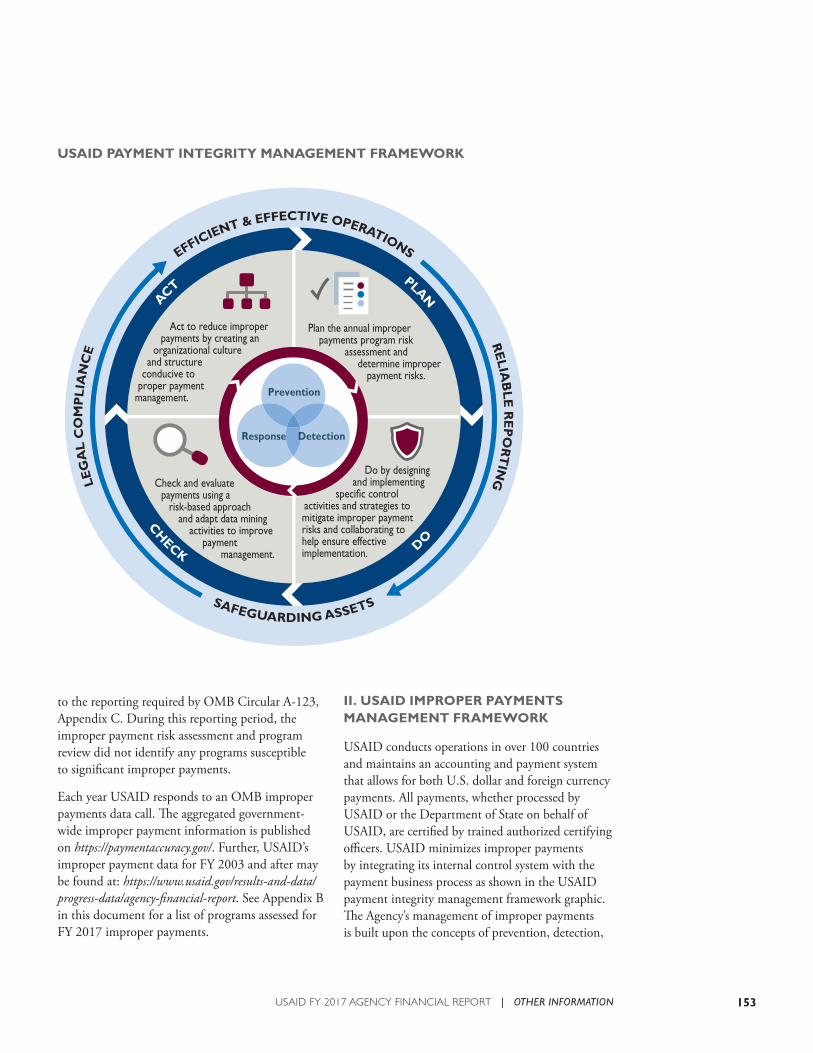
153USAID FY 2017 AGENCY FINANCIAL REPORT | OTHER INFORMATION
II. USAID IMPROPER PAYMENTS MANAGEMENT FRAMEWORK
USAID conducts operations in over 100 countries and maintains an accounting and payment system that allows for both U.S. dollar and foreign currency payments. All payments, whether processed by USAID or the Department of State on behalf of USAID, are certified by trained authorized certifying officers. USAID minimizes improper payments by integrating its internal control system with the payment business process as shown in the USAID payment integrity management framework graphic. The Agency’s management of improper payments is built upon the concepts of prevention, detection,
to the reporting required by OMB Circular A-123, Appendix C. During this reporting period, the improper payment risk assessment and program review did not identify any programs susceptible to significant improper payments.
Each year USAID responds to an OMB improper payments data call. The aggregated government-wide improper payment information is published on https://paymentaccuracy.gov/. Further, USAID’s improper payment data for FY 2003 and after may be found at: https://www.usaid.gov/results-and-data/progress-data/agency-financial-report. See Appendix B in this document for a list of programs assessed for FY 2017 improper payments.
USAID PAYMENT INTEGRITY MANAGEMENT FRAMEWORK
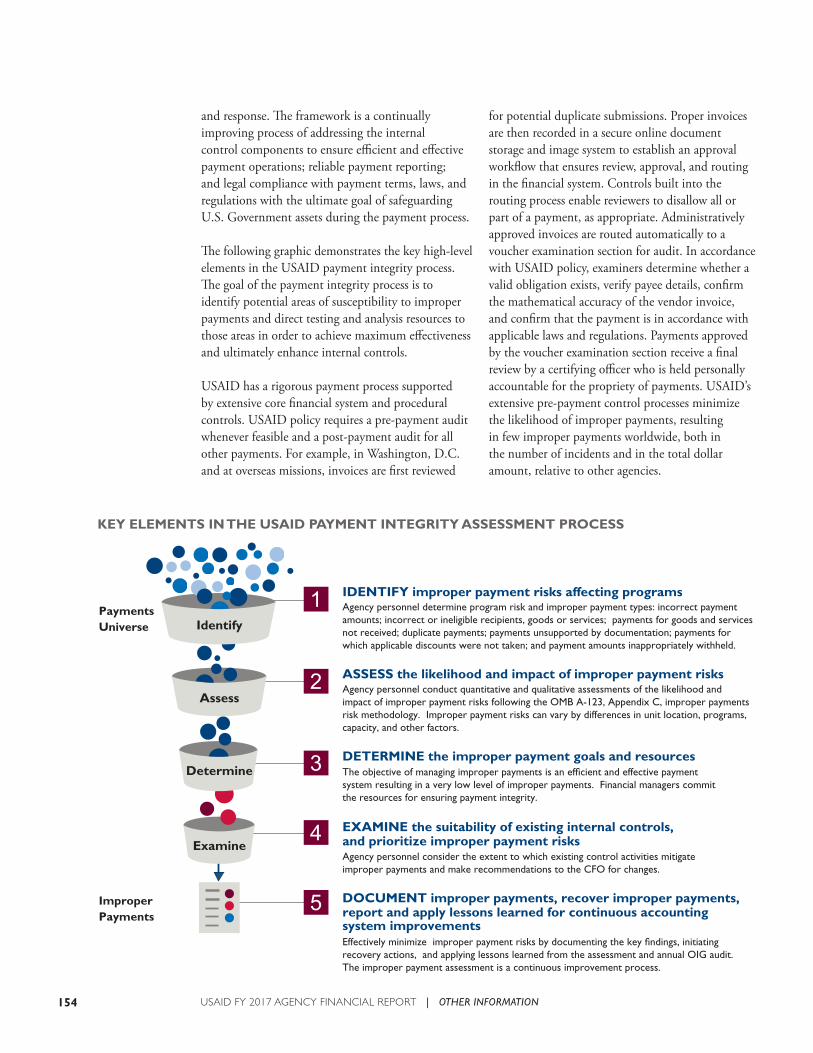
154 USAID FY 2017 AGENCY FINANCIAL REPORT | OTHER INFORMATION
and response. The framework is a continually improving process of addressing the internal control components to ensure efficient and effective payment operations; reliable payment reporting; and legal compliance with payment terms, laws, and regulations with the ultimate goal of safeguarding U.S. Government assets during the payment process.
The following graphic demonstrates the key high-level elements in the USAID payment integrity process. The goal of the payment integrity process is to identify potential areas of susceptibility to improper payments and direct testing and analysis resources to those areas in order to achieve maximum effectiveness and ultimately enhance internal controls.
USAID has a rigorous payment process supported by extensive core financial system and procedural controls. USAID policy requires a pre-payment audit whenever feasible and a post-payment audit for all other payments. For example, in Washington, D.C. and at overseas missions, invoices are first reviewed
for potential duplicate submissions. Proper invoices are then recorded in a secure online document storage and image system to establish an approval workflow that ensures review, approval, and routing in the financial system. Controls built into the routing process enable reviewers to disallow all or part of a payment, as appropriate. Administratively approved invoices are routed automatically to a voucher examination section for audit. In accordance with USAID policy, examiners determine whether a valid obligation exists, verify payee details, confirm the mathematical accuracy of the vendor invoice, and confirm that the payment is in accordance with applicable laws and regulations. Payments approved by the voucher examination section receive a final review by a certifying officer who is held personally accountable for the propriety of payments. USAID’s extensive pre-payment control processes minimize the likelihood of improper payments, resulting in few improper payments worldwide, both in the number of incidents and in the total dollar amount, relative to other agencies.
KEY ELEMENTS IN THE USAID PAYMENT INTEGRITY ASSESSMENT PROCESS
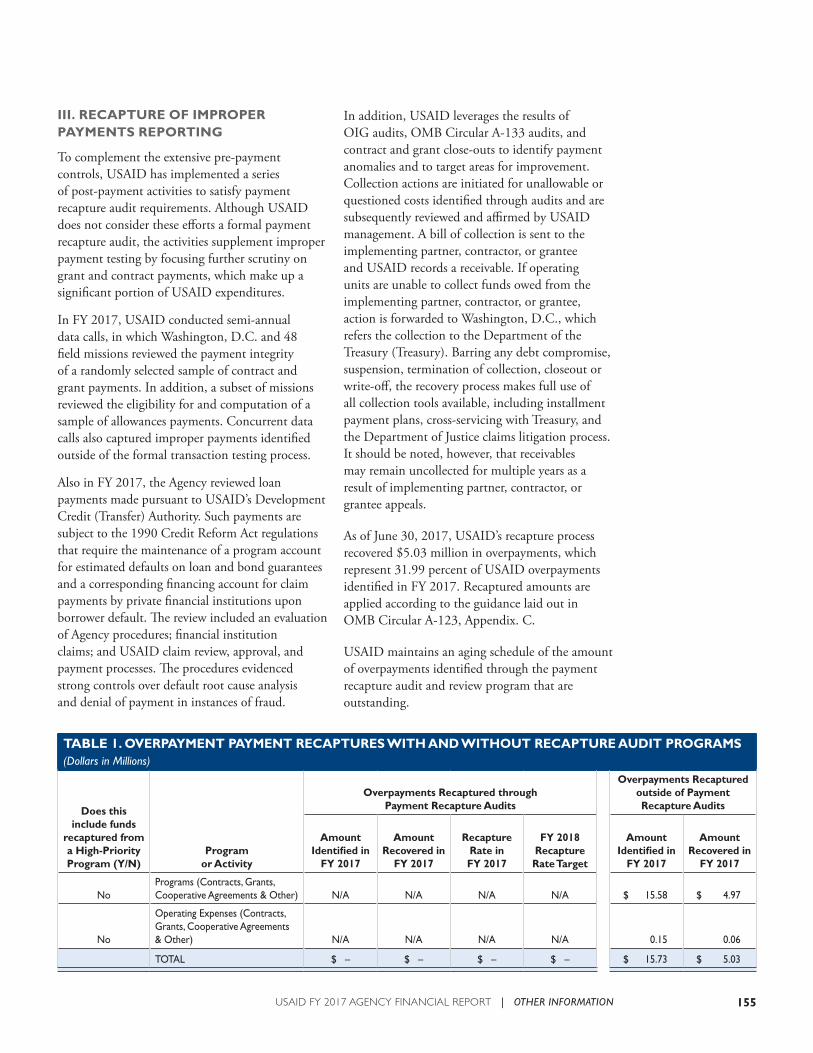
155USAID FY 2017 AGENCY FINANCIAL REPORT | OTHER INFORMATION
III. RECAPTURE OF IMPROPER PAYMENTS REPORTING
To complement the extensive pre-payment controls, USAID has implemented a series of post-payment activities to satisfy payment recapture audit requirements. Although USAID does not consider these efforts a formal payment recapture audit, the activities supplement improper payment testing by focusing further scrutiny on grant and contract payments, which make up a significant portion of USAID expenditures.
In FY 2017, USAID conducted semi-annual data calls, in which Washington, D.C. and 48 field missions reviewed the payment integrity of a randomly selected sample of contract and grant payments. In addition, a subset of missions reviewed the eligibility for and computation of a sample of allowances payments. Concurrent data calls also captured improper payments identified outside of the formal transaction testing process.
Also in FY 2017, the Agency reviewed loan payments made pursuant to USAID’s Development Credit (Transfer) Authority. Such payments are subject to the 1990 Credit Reform Act regulations that require the maintenance of a program account for estimated defaults on loan and bond guarantees and a corresponding financing account for claim payments by private financial institutions upon borrower default. The review included an evaluation of Agency procedures; financial institution claims; and USAID claim review, approval, and payment processes. The procedures evidenced strong controls over default root cause analysis and denial of payment in instances of fraud.
In addition, USAID leverages the results of OIG audits, OMB Circular A-133 audits, and contract and grant close-outs to identify payment anomalies and to target areas for improvement. Collection actions are initiated for unallowable or questioned costs identified through audits and are subsequently reviewed and affirmed by USAID management. A bill of collection is sent to the implementing partner, contractor, or grantee and USAID records a receivable. If operating units are unable to collect funds owed from the implementing partner, contractor, or grantee, action is forwarded to Washington, D.C., which refers the collection to the Department of the Treasury (Treasury). Barring any debt compromise, suspension, termination of collection, closeout or write-off, the recovery process makes full use of all collection tools available, including installment payment plans, cross-servicing with Treasury, and the Department of Justice claims litigation process. It should be noted, however, that receivables may remain uncollected for multiple years as a result of implementing partner, contractor, or grantee appeals.
As of June 30, 2017, USAID’s recapture process recovered $5.03 million in overpayments, which represent 31.99 percent of USAID overpayments identified in FY 2017. Recaptured amounts are applied according to the guidance laid out in OMB Circular A-123, Appendix. C.
USAID maintains an aging schedule of the amount of overpayments identified through the payment recapture audit and review program that are outstanding.
TABLE 1. OVERPAYMENT PAYMENT RECAPTURES WITH AND WITHOUT RECAPTURE AUDIT PROGRAMS (Dollars in Millions)
Does this include funds
recaptured from a High-Priority Program (Y/N)
Program or Activity
Overpayments Recaptured through Payment Recapture Audits
Overpayments Recaptured outside of Payment Recapture Audits
AmountIdentified in
FY 2017
AmountRecovered in
FY 2017
Recapture Rate in FY 2017
FY 2018 Recapture Rate Target
AmountIdentified in
FY 2017
AmountRecovered in
FY 2017
NoPrograms (Contracts, Grants, Cooperative Agreements & Other) N/A N/A N/A N/A $ 15.58 $ 4.97
No
Operating Expenses (Contracts, Grants, Cooperative Agreements & Other) N/A N/A N/A N/A 0.15 0.06
TOTAL $ – $ – $ – $ – $ 15.73 $ 5.03
156 USAID FY 2017 AGENCY FINANCIAL REPORT | OTHER INFORMATION
USAID continues to identify potential improper payments through prepayment initiatives and post-payment methods. Prepayment initiatives consist of multiple levels of completeness, existence, and accuracy reviews. Post-payment methods include monthly analytical reviews for duplicate payments and payments sent to the wrong implementing partner, contractor, or grantee. In addition, the Agency uses Treasury’s DNP portal to assist in the identification of improper payments.
IV. AGENCY REDUCTION OF IMPROPER PAYMENTS WITH THE DO NOT PAY INITIATIVE
The IPERIA law requires OMB to submit to Congress an annual report, “which may be included as part of another report submitted to Congress by the Director, regarding the operation of the DNP Initiative, which shall: (A) include an evaluation of whether the DNP Initiative has reduced improper payments or improper awards; and (B) provide the frequency of corrections or identification of incorrect information.”
• The Bureau for Management, Office of the Chief Financial Officer (M/CFO) has incorporated IPERIA listed DNP database searches into the existing improper payment and payment recapture processes. During FY 2017, Treasury sent a monthly DNP adjudication report listing possible DNP database matches to M/CFO. M/CFO then conducted a manual review of disbursed payments using the online DNP portal. For example, the monthly Treasury DNP adjudication report might identify five matches for a vendor named “Smith.” For each possible match, M/CFO would determine if the vendor was correctly identified and/or if the payment was proper. USAID is currently using the following databases:
– The Death Master File (DMF) of the Social Security Administration;
– The General Services Administration’s System for Award Management (SAM);
– The Debt Check Database for Treasury (Debt Check).
• For reporting purposes, the kind of data in question includes:
– Payments reviewed for improper payments, which includes all payments screened by the DNP Initiative or other USAID internal databases (M/CFO), as appropriate, that are disbursed by or on behalf of USAID;
– Payments stopped, which includes payments that were intercepted or were not disbursed due to the DNP Initiative;
– Improper payments reviewed and not stopped, which includes payments that were reviewed by the DNP databases, disbursed, and later identified as improper.
M/CFO plans to continue to use the portal to adjudicate any DNP matches.
During FY 2017, the DNP Initiative identified one matching improper payment for $2,310 out of 66,380 payments totaling $6.253 billion. Upon further review, this payment was found to be a proper payment. In the FY 2016 AFR, one improper payment identified for $385,000 was identified by the DNP Initiative. After further investigation, it was also determined to be a proper payment. The DNP Initiative is an automated portal designed to identify beneficiary matches for entitlements. USAID does not disburse entitlements.
Since FY 2014, USAID, using the DNP Initiative, has reviewed 262,663 payments totaling $23.65 billion with no matching improper payments. Based upon USAID experience to date, it is unlikely that the DNP Initiative will provide USAID with a large frequency of corrections or identify significant instances of incorrect information.
157USAID FY 2017 AGENCY FINANCIAL REPORT | OTHER INFORMATION
FRAUD REDUCTION REPORTUSAID recognizes the complex nature and fiduciary risk of transactions occurring in an international environment. As a result, the Agency expends considerable energy and resources on fraud prevention, detection, and response through strong internal controls, oversight, risk assessment, and training. Leveraging these existing policies and systems creates a collaborative team of stakeholders who employ evidence-based strategies to design an internal control system that effectively manages the Agency’s fiduciary risk and, in turn, reduces fraud.
BACKGROUND
The Fraud Reduction and Data Analytics Act of 2015 (Public Law (Pub. L.) No. 114-186) was signed into law on June 30, 2016.12 This legislation required the Office of Management and Budget (OMB) to establish guidelines for federal agencies to employ the use of the Government Accountability Office’s (GAO) Framework for Managing Fraud Risks in Federal Programs (GAO Framework). The GAO Framework’s purpose is to implement control activities related to fraud risk management.13 Together, Pub. L. No. 114-186 and the GAO Framework provide a mandate and the methods to strengthen USAID’s efforts to prevent, detect, and respond to fraudulent activities.
GAO’S FRAUD REDUCTION FRAMEWORK
The GAO Framework consists of three categories of general control activities: prevention, detection, and response. The GAO Framework complements existing guidance on combating fraud within the Federal Government generally. The Agency’s fraud reduction efforts include conformance with
existing regulations, such as the revised Standards for Internal Control in the Federal Government [2016] (GAO Green Book), the Improper Payments Information Act of 2002 (IPIA; Pub. L. 107 -300), and OMB Circular A-123, including the changes implemented in 2016 to incorporate Enterprise Risk Management (ERM).
USAID OPERATIONS
As described earlier in this report, USAID operates in more than 100 countries. These activities are described more fully at USAID’s foreign assistance data portal (http://foreignassistance.gov). USAID spending is planned through Country Development Cooperation Strategies (CDCSs) and is directed to specific development objectives and related operating expenses. In support of the Paris Declaration (2005), the Accra Agenda (2008), and the Busan Partnership (2011), USAID has given priority to increasing the Agency’s direct investment in partner governments and local organizations. This initiative is a result of the Presidential Policy Directive on Global Development (2010) and is articulated in the April 2014 Agency publication, Local Systems: A Framework for Supporting Sustained Development.14 Individual development projects are designed to partner with governmental organizations and non-governmental organizations—including civil society organizations and private sector organizations—in order to help people and sovereign governments progress beyond assistance. These projects occur within all technical sectors in countries and regions targeted for USAID development activities. This effort has increased the number of Agency implementing partners, both primary and sub-recipients, and has necessitated an increased vigilance in preventing, detecting, and responding to fraudulent activities.
12 U.S. Congress. “Public Law 114-186—June 30, 2016. Fraud Reduction and Data Analytics Act of 2015” (2016): n. page. U.S. Congress, June 30, 2016. Web. July 25, 2017. https://congress.gov/114/plaws/publ186/PLAW-114publ186.pdf.
13 U.S. GAO. “A Framework for Managing Fraud Risks in Federal Programs.” U.S. Government Accountability Office (U.S. GAO), July 28, 2015. Web. July 25, 2017. http://www.gao.gov/products/GAO-15-593SP.
14 USAID. “Local Systems: A Framework for Supporting Sustained Development.” U.S. Agency for International Development, Bureau for Policy, Planning and Learning (PPL), April 1, 2014. www.usaid.gov/policy/local-systems-framework.
158 USAID FY 2017 AGENCY FINANCIAL REPORT | OTHER INFORMATION
USAID’S FRAUD REDUCTION PRACTICES
As noted earlier, USAID is subject to the complete universe of laws, regulations, and Agency policies that collectively form an implicit framework for managing fraud risks. USAID is subject to the U.S. Government’s hierarchy of laws and regulations as set forth in the Code of Federal Regulations (CFR), the Federal Acquisition Regulation (FAR), USAID’s Acquisition Regulation (AIDAR), the Federal Managers Financial Integrity Act (FMFIA), the Federal Information Technology Acquisition Reform Act (FITARA), the Government Management Reform Act of 1994 (GMRA), the Federal Information Security Management Act (FISMA), the Federal Financial Management Improvement Act (FFMIA), and internal operational policies and procedures that are codified in USAID’s Automated Directives System (ADS). The ADS comprehensively covers Agency policy for Organization Management and Authorities, Development Programming, Acquisition and Assistance, Human Resources, Management Services, and Budget and Finance. Together these regulations and policies, coupled with training for staff, comprise a robust framework for fraud prevention and reduction. The GAO Framework allows the Agency to expand and strengthen efforts to combat fraud and protect Agency funds.
PREVENTION
The Agency has zero tolerance for fraud. Agency fraud reduction efforts include an internal controls system informed by all levels of the organization, as well as transactional supervisory reviews and quality assurance controls conducted worldwide to detect and prevent fraudulent activities and transactions. For example, all grants and contracts are subject to robust due diligence reviews and audit requirements. The Agency uses the Defense Contract Audit Agency (DCAA), other financial service providers (contractors), and Agency staff to conduct pre-award
surveys and Public Financial Management Risk Assessment Framework (PFMRAF) reviews to assess recipient absorptive capacity, technical expertise, internal controls, and financial risks. These assessments constitute a significant Agency effort to prevent opportunistic fraud and serve as a valuable mechanism in targeting awards to organizations with an ability to effectively manage and protect USAID funds.
Subsequent to the award process, USAID conducts targeted financial reviews and audits in compliance with FMFIA and Agency policies. USAID also conducts annual OMB Circular A-123, Appendix A, B, C, and D assessments. Collectively, these activities constitute measures of preventive and detective fraud controls for all U.S. Government funds within the USAID portfolio. Furthermore, the Agency conducts a 100 percent review of all travel vouchers, blocks specific credit card (travel and purchase) merchant codes, and employs both an automated and manual review of credit card transactions. Additionally, all employees receive mandatory ethics and fraud awareness training.
FRAUD DETECTION
USAID’s existing Fraud Prevention and Detection Framework includes efforts across the Agency, specifically the Bureau for Management’s Office of the Chief Financial Officer, the Office of the Chief Information Officer, and the Office of Acquisition and Assistance; the Office of General Counsel; the Office of Security; the Bureau for Policy, Planning and Learning (PPL); and the Bureau for Management, Office of Management Policy, Budget and Performance (M/MPBP). Because planning, execution, monitoring, and evaluation of USAID’s development instruments are all critical in complying with Agency policy for quality control, PPL also has a central role in preventing, detecting, and responding to allegations of Agency fraud, as well as identifying deficiencies, if any, in its Program Cycle for Design, Monitoring and Evaluation.
159USAID FY 2017 AGENCY FINANCIAL REPORT | OTHER INFORMATION
FRAUD RESPONSE
Any evidence of fraud within the confines of USAID operations is required to be reported to the Office of Inspector General (OIG) immediately. There are multiple channels for reporting suspected fraud, including hotlines, websites, and email. The OIG Office of Investigations conducts independent investigations based on a wide array of inputs, including the results of financial and performance audits. The protocol for fraud investigations involves notification, review, consultation, and investigations by the OIG; then investigations by the implementing partners as appropriate, with targeted referrals to Agency management including M/MPBP’s Compliance Division and the Office of Acquisition and Assistance (Contracting and Agreement Officers). The outcomes of fraud referrals are wide-ranging and include administrative actions, civil actions, and criminal prosecution.
FUTURE ADAPTATION TO THE GAO FRAMEWORK
The GAO Framework applies to both non-financial and financial fraud risks and includes four key elements: (1) USAID’s leadership commitment, (2) regular assessments of risks, (3) effective design, and (4) implementation of mitigation activities and risk-based evaluation of outcomes. The Agency’s ongoing implementation of the GAO Framework will integrate it throughout existing management and program structures, such as program design, monitoring and evaluation, and the ERM framework. USAID will use the GAO Framework’s recommended practices as a guide when developing efforts to combat fraud in a strategic, risk-based manner.
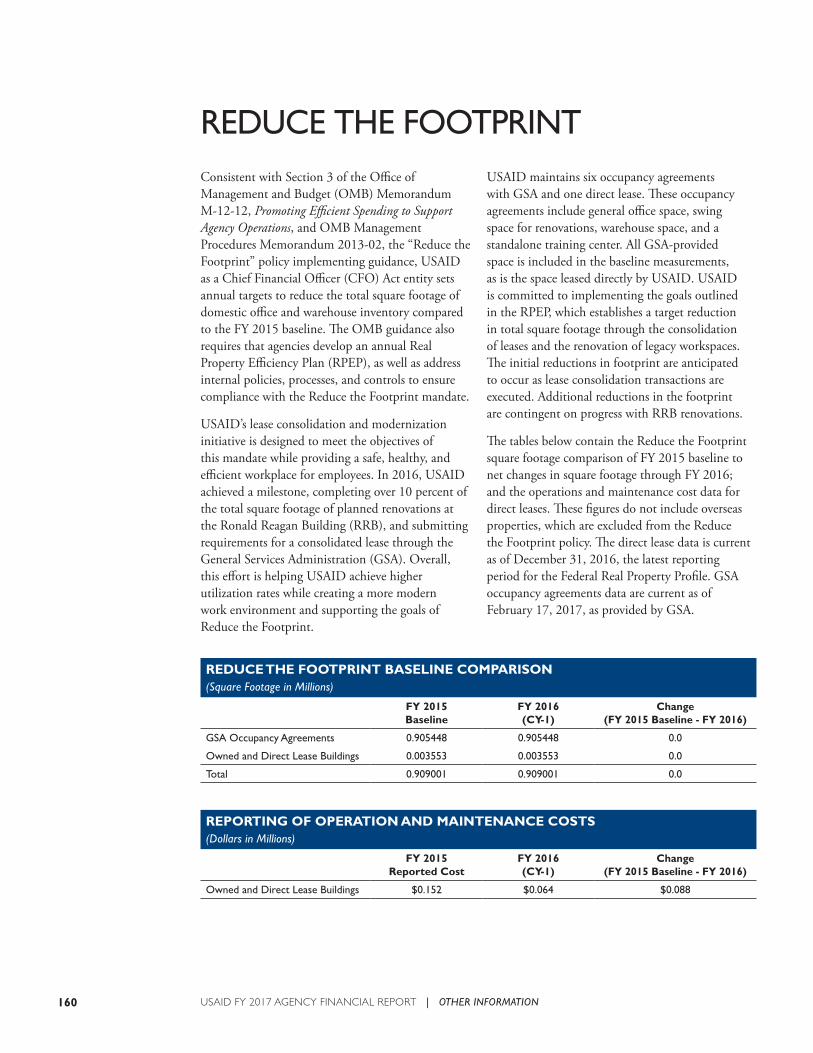
160 USAID FY 2017 AGENCY FINANCIAL REPORT | OTHER INFORMATION
REDUCE THE FOOTPRINTConsistent with Section 3 of the Office of Management and Budget (OMB) Memorandum M-12-12, Promoting Efficient Spending to Support Agency Operations, and OMB Management Procedures Memorandum 2013-02, the “Reduce the Footprint” policy implementing guidance, USAID as a Chief Financial Officer (CFO) Act entity sets annual targets to reduce the total square footage of domestic office and warehouse inventory compared to the FY 2015 baseline. The OMB guidance also requires that agencies develop an annual Real Property Efficiency Plan (RPEP), as well as address internal policies, processes, and controls to ensure compliance with the Reduce the Footprint mandate.
USAID’s lease consolidation and modernization initiative is designed to meet the objectives of this mandate while providing a safe, healthy, and efficient workplace for employees. In 2016, USAID achieved a milestone, completing over 10 percent of the total square footage of planned renovations at the Ronald Reagan Building (RRB), and submitting requirements for a consolidated lease through the General Services Administration (GSA). Overall, this effort is helping USAID achieve higher utilization rates while creating a more modern work environment and supporting the goals of Reduce the Footprint.
USAID maintains six occupancy agreements with GSA and one direct lease. These occupancy agreements include general office space, swing space for renovations, warehouse space, and a standalone training center. All GSA-provided space is included in the baseline measurements, as is the space leased directly by USAID. USAID is committed to implementing the goals outlined in the RPEP, which establishes a target reduction in total square footage through the consolidation of leases and the renovation of legacy workspaces. The initial reductions in footprint are anticipated to occur as lease consolidation transactions are executed. Additional reductions in the footprint are contingent on progress with RRB renovations.
The tables below contain the Reduce the Footprint square footage comparison of FY 2015 baseline to net changes in square footage through FY 2016; and the operations and maintenance cost data for direct leases. These figures do not include overseas properties, which are excluded from the Reduce the Footprint policy. The direct lease data is current as of December 31, 2016, the latest reporting period for the Federal Real Property Profile. GSA occupancy agreements data are current as of February 17, 2017, as provided by GSA.
REDUCE THE FOOTPRINT BASELINE COMPARISON(Square Footage in Millions)
FY 2015 Baseline
FY 2016 (CY-1)
Change (FY 2015 Baseline - FY 2016)
GSA Occupancy Agreements 0.905448 0.905448 0.0
Owned and Direct Lease Buildings 0.003553 0.003553 0.0
Total 0.909001 0.909001 0.0
REPORTING OF OPERATION AND MAINTENANCE COSTS(Dollars in Millions)
FY 2015 Reported Cost
FY 2016 (CY-1)
Change (FY 2015 Baseline - FY 2016)
Owned and Direct Lease Buildings $0.152 $0.064 $0.088
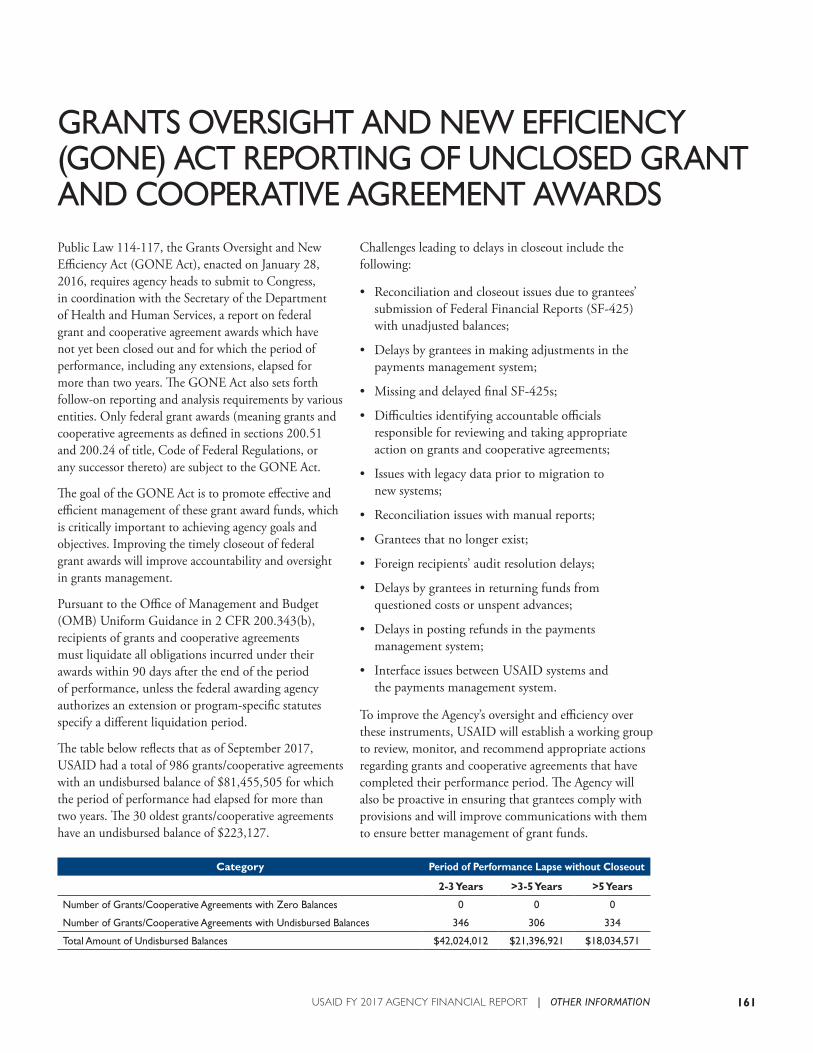
161USAID FY 2017 AGENCY FINANCIAL REPORT | OTHER INFORMATION
GRANTS OVERSIGHT AND NEW EFFICIENCY (GONE) ACT REPORTING OF UNCLOSED GRANT AND COOPERATIVE AGREEMENT AWARDSPublic Law 114-117, the Grants Oversight and New Efficiency Act (GONE Act), enacted on January 28, 2016, requires agency heads to submit to Congress, in coordination with the Secretary of the Department of Health and Human Services, a report on federal grant and cooperative agreement awards which have not yet been closed out and for which the period of performance, including any extensions, elapsed for more than two years. The GONE Act also sets forth follow-on reporting and analysis requirements by various entities. Only federal grant awards (meaning grants and cooperative agreements as defined in sections 200.51 and 200.24 of title, Code of Federal Regulations, or any successor thereto) are subject to the GONE Act.
The goal of the GONE Act is to promote effective and efficient management of these grant award funds, which is critically important to achieving agency goals and objectives. Improving the timely closeout of federal grant awards will improve accountability and oversight in grants management.
Pursuant to the Office of Management and Budget (OMB) Uniform Guidance in 2 CFR 200.343(b), recipients of grants and cooperative agreements must liquidate all obligations incurred under their awards within 90 days after the end of the period of performance, unless the federal awarding agency authorizes an extension or program-specific statutes specify a different liquidation period.
The table below reflects that as of September 2017, USAID had a total of 986 grants/cooperative agreements with an undisbursed balance of $81,455,505 for which the period of performance had elapsed for more than two years. The 30 oldest grants/cooperative agreements have an undisbursed balance of $223,127.
Challenges leading to delays in closeout include the following:
• Reconciliation and closeout issues due to grantees’ submission of Federal Financial Reports (SF-425) with unadjusted balances;
• Delays by grantees in making adjustments in the payments management system;
• Missing and delayed final SF-425s;
• Difficulties identifying accountable officials responsible for reviewing and taking appropriate action on grants and cooperative agreements;
• Issues with legacy data prior to migration to new systems;
• Reconciliation issues with manual reports;
• Grantees that no longer exist;
• Foreign recipients’ audit resolution delays;
• Delays by grantees in returning funds from questioned costs or unspent advances;
• Delays in posting refunds in the payments management system;
• Interface issues between USAID systems and the payments management system.
To improve the Agency’s oversight and efficiency over these instruments, USAID will establish a working group to review, monitor, and recommend appropriate actions regarding grants and cooperative agreements that have completed their performance period. The Agency will also be proactive in ensuring that grantees comply with provisions and will improve communications with them to ensure better management of grant funds.
Category Period of Performance Lapse without Closeout
2-3 Years >3-5 Years >5 Years
Number of Grants/Cooperative Agreements with Zero Balances 0 0 0
Number of Grants/Cooperative Agreements with Undisbursed Balances 346 306 334
Total Amount of Undisbursed Balances $42,024,012 $21,396,921 $18,034,571

162 USAID FY 2017 AGENCY FINANCIAL REPORT | OTHER INFORMATION

APPENDICES

(Preceding page) USAID began partnering with Lula Mena in 2012 to support economic opportunities for 70 artisans, most of them women. In El Salvador and around the world, USAID empowers thousands of female entrepreneurs. Meet Lula at stories.usaid.gov. PHOTO: DAVE COOPER FOR USAID
(Above) Rula Bandak cares for premature babies at Holy Family Hospital in Bethlehem. USAID supported the hospital to expand access to neonatal and gynecology services; train doctors, nurses, and midwives; and procure medical equipment. Meet Rula at stories.usaid.gov. PHOTO: BOBBY NEPTUNE FOR USAID
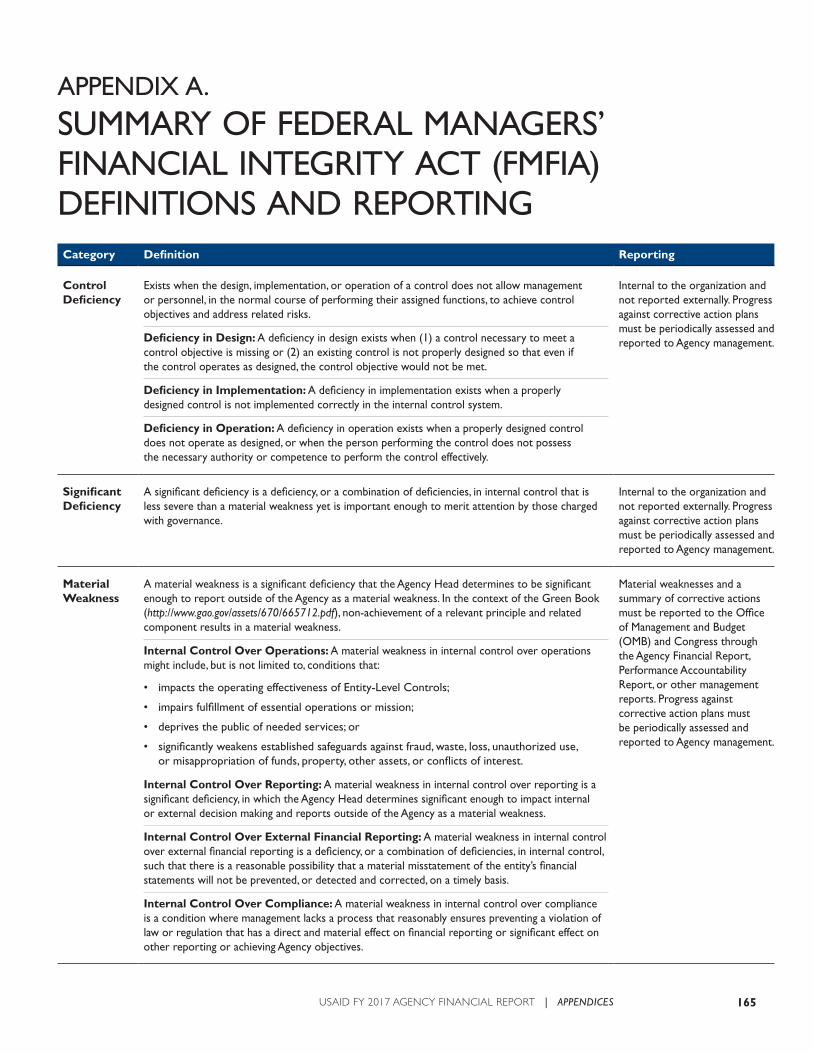
165USAID FY 2017 AGENCY FINANCIAL REPORT | APPENDICES
Category Definition Reporting
Control Deficiency
Exists when the design, implementation, or operation of a control does not allow management or personnel, in the normal course of performing their assigned functions, to achieve control objectives and address related risks.
Deficiency in Design: A deficiency in design exists when (1) a control necessary to meet a control objective is missing or (2) an existing control is not properly designed so that even if the control operates as designed, the control objective would not be met.
Deficiency in Implementation: A deficiency in implementation exists when a properly designed control is not implemented correctly in the internal control system.
Deficiency in Operation: A deficiency in operation exists when a properly designed control does not operate as designed, or when the person performing the control does not possess the necessary authority or competence to perform the control effectively.
Internal to the organization and not reported externally. Progress against corrective action plans must be periodically assessed and reported to Agency management.
Significant Deficiency
A significant deficiency is a deficiency, or a combination of deficiencies, in internal control that is less severe than a material weakness yet is important enough to merit attention by those charged with governance.
Internal to the organization and not reported externally. Progress against corrective action plans must be periodically assessed and reported to Agency management.
Material Weakness
A material weakness is a significant deficiency that the Agency Head determines to be significant enough to report outside of the Agency as a material weakness. In the context of the Green Book (http://www.gao.gov/assets/670/665712.pdf), non-achievement of a relevant principle and related component results in a material weakness.
Internal Control Over Operations: A material weakness in internal control over operations might include, but is not limited to, conditions that:
• impacts the operating effectiveness of Entity-Level Controls;
• impairs fulfillment of essential operations or mission;
• deprives the public of needed services; or
• significantly weakens established safeguards against fraud, waste, loss, unauthorized use, or misappropriation of funds, property, other assets, or conflicts of interest.
Internal Control Over Reporting: A material weakness in internal control over reporting is a significant deficiency, in which the Agency Head determines significant enough to impact internal or external decision making and reports outside of the Agency as a material weakness.
Internal Control Over External Financial Reporting: A material weakness in internal control over external financial reporting is a deficiency, or a combination of deficiencies, in internal control, such that there is a reasonable possibility that a material misstatement of the entity’s financial statements will not be prevented, or detected and corrected, on a timely basis.
Internal Control Over Compliance: A material weakness in internal control over compliance is a condition where management lacks a process that reasonably ensures preventing a violation of law or regulation that has a direct and material effect on financial reporting or significant effect on other reporting or achieving Agency objectives.
Material weaknesses and a summary of corrective actions must be reported to the Office of Management and Budget (OMB) and Congress through the Agency Financial Report, Performance Accountability Report, or other management reports. Progress against corrective action plans must be periodically assessed and reported to Agency management.
APPENDIX A. SUMMARY OF FEDERAL MANAGERS’ FINANCIAL INTEGRITY ACT (FMFIA) DEFINITIONS AND REPORTING
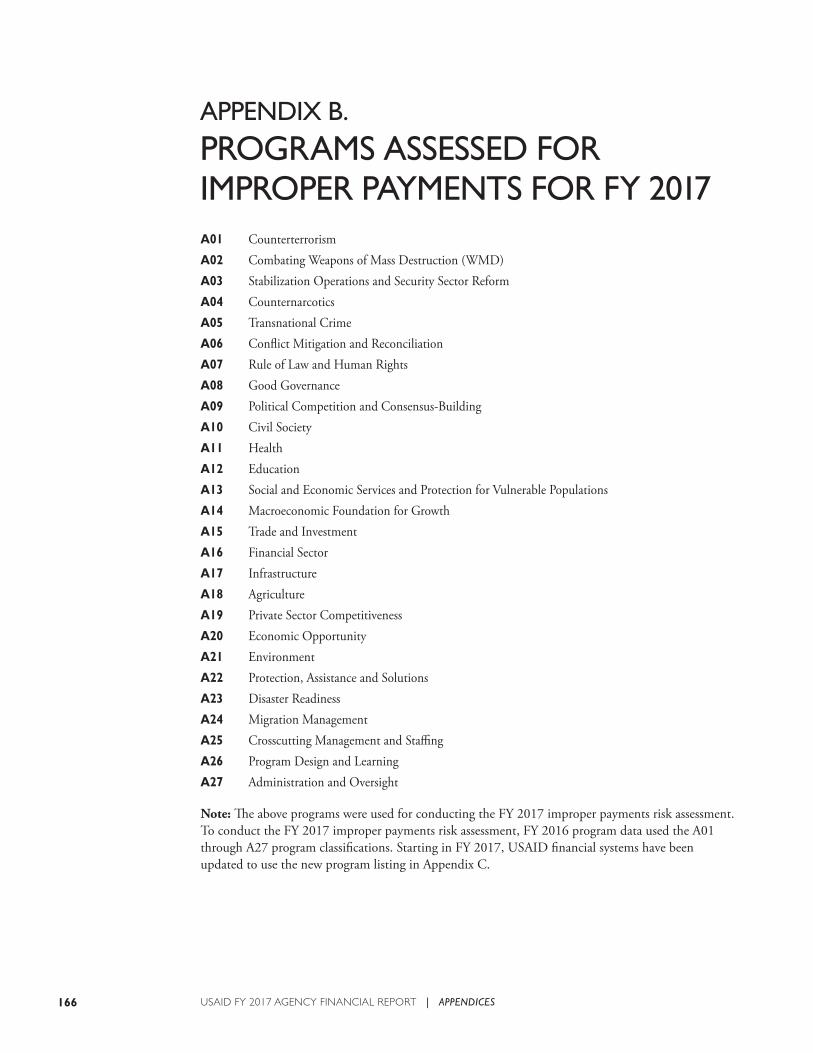
166 USAID FY 2017 AGENCY FINANCIAL REPORT | APPENDICES
APPENDIX B. PROGRAMS ASSESSED FOR IMPROPER PAYMENTS FOR FY 2017A01 CounterterrorismA02 Combating Weapons of Mass Destruction (WMD)A03 Stabilization Operations and Security Sector ReformA04 CounternarcoticsA05 Transnational CrimeA06 Conflict Mitigation and ReconciliationA07 Rule of Law and Human RightsA08 Good GovernanceA09 Political Competition and Consensus-BuildingA10 Civil SocietyA11 HealthA12 EducationA13 Social and Economic Services and Protection for Vulnerable PopulationsA14 Macroeconomic Foundation for GrowthA15 Trade and InvestmentA16 Financial SectorA17 InfrastructureA18 AgricultureA19 Private Sector CompetitivenessA20 Economic OpportunityA21 EnvironmentA22 Protection, Assistance and SolutionsA23 Disaster ReadinessA24 Migration ManagementA25 Crosscutting Management and StaffingA26 Program Design and LearningA27 Administration and Oversight
Note: The above programs were used for conducting the FY 2017 improper payments risk assessment. To conduct the FY 2017 improper payments risk assessment, FY 2016 program data used the A01 through A27 program classifications. Starting in FY 2017, USAID financial systems have been updated to use the new program listing in Appendix C.
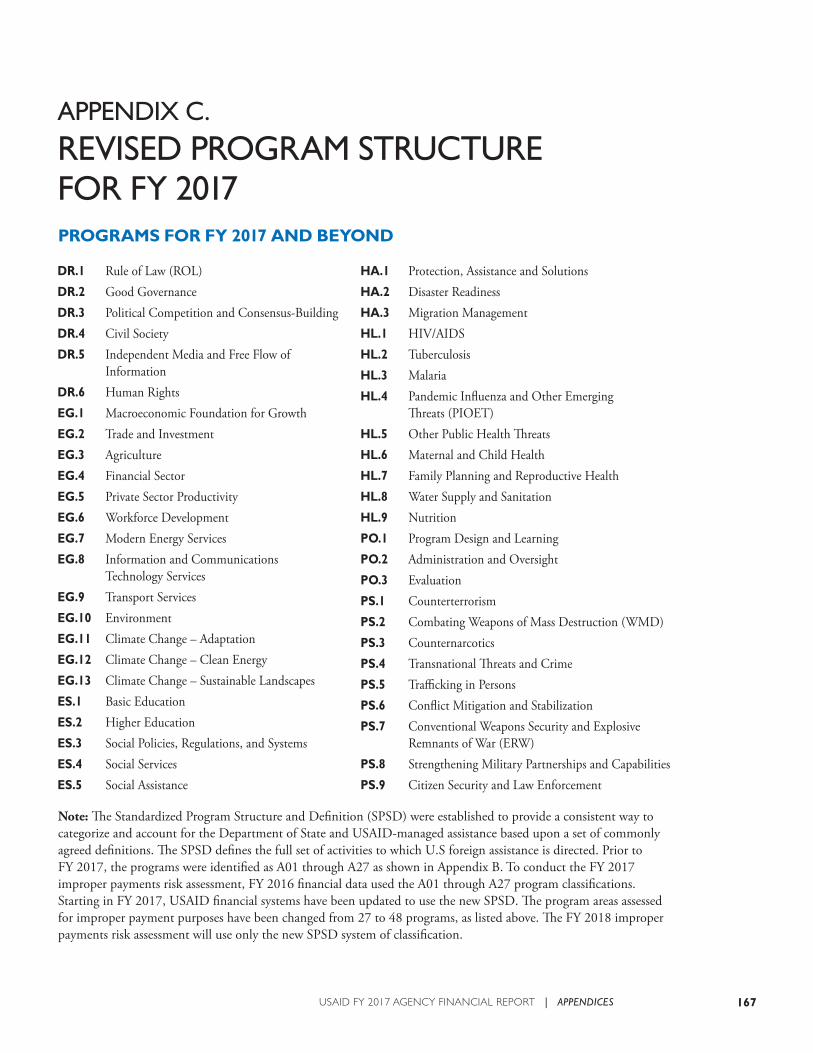
167USAID FY 2017 AGENCY FINANCIAL REPORT | APPENDICES
APPENDIX C. REVISED PROGRAM STRUCTURE FOR FY 2017PROGRAMS FOR FY 2017 AND BEYOND
Note: The Standardized Program Structure and Definition (SPSD) were established to provide a consistent way to categorize and account for the Department of State and USAID-managed assistance based upon a set of commonly agreed definitions. The SPSD defines the full set of activities to which U.S foreign assistance is directed. Prior to FY 2017, the programs were identified as A01 through A27 as shown in Appendix B. To conduct the FY 2017 improper payments risk assessment, FY 2016 financial data used the A01 through A27 program classifications. Starting in FY 2017, USAID financial systems have been updated to use the new SPSD. The program areas assessed for improper payment purposes have been changed from 27 to 48 programs, as listed above. The FY 2018 improper payments risk assessment will use only the new SPSD system of classification.
DR.1 Rule of Law (ROL)DR.2 Good GovernanceDR.3 Political Competition and Consensus-BuildingDR.4 Civil SocietyDR.5 Independent Media and Free Flow of
InformationDR.6 Human RightsEG.1 Macroeconomic Foundation for GrowthEG.2 Trade and InvestmentEG.3 AgricultureEG.4 Financial SectorEG.5 Private Sector ProductivityEG.6 Workforce DevelopmentEG.7 Modern Energy ServicesEG.8 Information and Communications
Technology ServicesEG.9 Transport ServicesEG.10 EnvironmentEG.11 Climate Change – AdaptationEG.12 Climate Change – Clean EnergyEG.13 Climate Change – Sustainable LandscapesES.1 Basic EducationES.2 Higher EducationES.3 Social Policies, Regulations, and SystemsES.4 Social ServicesES.5 Social Assistance
HA.1 Protection, Assistance and SolutionsHA.2 Disaster ReadinessHA.3 Migration ManagementHL.1 HIV/AIDSHL.2 TuberculosisHL.3 MalariaHL.4 Pandemic Influenza and Other Emerging
Threats (PIOET)HL.5 Other Public Health ThreatsHL.6 Maternal and Child HealthHL.7 Family Planning and Reproductive HealthHL.8 Water Supply and SanitationHL.9 NutritionPO.1 Program Design and LearningPO.2 Administration and OversightPO.3 EvaluationPS.1 CounterterrorismPS.2 Combating Weapons of Mass Destruction (WMD)PS.3 CounternarcoticsPS.4 Transnational Threats and CrimePS.5 Trafficking in PersonsPS.6 Conflict Mitigation and StabilizationPS.7 Conventional Weapons Security and Explosive
Remnants of War (ERW) PS.8 Strengthening Military Partnerships and CapabilitiesPS.9 Citizen Security and Law Enforcement
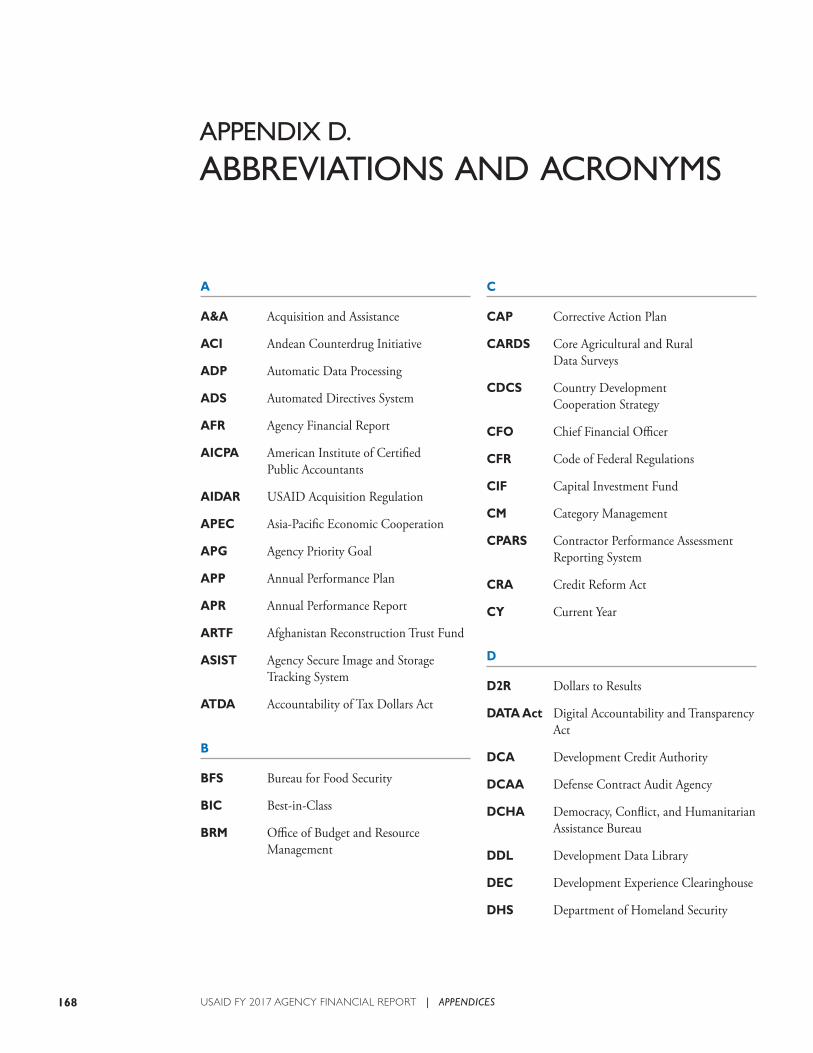
168 USAID FY 2017 AGENCY FINANCIAL REPORT | APPENDICES
APPENDIX D. ABBREVIATIONS AND ACRONYMS
A
A&A Acquisition and Assistance
ACI Andean Counterdrug Initiative
ADP Automatic Data Processing
ADS Automated Directives System
AFR Agency Financial Report
AICPA American Institute of Certified Public Accountants
AIDAR USAID Acquisition Regulation
APEC Asia-Pacific Economic Cooperation
APG Agency Priority Goal
APP Annual Performance Plan
APR Annual Performance Report
ARTF Afghanistan Reconstruction Trust Fund
ASIST Agency Secure Image and Storage Tracking System
ATDA Accountability of Tax Dollars Act
B
BFS Bureau for Food Security
BIC Best-in-Class
BRM Office of Budget and Resource Management
C
CAP Corrective Action Plan
CARDS Core Agricultural and Rural Data Surveys
CDCS Country Development Cooperation Strategy
CFO Chief Financial Officer
CFR Code of Federal Regulations
CIF Capital Investment Fund
CM Category Management
CPARS Contractor Performance Assessment Reporting System
CRA Credit Reform Act
CY Current Year
D
D2R Dollars to Results
DATA Act Digital Accountability and Transparency Act
DCA Development Credit Authority
DCAA Defense Contract Audit Agency
DCHA Democracy, Conflict, and Humanitarian Assistance Bureau
DDL Development Data Library
DEC Development Experience Clearinghouse
DHS Department of Homeland Security
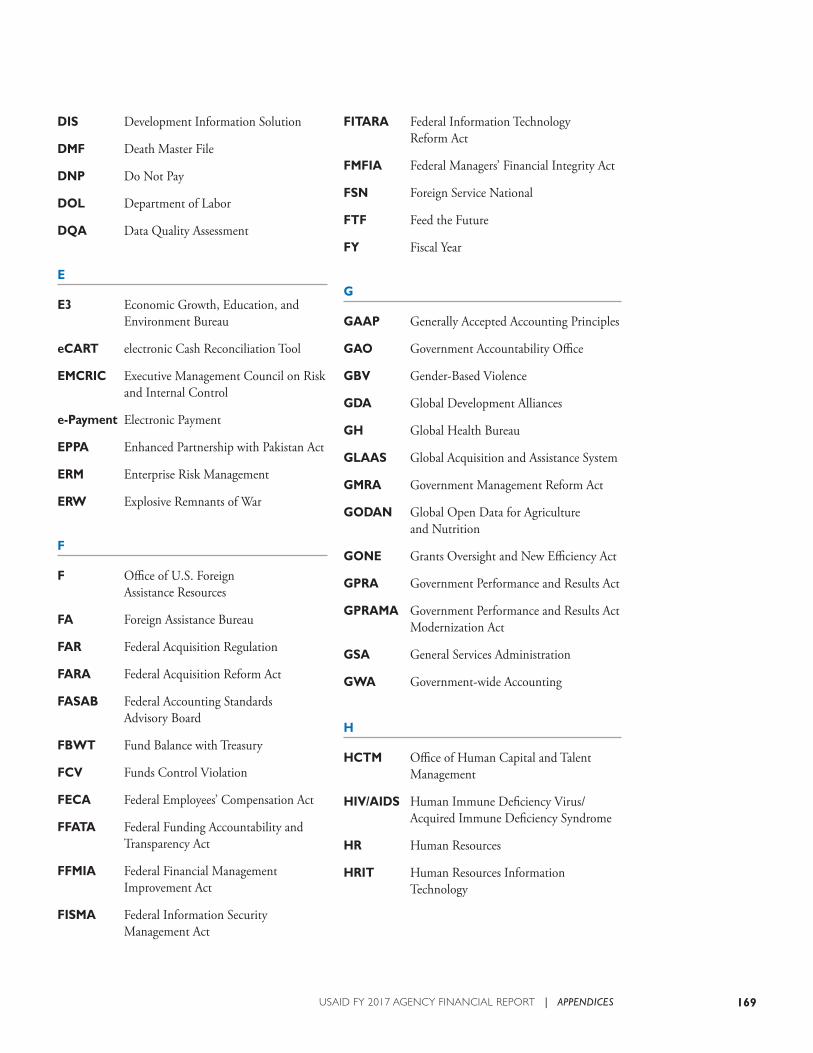
169USAID FY 2017 AGENCY FINANCIAL REPORT | APPENDICES
DIS Development Information Solution
DMF Death Master File
DNP Do Not Pay
DOL Department of Labor
DQA Data Quality Assessment
E
E3 Economic Growth, Education, and Environment Bureau
eCART electronic Cash Reconciliation Tool
EMCRIC Executive Management Council on Risk and Internal Control
e-Payment Electronic Payment
EPPA Enhanced Partnership with Pakistan Act
ERM Enterprise Risk Management
ERW Explosive Remnants of War
F
F Office of U.S. Foreign Assistance Resources
FA Foreign Assistance Bureau
FAR Federal Acquisition Regulation
FARA Federal Acquisition Reform Act
FASAB Federal Accounting Standards Advisory Board
FBWT Fund Balance with Treasury
FCV Funds Control Violation
FECA Federal Employees’ Compensation Act
FFATA Federal Funding Accountability and Transparency Act
FFMIA Federal Financial Management Improvement Act
FISMA Federal Information Security Management Act
FITARA Federal Information Technology Reform Act
FMFIA Federal Managers’ Financial Integrity Act
FSN Foreign Service National
FTF Feed the Future
FY Fiscal Year
G
GAAP Generally Accepted Accounting Principles
GAO Government Accountability Office
GBV Gender-Based Violence
GDA Global Development Alliances
GH Global Health Bureau
GLAAS Global Acquisition and Assistance System
GMRA Government Management Reform Act
GODAN Global Open Data for Agriculture and Nutrition
GONE Grants Oversight and New Efficiency Act
GPRA Government Performance and Results Act
GPRAMA Government Performance and Results Act Modernization Act
GSA General Services Administration
GWA Government-wide Accounting
H
HCTM Office of Human Capital and Talent Management
HIV/AIDS Human Immune Deficiency Virus/Acquired Immune Deficiency Syndrome
HR Human Resources
HRIT Human Resources Information Technology
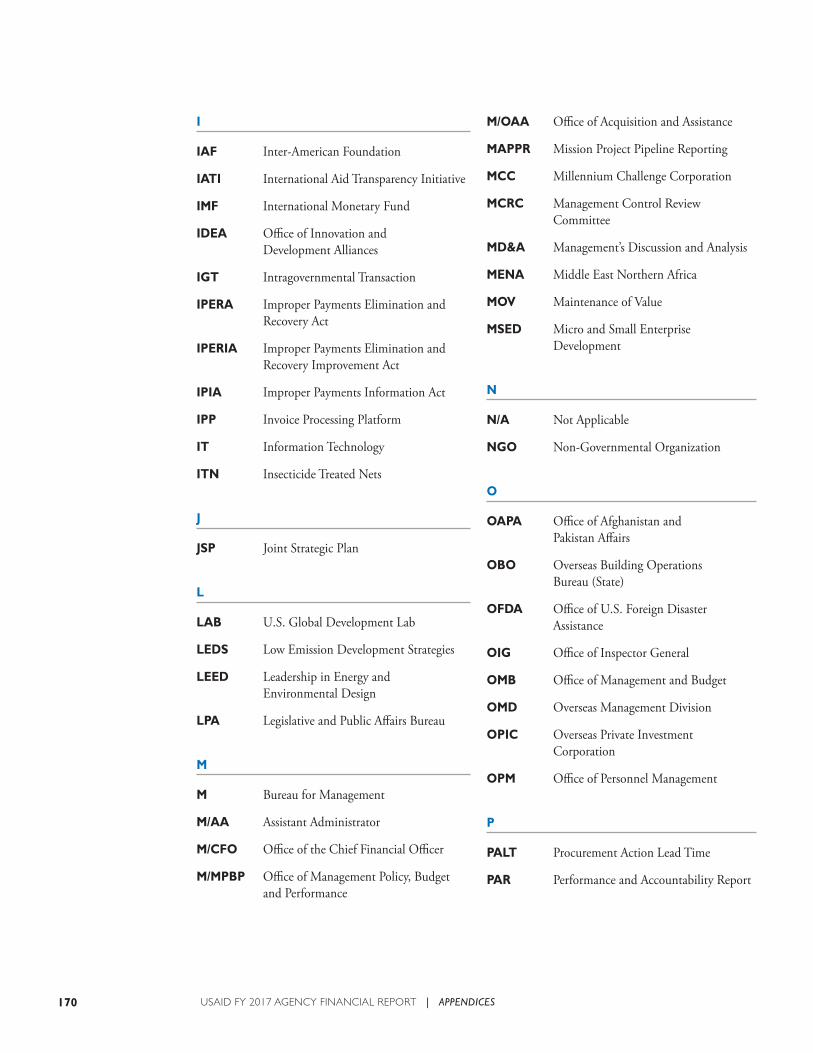
170 USAID FY 2017 AGENCY FINANCIAL REPORT | APPENDICES
I
IAF Inter-American Foundation
IATI International Aid Transparency Initiative
IMF International Monetary Fund
IDEA Office of Innovation and Development Alliances
IGT Intragovernmental Transaction
IPERA Improper Payments Elimination and Recovery Act
IPERIA Improper Payments Elimination and Recovery Improvement Act
IPIA Improper Payments Information Act
IPP Invoice Processing Platform
IT Information Technology
ITN Insecticide Treated Nets
J
JSP Joint Strategic Plan
L
LAB U.S. Global Development Lab
LEDS Low Emission Development Strategies
LEED Leadership in Energy and Environmental Design
LPA Legislative and Public Affairs Bureau
M
M Bureau for Management
M/AA Assistant Administrator
M/CFO Office of the Chief Financial Officer
M/MPBP Office of Management Policy, Budget and Performance
M/OAA Office of Acquisition and Assistance
MAPPR Mission Project Pipeline Reporting
MCC Millennium Challenge Corporation
MCRC Management Control Review Committee
MD&A Management’s Discussion and Analysis
MENA Middle East Northern Africa
MOV Maintenance of Value
MSED Micro and Small Enterprise Development
N
N/A Not Applicable
NGO Non-Governmental Organization
O
OAPA Office of Afghanistan and Pakistan Affairs
OBO Overseas Building Operations Bureau (State)
OFDA Office of U.S. Foreign Disaster Assistance
OIG Office of Inspector General
OMB Office of Management and Budget
OMD Overseas Management Division
OPIC Overseas Private Investment Corporation
OPM Office of Personnel Management
P
PALT Procurement Action Lead Time
PAR Performance and Accountability Report
171USAID FY 2017 AGENCY FINANCIAL REPORT | APPENDICES
PCAS Project Cost Accounting System
PEPFAR President’s Emergency Plan for AIDS Relief
PFMRAF Public Financial Management Risk Assessment Framework
PIO Public International Organization
PIOET Pandemic Influenza and Other Emerging Threats
PIRS Performance Indicator Reference Sheet
PMI U.S. President’s Malaria Initiative
PMP Performance Management Plan
PP&E Property, Plant and Equipment
PPIRS Past Performance Information Retrieval System
PPL Policy, Planning, and Learning Bureau
PPR Performance Plan and Report
Pub. L. Public Law
R
RMC Risk Management Council
ROL Rule of Law
RPEP Real Property Efficiency Plan
RRB Ronald Reagan Building
RSI Required Supplementary Information
S
SAM System for Award Management
SAT Senior Assessment Team
SBG Sovereign Bond Guarantee
SBR Statement of Budgetary Resources
SF-425 Federal Financial Report
SPSD Standardized Program Structure and Definition
SSAE Statement on Standards for Attestation Engagements
State Department of State
SWFF Securing Water for Food
T
TB Tuberculosis
Treasury Department of the Treasury
U
U.S. United States
U.S.C. United States Code
UE Urban and Environmental
UNICEF United Nations Children’s Fund
URICA Uniform Risk and Internal Control Assessment
USADF U.S African Development Foundation
USAID U.S. Agency for International Development
USSGL U.S. Standard General Ledger
V
VMIS Vehicle Management Information System
W
WMD Weapons of Mass Destruction

172 USAID FY 2017 AGENCY FINANCIAL REPORT | APPENDICES
173USAID FY 2017 AGENCY FINANCIAL REPORT | APPENDICES
ACKNOWLEDGMENTS
This report was produced with the energies and talents of the USAID staff. To these individuals we would like to offer our sincerest thanks and acknowledgment. In particular, we would like to recognize the following organizations and individuals for their contributions:
Office of the Administrator: Mitchell Craft, William Steiger
Executive Secretariat: Neilesh Shelat, Christopher Colbow, Kelly Costello, Daniel McDonald
Office of Human Capital and Talent Management: Kimberly A. Lewis, Cheryl Williams, Nancy Sanders Durosseau
Bureau for Management: Angelique M. Crumbly, Clinton White
Office of the Chief Financial Officer: Reginald W. Mitchell, Kent Kuyumjian, Morgan Brady, Raven Andrews, Michael Bowanko, Mekonnen Berhe, Antionette Cattledge, Cathy Collins, Qing Francis, Jaheda Guliwala, Nancy Mausolf, Connie Miconi, Herbert Morgan, Ohjin Pak, Jocelyn Rodriguez, Alfred Sandy, Scott Smith, Douglas Webster, Gloria White, Stephen Wills; with special thanks to the Financial Statement Preparation Team – Jacquelyn Manson, Tanina Cook, James Diawuo-Takyi, Sabrina D’Souza, Kwame Opoku-Mensah, Pamela Noppenberger, Shelley Smith, Eyasu Tilahun; Risk Management and Internal Control Team – James Esposito, Julie Callahan, Mimi Goodwin, Nancy Laurine; Appendix A & B Team – John Moynihan, Richard Persons, Carl Swanson, Davida Wilhelm, Genet Yohannes; Audit Follow-up Team – Teresa Cooper, Teresa Frakes, Gary Jacobs, Jeanetta Marshall, Cecelia Miller, Robert Reinard
Office of the Chief Information Officer: Jay Mahanand, Mark Johnson, Kenneth Kerttula, William Morgan
Office of Management Policy, Budget and Performance: Colleen Allen, Ruth Buckley, Erin Brown, Margaret Mesaros, Chris Meservy, Kevin Eck
Office of Management Services: Luis Garcia, Robert Coulson
Office of the General Counsel: David H. Moore, William Buckhold, Youshea Berry, Christina Reyes
Bureau for Legislative and Public Affairs: Wendy Coursen, Nan Dearborn, Patricia Adams, Will Cameron, Michelle Dworkin, James Kennedy, Jennifer Kwack, Scott Gruber, Angela Rucker, Greg Your
Bureau for Policy, Planning, and Learning: Patricia Rader, Elizabeth Roen, Jessica Klein, Sarah Allan, Concepcion Salazar, Adriel Harvey
Bureau for Economic Growth, Education, and Environment: Charles North, Michael Metzler, Scott Haller
We would also like to acknowledge the Office of Inspector General for the professional manner in which its staff conducted the audit of the FY 2017 financial statements. We offer special thanks to The DesignPond for its outstanding contributions in the design and production of this report.
We welcome your comments on how we can improve this report. Please provide comments to:
U.S. Agency for International DevelopmentSA-44 Building (Room 462)1300 Pennsylvania Avenue, N.W.Washington, DC 20523-2101
ATTN: Antionette CattledgeM/CFO/[email protected]
U.S. AGENCY FOR INTERNATIONAL DEVELOPMENT
1300 Pennsylvania Avenue, N.W.
Washington, DC 20523
202-712-0000
USAID.gov
PB-AAH-511


