Embed Size (px)
Citation preview


(IJACSA) International Journal of Advanced Computer Science and Applications,
Vol. 5, No. 12, 2014
(i)
www.ijacsa.thesai.org
Editorial Preface
From the Desk of Managing Editor…
It is our pleasure to present to you the December 2014 Issue of International Journal of Advanced Computer Science
and Applications.
Today, it is incredible to consider that in 1969 men landed on the moon using a computer with a 32-kilobyte memory
that was only programmable by the use of punch cards. In 1973, Astronaut Alan Shepherd participated in the first
computer "hack" while orbiting the moon in his landing vehicle, as two programmers back on Earth attempted to "hack"
into the duplicate computer, to find a way for Shepherd to convince his computer that a catastrophe requiring a
mission abort was not happening; the successful hack took 45 minutes to accomplish, and Shepherd went on to hit his
golf ball on the moon. Today, the average computer sitting on the desk of a suburban home office has more
computing power than the entire U.S. space program that put humans on another world!!
Computer science has affected the human condition in many radical ways. Throughout its history, its developers have
striven to make calculation and computation easier, as well as to offer new means by which the other sciences can be
advanced. Modern massively-paralleled super-computers help scientists with previously unfeasible problems such as
fluid dynamics, complex function convergence, finite element analysis and real-time weather dynamics.
At IJACSA we believe in spreading the subject knowledge with effectiveness in all classes of audience. Nevertheless,
the promise of increased engagement requires that we consider how this might be accomplished, delivering up-to-
date and authoritative coverage of advanced computer science and applications.
Throughout our archives, new ideas and technologies have been welcomed, carefully critiqued, and discarded or
accepted by qualified reviewers and associate editors. Our efforts to improve the quality of the articles published and
expand their reach to the interested audience will continue, and these efforts will require critical minds and careful
consideration to assess the quality, relevance, and readability of individual articles.
To summarise, the journal has offered its readership thought provoking theoretical, philosophical, and empirical ideas
from some of the finest minds worldwide. We thank all our readers for their continued support and goodwill for IJACSA.
We will keep you posted on updates about the new programmes launched in collaboration.
Lastly, we would like to express our gratitude to all authors, whose research results have been published in our journal, as
well as our referees for their in-depth evaluations.
We hope that materials contained in this volume will satisfy your expectations and entice you to submit your own
contributions in upcoming issues of IJACSA
Thank you for Sharing Wisdom!
Managing Editor
IJACSA
Volume 5 Issue 12 December 2014
ISSN 2156-5570 (Online)
ISSN 2158-107X (Print)
©2013 The Science and Information (SAI) Organization

(IJACSA) International Journal of Advanced Computer Science and Applications,
Vol. 5, No. 12, 2014
(ii)
www.ijacsa.thesai.org
Editorial Board
Editor-in-Chief
Dr. Kohei Arai - Saga University
Domains of Research: Human-Computer Interaction, Networking, Information Retrievals, Optimization
Theory, Modelling and Simulation, Satellite Remote Sensing, Computer Vision, Decision Making
Methodology
Associate Editors
Chao-Tung Yang
Department of Computer Science, Tunghai University, Taiwan
Domain of Research: Cloud Computing
Elena SCUTELNICU
“Dunarea de Jos" University of Galati, Romania
Domain of Research: e-Learning Tools, Modelling and Simulation of Welding Processes
Krassen Stefanov
Professor at Sofia University St. Kliment Ohridski, Bulgaria
Domains of Research: Digital Libraries
Maria-Angeles Grado-Caffaro
Scientific Consultant, Italy
Domain of Research: Sensing and Sensor Networks
Mohd Helmy Abd Wahab
Universiti Tun Hussein Onn Malaysia
Domain of Research: Data Mining, Database, Web-based Application, Mobile Computing
T. V. Prasad
Lingaya's University, India
Domain of Research: Bioinformatics, Natural Language Processing, Image Processing, Robotics, Knowledge
Representation

(IJACSA) International Journal of Advanced Computer Science and Applications,
Vol. 5, No. 12, 2014
(iii)
www.ijacsa.thesai.org
Reviewer Board Members
Abbas Karimi
Islamic Azad University Arak Branch
Abdel-Hameed Badawy
Arkansas Tech University
Abdelghni Lakehal
Fsdm Sidi Mohammed Ben Abdellah University
Abeer Elkorny
Faculty of computers and information, Cairo
University
ADEMOLA ADESINA University of the Western Cape, South Africa
Ahmed Boutejdar
Dr. Ahmed Nabih Zaki Rashed
Menoufia University
Aderemi A. Atayero
Covenant University
Akbar Hossin
Akram Belghith
University Of California, San Diego
Albert S
Kongu Engineering College
Alcinia Zita Sampaio
Technical University of Lisbon
Ali Ismail Awad
Luleå University of Technology
Alexandre Bouënard
Amitava Biswas
Cisco Systems
Anand Nayyar
KCL Institute of Management and Technology,
Jalandhar
Andi Wahju Rahardjo Emanuel
Maranatha Christian University, INDONESIA
Anirban Sarkar
National Institute of Technology, Durgapur, India
Anuranjan misra
Bhagwant Institute of Technology, Ghaziabad, India
Andrews Samraj
Mahendra Engineering College
Arash Habibi Lashakri
University Technology Malaysia (UTM)
Aris Skander
Constantine University
Ashraf Mohammed Iqbal
Dalhousie University and Capital Health
Ashok Matani
Ashraf Owis
Cairo University
Asoke Nath
St. Xaviers College
Ayad Ismaeel
Department of Information Systems Engineering- Technical Engineering College-Erbil / Hawler Polytechnic University, Erbil-Kurdistan Region- IRAQ
Babatunde Opeoluwa Akinkunmi
University of Ibadan
Badre Bossoufi
University of Liege
Basil Hamed
Islamic University of Gaza
Bharti Waman Gawali
Department of Computer Science & information
Bhanu Prasad Pinnamaneni
Rajalakshmi Engineering College; Matrix Vision
GmbH
Bilian Song
Brahim Raouyane
FSAC
Brij Gupta
University of New Brunswick
Bright Keswani
Suresh Gyan Vihar University, Jaipur (Rajasthan) INDIA
Constantin Filote
Stefan cel Mare University of Suceava
Constantin Popescu
Department of Mathematics and Computer Science, University of Oradea
Chandrashekhar Meshram
Chhattisgarh Swami Vivekananda Technical University
Chao Wang

(IJACSA) International Journal of Advanced Computer Science and Applications,
Vol. 5, No. 12, 2014
(iv)
www.ijacsa.thesai.org
Chi-Hua Chen
National Chiao-Tung University
Ciprian Dobre
University Politehnica of Bucharest
Chien-Pheg Ho
Information and Communications Research Laboratories, Industrial Technology Research Institute of Taiwan
Charlie Obimbo
University of Guelph
Chao-Tung Yang
Department of Computer Science, Tunghai University
Dana PETCU
West University of Timisoara
Deepak Garg
Thapar University
Dewi Nasien
Universiti Teknologi Malaysia
Dheyaa Kadhim
University of Baghdad
Dong-Han Ham
Chonnam National University
Dragana Becejski-Vujaklija
University of Belgrade, Faculty of organizational
sciences
Driss EL OUADGHIRI
Duck Hee Lee
Medical Engineering R&D Center/Asan Institute for Life Sciences/Asan Medical Center
Dr. Santosh Kumar
Graphic Era University, Dehradun, India
Elena Camossi
Joint Research Centre
Eui Lee
Elena SCUTELNICU
"Dunarea de Jos" University of Galati
Firkhan Ali Hamid Ali
UTHM
Fokrul Alom Mazarbhuiya
King Khalid University
Frank Ibikunle
Covenant University
Fu-Chien Kao
Da-Y eh University
Faris Al-Salem
GCET
gamil Abdel Azim
Associate prof - Suez Canal University
Ganesh Sahoo
RMRIMS
Gaurav Kumar
Manav Bharti University, Solan Himachal Pradesh
Ghalem Belalem
University of Oran (Es Senia)
Giri Babu
Indian Space Research Organisation
Giacomo Veneri
University of Siena
Giri Babu
Indian Space Research Organisation
Gerard Dumancas
Oklahoma Medical Research Foundation
Georgios Galatas
George Mastorakis
Technological Educational Institute of Crete
Gunaseelan Devaraj
Jazan University, Kingdom of Saudi Arabia
Gavril Grebenisan
University of Oradea
Hadj Tadjine
IAV GmbH
Hamid Mukhtar
National University of Sciences and Technology
Hamid Alinejad-Rokny
University of Newcastle
Harco Leslie Hendric Spits Warnars
Budi LUhur University
Harish Garg
Thapar University Patiala
Hamez l. El Shekh Ahmed
Pure mathematics
Hesham Ibrahim
Chemical Engineering Department, Faculty of Engineering, Al-Mergheb University
Dr. Himanshu Aggarwal
Punjabi University, India
Huda K. AL-Jobori
Ahlia University
Iwan Setyawan
Satya Wacana Christian University

(IJACSA) International Journal of Advanced Computer Science and Applications,
Vol. 5, No. 12, 2014
(v)
www.ijacsa.thesai.org
Dr. Jamaiah Haji Yahaya
Northern University of Malaysia (UUM), Malaysia
James Coleman
Edge Hill University
Jim Wang
The State University of New York at Buffalo, Buffalo, NY
John Salin
George Washington University
Jyoti Chaudary
High performance computing research lab
Jatinderkumar R. Saini
S.P.College of Engineering, Gujarat
K Ramani
K.S.Rangasamy College of Technology, Tiruchengode
K V.L.N.Acharyulu
Bapatla Engineering college
Kashif Nisar
Universiti Utara Malaysia
Kayhan Zrar Ghafoor
University Technology Malaysia
Kitimaporn Choochote
Prince of Songkla University, Phuket Campus
Kunal Patel
Ingenuity Systems, USA
Krasimir Yordzhev
South-West University, Faculty of Mathematics and Natural Sciences, Blagoevgrad, Bulgaria
Krassen Stefanov
Professor at Sofia University St. Kliment Ohridski
Labib Francis Gergis
Misr Academy for Engineering and Technology
Lai Khin Wee
Biomedical Engineering Department, University Malaya
Lazar Stosic
Collegefor professional studies educators Aleksinac, Serbia
Lijian Sun
Chinese Academy of Surveying and Mapping, China
Leandors Maglaras
Leon Abdillah
Bina Darma University
Ljubomir Jerinic
University of Novi Sad, Faculty of Sciences, Department of Mathematics and Computer Science
Lokesh Sharma
Indian Council of Medical Research
Long Chen
Qualcomm Incorporated
M. Reza Mashinchi
M. Tariq Banday
University of Kashmir
MAMTA BAHETI
SNJBS KBJ COLLEGE OF ENGINEERING, CHANDWAD, NASHIK, M.S. INDIA
Mazin Al-Hakeem
Research and Development Directorate - Iraqi Ministry of Higher Education and Research
Md Rana
University of Sydney
Miriampally Venkata Raghavendera
Adama Science & Technology University, Ethiopia
Mirjana Popvic
School of Electrical Engineering, Belgrade University
Manas deep
Masters in Cyber Law & Information Security
Manpreet Singh Manna
SLIET University, Govt. of India
Manuj Darbari
BBD University
Md. Zia Ur Rahman
Narasaraopeta Engg. College, Narasaraopeta
Messaouda AZZOUZI
Ziane AChour University of Djelfa
Dr. Michael Watts
University of Adelaide
Milena Bogdanovic
University of Nis, Teacher Training Faculty in Vranje
Miroslav Baca
University of Zagreb, Faculty of organization and
informatics / Center for biomet
Mohamed Ali Mahjoub
Preparatory Institute of Engineer of Monastir
Mohamed El-Sayed
Faculty of Science, Fayoum University, Egypt
Mohammad Yamin
Mohammad Ali Badamchizadeh
University of Tabriz
Mohamed Najeh Lakhoua
ESTI, University of Carthage

(IJACSA) International Journal of Advanced Computer Science and Applications,
Vol. 5, No. 12, 2014
(vi)
www.ijacsa.thesai.org
Mohammad Alomari
Applied Science University
Mohammad Kaiser
Institute of Information Technology
Mohammed Al-Shabi
Assistant Prof.
Mohammed Sadgal
Mourad Amad
Laboratory LAMOS, Bejaia University
Mohammed Ali Hussain
Sri Sai Madhavi Institute of Science & Technology
Mohd Helmy Abd Wahab
Universiti Tun Hussein Onn Malaysia
Mueen Uddin
Universiti Teknologi Malaysia UTM
Mona Elshinawy
Howard University
Maria-Angeles Grado-Caffaro
Scientific Consultant
Mehdi Bahrami
University of California, Merced
Miriampally Venkata Raghavendra
Adama Science & Technology University, Ethiopia
Murthy Dasika
SreeNidhi Institute of Science and Technology
Mostafa Ezziyyani
FSTT
Marcellin Julius Nkenlifack
University of Dschang
Natarajan Subramanyam
PES Institute of Technology
Noura Aknin
University Abdelamlek Essaadi
Nidhi Arora M.C.A. Institute, Ganpat University
Nazeeruddin Mohammad Prince Mohammad Bin Fahd University
Najib Kofahi Yarmouk University
NEERAJ SHUKLA ITM UNiversity, Gurgaon, (Haryana) Inida
N.Ch. Iyengar
VIT University
Om Sangwan
Oliviu Matel
Technical University of Cluj-Napoca
Osama Omer
Aswan University
Ousmane Thiare
Associate Professor University Gaston Berger of Saint-Louis SENEGAL
Omaima Al-Allaf
Assistant Professor
Paresh V Virparia
Sardar Patel University
Dr. Poonam Garg
Institute of Management Technology, Ghaziabad
Professor Ajantha Herath
Prabhat K Mahanti
UNIVERSITY OF NEW BRUNSWICK
Qufeng Qiao
University of Virginia
Rachid Saadane
EE departement EHTP
raed Kanaan
Amman Arab University
Raja boddu LENORA COLLEGE OF ENGINEERNG
Ravisankar Hari
SENIOR SCIENTIST, CTRI, RAJAHMUNDRY Raghuraj Singh Rajesh Kumar
National University of Singapore
Rakesh Balabantaray
IIIT Bhubaneswar
RashadAl-Jawfi
Ibb university
Rashid Sheikh
Shri Venkteshwar Institute of Technology , Indore
Ravi Prakash
University of Mumbai
Rawya Rizk
Port Said University
Reshmy Krishnan
Muscat College affiliated to stirling University.U
Ricardo Vardasca
Faculty of Engineering of University of Porto
Ritaban Dutta
ISSL, CSIRO, Tasmaniia, Australia
Rowayda Sadek
Ruchika Malhotra
Delhi Technoogical University
Saadi Slami
University of Djelfa

(IJACSA) International Journal of Advanced Computer Science and Applications,
Vol. 5, No. 12, 2014
(vii)
www.ijacsa.thesai.org
Sachin Kumar Agrawal
University of Limerick
Dr.Sagarmay Deb
University Lecturer, Central Queensland University, Australia
Said Ghoniemy
Taif University
Sasan Adibi
Research In Motion (RIM)
Sérgio Ferreira
School of Education and Psychology, Portuguese Catholic University
Sebastian Marius Rosu
Special Telecommunications Service
Selem charfi
University of Valenciennes and Hainaut Cambresis, France.
Seema Shah
Vidyalankar Institute of Technology Mumbai,
Sengottuvelan P
Anna University, Chennai
Senol Piskin
Istanbul Technical University, Informatics Institute
Seyed Hamidreza Mohades Kasaei
University of Isfahan
Shafiqul Abidin
G GS I P University
Shahanawaj Ahamad
The University of Al-Kharj
Shawkl Al-Dubaee
Assistant Professor
Shriram Vasudevan
Amrita University
Sherif Hussain
Mansoura University
Siddhartha Jonnalagadda
Mayo Clinic
Sivakumar Poruran
SKP ENGINEERING COLLEGE
Sim-Hui Tee
Multimedia University
Simon Ewedafe
Baze University
SUKUMAR SENTHILKUMAR
Universiti Sains Malaysia
Slim Ben Saoud
Sudarson Jena
GITAM University, Hyderabad
Sumit Goyal
Sumazly Sulaiman
Institute of Space Science (ANGKASA), Universiti Kebangsaan Malaysia
Sohail Jabb
Bahria University
Suhas J Manangi
Microsoft
Suresh Sankaranarayanan
Institut Teknologi Brunei
Susarla Sastry
J.N.T.U., Kakinada
Syed Ali
SMI University Karachi Pakistan
T C. Manjunath
HKBK College of Engg
T V Narayana Rao
Hyderabad Institute of Technology and Management
T. V. Prasad
Lingaya's University
Taiwo Ayodele
Infonetmedia/University of Portsmouth
Tarek Gharib THABET SLIMANI
College of Computer Science and Information Technology
Totok R. Biyanto
Engineering Physics, ITS Surabaya
TOUATI YOUCEF
Computer sce Lab LIASD - University of Paris 8
VINAYAK BAIRAGI
Sinhgad Academy of engineering, Pune
VISHNU MISHRA
SVNIT, Surat
Vitus S.W. Lam
The University of Hong Kong
Vuda SREENIVASARAO School of Computing and Electrical Engineering,BAHIR DAR UNIVERSITY, BAHIR DAR,ETHIOPA
Vaka MOHAN
TRR COLLEGE OF ENGINEERING
Wei Wei
Xiaojing Xiang
AT&T Labs

(IJACSA) International Journal of Advanced Computer Science and Applications,
Vol. 5, No. 12, 2014
(viii)
www.ijacsa.thesai.org
YASSER ATTIA ALBAGORY
College of Computers and Information Technology, Taif University, Saudi Arabia
YI FEI WANG
The University of British Columbia
Yilun Shang
University of Texas at San Antonio
YU QI
Mesh Capital LLC
Zacchaeus Omogbadegun
Covenant University
ZAIRI ISMAEL RIZMAN
UiTM (Terengganu) Dungun Campus
ZENZO POLITE NCUBE
North West University
ZHAO ZHANG
Deptment of EE, City University of Hong Kong
ZHIXIN CHEN
ILX Lightwave Corporation
ZLATKO STAPIC
University of Zagreb
Ziyue Xu
ZURAINI ISMAIL
Universiti Teknologi Malaysia

(IJACSA) International Journal of Advanced Computer Science and Applications,
Vol. 5, No. 12, 2014
(ix)
www.ijacsa.thesai.org
CONTENTS
Paper 1: Policy-Based Automation of Dynamique and Multipoint Virtual Private Network Simulation on OPNET Modeler
Authors: Ayoub BAHNASSE, Najib EL KAMOUN
PAGE 1 – 7
Paper 2: Development of Social Recommendation GIS for Tourist Spots
Authors: Tsukasa IKEDA, Kayoko YAMAMOTO
PAGE 8 – 21
Paper 3: A Feasibility Study on Porting the Community Land Model onto Accelerators Using Openacc
Authors: D. Wang, W. Wu, F. Winkler, W. Ding, O. Hernandez
PAGE 22 – 29
Paper 4: B2C E-Commerce Fact-Based Negotiation Using Big Data Analytics and Agent-Based Technologies
Authors: Hasan Al-Sakran
PAGE 30 – 37
Paper 5: A Study of MCA Learning Algorithm for Incident Signals Estimation
Authors: Rashid Ahmed, John N. Avaritsiotis
PAGE 38 – 44
Paper 6: Empirical Analyis of Public ICT Development Project Objectives in Hungary
Authors: Márta Aranyossy, András Nemeslaki, Adrienn Fekó
PAGE 45 – 54
Paper 7: Investigating the Idiotop Paratop Interaction in the Artificial Immune Networks
Authors: Hossam Meshref
PAGE 55 – 60
Paper 8: Using Object-Relational Mapping to Create the Distributed Databases in a Hybrid Cloud Infrastructure
Authors: Oleg Lukyanchikov, Evgeniy Pluzhnik, Simon Payain, Evgeny Nikulchev
PAGE 61 – 64
Paper 9: Definition of Tactile Interactions for a Multi-Criteria Selection in a Virtual World
Authors: Robin Vivian, David Bertolo, Jérôme Dinet
PAGE 65 – 71
Paper 10: Natural Language Processing and its Use in Education
Authors: Dr. Khaled M. Alhawiti
PAGE 72 – 76
Paper 11: An Upper Ontology for Benefits Management of Cloud Computing
Authors: Richard Greenwell*, Xiaodong Liu, Kevin Chalmers
PAGE 77 – 86
Paper 12: Determining the Efficient Structure of Feed-Forward Neural Network to Classify Breast Cancer Dataset
Authors: Ahmed Khalid, Noureldien A. Noureldien
PAGE 87 – 90

(IJACSA) International Journal of Advanced Computer Science and Applications,
Vol. 5, No. 12, 2014
(x)
www.ijacsa.thesai.org
Paper 13: Use of Geographic Information System Tools in Research on Neonatal Outcomes in a Maternity-School in Belo
Horizonte - Brazil
Authors: Juliano de S. Gaspar, Thabata Sá, Zilma S. N. Reis, Renato F. N. Júnior, Marcelo S. Júnior, Raphael R.
Gusmão
PAGE 91 – 96
Paper 14: A Grammatical Inference Sequential Mining Algorithm for Protein Fold Recognition
Authors: Taysir Hassan A. Soliman, Ahmed Sharaf Eldin, Marwa M. Ghareeb, Mohammed E. Marie
PAGE 97 – 106
Paper 15: Facial Expression Recognition Using 3D Convolutional Neural Network
Authors: Young-Hyen Byeon, Keun-Chang Kwak*
PAGE 107 – 112
Paper 16: Social Media in Azorean Organizations: Policies, Strategies and Perceptions
Authors: Nuno Filipe Cordeiro, Teresa Tiago, Flávio Tiago, Francisco Amaral
PAGE 113 – 119
Paper 17: Weighted Marking, Clique Structure and Node-Weighted Centrality to Predict Distribution Centre’s Location in
a Supply Chain Management
Authors: Amidu A. G. Akanmu, Frank Z. Wang, Fred A. Yamoah
PAGE 120 – 128
Paper 18: Social Networks’ Benefits, Privacy, and Identity Theft: KSA Case Study
Authors: Ahmad A. Al-Daraiseh, Afnan S. Al-Joudi, Hanan B. Al-Gahtani, Maha S. Al-Qahtani
PAGE 129 – 143
Paper 19: Software Architecture Reconstruction Method, a Survey
Authors: Zainab Nayyar, Nazish Rafique
PAGE 144 – 150
Paper 20: Zigbee Routing Opnet Simulation for a Wireless Sensors Network
Authors: ELKISSANI Kaoutar, Pr.Moughit Mohammed, Pr.Nasserdine Bouchaib
PAGE 151 – 154
(IJACSA) International Journal of Advanced Computer Science and Applications,
Vol. 5, No. 12, 2014
1 | P a g e
www.ijacsa.thesai.org
Policy-Based Automation of Dynamique and
Multipoint Virtual Private Network Simulation on
OPNET Modeler
Ayoub BAHNASSE
Department of physics
University Chouaïb Doukali
Faculty of science El Jadida
EL Jadida, MOROCCO
Najib EL KAMOUN
Department of physics
University Chouaïb Doukali
Faculty of science El Jadida
EL Jadida, MOROCCO
Abstract—The simulation of large-scale networks is a
challenging task especially if the network to simulate is the
Dynamic Multipoint Virtual Private Network, it requires expert
knowledge to properly configure its component technologies. The
study of these network architectures in a real environment is
almost impossible because it requires a very large number of
equipment, however, this task is feasible in a simulation
environment like OPNET Modeler, provided to master both the
tool and the different architectures of the Dynamic Multipoint
Virtual Private Network.
Several research studies have been conducted to automate the
generation and simulation of complex networks under various
simulators, according to our research no work has dealt with the
Dynamic Multipoint Virtual Private Network. In this paper we
present a simulation model of the Dynamic and Multipoint
Virtual Private network in OPNET Modeler, and a WEB-based
tool for project management on the same network.
Keywords—VPN; multipoint; Opnet; automation; DMVPN;
cloud; policy-based; WEB-BASED
I. INTRODUCTION
Dynamic multipoint Virtual Private Network “DMVPN” is a solution for building dynamic Virtual Private Network tunnels in an easy, scalable and dynamic manner supported on Cisco IOS routers and Unix Operating System, DMVPN is based on standard technologies such as Resolution Next Hop Protocol (NHRP) and multipoint Generic Routing Encapsulation (mGRE) for the dynamic creation of tunnels, and Internet Protocol Security (IPsec) to ensure security of data exchanges between multiple sites, as well as routing protocols to route data optimally [1] [2], several scientific studies have been conducted to study the effect of routing protocols on Non Broadcast Multi-Access networks (NBMA) [3] [4]. The HUB maintains in its NHRP cache, public and tunnel IP addresses of each SPOKE on the same network, this protocol is based on the client-server principle, the spokes (NHRP Clients) send periodic NHRP updates containing public and tunnels addresses to the HUB (NHS) of the network, for example when SPOKE1 wants to communicate with SPOKE2, SPOKE1 consults the NHRP cache of NHS to determine public IP associated with the IP tunnel of SPOKE2. A GRE interface can maintain multiple IPsec tunnels, both to simplify configuration and save time thanks to mGRE protocol. GRE protocol
encapsulates various higher layer protocols and carry all traffic types (unicast, multicast and broadcast), but doesn’t provide any authentication, integrity or confidentiality mechanism. IPsec is a suite of protocols; Encapsulation Security Payload (ESP) and Authentication Header (AH), the first protocol ensure the integrity, authentication and confidentiality of trade, the second provides integrity and authentication for data exchange. IPsec operates in two modes, tunnel and transport mode, transport mode does not change the initial header it sits between the network layer and transport of the OSI model, for this mode, NAT can cause a problem of integrity [5], the tunnel mode replaces the original IP and encapsulates the entire packet header.
OPNET Modeler is a software tool for network modeling and simulation. It allows to design and study communication of large scale networks, devices, protocols, and applications with great flexibility, it allows to study the system performance under varying conditions, it also contributes to the development of new protocols and architectures and their optimization and the analysis of the impact of emerging technologies, several books have been written to master OPNET Modeler environment and properly handle its associated objects [6, 7].
The process of setting up an Opnet project can be done by several methods including: Drag drop objects to the workspace;
Data Router configuration, to create the project based on the configuration files of routers such as Cisco and Juniper, to benefit from this feature the module Multi Vendor Import “ MVI ” must be turned on from license management;
Extensible Markup Language “ XML ”, the required form of the XML file to import to Opnet is specified in the
Document Data Type “ DTD ” , the file path is <opnet_dir> /
<reldir> / sys / etc / network.dtd.
The simulation of communication network is paramount in the design process task, planning and optimization of architectures. Through a simulation environment, many conditions can be studied such as scalability that is difficult to simulate in a real environment because of its very high cost, such as simulation of the dynamic and multipoint virtual private networks. Several scientific research simulators can be
(IJACSA) International Journal of Advanced Computer Science and Applications,
Vol. 5, No. 12, 2014
2 | P a g e
www.ijacsa.thesai.org
used as OPNET Modeler, NS2…[8,9,10], but managing a dynamic and multipoint VPN under OPNET Modeler simulator requires firstly a mastery of the tool and secondly the technology, this is a good motivation to develop a system for automatically creating projects for various architectures of the same network, for this reason we have created an automation model for simulating dynamic multipoint and multi architectures Virtual Private Network, and a GUI man/machinery application designed for this type of networks.
The simulation of a large scale network such as DMVPN in a simulator such as Opnet Modeler requires a mastery of VPN technology and the simulator, and since these VPNs can be composed of hundreds sometimes thousands of sites its simulation by the manual method without mistakes is a big challenge, various works has been done in the automation of networks simulations for Opnet modeler [11, 12] and the design of GUI-based tool for the conversion of simulation scenarios to the XML files meant for various simulators[13], unfortunately according to our research no automation model of generation and simulation of such networks was proposed, this is a good motivation to develop a new model for automating simulations of DMVPN networks for Opnet Modeler “DMVPN Automatic Simulation” and create a WEB-based tool for personalized management of projects.
The rest of the paper is organized as follows, in Section 2 we will discuss the developed model “DMVPN Automatic Simulation” and define its various modules, in Section 3 we will describe thoroughly various steps required by the model to automatically generate projects, Section 4 will be reserved for a sample demonstration of an automatic generation of project using the application implemented, and we will conclude in section 5.
II. DMVPN AUTOMATIC SIMULATION MODEL
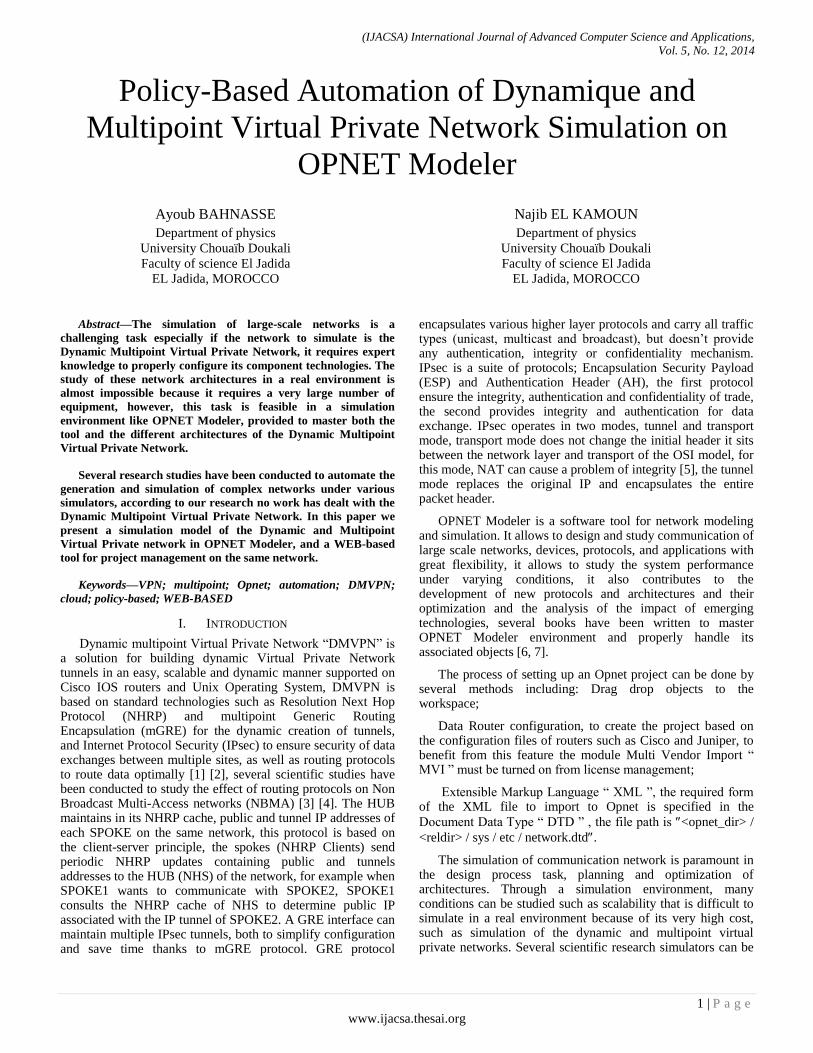
DMVPN Automatic Simulation model [Fig. 1] allows policy-based simulation automation for DMVPN network, multi-architectures, for Opnet model using a web graphical interface, the model is composed of two main agents “User Policies Definition” and “Treatment and generation”;
Fig. 1. Architecture of DMVPN Automatic Simulation
A. User Policies Definition:
This agent allows defining the attributes of security and routing policies of the DMVPN network, through a graphical man/machinery interaction.
This agent is composed of several modules; Architecture Module, Tunnel Module, Security Module, Routing Module and Key Module.
Architecture Module: This module defines the type of architecture to handle: Single Hub Single Cloud or Multiple Hub Multiple Cloud.
Tunnel Module: This module is responsible of establishing tunnels between the Hubs and Spokes depending on the type of architecture described in the previous module. The identification and authentication of tunnels will be made by Key Module attributes.
Security Module: This module defines the IPsec protocol to use and which could be AH or ESP, encryption protocols (DES, 3DES, AES) and integrity protocols (MD5, SHA) for two IKE phases, by default the mode used is transport to avoid a third encapsulating of the IP header.
Key Module: This module defines the identification key of the tunnel, the DMVPN cloud ID, the authentication key for access to the DMVPN network as well as the IPsec password.
Routing Module: This module allows the generation of a more suitable configuration of routing protocol for a specific DMVPN architecture, the proposed model supports; Routing Information Version 2 (RIPv2), Enhanced Interior Gateway Routing Protocol (EIGRP), Open Shortest Path First (OSPF) and Interior Border Gateway Protocol (iBGP).
B. Treatment and generation:
This agent describes the processing that occurs on the server side, converting user data into a project already configured ready to be simulated in Opnet Modeler, this agent is composed of three modules:
Device personalization module: This module allows the generation of nodes (routers and IPV4 clouds) with a customized number of interfaces according to the user-specified architecture.
XML to map OPNET Module: This module check the attributes of the file network.dtd to prepare a customized XML file with user specified data, XML attributes may differ from architecture to another, equipment generated by the previous module will be defined in the XML file.
Project generation module: This module allows the generation of XML file prepared by the previous module and run the simulation in Opnet Modeler.
(IJACSA) International Journal of Advanced Computer Science and Applications,
Vol. 5, No. 12, 2014
3 | P a g e
www.ijacsa.thesai.org
III. FUNCTIONING OF THE DMVPN AUTOMATIC
SIMULATION MODEL
In this section we will describe various steps required by
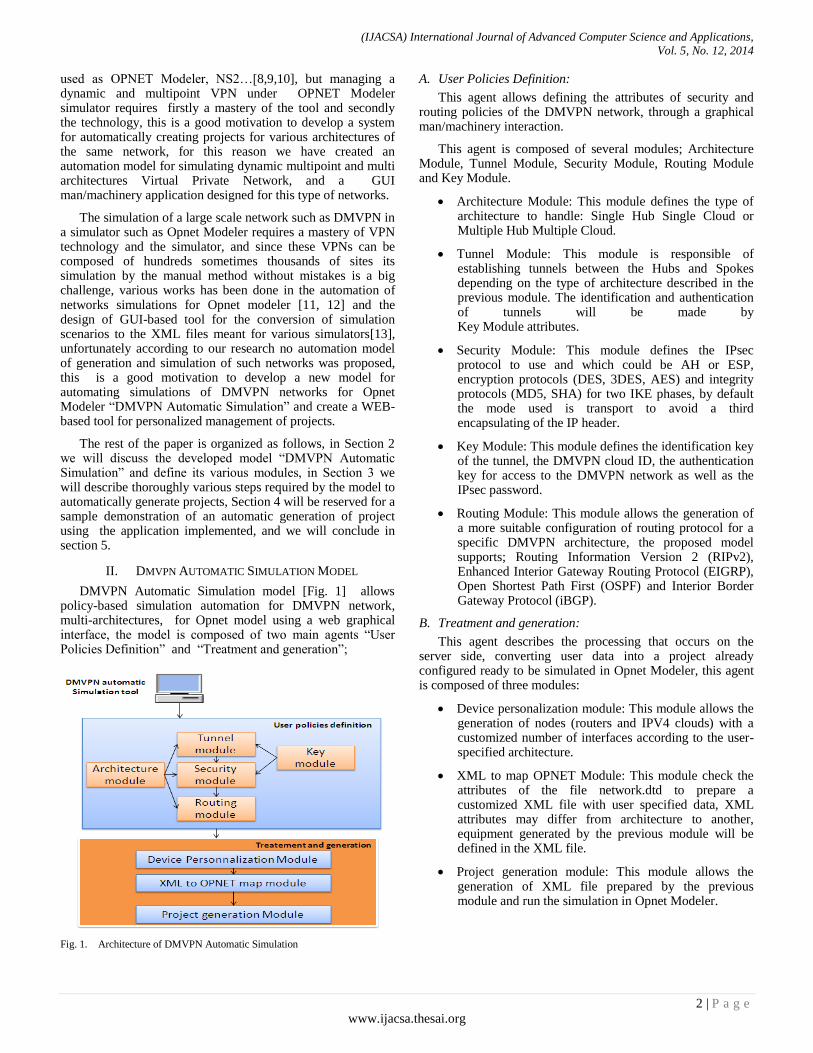
the model DMVPN Automatic Simulation to automatically generate projects, [Fig. 2] shows the operation of the model.
Fig. 2. Flow chart illustrate the operation of DMVPN Automatic Simulation
1) The user must choose the architecture to deploy; Single
Hub Single Cloud or Multiple Hub Multiple Cloud;
2) If the user chooses to simulate Single Hub Single Cloud
architecture, a specification of number of Spokes to deploy is
necessary, according to the specified number by the user a
graphical user interface will be generated automatically
composed of n + 1 rows, where n is the number of Spokes and
1 is the HUB line;
3) The user must specify for each device its Public IP
addresses, private IP address and the name of the public
interface;
4) The user defines graphically the security settings of IKE
Phase 1 and 2, specifies the NHRP password, NHRP + mGRE
keys and finally chooses the routing protocol (RIPv2, EIGRP,
OSPF, iBGP);
5) If the user chooses Multiple Hub Multiple Cloud, a
specification of number of Hubs and Spokes to deploy is
necessary;
6) The user must specify for each device its Public IP
address, private IP address, the name of the public interface
and the priority of each HUB, if routers have the same priority,
load balancing with equal cost will be made between HUBs, if
not the router with the highest priority will be the primary
router, the other will be considered secondary;
7) The user defines graphically the security settings of
IPsec IKE Phase 1 and 2, specifies NHRP password, NHRP +
mGRE keys and finally chooses the routing protocol (RIPv2,
EIGRP, OSPF, iBGP)
8) The nodes are created with a customized number of
interfaces according to user-specified architecture.
(IJACSA) International Journal of Advanced Computer Science and Applications,
Vol. 5, No. 12, 2014
4 | P a g e
www.ijacsa.thesai.org
9) XML attributes to be used for a specific version Opnet
model are prepared according to DTD file of current version
of Opnet Modeler installed;
10) The final generated XML file containing the position of
each node and its associated
configuration ready to be simulated in Opnet Modeler.
IV. DEMONSTRATION AND GUIDED VISIT
In order to validate the Designed model, an implementation is required, the tool created is based on a guided web graphical interface extremely easy to manipulate, any web browser and operating system can be used.
Developed tool (DMVPN Automatic Simulation Tool) has two mains purposes. First purpose is to provide a user-friendly entering and editing of parameters of DMVPN network. Second purpose is to automatically map user parameters into OPNET Modeler project and create custom nodes.
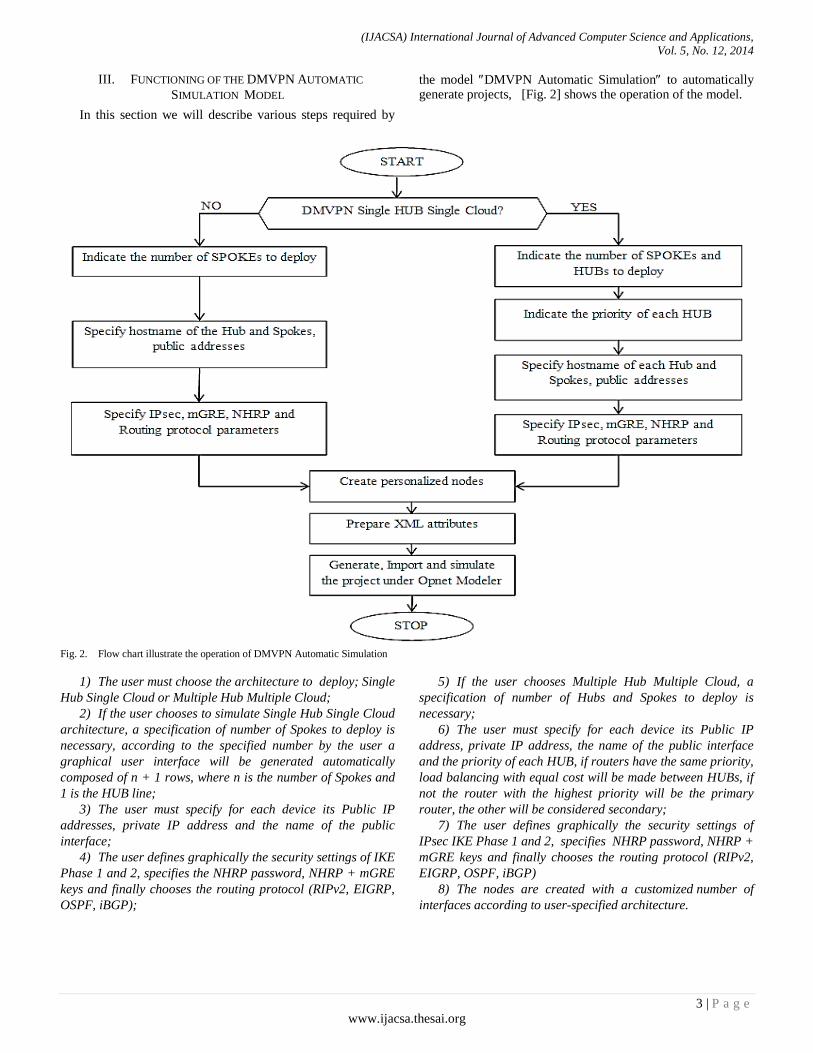
Fig. 3. Use Case Diagram of proposed tool
The modeling procedure [Fig. 3] consists of four steps:
Step 1: User must choose the architecture to deploy;
Step 2: User must indicate for each specific device its identity information (public, private and tunnel IP addresses, outside interface and private address mask);
Step 3: User must indicate Security policy (IPsec attribute, NHRP password and mGRE and NHRP Keys) and routing protocol (RIPv2, EIGRP, OSPF, iBGP) to be applied for all equipment on the same architecture;
Step 4: DMVPN Automatic Simulation Tool convert automatically user parameters into XML configuration file ready to be simulated under OPNET Modeler.
The following demonstration will be for the simulation of DMVPN network, Single Hub Single Cloud architecture, composed of two Spokes.
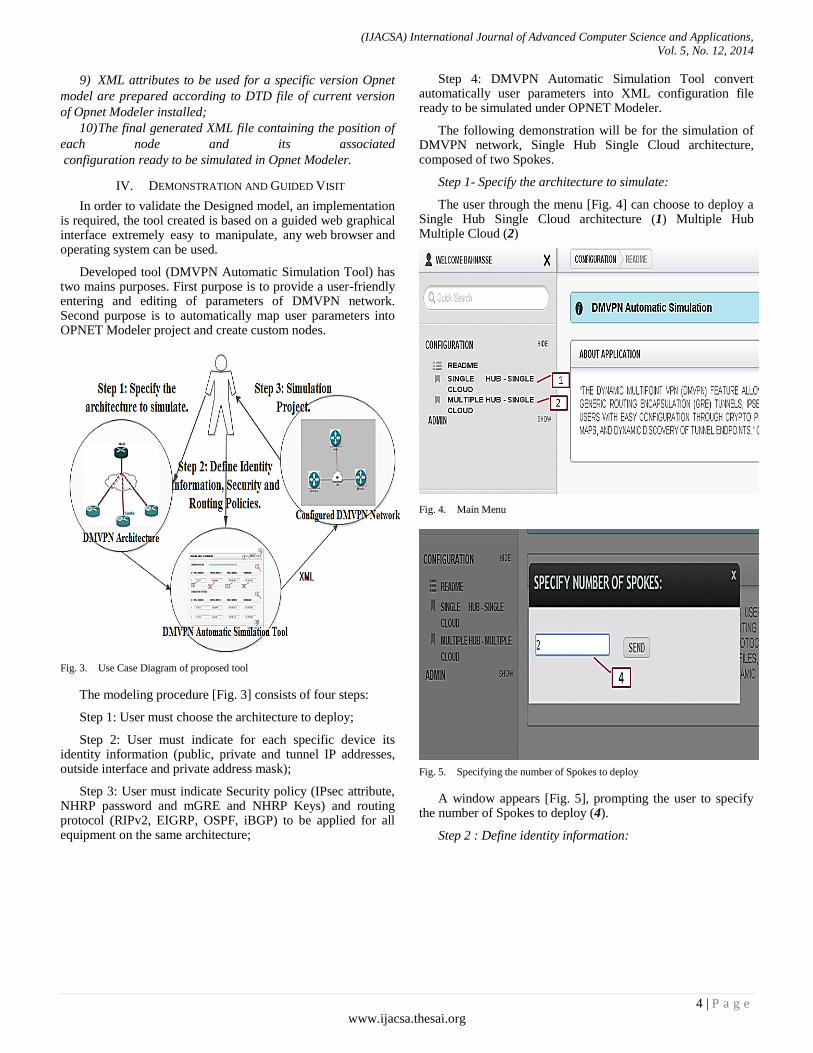
Step 1- Specify the architecture to simulate:
The user through the menu [Fig. 4] can choose to deploy a Single Hub Single Cloud architecture (1) Multiple Hub Multiple Cloud (2)
Fig. 4. Main Menu
Fig. 5. Specifying the number of Spokes to deploy
A window appears [Fig. 5], prompting the user to specify the number of Spokes to deploy (4).
Step 2 : Define identity information:

(IJACSA) International Journal of Advanced Computer Science and Applications,
Vol. 5, No. 12, 2014
5 | P a g e
www.ijacsa.thesai.org
Fig. 6. Specifying equipments data
After specifying the number of Spokes to install, a window [Fig. 6] is displayed, the window is mainly composed of two parts: identity configuration (5) security and routing policies configuration (6). The flap (5) consists of two sections: HUB Configuration (7) and Spokes Configuration (8), the two
sections are composed of the following fields: public IP address (9) outside interface (10), private IP address (11), subnet mask of private address (12), option (13) to reset all fields the current window.
Step 3 : Define security policy and routing protocol:
Fig. 7. Configuration of security and routing policies
The second section, security and routing policies configuration [Fig. 7] consists of four main sections: IPsec phase 1 configuration (15), IPsec phase 2 configuration (16), protection of the tunnel (17) and the choice of routing protocol (18).
Section (15) is composed of three fields, the choice of encryption protocol (19), the integrity protocol (20) and the password key derivation (21).
(IJACSA) International Journal of Advanced Computer Science and Applications,
Vol. 5, No. 12, 2014
6 | P a g e
www.ijacsa.thesai.org
Section (16) is composed of three fields, the protocol IPsec to use ESP or AHP (22), encryption protocols and integrity respectively (23) and (24); the default mode is set to Transport.
Section (17) is composed of three fields, NHRP password of current network (25), mGRE tunnel key (26) used to separate tunnels and provide authentication and the identifier of the NHRP network (27).
The last section (18) allows the user to pick through a list the protocol to be implemented which can be one of these protocols RIPv2, EIGRP, OSPF or iBGP (28).
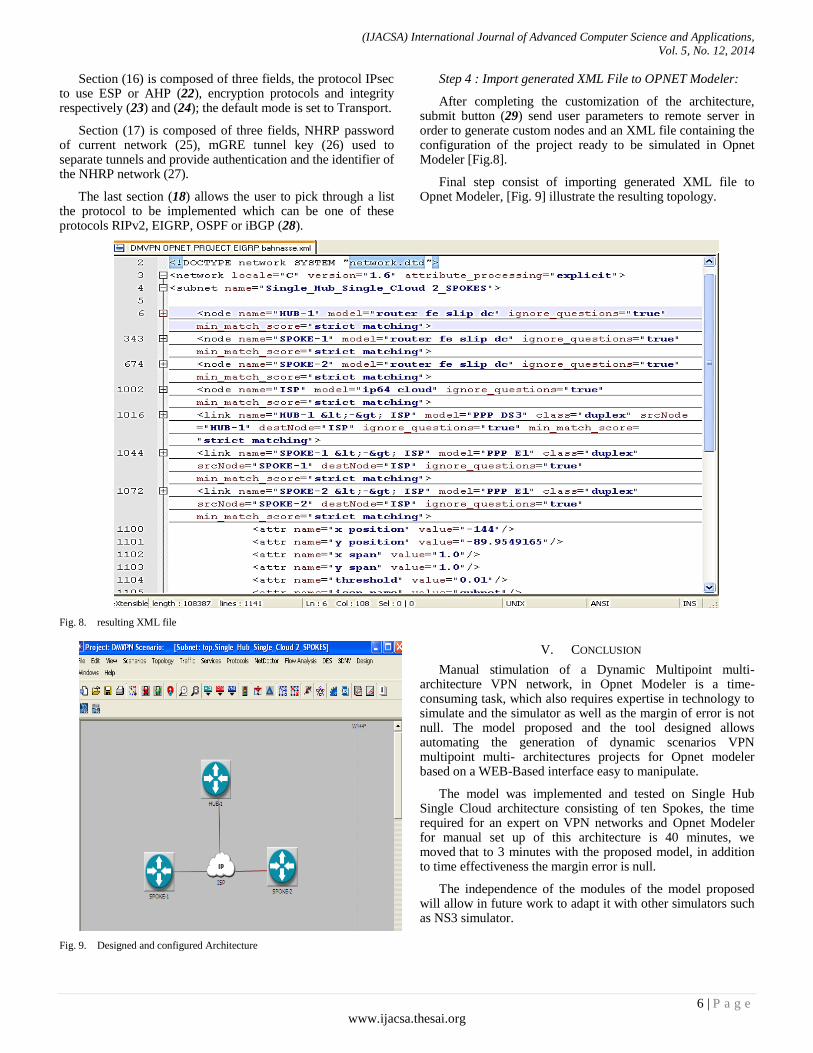
Step 4 : Import generated XML File to OPNET Modeler:
After completing the customization of the architecture, submit button (29) send user parameters to remote server in order to generate custom nodes and an XML file containing the configuration of the project ready to be simulated in Opnet Modeler [Fig.8].
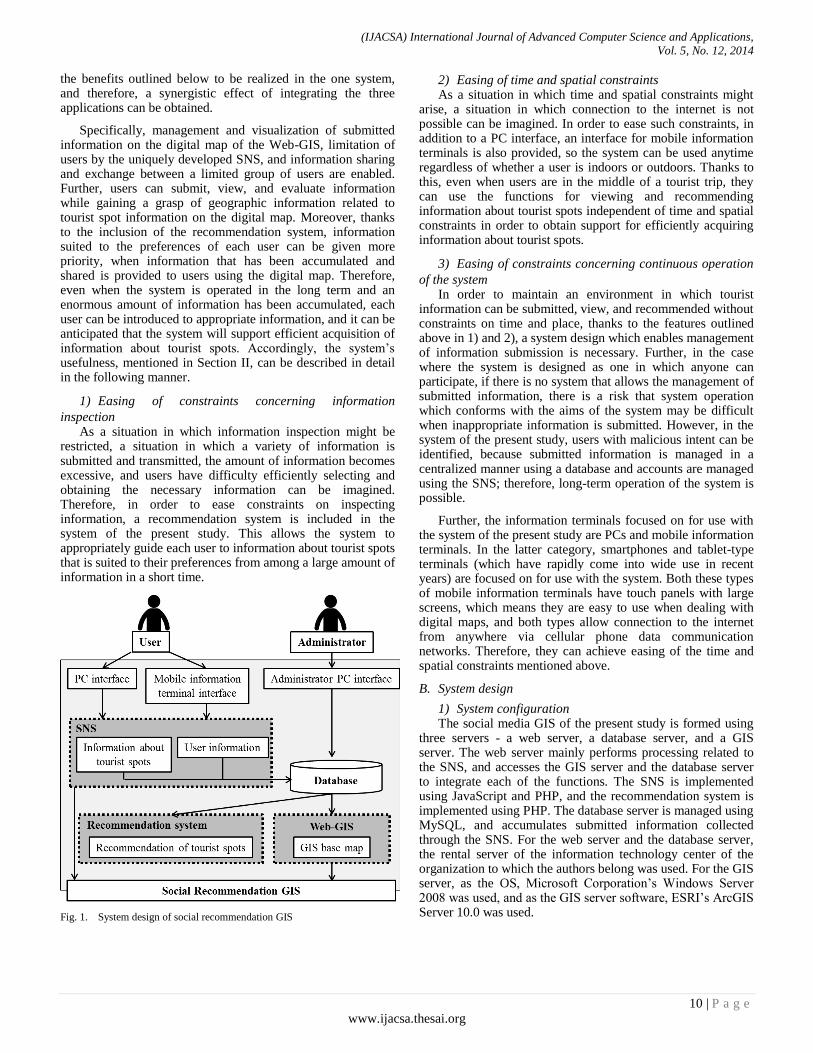
Final step consist of importing generated XML file to Opnet Modeler, [Fig. 9] illustrate the resulting topology.
Fig. 8. resulting XML file
Fig. 9. Designed and configured Architecture
V. CONCLUSION
Manual stimulation of a Dynamic Multipoint multi-architecture VPN network, in Opnet Modeler is a time-consuming task, which also requires expertise in technology to simulate and the simulator as well as the margin of error is not null. The model proposed and the tool designed allows automating the generation of dynamic scenarios VPN multipoint multi- architectures projects for Opnet modeler based on a WEB-Based interface easy to manipulate.
The model was implemented and tested on Single Hub Single Cloud architecture consisting of ten Spokes, the time required for an expert on VPN networks and Opnet Modeler for manual set up of this architecture is 40 minutes, we moved that to 3 minutes with the proposed model, in addition to time effectiveness the margin error is null.
The independence of the modules of the model proposed will allow in future work to adapt it with other simulators such as NS3 simulator.

(IJACSA) International Journal of Advanced Computer Science and Applications,
Vol. 5, No. 12, 2014
7 | P a g e
www.ijacsa.thesai.org
REFERENCES
[1] Asati, R., Khalid, M., Retana, A. E., Van Savage, D., & Sethi, P. P. (2013). U.S. Patent No. 8,346,961. Washington, DC: U.S. Patent and Trademark Office.
[2] Chen, H. (2011, May). Design and implementation of secure enterprise network based on DMVPN. In Business Management and Electronic Information (BMEI), 2011 International Conference on (Vol. 1, pp. 506-511). IEEE.
[3] Jankuniene, R., & Jankunaite, I. (2009, June). Route creation influence on DMVPN QoS. In Information Technology Interfaces, 2009. ITI'09. Proceedings of the ITI 2009 31st International Conference on (pp. 609-614). IEEE.
[4] Thorenoor, S. G. (2010, April). Dynamic routing protocol implementation decision between EIGRP, OSPF and RIP based on technical background using OPNET modeler. In Computer and Network Technology (ICCNT), 2010 Second International Conference on (pp. 191-195). IEEE.
[5] Adoba, B., & Dixon, W. (2004). RFC 3715–IPSec-network address translation (NAT) compatibility requirements.
[6] Lu, Zheng, and Hongji Yang. Unlocking the power of OPNET modeler. Cambridge University Press, 2012.
[7] Ibrahim, Q., & Khudher, I. A. (2011). Network Simulation Guide: Lecture Notes and Lab Manual.
[8] Altman, E., & Jimenez, T. (2012). NS Simulator for beginners. Synthesis Lectures on Communication Networks, 5(1), 1-184.
[9] Siraj, S., Gupta, A., & Badgujar, R. (2012). Network simulation tools survey.International Journal of Advanced Research in Computer and Communication Engineering, 1(4), 199-206.
[10] Borboruah, G., & Nandi, G. (2014) A Study on Large Scale Network Simulators5. International Journal of Computer Science and Information Technologies, Vol. 5 (6) , 7318-7322.
[11] Mohorko, J., Klampfer, S., Fras, M., & Cucej, Z. Expert System for Automatic Analysis of Results of Network Simulation.
[12] Li, H., & Lin, X. (2005, October). An OPNET-based 3-tier network simulation architecture. In Communications and Information Technology, 2005. ISCIT 2005. IEEE International Symposium on (Vol. 2, pp. 793-796). IEEE.
[13] Canonico, R., Emma, D., & Ventre, G. (2003, October). An XML description language for web-based network simulation. In Distributed Simulation and Real-Time Applications, 2003. Proceedings. Seventh IEEE International Symposium on (pp. 76-81).IEEE.

(IJACSA) International Journal of Advanced Computer Science and Applications,
Vol. 5, No. 12, 2014
8 | P a g e
www.ijacsa.thesai.org
Development of Social Recommendation GIS for
Tourist Spots
Tsukasa IKEDA
Graduate School Student,
Graduate School of Information Systems,
University of Electro-Communications
Tokyo, Japan
Kayoko YAMAMOTO
Associate Professor,
Graduate School of Information Systems,
University of Electro-Communications
Tokyo, Japan
Abstract—This study aims to develop a social
recommendation media GIS (Geographic Information Systems)
specially tailored to recommend tourist spots. The conclusions of
this study are summarized in the following three points. (1)
Social media GIS, an information system which integrates Web-
GIS, SNS and recommendation system into a single system, was
conducted in the central part of Yokohama City in Kanagawa
Prefecture, Japan. The social media GIS uses a design which
displays its usefulness in reducing the constraints of information
inspection, time and space, and continuity, making it possible to
redesign systems in accordance with target cases. (2) The social
media GIS was operated for two months for members of the
general public who are more than 18 years old. The total
numbers of users was 98, and the number of pieces of
information submitted was 232. (3) The web questionnaires of
users showed the usefulness of the integration of Web-GIS, SNS
and recommendation systems, because the functions of reference
and recommendation can be expected to support tourists’
excursion behavior. Since the access survey of log data showed
that about 35% of accesses were from mobile information
terminals, it can be said that the preparation of an optimal
interface for such terminals was effective.
Keywords—Social Recommendation GIS; Web-GIS; Social
Media; SNS; Recommendation Systems
I. INTRODUCTION
In recent years the transformation of Japan to an information-intensive society is progressing, and a variety of information is being transmitted using the internet. Similarly, a variety of information is also being transmitted using the internet in the field of tourism, and the internet has become a primary information source for planning tourist trips and searching for information about the area of a destination. However, due to the large amount of information, and the variety of types of information, it is difficult for users to appropriately select and acquire necessary information by themselves. In particular, the amount of information submitted and made public about tourist spots in urban areas is very large compared to that for regional tourist spots, and it is difficult for people who do not have much knowledge of or acquaintance with the places concerned to efficiently obtain information necessary for taking tourist trips. Therefore, a recommendation system for guiding users to appropriate information is necessary.
Meanwhile, Japanese society has become such that nowadays, anyone, anywhere, anytime can use an information
system to easily transmit, receive, and share information, and through the effective use of information systems, information possessed by ordinary people can be collected and accumulated. Of the information possessed by people involved in tourist spots as supporters of tourist services, local residents, and people who have visited the tourist spots as tourists, “experience-based knowledge” is the part that exists as “tacit knowledge” that is not visualized if it is not communicated to others. Therefore, by using an information system to change this “experience-based knowledge” into “explicit knowledge” which can be accumulated, organized, utilized, and made public, collecting the knowledge, and having users share the knowledge with each other, it will become possible for users to efficiently obtain necessary information and to go on fulfilling tourist excursions.
Based on the above-mentioned background, the aim of the present study is to uniquely develop a social recommendation GIS (Geographic Information Systems) which integrates a Web-GIS, an SNS, and a recommendation system, and is designed for recommending tourist spots, in order to support users’ efficient acquisition of information about tourist spots in urban tourist areas, about which a variety of information is transmitted, by enabling information to be accumulated, shared, and recommended.
Further, the system that is developed is also operated and evaluated, and measures to improve the system are identified. The aim is for the social recommendation GIS of the present study to transform information about tourist spots which is tacit knowledge into explicit knowledge and to accumulate and share the information so that the appeal of the tourist spots is communicated. In addition, the aim is for the social recommendation GIS to support users’ efficient acquisition of information about tourist spots by guiding users to appropriate information from among the enormous amount of varied information available.
II. RELAED WORK
The present study is related to three fields of research: (1) Research concerning tourism support systems and methods; (2) Research concerning systems and methods that recommend places such as tourist spots; and (3) Research concerning the development of social media GIS. Following are examples of previous studies in these related fields which focused on tourist information and regional information. In (1) Research concerning tourism support systems and methods, Ishizuka et

(IJACSA) International Journal of Advanced Computer Science and Applications,
Vol. 5, No. 12, 2014
9 | P a g e
www.ijacsa.thesai.org
al. (2007) [1] proposed a method of searching for similarities in data on movement paths of tourists based on location information and text information related to the location information. Kurata (2012) [2] developed a sightseeing route automatic generation system which utilized a Web-GIS and a genetic algorithm. Kawamura (2012) [3] proposed using a standard tag related to tourism in an SNS, set up a website, and organized tourist information about Hokkaido on the internet.
In (2) Research concerning systems and methods that recommend places such as tourist spots, Kurashima et al. (2011) [4] proposed a method for recommending travel routes that utilizes geotags in a photo-sharing website, and Van Canneyt et al. (2011) [5] proposed a system for recommending tourist attractions. Batet et al. (2012) [6] proposed a system for recommending tourist spots using a multi-agent system, and Uehara et al. (2012) [7] proposed a system which recommends tourist spots by extracting tourist information from the Web and calculating similarities between tourist spots based on multiple feature vectors. Further, among research concerning LBSN (location-based social networks), research concerning recommendation of points of interest (POIs) also belongs to the field of research about systems and methods that recommend places such as tourist spots. Representative examples of research concerning recommendation of POIs are the study by Yu and Chang (2009) [8] in which they proposed a POI recommendation system which supports trip planning, the study by Noguera et al. (2012) [9] in which they proposed a POI recommender system based on location information about present location, and the study by Baltrunas et al. (2011) [10] in which they proposed a POI recommender system based on location information and user preferences. Ye et al. (2011) [11] and Ying et al. (2012) [12] proposed POI recommendation methods based on location information, user preferences, and social networks. Similarly, Bao et al. (2013) [13] proposed a recommender system based on such things. Yuan et al. (2013) [14] proposed a POI recommendation method which took spatio-temporal information into account, and Liu et al. (2013) [15] proposed a POI recommendation method which took changes in user preferences into account.
In (3) Research concerning the development of social media GIS, using a Web-GIS, an SNS, and a wiki, Yanagisawa and Yamamoto (2011) [16] developed a system for accumulating local knowledge in local communities, and Nakahara et al. (2012) [17] developed a system for supporting communication concerning local knowledge in local communities. Further, using a Web-GIS, an SNS, and Twitter, Yamada and Yamamoto (2013) [18] developed a system for information exchange between regions, and Okuma and Yamamoto (2013) [19] developed a system for accumulating urban disaster information.
However, in the previous research mentioned above, there is no system that integrates a Web-GIS, an SNS, and a recommendation system. In the present study, we develop a system which integrates a Web-GIS, an SNS, and a recommendation system, and this makes the system unique. Further, support for efficient acquisition of information about tourist spots which takes into account the preferences of each user is enabled by making accumulation, sharing, and recommendation of information possible in the one system, and
in this respect, a synergistic effect of integrating the three above-mentioned applications is obtained. This demonstrates the usefulness of the system. Further, the present study also focuses on information exchange between users - something that until now has not been taken into account very much in studies involving just a recommendation system - and includes a recommendation system in an SNS. Through this, both effective recommendation of tourist spots to each user and information exchange between users which utilizes SNS communication functions are enabled in the one system, and this is another reason the system is useful.
III. RESEARCH OUTLINE AND METHOD
In the present study, research is conducted according to the following outline and method. Firstly, a social recommendation GIS which specializes in the aim of the present study is uniquely designed (Section IV) and developed (Section V). Next, anticipating users are the general public who are more than 18 years, an operation test and operation of the social recommendation GIS (Section VI) are conducted. Further, the system is evaluated and measures for improving use of the system are identified (Section VII). Anticipating that each user will use the system for about a month, an operation test and an evaluation of operation test are conducted, and then actual operation is conducted. In addition, web questionnaires are given to users, access is analyzed using log data during the period of actual operation, and submitted information is analyzed. Based on the results of these steps, the system is evaluated, and measures to improve the system in order to more effectively support people taking tourist trips are identified. The central part of Yokohama City in Kanagawa Prefecture was selected as the region for operation. One reason is that this area is a popular urban tourist area, so many tourists visit it; therefore, a lot of information about the area is submitted by people and published, with the result that it is difficult for tourists to efficiently obtain necessary information about the area. A further reason is that since this area has many kinds of tourist spots, the system of the present study can be used to recommend tourist spots that are suited to the preferences of various users.
IV. RESEARCH OUTLINE AND METHOD
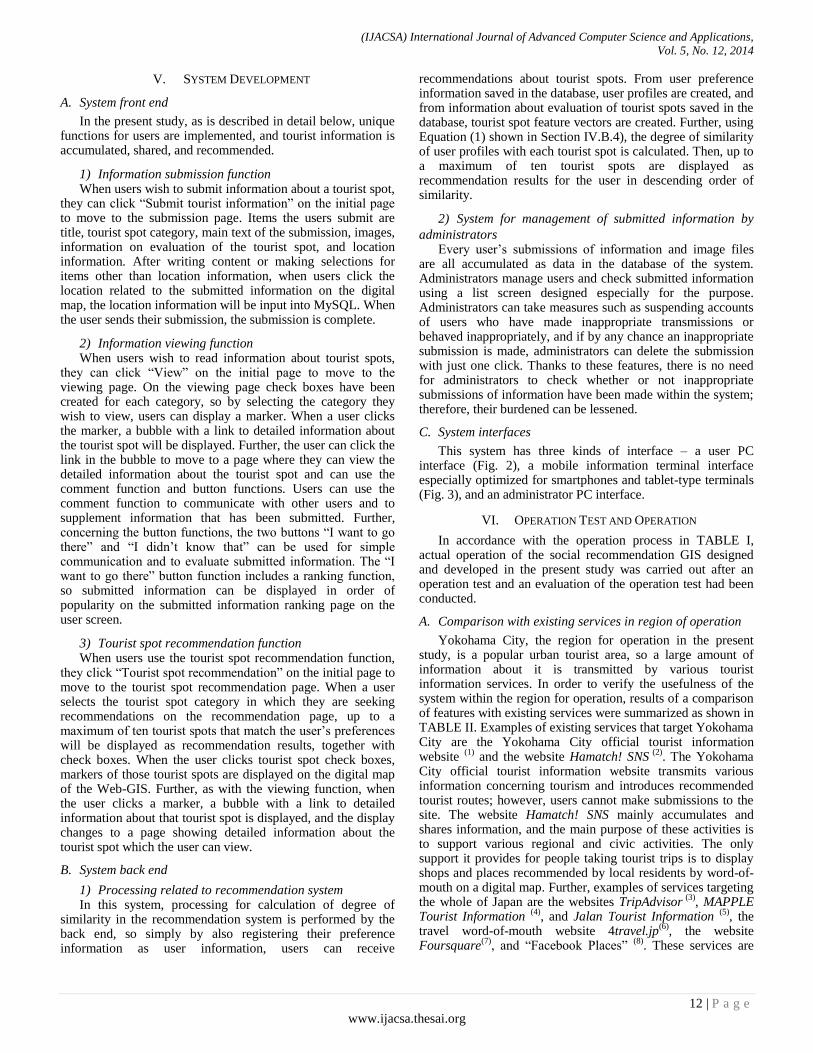
A. System Features
As shown in Fig. 1, the system proposed by the present study is formed by an integration of three applications – a Web-GIS, an SNS, and a recommendation system. The primary reason for integrating these three applications is that if only a Web-GIS is used, a system is limited to unilateral transmission of information using a digital map; therefore, an SNS was integrated with a Web-GIS to allow interactive transmission and reception of information. The second reason is that, as will be described in detail in Section IV.B.2), in the present study, Environmental Systems Research Institute, Inc.’s (ESRI’s) ArcGIS Server is used as the Web-GIS; however, a recommendation system cannot be directly included in the ArcGIS Server. Therefore, the Web-GIS and the recommendation system were included in the SNS to enable the three applications to be integrated together. Accordingly, integrating the three applications - that is, the Web-GIS, the SNS, and the recommendation system – enables
(IJACSA) International Journal of Advanced Computer Science and Applications,
Vol. 5, No. 12, 2014
10 | P a g e
www.ijacsa.thesai.org
the benefits outlined below to be realized in the one system, and therefore, a synergistic effect of integrating the three applications can be obtained.
Specifically, management and visualization of submitted information on the digital map of the Web-GIS, limitation of users by the uniquely developed SNS, and information sharing and exchange between a limited group of users are enabled. Further, users can submit, view, and evaluate information while gaining a grasp of geographic information related to tourist spot information on the digital map. Moreover, thanks to the inclusion of the recommendation system, information suited to the preferences of each user can be given more priority, when information that has been accumulated and shared is provided to users using the digital map. Therefore, even when the system is operated in the long term and an enormous amount of information has been accumulated, each user can be introduced to appropriate information, and it can be anticipated that the system will support efficient acquisition of information about tourist spots. Accordingly, the system’s usefulness, mentioned in Section II, can be described in detail in the following manner.
1) Easing of constraints concerning information
inspection As a situation in which information inspection might be
restricted, a situation in which a variety of information is submitted and transmitted, the amount of information becomes excessive, and users have difficulty efficiently selecting and obtaining the necessary information can be imagined. Therefore, in order to ease constraints on inspecting information, a recommendation system is included in the system of the present study. This allows the system to appropriately guide each user to information about tourist spots that is suited to their preferences from among a large amount of information in a short time.
Fig. 1. System design of social recommendation GIS
2) Easing of time and spatial constraints As a situation in which time and spatial constraints might
arise, a situation in which connection to the internet is not possible can be imagined. In order to ease such constraints, in addition to a PC interface, an interface for mobile information terminals is also provided, so the system can be used anytime regardless of whether a user is indoors or outdoors. Thanks to this, even when users are in the middle of a tourist trip, they can use the functions for viewing and recommending information about tourist spots independent of time and spatial constraints in order to obtain support for efficiently acquiring information about tourist spots.
3) Easing of constraints concerning continuous operation
of the system In order to maintain an environment in which tourist
information can be submitted, view, and recommended without constraints on time and place, thanks to the features outlined above in 1) and 2), a system design which enables management of information submission is necessary. Further, in the case where the system is designed as one in which anyone can participate, if there is no system that allows the management of submitted information, there is a risk that system operation which conforms with the aims of the system may be difficult when inappropriate information is submitted. However, in the system of the present study, users with malicious intent can be identified, because submitted information is managed in a centralized manner using a database and accounts are managed using the SNS; therefore, long-term operation of the system is possible.
Further, the information terminals focused on for use with the system of the present study are PCs and mobile information terminals. In the latter category, smartphones and tablet-type terminals (which have rapidly come into wide use in recent years) are focused on for use with the system. Both these types of mobile information terminals have touch panels with large screens, which means they are easy to use when dealing with digital maps, and both types allow connection to the internet from anywhere via cellular phone data communication networks. Therefore, they can achieve easing of the time and spatial constraints mentioned above.
B. System design
1) System configuration The social media GIS of the present study is formed using
three servers - a web server, a database server, and a GIS server. The web server mainly performs processing related to the SNS, and accesses the GIS server and the database server to integrate each of the functions. The SNS is implemented using JavaScript and PHP, and the recommendation system is implemented using PHP. The database server is managed using MySQL, and accumulates submitted information collected through the SNS. For the web server and the database server, the rental server of the information technology center of the organization to which the authors belong was used. For the GIS server, as the OS, Microsoft Corporation’s Windows Server 2008 was used, and as the GIS server software, ESRI’s ArcGIS Server 10.0 was used.

(IJACSA) International Journal of Advanced Computer Science and Applications,
Vol. 5, No. 12, 2014
11 | P a g e
www.ijacsa.thesai.org
2) Web-GIS In the present study, for the Web-GIS, ESRI’s ArcGIS
Server 10.0 was used, and for the GIS base map of the Web-GIS, the SHAPE version (Rel.8) of Shobunsha Publications, Inc.’s MAPPLE10000, which is part of their MAPPLE digital map data and includes detailed road system data, was used. As the map that was superimposed with this digital map data, the user interface of Google Maps was used. Among the options provided by ESRI that are ArcGIS Server 10.0 API targets, the Google Maps user interface is the one that has been used the most in previous studies in fields related to the present study. Concerning the superimposition of MAPPLE10000 (SHAPE version) and Google Maps, Google Maps employs the new geodetic system coordinates, while MAPPLE10000 conforms to the former geodetic system coordinates; therefore, ArcTKY2JGD, which is provided by ESRI as product support, was used to convert the MAPPLE10000 geodetic system coordinates to the new coordinates. Furthermore, editing was performed such that information about the region for operation could be input using ArcMap 10.0.
3) SNS In the present study, an SNS was selected as the social
media for integration with the Web-GIS and the recommendation system. The SNS was uniquely designed and developed to suit the objectives of the system. An SNS was chosen because in contrast to other forms of social media, if an SNS is used the system can be uniquely designed and developed in a way that best suits the objectives of use, and detailed system configuration can be performed in a unique manner to suit regional characteristics of the region in which the system is to be operated. Further, as mentioned in Section IV.A, developing our own unique SNS enabled the information transmission of the system to be interactive, and enabled the recommendation system to also be integrated into the system.
Firstly, features such as those relating to registering and publishing user information and to submitting, viewing, and recommending information were uniquely designed to suit to the objectives of the present study. Next, since in this system it is desirable that users voluntarily communicate with each other, in contrast to ordinary SNSs, friend registration and community functions were not designed, and as methods for communication, comment function and button functions were designed. The comment function is used for communication between users and for providing additions related to submitted information. Concerning the button functions, two buttons were designed – one for “I want to go there” and one for “I didn’t know that”. These buttons are used for simple communication and for evaluating submitted information. Of the button functions, a ranking function was also added to the “I want to go there” button function. In order to show clearly what kinds of submissions are attracting attention from users, submissions are shown in order of popularity on the submitted information ranking page of the user screen.
4) Recommendation system There are three methods for recommendation systems –
collaborative recommendation, content-based recommendation, and knowledge-based recommendation (Jannach et al., 2012) [20], and in this system, knowledge-based recommendation is used. A reason for this is that
knowledge-based recommendation can solve the cold start problem. The cold start problem is that it is difficult to make appropriate recommendations for users new to using the system, and difficult to recommend items which have been newly introduced to the system as items for recommendation. Concerning the problem of difficulty in making appropriate recommendations to new users, Kamishima (2008) [21] pointed out that if knowledge-based recommendation is employed, users directly write their own user profiles themselves, so the problem does not arise. Further, concerning the difficulty of recommending newly introduced items, Kamishima (2008) [21] pointed out that when content-based recommendation or knowledge-based recommendation is employed, if there are user profiles, even new items can be recommended without a problem, using their feature vectors as hints.
Further, this system is for use with ordinary people. Therefore, in the creation of user profiles based on user preference information, it is desirable to use a question format which is clear and intuitively easy to understand. Therefore, the question items are asked using values in five stages of from 1 to 5, and user profile vectors are created. Similarly, regarding tourist spot evaluation information, a submitter of new tourist spot information is asked questions about each evaluation item using values in five stages of from 1 to 5, and tourist spot feature vectors are created. Thus, for the purpose of dealing with the above-mentioned cold start problem as well, in this system a setting is used that means users must input evaluation information when they submit information about a tourist spot. Further, when appealing to people to use the system, this was explained in the operating instructions that were distributed, and people were asked to input evaluation information.
Based on the user profiles of users and tourist spot feature vectors that have been created, degree of similarity is calculated using Equation (1), and tourist spots with a high degree of similarity are recommended.
∑
√∑
√∑
: Degree of similarity
: User preference information
: Tourist spot evaluation information
: Question item number
: Tourist spot number
5) Management of submitted information As mentioned in Section IV.A regarding the easing of
constraints concerning continuous operation of the system, a system design which enables management of submitted information is necessary. Therefore, this system aims for long-term operation, and is designed such that no restrictions are imposed when submitted information is made public to all users, but in the case where an administrator determines that a posting has been made by a user with malicious intent or determines that submitted information does not suit the aims of the system, the administrator can exercise rights to delete accounts and delete posts. Specifically, the system is provided with a function that enables centralized management of submitted information through a database.
(IJACSA) International Journal of Advanced Computer Science and Applications,
Vol. 5, No. 12, 2014
12 | P a g e
www.ijacsa.thesai.org
V. SYSTEM DEVELOPMENT
A. System front end
In the present study, as is described in detail below, unique functions for users are implemented, and tourist information is accumulated, shared, and recommended.
1) Information submission function When users wish to submit information about a tourist spot,
they can click “Submit tourist information” on the initial page to move to the submission page. Items the users submit are title, tourist spot category, main text of the submission, images, information on evaluation of the tourist spot, and location information. After writing content or making selections for items other than location information, when users click the location related to the submitted information on the digital map, the location information will be input into MySQL. When the user sends their submission, the submission is complete.
2) Information viewing function When users wish to read information about tourist spots,
they can click “View” on the initial page to move to the viewing page. On the viewing page check boxes have been created for each category, so by selecting the category they wish to view, users can display a marker. When a user clicks the marker, a bubble with a link to detailed information about the tourist spot will be displayed. Further, the user can click the link in the bubble to move to a page where they can view the detailed information about the tourist spot and can use the comment function and button functions. Users can use the comment function to communicate with other users and to supplement information that has been submitted. Further, concerning the button functions, the two buttons “I want to go there” and “I didn’t know that” can be used for simple communication and to evaluate submitted information. The “I want to go there” button function includes a ranking function, so submitted information can be displayed in order of popularity on the submitted information ranking page on the user screen.
3) Tourist spot recommendation function When users use the tourist spot recommendation function,
they click “Tourist spot recommendation” on the initial page to move to the tourist spot recommendation page. When a user selects the tourist spot category in which they are seeking recommendations on the recommendation page, up to a maximum of ten tourist spots that match the user’s preferences will be displayed as recommendation results, together with check boxes. When the user clicks tourist spot check boxes, markers of those tourist spots are displayed on the digital map of the Web-GIS. Further, as with the viewing function, when the user clicks a marker, a bubble with a link to detailed information about that tourist spot is displayed, and the display changes to a page showing detailed information about the tourist spot which the user can view.
B. System back end
1) Processing related to recommendation system In this system, processing for calculation of degree of
similarity in the recommendation system is performed by the back end, so simply by also registering their preference information as user information, users can receive
recommendations about tourist spots. From user preference information saved in the database, user profiles are created, and from information about evaluation of tourist spots saved in the database, tourist spot feature vectors are created. Further, using Equation (1) shown in Section IV.B.4), the degree of similarity of user profiles with each tourist spot is calculated. Then, up to a maximum of ten tourist spots are displayed as recommendation results for the user in descending order of similarity.
2) System for management of submitted information by
administrators Every user’s submissions of information and image files
are all accumulated as data in the database of the system. Administrators manage users and check submitted information using a list screen designed especially for the purpose. Administrators can take measures such as suspending accounts of users who have made inappropriate transmissions or behaved inappropriately, and if by any chance an inappropriate submission is made, administrators can delete the submission with just one click. Thanks to these features, there is no need for administrators to check whether or not inappropriate submissions of information have been made within the system; therefore, their burdened can be lessened.
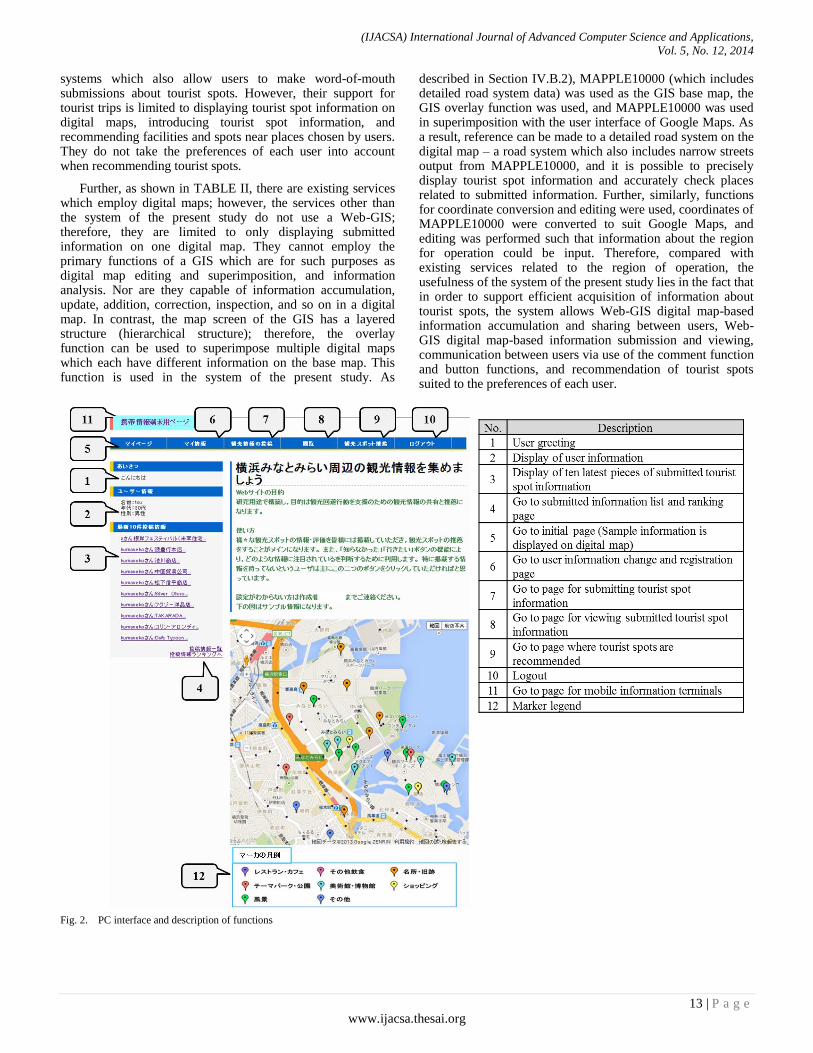
C. System interfaces
This system has three kinds of interface – a user PC interface (Fig. 2), a mobile information terminal interface especially optimized for smartphones and tablet-type terminals (Fig. 3), and an administrator PC interface.
VI. OPERATION TEST AND OPERATION
In accordance with the operation process in TABLE I, actual operation of the social recommendation GIS designed and developed in the present study was carried out after an operation test and an evaluation of the operation test had been conducted.
A. Comparison with existing services in region of operation
Yokohama City, the region for operation in the present study, is a popular urban tourist area, so a large amount of information about it is transmitted by various tourist information services. In order to verify the usefulness of the system within the region for operation, results of a comparison of features with existing services were summarized as shown in TABLE II. Examples of existing services that target Yokohama City are the Yokohama City official tourist information website
(1) and the website Hamatch! SNS
(2). The Yokohama
City official tourist information website transmits various information concerning tourism and introduces recommended tourist routes; however, users cannot make submissions to the site. The website Hamatch! SNS mainly accumulates and shares information, and the main purpose of these activities is to support various regional and civic activities. The only support it provides for people taking tourist trips is to display shops and places recommended by local residents by word-of-mouth on a digital map. Further, examples of services targeting the whole of Japan are the websites TripAdvisor
(3), MAPPLE
Tourist Information (4)
, and Jalan Tourist Information (5)
, the travel word-of-mouth website 4travel.jp
(6), the website
Foursquare(7)
, and “Facebook Places” (8)
. These services are
(IJACSA) International Journal of Advanced Computer Science and Applications,
Vol. 5, No. 12, 2014
13 | P a g e
www.ijacsa.thesai.org
systems which also allow users to make word-of-mouth submissions about tourist spots. However, their support for tourist trips is limited to displaying tourist spot information on digital maps, introducing tourist spot information, and recommending facilities and spots near places chosen by users. They do not take the preferences of each user into account when recommending tourist spots.
Further, as shown in TABLE II, there are existing services which employ digital maps; however, the services other than the system of the present study do not use a Web-GIS; therefore, they are limited to only displaying submitted information on one digital map. They cannot employ the primary functions of a GIS which are for such purposes as digital map editing and superimposition, and information analysis. Nor are they capable of information accumulation, update, addition, correction, inspection, and so on in a digital map. In contrast, the map screen of the GIS has a layered structure (hierarchical structure); therefore, the overlay function can be used to superimpose multiple digital maps which each have different information on the base map. This function is used in the system of the present study. As
described in Section IV.B.2), MAPPLE10000 (which includes detailed road system data) was used as the GIS base map, the GIS overlay function was used, and MAPPLE10000 was used in superimposition with the user interface of Google Maps. As a result, reference can be made to a detailed road system on the digital map – a road system which also includes narrow streets output from MAPPLE10000, and it is possible to precisely display tourist spot information and accurately check places related to submitted information. Further, similarly, functions for coordinate conversion and editing were used, coordinates of MAPPLE10000 were converted to suit Google Maps, and editing was performed such that information about the region for operation could be input. Therefore, compared with existing services related to the region of operation, the usefulness of the system of the present study lies in the fact that in order to support efficient acquisition of information about tourist spots, the system allows Web-GIS digital map-based information accumulation and sharing between users, Web-GIS digital map-based information submission and viewing, communication between users via use of the comment function and button functions, and recommendation of tourist spots suited to the preferences of each user.
Fig. 2. PC interface and description of functions
(IJACSA) International Journal of Advanced Computer Science and Applications,
Vol. 5, No. 12, 2014
14 | P a g e
www.ijacsa.thesai.org
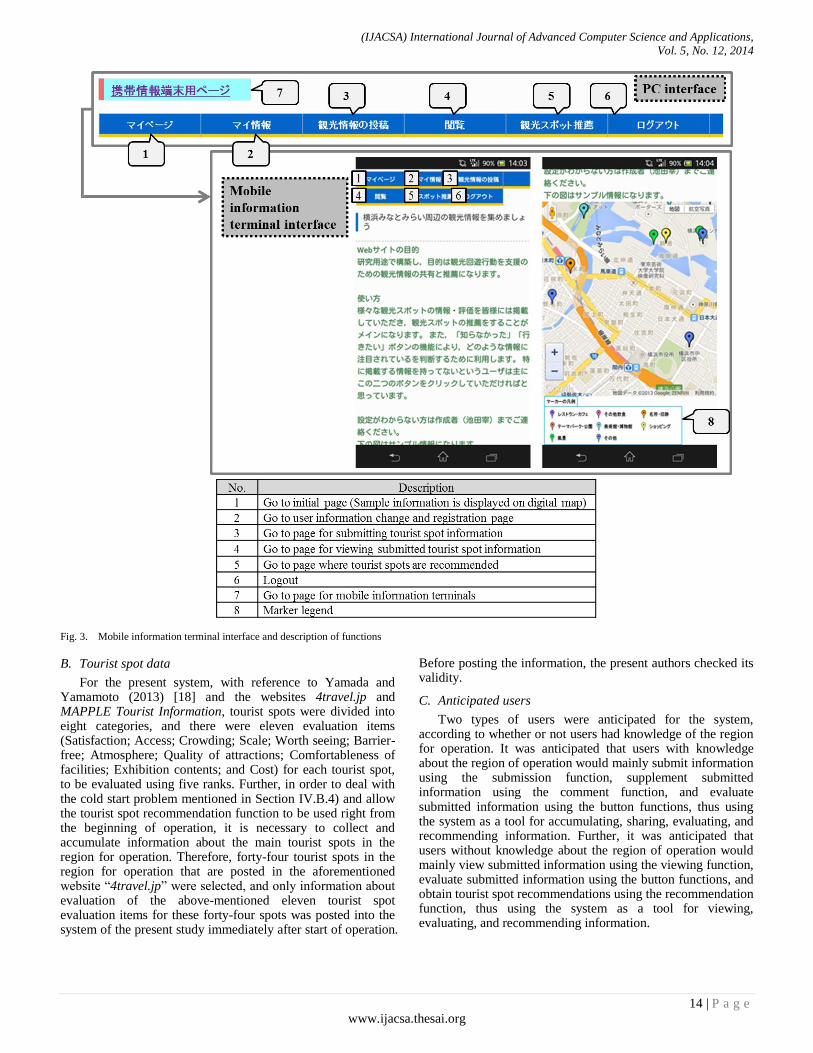
Fig. 3. Mobile information terminal interface and description of functions
B. Tourist spot data
For the present system, with reference to Yamada and Yamamoto (2013) [18] and the websites 4travel.jp and MAPPLE Tourist Information, tourist spots were divided into eight categories, and there were eleven evaluation items (Satisfaction; Access; Crowding; Scale; Worth seeing; Barrier-free; Atmosphere; Quality of attractions; Comfortableness of facilities; Exhibition contents; and Cost) for each tourist spot, to be evaluated using five ranks. Further, in order to deal with the cold start problem mentioned in Section IV.B.4) and allow the tourist spot recommendation function to be used right from the beginning of operation, it is necessary to collect and accumulate information about the main tourist spots in the region for operation. Therefore, forty-four tourist spots in the region for operation that are posted in the aforementioned website “4travel.jp” were selected, and only information about evaluation of the above-mentioned eleven tourist spot evaluation items for these forty-four spots was posted into the system of the present study immediately after start of operation.
Before posting the information, the present authors checked its validity.
C. Anticipated users
Two types of users were anticipated for the system, according to whether or not users had knowledge of the region for operation. It was anticipated that users with knowledge about the region of operation would mainly submit information using the submission function, supplement submitted information using the comment function, and evaluate submitted information using the button functions, thus using the system as a tool for accumulating, sharing, evaluating, and recommending information. Further, it was anticipated that users without knowledge about the region of operation would mainly view submitted information using the viewing function, evaluate submitted information using the button functions, and obtain tourist spot recommendations using the recommendation function, thus using the system as a tool for viewing, evaluating, and recommending information.
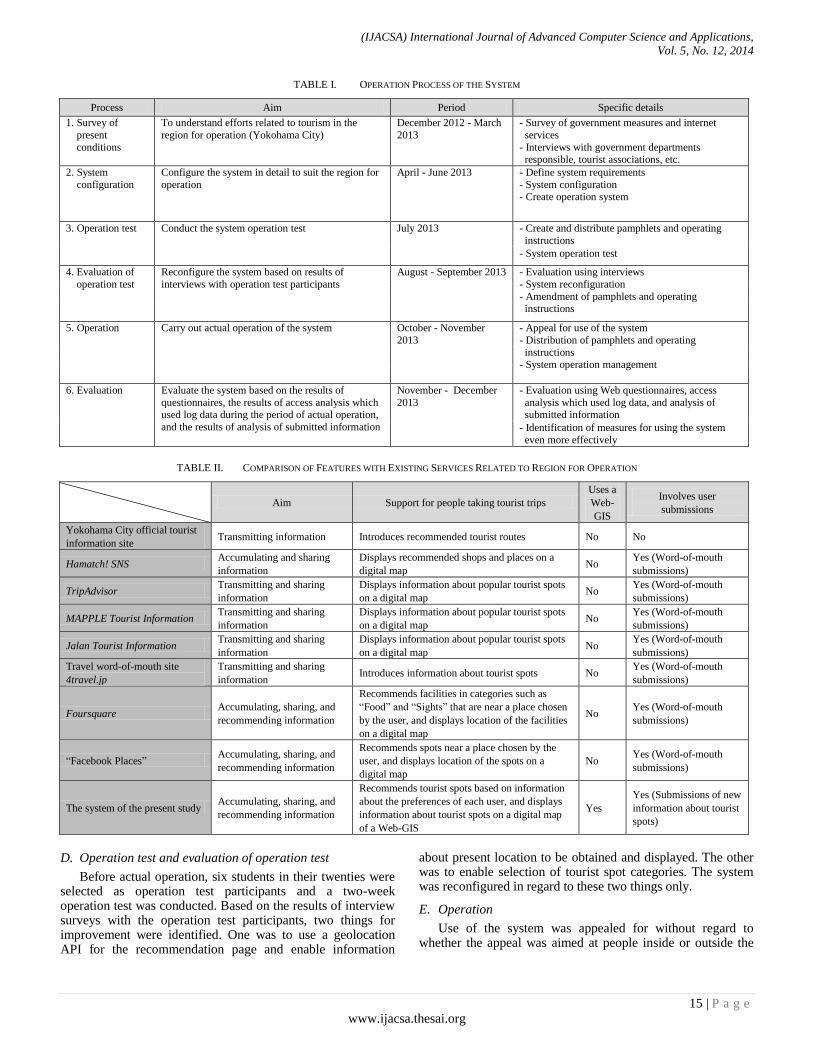
(IJACSA) International Journal of Advanced Computer Science and Applications,
Vol. 5, No. 12, 2014
15 | P a g e
www.ijacsa.thesai.org
TABLE I. OPERATION PROCESS OF THE SYSTEM
Process Aim Period Specific details
1. Survey of
present
conditions
To understand efforts related to tourism in the
region for operation (Yokohama City)
December 2012 - March
2013
- Survey of government measures and internet
services
- Interviews with government departments responsible, tourist associations, etc.
2. System
configuration
Configure the system in detail to suit the region for
operation
April - June 2013 - Define system requirements
- System configuration - Create operation system
3. Operation test Conduct the system operation test July 2013 - Create and distribute pamphlets and operating
instructions
- System operation test
4. Evaluation of
operation test
Reconfigure the system based on results of
interviews with operation test participants
August - September 2013 - Evaluation using interviews
- System reconfiguration
- Amendment of pamphlets and operating instructions
5. Operation Carry out actual operation of the system October - November
2013
- Appeal for use of the system
- Distribution of pamphlets and operating
instructions - System operation management
6. Evaluation Evaluate the system based on the results of
questionnaires, the results of access analysis which used log data during the period of actual operation,
and the results of analysis of submitted information
November - December
2013
- Evaluation using Web questionnaires, access
analysis which used log data, and analysis of submitted information
- Identification of measures for using the system
even more effectively
TABLE II. COMPARISON OF FEATURES WITH EXISTING SERVICES RELATED TO REGION FOR OPERATION
Aim Support for people taking tourist trips
Uses a
Web-
GIS
Involves user
submissions
Yokohama City official tourist
information site Transmitting information Introduces recommended tourist routes No No
Hamatch! SNS Accumulating and sharing
information
Displays recommended shops and places on a
digital map No
Yes (Word-of-mouth
submissions)
TripAdvisor Transmitting and sharing
information
Displays information about popular tourist spots
on a digital map No
Yes (Word-of-mouth
submissions)
MAPPLE Tourist Information Transmitting and sharing
information
Displays information about popular tourist spots
on a digital map No
Yes (Word-of-mouth
submissions)
Jalan Tourist Information Transmitting and sharing
information
Displays information about popular tourist spots
on a digital map No
Yes (Word-of-mouth
submissions)
Travel word-of-mouth site
4travel.jp
Transmitting and sharing
information Introduces information about tourist spots No
Yes (Word-of-mouth
submissions)
Foursquare Accumulating, sharing, and
recommending information
Recommends facilities in categories such as
“Food” and “Sights” that are near a place chosen
by the user, and displays location of the facilities
on a digital map
No Yes (Word-of-mouth
submissions)
“Facebook Places” Accumulating, sharing, and
recommending information
Recommends spots near a place chosen by the
user, and displays location of the spots on a
digital map
No Yes (Word-of-mouth
submissions)
The system of the present study Accumulating, sharing, and
recommending information
Recommends tourist spots based on information
about the preferences of each user, and displays
information about tourist spots on a digital map
of a Web-GIS
Yes
Yes (Submissions of new
information about tourist
spots)
D. Operation test and evaluation of operation test
Before actual operation, six students in their twenties were selected as operation test participants and a two-week operation test was conducted. Based on the results of interview surveys with the operation test participants, two things for improvement were identified. One was to use a geolocation API for the recommendation page and enable information
about present location to be obtained and displayed. The other was to enable selection of tourist spot categories. The system was reconfigured in regard to these two things only.
E. Operation
Use of the system was appealed for without regard to whether the appeal was aimed at people inside or outside the
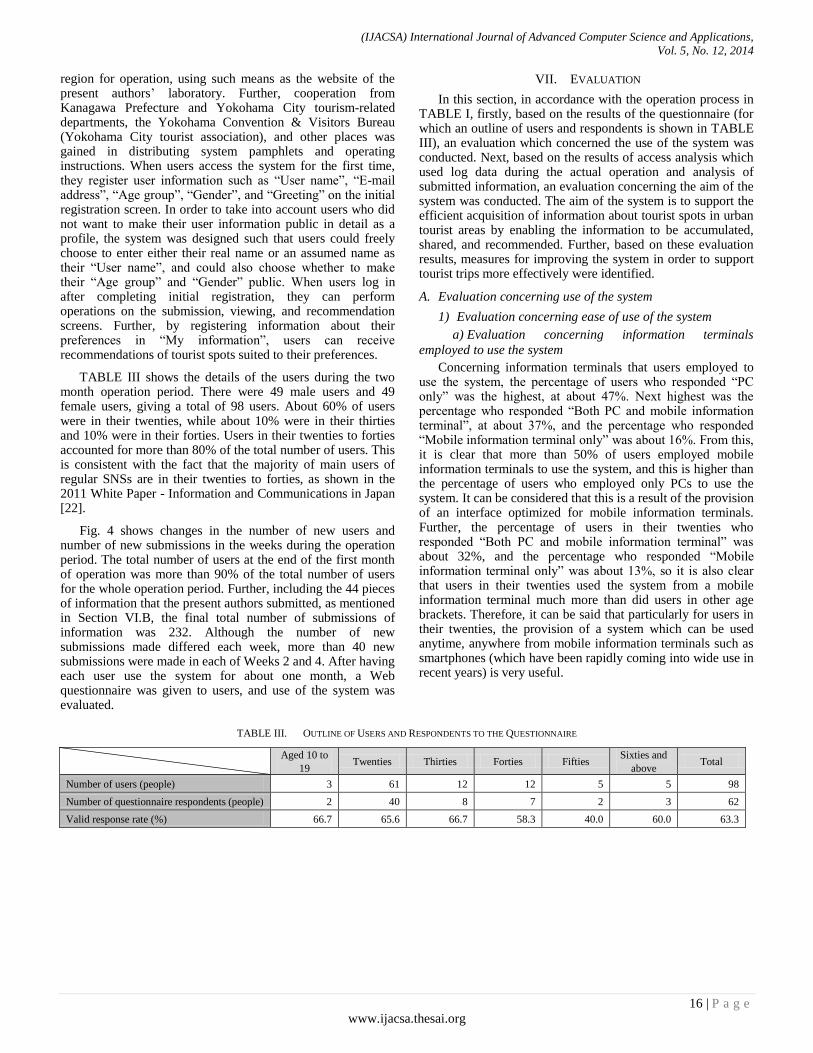
(IJACSA) International Journal of Advanced Computer Science and Applications,
Vol. 5, No. 12, 2014
16 | P a g e
www.ijacsa.thesai.org
region for operation, using such means as the website of the present authors’ laboratory. Further, cooperation from Kanagawa Prefecture and Yokohama City tourism-related departments, the Yokohama Convention & Visitors Bureau (Yokohama City tourist association), and other places was gained in distributing system pamphlets and operating instructions. When users access the system for the first time, they register user information such as “User name”, “E-mail address”, “Age group”, “Gender”, and “Greeting” on the initial registration screen. In order to take into account users who did not want to make their user information public in detail as a profile, the system was designed such that users could freely choose to enter either their real name or an assumed name as their “User name”, and could also choose whether to make their “Age group” and “Gender” public. When users log in after completing initial registration, they can perform operations on the submission, viewing, and recommendation screens. Further, by registering information about their preferences in “My information”, users can receive recommendations of tourist spots suited to their preferences.
TABLE III shows the details of the users during the two month operation period. There were 49 male users and 49 female users, giving a total of 98 users. About 60% of users were in their twenties, while about 10% were in their thirties and 10% were in their forties. Users in their twenties to forties accounted for more than 80% of the total number of users. This is consistent with the fact that the majority of main users of regular SNSs are in their twenties to forties, as shown in the 2011 White Paper - Information and Communications in Japan [22].
Fig. 4 shows changes in the number of new users and number of new submissions in the weeks during the operation period. The total number of users at the end of the first month of operation was more than 90% of the total number of users for the whole operation period. Further, including the 44 pieces of information that the present authors submitted, as mentioned in Section VI.B, the final total number of submissions of information was 232. Although the number of new submissions made differed each week, more than 40 new submissions were made in each of Weeks 2 and 4. After having each user use the system for about one month, a Web questionnaire was given to users, and use of the system was evaluated.
VII. EVALUATION
In this section, in accordance with the operation process in TABLE I, firstly, based on the results of the questionnaire (for which an outline of users and respondents is shown in TABLE III), an evaluation which concerned the use of the system was conducted. Next, based on the results of access analysis which used log data during the actual operation and analysis of submitted information, an evaluation concerning the aim of the system was conducted. The aim of the system is to support the efficient acquisition of information about tourist spots in urban tourist areas by enabling the information to be accumulated, shared, and recommended. Further, based on these evaluation results, measures for improving the system in order to support tourist trips more effectively were identified.
A. Evaluation concerning use of the system
1) Evaluation concerning ease of use of the system
a) Evaluation concerning information terminals
employed to use the system
Concerning information terminals that users employed to use the system, the percentage of users who responded “PC only” was the highest, at about 47%. Next highest was the percentage who responded “Both PC and mobile information terminal”, at about 37%, and the percentage who responded “Mobile information terminal only” was about 16%. From this, it is clear that more than 50% of users employed mobile information terminals to use the system, and this is higher than the percentage of users who employed only PCs to use the system. It can be considered that this is a result of the provision of an interface optimized for mobile information terminals. Further, the percentage of users in their twenties who responded “Both PC and mobile information terminal” was about 32%, and the percentage who responded “Mobile information terminal only” was about 13%, so it is also clear that users in their twenties used the system from a mobile information terminal much more than did users in other age brackets. Therefore, it can be said that particularly for users in their twenties, the provision of a system which can be used anytime, anywhere from mobile information terminals such as smartphones (which have been rapidly coming into wide use in recent years) is very useful.
TABLE III. OUTLINE OF USERS AND RESPONDENTS TO THE QUESTIONNAIRE
Aged 10 to
19 Twenties Thirties Forties Fifties
Sixties and
above Total
Number of users (people) 3 61 12 12 5 5 98
Number of questionnaire respondents (people) 2 40 8 7 2 3 62
Valid response rate (%) 66.7 65.6 66.7 58.3 40.0 60.0 63.3
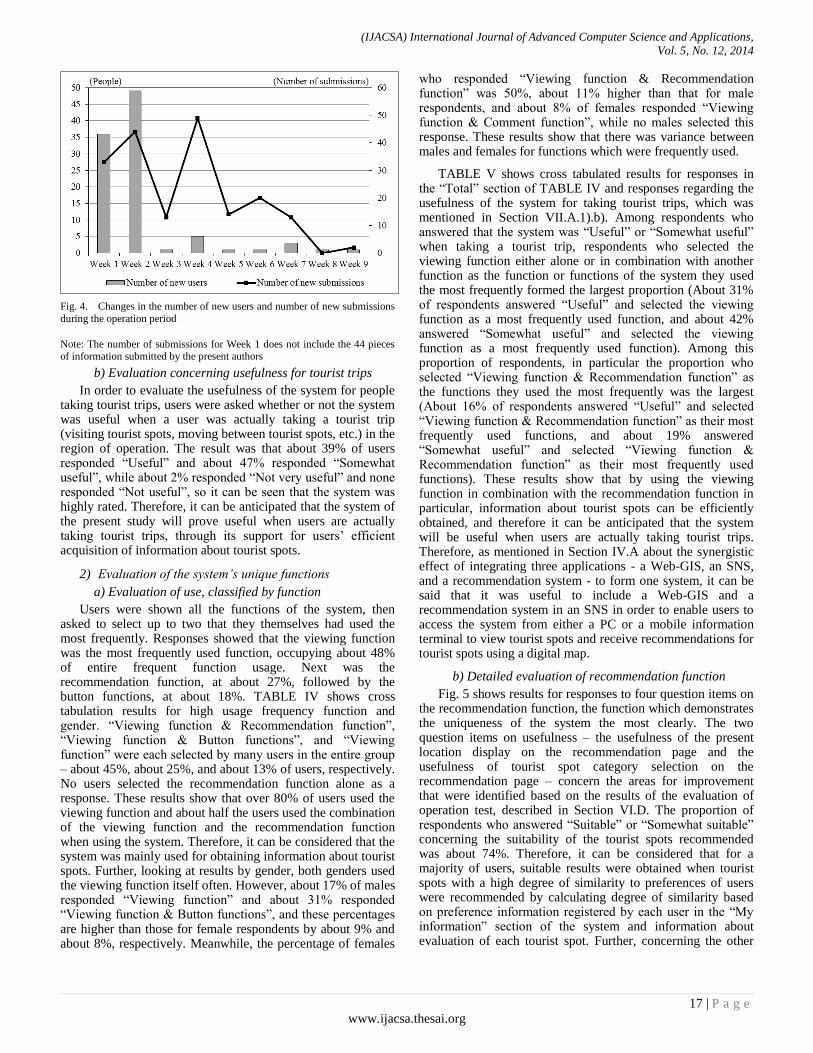
(IJACSA) International Journal of Advanced Computer Science and Applications,
Vol. 5, No. 12, 2014
17 | P a g e
www.ijacsa.thesai.org
Fig. 4. Changes in the number of new users and number of new submissions
during the operation period
Note: The number of submissions for Week 1 does not include the 44 pieces of information submitted by the present authors
b) Evaluation concerning usefulness for tourist trips
In order to evaluate the usefulness of the system for people taking tourist trips, users were asked whether or not the system was useful when a user was actually taking a tourist trip (visiting tourist spots, moving between tourist spots, etc.) in the region of operation. The result was that about 39% of users responded “Useful” and about 47% responded “Somewhat useful”, while about 2% responded “Not very useful” and none responded “Not useful”, so it can be seen that the system was highly rated. Therefore, it can be anticipated that the system of the present study will prove useful when users are actually taking tourist trips, through its support for users’ efficient acquisition of information about tourist spots.
2) Evaluation of the system’s unique functions
a) Evaluation of use, classified by function
Users were shown all the functions of the system, then asked to select up to two that they themselves had used the most frequently. Responses showed that the viewing function was the most frequently used function, occupying about 48% of entire frequent function usage. Next was the recommendation function, at about 27%, followed by the button functions, at about 18%. TABLE IV shows cross tabulation results for high usage frequency function and gender. “Viewing function & Recommendation function”, “Viewing function & Button functions”, and “Viewing function” were each selected by many users in the entire group – about 45%, about 25%, and about 13% of users, respectively. No users selected the recommendation function alone as a response. These results show that over 80% of users used the viewing function and about half the users used the combination of the viewing function and the recommendation function when using the system. Therefore, it can be considered that the system was mainly used for obtaining information about tourist spots. Further, looking at results by gender, both genders used the viewing function itself often. However, about 17% of males responded “Viewing function” and about 31% responded “Viewing function & Button functions”, and these percentages are higher than those for female respondents by about 9% and about 8%, respectively. Meanwhile, the percentage of females
who responded “Viewing function & Recommendation function” was 50%, about 11% higher than that for male respondents, and about 8% of females responded “Viewing function & Comment function”, while no males selected this response. These results show that there was variance between males and females for functions which were frequently used.
TABLE V shows cross tabulated results for responses in the “Total” section of TABLE IV and responses regarding the usefulness of the system for taking tourist trips, which was mentioned in Section VII.A.1).b). Among respondents who answered that the system was “Useful” or “Somewhat useful” when taking a tourist trip, respondents who selected the viewing function either alone or in combination with another function as the function or functions of the system they used the most frequently formed the largest proportion (About 31% of respondents answered “Useful” and selected the viewing function as a most frequently used function, and about 42% answered “Somewhat useful” and selected the viewing function as a most frequently used function). Among this proportion of respondents, in particular the proportion who selected “Viewing function & Recommendation function” as the functions they used the most frequently was the largest (About 16% of respondents answered “Useful” and selected “Viewing function & Recommendation function” as their most frequently used functions, and about 19% answered “Somewhat useful” and selected “Viewing function & Recommendation function” as their most frequently used functions). These results show that by using the viewing function in combination with the recommendation function in particular, information about tourist spots can be efficiently obtained, and therefore it can be anticipated that the system will be useful when users are actually taking tourist trips. Therefore, as mentioned in Section IV.A about the synergistic effect of integrating three applications - a Web-GIS, an SNS, and a recommendation system - to form one system, it can be said that it was useful to include a Web-GIS and a recommendation system in an SNS in order to enable users to access the system from either a PC or a mobile information terminal to view tourist spots and receive recommendations for tourist spots using a digital map.
b) Detailed evaluation of recommendation function
Fig. 5 shows results for responses to four question items on the recommendation function, the function which demonstrates the uniqueness of the system the most clearly. The two question items on usefulness – the usefulness of the present location display on the recommendation page and the usefulness of tourist spot category selection on the recommendation page – concern the areas for improvement that were identified based on the results of the evaluation of operation test, described in Section VI.D. The proportion of respondents who answered “Suitable” or “Somewhat suitable” concerning the suitability of the tourist spots recommended was about 74%. Therefore, it can be considered that for a majority of users, suitable results were obtained when tourist spots with a high degree of similarity to preferences of users were recommended by calculating degree of similarity based on preference information registered by each user in the “My information” section of the system and information about evaluation of each tourist spot. Further, concerning the other
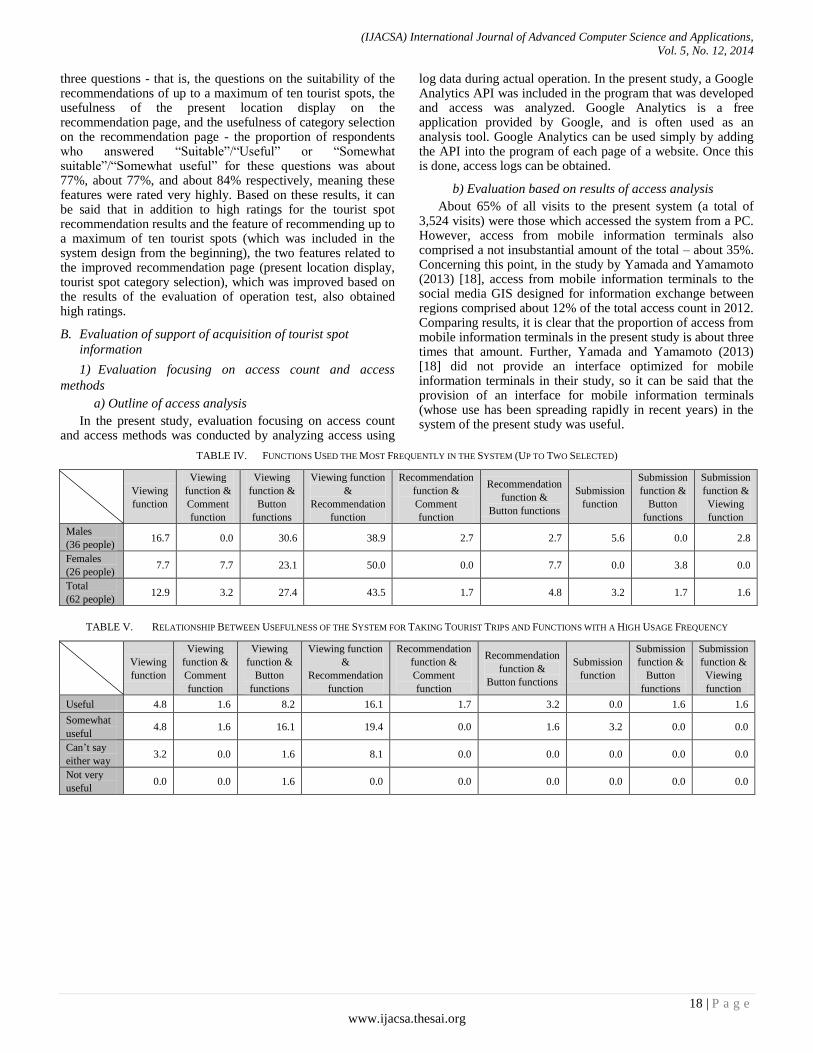
(IJACSA) International Journal of Advanced Computer Science and Applications,
Vol. 5, No. 12, 2014
18 | P a g e
www.ijacsa.thesai.org
three questions - that is, the questions on the suitability of the recommendations of up to a maximum of ten tourist spots, the usefulness of the present location display on the recommendation page, and the usefulness of category selection on the recommendation page - the proportion of respondents who answered “Suitable”/“Useful” or “Somewhat suitable”/“Somewhat useful” for these questions was about 77%, about 77%, and about 84% respectively, meaning these features were rated very highly. Based on these results, it can be said that in addition to high ratings for the tourist spot recommendation results and the feature of recommending up to a maximum of ten tourist spots (which was included in the system design from the beginning), the two features related to the improved recommendation page (present location display, tourist spot category selection), which was improved based on the results of the evaluation of operation test, also obtained high ratings.
B. Evaluation of support of acquisition of tourist spot
information
1) Evaluation focusing on access count and access
methods
a) Outline of access analysis
In the present study, evaluation focusing on access count and access methods was conducted by analyzing access using
log data during actual operation. In the present study, a Google Analytics API was included in the program that was developed and access was analyzed. Google Analytics is a free application provided by Google, and is often used as an analysis tool. Google Analytics can be used simply by adding the API into the program of each page of a website. Once this is done, access logs can be obtained.
b) Evaluation based on results of access analysis
About 65% of all visits to the present system (a total of 3,524 visits) were those which accessed the system from a PC. However, access from mobile information terminals also comprised a not insubstantial amount of the total – about 35%. Concerning this point, in the study by Yamada and Yamamoto (2013) [18], access from mobile information terminals to the social media GIS designed for information exchange between regions comprised about 12% of the total access count in 2012. Comparing results, it is clear that the proportion of access from mobile information terminals in the present study is about three times that amount. Further, Yamada and Yamamoto (2013) [18] did not provide an interface optimized for mobile information terminals in their study, so it can be said that the provision of an interface for mobile information terminals (whose use has been spreading rapidly in recent years) in the system of the present study was useful.
TABLE IV. FUNCTIONS USED THE MOST FREQUENTLY IN THE SYSTEM (UP TO TWO SELECTED)
Viewing
function
Viewing
function &
Comment
function
Viewing
function &
Button
functions
Viewing function
&
Recommendation
function
Recommendation
function &
Comment
function
Recommendation
function &
Button functions
Submission
function
Submission
function &
Button
functions
Submission
function &
Viewing
function
Males
(36 people) 16.7 0.0 30.6 38.9 2.7 2.7 5.6 0.0 2.8
Females
(26 people) 7.7 7.7 23.1 50.0 0.0 7.7 0.0 3.8 0.0
Total
(62 people) 12.9 3.2 27.4 43.5 1.7 4.8 3.2 1.7 1.6
TABLE V. RELATIONSHIP BETWEEN USEFULNESS OF THE SYSTEM FOR TAKING TOURIST TRIPS AND FUNCTIONS WITH A HIGH USAGE FREQUENCY
Viewing
function
Viewing
function &
Comment
function
Viewing
function &
Button
functions
Viewing function
&
Recommendation
function
Recommendation
function &
Comment
function
Recommendation
function &
Button functions
Submission
function
Submission
function &
Button
functions
Submission
function &
Viewing
function
Useful 4.8 1.6 8.2 16.1 1.7 3.2 0.0 1.6 1.6
Somewhat
useful 4.8 1.6 16.1 19.4 0.0 1.6 3.2 0.0 0.0
Can’t say
either way 3.2 0.0 1.6 8.1 0.0 0.0 0.0 0.0 0.0
Not very
useful 0.0 0.0 1.6 0.0 0.0 0.0 0.0 0.0 0.0
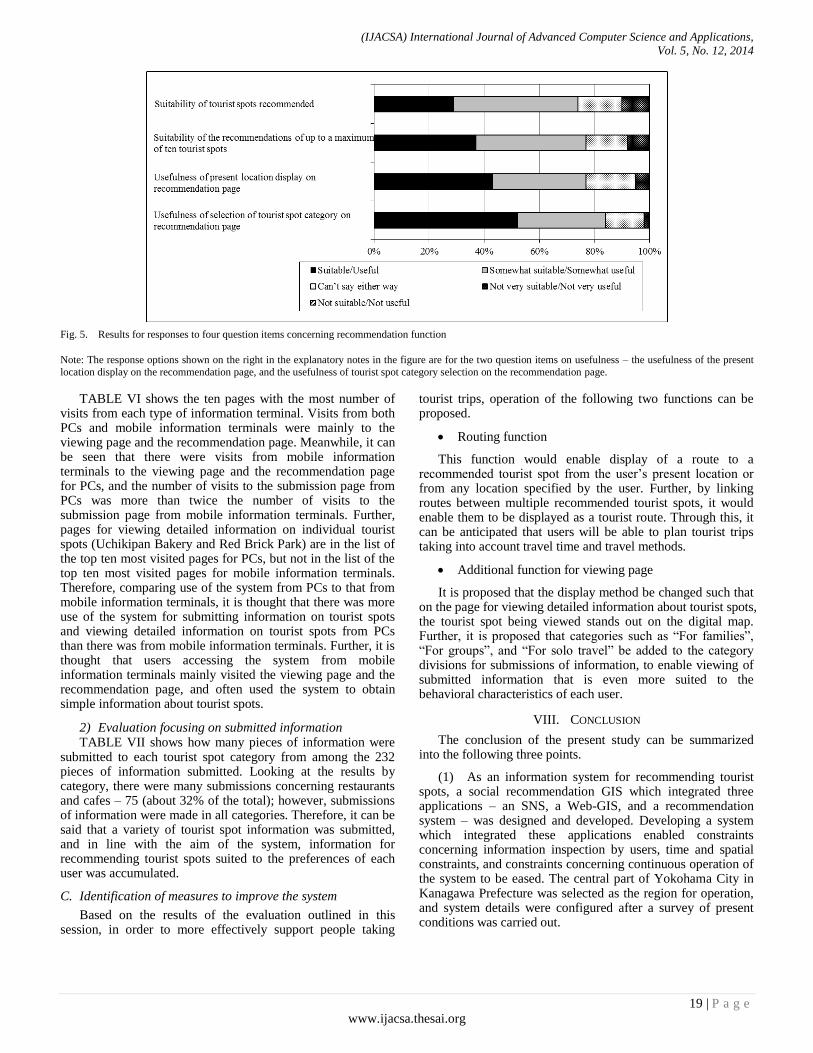
(IJACSA) International Journal of Advanced Computer Science and Applications,
Vol. 5, No. 12, 2014
19 | P a g e
www.ijacsa.thesai.org
Fig. 5. Results for responses to four question items concerning recommendation function
Note: The response options shown on the right in the explanatory notes in the figure are for the two question items on usefulness – the usefulness of the present
location display on the recommendation page, and the usefulness of tourist spot category selection on the recommendation page.
TABLE VI shows the ten pages with the most number of visits from each type of information terminal. Visits from both PCs and mobile information terminals were mainly to the viewing page and the recommendation page. Meanwhile, it can be seen that there were visits from mobile information terminals to the viewing page and the recommendation page for PCs, and the number of visits to the submission page from PCs was more than twice the number of visits to the submission page from mobile information terminals. Further, pages for viewing detailed information on individual tourist spots (Uchikipan Bakery and Red Brick Park) are in the list of the top ten most visited pages for PCs, but not in the list of the top ten most visited pages for mobile information terminals. Therefore, comparing use of the system from PCs to that from mobile information terminals, it is thought that there was more use of the system for submitting information on tourist spots and viewing detailed information on tourist spots from PCs than there was from mobile information terminals. Further, it is thought that users accessing the system from mobile information terminals mainly visited the viewing page and the recommendation page, and often used the system to obtain simple information about tourist spots.
2) Evaluation focusing on submitted information TABLE VII shows how many pieces of information were
submitted to each tourist spot category from among the 232 pieces of information submitted. Looking at the results by category, there were many submissions concerning restaurants and cafes – 75 (about 32% of the total); however, submissions of information were made in all categories. Therefore, it can be said that a variety of tourist spot information was submitted, and in line with the aim of the system, information for recommending tourist spots suited to the preferences of each user was accumulated.
C. Identification of measures to improve the system
Based on the results of the evaluation outlined in this session, in order to more effectively support people taking
tourist trips, operation of the following two functions can be proposed.
Routing function
This function would enable display of a route to a recommended tourist spot from the user’s present location or from any location specified by the user. Further, by linking routes between multiple recommended tourist spots, it would enable them to be displayed as a tourist route. Through this, it can be anticipated that users will be able to plan tourist trips taking into account travel time and travel methods.
Additional function for viewing page
It is proposed that the display method be changed such that on the page for viewing detailed information about tourist spots, the tourist spot being viewed stands out on the digital map. Further, it is proposed that categories such as “For families”, “For groups”, and “For solo travel” be added to the category divisions for submissions of information, to enable viewing of submitted information that is even more suited to the behavioral characteristics of each user.
VIII. CONCLUSION
The conclusion of the present study can be summarized into the following three points.
(1) As an information system for recommending tourist spots, a social recommendation GIS which integrated three applications – an SNS, a Web-GIS, and a recommendation system – was designed and developed. Developing a system which integrated these applications enabled constraints concerning information inspection by users, time and spatial constraints, and constraints concerning continuous operation of the system to be eased. The central part of Yokohama City in Kanagawa Prefecture was selected as the region for operation, and system details were configured after a survey of present conditions was carried out.
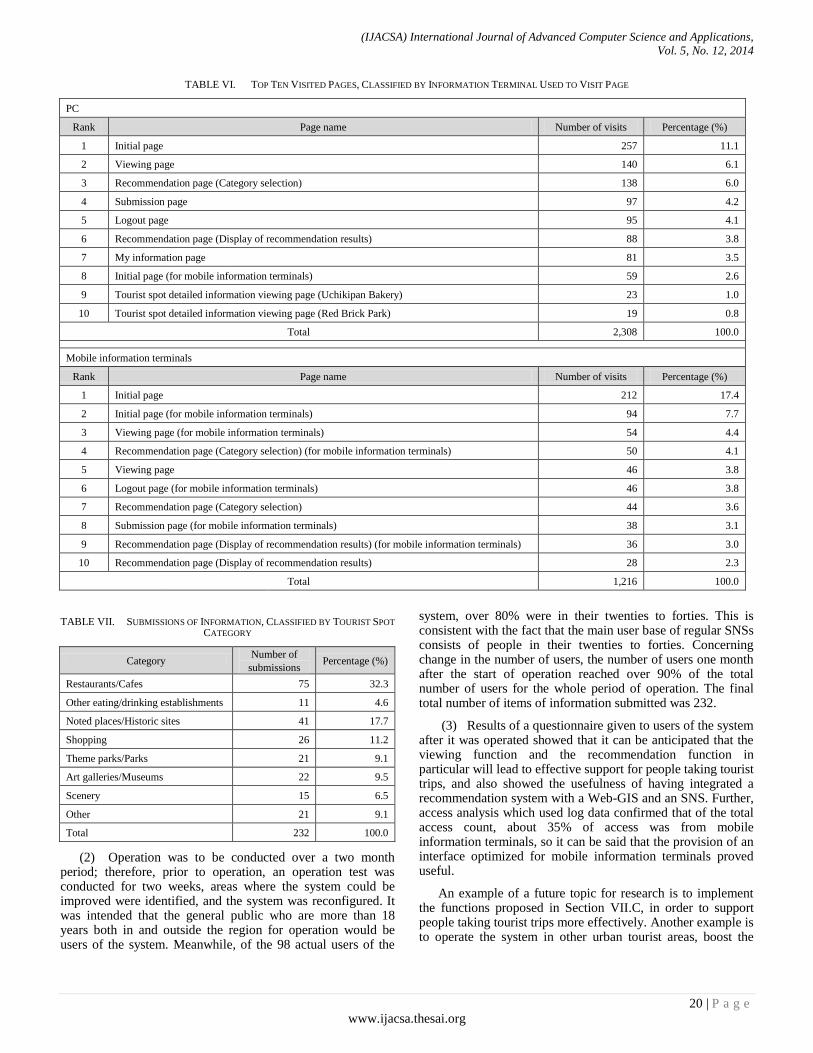
(IJACSA) International Journal of Advanced Computer Science and Applications,
Vol. 5, No. 12, 2014
20 | P a g e
www.ijacsa.thesai.org
TABLE VI. TOP TEN VISITED PAGES, CLASSIFIED BY INFORMATION TERMINAL USED TO VISIT PAGE
PC
Rank Page name Number of visits Percentage (%)
1 Initial page 257 11.1
2 Viewing page 140 6.1
3 Recommendation page (Category selection) 138 6.0
4 Submission page 97 4.2
5 Logout page 95 4.1
6 Recommendation page (Display of recommendation results) 88 3.8
7 My information page 81 3.5
8 Initial page (for mobile information terminals) 59 2.6
9 Tourist spot detailed information viewing page (Uchikipan Bakery) 23 1.0
10 Tourist spot detailed information viewing page (Red Brick Park) 19 0.8
Total 2,308 100.0
Mobile information terminals
Rank Page name Number of visits Percentage (%)
1 Initial page 212 17.4
2 Initial page (for mobile information terminals) 94 7.7
3 Viewing page (for mobile information terminals) 54 4.4
4 Recommendation page (Category selection) (for mobile information terminals) 50 4.1
5 Viewing page 46 3.8
6 Logout page (for mobile information terminals) 46 3.8
7 Recommendation page (Category selection) 44 3.6
8 Submission page (for mobile information terminals) 38 3.1
9 Recommendation page (Display of recommendation results) (for mobile information terminals) 36 3.0
10 Recommendation page (Display of recommendation results) 28 2.3
Total 1,216 100.0
TABLE VII. SUBMISSIONS OF INFORMATION, CLASSIFIED BY TOURIST SPOT
CATEGORY
Category Number of
submissions Percentage (%)
Restaurants/Cafes 75 32.3
Other eating/drinking establishments 11 4.6
Noted places/Historic sites 41 17.7
Shopping 26 11.2
Theme parks/Parks 21 9.1
Art galleries/Museums 22 9.5
Scenery 15 6.5
Other 21 9.1
Total 232 100.0
(2) Operation was to be conducted over a two month period; therefore, prior to operation, an operation test was conducted for two weeks, areas where the system could be improved were identified, and the system was reconfigured. It was intended that the general public who are more than 18 years both in and outside the region for operation would be users of the system. Meanwhile, of the 98 actual users of the
system, over 80% were in their twenties to forties. This is consistent with the fact that the main user base of regular SNSs consists of people in their twenties to forties. Concerning change in the number of users, the number of users one month after the start of operation reached over 90% of the total number of users for the whole period of operation. The final total number of items of information submitted was 232.
(3) Results of a questionnaire given to users of the system after it was operated showed that it can be anticipated that the viewing function and the recommendation function in particular will lead to effective support for people taking tourist trips, and also showed the usefulness of having integrated a recommendation system with a Web-GIS and an SNS. Further, access analysis which used log data confirmed that of the total access count, about 35% of access was from mobile information terminals, so it can be said that the provision of an interface optimized for mobile information terminals proved useful.
An example of a future topic for research is to implement the functions proposed in Section VII.C, in order to support people taking tourist trips more effectively. Another example is to operate the system in other urban tourist areas, boost the

(IJACSA) International Journal of Advanced Computer Science and Applications,
Vol. 5, No. 12, 2014
21 | P a g e
www.ijacsa.thesai.org
track record of use of the system, and increase the significance of using the system.
ACKNOWLEDGMENT
In the operation of the social recommendation GIS and the questionnaires of this study, enormous cooperation was received from those mainly in the Kanto region such as Kanagawa prefecture and Tokyo Metropolis. We would like to take this opportunity to gratefully acknowledge them.
NOTES
(1) Yokohama City official tourist information site: http://www.welcome.city.yokohama.jp/ja/. (accessed December. 20, 2013). (Website)
(2) Hamatch! SNS: http://sns.hamatch.jp/. (accessed December 15, 2013). (Website)
(3) TripAdvisor: http://www.tripadvisor.jp/. (accessed December 20, 2013). (Website)
(4) MAPPLE Tourist Information: http://www.mapple.net/. (accessed December 20, 2013). (Website)
(5) Jalan Tourist Information: http://www.jalan.net/kankou/. (accessed December 20, 2013). (Website)
(6) (The travel word-of-mouth site “4travel.jp”: http://4travel.jp/. (accessed December 20, 2013). (Website)
(7) Foursquare: https://ja.foursquare.com/. (accessed June 25, 2014). (Website)
(8) Facebook Places: https://www.facebook.com/directory/places/. (accessed June 25, 2014). (Website)
REFERENCES
[1] J. Ishizuka, Y. Suzuki and K. Kawagoe, “Method for searching for similarities in data on movement paths, designed to support sightseeing in Kyoto”, The Special Interest Group Technical Reports of Information Processing Society of Japan, CVIM, “Computer Vision and Image Media”, 2007(1), pp.17-23, 2007.
[2] Y. Kurata, “Introducing a hot-start mechanism to a web-based tour planner CT-Planner and Increasing its coverage areas”, Papers and Proceedings of the Geographic Information Systems Association of Japan, Vol.21, CD-ROM, 2012.
[3] H. Kawamura, Efforts to spread standard tags in Hokkaido tourist information, and the development of kyun-channel, Journal of Digital Practice, Vol.3, No.4, pp.272-280, 2012.
[4] T. Kurashima, T. Iwata, G. Irie and K. Fujimura, Travel Route Recommendation using Geotags on Photo Sharing Service, Technical Report of The Institute of Electronics, Information and Communication Engineers, LOIS, “Life Intelligence and Office Information Systems”, Vol.109, No.450, pp.55-60, 2010.
[5] S. Van Canneyt, S. Schockaert, O.V. Laere and B. Dhoedt, “Time-dependent recommendation of tourist attractions using Flickr”, Proceedings of the 23rd Benelux Conference on Artificial Intelligence, pp.255-262, 2011.
[6] M. Batet, A. Moreno and D. Sánchez, D. Isern and A. Valls, Turist@: Agent-based personalised recommendation of tourist activities, Expert Systems with Applications, Vol.39, No.8, pp.7319-7329, 2012.
[7] H. Uehara, K. Shimada and T. Endo, “Sightseeing location recommendation using tourism information on the Web”, Technical
Report of The Institute of Electronics, Information and Communication Engineers, NLC, “Natural langage Understanding and Models of Communication”, Vol.112, No.367, pp.13-18, 2012.
[8] C. C. Yu and H. P. Chang, “Personalized location-based recommendation services for tour planning in mobile tourism applications”, Proceedings of the 10th International Conference on E-Commerce and Web Technologies, pp.38-49, 2009.
[9] J. M. Noguera, M. J. Barranco, R. J. Segura and L. Martinez, “A mobile 3D-GIS hybrid recommender system for tourism”, Information Sciences, Vol.215, pp.37-52, 2012.
[10] L. Baltrunas, B. Ludwig, S. Peer and F. Ricci, Francesco, “Context-aware places of interest recommendations for mobile users. Design, User Experience, and Usability”, Theory, Methods, Tools and Practice, Lecture Notes in Computer Science, Vol.6769, pp.531-540, 2011.
[11] M. Ye, P. Yin, W. C. Lee and D. L. Lee, Exploiting geographical influence for collaborative point-of-interest recommendation, Proceedings of the 34th International ACM SIGIR Conference on Research and Development in Information Retrieval, pp.325-334, 2011.
[12] J. J. C. Ying, E. H. C. Lu, W. N. Kuo and V. S. Tseng, “Urban point-of-interest recommendation by mining user check-in behaviors”, Proceedings of the ACM SIGKDD International Workshop on Urban Computing, pp.63-70, 2012.
[13] J. Bao, Y. Zheng and M. F. Mokbel, “Location-based and preference-aware recommendation using sparse geo-social networking data”, Proceedings of the 20th International Conference on Advances in Geographic Information Systems, pp.199-208, 2012.
[14] Q. Yuan, G. Cong, Z. Ma, A. Sun and N. M. Thalmann, “Time-aware point-of-interest recommendation”, Proceedings of the 36th International ACM SIGIR Conference on Research and Development in Information Retrieval, pp.363-372, 2013.
[15] X. Liu, Y. Liu, K. Aberer andC. Miao, “Personalized point-of-interest recommendation by mining users’ preference transition”, Proceedings of the 22nd ACM International Conference on Information and Knowledge Management, pp.733-738, 2013.
[16] T. Yanagisawa and K. Yamamoto, “Study on Information Sharing GIS to Accumulate Local Knowledge in Local Communities”, Theory and Applications of GIS, Vol.20, No.1, pp.61-70, 2012.
[17] H. Nakahara, T. Yanagisawa and K. Yamamoto, “Study on a Web-GIS to Support the Communication of Regional Knowledge in Regional Communities: Focusing on Regional Residents’ Experiential Knowledge”, Socio- Informatics, Vol.1, No.2, pp.77-92, 2012.
[18] S. Yamada and K. Yamamoto, “Development of Social Media GIS for Information Exchange between Regions”, International Journal of Advanced Computer Science and Applications, Vol.4, No.8, pp.62-73, 2013.
[19] T. Okuma and K. Yamamoto, “Study on a Social Media GIS to Accumulate Urban Disaster Information: Accumulation of Disaster Information during Normal Times for Disaster Reduction Measures”, Socio-Informatics, Vol.2, No.2, pp.49-65, 2013.
[20] D. Jannach, M. Zanker, A. Felfernig, G. Friedrich, “Recommender Systems: An Introduction”, Cambridge University Press, U.K., 2011.
[21] T. Kamishima, “Algorithms for recommender systems (2)”, Transactions of Japanese Society of Artificial Intelligence, Vol.23, No.1, pp.89-103, 2008.
[22] Ministry of Internal Affairs and Communications of Japan, “2011 White paper - information and communications in Japan”, Tokyo, 2011.
(IJACSA) International Journal of Advanced Computer Science and Applications,
Vol. 5, No. 12, 2014
22 | P a g e
www.ijacsa.thesai.org
A Feasibility Study on Porting the Community Land
Model onto Accelerators Using Openacc
D. Wang
Climate Change Science Institute
Oak Ridge National Lab Oak, Ridge, TN, USA
W. Wu
Department of Computer Science
University of Tennessee Knoxville, TN, USA
F. Winkler, W. Ding, O.
Hernandez
Computer Science and Mathematics Division Oak Ridge
National Lab Oak, Ridge, TN, USA
Abstract—As environmental models (such as Accelerated
Climate Model for Energy (ACME), Parallel Reactive Flow and
Transport Model (PFLOTRAN), Arctic Terrestrial Simulator
(ATS), etc.) became more and more complicated, we are facing
enormous challenges regarding to porting those applications onto
hybrid computing architecture. OpenACC emerges as a very
promising technology, therefore, we have conducted a feasibility
analysis on porting the Community Land Model (CLM), a
terrestrial ecosystem model within the Community Earth System
Models (CESM)). Specifically, we used automatic function testing
platform to extract a small computing kernel out of CLM, then
we apply this kernel into the actually CLM dataflow procedure,
and investigate the strategy of data parallelization and the
benefit of data movement provided by current implementation of
OpenACC. Even it is a non-intensive kernel, on a single 16-core
computing node, the performance (based on the actual
computation time using one GPU) of OpenACC implementation
is 2.3 time faster than that of OpenMP implementation using
single OpenMP thread, but it is 2.8 times slower than the
performance of OpenMP implementation using 16 threads. On
multiple nodes, MPI_OpenACC implementation demonstrated
very good scalability on up to 128 GPUs on 128 computing nodes.
This study also provides useful information for us to look into the
potential benefits of “deep copy” capability and “routine” feature
of OpenACC standards. We believe that our experience on the
environmental model, CLM, can be beneficial to many other
scientific research programs who are interested to porting their
large scale scientific code using OpenACC onto high-end
computers, empowered by hybrid computing architecture.
Keywords—OpenACC; Climate Modeling; Community Land
Model; Functional Testing; Performance Analysis; Compiler-
assisted Analysis
I. INTRODUCTION
As the environmental models (such as Acclerated Climate Model for Energy (ACME), Parallel Reactive Flow and Transport Model (PFloTran), Arctic Terristrial Simulator (ATS), etc.) became more and more complicated, we are facing enormous challenges regarding to porting those applications onto hybrid computing architecture. OpenACC emerges as a very promising technology. In the paper, we present our feasibilty study on porting the Community Land Model (CLM) within the Community Earth System Models using OpenACC. Over the past several decades, researchers have made significant progress in developing high fidelity earth system models to advance our understanding on earth system, and to improve our capability of better projecting future scenarios [1].
The Community Earth System Model is one of the US leading earth system models. CESM is being actively developed under the “Accelarated Climate Model for Energy (ACME)” project to support Department of Energy’s climate and environmental research. Within the CESM framework, the CLM is designed to understand how natural and human changes in ecosystem affect climate [2]. The model represents several aspects of the land surface including surface heterogeneity and consists of submodels related to land biogeophysics, the hydrologic cycle, biogeochemistry, human dimensions, and ecosystem dynamics. Currently, the offline CLM simulation system contains of more than 1800 source files and over 350,000 lines of source code. It is well known that the software complexity of the Community Land Model becomes a barrier for rapid model improvements and validation, as well as efficient code porting to next generation HPCs [3,4].
The main purposes of our efforts shown in this paper include: 1) Test data parallelel schemes based on current CLM high level dataflow using a simple non-computing instentive function, 2) Investigate the usefullness of selective copy implemention within on CLM simulation. 3) Evaluate the benefit and cost of porting CLM on accleartors using OpenACC. Specifically, this paper presents detailed information in following sections. We first provide a overview of CLM software structure and dependancy, which leads to our effort of scientific function testing system development. Using our our scientific function testing system, we have extracted one computational kernel out of the whole system, and design and computational experiment for our model potring practices as well as the model computtional performance evaluations, using both OpenMP and OpenACC.
II. CLM SOFTWARE DEPENDENCY, DATA STRUCTURE
AND WORKFLOW
The software system of the global offline CLM includes physical earth system components, such as the CLM, data atmosphere (a proxy atmosphere model, which reads in atmospheric forcings to drive the CLM), stub ocean, stub ice and stub glacier. It contains an application driver to configure the parallel computing environment and the whole simulation system (physical earth system components and flux coupler between those components). It also includes several shared software modules and utilities, such as a flux coupler and its APIs to individual earth system component, parallel IO and performance profiling libraries [4,5]. The schematic diagram of the CLM software structure is shown in Figure 1. It is clear that
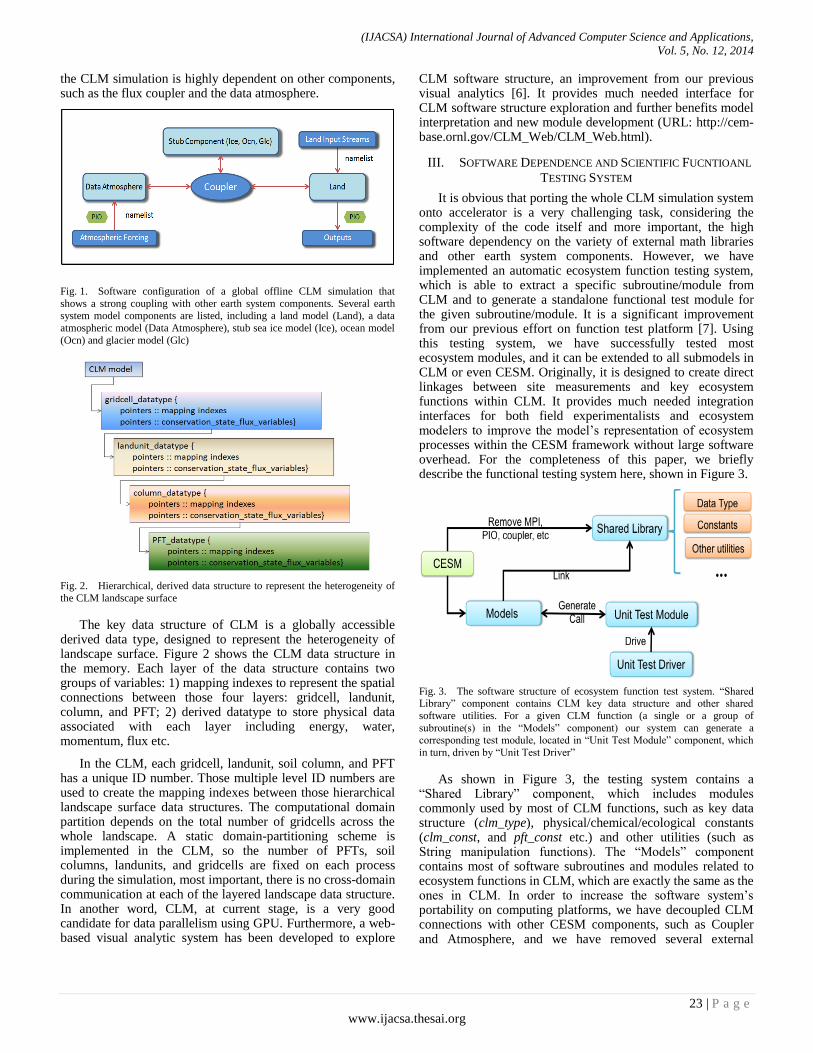
(IJACSA) International Journal of Advanced Computer Science and Applications,
Vol. 5, No. 12, 2014
23 | P a g e
www.ijacsa.thesai.org
the CLM simulation is highly dependent on other components, such as the flux coupler and the data atmosphere.
Fig. 1. Software configuration of a global offline CLM simulation that
shows a strong coupling with other earth system components. Several earth
system model components are listed, including a land model (Land), a data
atmospheric model (Data Atmosphere), stub sea ice model (Ice), ocean model
(Ocn) and glacier model (Glc)
Fig. 2. Hierarchical, derived data structure to represent the heterogeneity of
the CLM landscape surface
The key data structure of CLM is a globally accessible derived data type, designed to represent the heterogeneity of landscape surface. Figure 2 shows the CLM data structure in the memory. Each layer of the data structure contains two groups of variables: 1) mapping indexes to represent the spatial connections between those four layers: gridcell, landunit, column, and PFT; 2) derived datatype to store physical data associated with each layer including energy, water, momentum, flux etc.
In the CLM, each gridcell, landunit, soil column, and PFT has a unique ID number. Those multiple level ID numbers are used to create the mapping indexes between those hierarchical landscape surface data structures. The computational domain partition depends on the total number of gridcells across the whole landscape. A static domain-partitioning scheme is implemented in the CLM, so the number of PFTs, soil columns, landunits, and gridcells are fixed on each process during the simulation, most important, there is no cross-domain communication at each of the layered landscape data structure. In another word, CLM, at current stage, is a very good candidate for data parallelism using GPU. Furthermore, a web-based visual analytic system has been developed to explore
CLM software structure, an improvement from our previous visual analytics [6]. It provides much needed interface for CLM software structure exploration and further benefits model interpretation and new module development (URL: http://cem-base.ornl.gov/CLM_Web/CLM_Web.html).
III. SOFTWARE DEPENDENCE AND SCIENTIFIC FUCNTIOANL
TESTING SYSTEM
It is obvious that porting the whole CLM simulation system onto accelerator is a very challenging task, considering the complexity of the code itself and more important, the high software dependency on the variety of external math libraries and other earth system components. However, we have implemented an automatic ecosystem function testing system, which is able to extract a specific subroutine/module from CLM and to generate a standalone functional test module for the given subroutine/module. It is a significant improvement from our previous effort on function test platform [7]. Using this testing system, we have successfully tested most ecosystem modules, and it can be extended to all submodels in CLM or even CESM. Originally, it is designed to create direct linkages between site measurements and key ecosystem functions within CLM. It provides much needed integration interfaces for both field experimentalists and ecosystem modelers to improve the model’s representation of ecosystem processes within the CESM framework without large software overhead. For the completeness of this paper, we briefly describe the functional testing system here, shown in Figure 3.
Fig. 3. The software structure of ecosystem function test system. “Shared Library” component contains CLM key data structure and other shared
software utilities. For a given CLM function (a single or a group of
subroutine(s) in the “Models” component) our system can generate a
corresponding test module, located in “Unit Test Module” component, which
in turn, driven by “Unit Test Driver”
As shown in Figure 3, the testing system contains a “Shared Library” component, which includes modules commonly used by most of CLM functions, such as key data structure (clm_type), physical/chemical/ecological constants (clm_const, and pft_const etc.) and other utilities (such as String manipulation functions). The “Models” component contains most of software subroutines and modules related to ecosystem functions in CLM, which are exactly the same as the ones in CLM. In order to increase the software system’s portability on computing platforms, we have decoupled CLM connections with other CESM components, such as Coupler and Atmosphere, and we have removed several external
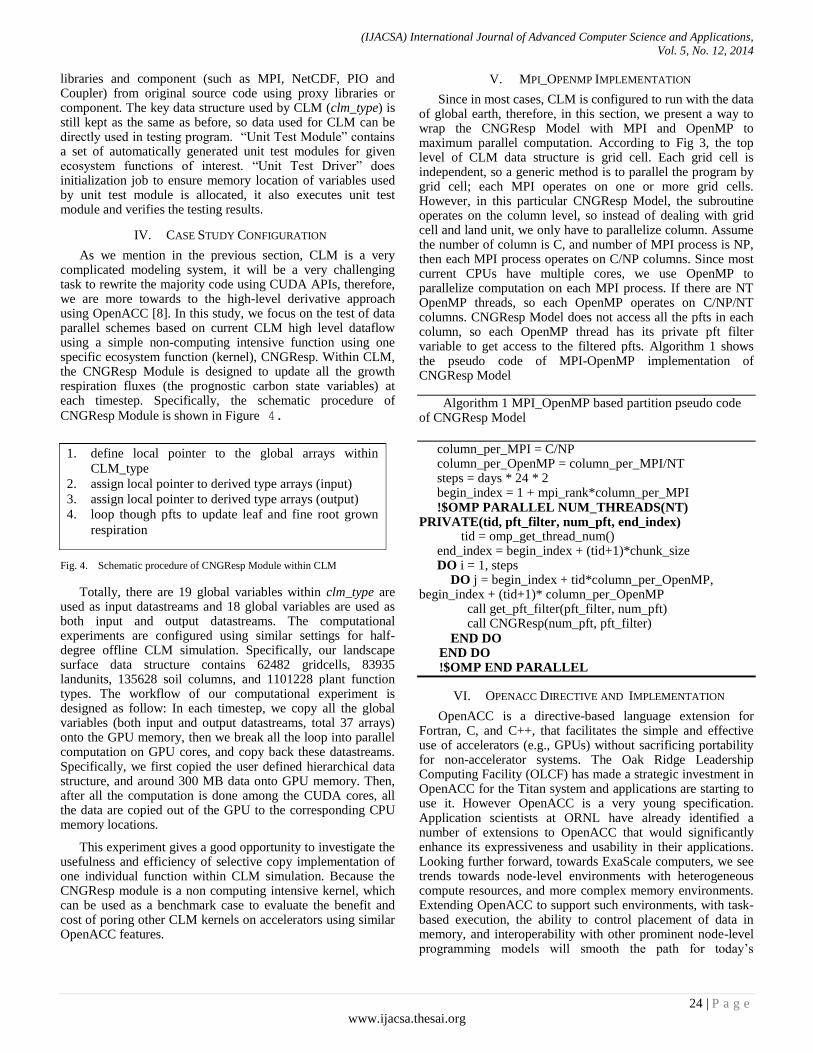
(IJACSA) International Journal of Advanced Computer Science and Applications,
Vol. 5, No. 12, 2014
24 | P a g e
www.ijacsa.thesai.org
libraries and component (such as MPI, NetCDF, PIO and Coupler) from original source code using proxy libraries or component. The key data structure used by CLM (clm_type) is still kept as the same as before, so data used for CLM can be directly used in testing program. “Unit Test Module” contains a set of automatically generated unit test modules for given ecosystem functions of interest. “Unit Test Driver” does initialization job to ensure memory location of variables used by unit test module is allocated, it also executes unit test module and verifies the testing results.
IV. CASE STUDY CONFIGURATION
As we mention in the previous section, CLM is a very complicated modeling system, it will be a very challenging task to rewrite the majority code using CUDA APIs, therefore, we are more towards to the high-level derivative approach using OpenACC [8]. In this study, we focus on the test of data parallel schemes based on current CLM high level dataflow using a simple non-computing intensive function using one specific ecosystem function (kernel), CNGResp. Within CLM, the CNGResp Module is designed to update all the growth respiration fluxes (the prognostic carbon state variables) at each timestep. Specifically, the schematic procedure of
CNGResp Module is shown in Figure 4.
Fig. 4. Schematic procedure of CNGResp Module within CLM
Totally, there are 19 global variables within clm_type are used as input datastreams and 18 global variables are used as both input and output datastreams. The computational experiments are configured using similar settings for half-degree offline CLM simulation. Specifically, our landscape surface data structure contains 62482 gridcells, 83935 landunits, 135628 soil columns, and 1101228 plant function types. The workflow of our computational experiment is designed as follow: In each timestep, we copy all the global variables (both input and output datastreams, total 37 arrays) onto the GPU memory, then we break all the loop into parallel computation on GPU cores, and copy back these datastreams. Specifically, we first copied the user defined hierarchical data structure, and around 300 MB data onto GPU memory. Then, after all the computation is done among the CUDA cores, all the data are copied out of the GPU to the corresponding CPU memory locations.
This experiment gives a good opportunity to investigate the usefulness and efficiency of selective copy implementation of one individual function within CLM simulation. Because the CNGResp module is a non computing intensive kernel, which can be used as a benchmark case to evaluate the benefit and cost of poring other CLM kernels on accelerators using similar OpenACC features.
V. MPI_OPENMP IMPLEMENTATION
Since in most cases, CLM is configured to run with the data of global earth, therefore, in this section, we present a way to wrap the CNGResp Model with MPI and OpenMP to maximum parallel computation. According to Fig 3, the top level of CLM data structure is grid cell. Each grid cell is independent, so a generic method is to parallel the program by grid cell; each MPI operates on one or more grid cells. However, in this particular CNGResp Model, the subroutine operates on the column level, so instead of dealing with grid cell and land unit, we only have to parallelize column. Assume the number of column is C, and number of MPI process is NP, then each MPI process operates on C/NP columns. Since most current CPUs have multiple cores, we use OpenMP to parallelize computation on each MPI process. If there are NT OpenMP threads, so each OpenMP operates on C/NP/NT columns. CNGResp Model does not access all the pfts in each column, so each OpenMP thread has its private pft filter variable to get access to the filtered pfts. Algorithm 1 shows the pseudo code of MPI-OpenMP implementation of CNGResp Model
Algorithm 1 MPI_OpenMP based partition pseudo code of CNGResp Model
column_per_MPI = C/NP column_per_OpenMP = column_per_MPI/NT steps = days * 24 * 2 begin_index = 1 + mpi_rank*column_per_MPI !$OMP PARALLEL NUM_THREADS(NT)
PRIVATE(tid, pft_filter, num_pft, end_index) tid = omp_get_thread_num()
end_index = begin_index + (tid+1)*chunk_size DO i = 1, steps DO j = begin_index + tid*column_per_OpenMP,
begin_index + (tid+1)* column_per_OpenMP call get_pft_filter(pft_filter, num_pft) call CNGResp(num_pft, pft_filter) END DO
END DO !$OMP END PARALLEL
VI. OPENACC DIRECTIVE AND IMPLEMENTATION
OpenACC is a directive-based language extension for Fortran, C, and C++, that facilitates the simple and effective use of accelerators (e.g., GPUs) without sacrificing portability for non-accelerator systems. The Oak Ridge Leadership Computing Facility (OLCF) has made a strategic investment in OpenACC for the Titan system and applications are starting to use it. However OpenACC is a very young specification. Application scientists at ORNL have already identified a number of extensions to OpenACC that would significantly enhance its expressiveness and usability in their applications. Looking further forward, towards ExaScale computers, we see trends towards node-level environments with heterogeneous compute resources, and more complex memory environments. Extending OpenACC to support such environments, with task-based execution, the ability to control placement of data in memory, and interoperability with other prominent node-level programming models will smooth the path for today’s
1. define local pointer to the global arrays within
CLM_type
2. assign local pointer to derived type arrays (input)
3. assign local pointer to derived type arrays (output)
4. loop though pfts to update leaf and fine root grown
respiration

(IJACSA) International Journal of Advanced Computer Science and Applications,
Vol. 5, No. 12, 2014
25 | P a g e
www.ijacsa.thesai.org
applications to make the transition to new ExaScale architectures, as well as preparing them to for the jump to next-generation programming models and languages. One of the important missing features that OpenACC needs is to support levels of memory copy. Data structures such as “struct” and “STL” are common used in C and C++ programming, but users are not allowed to copy those encapsulated data into GPU memories directly. Manually restructuring code to avoid dereference is a common way which is used to handle those cases. However this is a non-trivial process, especially when the code contains multiple levels of dereference. At current stage, a very straightforward method was adopted in this study to evaluate the efficiency of OpenACC copy by using our real scientific application. Specifically, we use copy function to copy both the data structure, and all the input datastreams for CNGResp module from the clm_type data structure in CPU, and break the computational do loop and map those computation onto GPU cores. After the computation on GPU, we use the copy function to move these output datastreams out from GPU and updates the data values within clm_type in CPU memory.
VII. MPI_OPENACC IMPLEMENTATION
Parallel partition scheme within our MPI_OpenACC Implementation is very similar to that within MPI_OpenMP. Assume the number of column is C, and number of MPI process is NP, then each MPI process operates on C/NP columns. Since each computing node has a GPU, we use OpenACC to parallel computations on each MPI process. If there are NT OpenACC threads, then each OpenACC operates on C/NP/NT columns. Algorithm 2 shows the pseudo code of MPI-OpenACC implementation of CNGResp Model. The significant parts of the code include 1) explicit data structure copy (copy in), and 2) explicit data value copy (both in and out). Due to the limitation of current PGI implementation, we are not able to use the “deep copy” and “routine” feature, but we are very confident that our program will greatly benefit from these two features once they are implemented, because we can use the “routine” feature to make the code structure more concise, and most importantly, we can use the “deep copy” capability to copy only these input variables on and output variables off the GPU memory.
Algorithm 2 MPI_OpenACC based partition pseudo code of CNGResp Model
column_per_MPI = C/NP steps = days * 24 * 2 begin_index = 1 + mpi_rank*column_per_MPI end_index = column_per_MPI*(mpi_rank+1) !$ACC DATA COPYIN(struct) COPY(members) DO i = 1, steps !$ACC KERNELS !$ACC LOOP INDEPENDENT DO j = begin_index, end_index Compute CNGResp END DO END DO !$ACC END KERNELS !$ACC END DATA
VIII. COMPUTATIONAL EXPERIMENTS AND SCALABILITY
ANALYSIS
In this section, we investigate performance impact of MPI-OpenMP and MPI-OpenACC implementation. The experiment case used in benchmark is a fixed size problem since size of the landscape surface data structure is already given. Therefore, strong scalability experiment is the best option to present the performance speedup by using MPI_OpenMP and MPI_OpenACC. In a strong scalability experiment, the problem size is fixed, while the number of OpenMP thread is increased.
A. Computational Platform
The computational platform used in this research is the Cray XT6 Titan supercomputer at the National Center for Computational Sciences (NCCS) at Oak Ridge National Laboratory (ORNL). Titan uses 16-core AMD Opteron central processing units (CPUs) in conjunction with NVidia Tesla K20X GPUs. It uses 18,688 CPUs paired with an equal number of graphics processing units (GPUs) to perform at a theoretical peak of 27 PetaFLOPS.
A center-wide Lustre file system provides 5 PB of disk space for all NCCS computing resources. The broach configuration of K20X GPU are listed as following: Processor clock, 732 MHz; Memory clock, 2.6 GHz; Memory size 6 GB; Memory I/O 384-bit GDDR5; and Memory configuration 24 pieces of 64M ×16 GDDR5 SDRAM. According to the online K20X GPU document [9], the peak double precision floating point performance (board) can reach 1.31 teraflops, and the memory bandwidth for board (ECC off) can reach 250 GBytes/sec. In our study, we used PGI FORTRAN compiler (version 14.7.0), Cray-mpich (version 6.3.0), OpenMP (version 3.1) and CUDAtoolkit (version 5.5.20-1.0402.7700.8.1).
B. Single Node (Shared Memory System)
In shared memory system benchmark, we demonstrate the performance impact by using OpenMP to parallel computation. Figure 5 presents the strong scalability performance of MPI-OpenMP implementation on 1 node. In ideal strong scaling, a program is considered to scale linearly if the speedup (in terms of work units completed per unit time) is equal to the number of processing elements used. While in our case, we are not able to achieve linear speedup when the number of threads varies from 1 to 16.
However, we did observe the performance increase (computation time decrease) when more OpenMP threads has been used. It is because the operation contained in CNGResp subroutine is mostly floating point operation. The experiment case is to simulate 30 days (1 iteration simulates plant growth respiration in 30 minutes). There is billions of floating point operations in total. Since the AMD CPU contains 16 cores, when more OpenMP threads have been used, less computation work was assigned on each CPU core, therefore, less time has been used for those floating point operations on each CPU core. For example, when 16 OpenMP threads were used, the computation time of each core is less than 13.3 second, which gave out a speedup number of 6.3, as shown in Figure 5.
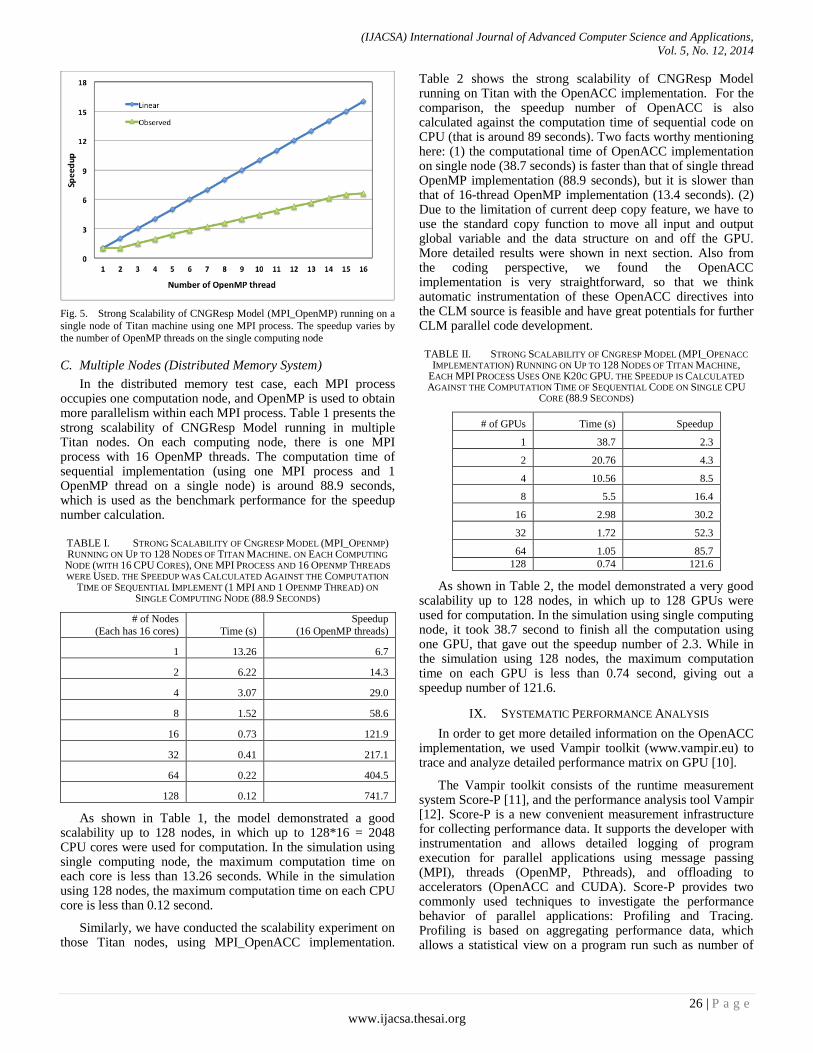
(IJACSA) International Journal of Advanced Computer Science and Applications,
Vol. 5, No. 12, 2014
26 | P a g e
www.ijacsa.thesai.org
Fig. 5. Strong Scalability of CNGResp Model (MPI_OpenMP) running on a
single node of Titan machine using one MPI process. The speedup varies by
the number of OpenMP threads on the single computing node
C. Multiple Nodes (Distributed Memory System)
In the distributed memory test case, each MPI process occupies one computation node, and OpenMP is used to obtain more parallelism within each MPI process. Table 1 presents the strong scalability of CNGResp Model running in multiple Titan nodes. On each computing node, there is one MPI process with 16 OpenMP threads. The computation time of sequential implementation (using one MPI process and 1 OpenMP thread on a single node) is around 88.9 seconds, which is used as the benchmark performance for the speedup number calculation.
TABLE I. STRONG SCALABILITY OF CNGRESP MODEL (MPI_OPENMP)
RUNNING ON UP TO 128 NODES OF TITAN MACHINE. ON EACH COMPUTING
NODE (WITH 16 CPU CORES), ONE MPI PROCESS AND 16 OPENMP THREADS
WERE USED. THE SPEEDUP WAS CALCULATED AGAINST THE COMPUTATION
TIME OF SEQUENTIAL IMPLEMENT (1 MPI AND 1 OPENMP THREAD) ON
SINGLE COMPUTING NODE (88.9 SECONDS)
# of Nodes
(Each has 16 cores) Time (s)
Speedup
(16 OpenMP threads)
1 13.26 6.7
2 6.22 14.3
4 3.07 29.0
8 1.52 58.6
16 0.73 121.9
32 0.41 217.1
64 0.22 404.5
128 0.12 741.7
As shown in Table 1, the model demonstrated a good scalability up to 128 nodes, in which up to 128*16 = 2048 CPU cores were used for computation. In the simulation using single computing node, the maximum computation time on each core is less than 13.26 seconds. While in the simulation using 128 nodes, the maximum computation time on each CPU core is less than 0.12 second.
Similarly, we have conducted the scalability experiment on those Titan nodes, using MPI_OpenACC implementation.
Table 2 shows the strong scalability of CNGResp Model running on Titan with the OpenACC implementation. For the comparison, the speedup number of OpenACC is also calculated against the computation time of sequential code on CPU (that is around 89 seconds). Two facts worthy mentioning here: (1) the computational time of OpenACC implementation on single node (38.7 seconds) is faster than that of single thread OpenMP implementation (88.9 seconds), but it is slower than that of 16-thread OpenMP implementation (13.4 seconds). (2) Due to the limitation of current deep copy feature, we have to use the standard copy function to move all input and output global variable and the data structure on and off the GPU. More detailed results were shown in next section. Also from the coding perspective, we found the OpenACC implementation is very straightforward, so that we think automatic instrumentation of these OpenACC directives into the CLM source is feasible and have great potentials for further CLM parallel code development.
TABLE II. STRONG SCALABILITY OF CNGRESP MODEL (MPI_OPENACC
IMPLEMENTATION) RUNNING ON UP TO 128 NODES OF TITAN MACHINE, EACH MPI PROCESS USES ONE K20C GPU. THE SPEEDUP IS CALCULATED
AGAINST THE COMPUTATION TIME OF SEQUENTIAL CODE ON SINGLE CPU
CORE (88.9 SECONDS)
# of GPUs Time (s) Speedup
1 38.7 2.3
2 20.76 4.3
4 10.56 8.5
8 5.5 16.4
16 2.98 30.2
32 1.72 52.3
64 1.05 85.7
128 0.74 121.6
As shown in Table 2, the model demonstrated a very good scalability up to 128 nodes, in which up to 128 GPUs were used for computation. In the simulation using single computing node, it took 38.7 second to finish all the computation using one GPU, that gave out the speedup number of 2.3. While in the simulation using 128 nodes, the maximum computation time on each GPU is less than 0.74 second, giving out a speedup number of 121.6.
IX. SYSTEMATIC PERFORMANCE ANALYSIS
In order to get more detailed information on the OpenACC implementation, we used Vampir toolkit (www.vampir.eu) to trace and analyze detailed performance matrix on GPU [10].
The Vampir toolkit consists of the runtime measurement system Score-P [11], and the performance analysis tool Vampir [12]. Score-P is a new convenient measurement infrastructure for collecting performance data. It supports the developer with instrumentation and allows detailed logging of program execution for parallel applications using message passing (MPI), threads (OpenMP, Pthreads), and offloading to accelerators (OpenACC and CUDA). Score-P provides two commonly used techniques to investigate the performance behavior of parallel applications: Profiling and Tracing. Profiling is based on aggregating performance data, which allows a statistical view on a program run such as number of
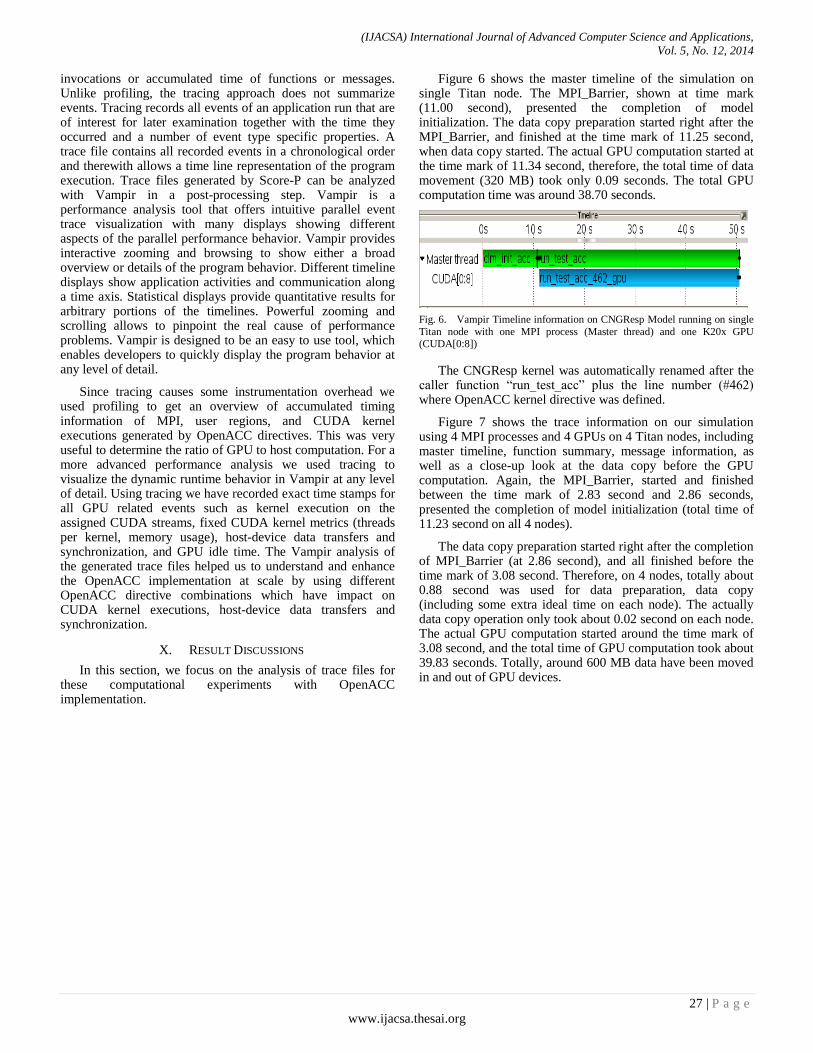
(IJACSA) International Journal of Advanced Computer Science and Applications,
Vol. 5, No. 12, 2014
27 | P a g e
www.ijacsa.thesai.org
invocations or accumulated time of functions or messages. Unlike profiling, the tracing approach does not summarize events. Tracing records all events of an application run that are of interest for later examination together with the time they occurred and a number of event type specific properties. A trace file contains all recorded events in a chronological order and therewith allows a time line representation of the program execution. Trace files generated by Score-P can be analyzed with Vampir in a post-processing step. Vampir is a performance analysis tool that offers intuitive parallel event trace visualization with many displays showing different aspects of the parallel performance behavior. Vampir provides interactive zooming and browsing to show either a broad overview or details of the program behavior. Different timeline displays show application activities and communication along a time axis. Statistical displays provide quantitative results for arbitrary portions of the timelines. Powerful zooming and scrolling allows to pinpoint the real cause of performance problems. Vampir is designed to be an easy to use tool, which enables developers to quickly display the program behavior at any level of detail.
Since tracing causes some instrumentation overhead we used profiling to get an overview of accumulated timing information of MPI, user regions, and CUDA kernel executions generated by OpenACC directives. This was very useful to determine the ratio of GPU to host computation. For a more advanced performance analysis we used tracing to visualize the dynamic runtime behavior in Vampir at any level of detail. Using tracing we have recorded exact time stamps for all GPU related events such as kernel execution on the assigned CUDA streams, fixed CUDA kernel metrics (threads per kernel, memory usage), host-device data transfers and synchronization, and GPU idle time. The Vampir analysis of the generated trace files helped us to understand and enhance the OpenACC implementation at scale by using different OpenACC directive combinations which have impact on CUDA kernel executions, host-device data transfers and synchronization.
X. RESULT DISCUSSIONS
In this section, we focus on the analysis of trace files for these computational experiments with OpenACC implementation.
Figure 6 shows the master timeline of the simulation on single Titan node. The MPI_Barrier, shown at time mark (11.00 second), presented the completion of model initialization. The data copy preparation started right after the MPI_Barrier, and finished at the time mark of 11.25 second, when data copy started. The actual GPU computation started at the time mark of 11.34 second, therefore, the total time of data movement (320 MB) took only 0.09 seconds. The total GPU computation time was around 38.70 seconds.
Fig. 6. Vampir Timeline information on CNGResp Model running on single
Titan node with one MPI process (Master thread) and one K20x GPU (CUDA[0:8])
The CNGResp kernel was automatically renamed after the caller function “run_test_acc” plus the line number (#462) where OpenACC kernel directive was defined.
Figure 7 shows the trace information on our simulation using 4 MPI processes and 4 GPUs on 4 Titan nodes, including master timeline, function summary, message information, as well as a close-up look at the data copy before the GPU computation. Again, the MPI_Barrier, started and finished between the time mark of 2.83 second and 2.86 seconds, presented the completion of model initialization (total time of 11.23 second on all 4 nodes).
The data copy preparation started right after the completion of MPI_Barrier (at 2.86 second), and all finished before the time mark of 3.08 second. Therefore, on 4 nodes, totally about 0.88 second was used for data preparation, data copy (including some extra ideal time on each node). The actually data copy operation only took about 0.02 second on each node. The actual GPU computation started around the time mark of 3.08 second, and the total time of GPU computation took about 39.83 seconds. Totally, around 600 MB data have been moved in and out of GPU devices.
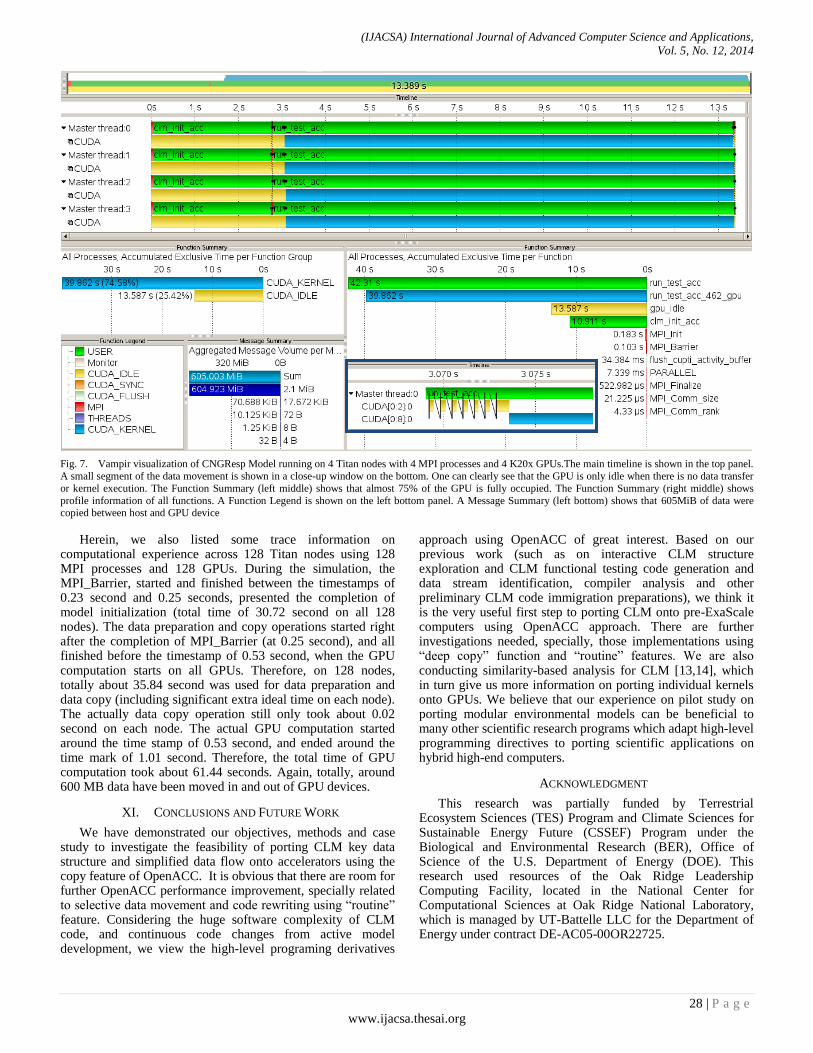
(IJACSA) International Journal of Advanced Computer Science and Applications,
Vol. 5, No. 12, 2014
28 | P a g e
www.ijacsa.thesai.org
Fig. 7. Vampir visualization of CNGResp Model running on 4 Titan nodes with 4 MPI processes and 4 K20x GPUs.The main timeline is shown in the top panel.
A small segment of the data movement is shown in a close-up window on the bottom. One can clearly see that the GPU is only idle when there is no data transfer
or kernel execution. The Function Summary (left middle) shows that almost 75% of the GPU is fully occupied. The Function Summary (right middle) shows
profile information of all functions. A Function Legend is shown on the left bottom panel. A Message Summary (left bottom) shows that 605MiB of data were copied between host and GPU device
Herein, we also listed some trace information on computational experience across 128 Titan nodes using 128 MPI processes and 128 GPUs. During the simulation, the MPI_Barrier, started and finished between the timestamps of 0.23 second and 0.25 seconds, presented the completion of model initialization (total time of 30.72 second on all 128 nodes). The data preparation and copy operations started right after the completion of MPI_Barrier (at 0.25 second), and all finished before the timestamp of 0.53 second, when the GPU computation starts on all GPUs. Therefore, on 128 nodes, totally about 35.84 second was used for data preparation and data copy (including significant extra ideal time on each node). The actually data copy operation still only took about 0.02 second on each node. The actual GPU computation started around the time stamp of 0.53 second, and ended around the time mark of 1.01 second. Therefore, the total time of GPU computation took about 61.44 seconds. Again, totally, around 600 MB data have been moved in and out of GPU devices.
XI. CONCLUSIONS AND FUTURE WORK
We have demonstrated our objectives, methods and case study to investigate the feasibility of porting CLM key data structure and simplified data flow onto accelerators using the copy feature of OpenACC. It is obvious that there are room for further OpenACC performance improvement, specially related to selective data movement and code rewriting using “routine” feature. Considering the huge software complexity of CLM code, and continuous code changes from active model development, we view the high-level programing derivatives
approach using OpenACC of great interest. Based on our previous work (such as on interactive CLM structure exploration and CLM functional testing code generation and data stream identification, compiler analysis and other preliminary CLM code immigration preparations), we think it is the very useful first step to porting CLM onto pre-ExaScale computers using OpenACC approach. There are further investigations needed, specially, those implementations using “deep copy” function and “routine” features. We are also conducting similarity-based analysis for CLM [13,14], which in turn give us more information on porting individual kernels onto GPUs. We believe that our experience on pilot study on porting modular environmental models can be beneficial to many other scientific research programs which adapt high-level programming directives to porting scientific applications on hybrid high-end computers.
ACKNOWLEDGMENT
This research was partially funded by Terrestrial Ecosystem Sciences (TES) Program and Climate Sciences for Sustainable Energy Future (CSSEF) Program under the Biological and Environmental Research (BER), Office of Science of the U.S. Department of Energy (DOE). This research used resources of the Oak Ridge Leadership Computing Facility, located in the National Center for Computational Sciences at Oak Ridge National Laboratory, which is managed by UT-Battelle LLC for the Department of Energy under contract DE-AC05-00OR22725.

(IJACSA) International Journal of Advanced Computer Science and Applications,
Vol. 5, No. 12, 2014
29 | P a g e
www.ijacsa.thesai.org
REFERENCES
[1] Washington, W. M., C. L. Parkinson, 2005, An Introduction to Three-Dimensional Climate Modeling, University Science Books, 2rn edition.
[2] Oleson, K., Lawrence, D., Gordon, B., Flanner, M., Kluzek, E., Peter, J., Levis, S., Swenson, S., Thornton, P., and Feddema J., 2010, Technical description of version 4.0 of the Community Land Model (CLM).
[3] Wang, D., Post, W., Wilson, B., 2011. Climate Change Modeling: Computational Opportunities and Challenges, IEEE Computing in Science and Engineering, Vol 13(5), pp36-42
[4] Wang, D., Schuchart, J., Janjusic, T., Winkler, F., and Xu, Y. 2014a. Toward Better Understanding of the Community Land Model within the Earth System Modeling Framework, International Conference on Computational Science, Cairns, Australia, 2014,
[5] Domke, J., Wang, D., Runtime Tracing of the Community Earth System Model: Feasibility Study and Benefits, 12th Workshop on Tools for Program Development and Analysis in Computational Science, Omaha, Nebraska, June 2012, procedia CS 9: pp1950-1958, 2012
[6] Xu, Y., Wang, D., Janjusic, T., Xu, X., A Web-based Visual Analytic System for Understanding the Structure of Community Land Model, International Conference on Software Engineering Research and Practice, June, 2014.
[7] Wang, D., Xu, Y., Thornton, P., King, A., Gu, L., Steed, C., Schuchart, J., 2014b. A Functional Testing Platform for the Community Land Model, Environmental Modeling and Software, Vol. 55, pp25-31, 10.1016/j.envsoft.2014.01.015
[8] Oscar Hernandez, Wei Ding, Barbara Chapman, Ramanan Sankaran, Richard L. Graham, Christos Kartsaklis, "Experiences with High-Level
Programming Directives for Porting Applications to GPUs". Facing the Multicore - Challenge II. Lecture Notes in Computer Science, Volume 7174/2012, pages 96-107, 2012
[9] Telse K-Series Overview, available online at http://www.nvidia.com/content/tesla/pdf/Tesla-KSeries-Overview-LR.pdf
[10] Dietrich, R., Winkler, F., William, T., Stolle, J., Henschel, R., & Berry, D. K. (2013). A Case Study: Holistic Performance Analysis on Heterogeneous Architectures using the Vampir Toolchain. In PARCO (pp. 793-802).
[11] A. Knüpfer, H. Brunst, J. Doleschal, M. Jurenz, M. Lieber, H. Mickler, M. Müller and W.E. Nagel, “The Vampir Performance Analysis Tool-Set”, Tools for High Performance Computing, pp 139-155, Springer Verlag, 2008
[12] A. Knüpfer, C. Rössel, D. an Mey, S. Biersdorf, K. Diethelm, D. Eschweiler, M. Gerndt, D. Lorenz, A. D. Malony, W. E. Nagel, Y. Oleynik, P. Saviankou, D. Schmidl, S. Shende, R. Tschüter, M. Wagner, B. Wesarg, F. Wolf: Score-P - A Joint Performance Measurement Run-Time Infrastructure for Periscope, Scalasca, TAU, and Vampir, Proceedings of 5th Parallel Tools Workshop, 2011
[13] Ding, W., Hsu, C. H., Hernandez, O., Chapman, B., & Graham, R. (2013). KLONOS: Similarity‐based planning tool support for porting scientific applications. Concurrency and Computation: Practice and Experience, 25(8), 1072-1088
[14] Wei Ding, Oscar Hernandez, and Barbara Chapman. "A Similarity-Based Analysis Tool for Porting OpenMP Applications". In Facing the Multicore-Challenge III, pp. 13-24. Springer Berlin Heidelberg, 2013.

(IJACSA) International Journal of Advanced Computer Science and Applications,
Vol. 5, No. 12, 2014
30 | P a g e
www.ijacsa.thesai.org
B2C E-Commerce Fact-Based Negotiation Using Big
Data Analytics and Agent-Based Technologies
Hasan Al-Sakran
Management Information Systems Dept
King Saud University
Riyadh, Saudi Arabia
Abstract—The focus of this study is application of intelligent
agent in negotiation between buyer and seller in B2C Commerce
using big data analytics. The developed model is used to conduct
negotiations on behalf of prospective buyers and sellers using
analytics to improve negotiations to meet the practical
requirements. The objective of this study is to explore the
opportunities of using big data and business analytics for
negotiation, where big data analytics can be used to create new
opportunities for bidding. Using big data analytics sellers may
learn to predict the buyers’ negotiation strategy and therefore
adopt optimal tactics to pursue results that are to their best
interests. An experimental design is used to collect intelligent
data that can be used in conducting the negotiation process. Such
approach will improve quality of negotiation decisions for both
parties.
Keywords—negotiations; e-commerce; agent technology; big
data; analytics
I. INTRODUCTION
Affordability of smart mobile devices with permanent connection, social networks and real-time conversation streams significantly changed B2C e-commerce. If some time ago we have been talking about negotiations, when negotiating parties had little or no knowledge of attributes and their values, now such information can be retrieved from multiple sources online.
Negotiation is one of the major components of many e-commerce activities, such as auctions, scheduling, contracting, and so on, and is one area that can greatly benefit from intelligent automation. We consider negotiations as a form of interaction between parties with conflicting goals who wish to cooperate in order to reach an agreement that will benefit all negotiating parties, a process that can be both complicated and time-consuming.
E-commerce negotiation is a decision-making process that seeks to find an electronic agreement, which will satisfy the requirements of two or more parties in presence of limited information and conflicting preferences [1]. In e-commerce negotiations buyers and sellers search for possible solutions until agreement is reached or negotiations fail. Both buyers and sellers can conduct their own utility assessment for every solution. The goal of negotiation is to seek a solution that optimizes utility value for both of them.
Due to recent technological advances mentioned above all organizations involved in B2C commerce are forced to improve existing and develop new services to retain old
customers and attract new one. Customers negotiate for better deals, and e-commerce business organizations are negotiating in order to keep their customers, to build lasting relationships, and to increase customer satisfaction Negotiation is one of such services. In a view of increased role of negotiations in B2C commerce it is appropriate to give this particular topic the attention it deserves. Negotiation can significantly benefit from big data analytics. Using analytics will allow businesses to shorten negotiation time and effort associated with it on one side. On the other side, it will help customers lacking knowledge of negotiation procedures and negotiation skills.
The success of e-negotiation in B2C commerce depends on volume of provided data and information, and how they are used to optimize the negotiation operations. The size of data is big enough to extract huge volumes of valuable knowledge that may determine firm‘s success or failure [2]. Using big data analytics a seller may learn to predict the buyer‘s negotiation strategy and develop and adopt optimal tactics to achieve results that are to his best interests. The ability to manage and transform data into useful information and utilize it as a strategic differentiator is a key contributor to the success of B2C negotiation. The B2C negotiation process must be designed to take advantage of large volumes of consumer data that have become available in recent years due to the Internet, social networking, mobile telephony applications, RFID and sensor applications, and new technologies that create and capture data, size of which is growing exponentially. Collected data are mainly unstructured and contain valuable customers‘ opinion and behavioral information. Big data analytics can be defined as integrated technologies, techniques, practices, methodologies, and applications that analyze critical business data to help an organization better understand its business and make real time decisions [3].
Despite large number of articles in this area, there has not been enough academic research on effective ways to leverage the big data to create meaningful information for e-commerce negotiations. Proposed model allows negotiators to engage simultaneously in multi-parties‘ negotiations. This agent-based e-negotiation system has incorporated big data analytics technologies to carry out goal-driven multi-parties‘ negotiations on several issues at the same time and support vital negotiation mechanism.
Using big data analytics, the seller agent (SA) will be able to predict the price a customer has in mind and find out what‘s included in other companies‘ offers in order to negotiate from a
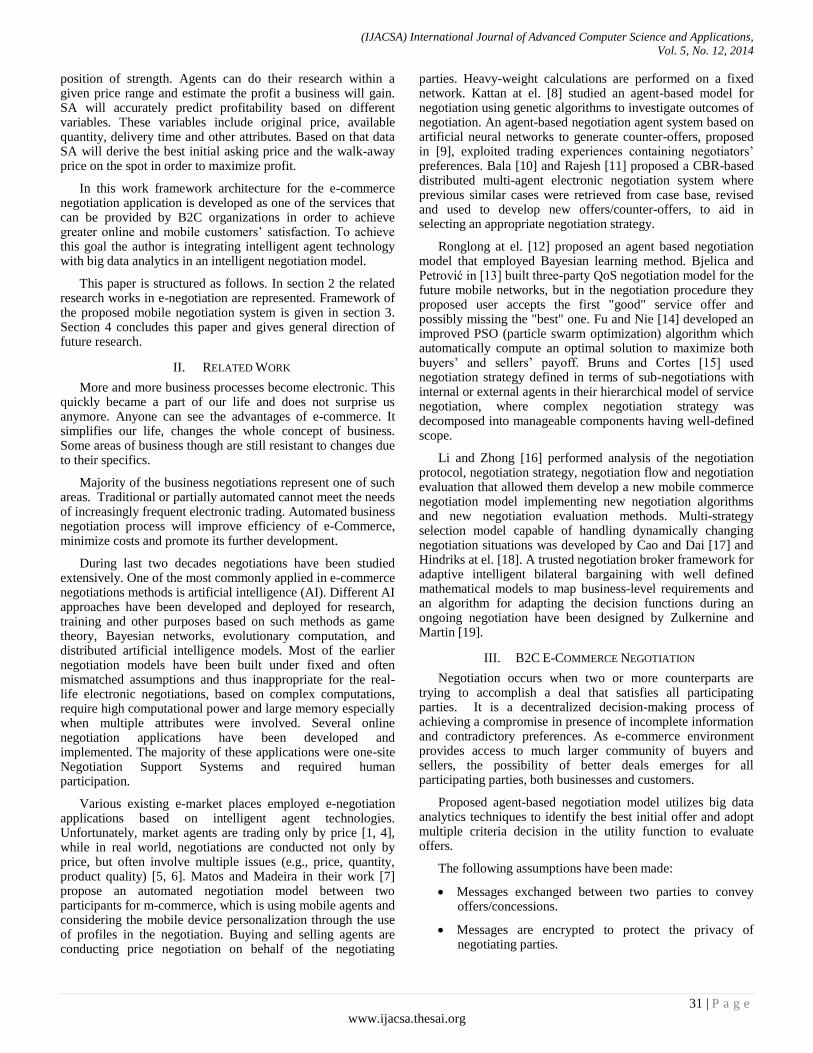
(IJACSA) International Journal of Advanced Computer Science and Applications,
Vol. 5, No. 12, 2014
31 | P a g e
www.ijacsa.thesai.org
position of strength. Agents can do their research within a given price range and estimate the profit a business will gain. SA will accurately predict profitability based on different variables. These variables include original price, available quantity, delivery time and other attributes. Based on that data SA will derive the best initial asking price and the walk-away price on the spot in order to maximize profit.
In this work framework architecture for the e-commerce negotiation application is developed as one of the services that can be provided by B2C organizations in order to achieve greater online and mobile customers‘ satisfaction. To achieve this goal the author is integrating intelligent agent technology with big data analytics in an intelligent negotiation model.
This paper is structured as follows. In section 2 the related research works in e-negotiation are represented. Framework of the proposed mobile negotiation system is given in section 3. Section 4 concludes this paper and gives general direction of future research.
II. RELATED WORK
More and more business processes become electronic. This quickly became a part of our life and does not surprise us anymore. Anyone can see the advantages of e-commerce. It simplifies our life, changes the whole concept of business. Some areas of business though are still resistant to changes due to their specifics.
Majority of the business negotiations represent one of such areas. Traditional or partially automated cannot meet the needs of increasingly frequent electronic trading. Automated business negotiation process will improve efficiency of e-Commerce, minimize costs and promote its further development.
During last two decades negotiations have been studied extensively. One of the most commonly applied in e-commerce negotiations methods is artificial intelligence (AI). Different AI approaches have been developed and deployed for research, training and other purposes based on such methods as game theory, Bayesian networks, evolutionary computation, and distributed artificial intelligence models. Most of the earlier negotiation models have been built under fixed and often mismatched assumptions and thus inappropriate for the real-life electronic negotiations, based on complex computations, require high computational power and large memory especially when multiple attributes were involved. Several online negotiation applications have been developed and implemented. The majority of these applications were one-site Negotiation Support Systems and required human participation.
Various existing e-market places employed e-negotiation applications based on intelligent agent technologies. Unfortunately, market agents are trading only by price [1, 4], while in real world, negotiations are conducted not only by price, but often involve multiple issues (e.g., price, quantity, product quality) [5, 6]. Matos and Madeira in their work [7] propose an automated negotiation model between two participants for m-commerce, which is using mobile agents and considering the mobile device personalization through the use of profiles in the negotiation. Buying and selling agents are conducting price negotiation on behalf of the negotiating
parties. Heavy-weight calculations are performed on a fixed network. Kattan at el. [8] studied an agent-based model for negotiation using genetic algorithms to investigate outcomes of negotiation. An agent-based negotiation agent system based on artificial neural networks to generate counter-offers, proposed in [9], exploited trading experiences containing negotiators‘ preferences. Bala [10] and Rajesh [11] proposed a CBR-based distributed multi-agent electronic negotiation system where previous similar cases were retrieved from case base, revised and used to develop new offers/counter-offers, to aid in selecting an appropriate negotiation strategy.
Ronglong at el. [12] proposed an agent based negotiation model that employed Bayesian learning method. Bjelica and Petrović in [13] built three-party QoS negotiation model for the future mobile networks, but in the negotiation procedure they proposed user accepts the first "good" service offer and possibly missing the "best" one. Fu and Nie [14] developed an improved PSO (particle swarm optimization) algorithm which automatically compute an optimal solution to maximize both buyers‘ and sellers‘ payoff. Bruns and Cortes [15] used negotiation strategy defined in terms of sub-negotiations with internal or external agents in their hierarchical model of service negotiation, where complex negotiation strategy was decomposed into manageable components having well-defined scope.
Li and Zhong [16] performed analysis of the negotiation protocol, negotiation strategy, negotiation flow and negotiation evaluation that allowed them develop a new mobile commerce negotiation model implementing new negotiation algorithms and new negotiation evaluation methods. Multi-strategy selection model capable of handling dynamically changing negotiation situations was developed by Cao and Dai [17] and Hindriks at el. [18]. A trusted negotiation broker framework for adaptive intelligent bilateral bargaining with well defined mathematical models to map business-level requirements and an algorithm for adapting the decision functions during an ongoing negotiation have been designed by Zulkernine and Martin [19].
III. B2C E-COMMERCE NEGOTIATION
Negotiation occurs when two or more counterparts are trying to accomplish a deal that satisfies all participating parties. It is a decentralized decision-making process of achieving a compromise in presence of incomplete information and contradictory preferences. As e-commerce environment provides access to much larger community of buyers and sellers, the possibility of better deals emerges for all participating parties, both businesses and customers.
Proposed agent-based negotiation model utilizes big data analytics techniques to identify the best initial offer and adopt multiple criteria decision in the utility function to evaluate offers.
The following assumptions have been made:
Messages exchanged between two parties to convey offers/concessions.
Messages are encrypted to protect the privacy of negotiating parties.
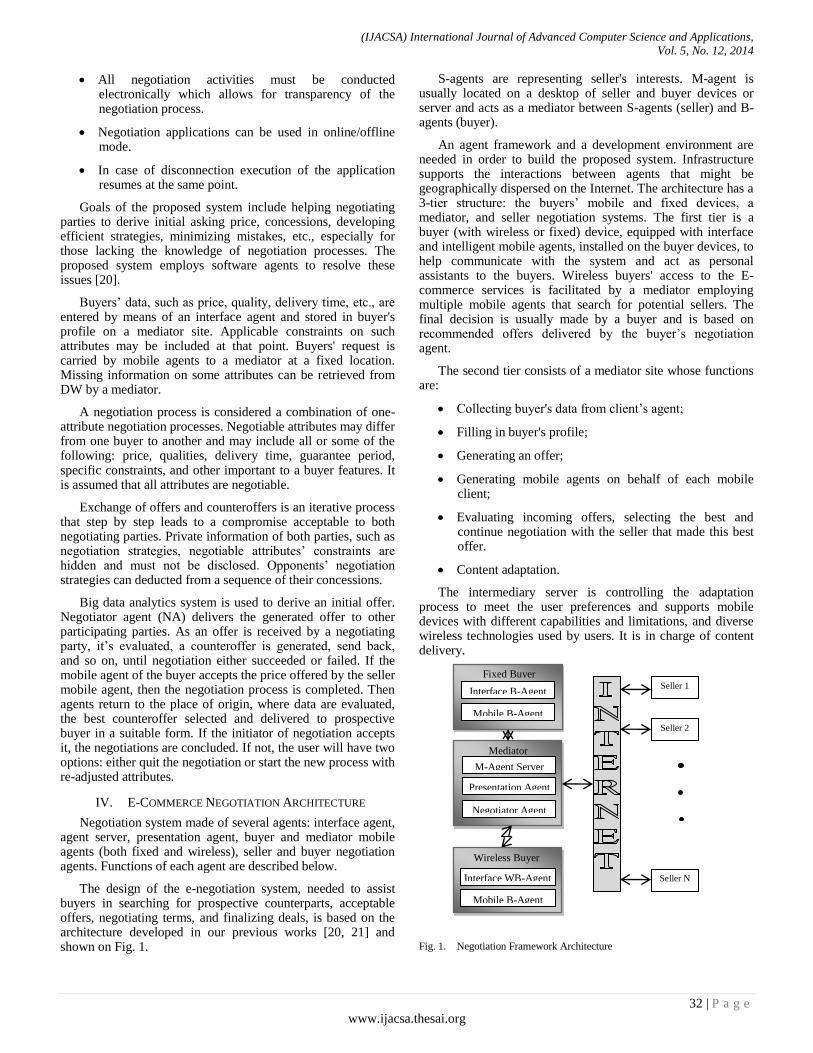
(IJACSA) International Journal of Advanced Computer Science and Applications,
Vol. 5, No. 12, 2014
32 | P a g e
www.ijacsa.thesai.org
All negotiation activities must be conducted electronically which allows for transparency of the negotiation process.
Negotiation applications can be used in online/offline mode.
In case of disconnection execution of the application resumes at the same point.
Goals of the proposed system include helping negotiating parties to derive initial asking price, concessions, developing efficient strategies, minimizing mistakes, etc., especially for those lacking the knowledge of negotiation processes. The proposed system employs software agents to resolve these issues [20].
Buyers‘ data, such as price, quality, delivery time, etc., are entered by means of an interface agent and stored in buyer's profile on a mediator site. Applicable constraints on such attributes may be included at that point. Buyers' request is carried by mobile agents to a mediator at a fixed location. Missing information on some attributes can be retrieved from DW by a mediator.
A negotiation process is considered a combination of one-attribute negotiation processes. Negotiable attributes may differ from one buyer to another and may include all or some of the following: price, qualities, delivery time, guarantee period, specific constraints, and other important to a buyer features. It is assumed that all attributes are negotiable.
Exchange of offers and counteroffers is an iterative process that step by step leads to a compromise acceptable to both negotiating parties. Private information of both parties, such as negotiation strategies, negotiable attributes‘ constraints are hidden and must not be disclosed. Opponents‘ negotiation strategies can deducted from a sequence of their concessions.
Big data analytics system is used to derive an initial offer. Negotiator agent (NA) delivers the generated offer to other participating parties. As an offer is received by a negotiating party, it‘s evaluated, a counteroffer is generated, send back, and so on, until negotiation either succeeded or failed. If the mobile agent of the buyer accepts the price offered by the seller mobile agent, then the negotiation process is completed. Then agents return to the place of origin, where data are evaluated, the best counteroffer selected and delivered to prospective buyer in a suitable form. If the initiator of negotiation accepts it, the negotiations are concluded. If not, the user will have two options: either quit the negotiation or start the new process with re-adjusted attributes.
IV. E-COMMERCE NEGOTIATION ARCHITECTURE
Negotiation system made of several agents: interface agent, agent server, presentation agent, buyer and mediator mobile agents (both fixed and wireless), seller and buyer negotiation agents. Functions of each agent are described below.
The design of the e-negotiation system, needed to assist buyers in searching for prospective counterparts, acceptable offers, negotiating terms, and finalizing deals, is based on the architecture developed in our previous works [20, 21] and shown on Fig. 1.
S-agents are representing seller's interests. M-agent is usually located on a desktop of seller and buyer devices or server and acts as a mediator between S-agents (seller) and B-agents (buyer).
An agent framework and a development environment are needed in order to build the proposed system. Infrastructure supports the interactions between agents that might be geographically dispersed on the Internet. The architecture has a 3-tier structure: the buyers‘ mobile and fixed devices, a mediator, and seller negotiation systems. The first tier is a buyer (with wireless or fixed) device, equipped with interface and intelligent mobile agents, installed on the buyer devices, to help communicate with the system and act as personal assistants to the buyers. Wireless buyers' access to the E-commerce services is facilitated by a mediator employing multiple mobile agents that search for potential sellers. The final decision is usually made by a buyer and is based on recommended offers delivered by the buyer‘s negotiation agent.
The second tier consists of a mediator site whose functions are:
Collecting buyer's data from client‘s agent;
Filling in buyer's profile;
Generating an offer;
Generating mobile agents on behalf of each mobile client;
Evaluating incoming offers, selecting the best and continue negotiation with the seller that made this best offer.
Content adaptation.
The intermediary server is controlling the adaptation process to meet the user preferences and supports mobile devices with different capabilities and limitations, and diverse wireless technologies used by users. It is in charge of content delivery.
Fig. 1. Negotiation Framework Architecture
Mediator
Interface B-Agent
Fixed Buyer
Mobile B-Agent
Interface WB-Agent
Wireless Buyer
Mobile B-Agent
M-Agent Server
Presentation Agent
Negotiator Agent
Seller 1
Seller 2
Seller N
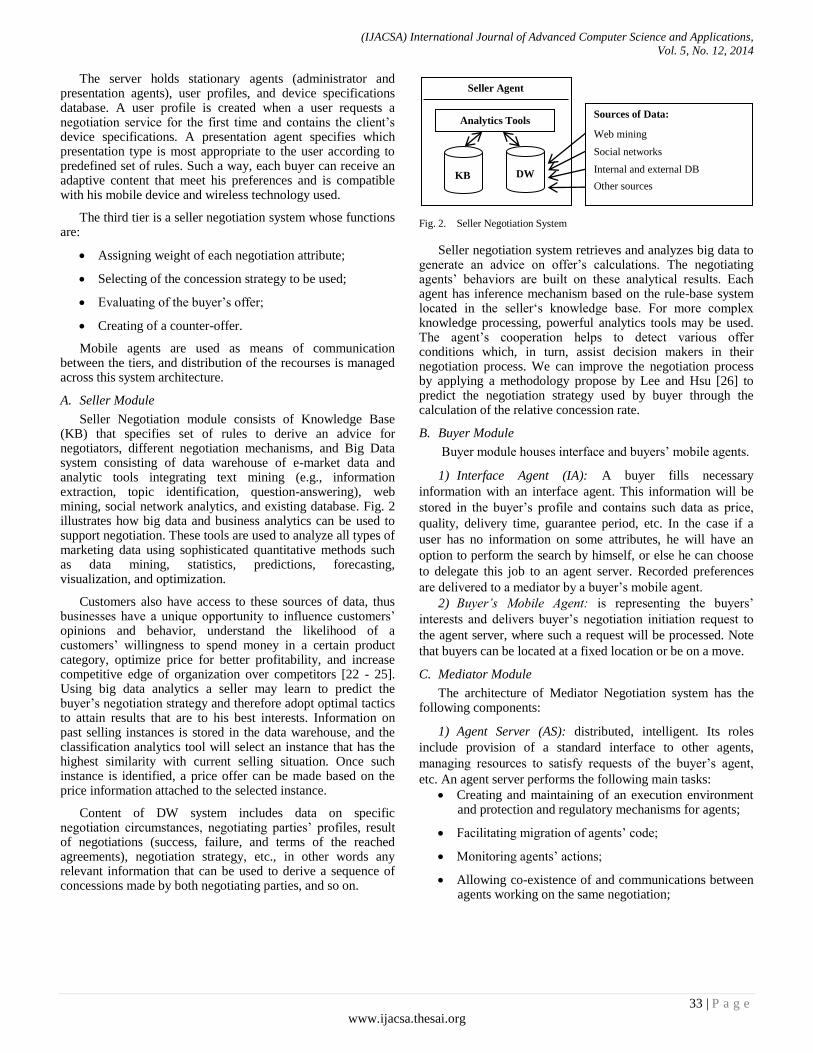
(IJACSA) International Journal of Advanced Computer Science and Applications,
Vol. 5, No. 12, 2014
33 | P a g e
www.ijacsa.thesai.org
The server holds stationary agents (administrator and presentation agents), user profiles, and device specifications database. A user profile is created when a user requests a negotiation service for the first time and contains the client‘s device specifications. A presentation agent specifies which presentation type is most appropriate to the user according to predefined set of rules. Such a way, each buyer can receive an adaptive content that meet his preferences and is compatible with his mobile device and wireless technology used.
The third tier is a seller negotiation system whose functions are:
Assigning weight of each negotiation attribute;
Selecting of the concession strategy to be used;
Evaluating of the buyer‘s offer;
Creating of a counter-offer.
Mobile agents are used as means of communication between the tiers, and distribution of the recourses is managed across this system architecture.
A. Seller Module
Seller Negotiation module consists of Knowledge Base (KB) that specifies set of rules to derive an advice for negotiators, different negotiation mechanisms, and Big Data system consisting of data warehouse of e-market data and analytic tools integrating text mining (e.g., information extraction, topic identification, question-answering), web mining, social network analytics, and existing database. Fig. 2 illustrates how big data and business analytics can be used to support negotiation. These tools are used to analyze all types of marketing data using sophisticated quantitative methods such as data mining, statistics, predictions, forecasting, visualization, and optimization.
Customers also have access to these sources of data, thus businesses have a unique opportunity to influence customers‘ opinions and behavior, understand the likelihood of a customers‘ willingness to spend money in a certain product category, optimize price for better profitability, and increase competitive edge of organization over competitors [22 - 25]. Using big data analytics a seller may learn to predict the buyer‘s negotiation strategy and therefore adopt optimal tactics to attain results that are to his best interests. Information on past selling instances is stored in the data warehouse, and the classification analytics tool will select an instance that has the highest similarity with current selling situation. Once such instance is identified, a price offer can be made based on the price information attached to the selected instance.
Content of DW system includes data on specific negotiation circumstances, negotiating parties‘ profiles, result of negotiations (success, failure, and terms of the reached agreements), negotiation strategy, etc., in other words any relevant information that can be used to derive a sequence of concessions made by both negotiating parties, and so on.
Fig. 2. Seller Negotiation System
Seller negotiation system retrieves and analyzes big data to generate an advice on offer‘s calculations. The negotiating agents‘ behaviors are built on these analytical results. Each agent has inference mechanism based on the rule-base system located in the seller‗s knowledge base. For more complex knowledge processing, powerful analytics tools may be used. The agent‘s cooperation helps to detect various offer conditions which, in turn, assist decision makers in their negotiation process. We can improve the negotiation process by applying a methodology propose by Lee and Hsu [26] to predict the negotiation strategy used by buyer through the calculation of the relative concession rate.
B. Buyer Module
Buyer module houses interface and buyers‘ mobile agents.
1) Interface Agent (IA): A buyer fills necessary
information with an interface agent. This information will be
stored in the buyer‘s profile and contains such data as price,
quality, delivery time, guarantee period, etc. In the case if a
user has no information on some attributes, he will have an
option to perform the search by himself, or else he can choose
to delegate this job to an agent server. Recorded preferences
are delivered to a mediator by a buyer‘s mobile agent.
2) Buyer’s Mobile Agent: is representing the buyers‘
interests and delivers buyer‘s negotiation initiation request to
the agent server, where such a request will be processed. Note
that buyers can be located at a fixed location or be on a move.
C. Mediator Module
The architecture of Mediator Negotiation system has the following components:
1) Agent Server (AS): distributed, intelligent. Its roles
include provision of a standard interface to other agents,
managing resources to satisfy requests of the buyer‘s agent,
etc. An agent server performs the following main tasks:
Creating and maintaining of an execution environment and protection and regulatory mechanisms for agents;
Facilitating migration of agents‘ code;
Monitoring agents‘ actions;
Allowing co-existence of and communications between agents working on the same negotiation;
Seller Agent
DW KB
Analytics Tools Sources of Data:
Web mining
Social networks
Internal and external DB
Other sources
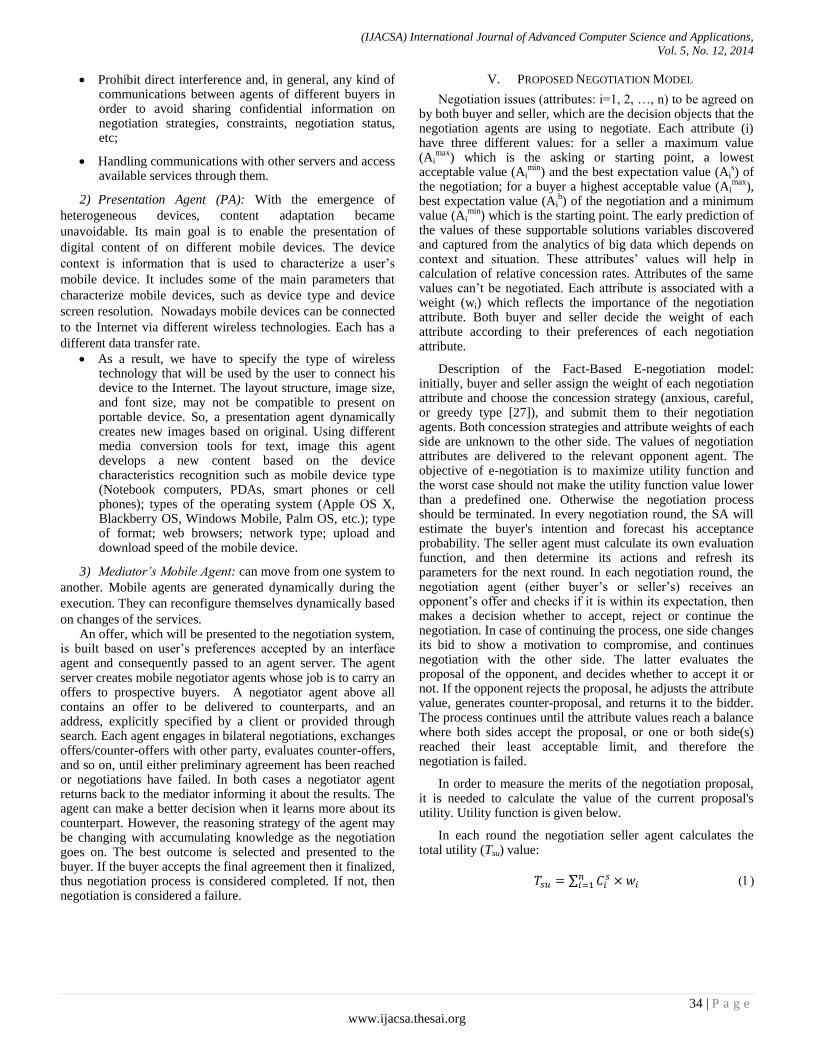
(IJACSA) International Journal of Advanced Computer Science and Applications,
Vol. 5, No. 12, 2014
34 | P a g e
www.ijacsa.thesai.org
Prohibit direct interference and, in general, any kind of communications between agents of different buyers in order to avoid sharing confidential information on negotiation strategies, constraints, negotiation status, etc;
Handling communications with other servers and access available services through them.
2) Presentation Agent (PA): With the emergence of
heterogeneous devices, content adaptation became
unavoidable. Its main goal is to enable the presentation of
digital content of on different mobile devices. The device
context is information that is used to characterize a user‘s
mobile device. It includes some of the main parameters that
characterize mobile devices, such as device type and device
screen resolution. Nowadays mobile devices can be connected
to the Internet via different wireless technologies. Each has a
different data transfer rate.
As a result, we have to specify the type of wireless technology that will be used by the user to connect his device to the Internet. The layout structure, image size, and font size, may not be compatible to present on portable device. So, a presentation agent dynamically creates new images based on original. Using different media conversion tools for text, image this agent develops a new content based on the device characteristics recognition such as mobile device type (Notebook computers, PDAs, smart phones or cell phones); types of the operating system (Apple OS X, Blackberry OS, Windows Mobile, Palm OS, etc.); type of format; web browsers; network type; upload and download speed of the mobile device.
3) Mediator’s Mobile Agent: can move from one system to
another. Mobile agents are generated dynamically during the
execution. They can reconfigure themselves dynamically based
on changes of the services. An offer, which will be presented to the negotiation system,
is built based on user‘s preferences accepted by an interface agent and consequently passed to an agent server. The agent server creates mobile negotiator agents whose job is to carry an offers to prospective buyers. A negotiator agent above all contains an offer to be delivered to counterparts, and an address, explicitly specified by a client or provided through search. Each agent engages in bilateral negotiations, exchanges offers/counter-offers with other party, evaluates counter-offers, and so on, until either preliminary agreement has been reached or negotiations have failed. In both cases a negotiator agent returns back to the mediator informing it about the results. The agent can make a better decision when it learns more about its counterpart. However, the reasoning strategy of the agent may be changing with accumulating knowledge as the negotiation goes on. The best outcome is selected and presented to the buyer. If the buyer accepts the final agreement then it finalized, thus negotiation process is considered completed. If not, then negotiation is considered a failure.
V. PROPOSED NEGOTIATION MODEL
Negotiation issues (attributes: i=1, 2, …, n) to be agreed on by both buyer and seller, which are the decision objects that the negotiation agents are using to negotiate. Each attribute (i) have three different values: for a seller a maximum value (Ai
max) which is the asking or starting point, a lowest
acceptable value (Aimin
) and the best expectation value (Ais) of
the negotiation; for a buyer a highest acceptable value (Aimax
), best expectation value (Ai
b) of the negotiation and a minimum
value (Aimin
) which is the starting point. The early prediction of the values of these supportable solutions variables discovered and captured from the analytics of big data which depends on context and situation. These attributes‘ values will help in calculation of relative concession rates. Attributes of the same values can‘t be negotiated. Each attribute is associated with a weight (wi) which reflects the importance of the negotiation attribute. Both buyer and seller decide the weight of each attribute according to their preferences of each negotiation attribute.
Description of the Fact-Based E-negotiation model: initially, buyer and seller assign the weight of each negotiation attribute and choose the concession strategy (anxious, careful, or greedy type [27]), and submit them to their negotiation agents. Both concession strategies and attribute weights of each side are unknown to the other side. The values of negotiation attributes are delivered to the relevant opponent agent. The objective of e-negotiation is to maximize utility function and the worst case should not make the utility function value lower than a predefined one. Otherwise the negotiation process should be terminated. In every negotiation round, the SA will estimate the buyer's intention and forecast his acceptance probability. The seller agent must calculate its own evaluation function, and then determine its actions and refresh its parameters for the next round. In each negotiation round, the negotiation agent (either buyer‘s or seller‘s) receives an opponent‘s offer and checks if it is within its expectation, then makes a decision whether to accept, reject or continue the negotiation. In case of continuing the process, one side changes its bid to show a motivation to compromise, and continues negotiation with the other side. The latter evaluates the proposal of the opponent, and decides whether to accept it or not. If the opponent rejects the proposal, he adjusts the attribute value, generates counter-proposal, and returns it to the bidder. The process continues until the attribute values reach a balance where both sides accept the proposal, or one or both side(s) reached their least acceptable limit, and therefore the negotiation is failed.
In order to measure the merits of the negotiation proposal, it is needed to calculate the value of the current proposal's utility. Utility function is given below.
In each round the negotiation seller agent calculates the total utility (Tsu) value:
∑
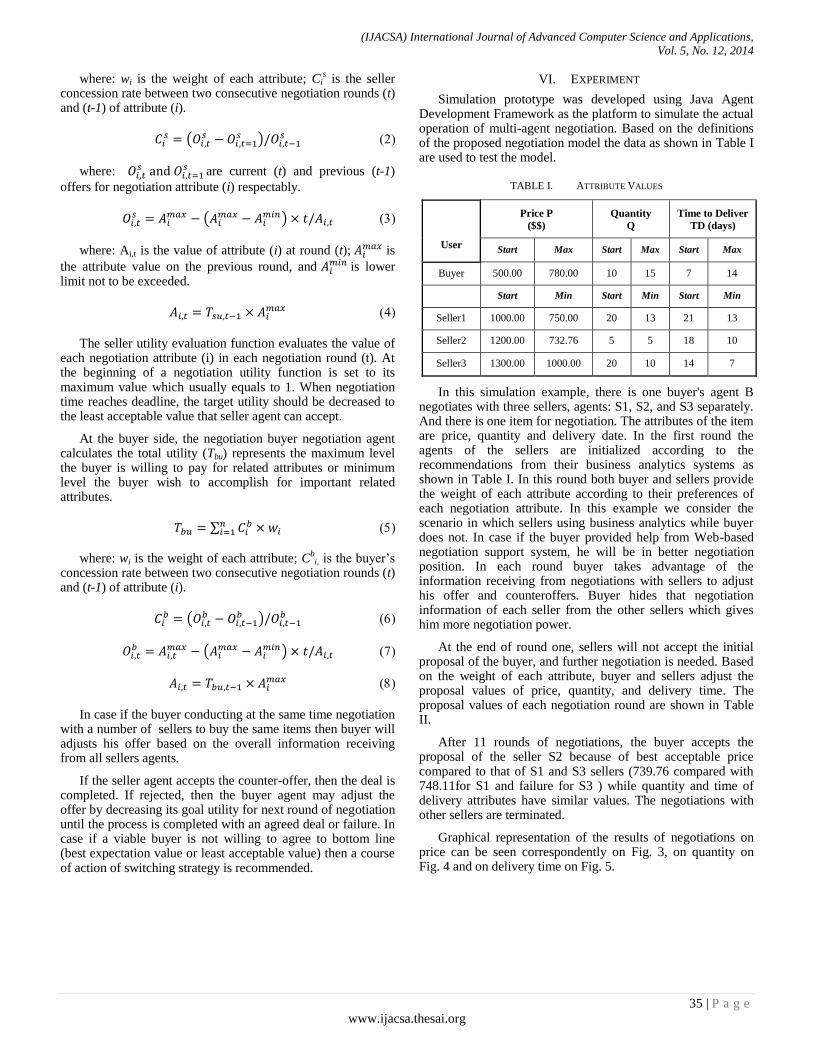
(IJACSA) International Journal of Advanced Computer Science and Applications,
Vol. 5, No. 12, 2014
35 | P a g e
www.ijacsa.thesai.org
where: wi is the weight of each attribute; Cis is the seller
concession rate between two consecutive negotiation rounds (t) and (t-1) of attribute (i).
(
)
where:
are current (t) and previous (t-1)
offers for negotiation attribute (i) respectably.
(
)
where: Ai,t is the value of attribute (i) at round (t); is
the attribute value on the previous round, and is lower
limit not to be exceeded.
The seller utility evaluation function evaluates the value of each negotiation attribute (i) in each negotiation round (t). At the beginning of a negotiation utility function is set to its maximum value which usually equals to 1. When negotiation time reaches deadline, the target utility should be decreased to the least acceptable value that seller agent can accept.
At the buyer side, the negotiation buyer negotiation agent calculates the total utility (Tbu) represents the maximum level the buyer is willing to pay for related attributes or minimum level the buyer wish to accomplish for important related attributes.
∑
where: wi is the weight of each attribute; Cbi, is the buyer‘s
concession rate between two consecutive negotiation rounds (t) and (t-1) of attribute (i).
(
)
(
)
In case if the buyer conducting at the same time negotiation with a number of sellers to buy the same items then buyer will adjusts his offer based on the overall information receiving from all sellers agents.
If the seller agent accepts the counter-offer, then the deal is completed. If rejected, then the buyer agent may adjust the offer by decreasing its goal utility for next round of negotiation until the process is completed with an agreed deal or failure. In case if a viable buyer is not willing to agree to bottom line (best expectation value or least acceptable value) then a course of action of switching strategy is recommended.
VI. EXPERIMENT
Simulation prototype was developed using Java Agent Development Framework as the platform to simulate the actual operation of multi-agent negotiation. Based on the definitions of the proposed negotiation model the data as shown in Table I are used to test the model.
TABLE I. ATTRIBUTE VALUES
User
Price P
($$)
Quantity
Q
Time to Deliver
TD (days)
Start Max Start Max Start Max
Buyer 500.00 780.00 10 15 7 14
Start Min Start Min Start Min
Seller1 1000.00 750.00 20 13 21 13
Seller2 1200.00 732.76 5 5 18 10
Seller3 1300.00 1000.00 20 10 14 7
In this simulation example, there is one buyer's agent B negotiates with three sellers, agents: S1, S2, and S3 separately. And there is one item for negotiation. The attributes of the item are price, quantity and delivery date. In the first round the agents of the sellers are initialized according to the recommendations from their business analytics systems as shown in Table I. In this round both buyer and sellers provide the weight of each attribute according to their preferences of each negotiation attribute. In this example we consider the scenario in which sellers using business analytics while buyer does not. In case if the buyer provided help from Web-based negotiation support system, he will be in better negotiation position. In each round buyer takes advantage of the information receiving from negotiations with sellers to adjust his offer and counteroffers. Buyer hides that negotiation information of each seller from the other sellers which gives him more negotiation power.
At the end of round one, sellers will not accept the initial proposal of the buyer, and further negotiation is needed. Based on the weight of each attribute, buyer and sellers adjust the proposal values of price, quantity, and delivery time. The proposal values of each negotiation round are shown in Table II.
After 11 rounds of negotiations, the buyer accepts the proposal of the seller S2 because of best acceptable price compared to that of S1 and S3 sellers (739.76 compared with 748.11for S1 and failure for S3 ) while quantity and time of delivery attributes have similar values. The negotiations with other sellers are terminated.
Graphical representation of the results of negotiations on price can be seen correspondently on Fig. 3, on quantity on Fig. 4 and on delivery time on Fig. 5.
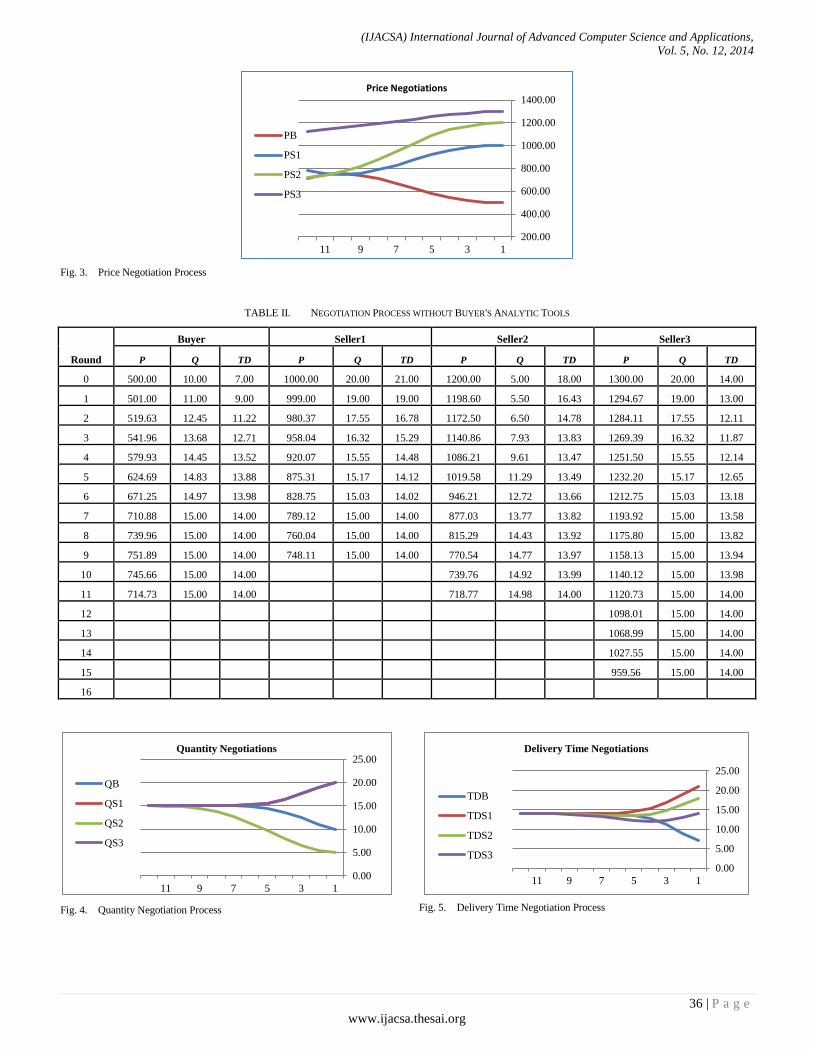
(IJACSA) International Journal of Advanced Computer Science and Applications,
Vol. 5, No. 12, 2014
36 | P a g e
www.ijacsa.thesai.org
Fig. 3. Price Negotiation Process
TABLE II. NEGOTIATION PROCESS WITHOUT BUYER'S ANALYTIC TOOLS
Round
Buyer Seller1 Seller2 Seller3
P Q TD P Q TD P Q TD P Q TD
0 500.00 10.00 7.00 1000.00 20.00 21.00 1200.00 5.00 18.00 1300.00 20.00 14.00
1 501.00 11.00 9.00 999.00 19.00 19.00 1198.60 5.50 16.43 1294.67 19.00 13.00
2 519.63 12.45 11.22 980.37 17.55 16.78 1172.50 6.50 14.78 1284.11 17.55 12.11
3 541.96 13.68 12.71 958.04 16.32 15.29 1140.86 7.93 13.83 1269.39 16.32 11.87
4 579.93 14.45 13.52 920.07 15.55 14.48 1086.21 9.61 13.47 1251.50 15.55 12.14
5 624.69 14.83 13.88 875.31 15.17 14.12 1019.58 11.29 13.49 1232.20 15.17 12.65
6 671.25 14.97 13.98 828.75 15.03 14.02 946.21 12.72 13.66 1212.75 15.03 13.18
7 710.88 15.00 14.00 789.12 15.00 14.00 877.03 13.77 13.82 1193.92 15.00 13.58
8 739.96 15.00 14.00 760.04 15.00 14.00 815.29 14.43 13.92 1175.80 15.00 13.82
9 751.89 15.00 14.00 748.11 15.00 14.00 770.54 14.77 13.97 1158.13 15.00 13.94
10 745.66 15.00 14.00 754.34 15.00 14.00 739.76 14.92 13.99 1140.12 15.00 13.98
11 714.73 15.00 14.00 785.27 15.00 14.00 718.77 14.98 14.00 1120.73 15.00 14.00
12 657.62 15.00 14.00 842.38 15.00 14.00 722.04 15.00 14.00 1098.01 15.00 14.00
13 566.21 15.00 14.00 933.79 15.00 14.00 753.91 15.00 14.00 1068.99 15.00 14.00
14 435.44 15.00 14.00 1064.56 15.00 14.00 820.69 15.00 14.00 1027.55 15.00 14.00
15 247.77 15.00 14.00 1252.23 15.00 14.00 935.62 15.00 14.00 959.56 15.00 14.00
16 -53.23 15.00 14.00 1553.23 15.00 14.00 1141.74 15.00 14.00 806.34 15.00 14.00
Fig. 4. Quantity Negotiation Process
Fig. 5. Delivery Time Negotiation Process
200.00
400.00
600.00
800.00
1000.00
1200.00
1400.00
1357911
Price Negotiations
PB
PS1
PS2
PS3
0.00
5.00
10.00
15.00
20.00
25.00
1357911
Quantity Negotiations
QB
QS1
QS2
QS3
0.00
5.00
10.00
15.00
20.00
25.00
1357911
Delivery Time Negotiations
TDB
TDS1
TDS2
TDS3

(IJACSA) International Journal of Advanced Computer Science and Applications,
Vol. 5, No. 12, 2014
37 | P a g e
www.ijacsa.thesai.org
VII. CONCLUSIONS AND FUTURE WORK
In this work a description of B2C e-commerce negotiation model is presented. The primary job of this model is to conduct negotiations on behalf prospective buyers and sellers representatives. It employs multiple software agents that represent specific functional of the system and applies big data analytics. Based on analytics results, agents are able to improve their behaviors over time and take proactive and reactive negotiation actions. From that analytics knowledge, they may get better with selecting and achieving goals and taking correct actions.
The system provides the customizable user interface. Information filled in by the buyer will be stored in the buyer‘s profile and used for generation of the original offer. Negotiations are conducted by multiple negotiator agents with several organizations in parallel to speed up the negotiation process; the best counter-offer is selected by the agent server and presented to the buyer.
Our future research will be concentrated on developing a secure fact based e-commerce negotiation agent-based system.
REFERENCES
[1] P. Braun, J. Brzostowski, G. Kersten, J. B. Kim, R. Kowalczyk, et al., "Intelligent decision-making support systems: foundations, applications and challenges", Springer, London, 2006, pp. 271-300.
[2] A. Rajpurohit, ―Big data for business managers — Bridging the gap between potential and value Big Data‖, 2013 IEEE International Conference on Digital Object, 2013 , pp. 29-31.
[3] H. Chen, R.H.L. Chiang, and V.C. Storey, ―Business intelligence and analytics: from big data to big impact‖, MIS Quarterly, vol. 36(4), 2012, pp. 1165-1188.
[4] K. D. Ahmadi, N. M. Charkari and N. Enami, ―E-negotiation system based on intelligent agents in B2C e-commerce, advances on information sciences and service sciences‖, vol. 3(2), March 2011.
[5] L. Liu, Y. Ma, and C. Wen, ―Multilateral multi-issue automated negotiation model based on GA‖, Int. Conf. on Intelligent Computation Technology and Automation, 2008, pp.85-89.
[6] K. C. Lee, H. Lee and N. Lee, ―Agent based mobile negotiation for personalized pricing of last minute theatre tickets‖, Expert Systems with Applications, vol. 39, 2012, pp. 9255–9263.
[7] F. Matos and E. Madeira, ―An automated negotiation model for m-commerce using mobile agents‖, ICWE'03 Pr. of the 2003 Int. Conf. on Web engineering, , Springer-Verlag, 2003, pp. 72-75.
[8] A. Kattan, Y.-S. Ong, and E.G. an-L´opez, ―Multi-agent multi-issue negotiations with incmplete information: a genetic algorithm based on discrete surrogate approach‖, IEEE Congress on Evolutionary Computation, 2013.
[9] S. J. Hussain and M. Kumar, ―Meta architecture to support layered banking systems ‗ In Proc. of ICET‘06, Int. Conf. on Emerging Technologies, vol. 13-14, pp.754 – 760.
[10] M. I. Bala, S. Vij and D. Mukhopadhyay, ―Intelligent agent for prediction in e-negotiation: an approach‖, Int. Conf. on Cloud & Ubiquitous Computing & Emerging Technologies, 2013, pp. 183 – 187.
[11] Rajesh and Shiv Kr. Tayal, ―An intelligent multi agent framework for e-commerce using case based reasoning and argumentation for negotiation‖. Int. J. of Business & Man. Research, vol. 2 (6), 2012, pp. 232-243.
[12] K. Ronglong and J. Tongqiang, ―E-commerce automated negotiation model research based on multi-agent‖, IHMSC, 2013 5th Int.. Conf. on Intelligent Human-Machine Systems and Cybernetics, vol. 1, 2013.
[13] M. Bjelica and Z. Petrović, ―A framework for QoS negotiation in future mobile networks‖, WSEAS Trans.s on Com., 2004.
[14] K. Fu and G. Nie, ―Application of particle swarm optimization algorithm in e-commerce negotiation‖, The 6th Wuhan Int. Conf. on E-Business - e-Business Track, 2001.
[15] G. Bruns, and M. Cortes, ―A hierarchical approach to service negotiation‖, 2011 IEEE Int. Conf. on Web Services (ICWS), 2011, Washington, DC, pp. 460 – 467.
[16] P. Li and Y. Zhong, ―A new multiple-attribute negotiation model of mobile e-commerce‖. ISECS '09 Proc. of the 2009 2nd Int. Symp. on Electronic Commerce and Security, Publisher: IEEE Comp. Soc., 2009, vol. 2, pp. 14-18.
[17] M. Cao, and X. Da, ―Multi-strategy selection model for automated negotiation‖, 47th Hawaii Int. Conf. on System Science, 2014.
[18] K. Hindriks, C. M. Jonker and D. Tykhonov, ―Let‘s dance! An analytic framework of negotiation dynamics and strategies‖, Web Intelligence and Agent Systems: An Int. J. vol. 9, 2011, pp. 319–335.
[19] F. H. Zulkernine and P. Martin, ―An adaptive and intelligent SLA negotiation system for web services‖. IEEE Trans. on Services Computing, vol. 4(1), pp. 31- 43.
[20] I. Serguievskaia, H. Al-Sakran, and J. Atoum, ―A multi-agent experience based e-negotiation system‖, Inf. and Com. Technologies, ICTTA‘06, 2006.
[21] H. Al-Sakran, M. Alsudairi, and I. Serguievskaia, ―Mobile e-loan negotiation architecture‖, J. of Internet Banking and Commerce, 2007, vol. 12(2), (http://www.arraydev.com/commerce/jibc/).
[22] T.H. Davenport, L.D. Mule and J. LuckerKnow, ―analytics know what your customers want before they do‖, Harvard Business Review. December 2011.
[23] R.S. Sathyanarayanan, ―Customer analytics –the genie is in the Detail, J. of Marketing & Communication, vol. 7(3), 2012.
[24] D. S. Putlerand and R. E. Krider, ―Customer and business analytics: applied data mining for business decision making using R‖, Int. Stat.l Review, Aug, 2013, pp. 328-328.
[25] Earley, ―Big data and predictive analytics: what's new? IT S. Professional, IEEE Computer Society, 2014, vol. 16(1), pp. 13 – 15.
[26] W.-M. Lee, and C.-C. Hsu, ―An intelligent negotiation strategy prediction system‖, In Proc. of the 9th Int. Conf. on Machine Learning and Cybernetics, Qingdao, 11-14 July 2010.
[27] R. H. Guttman, and P. Maes, ―Cooperative vs. competitive multi-agent negotiations in retail electronic commerce‖. In Proc. of the 2nd Int. Workshop on Cooperative Information Agents, vol. 1435, pp.135-147.

(IJACSA) International Journal of Advanced Computer Science and Applications,
Vol. 5, No. 12, 2014
38 | P a g e
www.ijacsa.thesai.org
A Study of MCA Learning Algorithm for Incident
Signals Estimation
Rashid Ahmed
National Technical University of Athens
School of Electrical and Computer Engineering
9, Iroon Polytechniou St., 15773 Athens, Greece
John N. Avaritsiotis
National Technical University of Athens
School of Electrical and Computer Engineering
9, Iroon Polytechniou St., 15773 Athens, Greece
Abstract—Many signal subspace-based approaches have
already been proposed for determining the fixed Direction of
Arrival (DOA) of plane waves impinging on an array of sensors.
Two procedures for DOA estimation based neural network are
presented. Firstly, Principal Component Analysis (PCA) is
employed to extract the maximum eigenvalue and eigenvector
from signal subspace to estimate DOA. Secondly, Minor
component analysis (MCA) is a statistical method of extracting
the eigenvector associated with the smallest eigenvalue of the
covariance matrix. In this paper, we will modify a MCA learning
algorithm to enhance the Convergence, where a Convergence is
essential for MCA algorithm towards practical applications. The
learning rate parameter is also presented, which ensures fast
convergence of the algorithm, because it has direct effect on the
convergence of the weight vector and the error level is affected
by this value. MCA is performed to determine the estimated
DOA. Simulation results will be furnished to illustrate the
theoretical results achieved.
Index Terms—Direction of Arrival; Neural networks; Principle
Component Analysis; Minor Component Analysis
I. INTRODUCTION
Neural networks have seen an explosion of interest over the last few years and are being successfully applied across an extraordinary range of problem domains, in areas as diverse as finance, medicine, engineering, geology, physics and biology. The excitement stems from the fact that these networks are attempts to model the capabilities of the human brain. From a statistical perspective neural networks are interesting because of their potential use in prediction and classification problems [1,2,3]. A neural network is an information–processing system that has certain performance characteristics in common with biological neural networks. Many methods for the estimation of the Direction of Arrival (DOA) have been proposed.
Dovid Levin et al in paper [4]: have explored the problem of SRP maximization with respect to a vector-sensor can be solved with a computationally inexpensive algorithm. A maximum likelihood (ML) DOA estimator is derived and sub subsequently shown to be a special case of DOA estimation by means of a search for the direction of maximum steered response power (SRP). The ML estimator achieves asymptotic efficiency and thus outperforms existing estimators with respect to the mean square angular error (MSAE) measure. The beampattern associated with the ML estimator is shown to be identical to that used by the minimum power distortion with less response beamformer for the purpose of signal enhancement.
Mitsuharu M. et al in paper [5]: have introduced the multiple signal classification (MUSIC) method that utilizes the transfer characteristics of microphones located at the same place, namely aggregated microphones. The conventional microphone array realizes a sound localization system according to the differences in the arrival time, phase shift and the level of the sound wave among each microphone. Therefore, it is difficult to miniaturize the microphone array.
Gao F. et al in paper [6]: have introduced a new spectral search-based direction-of-arrival (DOA) estimation method is proposed that extends the idea of the conventional ESPRIT DOA estimator to a much more general class of array geometries than assumed by the conventional ESPRIT technique.
In the context of DOA, the minor component is the direction in which the data have the smallest variance. Although eigenvalue decomposition or singular value decomposition can be used to extract minor component, these traditional matrix algebraic approaches are usually unsuitable for high-dimensional online input data. Neural networks can be used to solve the task of MCA learning algorithm [7]. Other classical methods involve costly matrix inversions, as well as poor estimation performance when the signal to noise ratio and number of samples are small and too large, respectively [8].
In many practical applications, a PCA algorithm deteriorates with decreasing signal to noise ratio and it may diverge in some cases to the learning rate giving incorrect results[9].For this reason, we need to handle this situation in order to overcome the divergence problem. In this context, we present a MCA(R) learning algorithm that has a low computational complexity. This allows the algorithm to update quickly (converge) to extract the smallest eigenvalue and eigenvector, which can be used to estimate DOA.
The paper is organized as follows. In Section II, we discuss the array signal model and we also describe a theoretical review of some existing Principal Component Analysis (PCA) and Minor Component Analysis (MCA) algorithms. In Section III, firstly we present the model for DOA measurements and then modified MCA algorithm is introduced. Finally in the same section, a convergence is analyzed. Simulations of results are included in Section IV to evaluate the convergence of the algorithm by comparison with aforementioned algorithms [10] and we verify our theoretical
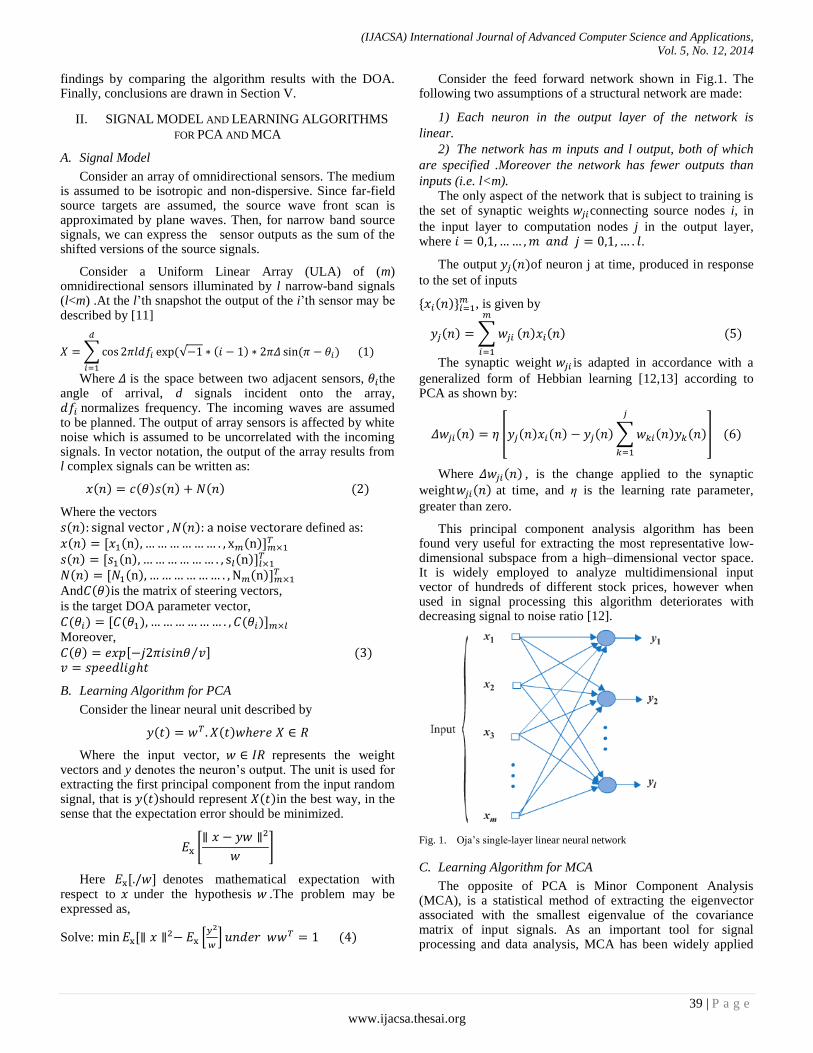
(IJACSA) International Journal of Advanced Computer Science and Applications,
Vol. 5, No. 12, 2014
39 | P a g e
www.ijacsa.thesai.org
findings by comparing the algorithm results with the DOA. Finally, conclusions are drawn in Section V.
II. SIGNAL MODEL AND LEARNING ALGORITHMS
FOR PCA AND MCA
A. Signal Model
Consider an array of omnidirectional sensors. The medium is assumed to be isotropic and non-dispersive. Since far-field source targets are assumed, the source wave front scan is approximated by plane waves. Then, for narrow band source signals, we can express the sensor outputs as the sum of the shifted versions of the source signals.
Consider a Uniform Linear Array (ULA) of (m) omnidirectional sensors illuminated by l narrow-band signals (l<m) .At the l’th snapshot the output of the i’th sensor may be described by [11]
∑ √ ) )
)
Where is the space between two adjacent sensors, the angle of arrival, d signals incident onto the array, normalizes frequency. The incoming waves are assumed to be planned. The output of array sensors is affected by white noise which is assumed to be uncorrelated with the incoming signals. In vector notation, the output of the array results from l complex signals can be written as:
) ) ) ) )
Where the vectors
) ) are defined as:
) ) )
) ) )
) ) )
And )is the matrix of steering vectors,
is the target DOA parameter vector,
) ) )
Moreover,
) ⁄ )
B. Learning Algorithm for PCA
Consider the linear neural unit described by
) )
Where the input vector, represents the weight vectors and y denotes the neuron’s output. The unit is used for extracting the first principal component from the input random signal, that is )should represent )in the best way, in the sense that the expectation error should be minimized.
[
]
Here denotes mathematical expectation with respect to under the hypothesis .The problem may be expressed as,
Solve: *
+ )
Consider the feed forward network shown in Fig.1. The following two assumptions of a structural network are made:
1) Each neuron in the output layer of the network is
linear.
2) The network has m inputs and l output, both of which
are specified .Moreover the network has fewer outputs than
inputs (i.e. l<m). The only aspect of the network that is subject to training is
the set of synaptic weights connecting source nodes i, in
the input layer to computation nodes j in the output layer, where .
The output )of neuron j at time, produced in response
to the set of inputs
) , is given by
) ∑
) ) )
The synaptic weight is adapted in accordance with a
generalized form of Hebbian learning [12,13] according to PCA as shown by:
) [ ) ) ) ∑ ) )
] )
Where ) , is the change applied to the synaptic
weight ) at time, and η is the learning rate parameter,
greater than zero.
This principal component analysis algorithm has been found very useful for extracting the most representative low-dimensional subspace from a high–dimensional vector space. It is widely employed to analyze multidimensional input vector of hundreds of different stock prices, however when used in signal processing this algorithm deteriorates with decreasing signal to noise ratio [12].
Fig. 1. Oja’s single-layer linear neural network
C. Learning Algorithm for MCA
The opposite of PCA is Minor Component Analysis (MCA), is a statistical method of extracting the eigenvector associated with the smallest eigenvalue of the covariance matrix of input signals. As an important tool for signal processing and data analysis, MCA has been widely applied

(IJACSA) International Journal of Advanced Computer Science and Applications,
Vol. 5, No. 12, 2014
40 | P a g e
www.ijacsa.thesai.org
to: total least squares (TLS) [14], clutter cancellation [15], curve and surface fitting [16], digital beamforming [17], bearing estimation [18], etc. One single linear neuron can be used to extract minor component from input signals adaptively and the eigenvector associated with the smallest eigenvalue of the covariance matrix is called Minor Component, where one seeks to find these directions that minimize the projection variance. These directions are the eigendirections corresponding to the minimum eigenvalue. The applications of MCA arise in total least square and eigenvalue-based spectral estimation methods [19,20]. It allows the extraction of the first minor component from a stationary multivariate random process based on the definition of cost function to be minimized under right constraints. The extraction of the least principal component is usually referred to as MCA. For first Minor Component, what must be found is the weight vector
that minimizes the power *
+of neurons output.
For convenience, we produce a cost function for minor component estimation, that the problem is minimizing the cost function
{ )
) } )
) )
With respect to the weight vector, its gradient has the expression,
⁄
Thus the optimal multiplier may be found by
vanishing
, that is by solving,
⁄
Now the main point is to recognize that from an optimization point of view the above system is equivalent to:
⁄ ) ,
Where , is a constant. It can be proven that the first minor converges to the expected solution providing that the constantβ is properly chosen. This is the way to compute the optimal multiplier to obtain the stabilized learning rule [16]. The most exploited solution to the aforementioned problems consists of invoking the discrete–time versions of first minor, as
) ) )
Where η, is the learning rate and it’s a common practice to makeηa sufficiently small value which ensures good convergence in a reasonably short time that represents the discrete time stochastic counterpart of first minor rules. Neural networks MCA learning algorithms can be used to adaptively update the weight vector and reach convergence to minor component of input data. In the first order the linear MCA will be:
) ) ) ) ) ) )
For a multiple output (neuron) the output )of neuron
j,is produced in response to the set of input,
)
And is given by,
) ∑ ) )
)
The synaptic weight is adapted in accordance with the
generalized form of Hebbian, where the target of MCA is to extract the minor component from the input data by updating the weight vector )adaptively,
for all ) , as,
) [ ) ) ) ∑ ) )
] )
Where ) , is the change applied to the synaptic
weight ) at time, and Examining Eq.11, the
term, ) ) on the right-hand side of the equation is
related to Hebbian learning. As for the second term,
) ∑ ) )
Is related to a competitive process that goes on among the synapses in the network. Simply put, as a result of this process, the most vigorously growing (i.e., fittest) synapses or neurons are selected at the expenses of the weaker ones. Indeed, it is this competitive process that alleviates the exponential growth in Hebbian learning working by itself. Note that stabilization of the algorithm through competition requires the use of a minus sign on the right-hand side of Eq.11. The distinctive feature of this algorithm is that it operates in a self-organized manner. This is an important characteristic of the algorithm that befits it for on-line learning. The generalized Hebbian Form of Eq.11, for a layer of neurons includes the algorithm of Eq.9, as
) ) )
Hence that,
) ) [ ) ) ) )] )
III. DOA MEASURMENT MODEL AND MCA MODIFIED
ALGORITHM
A. DOA Model
This algorithm uses measurements made on the signal received by an array of sensors. The wave fronts received by m sensors array element are linear combination of incident waveforms d and noises. The MCA begins with the following model of the received input data vector which is expressed as:
[
] ) ) [
] [
] )

(IJACSA) International Journal of Advanced Computer Science and Applications,
Vol. 5, No. 12, 2014
41 | P a g e
www.ijacsa.thesai.org
Where S, is the vector of incident signals, N is the noise vector and ) is the array steering vector corresponding to the DOA of the i'th signal. The received vector Xand the steering vector )as vector in m dimensional space, the input matrix can be expressed [21]:
)
In many practical applications, the smallest eigenvalue of the matrix R of input data is usually larger than zero due to the noisy signals. The column vectors of steering vectors, is perpendicular to the eigenvector corresponding to the noise. The MCA spectrum may be expressed as,
) ) ) )⁄
The matrix is a projection matrix onto the noise
subspace. For steering vectors that are orthogonal to the noise subspace, the denominator of Eq.16, will become very small and thus the peaks will occur in )corresponding to the angle of arrival of the signal. Where the ensemble average of the array input matrix R is known and the noise can be considered uncorrelated and identically distributed between the elements [22].
TABLE I. A SUMMARY OF DIFFERENT DOA ALGORITHMS
Method Power spectral as
function of,
1 PCA ) )
Signal subspace
2 MCA ) )
Noise subspace
B. The Modified MCA Algorithm
The algorithm is based on MCA learning, which allows to update quickly and to extract the smallest eigenvalue and eigenvector, that can use these values to estimate DOA. The learning rate parameter is also presented, which ensures fast convergence of the algorithm.
To develop insight, the behavior of the GHA can be shown
as: ) ) ∑ ) )
In the last section, the weight vector yielded by GHA can
further be modified by adding
to Hebbian rule (where
the learning rate is often employed as small value) and a positive value , that is greater than the largest eigenvalue of matrix . Recall from Section II-C, we can obtain the modified MCA algorithm as follows
) )
)[ ) )) )]
) )[ ) ) )) )]
By taking as ) )
for the modified MCA
algorithm, and , ⁄ , that is,
( ) )) ) )
Convergence analysis needs to confirm the Eq.17, will converge to the minor component subject to the learning rate.
C. Convergence Analysis
In order to confirm the weight vector we will converge to minor component of input data in Eq.17 and it is important to discuss the learning rate η because it has a direct effect on the convergence.
For convenience of analysis, since the matrix is a symmetrical nonnegative definite matrix.
The weight vector has unit length, that is
‖ ‖
‖ )‖
‖ )‖ ‖ )‖
‖ )‖ )
) ) ‖ )‖ ‖ )‖
Let us assume that be all the eigenvalues of matrix , are ordered by,
Where ) is the initial weight vector, is the largest eigenvalue of the matrix and the eigenvector associated with the smallest eigenvalue of .
Suppose a definition of an invariant set as
The convergence analysis shows the learning rate suppose,
⁄ ‖ ‖ ⁄ ,
Where select ) is the initial weight vector, is the largest eigenvalue of the matrix and the eigenvector associated with the smallest eigenvalue of , that
,
For ⁄ , it follows that
From Eq.17, the condition is satisfied,
‖ )‖
∑ ‖ )‖
For ‖ ‖ ⁄ ,
‖ )‖ ‖ )‖
⁄
IV. SIMULATION RESULTS
In this section we describe our simulation results. We will compare the convergence of our modified algorithm with aforementioned approaches by choosing a suitable learning rate where η should satisfy ⁄ , Programs were written for DOA estimation in Matlab. A general test example is used for this purpose, with two sources, signal located at the far field at ( , ) degree with normalized frequencies of (0.35,0.36) fs respectively were used. A ULA of five snapshots (L), eight sensors and sensor spacing equaling half wave length ( ), spacing was used to collect the data.
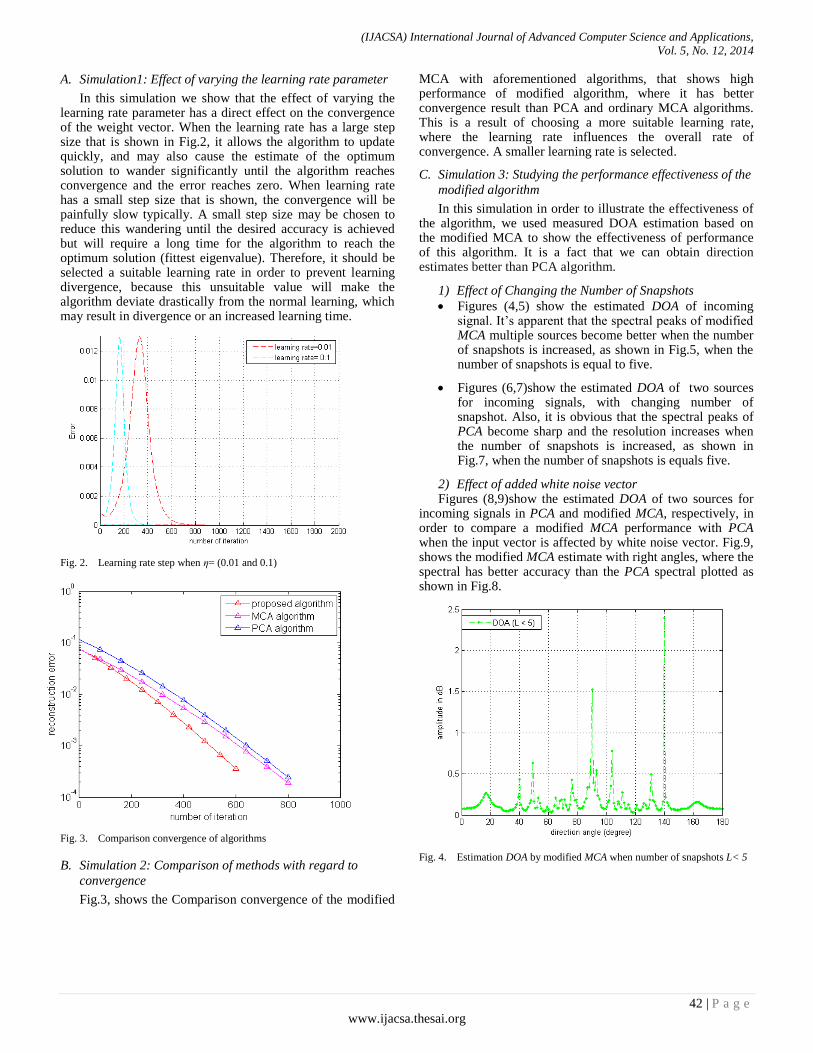
(IJACSA) International Journal of Advanced Computer Science and Applications,
Vol. 5, No. 12, 2014
42 | P a g e
www.ijacsa.thesai.org
A. Simulation1: Effect of varying the learning rate parameter
In this simulation we show that the effect of varying the learning rate parameter has a direct effect on the convergence of the weight vector. When the learning rate has a large step size that is shown in Fig.2, it allows the algorithm to update quickly, and may also cause the estimate of the optimum solution to wander significantly until the algorithm reaches convergence and the error reaches zero. When learning rate has a small step size that is shown, the convergence will be painfully slow typically. A small step size may be chosen to reduce this wandering until the desired accuracy is achieved but will require a long time for the algorithm to reach the optimum solution (fittest eigenvalue). Therefore, it should be selected a suitable learning rate in order to prevent learning divergence, because this unsuitable value will make the algorithm deviate drastically from the normal learning, which may result in divergence or an increased learning time.
Fig. 2. Learning rate step when η= (0.01 and 0.1)
Fig. 3. Comparison convergence of algorithms
B. Simulation 2: Comparison of methods with regard to
convergence
Fig.3, shows the Comparison convergence of the modified
MCA with aforementioned algorithms, that shows high performance of modified algorithm, where it has better convergence result than PCA and ordinary MCA algorithms. This is a result of choosing a more suitable learning rate, where the learning rate influences the overall rate of convergence. A smaller learning rate is selected.
C. Simulation 3: Studying the performance effectiveness of the
modified algorithm
In this simulation in order to illustrate the effectiveness of the algorithm, we used measured DOA estimation based on the modified MCA to show the effectiveness of performance of this algorithm. It is a fact that we can obtain direction estimates better than PCA algorithm.
1) Effect of Changing the Number of Snapshots
Figures (4,5) show the estimated DOA of incoming signal. It’s apparent that the spectral peaks of modified MCA multiple sources become better when the number of snapshots is increased, as shown in Fig.5, when the number of snapshots is equal to five.
Figures (6,7)show the estimated DOA of two sources for incoming signals, with changing number of snapshot. Also, it is obvious that the spectral peaks of PCA become sharp and the resolution increases when the number of snapshots is increased, as shown in Fig.7, when the number of snapshots is equals five.
2) Effect of added white noise vector Figures (8,9)show the estimated DOA of two sources for
incoming signals in PCA and modified MCA, respectively, in order to compare a modified MCA performance with PCA when the input vector is affected by white noise vector. Fig.9, shows the modified MCA estimate with right angles, where the spectral has better accuracy than the PCA spectral plotted as shown in Fig.8.
Fig. 4. Estimation DOA by modified MCA when number of snapshots L< 5
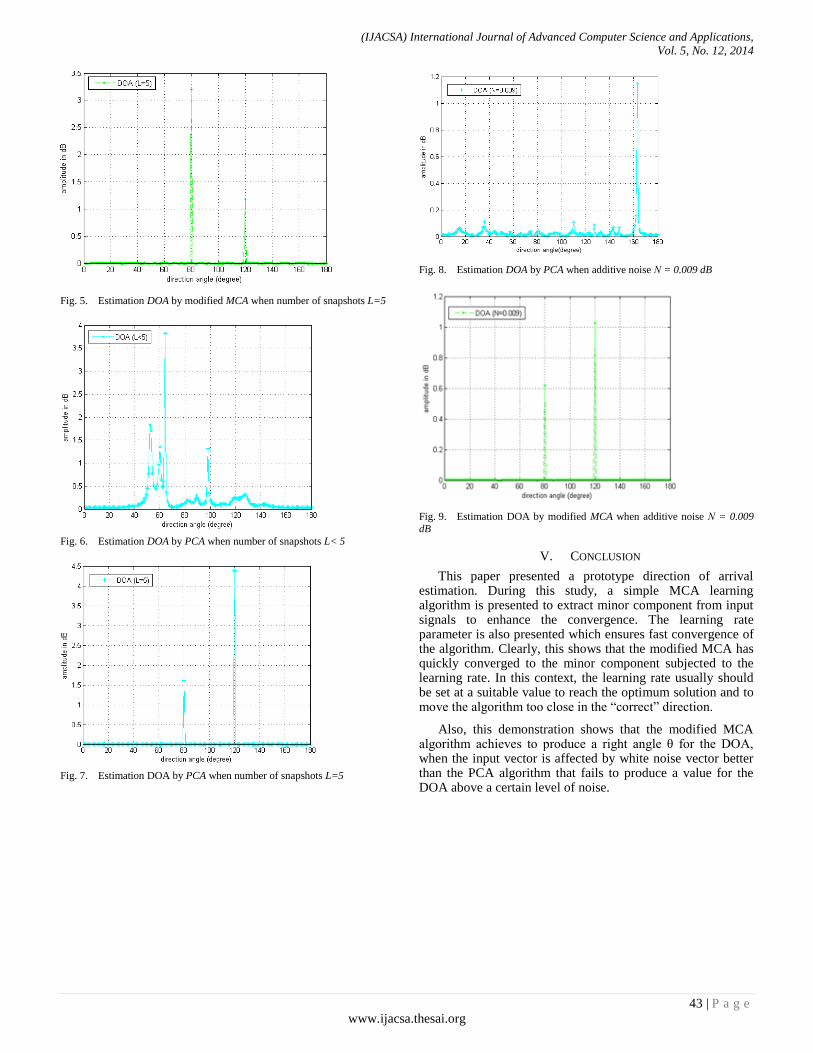
(IJACSA) International Journal of Advanced Computer Science and Applications,
Vol. 5, No. 12, 2014
43 | P a g e
www.ijacsa.thesai.org
Fig. 5. Estimation DOA by modified MCA when number of snapshots L=5
Fig. 6. Estimation DOA by PCA when number of snapshots L< 5
Fig. 7. Estimation DOA by PCA when number of snapshots L=5
Fig. 8. Estimation DOA by PCA when additive noise Ν = 0.009 dB
Fig. 9. Estimation DOA by modified MCA when additive noise Ν = 0.009
dB
V. CONCLUSION
This paper presented a prototype direction of arrival estimation. During this study, a simple MCA learning algorithm is presented to extract minor component from input signals to enhance the convergence. The learning rate parameter is also presented which ensures fast convergence of the algorithm. Clearly, this shows that the modified MCA has quickly converged to the minor component subjected to the learning rate. In this context, the learning rate usually should be set at a suitable value to reach the optimum solution and to move the algorithm too close in the “correct” direction.
Also, this demonstration shows that the modified MCA algorithm achieves to produce a right angle θ for the DOA, when the input vector is affected by white noise vector better than the PCA algorithm that fails to produce a value for the DOA above a certain level of noise.

(IJACSA) International Journal of Advanced Computer Science and Applications,
Vol. 5, No. 12, 2014
44 | P a g e
www.ijacsa.thesai.org
The main advantage of this algorithm is it can better tolerate noises signals to extract the minimum eigenvalue from noise subspace and it has been applied to find DOA estimation.
ACKNOWLEDGMENT
This research is supported by the School of Electrical and Computer Engineering, National Technical University in Athens (NTUA), Greece
REFERENCES
[1] Alexander I., Galushkin “Neural Networks Theory”Springer-Verlag Berlin Heidlberg, 2007, ISBN 0-387-94162-5 .
[2] Timo Honkela, Włodzisław Duch.” Artificial Neural Networks and Machine Learning –ICANN 2011” 21st International Conference on Artificial Neural Networks Espoo, Finland, June 14-17, 2011 Proceedings.
[3] G. Dreyfus.”Neural Networks, Methodology and Applications” Original French edition published by Eyrolles, springer, Paris,2004, ISBN 103-540-22980.
[4] Dovid Levin, Emanuel A., Sharon G. “Maximum Likelihood Estimation of Direction of Arrival using an acoustic vector-sensor”, International Audio Laboratories Erlangen, Germany, 2012.
[5] Mitsuharu M., Shuji H. “Multiple Signal Classification by Aggregated Microphones” 2005, IEICE, ISSN: 0916-8508.
[6] FeifeiGao and Alex B. Gershman “A Generalized ESPRIT Approach to Direction-of-Arrival Estimation”IEEE Signal Processing Letter, Vol. 12, No. 3, March 2005.
[7] Rashid Ahmed , John A. Avaritsiotis,” MCA Learning Algorithm for Incident Signals Estimation:A Review”, IJCTT Journal,Feb. 2014.
[8] G.Wang and X.-G.Xia.” Iterative Algorithm for Direction of Arrival Estimation with wideband chirp signals” IEEE., 2000, ISSN : 1350-2395.
[9] Weidong J., Shixi Y., Yongping C.,” DOA Estimation of Multiple Convolutively Mixed Sources Based on Principle Component Analysis”, Springer, ICONIP , pp. 340–348, 2009.
[10] Qingfu Zhang, Yiu-Wung Leung, “A Class of Learning Algorithms for Principal Component Analysis and Minor Component Analysis”, IEEE Transection on Neural Network, Vol. 11, No.2, March 2000.
[11] Adnan S.,” DOA Based Minor Component Estimation using Neural Networks”,AJES, Electrical Engineering Dept., Vol.3, No.1, 2010.
[12] Yanwa Zhang “CGHA For Principal Component Extraction In The Complex Domain “,IEEE, Transaction on Neural Networks ,Vol. 8,no. 5,pp. 1031-1036 ,sept. 1997.
[13] Kwang In Kim, Matthias O. Franz, Bernhard, “Kernel Hebbian Algorithm for Iterative Kernel Principal Component Analysis ”,Max Planck Institute for Biological Cybernetics, June 2003.
[14] K. Gao, M.O. Ahmad, M.N. Swamy, “Learning Algorithm for Total Least Squares Adaptive Signal Processing, Electronics Letters. Feb. 1992.
[15] S. Barbarossa, E. Daddio, G. Galati, “Comparison of Optimum and Linear Prediction Technique for Clutter Cancellation”, Communications, Radar and Signal Processing, IEE Proceedings, ISSN (0143-7070).
[16] L. Xu, E. Oja, C. Suen, “Modified Hebbian Learning for Curve and Surface Fitting, Neural Networks, 1992.
[17] J.W. Griffiths, “Adaptive Array Processing, A Tutorial, Communications, Radar and Signal Processing, IEE Proceedings, ISSN :0143-7070.
[18] R. Schmidt, Multiple Emitter Location and Signal Parameter Estimation, IEEE Trans. Antennas Propagation (1986) 276–280.
[19] Dezhong Peng, Zhang Yi.” A New Algorithm for Sequential Minor Component Analysis” International Journal of Computational Intelligence Research ,ISSN 0973-1873 Vol.2, No.2 (2006).
[20] Jie Luo, Xieting Ling “Minor Component Analysis with Independent to Blind 2 Channel Equalization,” IEEE, Fudan University-China.
[21] Donghai Li, Shihai Gao, Feng Wang, “Direction of Arrival Estimation Based on Minor Component Analysis Approach”, Neural Information Processing, Springer-Verlag Berlin Heidelberg , 2006.
[22] Belloni F., Richter A., Koivunen V. “ DOA Estimation via Manifold Separation for Arbitrary Array Structures,” IEEE, Transaction on signal processing, Vol, 55,No.10, October, 2007.
AUTHOR PROFILE
Rashid Ahmed is a Ph.D student in the School of Electrical and Computer Engineering, National Technical University of Athens-NTUA,
Greece, and is a student member of the IEEE.
John N. Avaritsiotis is a Professor of Microelectronics in the Department of Electrical and Computer Engineering of the National Technical University of Athens-NTUA. He has published over 80 technical articles in various scientific journals, and has presented more than 30 papers at international conferences. His present research interests concern the development of surface micro-machining processes for the production of micromechanical sensors and design and prototyping of various types of multi-sensor systems for various applications. He is the Director of two R&D Laboratories: the Microelectronics Lab and the Electronic Sensors Lab of NTUA. He is the Co-Editor of the Journal Active and Passive Electronic Devices, Guest Editor of IEEE Transactions on Components, Packaging and manufacturing Technology, Senior Member of IEEE and Member of IOP
and ISHM.
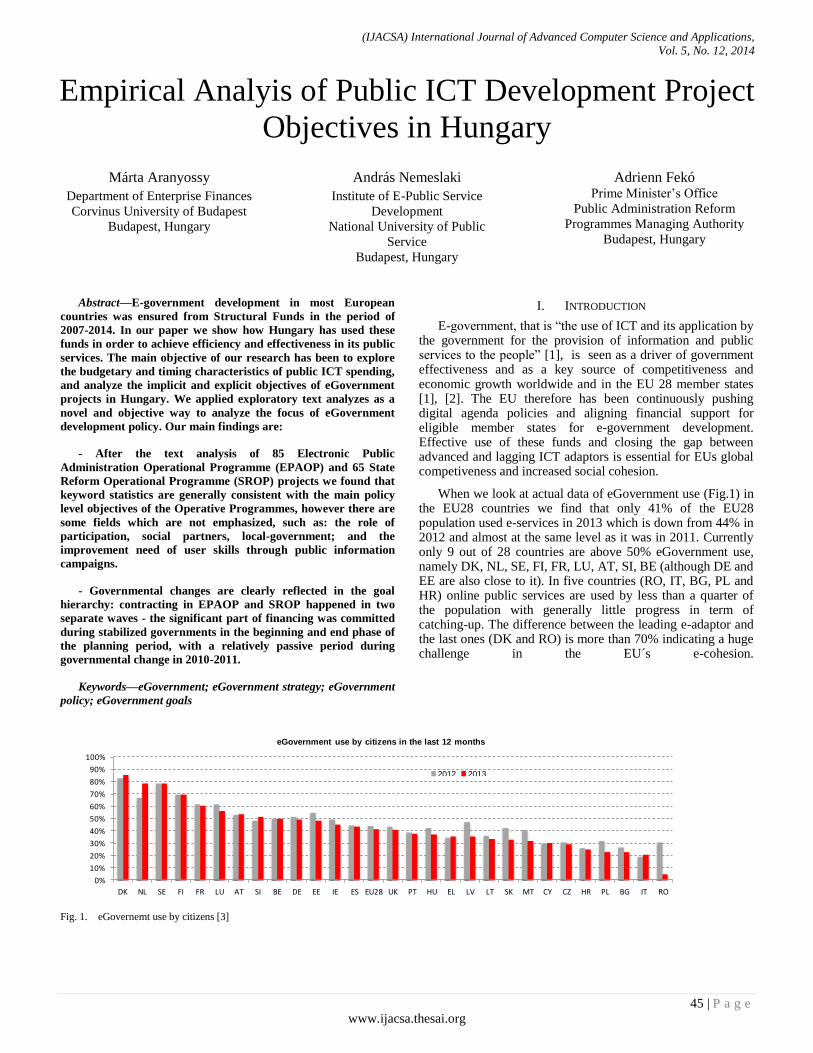
(IJACSA) International Journal of Advanced Computer Science and Applications,
Vol. 5, No. 12, 2014
45 | P a g e
www.ijacsa.thesai.org
Empirical Analyis of Public ICT Development Project
Objectives in Hungary
Márta Aranyossy
Department of Enterprise Finances
Corvinus University of Budapest
Budapest, Hungary
András Nemeslaki
Institute of E-Public Service
Development
National University of Public
Service
Budapest, Hungary
Adrienn Fekó
Prime Minister’s Office
Public Administration Reform
Programmes Managing Authority
Budapest, Hungary
Abstract—E-government development in most European
countries was ensured from Structural Funds in the period of
2007-2014. In our paper we show how Hungary has used these
funds in order to achieve efficiency and effectiveness in its public
services. The main objective of our research has been to explore
the budgetary and timing characteristics of public ICT spending,
and analyze the implicit and explicit objectives of eGovernment
projects in Hungary. We applied exploratory text analyzes as a
novel and objective way to analyze the focus of eGovernment
development policy. Our main findings are:
- After the text analysis of 85 Electronic Public
Administration Operational Programme (EPAOP) and 65 State
Reform Operational Programme (SROP) projects we found that
keyword statistics are generally consistent with the main policy
level objectives of the Operative Programmes, however there are
some fields which are not emphasized, such as: the role of
participation, social partners, local-government; and the
improvement need of user skills through public information
campaigns.
- Governmental changes are clearly reflected in the goal
hierarchy: contracting in EPAOP and SROP happened in two
separate waves - the significant part of financing was committed
during stabilized governments in the beginning and end phase of
the planning period, with a relatively passive period during
governmental change in 2010-2011.
Keywords—eGovernment; eGovernment strategy; eGovernment
policy; eGovernment goals
I. INTRODUCTION
E-government, that is “the use of ICT and its application by the government for the provision of information and public services to the people” [1], is seen as a driver of government effectiveness and as a key source of competitiveness and economic growth worldwide and in the EU 28 member states [1], [2]. The EU therefore has been continuously pushing digital agenda policies and aligning financial support for eligible member states for e-government development. Effective use of these funds and closing the gap between advanced and lagging ICT adaptors is essential for EUs global competiveness and increased social cohesion.
When we look at actual data of eGovernment use (Fig.1) in the EU28 countries we find that only 41% of the EU28 population used e-services in 2013 which is down from 44% in 2012 and almost at the same level as it was in 2011. Currently only 9 out of 28 countries are above 50% eGovernment use, namely DK, NL, SE, FI, FR, LU, AT, SI, BE (although DE and EE are also close to it). In five countries (RO, IT, BG, PL and HR) online public services are used by less than a quarter of the population with generally little progress in term of catching-up. The difference between the leading e-adaptor and the last ones (DK and RO) is more than 70% indicating a huge challenge in the EU´s e-cohesion.
Fig. 1. eGovernemt use by citizens [3]
0%
10%
20%
30%
40%
50%
60%
70%
80%
90%
100%
DK NL SE FI FR LU AT SI BE DE EE IE ES EU28 UK PT HU EL LV LT SK MT CY CZ HR PL BG IT RO
eGovernment use by citizens in the last 12 months
2012 2013
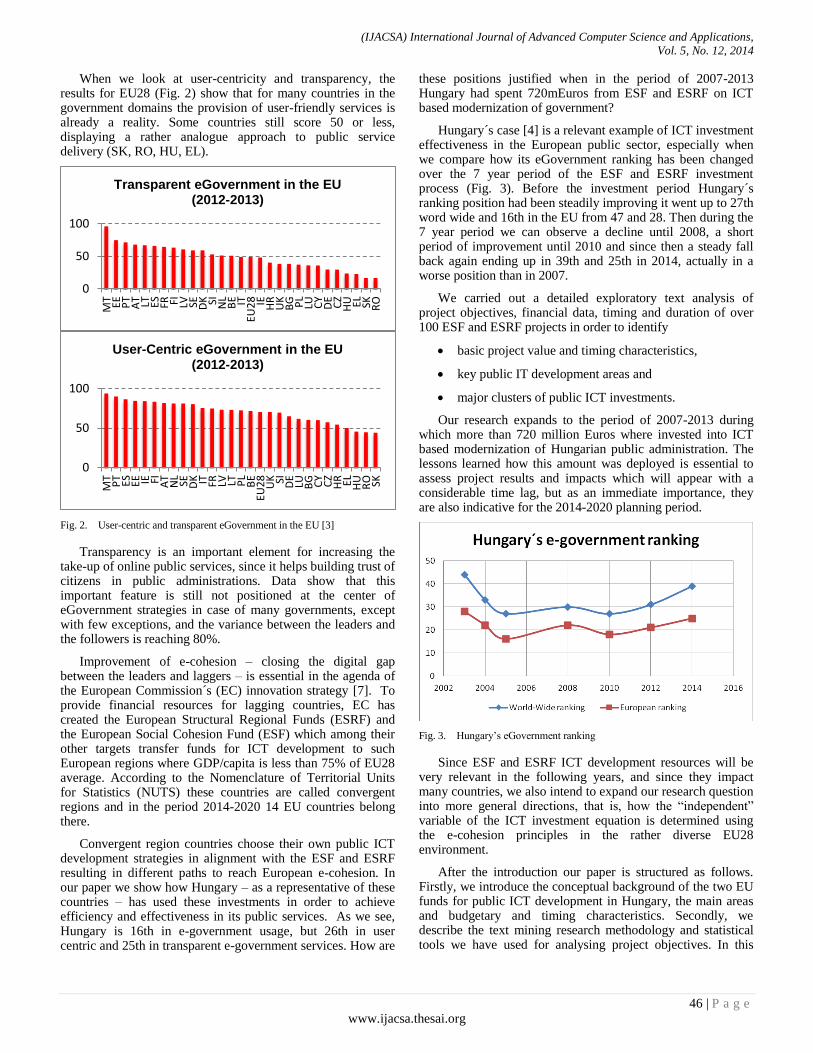
(IJACSA) International Journal of Advanced Computer Science and Applications,
Vol. 5, No. 12, 2014
46 | P a g e
www.ijacsa.thesai.org
When we look at user-centricity and transparency, the results for EU28 (Fig. 2) show that for many countries in the government domains the provision of user-friendly services is already a reality. Some countries still score 50 or less, displaying a rather analogue approach to public service delivery (SK, RO, HU, EL).
Fig. 2. User-centric and transparent eGovernment in the EU [3]
Transparency is an important element for increasing the take-up of online public services, since it helps building trust of citizens in public administrations. Data show that this important feature is still not positioned at the center of eGovernment strategies in case of many governments, except with few exceptions, and the variance between the leaders and the followers is reaching 80%.
Improvement of e-cohesion – closing the digital gap between the leaders and laggers – is essential in the agenda of the European Commission´s (EC) innovation strategy [7]. To provide financial resources for lagging countries, EC has created the European Structural Regional Funds (ESRF) and the European Social Cohesion Fund (ESF) which among their other targets transfer funds for ICT development to such European regions where GDP/capita is less than 75% of EU28 average. According to the Nomenclature of Territorial Units for Statistics (NUTS) these countries are called convergent regions and in the period 2014-2020 14 EU countries belong there.
Convergent region countries choose their own public ICT development strategies in alignment with the ESF and ESRF resulting in different paths to reach European e-cohesion. In our paper we show how Hungary – as a representative of these countries – has used these investments in order to achieve efficiency and effectiveness in its public services. As we see, Hungary is 16th in e-government usage, but 26th in user centric and 25th in transparent e-government services. How are
these positions justified when in the period of 2007-2013 Hungary had spent 720mEuros from ESF and ESRF on ICT based modernization of government?
Hungary´s case [4] is a relevant example of ICT investment effectiveness in the European public sector, especially when we compare how its eGovernment ranking has been changed over the 7 year period of the ESF and ESRF investment process (Fig. 3). Before the investment period Hungary´s ranking position had been steadily improving it went up to 27th word wide and 16th in the EU from 47 and 28. Then during the 7 year period we can observe a decline until 2008, a short period of improvement until 2010 and since then a steady fall back again ending up in 39th and 25th in 2014, actually in a worse position than in 2007.
We carried out a detailed exploratory text analysis of project objectives, financial data, timing and duration of over 100 ESF and ESRF projects in order to identify
basic project value and timing characteristics,
key public IT development areas and
major clusters of public ICT investments.
Our research expands to the period of 2007-2013 during which more than 720 million Euros where invested into ICT based modernization of Hungarian public administration. The lessons learned how this amount was deployed is essential to assess project results and impacts which will appear with a considerable time lag, but as an immediate importance, they are also indicative for the 2014-2020 planning period.
Fig. 3. Hungary’s eGovernment ranking
Since ESF and ESRF ICT development resources will be very relevant in the following years, and since they impact many countries, we also intend to expand our research question into more general directions, that is, how the “independent” variable of the ICT investment equation is determined using the e-cohesion principles in the rather diverse EU28 environment.
After the introduction our paper is structured as follows. Firstly, we introduce the conceptual background of the two EU funds for public ICT development in Hungary, the main areas and budgetary and timing characteristics. Secondly, we describe the text mining research methodology and statistical tools we have used for analysing project objectives. In this
0
50
100
MT EE PT
AT LT ES FR FI LV SE DK SI NL
BE IT
EU28 IE HR
UK
BG PL
LU CY
DE
CZ
HU EL SK RO
Transparent eGovernment in the EU (2012-2013)
0
50
100
MT
PT ES EE IE FI AT
NL
SE DK IT FR LV LT PL
BE
EU28
UK SI DE
LU BG CY
CZ
HR EL HU
RO SK
User-Centric eGovernment in the EU (2012-2013)
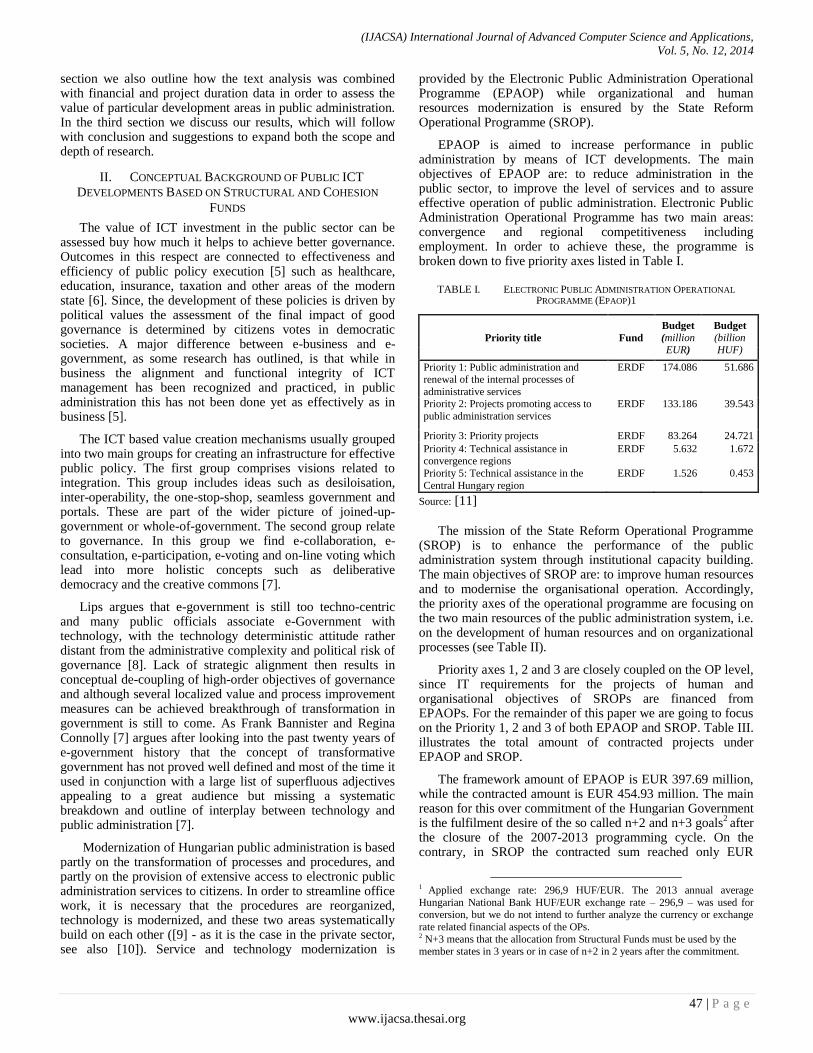
(IJACSA) International Journal of Advanced Computer Science and Applications,
Vol. 5, No. 12, 2014
47 | P a g e
www.ijacsa.thesai.org
section we also outline how the text analysis was combined with financial and project duration data in order to assess the value of particular development areas in public administration. In the third section we discuss our results, which will follow with conclusion and suggestions to expand both the scope and depth of research.
II. CONCEPTUAL BACKGROUND OF PUBLIC ICT
DEVELOPMENTS BASED ON STRUCTURAL AND COHESION
FUNDS
The value of ICT investment in the public sector can be assessed buy how much it helps to achieve better governance. Outcomes in this respect are connected to effectiveness and efficiency of public policy execution [5] such as healthcare, education, insurance, taxation and other areas of the modern state [6]. Since, the development of these policies is driven by political values the assessment of the final impact of good governance is determined by citizens votes in democratic societies. A major difference between e-business and e-government, as some research has outlined, is that while in business the alignment and functional integrity of ICT management has been recognized and practiced, in public administration this has not been done yet as effectively as in business [5].
The ICT based value creation mechanisms usually grouped into two main groups for creating an infrastructure for effective public policy. The first group comprises visions related to integration. This group includes ideas such as desiloisation, inter-operability, the one-stop-shop, seamless government and portals. These are part of the wider picture of joined-up-government or whole-of-government. The second group relate to governance. In this group we find e-collaboration, e-consultation, e-participation, e-voting and on-line voting which lead into more holistic concepts such as deliberative democracy and the creative commons [7].
Lips argues that e-government is still too techno-centric and many public officials associate e-Government with technology, with the technology deterministic attitude rather distant from the administrative complexity and political risk of governance [8]. Lack of strategic alignment then results in conceptual de-coupling of high-order objectives of governance and although several localized value and process improvement measures can be achieved breakthrough of transformation in government is still to come. As Frank Bannister and Regina Connolly [7] argues after looking into the past twenty years of e-government history that the concept of transformative government has not proved well defined and most of the time it used in conjunction with a large list of superfluous adjectives appealing to a great audience but missing a systematic breakdown and outline of interplay between technology and public administration [7].
Modernization of Hungarian public administration is based partly on the transformation of processes and procedures, and partly on the provision of extensive access to electronic public administration services to citizens. In order to streamline office work, it is necessary that the procedures are reorganized, technology is modernized, and these two areas systematically build on each other ([9] - as it is the case in the private sector, see also [10]). Service and technology modernization is
provided by the Electronic Public Administration Operational Programme (EPAOP) while organizational and human resources modernization is ensured by the State Reform Operational Programme (SROP).
EPAOP is aimed to increase performance in public administration by means of ICT developments. The main objectives of EPAOP are: to reduce administration in the public sector, to improve the level of services and to assure effective operation of public administration. Electronic Public Administration Operational Programme has two main areas: convergence and regional competitiveness including employment. In order to achieve these, the programme is broken down to five priority axes listed in Table I.
TABLE I. ELECTRONIC PUBLIC ADMINISTRATION OPERATIONAL
PROGRAMME (EPAOP)1
Priority title Fund
Budget (million EUR)
Budget (billion HUF)
Priority 1: Public administration and renewal of the internal processes of
administrative services
ERDF 174.086 51.686
Priority 2: Projects promoting access to
public administration services
ERDF 133.186 39.543
Priority 3: Priority projects ERDF 83.264 24.721
Priority 4: Technical assistance in convergence regions
ERDF 5.632 1.672
Priority 5: Technical assistance in the
Central Hungary region
ERDF 1.526 0.453
Source: [11]
The mission of the State Reform Operational Programme (SROP) is to enhance the performance of the public administration system through institutional capacity building. The main objectives of SROP are: to improve human resources and to modernise the organisational operation. Accordingly, the priority axes of the operational programme are focusing on the two main resources of the public administration system, i.e. on the development of human resources and on organizational processes (see Table II).
Priority axes 1, 2 and 3 are closely coupled on the OP level, since IT requirements for the projects of human and organisational objectives of SROPs are financed from EPAOPs. For the remainder of this paper we are going to focus on the Priority 1, 2 and 3 of both EPAOP and SROP. Table III. illustrates the total amount of contracted projects under EPAOP and SROP.
The framework amount of EPAOP is EUR 397.69 million, while the contracted amount is EUR 454.93 million. The main reason for this over commitment of the Hungarian Government is the fulfilment desire of the so called n+2 and n+3 goals
2 after
the closure of the 2007-2013 programming cycle. On the contrary, in SROP the contracted sum reached only EUR
1 Applied exchange rate: 296,9 HUF/EUR. The 2013 annual average
Hungarian National Bank HUF/EUR exchange rate – 296,9 – was used for conversion, but we do not intend to further analyze the currency or exchange
rate related financial aspects of the OPs. 2 N+3 means that the allocation from Structural Funds must be used by the
member states in 3 years or in case of n+2 in 2 years after the commitment.
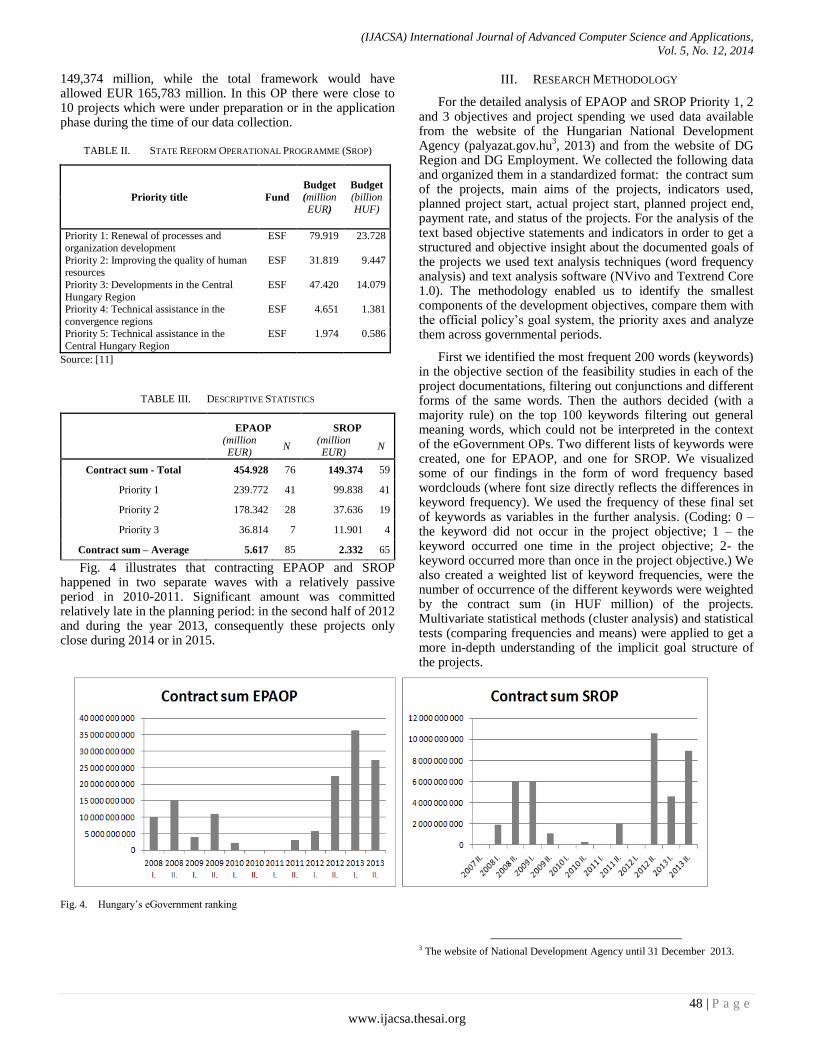
(IJACSA) International Journal of Advanced Computer Science and Applications,
Vol. 5, No. 12, 2014
48 | P a g e
www.ijacsa.thesai.org
149,374 million, while the total framework would have allowed EUR 165,783 million. In this OP there were close to 10 projects which were under preparation or in the application phase during the time of our data collection.
TABLE II. STATE REFORM OPERATIONAL PROGRAMME (SROP)
Priority title Fund
Budget (million EUR)
Budget (billion HUF)
Priority 1: Renewal of processes and
organization development
ESF 79.919 23.728
Priority 2: Improving the quality of human resources
ESF 31.819 9.447
Priority 3: Developments in the Central
Hungary Region
ESF 47.420 14.079
Priority 4: Technical assistance in the
convergence regions
ESF 4.651 1.381
Priority 5: Technical assistance in the
Central Hungary Region
ESF 1.974 0.586
Source: [11]
TABLE III. DESCRIPTIVE STATISTICS
EPAOP SROP
(million EUR)
N (million EUR)
N
Contract sum - Total 454.928 76 149.374 59
Priority 1 239.772 41 99.838 41
Priority 2 178.342 28 37.636 19
Priority 3 36.814 7 11.901 4
Contract sum – Average 5.617 85 2.332 65
Fig. 4 illustrates that contracting EPAOP and SROP happened in two separate waves with a relatively passive period in 2010-2011. Significant amount was committed relatively late in the planning period: in the second half of 2012 and during the year 2013, consequently these projects only close during 2014 or in 2015.
Fig. 4. Hungary’s eGovernment ranking
III. RESEARCH METHODOLOGY
For the detailed analysis of EPAOP and SROP Priority 1, 2 and 3 objectives and project spending we used data available from the website of the Hungarian National Development Agency (palyazat.gov.hu
3, 2013) and from the website of DG
Region and DG Employment. We collected the following data and organized them in a standardized format: the contract sum of the projects, main aims of the projects, indicators used, planned project start, actual project start, planned project end, payment rate, and status of the projects. For the analysis of the text based objective statements and indicators in order to get a structured and objective insight about the documented goals of the projects we used text analysis techniques (word frequency analysis) and text analysis software (NVivo and Textrend Core 1.0). The methodology enabled us to identify the smallest components of the development objectives, compare them with the official policy’s goal system, the priority axes and analyze them across governmental periods.
First we identified the most frequent 200 words (keywords) in the objective section of the feasibility studies in each of the project documentations, filtering out conjunctions and different forms of the same words. Then the authors decided (with a majority rule) on the top 100 keywords filtering out general meaning words, which could not be interpreted in the context of the eGovernment OPs. Two different lists of keywords were created, one for EPAOP, and one for SROP. We visualized some of our findings in the form of word frequency based wordclouds (where font size directly reflects the differences in keyword frequency). We used the frequency of these final set of keywords as variables in the further analysis. (Coding: 0 – the keyword did not occur in the project objective; 1 – the keyword occurred one time in the project objective; 2- the keyword occurred more than once in the project objective.) We also created a weighted list of keyword frequencies, were the number of occurrence of the different keywords were weighted by the contract sum (in HUF million) of the projects. Multivariate statistical methods (cluster analysis) and statistical tests (comparing frequencies and means) were applied to get a more in-depth understanding of the implicit goal structure of the projects.
3 The website of National Development Agency until 31 December 2013.

(IJACSA) International Journal of Advanced Computer Science and Applications,
Vol. 5, No. 12, 2014
49 | P a g e
www.ijacsa.thesai.org
IV. DISCUSSION AND FINDINGS
In Table IV we summarize our key findings on keyword priorities of EPAOP and SROP objectives. Both the normal count and the weighted frequency are in alignment with the generally stated objectives of these program portfolios, and show coherence. It is interesting to notice, however, that the leading keyword in the contract sum weighted list of SROP is “data” preceding the more general terms describing “organization”, “development” and “public administration”. From Table IV we can also observe the interplay between the initiatives of ICT based and human capacity based developments (EPAOP vs. SROP keywords): the first listing “systems”, “service” and “ICT support”, while the second focusing on “data”, “organizations”, and “public administration support”.
In order to adhere to the spatial limitation of the paper we present three findings from our analysis. Firstly we discuss how Priorities 1 and 2 in both EPAOP and SROP goal systems are structured. Secondly, we look at the relationship between the goal structure of EPAOP and SROP projects. Thirdly, we re-aggregate the decomposed objective elements according to the timeline of the 2007-2013 planning period and draw conclusion on the modernization priorities of the three governments in this era.
TABLE IV. TOP 20 KEYWORDS IN EPAOP AND SROP
EPAOP SROP
Keyword Count Keyword Count
system 108 project 59
project 92 objective 55
service 90 public 46
data 83 necessary 32
development 78 organizational 25
electronic 72 public administration 18
formation 63 tender 18
client 48 integrate 16
effective 47 development 15
support 47 objective 15
administration 47 system 13
integrate 45 new 13
public administration 40 municipality 12
relation 40 societal 12
application 37 program 11
registration 37 design 11
central 33 form 11
opportunity 32 state 11
modern 30 effective 11
total 30 adequate 11
TABLE V. EPAOP OFFICIAL PRIORITY GOALS VERSUS KEYWORDS
Priority EPAOP Priority goals in the official
EPAOP document
Keywords based on objective text analysis
(with priority-level frequency)
Priority
1.1
Electronization of public administration services and
to raise the level of transactions
Electronic (35); informatics (43); public administration (16); service (36); development
(46); integrated (26), central (11); project (48); data (52); hardware (8); software (13);
server (6)
The renewal of the procedures and IT support of
judicial system and the registry court
Renewal (5); procedure (19); execution (of penalty; 21; support (36); process (16); project
(48); punishment (system)
Setting-up service centres for local governments Service (36), project (48), public administration (16); integrated (26); processes (16);
relation (22)
IT background of law enforcement, emergency
organisations and public persecution offices
Project (48); magisterial (14); informatics (43); public administration (16); execution (of
penalty; 21); support (36); process (16); relation (22); development (46); hardware (8); software (13)
Priority 1.2
Establish the central electronic services required for the efficient operation of public administration
Central (11); electronic (35); service (36); effective (25); public administration (16); ); hardware (8); software (13); server (6); project (48); infrastructure (12), integrated (26);
network (6), support (36), development (46); modern (18); organisation (12)
Establishment of data links among public
administration systems
Data (52); relation (22); public administration (16); project (48); functional (9); processes
(16)
Implementation of electronic document
management system.
Electronic (35); procedure (19); project (48); hardware (8); software (13); central (11); complex (11); database (11); service (36)
Modernisation of the financial and
economic operation processes.
Internal (11); processes (16); modern (18); service (36)
Priority
2.1
Provision of service interface for clients. Service (47), integrate (14), central (17), electronic (31), project (39), data (28), informatics
(13), application (16), client (26)
Central client interface services. Central (17), client (26), service (47), development (24), electronic (31), integrate (14)
Electronic payment system. Electronic (31), project (39), integrate (14), central (17), client (26)
Front office services, common territorial service
centres, upgrade of government offices
Service (47), public administration (20), state (5), development (24), governmental (7),
project (39), integrate (14)
Priority
2.2
Development of the Central Electronic Service
System and IT security infrastructure.
Development (24), central (17), electronic (31), service (47), safety (5), hardware (2);
software (2); server (1); citizens (7), public administration (20), project (39), data (28),
information (8), info-communicational (2)
Priority 2.3
Electronic authentication of citizens Certified (0), identification (3), citizens (7), processes (4), project (39), client (26), data (28), administration (23), centralised (1)
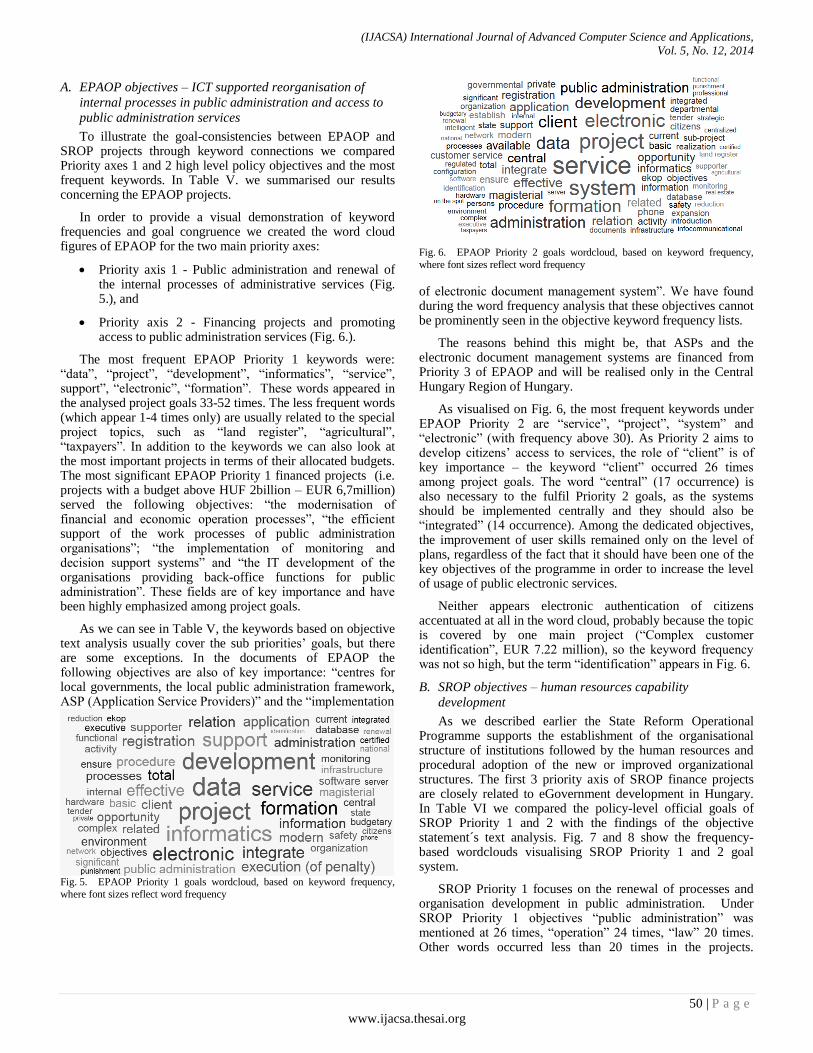
(IJACSA) International Journal of Advanced Computer Science and Applications,
Vol. 5, No. 12, 2014
50 | P a g e
www.ijacsa.thesai.org
A. EPAOP objectives – ICT supported reorganisation of
internal processes in public administration and access to
public administration services
To illustrate the goal-consistencies between EPAOP and SROP projects through keyword connections we compared Priority axes 1 and 2 high level policy objectives and the most frequent keywords. In Table V. we summarised our results concerning the EPAOP projects.
In order to provide a visual demonstration of keyword frequencies and goal congruence we created the word cloud figures of EPAOP for the two main priority axes:
Priority axis 1 - Public administration and renewal of the internal processes of administrative services (Fig. 5.), and
Priority axis 2 - Financing projects and promoting access to public administration services (Fig. 6.).
The most frequent EPAOP Priority 1 keywords were: “data”, “project”, “development”, “informatics”, “service”, support”, “electronic”, “formation”. These words appeared in the analysed project goals 33-52 times. The less frequent words (which appear 1-4 times only) are usually related to the special project topics, such as “land register”, “agricultural”, “taxpayers”. In addition to the keywords we can also look at the most important projects in terms of their allocated budgets. The most significant EPAOP Priority 1 financed projects (i.e. projects with a budget above HUF 2billion – EUR 6,7million) served the following objectives: “the modernisation of financial and economic operation processes”, “the efficient support of the work processes of public administration organisations”; “the implementation of monitoring and decision support systems” and “the IT development of the organisations providing back-office functions for public administration”. These fields are of key importance and have been highly emphasized among project goals.
As we can see in Table V, the keywords based on objective text analysis usually cover the sub priorities’ goals, but there are some exceptions. In the documents of EPAOP the following objectives are also of key importance: “centres for local governments, the local public administration framework, ASP (Application Service Providers)” and the “implementation
Fig. 5. EPAOP Priority 1 goals wordcloud, based on keyword frequency,
where font sizes reflect word frequency
Fig. 6. EPAOP Priority 2 goals wordcloud, based on keyword frequency,
where font sizes reflect word frequency
of electronic document management system”. We have found during the word frequency analysis that these objectives cannot be prominently seen in the objective keyword frequency lists.
The reasons behind this might be, that ASPs and the electronic document management systems are financed from Priority 3 of EPAOP and will be realised only in the Central Hungary Region of Hungary.
As visualised on Fig. 6, the most frequent keywords under EPAOP Priority 2 are “service”, “project”, “system” and “electronic” (with frequency above 30). As Priority 2 aims to develop citizens’ access to services, the role of “client” is of key importance – the keyword “client” occurred 26 times among project goals. The word “central” (17 occurrence) is also necessary to the fulfil Priority 2 goals, as the systems should be implemented centrally and they should also be “integrated” (14 occurrence). Among the dedicated objectives, the improvement of user skills remained only on the level of plans, regardless of the fact that it should have been one of the key objectives of the programme in order to increase the level of usage of public electronic services.
Neither appears electronic authentication of citizens accentuated at all in the word cloud, probably because the topic is covered by one main project (“Complex customer identification”, EUR 7.22 million), so the keyword frequency was not so high, but the term “identification” appears in Fig. 6.
B. SROP objectives – human resources capability
development
As we described earlier the State Reform Operational Programme supports the establishment of the organisational structure of institutions followed by the human resources and procedural adoption of the new or improved organizational structures. The first 3 priority axis of SROP finance projects are closely related to eGovernment development in Hungary. In Table VI we compared the policy-level official goals of SROP Priority 1 and 2 with the findings of the objective statement´s text analysis. Fig. 7 and 8 show the frequency-based wordclouds visualising SROP Priority 1 and 2 goal system.
SROP Priority 1 focuses on the renewal of processes and organisation development in public administration. Under SROP Priority 1 objectives “public administration” was mentioned at 26 times, “operation” 24 times, “law” 20 times. Other words occurred less than 20 times in the projects.

(IJACSA) International Journal of Advanced Computer Science and Applications,
Vol. 5, No. 12, 2014
51 | P a g e
www.ijacsa.thesai.org
“Development”, “effective”, “organisational” 19 times, “process, system, necessary” 16 times, and “support” 15 times. “Internal”, “integrate”, “governmental” and “services” proved
also as important keywords in SROP projects – these were mentioned 13 times.
TABLE VI. SROP OFFICIAL PRIORITY GOALS VERSUS KEYWORDS FROM OBJECTIVE TEXT ANALYSIS
Priority Priority goals in the official SROP document Keywords based on objective text analysis
(with priority-level frequency)
Priority 1.1 Improvement of the capacity for governance and local government
Training (1), effective (19), performance (8), governmental (13), project (38), operation (24), development (19)
Raising the quality of legislation
Law (20), project (38), organizational (19), simplifications (5), process (16)
Active involvement of the social partners -
Priority 1.2 Renewal of procedures and work processes as well as organisation development
New (12), process (16), organisational (19), development (19), project (38), problems (4), realisation (4)
Transformation of the case handling
administration procedures
Transformation (3), process (16), simplification (5), organisations (6), project (38)
Development of the efficient and cost-
effective organisations
Development (19), effective (19), organisational (19), culture (4), governmental (13), project (38)
Priority 2.1 Establishment of open recruitment and an efficient
internal replacement
Effective (7), internal (3), electronic (3), knowledge (4), public administration (28),
training (21), system (14), project (17)
Priority 2.2 Performance-based career pathways Effective (7), training (21), career (4), project (17)
Regarding the most frequent keywords we can assume that the official SROP goals are generally well translated into planned project goals, since all of the keywords of Priority 1’s general objectives occur more than 10 times (Fig. 7.): “new, processes, organisation and development”. It is interesting to see, however, that one of the main Priority 1 goals, “involvement of social partners” cannot be seen in terms of frequent objective key words. The authors´ assumption is that these objectives are left out due to other more important aims, and/or the related projects were under preparation or in the application phase during the data collection.
SROP Priority 2 aims to improve the quality of human resources in the public sector. Priority 2 official goals were usually covered by the project objectives, that is what the keyword frequency analysis shows. The most frequent keywords are (Fig. 8.): “public administration”, “training”, “project”, “system”, “necessary”.
Summarising the results of our keyword frequency analysis of EPAOP and SROP projects we can state that the keyword frequencies and wordclouds generally do illustrate the main policy level objectives of the Operative Programmes, however, there are some fields which are not emphasized among project goals – such as:
the role of participation and social partners, and local government;
improvement of user skills through public information campaigns.
We also have to reflect on the geographical coverage of the projects. There are some project goals which did not meet the broader objective of regional convergence; these were only applicable in the Central Hungary region. This poses a major challenge for the programming period of 2014-2020 in order to assure a countrywide coverage of development projects and goals. For example the ASP project has been implemented in the Central Hungary Region, but it seems an important aim to assure ASP services countrywide especially for productivity
improvement in local governments. Another important priority area sticks out from the analysis: the topic of electronic file and document management systems, that is to widen the usage of these solutions countrywide.
Fig. 7. SROP Priority 1 goals wordcloud, based on keyword frequency, where font sizes reflect word frequency
Fig. 8. SROP Priority 2 goals wordcloud, based on keyword frequency,
where font sizes reflect word frequency
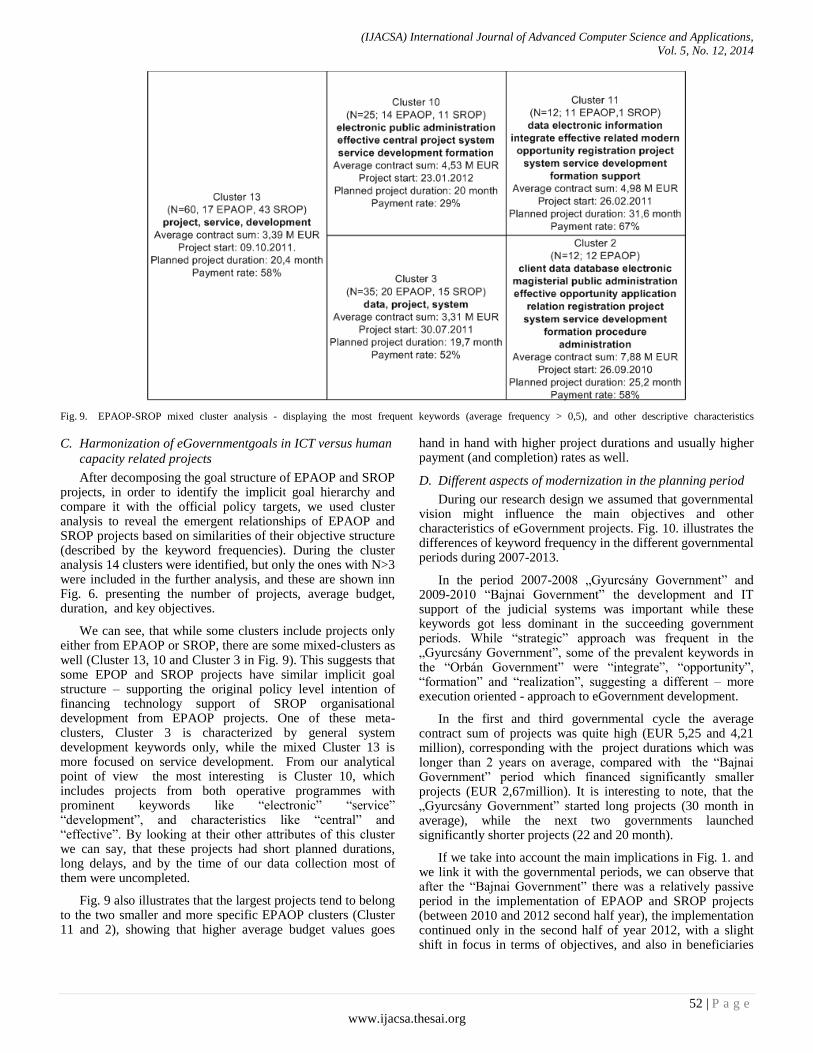
(IJACSA) International Journal of Advanced Computer Science and Applications,
Vol. 5, No. 12, 2014
52 | P a g e
www.ijacsa.thesai.org
Fig. 9. EPAOP-SROP mixed cluster analysis - displaying the most frequent keywords (average frequency > 0,5), and other descriptive characteristics
C. Harmonization of eGovernmentgoals in ICT versus human
capacity related projects
After decomposing the goal structure of EPAOP and SROP projects, in order to identify the implicit goal hierarchy and compare it with the official policy targets, we used cluster analysis to reveal the emergent relationships of EPAOP and SROP projects based on similarities of their objective structure (described by the keyword frequencies). During the cluster analysis 14 clusters were identified, but only the ones with N>3 were included in the further analysis, and these are shown inn Fig. 6. presenting the number of projects, average budget, duration, and key objectives.
We can see, that while some clusters include projects only either from EPAOP or SROP, there are some mixed-clusters as well (Cluster 13, 10 and Cluster 3 in Fig. 9). This suggests that some EPOP and SROP projects have similar implicit goal structure – supporting the original policy level intention of financing technology support of SROP organisational development from EPAOP projects. One of these meta-clusters, Cluster 3 is characterized by general system development keywords only, while the mixed Cluster 13 is more focused on service development. From our analytical point of view the most interesting is Cluster 10, which includes projects from both operative programmes with prominent keywords like “electronic” “service” “development”, and characteristics like “central” and “effective”. By looking at their other attributes of this cluster we can say, that these projects had short planned durations, long delays, and by the time of our data collection most of them were uncompleted.
Fig. 9 also illustrates that the largest projects tend to belong to the two smaller and more specific EPAOP clusters (Cluster 11 and 2), showing that higher average budget values goes
hand in hand with higher project durations and usually higher payment (and completion) rates as well.
D. Different aspects of modernization in the planning period
During our research design we assumed that governmental vision might influence the main objectives and other characteristics of eGovernment projects. Fig. 10. illustrates the differences of keyword frequency in the different governmental periods during 2007-2013.
In the period 2007-2008 „Gyurcsány Government” and 2009-2010 “Bajnai Government” the development and IT support of the judicial systems was important while these keywords got less dominant in the succeeding government periods. While “strategic” approach was frequent in the „Gyurcsány Government”, some of the prevalent keywords in the “Orbán Government” were “integrate”, “opportunity”, “formation” and “realization”, suggesting a different – more execution oriented - approach to eGovernment development.
In the first and third governmental cycle the average contract sum of projects was quite high (EUR 5,25 and 4,21 million), corresponding with the project durations which was longer than 2 years on average, compared with the “Bajnai Government” period which financed significantly smaller projects (EUR 2,67million). It is interesting to note, that the „Gyurcsány Government” started long projects (30 month in average), while the next two governments launched significantly shorter projects (22 and 20 month).
If we take into account the main implications in Fig. 1. and we link it with the governmental periods, we can observe that after the “Bajnai Government” there was a relatively passive period in the implementation of EPAOP and SROP projects (between 2010 and 2012 second half year), the implementation continued only in the second half of year 2012, with a slight shift in focus in terms of objectives, and also in beneficiaries
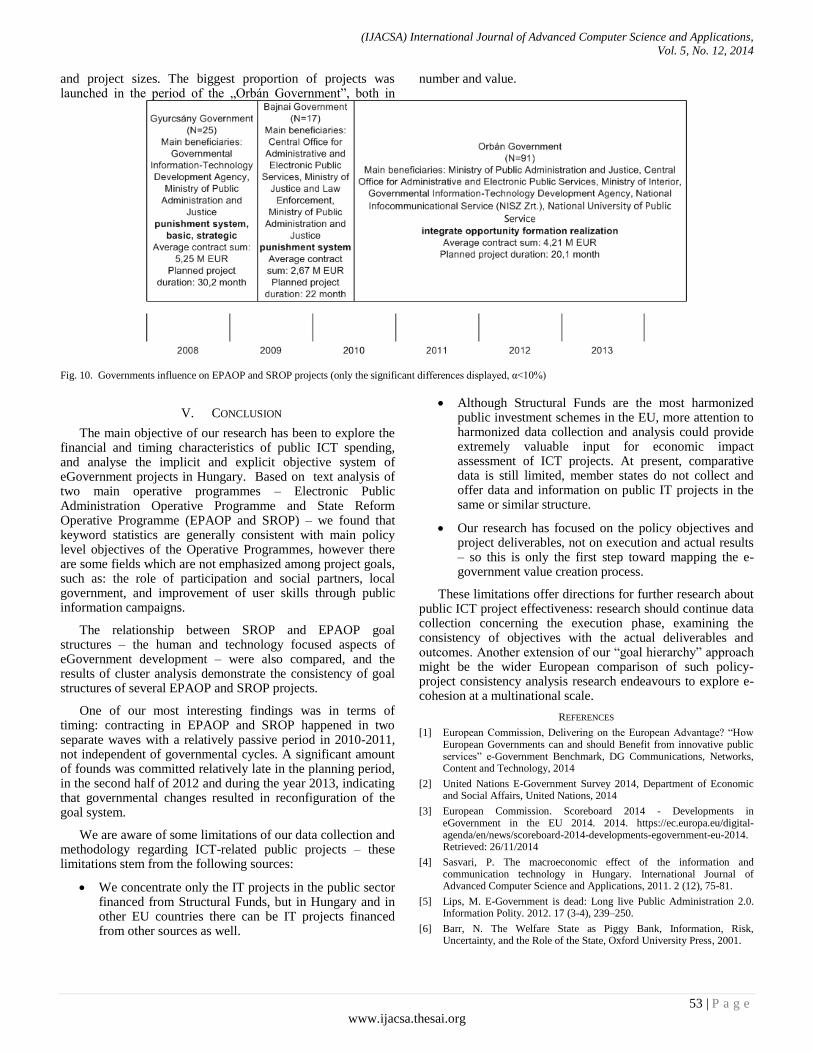
(IJACSA) International Journal of Advanced Computer Science and Applications,
Vol. 5, No. 12, 2014
53 | P a g e
www.ijacsa.thesai.org
and project sizes. The biggest proportion of projects was launched in the period of the „Orbán Government”, both in
number and value.
Fig. 10. Governments influence on EPAOP and SROP projects (only the significant differences displayed, α<10%)
V. CONCLUSION
The main objective of our research has been to explore the financial and timing characteristics of public ICT spending, and analyse the implicit and explicit objective system of eGovernment projects in Hungary. Based on text analysis of two main operative programmes – Electronic Public Administration Operative Programme and State Reform Operative Programme (EPAOP and SROP) – we found that keyword statistics are generally consistent with main policy level objectives of the Operative Programmes, however there are some fields which are not emphasized among project goals, such as: the role of participation and social partners, local government, and improvement of user skills through public information campaigns.
The relationship between SROP and EPAOP goal structures – the human and technology focused aspects of eGovernment development – were also compared, and the results of cluster analysis demonstrate the consistency of goal structures of several EPAOP and SROP projects.
One of our most interesting findings was in terms of timing: contracting in EPAOP and SROP happened in two separate waves with a relatively passive period in 2010-2011, not independent of governmental cycles. A significant amount of founds was committed relatively late in the planning period, in the second half of 2012 and during the year 2013, indicating that governmental changes resulted in reconfiguration of the goal system.
We are aware of some limitations of our data collection and methodology regarding ICT-related public projects – these limitations stem from the following sources:
We concentrate only the IT projects in the public sector financed from Structural Funds, but in Hungary and in other EU countries there can be IT projects financed from other sources as well.
Although Structural Funds are the most harmonized public investment schemes in the EU, more attention to harmonized data collection and analysis could provide extremely valuable input for economic impact assessment of ICT projects. At present, comparative data is still limited, member states do not collect and offer data and information on public IT projects in the same or similar structure.
Our research has focused on the policy objectives and project deliverables, not on execution and actual results – so this is only the first step toward mapping the e-government value creation process.
These limitations offer directions for further research about public ICT project effectiveness: research should continue data collection concerning the execution phase, examining the consistency of objectives with the actual deliverables and outcomes. Another extension of our “goal hierarchy” approach might be the wider European comparison of such policy-project consistency analysis research endeavours to explore e-cohesion at a multinational scale.
REFERENCES
[1] European Commission, Delivering on the European Advantage? “How European Governments can and should Benefit from innovative public services” e-Government Benchmark, DG Communications, Networks, Content and Technology, 2014
[2] United Nations E-Government Survey 2014, Department of Economic and Social Affairs, United Nations, 2014
[3] European Commission. Scoreboard 2014 - Developments in eGovernment in the EU 2014. 2014. https://ec.europa.eu/digital-agenda/en/news/scoreboard-2014-developments-egovernment-eu-2014. Retrieved: 26/11/2014
[4] Sasvari, P. The macroeconomic effect of the information and communication technology in Hungary. International Journal of Advanced Computer Science and Applications, 2011. 2 (12), 75-81.
[5] Lips, M. E-Government is dead: Long live Public Administration 2.0. Information Polity. 2012. 17 (3-4), 239–250.
[6] Barr, N. The Welfare State as Piggy Bank, Information, Risk, Uncertainty, and the Role of the State, Oxford University Press, 2001.

(IJACSA) International Journal of Advanced Computer Science and Applications,
Vol. 5, No. 12, 2014
54 | P a g e
www.ijacsa.thesai.org
[7] Bannister, F., Connolly, R. Forward to the past: Lessons for the future of e-government from the story so far. Information Polity. 2012. 17 (3-4), 211–226.
[8] Kanaan, R., Kanaan, G. The Failure of E-government in Jordan to Fulfill Potential. International Journal of Advanced Computer Science & Applications. 2013. 4(12). 157-161.
[9] Sensuse, D. I., Ramadhan, A. The Relationships of Soft Systems Methodology (SSM), Business Process Modeling and e-Government. International Journal of Advanced Computer Science and Applications, 2012. 3(1).
[10] Brynjolfsson, E., Hitt, L. M., Yang, S. Intangible assets: Computers and organizational capital. Brookings Papers on Economic Activity. 2002/1. 137-198.
[11] European Commission. Report on the Implementation of the Electronic Public Administration Operational Programme in 2012. Annual Implementation Report 2012. Approved by the EPAOP Monitoring Committee 11 June 2013. Submitted to the European Commission by 30 June 2013. Website of DG Region: ec.europa.eu/regional_policy/country/prordn/details_new.cfm?gv_PAY=HU&gv_reg=ALL&gv_PGM=1181&LAN=7&gv_per=2&gv_defL=7 Retrieved: 10/11/2013
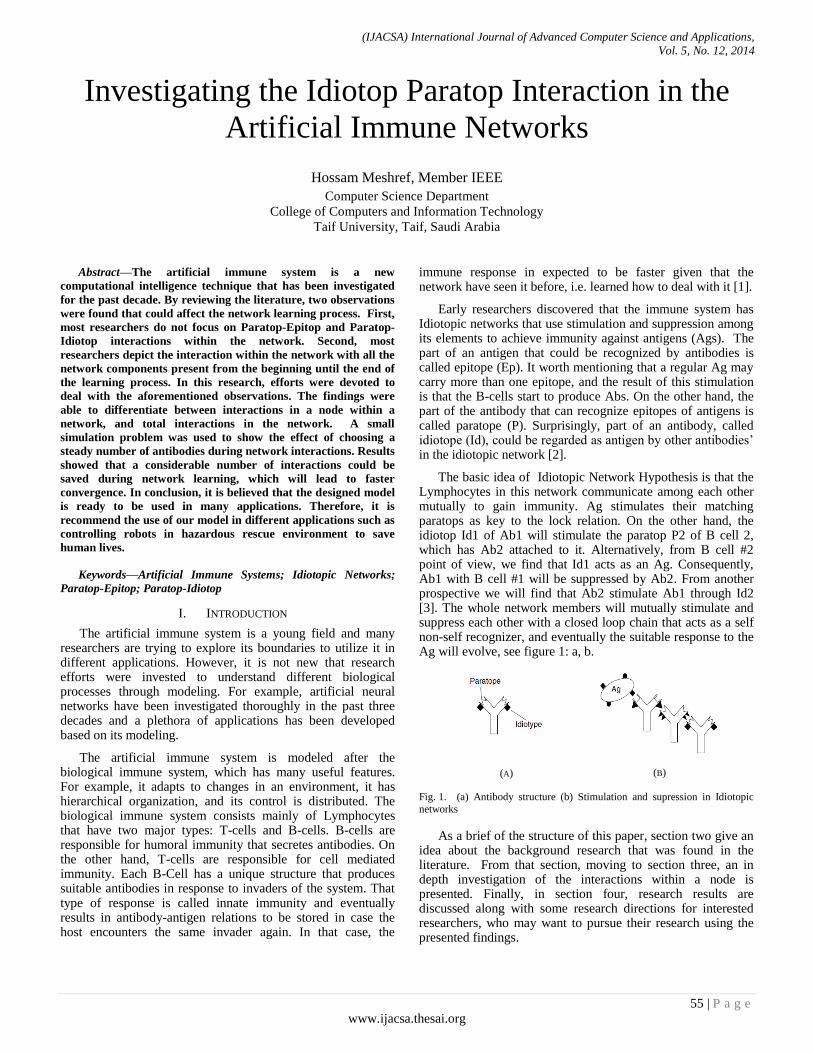
(IJACSA) International Journal of Advanced Computer Science and Applications,
Vol. 5, No. 12, 2014
55 | P a g e
www.ijacsa.thesai.org
Investigating the Idiotop Paratop Interaction in the
Artificial Immune Networks
Hossam Meshref, Member IEEE
Computer Science Department
College of Computers and Information Technology
Taif University, Taif, Saudi Arabia
Abstract—The artificial immune system is a new
computational intelligence technique that has been investigated
for the past decade. By reviewing the literature, two observations
were found that could affect the network learning process. First,
most researchers do not focus on Paratop-Epitop and Paratop-
Idiotop interactions within the network. Second, most
researchers depict the interaction within the network with all the
network components present from the beginning until the end of
the learning process. In this research, efforts were devoted to
deal with the aforementioned observations. The findings were
able to differentiate between interactions in a node within a
network, and total interactions in the network. A small
simulation problem was used to show the effect of choosing a
steady number of antibodies during network interactions. Results
showed that a considerable number of interactions could be
saved during network learning, which will lead to faster
convergence. In conclusion, it is believed that the designed model
is ready to be used in many applications. Therefore, it is
recommend the use of our model in different applications such as
controlling robots in hazardous rescue environment to save
human lives.
Keywords—Artificial Immune Systems; Idiotopic Networks;
Paratop-Epitop; Paratop-Idiotop
I. INTRODUCTION
The artificial immune system is a young field and many researchers are trying to explore its boundaries to utilize it in different applications. However, it is not new that research efforts were invested to understand different biological processes through modeling. For example, artificial neural networks have been investigated thoroughly in the past three decades and a plethora of applications has been developed based on its modeling.
The artificial immune system is modeled after the biological immune system, which has many useful features. For example, it adapts to changes in an environment, it has hierarchical organization, and its control is distributed. The biological immune system consists mainly of Lymphocytes that have two major types: T-cells and B-cells. B-cells are responsible for humoral immunity that secretes antibodies. On the other hand, T-cells are responsible for cell mediated immunity. Each B-Cell has a unique structure that produces suitable antibodies in response to invaders of the system. That type of response is called innate immunity and eventually results in antibody-antigen relations to be stored in case the host encounters the same invader again. In that case, the
immune response in expected to be faster given that the network have seen it before, i.e. learned how to deal with it [1].
Early researchers discovered that the immune system has Idiotopic networks that use stimulation and suppression among its elements to achieve immunity against antigens (Ags). The part of an antigen that could be recognized by antibodies is called epitope (Ep). It worth mentioning that a regular Ag may carry more than one epitope, and the result of this stimulation is that the B-cells start to produce Abs. On the other hand, the part of the antibody that can recognize epitopes of antigens is called paratope (P). Surprisingly, part of an antibody, called idiotope (Id), could be regarded as antigen by other antibodies’ in the idiotopic network [2].
The basic idea of Idiotopic Network Hypothesis is that the Lymphocytes in this network communicate among each other mutually to gain immunity. Ag stimulates their matching paratops as key to the lock relation. On the other hand, the idiotop Id1 of Ab1 will stimulate the paratop P2 of B cell 2, which has Ab2 attached to it. Alternatively, from B cell #2 point of view, we find that Id1 acts as an Ag. Consequently, Ab1 with B cell #1 will be suppressed by Ab2. From another prospective we will find that Ab2 stimulate Ab1 through Id2 [3]. The whole network members will mutually stimulate and suppress each other with a closed loop chain that acts as a self non-self recognizer, and eventually the suitable response to the Ag will evolve, see figure 1: a, b.
(B)
(A)
Fig. 1. (a) Antibody structure (b) Stimulation and supression in Idiotopic
networks
As a brief of the structure of this paper, section two give an idea about the background research that was found in the literature. From that section, moving to section three, an in depth investigation of the interactions within a node is presented. Finally, in section four, research results are discussed along with some research directions for interested researchers, who may want to pursue their research using the presented findings.
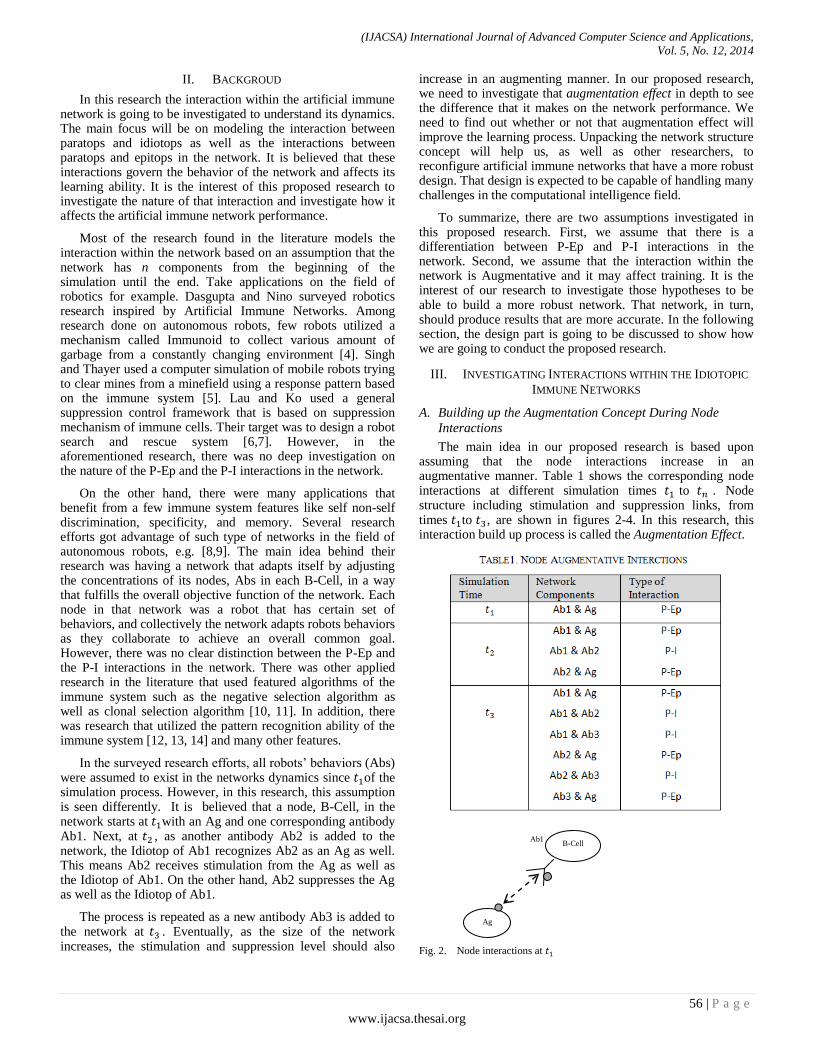
(IJACSA) International Journal of Advanced Computer Science and Applications,
Vol. 5, No. 12, 2014
56 | P a g e
www.ijacsa.thesai.org
II. BACKGROUD
In this research the interaction within the artificial immune network is going to be investigated to understand its dynamics. The main focus will be on modeling the interaction between paratops and idiotops as well as the interactions between paratops and epitops in the network. It is believed that these interactions govern the behavior of the network and affects its learning ability. It is the interest of this proposed research to investigate the nature of that interaction and investigate how it affects the artificial immune network performance.
Most of the research found in the literature models the interaction within the network based on an assumption that the network has n components from the beginning of the simulation until the end. Take applications on the field of robotics for example. Dasgupta and Nino surveyed robotics research inspired by Artificial Immune Networks. Among research done on autonomous robots, few robots utilized a mechanism called Immunoid to collect various amount of garbage from a constantly changing environment [4]. Singh and Thayer used a computer simulation of mobile robots trying to clear mines from a minefield using a response pattern based on the immune system [5]. Lau and Ko used a general suppression control framework that is based on suppression mechanism of immune cells. Their target was to design a robot search and rescue system [6,7]. However, in the aforementioned research, there was no deep investigation on the nature of the P-Ep and the P-I interactions in the network.
On the other hand, there were many applications that benefit from a few immune system features like self non-self discrimination, specificity, and memory. Several research efforts got advantage of such type of networks in the field of autonomous robots, e.g. [8,9]. The main idea behind their research was having a network that adapts itself by adjusting the concentrations of its nodes, Abs in each B-Cell, in a way that fulfills the overall objective function of the network. Each node in that network was a robot that has certain set of behaviors, and collectively the network adapts robots behaviors as they collaborate to achieve an overall common goal. However, there was no clear distinction between the P-Ep and the P-I interactions in the network. There was other applied research in the literature that used featured algorithms of the immune system such as the negative selection algorithm as well as clonal selection algorithm [10, 11]. In addition, there was research that utilized the pattern recognition ability of the immune system [12, 13, 14] and many other features.
In the surveyed research efforts, all robots’ behaviors (Abs) were assumed to exist in the networks dynamics since of the simulation process. However, in this research, this assumption is seen differently. It is believed that a node, B-Cell, in the network starts at with an Ag and one corresponding antibody Ab1. Next, at , as another antibody Ab2 is added to the network, the Idiotop of Ab1 recognizes Ab2 as an Ag as well. This means Ab2 receives stimulation from the Ag as well as the Idiotop of Ab1. On the other hand, Ab2 suppresses the Ag as well as the Idiotop of Ab1.
The process is repeated as a new antibody Ab3 is added to the network at . Eventually, as the size of the network increases, the stimulation and suppression level should also
increase in an augmenting manner. In our proposed research, we need to investigate that augmentation effect in depth to see the difference that it makes on the network performance. We need to find out whether or not that augmentation effect will improve the learning process. Unpacking the network structure concept will help us, as well as other researchers, to reconfigure artificial immune networks that have a more robust design. That design is expected to be capable of handling many challenges in the computational intelligence field.
To summarize, there are two assumptions investigated in this proposed research. First, we assume that there is a differentiation between P-Ep and P-I interactions in the network. Second, we assume that the interaction within the network is Augmentative and it may affect training. It is the interest of our research to investigate those hypotheses to be able to build a more robust network. That network, in turn, should produce results that are more accurate. In the following section, the design part is going to be discussed to show how we are going to conduct the proposed research.
III. INVESTIGATING INTERACTIONS WITHIN THE IDIOTOPIC
IMMUNE NETWORKS
A. Building up the Augmentation Concept During Node
Interactions
The main idea in our proposed research is based upon assuming that the node interactions increase in an augmentative manner. Table 1 shows the corresponding node interactions at different simulation times to . Node structure including stimulation and suppression links, from times to , are shown in figures 2-4. In this research, this interaction build up process is called the Augmentation Effect.
Fig. 2. Node interactions at
B-Cell
Ag
Ab1
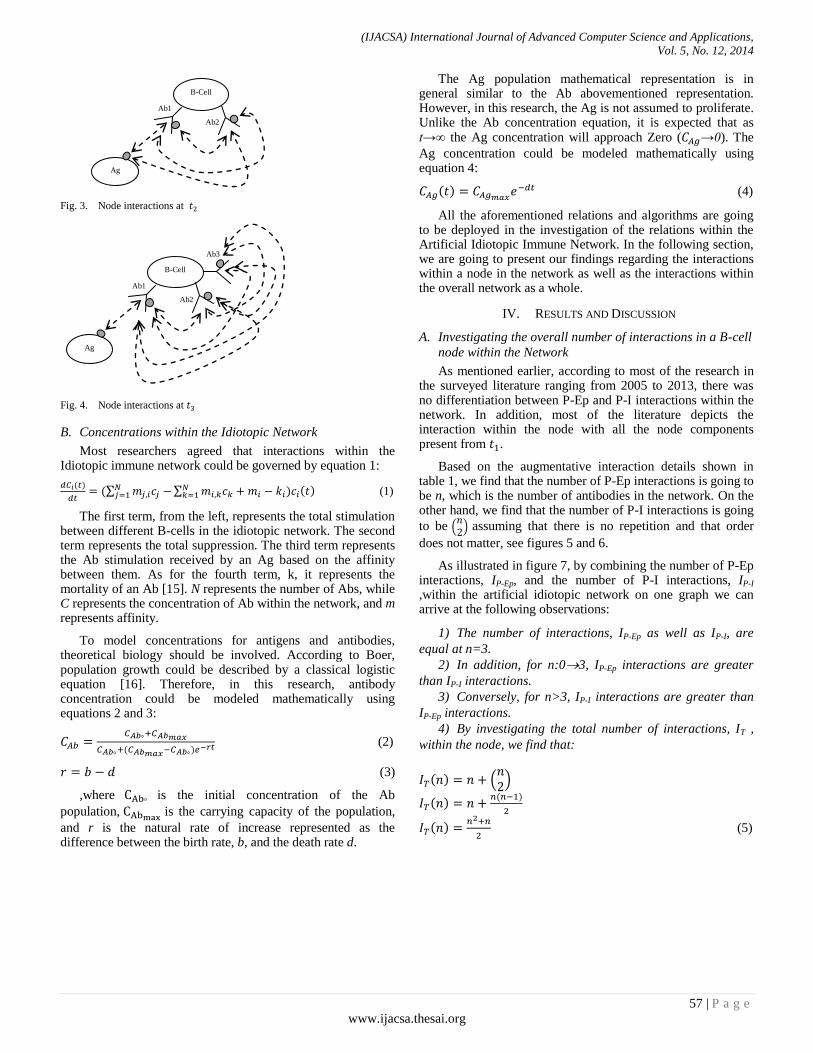
(IJACSA) International Journal of Advanced Computer Science and Applications,
Vol. 5, No. 12, 2014
57 | P a g e
www.ijacsa.thesai.org
Fig. 3. Node interactions at
Fig. 4. Node interactions at
B. Concentrations within the Idiotopic Network
Most researchers agreed that interactions within the Idiotopic immune network could be governed by equation 1:
∑
∑ (1)
The first term, from the left, represents the total stimulation between different B-cells in the idiotopic network. The second term represents the total suppression. The third term represents the Ab stimulation received by an Ag based on the affinity between them. As for the fourth term, k, it represents the mortality of an Ab [15]. N represents the number of Abs, while C represents the concentration of Ab within the network, and m represents affinity.
To model concentrations for antigens and antibodies, theoretical biology should be involved. According to Boer, population growth could be described by a classical logistic equation [16]. Therefore, in this research, antibody concentration could be modeled mathematically using equations 2 and 3:
(2)
(3)
,where is the initial concentration of the Ab
population, is the carrying capacity of the population,
and r is the natural rate of increase represented as the difference between the birth rate, b, and the death rate d.
The Ag population mathematical representation is in general similar to the Ab abovementioned representation. However, in this research, the Ag is not assumed to proliferate. Unlike the Ab concentration equation, it is expected that as t→∞ the Ag concentration will approach Zero ( →0). The
Ag concentration could be modeled mathematically using equation 4:
(4)
All the aforementioned relations and algorithms are going to be deployed in the investigation of the relations within the Artificial Idiotopic Immune Network. In the following section, we are going to present our findings regarding the interactions within a node in the network as well as the interactions within the overall network as a whole.
IV. RESULTS AND DISCUSSION
A. Investigating the overall number of interactions in a B-cell
node within the Network
As mentioned earlier, according to most of the research in the surveyed literature ranging from 2005 to 2013, there was no differentiation between P-Ep and P-I interactions within the network. In addition, most of the literature depicts the interaction within the node with all the node components present from .
Based on the augmentative interaction details shown in table 1, we find that the number of P-Ep interactions is going to be n, which is the number of antibodies in the network. On the other hand, we find that the number of P-I interactions is going
to be ( ) assuming that there is no repetition and that order
does not matter, see figures 5 and 6.
As illustrated in figure 7, by combining the number of P-Ep interactions, IP-Ep, and the number of P-I interactions, IP-I
,within the artificial idiotopic network on one graph we can arrive at the following observations:
1) The number of interactions, IP-Ep as well as IP-I, are
equal at n=3.
2) In addition, for n:03, IP-Ep interactions are greater
than IP-I interactions.
3) Conversely, for n>3, IP-I interactions are greater than
IP-Ep interactions.
4) By investigating the total number of interactions, IT ,
within the node, we find that:
( )
(5)
Ab2
Ag
B-Cell
Ab1
Ab1
B-Cell
Ag
Ab2
Ab3
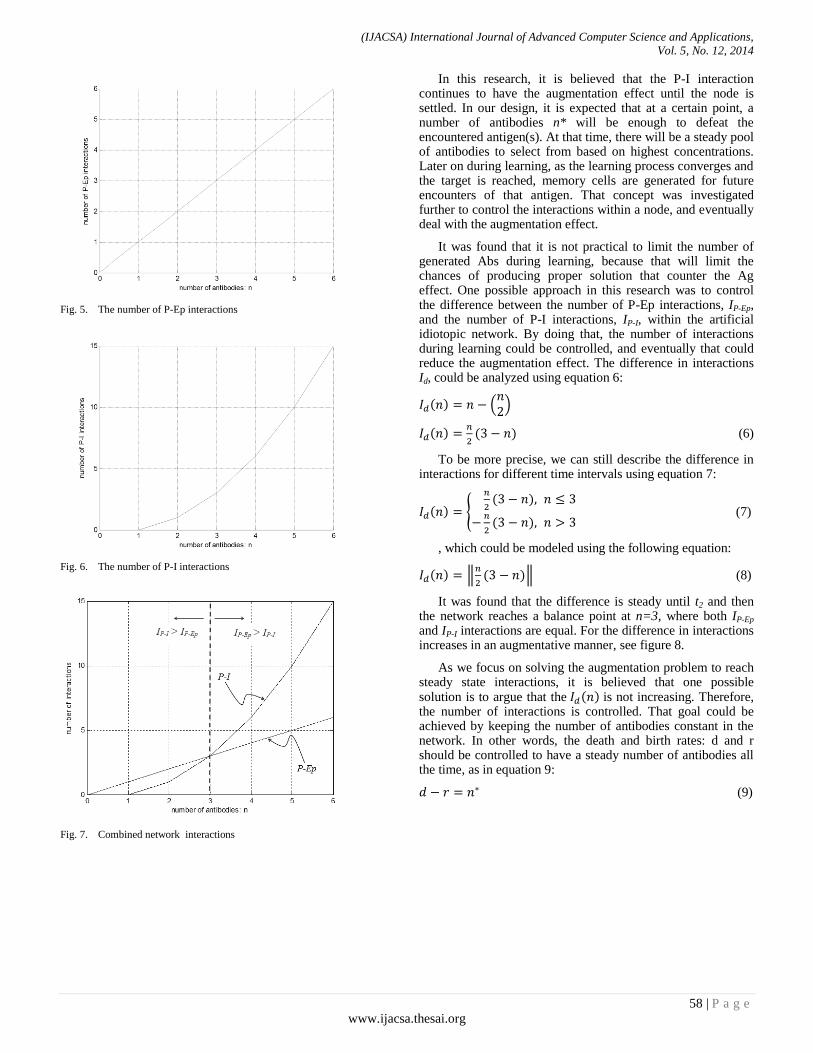
(IJACSA) International Journal of Advanced Computer Science and Applications,
Vol. 5, No. 12, 2014
58 | P a g e
www.ijacsa.thesai.org
Fig. 5. The number of P-Ep interactions
Fig. 6. The number of P-I interactions
Fig. 7. Combined network interactions
In this research, it is believed that the P-I interaction continues to have the augmentation effect until the node is settled. In our design, it is expected that at a certain point, a number of antibodies n* will be enough to defeat the encountered antigen(s). At that time, there will be a steady pool of antibodies to select from based on highest concentrations. Later on during learning, as the learning process converges and the target is reached, memory cells are generated for future encounters of that antigen. That concept was investigated further to control the interactions within a node, and eventually deal with the augmentation effect.
It was found that it is not practical to limit the number of generated Abs during learning, because that will limit the chances of producing proper solution that counter the Ag effect. One possible approach in this research was to control the difference between the number of P-Ep interactions, IP-Ep, and the number of P-I interactions, IP-I, within the artificial idiotopic network. By doing that, the number of interactions during learning could be controlled, and eventually that could reduce the augmentation effect. The difference in interactions Id, could be analyzed using equation 6:
( )
(6)
To be more precise, we can still describe the difference in interactions for different time intervals using equation 7:
{
(7)
, which could be modeled using the following equation:
‖
‖ (8)
It was found that the difference is steady until t2 and then the network reaches a balance point at n=3, where both IP-Ep and IP-I interactions are equal. For the difference in interactions increases in an augmentative manner, see figure 8.
As we focus on solving the augmentation problem to reach steady state interactions, it is believed that one possible solution is to argue that the is not increasing. Therefore, the number of interactions is controlled. That goal could be achieved by keeping the number of antibodies constant in the network. In other words, the death and birth rates: d and r should be controlled to have a steady number of antibodies all the time, as in equation 9:
(9)
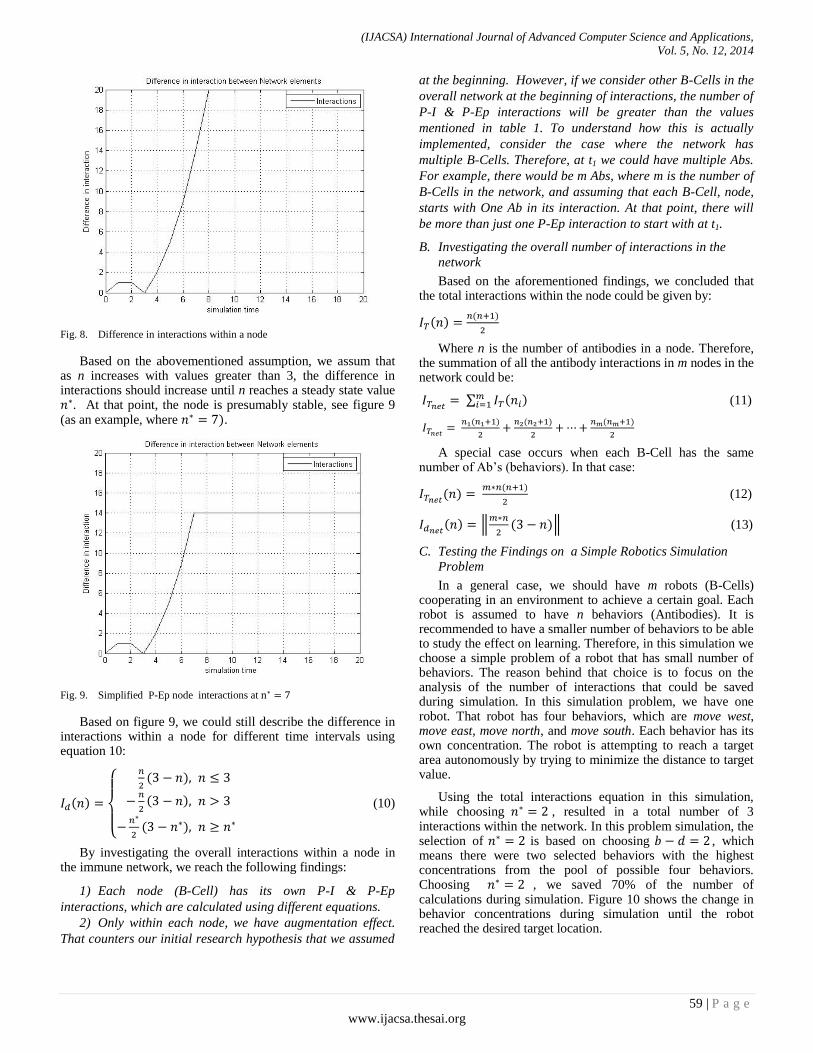
(IJACSA) International Journal of Advanced Computer Science and Applications,
Vol. 5, No. 12, 2014
59 | P a g e
www.ijacsa.thesai.org
Fig. 8. Difference in interactions within a node
Based on the abovementioned assumption, we assum that as n increases with values greater than 3, the difference in interactions should increase until n reaches a steady state value . At that point, the node is presumably stable, see figure 9 (as an example, where .
Fig. 9. Simplified P-Ep node interactions at
Based on figure 9, we could still describe the difference in interactions within a node for different time intervals using equation 10:
{
(10)
By investigating the overall interactions within a node in the immune network, we reach the following findings:
1) Each node (B-Cell) has its own P-I & P-Ep
interactions, which are calculated using different equations.
2) Only within each node, we have augmentation effect.
That counters our initial research hypothesis that we assumed
at the beginning. However, if we consider other B-Cells in the
overall network at the beginning of interactions, the number of
P-I & P-Ep interactions will be greater than the values
mentioned in table 1. To understand how this is actually
implemented, consider the case where the network has
multiple B-Cells. Therefore, at t1 we could have multiple Abs.
For example, there would be m Abs, where m is the number of
B-Cells in the network, and assuming that each B-Cell, node,
starts with One Ab in its interaction. At that point, there will
be more than just one P-Ep interaction to start with at t1.
B. Investigating the overall number of interactions in the
network
Based on the aforementioned findings, we concluded that the total interactions within the node could be given by:
Where n is the number of antibodies in a node. Therefore, the summation of all the antibody interactions in m nodes in the network could be:
∑
(11)
A special case occurs when each B-Cell has the same number of Ab’s (behaviors). In that case:
(12)
‖
‖ (13)
C. Testing the Findings on a Simple Robotics Simulation
Problem
In a general case, we should have m robots (B-Cells) cooperating in an environment to achieve a certain goal. Each robot is assumed to have n behaviors (Antibodies). It is recommended to have a smaller number of behaviors to be able to study the effect on learning. Therefore, in this simulation we choose a simple problem of a robot that has small number of behaviors. The reason behind that choice is to focus on the analysis of the number of interactions that could be saved during simulation. In this simulation problem, we have one robot. That robot has four behaviors, which are move west, move east, move north, and move south. Each behavior has its own concentration. The robot is attempting to reach a target area autonomously by trying to minimize the distance to target value.
Using the total interactions equation in this simulation, while choosing , resulted in a total number of 3 interactions within the network. In this problem simulation, the selection of is based on choosing , which means there were two selected behaviors with the highest concentrations from the pool of possible four behaviors. Choosing , we saved 70% of the number of calculations during simulation. Figure 10 shows the change in behavior concentrations during simulation until the robot reached the desired target location.
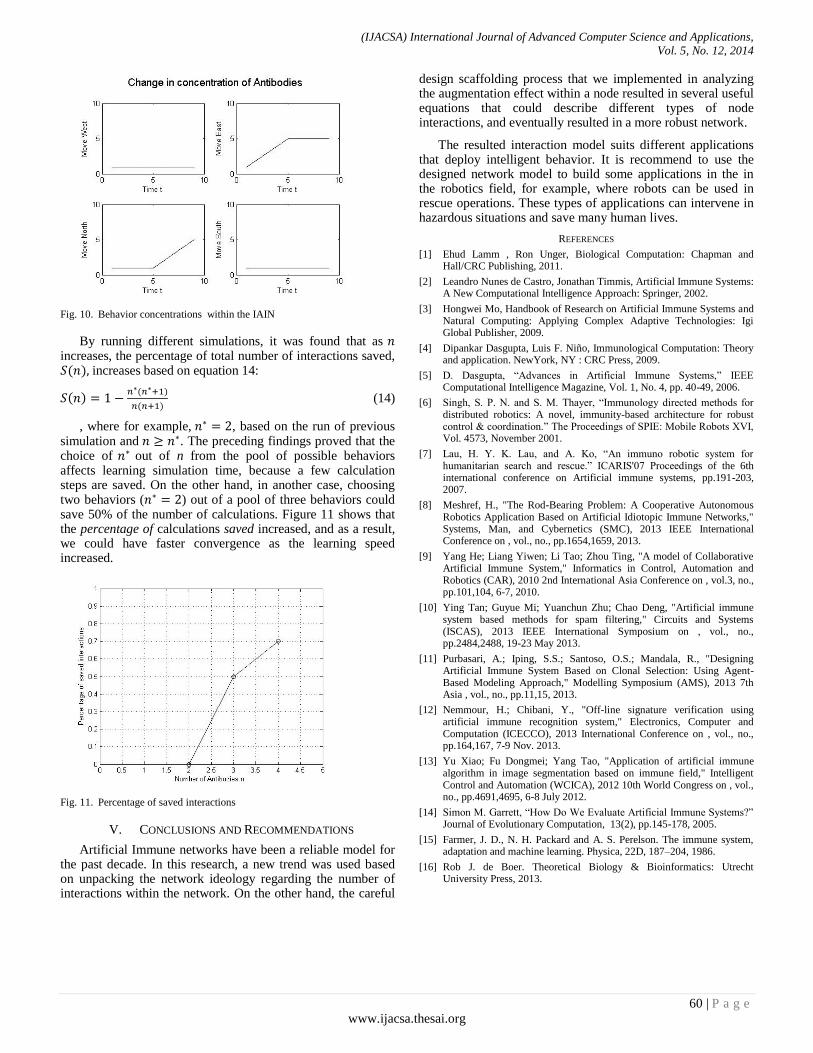
(IJACSA) International Journal of Advanced Computer Science and Applications,
Vol. 5, No. 12, 2014
60 | P a g e
www.ijacsa.thesai.org
Fig. 10. Behavior concentrations within the IAIN
By running different simulations, it was found that as increases, the percentage of total number of interactions saved, increases based on equation 14:
(14)
, where for example, , based on the run of previous simulation and . The preceding findings proved that the choice of out of n from the pool of possible behaviors affects learning simulation time, because a few calculation steps are saved. On the other hand, in another case, choosing two behaviors ( ) out of a pool of three behaviors could save 50% of the number of calculations. Figure 11 shows that the percentage of calculations saved increased, and as a result, we could have faster convergence as the learning speed increased.
Fig. 11. Percentage of saved interactions
V. CONCLUSIONS AND RECOMMENDATIONS
Artificial Immune networks have been a reliable model for the past decade. In this research, a new trend was used based on unpacking the network ideology regarding the number of interactions within the network. On the other hand, the careful
design scaffolding process that we implemented in analyzing the augmentation effect within a node resulted in several useful equations that could describe different types of node interactions, and eventually resulted in a more robust network.
The resulted interaction model suits different applications that deploy intelligent behavior. It is recommend to use the designed network model to build some applications in the in the robotics field, for example, where robots can be used in rescue operations. These types of applications can intervene in hazardous situations and save many human lives.
REFERENCES
[1] Ehud Lamm , Ron Unger, Biological Computation: Chapman and Hall/CRC Publishing, 2011.
[2] Leandro Nunes de Castro, Jonathan Timmis, Artificial Immune Systems: A New Computational Intelligence Approach: Springer, 2002.
[3] Hongwei Mo, Handbook of Research on Artificial Immune Systems and Natural Computing: Applying Complex Adaptive Technologies: Igi Global Publisher, 2009.
[4] Dipankar Dasgupta, Luis F. Niño, Immunological Computation: Theory and application. NewYork, NY : CRC Press, 2009.
[5] D. Dasgupta, “Advances in Artificial Immune Systems,” IEEE Computational Intelligence Magazine, Vol. 1, No. 4, pp. 40-49, 2006.
[6] Singh, S. P. N. and S. M. Thayer, “Immunology directed methods for distributed robotics: A novel, immunity-based architecture for robust control & coordination.” The Proceedings of SPIE: Mobile Robots XVI, Vol. 4573, November 2001.
[7] Lau, H. Y. K. Lau, and A. Ko, “An immuno robotic system for humanitarian search and rescue.” ICARIS'07 Proceedings of the 6th international conference on Artificial immune systems, pp.191-203, 2007.
[8] Meshref, H., "The Rod-Bearing Problem: A Cooperative Autonomous Robotics Application Based on Artificial Idiotopic Immune Networks," Systems, Man, and Cybernetics (SMC), 2013 IEEE International Conference on , vol., no., pp.1654,1659, 2013.
[9] Yang He; Liang Yiwen; Li Tao; Zhou Ting, "A model of Collaborative Artificial Immune System," Informatics in Control, Automation and Robotics (CAR), 2010 2nd International Asia Conference on , vol.3, no., pp.101,104, 6-7, 2010.
[10] Ying Tan; Guyue Mi; Yuanchun Zhu; Chao Deng, "Artificial immune system based methods for spam filtering," Circuits and Systems (ISCAS), 2013 IEEE International Symposium on , vol., no., pp.2484,2488, 19-23 May 2013.
[11] Purbasari, A.; Iping, S.S.; Santoso, O.S.; Mandala, R., "Designing Artificial Immune System Based on Clonal Selection: Using Agent-Based Modeling Approach," Modelling Symposium (AMS), 2013 7th Asia , vol., no., pp.11,15, 2013.
[12] Nemmour, H.; Chibani, Y., "Off-line signature verification using artificial immune recognition system," Electronics, Computer and Computation (ICECCO), 2013 International Conference on , vol., no., pp.164,167, 7-9 Nov. 2013.
[13] Yu Xiao; Fu Dongmei; Yang Tao, "Application of artificial immune algorithm in image segmentation based on immune field," Intelligent Control and Automation (WCICA), 2012 10th World Congress on , vol., no., pp.4691,4695, 6-8 July 2012.
[14] Simon M. Garrett, “How Do We Evaluate Artificial Immune Systems?” Journal of Evolutionary Computation, 13(2), pp.145-178, 2005.
[15] Farmer, J. D., N. H. Packard and A. S. Perelson. The immune system, adaptation and machine learning. Physica, 22D, 187–204, 1986.
[16] Rob J. de Boer. Theoretical Biology & Bioinformatics: Utrecht University Press, 2013.
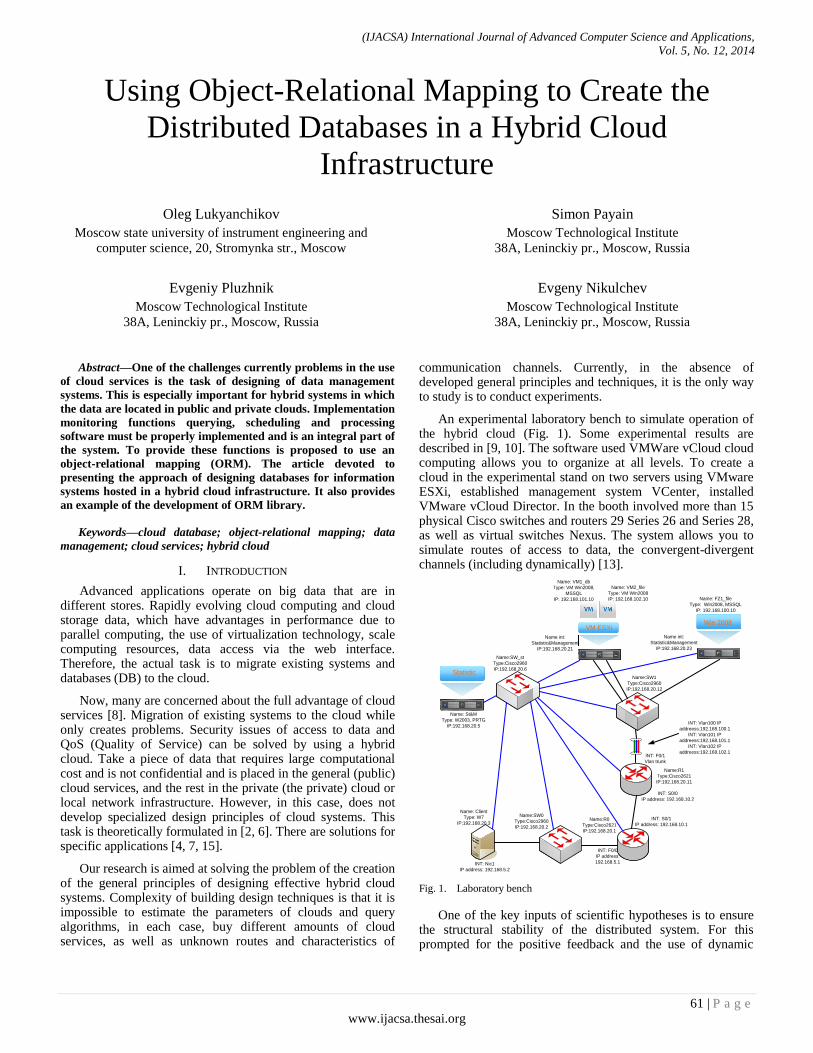
(IJACSA) International Journal of Advanced Computer Science and Applications,
Vol. 5, No. 12, 2014
61 | P a g e
www.ijacsa.thesai.org
Using Object-Relational Mapping to Create the
Distributed Databases in a Hybrid Cloud
Infrastructure
Oleg Lukyanchikov
Moscow state university of instrument engineering and
computer science, 20, Stromynka str., Moscow
Evgeniy Pluzhnik
Moscow Technological Institute
38A, Leninckiy pr., Moscow, Russia
Simon Payain
Moscow Technological Institute
38A, Leninckiy pr., Moscow, Russia
Evgeny Nikulchev
Moscow Technological Institute
38A, Leninckiy pr., Moscow, Russia
Abstract—One of the challenges currently problems in the use
of cloud services is the task of designing of data management
systems. This is especially important for hybrid systems in which
the data are located in public and private clouds. Implementation
monitoring functions querying, scheduling and processing
software must be properly implemented and is an integral part of
the system. To provide these functions is proposed to use an
object-relational mapping (ORM). The article devoted to
presenting the approach of designing databases for information
systems hosted in a hybrid cloud infrastructure. It also provides
an example of the development of ORM library.
Keywords—cloud database; object-relational mapping; data
management; cloud services; hybrid cloud
I. INTRODUCTION
Advanced applications operate on big data that are in different stores. Rapidly evolving cloud computing and cloud storage data, which have advantages in performance due to parallel computing, the use of virtualization technology, scale computing resources, data access via the web interface. Therefore, the actual task is to migrate existing systems and databases (DB) to the cloud.
Now, many are concerned about the full advantage of cloud services [8]. Migration of existing systems to the cloud while only creates problems. Security issues of access to data and QoS (Quality of Service) can be solved by using a hybrid cloud. Take a piece of data that requires large computational cost and is not confidential and is placed in the general (public) cloud services, and the rest in the private (the private) cloud or local network infrastructure. However, in this case, does not develop specialized design principles of cloud systems. This task is theoretically formulated in [2, 6]. There are solutions for specific applications [4, 7, 15].
Our research is aimed at solving the problem of the creation of the general principles of designing effective hybrid cloud systems. Complexity of building design techniques is that it is impossible to estimate the parameters of clouds and query algorithms, in each case, buy different amounts of cloud services, as well as unknown routes and characteristics of
communication channels. Currently, in the absence of developed general principles and techniques, it is the only way to study is to conduct experiments.
An experimental laboratory bench to simulate operation of the hybrid cloud (Fig. 1). Some experimental results are described in [9, 10]. The software used VMWare vCloud cloud computing allows you to organize at all levels. To create a cloud in the experimental stand on two servers using VMware ESXi, established management system VCenter, installed VMware vCloud Director. In the booth involved more than 15 physical Cisco switches and routers 29 Series 26 and Series 28, as well as virtual switches Nexus. The system allows you to simulate routes of access to data, the convergent-divergent channels (including dynamically) [13].
VM ESXiWin 2008
Name: VM1_db
Type: VM Win2008,
MSSQL
IP: 192.168.101.10
Name int:
Statistic&Management
IP:192.168.20.23
StatisticName:SW1
Type:Cisco2960
IP:192.168.20.12
Name: VM2_file
Type: VM Win2008
IP: 192.168.102.10 Name: FZ1_file
Type: Win2008, MSSQL
IP: 192.168.100.10
Name int:
Statistic&Management
IP:192.168.20.21
Name:R1
Type:Cisco2621
IP:192.168.20.11
Name:R0
Type:Cisco2621
IP:192.168.20.1
Name:SW0
Type:Cisco2960
IP:192.168.20.2
Name: Client
Type: W7
IP:192.168.20.3
Name: St&M
Type: W2003, PRTG
IP:192.168.20.5
Name:SW_st
Type:Cisco2960
IP:192.168.20.6
INT: S0/0
IP address: 192.168.10.2
INT: S0/1
IP address: 192.168.10.1
INT: F0/0
IP address:
192.168.5.1INT: Nic1
IP address: 192.168.5.2
INT: F0/1
Vlan trunk
INT: Vlan100 IP
addreess:192.168.100.1
INT: Vlan101 IP
addreess:192.168.101.1
INT: Vlan102 IP
addreess:192.168.102.1
Fig. 1. Laboratory bench
One of the key inputs of scientific hypotheses is to ensure the structural stability of the distributed system. For this prompted for the positive feedback and the use of dynamic
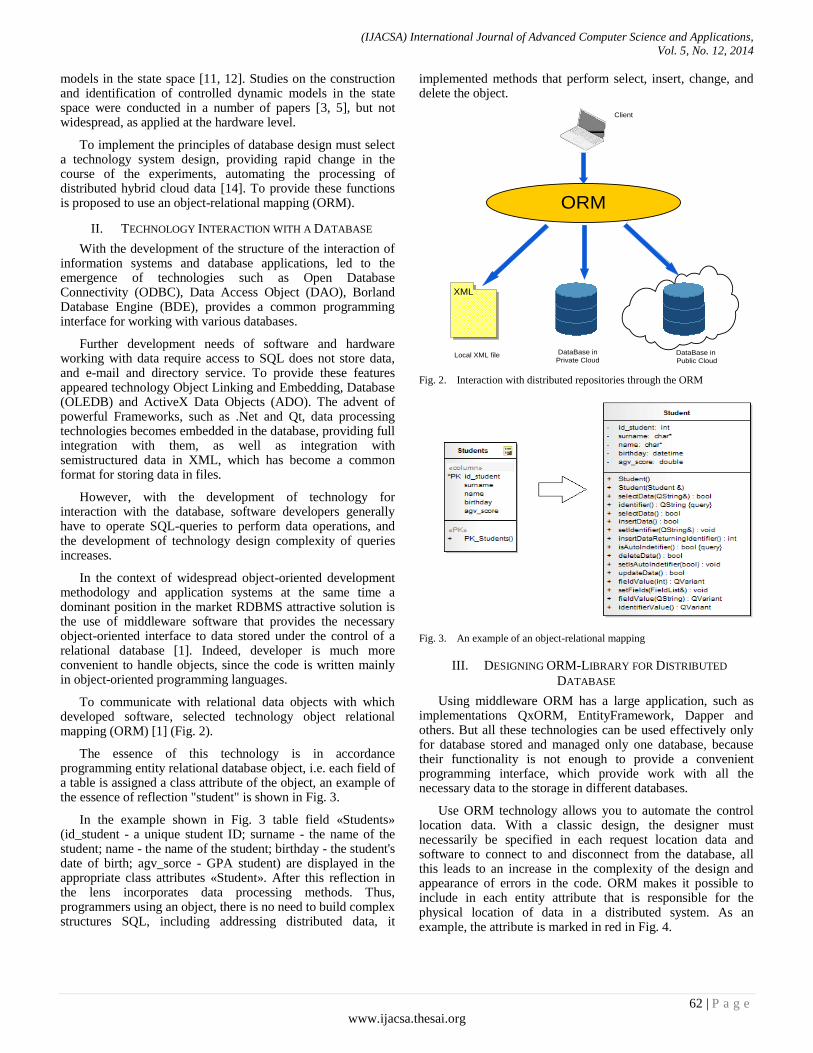
(IJACSA) International Journal of Advanced Computer Science and Applications,
Vol. 5, No. 12, 2014
62 | P a g e
www.ijacsa.thesai.org
models in the state space [11, 12]. Studies on the construction and identification of controlled dynamic models in the state space were conducted in a number of papers [3, 5], but not widespread, as applied at the hardware level.
To implement the principles of database design must select a technology system design, providing rapid change in the course of the experiments, automating the processing of distributed hybrid cloud data [14]. To provide these functions is proposed to use an object-relational mapping (ORM).
II. TECHNOLOGY INTERACTION WITH A DATABASE
With the development of the structure of the interaction of information systems and database applications, led to the emergence of technologies such as Open Database Connectivity (ODBC), Data Access Object (DAO), Borland Database Engine (BDE), provides a common programming interface for working with various databases.
Further development needs of software and hardware working with data require access to SQL does not store data, and e-mail and directory service. To provide these features appeared technology Object Linking and Embedding, Database (OLEDB) and ActiveX Data Objects (ADO). The advent of powerful Frameworks, such as .Net and Qt, data processing technologies becomes embedded in the database, providing full integration with them, as well as integration with semistructured data in XML, which has become a common format for storing data in files.
However, with the development of technology for interaction with the database, software developers generally have to operate SQL-queries to perform data operations, and the development of technology design complexity of queries increases.
In the context of widespread object-oriented development methodology and application systems at the same time a dominant position in the market RDBMS attractive solution is the use of middleware software that provides the necessary object-oriented interface to data stored under the control of a relational database [1]. Indeed, developer is much more convenient to handle objects, since the code is written mainly in object-oriented programming languages.
To communicate with relational data objects with which developed software, selected technology object relational mapping (ORM) [1] (Fig. 2).
The essence of this technology is in accordance programming entity relational database object, i.e. each field of a table is assigned a class attribute of the object, an example of the essence of reflection "student" is shown in Fig. 3.
In the example shown in Fig. 3 table field «Students» (id_student - a unique student ID; surname - the name of the student; name - the name of the student; birthday - the student's date of birth; agv_sorce - GPA student) are displayed in the appropriate class attributes «Student». After this reflection in the lens incorporates data processing methods. Thus, programmers using an object, there is no need to build complex structures SQL, including addressing distributed data, it
implemented methods that perform select, insert, change, and delete the object.
Fig. 2. Interaction with distributed repositories through the ORM
Fig. 3. An example of an object-relational mapping
III. DESIGNING ORM-LIBRARY FOR DISTRIBUTED
DATABASE
Using middleware ORM has a large application, such as implementations QxORM, EntityFramework, Dapper and others. But all these technologies can be used effectively only for database stored and managed only one database, because their functionality is not enough to provide a convenient programming interface, which provide work with all the necessary data to the storage in different databases.
Use ORM technology allows you to automate the control location data. With a classic design, the designer must necessarily be specified in each request location data and software to connect to and disconnect from the database, all this leads to an increase in the complexity of the design and appearance of errors in the code. ORM makes it possible to include in each entity attribute that is responsible for the physical location of data in a distributed system. As an example, the attribute is marked in red in Fig. 4.
Local XML file DataBase in
Private CloudDataBase in
Public Cloud
XML
Client
ORM
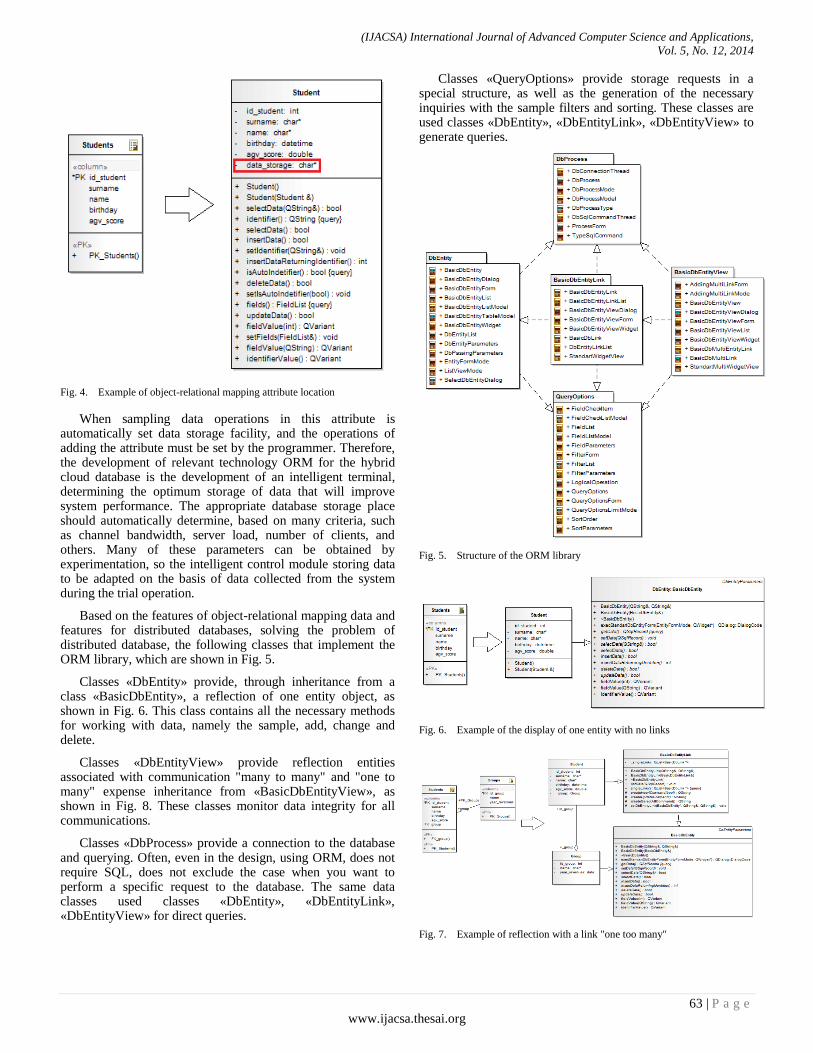
(IJACSA) International Journal of Advanced Computer Science and Applications,
Vol. 5, No. 12, 2014
63 | P a g e
www.ijacsa.thesai.org
Fig. 4. Example of object-relational mapping attribute location
When sampling data operations in this attribute is automatically set data storage facility, and the operations of adding the attribute must be set by the programmer. Therefore, the development of relevant technology ORM for the hybrid cloud database is the development of an intelligent terminal, determining the optimum storage of data that will improve system performance. The appropriate database storage place should automatically determine, based on many criteria, such as channel bandwidth, server load, number of clients, and others. Many of these parameters can be obtained by experimentation, so the intelligent control module storing data to be adapted on the basis of data collected from the system during the trial operation.
Based on the features of object-relational mapping data and features for distributed databases, solving the problem of distributed database, the following classes that implement the ORM library, which are shown in Fig. 5.
Classes «DbEntity» provide, through inheritance from a class «BasicDbEntity», a reflection of one entity object, as shown in Fig. 6. This class contains all the necessary methods for working with data, namely the sample, add, change and delete.
Classes «DbEntityView» provide reflection entities associated with communication "many to many" and "one to many" expense inheritance from «BasicDbEntityView», as shown in Fig. 8. These classes monitor data integrity for all communications.
Classes «DbProcess» provide a connection to the database and querying. Often, even in the design, using ORM, does not require SQL, does not exclude the case when you want to perform a specific request to the database. The same data classes used classes «DbEntity», «DbEntityLink», «DbEntityView» for direct queries.
Classes «QueryOptions» provide storage requests in a special structure, as well as the generation of the necessary inquiries with the sample filters and sorting. These classes are used classes «DbEntity», «DbEntityLink», «DbEntityView» to generate queries.
Fig. 5. Structure of the ORM library
Fig. 6. Example of the display of one entity with no links
Fig. 7. Example of reflection with a link "one too many"
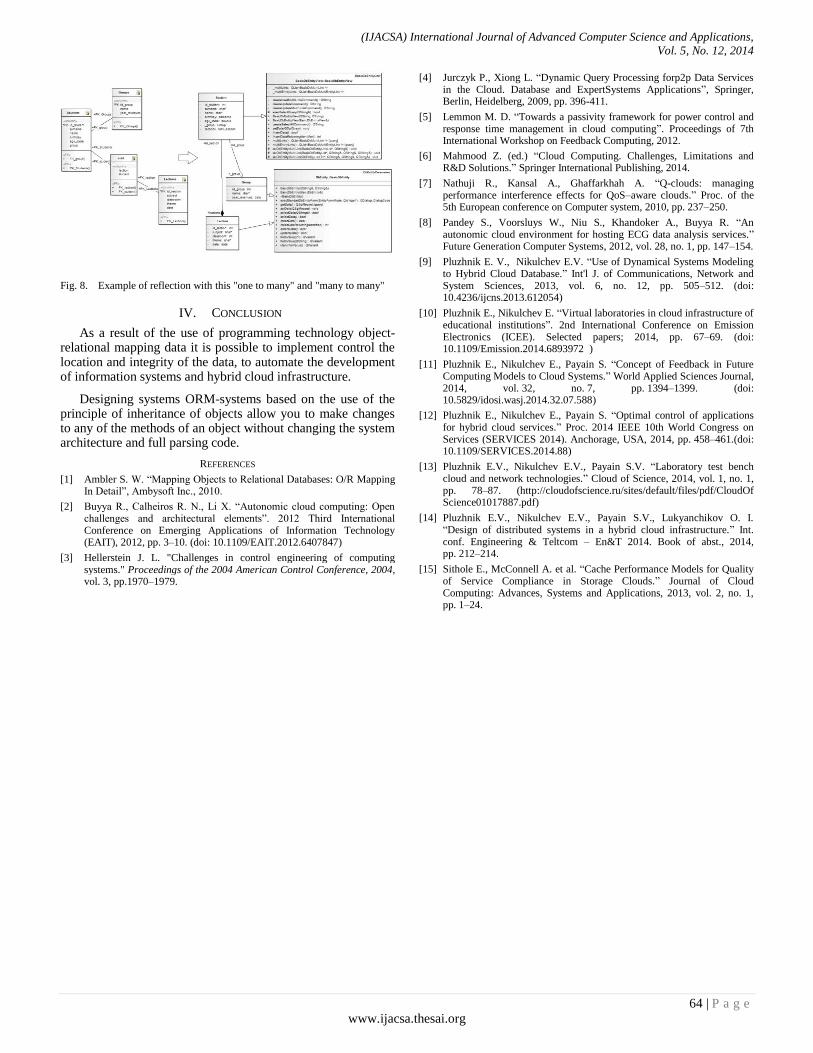
(IJACSA) International Journal of Advanced Computer Science and Applications,
Vol. 5, No. 12, 2014
64 | P a g e
www.ijacsa.thesai.org
Fig. 8. Example of reflection with this "one to many" and "many to many"
IV. CONCLUSION
As a result of the use of programming technology object-relational mapping data it is possible to implement control the location and integrity of the data, to automate the development of information systems and hybrid cloud infrastructure.
Designing systems ORM-systems based on the use of the principle of inheritance of objects allow you to make changes to any of the methods of an object without changing the system architecture and full parsing code.
REFERENCES
[1] Ambler S. W. “Mapping Objects to Relational Databases: O/R Mapping In Detail”, Ambysoft Inc., 2010.
[2] Buyya R., Calheiros R. N., Li X. “Autonomic cloud computing: Open challenges and architectural elements”. 2012 Third International Conference on Emerging Applications of Information Technology (EAIT), 2012, pp. 3–10. (doi: 10.1109/EAIT.2012.6407847)
[3] Hellerstein J. L. "Challenges in control engineering of computing systems." Proceedings of the 2004 American Control Conference, 2004, vol. 3, pp.1970–1979.
[4] Jurczyk P., Xiong L. “Dynamic Query Processing forp2p Data Services in the Cloud. Database and ExpertSystems Applications”, Springer, Berlin, Heidelberg, 2009, pp. 396-411.
[5] Lemmon M. D. “Towards a passivity framework for power control and response time management in cloud computing”. Proceedings of 7th International Workshop on Feedback Computing, 2012.
[6] Mahmood Z. (ed.) “Cloud Computing. Challenges, Limitations and R&D Solutions.” Springer International Publishing, 2014.
[7] Nathuji R., Kansal A., Ghaffarkhah A. “Q-clouds: managing performance interference effects for QoS–aware clouds.” Proc. of the 5th European conference on Computer system, 2010, pp. 237–250.
[8] Pandey S., Voorsluys W., Niu S., Khandoker A., Buyya R. “An autonomic cloud environment for hosting ECG data analysis services.” Future Generation Computer Systems, 2012, vol. 28, no. 1, pp. 147–154.
[9] Pluzhnik E. V., Nikulchev E.V. “Use of Dynamical Systems Modeling to Hybrid Cloud Database.” Int'l J. of Communications, Network and System Sciences, 2013, vol. 6, no. 12, pp. 505–512. (doi: 10.4236/ijcns.2013.612054)
[10] Pluzhnik E., Nikulchev E. “Virtual laboratories in cloud infrastructure of educational institutions”. 2nd International Conference on Emission Electronics (ICEE). Selected papers; 2014, pp. 67–69. (doi: 10.1109/Emission.2014.6893972 )
[11] Pluzhnik E., Nikulchev E., Payain S. “Concept of Feedback in Future Computing Models to Cloud Systems.” World Applied Sciences Journal, 2014, vol. 32, no. 7, pp. 1394–1399. (doi: 10.5829/idosi.wasj.2014.32.07.588)
[12] Pluzhnik E., Nikulchev E., Payain S. “Optimal control of applications for hybrid cloud services.” Proc. 2014 IEEE 10th World Congress on Services (SERVICES 2014). Anchorage, USA, 2014, pp. 458–461.(doi: 10.1109/SERVICES.2014.88)
[13] Pluzhnik E.V., Nikulchev E.V., Payain S.V. “Laboratory test bench cloud and network technologies.” Cloud of Science, 2014, vol. 1, no. 1, pp. 78–87. (http://cloudofscience.ru/sites/default/files/pdf/CloudOf Science01017887.pdf)
[14] Pluzhnik E.V., Nikulchev E.V., Payain S.V., Lukyanchikov O. I. “Design of distributed systems in a hybrid cloud infrastructure.” Int. conf. Engineering & Teltcom – En&T 2014. Book of abst., 2014, pp. 212–214.
[15] Sithole E., McConnell A. et al. “Cache Performance Models for Quality of Service Compliance in Storage Clouds.” Journal of Cloud Computing: Advances, Systems and Applications, 2013, vol. 2, no. 1, pp. 1–24.
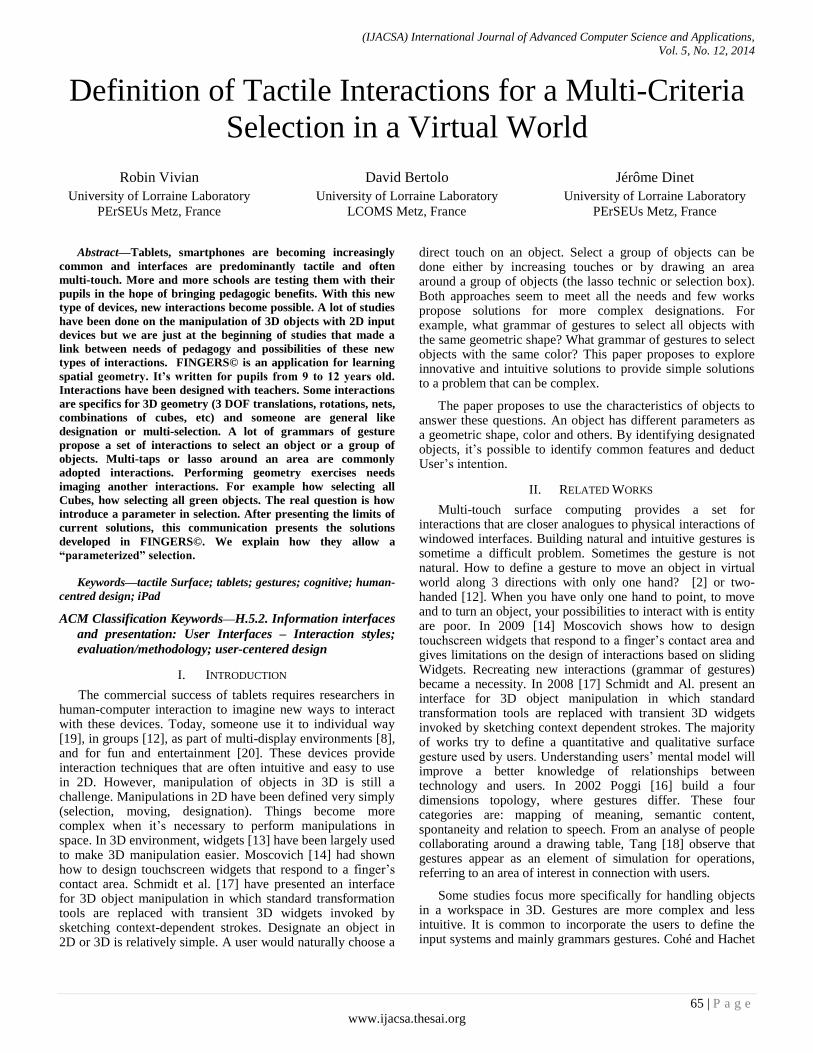
(IJACSA) International Journal of Advanced Computer Science and Applications,
Vol. 5, No. 12, 2014
65 | P a g e
www.ijacsa.thesai.org
Definition of Tactile Interactions for a Multi-Criteria
Selection in a Virtual World
Robin Vivian
University of Lorraine Laboratory
PErSEUs Metz, France
David Bertolo
University of Lorraine Laboratory
LCOMS Metz, France
Jérôme Dinet
University of Lorraine Laboratory
PErSEUs Metz, France
Abstract—Tablets, smartphones are becoming increasingly
common and interfaces are predominantly tactile and often
multi-touch. More and more schools are testing them with their
pupils in the hope of bringing pedagogic benefits. With this new
type of devices, new interactions become possible. A lot of studies
have been done on the manipulation of 3D objects with 2D input
devices but we are just at the beginning of studies that made a
link between needs of pedagogy and possibilities of these new
types of interactions. FINGERS© is an application for learning
spatial geometry. It’s written for pupils from 9 to 12 years old.
Interactions have been designed with teachers. Some interactions
are specifics for 3D geometry (3 DOF translations, rotations, nets,
combinations of cubes, etc) and someone are general like
designation or multi-selection. A lot of grammars of gesture
propose a set of interactions to select an object or a group of
objects. Multi-taps or lasso around an area are commonly
adopted interactions. Performing geometry exercises needs
imaging another interactions. For example how selecting all
Cubes, how selecting all green objects. The real question is how
introduce a parameter in selection. After presenting the limits of
current solutions, this communication presents the solutions
developed in FINGERS©. We explain how they allow a
“parameterized” selection.
Keywords—tactile Surface; tablets; gestures; cognitive; human-
centred design; iPad
ACM Classification Keywords—H.5.2. Information interfaces
and presentation: User Interfaces – Interaction styles;
evaluation/methodology; user-centered design
I. INTRODUCTION
The commercial success of tablets requires researchers in human-computer interaction to imagine new ways to interact with these devices. Today, someone use it to individual way [19], in groups [12], as part of multi-display environments [8], and for fun and entertainment [20]. These devices provide interaction techniques that are often intuitive and easy to use in 2D. However, manipulation of objects in 3D is still a challenge. Manipulations in 2D have been defined very simply (selection, moving, designation). Things become more complex when it’s necessary to perform manipulations in space. In 3D environment, widgets [13] have been largely used to make 3D manipulation easier. Moscovich [14] had shown how to design touchscreen widgets that respond to a finger’s contact area. Schmidt et al. [17] have presented an interface for 3D object manipulation in which standard transformation tools are replaced with transient 3D widgets invoked by sketching context-dependent strokes. Designate an object in 2D or 3D is relatively simple. A user would naturally choose a
direct touch on an object. Select a group of objects can be done either by increasing touches or by drawing an area around a group of objects (the lasso technic or selection box). Both approaches seem to meet all the needs and few works propose solutions for more complex designations. For example, what grammar of gestures to select all objects with the same geometric shape? What grammar of gestures to select objects with the same color? This paper proposes to explore innovative and intuitive solutions to provide simple solutions to a problem that can be complex.
The paper proposes to use the characteristics of objects to answer these questions. An object has different parameters as a geometric shape, color and others. By identifying designated objects, it’s possible to identify common features and deduct User’s intention.
II. RELATED WORKS
Multi-touch surface computing provides a set for interactions that are closer analogues to physical interactions of windowed interfaces. Building natural and intuitive gestures is sometime a difficult problem. Sometimes the gesture is not natural. How to define a gesture to move an object in virtual world along 3 directions with only one hand? [2] or two-handed [12]. When you have only one hand to point, to move and to turn an object, your possibilities to interact with is entity are poor. In 2009 [14] Moscovich shows how to design touchscreen widgets that respond to a finger’s contact area and gives limitations on the design of interactions based on sliding Widgets. Recreating new interactions (grammar of gestures) became a necessity. In 2008 [17] Schmidt and Al. present an interface for 3D object manipulation in which standard transformation tools are replaced with transient 3D widgets invoked by sketching context dependent strokes. The majority of works try to define a quantitative and qualitative surface gesture used by users. Understanding users’ mental model will improve a better knowledge of relationships between technology and users. In 2002 Poggi [16] build a four dimensions topology, where gestures differ. These four categories are: mapping of meaning, semantic content, spontaneity and relation to speech. From an analyse of people collaborating around a drawing table, Tang [18] observe that gestures appear as an element of simulation for operations, referring to an area of interest in connection with users.
Some studies focus more specifically for handling objects in a workspace in 3D. Gestures are more complex and less intuitive. It is common to incorporate the users to define the input systems and mainly grammars gestures. Cohé and Hachet
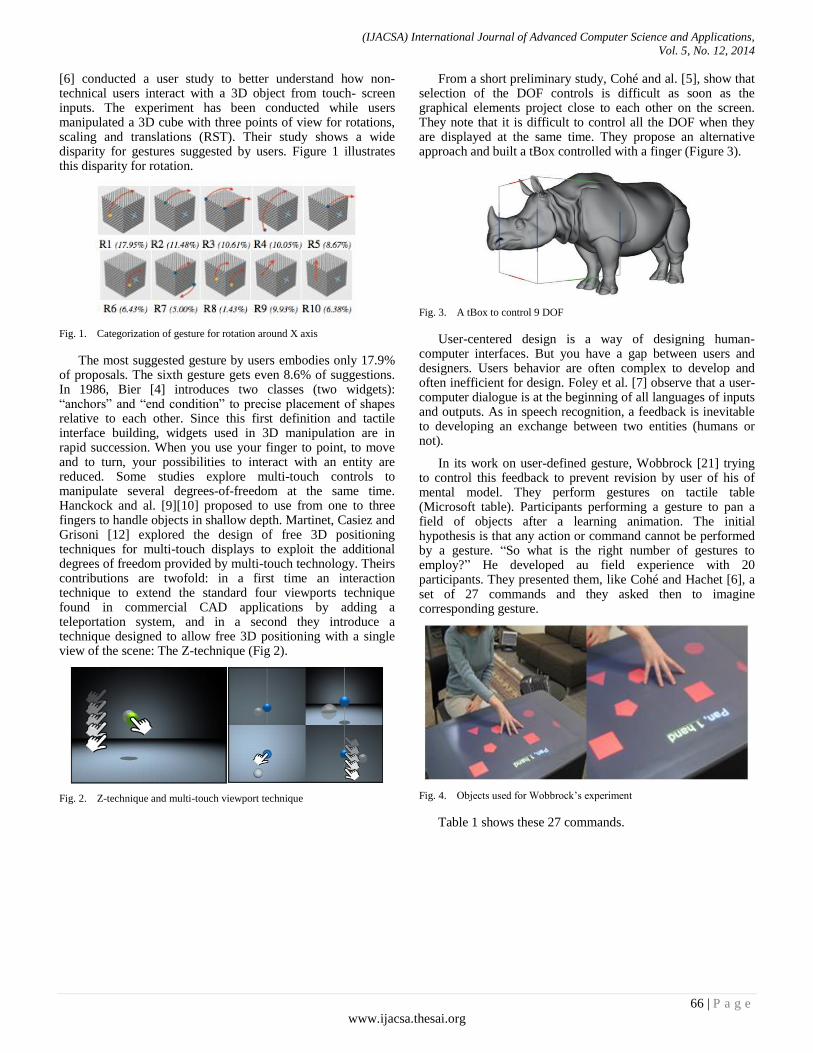
(IJACSA) International Journal of Advanced Computer Science and Applications,
Vol. 5, No. 12, 2014
66 | P a g e
www.ijacsa.thesai.org
[6] conducted a user study to better understand how non-technical users interact with a 3D object from touch- screen inputs. The experiment has been conducted while users manipulated a 3D cube with three points of view for rotations, scaling and translations (RST). Their study shows a wide disparity for gestures suggested by users. Figure 1 illustrates this disparity for rotation.
Fig. 1. Categorization of gesture for rotation around X axis
The most suggested gesture by users embodies only 17.9% of proposals. The sixth gesture gets even 8.6% of suggestions. In 1986, Bier [4] introduces two classes (two widgets): “anchors” and “end condition” to precise placement of shapes relative to each other. Since this first definition and tactile interface building, widgets used in 3D manipulation are in rapid succession. When you use your finger to point, to move and to turn, your possibilities to interact with an entity are reduced. Some studies explore multi-touch controls to manipulate several degrees-of-freedom at the same time. Hanckock and al. [9][10] proposed to use from one to three fingers to handle objects in shallow depth. Martinet, Casiez and Grisoni [12] explored the design of free 3D positioning techniques for multi-touch displays to exploit the additional degrees of freedom provided by multi-touch technology. Theirs contributions are twofold: in a first time an interaction technique to extend the standard four viewports technique found in commercial CAD applications by adding a teleportation system, and in a second they introduce a technique designed to allow free 3D positioning with a single view of the scene: The Z-technique (Fig 2).
Fig. 2. Z-technique and multi-touch viewport technique
From a short preliminary study, Cohé and al. [5], show that selection of the DOF controls is difficult as soon as the graphical elements project close to each other on the screen. They note that it is difficult to control all the DOF when they are displayed at the same time. They propose an alternative approach and built a tBox controlled with a finger (Figure 3).
Fig. 3. A tBox to control 9 DOF
User-centered design is a way of designing human-computer interfaces. But you have a gap between users and designers. Users behavior are often complex to develop and often inefficient for design. Foley et al. [7] observe that a user-computer dialogue is at the beginning of all languages of inputs and outputs. As in speech recognition, a feedback is inevitable to developing an exchange between two entities (humans or not).
In its work on user-defined gesture, Wobbrock [21] trying to control this feedback to prevent revision by user of his of mental model. They perform gestures on tactile table (Microsoft table). Participants performing a gesture to pan a field of objects after a learning animation. The initial hypothesis is that any action or command cannot be performed by a gesture. “So what is the right number of gestures to employ?” He developed au field experience with 20 participants. They presented them, like Cohé and Hachet [6], a set of 27 commands and they asked then to imagine corresponding gesture.
Fig. 4. Objects used for Wobbrock’s experiment
Table 1 shows these 27 commands.
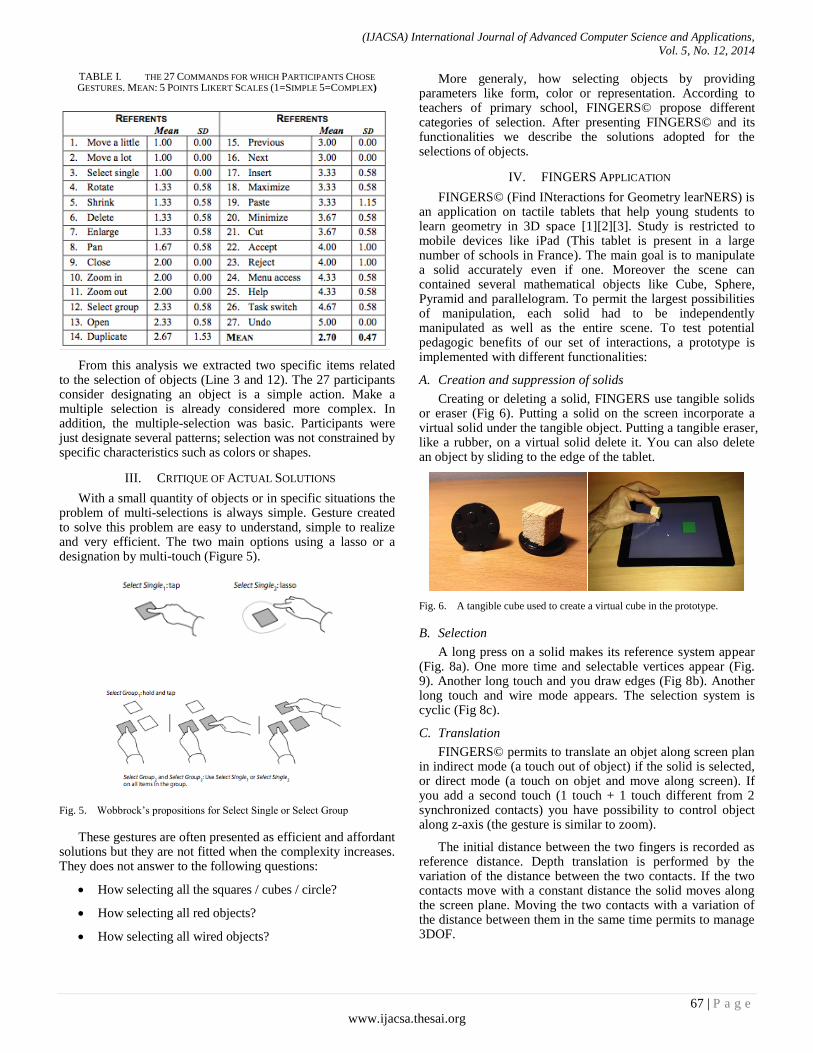
(IJACSA) International Journal of Advanced Computer Science and Applications,
Vol. 5, No. 12, 2014
67 | P a g e
www.ijacsa.thesai.org
TABLE I. THE 27 COMMANDS FOR WHICH PARTICIPANTS CHOSE
GESTURES. MEAN: 5 POINTS LIKERT SCALES (1=SIMPLE 5=COMPLEX)
From this analysis we extracted two specific items related to the selection of objects (Line 3 and 12). The 27 participants consider designating an object is a simple action. Make a multiple selection is already considered more complex. In addition, the multiple-selection was basic. Participants were just designate several patterns; selection was not constrained by specific characteristics such as colors or shapes.
III. CRITIQUE OF ACTUAL SOLUTIONS
With a small quantity of objects or in specific situations the problem of multi-selections is always simple. Gesture created to solve this problem are easy to understand, simple to realize and very efficient. The two main options using a lasso or a designation by multi-touch (Figure 5).
Fig. 5. Wobbrock’s propositions for Select Single or Select Group
These gestures are often presented as efficient and affordant solutions but they are not fitted when the complexity increases. They does not answer to the following questions:
How selecting all the squares / cubes / circle?
How selecting all red objects?
How selecting all wired objects?
More generaly, how selecting objects by providing parameters like form, color or representation. According to teachers of primary school, FINGERS© propose different categories of selection. After presenting FINGERS© and its functionalities we describe the solutions adopted for the selections of objects.
IV. FINGERS APPLICATION
FINGERS© (Find INteractions for Geometry learNERS) is an application on tactile tablets that help young students to learn geometry in 3D space [1][2][3]. Study is restricted to mobile devices like iPad (This tablet is present in a large number of schools in France). The main goal is to manipulate a solid accurately even if one. Moreover the scene can contained several mathematical objects like Cube, Sphere, Pyramid and parallelogram. To permit the largest possibilities of manipulation, each solid had to be independently manipulated as well as the entire scene. To test potential pedagogic benefits of our set of interactions, a prototype is implemented with different functionalities:
A. Creation and suppression of solids
Creating or deleting a solid, FINGERS use tangible solids or eraser (Fig 6). Putting a solid on the screen incorporate a virtual solid under the tangible object. Putting a tangible eraser, like a rubber, on a virtual solid delete it. You can also delete an object by sliding to the edge of the tablet.
Fig. 6. A tangible cube used to create a virtual cube in the prototype.
B. Selection
A long press on a solid makes its reference system appear (Fig. 8a). One more time and selectable vertices appear (Fig. 9). Another long touch and you draw edges (Fig 8b). Another long touch and wire mode appears. The selection system is cyclic (Fig 8c).
C. Translation
FINGERS© permits to translate an objet along screen plan in indirect mode (a touch out of object) if the solid is selected, or direct mode (a touch on objet and move along screen). If you add a second touch (1 touch + 1 touch different from 2 synchronized contacts) you have possibility to control object along z-axis (the gesture is similar to zoom).
The initial distance between the two fingers is recorded as reference distance. Depth translation is performed by the variation of the distance between the two contacts. If the two contacts move with a constant distance the solid moves along the screen plane. Moving the two contacts with a variation of the distance between them in the same time permits to manage 3DOF.
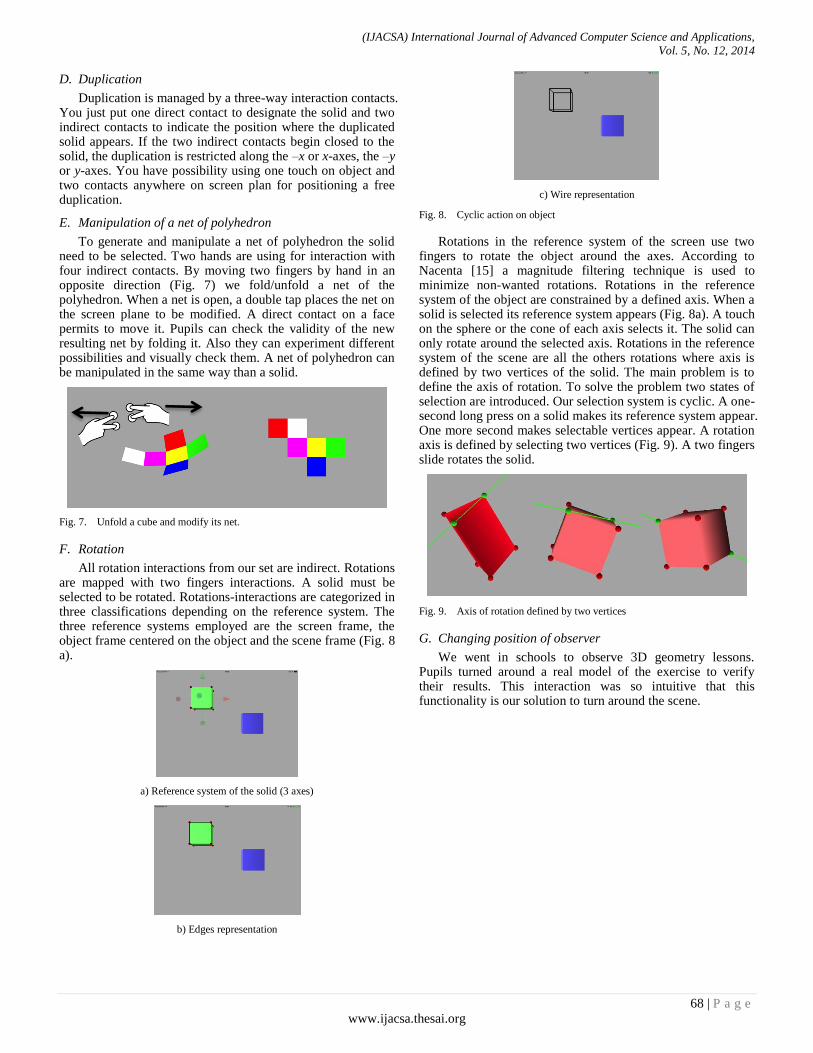
(IJACSA) International Journal of Advanced Computer Science and Applications,
Vol. 5, No. 12, 2014
68 | P a g e
www.ijacsa.thesai.org
D. Duplication
Duplication is managed by a three-way interaction contacts. You just put one direct contact to designate the solid and two indirect contacts to indicate the position where the duplicated solid appears. If the two indirect contacts begin closed to the solid, the duplication is restricted along the –x or x-axes, the –y or y-axes. You have possibility using one touch on object and two contacts anywhere on screen plan for positioning a free duplication.
E. Manipulation of a net of polyhedron
To generate and manipulate a net of polyhedron the solid need to be selected. Two hands are using for interaction with four indirect contacts. By moving two fingers by hand in an opposite direction (Fig. 7) we fold/unfold a net of the polyhedron. When a net is open, a double tap places the net on the screen plane to be modified. A direct contact on a face permits to move it. Pupils can check the validity of the new resulting net by folding it. Also they can experiment different possibilities and visually check them. A net of polyhedron can be manipulated in the same way than a solid.
Fig. 7. Unfold a cube and modify its net.
F. Rotation
All rotation interactions from our set are indirect. Rotations are mapped with two fingers interactions. A solid must be selected to be rotated. Rotations-interactions are categorized in three classifications depending on the reference system. The three reference systems employed are the screen frame, the object frame centered on the object and the scene frame (Fig. 8 a).
a) Reference system of the solid (3 axes)
b) Edges representation
c) Wire representation
Fig. 8. Cyclic action on object
Rotations in the reference system of the screen use two fingers to rotate the object around the axes. According to Nacenta [15] a magnitude filtering technique is used to minimize non-wanted rotations. Rotations in the reference system of the object are constrained by a defined axis. When a solid is selected its reference system appears (Fig. 8a). A touch on the sphere or the cone of each axis selects it. The solid can only rotate around the selected axis. Rotations in the reference system of the scene are all the others rotations where axis is defined by two vertices of the solid. The main problem is to define the axis of rotation. To solve the problem two states of selection are introduced. Our selection system is cyclic. A one-second long press on a solid makes its reference system appear. One more second makes selectable vertices appear. A rotation axis is defined by selecting two vertices (Fig. 9). A two fingers slide rotates the solid.
Fig. 9. Axis of rotation defined by two vertices
G. Changing position of observer
We went in schools to observe 3D geometry lessons. Pupils turned around a real model of the exercise to verify their results. This interaction was so intuitive that this functionality is our solution to turn around the scene.
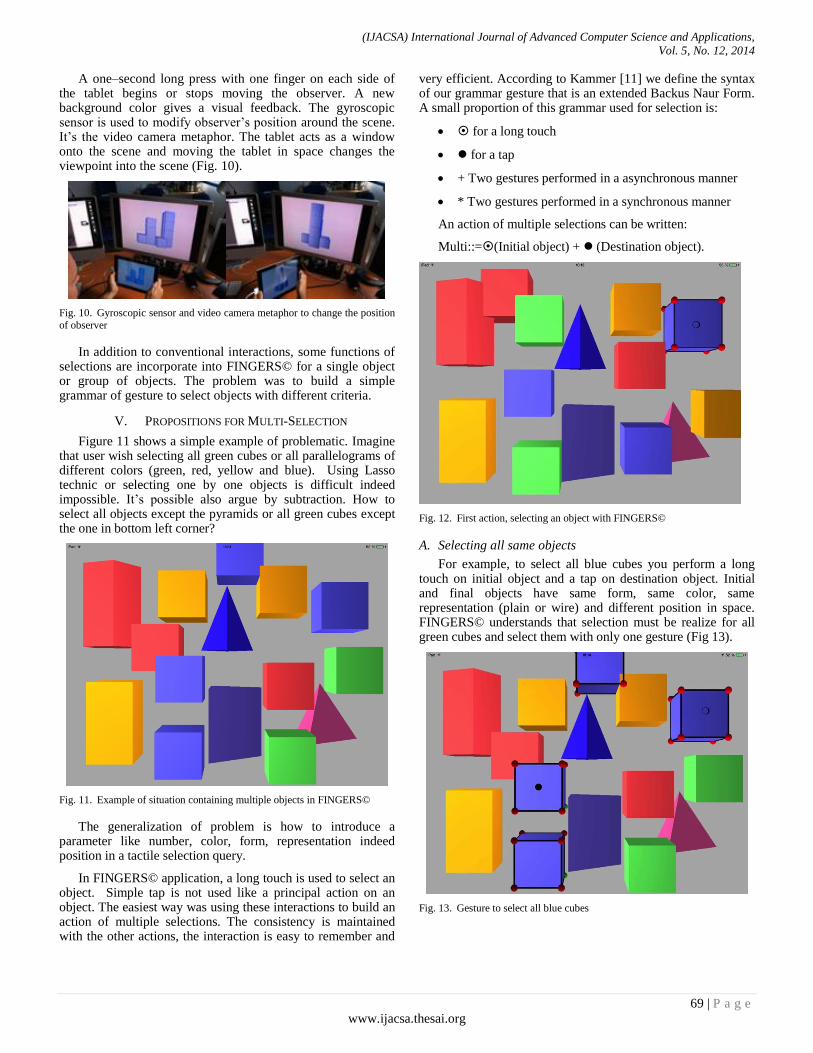
(IJACSA) International Journal of Advanced Computer Science and Applications,
Vol. 5, No. 12, 2014
69 | P a g e
www.ijacsa.thesai.org
A one–second long press with one finger on each side of the tablet begins or stops moving the observer. A new background color gives a visual feedback. The gyroscopic sensor is used to modify observer’s position around the scene. It’s the video camera metaphor. The tablet acts as a window onto the scene and moving the tablet in space changes the viewpoint into the scene (Fig. 10).
Fig. 10. Gyroscopic sensor and video camera metaphor to change the position
of observer
In addition to conventional interactions, some functions of selections are incorporate into FINGERS© for a single object or group of objects. The problem was to build a simple grammar of gesture to select objects with different criteria.
V. PROPOSITIONS FOR MULTI-SELECTION
Figure 11 shows a simple example of problematic. Imagine that user wish selecting all green cubes or all parallelograms of different colors (green, red, yellow and blue). Using Lasso technic or selecting one by one objects is difficult indeed impossible. It’s possible also argue by subtraction. How to select all objects except the pyramids or all green cubes except the one in bottom left corner?
Fig. 11. Example of situation containing multiple objects in FINGERS©
The generalization of problem is how to introduce a parameter like number, color, form, representation indeed position in a tactile selection query.
In FINGERS© application, a long touch is used to select an object. Simple tap is not used like a principal action on an object. The easiest way was using these interactions to build an action of multiple selections. The consistency is maintained with the other actions, the interaction is easy to remember and
very efficient. According to Kammer [11] we define the syntax of our grammar gesture that is an extended Backus Naur Form. A small proportion of this grammar used for selection is:
for a long touch
for a tap
+ Two gestures performed in a asynchronous manner
* Two gestures performed in a synchronous manner
An action of multiple selections can be written:
Multi::=(Initial object) + (Destination object).
Fig. 12. First action, selecting an object with FINGERS©
A. Selecting all same objects
For example, to select all blue cubes you perform a long touch on initial object and a tap on destination object. Initial and final objects have same form, same color, same representation (plain or wire) and different position in space. FINGERS© understands that selection must be realize for all green cubes and select them with only one gesture (Fig 13).
Fig. 13. Gesture to select all blue cubes
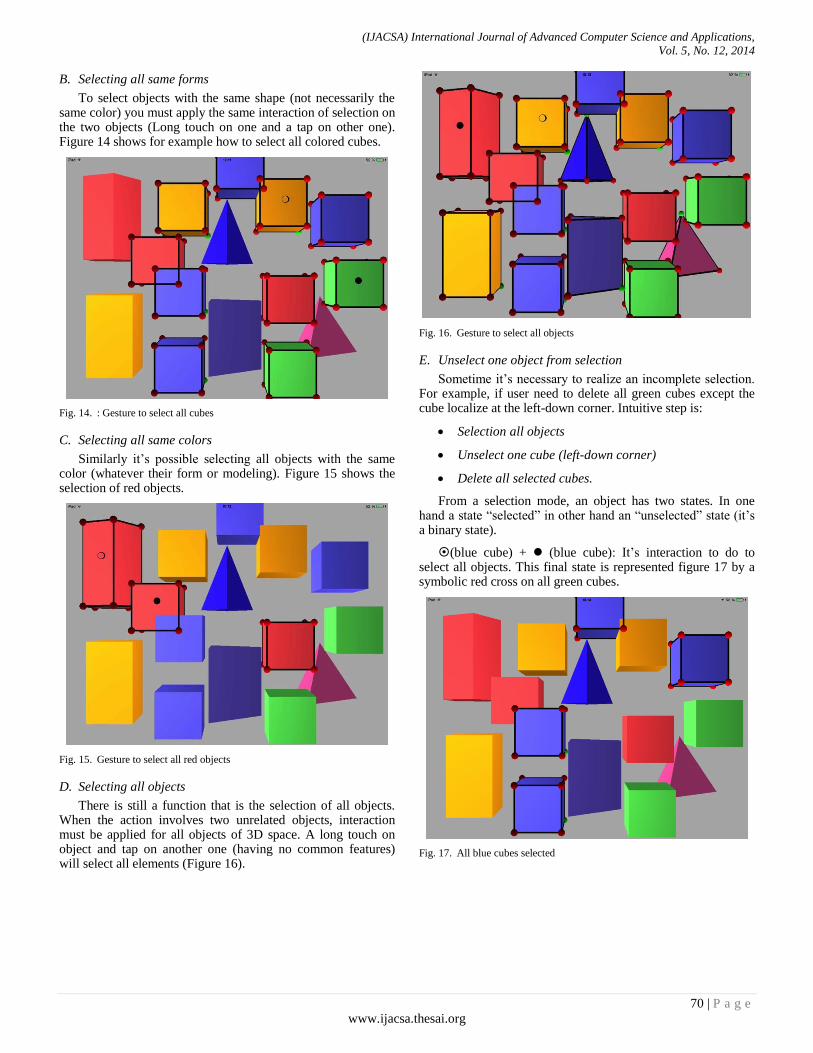
(IJACSA) International Journal of Advanced Computer Science and Applications,
Vol. 5, No. 12, 2014
70 | P a g e
www.ijacsa.thesai.org
B. Selecting all same forms
To select objects with the same shape (not necessarily the same color) you must apply the same interaction of selection on the two objects (Long touch on one and a tap on other one). Figure 14 shows for example how to select all colored cubes.
Fig. 14. : Gesture to select all cubes
C. Selecting all same colors
Similarly it’s possible selecting all objects with the same color (whatever their form or modeling). Figure 15 shows the selection of red objects.
Fig. 15. Gesture to select all red objects
D. Selecting all objects
There is still a function that is the selection of all objects. When the action involves two unrelated objects, interaction must be applied for all objects of 3D space. A long touch on object and tap on another one (having no common features) will select all elements (Figure 16).
Fig. 16. Gesture to select all objects
E. Unselect one object from selection
Sometime it’s necessary to realize an incomplete selection. For example, if user need to delete all green cubes except the cube localize at the left-down corner. Intuitive step is:
Selection all objects
Unselect one cube (left-down corner)
Delete all selected cubes.
From a selection mode, an object has two states. In one hand a state “selected” in other hand an “unselected” state (it’s a binary state).
(blue cube) + (blue cube): It’s interaction to do to select all objects. This final state is represented figure 17 by a symbolic red cross on all green cubes.
Fig. 17. All blue cubes selected
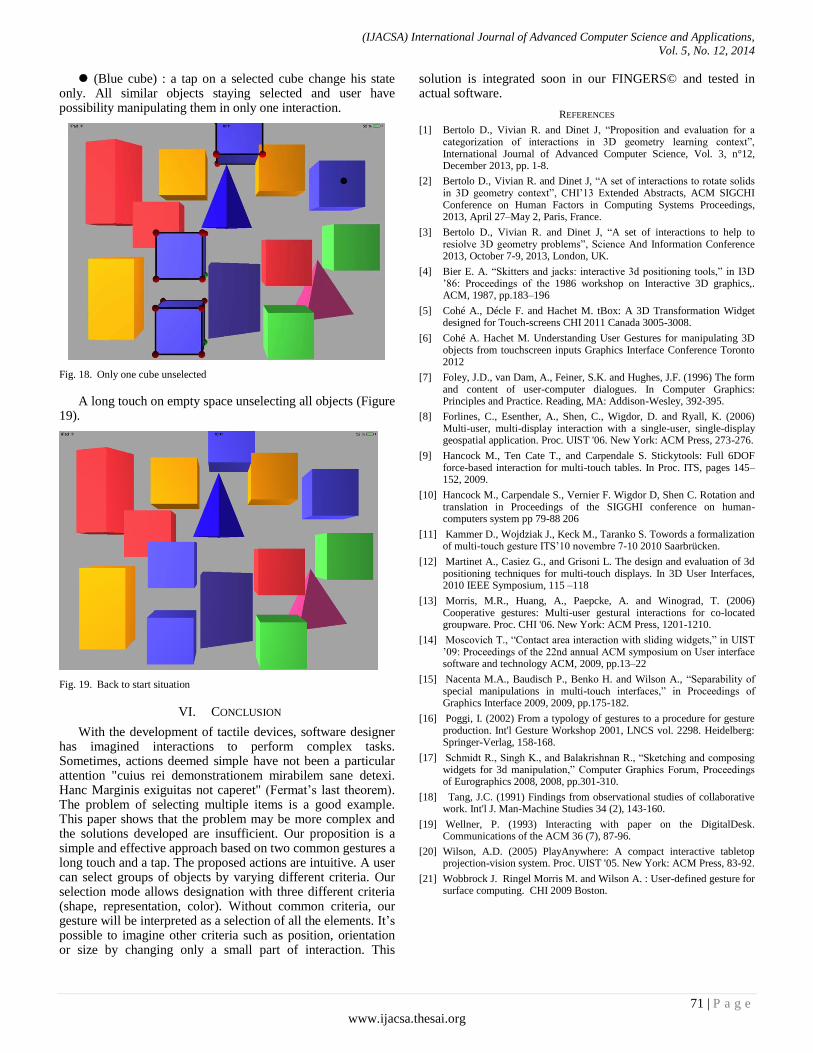
(IJACSA) International Journal of Advanced Computer Science and Applications,
Vol. 5, No. 12, 2014
71 | P a g e
www.ijacsa.thesai.org
(Blue cube) : a tap on a selected cube change his state only. All similar objects staying selected and user have possibility manipulating them in only one interaction.
Fig. 18. Only one cube unselected
A long touch on empty space unselecting all objects (Figure 19).
Fig. 19. Back to start situation
VI. CONCLUSION
With the development of tactile devices, software designer has imagined interactions to perform complex tasks. Sometimes, actions deemed simple have not been a particular attention "cuius rei demonstrationem mirabilem sane detexi. Hanc Marginis exiguitas not caperet" (Fermat’s last theorem). The problem of selecting multiple items is a good example. This paper shows that the problem may be more complex and the solutions developed are insufficient. Our proposition is a simple and effective approach based on two common gestures a long touch and a tap. The proposed actions are intuitive. A user can select groups of objects by varying different criteria. Our selection mode allows designation with three different criteria (shape, representation, color). Without common criteria, our gesture will be interpreted as a selection of all the elements. It’s possible to imagine other criteria such as position, orientation or size by changing only a small part of interaction. This
solution is integrated soon in our FINGERS© and tested in actual software.
REFERENCES
[1] Bertolo D., Vivian R. and Dinet J, “Proposition and evaluation for a categorization of interactions in 3D geometry learning context”, International Journal of Advanced Computer Science, Vol. 3, n°12, December 2013, pp. 1-8.
[2] Bertolo D., Vivian R. and Dinet J, “A set of interactions to rotate solids in 3D geometry context”, CHI’13 Extended Abstracts, ACM SIGCHI Conference on Human Factors in Computing Systems Proceedings, 2013, April 27–May 2, Paris, France.
[3] Bertolo D., Vivian R. and Dinet J, “A set of interactions to help to resiolve 3D geometry problems”, Science And Information Conference 2013, October 7-9, 2013, London, UK.
[4] Bier E. A. “Skitters and jacks: interactive 3d positioning tools,” in I3D ’86: Proceedings of the 1986 workshop on Interactive 3D graphics,. ACM, 1987, pp.183–196
[5] Cohé A., Décle F. and Hachet M. tBox: A 3D Transformation Widget designed for Touch-screens CHI 2011 Canada 3005-3008.
[6] Cohé A. Hachet M. Understanding User Gestures for manipulating 3D objects from touchscreen inputs Graphics Interface Conference Toronto 2012
[7] Foley, J.D., van Dam, A., Feiner, S.K. and Hughes, J.F. (1996) The form and content of user-computer dialogues. In Computer Graphics: Principles and Practice. Reading, MA: Addison-Wesley, 392-395.
[8] Forlines, C., Esenther, A., Shen, C., Wigdor, D. and Ryall, K. (2006) Multi-user, multi-display interaction with a single-user, single-display geospatial application. Proc. UIST '06. New York: ACM Press, 273-276.
[9] Hancock M., Ten Cate T., and Carpendale S. Stickytools: Full 6DOF force-based interaction for multi-touch tables. In Proc. ITS, pages 145–152, 2009.
[10] Hancock M., Carpendale S., Vernier F. Wigdor D, Shen C. Rotation and translation in Proceedings of the SIGGHI conference on human-computers system pp 79-88 206
[11] Kammer D., Wojdziak J., Keck M., Taranko S. Towords a formalization of multi-touch gesture ITS’10 novembre 7-10 2010 Saarbrücken.
[12] Martinet A., Casiez G., and Grisoni L. The design and evaluation of 3d positioning techniques for multi-touch displays. In 3D User Interfaces, 2010 IEEE Symposium, 115 –118
[13] Morris, M.R., Huang, A., Paepcke, A. and Winograd, T. (2006) Cooperative gestures: Multi-user gestural interactions for co-located groupware. Proc. CHI '06. New York: ACM Press, 1201-1210.
[14] Moscovich T., “Contact area interaction with sliding widgets,” in UIST ’09: Proceedings of the 22nd annual ACM symposium on User interface software and technology ACM, 2009, pp.13–22
[15] Nacenta M.A., Baudisch P., Benko H. and Wilson A., “Separability of special manipulations in multi-touch interfaces,” in Proceedings of Graphics Interface 2009, 2009, pp.175-182.
[16] Poggi, I. (2002) From a typology of gestures to a procedure for gesture production. Int'l Gesture Workshop 2001, LNCS vol. 2298. Heidelberg: Springer-Verlag, 158-168.
[17] Schmidt R., Singh K., and Balakrishnan R., “Sketching and composing widgets for 3d manipulation,” Computer Graphics Forum, Proceedings of Eurographics 2008, 2008, pp.301-310.
[18] Tang, J.C. (1991) Findings from observational studies of collaborative work. Int'l J. Man-Machine Studies 34 (2), 143-160.
[19] Wellner, P. (1993) Interacting with paper on the DigitalDesk. Communications of the ACM 36 (7), 87-96.
[20] Wilson, A.D. (2005) PlayAnywhere: A compact interactive tabletop projection-vision system. Proc. UIST '05. New York: ACM Press, 83-92.
[21] Wobbrock J. Ringel Morris M. and Wilson A. : User-defined gesture for surface computing. CHI 2009 Boston.

(IJACSA) International Journal of Advanced Computer Science and Applications,
Vol. 5, No. 12, 2014
72 | P a g e
www.ijacsa.thesai.org
Natural Language Processing and its Use in
Education
Dr. Khaled M. Alhawiti
Computer Science Department, Faculty of Computers and Information technology
Tabuk University, Tabuk, Saudi Arabia
Abstract—Natural Language Processing (NLP) is an effective
approach for bringing improvement in educational setting.
Implementing NLP involves initiating the process of learning
through the natural acquisition in the educational systems. It is
based on effective approaches for providing a solution for various
problems and issues in education. Natural Language Processing
provides solution in a variety of different fields associated with
the social and cultural context of language learning. It is an
effective approach for teachers, students, authors and educators
for providing assistance for writing, analysis, and assessment
procedures. Natural Language Processing is widely integrated
with the large number of educational contexts such as research,
science, linguistics, e-learning, evaluations system, and
contributes resulting positive outcomes in other educational
settings such as schools, higher education system, and
universities. The paper aims to address the process of natural
language learning and its implication in the educational settings.
The study also highlights how NLP can be utilized with scientific
computer programs to enhance the process of education. The
study follows qualitative approach. Data is collected from the
secondary resources in order to identify problems faced by the
teachers and students for understanding the context due to
obstacles of language. Results provide effectiveness of linguistic
tools such as grammar, syntax, and textual patterns that are
fairly productive in educational context for learning and
assessment.
Keywords—Natural Language Processing; education;
application; e-learning; scientific studies; educational system
I. INTRODUCTION
Natural language process is an effective process to assist students in the process of scientific learning. Implementing NLP in the educational setting not only helps in developing effective language process, but it is also significant for enhancing the academic performance. The NLP techniques follow the approach of the natural process of language acquisition integrated with the scientific approach of using computer programs.
A. Outline of the Study
This study is based on “Application of Natural Language Processing in Education”. The first section of this study will provide an “introduction” to the topic that discuss and define the background of natural language learning process. This part will also focus on the aims and objectives of the study. The second sections contain materials discussing the Natural language processing Arabic language and its implementation in the educational framework. Next section is comprised of procedure and method of the study, Material and methods
provide sufficient details to allow the work to be reproduced. Results provide detailed analysis of the data collected from the study. Discussion part of the study is comprised of detailed analysis and valuation of the results based on the data obtained from the research study. The last section of the study is conclusion, which is comprised of summary of the study and useful implementations and recommendations for further research.
B. BackGround of the Study
Natural language processing NLP is a major factor associated with the branch of science, which focus on the development and improvement in the process of learning. NLP provides theoretical grounds to assist in the process of developing techniques and effective approaches for providing assistance in the scientific learning by utilizing the effective theories and approaches. NLP can be effectively applied in the education for promoting the language learning and enhancing the academic performance of the students. [1] Natural language processing assists in developing effective process of learning in the educational setting by developing scientific approaches, which can assist in the process of using computer and internet for improvement the learning. In order to provide assistance, there are a number of different computer programs and effective language learning approaches to ensure that students can easily develop understanding of education in the natural settings. This is based on utilizing the effective and efficient language learning process in the natural settings [1]. NLP utilize the natural language process and utilize this process for developing effective approaches in order to bring improvement in the educational settings.
The approach in NLP is more focused on developing educational software systems and educational strategies that can assist in utilizing the natural languages for education, for example, e-rater and Text Adaptor [2]. The software systems with the NLP have the ability to identify the process of language learning in natural settings.
The Natural language processing is also an effective approach for developing an efficient system of managing linguistic input in the natural settings through various words, sentences, and texts. The Natural Language processing also use various grammatical rules and linguistic approaches such as derivations, infections, grammar tenses, semantic system, lexicon, corpus, morphemes, tenses etc. All these effective approaches can be applied in the educational settings in order to ensure that students can develop better understanding of the educational material and curriculum.
(IJACSA) International Journal of Advanced Computer Science and Applications,
Vol. 5, No. 12, 2014
73 | P a g e
www.ijacsa.thesai.org
Natural Language Processing is a widely recognized area in the language learning all over the world. It is successfully implemented in different languages as an effective way for bringing improvement in the educational systems. English is the most commonly recognized language in most of the researched studies, which reveals it’s effective of utilizing natural language learning process in educational process. NLP is also effective approach for bringing improvement in the educational system in Arab countries [3]. Despite that there are various approaches for bringing improvement in the social and educational settings; NLP is the best suitable approach, in which natural language processing use to create NLP tools to promote the education. These tools are based on utilizing various effective approaches for assisting in the process of education at college and university level. This requires developing the tools and corpus resources for the educational system in Arabic language.
C. Aims and Objectives
The major aims and objectives of this study is to
Understand the natural language learning processing.
The objective of this study is to apply the natural language processing NLP in educational setting.
II. MATERIAL AND METHODS
This study is based on qualitative approach. Method of data collection is based on gathering information from the secondary resources and analysis of the theories, which support and assist in understanding the natural language process and its implementation in the education. Various problems faced by the teachers and students for understanding the context due to obstacles of language. The use of effective linguistic tools such as grammar, syntax, and textual patterns are very effective for learning and assessment of text. The study is based on a qualitative approach. Method of data collection is based on gathering information from the secondary resources and analysis of the theories, which support and assist in understanding the natural language process and its implementation in the education. Various problems faced by the teachers and students for understanding the context due to obstacles of language. The use of effective linguistic tools such as grammar, syntax, and textual patterns are very effective for learning and assessment of text. [4]
A. NLP and Educational Setting
There are a number of different effective approaches in the NLP, which assist in educational settings such as role of empirical data, corpora, and other such linguistic aspects, which are essential and effective for the process of language learning. Corpora are very effective, which provides a large number of computational data for spoken and written language. For example, in British English, BNC (the British National Corpus) provides a large data about the vocabulary usage [4,5]. The large collection of information provides sufficient data regarding the usage of words, which assist enhancing the information and academic skills of the students.
There are various effective approaches, which are effective for managing patterns of grammar and other linguistic
approaches. NLP is also an effective technique for assessment process to enhance the ability of students to identify the relationships of different words and the use of such words in the search engine for generating treasure [5].Therefore; it is an effective approach, which allows learners and teachers to use these words more efficiently. The assessment procedure requires entering correct information in the text in order to enter in the next level. NLP assessment allows analysis of the students’ information by matching it with the requirement of the content [6].
B. Tools and Methods
Having access to a variety of tools, NLP enjoys the implementation in multiple fields such as laboratory, faculty of information, e-learning, and in the field of education. Availability of search engines also provide sufficient information for information search, but language constraints are a major issue for majority of students, which hinders the process of language learning through electronic sources and online material available on internet. The natural language learning processing is also associated with the understanding of various effective linguistic tools such as grammatical construction, syntax, sentence composition, etc [7].
The application of NLP in the area of e-learning is an effective approach, especially its application in the area of educations. The natural language processing can assist students in developing general understanding of the cognitive and psychological perspectives that play an important role in the language acquisition. In the educational process, natural language processing can be implemented effectively to ensure that there are various positive attributes of this approach such as specification of the synchronous or asynchronous mode. [8]
The methods for the implementation of NLP in education requires using the approach of e-learning or the utilization of teaching material for bringing improvement for further development [8,9].The method or the process of this study also requires implementation of the effective approaches and utilization of the language resources for bringing improvement in the system of education. There are also a large number of tools and methods, which assist in utilization of language technology such as linguistics software systems, which are very effective for managing and dealing with the need to bring improvement in the educational system [9].
The implementation of language tools can assist in developing better understanding of the content such as better understanding of material while reading, development of the reading text and material. There are two sides of the educational system: learning and teaching. Thus, tools for teaching and learning are both effective for assisting the process of educations such as websites, publications, digital libraries, e-books, podcasts, and scientific materials [10]. This is one of the most effective approaches, which allows students and teachers to focus and to explore more in the field of study. There are various effective methods to implement NLP in the educational settings such as classification and categorization of different sources in the learning perspectives. This can assist in identification of the authentic sources and avoiding the use of unreliable resources.

(IJACSA) International Journal of Advanced Computer Science and Applications,
Vol. 5, No. 12, 2014
74 | P a g e
www.ijacsa.thesai.org
Another method to assist language learners is through the process of enabling students to concentrate on their course material and content of the given topic. This approach is based on matching the course content knowledge of learners; this method is derived from the assessment procedure of NLP. For example, students can be asked to write an essay, which matches their curse content with the current information gathered from the online source. [11]
C. Theory
Reference [2] discussed emerging opportunities for bringing improvement in the natural language process NLP and its effectiveness for developing various educational tools such as for reading and writing content. According to Reference [2] NLP provides theoretical grounds and practical implementations for the technology based computer systems. Advancement of computer technology and the increase in approach of second language learning has resulted in the trend of using language as a major tool for providing assistance in the educational settings. According to Burstein, “the general lack of computer based technology proved to be an obstacle early on” [2].NLP allows the assessment of readability and text quality by analyzing the text quality especially n terms of the text analysis.
The linguistics aspects in the educational context can assist in managing and dealing with the complexities of reading and writing. This can be done with the approach of analyzing syntactic and morphological factors. Motivation in language learning is an effective approach, which can also be applied to enhance the educational practices and academic performance of students [12]. Teachers can motivate students to focus and develop understanding of their content; it also requires utilizing effective strategies for the students to set the programs in various domains. The linguistic tools assist in the process of evaluating and managing the problems of lexical and syntactic composition in writing and develop the understanding of content [13, 14]. Learning and developing better understanding of language can also assist in better understanding of the content. The theory of natural acquisition of language is also an effective approach to explain the ground for developing content knowledge acquisition.
III. RESULTS AND DISCUSSIONS
A. Innovatiove Education Applications of NLP
Text Evaluator also known as Source Rater is a trending tool that represent a trending concept for modeling text complexity, created to help assist developers assess source material for use in creation of new reading comprehension passages and items. This tool unites a large, cognitively based features set with sophisticated psychometric approaches in order to present text complexity categorizations that are highly associated with categorization provided by experienced educators.
Language Muse is another example educational application of NLP, using a web-based application for instructional authoring and projected to support K12 instructors in the creation of English-language learners’ curriculum material. The linguistic feedback given by this application highlights sentence structures, vocabulary, and discourse relations that
may be identified in classroom texts that may be unfamiliar to ELLs. Automated Generation of test items is another application towards the use of Natural Language Processing. [14]
B. Natural Language Processing and Edcation
Natural Language processing has various applications for educational purpose. It is very significant to develop new software systems and advanced techniques in the educational settings. The major purpose of using NLP in educational setting is to bring improvement in the educational system by implementing efficient and effective policies, which can assist in utilizing advance technologies for the bringing improvement in the educational system. For example, application of NLP in education for e-learning is very significant approach, which assist in producing educational material with technological development. Another significance of NLP application is the participation of both teachers and students. There are a number of various electronic, online sources available in English language, which assists students and teachers to access materials. Apart from the convenience of availability of large number of online resources, another major concern is associated with the increase in use of blogs, Wikipedia, and unreliable resources. This requires intelligent automatic processing for preventing the use of such unreliable resources and promoting the use of authentic resources. Application of NLP in education is also effective for mining, information retrieval, and quality assessment.
C. Relationship between Language and Text
Results based on the secondary sources and theoretical grounds reveal that text and technology have close relationships. Students cannot understand content without proper understanding of the language. Without understanding of language, it is not possible for the learners to understand and retain information. The process of natural language acquisition is one of the most important strategies that can assist in the process of language acquisition. The natural language acquisition process along with the motivation from teachers can serve as a major source for bringing improvement in the academic process of the students. Teachers and learners can both focus on the strategies, which are efficient for utilizing language in educational setting. For example, research studies reveal that context analysis is not possible without developing the understanding of text.
According to Reference [15] the implementation of natural language processing for education reveals that teachers and educators can follow NLP approach for designing and planning curriculum. This can also assists students to follow same strategic approach for learning and understanding the content. The authors of texts and content can use this approach for storing and coding the information for the students, and students follow same approach and linguistic composition for decoding the text. Therefore, knowledge of natural language process is effective for educators, teachers, authors, and students for better learning and understanding of the content, and improvement of writing skills. The results also suggest that this approach is effective for its application in the assisting students to study material from web resources, especially in the e-learning.
(IJACSA) International Journal of Advanced Computer Science and Applications,
Vol. 5, No. 12, 2014
75 | P a g e
www.ijacsa.thesai.org
D. Application of Natural Language Processing in Education
There are a number of different effective approaches, which assist in the process of e-learning and using web based current information related to the educational course and curriculum. E-learning applications and tools provide assistance for the learners to improve their education. Teachers also assist their students for enhancing their skills and knowledge for getting current information using the online resources, which assists in getting information from the online sources. NLP is also very effective for providing knowledge and information to the students for application of e-learning and NLP in understanding and dealing with the need of analyzing text. Understanding of text is based on the development of research-based analysis of the general and contextual learning.
Based on the research outcome, it is clear that students’ output can be increased by implementing the NLP in the education. NLP is very effective approach for developing the understanding of students in the natural settings and assessing the information available from the various sources. The better understanding of information and ability to access the information from large amount of data available on websites and other online sources can assist in generating and gathering information. Therefore, based on the results and effectiveness of NLP in the educational context, it is clear that NLP can be effectively applied for academic writing, assessment purposes, writing tests questions, and utilizing automatic writing systems for preparation of objective tests etc. [15]
The application of NLP in education system is also very effective for analysis of errors in objective assessments and for the assessment of essays. Various linguistic approaches and tools can be utilized for analyzing the errors such as grammatical and stylistic errors. Teachers can easily mark these errors in the papers of students. There are various effective grammar checkers and evaluation sources, which assist in resolving the problems of dealing with the current process of learning. Teachers can use NLP for assessment of multiple-choice questions and analysis of grammatical pattern in the text that needed to be analyzed. The application of Standard e-learning method is very effective in order to ensure that student can efficiently apply the data in the e-learning system. This approach is not only affective for its application in assessment, but it is also effective for writing purposes such as writing material for digital libraries, websites, and various other sources.
IV. CONCLUSIONS
In conclusion, Natural Language Processing and its Educational Application provide a perfect solution to the various problems and barriers in the educational system, which result in affecting the academic progress and learning of the students. Language is one of the major concerns for the students. NLP with an effective approach for assisting the progress and improvement in the learning ability of students based on development and implementation of various effective tools, assist writing, learning, and assessment of texts, such as use of search engines, electronic resources and analysis of grammatical construction, syntax, sentence composition, etc. All these are the effective techniques, which can be utilized to develop the structural framework for analysis of texts.
The use of grammar, syntax, and sentence composition can be efficiently utilized through linguistics software systems such as grammar checkers, which are saves times and provides assistance for both teachers and learners. Therefore, there is need for developing effective approach for the social and cultural perspectives. Implementation of NLP is also effective for using the e-learning approach in order to understand and learn from the data available from the electronic sources. There are also future implementations of this research, which can assists in identifying the complex pattern in language. Further research can be conducted to identify its impact in individual learning, understanding of context, and effectiveness of NLP in writing and assessment procedure.
REFERENCES
[1] Nadkarni, P. M., Ohno-Machado, L., & Chapman, W. W. (2011). Natural language processing: an introduction. Journal of the American Medical Informatics Association, 18(5), 544-551
[2] Burstein, J. (2009). Opportunities for natural language processing research in education. In Computational Linguistics and Intelligent Text Processing (pp. 6-27). Springer Berlin Heidelberg. http://link.springer.com/chapter/10.1007/978-3-642-00382-0_2#page-1
[3] Habash, N. Y. (2010). Introduction to Arabic natural language processing.Synthesis Lectures on Human Language Technologies, 3(1), 1-187. http://www.morganclaypool.com/doi/abs/10.2200/s00277ed1v01y201008hlt010
[4] Liu, K., Hogan, W. R., & Crowley, R. S. (2011). Natural language processing methods and systems for biomedical ontology learning. Journal of biomedical informatics, 44(1), 163-179.
[5] De Vries, M. H., Monaghan, P., Knecht, S., & Zwitserlood, P. (2008). Syntactic structure and artificial grammar learning: The learnability of embedded hierarchical structures. Cognition, 107(2), 763-774. http://dl.acm.org/citation.cfm?id=1967546
[6] Pascual-Nieto, I., Santos, O. C., Perez-Marin, D., & Boticario, J. G. (2011, July). Extending Computer Assisted Assessment Systems with Natural Language Processing, User Modeling, and Recommendations Based on Human Computer Interaction and Data Mining. In IJCAI Proceedings-International Joint Conference on Artificial Intelligence (Vol. 22, No. 3, p. 2519).
[7] Wahl, H., Winiwarter, W., & Quirchmayr, G. (2010, November). Natural language processing technologies for developing a language learning environment. In Proceedings of the 12th International Conference on Information Integration and Web-based Applications & Services (pp. 381-388). ACM.
[8] de-la-Fuente-Valentín, L., Carrasco, A., Konya, K., & Burgos, D. (2013). Emerging Technologies Landscape on Education. A review. International Jorunal of Interactive Multimedia and Artificial Intelligence, 2(3), 55-70. http://dialnet.unirioja.es/descarga/articulo/4426252.pdf
[9] Felix, U. (2005). E-learning pedagogy in the third millennium: the need for combining social and cognitive constructivist approaches. ReCALL, 17(01), 85-100. http://journals.cambridge.org/action/displayAbstract?fromPage=online&aid=305554&fileId=S0958344005000716
[10] Benson, P. (2013). Teaching and researching: Autonomy in language learning. Routledge. http://books.google.com/books?id=ZoarAgAAQBAJ&printsec=frontcover
[11] Castellani, S., Kaplan, A., Roulland, F., & Roux, C. (2010). U.S. Patent No. 7,797,303. Washington, DC: U.S. Patent and Trademark Office. http://www.google.com/patents/US7797303
[12] Shi, C., Verhagen, M., & Pustejovsky, J. (2014). A Conceptual Framework of Online Natural Language Processing Pipeline Application. COLING 2014, 53. http://www.aclweb.org/anthology/W/W14/W14-52.pdf#page=63

(IJACSA) International Journal of Advanced Computer Science and Applications,
Vol. 5, No. 12, 2014
76 | P a g e
www.ijacsa.thesai.org
[13] Najeeb, M. M., Abdelkader, A. A., & Al-Zghoul, M. B. (2014). Arabic Natural Language Processing Laboratory serving Islamic Sciences. International Journal. http://thesai.org/Downloads/Volume5No3/Paper_16-Arabic_Natural_Language_Processing_Laboratory_serving_Islamic_Sciences.pdf
[14] Richards JC, Rodgers T (2001) Approaches and Methods in Language Teaching. Second Edition. New York: Cambridge University Press
[15] Van den Branden (2012) Task-based language education. In: Burns A, Richards JC, The Cambridge Guide to Pedagogy and Practice in Language Teaching. New York: Cambridge University Press, 140–48.
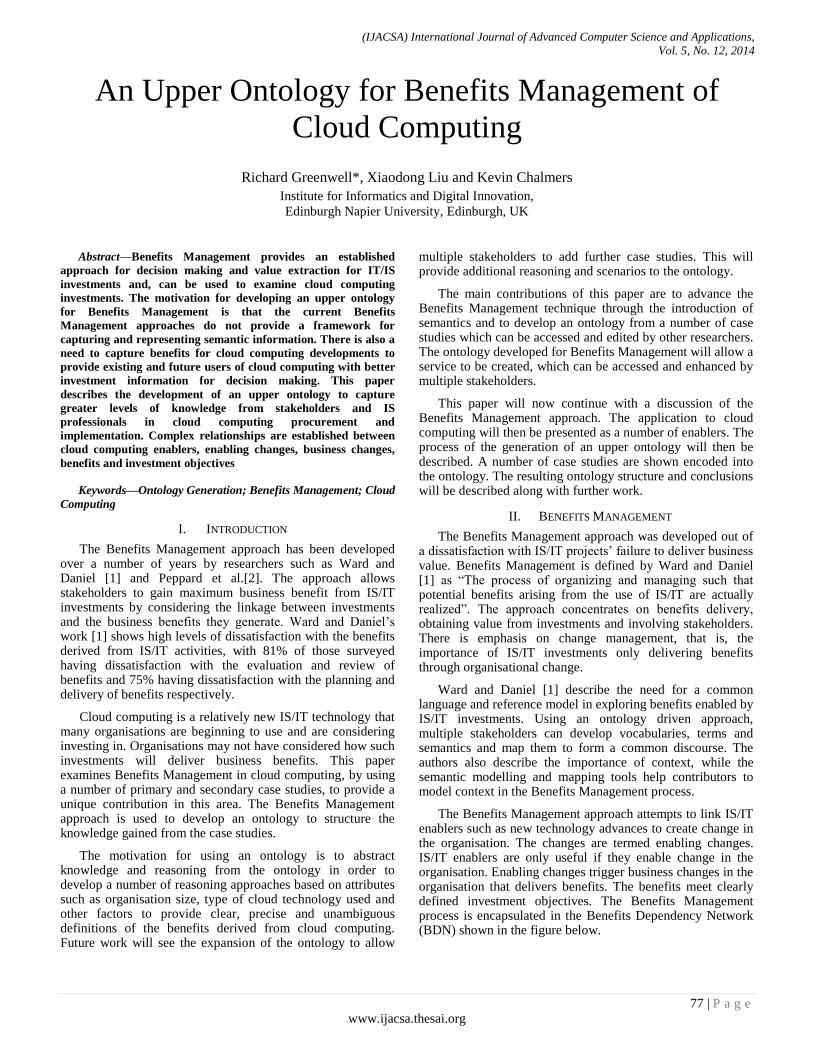
(IJACSA) International Journal of Advanced Computer Science and Applications,
Vol. 5, No. 12, 2014
77 | P a g e
www.ijacsa.thesai.org
An Upper Ontology for Benefits Management of
Cloud Computing
Richard Greenwell*, Xiaodong Liu and Kevin Chalmers
Institute for Informatics and Digital Innovation,
Edinburgh Napier University, Edinburgh, UK
Abstract—Benefits Management provides an established
approach for decision making and value extraction for IT/IS
investments and, can be used to examine cloud computing
investments. The motivation for developing an upper ontology
for Benefits Management is that the current Benefits
Management approaches do not provide a framework for
capturing and representing semantic information. There is also a
need to capture benefits for cloud computing developments to
provide existing and future users of cloud computing with better
investment information for decision making. This paper
describes the development of an upper ontology to capture
greater levels of knowledge from stakeholders and IS
professionals in cloud computing procurement and
implementation. Complex relationships are established between
cloud computing enablers, enabling changes, business changes,
benefits and investment objectives
Keywords—Ontology Generation; Benefits Management; Cloud
Computing
I. INTRODUCTION
The Benefits Management approach has been developed over a number of years by researchers such as Ward and Daniel [1] and Peppard et al.[2]. The approach allows stakeholders to gain maximum business benefit from IS/IT investments by considering the linkage between investments and the business benefits they generate. Ward and Daniel‟s work [1] shows high levels of dissatisfaction with the benefits derived from IS/IT activities, with 81% of those surveyed having dissatisfaction with the evaluation and review of benefits and 75% having dissatisfaction with the planning and delivery of benefits respectively.
Cloud computing is a relatively new IS/IT technology that many organisations are beginning to use and are considering investing in. Organisations may not have considered how such investments will deliver business benefits. This paper examines Benefits Management in cloud computing, by using a number of primary and secondary case studies, to provide a unique contribution in this area. The Benefits Management approach is used to develop an ontology to structure the knowledge gained from the case studies.
The motivation for using an ontology is to abstract knowledge and reasoning from the ontology in order to develop a number of reasoning approaches based on attributes such as organisation size, type of cloud technology used and other factors to provide clear, precise and unambiguous definitions of the benefits derived from cloud computing. Future work will see the expansion of the ontology to allow
multiple stakeholders to add further case studies. This will provide additional reasoning and scenarios to the ontology.
The main contributions of this paper are to advance the Benefits Management technique through the introduction of semantics and to develop an ontology from a number of case studies which can be accessed and edited by other researchers. The ontology developed for Benefits Management will allow a service to be created, which can be accessed and enhanced by multiple stakeholders.
This paper will now continue with a discussion of the Benefits Management approach. The application to cloud computing will then be presented as a number of enablers. The process of the generation of an upper ontology will then be described. A number of case studies are shown encoded into the ontology. The resulting ontology structure and conclusions will be described along with further work.
II. BENEFITS MANAGEMENT
The Benefits Management approach was developed out of a dissatisfaction with IS/IT projects‟ failure to deliver business value. Benefits Management is defined by Ward and Daniel [1] as “The process of organizing and managing such that potential benefits arising from the use of IS/IT are actually realized”. The approach concentrates on benefits delivery, obtaining value from investments and involving stakeholders. There is emphasis on change management, that is, the importance of IS/IT investments only delivering benefits through organisational change.
Ward and Daniel [1] describe the need for a common language and reference model in exploring benefits enabled by IS/IT investments. Using an ontology driven approach, multiple stakeholders can develop vocabularies, terms and semantics and map them to form a common discourse. The authors also describe the importance of context, while the semantic modelling and mapping tools help contributors to model context in the Benefits Management process.
The Benefits Management approach attempts to link IS/IT enablers such as new technology advances to create change in the organisation. The changes are termed enabling changes. IS/IT enablers are only useful if they enable change in the organisation. Enabling changes trigger business changes in the organisation that delivers benefits. The benefits meet clearly defined investment objectives. The Benefits Management process is encapsulated in the Benefits Dependency Network (BDN) shown in the figure below.
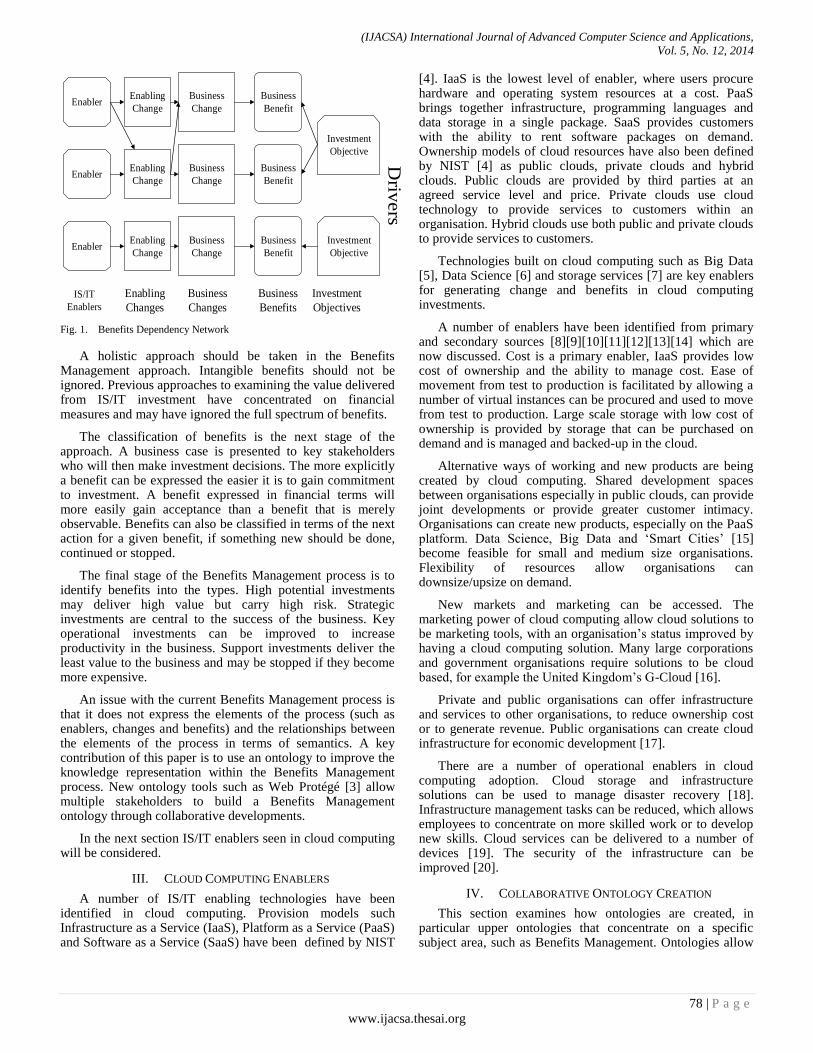
(IJACSA) International Journal of Advanced Computer Science and Applications,
Vol. 5, No. 12, 2014
78 | P a g e
www.ijacsa.thesai.org
Enabler
Enabler
Enabler
Enabling
Change
Enabling
Change
Enabling
Change
IS/IT
Enablers
Enabling
Changes
Business
Change
Business
Change
Business
Change
Business
Changes
Business
Benefit
Business
Benefit
Business
Benefit
Business
Benefits
Investment
Objective
Investment
Objective
Investment
Objectives
Driv
ers
Fig. 1. Benefits Dependency Network
A holistic approach should be taken in the Benefits Management approach. Intangible benefits should not be ignored. Previous approaches to examining the value delivered from IS/IT investment have concentrated on financial measures and may have ignored the full spectrum of benefits.
The classification of benefits is the next stage of the approach. A business case is presented to key stakeholders who will then make investment decisions. The more explicitly a benefit can be expressed the easier it is to gain commitment to investment. A benefit expressed in financial terms will more easily gain acceptance than a benefit that is merely observable. Benefits can also be classified in terms of the next action for a given benefit, if something new should be done, continued or stopped.
The final stage of the Benefits Management process is to identify benefits into the types. High potential investments may deliver high value but carry high risk. Strategic investments are central to the success of the business. Key operational investments can be improved to increase productivity in the business. Support investments deliver the least value to the business and may be stopped if they become more expensive.
An issue with the current Benefits Management process is that it does not express the elements of the process (such as enablers, changes and benefits) and the relationships between the elements of the process in terms of semantics. A key contribution of this paper is to use an ontology to improve the knowledge representation within the Benefits Management process. New ontology tools such as Web Protégé [3] allow multiple stakeholders to build a Benefits Management ontology through collaborative developments.
In the next section IS/IT enablers seen in cloud computing will be considered.
III. CLOUD COMPUTING ENABLERS
A number of IS/IT enabling technologies have been identified in cloud computing. Provision models such Infrastructure as a Service (IaaS), Platform as a Service (PaaS) and Software as a Service (SaaS) have been defined by NIST
[4]. IaaS is the lowest level of enabler, where users procure hardware and operating system resources at a cost. PaaS brings together infrastructure, programming languages and data storage in a single package. SaaS provides customers with the ability to rent software packages on demand. Ownership models of cloud resources have also been defined by NIST [4] as public clouds, private clouds and hybrid clouds. Public clouds are provided by third parties at an agreed service level and price. Private clouds use cloud technology to provide services to customers within an organisation. Hybrid clouds use both public and private clouds to provide services to customers.
Technologies built on cloud computing such as Big Data [5], Data Science [6] and storage services [7] are key enablers for generating change and benefits in cloud computing investments.
A number of enablers have been identified from primary and secondary sources [8][9][10][11][12][13][14] which are now discussed. Cost is a primary enabler, IaaS provides low cost of ownership and the ability to manage cost. Ease of movement from test to production is facilitated by allowing a number of virtual instances can be procured and used to move from test to production. Large scale storage with low cost of ownership is provided by storage that can be purchased on demand and is managed and backed-up in the cloud.
Alternative ways of working and new products are being created by cloud computing. Shared development spaces between organisations especially in public clouds, can provide joint developments or provide greater customer intimacy. Organisations can create new products, especially on the PaaS platform. Data Science, Big Data and „Smart Cities‟ [15] become feasible for small and medium size organisations. Flexibility of resources allow organisations can downsize/upsize on demand.
New markets and marketing can be accessed. The marketing power of cloud computing allow cloud solutions to be marketing tools, with an organisation‟s status improved by having a cloud computing solution. Many large corporations and government organisations require solutions to be cloud based, for example the United Kingdom‟s G-Cloud [16].
Private and public organisations can offer infrastructure and services to other organisations, to reduce ownership cost or to generate revenue. Public organisations can create cloud infrastructure for economic development [17].
There are a number of operational enablers in cloud computing adoption. Cloud storage and infrastructure solutions can be used to manage disaster recovery [18]. Infrastructure management tasks can be reduced, which allows employees to concentrate on more skilled work or to develop new skills. Cloud services can be delivered to a number of devices [19]. The security of the infrastructure can be improved [20].
IV. COLLABORATIVE ONTOLOGY CREATION
This section examines how ontologies are created, in particular upper ontologies that concentrate on a specific subject area, such as Benefits Management. Ontologies allow
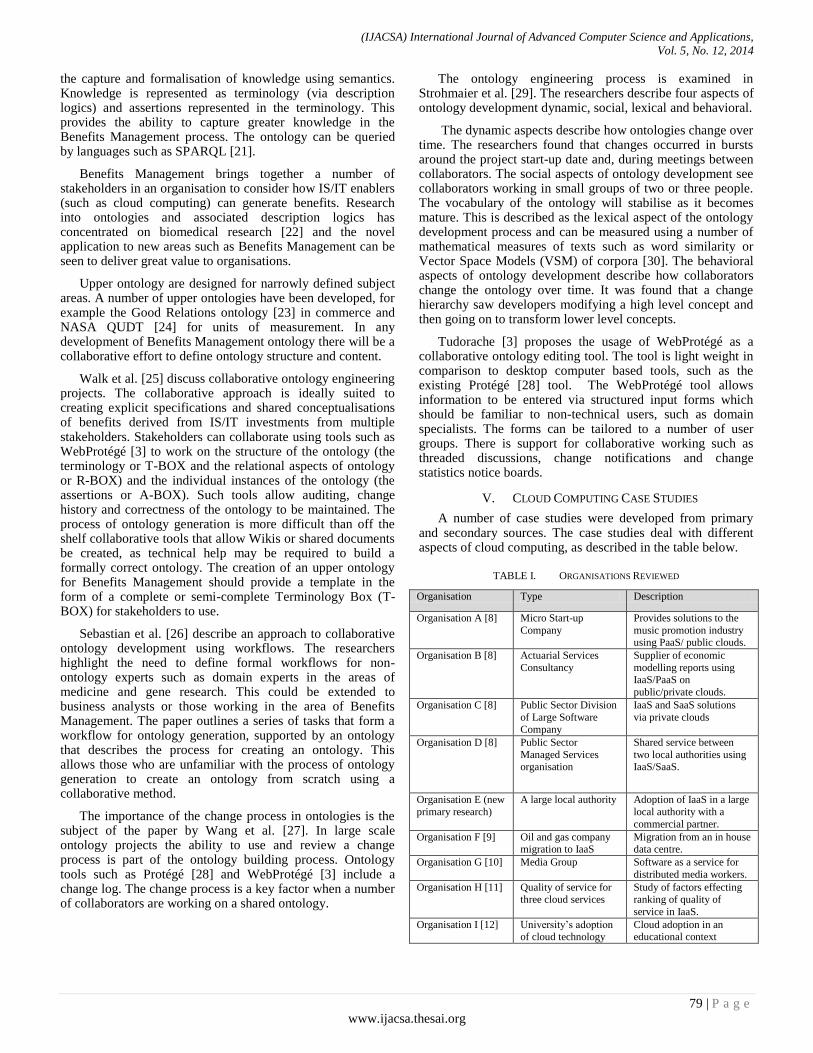
(IJACSA) International Journal of Advanced Computer Science and Applications,
Vol. 5, No. 12, 2014
79 | P a g e
www.ijacsa.thesai.org
the capture and formalisation of knowledge using semantics. Knowledge is represented as terminology (via description logics) and assertions represented in the terminology. This provides the ability to capture greater knowledge in the Benefits Management process. The ontology can be queried by languages such as SPARQL [21].
Benefits Management brings together a number of stakeholders in an organisation to consider how IS/IT enablers (such as cloud computing) can generate benefits. Research into ontologies and associated description logics has concentrated on biomedical research [22] and the novel application to new areas such as Benefits Management can be seen to deliver great value to organisations.
Upper ontology are designed for narrowly defined subject areas. A number of upper ontologies have been developed, for example the Good Relations ontology [23] in commerce and NASA QUDT [24] for units of measurement. In any development of Benefits Management ontology there will be a collaborative effort to define ontology structure and content.
Walk et al. [25] discuss collaborative ontology engineering projects. The collaborative approach is ideally suited to creating explicit specifications and shared conceptualisations of benefits derived from IS/IT investments from multiple stakeholders. Stakeholders can collaborate using tools such as WebProtégé [3] to work on the structure of the ontology (the terminology or T-BOX and the relational aspects of ontology or R-BOX) and the individual instances of the ontology (the assertions or A-BOX). Such tools allow auditing, change history and correctness of the ontology to be maintained. The process of ontology generation is more difficult than off the shelf collaborative tools that allow Wikis or shared documents be created, as technical help may be required to build a formally correct ontology. The creation of an upper ontology for Benefits Management should provide a template in the form of a complete or semi-complete Terminology Box (T-BOX) for stakeholders to use.
Sebastian et al. [26] describe an approach to collaborative ontology development using workflows. The researchers highlight the need to define formal workflows for non-ontology experts such as domain experts in the areas of medicine and gene research. This could be extended to business analysts or those working in the area of Benefits Management. The paper outlines a series of tasks that form a workflow for ontology generation, supported by an ontology that describes the process for creating an ontology. This allows those who are unfamiliar with the process of ontology generation to create an ontology from scratch using a collaborative method.
The importance of the change process in ontologies is the subject of the paper by Wang et al. [27]. In large scale ontology projects the ability to use and review a change process is part of the ontology building process. Ontology tools such as Protégé [28] and WebProtégé [3] include a change log. The change process is a key factor when a number of collaborators are working on a shared ontology.
The ontology engineering process is examined in Strohmaier et al. [29]. The researchers describe four aspects of ontology development dynamic, social, lexical and behavioral.
The dynamic aspects describe how ontologies change over time. The researchers found that changes occurred in bursts around the project start-up date and, during meetings between collaborators. The social aspects of ontology development see collaborators working in small groups of two or three people. The vocabulary of the ontology will stabilise as it becomes mature. This is described as the lexical aspect of the ontology development process and can be measured using a number of mathematical measures of texts such as word similarity or Vector Space Models (VSM) of corpora [30]. The behavioral aspects of ontology development describe how collaborators change the ontology over time. It was found that a change hierarchy saw developers modifying a high level concept and then going on to transform lower level concepts.
Tudorache [3] proposes the usage of WebProtégé as a collaborative ontology editing tool. The tool is light weight in comparison to desktop computer based tools, such as the existing Protégé [28] tool. The WebProtégé tool allows information to be entered via structured input forms which should be familiar to non-technical users, such as domain specialists. The forms can be tailored to a number of user groups. There is support for collaborative working such as threaded discussions, change notifications and change statistics notice boards.
V. CLOUD COMPUTING CASE STUDIES
A number of case studies were developed from primary and secondary sources. The case studies deal with different aspects of cloud computing, as described in the table below.
TABLE I. ORGANISATIONS REVIEWED
Organisation Type Description
Organisation A [8] Micro Start-up
Company
Provides solutions to the
music promotion industry using PaaS/ public clouds.
Organisation B [8] Actuarial Services
Consultancy
Supplier of economic
modelling reports using IaaS/PaaS on
public/private clouds.
Organisation C [8] Public Sector Division
of Large Software Company
IaaS and SaaS solutions
via private clouds
Organisation D [8] Public Sector
Managed Services organisation
Shared service between
two local authorities using IaaS/SaaS.
Organisation E (new
primary research)
A large local authority Adoption of IaaS in a large
local authority with a
commercial partner.
Organisation F [9] Oil and gas company migration to IaaS
Migration from an in house data centre.
Organisation G [10] Media Group Software as a service for
distributed media workers.
Organisation H [11] Quality of service for three cloud services
Study of factors effecting ranking of quality of
service in IaaS.
Organisation I [12] University‟s adoption of cloud technology
Cloud adoption in an educational context
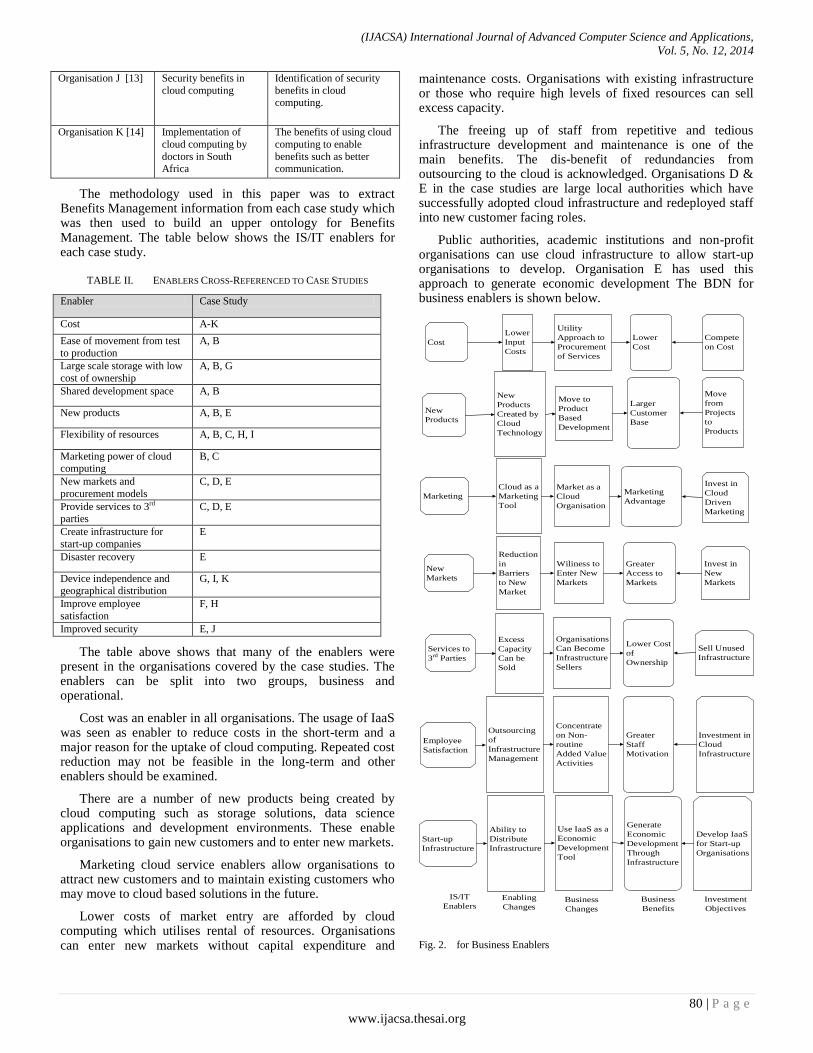
(IJACSA) International Journal of Advanced Computer Science and Applications,
Vol. 5, No. 12, 2014
80 | P a g e
www.ijacsa.thesai.org
Organisation J [13] Security benefits in
cloud computing
Identification of security
benefits in cloud
computing.
Organisation K [14] Implementation of
cloud computing by
doctors in South Africa
The benefits of using cloud
computing to enable
benefits such as better communication.
The methodology used in this paper was to extract Benefits Management information from each case study which was then used to build an upper ontology for Benefits Management. The table below shows the IS/IT enablers for each case study.
TABLE II. ENABLERS CROSS-REFERENCED TO CASE STUDIES
Enabler Case Study
Cost A-K
Ease of movement from test
to production
A, B
Large scale storage with low
cost of ownership
A, B, G
Shared development space A, B
New products A, B, E
Flexibility of resources A, B, C, H, I
Marketing power of cloud computing
B, C
New markets and
procurement models
C, D, E
Provide services to 3rd parties
C, D, E
Create infrastructure for
start-up companies
E
Disaster recovery E
Device independence and geographical distribution
G, I, K
Improve employee
satisfaction
F, H
Improved security E, J
The table above shows that many of the enablers were present in the organisations covered by the case studies. The enablers can be split into two groups, business and operational.
Cost was an enabler in all organisations. The usage of IaaS was seen as enabler to reduce costs in the short-term and a major reason for the uptake of cloud computing. Repeated cost reduction may not be feasible in the long-term and other enablers should be examined.
There are a number of new products being created by cloud computing such as storage solutions, data science applications and development environments. These enable organisations to gain new customers and to enter new markets.
Marketing cloud service enablers allow organisations to attract new customers and to maintain existing customers who may move to cloud based solutions in the future.
Lower costs of market entry are afforded by cloud computing which utilises rental of resources. Organisations can enter new markets without capital expenditure and
maintenance costs. Organisations with existing infrastructure or those who require high levels of fixed resources can sell excess capacity.
The freeing up of staff from repetitive and tedious infrastructure development and maintenance is one of the main benefits. The dis-benefit of redundancies from outsourcing to the cloud is acknowledged. Organisations D & E in the case studies are large local authorities which have successfully adopted cloud infrastructure and redeployed staff into new customer facing roles.
Public authorities, academic institutions and non-profit organisations can use cloud infrastructure to allow start-up organisations to develop. Organisation E has used this approach to generate economic development The BDN for business enablers is shown below.
IS/IT
EnablersEnabling
ChangesBusiness
Changes
Business
Benefits
Investment
Objectives
Cost
Lower
Input
Costs
Utility
Approach to
Procurement
of Services
Lower
Cost
Compete
on Cost
Invest in
Cloud
Driven
Marketing
Services to
3rd Parties
New
Products
Marketing
New
Products
Created by
Cloud
Technology
Cloud as a
Marketing
Tool
Move to
Product
Based
Development
Market as a
Cloud
Organisation
Larger
Customer
Base
Marketing
Advantage
New
Markets
Reduction
in
Barriers
to New
Market
Excess
Capacity
Can be
Sold
Wiliness to
Enter New
Markets
Organisations
Can Become
Infrastructure
Sellers
Move
from
Projects
to
Products
Greater
Access to
Markets
Lower Cost
of
Ownership
Invest in
New
Markets
Sell Unused
Infrastructure
Employee
Satisfaction
Start-up
Infrastructure
Outsourcing
of
Infrastructure
Management
Concentrate
on Non-
routine
Added Value
Activities
Greater
Staff
Motivation
Investment in
Cloud
Infrastructure
Ability to
Distribute
Infrastructure
Use IaaS as a
Economic
Development
Tool
Generate
Economic
Development
Through
Infrastructure
Develop IaaS
for Start-up
Organisations
Fig. 2. for Business Enablers
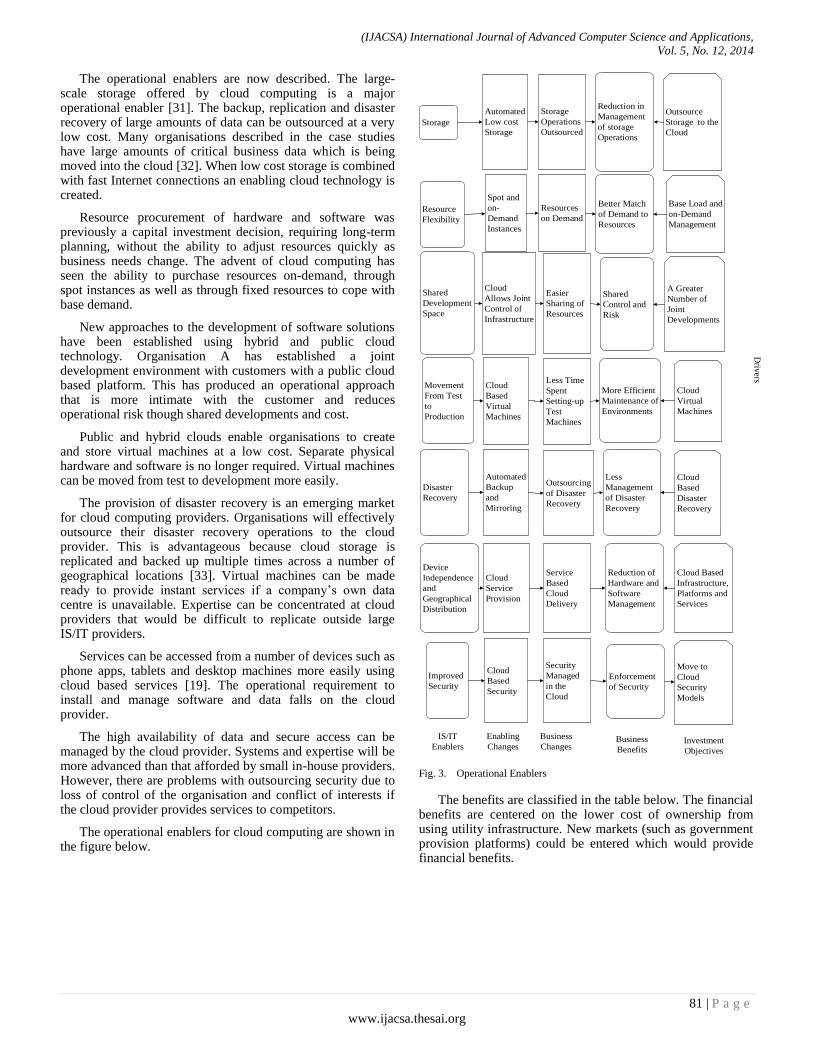
(IJACSA) International Journal of Advanced Computer Science and Applications,
Vol. 5, No. 12, 2014
81 | P a g e
www.ijacsa.thesai.org
The operational enablers are now described. The large-scale storage offered by cloud computing is a major operational enabler [31]. The backup, replication and disaster recovery of large amounts of data can be outsourced at a very low cost. Many organisations described in the case studies have large amounts of critical business data which is being moved into the cloud [32]. When low cost storage is combined with fast Internet connections an enabling cloud technology is created.
Resource procurement of hardware and software was previously a capital investment decision, requiring long-term planning, without the ability to adjust resources quickly as business needs change. The advent of cloud computing has seen the ability to purchase resources on-demand, through spot instances as well as through fixed resources to cope with base demand.
New approaches to the development of software solutions have been established using hybrid and public cloud technology. Organisation A has established a joint development environment with customers with a public cloud based platform. This has produced an operational approach that is more intimate with the customer and reduces operational risk though shared developments and cost.
Public and hybrid clouds enable organisations to create and store virtual machines at a low cost. Separate physical hardware and software is no longer required. Virtual machines can be moved from test to development more easily.
The provision of disaster recovery is an emerging market for cloud computing providers. Organisations will effectively outsource their disaster recovery operations to the cloud provider. This is advantageous because cloud storage is replicated and backed up multiple times across a number of geographical locations [33]. Virtual machines can be made ready to provide instant services if a company‟s own data centre is unavailable. Expertise can be concentrated at cloud providers that would be difficult to replicate outside large IS/IT providers.
Services can be accessed from a number of devices such as phone apps, tablets and desktop machines more easily using cloud based services [19]. The operational requirement to install and manage software and data falls on the cloud provider.
The high availability of data and secure access can be managed by the cloud provider. Systems and expertise will be more advanced than that afforded by small in-house providers. However, there are problems with outsourcing security due to loss of control of the organisation and conflict of interests if the cloud provider provides services to competitors.
The operational enablers for cloud computing are shown in the figure below.
IS/IT
Enablers
Enabling
Changes
Business
ChangesBusiness
BenefitsInvestment
Objectives
Storage
Automated
Low cost
Storage
Storage
Operations
Outsourced
Reduction in
Management
of storage
Operations
Outsource
Storage to the
Cloud
A Greater
Number of
Joint
Developments
Driv
ers
Disaster
Recovery
Resource
Flexibility
Shared
Development
Space
Spot and
on-
Demand
Instances
Cloud
Allows Joint
Control of
Infrastructure
Resources
on Demand
Easier
Sharing of
Resources
Better Match
of Demand to
Resources
Shared
Control and
Risk
Movement
From Test
to
Production
Cloud
Based
Virtual
Machines
Automated
Backup
and
Mirroring
Less Time
Spent
Setting-up
Test
Machines
Outsourcing
of Disaster
Recovery
Base Load and
on-Demand
Management
More Efficient
Maintenance of
Environments
Less
Management
of Disaster
Recovery
Cloud
Virtual
Machines
Cloud
Based
Disaster
Recovery
Device
Independence
and
Geographical
Distribution
Improved
Security
Cloud
Service
Provision
Service
Based
Cloud
Delivery
Reduction of
Hardware and
Software
Management
Cloud Based
Infrastructure,
Platforms and
Services
Cloud
Based
Security
Security
Managed
in the
Cloud
Enforcement
of Security
Move to
Cloud
Security
Models
Fig. 3. Operational Enablers
The benefits are classified in the table below. The financial benefits are centered on the lower cost of ownership from using utility infrastructure. New markets (such as government provision platforms) could be entered which would provide financial benefits.
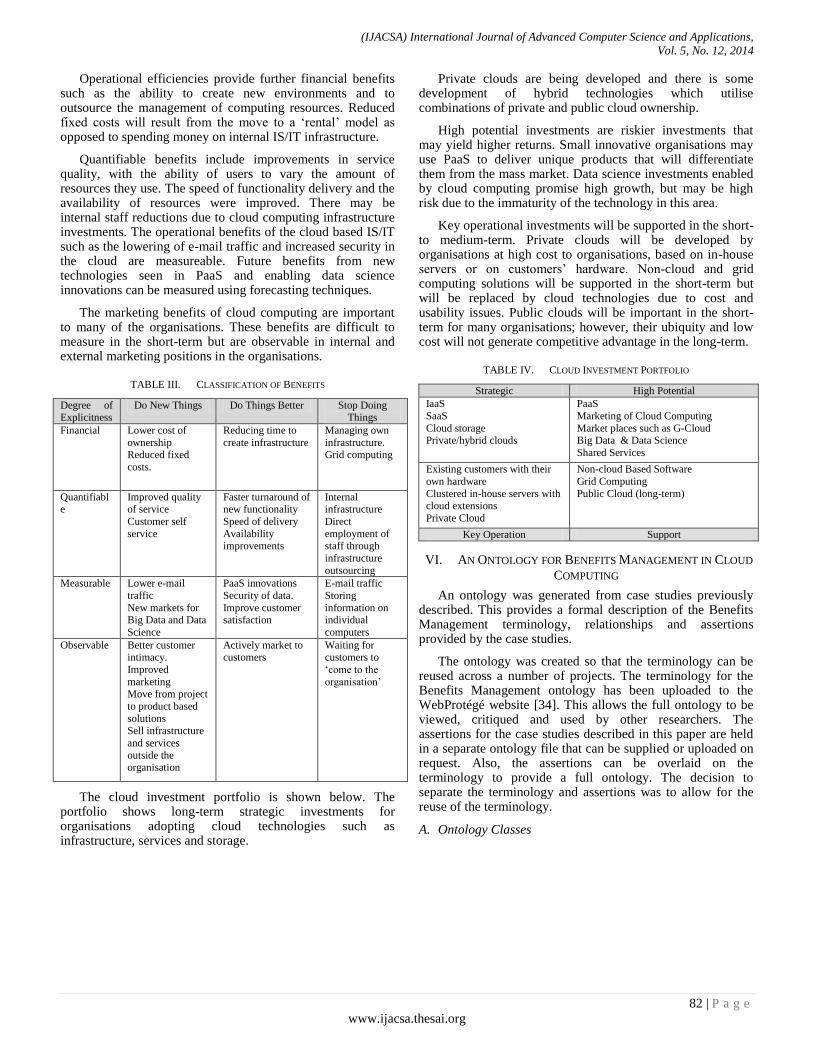
(IJACSA) International Journal of Advanced Computer Science and Applications,
Vol. 5, No. 12, 2014
82 | P a g e
www.ijacsa.thesai.org
Operational efficiencies provide further financial benefits such as the ability to create new environments and to outsource the management of computing resources. Reduced fixed costs will result from the move to a „rental‟ model as opposed to spending money on internal IS/IT infrastructure.
Quantifiable benefits include improvements in service quality, with the ability of users to vary the amount of resources they use. The speed of functionality delivery and the availability of resources were improved. There may be internal staff reductions due to cloud computing infrastructure investments. The operational benefits of the cloud based IS/IT such as the lowering of e-mail traffic and increased security in the cloud are measureable. Future benefits from new technologies seen in PaaS and enabling data science innovations can be measured using forecasting techniques.
The marketing benefits of cloud computing are important to many of the organisations. These benefits are difficult to measure in the short-term but are observable in internal and external marketing positions in the organisations.
TABLE III. CLASSIFICATION OF BENEFITS
Degree of Explicitness
Do New Things Do Things Better Stop Doing Things
Financial Lower cost of
ownership Reduced fixed
costs.
Reducing time to
create infrastructure
Managing own
infrastructure. Grid computing
Quantifiable
Improved quality of service
Customer self
service
Faster turnaround of new functionality
Speed of delivery
Availability improvements
Internal infrastructure
Direct
employment of staff through
infrastructure
outsourcing
Measurable Lower e-mail
traffic
New markets for Big Data and Data
Science
PaaS innovations
Security of data.
Improve customer satisfaction
E-mail traffic
Storing
information on individual
computers
Observable Better customer intimacy.
Improved
marketing Move from project
to product based
solutions
Sell infrastructure
and services
outside the organisation
Actively market to customers
Waiting for customers to
„come to the
organisation‟
The cloud investment portfolio is shown below. The portfolio shows long-term strategic investments for organisations adopting cloud technologies such as infrastructure, services and storage.
Private clouds are being developed and there is some development of hybrid technologies which utilise combinations of private and public cloud ownership.
High potential investments are riskier investments that may yield higher returns. Small innovative organisations may use PaaS to deliver unique products that will differentiate them from the mass market. Data science investments enabled by cloud computing promise high growth, but may be high risk due to the immaturity of the technology in this area.
Key operational investments will be supported in the short- to medium-term. Private clouds will be developed by organisations at high cost to organisations, based on in-house servers or on customers‟ hardware. Non-cloud and grid computing solutions will be supported in the short-term but will be replaced by cloud technologies due to cost and usability issues. Public clouds will be important in the short-term for many organisations; however, their ubiquity and low cost will not generate competitive advantage in the long-term.
TABLE IV. CLOUD INVESTMENT PORTFOLIO
Strategic High Potential
IaaS
SaaS
Cloud storage Private/hybrid clouds
PaaS
Marketing of Cloud Computing
Market places such as G-Cloud Big Data & Data Science
Shared Services
Existing customers with their
own hardware
Clustered in-house servers with cloud extensions
Private Cloud
Non-cloud Based Software
Grid Computing
Public Cloud (long-term)
Key Operation Support
VI. AN ONTOLOGY FOR BENEFITS MANAGEMENT IN CLOUD
COMPUTING
An ontology was generated from case studies previously described. This provides a formal description of the Benefits Management terminology, relationships and assertions provided by the case studies.
The ontology was created so that the terminology can be reused across a number of projects. The terminology for the Benefits Management ontology has been uploaded to the WebProtégé website [34]. This allows the full ontology to be viewed, critiqued and used by other researchers. The assertions for the case studies described in this paper are held in a separate ontology file that can be supplied or uploaded on request. Also, the assertions can be overlaid on the terminology to provide a full ontology. The decision to separate the terminology and assertions was to allow for the reuse of the terminology.
A. Ontology Classes
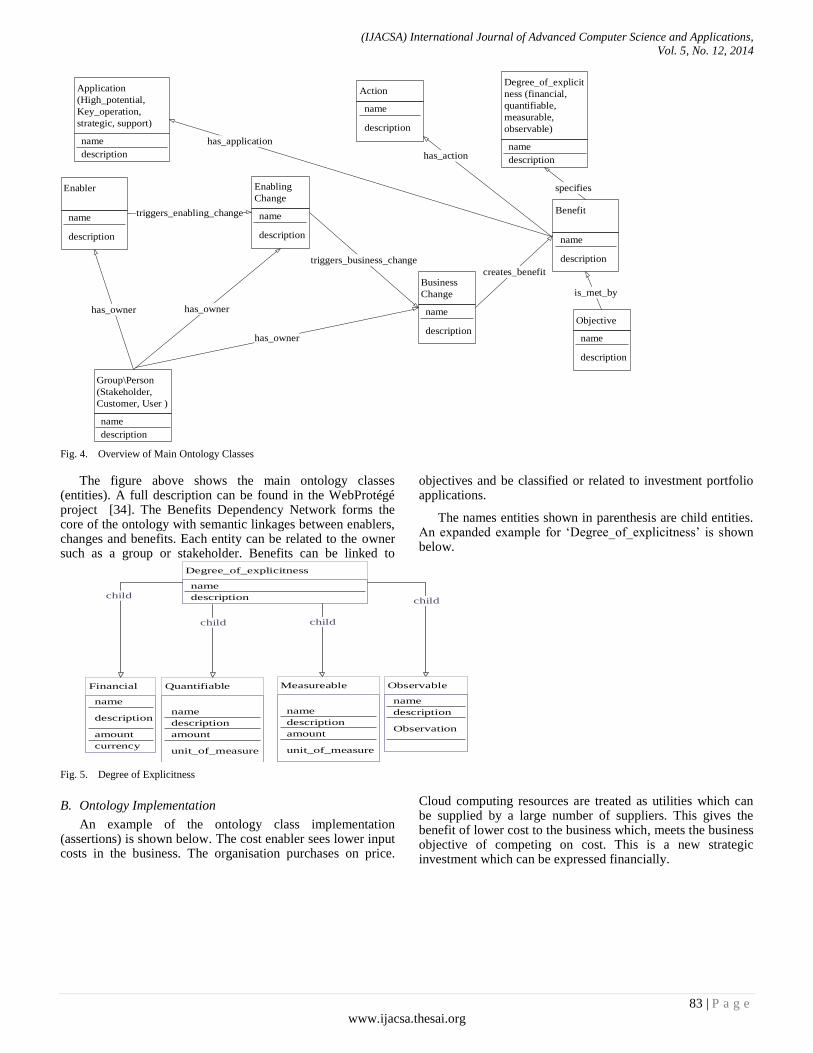
(IJACSA) International Journal of Advanced Computer Science and Applications,
Vol. 5, No. 12, 2014
83 | P a g e
www.ijacsa.thesai.org
triggers_enabling_change
triggers_business_change
creates_benefit
has_owner has_owner
has_owner
is_met_by
Degree_of_explicit
ness (financial,
quantifiable,
measurable,
observable)
name
description
specifies
has_action
Application
(High_potential,
Key_operation,
strategic, support)
name
description
has_application
Benefit
name
description
Enabler
name
description
Enabling
Change
name
description
Action
name
description
Group\Person
(Stakeholder,
Customer, User )
name
description
Business
Change
name
descriptionObjective
name
description
Fig. 4. Overview of Main Ontology Classes
The figure above shows the main ontology classes (entities). A full description can be found in the WebProtégé project [34]. The Benefits Dependency Network forms the core of the ontology with semantic linkages between enablers, changes and benefits. Each entity can be related to the owner such as a group or stakeholder. Benefits can be linked to
objectives and be classified or related to investment portfolio applications.
The names entities shown in parenthesis are child entities. An expanded example for „Degree_of_explicitness‟ is shown below.
Degree_of_explicitness
name
description childchild
child
Observable
description
Observation
name
Measureable
description
amount
name
unit_of_measure
Quantifiable
description
amount
name
unit_of_measure
Financial
description
amount
name
currency
child
Fig. 5. Degree of Explicitness
B. Ontology Implementation
An example of the ontology class implementation (assertions) is shown below. The cost enabler sees lower input costs in the business. The organisation purchases on price.
Cloud computing resources are treated as utilities which can be supplied by a large number of suppliers. This gives the benefit of lower cost to the business which, meets the business objective of competing on cost. This is a new strategic investment which can be expressed financially.
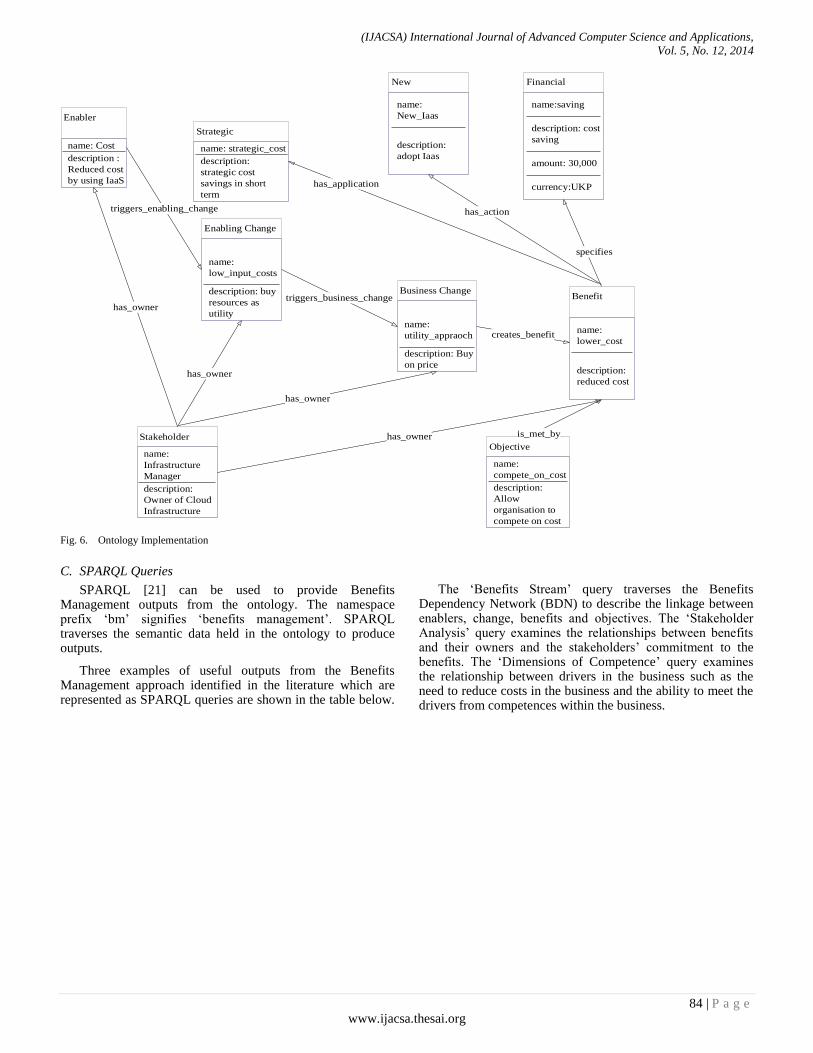
(IJACSA) International Journal of Advanced Computer Science and Applications,
Vol. 5, No. 12, 2014
84 | P a g e
www.ijacsa.thesai.org
Enabler
name: Cost
description :
Reduced cost
by using IaaS
triggers_enabling_change
triggers_business_change
creates_benefit
Stakeholder
name:
Infrastructure
Manager
description:
Owner of Cloud
Infrastructure
has_owner
has_owner
has_owner
has_ownerObjective
name:
compete_on_cost
description:
Allow
organisation to
compete on cost
is_met_by
specifies
has_action
Strategic
name: strategic_cost
description:
strategic cost
savings in short
term
has_application
Benefit
name:
lower_cost
description:
reduced cost
Financial
description: cost
saving
amount: 30,000
name:saving
currency:UKP
New
name:
New_Iaas
description:
adopt Iaas
Enabling Change
name:
low_input_costs
description: buy
resources as
utility
Business Change
name:
utility_appraoch
description: Buy
on price
Fig. 6. Ontology Implementation
C. SPARQL Queries
SPARQL [21] can be used to provide Benefits Management outputs from the ontology. The namespace prefix „bm‟ signifies „benefits management‟. SPARQL traverses the semantic data held in the ontology to produce outputs.
Three examples of useful outputs from the Benefits Management approach identified in the literature which are represented as SPARQL queries are shown in the table below.
The „Benefits Stream‟ query traverses the Benefits Dependency Network (BDN) to describe the linkage between enablers, change, benefits and objectives. The „Stakeholder Analysis‟ query examines the relationships between benefits and their owners and the stakeholders‟ commitment to the benefits. The „Dimensions of Competence‟ query examines the relationship between drivers in the business such as the need to reduce costs in the business and the ability to meet the drivers from competences within the business.
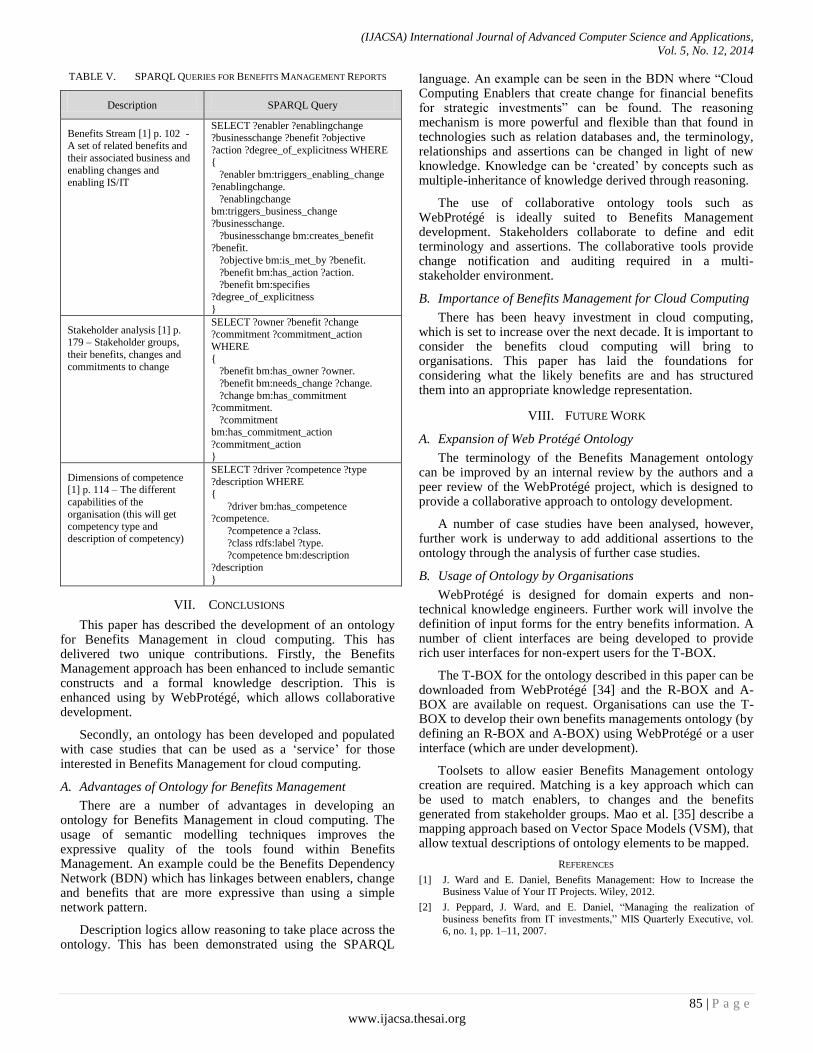
(IJACSA) International Journal of Advanced Computer Science and Applications,
Vol. 5, No. 12, 2014
85 | P a g e
www.ijacsa.thesai.org
TABLE V. SPARQL QUERIES FOR BENEFITS MANAGEMENT REPORTS
Description SPARQL Query
Benefits Stream [1] p. 102 - A set of related benefits and
their associated business and
enabling changes and enabling IS/IT
SELECT ?enabler ?enablingchange ?businesschange ?benefit ?objective
?action ?degree_of_explicitness WHERE
{ ?enabler bm:triggers_enabling_change
?enablingchange.
?enablingchange bm:triggers_business_change
?businesschange.
?businesschange bm:creates_benefit ?benefit.
?objective bm:is_met_by ?benefit.
?benefit bm:has_action ?action. ?benefit bm:specifies
?degree_of_explicitness
}
Stakeholder analysis [1] p. 179 – Stakeholder groups,
their benefits, changes and
commitments to change
SELECT ?owner ?benefit ?change ?commitment ?commitment_action
WHERE
{ ?benefit bm:has_owner ?owner.
?benefit bm:needs_change ?change.
?change bm:has_commitment ?commitment.
?commitment bm:has_commitment_action
?commitment_action
}
Dimensions of competence [1] p. 114 – The different
capabilities of the
organisation (this will get
competency type and
description of competency)
SELECT ?driver ?competence ?type ?description WHERE
{
?driver bm:has_competence ?competence.
?competence a ?class.
?class rdfs:label ?type. ?competence bm:description
?description
}
VII. CONCLUSIONS
This paper has described the development of an ontology for Benefits Management in cloud computing. This has delivered two unique contributions. Firstly, the Benefits Management approach has been enhanced to include semantic constructs and a formal knowledge description. This is enhanced using by WebProtégé, which allows collaborative development.
Secondly, an ontology has been developed and populated with case studies that can be used as a „service‟ for those interested in Benefits Management for cloud computing.
A. Advantages of Ontology for Benefits Management
There are a number of advantages in developing an ontology for Benefits Management in cloud computing. The usage of semantic modelling techniques improves the expressive quality of the tools found within Benefits Management. An example could be the Benefits Dependency Network (BDN) which has linkages between enablers, change and benefits that are more expressive than using a simple network pattern.
Description logics allow reasoning to take place across the ontology. This has been demonstrated using the SPARQL
language. An example can be seen in the BDN where “Cloud Computing Enablers that create change for financial benefits for strategic investments” can be found. The reasoning mechanism is more powerful and flexible than that found in technologies such as relation databases and, the terminology, relationships and assertions can be changed in light of new knowledge. Knowledge can be „created‟ by concepts such as multiple-inheritance of knowledge derived through reasoning.
The use of collaborative ontology tools such as WebProtégé is ideally suited to Benefits Management development. Stakeholders collaborate to define and edit terminology and assertions. The collaborative tools provide change notification and auditing required in a multi-stakeholder environment.
B. Importance of Benefits Management for Cloud Computing
There has been heavy investment in cloud computing, which is set to increase over the next decade. It is important to consider the benefits cloud computing will bring to organisations. This paper has laid the foundations for considering what the likely benefits are and has structured them into an appropriate knowledge representation.
VIII. FUTURE WORK
A. Expansion of Web Protégé Ontology
The terminology of the Benefits Management ontology can be improved by an internal review by the authors and a peer review of the WebProtégé project, which is designed to provide a collaborative approach to ontology development.
A number of case studies have been analysed, however, further work is underway to add additional assertions to the ontology through the analysis of further case studies.
B. Usage of Ontology by Organisations
WebProtégé is designed for domain experts and non-technical knowledge engineers. Further work will involve the definition of input forms for the entry benefits information. A number of client interfaces are being developed to provide rich user interfaces for non-expert users for the T-BOX.
The T-BOX for the ontology described in this paper can be downloaded from WebProtégé [34] and the R-BOX and A-BOX are available on request. Organisations can use the T-BOX to develop their own benefits managements ontology (by defining an R-BOX and A-BOX) using WebProtégé or a user interface (which are under development).
Toolsets to allow easier Benefits Management ontology creation are required. Matching is a key approach which can be used to match enablers, to changes and the benefits generated from stakeholder groups. Mao et al. [35] describe a mapping approach based on Vector Space Models (VSM), that allow textual descriptions of ontology elements to be mapped.
REFERENCES
[1] J. Ward and E. Daniel, Benefits Management: How to Increase the Business Value of Your IT Projects. Wiley, 2012.
[2] J. Peppard, J. Ward, and E. Daniel, “Managing the realization of business benefits from IT investments,” MIS Quarterly Executive, vol. 6, no. 1, pp. 1–11, 2007.

(IJACSA) International Journal of Advanced Computer Science and Applications,
Vol. 5, No. 12, 2014
86 | P a g e
www.ijacsa.thesai.org
[3] T. Tudorache, C. Nyulas, N. F. Noy, and M. A. Musen, “WebProtégé: A collaborative ontology editor and knowledge acquisition tool for the web,” Semantic web, vol. 4, no. 1, pp. 89–99, 2013.
[4] P. Mell and T. Grance, “The NIST definition of cloud computing,” 2011.
[5] D. Agrawal, “Towards the End-to-End Design for Big Data Management in the Cloud: Why, How, and When?,” presented at the BTW, 2013, pp. 15–16.
[6] I. T. Foster and R. K. Madduri, “Science as a service: how on-demand computing can accelerate discovery,” presented at the Proceedings of the 4th ACM workshop on Scientific cloud computing, 2013, pp. 1–2.
[7] C. Wang, K. Ren, W. Lou, and J. Li, “Toward publicly auditable secure cloud data storage services,” Network, IEEE, vol. 24, no. 4, pp. 19–24, 2010.
[8] R. Greenwell, X. Liu, and K. Chalmers, “Benefits Management of Cloud Computing Investments,” International Journal of Advanced Computer Science and Applications (IJACSA), vol. 5, no. 7, 2014.
[9] A. Khajeh-Hosseini, D. Greenwood, and I. Sommerville, “Cloud migration: A case study of migrating an enterprise it system to iaas,” presented at the Cloud Computing (CLOUD), 2010 IEEE 3rd International Conference on, 2010, pp. 450–457.
[10] N. Convery and K. Ferguson-Boucher, “Storing information in the cloud,” Bulletin of Information and Records Management Society, Issue, pp. 3–5, 2010.
[11] S. K. Garg, S. Versteeg, and R. Buyya, “A framework for ranking of cloud computing services,” Future Generation Computer Systems, vol. 29, no. 4, pp. 1012–1023, 2013.
[12] V. Chang and G. Wills, “A University of Greenwich Case Study of Cloud Computing,” E-Logistics and E-Supply Chain Management: Applications for Evolving Business, p. 232, 2013.
[13] M. Shi, “Capturing strategic competences: cloud security as a case study,” Journal of Business Strategy, vol. 34, no. 3, pp. 41–48, 2013.
[14] A. Coleman, M. E. Herselman, and M. Coleman, “Improving Computer-mediated Synchronous Communication of Doctors in Rural Communities through Cloud Computing A Case study of Rural Hospitals in South Africa.,” Oriental Anthropologists, vol. 13, no. 1, 2013.
[15] C. Perera, A. Zaslavsky, P. Christen, and D. Georgakopoulos, “Sensing as a service model for smart cities supported by internet of things,” Transactions on Emerging Telecommunications Technologies, vol. 25, no. 1, pp. 81–93, 2014.
[16] G-Cloud, “G-Cloud - Home of the UK Government G-Cloud Programme G-Cloud,” 2013. [Online]. Available: http://gcloud.civilservice.gov.uk/. [Accessed: 24-Nov-2014].
[17] J. Bughin, M. Chui, and J. Manyika, “Clouds, big data, and smart assets: Ten tech-enabled business trends to watch,” McKinsey Quarterly, vol. 56, 2010.
[18] O. H. Alhazmi and Y. K. Malaiya, “Evaluating disaster recovery plans using the cloud,” presented at the Reliability and Maintainability Symposium (RAMS), 2013 Proceedings-Annual, 2013, pp. 1–6.
[19] H. T. Dinh, C. Lee, D. Niyato, and P. Wang, “A survey of mobile cloud computing: architecture, applications, and approaches,” Wireless communications and mobile computing, vol. 13, no. 18, pp. 1587–1611, 2013.
[20] D. S. Marcon, R. R. Oliveira, M. C. Neves, L. S. Buriol, L. P. Gaspary, and M. P. Barcellos, “Trust-based Grouping for Cloud Datacenters: improving security in shared infrastructures,” presented at the IFIP Networking Conference, 2013, 2013, pp. 1–9.
[21] O. Hartig, “SPARQL for a web of linked data: semantics and computability,” in The Semantic Web: Research and Applications, Springer, 2012, pp. 8–23.
[22] D. Allemang and J. Hendler, Semantic Web for the Working Ontologist: Effective Modeling in RDFS and OWL. Elsevier Science, 2011.
[23] M. Hepp, “Goodrelations: An ontology for describing products and services offers on the web,” in Knowledge Engineering: Practice and Patterns, Springer, 2008, pp. 329–346.
[24] H. Rijgersberg, M. van Assem, and J. Top, “Ontology of units of measure and related concepts,” Semantic Web, vol. 4, no. 1, pp. 3–13, 2013.
[25] S. Walk, P. Singer, M. Strohmaier, D. Helic, N. Noy, and M. Musen, “Sequential Usage Patterns in Collaborative Ontology-Engineering Projects,” arXiv preprint arXiv: 1403.1070, 2014.
[26] A. Sebastian, N. F. Noy, T. Tudorache, and M. A. Musen, “A Generic Ontology for Collaborative Ontology-Development Workflows,” in Proceedings of the 16th international conference on Knowledge Engineering: Practice and Patterns, Berlin, Heidelberg, 2008, pp. 318–328.
[27] H. Wang, T. Tudorache, D. Dou, N. F. Noy, and M. A. Musen, “Analysis of User Editing Patterns in Ontology Development Projects,” presented at the On the Move to Meaningful Internet Systems: OTM 2013 Conferences, 2013, pp. 470–487.
[28] Protege, “The Protégé Ontology Editor and Knowledge Acquisition System,” 2014. [Online]. Available: http://protege.stanford.edu/. [Accessed: 24-Nov-2014].
[29] M. Strohmaier, S. Walk, J. Pöschko, D. Lamprecht, T. Tudorache, C. Nyulas, M. A. Musen, and N. F. Noy, “How ontologies are made: Studying the hidden social dynamics behind collaborative ontology engineering projects,” Web Semantics: Science, Services and Agents on the World Wide Web, vol. 20, pp. 18–34, 2013.
[30] C. Manning, P. Raghavan, and Schutze, Introduction to Information Retrieval. Cambridge University Press, 2008.
[31] A. N. Toosi, R. N. Calheiros, and R. Buyya, “Interconnected Cloud Computing Environments: Challenges, Taxonomy, and Survey,” ACM Computing Surveys (CSUR), vol. 47, no. 1, p. 7, 2014.
[32] Y. Han, “On the clouds: a new way of computing,” Information Technology and Libraries, vol. 29, no. 2, pp. 87–92, 2013.
[33] Z. Wu, M. Butkiewicz, D. Perkins, E. Katz-Bassett, and H. V. Madhyastha, “Spanstore: Cost-effective geo-replicated storage spanning multiple cloud services,” presented at the Proceedings of the Twenty-Fourth ACM Symposium on Operating Systems Principles, 2013, pp. 292–308.
[34] R. Greenwell, “Benefits Management Web-protege project,” 2014. [Online]. Available: http://webprotege.stanford.edu/#Edit:projectId=d9a84e6c-9448-4921-b38c-e5e4f0e0ef2c.
[35] M. Mao, Y. Peng, and M. Spring, “An adaptive ontology mapping approach with neural network based constraint satisfaction,” Web Semantics: Science, Services and Agents on the World Wide Web, vol. 8, no. 1, pp. 14–25, 2010.

(IJACSA) International Journal of Advanced Computer Science and Applications,
Vol. 5, No. 12, 2014
87 | P a g e
www.ijacsa.thesai.org
Determining the Efficient Structure of Feed-Forward
Neural Network to Classify Breast Cancer Dataset
Ahmed Khalid
Najran University, Community College
Department of Computer Science
Najran, KSA
Noureldien A. Noureldien
University of Science and Technology
Department of Computer Science
Omdurman, Sudan
Abstract—Classification is one of the most frequently
encountered problems in data mining. A classification problem
occurs when an object needs to be assigned in predefined classes
based on a number of observed attributes related to that object.
Neural networks have emerged as one of the tools that can
handle the classification problem. Feed-forward Neural Networks
(FNN's) have been widely applied in many different fields as a
classification tool.
Designing an efficient FNN structure with optimum number
of hidden layers and minimum number of layer's neurons, given
a specific application or dataset, is an open research problem.
In this paper, experimental work is carried out to determine
an efficient FNN structure, that is, a structure with the minimum
number of hidden layer's neurons for classifying the Wisconsin
Breast Cancer Dataset. We achieve this by measuring the
classification performance using the Mean Square Error (MSE)
and controlling the number of hidden layers, and the number of
neurons in each layer.
The experimental results show that the number of hidden
layers has a significant effect on the classification performance
and the best classification performance average is attained when
the number of layers is 5, and number of hidden layer's neurons
are small, typically 1 or 2.
Keywords—Hidden Layers; Number of neurons; Feed Forward
Neural Network; Breast Cancer; Classification Performance
I. INTRODUCTION Classification is one of the most frequently encountered
problems in decision making tasks. A classification problem occurs when an object needs to be assigned in predefined classes based on a number of observed attributes related to that object. Many problems in business, science, industry, and medicine can be treated as classification problems.
Neural networks have emerged as one of the tools that can handle the classification problem. The advantage of neural networks is that, neural networks are data driven self-adaptive methods so that they can adjust themselves to the data without any explicit specification of functional form for the underlying model, and they can approximate any function with arbitrary accuracy.
Artificial neural networks consist of an input layer of nodes, one or more hidden layers and an output layer. Each
node in a layer has one corresponding node in the next layer, thus creating the stacking effect [1].
The hidden layer is a collection of neurons which provide an intermediate layer between the input layer and the output layer. Activation functions are typically applied to hidden layers.
Neural Networks are biologically inspired and mimic the human brain. A neural network consists of neurons which are interconnected with connecting links, where each link have a weight that multiplied by the signal transmitted in the network. The output of each neuron is determined by using an activation function such as sigmoid and step. Usually nonlinear activation functions are used. Neural networks are trained by experience. When an unknown input to the network is applied, it can generalize from past experiences and product a new result [2], [3].
Feed-forward neural networks (FNN) are one of the popular structures among artificial neural networks. These efficient networks are widely used to solve complex problems by modeling complex input-output relationships [4], [5].
Neural networks have been widely used for breast cancer diagnosis [6] [7] [8], and Feed-forward Neural Network (FNN) is commonly used for classification. Many researches evaluates the effect of the number of neurons in the hidden layer [9] [10][11] [12].
In this paper an experimental investigation was conducted to see the effect of the number of neurons and hidden layers of feed forward neural network on classification performance for the breast cancer dataset. The work of this paper will be presented in different sections. In the second section materials and methods are introduced. An experiment and results are presented in the third section. Section four gives discussion and conclusions.
II. MATERIALS AND METHODS
The performance analysis of FFNN is to estimate the training and generalization errors. The result with the minimum estimated generalization error is used to determine an optimum for the application of neural network model [13].
The feed forward neural network is built using of Levenberg-Marquardt training algorithm which is widely used in classification literature [14,15,16].The network architecture used is composed of nine neurons for input layer and one neuron for the output layer. To achieve the paper objectives,

(IJACSA) International Journal of Advanced Computer Science and Applications,
Vol. 5, No. 12, 2014
88 | P a g e
www.ijacsa.thesai.org
the number of hidden layers and the number of neurons per hidden layer are changed during the training and simulation of the network. The learning rate of 0.5 was used. The number of maximum allows epochs were 1000.The activation functions used in the different layers of the neural network is logsig. The performance of the classification is measured by the mean square error (MSE) which is calculated by equation 1.
∑ =
∑
Where t(k) is the target output and a(k) is network output.
In this paper Wisconsin Breast Cancer Data (WBCD) is used, which have been analyzed by various researchers of medical diagnosis of breast cancer in the neural network literature [5], [16], [17], [18]. This data set contains 699 instances. The first attribute is the ID of an instance, and the next 9 attributes (Clump Thickness, Uniformity of Cell Size, Uniformity of Cell Shape, Marginal Adhesion, Single Epithelial Cell Size, Bare Nuclei, Bland Chromatin, Normal Nucleoli and Mitoses) represent different characteristics of an instance and the last attribute takes the values 2 and 4 (2 for benign, 4 for malignant). Each instance has one of 2 possible classes (benign or malignant).
In our experiments all 9 attributes are used. Each attribute has the domain 1-10. The data set was partitioned into two sets training and testing set. The testing set was not seen by neural network during the training phase. It is only used for testing the neural network after training.
In our classification experiments all 9 attributes are used, and 80% of the data is used for training, and the remaining 20% is used for testing.
III. EXPERIMENTS AND RESULTSA
Five experiments are carried out. In the first experiment the network is trained with one hidden layer; the number of neurons in this hidden layer is varies from 1 to 20. The network was trained 30 times for each structure.
Table (1) shows the ordered minimum mean of MSE for the 30 training trails for each number of neurons.
TABLE I. THE MINIMUM MEAN OF MSE IN THE 1ST EXPERIMENT
Number of neurons MSE Mean of 30 trails
1 0.0805
9 0.0857
16 0.0858
17 0.0945
11 0.0958
3 0.0983
19 0.0985
From Table (1), the numbers of neurons that achieve best performance in terms of MSE mean are 1, 9, 16, 17, 11, 3 and 19.
In the second experiment, the network was trained with two hidden layers. In the first layer the numbers of neurons that achieve the best performance in the first experiment are used. For the second hidden layer the number of neurons is varied from 1 to 10. The network was trained 30 times for each possible pair of neurons. Table2shows the pair of number of neurons in the two layers that achieve the minimum MSE mean.
TABLE II. THE MINIMUM MEAN OF MSE IIN THE 2ND EXPERIMENT
Mean of MSE
No. of Neurons in
the 2nd hidden
layer
No. of Neurons in
first hidden layer
0.0894 1 17
0.0952 1 3
0.0943 1 11
0.0992 2 19
0.1020 2 16
0.1030 5 9
0.1435 2 1
Table (2), the pairs of numbers of neurons that achieve best performance in terms of MSE mean are (17, 1) (11, 1), (3, 1), (19, 2), (16, 2), (9, 5), (1, 2).
In the third experiment the network is trained with three hidden layers. The number of neurons in the first and second hidden layer is those pairs which give better performance in experiment two as listed above. The number of neurons in the third hidden layer is varied from 1 to 10. The network was trained 30 times for each possible triple set of neurons. Table (3) shows the number of neurons in the three layers that achieve the minimum MSE mean.
From Table (3), the three numbers of neuron numbers in the three layers that achieve best performance in terms of MSE mean are (1, 2, 1), (3, 1, 1), (9, 5, 2), (19, 2,4), (17, 1, 1),(16, 2, 5), and (11, 1, 1) sequentially.
In a similar manner, in experiments 4 and 5 the network is trained using four layers and five layers respectively. Tables (4) and (5) show the numbers of neurons in different layers
that achieve the minimum MSE mean.
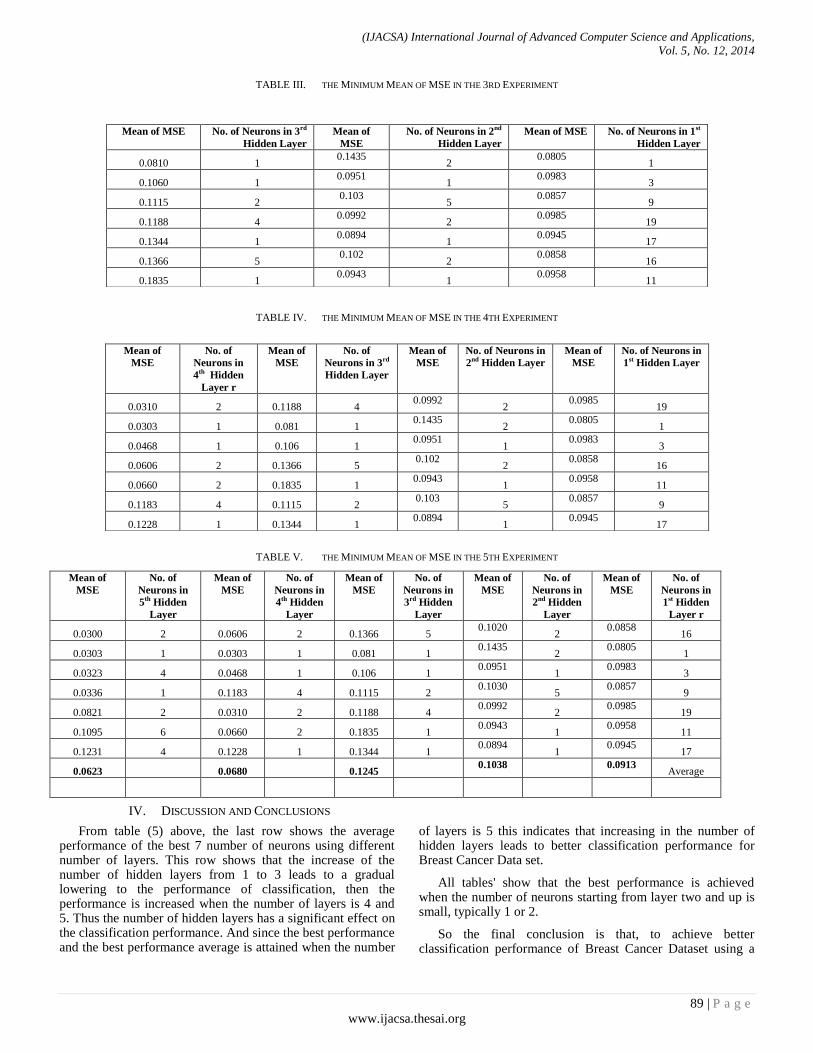
(IJACSA) International Journal of Advanced Computer Science and Applications,
Vol. 5, No. 12, 2014
89 | P a g e
www.ijacsa.thesai.org
TABLE III. THE MINIMUM MEAN OF MSE IN THE 3RD EXPERIMENT
TABLE IV. THE MINIMUM MEAN OF MSE IN THE 4TH EXPERIMENT
TABLE V. THE MINIMUM MEAN OF MSE IN THE 5TH EXPERIMENT
Mean of
MSE
No. of
Neurons in
5th Hidden
Layer
Mean of
MSE
No. of
Neurons in
4th Hidden
Layer
Mean of
MSE
No. of
Neurons in
3rd Hidden
Layer
Mean of
MSE
No. of
Neurons in
2nd Hidden
Layer
Mean of
MSE
No. of
Neurons in
1st Hidden
Layer r
0.0300 2 0.0606 2 0.1366 5 0.1020
2 0.0858
16
0.0303 1 0.0303 1 0.081 1 0.1435
2 0.0805
1
0.0323 4 0.0468 1 0.106 1 0.0951
1 0.0983
3
0.0336 1 0.1183 4 0.1115 2 0.1030
5 0.0857
9
0.0821 2 0.0310 2 0.1188 4 0.0992
2 0.0985
19
0.1095 6 0.0660 2 0.1835 1 0.0943
1 0.0958
11
0.1231 4 0.1228 1 0.1344 1 0.0894
1 0.0945
17
0.0623 0.0680 0.1245 0.1038
0.0913 Average
IV. DISCUSSION AND CONCLUSIONS
From table (5) above, the last row shows the average performance of the best 7 number of neurons using different number of layers. This row shows that the increase of the number of hidden layers from 1 to 3 leads to a gradual lowering to the performance of classification, then the performance is increased when the number of layers is 4 and 5. Thus the number of hidden layers has a significant effect on the classification performance. And since the best performance and the best performance average is attained when the number
of layers is 5 this indicates that increasing in the number of hidden layers leads to better classification performance for Breast Cancer Data set.
All tables' show that the best performance is achieved when the number of neurons starting from layer two and up is small, typically 1 or 2.
So the final conclusion is that, to achieve better classification performance of Breast Cancer Dataset using a
Mean of MSE No. of Neurons in 3rd
Hidden Layer
Mean of
MSE
No. of Neurons in 2nd
Hidden Layer
Mean of MSE No. of Neurons in 1st
Hidden Layer
0.0810 1 0.1435
2 0.0805
1
0.1060 1 0.0951
1 0.0983
3
0.1115 2 0.103
5 0.0857
9
0.1188 4 0.0992
2 0.0985
19
0.1344 1 0.0894
1 0.0945
17
0.1366 5 0.102
2 0.0858
16
0.1835 1 0.0943
1 0.0958
11
Mean of
MSE
No. of
Neurons in
4th Hidden
Layer r
Mean of
MSE
No. of
Neurons in 3rd
Hidden Layer
Mean of
MSE
No. of Neurons in
2nd Hidden Layer
Mean of
MSE
No. of Neurons in
1st Hidden Layer
0.0310 2 0.1188 4 0.0992
2 0.0985
19
0.0303 1 0.081 1 0.1435
2 0.0805
1
0.0468 1 0.106 1 0.0951
1 0.0983
3
0.0606 2 0.1366 5 0.102
2 0.0858
16
0.0660 2 0.1835 1 0.0943
1 0.0958
11
0.1183 4 0.1115 2 0.103
5 0.0857
9
0.1228 1 0.1344 1 0.0894
1 0.0945
17

(IJACSA) International Journal of Advanced Computer Science and Applications,
Vol. 5, No. 12, 2014
90 | P a g e
www.ijacsa.thesai.org
FNN, with 5 hidden layers and the number of layer's neurons should be small, typically 1 or 2.
REFERENCES
[1] Andina and Pham, "Computational Intelligence: For Engineering and Manufacturing", Springer, 2007, ISBN10 0-387-374507.
[2] Martin T. Hagan, Howard B. Demuth, Mark H. Beale "Neural Network Design", ISBN: 0-9717321-0-8
[3] Eric Kandel, James Schwartz, "Principles of Neural Science ", McGraw-Hill, fourth edition, 2000, ISBN 0-8385-7701-6
[4] Karimi B, Menhaj M. B. and Saboori I, Multilayer feed forward neural networks for controlling decentralized large-scale non-affine nonlinear systems with guaranteed stability, International Journal of Innovative Computing, Information and Control, vol.6, no.11, pp.4825-4841, 2010.
[5] Zare Nezhad B, and Aminian A. A multi-layer feed forward neural network model for accurate prediction of use gas sulfuric acid dew points in process industries, Applied Thermal Engineering, vol.30, no.6-7, pp.692-696, 2010
[6] Tuba Kiyan, Tulay Yildirim, “Breast Cancer Diagnosis Using Statistical Neural Networks”, Journal of Electrical and Electronics Engineering, 2004, vol. 4, Number 2, pp.1149-1153.
[7] Sudhir D. Swarkar, Ashok Ghatol, Amol P. Pande, “Neural Network Aided Breast Cancer Detection and Diagnosis Using Support Vector Machine” Proceedings of the International conference on Neural Networks, Cavtat, Croatia, June 12-14, 2006, pp. 158-163.
[8] Paulin F, A.Santhakumaran A, "Classification of Breast cancer by comparing Back Propagation training algorithms", International Journal on Computer Science and Engineering, ISSN: 0975-3397 Vol. 3 No. 1 Jan 2011 pp 327-332.
[9] Bindu Garg, M.M. Sufian Beg, A.Q. Ansari, "Optimizing Number of Inputs to Classify Breast Cancer Using Artificial Neural Network"
Journal of Computer Science & Systems Biology, JCSB, 2009, pp 247-254, ISSN: 0974-7230
[10] M L Freedman and M L R Nierodzik, "Cancer and Age", 2007 by Elsevier Inc.
[11] Jun Zhang MS, Haobo Ma Md MS, “An Implementation of Guildford Cytological Grading System to diagnose Breast Cancer Using Naïve Bayesian Classifier”, MEDINFO 2004, M. Fieschi et al. (Eds), Amsterdam: IOS Press
[12] ShuxiangXu, Ling Chen. "A Novel Approach for Determining the Optimal Number of Hidden Layer Neurons for FNN’s and Its Application in Data Mining", 5th International Conference on Information Technology and Applications, ICITA2008 ISBN: 978-0- 9803267-2-7, pp 683 - 686
[13] Fujita O. Statistical estimation of the number of hidden units for feed neural networks, Neural networks, 1998, pp: 851-859.
[14] Dario Baptista, Sandy Rodrigues, Fernando Morgado-Dias, "Performance comparison of ANN training algorithms for classification", Intelligent Signal Processing (WISP), 2013 IEEE.
[15] Muhammad IbnIbrahimy, Md. Rezwanul Ahsan, Othman Omran Khalifa, "Design and Optimization of Levenberg-Marquardt based Neural Network Classifier for EMG Signals to Identify Hand Motions", Measurement Science Review, Volume 13, No. 3, 2013.
[16] Reynaldi, A. ; Lukas, S. ; Margaretha, H., "Backpropagation and Levenberg-Marquardt Algorithm for raining Finite Element Neural Network", Computer Modeling and Simulation (EMS), Nov 2012 Sixth UK Sim, ISBN:978-1-4673-4977-2.
[17] Rudy Setiono, Huan Liu, “Neural-Network Feature Selector” IEEE Transactions On Neural Networks, vol. 8, No. 3, May 1997, pg 664-662
[18] Wlodzislaw Duch, Rafal Adamczak and Krzysztof Grabczewski, “A New methodology of Extraction, Optimization and Application of Crisp and Fuzzy Logic Rules” IEEE Transactions on Neural Networks, vol. 12, No. 2, March 2001, pp. 227-306.

(IJACSA) International Journal of Advanced Computer Science and Applications,
Vol. 5, No. 12, 2014
91 | P a g e
www.ijacsa.thesai.org
Use of Geographic Information System Tools in
Research on Neonatal Outcomes in a Maternity-
School in Belo Horizonte - Brazil
Juliano de S. Gaspar
Pós-Graduação em Saúde da Mulher
Faculty of Medicine of UFMG
Belo Horizonte, Brasil
Zilma S. N. Reis
Pós-Graduação em Saúde da Mulher
Faculty of Medicine of UFMG
Belo Horizonte, Brasil
Marcelo S. Júnior
Pós-Graduação em Saúde da Mulher
Faculty of Medicine of UFMG
Belo Horizonte, Brasil
Thabata Sá
Hospital das Clínicas of UFMG
Belo Horizonte, Brasil
Renato F. N. Júnior
Faculty of Production Engineering
Universidade Salgado de Oliveira
Belo Horizonte, Brasil
Raphael R. Gusmão
Faculty of Medicine of UFMG
Belo Horizonte, Brasil
Abstract—Aim: This study proposes to evaluate the spatial
distribution of the public obstetric care in the city of Belo
Horizonte. It will also correlate the primary care units (PCU)
with the immediate neonatal outcomes of a maternity-school of
Belo Horizonte, according to risk pregnancy and obstetric
outcome. Method: Descriptive geographic-spatial research. This
study analyzed a cohort of 2956 newborn who received care at
birth in maternity-school, Hospital das Clinicas (HC) of Federal
University of Minas Gerais (UFMG) between the January/2013
to July/2014. The gestational risk, the local of primary care unit
(PCU) of prenatal, immediate neonatal outcome was studied. The
QGIS 2.4 open source software was used to generate thematic
maps and analyses. Results: It was observed that among the 2083
births analyzed 1154 (55.4%) were classified as high risk for
maternal and 634 (30.4%) with poor neonatal outcome, also, that
has a concentration of women living in the northwest of the city
to officially refer to their childbirth mothers in the maternity-
school. In cases of high risk pregnancy and perinatal
complications referencing also occurs from practically all other
regions of the city. Discussion: The integration of hospital clinical
and administrative data with cartographic databases, through
through this study, was able to make clear the patterns of
referencing for childbirth in maternity-school in high risk
pregnancy. Despite the limitations of a descriptive study, the
analysis makes clear that the choice of place of childbirth,
exceeds the matters set out in government planning of emergency
obstetric referencing by sanitary districts.
Keywords—Geographic Information Systems (GIS); Fetal
Malformation; Health Indicators; Obstetrics Result; Primary Care
Unit (PCU); Public Health
I. INTRODUCTION
The decentralization of healthcare through regional and hierarchical connected health services, while sustaining the management of care in a primary level are guidelines from the Brazilian Heath System(SUS) [1]. In the obstetric context, even though the labor occurs in a hospital environment, its success must be seen as a final process initiated in the primary care. The gestation wellness initiate with a correct family planning, involves preconception evaluation, passes through an early and effective prenatal assistance and, undeniably, through proper parturitions conditions. All these steps depend on an accessible and well-scaled health care network with quality [2, 3].
About 2.9 million annual births are estimated in the country. Among these, there are deaths of approximately 10.6 in every 1000 conceptuses in the neonatal period and 64.8 women in each 100 thousand live births, this according to data from the year 2011 [4]. These are mostly considered preventable deaths [5]. Such maternal and child indicators are still far behind the desired expectations and are reflections of the level of economic development, culture and technology of the country, and the current difficulties of prenatal and delivery care in our health services [6, 7].
Efforts have been undertaken in the sense of better understand the mechanisms that lead to poor maternal and neonatal results. These will be studied in a special manner as to high-risk pregnancy, and systematized care for pregnant women in labor [8].
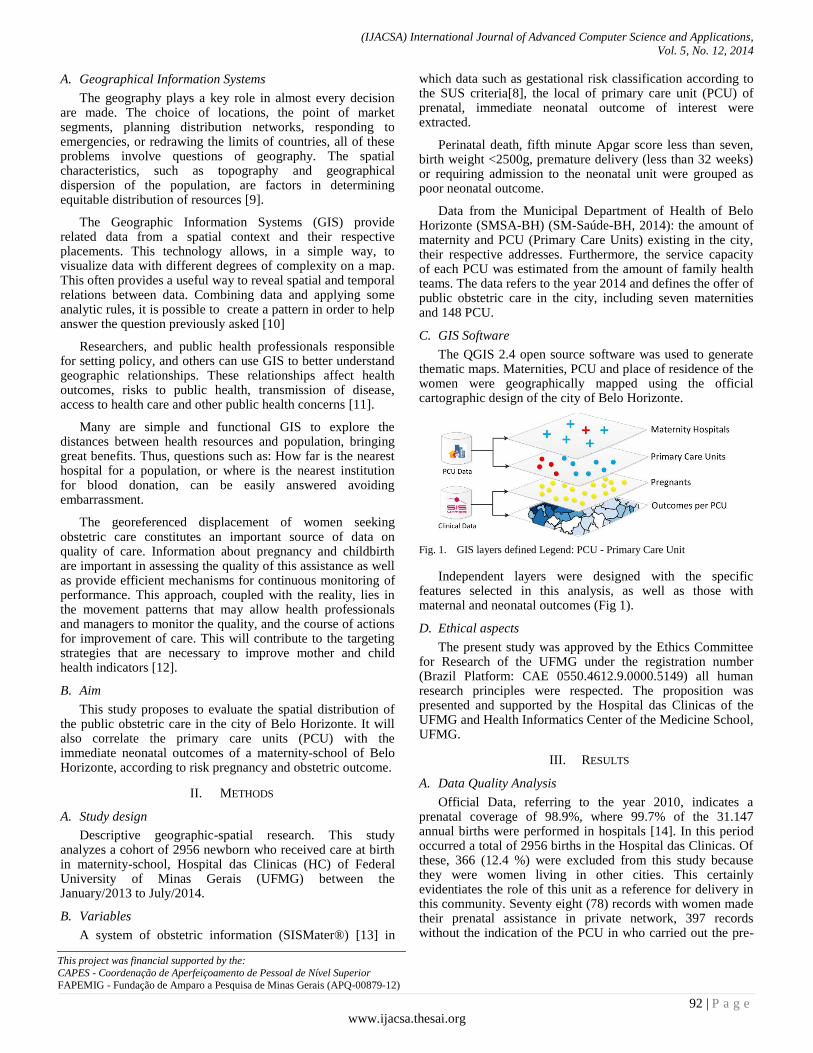
(IJACSA) International Journal of Advanced Computer Science and Applications,
Vol. 5, No. 12, 2014
92 | P a g e
www.ijacsa.thesai.org
A. Geographical Information Systems
The geography plays a key role in almost every decision are made. The choice of locations, the point of market segments, planning distribution networks, responding to emergencies, or redrawing the limits of countries, all of these problems involve questions of geography. The spatial characteristics, such as topography and geographical dispersion of the population, are factors in determining equitable distribution of resources [9].
The Geographic Information Systems (GIS) provide related data from a spatial context and their respective placements. This technology allows, in a simple way, to visualize data with different degrees of complexity on a map. This often provides a useful way to reveal spatial and temporal relations between data. Combining data and applying some analytic rules, it is possible to create a pattern in order to help answer the question previously asked [10]
Researchers, and public health professionals responsible for setting policy, and others can use GIS to better understand geographic relationships. These relationships affect health outcomes, risks to public health, transmission of disease, access to health care and other public health concerns [11].
Many are simple and functional GIS to explore the distances between health resources and population, bringing great benefits. Thus, questions such as: How far is the nearest hospital for a population, or where is the nearest institution for blood donation, can be easily answered avoiding embarrassment.
The georeferenced displacement of women seeking obstetric care constitutes an important source of data on quality of care. Information about pregnancy and childbirth are important in assessing the quality of this assistance as well as provide efficient mechanisms for continuous monitoring of performance. This approach, coupled with the reality, lies in the movement patterns that may allow health professionals and managers to monitor the quality, and the course of actions for improvement of care. This will contribute to the targeting strategies that are necessary to improve mother and child health indicators [12].
B. Aim
This study proposes to evaluate the spatial distribution of the public obstetric care in the city of Belo Horizonte. It will also correlate the primary care units (PCU) with the immediate neonatal outcomes of a maternity-school of Belo Horizonte, according to risk pregnancy and obstetric outcome.
II. METHODS
A. Study design
Descriptive geographic-spatial research. This study analyzes a cohort of 2956 newborn who received care at birth in maternity-school, Hospital das Clinicas (HC) of Federal University of Minas Gerais (UFMG) between the January/2013 to July/2014.
B. Variables
A system of obstetric information (SISMater®) [13] in
which data such as gestational risk classification according to the SUS criteria[8], the local of primary care unit (PCU) of prenatal, immediate neonatal outcome of interest were extracted.
Perinatal death, fifth minute Apgar score less than seven, birth weight <2500g, premature delivery (less than 32 weeks) or requiring admission to the neonatal unit were grouped as poor neonatal outcome.
Data from the Municipal Department of Health of Belo Horizonte (SMSA-BH) (SM-Saúde-BH, 2014): the amount of maternity and PCU (Primary Care Units) existing in the city, their respective addresses. Furthermore, the service capacity of each PCU was estimated from the amount of family health teams. The data refers to the year 2014 and defines the offer of public obstetric care in the city, including seven maternities and 148 PCU.
C. GIS Software
The QGIS 2.4 open source software was used to generate thematic maps. Maternities, PCU and place of residence of the women were geographically mapped using the official cartographic design of the city of Belo Horizonte.
Fig. 1. GIS layers defined Legend: PCU - Primary Care Unit
Independent layers were designed with the specific features selected in this analysis, as well as those with maternal and neonatal outcomes (Fig 1).
D. Ethical aspects
The present study was approved by the Ethics Committee for Research of the UFMG under the registration number (Brazil Platform: CAE 0550.4612.9.0000.5149) all human research principles were respected. The proposition was presented and supported by the Hospital das Clinicas of the UFMG and Health Informatics Center of the Medicine School, UFMG.
III. RESULTS
A. Data Quality Analysis
Official Data, referring to the year 2010, indicates a prenatal coverage of 98.9%, where 99.7% of the 31.147 annual births were performed in hospitals [14]. In this period occurred a total of 2956 births in the Hospital das Clinicas. Of these, 366 (12.4 %) were excluded from this study because they were women living in other cities. This certainly evidentiates the role of this unit as a reference for delivery in this community. Seventy eight (78) records with women made their prenatal assistance in private network, 397 records without the indication of the PCU in who carried out the pre-
This project was financial supported by the:
CAPES - Coordenação de Aperfeiçoamento de Pessoal de Nível Superior
FAPEMIG - Fundação de Amparo a Pesquisa de Minas Gerais (APQ-00879-12)
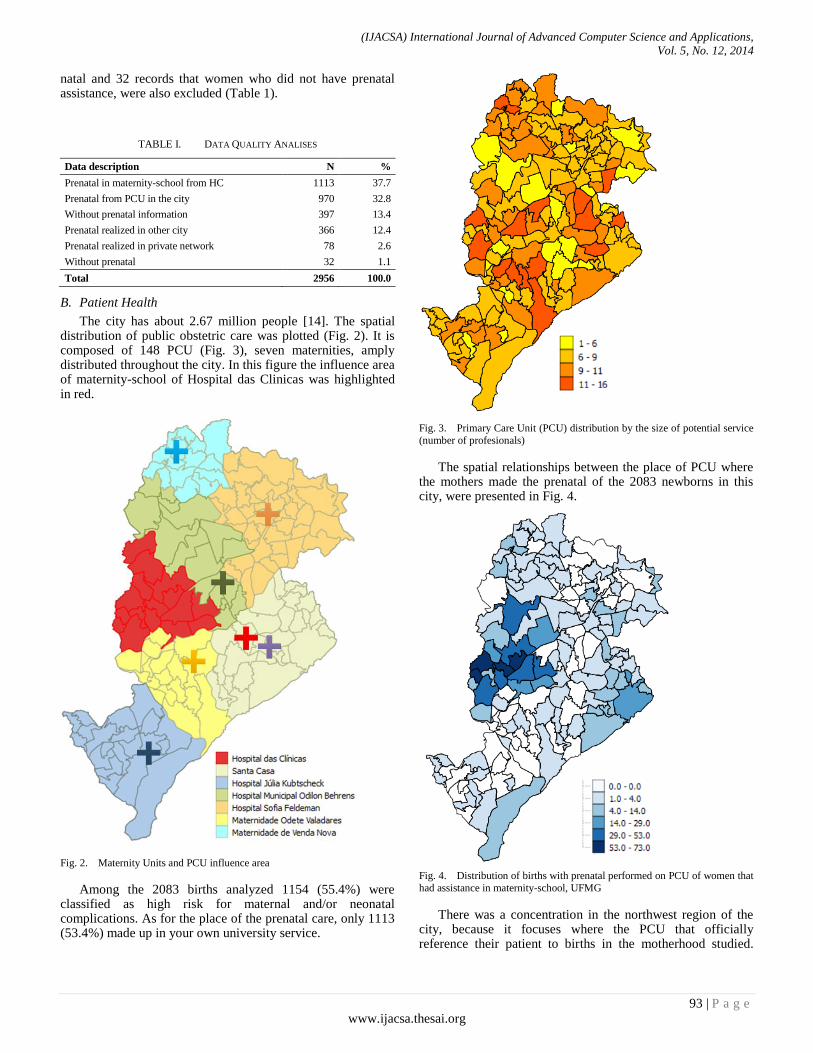
(IJACSA) International Journal of Advanced Computer Science and Applications,
Vol. 5, No. 12, 2014
93 | P a g e
www.ijacsa.thesai.org
natal and 32 records that women who did not have prenatal assistance, were also excluded (Table 1).
TABLE I. DATA QUALITY ANALISES
Data description N %
Prenatal in maternity-school from HC 1113 37.7
Prenatal from PCU in the city 970 32.8
Without prenatal information 397 13.4
Prenatal realized in other city 366 12.4
Prenatal realized in private network 78 2.6
Without prenatal 32 1.1
Total 2956 100.0
B. Patient Health
The city has about 2.67 million people [14]. The spatial distribution of public obstetric care was plotted (Fig. 2). It is composed of 148 PCU (Fig. 3), seven maternities, amply distributed throughout the city. In this figure the influence area of maternity-school of Hospital das Clinicas was highlighted in red.
Fig. 2. Maternity Units and PCU influence area
Among the 2083 births analyzed 1154 (55.4%) were classified as high risk for maternal and/or neonatal complications. As for the place of the prenatal care, only 1113 (53.4%) made up in your own university service.
Fig. 3. Primary Care Unit (PCU) distribution by the size of potential service
(number of profesionals)
The spatial relationships between the place of PCU where the mothers made the prenatal of the 2083 newborns in this city, were presented in Fig. 4.
Fig. 4. Distribution of births with prenatal performed on PCU of women that
had assistance in maternity-school, UFMG
There was a concentration in the northwest region of the city, because it focuses where the PCU that officially reference their patient to births in the motherhood studied.
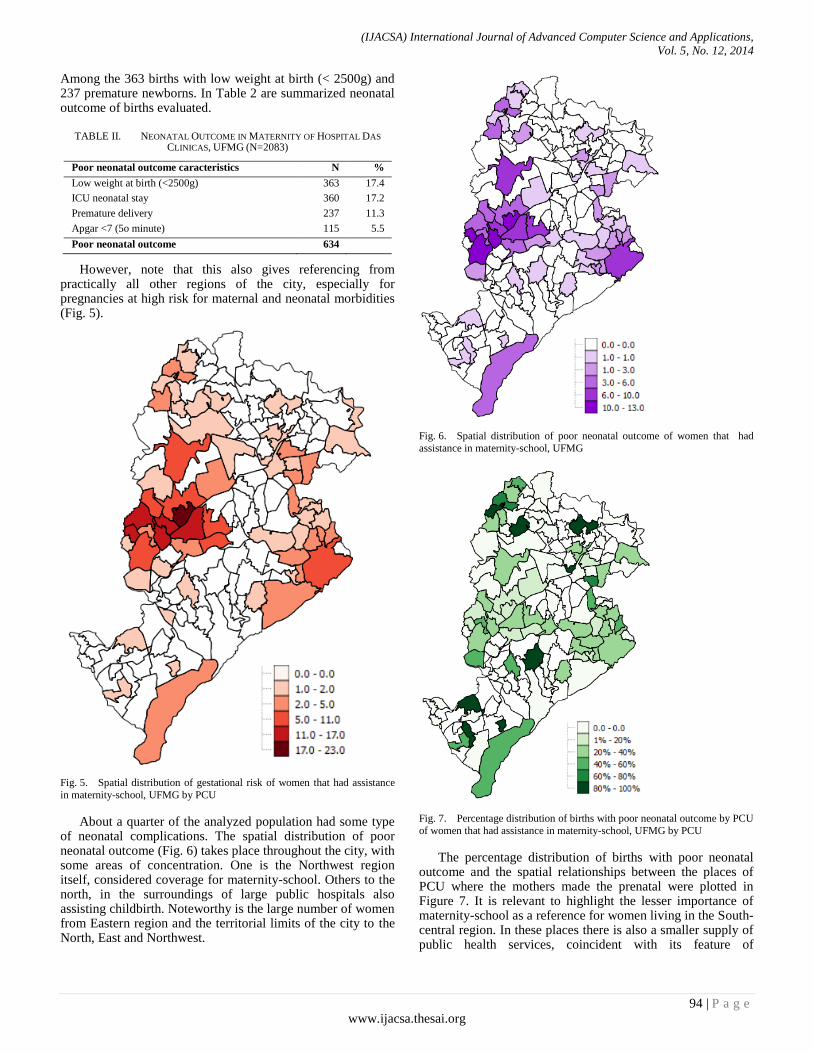
(IJACSA) International Journal of Advanced Computer Science and Applications,
Vol. 5, No. 12, 2014
94 | P a g e
www.ijacsa.thesai.org
Among the 363 births with low weight at birth (< 2500g) and 237 premature newborns. In Table 2 are summarized neonatal outcome of births evaluated.
TABLE II. NEONATAL OUTCOME IN MATERNITY OF HOSPITAL DAS
CLINICAS, UFMG (N=2083)
Poor neonatal outcome caracteristics N %
Low weight at birth (<2500g) 363 17.4
ICU neonatal stay 360 17.2
Premature delivery 237 11.3
Apgar <7 (5o minute) 115 5.5
Poor neonatal outcome 634
However, note that this also gives referencing from practically all other regions of the city, especially for pregnancies at high risk for maternal and neonatal morbidities (Fig. 5).
Fig. 5. Spatial distribution of gestational risk of women that had assistance
in maternity-school, UFMG by PCU
About a quarter of the analyzed population had some type of neonatal complications. The spatial distribution of poor neonatal outcome (Fig. 6) takes place throughout the city, with some areas of concentration. One is the Northwest region itself, considered coverage for maternity-school. Others to the north, in the surroundings of large public hospitals also assisting childbirth. Noteworthy is the large number of women from Eastern region and the territorial limits of the city to the North, East and Northwest.
Fig. 6. Spatial distribution of poor neonatal outcome of women that had
assistance in maternity-school, UFMG
Fig. 7. Percentage distribution of births with poor neonatal outcome by PCU
of women that had assistance in maternity-school, UFMG by PCU
The percentage distribution of births with poor neonatal outcome and the spatial relationships between the places of PCU where the mothers made the prenatal were plotted in Figure 7. It is relevant to highlight the lesser importance of maternity-school as a reference for women living in the South-central region. In these places there is also a smaller supply of public health services, coincident with its feature of
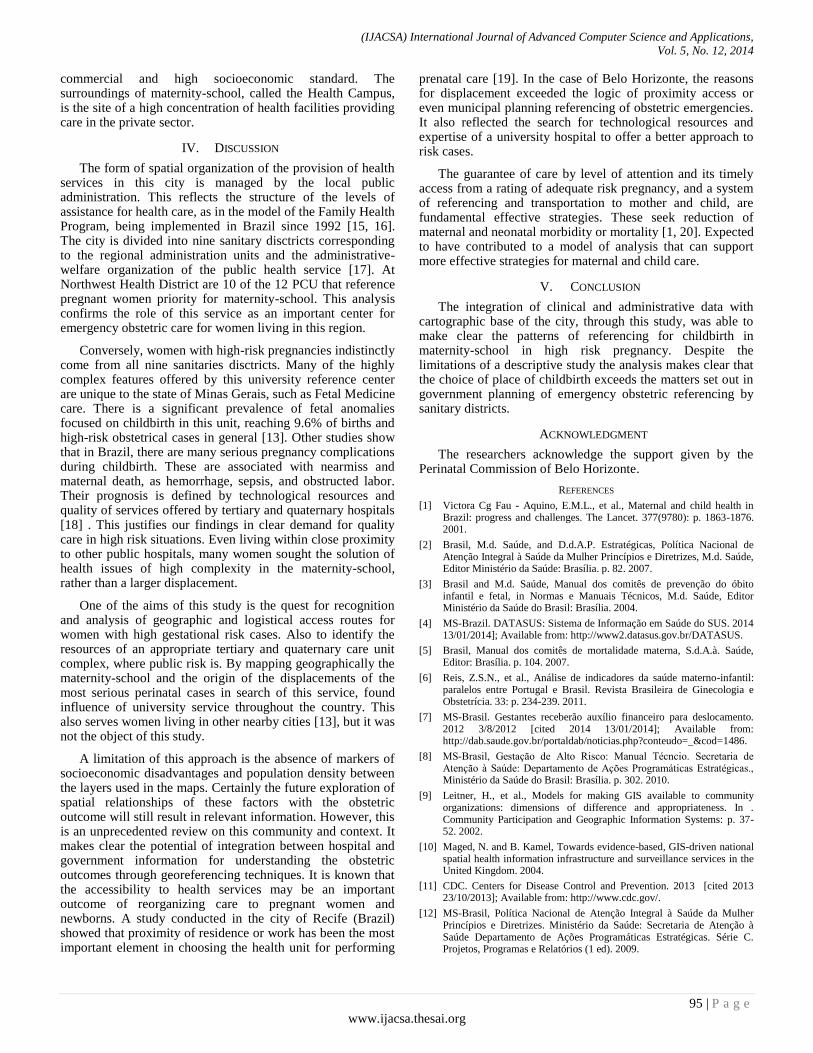
(IJACSA) International Journal of Advanced Computer Science and Applications,
Vol. 5, No. 12, 2014
95 | P a g e
www.ijacsa.thesai.org
commercial and high socioeconomic standard. The surroundings of maternity-school, called the Health Campus, is the site of a high concentration of health facilities providing care in the private sector.
IV. DISCUSSION
The form of spatial organization of the provision of health services in this city is managed by the local public administration. This reflects the structure of the levels of assistance for health care, as in the model of the Family Health Program, being implemented in Brazil since 1992 [15, 16]. The city is divided into nine sanitary disctricts corresponding to the regional administration units and the administrative-welfare organization of the public health service [17]. At Northwest Health District are 10 of the 12 PCU that reference pregnant women priority for maternity-school. This analysis confirms the role of this service as an important center for emergency obstetric care for women living in this region.
Conversely, women with high-risk pregnancies indistinctly come from all nine sanitaries disctricts. Many of the highly complex features offered by this university reference center are unique to the state of Minas Gerais, such as Fetal Medicine care. There is a significant prevalence of fetal anomalies focused on childbirth in this unit, reaching 9.6% of births and high-risk obstetrical cases in general [13]. Other studies show that in Brazil, there are many serious pregnancy complications during childbirth. These are associated with nearmiss and maternal death, as hemorrhage, sepsis, and obstructed labor. Their prognosis is defined by technological resources and quality of services offered by tertiary and quaternary hospitals [18] . This justifies our findings in clear demand for quality care in high risk situations. Even living within close proximity to other public hospitals, many women sought the solution of health issues of high complexity in the maternity-school, rather than a larger displacement.
One of the aims of this study is the quest for recognition and analysis of geographic and logistical access routes for women with high gestational risk cases. Also to identify the resources of an appropriate tertiary and quaternary care unit complex, where public risk is. By mapping geographically the maternity-school and the origin of the displacements of the most serious perinatal cases in search of this service, found influence of university service throughout the country. This also serves women living in other nearby cities [13], but it was not the object of this study.
A limitation of this approach is the absence of markers of socioeconomic disadvantages and population density between the layers used in the maps. Certainly the future exploration of spatial relationships of these factors with the obstetric outcome will still result in relevant information. However, this is an unprecedented review on this community and context. It makes clear the potential of integration between hospital and government information for understanding the obstetric outcomes through georeferencing techniques. It is known that the accessibility to health services may be an important outcome of reorganizing care to pregnant women and newborns. A study conducted in the city of Recife (Brazil) showed that proximity of residence or work has been the most important element in choosing the health unit for performing
prenatal care [19]. In the case of Belo Horizonte, the reasons for displacement exceeded the logic of proximity access or even municipal planning referencing of obstetric emergencies. It also reflected the search for technological resources and expertise of a university hospital to offer a better approach to risk cases.
The guarantee of care by level of attention and its timely access from a rating of adequate risk pregnancy, and a system of referencing and transportation to mother and child, are fundamental effective strategies. These seek reduction of maternal and neonatal morbidity or mortality [1, 20]. Expected to have contributed to a model of analysis that can support more effective strategies for maternal and child care.
V. CONCLUSION
The integration of clinical and administrative data with cartographic base of the city, through this study, was able to make clear the patterns of referencing for childbirth in maternity-school in high risk pregnancy. Despite the limitations of a descriptive study the analysis makes clear that the choice of place of childbirth exceeds the matters set out in government planning of emergency obstetric referencing by sanitary districts.
ACKNOWLEDGMENT
The researchers acknowledge the support given by the Perinatal Commission of Belo Horizonte.
REFERENCES
[1] Victora Cg Fau - Aquino, E.M.L., et al., Maternal and child health in Brazil: progress and challenges. The Lancet. 377(9780): p. 1863-1876. 2001.
[2] Brasil, M.d. Saúde, and D.d.A.P. Estratégicas, Política Nacional de Atenção Integral à Saúde da Mulher Princípios e Diretrizes, M.d. Saúde, Editor Ministério da Saúde: Brasília. p. 82. 2007.
[3] Brasil and M.d. Saúde, Manual dos comitês de prevenção do óbito infantil e fetal, in Normas e Manuais Técnicos, M.d. Saúde, Editor Ministério da Saúde do Brasil: Brasília. 2004.
[4] MS-Brazil. DATASUS: Sistema de Informação em Saúde do SUS. 2014 13/01/2014]; Available from: http://www2.datasus.gov.br/DATASUS.
[5] Brasil, Manual dos comitês de mortalidade materna, S.d.A.à. Saúde, Editor: Brasília. p. 104. 2007.
[6] Reis, Z.S.N., et al., Análise de indicadores da saúde materno-infantil: paralelos entre Portugal e Brasil. Revista Brasileira de Ginecologia e Obstetrícia. 33: p. 234-239. 2011.
[7] MS-Brasil. Gestantes receberão auxílio financeiro para deslocamento. 2012 3/8/2012 [cited 2014 13/01/2014]; Available from: http://dab.saude.gov.br/portaldab/noticias.php?conteudo=_&cod=1486.
[8] - Ministério da Saúde do Brasil: Brasília. p. 302. 2010.
[9] Leitner, H., et al., Models for making GIS available to community organizations: dimensions of difference and appropriateness. In . Community Participation and Geographic Information Systems: p. 37-52. 2002.
[10] Maged, N. and B. Kamel, Towards evidence-based, GIS-driven national spatial health information infrastructure and surveillance services in the United Kingdom. 2004.
[11] CDC. Centers for Disease Control and Prevention. 2013 [cited 2013 23/10/2013]; Available from: http://www.cdc.gov/.
[12] MS-Brasil, Política Nacional de Atenção Integral à Saúde da Mulher Princípios e Diretrizes. Ministério da Saúde: Secretaria de Atenção à Saúde Departamento de Ações Programáticas Estratégicas. Série C. Projetos, Programas e Relatórios (1 ed). 2009.

(IJACSA) International Journal of Advanced Computer Science and Applications,
Vol. 5, No. 12, 2014
96 | P a g e
www.ijacsa.thesai.org
[13] Gaspar, J., et al., Maternal and Neonatal Healthcare Information System: Development of an Obstetric Electronic Health Record and Healthcare Indicators Dashboard, in Information Technology in Bio- and Medical Informatics, M. Bursa, S. Khuri, and M.E. Renda, Editors. Springer Berlin Heidelberg. p. 62-76. 2013.
[14] Beale, T. and S. Heard, openEHR Architecture–Architecture Overview, 2008. 2010.
[15] Victora, C.G., et al., Health conditions and health-policy innovations in Brazil: the way forward. The Lancet. 377(9782): p. 2042-2053. 2011.
[16] Paim, J., et al., The Brazilian health system: history, advances, and challenges. The Lancet. 377(9779): p. 1778-1797. 2011.
[17] SM-Saúde-BH. Áreas de Abrangência dos Centros de Saúde. 2014 [cited 2014; Available from: http://gestaocompartilhada.pbh.gov.br/estrutura-territorial/areas-de-abrangencia-dos-centros-de-saude.
[18] Beale, T., et al., OpenEHR architecture overview. The OpenEHR Foundation. 2006.
[19] Kalra, D., Electronic health record standards. Yearb Med Inform: p. 136-144. 2006.
[20] MS-Brasil, Portaria Nº 1.459, 24/06/2011 - Institui, no âmbito do Sistema Único de Saúde - SUS - a Rede Cegonha., M.d.S.d. Brasil, Editor Ministério da Saúde: Brasília. 2011.
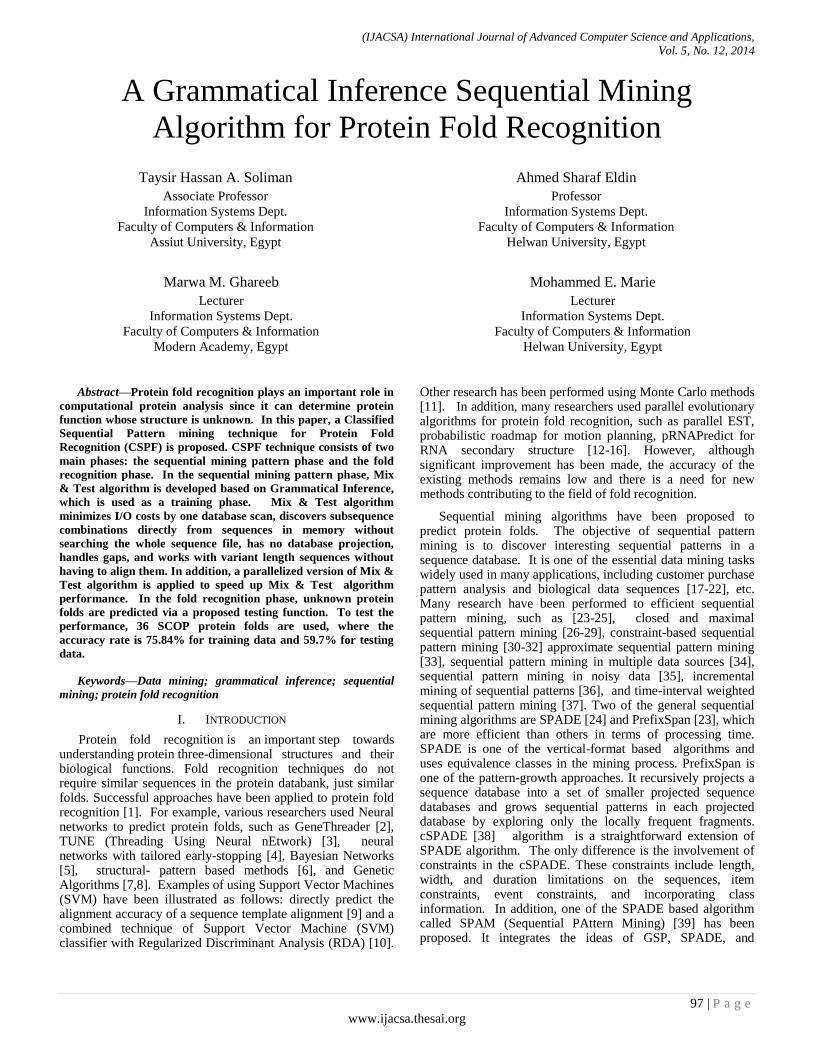
(IJACSA) International Journal of Advanced Computer Science and Applications,
Vol. 5, No. 12, 2014
97 | P a g e
www.ijacsa.thesai.org
A Grammatical Inference Sequential Mining
Algorithm for Protein Fold Recognition
Taysir Hassan A. Soliman
Associate Professor
Information Systems Dept.
Faculty of Computers & Information
Assiut University, Egypt
Ahmed Sharaf Eldin
Professor
Information Systems Dept.
Faculty of Computers & Information
Helwan University, Egypt
Marwa M. Ghareeb
Lecturer
Information Systems Dept.
Faculty of Computers & Information
Modern Academy, Egypt
Mohammed E. Marie
Lecturer
Information Systems Dept.
Faculty of Computers & Information
Helwan University, Egypt
Abstract—Protein fold recognition plays an important role in
computational protein analysis since it can determine protein
function whose structure is unknown. In this paper, a Classified
Sequential Pattern mining technique for Protein Fold
Recognition (CSPF) is proposed. CSPF technique consists of two
main phases: the sequential mining pattern phase and the fold
recognition phase. In the sequential mining pattern phase, Mix
& Test algorithm is developed based on Grammatical Inference,
which is used as a training phase. Mix & Test algorithm
minimizes I/O costs by one database scan, discovers subsequence
combinations directly from sequences in memory without
searching the whole sequence file, has no database projection,
handles gaps, and works with variant length sequences without
having to align them. In addition, a parallelized version of Mix &
Test algorithm is applied to speed up Mix & Test algorithm
performance. In the fold recognition phase, unknown protein
folds are predicted via a proposed testing function. To test the
performance, 36 SCOP protein folds are used, where the
accuracy rate is 75.84% for training data and 59.7% for testing
data.
Keywords—Data mining; grammatical inference; sequential
mining; protein fold recognition
I. INTRODUCTION
Protein fold recognition is an important step towards understanding protein three-dimensional structures and their biological functions. Fold recognition techniques do not require similar sequences in the protein databank, just similar folds. Successful approaches have been applied to protein fold recognition [1]. For example, various researchers used Neural networks to predict protein folds, such as GeneThreader [2], TUNE (Threading Using Neural nEtwork) [3], neural networks with tailored early-stopping [4], Bayesian Networks [5], structural- pattern based methods [6], and Genetic Algorithms [7,8]. Examples of using Support Vector Machines (SVM) have been illustrated as follows: directly predict the alignment accuracy of a sequence template alignment [9] and a combined technique of Support Vector Machine (SVM) classifier with Regularized Discriminant Analysis (RDA) [10].
Other research has been performed using Monte Carlo methods [11]. In addition, many researchers used parallel evolutionary algorithms for protein fold recognition, such as parallel EST, probabilistic roadmap for motion planning, pRNAPredict for RNA secondary structure [12-16]. However, although significant improvement has been made, the accuracy of the existing methods remains low and there is a need for new methods contributing to the field of fold recognition.
Sequential mining algorithms have been proposed to predict protein folds. The objective of sequential pattern mining is to discover interesting sequential patterns in a sequence database. It is one of the essential data mining tasks widely used in many applications, including customer purchase pattern analysis and biological data sequences [17-22], etc. Many research have been performed to efficient sequential pattern mining, such as [23-25], closed and maximal sequential pattern mining [26-29], constraint-based sequential pattern mining [30-32] approximate sequential pattern mining [33], sequential pattern mining in multiple data sources [34], sequential pattern mining in noisy data [35], incremental mining of sequential patterns [36], and time-interval weighted sequential pattern mining [37]. Two of the general sequential mining algorithms are SPADE [24] and PrefixSpan [23], which are more efficient than others in terms of processing time. SPADE is one of the vertical-format based algorithms and uses equivalence classes in the mining process. PrefixSpan is one of the pattern-growth approaches. It recursively projects a sequence database into a set of smaller projected sequence databases and grows sequential patterns in each projected database by exploring only the locally frequent fragments. cSPADE [38] algorithm is a straightforward extension of SPADE algorithm. The only difference is the involvement of constraints in the cSPADE. These constraints include length, width, and duration limitations on the sequences, item constraints, event constraints, and incorporating class information. In addition, one of the SPADE based algorithm called SPAM (Sequential PAttern Mining) [39] has been proposed. It integrates the ideas of GSP, SPADE, and

(IJACSA) International Journal of Advanced Computer Science and Applications,
Vol. 5, No. 12, 2014
98 | P a g e
www.ijacsa.thesai.org
FreeSpan and combines a vertical bitmap representation of the database with efficient support counting.
One of the promising areas is Formal Language Theory and Grammatical Inference (GI), which is playing important role in the development of new methods to process biological data [40]. Many works propose GI techniques to tackle bioinformatics tasks, such as secondary structure identification [41], protein motifs detection [42], and optimal consensus sequence discovery [43]. In this paper, GI is used as the backbone of the sequential pattern mining algorithm, which has achieved faster and higher performance accuracy than other sequential pattern mining algorithms for protein fold recognition.
In this paper, we introduce a Classified Sequential Pattern mining technique for Protein Fold Recognition (CSPF). CSPF consists of two main phases: 1) Sequential pattern mining and 2) fold recognition. It handles gap constraints, uses data parallelization, and performs incremental updating. CSPF has shown efficient results when applied to 36 SCOP protein folds. This paper is organized as follows: section 2 explains the proposed CSPF technique. Section 3 describes datasets used and the performance study. Finally, section 4 gives the conclusions and future work.
II. METHODS
CSPF technique consists of two main phases: the sequential pattern mining phase and the fold recognition phase. In the sequential pattern mining phase, Mix & Test algorithm is developed, which is used as a training phase. In the fold recognition phase, unknown protein folds are predicted via a proposed testing function. Our work is close to the sequential pattern mining suggested in [13]. However, this work depends on a new algorithm for sequential pattern mining, based on grammatical inference. In addition, it employs parallel sequential pattern mining and incremental updating.
A. Phase I: Sequential Pattern Mining:
During this phase, Mix & Test algorithm is developed in order to mine sequential patterns for each fold, based on Grammatical Inference. The key advantages of Mix &Test algorithm are minimizing I/O costs via one database scan, discovering combinations directly from sequences in-memory without searching the whole sequences file, no database projection, handling gaps, and working with variant length sequences without having to align them. In addition, Mix & Test algorithm supports incremental updating, where it does not prune infrequent patterns and count the support of them during the mining steps. Mix & Test algorithm acts iteratively. First, it generates a list of no gap sequential combinations, which will serve as the seed for the coming generation if there is a gap value specified. If no gap is specified, this list will be evaluated by the testing strategy with the specified minimum support threshold. Thus, this list will obtain the frequent and infrequent lists. If the gap value is specified, Mix &Test will loop to the combinations generation step and will use the combinations list obtained from the previous step to construct new combinations list with a gap by following steps of Mix &Test algorithm’s grammar.
The steps of the algorithm are shown in Fig. 1.
1) Mix Strategy:
Problem Definition: Given a sequences file S that contains a
set of sequences S= {s1, s2, ..., sm} and a set of items I = { i1,
i2, …, in} that may appear in any sequence (here, a set of
amino acids), where m is the number of sequences in a file
and n is the number of amino acids. A sequence sj= <i1, ...,in>
, where i1 is the first item in the sequence and in is the last item
in the sequence. Let P is a subsequence that is derived from sj,
Pt is the current generated subsequence. Pt-1 is the previous
generated subsequence. The first generated subsequence will
be:
P1(sj) = in-1 & in(1)
The generated subsequence will be:
Pt(sj)= in-t & Pt-1(sj) (2)
1. Read New Protein Sequences
2. Apply Mix Strategy to generate sequential
combination 3. If New Combination then
Add new combination to Arraylist with
support =1 Else
Increase it support by 1
4. If End of sequences file then If stopping criterion is reached
(No_of Max gaps) then
If Combinations’ support >=Minsup then Output frequent Sequential patterns
Else
Output Infrequent Sequential patterns Else
GOTO step 3
Else GOTO step 2
Fig. 1. Mix & Test Algorithm Flowchart
Sequential combinations Generation "No-Gap combinations"
Mix strategy will first generate all "no gap combinations" list. It starts by reading the first sequence of protein sequences file and generates all possible sequential combinations of it. Mix strategy inserts the generated combination to the "no gap combinations" list with support equals to 1. Mix strategy will loop through new generated P to generate all possible combinations of it, using a removing procedure. This procedure removes the last item of the last generated combination to get a new combination from current P. It will stop generate Pt when t equals to number of items in the sequence n. An example of generated sequential combinations of “No-gap combinations” is illustrated in Table I, given original sequence MAKNNGCDP. After generating all possible sequential combinations from the first sequence of the protein sequences file. It will start to read the second sequence and go through the previous steps and generate all new combinations. If the new generated combination is previously composed, its support will be incremented by one; otherwise, it
(IJACSA) International Journal of Advanced Computer Science and Applications,
Vol. 5, No. 12, 2014
99 | P a g e
www.ijacsa.thesai.org
will be inserted to "no gap combinations" list with support equals to 1, as clarified in Fig. 1.
Gapped Sequential combinations Generation
If there is a gap value specified, the "no gap combinations" list will be used to generate "one gap combinations" list, which will be used to generate "two gaps combinations" list, and so on. Mix strategy will use two procedures to generate all possible gapped sequential combinations: Ladder and CrissCross procedures.
First, the Ladder procedure reads each combination in "no gap combinations" list and loops through it by inserting one gap at a time starting from the second character position shifted right in each loop until reaching the last character of the combination. Then, it will start again to read the next no gap combination and apply the previous steps on it.
TABLE I. LIST OF GENERATED SEQUENTIAL COMBINATIONS “NO-GAP
COMBINATIONS”
SUBSEQUENCE LIST OF GENERATED COMBINATIONS
P1 DP
P2 CD, CDP
P3 GC, GCD, GCDP
P4 NG, NGC, NGCD, NGCDP
P5 NN, NNG, NNGC, NNGCD, NNGCDP
P6 KN, KNN, KNNG, KNNGC, KNNGCD,
KNNGCDP
P7 AK, AKN, AKNN, AKNNG, AKNNGC,
AKNNGCD, AKNNGCDP
P8 MA, MAK, MAKN, MAKNN,
MAKNNG, MAKNNGC, MAKNNGCD, MAKNNGCDP
Definition 1: Given C as a "no gap combinations" list. Ci is a no gap combination. Let L be the gapped combination list generated by Ladder procedure, as follows:
Ly(Ci(Sj)) = Ci – iy+1 (3)
Where Ly(Ci(Sj)) is the y combination generated by Ladder procedure from no gap combination Ci, and iy+1 is the item i with the position y+1 in Ci combination.
Consider the first combination in the "No gap combinations" list is MAKNNGCDP, applying this procedure, we will obtain these one gap combinations: M_KNNGCDP, MA_NNGCDP, MAK_NGCDP, MAKN_GCDP, MAKNN_CDP, MAKNNG_DP, and MAKNNGC_P. Note that MAK_NGCDP is equivalent to MAKN_GCDP, so that they are treated as one combination and inserted only once in "one gap combinations" list as MAKNGCDP.
Second, the Crisscross procedure generates the rest of possible gapped sequential combinations of "one gap combinations" list. It reads each combination in "no gap combinations" list, looping through it and inserting one gap between each character of combination's characters. It starts from the second character's position shifted right one character position in each loop.
Definition 2: Given C as a "no gap combinations" list. Ci is a no gap combination. Let Q be the gapped combination list generated by Crisscross procedure, as follows:
Qr(Ci(Sj)) = Ci – (ir+1 & ir+3 & ir+5 & ir+7 … in) (4)
Where Qr(Ci(Sj)) is the r combination generated by Crisscross procedure from no gap combination Ci, and ir+1 is the item i with the position r+1 in Ci combination. The concatenation part of the function will stop when n equals to or greater than the number of items in Ci.
By applying this procedure in the last example, MAKNNGCDP no-gap combination will produce: M_K_N_C_P, MA_N_G_D, MAK_N_C_P, MAKN_G_D, MAKNN_C_P, MAKNNG_D, and MAKNNGC_P. Notice that all these derivative combinations by the two procedures will take the same support of the parent no gap combination which they are derived from it. Mix strategy will stop generating new combinations when the number of sequences in protein sequences file. The final result from applying the Mix strategy will be a list of all combinations derived from all combinations lists.
2) Test strategy: The Test strategy will filter final combinations list, which
contains all no-gap and gapped combinations to distinguish frequent and infrequent patterns, according to user-specified support. However, infrequent patterns will not be discarded because incremental updating will be performed later on.
The most time consuming step in the Mix&Test algorithm is updating the combinations list, where a search is required in order to ensure if the generated combination is a new one to insert it or an old one to update its support. Thus, the combinations list may become very large. Therefore, a lexicographic prefix tree of lists is suggested, where each list contains all combinations with the same prefix. For example, let P = {p1, p2, … , pn} be a set of lists (here n= 20 Amino Acids). Each pi represents a list of all combinations with a prefix i. For example, if i = M, the list Pm can contain combinations, such as MV, MVV, MTV, MNKLSV. After Mix strategy generates the new combination, the first character of this combination is checked to determine which list to be inserted in. So, instead of having one big list, we will have pn lists, this shrinks time T to find or insert combination to T/n. In order to increase the speed of computing and minimize the time required to generate the combinations in Mix strategy, especially with the large number of files and the rapid incoming rates, Parallel Mix strategy (PMix) is proposed. PMix uses horizontal data parallelization, where the data are split into chunks in the memory for the task. These data chunks will be distributed on PMix threads. Each thread will apply Mix strategy to generate the combinations of candidate patterns of this data chunk. After all threads finish their work, a combination integrator module will integrate all combinations generated from the threads into one final combinations list. The final combinations list is used by combinations evaluator module, which applies test strategy to get frequent and infrequent patterns.
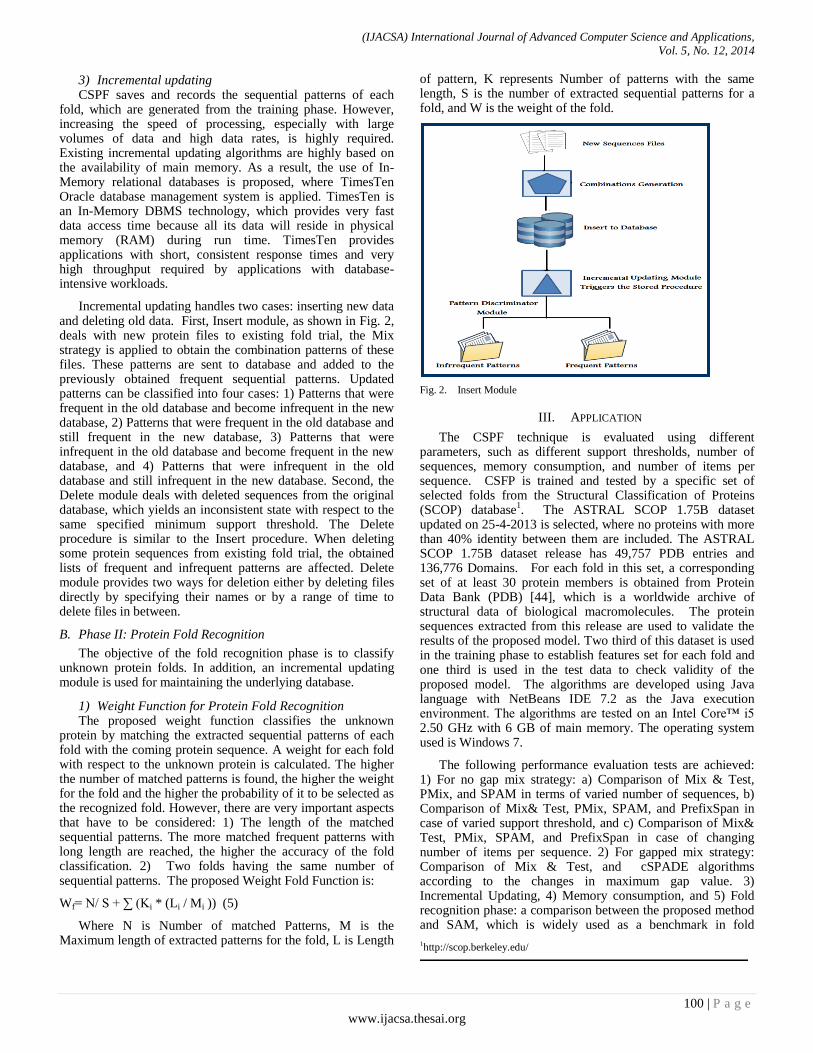
(IJACSA) International Journal of Advanced Computer Science and Applications,
Vol. 5, No. 12, 2014
100 | P a g e
www.ijacsa.thesai.org
3) Incremental updating CSPF saves and records the sequential patterns of each
fold, which are generated from the training phase. However, increasing the speed of processing, especially with large volumes of data and high data rates, is highly required. Existing incremental updating algorithms are highly based on the availability of main memory. As a result, the use of In-Memory relational databases is proposed, where TimesTen Oracle database management system is applied. TimesTen is an In-Memory DBMS technology, which provides very fast data access time because all its data will reside in physical memory (RAM) during run time. TimesTen provides applications with short, consistent response times and very high throughput required by applications with database-intensive workloads.
Incremental updating handles two cases: inserting new data and deleting old data. First, Insert module, as shown in Fig. 2, deals with new protein files to existing fold trial, the Mix strategy is applied to obtain the combination patterns of these files. These patterns are sent to database and added to the previously obtained frequent sequential patterns. Updated patterns can be classified into four cases: 1) Patterns that were frequent in the old database and become infrequent in the new database, 2) Patterns that were frequent in the old database and still frequent in the new database, 3) Patterns that were infrequent in the old database and become frequent in the new database, and 4) Patterns that were infrequent in the old database and still infrequent in the new database. Second, the Delete module deals with deleted sequences from the original database, which yields an inconsistent state with respect to the same specified minimum support threshold. The Delete procedure is similar to the Insert procedure. When deleting some protein sequences from existing fold trial, the obtained lists of frequent and infrequent patterns are affected. Delete module provides two ways for deletion either by deleting files directly by specifying their names or by a range of time to delete files in between.
B. Phase II: Protein Fold Recognition
The objective of the fold recognition phase is to classify unknown protein folds. In addition, an incremental updating module is used for maintaining the underlying database.
1) Weight Function for Protein Fold Recognition The proposed weight function classifies the unknown
protein by matching the extracted sequential patterns of each fold with the coming protein sequence. A weight for each fold with respect to the unknown protein is calculated. The higher the number of matched patterns is found, the higher the weight for the fold and the higher the probability of it to be selected as the recognized fold. However, there are very important aspects that have to be considered: 1) The length of the matched sequential patterns. The more matched frequent patterns with long length are reached, the higher the accuracy of the fold classification. 2) Two folds having the same number of sequential patterns. The proposed Weight Fold Function is:
Wf= N/ S + ∑ (Ki * (Li / Mi )) (5)
Where N is Number of matched Patterns, M is the Maximum length of extracted patterns for the fold, L is Length
of pattern, K represents Number of patterns with the same length, S is the number of extracted sequential patterns for a fold, and W is the weight of the fold.
Fig. 2. Insert Module
III. APPLICATION
The CSPF technique is evaluated using different parameters, such as different support thresholds, number of sequences, memory consumption, and number of items per sequence. CSFP is trained and tested by a specific set of selected folds from the Structural Classification of Proteins (SCOP) database
1. The ASTRAL SCOP 1.75B dataset
updated on 25-4-2013 is selected, where no proteins with more than 40% identity between them are included. The ASTRAL SCOP 1.75B dataset release has 49,757 PDB entries and 136,776 Domains. For each fold in this set, a corresponding set of at least 30 protein members is obtained from Protein Data Bank (PDB) [44], which is a worldwide archive of structural data of biological macromolecules. The protein sequences extracted from this release are used to validate the results of the proposed model. Two third of this dataset is used in the training phase to establish features set for each fold and one third is used in the test data to check validity of the proposed model. The algorithms are developed using Java language with NetBeans IDE 7.2 as the Java execution environment. The algorithms are tested on an Intel Core™ i5 2.50 GHz with 6 GB of main memory. The operating system used is Windows 7.
The following performance evaluation tests are achieved: 1) For no gap mix strategy: a) Comparison of Mix & Test, PMix, and SPAM in terms of varied number of sequences, b) Comparison of Mix& Test, PMix, SPAM, and PrefixSpan in case of varied support threshold, and c) Comparison of Mix& Test, PMix, SPAM, and PrefixSpan in case of changing number of items per sequence. 2) For gapped mix strategy: Comparison of Mix & Test, and cSPADE algorithms according to the changes in maximum gap value. 3) Incremental Updating, 4) Memory consumption, and 5) Fold recognition phase: a comparison between the proposed method and SAM, which is widely used as a benchmark in fold
1http://scop.berkeley.edu/
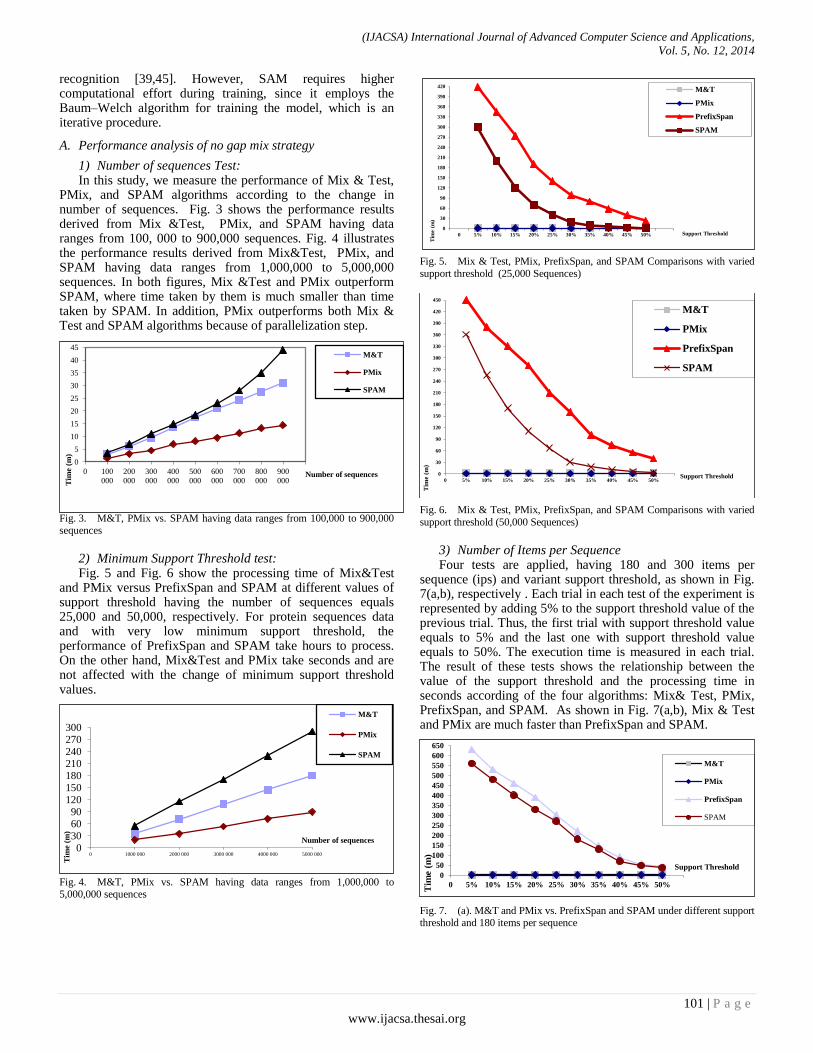
(IJACSA) International Journal of Advanced Computer Science and Applications,
Vol. 5, No. 12, 2014
101 | P a g e
www.ijacsa.thesai.org
0
5
10
15
20
25
30
35
40
45
0 100
000
200
000
300
000
400
000
500
000
600
000
700
000
800
000
900
000Tim
e (m
)
Number of sequences
M&T
PMix
SPAM
0306090
120150180210240270300
0 1000 000 2000 000 3000 000 4000 000 5000 000
Tim
e (m
)
Number of sequences
M&T
PMix
SPAM
0
30
60
90
120
150
180
210
240
270
300
330
360
390
420
0 5% 10% 15% 20% 25% 30% 35% 40% 45% 50%
Tim
e (
m)
Support Threshold
M&T
PMix
PrefixSpan
SPAM
recognition [39,45]. However, SAM requires higher computational effort during training, since it employs the Baum–Welch algorithm for training the model, which is an iterative procedure.
A. Performance analysis of no gap mix strategy
1) Number of sequences Test: In this study, we measure the performance of Mix & Test,
PMix, and SPAM algorithms according to the change in number of sequences. Fig. 3 shows the performance results derived from Mix &Test, PMix, and SPAM having data ranges from 100, 000 to 900,000 sequences. Fig. 4 illustrates the performance results derived from Mix&Test, PMix, and SPAM having data ranges from 1,000,000 to 5,000,000 sequences. In both figures, Mix &Test and PMix outperform SPAM, where time taken by them is much smaller than time taken by SPAM. In addition, PMix outperforms both Mix & Test and SPAM algorithms because of parallelization step.
Fig. 3. M&T, PMix vs. SPAM having data ranges from 100,000 to 900,000
sequences
2) Minimum Support Threshold test: Fig. 5 and Fig. 6 show the processing time of Mix&Test
and PMix versus PrefixSpan and SPAM at different values of support threshold having the number of sequences equals 25,000 and 50,000, respectively. For protein sequences data and with very low minimum support threshold, the performance of PrefixSpan and SPAM take hours to process. On the other hand, Mix&Test and PMix take seconds and are not affected with the change of minimum support threshold values.
Fig. 4. M&T, PMix vs. SPAM having data ranges from 1,000,000 to 5,000,000 sequences
Fig. 5. Mix & Test, PMix, PrefixSpan, and SPAM Comparisons with varied
support threshold (25,000 Sequences)
Fig. 6. Mix & Test, PMix, PrefixSpan, and SPAM Comparisons with varied
support threshold (50,000 Sequences)
3) Number of Items per Sequence Four tests are applied, having 180 and 300 items per
sequence (ips) and variant support threshold, as shown in Fig. 7(a,b), respectively . Each trial in each test of the experiment is represented by adding 5% to the support threshold value of the previous trial. Thus, the first trial with support threshold value equals to 5% and the last one with support threshold value equals to 50%. The execution time is measured in each trial. The result of these tests shows the relationship between the value of the support threshold and the processing time in seconds according of the four algorithms: Mix& Test, PMix, PrefixSpan, and SPAM. As shown in Fig. 7(a,b), Mix & Test and PMix are much faster than PrefixSpan and SPAM.
Fig. 7. (a). M&T and PMix vs. PrefixSpan and SPAM under different support threshold and 180 items per sequence
0
30
60
90
120
150
180
210
240
270
300
330
360
390
420
450
0 5% 10% 15% 20% 25% 30% 35% 40% 45% 50%
Tim
e (m
)
Support Threshold
M&T
PMix
PrefixSpan
SPAM
0
50
100
150
200
250
300
350
400
450
500
550
600
650
0 5% 10% 15% 20% 25% 30% 35% 40% 45% 50%
Tim
e (
m)
Support Threshold
M&T
PMix
PrefixSpan
SPAM
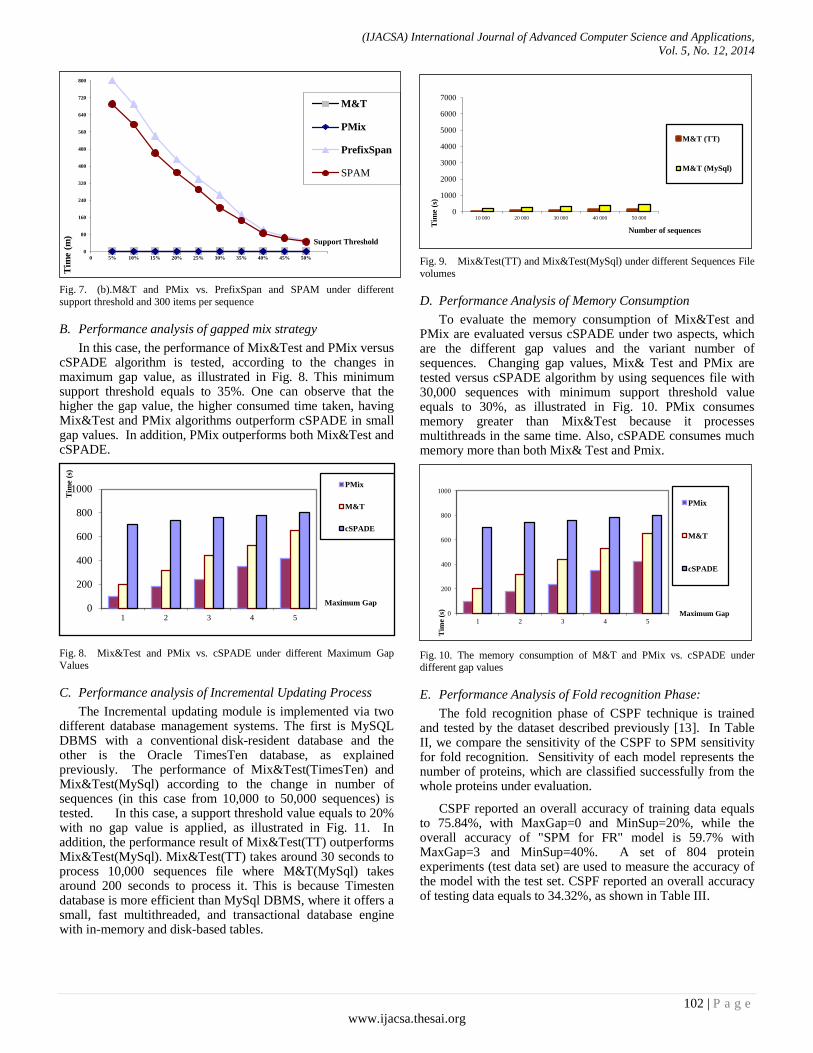
(IJACSA) International Journal of Advanced Computer Science and Applications,
Vol. 5, No. 12, 2014
102 | P a g e
www.ijacsa.thesai.org
0
1000
2000
3000
4000
5000
6000
7000
10 000 20 000 30 000 40 000 50 000
Tim
e (s
)
Number of sequences
M&T (TT)
M&T (MySql)
0
200
400
600
800
1000
1 2 3 4 5
Tim
e (s
)
Maximum Gap
PMix
M&T
cSPADE
0
200
400
600
800
1000
1 2 3 4 5
Tim
e (s
)
Maximum Gap
PMix
M&T
cSPADE
Fig. 7. (b).M&T and PMix vs. PrefixSpan and SPAM under different
support threshold and 300 items per sequence
B. Performance analysis of gapped mix strategy
In this case, the performance of Mix&Test and PMix versus cSPADE algorithm is tested, according to the changes in maximum gap value, as illustrated in Fig. 8. This minimum support threshold equals to 35%. One can observe that the higher the gap value, the higher consumed time taken, having Mix&Test and PMix algorithms outperform cSPADE in small gap values. In addition, PMix outperforms both Mix&Test and cSPADE.
Fig. 8. Mix&Test and PMix vs. cSPADE under different Maximum Gap
Values
C. Performance analysis of Incremental Updating Process
The Incremental updating module is implemented via two different database management systems. The first is MySQL DBMS with a conventional disk-resident database and the other is the Oracle TimesTen database, as explained previously. The performance of Mix&Test(TimesTen) and Mix&Test(MySql) according to the change in number of sequences (in this case from 10,000 to 50,000 sequences) is tested. In this case, a support threshold value equals to 20% with no gap value is applied, as illustrated in Fig. 11. In addition, the performance result of Mix&Test(TT) outperforms Mix&Test(MySql). Mix&Test(TT) takes around 30 seconds to process 10,000 sequences file where M&T(MySql) takes around 200 seconds to process it. This is because Timesten database is more efficient than MySql DBMS, where it offers a small, fast multithreaded, and transactional database engine with in-memory and disk-based tables.
Fig. 9. Mix&Test(TT) and Mix&Test(MySql) under different Sequences File
volumes
D. Performance Analysis of Memory Consumption
To evaluate the memory consumption of Mix&Test and PMix are evaluated versus cSPADE under two aspects, which are the different gap values and the variant number of sequences. Changing gap values, Mix& Test and PMix are tested versus cSPADE algorithm by using sequences file with 30,000 sequences with minimum support threshold value equals to 30%, as illustrated in Fig. 10. PMix consumes memory greater than Mix&Test because it processes multithreads in the same time. Also, cSPADE consumes much memory more than both Mix& Test and Pmix.
Fig. 10. The memory consumption of M&T and PMix vs. cSPADE under different gap values
E. Performance Analysis of Fold recognition Phase:
The fold recognition phase of CSPF technique is trained and tested by the dataset described previously [13]. In Table II, we compare the sensitivity of the CSPF to SPM sensitivity for fold recognition. Sensitivity of each model represents the number of proteins, which are classified successfully from the whole proteins under evaluation.
CSPF reported an overall accuracy of training data equals to 75.84%, with MaxGap=0 and MinSup=20%, while the overall accuracy of "SPM for FR" model is 59.7% with MaxGap=3 and MinSup=40%. A set of 804 protein experiments (test data set) are used to measure the accuracy of the model with the test set. CSPF reported an overall accuracy of testing data equals to 34.32%, as shown in Table III.
0
80
160
240
320
400
480
560
640
720
800
0 5% 10% 15% 20% 25% 30% 35% 40% 45% 50%
Tim
e (
m)
Support Threshold
M&T
PMix
PrefixSpan
SPAM

(IJACSA) International Journal of Advanced Computer Science and Applications,
Vol. 5, No. 12, 2014
103 | P a g e
www.ijacsa.thesai.org
TABLE II. SENSITIVITY FOR ALL FOLDS AND OVERALL ACCURACY OF
THE PROPOSED CSPF TECHNIQUE AND "SPM FOR FOLD RECOGNITION (FR)"
Fold index CSPF Sensitivity SPM for FR
Sensitivity
(Proteins) (%) (Proteins) (%)
a1 20/21 95.2 15/21 71.4
a3 20/20 100 17/20 85
a4 38/103 36.89 30/103 29.1
a24 28/28 100 28/28 100
a39 27/31 87.09 26/31 83
a60 21/25 84 19/25 76
a118 30/32 93.75 28/32 87.5
Class A (total) 184/260 70.76 163/260 62.7
b1 81/132 61.36 68/132 51.5
b2 20/20 100 19/20 95
b18 21/21 100 20/21 95.2
b29 22/24 91.6 21/24 87.5
b34 22/44 50 10/44 22.7
b40 26/61 42.6 25/61 41
b47 25/25 100 24/25 96
b55 18/24 75 16/24 66
b82 22/28 78.5 20/28 71.4
b121 27/27 100 26/27 96.3
Class B (total) 284/406 69.95 249/406 61.3
c1 82/143 57.34 16/143 11.2
c2 88/91 96.70 85/91 93.4
c3 20/22 90.9 22/22 100
c23 49/58 84.4 30/58 51.7
c26 31/35 88.57 29/35 82.9
c37 79/91 86.8 32/91 35.2
c47 34/39 87.1 22/39 56.4
c55 31/31 100 30/31 96.8
c56 18/20 90 20/20 100
c66 36/40 90 27/40 67.5
c67 30/31 96.77 31/31 100
c69 32/34 94.1 29/34 85.3
c94 22/23 95.6 19/23 82.6
Class C (total) 552/658 83.8 392/658 59.6
d15 39/44 88.6 21/44 47.7
d17 18/20 90 14/20 70
d58 38/102 37.25 22/102 21.6
d144 21/23 91.3 22/23 95.7
Class D (total) 116/189 90.4 79/189 41.8
f23 20/25 80 16/25 64
Class F (total) 20/25 80 16/25 64
g3 62/68 91.1 60/68 88.2
Class G (total) 62/68 91.1 60/68 88.2
Overall 1218/1606 75.84 959/1606 59.7
Using the same test datasets and in order to compare the efficiency of the proposed model, SAM model [16] is also employed. A comparison of the results obtained by CPSF, "SPM for FR" and SAM (E-values ranking) are presented in Table IV.
CSPF outperforms the other two models, where it reports an overall accuracy of testing data equals to 34.32% while the overall accuracy of "SPM for FR" model was 24.9% and SAM’s overall accuracy was 29.4%. The classification results of the proposed method CSPF, and "SPM for FR" algorithm and SAM (E-values) of the test set are shown in Table IV.
In terms of space complexity, for a sequence file with n as the number of sequences, and m as the number of items per sequence and number of items equals to 20 which is the 20 amino acids, the space complexity of Mix&Test algorithm is O(20m+n). In terms of time complexity, the complexity of generating all the candidate patterns of Mix&Test with no gap is O(n2). The complexity of generating all the candidate patterns of Mix&Test with a gap m is O(n2)*m. The complexity of discovering the frequent patterns is O(N).
IV. CONCLUSIONS
In this work, we proposed a CSFP technique for protein fold recognition. This technique consisted of two main phases: sequential patterns extraction and protein fold recognition. Sequential patterns extraction phase introduced Mix & Test algorithm. Several experiments were conducted to assess the performance of Mix&Test and PMix. The performance of M&T and PMix algorithms were compared with PrefixSpan, SPAM and cSPADE algorithms.
In addition, performance of CSFP fold recognition was compared with "SPM for FR" and SAM (E-values) models. CSPF outperformed "SPM for FR" and SAM (E-values) models with an overall accuracy for training data equals to 75.84% and "SPM for FR" model was 59.7% for testing data. Future work of CSFP can be in several directions: utilizing optimization techniques to enhance the prediction results and applying high performance computing to provide very fast process over protein sequences databases. In addition, more protein sequences will be used.

(IJACSA) International Journal of Advanced Computer Science and Applications,
Vol. 5, No. 12, 2014
104 | P a g e
www.ijacsa.thesai.org
TABLE III. DETAILED SENSITIVITY RESULTS FOR ALL FOLDS UNDER
EVALUATION AND OVERALL ACCURACY OF THE PROPOSED CSPF MODEL IN
THE TEST SET
Fold index
CSPF
Sensitivity
(Proteins)
CSPF
Sensitivity
%
a1 4/11 36.36
a3 8/10 80
a4 3/52 5.7
a24 15/15 100
a39 11/15 37.3
a60 2/12 16.3
a118 3/16 18.75
Class A (total) 46/131 35.11
b1 31/66 46.9
b2 2/10 20
b18 3/10 30
b29 2/12 16.6
b34 11/22 50
b40 12/31 38.7
b47 10/12 83.7
b55 2/12 16.6
b82 0 0
b121 9/14 64.3
Class B (total) 82/203 40.39
c1 2/71 2.8
c2 36/46 78.2
c3 2/11 18.1
c23 11/29 37.9
c26 7/17 41.1
c37 9/46 19.5
c47 1/20 5
c55 1/15 6.6
c56 0 0
c66 3/20 15
c67 8/15 53.3
c69 3/17 17.6
c94 9/12 75
Class C (total) 92/329 27.9
d15 7/22 31.8
d17 1/10 10
d58 8/51 15.6
d144 3/12 25
Class D (total) 19/95 20
f23 8/12 66.6
Class F (total) 8/12 66.6
g3 29/34 85.2
Class G (total) 29/34 85.2
Overall 276/804 34.32
TABLE IV. CLASSIFICATION RESULTS OF THE PROPOSED METHOD CSPF, "SPM FOR FR" ALGORITHM AND SAM (E-VALUES) IN THE TEST SET
Fold index
CSPF
Sensitivity
%
SAM(E-
values)
Sensitivity%
SPM for
FR
Sensitivity
%
a1 36.36 81.8 18.2
a3 80 60 20
a4 5.7 3.8 28.8
a24 100 6.7 33.3
a39 37.3 87.7 66.7
a60 16.3 16.7 16.7
a118 18.75 0 37.5
Class A (total) 35.11 25.2 32.1
b1 46.9 50 36.4
b2 20 0 30
b18 30 30 20
b29 16.6 25 8.3
b34 50 36.4 0
b40 38.7 6.5 19.4
b47 83.7 83.3 58.3
b55 16.6 25 0
b82 0 14.3 0
b121 64.3 7.1 64.3
Class B (total) 40.39 32 25.6
c1 2.8 14.1 0
c2 78.2 23.9 69.6
c3 18.1 100 9.1
c23 37.9 27.6 24.1
c26 41.1 11.8 47.1
c37 19.5 80.4 10.9
c47 5 25 0
c55 6.6 13.3 0
c56 0 10 0
c66 15 20 5
c67 53.3 80 46.7
c69 17.6 5.9 5.9
c94 75 25 58.3
Class C (total) 27.9 32.5 21
d15 31.8 0 9.1
d17 10 0 0
d58 15.6 3.9 3.9
d144 25 91.7 16.7
Class D (total) 20 13.7 6.3
f23 66.6 25 41.7
Class F (total) 66.6 25 41.7
g3 85.2 44.1 76.5
Class G (total) 85.2 44.1 76.5
Overall 34.32 29.4 24.9

(IJACSA) International Journal of Advanced Computer Science and Applications,
Vol. 5, No. 12, 2014
105 | P a g e
www.ijacsa.thesai.org
REFERENCES
[1] A. Sharaf Eldin, T. H.A. Soliman, M. E. Marie, and M. M. Ghareeb, “A Deep Glimpse into Protein Fold Recognition,” International Journal of Sciences, vol. 2, pp.24-33, 2013.
[2] D. T. Jones, “GenTHREADER: An efficient and reliable protein fold recognition method for genomic sequences,” J. Mol. Biol. vol. 287, pp.797-815, 1999.
[3] Lin K, May A and Taylor W (2002) Threading using neural network (TUNE): The measure of protein sequence-structure compatibility. Bioinformatics, vol. 18, 1350-1357.
[4] W. Thomas, C. Igel, and J. Gebert, “Protein fold class prediction using neural networks with tailored early-stopping,” IEEE International Joint Conference on Neural Networks IJCNN, vol. 3, pp.1693 – 1697, 2004.
[5] A. Raval, Z. Ghahramani, and D. Wild, “A Bayesian network model for protein fold and remote homologue recognition,” Bioinformatics, vol. 18: pp.788-801, 2002.
[6] J. Xu, “Fold recognition by predicted alignment accuracy,” IEEE/ACM Trans. Comput. Biol. Bioinform, vol. 2 , pp.157-165, 2005.
[7] M. Judy and K. Ravichandran, “A solution to protein folding problem using a genetic algorithm with modified keep best reproduction strategy,” Proceeding of IEEE Congress on Evolution Computation, Sep. 25-28, Singapore, pp. 4776-4780, 2007.
[8] R. Unger, “The genetic algorithm approach to protein structure prediction,” Struct. Bond., vol. 110 , pp.153-175, 2004.
[9] S. Han, B. Lee, S. Yu, C. Jeong, S. Lee, and D. Kim, “Fold recognition by combining profile-profile alignment and support vector machine,” Bioinformatics, vol. 21, pp.2667-2673, 2005.
[10] W. Chmielnicki and K. Stapor, “Protein fold recognition with combined SVM-RDA classifier,” Proceedings of the HAIS, Part I, LNAI 2010, vol. 6076, pp.162-169, 2010.
[11] F. Liang and W. Wong, “Evolutionary Monte Carlo for protein folding simulations,” J. Chemi. Phy., vol.115, pp.3374-3380, 2001.
[12] N. Alione, “Parallel evolution strategy on grids for the protein threading problem,” J. Parallel Distributed Computing, vol. 66, pp.489-1502,2006.
[13] C. Carpio, S. Sasaki, L. Baranyi, and H. Okada, “A parallel hybrid GA for peptide 3D structure prediction,” Proceedings of the Workshop on Genome Informatics, Universal Academy Press, Tokyo, 1995.
[14] R. Islam and A. Ngom, “Parallel evolution strategy for protein threading,” Proceedings of the 25th International Conference on Chilean Computer Science Society, IEEE Computer Society, Washington, DC., USA, pp. 2347 – 2354, 2005.
[15] D. Nguyen, I. Yoshihara, K. Yamamori, and M. Yasunaga, “Aligning multiple protein sequences by parallel hybrid genetic algorithm,” Genome Inform, vol. 13, pp.123-132, 2002.
[16] S. Thomas and N. Amato, “Parallel protein folding with STAPL,” Proceedings of the IEEE 18th International Parallel and Distributed Processing Symposium, Washington, DC., USA., doi: 10.1109/IPDPS.2004.1303204, 2004.
[17] R. Agrawal and R. Srikant, “Mining sequential patterns,” Proceedings of the 1995 International Conference on Data Engineering, pp.3–14, 1995.
[18] A. Brazma, I. Johansen, J. Vilo, E. Ukkonen, “Pattern Discovery and Biosequences,” Honavar, V G, Slutzki G (eds.) ICGI, LNCS (LNAI) 2000, vol. 1433, pp.257-270, Springer, Heidelberg, 2000.
[19] M. Ester, “A top-down method for mining most specific frequent patterns in biological sequence data,” Proceedings of the 2004 SIAM International Conference on Data Mining (SDM ’04), pp. 90–101, 2004.
[20] K. Wang, Y. Xu, and J. Yu, “Scalable sequential pattern mining for biological sequences,” Proceedings of the 2004 ACM International Conference on Information and Knowledge Management (CIKM ’04), pp. 178–187, 2004.
[21] Y. Xiong, J. He, and Y. Zhu, “TOPPER: An algorithm for mining top k patterns in biological sequences based on regularity measurement,” Proceedings of IEEE Bioinformatics and Biomedicine Workshops (BIBMW), pp.283-288, 2004.
[22] L. Chen and W. Liu W, “An algorithm for mining frequent patterns in biological sequence,” Proceedings of the IEEE 1st International
Conference on Computational Advances in Bio and Medical Sciences (ICCABS), pp. 63-68, 2011.
[23] J. Han, J. Pei, B. Mortazavi-Asl, Q. Chen, U. Dayal, and M. Hsu, “FreeSpan: frequent pattern-projected sequential pattern mining,” Proceedings of the ACM 2000 SIGKDD International Conference on Knowledge Discovery and Data Mining (KDD ’00), pp. 355–359, 2000.
[24] M. Zaki, “SPADE: an efficient algorithm for mining frequent sequences,” Machine Learning, vol. 42 (1/2), pp.31–60, 2001.
[25] J. Pei, J. Han, B. Mortazavi-Asl, J. Wang, H. Pinto, Q. Chen, U. Dayal, and M. Hsu, “Mining sequential patterns by pattern-growth: the PrefixSpan approach,” IEEE Transactions on Knowledge and Data Engineering, vol. 16 (11), pp.1424–1440, 2004.
[26] X. Yan, J. Han, and R. Afshar, “CloSpan: mining closed sequential patterns in large datasets,” Proceedings of the 2003 SIAM International Conference on Data Mining (SDM ’03), pp. 166–177, 2003.
[27] P. Tzvetkov, X. Yan, and J. Han, “TSP: mining Top-K closed sequential patterns,” Knowledge and Information Systems, vol. 7 (4), pp. 438–457, 2005.
[28] J. Wang, J. Han, and C. Li, “Frequent closed sequence mining without candidate maintenance,” IEEE Transactions on Knowledge and Data Engineering, vol. 19 (8), pp.1042–1056, 2007.
[29] C. Luo and S. Chung, “Efficient mining of maximal sequential patterns using multiple samples,” Proceedings of the 2005 SIAM International Conference on Data Mining (SDM ’05), pp. 64–72, 2005.
[30] J. Pei, J. Han, and W. Wang, “Mining sequential patterns with constraints in large databases,” Proceedings of the 2002 ACM International Conference on Information and Knowledge Management (CIKM ’02), pp. 18–25, 2002.
[31] X. Ji, J. Bailey, and G. Dong, “Mining minimal distinguishing subsequence patterns with gap constraints,” Knowledge and Information Systems, vol. 11 (3), pp.259–296, 2005.
[32] E. Chen, H. Cao, Q. Li, and T. Qian, “Efficient strategies for tough aggregate constraint-based sequential pattern mining,” Information Sciences; 178 (6), pp.1498–1518, 2008.
[33] H. Kum, J. Pei, W. Wang, and D. Duncan, “ApproxMAP: approximate mining of consensus sequential patterns,” Proceedings of the 2003 SIAM International Conference on Data Mining (SDM ’03), pp. 311–315, 2003.
[34] C. Kum, J. Chang, and W. Wang, “Sequential pattern mining in multi-databases via multiple alignment,” Data Mining and Knowledge Discovery, vol.12, pp.151–180, 2002.
[35] J. Yang, P. Yu, W. Wang, and J. Han, “Mining long sequential patterns in a noisy environment,” Proceedings of the 2002 ACM SIGMOD International Conference on Management of Data (SIGMOD ’02), pp. 406–417, 2002.
[36] H. Cheng, X. Yan, and J. Han, “IncSpan: incremental mining of sequential patterns in large databases,” Proceedings of the 2004 ACM SIGKDD International Conference on Knowledge Discovery and Data Mining (KDD ’04), pp. 527–532, 2004.
[37] M. Lin, S. Hsueh, and C. Chang, “Fast discovery of sequential patterns in large databases using effective time-indexing,” Information Sciences, vol.178( 22), pp.4228–4245, 2008.
[38] M. Zaki, “Sequence Mining in Categorical Domains: Incorporating Constraints,” Proceedings of the in 9th Int’l Conference on Information and Knowledge Management, Washington, DC, 2000.
[39] T. Exarchos, C. Papaloukas, C. Lampros, and D. Fotiadis, “Mining sequential patterns for protein fold recognition,” Journal of Biomedical Informatics, vol. 41: 165–179, 2008.
[40] U. Sakakibara, “Grammatical Inference in Bioinformatics,” IEEE Transactions on Pattern Analysis and Machine Intelligence 27(7), pp. 1051-1062, 2005.
[41] P. Peris, D. Lopez, and M. Campos, “Igtm: an algorithm to predict transmembrane domains and toplogy in proteins,” BMC-Bioinformatics 9, pp.367-378, 2008.
[42] P. Peris, D. Lopez, M. Campo, and J. Sempere, “Protein motif prediction by grammatical inference,” In Sakakibara, Y., Y., Kobayashi, S., K., Nishino, T., Tomita, E. (eds) ICGI 2006. (LNCS (LNAI), vol. 4201,

(IJACSA) International Journal of Advanced Computer Science and Applications,
Vol. 5, No. 12, 2014
106 | P a g e
www.ijacsa.thesai.org
pp.175-187. Springer, Heidelberg, 2008.
[43] T. Yokomori and S. Kobayashi, “Learning Local Languages and Their Application to DNA Sequence Analysis,” IEEE Transactions Pattern Analysis Machine Intelligence, 20(10), pp.1067-1079, 1998.
[44] H. Berman, J. Westbrook, Z. Feng, G. Gilliland, T. Bhat, H. Weissig, I. Shindyalov, P. Bourne, “The Protein Data Bank,” Nucleic Acids Research, Vol. 28, pp.235–242, 2000.
[45] D. Fischer, “Servers for protein structure prediction,” Curr Opin Struct Biol, vol. 16(2), pp.178–182, 2006.

(IJACSA) International Journal of Advanced Computer Science and Applications,
Vol. 5, No. 12, 2014
107 | P a g e
www.ijacsa.thesai.org
Facial Expression Recognition Using 3D
Convolutional Neural Network
Young-Hyen Byeon
Department of Control and Instrumentation Engineering,
Chosun University
Gwangju, Korea
Keun-Chang Kwak*
Department of Control and Instrumentation Engineering,
Chosun University
Gwangju, Korea
Abstract—This paper is concerned with video-based facial
expression recognition frequently used in conjunction with HRI
(Human-Robot Interaction) that can naturally interact between
human and robot. For this purpose, we design a 3D-CNN(3D
Convolutional Neural Networks) by augmenting dimensionality
reduction methods such as PCA(Principal Component Analysis)
and TMPCA(Tensor-based Multilinear Principal Component
Analysis) to recognize simultaneously the successive frames with
facial expression images obtained through video camera. The 3D-
CNN can achieve some degree of shift and deformation
invariance using local receptive fields and spatial subsampling
through dimensionality reduction of redundant CNN’s output.
The experimental results on video-based facial expression
database reveal that the presented method shows a good
performance in comparison to the conventional methods such as
PCA and TMPCA.
Keywords—convolutional neural network; facial expression
recognition; deep learning
I. INTRODUCTION
HRI (Human-Robot Interaction) is a critical technology as evaluating, developing and designing interactional environments for intelligent system to make cognitive and emotional interaction through some communicational channels between human and robot. It is for synthetically understanding a user’s intention and then responding [1]-[5].
Such HRI has basic difference in autonomy for robot and conventional HCI (Human-Computer Interface) to have, interactional bidirection and diversity of interaction or controlling level[6][7].
In a routine living with human for robot to give service should need ability to interact with human using same means. Likewise, for efficient interaction between human and robot should need system of C3 paradigm that consists of modules to develop convenience, cooperativeness and closeness of interaction between human and robot. Also, for efficient interaction between human and robot should need those technologies of various areas are converged. For example, it needs multimodal interactive method that can provide mediator of various communications like vision, auditory, feel and mediating interface, and multimodal technology that converges information inputted through various interactive channels. Besides, for performing proper works to requests from user and situation should need a series of cognitive course like recognition of situation, inference, decision making and plan. Also, it needs technologies to make proper emotional move
fitted to situation and for robot to be characterized under recognizing various emotional response like voice and expression [6]. We especially focus on video-based facial expression recognition technique.
People express their mind through gestures and facial expressions. The facial expression is the most useful, natural mean to notify their mind. Study about facial expression have been researched long ago by cognitive scientist and recently many researcher try to develop methods to recognize facial expression automatically and accurately [8][9].
There are methods to recognize facial expression such as comparing positions of eye, nose and mouth[10], optical flow extracting muscle’s movement[11][12], PCA(Principal Component Analysis)[13] and LDA(Linear Discriminant Analysis)[9][14][15]. Ekman, a psychologist who researches facial expression, said human’s facial expression disappears within seconds [16]. That is, facial expression recognition needs to work under keeping facial expression both long and short [17]. That means we need to study facial expression recognition using a stationary image and video having time base [18][19]. However, Methods referred above are a little difficult to use for video-based facial expression recognition, including successive frames with facial expression images.
On the other hand, Convolutional Neural Networks (CNN) has been successfully applied to face recognition from two-dimensional images [20]. The networks incorporate constraints and achieve some degree of shift and deformation invariance. This method has demonstrated to be successful in various fields such as character recognition [21], document recognition [22], object recognition [23], handwritten digit recognition [24], EEG signal classification [25], and facial expression recognition [26]. However, the conventional CNNs are currently limited to handling video-based images. Furthermore, because this network is trained with the usual backpropagation gradient descent procedure, it is not appropriate for video-based face images with redundant CNN’s output.
Therefore, we design a 3D-CNN (3D Convolutional Neural Networks) by expanding 2D structure of CNN to 3D structure of CNN for video-based facial expression recognition. There has been no study that tried to apply 3D-CNN for video-based facial recognition. The experiment uses video-based facial expression database of CNU captured from video camera. The experimental results reveal that the 3d-CNN shows a good performance in comparison with the previous approaches with vector representation such as PCA and TMPCA [17].
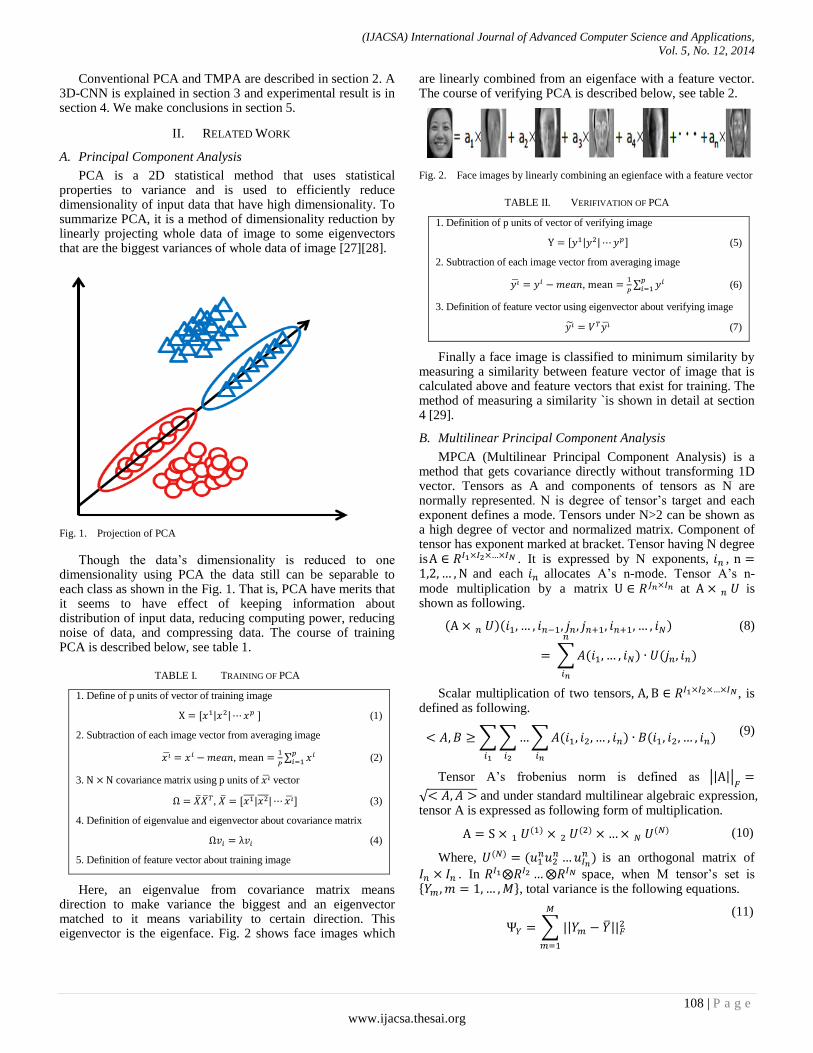
(IJACSA) International Journal of Advanced Computer Science and Applications,
Vol. 5, No. 12, 2014
108 | P a g e
www.ijacsa.thesai.org
Conventional PCA and TMPA are described in section 2. A 3D-CNN is explained in section 3 and experimental result is in section 4. We make conclusions in section 5.
II. RELATED WORK
A. Principal Component Analysis
PCA is a 2D statistical method that uses statistical properties to variance and is used to efficiently reduce dimensionality of input data that have high dimensionality. To summarize PCA, it is a method of dimensionality reduction by linearly projecting whole data of image to some eigenvectors that are the biggest variances of whole data of image [27][28].
Fig. 1. Projection of PCA
Though the data’s dimensionality is reduced to one dimensionality using PCA the data still can be separable to each class as shown in the Fig. 1. That is, PCA have merits that it seems to have effect of keeping information about distribution of input data, reducing computing power, reducing noise of data, and compressing data. The course of training PCA is described below, see table 1.
TABLE I. TRAINING OF PCA
1. Define of p units of vector of training image
, | | - (1)
2. Subtraction of each image vector from averaging image
,
∑ (2)
3. covariance matrix using p units of vector
, , | | - (3)
4. Definition of eigenvalue and eigenvector about covariance matrix
(4)
5. Definition of feature vector about training image
Here, an eigenvalue from covariance matrix means direction to make variance the biggest and an eigenvector matched to it means variability to certain direction. This eigenvector is the eigenface. Fig. 2 shows face images which
are linearly combined from an eigenface with a feature vector. The course of verifying PCA is described below, see table 2.
Fig. 2. Face images by linearly combining an egienface with a feature vector
TABLE II. VERIFIVATION OF PCA
1. Definition of p units of vector of verifying image
, | | - (5)
2. Subtraction of each image vector from averaging image
,
∑ (6)
3. Definition of feature vector using eigenvector about verifying image
(7)
Finally a face image is classified to minimum similarity by measuring a similarity between feature vector of image that is calculated above and feature vectors that exist for training. The method of measuring a similarity `is shown in detail at section 4 [29].
B. Multilinear Principal Component Analysis
MPCA (Multilinear Principal Component Analysis) is a method that gets covariance directly without transforming 1D vector. Tensors as A and components of tensors as N are normally represented. N is degree of tensor’s target and each exponent defines a mode. Tensors under N>2 can be shown as a high degree of vector and normalized matrix. Component of tensor has exponent marked at bracket. Tensor having N degree is . It is expressed by N exponents, , and each allocates A’s n-mode. Tensor A’s n-mode multiplication by a matrix at is shown as following.
( )( )
∑ ( ) ( )
(8)
Scalar multiplication of two tensors, , is defined as following.
∑∑ ∑ ( ) ( )
(9)
Tensor A’s frobenius norm is defined as || ||
√ and under standard multilinear algebraic expression, tensor A is expressed as following form of multiplication.
( )
( ) ( ) (10)
Where, ( ) (
) is an orthogonal matrix of
. In space, when M tensor’s set is * +, total variance is the following equations.
∑ || ||
(11)
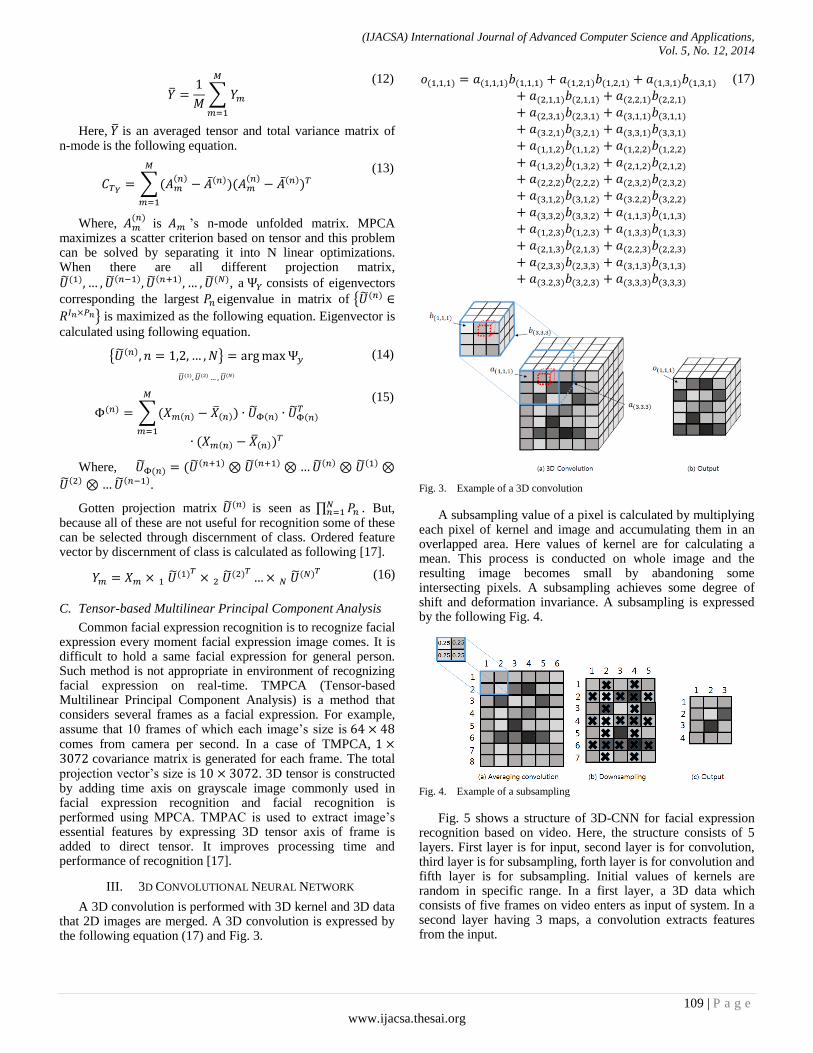
(IJACSA) International Journal of Advanced Computer Science and Applications,
Vol. 5, No. 12, 2014
109 | P a g e
www.ijacsa.thesai.org
∑
(12)
Here, is an averaged tensor and total variance matrix of n-mode is the following equation.
∑( ( ) ( ))(
( ) ( ))
(13)
Where, ( )
is ’s n-mode unfolded matrix. MPCA maximizes a scatter criterion based on tensor and this problem can be solved by separating it into N linear optimizations. When there are all different projection matrix,
( ) ( ) ( ) ( ), a consists of eigenvectors
corresponding the largest eigenvalue in matrix of { ( )
} is maximized as the following equation. Eigenvector is
calculated using following equation.
{ ( ) }
( ) ( ) ( )
(14)
( ) ∑( ( ) ( )) ( ) ( )
( ( ) ( ))
(15)
Where, ( ) ( ( ) ( ) ( ) ( )
( ) ( ).
Gotten projection matrix ( ) is seen as ∏ . But,
because all of these are not useful for recognition some of these can be selected through discernment of class. Ordered feature vector by discernment of class is calculated as following [17].
( )
( ) ( ) (16)
C. Tensor-based Multilinear Principal Component Analysis
Common facial expression recognition is to recognize facial expression every moment facial expression image comes. It is difficult to hold a same facial expression for general person. Such method is not appropriate in environment of recognizing facial expression on real-time. TMPCA (Tensor-based Multilinear Principal Component Analysis) is a method that considers several frames as a facial expression. For example, assume that 10 frames of which each image’s size is comes from camera per second. In a case of TMPCA, covariance matrix is generated for each frame. The total projection vector’s size is . 3D tensor is constructed by adding time axis on grayscale image commonly used in facial expression recognition and facial recognition is performed using MPCA. TMPAC is used to extract image’s essential features by expressing 3D tensor axis of frame is added to direct tensor. It improves processing time and performance of recognition [17].
III. 3D CONVOLUTIONAL NEURAL NETWORK
A 3D convolution is performed with 3D kernel and 3D data that 2D images are merged. A 3D convolution is expressed by the following equation (17) and Fig. 3.
( ) ( ) ( ) ( ) ( ) ( ) ( ) ( ) ( ) ( ) ( ) ( ) ( ) ( ) ( ) ( ) ( ) ( ) ( ) ( ) ( ) ( ) ( ) ( ) ( ) ( ) ( ) ( ) ( ) ( ) ( ) ( ) ( ) ( ) ( ) ( ) ( ) ( ) ( ) ( ) ( ) ( ) ( ) ( ) ( ) ( ) ( ) ( ) ( ) ( ) ( ) ( ) ( ) ( ) ( )
(17)
Fig. 3. Example of a 3D convolution
A subsampling value of a pixel is calculated by multiplying each pixel of kernel and image and accumulating them in an overlapped area. Here values of kernel are for calculating a mean. This process is conducted on whole image and the resulting image becomes small by abandoning some intersecting pixels. A subsampling achieves some degree of shift and deformation invariance. A subsampling is expressed by the following Fig. 4.
Fig. 4. Example of a subsampling
Fig. 5 shows a structure of 3D-CNN for facial expression recognition based on video. Here, the structure consists of 5 layers. First layer is for input, second layer is for convolution, third layer is for subsampling, forth layer is for convolution and fifth layer is for subsampling. Initial values of kernels are random in specific range. In a first layer, a 3D data which consists of five frames on video enters as input of system. In a second layer having 3 maps, a convolution extracts features from the input.
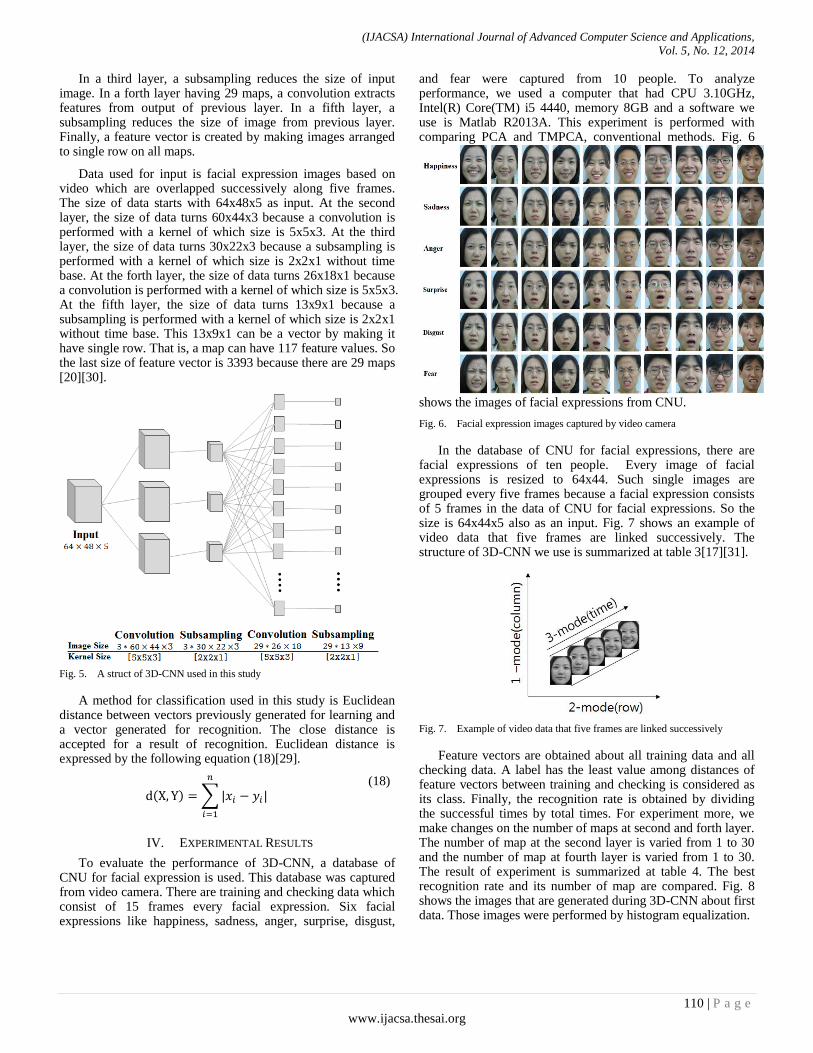
(IJACSA) International Journal of Advanced Computer Science and Applications,
Vol. 5, No. 12, 2014
110 | P a g e
www.ijacsa.thesai.org
In a third layer, a subsampling reduces the size of input image. In a forth layer having 29 maps, a convolution extracts features from output of previous layer. In a fifth layer, a subsampling reduces the size of image from previous layer. Finally, a feature vector is created by making images arranged to single row on all maps.
Data used for input is facial expression images based on video which are overlapped successively along five frames. The size of data starts with 64x48x5 as input. At the second layer, the size of data turns 60x44x3 because a convolution is performed with a kernel of which size is 5x5x3. At the third layer, the size of data turns 30x22x3 because a subsampling is performed with a kernel of which size is 2x2x1 without time base. At the forth layer, the size of data turns 26x18x1 because a convolution is performed with a kernel of which size is 5x5x3. At the fifth layer, the size of data turns 13x9x1 because a subsampling is performed with a kernel of which size is 2x2x1 without time base. This 13x9x1 can be a vector by making it have single row. That is, a map can have 117 feature values. So the last size of feature vector is 3393 because there are 29 maps [20][30].
Fig. 5. A struct of 3D-CNN used in this study
A method for classification used in this study is Euclidean distance between vectors previously generated for learning and a vector generated for recognition. The close distance is accepted for a result of recognition. Euclidean distance is expressed by the following equation (18)[29].
( ) ∑| |
(18)
IV. EXPERIMENTAL RESULTS
To evaluate the performance of 3D-CNN, a database of CNU for facial expression is used. This database was captured from video camera. There are training and checking data which consist of 15 frames every facial expression. Six facial expressions like happiness, sadness, anger, surprise, disgust,
and fear were captured from 10 people. To analyze performance, we used a computer that had CPU 3.10GHz, Intel(R) Core(TM) i5 4440, memory 8GB and a software we use is Matlab R2013A. This experiment is performed with comparing PCA and TMPCA, conventional methods. Fig. 6
shows the images of facial expressions from CNU.
Fig. 6. Facial expression images captured by video camera
In the database of CNU for facial expressions, there are facial expressions of ten people. Every image of facial expressions is resized to 64x44. Such single images are grouped every five frames because a facial expression consists of 5 frames in the data of CNU for facial expressions. So the size is 64x44x5 also as an input. Fig. 7 shows an example of video data that five frames are linked successively. The structure of 3D-CNN we use is summarized at table 3[17][31].
Fig. 7. Example of video data that five frames are linked successively
Feature vectors are obtained about all training data and all checking data. A label has the least value among distances of feature vectors between training and checking is considered as its class. Finally, the recognition rate is obtained by dividing the successful times by total times. For experiment more, we make changes on the number of maps at second and forth layer. The number of map at the second layer is varied from 1 to 30 and the number of map at fourth layer is varied from 1 to 30. The result of experiment is summarized at table 4. The best recognition rate and its number of map are compared. Fig. 8 shows the images that are generated during 3D-CNN about first data. Those images were performed by histogram equalization.
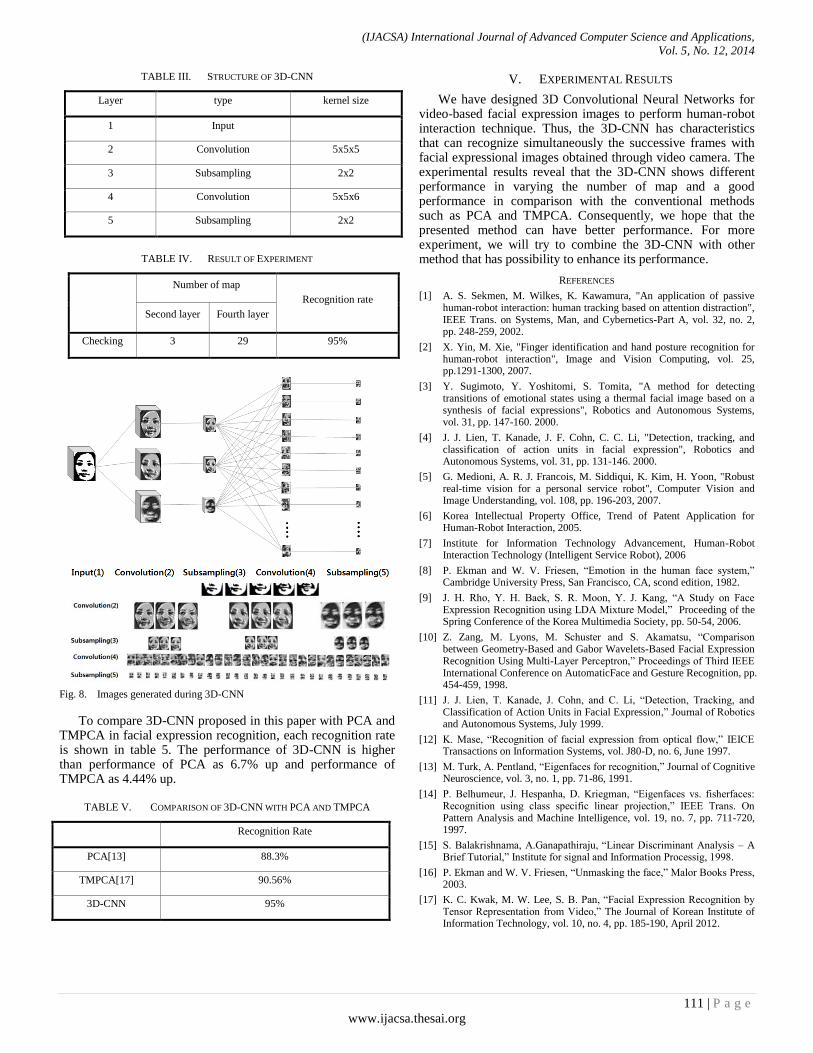
(IJACSA) International Journal of Advanced Computer Science and Applications,
Vol. 5, No. 12, 2014
111 | P a g e
www.ijacsa.thesai.org
TABLE III. STRUCTURE OF 3D-CNN
Layer type kernel size
1 Input
2 Convolution 5x5x5
3 Subsampling 2x2
4 Convolution 5x5x6
5 Subsampling 2x2
TABLE IV. RESULT OF EXPERIMENT
Number of map
Recognition rate
Second layer Fourth layer
Checking 3 29 95%
Fig. 8. Images generated during 3D-CNN
To compare 3D-CNN proposed in this paper with PCA and TMPCA in facial expression recognition, each recognition rate is shown in table 5. The performance of 3D-CNN is higher than performance of PCA as 6.7% up and performance of TMPCA as 4.44% up.
TABLE V. COMPARISON OF 3D-CNN WITH PCA AND TMPCA
Recognition Rate
PCA[13] 88.3%
TMPCA[17] 90.56%
3D-CNN 95%
V. EXPERIMENTAL RESULTS
We have designed 3D Convolutional Neural Networks for video-based facial expression images to perform human-robot interaction technique. Thus, the 3D-CNN has characteristics that can recognize simultaneously the successive frames with facial expressional images obtained through video camera. The experimental results reveal that the 3D-CNN shows different performance in varying the number of map and a good performance in comparison with the conventional methods such as PCA and TMPCA. Consequently, we hope that the presented method can have better performance. For more experiment, we will try to combine the 3D-CNN with other method that has possibility to enhance its performance.
REFERENCES
[1] A. S. Sekmen, M. Wilkes, K. Kawamura, "An application of passive human-robot interaction: human tracking based on attention distraction", IEEE Trans. on Systems, Man, and Cybernetics-Part A, vol. 32, no. 2, pp. 248-259, 2002.
[2] X. Yin, M. Xie, "Finger identification and hand posture recognition for human-robot interaction", Image and Vision Computing, vol. 25, pp.1291-1300, 2007.
[3] Y. Sugimoto, Y. Yoshitomi, S. Tomita, "A method for detecting transitions of emotional states using a thermal facial image based on a synthesis of facial expressions", Robotics and Autonomous Systems, vol. 31, pp. 147-160. 2000.
[4] J. J. Lien, T. Kanade, J. F. Cohn, C. C. Li, "Detection, tracking, and classification of action units in facial expression", Robotics and Autonomous Systems, vol. 31, pp. 131-146. 2000.
[5] G. Medioni, A. R. J. Francois, M. Siddiqui, K. Kim, H. Yoon, "Robust real-time vision for a personal service robot", Computer Vision and Image Understanding, vol. 108, pp. 196-203, 2007.
[6] Korea Intellectual Property Office, Trend of Patent Application for Human-Robot Interaction, 2005.
[7] Institute for Information Technology Advancement, Human-Robot Interaction Technology (Intelligent Service Robot), 2006
[8] P. Ekman and W. V. Friesen, “Emotion in the human face system,” Cambridge University Press, San Francisco, CA, scond edition, 1982.
[9] J. H. Rho, Y. H. Baek, S. R. Moon, Y. J. Kang, “A Study on Face Expression Recognition using LDA Mixture Model,” Proceeding of the Spring Conference of the Korea Multimedia Society, pp. 50-54, 2006.
[10] Z. Zang, M. Lyons, M. Schuster and S. Akamatsu, “Comparison between Geometry-Based and Gabor Wavelets-Based Facial Expression Recognition Using Multi-Layer Perceptron,” Proceedings of Third IEEE International Conference on AutomaticFace and Gesture Recognition, pp. 454-459, 1998.
[11] J. J. Lien, T. Kanade, J. Cohn, and C. Li, “Detection, Tracking, and Classification of Action Units in Facial Expression,” Journal of Robotics and Autonomous Systems, July 1999.
[12] K. Mase, “Recognition of facial expression from optical flow,” IEICE Transactions on Information Systems, vol. J80-D, no. 6, June 1997.
[13] M. Turk, A. Pentland, “Eigenfaces for recognition,” Journal of Cognitive Neuroscience, vol. 3, no. 1, pp. 71-86, 1991.
[14] P. Belhumeur, J. Hespanha, D. Kriegman, “Eigenfaces vs. fisherfaces: Recognition using class specific linear projection,” IEEE Trans. On Pattern Analysis and Machine Intelligence, vol. 19, no. 7, pp. 711-720, 1997.
[15] S. Balakrishnama, A.Ganapathiraju, “Linear Discriminant Analysis – A Brief Tutorial,” Institute for signal and Information Processig, 1998.
[16] P. Ekman and W. V. Friesen, “Unmasking the face,” Malor Books Press, 2003.
[17] K. C. Kwak, M. W. Lee, S. B. Pan, “Facial Expression Recognition by Tensor Representation from Video,” The Journal of Korean Institute of Information Technology, vol. 10, no. 4, pp. 185-190, April 2012.

(IJACSA) International Journal of Advanced Computer Science and Applications,
Vol. 5, No. 12, 2014
112 | P a g e
www.ijacsa.thesai.org
[18] Y. H. Joo, K. H. Jeong, M. H. Kim, J. B. Park, J. Lee, Y. J. Cho, “Facial Image Analysis Algorithm for Emotion Recognition,” Journal of Korean Institute of Intelligent Systems, vol. 14, no. 7, pp. 801-806, December 2004.
[19] J. T. Joo, G. J. Park, G. E. Gho, H. C. Yang, G. B. Sim, “Emotion Recognition and Expression using Facial Expression,” Proceedings of KFIS Spring Conference, vol. 17, no. 1, pp. 295-298, 2007.
[20] S. Lawrence, C. L. Giles, A. C. Tsoi, and A. D. Back, “Face Recognition: A Convolutional Neural-Network Approach”, IEEE Trans. on Neural Networks, Vol. 8, No. 1, pp. 98-113, 1997.
[21] G. Lv, “Recognition of multi-fontstyle characters based on Convolutional neural network”, International Symposium on Computation Intelligence and Design, Vol. 2, pp. 223-225, 2011.
[22] Y. Lecun, L. Bottou, Y. Bengio, and P. Haffner, “Gradient-Based Learning Applied to Document Recognition”, Proceeding of IEEE , Vol. 86, No. 11, pp.2278-2324, 1998.
[23] Y. Lecun, F. J. Huang, L. Bottou, “Learning methods for generic object recognition with invariance to pose and lighting”, Proceeding of the Computer Vision and Pattern Recognition, vol. 2, pp. 97-104, 2004.
[24] X. X. Niu, and C. Y. Suen, “A novel hybrid CNN-SVM classifier for recognizing handwritten digits”, Pattern Recognition, Vol. 45, No. 4, pp. 1318-1325, 2012.
[25] H. Cecotti, and A. Greaser, “Convolutional Neural Network with embedded Fourier Transform for EEG classification”, International Conference on Pattern Recognition, pp. 1-4, 2008.
[26] M. Matsugu, K. Mori, Y. Mitari, and Y. Kaneda, “Subject independent facial expression recognition with robust face detection using a convolutional neural network”, Neural Networks, Vol. 16, No. 5-6, pp. 555-559, 2003.
[27] P. N. Belhumeur, J. P. Hespanha, and D. J. Kriegman, “Eigenfaces vs. Fisherfaces: recognition using class specific linear projection,” IEEE Trans. on Pattern Analysis and Machine Intelligence, Vol. 19, No. 7, pp. 711-720, 1997.
[28] Y. H. Shin, J. S. Ju, E. Y. Kim, T. Kurata, A. K. Jain, S. Park, K. Jung, “Automatic Facial Expression Recognition using Tree Structures for Human Computer Interaction,” Korea Society of Industrial Information Systems, vol. 12, no. 3, pp. 60-68, 2007.
[29] M. Y. Lee, “Facial Expression Recognition by Tensor Representation from Video”, Chosun University, 2012.
[30] Shuiwang Ji, Wei Xu, Ming Yang, and Kai Yu, “3D Convolutional Neural Networks for Human Action Recognition”, IEEE Trans. on Pattern Analysis and Machine Intelligence, Vol. 35, No. 1, pp. 221-231, 2013.
[31] S. J. Han, K. C. Kwak, H. J. Go, S. S. Kim, M. G. Chun, “Facial Expression Recognition using ICA-Factorial Representation Method,” Journal of Korean Institute of Intelligent Systems, vol 13. no. 3, pp. 371-376, june 2003.
AUTHORS PROFILE
Young-Hyen Byeon received the B.Sc and M.Sc. from Chosun University, Gwangju, Korea, in 2012 and 2014, respectively. He is currently pursuing a Ph.D. candidate. His research interests include human–robot interaction, computational intelligence, and pattern recognition.
Keun-Chang Kwak received the B.Sc., M.Sc., and Ph.D. degrees from Chungbuk National University, Cheongju, Korea, in 1996, 1998, and 2002, respectively. During 2003–2005, he was a Postdoctoral Fellow with the Department of Electrical and Computer Engineering, University of Alberta, Edmonton, AB, Canada. From 2005 to 2007, he was a Senior Researcher with the Human–Robot Interaction Team, Intelligent Robot Division, Electronics and Telecommunications Research Institute, Daejeon, Korea. He is currently the Associative Professor with the Department of Control and Instrumentation, Engineering, Chosun University, Gwangju, Korea. His research interests include human–robot interaction, computational intelligence, biometrics, and pattern recognition. Dr. Kwak is a member of IEEE, IEICE, KFIS, KRS, ICROS, KIPS, and IEEK.

(IJACSA) International Journal of Advanced Computer Science and Applications,
Vol. 5, No. 12, 2014
113 | P a g e
www.ijacsa.thesai.org
Social Media in Azorean Organizations: Policies,
Strategies and Perceptions
Nuno Filipe Cordeiro
Business and Economics Department
University of the Azores
Ponta Delgada, Portugal
Teresa Tiago
Business and Economics Department
University of the Azores
Ponta Delgada, Portugal
Flávio Tiago
Business and Economics Department
University of the Azores
Ponta Delgada, Portugal
Francisco Amaral
Business and Economics Department
University of the Azores
Ponta Delgada, Portugal
Abstract—Social media have brought new opportunities, and
also new challenges, for organizations. With them came the rise
of a new context of action, largely influenced by the changing
habits and the behavior of the consumer. The purpose of the
following research is to analyze the views and strategies
embraced by Azorean organizations, as well as the perceptions
arising from the use of social media.
For this study, a quantitative type of research, of a descriptive
nature, was chosen, using an online survey. A total of 232 valid
surveys obtained led to a range of perceptions about the use of
social media. The study hypotheses were verified using the
Kruskal-Wallis analysis.
The results demonstrate that the majority of organizations
involved in the study already use social media and that almost all
of them use Facebook. The main reasons are to reach a wider
audience, to increase notoriety and to communicate with
customers. The most relevant difficulty felt after joining the
social media is the lack of resources and availability. Marketing
initiatives and content creation are the most-used activities.
Remarkably, more than half don’t have a defined strategy, nor
use measuring instruments to assess their presence. However,
they consider that social media enhance their performance.
Social media is a widely studied topic from the consumer’s
point of view, but there is still little investigation from an
organizational perspective. This work sought to contribute to the
knowledge about the use and involvement of organizations in
social media, especially in the peripheral context.
Keywords—Internet; Web 2.0; Social Media; User Generated
Content
I. INTRODUCTION
Today, access to the Internet is greatly facilitated and related technologies are in a continuous evolution. Social media constitute one of these evolutions, and are very popular among users. Sites like Facebook, YouTube, Twitter and others have attracted users around the world, who spend a considerable part of their time on them [1].
These sites have been modifying the habits and behaviors of better-informed consumers. One property that contributed to success of social media was the possibility of two-way communication, allowing user content to be generated daily on these sites, without organizational control. This permitted clients to express their points of view about products and services, share experiences and provide recommendations. These content has influence on other consumers’ purchasing decisions [2].
These facts piqued the interest of firms, motivating them to integrate social media into their business process [3], utilize the chance to be closer to their clients, identify their behaviors and satisfy them [2]. The literature review reveals that many studies focus primarily on the consumer perspective, and some authors and research organizations suggest that the enterprise perspective is often overlooked by social media research.
This work is about a firm’s exploitations of social media to reach clients, especially in identifying which channels and activities they use, their motivations to use social media, whether they use it, which metrics are used to evaluate their presence on social media and finally, the benefits of using social media. Additionally, it tries to unveil a firm’s strategies regarding social media, the investment policies and the best practices used to achieve the defined objectives.
For practical reasons, this study focuses on Azorean firms’ utilizations of social media. Data gathering was conducted over e-mail with the survey sent to Azorean enterprises during February 2013.
The rest of this paper is organized as follows: Section 2 discusses the related literature reviewed for this research study. The subsequent sub-section outline the conceptual model and experimental hypothesis on which the model is based and presents methodology and discussion of the empirical findings. Section 4 describes the paper's results. The implications for organizations as well as for research and limitations and scope for future research are discussed in sections 5 and 6 respectively.
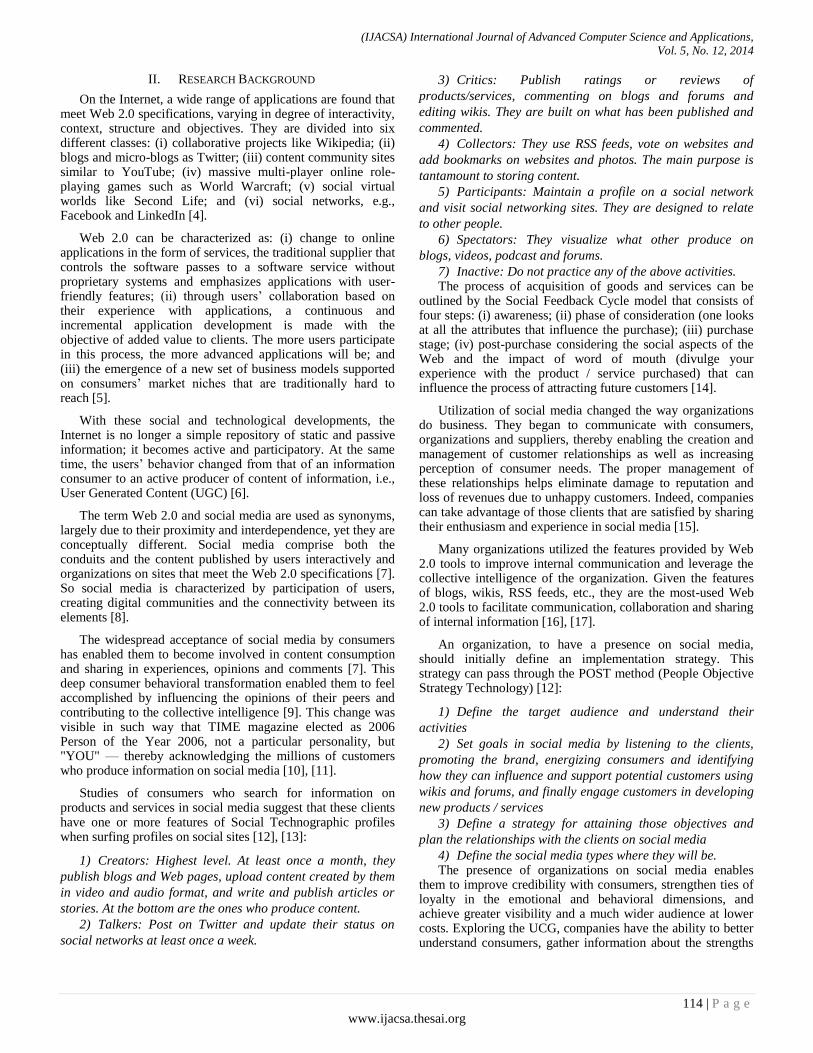
(IJACSA) International Journal of Advanced Computer Science and Applications,
Vol. 5, No. 12, 2014
114 | P a g e
www.ijacsa.thesai.org
II. RESEARCH BACKGROUND
On the Internet, a wide range of applications are found that meet Web 2.0 specifications, varying in degree of interactivity, context, structure and objectives. They are divided into six different classes: (i) collaborative projects like Wikipedia; (ii) blogs and micro-blogs as Twitter; (iii) content community sites similar to YouTube; (iv) massive multi-player online role-playing games such as World Warcraft; (v) social virtual worlds like Second Life; and (vi) social networks, e.g., Facebook and LinkedIn [4].
Web 2.0 can be characterized as: (i) change to online applications in the form of services, the traditional supplier that controls the software passes to a software service without proprietary systems and emphasizes applications with user-friendly features; (ii) through users’ collaboration based on their experience with applications, a continuous and incremental application development is made with the objective of added value to clients. The more users participate in this process, the more advanced applications will be; and (iii) the emergence of a new set of business models supported on consumers’ market niches that are traditionally hard to reach [5].
With these social and technological developments, the Internet is no longer a simple repository of static and passive information; it becomes active and participatory. At the same time, the users’ behavior changed from that of an information consumer to an active producer of content of information, i.e., User Generated Content (UGC) [6].
The term Web 2.0 and social media are used as synonyms, largely due to their proximity and interdependence, yet they are conceptually different. Social media comprise both the conduits and the content published by users interactively and organizations on sites that meet the Web 2.0 specifications [7]. So social media is characterized by participation of users, creating digital communities and the connectivity between its elements [8].
The widespread acceptance of social media by consumers has enabled them to become involved in content consumption and sharing in experiences, opinions and comments [7]. This deep consumer behavioral transformation enabled them to feel accomplished by influencing the opinions of their peers and contributing to the collective intelligence [9]. This change was visible in such way that TIME magazine elected as 2006 Person of the Year 2006, not a particular personality, but "YOU" — thereby acknowledging the millions of customers who produce information on social media [10], [11].
Studies of consumers who search for information on products and services in social media suggest that these clients have one or more features of Social Technographic profiles when surfing profiles on social sites [12], [13]:
1) Creators: Highest level. At least once a month, they
publish blogs and Web pages, upload content created by them
in video and audio format, and write and publish articles or
stories. At the bottom are the ones who produce content.
2) Talkers: Post on Twitter and update their status on
social networks at least once a week.
3) Critics: Publish ratings or reviews of
products/services, commenting on blogs and forums and
editing wikis. They are built on what has been published and
commented.
4) Collectors: They use RSS feeds, vote on websites and
add bookmarks on websites and photos. The main purpose is
tantamount to storing content.
5) Participants: Maintain a profile on a social network
and visit social networking sites. They are designed to relate
to other people.
6) Spectators: They visualize what other produce on
blogs, videos, podcast and forums.
7) Inactive: Do not practice any of the above activities. The process of acquisition of goods and services can be
outlined by the Social Feedback Cycle model that consists of four steps: (i) awareness; (ii) phase of consideration (one looks at all the attributes that influence the purchase); (iii) purchase stage; (iv) post-purchase considering the social aspects of the Web and the impact of word of mouth (divulge your experience with the product / service purchased) that can influence the process of attracting future customers [14].
Utilization of social media changed the way organizations do business. They began to communicate with consumers, organizations and suppliers, thereby enabling the creation and management of customer relationships as well as increasing perception of consumer needs. The proper management of these relationships helps eliminate damage to reputation and loss of revenues due to unhappy customers. Indeed, companies can take advantage of those clients that are satisfied by sharing their enthusiasm and experience in social media [15].
Many organizations utilized the features provided by Web 2.0 tools to improve internal communication and leverage the collective intelligence of the organization. Given the features of blogs, wikis, RSS feeds, etc., they are the most-used Web 2.0 tools to facilitate communication, collaboration and sharing of internal information [16], [17].
An organization, to have a presence on social media, should initially define an implementation strategy. This strategy can pass through the POST method (People Objective Strategy Technology) [12]:
1) Define the target audience and understand their
activities
2) Set goals in social media by listening to the clients,
promoting the brand, energizing consumers and identifying
how they can influence and support potential customers using
wikis and forums, and finally engage customers in developing
new products / services
3) Define a strategy for attaining those objectives and
plan the relationships with the clients on social media
4) Define the social media types where they will be. The presence of organizations on social media enables
them to improve credibility with consumers, strengthen ties of loyalty in the emotional and behavioral dimensions, and achieve greater visibility and a much wider audience at lower costs. Exploring the UCG, companies have the ability to better understand consumers, gather information about the strengths
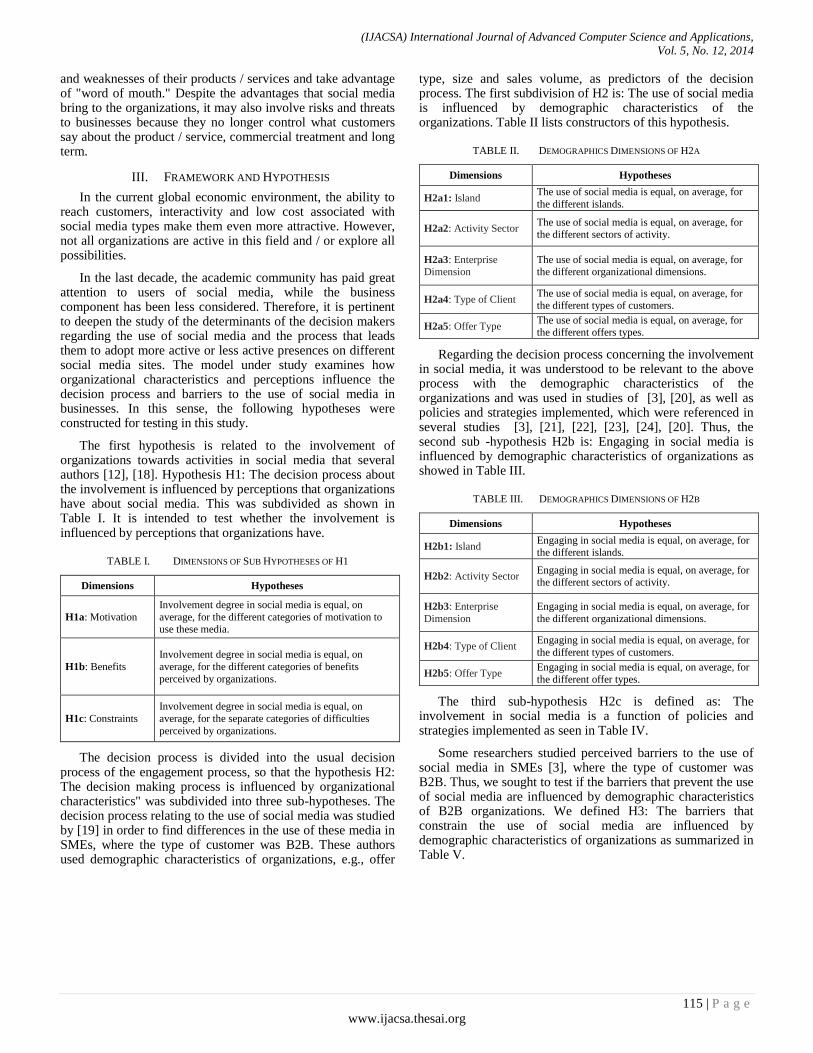
(IJACSA) International Journal of Advanced Computer Science and Applications,
Vol. 5, No. 12, 2014
115 | P a g e
www.ijacsa.thesai.org
and weaknesses of their products / services and take advantage of "word of mouth." Despite the advantages that social media bring to the organizations, it may also involve risks and threats to businesses because they no longer control what customers say about the product / service, commercial treatment and long term.
III. FRAMEWORK AND HYPOTHESIS
In the current global economic environment, the ability to reach customers, interactivity and low cost associated with social media types make them even more attractive. However, not all organizations are active in this field and / or explore all possibilities.
In the last decade, the academic community has paid great attention to users of social media, while the business component has been less considered. Therefore, it is pertinent to deepen the study of the determinants of the decision makers regarding the use of social media and the process that leads them to adopt more active or less active presences on different social media sites. The model under study examines how organizational characteristics and perceptions influence the decision process and barriers to the use of social media in businesses. In this sense, the following hypotheses were constructed for testing in this study.
The first hypothesis is related to the involvement of organizations towards activities in social media that several authors [12], [18]. Hypothesis H1: The decision process about the involvement is influenced by perceptions that organizations have about social media. This was subdivided as shown in Table I. It is intended to test whether the involvement is influenced by perceptions that organizations have.
TABLE I. DIMENSIONS OF SUB HYPOTHESES OF H1
Dimensions Hypotheses
H1a: Motivation
Involvement degree in social media is equal, on
average, for the different categories of motivation to use these media.
H1b: Benefits
Involvement degree in social media is equal, on
average, for the different categories of benefits
perceived by organizations.
H1c: Constraints
Involvement degree in social media is equal, on
average, for the separate categories of difficulties
perceived by organizations.
The decision process is divided into the usual decision process of the engagement process, so that the hypothesis H2: The decision making process is influenced by organizational characteristics" was subdivided into three sub-hypotheses. The decision process relating to the use of social media was studied by [19] in order to find differences in the use of these media in SMEs, where the type of customer was B2B. These authors used demographic characteristics of organizations, e.g., offer
type, size and sales volume, as predictors of the decision process. The first subdivision of H2 is: The use of social media is influenced by demographic characteristics of the organizations. Table II lists constructors of this hypothesis.
TABLE II. DEMOGRAPHICS DIMENSIONS OF H2A
Dimensions Hypotheses
H2a1: Island The use of social media is equal, on average, for
the different islands.
H2a2: Activity Sector The use of social media is equal, on average, for the different sectors of activity.
H2a3: Enterprise Dimension
The use of social media is equal, on average, for the different organizational dimensions.
H2a4: Type of Client The use of social media is equal, on average, for the different types of customers.
H2a5: Offer Type The use of social media is equal, on average, for the different offers types.
Regarding the decision process concerning the involvement in social media, it was understood to be relevant to the above process with the demographic characteristics of the organizations and was used in studies of [3], [20], as well as policies and strategies implemented, which were referenced in several studies [3], [21], [22], [23], [24], [20]. Thus, the second sub -hypothesis H2b is: Engaging in social media is influenced by demographic characteristics of organizations as showed in Table III.
TABLE III. DEMOGRAPHICS DIMENSIONS OF H2B
Dimensions Hypotheses
H2b1: Island Engaging in social media is equal, on average, for the different islands.
H2b2: Activity Sector Engaging in social media is equal, on average, for the different sectors of activity.
H2b3: Enterprise
Dimension
Engaging in social media is equal, on average, for
the different organizational dimensions.
H2b4: Type of Client Engaging in social media is equal, on average, for
the different types of customers.
H2b5: Offer Type Engaging in social media is equal, on average, for the different offer types.
The third sub-hypothesis H2c is defined as: The involvement in social media is a function of policies and strategies implemented as seen in Table IV.
Some researchers studied perceived barriers to the use of social media in SMEs [3], where the type of customer was B2B. Thus, we sought to test if the barriers that prevent the use of social media are influenced by demographic characteristics of B2B organizations. We defined H3: The barriers that constrain the use of social media are influenced by demographic characteristics of organizations as summarized in Table V.
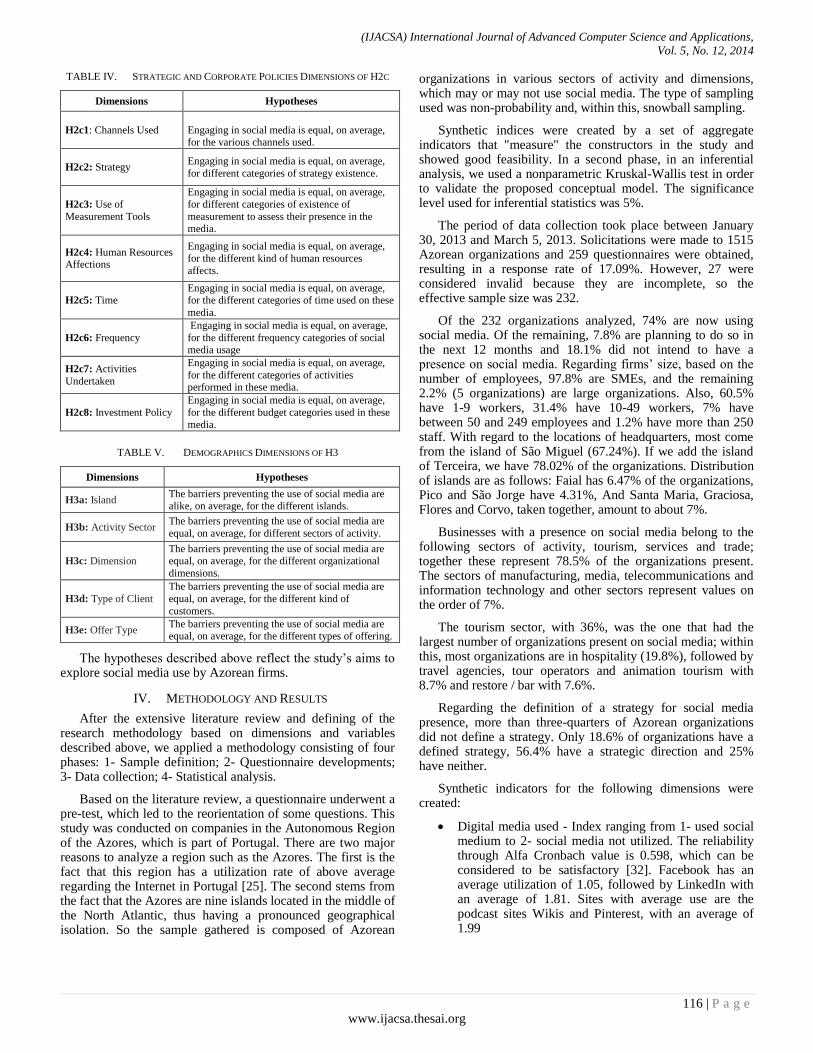
(IJACSA) International Journal of Advanced Computer Science and Applications,
Vol. 5, No. 12, 2014
116 | P a g e
www.ijacsa.thesai.org
TABLE IV. STRATEGIC AND CORPORATE POLICIES DIMENSIONS OF H2C
Dimensions Hypotheses
H2c1: Channels Used
Engaging in social media is equal, on average, for the various channels used.
H2c2: Strategy Engaging in social media is equal, on average,
for different categories of strategy existence.
H2c3: Use of
Measurement Tools
Engaging in social media is equal, on average,
for different categories of existence of
measurement to assess their presence in the media.
H2c4: Human Resources Affections
Engaging in social media is equal, on average,
for the different kind of human resources
affects.
H2c5: Time Engaging in social media is equal, on average, for the different categories of time used on these
media.
H2c6: Frequency
Engaging in social media is equal, on average,
for the different frequency categories of social media usage
H2c7: Activities
Undertaken
Engaging in social media is equal, on average,
for the different categories of activities performed in these media.
H2c8: Investment Policy
Engaging in social media is equal, on average,
for the different budget categories used in these media.
TABLE V. DEMOGRAPHICS DIMENSIONS OF H3
Dimensions Hypotheses
H3a: Island The barriers preventing the use of social media are alike, on average, for the different islands.
H3b: Activity Sector The barriers preventing the use of social media are
equal, on average, for different sectors of activity.
H3c: Dimension The barriers preventing the use of social media are equal, on average, for the different organizational
dimensions.
H3d: Type of Client
The barriers preventing the use of social media are
equal, on average, for the different kind of
customers.
H3e: Offer Type The barriers preventing the use of social media are equal, on average, for the different types of offering.
The hypotheses described above reflect the study’s aims to explore social media use by Azorean firms.
IV. METHODOLOGY AND RESULTS
After the extensive literature review and defining of the research methodology based on dimensions and variables described above, we applied a methodology consisting of four phases: 1- Sample definition; 2- Questionnaire developments; 3- Data collection; 4- Statistical analysis.
Based on the literature review, a questionnaire underwent a pre-test, which led to the reorientation of some questions. This study was conducted on companies in the Autonomous Region of the Azores, which is part of Portugal. There are two major reasons to analyze a region such as the Azores. The first is the fact that this region has a utilization rate of above average regarding the Internet in Portugal [25]. The second stems from the fact that the Azores are nine islands located in the middle of the North Atlantic, thus having a pronounced geographical isolation. So the sample gathered is composed of Azorean
organizations in various sectors of activity and dimensions, which may or may not use social media. The type of sampling used was non-probability and, within this, snowball sampling.
Synthetic indices were created by a set of aggregate indicators that "measure" the constructors in the study and showed good feasibility. In a second phase, in an inferential analysis, we used a nonparametric Kruskal-Wallis test in order to validate the proposed conceptual model. The significance level used for inferential statistics was 5%.
The period of data collection took place between January 30, 2013 and March 5, 2013. Solicitations were made to 1515 Azorean organizations and 259 questionnaires were obtained, resulting in a response rate of 17.09%. However, 27 were considered invalid because they are incomplete, so the effective sample size was 232.
Of the 232 organizations analyzed, 74% are now using social media. Of the remaining, 7.8% are planning to do so in the next 12 months and 18.1% did not intend to have a presence on social media. Regarding firms’ size, based on the number of employees, 97.8% are SMEs, and the remaining 2.2% (5 organizations) are large organizations. Also, 60.5% have 1-9 workers, 31.4% have 10-49 workers, 7% have between 50 and 249 employees and 1.2% have more than 250 staff. With regard to the locations of headquarters, most come from the island of São Miguel (67.24%). If we add the island of Terceira, we have 78.02% of the organizations. Distribution of islands are as follows: Faial has 6.47% of the organizations, Pico and São Jorge have 4.31%, And Santa Maria, Graciosa, Flores and Corvo, taken together, amount to about 7%.
Businesses with a presence on social media belong to the following sectors of activity, tourism, services and trade; together these represent 78.5% of the organizations present. The sectors of manufacturing, media, telecommunications and information technology and other sectors represent values on the order of 7%.
The tourism sector, with 36%, was the one that had the largest number of organizations present on social media; within this, most organizations are in hospitality (19.8%), followed by travel agencies, tour operators and animation tourism with 8.7% and restore / bar with 7.6%.
Regarding the definition of a strategy for social media presence, more than three-quarters of Azorean organizations did not define a strategy. Only 18.6% of organizations have a defined strategy, 56.4% have a strategic direction and 25% have neither.
Synthetic indicators for the following dimensions were created:
Digital media used - Index ranging from 1- used social medium to 2- social media not utilized. The reliability through Alfa Cronbach value is 0.598, which can be considered to be satisfactory [32]. Facebook has an average utilization of 1.05, followed by LinkedIn with an average of 1.81. Sites with average use are the podcast sites Wikis and Pinterest, with an average of 1.99
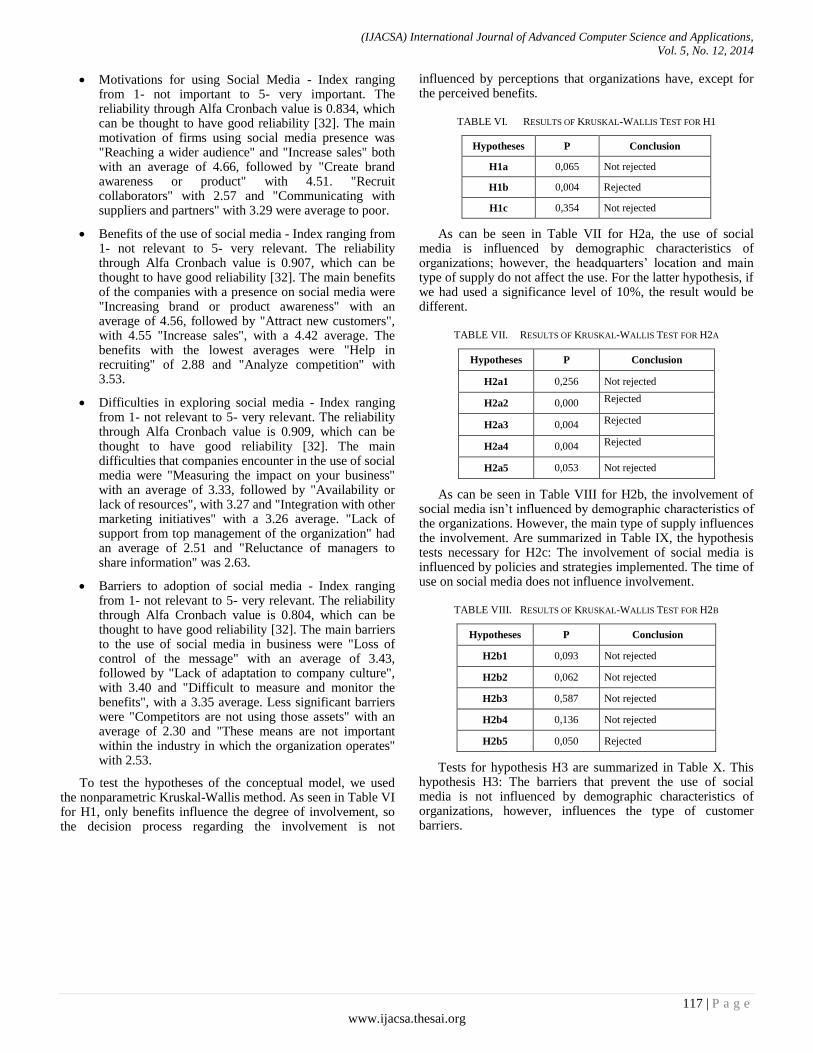
(IJACSA) International Journal of Advanced Computer Science and Applications,
Vol. 5, No. 12, 2014
117 | P a g e
www.ijacsa.thesai.org
Motivations for using Social Media - Index ranging from 1- not important to 5- very important. The reliability through Alfa Cronbach value is 0.834, which can be thought to have good reliability [32]. The main motivation of firms using social media presence was "Reaching a wider audience" and "Increase sales" both with an average of 4.66, followed by "Create brand awareness or product" with 4.51. "Recruit collaborators" with 2.57 and "Communicating with suppliers and partners" with 3.29 were average to poor.
Benefits of the use of social media - Index ranging from 1- not relevant to 5- very relevant. The reliability through Alfa Cronbach value is 0.907, which can be thought to have good reliability [32]. The main benefits of the companies with a presence on social media were "Increasing brand or product awareness" with an average of 4.56, followed by "Attract new customers", with 4.55 "Increase sales", with a 4.42 average. The benefits with the lowest averages were "Help in recruiting" of 2.88 and "Analyze competition" with 3.53.
Difficulties in exploring social media - Index ranging from 1- not relevant to 5- very relevant. The reliability through Alfa Cronbach value is 0.909, which can be thought to have good reliability [32]. The main difficulties that companies encounter in the use of social media were "Measuring the impact on your business" with an average of 3.33, followed by "Availability or lack of resources", with 3.27 and "Integration with other marketing initiatives" with a 3.26 average. "Lack of support from top management of the organization" had an average of 2.51 and "Reluctance of managers to share information" was 2.63.
Barriers to adoption of social media - Index ranging from 1- not relevant to 5- very relevant. The reliability through Alfa Cronbach value is 0.804, which can be thought to have good reliability [32]. The main barriers to the use of social media in business were "Loss of control of the message" with an average of 3.43, followed by "Lack of adaptation to company culture", with 3.40 and "Difficult to measure and monitor the benefits", with a 3.35 average. Less significant barriers were "Competitors are not using those assets" with an average of 2.30 and "These means are not important within the industry in which the organization operates" with 2.53.
To test the hypotheses of the conceptual model, we used the nonparametric Kruskal-Wallis method. As seen in Table VI for H1, only benefits influence the degree of involvement, so the decision process regarding the involvement is not
influenced by perceptions that organizations have, except for the perceived benefits.
TABLE VI. RESULTS OF KRUSKAL-WALLIS TEST FOR H1
Hypotheses P Conclusion
H1a 0,065 Not rejected
H1b 0,004 Rejected
H1c 0,354 Not rejected
As can be seen in Table VII for H2a, the use of social media is influenced by demographic characteristics of organizations; however, the headquarters’ location and main type of supply do not affect the use. For the latter hypothesis, if we had used a significance level of 10%, the result would be different.
TABLE VII. RESULTS OF KRUSKAL-WALLIS TEST FOR H2A
Hypotheses P Conclusion
H2a1 0,256 Not rejected
H2a2 0,000 Rejected
H2a3 0,004 Rejected
H2a4 0,004 Rejected
H2a5 0,053 Not rejected
As can be seen in Table VIII for H2b, the involvement of social media isn’t influenced by demographic characteristics of the organizations. However, the main type of supply influences the involvement. Are summarized in Table IX, the hypothesis tests necessary for H2c: The involvement of social media is influenced by policies and strategies implemented. The time of use on social media does not influence involvement.
TABLE VIII. RESULTS OF KRUSKAL-WALLIS TEST FOR H2B
Hypotheses P Conclusion
H2b1 0,093 Not rejected
H2b2 0,062 Not rejected
H2b3 0,587 Not rejected
H2b4 0,136 Not rejected
H2b5 0,050 Rejected
Tests for hypothesis H3 are summarized in Table X. This hypothesis H3: The barriers that prevent the use of social media is not influenced by demographic characteristics of organizations, however, influences the type of customer barriers.
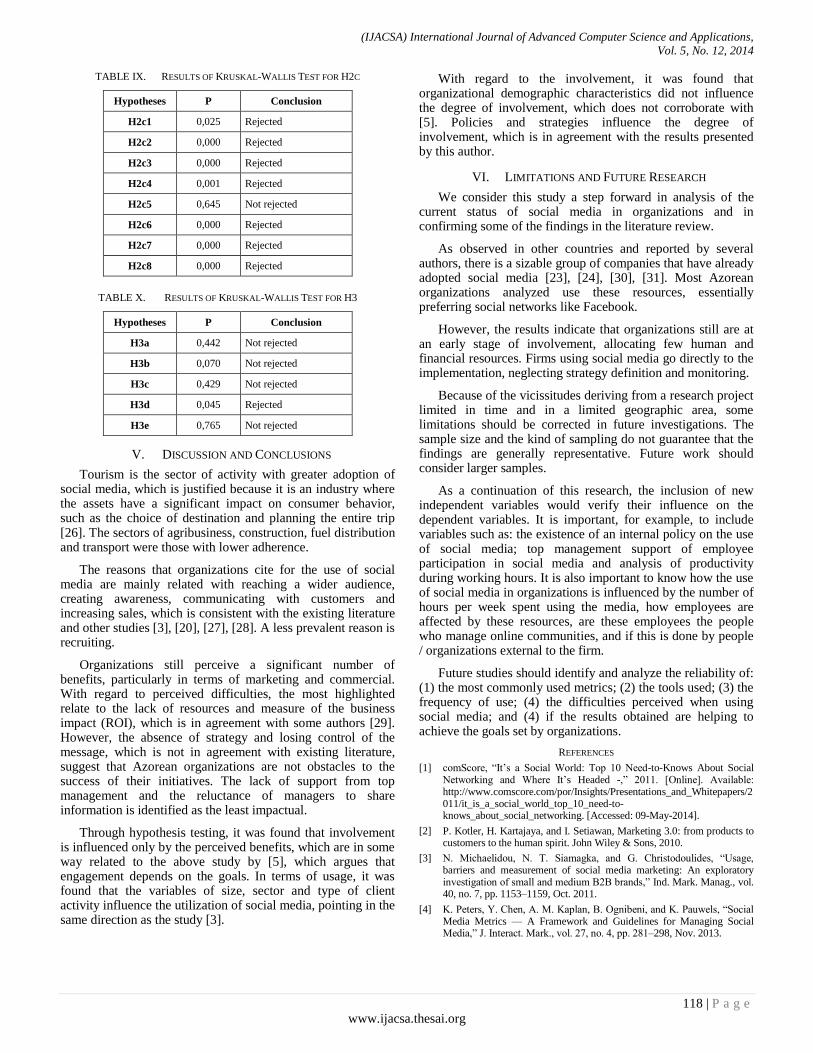
(IJACSA) International Journal of Advanced Computer Science and Applications,
Vol. 5, No. 12, 2014
118 | P a g e
www.ijacsa.thesai.org
TABLE IX. RESULTS OF KRUSKAL-WALLIS TEST FOR H2C
Hypotheses P Conclusion
H2c1 0,025 Rejected
H2c2 0,000 Rejected
H2c3 0,000 Rejected
H2c4 0,001 Rejected
H2c5 0,645 Not rejected
H2c6 0,000 Rejected
H2c7 0,000 Rejected
H2c8 0,000 Rejected
TABLE X. RESULTS OF KRUSKAL-WALLIS TEST FOR H3
Hypotheses P Conclusion
H3a 0,442 Not rejected
H3b 0,070 Not rejected
H3c 0,429 Not rejected
H3d 0,045 Rejected
H3e 0,765 Not rejected
V. DISCUSSION AND CONCLUSIONS
Tourism is the sector of activity with greater adoption of social media, which is justified because it is an industry where the assets have a significant impact on consumer behavior, such as the choice of destination and planning the entire trip [26]. The sectors of agribusiness, construction, fuel distribution and transport were those with lower adherence.
The reasons that organizations cite for the use of social media are mainly related with reaching a wider audience, creating awareness, communicating with customers and increasing sales, which is consistent with the existing literature and other studies [3], [20], [27], [28]. A less prevalent reason is recruiting.
Organizations still perceive a significant number of benefits, particularly in terms of marketing and commercial. With regard to perceived difficulties, the most highlighted relate to the lack of resources and measure of the business impact (ROI), which is in agreement with some authors [29]. However, the absence of strategy and losing control of the message, which is not in agreement with existing literature, suggest that Azorean organizations are not obstacles to the success of their initiatives. The lack of support from top management and the reluctance of managers to share information is identified as the least impactual.
Through hypothesis testing, it was found that involvement is influenced only by the perceived benefits, which are in some way related to the above study by [5], which argues that engagement depends on the goals. In terms of usage, it was found that the variables of size, sector and type of client activity influence the utilization of social media, pointing in the same direction as the study [3].
With regard to the involvement, it was found that organizational demographic characteristics did not influence the degree of involvement, which does not corroborate with [5]. Policies and strategies influence the degree of involvement, which is in agreement with the results presented by this author.
VI. LIMITATIONS AND FUTURE RESEARCH
We consider this study a step forward in analysis of the current status of social media in organizations and in confirming some of the findings in the literature review.
As observed in other countries and reported by several authors, there is a sizable group of companies that have already adopted social media [23], [24], [30], [31]. Most Azorean organizations analyzed use these resources, essentially preferring social networks like Facebook.
However, the results indicate that organizations still are at an early stage of involvement, allocating few human and financial resources. Firms using social media go directly to the implementation, neglecting strategy definition and monitoring.
Because of the vicissitudes deriving from a research project limited in time and in a limited geographic area, some limitations should be corrected in future investigations. The sample size and the kind of sampling do not guarantee that the findings are generally representative. Future work should consider larger samples.
As a continuation of this research, the inclusion of new independent variables would verify their influence on the dependent variables. It is important, for example, to include variables such as: the existence of an internal policy on the use of social media; top management support of employee participation in social media and analysis of productivity during working hours. It is also important to know how the use of social media in organizations is influenced by the number of hours per week spent using the media, how employees are affected by these resources, are these employees the people who manage online communities, and if this is done by people / organizations external to the firm.
Future studies should identify and analyze the reliability of: (1) the most commonly used metrics; (2) the tools used; (3) the frequency of use; (4) the difficulties perceived when using social media; and (4) if the results obtained are helping to achieve the goals set by organizations.
REFERENCES
[1] comScore, ―It’s a Social World: Top 10 Need-to-Knows About Social Networking and Where It’s Headed -,‖ 2011. [Online]. Available: http://www.comscore.com/por/Insights/Presentations_and_Whitepapers/2011/it_is_a_social_world_top_10_need-to-knows_about_social_networking. [Accessed: 09-May-2014].
[2] P. Kotler, H. Kartajaya, and I. Setiawan, Marketing 3.0: from products to customers to the human spirit. John Wiley & Sons, 2010.
[3] N. Michaelidou, N. T. Siamagka, and G. Christodoulides, ―Usage, barriers and measurement of social media marketing: An exploratory investigation of small and medium B2B brands,‖ Ind. Mark. Manag., vol. 40, no. 7, pp. 1153–1159, Oct. 2011.
[4] K. Peters, Y. Chen, A. M. Kaplan, B. Ognibeni, and K. Pauwels, ―Social Media Metrics — A Framework and Guidelines for Managing Social Media,‖ J. Interact. Mark., vol. 27, no. 4, pp. 281–298, Nov. 2013.

(IJACSA) International Journal of Advanced Computer Science and Applications,
Vol. 5, No. 12, 2014
119 | P a g e
www.ijacsa.thesai.org
[5] E. Constantinides and S. J. Fountain, ―Web 2.0: Conceptual foundations and marketing issues,‖ J. Direct, Data Digit. Mark. Pract., vol. 9, no. 3, pp. 231–244, Mar. 2008.
[6] T. O’Reilly, ―What Is Web 2.0,‖ 2005. [Online]. Available: http://oreilly.com/web2/archive/what-is-web-20.html. [Accessed: 17-May-2014].
[7] P. R. Berthon, L. F. Pitt, K. Plangger, and D. Shapiro, ―Marketing meets Web 2.0, social media, and creative consumers: Implications for international marketing strategy,‖ Bus. Horiz., vol. 55, no. 3, pp. 261–271, May 2012.
[8] Tiago, M.T., Veríssimo, J. ―Digital Marketing and Social Media: Why bother?, Bus. Horiz., vol. 57, pp. 703—708
[9] J. Surowiecki, ―The Wisdom of Crowds,‖ Am. J. Phys., vol. 75, p. 336, 2005.
[10] L. Grossman, ―You -- Yes, You -- Are TIME’s Person of the Year - TIME,‖ Time, 2006. [Online]. Available: http://content.time.com/time/magazine/article/0,9171,1570810,00.html. [Accessed: 26-Jun-2014].
[11] Wikipedia, ―You (Time Person of the Year),‖ 2007. [Online]. Available: http://en.wikipedia.org/wiki/You_(Time_Person_of_the_Year).
[12] J. Bernoff and C. Li, ―The POST Method: A systematic approach to social strategy,‖ 2007. [Online]. Available: http://forrester.typepad.com/groundswell/2007/12/the-post-method.html. [Accessed: 26-Jun-2014].
[13] J. Bernoff, ―Social Technographics: Conversationalists get onto the ladder,‖ 2010. [Online]. Available: http://forrester.typepad.com/groundswell/2010/01/conversationalists-get-onto-the-ladder.html. [Accessed: 26-Jun-2014].
[14] D. Evans, Social media marketing: An hour a day. 2008.
[15] T. Weinberg, The new community rules: Marketing on the social web. ― O’Reilly Media, Inc.,‖ 2009.
[16] L. S. L. Lai and E. Turban, ―Groups Formation and Operations in the Web 2.0 Environment and Social Networks,‖ Gr. Decis. Negot., vol. 17, no. 5, pp. 387–402, Jun. 2008.
[17] A. Richter, A. Stocker, S. Müller, and G. Avram, ―Knowledge management goals revisited: A cross-sectional analysis of social software adoption in corporate environments,‖ VINE, vol. 43, no. 2, pp. 132–148, 2013.
[18] G. Drury, ―Opinion piece: Social media: Should marketers engage and how can it be done effectively?,‖ J. Direct, Data Digit. Mark. Pract., vol. 9, no. 3, pp. 274–277, Mar. 2008.
[19] N. Michaelidou, N. T. Siamagka, and G. Christodoulides, ―Usage, barriers and measurement of social media marketing: An exploratory
investigation of small and medium B2B brands,‖ Ind. Mark. Manag., vol. 40, no. 7, pp. 1153–1159, Oct. 2011.
[20] J. M. Veríssimo and G. Coimbra, ―Marketing Digital em Portugal: Situação Actual e Tendências,‖ 2011.
[21] D. E. R. Service, ―Enterprise 2.0 - Harnessing social media,‖ Deloitte, 2011. [Online]. Available: https://www.deloitte.com/assets/Dcom-Canada/Local Assets/Documents/ERS/ca_en_ers_enterprise_20_050611.pdf. [Accessed: 27-Jun-2014].
[22] H. B. R. A. Services, ―the New Conversation: taking Social Media from talk to action,‖ 2010.
[23] M. A. Stelzner, ―2011 Social Media Marketing Report - How Marketers Are Using Social Media to Grow Their Businesses,‖ Social Media Examiner, 2011. [Online]. Available: http://www.socialmediaexaminer.com/SocialMediaMarketingReport2011.pdf. [Accessed: 27-Jun-2014].
[24] M. A. Stelzner, ―2012 Social Media Marketing Industry Report - How Marketers Are Using Social Media to Grow Their Businesses,‖ Social Media Examiner, 2012. [Online]. Available: http://www.socialmediaexaminer.com/SocialMediaMarketingIndustryReport2012.pdf. [Accessed: 27-Jun-2014].
[25] INE, ―Inquérito à Utilização de Tecnologias da Informação e da Comunicação nas Empresas 2012,‖ 2012.
[26] J. Miguéns, R. Baggio, and C. Costa, ―Social media and Tourism Destinations : TripAdvisor Case Study,‖ in Advances in Tourism Research, 2008, vol. 2008, pp. 1–6.
[27] F. Cipriani, ―Mídias sociais nas empresas - O relacionamento online com o mercado,‖ Deloitte, 2010. [Online]. Available: http://www.deloitte.com/assets/dcom-brazil/local assets/documents/estudos e pesquisas/apresentacao_midiassociais.pdf. [Accessed: 30-Jun-2014].
[28] Webmarketing123, ―2012 State of Digital Marketing Report,‖ 2012.
[29] J. Evans, Dave; Mckee, Social media marketing: the next generation of business engagement. John Wiley & Sons, 2010.
[30] M. A. Stelzner, ―2013 Social Media Marketing Industry Report - How Marketers Are Using Social Media to Grow Their Businesses,‖ Social Media Examiner, 2013. [Online]. Available: http://www.socialmediaexaminer.com/SocialMediaMarketingIndustryReport2013.pdf. [Accessed: 27-Jun-2014].
[31] B. D. Weinberg and E. Pehlivan, ―Social spending: Managing the social media mix,‖ Bus. Horiz., vol. 54, no. 3, pp. 275–282, May 2011.
[32] R. A. Peterson, ―A meta-analysis of Cronbach's coefficient alpha.‖ Journal of consumer research, pp. 381-391, 1994.

(IJACSA) International Journal of Advanced Computer Science and Applications,
Vol. 5, No. 12, 2014
120 | P a g e
www.ijacsa.thesai.org
Weighted Marking, Clique Structure and Node-
Weighted Centrality to Predict Distribution Centre’s
Location in a Supply Chain Management
Akanmu, Amidu A. G.,
School of Computing,
University of Kent, Medway,
ME4 4AG, Kent
Wang, Frank Z.,
School of Computing,
University of Kent, Canterbury,
Kent
Yamoah, Fred A.,
School of Business,
University of Kent, Medway,
ME4 4AG, Kent
Abstract—Despite the importance attached to the weights or
strengths on the edges of a graph, a graph is only complete if it
has both the combinations of nodes and edges. As such, this
paper brings to bare the fact that the node-weight of a graph is
also a critical factor to consider in any graph/network’s
evaluation, rather than the link-weight alone as commonly
considered. In fact, the combination of the weights on both the
nodes and edges as well as the number of ties together contribute
effectively to the measure of centrality for an entire graph or
network, thereby clearly showing more information. Two
methods which take into consideration both the link-weights and
node-weights of graphs (the Weighted Marking method of
prediction of location and the Clique/Node-Weighted centrality
measures) are considered, and the result from the case studies
shows that the clique/node-weighted centrality measures give an
accuracy of 18% more than the weighted marking method, in the
prediction of Distribution Centre location of the Supply Chain
Management.
Keywords—Centrality measures; Graph; Network; Clique
I. INTRODUCTION
The formal theory of social network analysis encompasses centrality measures, and these are to be employed in this research that dwells on the mergers of weights (link-weights and node weights) to evaluate network topologies and make a prediction. The strength attached to the nodes also called the node-weights represents a certain attribute of a particular node (e.g. population of a city), and the same goes for the strength attached to edges (e.g. distance between cities).[1]
According to [2], in their study of weighted networks, they carried out statistical analysis of complex networks whose edges have assigned a given weight (the flow or the intensity), and such according to them can generally be described in terms of weighted graphs and more so that a more complete view of complex networks is provided by the study of the interactions defining the links of those systems. Although, [3], [4], [2], [5] have only emphasized on the attachment of weights to the edges and not to the nodes in their various studies, [6] and [7] have considered both the weights on the edges and also the number of edges attached to a particular node. This work however concerns itself with both nodes and edges while considering the degree, eigenvector, betweenness and closeness centralities.
The importance of location of distribution centre is echoed by [8], when they said “Moreover, the advantage of an optimal location for distribution centre is not only to reduce transportation costs, but also to improve business performance, increase competitiveness and profitability”.
Although, [9] indicated that “Rarely do members of a group have direct ties with each and every member.”, the case studies we focused on are the road links(edges) to shops coupled with the node weights(sales values of each shop) and this is such that every shop has a road link to another shop thereby forming a clique.
Link-Weighted Centrality
The equation (1) below represents the weighted degree centrality with respect to the edges or links.
1)(
n
w
pCS
N
q
pq
W
Dp
(1)
where p is the focal node ; q= adjacent node ; w= weight attached to the edge ; and n= total number of nodes in the graph.
The above argument is now extended to the weighted centrality of the four measures, i.e. Degree, Closeness, Betweenness and the Eigenvector. The degree centrality of any node S taking cognisance of the strength of the incident edges is herein defined as the weighted degree centrality of node s and is represented in normalised form as
(2)
where wst is the sum of the weights of edges connected to the particular source node s and t represents a particular target
node. In the same vein, the weighted closeness centrality,
(s) is also represented by
(3)
CDW (s) =
wstt
n
å
n-1
w
cc
CCW (s) = n-1
dw (s,t )å
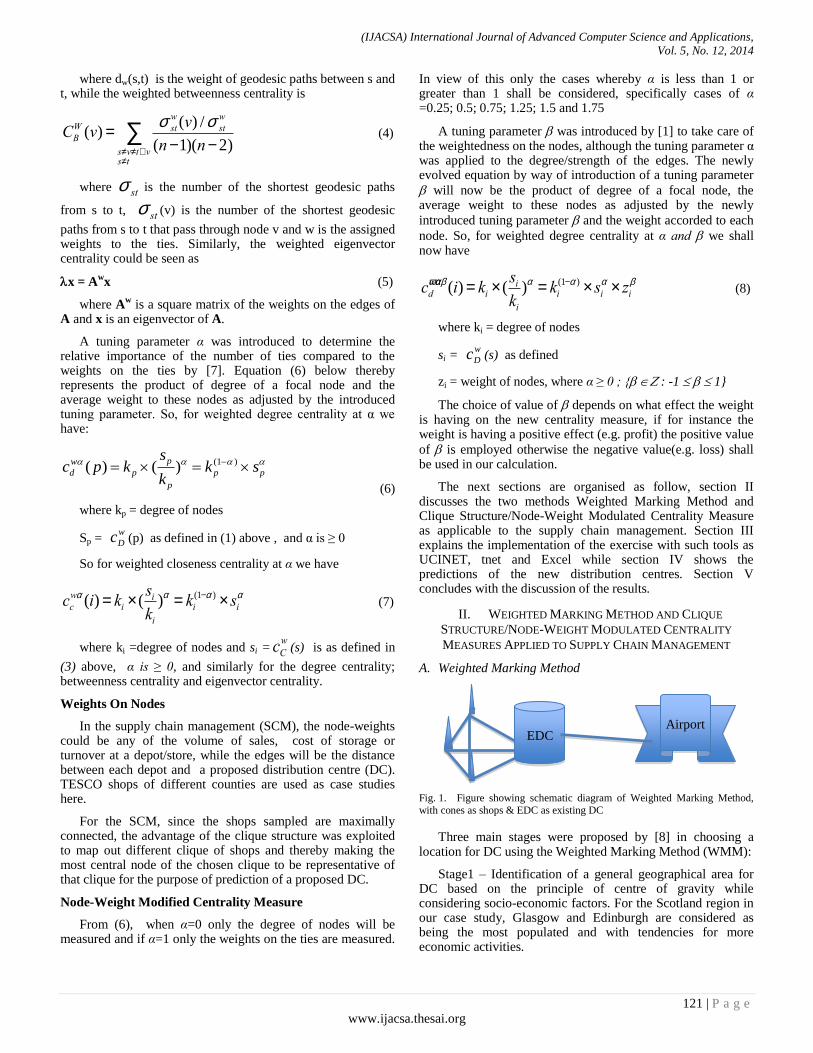
(IJACSA) International Journal of Advanced Computer Science and Applications,
Vol. 5, No. 12, 2014
121 | P a g e
www.ijacsa.thesai.org
where dw(s,t) is the weight of geodesic paths between s and t, while the weighted betweenness centrality is
(4)
where is the number of the shortest geodesic paths
from s to t, (v) is the number of the shortest geodesic
paths from s to t that pass through node v and w is the assigned weights to the ties. Similarly, the weighted eigenvector centrality could be seen as
x = Awx (5)
where Aw is a square matrix of the weights on the edges of
A and x is an eigenvector of A.
A tuning parameter α was introduced to determine the relative importance of the number of ties compared to the weights on the ties by [7]. Equation (6) below thereby represents the product of degree of a focal node and the average weight to these nodes as adjusted by the introduced tuning parameter. So, for weighted degree centrality at α we have:
pp
p
p
p
w
d skk
skpc )1()()(
(6)
where kp = degree of nodes
Sp = (p) as defined in (1) above , and α is ≥ 0
So for weighted closeness centrality at α we have
(7)
where ki =degree of nodes and si = (s) is as defined in
(3) above, α is ≥ 0, and similarly for the degree centrality; betweenness centrality and eigenvector centrality.
Weights On Nodes
In the supply chain management (SCM), the node-weights could be any of the volume of sales, cost of storage or turnover at a depot/store, while the edges will be the distance between each depot and a proposed distribution centre (DC). TESCO shops of different counties are used as case studies here.
For the SCM, since the shops sampled are maximally connected, the advantage of the clique structure was exploited to map out different clique of shops and thereby making the most central node of the chosen clique to be representative of that clique for the purpose of prediction of a proposed DC.
Node-Weight Modified Centrality Measure
From (6), when α=0 only the degree of nodes will be measured and if α=1 only the weights on the ties are measured.
In view of this only the cases whereby α is less than 1 or greater than 1 shall be considered, specifically cases of α =0.25; 0.5; 0.75; 1.25; 1.5 and 1.75
A tuning parameter was introduced by [1] to take care of the weightedness on the nodes, although the tuning parameter α was applied to the degree/strength of the edges. The newly evolved equation by way of introduction of a tuning parameter
will now be the product of degree of a focal node, the average weight to these nodes as adjusted by the newly
introduced tuning parameter and the weight accorded to each
node. So, for weighted degree centrality at α and we shall now have
(8)
where ki = degree of nodes
si = (s) as defined
zi = weight of nodes, where α ≥ 0 ; { : -1 1}
The choice of value of depends on what effect the weight is having on the new centrality measure, if for instance the weight is having a positive effect (e.g. profit) the positive value
of is employed otherwise the negative value(e.g. loss) shall be used in our calculation.
The next sections are organised as follow, section II discusses the two methods Weighted Marking Method and Clique Structure/Node-Weight Modulated Centrality Measure as applicable to the supply chain management. Section III explains the implementation of the exercise with such tools as UCINET, tnet and Excel while section IV shows the predictions of the new distribution centres. Section V concludes with the discussion of the results.
II. WEIGHTED MARKING METHOD AND CLIQUE
STRUCTURE/NODE-WEIGHT MODULATED CENTRALITY
MEASURES APPLIED TO SUPPLY CHAIN MANAGEMENT
A. Weighted Marking Method
Fig. 1. Figure showing schematic diagram of Weighted Marking Method,
with cones as shops & EDC as existing DC
Three main stages were proposed by [8] in choosing a location for DC using the Weighted Marking Method (WMM):
Stage1 – Identification of a general geographical area for DC based on the principle of centre of gravity while considering socio-economic factors. For the Scotland region in our case study, Glasgow and Edinburgh are considered as being the most populated and with tendencies for more economic activities.
CBW (v) =
s w
st (v) /s w
st
(n-1)(n- 2)s¹v¹tÎvs¹t
å
s st
s st
w
Dc
ccwa (i) = ki ´ (
si
ki)a = ki
(1-a ) ´ sia
cCw
cdwawab (i) = ki ´ (
si
ki)a = ki
(1-a ) ´ sia ´ zi
b
w
Dc
Airport EDC
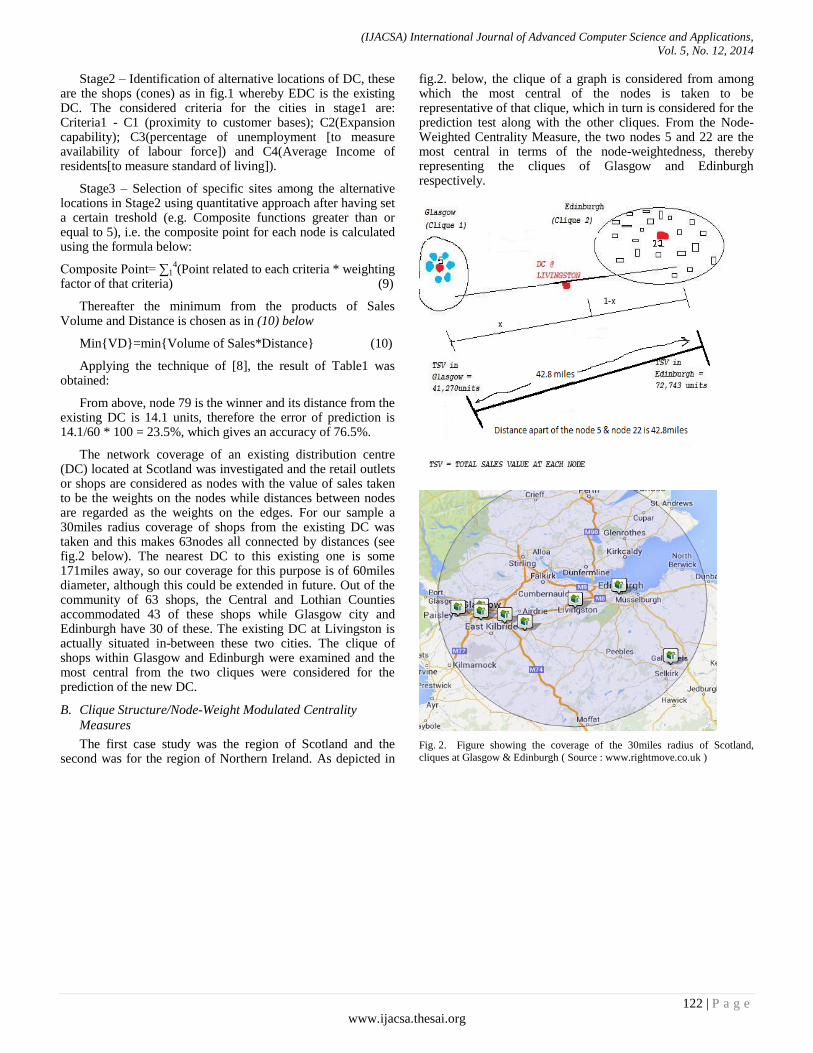
(IJACSA) International Journal of Advanced Computer Science and Applications,
Vol. 5, No. 12, 2014
122 | P a g e
www.ijacsa.thesai.org
Stage2 – Identification of alternative locations of DC, these are the shops (cones) as in fig.1 whereby EDC is the existing DC. The considered criteria for the cities in stage1 are: Criteria1 - C1 (proximity to customer bases); C2(Expansion capability); C3(percentage of unemployment [to measure availability of labour force]) and C4(Average Income of residents[to measure standard of living]).
Stage3 – Selection of specific sites among the alternative locations in Stage2 using quantitative approach after having set a certain treshold (e.g. Composite functions greater than or equal to 5), i.e. the composite point for each node is calculated using the formula below:
Composite Point= ∑14(Point related to each criteria * weighting
factor of that criteria) (9)
Thereafter the minimum from the products of Sales Volume and Distance is chosen as in (10) below
Min{VD}=min{Volume of Sales*Distance} (10)
Applying the technique of [8], the result of Table1 was obtained:
From above, node 79 is the winner and its distance from the existing DC is 14.1 units, therefore the error of prediction is 14.1/60 * 100 = 23.5%, which gives an accuracy of 76.5%.
The network coverage of an existing distribution centre (DC) located at Scotland was investigated and the retail outlets or shops are considered as nodes with the value of sales taken to be the weights on the nodes while distances between nodes are regarded as the weights on the edges. For our sample a 30miles radius coverage of shops from the existing DC was taken and this makes 63nodes all connected by distances (see fig.2 below). The nearest DC to this existing one is some 171miles away, so our coverage for this purpose is of 60miles diameter, although this could be extended in future. Out of the community of 63 shops, the Central and Lothian Counties accommodated 43 of these shops while Glasgow city and Edinburgh have 30 of these. The existing DC at Livingston is actually situated in-between these two cities. The clique of shops within Glasgow and Edinburgh were examined and the most central from the two cliques were considered for the prediction of the new DC.
B. Clique Structure/Node-Weight Modulated Centrality
Measures
The first case study was the region of Scotland and the second was for the region of Northern Ireland. As depicted in
fig.2. below, the clique of a graph is considered from among which the most central of the nodes is taken to be representative of that clique, which in turn is considered for the prediction test along with the other cliques. From the Node-Weighted Centrality Measure, the two nodes 5 and 22 are the most central in terms of the node-weightedness, thereby representing the cliques of Glasgow and Edinburgh respectively.
Fig. 2. Figure showing the coverage of the 30miles radius of Scotland,
cliques at Glasgow & Edinburgh ( Source : www.rightmove.co.uk )

(IJACSA) International Journal of Advanced Computer Science and Applications,
Vol. 5, No. 12, 2014
123 | P a g e
www.ijacsa.thesai.org
Fig. 3. Figure showing the cliques at Northern Ireland cities (Londonderry,
NewtonAbbey & Belfast)
Tables II & III below show the respective results that were obtained when the Node-Weight Modulated Centrality Measures are applied to the 7 nodes of Glasgow and 23 nodes of Edinburgh from the supply chain management dataset.
III. IMPLEMENTATION
The initial dataset of the distances between the 30 sales outlets of Glasgow and Edinburgh’s cliques were presented as a 7x7 square matrix and 23 x 23 square matrix respectively, these were obtained from the UCINET and tnet software, saved in Excel format and later imported into UCINET for the purpose of centralities calculations, see fig. 4 below.
The results came out as text files listing the different columns for each centrality measure, and for the purpose of calculations of the node-weight modulated centrality, the values from the text files were exported into Excel where a column was created for the weights on the nodes. Tables II & III below depict the node-weighted centrality measures at
different values of alpha (in terms of degree, closeness, eigenvector and betweenness).
Fig. 4. Figure showing the implementation of node-weighted centrality measure to the cliques of SCM
The radius of coverage according to fig.1 is 30miles, accordingly the farthest possible distance apart of any two nodes will be the diameter of such circle which is 60miles. This was used for the calculation of ratio of distances from any node to that of farthest distance apart. The percentage error of prediction is therefore calculated by multiplying this ratio by 100 and from this emerges the percentage accuracy.
IV. CLIQUE/NODE-WEIGHTED MEASURE APPLIED TO THE
SUPPLY CHAIN MANAGEMENT (SCM)
x is the proportional distance to the proposed Distribution Centre. TSV = Total Sales Values
The driving distance between node 5 (representing Glasgow clique) and node 22 (representing Edinburgh clique) is 42.8miles.
1-x/ x = 41270/72743
x = 0.36 (i.e. 36% of 42.8) which is 13.1miles
If x is some 13.1miles away from the highest sales valued node 22 (Edinburgh) , and the existing DC is 15.4 miles away from the same node 22, the difference of the predicted DC will be 2.3miles away from the existing DC, hence
The error rate of the predicted DC = (2.3/42.80) x 100 = 5.37% i.e. the percentage accuracy of the prediction = 94.63%

(IJACSA) International Journal of Advanced Computer Science and Applications,
Vol. 5, No. 12, 2014
124 | P a g e
www.ijacsa.thesai.org
With all the results above one is now in a position to predict the most probable (regions with respect to the nodes) that could serve as a distribution center for all other outlets considering their node-weighted centrality and clique structures going by the percentage accuracy of the prediction.
Similar argument is also extended to some 51 shops at the Northern Ireland whereby three cliques are considered, that is the cliques at Belfast (14 shops); Londonderry (three shops) and NewtonAbbey (four shops). See fig.3 above, whereby the centre of mass of the triangle was considered to be the predicted Distribution Centre, while the angles of the nodes are calculated using the cosine rule, see fig.5 below:
Fig. 5. Figure showing the angles of triangle BNL, distances apart of the
nodes and sales values of each clique
Since only the distance between the shops are available, from the calculated angles the co-ordinates were arrived at. See fig.6.
From the figure above, B(0,0) indicates origin whereby x1= 0 and y1 = 0
a1 = 74.2 Cos46.4 = 51.17 h = 74.2 Sin46.4 = 53.73
The co-ordinate of the centre of mass for the triangle BNL is calculated using facts from fig.6. above, whereby x1= 0; x2= 7.4 ; x3=51.17 ; y1 = 0; y2 = 0; and y3 = 53.73
Total sales value at clique B (w1 = 88732) ; at clique N (w2 =18929) and at clique L (w3 = 16279) .
Fig. 6. Figure showing the co-ordinates of the triangle
Hence, for the predicted DC (the centre of mass), the co-ordinates are
M
xm
nx
n
i
ii
cm
11
(11)
M
ym
ny
n
i
ii
cm
11
(12)
where
n
i
imM1
(the total weights on the nodes) and
n = number of nodes/vertices.

(IJACSA) International Journal of Advanced Computer Science and Applications,
Vol. 5, No. 12, 2014
125 | P a g e
www.ijacsa.thesai.org
Substituting in the values from fig.6 above, equations (ii) and (iii) become respectively,
xcm = {[0 x 88732]/[88732+18929+16279] + [7.4 x
18929]/[88732+18929+16279] + [51.17 x
16279]/[88732+18929+16279]}/3 therefore, xcm =2.62 . Similarly, ycm = 2.35
So, the predicted DC has co-ordinates (2.62, 2.35), hence the distance from clique B as shown in fig.7.
BP = {2.352 + 2.62
2)
½ = 3.52
From fig.3 above, the existing DC is 6.3 miles to the clique at Belfast, so the error is 6.3 – 3.52 = 2.78 , that is, the percentage error is (2.78/73.6 x 100) , the farthest distance apart from the existing DC being 73.6, therefore the percentage accuracy for this prediction is 96.2%.
Fig. 7. figure showing the carved out portion of triangle BPH from triangle
BNL of fig.6 above. P is the predicted DC
TABLE I. RESULTS OF WEIGHTED MARKING METHOD APPLIED TO SCOTLAND DATASETS
C1
%AGE
of C1
%AGE
of C2 C3
%AGE
of C3 C4
%AGE
of C4
No
de
No
Unit
s
Sold
Store
Format
Town
/City
Distan
ce to
Existi
ng DC
Point of
Evaluati
on
PT X
WT
FACT
OR
Expansi
on
capacity
PT X
WT
FACT
OR
Availabil
ity of
W/Force
Point of
Evaluati
on
PT X
WT
FACT
OR
Standa
rd of
Living
Point of
Evaluati
on
PT X
WT
FACT
OR
Compos
ite Point
PRODU
CT OF
DIST.
TO DC
&UNITS
SOLD
1
439
0 Extra
GLASGO
W 29.5 1 0.25 8 2 VH 9 2.25 852 7 1.75 6.25 129505
6
930
0 Extra
GLASGO
W 29 2 0.5 8 2 VH 9 2.25 852 7 1.75 6.5 269700
8
107
90 Extra
GLASGO
W 30 1 0.25 8 2 FH 7 1.75 860 7 1.75 5.75 323700
55
147
80 Extra
EDINBUR
GH 15 9 2.25 8 2 - 0 0 939 9 2.25 6.5 221700
56
111
0 Metro
EDINBUR
GH 20.3 6 1.5 4 1 VL 3 0.75 867 7 1.75 5 22533
57
185
0 Metro
EDINBUR
GH 17.1 7 1.75 4 1 LST 1 0.25 939 9 2.25 5.25 31635
64
532
0
Superst
ore
EDINBUR
GH 20.3 6 1.5 6 1.5 FH 7 1.75 860 7 1.75 6.5 107996
65
104
80
Superst
ore
EDINBUR
GH 17.9 7 1.75 6 1.5 FH 7 1.75 860 7 1.75 6.75 187592
66
940
0
Superst
ore
EDINBUR
GH 13.1 9 2.25 6 1.5 VH 9 2.25 852 7 1.75 7.75 123140
67
615
0
Superst
ore
EDINBUR
GH 21.2 5 1.25 6 1.5 FH 7 1.75 860 7 1.75 6.25 130380
71 130 Express
EDINBUR
GH 19 7 1.75 2 0.5 FH 7 1.75 810 5 1.25 5.25 2470
72 690 Express
EDINBUR
GH 19.4 6 1.5 2 0.5 FH 7 1.75 860 7 1.75 5.5 13386
73 200 Express
EDINBUR
GH 25.8 3 0.75 2 0.5 VH 9 2.25 852 7 1.75 5.25 5160
74 230 Express
EDINBUR
GH 15.8 8 2 2 0.5 VL 3 0.75 899 7 1.75 5 3634
75 260 Express
EDINBUR
GH 17.1 7 1.75 2 0.5 FH 7 1.75 860 7 1.75 5.75 4446
77 890 Express
EDINBUR
GH 22.7 5 1.25 2 0.5 FH 7 1.75 860 7 1.75 5.25 20203
78 390 Express
EDINBUR
GH 17.7 7 1.75 2 0.5 FH 7 1.75 860 7 1.75 5.75 6903
79 70 Express
EDINBUR
GH 14.1 9 2.25 2 0.5 VL 3 0.75 860 7 1.75 5.25 987
80 320 Express
EDINBUR
GH 20.8 6 1.5 2 0.5 FH 7 1.75 860 7 1.75 5.5 6656
82 520 Express
EDINBUR
GH 16.5 8 2 2 0.5 LO 5 1.25 860 7 1.75 5.5 8580
84 700 Express
EDINBUR
GH 21.3 5 1.25 2 0.5 FH 7 1.75 860 7 1.75 5.25 14910

(IJACSA) International Journal of Advanced Computer Science and Applications,
Vol. 5, No. 12, 2014
126 | P a g e
www.ijacsa.thesai.org
TABLE II. TABLE SHOWING THE NODE-WEIGHTED CENTRALITIES AT DIFFERENT ALPHA AND AT BETA=1 FOR GLASGOW (CLIQUE1)
NODE-WEIGHTED DEGREE CENTRALITY NODE-WEIGHTED EIGEN-VECTOR CENTRALITY NODE-WEIGHTED BETWEENNESS CENTRALITY NODE-WEIGHTED CLOSENESS CENTRALITY
NO
DE
α=¼
α=½
α=¾
α=1¼
α=1½
α=1¾
α=¼
α=½
α=¾
α=1¼
α=1½
α=1¾
α=¼
α=½
α=¾
α=1¼
α=1½
α=1¾
α=¼
α=½
α=¾
α=1¼
α=1½
α=1¾
1 4487
1.4
63609.
9 9017
3.7
181213.
3 256888.7
364166.5
51495.
5
83776.
9
136294
.6 360734.7
586870
.9
954766
.6
39265.
4
48708.
6 6042
2.8 929
80.5 11534
2.0 14308
1.3 194
79.8 119
88.2 7377.7 2794.2
1719.6
1058.3
3 9768
0.6
141956
.1 206300.4
435704.
2 633195.2
920202.8
111193
.7
183949
.4
304310
.2 832822.6
1377750.4
2279232.3
86712.
6
111867
.1 144318.5
240193.
9 30987
1.7 39976
2.4 424
68.9 268
33.7 169
54.7 6768.7 4276.8
2702.2
4 6535
9.7
103170
.8 162855.8
405785.
6 640535.6
1011090.4
73621.
3
130901
.3
232747
.0 735808.2
1308292.6
2326189.8
59336.
6
85032.
0 121854.5
250242.
3 35860
8.2 51390
1.2 277
18.2 185
55.2 124
21.3 5566.4 3726.3
2494.4
5 126771.6
201788
.8 321197.7
813810.
0
1295383.
4 2061
928.6
145086
.8
264307
.3
481493
.6 1597
913.3
2910948.7
5302930.0
103780
.1
135232
.6 176217.4
299215.
2 38989
8.1 50806
4.2 550
37.5 380
33.9 262
83.4 12551.
8 8674.0
5994.2
11
36548.1
58714.
3 9432
4.3
243434.
6 391076.5
628262.6
41543.
2
75860.
3
138525
.5 461912.0
843478
.6
1540241.6
31720.
4
44227.
5 6166
6.1
119882.
1 16715
0.6 23305
6.8 156
91.6 108
23.0 7465.0 3551.3
2449.5
1689.5
13
3896.4
5544.0
7888.5
15970.6
22724.1
32333.5
4465.1
7280.7
11871.
6 3156
3.2
51465.
8
83918.
1 3290.5
3953.8
4750.9
6859.5 8242.4 9904.0
1690.3
1043.4
644.1 245.4
151.5 93.5
15
3199.0
4617.4
6664.5
13883.9
20039.3
28923.8
3662.5
6052.2
10001.
1 2730
9.7
45128.
5
74573.
5 2742.1
3392.4
4196.9
6423.7 7947.2 9832.0
1421.0
911.0
584.1 240.1
153.9 98.7
TABLE III. TABLE SHOWING THE NODE-WEIGHTED CENTRALITIES AT DIFFERENT ALPHA AND AT BETA=1 FOR EDINBURGH (CLIQUE2)
NODE-WEIGHTED DEGREE
CENTRALITY
NODE-WEIGHTED EIGEN-VECTOR
CENTRALITY
NODE-WEIGHTED BETWEENNESS
CENTRALITY
NODE-WEIGHTED
CLOSENESS CENTRALITY
NO
DE
α=¼
α=½
α=¾
α=1¼
α=1½
α=1¾
α=¼
α=½
α=¾
α=1¼
α=1½
α=1¾
α=¼
α=½
α=¾
α=1¼
α=1½
α=1¾
α=¼
α=½
α=¾
α=1¼
α=1½
α=1¾
22
441646.
1 48542
8.6
533551.
6
644582.
4 70848
3.1 77871
8.5
453097.
5
510928.
4
576140.
5 73259
6.9
826101.
5
931540.
6
303108.
9
228651.
4
172484.
2 98152.
2 74041
.5 55853.
5
203579.
3
103143.9
52258.1
13414.5
6796.5
3443.5
23 322
32.5 30416.
3 287
02.4 255
58.9 24118.
7 22759.
7 338
70.3 335
85.7 333
03.6 32746.
4 324
71.3 321
98.5 206
34.5 124
65.4 7530.4 2748.1
1660.2 1002.9
15261.9
6819.2
3046.9
608.3
271.8
121.4
24 612
98.6 65972.
5 710
02.7 822
43.2 88514.
1 95263.
1 631
65.7 700
52.7 776
90.6 95555.
4
105973.
8
117528.
2 420
51.1 310
46.7 229
22.1 12494.
9 9225.
1 6811.0 280
01.3
13766.3
6768.0
1635.8
804.2
395.4
25 742
06.1 69365.
2 648
40.2 566
56.4 52960.
4 49505.
5 785
87.1 777
97.5 770
15.8 75475.
8 747
17.4 739
66.6 468
33.4 276
29.6 163
00.2 5673.2 3346.
9 1974.5 364
35.0
16722.4
7675.0
1616.8
742.0
340.6
30
144722.
5 13898
8.2
133481.
0
123112.
8 11823
4.7 11354
9.9
152807.
8
154952.
0
157126.
2 16156
6.5
163833.
5
166132.
3 921
32.9 563
29.4 344
39.4 12873.
5 7870.
7 4812.1 694
73.0
32028.6
14765.9
3138.4
1446.9
667.0
31
318409.
5 33837
2.0
359586.
2
406087.
9 43154
7.4 45860
3.1
328540.
4
360246.
8
395013.
1 47493
5.1
520769.
5
571027.
4
215012.
3
154294.
1
110722.
3 57017.
4 40916
.0 29361.
6
143261.
1
68498.2
32751.4
7487.4
3580.0
1711.7
32
290386.
7 33044
2.0
376022.
5
486912.
5 55407
6.2 63050
4.3
297308.
6
346383.
0
403557.
8 54777
7.5
638195.
0
743537.
0
198860.
2
154966.
4
120761.
2 73334.
2 57147
.4 44533.
4
132057.
8
68339.2
35365.2
9470.8
4901.1
2536.3
33
157564.
6 15762
9.0
157693.
5
157822.
4 15788
6.9 15795
1.5
165476.
9
173857.
7
182662.
9 20163
3.7
211845.
6
222574.
7
102367.
7 665
34.2 432
44.1 18268.
0 11873
.3 7717.1 746
47.8
35379.6
16768.3
3766.7
1785.2
846.1
35 3229.5 3048.7
2878.0
2564.8 2421.2 2285.7
3412.6
3404.2
3395.9 3379.3
3371.0
3362.7
2006.6
1177.0
690.3 237.5 139.3 81.7
1575.7
725.8
334.3
70.9
32.7
15.0
36 199
42.1 18730.
5 175
92.4 155
19.5 14576.
5 13690.
9 211
28.7 210
25.6 209
23.1 20719.
5 206
18.5 205
18.0 124
34.6 7282.3
4264.8 1462.8 856.7 501.7
9734.5
4463.0
2046.2
430.1
197.2
90.4
37 5036.8 5554.6
6125.7
7450.1 8216.0 9060.8
5285.0
6115.7
7076.9 9476.3
10965.7
12689.2
3247.1
2308.6
1641.3 829.6 589.8 419.4
2362.2
1221.8
631.9
169.1
87.4
45.2
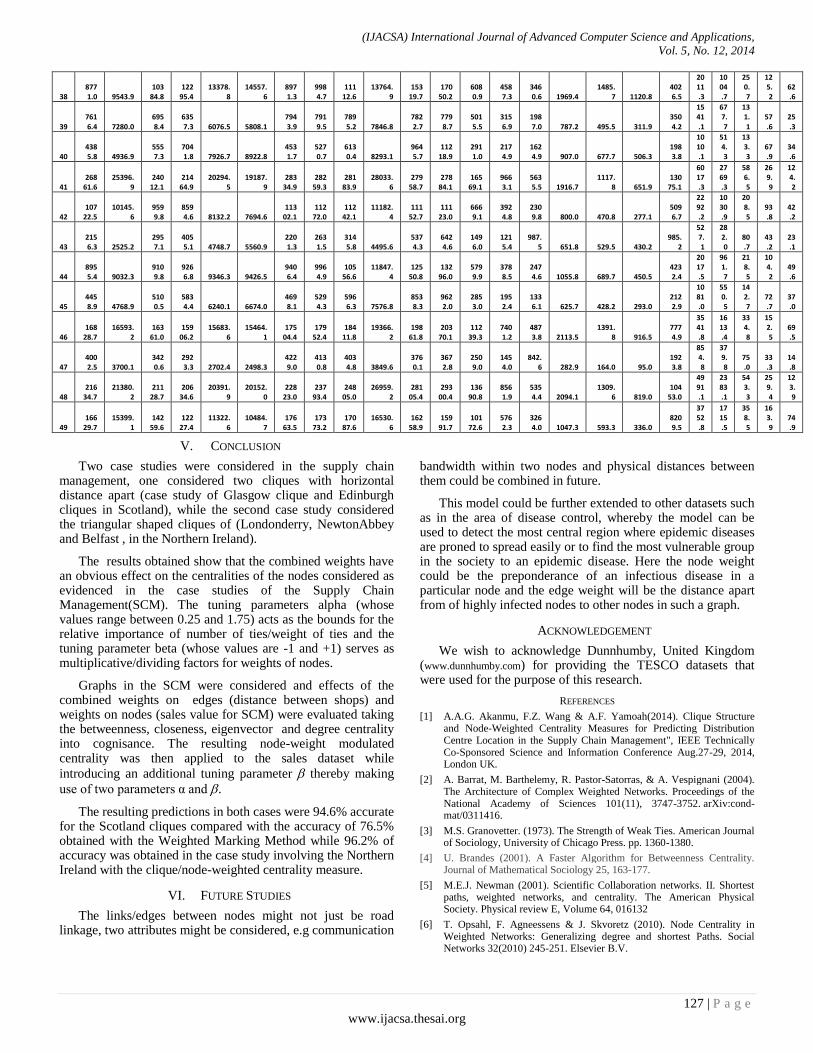
(IJACSA) International Journal of Advanced Computer Science and Applications,
Vol. 5, No. 12, 2014
127 | P a g e
www.ijacsa.thesai.org
38 8771.0 9543.9
10384.8
12295.4
13378.8
14557.6
8971.3
9984.7
11112.6
13764.9
15319.7
17050.2
6080.9
4587.3
3460.6 1969.4
1485.7 1120.8
4026.5
2011.3
1004.7
250.7
125.2
62.6
39 7616.4 7280.0
6958.4
6357.3 6076.5 5808.1
7943.9
7919.5
7895.2 7846.8
7822.7
7798.7
5015.5
3156.9
1987.0 787.2 495.5 311.9
3504.2
1541.1
677.7
131.1
57.6
25.3
40 4385.8 4936.9
5557.3
7041.8 7926.7 8922.8
4531.7
5270.7
6130.4 8293.1
9645.7
11218.9
2911.0
2174.9
1624.9 907.0 677.7 506.3
1983.8
1010.1
514.3
133.3
67.9
34.6
41 268
61.6 25396.
9 240
12.1 214
64.9 20294.
5 19187.
9 283
34.9 282
59.3 281
83.9 28033.
6 279
58.7 278
84.1 165
69.1 9663.1
5635.5 1916.7
1117.8 651.9
13075.1
6017.3
2769.3
586.5
269.9
124.2
42 107
22.5 10145.
6 9599.8
8594.6 8132.2 7694.6
11302.1
11272.0
11242.1
11182.4
11152.7
11123.0
6669.1
3924.8
2309.8 800.0 470.8 277.1
5096.7
2292.2
1030.9
208.5
93.8
42.2
43 2156.3 2525.2
2957.1
4055.1 4748.7 5560.9
2201.3
2631.5
3145.8 4495.6
5374.3
6424.6
1496.0
1215.4
987.5 651.8 529.5 430.2
985.2
527.1
282.0
80.7
43.2
23.1
44 8955.4 9032.3
9109.8
9266.8 9346.3 9426.5
9406.4
9964.9
10556.6
11847.4
12550.8
13296.0
5799.9
3788.5
2474.6 1055.8 689.7 450.5
4232.4
2017.5
961.7
218.5
104.2
49.6
45 4458.9 4768.9
5100.5
5834.4 6240.1 6674.0
4698.1
5294.3
5966.3 7576.8
8538.3
9622.0
2853.0
1952.4
1336.1 625.7 428.2 293.0
2122.9
1081.0
550.5
142.7
72.7
37.0
46 168
28.7 16593.
2 163
61.0 159
06.2 15683.
6 15464.
1 175
04.4 179
52.4 184
11.8 19366.
2 198
61.8 203
70.1 112
39.3 7401.2
4873.8 2113.5
1391.8 916.5
7774.9
3541.8
1613.4
334.8
152.5
69.5
47 4002.5 3700.1
3420.6
2923.3 2702.4 2498.3
4229.0
4130.8
4034.8 3849.6
3760.1
3672.8
2509.0
1454.0
842.6 282.9 164.0 95.0
1923.8
854.8
379.8
75.0
33.3
14.8
48 216
34.7 21380.
2 211
28.7 206
34.6 20391.
9 20152.
0 228
23.0 237
93.4 248
05.0 26959.
2 281
05.4 293
00.4 136
90.8 8561.9
5354.4 2094.1
1309.6 819.0
10453.0
4991.1
2383.1
543.3
259.4
123.9
49 166
29.7 15399.
1 142
59.6 122
27.4 11322.
6 10484.
7 176
63.5 173
73.2 170
87.6 16530.
6 162
58.9 159
91.7 101
72.6 5762.3
3264.0 1047.3 593.3 336.0
8209.5
3752.8
1715.5
358.5
163.9
74.9
V. CONCLUSION
Two case studies were considered in the supply chain management, one considered two cliques with horizontal distance apart (case study of Glasgow clique and Edinburgh cliques in Scotland), while the second case study considered the triangular shaped cliques of (Londonderry, NewtonAbbey and Belfast , in the Northern Ireland).
The results obtained show that the combined weights have an obvious effect on the centralities of the nodes considered as evidenced in the case studies of the Supply Chain Management(SCM). The tuning parameters alpha (whose values range between 0.25 and 1.75) acts as the bounds for the relative importance of number of ties/weight of ties and the tuning parameter beta (whose values are -1 and +1) serves as multiplicative/dividing factors for weights of nodes.
Graphs in the SCM were considered and effects of the combined weights on edges (distance between shops) and weights on nodes (sales value for SCM) were evaluated taking the betweenness, closeness, eigenvector and degree centrality into cognisance. The resulting node-weight modulated centrality was then applied to the sales dataset while
introducing an additional tuning parameter thereby making
use of two parameters α and .
The resulting predictions in both cases were 94.6% accurate for the Scotland cliques compared with the accuracy of 76.5% obtained with the Weighted Marking Method while 96.2% of accuracy was obtained in the case study involving the Northern Ireland with the clique/node-weighted centrality measure.
VI. FUTURE STUDIES
The links/edges between nodes might not just be road linkage, two attributes might be considered, e.g communication
bandwidth within two nodes and physical distances between them could be combined in future.
This model could be further extended to other datasets such as in the area of disease control, whereby the model can be used to detect the most central region where epidemic diseases are proned to spread easily or to find the most vulnerable group in the society to an epidemic disease. Here the node weight could be the preponderance of an infectious disease in a particular node and the edge weight will be the distance apart from of highly infected nodes to other nodes in such a graph.
ACKNOWLEDGEMENT
We wish to acknowledge Dunnhumby, United Kingdom (www.dunnhumby.com) for providing the TESCO datasets that were used for the purpose of this research.
REFERENCES
[1] A.A.G. Akanmu, F.Z. Wang & A.F. Yamoah(2014). Clique Structure and Node-Weighted Centrality Measures for Predicting Distribution Centre Location in the Supply Chain Management", IEEE Technically Co-Sponsored Science and Information Conference Aug.27-29, 2014, London UK.
[2] A. Barrat, M. Barthelemy, R. Pastor-Satorras, & A. Vespignani (2004). The Architecture of Complex Weighted Networks. Proceedings of the National Academy of Sciences 101(11), 3747-3752. arXiv:cond-mat/0311416.
[3] M.S. Granovetter. (1973). The Strength of Weak Ties. American Journal of Sociology, University of Chicago Press. pp. 1360-1380.
[4] U. Brandes (2001). A Faster Algorithm for Betweenness Centrality. Journal of Mathematical Sociology 25, 163-177.
[5] M.E.J. Newman (2001). Scientific Collaboration networks. II. Shortest paths, weighted networks, and centrality. The American Physical Society. Physical review E, Volume 64, 016132
[6] T. Opsahl, F. Agneessens & J. Skvoretz (2010). Node Centrality in Weighted Networks: Generalizing degree and shortest Paths. Social Networks 32(2010) 245-251. Elsevier B.V.

(IJACSA) International Journal of Advanced Computer Science and Applications,
Vol. 5, No. 12, 2014
128 | P a g e
www.ijacsa.thesai.org
[7] H. Zhuge & J. Zhang(2010). Topological Centrality and It’s e-Science Applications. Wiley Interscience.
[8] V.V. Thai & D. Grewal(2005).Selecting the location of Distribution Centre in Logistics Operations: A Conceptual Framework and Case Study. Asia Pacific Journal of Marketing and Logistics, 17(3), 3-24.
[9] B.V. Carolan(2014). Social Network Analysis and Education: Theory, Methods & Applications.SAGE Publications, USA. pp120
[10] Mapdata(2014). Properties on Map. Accessed 26 December, 2014 from http://www.rightmove.co.uk/commercial-property-to-let/map.html?locationIdentifier=REGION%5E815&insId=1&radius=40.0
(IJACSA) International Journal of Advanced Computer Science and Applications,
Vol. 5, No. 12, 2014
129 | P a g e
www.ijacsa.thesai.org
Social Networks‟ Benefits, Privacy, and Identity
Theft: KSA Case Study
Ahmad A. Al-Daraiseh
dep. Information System
King Saud University, KSA
Riyadh, Saudi Arabia
Afnan S. Al-Joudi
dep. Information System
King Saud University, KSA
Riyadh, Saudi Arabia
Hanan B. Al-Gahtani
dep. Information System
King Saud University, KSA
Riyadh, Saudi Arabia
Maha S. Al-Qahtani
dep. Information System
King Saud University, KSA
Riyadh, Saudi Arabia
Abstract—Privacy breaches and Identity Theft cases are
increasing at an alarming rate. Social Networking Sites (SN’s)
are making it worse. Facebook (FB), Twitter and other SN’s offer
attackers a wide and easily accessible platform. Privacy in the
Kingdom of Saudi Arabia (KSA) is extremely important due to
cultural beliefs besides the other typical reasons. In this research
we comprehensively cover Privacy and Identity Theft in SNs
from many aspects; such as, methods of stealing, contributing
factors, ways to use stolen information, examples and other
aspects. A study on the local community was also conducted. In
the survey, the participants were asked about privacy on SN’s,
SN’s privacy policies, and whether they think that SN’s benefits
outweigh their risks. A social experiment was also conducted on
FB and Twitter to show how fragile the systems are and how easy
it is to gain access to private profiles. Results from the survey are
scary: 43% of all the accounts are public, 76% of participants do
not read the policies, and almost 60% believe that the benefits of
SN’s outweigh their risks. Not too far from this, the results of the
experiment show that it is extremely easy to obtain information
from private accounts on FB and Twitter.
Keywords—social network; identity theft; fraud; privacy; fake
identities
I. INTRODUCTION
Computer technology and the Internet have become essential necessities of modern life; they provide knowledge, communications, entertainment, and a means for sharing. Nowadays, almost everyone is connected. People became so addicted to this technology to the limit that it is a challenge now to stay away for a while. Perhaps the most attractive services for many are those provided by social networks.
Social Networks (SN) are Internet based services that allow people to interact, express and share their ideas and thoughts in multiple formats; such as, text, images, audio, and video. Although still young, SN‟s gained large popularity. As of Sep 2014, Facebook (FB) prides itself for having more than 860 million active users daily [1]. When using SN‟s, different people share different amounts of their personal information. Having our personal information fully or partially exposed to the public, makes us ideal targets for different types of attacks, the worst of which could be identity theft.
Identity theft occurs when someone uses another person‟s information for a personal gain or goal. During the past years, online identity theft has been a major problem since it affected millions of peoples around the world [2]. Victims of identity theft may suffer different types of consequences; for example, they might lose time/money, get sent to jail, get their public image ruined, or have their relationships with friends and family broken.
Today, the majority of SN‟s do not verify normal users‟ accounts and have very weak privacy and security policies. In fact, most SN‟s applications default their settings to minimal privacy; and hence, SN‟s became an ideal platform for fraud and abuse. Social Networking services have facilitated identity theft and Impersonation attacks for serious as well as naive attackers. To make things worse, users are required to provide accurate information to establish an account in Social Networking sites. Simple monitoring of what users share online could lead to catastrophic losses, let alone, if such accounts were hacked.
In this article, we shed a light on the benefits and risks associated with SN‟s. We study the local community in the Kingdom of Saudi Arabia (KSA) to see if the benefits of SN‟s outweigh their risks and dangers. Knowing that, Saudi communities are amongst the most protective in the whole world, yet have indulged deeply into the usage of SN‟s.
A. KSA at a Glance
The Internet first emerged in KSA in 1990. According to the latest statistics and global studies presented by many competent authorities, KSA currently is in the forefront of international rankings in terms of the use of FB and Twitter. There are 100 thousand Tweets per minute and up to 20 victims of online identity theft. Another study stated that the number of FB users in KSA was 6 million in 2012, and in 2013, the number reached 7.8 million, with five million of them accessing their accounts from their mobiles [3].
Recently, many people in KSA from different communities became outraged by impersonation and hacking attacks that targeted their SN accounts. Most of the attacks aim to smear a

(IJACSA) International Journal of Advanced Computer Science and Applications,
Vol. 5, No. 12, 2014
130 | P a g e
www.ijacsa.thesai.org
person or ruin his/her image, others tried to disseminate lies and/or mislead the facts to acquire a large number of followers. In 2013, “AlSharq Newspaper” published an article stating that 35 persons stole a famous Saudi actor's identity in Twitter. Most of them had more than 30 thousand followers, some of them reached 50 thousand, and few reached 80 thousand followers. The fake accounts were used to disseminate lies and to publish undesirable images [4].
The laws in KSA set penalties for anyone who commits any cybercrimes; such as, breaking into websites, or accessing the material sent over the Internet. In Saudi laws, a penalty of up to three million Saudi Riyal, and imprisonment of up to four years for any person who uses unauthorized access to private information [5].
The rest of the paper is organized as follows: In section 2, related work is discussed. In section 3, the methodology is presented. In section 4, a comprehensive study of SN‟s and Identity Theft is provided. In section 5, Results are analyzed. In sections 6 and 7 Recommendations and conclusions are listed respectively.
II. RELATED WORK
Previously, several researchers published and highlighted the SN‟s benefits and issues. In the following, few paragraphs we provide a summary of the most recent related work.
M. Reznik [6] published a paper about the identity theft in SN‟s and methods of Internet impersonation. Maksim discussed two methods that an offender may use to steal the identity of victims on the internet: Firstly, when the offender creates a fictitious profile of the victim and uses it without the victim‟s permission, secondly, when the offender gains unauthorized access to the victim‟s account by stealing their credentials.
K. Krombholz et al. [7] reported that one of the main issues in social media is information accuracy. Many FB profiles are fake because many users use false information when they create their profiles. FB rules stated that the user should provide real information to prevent fake identities. The author also said that, to prevent users diverting; FB priority should be safety of their users.
F. Stutzman and J. Kramer-Duffield [8] provide advice on how to enhance the privacy of users in SN‟s. In order to avoid identity theft, they suggest making users profiles private for friends only, which will reduce the information theft risks on SN‟s.
A. Verma et al. [9] found that the architecture of centralized SN‟s such as the current ones don‟t ensure the privacy and security of the users. Therefore, they proposed a decentralized and distributed architecture that preserves privacy and security of the users in online SN‟s. This architecture is based on the decentralized SN‟s using “Freedom box” as a personal server. It uses Diaspora as a social platform. Therefore, each user has a Freedom box to store his/her personal information. They enhanced the privacy and security by the use of a cryptographic technique like (Random Sequence Algorithm) RSA and digital signatures.
L. Bilge et al. [10] examined how easy for an attacker to start automated crawling and identity theft attacks in popular SN‟s sites to access user personal information. They presented two attacks on victims who have public profiles, one for registered users, and the other one for non-registered users. The first attack is called automated identity theft. In this attack, the authors created cloned victims‟ profiles then sent friend requests to the contacts of those victims. The second attack is launched an automated cross-site profile cloning attack. In this attack, the attacker can automatically create a forged profile in SN‟s where the victim is not registered yet, and reach the victim‟s friends who registered on both networks. The experimental results show that the automated attacks are effective and feasible in practice.
M. Al-Mujeb [11] reviews the relationship between KSA culture and privacy and FB privacy risks. The aim was to know how the KSA‟s cultural privacy norms affect the user's behavior in FB. She concluded that „‟the most participants who are active users of FB are not aware of many of the privacy risks that can arise from sharing personal information and the potential consequences of this, such as stalking, theft and credit card fraud‟‟. The results confirmed, “The users were unaware of the privacy setting in FB that can help them to protect their privacy”. The main recommendation of the thesis was encouraging the user to not accept strangers as friends, never share personal information, limit the information available to "Everyone” and read the privacy policy with terms of use.
R. Demyati [12] also talked about FB privacy issues. She discussed how FB responded to the privacy concerns and how that response affected its users. The main concerns were whether FB shares users‟ information with advertisers and who can see users‟ photos when their friends tag them. As for FB response, they agreed to change some of their privacy policy and refused to change other parts of it. She concluded with some recommendations such as, encouraging the user to read the privacy policy, keep the sensitive information private, do not accept a friend's request from strangers, open a new email account for FB and report any issues to FB team.
C. Marcum et al. [13] defined identity theft as a type of crime; the high growth of technology has provided new methods to steal the personal information of thousands of victims at once. Indeed, the increased number of users on SN‟s sites, and the relatively weak security and authentication procedures have exacerbated this problem. The research also suggested that users may not understand the risks associated with sharing personal information or the potentiality to use this information to predict highly confidential data like social security numbers.
J. Mali [14] said that in 2012, there were more than 12 million victims of identity theft in the US. Many financial institutions and companies are enforcing measures to protect their customers, but criminals explore new ways to collect sensitive data through SN. FB claimed that users data was safe, while Twitter suffered an attack were more than 250,000 accounts were affected.
B. Pragides [15] found that most of identity theft cases occur to the younger generation because they use SN‟s as a

(IJACSA) International Journal of Advanced Computer Science and Applications,
Vol. 5, No. 12, 2014
131 | P a g e
www.ijacsa.thesai.org
way to communicate with friends and to make new relationships with new people.
Up to our knowledge, no one comprehensively studied SN‟s and identity theft, or provided a field study to measure the impact of risks on users‟ usage of such services; and hence, this paper is unique as it fully and exclusively covers SN‟s issues in KSA.
III. METHODOLOGY
In this research, we focus on finding and analyzing the reasons of identity theft in SN‟s and the prevalent plans for handling identity theft related to it. We discuss the answers of the following questions: To what extent do users trust SN‟s sites? Are the SN‟s sites a safe place to share personal information? Do the advantages of SN‟s outweigh the risk of identity theft in KSA?. To find and understand the answers, we did a field study to examine the qualitative outcomes along with the quantitative ones by applying three methods:
Data Collection: We collected the data through an online survey, which was made available to everyone to evaluate their knowledge regarding the privacy and security policies of SN‟s providers, and to discover their concerns regarding such services.
Data Analysis: After gathering data, we analyzed it to find out what the main reasons for identity theft in SN‟s are, also, to find out the level of personal information that the user can share on SN‟s.
Social Experiment: In order to test the confidence and awareness among users of SN‟s, their knowledge in terms of their security and privacy, and to measure the robustness of FB‟s and Twitter‟s privacy measures, we designed a social experiment. In this experiment, we cloned public accounts and sent requests to friends of the original account owner who sat their profiles to private.
IV. SOCIAL NETWORKS
Nowadays, SN‟s gather millions of people who share news, images, and other information. It is clear that SN‟s have made a significant change in how people communicate and exchange information. A SN is an online service provided by a major company in order to connect users who share the same interests or activity, backgrounds or real-life connections. Most of the SN‟s are a websites that offer a range of services for their users; such as instant messaging, private messages, blogging, file sharing and other services. The most famous SN‟s currently are Facebook, Tumblr, Twitter, and Google+.
The social clinic statistics confirms that in 2013, the active users of FB in KSA were 7.8 million users, 26% of whom are females and 74% males [16]. This indicates an increase of 1.8 million users since 2012. Twitter prevalence among Internet users in KSA is the highest worldwide with a total number of 5 million active users and 150 million tweets a day. The number of Twitter users has increased 2 million since 2012 [17].
A. Social Networks’ Benefits
SN‟s provide different benefits based on the way they are utilized. The most famous benefits of using social networks in KSA are:
Expand the circle of user contacts and acquaintances: SN‟s gives users a way to represent themselves. It allows users to form friendships with people from all over the world. Users might find former friends whom they lost connection with.
Social networks in education: SN‟s can be an excellent tool for education. KSA does not utilize SN‟s properly for educational purposes yet. Their use in education is limited to individual's efforts and the existence of official profiles representing the Ministry of Education and its leaders.
Keep in touch with families and friends: SN‟s allow people to share their daily life in a public way. SN‟s allow families to share events, images, and videos in real time. Family and friends can watch and experience all the things that done individually, and comment on them. They share the experience rather than being informed over a phone call. Pew Research report by Aaron Smith [18] shows that (67%) of social networks users say that the main reason they sing-up in SN‟s is to keep in touch with their family members and friends. It is a quick way to communicate with relatives and friends who lived in other countries. Some SN‟s formed a bridge linking the members of the displaced families who were separated by wars and crises of natural disasters.
Information gathering and dissemination: SN‟s serve as news and media platform, where it can provide news in real time. A user has the agility and mobility at the same time to pass information faster than ordinary news platform. Many Arabs consider SN‟s a strong competitor to traditional media as SN‟s stay the main source of news for millions of Arabs. The Arab Social Media Report 2014 [19] shows that nearly 27.59% of the Arab respondents from across the Arab world are getting their news from SN‟s as the main source. The number of users has increased 21.59% since 2013.
Social influence: SN‟s are useful in formulating and gathering public opinion, where information can rapidly spread. This impact can vary in its directions. SN‟s played a big role in the revolutions of the Arab Spring. SN‟s have all the power to change people opinion, form a protest, or Intercept a public decision. In a report published by foreign policy magazine [20], discusses “The role of new media in moving the masses and more specifically the role of SN‟s". The writers said, “That SN‟s are playing a significant and possibly crucial role in empowering rebels and protesters in ways that couldn't have been imagined before”. They added, “SN‟s may be rebels' favorite weapon, but at the same time research on Syria's revolution confirmed that it can do as much harm as good”.
Finding job opportunities: The role of SN‟s is not limited to the social side, but also extends to academic
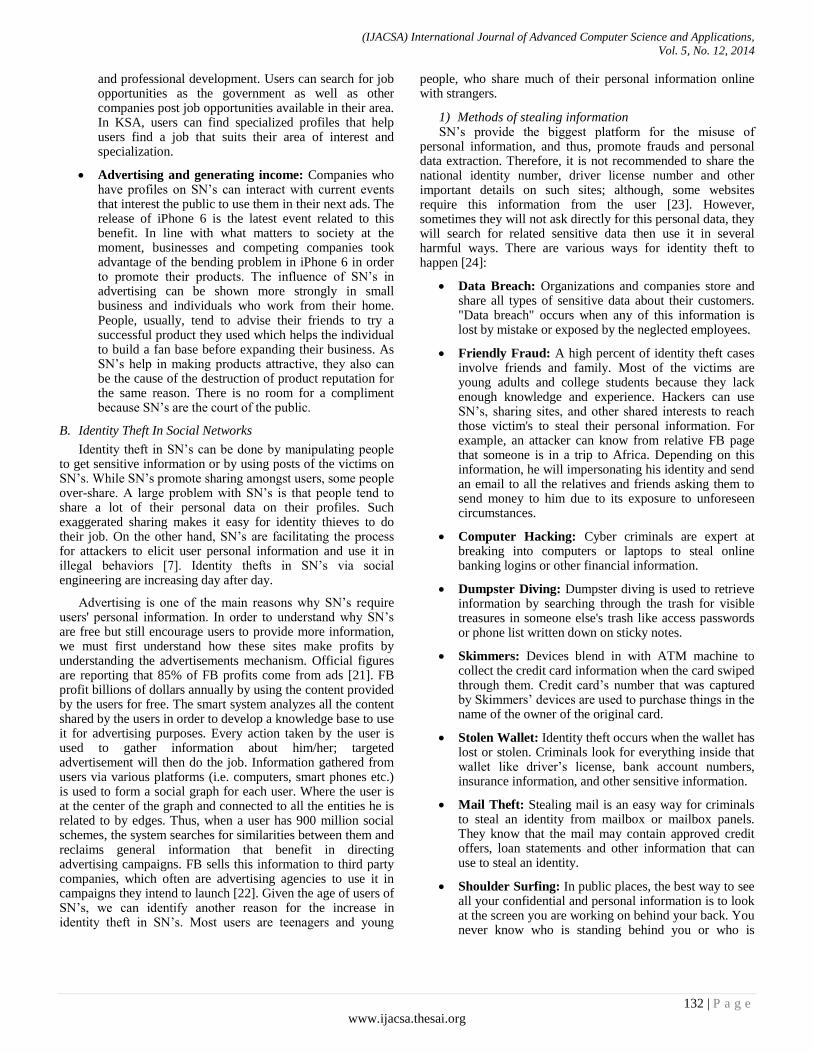
(IJACSA) International Journal of Advanced Computer Science and Applications,
Vol. 5, No. 12, 2014
132 | P a g e
www.ijacsa.thesai.org
and professional development. Users can search for job opportunities as the government as well as other companies post job opportunities available in their area. In KSA, users can find specialized profiles that help users find a job that suits their area of interest and specialization.
Advertising and generating income: Companies who have profiles on SN‟s can interact with current events that interest the public to use them in their next ads. The release of iPhone 6 is the latest event related to this benefit. In line with what matters to society at the moment, businesses and competing companies took advantage of the bending problem in iPhone 6 in order to promote their products. The influence of SN‟s in advertising can be shown more strongly in small business and individuals who work from their home. People, usually, tend to advise their friends to try a successful product they used which helps the individual to build a fan base before expanding their business. As SN‟s help in making products attractive, they also can be the cause of the destruction of product reputation for the same reason. There is no room for a compliment because SN‟s are the court of the public.
B. Identity Theft In Social Networks
Identity theft in SN‟s can be done by manipulating people to get sensitive information or by using posts of the victims on SN‟s. While SN‟s promote sharing amongst users, some people over-share. A large problem with SN‟s is that people tend to share a lot of their personal data on their profiles. Such exaggerated sharing makes it easy for identity thieves to do their job. On the other hand, SN‟s are facilitating the process for attackers to elicit user personal information and use it in illegal behaviors [7]. Identity thefts in SN‟s via social engineering are increasing day after day.
Advertising is one of the main reasons why SN‟s require users' personal information. In order to understand why SN‟s are free but still encourage users to provide more information, we must first understand how these sites make profits by understanding the advertisements mechanism. Official figures are reporting that 85% of FB profits come from ads [21]. FB profit billions of dollars annually by using the content provided by the users for free. The smart system analyzes all the content shared by the users in order to develop a knowledge base to use it for advertising purposes. Every action taken by the user is used to gather information about him/her; targeted advertisement will then do the job. Information gathered from users via various platforms (i.e. computers, smart phones etc.) is used to form a social graph for each user. Where the user is at the center of the graph and connected to all the entities he is related to by edges. Thus, when a user has 900 million social schemes, the system searches for similarities between them and reclaims general information that benefit in directing advertising campaigns. FB sells this information to third party companies, which often are advertising agencies to use it in campaigns they intend to launch [22]. Given the age of users of SN‟s, we can identify another reason for the increase in identity theft in SN‟s. Most users are teenagers and young
people, who share much of their personal information online with strangers.
1) Methods of stealing information SN‟s provide the biggest platform for the misuse of
personal information, and thus, promote frauds and personal data extraction. Therefore, it is not recommended to share the national identity number, driver license number and other important details on such sites; although, some websites require this information from the user [23]. However, sometimes they will not ask directly for this personal data, they will search for related sensitive data then use it in several harmful ways. There are various ways for identity theft to happen [24]:
Data Breach: Organizations and companies store and share all types of sensitive data about their customers. "Data breach" occurs when any of this information is lost by mistake or exposed by the neglected employees.
Friendly Fraud: A high percent of identity theft cases involve friends and family. Most of the victims are young adults and college students because they lack enough knowledge and experience. Hackers can use SN‟s, sharing sites, and other shared interests to reach those victim's to steal their personal information. For example, an attacker can know from relative FB page that someone is in a trip to Africa. Depending on this information, he will impersonating his identity and send an email to all the relatives and friends asking them to send money to him due to its exposure to unforeseen circumstances.
Computer Hacking: Cyber criminals are expert at breaking into computers or laptops to steal online banking logins or other financial information.
Dumpster Diving: Dumpster diving is used to retrieve information by searching through the trash for visible treasures in someone else's trash like access passwords or phone list written down on sticky notes.
Skimmers: Devices blend in with ATM machine to collect the credit card information when the card swiped through them. Credit card‟s number that was captured by Skimmers‟ devices are used to purchase things in the name of the owner of the original card.
Stolen Wallet: Identity theft occurs when the wallet has lost or stolen. Criminals look for everything inside that wallet like driver‟s license, bank account numbers, insurance information, and other sensitive information.
Mail Theft: Stealing mail is an easy way for criminals to steal an identity from mailbox or mailbox panels. They know that the mail may contain approved credit offers, loan statements and other information that can use to steal an identity.
Shoulder Surfing: In public places, the best way to see all your confidential and personal information is to look at the screen you are working on behind your back. You never know who is standing behind you or who is

(IJACSA) International Journal of Advanced Computer Science and Applications,
Vol. 5, No. 12, 2014
133 | P a g e
www.ijacsa.thesai.org
watching you. This method commonly used to obtain user passwords, PINs, and similar information.
Account Takeover: In SN‟s, when users set their accounts to public it would increase their chances of being victims. Attackers seek to steal personal information of those victims to create fake accounts. An attacker will create a fake account then start to send friend requests to the victim‟s friends. When a request is accepted, attackers use different techniques to obtain sensitive information from them.
Spam Attack: In SN‟s, attackers know that users spend more of their time in SN‟s than on emails. So attackers send spam through SN‟s by using fake profiles and spam applications that send spam to the friends of the victims [25].
Malware: Malware can spread over SN‟s by using malicious URL's or by using a fake profile. For example, attackers can create a fake account by using the same name of any famous person and ask victims to contact them, and then attacker can send malware to the victims [25].
Spyware: It is an undesirable program used to collect secretly and record the activities of a person without knowledge of that person. This program loaded through downloading new programs from an unauthorized source.
Social Engineering: The most commonly prevalent identity theft process in KSA. It is a way to gain access to people information without realizing that they are the victim of a security breach using fraud and impersonation. Social engineering is a successful process because the victims tend to be good people, are keen to trust others and tend spontaneously to provide assistance to others. There are many different goals of social engineering hacking, which are fraud, network intrusion, and identity theft disabling systems and networks, and gain unauthorized access to sensitive information. There are several methods of social engineering hacking. For this paper, we will focus on how social engineering is implemented using SN‟s. Social engineering can be accomplished through the following methods [26]:
Online Phishing: In online phishing, the attackers try to obtain access to the user‟s sensitive data such as banking information by creating a fake website that looks authentic for a specific bank. Then, attackers send emails and messages to people with a link to a fake website asking them to login for one reason or another.
Phone Phishing: It occurs when the victim receives a call on the phone from people saying they work on trusted bank or company, and they say that that the account need to be updated. In order to update the account, they ask for sensitive information for verification.
Romantic Fraud: This type of fraud frequently occurs through SN‟s on the Internet. In romantic fraud,
attackers rely on stolen images and fake data to the rhythm of their victims from users looking for love and online romance. Continue to deceive victims with stories of love for weeks, and then attackers claim that they need money because of exposure to a tragic accident or injury, and then seek help from the new beloved.
Spoofing: It occurs when an attacker impersonates someone's identity where he can steal credit card information and claiming that the client uses it. Another way of spoofing is when an attacker pretends to be an authorized party or the future party like a bank employee or location to get personal information from the client.
Job Posting: One serious technique used in KSA. The attackers are fake companies or persons who post fake tempting jobs. Desperate unemployed people apply and their data is extracted and used.
2) Factors contributing to identity theft in SN’s The primary profile data that was used by the attacker in
order to misuse or steal a user‟s identity are full name, date of birth, hometown, school info, bank accounts, relationship status and hobbies or interests. Sensitive data can be obtained through GPS enabled devices, like your home address, workplace and places you visit. There are many reasons to keep this information private, because providing this information is potentially dangerous for the user and can put her identity at risk. In KSA, several factors influence and simplify the theft of user‟s identity on SN‟s. The main ones are:
Lack of knowledge on how to protect online identity.
Lack of knowledge in regulations and cyber laws.
The overconfidence in the SN provides.
The enormous expansion in the number of users along with the emerging need of SN‟s is encouraging the organizations to generate profits using those sites.
Shortage in knowledge and awareness concerning the privacy policies given by the SN providers.
Unemployment is a major factor. A large number of unemployed, well-educated youth exist in KSA. Such young people have excellent IT and hacking skills, in addition to all the time they need to perform sophisticated cybercrimes [27].
Currently, these problems are the main focus but policies and laws are being prepared to resolve these concerns. There are different methods and solutions to keep us safe from identity theft. Awareness and knowledge of identity theft and fraud issues are the easiest and cheapest to implement.
3) Fraud and methods of using stolen data A statistics report published by Trend Micro states that
KSA was ranked first as the most vulnerable of the gulf countries to cybercrimes [27]. Identity theft involves stealing and misusing user's identity to gain access to resources or obtaining other profits that are limited to this user. Identity

(IJACSA) International Journal of Advanced Computer Science and Applications,
Vol. 5, No. 12, 2014
134 | P a g e
www.ijacsa.thesai.org
fraud means the usage of a stolen identity to implement criminal behaviors. The problem occurs when a violator has information about someone's identity such as name, current addresses, and date of birth etc., in order to defraud his identity. As it can be done for those who are alive, Identity theft can be performed on the dead. An Identity thief can do many things with the information he has, the most common are:
Engage in illegal activities: If a thief gets caught committing a crime using a stolen identity, the fingerprints and criminal records will put in the victim's name. That will be damaging to the victim‟s reputation where the criminal record may cause the victim to fall in the background checks.
Obtain a cell phone account: It happens when identity thieves create a cell phone account using the victim‟s stolen information. Then the account charged large bills on the victim‟s name.
Illegal use of credit card accounts: The most famous identity theft and the most commonly used process. A burglar gets the victim‟s credit card or its information to use it as much as they want on the victim's account. Credit card numbers are usually stolen in bulk from e-commerce businesses; they get sold later on to gangs to be used.
Obtaining bank loans: Frauds can be applied to get loans simply by obtaining a victim‟s private data; for e.g. national identity number, address, and work information. Such loans are never paid back, and hence the victim‟s credit history will be damaged.
Spending victim’s checking and saving accounts: Thieves can use victim‟s personal info to withdraw money from his bank account, transfer savings and take his investments.
Get a new ID: The thieves can use personal information of a live or dead person to create a new ID in their name, but with their images; such as driver‟s license.
Unauthorized access to utility accounts: Charging utilities using the victim‟s identity; such as Internet, phone, cable, water and electricity utilities. Thieves can open utility accounts using someone's identity simply by extracting little details about the victim.
Black market sales: Hackers use underground online black market for selling the stolen IDs. These black markets are frequently used by hackers around the world to buy the stolen data, or to sell to other hackers locally. Hackers have new ways to make money with SN‟s profiles. Researchers at VeriSign‟s say that stolen profiles on the FB are now on sale on the black market [28]. Stolen data such as, names, pictures, email addresses, dates of birth are used to create fake profiles. For example, photographs of famous people are used to create false aliases to lure victims [29].
C. Statistics And Examples Of Identity Theft
Statistics show that more than 600,000 FB profiles get compromised each day, were one of six users said that someone hacked their account and stole their identity. Four of ten users have been victims of cybercrime on SN‟s, and one of ten users said that they had been a victim to a false link on SN‟s. Three of four think that the focusing of cyber criminals is on SN‟s platforms. Considering dangerous behavior on SN‟s, statistics confirms that one of three users do not log out after sessions. One of five users does not check received links before they share it. One of six users has no clue about their privacy settings if they are public or private. Less than half users use a security tool to defend against SN‟s risks and only half of the users use privacy settings to manage the information they share and with whom. Regarding social friends, 36% have accepted friend requests from strangers, and three of ten users received messages from strangers [30].
Communications and Information Technology Commission (CITC) of KSA started a campaign to raise awareness on cybercrimes, but the campaign focused more on the penalties for those crimes [31]. The campaign includes an explanation of the most important types of cybercrimes, and the mechanisms to deal with it. The commission has also established a website called Computer Emergency Response Team [32]. The site goal is to raise the level of awareness, knowledge to detect and response to information security incident at a national level, and to be an official reference for information security in KSA. CITC also established a website called (internet.sa) to be an Internet service gateway in KSA for services, information and statistics references [33]. However, there is no confirmed statistics on the number of identity theft victims on SN‟s in KSA; so we decided to go back to the source.
We communicated with a number of experts/hackers and sent them our questions that they answered. In KSA, users can find famous Twitter profiles that can help them at no cost if they lost their account to a hacker. The person behind the profile, usually, had an excellent knowledge in hacking and phishing. They said that the numbers of victims who communicate with them are nearly 150 users a week. From their point of view, their goals in restoring and stealing accounts are noble goals as they consider themselves ethical hackers. Some of them will do it if he sees the accounts interfere with society's values, other do it in order to help the oppressed victim. A lot of Arabs celebrities are seeking their help to restore stolen accounts. Where a many of them did not know that they can contact the technical support team to recover their profiles. On the other side, some hackers do it to sell the accounts, which have large numbers of followers to someone who's interested in making it an advertising account. The fact that SN‟s are becoming a potential monetary gain for the hackers is a major threat to users. Particularly for users that do not have a profile on SN‟s where some people may use their name in order to make profits by advertising.
Nowadays, almost all companies have official profiles on SN‟s. Companies‟ representatives manage these profiles. They are constantly conscious about what to post to preserve the company‟s public image. Unfortunately, those accounts become targets of unhappy former employees, or angry customers who have an excellent knowledge in hacking. Such profiles may get hacked. Attackers share posts that may deform
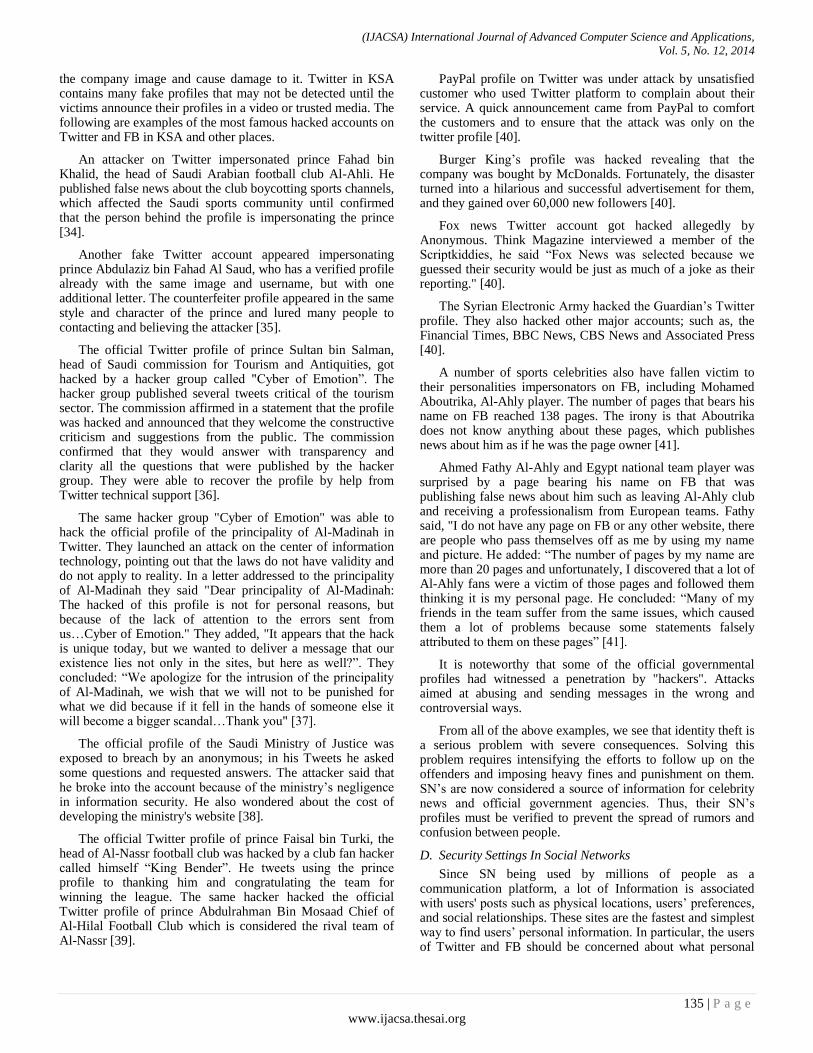
(IJACSA) International Journal of Advanced Computer Science and Applications,
Vol. 5, No. 12, 2014
135 | P a g e
www.ijacsa.thesai.org
the company image and cause damage to it. Twitter in KSA contains many fake profiles that may not be detected until the victims announce their profiles in a video or trusted media. The following are examples of the most famous hacked accounts on Twitter and FB in KSA and other places.
An attacker on Twitter impersonated prince Fahad bin Khalid, the head of Saudi Arabian football club Al-Ahli. He published false news about the club boycotting sports channels, which affected the Saudi sports community until confirmed that the person behind the profile is impersonating the prince [34].
Another fake Twitter account appeared impersonating prince Abdulaziz bin Fahad Al Saud, who has a verified profile already with the same image and username, but with one additional letter. The counterfeiter profile appeared in the same style and character of the prince and lured many people to contacting and believing the attacker [35].
The official Twitter profile of prince Sultan bin Salman, head of Saudi commission for Tourism and Antiquities, got hacked by a hacker group called "Cyber of Emotion”. The hacker group published several tweets critical of the tourism sector. The commission affirmed in a statement that the profile was hacked and announced that they welcome the constructive criticism and suggestions from the public. The commission confirmed that they would answer with transparency and clarity all the questions that were published by the hacker group. They were able to recover the profile by help from Twitter technical support [36].
The same hacker group "Cyber of Emotion" was able to hack the official profile of the principality of Al-Madinah in Twitter. They launched an attack on the center of information technology, pointing out that the laws do not have validity and do not apply to reality. In a letter addressed to the principality of Al-Madinah they said "Dear principality of Al-Madinah: The hacked of this profile is not for personal reasons, but because of the lack of attention to the errors sent from us…Cyber of Emotion." They added, "It appears that the hack is unique today, but we wanted to deliver a message that our existence lies not only in the sites, but here as well?”. They concluded: “We apologize for the intrusion of the principality of Al-Madinah, we wish that we will not to be punished for what we did because if it fell in the hands of someone else it will become a bigger scandal…Thank you" [37].
The official profile of the Saudi Ministry of Justice was exposed to breach by an anonymous; in his Tweets he asked some questions and requested answers. The attacker said that he broke into the account because of the ministry‟s negligence in information security. He also wondered about the cost of developing the ministry's website [38].
The official Twitter profile of prince Faisal bin Turki, the head of Al-Nassr football club was hacked by a club fan hacker called himself “King Bender”. He tweets using the prince profile to thanking him and congratulating the team for winning the league. The same hacker hacked the official Twitter profile of prince Abdulrahman Bin Mosaad Chief of Al-Hilal Football Club which is considered the rival team of Al-Nassr [39].
PayPal profile on Twitter was under attack by unsatisfied customer who used Twitter platform to complain about their service. A quick announcement came from PayPal to comfort the customers and to ensure that the attack was only on the twitter profile [40].
Burger King‟s profile was hacked revealing that the company was bought by McDonalds. Fortunately, the disaster turned into a hilarious and successful advertisement for them, and they gained over 60,000 new followers [40].
Fox news Twitter account got hacked allegedly by Anonymous. Think Magazine interviewed a member of the Scriptkiddies, he said “Fox News was selected because we guessed their security would be just as much of a joke as their reporting." [40].
The Syrian Electronic Army hacked the Guardian‟s Twitter profile. They also hacked other major accounts; such as, the Financial Times, BBC News, CBS News and Associated Press [40].
A number of sports celebrities also have fallen victim to their personalities impersonators on FB, including Mohamed Aboutrika, Al-Ahly player. The number of pages that bears his name on FB reached 138 pages. The irony is that Aboutrika does not know anything about these pages, which publishes news about him as if he was the page owner [41].
Ahmed Fathy Al-Ahly and Egypt national team player was surprised by a page bearing his name on FB that was publishing false news about him such as leaving Al-Ahly club and receiving a professionalism from European teams. Fathy said, "I do not have any page on FB or any other website, there are people who pass themselves off as me by using my name and picture. He added: “The number of pages by my name are more than 20 pages and unfortunately, I discovered that a lot of Al-Ahly fans were a victim of those pages and followed them thinking it is my personal page. He concluded: “Many of my friends in the team suffer from the same issues, which caused them a lot of problems because some statements falsely attributed to them on these pages” [41].
It is noteworthy that some of the official governmental profiles had witnessed a penetration by "hackers". Attacks aimed at abusing and sending messages in the wrong and controversial ways.
From all of the above examples, we see that identity theft is a serious problem with severe consequences. Solving this problem requires intensifying the efforts to follow up on the offenders and imposing heavy fines and punishment on them. SN‟s are now considered a source of information for celebrity news and official government agencies. Thus, their SN‟s profiles must be verified to prevent the spread of rumors and confusion between people.
D. Security Settings In Social Networks
Since SN being used by millions of people as a communication platform, a lot of Information is associated with users' posts such as physical locations, users‟ preferences, and social relationships. These sites are the fastest and simplest way to find users‟ personal information. In particular, the users of Twitter and FB should be concerned about what personal
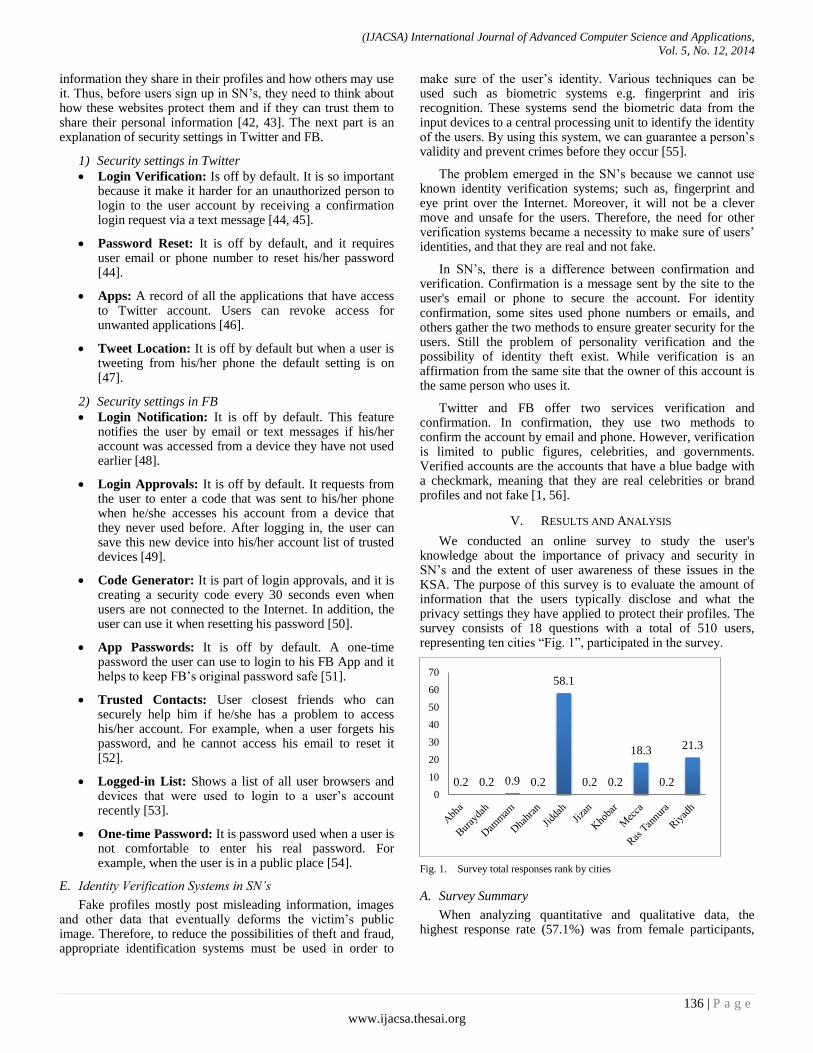
(IJACSA) International Journal of Advanced Computer Science and Applications,
Vol. 5, No. 12, 2014
136 | P a g e
www.ijacsa.thesai.org
information they share in their profiles and how others may use it. Thus, before users sign up in SN‟s, they need to think about how these websites protect them and if they can trust them to share their personal information [42, 43]. The next part is an explanation of security settings in Twitter and FB.
1) Security settings in Twitter
Login Verification: Is off by default. It is so important because it make it harder for an unauthorized person to login to the user account by receiving a confirmation login request via a text message [44, 45].
Password Reset: It is off by default, and it requires user email or phone number to reset his/her password [44].
Apps: A record of all the applications that have access to Twitter account. Users can revoke access for unwanted applications [46].
Tweet Location: It is off by default but when a user is tweeting from his/her phone the default setting is on [47].
2) Security settings in FB
Login Notification: It is off by default. This feature notifies the user by email or text messages if his/her account was accessed from a device they have not used earlier [48].
Login Approvals: It is off by default. It requests from the user to enter a code that was sent to his/her phone when he/she accesses his account from a device that they never used before. After logging in, the user can save this new device into his/her account list of trusted devices [49].
Code Generator: It is part of login approvals, and it is creating a security code every 30 seconds even when users are not connected to the Internet. In addition, the user can use it when resetting his password [50].
App Passwords: It is off by default. A one-time password the user can use to login to his FB App and it helps to keep FB‟s original password safe [51].
Trusted Contacts: User closest friends who can securely help him if he/she has a problem to access his/her account. For example, when a user forgets his password, and he cannot access his email to reset it [52].
Logged-in List: Shows a list of all user browsers and devices that were used to login to a user‟s account recently [53].
One-time Password: It is password used when a user is not comfortable to enter his real password. For example, when the user is in a public place [54].
E. Identity Verification Systems in SN’s
Fake profiles mostly post misleading information, images and other data that eventually deforms the victim‟s public image. Therefore, to reduce the possibilities of theft and fraud, appropriate identification systems must be used in order to
make sure of the user‟s identity. Various techniques can be used such as biometric systems e.g. fingerprint and iris recognition. These systems send the biometric data from the input devices to a central processing unit to identify the identity of the users. By using this system, we can guarantee a person‟s validity and prevent crimes before they occur [55].
The problem emerged in the SN‟s because we cannot use known identity verification systems; such as, fingerprint and eye print over the Internet. Moreover, it will not be a clever move and unsafe for the users. Therefore, the need for other verification systems became a necessity to make sure of users‟ identities, and that they are real and not fake.
In SN‟s, there is a difference between confirmation and verification. Confirmation is a message sent by the site to the user's email or phone to secure the account. For identity confirmation, some sites used phone numbers or emails, and others gather the two methods to ensure greater security for the users. Still the problem of personality verification and the possibility of identity theft exist. While verification is an affirmation from the same site that the owner of this account is the same person who uses it.
Twitter and FB offer two services verification and confirmation. In confirmation, they use two methods to confirm the account by email and phone. However, verification is limited to public figures, celebrities, and governments. Verified accounts are the accounts that have a blue badge with a checkmark, meaning that they are real celebrities or brand profiles and not fake [1, 56].
V. RESULTS AND ANALYSIS
We conducted an online survey to study the user's knowledge about the importance of privacy and security in SN‟s and the extent of user awareness of these issues in the KSA. The purpose of this survey is to evaluate the amount of information that the users typically disclose and what the privacy settings they have applied to protect their profiles. The survey consists of 18 questions with a total of 510 users, representing ten cities “Fig. 1”, participated in the survey.
Fig. 1. Survey total responses rank by cities
A. Survey Summary
When analyzing quantitative and qualitative data, the highest response rate (57.1%) was from female participants,
0.2 0.2 0.9 0.2
58.1
0.2 0.2
18.3
0.2
21.3
0
10
20
30
40
50
60
70

(IJACSA) International Journal of Advanced Computer Science and Applications,
Vol. 5, No. 12, 2014
137 | P a g e
www.ijacsa.thesai.org
where the lowest response rate (42.9%) was from male participants “Fig. 3”.
Most respondents aged between 16-20 years old (23.3%), where least respondents aged between 41-45 years old (4.7%) “Fig. 2”.
For the level of education, "Fig. 4" shows that the most participants were undergraduate users (38.2%) and Twitter was the most popular SN‟s among them. The youngest participants were elementary school users (4.9%), and Instagram was the most popular SN‟s among this group “Fig. 16”.
(58.6%) Of participants agreed that the benefits of SN‟s sites overcomes their risks, therefore (58.3%) of the users want to verify their profiles on SN‟s “Fig. 5”.
(6.5%) Of participants does not use SN‟s “Fig. 6”, and the reason that prevent (48.5%) of them from signing-up is the social and religious irregularities, especially that there are a lot of inappropriate profiles on SN‟s. The second reason is that the SN‟s are not safe in terms of privacy (42.4%) “Fig. 7”.
On the other hand, (93.5%) Of all participants sign-up in SN‟s. (63.9%) of them selected “to communicate with their friends and families”, and (57.7%) of them selected “finding useful information” “Fig. 8”.
We found that participants prefer to write a partial of their real name on their profiles (45.5%) rather than their real name (32.5%) or a fake name (22.0%) “Fig. 9”.
(43.6%) Of participants choose to make their profiles public to everyone and only (31.7%) prefer to make their profiles private to friends and family “Fig. 10”.
The three prevalent information users like to share are email (64.2%), city (38.4%), and phone number (34.8%) “Fig. 11”.
The result shows that (55.4%) of users only trust the news and information from verified profiles while (26.4%) of users always check the well-known newspapers. In contrast, (18.2%) of users believe any news and information on SN‟s “Fig. 12”.
(50.1%) Of participants are confident in their level of privacy, in return (49.9%) of participants are not sure in their level of privacy on SN‟s “Fig. 13”.
(75.5%) Of users does not read the privacy policy "Fig. 14" and maybe that is the reason that (78.0%) of them do not trust the SN‟s provider in protecting their personal information “Fig. 15”.
B. Discussion
1) People who do not own a SN’s account 33 Of the participants do not have accounts in SN‟s; most
of them are older than 46 years old. The main reasons for this are they found that this site's overwhelmed with social and religious irregularities and it is not safe in terms of privacy and security. They see the bad side of SN‟s where there is a lot of impersonation, rumors and harassment. Some of them find it hard to fully understand it and get used to it. Other simply does not find the time or the interest to be a part of such sites.
We have found that older people do not want to join SN‟s because of the negative sides. They consider it an unsafe environment for them. The youngsters do not have fully understood the value and the importance of privacy in order to maintain their personal information. On the contrary, they share every single detail about their personal life on their accounts.
Therefore, it becomes a cause of defaming to them, and it can be used against them in the future. The majority of concerned parents do not want their children to join this community because their children are not aware of the meaning of security policies and related problems, and they are not old enough to make smart decisions. For that, children and many adults need to be given enough knowledge and awareness about to protect their information and how to maintain their privacy.
2) People who do have a SN’s account The ages of the participants are diverse, were the most
interactive group that is involved in SN‟s are teenagers and young adults. While 58% of the participants believed that, the benefits of SN‟s overcome its risks. Teenagers and young adults were the two groups that thought otherwise “Fig. 17”. The majority of the two groups believed that the risks outweigh the benefits, yet they have active accounts!. The number of female participants outnumbered males by a narrow margin estimated by (14%) this could be evidence that the female users are more than the male users.
The results show that the most used SN‟s in KSA respectively are Twitter, Instagram, YouTube, FB, and Google+. The most famous SN‟s among elementary and middle school are Instagram. Where for high school, undergraduate and higher education was Twitter “Fig. 16”. As for the benefits of SN‟s, the most purposes were to entertain and spend time, Find useful information and of course communicate with friends and family. The teenagers score the highest rate in selecting a fake name or a part of their real name and as the age increased, the participants choose to write their full real names.
The level of privacy was different according to the level of the education. Where the school students and undergraduate were more open in their privacy as they choose their profile to be public. While some of them did not care about their privacy setting or they did not know about it. In return, the higher education participants were more conservative about their privacy were they want their profiles to be private to their friends and families “Fig. 18”.
As a result, the users who made their profiles public were the majority of participants who wanted to verify their profiles. While the users who made their profiles private were the minority of participants who wanted to verify their profiles.
The ranking of information that user share the most on SN‟s are email, city, phone number, interests, images, local location, education and marital Status. 15.5% of the participants share nothing on their profiles, and those are the ones who did not care about verifying their profiles as they did not find the need to protect their information.

(IJACSA) International Journal of Advanced Computer Science and Applications,
Vol. 5, No. 12, 2014
138 | P a g e
www.ijacsa.thesai.org
Teenagers are the most confident in the news and information published in SN‟s sites. Compared to the rest of the participants where they do not trust any information except for news published by the government verified profiles. However, in many cases, these accounts may be exposed to theft and could release a lot of misleading information before they are restored.
The biggest problem in misunderstanding how SN‟s deals with the user's information is related to the fact that the users never read the privacy policy. A lot of users don‟t know how SN‟s providers protect or deal with their personal information. Therefore, the majority of the participants do not trust SN providers.
C. The Social Experiment
1) Twitter social experiment For our first Twitter experiment, we tested the user's
knowledge and awareness in security. We sent them a link in the broadcast as follows “To verify your account on twitter quickly just click on the following link.”. In the first page, we asked the participant to enter his/her Twitter username. When they did that, we directed them to page number two where we described our experiment to them.
The plan is to see how people's confidence in the anonymous links that asks them to provide private information. Even though we asked them to give something general "their username", but it also shows how much they are willing to give their personal information to anonymous and strangers. 198 (43%) users entered the link; only 55 (28%) users did not enter their usernames “Fig. 19”.
143 (72%) users entered their Twitter usernames. The reason behind that from their point of view is they consider usernames public and okay to share. However, this information is considered valuable to a stranger who does not know that the respondent own a Twitter account in the first place. Through this information, he can monitor them, know their information, and even hack their profile or email to gain access to more info.
TABLE I. TWITTER LINK
Elementary Middle
School
High
School
Undergraduate Higher
Education
Users who
enter the
link
14 50 55 55 24
Users who
enter the
username
9 46 40 35 13
Users who
didn‟t
enter the
username
5 4 15 20 11
*Check the appendix
2) FB and Twitter experiment In this experiment, we wanted to prove that penetrating
private accounts are very easy. The idea is to select a public profile at random, clone the profile with a similar username,
and send friend requests to friends who have private profiles. Of course, if the friend accepted our request we were able to see all of their information. (all the people whom we contacted were sent an apology message and their data was not touched). We did the same experiment on two public accounts, one from FB and the other one from Twitter.
On FB, we chose a public account X for our experiment. Then we created a new account with the same name. In addition, we changed the profile picture and the cover photo to the same real ones. After that, we sent requests to private accounts on X‟s list. The total requests we sent were 121, and the responses we got were 30, about 24.8%.
On Twitter, we choose a public account Y for our experiment. Then we created a new account with a username Y‟ (close to the real username), and we changed the profile picture to the same real one. After that, we requested to follow the private accounts. The total requests we sent were 75, and the responses we got were 33, about 44%.
The results from this experiment show us many points:
Public profiles can be cloned very easily on both networks.
Public profiles can endanger private ones on their lists.
Friends of the victims show high acceptance for any incoming messages from their fake friends.
We noticed that FB provides more settings to protect privacy and security.
Twitter users are more willing to accept such requests than those of FB.
Of course, we realize that the numbers we got cannot be trusted because of the small sample, however, for ethical reasons, we didn‟t want to involve more accounts in this experiment; as the goal was just to prove the simplicity of the process.
VI. WAYS TO PROTECT OUR PRIVACY
Based on this research, we would like to emphasize that privacy is a personal responsibility; users should not give their personal information to others who may use it illegally. SN‟s continually change their privacy policies to protect themselves and to put the blame on the users. According to [57, 58] users can do the following:
Secure your PC against theft: Activate hard disk encryption and always use password to access your devices. Continually update your operating system, security packages and review your web browser security setting. Install and automatically update your anti-virus, anti-spyware software, use an anti-phishing tool and use a good firewall.
Be careful when you share your personal data: Always be careful from sharing your personal information with strangers and trusted people especially over unsecure medium.

(IJACSA) International Journal of Advanced Computer Science and Applications,
Vol. 5, No. 12, 2014
139 | P a g e
www.ijacsa.thesai.org
Do not use one email: Create a new email for SN‟s sites and do not use your personal email or work email to sign-up in SN‟s. Do not share your email that you used to register with anyone and do not choose a username that is similar to your email. If a hacker knows your email, you will facilitate his job to send you viruses or suspicious links. Make sure to use a real email in your profile to help you to restore your forgotten password.
Create a difficult password: Users should not use weak passwords in personal accounts or use the names of relatives as password as that can be easily guessed. Many software systems can identify weak passwords. Moreover, users should not use the same password for all accounts. When creating a new password, use letters, numbers, and symbols at the beginning or end of the password. Users should always try to make the password at least 12 characters to make it unpredictable and impenetrable and never use a password similar to email or username.
Be careful with any message from a stranger: Attackers use different methods and different messages to reach their victims. A careful user will always very the sender before responding to such messages.
Be careful of phishing: Phishing is an attempt to gain sensitive data such as username, password, and credit card information by impersonating trustworthy pages in SN‟s. Some hacker will pretend to help you in promoting your profile by increases your followers or protecting your account. Where he will ask you to enter your personal data in false sites that look similar to the real one. To protect against phishing attacks, experts advise paying attention not opening a suspicious link and ignoring any request to enter your personal data unless it is the official site otherwise your account will be at risk. Furthermore, make sure access to the company's website via the correct URL.
Stay away from Spyware: Programs and messages reach many users through SN‟s and email. Some messages contain wrong information aimed at stealing user‟s data. Users need to ignore messages that they do not know their origin and update antivirus software regularly.
Do not download unknown software for portable devices: Many users download unknown software or games to their devices. Many of such applications can be malware. Users need to be careful when loading any unknown programs; they should only deal with websites of the reliable and well-known companies.
Avoid the use of public computers or networks: Many risks exist when using public devices or network, such as in libraries, cafes and airports, especially when reviewing the financial statements. If necessary, use it but be careful, you must delete personal files, cookies, and Internet history and never forget to log out.
Very job posters: Before sending an application online or in person make sure that the advertiser is a real company.
Make your profile “private”: Based on our experiment, users should always choose to have private accounts and be cautious when accepting requesting from friends who have public accounts.
VII. CONCLUSION AND FUTURE WORK
There is no doubt that SN‟s provide a wide range of benefits to users. However, those benefits are not free of risks. Sever risks of privacy breaches and Identity Theft exist. The facts that the majority of users are not aware of such risks and that SN‟s providers lack proper protection and verification methods make the situation much worse.
In KSA, our survey revealed many results some of which are scary. The fact that 59% of all participants believe that the benefits of SN‟s outweigh their risks justifies the unprecedented increase in the number of users. When 43% of all profiles are public, and 25% are not aware of their privacy settings, the privacy of those with private profiles is at a great risk. Other results show that the majority never read privacy policies, share too much information, and have confidence in SN‟s.
Our small experiment revealed that users with private accounts are not safe as well. Having friends with public profiles endangers the privacy of such users.
To improve the privacy of users and reduce their risks we provided a list of recommendations. We believe that awareness at a national level is needed, users need to be cautious and protective, and SN providers need to provide more protection and verification to users.
Finally, from the experiment‟s results we found that Facebook provides more privacy and security tools than Twitter. Therefore, identity theft cases on Facebook appear to be less than that of Twitter.
REFERENCES
[1] Facebook, (2014). Facebook Website. [online] Available at: http://www.Facebook.com [Accessed 12 Sep. 2014].
[2] K. Finklea, 'Identity Theft: Trends and Issues', Congressional Research Service, 2014.
[3] S. Gazette, 'Use of mobiles in social media on the rise in KSA', Saudigazette.com.sa, 2014. [Online]. Available: http://www.saudigazette.com.sa/index.cfm?method=home.regcon&contentid=20140109192016. [Accessed: 17- Apr- 2014].
[4] S. Al-Qahtani, 'hackers loot 2.5 billion SR from 3.5 million Saudi in one year', Alsharq.net.sa, 2013. [Online]. Available: http://www.alsharq.net.sa/lite-post?id=792821. [Accessed: 24- Nov- 2013].
[5] Citc.gov.sa, 'Anti-Cyber Crime Law', 2007. [Online]. Available: http://www.citc.gov.sa/English/rulesandsystems/citcsyste/pages/cybercrimesact.aspx. [Accessed: 17- Nov- 2014].
[6] Reznik, Maksim (2013) "Identity Theft on Social Networking Sites: Developing Issues of Internet Impersonation," Touro Law Review: Vol. 29: No. 2, Article 12.
[7] K. Krombholz, D. Merkl and E. Weippl, 'Fake identities in social media: A case study on the sustainability of the Facebook business model', Journal of Service Science Research, vol. 4, no. 2, 2012.

(IJACSA) International Journal of Advanced Computer Science and Applications,
Vol. 5, No. 12, 2014
140 | P a g e
www.ijacsa.thesai.org
[8] Stutzman, Fred and Kramer-Duffield, Jacob (2010): Friends only: examining a privacy-enhancing behavior in Facebook. In: Proceedings of ACM CHI 2010 Conference on Human Factors in Computing Systems 2010. pp. 1553-1562.
[9] Verma, D. Kshirsagar and S. Khan, 'Privacy and Security: Online Social Networking', Association of Computer Communication Education for National Triumph (ACCENT), vol. 3, no. 8, pp. 310-315, 2013.
[10] L. Bilge, T. Strufe, D. Balzarotti and E. Kirda, 'All your contacts are belong to us: automated identity theft attacks on social networks', pp. 551--560, 2009.
[11] M. Al-Mujeb. “Saudis‟ Awareness of Privacy Risks on Facebook” M.A. thesis, University of Glamorgan, UK, 2010.
[12] R. Demyati. “Privacy Issues in Facebook” M.A. thesis, Australia, 2011.
[13] Catherine D. Marcum, George E. Higgins (April 28, 2014 by CRC Press) Social Networking as a Criminal Enterprise. Criminal Justice & Law [Online]. Available at: http://www.crcpress.com/product/isbn/9781466589797 (Accessed: 31 Nov 2014).
[14] Joy Mali (2012) Identity Theft Through Social Networking, Available at: http://www.lifehack.org/articles/technology/identity-theft-through-social-networking-lessons-take-now.html (Accessed: 14 Nov 2014).
[15] Bernard Pragides, Identity Theft and Social Networking Sites, Available at: http://www.streetdirectory.com/travel_guide/140727/identity_theft/identity_theft_and_social_networking_sites.html (Accessed: 14 Nov 2014).
[16] T. Clinic Team, 'The State of Social Media in Saudi Arabia 2012', The Social Clinic, 2013. [Online]. Available: http://www.thesocialclinic.com/the-state-of-social-media-in-saudi-arabia-2012-2/. [Accessed: 08- May- 2014].
[17] T. Clinic Team, 'The State of Social Media in Saudi Arabia 2013', The Social Clinic, 2014. [Online]. Available: http://www.thesocialclinic.com/the-state-of-social-media-in-saudi-arabia-2013/. [Accessed: 08- May- 2014].
[18] Smith, 'Why Americans use social media', Pew Research Center's Internet & American Life Project, 2011. [Online]. Available: http://www.pewinternet.org/2011/11/15/why-americans-use-social-media/#fn-250-1. [Accessed: 14- Jun- 2014].
[19] Mbrsg.ae, 'Arab Social Media Outlook 2014', 2014. [Online]. Available: http://www.mbrsg.ae/HOME/PUBLICATIONS/White-Papers-(1)/Arab-Social-Media-Outlook-2014.aspx?lang=en-US. [Accessed: 23- Oct- 2014].
[20] S. HIMELFARB and S. ADAY, 'Media That Moves Millions', Foreign Policy, 2014. [Online]. Available: http://www.foreignpolicy.com/articles/2014/01/17/media_moves_millions_social_ukraine_twitter. [Accessed: 07- Nov- 2014].
[21] M. Habash, 'How does Facebook achieve its profits?', Tech-wd, 2012. [Online]. Available: http://www.tech-wd.com/wd/2012/05/28/how-can-facebook-make-money/. [Accessed: 28- Oct- 2014].
[22] Facebook.com, 'Under the Hood: The Entities Graph', 2014. [Online]. Available: https://www.facebook.com/notes/facebook-engineering/under-the-hood-the-entities-graph/10151490531588920. [Accessed: 13- Nov- 2014].
[23] Carrns, 'Careless Social Media Use May Raise Risk of Identity Fraud', Bucks Blog, 2012. [Online]. Available: http://bucks.blogs.nytimes.com/2012/02/29/careless-social-media-use-may-raise-risk-of-identity-fraud/?_php=true&_type=blogs&_php=true&_type=blogs&_r=1. [Accessed: 14- May- 2014].
[24] INVISUS (2014) How Identity Theft Happens, Available at: http://www.idefendfamily.com/how_id_theft_happens.aspx#cs (Accessed: 15 Nov 2014).
[25] Gunatilaka, A Survey of Privacy and Security Issues in Social Networks, 1st ed. 2011.
[26] Carnegie Mellon University (2014) How cyber criminals operate, Available at: http://www.carnegiecyberacademy.com/facultyPages/cyberCrime.html (Accessed: 15 Nov 2014).
[27] P. DWYER, CYBER CRIME IN THE MIDDLE EAST, 1st ed. 2010.
[28] RIVA RICHMOND (May 2, 2010) 'Stolen Facebook Accounts for Sale', The New York Times, pp. B3 [Online]. Available at: http://www.nytimes.com/2010/05/03/technology/internet/03facebook.html?_r=0 (Accessed: 15 Nov 2014).
[29] Hayley Dixon (2013) 'Online dating sites use stolen data to create fake profiles, it is alleged', The Telegraph, 29 Jul , p. http://www.telegraph.co.uk/news/uknews/law-and-order/10207712/Online-dating-sites-use-stolen-data-to-create-fake-profiles-it-is-alleged.html.
[30] 2012 NORTON CYBERCRIME REPORT, 1st ed. 2012.
[31] Citc.gov.sa, 'Cybercrime Awareness Campaign', 2014. [Online]. Available: http://citc.gov.sa/arabic/MediaCenter/awarenesscampaigns/Pages/PR_AWR_005.aspx. [Accessed: 08- Oct- 2014].
[32] Cert.gov.sa, 'Computer Emergency Response Team - SA', 2014. [Online]. Available: http://www.cert.gov.sa/index.php?option=com_frontpage&Itemid=1. [Accessed: 07- Oct- 2014].
[33] Internet.sa, 'Reporting on impersonation (Twitter) | Internet Saudia Arabia', Web1.internet.sa. [Online]. Available: http://web1.internet.sa/ar/twitter_impersonate/. [Accessed: 08- Oct- 2014].
[34] Alarabiya.net, 'Hacker penetrates the head of Al-Ahli club account in Twitter', 2014. [Online]. Available: http://www.alarabiya.net/articles/2012/04/15/207846.html. [Accessed: 10- Nov- 2014].
[35] H. Lhd, 'User impersonating Prince Abdulaziz bin Fahd on Twitter', Burnews.com, 2014. [Online]. Available: http://www.burnews.com/news/2012/03/31/عبذ-االمير-شخصية-ينتحل-مغرد- .[Accessed: 14- Nov- 2014] .التويتر-على-فهذ-بن-العزيز
[36] M. Houdad, '"Tourism" undertakes to answer the questions from the hacker', Sabq.org, 2014. [Online]. Available: http://sabq.org/kvngde. [Accessed: 14- Nov- 2014].
[37] K. Ashamany, '"Hacker" penetrates the profile of principality of Al-Madinah in "Twitter"', Sabq.org, 2014. [Online]. Available: http://sabq.org/Ijngde. [Accessed: 17- Nov- 2014].
[38] Y. Al-Otaibi, '"Hacker" penetrates Ministry of Justice account in "Twitter"', Sabq.org, 2014. [Online]. Available: http://sabq.org/W1ngde. [Accessed: 17- Nov- 2014].
[39] Barqawi, 'For thanking and challenging', Sabq.org, 2014. [Online]. Available: http://sabq.org/u7Xfde. [Accessed: 17- Nov- 2014].
[40] J. Philips, '7 Examples of What Happens When Your Twitter Account is Hacked - Jeffbullas's Blog', Jeffbullas's Blog, 2013. [Online]. Available: http://www.jeffbullas.com/2013/07/12/7-examples-of-what-happens-when-your-twitter-account-is-hacked/. [Accessed: 03- Oct- 2014].
[41] H. Zayed, 'Impersonation on "Facebook"', Alwatan.com.sa, 2014. [Online]. Available: http://www.alwatan.com.sa/Nation/News_Detail.aspx?ArticleID=76105. [Accessed: 17- Nov- 2014].
[42] Beach, M. Gartrell and R. Han, 'Solutions to security and privacy issues in mobile social networking', vol. 4, pp. 1036--1042, 2009.
[43] Securityinabox.org, 'How to Change Basic Account Settings on Twitter | Security In A Box', 2014. [Online]. Available: https://securityinabox.org/twitter_basic#2.1. [Accessed: 20- Sep- 2014].
[44] L. Hardwick, 'How to improve your Twitter security and privacy', Naked Security, 2014. [Online]. Available: http://nakedsecurity.sophos.com/2014/08/26/how-to-improve-your-twitter-security-and-privacy/. [Accessed: 26- Sep- 2014].
[45] Support.twitter.com, 'Twitter Help Center | Using login verification', 2014. [Online]. Available: https://support.twitter.com/articles/20170388. [Accessed: 24- Sep- 2014].
[46] Support.twitter.com, 'Twitter Help Center | Connecting or revoking third-party applications'. [Online]. Available: https://support.twitter.com/groups/57-safety-security/topics/276-understand-your-settings/articles/76052-connecting-or-revoking-third-party-applications. [Accessed: 08- Oct- 2014].
[47] Support.twitter.com, 'Twitter Help Center | Adding your location to a Tweet'. [Online]. Available: https://support.twitter.com/groups/57-
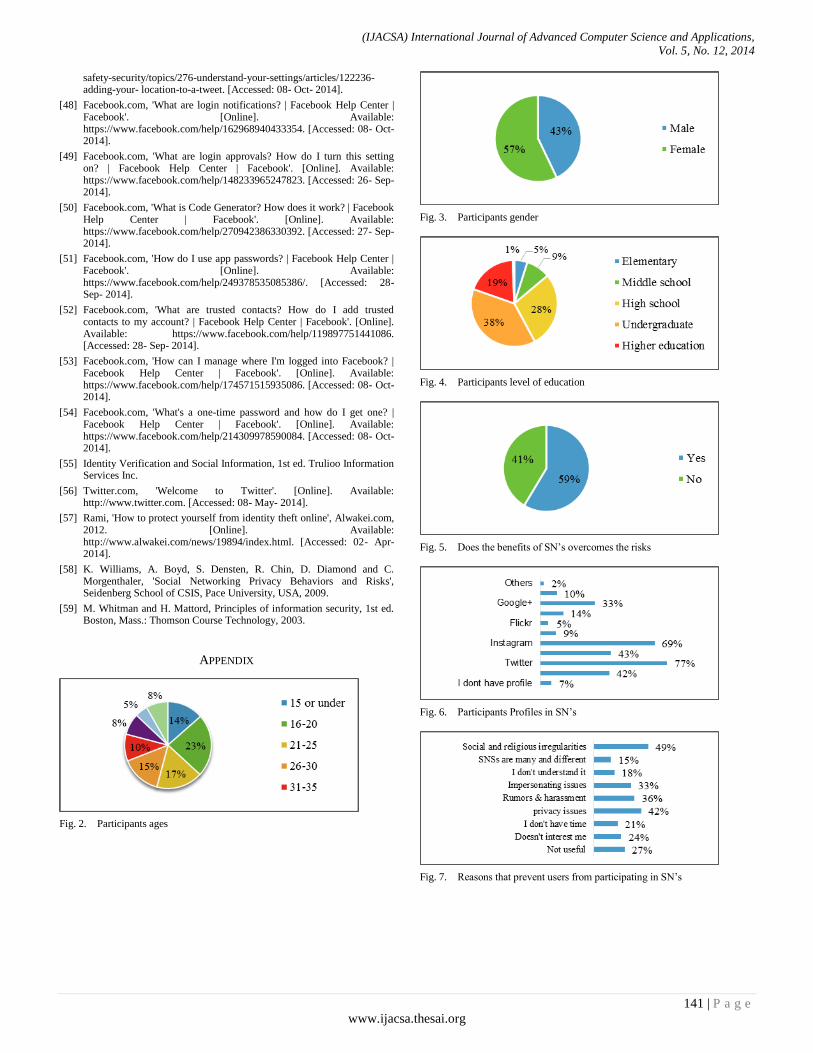
(IJACSA) International Journal of Advanced Computer Science and Applications,
Vol. 5, No. 12, 2014
141 | P a g e
www.ijacsa.thesai.org
safety-security/topics/276-understand-your-settings/articles/122236-adding-your- location-to-a-tweet. [Accessed: 08- Oct- 2014].
[48] Facebook.com, 'What are login notifications? | Facebook Help Center | Facebook'. [Online]. Available: https://www.facebook.com/help/162968940433354. [Accessed: 08- Oct- 2014].
[49] Facebook.com, 'What are login approvals? How do I turn this setting on? | Facebook Help Center | Facebook'. [Online]. Available: https://www.facebook.com/help/148233965247823. [Accessed: 26- Sep- 2014].
[50] Facebook.com, 'What is Code Generator? How does it work? | Facebook Help Center | Facebook'. [Online]. Available: https://www.facebook.com/help/270942386330392. [Accessed: 27- Sep- 2014].
[51] Facebook.com, 'How do I use app passwords? | Facebook Help Center | Facebook'. [Online]. Available: https://www.facebook.com/help/249378535085386/. [Accessed: 28- Sep- 2014].
[52] Facebook.com, 'What are trusted contacts? How do I add trusted contacts to my account? | Facebook Help Center | Facebook'. [Online]. Available: https://www.facebook.com/help/119897751441086. [Accessed: 28- Sep- 2014].
[53] Facebook.com, 'How can I manage where I'm logged into Facebook? | Facebook Help Center | Facebook'. [Online]. Available: https://www.facebook.com/help/174571515935086. [Accessed: 08- Oct- 2014].
[54] Facebook.com, 'What's a one-time password and how do I get one? | Facebook Help Center | Facebook'. [Online]. Available: https://www.facebook.com/help/214309978590084. [Accessed: 08- Oct- 2014].
[55] Identity Verification and Social Information, 1st ed. Trulioo Information Services Inc.
[56] Twitter.com, 'Welcome to Twitter'. [Online]. Available: http://www.twitter.com. [Accessed: 08- May- 2014].
[57] Rami, 'How to protect yourself from identity theft online', Alwakei.com, 2012. [Online]. Available: http://www.alwakei.com/news/19894/index.html. [Accessed: 02- Apr- 2014].
[58] K. Williams, A. Boyd, S. Densten, R. Chin, D. Diamond and C. Morgenthaler, 'Social Networking Privacy Behaviors and Risks', Seidenberg School of CSIS, Pace University, USA, 2009.
[59] M. Whitman and H. Mattord, Principles of information security, 1st ed. Boston, Mass.: Thomson Course Technology, 2003.
APPENDIX
Fig. 2. Participants ages
Fig. 3. Participants gender
Fig. 4. Participants level of education
Fig. 5. Does the benefits of SN‟s overcomes the risks
Fig. 6. Participants Profiles in SN‟s
Fig. 7. Reasons that prevent users from participating in SN‟s
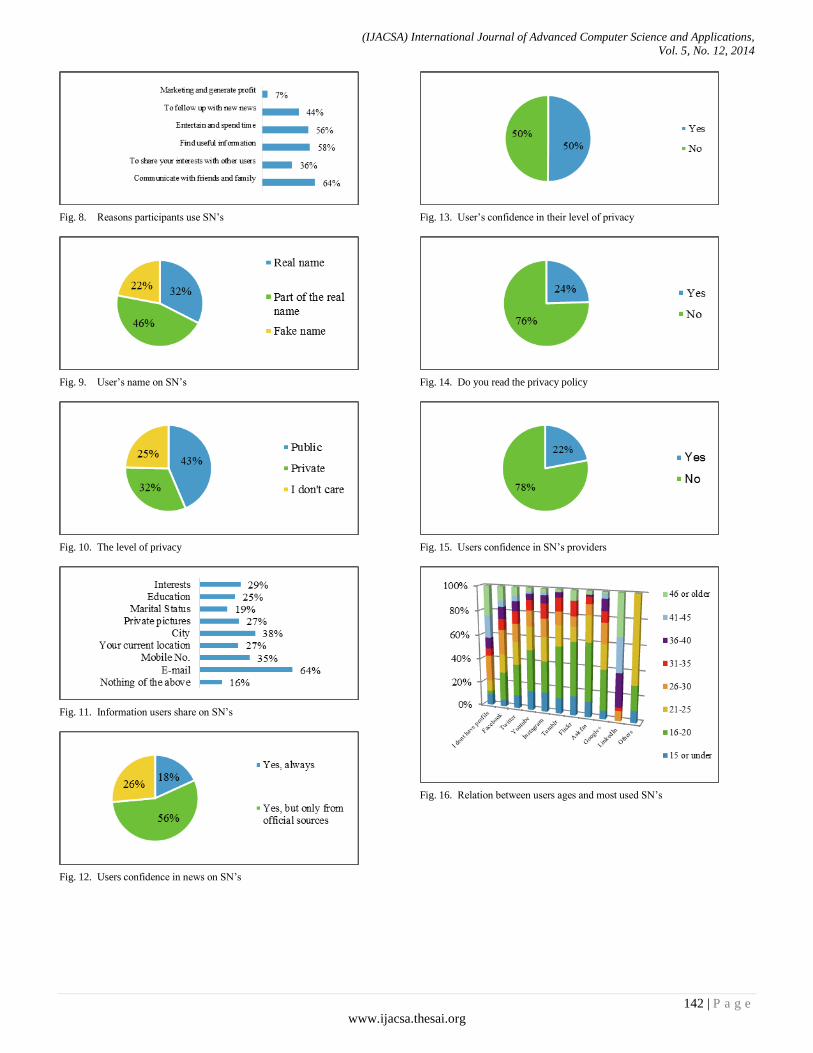
(IJACSA) International Journal of Advanced Computer Science and Applications,
Vol. 5, No. 12, 2014
142 | P a g e
www.ijacsa.thesai.org
Fig. 8. Reasons participants use SN‟s
Fig. 9. User‟s name on SN‟s
Fig. 10. The level of privacy
Fig. 11. Information users share on SN‟s
Fig. 12. Users confidence in news on SN‟s
Fig. 13. User‟s confidence in their level of privacy
Fig. 14. Do you read the privacy policy
Fig. 15. Users confidence in SN‟s providers
Fig. 16. Relation between users ages and most used SN‟s
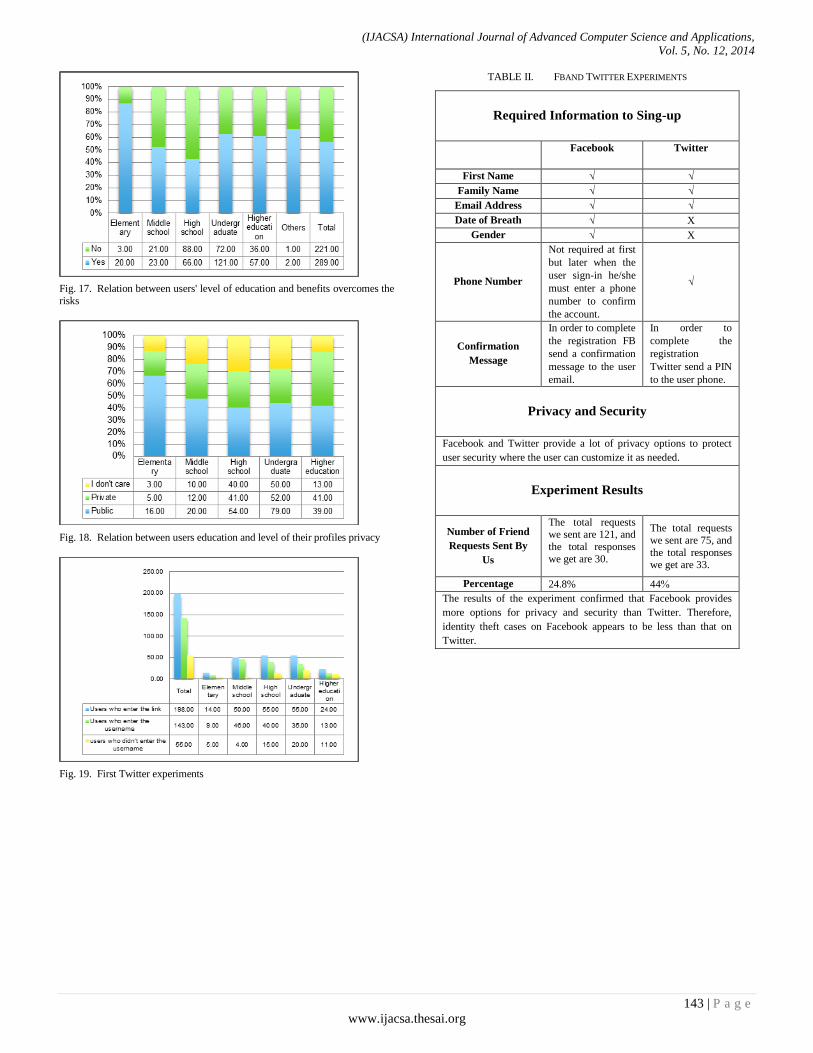
(IJACSA) International Journal of Advanced Computer Science and Applications,
Vol. 5, No. 12, 2014
143 | P a g e
www.ijacsa.thesai.org
Fig. 17. Relation between users' level of education and benefits overcomes the
risks
Fig. 18. Relation between users education and level of their profiles privacy
Fig. 19. First Twitter experiments
TABLE II. FBAND TWITTER EXPERIMENTS
Required Information to Sing-up
Twitter Facebook
√ √ First Name
√ √ Family Name
√ √ Email Address
X √ Date of Breath
X √ Gender
√
Not required at first
but later when the
user sign-in he/she
must enter a phone
number to confirm
the account.
Phone Number
In order to
complete the
registration
Twitter send a PIN
to the user phone.
In order to complete
the registration FB
send a confirmation
message to the user
email.
Confirmation
Message
Privacy and Security
Facebook and Twitter provide a lot of privacy options to protect
user security where the user can customize it as needed.
Experiment Results
The total requests
we sent are 75, and
the total responses we get are 33.
The total requests we sent are 121, and
the total responses
we get are 30.
Number of Friend
Requests Sent By
Us
44% 24.8% Percentage
The results of the experiment confirmed that Facebook provides
more options for privacy and security than Twitter. Therefore,
identity theft cases on Facebook appears to be less than that on
Twitter.
(IJACSA) International Journal of Advanced Computer Science and Applications,
Vol. 5, No. 12, 2014
144 | P a g e
www.ijacsa.thesai.org
Software Architecture Reconstruction Method, a
Survey
Zainab Nayyar
Department of computer Engineering EME, National
University of Science and Technology (NUST), H-12,
Islamabad, Pakistan
Nazish Rafique
Department of Computer Engineering, College of EME,
National University of Science and Technology (NUST),H-
12,Islamabad, Pakistan
Abstract—Architecture reconstruction belongs to a reverse
engineering process, in which we move from code to architecture
level for reconstructing architecture. Software architectures are
the blue prints of projects which depict the external overview of
the software system. Mostly maintenance and testing cause the
software to deviate from its original architecture, because
sometimes for enhancing the functionality of a system the
software deviates from its documented specifications, some new
modules are included in the system without modifying the
architecture of a system which create issues while reconstructing
the system, as much as the software is closed to the architecture
the more it is easy to maintain and change the document so the
conformance of architecture with the product is checked by
applying the reverse engineering method. Another reason for
reconstructing the architecture is observed in the case of legacy
systems, when they need modification or an enhanced version of
the system is needed to be developed. This paper includes the
methods and tools involved in reconstructing the architecture
and by comparing them the best method for reconstructing
architecture will be suggested.
Keywords—Software architecture; reverse engineering;
architecture reconstruction; architecture erosion; architecture
mismatch; architecture chasm; architecture drift; forward
engineering; architectural aging
I. INTRODUCTION
Many organizations use old softwares but as the new advancements in technology occurring day by day there is often a need to mold the softwares according to the current and latest technological aspects. But sometimes it is difficult to made changes to the code because as the time passes the documents which comprises the implementation of software are outdated or missing. Mostly the idea of developing the new software from scratch is not favored so software architecture reconstruction is used to recover the architecture and then documenting and updating the architecture.
There are certain problems which arise while maintaining and understanding the system. The first problem is that mostly architecture of a system does not explicitly shown in the system unlike classes and packages; another problem is that many large and important applications were developed over time so their architecture drifts [1]. These problems are solved by doing software architecture reconstruction [2].
Software architecture represents the model of the software system which expresses the high level of abstraction. The
architectural view of the system hides details of implementation, data representation and algorithms and only concentrates on developing a link between requirements and implementation. The software architecture depicts actually the tangible entities of a system and relationship between those entities. The role of software architecture in developing the software is to understand, reusability, construction, evolution, analysis and management of a system [3].
However, only few organizations participate in software architecture reconstruction efforts. Architecture of software systems plays a significant role in attaining specific business goals. Therefore it is very important to understand the environment of organization and the importance of software architecture so that it is easy to out line the software architecture efficiently [4].
The architecture of software is designed to validate and verify, which requirements can be implemented and which cannot. Architecture of a software system generally restrict the developer within the scope, more the software is closest to the architecture more it is easy to validate its conformance with the requirements.
Architecture reconstruction process is an iterative and interactive approach. It consists of four steps. In the first step, set of views are extracted from software implementation such as source code and dynamic information. These views represent the system‟s essential structural and behavioral components. Second step consists of fusion of extracted views. It is used to create fused views that enhance and improve the extracted views. In the Third step, the job of analyst is to iteratively and interactively improve and applies design patterns to the fused views to reconstruct the architectural-level views. Design pattern helps analyst to understand the architecture of the system as structural and behavioral relationships among different components. In the last step, derived views are further investigated to evaluate conformance of architecture, to identify goals for reengineering or reuse, and to analyze the essential qualities of architecture [5].
II. LITERATURE REVIEW
This section presents an extended review of the research work that has been done so far regarding the software architecture reconstruction. It also includes the detail discussion on tools and techniques used for reconstruction of architecture.
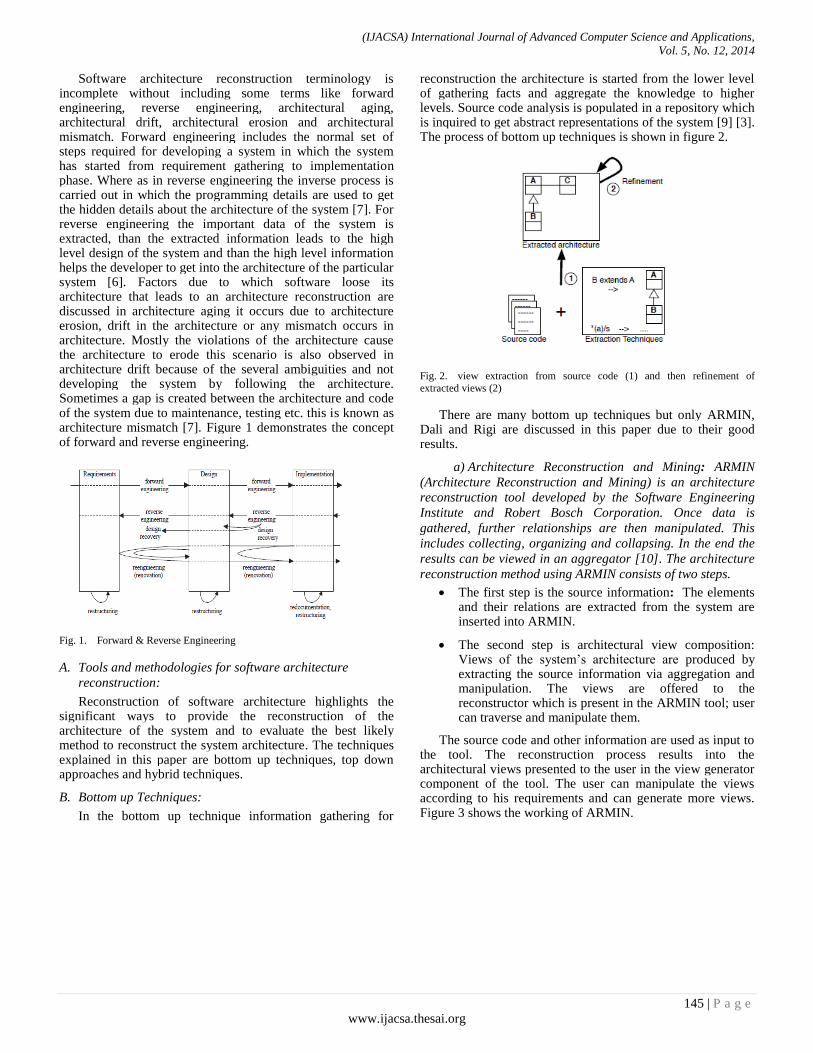
(IJACSA) International Journal of Advanced Computer Science and Applications,
Vol. 5, No. 12, 2014
145 | P a g e
www.ijacsa.thesai.org
Software architecture reconstruction terminology is incomplete without including some terms like forward engineering, reverse engineering, architectural aging, architectural drift, architectural erosion and architectural mismatch. Forward engineering includes the normal set of steps required for developing a system in which the system has started from requirement gathering to implementation phase. Where as in reverse engineering the inverse process is carried out in which the programming details are used to get the hidden details about the architecture of the system [7]. For reverse engineering the important data of the system is extracted, than the extracted information leads to the high level design of the system and than the high level information helps the developer to get into the architecture of the particular system [6]. Factors due to which software loose its architecture that leads to an architecture reconstruction are discussed in architecture aging it occurs due to architecture erosion, drift in the architecture or any mismatch occurs in architecture. Mostly the violations of the architecture cause the architecture to erode this scenario is also observed in architecture drift because of the several ambiguities and not developing the system by following the architecture. Sometimes a gap is created between the architecture and code of the system due to maintenance, testing etc. this is known as architecture mismatch [7]. Figure 1 demonstrates the concept of forward and reverse engineering.
Fig. 1. Forward & Reverse Engineering
A. Tools and methodologies for software architecture
reconstruction:
Reconstruction of software architecture highlights the significant ways to provide the reconstruction of the architecture of the system and to evaluate the best likely method to reconstruct the system architecture. The techniques explained in this paper are bottom up techniques, top down approaches and hybrid techniques.
B. Bottom up Techniques:
In the bottom up technique information gathering for
reconstruction the architecture is started from the lower level of gathering facts and aggregate the knowledge to higher levels. Source code analysis is populated in a repository which is inquired to get abstract representations of the system [9] [3]. The process of bottom up techniques is shown in figure 2.
Fig. 2. view extraction from source code (1) and then refinement of
extracted views (2)
There are many bottom up techniques but only ARMIN, Dali and Rigi are discussed in this paper due to their good results.
a) Architecture Reconstruction and Mining: ARMIN
(Architecture Reconstruction and Mining) is an architecture
reconstruction tool developed by the Software Engineering
Institute and Robert Bosch Corporation. Once data is
gathered, further relationships are then manipulated. This
includes collecting, organizing and collapsing. In the end the
results can be viewed in an aggregator [10]. The architecture
reconstruction method using ARMIN consists of two steps.
The first step is the source information: The elements and their relations are extracted from the system are inserted into ARMIN.
The second step is architectural view composition: Views of the system‟s architecture are produced by extracting the source information via aggregation and manipulation. The views are offered to the reconstructor which is present in the ARMIN tool; user can traverse and manipulate them.
The source code and other information are used as input to the tool. The reconstruction process results into the architectural views presented to the user in the view generator component of the tool. The user can manipulate the views according to his requirements and can generate more views. Figure 3 shows the working of ARMIN.
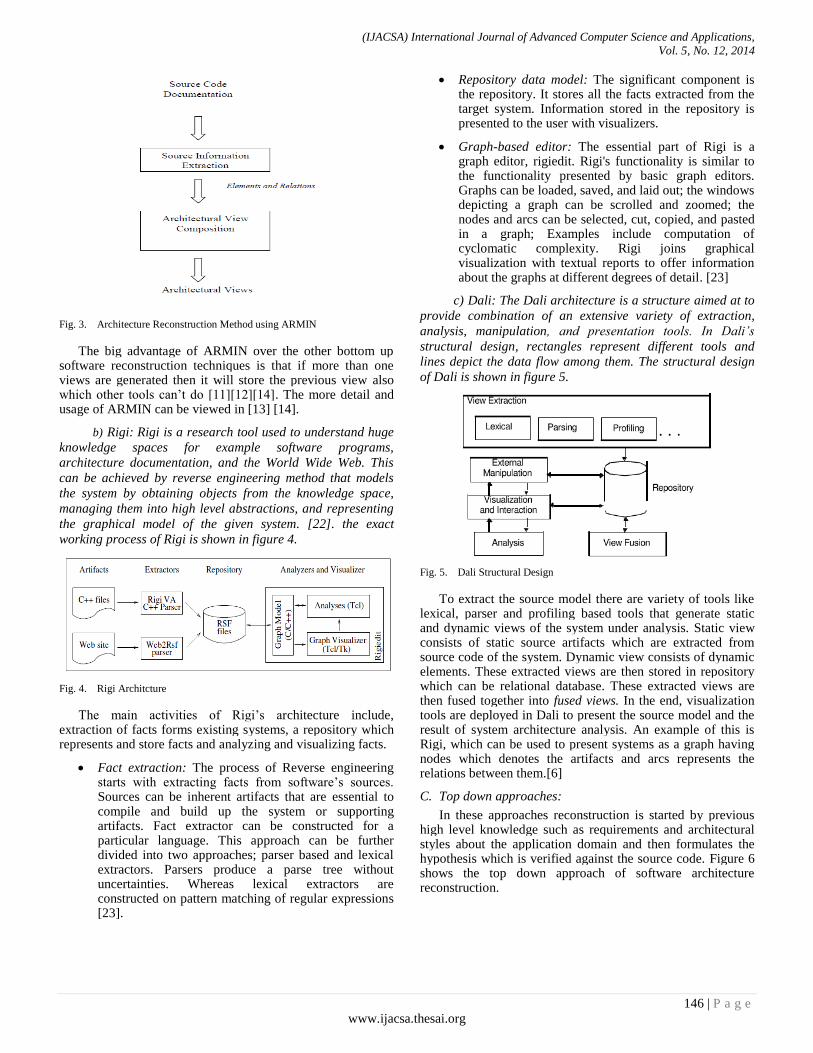
(IJACSA) International Journal of Advanced Computer Science and Applications,
Vol. 5, No. 12, 2014
146 | P a g e
www.ijacsa.thesai.org
Fig. 3. Architecture Reconstruction Method using ARMIN
The big advantage of ARMIN over the other bottom up software reconstruction techniques is that if more than one views are generated then it will store the previous view also which other tools can‟t do [11][12][14]. The more detail and usage of ARMIN can be viewed in [13] [14].
b) Rigi: Rigi is a research tool used to understand huge
knowledge spaces for example software programs,
architecture documentation, and the World Wide Web. This
can be achieved by reverse engineering method that models
the system by obtaining objects from the knowledge space,
managing them into high level abstractions, and representing
the graphical model of the given system. [22]. the exact
working process of Rigi is shown in figure 4.
Fig. 4. Rigi Architcture
The main activities of Rigi‟s architecture include, extraction of facts forms existing systems, a repository which represents and store facts and analyzing and visualizing facts.
Fact extraction: The process of Reverse engineering starts with extracting facts from software‟s sources. Sources can be inherent artifacts that are essential to compile and build up the system or supporting artifacts. Fact extractor can be constructed for a particular language. This approach can be further divided into two approaches; parser based and lexical extractors. Parsers produce a parse tree without uncertainties. Whereas lexical extractors are constructed on pattern matching of regular expressions [23].
Repository data model: The significant component is the repository. It stores all the facts extracted from the target system. Information stored in the repository is presented to the user with visualizers.
Graph-based editor: The essential part of Rigi is a graph editor, rigiedit. Rigi's functionality is similar to the functionality presented by basic graph editors. Graphs can be loaded, saved, and laid out; the windows depicting a graph can be scrolled and zoomed; the nodes and arcs can be selected, cut, copied, and pasted in a graph; Examples include computation of cyclomatic complexity. Rigi joins graphical visualization with textual reports to offer information about the graphs at different degrees of detail. [23]
c) Dali: The Dali architecture is a structure aimed at to
provide combination of an extensive variety of extraction,
analysis, manipulation, and presentation tools. In Dali’s
structural design, rectangles represent different tools and
lines depict the data flow among them. The structural design
of Dali is shown in figure 5.
Fig. 5. Dali Structural Design
To extract the source model there are variety of tools like lexical, parser and profiling based tools that generate static and dynamic views of the system under analysis. Static view consists of static source artifacts which are extracted from source code of the system. Dynamic view consists of dynamic elements. These extracted views are then stored in repository which can be relational database. These extracted views are then fused together into fused views. In the end, visualization tools are deployed in Dali to present the source model and the result of system architecture analysis. An example of this is Rigi, which can be used to present systems as a graph having nodes which denotes the artifacts and arcs represents the relations between them.[6]
C. Top down approaches:
In these approaches reconstruction is started by previous high level knowledge such as requirements and architectural styles about the application domain and then formulates the hypothesis which is verified against the source code. Figure 6 shows the top down approach of software architecture reconstruction.
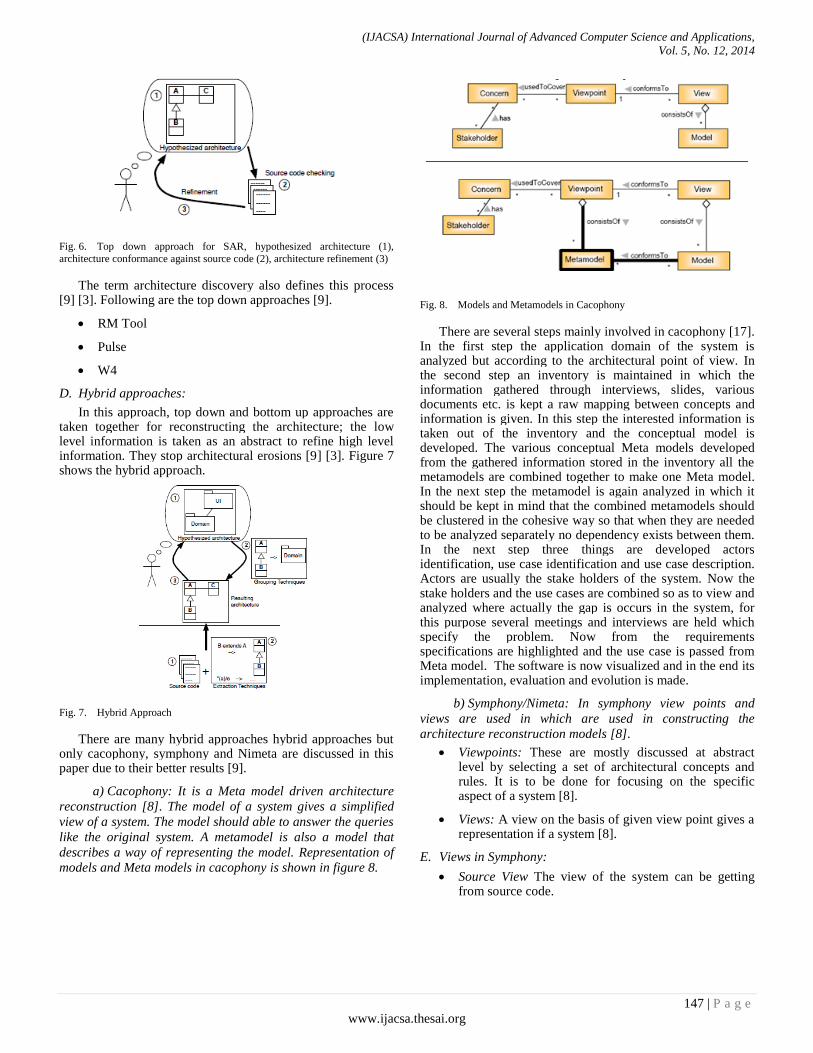
(IJACSA) International Journal of Advanced Computer Science and Applications,
Vol. 5, No. 12, 2014
147 | P a g e
www.ijacsa.thesai.org
Fig. 6. Top down approach for SAR, hypothesized architecture (1),
architecture conformance against source code (2), architecture refinement (3)
The term architecture discovery also defines this process [9] [3]. Following are the top down approaches [9].
RM Tool
Pulse
W4
D. Hybrid approaches:
In this approach, top down and bottom up approaches are taken together for reconstructing the architecture; the low level information is taken as an abstract to refine high level information. They stop architectural erosions [9] [3]. Figure 7 shows the hybrid approach.
Fig. 7. Hybrid Approach
There are many hybrid approaches hybrid approaches but only cacophony, symphony and Nimeta are discussed in this paper due to their better results [9].
a) Cacophony: It is a Meta model driven architecture
reconstruction [8]. The model of a system gives a simplified
view of a system. The model should able to answer the queries
like the original system. A metamodel is also a model that
describes a way of representing the model. Representation of
models and Meta models in cacophony is shown in figure 8.
Fig. 8. Models and Metamodels in Cacophony
There are several steps mainly involved in cacophony [17]. In the first step the application domain of the system is analyzed but according to the architectural point of view. In the second step an inventory is maintained in which the information gathered through interviews, slides, various documents etc. is kept a raw mapping between concepts and information is given. In this step the interested information is taken out of the inventory and the conceptual model is developed. The various conceptual Meta models developed from the gathered information stored in the inventory all the metamodels are combined together to make one Meta model. In the next step the metamodel is again analyzed in which it should be kept in mind that the combined metamodels should be clustered in the cohesive way so that when they are needed to be analyzed separately no dependency exists between them. In the next step three things are developed actors identification, use case identification and use case description. Actors are usually the stake holders of the system. Now the stake holders and the use cases are combined so as to view and analyzed where actually the gap is occurs in the system, for this purpose several meetings and interviews are held which specify the problem. Now from the requirements specifications are highlighted and the use case is passed from Meta model. The software is now visualized and in the end its implementation, evaluation and evolution is made.
b) Symphony/Nimeta: In symphony view points and
views are used in which are used in constructing the
architecture reconstruction models [8].
Viewpoints: These are mostly discussed at abstract level by selecting a set of architectural concepts and rules. It is to be done for focusing on the specific aspect of a system [8].
Views: A view on the basis of given view point gives a representation if a system [8].
E. Views in Symphony:
Source View The view of the system can be getting from source code.
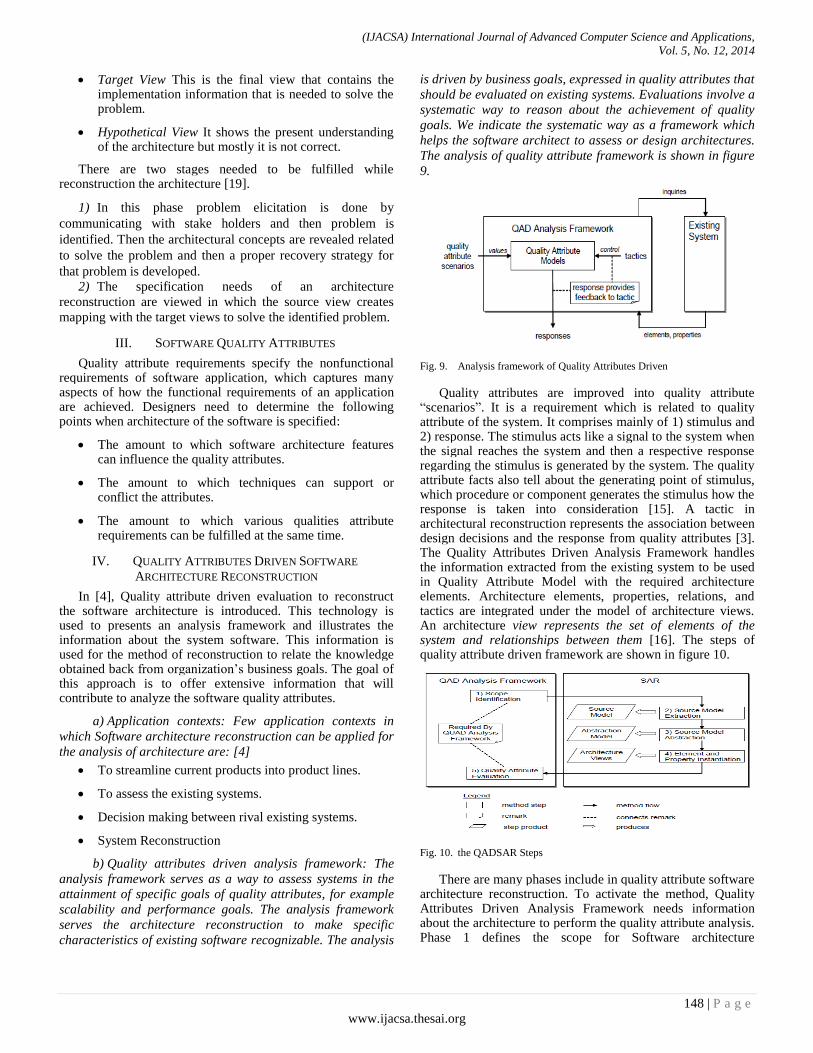
(IJACSA) International Journal of Advanced Computer Science and Applications,
Vol. 5, No. 12, 2014
148 | P a g e
www.ijacsa.thesai.org
Target View This is the final view that contains the implementation information that is needed to solve the problem.
Hypothetical View It shows the present understanding of the architecture but mostly it is not correct.
There are two stages needed to be fulfilled while reconstruction the architecture [19].
1) In this phase problem elicitation is done by
communicating with stake holders and then problem is
identified. Then the architectural concepts are revealed related
to solve the problem and then a proper recovery strategy for
that problem is developed.
2) The specification needs of an architecture
reconstruction are viewed in which the source view creates
mapping with the target views to solve the identified problem.
III. SOFTWARE QUALITY ATTRIBUTES
Quality attribute requirements specify the nonfunctional requirements of software application, which captures many aspects of how the functional requirements of an application are achieved. Designers need to determine the following points when architecture of the software is specified:
The amount to which software architecture features can influence the quality attributes.
The amount to which techniques can support or conflict the attributes.
The amount to which various qualities attribute requirements can be fulfilled at the same time.
IV. QUALITY ATTRIBUTES DRIVEN SOFTWARE
ARCHITECTURE RECONSTRUCTION
In [4], Quality attribute driven evaluation to reconstruct the software architecture is introduced. This technology is used to presents an analysis framework and illustrates the information about the system software. This information is used for the method of reconstruction to relate the knowledge obtained back from organization‟s business goals. The goal of this approach is to offer extensive information that will contribute to analyze the software quality attributes.
a) Application contexts: Few application contexts in
which Software architecture reconstruction can be applied for
the analysis of architecture are: [4]
To streamline current products into product lines.
To assess the existing systems.
Decision making between rival existing systems.
System Reconstruction
b) Quality attributes driven analysis framework: The
analysis framework serves as a way to assess systems in the
attainment of specific goals of quality attributes, for example
scalability and performance goals. The analysis framework
serves the architecture reconstruction to make specific
characteristics of existing software recognizable. The analysis
is driven by business goals, expressed in quality attributes that
should be evaluated on existing systems. Evaluations involve a
systematic way to reason about the achievement of quality
goals. We indicate the systematic way as a framework which
helps the software architect to assess or design architectures.
The analysis of quality attribute framework is shown in figure
9.
Fig. 9. Analysis framework of Quality Attributes Driven
Quality attributes are improved into quality attribute “scenarios”. It is a requirement which is related to quality attribute of the system. It comprises mainly of 1) stimulus and 2) response. The stimulus acts like a signal to the system when the signal reaches the system and then a respective response regarding the stimulus is generated by the system. The quality attribute facts also tell about the generating point of stimulus, which procedure or component generates the stimulus how the response is taken into consideration [15]. A tactic in architectural reconstruction represents the association between design decisions and the response from quality attributes [3]. The Quality Attributes Driven Analysis Framework handles the information extracted from the existing system to be used in Quality Attribute Model with the required architecture elements. Architecture elements, properties, relations, and tactics are integrated under the model of architecture views. An architecture view represents the set of elements of the system and relationships between them [16]. The steps of quality attribute driven framework are shown in figure 10.
Fig. 10. the QADSAR Steps
There are many phases include in quality attribute software architecture reconstruction. To activate the method, Quality Attributes Driven Analysis Framework needs information about the architecture to perform the quality attribute analysis. Phase 1 defines the scope for Software architecture
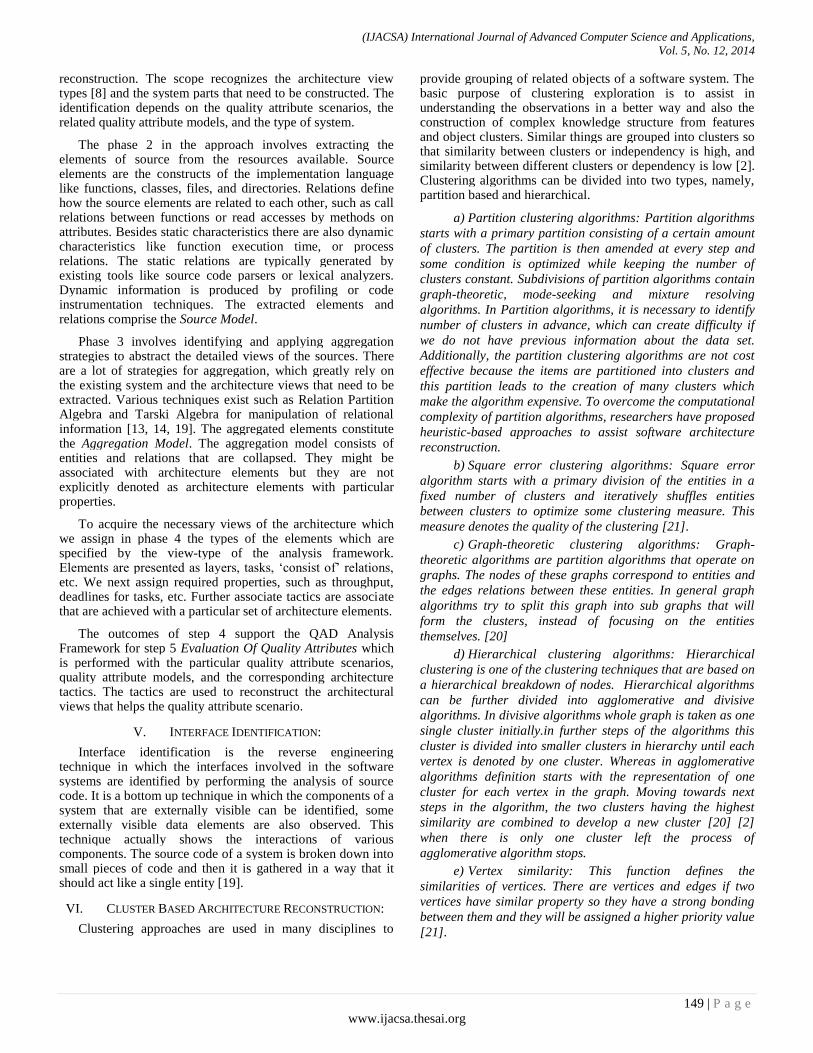
(IJACSA) International Journal of Advanced Computer Science and Applications,
Vol. 5, No. 12, 2014
149 | P a g e
www.ijacsa.thesai.org
reconstruction. The scope recognizes the architecture view types [8] and the system parts that need to be constructed. The identification depends on the quality attribute scenarios, the related quality attribute models, and the type of system.
The phase 2 in the approach involves extracting the elements of source from the resources available. Source elements are the constructs of the implementation language like functions, classes, files, and directories. Relations define how the source elements are related to each other, such as call relations between functions or read accesses by methods on attributes. Besides static characteristics there are also dynamic characteristics like function execution time, or process relations. The static relations are typically generated by existing tools like source code parsers or lexical analyzers. Dynamic information is produced by profiling or code instrumentation techniques. The extracted elements and relations comprise the Source Model.
Phase 3 involves identifying and applying aggregation strategies to abstract the detailed views of the sources. There are a lot of strategies for aggregation, which greatly rely on the existing system and the architecture views that need to be extracted. Various techniques exist such as Relation Partition Algebra and Tarski Algebra for manipulation of relational information [13, 14, 19]. The aggregated elements constitute the Aggregation Model. The aggregation model consists of entities and relations that are collapsed. They might be associated with architecture elements but they are not explicitly denoted as architecture elements with particular properties.
To acquire the necessary views of the architecture which we assign in phase 4 the types of the elements which are specified by the view-type of the analysis framework. Elements are presented as layers, tasks, „consist of‟ relations, etc. We next assign required properties, such as throughput, deadlines for tasks, etc. Further associate tactics are associate that are achieved with a particular set of architecture elements.
The outcomes of step 4 support the QAD Analysis Framework for step 5 Evaluation Of Quality Attributes which is performed with the particular quality attribute scenarios, quality attribute models, and the corresponding architecture tactics. The tactics are used to reconstruct the architectural views that helps the quality attribute scenario.
V. INTERFACE IDENTIFICATION:
Interface identification is the reverse engineering technique in which the interfaces involved in the software systems are identified by performing the analysis of source code. It is a bottom up technique in which the components of a system that are externally visible can be identified, some externally visible data elements are also observed. This technique actually shows the interactions of various components. The source code of a system is broken down into small pieces of code and then it is gathered in a way that it should act like a single entity [19].
VI. CLUSTER BASED ARCHITECTURE RECONSTRUCTION:
Clustering approaches are used in many disciplines to
provide grouping of related objects of a software system. The basic purpose of clustering exploration is to assist in understanding the observations in a better way and also the construction of complex knowledge structure from features and object clusters. Similar things are grouped into clusters so that similarity between clusters or independency is high, and similarity between different clusters or dependency is low [2]. Clustering algorithms can be divided into two types, namely, partition based and hierarchical.
a) Partition clustering algorithms: Partition algorithms
starts with a primary partition consisting of a certain amount
of clusters. The partition is then amended at every step and
some condition is optimized while keeping the number of
clusters constant. Subdivisions of partition algorithms contain
graph-theoretic, mode-seeking and mixture resolving
algorithms. In Partition algorithms, it is necessary to identify
number of clusters in advance, which can create difficulty if
we do not have previous information about the data set.
Additionally, the partition clustering algorithms are not cost
effective because the items are partitioned into clusters and
this partition leads to the creation of many clusters which
make the algorithm expensive. To overcome the computational
complexity of partition algorithms, researchers have proposed
heuristic-based approaches to assist software architecture
reconstruction.
b) Square error clustering algorithms: Square error
algorithm starts with a primary division of the entities in a
fixed number of clusters and iteratively shuffles entities
between clusters to optimize some clustering measure. This
measure denotes the quality of the clustering [21].
c) Graph-theoretic clustering algorithms: Graph-
theoretic algorithms are partition algorithms that operate on
graphs. The nodes of these graphs correspond to entities and
the edges relations between these entities. In general graph
algorithms try to split this graph into sub graphs that will
form the clusters, instead of focusing on the entities
themselves. [20]
d) Hierarchical clustering algorithms: Hierarchical
clustering is one of the clustering techniques that are based on
a hierarchical breakdown of nodes. Hierarchical algorithms
can be further divided into agglomerative and divisive
algorithms. In divisive algorithms whole graph is taken as one
single cluster initially.in further steps of the algorithms this
cluster is divided into smaller clusters in hierarchy until each
vertex is denoted by one cluster. Whereas in agglomerative
algorithms definition starts with the representation of one
cluster for each vertex in the graph. Moving towards next
steps in the algorithm, the two clusters having the highest
similarity are combined to develop a new cluster [20] [2]
when there is only one cluster left the process of
agglomerative algorithm stops.
e) Vertex similarity: This function defines the
similarities of vertices. There are vertices and edges if two
vertices have similar property so they have a strong bonding
between them and they will be assigned a higher priority value
[21].
(IJACSA) International Journal of Advanced Computer Science and Applications,
Vol. 5, No. 12, 2014
150 | P a g e
www.ijacsa.thesai.org
VII. COMPARATIVE ANALYSIS
In architecture reconstruction process the top down and bottom up approaches are used these approaches are not only advantageous but also they have many draw backs. The drawback of bottom up approaches is that they are mostly manual, consume much time and they can only work in the particular domain the knowledge used in the specified domains are mostly used as an input knowledge. The drawback of clustering is that these algorithms are automated and their verification is manual. The drawback of top down approach is that they generate many views at a time during exploration and it creates ambiguities in finding the interested views so an interested view can only be found by analyzing each view separately [24].
ARMIN extracted information from the code in rigi standard format [14]. The big advantage of ARMIN over the other bottom up software reconstruction techniques is that if more than one views are generated then it will store the previous view also which other tools can‟t do [11][12][14].
The information gathered from software is manipulated and visualized using rigi. It contains an interpreter that applies operations on the visuals extracted from the software. The nodes can be selected or removed manually. Parsers are present in rigi that give the extracted information in rigi standard format. Dali is the collection of many tools. Dali is the extension of rigi because in rigi only the visual effect of the extracted information is shown but in Dali queries can be applied on data generated by view of the system. In Dali more than one view are generated at a time. ARMIN is the further extension of Dali. It has the effect of both rigi and Dali but it is advantageous over both the techniques that it not only generates many views bit it can also store the previous views [25].
VIII. CONCLUSION
In this paper we briefly analyze different approaches for software architecture reconstruction process. It is seen that among all approaches bottom up approach is the appropriate approach for reconstruction the architecture because top down and hybrid approaches at certain points leads to the bottom approach. ARMIN is the most appropriate tool for performing architecture reconstruction because it sum up the aspects of all other tools in it and provides an ease of use to the users. After this survey in the future the architecture reconstruction is performed practically using ARMIN.
REFERENCES
[1] Damien Pollet Stéphane Ducasse Loïc Poyet Ilham Alloui Sorana Cîmpan Hervé Verjus Towards A Process-Oriented Software Architecture Reconstruction Taxonomy, LISTIC, University de Savoie, France, july-aug-2009.
[2] Ioana Sora, Gabriel Glodean, Mihai Gligor, Software Architecture Reconstruction: An Approach Based on Combining Graph Clustering and Partitioning. Proceedings of the (ICCC-CONTI), 2010 International Joint Conference on 27-29 May 2010 Department of Computers Politehnica University of Timisoara
[3] Stéphane Ducasse Damien Pollet. Software Architecture Reconstruction: a Process-Oriented Taxonomy July/August 2009 (vol. 35 no. 4)
[4] Christophe Stoermer, liam O‟brien , Chris Verhoe, Moving Towards Quality Attribute Driven Software Architecture Reconstruction.
Proceeding WCRE '03 Proceedings of the 10th Working Conference on Reverse Engineering
[5] http://www.sei.cmu.edu/architecture/research/previousresearch/reconstruction.cfm. Liam O‟Brien Software Engineering Institute Carnegie Mellon University 4500 Fifth Avenue Pittsburgh, Chris Verhoef Free University of Amsterdam De Boelelaan 1081a 1081 HV Amsterdam The Netherlands
[6] Software Architecture Reconstruction René L. Krikhaar.
[7] Claudio Riva, View-based Software Architecture Reconstruction. Institute of Information Systems Distributed Systems Group Vienna, Austria
[8] Vijaya Datta Mayyuri Software Architecture Reconstruction, Symphony, Cacophony. Reverse Engineering, 2004. Proceedings. 11th Working Conference, 8-12 Nov, 2004.
[9] Mircea Lungu ,The 5 questions you always asked yourself about Software Architecture Recovery, Faculty of Informatics, University of Lugano October 2008.
[10] Ian Gorton, Liming Zhu, Tool Support for Just-in-Time Architecture Reconstruction and Evaluation: An Experience Report. Proceedings of the 27th international conference on Software engineering, 2005
[11] Study Liam O‟Brien Christoph Stoermer ,Architecture Reconstruction Case, April 2003
[12] Liam O' BrienVorachat Tamarree Architecture Reconstruction of J2EE Applications: Generating Views from the IVIodule View type, November 2003
[13] Rick Kazman Liam O'Brien Chris Verhoef , Architecture Reconstruction Guidelines, Third Edition Publisher, Software Engineering Institute, November 2003.
[14] Liam O‟Brien1 Dennis Smith, Grace Lewis Supporting Migration to Services using Software Architecture Reconstruction, Software Technology and Engineering Practice, 2005. 13th IEEE International Workshop
[15] Bass, L.; Clements, P. and Kazman, R. Software Architecture in Practice, third Edition. Publisher, Addison Wesley, October 5, 2012
[16] Clements, P.; Bachmann, F.; Bass, L.; Garlan, D.; Ivers, J.; Little, R.; Nord, R. and Stafford, J., Documenting Software Architectures: Views and Beyond, publisher, Addison Wesley, October 6, 2002.
[17] Jean-Marie Favre, Cacophony Metamodel-Driven Software Architecture Reconstruction, University of Grenoble, France
[18] van Deursen, A. CWI & Delft Univ. of Technol., Netherlands Hofmeister, Christine ; Koschke, R. ; Moonen, L. ; Symphony: View-Driven Software Architecture Reconstruction. Software Architecture, 2004. WICSA 2004. Proceedings. Fourth Working IEEE/IFIP Conference on12-15 June 2004
[19] Michael W. Barton Richard C. Chapman. A Technique to Identify Component Interfaces.
[20] Chung-Horng Lung , Software Architecture Recovery and Restructuring through Clustering Techniques, ,Software Engineering Analysis Lab, Nortel, Proc. of the 3rd International Software Architecture Workshop (ISAW), 1998
[21] Niels Streekmann, Clustering-Based Support for Software Architecture Restructuring, Publisher, Vieweg+Teubner Verlag; 2011 edition (December 14, 2011)
[22] Kenny Wong , Rigi User‟s Manual Version 5.4.4 June 30, 1998
[23] Holger M. Kienle Hausi A. Muller, the Rigi Reverse Engineering Environment, University of Victoria, Canada
[24] Mrs. S. Rajeshwari Mr. Telugu Manohar Software Reconstruction Techniques For Software Architecture published in International Journal of Advanced Trends in Computer Science and Engineering, , 2013.
[25] Carnegie Mellon Liam O'Brien Christoph Stoermer Chris Verhoef Software Architecture Reconstruction: Practice Needs and Current Approaches Publisher, Software Engineering Institute August 2002

(IJACSA) International Journal of Advanced Computer Science and Applications,
Vol. 5, No. 12, 2014
151 | P a g e
www.ijacsa.thesai.org
Zigbee Routing Opnet Simulation for a Wireless
Sensors Network
ELKISSANI Kaoutar
Labo IR2M FST Settat
Université Hassan 1er
Settat,Morroco
Pr.Moughit Mohammed
Labo IR2M FST Settat
Université Hassan 1er
Settat,Morroco
Pr.Nasserdine Bouchaib
Labo IR2M FST Settat
Université Hassan 1er
Settat,Morroco
Abstract—Wireless sensor network are nowadays considered
as a viable solution for medical application . A zigbee network
model is more suitable for battery capacity, bandwidth, and
computing limitation for WSN. This paper will present an Opnet
simulation of a zigbee network performance in order to compare
routing results in 3 different topologies ( Star , Mesh and Tree ).
Keywords—WSN ; Zigbee; rooting; Opnet
I. INTRODUCTION
The miniaturization of the sensors, the increasingly low cost, the broad range of the types of sensors available as well as wireless support of communication, allow the networks sensors to develop in several applications . They also make it possible to extend the existing applications. The sensors network can appear very useful in many applications when it is a question of collecting and processing data coming from the environment. Among the fields where these networks can offer the best contributions, we quote : military , monitoring, environmental, medical, domestic, commercial, etc.
We could imagine that in the future, the monitoring of the human being vital functions would be possible thanks to microsensors which could be swallowed or installed under the skin [1]. Currently, of the micro-cameras which can be swallowed exist. They are able, without having recourse to the surgery[4], to transmit images of the interior of a human body with a 24 hour endurance[5]. Other ambitious biomedical applications are also presented, such as: monitoring of the level of glucose, the monitoring of the vital bodies or the detection of cancers. The use of the networks of sensors in the field of medicine could bring a permanent monitoring of the patients and a possibility of collecting physiological information of better quality, thus facilitating the diagnosis of some diseases[6].
II. ZIGBEE:
ZigBee is a LP-WPAN (Low Power-Wireless Personal Area Network): it is a wireless network with short range and low power consumption. It is characterized by a range of a few hundred meters and a low flow (250kbit/s max)[2]. The standard was conceived to inter-connect embarked units like sensors.
It is based on the standard IEEE 802.15.4 for the physical and data link layers proposes its own other layers (network, etc)[2]. The difference between ZigBee and the majority of the other WPAN are the use of the medium; ZigBee is optimized
for a weak use of the medium shared by all, for example 0,1% of time.
Typically, a transmitting receiving ZigBee module will occupy the medium during a few milliseconds in emission, will await possibly an answer or an aquitiment , then will be be in stand by for a long period before the next emission, which will take place at one predetermined moment.
This need introduces interesting problems of research, in particular on the level of the data link layer (Delay , storage and access to the medium) and network (routing respecting energy constraints). ZigBee envisages two types of entities network: the FFD (Full Function Device) implement the totality of the specification and the RFD (Reduced Function Device) are entities reduced in an objective of less power consumption and less memory use for the microcontrolor.
RFD are necessarily final nodes of the network because they does not implement a routing mechanism. Typically, an embarked sensor will be RFD and supplied with batteries, whereas a central processing unit of treatment, supplied with a source not forced by an energy containte (hand powered), is FFD with the function of routing.
IEEE 802.15.4, ZigBee can work on three frequency bands: 868MHz (Europe), 915MHz (North America) and 2,4GHz (World). The standard envisages two different physical layers (PHY), for the 868/915MHz (PHY868/915) and a second for 2,4GHz (PHY2450) implementing a spread spectrum modulation.
A. Zigbee protocole:
The ZigBee pile is composed of several layers of which the physical layer (PHY), MAC layer, layer network (NWK), underlayer support application (APS) and ZigBee Device Object (ZDO). In the following figure is the ZigBee pile with its layers.
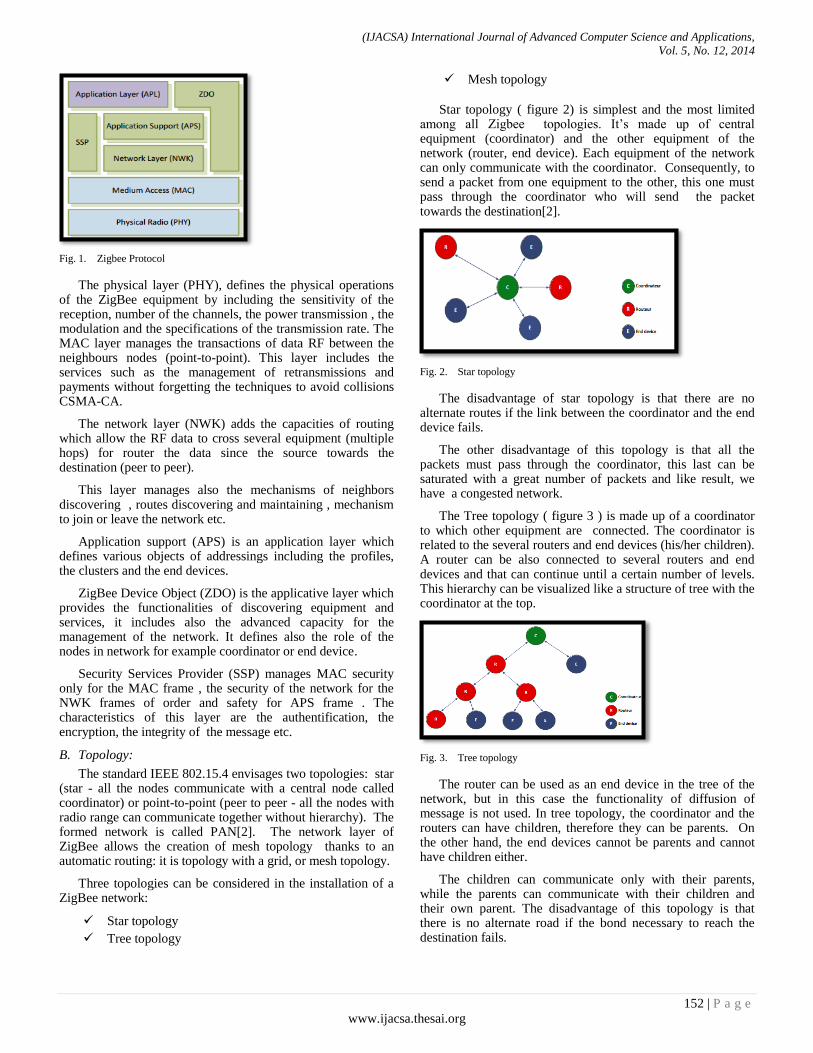
(IJACSA) International Journal of Advanced Computer Science and Applications,
Vol. 5, No. 12, 2014
152 | P a g e
www.ijacsa.thesai.org
Fig. 1. Zigbee Protocol
The physical layer (PHY), defines the physical operations of the ZigBee equipment by including the sensitivity of the reception, number of the channels, the power transmission , the modulation and the specifications of the transmission rate. The MAC layer manages the transactions of data RF between the neighbours nodes (point-to-point). This layer includes the services such as the management of retransmissions and payments without forgetting the techniques to avoid collisions CSMA-CA.
The network layer (NWK) adds the capacities of routing which allow the RF data to cross several equipment (multiple hops) for router the data since the source towards the destination (peer to peer).
This layer manages also the mechanisms of neighbors discovering , routes discovering and maintaining , mechanism to join or leave the network etc.
Application support (APS) is an application layer which defines various objects of addressings including the profiles, the clusters and the end devices.
ZigBee Device Object (ZDO) is the applicative layer which provides the functionalities of discovering equipment and services, it includes also the advanced capacity for the management of the network. It defines also the role of the nodes in network for example coordinator or end device.
Security Services Provider (SSP) manages MAC security only for the MAC frame , the security of the network for the NWK frames of order and safety for APS frame . The characteristics of this layer are the authentification, the encryption, the integrity of the message etc.
B. Topology:
The standard IEEE 802.15.4 envisages two topologies: star (star - all the nodes communicate with a central node called coordinator) or point-to-point (peer to peer - all the nodes with radio range can communicate together without hierarchy). The formed network is called PAN[2]. The network layer of ZigBee allows the creation of mesh topology thanks to an automatic routing: it is topology with a grid, or mesh topology.
Three topologies can be considered in the installation of a ZigBee network:
Star topology
Tree topology
Mesh topology
Star topology ( figure 2) is simplest and the most limited among all Zigbee topologies. It’s made up of central equipment (coordinator) and the other equipment of the network (router, end device). Each equipment of the network can only communicate with the coordinator. Consequently, to send a packet from one equipment to the other, this one must pass through the coordinator who will send the packet towards the destination[2].
Fig. 2. Star topology
The disadvantage of star topology is that there are no alternate routes if the link between the coordinator and the end device fails.
The other disadvantage of this topology is that all the packets must pass through the coordinator, this last can be saturated with a great number of packets and like result, we have a congested network.
The Tree topology ( figure 3 ) is made up of a coordinator to which other equipment are connected. The coordinator is related to the several routers and end devices (his/her children). A router can be also connected to several routers and end devices and that can continue until a certain number of levels. This hierarchy can be visualized like a structure of tree with the coordinator at the top.
Fig. 3. Tree topology
The router can be used as an end device in the tree of the network, but in this case the functionality of diffusion of message is not used. In tree topology, the coordinator and the routers can have children, therefore they can be parents. On the other hand, the end devices cannot be parents and cannot have children either.
The children can communicate only with their parents, while the parents can communicate with their children and their own parent. The disadvantage of this topology is that there is no alternate road if the bond necessary to reach the destination fails.
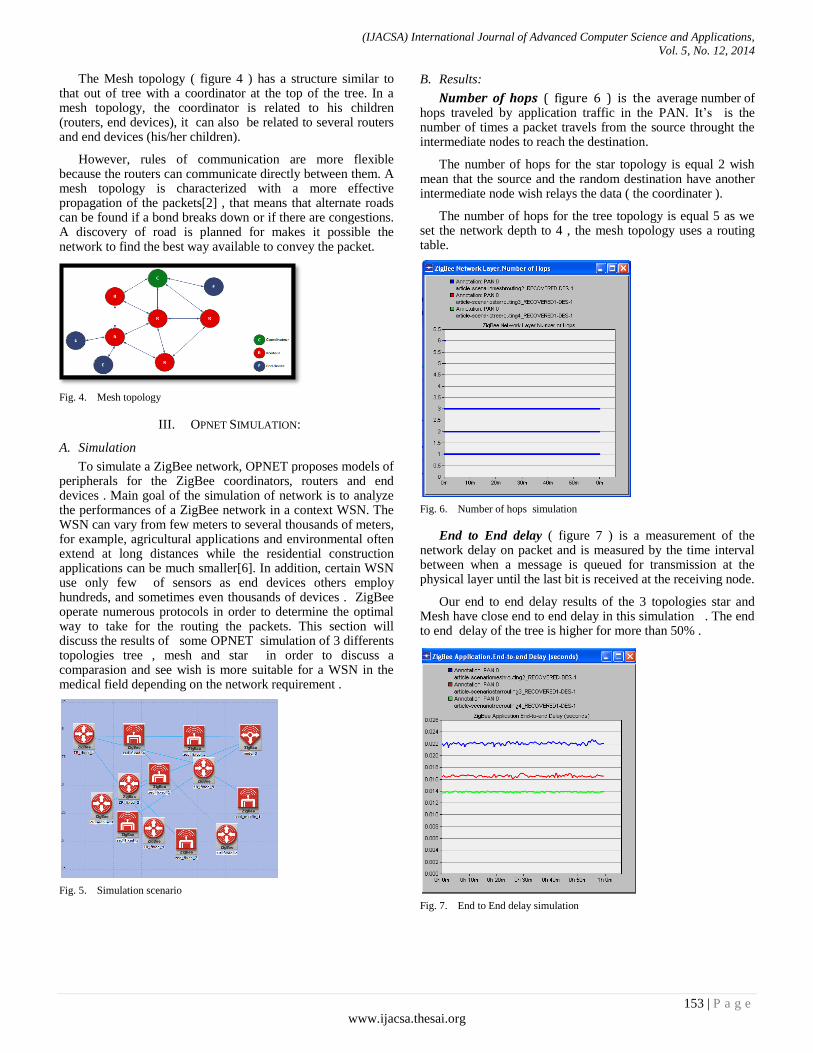
(IJACSA) International Journal of Advanced Computer Science and Applications,
Vol. 5, No. 12, 2014
153 | P a g e
www.ijacsa.thesai.org
The Mesh topology ( figure 4 ) has a structure similar to that out of tree with a coordinator at the top of the tree. In a mesh topology, the coordinator is related to his children (routers, end devices), it can also be related to several routers and end devices (his/her children).
However, rules of communication are more flexible because the routers can communicate directly between them. A mesh topology is characterized with a more effective propagation of the packets[2] , that means that alternate roads can be found if a bond breaks down or if there are congestions. A discovery of road is planned for makes it possible the network to find the best way available to convey the packet.
Fig. 4. Mesh topology
III. OPNET SIMULATION:
A. Simulation
To simulate a ZigBee network, OPNET proposes models of peripherals for the ZigBee coordinators, routers and end devices . Main goal of the simulation of network is to analyze the performances of a ZigBee network in a context WSN. The WSN can vary from few meters to several thousands of meters, for example, agricultural applications and environmental often extend at long distances while the residential construction applications can be much smaller[6]. In addition, certain WSN use only few of sensors as end devices others employ hundreds, and sometimes even thousands of devices . ZigBee operate numerous protocols in order to determine the optimal way to take for the routing the packets. This section will discuss the results of some OPNET simulation of 3 differents topologies tree , mesh and star in order to discuss a comparasion and see wish is more suitable for a WSN in the medical field depending on the network requirement .
Fig. 5. Simulation scenario
B. Results:
Number of hops ( figure 6 ) is the average number of hops traveled by application traffic in the PAN. It’s is the number of times a packet travels from the source throught the intermediate nodes to reach the destination.
The number of hops for the star topology is equal 2 wish mean that the source and the random destination have another intermediate node wish relays the data ( the coordinater ).
The number of hops for the tree topology is equal 5 as we set the network depth to 4 , the mesh topology uses a routing table.
Fig. 6. Number of hops simulation
End to End delay ( figure 7 ) is a measurement of the network delay on packet and is measured by the time interval between when a message is queued for transmission at the physical layer until the last bit is received at the receiving node.
Our end to end delay results of the 3 topologies star and Mesh have close end to end delay in this simulation . The end to end delay of the tree is higher for more than 50% .
Fig. 7. End to End delay simulation

(IJACSA) International Journal of Advanced Computer Science and Applications,
Vol. 5, No. 12, 2014
154 | P a g e
www.ijacsa.thesai.org
IV. CONCLUSION
From all the results , it can be conclude that the tree routing even if it present the lower and to end delay , it’s less suitable for WSN due to number of hops results wish mean more energy consumption . Our future work will be more detailed study of energy efficiency and reliability. The major goal is developing a protocol that would be energy aware considering a medical application for WSN.
REFERENCES
[1] H. Alemdar and C. Ersoy, “Wireless Sensor Networks for Healthcare: A Survey,” ComputerNetworks, Volume 54, Issue 15, pp. 2688-2710, October 2010
[2] P. Baronti, P. Pillai, V. Chook, S. Chessa, A. Gotta, Y.F. Hu, “Wireless Sensor Networks: a Survey on the State of the Art and the 802.15.4 and ZigBee Standards,” Computer Communication, Vol. 30, N°. 7, pp. 1655-1695, 2007.
[3] M. Chen, S. Gonzalez, A. Vasilakos, H. Cao andV-C-M. Leung, “Body Area Networks: A Survey,” Mobile Networks and Applications, Springer, 2010.
[4] Emil Jovanov, Aleksandar Milenkovic, Chris Otto and Piet C de Groen, “A wireless body area network of intelligent motion sensors for computer assisted physical rehabilitation,”
[5] A. Milenkovic, C. Otto, E. Jovanov, “Wireless sensor networks for personal health monitoring: Issues and an implementation”
[6] “A Study of ZigBee Network Topologies for Wireless Sensor Network with One Coordinator and Multiple Coordinators” :Tikrit Journal of Engineering Sciences/Vol.19/No.4/December 2012,


