Embed Size (px)
Citation preview

PREFACE
Objective of Environment Statistics is to provide information about the environment,
its most important changes over time and across locations, and the main factors that
influence them. Ultimately, environment statistics aim at providing high quality statistical
information to improve knowledge of the environment, to support evidence-based policy and
decision making, and to provide information for the general public, as well as for specific
user groups. Environment statistics are multidisciplinary and cross-cutting, involving
numerous sources and stakeholders
Environment statistics aggregate, synthesize and structure environmental and other
data according to statistical methods, standards and procedures. It is the role of environment
statistics to process environmental data into meaningful statistics that describe the state and
trends of the environment and the main processes affecting them. Not all environmental data
are used in the production of environment statistics. The Framework for the Development of
Environment Statistics (FDES) provides a framework that marks out environmental data that
fall within its scope and then structures, synthesizes and aggregates them into meaningful
statistics. Environment statistics support evidence based policy making by enabling the
identification of environmental policy issues and the objective quantification of measures and
impacts of policy initiatives. They strengthen assessments through quantitative metrics,
making analyses more robust through the use of timely and comparable data. The main
products of environment statistics are detailed tabulated environment statistics series,
environmental accounts and environmental indicators
As an endeavor to know our environment, the Department of Economics and
Statistics, Government of Kerala, has been bringing out the publication. This publication has
been categorized into different chapters so as to make it easy for reference. The Department
would like to express gratitude to all parties concerned for their co-operation and assistance
in providing the required data.
This publication is an outcome of earnest effort of Publication Division under the
guidance and supervision of Sri. P. V. Babu, Addl. Director (General) comments and
suggestions towards improving future reports would be greatly appreciated.
Thiruvananthapuram, V. RAMACHANDRAN 27.05.2017 DIRECTOR GENERAL

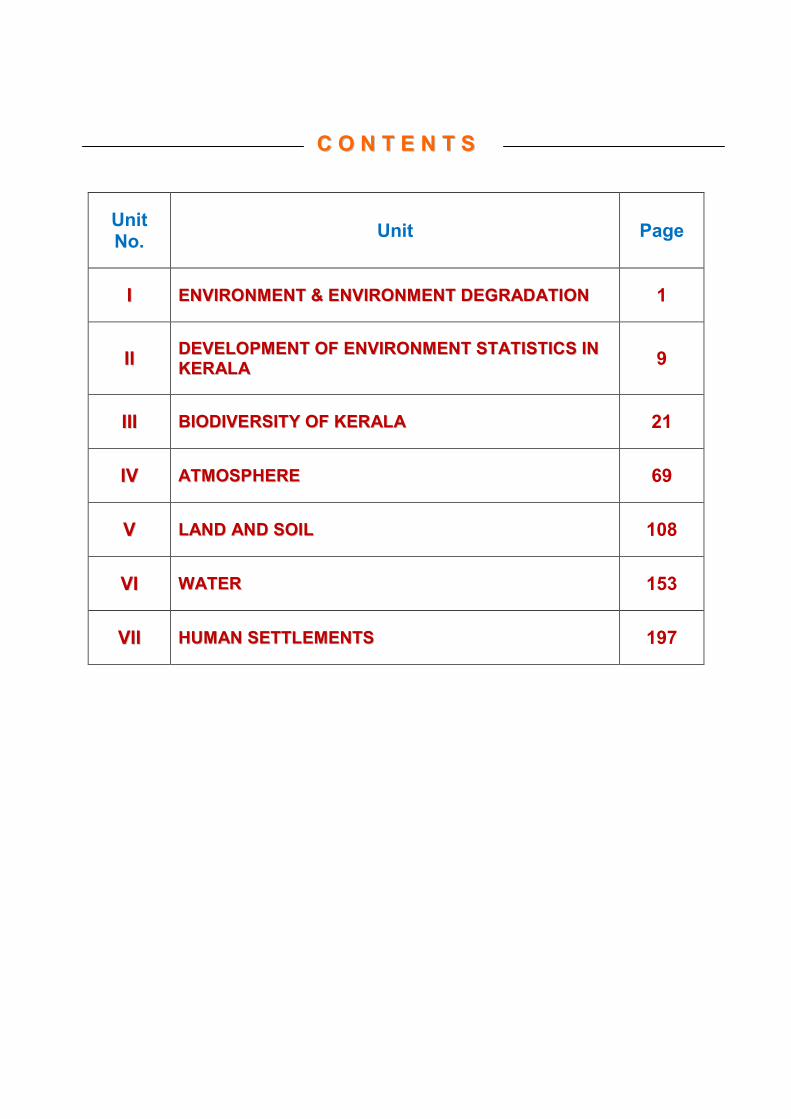
CC OO NN TT EE NN TT SS
Unit No. Unit Page
II EENNVVIIRROONNMMEENNTT && EENNVVIIRROONNMMEENNTT DDEEGGRRAADDAATTIIOONN 1
IIII DDEEVVEELLOOPPMMEENNTT OOFF EENNVVIIRROONNMMEENNTT SSTTAATTIISSTTIICCSS IINN KKEERRAALLAA 9
IIIIII BBIIOODDIIVVEERRSSIITTYY OOFF KKEERRAALLAA 21
IIVV AATTMMOOSSPPHHEERREE 69
VV LLAANNDD AANNDD SSOOIILL 108
VVII WWAATTEERR 153
VVIIII HHUUMMAANN SSEETTTTLLEEMMEENNTTSS 197

C O N T E N TS
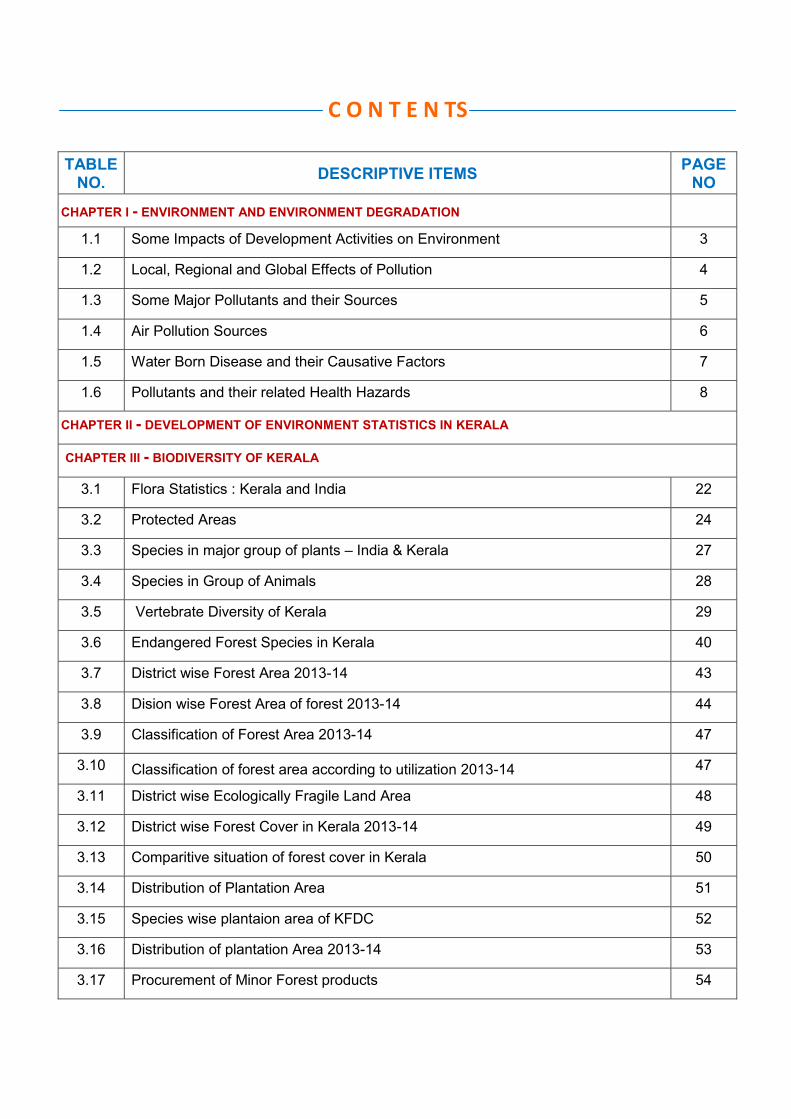
TABLE NO. DESCRIPTIVE ITEMS PAGE
NO CHAPTER I - ENVIRONMENT AND ENVIRONMENT DEGRADATION
1.1 Some Impacts of Development Activities on Environment 3
1.2 Local, Regional and Global Effects of Pollution 4
1.3 Some Major Pollutants and their Sources 5
1.4 Air Pollution Sources 6
1.5 Water Born Disease and their Causative Factors 7
1.6 Pollutants and their related Health Hazards 8
CHAPTER II - DEVELOPMENT OF ENVIRONMENT STATISTICS IN KERALA
CHAPTER III - BIODIVERSITY OF KERALA
3.1 Flora Statistics : Kerala and India 22
3.2 Protected Areas 24
3.3 Species in major group of plants – India & Kerala 27
3.4 Species in Group of Animals 28
3.5 Vertebrate Diversity of Kerala 29
3.6 Endangered Forest Species in Kerala 40
3.7 District wise Forest Area 2013-14 43
3.8 Dision wise Forest Area of forest 2013-14 44
3.9 Classification of Forest Area 2013-14 47
3.10 Classification of forest area according to utilization 2013-14 47
3.11 District wise Ecologically Fragile Land Area 48
3.12 District wise Forest Cover in Kerala 2013-14 49
3.13 Comparitive situation of forest cover in Kerala 50
3.14 Distribution of Plantation Area 51
3.15 Species wise plantaion area of KFDC 52
3.16 Distribution of plantation Area 2013-14 53
3.17 Procurement of Minor Forest products 54
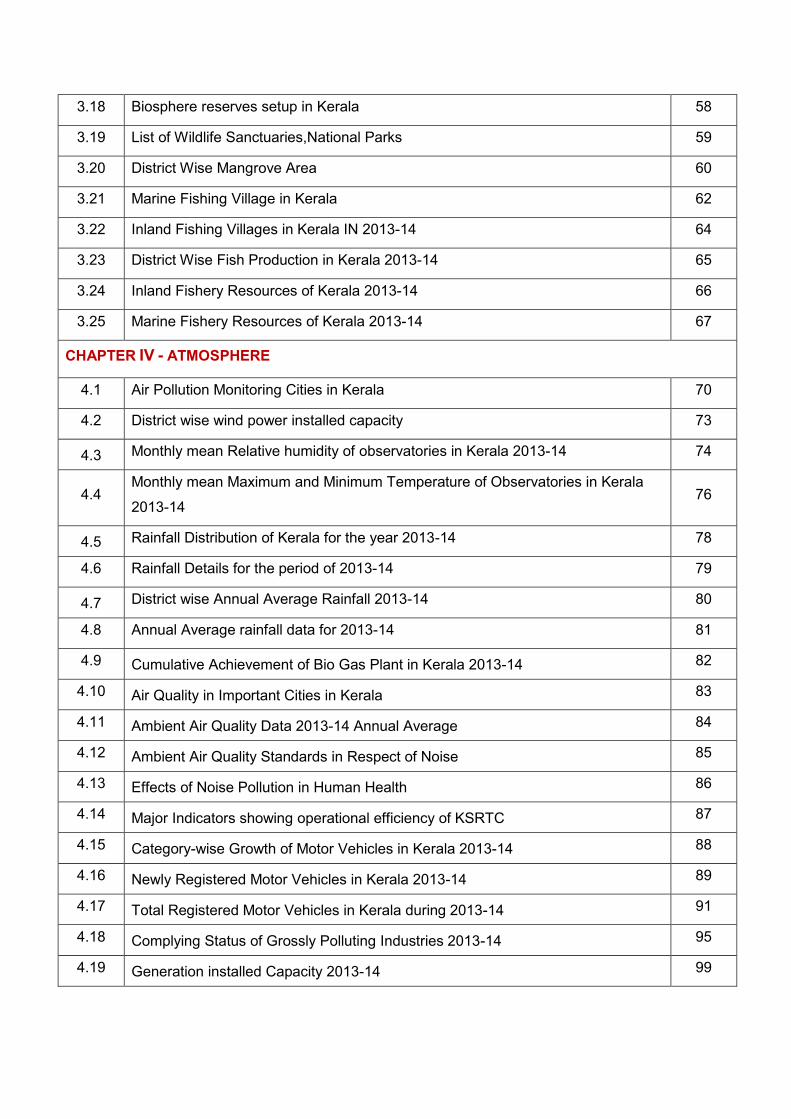
3.18 Biosphere reserves setup in Kerala 58
3.19 List of Wildlife Sanctuaries,National Parks 59
3.20 District Wise Mangrove Area 60
3.21 Marine Fishing Village in Kerala 62
3.22 Inland Fishing Villages in Kerala IN 2013-14 64
3.23 District Wise Fish Production in Kerala 2013-14 65
3.24 Inland Fishery Resources of Kerala 2013-14 66
3.25 Marine Fishery Resources of Kerala 2013-14 67
CHAPTER IV - ATMOSPHERE
4.1 Air Pollution Monitoring Cities in Kerala 70
4.2 District wise wind power installed capacity 73
4.3 Monthly mean Relative humidity of observatories in Kerala 2013-14 74
4.4 Monthly mean Maximum and Minimum Temperature of Observatories in Kerala
2013-14 76
4.5 Rainfall Distribution of Kerala for the year 2013-14 78
4.6 Rainfall Details for the period of 2013-14 79
4.7 District wise Annual Average Rainfall 2013-14 80
4.8 Annual Average rainfall data for 2013-14 81
4.9 Cumulative Achievement of Bio Gas Plant in Kerala 2013-14 82
4.10 Air Quality in Important Cities in Kerala 83
4.11 Ambient Air Quality Data 2013-14 Annual Average 84
4.12 Ambient Air Quality Standards in Respect of Noise 85
4.13 Effects of Noise Pollution in Human Health 86
4.14 Major Indicators showing operational efficiency of KSRTC 87
4.15 Category-wise Growth of Motor Vehicles in Kerala 2013-14 88
4.16 Newly Registered Motor Vehicles in Kerala 2013-14 89
4.17 Total Registered Motor Vehicles in Kerala during 2013-14 91
4.18 Complying Status of Grossly Polluting Industries 2013-14 95
4.19 Generation installed Capacity 2013-14 99

4.20 Transmission & Distribution Lines 2013-14 99
4.21 Generation of Power at different Stations 2013-14 100
4.22 Electricity Generating Capacity of Kerala 2013-14 (MW) 101
4.23 Electricity Generating Capacity of Kerala (MU) 101
4.24 Category wise sales of energy in Kerala 2013-14 102
4.25 Electricity Generating Capacity, Maximum Demand and Load Factor 103
4.26 The details of Indian standards for maximum permissible limits for industrial effluent discharges
104
4.27 Average Gaseous composition of Dry Air in the Troposphere 105
4.28 Summary of Health Effects of Basic Air Polutant 107
CHAPTER V - LAND AND SOIL
5.1 Gross cropped Area, Net Cropped Area and Cropping Intensity 2013-14 113
5.2 Classification of Area on the Basis of Land Utilization 2013-14 115
5.3 Net Area Irrigated Source wise 2013-14 118
5.4 Gross Area under Irrigation (Crop wise ) 2013-14 119
5.5 Area and production of Important Crops in Kerala 2013-14 120
5.6 Area, Production, Productivity of Plantation Crops 2013-14 121
5.7 Chemical Utilization in Kerala 122
5.8 Soil Types in Kerala - District wise 124
5.9 Mineral wise details of Area covered by Mining Leases 127
5.10 Production and Royalty of Minerals in Kerala 2013-14 128
5.11 Heavy Mineral Deposits in Kerala 130
5.12 Heavy Mineral Deposits Oxidised and Unoxidized in Kerala 131
5.13 Graphite deposits in Kerala 2013-14 134
5.14 Consumption of Chemical Fertilizers in Kerala 2013-14 141
5.15 Out turn of Major Forest Produce 2013-14 143
5.16 Total consumtion of all kinds of Wood during 2013-14 144
5.17 Out turn of Timbers based on utility 2013-14 146
5.18 Kerala’s Major Natural Disasters 2013-14 150
5.19 Frequently Occuring Natural Disasters in Kerala 2013-14 151
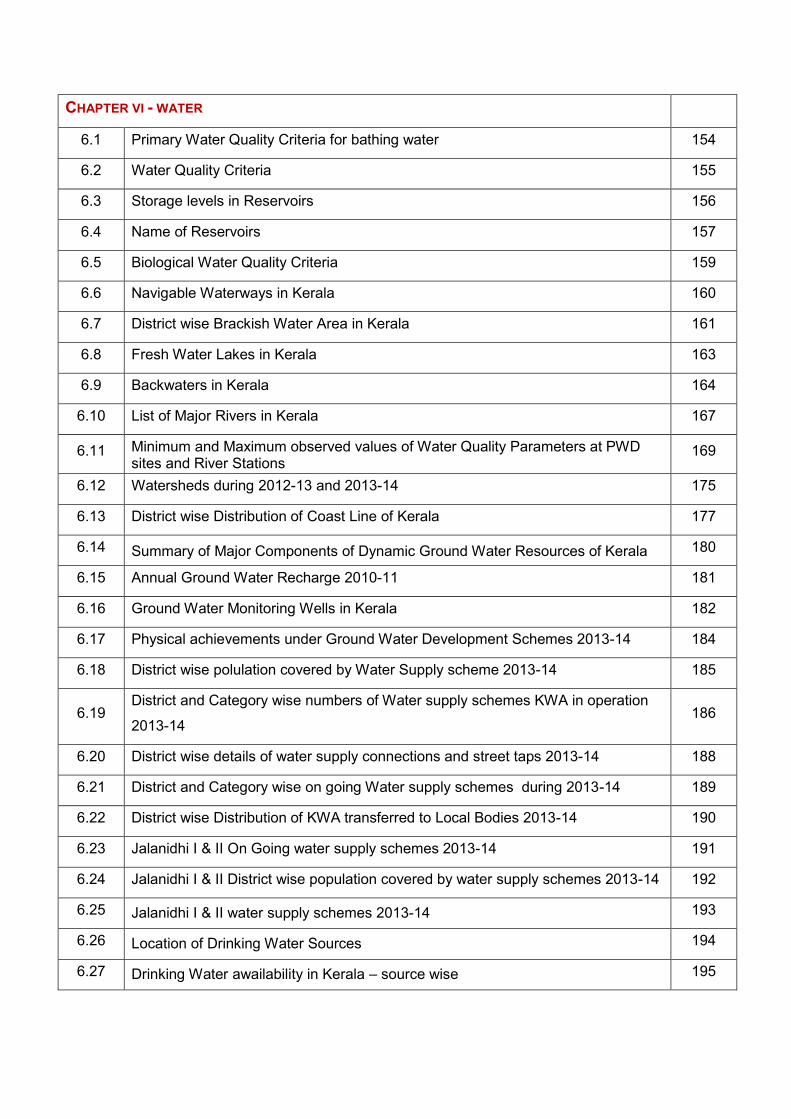
CHAPTER VI - WATER
6.1 Primary Water Quality Criteria for bathing water 154
6.2 Water Quality Criteria 155
6.3 Storage levels in Reservoirs 156
6.4 Name of Reservoirs 157
6.5 Biological Water Quality Criteria 159
6.6 Navigable Waterways in Kerala 160
6.7 District wise Brackish Water Area in Kerala 161
6.8 Fresh Water Lakes in Kerala 163
6.9 Backwaters in Kerala 164
6.10 List of Major Rivers in Kerala 167
6.11 Minimum and Maximum observed values of Water Quality Parameters at PWD sites and River Stations
169
6.12 Watersheds during 2012-13 and 2013-14 175
6.13 District wise Distribution of Coast Line of Kerala 177
6.14 Summary of Major Components of Dynamic Ground Water Resources of Kerala 180
6.15 Annual Ground Water Recharge 2010-11 181
6.16 Ground Water Monitoring Wells in Kerala 182
6.17 Physical achievements under Ground Water Development Schemes 2013-14 184
6.18 District wise polulation covered by Water Supply scheme 2013-14 185
6.19 District and Category wise numbers of Water supply schemes KWA in operation
2013-14 186
6.20 District wise details of water supply connections and street taps 2013-14 188
6.21 District and Category wise on going Water supply schemes during 2013-14 189
6.22 District wise Distribution of KWA transferred to Local Bodies 2013-14 190
6.23 Jalanidhi I & II On Going water supply schemes 2013-14 191
6.24 Jalanidhi I & II District wise population covered by water supply schemes 2013-14 192
6.25 Jalanidhi I & II water supply schemes 2013-14 193
6.26 Location of Drinking Water Sources 194
6.27 Drinking Water awailability in Kerala – source wise 195
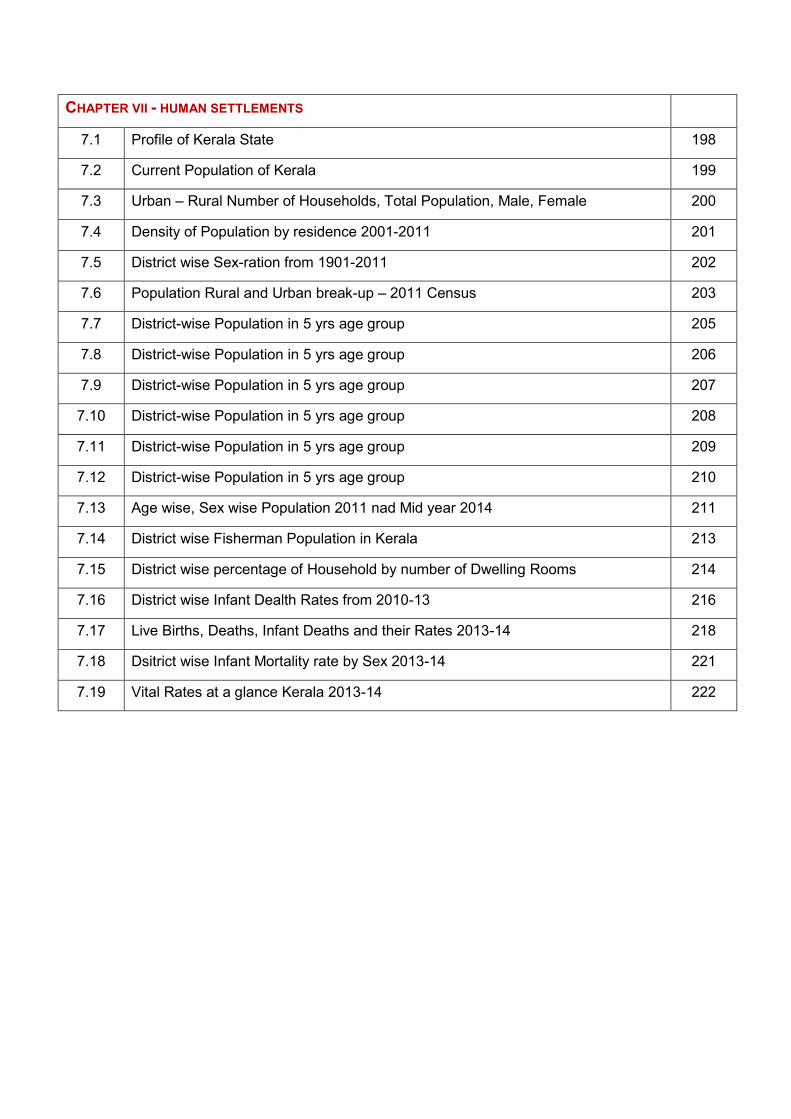
CHAPTER VII - HUMAN SETTLEMENTS
7.1 Profile of Kerala State 198
7.2 Current Population of Kerala 199
7.3 Urban – Rural Number of Households, Total Population, Male, Female 200
7.4 Density of Population by residence 2001-2011 201
7.5 District wise Sex-ration from 1901-2011 202
7.6 Population Rural and Urban break-up – 2011 Census 203
7.7 District-wise Population in 5 yrs age group 205
7.8 District-wise Population in 5 yrs age group 206
7.9 District-wise Population in 5 yrs age group 207
7.10 District-wise Population in 5 yrs age group 208
7.11 District-wise Population in 5 yrs age group 209
7.12 District-wise Population in 5 yrs age group 210
7.13 Age wise, Sex wise Population 2011 nad Mid year 2014 211
7.14 District wise Fisherman Population in Kerala 213
7.15 District wise percentage of Household by number of Dwelling Rooms 214
7.16 District wise Infant Dealth Rates from 2010-13 216
7.17 Live Births, Deaths, Infant Deaths and their Rates 2013-14 218
7.18 Dsitrict wise Infant Mortality rate by Sex 2013-14 221
7.19 Vital Rates at a glance Kerala 2013-14 222

Environment Statistics
nvironment Statistics describe the qualitative and quantitative aspects of the
state of the environment and it’s Interaction with human activities and natural events
by integrating data from a multitude of different subject areas and sources.
Environment statistics is an emerging statistical field in official statistics in most
countries and it is indispensable for evidence based policies and decision making to
support sustainable development.
The Environmental Impact Assessment (EIA) experience in India indicates
that the lack of timely availability of reliable and authentic environmental data has
been a major bottle neck in achieving the full benefits of EIA. The environments
being a multi-disciplinary subject, a multitude of agencies are involved in collection of
environmental data. However, no single organization in India tracks available data
from these agencies and makes it available in one place in a form required by
environmental impact assessment practitioners. Further, environmental data is not
available in enhanced forms that improve the quality of the EIA. This makes it harder
and more time-consuming to generate environmental impact assessments and
receive timely environmental clearances from regulators. With this background, the
Environmental Information Centre (EIC) has been set up to serve as a professionally
managed clearing house of environmental information that can be used by MoEF,
project proponents, consultants, NGOs and other stakeholders involved in the
process of environmental impact assessment in India. EIC caters to the need of
creating and disseminating of organized environmental data for various
developmental initiatives all over the country.
CHAPTER-I
-
CHAPTER-Ii
-
CHAPTER-Iii
-
CHAPTER-IV
-
CHAPTER-V
-
CHAPTER-VI
-
CHAPTER-VII
1
CHAPTER - I
Environment and Environment Degradation
Introduction
nvironment Statistics Kerala is aimed to provide statistical information about the
environment, environmental changes over time in different locations of the State and its impact. It
also support to produce quality statistical information to improve awareness of the environment,
give data support to planners and decision makers in this field and to provide information for the
general public. Statistical information collected and compiled in this publication is based on the
statistical methods, standards and procedures developed by UNSD’s Frame work for the
Development of Environment Statistics (FDES). The role of Environment Statistics is to process
environmental data into meaningful statistics that bring light on the status and trends of the
environment and its impact. Environment regulates the life of the organisms including human
beings that interacting systems of physical, biological and cultural elements which are interlinked
both individually and collectively.
Environment can be defined as the physical surrounding of human being of whom there is
a part on which he/she is depended for their activities like physiological functioning, production
and consumption. The physical environment stretches from air, water and land to natural
resources like energy carriers, soil and plants, animals and ecosystems. The deterioration of the
environment through depletion of resources such as air, water and soil; the destruction of
ecosystems and its impact. It is defined as any change or disturbance to the environment
perceived to be undesirable.
Environment Degradation
Environmental degradation is the deterioration of the environment through depletion of
resources such as air, water and soil; the destruction of ecosystems and the extinction of wildlife.
It is a process through which the natural environment is compromised in some way, reducing
biological diversity and the general health of the environment. This process can be entirely natural
in origin, or it can be accelerated or caused by human intervocations. When natural habitats are
destroyed or natural resources are depleted, the environment is degraded. Efforts to counteract
this problem include environmental protection and environmental resources management. Air,
2
water, and soil are all resources which are vulnerable to depletion through overuse, Scarcity of
natural resources slow down the sustainable production activity and consumption activities which
directly effect the economic development.
Factors affecting Environment degradation:
1. Destruction of natural resources - Soil erosion, land salinization and the loss of nutrients are
the major result of agriculture development and farming activities. Unscientific agricultural
practices, over exploitation of water resources, increased rate of usage of fertilizers and
pesticides and increased non agricultural use of land resulting land degradation and depleting
resources.
2. Water pollution and scarcity – Over use of pesticides and fertilizers and unscientific waste
disposals are the major source of contamination of water bodies.
3. Deforestation - Expansion of agriculture land, unplanned expansion of cities, industrialization,
tourism, etc contribute a lot for the shrinkage of forest area.
4. Air pollution - Air Pollution creates problems of acidification, urban air quality deterioration and
chronic health problems. Urban air quality deterioration is one of the major concerns of present
day urban life.
Social factors:
1. Population - Population impacts in the environment is basically due to the excessive use of
natural resources and unscientific disposal of large quantity of solid and liquid wastes which
resulted in harmful environmental degradation and loss of biodiversity.
2. Poverty - Environment degradation linked with poverty mainly due to pressure extended to
surrounding environment for daily livelihood. Continueous exploitation of natural resources to
satisfy the livelihood of the community degraded the environment to an extend which no
longer sustainable and lead to more poverty and environmental related problems such as
deforestation, poor sanitation, air and water pollution, draught, famine, etc.
3. Urbanization - Deterioration of air and water quality, generation of waste, rural to urban
migration, shortage of proper sanitation and housing facilities together contribute to urban
poverty and environmental degradation. Direct loss in vegetation, biomass from areas with
high probability of urban expansion contributes about 5% of total emission from tropical
deforestation and land use change.
3
Table : 1.1 Some Impacts of Development Activities on Environment
Development Activities Major Impacts on Environment
Forest clearing and land resettlements
Climate change and resultant outcome of extinction of rare species of flora and fauna, creation of condition for mosquito breeding leading to infectious diseases such as malaria, dengue etc.
Shifting cultivation in upland agriculture
Soil erosion in upland areas, soil fertility declines due to shorter cultivation cycle. The ore under natural forest may be declined fragmentation of habitant, disappeance of native species and invation of exotic weeds and other other plants are the ecological areas of flooding of low land areas.
Agro industries create environmental pollution through discharge of organic or hazardous waste to water bodies emission of gasses that affect air quality and produce toxic substances.
Air pollution due to burning of biogases as fuel in sugar mills, large amount of highly polluting organic wastes, surface water pollution
Introduction of new varieties of cereals
Reduction of genetic diversity of traditional monoculture resulting in instability, danger of multiplication of local strains of fungus, bacteria or virus on new variety
Use of pesticides
Organism develops resistance and new control methods are needed (e.g. in malaria, widespread use of dieldrin as a prophylactic agent against pests of oil palms made the problem worse), creation of complex and widespread environment problems. The pesticides used in agriculture sometimes go into food chain or in water bodies which may result in harmful health hazards.
Timber extraction Degrades land, destroys surface soil, reduces production potential of future forests.
Urbanisation and industrialization Concentration of population in urban centers makes huge demands on production in rural areas and put pressures on land, air and water pollution.
Water resource projects, e.g. Dam, extensive irrigation
Human settlement & resettlement, spread of waterborne diseases, reduction of fisheries, siltation, physical changes e.g. temperature, humidity.
4
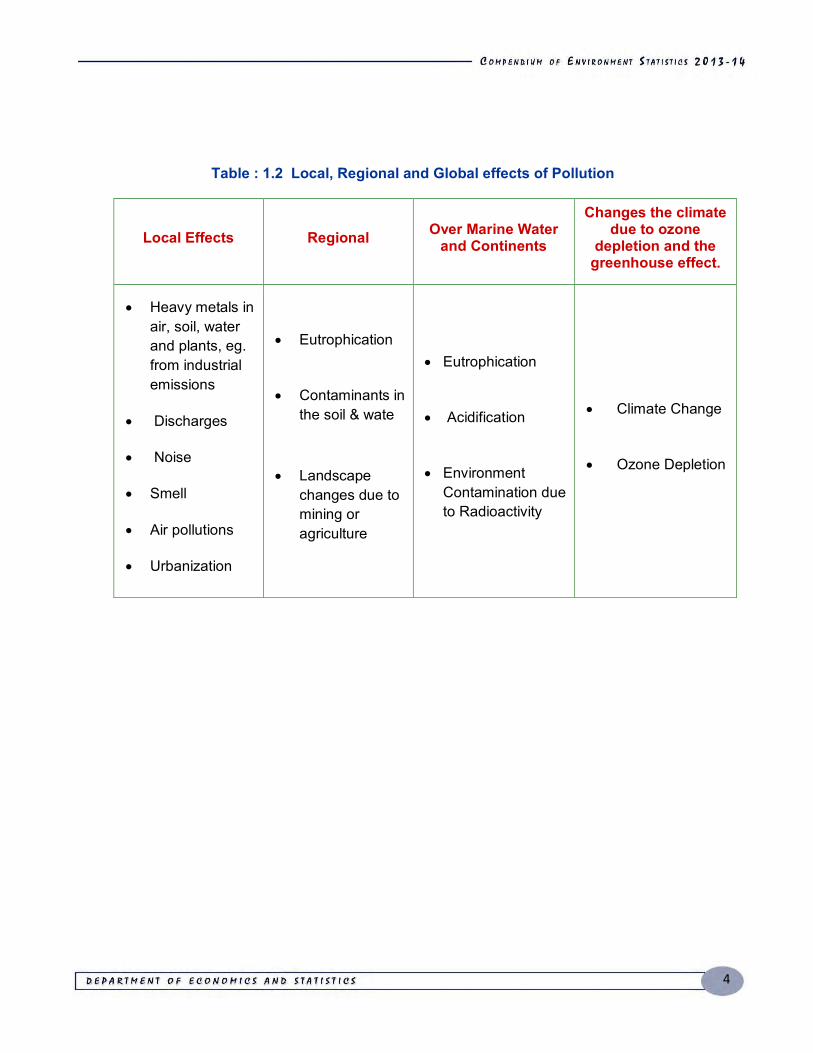
Table : 1.2 Local, Regional and Global effects of Pollution
Local Effects Regional Over Marine Water and Continents
Changes the climate due to ozone
depletion and the greenhouse effect.
Heavy metals in air, soil, water and plants, eg. from industrial emissions
Discharges
Noise
Smell
Air pollutions
Urbanization
Eutrophication
Contaminants in the soil & wate
Landscape changes due to mining or agriculture
Eutrophication
Acidification
Environment Contamination due to Radioactivity
Climate Change
Ozone Depletion

5
Table: 1.3 Some Major Pollutants and their Sources
Pollutant Source
Carbon monoxide Incomplete fuel combustion (e.g. two/four stroke engines)
Sulphur dioxide Emissions by vehicles
Suspended particulate matter Smoke from domestic, industrial and vehicular sources.
Oxides of nitrogen Fuel combustion of motor vehicles, emission from power stations and industrial furnaces
Volatile hydrocarbons Partial combustion of carbonaceous fuels (two stroke engines, industrial processes, disposal of solid wastes).
Oxidants and ozone Emissions from motor vehicles, photochemical reactions of nitrogen oxides and reactive hydrocarbons
Lead Emissions from motor vehicles, Battery industries
6
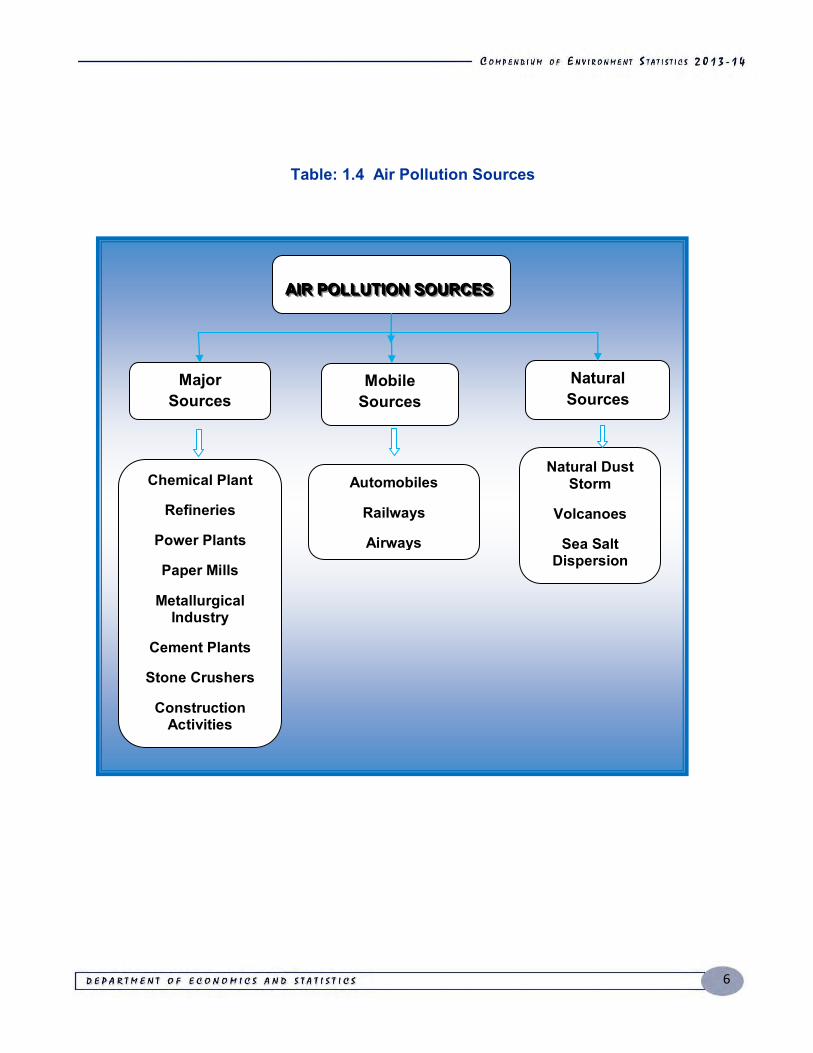
Table: 1.4 Air Pollution Sources
AAAIIIRRR PPPOOOLLLLLLUUUTTTIIIOOONNN SSSOOOUUURRRCCCEEESSS
Major Sources
Mobile Sources
Natural Sources
Chemical Plant
Refineries
Power Plants
Paper Mills
Metallurgical Industry
Cement Plants
Stone Crushers
Construction Activities
Automobiles
Railways
Airways
Natural Dust Storm
Volcanoes
Sea Salt Dispersion
7
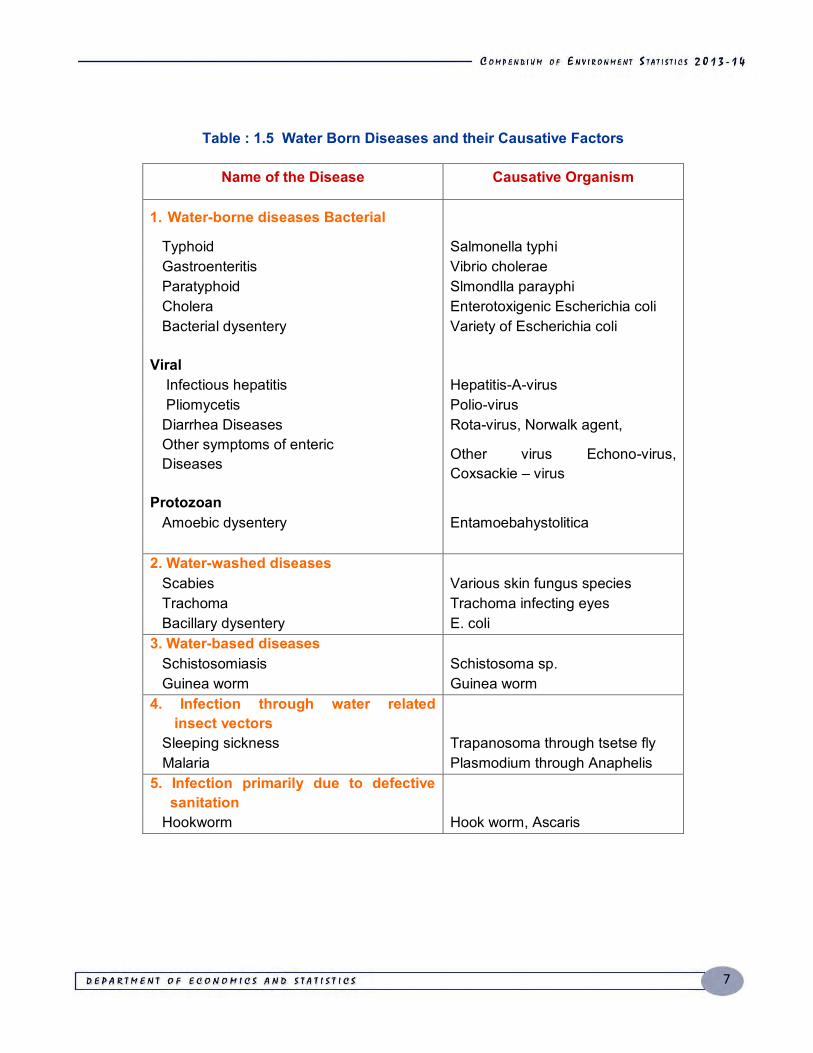
Table : 1.5 Water Born Diseases and their Causative Factors
Name of the Disease Causative Organism
1. Water-borne diseases Bacterial Typhoid Salmonella typhi Gastroenteritis Vibrio cholerae Paratyphoid Slmondlla parayphi Cholera Enterotoxigenic Escherichia coli Bacterial dysentery Variety of Escherichia coli
Viral
Infectious hepatitis Hepatitis-A-virus Pliomycetis Polio-virus Diarrhea Diseases Rota-virus, Norwalk agent, Other symptoms of enteric
Diseases
Other virus Echono-virus, Coxsackie – virus
Protozoan
Amoebic dysentery Entamoebahystolitica
2. Water-washed diseases
Scabies Various skin fungus species Trachoma Trachoma infecting eyes Bacillary dysentery E. coli
3. Water-based diseases
Schistosomiasis Schistosoma sp. Guinea worm Guinea worm
4. Infection through water related insect vectors
Sleeping sickness Trapanosoma through tsetse fly Malaria Plasmodium through Anaphelis
5. Infection primarily due to defective sanitation
Hookworm Hook worm, Ascaris
8
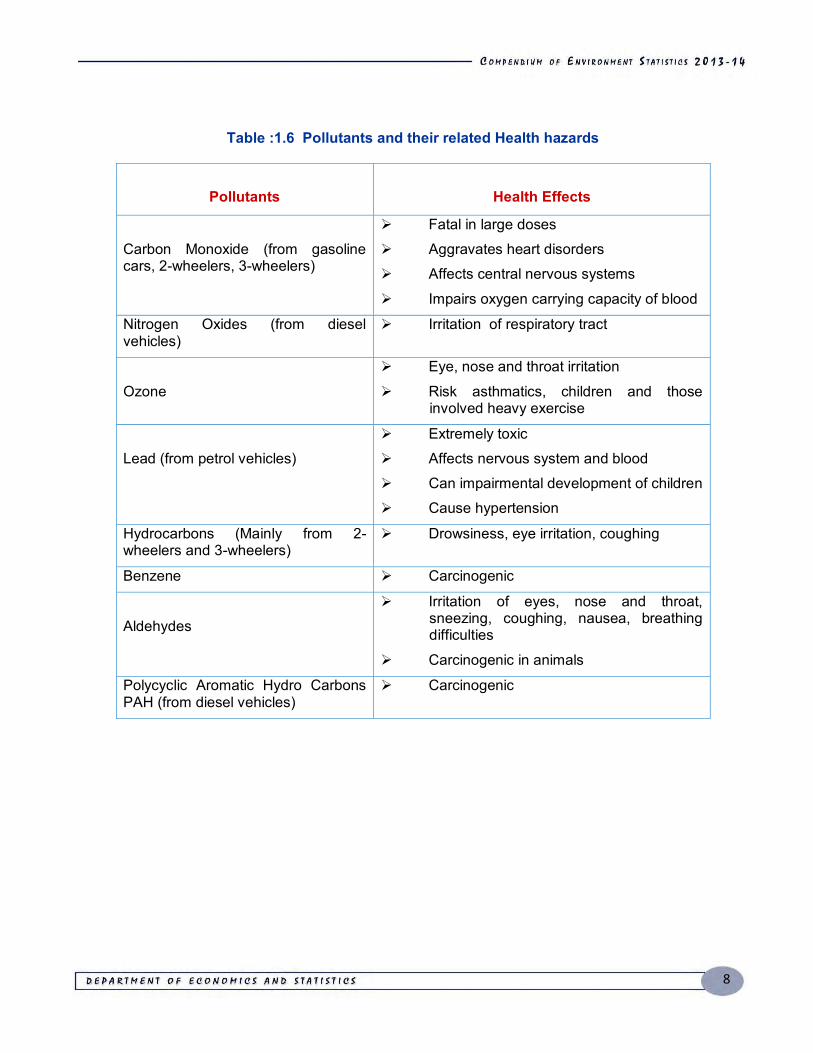
Table :1.6 Pollutants and their related Health hazards
Pollutants
Health Effects
Carbon Monoxide (from gasoline cars, 2-wheelers, 3-wheelers)
Fatal in large doses Aggravates heart disorders Affects central nervous systems
Impairs oxygen carrying capacity of blood
Nitrogen Oxides (from diesel vehicles)
Irritation of respiratory tract
Ozone
Eye, nose and throat irritation
Risk asthmatics, children and those involved heavy exercise
Lead (from petrol vehicles)
Extremely toxic Affects nervous system and blood Can impairmental development of children Cause hypertension
Hydrocarbons (Mainly from 2-wheelers and 3-wheelers)
Drowsiness, eye irritation, coughing
Benzene Carcinogenic
Aldehydes
Irritation of eyes, nose and throat, sneezing, coughing, nausea, breathing difficulties
Carcinogenic in animals
Polycyclic Aromatic Hydro Carbons PAH (from diesel vehicles)
Carcinogenic
9
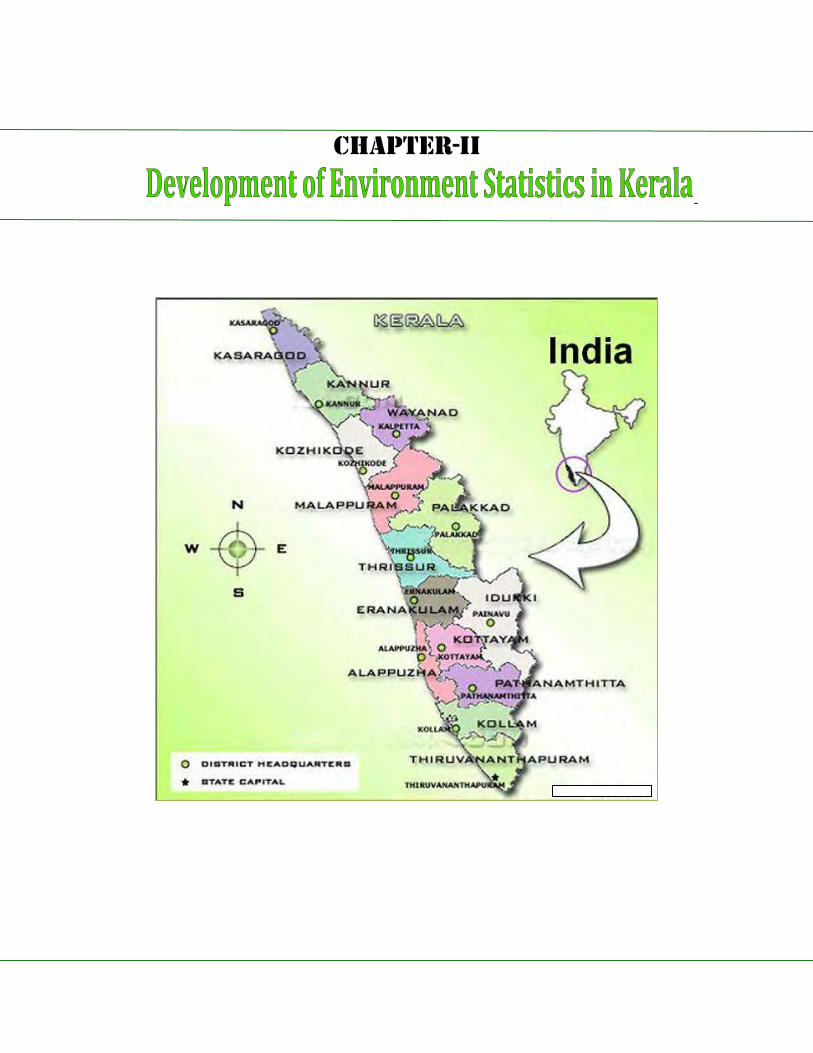
CHAPTER - II
Development of Environment Statistics in Kerala
Introduction
erala State spread over a total area of 38,863 Km2, population of more than 33 million
lie in latitude between 8018’ and 12048’ and longitude between 74052’ and 77022’. The long
coastline of 580 Km with a intricate system of backwaters along the coast. The tropical moist
forest is Western Ghat is highly undulating terrain and the tropical monsoon climate make the
state a unique geographical and environmental entity. The people have a high level of literacy
rate of 93.91 and are generally conscious of healthcare and hygienic practices resulting in high
level of life expectancy, low population growth and low infant mortality rate. The undesirable act
of development measures carried out without proper environmental considerations and concerns
have left indubitable impacts on the environment.
Infrastructure and Environment Statistics Division
According to the recommendation of the 19th COCSSO, it is decided to constitute an
Infrastructure and Environment Statistics Division in this Office. Hence I & ES Division came to
effect on the lines of Environment Statistics guidelines brought out by Central Statistical Office,
Ministry of Statistics and Programme Implementation, Govt. of India. So far three reports have
been released from this division and Environment Statistics 2013-14 is the fourth publication from
this division. The data presented in this report are collected from various Agencies and
Departments working for the protection of environment or monitor the level of impart on
environment.
The Environment Statistics is an annual publication of this division covering the one of bio-
diversity of the State, Atmosphere, Rithosphere, Hydrosphere and Human Intervention and
related stress on the environment.
Kerala State Pollution Control Board
Kerala State Pollution Control Board has been constituted on 12.9.1974 by the Govt. of
Kerala for prevention and Control of Water Pollution. It was the first State Board constituted in the
country under the Water Act in 1984. The Kerala State Pollution Control Board entrusted with the
10
implementation of the Air Act also. Administrative control over the Board is vested with the
Environmental Department of the Government of Kerala and the Ministry of Environment and
Forest, Government of India. The activities of the State Boards are co ordinated by Central
Pollution Control Board.
1. The Water Act (Prevention & Control of Pollution)
Plan a comprehensive program for the prevention, control or abatement of pollution of
streams and wells in the State and to secure the execution thereof;
Advise the State Government on any matter concerning the prevention, control or
abatement of water pollution;
Collect and disseminate information relating to water pollution and the prevention, control
or abatement thereof;
Encourage, conduct and participate in investigations and research relating to problems of
water pollution and prevention, control or abatement of water pollution;
to collaborate with the Central Board in organising the training of persons engaged or to
be engaged in programs relating to prevention, control or abatement of water pollution and
to organise mass education programs;
Inspect sewage or trade effluents, works and plants for the treatment of sewage and trade
effluents and to review plans, specifications or other data relating to plants set up for the
treatment of water, works for the purification there of and the system for the disposal of
sewage or trade effluents or in connection with the grant of any consent as required by this
Act lay down, modify or annul effluent standards for the sewage and trade effluents and for
the quality of receiving waters (not being water in an interstate stream) resulting from the
discharge of effluents and to classify waters of the State.
2. The Water Cess Act (Prevention & Control of Pollution)
Receive water consumption returns from persons liable to pay cess;
Assess the cess payable by the concerned person carrying on any special industry or local
authority;
Allow rebate on the cess payable by any person carrying on any industry or local authority
who install requisite plant for treatment of sewage or trade effluent;
Collect cess from the assessees.

11
3. The Air Act (Prevention & Control of Pollution)
Plan a comprehensive programme for prevention, control and abatement of air pollution
and to secure the execution thereof;
Advise the State Government on any matter concerning prevention, control or abatement
of air pollution.;
Collect and disseminate information relating to air pollution;
Collaborate with the Central Board in organising the training of persons engaged or to be
engaged in programmes relating to prevention, control or abatement of air pollution and to
organise mass education programmes relating thereto;
Inspect, at all reasonable times, any control equipment, industrial plant or manufacturing
process and to give, by order, such directions to such persons as may be considered
necessary to take steps for prevention, control or abatement of air pollution;
Inspect air pollution control areas at such intervals as it may think necessary, assess the
quality of air therein and take steps for the prevention, control or abatement of air pollution
in such areas
Lay down, in consultation with the Central Board and having regarding to the standards for
the quality of air laid down by the Central Board, standards for emission of air pollutants
into the atmosphere from industrial plants and automobiles or for the discharge of any air
pollutant into atmosphere from any other source whatsoever not being a ship or an
aircraft, provided that different standards for emission may be laid down under this clause
for different industrial plants having regard to the quantity and composition of emission of
air pollutant into the atmosphere from such industrial plants.
4. The Environment (Protection) Act
Implement measures for the protection and improvement of environment and the
prevention of hazards to human beings, other living creatures, plants and property;
Remedial measures to prevent or mitigate environmental pollution in case of accidents;
Inspections to check compliance and to collect or seize evidence thereof;
Collect samples of air, water, soil or other substances;
Service as Environmental Laboratory;
Standardised methods for sampling and analysis of various types of environmental
pollutants;
Analyse samples sent by empowered officers;
12
Carry out investigations to lay down standards, to monitor and to enforce standards;
Carry out any other entrusted function;
Take cognisance of offences.
Hazardous Wastes Rules
Process applications for and to issue/refuse/renew authorisation for collection, reception,
treatment, storage and disposal of hazardous wastes;
Monitor compliance with the provisions and conditions of authorisation;
Process and forward to the Ministry of Environment & Forests applications for imports;
Review matters pertaining to identification and notification of disposal sites.
The Manufacture, Storage and Import of Hazardous Chemical Rules, particularly
Enforce directions and procedures in respect of isolated storage of hazardous chemicals,
regarding;
Co-operate in preparation of on-site emergency plans;
Enforce directions and procedures on import of hazardous chemicals on information
regarding import;
Issue direction to importer to take appropriate safety measures, including stoppage of
import, if necessary;
Informing concerned port authority on safety measures;
Serve improvement notice on persons contravening the Rules.
Rules for the Manufacture, Use, Import, Export and Storage of Hazardous Micro-organisms, Genetically Engineered Organisms or Cells
Inspect, investigate and take punitive action on behalf of the State Biotechnology Co-
ordination Committee in case of violations;
Supervise, on behalf of the Genetic Engineering Approval Committee, implementation of
the terms and conditions of approvals granted by the Committee.
13
The Chemical Accidents Rules (Emergency Planning, Preparedness and Response)
To serve in the State Crisis Group;
To serve in the District Crisis Groups which are the apex bodies in the respective areas to
deal with major chemical accidents and to provide expert guidance for handling chemical
accidents.
The Biomedical Waste Rules (Management and Handling)
Receive from institutions generating, collecting, receiving, storing, transporting, treating,
disposing and/or handling biomedical wastes applications for authorisation, to process the
same and issue/ refuse/ renew/ cancel/ suspend authorisation;
Compile and furnish to the Central Pollution Control Board annual reports from occupiers /
operators;
Inspect and verify facilities and records;
Receive and act upon reports of accidents.
The Plastics Manufacture, Sales and Usage Rules
Receive and process applications for registration for manufacture of virgin/recycled or both
plastic carry bags and containers and to issue/refuse/renew/cancel registration.
The Municipal Solid Wastes Rules (Management and Handling)
Monitor compliance with standards on ground water, ambient air, leachate quality,
compost quality and incineration;
Receive and process application for authorisation for setting up waste processing and
disposal facility and to issue / refuse / renew / cancel authorisation;
Furnish annual reports to the Central Pollution Control Board.
The Noise Pollution Rules (Regulation and Control)
Regulate and control noise of industrial origin;
Monitor ambient sound levels;
Advise the State Government on pollution control.
14
The Batteries Rules (Management and Handling)
Receive and verify half yearly returns on sale of new batteries and collection of old
batteries;
Receive and verify half yearly returns on sale and collection of batteries by dealers;
Receive and verify annual returns from recyclers of used batteries;
Receive and verify half yearly returns form bulk consumers of batteries;
Receive and verify half yearly returns by auctioneers of used batteries;
Ensure compliance with the Rules;
File annual compliance status report to the Central Pollution Control Board.
The EIA notification
Receive request for environment public hearing;
Notify the details of public hearing;
Assist District Collector for public hearing and to furnish report thereof to the Ministry of
Environmental and Forests.
Public Liability Insurance Act, 1991
Make application to court to restrain owner under section 13(1) from handling hazardous
substances, to implement the order of the Court under section 13(3)(b) and to recover
cost thereof under section 13(4).
Receive and act upon notice under section 18(b) of intention to make complaint to Court
Western Ghats Development Programme
The Western Ghat region of Kerala (Sahyadri) stretches over 450 km (28.12%) out of the
total length of 1600 km and is spread over 80 Block Panchayats and 537 Grama
Panchayats. 31 Taluks in the State with a total geographical area of 28008 sq.km and
around 50% of the State’s population is in the Western Ghat region. Western Ghats plays
an important role acting as barrier to southeast monsoons causing substantial rainfall over
the hills (more than 3000 mm annually) and the “Sahyadri” gives birth to all the 44 rivers
flowing through the State and sustains rich natural forests and minerals. This region is a
treasure of plants and animals and is declared as one of the bio diversity hot spots in the
world.

15
The Western Ghats in Kerala have two major segments, southern segment south of
Palakkad Gap and northern segment beyond the gap extending up to the Kodugu
boundary. There are three sections of the eastern slopes of Western Ghats falling within
Kerala viz. the Pambar- Chinnar basin, the Attappady Plateau drained by Bhavani, and the
Wayanad section drained by Kabani. The Western Ghats that rise from low altitude of
about 70 m MSL extend up to 2000m MSL on an average on the eastern boundary.
Anamudy is the highest peak with an altitude of 2690m MSL.
Western Ghats that supports a wide range of forest types ranging from tropical wet
evergreen forests to grasslands, some 4000 species of flowering plants with high degree
of endemism and rich fauna with endemism ranging from 11% to 78% among different
groups. Consequently, Western Ghats constitutes not only one of the hotspots of
biodiversity in the world, but also one among world’s eight hottest hotspots.
The life supporting and biodiversity rich ecosystems of Western Ghats are threatened
today due to habitat pressures.
Western Ghats Development Programme, a centrally sponserd scheme funded by
Government of India under the Hill and Railfall area development scheme to protect the rich
biodiversity in this region through generation of the forest cover with People’s Participation, Eco-
Preservation, Natural Resource Management and Watershed Development programme.
Department of Environment
Department of Environment Statistics is responsible for the coordination of activities of
different departments, authorities, and local bodies in the State relating to environment and
implementation of the Environment Policy of the State. The department will focus on promotional
aspects for the protection and conservation of the environment with the help of the concerned
government departments, research institutes, regulatory bodies, local bodies and reputed non-
governmental organizations, researchers and academicians.
16
National Centre for Earth Science Studies
National Centre for Earth Science Studies (NCESS) is the leading centres of excellence in
the field of Earth System Science in the country, and is functional for the past 36 years. The
CESS, as a scientific establishment carried out extensive research and development work in
major components of Geosphere, Hydrosphere, and Atmosphere. The approach and
accomplishments of CESS, in understanding and addressing the geological evolution of south
India, complexities of the coastal processes and natural hazards, natural resources management
have all along been consistent with the national R&D priorities in Earth Sciences and thrust areas
of the Ministry of Earth Sciences (MoES). CESS has made important contributions towards
understanding the complexities of coastal processes including the mud banks which is unique for
the south-west coast of India.
Data generated under this programme found useful for various planning purposes at the
State level and also to pursue systematic studies under various geo-environmental conditions.
Data base has been generated under the broad resource categories of land, land use, water,
forest, infrastructure, and population and allied activities. Water quality analysis also taken up for
selected rivers and back waters for pollution monitoring and data base development. Land system
and drainage pattern analyses are based on maps, images and direct field measurements.
Earthquake monitoring and study of neo-tectonics are in hazard studies. Physical and social
vulnerability analyses are taken up for hot spots in the Western Ghats and selected coastal
stretch to develop management plans. Data on climatic parameters and greenhouse gases (GHG)
will be acquired by installing field stations, one along coast and another at Munnar in Western
Ghats region. Application of remote sensing will cover geological studies, corals and agricultural
operations.
Kerala State Biodiversity Board
Kerala State Biodiversity Board has function as a centre for applied research for
conservation of Kerala’s biological diversity. The centre is being established for collection,
collation, management, analysis, and dissemination of data on biological diversity. The research
centre will provide scientific support to Kerala State Biodiversity Board in decision making on
matters related to biodiversity, so as to enable the Board to advise the State Government on
salient environmental and conservation issues. The centre will also enable the Board for
17
translating the knowledge generated for sustainable development and access to diverse species
enables diversification of livelihood through, planting multiple crops and thus enabling food
production throughout the year, or engaging in alternative income-generating activities. The
availability of diverse resources also allows different genders, cultural or age groups to engage in
and benefit from the resources.
Jawaharlal Nehru Tropical Botanic Garden and Research Institute (JNTBGRI)
Jawaharlal Nehru Tropical Botanic Garden and Research Institute (JNTBGRI) formerly
known as Tropical Botanic Garden and Research Institute (TBGRI) was founded in 1979 with the
objective of establishing a Conservatory Botanic Garden of tropical plant resources in general and
of the country and the Kerala state in particular. It also undertakes research programmes for the
sustainable utilization of these resources. The Government of Kerala established the Institute as
an autonomous research and development organisation in 1979. In 1996, the Saraswathi
Thangavelu Extension Centre of JNTBGRI housing the bioinformatics component became
functional. During the year 2003, JNTBGRI was brought under the newly formed society, Kerala
State Council for Science, Technology and Environment (KSCSTE), which is registered as a
society under the Science and Technology Department, Government of Kerala. The institute is
located in 300 acres of natural forestland, right in the lap of the Western Ghats of Palode, 40 km
northeast to Thiruvananthapuram city, on the Thiruvananthapuram- Shenkottah state highway.
The Extension Centre is situated at Puthenthoppe, 15 km north of Thiruvananthapuram city, near
the sea coast.
Conservation and sustainable utilisation of the plant biodiversity advance knowledge,
enjoyment and conservation of plants through excellence in biodiversity research management,
horticulture displays and educational. JNTBGRI is reckoned as the biggest conservatory garden in
Asia with over 50,000 accessions belonging to 4000 species. Highly coordinated multidisciplinary
research is undertaken in the areas of Plant Taxonamy, Conservation Biology, Ethnobotany and
Bioprospecting (Biotechnological, Pharmocological and Phytochemical).
National Institute of Oceanography
The National Institute of Oceanography Kochi Regional Centre is one of the 37
Constituent Laboratories of the Council of Scientific and Industrial Research Centres (CSIR) New
Delhi. CSIR-NIO was established on 1966 following the international Indian Ocean Expedition in
the 1960s. In addition of basic research of observing and understanding special oceanographic

18
characteristics of Indian Ocean, the institute also carries out Oceanographic data collection,
environmental impact assessment, and modelling to predict environmental impact. The Institute
also provide consultancy on a number of issues including marine environmental protection and
coastal zone regulations. With the largest collection of ocean scientists in the country, and
equipped with suitable ocean research infrastructure, CSIR-NIO serves as an advanced centre of
education in ocean sciences. It has a School of Oceanography under the Academy of Scientific &
Innovative Research (AcSIR). In addition, it is a recognized centre for doctoral research by a large
number of universities.
Marine biodiversity - The Indian Ocean is a region of very high biological diversity has
been analyzing and documenting diversity of all forms of life – microbes, plants and animals -
from various marine ecosystems. National Institute of Oceanography has carried out
investigations to unravel interactions between the environment and organisms and the key area of
its research is the impact of natural and human-induced stresses such as deoxygenating,
eutrophication and acidification on biogeochemistry and ecosystems in fresh water and marine
environments. National Institute of Oceanography is actively engaged in monitoring the health of
Indian coastal environs.
19
Kerala University of Fisheries and Ocean Studies (KUFOS)
Kerala University of fisheries and Ocean Studies (KUFOS) is an autonomous institution
established on 20th November 2010. KUFOS is the first fisheries university in the country. The
head quarters of KUFOS at Panangad 12 km away from Kochi City. It provides high quality
instructional programmes in fisheries, Ocean Sciences and allied subjects.
Central Marine Fisheries Research Institute
Government of India established the Central Marine Fisheries Research Institute, Kochi on
3rd February 1947 under the Ministry of Agriculture and Farmers Welfare and later it joined the
ICAR in 1967. During the course of over 65 years the Institute has emerged as a leading tropical
marine fisheries research institute in the world. CMFRI devoted its research attention towards the
estimation of marine fisheries landings and effort, taxonomy of marine organisms and the bio-
economic characteristics of the exploited stocks of finfish and shellfish. This research effort
contributed significantly to India’s marine fisheries development from a predominantly artisanal,
sustenance fishery till the early sixties to that of complex, multi-gear, multi-species fisheries.
Cochin University School of Environmental Studies
The School of Environmental Studies, a Centre for higher learning dedicated to
environmental protection and sustainable development conceptualized in 1980 was established in
1983 to serve the cause of well-being of the society by imparting knowledge and by providing
trained manpower and appropriate environmental technology. To achieve these objectives, the
School offers a carefully designed regularly updated curriculum, competence-based consultancy
and reaches out to the community with socially relevant extension programmes. Doctoral
programme is offered in various facets of Environmental Science and Technology including
Environmental Biology, Chemistry, Microbiology, Meteorology and Toxicology. The School has
state-of-the-art laboratories in Environmental Chemistry, Environmental Biology, Environmental
Toxicology, Environmental Virology, Environmental Biotechnology, Environmental Microbiology,
and Remote Sensing Environmental Resource and Disaster Management. The School of
Environmental Studies give equal importance to Research, Teaching and Extension in
Environmental Science and Technology with the motto of Environmental protection for a
sustainable development aiming at a better tomorrow.
20
Activities
Region based biodiversity conservation movement with the help of Life science
Departments of local colleges. Activity includes biodiversity registry development, examination of
local agricultural and industrial activities and any anthropogenic activity which would affect the
existing biodiversity, develop alternative strategy to protect the ecosystem, creation and
awareness among the local people on the need of protecting the biodiversity for holistic
development. This also includes propagation of endangered species of plants and animals also.
Protection of Mangrove ecosystem of Kerala: Kerala was well known of its diverse
mangrove plant species which formed the nursery ground of finfish and shell fishes and protected
the coastal zone from erosion. This magnificent ecosystem is vanishing. A comprehensive
programme to protect the system by bringing under mangrove aforestation more regions with the
species lost from the region has been planned.
Protection of the rivers of Kerala: Kerala is blessed with 45 rivers. Tragically several of
them are dieing. Immediate action has to be taken to revive them with people's participation. A
comprehensive package is under development incorporating the NGOs who have been working in
this realm for a long period.
National Centre for Aquatics Animal Health (formerly Centre for Fish Disease Diagnosis
and Management) incepted in January 2000 under the faculty of Environmental Studies,
pioneered the promotion of sustainable aquaculture using the latest developments in Marine
Biotechnology in India. Motto of the centre is relentless effort for the Protection of Health of
Aquatic Animals and their Environment and it continually endeavors to transfer the outputs of
research directly to the end users, the aquarists. The research and development activities of the
centre use cutting edge technology to bring in novel innovations for the development of
sustainable aquaculture in India.
21
CHAPTER - III
Biodiversity of Kerala
iodiversity reflects the number, variety and variability of living organisms and how
these are change from one location to another and over time. Biodiversity includes diversity within
species, between species, and between ecosystems. Biodiversity is essential for the ecosystems
which provide regulating and supporting services for life in our planet. Air, water and food have
been naturally regulated through a huge range of physical, chemical and biological interactions.
The dispersal and dilution of pollutants, steady supply of clean water, protection of coast,
prevention of flooding, regulation of climate through locking away of carbon, etc. The supporting
services like the natural environment provides income from tourism, food, water and fuel. Wise
and sustainable use of environment replace and replenish resources. Its role goes beyond
ensuring the availability of raw materials to include security, resiliency, social relations, health and
freedoms and choices.
Plant and animal biodiversity as a national and global resource is extremely valuable,
inadequately documented and often waste. The preservation of biodiversity is both a matter of
investment and insurance to sustain and improve agricultural, forestry and fisheries productions
also act as a buffer against harmful environmental changes, provide raw materials for scientific
and industrial innovations, and safe guard transferring biological richness to future generations.
In the atmosphere, gases such as water vapour, carbon dioxide, ozone, and methane act
like the glass roof of a greenhouse by trapping heat and warming the planet. These gases are
called greenhouse gases. The natural levels of these gases are being supplemented by
emissions resulting from human activities, such as the burning of fossil fuels, farming activities
and land-use changes. As a result, the Earth’s surface and lower atmosphere are warming, and
this rise in temperature is accompanied by many other changes.
There is ample evidence that climate change affects biodiversity. According to the Millennium
Ecosystem Assessment, climate change is likely to become one of the most significant drivers of
biodiversity loss by the end of the century. Climate change is already forcing biodiversity to adapt
either through shifting habitat, changing life cycles, or the development of new physical traits.
22
Plant Diversity in Kerala
The Western Ghats region of the state is one of the 25 biodiversity hotspots in the whole
world. The researchers in the field identified more than 4,500 species of flowering plants in the
state and out of which about 1,500 taxa are endemic in nature. There is also equally rich fauna
belt in the state. The diversity of lower plants and animal groups, and the marine flora and fauna
in particular even though not fully known, is remarkably rich in the state. An earlier estimate had
shown that there are about 10,035 plant species indigenous to the state. The available total floral
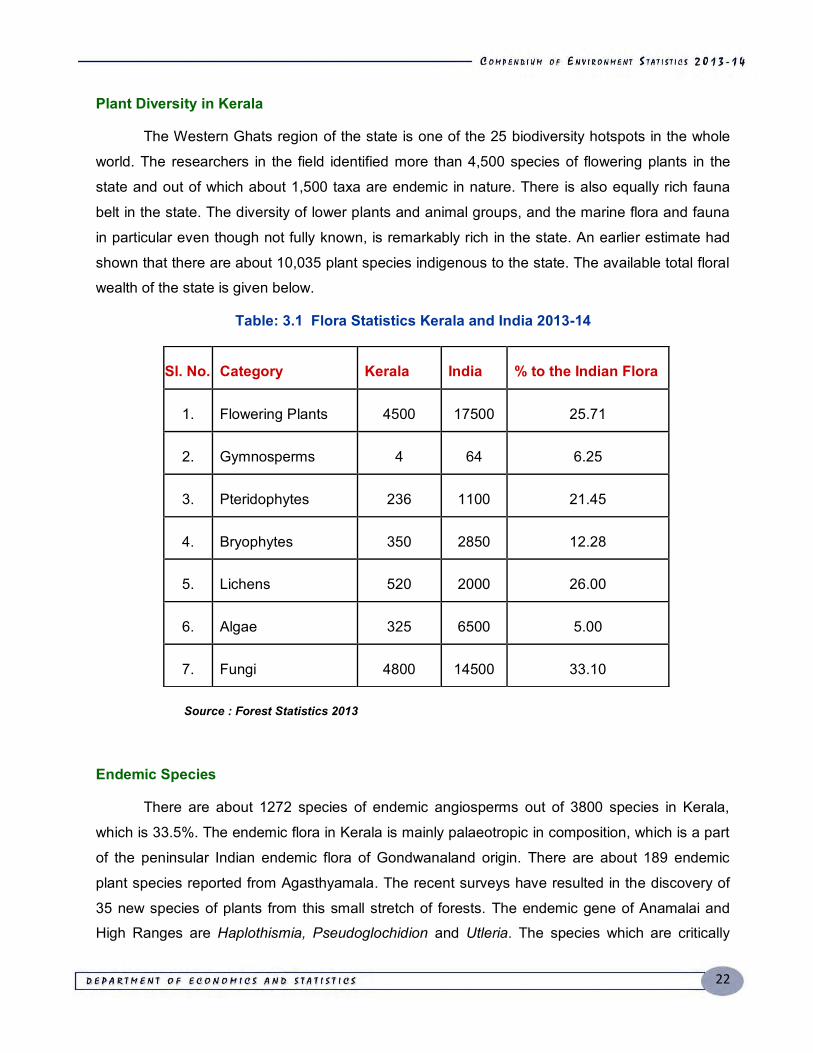
wealth of the state is given below.
Table: 3.1 Flora Statistics Kerala and India 2013-14
Source : Forest Statistics 2013
Endemic Species
There are about 1272 species of endemic angiosperms out of 3800 species in Kerala,
which is 33.5%. The endemic flora in Kerala is mainly palaeotropic in composition, which is a part
of the peninsular Indian endemic flora of Gondwanaland origin. There are about 189 endemic
plant species reported from Agasthyamala. The recent surveys have resulted in the discovery of
35 new species of plants from this small stretch of forests. The endemic gene of Anamalai and High Ranges are Haplothismia, Pseudoglochidion and Utleria. The species which are critically
Sl. No. Category Kerala India % to the Indian Flora
1. Flowering Plants 4500 17500 25.71
2. Gymnosperms 4 64 6.25
3. Pteridophytes 236 1100 21.45
4. Bryophytes 350 2850 12.28
5. Lichens 520 2000 26.00
6. Algae 325 6500 5.00
7. Fungi 4800 14500 33.10
23
endangered or probably extinct are Anaphalis barnesii, Begonia aliciae, Didymocarpus
macrostachya, Habenaria flabelliformis, Impatiens anaimudica, I. johnii, I. macrocarpa, I.
platyadena, I. verecunda, Ophiorrhiza barnesii, O. caudata, O. munnarensis and Sonerila
nemakadensis. The five endemic genera occurring in the Silent Valley - Wayanad region are:
Chandrasekharania, Baeolepis, Kanjarum, Meteoromyrtus, and Silentvalleya.
Invasive alien species and biodiversity
Alien species are non-native or exotic organisms that occur outside their natural adapted
ranges and dispersal potential. Many alien species support our farming and forestry systems,
some of the alien species become invasive when they are introduced deliberately or
unintentionally outside their natural habitats into new areas where they express the capability to
establish, invade and out compete native species. Plants, mammals and insects comprise most
common types of invasive alien species in terrestrial environments. The threat to biodiversity due
to invasive alien species is considered second only to that of habitat destruction. Invasive species
cause loss of biodiversity including species extinctions, and changes in hydrology and ecosystem
function. Differences between native and exotic plant species in their requirements and modes of
resource acquisition and consumption may cause a change in soil structure, its profile,
decomposition, nutrient content of soil, moisture availability, etc.
Alien species cause major environmental and economic problems worldwide. Many native
species are threatened by competition and predation from the invaders, resulting in the ecosystem modification and loss of biodiversity. Quantification of the ecosystem damage and loss to biodiversity
due to alien species invasion is complex due to the interaction of many biotic and abiotic factors. Growth of human population and human activities related to trade and tourism, witnessing increased
risks associated with aIien species introductions.
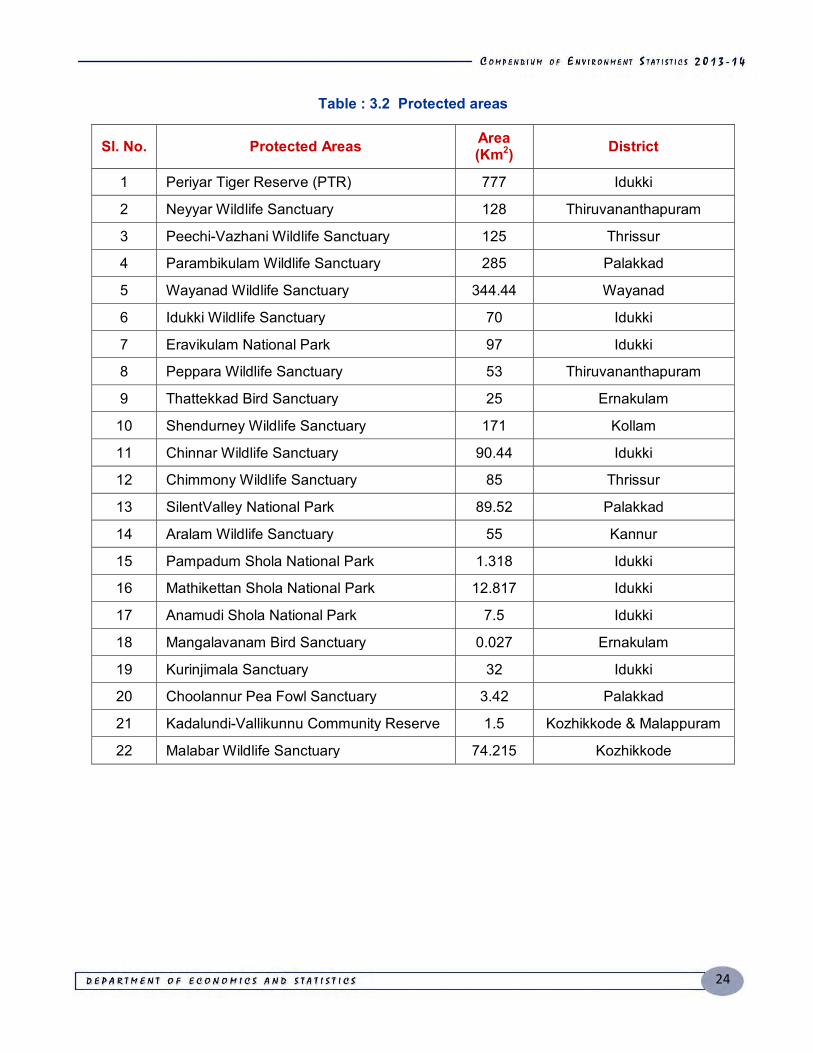
Protected Areas of Kerala : The Protected areas of Kerala include a wide range of biomes,
extending east from the coral reefs, estuaries, salt marshes, mangroves and beaches of the
Arabian Sea through the tropical moist broadleaf forests of the Malabar Coast moist forests to the
North Western Ghats moist deciduous forests and South Western Ghats moist deciduous forests
to South Western Ghats montane rain forests on the western border of Tamilnadu in the Western
Ghats.
24
Table : 3.2 Protected areas
Sl. No. Protected Areas Area (Km2) District
1 Periyar Tiger Reserve (PTR) 777 Idukki
2 Neyyar Wildlife Sanctuary 128 Thiruvananthapuram
3 Peechi-Vazhani Wildlife Sanctuary 125 Thrissur
4 Parambikulam Wildlife Sanctuary 285 Palakkad
5 Wayanad Wildlife Sanctuary 344.44 Wayanad
6 Idukki Wildlife Sanctuary 70 Idukki
7 Eravikulam National Park 97 Idukki
8 Peppara Wildlife Sanctuary 53 Thiruvananthapuram
9 Thattekkad Bird Sanctuary 25 Ernakulam
10 Shendurney Wildlife Sanctuary 171 Kollam
11 Chinnar Wildlife Sanctuary 90.44 Idukki
12 Chimmony Wildlife Sanctuary 85 Thrissur
13 SilentValley National Park 89.52 Palakkad
14 Aralam Wildlife Sanctuary 55 Kannur
15 Pampadum Shola National Park 1.318 Idukki
16 Mathikettan Shola National Park 12.817 Idukki
17 Anamudi Shola National Park 7.5 Idukki
18 Mangalavanam Bird Sanctuary 0.027 Ernakulam
19 Kurinjimala Sanctuary 32 Idukki
20 Choolannur Pea Fowl Sanctuary 3.42 Palakkad
21 Kadalundi-Vallikunnu Community Reserve 1.5 Kozhikkode & Malappuram
22 Malabar Wildlife Sanctuary 74.215 Kozhikkode
25
Western Ghats
The Western Ghats Region of Kerala covers 450 Kms. (28.12%) out of the total length of
1600 Kms. The Kerala region (Sahyadri) of Western Ghats comprises of 72% of the total
geographical area of the State and around 50% of the State’s population. Western Ghats play an
important role in providing substantial rainfall in the State. The ‘Sahyadri’ is the birth place of 44
major rivers flowing through the State. The rich natural forests of this region are a treasure house
of palnts, animals and minerals. The influence of Western Ghats has been remarkable in the
preservation of ecology of the State.
Western Ghats province with five regions recognised for conservation management and
they are Wayanad, Upper Nilgiri, Anamalai, Periyar and Agastyamalai. High rainfalls on the Ghats
have blessed the state with tremendous biological values of great variety, Kerala has
considerable ecological diversity. The peculiar topography of the state created spatial variation in
climate and soil parameters. The high levels of local endemism can be attributed to biogeographic
barriers provided by the large valleys. Today Kerala has 22 Protected Areas totaling 2,308 sq km
or 5.9% of the total land area, which is inadequate to protect the great biological wealth of the
forests.
Biological Values
The coastline largely degraded. Most biological values are found in the Western Ghat
province. Kerala part of the Ghats has the Wettest, most tropical and most biologically diverse
forests. Of the seven evergreen forest types recognised in the region, Kerala has four: Cullenia-
Mesua; Persea - Dipterocarpus; Dipercarpus-Mesua; and montane shola. Major biogeographic
barriers separate the Wayanad-Nilgiri areas from Anamalai-Periyar and that form the southern
Agastyamalai hills. Extreme levels of localised endemism are borne out of the fact that the Kerala
area of Agastyamalai has some 109 totally endemic plants, Nilgiri another 95 and Anamalai 39.
The area's biological diversity is equally true of animal life. More than half of the country's
amphibians are restricted to the Western Ghats. These are endemic reptiles like the Travancore
tortoise, birds like the Grey Malabar Hornbill and mammals like the Malabar civet. The forests in
Kerala have significant populations of tiger, leopard, elephant, gaur and many lesser ungulates.
The Nilgiri Tahr is characteristic of higher mountain grasslands. There are two primates endemic
to the area: the Nilgiri Langur and the Lion - tailed macaque. The Silent Valley National Park with
its diverse flora and fauna is an excellent example of evergreen forest of immense biological
values.
26
The Wayanad Evergreen Forests
Spread across Kerala and Karnataka, this region is the transition zone between the
southern Cullenia dominated forest and the drier Dipterocarpus of the north. Floristically very rich,
the tract has two small Sanctuaries: while Aralam Wild Life Sanctuary with an extent of 55 sq km
is in Kerala, the Brahmagiri WLS is in Karnataka. Located on the western slopes of the Ghats,
Aralam is rich in wildlife. Elephant, deer, bison are common. The plant life is typical of evergreen
and semi-evergreen forests of the Ghats. The altitude varies from 50m to 1145m from MSL.
Temperature varies at the foothills from 21°c to 40°c whereas on the higher reaches it is between
8°c and 25°c. The average rainfall is about 300 mm. June to August are the wettest months.
Adjacent to the three contiguous protected areas of Nagarhole, Bandipore and Mudumalai is the
Wayanad Wildlife Sanctuary of Kerala with an extent of 144 sq km. It is also an integral part of the
Nilgiri Biosphere Reserve which was established for the conservation of the biological diversity of
the region. There is a large elephant population, there are different kinds of deer, monkeys and
birds. Tree species and plants common to South Indian moist deciduous forests and West coast
semi-evergreen forests are seen.
The Upper Nilgiri of Kerala
The Nilgiri plateau and western slopes contain some of the finest forest Wildlife habitat in
India. Two small partially adjacent Protected Areas are located here, one is the Silent Valley
National Park of Kerala and the other is the Nilgiri Tahr WLS in Tamil Nadu. Only 89 sq km in
extent, the Silent Valley National Park is the Core of the Nilgiri Biosphere Reserve and claims a
long unbroken ecological history. The forests belong to the biogeographical class of the Malabar
Rain Forests, and relic of the ancient India- Malayan continuum and harbour a thousand species
of plants. The Valley has a fair representation of all peninsular mammals. There are also several
species of birds, butterflies and moths.
The Anamalai Hills of Kerala
The Annamalai Hills are also known as Elephant Hills, the range of mountains that form
the southern portion of the Western Ghats and the border of Kerala and Tamil Nadu. Anamudi
(2700m) is the highest peak in the entire Western Ghats. The Palghat Gap has isolated the
Anamalai Hills resulting in extensive speciation in several plant and animal groups. Elevation
ranges between 150 m and 2500m. Forests extending from lowland Dipterocarp communities to
wet temperate shola forests to moist and dry deciduous formations contain the most varied set of
habitats and animal and plant species of any region in peninsular India.
27
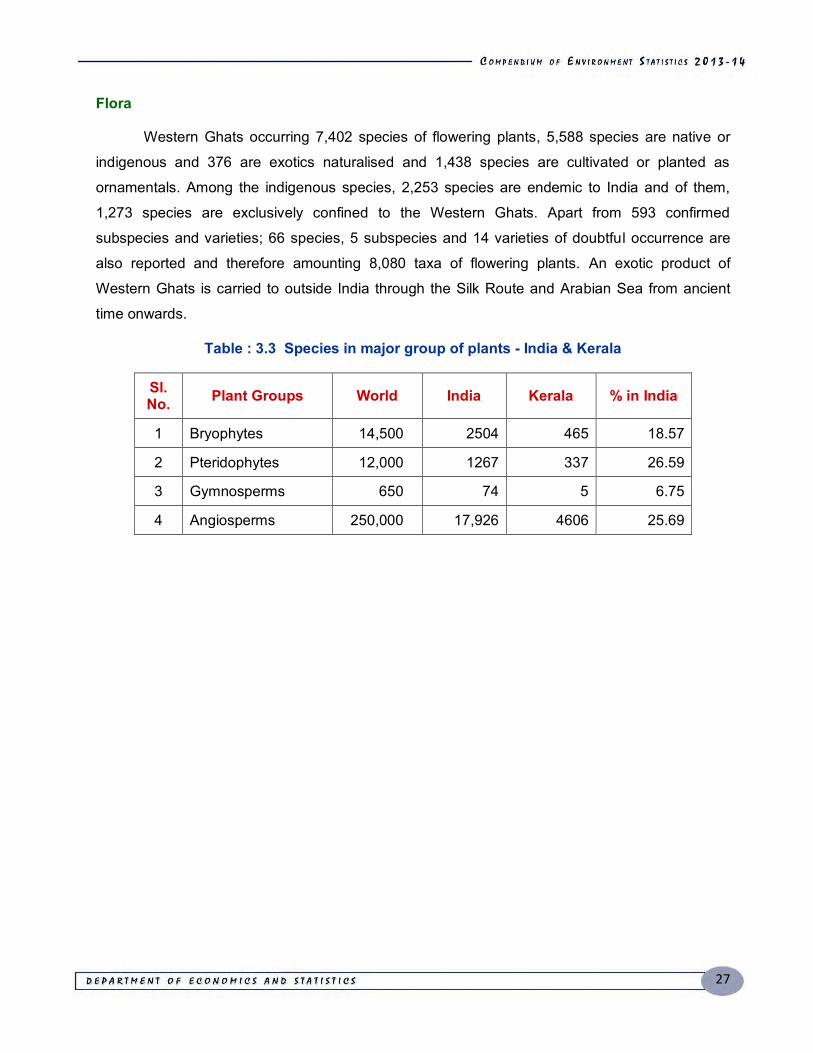
Flora
Western Ghats occurring 7,402 species of flowering plants, 5,588 species are native or
indigenous and 376 are exotics naturalised and 1,438 species are cultivated or planted as
ornamentals. Among the indigenous species, 2,253 species are endemic to India and of them,
1,273 species are exclusively confined to the Western Ghats. Apart from 593 confirmed
subspecies and varieties; 66 species, 5 subspecies and 14 varieties of doubtful occurrence are
also reported and therefore amounting 8,080 taxa of flowering plants. An exotic product of
Western Ghats is carried to outside India through the Silk Route and Arabian Sea from ancient
time onwards.
Table : 3.3 Species in major group of plants - India & Kerala
Sl. No. Plant Groups World India Kerala % in India
1 Bryophytes 14,500 2504 465 18.57
2 Pteridophytes 12,000 1267 337 26.59
3 Gymnosperms 650 74 5 6.75
4 Angiosperms 250,000 17,926 4606 25.69
28
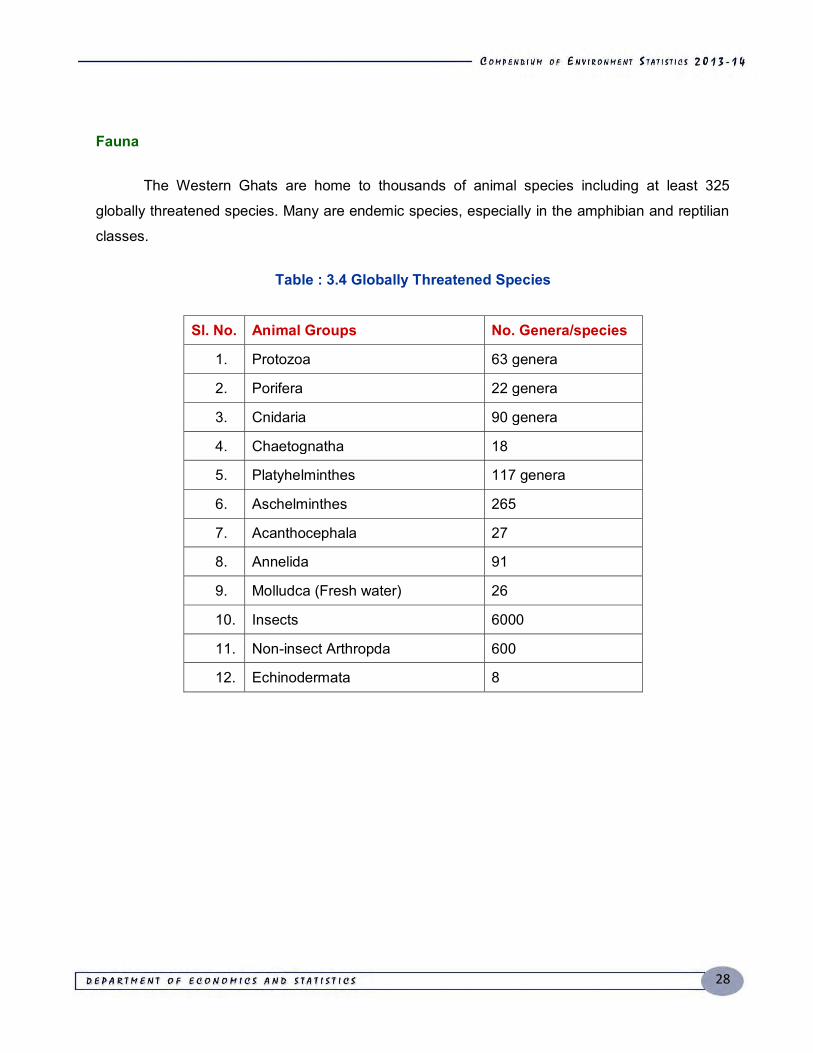
Fauna
The Western Ghats are home to thousands of animal species including at least 325
globally threatened species. Many are endemic species, especially in the amphibian and reptilian
classes.
Table : 3.4 Globally Threatened Species
Sl. No. Animal Groups No. Genera/species
1. Protozoa 63 genera
2. Porifera 22 genera
3. Cnidaria 90 genera
4. Chaetognatha 18
5. Platyhelminthes 117 genera
6. Aschelminthes 265
7. Acanthocephala 27
8. Annelida 91
9. Molludca (Fresh water) 26
10. Insects 6000
11. Non-insect Arthropda 600
12. Echinodermata 8
29
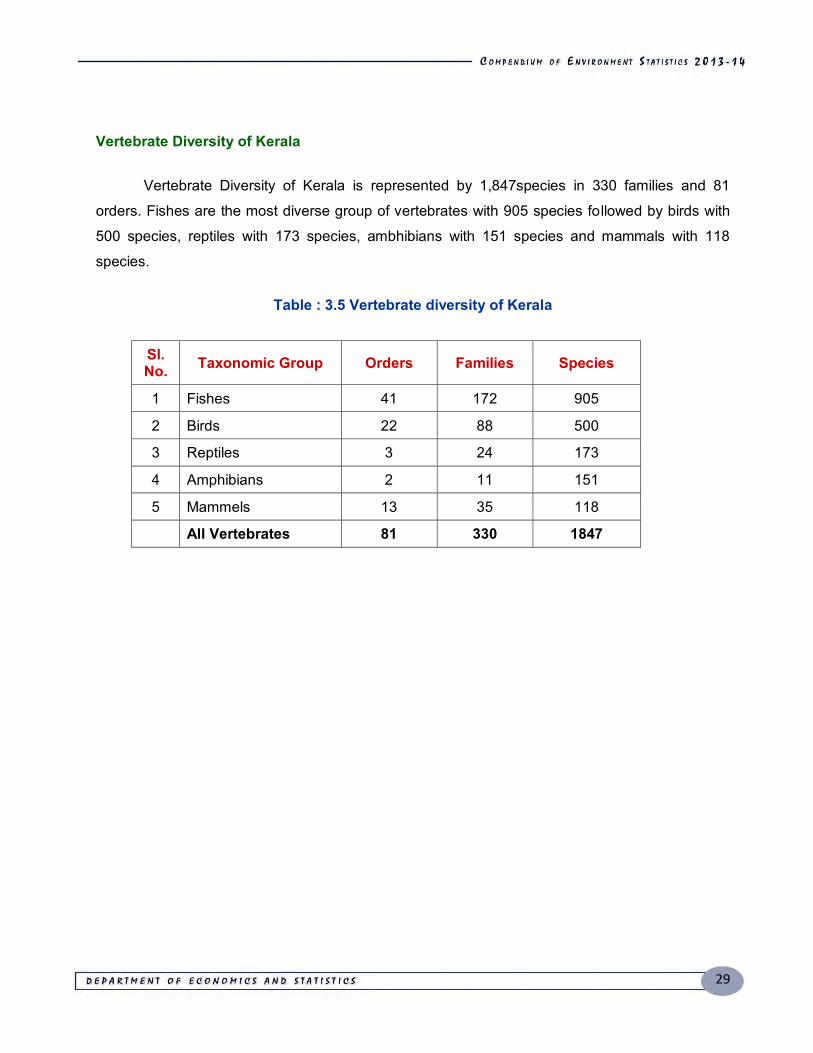
Vertebrate Diversity of Kerala
Vertebrate Diversity of Kerala is represented by 1,847species in 330 families and 81
orders. Fishes are the most diverse group of vertebrates with 905 species followed by birds with
500 species, reptiles with 173 species, ambhibians with 151 species and mammals with 118
species.
Table : 3.5 Vertebrate diversity of Kerala
Sl. No. Taxonomic Group Orders Families Species
1 Fishes 41 172 905
2 Birds 22 88 500
3 Reptiles 3 24 173
4 Amphibians 2 11 151
5 Mammels 13 35 118
All Vertebrates 81 330 1847
30
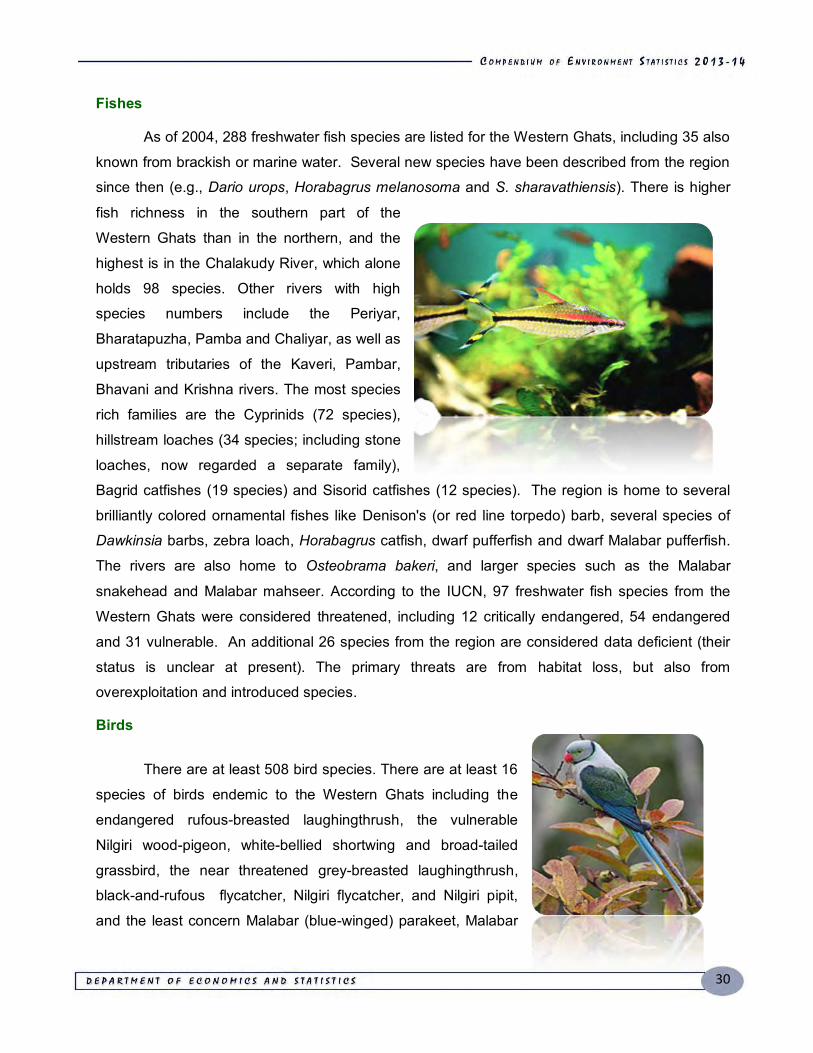
Fishes
As of 2004, 288 freshwater fish species are listed for the Western Ghats, including 35 also
known from brackish or marine water. Several new species have been described from the region
since then (e.g., Dario urops, Horabagrus melanosoma and S. sharavathiensis). There is higher
fish richness in the southern part of the
Western Ghats than in the northern, and the
highest is in the Chalakudy River, which alone
holds 98 species. Other rivers with high
species numbers include the Periyar,
Bharatapuzha, Pamba and Chaliyar, as well as
upstream tributaries of the Kaveri, Pambar,
Bhavani and Krishna rivers. The most species
rich families are the Cyprinids (72 species),
hillstream loaches (34 species; including stone
loaches, now regarded a separate family),
Bagrid catfishes (19 species) and Sisorid catfishes (12 species). The region is home to several
brilliantly colored ornamental fishes like Denison's (or red line torpedo) barb, several species of
Dawkinsia barbs, zebra loach, Horabagrus catfish, dwarf pufferfish and dwarf Malabar pufferfish.
The rivers are also home to Osteobrama bakeri, and larger species such as the Malabar
snakehead and Malabar mahseer. According to the IUCN, 97 freshwater fish species from the
Western Ghats were considered threatened, including 12 critically endangered, 54 endangered
and 31 vulnerable. An additional 26 species from the region are considered data deficient (their
status is unclear at present). The primary threats are from habitat loss, but also from
overexploitation and introduced species.
Birds
There are at least 508 bird species. There are at least 16
species of birds endemic to the Western Ghats including the
endangered rufous-breasted laughingthrush, the vulnerable
Nilgiri wood-pigeon, white-bellied shortwing and broad-tailed
grassbird, the near threatened grey-breasted laughingthrush,
black-and-rufous flycatcher, Nilgiri flycatcher, and Nilgiri pipit,
and the least concern Malabar (blue-winged) parakeet, Malabar
31
grey hornbill, white-bellied treepie, grey-headed bulbul, rufous babbler, Waynaad laughingthrush,
white-bellied blue-flycatcher and the crimson-backed sunbird.
Reptiles
The major population of snake family Uropeltidae of the reptile class is restricted to the
region. The region has significant population of vulnerable Mugger crocodiles.
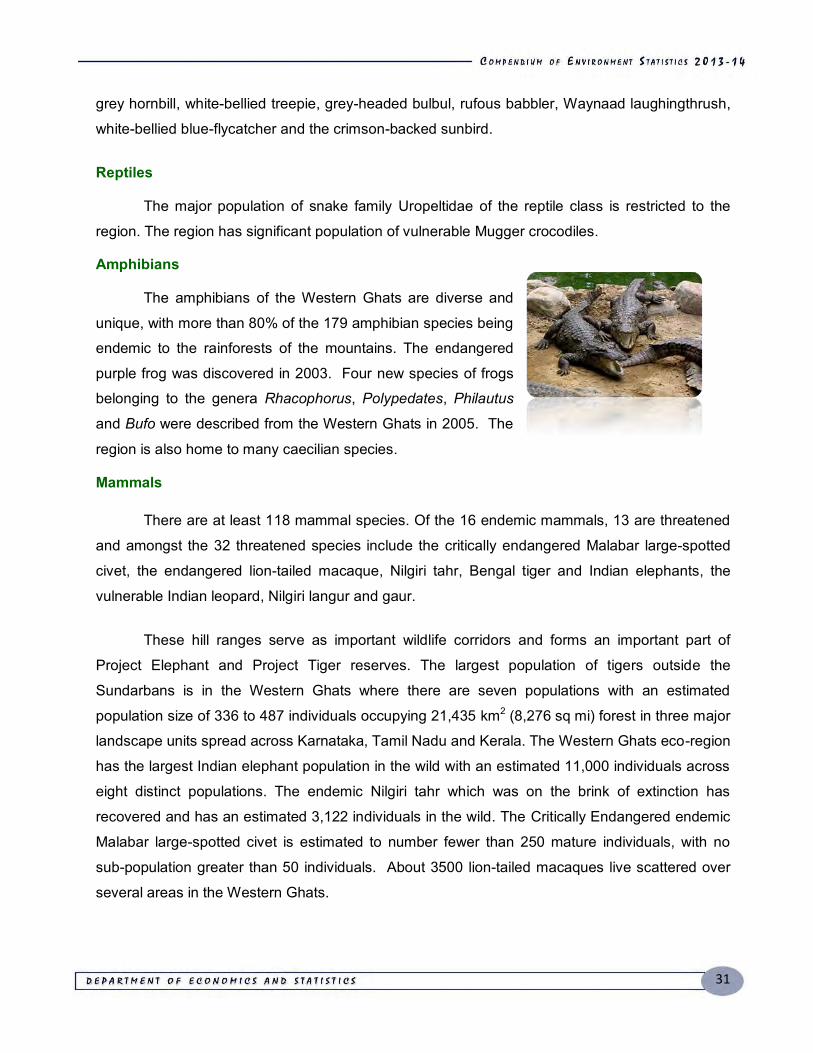
Amphibians
The amphibians of the Western Ghats are diverse and
unique, with more than 80% of the 179 amphibian species being
endemic to the rainforests of the mountains. The endangered
purple frog was discovered in 2003. Four new species of frogs
belonging to the genera Rhacophorus, Polypedates, Philautus
and Bufo were described from the Western Ghats in 2005. The
region is also home to many caecilian species.
Mammals
There are at least 118 mammal species. Of the 16 endemic mammals, 13 are threatened
and amongst the 32 threatened species include the critically endangered Malabar large-spotted
civet, the endangered lion-tailed macaque, Nilgiri tahr, Bengal tiger and Indian elephants, the
vulnerable Indian leopard, Nilgiri langur and gaur.
These hill ranges serve as important wildlife corridors and forms an important part of
Project Elephant and Project Tiger reserves. The largest population of tigers outside the
Sundarbans is in the Western Ghats where there are seven populations with an estimated
population size of 336 to 487 individuals occupying 21,435 km2 (8,276 sq mi) forest in three major
landscape units spread across Karnataka, Tamil Nadu and Kerala. The Western Ghats eco-region
has the largest Indian elephant population in the wild with an estimated 11,000 individuals across
eight distinct populations. The endemic Nilgiri tahr which was on the brink of extinction has
recovered and has an estimated 3,122 individuals in the wild. The Critically Endangered endemic
Malabar large-spotted civet is estimated to number fewer than 250 mature individuals, with no
sub-population greater than 50 individuals. About 3500 lion-tailed macaques live scattered over
several areas in the Western Ghats.
32
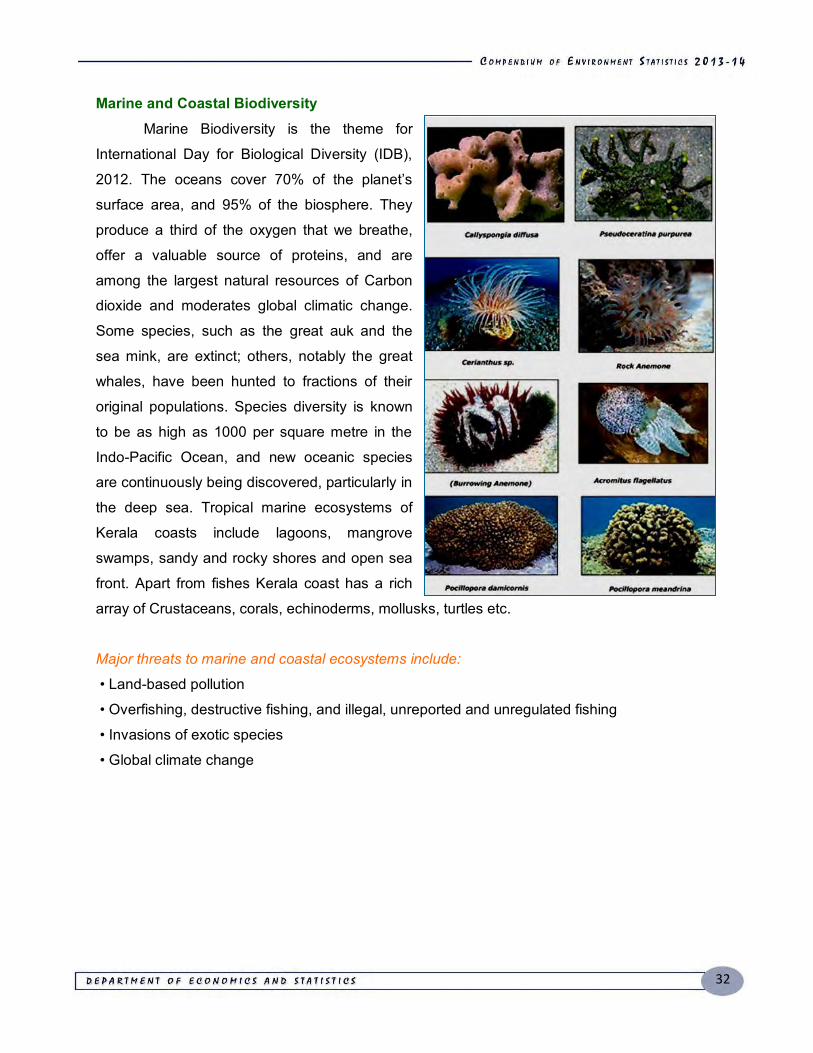
Marine and Coastal Biodiversity
Marine Biodiversity is the theme for
International Day for Biological Diversity (IDB),
2012. The oceans cover 70% of the planet’s
surface area, and 95% of the biosphere. They
produce a third of the oxygen that we breathe,
offer a valuable source of proteins, and are
among the largest natural resources of Carbon
dioxide and moderates global climatic change.
Some species, such as the great auk and the
sea mink, are extinct; others, notably the great
whales, have been hunted to fractions of their
original populations. Species diversity is known
to be as high as 1000 per square metre in the
Indo-Pacific Ocean, and new oceanic species
are continuously being discovered, particularly in
the deep sea. Tropical marine ecosystems of
Kerala coasts include lagoons, mangrove
swamps, sandy and rocky shores and open sea
front. Apart from fishes Kerala coast has a rich
array of Crustaceans, corals, echinoderms, mollusks, turtles etc.
Major threats to marine and coastal ecosystems include:
• Land-based pollution
• Overfishing, destructive fishing, and illegal, unreported and unregulated fishing
• Invasions of exotic species
• Global climate change
33
Threats to the Biodiversity of Kerala
1. Encroachments : Kerala is one of the greater heights in the matter of biodiversity
conservation and resource generation. Organised encroachment of forest land might have started
as early as 1950s. Initially the policy of government was to allot forest land for schemes; like ‘grow
more food’, ‘arable land’ etc. The direct impact of encroachment is habitat loss, besides the
existence of constant threat on the forests by the fringe people. In addition to their involvement
directly in the illegal activities they provide shelter for the unscrupulous offenders of the plains
who are engaged in all kinds of illegal activities.
2. Cattle grazing : Grazing by cattle in forest, although not rampant as else where in the country,
is identified as a threat to biodiversity in Kerala. The grazing not only removes the biomass and
competes with wild herbivores, but also spread contagious diseases to wild animals. The
trampling leads to soil erosion and changes the physical properties of soil. Intensive grazing will
lead to domination of a single or a few species, changing the species composition of natural
vegetation. Cattle grazing speeds up the invasion of weeds.
3. Collection of Fire wood : Firewood collection directly poses threat in the form of removal of
biomass, which affects microhabitat of flora and fauna, and indirectly leads to extensive fire and
other illegal activities. The proximity of settlements to the forests is the main factor, which
determines the intensity of firewood collection. The firewood collection leads to degradation of
habitats which subsequently alters the species composition and vegetation types. It is roughly
estimated that 0.8 million cubic meters of firewood is illegally removed from the forest annually.
Along with dead and wind fallen trees, standing trees and poles are also removed as firewood.
4. Man-Animal Conflict : A major problem associated with the conservation of wild animals
especially the herbivores like elephants are that of crop depredation and man-slaughter. Animals
such as elephants, gaur, sambar, wild boar and birds like peacock, cause extensive damage to
the crops. This phenomenon has registered significant increase in recent years due to habitat
fragmentation and degradation of natural forests and corridors. Almost all the Protected Areas
and Non-Protected Areas of Kerala contain a large number of settlements either inside or on the
periphery. This leads to degradation of surrounding habitats. The traditional tolerance among the
people who live inside the forests or its adjacent areas are fast disappearing and people have
become increasingly antagonistic. As a result, the people tend to kill the animals either by
poisoning or by other means, like keeping crackers in fruits, etc.. This problem is very severe in
northern Kerala where cultivation of paddy is extensive. At present Kerala Forest Department
34
provides compensation for the crop and property damage, human causalities and cattle loss
caused by the scheduled animals like elephant, tiger, leopard, gaur, etc. Providing compensation
is not a long term solution.
5. Poaching : The abundance of wild animals and high demand for their products in the
clandestine, market pose threat to wild animals. Herbivores like gaur, sambar, chital etc are being
poached for their meat. A lot of other not so spectacular species of animals ranging from reptiles
to birds as well as plants and medicinal herbs are all part of the illegal wildlife trade. The major
impact of poaching is species loss and change in their demography apart from extensive fire and
other illicit activities.
6. Illegal and unsustainable/unscientific collection of Non-Timber Forest Produce (NTFP): Non-Timber Forest Produce (NTFP) collection is one of the major livelihoods of the local people.
The NTFP consist of a variety of products, which are sources of food, fibre, manure, construction
materials, cosmetics and cultural products. The users of NTFP range from local individuals to
multinational companies. The forests of Kerala are very rich in NTFP including edible products,
medicinal plants, toiletries, tans, dyes, gums, resins, rattan, bamboo, grasses and animal
products. Although 500 species of NTFP are available in the forests of Kerala, about 120 items
are listed as commercially important by the Kerala Forest Department. But as per record more
than 200 species are being collected. Considering its widespread nature and higher prioritization,
the threat needs to be tackled immediately to conserve biodiversity.
7. Mining : It is a threat to the stability of a landscape, which results in land sliding and lowering of
water table. The removal of habitat will endanger the survival of riparian species since most of
them occupied a very narrow habitat niche. At the same time regulated sand mining would help in
keeping the health of the streams and reservoirs. Indiscriminate sand mining in some rivers
systems in the state is posing severe threat to the stability of bridges and banks. Transportation of
sand through the forests and other related activities pose severe threat to the ecosystem.
8. Mass Tourism and Pilgrimage : Mass Tourism and Pilgrimage are considered to be one of
the major and increasing threats to biodiversity conservation. Approximately 13 million people visit
forest areas annually either as pilgrims or visitors. Among all the Protected Areas in India, Periyar
Tiger Reserve receives a maximum number of tourists. The major impact of tourism and
pilgrimage is littering and over-utilization of resources such as soil erosion, fire, disturbance to
wild animals for feeding, ranging etc are also reported due to a large number of pilgrims and
unruly behaviour of visitors.
35
9. Forest Fires : Fire is one of the major threats facing the forests of Kerala. People who are
engaged in grazing livestock often burn the area to get fresh shoots for their cattle, during lean
season. Apart from this, those who are involved in illicit activities such as ganja cultivation,
poaching, tree felling, NTFP collection and very often the ignorant tourists and pilgrims are also
responsible for big forest fires. The effect of fire depends on the type of vegetation, frequency and
intensity of fire and season of burning. Fire causes extensive damage in deciduous forests and
grasslands due to heavy fuel load. Only some weeds manage to establish a strong foothold even
after severe fire with the help of fire resistant adaptations. The direct impacts of fire are change in
vegetation composition and physical properties of soil, soil erosion and loss of habitat.
10. Illicit Felling : Tree felling is one of the severe threats to biodiversity conservation in the
state. The primary effect of tree felling on bio diversity is the removal of biomass and loss of
habitat for many epiphytic and arboreal species. Tree felling leads to soil erosion and change of
the soil properties. In some cases people involved in tree falling set fire to the forests. The
opening up of canopy due to felling changes the microclimate and invite weeds to colonize and in
turn changes the structure of vegetation. Apart from the direct impact of loss in terms of money to
the state, the indirect impact of felling is the constant conflict between the administrative staff and
the people involved in this illegal activity.
11. Invasive species: These are non indigenous or non-native plants and animals that adversely
affect the habitats and bio regions they invade economically, environmentally and ecologically.
The weed prevents sunlight and oxygen from reaching the water column and submerged plants.
By crowding out native aquatic plants, it dramatically reduces biological diversity in aquatic
ecosystems. Listed as one the 100 most dangerous invasive alien species of the world, this
aquatic weed native to South America, was introduced to the country as an ornamental plant for
cultivation in ponds because of its beautiful, large purple and violet flowers. Today, it invades
more than 50 countries in five continents. Examples of animal invasion in our state include like
Tilapia fish (Oreochromis mossambica), Sucker catfish (Plecostomus multiradiatus) and the
African Giant Snail (Achatina fulica).
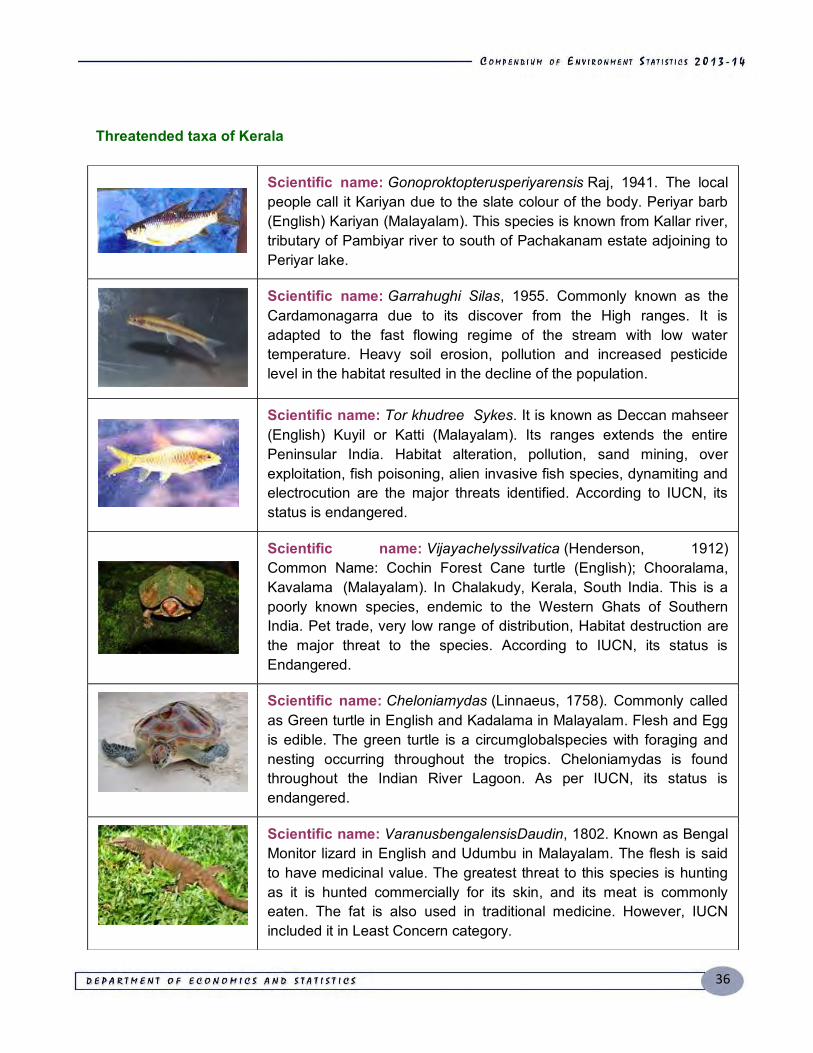
36
Threatended taxa of Kerala
Scientific name: Gonoproktopterusperiyarensis Raj, 1941. The local people call it Kariyan due to the slate colour of the body. Periyar barb (English) Kariyan (Malayalam). This species is known from Kallar river, tributary of Pambiyar river to south of Pachakanam estate adjoining to Periyar lake.
Scientific name: Garrahughi Silas, 1955. Commonly known as the Cardamonagarra due to its discover from the High ranges. It is adapted to the fast flowing regime of the stream with low water temperature. Heavy soil erosion, pollution and increased pesticide level in the habitat resulted in the decline of the population.
Scientific name: Tor khudree Sykes. It is known as Deccan mahseer (English) Kuyil or Katti (Malayalam). Its ranges extends the entire Peninsular India. Habitat alteration, pollution, sand mining, over exploitation, fish poisoning, alien invasive fish species, dynamiting and electrocution are the major threats identified. According to IUCN, its status is endangered.
Scientific name: Vijayachelyssilvatica (Henderson, 1912) Common Name: Cochin Forest Cane turtle (English); Chooralama, Kavalama (Malayalam). In Chalakudy, Kerala, South India. This is a poorly known species, endemic to the Western Ghats of Southern India. Pet trade, very low range of distribution, Habitat destruction are the major threat to the species. According to IUCN, its status is Endangered.
Scientific name: Cheloniamydas (Linnaeus, 1758). Commonly called as Green turtle in English and Kadalama in Malayalam. Flesh and Egg is edible. The green turtle is a circumglobalspecies with foraging and nesting occurring throughout the tropics. Cheloniamydas is found throughout the Indian River Lagoon. As per IUCN, its status is endangered.
Scientific name: VaranusbengalensisDaudin, 1802. Known as Bengal Monitor lizard in English and Udumbu in Malayalam. The flesh is said to have medicinal value. The greatest threat to this species is hunting as it is hunted commercially for its skin, and its meat is commonly eaten. The fat is also used in traditional medicine. However, IUCN included it in Least Concern category.
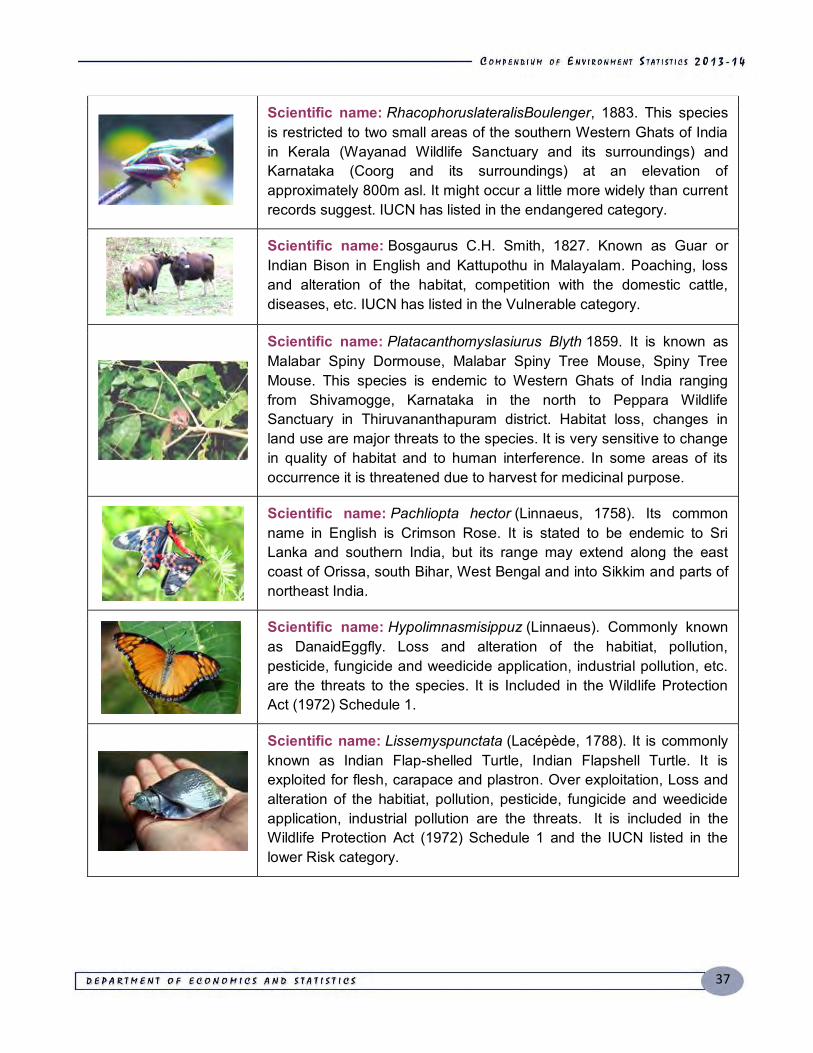
37
Scientific name: RhacophoruslateralisBoulenger, 1883. This species is restricted to two small areas of the southern Western Ghats of India in Kerala (Wayanad Wildlife Sanctuary and its surroundings) and Karnataka (Coorg and its surroundings) at an elevation of approximately 800m asl. It might occur a little more widely than current records suggest. IUCN has listed in the endangered category.
Scientific name: Bosgaurus C.H. Smith, 1827. Known as Guar or Indian Bison in English and Kattupothu in Malayalam. Poaching, loss and alteration of the habitat, competition with the domestic cattle, diseases, etc. IUCN has listed in the Vulnerable category.
Scientific name: Platacanthomyslasiurus Blyth 1859. It is known as Malabar Spiny Dormouse, Malabar Spiny Tree Mouse, Spiny Tree Mouse. This species is endemic to Western Ghats of India ranging from Shivamogge, Karnataka in the north to Peppara Wildlife Sanctuary in Thiruvananthapuram district. Habitat loss, changes in land use are major threats to the species. It is very sensitive to change in quality of habitat and to human interference. In some areas of its occurrence it is threatened due to harvest for medicinal purpose.
Scientific name: Pachliopta hector (Linnaeus, 1758). Its common name in English is Crimson Rose. It is stated to be endemic to Sri Lanka and southern India, but its range may extend along the east coast of Orissa, south Bihar, West Bengal and into Sikkim and parts of northeast India.
Scientific name: Hypolimnasmisippuz (Linnaeus). Commonly known as DanaidEggfly. Loss and alteration of the habitiat, pollution, pesticide, fungicide and weedicide application, industrial pollution, etc. are the threats to the species. It is Included in the Wildlife Protection Act (1972) Schedule 1.
Scientific name: Lissemyspunctata (Lacépède, 1788). It is commonly known as Indian Flap-shelled Turtle, Indian Flapshell Turtle. It is exploited for flesh, carapace and plastron. Over exploitation, Loss and alteration of the habitiat, pollution, pesticide, fungicide and weedicide application, industrial pollution are the threats. It is included in the Wildlife Protection Act (1972) Schedule 1 and the IUCN listed in the lower Risk category.
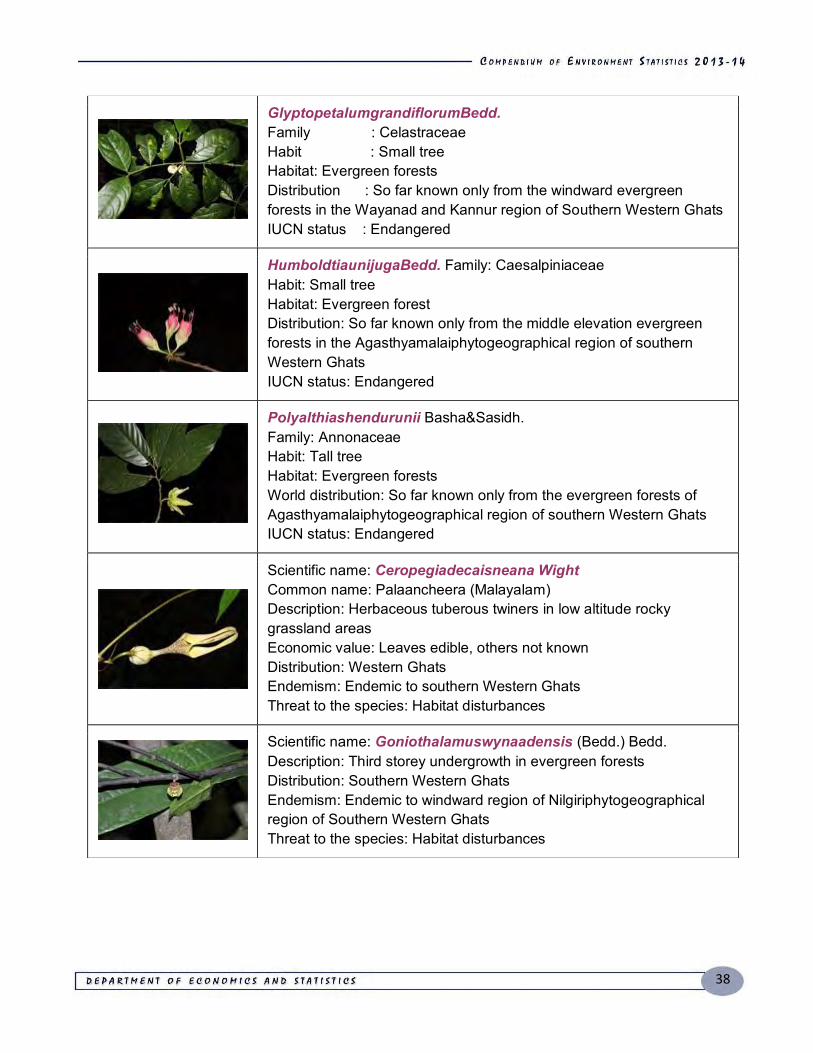
38
GlyptopetalumgrandiflorumBedd. Family : Celastraceae Habit : Small tree Habitat: Evergreen forests Distribution : So far known only from the windward evergreen forests in the Wayanad and Kannur region of Southern Western Ghats IUCN status : Endangered
HumboldtiaunijugaBedd. Family: Caesalpiniaceae Habit: Small tree Habitat: Evergreen forest Distribution: So far known only from the middle elevation evergreen forests in the Agasthyamalaiphytogeographical region of southern Western Ghats IUCN status: Endangered
Polyalthiashendurunii Basha&Sasidh. Family: Annonaceae Habit: Tall tree Habitat: Evergreen forests World distribution: So far known only from the evergreen forests of Agasthyamalaiphytogeographical region of southern Western Ghats IUCN status: Endangered
Scientific name: Ceropegiadecaisneana Wight Common name: Palaancheera (Malayalam) Description: Herbaceous tuberous twiners in low altitude rocky grassland areas Economic value: Leaves edible, others not known Distribution: Western Ghats Endemism: Endemic to southern Western Ghats Threat to the species: Habitat disturbances
Scientific name: Goniothalamuswynaadensis (Bedd.) Bedd. Description: Third storey undergrowth in evergreen forests Distribution: Southern Western Ghats Endemism: Endemic to windward region of Nilgiriphytogeographical region of Southern Western Ghats Threat to the species: Habitat disturbances
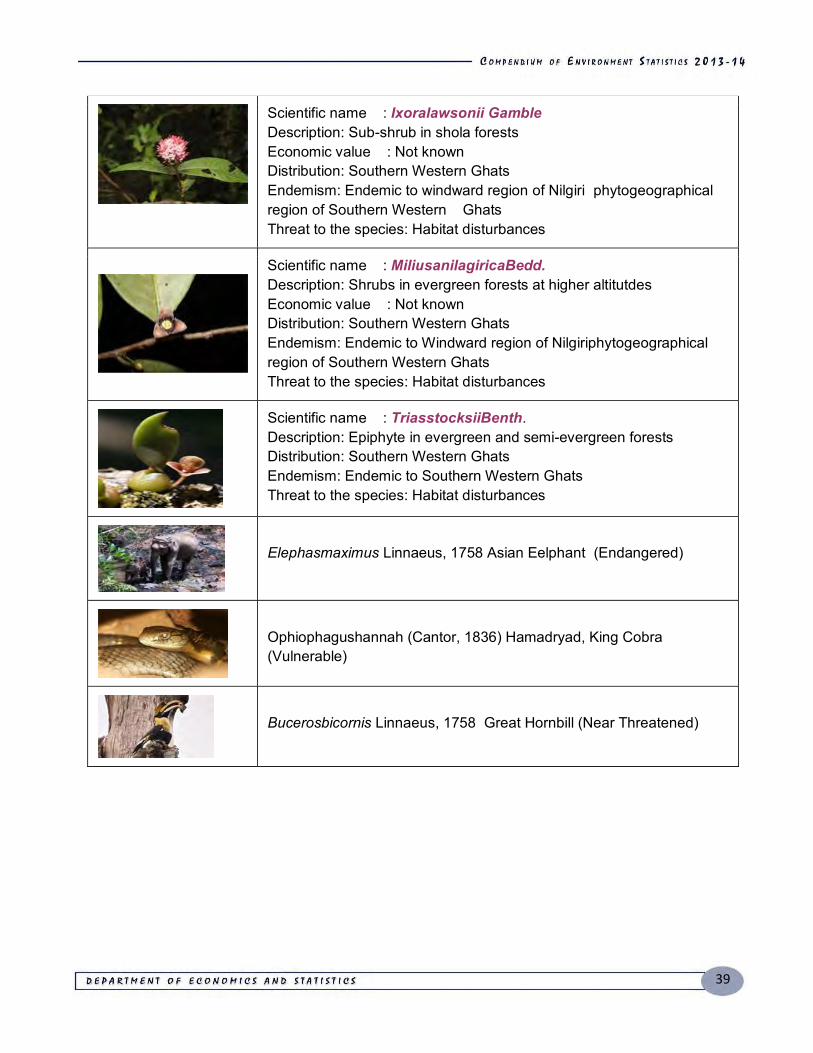
39
Scientific name : Ixoralawsonii Gamble Description: Sub-shrub in shola forests Economic value : Not known Distribution: Southern Western Ghats Endemism: Endemic to windward region of Nilgiri phytogeographical region of Southern Western Ghats Threat to the species: Habitat disturbances
Scientific name : MiliusanilagiricaBedd. Description: Shrubs in evergreen forests at higher altitutdes Economic value : Not known Distribution: Southern Western Ghats Endemism: Endemic to Windward region of Nilgiriphytogeographical region of Southern Western Ghats Threat to the species: Habitat disturbances
Scientific name : TriasstocksiiBenth. Description: Epiphyte in evergreen and semi-evergreen forests Distribution: Southern Western Ghats Endemism: Endemic to Southern Western Ghats Threat to the species: Habitat disturbances
Elephasmaximus Linnaeus, 1758 Asian Eelphant (Endangered)
Ophiophagushannah (Cantor, 1836) Hamadryad, King Cobra (Vulnerable)
Bucerosbicornis Linnaeus, 1758 Great Hornbill (Near Threatened)

40
Table : 3.6 Endangered Forest Species in Kerala
Sl. No. Species Family Habit
1. Acampe congesta Orchidaceae Herbs 2. Adenosma malabaricum Scrophulariaceae Herbs 3. Anaphalis barnesii Compositae Herbs 4. Arisaema attenuatum Araceae Herbs 5. Arisaema auriculata Araceae Herbs 6. Arisaema peltatum Araceae Herbs 7. Hydnocarepus macrocarpa Flacourtiaceae Trees 8. Atuna travancorica Rosaceae Trees 9. Bombax scopulorum Bombacaceae Trees
10. Buchanania barberi Anacardiaceae Trees 11. Buchanania lanceolata Anacardiaceae Trees 12. Bulbophyllum aureum Orchidaceae Herbs 13. Calamus travancoricus Arecaceae Shrubs 14. Ceropegia beddomei Asclepiadaceae Climbers 15. Cirrhopetalum avreum Orchidaceae Herbs 16. Clematis bourdillonni Ranunculaceae Climbers 17. Colubrinma travancorica Rhamnaceae Shrubs 18. Cyclea fissicalyx Menispermaceae Climbers 19. Cynometra beddomei Fabaceae Trees 20. Cynometra travancorica Fabaceae Trees 21. Dalbergia beddomei Fabaceae Lianas 22. Dialium travancoricum Fabaceae Trees 23. Didymocarpus macrostachya Gesneriaceae Herbs 24. Dysoxylum beddomei Meliaceae Trees 25. Dysoxylum ficiforme Meliaceae Trees 26. Eugenia argentea Myrtaceae Trees 27. Eugenia discifera Myrtaceae Trees 28. Garcinia imberti Guttiferae Trees 29. Haplothismia exannulata Burmanniaceae Herbs 30. Hedyotis beddomei Rubiaceae Herbs 31. Hedyotis bourdillonii Rubiaceae Herbs 32. Hedyotis wynaadensis Rubiaceae Herbs 33. Hyalisma janthina Triuridaceae Herbs 34. Hydrobryum johnsonii Podostemaceae Herbs 35. Cinnamomum travancoricum Lauraceae Trees
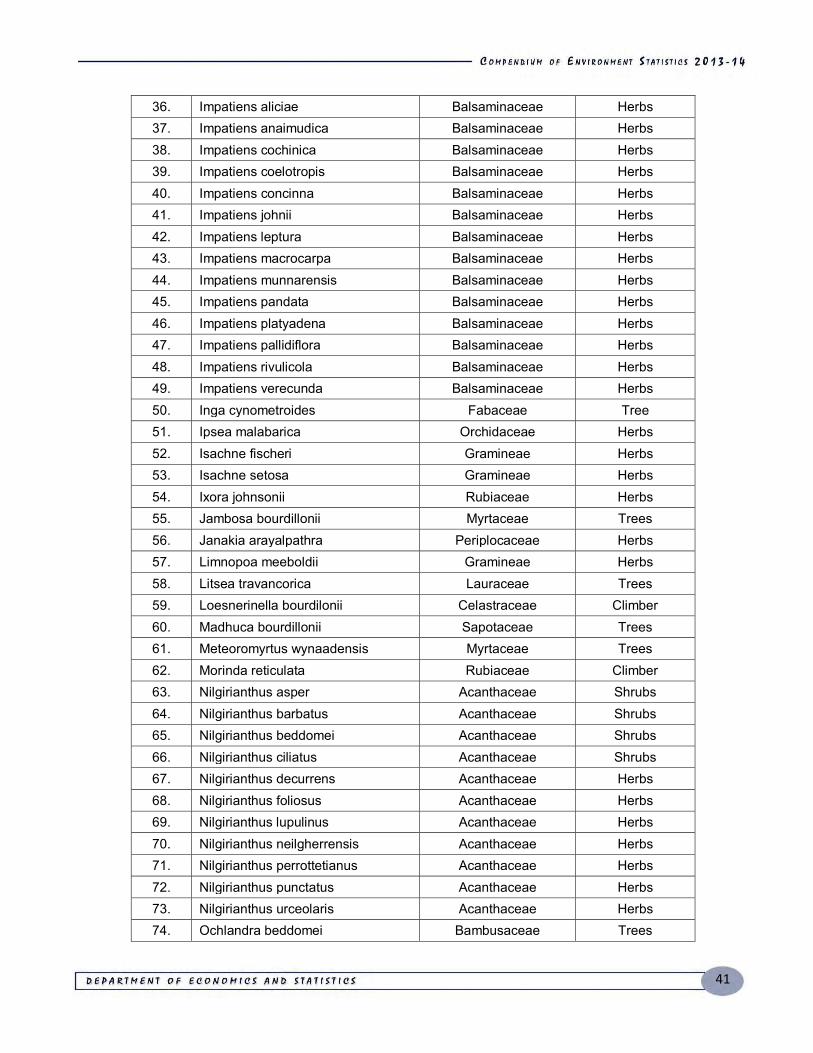
41
36. Impatiens aliciae Balsaminaceae Herbs 37. Impatiens anaimudica Balsaminaceae Herbs 38. Impatiens cochinica Balsaminaceae Herbs 39. Impatiens coelotropis Balsaminaceae Herbs 40. Impatiens concinna Balsaminaceae Herbs 41. Impatiens johnii Balsaminaceae Herbs 42. Impatiens leptura Balsaminaceae Herbs 43. Impatiens macrocarpa Balsaminaceae Herbs 44. Impatiens munnarensis Balsaminaceae Herbs 45. Impatiens pandata Balsaminaceae Herbs 46. Impatiens platyadena Balsaminaceae Herbs 47. Impatiens pallidiflora Balsaminaceae Herbs 48. Impatiens rivulicola Balsaminaceae Herbs 49. Impatiens verecunda Balsaminaceae Herbs 50. Inga cynometroides Fabaceae Tree 51. Ipsea malabarica Orchidaceae Herbs 52. Isachne fischeri Gramineae Herbs 53. Isachne setosa Gramineae Herbs 54. Ixora johnsonii Rubiaceae Herbs 55. Jambosa bourdillonii Myrtaceae Trees 56. Janakia arayalpathra Periplocaceae Herbs 57. Limnopoa meeboldii Gramineae Herbs 58. Litsea travancorica Lauraceae Trees 59. Loesnerinella bourdilonii Celastraceae Climber 60. Madhuca bourdillonii Sapotaceae Trees 61. Meteoromyrtus wynaadensis Myrtaceae Trees 62. Morinda reticulata Rubiaceae Climber 63. Nilgirianthus asper Acanthaceae Shrubs 64. Nilgirianthus barbatus Acanthaceae Shrubs 65. Nilgirianthus beddomei Acanthaceae Shrubs 66. Nilgirianthus ciliatus Acanthaceae Shrubs 67. Nilgirianthus decurrens Acanthaceae Herbs 68. Nilgirianthus foliosus Acanthaceae Herbs 69. Nilgirianthus lupulinus Acanthaceae Herbs 70. Nilgirianthus neilgherrensis Acanthaceae Herbs 71. Nilgirianthus perrottetianus Acanthaceae Herbs 72. Nilgirianthus punctatus Acanthaceae Herbs 73. Nilgirianthus urceolaris Acanthaceae Herbs 74. Ochlandra beddomei Bambusaceae Trees
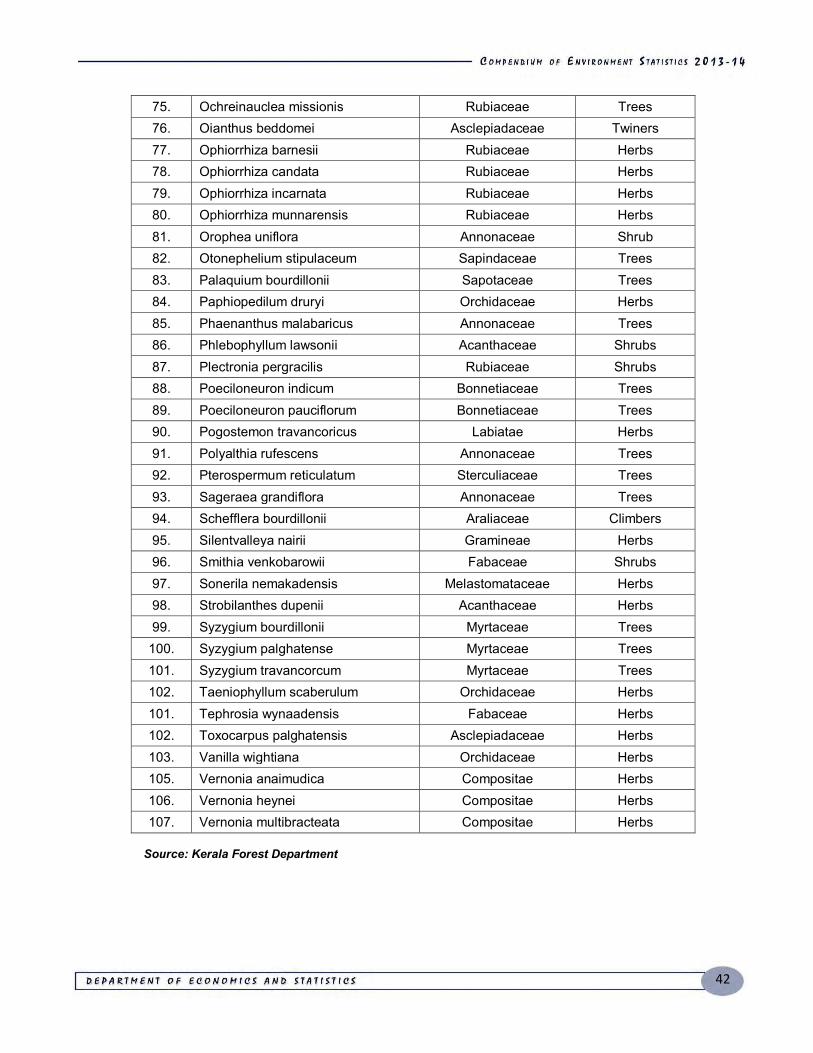
42
75. Ochreinauclea missionis Rubiaceae Trees 76. Oianthus beddomei Asclepiadaceae Twiners 77. Ophiorrhiza barnesii Rubiaceae Herbs 78. Ophiorrhiza candata Rubiaceae Herbs 79. Ophiorrhiza incarnata Rubiaceae Herbs 80. Ophiorrhiza munnarensis Rubiaceae Herbs 81. Orophea uniflora Annonaceae Shrub 82. Otonephelium stipulaceum Sapindaceae Trees 83. Palaquium bourdillonii Sapotaceae Trees 84. Paphiopedilum druryi Orchidaceae Herbs 85. Phaenanthus malabaricus Annonaceae Trees 86. Phlebophyllum lawsonii Acanthaceae Shrubs 87. Plectronia pergracilis Rubiaceae Shrubs 88. Poeciloneuron indicum Bonnetiaceae Trees 89. Poeciloneuron pauciflorum Bonnetiaceae Trees 90. Pogostemon travancoricus Labiatae Herbs 91. Polyalthia rufescens Annonaceae Trees 92. Pterospermum reticulatum Sterculiaceae Trees 93. Sageraea grandiflora Annonaceae Trees 94. Schefflera bourdillonii Araliaceae Climbers 95. Silentvalleya nairii Gramineae Herbs 96. Smithia venkobarowii Fabaceae Shrubs 97. Sonerila nemakadensis Melastomataceae Herbs 98. Strobilanthes dupenii Acanthaceae Herbs 99. Syzygium bourdillonii Myrtaceae Trees
100. Syzygium palghatense Myrtaceae Trees 101. Syzygium travancorcum Myrtaceae Trees 102. Taeniophyllum scaberulum Orchidaceae Herbs 101. Tephrosia wynaadensis Fabaceae Herbs 102. Toxocarpus palghatensis Asclepiadaceae Herbs 103. Vanilla wightiana Orchidaceae Herbs 105. Vernonia anaimudica Compositae Herbs 106. Vernonia heynei Compositae Herbs 107. Vernonia multibracteata Compositae Herbs
Source: Kerala Forest Department
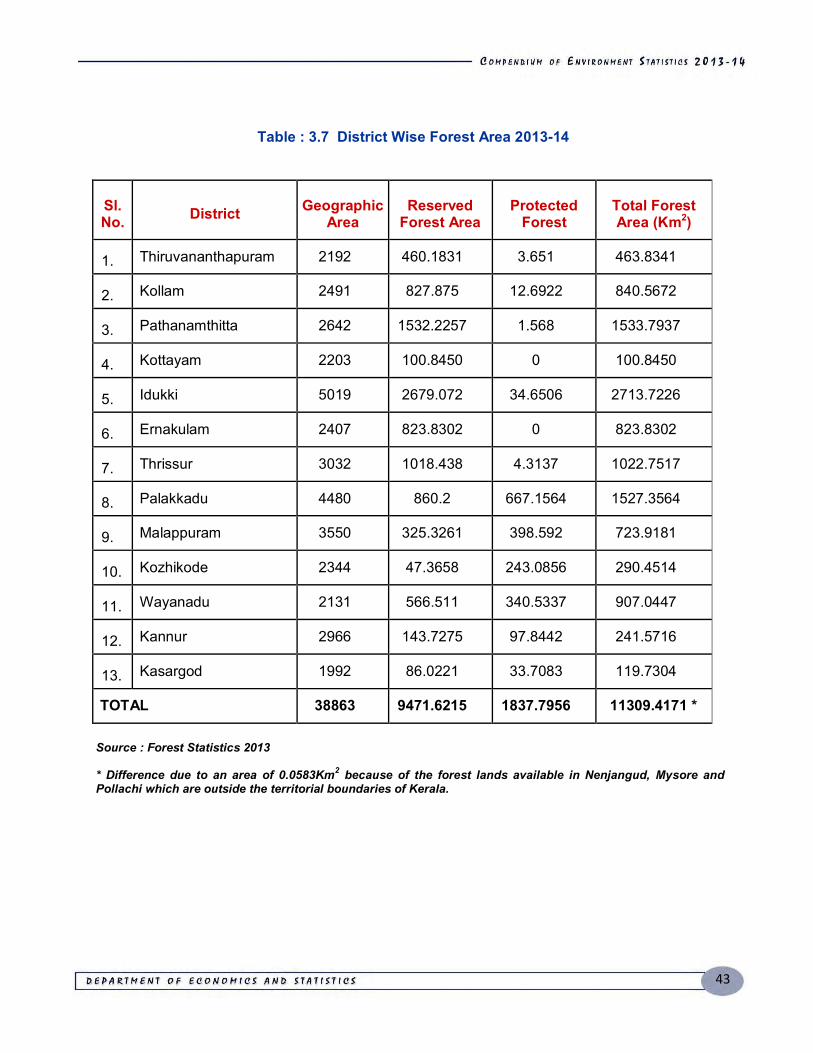
43
Table : 3.7 District Wise Forest Area 2013-14
Sl. No. District Geographic
Area Reserved
Forest Area Protected
Forest Total Forest Area (Km2)
1. Thiruvananthapuram 2192 460.1831 3.651 463.8341
2. Kollam 2491 827.875 12.6922 840.5672
3. Pathanamthitta 2642 1532.2257 1.568 1533.7937
4. Kottayam 2203 100.8450 0 100.8450
5. Idukki 5019 2679.072 34.6506 2713.7226
6. Ernakulam 2407 823.8302 0 823.8302
7. Thrissur 3032 1018.438 4.3137 1022.7517
8. Palakkadu 4480 860.2 667.1564 1527.3564
9. Malappuram 3550 325.3261 398.592 723.9181
10. Kozhikode 2344 47.3658 243.0856 290.4514
11. Wayanadu 2131 566.511 340.5337 907.0447
12. Kannur 2966 143.7275 97.8442 241.5716
13. Kasargod 1992 86.0221 33.7083 119.7304
TOTAL 38863 9471.6215 1837.7956 11309.4171 *
Source : Forest Statistics 2013 * Difference due to an area of 0.0583Km2 because of the forest lands available in Nenjangud, Mysore and Pollachi which are outside the territorial boundaries of Kerala.
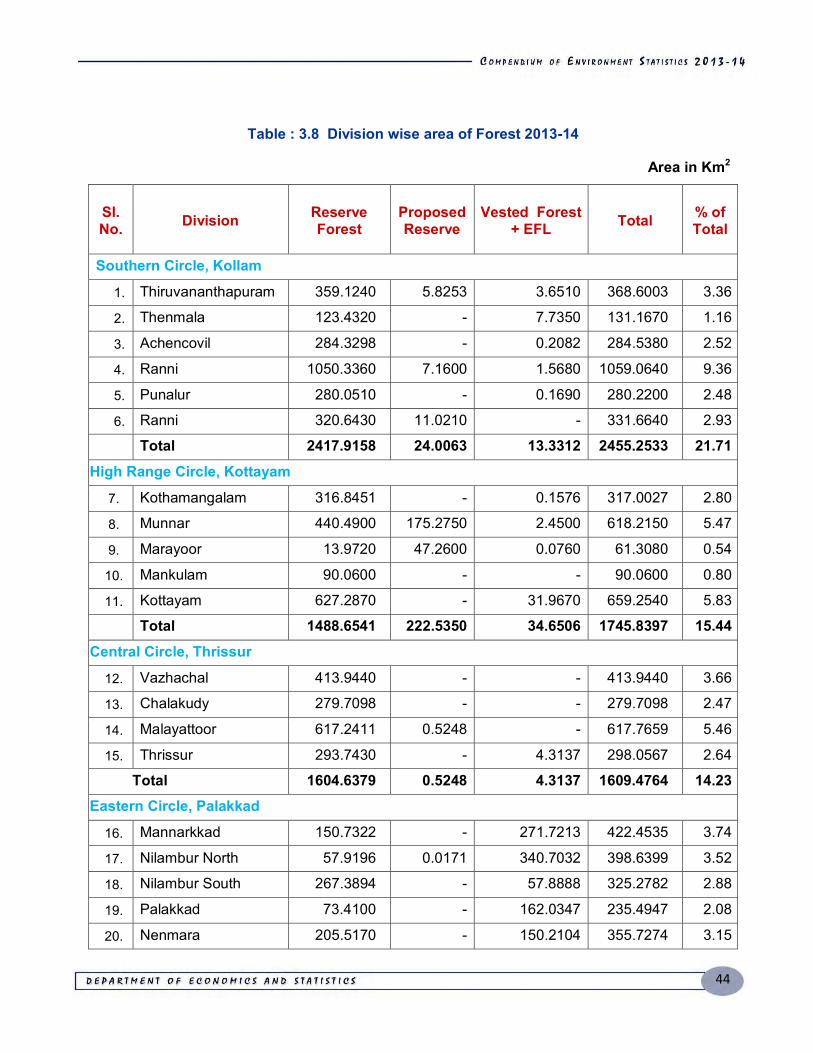
44
Table : 3.8 Division wise area of Forest 2013-14
Area in Km2
Sl. No. Division Reserve
Forest Proposed Reserve
Vested Forest + EFL Total % of
Total
Southern Circle, Kollam
1. Thiruvananthapuram 359.1240 5.8253 3.6510 368.6003 3.36
2. Thenmala 123.4320 - 7.7350 131.1670 1.16
3. Achencovil 284.3298 - 0.2082 284.5380 2.52
4. Ranni 1050.3360 7.1600 1.5680 1059.0640 9.36
5. Punalur 280.0510 - 0.1690 280.2200 2.48
6. Ranni 320.6430 11.0210 - 331.6640 2.93
Total 2417.9158 24.0063 13.3312 2455.2533 21.71 High Range Circle, Kottayam
7. Kothamangalam 316.8451 - 0.1576 317.0027 2.80
8. Munnar 440.4900 175.2750 2.4500 618.2150 5.47
9. Marayoor 13.9720 47.2600 0.0760 61.3080 0.54
10. Mankulam 90.0600 - - 90.0600 0.80
11. Kottayam 627.2870 - 31.9670 659.2540 5.83
Total 1488.6541 222.5350 34.6506 1745.8397 15.44 Central Circle, Thrissur
12. Vazhachal 413.9440 - - 413.9440 3.66
13. Chalakudy 279.7098 - - 279.7098 2.47
14. Malayattoor 617.2411 0.5248 - 617.7659 5.46
15. Thrissur 293.7430 - 4.3137 298.0567 2.64
Total 1604.6379 0.5248 4.3137 1609.4764 14.23 Eastern Circle, Palakkad
16. Mannarkkad 150.7322 - 271.7213 422.4535 3.74
17. Nilambur North 57.9196 0.0171 340.7032 398.6399 3.52
18. Nilambur South 267.3894 - 57.8888 325.2782 2.88
19. Palakkad 73.4100 - 162.0347 235.4947 2.08
20. Nenmara 205.5170 - 150.2104 355.7274 3.15
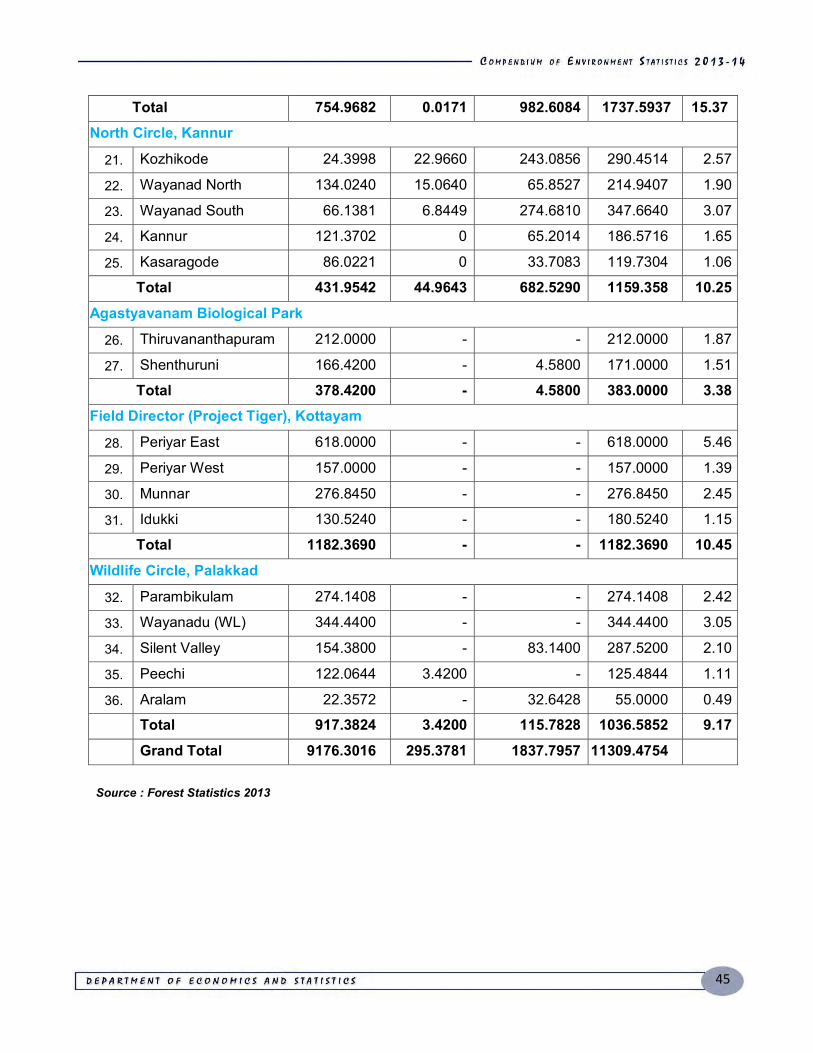
45
Total 754.9682 0.0171 982.6084 1737.5937 15.37 North Circle, Kannur
21. Kozhikode 24.3998 22.9660 243.0856 290.4514 2.57
22. Wayanad North 134.0240 15.0640 65.8527 214.9407 1.90
23. Wayanad South 66.1381 6.8449 274.6810 347.6640 3.07
24. Kannur 121.3702 0 65.2014 186.5716 1.65
25. Kasaragode 86.0221 0 33.7083 119.7304 1.06
Total 431.9542 44.9643 682.5290 1159.358 10.25 Agastyavanam Biological Park
26. Thiruvananthapuram 212.0000 - - 212.0000 1.87
27. Shenthuruni 166.4200 - 4.5800 171.0000 1.51
Total 378.4200 - 4.5800 383.0000 3.38 Field Director (Project Tiger), Kottayam
28. Periyar East 618.0000 - - 618.0000 5.46
29. Periyar West 157.0000 - - 157.0000 1.39
30. Munnar 276.8450 - - 276.8450 2.45
31. Idukki 130.5240 - - 180.5240 1.15
Total 1182.3690 - - 1182.3690 10.45 Wildlife Circle, Palakkad
32. Parambikulam 274.1408 - - 274.1408 2.42
33. Wayanadu (WL) 344.4400 - - 344.4400 3.05
34. Silent Valley 154.3800 - 83.1400 287.5200 2.10
35. Peechi 122.0644 3.4200 - 125.4844 1.11
36. Aralam 22.3572 - 32.6428 55.0000 0.49
Total 917.3824 3.4200 115.7828 1036.5852 9.17 Grand Total 9176.3016 295.3781 1837.7957 11309.4754 Source : Forest Statistics 2013
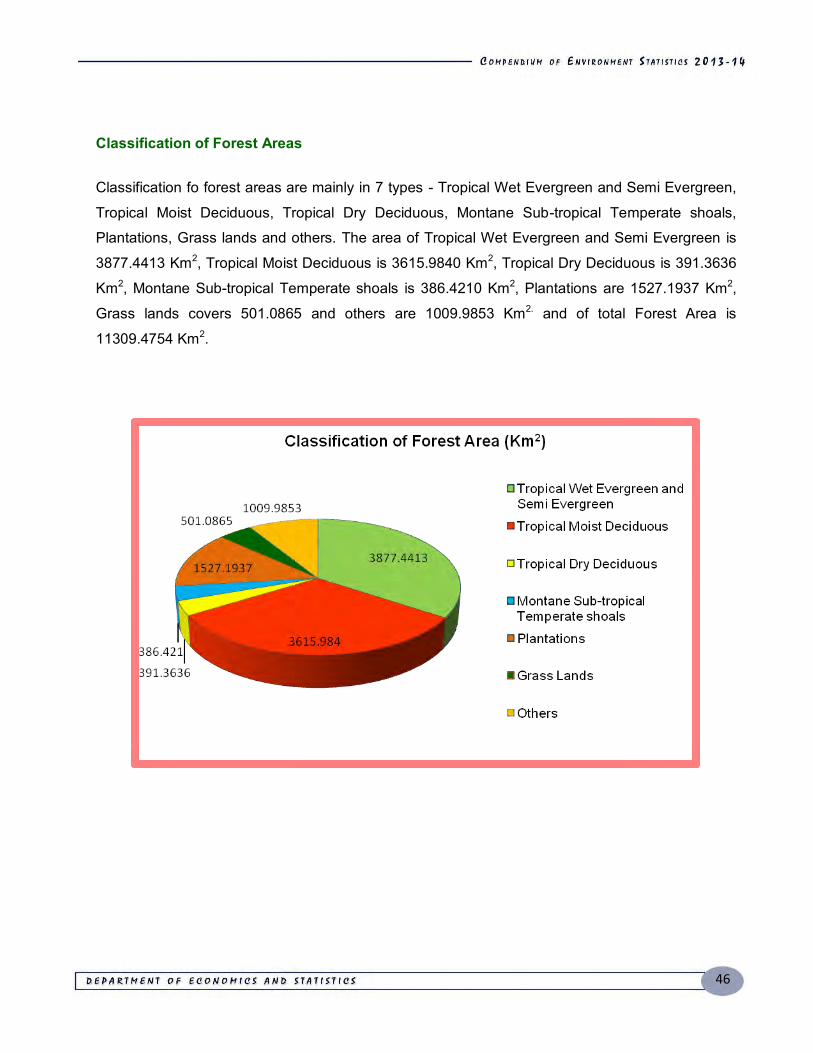
46
Classification of Forest Areas
Classification fo forest areas are mainly in 7 types - Tropical Wet Evergreen and Semi Evergreen,
Tropical Moist Deciduous, Tropical Dry Deciduous, Montane Sub-tropical Temperate shoals,
Plantations, Grass lands and others. The area of Tropical Wet Evergreen and Semi Evergreen is
3877.4413 Km2, Tropical Moist Deciduous is 3615.9840 Km2, Tropical Dry Deciduous is 391.3636
Km2, Montane Sub-tropical Temperate shoals is 386.4210 Km2, Plantations are 1527.1937 Km2,
Grass lands covers 501.0865 and others are 1009.9853 Km2. and of total Forest Area is
11309.4754 Km2.
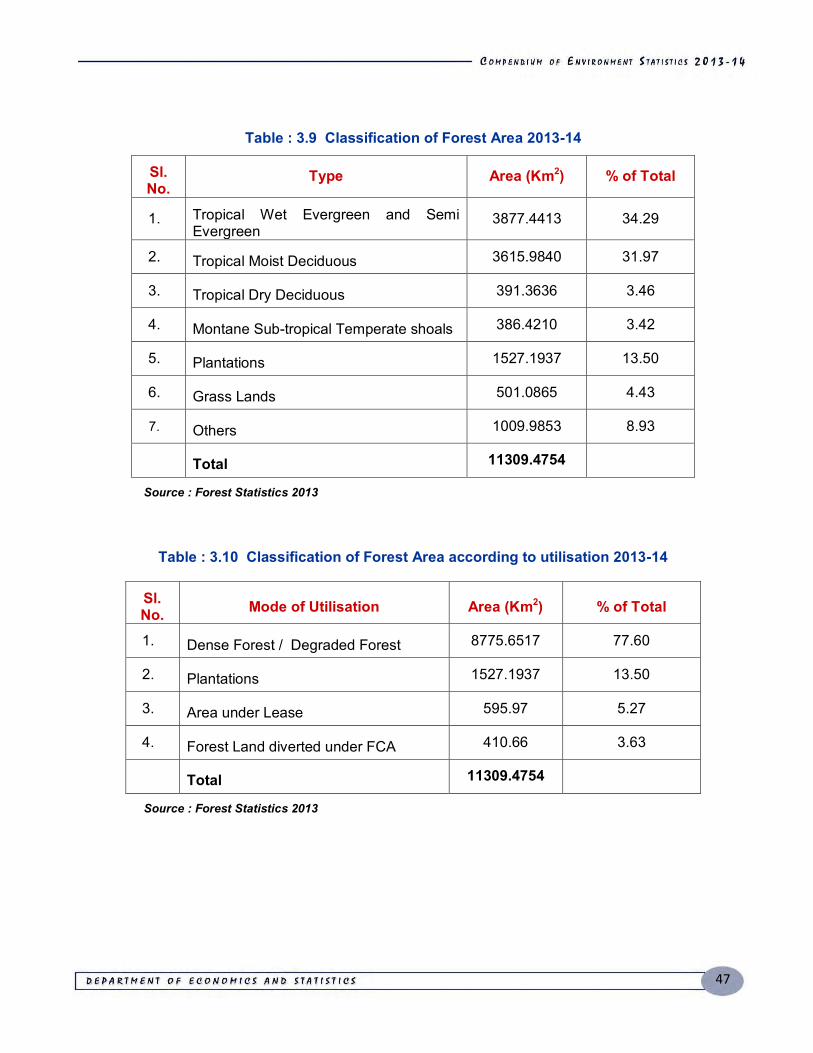
47
Table : 3.9 Classification of Forest Area 2013-14
Sl. No.
Type Area (Km2) % of Total
1. Tropical Wet Evergreen and Semi Evergreen
3877.4413 34.29
2. Tropical Moist Deciduous 3615.9840 31.97
3. Tropical Dry Deciduous 391.3636 3.46
4. Montane Sub-tropical Temperate shoals 386.4210 3.42
5. Plantations 1527.1937 13.50
6. Grass Lands 501.0865 4.43
7. Others 1009.9853 8.93
Total 11309.4754
Source : Forest Statistics 2013
Table : 3.10 Classification of Forest Area according to utilisation 2013-14
Sl. No. Mode of Utilisation Area (Km2) % of Total
1. Dense Forest / Degraded Forest 8775.6517 77.60
2. Plantations 1527.1937 13.50
3. Area under Lease 595.97 5.27
4. Forest Land diverted under FCA 410.66 3.63
Total 11309.4754
Source : Forest Statistics 2013
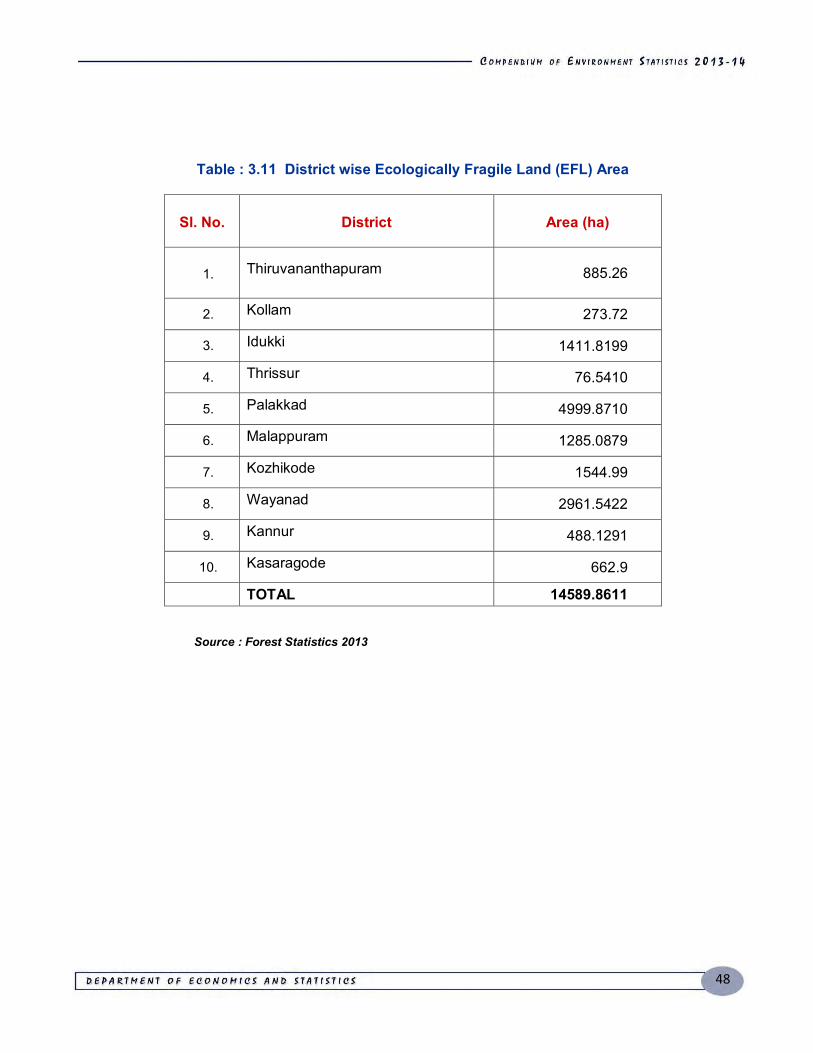
48
Table : 3.11 District wise Ecologically Fragile Land (EFL) Area
Sl. No. District Area (ha)
1. Thiruvananthapuram 885.26
2. Kollam 273.72
3. Idukki 1411.8199
4. Thrissur 76.5410
5. Palakkad 4999.8710
6. Malappuram 1285.0879
7. Kozhikode 1544.99
8. Wayanad 2961.5422
9. Kannur 488.1291
10. Kasaragode 662.9
TOTAL 14589.8611
Source : Forest Statistics 2013
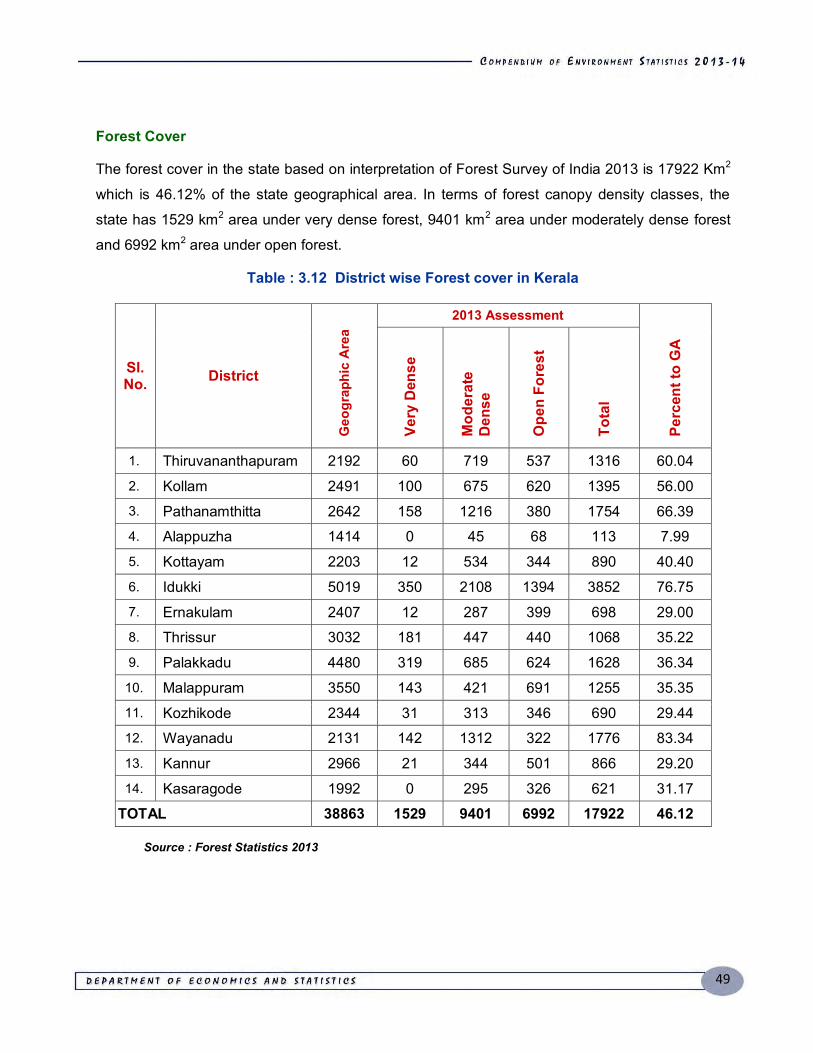
49
Forest Cover
The forest cover in the state based on interpretation of Forest Survey of India 2013 is 17922 Km2
which is 46.12% of the state geographical area. In terms of forest canopy density classes, the
state has 1529 km2 area under very dense forest, 9401 km2 area under moderately dense forest
and 6992 km2 area under open forest.
Table : 3.12 District wise Forest cover in Kerala
Sl. No. District
Geo
grap
hic
Are
a
2013 Assessment
Perc
ent t
o G
A
Very
Den
se
Mod
erat
e D
ense
Ope
n Fo
rest
Tota
l
1. Thiruvananthapuram 2192 60 719 537 1316 60.04 2. Kollam 2491 100 675 620 1395 56.00 3. Pathanamthitta 2642 158 1216 380 1754 66.39 4. Alappuzha 1414 0 45 68 113 7.99 5. Kottayam 2203 12 534 344 890 40.40 6. Idukki 5019 350 2108 1394 3852 76.75 7. Ernakulam 2407 12 287 399 698 29.00 8. Thrissur 3032 181 447 440 1068 35.22 9. Palakkadu 4480 319 685 624 1628 36.34
10. Malappuram 3550 143 421 691 1255 35.35 11. Kozhikode 2344 31 313 346 690 29.44 12. Wayanadu 2131 142 1312 322 1776 83.34 13. Kannur 2966 21 344 501 866 29.20 14. Kasaragode 1992 0 295 326 621 31.17
TOTAL 38863 1529 9401 6992 17922 46.12 Source : Forest Statistics 2013
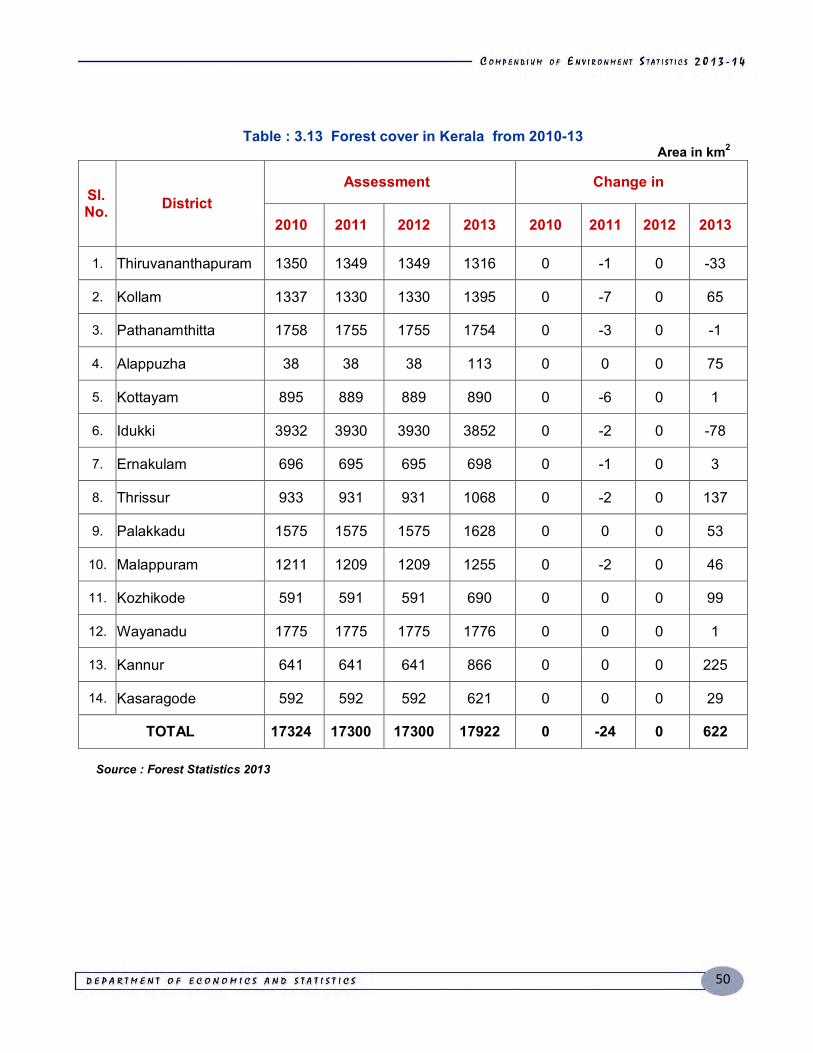
50
Table : 3.13 Forest cover in Kerala from 2010-13 Area in km2
Sl. No. District
Assessment Change in
2010 2011 2012 2013 2010 2011 2012 2013
1. Thiruvananthapuram 1350 1349 1349 1316 0 -1 0 -33
2. Kollam 1337 1330 1330 1395 0 -7 0 65
3. Pathanamthitta 1758 1755 1755 1754 0 -3 0 -1
4. Alappuzha 38 38 38 113 0 0 0 75
5. Kottayam 895 889 889 890 0 -6 0 1
6. Idukki 3932 3930 3930 3852 0 -2 0 -78
7. Ernakulam 696 695 695 698 0 -1 0 3
8. Thrissur 933 931 931 1068 0 -2 0 137
9. Palakkadu 1575 1575 1575 1628 0 0 0 53
10. Malappuram 1211 1209 1209 1255 0 -2 0 46
11. Kozhikode 591 591 591 690 0 0 0 99
12. Wayanadu 1775 1775 1775 1776 0 0 0 1
13. Kannur 641 641 641 866 0 0 0 225
14. Kasaragode 592 592 592 621 0 0 0 29
TOTAL 17324 17300 17300 17922 0 -24 0 622
Source : Forest Statistics 2013
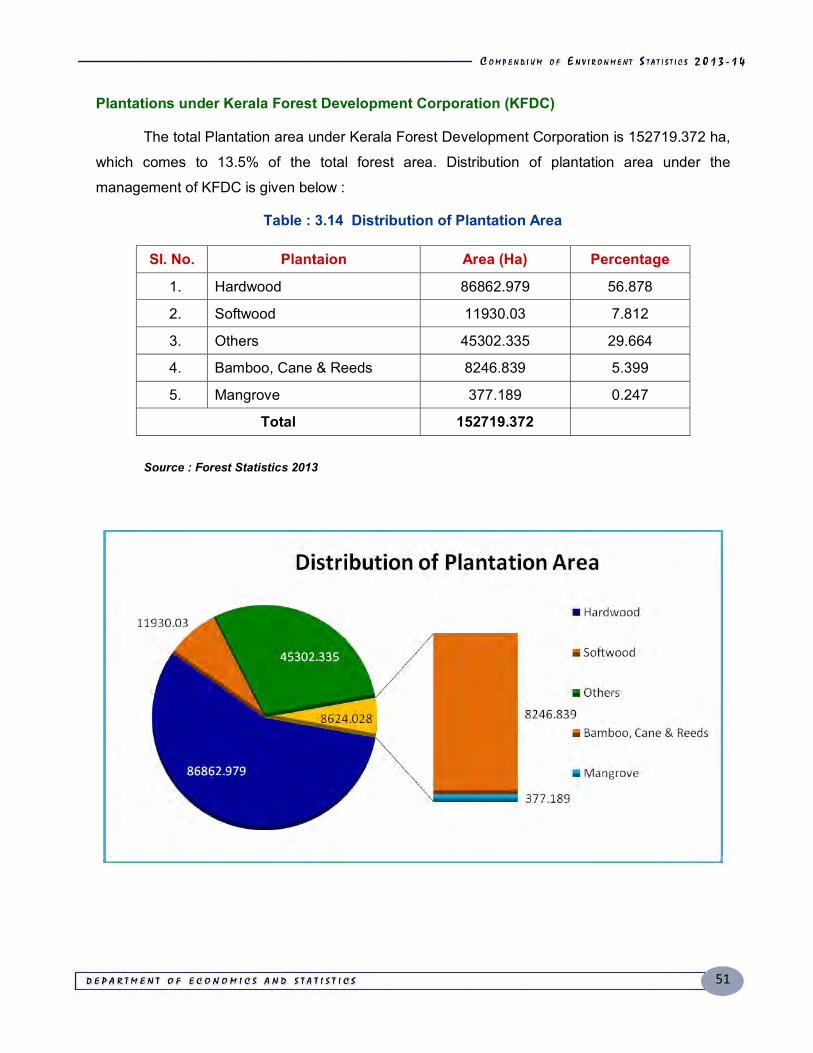
51
Plantations under Kerala Forest Development Corporation (KFDC)
The total Plantation area under Kerala Forest Development Corporation is 152719.372 ha,
which comes to 13.5% of the total forest area. Distribution of plantation area under the
management of KFDC is given below :
Table : 3.14 Distribution of Plantation Area
Sl. No. Plantaion Area (Ha) Percentage
1. Hardwood 86862.979 56.878
2. Softwood 11930.03 7.812
3. Others 45302.335 29.664
4. Bamboo, Cane & Reeds 8246.839 5.399
5. Mangrove 377.189 0.247
Total 152719.372 Source : Forest Statistics 2013
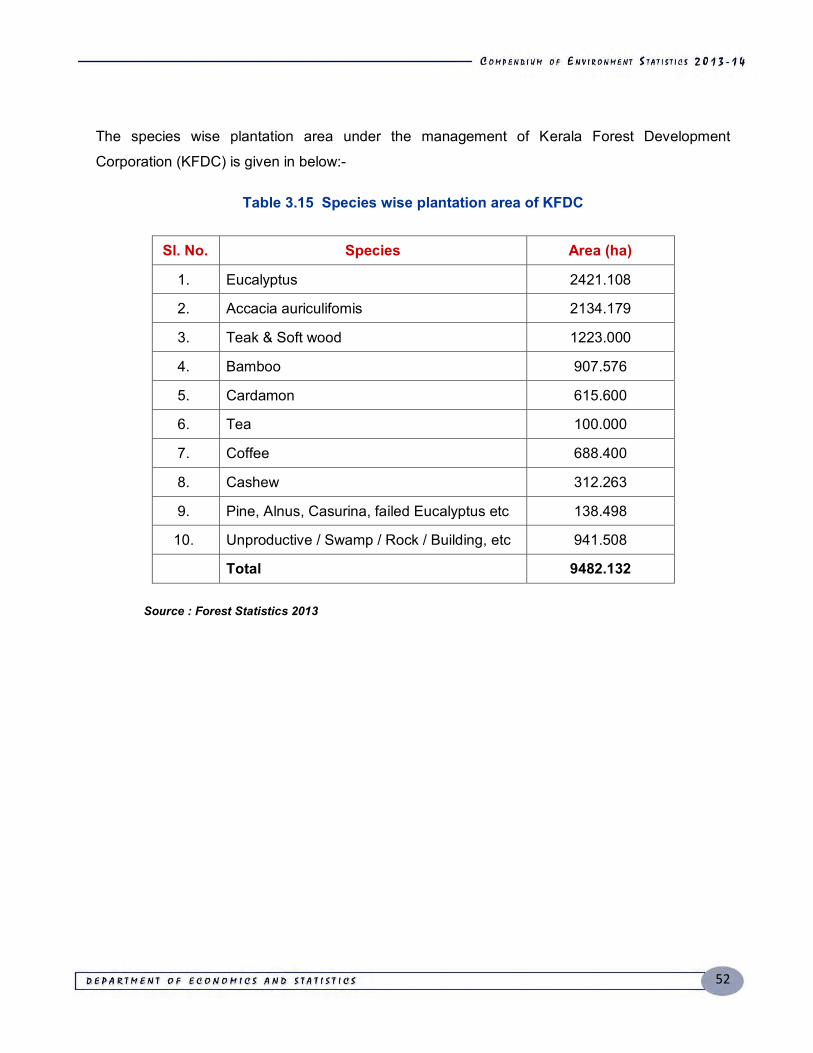
52
The species wise plantation area under the management of Kerala Forest Development
Corporation (KFDC) is given in below:-
Table 3.15 Species wise plantation area of KFDC
Sl. No. Species Area (ha)
1. Eucalyptus 2421.108
2. Accacia auriculifomis 2134.179
3. Teak & Soft wood 1223.000
4. Bamboo 907.576
5. Cardamon 615.600
6. Tea 100.000
7. Coffee 688.400
8. Cashew 312.263
9. Pine, Alnus, Casurina, failed Eucalyptus etc 138.498
10. Unproductive / Swamp / Rock / Building, etc 941.508
Total 9482.132 Source : Forest Statistics 2013
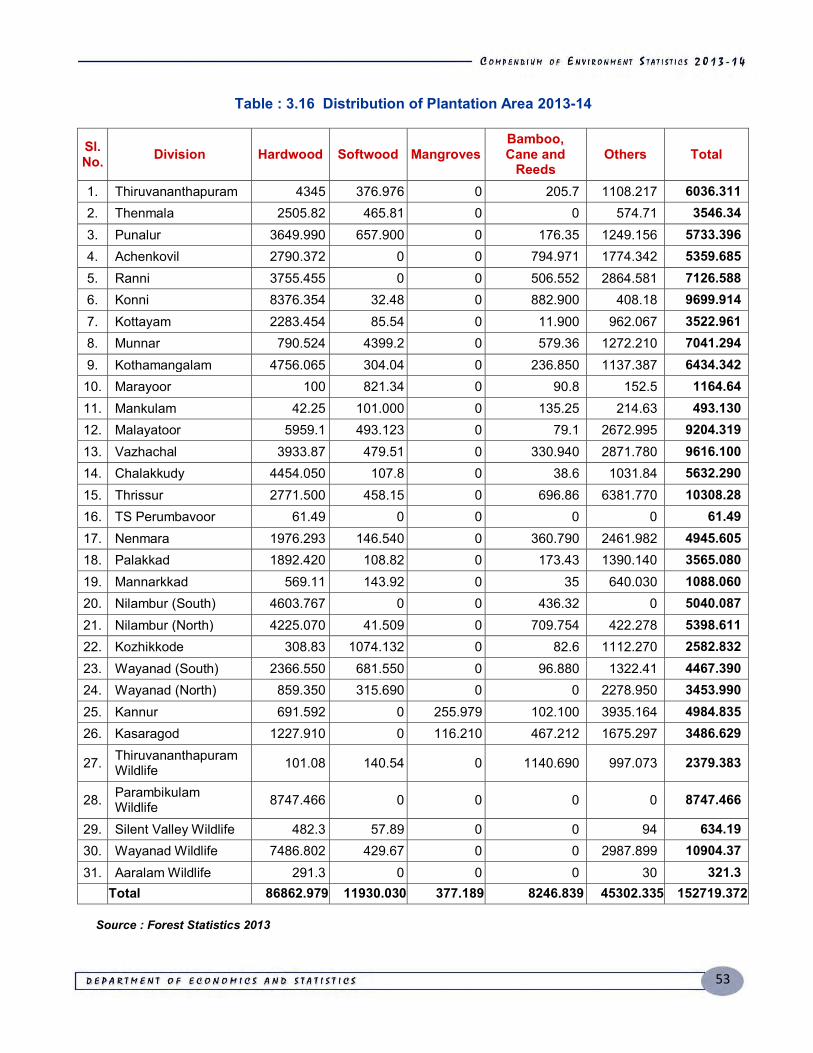
53
Table : 3.16 Distribution of Plantation Area 2013-14
Sl. No. Division Hardwood Softwood Mangroves
Bamboo, Cane and
Reeds Others Total
1. Thiruvananthapuram 4345 376.976 0 205.7 1108.217 6036.311 2. Thenmala 2505.82 465.81 0 0 574.71 3546.34 3. Punalur 3649.990 657.900 0 176.35 1249.156 5733.396 4. Achenkovil 2790.372 0 0 794.971 1774.342 5359.685 5. Ranni 3755.455 0 0 506.552 2864.581 7126.588 6. Konni 8376.354 32.48 0 882.900 408.18 9699.914 7. Kottayam 2283.454 85.54 0 11.900 962.067 3522.961 8. Munnar 790.524 4399.2 0 579.36 1272.210 7041.294 9. Kothamangalam 4756.065 304.04 0 236.850 1137.387 6434.342
10. Marayoor 100 821.34 0 90.8 152.5 1164.64 11. Mankulam 42.25 101.000 0 135.25 214.63 493.130 12. Malayatoor 5959.1 493.123 0 79.1 2672.995 9204.319 13. Vazhachal 3933.87 479.51 0 330.940 2871.780 9616.100 14. Chalakkudy 4454.050 107.8 0 38.6 1031.84 5632.290 15. Thrissur 2771.500 458.15 0 696.86 6381.770 10308.28 16. TS Perumbavoor 61.49 0 0 0 0 61.49 17. Nenmara 1976.293 146.540 0 360.790 2461.982 4945.605 18. Palakkad 1892.420 108.82 0 173.43 1390.140 3565.080 19. Mannarkkad 569.11 143.92 0 35 640.030 1088.060 20. Nilambur (South) 4603.767 0 0 436.32 0 5040.087 21. Nilambur (North) 4225.070 41.509 0 709.754 422.278 5398.611 22. Kozhikkode 308.83 1074.132 0 82.6 1112.270 2582.832 23. Wayanad (South) 2366.550 681.550 0 96.880 1322.41 4467.390 24. Wayanad (North) 859.350 315.690 0 0 2278.950 3453.990 25. K Kannur 691.592 0 255.979 102.100 3935.164 4984.835 26. Kasaragod 1227.910 0 116.210 467.212 1675.297 3486.629
27. Thiruvananthapuram Wildlife 101.08 140.54 0 1140.690 997.073 2379.383
28. Parambikulam Wildlife 8747.466 0 0 0 0 8747.466
29. Silent Valley Wildlife 482.3 57.89 0 0 94 634.19 30. Wayanad Wildlife 7486.802 429.67 0 0 2987.899 10904.37 31. Aaralam Wildlife 291.3 0 0 0 30 321.3
Total 86862.979 11930.030 377.189 8246.839 45302.335 152719.372
Source : Forest Statistics 2013
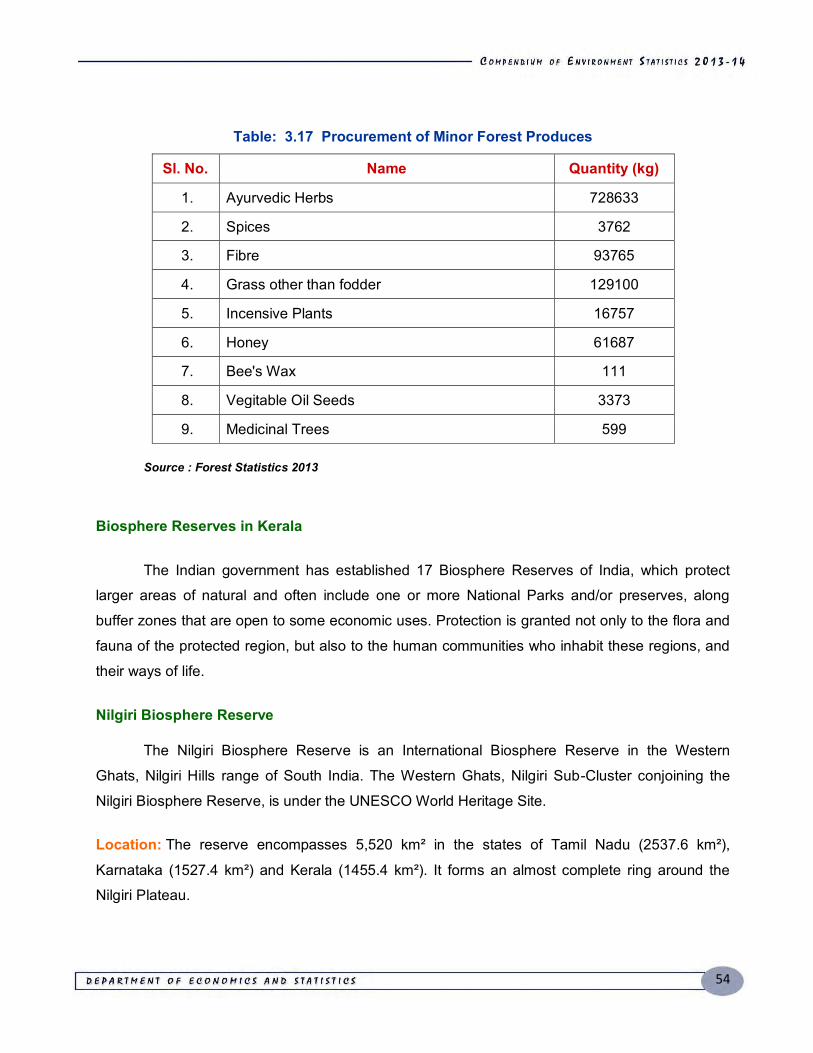
54
Table: 3.17 Procurement of Minor Forest Produces
Sl. No. Name Quantity (kg)
1. Ayurvedic Herbs 728633
2. Spices 3762
3. Fibre 93765
4. Grass other than fodder 129100
5. Incensive Plants 16757
6. Honey 61687
7. Bee's Wax 111
8. Vegitable Oil Seeds 3373
9. Medicinal Trees 599 Source : Forest Statistics 2013
Biosphere Reserves in Kerala
The Indian government has established 17 Biosphere Reserves of India, which protect
larger areas of natural and often include one or more National Parks and/or preserves, along
buffer zones that are open to some economic uses. Protection is granted not only to the flora and
fauna of the protected region, but also to the human communities who inhabit these regions, and
their ways of life.
Nilgiri Biosphere Reserve
The Nilgiri Biosphere Reserve is an International Biosphere Reserve in the Western
Ghats, Nilgiri Hills range of South India. The Western Ghats, Nilgiri Sub-Cluster conjoining the
Nilgiri Biosphere Reserve, is under the UNESCO World Heritage Site.
Location: The reserve encompasses 5,520 km² in the states of Tamil Nadu (2537.6 km²),
Karnataka (1527.4 km²) and Kerala (1455.4 km²). It forms an almost complete ring around the
Nilgiri Plateau.
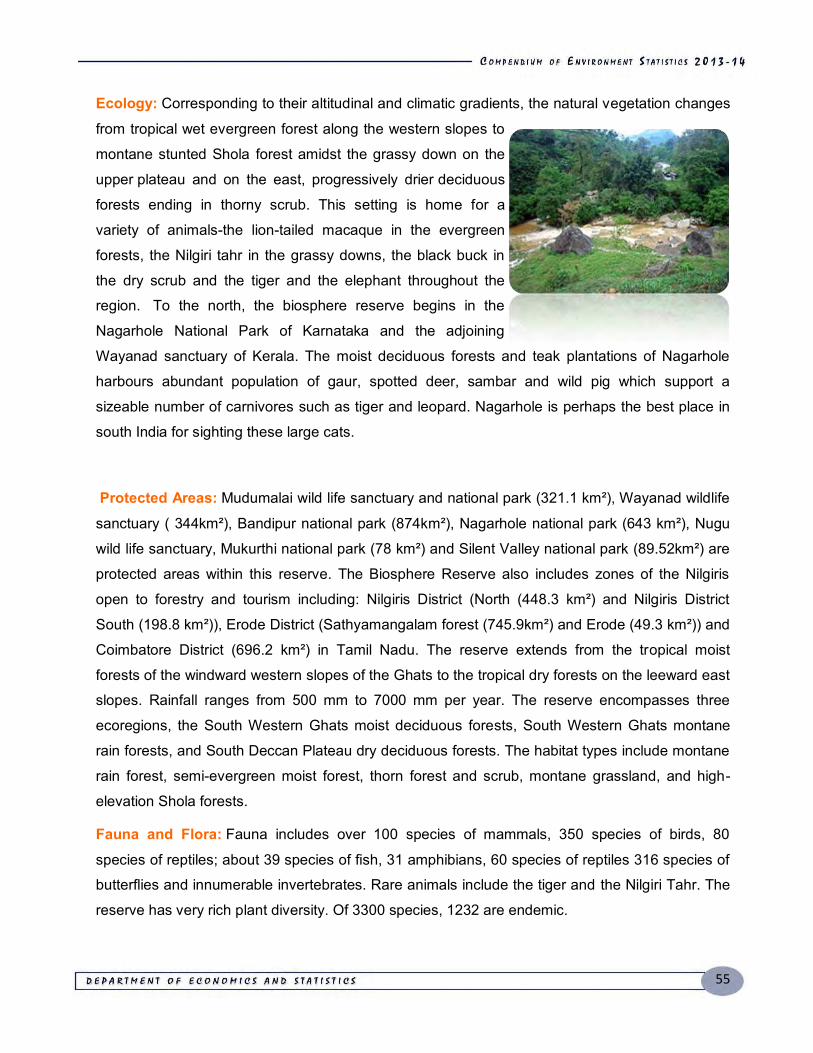
55
Ecology: Corresponding to their altitudinal and climatic gradients, the natural vegetation changes
from tropical wet evergreen forest along the western slopes to
montane stunted Shola forest amidst the grassy down on the
upper plateau and on the east, progressively drier deciduous
forests ending in thorny scrub. This setting is home for a
variety of animals-the lion-tailed macaque in the evergreen
forests, the Nilgiri tahr in the grassy downs, the black buck in
the dry scrub and the tiger and the elephant throughout the
region. To the north, the biosphere reserve begins in the
Nagarhole National Park of Karnataka and the adjoining
Wayanad sanctuary of Kerala. The moist deciduous forests and teak plantations of Nagarhole
harbours abundant population of gaur, spotted deer, sambar and wild pig which support a
sizeable number of carnivores such as tiger and leopard. Nagarhole is perhaps the best place in
south India for sighting these large cats.
Protected Areas: Mudumalai wild life sanctuary and national park (321.1 km²), Wayanad wildlife
sanctuary ( 344km²), Bandipur national park (874km²), Nagarhole national park (643 km²), Nugu
wild life sanctuary, Mukurthi national park (78 km²) and Silent Valley national park (89.52km²) are
protected areas within this reserve. The Biosphere Reserve also includes zones of the Nilgiris
open to forestry and tourism including: Nilgiris District (North (448.3 km²) and Nilgiris District
South (198.8 km²)), Erode District (Sathyamangalam forest (745.9km²) and Erode (49.3 km²)) and
Coimbatore District (696.2 km²) in Tamil Nadu. The reserve extends from the tropical moist
forests of the windward western slopes of the Ghats to the tropical dry forests on the leeward east
slopes. Rainfall ranges from 500 mm to 7000 mm per year. The reserve encompasses three
ecoregions, the South Western Ghats moist deciduous forests, South Western Ghats montane
rain forests, and South Deccan Plateau dry deciduous forests. The habitat types include montane
rain forest, semi-evergreen moist forest, thorn forest and scrub, montane grassland, and high-
elevation Shola forests.
Fauna and Flora: Fauna includes over 100 species of mammals, 350 species of birds, 80
species of reptiles; about 39 species of fish, 31 amphibians, 60 species of reptiles 316 species of
butterflies and innumerable invertebrates. Rare animals include the tiger and the Nilgiri Tahr. The
reserve has very rich plant diversity. Of 3300 species, 1232 are endemic.
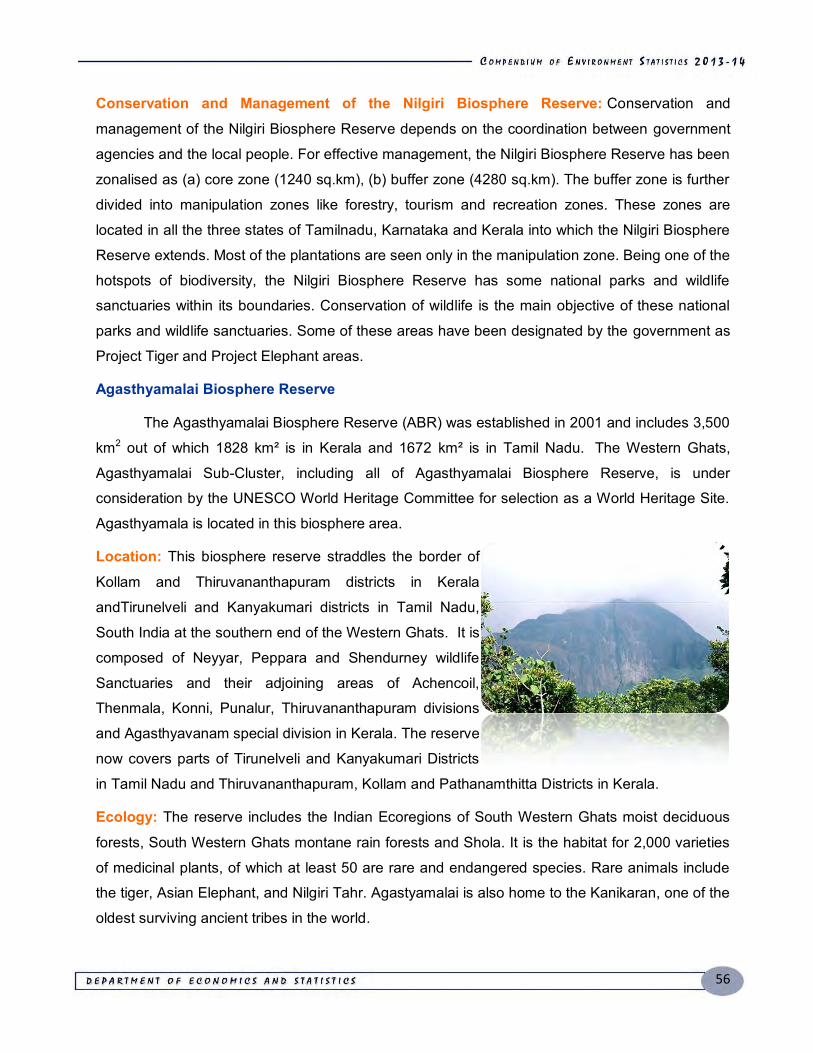
56
Conservation and Management of the Nilgiri Biosphere Reserve: Conservation and
management of the Nilgiri Biosphere Reserve depends on the coordination between government
agencies and the local people. For effective management, the Nilgiri Biosphere Reserve has been
zonalised as (a) core zone (1240 sq.km), (b) buffer zone (4280 sq.km). The buffer zone is further
divided into manipulation zones like forestry, tourism and recreation zones. These zones are
located in all the three states of Tamilnadu, Karnataka and Kerala into which the Nilgiri Biosphere
Reserve extends. Most of the plantations are seen only in the manipulation zone. Being one of the
hotspots of biodiversity, the Nilgiri Biosphere Reserve has some national parks and wildlife
sanctuaries within its boundaries. Conservation of wildlife is the main objective of these national
parks and wildlife sanctuaries. Some of these areas have been designated by the government as
Project Tiger and Project Elephant areas.
Agasthyamalai Biosphere Reserve
The Agasthyamalai Biosphere Reserve (ABR) was established in 2001 and includes 3,500
km2 out of which 1828 km² is in Kerala and 1672 km² is in Tamil Nadu. The Western Ghats,
Agasthyamalai Sub-Cluster, including all of Agasthyamalai Biosphere Reserve, is under
consideration by the UNESCO World Heritage Committee for selection as a World Heritage Site.
Agasthyamala is located in this biosphere area.
Location: This biosphere reserve straddles the border of
Kollam and Thiruvananthapuram districts in Kerala
andTirunelveli and Kanyakumari districts in Tamil Nadu,
South India at the southern end of the Western Ghats. It is
composed of Neyyar, Peppara and Shendurney wildlife
Sanctuaries and their adjoining areas of Achencoil,
Thenmala, Konni, Punalur, Thiruvananthapuram divisions
and Agasthyavanam special division in Kerala. The reserve
now covers parts of Tirunelveli and Kanyakumari Districts
in Tamil Nadu and Thiruvananthapuram, Kollam and Pathanamthitta Districts in Kerala.
Ecology: The reserve includes the Indian Ecoregions of South Western Ghats moist deciduous
forests, South Western Ghats montane rain forests and Shola. It is the habitat for 2,000 varieties
of medicinal plants, of which at least 50 are rare and endangered species. Rare animals include
the tiger, Asian Elephant, and Nilgiri Tahr. Agastyamalai is also home to the Kanikaran, one of the
oldest surviving ancient tribes in the world.
57
The sanctuaries covered are Kalakad Mundanthurai Tiger Reserve. This region, extending
to nearly 3,500 sq. Km., is considered the richest bio-geographic province in the Indian sub-
continent. A sizable portion of the proposed biosphere reserve enjoys protected status at present.
The biosphere concept recognises the need to involve the people subsisting on the resources of
the region in the conservation efforts. The flow of funds under the programme targets the uplift of
these people so that their dependence on the biological resources is brought to a sustainable
level. The programme also lays stress on research and monitoring activities, documentation of the
resources, environmental education and training and international interaction at a scientific level.
Protected Area: The protected area of the reserver includes Neyyar, Peppara and Shenduruny
wildlife sanctuaries of Kerala and Kalakkad-Mundanthurai Tiger Reserve of Tamil Nadu.
Fauna and Flora: The proposed Agasthyamalai Biosphere Reserve is a pristine paleotropic
region with a very high floral endemism and tremendously rich biodiversity, locked up in an area
exhibiting an overall representation of the biota of the southern Western Ghats. The site
represents the richest centre of endemic plants, abode of all vegetation types met within the
peninsula, richest repository of medicinal plants, the southern-most haven of endangered animals
including primates, amphibians, reptiles and fishes and a treasure house of wild relatives of
domesticated crops.
Conservation and Management: A local committee and a state level Biosphere Management
Committee co-ordinate the activities of various departments in the Agasthyamalai Biosphere
Reserve area and ensure the scientific management of the ABR according to guidelines of the
Indian Ministry of Environment and Forests. The Agasthyamalai reserve management is awaiting
approval as participant in the UNESCO Man and the Biosphere (MAB) Programme.
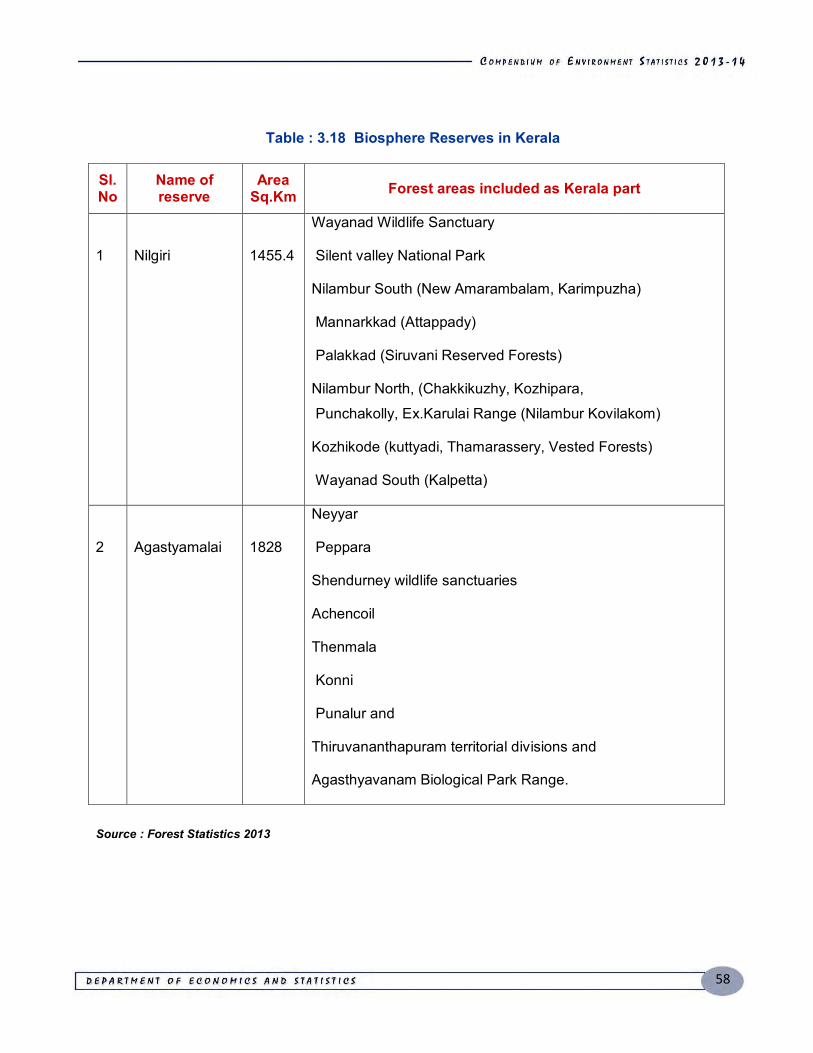
58
Table : 3.18 Biosphere Reserves in Kerala
Sl. No
Name of reserve
Area Sq.Km Forest areas included as Kerala part
1
Nilgiri
1455.4
Wayanad Wildlife Sanctuary
Silent valley National Park
Nilambur South (New Amarambalam, Karimpuzha)
Mannarkkad (Attappady)
Palakkad (Siruvani Reserved Forests)
Nilambur North, (Chakkikuzhy, Kozhipara,
Punchakolly, Ex.Karulai Range (Nilambur Kovilakom)
Kozhikode (kuttyadi, Thamarassery, Vested Forests)
Wayanad South (Kalpetta)
2
Agastyamalai
1828
Neyyar
Peppara
Shendurney wildlife sanctuaries
Achencoil
Thenmala
Konni
Punalur and
Thiruvananthapuram territorial divisions and
Agasthyavanam Biological Park Range.
Source : Forest Statistics 2013
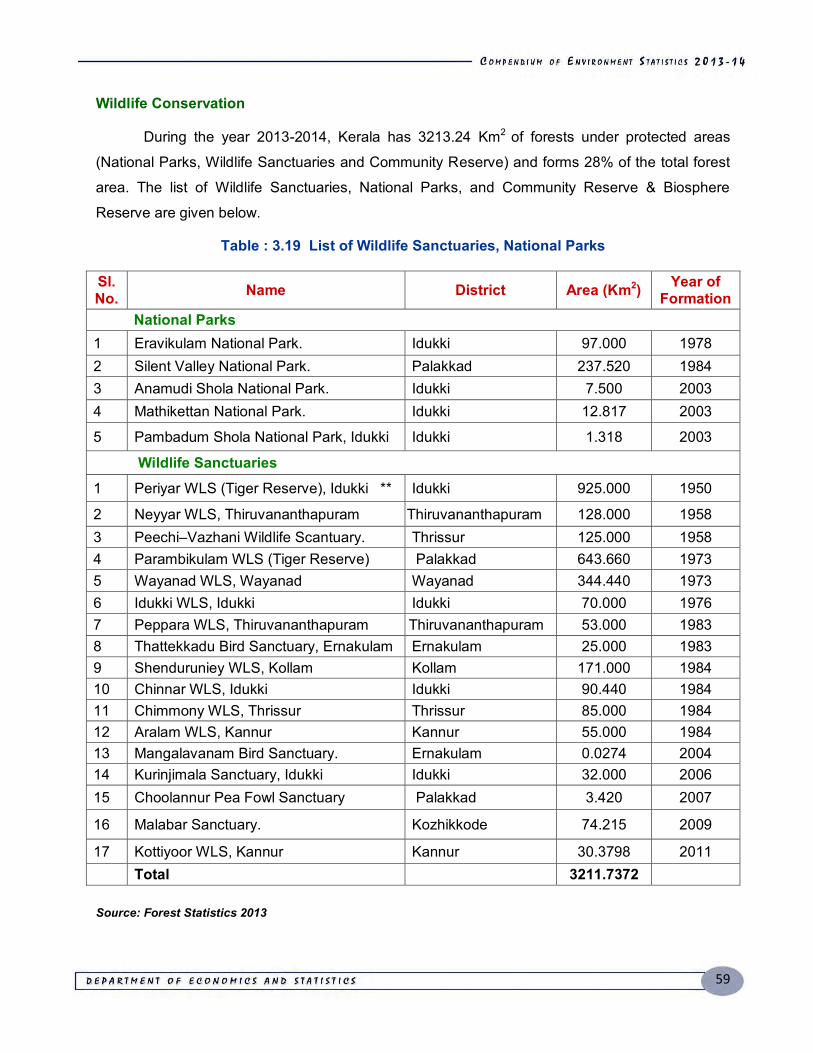
59
Wildlife Conservation
During the year 2013-2014, Kerala has 3213.24 Km2 of forests under protected areas
(National Parks, Wildlife Sanctuaries and Community Reserve) and forms 28% of the total forest
area. The list of Wildlife Sanctuaries, National Parks, and Community Reserve & Biosphere
Reserve are given below.
Table : 3.19 List of Wildlife Sanctuaries, National Parks
Sl. No. Name District Area (Km2) Year of
Formation National Parks 1 Eravikulam National Park. Idukki 97.000 1978 2 Silent Valley National Park. Palakkad 237.520 1984 3 Anamudi Shola National Park. Idukki 7.500 2003 4 Mathikettan National Park. Idukki 12.817 2003
5 Pambadum Shola National Park, Idukki Idukki 1.318 2003
Wildlife Sanctuaries 1 Periyar WLS (Tiger Reserve), Idukki ** Idukki 925.000 1950
2 Neyyar WLS, Thiruvananthapuram Thiruvananthapuram 128.000 1958 3 Peechi–Vazhani Wildlife Scantuary. Thrissur 125.000 1958 4 Parambikulam WLS (Tiger Reserve) Palakkad 643.660 1973 5 Wayanad WLS, Wayanad Wayanad 344.440 1973 6 Idukki WLS, Idukki Idukki 70.000 1976 7 Peppara WLS, Thiruvananthapuram Thiruvananthapuram 53.000 1983 8 Thattekkadu Bird Sanctuary, Ernakulam Ernakulam 25.000 1983 9 Shenduruniey WLS, Kollam Kollam 171.000 1984 10 Chinnar WLS, Idukki Idukki 90.440 1984 11 Chimmony WLS, Thrissur Thrissur 85.000 1984 12 Aralam WLS, Kannur Kannur 55.000 1984 13 Mangalavanam Bird Sanctuary. Ernakulam 0.0274 2004 14 Kurinjimala Sanctuary, Idukki Idukki 32.000 2006 15 Choolannur Pea Fowl Sanctuary Palakkad 3.420 2007
16 Malabar Sanctuary. Kozhikkode 74.215 2009
17 Kottiyoor WLS, Kannur Kannur 30.3798 2011 Total 3211.7372 Source: Forest Statistics 2013
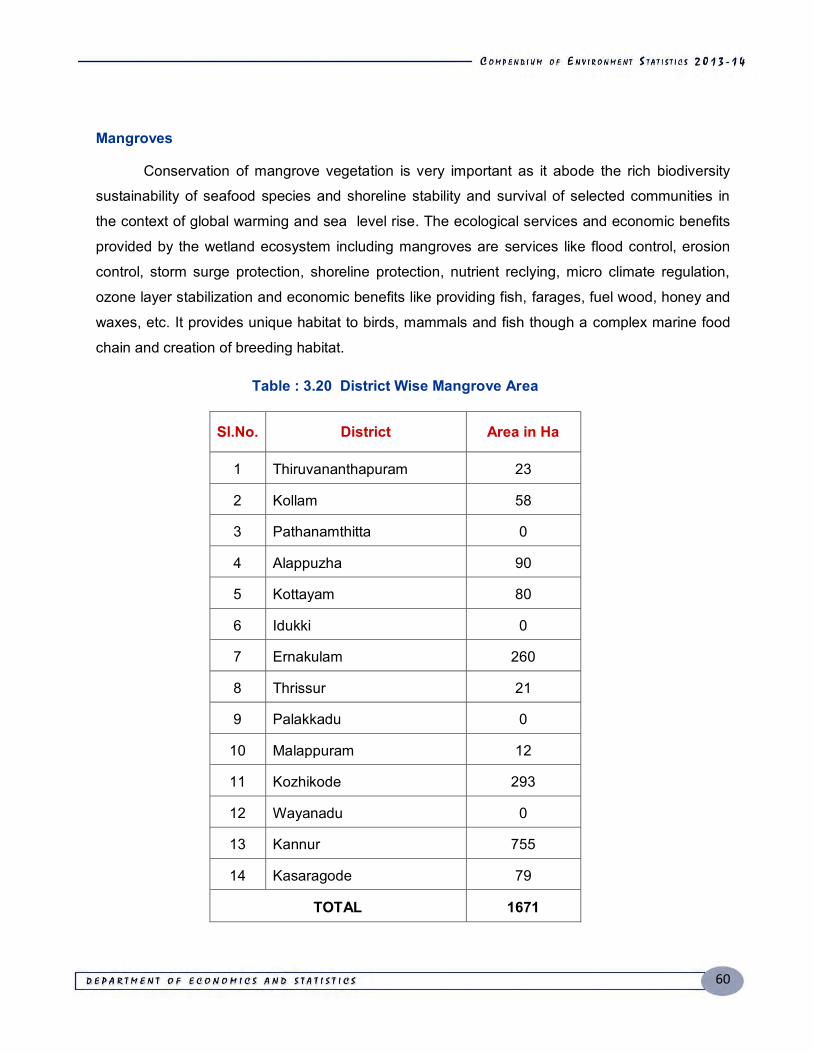
60
Mangroves
Conservation of mangrove vegetation is very important as it abode the rich biodiversity
sustainability of seafood species and shoreline stability and survival of selected communities in
the context of global warming and sea level rise. The ecological services and economic benefits
provided by the wetland ecosystem including mangroves are services like flood control, erosion
control, storm surge protection, shoreline protection, nutrient reclying, micro climate regulation,
ozone layer stabilization and economic benefits like providing fish, farages, fuel wood, honey and
waxes, etc. It provides unique habitat to birds, mammals and fish though a complex marine food
chain and creation of breeding habitat.
Table : 3.20 District Wise Mangrove Area
Sl.No. District Area in Ha
1 Thiruvananthapuram 23
2 Kollam 58
3 Pathanamthitta 0
4 Alappuzha 90
5 Kottayam 80
6 Idukki 0
7 Ernakulam 260
8 Thrissur 21
9 Palakkadu 0
10 Malappuram 12
11 Kozhikode 293
12 Wayanadu 0
13 Kannur 755
14 Kasaragode 79
TOTAL 1671

61
Marine Eco System
Exorting pressure on the marine and coastal ecosystem due to land use changes, water
disposal, coastal erosion, tourism industry and sand mining are reported from various studies in
the State. The fisheries sector is facing pressure from access fishing fleet, habitat degradation,
over fishing and juvenile fishing. Bottom trancing poses major threat to the marine ecosystem
along the coast of Kerala. Kerala has high population density along with its 580 Km long coastline
and coastal villages. The climate induced changes adversily affect livelihood option of fisherman
community and a few millimetre rise in sea level directly affect the vulnerable coastal population.
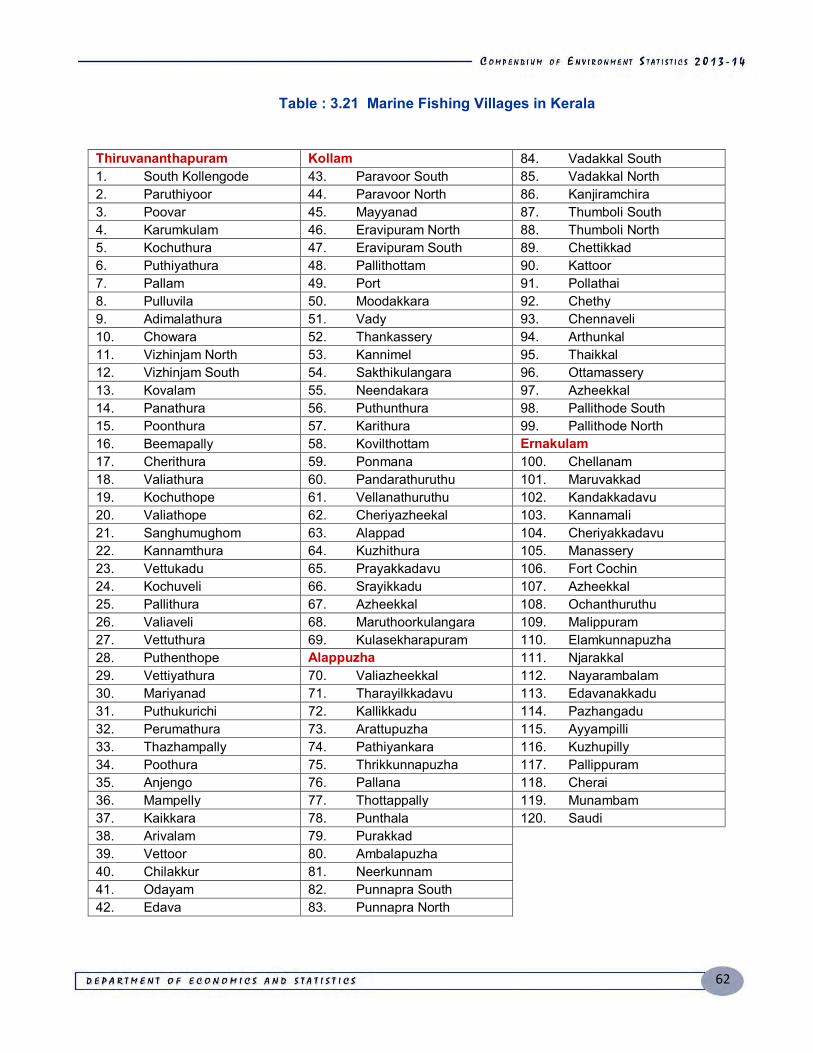
62
Table : 3.21 Marine Fishing Villages in Kerala
Thiruvananthapuram Kollam 84. Vadakkal South 1. South Kollengode 43. Paravoor South 85. Vadakkal North 2. Paruthiyoor 44. Paravoor North 86. Kanjiramchira 3. Poovar 45. Mayyanad 87. Thumboli South 4. Karumkulam 46. Eravipuram North 88. Thumboli North 5. Kochuthura 47. Eravipuram South 89. Chettikkad 6. Puthiyathura 48. Pallithottam 90. Kattoor 7. Pallam 49. Port 91. Pollathai 8. Pulluvila 50. Moodakkara 92. Chethy 9. Adimalathura 51. Vady 93. Chennaveli 10. Chowara 52. Thankassery 94. Arthunkal 11. Vizhinjam North 53. Kannimel 95. Thaikkal 12. Vizhinjam South 54. Sakthikulangara 96. Ottamassery 13. Kovalam 55. Neendakara 97. Azheekkal 14. Panathura 56. Puthunthura 98. Pallithode South 15. Poonthura 57. Karithura 99. Pallithode North 16. Beemapally 58. Kovilthottam Ernakulam 17. Cherithura 59. Ponmana 100. Chellanam 18. Valiathura 60. Pandarathuruthu 101. Maruvakkad 19. Kochuthope 61. Vellanathuruthu 102. Kandakkadavu 20. Valiathope 62. Cheriyazheekal 103. Kannamali 21. Sanghumughom 63. Alappad 104. Cheriyakkadavu 22. Kannamthura 64. Kuzhithura 105. Manassery 23. Vettukadu 65. Prayakkadavu 106. Fort Cochin 24. Kochuveli 66. Srayikkadu 107. Azheekkal 25. Pallithura 67. Azheekkal 108. Ochanthuruthu 26. Valiaveli 68. Maruthoorkulangara 109. Malippuram 27. Vettuthura 69. Kulasekharapuram 110. Elamkunnapuzha 28. Puthenthope Alappuzha 111. Njarakkal 29. Vettiyathura 70. Valiazheekkal 112. Nayarambalam 30. Mariyanad 71. Tharayilkkadavu 113. Edavanakkadu 31. Puthukurichi 72. Kallikkadu 114. Pazhangadu 32. Perumathura 73. Arattupuzha 115. Ayyampilli 33. Thazhampally 74. Pathiyankara 116. Kuzhupilly 34. Poothura 75. Thrikkunnapuzha 117. Pallippuram 35. Anjengo 76. Pallana 118. Cherai 36. Mampelly 77. Thottappally 119. Munambam 37. Kaikkara 78. Punthala 120. Saudi 38. Arivalam 79. Purakkad
39. Vettoor 80. Ambalapuzha 40. Chilakkur 81. Neerkunnam 41. Odayam 82. Punnapra South 42. Edava 83. Punnapra North
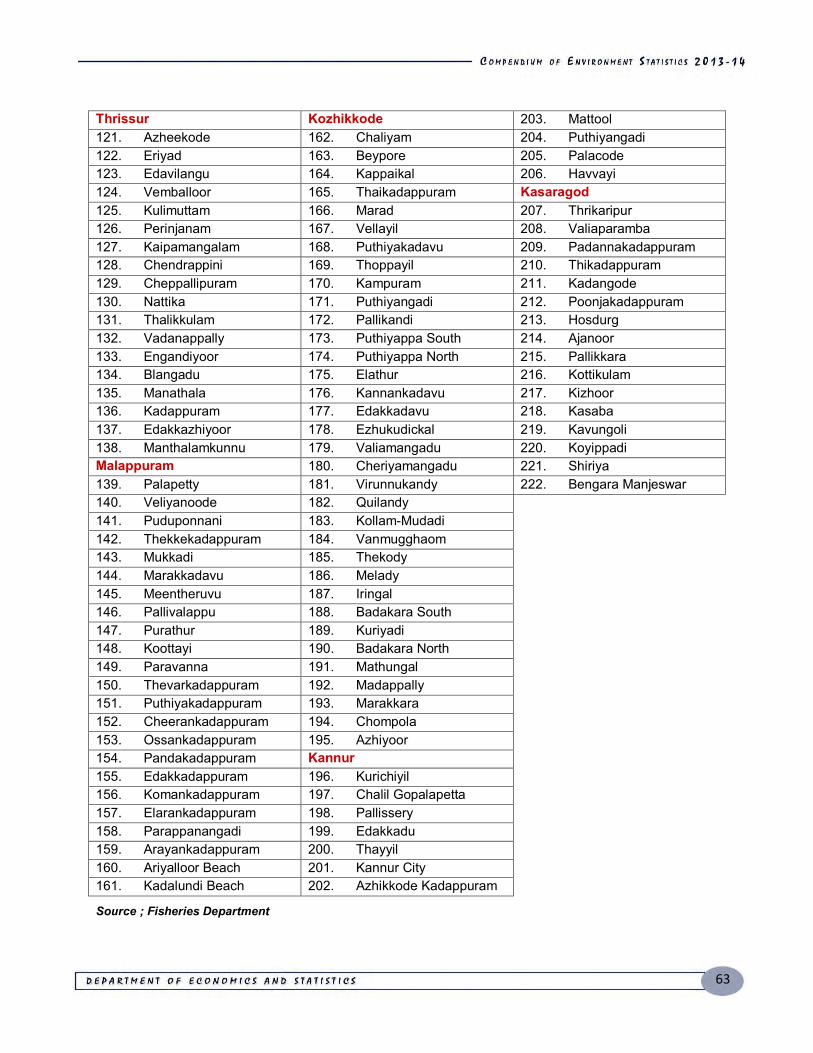
63
Thrissur Kozhikkode 203. Mattool 121. Azheekode 162. Chaliyam 204. Puthiyangadi 122. Eriyad 163. Beypore 205. Palacode 123. Edavilangu 164. Kappaikal 206. Havvayi 124. Vemballoor 165. Thaikadappuram Kasaragod 125. Kulimuttam 166. Marad 207. Thrikaripur 126. Perinjanam 167. Vellayil 208. Valiaparamba 127. Kaipamangalam 168. Puthiyakadavu 209. Padannakadappuram 128. Chendrappini 169. Thoppayil 210. Thikadappuram 129. Cheppallipuram 170. Kampuram 211. Kadangode 130. Nattika 171. Puthiyangadi 212. Poonjakadappuram 131. Thalikkulam 172. Pallikandi 213. Hosdurg 132. Vadanappally 173. Puthiyappa South 214. Ajanoor 133. Engandiyoor 174. Puthiyappa North 215. Pallikkara 134. Blangadu 175. Elathur 216. Kottikulam 135. Manathala 176. Kannankadavu 217. Kizhoor 136. Kadappuram 177. Edakkadavu 218. Kasaba 137. Edakkazhiyoor 178. Ezhukudickal 219. Kavungoli 138. Manthalamkunnu 179. Valiamangadu 220. Koyippadi Malappuram 180. Cheriyamangadu 221. Shiriya 139. Palapetty 181. Virunnukandy 222. Bengara Manjeswar 140. Veliyanoode 182. Quilandy 141. Puduponnani 183. Kollam-Mudadi 142. Thekkekadappuram 184. Vanmugghaom 143. Mukkadi 185. Thekody 144. Marakkadavu 186. Melady 145. Meentheruvu 187. Iringal 146. Pallivalappu 188. Badakara South 147. Purathur 189. Kuriyadi 148. Koottayi 190. Badakara North 149. Paravanna 191. Mathungal 150. Thevarkadappuram 192. Madappally 151. Puthiyakadappuram 193. Marakkara 152. Cheerankadappuram 194. Chompola 153. Ossankadappuram 195. Azhiyoor 154. Pandakadappuram Kannur 155. Edakkadappuram 196. Kurichiyil 156. Komankadappuram 197. Chalil Gopalapetta 157. Elarankadappuram 198. Pallissery 158. Parappanangadi 199. Edakkadu 159. Arayankadappuram 200. Thayyil 160. Ariyalloor Beach 201. Kannur City 161. Kadalundi Beach 202. Azhikkode Kadappuram
Source ; Fisheries Department
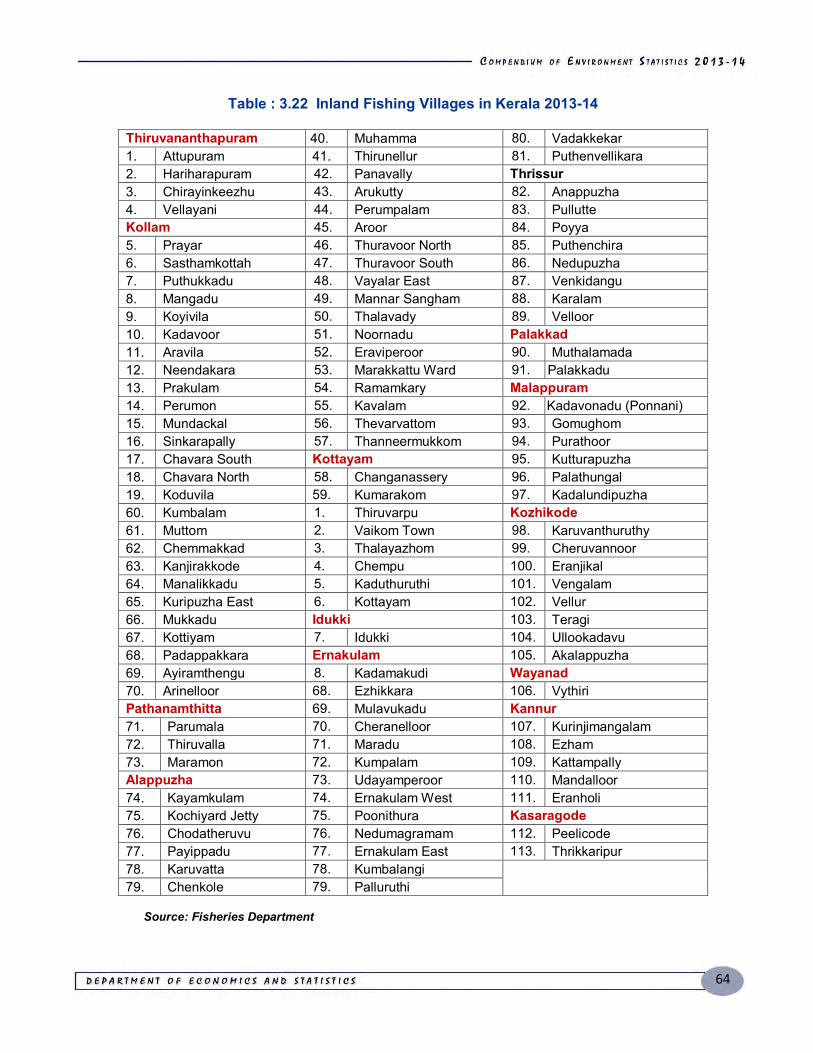
64
Table : 3.22 Inland Fishing Villages in Kerala 2013-14
Thiruvananthapuram 40. Muhamma 80. Vadakkekar 1. Attupuram 41. Thirunellur 81. Puthenvellikara 2. Hariharapuram 42. Panavally Thrissur 3. Chirayinkeezhu 43. Arukutty 82. Anappuzha 4. Vellayani 44. Perumpalam 83. Pullutte Kollam 45. Aroor 84. Poyya 5. Prayar 46. Thuravoor North 85. Puthenchira 6. Sasthamkottah 47. Thuravoor South 86. Nedupuzha 7. Puthukkadu 48. Vayalar East 87. Venkidangu 8. Mangadu 49. Mannar Sangham 88. Karalam 9. Koyivila 50. Thalavady 89. Velloor 10. Kadavoor 51. Noornadu Palakkad 11. Aravila 52. Eraviperoor 90. Muthalamada 12. Neendakara 53. Marakkattu Ward 91. Palakkadu 13. Prakulam 54. Ramamkary Malappuram 14. Perumon 55. Kavalam 92. Kadavonadu (Ponnani) 15. Mundackal 56. Thevarvattom 93. Gomughom 16. Sinkarapally 57. Thanneermukkom 94. Purathoor 17. Chavara South Kottayam 95. Kutturapuzha 18. Chavara North 58. Changanassery 96. Palathungal 19. Koduvila 59. Kumarakom 97. Kadalundipuzha 60. Kumbalam 1. Thiruvarpu Kozhikode 61. Muttom 2. Vaikom Town 98. Karuvanthuruthy 62. Chemmakkad 3. Thalayazhom 99. Cheruvannoor 63. Kanjirakkode 4. Chempu 100. Eranjikal 64. Manalikkadu 5. Kaduthuruthi 101. Vengalam 65. Kuripuzha East 6. Kottayam 102. Vellur 66. Mukkadu Idukki 103. Teragi 67. Kottiyam 7. Idukki 104. Ullookadavu 68. Padappakkara Ernakulam 105. Akalappuzha 69. Ayiramthengu 8. Kadamakudi Wayanad 70. Arinelloor 68. Ezhikkara 106. Vythiri Pathanamthitta 69. Mulavukadu Kannur 71. Parumala 70. Cheranelloor 107. Kurinjimangalam 72. Thiruvalla 71. Maradu 108. Ezham 73. Maramon 72. Kumpalam 109. Kattampally Alappuzha 73. Udayamperoor 110. Mandalloor 74. Kayamkulam 74. Ernakulam West 111. Eranholi 75. Kochiyard Jetty 75. Poonithura Kasaragode 76. Chodatheruvu 76. Nedumagramam 112. Peelicode 77. Payippadu 77. Ernakulam East 113. Thrikkaripur 78. Karuvatta 78. Kumbalangi 79. Chenkole 79. Palluruthi
Source: Fisheries Department
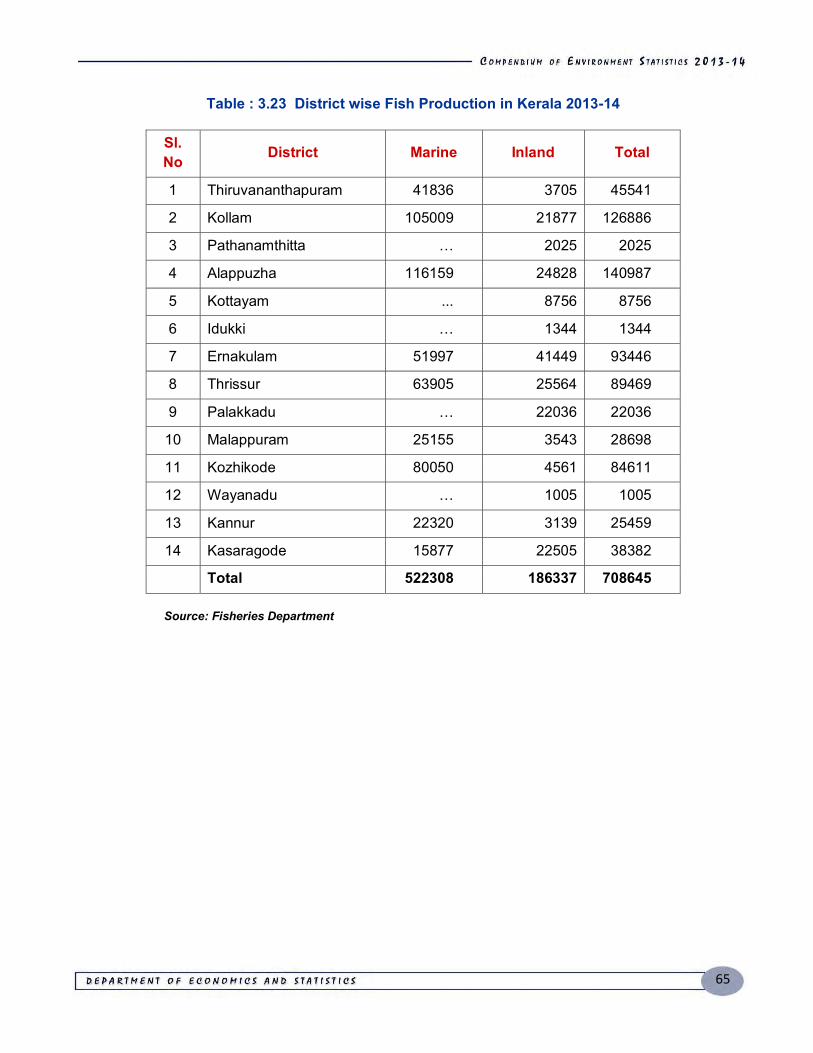
65
Table : 3.23 District wise Fish Production in Kerala 2013-14
Sl. No District Marine Inland Total
1 Thiruvananthapuram 41836 3705 45541
2 Kollam 105009 21877 126886
3 Pathanamthitta … 2025 2025
4 Alappuzha 116159 24828 140987
5 Kottayam ... 8756 8756
6 Idukki … 1344 1344
7 Ernakulam 51997 41449 93446
8 Thrissur 63905 25564 89469
9 Palakkadu … 22036 22036
10 Malappuram 25155 3543 28698
11 Kozhikode 80050 4561 84611
12 Wayanadu … 1005 1005
13 Kannur 22320 3139 25459
14 Kasaragode 15877 22505 38382
Total 522308 186337 708645 Source: Fisheries Department
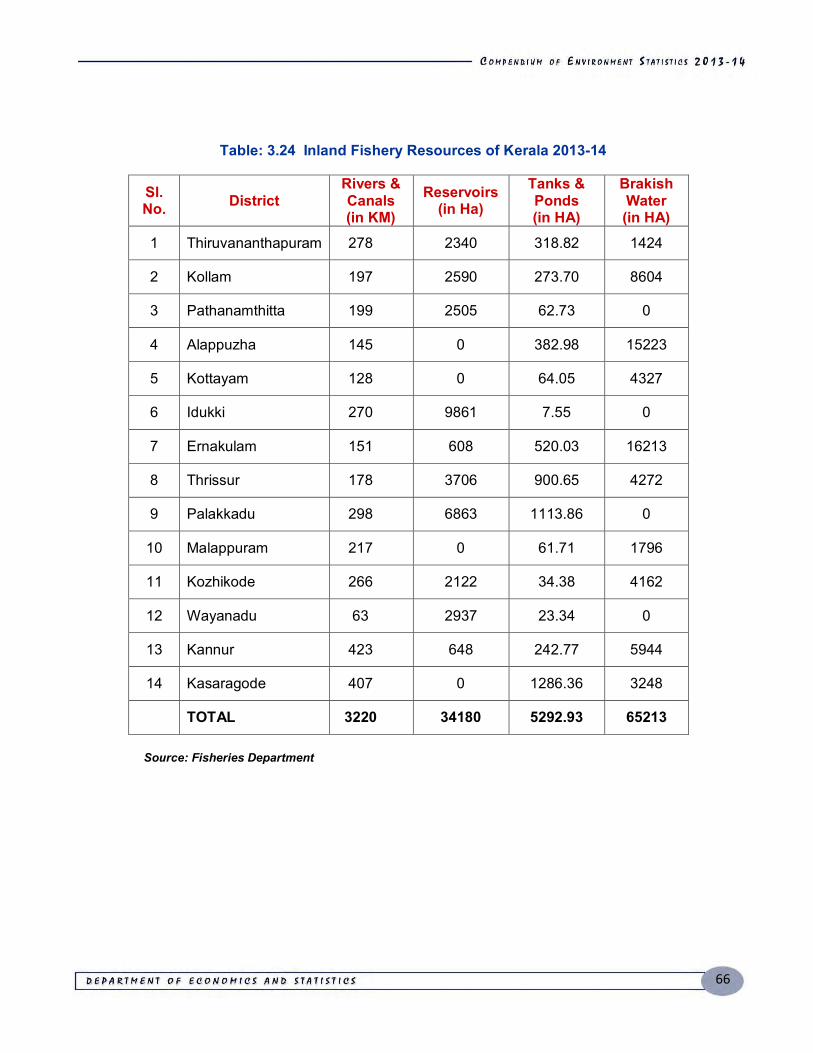
66
Table: 3.24 Inland Fishery Resources of Kerala 2013-14
Sl. No. District
Rivers & Canals (in KM)
Reservoirs (in Ha)
Tanks & Ponds (in HA)
Brakish Water (in HA)
1 Thiruvananthapuram 278 2340 318.82 1424
2 Kollam 197 2590 273.70 8604
3 Pathanamthitta 199 2505 62.73 0
4 Alappuzha 145 0 382.98 15223
5 Kottayam 128 0 64.05 4327
6 Idukki 270 9861 7.55 0
7 Ernakulam 151 608 520.03 16213
8 Thrissur 178 3706 900.65 4272
9 Palakkadu 298 6863 1113.86 0
10 Malappuram 217 0 61.71 1796
11 Kozhikode 266 2122 34.38 4162
12 Wayanadu 63 2937 23.34 0
13 Kannur 423 648 242.77 5944
14 Kasaragode 407 0 1286.36 3248
TOTAL 3220 34180 5292.93 65213 Source: Fisheries Department
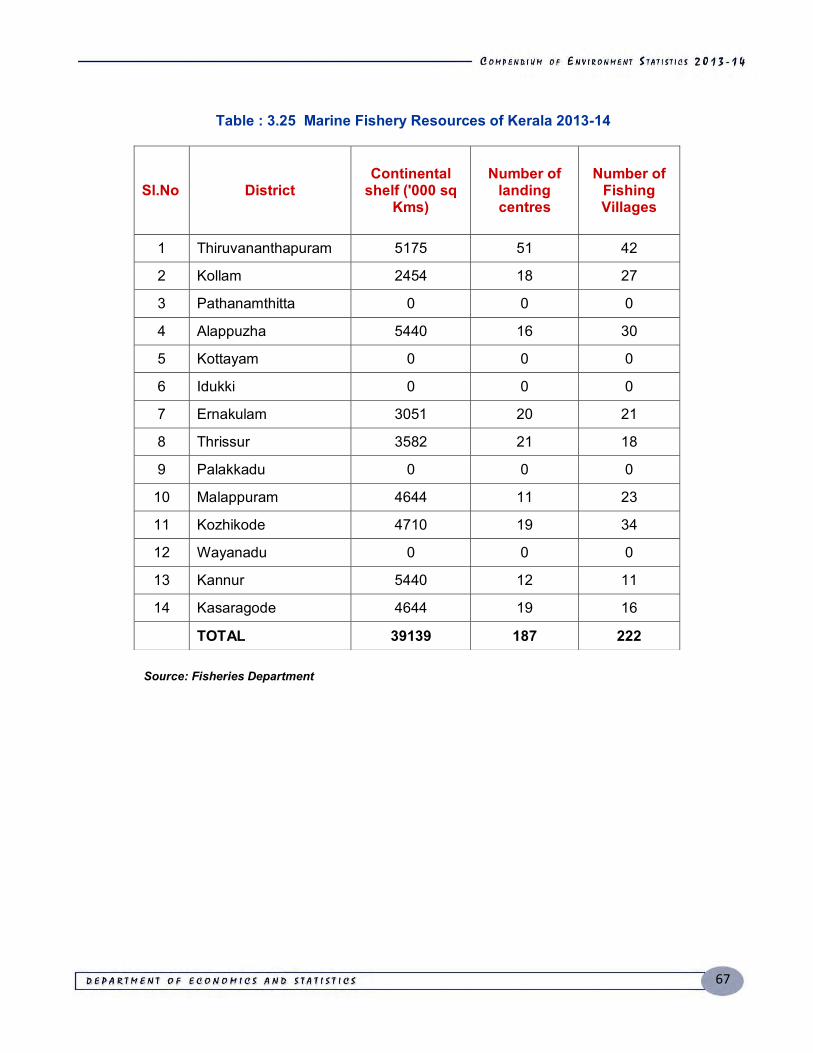
67
Table : 3.25 Marine Fishery Resources of Kerala 2013-14
Source: Fisheries Department
Sl.No District Continental
shelf ('000 sq Kms)
Number of landing centres
Number of Fishing Villages
1 Thiruvananthapuram 5175 51 42
2 Kollam 2454 18 27
3 Pathanamthitta 0 0 0
4 Alappuzha 5440 16 30
5 Kottayam 0 0 0
6 Idukki 0 0 0
7 Ernakulam 3051 20 21
8 Thrissur 3582 21 18
9 Palakkadu 0 0 0
10 Malappuram 4644 11 23
11 Kozhikode 4710 19 34
12 Wayanadu 0 0 0
13 Kannur 5440 12 11
14 Kasaragode 4644 19 16
TOTAL 39139 187 222
68
69
CHAPTER - IV
Atmosphere
Atmospheric Pollution
ntil a decade ago pollution was not a matter of concern for our State. Increasing use
of fossil fuel in the transportation and industrial sectors is adversely affecting the air quality. Major
cities like Thiruvananthapuram, Kochi and Kozhikode in the State have been experiencing
degradation of air quality due to increasing population and vehicular traffic. Improper collection
and disposal of garbage is aggrevating the problem. Scientific disposal facilities are inadequate
even in major cities and garbage burned in open space is one among the major cause of air
pollution. Vehicular movements and unrest use of loud speakers are responsible for the noise
pollutions in the urban areas.
A recent study conducted by the State Pollution Control Board (SPCB) reveals that there
is a sudden rise in air pollution, especially in the respirable suspended particulate matter(RSPM)
and a subsequent fall in Oxygen content in many parts of the State. A trend analysis of major
towns in the past decade by Pollution control Board shows that more than 10 tonnes exceeded
the RSPM levels of 60 microgram per cubic meter (Mg/Md) which is the upper limit as per the
National Ambient Air Quality Monitoring Program me (NAMP) standards.
The number of vehicles has increased 2000% from 119720 in 1975 to 2315372 in 2002.
But the corresponding increase in road length for the same period has only 44%. The pollution
from industries are mainly contributed from four major industrial areas of the state, three in
Ernakulam and one in Kanjikkode at Palakkad. Most of the major/medium industries and the
percentage share of total in the State are more in Ernakulam which naturally resulted in and
adverse impact in the air quality. In the case of solid, hazardous and biomedical wastes the
average waste generation per capita in Kerala is high in the State compared to the national
average. The database of WHO regarding the air pollution monitoring from 1600 cities all over
the world includes 124 cities from India of which eight are from Kerala.
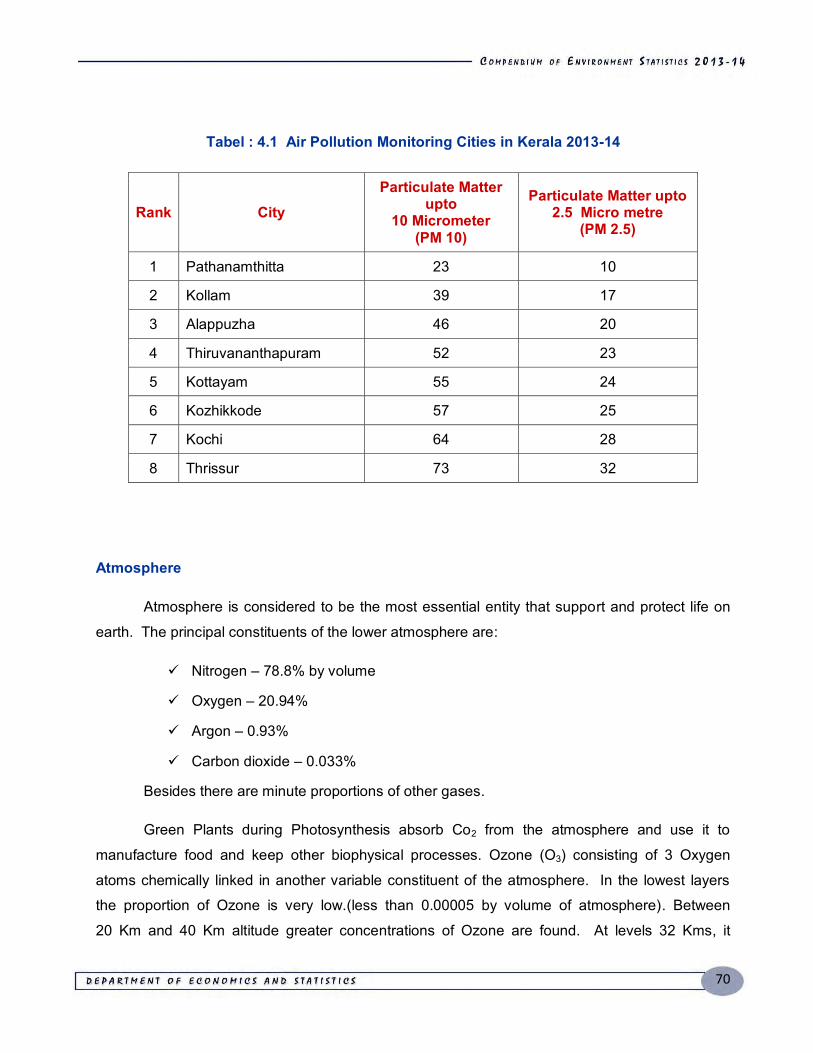
70
Tabel : 4.1 Air Pollution Monitoring Cities in Kerala 2013-14
Rank City Particulate Matter
upto 10 Micrometer
(PM 10)
Particulate Matter upto 2.5 Micro metre
(PM 2.5)
1 Pathanamthitta 23 10
2 Kollam 39 17
3 Alappuzha 46 20
4 Thiruvananthapuram 52 23
5 Kottayam 55 24
6 Kozhikkode 57 25
7 Kochi 64 28
8 Thrissur 73 32
Atmosphere
Atmosphere is considered to be the most essential entity that support and protect life on
earth. The principal constituents of the lower atmosphere are:
Nitrogen – 78.8% by volume
Oxygen – 20.94%
Argon – 0.93%
Carbon dioxide – 0.033%
Besides there are minute proportions of other gases.
Green Plants during Photosynthesis absorb Co2 from the atmosphere and use it to
manufacture food and keep other biophysical processes. Ozone (O3) consisting of 3 Oxygen
atoms chemically linked in another variable constituent of the atmosphere. In the lowest layers
the proportion of Ozone is very low.(less than 0.00005 by volume of atmosphere). Between
20 Km and 40 Km altitude greater concentrations of Ozone are found. At levels 32 Kms, it
71
increases forming what is known as Ozone belt, it plays a crucial role in blocking the harmful
ultraviolet radiation from the sun. Water vapour is one of the most variable gaseous substances
present in the atmosphere, constituting between 0.02% and 4% of the total volume in cold, dry,
humid tropical climate respectively. 90% of moisture content in the atmosphere exist within 6 Km
on the surface of the earth. Atmosphere also contains a colloid of fine solid particles or liquid
droplets, in air or another gas which is known as aerosol. In addition, negligible quantities of other
gases such as Argon, Neon, Helium, Hydrogen, Zeon, Krypton, Methane etc. were present in the
Atmosphere.
Atmosphere can be classified into Troposphere, Stratosphere, Mesosphere,
Thermosphere (Ionosphere) and Exosphere. Of the five layers constitute Atmosphere weather of
course in the lowest layer known as Troposphere which lies close to the surface of the earth, it
extend roughly to a height of 7 to 8 Km near the poles to some 16 Km all of the equator.
Stratosphere is a region of uniform temperature extending from an altitude of about 11 Km
above the earth to a height of nearly 50 Km. It is free from water vapour clouds and dust. The
upper part of the Stratosphere has plenty of Ozone which affords protection to human beings on
the earth against fatal effects of ultraviolet radiations. Stratosphere also provides ideal conditions
for flying aeroplanes. The upper limit of this layer is called Stratopause.
Mesosphere is a very cold region above the Stratosphere which extends from 50 or 80 Km
above the earth surface. Mesopause is the boundary line between Ionosphere and Mesosphere.
Thermosphere is the upper most layer of atmosphere extending from, the mesopause at an
altitude of about 85 Km to the outer limits of atmosphere. Ionosphere is that part of the
thermosphere which extends above the mesosphere from 65 Km to nearly 400 Km above the
earth surface. It is an electrically charged layer characterised by the Ionisation of atoms. Due to
the presence of electrical disharge in the Ionosphere, radio waves transmitted from the earth are
reflected to the earth by this layer. Exosphere is the upper most region of the atmosphere. It
extends beyond the Ionosphere above a height of about 400Km. The air is extremely rarefied and
the temperature gradually increases through the layer. The pressure exerted by atmosphere as a
result of its weight above a unit area of the earth’s surface is called the atmospheric pressure
which is expressed in millibars (mb) and is measured with a mercury barometer. Insolation is the
radiant energy that reaches the surface of earth from the sun, insolation is the most important
single source of atmospheric heat.
72
Green House Gas Emission in Kerala
Kerala has a fragile and closed ecosystem. In Kerala the emission rate of Co2 and other
green house gases (GHG) are comparatively low in the State. A study by Cochin University of
Science and Technology reveals that sea level rise and climate changes which effects monsoon
are very much linked to green house gas emission. Considering the high population of Kerala the
total green house gas emissions will be 50.08 million tonnes. However the actual emissions for
the state could be far below this range. Due to the population pressure, forest areas are under
threat which leads to the higher concentration of Co2 in atmosphere.
Ozone Depletion
Ozone depletion occurs when chlorofluoro carbon (CFCS) formerly found in aerosol spray
cans and refrigerants are released into the atmosphere. These gases, through several chemical
reactions, cause the ozone molecules to break down, reducing ozone’s ultraviolet (UV) radiation
absorbing capacity. CFCS are used in a variety of industrial, commercial and household
applications. Depletion of ozone layer results in increased levels of ultraviolet radiation reaching
the earth’s surface. This leads to higher rates of skin cancer, cataract and damage to people’s
immune systems. Small increase in ultra violet radiation diminishes the productivity of important
food crops and reduces levels of plankton in other ocean adversely affecting marine food
supplies. There are many other substances that lead to ozone layer depletion such as hydro
chlorofluoro carbons (HCFCs) and volatile organic compounds (VOCs). Such substances are
found in vehicular emissions, by-products of industrial processes, aerosols and refrigerants. All
these ozone depleting substances remain stable in the lower atmospheric region , but as they
reach the stratosphere , they get exposed to the ultraviolet rays. This leads to their breakdown
and releasing of free chlorine atoms which reacts with the ozone gas, thus leading to the
depletion of the ozone layer. Hydrochlorofluoro Carbons (HCFC) are used mainly in the air
conditioning, refrigeration , polyurethane foam manufacturing and cold chain sectors and must be
replaced with better alternatives. The scenario is not different in Kerala which is considered to be
a typical fast growing urbanised society. The refrigerant consumption shows a rapid growing
trend in our state. The fact according to European Union report that HCFC gases are mostly used
by split air conditioning units, car ACs and commercial refrigeration thus becomes a major threat
which we will have to face in the near future.
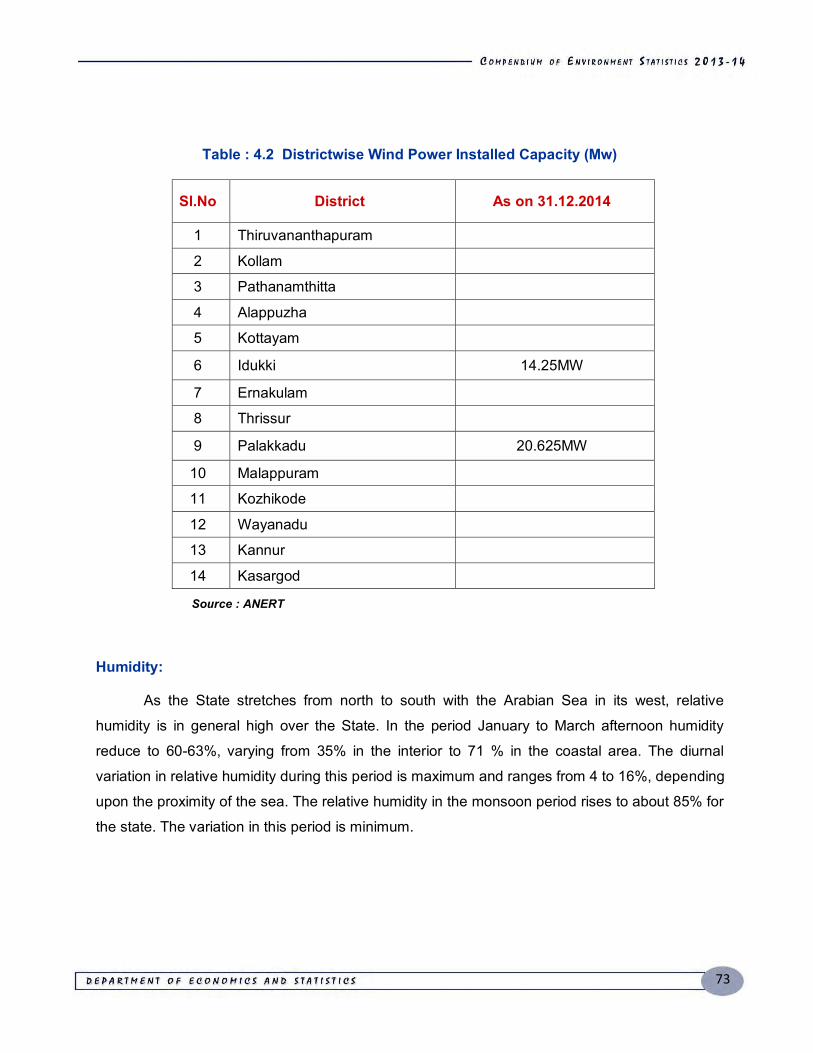
73
Table : 4.2 Districtwise Wind Power Installed Capacity (Mw)
Sl.No District As on 31.12.2014
1 Thiruvananthapuram 2 Kollam 3 Pathanamthitta 4 Alappuzha 5 Kottayam 6 Idukki 14.25MW
7 Ernakulam 8 Thrissur 9 Palakkadu 20.625MW
10 Malappuram 11 Kozhikode 12 Wayanadu 13 Kannur 14 Kasargod Source : ANERT
Humidity:
As the State stretches from north to south with the Arabian Sea in its west, relative
humidity is in general high over the State. In the period January to March afternoon humidity
reduce to 60-63%, varying from 35% in the interior to 71 % in the coastal area. The diurnal
variation in relative humidity during this period is maximum and ranges from 4 to 16%, depending
upon the proximity of the sea. The relative humidity in the monsoon period rises to about 85% for
the state. The variation in this period is minimum.
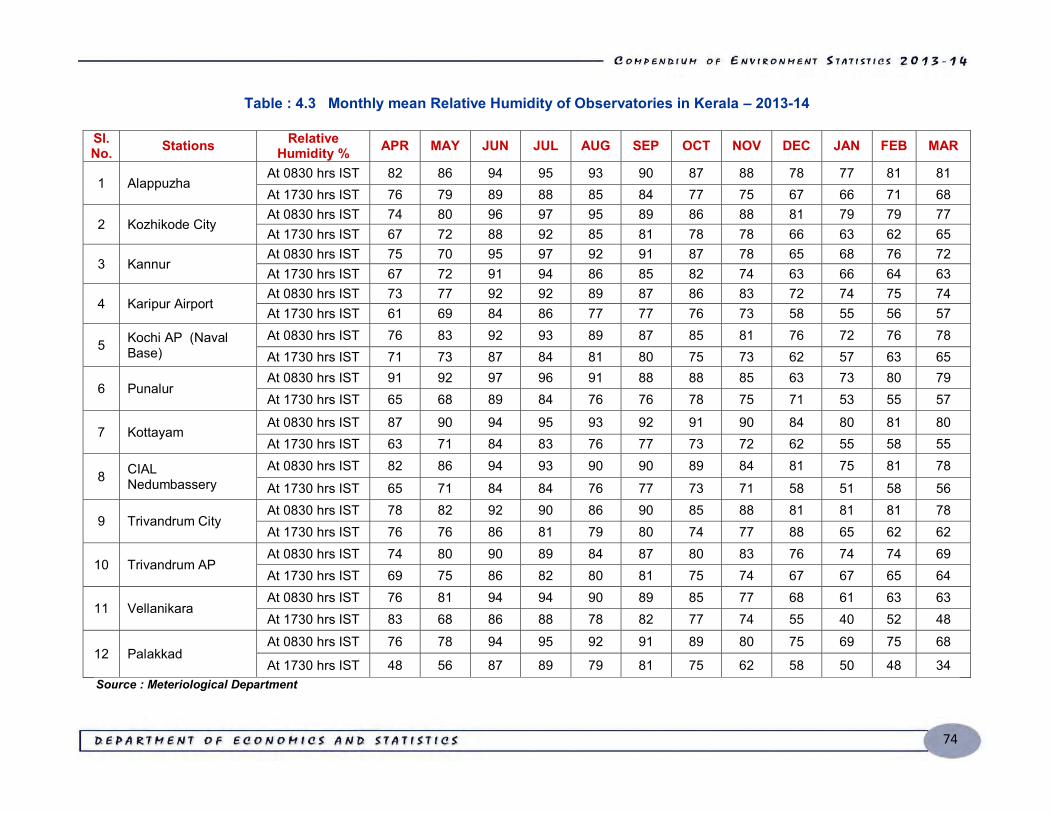
74
Table : 4.3 Monthly mean Relative Humidity of Observatories in Kerala – 2013-14 Sl. No. Stations Relative
Humidity % APR MAY JUN JUL AUG SEP OCT NOV DEC JAN FEB MAR
1 Alappuzha At 0830 hrs IST 82 86 94 95 93 90 87 88 78 77 81 81 At 1730 hrs IST 76 79 89 88 85 84 77 75 67 66 71 68
2 Kozhikode City At 0830 hrs IST 74 80 96 97 95 89 86 88 81 79 79 77 At 1730 hrs IST 67 72 88 92 85 81 78 78 66 63 62 65
3 Kannur At 0830 hrs IST 75 70 95 97 92 91 87 78 65 68 76 72 At 1730 hrs IST 67 72 91 94 86 85 82 74 63 66 64 63
4 Karipur Airport At 0830 hrs IST 73 77 92 92 89 87 86 83 72 74 75 74 At 1730 hrs IST 61 69 84 86 77 77 76 73 58 55 56 57
5 Kochi AP (Naval Base)
At 0830 hrs IST 76 83 92 93 89 87 85 81 76 72 76 78 At 1730 hrs IST 71 73 87 84 81 80 75 73 62 57 63 65
6 Punalur At 0830 hrs IST 91 92 97 96 91 88 88 85 63 73 80 79 At 1730 hrs IST 65 68 89 84 76 76 78 75 71 53 55 57
7 Kottayam At 0830 hrs IST 87 90 94 95 93 92 91 90 84 80 81 80 At 1730 hrs IST 63 71 84 83 76 77 73 72 62 55 58 55
8 CIAL Nedumbassery
At 0830 hrs IST 82 86 94 93 90 90 89 84 81 75 81 78 At 1730 hrs IST 65 71 84 84 76 77 73 71 58 51 58 56
9 Trivandrum City At 0830 hrs IST 78 82 92 90 86 90 85 88 81 81 81 78 At 1730 hrs IST 76 76 86 81 79 80 74 77 88 65 62 62
10 Trivandrum AP At 0830 hrs IST 74 80 90 89 84 87 80 83 76 74 74 69 At 1730 hrs IST 69 75 86 82 80 81 75 74 67 67 65 64
11 Vellanikara At 0830 hrs IST 76 81 94 94 90 89 85 77 68 61 63 63 At 1730 hrs IST 83 68 86 88 78 82 77 74 55 40 52 48
12 Palakkad At 0830 hrs IST 76 78 94 95 92 91 89 80 75 69 75 68
At 1730 hrs IST 48 56 87 89 79 81 75 62 58 50 48 34 Source : Meteriological Department
75
Temperature:
Day temperatures are more or less uniform over the plains throughout the year except
during monsoon months when these temperatures drop down by about 3 to 5°C. Both day
and night temperatures are lower over the plateau and at high level stations than over the
plain. Day temperatures of coastal places are less than those of interior places. March is
hottest month with a mean maximum temperature of about 33°C. Mean maximum
temperature is minimum in the month of July when the State receives plenty of rainfall and
the sky is heavily clouded. It is 28.5°C for the State as a whole in July, varying from about
28°C in the north to about 29°C in the South. Inland stations experience higher maximum
temperatures than the coastal stations. From May onwards both the maximum and
minimum temperatures start falling, the latter very rapidly while the former slowly.

76
Table :4.4 Monthly mean Maximum and Minimum Temperature of Observatories in Kerala, Year 2013-14 Sl. No. Stations Temperature (oC) APR MAY JUN JUL AUG SEP OCT NOV DEC JAN FEB MAR
1 Alappuzha Maximum 33.2 32.4 28.6 28.5 29.1 29.9 30.5 31.4 31.5 32.4 32.7 33.5 Minimum 28.8 26.2 23.4 23.3 23.8 24.3 24.5 24.4 23.4 23.3 24.0 25.2
2 Kozhikode City Maximum 35.2 35.0 29.2 28.6 30.4 31.2 31.7 33.0 33.3 34.0 34.5 35.3 Minimum 27.2 27.1 23.5 23.3 23.8 24.2 24.4 24.5 22.8 23.9 24.3 25.6
3 Kannur Maximum 33.9 33.7 28.6 28.0 28.9 30.6 31.2 33.2 33.3 33.6 34.2 35.4 Minimum 26.1 26.7 23.3 23.4 23.9 24.0 24.1 24.7 22.7 23.2 23.9 25.2
4 Karipur Airport Maximum 34.1 33.4 28.5 28.0 29.1 29.7 30.4 32.0 32.2 33.0 33.5 34.8 Minimum 26.0 25.6 22.6 22.4 22.8 23.0 23.1 23.4 21.6 21.9 23.2 25.1
5 Kochi AP (Naval Base)
Maximum 33.5 33.0 29.8 30.5 30.8 30.7 31.1 32.2 32.3 32.8 32.8 34.1 Minimum 25.8 24.9 22.2 22.1 23.0 23.2 22.8 23.3 22.0 22.2 22.8 24.2
6 Punalur Maximum 36.4 34.0 28.9 28.9 30.5 31.1 32.0 32.9 32.3 33.6 35.5 36.6 Minimum 25.4 24.9 22.9 22.9 23.1 22.5 22.3 22.4 20.9 20.5 20.4 21.6
7 Kottayam Maximum 35.2 33.3 28.9 28.9 29.8 30.7 31.9 33.3 33.2 34.0 34.2 35.9 Minimum 25.1 25.1 22.7 22.7 21.7 22.4 21.6 23.3 22.2 22.4 23.0 23.9
8 CIAL Nedumbassery
Maximum 34.6 33.4 28.8 28.9 30.1 30.5 31.3 33.0 32.8 34.0 34.7 35.9 Minimum 25.2 25.1 22.8 22.7 23.4 23.2 23.0 23.3 21.2 21.0 22.4 23.6
9 Trivandrum City Maximum 34.6 32.9 29.3 29.7 30.6 30.9 32.4 31.8 32.9 32.6 33.5 34.4 Minimum 28.2 25.4 23.3 23.3 23.9 23.8 23.6 23.9 22.9 22.7 23.2 24.1
10 Trivandrum AP Maximum 33.4 32.4 28.9 29.4 29.8 29.4 31.2 30.9 31.6 31.1 31.7 32.8 Minimum 26.4 25.7 23.7 23.5 24.1 24.1 24.2 24.2 23.6 23.0 23.4 24.1
11 Vellanikara Maximum 34.8 33.9 28.6 28.4 29.7 30.1 30.7 32.6 31.9 32.9 34.6 36.6 Minimum 25.1 25.2 22.7 22.7 22.9 22.2 22.7 23.8 22.3 23.0 22.9 24.2
12 Palakkad Maximum 37.8 36.5 28.2 27.6 30.0 30.7 31.7 32.5 31.1 31.8 34.5 36.7
Minimum 26.3 26.6 23.3 23.0 23.6 23.6 23.7 24.8 23.3 23.9 23.7 24.9 Source : Meteriological Department
77
Rainfall:
The total annual rainfall in the State varies from 360 cm. over the extreme northern parts to
about 180 cm. in the southern parts. The southwest monsoon (June-October) is the principal rainy
season when the State receives about 70% of its annual rainfall. Monsoon rainfall as percentage of
annual rainfall decreases from north to south and varies from 83 % in northern district of Kasaragode to
50% southern district of Thiruvananthapuram. Northeast monsoon rainfall as percentage of annual
rainfall increases from north to south and varies from 9% in north district of Kasaragode to 27% in south
most district to Thiruvananthapuram. The rainfall amount in the State decreases towards the south with
decrease of height of Western Ghats. The southern most district of Thiruvananthapuram, where
Western Ghats are nearest to the sea coast and its average height is also least in the State receives
minimum amount of rainfall. The thunderstorm rains in the pre-monsoon months of April and May and
that of monsoon months are locally known as 'EDAVAPATHI'. Rainfall during northeast monsoon
season is known as 'THULAVARSHAM'. The southwest monsoon sets-over the southern parts of the
State by about 1st June and extends over the entire State by 5th June. June and July are the rainiest
months, each accounting individually to about 23% of annual rainfall monthly distribution of Normal and
Actual rainfall.
The diversity of the geographical features of the state has resulted in a corresponding diversity
in climate. The High Ranges have a cool and bracing climate throughout the year, while the plains are
hot and humid. The average level of annual rainfall is quite high when compared to other Indian states.
The state basically enjoys 4 types of climate such as Winter, Summer, South West Monsoon and North
East Monsoon.
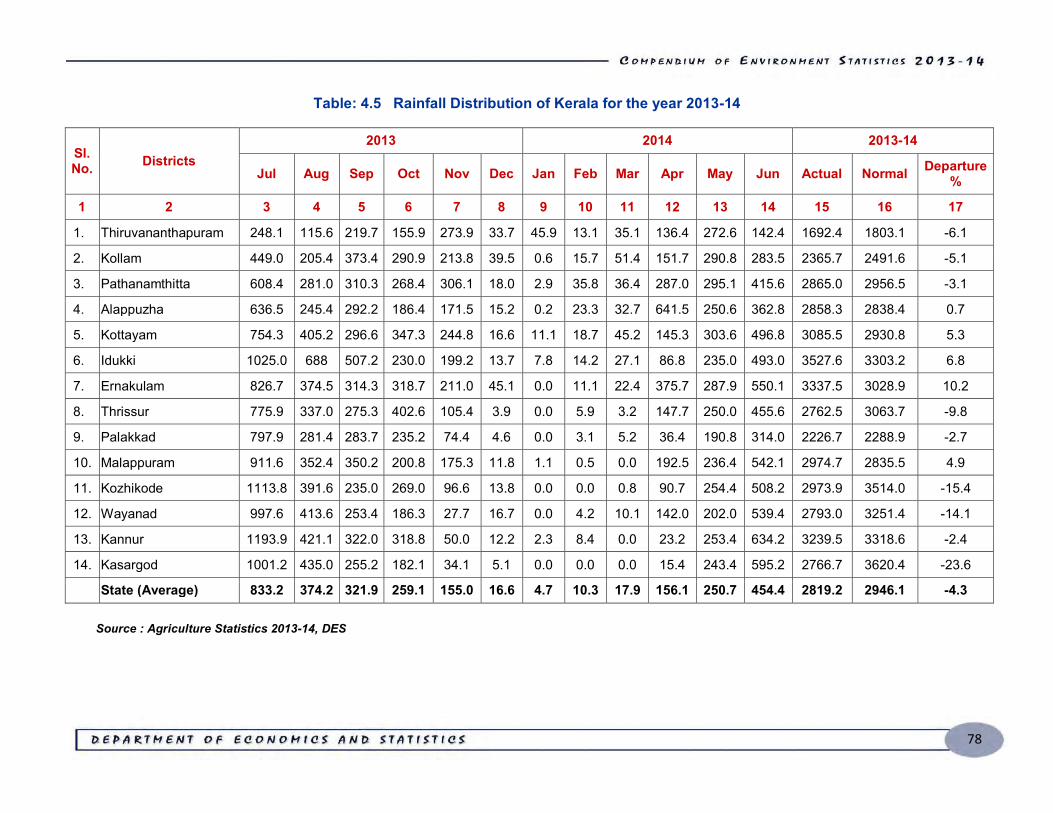
78
Table: 4.5 Rainfall Distribution of Kerala for the year 2013-14
Sl. No. Districts
2013 2014 2013-14
Jul Aug Sep Oct Nov Dec Jan Feb Mar Apr May Jun Actual Normal Departure %
1 2 3 4 5 6 7 8 9 10 11 12 13 14 15 16 17
1. Thiruvananthapuram 248.1 115.6 219.7 155.9 273.9 33.7 45.9 13.1 35.1 136.4 272.6 142.4 1692.4 1803.1 -6.1
2. Kollam 449.0 205.4 373.4 290.9 213.8 39.5 0.6 15.7 51.4 151.7 290.8 283.5 2365.7 2491.6 -5.1
3. Pathanamthitta 608.4 281.0 310.3 268.4 306.1 18.0 2.9 35.8 36.4 287.0 295.1 415.6 2865.0 2956.5 -3.1
4. Alappuzha 636.5 245.4 292.2 186.4 171.5 15.2 0.2 23.3 32.7 641.5 250.6 362.8 2858.3 2838.4 0.7
5. Kottayam 754.3 405.2 296.6 347.3 244.8 16.6 11.1 18.7 45.2 145.3 303.6 496.8 3085.5 2930.8 5.3
6. Idukki 1025.0 688 507.2 230.0 199.2 13.7 7.8 14.2 27.1 86.8 235.0 493.0 3527.6 3303.2 6.8
7. Ernakulam 826.7 374.5 314.3 318.7 211.0 45.1 0.0 11.1 22.4 375.7 287.9 550.1 3337.5 3028.9 10.2
8. Thrissur 775.9 337.0 275.3 402.6 105.4 3.9 0.0 5.9 3.2 147.7 250.0 455.6 2762.5 3063.7 -9.8
9. Palakkad 797.9 281.4 283.7 235.2 74.4 4.6 0.0 3.1 5.2 36.4 190.8 314.0 2226.7 2288.9 -2.7
10. Malappuram 911.6 352.4 350.2 200.8 175.3 11.8 1.1 0.5 0.0 192.5 236.4 542.1 2974.7 2835.5 4.9
11. Kozhikode 1113.8 391.6 235.0 269.0 96.6 13.8 0.0 0.0 0.8 90.7 254.4 508.2 2973.9 3514.0 -15.4
12. Wayanad 997.6 413.6 253.4 186.3 27.7 16.7 0.0 4.2 10.1 142.0 202.0 539.4 2793.0 3251.4 -14.1
13. Kannur 1193.9 421.1 322.0 318.8 50.0 12.2 2.3 8.4 0.0 23.2 253.4 634.2 3239.5 3318.6 -2.4
14. Kasargod 1001.2 435.0 255.2 182.1 34.1 5.1 0.0 0.0 0.0 15.4 243.4 595.2 2766.7 3620.4 -23.6
State (Average) 833.2 374.2 321.9 259.1 155.0 16.6 4.7 10.3 17.9 156.1 250.7 454.4 2819.2 2946.1 -4.3 Source : Agriculture Statistics 2013-14, DES
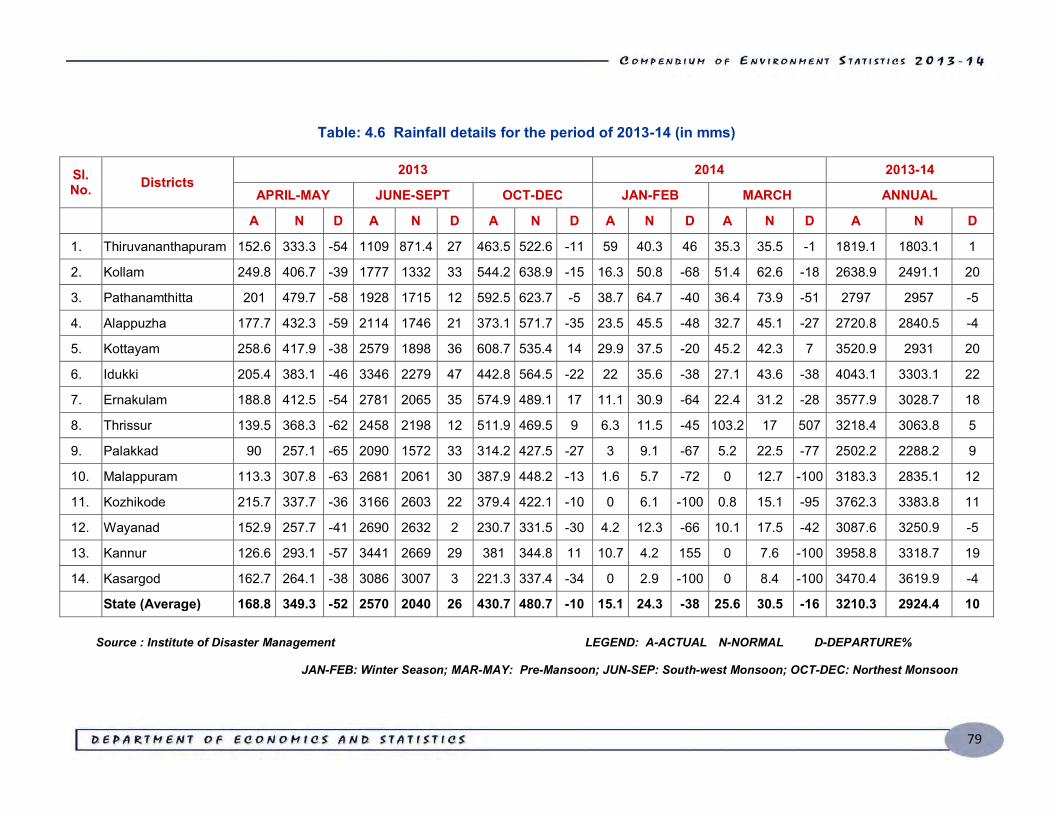
79
Table: 4.6 Rainfall details for the period of 2013-14 (in mms)
Sl. No. Districts
2013 2014 2013-14
APRIL-MAY JUNE-SEPT OCT-DEC JAN-FEB MARCH ANNUAL
A N D A N D A N D A N D A N D A N D
1. Thiruvananthapuram 152.6 333.3 -54 1109 871.4 27 463.5 522.6 -11 59 40.3 46 35.3 35.5 -1 1819.1 1803.1 1
2. Kollam 249.8 406.7 -39 1777 1332 33 544.2 638.9 -15 16.3 50.8 -68 51.4 62.6 -18 2638.9 2491.1 20
3. Pathanamthitta 201 479.7 -58 1928 1715 12 592.5 623.7 -5 38.7 64.7 -40 36.4 73.9 -51 2797 2957 -5
4. Alappuzha 177.7 432.3 -59 2114 1746 21 373.1 571.7 -35 23.5 45.5 -48 32.7 45.1 -27 2720.8 2840.5 -4
5. Kottayam 258.6 417.9 -38 2579 1898 36 608.7 535.4 14 29.9 37.5 -20 45.2 42.3 7 3520.9 2931 20
6. Idukki 205.4 383.1 -46 3346 2279 47 442.8 564.5 -22 22 35.6 -38 27.1 43.6 -38 4043.1 3303.1 22
7. Ernakulam 188.8 412.5 -54 2781 2065 35 574.9 489.1 17 11.1 30.9 -64 22.4 31.2 -28 3577.9 3028.7 18
8. Thrissur 139.5 368.3 -62 2458 2198 12 511.9 469.5 9 6.3 11.5 -45 103.2 17 507 3218.4 3063.8 5
9. Palakkad 90 257.1 -65 2090 1572 33 314.2 427.5 -27 3 9.1 -67 5.2 22.5 -77 2502.2 2288.2 9
10. Malappuram 113.3 307.8 -63 2681 2061 30 387.9 448.2 -13 1.6 5.7 -72 0 12.7 -100 3183.3 2835.1 12
11. Kozhikode 215.7 337.7 -36 3166 2603 22 379.4 422.1 -10 0 6.1 -100 0.8 15.1 -95 3762.3 3383.8 11
12. Wayanad 152.9 257.7 -41 2690 2632 2 230.7 331.5 -30 4.2 12.3 -66 10.1 17.5 -42 3087.6 3250.9 -5
13. Kannur 126.6 293.1 -57 3441 2669 29 381 344.8 11 10.7 4.2 155 0 7.6 -100 3958.8 3318.7 19
14. Kasargod 162.7 264.1 -38 3086 3007 3 221.3 337.4 -34 0 2.9 -100 0 8.4 -100 3470.4 3619.9 -4
State (Average) 168.8 349.3 -52 2570 2040 26 430.7 480.7 -10 15.1 24.3 -38 25.6 30.5 -16 3210.3 2924.4 10 Source : Institute of Disaster Management LEGEND: A-ACTUAL N-NORMAL D-DEPARTURE%
JAN-FEB: Winter Season; MAR-MAY: Pre-Mansoon; JUN-SEP: South-west Monsoon; OCT-DEC: Northest Monsoon
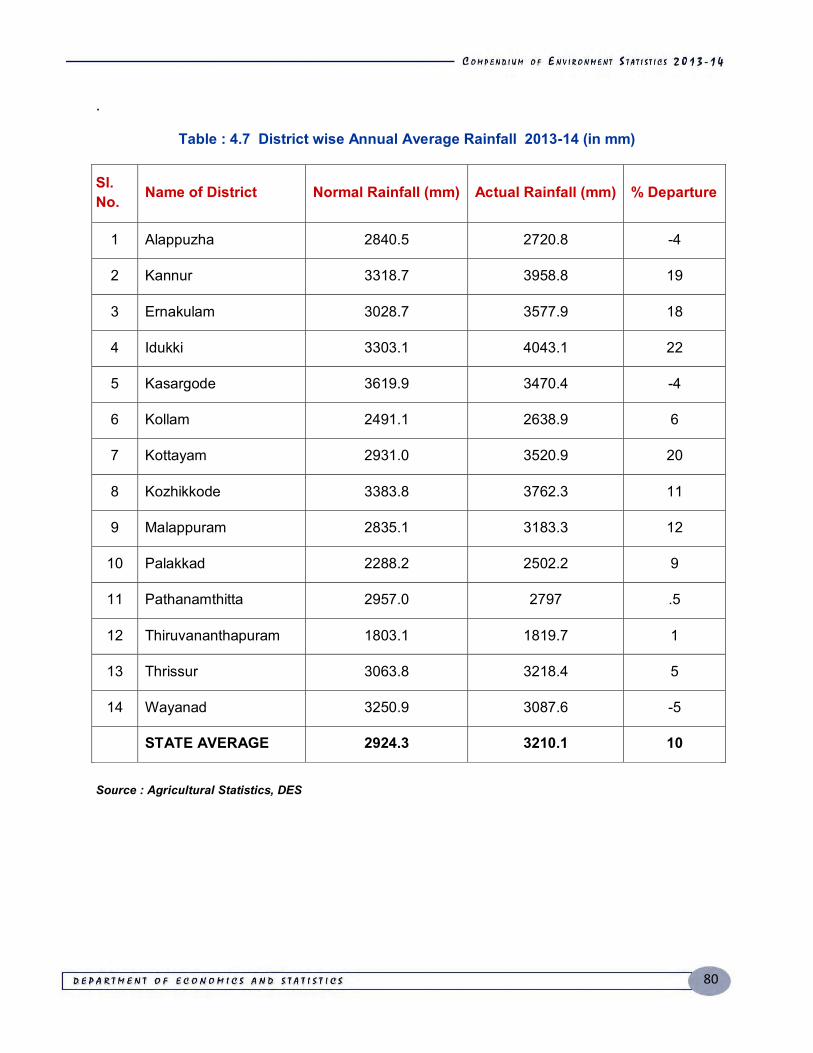
80
.
Table : 4.7 District wise Annual Average Rainfall 2013-14 (in mm)
Sl. No. Name of District Normal Rainfall (mm) Actual Rainfall (mm) % Departure
1 Alappuzha 2840.5 2720.8 -4
2 Kannur 3318.7 3958.8 19
3 Ernakulam 3028.7 3577.9 18
4 Idukki 3303.1 4043.1 22
5 Kasargode 3619.9 3470.4 -4
6 Kollam 2491.1 2638.9 6
7 Kottayam 2931.0 3520.9 20
8 Kozhikkode 3383.8 3762.3 11
9 Malappuram 2835.1 3183.3 12
10 Palakkad 2288.2 2502.2 9
11 Pathanamthitta 2957.0 2797 .5
12 Thiruvananthapuram 1803.1 1819.7 1
13 Thrissur 3063.8 3218.4 5
14 Wayanad 3250.9 3087.6 -5
STATE AVERAGE 2924.3 3210.1 10 Source : Agricultural Statistics, DES
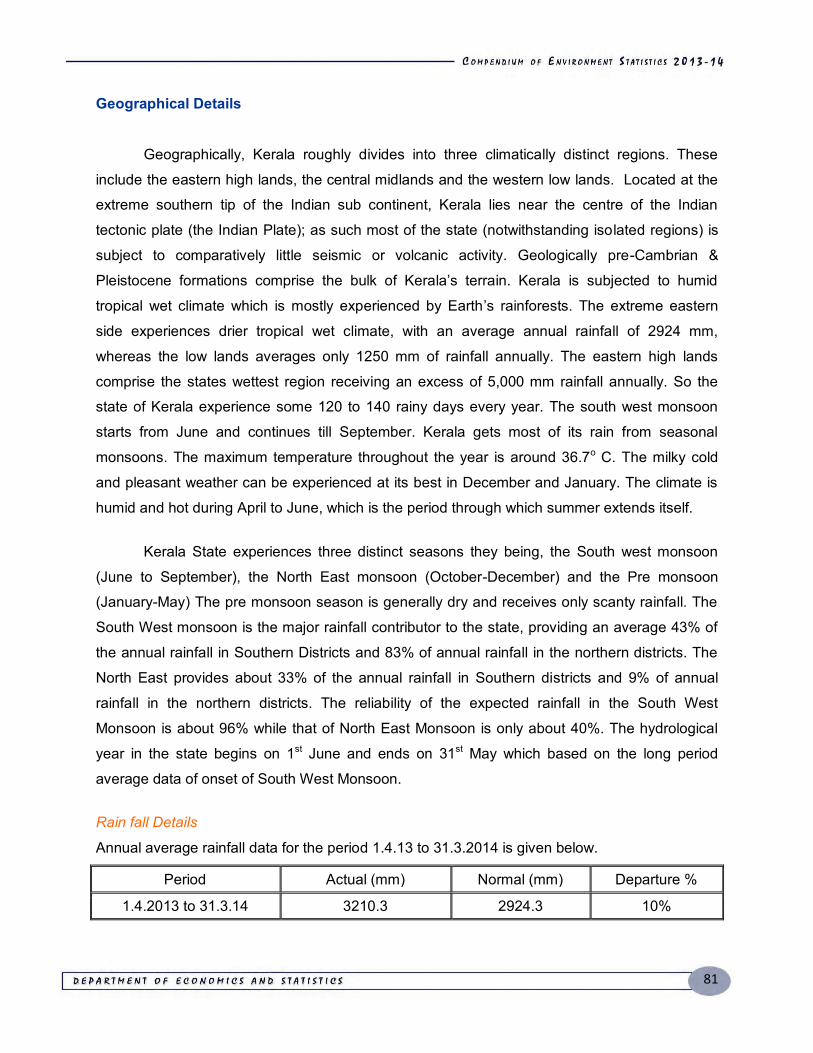
81
Geographical Details
Geographically, Kerala roughly divides into three climatically distinct regions. These
include the eastern high lands, the central midlands and the western low lands. Located at the
extreme southern tip of the Indian sub continent, Kerala lies near the centre of the Indian
tectonic plate (the Indian Plate); as such most of the state (notwithstanding isolated regions) is
subject to comparatively little seismic or volcanic activity. Geologically pre-Cambrian &
Pleistocene formations comprise the bulk of Kerala’s terrain. Kerala is subjected to humid
tropical wet climate which is mostly experienced by Earth’s rainforests. The extreme eastern
side experiences drier tropical wet climate, with an average annual rainfall of 2924 mm,
whereas the low lands averages only 1250 mm of rainfall annually. The eastern high lands
comprise the states wettest region receiving an excess of 5,000 mm rainfall annually. So the
state of Kerala experience some 120 to 140 rainy days every year. The south west monsoon
starts from June and continues till September. Kerala gets most of its rain from seasonal
monsoons. The maximum temperature throughout the year is around 36.7o C. The milky cold
and pleasant weather can be experienced at its best in December and January. The climate is
humid and hot during April to June, which is the period through which summer extends itself.
Kerala State experiences three distinct seasons they being, the South west monsoon
(June to September), the North East monsoon (October-December) and the Pre monsoon
(January-May) The pre monsoon season is generally dry and receives only scanty rainfall. The
South West monsoon is the major rainfall contributor to the state, providing an average 43% of
the annual rainfall in Southern Districts and 83% of annual rainfall in the northern districts. The
North East provides about 33% of the annual rainfall in Southern districts and 9% of annual
rainfall in the northern districts. The reliability of the expected rainfall in the South West
Monsoon is about 96% while that of North East Monsoon is only about 40%. The hydrological
year in the state begins on 1st June and ends on 31st May which based on the long period
average data of onset of South West Monsoon.
Rain fall Details
Annual average rainfall data for the period 1.4.13 to 31.3.2014 is given below.
Period Actual (mm) Normal (mm) Departure %
1.4.2013 to 31.3.14 3210.3 2924.3 10%
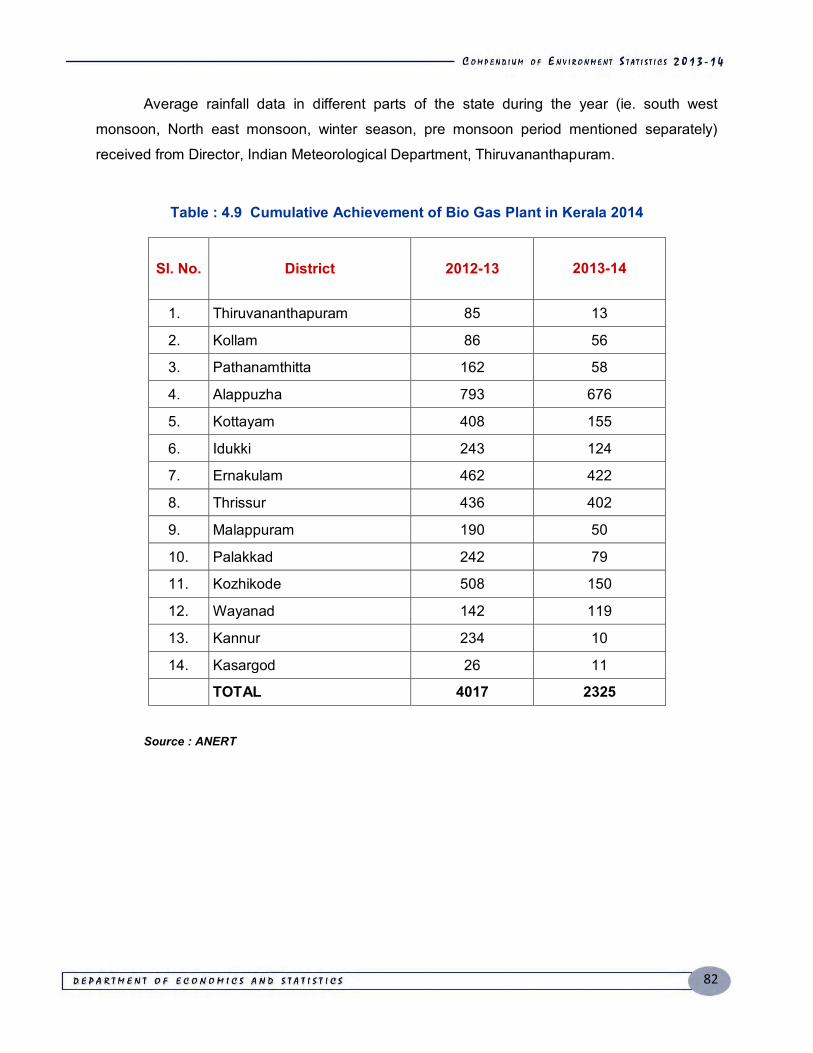
82
Average rainfall data in different parts of the state during the year (ie. south west
monsoon, North east monsoon, winter season, pre monsoon period mentioned separately)
received from Director, Indian Meteorological Department, Thiruvananthapuram.
Table : 4.9 Cumulative Achievement of Bio Gas Plant in Kerala 2014
Sl. No. District 2012-13
2013-14
1. Thiruvananthapuram 85 13
2. Kollam 86 56
3. Pathanamthitta 162 58
4. Alappuzha 793 676
5. Kottayam 408 155
6. Idukki 243 124
7. Ernakulam 462 422
8. Thrissur 436 402
9. Malappuram 190 50
10. Palakkad 242 79
11. Kozhikode 508 150
12. Wayanad 142 119
13. Kannur 234 10
14. Kasargod 26 11
TOTAL 4017 2325
Source : ANERT

83
Table : 4.10 Air quality in important Cities in Kerala
Annual Average mg/m3
Sl.No. District So 2 Air quality NO2 Air
quality PM10 Air quality
1 Kochi 3 L 13 L 38 M
2 Kozhikkodu 2 L 8 L 46 M 3 Thrisur 2 L 14 L 33 M 4 Malappuram 2 L 5 L 30 L 5 Thiruvananthapuram 10 L 23 M 58 M 6 Kollam 4 L 20 L 53 M
SO2 Sulphur Dioxide, NO2 Nitrogen Dioxide PM10 Particulate Matter having an aerodynamic
diameter
L- Low; M- Medium
Source : Kerala State Pollution Control Board
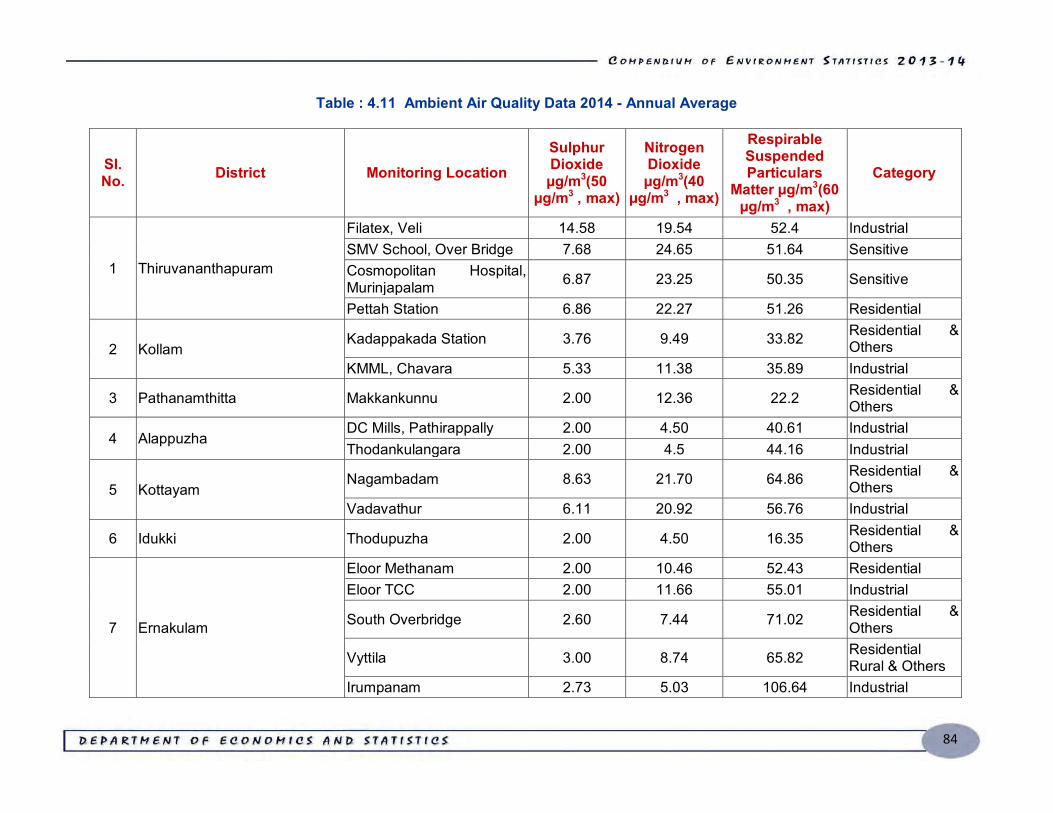
84
Table : 4.11 Ambient Air Quality Data 2014 - Annual Average
Sl. No. District Monitoring Location
Sulphur Dioxide µg/m3(50
µg/m3 , max)
Nitrogen Dioxide µg/m3(40
µg/m3 , max)
Respirable Suspended Particulars
Matter µg/m3(60 µg/m3 , max)
Category
1 Thiruvananthapuram
Filatex, Veli 14.58 19.54 52.4 Industrial SMV School, Over Bridge 7.68 24.65 51.64 Sensitive Cosmopolitan Hospital, Murinjapalam 6.87 23.25 50.35 Sensitive
Pettah Station 6.86 22.27 51.26 Residential
2 Kollam Kadappakada Station 3.76 9.49 33.82 Residential &
Others KMML, Chavara 5.33 11.38 35.89 Industrial
3 Pathanamthitta Makkankunnu 2.00 12.36 22.2 Residential & Others
4 Alappuzha DC Mills, Pathirappally 2.00 4.50 40.61 Industrial Thodankulangara 2.00 4.5 44.16 Industrial
5 Kottayam Nagambadam 8.63 21.70 64.86 Residential &
Others Vadavathur 6.11 20.92 56.76 Industrial
6 Idukki Thodupuzha 2.00 4.50 16.35 Residential & Others
7 Ernakulam
Eloor Methanam 2.00 10.46 52.43 Residential Eloor TCC 2.00 11.66 55.01 Industrial
South Overbridge 2.60 7.44 71.02 Residential & Others
Vyttila 3.00 8.74 65.82 Residential Rural & Others
Irumpanam 2.73 5.03 106.64 Industrial
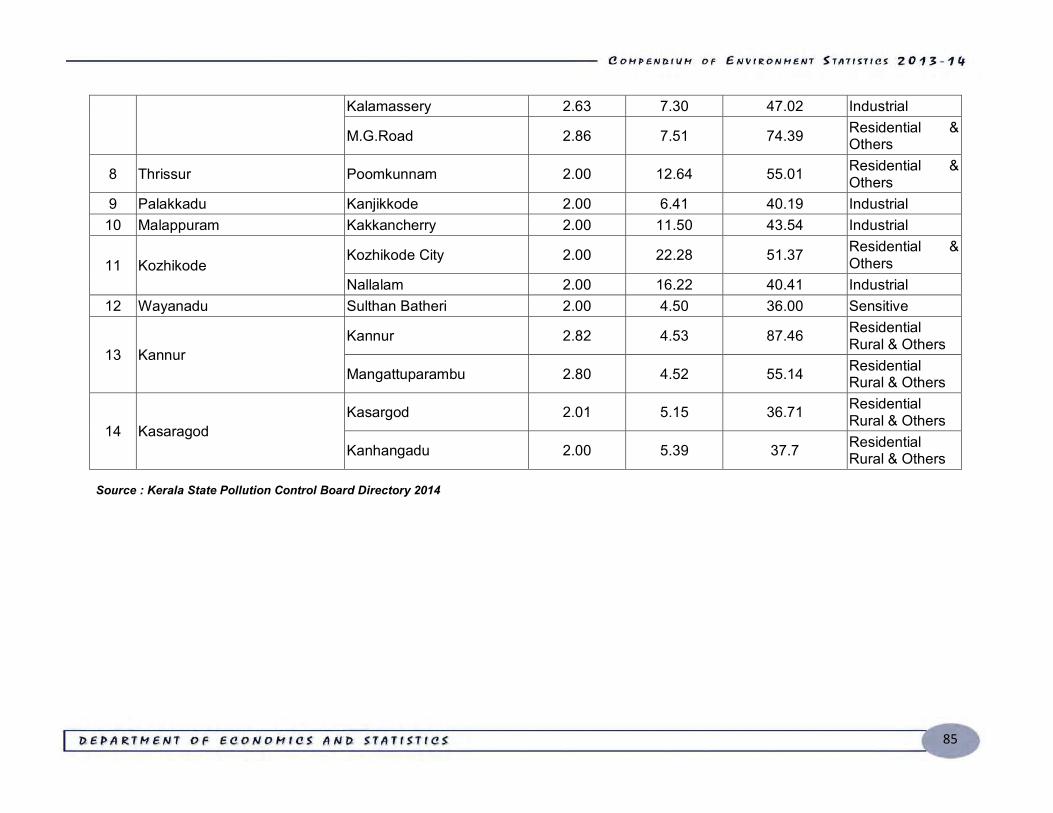
85
Kalamassery 2.63 7.30 47.02 Industrial
M.G.Road 2.86 7.51 74.39 Residential & Others
8 Thrissur Poomkunnam 2.00 12.64 55.01 Residential & Others
9 Palakkadu Kanjikkode 2.00 6.41 40.19 Industrial 10 Malappuram Kakkancherry 2.00 11.50 43.54 Industrial
11 Kozhikode Kozhikode City 2.00 22.28 51.37 Residential &
Others Nallalam 2.00 16.22 40.41 Industrial
12 Wayanadu Sulthan Batheri 2.00 4.50 36.00 Sensitive
13 Kannur Kannur 2.82 4.53 87.46 Residential
Rural & Others
Mangattuparambu 2.80 4.52 55.14 Residential Rural & Others
14 Kasaragod Kasargod 2.01 5.15 36.71 Residential
Rural & Others
Kanhangadu 2.00 5.39 37.7 Residential Rural & Others
Source : Kerala State Pollution Control Board Directory 2014
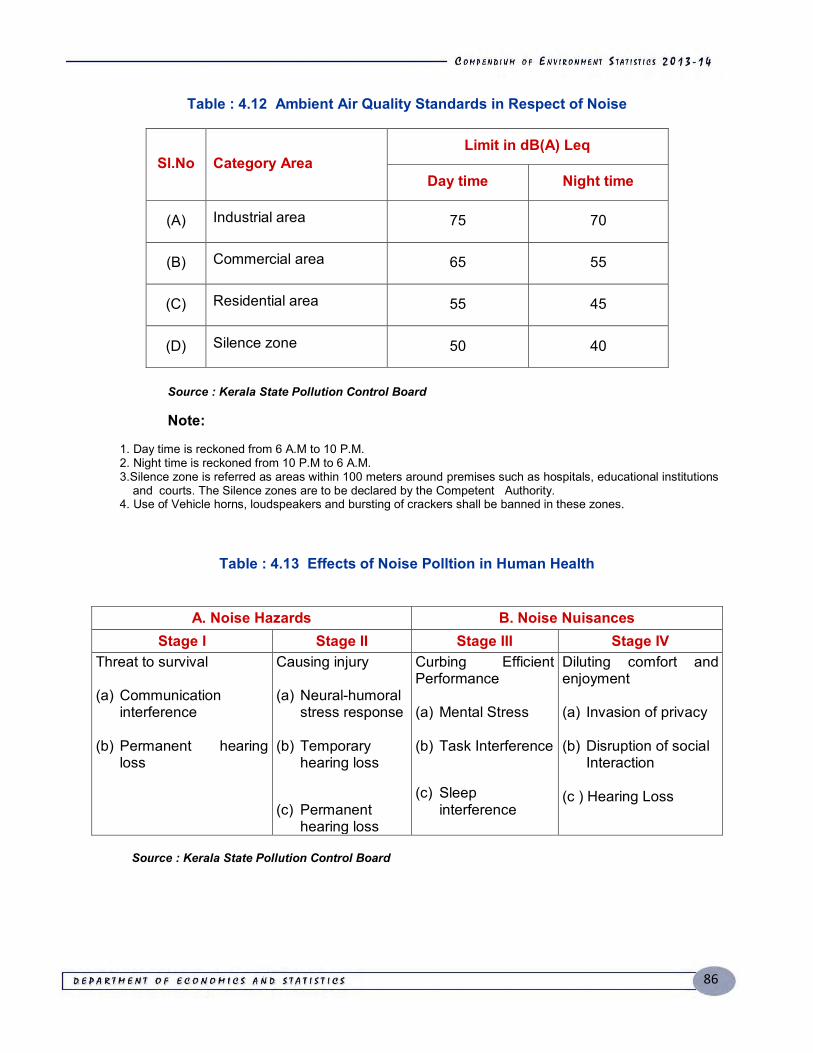
86
Table : 4.12 Ambient Air Quality Standards in Respect of Noise
Sl.No Category Area Limit in dB(A) Leq
Day time Night time
(A) Industrial area 75 70
(B) Commercial area 65 55
(C) Residential area 55 45
(D) Silence zone 50 40
Source : Kerala State Pollution Control Board
Note:
1. Day time is reckoned from 6 A.M to 10 P.M. 2. Night time is reckoned from 10 P.M to 6 A.M. 3.Silence zone is referred as areas within 100 meters around premises such as hospitals, educational institutions
and courts. The Silence zones are to be declared by the Competent Authority. 4. Use of Vehicle horns, loudspeakers and bursting of crackers shall be banned in these zones.
Table : 4.13 Effects of Noise Polltion in Human Health
A. Noise Hazards B. Noise Nuisances Stage I Stage II Stage III Stage IV
Threat to survival (a) Communication
interference
(b) Permanent hearing loss
Causing injury (a) Neural-humoral
stress response
(b) Temporary hearing loss
(c) Permanent hearing loss
Curbing Efficient Performance (a) Mental Stress
(b) Task Interference
(c) Sleep interference
Diluting comfort and enjoyment (a) Invasion of privacy
(b) Disruption of social
Interaction
(c ) Hearing Loss
Source : Kerala State Pollution Control Board

87
Table : 4.13 Major Indicators showing operational efficiency of KSRTC
Sl. No. Items
Year
2012-13 2013-14
1 Fleet Strength (Nos) 5812 5860
2 Gross Revenue Earnings (RS. In Crores) 1704.8 1863.56
3 Gross Revenue Expenditure (RS. In Crores) 2200.69 2433.66
4 Gross operating loss (RS. In Crores) (-)495.89 (-)570.16
5 No. schedules operated 4067 4754
6 Average earnings per vehicle on road per day (Rs) 9197 9812
7 Average earnings per km. of Buses operated (paise) 2832 2989
8 Average Earnings per Passenger (paise) 1294 1426
9 Average route length (Kms) 50.57 52.01
10 Average kms. Run per bus per day 318.92 323.38
11 Average number of buses held daily (Nos) 5847 5830
12 Passengers carried (Lakhs) 12156 11634
Source : Kerala State Transport Commisionerate
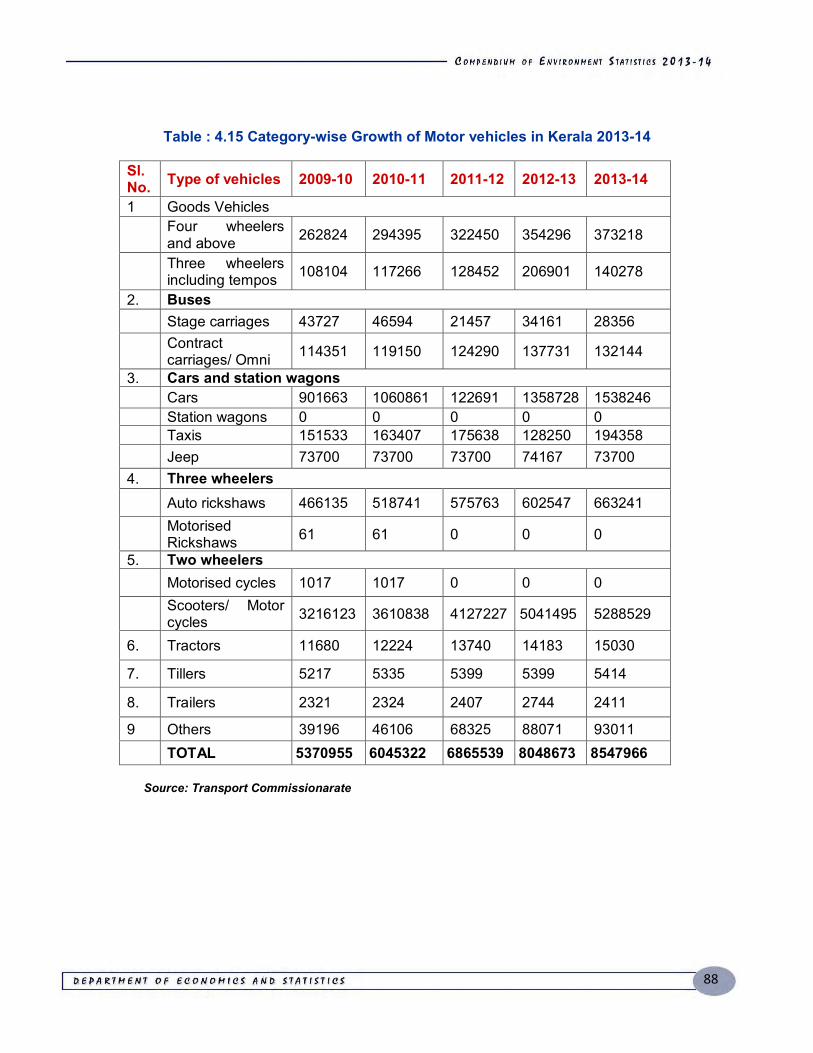
88
Table : 4.15 Category-wise Growth of Motor vehicles in Kerala 2013-14
Sl. No. Type of vehicles 2009-10 2010-11 2011-12 2012-13 2013-14
1 Goods Vehicles
Four wheelers and above 262824 294395 322450 354296 373218
Three wheelers including tempos 108104 117266 128452 206901 140278
2. Buses Stage carriages 43727 46594 21457 34161 28356
Contract carriages/ Omni 114351 119150 124290 137731 132144
3. Cars and station wagons Cars 901663 1060861 122691 1358728 1538246 Station wagons 0 0 0 0 0 Taxis 151533 163407 175638 128250 194358 Jeep 73700 73700 73700 74167 73700 4. Three wheelers Auto rickshaws 466135 518741 575763 602547 663241
Motorised Rickshaws 61 61 0 0 0
5. Two wheelers Motorised cycles 1017 1017 0 0 0
Scooters/ Motor cycles 3216123 3610838 4127227 5041495 5288529
6. Tractors 11680 12224 13740 14183 15030
7. Tillers 5217 5335 5399 5399 5414
8. Trailers 2321 2324 2407 2744 2411
9 Others 39196 46106 68325 88071 93011 TOTAL 5370955 6045322 6865539 8048673 8547966
Source: Transport Commissionarate
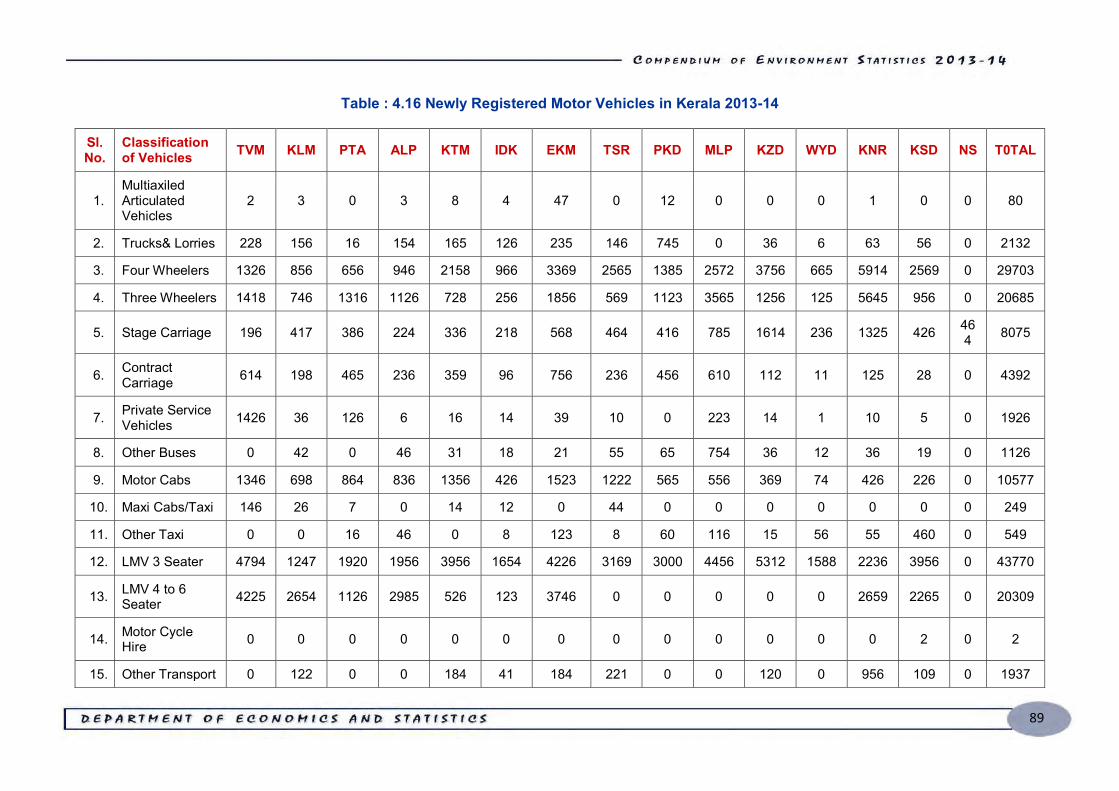
89
Table : 4.16 Newly Registered Motor Vehicles in Kerala 2013-14
Sl. No.
Classification of Vehicles TVM KLM PTA ALP KTM IDK EKM TSR PKD MLP KZD WYD KNR KSD NS T0TAL
1. Multiaxiled Articulated Vehicles
2 3 0 3 8 4 47 0 12 0 0 0 1 0 0 80
2. Trucks& Lorries 228 156 16 154 165 126 235 146 745 0 36 6 63 56 0 2132
3. Four Wheelers 1326 856 656 946 2158 966 3369 2565 1385 2572 3756 665 5914 2569 0 29703
4. Three Wheelers 1418 746 1316 1126 728 256 1856 569 1123 3565 1256 125 5645 956 0 20685
5. Stage Carriage 196 417 386 224 336 218 568 464 416 785 1614 236 1325 426 464 8075
6. Contract Carriage 614 198 465 236 359 96 756 236 456 610 112 11 125 28 0 4392
7. Private Service Vehicles 1426 36 126 6 16 14 39 10 0 223 14 1 10 5 0 1926
8. Other Buses 0 42 0 46 31 18 21 55 65 754 36 12 36 19 0 1126
9. Motor Cabs 1346 698 864 836 1356 426 1523 1222 565 556 369 74 426 226 0 10577
10. Maxi Cabs/Taxi 146 26 7 0 14 12 0 44 0 0 0 0 0 0 0 249
11. Other Taxi 0 0 16 46 0 8 123 8 60 116 15 56 55 460 0 549
12. LMV 3 Seater 4794 1247 1920 1956 3956 1654 4226 3169 3000 4456 5312 1588 2236 3956 0 43770
13. LMV 4 to 6 Seater 4225 2654 1126 2985 526 123 3746 0 0 0 0 0 2659 2265 0 20309
14. Motor Cycle Hire 0 0 0 0 0 0 0 0 0 0 0 0 0 2 0 2
15. Other Transport 0 122 0 0 184 41 184 221 0 0 120 0 956 109 0 1937
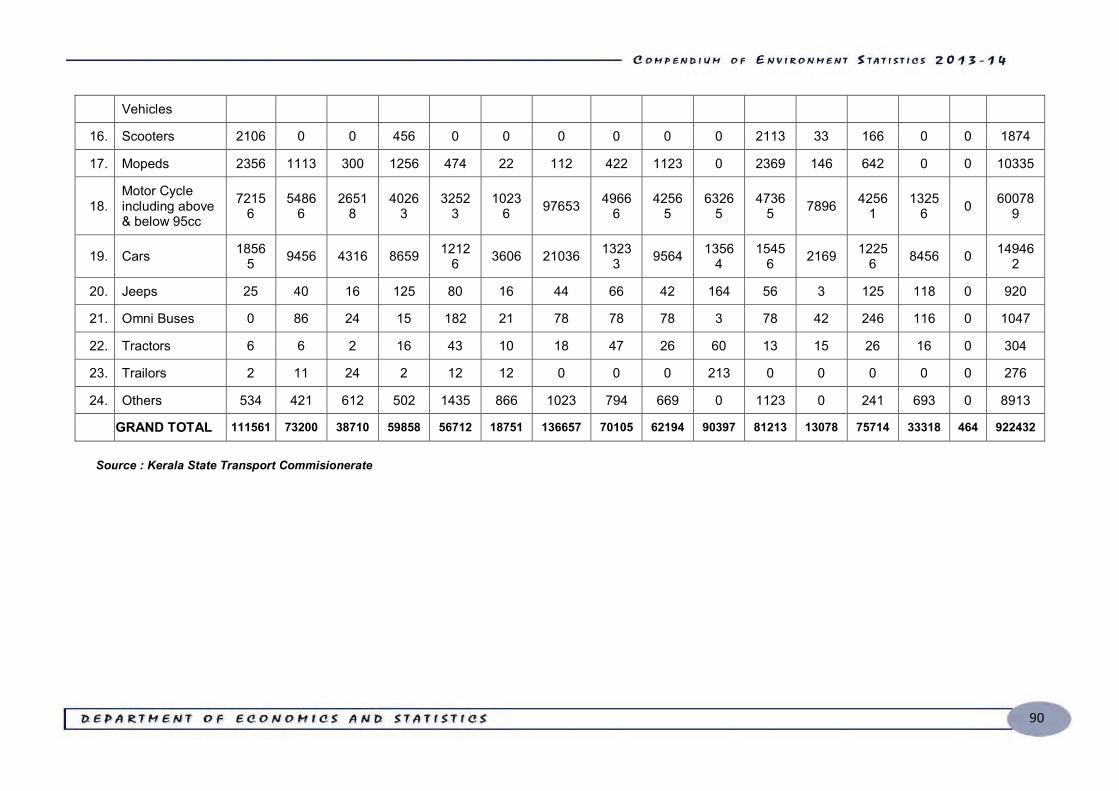
90
Vehicles
16. Scooters 2106 0 0 456 0 0 0 0 0 0 2113 33 166 0 0 1874
17. Mopeds 2356 1113 300 1256 474 22 112 422 1123 0 2369 146 642 0 0 10335
18. Motor Cycle including above & below 95cc
72156
54866
26518
40263
32523
10236 97653 4966
6 4256
5 6326
5 4736
5 7896 42561
13256 0 60078
9
19. Cars 18565 9456 4316 8659 1212
6 3606 21036 13233 9564 1356
4 1545
6 2169 12256 8456 0 14946
2
20. Jeeps 25 40 16 125 80 16 44 66 42 164 56 3 125 118 0 920
21. Omni Buses 0 86 24 15 182 21 78 78 78 3 78 42 246 116 0 1047
22. Tractors 6 6 2 16 43 10 18 47 26 60 13 15 26 16 0 304
23. Trailors 2 11 24 2 12 12 0 0 0 213 0 0 0 0 0 276
24. Others 534 421 612 502 1435 866 1023 794 669 0 1123 0 241 693 0 8913
GRAND TOTAL 111561 73200 38710 59858 56712 18751 136657 70105 62194 90397 81213 13078 75714 33318 464 922432
Source : Kerala State Transport Commisionerate
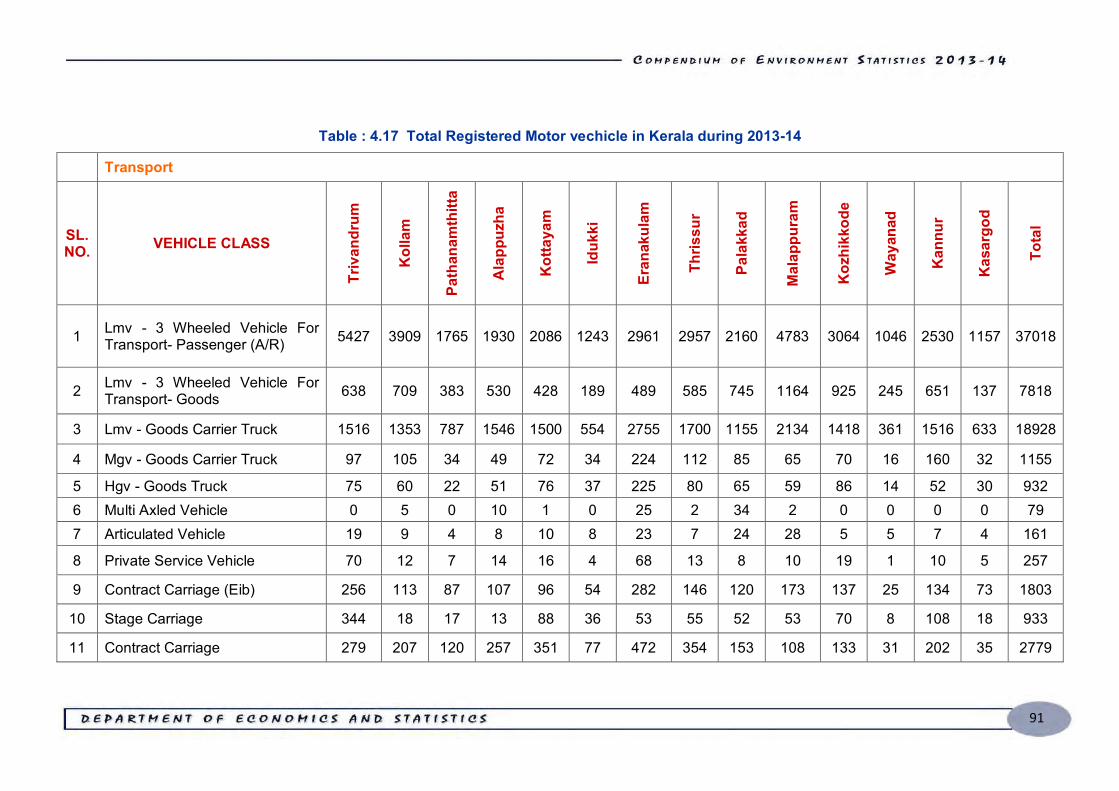
91
Table : 4.17 Total Registered Motor vechicle in Kerala during 2013-14
Transport
SL. NO. VEHICLE CLASS
Triv
andr
um
Kol
lam
Path
anam
thitt
a
Ala
ppuz
ha
Kot
taya
m
Iduk
ki
Eran
akul
am
Thris
sur
Pala
kkad
Mal
appu
ram
Koz
hikk
ode
Way
anad
Kan
nur
Kas
argo
d
Tota
l
1 Lmv - 3 Wheeled Vehicle For Transport- Passenger (A/R) 5427 3909 1765 1930 2086 1243 2961 2957 2160 4783 3064 1046 2530 1157 37018
2 Lmv - 3 Wheeled Vehicle For Transport- Goods 638 709 383 530 428 189 489 585 745 1164 925 245 651 137 7818
3 Lmv - Goods Carrier Truck 1516 1353 787 1546 1500 554 2755 1700 1155 2134 1418 361 1516 633 18928
4 Mgv - Goods Carrier Truck 97 105 34 49 72 34 224 112 85 65 70 16 160 32 1155
5 Hgv - Goods Truck 75 60 22 51 76 37 225 80 65 59 86 14 52 30 932 6 Multi Axled Vehicle 0 5 0 10 1 0 25 2 34 2 0 0 0 0 79 7 Articulated Vehicle 19 9 4 8 10 8 23 7 24 28 5 5 7 4 161
8 Private Service Vehicle 70 12 7 14 16 4 68 13 8 10 19 1 10 5 257
9 Contract Carriage (Eib) 256 113 87 107 96 54 282 146 120 173 137 25 134 73 1803
10 Stage Carriage 344 18 17 13 88 36 53 55 52 53 70 8 108 18 933
11 Contract Carriage 279 207 120 257 351 77 472 354 153 108 133 31 202 35 2779
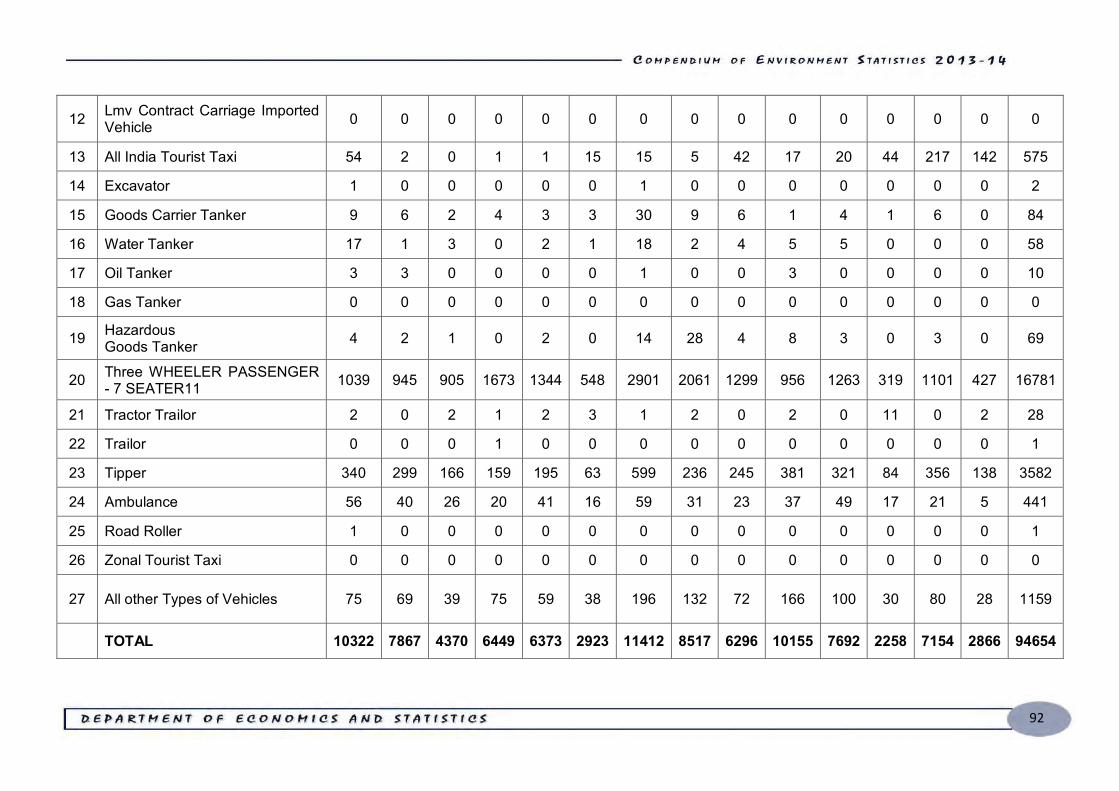
92
12 Lmv Contract Carriage Imported Vehicle 0 0 0 0 0 0 0 0 0 0 0 0 0 0 0
13 All India Tourist Taxi 54 2 0 1 1 15 15 5 42 17 20 44 217 142 575
14 Excavator 1 0 0 0 0 0 1 0 0 0 0 0 0 0 2
15 Goods Carrier Tanker 9 6 2 4 3 3 30 9 6 1 4 1 6 0 84
16 Water Tanker 17 1 3 0 2 1 18 2 4 5 5 0 0 0 58
17 Oil Tanker 3 3 0 0 0 0 1 0 0 3 0 0 0 0 10
18 Gas Tanker 0 0 0 0 0 0 0 0 0 0 0 0 0 0 0
19 Hazardous Goods Tanker 4 2 1 0 2 0 14 28 4 8 3 0 3 0 69
20 Three WHEELER PASSENGER - 7 SEATER11 1039 945 905 1673 1344 548 2901 2061 1299 956 1263 319 1101 427 16781
21 Tractor Trailor 2 0 2 1 2 3 1 2 0 2 0 11 0 2 28
22 Trailor 0 0 0 1 0 0 0 0 0 0 0 0 0 0 1
23 Tipper 340 299 166 159 195 63 599 236 245 381 321 84 356 138 3582
24 Ambulance 56 40 26 20 41 16 59 31 23 37 49 17 21 5 441
25 Road Roller 1 0 0 0 0 0 0 0 0 0 0 0 0 0 1
26 Zonal Tourist Taxi 0 0 0 0 0 0 0 0 0 0 0 0 0 0 0
27 All other Types of Vehicles 75 69 39 75 59 38 196 132 72 166 100 30 80 28 1159
TOTAL 10322 7867 4370 6449 6373 2923 11412 8517 6296 10155 7692 2258 7154 2866 94654
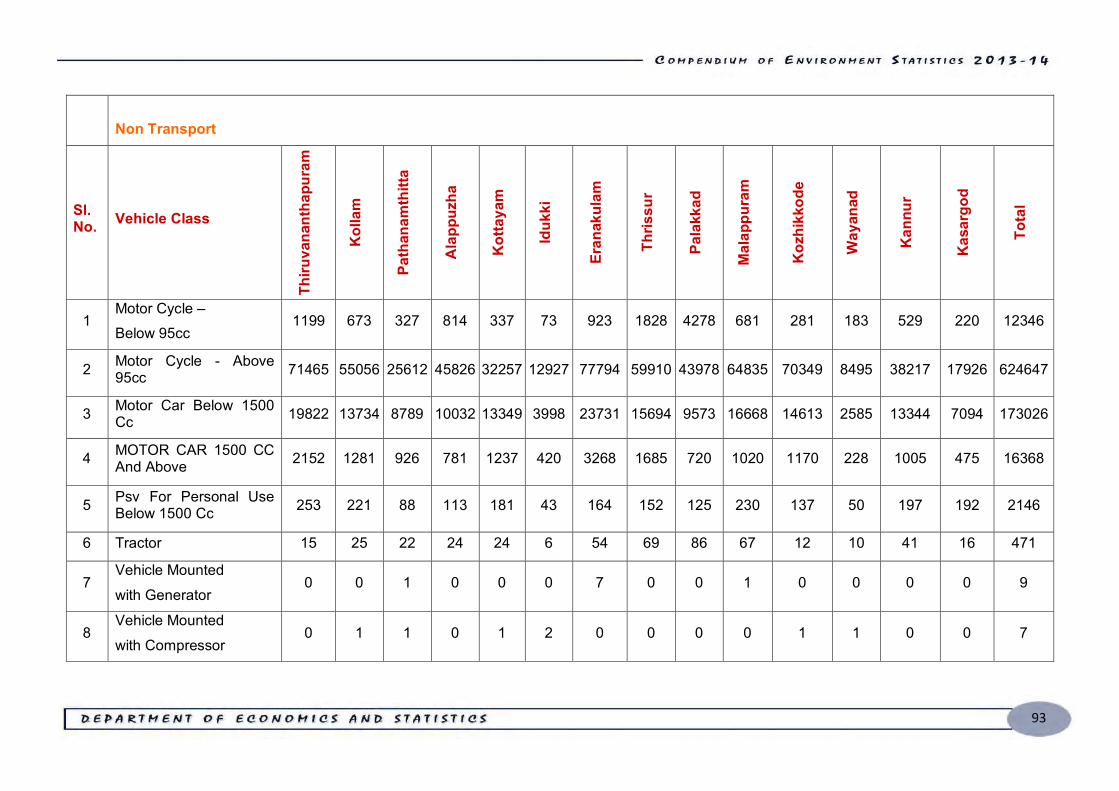
93
Non Transport
Sl. No. Vehicle Class
Thiru
vana
ntha
pura
m
Kol
lam
Path
anam
thitt
a
Ala
ppuz
ha
Kot
taya
m
Iduk
ki
Eran
akul
am
Thris
sur
Pala
kkad
Mal
appu
ram
Koz
hikk
ode
Way
anad
Kan
nur
Kas
argo
d
Tota
l
1 Motor Cycle – Below 95cc
1199 673 327 814 337 73 923 1828 4278 681 281 183 529 220 12346
2 Motor Cycle - Above 95cc 71465 55056 25612 45826 32257 12927 77794 59910 43978 64835 70349 8495 38217 17926 624647
3 Motor Car Below 1500 Cc 19822 13734 8789 10032 13349 3998 23731 15694 9573 16668 14613 2585 13344 7094 173026
4 MOTOR CAR 1500 CC And Above 2152 1281 926 781 1237 420 3268 1685 720 1020 1170 228 1005 475 16368
5 Psv For Personal Use Below 1500 Cc 253 221 88 113 181 43 164 152 125 230 137 50 197 192 2146
6 Tractor 15 25 22 24 24 6 54 69 86 67 12 10 41 16 471
7 Vehicle Mounted
with Generator 0 0 1 0 0 0 7 0 0 1 0 0 0 0 9
8 Vehicle Mounted
with Compressor 0 1 1 0 1 2 0 0 0 0 1 1 0 0 7
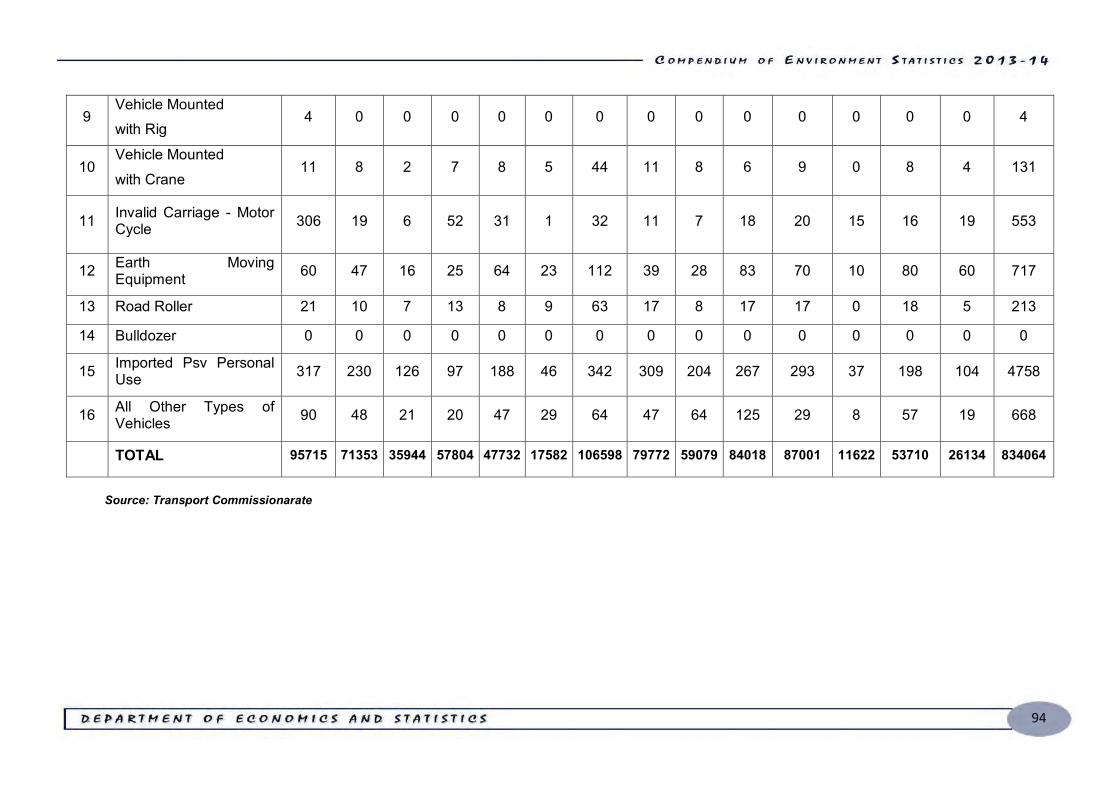
94
9 Vehicle Mounted with Rig
4 0 0 0 0 0 0 0 0 0 0 0 0 0 4
10 Vehicle Mounted
with Crane 11 8 2 7 8 5 44 11 8 6 9 0 8 4 131
11 Invalid Carriage - Motor Cycle 306 19 6 52 31 1 32 11 7 18 20 15 16 19 553
12 Earth Moving Equipment 60 47 16 25 64 23 112 39 28 83 70 10 80 60 717
13 Road Roller 21 10 7 13 8 9 63 17 8 17 17 0 18 5 213
14 Bulldozer 0 0 0 0 0 0 0 0 0 0 0 0 0 0 0
15 Imported Psv Personal Use 317 230 126 97 188 46 342 309 204 267 293 37 198 104 4758
16 All Other Types of Vehicles 90 48 21 20 47 29 64 47 64 125 29 8 57 19 668
TOTAL 95715 71353 35944 57804 47732 17582 106598 79772 59079 84018 87001 11622 53710 26134 834064
Source: Transport Commissionarate
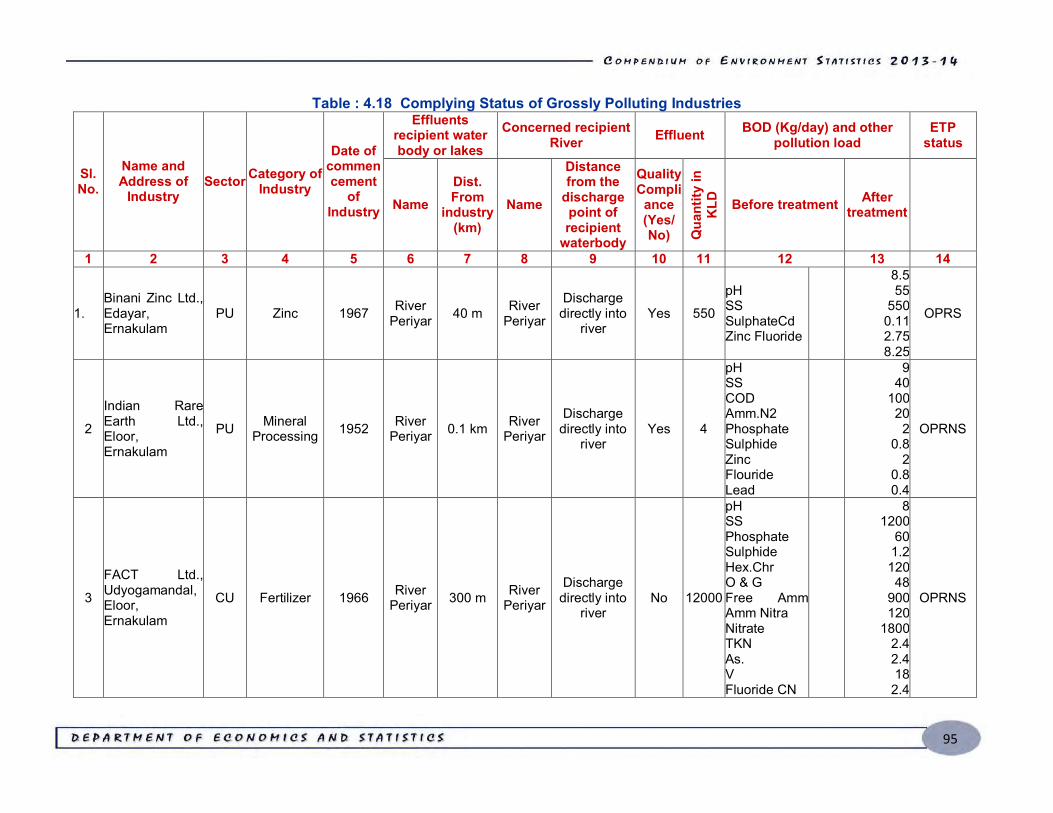
95
Table : 4.18 Complying Status of Grossly Polluting Industries
Sl. No.
Name and Address of
Industry Sector Category of
Industry
Date of commencement
of Industry
Effluents recipient water body or lakes
Concerned recipient River Effluent BOD (Kg/day) and other
pollution load ETP
status
Name Dist. From
industry (km)
Name
Distance from the
discharge point of recipient
waterbody
Quality Compli
ance (Yes/ No) Q
uant
ity in
K
LD
Before treatment After treatment
1 2 3 4 5 6 7 8 9 10 11 12 13 14
1. Binani Zinc Ltd., Edayar, Ernakulam
PU Zinc 1967 River Periyar 40 m River
Periyar
Discharge directly into
river Yes 550
pH SS SulphateCd Zinc Fluoride
8.5 55
550 0.11 2.75 8.25
OPRS
2
Indian Rare Earth Ltd., Eloor, Ernakulam
PU Mineral Processing 1952 River
Periyar 0.1 km River Periyar
Discharge directly into
river Yes 4
pH SS COD Amm.N2 Phosphate Sulphide Zinc Flouride Lead
9 40
100 20
2 0.8
2 0.8 0.4
OPRNS
3
FACT Ltd., Udyogamandal, Eloor, Ernakulam
CU Fertilizer 1966 River Periyar 300 m River
Periyar
Discharge directly into
river No 12000
pH SS Phosphate Sulphide Hex.Chr O & G Free Amm Amm Nitra Nitrate TKN As. V Fluoride CN
8 1200
60 1.2 120 48
900 120
1800 2.4 2.4 18
2.4
OPRNS
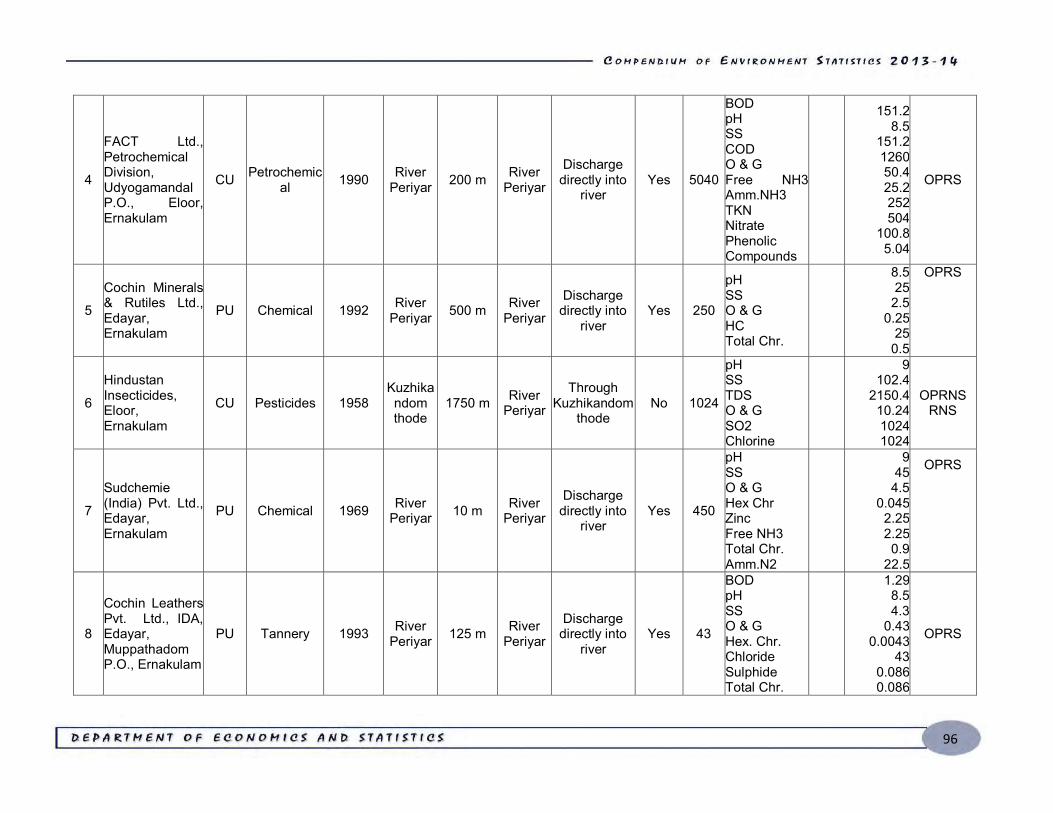
96
4
FACT Ltd., Petrochemical Division, Udyogamandal P.O., Eloor, Ernakulam
CU Petrochemical 1990 River
Periyar 200 m River Periyar
Discharge directly into
river Yes 5040
BOD pH SS COD O & G Free NH3 Amm.NH3 TKN Nitrate Phenolic Compounds
151.2 8.5
151.2 1260 50.4 25.2 252 504
100.8 5.04
OPRS
5
Cochin Minerals & Rutiles Ltd., Edayar, Ernakulam
PU Chemical 1992 River Periyar 500 m River
Periyar
Discharge directly into
river Yes 250
pH SS O & G HC Total Chr.
8.5 25
2.5 0.25
25 0.5
OPRS
6
Hindustan Insecticides, Eloor, Ernakulam
CU Pesticides 1958 Kuzhikandom thode
1750 m River Periyar
Through Kuzhikandom
thode No 1024
pH SS TDS O & G SO2 Chlorine
9 102.4
2150.4 10.24 1024 1024
OPRNS RNS
7
Sudchemie (India) Pvt. Ltd., Edayar, Ernakulam
PU Chemical 1969 River Periyar 10 m River
Periyar
Discharge directly into
river Yes 450
pH SS O & G Hex Chr Zinc Free NH3 Total Chr. Amm.N2
9 45
4.5 0.045
2.25 2.25 0.9
22.5
OPRS
8
Cochin Leathers Pvt. Ltd., IDA, Edayar, Muppathadom P.O., Ernakulam
PU Tannery 1993 River Periyar 125 m River
Periyar
Discharge directly into
river Yes 43
BOD pH SS O & G Hex. Chr. Chloride Sulphide Total Chr.
1.29 8.5 4.3
0.43 0.0043
43 0.086 0.086
OPRS
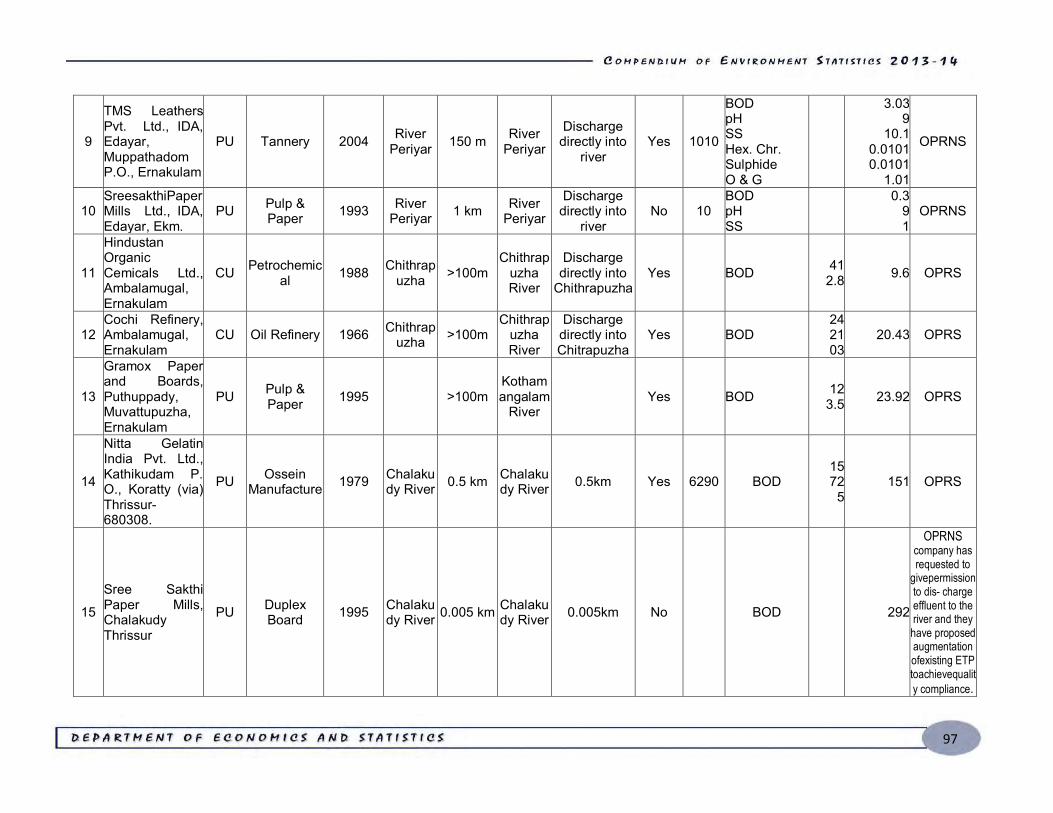
97
9
TMS Leathers Pvt. Ltd., IDA, Edayar, Muppathadom P.O., Ernakulam
PU Tannery 2004 River Periyar 150 m River
Periyar
Discharge directly into
river Yes 1010
BOD pH SS Hex. Chr. Sulphide O & G
3.03 9
10.1 0.0101 0.0101
1.01
OPRNS
10 SreesakthiPaper Mills Ltd., IDA, Edayar, Ekm.
PU Pulp & Paper 1993 River
Periyar 1 km River Periyar
Discharge directly into
river No 10
BOD pH SS
0.3
9 1
OPRNS
11
Hindustan Organic Cemicals Ltd., Ambalamugal, Ernakulam
CU Petrochemical 1988 Chithrap
uzha >100m Chithrap
uzha River
Discharge directly into
Chithrapuzha Yes BOD 41
2.8 9.6 OPRS
12 Cochi Refinery, Ambalamugal, Ernakulam
CU Oil Refinery 1966 Chithrapuzha >100m
Chithrapuzha River
Discharge directly into Chitrapuzha
Yes BOD 24 21 03
20.43 OPRS
13
Gramox Paper and Boards, Puthuppady, Muvattupuzha, Ernakulam
PU Pulp & Paper 1995 >100m
Kothamangalam
River Yes BOD 12
3.5 23.92 OPRS
14
Nitta Gelatin India Pvt. Ltd., Kathikudam P. O., Koratty (via) Thrissur-680308.
PU Ossein Manufacture 1979 Chalaku
dy River 0.5 km Chalakudy River 0.5km Yes 6290 BOD
15 72
5 151 OPRS
15
Sree Sakthi Paper Mills, Chalakudy Thrissur
PU Duplex Board 1995 Chalaku
dy River 0.005 km Chalakudy River 0.005km No BOD 292
OPRNS company has requested to
givepermission to dis- charge effluent to the river and they have proposed augmentation ofexisting ETP toachievequalit
y compliance.
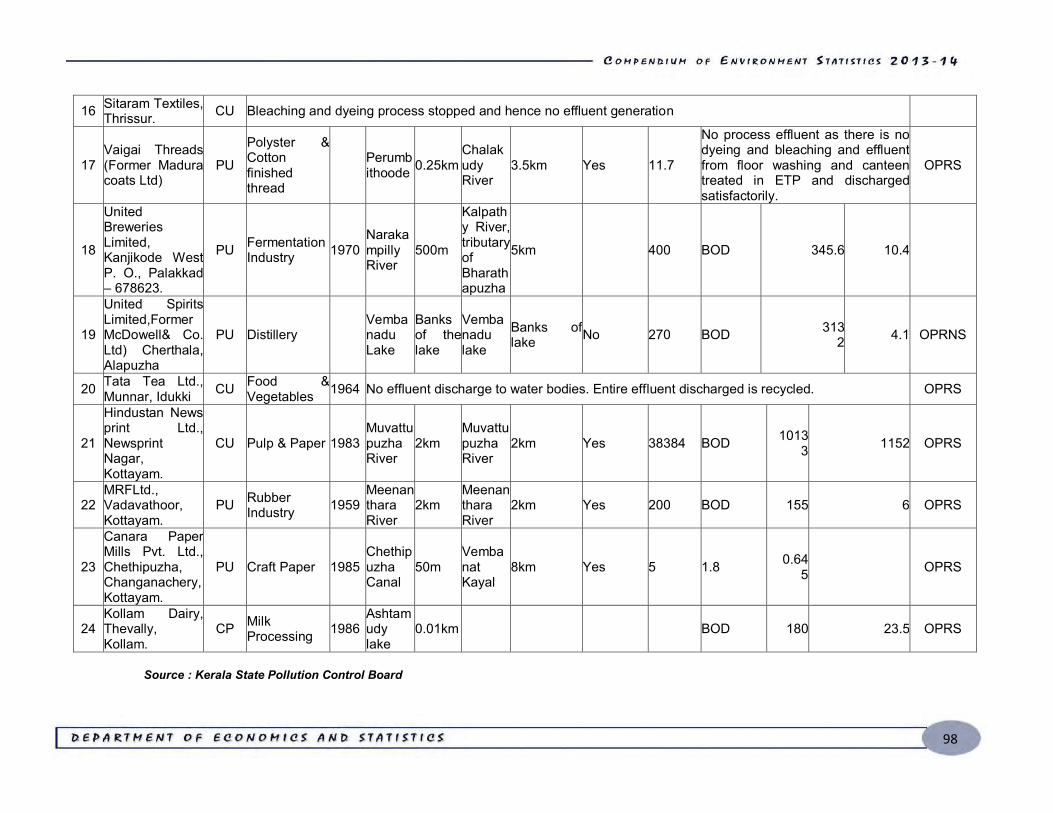
98
16 Sitaram Textiles, Thrissur. CU Bleaching and dyeing process stopped and hence no effluent generation
17 Vaigai Threads (Former Madura coats Ltd)
PU
Polyster & Cotton finished thread
Perumbithoode 0.25km
Chalakudy River
3.5km Yes 11.7
No process effluent as there is no dyeing and bleaching and effluent from floor washing and canteen treated in ETP and discharged satisfactorily.
OPRS
18
United Breweries Limited, Kanjikode West P. O., Palakkad – 678623.
PU Fermentation Industry 1970
Narakampilly River
500m
Kalpathy River, tributary of Bharathapuzha
5km 400 BOD 345.6 10.4
19
United Spirits Limited,Former McDowell& Co. Ltd) Cherthala, Alapuzha
PU Distillery Vembanadu Lake
Banks of the lake
Vembanadu lake
Banks of lake No 270 BOD 313
2 4.1 OPRNS
20 Tata Tea Ltd., Munnar, Idukki CU Food &
Vegetables 1964 No effluent discharge to water bodies. Entire effluent discharged is recycled. OPRS
21
Hindustan News print Ltd., Newsprint Nagar, Kottayam.
CU Pulp & Paper 1983 Muvattupuzha River
2km Muvattupuzha River
2km Yes 38384 BOD 1013 3 1152 OPRS
22 MRFLtd., Vadavathoor, Kottayam.
PU Rubber Industry 1959
Meenanthara River
2km Meenanthara River
2km Yes 200 BOD 155 6 OPRS
23
Canara Paper Mills Pvt. Ltd., Chethipuzha, Changanachery, Kottayam.
PU Craft Paper 1985 Chethipuzha Canal
50m Vembanat Kayal
8km Yes 5 1.8 0.64 5 OPRS
24 Kollam Dairy, Thevally, Kollam.
CP Milk Processing 1986
Ashtamudy lake
0.01km BOD 180 23.5 OPRS
Source : Kerala State Pollution Control Board
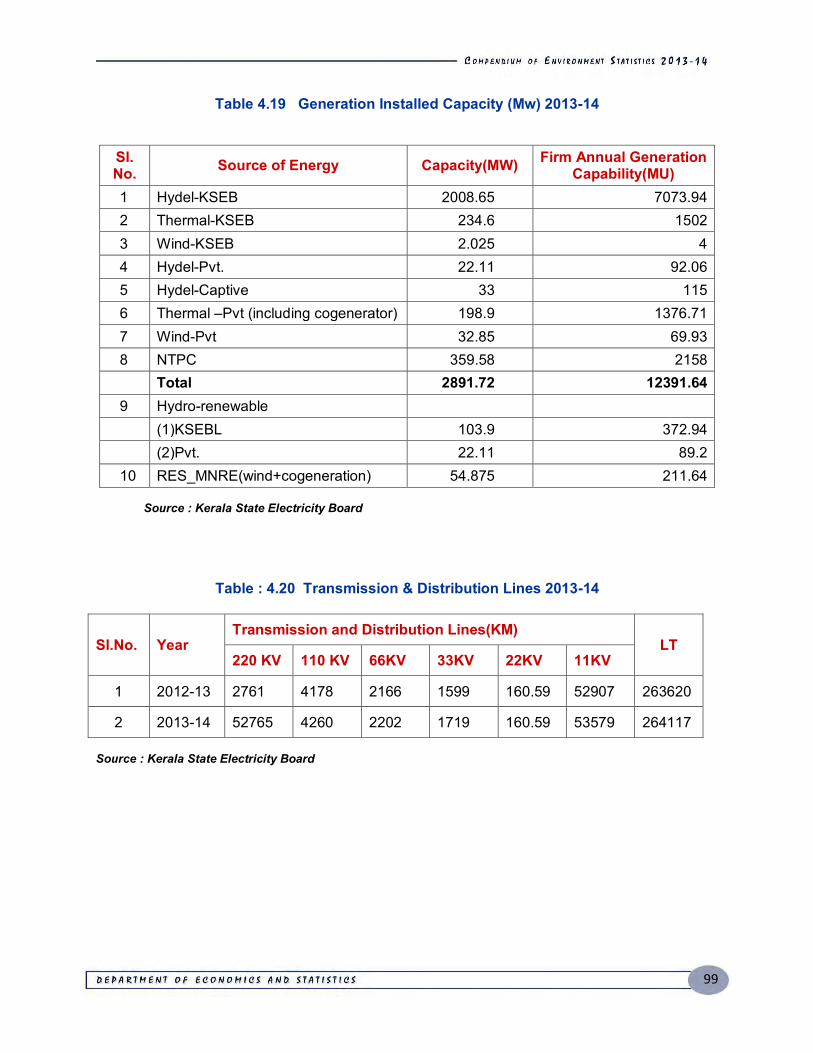
99
Table 4.19 Generation Installed Capacity (Mw) 2013-14
Sl. No. Source of Energy Capacity(MW) Firm Annual Generation
Capability(MU) 1 Hydel-KSEB 2008.65 7073.94 2 Thermal-KSEB 234.6 1502 3 Wind-KSEB 2.025 4 4 Hydel-Pvt. 22.11 92.06 5 Hydel-Captive 33 115 6 Thermal –Pvt (including cogenerator) 198.9 1376.71 7 Wind-Pvt 32.85 69.93 8 NTPC 359.58 2158 Total 2891.72 12391.64 9 Hydro-renewable (1)KSEBL 103.9 372.94 (2)Pvt. 22.11 89.2 10 RES_MNRE(wind+cogeneration) 54.875 211.64
Source : Kerala State Electricity Board
Table : 4.20 Transmission & Distribution Lines 2013-14
Source : Kerala State Electricity Board
Sl.No. Year Transmission and Distribution Lines(KM)
LT 220 KV 110 KV 66KV 33KV 22KV 11KV
1 2012-13 2761 4178 2166 1599 160.59 52907 263620
2 2013-14 52765 4260 2202 1719 160.59 53579 264117
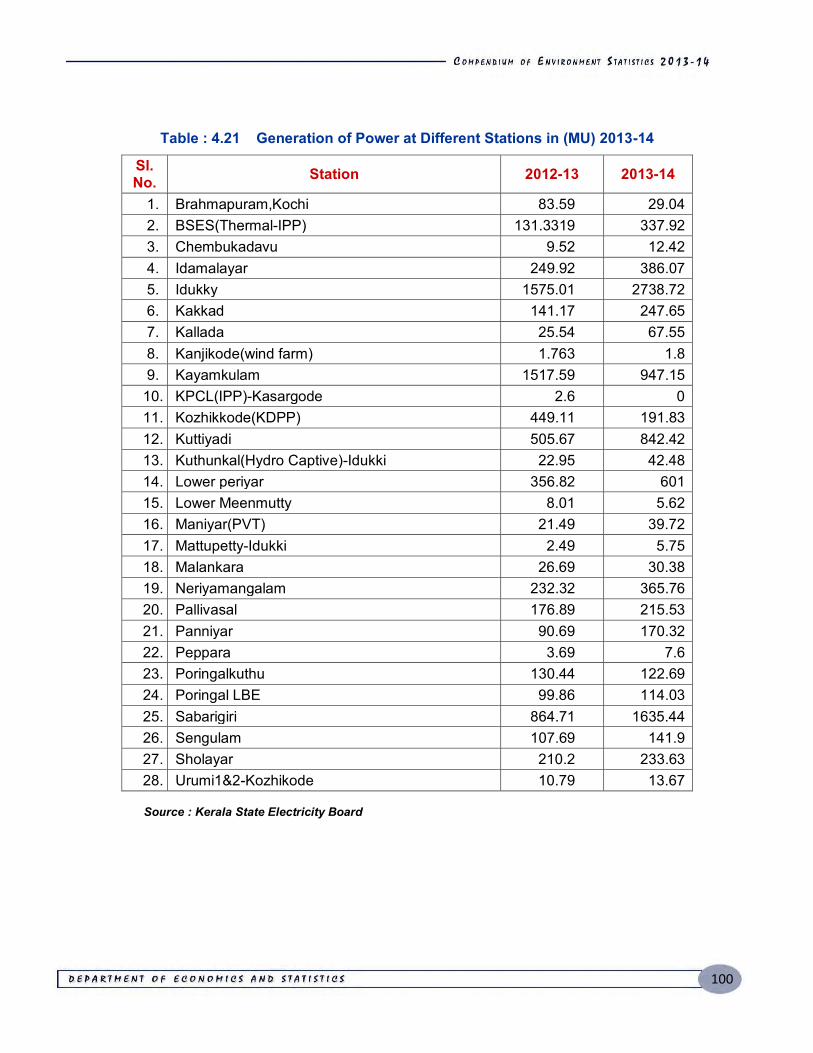
100
Table : 4.21 Generation of Power at Different Stations in (MU) 2013-14
Sl. No. Station 2012-13 2013-14
1. Brahmapuram,Kochi 83.59 29.04 2. BSES(Thermal-IPP) 131.3319 337.92 3. Chembukadavu 9.52 12.42 4. Idamalayar 249.92 386.07 5. Idukky 1575.01 2738.72 6. Kakkad 141.17 247.65 7. Kallada 25.54 67.55 8. Kanjikode(wind farm) 1.763 1.8 9. Kayamkulam 1517.59 947.15 10. KPCL(IPP)-Kasargode 2.6 0 11. Kozhikkode(KDPP) 449.11 191.83 12. Kuttiyadi 505.67 842.42 13. Kuthunkal(Hydro Captive)-Idukki 22.95 42.48 14. Lower periyar 356.82 601 15. Lower Meenmutty 8.01 5.62 16. Maniyar(PVT) 21.49 39.72 17. Mattupetty-Idukki 2.49 5.75 18. Malankara 26.69 30.38 19. Neriyamangalam 232.32 365.76 20. Pallivasal 176.89 215.53 21. Panniyar 90.69 170.32 22. Peppara 3.69 7.6 23. Poringalkuthu 130.44 122.69 24. Poringal LBE 99.86 114.03 25. Sabarigiri 864.71 1635.44 26. Sengulam 107.69 141.9 27. Sholayar 210.2 233.63 28. Urumi1&2-Kozhikode 10.79 13.67 Source : Kerala State Electricity Board
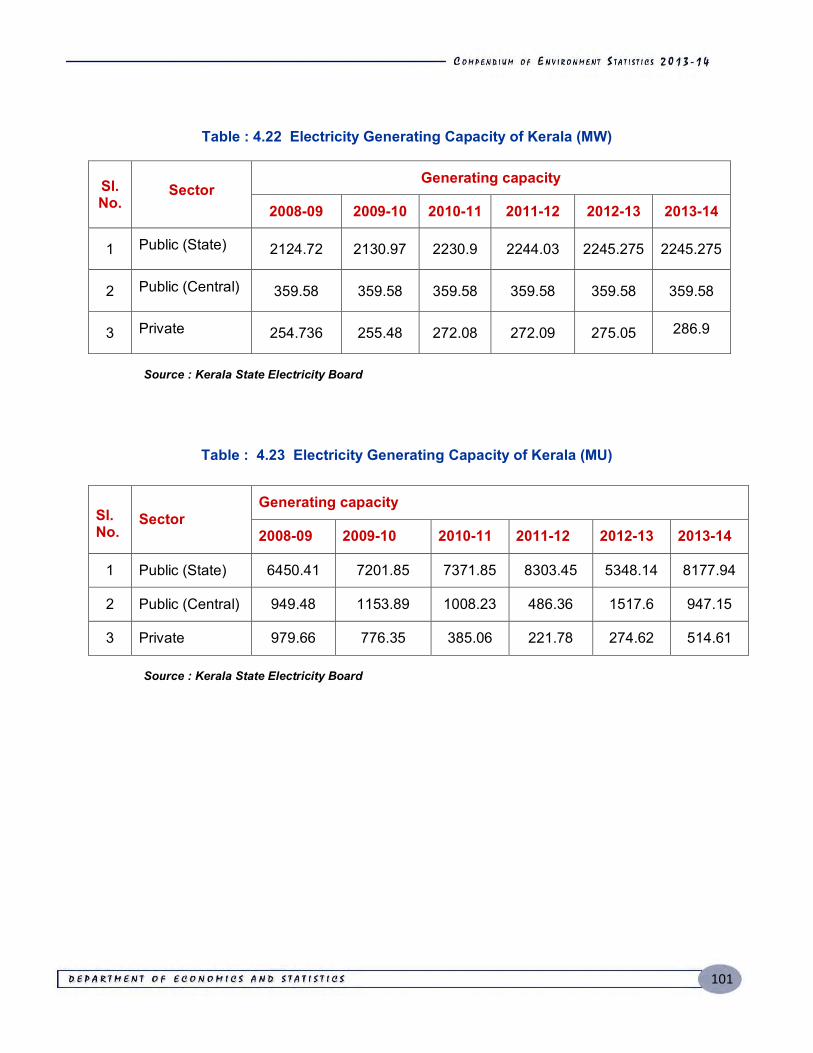
101
Table : 4.22 Electricity Generating Capacity of Kerala (MW)
Sl. No.
Sector Generating capacity
2008-09 2009-10 2010-11 2011-12 2012-13 2013-14
1 Public (State) 2124.72 2130.97 2230.9 2244.03 2245.275 2245.275
2 Public (Central) 359.58 359.58 359.58 359.58 359.58 359.58
3 Private 254.736 255.48 272.08 272.09 275.05 286.9
Source : Kerala State Electricity Board
Table : 4.23 Electricity Generating Capacity of Kerala (MU)
Sl. No.
Sector Generating capacity
2008-09 2009-10 2010-11 2011-12 2012-13 2013-14
1 Public (State) 6450.41 7201.85 7371.85 8303.45 5348.14 8177.94
2 Public (Central) 949.48 1153.89 1008.23 486.36 1517.6 947.15
3 Private 979.66 776.35 385.06 221.78 274.62 514.61
Source : Kerala State Electricity Board
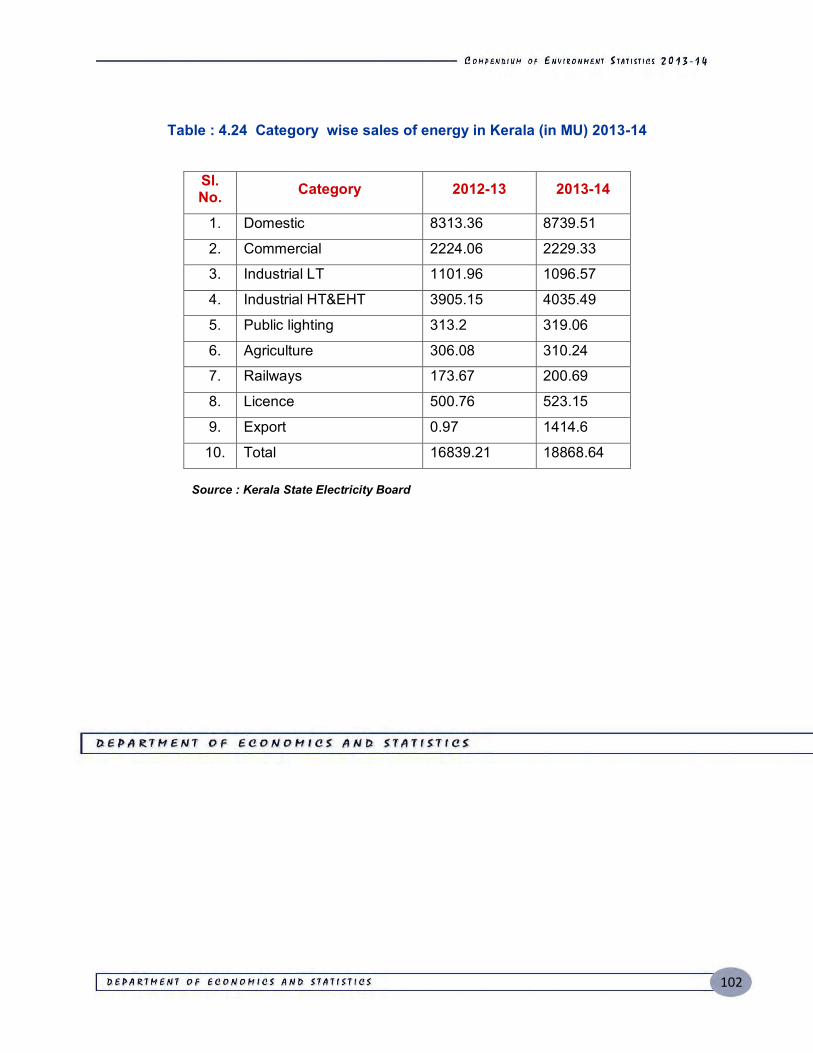
102
Table : 4.24 Category wise sales of energy in Kerala (in MU) 2013-14
Sl. No. Category 2012-13 2013-14
1. Domestic 8313.36 8739.51
2. Commercial 2224.06 2229.33
3. Industrial LT 1101.96 1096.57
4. Industrial HT&EHT 3905.15 4035.49
5. Public lighting 313.2 319.06
6. Agriculture 306.08 310.24
7. Railways 173.67 200.69
8. Licence 500.76 523.15
9. Export 0.97 1414.6
10. Total 16839.21 18868.64 Source : Kerala State Electricity Board
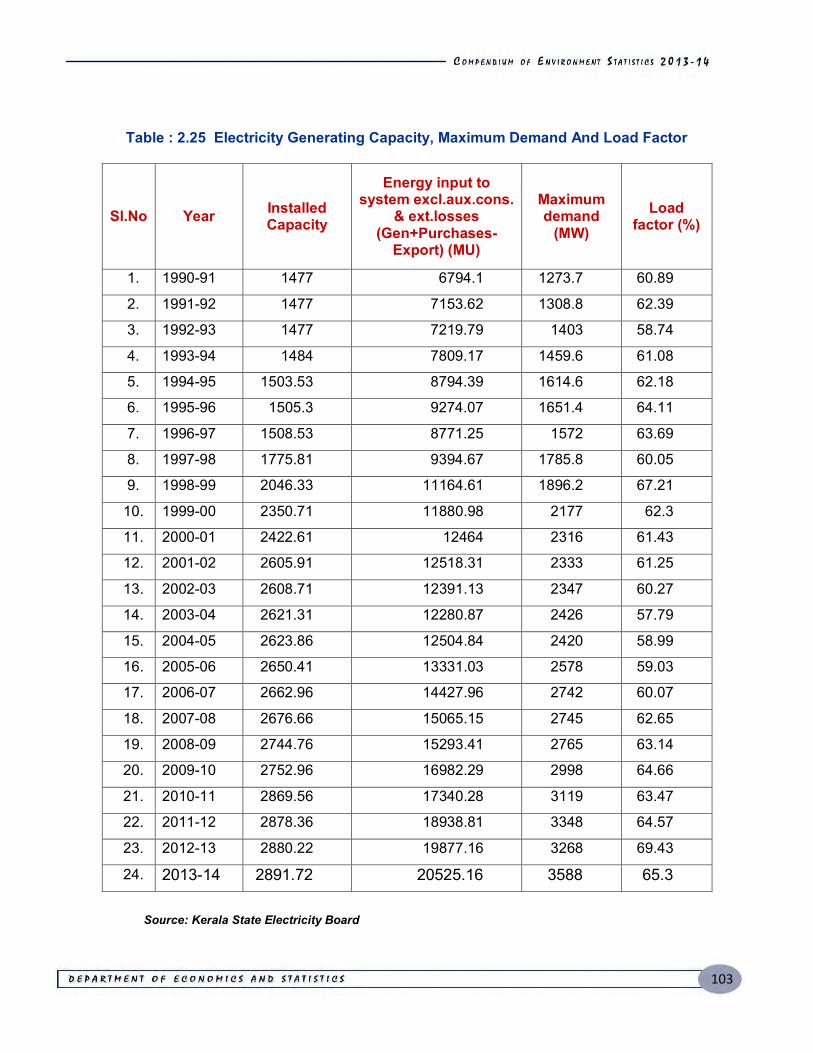
103
Table : 2.25 Electricity Generating Capacity, Maximum Demand And Load Factor
Sl.No Year Installed Capacity
Energy input to system excl.aux.cons.
& ext.losses (Gen+Purchases-
Export) (MU)
Maximum demand
(MW) Load
factor (%)
1. 1990-91 1477 6794.1 1273.7 60.89
2. 1991-92 1477 7153.62 1308.8 62.39
3. 1992-93 1477 7219.79 1403 58.74
4. 1993-94 1484 7809.17 1459.6 61.08
5. 1994-95 1503.53 8794.39 1614.6 62.18
6. 1995-96 1505.3 9274.07 1651.4 64.11
7. 1996-97 1508.53 8771.25 1572 63.69
8. 1997-98 1775.81 9394.67 1785.8 60.05
9. 1998-99 2046.33 11164.61 1896.2 67.21
10. 1999-00 2350.71 11880.98 2177 62.3
11. 2000-01 2422.61 12464 2316 61.43
12. 2001-02 2605.91 12518.31 2333 61.25
13. 2002-03 2608.71 12391.13 2347 60.27
14. 2003-04 2621.31 12280.87 2426 57.79
15. 2004-05 2623.86 12504.84 2420 58.99
16. 2005-06 2650.41 13331.03 2578 59.03
17. 2006-07 2662.96 14427.96 2742 60.07
18. 2007-08 2676.66 15065.15 2745 62.65
19. 2008-09 2744.76 15293.41 2765 63.14
20. 2009-10 2752.96 16982.29 2998 64.66
21. 2010-11 2869.56 17340.28 3119 63.47
22. 2011-12 2878.36 18938.81 3348 64.57
23. 2012-13 2880.22 19877.16 3268 69.43
24. 2013-14 2891.72 20525.16 3588 65.3 Source: Kerala State Electricity Board
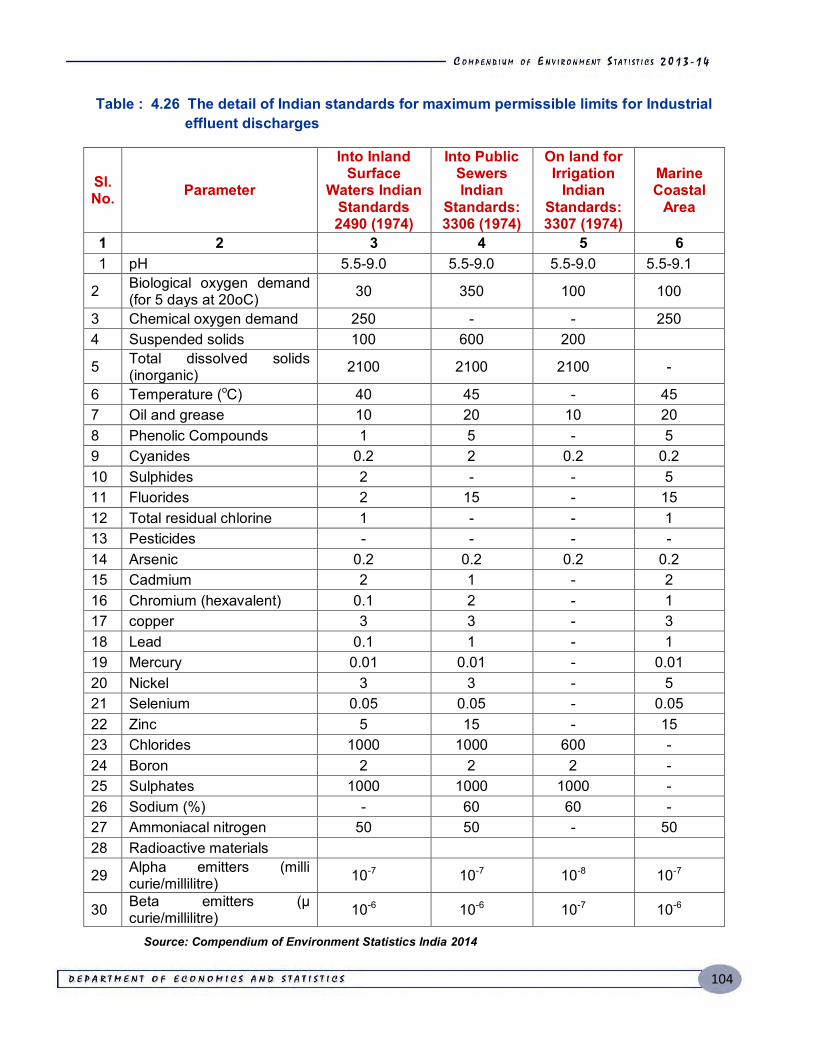
104
Table : 4.26 The detail of Indian standards for maximum permissible limits for Industrial effluent discharges
Sl. No. Parameter
Into Inland Surface
Waters Indian Standards 2490 (1974)
Into Public Sewers Indian
Standards: 3306 (1974)
On land for Irrigation
Indian Standards: 3307 (1974)
Marine Coastal
Area
1 2 3 4 5 6 1 pH 5.5-9.0 5.5-9.0 5.5-9.0 5.5-9.1
2 Biological oxygen demand (for 5 days at 20oC) 30 350 100 100
3 Chemical oxygen demand 250 - - 250 4 Suspended solids 100 600 200 5 Total dissolved solids
(inorganic) 2100 2100 2100 -
6 Temperature (oC) 40 45 - 45 7 Oil and grease 10 20 10 20 8 Phenolic Compounds 1 5 - 5 9 Cyanides 0.2 2 0.2 0.2 10 Sulphides 2 - - 5 11 Fluorides 2 15 - 15 12 Total residual chlorine 1 - - 1 13 Pesticides - - - - 14 Arsenic 0.2 0.2 0.2 0.2 15 Cadmium 2 1 - 2 16 Chromium (hexavalent) 0.1 2 - 1 17 copper 3 3 - 3 18 Lead 0.1 1 - 1 19 Mercury 0.01 0.01 - 0.01 20 Nickel 3 3 - 5 21 Selenium 0.05 0.05 - 0.05 22 Zinc 5 15 - 15 23 Chlorides 1000 1000 600 - 24 Boron 2 2 2 - 25 Sulphates 1000 1000 1000 - 26 Sodium (%) - 60 60 - 27 Ammoniacal nitrogen 50 50 - 50 28 Radioactive materials 29 Alpha emitters (milli
curie/millilitre) 10-7 10-7 10-8 10-7
30 Beta emitters (μ curie/millilitre) 10-6 10-6 10-7 10-6
Source: Compendium of Environment Statistics India 2014
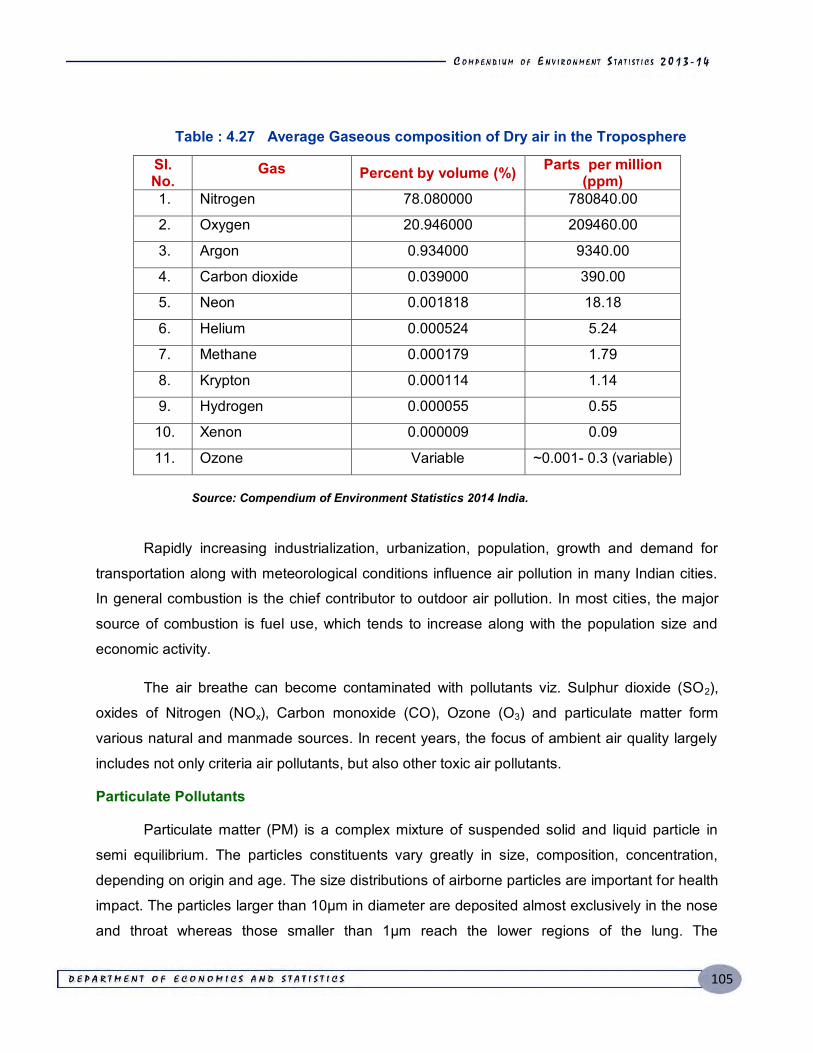
105
Table : 4.27 Average Gaseous composition of Dry air in the Troposphere
Sl. No.
Gas Percent by volume (%) Parts per million (ppm)
1. Nitrogen 78.080000 780840.00
2. Oxygen 20.946000 209460.00
3. Argon 0.934000 9340.00
4. Carbon dioxide 0.039000 390.00
5. Neon 0.001818 18.18
6. Helium 0.000524 5.24
7. Methane 0.000179 1.79
8. Krypton 0.000114 1.14
9. Hydrogen 0.000055 0.55
10. Xenon 0.000009 0.09
11. Ozone Variable ~0.001- 0.3 (variable)
Source: Compendium of Environment Statistics 2014 India.
Rapidly increasing industrialization, urbanization, population, growth and demand for
transportation along with meteorological conditions influence air pollution in many Indian cities.
In general combustion is the chief contributor to outdoor air pollution. In most cities, the major
source of combustion is fuel use, which tends to increase along with the population size and
economic activity.
The air breathe can become contaminated with pollutants viz. Sulphur dioxide (SO2),
oxides of Nitrogen (NOx), Carbon monoxide (CO), Ozone (O3) and particulate matter form
various natural and manmade sources. In recent years, the focus of ambient air quality largely
includes not only criteria air pollutants, but also other toxic air pollutants.
Particulate Pollutants
Particulate matter (PM) is a complex mixture of suspended solid and liquid particle in
semi equilibrium. The particles constituents vary greatly in size, composition, concentration,
depending on origin and age. The size distributions of airborne particles are important for health
impact. The particles larger than 10µm in diameter are deposited almost exclusively in the nose
and throat whereas those smaller than 1µm reach the lower regions of the lung. The
106
intermediate size range gets deposited between these two extremes of the respiratory tract.
Outdoor (ambient) PM size ranges from approximately 0.001-100 µm in aerodynamic diameter.
PM is considered as the single best indicator of potential harm. There are two main size
categories for PM measured in ambient air.
Environment Protection Rules Schl:38
i. Implementation of the following Pollution Control Measures:
a) Dust containment cum suppression system of the equipment.
b) Construction of wind breaking walls
c) Construction of metalled roads within the premises
d) Regular cleaning and wetting of the ground within the premises.
e) Growing of a green belt along the periphery.
ii) Quantitative standards for the SPM:
The suspended particulate matter contribution value at a distance of 40 meters from a controlled isolated as well as from a unit located should be less than 600 mg NM3. The measurements are to be conducted at least twice a month for all the 12 months in a year.
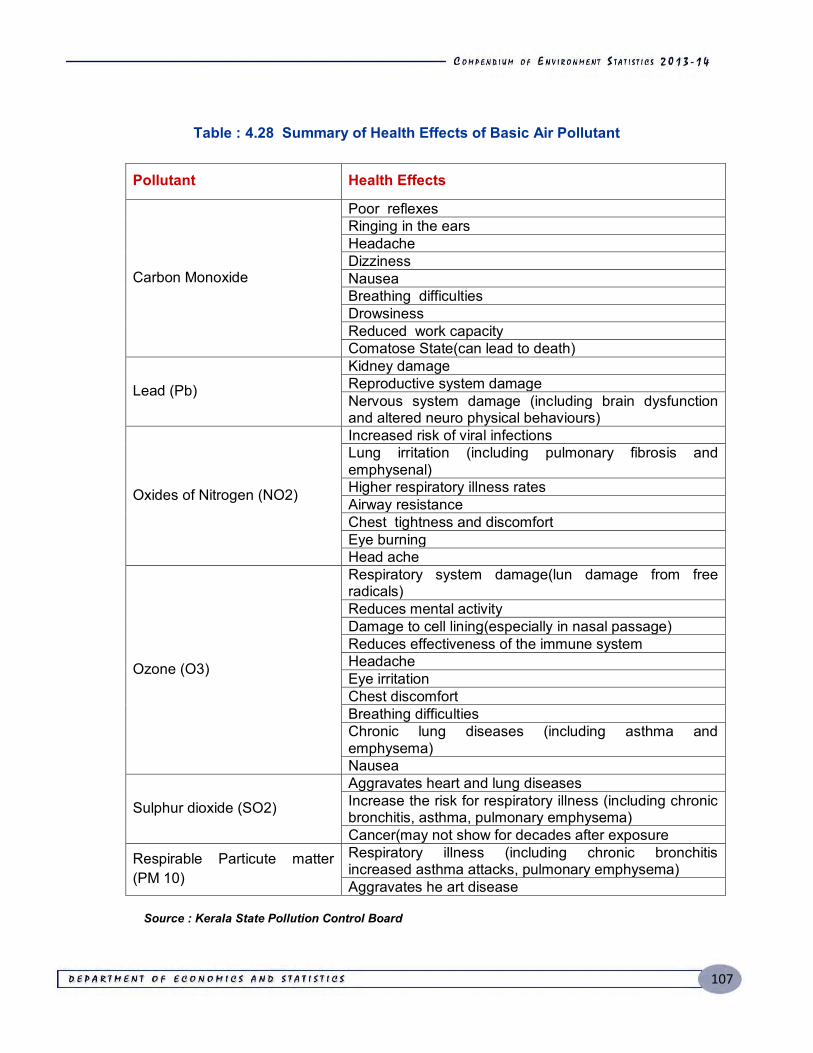
107
Table : 4.28 Summary of Health Effects of Basic Air Pollutant
Pollutant Health Effects
Carbon Monoxide
Poor reflexes Ringing in the ears Headache Dizziness Nausea Breathing difficulties Drowsiness Reduced work capacity Comatose State(can lead to death)
Lead (Pb) Kidney damage Reproductive system damage Nervous system damage (including brain dysfunction and altered neuro physical behaviours)
Oxides of Nitrogen (NO2)
Increased risk of viral infections Lung irritation (including pulmonary fibrosis and emphysenal) Higher respiratory illness rates Airway resistance Chest tightness and discomfort Eye burning Head ache
Ozone (O3)
Respiratory system damage(lun damage from free radicals) Reduces mental activity Damage to cell lining(especially in nasal passage) Reduces effectiveness of the immune system Headache Eye irritation Chest discomfort Breathing difficulties Chronic lung diseases (including asthma and emphysema) Nausea
Sulphur dioxide (SO2) Aggravates heart and lung diseases Increase the risk for respiratory illness (including chronic bronchitis, asthma, pulmonary emphysema) Cancer(may not show for decades after exposure
Respirable Particute matter (PM 10)
Respiratory illness (including chronic bronchitis increased asthma attacks, pulmonary emphysema) Aggravates he art disease
Source : Kerala State Pollution Control Board
108
CHAPTER - V
Land and Soil
erala is located on the southernmost tip of India and embraces the coast of Arabian
Sea on the west and is bounded by the Western Ghats in the east. This South Indian state
stretches from north to south along the coast line of 580 kms with an approximate breadth of 35
to 120 kms. Lying within east longitudes 74 degree 52' and 72 degree 22' and north latitudes 8
degree 18' and 12 degree 48' this idyllic land of pleasing beauty embraces1.18 % area of the
country with a total area of Kerala is 38, 863 Sq Km.
Kerala is endowed with a combination of distinct altitudinal variations resulting from the
rise of the land mass from 5 meters below sea level in the west to the soaring heights of 2695
meters in the east within the short span of 120 km. The small expanse of land with an area
of 38,863 km2 has a base length of 560 km along the coast and width ranging from 11 Km
to 124 Km. Physiographically, the terrain has three natural regions namely, lowlands, midland
and highlands. Geologically, Kerala is occupied by four major rock formations namely,
crystalline rocks of Precambrian age, sedimentary rocks of Tertiary confined to Neogene period,
laterites capping the crystalline and sedimentary rocks and recent and sub recent sediments
forming the low-lying areas and river valleys. There are sporadic Paleozoic granites and
pegmatite and Meso-Cenozoic dykes intruding these rocks. The oldest rocks so far dated in
Kerala are the charnockites, which yielded an age of 2930 +/- 50 Ma (Soman, 1997& 2002).
The varied rock formations under different geological domains harbour different mineral
deposits and the transformed rock strata stockpile copious groundwater resource.
Traditionally Indian soils are divided into four major groups namely : red, black, alluvial,
and laterite. The state is gifted with ten soil types derived from the laterite base and has 12
distinct agro climatic zones. The undulating topography, vibrant climate and vivacious hydrology
in the background of ever active tectonics resulted in 44 river basins, 1750 sub basins and 4452
mini watersheds providing multitudes of lively micro ecosystems. The environment of these
micro watersheds are conducive to varying crop types, such as, coconut and rice in the sultry
109
lowlands, rice, tapioca, banana, arecanut, coconut, pepper, cashew and rubber in hot humid
midlands and tea, coffee and cardamom in the cool subtropic highlands.
The Western Ghats - The mighty Western Ghats, a sequence of Rocky Mountains, edges the eastern boundary of Kerala and ascends roughly upto 1,500 m above sea level with the lofty peaks rising upto 2,500 m.
Hill and Valleys - The narrow piece of land on the eastern border, close to the Western Ghats, encompasses precipitous hills, deep valleys and gorges which are covered with thick woods. Almost all the rivers of the state originate here.
Midland Plains- These plains which lie along central Kerala, are located in the west of the hills and mountains.
Coastal Belt – The narrow belt of coastal land along the Arabian Sea is characterized by paddy fields, rows of coconut trees and serene, and backwaters internally linked by rivers and inland waterways.
Backwaters and Rivers -The Backwaters consists of lakes and inlets of oceans which straggle out in the land. The largest backwater is the Vembanad Lake which stretches out into the Arabian Sea at Cochin Port. There are 49 river/lakes flowing in the state of Kerala among them 46 flows to the west and the other 3 flow to the east. They evolve from Western Ghats and rush towards the west into the Arabian Sea.
Soil and Vegetation
The state of Kerala with its wide array of topographical features such as coastlines along
the Arabian Sea, hills of the Western Ghats, valleys, abundant waterbodies ,is the reserve of
diverse types of soil such as red, ferruginous, sandy, black, peat and loamy soil. There are an
assortment of flora and other plantation crops which grow in these soils. The natural vegetation
of Kerala comprises 3,872 flowering plants including 900 plants of great medicinal value. The
forested regions with an area of 9,400 km² comprises tropical wet evergreen partly-evergreen
forests with thick undergrowth in the lower and mid altitudes, tropical damp and arid deciduous
forests in the middle altitudes plus mountainous subtropical and temperate (shola) forests in the
precipitous hills. Kerala basically thrives on agriculture. The main crops are paddy, coconut,
pepper, cashew, tapioca and plantation crops like rubber, tea and coffee and other cash crops
like spices, nutmeg, vanilla and cashew nut.
110
Land capability
Land is degraded when it suffers a loss of intrinsic qualities, decline in its capabilities or
loss in its productive capacity. Land degradation may be due to natural or human causes or it
may be due to combination of both. Considering the characteristics of soil, drainage/wetness,
erosion, runoff etc., Kerala has 18 land capability subclass associations of five broad land
capability (LC) classes (KSLUB, 1995 and 2002). The broad LC classes are Class II (Good
cultivable land), Class III (Moderately good cultivable land), Class IV (Fairly good cultivable
lands), Class VI (Well suited for forestry or grazing), and Class VIII (Land suited only for wildlife
and recreation). The approximate area under each class is given in Figure2. The soil of Kerala
has limitations for sustained use under irrigation. Only about 37% of the area of Kerala is
suitable for irrigation with certain limitations.
Land Use Pattern
Recently the land put under non – agricultural use has increased due to in developmental
activities like housing, transport system, irrigation etc.The total geographical area of the State is
3886287 Ha. And the area classified according to thirteen different type of uses of land during
2013-14 which is presented in the chart given below. The net are under cultivation during the
year 2013-14 was 20,50,994 Ha., which occupies 52.78% of the total area in the State. The
gross cropped area is 26,16,670 Ha.
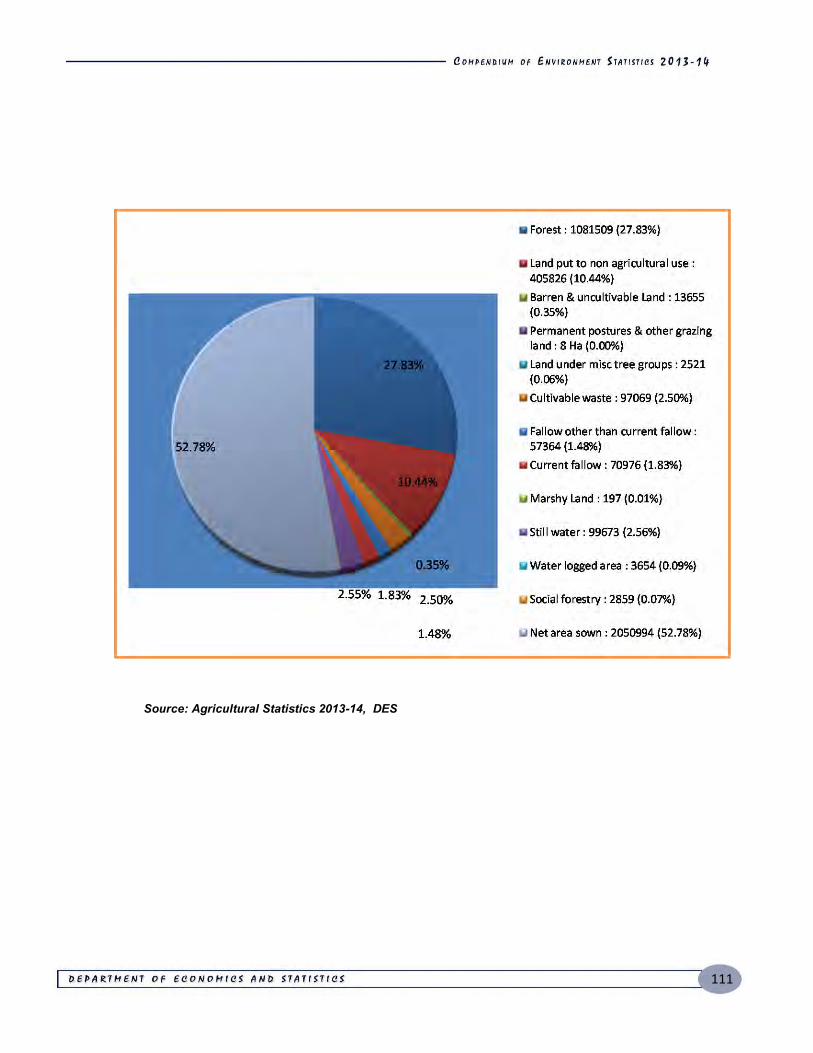
111
Source: Agricultural Statistics 2013-14, DES
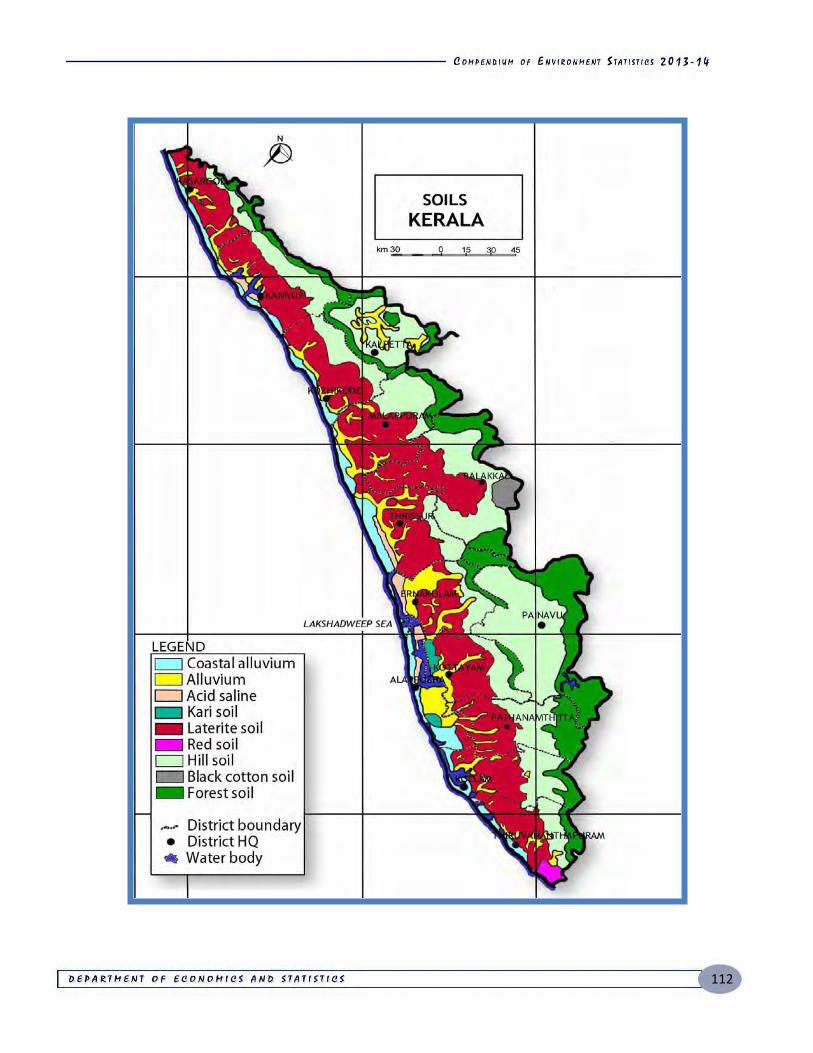
112
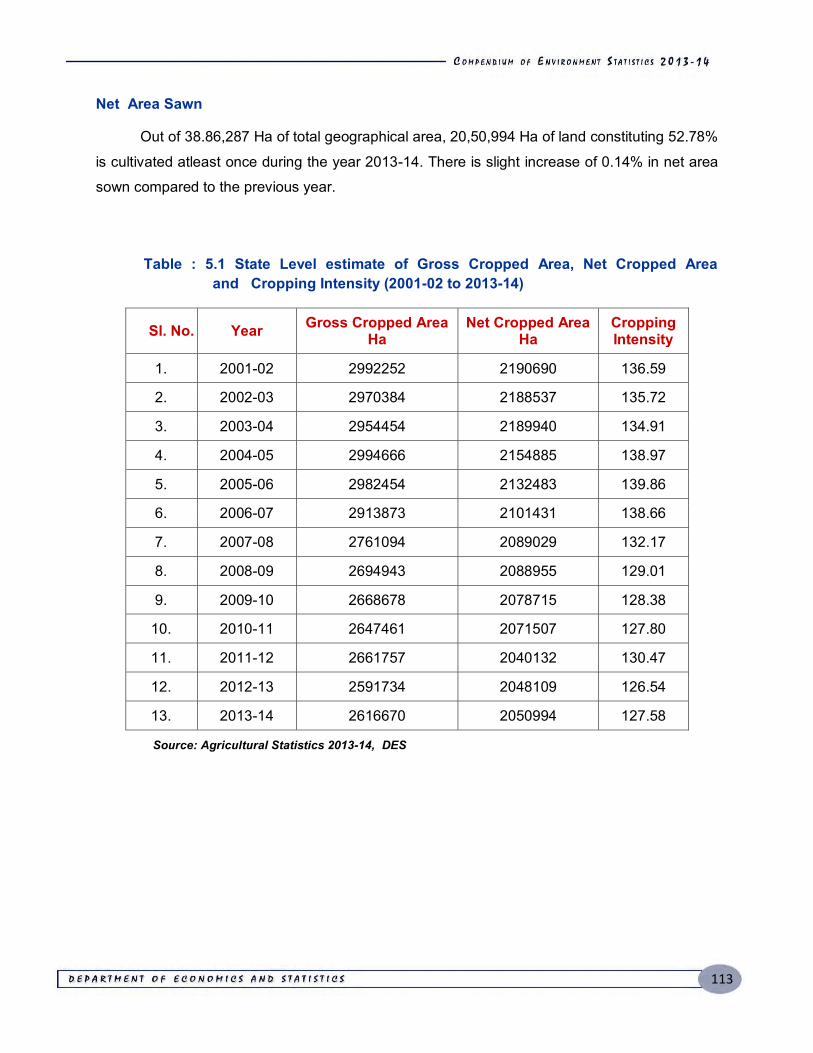
113
Net Area Sawn
Out of 38.86,287 Ha of total geographical area, 20,50,994 Ha of land constituting 52.78%
is cultivated atleast once during the year 2013-14. There is slight increase of 0.14% in net area
sown compared to the previous year.
Table : 5.1 State Level estimate of Gross Cropped Area, Net Cropped Area and Cropping Intensity (2001-02 to 2013-14)
Sl. No. Year Gross Cropped Area Ha
Net Cropped Area Ha
Cropping Intensity
1. 2001-02 2992252 2190690 136.59
2. 2002-03 2970384 2188537 135.72
3. 2003-04 2954454 2189940 134.91
4. 2004-05 2994666 2154885 138.97
5. 2005-06 2982454 2132483 139.86
6. 2006-07 2913873 2101431 138.66
7. 2007-08 2761094 2089029 132.17
8. 2008-09 2694943 2088955 129.01
9. 2009-10 2668678 2078715 128.38
10. 2010-11 2647461 2071507 127.80
11. 2011-12 2661757 2040132 130.47
12. 2012-13 2591734 2048109 126.54
13. 2013-14 2616670 2050994 127.58
Source: Agricultural Statistics 2013-14, DES
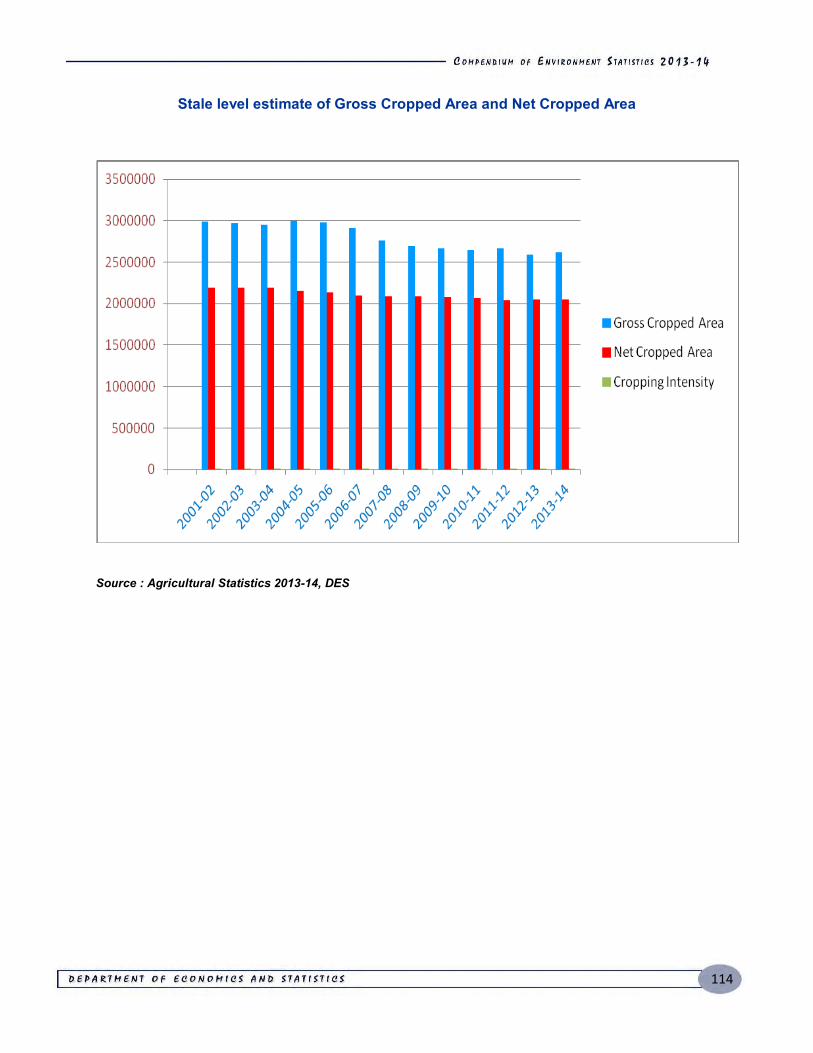
114
Stale level estimate of Gross Cropped Area and Net Cropped Area
Source : Agricultural Statistics 2013-14, DES
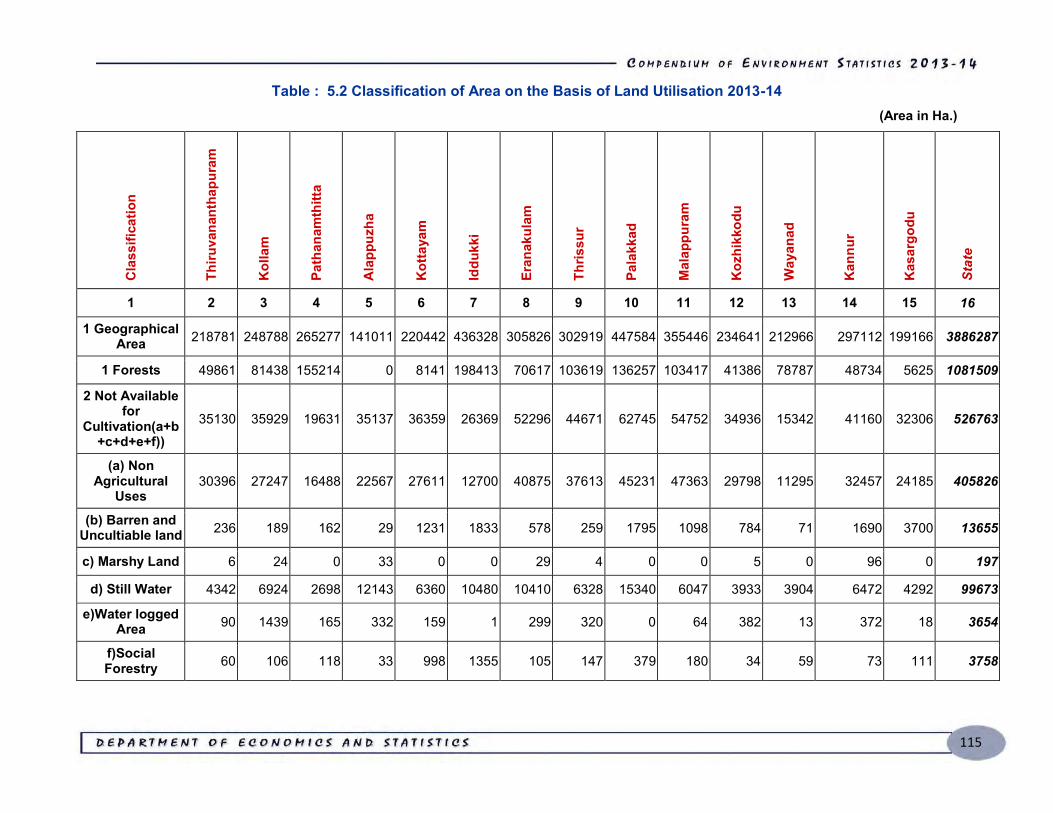
115
Table : 5.2 Classification of Area on the Basis of Land Utilisation 2013-14 (Area in Ha.)
Cla
ssifi
catio
n
Thiru
vana
ntha
pura
m
Kol
lam
Path
anam
thitt
a
Ala
ppuz
ha
Kot
taya
m
Iddu
kki
Eran
akul
am
Thris
sur
Pala
kkad
Mal
appu
ram
Koz
hikk
odu
Way
anad
Kan
nur
Kas
argo
du
Stat
e
1 2 3 4 5 6 7 8 9 10 11 12 13 14 15 16
1 Geographical Area 218781 248788 265277 141011 220442 436328 305826 302919 447584 355446 234641 212966 297112 199166 3886287
1 Forests 49861 81438 155214 0 8141 198413 70617 103619 136257 103417 41386 78787 48734 5625 1081509
2 Not Available for
Cultivation(a+b+c+d+e+f))
35130 35929 19631 35137 36359 26369 52296 44671 62745 54752 34936 15342 41160 32306 526763
(a) Non Agricultural
Uses 30396 27247 16488 22567 27611 12700 40875 37613 45231 47363 29798 11295 32457 24185 405826
(b) Barren and Uncultiable land 236 189 162 29 1231 1833 578 259 1795 1098 784 71 1690 3700 13655
c) Marshy Land 6 24 0 33 0 0 29 4 0 0 5 0 96 0 197
d) Still Water 4342 6924 2698 12143 6360 10480 10410 6328 15340 6047 3933 3904 6472 4292 99673
e)Water logged Area 90 1439 165 332 159 1 299 320 0 64 382 13 372 18 3654
f)Social Forestry 60 106 118 33 998 1355 105 147 379 180 34 59 73 111 3758
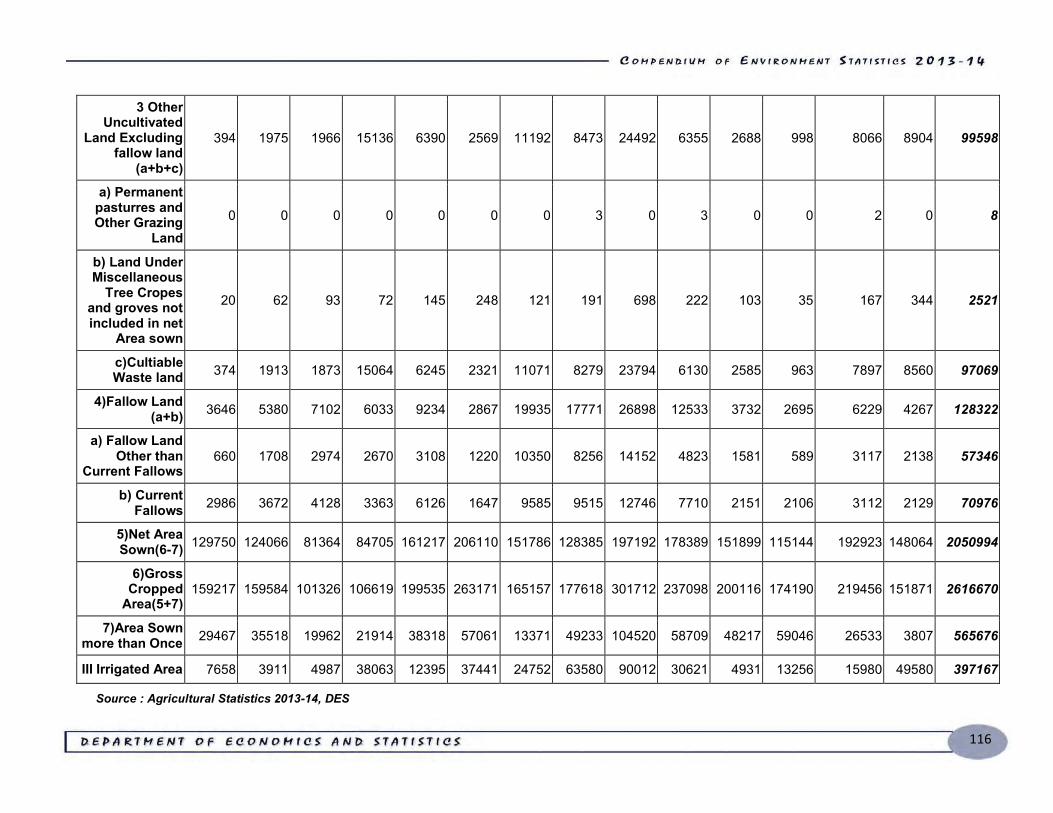
116
3 Other Uncultivated
Land Excluding fallow land
(a+b+c)
394 1975 1966 15136 6390 2569 11192 8473 24492 6355 2688 998 8066 8904 99598
a) Permanent pasturres and Other Grazing
Land 0 0 0 0 0 0 0 3 0 3 0 0 2 0 8
b) Land Under Miscellaneous
Tree Cropes and groves not included in net
Area sown
20 62 93 72 145 248 121 191 698 222 103 35 167 344 2521
c)Cultiable Waste land 374 1913 1873 15064 6245 2321 11071 8279 23794 6130 2585 963 7897 8560 97069
4)Fallow Land (a+b) 3646 5380 7102 6033 9234 2867 19935 17771 26898 12533 3732 2695 6229 4267 128322
a) Fallow Land Other than
Current Fallows 660 1708 2974 2670 3108 1220 10350 8256 14152 4823 1581 589 3117 2138 57346
b) Current Fallows 2986 3672 4128 3363 6126 1647 9585 9515 12746 7710 2151 2106 3112 2129 70976
5)Net Area Sown(6-7) 129750 124066 81364 84705 161217 206110 151786 128385 197192 178389 151899 115144 192923 148064 2050994
6)Gross Cropped
Area(5+7) 159217 159584 101326 106619 199535 263171 165157 177618 301712 237098 200116 174190 219456 151871 2616670
7)Area Sown more than Once 29467 35518 19962 21914 38318 57061 13371 49233 104520 58709 48217 59046 26533 3807 565676
III Irrigated Area 7658 3911 4987 38063 12395 37441 24752 63580 90012 30621 4931 13256 15980 49580 397167
Source : Agricultural Statistics 2013-14, DES
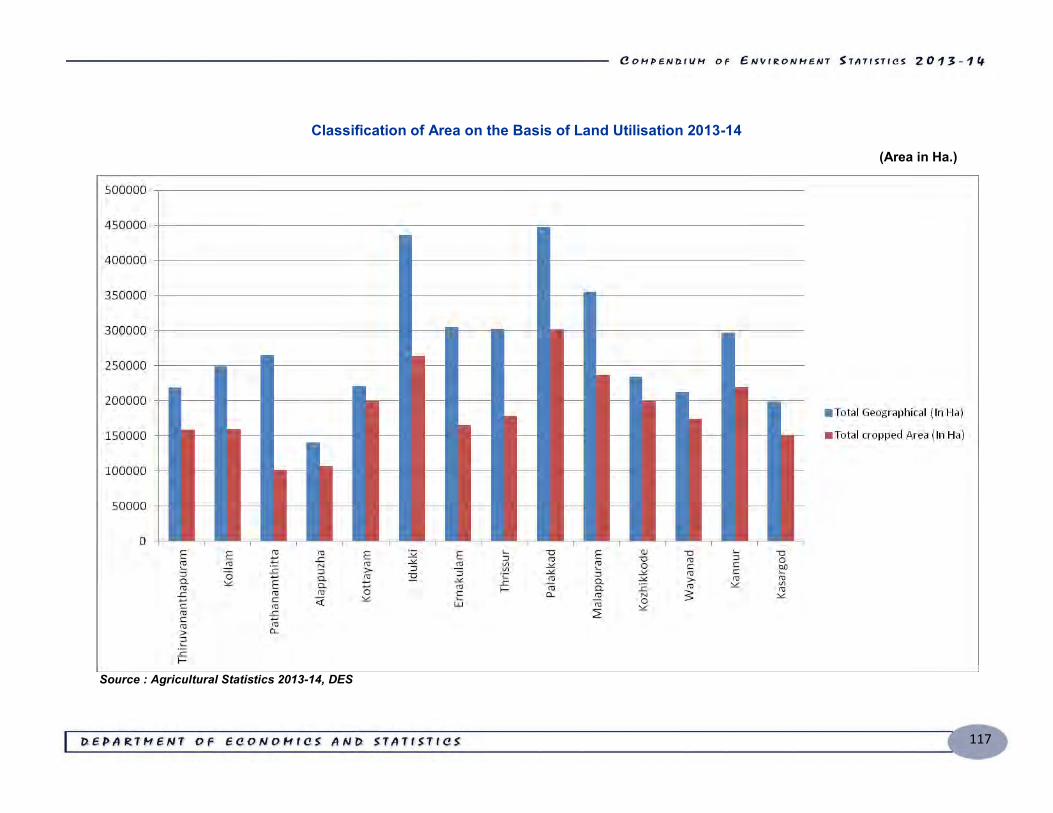
117
Classification of Area on the Basis of Land Utilisation 2013-14 (Area in Ha.)
Source : Agricultural Statistics 2013-14, DES
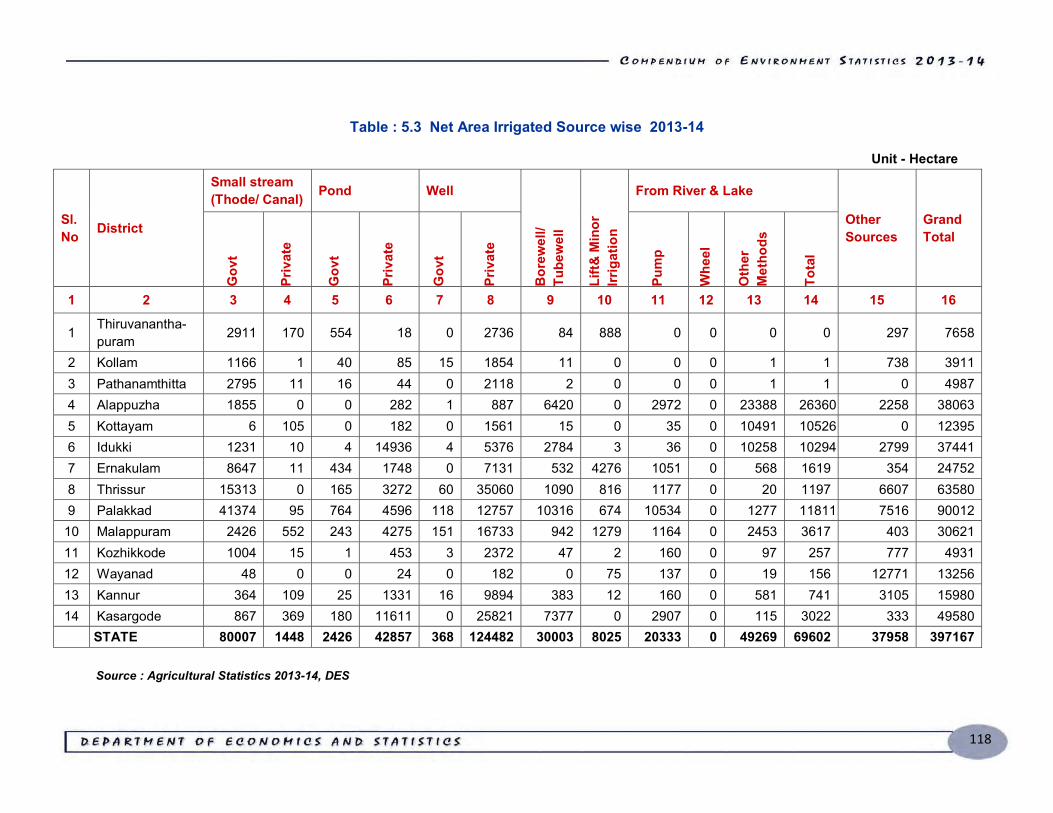
118
Table : 5.3 Net Area Irrigated Source wise 2013-14
Unit - Hectare
Sl. No District
Small stream (Thode/ Canal) Pond Well
Bor
ewel
l/ Tu
bew
ell
Lift&
Min
or
Irrig
atio
n
From River & Lake
Other Sources
Grand Total
Gov
t
Priv
ate
Gov
t
Priv
ate
Gov
t
Priv
ate
Pum
p
Whe
el
Oth
er
Met
hods
Tota
l
1 2 3 4 5 6 7 8 9 10 11 12 13 14 15 16
1 Thiruvanantha-puram 2911 170 554 18 0 2736 84 888 0 0 0 0 297 7658
2 Kollam 1166 1 40 85 15 1854 11 0 0 0 1 1 738 3911 3 Pathanamthitta 2795 11 16 44 0 2118 2 0 0 0 1 1 0 4987 4 Alappuzha 1855 0 0 282 1 887 6420 0 2972 0 23388 26360 2258 38063 5 Kottayam 6 105 0 182 0 1561 15 0 35 0 10491 10526 0 12395 6 Idukki 1231 10 4 14936 4 5376 2784 3 36 0 10258 10294 2799 37441 7 Ernakulam 8647 11 434 1748 0 7131 532 4276 1051 0 568 1619 354 24752 8 Thrissur 15313 0 165 3272 60 35060 1090 816 1177 0 20 1197 6607 63580 9 Palakkad 41374 95 764 4596 118 12757 10316 674 10534 0 1277 11811 7516 90012
10 Malappuram 2426 552 243 4275 151 16733 942 1279 1164 0 2453 3617 403 30621 11 Kozhikkode 1004 15 1 453 3 2372 47 2 160 0 97 257 777 4931 12 Wayanad 48 0 0 24 0 182 0 75 137 0 19 156 12771 13256 13 Kannur 364 109 25 1331 16 9894 383 12 160 0 581 741 3105 15980 14 Kasargode 867 369 180 11611 0 25821 7377 0 2907 0 115 3022 333 49580 STATE 80007 1448 2426 42857 368 124482 30003 8025 20333 0 49269 69602 37958 397167
Source : Agricultural Statistics 2013-14, DES
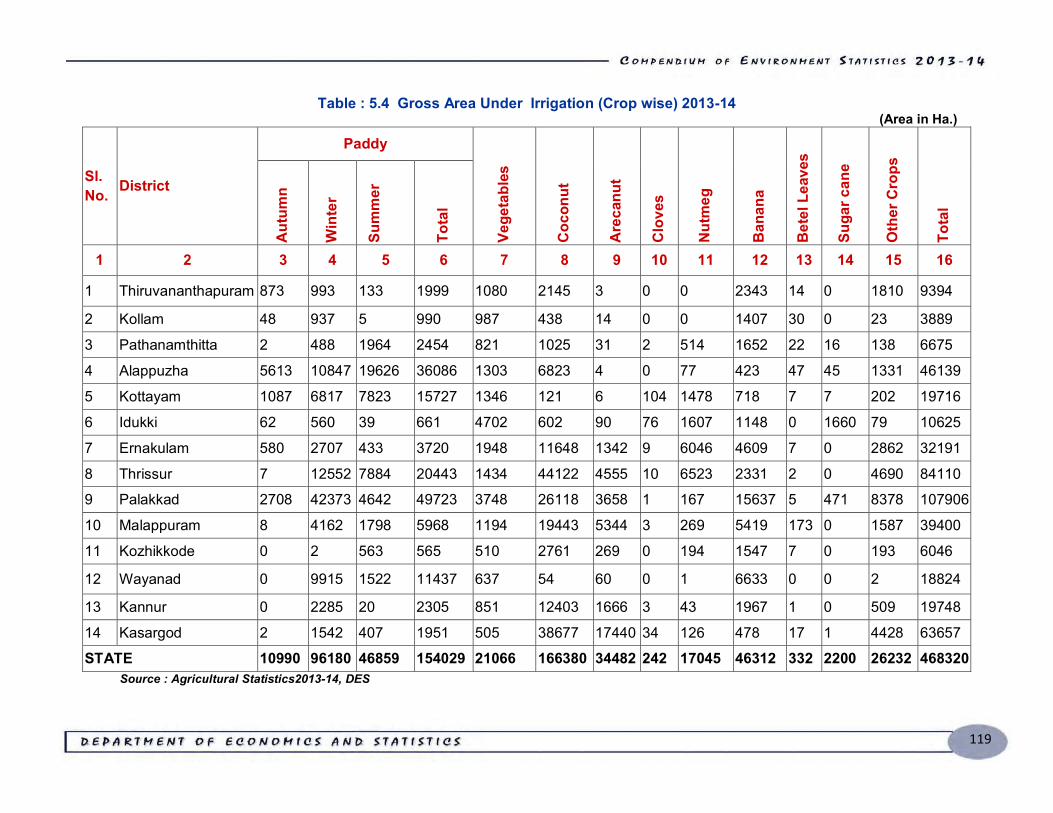
119
Table : 5.4 Gross Area Under Irrigation (Crop wise) 2013-14 (Area in Ha.)
Sl. No. District
Paddy
Vege
tabl
es
Coc
onut
Are
canu
t
Clo
ves
Nut
meg
Ban
ana
Bet
el L
eave
s
Suga
r can
e
Oth
er C
rops
Tota
l
Aut
umn
Win
ter
Sum
mer
To
tal
1 2 3 4 5 6 7 8 9 10 11 12 13 14 15 16
1 Thiruvananthapuram 873 993 133 1999 1080 2145 3 0 0 2343 14 0 1810 9394
2 Kollam 48 937 5 990 987 438 14 0 0 1407 30 0 23 3889
3 Pathanamthitta 2 488 1964 2454 821 1025 31 2 514 1652 22 16 138 6675
4 Alappuzha 5613 10847 19626 36086 1303 6823 4 0 77 423 47 45 1331 46139
5 Kottayam 1087 6817 7823 15727 1346 121 6 104 1478 718 7 7 202 19716
6 Idukki 62 560 39 661 4702 602 90 76 1607 1148 0 1660 79 10625
7 Ernakulam 580 2707 433 3720 1948 11648 1342 9 6046 4609 7 0 2862 32191
8 Thrissur 7 12552 7884 20443 1434 44122 4555 10 6523 2331 2 0 4690 84110
9 Palakkad 2708 42373 4642 49723 3748 26118 3658 1 167 15637 5 471 8378 107906
10 Malappuram 8 4162 1798 5968 1194 19443 5344 3 269 5419 173 0 1587 39400
11 Kozhikkode 0 2 563 565 510 2761 269 0 194 1547 7 0 193 6046
12 Wayanad 0 9915 1522 11437 637 54 60 0 1 6633 0 0 2 18824
13 Kannur 0 2285 20 2305 851 12403 1666 3 43 1967 1 0 509 19748
14 Kasargod 2 1542 407 1951 505 38677 17440 34 126 478 17 1 4428 63657
STATE 10990 96180 46859 154029 21066 166380 34482 242 17045 46312 332 2200 26232 468320 Source : Agricultural Statistics2013-14, DES
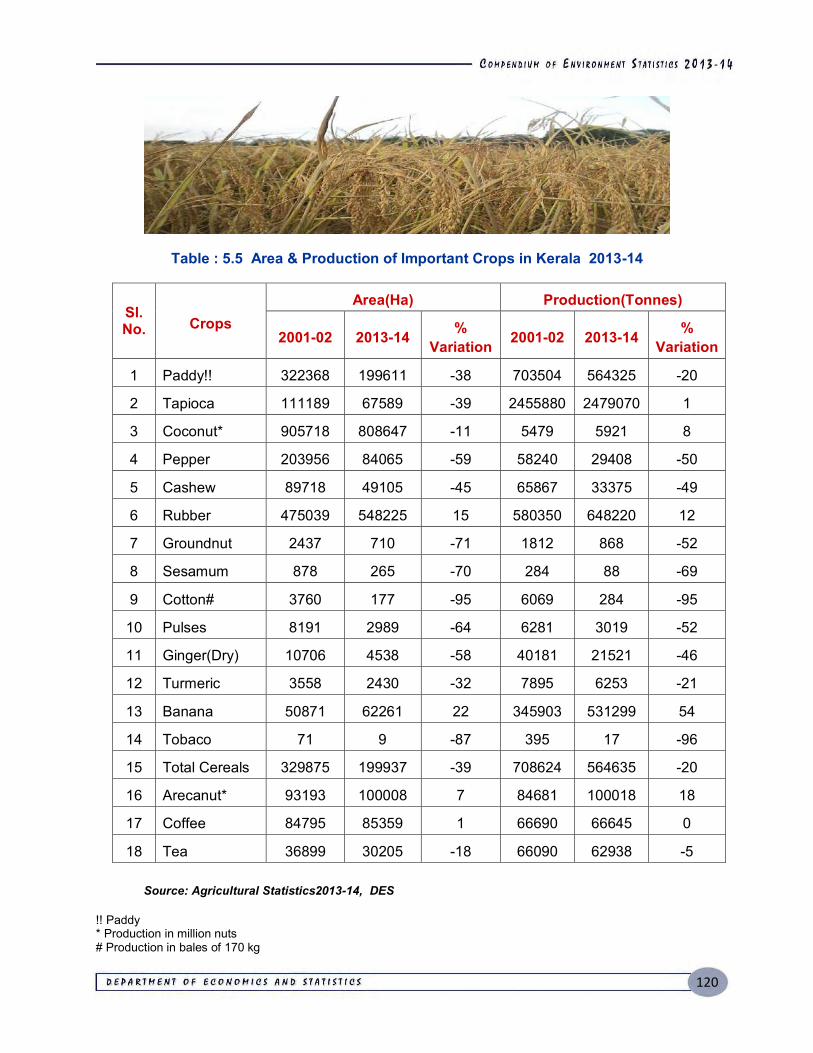
120
Table : 5.5 Area & Production of Important Crops in Kerala 2013-14
Sl. No. Crops
Area(Ha) Production(Tonnes)
2001-02 2013-14 % Variation 2001-02 2013-14 %
Variation
1 Paddy!! 322368 199611 -38 703504 564325 -20
2 Tapioca 111189 67589 -39 2455880 2479070 1
3 Coconut* 905718 808647 -11 5479 5921 8
4 Pepper 203956 84065 -59 58240 29408 -50
5 Cashew 89718 49105 -45 65867 33375 -49
6 Rubber 475039 548225 15 580350 648220 12
7 Groundnut 2437 710 -71 1812 868 -52
8 Sesamum 878 265 -70 284 88 -69
9 Cotton# 3760 177 -95 6069 284 -95
10 Pulses 8191 2989 -64 6281 3019 -52
11 Ginger(Dry) 10706 4538 -58 40181 21521 -46
12 Turmeric 3558 2430 -32 7895 6253 -21
13 Banana 50871 62261 22 345903 531299 54
14 Tobaco 71 9 -87 395 17 -96
15 Total Cereals 329875 199937 -39 708624 564635 -20
16 Arecanut* 93193 100008 7 84681 100018 18
17 Coffee 84795 85359 1 66690 66645 0
18 Tea 36899 30205 -18 66090 62938 -5 Source: Agricultural Statistics2013-14, DES
!! Paddy * Production in million nuts # Production in bales of 170 kg
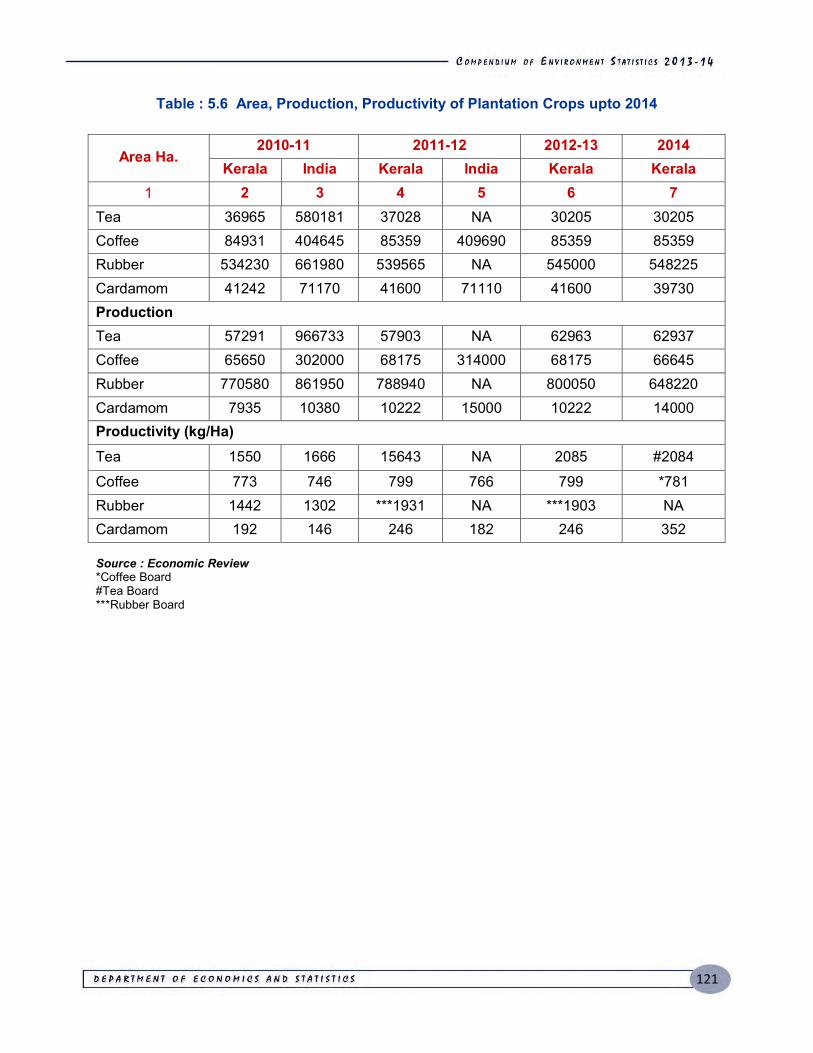
121
Table : 5.6 Area, Production, Productivity of Plantation Crops upto 2014
Area Ha. 2010-11 2011-12 2012-13 2014
Kerala India Kerala India Kerala Kerala 1 2 3 4 5 6 7
Tea 36965 580181 37028 NA 30205 30205 Coffee 84931 404645 85359 409690 85359 85359 Rubber 534230 661980 539565 NA 545000 548225 Cardamom 41242 71170 41600 71110 41600 39730 Production Tea 57291 966733 57903 NA 62963 62937 Coffee 65650 302000 68175 314000 68175 66645 Rubber 770580 861950 788940 NA 800050 648220 Cardamom 7935 10380 10222 15000 10222 14000 Productivity (kg/Ha) Tea 1550 1666 15643 NA 2085 #2084
Coffee 773 746 799 766 799 *781 Rubber 1442 1302 ***1931 NA ***1903 NA Cardamom 192 146 246 182 246 352 Source : Economic Review *Coffee Board #Tea Board ***Rubber Board

122
Table : 5.7 Chemical Fertilizers utilization in Kerala 2002-03 to 2013-14
Year Nitrogen Phosphorous Pottash Total
N:(P+K)% Kerala India
1 2 3 4 5 6 7
2002-03 29.18 13.53 26.19 68.90 86.00 73
2003-04 28.92 13.20 22.93 65.05 89.80 80
2004-05 29.87 14.14 24.2 68.21 98.34 78
2005-06 28.00 15.00 25.00 68.00 104.50 70
2006-07 31.00 16.00 43.00 89.00 113.26 53
2007-08 32.00 15.00 25.00 72.00 117.07 80
2008-09 38.00 19.00 32.00 89.00 NA 74
2009-10 39.00 20.00 32.00 91.00 NA 75
2010-11 40.00 24.00 33.00 97.00 NA 70
2011-12 44.00 22.00 32.00 98.00 NA 81
2012-13 52.00 16.00 26.00 94.00 NA 124
2013-14 53.00 27.00 45.00 125.00 NA 73 Source: Agricultural Department, CMIE
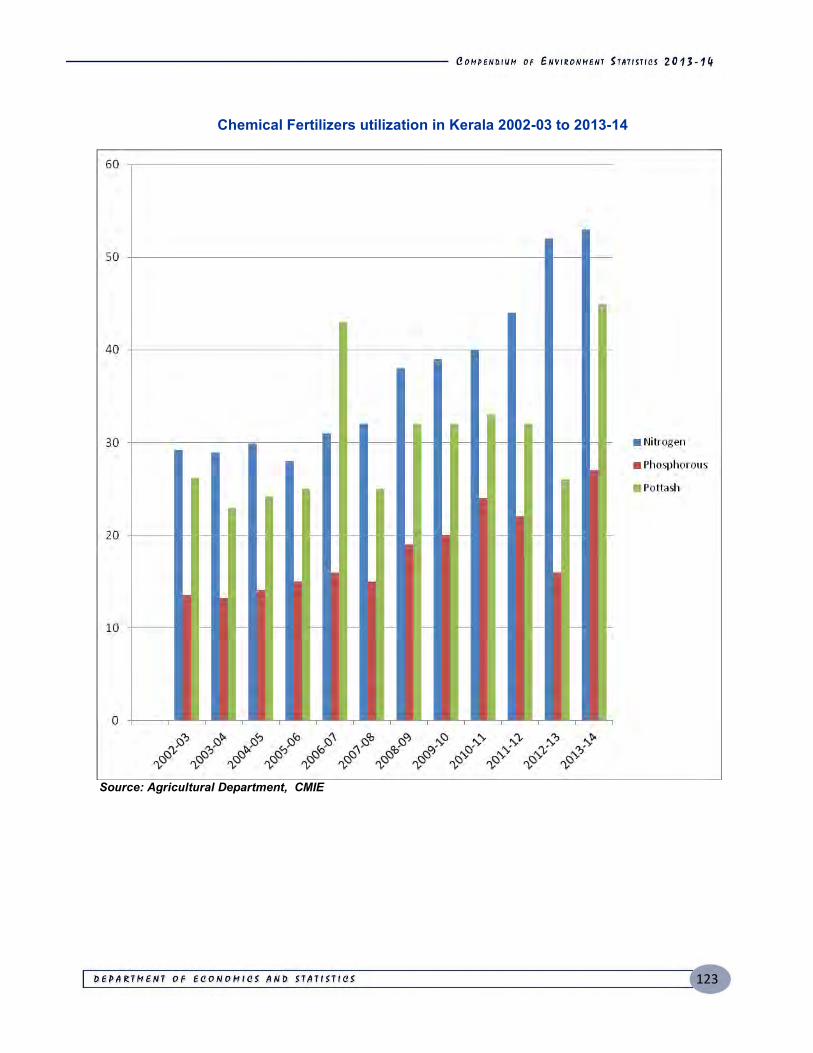
123
Chemical Fertilizers utilization in Kerala 2002-03 to 2013-14
Source: Agricultural Department, CMIE
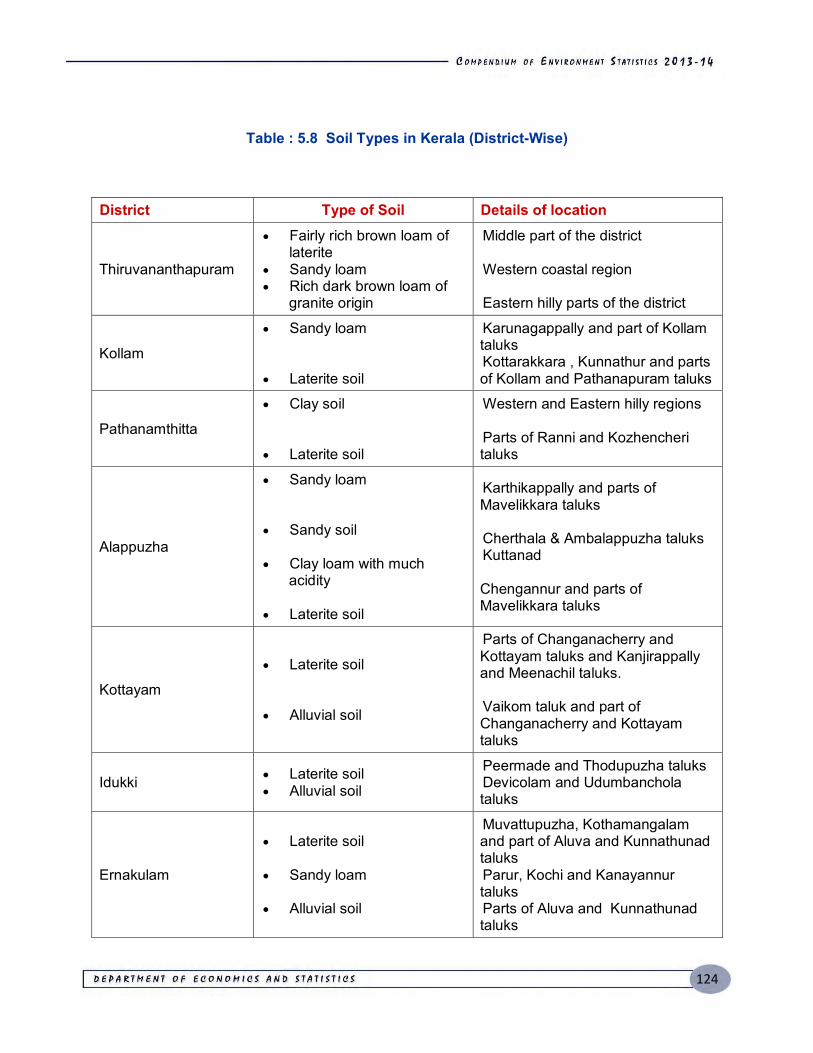
124
Table : 5.8 Soil Types in Kerala (District-Wise)
District Type of Soil Details of location
Thiruvananthapuram
Fairly rich brown loam of laterite Sandy loam Rich dark brown loam of granite origin
Middle part of the district Western coastal region Eastern hilly parts of the district
Kollam
Sandy loam Laterite soil
Karunagappally and part of Kollam taluks Kottarakkara , Kunnathur and parts of Kollam and Pathanapuram taluks
Pathanamthitta
Clay soil Laterite soil
Western and Eastern hilly regions Parts of Ranni and Kozhencheri taluks
Alappuzha
Sandy loam Sandy soil Clay loam with much acidity Laterite soil
Karthikappally and parts of Mavelikkara taluks Cherthala & Ambalappuzha taluks Kuttanad Chengannur and parts of Mavelikkara taluks
Kottayam
Laterite soil Alluvial soil
Parts of Changanacherry and Kottayam taluks and Kanjirappally and Meenachil taluks. Vaikom taluk and part of Changanacherry and Kottayam taluks
Idukki Laterite soil Alluvial soil
Peermade and Thodupuzha taluks Devicolam and Udumbanchola taluks
Ernakulam
Laterite soil Sandy loam Alluvial soil
Muvattupuzha, Kothamangalam and part of Aluva and Kunnathunad taluks Parur, Kochi and Kanayannur taluks Parts of Aluva and Kunnathunad taluks
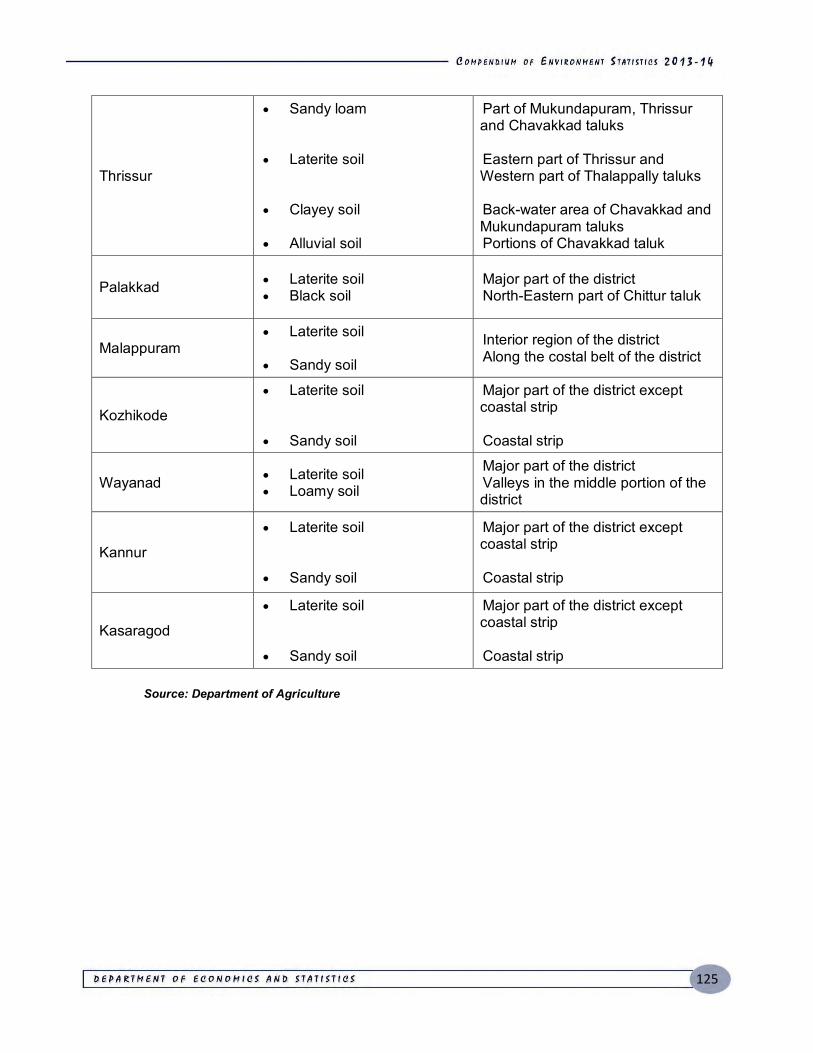
125
Thrissur
Sandy loam Laterite soil Clayey soil Alluvial soil
Part of Mukundapuram, Thrissur and Chavakkad taluks Eastern part of Thrissur and Western part of Thalappally taluks Back-water area of Chavakkad and Mukundapuram taluks Portions of Chavakkad taluk
Palakkad Laterite soil Black soil
Major part of the district North-Eastern part of Chittur taluk
Malappuram Laterite soil Sandy soil
Interior region of the district Along the costal belt of the district
Kozhikode
Laterite soil Sandy soil
Major part of the district except coastal strip Coastal strip
Wayanad Laterite soil Loamy soil
Major part of the district Valleys in the middle portion of the district
Kannur
Laterite soil Sandy soil
Major part of the district except coastal strip Coastal strip
Kasaragod
Laterite soil Sandy soil
Major part of the district except coastal strip Coastal strip
Source: Department of Agriculture
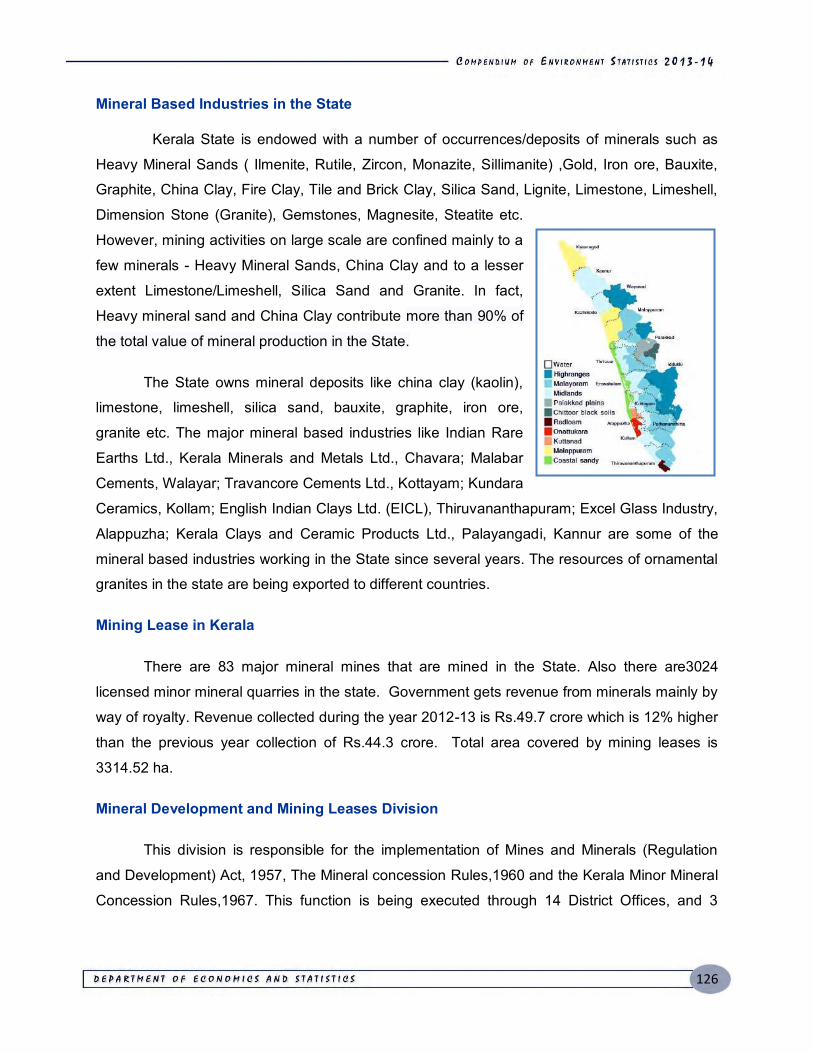
126
Mineral Based Industries in the State
Kerala State is endowed with a number of occurrences/deposits of minerals such as
Heavy Mineral Sands ( Ilmenite, Rutile, Zircon, Monazite, Sillimanite) ,Gold, Iron ore, Bauxite,
Graphite, China Clay, Fire Clay, Tile and Brick Clay, Silica Sand, Lignite, Limestone, Limeshell,
Dimension Stone (Granite), Gemstones, Magnesite, Steatite etc.
However, mining activities on large scale are confined mainly to a
few minerals - Heavy Mineral Sands, China Clay and to a lesser
extent Limestone/Limeshell, Silica Sand and Granite. In fact,
Heavy mineral sand and China Clay contribute more than 90% of
the total value of mineral production in the State.
The State owns mineral deposits like china clay (kaolin),
limestone, limeshell, silica sand, bauxite, graphite, iron ore,
granite etc. The major mineral based industries like Indian Rare
Earths Ltd., Kerala Minerals and Metals Ltd., Chavara; Malabar
Cements, Walayar; Travancore Cements Ltd., Kottayam; Kundara
Ceramics, Kollam; English Indian Clays Ltd. (EICL), Thiruvananthapuram; Excel Glass Industry,
Alappuzha; Kerala Clays and Ceramic Products Ltd., Palayangadi, Kannur are some of the
mineral based industries working in the State since several years. The resources of ornamental
granites in the state are being exported to different countries.
Mining Lease in Kerala
There are 83 major mineral mines that are mined in the State. Also there are3024
licensed minor mineral quarries in the state. Government gets revenue from minerals mainly by
way of royalty. Revenue collected during the year 2012-13 is Rs.49.7 crore which is 12% higher
than the previous year collection of Rs.44.3 crore. Total area covered by mining leases is
3314.52 ha.
Mineral Development and Mining Leases Division
This division is responsible for the implementation of Mines and Minerals (Regulation
and Development) Act, 1957, The Mineral concession Rules,1960 and the Kerala Minor Mineral
Concession Rules,1967. This function is being executed through 14 District Offices, and 3
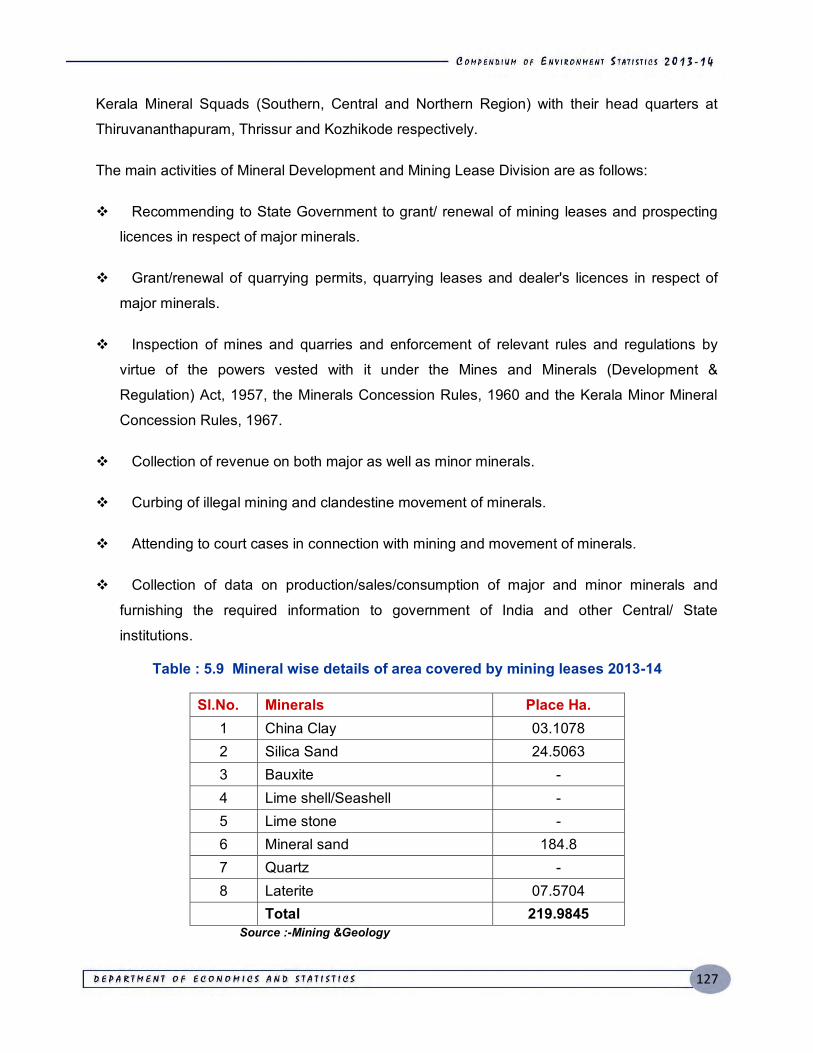
127
Kerala Mineral Squads (Southern, Central and Northern Region) with their head quarters at
Thiruvananthapuram, Thrissur and Kozhikode respectively.
The main activities of Mineral Development and Mining Lease Division are as follows:
Recommending to State Government to grant/ renewal of mining leases and prospecting
licences in respect of major minerals.
Grant/renewal of quarrying permits, quarrying leases and dealer's licences in respect of
major minerals.
Inspection of mines and quarries and enforcement of relevant rules and regulations by
virtue of the powers vested with it under the Mines and Minerals (Development &
Regulation) Act, 1957, the Minerals Concession Rules, 1960 and the Kerala Minor Mineral
Concession Rules, 1967.
Collection of revenue on both major as well as minor minerals.
Curbing of illegal mining and clandestine movement of minerals.
Attending to court cases in connection with mining and movement of minerals.
Collection of data on production/sales/consumption of major and minor minerals and
furnishing the required information to government of India and other Central/ State
institutions.
Table : 5.9 Mineral wise details of area covered by mining leases 2013-14
Sl.No. Minerals Place Ha. 1 China Clay 03.1078 2 Silica Sand 24.5063 3 Bauxite - 4 Lime shell/Seashell - 5 Lime stone - 6 Mineral sand 184.8 7 Quartz - 8 Laterite 07.5704
Total 219.9845 Source :-Mining &Geology
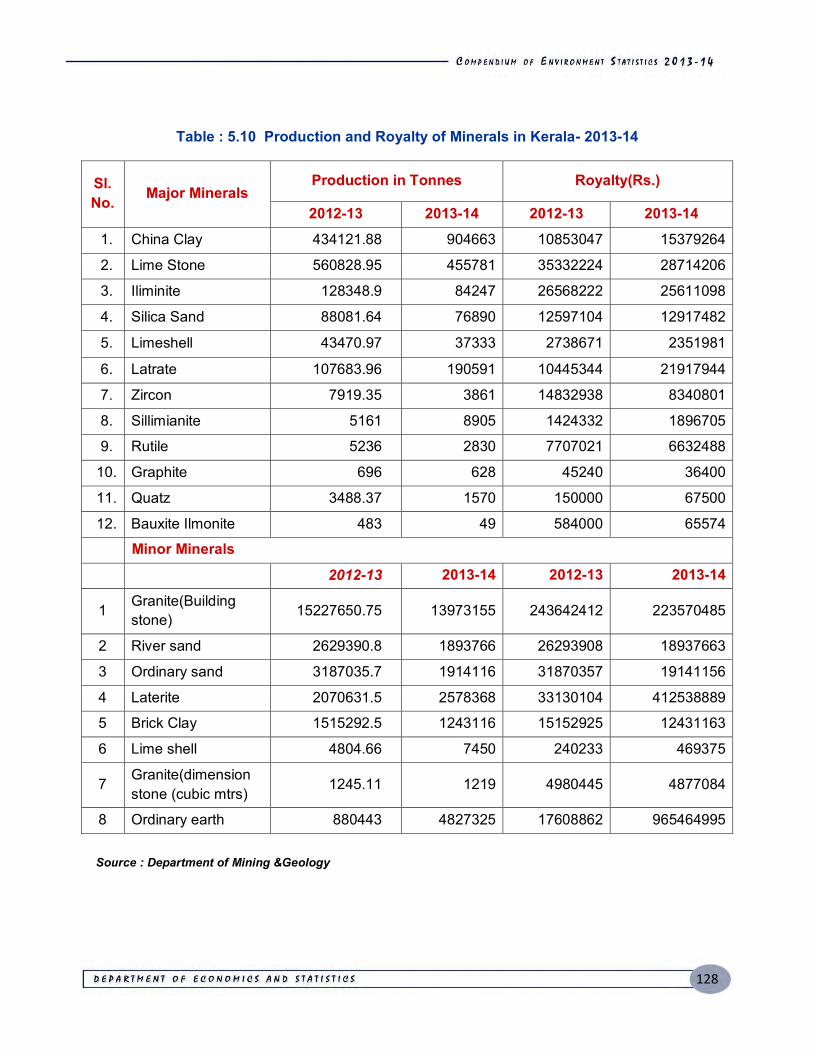
128
Table : 5.10 Production and Royalty of Minerals in Kerala- 2013-14
Sl.No. Major Minerals
Production in Tonnes Royalty(Rs.)
2012-13 2013-14 2012-13 2013-14 1. China Clay 434121.88 904663 10853047 15379264
2. Lime Stone 560828.95 455781 35332224 28714206
3. Iliminite 128348.9 84247 26568222 25611098
4. Silica Sand 88081.64 76890 12597104 12917482
5. Limeshell 43470.97 37333 2738671 2351981
6. Latrate 107683.96 190591 10445344 21917944
7. Zircon 7919.35 3861 14832938 8340801
8. Sillimianite 5161 8905 1424332 1896705
9. Rutile 5236 2830 7707021 6632488
10. Graphite 696 628 45240 36400
11. Quatz 3488.37 1570 150000 67500
12. Bauxite Ilmonite 483 49 584000 65574
Minor Minerals 2012-13 2013-14 2012-13 2013-14
1 Granite(Building stone) 15227650.75 13973155 243642412 223570485
2 River sand 2629390.8 1893766 26293908 18937663
3 Ordinary sand 3187035.7 1914116 31870357 19141156
4 Laterite 2070631.5 2578368 33130104 412538889
5 Brick Clay 1515292.5 1243116 15152925 12431163
6 Lime shell 4804.66 7450 240233 469375
7 Granite(dimension stone (cubic mtrs) 1245.11 1219 4980445 4877084
8 Ordinary earth 880443 4827325 17608862 965464995
Source : Department of Mining &Geology
129
Individual Mineral Deposits Mineral Sand
The Heavy Mineral Sand deposits in Kerala contain an assemblage of Ilmenite, Rutile,
Leucoxene, Monazite, Zircon and Sillimanite. The State possesses one of the world class
deposits of mineral sands in the coastal tracts between Neendakara and Kayamkulam. This,
commonly known as the Chavara deposit, after the main locality, covers a total length of 22 km
and a width of about 8 km in the northern side and 6 km in the southern side. The Chavara
barrier beach portion contains concentration of heavy minerals above 60%. The Chavara
deposit is estimated to contain 127 million tonnes of heavy minerals with ilmenite content of 80
million tonnes from the total reserve of raw sand of the order of 1400 million tonnes. In the
northern portion beyond Kayamkulam Pozhi extending up to Thottappally in Alappuzha district,
the total reserve of heavy minerals estimated to the order of 17 million tonnes with ilmenite
content of 9 million tonnes from the raw sand of 242 million tonnes.
Chavara barrier beach with a width of 225 m is divided into 8 blocks numbered I to VIII
for separating ilmenite for the manufacture of TiO2. The blocks are apportioned between Kerala
Minerals and Metals Ltd. (KMML),a State Government undertaking and Indian Rare Earths Ltd.
(IRE), a Government of India enterprise under the Department of Atomic Energy. Apart from
the Chavara heavy mineral deposits a number of heavy mineral placers have been delineated in
different parts of the State.
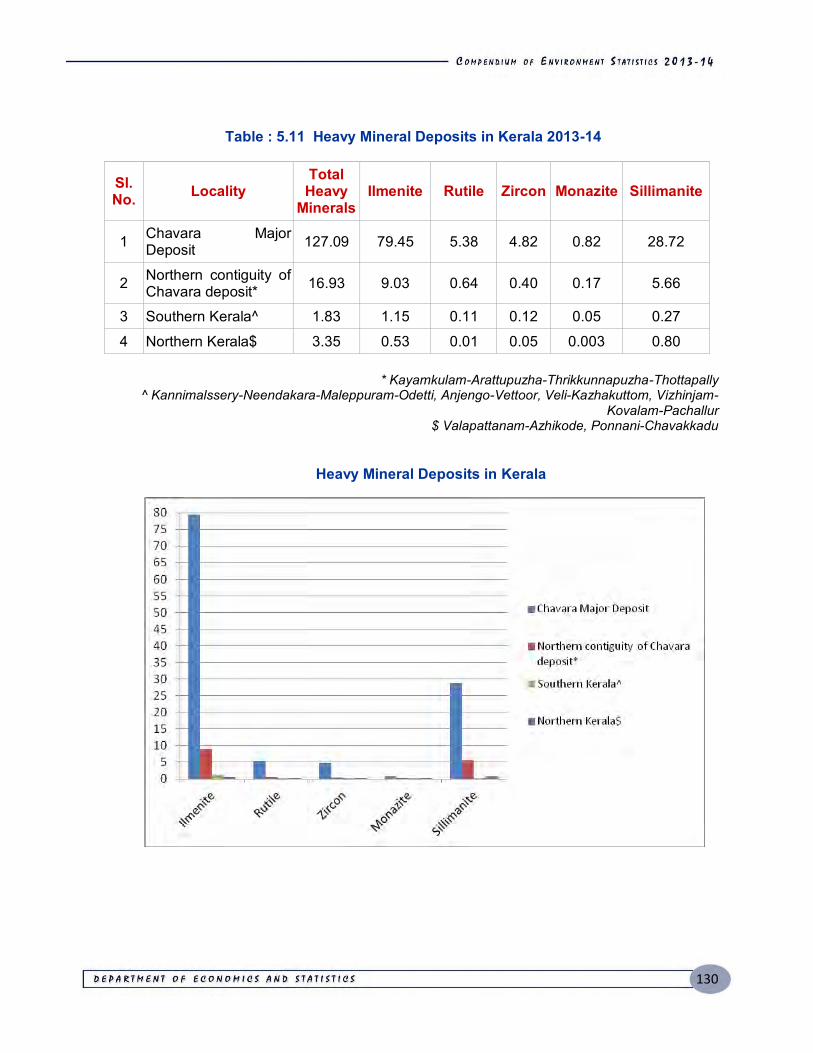
130
Table : 5.11 Heavy Mineral Deposits in Kerala 2013-14
Sl. No. Locality
Total Heavy
Minerals Ilmenite Rutile Zircon Monazite Sillimanite
1 Chavara Major Deposit 127.09 79.45 5.38 4.82 0.82 28.72
2 Northern contiguity of Chavara deposit* 16.93 9.03 0.64 0.40 0.17 5.66
3 Southern Kerala^ 1.83 1.15 0.11 0.12 0.05 0.27
4 Northern Kerala$ 3.35 0.53 0.01 0.05 0.003 0.80
* Kayamkulam-Arattupuzha-Thrikkunnapuzha-Thottapally ^ Kannimalssery-Neendakara-Maleppuram-Odetti, Anjengo-Vettoor, Veli-Kazhakuttom, Vizhinjam-
Kovalam-Pachallur $ Valapattanam-Azhikode, Ponnani-Chavakkadu
Heavy Mineral Deposits in Kerala
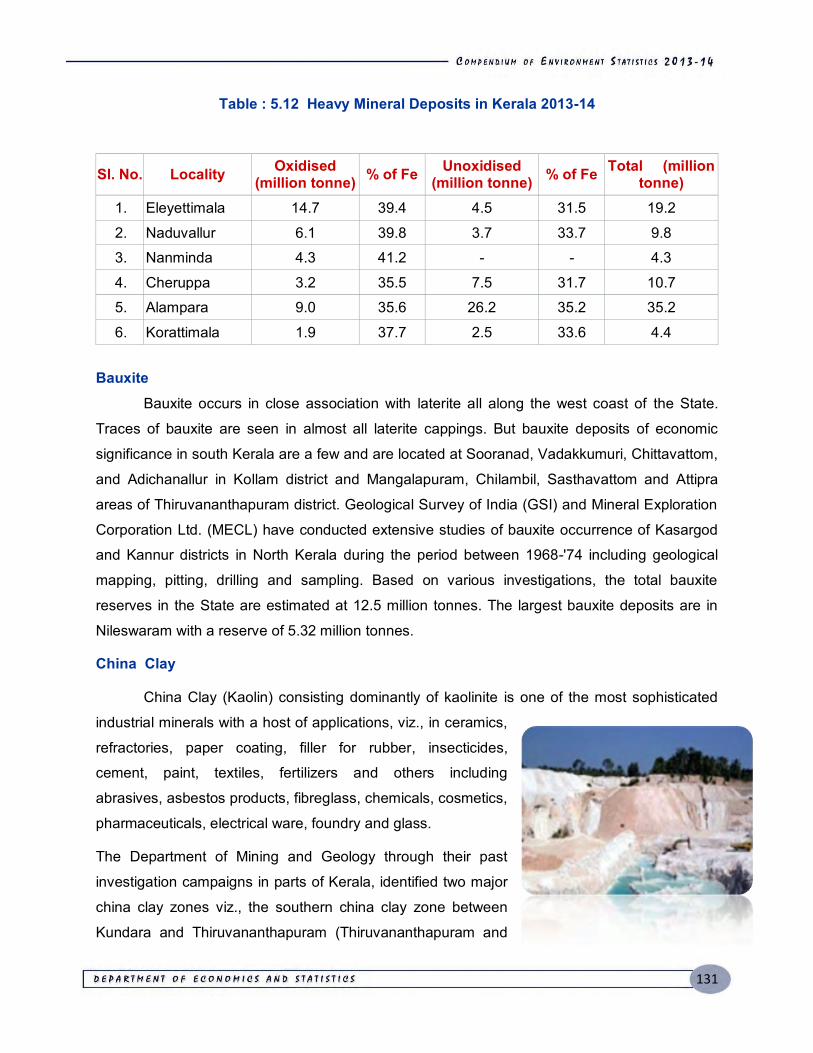
131
Table : 5.12 Heavy Mineral Deposits in Kerala 2013-14
Sl. No. Locality Oxidised (million tonne) % of Fe Unoxidised
(million tonne) % of Fe Total (million tonne)
1. Eleyettimala 14.7 39.4 4.5 31.5 19.2
2. Naduvallur 6.1 39.8 3.7 33.7 9.8 3. Nanminda 4.3 41.2 - - 4.3
4. Cheruppa 3.2 35.5 7.5 31.7 10.7 5. Alampara 9.0 35.6 26.2 35.2 35.2
6. Korattimala 1.9 37.7 2.5 33.6 4.4 Bauxite
Bauxite occurs in close association with laterite all along the west coast of the State.
Traces of bauxite are seen in almost all laterite cappings. But bauxite deposits of economic
significance in south Kerala are a few and are located at Sooranad, Vadakkumuri, Chittavattom,
and Adichanallur in Kollam district and Mangalapuram, Chilambil, Sasthavattom and Attipra
areas of Thiruvananthapuram district. Geological Survey of India (GSI) and Mineral Exploration
Corporation Ltd. (MECL) have conducted extensive studies of bauxite occurrence of Kasargod
and Kannur districts in North Kerala during the period between 1968-'74 including geological
mapping, pitting, drilling and sampling. Based on various investigations, the total bauxite
reserves in the State are estimated at 12.5 million tonnes. The largest bauxite deposits are in
Nileswaram with a reserve of 5.32 million tonnes.
China Clay
China Clay (Kaolin) consisting dominantly of kaolinite is one of the most sophisticated
industrial minerals with a host of applications, viz., in ceramics,
refractories, paper coating, filler for rubber, insecticides,
cement, paint, textiles, fertilizers and others including
abrasives, asbestos products, fibreglass, chemicals, cosmetics,
pharmaceuticals, electrical ware, foundry and glass.
The Department of Mining and Geology through their past
investigation campaigns in parts of Kerala, identified two major
china clay zones viz., the southern china clay zone between
Kundara and Thiruvananthapuram (Thiruvananthapuram and
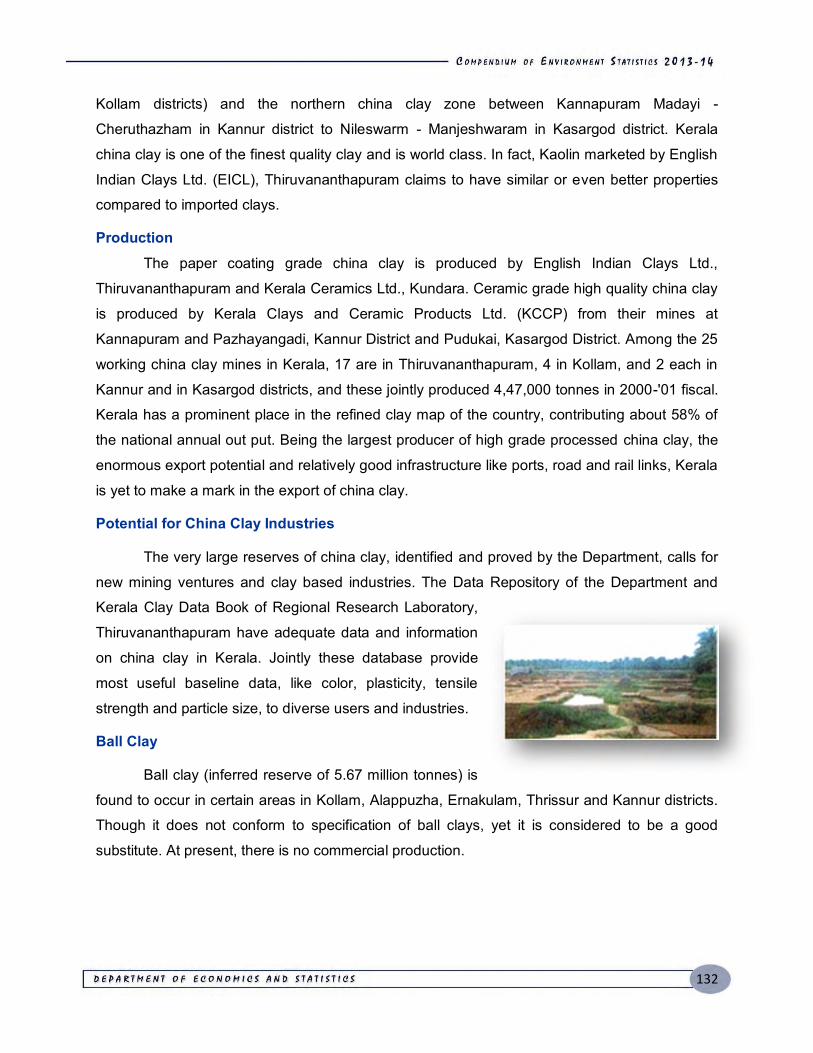
132
Kollam districts) and the northern china clay zone between Kannapuram Madayi -
Cheruthazham in Kannur district to Nileswarm - Manjeshwaram in Kasargod district. Kerala
china clay is one of the finest quality clay and is world class. In fact, Kaolin marketed by English
Indian Clays Ltd. (EICL), Thiruvananthapuram claims to have similar or even better properties
compared to imported clays.
Production
The paper coating grade china clay is produced by English Indian Clays Ltd.,
Thiruvananthapuram and Kerala Ceramics Ltd., Kundara. Ceramic grade high quality china clay
is produced by Kerala Clays and Ceramic Products Ltd. (KCCP) from their mines at
Kannapuram and Pazhayangadi, Kannur District and Pudukai, Kasargod District. Among the 25
working china clay mines in Kerala, 17 are in Thiruvananthapuram, 4 in Kollam, and 2 each in
Kannur and in Kasargod districts, and these jointly produced 4,47,000 tonnes in 2000-'01 fiscal.
Kerala has a prominent place in the refined clay map of the country, contributing about 58% of
the national annual out put. Being the largest producer of high grade processed china clay, the
enormous export potential and relatively good infrastructure like ports, road and rail links, Kerala
is yet to make a mark in the export of china clay.
Potential for China Clay Industries
The very large reserves of china clay, identified and proved by the Department, calls for
new mining ventures and clay based industries. The Data Repository of the Department and
Kerala Clay Data Book of Regional Research Laboratory,
Thiruvananthapuram have adequate data and information
on china clay in Kerala. Jointly these database provide
most useful baseline data, like color, plasticity, tensile
strength and particle size, to diverse users and industries.
Ball Clay
Ball clay (inferred reserve of 5.67 million tonnes) is
found to occur in certain areas in Kollam, Alappuzha, Ernakulam, Thrissur and Kannur districts.
Though it does not conform to specification of ball clays, yet it is considered to be a good
substitute. At present, there is no commercial production.
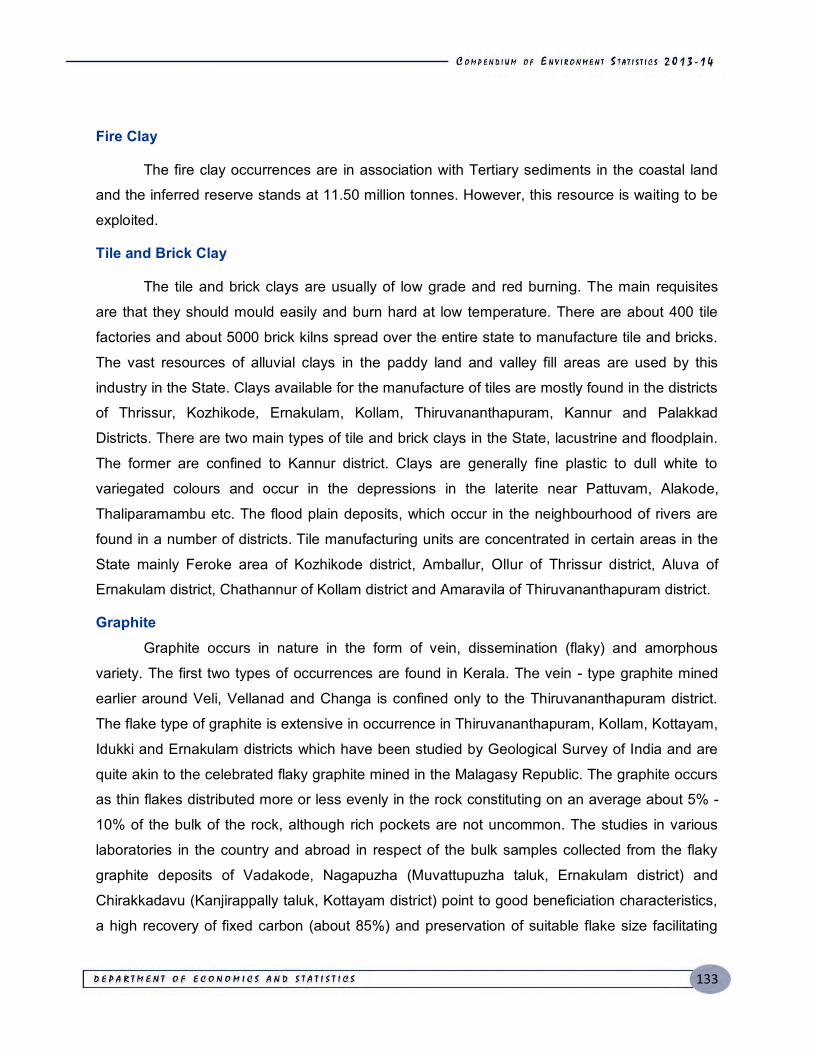
133
Fire Clay
The fire clay occurrences are in association with Tertiary sediments in the coastal land
and the inferred reserve stands at 11.50 million tonnes. However, this resource is waiting to be
exploited.
Tile and Brick Clay
The tile and brick clays are usually of low grade and red burning. The main requisites
are that they should mould easily and burn hard at low temperature. There are about 400 tile
factories and about 5000 brick kilns spread over the entire state to manufacture tile and bricks.
The vast resources of alluvial clays in the paddy land and valley fill areas are used by this
industry in the State. Clays available for the manufacture of tiles are mostly found in the districts
of Thrissur, Kozhikode, Ernakulam, Kollam, Thiruvananthapuram, Kannur and Palakkad
Districts. There are two main types of tile and brick clays in the State, lacustrine and floodplain.
The former are confined to Kannur district. Clays are generally fine plastic to dull white to
variegated colours and occur in the depressions in the laterite near Pattuvam, Alakode,
Thaliparamambu etc. The flood plain deposits, which occur in the neighbourhood of rivers are
found in a number of districts. Tile manufacturing units are concentrated in certain areas in the
State mainly Feroke area of Kozhikode district, Amballur, Ollur of Thrissur district, Aluva of
Ernakulam district, Chathannur of Kollam district and Amaravila of Thiruvananthapuram district.
Graphite
Graphite occurs in nature in the form of vein, dissemination (flaky) and amorphous
variety. The first two types of occurrences are found in Kerala. The vein - type graphite mined
earlier around Veli, Vellanad and Changa is confined only to the Thiruvananthapuram district.
The flake type of graphite is extensive in occurrence in Thiruvananthapuram, Kollam, Kottayam,
Idukki and Ernakulam districts which have been studied by Geological Survey of India and are
quite akin to the celebrated flaky graphite mined in the Malagasy Republic. The graphite occurs
as thin flakes distributed more or less evenly in the rock constituting on an average about 5% -
10% of the bulk of the rock, although rich pockets are not uncommon. The studies in various
laboratories in the country and abroad in respect of the bulk samples collected from the flaky
graphite deposits of Vadakode, Nagapuzha (Muvattupuzha taluk, Ernakulam district) and
Chirakkadavu (Kanjirappally taluk, Kottayam district) point to good beneficiation characteristics,
a high recovery of fixed carbon (about 85%) and preservation of suitable flake size facilitating
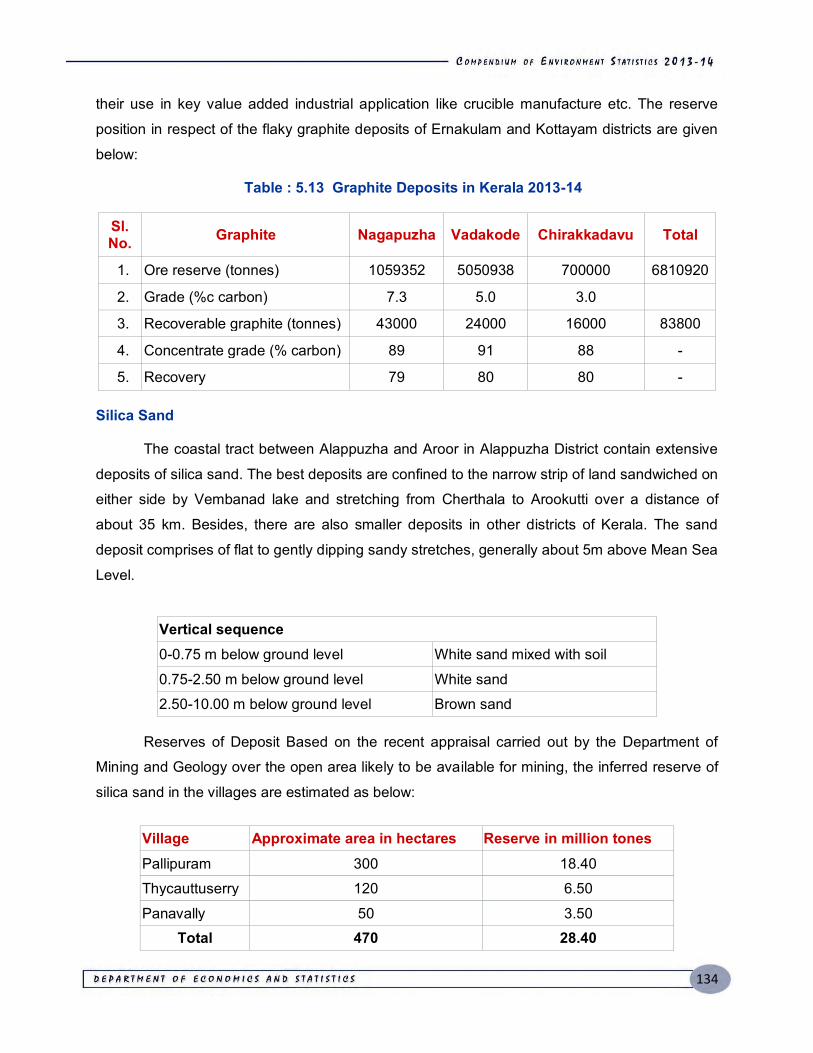
134
their use in key value added industrial application like crucible manufacture etc. The reserve
position in respect of the flaky graphite deposits of Ernakulam and Kottayam districts are given
below:
Table : 5.13 Graphite Deposits in Kerala 2013-14
Sl. No. Graphite Nagapuzha Vadakode Chirakkadavu Total
1. Ore reserve (tonnes) 1059352 5050938 700000 6810920
2. Grade (%c carbon) 7.3 5.0 3.0 3. Recoverable graphite (tonnes) 43000 24000 16000 83800
4. Concentrate grade (% carbon) 89 91 88 -
5. Recovery 79 80 80 - Silica Sand
The coastal tract between Alappuzha and Aroor in Alappuzha District contain extensive
deposits of silica sand. The best deposits are confined to the narrow strip of land sandwiched on
either side by Vembanad lake and stretching from Cherthala to Arookutti over a distance of
about 35 km. Besides, there are also smaller deposits in other districts of Kerala. The sand
deposit comprises of flat to gently dipping sandy stretches, generally about 5m above Mean Sea
Level.
Vertical sequence
0-0.75 m below ground level White sand mixed with soil
0.75-2.50 m below ground level White sand 2.50-10.00 m below ground level Brown sand
Reserves of Deposit Based on the recent appraisal carried out by the Department of
Mining and Geology over the open area likely to be available for mining, the inferred reserve of
silica sand in the villages are estimated as below:
Village Approximate area in hectares Reserve in million tones Pallipuram 300 18.40 Thycauttuserry 120 6.50
Panavally 50 3.50 Total 470 28.40
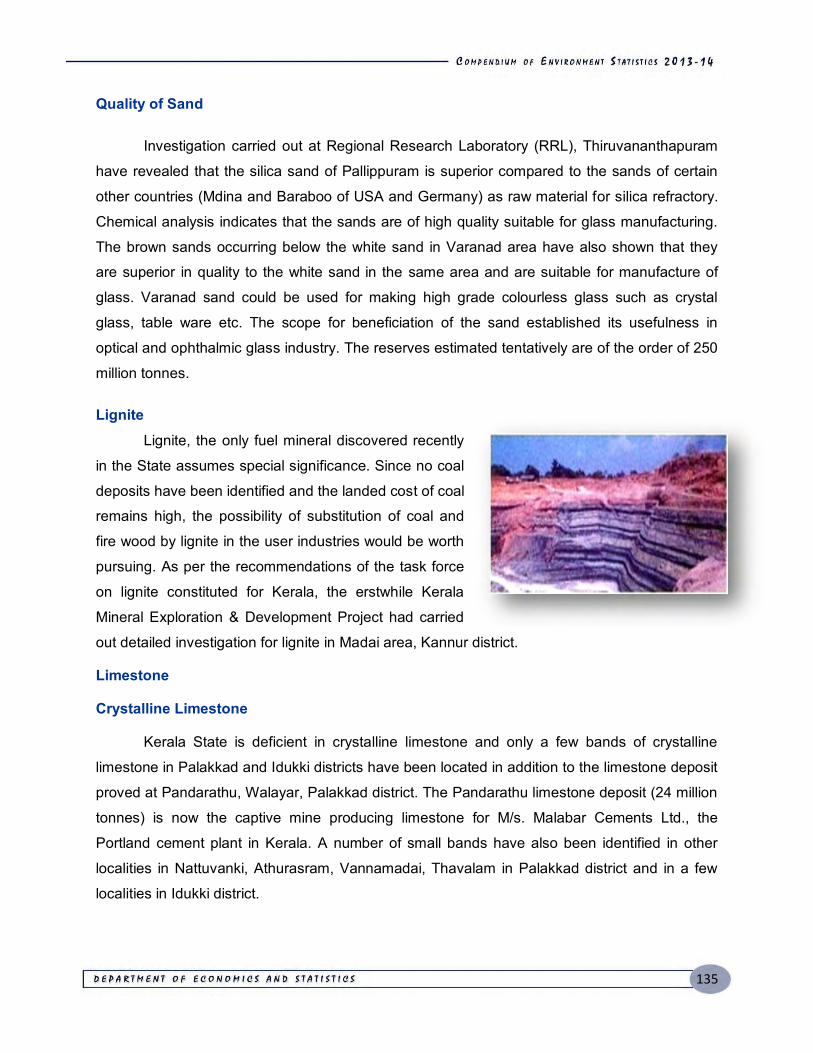
135
Quality of Sand
Investigation carried out at Regional Research Laboratory (RRL), Thiruvananthapuram
have revealed that the silica sand of Pallippuram is superior compared to the sands of certain
other countries (Mdina and Baraboo of USA and Germany) as raw material for silica refractory.
Chemical analysis indicates that the sands are of high quality suitable for glass manufacturing.
The brown sands occurring below the white sand in Varanad area have also shown that they
are superior in quality to the white sand in the same area and are suitable for manufacture of
glass. Varanad sand could be used for making high grade colourless glass such as crystal
glass, table ware etc. The scope for beneficiation of the sand established its usefulness in
optical and ophthalmic glass industry. The reserves estimated tentatively are of the order of 250
million tonnes.
Lignite
Lignite, the only fuel mineral discovered recently
in the State assumes special significance. Since no coal
deposits have been identified and the landed cost of coal
remains high, the possibility of substitution of coal and
fire wood by lignite in the user industries would be worth
pursuing. As per the recommendations of the task force
on lignite constituted for Kerala, the erstwhile Kerala
Mineral Exploration & Development Project had carried
out detailed investigation for lignite in Madai area, Kannur district.
Limestone
Crystalline Limestone
Kerala State is deficient in crystalline limestone and only a few bands of crystalline
limestone in Palakkad and Idukki districts have been located in addition to the limestone deposit
proved at Pandarathu, Walayar, Palakkad district. The Pandarathu limestone deposit (24 million
tonnes) is now the captive mine producing limestone for M/s. Malabar Cements Ltd., the
Portland cement plant in Kerala. A number of small bands have also been identified in other
localities in Nattuvanki, Athurasram, Vannamadai, Thavalam in Palakkad district and in a few
localities in Idukki district.
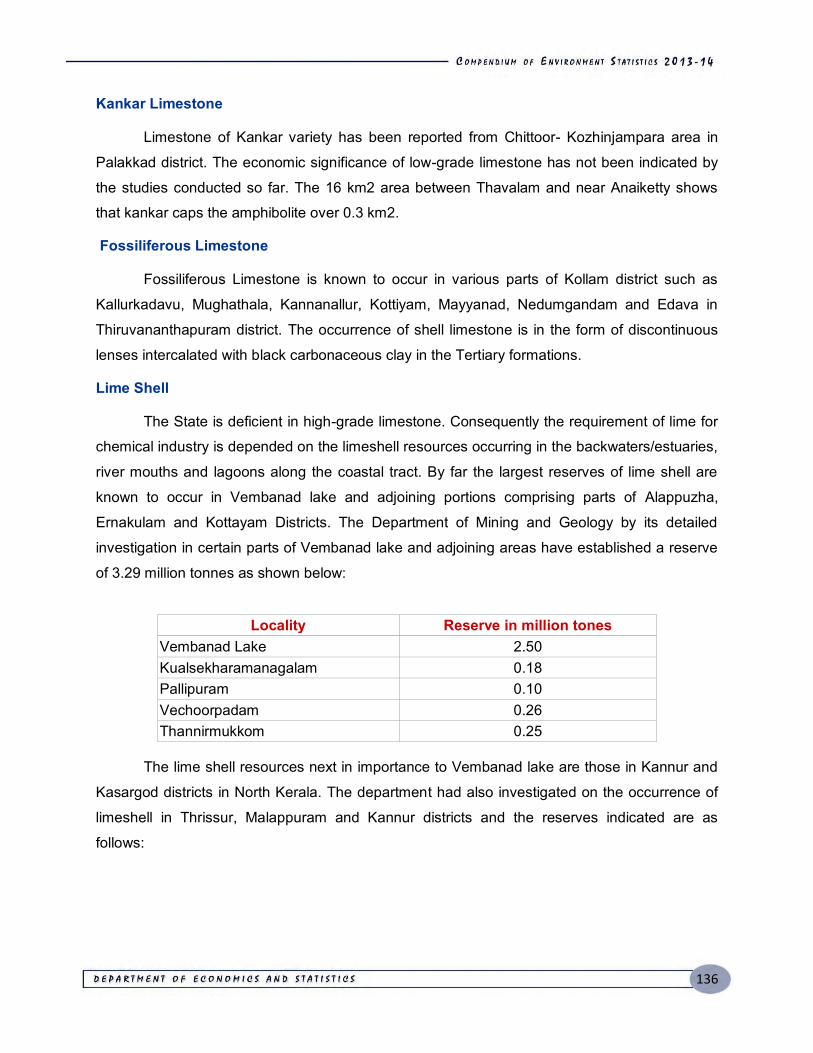
136
Kankar Limestone
Limestone of Kankar variety has been reported from Chittoor- Kozhinjampara area in
Palakkad district. The economic significance of low-grade limestone has not been indicated by
the studies conducted so far. The 16 km2 area between Thavalam and near Anaiketty shows
that kankar caps the amphibolite over 0.3 km2.
Fossiliferous Limestone
Fossiliferous Limestone is known to occur in various parts of Kollam district such as
Kallurkadavu, Mughathala, Kannanallur, Kottiyam, Mayyanad, Nedumgandam and Edava in
Thiruvananthapuram district. The occurrence of shell limestone is in the form of discontinuous
lenses intercalated with black carbonaceous clay in the Tertiary formations.
Lime Shell
The State is deficient in high-grade limestone. Consequently the requirement of lime for
chemical industry is depended on the limeshell resources occurring in the backwaters/estuaries,
river mouths and lagoons along the coastal tract. By far the largest reserves of lime shell are
known to occur in Vembanad lake and adjoining portions comprising parts of Alappuzha,
Ernakulam and Kottayam Districts. The Department of Mining and Geology by its detailed
investigation in certain parts of Vembanad lake and adjoining areas have established a reserve
of 3.29 million tonnes as shown below:
Locality Reserve in million tones
Vembanad Lake 2.50 Kualsekharamanagalam 0.18 Pallipuram 0.10 Vechoorpadam 0.26 Thannirmukkom 0.25
The lime shell resources next in importance to Vembanad lake are those in Kannur and
Kasargod districts in North Kerala. The department had also investigated on the occurrence of
limeshell in Thrissur, Malappuram and Kannur districts and the reserves indicated are as
follows:
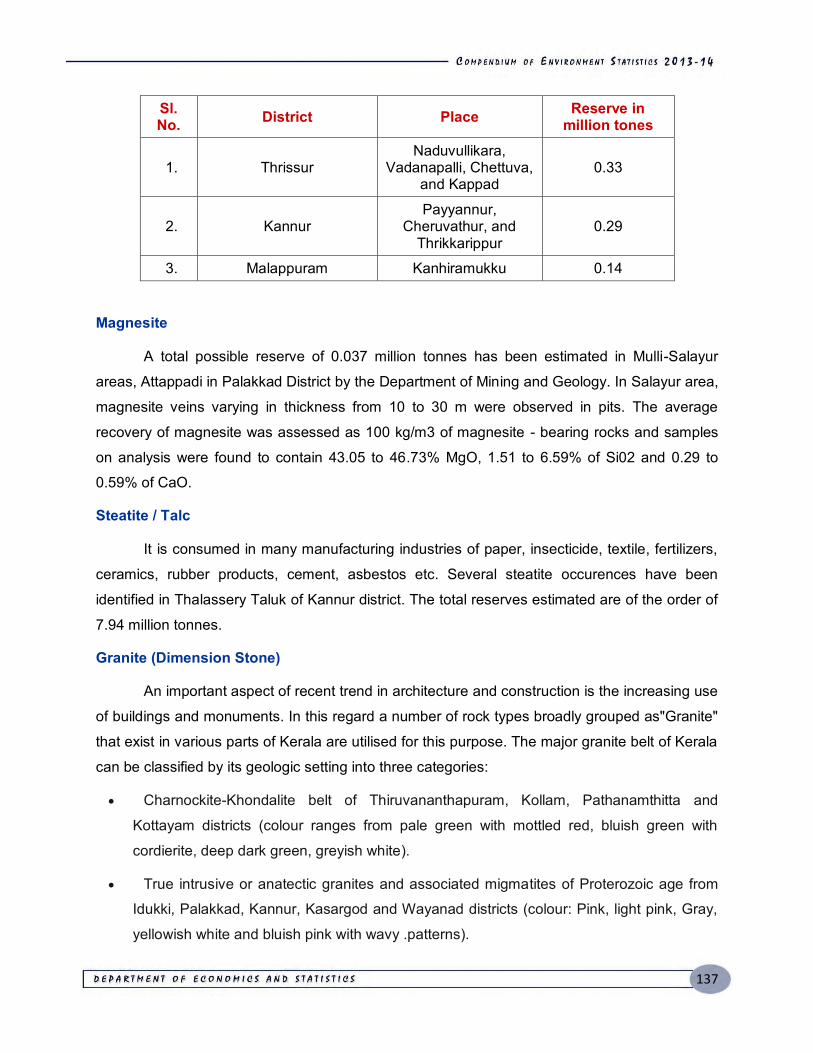
137
Sl. No. District Place Reserve in
million tones
1. Thrissur Naduvullikara,
Vadanapalli, Chettuva, and Kappad
0.33
2. Kannur Payyannur,
Cheruvathur, and Thrikkarippur
0.29
3. Malappuram Kanhiramukku 0.14 Magnesite
A total possible reserve of 0.037 million tonnes has been estimated in Mulli-Salayur
areas, Attappadi in Palakkad District by the Department of Mining and Geology. In Salayur area,
magnesite veins varying in thickness from 10 to 30 m were observed in pits. The average
recovery of magnesite was assessed as 100 kg/m3 of magnesite - bearing rocks and samples
on analysis were found to contain 43.05 to 46.73% MgO, 1.51 to 6.59% of Si02 and 0.29 to
0.59% of CaO.
Steatite / Talc
It is consumed in many manufacturing industries of paper, insecticide, textile, fertilizers,
ceramics, rubber products, cement, asbestos etc. Several steatite occurences have been
identified in Thalassery Taluk of Kannur district. The total reserves estimated are of the order of
7.94 million tonnes.
Granite (Dimension Stone)
An important aspect of recent trend in architecture and construction is the increasing use
of buildings and monuments. In this regard a number of rock types broadly grouped as"Granite"
that exist in various parts of Kerala are utilised for this purpose. The major granite belt of Kerala
can be classified by its geologic setting into three categories:
Charnockite-Khondalite belt of Thiruvananthapuram, Kollam, Pathanamthitta and
Kottayam districts (colour ranges from pale green with mottled red, bluish green with
cordierite, deep dark green, greyish white).
True intrusive or anatectic granites and associated migmatites of Proterozoic age from
Idukki, Palakkad, Kannur, Kasargod and Wayanad districts (colour: Pink, light pink, Gray,
yellowish white and bluish pink with wavy .patterns).
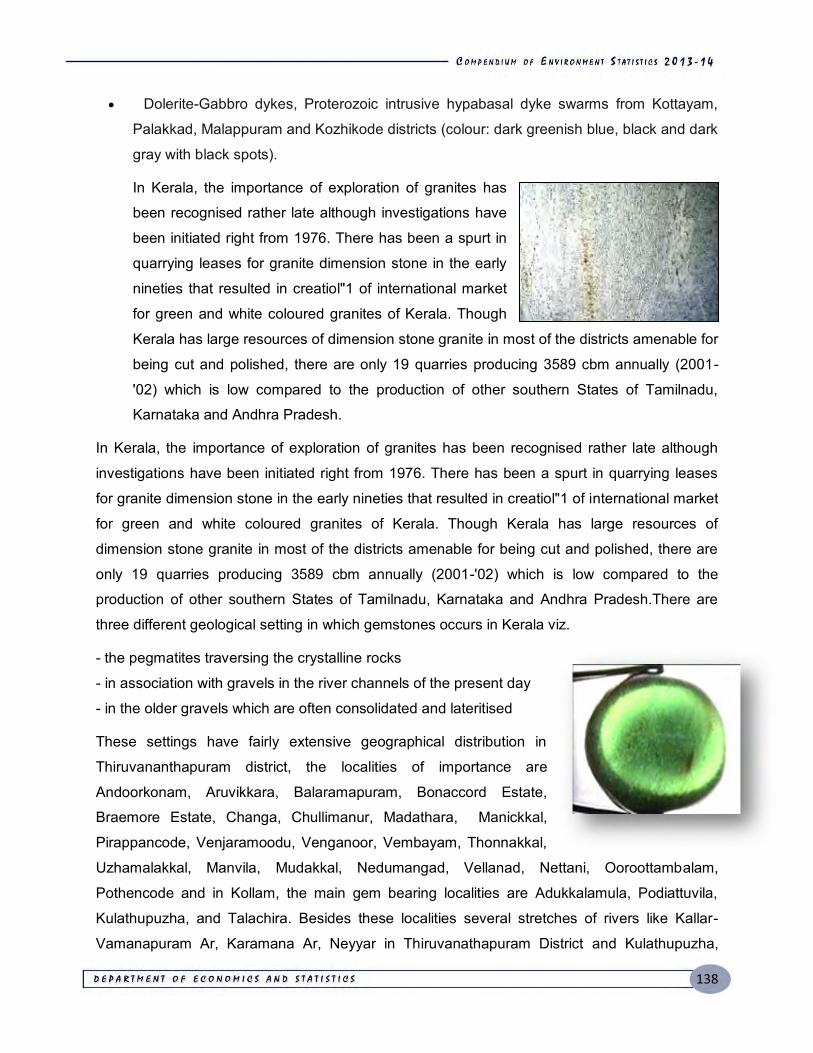
138
Dolerite-Gabbro dykes, Proterozoic intrusive hypabasal dyke swarms from Kottayam,
Palakkad, Malappuram and Kozhikode districts (colour: dark greenish blue, black and dark
gray with black spots).
In Kerala, the importance of exploration of granites has
been recognised rather late although investigations have
been initiated right from 1976. There has been a spurt in
quarrying leases for granite dimension stone in the early
nineties that resulted in creatiol"1 of international market
for green and white coloured granites of Kerala. Though
Kerala has large resources of dimension stone granite in most of the districts amenable for
being cut and polished, there are only 19 quarries producing 3589 cbm annually (2001-
'02) which is low compared to the production of other southern States of Tamilnadu,
Karnataka and Andhra Pradesh.
In Kerala, the importance of exploration of granites has been recognised rather late although
investigations have been initiated right from 1976. There has been a spurt in quarrying leases
for granite dimension stone in the early nineties that resulted in creatiol"1 of international market
for green and white coloured granites of Kerala. Though Kerala has large resources of
dimension stone granite in most of the districts amenable for being cut and polished, there are
only 19 quarries producing 3589 cbm annually (2001-'02) which is low compared to the
production of other southern States of Tamilnadu, Karnataka and Andhra Pradesh.There are
three different geological setting in which gemstones occurs in Kerala viz.
- the pegmatites traversing the crystalline rocks
- in association with gravels in the river channels of the present day
- in the older gravels which are often consolidated and lateritised
These settings have fairly extensive geographical distribution in
Thiruvananthapuram district, the localities of importance are
Andoorkonam, Aruvikkara, Balaramapuram, Bonaccord Estate,
Braemore Estate, Changa, Chullimanur, Madathara, Manickkal,
Pirappancode, Venjaramoodu, Venganoor, Vembayam, Thonnakkal,
Uzhamalakkal, Manvila, Mudakkal, Nedumangad, Vellanad, Nettani, Ooroottambalam,
Pothencode and in Kollam, the main gem bearing localities are Adukkalamula, Podiattuvila,
Kulathupuzha, and Talachira. Besides these localities several stretches of rivers like Kallar-
Vamanapuram Ar, Karamana Ar, Neyyar in Thiruvanathapuram District and Kulathupuzha,
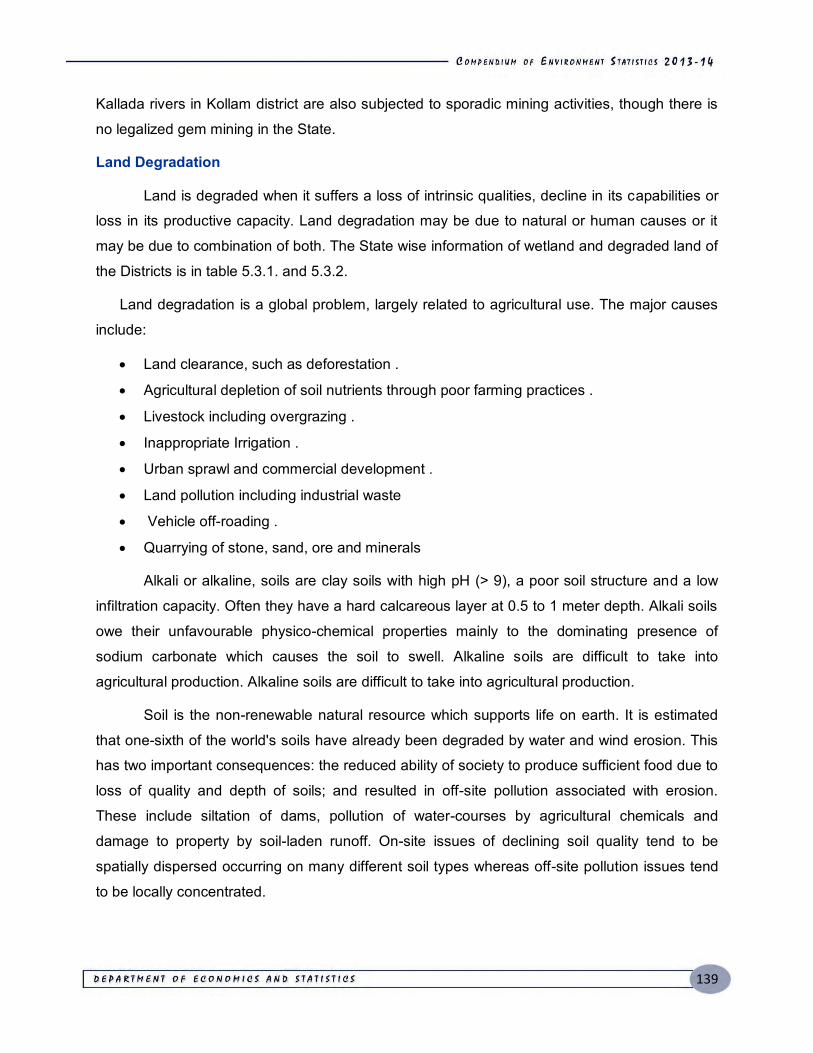
139
Kallada rivers in Kollam district are also subjected to sporadic mining activities, though there is
no legalized gem mining in the State.
Land Degradation
Land is degraded when it suffers a loss of intrinsic qualities, decline in its capabilities or
loss in its productive capacity. Land degradation may be due to natural or human causes or it
may be due to combination of both. The State wise information of wetland and degraded land of
the Districts is in table 5.3.1. and 5.3.2.
Land degradation is a global problem, largely related to agricultural use. The major causes
include:
Land clearance, such as deforestation .
Agricultural depletion of soil nutrients through poor farming practices .
Livestock including overgrazing .
Inappropriate Irrigation .
Urban sprawl and commercial development .
Land pollution including industrial waste
Vehicle off-roading .
Quarrying of stone, sand, ore and minerals
Alkali or alkaline, soils are clay soils with high pH (> 9), a poor soil structure and a low
infiltration capacity. Often they have a hard calcareous layer at 0.5 to 1 meter depth. Alkali soils
owe their unfavourable physico-chemical properties mainly to the dominating presence of
sodium carbonate which causes the soil to swell. Alkaline soils are difficult to take into
agricultural production. Alkaline soils are difficult to take into agricultural production.
Soil is the non-renewable natural resource which supports life on earth. It is estimated
that one-sixth of the world's soils have already been degraded by water and wind erosion. This
has two important consequences: the reduced ability of society to produce sufficient food due to
loss of quality and depth of soils; and resulted in off-site pollution associated with erosion.
These include siltation of dams, pollution of water-courses by agricultural chemicals and
damage to property by soil-laden runoff. On-site issues of declining soil quality tend to be
spatially dispersed occurring on many different soil types whereas off-site pollution issues tend
to be locally concentrated.
140
Soil erosion by rain and river that takes place in hilly areas causes landslides and floods,
while cutting trees for firewood, agricultural implements and timber, grazing by a large number
of livestock, over and above, the carrying capacity of grass lands, traditional agricultural
practices, construction of roads, indiscriminate (limestone) quarrying and other activities, have
all led to the opening of hill-faces to heavy soil erosion. Wind erosion causes expansion of
deserts, dust, storms, whirlwinds and destruction of crops, while moving sand covers the land
and makes it sterile. Excessive soil erosion with consequent high rate of sedimentation in the
reservoirs and decreased fertility has become serious environmental problems with disastrous
economic consequences.
Soil erosion results in huge loss of nutrients in suspension or solution, which are
removed away from one place to another, thus causing depletion or enrichment of nutrients.
Besides the loss of nutrients from the topsoil, there is also degradation through the creation of
gullies and ravines, which makes the land unsuitable for agricultural production. Subsidence of
the land in some areas and landslides in the hilly tracts are problems affecting highways,
habitations and irrigation dams.
Land degradation implies "temporary or permanent recession from a higher to a lower
status of productivity through deterioration of physical, chemical and biological aspects". Land
degradation has numerous environmental, economic, social and ecological consequences.
Every ecosystem on the surface of the earth is affected by some or other form of land
degradation. The past five decades have witnessed a significant rise in food production, but in
many places the better yields have been associated with agricultural practices that have
degraded the land and water systems. Farming systems “face the risk of progressive
breakdown of their productive capacity under a combination of excessive demographic pressure
and unsustainable agriculture use and practices.
The total spatial extent of land degradation in Kerala is 5.2 lakh hectares constituting
13.4 percent of geographical area. A major consideration in present estimate is with respect
seasonal water logging. In valley fills, under high rainfall conditions, the choice of cropping is
restricted to paddy and other economically beneficial crop cannot be cultivated. Hence it was
considered as a land degradation problem.
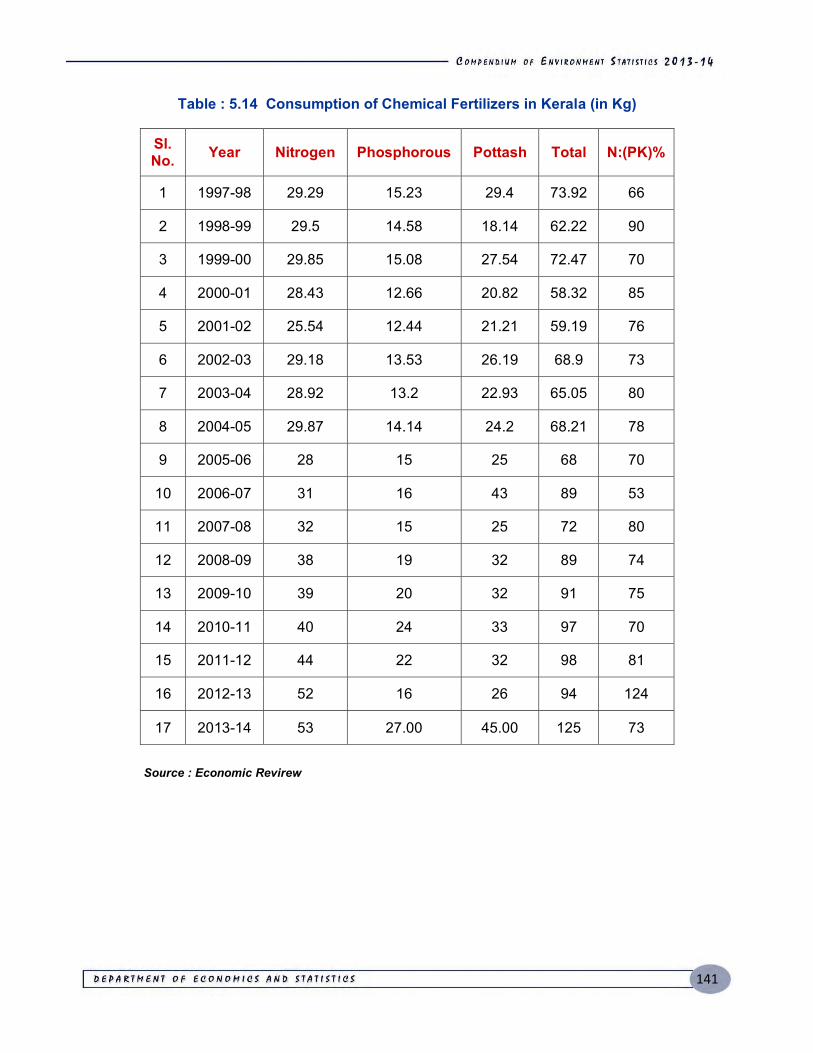
141
Table : 5.14 Consumption of Chemical Fertilizers in Kerala (in Kg)
Sl. No. Year Nitrogen Phosphorous Pottash Total N:(PK)%
1 1997-98 29.29 15.23 29.4 73.92 66
2 1998-99 29.5 14.58 18.14 62.22 90
3 1999-00 29.85 15.08 27.54 72.47 70
4 2000-01 28.43 12.66 20.82 58.32 85
5 2001-02 25.54 12.44 21.21 59.19 76
6 2002-03 29.18 13.53 26.19 68.9 73
7 2003-04 28.92 13.2 22.93 65.05 80
8 2004-05 29.87 14.14 24.2 68.21 78
9 2005-06 28 15 25 68 70
10 2006-07 31 16 43 89 53
11 2007-08 32 15 25 72 80
12 2008-09 38 19 32 89 74
13 2009-10 39 20 32 91 75
14 2010-11 40 24 33 97 70
15 2011-12 44 22 32 98 81
16 2012-13 52 16 26 94 124
17 2013-14 53 27.00 45.00 125 73
Source : Economic Revirew
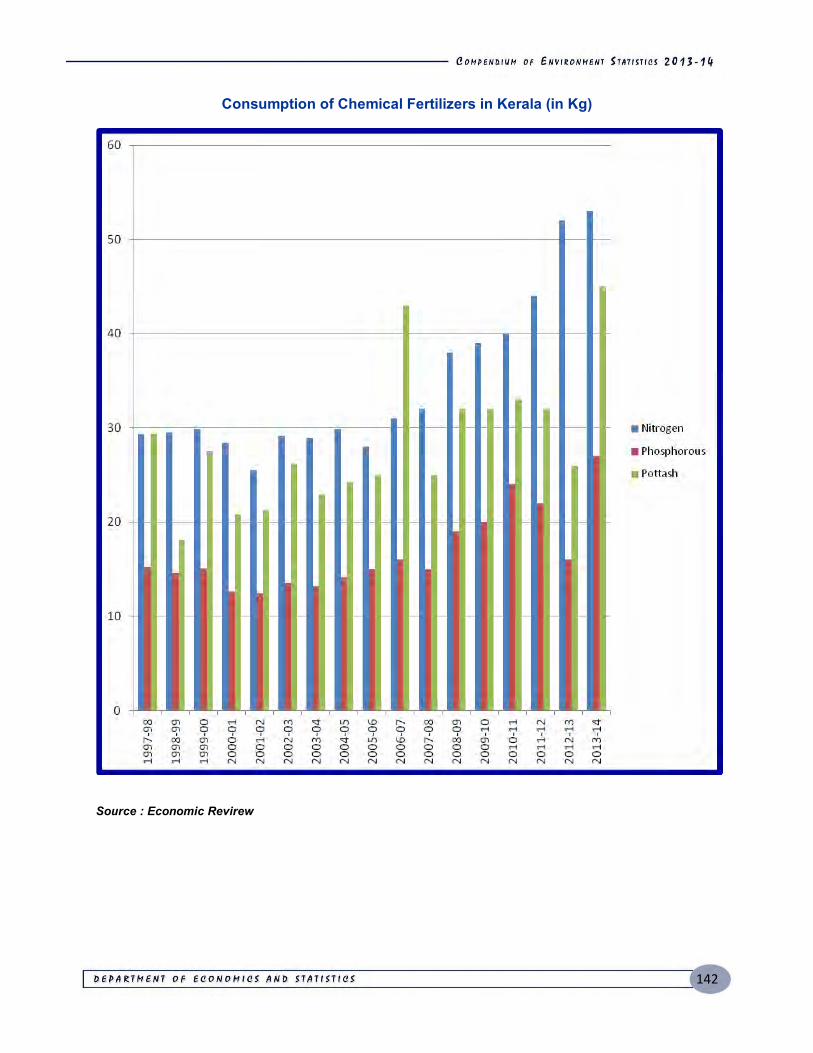
142
Consumption of Chemical Fertilizers in Kerala (in Kg)
Source : Economic Revirew
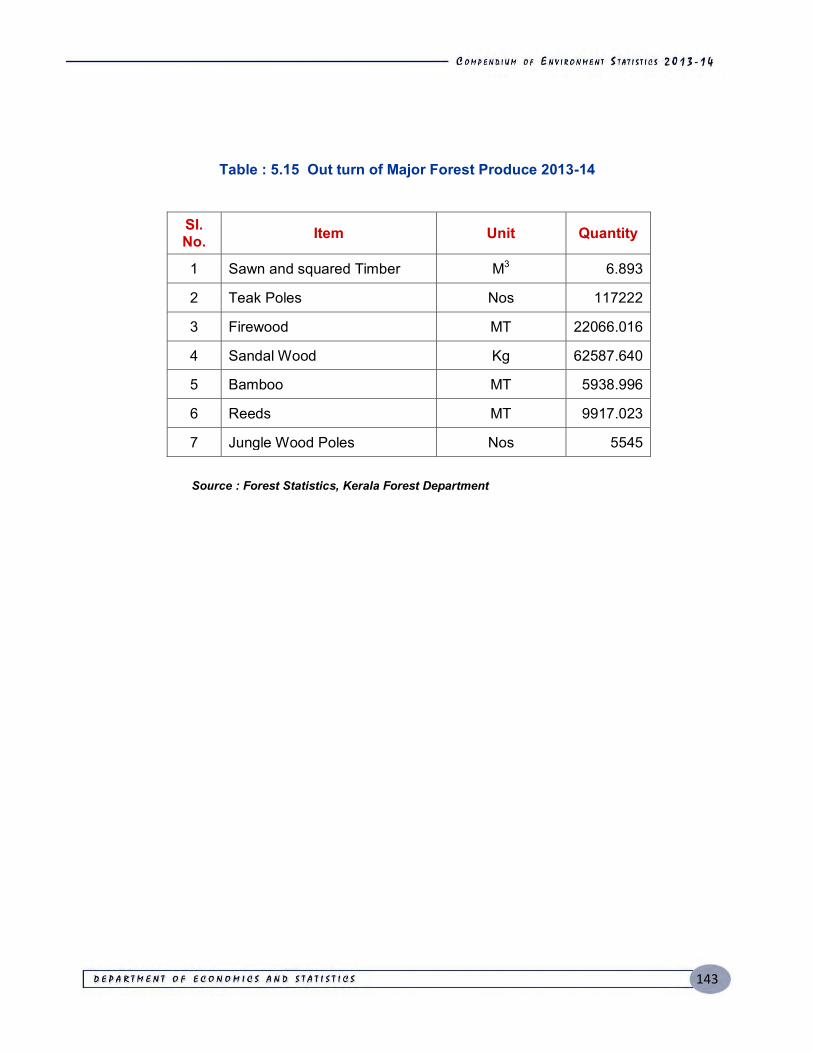
143
Table : 5.15 Out turn of Major Forest Produce 2013-14
Sl. No. Item Unit Quantity
1 Sawn and squared Timber M3 6.893
2 Teak Poles Nos 117222
3 Firewood MT 22066.016
4 Sandal Wood Kg 62587.640
5 Bamboo MT 5938.996
6 Reeds MT 9917.023
7 Jungle Wood Poles Nos 5545
Source : Forest Statistics, Kerala Forest Department
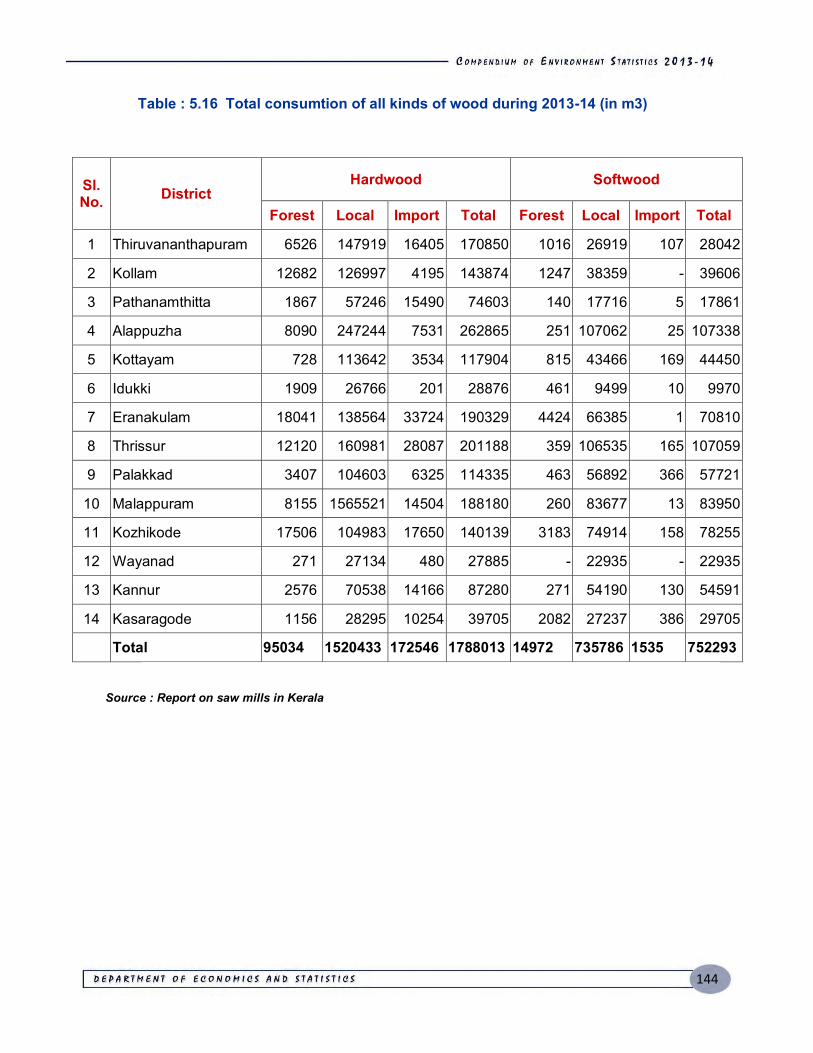
144
Table : 5.16 Total consumtion of all kinds of wood during 2013-14 (in m3)
Sl. No. District
Hardwood Softwood
Forest Local Import Total Forest Local Import Total
1 Thiruvananthapuram 6526 147919 16405 170850 1016 26919 107 28042
2 Kollam 12682 126997 4195 143874 1247 38359 - 39606
3 Pathanamthitta 1867 57246 15490 74603 140 17716 5 17861
4 Alappuzha 8090 247244 7531 262865 251 107062 25 107338
5 Kottayam 728 113642 3534 117904 815 43466 169 44450
6 Idukki 1909 26766 201 28876 461 9499 10 9970
7 Eranakulam 18041 138564 33724 190329 4424 66385 1 70810
8 Thrissur 12120 160981 28087 201188 359 106535 165 107059
9 Palakkad 3407 104603 6325 114335 463 56892 366 57721
10 Malappuram 8155 1565521 14504 188180 260 83677 13 83950
11 Kozhikode 17506 104983 17650 140139 3183 74914 158 78255
12 Wayanad 271 27134 480 27885 - 22935 - 22935
13 Kannur 2576 70538 14166 87280 271 54190 130 54591
14 Kasaragode 1156 28295 10254 39705 2082 27237 386 29705
Total 95034 1520433 172546 1788013 14972 735786 1535 752293
Source : Report on saw mills in Kerala
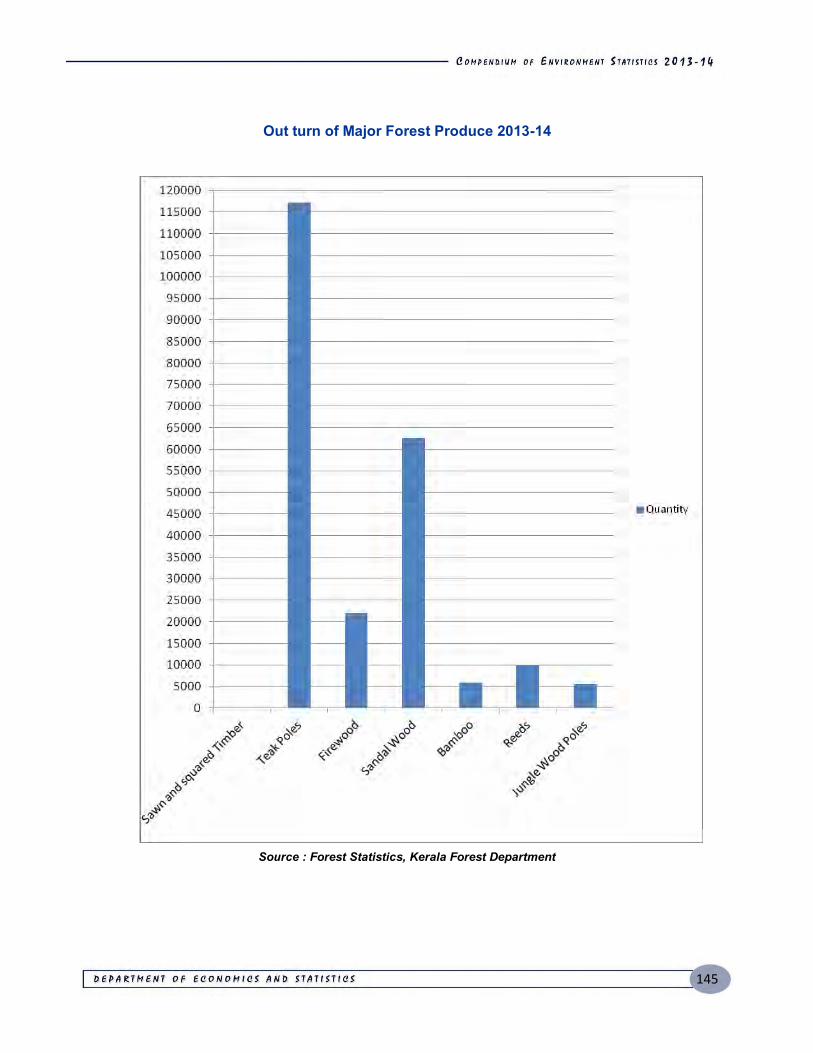
145
Out turn of Major Forest Produce 2013-14
Source : Forest Statistics, Kerala Forest Department
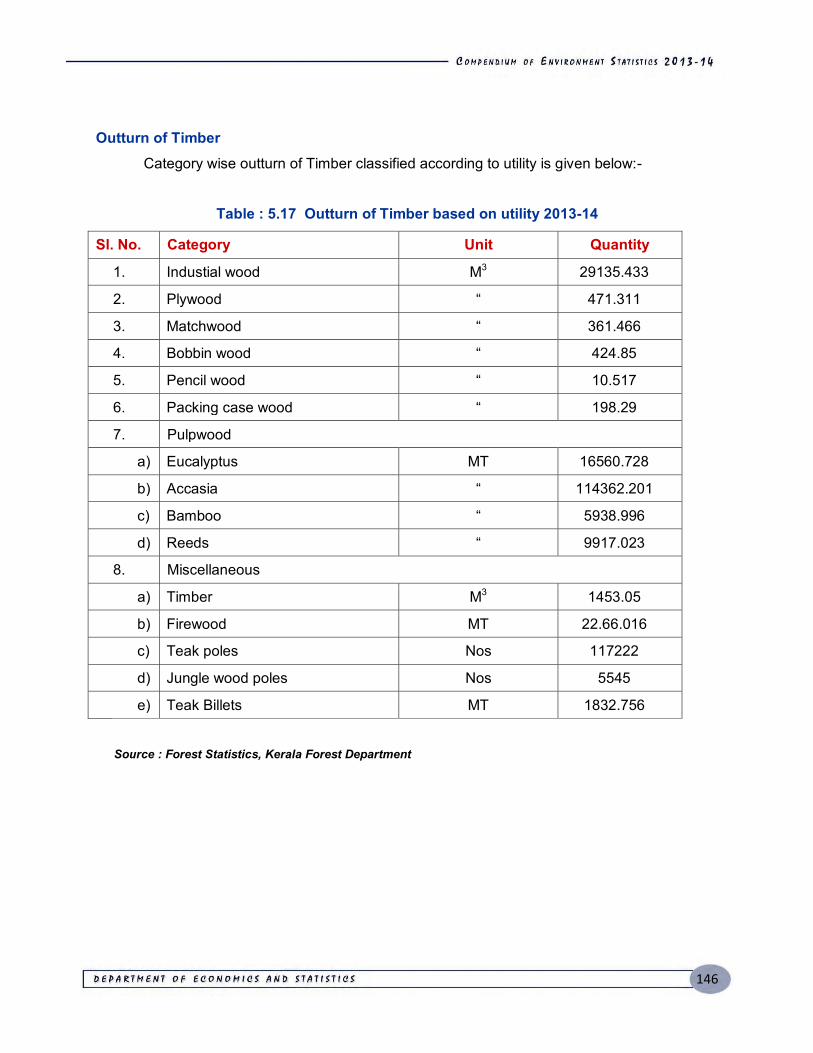
146
Outturn of Timber Category wise outturn of Timber classified according to utility is given below:-
Table : 5.17 Outturn of Timber based on utility 2013-14
Sl. No. Category Unit Quantity
1. Industial wood M3 29135.433
2. Plywood “ 471.311
3. Matchwood “ 361.466
4. Bobbin wood “ 424.85
5. Pencil wood “ 10.517
6. Packing case wood “ 198.29
7. Pulpwood
a) Eucalyptus MT 16560.728
b) Accasia “ 114362.201
c) Bamboo “ 5938.996
d) Reeds “ 9917.023
8. Miscellaneous
a) Timber M3 1453.05
b) Firewood MT 22.66.016
c) Teak poles Nos 117222
d) Jungle wood poles Nos 5545
e) Teak Billets MT 1832.756
Source : Forest Statistics, Kerala Forest Department
147
Natural Disaster A natural disaster is the consequence of the combination of a natural hazard (a physical
event e.g. volcanic eruption, earthquake, landslide) and human activities. Human vulnerability,
caused by the lack of appropriate emergency management, leads to financial, structural, and
human losses. The resulting loss depends on the capacity of the population to support or resist
the disaster, their resilience. This understanding is concentrated in the formulation: "disasters
occur when hazards meet vulnerability". A natural hazard will hence never result in a natural
disaster in areas without vulnerability, e.g. strong earthquakes in uninhabited areas. The term
natural has consequently been disputed because the events simply are not hazards or disasters
without human involvement. The degree of potential loss can also depend on the nature of the
hazard itself, ranging from wildfires, which threaten individual buildings, to impact events, which
have the potential to end civilization.
Specific vulnerabilities of the State
History of vulnerability of the state to the disasters of different types . The state of Kerala
is vulnerable to a multitude of hazards and is categorized as a multiple-hazard prone state. The
state experiences various kinds of disasters of recurrent nature that results in loss of life,
livelihood and property, and disruption of economic activity, besides causing immense hardship
to the affected population. Kerala has a long coast line of 590kms out of which, 322 Km is prone
to severe sea erosion. The density of population is 819 persons per sq.km which is the second
highest density in the country. About 96.9% of the total area in the state lies in the 140.4km/h
wind zone which is classified as Moderate Damage Risk Zone by the BMPTC Atlas while the
remaining area lies in 118.8km/h wind zone
The mean maximum storm surge height in the state is 3.5m and minimum is 2.3m. If the
storm surge is during high tide, the maximum surge height in the state will be 4.2m and
minimum storm height will reach up to 3m, as observed by the Meteorological Department,
Thiruvanthapuram. The coastal belt of Kerala is one of the most densely populated regions in
the country, which adds to its vulnerability. The Western flank of the Western Ghats covering
the eastern part of Kerala is identified as one of the major landslide prone areas of the country.
148
Floods: In Kerala, riverine flooding is a recurring event consequent to heavy or continuous
rainfall exceeding the absorptive capacity of soil and flow capacity of streams and rivers. This
causes a water course to overflow its banks onto flood plains; which by definition is a relatively
flat land adjacent to a natural water course, composed primarily of unconsolidated depositional
material derived from sediments transported by the related stream and subjected to periodic
flooding. Reclamation and settlement in floodplain areas is a major cause of flood damage in
Kerala. Defining the entire flood potential in a given area is a delicate task.
Landslides: In Kerala, landslides commonly occur in localised areas of the Western Ghats
region where the slope is steep and the soil is over saturated as a result of prolonged rainfall.
These events vary from events affecting a parcel of land to those larger ones with much
causality. Only the larger ones with losses of lives have been highlighted and studied in detail.
The smaller events also indicate landslide potential of an area. Case studies by CESS show
that most of the events are of debris flow type triggered by excess rainfall and are influenced by
terrain factors like slope, overburden thickness, landuse, relative relief, disposition of streams,
landform at micro level etc. The area of the state is about 38863 sq.km of which 40% lies in the
highland region forming the western slopes of Western Ghats. A considerable part of all districts
of Kerala except the coastal district of Alleppey falls within this region. The western declivity of
the Western Ghats is steep and usually terraced resembling ghat or landing stairs from which it
derives the name. This region is characterized by rugged hills with steep slopes on which rests
the soil and earth materials. The slope in the Western Ghats region is generally steep to very
steep with plateau edges highly indented having > 25 slope. The term landslide includes a
broad range of different types of motion whereby earth material is dislodged by falling, sliding
and flowing under the influence of gravity. In fact mass movements such as landslides are
natural phenomenon that causes landscape changes, threat to life and destruction of property.
The most common type of landslides in Kerala is debris flows.
Earthquakes: Kerala has experienced occasional mild tremors since historical times. None of
them are reported to have caused casualties or major damages to built-up structures as in the
case of Lathur earthquake. A seismic hazard map with 10% probability of exceedance in 50
years assigns low-level hazard to regions falling in Kerala. However pockets of higher ground
acceleration have been identified in central Kerala. In this region higher levels of earthquake
hazard are expected calling for the introduction of better building practices.
149
Tsunami: The superimposition of tsunami waves with high tide was a factor that compounded
the inundation resulted in higher intensity of damage. The worst affected part of the coast in
terms of inundation, run-up and erosion was the 10 km segment of Azhikkal coast. Satellite
imagery of this tract a day after the tsunami clearly shows highly turbid sediment-laden water.
Many concrete houses, fishing boats canoes and automobiles of this area were uprooted and
thrown to distances of 100 to 200 m. Even blocks of rocks (1m size) of the seawall were thrown
ashore to 150m by the rushing tsunami waves.
Coastal hazards: In Kerala, out of 14 districts, 9 districts are bordering the sea coast
vulnerable to various disasters such as floods, cyclones, coastal erosion, landslides etc. These
nine districts are namely, Kasargode, Kannur, Kozhikode, Malappuram, Thrissur, Ernakulam,
Alappuzha, Kollam and Thiruvananthapuram. The state has 223 coastal villages which has the
probability of being affected by cyclone. Natural causes of coastal erosion are due to the action
of waves, winds, tides, near shore currents, storm surges and sealevel rise. Human activities
such as the construction of harbours, jetties and groynes, river training works, mining and
dredging can also lead to erosion of certain regions. Some of the coastal stretches in Kerala
have shown long-term erosion with net loss of land. It is reported that about 480 km length of
the coast is under the threat of erosion. The rocky coasts with pocket beaches have minimum
level of erosion. In areas with laterite cliffs, under cutting of the softer clay layers lead to
slumping with a net landward migration of the shoreline. In the sandy areas some of the
segments show long term erosion while others with either accretion or stable condition.
Lightning: Lightning is a weather phenomenon. It is essentially an electrical discharge. This
is not a phenomenon peculiar to Kerala. It is part of a global electrical system known as the
Global Electric Circuit‘ involving the earth, ionosphere, and the atmosphere in between. On an
average about 70 people in the state die due to lightning. There are numerous overlaps of dots
in the plot. It can be seen that there is a relative void in incidents in an area west of the
Palakkad. More specifically the region west of Palakkad namely the region near Thrisur has less
incidence. This is because the mountain range has a gap in Palakkad and so the absence of
mountain results in less Cb formation and lightning incidence. The two figures indicate that the
mid land of Kerala has more lightning.
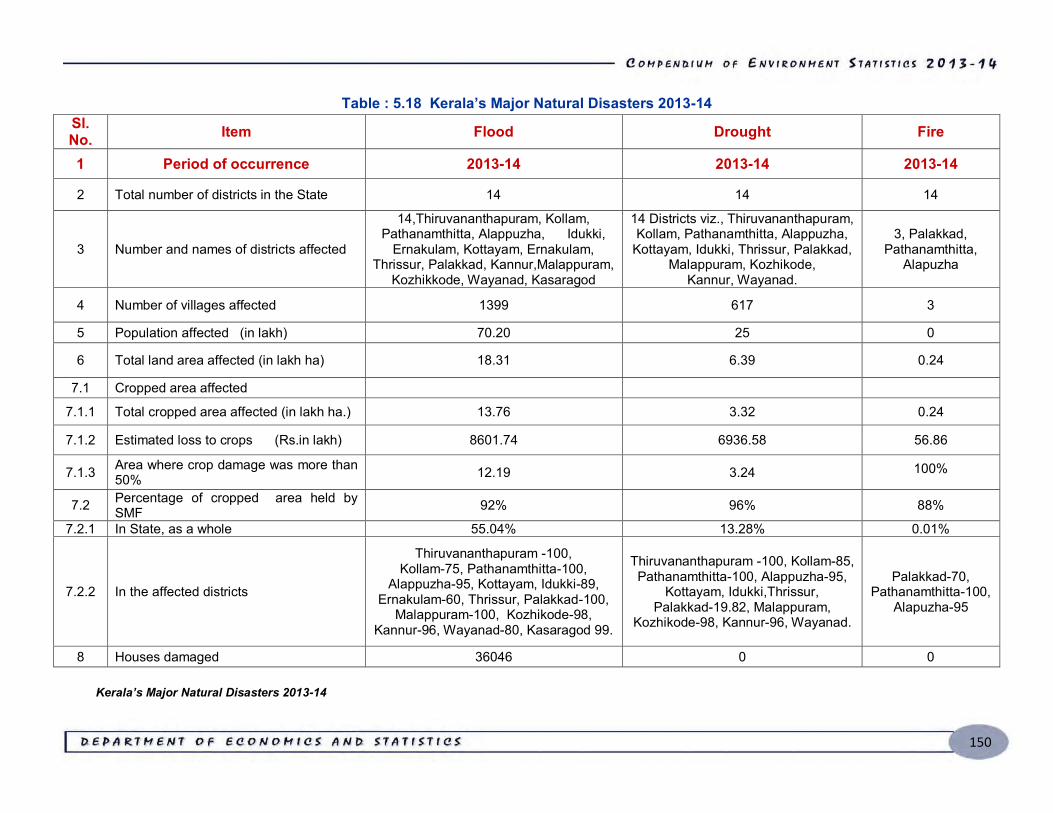
150
Table : 5.18 Kerala’s Major Natural Disasters 2013-14 Sl. No. Item Flood Drought Fire
1 Period of occurrence 2013-14 2013-14 2013-14
2 Total number of districts in the State 14 14 14
3 Number and names of districts affected
14,Thiruvananthapuram, Kollam, Pathanamthitta, Alappuzha, Idukki,
Ernakulam, Kottayam, Ernakulam, Thrissur, Palakkad, Kannur,Malappuram,
Kozhikkode, Wayanad, Kasaragod
14 Districts viz., Thiruvananthapuram, Kollam, Pathanamthitta, Alappuzha,
Kottayam, Idukki, Thrissur, Palakkad, Malappuram, Kozhikode,
Kannur, Wayanad.
3, Palakkad, Pathanamthitta,
Alapuzha
4 Number of villages affected 1399 617 3
5 Population affected (in lakh) 70.20 25 0
6 Total land area affected (in lakh ha) 18.31 6.39 0.24
7.1 Cropped area affected 7.1.1 Total cropped area affected (in lakh ha.) 13.76 3.32 0.24
7.1.2 Estimated loss to crops (Rs.in lakh) 8601.74 6936.58 56.86
7.1.3 Area where crop damage was more than 50% 12.19 3.24 100%
7.2 Percentage of cropped area held by SMF 92% 96% 88%
7.2.1 In State, as a whole 55.04% 13.28% 0.01%
7.2.2 In the affected districts
Thiruvananthapuram -100, Kollam-75, Pathanamthitta-100,
Alappuzha-95, Kottayam, Idukki-89, Ernakulam-60, Thrissur, Palakkad-100,
Malappuram-100, Kozhikode-98, Kannur-96, Wayanad-80, Kasaragod 99.
Thiruvananthapuram -100, Kollam-85, Pathanamthitta-100, Alappuzha-95,
Kottayam, Idukki,Thrissur, Palakkad-19.82, Malappuram,
Kozhikode-98, Kannur-96, Wayanad.
Palakkad-70, Pathanamthitta-100,
Alapuzha-95
8 Houses damaged 36046 0 0 Kerala’s Major Natural Disasters 2013-14
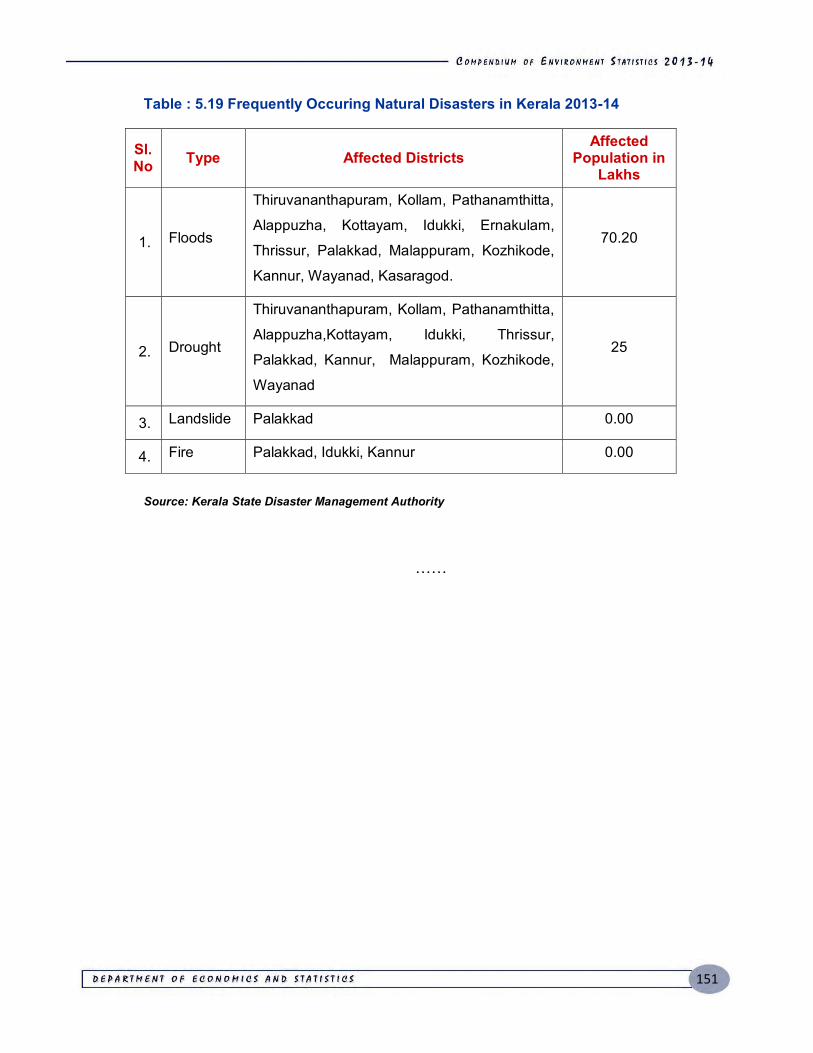
151
Table : 5.19 Frequently Occuring Natural Disasters in Kerala 2013-14
Sl.No Type Affected Districts
Affected Population in
Lakhs
1. Floods
Thiruvananthapuram, Kollam, Pathanamthitta,
Alappuzha, Kottayam, Idukki, Ernakulam,
Thrissur, Palakkad, Malappuram, Kozhikode,
Kannur, Wayanad, Kasaragod.
70.20
2. Drought
Thiruvananthapuram, Kollam, Pathanamthitta,
Alappuzha,Kottayam, Idukki, Thrissur,
Palakkad, Kannur, Malappuram, Kozhikode,
Wayanad
25
3. Landslide Palakkad 0.00
4. Fire Palakkad, Idukki, Kannur 0.00
Source: Kerala State Disaster Management Authority
……
152
153
CHAPTER - VI
Water
ater quality management in India is accomplished under the provision of water
(Prevention to control of pollution) Act1974. Main objective of the act is to prevent the pollution
of water by Industrial, agricultural and household waste water that can contaminate our water
source.
Water is used for drinking & other domestic purposes in most communities are obtained
from Natural Sources such as rivers, streams, lakes, ponds & springs of artificial sources such
as wells and bore wells. Most times these water supplies are likely to be polluted with waste.
Micro organisms in these natural sources are numerous in both number and diversity. Water
plays a very important role in human health. To determining the health of individuals and the
whole communities , the quality of water supplied is more important.
Bacteriological monitoring is based on knowledge of the sanitary condition of water
supply which is based on the detection of Colifom bacteria in the specific indicator of human
faecal condamination, Escherichacol(E.coli) The term indicator organisms refers to micro organ
isms whose presence in water shows that the water is polluted with faecal method from human
or other warm blooded animals. Coliform bacteria are a group of becteria found in the intestinal
trait of human and other animals. There are rod-shaped micro organism.
Coliform will not likely cause illness. However the presence of coliform in drinking indicates the
presence of disease-cause of organisms Eschericha-coli, Enterobacteria,, aeigens, Salmonella
and Klebasialla re some examples of this group. Coliform bacteria do not occur naturally in
ground water. However it can live within biofilm formed by naturally occurring ground water
micro organisms. The main cause of contamination are :
1) Missing/defective well cap seals around wires/pipes
2) Coracles of holes in the well casing
3) Many older wells were not sealed with grout when constructed.
4) Well flooding
5) Close proximity of a well to septic tanks, drain fields sewers, drains and surface water
6) Cross connection with waste water plumping.
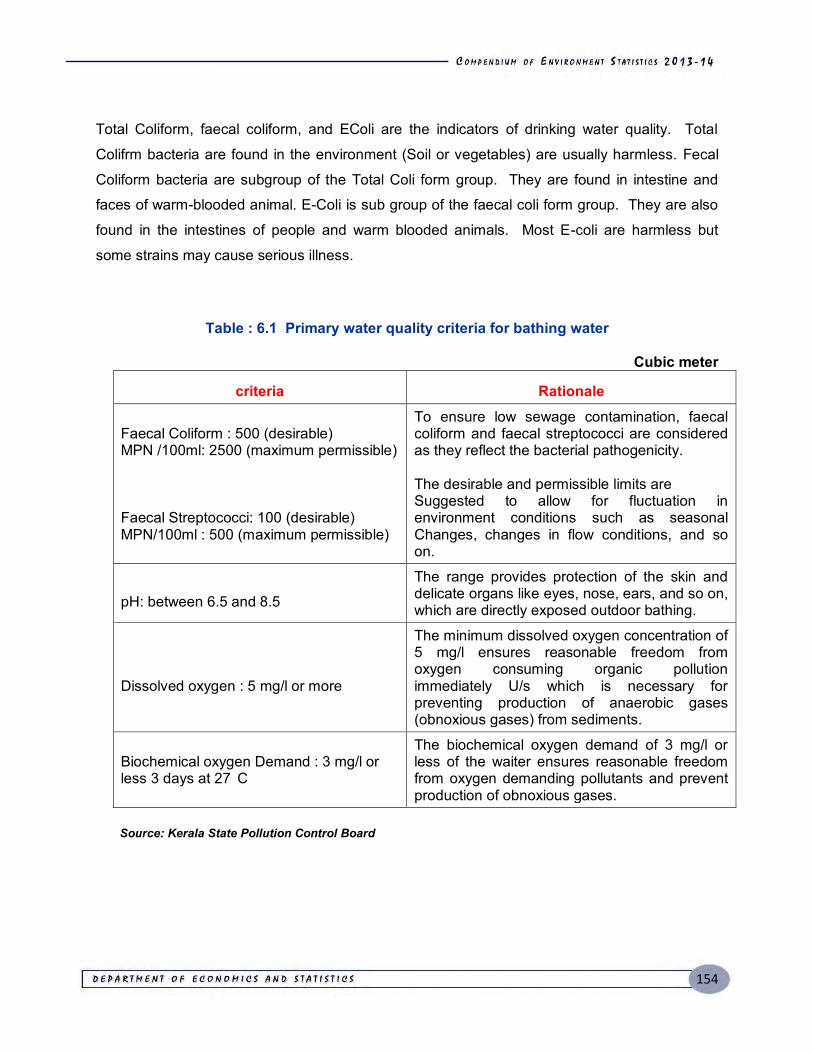
154
Total Coliform, faecal coliform, and EColi are the indicators of drinking water quality. Total
Colifrm bacteria are found in the environment (Soil or vegetables) are usually harmless. Fecal
Coliform bacteria are subgroup of the Total Coli form group. They are found in intestine and
faces of warm-blooded animal. E-Coli is sub group of the faecal coli form group. They are also
found in the intestines of people and warm blooded animals. Most E-coli are harmless but
some strains may cause serious illness.
Table : 6.1 Primary water quality criteria for bathing water
Cubic meter
criteria Rationale
Faecal Coliform : 500 (desirable) MPN /100ml: 2500 (maximum permissible) Faecal Streptococci: 100 (desirable) MPN/100ml : 500 (maximum permissible)
To ensure low sewage contamination, faecal coliform and faecal streptococci are considered as they reflect the bacterial pathogenicity. The desirable and permissible limits are Suggested to allow for fluctuation in environment conditions such as seasonal Changes, changes in flow conditions, and so on.
pH: between 6.5 and 8.5
The range provides protection of the skin and delicate organs like eyes, nose, ears, and so on, which are directly exposed outdoor bathing.
Dissolved oxygen : 5 mg/l or more
The minimum dissolved oxygen concentration of 5 mg/l ensures reasonable freedom from oxygen consuming organic pollution immediately U/s which is necessary for preventing production of anaerobic gases (obnoxious gases) from sediments.
Biochemical oxygen Demand : 3 mg/l or less 3 days at 27 C
The biochemical oxygen demand of 3 mg/l or less of the waiter ensures reasonable freedom from oxygen demanding pollutants and prevent production of obnoxious gases.
Source: Kerala State Pollution Control Board
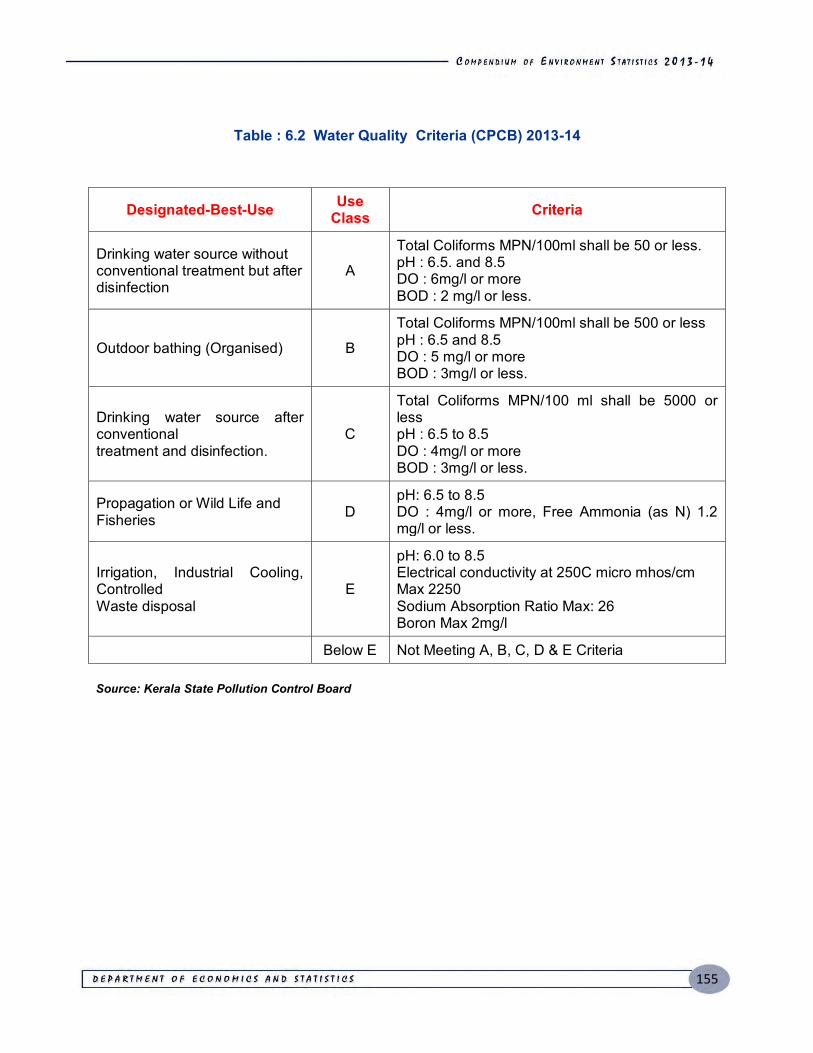
155
Table : 6.2 Water Quality Criteria (CPCB) 2013-14
Designated-Best-Use Use Class Criteria
Drinking water source without conventional treatment but after disinfection
A
Total Coliforms MPN/100ml shall be 50 or less. pH : 6.5. and 8.5 DO : 6mg/l or more BOD : 2 mg/l or less.
Outdoor bathing (Organised) B
Total Coliforms MPN/100ml shall be 500 or less pH : 6.5 and 8.5 DO : 5 mg/l or more BOD : 3mg/l or less.
Drinking water source after conventional treatment and disinfection.
C
Total Coliforms MPN/100 ml shall be 5000 or less pH : 6.5 to 8.5 DO : 4mg/l or more BOD : 3mg/l or less.
Propagation or Wild Life and Fisheries D
pH: 6.5 to 8.5 DO : 4mg/l or more, Free Ammonia (as N) 1.2 mg/l or less.
Irrigation, Industrial Cooling, Controlled Waste disposal
E
pH: 6.0 to 8.5 Electrical conductivity at 250C micro mhos/cm Max 2250 Sodium Absorption Ratio Max: 26 Boron Max 2mg/l
Below E Not Meeting A, B, C, D & E Criteria Source: Kerala State Pollution Control Board
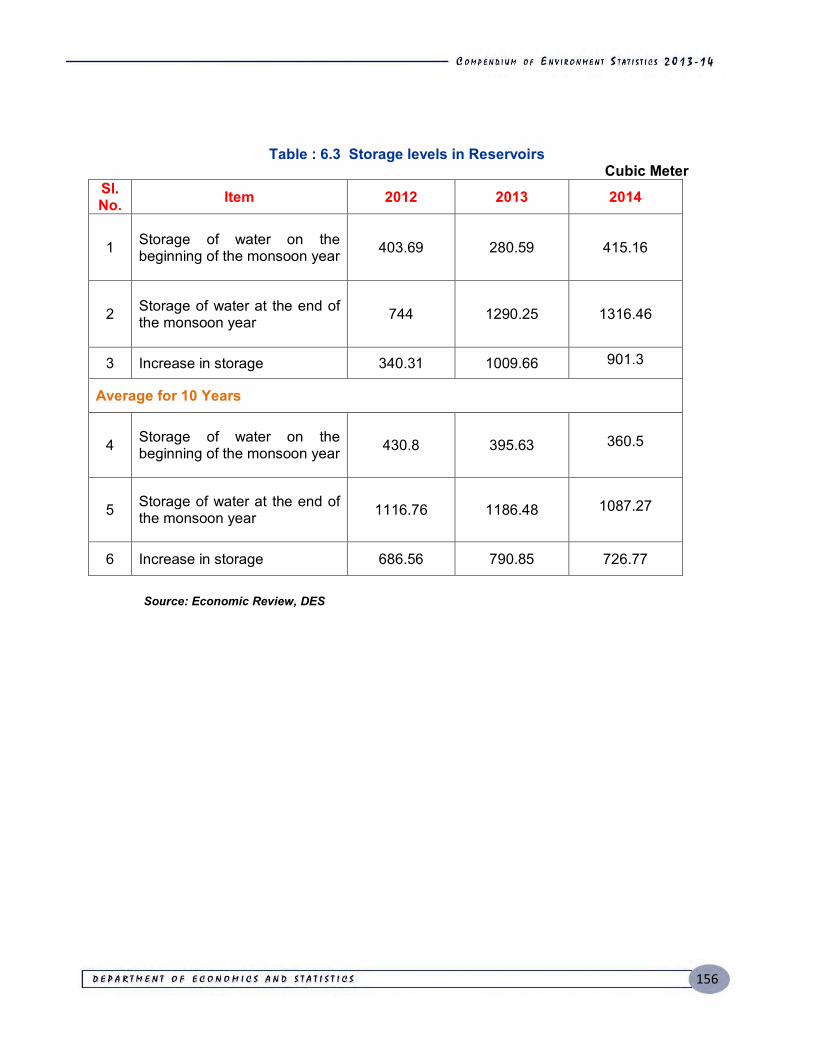
156
Table : 6.3 Storage levels in Reservoirs Cubic Meter
Sl. No. Item 2012 2013 2014
1 Storage of water on the beginning of the monsoon year 403.69 280.59 415.16
2 Storage of water at the end of the monsoon year 744 1290.25 1316.46
3 Increase in storage 340.31 1009.66 901.3
Average for 10 Years
4 Storage of water on the beginning of the monsoon year 430.8 395.63 360.5
5 Storage of water at the end of the monsoon year 1116.76 1186.48 1087.27
6 Increase in storage 686.56 790.85 726.77
Source: Economic Review, DES
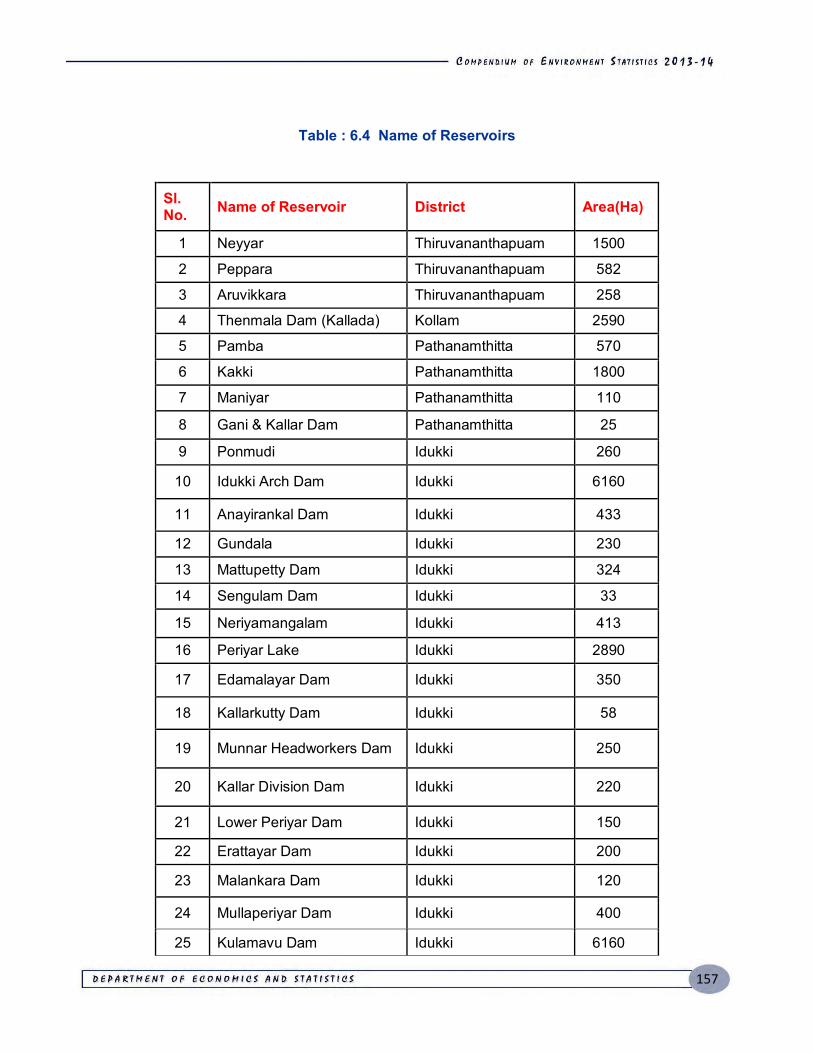
157
Table : 6.4 Name of Reservoirs
Sl. No. Name of Reservoir District Area(Ha)
1 Neyyar Thiruvananthapuam 1500
2 Peppara Thiruvananthapuam 582
3 Aruvikkara Thiruvananthapuam 258
4 Thenmala Dam (Kallada) Kollam 2590
5 Pamba Pathanamthitta 570
6 Kakki Pathanamthitta 1800
7 Maniyar Pathanamthitta 110
8 Gani & Kallar Dam Pathanamthitta 25
9 Ponmudi Idukki 260
10 Idukki Arch Dam Idukki 6160
11 Anayirankal Dam Idukki 433
12 Gundala Idukki 230
13 Mattupetty Dam Idukki 324
14 Sengulam Dam Idukki 33
15 Neriyamangalam Idukki 413
16 Periyar Lake Idukki 2890
17 Edamalayar Dam Idukki 350
18 Kallarkutty Dam Idukki 58
19 Munnar Headworkers Dam Idukki 250
20 Kallar Division Dam Idukki 220
21 Lower Periyar Dam Idukki 150
22 Erattayar Dam Idukki 200
23 Malankara Dam Idukki 120
24 Mullaperiyar Dam Idukki 400
25 Kulamavu Dam Idukki 6160
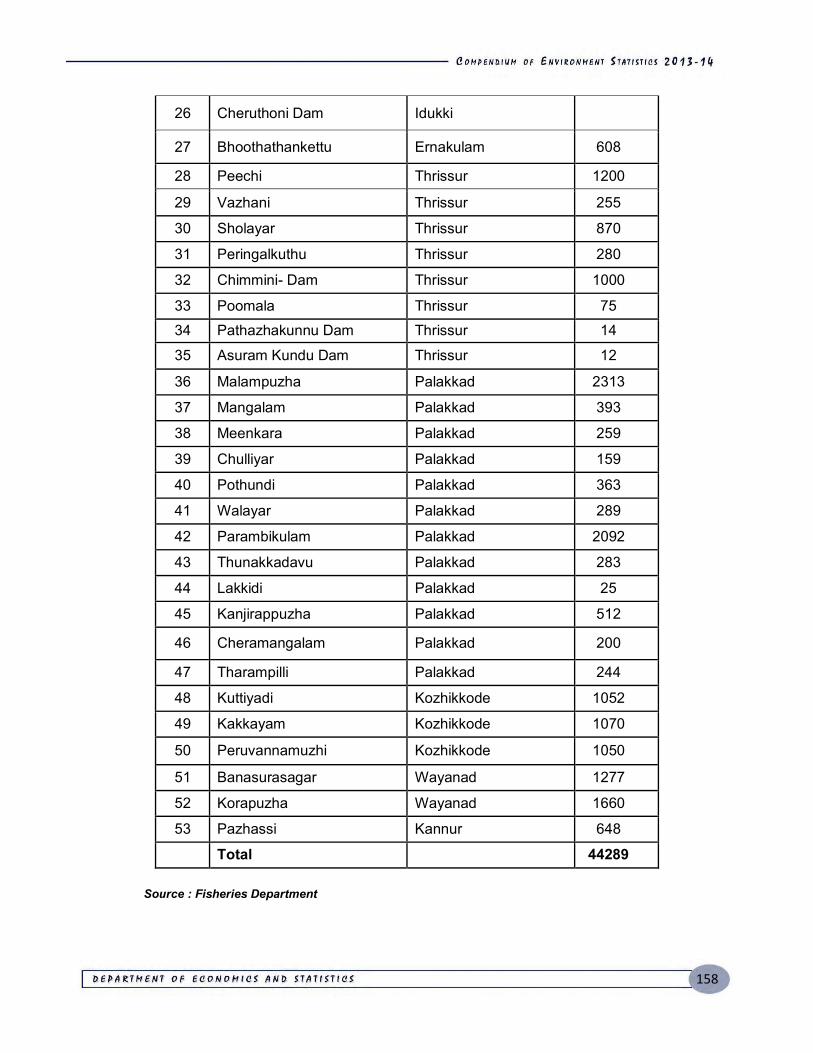
158
26 Cheruthoni Dam Idukki
27 Bhoothathankettu Ernakulam 608
28 Peechi Thrissur 1200
29 Vazhani Thrissur 255
30 Sholayar Thrissur 870
31 Peringalkuthu Thrissur 280
32 Chimmini- Dam Thrissur 1000
33 Poomala Thrissur 75 34 Pathazhakunnu Dam Thrissur 14
35 Asuram Kundu Dam Thrissur 12
36 Malampuzha Palakkad 2313
37 Mangalam Palakkad 393
38 Meenkara Palakkad 259
39 Chulliyar Palakkad 159
40 Pothundi Palakkad 363
41 Walayar Palakkad 289
42 Parambikulam Palakkad 2092
43 Thunakkadavu Palakkad 283
44 Lakkidi Palakkad 25
45 Kanjirappuzha Palakkad 512
46 Cheramangalam Palakkad 200
47 Tharampilli Palakkad 244
48 Kuttiyadi Kozhikkode 1052
49 Kakkayam Kozhikkode 1070
50 Peruvannamuzhi Kozhikkode 1050
51 Banasurasagar Wayanad 1277
52 Korapuzha Wayanad 1660
53 Pazhassi Kannur 648
Total 44289 Source : Fisheries Department
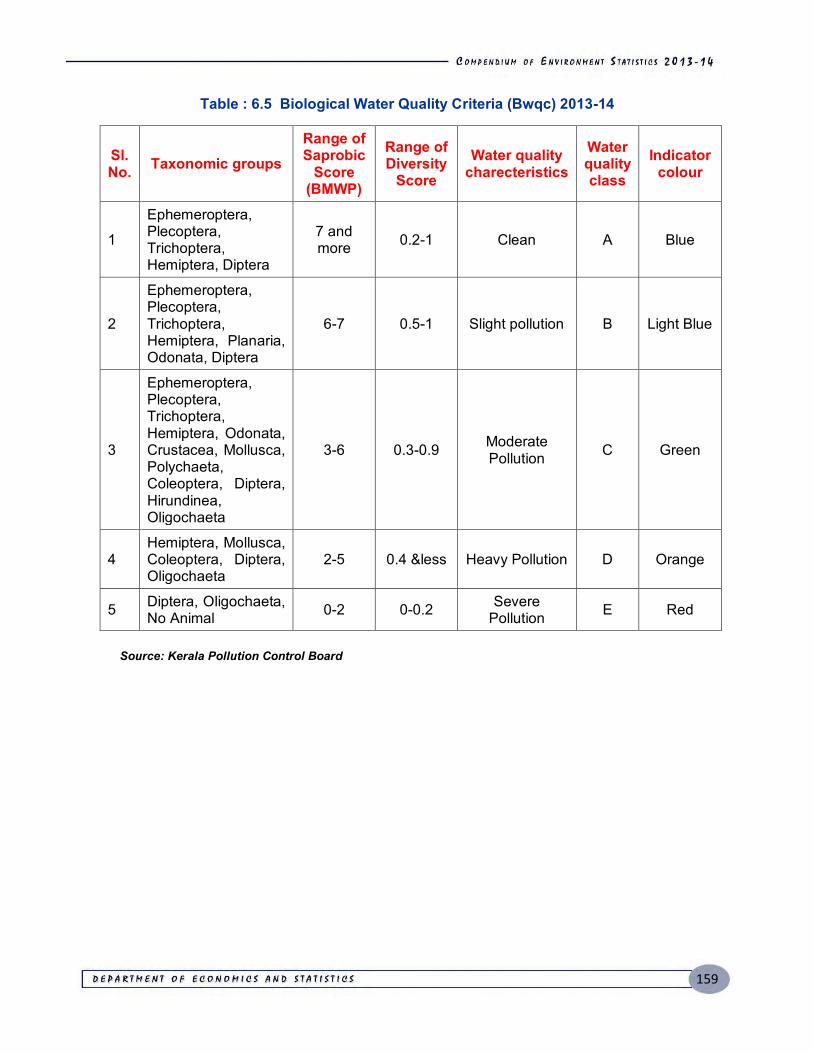
159
Table : 6.5 Biological Water Quality Criteria (Bwqc) 2013-14
Sl. No. Taxonomic groups
Range of Saprobic
Score (BMWP)
Range of Diversity
Score Water quality
charecteristics Water quality class
Indicator colour
1
Ephemeroptera, Plecoptera, Trichoptera, Hemiptera, Diptera
7 and more 0.2-1 Clean A Blue
2
Ephemeroptera, Plecoptera, Trichoptera, Hemiptera, Planaria, Odonata, Diptera
6-7 0.5-1 Slight pollution B Light Blue
3
Ephemeroptera, Plecoptera, Trichoptera, Hemiptera, Odonata, Crustacea, Mollusca, Polychaeta, Coleoptera, Diptera, Hirundinea, Oligochaeta
3-6 0.3-0.9 Moderate Pollution C Green
4 Hemiptera, Mollusca, Coleoptera, Diptera, Oligochaeta
2-5 0.4 &less Heavy Pollution D Orange
5 Diptera, Oligochaeta, No Animal 0-2 0-0.2 Severe
Pollution E Red
Source: Kerala Pollution Control Board
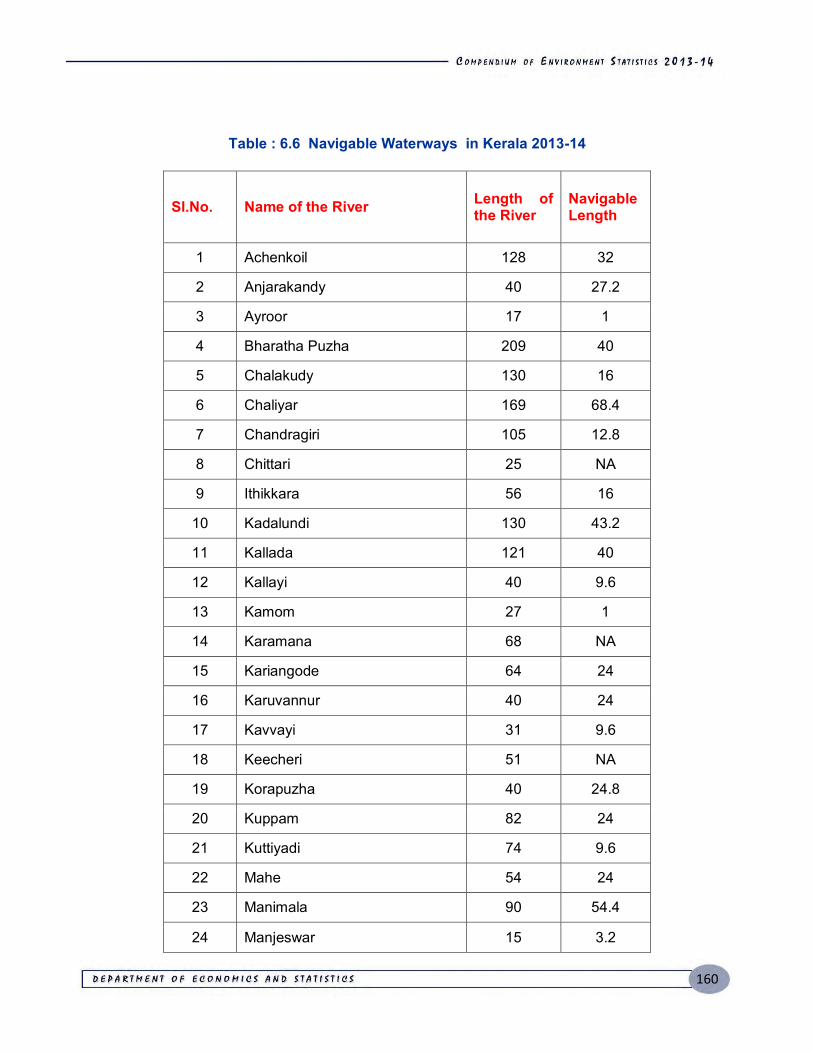
160
Table : 6.6 Navigable Waterways in Kerala 2013-14
Sl.No. Name of the River Length of the River
Navigable Length
1 Achenkoil 128 32
2 Anjarakandy 40 27.2
3 Ayroor 17 1
4 Bharatha Puzha 209 40
5 Chalakudy 130 16
6 Chaliyar 169 68.4
7 Chandragiri 105 12.8
8 Chittari 25 NA
9 Ithikkara 56 16
10 Kadalundi 130 43.2
11 Kallada 121 40
12 Kallayi 40 9.6
13 Kamom 27 1
14 Karamana 68 NA
15 Kariangode 64 24
16 Karuvannur 40 24
17 Kavvayi 31 9.6
18 Keecheri 51 NA
19 Korapuzha 40 24.8
20 Kuppam 82 24
21 Kuttiyadi 74 9.6
22 Mahe 54 24
23 Manimala 90 54.4
24 Manjeswar 15 3.2
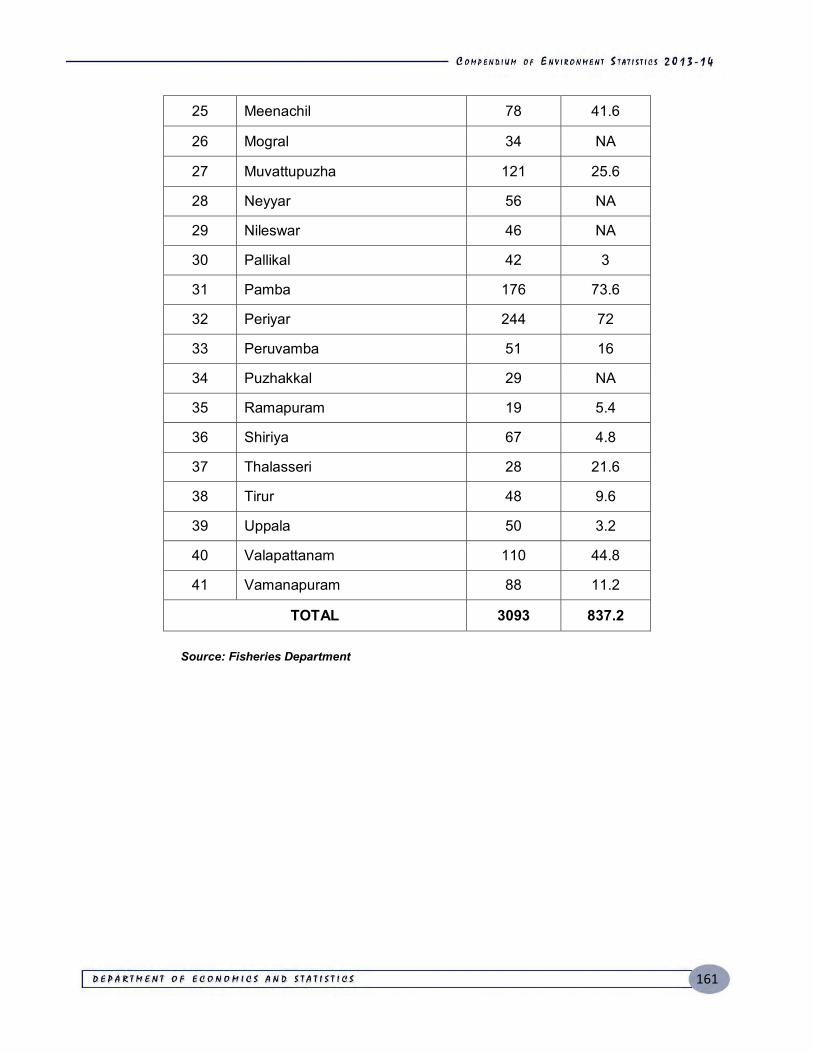
161
25 Meenachil 78 41.6
26 Mogral 34 NA
27 Muvattupuzha 121 25.6
28 Neyyar 56 NA
29 Nileswar 46 NA
30 Pallikal 42 3
31 Pamba 176 73.6
32 Periyar 244 72
33 Peruvamba 51 16
34 Puzhakkal 29 NA
35 Ramapuram 19 5.4
36 Shiriya 67 4.8
37 Thalasseri 28 21.6
38 Tirur 48 9.6
39 Uppala 50 3.2
40 Valapattanam 110 44.8
41 Vamanapuram 88 11.2
TOTAL 3093 837.2 Source: Fisheries Department
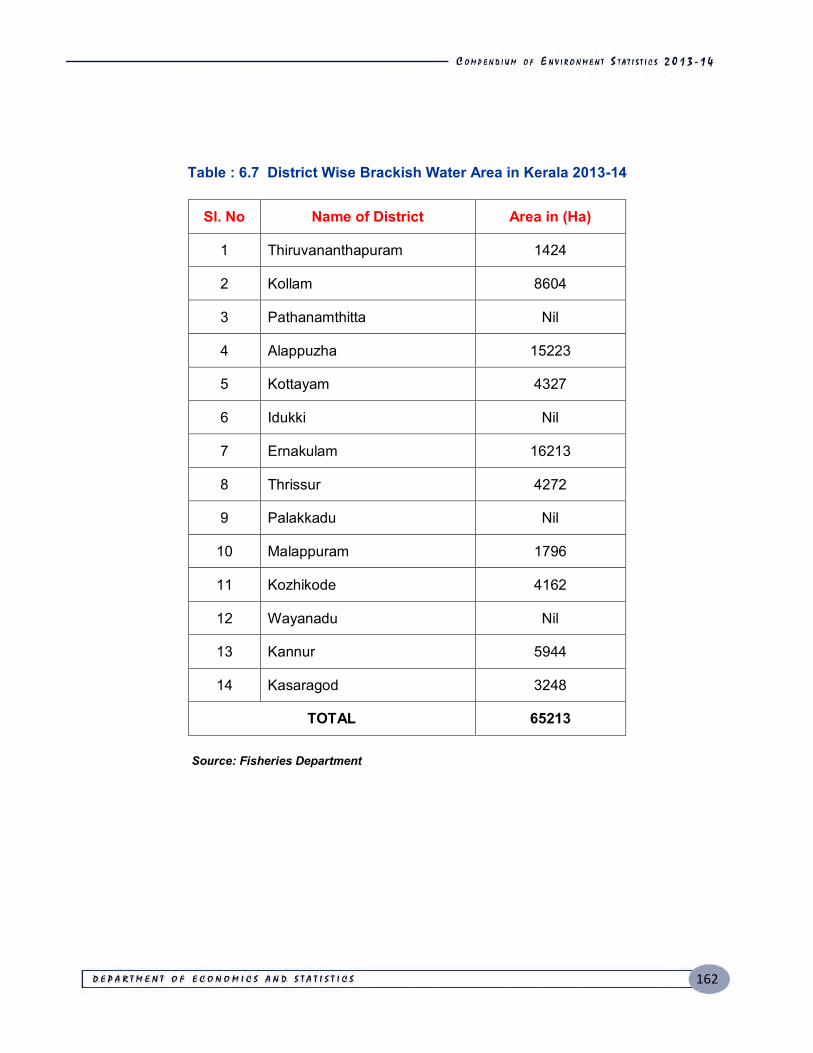
162
Table : 6.7 District Wise Brackish Water Area in Kerala 2013-14
Sl. No Name of District Area in (Ha)
1 Thiruvananthapuram 1424
2 Kollam 8604
3 Pathanamthitta Nil
4 Alappuzha 15223
5 Kottayam 4327
6 Idukki Nil
7 Ernakulam 16213
8 Thrissur 4272
9 Palakkadu Nil
10 Malappuram 1796
11 Kozhikode 4162
12 Wayanadu Nil
13 Kannur 5944
14 Kasaragod 3248
TOTAL 65213
Source: Fisheries Department
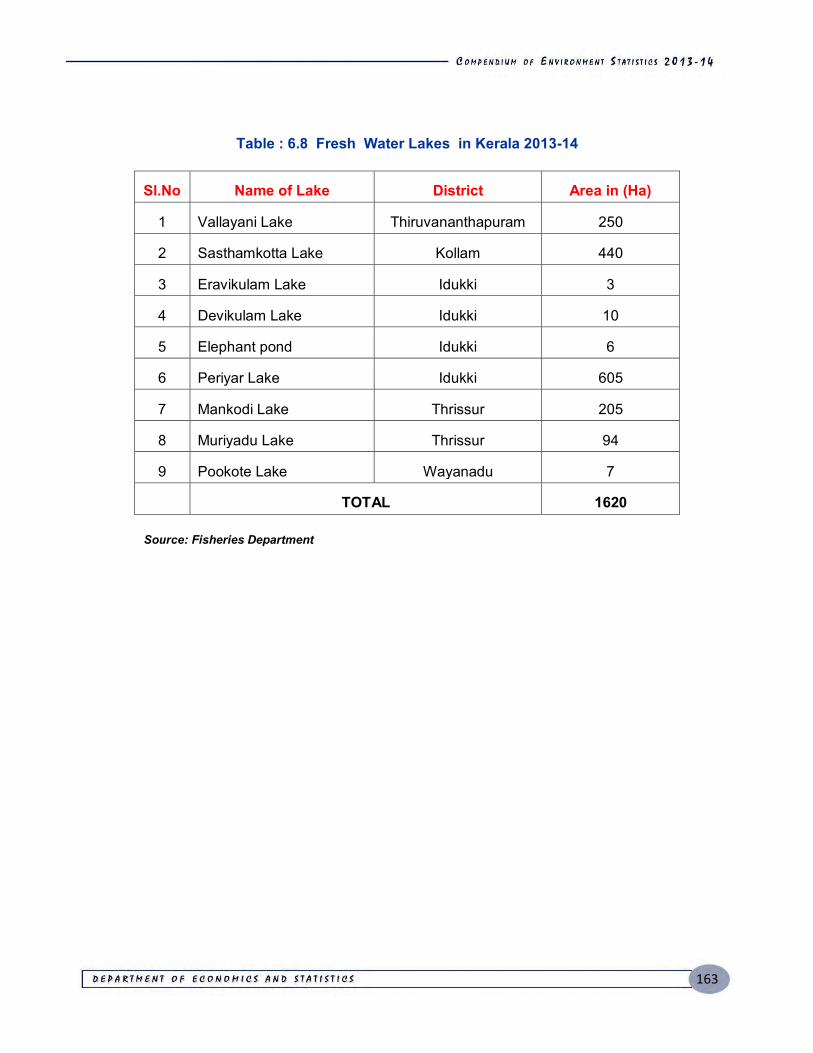
163
Table : 6.8 Fresh Water Lakes in Kerala 2013-14
Sl.No Name of Lake District Area in (Ha)
1 Vallayani Lake Thiruvananthapuram 250
2 Sasthamkotta Lake Kollam 440
3 Eravikulam Lake Idukki 3
4 Devikulam Lake Idukki 10
5 Elephant pond Idukki 6
6 Periyar Lake Idukki 605
7 Mankodi Lake Thrissur 205
8 Muriyadu Lake Thrissur 94
9 Pookote Lake Wayanadu 7
TOTAL 1620 Source: Fisheries Department
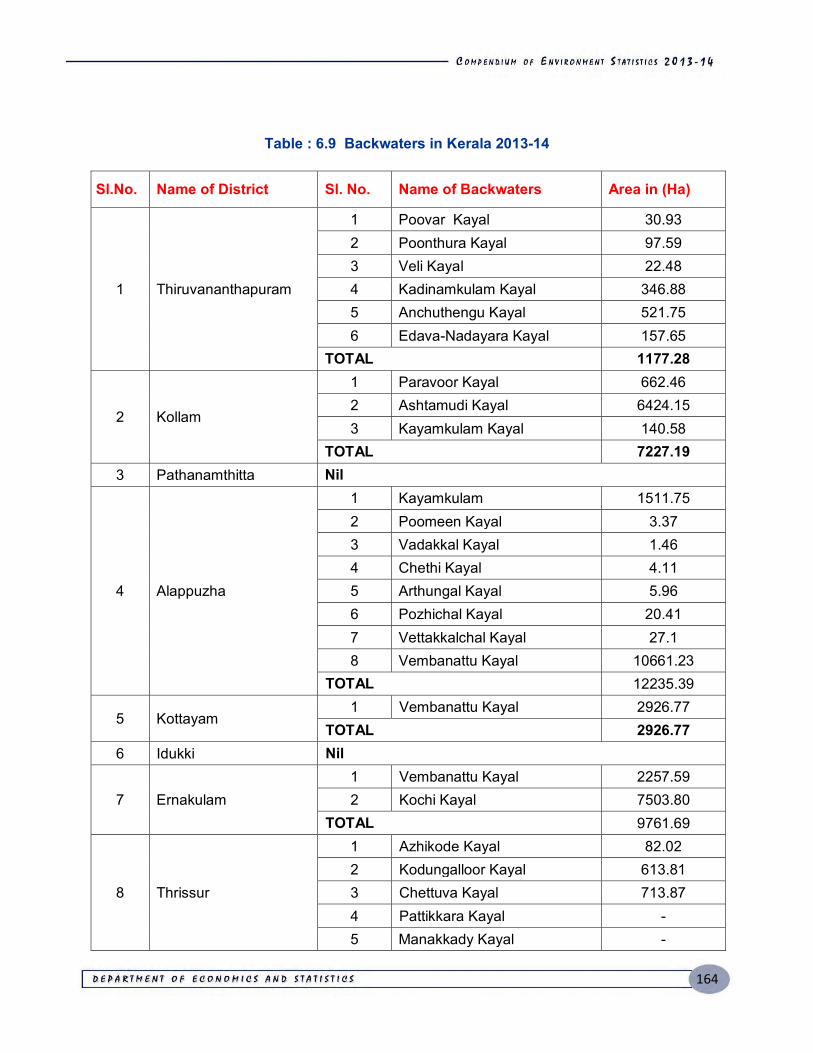
164
Table : 6.9 Backwaters in Kerala 2013-14
Sl.No. Name of District Sl. No. Name of Backwaters Area in (Ha)
1 Thiruvananthapuram
1 Poovar Kayal 30.93 2 Poonthura Kayal 97.59 3 Veli Kayal 22.48 4 Kadinamkulam Kayal 346.88 5 Anchuthengu Kayal 521.75 6 Edava-Nadayara Kayal 157.65
TOTAL 1177.28
2 Kollam
1 Paravoor Kayal 662.46 2 Ashtamudi Kayal 6424.15 3 Kayamkulam Kayal 140.58
TOTAL 7227.19 3 Pathanamthitta Nil
4 Alappuzha
1 Kayamkulam 1511.75 2 Poomeen Kayal 3.37 3 Vadakkal Kayal 1.46 4 Chethi Kayal 4.11 5 Arthungal Kayal 5.96 6 Pozhichal Kayal 20.41 7 Vettakkalchal Kayal 27.1 8 Vembanattu Kayal 10661.23
TOTAL 12235.39
5 Kottayam 1 Vembanattu Kayal 2926.77
TOTAL 2926.77 6 Idukki Nil
7 Ernakulam 1 Vembanattu Kayal 2257.59 2 Kochi Kayal 7503.80
TOTAL 9761.69
8 Thrissur
1 Azhikode Kayal 82.02 2 Kodungalloor Kayal 613.81 3 Chettuva Kayal 713.87 4 Pattikkara Kayal - 5 Manakkady Kayal -
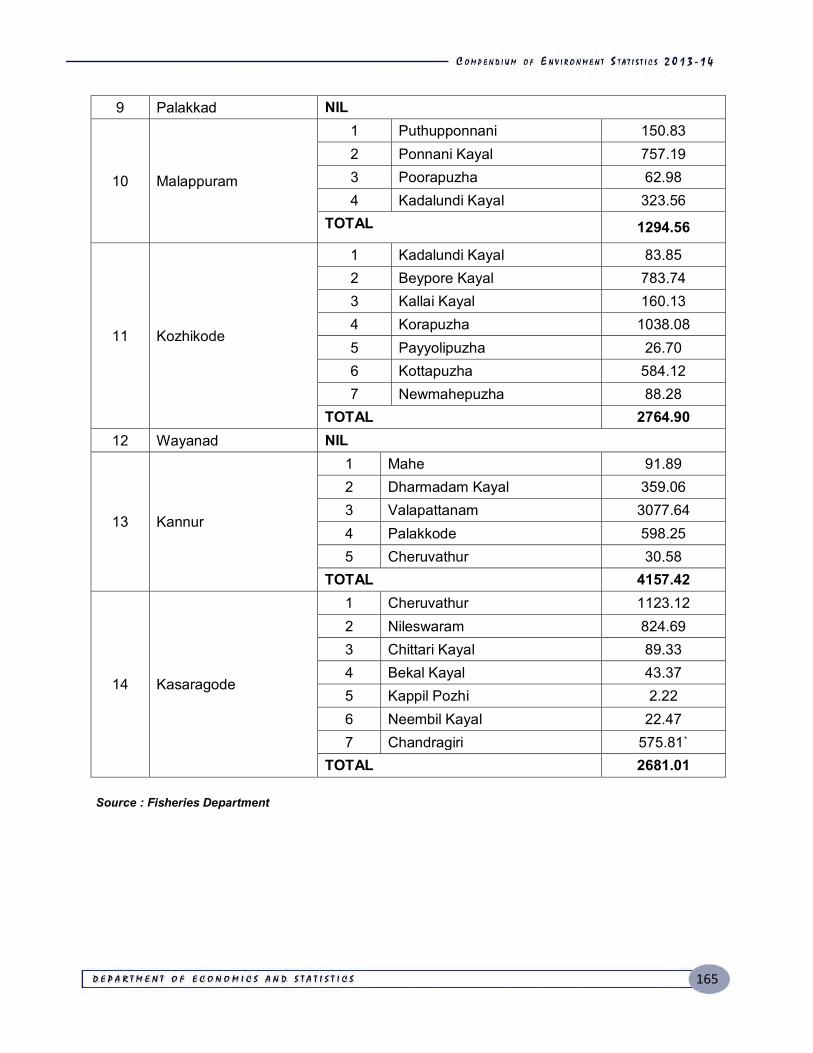
165
9 Palakkad NIL
10 Malappuram
1 Puthupponnani 150.83 2 Ponnani Kayal 757.19 3 Poorapuzha 62.98 4 Kadalundi Kayal 323.56
TOTAL 1294.56
11 Kozhikode
1 Kadalundi Kayal 83.85 2 Beypore Kayal 783.74 3 Kallai Kayal 160.13 4 Korapuzha 1038.08 5 Payyolipuzha 26.70 6 Kottapuzha 584.12 7 Newmahepuzha 88.28
TOTAL 2764.90 12 Wayanad NIL
13
Kannur
1 Mahe 91.89 2 Dharmadam Kayal 359.06 3 Valapattanam 3077.64 4 Palakkode 598.25 5 Cheruvathur 30.58
TOTAL 4157.42
14 Kasaragode
1 Cheruvathur 1123.12 2 Nileswaram 824.69 3 Chittari Kayal 89.33 4 Bekal Kayal 43.37 5 Kappil Pozhi 2.22 6 Neembil Kayal 22.47 7 Chandragiri 575.81`
TOTAL 2681.01 Source : Fisheries Department
166
Rain Water
India is home to an extraordinary variety of climatic regions, ranging from tropical in the
south to temperate and alpine in the Himalayan north, where elevated regions receive sustained
winter snowfall. The nation's climate is strongly influenced by the Himalayas and the Thar
Desert. The Himalayas, along with the Hindu Kush mountains in Pakistan, prevent cold Central
Asian katabatic winds from blowing in, keeping the bulk of the Indian subcontinent warmer than
most locations at similar latitudes. Simultaneously, the Thar Desert plays a role in attracting
moisture-laden southwest summer monsoon winds, that, between June and September, provide
the majority of India's rainfall. The rainfall in the country is mostly confined to four monsoon
months between June to September during which almost 80% of the total rainfall takes place.
Rainwater harvesting can enable households, factories, schools and offices to overcome
their problems of irregular and inadequate water supply or water supply of poor quality. The
process involves storing rainwater that falls within one’s premises and re-using it after basic
treatment. By using equipment that is easily available, rainwater is diverted towards existing
underground tanks or terrace fitted tanks and then supplied to the taps. The purification
methods can be used by households, factories and offices to treat rainwater. Treated rainwater
is safe not just for cleaning and washing but also for cooking and personal consumption. The
amount of rainfall notwithstanding, people living and working in various types of geographical
terrains can harvest rainwater. In the long run, rainwater harvesting can replenish India’s rapidly
depleting ground water levels, and lead to water security and sustainability.
Rivers
Out of the 44 rivers flowing through the State, 41originate from the Western Ghats
region on the east of the state and flow westward to join the Lakshadweep sea; The remaining
three rivers (Kabani, Bhavani and Paambar) originate from the Western Ghats and flows
towards the east and finally join the Bay of Bengal, after flowing through the neighbouring
States.
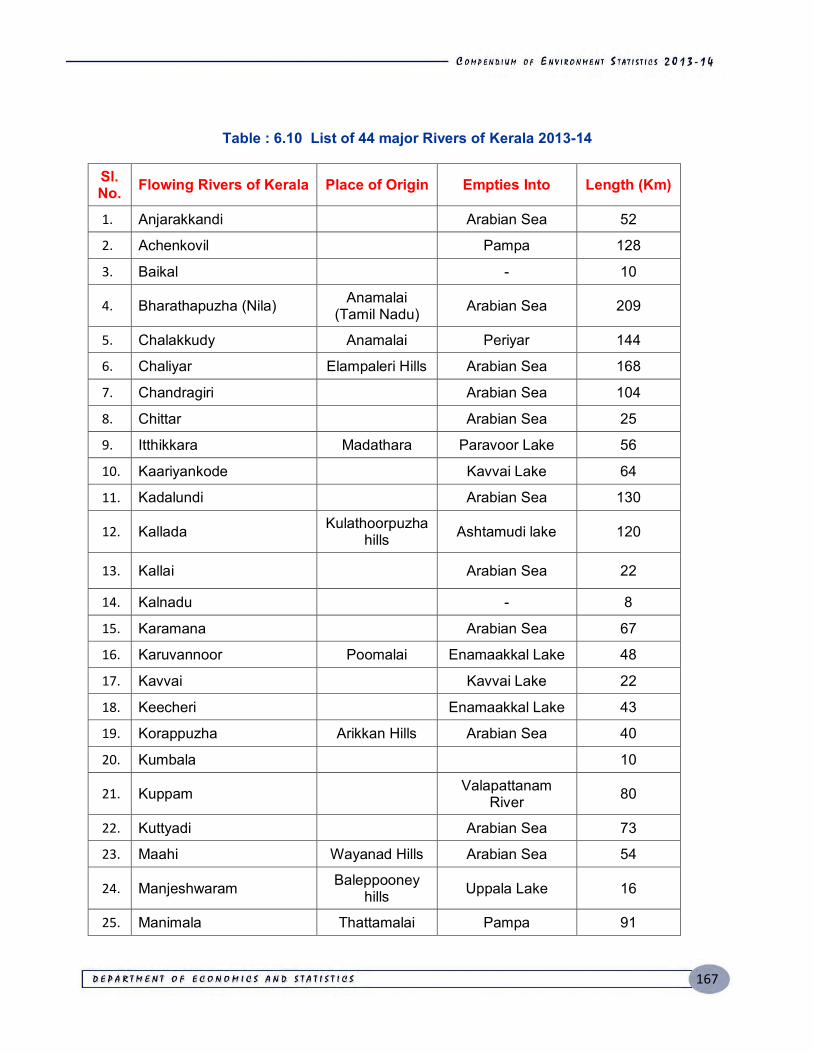
167
Table : 6.10 List of 44 major Rivers of Kerala 2013-14
Sl. No. Flowing Rivers of Kerala Place of Origin Empties Into Length (Km)
1. Anjarakkandi Arabian Sea 52
2. Achenkovil Pampa 128
3. Baikal - 10
4. Bharathapuzha (Nila) Anamalai (Tamil Nadu) Arabian Sea 209
5. Chalakkudy Anamalai Periyar 144
6. Chaliyar Elampaleri Hills Arabian Sea 168
7. Chandragiri Arabian Sea 104
8. Chittar Arabian Sea 25
9. Itthikkara Madathara Paravoor Lake 56
10. Kaariyankode Kavvai Lake 64
11. Kadalundi Arabian Sea 130
12. Kallada Kulathoorpuzha hills Ashtamudi lake 120
13. Kallai Arabian Sea 22
14. Kalnadu - 8
15. Karamana Arabian Sea 67
16. Karuvannoor Poomalai Enamaakkal Lake 48
17. Kavvai Kavvai Lake 22
18. Keecheri Enamaakkal Lake 43
19. Korappuzha Arikkan Hills Arabian Sea 40
20. Kumbala 10
21. Kuppam Valapattanam River 80
22. Kuttyadi Arabian Sea 73
23. Maahi Wayanad Hills Arabian Sea 54
24. Manjeshwaram Baleppooney hills Uppala Lake 16
25. Manimala Thattamalai Pampa 91
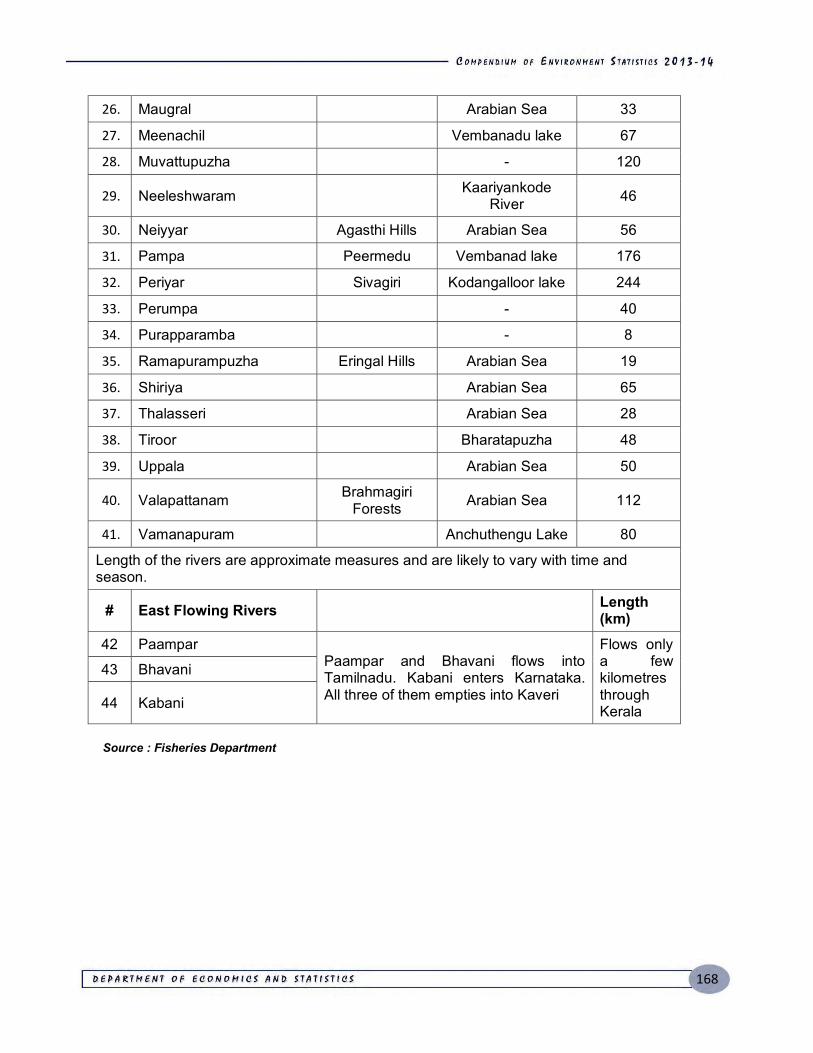
168
26. Maugral Arabian Sea 33
27. Meenachil Vembanadu lake 67
28. Muvattupuzha - 120
29. Neeleshwaram Kaariyankode River 46
30. Neiyyar Agasthi Hills Arabian Sea 56
31. Pampa Peermedu Vembanad lake 176
32. Periyar Sivagiri Kodangalloor lake 244
33. Perumpa - 40
34. Purapparamba - 8
35. Ramapurampuzha Eringal Hills Arabian Sea 19
36. Shiriya Arabian Sea 65
37. Thalasseri Arabian Sea 28
38. Tiroor Bharatapuzha 48
39. Uppala Arabian Sea 50
40. Valapattanam Brahmagiri Forests Arabian Sea 112
41. Vamanapuram Anchuthengu Lake 80
Length of the rivers are approximate measures and are likely to vary with time and season.
# East Flowing Rivers Length (km)
42 Paampar Paampar and Bhavani flows into Tamilnadu. Kabani enters Karnataka. All three of them empties into Kaveri
Flows only a few kilometres through Kerala
43 Bhavani
44 Kabani
Source : Fisheries Department
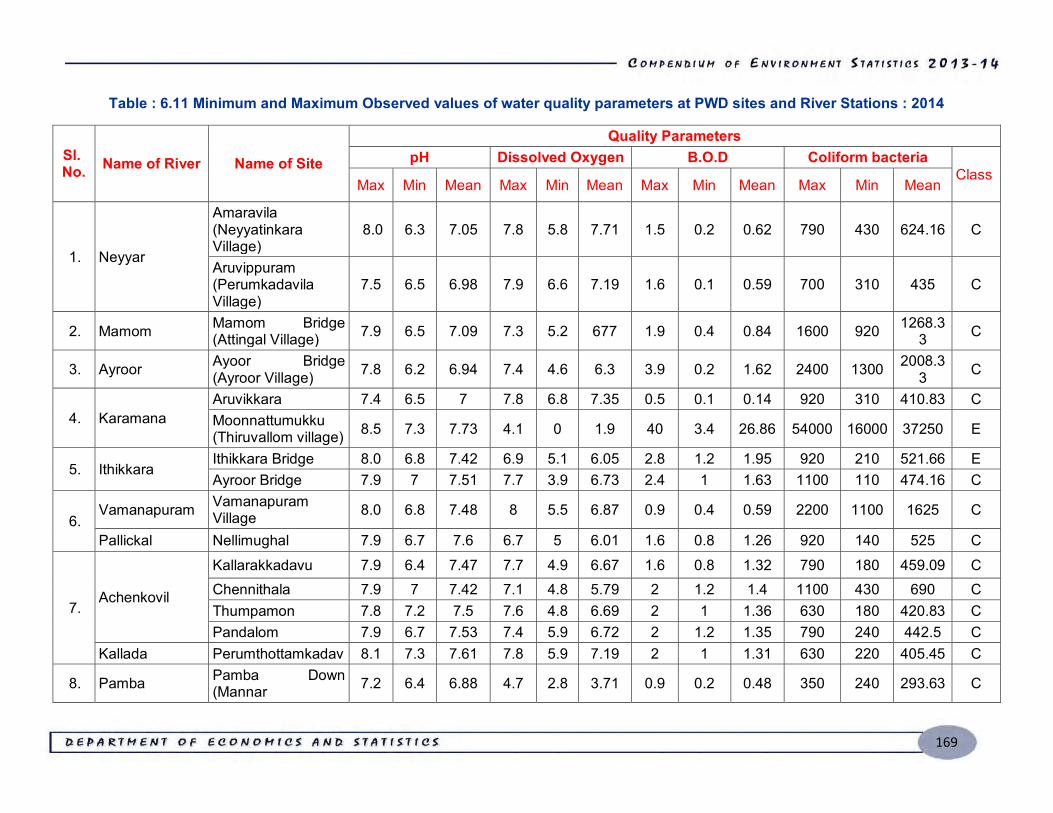
169
Table : 6.11 Minimum and Maximum Observed values of water quality parameters at PWD sites and River Stations : 2014
Sl. No. Name of River Name of Site
Quality Parameters pH Dissolved Oxygen B.O.D Coliform bacteria
Class Max Min Mean Max Min Mean Max Min Mean Max Min Mean
1. Neyyar
Amaravila (Neyyatinkara Village)
8.0 6.3 7.05 7.8 5.8 7.71 1.5 0.2 0.62 790 430 624.16 C
Aruvippuram (Perumkadavila Village)
7.5 6.5 6.98 7.9 6.6 7.19 1.6 0.1 0.59 700 310 435 C
2. Mamom Mamom Bridge (Attingal Village) 7.9 6.5 7.09 7.3 5.2 677 1.9 0.4 0.84 1600 920 1268.3
3 C
3. Ayroor Ayoor Bridge (Ayroor Village) 7.8 6.2 6.94 7.4 4.6 6.3 3.9 0.2 1.62 2400 1300 2008.3
3 C
4. Karamana Aruvikkara 7.4 6.5 7 7.8 6.8 7.35 0.5 0.1 0.14 920 310 410.83 C Moonnattumukku (Thiruvallom village) 8.5 7.3 7.73 4.1 0 1.9 40 3.4 26.86 54000 16000 37250 E
5. Ithikkara Ithikkara Bridge 8.0 6.8 7.42 6.9 5.1 6.05 2.8 1.2 1.95 920 210 521.66 E Ayroor Bridge 7.9 7 7.51 7.7 3.9 6.73 2.4 1 1.63 1100 110 474.16 C
6. Vamanapuram Vamanapuram
Village 8.0 6.8 7.48 8 5.5 6.87 0.9 0.4 0.59 2200 1100 1625 C
Pallickal Nellimughal 7.9 6.7 7.6 6.7 5 6.01 1.6 0.8 1.26 920 140 525 C
7. Achenkovil
Kallarakkadavu 7.9 6.4 7.47 7.7 4.9 6.67 1.6 0.8 1.32 790 180 459.09 C Chennithala 7.9 7 7.42 7.1 4.8 5.79 2 1.2 1.4 1100 430 690 C Thumpamon 7.8 7.2 7.5 7.6 4.8 6.69 2 1 1.36 630 180 420.83 C Pandalom 7.9 6.7 7.53 7.4 5.9 6.72 2 1.2 1.35 790 240 442.5 C
Kallada Perumthottamkadav 8.1 7.3 7.61 7.8 5.9 7.19 2 1 1.31 630 220 405.45 C
8. Pamba Pamba Down (Mannar 7.2 6.4 6.88 4.7 2.8 3.71 0.9 0.2 0.48 350 240 293.63 C
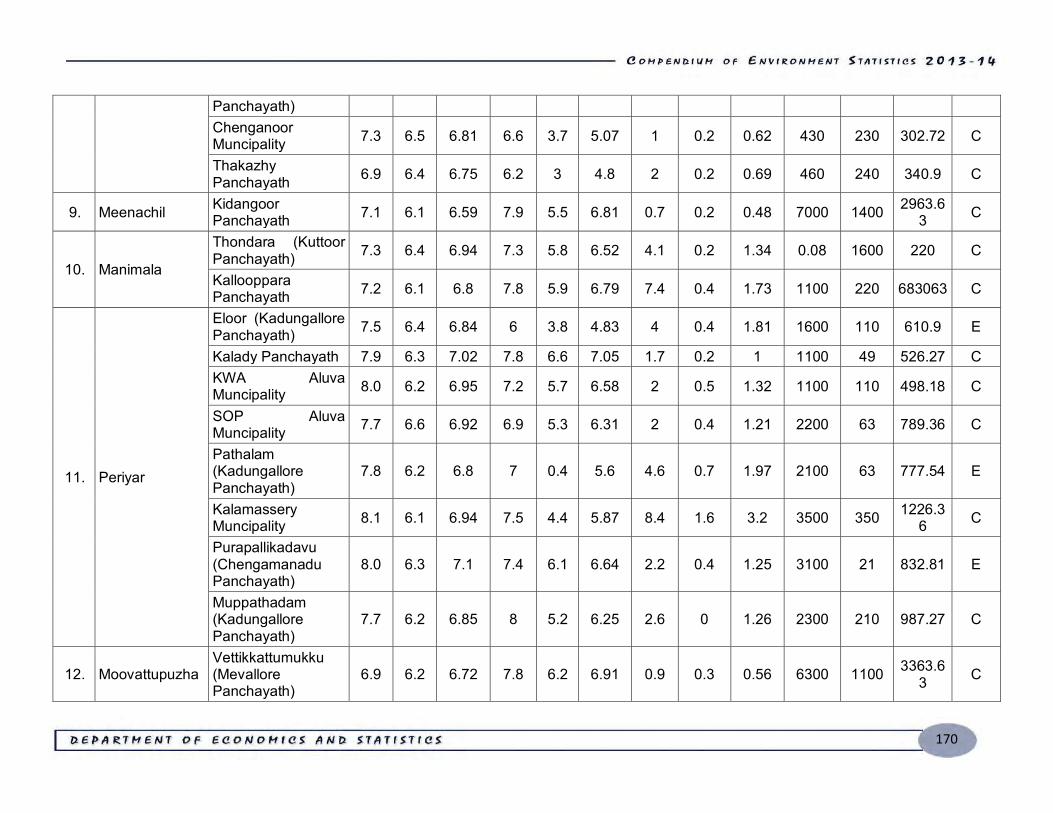
170
Panchayath) Chenganoor Muncipality 7.3 6.5 6.81 6.6 3.7 5.07 1 0.2 0.62 430 230 302.72 C
Thakazhy Panchayath 6.9 6.4 6.75 6.2 3 4.8 2 0.2 0.69 460 240 340.9 C
9. Meenachil Kidangoor Panchayath 7.1 6.1 6.59 7.9 5.5 6.81 0.7 0.2 0.48 7000 1400 2963.6
3 C
10. Manimala
Thondara (Kuttoor Panchayath) 7.3 6.4 6.94 7.3 5.8 6.52 4.1 0.2 1.34 0.08 1600 220 C
Kallooppara Panchayath 7.2 6.1 6.8 7.8 5.9 6.79 7.4 0.4 1.73 1100 220 683063 C
11. Periyar
Eloor (Kadungallore Panchayath) 7.5 6.4 6.84 6 3.8 4.83 4 0.4 1.81 1600 110 610.9 E
Kalady Panchayath 7.9 6.3 7.02 7.8 6.6 7.05 1.7 0.2 1 1100 49 526.27 C KWA Aluva Muncipality 8.0 6.2 6.95 7.2 5.7 6.58 2 0.5 1.32 1100 110 498.18 C
SOP Aluva Muncipality 7.7 6.6 6.92 6.9 5.3 6.31 2 0.4 1.21 2200 63 789.36 C
Pathalam (Kadungallore Panchayath)
7.8 6.2 6.8 7 0.4 5.6 4.6 0.7 1.97 2100 63 777.54 E
Kalamassery Muncipality 8.1 6.1 6.94 7.5 4.4 5.87 8.4 1.6 3.2 3500 350 1226.3
6 C
Purapallikadavu (Chengamanadu Panchayath)
8.0 6.3 7.1 7.4 6.1 6.64 2.2 0.4 1.25 3100 21 832.81 E
Muppathadam (Kadungallore Panchayath)
7.7 6.2 6.85 8 5.2 6.25 2.6 0 1.26 2300 210 987.27 C
12. Moovattupuzha Vettikkattumukku (Mevallore Panchayath)
6.9 6.2 6.72 7.8 6.2 6.91 0.9 0.3 0.56 6300 1100 3363.63 C
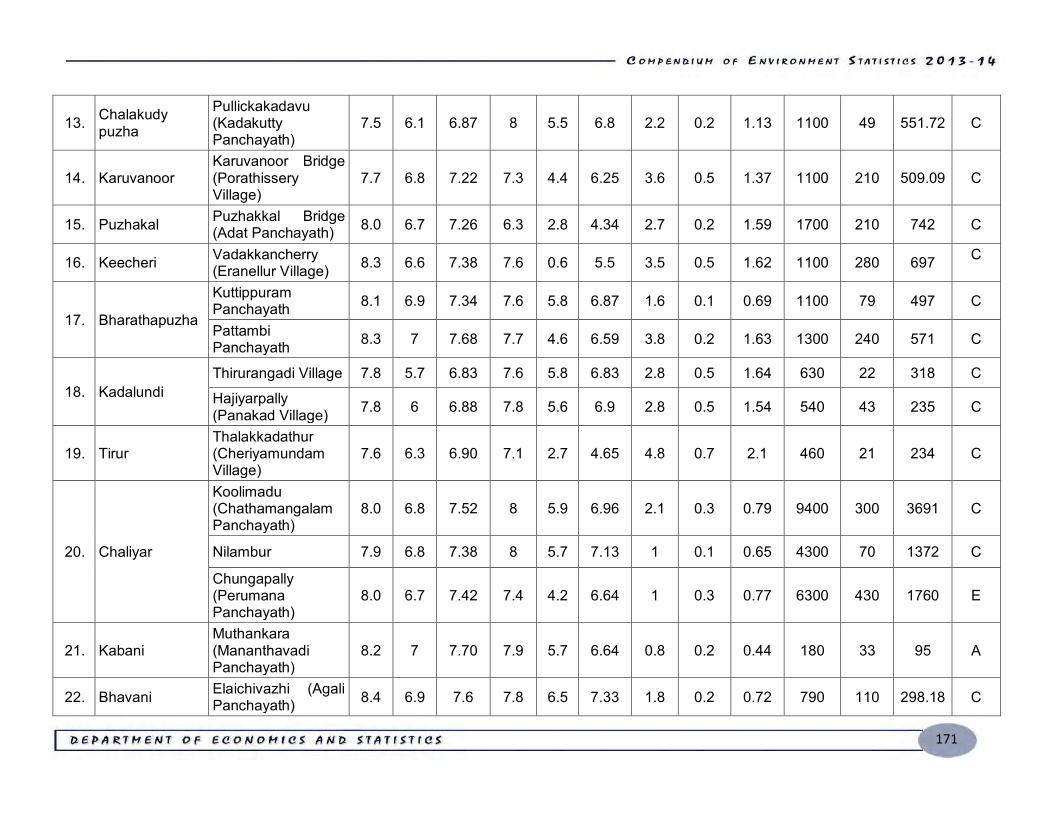
171
13. Chalakudy puzha
Pullickakadavu (Kadakutty Panchayath)
7.5 6.1 6.87 8 5.5 6.8 2.2 0.2 1.13 1100 49 551.72 C
14. Karuvanoor Karuvanoor Bridge (Porathissery Village)
7.7 6.8 7.22 7.3 4.4 6.25 3.6 0.5 1.37 1100 210 509.09 C
15. Puzhakal Puzhakkal Bridge (Adat Panchayath) 8.0 6.7 7.26 6.3 2.8 4.34 2.7 0.2 1.59 1700 210 742 C
16. Keecheri Vadakkancherry (Eranellur Village) 8.3 6.6 7.38 7.6 0.6 5.5 3.5 0.5 1.62 1100 280 697 C
17. Bharathapuzha
Kuttippuram Panchayath 8.1 6.9 7.34 7.6 5.8 6.87 1.6 0.1 0.69 1100 79 497 C
Pattambi Panchayath 8.3 7 7.68 7.7 4.6 6.59 3.8 0.2 1.63 1300 240 571 C
18. Kadalundi Thirurangadi Village 7.8 5.7 6.83 7.6 5.8 6.83 2.8 0.5 1.64 630 22 318 C
Hajiyarpally (Panakad Village) 7.8 6 6.88 7.8 5.6 6.9 2.8 0.5 1.54 540 43 235 C
19. Tirur Thalakkadathur (Cheriyamundam Village)
7.6 6.3 6.90 7.1 2.7 4.65 4.8 0.7 2.1 460 21 234 C
20. Chaliyar
Koolimadu (Chathamangalam Panchayath)
8.0 6.8 7.52 8 5.9 6.96 2.1 0.3 0.79 9400 300 3691 C
Nilambur 7.9 6.8 7.38 8 5.7 7.13 1 0.1 0.65 4300 70 1372 C
Chungapally (Perumana Panchayath)
8.0 6.7 7.42 7.4 4.2 6.64 1 0.3 0.77 6300 430 1760 E
21. Kabani Muthankara (Mananthavadi Panchayath)
8.2 7 7.70 7.9 5.7 6.64 0.8 0.2 0.44 180 33 95 A
22. Bhavani Elaichivazhi (Agali Panchayath) 8.4 6.9 7.6 7.8 6.5 7.33 1.8 0.2 0.72 790 110 298.18 C
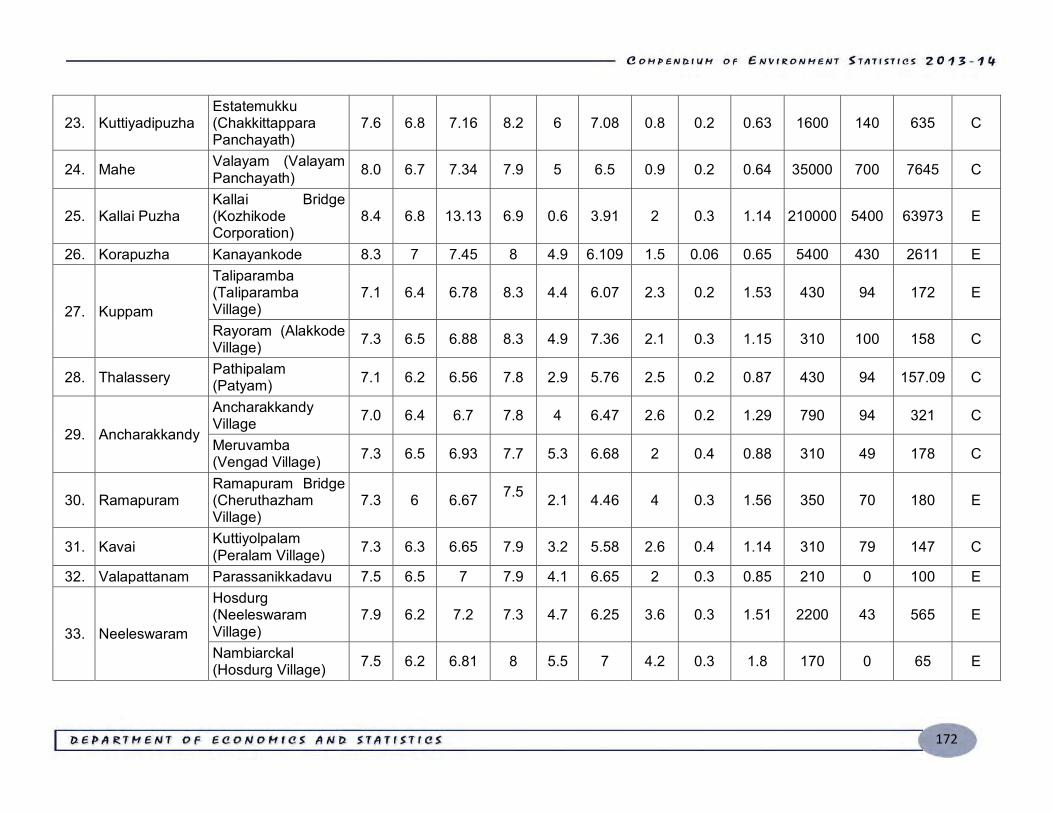
172
23. Kuttiyadipuzha Estatemukku (Chakkittappara Panchayath)
7.6 6.8 7.16 8.2 6 7.08 0.8 0.2 0.63 1600 140 635 C
24. Mahe Valayam (Valayam Panchayath) 8.0 6.7 7.34 7.9 5 6.5 0.9 0.2 0.64 35000 700 7645 C
25. Kallai Puzha Kallai Bridge (Kozhikode Corporation)
8.4 6.8 13.13 6.9 0.6 3.91 2 0.3 1.14 210000 5400 63973 E
26. Korapuzha Kanayankode 8.3 7 7.45 8 4.9 6.109 1.5 0.06 0.65 5400 430 2611 E
27. Kuppam
Taliparamba (Taliparamba Village)
7.1 6.4 6.78 8.3 4.4 6.07 2.3 0.2 1.53 430 94 172 E
Rayoram (Alakkode Village) 7.3 6.5 6.88 8.3 4.9 7.36 2.1 0.3 1.15 310 100 158 C
28. Thalassery Pathipalam (Patyam) 7.1 6.2 6.56 7.8 2.9 5.76 2.5 0.2 0.87 430 94 157.09 C
29. Ancharakkandy
Ancharakkandy Village 7.0 6.4 6.7 7.8 4 6.47 2.6 0.2 1.29 790 94 321 C
Meruvamba (Vengad Village) 7.3 6.5 6.93 7.7 5.3 6.68 2 0.4 0.88 310 49 178 C
30. Ramapuram Ramapuram Bridge (Cheruthazham Village)
7.3 6 6.67 7.5 2.1 4.46 4 0.3 1.56 350 70 180 E
31. Kavai Kuttiyolpalam (Peralam Village) 7.3 6.3 6.65 7.9 3.2 5.58 2.6 0.4 1.14 310 79 147 C
32. Valapattanam Parassanikkadavu 7.5 6.5 7 7.9 4.1 6.65 2 0.3 0.85 210 0 100 E
33. Neeleswaram
Hosdurg (Neeleswaram Village)
7.9 6.2 7.2 7.3 4.7 6.25 3.6 0.3 1.51 2200 43 565 E
Nambiarckal (Hosdurg Village) 7.5 6.2 6.81 8 5.5 7 4.2 0.3 1.8 170 0 65 E
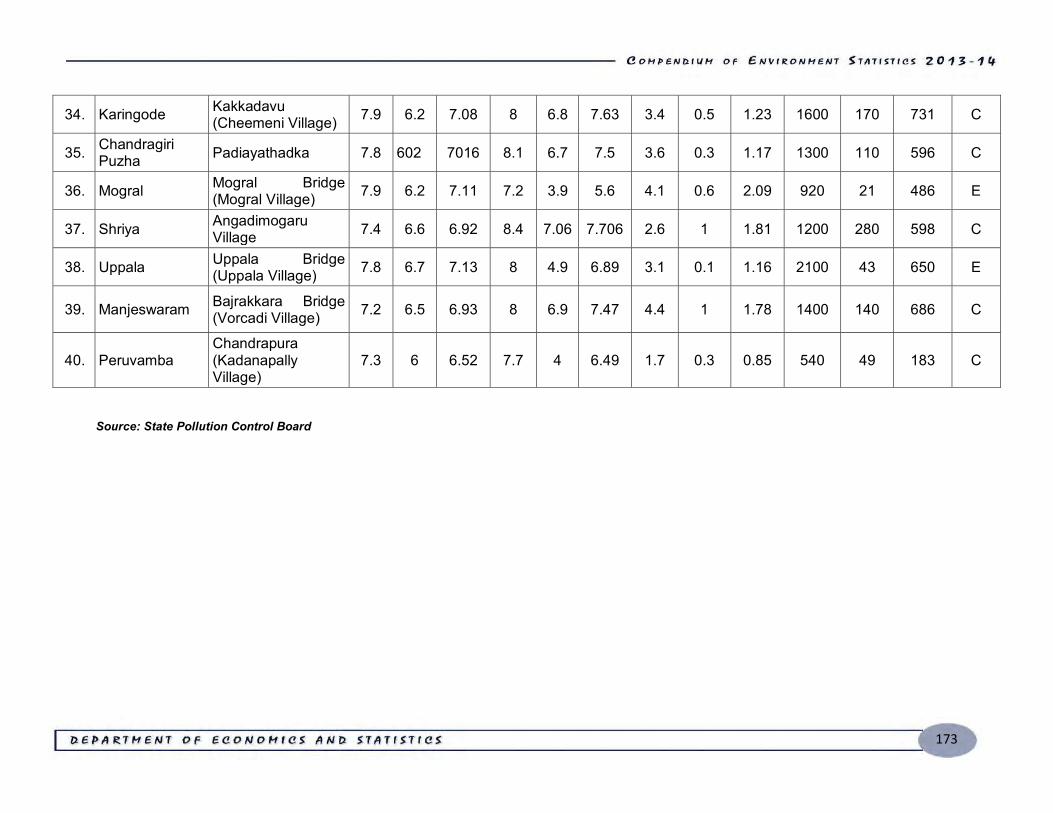
173
34. Karingode Kakkadavu (Cheemeni Village) 7.9 6.2 7.08 8 6.8 7.63 3.4 0.5 1.23 1600 170 731 C
35. Chandragiri Puzha Padiayathadka 7.8 602 7016 8.1 6.7 7.5 3.6 0.3 1.17 1300 110 596 C
36. Mogral Mogral Bridge (Mogral Village) 7.9 6.2 7.11 7.2 3.9 5.6 4.1 0.6 2.09 920 21 486 E
37. Shriya Angadimogaru Village 7.4 6.6 6.92 8.4 7.06 7.706 2.6 1 1.81 1200 280 598 C
38. Uppala Uppala Bridge (Uppala Village) 7.8 6.7 7.13 8 4.9 6.89 3.1 0.1 1.16 2100 43 650 E
39. Manjeswaram Bajrakkara Bridge (Vorcadi Village) 7.2 6.5 6.93 8 6.9 7.47 4.4 1 1.78 1400 140 686 C
40. Peruvamba Chandrapura (Kadanapally Village)
7.3 6 6.52 7.7 4 6.49 1.7 0.3 0.85 540 49 183 C
Source: State Pollution Control Board
174
Watersheds
A watershed is a georgraphical area that drains to a common point, which makes it an
ideal unit of conservation of soil and water. Micro Watershed in the Grama Panchayat are
chosen for easy administration. It is a logical unit for planning in the three tier system of Local
Self Government and optimum development of the “resource trinity” namely land, water and
biomass. It may extend over a Grama Panchayat or several Panchayts, contain both arable and
non-arable lands, various categories of land-holdings and farmers whose action may impact on
each other’s interest. In those Watersheds extending beyond a Grama Panchayat, the
Panchayat having major area in the Watershed will be the Programme Implementing Agency.
The Programme Implementing Agency should arrange collection and compilation of baseline
data on land use pattern, cropping pattern, productivity of important crops, water level of wells
and ponds, socio-economic data of watershed population etc. before starting any intervention in
the project area. The water shed development programme taken up in the State through the
Western Ghats Development Programme (WGDP) with the financial support of Government of
India is given in table 6.12. The basic intentions of the programme is to preserve the natural
resources with the judicious use of resources and conservation methods. Other agencies like
soil conservation Department and Rural Development Department also implementing various
schemes and programmes for watershed based development programmes.
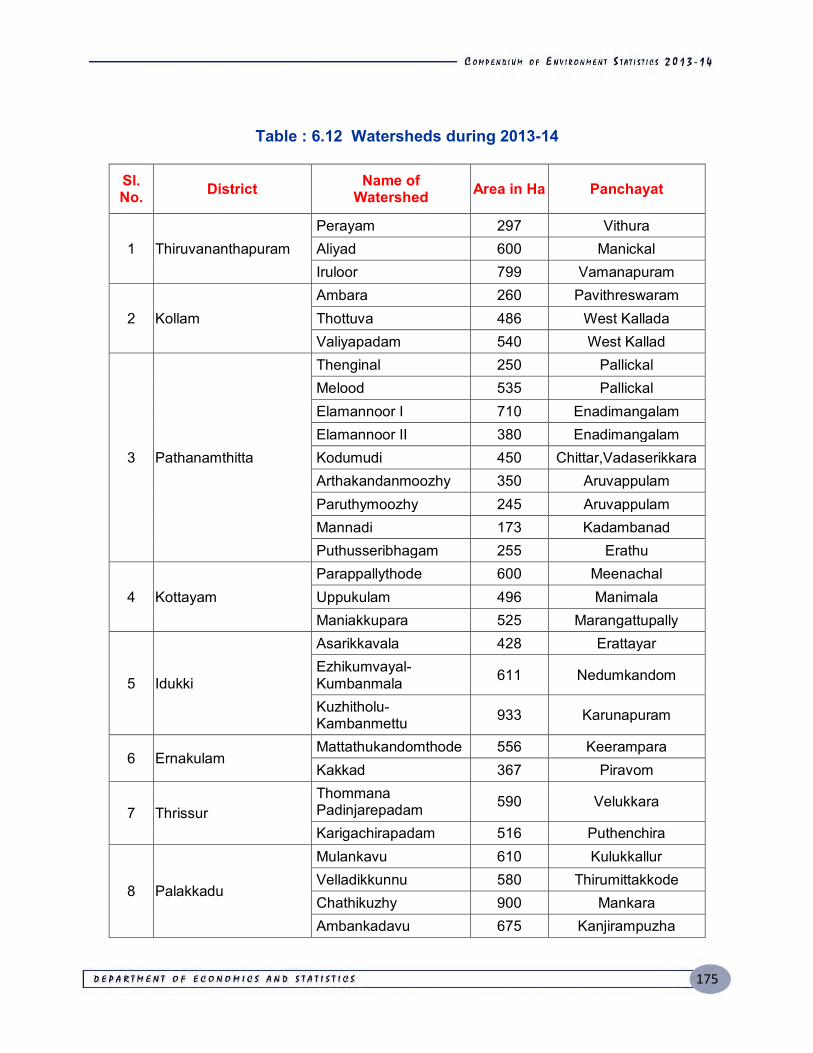
175
Table : 6.12 Watersheds during 2013-14
Sl. No. District Name of
Watershed Area in Ha Panchayat
1 Thiruvananthapuram Perayam 297 Vithura Aliyad 600 Manickal Iruloor 799 Vamanapuram
2 Kollam Ambara 260 Pavithreswaram Thottuva 486 West Kallada Valiyapadam 540 West Kallad
3 Pathanamthitta
Thenginal 250 Pallickal Melood 535 Pallickal Elamannoor I 710 Enadimangalam Elamannoor II 380 Enadimangalam Kodumudi 450 Chittar,Vadaserikkara Arthakandanmoozhy 350 Aruvappulam Paruthymoozhy 245 Aruvappulam Mannadi 173 Kadambanad Puthusseribhagam 255 Erathu
4 Kottayam Parappallythode 600 Meenachal Uppukulam 496 Manimala Maniakkupara 525 Marangattupally
5 Idukki
Asarikkavala 428 Erattayar Ezhikumvayal- Kumbanmala 611 Nedumkandom
Kuzhitholu-Kambanmettu 933 Karunapuram
6 Ernakulam Mattathukandomthode 556 Keerampara Kakkad 367 Piravom
7 Thrissur Thommana Padinjarepadam 590 Velukkara
Karigachirapadam 516 Puthenchira
8 Palakkadu
Mulankavu 610 Kulukkallur Velladikkunnu 580 Thirumittakkode Chathikuzhy 900 Mankara Ambankadavu 675 Kanjirampuzha
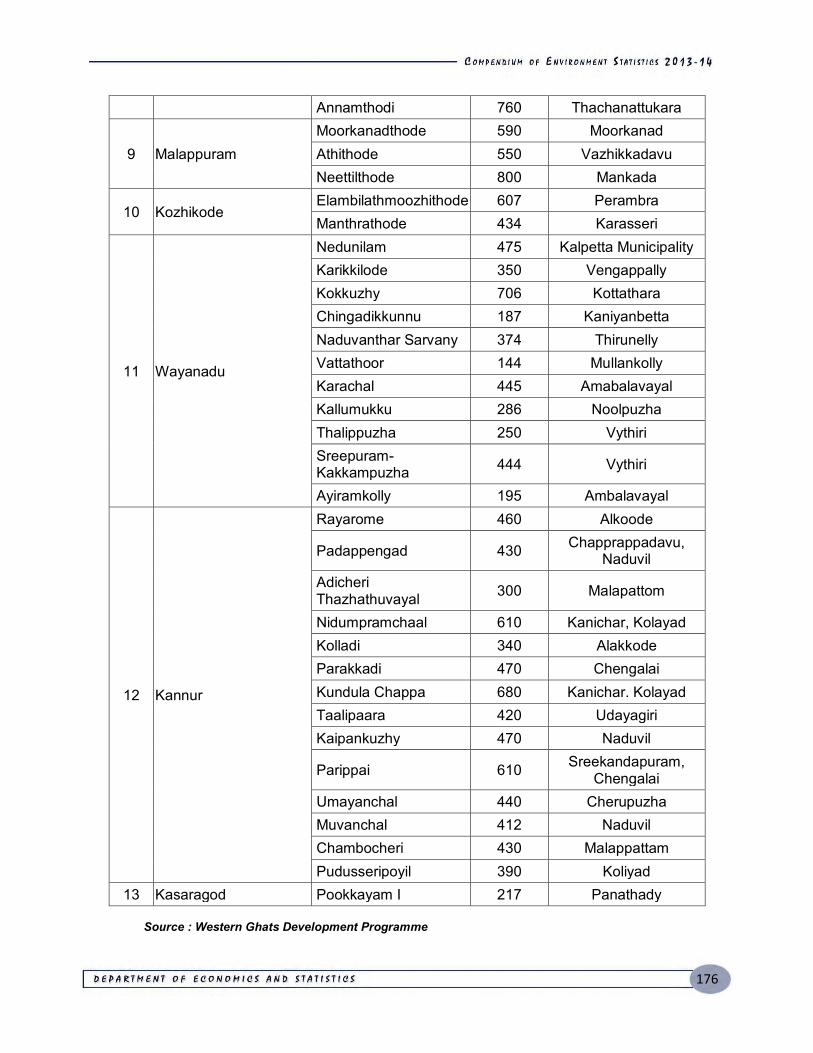
176
Annamthodi 760 Thachanattukara
9 Malappuram Moorkanadthode 590 Moorkanad Athithode 550 Vazhikkadavu Neettilthode 800 Mankada
10 Kozhikode Elambilathmoozhithode 607 Perambra Manthrathode 434 Karasseri
11 Wayanadu
Nedunilam 475 Kalpetta Municipality Karikkilode 350 Vengappally Kokkuzhy 706 Kottathara Chingadikkunnu 187 Kaniyanbetta Naduvanthar Sarvany 374 Thirunelly Vattathoor 144 Mullankolly Karachal 445 Amabalavayal Kallumukku 286 Noolpuzha Thalippuzha 250 Vythiri Sreepuram-Kakkampuzha 444 Vythiri
Ayiramkolly 195 Ambalavayal
12 Kannur
Rayarome 460 Alkoode
Padappengad 430 Chapprappadavu, Naduvil
Adicheri Thazhathuvayal 300 Malapattom
Nidumpramchaal 610 Kanichar, Kolayad Kolladi 340 Alakkode Parakkadi 470 Chengalai Kundula Chappa 680 Kanichar. Kolayad Taalipaara 420 Udayagiri Kaipankuzhy 470 Naduvil
Parippai 610 Sreekandapuram, Chengalai
Umayanchal 440 Cherupuzha Muvanchal 412 Naduvil Chambocheri 430 Malappattam Pudusseripoyil 390 Koliyad
13 Kasaragod Pookkayam I 217 Panathady
Source : Western Ghats Development Programme
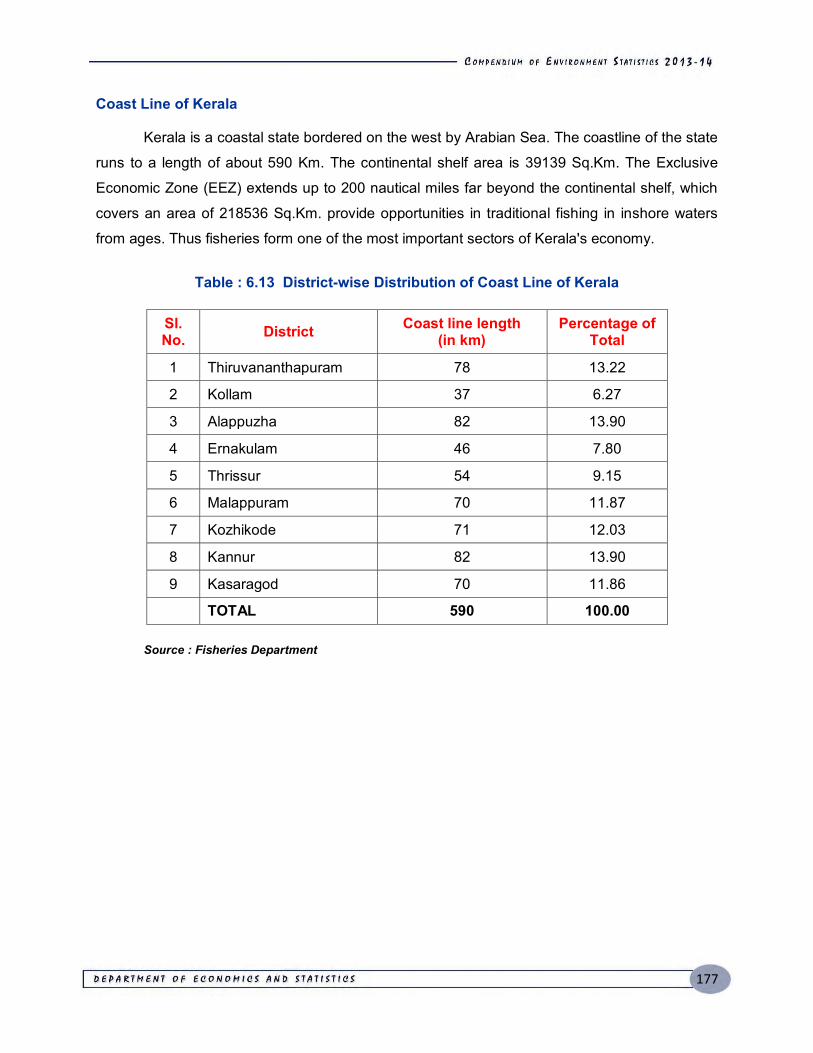
177
Coast Line of Kerala
Kerala is a coastal state bordered on the west by Arabian Sea. The coastline of the state
runs to a length of about 590 Km. The continental shelf area is 39139 Sq.Km. The Exclusive
Economic Zone (EEZ) extends up to 200 nautical miles far beyond the continental shelf, which
covers an area of 218536 Sq.Km. provide opportunities in traditional fishing in inshore waters
from ages. Thus fisheries form one of the most important sectors of Kerala's economy.
Table : 6.13 District-wise Distribution of Coast Line of Kerala
Sl. No. District Coast line length
(in km) Percentage of
Total
1 Thiruvananthapuram 78 13.22
2 Kollam 37 6.27
3 Alappuzha 82 13.90
4 Ernakulam 46 7.80
5 Thrissur 54 9.15
6 Malappuram 70 11.87
7 Kozhikode 71 12.03
8 Kannur 82 13.90
9 Kasaragod 70 11.86
TOTAL 590 100.00 Source : Fisheries Department
178
Water Supply
Kerala water authority is an autonomous authority established for the development and
regulation of water supply and waste water collection and disposal. Kerala Water Authority is
the largest entity in the field of water supply and implemented thousands of small, medium and
large urban and rural piped water supply schemes. The interaction between water and human
health are indeed complex. Access to safe drinking water is a recognised Universal human
need. Kerala Water Authority came into existence on Ist April 1984. Government of Kerala
thousand of water supply schemes were implemented under the Panchayat System as well.
The State also gets rain from the North-East monsoon during October to December and the
South west monsoon during May to June. In early period the rural household for domestic water
supply depends are traditional ground water system and rarely use piped water supply system
and early used pipe water system.
With the high density of population, Industrialisation and rapid urbanisation on the one
hard and the impact of climate change the availability of different user groups on the other
climate condition of the earth has been changing over the few year. This will affect the weather
condition of Kerala.
Ground Water
Ground water is one among the nations most important natural resources. Groundwater
has been the main stay for meeting the domestic needs of more than 80 % of rural and 50% of
urban population. The ground water level receding drastically during the summer months and
drying up of wells are common features of the ground water levels in many parts of Kerala. The
availability of the ground water level between the post and one monsoon levels varies widely.
Kerala water authority is a autonomous authority established for the development and regulation
of water supply and waste water collection and disposal. The National Water policy of the Govt.
of India states that the non conventional method for utilisation of water such a through artificial
recharge of ground water and traditional water conservation practices like rain water harvesting
need to be practised to increase the utilisable water resources. In the past we used to depend
more on surface water sources like rivers ponds and streams. But with depletion of water
bodies due to extremes summer and other factors the peoples shifted our focus to ground
water.
179
Jalanidhi Project
Jalanidhi is a project of Kerala Rural Water Supply Authority (KRWSA) which is aided by
World Bank. The World Bank aided Jalanidhi scheme for rural water supply. It aims to assist
Govt of Kerala in improving the quality of rural water supply and delivery of environmental
sanitation services to achieve sustainability of investment. The KRWSA was launched as a
nodal agency to facilitate the implementation of rural water supply systems. Jalanidhi – I Project
completed during the year 2000-08 with the cost of Rs.381.50 crores had completed 3705 water
supply schemes covering 112 Grama panchayaths. Consequent to the successful
implementation of Jalanidhi-I, Govt of Kerala has decided to implement Jalanidhi -2 with world
bank support Jalanidhi projects covers 112 Grama Panchayaths from all districts of Kerala.
Jalanidhi I & II water supply connection provided in domestic and non domestic
purposes, 195928 and 175 connection respectively.
Dug wells are unlined boreholes and used for maximum height of free water over intake
length. Piezometers are line bore holes used for measuring pressure of free water at intake
depth. On the analysis of date related to ground water, the total number of dug wells is 428 but
piezometers are 426. Kasargode has highest dug well at rate of 9%, but piezometers has
highest in Thiruvananthapuram at rate of 10%.
KWA implement many schemes related to drinking water in the state. Schemes are
divided into 2 streams namely urban water supply and rural water supply. Rural water supply
schemes included multi Panchayath and single Panchayath. In rural water supply schemes
,single panchayath has 1067 connections . It is comparatively higher than multi Panchayath
schemes and urban water supply schemes.
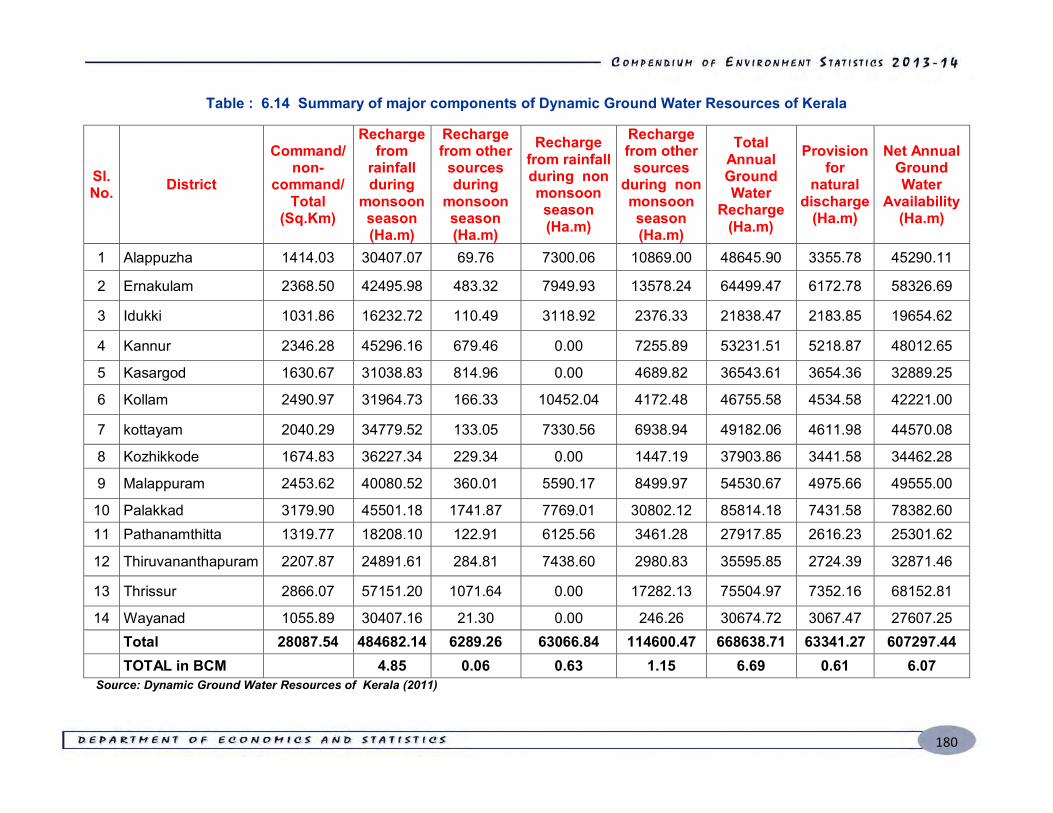
180
Table : 6.14 Summary of major components of Dynamic Ground Water Resources of Kerala
Sl. No. District
Command/ non-
command/ Total
(Sq.Km)
Recharge from
rainfall during
monsoon season (Ha.m)
Recharge from other
sources during
monsoon season (Ha.m)
Recharge from rainfall during non monsoon season (Ha.m)
Recharge from other
sources during non monsoon season (Ha.m)
Total Annual Ground Water
Recharge (Ha.m)
Provision for
natural discharge
(Ha.m)
Net Annual Ground Water
Availability (Ha.m)
1 Alappuzha 1414.03 30407.07 69.76 7300.06 10869.00 48645.90 3355.78 45290.11
2 Ernakulam 2368.50 42495.98 483.32 7949.93 13578.24 64499.47 6172.78 58326.69
3 Idukki 1031.86 16232.72 110.49 3118.92 2376.33 21838.47 2183.85 19654.62
4 Kannur 2346.28 45296.16 679.46 0.00 7255.89 53231.51 5218.87 48012.65
5 Kasargod 1630.67 31038.83 814.96 0.00 4689.82 36543.61 3654.36 32889.25
6 Kollam 2490.97 31964.73 166.33 10452.04 4172.48 46755.58 4534.58 42221.00
7 kottayam 2040.29 34779.52 133.05 7330.56 6938.94 49182.06 4611.98 44570.08
8 Kozhikkode 1674.83 36227.34 229.34 0.00 1447.19 37903.86 3441.58 34462.28
9 Malappuram 2453.62 40080.52 360.01 5590.17 8499.97 54530.67 4975.66 49555.00
10 Palakkad 3179.90 45501.18 1741.87 7769.01 30802.12 85814.18 7431.58 78382.60 11 Pathanamthitta 1319.77 18208.10 122.91 6125.56 3461.28 27917.85 2616.23 25301.62
12 Thiruvananthapuram 2207.87 24891.61 284.81 7438.60 2980.83 35595.85 2724.39 32871.46
13 Thrissur 2866.07 57151.20 1071.64 0.00 17282.13 75504.97 7352.16 68152.81
14 Wayanad 1055.89 30407.16 21.30 0.00 246.26 30674.72 3067.47 27607.25 Total 28087.54 484682.14 6289.26 63066.84 114600.47 668638.71 63341.27 607297.44 TOTAL in BCM 4.85 0.06 0.63 1.15 6.69 0.61 6.07
Source: Dynamic Ground Water Resources of Kerala (2011)
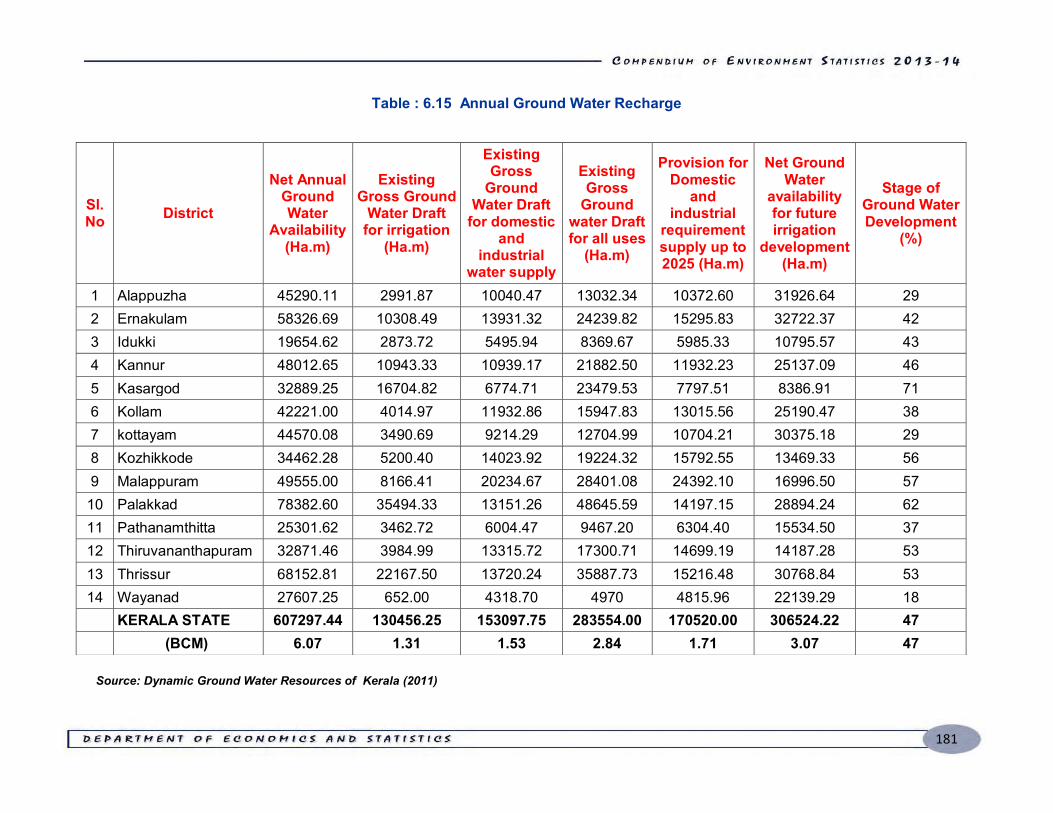
181
Table : 6.15 Annual Ground Water Recharge
Source: Dynamic Ground Water Resources of Kerala (2011)
Sl. No District
Net Annual Ground Water
Availability (Ha.m)
Existing Gross Ground
Water Draft for irrigation
(Ha.m)
Existing Gross
Ground Water Draft
for domestic and
industrial water supply
Existing Gross
Ground water Draft for all uses
(Ha.m)
Provision for Domestic
and industrial
requirement supply up to 2025 (Ha.m)
Net Ground Water
availability for future irrigation
development (Ha.m)
Stage of Ground Water Development
(%)
1 Alappuzha 45290.11 2991.87 10040.47 13032.34 10372.60 31926.64 29 2 Ernakulam 58326.69 10308.49 13931.32 24239.82 15295.83 32722.37 42 3 Idukki 19654.62 2873.72 5495.94 8369.67 5985.33 10795.57 43 4 Kannur 48012.65 10943.33 10939.17 21882.50 11932.23 25137.09 46 5 Kasargod 32889.25 16704.82 6774.71 23479.53 7797.51 8386.91 71 6 Kollam 42221.00 4014.97 11932.86 15947.83 13015.56 25190.47 38 7 kottayam 44570.08 3490.69 9214.29 12704.99 10704.21 30375.18 29 8 Kozhikkode 34462.28 5200.40 14023.92 19224.32 15792.55 13469.33 56 9 Malappuram 49555.00 8166.41 20234.67 28401.08 24392.10 16996.50 57 10 Palakkad 78382.60 35494.33 13151.26 48645.59 14197.15 28894.24 62 11 Pathanamthitta 25301.62 3462.72 6004.47 9467.20 6304.40 15534.50 37 12 Thiruvananthapuram 32871.46 3984.99 13315.72 17300.71 14699.19 14187.28 53 13 Thrissur 68152.81 22167.50 13720.24 35887.73 15216.48 30768.84 53 14 Wayanad 27607.25 652.00 4318.70 4970 4815.96 22139.29 18 KERALA STATE 607297.44 130456.25 153097.75 283554.00 170520.00 306524.22 47 (BCM) 6.07 1.31 1.53 2.84 1.71 3.07 47

182
Table : 6.16 Ground Water Monitoring Wells in Kerala
Sl. No. Districts
No. of GWMW
Dug Wells Piezometers Total
1 Thiruvananthapuram 31 41 72
2 Kollam 25 30 55
3 Pathanamthitta 17 30 47
4 Alappuzha 29 40 69
5 Kottayam 23 29 52
6 Idukki 22 25 47
7 Ernakulam 39 25 64
8 Thrissur 31 37 68
9 Palakkadu 31 37 68
10 Malappuram 28 30 58
11 Kozhikode 34 34 68 12 Wayanadu 25 19 44 13 Kannur 39 28 67
14 Kasargode 49 21 70
TOTAL 423 426 849
Source: Dynamic Ground Water Resources of Kerala (2011)
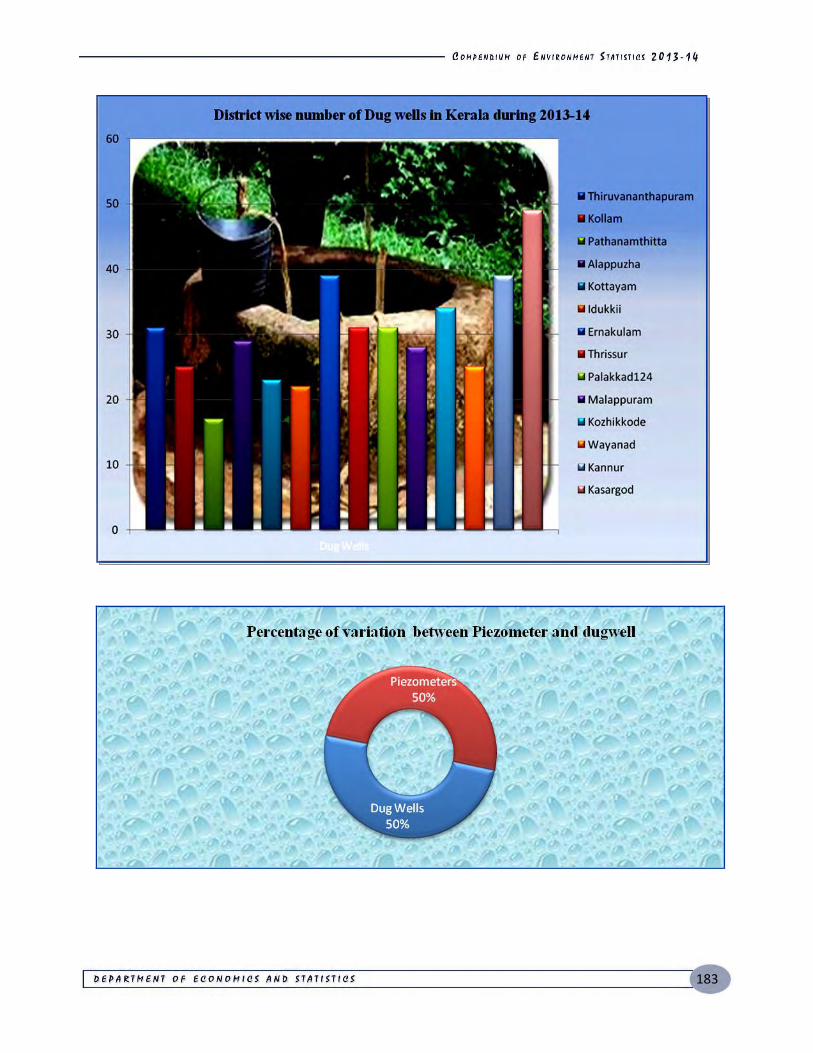
183
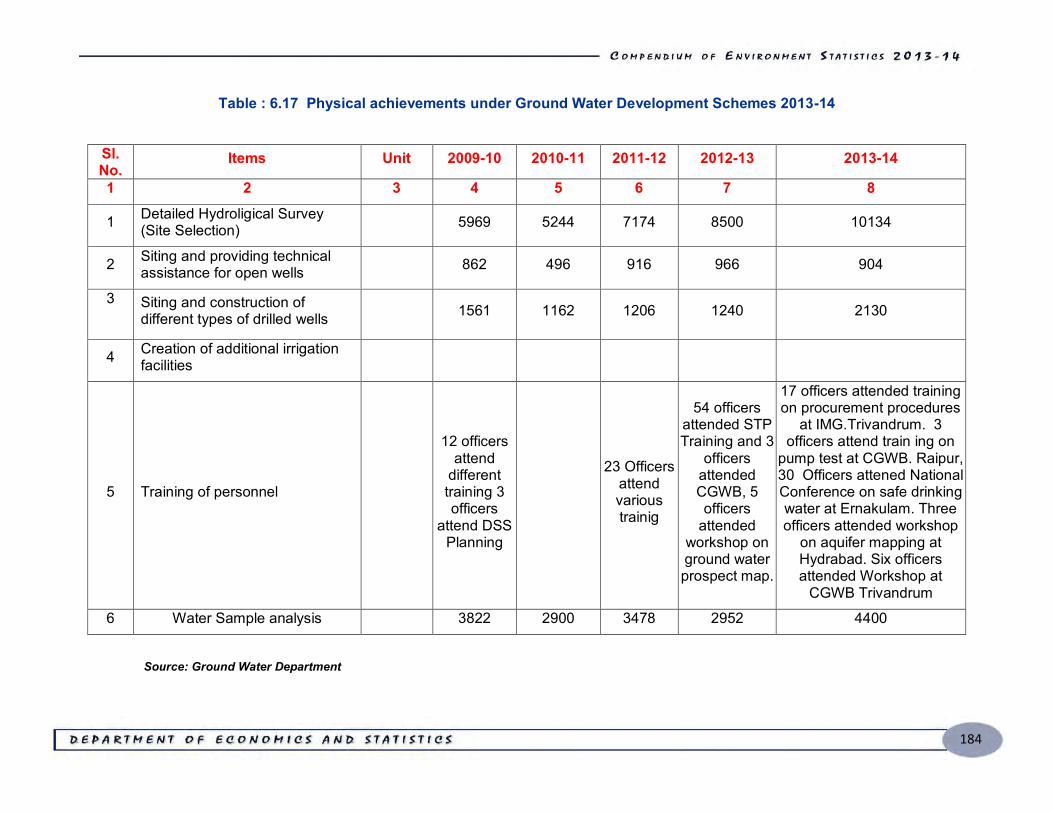
184
Table : 6.17 Physical achievements under Ground Water Development Schemes 2013-14
Sl. No.
Items Unit 2009-10 2010-11 2011-12 2012-13 2013-14
1 2 3 4 5 6 7 8
1 Detailed Hydroligical Survey (Site Selection) 5969 5244 7174 8500 10134
2 Siting and providing technical assistance for open wells 862 496 916 966 904
3
Siting and construction of different types of drilled wells 1561 1162 1206 1240 2130
4 Creation of additional irrigation facilities
5 Training of personnel
12 officers attend
different training 3 officers
attend DSS Planning
23 Officers attend various trainig
54 officers attended STP Training and 3
officers attended CGWB, 5 officers
attended workshop on ground water prospect map.
17 officers attended training on procurement procedures
at IMG.Trivandrum. 3 officers attend train ing on
pump test at CGWB. Raipur, 30 Officers attened National Conference on safe drinking water at Ernakulam. Three officers attended workshop
on aquifer mapping at Hydrabad. Six officers attended Workshop at
CGWB Trivandrum
6 Water Sample analysis 3822 2900 3478 2952 4400
Source: Ground Water Department
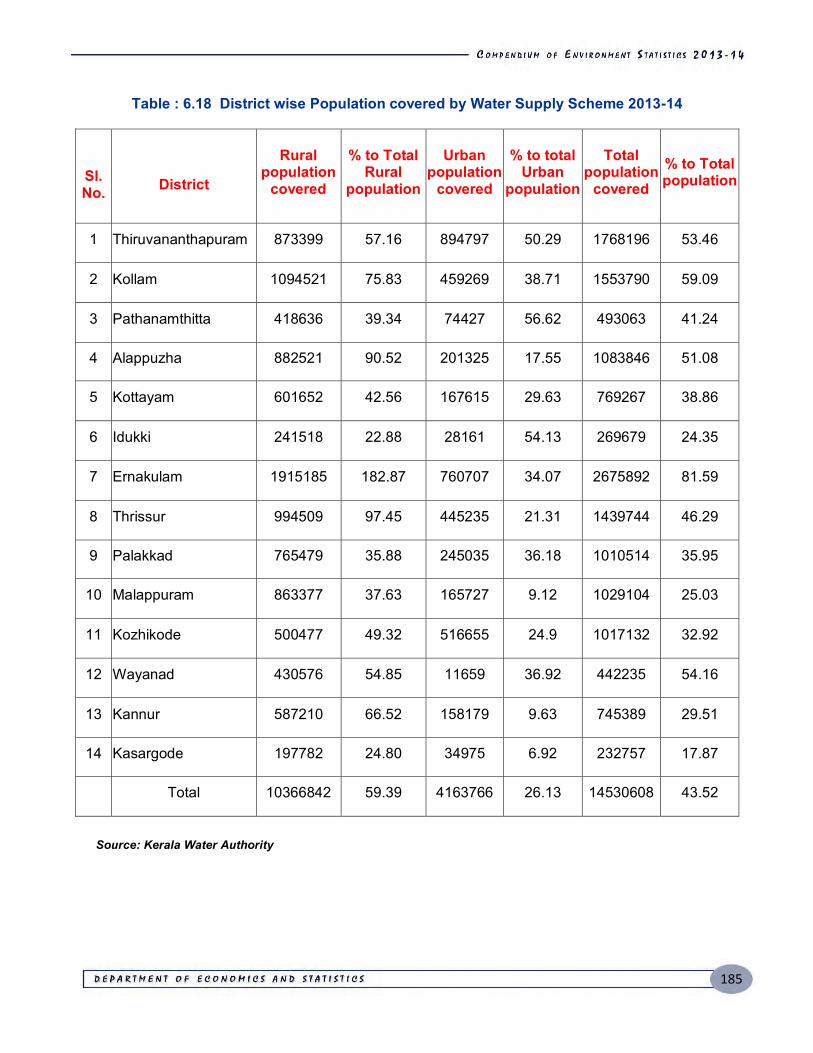
185
Table : 6.18 District wise Population covered by Water Supply Scheme 2013-14
Sl. No.
District
Rural population
covered
% to Total Rural
population
Urban population
covered
% to total Urban
population
Total population
covered % to Total population
1 Thiruvananthapuram 873399 57.16 894797 50.29 1768196 53.46
2 Kollam 1094521 75.83 459269 38.71 1553790 59.09
3 Pathanamthitta 418636 39.34 74427 56.62 493063 41.24
4 Alappuzha 882521 90.52 201325 17.55 1083846 51.08
5 Kottayam 601652 42.56 167615 29.63 769267 38.86
6 Idukki 241518 22.88 28161 54.13 269679 24.35
7 Ernakulam 1915185 182.87 760707 34.07 2675892 81.59
8 Thrissur 994509 97.45 445235 21.31 1439744 46.29
9 Palakkad 765479 35.88 245035 36.18 1010514 35.95
10 Malappuram 863377 37.63 165727 9.12 1029104 25.03
11 Kozhikode 500477 49.32 516655 24.9 1017132 32.92
12 Wayanad 430576 54.85 11659 36.92 442235 54.16
13 Kannur 587210 66.52 158179 9.63 745389 29.51
14 Kasargode 197782 24.80 34975 6.92 232757 17.87
Total 10366842 59.39 4163766 26.13 14530608 43.52
Source: Kerala Water Authority
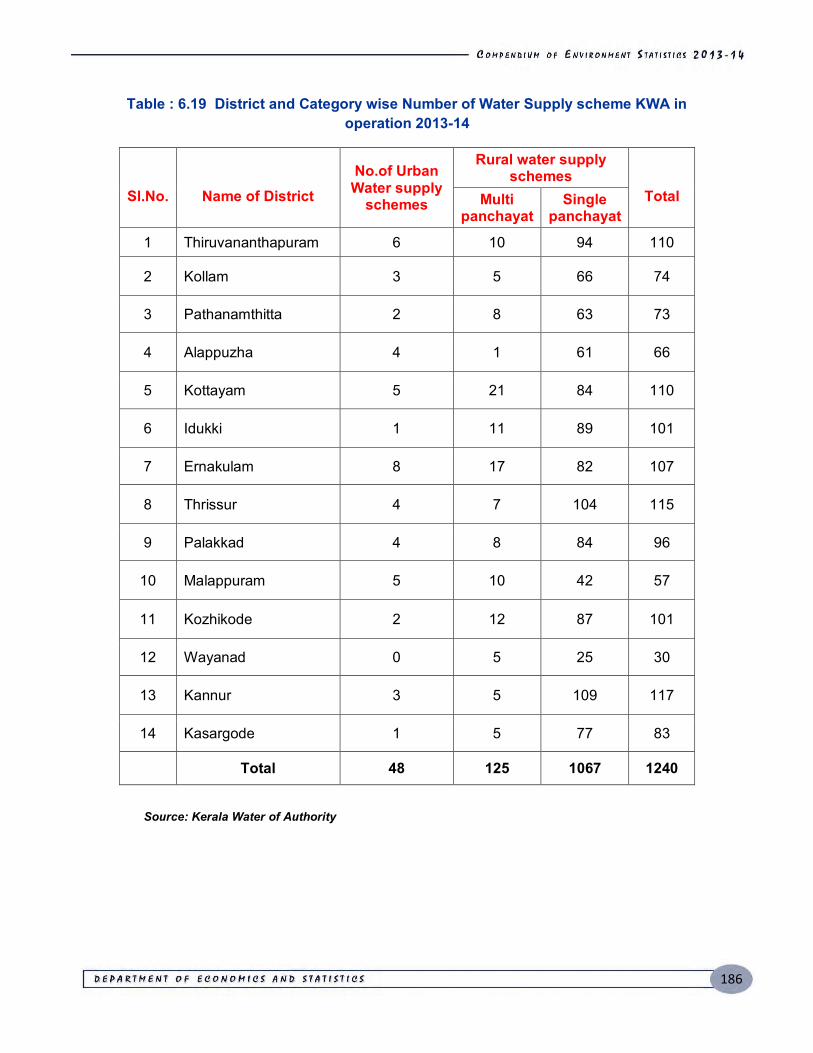
186
Table : 6.19 District and Category wise Number of Water Supply scheme KWA in operation 2013-14
Sl.No.
Name of District
No.of Urban Water supply
schemes
Rural water supply schemes
Total Multi panchayat
Single panchayat
1 Thiruvananthapuram 6 10 94 110
2 Kollam 3 5 66 74
3 Pathanamthitta 2 8 63 73
4 Alappuzha 4 1 61 66
5 Kottayam 5 21 84 110
6 Idukki 1 11 89 101
7 Ernakulam 8 17 82 107
8 Thrissur 4 7 104 115
9 Palakkad 4 8 84 96
10 Malappuram 5 10 42 57
11 Kozhikode 2 12 87 101
12 Wayanad 0 5 25 30
13 Kannur 3 5 109 117
14 Kasargode 1 5 77 83
Total 48 125 1067 1240
Source: Kerala Water of Authority
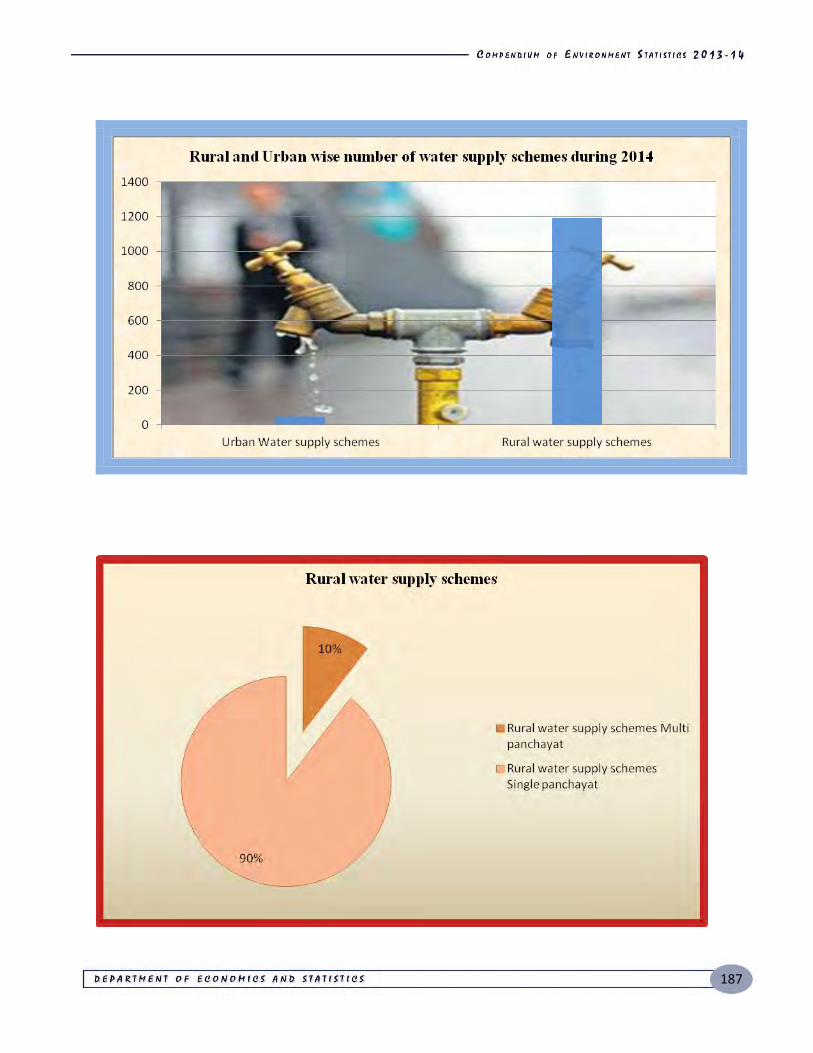
187
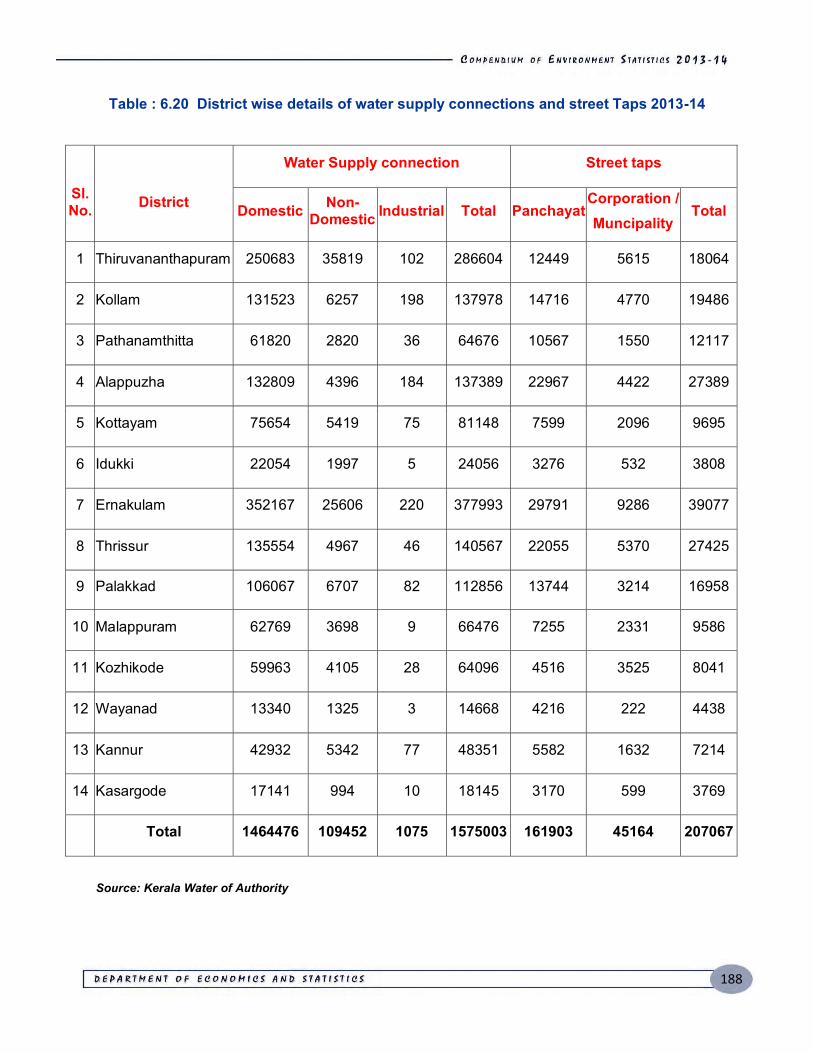
188
Table : 6.20 District wise details of water supply connections and street Taps 2013-14
Sl. No.
District
Water Supply connection Street taps
Domestic Non-Domestic Industrial Total Panchayat
Corporation / Muncipality
Total
1 Thiruvananthapuram 250683 35819 102 286604 12449 5615 18064
2 Kollam 131523 6257 198 137978 14716 4770 19486
3 Pathanamthitta 61820 2820 36 64676 10567 1550 12117
4 Alappuzha 132809 4396 184 137389 22967 4422 27389
5 Kottayam 75654 5419 75 81148 7599 2096 9695
6 Idukki 22054 1997 5 24056 3276 532 3808
7 Ernakulam 352167 25606 220 377993 29791 9286 39077
8 Thrissur 135554 4967 46 140567 22055 5370 27425
9 Palakkad 106067 6707 82 112856 13744 3214 16958
10 Malappuram 62769 3698 9 66476 7255 2331 9586
11 Kozhikode 59963 4105 28 64096 4516 3525 8041
12 Wayanad 13340 1325 3 14668 4216 222 4438
13 Kannur 42932 5342 77 48351 5582 1632 7214
14 Kasargode 17141 994 10 18145 3170 599 3769
Total 1464476 109452 1075 1575003 161903 45164 207067
Source: Kerala Water of Authority
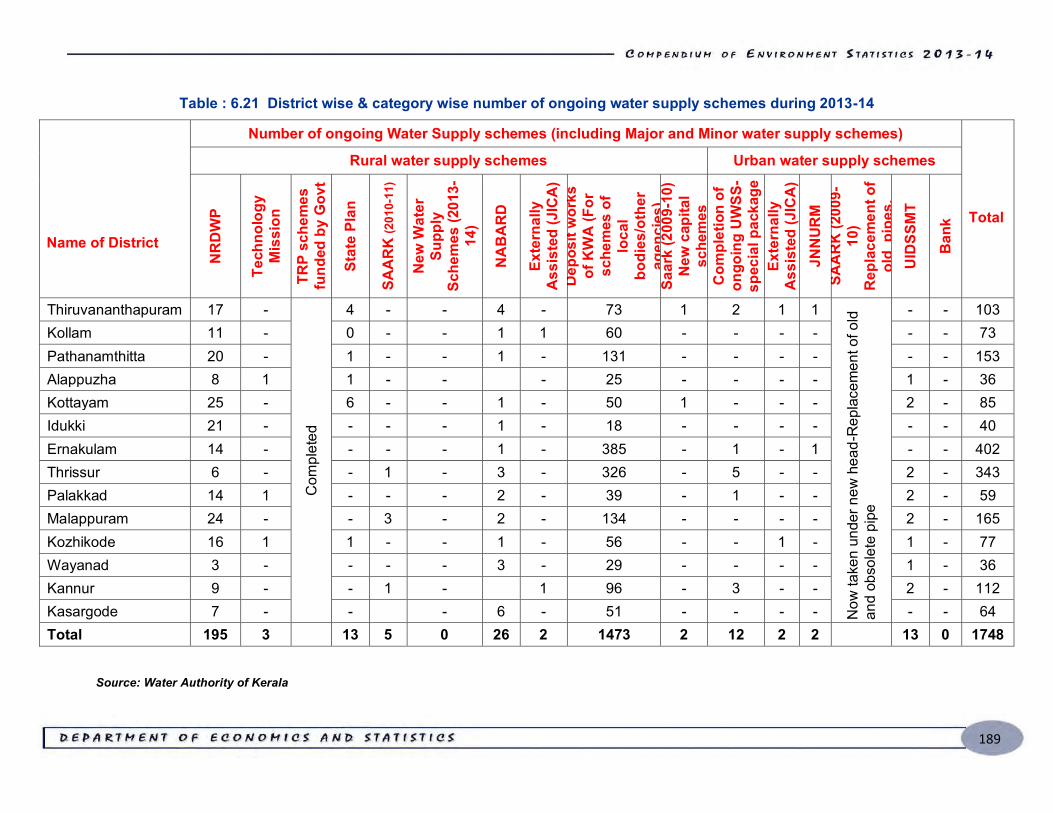
189
Table : 6.21 District wise & category wise number of ongoing water supply schemes during 2013-14
Name of District
Number of ongoing Water Supply schemes (including Major and Minor water supply schemes)
Total
Rural water supply schemes Urban water supply schemes
NR
DW
P
Tech
nolo
gy
Mis
sion
TRP
sche
mes
fu
nded
by
Gov
t
Stat
e Pl
an
SAA
RK
(201
0-11
)
New
Wat
er
Supp
ly
Sche
mes
(201
3-14
)
NA
BA
RD
Exte
rnal
ly
Ass
iste
d (J
ICA
) D
epos
it w
orks
of
KW
A (F
or
sche
mes
of
loca
l bo
dies
/oth
er
agen
cies
) Sa
ark
(200
9-10
) N
ew c
apita
l sc
hem
es
Com
plet
ion
of
ongo
ing
UW
SS-
spec
ial p
acka
ge
Exte
rnal
ly
Ass
iste
d (J
ICA
) JN
NUR
M
SAA
RK
(200
9-10
) R
epla
cem
ent o
f ol
d p
ipes
. U
IDSS
MT
Ban
k
Thiruvananthapuram 17 - C
ompl
eted
4 - - 4 - 73 1 2 1 1
Now
take
n un
der n
ew h
ead-
Rep
lace
men
t of o
ld
and
obso
lete
pip
e
- - 103 Kollam 11 - 0 - - 1 1 60 - - - - - - 73 Pathanamthitta 20 - 1 - - 1 - 131 - - - - - - 153 Alappuzha 8 1 1 - - - 25 - - - - 1 - 36 Kottayam 25 - 6 - - 1 - 50 1 - - - 2 - 85 Idukki 21 - - - - 1 - 18 - - - - - - 40 Ernakulam 14 - - - - 1 - 385 - 1 - 1 - - 402 Thrissur 6 - - 1 - 3 - 326 - 5 - - 2 - 343 Palakkad 14 1 - - - 2 - 39 - 1 - - 2 - 59 Malappuram 24 - - 3 - 2 - 134 - - - - 2 - 165 Kozhikode 16 1 1 - - 1 - 56 - - 1 - 1 - 77 Wayanad 3 - - - - 3 - 29 - - - - 1 - 36 Kannur 9 - - 1 - 1 96 - 3 - - 2 - 112 Kasargode 7 - - - 6 - 51 - - - - - - 64 Total 195 3 13 5 0 26 2 1473 2 12 2 2 13 0 1748
Source: Water Authority of Kerala
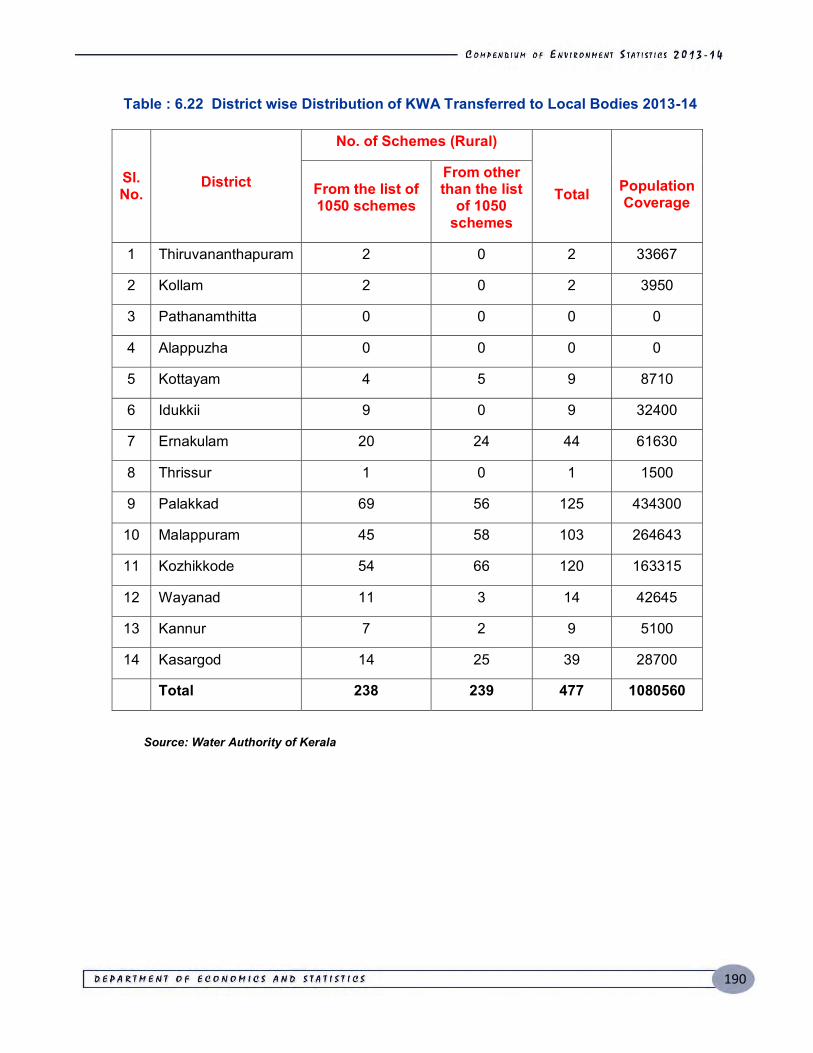
190
Table : 6.22 District wise Distribution of KWA Transferred to Local Bodies 2013-14
Sl. No.
District
No. of Schemes (Rural)
Total
Population Coverage
From the list of 1050 schemes
From other than the list
of 1050 schemes
1 Thiruvananthapuram 2 0 2 33667
2 Kollam 2 0 2 3950
3 Pathanamthitta 0 0 0 0
4 Alappuzha 0 0 0 0
5 Kottayam 4 5 9 8710
6 Idukkii 9 0 9 32400
7 Ernakulam 20 24 44 61630
8 Thrissur 1 0 1 1500
9 Palakkad 69 56 125 434300
10 Malappuram 45 58 103 264643
11 Kozhikkode 54 66 120 163315
12 Wayanad 11 3 14 42645
13 Kannur 7 2 9 5100
14 Kasargod 14 25 39 28700
Total 238 239 477 1080560
Source: Water Authority of Kerala
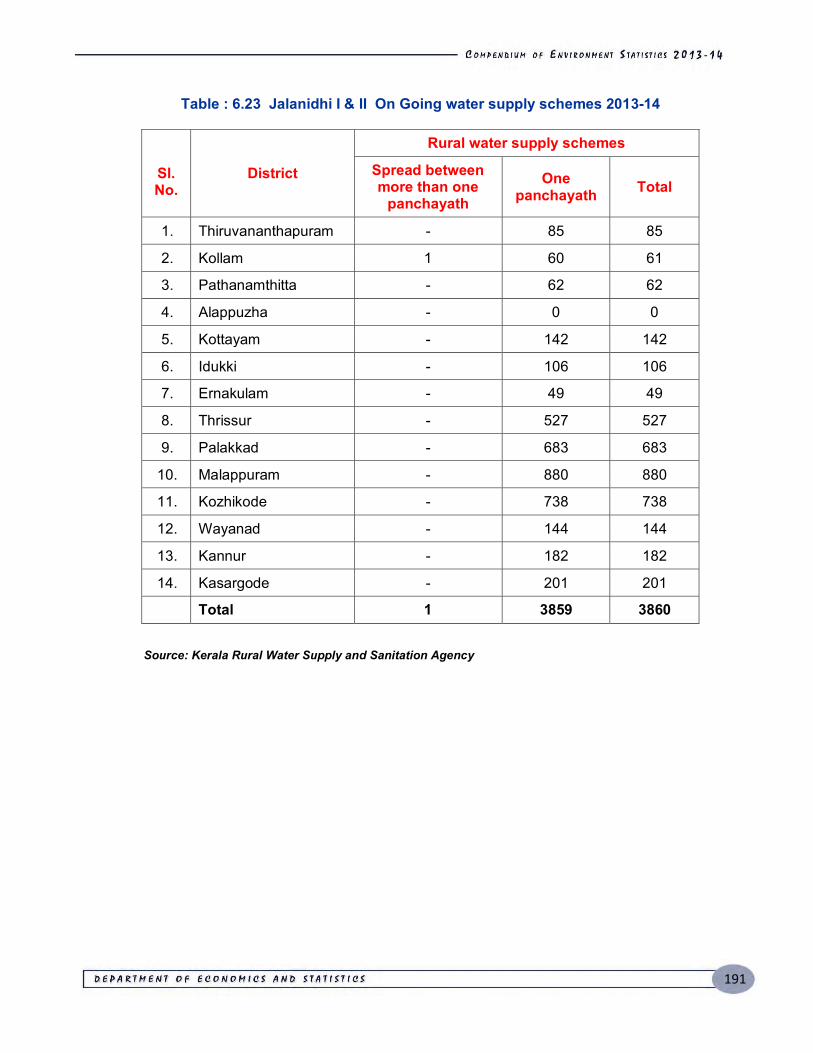
191
Table : 6.23 Jalanidhi I & II On Going water supply schemes 2013-14
Sl. No.
District
Rural water supply schemes
Spread between more than one
panchayath One
panchayath Total
1. Thiruvananthapuram - 85 85
2. Kollam 1 60 61
3. Pathanamthitta - 62 62
4. Alappuzha - 0 0
5. Kottayam - 142 142
6. Idukki - 106 106
7. Ernakulam - 49 49
8. Thrissur - 527 527
9. Palakkad - 683 683
10. Malappuram - 880 880
11. Kozhikode - 738 738
12. Wayanad - 144 144
13. Kannur - 182 182
14. Kasargode - 201 201
Total 1 3859 3860
Source: Kerala Rural Water Supply and Sanitation Agency
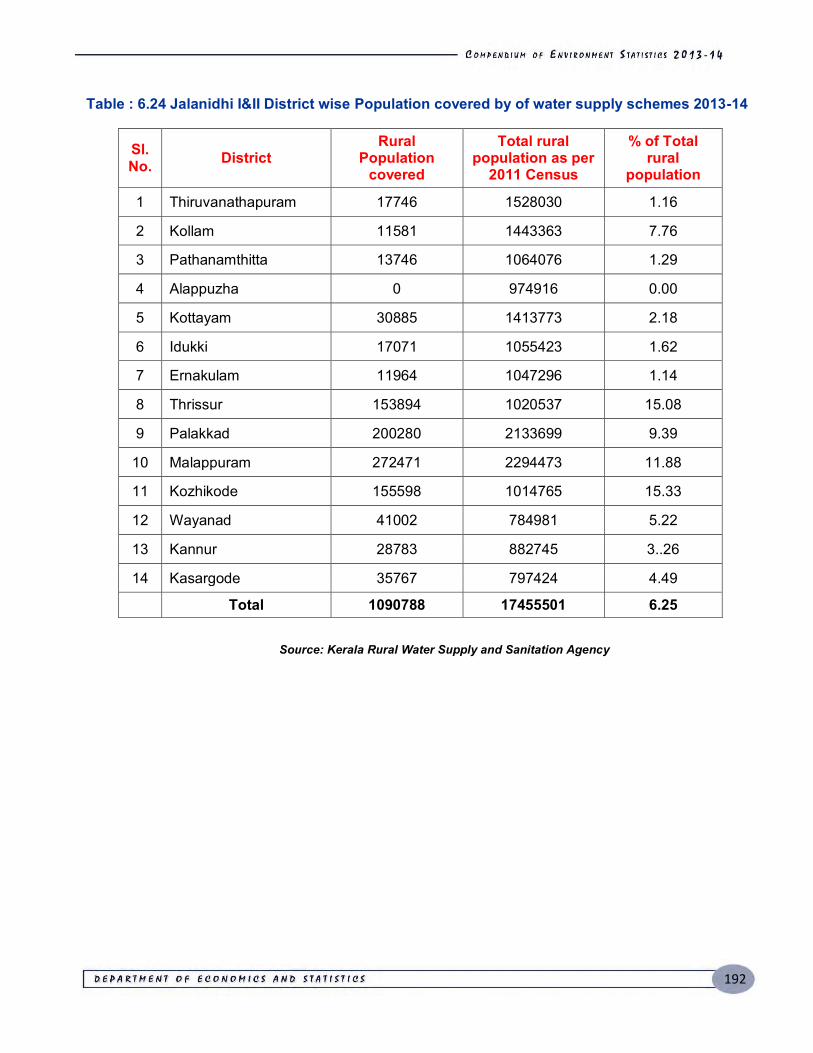
192
Table : 6.24 Jalanidhi I&II District wise Population covered by of water supply schemes 2013-14
Sl. No. District
Rural Population
covered
Total rural population as per
2011 Census
% of Total rural
population
1 Thiruvanathapuram 17746 1528030 1.16
2 Kollam 11581 1443363 7.76
3 Pathanamthitta 13746 1064076 1.29
4 Alappuzha 0 974916 0.00
5 Kottayam 30885 1413773 2.18
6 Idukki 17071 1055423 1.62
7 Ernakulam 11964 1047296 1.14
8 Thrissur 153894 1020537 15.08
9 Palakkad 200280 2133699 9.39
10 Malappuram 272471 2294473 11.88
11 Kozhikode 155598 1014765 15.33
12 Wayanad 41002 784981 5.22
13 Kannur 28783 882745 3..26
14 Kasargode 35767 797424 4.49
Total 1090788 17455501 6.25
Source: Kerala Rural Water Supply and Sanitation Agency
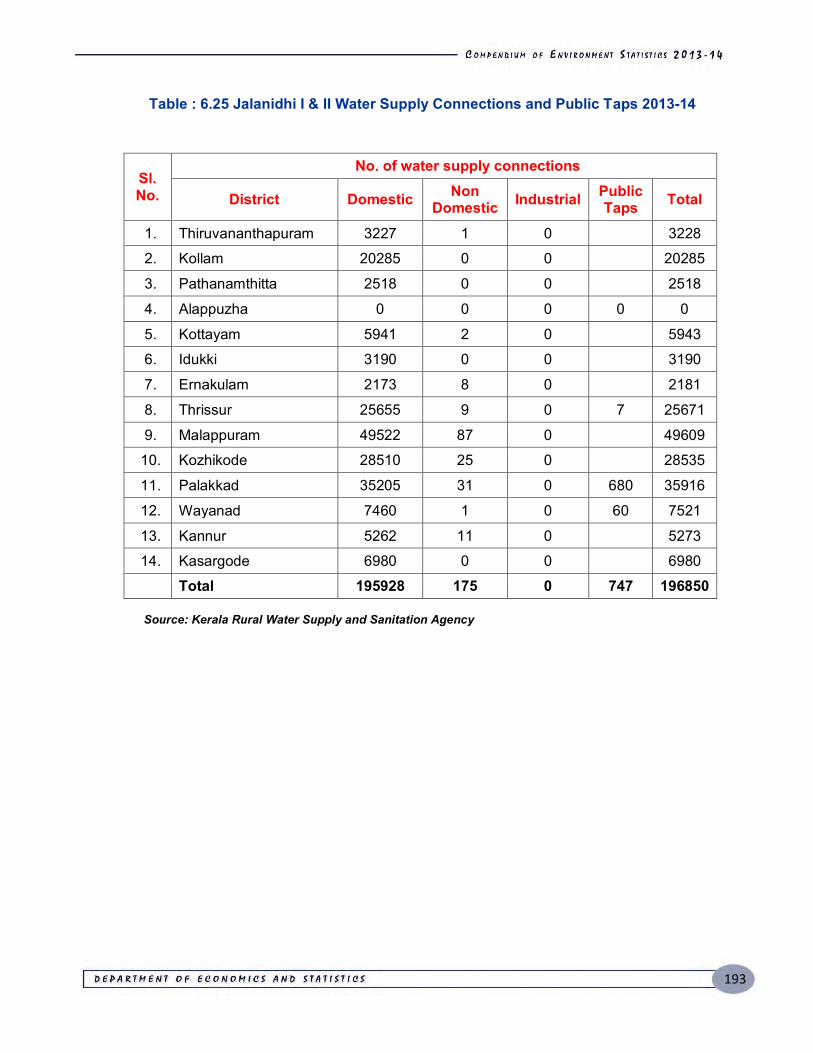
193
Table : 6.25 Jalanidhi I & II Water Supply Connections and Public Taps 2013-14
Sl. No.
No. of water supply connections
District Domestic Non Domestic Industrial Public
Taps Total
1. Thiruvananthapuram 3227 1 0 3228
2. Kollam 20285 0 0 20285
3. Pathanamthitta 2518 0 0 2518
4. Alappuzha 0 0 0 0 0
5. Kottayam 5941 2 0 5943
6. Idukki 3190 0 0 3190
7. Ernakulam 2173 8 0 2181
8. Thrissur 25655 9 0 7 25671
9. Malappuram 49522 87 0 49609
10. Kozhikode 28510 25 0 28535
11. Palakkad 35205 31 0 680 35916
12. Wayanad 7460 1 0 60 7521
13. Kannur 5262 11 0 5273
14. Kasargode 6980 0 0 6980
Total 195928 175 0 747 196850
Source: Kerala Rural Water Supply and Sanitation Agency
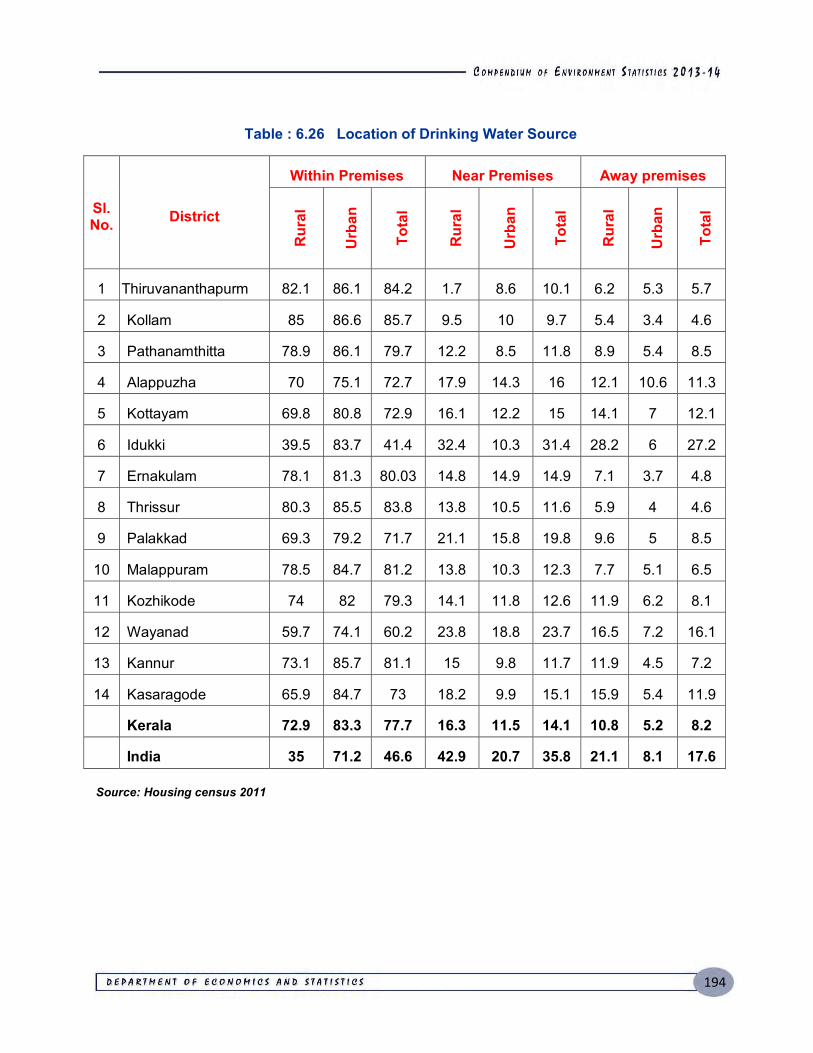
194
Table : 6.26 Location of Drinking Water Source
Sl. No. District
Within Premises Near Premises Away premises
Rur
al
Urb
an
Tota
l
Rur
al
Urb
an
Tota
l
Rur
al
Urb
an
Tota
l
1 Thiruvananthapurm 82.1 86.1 84.2 1.7 8.6 10.1 6.2 5.3 5.7
2 Kollam 85 86.6 85.7 9.5 10 9.7 5.4 3.4 4.6
3 Pathanamthitta 78.9 86.1 79.7 12.2 8.5 11.8 8.9 5.4 8.5
4 Alappuzha 70 75.1 72.7 17.9 14.3 16 12.1 10.6 11.3
5 Kottayam 69.8 80.8 72.9 16.1 12.2 15 14.1 7 12.1
6 Idukki 39.5 83.7 41.4 32.4 10.3 31.4 28.2 6 27.2
7 Ernakulam 78.1 81.3 80.03 14.8 14.9 14.9 7.1 3.7 4.8
8 Thrissur 80.3 85.5 83.8 13.8 10.5 11.6 5.9 4 4.6
9 Palakkad 69.3 79.2 71.7 21.1 15.8 19.8 9.6 5 8.5
10 Malappuram 78.5 84.7 81.2 13.8 10.3 12.3 7.7 5.1 6.5
11 Kozhikode 74 82 79.3 14.1 11.8 12.6 11.9 6.2 8.1
12 Wayanad 59.7 74.1 60.2 23.8 18.8 23.7 16.5 7.2 16.1
13 Kannur 73.1 85.7 81.1 15 9.8 11.7 11.9 4.5 7.2
14 Kasaragode 65.9 84.7 73 18.2 9.9 15.1 15.9 5.4 11.9
Kerala 72.9 83.3 77.7 16.3 11.5 14.1 10.8 5.2 8.2
India 35 71.2 46.6 42.9 20.7 35.8 21.1 8.1 17.6 Source: Housing census 2011
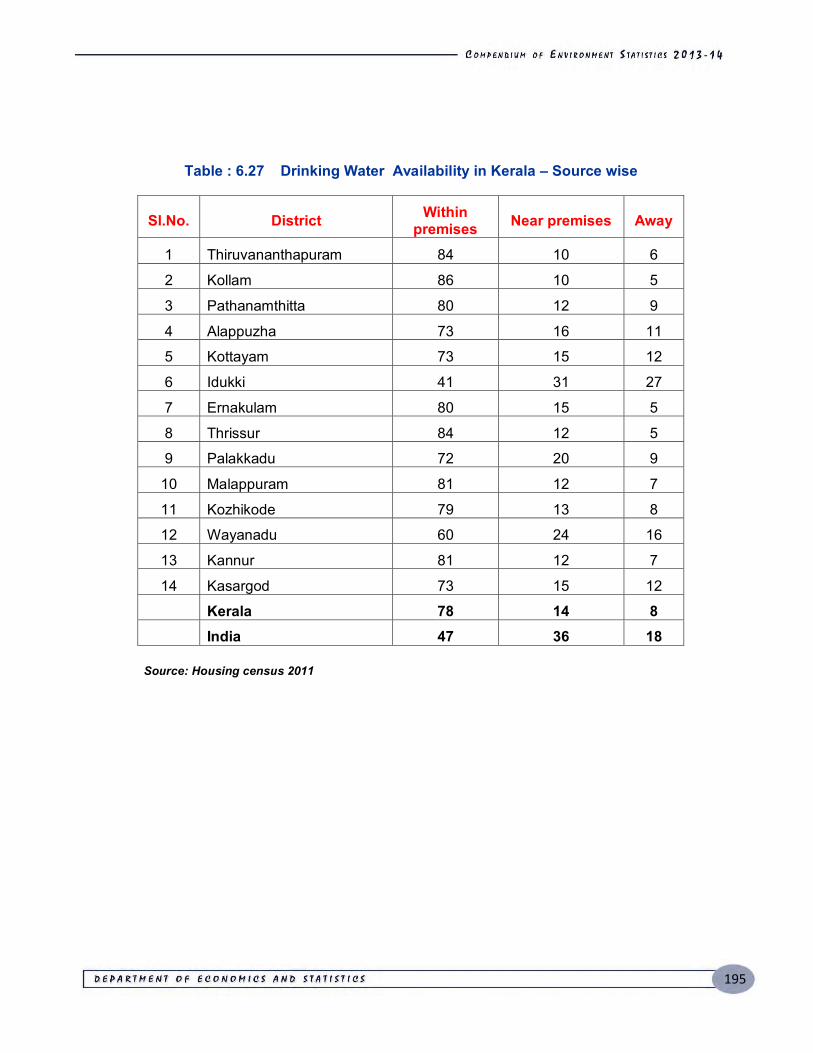
195
Table : 6.27 Drinking Water Availability in Kerala – Source wise
Sl.No. District Within premises Near premises Away
1 Thiruvananthapuram 84 10 6
2 Kollam 86 10 5
3 Pathanamthitta 80 12 9
4 Alappuzha 73 16 11
5 Kottayam 73 15 12
6 Idukki 41 31 27
7 Ernakulam 80 15 5
8 Thrissur 84 12 5
9 Palakkadu 72 20 9
10 Malappuram 81 12 7
11 Kozhikode 79 13 8
12 Wayanadu 60 24 16
13 Kannur 81 12 7
14 Kasargod 73 15 12
Kerala 78 14 8 India 47 36 18
Source: Housing census 2011
196
197
CHAPTER - VII
Human Settlement
ensity of population in the State is 819 during 2001 census and 860 in 2011
census. It shows that the density of population has increased at last decades. Similarly, the
population of Kerala has increased from 31841374 in 2001 census to 33406061 in 2011 census
increased by 4.68%. The analysis of population growth rate indicates that Kerala is likely to
achieve zero population growth in 25 to 30 years. The low population growth rate with high
level of urbanisation will increase the scarcity of labour in agriculture and in otherside depletion
of natural resources due to industrialization and infrastructure development activities. Migration
of rural to urban area further added pressure to the urban centres for meeting adequate food,
water and sewerage needs. Most of the migration to Urban area is due to search of
employment opportunities and better facilities available in urban area.
The rural population in Kerala as per 2011 census is 17471135 in which the male
population is 84080547 and the female population is 9063081. Out of 15934926 urban
population, male population is 7619358 and female population is 8315568 which constituted
52.29% population rural area and 47.70% population in urban area respectively.
Population Census
As per population census 2011 the total population of Kerala is 33406061 of which male
and female are 16027412 and 17378649 respectively. The most populated district in Kerala is
Malappuram in which 4112920 followed by Thiruvananthapuram is 3301427. As per the
projected figure of population in 2014 Kerala is 33941670 of which male population is 16284385
and female population is 17657285. Age is one of the most important characteristics of
population composition. The age groups 0-14 and above 65+ are economically inactive
population. 10.77% of the State population is dependent and 68.13% of population is
considered as working age population and they are economically active.
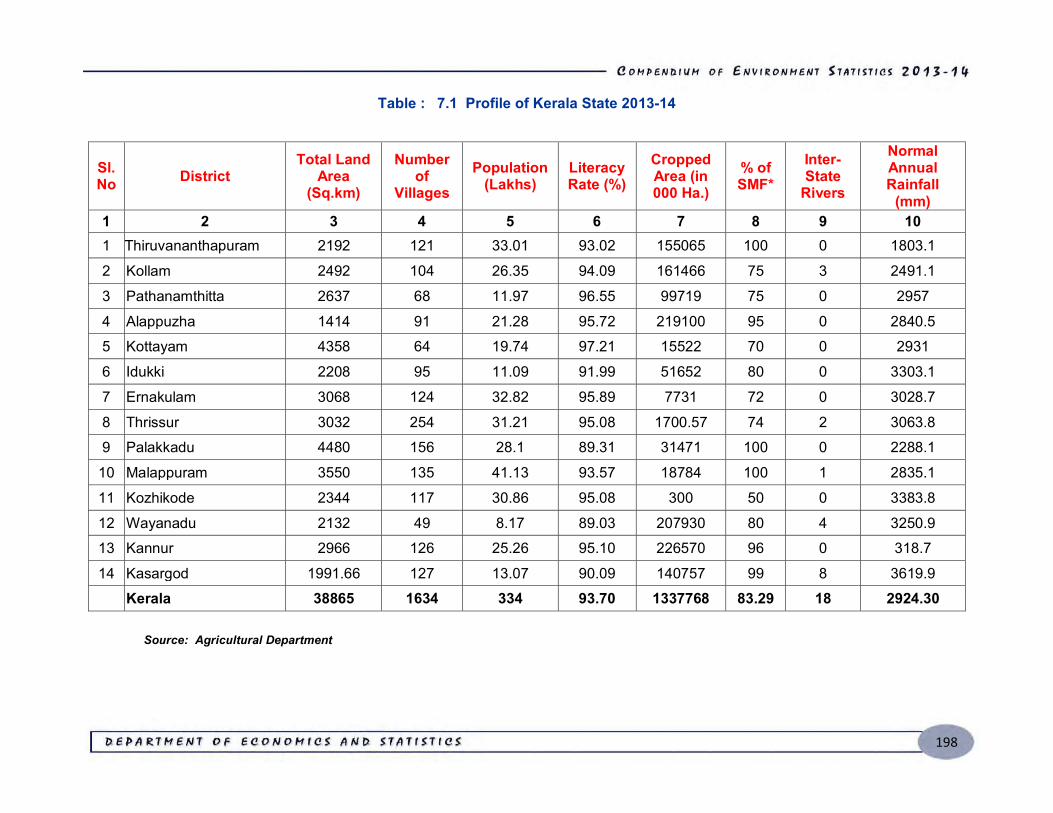
198
Table : 7.1 Profile of Kerala State 2013-14
Sl. No District
Total Land Area
(Sq.km)
Number of
Villages Population
(Lakhs) Literacy Rate (%)
Cropped Area (in 000 Ha.)
% of SMF*
Inter-State
Rivers
Normal Annual Rainfall
(mm) 1 2 3 4 5 6 7 8 9 10 1 Thiruvananthapuram 2192 121 33.01 93.02 155065 100 0 1803.1
2 Kollam 2492 104 26.35 94.09 161466 75 3 2491.1
3 Pathanamthitta 2637 68 11.97 96.55 99719 75 0 2957
4 Alappuzha 1414 91 21.28 95.72 219100 95 0 2840.5
5 Kottayam 4358 64 19.74 97.21 15522 70 0 2931
6 Idukki 2208 95 11.09 91.99 51652 80 0 3303.1
7 Ernakulam 3068 124 32.82 95.89 7731 72 0 3028.7
8 Thrissur 3032 254 31.21 95.08 1700.57 74 2 3063.8
9 Palakkadu 4480 156 28.1 89.31 31471 100 0 2288.1
10 Malappuram 3550 135 41.13 93.57 18784 100 1 2835.1
11 Kozhikode 2344 117 30.86 95.08 300 50 0 3383.8
12 Wayanadu 2132 49 8.17 89.03 207930 80 4 3250.9
13 Kannur 2966 126 25.26 95.10 226570 96 0 318.7
14 Kasargod 1991.66 127 13.07 90.09 140757 99 8 3619.9
Kerala 38865 1634 334 93.70 1337768 83.29 18 2924.30
Source: Agricultural Department

199
Table : 7.2 District wise Population
Sl. No. Districts
Census 2011
Male Female Population Ratio
1. Thiruvananthapuram 1581678 1719749 3301427 1088
2. Kollam 1246968 1388407 2635375 1113
3. Pathanamthitta 561716 635696 1197412 1129
4. Alappuzha 1013142 1114647 2127789 1100
5. Kottayam 968289 1006262 1974551 1040
6. Idukki 552808 556166 1108974 1006
7. Ernakulam 1619557 1662831 3282388 1028
8. Thrissur 1480763 1640437 3121200 1109
9. Palakkad 1359478 1450456 2809934 1067
10. Malappuram 1960328 2152592 4112920 1096
11. Kozhikode 1470942 1615351 3086293 1097
12. Wayanad 401684 415736 817420 1035
13. Kannur 1181446 1341557 2523003 1133
14. Kasaragode 628613 678762 1307375 1079
Kerala 16027412 17378649 33406061 1084
Source: Census 2011
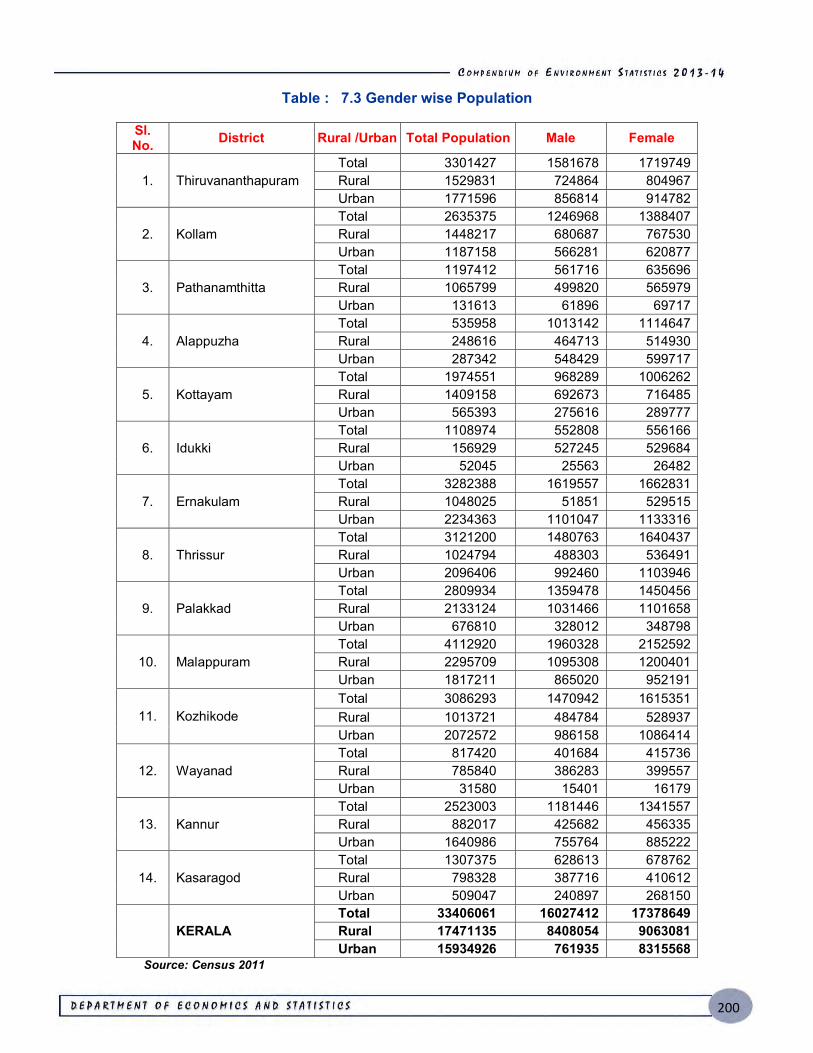
200
Table : 7.3 Gender wise Population
Sl. No. District Rural /Urban Total Population Male Female
1. Thiruvananthapuram Total 3301427 1581678 1719749 Rural 1529831 724864 804967 Urban 1771596 856814 914782
2. Kollam Total 2635375 1246968 1388407 Rural 1448217 680687 767530 Urban 1187158 566281 620877
3. Pathanamthitta Total 1197412 561716 635696 Rural 1065799 499820 565979 Urban 131613 61896 69717
4. Alappuzha Total 535958 1013142 1114647 Rural 248616 464713 514930 Urban 287342 548429 599717
5. Kottayam Total 1974551 968289 1006262 Rural 1409158 692673 716485 Urban 565393 275616 289777
6. Idukki Total 1108974 552808 556166 Rural 156929 527245 529684 Urban 52045 25563 26482
7. Ernakulam Total 3282388 1619557 1662831 Rural 1048025 51851 529515 Urban 2234363 1101047 1133316
8. Thrissur Total 3121200 1480763 1640437 Rural 1024794 488303 536491 Urban 2096406 992460 1103946
9. Palakkad Total 2809934 1359478 1450456 Rural 2133124 1031466 1101658 Urban 676810 328012 348798
10. Malappuram Total 4112920 1960328 2152592 Rural 2295709 1095308 1200401 Urban 1817211 865020 952191
11. Kozhikode Total 3086293 1470942 1615351 Rural 1013721 484784 528937 Urban 2072572 986158 1086414
12. Wayanad Total 817420 401684 415736 Rural 785840 386283 399557 Urban 31580 15401 16179
13. Kannur Total 2523003 1181446 1341557 Rural 882017 425682 456335 Urban 1640986 755764 885222
14. Kasaragod Total 1307375 628613 678762 Rural 798328 387716 410612 Urban 509047 240897 268150
KERALA
Total 33406061 16027412 17378649 Rural 17471135 8408054 9063081 Urban 15934926 761935 8315568
Source: Census 2011
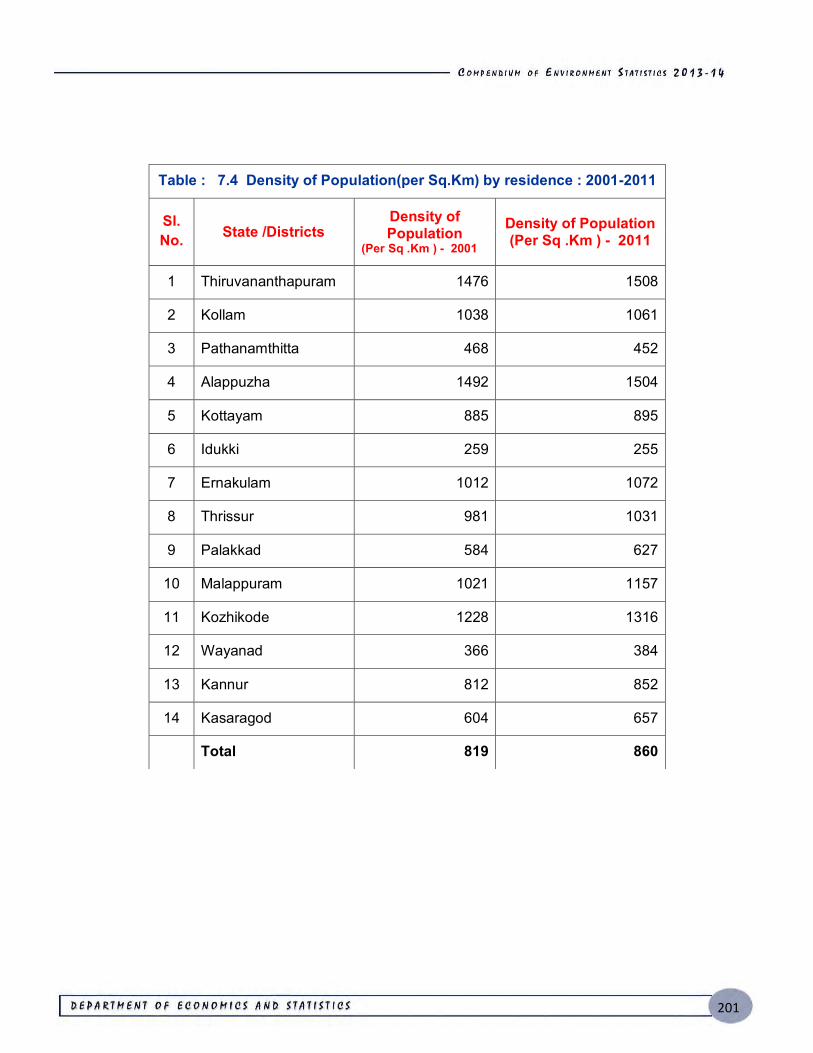
201
Table : 7.4 Density of Population(per Sq.Km) by residence : 2001-2011
Sl. No. State /Districts
Density of Population
(Per Sq .Km ) - 2001
Density of Population (Per Sq .Km ) - 2011
1 Thiruvananthapuram 1476 1508
2 Kollam 1038 1061
3 Pathanamthitta 468 452
4 Alappuzha 1492 1504
5 Kottayam 885 895
6 Idukki 259 255
7 Ernakulam 1012 1072
8 Thrissur 981 1031
9 Palakkad 584 627
10 Malappuram 1021 1157
11 Kozhikode 1228 1316
12 Wayanad 366 384
13 Kannur 812 852
14 Kasaragod 604 657
Total 819 860
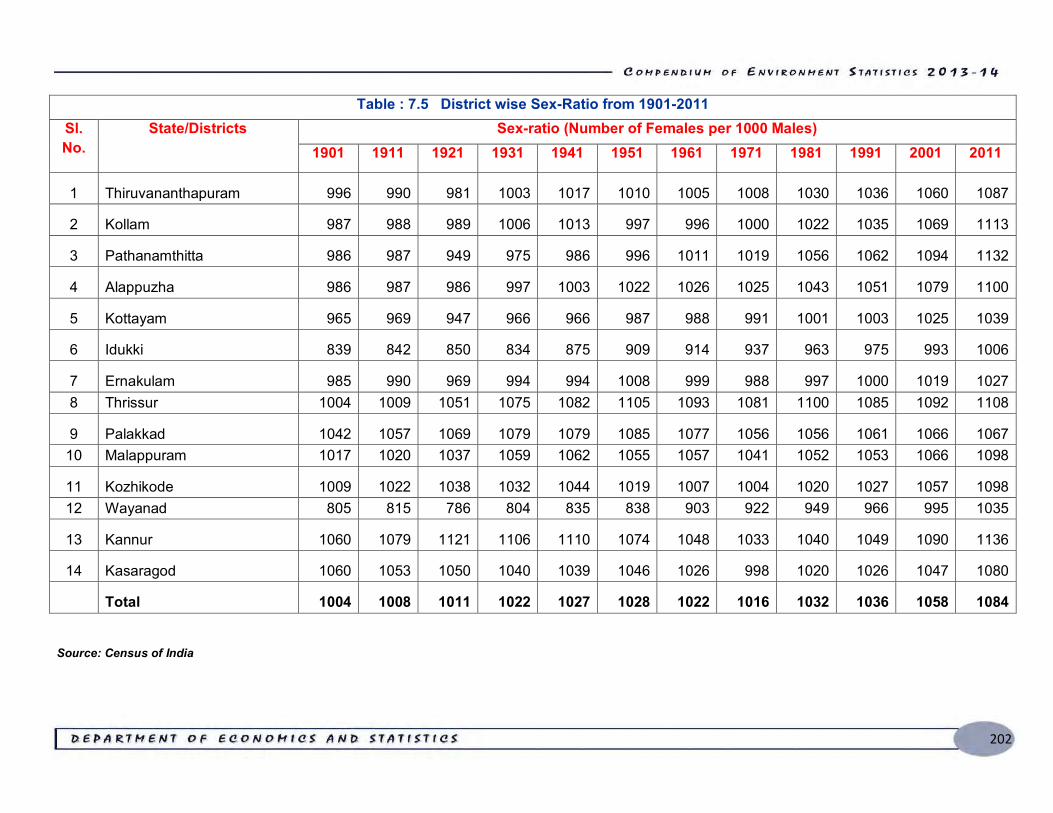
202
Table : 7.5 District wise Sex-Ratio from 1901-2011 Sl. No.
State/Districts Sex-ratio (Number of Females per 1000 Males) 1901 1911 1921 1931 1941 1951 1961 1971 1981 1991 2001 2011
1 Thiruvananthapuram 996 990 981 1003 1017 1010 1005 1008 1030 1036 1060 1087
2 Kollam 987 988 989 1006 1013 997 996 1000 1022 1035 1069 1113
3 Pathanamthitta 986 987 949 975 986 996 1011 1019 1056 1062 1094 1132
4 Alappuzha 986 987 986 997 1003 1022 1026 1025 1043 1051 1079 1100
5 Kottayam 965 969 947 966 966 987 988 991 1001 1003 1025 1039
6 Idukki 839 842 850 834 875 909 914 937 963 975 993 1006
7 Ernakulam 985 990 969 994 994 1008 999 988 997 1000 1019 1027 8 Thrissur 1004 1009 1051 1075 1082 1105 1093 1081 1100 1085 1092 1108
9 Palakkad 1042 1057 1069 1079 1079 1085 1077 1056 1056 1061 1066 1067 10 Malappuram 1017 1020 1037 1059 1062 1055 1057 1041 1052 1053 1066 1098
11 Kozhikode 1009 1022 1038 1032 1044 1019 1007 1004 1020 1027 1057 1098 12 Wayanad 805 815 786 804 835 838 903 922 949 966 995 1035
13 Kannur 1060 1079 1121 1106 1110 1074 1048 1033 1040 1049 1090 1136
14 Kasaragod 1060 1053 1050 1040 1039 1046 1026 998 1020 1026 1047 1080
Total 1004 1008 1011 1022 1027 1028 1022 1016 1032 1036 1058 1084
Source: Census of India
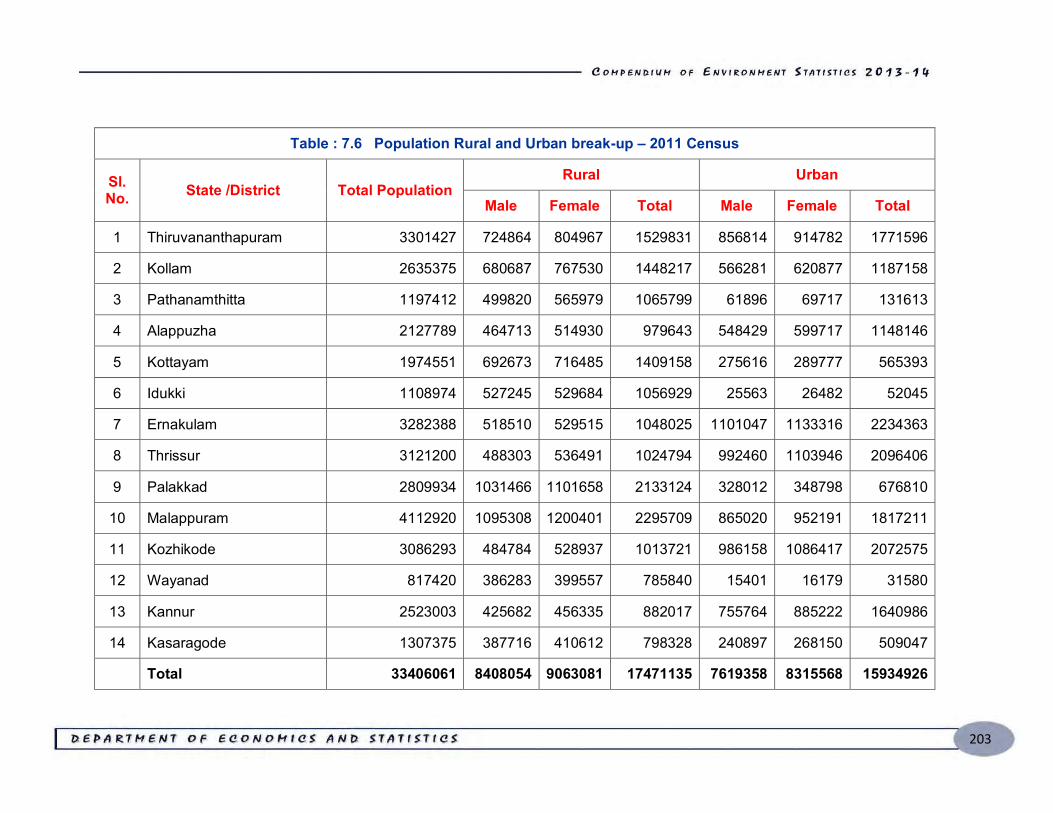
203
Table : 7.6 Population Rural and Urban break-up – 2011 Census
Sl. No. State /District Total Population
Rural Urban
Male Female Total Male Female Total
1 Thiruvananthapuram 3301427 724864 804967 1529831 856814 914782 1771596
2 Kollam 2635375 680687 767530 1448217 566281 620877 1187158
3 Pathanamthitta 1197412 499820 565979 1065799 61896 69717 131613
4 Alappuzha 2127789 464713 514930 979643 548429 599717 1148146
5 Kottayam 1974551 692673 716485 1409158 275616 289777 565393
6 Idukki 1108974 527245 529684 1056929 25563 26482 52045
7 Ernakulam 3282388 518510 529515 1048025 1101047 1133316 2234363
8 Thrissur 3121200 488303 536491 1024794 992460 1103946 2096406
9 Palakkad 2809934 1031466 1101658 2133124 328012 348798 676810
10 Malappuram 4112920 1095308 1200401 2295709 865020 952191 1817211
11 Kozhikode 3086293 484784 528937 1013721 986158 1086417 2072575
12 Wayanad 817420 386283 399557 785840 15401 16179 31580
13 Kannur 2523003 425682 456335 882017 755764 885222 1640986
14 Kasaragode 1307375 387716 410612 798328 240897 268150 509047
Total 33406061 8408054 9063081 17471135 7619358 8315568 15934926
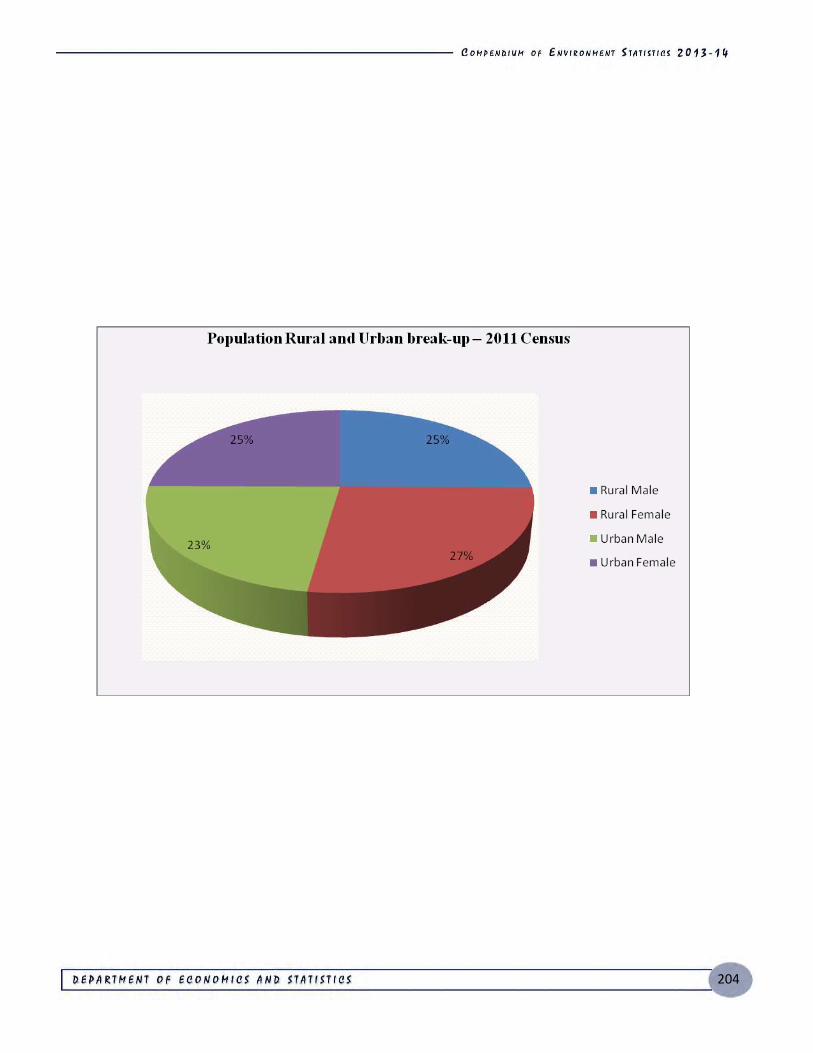
204
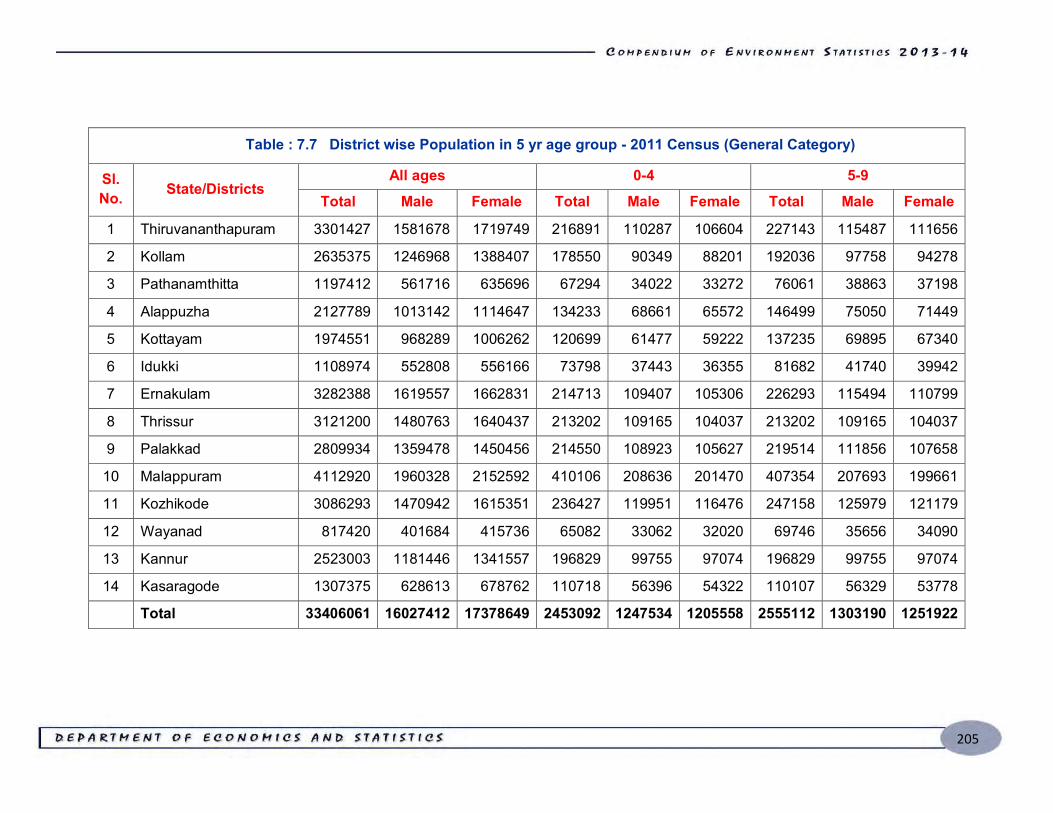
205
Table : 7.7 District wise Population in 5 yr age group - 2011 Census (General Category)
Sl. No. State/Districts
All ages 0-4 5-9 Total Male Female Total Male Female Total Male Female
1 Thiruvananthapuram 3301427 1581678 1719749 216891 110287 106604 227143 115487 111656
2 Kollam 2635375 1246968 1388407 178550 90349 88201 192036 97758 94278
3 Pathanamthitta 1197412 561716 635696 67294 34022 33272 76061 38863 37198
4 Alappuzha 2127789 1013142 1114647 134233 68661 65572 146499 75050 71449
5 Kottayam 1974551 968289 1006262 120699 61477 59222 137235 69895 67340
6 Idukki 1108974 552808 556166 73798 37443 36355 81682 41740 39942
7 Ernakulam 3282388 1619557 1662831 214713 109407 105306 226293 115494 110799
8 Thrissur 3121200 1480763 1640437 213202 109165 104037 213202 109165 104037
9 Palakkad 2809934 1359478 1450456 214550 108923 105627 219514 111856 107658
10 Malappuram 4112920 1960328 2152592 410106 208636 201470 407354 207693 199661
11 Kozhikode 3086293 1470942 1615351 236427 119951 116476 247158 125979 121179
12 Wayanad 817420 401684 415736 65082 33062 32020 69746 35656 34090
13 Kannur 2523003 1181446 1341557 196829 99755 97074 196829 99755 97074
14 Kasaragode 1307375 628613 678762 110718 56396 54322 110107 56329 53778
Total 33406061 16027412 17378649 2453092 1247534 1205558 2555112 1303190 1251922
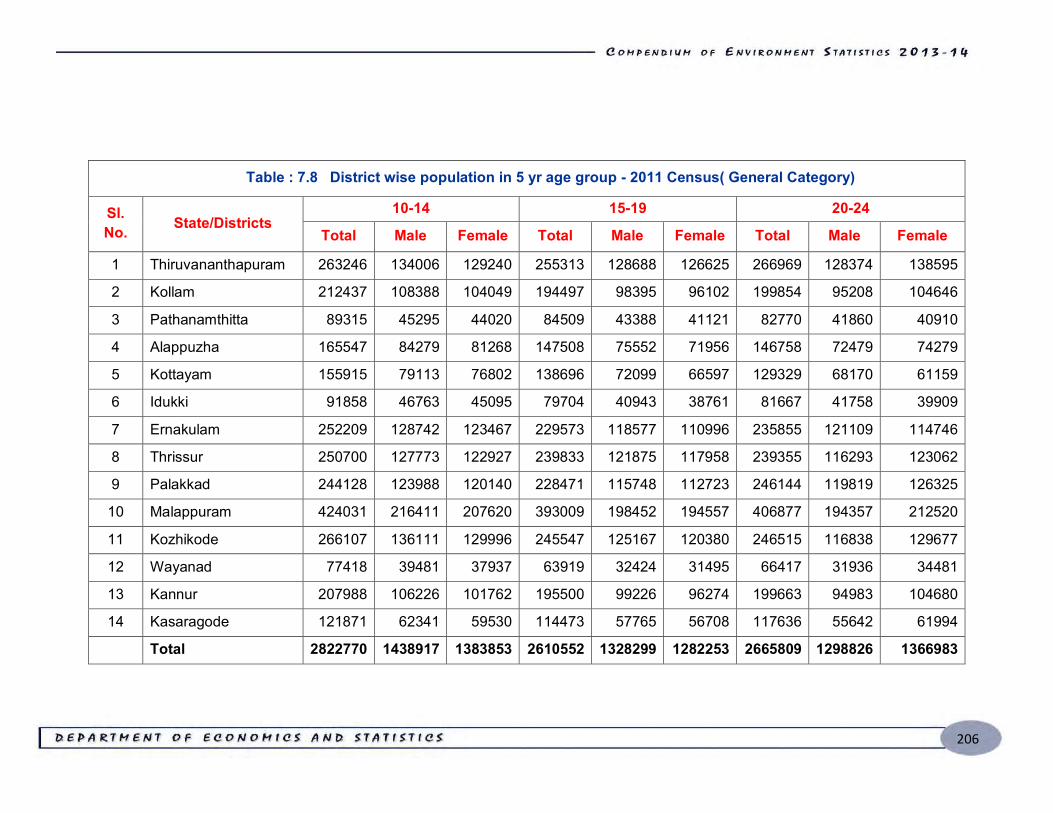
206
Table : 7.8 District wise population in 5 yr age group - 2011 Census( General Category)
Sl. No. State/Districts
10-14 15-19 20-24
Total Male Female Total Male Female Total Male Female
1 Thiruvananthapuram 263246 134006 129240 255313 128688 126625 266969 128374 138595
2 Kollam 212437 108388 104049 194497 98395 96102 199854 95208 104646
3 Pathanamthitta 89315 45295 44020 84509 43388 41121 82770 41860 40910
4 Alappuzha 165547 84279 81268 147508 75552 71956 146758 72479 74279
5 Kottayam 155915 79113 76802 138696 72099 66597 129329 68170 61159
6 Idukki 91858 46763 45095 79704 40943 38761 81667 41758 39909
7 Ernakulam 252209 128742 123467 229573 118577 110996 235855 121109 114746
8 Thrissur 250700 127773 122927 239833 121875 117958 239355 116293 123062
9 Palakkad 244128 123988 120140 228471 115748 112723 246144 119819 126325
10 Malappuram 424031 216411 207620 393009 198452 194557 406877 194357 212520
11 Kozhikode 266107 136111 129996 245547 125167 120380 246515 116838 129677
12 Wayanad 77418 39481 37937 63919 32424 31495 66417 31936 34481
13 Kannur 207988 106226 101762 195500 99226 96274 199663 94983 104680
14 Kasaragode 121871 62341 59530 114473 57765 56708 117636 55642 61994
Total 2822770 1438917 1383853 2610552 1328299 1282253 2665809 1298826 1366983
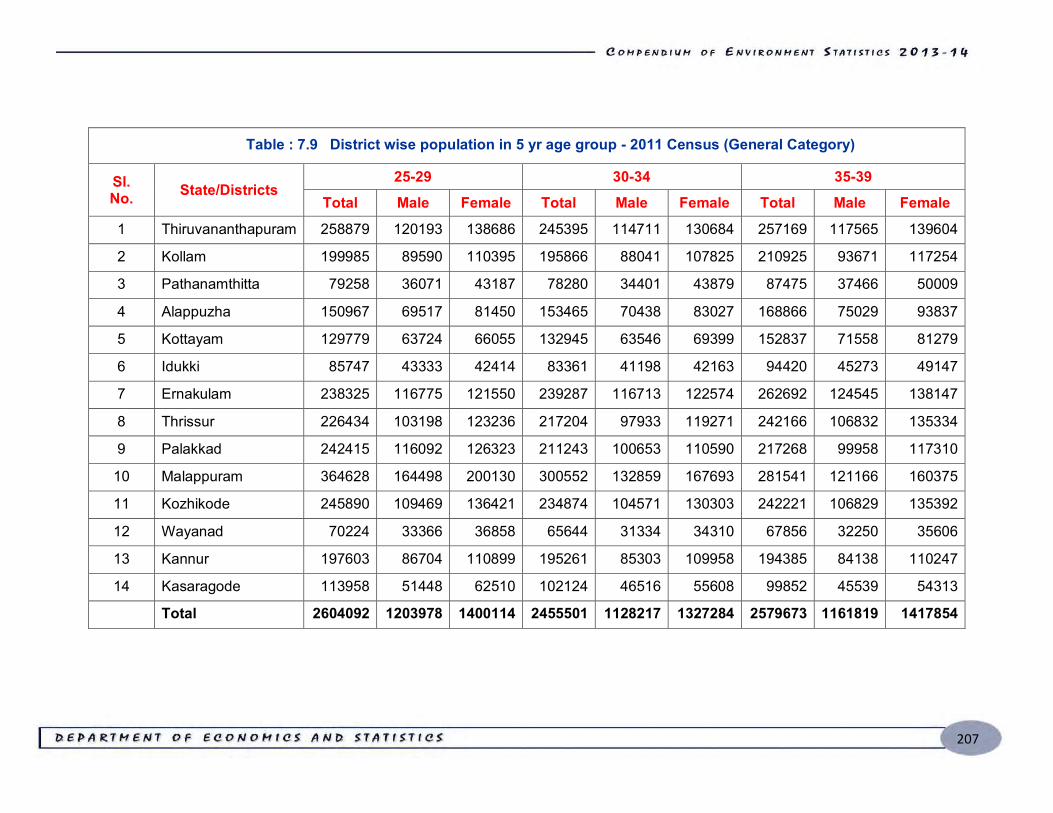
207
Table : 7.9 District wise population in 5 yr age group - 2011 Census (General Category)
Sl. No. State/Districts
25-29 30-34 35-39 Total Male Female Total Male Female Total Male Female
1 Thiruvananthapuram 258879 120193 138686 245395 114711 130684 257169 117565 139604
2 Kollam 199985 89590 110395 195866 88041 107825 210925 93671 117254
3 Pathanamthitta 79258 36071 43187 78280 34401 43879 87475 37466 50009
4 Alappuzha 150967 69517 81450 153465 70438 83027 168866 75029 93837
5 Kottayam 129779 63724 66055 132945 63546 69399 152837 71558 81279
6 Idukki 85747 43333 42414 83361 41198 42163 94420 45273 49147
7 Ernakulam 238325 116775 121550 239287 116713 122574 262692 124545 138147
8 Thrissur 226434 103198 123236 217204 97933 119271 242166 106832 135334
9 Palakkad 242415 116092 126323 211243 100653 110590 217268 99958 117310
10 Malappuram 364628 164498 200130 300552 132859 167693 281541 121166 160375
11 Kozhikode 245890 109469 136421 234874 104571 130303 242221 106829 135392
12 Wayanad 70224 33366 36858 65644 31334 34310 67856 32250 35606
13 Kannur 197603 86704 110899 195261 85303 109958 194385 84138 110247
14 Kasaragode 113958 51448 62510 102124 46516 55608 99852 45539 54313
Total 2604092 1203978 1400114 2455501 1128217 1327284 2579673 1161819 1417854
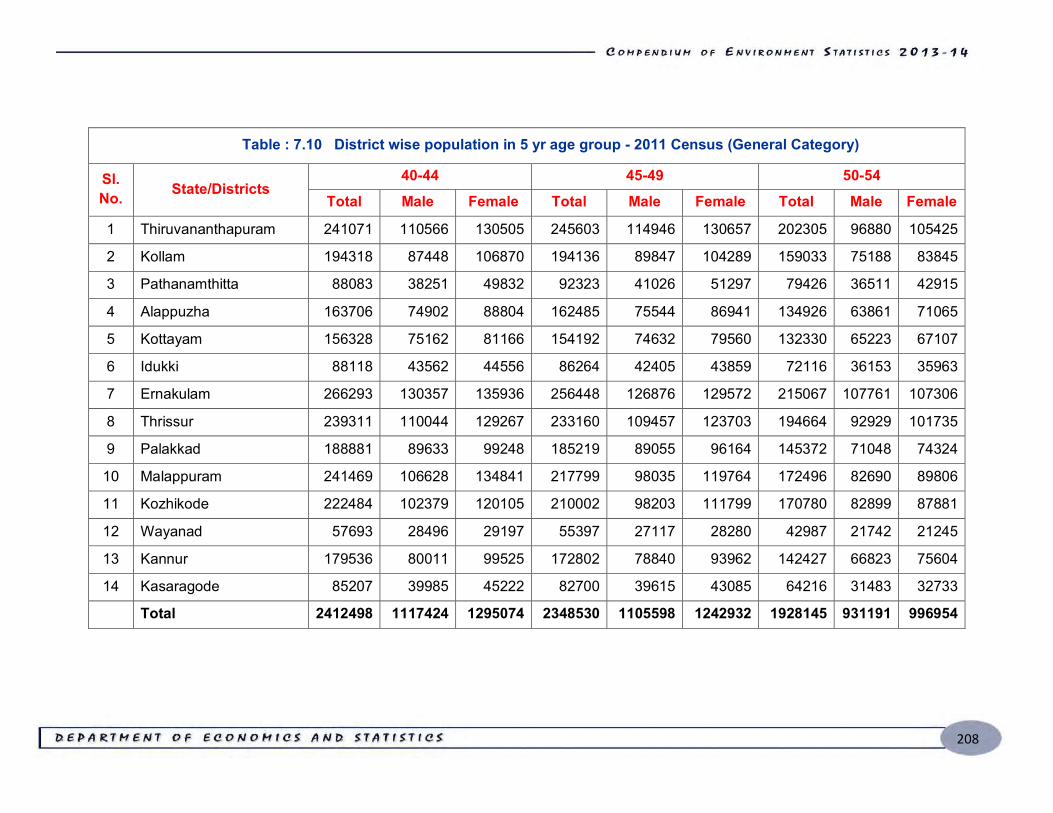
208
Table : 7.10 District wise population in 5 yr age group - 2011 Census (General Category)
Sl. No. State/Districts
40-44 45-49 50-54 Total Male Female Total Male Female Total Male Female
1 Thiruvananthapuram 241071 110566 130505 245603 114946 130657 202305 96880 105425
2 Kollam 194318 87448 106870 194136 89847 104289 159033 75188 83845
3 Pathanamthitta 88083 38251 49832 92323 41026 51297 79426 36511 42915
4 Alappuzha 163706 74902 88804 162485 75544 86941 134926 63861 71065
5 Kottayam 156328 75162 81166 154192 74632 79560 132330 65223 67107
6 Idukki 88118 43562 44556 86264 42405 43859 72116 36153 35963
7 Ernakulam 266293 130357 135936 256448 126876 129572 215067 107761 107306
8 Thrissur 239311 110044 129267 233160 109457 123703 194664 92929 101735
9 Palakkad 188881 89633 99248 185219 89055 96164 145372 71048 74324
10 Malappuram 241469 106628 134841 217799 98035 119764 172496 82690 89806
11 Kozhikode 222484 102379 120105 210002 98203 111799 170780 82899 87881
12 Wayanad 57693 28496 29197 55397 27117 28280 42987 21742 21245
13 Kannur 179536 80011 99525 172802 78840 93962 142427 66823 75604
14 Kasaragode 85207 39985 45222 82700 39615 43085 64216 31483 32733
Total 2412498 1117424 1295074 2348530 1105598 1242932 1928145 931191 996954
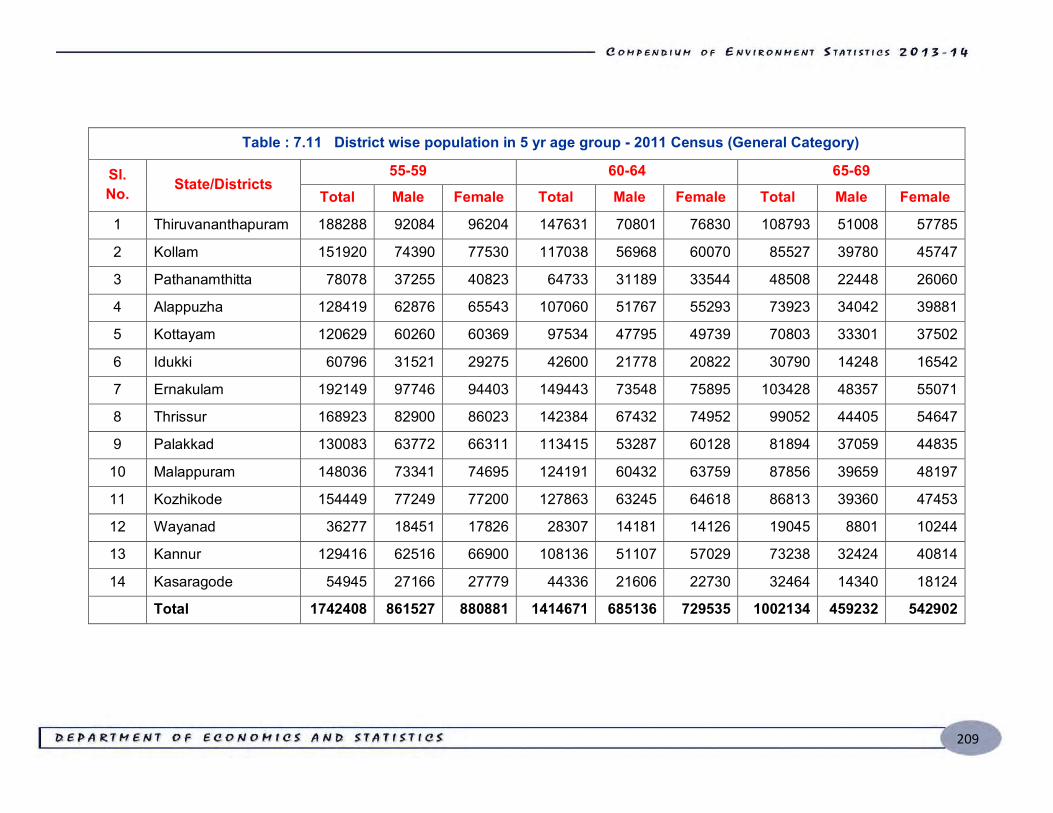
209
Table : 7.11 District wise population in 5 yr age group - 2011 Census (General Category)
Sl. No. State/Districts
55-59 60-64 65-69
Total Male Female Total Male Female Total Male Female
1 Thiruvananthapuram 188288 92084 96204 147631 70801 76830 108793 51008 57785
2 Kollam 151920 74390 77530 117038 56968 60070 85527 39780 45747
3 Pathanamthitta 78078 37255 40823 64733 31189 33544 48508 22448 26060
4 Alappuzha 128419 62876 65543 107060 51767 55293 73923 34042 39881
5 Kottayam 120629 60260 60369 97534 47795 49739 70803 33301 37502
6 Idukki 60796 31521 29275 42600 21778 20822 30790 14248 16542
7 Ernakulam 192149 97746 94403 149443 73548 75895 103428 48357 55071
8 Thrissur 168923 82900 86023 142384 67432 74952 99052 44405 54647
9 Palakkad 130083 63772 66311 113415 53287 60128 81894 37059 44835
10 Malappuram 148036 73341 74695 124191 60432 63759 87856 39659 48197
11 Kozhikode 154449 77249 77200 127863 63245 64618 86813 39360 47453
12 Wayanad 36277 18451 17826 28307 14181 14126 19045 8801 10244
13 Kannur 129416 62516 66900 108136 51107 57029 73238 32424 40814
14 Kasaragode 54945 27166 27779 44336 21606 22730 32464 14340 18124
Total 1742408 861527 880881 1414671 685136 729535 1002134 459232 542902
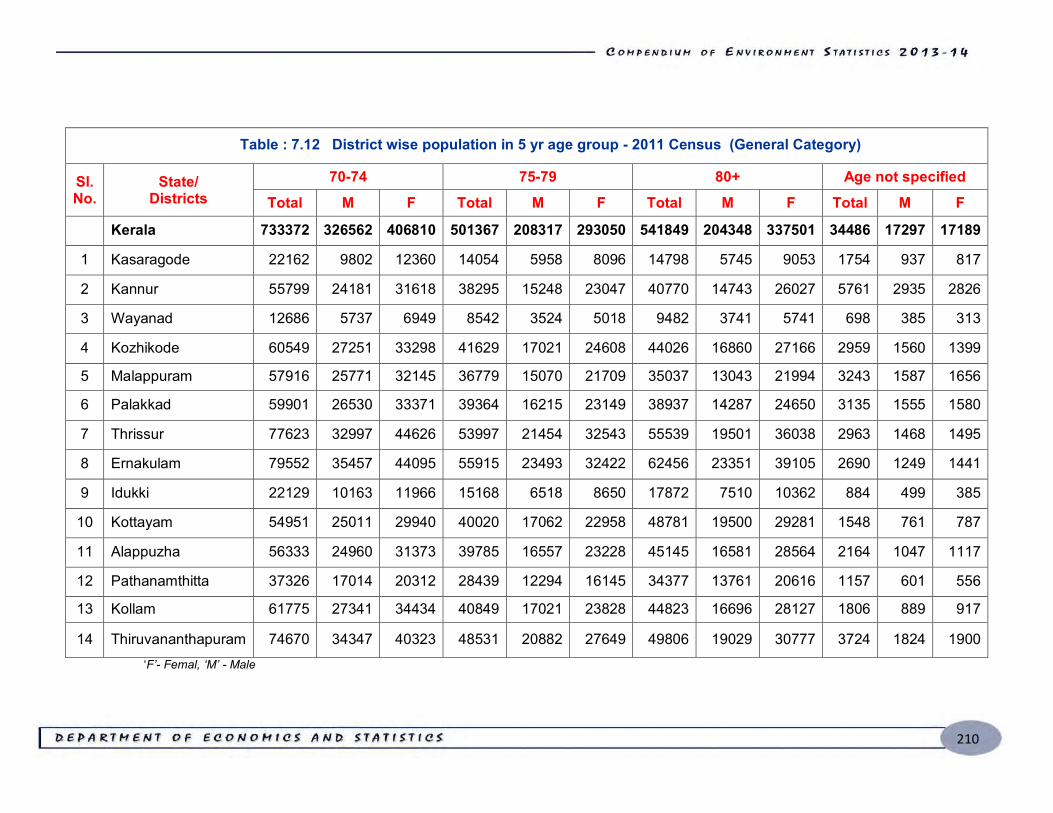
210
Table : 7.12 District wise population in 5 yr age group - 2011 Census (General Category)
Sl. No.
State/ Districts
70-74 75-79 80+ Age not specified Total M F Total M F Total M F Total M F
Kerala 733372 326562 406810 501367 208317 293050 541849 204348 337501 34486 17297 17189
1 Kasaragode 22162 9802 12360 14054 5958 8096 14798 5745 9053 1754 937 817
2 Kannur 55799 24181 31618 38295 15248 23047 40770 14743 26027 5761 2935 2826
3 Wayanad 12686 5737 6949 8542 3524 5018 9482 3741 5741 698 385 313
4 Kozhikode 60549 27251 33298 41629 17021 24608 44026 16860 27166 2959 1560 1399
5 Malappuram 57916 25771 32145 36779 15070 21709 35037 13043 21994 3243 1587 1656
6 Palakkad 59901 26530 33371 39364 16215 23149 38937 14287 24650 3135 1555 1580
7 Thrissur 77623 32997 44626 53997 21454 32543 55539 19501 36038 2963 1468 1495
8 Ernakulam 79552 35457 44095 55915 23493 32422 62456 23351 39105 2690 1249 1441
9 Idukki 22129 10163 11966 15168 6518 8650 17872 7510 10362 884 499 385
10 Kottayam 54951 25011 29940 40020 17062 22958 48781 19500 29281 1548 761 787
11 Alappuzha 56333 24960 31373 39785 16557 23228 45145 16581 28564 2164 1047 1117
12 Pathanamthitta 37326 17014 20312 28439 12294 16145 34377 13761 20616 1157 601 556
13 Kollam 61775 27341 34434 40849 17021 23828 44823 16696 28127 1806 889 917
14 Thiruvananthapuram 74670 34347 40323 48531 20882 27649 49806 19029 30777 3724 1824 1900 ‘F’- Femal, ‘M’ - Male
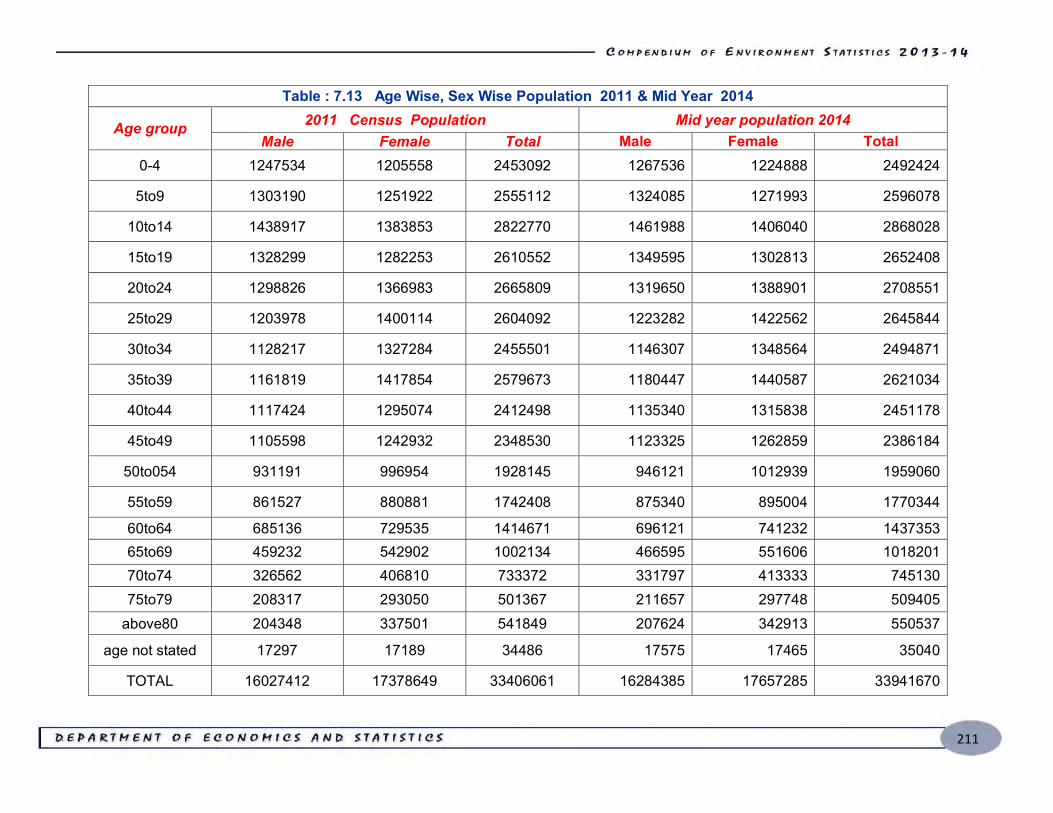
211
Table : 7.13 Age Wise, Sex Wise Population 2011 & Mid Year 2014
Age group 2011 Census Population Mid year population 2014 Male Female Total Male Female Total
0-4 1247534 1205558 2453092 1267536 1224888 2492424
5to9 1303190 1251922 2555112 1324085 1271993 2596078
10to14 1438917 1383853 2822770 1461988 1406040 2868028
15to19 1328299 1282253 2610552 1349595 1302813 2652408
20to24 1298826 1366983 2665809 1319650 1388901 2708551
25to29 1203978 1400114 2604092 1223282 1422562 2645844
30to34 1128217 1327284 2455501 1146307 1348564 2494871
35to39 1161819 1417854 2579673 1180447 1440587 2621034
40to44 1117424 1295074 2412498 1135340 1315838 2451178
45to49 1105598 1242932 2348530 1123325 1262859 2386184
50to054 931191 996954 1928145 946121 1012939 1959060
55to59 861527 880881 1742408 875340 895004 1770344
60to64 685136 729535 1414671 696121 741232 1437353 65to69 459232 542902 1002134 466595 551606 1018201 70to74 326562 406810 733372 331797 413333 745130 75to79 208317 293050 501367 211657 297748 509405
above80 204348 337501 541849 207624 342913 550537
age not stated 17297 17189 34486 17575 17465 35040
TOTAL 16027412 17378649 33406061 16284385 17657285 33941670
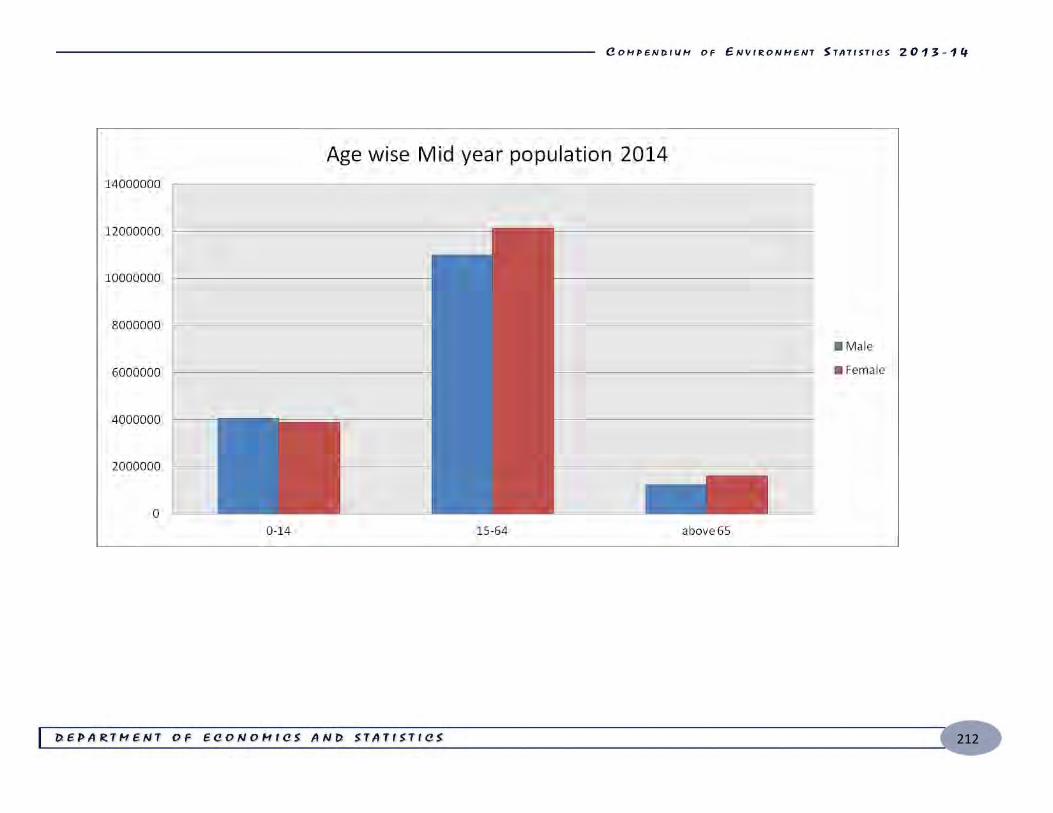
212
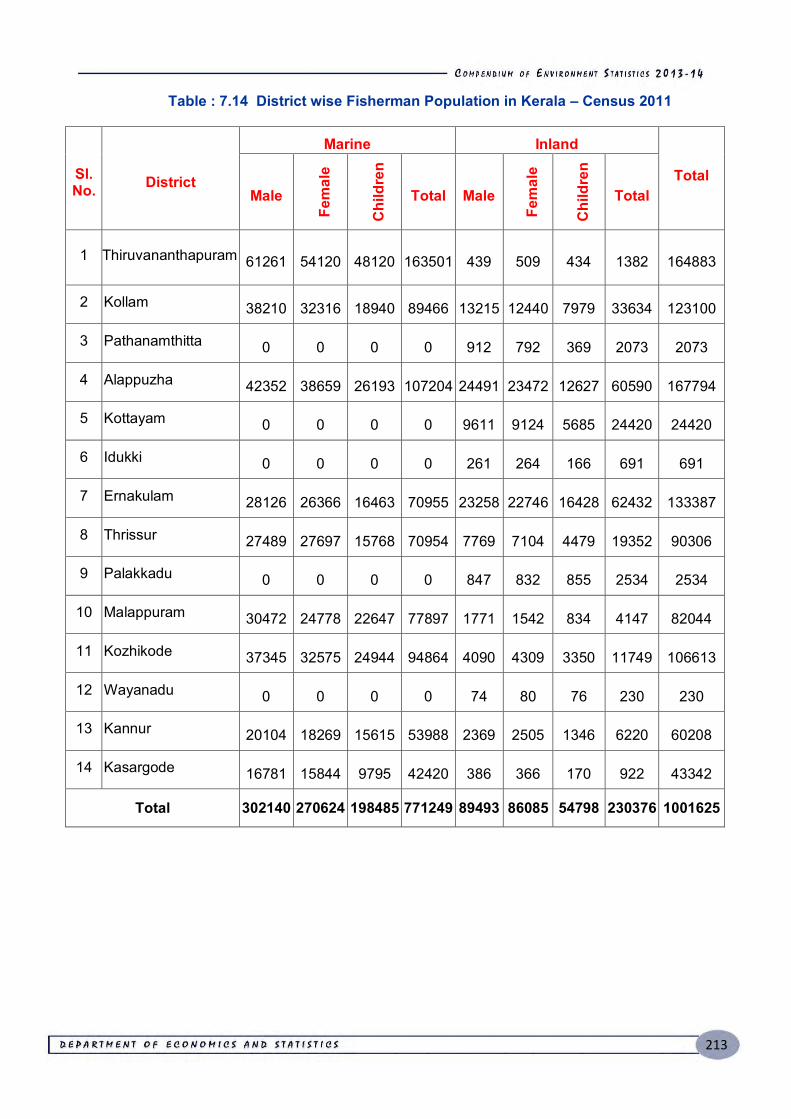
213
Table : 7.14 District wise Fisherman Population in Kerala – Census 2011
Sl. No. District
Marine Inland Total
Male
Fem
ale
Chi
ldre
n
Total Male
Fem
ale
Chi
ldre
n
Total
1 Thiruvananthapuram 61261 54120 48120 163501 439 509 434 1382 164883
2 Kollam 38210 32316 18940 89466 13215 12440 7979 33634 123100
3 Pathanamthitta 0 0 0 0 912 792 369 2073 2073
4 Alappuzha 42352 38659 26193 107204 24491 23472 12627 60590 167794
5 Kottayam 0 0 0 0 9611 9124 5685 24420 24420
6 Idukki 0 0 0 0 261 264 166 691 691
7 Ernakulam 28126 26366 16463 70955 23258 22746 16428 62432 133387
8 Thrissur 27489 27697 15768 70954 7769 7104 4479 19352 90306
9 Palakkadu 0 0 0 0 847 832 855 2534 2534
10 Malappuram 30472 24778 22647 77897 1771 1542 834 4147 82044
11 Kozhikode 37345 32575 24944 94864 4090 4309 3350 11749 106613
12 Wayanadu 0 0 0 0 74 80 76 230 230
13 Kannur 20104 18269 15615 53988 2369 2505 1346 6220 60208
14 Kasargode 16781 15844 9795 42420 386 366 170 922 43342
Total 302140 270624 198485 771249 89493 86085 54798 230376 1001625
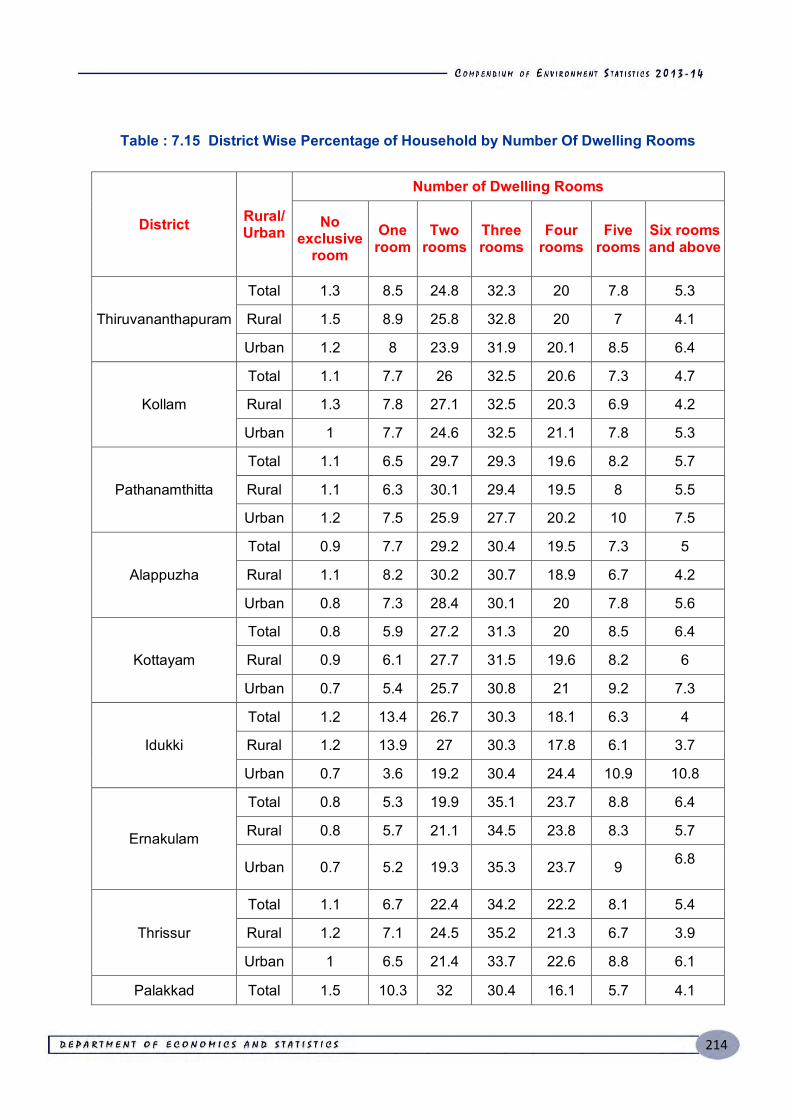
214
Table : 7.15 District Wise Percentage of Household by Number Of Dwelling Rooms
District Rural/ Urban
Number of Dwelling Rooms
No exclusive
room One room
Two rooms
Three rooms
Four rooms
Five rooms
Six rooms and above
Thiruvananthapuram
Total 1.3 8.5 24.8 32.3 20 7.8 5.3
Rural 1.5 8.9 25.8 32.8 20 7 4.1
Urban 1.2 8 23.9 31.9 20.1 8.5 6.4
Kollam
Total 1.1 7.7 26 32.5 20.6 7.3 4.7
Rural 1.3 7.8 27.1 32.5 20.3 6.9 4.2
Urban 1 7.7 24.6 32.5 21.1 7.8 5.3
Pathanamthitta
Total 1.1 6.5 29.7 29.3 19.6 8.2 5.7
Rural 1.1 6.3 30.1 29.4 19.5 8 5.5
Urban 1.2 7.5 25.9 27.7 20.2 10 7.5
Alappuzha
Total 0.9 7.7 29.2 30.4 19.5 7.3 5
Rural 1.1 8.2 30.2 30.7 18.9 6.7 4.2
Urban 0.8 7.3 28.4 30.1 20 7.8 5.6
Kottayam
Total 0.8 5.9 27.2 31.3 20 8.5 6.4
Rural 0.9 6.1 27.7 31.5 19.6 8.2 6
Urban 0.7 5.4 25.7 30.8 21 9.2 7.3
Idukki
Total 1.2 13.4 26.7 30.3 18.1 6.3 4
Rural 1.2 13.9 27 30.3 17.8 6.1 3.7
Urban 0.7 3.6 19.2 30.4 24.4 10.9 10.8
Ernakulam
Total 0.8 5.3 19.9 35.1 23.7 8.8 6.4
Rural 0.8 5.7 21.1 34.5 23.8 8.3 5.7
Urban 0.7 5.2 19.3 35.3 23.7 9 6.8
Thrissur
Total 1.1 6.7 22.4 34.2 22.2 8.1 5.4
Rural 1.2 7.1 24.5 35.2 21.3 6.7 3.9
Urban 1 6.5 21.4 33.7 22.6 8.8 6.1
Palakkad Total 1.5 10.3 32 30.4 16.1 5.7 4.1
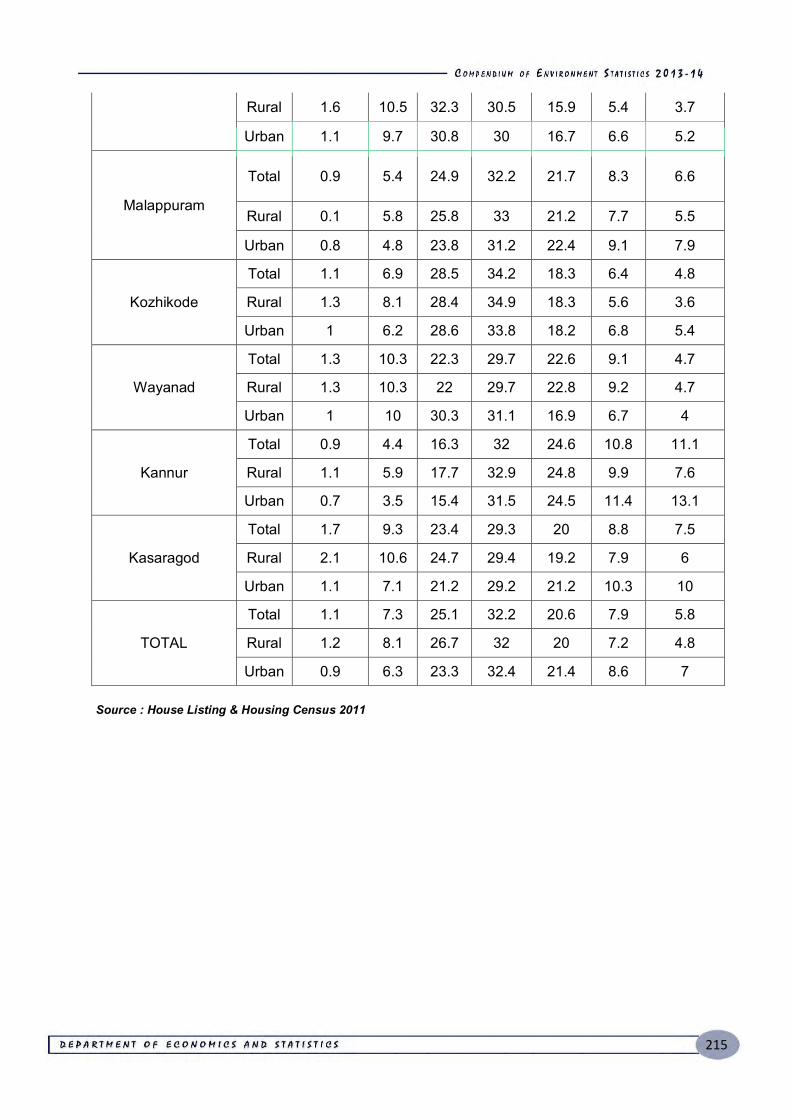
215
Rural 1.6 10.5 32.3 30.5 15.9 5.4 3.7
Urban 1.1 9.7 30.8 30 16.7 6.6 5.2
Malappuram
Total 0.9 5.4 24.9 32.2 21.7 8.3 6.6
Rural 0.1 5.8 25.8 33 21.2 7.7 5.5
Urban 0.8 4.8 23.8 31.2 22.4 9.1 7.9
Kozhikode
Total 1.1 6.9 28.5 34.2 18.3 6.4 4.8
Rural 1.3 8.1 28.4 34.9 18.3 5.6 3.6
Urban 1 6.2 28.6 33.8 18.2 6.8 5.4
Wayanad
Total 1.3 10.3 22.3 29.7 22.6 9.1 4.7
Rural 1.3 10.3 22 29.7 22.8 9.2 4.7
Urban 1 10 30.3 31.1 16.9 6.7 4
Kannur
Total 0.9 4.4 16.3 32 24.6 10.8 11.1
Rural 1.1 5.9 17.7 32.9 24.8 9.9 7.6
Urban 0.7 3.5 15.4 31.5 24.5 11.4 13.1
Kasaragod
Total 1.7 9.3 23.4 29.3 20 8.8 7.5
Rural 2.1 10.6 24.7 29.4 19.2 7.9 6
Urban 1.1 7.1 21.2 29.2 21.2 10.3 10
TOTAL
Total 1.1 7.3 25.1 32.2 20.6 7.9 5.8
Rural 1.2 8.1 26.7 32 20 7.2 4.8
Urban 0.9 6.3 23.3 32.4 21.4 8.6 7
Source : House Listing & Housing Census 2011
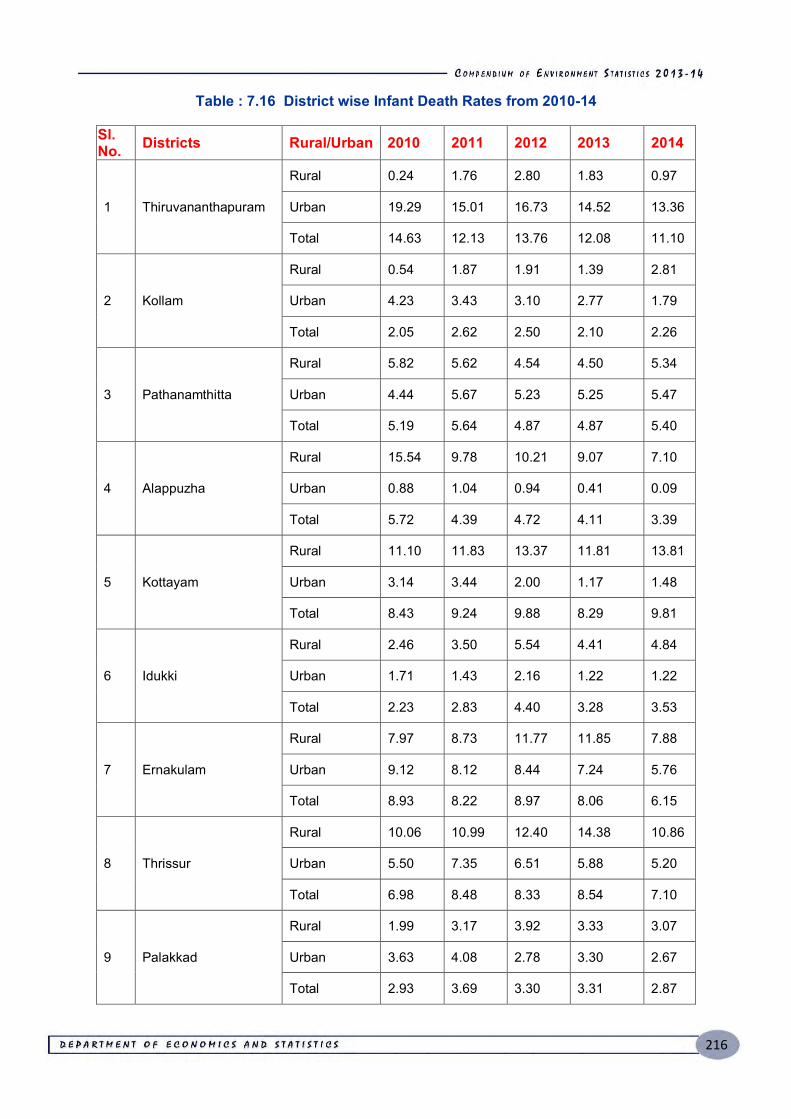
216
Table : 7.16 District wise Infant Death Rates from 2010-14
Sl. No. Districts Rural/Urban 2010 2011 2012 2013 2014
1 Thiruvananthapuram
Rural 0.24 1.76 2.80 1.83 0.97
Urban 19.29 15.01 16.73 14.52 13.36
Total 14.63 12.13 13.76 12.08 11.10
2 Kollam
Rural 0.54 1.87 1.91 1.39 2.81
Urban 4.23 3.43 3.10 2.77 1.79
Total 2.05 2.62 2.50 2.10 2.26
3 Pathanamthitta
Rural 5.82 5.62 4.54 4.50 5.34
Urban 4.44 5.67 5.23 5.25 5.47
Total 5.19 5.64 4.87 4.87 5.40
4 Alappuzha
Rural 15.54 9.78 10.21 9.07 7.10
Urban 0.88 1.04 0.94 0.41 0.09
Total 5.72 4.39 4.72 4.11 3.39
5 Kottayam
Rural 11.10 11.83 13.37 11.81 13.81
Urban 3.14 3.44 2.00 1.17 1.48
Total 8.43 9.24 9.88 8.29 9.81
6 Idukki
Rural 2.46 3.50 5.54 4.41 4.84
Urban 1.71 1.43 2.16 1.22 1.22
Total 2.23 2.83 4.40 3.28 3.53
7 Ernakulam
Rural 7.97 8.73 11.77 11.85 7.88
Urban 9.12 8.12 8.44 7.24 5.76
Total 8.93 8.22 8.97 8.06 6.15
8 Thrissur
Rural 10.06 10.99 12.40 14.38 10.86
Urban 5.50 7.35 6.51 5.88 5.20
Total 6.98 8.48 8.33 8.54 7.10
9 Palakkad
Rural 1.99 3.17 3.92 3.33 3.07
Urban 3.63 4.08 2.78 3.30 2.67
Total 2.93 3.69 3.30 3.31 2.87
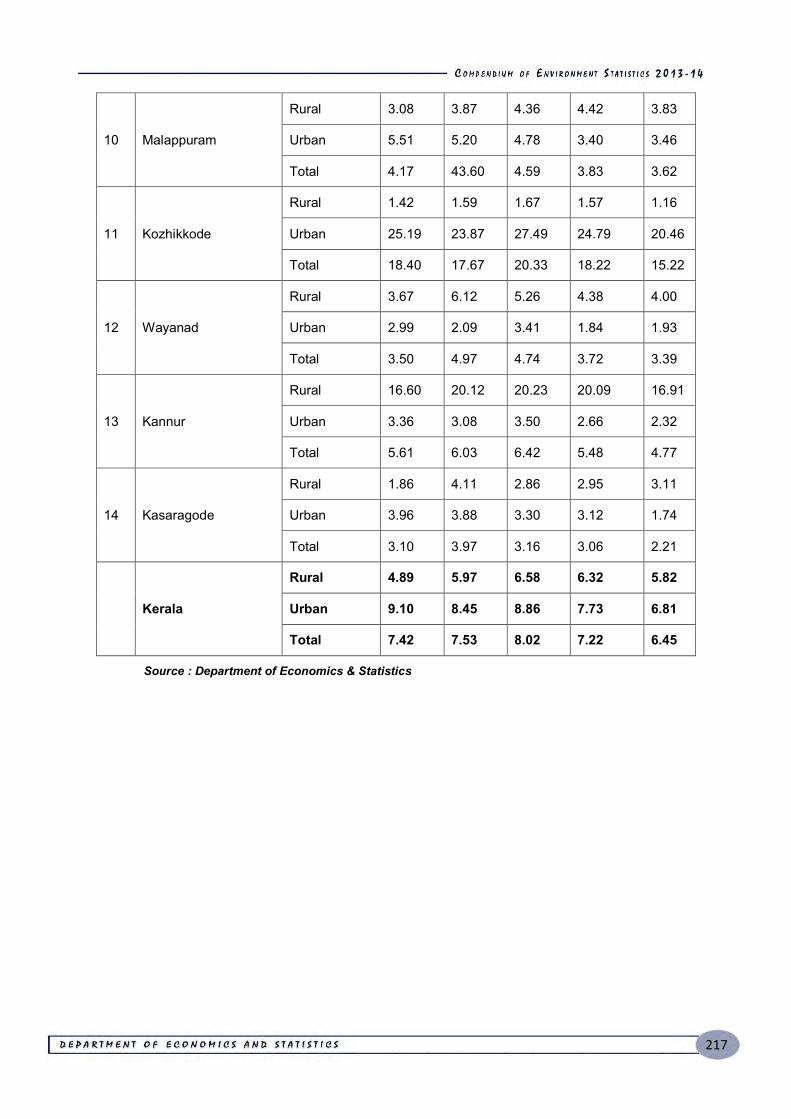
217
10 Malappuram
Rural 3.08 3.87 4.36 4.42 3.83
Urban 5.51 5.20 4.78 3.40 3.46
Total 4.17 43.60 4.59 3.83 3.62
11 Kozhikkode
Rural 1.42 1.59 1.67 1.57 1.16
Urban 25.19 23.87 27.49 24.79 20.46
Total 18.40 17.67 20.33 18.22 15.22
12 Wayanad
Rural 3.67 6.12 5.26 4.38 4.00
Urban 2.99 2.09 3.41 1.84 1.93
Total 3.50 4.97 4.74 3.72 3.39
13 Kannur
Rural 16.60 20.12 20.23 20.09 16.91
Urban 3.36 3.08 3.50 2.66 2.32
Total 5.61 6.03 6.42 5.48 4.77
14 Kasaragode
Rural 1.86 4.11 2.86 2.95 3.11
Urban 3.96 3.88 3.30 3.12 1.74
Total 3.10 3.97 3.16 3.06 2.21
Kerala
Rural 4.89 5.97 6.58 6.32 5.82
Urban 9.10 8.45 8.86 7.73 6.81
Total 7.42 7.53 8.02 7.22 6.45
Source : Department of Economics & Statistics
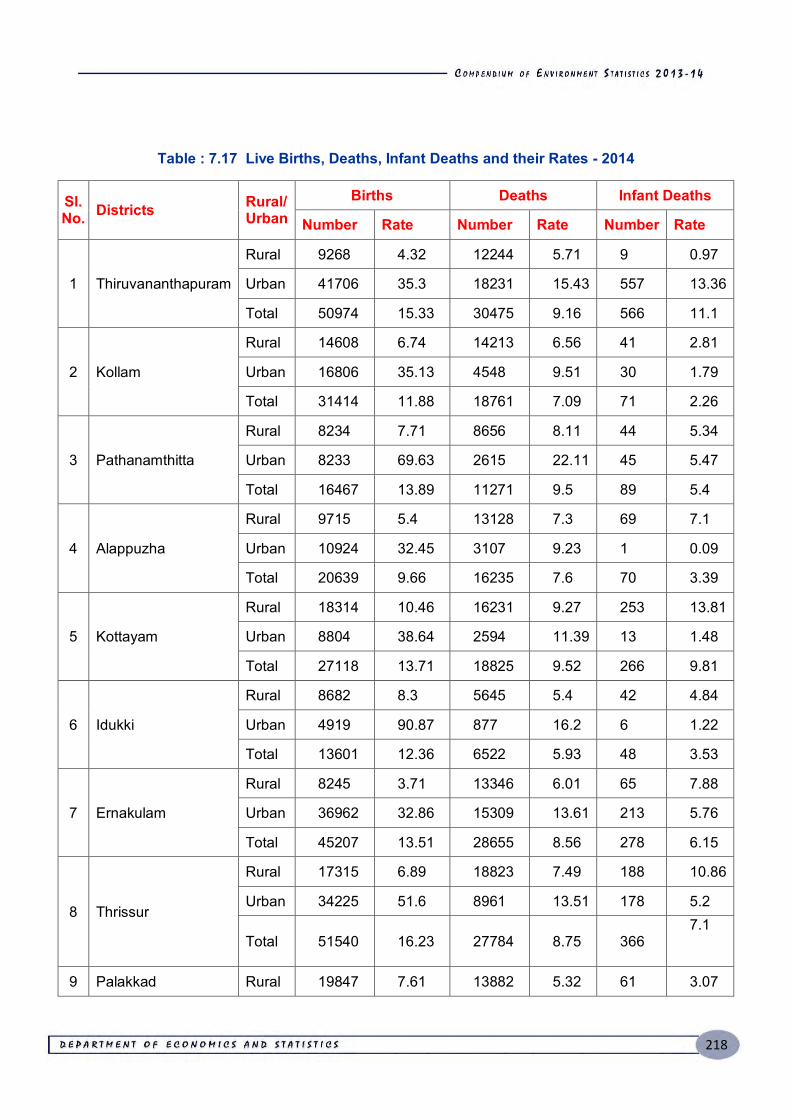
218
Table : 7.17 Live Births, Deaths, Infant Deaths and their Rates - 2014
Sl. No. Districts Rural/
Urban Births Deaths Infant Deaths
Number Rate Number Rate Number Rate
1 Thiruvananthapuram
Rural 9268 4.32 12244 5.71 9 0.97
Urban 41706 35.3 18231 15.43 557 13.36
Total 50974 15.33 30475 9.16 566 11.1
2 Kollam
Rural 14608 6.74 14213 6.56 41 2.81
Urban 16806 35.13 4548 9.51 30 1.79
Total 31414 11.88 18761 7.09 71 2.26
3 Pathanamthitta
Rural 8234 7.71 8656 8.11 44 5.34
Urban 8233 69.63 2615 22.11 45 5.47
Total 16467 13.89 11271 9.5 89 5.4
4 Alappuzha
Rural 9715 5.4 13128 7.3 69 7.1
Urban 10924 32.45 3107 9.23 1 0.09
Total 20639 9.66 16235 7.6 70 3.39
5 Kottayam
Rural 18314 10.46 16231 9.27 253 13.81
Urban 8804 38.64 2594 11.39 13 1.48
Total 27118 13.71 18825 9.52 266 9.81
6 Idukki
Rural 8682 8.3 5645 5.4 42 4.84
Urban 4919 90.87 877 16.2 6 1.22
Total 13601 12.36 6522 5.93 48 3.53
7 Ernakulam
Rural 8245 3.71 13346 6.01 65 7.88
Urban 36962 32.86 15309 13.61 213 5.76
Total 45207 13.51 28655 8.56 278 6.15
8 Thrissur
Rural 17315 6.89 18823 7.49 188 10.86
Urban 34225 51.6 8961 13.51 178 5.2
Total 51540 16.23 27784 8.75 366 7.1
9 Palakkad Rural 19847 7.61 13882 5.32 61 3.07
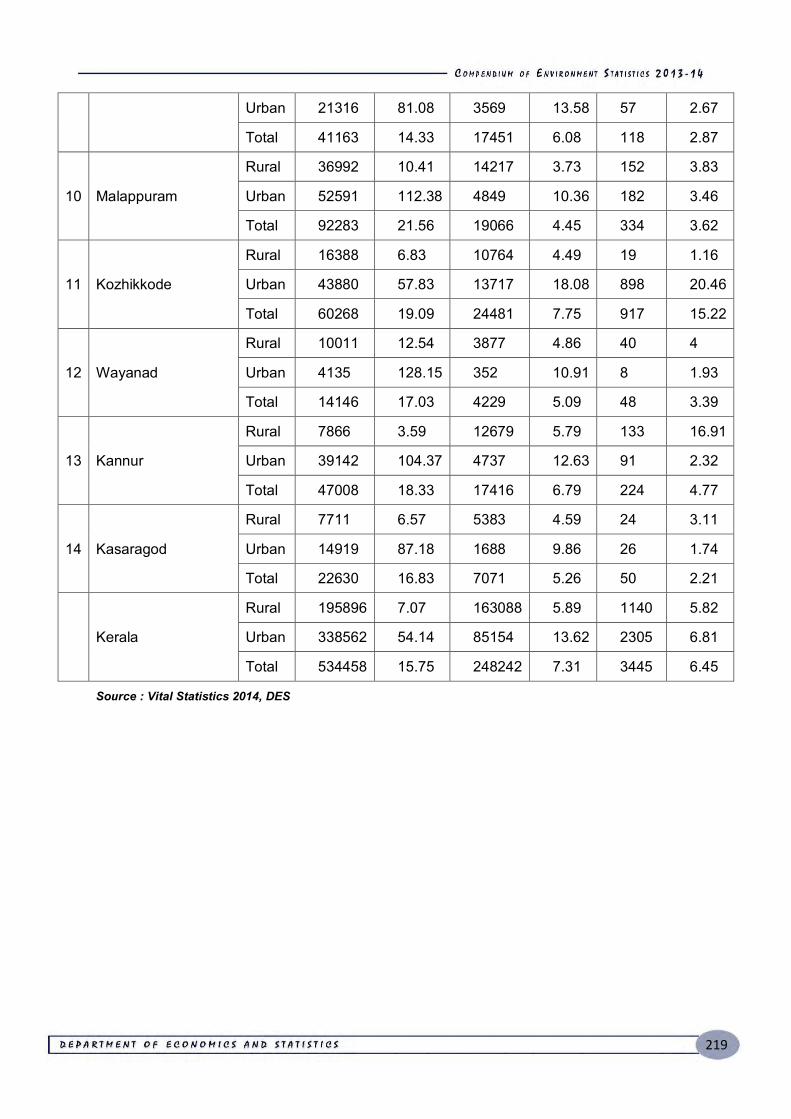
219
Urban 21316 81.08 3569 13.58 57 2.67
Total 41163 14.33 17451 6.08 118 2.87
10 Malappuram
Rural 36992 10.41 14217 3.73 152 3.83
Urban 52591 112.38 4849 10.36 182 3.46
Total 92283 21.56 19066 4.45 334 3.62
11 Kozhikkode
Rural 16388 6.83 10764 4.49 19 1.16
Urban 43880 57.83 13717 18.08 898 20.46
Total 60268 19.09 24481 7.75 917 15.22
12 Wayanad
Rural 10011 12.54 3877 4.86 40 4
Urban 4135 128.15 352 10.91 8 1.93
Total 14146 17.03 4229 5.09 48 3.39
13 Kannur
Rural 7866 3.59 12679 5.79 133 16.91
Urban 39142 104.37 4737 12.63 91 2.32
Total 47008 18.33 17416 6.79 224 4.77
14 Kasaragod
Rural 7711 6.57 5383 4.59 24 3.11
Urban 14919 87.18 1688 9.86 26 1.74
Total 22630 16.83 7071 5.26 50 2.21
Kerala
Rural 195896 7.07 163088 5.89 1140 5.82
Urban 338562 54.14 85154 13.62 2305 6.81
Total 534458 15.75 248242 7.31 3445 6.45
Source : Vital Statistics 2014, DES
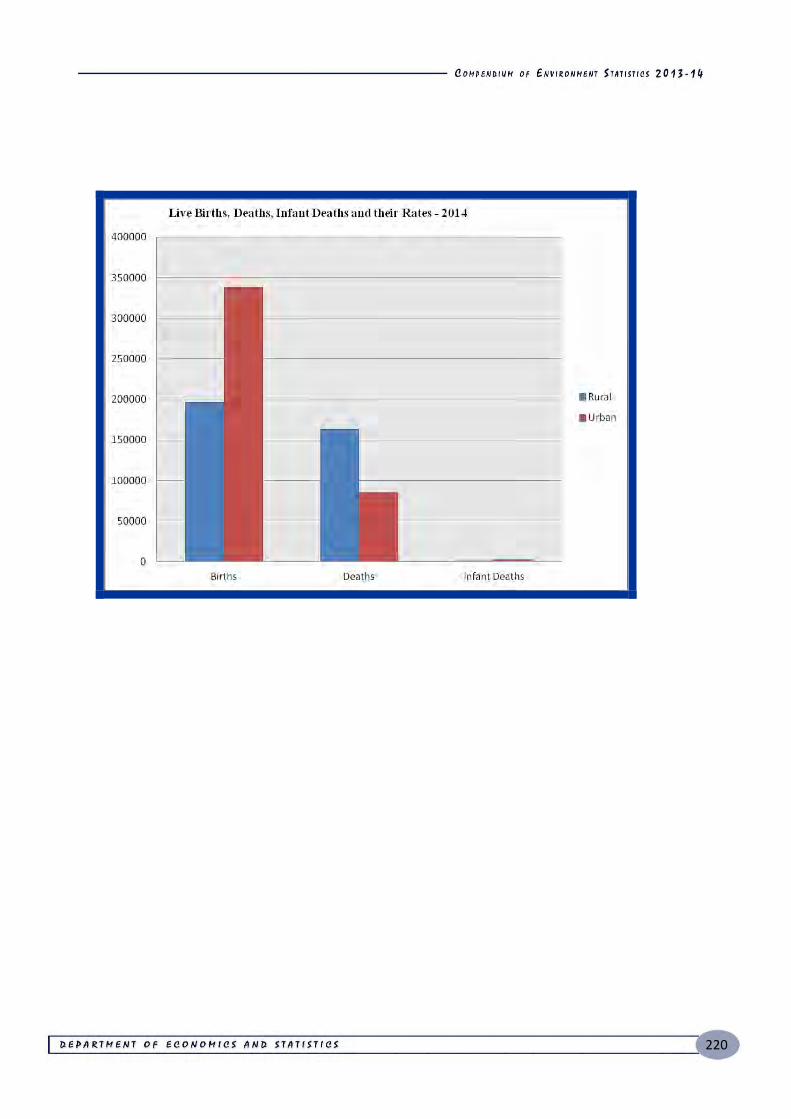
220
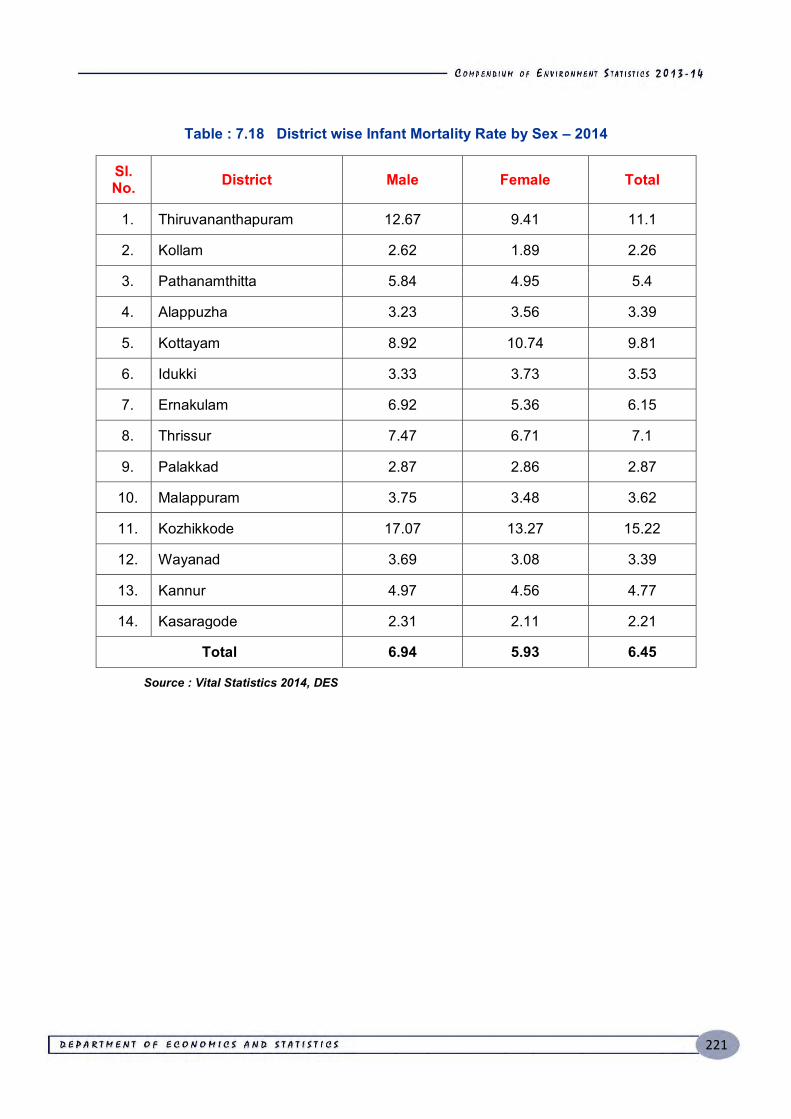
221
Table : 7.18 District wise Infant Mortality Rate by Sex – 2014
Sl. No. District Male Female Total
1. Thiruvananthapuram 12.67 9.41 11.1
2. Kollam 2.62 1.89 2.26
3. Pathanamthitta 5.84 4.95 5.4
4. Alappuzha 3.23 3.56 3.39
5. Kottayam 8.92 10.74 9.81
6. Idukki 3.33 3.73 3.53
7. Ernakulam 6.92 5.36 6.15
8. Thrissur 7.47 6.71 7.1
9. Palakkad 2.87 2.86 2.87
10. Malappuram 3.75 3.48 3.62
11. Kozhikkode 17.07 13.27 15.22
12. Wayanad 3.69 3.08 3.39
13. Kannur 4.97 4.56 4.77
14. Kasaragode 2.31 2.11 2.21
Total 6.94 5.93 6.45
Source : Vital Statistics 2014, DES
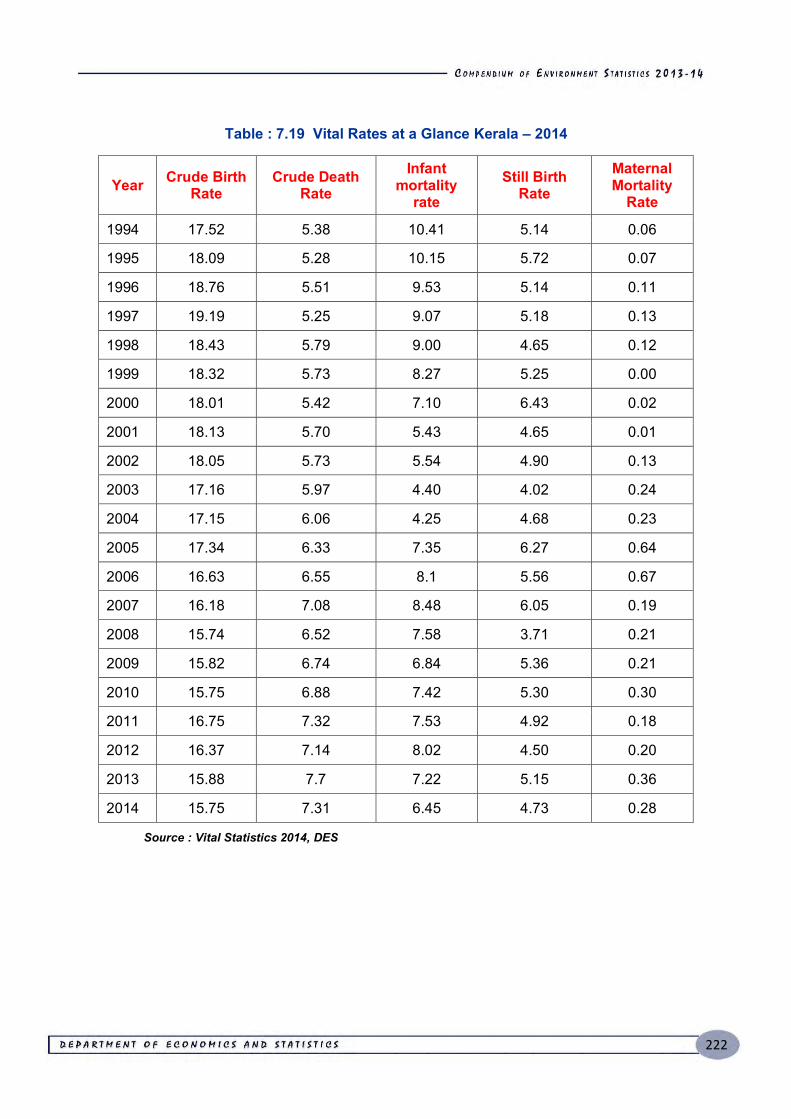
222
Table : 7.19 Vital Rates at a Glance Kerala – 2014
Year Crude Birth Rate
Crude Death Rate
Infant mortality
rate Still Birth
Rate Maternal Mortality
Rate
1994 17.52 5.38 10.41 5.14 0.06
1995 18.09 5.28 10.15 5.72 0.07
1996 18.76 5.51 9.53 5.14 0.11
1997 19.19 5.25 9.07 5.18 0.13
1998 18.43 5.79 9.00 4.65 0.12
1999 18.32 5.73 8.27 5.25 0.00
2000 18.01 5.42 7.10 6.43 0.02
2001 18.13 5.70 5.43 4.65 0.01
2002 18.05 5.73 5.54 4.90 0.13
2003 17.16 5.97 4.40 4.02 0.24
2004 17.15 6.06 4.25 4.68 0.23
2005 17.34 6.33 7.35 6.27 0.64
2006 16.63 6.55 8.1 5.56 0.67
2007 16.18 7.08 8.48 6.05 0.19
2008 15.74 6.52 7.58 3.71 0.21
2009 15.82 6.74 6.84 5.36 0.21
2010 15.75 6.88 7.42 5.30 0.30
2011 16.75 7.32 7.53 4.92 0.18
2012 16.37 7.14 8.02 4.50 0.20
2013 15.88 7.7 7.22 5.15 0.36
2014 15.75 7.31 6.45 4.73 0.28
Source : Vital Statistics 2014, DES