Embed Size (px)
Citation preview


CHAIRMANYANG, CHI-JEN
★Spokesperson Name: Kuei-Chun LiuTitle: Assistant Vice President, FinanceTelephone: (04) 8345171E-mail:[email protected]
★Deputy Spokesperson Name: Ching-Hui WuTitle: Finance ManagerTelephone: (04) 8345171E-mail:[email protected]
★Addresses and telephone numbers of Headquarters and factory sites:Headquarters: No. 146, Section 1, Chung Shan Road, Yuanlin City, Changhua CountyTelephone: (04) 8345171-82 Fax: (04) 8331865Website: http://www.kendatire.comMain Factory: No. 146, Section 1, Zhongshan Road, Yuanlin City, Changhua CountyTelephone: (04) 8345171-82 Fax: (04) 8331865Yunlin Factory: No. 50, Yanping Road, Citong Village, Citong Township, Yunlin County Telephone: (05) 5845271-2 Fax: (05) 5849325Taipei Office: 11F, Rear Building, No. 201-24, Dunhua North Road, Taipei City Telephone: (02) 27153125-7 Fax: (02) 27198900
★Stock transfer agentName: Transfer Agency Department, CTBC BankAddress: 5F, No. 83, Section 1, Chongqing South Rd., Zhongzheng Dist., Taipei City Telephone: (02) 6636-5566 Website: https://www.ctbcbank.com
★Financial statements auditors for the most recent year Accounting firm: Deloitte & Touche TaiwanAuditors: Wang, Yi-Wen and Tseng, Done-Yuin, CPA Address: 20F, No. 100, Songren Road, Taipei City Telephone: (02)2725-9988Website: https:// www.deloitte.com.tw
KENDA RUBBER IND.CO., LTD.

Table of Contents One. Letter to Shareholders ________________________________________________________ 1
I. The 2020 Business Report _______________________________________________ 2 II. Summary Of Business Plan for 2021 _______________________________________ 4 III. The Company's Future Development Strategy ________________________________ 6 IV. The Effect Of External Competition ________________________________________ 7 V. The Effect Of Legal Environment _________________________________________ 7 VI. The Effect Of the Overall Business Environment _____________________________ 8
Two. Introduction Of the Company _________________________________________________ 10 Three. Corporate Governance Report _______________________________________________ 17
I. Organization _________________________________________________________ 17 II. Directors, Supervisors, General Manager, Vice Presidents, Assistant Vice Presidents
and Branch Managers___________________________________________________ 20 III. Remuneration to Directors, Supervisors, General Manager, And Vice Presidents
In the Most Recent Year _________________________________________________ 25 IV. The Implementation Status of The Corporate Governance ______________________ 30 V. Information On CPA fees _______________________________________________ 69 VI. Information On Change in CPA __________________________________________ 71 VII. Chairman, President, Finance or Accounting Managers Who Have Worked In The
Accounting Firm Who Audit The Company’s Reports or Its Affiliates During The Most Recent Year ______________________________________________________ 71
VIII. Share Transfers And Change In Pledges On Shares By Directors, Supervisors, Managers And Shareholders With At Least 10% Stakes During The Most Recent Year And As Of The Print Date of This Annual Report _________________________ 72
IX. Information on The Top 10 Shareholders Who Are Related To Each Other Under SFAS No. 6 Or Are Related To Each Other As Spouses, Second Degree Of Kinship _ 74
X. Ownership Of Shares in Affiliated Companies _______________________________ 75 Four. Capitalization ____________________________________________________________ 76
I. Capitalization And Shares _______________________________________________ 76 II. Corporate Bonds ______________________________________________________ 83 III. Preferred Shares ______________________________________________________ 83 IV. Overseas Depositary Receipts ____________________________________________ 84 V. Employee Stock Options Plan (ESOP) _____________________________________ 84 VI. New Restricted Shares To Employees _____________________________________ 84 VII. Mergers & Acquisitions ________________________________________________ 84 VIII. Implementation of Capital Utilization Plan _________________________________ 84
Five. Operations ________________________________________________________________ 85 I. Content of Businesses __________________________________________________ 85 II. Market, Production and Sales Overview ____________________________________ 89 III. Employees ___________________________________________________________ 96 IV. Environmental Protection Expenses _______________________________________ 96 V. Labor Relations _______________________________________________________ 99

VI. Important Contracts ___________________________________________________ 104 Six. Financials ________________________________________________________________ 105
I. The Condensed Balance Sheet, Consolidated Income Statement Over The Past Five Years, Names of The Certified Public Accountants And Their Audit Opinions ____ 105
II. Financial Analysis For The Most Recent Five Years _________________________ 109 III. Review Reports By Audit Committee On Financial Statements For The Most Recent
Years ______________________________________________________________ 113 IV. Consolidated Financial Statements Of The Latest Year Duly Audited By The
Certified Public Accountants ____________________________________________ 114 V. Individual Consolidated Financial Statements Duly Audited By The Certified Public
Accountants In Recent Years ___________________________________________ 184 VI. Financial Difficulty Experienced By The Company Or Its Affiliates During The
Most Recent Year And As Of The Print Date Of This Annual Report ____________ 254 Seven. Review And Analysis Of Financials And Financial Performance And Risks __________ 254
I. Financial Status ______________________________________________________ 254 II. Financial Performance ________________________________________________ 255 III. Cash Flows _________________________________________________________ 256 IV. Impact Of Major Capital Expenditures On Finance And Business During Most
Recent Year _________________________________________________________ 256 V. Investment Policies, Main Causes For Profit Or Loss And Improvement Plans In
The Most Recent Year And Investment Plans For The Coming Year _____________ 257 VI. Risks ______________________________________________________________ 257 VII. Other Important Matters _______________________________________________ 262
Eight. Special Notes & Supplementary Information ___________________________________ 263 I. Data On Affiliated Companies __________________________________________ 263 II. Private Placement Of Marketable Securities During The Most Recent Year And As
Of The Print Date Of This Annual Report _________________________________ 267 III. Possession Or Disposal Of The Company’s Shares By Subsidiaries During The
Most Recent Year And As Of The Print Date Of This Annual Report ____________ 267 IV. Other Required Supplementary Information _______________________________ 267

1
One. Letter to Shareholders In 2020, the COVID-19 pandemic changed the supply chain as well as the transition of
economy and trade in this world. In addition, the U.S. Department of Commerce imposed a high anti-dumping duty on Taiwan tires sold to the U.S., which severely affected the competitiveness of Taiwan’s tire manufacturers in the U.S. market. In response to market changes, the Company shifted the tires for passenger cars and light trucks exported from the factory in Taiwan to the United States to be produced in Vietnam and then sold to the United States, in order to avoid the risk of being subject to high anti-dumping duties. As for the car and light truck tires produced by Taiwanese manufacturers, we have switched the market focus on the "non-US markets", including Europe, the Middle East and Asia to reduce such impacts. Despite a 5.8% decline in revenue in 2020 compared to 2019, the newly developed car and SUV tires at the R&D center won the IDA International Design Award and were well received after their launch into the market; thus, their market share was among the top 10 in the US market and, together with higher selling prices, resulting in an increase in profitability; thus, the Company's operating performance was better than its competitors in the same industry.
Looking ahead to the coming year, given the impacts arising from the trade war between the US and China, the COVID-19 pandemic, exchange rate fluctuations, raw material price increases and industry supply chain restructuring, the Company continues to invest in expanding the production scale in Phase III of Vietnam Plant 2 and expanding the production capacity of Indonesia Plant in order to provide timely supply to meet the increasing orders from car and bicycle tire buyers when container and shipping logistics gradually return to normal. We expect the Group's turnover will grow rapidly. In response to the COVID-19 pandemic, we have strengthened the occupational safety and health management to ensure workplace safety, and continued to promote the Productivity 4.0 smart manufacturing and MES production monitoring system to ensure the quality and increase the production capacity. Our global R&D headquarters was opened in 2020; it will expand the Group's R&D team, integrate the resources from the US and European R&D centers, and take advantage of the industry-government-university cooperation to enhance the overall R&D capacity and launch more tires with high cost performance. In addition, the Shenzhen plant's urbanization development project has been successfully launched, the benefits of which will be highly beneficial to the company's overall operating performance, thereby fulfilling the expectations of shareholders.
~ 1 ~

2
I. The 2020 Business Report (I) Results of the 2020 Business Plan Implementation
1. Production and Sales: In thousand units; % Year
ProductProduction in
2020Sales in 2020 Sales in 2019
Percentage of increase/decrease
(%)Bicycle tires 44,519 43,153 41,750 3.36Tires for motorcycles and other bias tires
29,629 34,597 40,433 -14.43
Radial tires 7,411 5,878 6,387 -7.97Inner tube 81,818 80,229 78,802 1.81
2. Operational Status: Consolidated Unit: NTD Thousands; %
Year Item 2020 2019
Percentage of increase/decrease
(%)Net operating income 30,260,185 32,127,436 -5.81%Operating cost 22,910,212 25,570,683 -10.40%Operating expenses 4,876,452 5,302,222 -8.03%Profit from operations 1,535,939 1,254,531 22.43%Profit after tax 972,225 1,013,559 -4.08%
Individual Unit: NTD Thousands; % Year
Item 2020 2019 Percentage of
increase/decrease (%)
Net operating income 5,946,286 5,947,113 -0.01%Operating cost 3,993,110 4,360,674 -8.43%Operating expenses 1,185,245 1,172,746 1.07%Profit from operations 744,618 386,582 92.62%Profit after tax 972,225 1,013,562 -4.08%
(II) Budget implementation
The Company's actual revenues for the year 2020 were NT$30.26 billion, representing an achievement of 81.34% compared to the forecasted target of NT$37.2 billion for the year 2020.
~ 2 ~

3
(III) Analysis of receipts, expenditures, and profitability Consolidated Unit: NTD Thousands
YearItem 2020 2019 Increase
(decrease) % Receiptsandexpenditures
Operating income 30,260,185 32,127,436 -5.81%Gross profit 7,349,973 6,556,753 12.10%Profit after tax 972,225 1,013,559 -4.08%
Profitability Analysis
Ratio of Return on Total Assets (%) 2.69 2.98 -7.38%
Ratio of Return on Equity (%) 5.13 5.36 -4.29%Ratio of income before tax to paid-in capital (%) 14.20 14.35 -1.05%
Profit ratio (%) 3.21 3.15 1.90%Earnings per share (NT$) 1.07 1.16 -7.76%
Individual Unit: NTD Thousands Year
Item 2020 2019 Increase (decrease) %
Receiptsandexpenditures
Operating income 5,946,286 5,947,113 -0.01%Gross profit 1,929,863 1,559,328 23.76%Profit after tax 972,225 1,013,562 -4.08%
Profitability Analysis
Ratio of Return on Total Assets (%) 3.19 3.37 -5.48%
Ratio of Return on Equity (%) 5.13 5.36 -4.26%Ratio of income before tax to paid-in capital (%) 12.92 12.36 4.53%
Profit ratio (%) 16.35 17.04 -4.05%Earnings per share (NT$) 1.07 1.16 -7.76%
(IV) Examine the research and development work for the last two years Due to the climate change and resource constraint around the world, nations are
becoming more aware of environmental protection, which has led to the increase of
eco-friendly, energy-saving and other environmental protection industries. Therefore,
people has been trying to reduce the material used in tires and use the eco-friendly materials
instead.
The global economy is affected by the unstable trade situation and increased
protectionism.The tire industry will change from a passive component to an active one,
which will provide all the performance parameters when driving the vehicle under the
influence of the automation, intelligence and digitization.
The only way to survive in this highly competitive environment is to change, so that
the business can remain stable. We can only create a new business opportunity by changing
~ 3 ~

4
the traditional mindset and adopting an innovative one.Inflatable tires are no longer the only
design for tires; the smart tires are also feasible.
Kenda will continue to develop the energy-saving technology and the dynamic
simulation:
1. Research on the advance technology for smart tires to innovate new ideas in the tire
industry.
2. Study on the advance technology for a new type of non-inflatable tire.
3. Provide the high value-added products and introduce automatic equipment to ensure the
quality of our products.
4. Establish a tire laboratory to enhance the technology capability for dynamic tire
simulation.
5. Establish a VOC (odor) laboratory in response to the new international regulations to
reduce the tire odors and enhance the technical capability of the Company.
6. In 2020, the Company completed more than 800 new product developments and patents.
7. Kenda has won the 29th Taiwan Excellence Award, which is the 14th consecutive year
for Kenda's products to be awarded, including the AGC technology for off-road
downhill bicycle, ultra-thin lightweight inner tube for bicycle, NRF noise reduction
technology for automobile tire, the K6025 all-terrain motorbike tire, the K3211
all-terrain multi-purpose automobile tire, and the KR100 light truck tire.In order to
actively promote the intelligent property control plan, the implementation status of the
plan in the recent years is as follows:
In 2020, the Company developed a Kenda standard operating procedure for establishing
the R & D and patent licensing standards.
In 2020, the Company invited the Inspector from the Intellectual Property Office of the
Ministry of Economic Affairs to conduct patent knowledge education and training.
Future plan:
In 2021, the R&D BSC will set the number of patent applications and regularly review
the technology produced by the department.
In 2021, the Company will invite Taiwan Intellectual Property Office to conduct
educational training on patent search, patent specifications and claims.
II. Summary of Business Plan for 2021
(I) Business policy for 2021: We focus on continuing to launch innovative products with high cost performance,
strengthening occupational safety and health, and expanding the marketing scale:
~ 4 ~

5
1. Expand the product lines and production capacity in Vietnam and Indonesia factories to
avoid the US-China trade war and the US anti-dumping and countervailing duties, and
enhance our competitiveness to increase the global market share and business scale.
2. Reorganize the supply chain management in response to the COVID-19 to ensure that
the raw material procurement remains on track to meet our global customers' needs.
3. Maintain the occupational safety and health and environmental protection management
in order to respond to the impact from the post COVID-19 pandemic and to ensure the
workplace and production safety.
4. Build a digital marketing management system to promoteKENDA's brand awareness in
order to enrich theKENDA brand.
5. We will expand the management team and sales channels for subsidiaries in Europe,
STARCO and the European Research Center to increase the market share and marketing
scale in Europe and Eastern Europe markets.
6. Develop a trial run for the all-steel radial truck and complete the product line.
7. Develop high value-added products and optimize the existing one to expand into new
markets.
8. Innovate and develop high value-added products for specific markets, and build up the
channels to increase the market share.
9. Continue to research and develop the eco-friendly passenger car tire with EU A grade
low rolling resistance and good wet grip performance.
10. Expand the product lines including the car tires for SUV, UHP, new snow tires, and the
AT, RT, MT and MCR tires.
11. Extend the OEM business for PCR and LTR.
12. Refine human resources, enhance team discipline and improve the management
capability and operational performance.
(II) The sales volume forecast and its basis: The forecast is based on the Company's annual operating targets and the market survey.
ConsolidatedYear
Product Type
2021Sales Volume (in thousand
units) Bicycle tires 56,615 Tires for motorcycles and other bias tires
35,531
Radial tires 10,793 Inner tube 100,691 Total 203,630
~ 5 ~

6
IndividualYear
Product Type
2021Sales Volume (in thousand
units) Bicycle tires 3,868 Tires for motorcycles and other bias tires
4,343
Radial tires 1,419 Inner tube 14,536 Total 24,166
III. The company's future development strategy Our business strategy is to "Operate in Taiwan; Distribute globally; Deeply develop around
the world", to increase the production capacity, to innovate and develop new products with high quality and low price, and to serve global customers with the KENDA brand.
1. The Company will continue to invest in Vietnam factory to expand the product line and production capacity for passenger car tires, and expand the production capacity in Indonesia factory for bicycle and motorbike tires, as well as to set up the local sales channels for both domestic sales and sales in the nearby ASEAN countries in order to increase the market share and increase the operating scale in the ASEAN region.
2. The Company will expand the management team and sales channels with STARCO and the European subsidiary to increase the marketing scale and market share for bicycle and motorbike tires, special tires for the agricultural industry and car tires in Europe and Eastern Europe markets.
3. The Company will integrate R&D resources from the R&D headquarters, the US R&D center, the China R&D center and the European R&D center to strengthen the R&D capability and technology and to develop all kinds of tires with good cost performance to meet the market demand in the new car and car repair market.
4. The Company will collaborate with OE car manufacturers to develop OE car tires in order to increase the market share in the new car market for passenger car tires and spare tires.
5. The Company will introduce automation equipment and promote intelligent manufacturing to stabilize the quality in production processes and improve the productivity based on the MES production control management system.
6. Build a factory for all-steel truck radial tires to produce and sell all-steel truck radial tires in order to expand the operation scale.
7. Continue to research and develop asymmetric radial tires for passenger cars, new snow tires and progressively update the AT, MT, RT and MCR product lines.
8. Innovate and develop high value-added products for specific markets, and build up the channels to increase the market share.
~ 6 ~

7
9. Integrate human resources, reinforce team discipline and enhance the management capability and operational performance.
IV. The effect of external competition 1. The EU continues to impose dumping duties on bicycles manufactured in China, which may
continue to affect the bicycle tires sales indirectly as the OE factory's sales are being restricted.
2. Turkey imposes anti-dumping duties on bicycle and motorbike tires imported from Taiwan, China and Vietnam which results in sale to Turkey being restricted.
3. Brazil imposes anti-dumping duties on bicycle and motorbike tires from China and Vietnam, and anti-dumping duties on car tires from China and Taiwan which affects the sales in Brazil.
4. The US imposes anti-dumping and countervailing duties on passenger car tires and light truck tires from China. The anti-dumping duty rate in our latest administrative review is 0 and the countervailing duty rate is 15.56%, which is lower than other manufacturers in China. Once the US terminates the 25% tariff imposed under Special 301 Act, our Kunshan factory will regain the competitiveness in exporting these products to the US.
5. The Indian government had announced the ban on the tires imported from other countries in June 2020, which would seriously affect our sales to the Indian market.
6. The Chinese tire manufacturers have invested and set up factories worldwide to intensify the competition in tire manufacturing industry.
V. The effect of legal environment
1. The norms and standards for the tire product certification have continued to increase and become more time-consuming and costly; for example, the E-mark and labelling act in EU, DOT in US, CCC in China, SNI in Indonesia, GCC in the Middle East, INMETRO in Brazil, TIS in Thailand, BIS in India and other requirements that cause the barriers in trading.
2. The United States imposed punitive trade tariffs on Chinese tires including the countervailing and anti-dumping duties under the US-China trade war and the 301 Act, which seriously affected the competitiveness of the Chinese tire manufacturers in the US market.
3. The US imposes a high anti-dumping tariff on tires from Taiwan which affects the competitiveness of Taiwanese tire manufacturers in the US market.
4. Due to the lack of progress for Taiwan's participation in regional economic organizations and the signing the free trade agreements with the trade partner countries, it is not beneficial to the competitiveness of Taiwan's tire industry in the global markets.
5. China's "Five social insurance and one housing fund", the industrial policy of the 13th Five-Year Plan and the Taiwan government's " One fixed day off and one flexible rest day" policies have increased the operating costs for the industry and are affecting the competitiveness of the tire industry in the global market.
~ 7 ~

8
VI. The effect of the overall business environment 1. Favorable factors:
(1) Due to the rapid growth in the China automotive market in the past few years and the replacement of tires, the market for repairing tires has increased significantly as well as the sales of vehicle tires by automobile manufacturers.
(2) The growth in automobiles, electric bicycles and electric motorbikes in China has contributed greatly to the sales expansion of Kenda's high-priced products in China.
(3) Kenda has decentralized its production base for car tires in order to increase the competitiveness of its products in response to the increase in regional trade protectionism and the retaliatory measures taken by the US against the PRC under the 301 Act.
(4) Kenda has expanded its production network around the world to increase its supply flexibility and the ability to respond to international trade protection measures and political and economic changes.
(5) In response to the anti-dumping investigations conducted by various countries, KENDA's Kunshan and Vietnam factories have obtained a favorable result of 0% anti-dumping tax rate on the anti-dumping investigation of sedan and passenger car tires exported to the U.S., which has increased our competitiveness in exporting these products to the U.S.
(6) The Company has set up sales offices in Europe and the United States to develop local markets, to localize the sales and to build up the motivation for future growth.
(7) The Company set up a Research and Development Center to strengthen its research and development capability, speed up the launching of new products and achieve great profits.
(8) The global bicycle market was affected by the COVID-19 pandemic, resulting in a large increase in demand; therefore, KI factory continues to expand the production.
2. Unfavorable factors: Due to the impact of the COVID-19 pandemic, the cities in mainland China were locked down from the beginning of spring 2020, despite the fact that the production resumed in mid-February, turnover was declined in the first quarter. In addition, due to the influence of the COVID-19 pandemic, the international oil price dropped drastically, which affected the raw material price. In addition, after the production of mainland China's competitors resumed production, they adopted price cuts in order to obtain orders. From March 2020, the COVID-19 gradually spread to Europe and the United States, which affected the sales since the second quarter, but because of the major tire factories in Europe and the United States shut down due to the pandemic, the production capacity of our mainland factory gradually resumed, and the production capacity of our Vietnam factory gradually increased, which could make up for part of the shortage in the European and American markets. Despite the environmental challenges we faced, we were able to control the production schedule at each of our factories to minimize the impact caused by the COVID-19 pandemic. The local tire manufacturers in mainland China are rapidly expanding their production capacity for passenger car tires while the US has taken the 301 Act retaliation measures against China; therefor, the market price of passenger car tires outside the US will be influenced and the
~ 8 ~

9
competition in the middle and low price passenger car tire market will become more intense in the future. The Company will continue to develop high value-added tires and to differentiate the market to cope with the increasing competition. Due to the impact of the COVID-19 pandemic, the bicycle export declined significantly in the first half of the year; in the second half of the year, the bicycle became the main commuting and sporting vehicle for which the demand increased drastically; however, due to the limitation of the production capacity among the bicycle parts suppliers, the materials supply was not sufficient and the bicycle assembly plants hoarded a lot of materials to ensure the assembly of bicycles smoothly; furthermore, as the containers could not be unpacked in time after exporting to Europe and the United States which resulted in the shortage of containers and the drastic increase of freight cost; therefore, the sales of bicycles in 2020 were 20.05% less than that in 2019. The average selling price will increase from USD631.03 in 2019 to USD646.24 in 2020. The market for electronic assisted bicycles increased by 17.99% in 2020 compared to that in 2019. The average selling price declined from USD 1339.43 in 2019 to USD 1298.45 in 2020.
Kenda Rubber Ind. Co., Ltd.
Yang, Chi-Jen
Chairman
~ 9 ~

10
Two. Introduction of the Company
I. Established and registered on: March 30, 1962
II. Organization and operations: 1962~1982 The company was established in March 1962 with a capital of $960,000 and 50
employees. At the beginning, the company was mainly producing bicycle inner and outer tires. In 1980, the capital was increased to $126.1 million, which was used to expand the factory, purchase machines and equipment, and improve the quality and output of the products; therefore, the business turnover was increased every year. In 1978, the Yuanlin Factory was officially awarded with CNS Mark. In 1981, the Company's capital was increased by $69.35 million from the retained earnings, resulting in the total capital being $195.45 million. The Company acquired additional land for the Yuanlin factory and a new factory site in Yunlin. The first phase construction of the Yunlin factory included a raw material mixing plant, a public works building and an air-raid shelter. In 1982, the company diversified its investment portfolio by investing in Kenjou Ind. Co., Ltd.
1985~1991 In 1985, the capital was increased by the capitalization of $130.96 million from retained earnings and an IPO. In 1986, the capital was increased to $430.86 million after the capitalization of $104.45 million from retained earnings. The capital was used to build a new factory in Yunlin and acquire equipment for manufacturing cover tires, including a set of equipment for tire covering rubber, a set of equipment for mixing rubber materials and other equipment. In 1988, the company's capital was increased to $500,000,000 by the capitalization of $69,140,000 from the retained earnings; the Yuanlin factory was also awarded the "JIS" Japanese Industrial Standard symbol. In 1989, the Yunlin factory was awarded the "JIS" Japanese Industrial Standard symbol and the "CNS" mark. In 1990, the capital was increased to $800 million by the capitalization of $199.6 million from the retained earnings and a cash capital increase of $100.4 million. The Company was officially listed on the Taiwan Stock Exchange on 20 December 1990. In 1991, the Company's capital was increased to $960 million by the capitalization of $96 million from the retained earnings and $64 million from the capital reserve; in April, the Company received the "E" mark from the European Common Market.
1992~1996 The Company's capital increased to NT$1,132.8 million in 1992 by the capitalization of NT$76.8 million from the retained earnings and NT$96 million from capital surplus. Also, in 1992, Total Lubricants Taiwan Ltd. was established as a joint venture with Total SE; a Hong Kong subsidiary was established as well. In 1993, the Company increased the capital to NT$1,300 million by the capitalization of NT$92,538,000 from the retained earnings and NT$74,662,000 from the capital surplus.The Company also merged the Kenda Tire (Shenzhen) Limited via Kenda Industrial (Hong Kong) Limited
~ 10 ~

11
for US$10 million and applied for an additional US$5 million to invest in Kenda Tire (Shenzhen) Limited. The investment was approved by MOEAIC. The Company also applied to MOEAIC for an investment of US$15 million to establish Kenda Rubber (China) Limited, which was approved. Chou Chin Industrial (HK) Co., Ltd. was established in Hong Kong and Shanghai Bomy Foodstuff Co., Ltd. was established as the joint ventures with Chou-Chin Industrial C0., Ltd. In 1994, the Company completed the capital increase of US$5 million for Kenda Tire (Shenzhen) Limited; in September, both the Yuanlin and Yunlin factories were certified with ISO-9002 by the Bureau of Standards, Metrology and Inspection of the Ministry of Economic Affairs. In 1995, the Company's capital was increased to $1,625 million by the capitalization of $280.8 million from the retained earnings and $44.2 million from capital surplus. In October, the Kenda Tire (Shenzhen) Limited was certified to the ISO-9002 standard from the Shenzhen Quality Certification Centre and the British Vehicle Certification Authority (VCA); in the same year, the Company also established a joint venture with the Chinfon Group to build a tire factory in Vietnam. The Company's capital was increased to $1,738,750,000 by the capitalization of $81,250,000 from the retained earnings and $32,500,000 from the capital surplus in 1996; the shareholders' meeting on May 29th resolved to authorize the Board of Directors to invest up to $10 millions to set up a factory, and the contract was signed in December. In January of the same year, our Yuanlin Factory was certified with ISO9001 by the Bureau of Standards, Metrology and Inspection of the Ministry of Economic Affairs and the British BSI.
1997~2001 In 1997, the Company's capital was increased to NT$1,982,175,000 by the capitalization of NT$208,650,000 from retained earnings and NT$34,775,000 from capital surplus. On 23 May 1997, the Company's Board resolved to establish KENDA GLOBAL HOLDING CO., LTD. In 1998, the Company's capital was increased to $2,229,323,000 by the capitalization of $279,487,000 from the retained earnings and $37,661,000 from the capital surplus; in June of the same year, the Yuanlin Factory and the Yunlin Factory were certified with the ISO-14001 Environment Management System. In 1999, The Company's capital was increased to $2,713,201,000 by the capitalization of $390,885,000 from the retained earnings and $22,993,000 from the capital surplus. In 2000, the Company’s capital was increased to $3,065,917,000 by the capitalization of $339,150,000 from the retained earnings and $13,566,000 from capital surplus. In 2001, the Company’s capital was increased to $3,203,884,000 by the capitalization of $122,637,000 from the retained earnings and $15,330,000 from capital surplus.
2002~2006 In 2002, the Company's capital was increased to $3,364.08 million by the capitalization of $160,196,000 from the retained earnings. In 2003, the Company's capital was increased to $3,600 million by the capitalization of $235.92 million from the retained earnings. In December, the Board of Directors resolved that Kenda Global Investment Corporation, a subsidiary of the Company, and Cooper Tire & Rubber Company in the United States, would
~ 11 ~

12
jointly establish a production and sales company for passenger car and truck ply tires in Mainland China. The subsidiary, Kenda Global Investment Corporation, would invest US$25 million and hold a 50% shareholding in this joint venture company. In 2004, the Company's capital was increased to $3,960 million by the capitalization of $360 million from the retained earnings. In January of the same year, a capital increase of US$15 million was made to Kenda Rubber (China) Co., Ltd. The Company also increased the investment in Kenda Rubber (Vietnam) Co., Ltd. by US$6 million in March. In August, the Board of Directors resolved that Kenda Global Investment Corporation, a subsidiary, would invest US$1.3 million and hold a 13% shareholding to establish a joint venture company in Mainland China with Kenjou Ind. Co., Ltd. and Inoac International Co., Ltd. The new joint venture would be used to manufacture automotive parts. In October, the Company increased the investment in its subsidiary, AMERICAN KENDA RUBBER IND.CO., LTD. by US$4 million. In October of the same year, the Company invested another US$40,000 to acquire 20% of the equity of Cooper (Shanghai) Sales And Marketing Co., Ltd., a joint venture with Cooper Tire & Rubber Company of the United States. The establishment of Cooper (Shanghai) Sales And Marketing Co. is expected to serve both the domestic and export operations for Cooper & Kenda Tire (Kunshan) Co. Ltd. in mainland China. In 2005, the Company's capital was increased to $4,356 million by the capitalization of $396 million from the retained earnings. In December of the same year, a capital increase of US$15 million was made to Kenda Rubber (China) Co., Ltd. In 2006, the capital was increased to $4,595,580,000 by the capitalization of $239,580,000 from the retained earnings, and in March of the same year, the Board of Directors resolved to increase the capital of Cooper and Kenda Tire (Kunshan) Co., Ltd., a joint venture subsidiary of the Company, by $18 million.
2007 ~ 2011 In 2007, the Company's capital was increased to $4,895 million by the capitalization of $299.42 million from the retained earnings. The Board of Directors' meeting in June resolved to authorize the Chairman to have full authority to establish a factory in North China. In August, the Board of Directors resolved to increase the investment in Cooper and Kenda Tire (Kunshan) Co., Ltd., a joint venture subsidiary of the Company, by US$12 million. In August of the same year, the board of directors of the Company authorized the chairman of the Board to have full power to approve the investment of US$3.6 million to Kenda Tire (Tianjin) Limited from the retained earnings allocated to Kenda Tire (Shenzhen) Limited through the Company’s subsidiary, KENDA GLOBAL HOLDING CO. Ltd.;and the investment of US$5.4 million in Kenda Tire (Tianjin) Limited from the retained earnings allocated to Kenda Tire (Shenzhen) Co., Ltd. through the Company's subsidiary, Kenda Industrial (Hong Kong) Limited. In 2008, the Company's capital was increased to $5,262.5 million by the capitalization of $367.5 million from the retained earnings. In March, the Board of Directors resolved to increase the investment in Kenda Tire (Tianjin) Co., Ltd. by US$6.4 million; in August, the Board of Directors resolved to increase the investment in Kenda Rubber (China)
~ 12 ~

13
Co., Ltd. by US$10 million. In October, the Board of Directors resolved to cancel the investment in Cooper (Shanghai)Sales And Marketing Co.,Ltd. a joint venture subsidiary of KENDA and COOPER. The Company received the 2008 Industrial Sustainable Excellence Award from the Industrial Development Bureau of the Ministry of Economic Affairs in December. In 2009, the Company's capital was increased to $5,526 million by the capitalization of $263.5 million from the retained earnings. In March, the Board of Directors resolved to increase investment in Dongguan Inoac Kenjou Automotive Co., Ltd. by US$403,000. In August, the Board of Directors resolved to increase the investment in Kenda Rubber (Tianjin) Limited by US$9.6 million. The Company received the 17th Industrial Technology Advancement Award (Excellent Innovation Enterprise Award) from the Ministry of Economic Affairs in November. In 2010, the Company's capital was increased to $6,206 million by the capitalization of $680 million from the retained earnings. In February, the Board of Directors resolved to increase the investment in Cooper and Kenda Tire (Kunshan) Co., Ltd., a joint venture subsidiary of the Company, by US$1.5 million. In February, the Board of Directors resolved to increase the investment in Kenda Tire (Tianjin) Limited by US$9 million. In 2011, the Company's capital was increased to $6,889 million by the capitalization of $683 million from the retained earnings. The Board of Directors resolved to approve the disposal of 50% of the shares of COOPER KENDA GLOBAL HOLDING CO. LTD held by the KENDA GLOBAL INVESTMENT CORPORATION through the KENDA INTERNATIONAL CORPORATION in March. In April, the Board of Directors resolved to increase the investment in Kenda Rubber (Tianjin) Limited by US$15 million. The Company was awarded the China Well-known Trademark in June.
2012 ~ 2013 In 2012, the Company's capital was increased to $7,336.8 million by the capitalization of $447.8 million from the retained earnings. In August, the Board of Directors resolved to increase the investment in Kenda Rubber (Tianjin) Limited by US$30 million; in October, the Board of Directors resolved to increase the investment in Kenda Tire (Tianjin) Limited by US$6 million; in September, the Company was awarded the 2nd National Industry Innovation Award by the Ministry of Economic Affairs; and the Company was ranked the 24th in Branding Taiwan. In 2013, the Company's capital was increased to $7,630,300,000 by the capitalization of $293,500,000 from the retained earnings. In January 2013, the Company was awarded the JIPM (Japan Institute of Plant Maintenance) TPM Excellence Award; in February, the Company was awarded the 1st Taiwan Outstanding Medium Enterprise Award by the Ministry of Economic Affairs; in March, the Company was awarded the Guangdong Outstanding Taiwanese Enterprise Award; in August, the Company was awarded the 1st Outstanding Taiwanese Enterprise Award for Export Sales; in September, the Company was awarded the Product Innovation Award by the Taiwan Chemical Industry Association; and in November, the Company was awarded the "Carbon Footprint Certification" by the Industrial Development Bureau. In March, the
~ 13 ~

14
Board of Directors resolved to establish Kenda Rubber (Huizhou) Limited; in May, the Board of Directors resolved to establish Kenda Rubber Industries (Europe) Limited; in November, the Board of Directors resolved to merge the U.S. Development Investment Corporation with Kenda's U.S. subsidiary; to establish KF Trading Company Limited and KENDA GLOBAL HOLDING (CHINA) CO., LTD.; and to increase the investment in Kenda Rubber (China) Limited by USD 33 million.
2014 ~ 2015 In 2014, the Company's capital was increased to $8,164.5 million by the capitalization of $534.2 million from the retained earnings. In April, Kenda Rubber (Tianjin) Co., Ltd. was certified with ISO/TS 16949; in May, the Board of Directors resolved to expand the R&D headquarters by establishing a R&D center; in June, Kenda joined the European Imported Tyre Manufacturers Association (ITMA); in August, the Board of Directors resolved to establish Kenda Rubber (Indonesia) with a total investment of US$100 million; in December, the Yuanlin and Yunlin factories in Taiwan was certified with ISO 50001. In February 2015, the Board of Directors resolved to change the name of the subsidiary KF Trading Co., Ltd. to KF Industrial Co., Ltd. and to increase the investment by $197 million in order to acquire a factory site in the Shihliuban Industrial Park in Yunlin; in March, the Board of Directors resolved to lease land in Dong Nai Province, Vietnam for the expansion of the passenger car tire factory in Vietnam. For nine years in a row, the Company's products won the Taiwan Excellence Award and from these, the Company was awarded the Taiwan Excellence Gold and Silver Award again.
2015 ~2016 In 2015, the Company's capital was increased to $8,572.8 million by the capitalization of $408.3 million from the retained earnings. The product K1127B won the 23rd Taiwan Excellence Silver Award in April. In August, the Board of Directors resolved to increase the investment in Kenda Rubber (Tianjin) Limited, the subsidiary of the Company by US$35 million. The Company signed a land lease agreement for the establishment of the passenger car tire factory in Vietnam in September. In November, the U.S. Research and Development Center was officially established; the Company's products KR50, K1174, K518 and KD1 won the 24th Taiwan Excellence Award again; the Board of Directors resolved to increase the investment of US$8 million in the subsidiary, Kenda Rubber (Vietnam) Co., Ltd. In February 2016, the Investment Commission approved the cancellation of the subsidiary - Kenda Rubber (Shenzhen) Company Limited; the Company was awarded as one of the Top Ten Brand Enterprises in Kunshan, Jiangsu Province in China.
2016 ~2017 In 2016, the Company's capital was increased to $8,744.3 million by the capitalization of $171.5 million from the retained earnings. In May, the construction of a new factory in Douliu, Yunlin, was started. In June, the construction of the second factory in Vietnam began. In August, the Board of Directors resolved to increase the investment of US$15 million in the subsidiary, Kenda Rubber (Indonesia) Limited. In December, the Company's products K1160X and K3201 won the 25th Taiwan Excellence Award. In February 2017, the K1160X product was awarded the Taiwan Excellence Silver
~ 14 ~

15
Award again. 2017~2018 In September 2017, the Company's products K779, K1201, KR41 and K3203 won the
26th Taiwan Excellence Award. This is the 11th consecutive year that the Company's products have been recognized by the Taiwan Excellence Awards. In October, the Company acquired the Danish-based rim company STARCO EUROPE A/S; the second factory in Vietnam started the trial runs for passenger car tire and light truck tire. In November, the Board of Directors resolved to acquire land in the Tai Jiang Industrial Park, where the Yunlin factory is located, to increase investment in the area.
2018~2019 In May, July and September 2018, the Tianjin, Yunlin and Shanghai factories were certified with IATF 16949:2016 Quality Management System for Automotive Industry respectively. In October, the Company was certified the "Talent Quality-management System" by the Workforce Development Agency of the Ministry of Labor. In November, the Company was awarded the Yunlin County Occupational Safety and Health Excellence Award and certified as the D-U-N-S® Registered™ enterprise. In November, the Company's products K1211/K1211E off-road mountain bike tires, K678F/K678 all-terrain motorbike tires, K576A all-terrain multi-purpose car tire and KR600 light truck tire won the 27th Taiwan Excellence Award.
In December, the Company was awarded the "Excellent Enterprise in Occupational Safety and Health Performance" by the Ministry of Labor. In March 2019, the Board of Directors resolved to increase the investment in the subsidiary - Kenda Rubber (Vietnam) Limited by NT$1.5 billion.
2019~2020 In October 2019, we were awarded the 16th National Brand Yushan Award - Outstanding Enterprise category by the Republic of China National Enterprise Competitiveness Development Association and the National Brand Yushan Award Selection Committee. In November, the Company's products K1227 XC off-road bicycle tire, K590 all-terrain multi-purpose car tire, K6022 dual-purpose compound motorbike tire, KR52 SUV asymmetrical RV tire and K3003/K3004 non-inflatable tires won the 28th Taiwan Excellence Award. In December, the Company was awarded the 2019 National Talent Development Award by the Ministry of Labor in the Large Enterprise category. In January 2020, the Company was awarded the 2019 Excellent Technology Award by Kwang Yang Motor Co., Ltd. In January, the Board of Directors resolved to increase the investment of US$33 million in the subsidiary, Kenda Rubber (Vietnam) Limited, and the investment of US$8 million in the subsidiary, Kenda Rubber (Indonesia) Limited. In February, the company was awarded the Outstanding Performance Award in Regular Evaluation by Sanyang Motor Co., Ltd. and the Outstanding Contribution Award by China Motor Corporation Association.
2020~2021 In 2020, the Company's capital was increased to $9,094.1 million by the capitalization from the retained earnings of $349.8 million. In November, the Company's products AGC off-road downhill bicycle tire technology, ultra-thin lightweight bicycle inner tube, NRF noise reduction foam technology in car tire, all-terrain motorbike tire - K6025, all-terrain multi-purpose vehicle tire - K3211, light truck tire - KR100 won the
~ 15 ~

16
29th Taiwan Excellence Award, and in January 2021, won the 2020 Technology Award from Kwang Yang Motor Co., Ltd. In January, the EMERA SUV607 UHP KR607 car tire, the Noise Reduction Foam Technology (NRF) KR41 (silent foam) car tire and the Advanced Gravity Casing (AGC) K1201/K1202/K1235/ K1241 bicycle downhill tires won the 2020 Chicago Good Design Award. In February, the company was awarded the Outstanding Performance Award in Regular Evaluation by Sanyang Motor Co., Ltd.
~ 16 ~

Thre
e. C
orpo
rate
Gov
erna
nce
Rep
ort
I. O
rgan
izat
ion
(I) O
rgan
izat
iona
l stru
ctur
e
Offi
ce o
f Int
erna
l Au
dit
Sale
sD
epar
tmen
tR
&D
Dep
artm
ent
Adm
inis
trat
ion
Dep
artm
ent
Prod
uctio
nD
epar
tmen
tFa
ctor
ies
in
Taiw
an
Vice
Pre
side
nt
The
Hea
dqua
rter
Vice
Cha
irman
Pres
iden
t
Cha
irman
Boa
rd o
f D
irect
ors
Yuanlin Factory
Sales Department IISh
areh
olde
rs’
Mee
ting
Yunlin Factory Department
Yunlin Manufacturing Division II
Finance Department
Sales Department V
Sales Department III
Fina
nce
Dep
artm
ent
Production Technology Department
Engineering Department
Quality Assurance Department
Yunlin Manufacturing Division I
Sales Department I
Audi
t Com
mitt
ee
Offi
ce o
f the
Boa
rd
Secr
etar
y
Rem
uner
atio
nC
omm
ittee
Cha
irman
’s O
ffice
HR Department
Information Department
Material Department
Environmental & Safety OfficeFu
nctio
nal
Com
mitt
ees
R&D Division III
R&D Division II
R&D Division I
Douliu Factory
~ 17 ~

18
(II) Business for each segment: Segment Job Description
Office of Internal Audit
Establishes the internal control system for the Group, reviews the rules and regulations, implements the audit and proposes the improvement measures.
Chairman’s Office 1. Plans and supervises the operations for the shareholders' meeting, the board of directors, the remuneration committee, the audit committee and the CSR.
2. Plans the short-term, mid-term and long-term business operations, develops the annual business policies and controls the performance for the Group.
3. Plans, implements and maintains the appropriateness and effectiveness of the internal control system.
4. Plans, investigates and evaluates overseas investment projects including the application, filing and approval of the said investment projects.
5. Supervises the businesses in all the subsidiaries and invested enterprises. 6. Plans and implements the Group's intellectual property rights (trademarks and patents), contract
review, legal affairs, product liability insurance and liability insurance for directors and supervisors.
7. Plans and executes the activities for the Kenda Cultural and Education Foundation. Kenda Rubber
( America) Be responsible for the market development and the product sales in North America.
Kenda Rubber (Vietnam)
Manufactures and sells the tubes and tires of bicycles, motorbikes and industrial vehicles.
Kenda Rubber (Shenzhen)
Manufactures and sells the tubes and tires of bicycles, motorbikes, industrial vehicles and light trucks.
Kenda Rubber (China)
Manufactures and sells the tubes and tires of bicycles, motorbikes, industrial vehicles and light trucks, and radial tires for cars.
Kenda Rubber (Tianjin)
Manufactures and sells the tubes and tires of bicycles, motorbikes, industrial vehicles and light trucks, and radial tires for cars, waterproof tape and other rubber products
Kenda Rubber (Europe)
Be in charge of the product marketing
KF Be in charge of the sale for all kinds of tire products in Taiwan. Yunlin
ManufacturingDivision I
Manufactures the cover tires for motorbikes, cars and industrial vehicles.
Yunlin Manufacturing
Division II
Manufactures the radial tires for cars.
Yunlin Factory Department
1. Develops and manages the engineering and quality control of tire manufacturing. 2. Promotes the CSR related activities.
Yuanlin Factory Manufacturse the cover tires of bicycles, motorbikes and industrial vehicles, and all kinds of tubes. Douliu Factory Be in charge of product shipping and other rubber products manufacturing.
EngineeringDepartment
1. Develops and introduces the manufacturing equipment for the Group and improve the production process.
2. Manages the facilities and equipment for the Group. 3. Promotes and manages the energy reduction and certification.
Quality Assurance Department
Maintains the Group's quality assurance system, quality certification, after-sales service, and continuously implements the quality improvements.
Production 1. Introduces new equipment, establishes the new process for production, assists in the development
~ 18 ~

19
Segment Job Description Technology Department
of new equipment and process testing, solves problems and establishes the production technology.2. Improves the manufacturing technology for the Group's existing equipment; evaluates, analyses
and develops the process improvement projects for each factory; accepts, reviews, changes the design and validates and develops the results.
FinanceDepartment
1. Processes accounts, calculates costs, plans budgets, and analyzes financial and operational results.2. Provides financial planning, consolidation and budgeting for the Group; handles the accounts and
taxation for the overseas holding companies. Environmental &
Safety Office 1. Plans, executes, guides and audits the environmental protection and industrial safety management
system. 2. Works on the environmental management system certification.
HR Department 1. Plans and integrates the Group's HR and general affairs, and manages the oversea staff deployment.2. Promotes the CSR related activities.
Information Department
Designs and manages the Group's information systems.
MaterialDepartment
Plans, manages and integrates the Group's procurement business.
R&D Division I 1. Develops, designs and controls the raw materials and formulations for the Group's new products; manages and tests the raw materials and formulations and conducts the evaluation.
2. Develops the raw material specifications for the Group. 3. Conducts the fundamental research on innovative rubber and tires; develops the polymer analysis
and test methods. R&D Division II 1.Designs and controls the new product development for the Group (structure & mold), manages the
trial production and new product development business. 2. Develops the specifications for the Group’s products. 3. Develops the product design theory and the method for product validation. 4. Develops and analyzes the evaluation method and related technology.
R&D Division III 1. Implements the "R&D Project for Green Tire Design" by the Government. 2. Conducts the fundamental research on innovative rubber and tires, as well as polymer analysis and
testing.3. Provides trial run, pilot production and mass production assistance for eco-friendly new material
applications and new formulation development. 4. Controls the design for new product development. 5. Collects and calibrates feedback on the market evaluation information. 6. Provides overseas staff assignment, training and support.
Sales Department I
Conducts the product planning, marketing planning, market development and sales activities.
Sales Department II
Conducts the product planning, marketing planning, market development and sales activities.
Sales Department III
Conducts the product planning, marketing planning, market development and sales activities.
Sales Department V
Conducts the product planning, marketing planning, market development and sales activities.
~ 19 ~
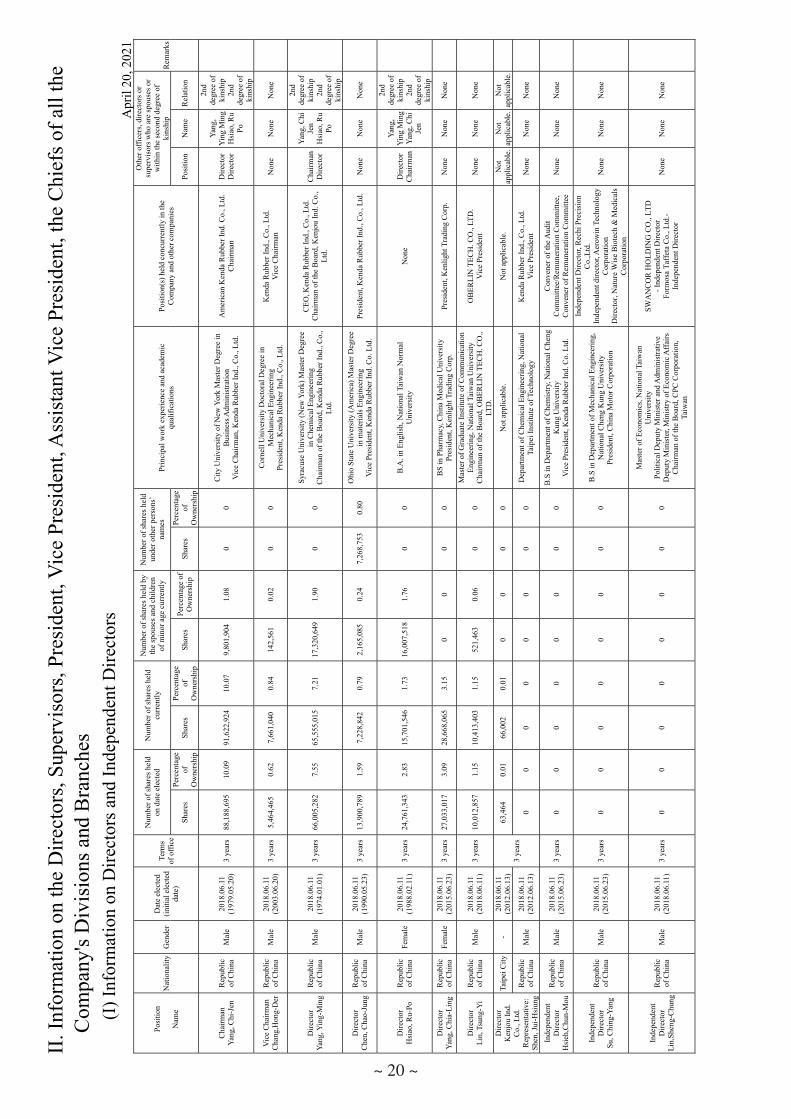
II. I
nfor
mat
ion
on th
e D
irect
ors,
Supe
rvis
ors,
Pres
iden
t, V
ice
Pres
iden
t, A
ssis
tant
Vic
e Pr
esid
ent,
the
Chi
efs o
f all
the
Com
pany
's D
ivis
ions
and
Bra
nche
s (I
) Inf
orm
atio
n on
Dire
ctor
s and
Inde
pend
ent D
irect
ors
A
pril
20, 2
021
Posi
tion
Nam
e N
atio
nalit
y G
ende
rD
ate
elec
ted
(initi
al e
lect
ed
date
)
Term
s of
offi
ce
Num
ber o
f sha
res h
eld
on d
ate
elec
ted
Num
ber o
f sha
res h
eld
curr
ently
Num
ber o
f sha
res h
eld
by
the
spou
ses a
nd c
hild
ren
of m
inor
age
cur
rent
ly
Num
ber o
f sha
res h
eld
unde
r oth
er p
erso
ns’
na
mes
Prin
cipa
l wor
k ex
perie
nce
and
acad
emic
qu
alifi
catio
ns
Posi
tion(
s) h
eld
conc
urre
ntly
in th
e C
ompa
ny a
nd o
ther
com
pani
es
Oth
er o
ffice
rs, d
irect
ors o
r su
perv
isor
s who
are
spou
ses o
r w
ithin
the
seco
nd d
egre
e of
ki
nshi
p R
emar
ks
Shar
es
Perc
enta
ge
ofO
wne
rshi
pSh
ares
Pe
rcen
tage
ofO
wne
rshi
pSh
ares
Pe
rcen
tage
of
Ow
ners
hip
Shar
es
Perc
enta
ge
ofO
wne
rshi
p Po
sitio
nN
ame
Rel
atio
n
Cha
irman
Ya
ng, C
hi-J
en
Rep
ublic
of C
hina
M
ale
2018
.06.
11
(197
9.05
.20)
3
year
s 88
,188
,695
10
.09
91,6
22,9
2410
.07
9,80
1,90
41.
08
0 0
City
Uni
vers
ity o
f New
Yor
k M
aste
r Deg
ree
in
Bus
ines
s Adm
inis
tratio
n V
ice
Cha
irman
, Ken
da R
ubbe
r Ind
., C
o., L
td.
Am
eric
an K
enda
Rub
ber I
nd. C
o., L
td.
Cha
irman
D
irect
orD
irect
or
Yang
, Y
ing
Min
g H
siao
, Ru
Po
2nd
degr
ee o
f ki
nshi
p 2n
dde
gree
of
kins
hip
Vic
e C
hairm
an
Cha
ng,H
ong-
Der
R
epub
licof
Chi
na
Mal
e20
18.0
6.11
(2
003.
06.2
0)
3 ye
ars
5,46
4,46
5 0.
62
7,66
1,04
00.
84
142,
561
0.02
0
0 C
orne
ll U
nive
rsity
Doc
tora
l Deg
ree
in
Mec
hani
cal E
ngin
eerin
g Pr
esid
ent,
Ken
da R
ubbe
r Ind
., C
o., L
td.
Ken
da R
ubbe
r Ind
., C
o., L
td.
Vic
e C
hairm
an
Non
e N
one
Non
e
Dire
ctor
Ya
ng, Y
ing-
Min
g R
epub
licof
Chi
na
Mal
e20
18.0
6.11
(1
974.
01.0
1)
3 ye
ars
66,0
05,2
82
7.55
65
,555
,015
7.21
17
,320
,649
1.90
0
0
Syra
cuse
Uni
vers
ity (N
ew Y
ork)
Mas
ter D
egre
e in
Che
mic
al E
ngin
eerin
g C
hairm
an o
f the
Boa
rd, K
enda
Rub
ber I
nd.,
Co.
, Lt
d.
CEO
, Ken
da R
ubbe
r Ind
., C
o., L
td.
Cha
irman
of t
he B
oard
, Ken
jou
Ind.
Co.
, Lt
d.
Cha
irman
Dire
ctor
Yang
, Chi
Je
n H
siao
, Ru
Po
2nd
degr
ee o
f ki
nshi
p 2n
dde
gree
of
kins
hip
Dire
ctor
C
hen,
Cha
o-Ju
ng
Rep
ublic
of C
hina
M
ale
2018
.06.
11
(199
0.05
.23)
3
year
s 13
,900
,789
1.
59
7,22
8,84
20.
79
2,16
5,08
50.
24
7,26
8,75
30.
80
Ohi
o St
ate
Uni
vers
ity (A
mer
ica)
Mas
ter D
egre
e in
mat
eria
ls E
ngin
eerin
g V
ice
Pres
iden
t, K
enda
Rub
ber I
nd. C
o. L
td.
Pres
iden
t, K
enda
Rub
ber I
nd.,
Co.
, Ltd
.N
one
Non
e N
one
Dire
ctor
H
siao
, Ru-
Po
Rep
ublic
of C
hina
Fe
mal
e20
18.0
6.11
(1
988.
02.1
1)
3 ye
ars
24,7
61,3
43
2.83
15
,701
,546
1.73
16
,007
,518
1.76
0
0 B
.A. i
n En
glis
h, N
atio
nal T
aiw
an N
orm
al
Uni
vers
ity
Non
e D
irect
orC
hairm
an
Yang
, Y
ing
Min
g Ya
ng, C
hi
Jen
2nd
degr
ee o
f ki
nshi
p 2n
dde
gree
of
kins
hip
Dire
ctor
Ya
ng, C
hia-
Ling
R
epub
licof
Chi
na
Fem
ale
2018
.06.
11
(201
5.06
.23)
3
year
s 27
,033
,017
3.
09
28,6
68,0
653.
15
0 0
0 0
BS
in P
harm
acy,
Chi
na M
edic
al U
nive
rsity
Pr
esid
ent,
Ken
light
Tra
ding
Cor
p.
Pres
iden
t, K
enlig
ht T
radi
ng C
orp.
N
one
Non
e N
one
Dire
ctor
Li
n, T
sung
-Yi
Rep
ublic
of C
hina
M
ale
2018
.06.
11
(201
8.06
.11)
3
year
s 10
,012
,857
1.
15
10,4
13,4
031.
15
521,
463
0.06
0
0
Mas
ter o
f Gra
duat
e In
stitu
te o
f Com
mun
icat
ion
Engi
neer
ing,
Nat
iona
l Tai
wan
Uni
vers
ity
Cha
irman
of t
he B
oard
, OB
ERLI
N T
ECH
. CO
., LT
D.
OB
ERLI
N T
ECH
. CO
., LT
D.
Vic
e Pr
esid
ent
Non
e N
one
Non
e
Dire
ctor
K
enjo
u In
d.
Co.
, Ltd
. R
epre
sent
ativ
e:
Shen
, Jui
-Hsi
ung
Taip
ei C
ity
- 20
18.0
6.11
(2
012.
06.1
3)
3 ye
ars
63,4
64
0.01
66
,002
0.
01
0 0
0 0
Not
app
licab
le.
Not
app
licab
le.
Not
appl
icab
le.
Not
appl
icab
le.
Not
appl
icab
le.
Rep
ublic
of C
hina
M
ale
2018
.06.
11
(201
2.06
.13)
0
0 0
0 0
0 0
0 D
epar
tmen
t of C
hem
ical
Eng
inee
ring,
Nat
iona
l Ta
ipei
Inst
itute
of T
echn
olog
y K
enda
Rub
ber I
nd.,
Co.
, Ltd
. V
ice
Pres
iden
t N
one
Non
e N
one
Inde
pend
ent
Dire
ctor
H
sieh
,Chu
n-M
ou
Rep
ublic
of C
hina
M
ale
2018
.06.
11
(201
5.06
.23)
3
year
s 0
0 0
0 0
0 0
0 B
.S in
Dep
artm
ent o
f Che
mis
try, N
atio
nal C
heng
K
ung
Uni
vers
ity
Vic
e Pr
esid
ent,
Ken
da R
ubbe
r Ind
. Co.
Ltd
.
Con
vene
r of t
he A
udit
Com
mitt
ee/R
emun
erat
ion
Com
mitt
ee,
Con
vene
r of R
emun
erat
ion
Com
mitt
ee
Non
e N
one
Non
e
Inde
pend
ent
Dire
ctor
Su
, Chi
ng-Y
ang
Rep
ublic
of C
hina
M
ale
2018
.06.
11
(201
5.06
.23)
3
year
s 0
0 0
0 0
0 0
0 B
.S in
Dep
artm
ent o
f Mec
hani
cal E
ngin
eerin
g,
Nat
iona
l Che
ng K
ung
Uni
vers
ity
Pres
iden
t, C
hina
Mot
or C
orpo
ratio
n
Inde
pend
ent D
irect
or, R
echi
Pre
cisi
on
Co.
,Ltd
. In
depe
nden
t dire
ctor
, Aer
owin
Tec
hnol
ogy
Cor
pora
tion
Dire
ctor
, Nat
ure
Wis
e B
iote
ch &
Med
ical
s C
orpo
ratio
n
Non
e N
one
Non
e
Inde
pend
ent
Dire
ctor
Li
n,Sh
eng-
Chu
ng
Rep
ublic
of C
hina
M
ale
2018
.06.
11
(201
8.06
.11)
3
year
s 0
0 0
0 0
0 0
0
Mas
ter o
f Eco
nom
ics,
Nat
iona
l Tai
wan
U
nive
rsity
Po
litic
al D
eput
y M
inis
ter a
nd A
dmin
istra
tive
Dep
uty
Min
iste
r, M
inis
try o
f Eco
nom
ic A
ffairs
Cha
irman
of t
he B
oard
, CPC
Cor
pora
tion,
Ta
iwan
SWA
NC
OR
HO
LDIN
G C
O.,
LTD
- I
ndep
ende
nt D
irect
or
Form
osa
Taff
eta
Co.
, Ltd
.- In
depe
nden
t Dire
ctor
Non
e N
one
Non
e
~ 20 ~

21
Table 1: Major shareholders of corporate shareholders Name of the corporate shareholder (Note 1) Major shareholders of corporate shareholders (Note 2)
Kenjou Co., Ltd. Yang, Ying Ming (20%) Yang, Chi Jen (20%) Hsiao, Ru Po (15%)
Note 1: If the director or supervisor is a representative of a corporate shareholder, the corporate shareholder's name
should be stated.
Note 2: Fill in the names of the major shareholders of the corporate shareholder (whose shareholding is among the top
ten shareholders) and their shareholding ratio. If the major shareholder is a corporate shareholder, the following
table 2 should be included.
Note 3: If a corporate shareholder is not a registered company, the name of the shareholder and the percentage of
shareholding disclosed in the preceding paragraph shall be the name of the contributor or donor and the
percentage of contribution or donation.
Information on Directors and Independent Directors (2)
Requirements
Name(Note 1)
Have at least 5 years working experience with the following professional qualifications Eligible for independence (Note 2)
The number of other listed
companies that
concurrently serve as
independent directors
An instructor or higher up in a department of commerce, law, finance,
accounting, or other academic
departmentrelated to company
business in a public or
private junior college,
college, or university.
A judge, public prosecutor,
attorney, certified public accountant,
or other professional or
technical specialist who has passed a national examination and has been awarded a certificate in a
professionalcapacity that is necessary for
company business.
With work experiencein the area
ofcommerce, law, finance
oraccounting,
orotherwisenecessary
forcompany business.
1 2 3 4 5 6 7 8 9 10 11 12
Yang, Chi-Jen -Chang, Hong-Der -Yang, Ying-Ming -Chen, Chao-Jung -
Hsiao, Ru-Po -Yang, Chia-Ling -
Lin, Tsung-Yi -Kenjou Co., Ltd.
Representative:
Shen, Jui-Hsiung
-
Hsieh,Chun-Mou -Su, Ching-Yang 2
Lin,Sheng-Chung 2
~ 21 ~
22
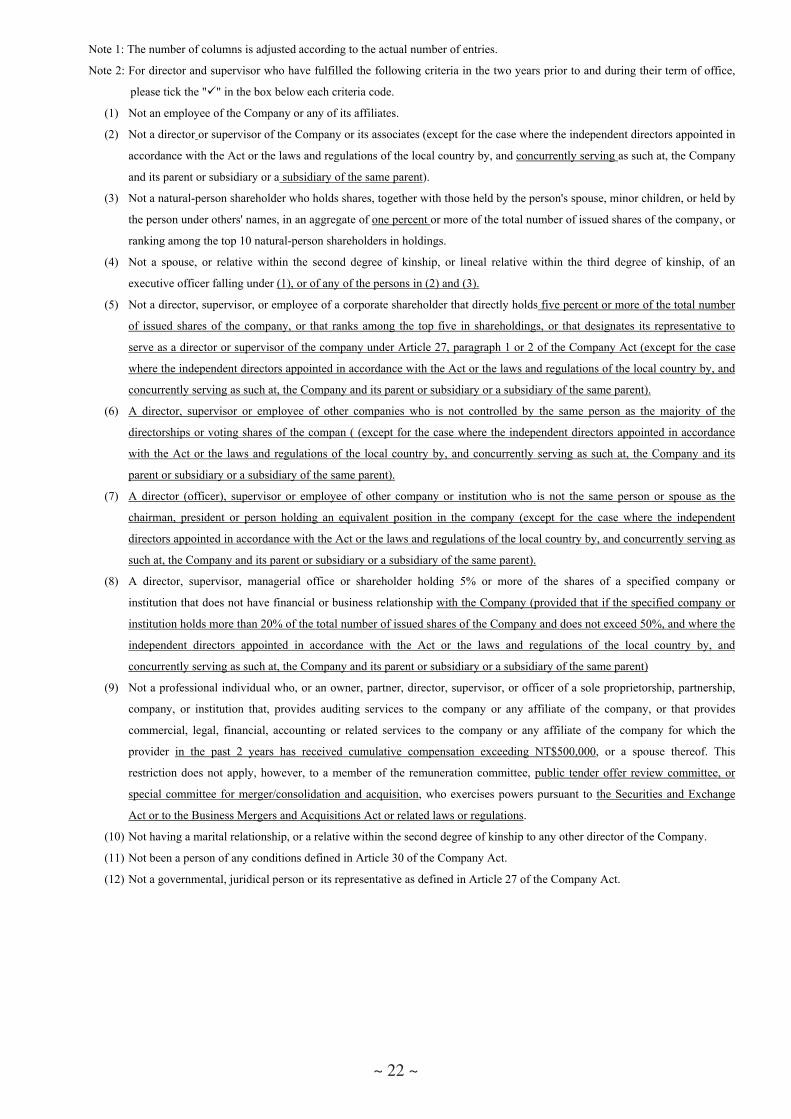
Note 1: The number of columns is adjusted according to the actual number of entries.
Note 2: For director and supervisor who have fulfilled the following criteria in the two years prior to and during their term of office,
please tick the "" in the box below each criteria code.
(1) Not an employee of the Company or any of its affiliates.
(2) Not a director or supervisor of the Company or its associates (except for the case where the independent directors appointed in
accordance with the Act or the laws and regulations of the local country by, and concurrently serving as such at, the Company
and its parent or subsidiary or a subsidiary of the same parent).
(3) Not a natural-person shareholder who holds shares, together with those held by the person's spouse, minor children, or held by
the person under others' names, in an aggregate of one percent or more of the total number of issued shares of the company, or
ranking among the top 10 natural-person shareholders in holdings.
(4) Not a spouse, or relative within the second degree of kinship, or lineal relative within the third degree of kinship, of an
executive officer falling under (1), or of any of the persons in (2) and (3).
(5) Not a director, supervisor, or employee of a corporate shareholder that directly holds five percent or more of the total number
of issued shares of the company, or that ranks among the top five in shareholdings, or that designates its representative to
serve as a director or supervisor of the company under Article 27, paragraph 1 or 2 of the Company Act (except for the case
where the independent directors appointed in accordance with the Act or the laws and regulations of the local country by, and
concurrently serving as such at, the Company and its parent or subsidiary or a subsidiary of the same parent).
(6) A director, supervisor or employee of other companies who is not controlled by the same person as the majority of the
directorships or voting shares of the compan ( (except for the case where the independent directors appointed in accordance
with the Act or the laws and regulations of the local country by, and concurrently serving as such at, the Company and its
parent or subsidiary or a subsidiary of the same parent).
(7) A director (officer), supervisor or employee of other company or institution who is not the same person or spouse as the
chairman, president or person holding an equivalent position in the company (except for the case where the independent
directors appointed in accordance with the Act or the laws and regulations of the local country by, and concurrently serving as
such at, the Company and its parent or subsidiary or a subsidiary of the same parent).
(8) A director, supervisor, managerial office or shareholder holding 5% or more of the shares of a specified company or
institution that does not have financial or business relationship with the Company (provided that if the specified company or
institution holds more than 20% of the total number of issued shares of the Company and does not exceed 50%, and where the
independent directors appointed in accordance with the Act or the laws and regulations of the local country by, and
concurrently serving as such at, the Company and its parent or subsidiary or a subsidiary of the same parent)
(9) Not a professional individual who, or an owner, partner, director, supervisor, or officer of a sole proprietorship, partnership,
company, or institution that, provides auditing services to the company or any affiliate of the company, or that provides
commercial, legal, financial, accounting or related services to the company or any affiliate of the company for which the
provider in the past 2 years has received cumulative compensation exceeding NT$500,000, or a spouse thereof. This
restriction does not apply, however, to a member of the remuneration committee, public tender offer review committee, or
special committee for merger/consolidation and acquisition, who exercises powers pursuant to the Securities and Exchange
Act or to the Business Mergers and Acquisitions Act or related laws or regulations.
(10) Not having a marital relationship, or a relative within the second degree of kinship to any other director of the Company.
(11) Not been a person of any conditions defined in Article 30 of the Company Act.
(12) Not a governmental, juridical person or its representative as defined in Article 27 of the Company Act.
~ 22 ~

(II)
Chi
ef E
xecu
tive
Offi
cer,
Pres
iden
t, V
ice
Pres
iden
t, A
ssis
tant
Vic
e Pr
esid
ent,
the
Chi
efs o
f all
the
Com
pany
's D
ivis
ions
and
Bra
nche
s
In
form
atio
n on
the
Chi
ef E
xecu
tive
Off
icer
, Pre
side
nt, V
ice
Pres
iden
t, A
ssis
tant
Vic
e Pr
esid
ent,
the
Chi
efs o
f all
the
Com
pany
's D
ivis
ions
and
Bra
nche
s A
pril
20, 2
021
Posi
tion
Nat
iona
lity
Nam
e G
ende
r
Dat
e on
w
hich
curr
ent
posi
tion
was
as
sum
ed
Shar
ehol
ding
N
umbe
r of s
hare
s hel
d by
spou
se a
nd c
hild
ren
of m
inor
age
Num
ber o
f sha
res h
eld
unde
r oth
er p
erso
ns’
nam
es
Prin
cipa
l wor
k ex
perie
nce
and
acad
emic
qu
alifi
catio
ns(N
ote
2)
Posi
tion(
s)he
ldco
ncur
rent
ly
in o
ther
co
mpa
nies
Man
ager
s who
are
rela
ted
to th
e sp
ouse
or t
he
seco
nd d
egre
e of
kin
ship
Rem
arks
(Not
e 3)
Sh
ares
Pe
rcen
tage
of
Ow
ners
hip
Shar
es
Perc
enta
ge
ofO
wne
rshi
pSh
ares
Pe
rcen
tage
of
Ow
ners
hip
Posi
tion
Nam
e R
elat
ion
Chi
efEx
ecut
ive
Offi
cer
Rep
ublic
of C
hina
Yang
, Yin
g-M
ing
Mal
e 20
18.0
6.11
65,5
55,0
157.
2117
,320
,649
1.90
0
0
Syra
cuse
Uni
vers
ity
(New
Yor
k), U
SAM
aste
r of C
hem
ical
En
gine
erin
g
chai
rman
of
Ken
jou
Ind.
C
o., L
td.
Non
eN
one
Non
e
Pres
iden
t R
epub
licof
Chi
naC
hen,
Cha
o-Ju
ng
Mal
e 20
18.0
8.09
7,22
8,84
20.
792,
165,
085
0.24
7,
268,
753
0.80
Ohi
o St
ate
Uni
vers
ity, U
SAM
aste
r of S
cien
ce
in M
ater
ials
En
gine
erin
g
Non
e N
one
Non
e N
one
Vic
e Pr
esid
ent
Rep
ublic
of C
hina
Shen
, Jui
-Hsi
ung
Mal
e 20
18.0
8.09
00
00
00
Dep
artm
ent o
f C
hem
ical
En
gine
erin
g,N
atio
nal T
aipe
i In
stitu
te o
f Te
chno
logy
Non
e N
one
Non
e N
one
Ass
ista
nt
Vic
e Pr
esid
ent
Rep
ublic
of C
hina
Hua
ng,S
hi-C
heng
M
ale
2005
.11.
0113
,390
0.00
39,5
600.
00
00
Dep
artm
ent o
f C
hem
ical
En
gine
erin
g, C
hung
Yu
an C
hris
tian
Uni
vers
ity
Non
e N
one
Non
e N
one
Ass
ista
nt
Vic
e Pr
esid
ent
Rep
ublic
of C
hina
Lin,
Chu
n-K
e M
ale
2006
.04.
016,
972
0.00
00
00
Dep
artm
ent o
f C
hem
ical
En
gine
erin
g,N
atio
nal T
aipe
i In
stitu
te o
f Te
chno
logy
Non
e N
one
Non
e N
one
Ass
ista
nt
Vic
e Pr
esid
ent
Rep
ublic
of C
hina
Che
n, C
hin-
Fu
Mal
e 20
06.0
4.01
00
00
00
Dep
artm
ent o
f M
echa
nica
l En
gine
erin
g,N
atio
nal T
aipe
i In
stitu
te o
f Te
chno
logy
Non
e N
one
Non
e N
one
~ 23 ~

Ass
ista
nt
Vic
e Pr
esid
ent
Rep
ublic
of C
hina
Cha
ng, H
ui-C
hu
Fem
ale
2011
.04.
010
00
0 0
0
Dep
artm
ent o
f Fo
reig
n La
ngua
ges,
Nat
iona
l Chu
ng
Hsi
ng U
nive
rsity
Non
e N
one
Non
e N
one
Ass
ista
nt
Vic
e Pr
esid
ent
Rep
ublic
of C
hina
Wu,
Wu-
Long
M
ale
2014
.06.
160
00
0 0
0
Dep
artm
ent o
f C
hem
ical
En
gine
erin
g,N
atio
nal C
heng
K
ung
Uni
vers
ity
Non
e N
one
Non
e N
one
Ass
ista
nt
Vic
e Pr
esid
ent
Rep
ublic
of C
hina
Liu,
Kue
i-Chu
n M
ale
2017
.07.
160
00
0 0
0
Dep
artm
ent o
f Fi
nanc
e an
d Ta
xatio
n, T
amsu
i In
stitu
te o
f B
usin
ess
Adm
inis
tratio
n
Non
e N
one
Non
e N
one
Ass
ista
nt
Vic
e Pr
esid
ent
Rep
ublic
of C
hina
Hsi
ao,W
ei-L
ien
Mal
e 20
19.0
5.14
00
00
00
Dep
artm
ent o
f A
gric
ultu
ral
Exte
nsio
n, N
atio
nal
Taiw
an U
nive
rsity
Non
e N
one
Non
e N
one
Not
e 1:
The
info
rmat
ion
of th
e Pr
esid
ent,
Vic
e Pr
esid
ent,
Ass
ista
nt V
ice
Pres
iden
t, D
epar
tmen
t and
Bra
nch
Hea
ds sh
all b
e di
sclo
sed,
as w
ell a
s tho
se w
hose
pos
ition
is
equi
vale
nt to
Pre
side
nt, V
ice
Pres
iden
t for
exa
mpl
e: C
EO, D
irect
or, a
nd so
on,
shal
l als
o be
dis
clos
ed n
o m
atte
r the
ir tit
les.
Not
e 2:
For
thos
e w
ho h
ave
wor
ked
for a
CPA
firm
or a
n af
filia
ted
com
pany
dur
ing
the
prev
ious
repo
rting
per
iod
in re
latio
n to
thei
r cur
rent
pos
ition
, the
title
of t
he p
ositi
on
and
the
dutie
s for
whi
ch th
ey w
ere
resp
onsi
ble
shou
ld b
e di
sclo
sed:
Non
e.
Not
e 3:
If th
e Pr
esid
ent o
r equ
ival
ent (
the
mos
t sen
ior m
anag
er) a
nd th
e C
hairm
an o
f the
Boa
rd a
re th
e sa
me
pers
on a
nd a
re re
late
d to
eac
h ot
her a
s spo
uses
or f
irst d
egre
e of
k
in, t
he re
ason
s, re
ason
able
ness
, nec
essi
ty a
nd m
easu
res (
e.g.
incr
easi
ng th
e nu
mbe
r of i
ndep
ende
nt d
irect
ors a
nd h
avin
g a
maj
ority
of d
irect
ors w
ho a
re n
ot a
lso
empl
oyee
s or m
anag
ers)
shou
ld b
e di
sclo
sed:
Non
e.
Not
e 4:
Ass
ista
nt V
ice
Pres
iden
t Wu,
Wu
Long
was
resi
gned
on
May
13,
201
9; M
r. H
siao
Wei
Lie
n to
ok th
e po
sitio
n on
May
14,
201
9.
(III
) W
here
the
Cha
irman
of t
he B
oard
of D
irect
ors a
nd th
e Pr
esid
ent o
r per
son
of a
n eq
uiva
lent
pos
t (th
e hi
ghes
t lev
el m
anag
er)
are
the
sam
e pe
rson
, spo
uses
, or r
elat
ives
with
in th
e fir
st d
egre
e of
kin
ship
, an
expl
anat
ion
shal
l be
give
n of
the
reas
on fo
r,re
ason
able
ness
, nec
essi
ty th
ereo
f, an
d th
e m
easu
res a
dopt
ed in
resp
onse
ther
eto:
Non
e.
~ 24 ~

III.
The
rem
uner
atio
n pa
id to
Dire
ctor
s, Su
perv
isor
s, Pr
esid
ent a
nd V
ice
Pres
iden
t in
the
mos
t rec
ent y
ear
(I) R
emun
erat
ion
paid
to D
irect
ors a
nd In
depe
nden
t Dire
ctor
s (w
ith th
e na
me(
s) in
dica
ted
for e
ach
rem
uner
atio
n ra
nge)
Dec
embe
r 31,
202
0
In N
ew T
aiw
an D
olla
rs
Posi
tion
Nam
e
Rem
uner
atio
n pa
id to
Dire
ctor
s
(A+B
+C+D
) as a
%
of N
et In
com
e
Rem
uner
atio
n pa
id to
par
t-tim
e em
ploy
ees
(A+B
+C+D
+ E+
F+G
) a
s a %
o
f Net
Inco
me
C
ompe
nsat
ion
Rec
eive
d fr
om
Non
-con
solid
ated
Aff
iliat
es o
r Pa
rent
Com
pany
Rem
uner
atio
n (A
) Se
vera
nce
Pay
and
Pens
ions
(B)
Dire
ctor
’s
rem
uner
atio
n (C
) Ex
pens
es fr
om
prof
essi
onal
pra
ctic
e (D
) Sa
lary
, Bon
uses
and
A
llow
ance
s (E)
Se
vera
nce
Pay
and
Pens
ions
(F)
Rem
uner
atio
n to
em
ploy
ees
(G)
From
the
Com
pany
From
All
Con
solid
ated
En
titie
s
From
the
Com
pany
From
All
Con
solid
ated
En
titie
s
From
the
Com
pany
From
All
Con
solid
ated
En
titie
s
From
the
Com
pany
From
All
Con
solid
ated
En
titie
s
From
the
Com
pany
From
All
Con
solid
ated
Entit
ies
From
the
Com
pany
From
All
Con
solid
ated
En
titie
s
From
the
Com
pany
From
All
Con
solid
ated
Entit
ies
From
the
Com
pany
From
All
Con
solid
ated
En
titie
sFr
om th
e C
ompa
ny
From
All
Con
solid
ated
Entit
ies
Cas
h St
ock
Cas
h St
ock
Dire
ctor
Yang
, Chi
-Jen
2,65
1,51
02,
651,
510
273,
227
273,
227
16,7
92,5
4616
,792
,546
227,
521
227,
521
2.05
2.05
6,41
5,11
29,
972,
575
557,
592
557,
592
389,
609
-38
9,60
9-
2.81
3.17
-
Cha
ng, H
ong-
Der
Yang
, Yin
g-M
ing
Che
n, C
hao-
Jung
Hsi
ao, R
u-Po
Yang
, Chi
a-Li
ng
Lin,
Tsu
ng-Y
i
Ken
jou
Co.
, Ltd
. R
epre
sent
ativ
e:
Shen
, Jui
-Hsi
ung
Inde
pend
ent
Dire
ctor
Hsi
eh,C
hun-
Mou
1,83
5,06
41,
835,
064
- -
--
218,
000
218,
000
0.21
0.21
-
--
--
--
-0.
220.
22
- Su
, Chi
ng-Y
ang
Lin,
Shen
g-C
hung
1. P
leas
e st
ate
the
polic
y, sy
stem
, sta
ndar
ds a
nd st
ruct
ure
for t
he re
mun
erat
ion
paid
to in
depe
nden
t dire
ctor
s and
the
linka
ge to
the
amou
nt p
aid
in re
spec
t of t
he re
spon
sibi
litie
s, ris
ks, t
ime
and
othe
r fac
tors
that
they
are
invo
lved
in.
Th
e re
mun
erat
ion
paid
to th
e in
depe
nden
t dire
ctor
s is a
mon
thly
fixe
d re
mun
erat
ion
plus
tran
spor
tatio
n co
sts t
o at
tend
mee
tings
. The
mon
thly
fixe
d re
mun
erat
ion
is a
ppro
ved
by th
e R
emun
erat
ion
Com
mitt
ee a
nd d
iscu
ssed
and
reso
lved
by
the
Boa
rd o
f Dire
ctor
s.
2. E
xcep
t as d
iscl
osed
in th
e pr
eced
ing
tabl
e, th
e re
mun
erat
ion
paid
to th
e di
rect
ors o
f the
Com
pany
for s
ervi
ces r
ende
red
to a
ll co
mpa
nies
con
solid
ated
in th
e Fi
nanc
ial R
epor
t (e.
g. a
s non
-em
ploy
ee c
onsu
ltant
s) in
the
mos
t rec
ent y
ear:
Non
e.
~ 25 ~

Rem
uner
atio
n R
ange
Tab
le
Rem
uner
atio
n pa
id to
dire
ctor
s D
irect
ors’
Nam
esTo
tal o
f the
rem
uner
atio
ns (A
+B+C
+D)
Tota
l of t
he re
mun
erat
ions
(A+B
+C+D
+E+F
+G
) Fr
om th
e C
ompa
nyFr
om A
ll C
onso
lidat
edEn
titie
s (H
) Fr
om th
e C
ompa
nyFr
om A
ll C
onso
lidat
edEn
titie
s(I)
$0 ~
$99
9,99
9 Sh
en, J
ui-H
siun
g,
Hsi
eh, C
hun-
Mou
Su, C
hing
-Yan
g,
Lin,
She
ng-C
hung
Shen
, Jui
-Hsi
ung,
H
sieh
, Chu
n-M
ou
Su, C
hing
-Yan
g,
Lin,
She
ng-C
hung
H
sieh
, Chu
n-M
ou,
Su,
Chi
ng-Y
ang
Lin,
She
ng-C
hung
H
sieh
, Chu
n-M
ou,
Su,
Chi
ng-Y
ang
Li
n, S
heng
-Chu
ng
$1,0
00,0
00 ~
$1,
999,
999
H
siao
, Ru-
Po,
Yan
g, C
hia-
Ling
L
in, T
sung
-Yi
Hsi
ao, R
u-Po
, Y
ang,
Chi
a-Li
ng
Lin
, Tsu
ng-Y
i H
siao
, Ru-
Po,
Y
ang,
Chi
a-Li
ng S
hen,
Jui-H
siun
g,
Lin,
Tsu
ng-Y
iH
siao
, Ru-
Po,
Y
ang,
Chi
a-Li
ng
She
n, Ju
i-Hsi
ung,
Li
n, T
sung
-Yi
$2,0
00,0
00 ~
$3,
499,
999
Yan
g, Y
ing
-Min
g,
Cha
ng, H
ong-
Der
C
hen,
Cha
o-Ju
ng
Yan
g, Y
ing
-Min
g,
Cha
ng, H
ong-
Der
C
hen,
Cha
o-Ju
ng
Cha
ng, H
ong-
Der
C
hang
, Hon
g-D
er
$3,5
00,0
00 ~
$4,
999,
999
Yan
g, C
hi-J
en
Yan
g, C
hi-J
en
Yan
g, C
hi-J
en
$5,0
00,0
00 ~
$9,
999,
999
Yan
g, Y
ing-
Min
g,
Che
n, C
hao-
Jung
Yan
g, Y
in- M
ing,
Y
ang,
Chi
-Jen
C
hen,
Cha
o-Ju
ng
$10,
000,
000
~ $1
4,99
9,99
9
$15,
000,
000
~ $2
9,99
9,99
9
$30,
000,
000
~ $4
9,99
9,99
9
$50,
000,
000
~ $9
9,99
9,99
9
Ove
r $10
0,00
0,00
0
To
tal
11
11
11
11
(II)
Rem
uner
atio
n pa
id to
supe
rvis
ors:
The
Com
pany
has
set u
p an
Aud
it C
omm
ittee
; the
refo
re, t
here
is n
o su
perv
isor
.
~ 26 ~

(III
) Rem
uner
atio
n pa
id to
CEO
, Pre
side
nt a
nd V
ice
Pres
iden
t (w
ith th
e na
me(
s) in
dica
ted
for e
ach
rem
uner
atio
n ra
nge)
Dec
embe
r 31,
201
9
In N
ew T
aiw
an D
olla
rs
Posi
tion
Nam
e
Sala
ry (A
) Se
vera
nce
Pay
and
Pens
ions
(B
) B
onus
es a
nd A
llow
ance
s (C
)R
emun
erat
ion
to e
mpl
oyee
s (D
) (A
+B+C
+D) a
s a %
of
Net
Inco
me
Com
pens
atio
n R
ecei
ved
from
N
on-c
onso
lidat
ed
Aff
iliat
es o
r Par
ent
Com
pany
From
the
Com
pany
From
All
Con
solid
ated
Entit
ies
From
the
Com
pany
From
All
Con
solid
ated
Entit
ies
From
the
Com
pany
From
All
Con
solid
ated
Entit
ies
From
the
Com
pany
Fr
om A
ll C
onso
lidat
ed
Entit
ies
From
the
Com
pany
From
All
Con
solid
ated
Entit
ies
Cas
h St
ock
Cas
h St
ock
Chi
ef E
xecu
tive
Off
icer
Ya
ng, Y
ing
Min
g 4,
528,
336
4,52
8,33
655
7,59
255
7,59
21,
886,
776
1,88
6,77
6 25
1,05
00
251,
050
00.
740.
74N
one
Pres
iden
t C
hen,
Cha
o Ju
ngV
ice
Pres
iden
t Sh
en, J
ui H
siun
g
Rem
uner
atio
n R
ange
Tab
le
Rem
uner
atio
n Pa
id to
Pre
side
nts a
nd V
ice
Pres
iden
ts
Nam
es o
f the
Pre
side
nt a
nd V
ice
Pres
iden
t
From
the
Com
pany
Fr
om A
ll C
onso
lidat
ed E
ntiti
es(E
)
$0 ~
$99
9,99
9 $1
,000
,000
~ $
1,99
9,99
9
Shen
, Jui
-Hsi
ung
Shen
, Jui
-Hsi
ung
$2,0
00,0
00 ~
$3,
499,
999
Che
n, C
hao-
Jung
Ya
ng, Y
ing-
Min
g C
hen,
Cha
o-Ju
ng
Yang
, Yin
g-M
ing
$3,5
00,0
00 ~
$4,
999,
999
$5,0
00,0
00 ~
$9,
999,
999
$10,
000,
000
~ $1
4,99
9,99
9 $1
5,00
0,00
0 ~
$29,
999,
999
$30,
000,
000
~ $4
9,99
9,99
9 $5
0,00
0,00
0 ~
$99,
999,
999
O
ver $
100,
000,
000
Tota
l 3
3 *T
he re
mun
erat
ion
disc
lose
d in
this
tabl
e is
for i
nfor
mat
ion
purp
oses
onl
y an
d is
not
inte
nded
to b
e us
ed fo
r tax
pur
pose
s as t
he d
efin
ition
of i
ncom
e
is d
iffer
ent f
rom
that
und
er th
e In
com
e Ta
x A
ct.
~ 27 ~

28
Employees’ Profit Sharing Bonus Paid to Management Team December 31, 2020
Position Name Stock Cash Amount Total Proportion to
Earnings After Tax (%)
Managers
Chief Executive Officer
Yang, Ying-Ming
0 487,072 487,072 0.0501
President Chen,
Chao-Jung
Vice President Shen,
Jui-Hsiung Assistant Vice
President Lin, Chun-Ke
Assistant Vice President
Chen, Chin-Fu
Assistant Vice President
Huang, Shi-Cheng
Assistant Vice President
Chang, Hui-Chu
Assistant Vice President
Liu, Kuei-Chun
Assistant Vice President
Hsiao,Wei-Lien
(IV) The analysis of the total remuneration, as a percentage of net income paid by the Company and by each other company included in the consolidated financial statements during the past 2 fiscal years to directors, supervisors, president, and vice presidents, and the description of the remuneration policies, standards, and packages, the procedure for determining remuneration, and its linkage to operating performance and future risk exposure.
1. The total remuneration, as a percentage of net income paid by the Company and by each other company included in the consolidated financial statements to directors, supervisors, president, and vice presidents,
2019 2020Remuneration paid to Directors, Supervisors,
President and Vice President Proportion to Earnings After Tax (Individual Financial Statement)
2.83% 3.02%
Remuneration paid to Directors, Supervisors, President and Vice President
Proportion to Earnings After Tax (Consolidated Financial Statement)
3.20% 3.39%
~ 28 ~

29
The Company's net income for 2019 was NT$1,013,562,000. The consolidated net income for 2019 was NT$1,013,559,000. The Company's net income for 2020 was NT$972,225,000. The consolidated net income for 2020 was NT$972,225,000.
2. The description of the remuneration policies, standards, and packages, the procedure for determining remuneration, and its linkage to operating performance and future risk exposure:
The Company's directors' remuneration shall be determined in accordance with Article 27-1
of the Company's Articles of Incorporation and shall be paid at a rate not exceeding 3% of the
Company's profit for the year, taking into account the Company's operating results and the extent
of the directors' contribution to the Company's operating objectives, and shall be evaluated in
accordance with the "Regulations Governing the Remuneration of Directors".The remuneration
paid to the President and Vice President is determined in accordance with the "Regulations
Governing the Remuneration of Managerial Officers", the average salary rate in the same industry,
the scope of authority and responsibility for that position and the contribution to the operational
objectives in the Company. In addition to the Company's overall operating performance (e.g. the
growth rate in profit before tax, the growth rate in operating revenue, and the over-consumption
rate in the Group), the risks associated with the business operation and future development in the
industry, the remuneration procedures also take into account the individual's performance
achievement rate and the extent of his or her contribution to the Company's performance (e.g.
Disabling Frequency Rate, the turnover rate, and the number of trial productions and trial runs).
The reasonableness regarding the performance evaluation and remuneration are reviewed by the
Remuneration Committee and the Board of Directors. In addition, the operational status and
relevant laws and regulations are reviewed in a timely manner in order to achieve the
sustainability and the risk management for the Company.
~ 29 ~

30
IV. The implementation status of the corporate governance: (I) The state of operations of the board of directors
Information on the Operations of the Board
There were five meetings of the Board of Directors in the year 2020, the attendance of Directors and
Supervisors at these meetings was as follows: Position Name Attendance in
person Attendance by proxy Attendance rate in person (%)
Remarks
Chairman Yang, Chi-Jen 5 0 100%
Vice Chairman Chang, Hong-Der 5 0 100%
Director Yang, Ying-Ming 5 0 100%
Director Hsiao, Ru-Po 5 0 100%
Director Chen, Chao-Jung 5 0 100%
Director Kenjou Co., Ltd. Representative: Shen, Jui-Hsiung
5 0 100%
Director Yang, Chia-Ling 5 0 100%
Director Lin, Tsung-Yi 4 0 80% Independent
Director Hsieh,Chun-Mou 5 0 100%
Independent Director Su, Ching-Yang 5 0 100%
Independent Director Lin,Sheng-Chung 5 0 100%
Other matters that require reporting: I. The implementation of the Board shall state the date and session of the Board meeting, the resolution, the opinions of all independent directors
and the Company's response to such opinions, if any of the following circumstances apply: (I) Items listed in paragraph 3 of Article 14 of the Securities and Exchange Act:
Board of Directors Meeting
DatesResolutions
Independent Director Had a Dissenting Opinion or Qualified Opinion
Company’s Response to Independent Director’sDissentingOpinion or Qualified Opinion
2020.01.17 The 8th meeting of the 19th of the Board of Directors
1. The proposal of the year-end bonus for the Company's managerial officers. 2. The proposal of the year-end bonus for the directors of the Company who execute the business operations. 3. A motion to review the salaries for the directors and the managerial officers of the Company who execute the business operations. 4. The proposal for increasing the investment in Kenda Rubber (Vietnam) Co., Ltd., the subsidiary of the Company. 5. The proposal for increasing the investment in Kenda Rubber (Indonesia) Co., Ltd., the subsidiary of the Company. 6. The proposal for destruction of the Company's accounting books and documents upon the expiration of their retention period. 7. The proposal of the endorsement and guarantee for the Company's subsidiaries. 8. The proposal of the loan amount application for the Company.
None. None.
2020.03.26 The 9th meeting of the 19th of the Board of Directors
1. The proposal of the employees' and directors' remuneration for the year 2019. 2. The adoption of the 2019 Business Report and Financial Statements. 3. The proposal of the 2019 earning distribution. 4. The proposal to distribute the cash dividends to shareholders from the 2019 earnings
of the Company. 5. The proposal for new shares issue through the capitalization of earnings. 6. The amendments to the company’s “Articles of Incorporation”
None. None.
~ 30 ~

31
Board of Directors
DateResolutions
Independent Director Had a Dissenting Opinion or Qualified Opinion
Company’s Response to Independent Director’sDissentingOpinion or Qualified Opinion
2020.03.26 The 9th meeting of the 19th of the Board of Directors
7. Matters related to the shareholders' proposal for the 2020 Annual Shareholders' Meeting being accepted by the Company. 8. The proposal to convene the 2020 Annual Shareholders’ Meeting of the Company. 9. The proposal to lease the land and factory from KF Co., Ltd. 10. The statement of the Internal Control System of the Company. 11. The amendment to the “Internal Control System” of the Company. 12. The amendment to the “Internal Audit Implementation Rules” of the Company. 13. The proposal of the endorsement and guarantee for the Company's subsidiaries. 14. The proposal of the loan amount application for the Company.
None. None.
2020.05.06 The 10th meeting of the 19th of the Board of Directors
1. The proposal of the Company's financial statements for the first quarter of 2020. 2. The proposal to review the shareholders who hold more than one percent or more of
the total number of issued shares of the Company. 3. The proposal to convene the 2020 Annual Shareholders’ Meeting of the Company. 4. The application for extending the endorsement and guarantee for the Company's associates. 5. The proposal of the loan amount application for the Company.
None. None.
2020.08.12 The 11th meeting of the 19th of the Board of Directors
1. The proposal of the Company's financial statements for the second quarter of 2020. 2. The proposals to issue new shares by the capitalization of the Company's 2019
earnings and to determine the record date for cash dividends and other related matters.
3. The amendment to the Corporate Governance Best Practice Principles of the Company. 4. The proposal of the endorsement and guarantee for the Company's subsidiaries. 5. The proposal of the loan amount application for the Company.
None. None.
2020.11.11 The 12th meeting of the 19th of the Board of Directors
1. The preparation of the Company's audit plan for 2021. 2. The proposal of the Company's financial statements for the third quarter of 2020. 3. The distribution of remuneration to the directors of the Company. 4. The distribution of remuneration to the managerial officers and directors of the Company who execute the business operations. 5. A motion to review the salaries for the managerial officers and directors of the Company who execute the business operations. 6. The amendment to the " Regulations on the Performance Evaluation of the Board of
Directors and Functional Committees" of the Company. 7. The amendment to the Company's "Rules of Procedure for Board of Directors Meetings".8. The amendment to the Company’s “Audit Committee Charter”. 9. The amendment to the Company’s “Rules Governing the Scope of Powers of Independent Directors”. 10. The amendment to the Company’s “Remuneration Committee Charter”. 11. The proposal of the endorsement and guarantee for the Company's subsidiaries. 12. The proposal of the loan amount application for the Company.
None. None.
(II) Except for the preceding matters, other Board resolutions on which the independent directors express objections or reservations that have been included in records or stated in writing: None.
II. The implementation status of the directors' recusal from a resolution in which they may have interests shall include the directors' names, the contents of the resolution, the reasons for the recusal and the participation in voting.
Date Directors’ Names Resolutions Reasons for the recusal Participation in voting 01.17 Directors presented -
Yang, Ying Ming, Yang, Chi Jen Chang, Hong Der, Chen, Chao Jung Shen, Jui Hsiung
The proposal of the year-end bonus for the directors who execute the business operations.
Resolved to distribute the year-end bonus for the directors who execute the business operations.
Resolved by the rest of the Directors present without objection.
01.17 Directors presented - Yang, Ying Ming, Yang, Chi Jen Chang, Hong Der, Chen, Chao Jung Shen, Jui Hsiung
A motion to review the salaries for the directors and the managerial officers who execute the business operations.
Resolved to pay the salaries for the directors and the managerial officers who execute the business operations.
Resolved by the rest of the Directors present without objection.
~ 31 ~

32
11.11 Directors presented - Yang, Ying Ming, Yang, Chi Jen Chang, Hong Der, Chen, Chao Jung, Shen, Jui Hsiung, Hsiao, Ru Po Yang, Chia Ling, Lin Tsung Yi
The distribution of remuneration to the directors of the Company.
With the exception of Mr. Shen, Jui Hsiung, who is involved in the remuneration distribution to corporate directors, the other directors are involved in the remuneration distribution to themselves.
When resolving on the remuneration of each Director, the person being voted shall be recused and the rest of the Directors present shall pass the resolution without objection. When resolving on the remuneration of the corporate director of Kenjou Co., Ltd, Mr. Shen Jui Hsiung, the representative of the company, recused himself and the rest of the directors present passed the resolution without objection.
11.11 Directors presented - Yang, Ying Ming, Yang, Chi Jen Chang, Hong Der, Chen, Chao Jung Shen, Jui Hsiung
The distribution of remuneration to the managerial officers, directors who execute the business operations and employees.
Resolved to distribute the remuneration to the managerial officers, directors who execute the business operations and the employees.
When resolving on the remuneration of the managerial officers and directors, the person being voted shall be recused and the rest of the Directors present shall pass the resolution without objection.
11.11 Directors presented - Yang, Ying Ming, Yang, Chi Jen Chang, Hong Der, Chen, Chao Jung Shen, Jui Hsiung
A motion to review the salaries for the directors who execute the business operations and managerial officers.
Resolved to pay the salaries for the directors and the managerial officers who execute the business operations.
Resolved by the rest of the Directors present without objection.
III. Information on the evaluation cycle, period, scope, method and content of the self- (or peer) evaluation of the Board: The implementation status of the Board's evaluation
Cycle Period Scope Method Content Once a year
2020.01.01 ~ 2020.12.31
Performance evaluations of the Board of Directors, Board members, Audit Committee, and Remuneration Committee
Internal evaluation of the Board, Board member’s self-evaluation,Self-evaluationof the Audit Committee, Self-evaluation of the remuneration committee
I. Board of Directors 1. Participation in the operation of the company. 2. Improvement of the quality of the board of directors' decision making. 3. Composition and structure of the board of directors.4. Election and continuing education of the directors.5. Internal Control. II. Board members 1. Alignment of the goals and mission of the company. 2. Awareness of the duties of a director. 3. Participation in the operation of the company. 4. Management of internal relationship and communication.5. The director's professionalism and continuing education. 6. Internal Control.
III. Audit Committee 1. Participation in the operation of the company. 2. Awareness of the duties of the Audit Committee 3. Improvement of quality of decisions made
by the Audit Committee 4. Composition of the Audit Committee, and
election and appointment of committee members
5. Internal Control. IV. Remuneration Committee 1. Participation in the operation of the company. 2. Recognition of the duties of the Remuneration Committee 3. Improvement in the quality of decision making by the Remuneration Committee 4. Composition of the Remuneration
Committee, and election and appointment
~ 32 ~

33
of committee members
IV. An evaluation of the current and most recent year's goals for improving the Board's functions (e.g. establishing an audit committee, improving information transparency and so on) and the implementation status: (I) The Company adopted a candidate nomination system to elect 11 directors (including 3 independent directors) for the 19th term of the Board
of Directors in 2018. All independent directors served as members of the Audit Committee that was established to replace the Supervisors in order to strengthen the independence and diversity of the Board of Directors; the basic qualifications and the values include: gender, age, nationality and culture; and the professional knowledge and skills include: Professional background, professional skills and experiences in the industry. The members of the Board of Directors undertake continuingeducation each year during their term of office. The Company purchases liability insurance for all Directors in respect of the scope of business they conduct. The Board of Directors is responsible to the shareholders of the Company and exercises its powers in accordance with the laws and regulations, the Articles of Incorporation and the resolutions of the shareholders' meeting. To achieve the best company interests, the members of the Board evaluate the Company's business strategies, risk management, investment plans and other major projects with duties of loyalty and the due care of a good-faith administrator, as well as focus on corporate governance and theimplementation of internal control systems.
(II) The composition of the Company's Board of Directors includes overall consideration of operational judgment, management ability, financial analysis ability, crisis management ability, industry knowledge, international market perspective, ability to lead, and ability to make policy decisions.
(III) The Company amended the Procedures for Election of Directors, the Rules of Procedure for Board of Directors Meetings and the Corporate Governance Practices in accordance with the laws and regulations, and disclosed them on the Company's website and the Market Observation Post System.
(IV) The Company discloses the information on directors' continuing education, attendance at board meetings and directors' remuneration on the Market Observation Post System.
(V) The Company's website discloses the major resolutions of the Board of Directors, the profiles of the Board members and the diversity policy for the Board.
(VI) The Company has established an Audit Committee to supervise the fair expression of the Company's financial statements, the selection (dismissal) and independence and performance of the certified public accountant, the effective implementation of the Company's internal controls, the legal compliance of the Company with relevant orders and regulations, and the control of the Company's inherent or potential risks.
~ 33 ~

34
(II) The implementation status of the Audit Committee: There were five meetings of the Audit Committee in the year 2020, the attendance of independent directors at these meetings was as follows:
Position Name Attendance in person
Attendance by proxy
Attendance rate in person (%)
Remarks
Independent Director Hsieh,Chun-Mou 5 0 100%
Independent Director Su, Ching Yang 5 0 100%
Independent Director Lin, Sheng-Chung 5 0 100%
Other matters that require reporting: I. The implementation of the Audit Committee shall state the date and session of the Board meeting, the resolution, the results of all Audit
Committee meetings and the Company's response to such results, if any of the following circumstances apply (I) Items listed in paragraph 5 of Article 14 of the Securities and Exchange Act.
Board of Directors
Meeting Dates Resolutions
Results of the Audit Committee’s
resolution
The Company’s handling of the recommendation of the Audit
Committee 2020.01.17 The 8th meeting of the 19th of the Board of Directors
1. Report on the independence evaluation of the CPA. 2. The proposal of the endorsement and guarantee of the
Company. 3. The proposal for increasing the investment in Kenda Rubber
(Vietnam) Co., Ltd., the subsidiary of the Company. 4. The proposal for increasing the investment in Kenda Rubber
(Indonesia) Co., Ltd., the subsidiary of the Company.
RESOLVED by all members present.
Resolved by all Directors present at the Board Meeting on January 17, 2020.
2020.03.26 The 9th meeting of the 19th of the Board of Directors
1. The adoption of the 2019 Business Report and Financial Statements.
2. The proposal of the 2019 Earnings Distribution. 3. The proposal to distribute the cash dividends to shareholders
from the 2019 earnings of the Company. 4. The proposal for the new shares issue through the
capitalization of earnings. 5. The amendments to the company’s “Articles of
Incorporation”6. The proposal to lease the land and factory from KF Co., Ltd. 7. The statement of the Internal Control System of the
Company. 8. The amendment to the “Internal Control System” of the
Company. 9. The amendment to the “Internal Audit Implementation
Rules” of the Company. 10. The proposal of the endorsement and guarantee of the
Company.
RESOLVED by all members present.
Resolved by all Directors present at the Board Meeting on March 26, 2020.
2020.05.06 The 10th meeting of the 19th of the Board of Directors
1. The proposal of the Company's consolidated financial statements for the first quarter of 2020.
2. The application for extending the endorsement and guarantee for the Company's associates.
RESOLVED by all members present.
Resolved by all Directors present at the Board Meeting on May 6, 2020.
2020.08.12 The 11th meeting of the 19th of the Board of Directors
1. The proposal of the Company's financial statements for the second quarter of 2020.
2. The proposals to issue new shares by the capitalization of the Company's 2019 earnings and to determine the record date for cash dividends and other related matters.
3. The proposal of the endorsement and guarantee of the Company.
RESOLVED by all members present.
Resolved by all Directors present at the Board Meeting on August 12, 2020.
2020.11.11 The 12th meeting of the 19th of the Board of Directors
1. The preparation of the Company's audit plan for 2021. 2. The proposal of the Company's financial statements for the third
quarter of 2020. 3. The proposal of the endorsement and guarantee of the
Company.
RESOLVED by all members present.
Resolved by all Directors present at the Board Meeting on November 11, 2020.
(II) Other than the preceding matters, matter that has not been passed by the audit committee, but has been adopted with the approval of two-thirds or more of all board directors without having been passed by the audit committee: None.
II. The implementation status of the independent directors' recusal from a resolution in which they may have interests shall include the independent directors' names, the contents of the resolution, the reasons for the recusal and the participation in voting: None.
~ 34 ~

35
III. Communication between the independent directors and the internal auditors and the independent auditors (including the major issues, methods and results of communication regarding the financial and operating positions of the Company).
(I) Summary of the communications between the independent directors and the internal auditors for the year 2020
Meeting Dates Content of Communication Method of Communication Result of Communication
2020.01.17 Report on the implementation of internal audits. Presentation in the meeting
Acknowledged, no further comments.
2020.03.26 1. Report on the implementation of internal audits. 2. Discussion on the Statement of the Internal Control System. 3. Discussion on the amendment to the “Internal Control System” of the Company. 4. Discussion on the amendment to the “Internal Audit Implementation Rules” of the Company.
Presentation in the meeting
Acknowledged, no further comments.
2020.05.06 Report on the implementation of internal audits. Presentation in the meeting
Acknowledged, no further comments.
2020.08.12 Report on the implementation of internal audits. Presentation in the meeting
Acknowledged, no further comments.
2020.11.11 1. Report on the implementation of internal audits. 2. Discussion on the audit plan for 2021.
Presentation in the meeting
Acknowledged, no further comments.
(II) Summary of the communications between the independent directors and the independent auditors for the year 2020
Meeting Dates Content of Communication Method of Communication Result of Communication
2020.03.26 Communicate with the corporate governance unit on the audit scope of the financial report and the audit opinion.
Presentation in the meeting
Acknowledged, no further comments.
2020.11.11 Communicate with the corporate governance unit on the audit priorities and key audit items for the 2020 financial report.
Presentation in the meeting
Acknowledged, no further comments.
IV. The Audit Committee's primary function is to assist the Board of Directors in overseeing the accounting, financial and auditing quality of the Company. The Audit Committee is responsible to review the following major matters:
(I) Adoption or amendment of an internal control system in accordance with Article 14-1 of the Securities and Exchange Act (II) Assessment of the effectiveness of the internal control system. (III) Adoption or amendment, pursuant to Article 36-1 of the Securities and Exchange Act, of handling procedures for financial or
operational actions of material significance, such as acquisition or disposal of assets, derivatives trading, extension of monetary loans to others, and endorsements or guarantees for others.
(IV) A matter bearing on the personal interest of a director or supervisor. (V) A transaction involving material asset or derivatives trading. (VI) A material monetary loan, endorsement, or provision of guarantee. (VII) The offering, issuance, or private placement of any equity-type securities. (VIII) The hiring, dismissal or remuneration of an attesting certified public accountant. (IX) The appointment or dismissal of a financial, accounting, or internal auditing officer. (X) The annual financial report and the semi-annual financial report. (XI) The Business Report, earning distribution or loss make-up proposal. (XII) Any other material matter so determined by the company or the competent authority.
V. The implementation status of Audit Committee for the year 2020: (I) Convene the quarterly Audit Committee meeting to oversee the Company's financial performance and internal control system. (II) Review the financial statements (III) Evaluate the effectiveness of the internal control system. (IV) Statement on Internal Control for 2020. (V) Major endorsement and guarantee cases. (VI) Capital increase proposal. (VII) Evaluate the independence of the CPA.
~ 35 ~

(III
) The
stat
e of
the
Com
pany
's im
plem
enta
tion
of c
orpo
rate
gov
erna
nce,
any
var
ianc
e of
such
impl
emen
tatio
n fr
om th
e C
orpo
rate
Gov
erna
nce
Bes
t Pra
ctic
e Pr
inci
ples
for T
WSE
/TPE
x Li
sted
Com
pani
es, a
nd th
e re
ason
for a
ny su
ch v
aria
nce
Ass
esse
d Ite
ms
Impl
emen
tatio
n St
atus
(Not
e 1)
N
on-im
plem
enta
tion
and
its re
ason
s Ye
sN
oSu
mm
ary
and
Expl
anat
ion
I. D
oes C
ompa
ny fo
llow
“C
orpo
rate
Gov
erna
nce
Bes
t Pra
ctic
e Pr
inci
ples
for T
WSE
/TPE
x Li
sted
Com
pani
es”
to e
stab
lish
and
disc
lose
its c
orpo
rate
gov
erna
nce
prac
tices
?
Th
e C
ompa
ny h
as e
stab
lishe
d a
Cor
pora
te G
over
nanc
e Pr
actic
e Pr
inci
ples
in
acco
rdan
ce w
ith C
orpo
rate
Gov
erna
nce
Bes
t Pra
ctic
e Pr
inci
ples
for T
WSE
/TPE
x Li
sted
Com
pani
es, w
hich
is d
iscl
osed
on
the
Mar
ket O
bser
vatio
n Po
st S
yste
m a
nd
the
Com
pany
's w
ebsi
te.
No
mat
eria
l diff
eren
ce.
II.
Shar
ehol
ding
Stru
ctur
e &
Sha
reho
lder
s’ R
ight
s (I
) D
oes C
ompa
ny h
ave
Inte
rnal
Ope
ratio
n Pr
oced
ures
for
hand
ling
shar
ehol
ders
’ sug
gest
ions
, con
cern
s, di
sput
es a
nd
litig
atio
n m
atte
rs. I
f yes
, has
thes
e pr
oced
ures
bee
n im
plem
ente
d ac
cord
ingl
y?
(II)
D
oes C
ompa
ny p
osse
ss a
list
of m
ajor
shar
ehol
ders
and
be
nefic
ial o
wne
rs o
f the
se m
ajor
shar
ehol
ders
? (I
II)
Has
the
Com
pany
bui
lt an
d ex
ecut
ed a
risk
man
agem
ent
syst
em a
nd “
firew
all”
bet
wee
n th
e C
ompa
ny a
nd it
s af
filia
tes?
(IV
) H
as th
e C
ompa
ny e
stab
lishe
d in
tern
al ru
les p
rohi
bitin
g in
side
r tra
ding
on
undi
sclo
sed
info
rmat
ion?
The
Com
pany
has
est
ablis
hed
Rul
es o
f Pro
cedu
re fo
r Sha
reho
lder
s' M
eetin
gs a
nd
has a
spok
espe
rson
and
an
actin
g sp
okes
pers
on to
han
dle
the
rele
vant
issu
es.
The
Com
pany
mai
ntai
ns a
shar
ehol
ders
rost
er th
roug
h its
shar
ehol
der s
ervi
ce a
gent
an
d is
con
trolle
d by
an
insi
der s
hare
repo
rting
syst
em.
The
Com
pany
has
est
ablis
hed
and
impl
emen
ted
the
supe
rvis
ion
and
man
agem
ent o
f th
e su
bsid
iarie
s in
acco
rdan
ce w
ith th
e re
gula
tions
. The
aud
itors
als
o pe
riodi
cally
vi
sit e
ach
subs
idia
ry to
mon
itor a
nd a
udit
the
subs
idia
ries i
n ac
cord
ance
with
the
regu
latio
ns.
The
Com
pany
has
est
ablis
hed
the
" R
egul
atio
ns o
n Pr
even
tion
of In
side
r Tra
ding
" to
cont
rol t
he tr
adin
g of
secu
ritie
s by
insi
ders
of t
he C
ompa
ny w
ith in
form
atio
n th
at is
no
t yet
pub
licly
ann
ounc
ed in
the
mar
ket.
The
Com
pany
con
duct
s ann
ual t
rain
ing
and
educ
atio
n co
urse
s on
"Pre
vent
ion
of In
side
r Tra
ding
" fo
r em
ploy
ees a
nd
insi
ders
.
No
mat
eria
l diff
eren
ce.
III.
Com
posi
tion
and
Res
pons
ibili
ties o
f the
Boa
rd o
f D
irect
ors
(I)
Has
the
Com
pany
est
ablis
hed
a di
vers
ifica
tion
polic
y fo
r th
e co
mpo
sitio
n of
its B
oard
of D
irect
ors a
nd h
as it
bee
n
The
Com
pany
ha
s es
tabl
ishe
d an
d im
plem
ente
d a
dive
rsifi
catio
n po
licy
in
acco
rdan
ce w
ith A
rticl
e 20
of
the
"Cor
pora
te G
over
nanc
e Pr
inci
ples
of
Ken
da N
o m
ater
ial d
iffer
ence
.
~ 36 ~

Ass
esse
d Ite
ms
Impl
emen
tatio
n St
atus
(Not
e 1)
N
on-im
plem
enta
tion
and
its re
ason
s Ye
sN
oSu
mm
ary
and
Expl
anat
ion
impl
emen
ted
acco
rdin
gly?
Indu
stria
l C
o., L
td.",
inc
ludi
ng b
asic
req
uire
men
ts a
nd v
alue
s, ta
king
int
o ac
coun
t ge
nder
, ag
e, n
atio
nalit
y an
d cu
lture
.In a
dditi
on,
the
prof
essi
onal
kno
wle
dge
with
sk
ills
and
expe
rtise
req
uire
d to
exe
cute
the
dut
ies
incl
ude
oper
atio
nal
judg
emen
t, ac
coun
ting
and
finan
cial
ana
lysi
s sk
ills,
busi
ness
man
agem
ent,
cris
is m
anag
emen
t, le
ader
ship
an
d de
cisi
on-m
akin
g sk
ills,
as
wel
l as
in
dust
ry
know
ledg
e an
d in
tern
atio
nal m
arke
t per
spec
tive.
Th
ere
are
tota
l 11
mem
bers
on
the
Boa
rd o
f Dire
ctor
s; o
f whi
ch 4
5% a
re e
mpl
oyee
s of
the
Com
pany
, 27%
are
inde
pend
ent d
irect
ors
(3 in
depe
nden
t dire
ctor
s), 1
8% a
re
fem
ale
dire
ctor
s (2
fem
ale
dire
ctor
s), 1
inde
pend
ent d
irect
or h
as s
erve
d fo
r les
s th
an
3 ye
ars,
2 in
depe
nden
t dire
ctor
s ha
ve s
erve
d fo
r 4-
6 ye
ars,
4 di
rect
ors
are
over
70
year
s ol
d, 3
dire
ctor
s ar
e be
twee
n th
e ag
es o
f 61
to 7
0, 2
dire
ctor
s ar
e be
twee
n th
e ag
es o
f 51
to 6
0 an
d 2
are
unde
r the
age
of 5
0.
The
Boa
rd o
f D
irect
ors
of t
he C
ompa
ny c
onsi
sts
a w
ide
rang
e of
pro
fess
iona
l ba
ckgr
ound
s, an
d w
e ha
ve re
crui
ted
a w
ide
rang
e of
tale
nts
to a
chie
ve th
e di
vers
ity
in th
e B
oard
. The
com
posi
tion
of th
e B
oard
incl
uded
the
chem
ical
, mec
hani
cal a
nd
mar
ketin
g pr
ofes
sion
als
who
are
rel
ated
to th
e C
ompa
ny' s
bus
ines
s. Th
e C
ompa
ny
sele
cts i
ts D
irect
ors o
n th
e m
erit
basi
s and
with
out a
ny d
iscr
imin
atio
n.
1.Im
plem
ent s
ound
gov
erna
nce
syst
ems
for t
he B
oard
, and
con
side
r the
div
ersi
ty
and
prof
essi
onal
ism
of B
oard
mem
bers
: (1
) Boa
rd d
iver
sity
G
oal:
The
Com
pany
has
spe
cifie
d in
the
Cor
pora
te G
over
nanc
e Pr
inci
ples
that
th
e co
mpo
sitio
n of
the
Boa
rd o
f D
irect
ors
shou
ld t
ake
into
acc
ount
the
di
vers
ity o
f th
e C
ompa
ny's
mem
bers
, an
d th
at t
he C
ompa
ny s
houl
d de
velo
p an
app
ropr
iate
div
ersi
ty p
olic
y w
ith r
egar
d to
its
ope
ratio
ns,
busi
ness
mod
el a
nd d
evel
opm
ent n
eeds
, and
that
the
Boa
rd o
f D
irect
ors
shou
ld h
ave
the
nece
ssar
y kn
owle
dge,
ski
lls a
nd q
ualit
ies
to p
erfo
rm it
s du
ties i
n or
der t
o ac
hiev
e th
e ob
ject
ives
of c
orpo
rate
gov
erna
nce.
~ 37 ~

Ass
esse
d Ite
ms
Impl
emen
tatio
n St
atus
(Not
e 1)
N
on-im
plem
enta
tion
and
its re
ason
s Ye
sN
oSu
mm
ary
and
Expl
anat
ion
Ach
ieve
men
ts: T
he C
ompa
ny's
dire
ctor
s are
all
qual
ified
and
exp
erie
nced
in
cond
uctin
g th
e C
ompa
ny's
busi
ness
; the
pro
fess
iona
l bac
kgro
und
of th
e C
ompa
ny's
dire
ctor
s inc
lude
: app
roxi
mat
ely
36%
of t
he
dire
ctor
s with
a b
ackg
roun
d in
the
chem
ical
eng
inee
ring;
18%
in
finan
ce; 5
5% in
bus
ines
s man
agem
ent;
and
27%
in b
oth
busi
ness
m
anag
emen
t and
che
mic
al e
ngin
eerin
g.
(2) D
irect
ors’
prof
essi
onal
qua
lific
atio
ns
Goa
l: Th
e B
oard
of
D
irect
ors'
over
all
abili
ties
incl
ude
abili
ty
to
mak
e op
erat
iona
l ju
dgm
ents
; ab
ility
to
pe
rfor
m
acco
untin
g an
d fin
anci
al
anal
ysis
; ab
ility
to
co
nduc
t m
anag
emen
t ad
min
istra
tion;
ab
ility
to
co
nduc
t cris
is m
anag
emen
t; kn
owle
dge
of th
e in
dust
ry; a
n in
tern
atio
nal
mar
ket
pers
pect
ive;
abi
lity
to l
ead;
abi
lity
to m
ake
polic
y de
cisi
ons.
Furth
erm
ore,
in o
rder
to s
treng
then
the
prof
essi
onal
ism
of
the
Boa
rd o
f D
irect
ors,
a m
inim
um o
f 6 h
ours
of t
rain
ing
is re
quire
d ea
ch y
ear.
Ach
ieve
men
t: Th
e co
ntin
uing
edu
catio
n ho
urs
for
the
Com
pany
's di
rect
ors
in
2020
hav
e al
l bee
n ac
com
plis
hed.
2.
For t
he p
urpo
ses o
f dev
elop
ing
supe
rvis
ory
func
tions
, con
side
ring
enha
ncin
g th
e fr
eque
ncy
of th
e B
oard
's op
erat
ions
: G
oal:
Con
vene
at l
east
onc
e a
quar
ter t
o re
view
the
oper
atio
nal p
erfo
rman
ce a
nd
disc
uss k
ey st
rate
gic
initi
ativ
es.
Ach
ieve
men
t: Th
e at
tend
ance
rate
is 9
8%.
3.Fo
r th
e pu
rpos
e of
st
reng
then
ing
man
agem
ent
mec
hani
sms,
cons
ider
st
reng
then
ing
the
effic
ienc
y of
the
Boa
rd's
oper
atio
ns:
Goa
l: In
201
5, th
e C
ompa
ny e
stab
lishe
d th
e "S
elf-
Eval
uatio
n or
Pee
r Eva
luat
ion
of t
he B
oard
of
Dire
ctor
s ",
und
er w
hich
the
ann
ual
perf
orm
ance
ev
alua
tion
is c
ondu
cted
int
erna
lly.In
202
0, a
per
form
ance
eva
luat
ion
requ
irem
ent
for
func
tiona
l co
mm
ittee
s w
as a
dded
and
per
form
ance
~ 38 ~

Ass
esse
d Ite
ms
Impl
emen
tatio
n St
atus
(Not
e 1)
N
on-im
plem
enta
tion
and
its re
ason
s Ye
sN
oSu
mm
ary
and
Expl
anat
ion
(II)
O
ther
than
the
Rem
uner
atio
n C
omm
ittee
and
the A
udit
Com
mitt
ee w
hich
are
requ
ired
by la
w, d
oes t
he C
ompa
ny
plan
to se
t up
othe
r fun
ctio
nal c
omm
ittee
s?
(III
) H
as th
e C
ompa
ny e
stab
lishe
d m
etho
dolo
gy fo
r eva
luat
ing
the
perf
orm
ance
of i
ts B
oard
of D
irect
ors,
on a
n an
nual
ba
sis a
nd o
n a
regu
lar b
asis
, and
repo
rted
the
resu
lts o
f the
pe
rfor
man
ce e
valu
atio
n to
the
Boa
rd o
f Dire
ctor
s and
use
d th
em a
s the
refe
renc
e fo
r ind
ivid
ual d
irect
ors'
rem
uner
atio
n an
d no
min
atio
n fo
r re-
elec
tion?
eval
uatio
ns a
re a
lso
cond
ucte
d an
nual
ly.
Ach
ieve
men
t: Th
e 20
20 s
elf-
eval
uatio
n of
the
per
form
ance
for
the
Boa
rd o
f D
irect
ors
(with
a s
core
of 9
3.7)
, the
sel
f-ev
alua
tion
of th
e B
oard
m
embe
rs (
with
a s
core
of 9
6.4)
, the
sel
f-ev
alua
tion
of th
e A
udit
Com
mitt
ee (
with
a s
core
of
96.0
) an
d th
e se
lf-ev
alua
tion
of th
e R
emun
erat
ion
Com
mitt
ee (
with
a sc
ore
of 9
3.6)
Th
e C
ompa
ny h
as n
o ot
her f
unct
iona
l com
mitt
ees a
t pre
sent
.
On
11 M
ay 2
015,
the
Com
pany
est
ablis
hed
the
"Sel
f-Ev
alua
tion
or P
eer E
valu
atio
n of
the
Boa
rd o
f Dire
ctor
s " a
nd c
ondu
cted
ann
ual p
erfo
rman
ce e
valu
atio
n to
im
plem
ent c
orpo
rate
gov
erna
nce
and
enha
nce
the
func
tions
of t
he B
oard
of
Dire
ctor
s; o
n 11
Nov
embe
r 202
0, th
e pe
rfor
man
ce e
valu
atio
n of
func
tiona
l co
mm
ittee
s was
add
ed a
nd th
e "S
elf-
Eval
uatio
n or
Pee
r Eva
luat
ion
of th
e B
oard
of
Dire
ctor
s and
Fun
ctio
nal C
omm
ittee
s" w
as e
stabl
ishe
d w
hich
was
als
o an
noun
ced
on
the
Com
pany
's w
ebsi
te T
he p
erfo
rman
ce e
valu
atio
n fo
r 202
0 w
as c
ompl
eted
by
the
end
of D
ecem
ber o
f tha
t yea
r. Th
e ev
alua
tion
perio
d is
for t
he w
hole
yea
r of 2
020.
Th
e sc
ope
of th
e ev
alua
tion
incl
udes
the
perf
orm
ance
eva
luat
ion
of th
e B
oard
of
Dire
ctor
s as a
who
le, i
ndiv
idua
l Boa
rd m
embe
rs a
nd fu
nctio
nal c
omm
ittee
s; th
e ev
alua
tion
met
hod
is se
lf-ev
alua
tion
of th
e pe
rfor
man
ce o
f the
Boa
rd o
f Dire
ctor
s, se
lf-ev
alua
tion
of th
e pe
rfor
man
ce o
f the
indi
vidu
al B
oard
mem
bers
, sel
f-ev
alua
tion
of th
e pe
rfor
man
ce o
f the
Aud
it C
omm
ittee
and
self-
eval
uatio
n of
the
perf
orm
ance
of
the
Rem
uner
atio
n C
omm
ittee
. The
resu
lts o
f the
202
0 pe
rfor
man
ce e
valu
atio
n w
ere
subm
itted
to th
e R
emun
erat
ion
Com
mitt
ee a
nd th
e B
oard
of D
irect
ors o
n 3
Febr
uary
202
1 to
use
them
as r
efer
ence
in d
eter
min
ing
com
pens
atio
n fo
r ind
ivid
ual
dire
ctor
s, th
eir n
omin
atio
n an
d ad
ditio
nal o
ffice
term
. Th
e re
sults
of t
he p
erfo
rman
ce e
valu
atio
n of
the
Boa
rd &
Fun
ctio
nal C
omm
ittee
s are
~ 39 ~

Ass
esse
d Ite
ms
Impl
emen
tatio
n St
atus
(Not
e 1)
N
on-im
plem
enta
tion
and
its re
ason
s Ye
sN
oSu
mm
ary
and
Expl
anat
ion
as fo
llow
s:
1. S
elf-
Eval
uatio
n of
Per
form
ance
of t
he B
oard
Wha
t is b
eing
eva
luat
ed
Scor
e
A. P
artic
ipat
ion
in th
e op
erat
ion
of th
e co
mpa
ny.
24
B. I
mpr
ovem
ent o
f the
qua
lity
of th
e bo
ard
of d
irect
ors'
deci
sion
m
akin
g.
29.5
C. C
ompo
sitio
n an
d st
ruct
ure
of th
e bo
ard
of d
irect
ors.
14.4
D. E
lect
ion
and
cont
inui
ng e
duca
tion
of th
e di
rect
ors.
8.4
E. In
tern
al C
ontro
l. 17
.4
T
otal
93
.7
Eval
uatio
n re
sults
: Exc
elle
nt
2. S
elf-
Eval
uatio
n of
Per
form
ance
of B
oard
Mem
bers
Wha
t is b
eing
eva
luat
ed
Scor
e
A. A
lignm
ent o
f the
goa
ls a
nd m
issi
on o
f the
com
pany
11
.78
B. A
war
enes
s of t
he d
utie
s of a
dire
ctor
. 19
.78
C. P
artic
ipat
ion
in th
e op
erat
ion
of th
e co
mpa
ny
30.3
3
D. M
anag
emen
t of i
nter
nal r
elat
ions
hip
and
com
mun
icat
ion
11.4
2
E. T
he d
irect
or's
prof
essi
onal
ism
and
con
tinui
ng e
duca
tion
11.5
6
F. In
tern
al c
ontro
l 11
.56
T
otal
96
.43
Eval
uatio
n re
sults
: Exc
elle
nt
3. S
elf-
Eval
uatio
n of
Per
form
ance
of t
he A
udit
Com
mitt
ee
Wha
t is b
eing
eva
luat
ed
Scor
e
A. P
artic
ipat
ion
in th
e op
erat
ion
of th
e co
mpa
ny.
20
B. R
ecog
nitio
n of
the
dutie
s of t
he A
udit
Com
mitt
ee
23
~ 40 ~

Ass
esse
d Ite
ms
Impl
emen
tatio
n St
atus
(Not
e 1)
N
on-im
plem
enta
tion
and
its re
ason
s Ye
sN
oSu
mm
ary
and
Expl
anat
ion
(IV
) D
oes t
he C
ompa
ny re
gula
rly e
valu
ate
its e
xter
nal a
udito
rs’
inde
pend
ence
?
C. I
mpr
ovem
ent i
n th
e qu
ality
of d
ecis
ion
mak
ing
by th
e Aud
it
Com
mitt
ee
30
D. C
ompo
sitio
n of
the A
udit
Com
mitt
ee, a
nd e
lect
ion
and
appo
intm
ent o
f com
mitt
ee m
embe
rs
10
E. In
tern
al C
ontro
l. 13
T
otal
96
Eval
uatio
n re
sults
: Exc
elle
nt
4. S
elf-
Eval
uatio
n of
Per
form
ance
of t
he R
emun
erat
ion
Com
mitt
ee
Wha
t is b
eing
eva
luat
ed
Scor
e
A. P
artic
ipat
ion
in th
e op
erat
ion
of th
e co
mpa
ny.
25.2
B. R
ecog
nitio
n of
the
dutie
s of t
he R
emun
erat
ion
Com
mitt
ee
16.8
C. I
mpr
ovem
ent i
n th
e qu
ality
of d
ecis
ion
mak
ing
by th
e R
emun
erat
ion
Com
mitt
ee
36
D. C
ompo
sitio
n of
the
Rem
uner
atio
n C
omm
ittee
, and
ele
ctio
n an
d ap
poin
tmen
t of c
omm
ittee
mem
bers
15
.6
T
otal
93
.6
Eval
uatio
n re
sults
: Exc
elle
nt.
The
appo
intm
ent
of t
he C
ompa
ny's
inde
pend
ent
audi
tor
is a
ppro
ved
by t
he A
udit
Com
mitt
ee a
nd th
en p
ropo
sed
to th
e B
oard
of D
irect
ors f
or re
solu
tion.
The
Com
pany
ha
s es
tabl
ishe
d th
e m
etho
d fo
r ev
alua
ting
the
inde
pend
ence
of
the
certi
fied
publ
ic
acco
unts
in 2
015.
The
Com
pany
reg
ular
ly c
heck
s th
e in
depe
nden
ce o
f th
e ce
rtifie
d pu
blic
acc
ount
and
repo
rts to
the
Aud
it C
omm
ittee
and
the
Boa
rd o
f Dire
ctor
s ea
ch
year
to d
eter
min
e w
heth
er th
ere
is a
ny v
iola
tion
of th
e B
ulle
tin N
o. 1
0 of
the
Nor
m
of P
rofe
ssio
nal E
thic
s fo
r Cer
tifie
d Pu
blic
Acc
ount
ant o
f the
Rep
ublic
of C
hina
and
A
rticl
e 47
of
the
Cer
tifie
d Pu
blic
Acc
ount
ant A
ct, t
o en
sure
that
the
CPA
s ha
ve n
o
~ 41 ~

Ass
esse
d Ite
ms
Impl
emen
tatio
n St
atus
(Not
e 1)
N
on-im
plem
enta
tion
and
its re
ason
s Ye
sN
oSu
mm
ary
and
Expl
anat
ion
othe
r fin
anci
al i
nter
est
or b
usin
ess
rela
tions
hip
with
the
Com
pany
oth
er t
han
com
pens
atio
n fo
r au
dit
and
taxa
tion
case
s, an
d to
rev
iew
whe
ther
the
CPA
s ar
e di
rect
ors
or m
anag
ers
of th
e C
ompa
ny o
r ar
e re
mun
erat
ed b
y th
e C
ompa
ny, a
nd to
co
nfirm
that
the
CPA
s are
not
a re
late
d pa
rties
bef
ore
mak
ing
the
appo
intm
ent.
Eval
uatio
n of
the
exte
rnal
CPA
s’ In
depe
nden
ce:
1.N
ot a
n em
ploy
ee o
f the
Com
pany
or a
ny o
f its
affil
iate
s. 2.
Not
a d
irect
or o
r sup
ervi
sor o
f the
Com
pany
or a
ny o
f its
affi
liate
s. 3.
Not
a n
atur
al-p
erso
n sh
areh
olde
r who
hol
ds s
hare
s, to
geth
er w
ith th
ose
held
by
the
pers
on’s
spo
use,
min
or c
hild
ren,
or h
eld
by th
e pe
rson
und
er o
ther
s’ na
mes
, in
an
aggr
egat
e am
ount
of
one
perc
ent
or m
ore
of t
he t
otal
num
ber
of i
ssue
d sh
ares
of t
he c
ompa
ny o
r ran
ks a
s one
of i
ts to
p te
n sh
areh
olde
rs.
4.N
ot a
spo
use,
rel
ativ
e w
ithin
the
sec
ond
degr
ee o
f ki
nshi
p, o
r lin
eal
rela
tive
with
in t
he t
hird
deg
ree
of k
insh
ip,
of a
ny o
f th
e of
ficer
in
the
prec
edin
g 3
para
grap
hs.
5.N
ot a
dire
ctor
, sup
ervi
sor
or e
mpl
oyee
of
a co
rpor
ate
shar
ehol
der
who
dire
ctly
ho
lds
mor
e th
an fi
ve p
erce
nt o
r mor
e of
the
tota
l num
ber o
f iss
ued
shar
es o
f the
C
ompa
ny,
or a
dire
ctor
, su
perv
isor
or
empl
oyee
of
the
top
five
corp
orat
e sh
areh
olde
rs o
f the
Com
pany
. 6.
Not
a d
irect
or, s
uper
viso
r, of
ficer
, or s
hare
hold
er h
oldi
ng fi
ve p
erce
nt o
r mor
e of
th
e sh
ares
of a
spe
cifie
d co
mpa
ny o
r ins
titut
ion
that
has
a fi
nanc
ial o
r bus
ines
s re
latio
nshi
p w
ith th
e C
ompa
ny.
7.N
ot h
avin
g a
mar
ital
rela
tions
hip,
or
a re
lativ
e w
ithin
the
sec
ond
degr
ee o
f ki
nshi
p to
any
oth
er d
irect
or o
f the
Com
pany
. 8.
Not
bee
n a
pers
on o
f any
con
ditio
ns d
efin
ed in
Arti
cle
30 o
f the
Com
pany
Act
. 9.
Not
a g
over
nmen
tal,
jurid
ical
per
son
or it
s re
pres
enta
tive
as d
efin
ed in
Arti
cle
27 o
f the
Com
pany
Act
. 10
. W
heth
er
the
"Con
firm
atio
n of
in
depe
nden
ce"
issu
ed
by
the
appo
inte
d
~ 42 ~

Ass
esse
d Ite
ms
Impl
emen
tatio
n St
atus
(Not
e 1)
N
on-im
plem
enta
tion
and
its re
ason
s Ye
sN
oSu
mm
ary
and
Expl
anat
ion
inde
pend
ent a
udito
rs a
nd a
udit
team
is a
vaila
ble.
Th
e C
ompa
ny's
Inde
pend
ent A
udito
r's in
depe
nden
ce re
quire
men
t was
eva
luat
ed a
nd
fulfi
lled
for
the
year
and
, the
res
ults
wer
e re
porte
d to
the
Aud
it C
omm
ittee
and
the
Boa
rd o
f D
irect
ors
on 3
Feb
ruar
y 20
21.
The
Con
form
atio
n of
Ind
epen
denc
e fo
r A
ccou
ntan
ts a
nd A
udit
Team
and
the
Acc
ount
ants
' Ind
epen
denc
e Ev
alua
tion
Rep
ort
are
publ
ishe
d on
the
Com
pany
's w
ebsi
te.
IV.
Doe
s the
TW
SE/T
PEx
liste
d co
mpa
ny h
ave
an a
dequ
ate
num
ber o
f cor
pora
te g
over
nanc
e pe
rson
nel w
ith a
ppro
pria
te
qual
ifica
tions
and
app
oint
a c
hief
cor
pora
te g
over
nanc
e of
ficer
to b
e in
cha
rge
of c
orpo
rate
gov
erna
nce
affa
irs
(incl
udin
g bu
t not
lim
ited
to fu
rnis
hing
info
rmat
ion
requ
ired
for b
usin
ess e
xecu
tion
by d
irect
ors a
nd su
perv
isor
s, as
sist
ing
dire
ctor
s and
supe
rvis
ors w
ith le
gal c
ompl
ianc
e, h
andl
ing
mat
ters
rela
ting
to b
oard
mee
tings
and
shar
ehol
ders
mee
tings
ac
cord
ing
to la
ws a
nd p
rodu
cing
min
utes
of b
oard
mee
tings
an
d sh
areh
olde
rs m
eetin
gs)?
The
Com
pany
's B
oard
of
Dire
ctor
s re
solv
ed o
n 6
May
202
1 to
app
oint
a C
hief
of
Cor
pora
te G
over
nanc
e, M
r. Li
n, C
hun-
Ke,
who
is a
lso
the
Ass
ista
nt V
ice
Pres
iden
t of
the
Boa
rd o
f D
irect
ors.
Mr.
Lin
has
serv
ed a
s th
e he
ad o
f sh
areh
oldi
ng a
nd
corp
orat
e go
vern
ance
rela
ted
affa
irs in
a li
sted
com
pany
for a
t lea
st th
ree
year
s. Th
e C
ompa
ny a
lso
has
a co
rpor
ate
gove
rnan
ce p
erso
nnel
to
assi
st h
im.
The
Chi
ef o
f C
orpo
rate
Gov
erna
nce
is r
espo
nsib
le f
or m
atte
rs r
elat
ing
to b
oard
mee
tings
and
sh
areh
olde
rs m
eetin
gs,
prod
ucin
g m
inut
es o
f bo
ard
mee
tings
and
sha
reho
lder
s m
eetin
gs,
furn
ishi
ng i
nfor
mat
ion
requ
ired
for
busi
ness
exe
cutio
n by
dire
ctor
s, as
sist
ing
in
onbo
ardi
ng
and
cont
inuo
us
deve
lopm
ent
of
dire
ctor
s an
d le
gal
com
plia
nce
in a
ccor
danc
e w
ith th
e la
w.
The
impl
emen
tatio
n st
atus
for t
he y
ear 2
019
and
2020
are
as f
ollo
w:
1. H
andl
ing
mat
ters
rel
atin
g to
the
boa
rd m
eetin
gs a
nd s
hare
hold
er m
eetin
gs i
n co
mpl
ianc
e w
ith th
e la
w.
2. A
rran
ging
con
tinuo
us d
evel
opm
ent o
f dire
ctor
s. 3.
Fur
nish
ing
info
rmat
ion
requ
ired
for b
usin
ess e
xecu
tion
by d
irect
ors.
4. R
evie
win
g th
e am
endm
ents
to
the
rule
s an
d re
gula
tions
rel
atin
g to
cor
pora
te
gove
rnan
ce.
The
mat
ters
rel
atin
g to
the
reg
istra
tion
and
chan
ges
to t
he r
egis
tratio
n of
the
C
ompa
ny a
re p
erfo
rmed
by
the
Fina
nce
Dep
artm
ent o
f the
Com
pany
.
No
mat
eria
l diff
eren
ce.
~ 43 ~

Ass
esse
d Ite
ms
Impl
emen
tatio
n St
atus
(Not
e 1)
N
on-im
plem
enta
tion
and
its re
ason
s Ye
sN
oSu
mm
ary
and
Expl
anat
ion
V.
Has
the
Com
pany
est
ablis
hed
a m
eans
of c
omm
unic
atin
g w
ith it
s Sta
keho
lder
s (in
clud
ing
but n
ot li
mite
d to
sh
areh
olde
rs, e
mpl
oyee
s, cu
stom
ers,
supp
liers
, etc
.) or
cr
eate
d a
Stak
ehol
ders
Sec
tion
on it
s Com
pany
web
site
? D
oes t
he C
ompa
ny re
spon
d to
stak
ehol
ders
’ que
stio
ns o
n co
rpor
ate
resp
onsi
bilit
ies?
The
Com
pany
no
t on
ly
adop
ts
a sp
okes
pers
on
syst
em,
but
also
pr
ovid
es
a co
mm
unic
atio
n ch
anne
l for
em
ploy
ees,
supp
liers
, cus
tom
ers
and
othe
r st
akeh
olde
rs
to e
nsur
e th
at c
omm
unic
atio
n is
sm
ooth
and
that
the
spok
espe
rson
has
ful
l con
trol
over
the
se c
omm
unic
atio
ns.
We
have
als
o se
t up
an
inve
stor
rel
atio
nshi
p an
d a
stak
ehol
der
info
rmat
ion
on t
he c
ompa
ny's
web
site
to
disc
lose
the
rel
ated
rul
es o
f co
rpor
ate
soci
al
resp
onsi
bilit
y an
d to
pro
vide
fe
edba
ck
on r
elat
ed
issu
es (
A
desi
gnat
ed o
ffice
r is
ass
igne
d to
ass
ist
with
sup
plie
rs,
cust
omer
s, in
vest
ors,
and
empl
oyee
s, an
d th
e co
ntac
t inf
orm
atio
n is
pos
ted
on th
e C
ompa
ny's
web
-site
).
No
mat
eria
l diff
eren
ce.
VI.
Has
the
Com
pany
app
oint
ed a
pro
fess
iona
l sha
reho
lder
se
rvic
e ag
ent f
or it
s Sha
reho
lder
s’ M
eetin
gs?
Th
e St
ock
Age
ncy
of th
e C
ompa
ny: T
he S
tock
Age
ncy
Dep
artm
ent o
f Chi
natru
st
Com
mer
cial
Ban
k w
as a
ppoi
nted
by
the
Com
pany
to c
ondu
ct th
e Ann
ual
Shar
ehol
ders
' Mee
ting.
No
mat
eria
l diff
eren
ce.
VII
. In
form
atio
n D
iscl
osur
e (I
) H
as th
e C
ompa
ny e
stab
lishe
d a
corp
orat
e w
ebsi
te to
di
sclo
se in
form
atio
n re
gard
ing
its fi
nanc
ials
,bus
ines
s and
co
rpor
ate
gove
rnan
ce st
atus
? (I
I)
Doe
s the
Com
pany
use
oth
er in
form
atio
n di
sclo
sure
ch
anne
ls (e
.g. m
aint
aini
ng a
n En
glis
h-la
ngua
ge w
ebsi
te,
desi
gnat
ing
staf
f to
hand
le in
form
atio
n co
llect
ion
and
disc
losu
re, a
ppoi
ntin
g sp
okes
pers
ons,
web
cast
ing
inve
stor
s con
fere
nce
etc.
)?
(III
) D
oes t
he C
ompa
ny a
nnou
nce
and
repo
rt th
e an
nual
fin
anci
al st
atem
ents
with
in tw
o m
onth
s afte
r the
end
of t
he
fisca
l yea
r, an
d an
noun
ce a
nd re
port
the
first
, sec
ond,
and
th
ird q
uarte
r fin
anci
al st
atem
ents
as w
ell a
s the
ope
ratin
g st
atus
of e
ach
mon
th b
efor
e th
e pr
escr
ibed
dea
dlin
e?
The
Com
pany
has
dis
clos
ed th
e fin
anci
al in
form
atio
n an
d co
rpor
ate
gove
rnan
ce
info
rmat
ion
on th
e C
ompa
ny's
web
site
in c
ompl
ianc
e w
ith th
e la
w.
The
Com
pany
has
a sp
okes
pers
on re
spon
sible
for c
olle
ctin
g an
d di
sclo
sing
the
Com
pany
's in
form
atio
n an
d im
med
iate
ly u
ploa
ding
the
info
rmat
ion
to th
e C
ompa
ny's
web
site
for p
ublic
acc
ess,
and
the
Com
pany
has
set u
p a
spok
espe
rson
an
d im
plem
ente
d a
spok
espe
rson
syst
em in
acc
orda
nce
with
the
regu
latio
ns.
Info
rmat
ion
on th
e pa
st in
vest
or c
onfe
renc
es is
ava
ilabl
e on
the
Com
pany
's w
ebsi
te
for i
nves
tors
' ref
eren
ce.
The
Com
pany
's fin
anci
al st
atem
ents
and
mon
thly
ope
ratin
g re
sults
are
pub
licly
an
noun
ced
with
in th
e pr
escr
ibed
tim
efra
me.
No
mat
eria
l diff
eren
ce.
VII
I. H
as th
e C
ompa
ny d
iscl
osed
oth
er in
form
atio
n to
faci
litat
e a
bette
r und
erst
andi
ng o
f its
cor
pora
te g
over
nanc
e pr
actic
es
1. E
mpl
oyee
righ
ts: T
he C
ompa
ny is
com
mitt
ed to
pro
tect
ing
the
right
s of o
ur
empl
oyee
s with
inte
grity
and
in c
ompl
ianc
e w
ith th
e La
bor S
tand
ards
Act
. The
N
o m
ater
ial d
iffer
ence
.
~ 44 ~

Ass
esse
d Ite
ms
Impl
emen
tatio
n St
atus
(Not
e 1)
N
on-im
plem
enta
tion
and
its re
ason
s Ye
sN
oSu
mm
ary
and
Expl
anat
ion
(e.g
. inc
ludi
ng b
ut n
ot li
mite
d to
em
ploy
ee ri
ghts
, em
ploy
ee
wel
lnes
s, in
vest
or re
latio
ns, s
uppl
ier r
elat
ions
, rig
hts o
f st
akeh
olde
rs, d
irect
ors’
and
supe
rvis
ors’
train
ing
reco
rds,
the
impl
emen
tatio
n of
risk
man
agem
ent p
olic
ies a
nd ri
sk
eval
uatio
n m
easu
res,
the
impl
emen
tatio
n of
cus
tom
er
rela
tions
pol
icie
s, an
d pu
rcha
sing
insu
ranc
e fo
r dire
ctor
s and
su
perv
isor
s)?
Uni
on h
as b
een
set u
p to
ens
ure
empl
oyee
s' rig
hts a
nd b
enef
its, i
n ad
ditio
n to
ba
sic
bene
fits s
uch
as la
bor i
nsur
ance
, nat
iona
l hea
lth in
sura
nce
and
pens
ion
fund
allo
catio
n, th
e C
ompa
ny a
lso
prov
ides
regu
lar h
ealth
che
cks a
nd g
roup
in
sura
nce
for o
ur e
mpl
oyee
s. 2.
Em
ploy
ee c
are:
The
com
pany
con
side
rs e
mpl
oyee
s as a
sset
s of t
he C
ompa
ny a
nd
care
s for
them
bas
ed o
n th
e La
bor S
tand
ards
Act
. The
Com
pany
has
est
ablis
hed
a la
bor u
nion
to h
old
regu
lar l
abor
-man
agem
ent m
eetin
gs to
com
mun
icat
e w
ith th
e em
ploy
ees,
and
has s
et u
p an
Em
ploy
ee W
elfa
re C
omm
ittee
to a
lloca
te fu
nds o
n a
mon
thly
bas
is a
nd o
rgan
ize
regu
lar e
mpl
oyee
wel
fare
act
iviti
es. T
here
are
3
on-s
ite v
isits
per
mon
th b
y oc
cupa
tiona
l med
icin
e do
ctor
s. 3.
Inve
stor
rela
tions
: We
prov
ide
inve
stor
s, an
alys
ts a
nd d
omes
tic a
nd in
tern
atio
nal
inve
stors
with
the
best
pos
sible
serv
ice
by m
akin
g th
e in
form
atio
n av
aila
ble
thro
ugh
the
Mar
ket O
bser
vatio
n Po
st S
yste
m, t
he S
poke
sper
son
Syst
em a
nd th
e In
vest
or R
elat
ions
sect
ion
on th
e C
ompa
ny's
web
site
, so
that
inve
stor
s can
fully
un
ders
tand
the
Com
pany
's op
erat
ing
resu
lts a
nd p
erfo
rman
ce a
nd th
e di
rect
ion
of
its lo
ng-te
rm b
usin
ess s
trate
gy in
real
tim
e.
4. S
uppl
ier r
elat
ions
: We
prom
ote
"gre
en p
rocu
rem
ent"
to st
reng
then
the
posi
tive
impa
ct o
n so
ciet
y an
d th
e en
viro
nmen
t fro
m o
ur su
pplie
rs. W
e m
aint
ain
good
pa
rtner
ship
s with
our
supp
liers
bas
ed o
n th
e pr
inci
ple
of e
qual
ity a
nd re
cipr
ocity
. W
e ha
ve e
stab
lishe
d a
stab
le su
pply
cha
in a
nd c
ondu
ct a
udits
from
tim
e to
tim
e to
ens
ure
the
qual
ity o
f pro
duct
s sup
plie
d.
5. S
take
hold
ers'
right
s: S
take
hold
ers m
ay c
omm
unic
ate
and
mak
e su
gges
tions
to th
e C
ompa
ny in
ord
er to
pro
tect
thei
r leg
itim
ate
right
s and
inte
rest
s. Th
e C
ompa
ny
has a
lso
esta
blis
hed
rule
s gov
erni
ng th
e ac
tiviti
es th
at e
mpl
oyee
s may
eng
age
in
with
the
stak
ehol
ders
of t
he C
ompa
ny.
6. C
ontin
uing
edu
catio
n fo
r dire
ctor
s, fin
anci
al o
ffice
rs a
nd in
tern
al a
udito
rs: T
he
cont
inui
ng e
duca
tion
hour
s of t
he C
ompa
ny's
dire
ctor
s, fin
anci
al o
ffice
rs a
nd
~ 45 ~

Ass
esse
d Ite
ms
Impl
emen
tatio
n St
atus
(Not
e 1)
N
on-im
plem
enta
tion
and
its re
ason
s Ye
sN
oSu
mm
ary
and
Expl
anat
ion
inte
rnal
aud
itors
are
all
in c
ompl
ianc
e w
ith th
e re
quire
men
ts fo
r con
tinui
ng
educ
atio
n (p
leas
e re
fer t
o Ta
ble
1).
7. T
he im
plem
enta
tion
of ri
sk m
anag
emen
t pol
icie
s and
risk
eva
luat
ion
mea
sure
s:
The
Com
pany
has
est
ablis
hed
vario
us in
tern
al ru
les a
nd re
gula
tions
to m
anag
e an
d ev
alua
te a
ll ki
nds o
f ris
ks in
acc
orda
nce
with
the
law
. The
Com
pany
id
entif
ies t
he ri
sks t
hrou
gh th
e im
plem
enta
tion
and
audi
ting
proc
esse
s in
the
acco
untin
g an
d m
anag
emen
t sys
tem
, pre
vent
s the
risk
s fro
m o
ccur
ring
thro
ugh
the
risk
asse
ssm
ent o
f eac
h de
partm
ent,
and
ensu
res t
hat t
he ri
sks a
re e
ffect
ivel
y co
ntro
lled
and
the
obje
ctiv
es a
re a
chie
ved
thro
ugh
the
inte
rnal
aud
it sy
stem
, an
nual
aud
it pl
an, a
nd c
ontro
l of a
ll m
eetin
gs.
P
leas
e re
fer t
o pa
ges1
4-15
of t
he 2
020
CSR
Rep
ort.
8.
The
impl
emen
tatio
n of
cus
tom
er re
latio
ns p
olic
ies:
The
Com
pany
mai
ntai
ns a
st
eady
and
goo
d re
latio
nshi
p w
ith a
ll th
e cu
stom
ers t
o cr
eate
win
-win
re
latio
nshi
ps.
9. T
he im
plem
enta
tion
of
purc
hasi
ng in
sura
nce
for d
irect
ors:
The
Com
pany
has
pu
rcha
sed
liabi
lity
insu
ranc
e fo
r the
dire
ctor
s, th
e co
vera
ge o
f whi
ch is
up
to
June
202
1, a
nd h
as re
porte
d to
the
Boa
rd o
f Dire
ctor
s.
IX.
The
impr
ovem
ent s
tatu
s for
the
resu
lt of
Cor
pora
te G
over
nanc
e Ev
alua
tion
anno
unce
d by
Tai
wan
Sto
ck E
xcha
nge.
(thi
s inf
orm
atio
n is
not
requ
ired
for t
hose
com
pani
es n
ot li
sted
in
the
asse
ssm
ent)
We
will
mak
e En
glis
h-la
ngua
ge in
form
atio
n av
aila
ble
to th
e pu
blic
; we
will
est
ablis
h a
Chi
ef o
f Cor
pora
te G
over
nanc
e in
May
202
1; a
nd w
e w
ill p
repa
re th
e 20
20 A
nnua
l Rep
ort a
nd
2021
Sha
reho
lder
s' M
eetin
g H
andb
ook
in E
nglis
h.
X.
The
succ
essi
on p
lans
of t
he B
oard
of D
irect
ors a
nd k
ey m
anag
emen
t per
sonn
el o
f the
Com
pany
are
as f
ollo
ws:
In
2016
, the
Com
pany
org
aniz
ed a
succ
essi
on se
min
ar, i
nviti
ng o
utst
andi
ng b
usin
ess l
eade
rs to
shar
e th
eir e
xper
ienc
es a
nd th
e st
rate
gies
of s
ucce
ss in
ent
repr
eneu
rshi
p, in
nova
tion
and
busi
ness
man
agem
ent,
in o
rder
to p
rovi
de o
ppor
tuni
ties f
or th
e m
iddl
e an
d se
nior
exe
cutiv
es in
the
next
gen
erat
ion
to d
evel
op th
eir b
usin
ess m
anag
emen
t ski
lls, t
o in
nova
te a
nd
chan
ge, a
nd to
seek
for s
usta
inab
ility
. The
ann
ual s
trate
gy m
eetin
g is
hel
d in
the
first
qua
rter o
f eac
h ye
ar. T
he m
anag
ers f
rom
eac
h de
partm
ent s
hare
thei
r act
ion
plan
s to
achi
eve
the
shor
t, m
ediu
m a
nd lo
ng te
rm st
rate
gy a
nd m
anag
emen
t obj
ectiv
es o
f the
Com
pany
in o
rder
to c
onso
lidat
e an
d fo
cus t
he C
ompa
ny's
busi
ness
obj
ectiv
es th
roug
h di
scus
sion
and
co
nsen
sus a
t the
mee
ting.
~ 46 ~

Ass
esse
d Ite
ms
Impl
emen
tatio
n St
atus
(Not
e 1)
N
on-im
plem
enta
tion
and
its re
ason
s Ye
sN
oSu
mm
ary
and
Expl
anat
ion
Gro
up C
hairm
an Y
ang
Yin
g M
ing
spok
e in
the
sess
ion
of th
e G
loba
l Vie
ws 1
7th
Chi
nese
Lea
ders
Sum
mit
2019
, he
said
"Pa
ssin
g on
a so
n is
one
of t
he o
ptio
ns, b
ut n
ot th
e on
ly o
ne,
fam
ily sp
irit a
nd a
pro
fess
iona
l man
agem
ent t
eam
is th
e w
ay to
run
a su
stai
nabl
e bu
sine
ss. T
he fo
unde
r of t
he c
ompa
ny w
as a
war
e of
the
impo
rtanc
e of
succ
essi
on lo
ng a
go. W
hen
I w
as a
stud
ent i
n th
e D
epar
tmen
t of M
echa
nica
l Eng
inee
ring
at N
atio
nal T
aiw
an U
nive
rsity
, I w
as a
sked
to tr
ansf
er to
the
Dep
artm
ent o
f Che
mic
al E
ngin
eerin
g in
soph
omor
e ye
ar
beca
use
he a
dvis
ed m
e to
do
so, t
hink
ing
that
my
fam
ily w
as in
the
tire
and
rubb
er b
usin
esse
s. A
fter I
gra
duat
ed fr
om N
TU, I
wen
t to
the
Uni
ted
Stat
es to
pur
sue
a m
aste
r's d
egre
e an
d I a
lso
got a
scho
lars
hip
for P
hD. H
e w
as w
orrie
d th
at if
I ha
d a
PhD
deg
ree,
I w
ould
pur
sue
an a
cade
mic
or t
each
ing
care
er, s
o he
adv
ised
me
not t
o st
udy
for a
PhD
but
to w
ork
for a
bi
cycl
e co
mpa
ny in
the
Uni
ted
Stat
es in
stea
d. It
was
onl
y af
ter w
orki
ng fo
r a y
ear t
hat I
retu
rned
to T
aiw
an. W
hen
I joi
ned
Ken
da, h
e w
as st
ill in
cha
rge
of m
ost o
f the
ope
ratio
ns. I
be
gan
my
care
er in
Ken
da a
s a sa
lesm
an; s
ubse
quen
tly, t
he C
ompa
ny c
ontin
ued
to e
xpan
d th
e ov
erse
as b
usin
ess u
ntil
the
foun
der h
ande
d ov
er th
e C
hairm
an p
ositi
on to
me
at th
e ag
e of
70.
Afte
r 24
year
s as C
hairm
an o
f the
Boa
rd, I
als
o ha
nded
ove
r the
pos
ition
to m
y yo
unge
r bro
ther
, Mr.
Yan
g, C
hi Je
n in
201
8, a
nd m
y tw
o ne
phew
s wer
e pr
omot
ed to
Vic
e C
hairm
an a
nd P
resi
dent
resp
ectiv
ely
to ta
ke o
n m
ore
resp
onsi
bilit
ies.
Perh
aps i
n fiv
e or
six
year
s, th
e th
ird g
ener
atio
n w
ill ta
ke o
ver a
nd, t
oget
her w
ith p
rofe
ssio
nal e
xecu
tives
, we
will
bui
ld a
stro
nger
succ
essi
on te
am to
lead
the
Com
pany
into
a n
ew e
ra to
war
ds th
e es
tabl
ishe
d bu
sine
ss st
rate
gy.
~ 47 ~

48
Schedule 1: The progress of continuing education of directors, supervisors, financial supervisors and internal auditors in 2020
Position Name Date of
Continuing Education
Organizer Course Name Continuing Education
Hours
Chairman Yang, Chi-Jen 2020.05.20 Accounting Research and Development Foundation
Corporate Crisis Management - with a focus on Risk Management and Crisis Communication
6
ViceChairman Chang, Hong-Der 2020.07.13 Accounting Research and
Development Foundation
How to analyze the key financial information and strengthen the crisis warning capability for the
company 6
Director Yang, Ying-Ming 2020.02.20 Taiwan Institute of Directors Strategies for Business Growth and Innovation Breakthroughs
3
Director Yang, Ying-Ming 2020.07.24 UBS and Taiwan Academy of Banking and Finance Corporate Governance and Sustainability Workshop 3
Director Yang, Ying-Ming 2020.08.16 Taiwan Institute of Directors Review for Corporate Sustainability 3
Director Yang, Ying-Ming 2020.11.22 International Artificial Intelligence and Law Research Foundation
The Legal Impact on Intellectual Manufacturing 6
Director Hsiao, Ru-Po 2020.07.22 UBS and Taiwan Academy of Banking and Finance Corporate Governance and Sustainability Workshop 3
Director Hsiao, Ru-Po 2020.10.14 Taiwan Stock Exchange (TWSE) Corporation
The 2020 Insider Trading Prevention and Insider Share Transaction Seminar
3
Director Chen, Chao-Jung 2020.11.22 International Artificial Intelligence and Law Research Foundation
The Legal Impact on Intellectual Manufacturing 6
Director Shen, Jui-Hsiung 2020.07.24 UBS and Taiwan Academy of Banking and Finance Corporate Governance and Sustainability Workshop 3
Director Shen, Jui-Hsiung 2020.09.04 Taiwan Stock Exchange (TWSE) Corporation
The 2020 Insider Trading Prevention and Insider Share Transaction Seminar
3
Director Yang, Chi-Ling 2020.07.22 UBS and Taiwan Academy of Banking and Finance
Corporate Governance and Sustainability Workshop 3
Director Yang, Chia-Ling 2020.08.19 Securities and Futures Institute The 2020 Annual Workshop for Understanding the
Futures Derivative Trading for Hedging and Conducting a Sound Corporate Sustainability
3
Director Lin, Tsung-Yi 2020.09.09 Taiwan Development & Research
Academia of Economic and Technology
Interpreting and analyzing the financial statements 6
Independent Director Hsieh,Chun-Mou 2020.07.24 UBS and Taiwan Academy of
Banking and Finance Corporate Governance and Sustainability Workshop 3
Independent Director Hsieh,Chun-Mou 2020.09.04 Taiwan Stock Exchange (TWSE)
Corporation The 2020 Insider Trading Prevention and Insider
Share Transaction Seminar 3
Independent Director Su, Ching-Yang 2020.05.28 Securities and Futures Institute
Advanced Seminar on Directors and Supervisors (including Independent Directors & Supervisors) and
the Chief of Corporate Governance 3
Independent Director Su, Ching-Yang 2020.10.16 Taiwan Stock Exchange (TWSE)
Corporation The 2020 Conference for Directors and Supervisors on Corporate Governance and Corporate Integrity
3
Independent Director Lin,Sheng-Chung 2020.05.26 Chinese National Association of
Industry and Commerce, Taiwan Risk Management and Legal Responsibility for
Independent Directors 3
Independent Director Lin,Sheng-Chung 2020.07.28 Chinese National Association of
Industry and Commerce, Taiwan Norms and practices for directors and supervisors in
relation to related party transactions 3
FinancialOfficer Liu, Kuei-Chun 2020.08.20
2020.08.21 Accounting Research and Development Foundation
Issuers, Securities Dealers, and Stock Exchanges Continuing Education for Accounting Supervisors
(Accounting, Corporate Governance, Ethics & Legal Responsibility)
12
AuditingSupervisor Hsieh, Yu-Huang 2020.04.16 The Institute of Internal Auditors -
Chinese Taiwan Practical Exercise on the Labor Incident Act 6
AuditingSupervisor Hsieh, Yu-Huang 2020.06.12 The Institute of Internal Auditors -
Chinese Taiwan
Policy Analysis on Improving the Ability to Self-Prepare Financial Reports and Key Discussions
on the Internal Audit and Control Practices 6
Internal Auditor Chen, Yu-Jui 2020.07.03 The Institute of Internal Auditors -
Chinese Taiwan Labor Law Knowledge for Auditors - From
Recruitment to Termination 6
Internal Auditor Chen, Yu-Jui 2020.10.13 The Institute of Internal Auditors -
Chinese Taiwan How to Detect Hidden Fraud and Case Studies 6
~ 48 ~

49
(IV) The composition, duties and operation of the Remuneration Committee:
1. The Company's Remuneration Committee is responsible for periodically reviewing the Company's directors' and managers' performance assessment standards, the annual and long-term performance goals, and the policies, systems, standards and structure of remuneration. Also, periodically assessing the degree to which performance goals for the directors and managerial officers of the Company have been achieved, setting the types and amounts of their individual compensation based on the results of the reviews conducted in accordance with the performance assessment standards. The performance assessments and compensation levels of directors and managerial officers shall take into account the general pay levels in the industry, the time spent by the individual and their responsibilities, the extent of goal achievement, their performance in other positions, and the compensation paid to employees holding equivalent positions in recent years. Also to be evaluated are the reasonableness of the correlation between the individual's performance and the Company's operational performance and future risk exposure, with respect to the achievement of short-term and long-term business goals and the financial position of the Company.
2. Information on the members of the Remuneration Committee:
Status (Note 1)
Requirements
Name
Have at least 5 years working experience with the following professional qualifications
Eligible for independence (Note 2)
Number of other listed companies concurrently serving as members of remuneration committees
Remarks
An instructor or higher up in a department of commerce, law, finance, accounting, or other academic department related to company business in a public or private junior college, college, or university.
A judge, public prosecutor, attorney, certified public accountant, or other professional or technical specialist who has passed a national examination and has been awarded a certificate in a professional capacity that is necessary for company business.
Having work experience in the area of commerce, law, finance or accounting, or otherwise necessary for company business.
1 2 3 4 5 6 7 8 9 10
Independent Director Hsieh,Chun-Mou 0
Independent Director Su, Ching-Yang 2
Others Chen, Ming-Chang 0Others Liu, Shih-Tsung 0
Note 1: Please state whether the status is Director, Independent Director or Other. Note 2: For members who have fulfilled the following criteria in the two years prior to and during their term of office, please tick the "v" in the
box below each criteria code. (1) Not an employee of the Company or any of its affiliates. (2) Not a director or supervisor of the Company or its associates (except for the case where the independent directors appointed in
accordance with the Act or the laws and regulations of the local country by, and concurrently serving as such at, the Company and its parent or subsidiary or a subsidiary of the same parent).
(3) Not a natural-person shareholder who holds shares, together with those held by the person's spouse, minor children, or held by the person under others' names, in an aggregate of one percent or more of the total number of issued shares of the company, or ranking among the top 10 natural-person shareholders in holdings.
(4) Not a spouse, or relative within the second degree of kinship, or lineal relative within the third degree of kinship, of an executive officer falling under (1), or of any of the persons in (2) and (3).
(5) Not a director, supervisor, or employee of a corporate shareholder that directly holds five percent or more of the total number of issued shares of the company, or that ranks among the top five in shareholdings, or that designates its representative to serve as a director or supervisor of the company under Article 27, paragraph 1 or 2 of the Company Act (except for the case where the independent directorsappointed in accordance with the Act or the laws and regulations of the local country by, and concurrently serving as such at, the
~ 49 ~

50
Company and its parent or subsidiary or a subsidiary of the same parent). (6) A director, supervisor or employee of other companies who is not controlled by the same person as the majority of the directorships or
voting shares of the company (except for the case where the independent directors appointed in accordance with the Act or the laws and regulations of the local country by, and concurrently serving as such at, the Company and its parent or subsidiary or a subsidiary of the same parent).
(7) A director (officer), supervisor or employee of other company or institution who is not the same person or spouse as the chairman,president or person holding an equivalent position in the company (except for the case where the independent directors appointed in accordance with the Act or the laws and regulations of the local country by, and concurrently serving as such at, the Company and its parent or subsidiary or a subsidiary of the same parent). .
(8) A director, supervisor, managerial office or shareholder holding 5% or more of the shares of a specified company or institution that does not have financial or business relationship with the Company (provided that if the specified company or institution holds more than 20% of the total number of issued shares of the Company and does not exceed 50%, and where the independent directors appointed in accordance with the Act or the laws and regulations of the local country by, and concurrently serving as such at, the Company and its parent or subsidiary or a subsidiary of the same parent)
(9) Not a professional individual who, or an owner, partner, director, supervisor, or officer of a sole proprietorship, partnership, company, or institution that, provides auditing services to the company or any affiliate of the company, or that provides commercial, legal,financial, accounting or related services to the company or any affiliate of the company for which the provider in the past 2 years has received cumulative compensation exceeding NT$500,000, or a spouse thereof. This restriction does not apply to a member of the remuneration committee, public tender offer review committee, or special committee for merger/consolidation and acquisition, whoexercises powers pursuant to the Securities and Exchange Act or to the Business Mergers and Acquisitions Act or related laws orregulations. .
(10) Not been a person of any conditions defined in Article 30 of the Company Act.
3. Information on the meeting status of the Remuneration Committee (1) There are three members in the Remuneration Committee of the Company. (2) The term of office: From 9 August 2018 to 10 June 2021.
There were three meetings held for the Remuneration Committee in 2020, with the following attendance: Position Name Attendance in Person Attendance by proxy Attendance Rate in Person
(%) Remarks
Convener Hsieh,Chun-Mou 3 100% Independent
Director Su, Ching-Yang 3 100%
Committee member Liu, Shih-Tsung 3 100%
Other matters that require reporting: I. If the Board of Directors does not adopt or amend the recommendation of the Remuneration Committee, it shall state the date and period, the content of the
resolution, the result of the resolution and the Company's handling of the recommendation of the Remuneration Committee (if the remuneration approved by the Board of Directors is better than the recommendation of the Remuneration Committee, it shall state the difference and the reasons for the difference): None
II. Matters resolved by the Remuneration Committee in 2020, where the members expressed objections or reservations on the committee’s resolutions, the date of the meeting, session, content of the motion, all members’ opinions and the response to members’ opinion should be specified: None.
Meeting dates of the
Remuneration Committee
Resolutions Result of the resolutions
The Company’s handling of the recommendation of the
Remuneration Committee
2020.01.17 The 4th session The 4th meeting
1. The proposal of the year-end bonus for the Company's managerial officers.
2. The proposal of the year-end bonus for the directors of the Company who execute the business operations.
3. A motion to review the salaries for the directors and the managerial officers of the Company who execute the business operations.
RESOLVED by all members present.
On January 17, 2020, the Directors recused themselves from the resolution in relation to the motion and the other Directors who were present at the meeting approved the resolution.
2020.03.26 The 4th session The 5th meeting
The proposal of the employees' and directors' remuneration for the year 2019.
RESOLVED by all members present.
Resolved by all Directors present at the Board Meeting on March 26, 2020.
2020.10.29 The 4th session The 6th meeting
1. The distribution of remuneration to the directors of the Company. 2. The distribution of remuneration to the managerial officers and
directors of the Company who execute the business operations. 3. A motion to review the salaries for the directors and the managerial
officers of the Company who execute the business operations. 4. The amendment to the " Regulations on the Performance
Evaluation of the Board of Directors and Functional Committees" of the Company.
RESOLVED by all members present.
On November 11, 2020, the Directors recused themselves from the resolution in relation to the motion and the other Directors who were present at the meeting approved the resolution.
III. Matters resolved by the Remuneration Committee in 2021, where the members expressed objections or reservations on the committee’s resolutions, the date of the meeting, session, content of the motion, all members’ opinions and the response to members’ opinion should be specified: None.
~ 50 ~

51
Meeting dates of the
Remuneration Committee
Resolutions Result of the resolutions
The Company’s handling of the recommendation of the
Remuneration Committee
2021.02.03 The 4th session The 7th meeting
1. Report on matters resolved by the last Remuneration Committee meeting.
2. The results of the performance evaluation of the Board & Functional Committees.
3. Discuss the payment of the year-end bonus for the Company's managerial officers.
4. Discuss the payment of the year-end bonus for the Company’s directors who execute the business operations.
5. Review the salaries for the directors and the managerial officers of the Company who execute the business operations.
6. Review the amendment to the Company's Articles of Incorporation.
RESOLVED by all members
present.
On February 3, 2021, the Directors recused themselves from the resolution in relation to the motion and the other Directors who were present at the meeting approved the resolution.
2021.03.25 The 4th session The 8th meeting
1. Report on matters resolved by the last Remuneration Committee meeting.
2. Discuss the distribution of the remuneration to employees and directors of the Company for the year 2020.
RESOLVED by all members
present.
Resolved by all Directors present at the Board Meeting on March 25, 2021.
~ 51 ~

(V) T
he st
ate
of th
e C
ompa
ny's
perf
orm
ance
of s
ocia
l res
pons
ibili
ties,
any
varia
nce
from
the
Cor
pora
te S
ocia
l Res
pons
ibili
ty B
est P
ract
ice
Prin
cipl
es fo
r TW
SE/T
PEx
List
ed C
ompa
nies
, and
the
reas
on fo
r any
such
var
ianc
e.
Ass
esse
d Ite
ms
Impl
emen
tatio
n St
atus
(Not
e 1)
Non
-impl
emen
tatio
n an
d its
reas
ons
Yes
No
Sum
mar
y an
d Ex
plan
atio
n (N
ote
2)
I. D
oes t
he c
ompa
ny c
ondu
ct ri
sk
asse
ssm
ents
of e
nviro
nmen
tal,
soci
al
and
corp
orat
e go
vern
ance
issu
es
perta
inin
g to
com
pany
ope
ratio
ns a
nd
esta
blis
h th
e re
leva
nt ri
sk m
anag
emen
t po
licy
or st
rate
gy in
acc
orda
nce
with
th
e m
ater
ialit
y pr
inci
ple?
(Not
e 3)
Th
e C
ompa
ny m
anag
es th
e bu
sine
ss ri
sks b
y im
prov
ing
the
inte
rnal
con
trol s
yste
m, e
nsur
ing
the
effe
ctiv
e im
plem
enta
tion
of th
e in
tern
al c
ontro
l sys
tem
thro
ugh
an a
udit
syst
em, t
rack
ing
and
corr
ectin
g in
tern
al a
udit
irreg
ular
ities
, and
repo
rting
to th
e A
udit
Com
mitt
ee a
nd th
e B
oard
of D
irect
ors t
o av
oid
the
risks
and
dam
ages
cau
sed
by th
e fa
ilure
of t
he in
tern
al c
ontro
l sy
stem
. T
he a
nnua
l bud
get i
s pre
pare
d in
acc
orda
nce
with
the
regu
latio
ns o
n th
e an
nual
bu
dget
syst
em in
ord
er to
man
age
the
oper
atin
g fu
nds r
equi
red.
The
Com
pany
man
ages
the
finan
cial
risk
s, su
ch a
s mar
ket r
isk
(exc
hang
e ra
te ri
sk, i
nter
est r
ate
risk
and
pric
e ris
k), c
redi
t ris
k an
d liq
uidi
ty ri
sk o
n a
daily
bas
is to
mai
ntai
n a
stab
le fi
nanc
ial p
ositi
on a
nd to
pre
vent
fr
om m
arke
t unc
erta
inty
. In
addi
tion,
the
Com
pany
iden
tifie
s the
env
ironm
enta
l, so
cial
and
ec
onom
ic is
sues
that
hav
e a
sign
ifica
nt in
fluen
ce o
n th
e C
ompa
ny's
inve
stor
s and
oth
er
stak
ehol
ders
and
est
ablis
hes t
he re
leva
nt m
anag
emen
t pol
icie
s and
man
agem
ent o
bjec
tives
, w
hich
are
man
aged
by
the
rele
vant
man
agem
ent u
nits
and
the
high
est a
utho
rity.
Th
e ris
ks a
risin
g fr
om th
ose
sign
ifica
nt is
sues
are
eva
luat
ed a
s fol
low
s:
Envi
ronm
enta
l iss
ues:
The
risk
s to
the
envi
ronm
ent a
nd sa
fety
and
hea
lth, a
nd th
e ris
ks to
cl
imat
e ch
ange
. In
resp
onse
to th
e ris
k of
'clim
ate
chan
ge',
the
Com
pany
has
pro
pose
d a
cont
inge
ncy
plan
for s
uppl
iers
, pro
mot
ed
gree
nhou
se g
as re
duct
ion
and
mai
ntai
ned
a sa
fety
stoc
k fo
r pro
duct
s. So
cial
issu
es: I
nclu
ding
the
prod
uct r
isk,
the
raw
mat
eria
l ris
k an
d th
e em
ploy
ee ri
sk. T
he
mai
n fo
cus i
s on
prod
uct q
ualit
y an
d st
aff c
ompe
titiv
enes
s. Th
e st
rate
gy is
to
impr
ove
the
yiel
d ra
te o
f our
pro
duct
s and
to p
rovi
de a
goo
d w
orki
ng
envi
ronm
ent f
or th
e em
ploy
ees.
Cor
pora
te g
over
nanc
e is
sues
: reg
ulat
ion
com
plia
nce
risk,
fina
ncia
l ris
k, in
form
atio
n se
curit
y ris
k an
d m
arke
t ris
k. T
he m
ain
stra
tegi
es a
re to
ens
ure
the
lega
l co
mpl
ianc
e an
d th
e in
form
atio
n se
curit
y co
ntro
l. Pl
ease
refe
r to
page
s 14-
15 o
f the
Com
pany
's 20
20 C
SR R
epor
t and
pag
es 2
60-2
62 o
f the
A
nnua
l Rep
ort f
or th
e ris
k m
anag
emen
t stra
tegy
and
pol
icy.
No
mat
eria
l diff
eren
ce.
II.
Doe
s the
Com
pany
hav
e a
dedi
cate
d (o
r ad-
hoc)
CSR
org
aniz
atio
n w
ith
Boa
rd o
f Dire
ctor
s aut
horiz
atio
n fo
r se
nior
man
agem
ent,
whi
ch re
ports
to
the
Boa
rd o
f Dire
ctor
s?
A
cro
ss-d
epar
tmen
tal c
omm
ittee
is fo
rmed
by
all a
ssis
tant
vic
e pr
esid
ents
of t
he C
ompa
ny to
pr
omot
e C
SR, a
nd th
e C
hairm
an's
Offi
ce a
nd th
e Adm
inis
tratio
n D
epar
tmen
t are
resp
onsi
ble
for p
rom
otin
g th
ese
CSR
act
iviti
es.
The
impl
emen
tatio
n st
atus
of t
he C
SR C
omm
ittee
is a
s fol
low
s:
1.A
n an
nual
mee
ting
is h
eld,
and
eac
h de
partm
ent's
ass
ista
nt v
ice
pres
iden
t and
abo
ve w
ill
parti
cipa
te in
the
mee
ting,
and
the
rele
vant
dep
artm
ents
will
exp
lain
the
impl
emen
tatio
n
No
mat
eria
l diff
eren
ce.
~ 52 ~

Ass
esse
d Ite
ms
Impl
emen
tatio
n St
atus
(Not
e 1)
Non
-impl
emen
tatio
n an
d its
reas
ons
Yes
No
Sum
mar
y an
d Ex
plan
atio
n (N
ote
2)
stat
us o
f CSR
and
the
com
mun
icat
ion
with
the
stak
ehol
ders
; if n
eces
sary
, mee
tings
will
be
held
from
on
an ir
regu
lar b
asis
.
2. C
ompo
sitio
n:
(1) C
SR C
omm
ittee
: Coo
rdin
ate
CSR
-rel
ated
indi
cato
rs a
nd p
erfo
rman
ce re
sults
. (2
) Sal
es D
epar
tmen
t: M
aint
ain
the
rela
tions
hip
with
cus
tom
ers a
nd th
e lia
ison
of t
he p
rodu
ct
liabi
lity.
(3
) Res
earc
h an
d D
evel
opm
ent D
epar
tmen
t: R
esea
rch
to d
evel
op e
co-f
riend
ly p
rodu
cts.
(4) T
he A
dmin
istra
tion
Dep
artm
ent:
Bui
ld a
sust
aina
ble
envi
ronm
ent a
nd a
frie
ndly
w
orkp
lace
as w
ell a
s man
age
the
supp
ly c
hain
. (5
) Fin
ance
Dep
artm
ent:
Con
trol a
nd m
anag
e th
e op
erat
iona
l per
form
ance
and
fina
ncia
l ris
ks.
(6) P
rodu
ctio
n D
epar
tmen
t: M
anag
e ec
o-fr
iend
ly p
rodu
ctio
n an
d pr
oduc
t lia
bilit
y.
3. T
he C
ompa
ny w
ill re
view
the
CSR
per
form
ance
indi
cato
rs a
nd e
xam
ine
the
annu
al C
SR
repo
rt ev
ery
year
. The
Com
pany
's C
SR re
ports
for 2
020
and
2019
wer
e su
bmitt
ed to
the
Boa
rd o
f Dire
ctor
s on
2021
.05.
06 a
nd 2
020.
05.0
6 re
spec
tivel
y.
Plea
se re
fer t
o pa
ges 8
and
9 o
f the
202
0 C
SR R
epor
t.II
I. En
viro
nmen
tal I
ssue
s (I
) H
as th
e co
mpa
ny e
stab
lishe
d an
ap
prop
riate
env
ironm
enta
l m
anag
emen
t sys
tem
bas
ed o
n th
e in
dust
ry c
hara
cter
istic
s?
W
e ar
e an
ISO
140
01:2
015,
ISO
450
01:2
018,
CN
S 45
001:
2018
, and
ISO
500
01:2
018
certi
fied
com
pany
. 1.
The
valid
ity p
erio
d of
ISO
140
01:2
015
is fr
om 2
020.
01.1
7 to
202
3.01
.16.
2.
The
valid
ity p
erio
d of
ISO
450
01:2
018
is fr
om 2
020.
11.0
2 to
202
3.11
.01.
3.
The
valid
ity p
erio
d of
CN
S 45
001:
2018
is fr
om 2
020.
11.0
2 to
202
3.11
.01.
4.
Th
e va
lidity
per
iod
of IS
O 5
0001
:201
8 is
from
202
0.12
.05
to 2
023.
12.0
4.
The
envi
ronm
enta
l saf
ety
and
heal
th m
anag
emen
t sys
tem
is im
plem
ente
d th
roug
h a
com
bina
tion
of d
aily
man
agem
ent a
nd to
tal p
rodu
ctio
n m
anag
emen
t (TP
M) a
ctiv
ities
. The
C
ompa
ny in
tegr
ates
the
envi
ronm
enta
l saf
ety
and
heal
th m
anag
emen
t pla
n w
ith th
e ac
tual
op
erat
ion
in th
e fa
ctor
y an
d im
plem
ents
the
syst
em a
ccor
ding
to th
e Pl
an, D
o, C
heck
and
A
ctio
n m
odes
. The
env
ironm
enta
l and
hea
lth ri
sks a
ssoc
iate
d w
ith th
e co
mpa
ny's
oper
atio
ns
are
syst
emat
ical
ly e
valu
ated
in o
rder
to d
eter
min
e th
e po
tent
ial i
mpa
cts o
n th
e en
viro
nmen
t an
d em
ploy
ees f
rom
the
use
of th
e ra
w m
ater
ials
to th
e w
aste
out
put p
roce
sses
. The
Com
pany
w
ill e
valu
ate,
repl
ace
and
redu
ce th
e am
ount
of r
aw m
ater
ials
, con
trol a
nd re
duce
the
amou
nt
of p
roce
ss c
onta
min
atio
n an
d ef
fect
ivel
y de
al w
ith e
nd-o
f-pi
pe c
onta
min
atio
n fo
r ite
ms t
hat
may
cau
se si
gnifi
cant
env
ironm
enta
l im
pact
.In te
rms o
f the
safe
ty a
nd h
ealth
asp
ect,
risk
man
agem
ent i
s im
plem
ente
d w
ith th
e in
trins
ic sa
fety
of t
he e
quip
men
t, ch
emic
al sa
fety
and
op
erat
iona
l saf
ety
as th
e st
artin
g po
int,
in o
rder
to p
rote
ct th
e sa
fety
and
phy
sica
l and
men
tal
heal
th fo
r all
empl
oyee
s. In
ord
er to
ach
ieve
the
goal
of s
usta
inab
ility
, we
have
est
ablis
hed
the
No
mat
eria
l diff
eren
ce.
~ 53 ~

Ass
esse
d Ite
ms
Impl
emen
tatio
n St
atus
(Not
e 1)
Non
-impl
emen
tatio
n an
d its
reas
ons
Yes
No
Sum
mar
y an
d Ex
plan
atio
n (N
ote
2)
(II)
Is
the
com
pany
com
mitt
ed to
im
prov
ing
the
reso
urce
s util
izat
ion
and
the
use
of re
new
able
mat
eria
ls th
at
have
low
impa
ct o
n th
e en
viro
nmen
t?
(III
) D
oes t
he C
ompa
ny e
valu
ate
curr
ent
and
futu
re c
limat
e ch
ange
pot
entia
l ris
ks a
nd o
ppor
tuni
ties a
nd ta
ke
mea
sure
s rel
ated
to c
limat
e re
late
d to
pics
? (I
V)
Doe
s the
Com
pany
col
lect
dat
a fo
r gr
eenh
ouse
gas
em
issi
ons,
wat
er u
sage
an
d w
aste
qua
ntity
in th
e pa
st tw
o ye
ars,
and
set e
nerg
y co
nser
vatio
n,
gree
nhou
se g
as e
mis
sion
s red
uctio
n,
wat
er u
sage
redu
ctio
n an
d ot
her w
aste
m
anag
emen
t pol
icie
s?
"Env
ironm
enta
l Saf
ety
and
Hea
lth P
olic
y" to
con
tinuo
usly
impr
ove
our e
nviro
nmen
tal s
afet
y an
d he
alth
per
form
ance
, with
"Zer
o D
isas
ter,
Zero
Pol
lutio
n" a
s the
ulti
mat
e go
al fo
r en
viro
nmen
tal p
rote
ctio
n an
d sa
fety
and
hea
lth e
fforts
. The
Com
pany
has
set a
nnua
l tar
gets
fo
r its
env
ironm
enta
l hea
lth a
nd sa
fety
man
agem
ent s
yste
m, a
nd is
com
mitt
ed to
con
tinuo
usly
im
prov
ing
envi
ronm
enta
l pro
tect
ion
and
heal
th a
nd sa
fety
man
agem
ent t
o re
duce
en
viro
nmen
tal i
mpa
cts a
nd im
prov
e en
viro
nmen
tal h
ealth
and
safe
ty in
the
Com
pany
. Th
e C
ompa
ny is
equ
ippe
d w
ith p
ollu
tion
prev
entio
n eq
uipm
ent f
or v
ario
us ty
pes o
f pol
lutio
n su
ch a
s was
te w
ater
, was
te g
as a
nd w
aste
mat
eria
ls in
acc
orda
nce
with
env
ironm
enta
l pr
otec
tion
regu
latio
ns. T
he C
ompa
ny a
lso
prov
ides
was
te se
para
tion
and
recy
clin
g an
d co
ntin
ues t
o im
prov
e th
e en
ergy
effi
cien
cy, m
ainl
y fo
cusi
ng o
n im
prov
ing
the
sour
ce a
nd
incr
easi
ng th
e ut
iliza
tion
effic
ienc
y fo
r all
reso
urce
s in
orde
r to
redu
ce th
e ra
w m
ater
ials
or
was
te m
ater
ials
and
to m
inim
ize
the
impa
ct o
n th
e en
viro
nmen
t. W
e ac
tivel
y us
e ec
o-fr
iend
ly p
acka
ging
mat
eria
ls, s
et u
p re
cycl
ing,
use
ene
rgy-
savi
ng li
ghtin
g eq
uipm
ent,
inst
all e
nerg
y-sa
ving
equ
ipm
ent w
ith sc
hedu
led
pow
er d
isco
nnec
tion,
use
w
ater
-sav
ing
equi
pmen
t in
toile
ts, a
nd u
se e
nerg
y-sa
ving
ligh
ts to
redu
ce th
e im
pact
on
the
envi
ronm
ent i
n or
der t
o ac
hiev
e th
e su
stai
nabi
lity.
In
add
ition
, the
Com
pany
has
dis
clos
ed it
s env
ironm
enta
l pro
tect
ion
stra
tegi
es su
ch a
s ene
rgy
savi
ng, c
arbo
n re
duct
ion
and
gree
nhou
se g
as re
duct
ion
on th
e w
ebsi
te, a
nd a
nnou
nced
the
track
ing
resu
lts p
erio
dica
lly.
The
Com
pany
man
ages
the
clim
ate
chan
ge ri
sk th
roug
h pr
ocur
emen
t mee
tings
, bus
ines
s m
eetin
gs, o
ccup
atio
nal s
afet
y an
d he
alth
and
env
ironm
enta
l com
mitt
ees;
in a
dditi
onal
, the
C
ompa
ny h
as d
evel
oped
a su
pplie
r res
pons
e pl
an, p
rom
oted
gre
enho
use
gas r
educ
tion,
and
m
aint
aine
d a
safe
inve
ntor
y of
pro
duct
s.
1. In
form
atio
n on
the
carb
on d
ioxi
de e
mis
sion
s for
the
last
two
year
s: (1
) Yua
nlin
Fac
tory
: 202
0: 1
8,25
9 to
ns, 2
019:
17,
491
tons
. Thi
s rep
rese
nts a
n in
crea
se o
f 4.3
9 %
in 2
020
com
pare
d to
201
9.
(2)
Yunl
in F
acto
ry: 2
020:
40,
676
tons
, 201
9: 3
9,84
9 to
ns. T
his r
epre
sent
s an
incr
ease
of 2
.08
% in
202
0 co
mpa
red
to 2
019.
2.
Info
rmat
ion
on th
e w
ater
con
sum
ptio
n fo
r the
last
two
year
s:
(1) Y
uanl
in F
acto
ry: 2
020:
132
,884
tons
, 201
9: 1
36,0
23 to
ns. T
his r
epre
sent
s a d
ecre
ase
of
2.3%
in 2
020
com
pare
d to
201
9.
(2)
Yunl
in F
acto
ry: 2
020:
143
,660
tons
, 201
9: 1
39,2
49 to
ns. T
his r
epre
sent
s an
incr
ease
of
3.17
% in
202
0 co
mpa
red
to 2
019.
3.
Info
rmat
ion
on th
e w
ast g
ener
atio
n fo
r the
last
two
year
s:
~ 54 ~

Ass
esse
d Ite
ms
Impl
emen
tatio
n St
atus
(Not
e 1)
Non
-impl
emen
tatio
n an
d its
reas
ons
Yes
No
Sum
mar
y an
d Ex
plan
atio
n (N
ote
2)
(1) Y
uanl
in F
acto
ry: 2
020:
53.
45 to
ns, 2
019:
59.
6 to
ns. T
his r
epre
sent
s a d
ecre
ase
of 1
0.32
%
in 2
020
com
pare
d to
201
9.
(2)
Yunl
in F
acto
ry: 2
020:
159
tons
, 201
9: 1
84.4
tons
. Thi
s rep
rese
nts a
dec
reas
e of
13.
77%
in
2020
com
pare
d to
201
9.
4. T
he e
nerg
y sa
ving
resu
lts:
(1) E
nerg
y sa
ving
s: 2
,156
,851
kW
h/ye
ar.
(2)
Elec
trici
ty c
ost s
avin
gs: $
5,46
7,13
4/ye
ar.
(3) C
O2 r
educ
tion:
1,3
15.5
tons
/yea
r. In
line
with
the
gree
nhou
se g
as in
vent
ory,
the
Com
pany
has
bee
n w
orki
ng o
n th
e en
ergy
m
anag
emen
t sys
tem
of I
SO 5
0001
, car
bon
redu
ctio
n, p
rodu
ct c
arbo
n fo
otpr
int d
iscl
osur
e an
d w
aste
redu
ctio
n to
redu
ce th
e gr
eenh
ouse
gas
em
issi
ons,
incr
ease
the
wat
er re
cycl
ing
ef
ficie
ncy,
save
wat
er re
sour
ces,
redu
ce w
aste
from
the
proc
ess s
ourc
e an
d im
prov
e th
e
recy
clin
g of
was
te in
ord
er to
mak
e ef
forts
to su
stai
nabl
e en
viro
nmen
t. P
leas
e re
fer t
o pa
ges
45 a
nd 4
6 of
the
2020
CSR
Rep
ort f
or m
ore
info
rmat
ion.
Fu
ture
qua
ntita
tive
targ
ets f
or e
nerg
y sa
ving
pla
ns:
1. T
he C
ompa
ny p
lans
to b
uild
a so
lar p
ower
faci
lity
on th
e ro
of o
f the
R&
D h
eadq
uarte
rs,
whi
ch is
est
imat
ed to
redu
ce C
O2 e
mis
sion
s by
311
tons
per
yea
r. 2.
The
2021
ene
rgy
savi
ng o
bjec
tives
: (1
)El
ectri
city
: Yua
nlin
Fac
tory
: 0.8
09 k
g/kw
h; Y
unlin
Fac
tory
: 1.0
00 k
g/kw
h.
(2)
Fuel
: Yua
nlin
Fac
tory
: 0.3
53 k
g/kc
al; Y
unlin
Fac
tory
: 0.5
38 k
g/kc
al.
3. R
educ
e th
e m
ixin
g se
ctio
ns a
nd sh
orte
n th
e m
ixin
g tim
e, th
e C
ompa
ny a
ims t
o re
duce
the
annu
al p
ower
con
sum
ptio
n to
bel
ow 1
50 k
Wh
in th
e fu
ture
. 4.
The
wat
er re
cycl
ing
and
reus
e go
al fo
r 202
1 is
10%
. 5.
Rep
lace
hea
vy o
il bo
ilers
with
nat
ural
gas
boi
lers
and
redu
ce C
O2 e
mis
sion
by
5% in
202
1.C
limat
e ch
ange
risk
: R
isks
to th
e sa
fe in
vent
ory
in th
e su
pply
cha
in, p
rodu
ct tr
ansp
orta
tion,
una
vaila
bilit
y of
su
pplie
s and
ene
rgy
shor
tage
s. In
resp
onse
to c
limat
e ch
ange
: 1.
Bui
ld so
lar p
ower
faci
litie
s. 2.
Pro
mot
e ca
rbon
redu
ctio
n ac
tiviti
es.
3. P
urch
ase
eco-
frie
ndly
raw
mat
eria
ls.
4. R
ecyc
le a
nd re
use
the
wat
er re
sour
ces.
5.
Mai
ntai
n a
safe
inve
ntor
y at
eac
h sa
les o
ffic
e; fo
r tho
se lo
catio
n w
ithou
t a sa
les o
ffic
e to
ke
ep a
safe
inve
ntor
y, w
e w
ill e
nsur
e th
at o
ur c
usto
mer
s hav
e a
safe
inve
ntor
y.
~ 55 ~

Ass
esse
d Ite
ms
Impl
emen
tatio
n St
atus
(Not
e 1)
Non
-impl
emen
tatio
n an
d its
reas
ons
Yes
No
Sum
mar
y an
d Ex
plan
atio
n (N
ote
2)
IV.
Soci
al Is
sues
(I
) D
oes t
he C
ompa
ny se
t pol
icie
s and
pr
oced
ures
in c
ompl
ianc
e w
ith
regu
latio
ns a
nd in
tern
atio
nally
re
cogn
ized
hum
an ri
ghts
prin
cipl
es?
(II)
H
as th
e C
ompa
ny e
stab
lishe
d ap
prop
riate
ly m
anag
ed e
mpl
oyee
w
elfa
re m
easu
res (
incl
ude
sala
ry a
nd
com
pens
atio
n, le
ave
and
othe
rs),
and
link
oper
atio
nal p
erfo
rman
ce o
r ac
hiev
emen
ts w
ith e
mpl
oyee
sala
ry
and
com
pens
atio
n?
(III
) D
oes t
he C
ompa
ny p
rovi
de e
mpl
oyee
s w
ith a
safe
and
hea
lthy
wor
king
en
viro
nmen
t, w
ith re
gula
r saf
ety
and
heal
th tr
aini
ng?
The
Com
pany
is c
omm
itted
in p
rote
ctin
g th
e w
orke
rs' r
ight
s and
com
plyi
ng w
ith th
e La
bor
Stan
dard
s Act
and
the
gove
rnm
ent's
hum
an ri
ghts
pol
icy.
We
not o
nly
impl
emen
t the
pol
icy,
bu
t als
o se
t up
a va
riety
of c
omm
unic
atio
n ch
anne
ls a
nd m
anag
emen
t mec
hani
sms t
o en
sure
th
at a
ll em
ploy
ees a
re w
ell p
rote
cted
so th
at w
e ca
n cr
eate
a re
spec
tful,
carin
g an
d hu
man
rig
hts-
prot
ectiv
e w
orki
ng e
nviro
nmen
t. Th
e C
ompa
ny p
rovi
des a
safe
and
hea
lthy
wor
king
en
viro
nmen
t and
est
ablis
hes p
reca
utio
ns to
avo
id a
ccid
ents
or h
ealth
haz
ards
at w
ork.
The
C
ompa
ny d
oes n
ot d
iscr
imin
ate
in h
iring
, rem
uner
atio
n, p
rom
otio
n, tr
aini
ng, r
etire
men
t or
term
inat
ion
of e
mpl
oym
ent o
n th
e ba
sis o
f rac
e, n
atio
nalit
y, re
ligio
n, g
ende
r, ag
e, so
cial
cla
ss,
phys
ical
dis
abili
ty, f
amily
and
mar
ital s
tatu
s, un
ion
mem
bers
hip,
and
pol
itica
l pre
fere
nce.
In
addi
tion,
the
Com
pany
doe
s not
inte
rfer
e w
ith th
e w
orke
rs' r
elig
ion,
pol
itica
l par
ty, m
arria
ge
and
the
right
to w
orsh
ip a
ll ki
nds o
f tra
ditio
ns a
nd c
usto
ms.
The
Com
pany
had
no
inci
dent
s th
at v
iola
ted
the
hum
an ri
ghts
, dis
crim
inat
ion
and
right
s of d
isad
vant
aged
and
vul
nera
ble
peop
le in
202
0, a
nd th
ere
wer
e no
cas
es th
at w
ere
subj
ect t
o hu
man
righ
ts re
view
or i
mpa
ct
asse
ssm
ent.
We
belie
ve th
at o
ur e
mpl
oyee
s are
the
mos
t val
uabl
e as
set f
or th
e C
ompa
ny a
nd w
e ar
e co
mm
itted
to sh
are
the
prof
its w
ith a
ll ou
r em
ploy
ees;
we
are
also
ded
icat
ed to
pro
vide
a
perf
ect w
orki
ng e
nviro
nmen
t and
syst
em b
y se
tting
rule
s for
cal
cula
ting
the
sala
ry, s
peci
al
leav
e an
d ot
her b
enef
its, p
leas
e re
fer t
o pa
ges 8
3 to
87
of th
is y
ear's
Ann
ual R
epor
t and
pag
es
71 to
74
of th
e 20
20 C
SR R
epor
t. Th
e m
onth
ly p
erfo
rman
ce b
onus
es a
re p
aid
base
d on
the
perf
orm
ance
ach
ieve
men
t rat
e as
eva
luat
ed.
The
Com
pany
has
mad
e an
nual
sala
ry a
djus
tmen
ts fo
r the
em
ploy
ees b
ased
on
the
prof
itabi
lity.
The
ave
rage
ann
ual s
alar
ies f
or fu
ll-tim
e em
ploy
ees w
ho a
re n
ot in
a m
anag
eria
l po
sitio
n w
ere
$622
,178
and
$53
5,73
0 in
202
0 an
d 20
19, r
epre
sent
ing
an in
crea
se o
f 16.
14%
; th
e m
edia
n an
nual
sala
ries f
or fu
ll-tim
e em
ploy
ees w
ho a
re n
ot in
a m
anag
eria
l pos
ition
wer
e $5
75,5
52 a
nd $
499,
599
in 2
020
and
2019
, whi
ch re
pres
ents
an
incr
ease
of 1
5.20
%.
Th
e C
ompa
ny is
ISO
450
01:2
018
certi
fied,
and
follo
ws t
he IS
O 4
5001
occ
upat
iona
l saf
ety
and
heal
th m
anag
emen
t sys
tem
to p
rom
ote
the
on-s
ite im
plem
enta
tion
for o
ccup
atio
nal s
afet
y an
d he
alth
man
agem
ent,
to c
ondu
ct re
gula
r ins
pect
ions
on
wor
kpla
ces,
to im
plem
ent c
ontra
ct
man
agem
ent,
to in
trodu
ce a
fals
e al
arm
repo
rting
syst
em, t
o co
nduc
t act
iviti
es fo
r saf
ety,
to
man
age
toxi
c ch
emic
al su
bsta
nces
, and
to h
old
regu
lar t
rain
ing
on sa
fety
and
hea
lth. I
t is o
ur
resp
onsi
bilit
y to
pro
vide
a w
orki
ng e
nviro
nmen
t tha
t sat
isfie
s the
lega
l and
clie
nt
requ
irem
ents
thro
ugh
a co
ntin
uous
impr
ovem
ent b
ased
on
the
PDC
A m
anag
emen
t cyc
le fo
r ou
r em
ploy
ees a
nd th
eir f
amili
es.
The
Com
pany
regu
larly
hol
ds se
min
ars o
n em
ploy
ee sa
fety
and
con
duct
s saf
ety
insp
ectio
ns
No
mat
eria
l diff
eren
ce.
~ 56 ~

Ass
esse
d Ite
ms
Impl
emen
tatio
n St
atus
(Not
e 1)
Non
-impl
emen
tatio
n an
d its
reas
ons
Yes
No
Sum
mar
y an
d Ex
plan
atio
n (N
ote
2)
(IV
) H
as th
e C
ompa
ny e
stab
lishe
d ef
fect
ive
care
er d
evel
opm
ent t
rain
ing
plan
s?
(V)
Doe
s the
Com
pany
’s p
rodu
ct a
nd
serv
ice
com
ply
with
rela
ted
regu
latio
ns a
nd in
tern
atio
nal r
ules
for
cust
omer
s’ he
alth
and
safe
ty, p
rivac
y,
sale
s,lab
ellin
g an
d se
t pol
ices
to
for t
he w
orki
ng e
nviro
nmen
t, pr
epar
es a
man
ual o
n sa
fety
and
hyg
iene
pra
ctic
es.T
he sa
fety
an
d he
alth
wor
k ru
les h
ave
been
pre
pare
d fo
r all
empl
oyee
s, an
d m
anag
emen
t sta
ff ha
ve b
een
requ
ired
to a
ttend
wor
k sa
fety
rela
ted
cour
ses;
the
Com
pany
has
als
o al
loca
ted
fund
s to
impr
ove
the
safe
ty a
nd e
nviro
nmen
tal f
acili
ties i
n th
e fa
ctor
y.
Our
safe
ty a
nd h
ealth
edu
catio
n in
clud
es
1. In
com
plia
nce
with
the
occu
patio
nal s
afet
y an
d he
alth
edu
catio
n an
d tra
inin
g re
quire
men
ts:
(1)
For n
ew e
mpl
oyee
s: th
ree-
hour
cou
rses
. (2
)Fo
r the
supe
rvis
ors:
two-
hour
cou
rses
per
yea
r. (3
)O
n-si
te sp
ecia
l ope
rato
rs: 3
-hou
r cou
rse
ever
y 3
year
s on
safe
ty, h
ygie
ne, h
ealth
and
fire
ed
ucat
ion.
(4
)Fo
r on-
site
staf
f: (a
)B
efor
e th
e ne
w e
mpl
oyee
star
ts w
ork
on th
e fir
st d
ay, h
e/sh
e w
ill b
e gi
ven
a on
e-ho
ur
cour
se o
n eq
uipm
ent s
afet
y, h
azar
d id
entif
icat
ion
and
safe
ty a
war
enes
s acc
ordi
ng to
the
job
desc
riptio
n.
(b)
The
empl
oyee
s will
be
give
n on
e ho
ur se
min
ar o
n eq
uipm
ent s
afet
y, h
azar
d id
entif
icat
ion
and
safe
ty a
war
enes
s eve
ry y
ear a
ccor
ding
to th
e jo
b de
scrip
tion.
(5
)O
ccup
atio
nal S
afet
y an
d H
ealth
Sta
ff: T
hey
mus
t atte
nd 1
2 ho
urs o
f occ
upat
iona
l saf
ety
and
heal
th c
ours
es o
rgan
ized
by
exte
rnal
inst
itute
s eve
ry 2
yea
rs.
2. A
ccor
ding
to th
e Fi
re S
ervi
ces A
ct, t
he G
ener
al A
ffai
rs S
ectio
n sh
all i
nvite
fire
fight
ers t
o co
nduc
t fac
tory
-wid
e fir
e dr
ills f
or a
ll em
ploy
ees i
n th
e C
ompa
ny fo
r fou
r hou
rs e
very
six
mon
ths.
The
tota
l num
ber o
f tra
inin
g ho
urs f
or o
ccup
atio
nal s
afet
y an
d he
alth
, env
ironm
enta
l pr
otec
tion
and
fire
educ
atio
n in
202
0 is
23,
533
hour
s with
20,
368
parti
cipa
nts.
A se
ries o
f edu
catio
n an
d tra
inin
g is
pla
nned
for n
ew re
crui
ts fr
om th
e ve
ry b
egin
ning
, and
the
train
ing
is c
ondu
cted
acc
ordi
ng to
diff
eren
t lev
els a
nd u
nits
with
ince
ntiv
es a
nd su
bsid
ies t
o en
cour
age
empl
oyee
s to
activ
ely
stud
y in
lang
uage
s or o
ther
are
as. W
e pr
ovid
e a
wid
e ra
nge
of tr
aini
ng c
ours
es th
at a
re u
sed
as c
riter
ia to
pro
mot
e ou
r sta
ff, in
clud
ing
Trai
ning
for N
ew
Rec
ruits
, Tra
inin
g fo
r Cor
e Fu
nctio
ns, T
rain
ing
for M
anag
emen
t Fun
ctio
ns, T
rain
ing
for
Proj
ects
, and
Tra
inin
g fo
r Sel
f-de
velo
pmen
t eve
ry y
ear.
Ple
ase
refe
r to
page
s 55
- 58
of th
e 20
20 C
SR R
epor
t for
mor
e in
form
atio
n.
All
of o
ur m
otor
bike
tire
s are
pro
duce
d us
ing
eco-
frie
ndly
oils
with
out t
he u
se o
f pol
ycyc
lic
arom
atic
hyd
roca
rbon
s (PA
Hs)
in o
rder
to e
nsur
e th
e sa
fety
of b
oth
cons
umer
s and
em
ploy
ees.
Our
pro
duct
s and
serv
ices
are
mar
kete
d an
d la
belle
d in
acc
orda
nce
with
the
rele
vant
re
gula
tions
and
are
cer
tifie
d w
ith IS
O 9
001:
2015
and
IATF
169
49:2
016.
~ 57 ~

Ass
esse
d Ite
ms
Impl
emen
tatio
n St
atus
(Not
e 1)
Non
-impl
emen
tatio
n an
d its
reas
ons
Yes
No
Sum
mar
y an
d Ex
plan
atio
n (N
ote
2)
prot
ect c
onsu
mer
s’ rig
hts a
nd
cons
umer
app
eal p
roce
dure
s?
(VI)
D
oes t
he C
ompa
ny se
t sup
plie
r m
anag
emen
t pol
icy
and
requ
est
supp
liers
to c
ompl
y w
ith re
late
d st
anda
rds o
n th
e to
pics
of
envi
ronm
enta
l, oc
cupa
tiona
l saf
ety
and
heal
th o
r lab
or ri
ght,
and
thei
r im
plem
enta
tion
stat
us?
Our
pro
duct
s are
cer
tifie
d w
orld
wid
e w
ith B
IS (I
ndia
), C
CC
(Chi
na),
Col
ombi
a, D
OT
(USA
), E-
MA
RT (E
urop
e), G
SO (G
CC
), SA
SO (S
audi
Ara
bia)
, I-M
ART
(Bra
zil),
KAT
ECH
(Kor
ea),
SNI (
Indo
nesi
a) a
nd T
IS (T
haila
nd).
Our
pro
duct
s are
als
o ce
rtifie
d in
Tai
wan
with
the
BSM
I, th
e C
NS
Mar
k, th
e Ve
hicl
e Sa
fety
C
ompo
nent
Cer
tific
atio
n (V
SCC
) and
the
Taiw
an T
ire E
nerg
y Ef
ficie
ncy
Labe
l. W
e ha
ve se
t up
a st
akeh
olde
r inf
orm
atio
n on
our
web
site
( ht
tp://
csr.k
enda
.com
.tw),
and
have
es
tabl
ishe
d ru
les f
or m
anag
ing
cust
omer
com
plai
nts a
nd a
fter-s
ales
serv
ice.
The
Qua
lity
Ass
uran
ce D
epar
tmen
t is a
ssig
ned
to h
andl
e th
e co
nsum
er p
rote
ctio
n an
d th
e cu
stom
er
com
plai
nts,
and
to c
ondu
ct th
e cu
stom
er sa
tisfa
ctio
n su
rvey
. W
hen
the
Com
pany
eva
luat
es th
e su
pplie
rs, i
n ad
ditio
n to
info
rmat
ion
on m
anag
emen
t, te
chni
cal c
apab
ility
and
pro
duct
ion
capa
city
, new
supp
liers
mus
t pro
vide
the
"Bas
ic S
uppl
ier
Info
rmat
ion
Surv
ey F
orm
" w
ith th
e "D
ecla
ratio
n of
Non
-Use
of E
nviro
nmen
tal H
azar
dous
Su
bsta
nces
and
Con
flict
Min
eral
s", t
he "
CSR
Sta
tem
ent f
or S
uppl
iers
" an
d sa
mpl
es
(incl
udin
g th
e SD
S Sa
fety
Info
rmat
ion
Shee
t) fo
r the
Com
pany
's re
spon
sibl
e de
partm
ent t
o in
vest
igat
e an
d ev
alua
te b
efor
e th
ey c
an b
e cl
assi
fied
as q
ualif
ied
supp
liers
. The
Com
pany
al
so c
onsi
ders
that
supp
liers
shou
ld h
ave
a so
und
qual
ity sy
stem
ava
ilabl
e.
Maj
or ra
w
mat
eria
l sup
plie
rs m
ust a
lso
be c
ertif
ied
with
ISO
900
1 qu
ality
syst
em. T
he se
lect
ion
of n
ew
supp
liers
is b
ased
on
the
crite
ria su
ch a
s qua
lity,
del
iver
y tim
e, su
pply
stat
us, o
pera
tiona
l pe
rfor
man
ce, s
ervi
ce c
apab
ility
and
so o
n, in
add
ition
to e
nviro
nmen
tal p
rote
ctio
n, la
bor
prac
tices
, hum
an ri
ghts
and
ant
i-cor
rupt
ion.
In 2
016,
the
Com
pany
star
ted
to c
ondu
ct C
SR
eval
uatio
n an
d co
mm
unic
atio
n w
ith 9
96 d
omes
tic a
nd o
vers
eas s
uppl
iers
, inc
ludi
ng th
e se
ndin
g C
SR d
ecla
ratio
n to
supp
liers
, ask
ing
them
to fi
ll in
the
decl
arat
ion
and
retu
rn it
, and
co
nduc
ting
CSR
surv
eys t
o ne
w su
pplie
rs a
nd e
xist
ing
supp
liers
. As a
resu
lt, 9
1% o
f the
su
pplie
rs h
ave
qual
ified
, and
thos
e w
ho fa
il to
mee
t the
stan
dard
mus
t be
requ
ired
to m
ake
impr
ovem
ents
by
a ce
rtain
dat
e, o
ther
wis
e th
ey w
ill n
ot b
e cl
assi
fied
as q
ualif
ied
supp
liers
.V.
D
oes t
he C
ompa
ny re
fer t
o in
tern
atio
nal r
epor
ting
rule
s or
guid
elin
es to
pub
lish
CSR
Rep
ort t
o di
sclo
se n
on-f
inan
cial
info
rmat
ion
of
the
Com
pany
? H
as th
e sa
id R
epor
t ac
quire
3rd
cer
tific
atio
n pa
rty
verif
icat
ion
or st
atem
ent o
f ass
uran
ce?
Th
e C
ompa
ny p
repa
res t
he C
SR re
port
in a
ccor
danc
e w
ith th
e G
RI S
tand
ards
pub
lishe
d by
th
e G
loba
l Rep
ortin
g In
itiat
ive.
The
Com
pany
has
not
yet
acq
uire
d 3r
d ce
rtific
atio
n pa
rty
verif
icat
ion
or st
atem
ent o
f ass
uran
ce. I
n th
e fu
ture
, the
Com
pany
exp
ects
to d
iscl
ose
CSR
re
ports
with
the
goal
of a
cqui
ring
3rd
certi
ficat
ion
party
ver
ifica
tion
or st
atem
ent o
f as
sura
nce.
No
mat
eria
l diff
eren
ce.
VI.
If th
e co
mpa
ny h
as e
stab
lishe
d its
cor
pora
te so
cial
resp
onsi
bilit
y co
de o
f pra
ctic
e ac
cord
ing
to “
Cor
pora
te S
ocia
l Res
pons
ibili
ty B
est P
ract
ice
Prin
cipl
es fo
r TW
SE/G
TSM
Li
sted
Com
pani
es”
plea
se d
escr
ibe
the
oper
atio
nal s
tatu
s and
diff
eren
ces.
The
Com
pany
has
form
ulat
ed th
e "C
ode
of P
ract
ice
on C
orpo
rate
Soc
ial R
espo
nsib
ility
" in
acc
orda
nce
with
the
rele
vant
pro
visio
ns o
f the
"C
orpo
rate
Soc
ial R
espo
nsib
ility
Bes
t
~ 58 ~

Ass
esse
d Ite
ms
Impl
emen
tatio
n St
atus
(Not
e 1)
Non
-impl
emen
tatio
n an
d its
reas
ons
Yes
No
Sum
mar
y an
d Ex
plan
atio
n (N
ote
2)
Prac
tice
Prin
cipl
es fo
r TW
SE/G
TSM
Lis
ted
Com
pani
es"
and
has f
ollo
wed
the
rele
vant
regu
latio
ns. T
here
is n
o di
ffere
nce
betw
een
the
oper
atio
n an
d th
e re
gula
tions
.
VII
. O
ther
impo
rtant
info
rmat
ion
to fa
cilit
ate
bette
r und
erst
andi
ng o
f the
com
pany
’s im
plem
enta
tion
of c
orpo
rate
soci
al re
spon
sibili
ty:
(I) I
mpl
emen
tatio
n st
atus
for C
SR:
1. E
stab
lishe
d th
e K
enda
Cul
tura
l and
Edu
catio
nal F
ound
atio
n:
(1) E
ncou
rage
stud
ents
to c
ontin
ue th
eir s
tudi
es b
y aw
ardi
ng th
em w
ith th
e K
enda
Out
stan
ding
Sch
olar
ship
and
Und
erpr
ivile
ged
Scho
lars
hip
for F
resh
men
Stu
dent
s. (2
) Pro
mot
e ed
ucat
ion,
cul
ture
and
arts
act
iviti
es: T
he C
ompa
ny re
gula
rly o
rgan
izes
ann
ual s
umm
er c
amps
for c
hild
ren,
New
ton
Scie
nce
Cam
p an
d co
ncer
ts, a
nd G
olde
n Ja
de
Lect
ures
. (3
) Sup
port
for s
tude
nts w
ho h
ave
suffe
red
from
fam
ily p
robl
ems,
dona
tions
to sc
hool
s in
rura
l are
as, a
nd b
icyc
les f
or e
cono
mic
ally
dis
adva
ntag
ed st
uden
ts.
2. S
ocia
l con
cern
s:
(1) T
he U
S su
bsid
iary
don
ated
per
sona
l pro
tect
ive
supp
lies t
o he
alth
car
e w
orke
rs in
Eur
ope
and
the
US.
(2
) The
Com
pany
don
ated
resi
dent
ial f
ire a
larm
s to
the
Fire
Dep
artm
ents
of C
ihto
ng T
owns
hip
and
the
Wes
t Dis
trict
of Y
uanl
in C
ity.
(3) T
he C
ompa
ny m
aint
ains
and
cle
ans t
he ro
ads a
roun
d th
e co
mm
unity
are
a.
(4) T
he C
ompa
ny sp
onso
red
the
Bic
ycle
Fes
tival
org
aniz
ed b
y G
iant
Man
ufac
turin
g C
o. L
td.
(5) T
he C
ompa
ny su
ppor
ts v
ario
us sp
orts
eve
nts i
n Ta
iwan
and
has
bee
n sp
onso
ring
a nu
mbe
r of p
oten
tial g
olfe
rs fo
r a lo
ng ti
me.
Plea
se re
fer t
o pa
ges 7
5 - 8
1 of
the
2020
CSR
Rep
ort f
or m
ore
info
rmat
ion.
(I
I)
For o
ther
info
rmat
ion
on th
e C
ompa
ny's
CSR
impl
emen
tatio
n, p
leas
e re
fer t
o th
e 20
20 C
SR R
epor
t. (h
ttp://
csr.k
enda
.com
.tw/d
efau
lt.as
px?l
ang=
0&m
enui
d=4&
edita
ble=
1)
Not
e 1:
If "
Yes"
is se
lect
ed fo
r the
impl
emen
tatio
n st
atus
, ple
ase
stat
e th
e im
porta
nt p
olic
ies,
stra
tegi
es a
nd m
easu
res a
dopt
ed a
nd th
eir i
mpl
emen
tatio
n st
atus
. If "
No"
is se
lect
ed fo
r
the
impl
emen
tatio
n st
atus
, ple
ase
expl
ain
the
reas
ons a
nd st
ate
the
plan
s for
the
futu
re p
olic
ies,
stra
tegi
es a
nd m
easu
res t
o be
impl
emen
ted.
Not
e 2:
If th
e C
ompa
ny h
as p
repa
red
a C
SR re
port,
the
impl
emen
tatio
n st
atus
shou
ld in
dica
te h
ow to
vie
w th
e C
SR re
port
and
the
inde
x pa
ge in
stea
d.
Not
e 3:
The
mat
eria
lity
prin
cipl
e re
fers
to e
nviro
nmen
tal,
soci
al a
nd c
orpo
rate
gov
erna
nce
issu
es th
at h
ave
a si
gnifi
cant
impa
ct o
n th
e C
ompa
ny's
inve
stor
s and
oth
er st
akeh
olde
rs.
~ 59 ~

(VI)
The
stat
e of
the
Com
pany
's C
ode
of C
ondu
ct o
n in
tegr
ity, a
ny v
aria
nce
from
the
Ethi
cal C
orpo
rate
Man
agem
ent B
est P
ract
ice
Prin
cipl
esfo
r TW
SE/G
TSM
Lis
ted
Com
pani
es, a
nd th
e re
ason
s for
such
var
ianc
es.
Ass
esse
d Ite
ms
Impl
emen
tatio
n St
atus
(Not
e 1)
Non
-impl
emen
tatio
n an
d its
reas
ons
Yes
No
Sum
mar
y an
d Ex
plan
atio
n
I. Es
tabl
ishm
ent o
f Cor
pora
te C
ondu
ct a
nd
Ethi
cs P
olic
y an
d Im
plem
enta
tion
Mea
sure
s (I
) D
oes t
he c
ompa
ny h
ave
a cl
ear e
thic
al
corp
orat
e m
anag
emen
t pol
icy
appr
oved
by
its B
oard
of D
irect
ors,
and
byla
ws a
nd
publ
icly
ava
ilabl
e do
cum
ents
add
ress
ing
its c
orpo
rate
con
duct
and
eth
ics p
olic
y an
d m
easu
res,
and
com
mitm
ent r
egar
ding
im
plem
enta
tion
of su
ch p
olic
y fr
om th
e B
oard
of D
irect
ors a
nd th
e to
p m
anag
emen
t tea
m?
(II)
W
heth
er th
e co
mpa
ny h
as e
stab
lishe
d an
as
sess
men
t mec
hani
sm fo
r the
risk
of
unet
hica
l con
duct
; reg
ular
ly a
naly
zes a
nd
eval
uate
s with
in a
bus
ines
s con
text
, the
The
Com
pany
has
est
ablis
hed
the
"Eth
ical
Cor
pora
te M
anag
emen
t Bes
t Pra
ctic
es P
rinci
ples
",
"Cod
es o
f Eth
ical
Con
duct
and
Reg
ulat
ions
on
the
Publ
ic R
ecus
al o
f Int
eres
ted
Parti
es" a
s re
solv
ed b
y th
e B
oard
of D
irect
ors.
The
Com
pany
requ
ires t
he B
oard
of D
irect
ors,
seni
or
exec
utiv
es a
nd a
ll em
ploy
ees t
o im
plem
ent t
hese
regu
latio
ns. T
hese
pol
icie
s and
regu
latio
ns
prov
ide
that
the
Com
pany
and
its s
ubsi
diar
ies s
hall
esta
blis
h po
licie
s bas
ed o
n in
tegr
ity,
trans
pare
ncy
and
acco
unta
bilit
y, a
nd e
stab
lish
good
cor
pora
te g
over
nanc
e an
d ris
k co
ntro
l m
echa
nism
s to
crea
te a
bus
ines
s env
ironm
ent f
or th
e su
stai
nabi
lity
of th
e C
ompa
ny.
In
addi
tion
to c
ompl
ying
with
the
rele
vant
law
s and
regu
latio
ns, t
he C
ompa
ny A
ct, t
he S
ecur
ities
an
d Ex
chan
ge A
ct, t
he B
usin
ess E
ntity
Acc
ount
ing
Act
, the
Pol
itica
l Don
atio
ns A
ct, t
he
Ant
i-Cor
rupt
ion
Act
, the
Gov
ernm
ent P
rocu
rem
ent A
ct, A
ct o
n R
ecus
al o
f Pub
lic S
erva
nts D
ue
to C
onfli
cts o
f Int
eres
t, th
e re
gula
tions
rela
ting
to th
e lis
ted
com
pani
es o
r oth
er b
usin
ess c
ondu
ct
rela
ted
law
s and
regu
latio
ns a
re a
lso
appl
icab
le. O
ffer
ing
and
acce
ptan
ce o
f brib
es, i
llega
l po
litic
al d
onat
ions
, im
prop
er c
harit
able
don
atio
ns o
r spo
nsor
ship
s, of
ferin
g or
acc
epta
nce
of
unre
ason
able
pre
sent
s, ho
spita
lity
or o
ther
impr
oper
ben
efits
, mis
appr
opria
tion
of tr
ade
secr
ets
and
infr
inge
men
t of t
rade
mar
k rig
hts,
pate
nt ri
ghts
, cop
yrig
hts,
and
othe
r int
elle
ctua
l pro
perty
rig
hts,
and
enga
ging
in u
nfai
r com
petit
ive
prac
tices
are
stric
tly p
rohi
bite
d.
The
Com
pany
's di
rect
ors a
nd se
nior
exe
cutiv
es sh
all e
xerc
ise
a hi
gh d
egre
e of
self-
disc
iplin
e. If
a d
irect
or
or a
ju
ristic
per
son
repr
esen
ted
by th
e di
rect
or is
an
inte
rest
ed p
arty
with
resp
ect t
o an
y pr
opos
al fo
r a
boar
d m
eetin
g, th
e di
rect
or sh
all s
tate
the
impo
rtant
asp
ects
of t
he in
tere
sted
par
ty re
latio
nshi
p at
th
e m
eetin
g. W
hen
the
rela
tions
hip
is li
kely
to p
reju
dice
the
inte
rest
s of t
he C
ompa
ny, t
he
dire
ctor
may
not
par
ticip
ate
in d
iscu
ssio
n or
vot
ing
on th
at p
ropo
sal a
nd sh
all e
nter
recu
sal
durin
g th
e di
scus
sion
and
vot
ing.
The
dire
ctor
als
o m
ay n
ot a
ct a
s ano
ther
dire
ctor
's pr
oxy
to
exer
cise
vot
ing
right
s on
that
mat
ter.
In 2
020,
the
Com
pany
con
duct
ed in
tern
al a
nd e
xter
nal t
rain
ing
rela
ted
to e
thic
al m
anag
emen
t (in
clud
ing
ethi
cal m
anag
emen
t reg
ulat
ions
, int
erna
l con
trol s
yste
ms,
acco
untin
g sy
stem
s, tir
e qu
ality
regu
latio
ns a
nd p
olic
ies,
safe
ty a
nd h
ealth
and
man
agem
ent)
for a
tota
l of 2
3,20
4 pa
rtici
pant
s and
26.
500
hour
s. Fo
r bus
ines
s act
iviti
es w
ith a
hig
her r
isk
of u
neth
ical
con
duct
, the
Com
pany
shal
l fol
low
the
acco
untin
g sy
stem
and
inte
rnal
con
trol s
yste
m e
stab
lishe
d by
the
Com
pany
. The
Com
pany
doe
s no
t allo
w e
xter
nal a
ccou
nts o
r sec
ret a
ccou
nts,
and
cons
tant
ly re
view
s to
ensu
re th
e ap
prop
riate
ness
of t
he sy
stem
des
ign
and
the
cont
inuo
us e
ffect
iven
ess o
f its
impl
emen
tatio
n. T
he N
o m
ater
ial
diffe
renc
e.
~ 60 ~

Ass
esse
d Ite
ms
Impl
emen
tatio
n St
atus
(Not
e 1)
Non
-impl
emen
tatio
n an
d its
reas
ons
Yes
No
Sum
mar
y an
d Ex
plan
atio
n
busi
ness
act
iviti
es w
ith a
hig
her r
isk
of
unet
hica
l con
duct
; has
form
ulat
ed a
pr
ogra
m to
pre
vent
une
thic
al c
ondu
ct
with
a sc
ope
no le
ss th
an th
e ac
tiviti
es
pres
crib
ed in
par
agra
ph 2
, Arti
cle
7 of
the
Ethi
cal C
orpo
rate
Man
agem
ent B
est
Prac
tice
Prin
cipl
es fo
r TW
SE/G
TSM
Li
sted
Com
pani
es?
(III
) Sp
ecia
l Ass
ista
nce:
Whe
ther
the
com
pany
ha
s est
ablis
hed
rele
vant
pol
icie
s tha
t are
du
ly e
nfor
ced
to p
reve
nt u
neth
ical
con
duct
, pr
ovid
ed im
plem
enta
tion
proc
edur
es,
guid
elin
es, c
onse
quen
ces o
f vio
latio
n an
d co
mpl
aint
pro
cedu
res,
and
perio
dica
lly
revi
ews a
nd re
vise
s suc
h po
licie
s?
Com
pany
's A
udit
Offi
ce sh
all c
ondu
ct a
udits
on
the
com
plia
nce
of th
e pr
eced
ing
syst
em fr
om
time
to ti
me
and
shal
l pre
pare
an
audi
t rep
ort t
o th
e B
oard
and
may
app
oint
an
acco
unta
nt to
pe
rfor
m su
ch a
udits
and
, if n
eces
sary
, an
inde
pend
ent a
udito
r or p
rofe
ssio
nal t
o pe
rfor
m su
ch
audi
ts.
In o
rder
to im
prov
e th
e m
echa
nism
, we
have
set u
p a
clea
r and
eff
ectiv
e re
war
d an
d pu
nish
men
t sy
stem
by
inte
grat
ing
the
ethi
cal m
anag
emen
t pol
icy
with
em
ploy
ee p
erfo
rman
ce e
valu
atio
n an
d hu
man
reso
urce
s pol
icy
thro
ugh
educ
atio
n, tr
aini
ng a
nd e
valu
atio
n. T
here
is a
lso
a sy
stem
for
whi
stle
blow
ing,
pun
ishm
ent a
nd g
rieva
nce.
New
supp
liers
of t
he C
ompa
ny a
re re
quire
d to
sign
a
"Let
ter o
f Com
plia
nce
with
Cor
pora
te S
ocia
l Res
pons
ibili
ty R
equi
rem
ents
for S
uppl
iers
" as a
gu
aran
tee.
Th
e C
ompa
ny h
as e
stab
lishe
d a
code
of c
ondu
ct fo
r the
rela
tions
hip
of in
tere
sted
par
ties a
nd
ethi
cs g
uide
lines
, as w
ell a
s a n
on-d
iscl
osur
e po
licy
for i
ts e
mpl
oyee
s, w
hich
pro
vide
cle
ar
dire
ctio
ns fo
r dire
ctor
s, m
anag
eria
l per
sonn
el, e
mpl
oyee
s and
per
sons
hav
ing
subs
tant
ial c
ontro
l ov
er th
e C
ompa
ny. I
n ad
ditio
n, th
e m
anag
emen
t and
ope
ratio
n of
eac
h bu
sine
ss is
gov
erne
d by
a
inte
rnal
con
trol s
yste
m th
at c
lear
ly re
veal
s the
dis
cipl
inar
y m
etho
ds a
nd p
rovi
des a
ppro
pria
te
rem
edie
s for
grie
vanc
es.
II.
Ethi
c M
anag
emen
t Pra
ctic
e (I
) W
heth
er th
e co
mpa
ny h
as a
sses
sed
the
ethi
cs re
cord
s of w
hom
it h
as b
usin
ess
rela
tions
hip
with
and
incl
ude
busi
ness
co
nduc
t and
eth
ics r
elat
ed c
laus
es in
the
busi
ness
con
tract
s?
(II)
W
heth
er th
e co
mpa
ny h
as se
t up
a un
it w
hich
is d
edic
ated
to p
rom
otin
g th
e co
mpa
ny’s
eth
ical
stan
dard
s and
regu
larly
(a
t lea
st o
nce
a ye
ar) r
epor
ts d
irect
ly to
the
Boa
rd o
f Dire
ctor
s on
its e
thic
al c
orpo
rate
m
anag
emen
t pol
icy
and
rele
vant
mat
ters
, an
d pr
ogra
m to
pre
vent
une
thic
al c
ondu
ct
and
mon
itor i
ts im
plem
enta
tion?
The
supp
liers
and
cus
tom
ers o
f the
Com
pany
hav
e si
gned
the
Lette
r of U
nder
taki
ng o
f Int
egrit
y in
com
plia
nce
with
theA
ct o
n R
ecus
al o
f Pub
lic S
erva
nts D
ue to
Con
flict
s of I
nter
est a
nd th
e Et
hics
Gui
delin
es fo
r Civ
il Se
rvan
ts.
The
Com
pany
doe
s not
set u
p an
eth
ical
man
agem
ent u
nit.
The
impl
emen
tatio
n st
atus
for e
thic
al m
anag
emen
t 1.
In o
rder
to im
plem
ent t
he e
thic
al m
anag
emen
t pol
icy
and
prev
ent u
neth
ical
con
duct
, the
C
ompa
ny h
olds
ann
ual t
rain
ing
cour
ses o
n re
leva
nt la
ws a
nd re
gula
tions
. The
cou
rses
cov
er
ethi
cal m
anag
emen
t, pr
oced
ures
for i
nves
tigat
ion
and
publ
ic h
andl
ing
of m
ater
ial
info
rmat
ion,
pre
vent
ion
of in
side
r tra
ding
, the
Com
pany
Act
, the
Sec
uriti
es a
nd E
xcha
nge
Act
and
oth
er la
ws a
nd re
gula
tions
. 2.
202
0.12
.30
The
Com
pany
's le
gal a
dvis
or, M
r. C
hen,
Cho
ng Y
i, w
as in
vite
d to
the
mor
ning
m
eetin
g to
exp
lain
to a
ll th
e di
rect
ors a
nd o
ffice
rs a
bove
the
team
lead
er le
vel a
nd th
e fo
urth
gr
ade
staf
f abo
ut th
e re
gula
tions
rela
ted
to "
insi
der t
radi
ng".
116
peop
le p
artic
ipat
ed in
the
mee
ting
and
the
rele
vant
info
rmat
ion
was
pos
ted
on th
e C
ompa
ny's
inte
rnal
web
site
and
sent
to
the
dire
ctor
s for
all
empl
oyee
s to
dow
nloa
d an
d st
udy.
No
mat
eria
l di
ffere
nce.
~ 61 ~

Ass
esse
d Ite
ms
Impl
emen
tatio
n St
atus
(Not
e 1)
Non
-impl
emen
tatio
n an
d its
reas
ons
Yes
No
Sum
mar
y an
d Ex
plan
atio
n
(III
) W
heth
er th
e co
mpa
ny h
as e
stab
lishe
d po
licie
s to
prev
ent c
onfli
ct o
f int
eres
ts,
prov
ide
appr
opria
te c
omm
unic
atio
n an
d co
mpl
aint
cha
nnel
s and
impl
emen
t suc
h po
licie
s pro
perly
? (I
V)
To im
plem
ent r
elev
ant p
olic
ies o
n et
hica
l co
nduc
ts, h
as th
e co
mpa
ny e
stab
lishe
d ef
fect
ive
acco
untin
g an
d in
tern
al c
ontro
l sy
stem
s, au
dit p
lans
bas
ed o
n th
e as
sess
men
t of u
neth
ical
con
duct
, and
ha
ve it
s eth
ical
con
duct
pro
gram
aud
ited
by in
tern
al a
udito
rs o
r CPA
per
iodi
cally
?(V
) D
oes t
he c
ompa
ny p
rovi
de in
tern
al a
nd
exte
rnal
eth
ical
con
duct
trai
ning
pr
ogra
ms o
n a
regu
lar b
asis?
3. T
he C
ompa
ny h
as e
stab
lishe
d a
spec
ific
whi
stle
blow
ing
syst
em a
nd a
nnou
nced
the
inte
rnal
in
depe
nden
t whi
stle
blow
ing
mai
lbox
and
hot
line
on th
e C
ompa
ny's
web
site
in th
e St
akeh
olde
rs' s
ectio
n an
d th
e C
SR R
epor
t. T
he C
ompa
ny h
as d
esig
nate
d a
resp
onsi
ble
pers
on o
r uni
t to
hand
le re
ports
that
invo
lve
dire
ctor
s or s
enio
r exe
cutiv
es. T
he re
port
shou
ld
be su
bmitt
ed to
the
inde
pend
ent d
irect
ors o
r the
Aud
it C
omm
ittee
, and
the
type
s of m
atte
rs to
be
repo
rted
and
the
stan
dard
ope
ratin
g pr
oced
ures
for t
he in
vest
igat
ion
shou
ld b
e es
tabl
ishe
d.
Inve
stig
atio
n ca
ses,
inve
stig
atio
n pr
oces
ses,
resu
lts a
nd re
late
d do
cum
ents
shal
l be
reco
rded
an
d m
aint
aine
d.
Kee
p th
e id
entit
y of
the
whi
stle
blow
er a
nd th
e co
nten
ts o
f the
w
hist
lebl
owin
g re
port
conf
iden
tial.
Prot
ect t
he w
hist
lebl
ower
from
impr
oper
trea
tmen
t due
to
his/
her w
hist
lebl
owin
g.
The
Com
pany
has
a "
Cod
e of
Eth
ical
Con
duct
and
Reg
ulat
ions
on
Con
flict
of I
nter
est i
n Pu
blic
R
ecus
al" t
o pr
even
t con
flict
of i
nter
est r
elat
ed b
usin
ess;
the
empl
oyee
who
has
a c
onfli
ct o
f in
tere
st in
the
busi
ness
shou
ld in
form
the
supe
rvis
or a
nd re
cuse
him
self/
hers
elf;
the
Boa
rd
mem
bers
will
not
par
ticip
ate
in th
e di
scus
sion
and
vot
e on
the
mot
ion
if a
conf
lict o
f int
eres
t is
invo
lved
. Th
e C
ompa
ny h
as a
n ef
fect
ive
acco
untin
g sy
stem
and
inte
rnal
con
trol s
yste
m, w
hich
is a
udite
d by
an
audi
t uni
t und
er th
e B
oard
of D
irect
ors a
nd b
y pr
ofes
sion
al in
depe
nden
t aud
itors
.
In 2
020,
the
Com
pany
con
duct
ed in
tern
al a
nd e
xter
nal t
rain
ing
rela
ted
to e
thic
al m
anag
emen
t (in
clud
ing
ethi
cal m
anag
emen
t reg
ulat
ions
, int
erna
l con
trol s
yste
ms,
acco
untin
g sy
stem
s, tir
e qu
ality
regu
latio
ns a
nd p
olic
ies,
safe
ty a
nd h
ealth
and
man
agem
ent)
for a
tota
l of 2
3,20
4 pa
rtici
pant
s and
26.
500
hour
s.II
I. Im
plem
enta
tion
stat
us o
f whi
stle
blow
ing
proc
edur
es
(I)
Doe
s the
com
pany
est
ablis
h sp
ecifi
c w
hist
lebl
owin
g an
d re
war
d pr
oced
ures
, se
t up
conv
enie
ntly
acc
essi
ble
repo
rting
ch
anne
ls, a
nd d
esig
nate
resp
onsi
ble
pers
onne
l to
hand
le th
e re
ports
rece
ived
?(I
I)
Whe
ther
the
com
pany
has
est
ablis
hed
stan
dard
ope
ratio
n pr
oced
ures
for
The
Com
pany
has
est
ablis
hed
a sp
ecifi
c w
hist
lebl
owin
g sy
stem
and
ann
ounc
ed th
e in
tern
al
inde
pend
ent w
hist
lebl
owin
g m
ailb
ox, h
otlin
e, re
spon
sibl
e pe
rson
nel o
r uni
t on
the
Com
pany
's w
ebsi
te in
the
Stak
ehol
ders
' sec
tion
and
the
CSR
Rep
ort.
Fo
r rel
ated
info
rmat
ion,
ple
ase
go to
the
Com
pany
’s w
ebsi
te:
(http
://cs
r.ken
da.c
om.tw
/def
ault.
aspx
?lan
g=0&
men
uid=
5)
The
Com
pany
has
des
igna
ted
a re
spon
sibl
e pe
rson
or u
nit t
o ha
ndle
repo
rts th
at in
volv
e di
rect
ors
or se
nior
exe
cutiv
es. T
he re
port
shou
ld b
e su
bmitt
ed to
the
inde
pend
ent d
irect
ors o
r the
Aud
it
No
mat
eria
l di
ffere
nce.
~ 62 ~

Ass
esse
d Ite
ms
Impl
emen
tatio
n St
atus
(Not
e 1)
Non
-impl
emen
tatio
n an
d its
reas
ons
Yes
No
Sum
mar
y an
d Ex
plan
atio
n
inve
stig
atin
g th
e co
mpl
aint
s rec
eive
d,
follo
w-u
p m
easu
res a
fter i
nves
tigat
ion
are
com
plet
ed, a
nd e
nsur
ing
such
co
mpl
aint
s are
han
dled
in a
con
fiden
tial
man
ner?
(I
II)
Doe
s the
com
pany
ado
pt p
rope
r mea
sure
s to
pre
vent
impr
oper
trea
tmen
t fro
m
reta
liatio
n fo
r whi
stle
blow
er?
Com
mitt
ee, a
nd th
e ty
pes o
f mat
ters
to b
e re
porte
d an
d th
e st
anda
rd o
pera
ting
proc
edur
es fo
r the
in
vest
igat
ion
shou
ld b
e es
tabl
ishe
d. F
or th
e in
vest
igat
ion
case
s, in
vest
igat
ion
proc
esse
s, re
sults
an
d re
late
d do
cum
ents
are
pro
perly
reco
rded
and
mai
ntai
ned.
Th
e C
ompa
ny k
eeps
the
iden
tity
of th
e w
hist
lebl
ower
and
the
cont
ents
of t
he w
hist
lebl
owin
g re
port
conf
iden
tial.
The
Com
pany
shal
l kee
p th
e id
entit
y of
the
whi
stle
blow
er a
nd th
e co
nten
ts o
f the
whi
stle
blow
ing
repo
rt co
nfid
entia
l, an
d sh
all p
rote
ct th
e w
hist
lebl
ower
from
impr
oper
trea
tmen
t due
to h
is/h
er
whi
stle
blow
ing.
IV.
In
form
atio
n D
iscl
osur
e (I
) D
oes t
he c
ompa
ny d
iscl
ose
its g
uide
lines
on
bus
ines
s eth
ics a
s wel
l as i
nfor
mat
ion
abou
t im
plem
enta
tion
of su
ch g
uide
lines
on
its w
ebsi
te a
nd M
arke
t Obs
erva
tion
Post
Sys
tem
(“M
OPS
”)?
Th
e C
ompa
ny h
as e
stab
lishe
d a
Cod
e of
Con
duct
on
Inte
grity
, whi
ch is
dis
clos
ed o
n th
e C
ompa
ny's
web
site
and
the
Mar
ket O
bser
vatio
n Po
st S
yste
m.
No
mat
eria
l di
ffere
nce.
V.
If th
e co
mpa
ny h
as e
stab
lishe
d co
rpor
ate
gove
rnan
ce p
olic
ies b
ased
on
Ethi
cal C
orpo
rate
Man
agem
ent B
est P
ract
ice
Prin
cipl
es fo
r TW
SE/G
TSM
Lis
ted
Com
pani
es, p
leas
e de
scrib
e an
y di
scre
panc
y be
twee
n th
e po
licie
s and
thei
r im
plem
enta
tion.
Th
e C
ompa
ny h
as e
stab
lishe
d th
e "E
thic
al C
orpo
rate
Man
agem
ent B
est P
ract
ice
Prin
cipl
es"
in a
ccor
danc
e w
ith th
e "E
thic
al C
orpo
rate
Man
agem
ent B
est P
ract
ice
Prin
cipl
es
for T
WSE
/GTS
M L
iste
d C
ompa
nies
" an
d ha
s fol
low
ed th
e re
leva
nt re
gula
tions
. The
re is
no
diffe
renc
e be
twee
n th
e op
erat
ion
and
the
regu
latio
ns.
VI.
Oth
er im
porta
nt in
form
atio
n to
faci
litat
e be
tter u
nder
stan
ding
of t
he c
ompa
ny’s
cor
pora
te c
ondu
ct a
nd e
thic
s com
plia
nce
prac
tices
(e.g
., re
view
the
com
pany
’s c
orpo
rate
co
nduc
t and
eth
ics p
olic
y)
The
Com
pany
will
revi
ew a
nd a
men
d th
e Et
hica
l Cor
pora
te M
anag
emen
t Bes
t Pra
ctic
e Pr
inci
ples
y b
ased
on
the
impl
emen
tatio
n st
atus
eac
h ye
ar a
nd th
e re
leva
nt la
w a
nd
regu
latio
ns.
Not
e: 1
. Sup
plie
rs: h
ttp://
csr.k
enda
.com
.tw/d
efau
lt.as
px?l
ang=
0&m
enui
d=5,
37,7
1 2.
Cus
tom
ers:
http
://cs
r.ken
da.c
om.tw
/def
ault.
aspx
?lan
g=0&
men
uid=
5,38
,73
3. E
mpl
oyee
s:ht
tp://
csr.k
enda
.com
.tw/d
efau
lt.as
px?l
ang=
0&m
enui
d=5,
36,5
9 4.
Sha
reho
lder
s: h
ttp://
csr.k
enda
.com
.tw/d
efau
lt.as
px?l
ang=
0&m
enui
d=3,
23&
edita
ble=
1
~ 63 ~

64
(VII) If the company has adopted corporate governance best-practice principles or related bylaws, disclose how these are to be searched. The Company's Corporate Governance Principles, Corporate Social Responsibility
Principles, Code of Ethical Conduct and Regulations on Recusal of Stakeholders, and
Ethical Corporate Management Best Practice Principles are all clearly defined and
available on the Company's website (http://csr.kenda.com.tw/) and on the Market
Observation Post System.
(VIII) Other significant information that will provide a better understanding of the state of the company's implementation of corporate governance may also be disclosed.
1. The Company's corporate governance practices are disclosed on the website
( http://csr.kenda.com.tw/ ) and on the Market Observation Post System.
2. We will comply with the internal control system, ensure its on-going and effective
operation, implement internal control self-examination, strengthen the audit and report to
the Board of Directors.
3. The Company implements a spokesperson system to make information transparent and
fully disclose material information so that our shareholders have the right to receive
information on an equal basis.
4. Directors of the Company attend continuing education courses to fulfil the corporate
governance practices of the Company.
(IX) The implementation status of the company's internal control system 1. Statement on Internal Control
~ 64 ~

65
Kenda Rubber Ind. Co., Ltd.
The statement of the Internal Control System of the Company.
Date: March 25, 2021
Based on the findings of a self-assessment, the Company states the following with regard to its internal control system during
the year 2020:
I. The Company’s Board of Directors and management are responsible for establishing, implementing, and maintaining an
adequate internal control system. Our internal control is a process designed to provide reasonable assurance over the
effectiveness and efficiency of our operations (including profitability, performance and safeguarding of assets), reliability
of the financial reporting, and compliance with laws and regulations.
II. An internal control system has inherent limitations. No matter how perfectly designed, an effective internal control
system can provide only reasonable assurance of accomplishing its stated objectives. Moreover, the effectiveness of an
internal control system may be subject to changes due to extenuating circumstances beyond our control. Nevertheless,
our internal control system contains self-monitoring mechanisms, and the Company takes immediate remedial actions in
response to any identified deficiencies.
III. The Company evaluates the design and operating effectiveness of its internal control system based on the criteria
provided in the Regulations Governing Establishment of Internal Control Systems by Public Companies (herein below,
the “Regulations”). The criteria adopted by the Regulations identify five key components of managerial internal control:
(1) control environment, (2) risk assessment, (3) control activities, (4) information and communication, and (5)
monitoring activities. There are several items in each key components. Please refer to the Regulations for the preceding
items.
IV. The Company has evaluated the design and operating effectiveness of its internal control system according to the
aforesaid Regulations.
V. Based on the findings of such evaluation, the Company believes that, on December 31, 2019, it has maintained, in all
material respects, an effective internal control system (that includes the supervision and management of our subsidiaries),
to provide reasonable assurance over our operational effectiveness and efficiency, reliability of the financial reporting,
and compliance with laws and regulations.
VI. This Statement is an integral part of the Company’s annual report and prospectus, and will be made public. Any
falsehood,concealment, or other illegality in the content made public will entail legal liability under Articles 20, 32, 171,
and 174 of the Securities and Exchange Act.
VII. This Statement was passed by the Board of Directors in their meeting held on March 25, 2021, all the 11 directors
present hereby affirm the content of this Statement.
Kenda Rubber Ind. Co., Ltd.
Chairman:Yang, Chi-Jen
President:Chen, Chao-Jung
2. If CPA was engaged to conduct a special audit of internal control system, provide its audit report: None.
~ 65 ~

66
(X) If there has been any legal penalty against the Company or its internal personnel, or any disciplinary penalty by the Company against its internal personnel for violation of the internal control system, during the most recent fiscal year or during the current fiscal year up to the publication date of the annual report, where the result of such penalty could have a material effect on shareholder equity or securities prices, the annual report shall disclose the penalty, the main shortcomings, and condition of improvement: None.
(XI) Material resolutions of a shareholders meeting or a board of directors meeting during the most recent fiscal year or during the current fiscal year up to the date of publication of the annual report: None.
1. The result and implementation status of the Annual Shareholders Meeting: The Annual Shareholders Meeting was convened on June 16, 2020.
Proposals
Resolutions and voting results
Implementation statusResult of the votes
Percentage of the total votes represented by the attending shareholders at the time of voting
1. Adoption of the 2019 Business Report and Financial Statements.
Approval votes: 692,223,667 (including 150,688,410 electronic votes) 98.94% Publicly announced according to the resolution.
Disapproval votes: 57,301 (including 57,301 electronic votes) 0.00% Invalid votes: 0 (including 0 electronic vote) 0.00% Abstention votes/no votes: 7,323,409 (including 7,233,689 electronic votes) 1.04%
This proposal was adopted as proposed. 2. Adoption of the
2019 Earnings Distribution.
Approval votes: 650,981,167 (including 109,445,910 electronic votes) 93.04% Cash dividend paid on October 7, 2020 at NT$0.4 per share; the record date for the stock dividend distribution is September 8, 2020.
Disapproval votes: 42,024,454 (including 42,024,454 electronic votes) 6.00% Invalid votes: 0 (including 0 electronic vote) 0.00% Abstention votes/no votes: 6,598,756 (including 6,509,036 electronic votes) 0.94%
This proposal was adopted as proposed.
3. Amendment to the Company's Articles of Incorporation.
Approval votes: 692,925,467 (including 151,390,210 electronic votes) 99.04% The amendment was made in accordance with the resolution, publicly announced and approved by the Ministry of Economic Affairs on July 20, 2020.
Disapproval votes: 71,669 (including 71,669 electronic votes) 0.01% Invalid votes: 0 (including 0 electronic vote) 0.00% Abstention votes/no votes: 6,607,241 (including 6,517,521 electronic votes) 0.94%
This proposal was approved as proposed.
4. Proposal for new shares issue through the capitalization of earnings.
Approval votes: 92,917,520 (including 151,382,263 electronic votes) 99.04% The new shares were issued in accordance with the resolution. The change of registration was approved by the Ministry of Economic Affairs on 22 September 2020.
Disapproval votes: 86,402 (including 86,402 electronic votes) 0.01% Invalid votes: 0 (including 0 electronic vote) 0.00% Abstention votes/no votes: 6,600,455 (including 6,510,735 electronic votes) 0.94%
This proposal was approved as proposed.
~ 66 ~

67
2. Major decisions of Board Meetings
Date Major Proposals
2020.01.17 1. The proposal of the year-end bonus for the Company's managerial officers.
2. The proposal of the year-end bonus for the directors of the Company who execute the business
operations.
3. A motion to review the salaries for the directors and the managerial officers of the Company who
execute the business operations.
4. The proposal for increasing the investment in Kenda Rubber (Vietnam) Co., Ltd., the subsidiary of the
Company.
5. The proposal for increasing the investment in Kenda Rubber (Indonesia) Co., Ltd., the subsidiary of
he Company.
6. The proposal for destruction of the Company's accounting books and documents upon the expiration
of their retention period.
7. The proposal of the endorsement and guarantee for the Company's subsidiaries.
8. The proposal of the loan amount application for the Company.
2020.03.26 1. The proposal of the employees' and directors' remuneration for the year 2019.
2. The adoption of the 2019 Business Report and Financial Statements.
3. The proposal of the 2019 earning distribution.
4. The proposal to distribute the cash dividends to shareholders from the 2019 earnings of the Company.
5. The proposal for new shares issue through the capitalization of earnings.
6. The amendments to the company’s “Articles of Incorporation”
7. Matters related to the shareholders' proposal for the 2020 Annual Shareholders' Meeting being
accepted by the Company.
8. The proposal to convene the 2020 Annual Shareholders’ Meeting of the Company.
9. The proposal to lease the land and factory from KF Co., Ltd.
10. The statement of the Internal Control System of the Company.
11. The amendment to the “Internal Control System” of the Company.
12. The amendment to the “Internal Audit Implementation Rules” of the Company.
13. The proposal of the endorsement and guarantee for the Company's subsidiaries.
14. The proposal of the loan amount application for the Company.
2020.05.06 1. The proposal of the Company's financial statements for the first quarter of 2020.
2. The proposal to review the shareholders who hold more than one percent or more of the total number
of issued shares of the Company.
3. The proposal to convene the 2020 Annual Shareholders’ Meeting of the Company.
4. The application for extending the endorsement and guarantee for the Company's associates.
5. The proposal of the loan amount application for the Company.
~ 67 ~

68
Date Major Proposals
2020.08.12 1. The proposal of the Company's financial statements for the second quarter of 2020.
2. The proposals to issue new shares by the capitalization of the Company's 2019 earnings and to
determine the record date for cash dividends and other related matters.
3. The amendment to the Corporate Governance Best Practice Principles of the Company.
4. The proposal of the endorsement and guarantee for the Company's subsidiaries.
5. The proposal of the loan amount application for the Company.
2020.11.11 1. The preparation of the Company's audit plan for 2021.
2. The proposal of the Company's financial statements for the third quarter of 2020.
3. The distribution of remuneration to the directors of the Company.
4. The distribution of remuneration to the managerial officers and directors of the Company who execute
the business operations.
5. A motion to review the salaries for the managerial officers and directors of the Company who execute
the business operations.
6. The amendment to the " Regulations on the Performance Evaluation of the Board of Directors and
Functional Committees" of the Company.
7. The amendment to the Company's "Rules of Procedure for Board of Directors Meetings".
8. The amendment to the Company’s “Audit Committee Charter”.
9. The amendment to the Company’s “Rules Governing the Scope of Powers of Independent Directors”.
10. The amendment to the Company’s “Remuneration Committee Charter”.
11. The proposal of the endorsement and guarantee for the Company's subsidiaries.
12. The proposal of the loan amount application for the Company.
2021.02.03 1. The proposal of the year-end bonus for the Company's managerial officers.
2. The proposal of the year-end bonus for the directors of the Company who execute the business
operations.
3. A motion to review the salaries for the directors and the managerial officers of the Company who
execute the business operations.
4. The amendments to the company’s “Articles of Incorporation”
5. The proposal of the endorsement and guarantee for the Company's subsidiaries.
6. The proposal of the loan amount application for the Company.
2021.03.25 1. The proposal of the employees' and directors' remuneration for the year 2020.
2. The adoption of the 2020 Business Report and Financial Statements.
3. The proposal of the 2020 earning distribution.
4. The proposal to distribute the cash dividends to shareholders from the 2020 earnings of the Company.
5. Amendment to the Company's Articles of Incorporation.
6. Amendment to the Company’s Rules of Procedures for Shareholders Meetings.
7. The re-election of directors (including independent directors) of the Company.
8. The proposal to convene the 2021 Annual Shareholders’ Meeting of the Company.
9. The Company accepted the shareholders' motions for the 2021 Annual Shareholders' Meeting and
matters relating to the acceptance of nominations of Directors and Independent Director candidates.
~ 68 ~

69
Date Major Proposals
2021.03.25 10. The proposal to nominate candidates for directors (including independent directors) by the Board of
Directors of the Company and to review the qualifications of the nominees.
11. Release the prohibition on directors from participation in competitive business.
12. The statement of the Internal Control System of the Company.
13. The proposal of the endorsement and guarantee for the Company's subsidiaries.
14. The proposal of the loan amount application for the Company.
2021.05.06 1. The proposal of the Company's financial statements for the first quarter of 2021.
2. The proposal to appoint a chief corporate governance officer.
3. The application for extending the endorsement and guarantee for the Company's associates.
4. The proposal of the loan amount application for the Company.
(XII) Where, during the most recent fiscal year or during the current fiscal year up to the date of publication of the annual report, a director or supervisor has expressed a dissenting opinion with respect to a material resolution passed by the board of directors, and said dissenting opinion has been recorded or prepared as a written declaration, disclose the principal content thereof: None.
(XIII) A summary of resignations and dismissals, during the most recent fiscal year or during the current fiscal year up to the date of publication of the annual report, of the company's chairman, president, chief accounting officer, chief financial officer, chief internal auditor, chief corporate governance officer, and chief research and development officer: None.
V. Information on CPA fees: (I) When non-audit fees paid to the certified public accountant, to the accounting firm of the
certified public accountant, and/or to any affiliated enterprise of such accounting firm are one quarter or more of the audit fees paid thereto, the amounts of both audit and non-audit fees as well as details of non-audit services shall be disclosed: Not applicable.
Accounting firm Name of CPA Audit period Remark
Deloitte & Touche Taiwan Wang, Yi-Wen, Tseng, Done-Yuin
2020
CPA professional fees range table Unit: In Thousand New Taiwan Dollars
Professional FeesFee Range Audit Fees Non-Audit Fees Total
1 $0 ~ $1,999,999
2 $2,000,000 to $3,999,999
3 $4,000,000 to $5,999,999
4 $6,000,000 to $7,999,999
5 $8,000,000 to $9,999,999 6 More than $10,000,000
Note: Non-audit fees include transfer pricing
~ 69 ~

70
Unit: In Thousand New Taiwan Dolalrs
Accountingfirm
Name of CPA Audit Fees
Non-Audit Fees CPA’s Audit Period
RemarkSystem (policy)design
BusinessRegistration
Human resource
Others(Note 2)
Subtotal
Deloitte &
Touche Taiwan
Wang, Yi-Wen, Tseng,Done-Yuin
5,132 1,781 1,781 2020
Transfer Pricing Report, Information on Salaries of
Full-time Employees in Non-Management Positions Checklist
Note 1: If the Company has replaced its CPA or accounting firm during the year, please indicate the period of audit and the reasons for the change in the remarks column, and disclose information on the audit and non-audit fees paid respectively.
Note 2: Non-audit fees should be listed separately by service item. If the "Other" non-audit fees amount exceed 25% of the total non-audit fees, the description of the service should be listed in the Remarks column.
(II) When the Company changes its accounting firm and the audit fees paid for the financial
year in which the change took place are lower than those paid for the financial year
immediately preceding the change, the amount of the audit fees before and after the
change and the reason shall be disclosed: Not applicable.
(III) When the audit fees paid for the current financial year are lower than those paid for the
immediately preceding financial year by 15 percent or more, the amount and percentage
of and reason for the reduction in audit fees shall be disclosed: None.
~ 70 ~

71
VI. Information on change in CPA: (I) Regarding the former CPA:
Date of Change in CPA January 29, 2019Reason and description for
the change in CPAThe Company changed its accounting firm and certified public accountants to meet the operational needs of the Company
Description of whether the CPA or the Company terminated or discontinued the engagement.
ClientStatus Certified Public
Accountant Consignor
Appointment terminated automatically
Lin, Ming-Shou and Yang, Chen-Yu
Kenda Rubber Ind. Co., Ltd.
Appointment rejected (discontinued)
The Opinions other than Unmodified Opinion Issued in the Last Two Years and the Reasons for the Said Opinions
None
Differences with the Company
Yes
Accounting principles or practices
Disclosure of Financial Statements
Audit scope or steps
Others
NoneExplanation
Supplementary Disclosures (Disclosures Specified in Article 10.6.1.4~7 of the Standards)
None
(II) Regarding the successor CPA: Accounting firm Deloitte & Touche Taiwan
Name of CPA Wang, Yi-Wen Tseng,Done-Yuin
Date of engagement January 29, 2019Prior to the Formal Engagement, Any Inquiry or Consultation on the Accounting Treatment or Accounting Principles for Specific Transactions, and the Type of Audit Opinion that Might be Rendered on the Financial Report
None
Written Opinions from the Successor CPAs that are Different from the Former CPA’s Opinions
None
(III) The Reply of Former CPAs on Article 10.6.1 and Article 10.6.2.3 of the Standards: None.
VII. Chairman, President, finance or accounting managers who have worked in the accounting firm who audit the Company’s reports or its affiliates during the most recent year:None
~ 71 ~

72
VIII. Share transfers and change in pledges on shares by directors, supervisors, managers and shareholders with at least 10% stakes during the most recent year and as of the print date of this annual report:
(I) Information on changes in the shareholdings of directors, supervisors, managerial officers and major shareholders (holding more than 10% of the shares):
Unit: shares
Position (Note 1)
Name
2020As of April 20 of the
current year
Increase (decrease) in the number of
shares held
Increase (decrease) in the number of shares pledged
Increase (decrease) in the number of
shares held
Increase (decrease) in the number of
shares pledgedChairman
(Major Shareholders)Yang, Chi-Jen 3,434,229 0 0 (1,800,000)
Vice Chairman Chang, Hong-Der 2,196,575 0 0 0
Director Yang, Ying-Ming 1,437,540 0 0 0
Director Hsiao, Ru-Po (240,797) 0 (7,000,000) 0
Director Chen, Chao-Jung (6,671,947) 0 0 0Director Yang, Chia-Ling 1,443,048 0 (9,000) 2,000,000Director Lin, Tsung-Yi 400,546 0 0 0Director Kenjou. Co., Ltd. 2,538
Independent Director
Hsieh,Chun-Mou 0 0 0 0
Independent Director
Su, Ching-Yang 0 0 0 0
Independent Director
Lin,Sheng-Chung 0 0 0 0
Vice President Shen, Jui-Hsiung 0 0 0 0Assistant
Vice PresidentHuang, Shi-Cheng 515 0 0 0
Assistant Vice President
Lin, Chun-Ke 268 0 0 0
Assistant Vice President
Chen, Chin-Fu 0 0 0 0
Assistant Vice President
Chang, Hui-Chu 3,320 0 (3,320) 0
Assistant Vice President
Wu, Wu-Long (Note 2)
0 0 0 0
Assistant Vice President
Liu, Kuei-Chun 0 0 0 0
Assistant Vice President
Hsiao,Wei-Lien (Note 2)
0 0 0 0
Note 1: The shareholders holding more than 10% of the total shares of the Company should be indicated as major shareholders andlisted separately.
Note 2: Assistant Vice President Wu, Wu-Long was resigned on May 13, 2019; Mr. Hsiao Wei-Lien took the position on May 14, 2019.
~ 72 ~

73
(II) Information on the share transfer:
Name (Note 1)
Reason for transferring
the share (Note 2)
Transaction Date
Trading Counterpart
Relationship between the trading counterpart and the
company, the directors, managers and shareholders
holding more than 10 per cent of the shares
SharesTransaction
price
Chang, Hong-Der
acquired 2020.02.04Chang Yang ,
Hui-Meimother and son 190,374 47.50
Chang, Hong-Der
acquired 2020.02.18Chang Yang ,
Hui-Meimother and son 1,709,036 47.50
Chang, Hong-Der
acquired 2020.11.16Chang Yang ,
Hui-Meimother and son 99 0.00
Chang, Hong-Der
acquired 2020.11.16Chang Yang ,
Hui-Meimother and son 2,488 47.50
Chen, Chao-Jung
disposed 2020.05.27Chiang,
Tsai-FengHusband and wife 50,000 24.60
Chen, Chao-Jung
disposed 2020.08.19Stretch
Investment Co., Ltd.
Number of shares held under other persons’ names
6,900,000 27.90
Yang, Chia-Ling
acquired 2020.08.13Huang, Yu-Hwa
mother and daughter 340,000 24.40
Yang, Chi-Jen
disposed 2020.05.13Yang,
Sheng-Jiefather and son 90,000 24.40
Yang, Ying Ming
disposed 2020.06.03Yang,
Su-Tingfather and daughter 1,084,000 24.40
Hsiao, Ru-Po
disposed 2020.08.06Yang, Jin-Yi
mother and daughter-in-law 1,114,000 24.40
Hsiao, Ru-Po
disposed 2021.03.25Yang,
Shin-NanHusband and wife 7,000,000 34.20
Note 1: These names include the names of directors, supervisors, managers and shareholders holding more than 10% of the shares of the Company.
Note 2: This represents either acquisition or disposal.
(III) Information on the share pledge:
The counterparty of the share pledge of the Company is a related party: None.
~ 73 ~

74
IX. Information on the top 10 shareholders who are related to each other under SFAS No. 6 or are related to each other as spouses, second degree of kinship:
Relationship information among the top ten shareholders Unit: Shares; %
Name
Number of shares held in person
Number of shares held by spouse and children
of minor age
Total number of shares held under
other persons’ names
The names and relationships
of the top ten shareholders who are related parties or
are related to each other as a spouse or second
degree of kinship.
Remarks
Shares Percentage
of Ownership
Shares Percentage
of Ownership
SharesPercentage
of Ownership
Name Relation
Yang, Chi-Jen 91,622,924 10.07% 9,801,904 1.08% 0 0
Yang, Ying-Ming Yang, Hsiu-Ya
2nd degree of kinship
Yang, Ying-Ming 65,555,015 7.21% 17,320,649 1.90% 0 0
Yang, Chi-Jen Yang, Su-Ting
2nd degree of kinship
Fubon Life Insurance Co., Ltd.
53,079,761 5.84% 0 0 0 0 None None
Representative: Tsai,
Ming-Hsing 0 0 0 0 0 0 None None
Yang, Jin-Yi
39,783,360 4.37% 0 0 0 0Yang, Shu-Yuan Yang,Ying-Yuan
2nd degree of kinship
Yang, Chia-Ling
28,668,065 3.15% 0 0 0 0 Yang, Chia-Yu 2nd degree of kinship
Yang, Hsiu-Ya
26,416,551 2.90% 0 0 0 0 Yang, Chi-Jen 2nd degree of kinship
Yang, Shu-Yuan
25,119,924 2.76% 0 0 0 0Yang,Jin-Yi
Yang, Ying-Yuan 2nd degree of kinship
Yang, Ying-Yuan
25,119,924 2.76% 0 0 0 0Yang,Jin-Yi
Yang, Shu-Yuan 2nd degree of kinship
Yang, Su-Ting
21,679,793 2.38% 0 0 0 0 Yang, Ying-Ming 2nd degree of kinship
Yang, Chia-Yu
20,164,793 2.22% 2,398,969 0.26% 0 0 Yang, Chia-Ling 2nd degreeof kinship
Note 1: The top ten shareholders should all be listed, and the names of corporate shareholders and the names of their representatives should be listed separately.
Note 2: The calculation of the percentage of ownership refers to the calculation of the percentage of shareholding in the name of oneself, one's spouse, one's minor children or the name of another person respectively.
Note 3: The shareholders listed in the preceding paragraph shall include both juristic and natural persons and the relationship between them shall be disclosed as well.
~ 74 ~

75
X. Ownership of Shares in Affiliated Companies: Unit: Thousand Shares; %
Investment Business
Invested by the
Company
Investment made by directors,
supervisors, managers and companies
directly or indirectly controlled by
them
Consolidated
Investments
SharesShares
RatioShares Shares Ratio Shares
Shares
Ratio
KA subsidiary - 100.00 - - - 100.00
KHK Subsidiary - 100.00 - - - 100.00
KV Subsidiary - 100.00 - - - 100.00
KE Subsidiary - 100.00 - - - 100.00
Kenda International
Corporation, Subsidiary- 100.00 - - - 100.00
KF, Subsidiary - 100.00 - - - 100.00
KI Subsidiary - 99.99 - 0.01 - 100.00
Note: Long-term investments accounted for using the equity method.
~ 75 ~

76
Four. Capitalization
I. Capitalization and shares (I) Source of share capital
Year/ month
Issuance price
Authorized capital Paid-in capital Remarks
Shares Amount Shares Amount Source of share capital Contribution to share capital with non-cash assets
Others
1962.03 100 9,600 960,000 9,600 960,000 Founding share capital None None
1966.03 100 30,000 3,000,000 30,000 3,000,000 Issuance of common stock for cash 2,040,000 None None
1967.03 100 48,000 4,800,000 48,000 4,800,000 Issuance of common stock for cash 1,800,000 None None
1968.01 100 60,000 6,000,000 60,000 6,000,000 Issuance of common stock for cash 1,200,000 None None
1970.04 100 80,000 8,000,000 80,000 8,000,000 Issuance of common stock for cash 2,000,000 None None
1973.09 100 160,000 16,000,000 160,000 16,000,000 Issuance of common stock for cash 8,000,000 None None
1974.12 100 240,000 24,000,000 240,000 24,000,000 Issuance of common stock for cash 8,000,000 None None
1975.12 100 360,000 36,000,000 360,000 36,000,000
Issuance of common stock for cash 1,776,000 Issuance of shares for capitalization of capital surplus 10,224,000
None None
1977.04 100 480,000 48,000,000 480,000 48,000,000
Issuance of common stock for cash 7,320,000 Issuance of shares for capitalization of earnings 4,680,000
None None
1978.08 100 600,000 60,000,000 600,000 60,000,000
Issuance of common stock for cash 8,400,000 Issuance of shares for capitalization of earnings 3,600,000
None None
1979.07 100 860,000 86,000,000 860,000 86,000,000
Issuance of common stock for cash 11,000,000 Issuance of shares for capitalization of earnings 15,000,000
None None
1980.06 10 12,610,000 126,100,000 12,610,000 126,100,000
Issuance of common stock for cash 10,000,000 Issuance of shares for capitalization of earnings 30,100,000
None None
1981.07 10 19,545,500 195,455,000 19,545,500 195,455,000 Issuance of shares for capitalization of earnings 69,355,000
None None
1985.05 10 32,640,985 326,409,850 32,640,985 326,409,850 Issuance of shares for capitalization of earnings 130,954,850
None Public issuance status in 1985 Official Letter Taiwan-Finance-Securities (I) No. 00682 on May 27, 1985
1986.08 10 43,086,100 430,861,000 43,086,100 430,861,000 Issuance of shares for capitalization of earnings 104,451,150
None Official Letter Taiwan-Finance-Securities (I) No.00812 on August 6, 1986
1988.09 10 60,000,000 600,000,000 50,000,000 500,000,000 Issuance of shares for capitalization of earnings 69,139,000
None Official Letter Taiwan-Finance-Securities (I) No. 09055 on September 16, 1988
1990.01 10 60,000,000 600,000,000 60,000,000 600,000,000 Issuance of shares for capitalization of earnings 100,000,000
None Official Letter Taiwan-Finance-Securities (I) No. 02601 on December 29, 1989
1990.11 10 80,000,000 800,000,000 80,000,000 800,000,000
Issuance of common stock for cash 100,400,000 Issuance of shares for capitalization of earnings 99,600,000
None Official Letter Taiwan-Finance-Securities (I) No. 35820 on October 17, 1990
1991.08 10 96,000,000 960,000,000 96,000,000 960,000,000
Issuance of shares for capitalization of earnings 96,000,000 Issuance of shares for capitalization of capital surplus 64,000,000
None Official Letter Taiwan-Finance-Securities (I) No. 01562 on July 17, 1991
~ 76 ~

77
Year/ month
Issuance price
Authorized capital Paid-in capital Remarks
Shares Amount Shares Amount Source of share capital Contribution to share capital with non-cash assets
Others
1992.08 10 120,000,000 1,200,000,000 113,280,000 1,132,800,000
Issuance of shares for capitalization of earnings 76,800,000 Issuance of shares for capitalization of capital surplus 96,000,000
None Official Letter Taiwan-Finance-Securities (I) No. 01584 on July 13, 1992
1993.08 10 160,000,000 1,600,000,000 130,000,000 1,300,000,000
Issuance of shares for capitalization of earnings 92,538,000 Issuance of shares for capitalization of capital surplus 74,662,000
None Official Letter Taiwan-Finance-Securities (I) No. 01700 on July 14, 1993
1995.07 10 162,500,000 1,625,000,000 162,500,000 1,625,000,000
Issuance of shares for capitalization of earnings 280,800,000 Issuance of shares for capitalization of capital surplus 44,200,000
None Official Letter Taiwan-Finance-Securities (I) No. 37684 on June 27, 1995
1996.07 10 173,875,000 1,738,750,000 173,875,000 1,738,750,000
Issuance of shares for capitalization of earnings 81,250,000 Issuance of shares for capitalization of capital surplus 32,500,000
None Official Letter Taiwan-Finance-Securities (I) No. 37640 on June 14, 1996
1997.07 10 198,217,500 1,982,175,000 198,217,500 1,982,175,000
Issuance of shares for capitalization of earnings 208,650,000 Issuance of shares for capitalization of capital surplus 34,775,000
None Official Letter Taiwan-Finance-Securities (I) No. 48771 on June 24, 1997
1998.07 10 300,000,000 3,000,000,000 229,932,300 2,299,323,000
Issuance of shares for capitalization of earnings 279,486,675 Issuance of shares for capitalization of capital surplus 37,661,325
None Official Letter Taiwan-Finance-Securities (I) No. 54403 on June 22, 1998
1999.07 10 300,000,000 3,000,000,000 271,320,114 2,713,201,140
Issuance of shares for capitalization of earnings 390,884,910 Issuance of shares for capitalization of capital surplus 22,993,230
None Official Letter Taiwan-Finance-Securities (I) No. 58268 on June 25, 1999
2000.07 10 320,000,000 3,200,000,000 306,591,728 3,065,917,280
Issuance of shares for capitalization of earnings 339,150,140 Issuance of shares for capitalization of capital surplus 13,566,000
None Official Letter Taiwan-Finance-Securities (I) No. 55494 on June 27, 2000
2001.07 10 320,388,400 3,203,884,000 320,388,400 3,203,884,000
Issuance of shares for capitalization of earnings 122,636,690 Issuance of shares for capitalization of capital surplus 15,330,030
None Official Letter Taiwan-Finance-Securities (I) No. 140082 on June 26, 2001
2002.07 10 336,408,000 3,364,080,000 336,408,000 3,364,080,000 Issuance of shares for capitalization of earnings 160,196,000
None Official Letter Taiwan-Finance-Securities No. 0910134107 on June 24, 2002
2003.07 10 430,000,000 4,30,000,0000 360,000,000 3,600,000,000 Issuance of shares for capitalization of earnings 235,920,000
None Official Letter Taiwan-Finance-Securities (1) No. 0920129322 on July 2, 2003
2004.07 10 430,000,000 4,300,000,000 396,000,000 3,960,000,000 Issuance of shares for capitalization of earnings 360,000,000
None Official Letter Securities-Futures (1) No. 0930129968 on July 7, 2004
2005.07 10 450,000,000 4,500,000,000 435,600,000 4,356,000,000 Issuance of shares for capitalization of earnings 396,000,000
None Official Letter FSC(1) No. 0940126863 on July 5, 2005
2006.06 10 480,000,000 4,800,000,000 459,558,000 4,595,580,000 Issuance of shares for capitalization of earnings 239,580,000
None Official Letter FSC(1) No. 0950126935 on June 28, 2006
2007.07 10 500,000,000 5,000,000,000 489,500,000 4,895,000,000 Issuance of shares for capitalization of earnings 299,420,000
None Official Letter FSC (1) No. 0960033561 on July 3, 2007
2008.06 10 530,000,000 5,300,000,000 526,250,000 5,262,500,000 Issuance of shares for capitalization of earnings 367,500,000
None Official Letter FSC (1) No. 0970031758 on June 26, 2008
2009.07 10 560,000,000 5,600,000,000 552,600,000 5,526,000,000 Issuance of shares for capitalization of earnings 263,500,000
None Official Letter FSC (1) No. 0980032824 on July 2, 2009
~ 77 ~

78
Year/ month
Issuance price
Authorized capital Paid-in capital Remarks
Shares Amount Shares Amount Source of share capital Contribution to share capital with non-cash assets
Others
2010.07 10 630,000,000 6,300,000,000 620,600,000 6,206,000,000 Issuance of shares for capitalization of earnings 680,000,000
None Official Letter FSC (1) No. 0990034001 on July 1, 2010
2011.07 10 700,000,000 7,000,000,000 688,900,000 6,889,000,000 Issuance of shares for capitalization of earnings 683,000,000
None Official Letter FSC (1) No. 1000030584 on July 1, 2011
2012.07 10 740,000,000 7,400,000,000 733,680,000 7,336,800,000 Issuance of shares for capitalization of earnings 447,800,000
None Official Letter FSC (1) No. 1010029032 on July 2, 2012
2013.07 10 770,000,000 7,700,000,000 763,030,000 7,630,300,000 Issuance of shares for capitalization of earnings 293,500,000
None Official Letter FSC (1) No. 1020027562 on July 23, 2013
2014.07 10 820,000,000 8,200,000,000 816,450,000 8,164,500,000 Issuance of shares for capitalization of earnings 534,420,000
None Official Letter FSC (1) No. 1030028779 on July 29, 2014
2015.07 10 860,000,000 8,600,000,000 857,280,000 8,572,800,000 Issuance of shares for capitalization of earnings 408,300,000
None Official Letter FSC (1) No. 1040028293 on July 27, 2015
2016.09 10 880,000,000 8,800,000,000 874,430,000 8,744,300,000 Issuance of shares for capitalization of earnings 171,500,000
None Official Letter MOEA-Authorization-Business No. 10501227020 on September 22, 2016
2020.09 10 910,000,000 9,100,000,000 909,410,000 9,094,100,000 Issuance of shares for capitalization of earnings 349,800,000
None Official Letter MOEA-Authorization-Business No. 10901177170 on September 22, 2020
April 20, 2021
Type of shares
Authorized capital
Remarks No. of shares outstanding (note)
No. of shares
unissuedTotal
Commonshare
909,410,000 shares 590,000 910,000,000
shares Note: The shares are listed without
restrictions on trading.
(II) Shareholder structure April 20, 2021
Shareholder structure
Number
Government agencies
Financialinstitutions
Other legal persons
Foreigninstitutions
and foreigners Individual Total
Number of shareholders
4 13 103 197 28,999 29,316
Number of shares held
292 81,081,440 68,798,117 76,128,532 683,401,619 909,410,000
Shareholding % 0.00 8.92 7.57 8.37 75.14 100
~ 78 ~

79
(III) Dispersion of ownership April 20, 2021
Shareholder bracket Number of shareholders Number of shares held Shares Ratio
1 ~ 999 13,643 3,058,873 0.34%
1,000 ~ 5,000 10,654 22,275,106 2.45%
5,001 ~ 10,000 2,273 15,785,625 1.74%
10,001 ~ 15,000 939 11,157,446 1.23%
15,001 ~ 20,000 430 7,603,345 0.84%
20,001 ~ 30,000 447 10,664,447 1.17%
30,001 ~ 40,000 218 7,502,421 0.82%
40,001 ~ 50,000 139 6,290,296 0.69%
50,001 ~ 100,000 238 16,665,385 1.83%
100,001~ 200,000 138 18,596,651 2.04%
200,001 ~ 400,000 73 20,156,273 2.22%
400,001 ~ 600,000 24 12,105,118 1.33%
600,001~ 800,000 12 8,387,164 0.92%
800,001~ 1,000,000 13 11,916,847 1.31%
1,000,001 or above 75 737,245,003 81.07%
Total 29,316 909,410,000 100.00%
(IV) Major shareholders: with 5% or more stakes or top ten shareholders
Shareholdings Name of major shareholder
Number of shares held
Shareholding %
Yang, Chi-Jen 91,622,924 10.07%
Yang, Ying-Ming 65,555,015 7.21%
Fubon Life Insurance Co., Ltd. representative: Tsai Ming-Hsing
53,079,761 5.84%
Yang, Jin-Yi 39,783,360 4.37%
Yang, Chia-Ling 28,668,065 3.15%
Yang, Hsiu-Ya 26,416,551 2.90%
~ 79 ~

80
ShareholdingsName of major shareholder
Number of shares held
Shareholding %
Yang, Shu-Yuan 25,119,924 2.76%
Yang, Ying-Yuan 25,119,924 2.76%
Yang, Su-Ting 21,679,793 2.38%
Yang, Chia-Yu 20,164,793 2.22%
(V) Market price, net value, earnings and dividends per share and relevant data during the most recent two years
Market Price, Book value, Earnings and Dividends per share Year
Item2019 2020
As of March 31, 2021
Market price per share
Highest 33.40 38.15 44.45
Lowest 27.75 24.10 31.10
Average 30.15 29.99 35.37
Net value per share
Before distribution 21.48 21.01 -
After distribution 19.88 20.01 -
Earnings per share (EPS)
Weighted average number of shares 874,430,000
shares909,410,000
shares 909,410,000
shares
Earnings per share (EPS)
Before adjustment 1.16 1.07 -
After adjustment 1.11 1.07 -
Dividends per share
Cash dividends 0.4 1.0 -
Bonus shares
Stock dividends via capitalization of earnings
0.4 0.0 -
Stock dividends via capitalization of capital surplus
- - -
Cumulative unpaid dividends - - -
Return on investment
Price earnings ratios 25.99 28.03 -
Price earnings ratio 75.38 29.99 -
Cash dividend yield (%) 1.33 3.33 -
Note 1: The earnings distribution has yet to be ratified by the general shareholders’ meeting. Note 2: Price earnings ratio based on pre-adjusted earnings
(VI) Dividend policy and implementation status
1. Dividend policy If there is any retained earnings at the year-end, the Company shall first pay tax and make up for the accumulated deficits, and then set aside 10% of such earnings as a legal reserve, unless the legal reserve has reached the Company's total capital. If necessary, the special reserve shall be set aside or reversed as required by law or by the competent authority.
~ 80 ~
81
The Company takes into consideration its business environment and growth stage in its capital requirements and long-term financial planning as well as cash inflows required by shareholders.The Board of Directors will propose, together with the accumulated undistributed earnings from the previous year, to set aside 10% to 80% of the available earnings for distribution. When new shares are issued for dividends, a resolution by the shareholders’ meeting shall be required. However, the ratio of new shares to be issued for the earnings distribution may be adjusted by a resolution of the shareholders' meeting, depending on the actual profitability and capital position of the year; of which the cash dividends shall not be less than 10% of the total dividends. The Company authorizes the Board of Directors, with the presence of at least two-thirds of the Directors and a resolution by a majority of the Directors present, to distribute all or part of the dividends from earnings, legal reserve and capital surplus in the form of cash and report the same to the shareholders' meeting.
2. Percentage of profits to be distributed as remuneration to employees and directors The Company shall distribute remuneration to its employees at a rate of 0.5% to 1% of the profit for the year. The Company shall distribute the Directors' remuneration not exceeding 3% of the profit for the year. Where the Company has accumulated losses as provided in the preceding two paragraphs, an amount to cover the losses shall first be set aside. Employees' remuneration may be paid in shares or in cash to employees of the Company and to employees of controlled or associated companies who meet certain requirements as determined by the Board of Directors. The earnings for the year referred to in paragraphs 1 and 2 are the earnings before taxation for the year excluding the remuneration to employees and directors. The distribution of remuneration to employees and directors shall be resolved by a majority vote at a meeting of board of directors attended by two-thirds of the total number of directors, and in addition thereto a report of such distribution shall be submitted to the shareholders’ meeting.
~ 81 ~

82
3. Proposal to the 2020 general shareholders’ meeting the distribution of dividends:
Kenda Rubber Ind. Co., Ltd.
Earnings Distribution Table for the Year 2020 Unit: NT$
Unappropriated retained earnings at the beginning of the period
Net profit after tax for the period
$ 6,125,575,016
972,224,651
The remeasurement of defined benefit plans recognized in
retained earnings (24,546,008)
Net profit after tax and items excluded from net profit after tax
for the period to be added into unappropriated earnings of the
year 947,678,643
Less: Legal reserve (10%) ( 94,767,864)
Less: Special reserve (Note) (270,947,315)
Distributable net profit for the period 6,707,538,480
Distributable items:
Cash Dividend for shareholders’ bonus (at 1.0 per share)
Stock Dividend for shareholders’ bonus
909,410,000
0
Unappropriated retained earnings $ 5,798,128,480
Note: Special reserve is recognized in accordance with Jin-Guan-Zheng-Fa-Zi No. 1010012865.
(VII) Impact of the issuance of bonus shares proposed to this shareholders’ meeting on the Company’s operating performance and earnings per share:
There is no issuance of bonus shares proposed to this shareholders’ meeting.
(VIII) Remuneration to employees and directors 1. Percentage or scope of remunerations to employees and directors stated in the Articles
of Incorporation: Please refer to (VI) for the dividend policy.
2. Basis of estimates for remunerations to employees and director for the period,
calculation for the number of shares to be distributed as employees’ remunerations, and
accounting treatment of any discrepancy between the actual distributed amount and the
estimated amount: To be recognized as adjustment to profit or losses for the following
year.
3. Remuneration distribution approved by the Board of Directors
~ 82 ~

83
(1) Amount of remunerations to employees and directors issued in cash or shares
Difference in amounts, reasons and treatment of any discrepancy between estimated
amount and recognized expenses for the year:
The special resolution by the Board of Directors in 2020 decided to issue the
following:
The percentage of profits to be distributed to employees is 0.93% or
NT$11,188,489 in total; the percentage of profits to be distributed to directors is
1.40% or NT$16,792,546 in total. All distributions are in cash.
There is no difference between the recognized amount and the amount intended to
be distributed.
(2) The amount of employees’ remunerations issued with stocks and such amount as a
percentage of net incomes in the parent company’s or the individual financial report
during the period and as a percentage of the total amount of employees’
remunerations:
There is no issuance of stock dividends to employees.
4. Actual distribution of remunerations to employees, directors and supervisors during the
previous year (including the number of shares issued, the amount, and share prices)
Difference in amounts, reasons and treatment of any discrepancy from the recognized
expenses for remunerations to employees, directors and supervisors
Item Recognized
amount
Proposed
amount Difference
Reason for the
differenceTreatment
Remuneration to
employees 11,040,000 11,040,000 0
Not applicable. Not applicable.Remuneration to
directors and
supervisors
16,570,000 16,570,000 0
(IX) Share repurchases: none
II. Corporate bonds: none
III. Preferred shares: none
~ 83 ~

84
IV. Overseas depositary receipts: none
V. Employee Stock Options Plan (ESOP): none
VI. New restricted shares to employees: none
VII. Mergers & acquisitions: none
VIII. Implementation of capital utilization plan: None.
~ 84 ~

85
Five. Operations
I. Content of Businesses (I) Scope of businesses
1. Content of businesses (1) C804010 Tyres Manufacturing (2) CD01050 Bicycles and Parts Manufacturing (3) C805070 Reinforced Plastic Products Manufacturing (4) CB01010 Mechanical Equipment Manufacturing (5) F401010 International Trade (6) F114030 Wholesale of Motor Vehicle Parts and Motorcycle Parts, Accessories (7) F114040 Wholesale of Bicycle and Component Parts Thereof (8) F114050 Wholesale of Tires (9) F214030 Retail Sale of Motor Vehicle Parts and Motorcycle Parts, Accessories (10) F214040 Retail Sale of Bicycle and Component Parts Thereof (11) F214050 Retail Sale of Tires (12) ZZ99999 All business items that are not prohibited or restricted by law, except those that
are subject to special approval.
2. Revenue proportion
Content of businesses Revenue
proportion(1) Manufacturing, processing, wholesale and retail of a variety of
rubber and plastic products 85.79 %(2) Manufacturing, wholesale and retail of a variety of bicycles,
motorcycles and components 0 %(3) Manufacturing, wholesale and retail of a variety of carbon fibers
and composite materials 0 %(4) Manufacturing, wholesale and retail of a variety of carbon fiber
products 0 %(5) Manufacturing, wholesale and retail of a variety of 0 %(6) Imports, exports and trading of the abovementioned products 14.21 %
3. The Company’s current product portfolios: Inner tubes and cover tires of bicycles, motorbikes, industrial vehicles and light trucks; and radial tires
4. New products under development: airless tires; all steel STR trailer tires; ultra high-performance tires for sports utility vehicles
~ 85 ~

86
(II) Industry 1. Current status and development (1) The bicycle industry in Taiwan posted a 20.05% decline in shipments in 2020, down to
1.699 million units from 2.125 million in 2019. The export value dropped 18.14% in 2020, down to US$1.091 billion from US$1.341 billion in 2019. The average selling price increased 2.41% from US$631.03 in 2019 to US$646.24 in 2020. Taiwan’s export of electrically assisted bicycles increased 17.99% in 2020 to 760,000 million units from 644,000 units in 2019. The export value went up by 14.38% in 2020 to US$987 million from US$863 million in 2019. The average selling price dropped by 3.06% in 2020 to US$1.298.45 from US$1,339.43 in 2019.
(2) Taiwan produced a total of 1.297 million motorcycles (including all-terrain vehicle and motorbikes) in 2020, up by 10.48% from 1.1174 million units in 2019. Exports totaled 1.036 million units in 2020, up by 14.86% from 0.902 million units in 2019. Due to competition from China, ts the ATVs and motorbikes from Taiwan are increasingly for overseas and high-end markets. As a result, tires are increasingly moving toward high unit prices.
(3) Taiwan produced 245,600 cars in 2020, down 2.26% from 251,300 cars in 2019. Domestic sales reached 241,700 cars in 2020, up 5.17% from 229,800 cars in 2019. The number of new cars sold in 2020 exceeded 400,000 again and reached 457,435 units, up by 4% from 439,836 in 2019.
2. Upstream, midstream, and downstream of the industry In China, a total of 25.311 million cars (including commercial vehicles and passenger vehicles) were sold in 2020, down 1.9% year-over-year.
3. Product development trends and competition (1) The car market in China began stable growth in 2021 and is expected to reach 30 million
units in 2025. Despite COVID-19,over 25 million cars were sold in China in 2020, only 2% deviated from the original target.
(2) In 2020, the demand to combat COVID-19 and for infrastructure and logistics and the multiplication effect by policies & regulations and economic stimulus measures, medium and heavy trucks (particularly tow trucks) are growing at a high speed and with a heavier duty. The demand for commercial vehicles in 2021 will be about 4.4 million units.
(3) The market share of sport utility vehicles (SUVs) will continue to rise. The year 2020 saw for the first time the share of SUVs exceeded that of passenger vehicles. The SUVs to passenger cars ratio may reach 55:45 in 2025.
(4) The 2020 was the fast-growing year for the sales of new energy vehicles. All the OEMs around the world are working hard on the roadmap, R&D and distribution of new energy vehicles. In 2020, 1.36 million new energy vehicles were sold in China and more than 3
~ 86 ~

87
million in the world. The global market is expected to exceed 4 million units in 2021, with over 1.7 million sold in China, and 15 million in 2025, with about 5 million sold in China.
(III) Technology and R&D status1. From 2020 to March 31, 2021, the Company spent a total of NT$1,707,339,000 in R&D
expenses.
2. Technologies or products successfully developed from 2020 to March 31, 2021
(1) Development of low heat build-up and high-reinforcing side reinforced rubber,
introduction of new butadiene rubber with a modified recipe for run-flat tires
(2) Development of inner rubes with significantly higher gas barrier properties by using a new
liquid material and a breakthrough manufacturing process
(3) Development of tread rubber with low VOC (volatile organic compounds) residuals to
meet with the environmental protection requirements
(4) Development of color tread rubber for bicycle tires with high color fastness by introducing
weathering resistant rubber and using the recipe technology to maintain original
functionality
(5) Development of low heat build-up rubber for tread rubber of passenger cars, in order to
extend the service life of tires and reduce the likelihood of inner liner peel-off
(6) Development of tread rubber for high LTR (land transport rules) commercial vehicles with
high rigidity to enhance abrasion resistance of tires
(7) Establishment of a yaw angle testing method for bicycle tires
(8) Establishment of a pull-off test method for adhesion of non-pneumatic (NPT) tires
(9) Establishment of a tire tread testing method
(10) Establishment of a testing method for air going though tire cord yards
(11) Development of light and low rolling resistant MTB XC products
(12) Development of cyclocross gravel tires
(13) Development of electric bike cargo tires
(14) Development of high grip performance MTB DH car tires for downward slops
(15) Development of highly safe and low noise tires for mobility scooters
(16) Development of tires with low rolling resistance and high grip performance for all terrain
vehicles
(17) Development of KM1 radial tires for heavy vehicles
(18) Development of wire tires for scooters
(19) Development of comfortable, energy efficient and advanced tires for passenger cars
(20) Development of SUV snow tires in adherence to EU regulatory requirements
(21) Development of all season passenger car tires in adherence to EU regulatory requirements
~ 87 ~

88
3. R&D plan for the following year
(1) Development of Grade A environmental friendly tires with low rolling resistance and high
wet grip performance and in adherence to the new EU standards
(2) Development of new, recyclable and environmental friendly materials and recipes
(3) Development of new and environmental friendly tire technologies
(4) Continued development of VTDS (virtual tire development system)
(5) Development of all steel STR trailer tires
(6) Development of puncture-resistant tires for motorcycles
(7) Development of light and energy efficient tires
(8) Development of light radial tires for all terrain cross-country vehicles
(9) Development of half-wire radial tires for industrial vehicles
(10) Development of new of non-pneumatic (NPT) tires
(11) Development of a composite structure for tread rubber of bicycle tires
(12) Development of hook-less TLR (tubeless ready) bicycle tires
(13) Development of tires specially designed for electric vehicles
(14) Development of analytics technology for smart tires
(15) Development of special technology for wire cushioning materials
(IV) Short-term and long-term business development plan 1. Short-term plan (1) Market development for high valued added B/C tires, such as tires for E-bikes, E-Cargo
bikes and TLR tires (2) Continued business development for M/C tires in the global OEMs and aftermarkets;
business development of tires for large capacity vehicles and MCR (motorcycle radial) tires
(3) Development of the SUV tire business (4) Development of the UHP (ultra high performance) tire business (5) Increase of sales of radial tires in the global market (6) Development of the snow tire business (7) Development of the AT (all terrain) tire business (8) Development of the MT (mud terrain) tire business (9) Development of the RT (rugged terrain) tire business (10) Development of the road tire business (11) Development of contracted manufacturing business for PCR (passenger car radial) and
LTR (land transport rules) tires (12) Development of the all season tire business
~ 88 ~

89
(13) Development of the radial tire business in the golf cart market (14) Promotion of of non-pneumatic (NPT) tires tires for golf carts
2. Long-term plan (1) Development of the MCR (motorcycle radial) tire business (2) Development of the slick tire business (Performance tires for motorcycles and PCR drift
tires) (3) Development of the TBR (truck and bus radial) tire business (4) Increase in the snow tire product range (5) Higher percentage of sales of radial tires in all market segments (6) Development of the tire business for large agricultural and industrial vehicles (7) Development of the business for high-performance/speed motorcycle tires and
cross-road motorcycle tires (8) Continued development of high-performance and high value added B/C tire business in
the mid-priced premier segment (9) Development of the ATV (all-terrain vehicle) radial tire business (10) Development of the dual-compound tire business
II. Market, Production and Sales Overview (I) Market analysis
1. Overseas markets (1) Markets for the Company’s main products
North America, Europe, Central and South America, Middle East and Africa, Asia, New Zealand and Australia
(2) Market shares According to the 2020 Global Tire Company Rankings, we were the top 26th player based on 2019 sales.
(3) Supply, demand and market growth in the future We will continue to enhance the brand image KENDA, develop high value added products for the market and strive to increase customers’ satisfaction and recognition. The performance of multiple PCR products launched in 2020 received great ratings in the market and are expected to generate strong sales. Our factory in Indonesia ramped up in the second quarter of 2017, expanded capacity in 2018 and 2019 and again in 2020. To meet the demand for car tires and spare tires, we have installed new equipment for additional capacities in Kunshan and Tianjin in China and Yunlin in Taiwan. The new facility in Vietnam for passenger car tires ramped up in 2018.
(4) The U.S. government conducted an anti-dumping investigation on passenger car tires and light truck tires from Taiwan, South Korea and Thailand and an anti-dumping and
~ 89 ~

90
countervailing-duty investigation on Vietnam. The preliminary expectation for our factory in Vietnam is 0% anti-dumping duty and 6.77% countervailing duty. This is lower than the duties on manufacturers in other regions and protective of our competitiveness of products exported to the U.S.
(5) Competitive niches (5.1)We proactively participate in and sponsor tradeshows in relation to our products and famous racing teams, racers and competitions around the world such as the follows:
Columbus Blue Jacket for NHL (National Hockey League); Cleveland Indians for MLB (Major League Baseball); Phoenix Suns, New Orleans Pelicans, San Antonio Spurs, Boston Celtics and Miami Heat for NBA (National Basketball Association);Ohio State University for NCAA (National Collegiate Athletic Association) basketball; Ohio State University for NCCA soccer; female golfers Candie Kung and Hsinning Yeh; UHC Rally Road, Norco Factory Bicycle Team, PolygonDH Team;Chinese Taipei Cycling Team; Kenda Global Cycling Team in the US; Norco Factory Team in the US; Incycle Enduro Team; Team KHS; riders such as Mike Steidley, Kyle Strait, Eric Porter, Andrew Taylor, Nic Beechan, Austin Warren, Rachel Strait, Laura Slavin, and Rebecca Gross;Speed EVO&JNRT Team in Taiwan; ELITE Fly Team in Taiwan; 2019 SongShan Cup International Tournament (basketball); Unilions for Chinese Professional Baseball League in Taiwan; Formula Drift Japan; and TSR & KCC Challenge for motorcyclers in Taiwan. The KENDA brand is well-exposed around the world. Tradeshows Bicycle tradeshows around the world, such as EUROBIKE and TAIPEI CYCLE; auto tradeshows such as SEMA Show in the U.S., MIMS Automechanika Moscow, TIRE COLOGNE and Bologna Motor Show; motorcycle tradeshows such as AIMExpo in the U.S., EICMA and INTERMOT in Europe. KENDA booths and services are present at all these tradeshows.
(5.2) Wheel fitment in Europe and the U.S. is an additional distribution channel and source of profits.
(5.3) The gradual reduction of tariffs and the increase of motorcycle sales in the Southeast Asian market have greatly benefited the Company’s business expansion in Southeast Asia for factories in Vietnam and Indonesia.
(5.4) In addition to stepping up sports marketing around the world, we are also significantly increasing advertising spending on billboards, in-store promotion, product presentations, digital marketing and social media so that the KENDA brand continues to increase exposure.
(5.5) The Company continues with the advertisements on trolleys at Shenzhen Bao'an International Airport and signboards along Shanghai-Nanjing Highway in China.
(5.6) Expansion of online marketing to quickly boost the brand exposure and shorten the distance with customers
~ 90 ~

91
(6) Positive and negative factors for development, and responding strategies (6.1) Positive factors (a) Policy support from the Chinese government such as the lifting of purchase restrictions
and “Cars Going to the Countryside” campaign are stimulating the new car market and boosting the penetration of cars. Despite the pandemic in 2020, the demand for automobiles still increased.
(b) New cars come with large-sized tires. Some mid-range models have changed from R14/15 to R16/17/18. This benefits the sale of large-diameter tires. Meanwhile, there is a demographic shift among car buyers. The number of car owners is on the rise. This supports the demand for SUVs and luxury cars. With the launch of a few high-performance SUV tires over recent years, the Company is seeing rapid growth in this segment.
(c) The electric vehicle market in China is growing fast. Foreign brands have entered the competition and the new energy vehicle market is increasingly mature. The Company’s R&D and sales department have launched market surveys and developed requirements. A development special project has been established. A quick launch of electric vehicle tires can boost the sales for both OEMs and aftermarkets.
(d) In Taiwan, the subsidy program for old vehicle replacement is extended for another five years. However, a subsidy reduction for electric motorcycles has direct influence on the sales volumes. The previously replaced motorcycles will soon need to replace tires and this will boost the demand in the aftermarket.
(e) The U.S. government conducted an anti-dumping investigation on passenger car tires and light truck tires from Taiwan, South Korea and Thailand and an anti-dumping and countervailing-duty investigation on Vietnam. The preliminary expectation for our factory in Vietnam is 0% anti-dumping duty and 6.77% countervailing duty. This is lower than the duties on manufacturers in other regions and protective of our competitiveness of products exported to the U.S.
(f) After years of efforts, Kenda North American Technical Center (KATC), the Company’s R&D center in the U.S., has developed multiple competitive PCR (passenger car radial) tires and LTR (land transport rules ) tires and gradually gained traction among U.S. consumers and market shares in North America. Through KATC’s continued R&D, marketing and advertising efforts, better sales and services, Kenda expects to soon achieve its 5% market share target in North America for PCR (passenger car radial) tires and LTR (land transport rules) tires.
(6.2) Negative factors and responding strategies Chinese tire manufacturers are rapidly expanding capacities for passenger car tires
but the US has taken Section 301 actions against China. This will lead to intensified competition in the low-and-mid-end segments. Therefore, Kenda will develop high value added products and differentiations, particularly in the SUV, 4x4, UHP (ultra high performance) tire markets.
~ 91 ~

92
Due to COVID-19, bicycle exports declined sharply in the first half of the year but demand surged during the second half of the year with bikes becoming the main commuting and sporting vehicle. However, component makers were not able to prepare for the supplies in time due to capacity constraints. Assembly plants thus hoarded materials in order to ensure smooth shipments. Meanwhile, containers arrived in Europe and the U.S. but unloading could not be processed on time. This resulted in a container shortage and soaring transportation costs. The assembled bicycles could not be exported due to a lack of containers. The sales of bicycles in 2020 dropped 20.05% from 2019. The average selling price increased from US$631.03 in 2019 to USD646.24 in 2020. The market for electrically assisted bicycles increased by 17.99% in 2020 from 2019. The average selling price declined from US$1,339.43 in 2019 to US$1,298.45 in 2020.
2. Domestic market (1) Establishment of distribution channels
With different distributors for motorcycle tires, bicycle tires and passenger car tires, the Company has established a strong distribution network all over Taiwan. Our sales continue growing because we are close to customers and our quality is well recognized.
(2) New product R&D, innovation and launch of high-performance products The Company has developed innovative and high-performance bicycle tires, motorcycle tires, ATV (all-terrain vehicle) and passenger car tires. The introduction of slick tires for racing cars and low rolling resistant tires for electric vehicles continues to enhance KENDA as a professional brand. We meet customers’ needs in both OEMs and aftermarkets.
(3) Establishment of own brand We have been engaged in sports marketing and investing in multimedia advertisements around the world, so that KENDA is a widely-known global brand.
(4) Development of sports marketing By participating in public interest campaigns, fulfilling social responsibility and sponsoring national teams, professional baseball teams, cycling teams and golfing competitions, we seek to enhance our brand exposure.
~ 92 ~

93
(II) Main utilization and production/manufacturing process of key products 1. Main utilization of key products
By end market Bicycle tires Motorcycle tires Tires for agricultural and
industrial vehicles Tires for passenger
cars and trucks Mountain bike tires Tires for racing vehicles Tires for agriculture use Tires for large trucks
By vehicle
Cyclocross bikes Mountain bikes, cyclocross bikes Forklift tires Light trucks
Racing cars, recreational vehicles Street bikes Tires for golf carts High-speed caravans
Street bikes Scooters Tires for beach buggies Passenger cars
Tires for mobility scooters
Tires for lawn Mowers
2. Production/manufacturing process of key products
(1) Manufacturing flows for cover tires
Rubber compounding
Bead building Forming of
green tires Vulcanization Inspection WarehousingExtrusion of tread rubber/inner liner
Ply covering/cutting
(2) Manufacturing flows for inner tube:
Rubber compounding Tire tube extrusion Nose piecing Splicing Vulcanization Inspection Warehousing
(III) Supply of major materials Product name Supply status Natural rubber Mainly imported from Southeast Asia. Stable supply
Synthetic rubber Mainly imported from manufacturers in Asia and Europe and some domestic suppliers Stable supply
Reclaimed rubber Mainly imported from China and India. Stable supply Butyl rubber Mainly imported from China and Europe. Stable supply
Carbon black Mainly from manufacturers in Taiwan, China and other Asian countries. Stable supply
Plies Mainly from manufacturers in Taiwan, China and other Asian countries. Stable supply
Steel wires Mainly from manufacturers in China and other Asian countries. Stable supply
(IV) List of suppliers/customers accounting for at least 10% of purchases/sales
during the past two years, amounts and percentages of total
purchases/sales
~ 93 ~

94
1. Supplies accounting for at least 10% of purchasesUnit: NT$ Thousand
2020 2019 As of the first quarter of 2021
Item Name Amount As % of total
purchases for the year
Relation with the issuer
Name Amount As % of total
purchases for the year
Relation with the issuer
Name Amount As % of total purchases during the
most recent quarter of thecurrent year
Relation with the issuer
1 None - - - None - - - None - - - Net
purchases 10,717,347 100 Netpurchases 13,049,156 100 Net
purchases 5,289,732 100
2. Customers accounting for at least 10% of sales Unit: NT$ Thousand
2020 2019 As of the first quarter of 2021
Item Name Amount As % of total sales
for the year
Relation with the issuer
Name Amount As % of total sales
for the year
Relation with the issuer
Name Amount As % of total sales during
the most recent quarter of the current
year
Relation with the issuer
1 None - - - None - - - None - - - Net
sales 30,260,185 100 Netsales 32,127,436 100 Net
sales 8,563,973 100
Note 1: Please list the suppliers/customers accounting for at least 10% of purchases/sales during the past two years, amounts and percentages of total purchases/sales. However, indications may be made in codes if customers’ names cannot be disclosed due to contractual agreements or counterparties are non-related individuals.
Note 2: TWSE/TPEx listed companies should disclose financial data audited or reviewed by independent auditors for the most recent period as of the print date of the annual report.
The Company’s relation with suppliers, implementation of risk management policies and risk measurement criteria As our demand for raw materials grows over time, the assurance of reliable quality and timely supply of procured products is an important element of our supply chain management policy. For all the raw materials, we seek to maintain multiple suppliers with good and reliable quality and healthy operations, in order to avoid stock-outs. We conduct onsite audits on suppliers each year and on an ad-hoc basis, to ensure supply quality, delivery dates and quantities and fulfil corporate social responsibility. The global commodity market has been witnessing grater volatility during recent years. Therefore, the procurement strategy is centered on stability, with purchase in required quantities and control over inventory and cost risks. The Company always views suppliers as long-standing and reliable partners. Good suppliers are a key support to sales growth. Based on the principles of safety, prices, delivery dates, quality, service, environmental protection and sustainability, the Company carefully selects qualified suppliers and periodically reviews their product quality, delivery and service, as well as continued improvement and emphasis on the environment issues.
The Company is concerned with the economic, environmental and social developments of the whole
~ 94 ~
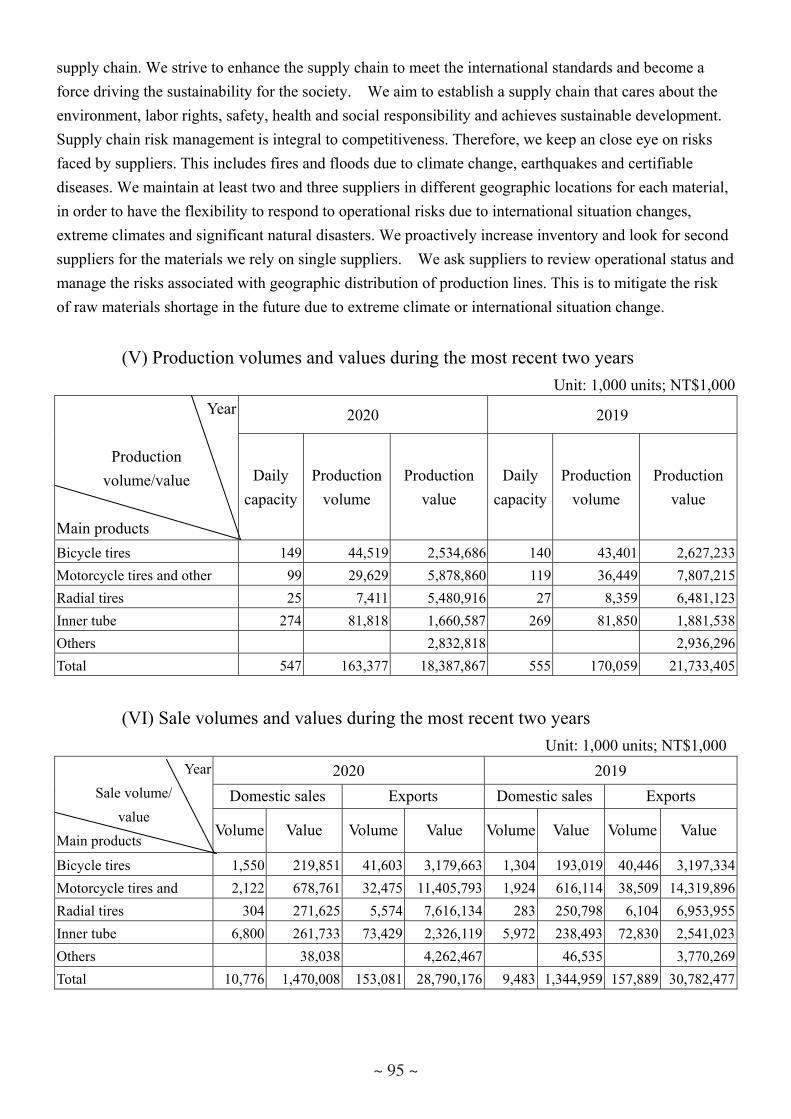
95
supply chain. We strive to enhance the supply chain to meet the international standards and become a force driving the sustainability for the society. We aim to establish a supply chain that cares about the environment, labor rights, safety, health and social responsibility and achieves sustainable development. Supply chain risk management is integral to competitiveness. Therefore, we keep an close eye on risks faced by suppliers. This includes fires and floods due to climate change, earthquakes and certifiable diseases. We maintain at least two and three suppliers in different geographic locations for each material, in order to have the flexibility to respond to operational risks due to international situation changes, extreme climates and significant natural disasters. We proactively increase inventory and look for second suppliers for the materials we rely on single suppliers. We ask suppliers to review operational status and manage the risks associated with geographic distribution of production lines. This is to mitigate the risk of raw materials shortage in the future due to extreme climate or international situation change.
(V) Production volumes and values during the most recent two years Unit: 1,000 units; NT$1,000
Year
Productionvolume/value
Main products
2020 2019
Dailycapacity
Productionvolume
Productionvalue
Dailycapacity
Productionvolume
Productionvalue
Bicycle tires 149 44,519 2,534,686 140 43,401 2,627,233 Motorcycle tires and other 99 29,629 5,878,860 119 36,449 7,807,215 Radial tires 25 7,411 5,480,916 27 8,359 6,481,123 Inner tube 274 81,818 1,660,587 269 81,850 1,881,538 Others 2,832,818 2,936,296 Total 547 163,377 18,387,867 555 170,059 21,733,405
(VI) Sale volumes and values during the most recent two yearsUnit: 1,000 units; NT$1,000
Year Sale volume/
valueMain products
2020 2019 Domestic sales Exports Domestic sales Exports
Volume Value Volume Value Volume Value Volume Value
Bicycle tires 1,550 219,851 41,603 3,179,663 1,304 193,019 40,446 3,197,334 Motorcycle tires and 2,122 678,761 32,475 11,405,793 1,924 616,114 38,509 14,319,896 Radial tires 304 271,625 5,574 7,616,134 283 250,798 6,104 6,953,955 Inner tube 6,800 261,733 73,429 2,326,119 5,972 238,493 72,830 2,541,023 Others 38,038 4,262,467 46,535 3,770,269Total 10,776 1,470,008 153,081 28,790,176 9,483 1,344,959 157,889 30,782,477
~ 95 ~

96
III. Employees Employees data during the most recent two years and as of the print date of the annual report
Year 2019 2020 As of March 31, 2021
No. of employees
Office workers 3,362 3,544 3,568Operators 8,155 7,929 8,102
Total 11,517 11,473 11,670Average age 34.72 35.36 34.69
Average tenure 5.61 5.37 5.37
Distributionof education backgrounds
Doctoral Degree 3 3 3Master’s degree 76 84 86
Colleges and 2,515 2,476 2,413Senior high 2,524 3,112 3,299
Below senior 6,399 5,822 5,870
IV. Environmental protection expenses (I) Losses and penalties due to environmental pollution during the most recent
two years 1. The Environmental Protection Administration audited the Yunlin plant on November 26,
2019, identified the volume of raw materials used per hour for compounding recipes exceeding the maximum designed volume for stationary pollution sources stated in the operation permit, and imposed a fine of NT$100,000 according to Article 62 of the Air Pollution Control Act.
2. The Environmental Protection Bureau of Changhua County audited the Yuanlin plant on August 19, 2019, identified the storage of hazardous chemical waste liquids for over one year without cleaning or applying in advance for an extension for the storage, and imposed a fine of NT$60,000 due to violation of the Waste Disposal Act.
(II) Response to the Restriction of Hazardous Substances (RoHS) Directives in the European Union: N/A
~ 96 ~
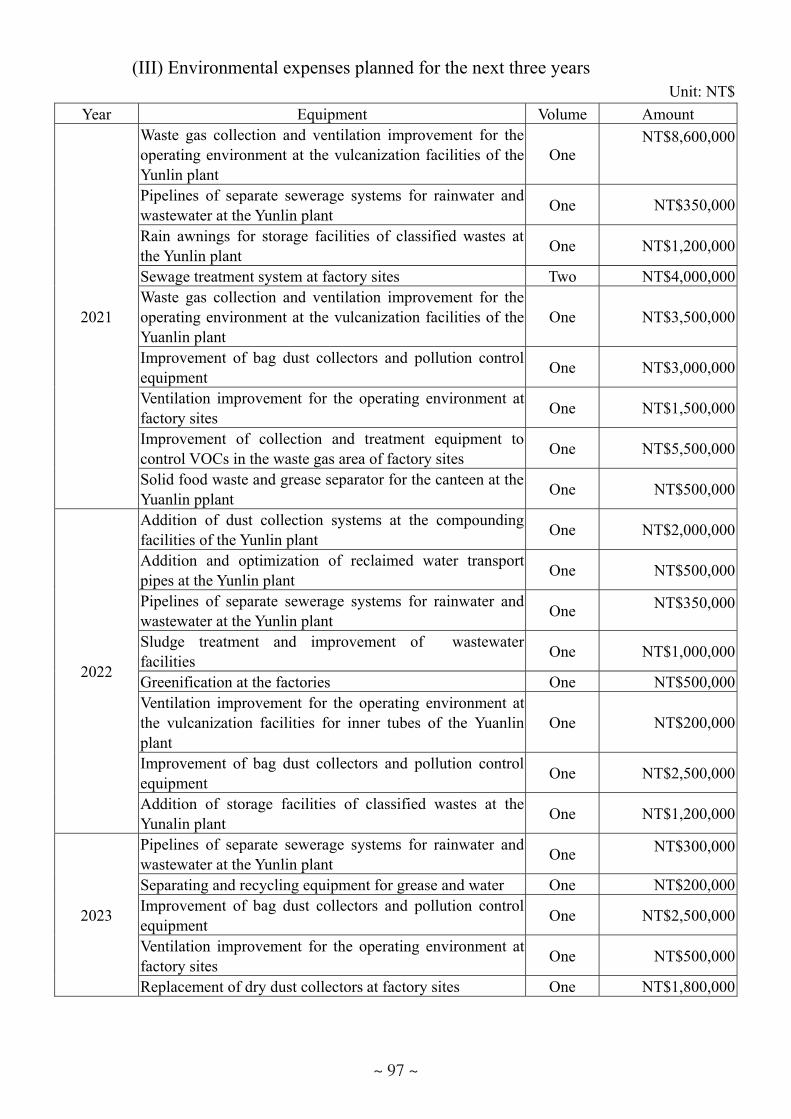
97
(III) Environmental expenses planned for the next three years Unit: NT$
Year Equipment Volume Amount
2021
Waste gas collection and ventilation improvement for the operating environment at the vulcanization facilities of the Yunlin plant
OneNT$8,600,000
Pipelines of separate sewerage systems for rainwater and wastewater at the Yunlin plant One NT$350,000
Rain awnings for storage facilities of classified wastes at the Yunlin plant One NT$1,200,000
Sewage treatment system at factory sites Two NT$4,000,000Waste gas collection and ventilation improvement for the operating environment at the vulcanization facilities of the Yuanlin plant
One NT$3,500,000
Improvement of bag dust collectors and pollution control equipment One NT$3,000,000
Ventilation improvement for the operating environment at factory sites One NT$1,500,000
Improvement of collection and treatment equipment to control VOCs in the waste gas area of factory sites One NT$5,500,000
Solid food waste and grease separator for the canteen at the Yuanlin pplant One NT$500,000
2022
Addition of dust collection systems at the compounding facilities of the Yunlin plant One NT$2,000,000
Addition and optimization of reclaimed water transport pipes at the Yunlin plant One NT$500,000
Pipelines of separate sewerage systems for rainwater and wastewater at the Yunlin plant One NT$350,000
Sludge treatment and improvement of wastewater facilities One NT$1,000,000
Greenification at the factories One NT$500,000Ventilation improvement for the operating environment at the vulcanization facilities for inner tubes of the Yuanlin plant
One NT$200,000
Improvement of bag dust collectors and pollution control equipment One NT$2,500,000
Addition of storage facilities of classified wastes at the Yunalin plant One NT$1,200,000
2023
Pipelines of separate sewerage systems for rainwater and wastewater at the Yunlin plant One NT$300,000
Separating and recycling equipment for grease and water One NT$200,000Improvement of bag dust collectors and pollution control equipment One NT$2,500,000
Ventilation improvement for the operating environment at factory sites One NT$500,000
Replacement of dry dust collectors at factory sites One NT$1,800,000
~ 97 ~

98
(IV) Environmental safety & health policy Green production, safety & health and sustainable operation
(V) Responding strategies: The Company has been emphasizing both industrial development and environmental protection since inception. We implement environmental friendly measures in water conservation, energy efficiency, carbon reduction and resource sustainability, in order to fulfill corporate social responsibility. Going forward, we will continue to improve the environmental qualify by adhering to the following strategies:
1. Careful operation and maintenance of water pollution control equipment and enhancement of emergency response capability for wastewater treatment, in order to avoid usual pollution events
2. Greenhouse gas inventory inspection; ISO 50001 energy management system; continued carbon reduction; product carbon footprint disclosure and waste reduction to reduce greenhouse gas emissions; better water recycling efficiency to conserve water resources; reduction in wastes from the manufacturing sources; enhancement of waste recycling and reuse
3. Implementation of the ISO 14001 environmental management system; pollution control and prevention; continued improvement of green production performance so that the manufacturing process is cleaner, more environmental friendly with less environmental impact to achieve corporate sustainability
(VI) Systems, measures and implementation of environmental protection, safety and health The Company’s environmental safety and health management was established according to the ISO 14001 and ISO 45001/TOSHMS standards. We became the first tire manufacturer that obtained the ISO 14001certification in 1998 and the ISO 45001/TOSHM certification in 2009. The environmental safety and health management system is implemented through a combination of daily management and total production management (TPM) activities. The Company integrates the environmental safety and health management plan with the actual operation in the factories and uses the PDCA (Plan, Do, Check and Action) cycle in implementations. The environmental and health risks associated with the company's operations are systematically evaluated in order to determine the potential impacts on the environment and employees from the use of the raw materials to the waste output processes. The Company will evaluate, replace and reduce the raw materials, control and mitigate the process pollution and effectively deal with end-of-pipe contamination for items that may cause a significant environmental impact. When it comes to safety and health, risk management is focusing on intrinsic safety of the equipment, safety of
~ 98 ~

99
chemicals and operations at the starting point, in order to protect the safety and physical and mental health for all employees. In order to achieve the goal of sustainability, we have established the "Environmental Safety and Health Policy" to continuously improve our environmental safety and health performance, with "Zero Disaster, Zero Pollution" as the ultimate goal for environmental protection and safety and health efforts. We set annual targets for the environmental health and safety management system and are committed to continuously improving environmental protection and health and safety management to reduce environmental impacts. We strive to prevent pollution and continuously improve the performance in environmental protection and management in health and safety.
V. Labor relations
(I) Current and important labor agreements and implementation status 1. Employees’ benefits: To boost employees’ morale and work efficiency, enhance
employee engagement and establish a stable work environment, the Company
established Kenda Employee Benefit Committee in March 1966 to drive many
benefit measures and harmonize labor relations. Below is a description of employee
benefits:
(1) To nurture talents in line with corporate development strategies, we organize
multiple training and education curricula and provide a variety of professional
competence training each year.
(2) Annual health checks for employees each year
(3) Establishment of employee leisure clubs such as in bowling, tennis, table tennis,
wellbeing, mountain climbing and cycling
(4) Bonuses for Labor Day, Dragon Boat Festival, Middle Autumn Festival and
year-end banquet each year
(5) Organized employee travels each year
(6) Scholarships for employees and their children, subsidies for childcare,
weddings, funerals and hospital stays
(7) Canteens to provide free meals to employees
(8) To reduce commuting troubles and take care of family, the Company started
the flexible work system in January 2019.This is to respect the employees’
need to balance between work and family, cultivate a pleasant work
environment, boost moral and administrative efficiency.
~ 99 ~
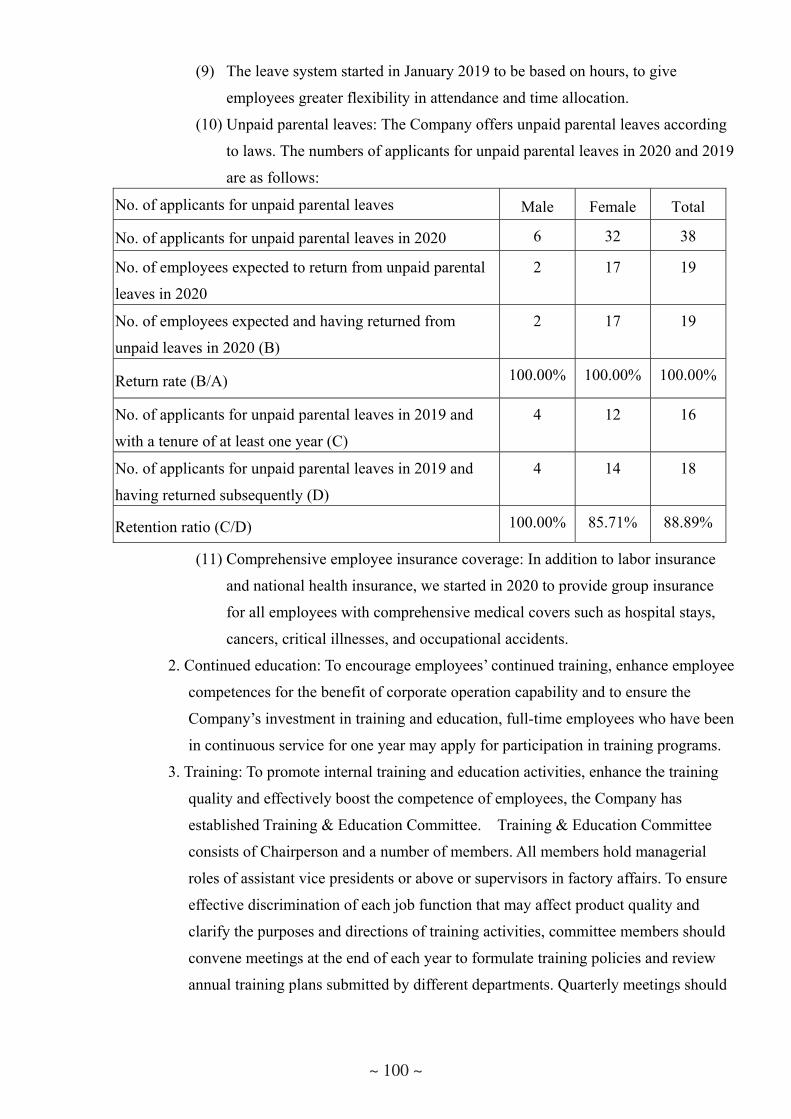
100
(9) The leave system started in January 2019 to be based on hours, to give
employees greater flexibility in attendance and time allocation.
(10) Unpaid parental leaves: The Company offers unpaid parental leaves according
to laws. The numbers of applicants for unpaid parental leaves in 2020 and 2019
are as follows:
No. of applicants for unpaid parental leaves Male Female Total
No. of applicants for unpaid parental leaves in 2020 6 32 38
No. of employees expected to return from unpaid parental
leaves in 2020
2 17 19
No. of employees expected and having returned from
unpaid leaves in 2020 (B)
2 17 19
Return rate (B/A) 100.00% 100.00% 100.00%
No. of applicants for unpaid parental leaves in 2019 and
with a tenure of at least one year (C)
4 12 16
No. of applicants for unpaid parental leaves in 2019 and
having returned subsequently (D)
4 14 18
Retention ratio (C/D) 100.00% 85.71% 88.89%
(11) Comprehensive employee insurance coverage: In addition to labor insurance
and national health insurance, we started in 2020 to provide group insurance
for all employees with comprehensive medical covers such as hospital stays,
cancers, critical illnesses, and occupational accidents.
2. Continued education: To encourage employees’ continued training, enhance employee
competences for the benefit of corporate operation capability and to ensure the
Company’s investment in training and education, full-time employees who have been
in continuous service for one year may apply for participation in training programs.
3. Training: To promote internal training and education activities, enhance the training
quality and effectively boost the competence of employees, the Company has
established Training & Education Committee. Training & Education Committee
consists of Chairperson and a number of members. All members hold managerial
roles of assistant vice presidents or above or supervisors in factory affairs. To ensure
effective discrimination of each job function that may affect product quality and
clarify the purposes and directions of training activities, committee members should
convene meetings at the end of each year to formulate training policies and review
annual training plans submitted by different departments. Quarterly meetings should
~ 100 ~

101
be organized to examine the implementation effectiveness of the previous quarter, so
that there is basis for the Company’s overall training and education.
The Company’s training and education system can be divided into (I) by nature:
pre-employment and on-the-job training and education; (II) by venue: onsite and
offsite. On-the-job training and education includes orientation for new hires, training &
education for different levels and specializations. This comprehensive training and
education system aims to enhance the professional knowledge and skills of employees
and boost the quality of human resources for the organization by the completion of
different training programs. Pre-employment training and education contains the
company introduction; organization; business philosophy; quality policy; environment,
safety and health policy; human resource management charter; employee benefits;
social groups; industrial safety and health; introduction to the factory environment.
Orientation for new hires focuses on the introduction of business units; daily
management rules; document management rules; periodical work lists; management
styles; and basic skills for the job descriptions.
Training and education for different levels are the curricula required for different
positions. These include quality control methods (fundamentals and practicals);
knowledge about tires and product safety; IT system operation; word processing;
briefing techniques; cost management; human resource management; BSC
management; 3T basics and practical foundation; management information utilization;
marketing overview; planning and implementation of the internal control system;
understanding of financial reporting; strategic planning and goal setting, etc.
Training and education for different specializations are the training of specialized
functions or about government regulations for sales personnel. The curricula include
incoming materials inspections; manufacturing process inspections; product
appearance inspections; product function inspections; instruments and equipment
calibration; measurement system & analysis; audits on internal quality, environment,
safety and health; product design and product testing. Special programs are
organized for meeting annual targets. For instance, the classes designed for sales
department include business negotiations and psychology of bargaining; product
pricing methods; management skills; B2B brand marketing (how to do brand
marketing to corporate customers); and development of core competitiveness for sales
managers. The training programs for production managers and team leaders cover
safety, production efficiency, environmental protection, quality, human resources and
leadership.
Our training and education expenses totaled NT$9,224,640 in 2020. Given a total of
~ 101 ~

102
55,687 hours, this translates to NT$27.94 hour/person. In sum, the enhancement of
human capital is one of the important tasks for the Company.
4. Retirement system
The Company makes pension contributions according to the Labor Standards Act
and the Labor Pension Act. The contributions under the new and old systems are 6%
and 15%, respectively. Pensions are paid monthly to personal accounts and in lump
sums from the dedicated account with Bank of Taiwan.
(1) Pension contributions according to laws range between 2% to 15% under the old
pension system. To protect employees’ life in retirement, the Company
contributes at the highest ratio of 15% each month to the account with Bank of
Taiwan. The contribution up to December 31, 2020 totaled NT$401,347,023.
(2) Contributions under the new pension system is at 6% monthly to personal wage
accounts of employees.
Retirement by employees is divided into voluntary retirement and mandatory retirement.
(1) Employees may retire voluntarily in any of the following circumstances:
(1.1) In service for 15 years or longer and aged 55 years old
(1.2) In service for 25 years or longer
(1.3) In service for 10 years or longer and aged 60 years old
(2) The Company may for mandatory retirement in any of the following
circumstances:
(2.1) Aged 65 years old
(2.2) Incapable of the job due to insanity or physical disability
(2.2) The definitions of insanity or physical disability are based on the
disabilities from the first grade to the six grade for labor insurance
(3) Retirement may be approved by the Company after a continued service and at
the age of 70 or higher.
Criteria for pension distributions (for those opt for the old system)
(1) One full year in service is entitled to a two-month pension credit. However, the
service over 15 years is granted one pension credit for each year beyond 15 years.
The number of pension credits is caped at 45. A service period of less than six
months is counted as half a year, a service period of more than six months as one
year. The service before the promulgation of the Labor Standards Act is
calculated according to Article 9 of the Regulations Governing the Retirement of
Factory Workers of Taiwan Province.
(2) If a worker is forced into mandatory retirement according to the second
paragraph of Article 54-1 of the Labor Standards Act due to insanity or physical
~ 102 ~

103
disability caused by performing job duties, an extra 20% is granted on top of the
aforesaid pension credit scheme. The basis for the pension credit in the first
paragraph is based on the average monthly wage at the time of approved
retirement.
Criteria for pension distributions (for those opt for the new system)
Those who joined before July 1, 2005 may opt for the new system or the
old system or choose not to select either initially. Those who opt for the old
system or choose not to select initially may decide to change once before June 30,
2010. Failure to submit a request for change is deemed to have opted for the old
system (for the calculation of service and pensions). Those who opt for the new
system may not change. However, those who joined on or after July 1, 2005 are
placed under the new system. As required, the Company contributes each month
to the personal accounts of employees under the new system. Employees may also
contribute 1%~6% of wages to their personal accounts.
5. Human right protection policy
(1)The Company strives to protect workers’ rights and abides by the Labor
Standards Act and relevant government policies on human rights. In addition to
policy advocacy, we have established multiple communication channels and
management mechanisms, to ensure that workers are properly taken care of. We
create a corporate environment that respects, cares about and protects human
rights. We provide a safe and healthy working environment and establish
precautions to avoid accidents or health hazards at work. We do not discriminate
in hiring, remuneration, promotion, training, retirement or termination of
employment on the basis of race, nationality, religion, gender, age, social class,
physical disability, family and marital status, union membership, or political
preference. In addition, the Company does not interfere with the workers'
religion, political party, marriage and the right to worship all kinds of traditions
and customs. In 2019, the Company did not violate human rights or
discriminated or infringed the disadvantaged and the vulnerable. There were no
cases subject to human rights review or impact assessment.
(2) To ensure the mental and physical health of employees and compliance with the
Labor Standards Act, the Company does not employ child labor below 16 years
old.
(3) The Company respects freedom of employment and there is no forced labor via
coercion, threat, confinement or other illegal means. The Company does not
withhold wages as default penalties or damages. Employees have the right to
~ 103 ~

104
terminate contracts according to the Labor Standards Law. We also ask our
suppliers to sign a statement for corporate social responsibility by committing
not to force or coerce labor.
6. Protective measures for employees’ safety and work environment and implementation
status
To protect work safety of all employees, the Company provides a work environment
with comprehensive facilities for occupational safety and health. In event of any
occupational hazards or accidents, employees will be sent to the hospital and relevant
assistance shall be provided according to the procedures in disaster responses. In
terms of human rights management, there is no unfair treatment. To avoid physical or
mental diseases caused by illegal infringement on the physical or mental status of
employees, any improper management by executives is strictly prohibited.
7. Labor agreement: There is no labor agreement given the Company’s long-standing
harmonious relation with workers and a lack of labor disputes.
(II) Losses incurred due to labor disputes during the most recent year and as of the print date of the annual report; disclosure of the estimated amount up date or possibly in the future and responding measures: none
VI. Important contracts: none
~ 104 ~

105
Six. Financials I. Summary financial statements during the most recent five years
(I) Names of the Certified Public Accountants and their audit opinions during the most recent five years
Year Names of independent auditors Audit opinions 2016 Benny Shao; Ming-Tang Lai Unqualified opinion 2017 Milton Lin, Benny Shao Unqualified opinion 2018 Milton Lin, Chen-Yu Yang Unqualified opinion 2019 Wang, Yi-Wen, Tseng, Done-Yuin Unqualified opinion 2020 Wang, Yi-Wen, Tseng, Done-Yuin Unqualified opinion
(II) Summary balance sheet Summary consolidated balance sheet –
International Financial ReportingStandards (IFRS) Unit: NT$1,000
Year
Item
Financial data during the past five years Financial data as of March 31, 2021 for the current year
2016 2017 2018 2019 2020
Current asset 28,702,073 25,263,266 23,622,678 23,140,356 22,572,473 25,503,189Property, Plant and Equipment 10,529,959 12,078,899 14,065,181 14,246,939 14,543,978 14,246,217Intangible asset 66,224 65,565 64,825 74,095 60,826 249,582Other assets 2,579,136 3,545,312 2,396,794 4,558,395 5,212,762 5,201,695Total assets 41,877,392 40,953,042 40,149,478 42,019,785 42,390,039 45,200,683
Current liability
Before distribution 8,182,924 9,380,640 10,092,227 8,473,776 10,038,519 10,763,524
After distribution 8,135,534 9,372,380 10,076,478 8,446,166 - -
Non-current liabilities 12,153,822 12,374,590 11,041,151 14,763,241 13,241,793 15,423,714
Total liabilities
Before distribution 20,336,746 21,755,230 21,133,378 23,237,017 23,280,312 26,187,238
After distribution 20,289,356 21,746,970 21,117,629 23,209,407 - -
Equity attributable to shareholders of the parent - - - - - -
Share capital 8,744,300 8,744,300 8,744,300 8,744,300 9,094,100 9,094,100 Additional paid-in capital 41 41 41 41 41 41
Retained earnings
Before distribution 12,973,016 11,530,840 11,240,693 11,368,463 11,616,570 11,407,078
After distribution 12,925,626 11,522,580 11,224,944 11,340,853 - -
Other equities (176,741) (1,077,395) (968,955) (1,330,054) (1,601,002) (1,487,792) Treasury shares - - - - - -non-controlling interest 30 26 21 18 18 18Total equity Before
distribution 21,540,646 19,197,812 19,016,100 18,782,768 19,109,727 19,013,445
After distribution 21,493,256 19,189,552 19,000,351 18,755,158 - -
Note: Financial statements for the fourth quarter of 2020 audited by independent auditors Pre-audited financial statements for the first quarter of 2021
~ 105 ~

106
Summary individual balance sheet – International Financial Reporting Standards (IFRS)
Unit: NT$1,000 Year
Item
Financial data during the past five years
2016 2017 2018 2019 2020
Current asset 4,885,924 4,786,544 3,208,256 3,764,394 3,779,578
Property, Plant and Equipment 3,343,302 3,567,654 4,252,214 4,191,659 4,031,537
Intangible asset 11,951 15,465 10,767 10,469 4,969
Other assets 28,226,925 25,880,390 25,914,305 25,484,608 25,853,715
Total assets 36,468,102 34,250,053 33,385,542 33,451,130 33,669,799
Current liability Before distribution 4,539,023 4,121,745 5,260,536 2,428,051 2,982,470
After distribution 4,491,633 4,113,485 5,244,787 2,400,441 -
non-current liabilities 10,388,463 10,930,522 9,108,927 12,240,329 11,577,620
Total liabilities Before distribution 14,927,486 15,052,267 14,369,463 14,668,380 14,560,090
After distribution 14,880,096 15,044,007 14,353,714 14,640,770 -
Equity attributable to shareholders of the parent 21,540,616 19,197,786 19,016,079 18,782,750 19,109,709
Share capital 8,744,300 8,744,300 8,744,300 8,744,300 9,094,100
Additional paid-in capital 41 41 41 41 41
Retained
earnings
Before distribution 12,973,016 11,530,840 11,240,693 11,368,463 11,616,570
After distribution 12,925,626 11,522,580 11,224,944 11,340,853 -
Other equities (176,741) (1,077,395) (968,955) (1,330,054) (1,601,002)
Treasury shares - - - - -
non-controlling interest - - - - -
Total equity Before distribution 21,540,616 19,197,786 19,016,079 18,782,750 19,109,709
After distribution 21,493,226 19,189,526 19,000,330 18,755,140 -
Note: Financial statements for the fourth quarter of 2020 audited by independent auditors
~ 106 ~

107
(III) Summary income statement Summary consolidated income statement –
International Financial Reporting Standards (IFRS)
Unit: NT$1,000 Year
Item Financial data during the past five years
Financial data as of March 31, 2021 for
the current year 2016 2017 2018 2019 2020
Operating income 29,493,628 30,532,686 31,526,206 32,127,436 30,260,185 8,563,804
Gross profit 7,971,783 6,062,143 5,654,629 6,556,753 7,349,973 2,136,918
Operating profit (loss) 3,351,178 1,179,434 570,145 1,254,531 1,535,939 856,460
Non-operating income and
expense 448,717 (520,025) 591,149 112,447 (244,476) (3,131)
Profit before tax 3,799,895 659,409 1,161,294 1,366,978 1,291,463 853,329
Income from continuing
operation 3,092,443 334,595 711,798 1,013,559 972,225 699,918
Loss from discontinued
operations - (5,630) (22,636) 0 0 0
Net profit 3,092,443 328,965 689,162 1,013,559 972,225 699,918
Other comprehensive
income recognized for the
period Profit after tax
(1,352,166) (922,939) 228 (372,461) (295,494) (35,861)
Total comprehensive
income in the current period 1,740,277 (593,974) 689,390 641,098 676,731 664,057
Net profit attributable to
shareholders of the parent 3,092,443 328,967 689,167 1,013,562 972,225 699,918
Net profit attributable to
non-controlling interest - (2) (5) (3) 0 0
Total comprehensive
income attributable to
shareholders of the parent
1,740,277 (593,970) 689,395 641,101 676,731 664,057
Total comprehensive
income attributable to
non-controlling interest
- (4) (5) (3) 0 0
Earnings per share (EPS) 3.54 0.38 0.79 1.16 1.07 0.77
Note: Financial statements for the fourth quarter of 2020 audited by independent auditors Pre-audited financial statements for the first quarter of 2021
~ 107 ~

108
Summary individual income statement sheet – International Financial Reporting Standards (IFRS)
Unit: NT$1,000 Year
Item Financial data during the past five years
2016 2017 2018 2019 2020
Operating income 6,254,732 6,050,315 5,800,894 5,947,113 5,946,286
Gross profit 2,284,099 1,567,285 1,460,115 1,559,328 1,929,863
Operating profit (loss) 1,089,586 374,233 252,404 386,582 744,618
Non-operating income and expense 2,235,241 45,420 547,873 694,546 430,759
Profit before tax 3,324,827 419,653 800,277 1,081,128 1,175,377
Income from continuing operation 3,092,443 328,967 689,167 1,013,562 972,225
Loss from discontinued operations - - - - -
Net profit 3,092,443 328,967 689,167 1,013,562 972,225
Other comprehensive income recognized
for the period
Profit after tax
(1,352,166) (922,937) 228 (372,461) (295,494)
Total comprehensive income in the current
period 1,740,277 (593,970) 689,395 641,101 676,731
Net profit attributable to shareholders of the
parent 3,092,443 328,967 689,167 1,013,562 972,225
Net profit attributable to non-controlling
interest - - - - -
Total comprehensive income attributable to
shareholders of the parent 1,740,277 (593,970) 689,395 641,101 676,731
Total comprehensive income attributable to
non-controlling interest - - - - -
Earnings per share (EPS) 3.54 0.38 0.79 1.16 1.07
Note: Financial statements for the fourth quarter of 2020 audited by independent auditors
~ 108 ~

109
II. Financial analysis for the most recent five years
Analysis of consolidated financials - International Financial Reporting Standards (IFRS)
YearItem
Financial analysis for the most recent five years As of March 31, 2021 2016 2017 2018 2019 2020
Financialstructure(%)
Ratio of Liabilities to Assets 48.56 53.12 52.64 55.30 54.92 57.94
Ratio of long-term capital to property, plant and equipment 302.14 249.70 204.01 223.52 212.83 225.03
Solvency (%)
Current ratio 350.76 269.31 234.07 273.08 224.86 236.94
Quick ratio 281.57 190.63 154.83 173.44 144.18 149.96
Interest coverage ratio 23.35 4.41 6.02 5.85 7.31 20.41
Operatingefficiency
Accounts receivable turnover (times)
7.76 7.51 7.73 8.38 7.74 2.02
Days sales outstanding 47.03 48.60 47.22 43.56 47.16 181.12Inventory turnover (times) 3.76 3.78 3.48 3.30 2.93 0.78Accounts payable turnover (times)
5.75 5.54 5.56 5.83 5.23 1.27
Days inventory outstanding 97.07 96.56 104.89 110.61 124.57 466.31Property, Plant and EquipmentTurnover (times)
2.80 2.53 2.24 2.26 2.08 0.60
Total asset turnover (times) 0.70 0.75 0.79 0.76 0.71 0.19
Profitability
Return on assets (%) 7.82 1.18 2.16 3.02 2.69 1.68Return on equity (%) 14.31 1.62 3.61 5.36 5.13 3.68Profit before tax to paid-in capital ratio (%)
43.56 7.54 13.28 14.35 16.89 9.38
Net margin (%) 10.49 1.08 2.19 3.15 3.21 8.17Earnings per share (NT$) 3.54 0.38 0.79 1.16 1.07 0.77
Cash flow
Operating cash flow ratio (%) 54.69 -6.94 20.56 16.28 27.78 -3.78
Cash flow adequacy ratio (%) 171.18 112.44 97.87 80.86 73.71 16.14
Cash re-investment ratio (%) 5.94 -5.70 2.48 1.13 5.53 -0.99
LeverageOperating leverage 2.09 3.09 8.01 4.52 4.43 2.19
Financial leverage 1.05 1.20 1.63 1.29 1.15 1.05
Note: Financial statements for the fourth quarter of 2020 audited by independent auditors Pre-audited financial statements for the first quarter of 2021
Analysis on +/- change by at least 20% 1. Higher operating cash flow ratio due to the increase in net cash flows from operating activities
greater than the increase in current liabilities 2. Higher cash re-investment ratio due to a significant increase in cash flows from operating activities
and a reduction in cash dividends
~ 109 ~

110
Analysis of individual financials - International Financial Reporting Standards (IFRS)
YearItem
Financial analysis for the most recent five years
2016 2017 2018 2019 2020
Financialstructure(%)
Ratio of Liabilities to Assets 40.93 43.95 43.04 43.85 43.24
Ratio of long-term capital to property, plant and equipment 915.67 820.15 642.21 723.29 749.18
Solvency (%)
Current ratio 107.64 116.13 60.99 155.04 126.73
Quick ratio 92.50 97.02 46.12 121.63 97.71
Interest coverage ratio 26.33 4.02 6.46 8.61 10.70
Operatingefficiency
Accounts receivable turnover (times) 3.36 3.58 4.06 3.35 3.12 Days sales outstanding 109 102 90 109 117 Inventory turnover (times) 5.53 6.30 5.51 5.43 4.86 Accounts payable turnover (times) 4.67 5.20 5.47 5.70 4.94 Days inventory outstanding 66 58 66 67 75 Property, Plant and Equipment Turnover (times) 1.95 1.75 1.48 1.41 1.45
Total asset turnover (times) 0.17 0.17 0.17 0.18 0.18
Profitability
Return on assets (%) 8.91 1.26 2.31 3.37 3.19 Return on equity (%) 14.31 1.62 3.61 5.36 5.13 Profit before tax to paid-in capital ratio (%) 38.02 4.80 9.15 12.36 12.92
Net margin (%) 49.44 5.44 11.88 17.04 16.35 Earnings per share (NT$) 3.54 0.38 0.79 1.16 1.07
Cash flow
Operating cash flow ratio (%) 21.17 41.38 14.47 39.50 100.34
Cash flow adequacy ratio (%) 48.23 43.22 46.45 52.67 90.67
Cash re-investment ratio (%) (2.74) (0.14) -0.95 0.26 8.41
LeverageOperating leverage 1.64 3.46 4.4 3.64 2.39
Financial leverage 1.14 1.59 2.22 1.58 1.19
Note: Financial statements for the fourth quarter of 2020 audited by independent auditors
Analysis on +/- change by at least 20% 1. Lower quick ration primarily due to an increase in current liabilities 2. Higher interest coverage ratio due to an increase in net profits and a reduce in interest expenses 3.Higher operating cash flow ratio primarily due to an increase in net cash flows from operating activities 4. Higher cash flow adequacy ratio (%) due to an increase of net cash flows from operating activities during
the past five years and an reduction in capital expenditures during the past five years 5. Higher cash re-investment ratiodue to a significant increase in cash flows from operating activities and a
reduction in cash dividends 6. Lower operating leverage primarily due to higher operating profits 7.Lower financial leverage due to higher operating profits
~ 110 ~

111
Calculation equations based on IFRS items: 1. Financial structure (1) Liabilities to assets ratio = total liabilities / total assets (2) Ratio of long-term capital to property, plant and equipment =(Equity+non-current liabilities / Net
property, plant and equipment 2. Solvency (1) Current ratio = current assets /current liabilities (2) Quick ratio = (current assets - inventory - prepaid expenses)/ current liabilities (3) Interest coverage ratio = earnings before interest and taxes /interest expenses
3. Operating efficiency (1) Accounts receivable turnover (including accounts receivable and notes receivable due to operating activities)
= net sales /average accounts receivable (including accounts receivable and notes receivable due to
operating activities) (2) Days sales outstanding=365/Accounts receivable turnover (3) Inventory turnover = cost of goods sold /average inventory (4) Accounts payable turnover (including accounts payable and notes payable due to operating activities) =
cost of goods sold /average accounts payable
(including accounts payable and notes payable due to operating activities) (5) Days inventory outstanding 365/ inventory turnover (6) Property, plant and equipment turnover =net sales /net average property, plant and equipment
(7) Total asset turnover = net sales/average total assets
4. Profitability (1) Return on assets=(net income+ interest expense × (1- tax rate))/ average total assets (2) Return on equity = net income/average total equity (3) Net margin = net income /net sales (4) Earnings per share=(net profit attributable to shareholders of the parent-preferred share dividends)/
weighted average number of issued shares (Note 1) 5. Cash flows (1) Operating cash flow ratio=Net cash flow from operating activities /current liabilities (2) Cash flow adequacy ratio =Net cash flows from operating activities during the past five years /(capital
expenditure+increase in inventory +cash dividends) during the past five years (3) Cash re-investment ratio =(Net cash flows from operating activities-cash dividends)/(Gross property,
plant and equipment+long-term investment + other non-current assets+working capital) (Note 2)
6. Leverage (1) Operating leverage =(net sales - variable costs and expenses) /operating profits (Note 3) (2) Financial leverage = operating profits/ (operating profits-interest expenses)
Note 1: The above calculation of earnings per share is based on the following: 1. It is based on the number of weighted average ordinary shares, not the number of issued shares at year
end.2. Rights issues or treasury share transactions should be taken into account according to the outstanding
~ 111 ~

112
period in the calculation of the number of weighted average shares. 3. Capitalization of earnings or capital surplus via share issuance should be retrospectively adjusted pro rata
for earnings per share of prior years and half years, without taking into consideration the issuance periods. 4. If preferred shares are cumulative and not convertible, dividends for the current year (whether issued or
not) should be deducted from net incomes or added to net losses. If preferred shares are non-cumulative, dividends to preferred shares should be deducted from net incomes but no adjustment is required for net losses.
Note 2: The cash flow analysis should take into account the following issues: 1. Net cash flows from operating activities refer to the net cash inflows from operating activities in the
statement of cash flows. 2. Capital expenditures refer to the cash outflows each year on capex. 3. The increase in inventory is only calculated when the ending balance is greater than the opening balance.
If the inventory is reduced at year end, it is counted as zero. 4. Cash dividends include cash dividends to ordinary shares and to preferred shares. 5. Gross property, plant and equipment refers to the total value of property, plant and equipment before
accumulated depreciation. Note 3: The issuer should divide all operating costs and expenses by nature into fixed and variable. Any estimates or
subjective judgement should be reasonable and consistent. Note 4: The ratios in relation to paid-in capital for foreign companies shall be calculated with net value.
~ 112 ~

113
III. Review reports by Audit Committee on financial statements for the most recent years
Audit Committee’s Audit Report
The Board of Directors has prepared and submitted the Company's 2020 annual business report,
financial statements and profit distribution proposal. The financial statements have been audited and
attested by CPA Wang, Yi-Wen and CPA Tseng, Tung-Yun from Deloitte Taiwan. An Independent’s
audit report has been issued. The above-mentioned business report, financial statements and proposal for
earnings distribution have been audited by the Audit Committee and found to be in order; therefore, we
hereby report the above in accordance with Article 14-4 of the Securities and Exchange Act and Article
219 of the Company Act for your review.
To
The 2021 Regular Shareholders Meeting
Kenda Rubber Ind. Co., Ltd.
Convener of the Audit Committee: Hsieh, Chun-Mou
March 25, 2021
~ 113 ~

Kenda Rubber Ind. Co., Ltd. and Subsidiaries
Consolidated Financial Statements for the Years Ended December 31, 2020 and 2019 and
Independent Auditors’ Report
IV. Consolidated Financial Statements of the latest year duly
audited by the Certified Public Accountants
~ 114 ~

- 1 -
DECLARATION OF CONSOLIDATION OF FINANCIAL STATEMENTS OF AFFILIATES
The entities that are required to be included in the combined financial statements of Kenda Rubber Ind.
Co., Ltd. as of and for the year ended December 31, 2020, under the “Criteria Governing Preparation of
Affiliation Reports, Consolidated Business Reports and Consolidated Financial Statements of Affiliated
Enterprises” are the same as those included in the consolidated financial statements prepared in
conformity with the International Financial Reporting Standard No. 10, “Consolidated Financial
Statements.” In addition, the information required to be disclosed in the combined financial statements is
included in the consolidated financial statements. Consequently, Kenda Rubber Ind. Co., Ltd. and
subsidiaries do not prepare a separate set of combined financial statements.
Very truly yours,
KENDA RUBBER IND. CO., LTD.
By
YANG CHI JEN
March 25, 2021
~ 115 ~

- 2 -
INDEPENDENT AUDITORS’ REPORT
The Board of Directors and Shareholders Kenda Rubber Ind. Co., Ltd.
Opinion
We have audited the accompanying consolidated financial statements of Kenda Rubber Ind. Co., Ltd. and its subsidiaries (collectively referred to as the “Group”), which comprise the consolidated balance sheets as of December 31, 2020 and 2019, and the consolidated statements of comprehensive income, changes in equity and cash flows for the years then ended, and the notes to the consolidated financial statements, including a summary of significant accounting policies (collectively referred to as the “consolidated financial statements”).
In our opinion, the accompanying consolidated financial statements present fairly, in all material respects, the consolidated financial position of the Group as of December 31, 2020 and 2019, and its consolidated financial performance and its consolidated cash flows for the years then ended in accordance with the Regulations Governing the Preparation of Financial Reports by Securities Issuers and the International Financial Reporting Standards (IFRS), International Accounting Standards (IAS), IFRIC Interpretations (IFRIC), and SIC Interpretations (SIC) endorsed and issued into effect by the Financial Supervisory Commission of the Republic of China.
Basis for Opinion
We conducted our audits in accordance with the Regulations Governing Auditing and Attestation of Financial Statements by Certified Public Accountants, and auditing standards generally accepted in the Republic of China. Our responsibilities under those standards are further described in the Auditors’ Responsibilities for the Audit of the Consolidated Financial Statements section of our report. We are independent of the Group in accordance with The Norm of Professional Ethics for Certified Public Accountant of the Republic of China, and we have fulfilled our other ethical responsibilities in accordance with these requirements. We believe that the audit evidence we have obtained is sufficient and appropriate to provide a basis for our opinion.
Key Audit Matters
Key audit matters are those matters that, in our professional judgment, were of most significance in our audit of the consolidated financial statements for the year ended December 31, 2020. These matters were addressed in the context of our audit of the consolidated financial statements as a whole, and in forming our opinion thereon, and we do not provide a separate opinion on these matters.
~ 116 ~

- 3 -
The key audit matter of the Group’s consolidated financial statements for the year ended December 31, 2020 is stated as follows:
Appropriateness of the Revenue Cutoff
The Group has worldwide sales network, and the terms of sales are different by customer or geography. Revenue is recognized when performance obligations are satisfied by the transfer of the promised goods to customers but the timing of the transfer may be based on the time of actual delivery or on the time of actual receipt of the goods. The Group’s revenue recognition process involves manual inspection of relevant documents, or an estimate of arrival time of the goods shipped to customers based on historical experience to determine the timing of the transfer of control of the promised goods to customers. Therefore, mistakes may occur in the evaluation process, and revenue could be recorded in the incorrect reporting period.
The main audit procedures that we performed in respect of the cutoff of revenue recognition included the following:
1. We obtained an understanding of and reviewed the sales contracts and the terms between the Group and its customers to identify the appropriate point of revenue recognition.
2. We obtained an understanding of and evaluated the process and related controls over revenue recognition.
3. We performed cutoff testing procedures covering a certain period before and after the balance sheet date and examined relevant supporting documents. We determined that revenue was recognized in the correct reporting period, as evidenced by sales terms.
Other Matter
We have also audited the parent company only financial statements of Kenda Rubber Ind. Co., Ltd. as of and for the years ended December 31, 2020 and 2019, on which we have issued an unmodified opinion.
Responsibilities of Management and Those Charged with Governance for the Consolidated Financial Statements
Management is responsible for the preparation and fair presentation of the consolidated financial statements in accordance with the Regulations Governing the Preparation of Financial Reports by Securities Issuers and the IFRS, IAS, IFRIC, and SIC endorsed and issued into effect by the Financial Supervisory Commission of the Republic of China, and for such internal control as management determines is necessary to enable the preparation of consolidated financial statements that are free from material misstatement, whether due to fraud or error.
In preparing the consolidated financial statements, management is responsible for assessing the Group’s ability to continue as a going concern, disclosing, as applicable, matters related to going concern and using the going concern basis of accounting unless management either intends to liquidate the Group or to cease operations, or has no realistic alternative but to do so.
Those charged with governance, including members of the audit committee, are responsible for overseeing the Group’s financial reporting process.
~ 117 ~

- 4 -
Auditors’ Responsibilities for the Audit of the Consolidated Financial Statements
Our objectives are to obtain reasonable assurance about whether the consolidated financial statements as a whole are free from material misstatement, whether due to fraud or error, and to issue an auditors’ report that includes our opinion. Reasonable assurance is a high level of assurance, but is not a guarantee that an audit conducted in accordance with the auditing standards generally accepted in the Republic of China will always detect a material misstatement when it exists. Misstatements can arise from fraud or error and are considered material if, individually or in the aggregate, they could reasonably be expected to influence the economic decisions of users taken on the basis of these consolidated financial statements.
As part of an audit in accordance with the auditing standards generally accepted in the Republic of China, we exercise professional judgment and maintain professional skepticism throughout the audit. We also:
1. Identify and assess the risks of material misstatement of the consolidated financial statements, whether due to fraud or error, design and perform audit procedures responsive to those risks, and obtain audit evidence that is sufficient and appropriate to provide a basis for our opinion. The risk of not detecting a material misstatement resulting from fraud is higher than for one resulting from error, as fraud may involve collusion, forgery, intentional omissions, misrepresentations, or the override of internal control.
2. Obtain an understanding of internal control relevant to the audit in order to design audit procedures that are appropriate in the circumstances, but not for the purpose of expressing an opinion on the effectiveness of the Group’s internal control.
3. Evaluate the appropriateness of accounting policies used and the reasonableness of accounting estimates and related disclosures made by management.
4. Conclude on the appropriateness of management’s use of the going concern basis of accounting and, based on the audit evidence obtained, whether a material uncertainty exists related to events or conditions that may cast significant doubt on the Group’s ability to continue as a going concern. If we conclude that a material uncertainty exists, we are required to draw attention in our auditors’ report to the related disclosures in the consolidated financial statements or, if such disclosures are inadequate, to modify our opinion. Our conclusions are based on the audit evidence obtained up to the date of our auditors’ report. However, future events or conditions may cause the Group to cease to continue as a going concern.
5. Evaluate the overall presentation, structure and content of the consolidated financial statements, including the disclosures, and whether the consolidated financial statements represent the underlying transactions and events in a manner that achieves fair presentation.
6. Obtain sufficient and appropriate audit evidence regarding the financial information of the entities or business activities within the Group to express an opinion on the consolidated financial statements. We are responsible for the direction, supervision and performance of the group audit. We remain solely responsible for our audit opinion.
We communicate with those charged with governance regarding, among other matters, the planned scope and timing of the audit and significant audit findings, including any significant deficiencies in internal control that we identify during our audit.
We also provide those charged with governance with a statement that we have complied with relevant ethical requirements regarding independence, and to communicate with them all relationships and other matters that may reasonably be thought to bear on our independence, and where applicable, related safeguards.
~ 118 ~

- 5 -
From the matters communicated with those charged with governance, we determine those matters that were of most significance in the audit of the consolidated financial statements for the year ended December 31, 2020, and are therefore the key audit matters. We describe the matter in our auditors’ report unless law or regulation precludes public disclosure about the matter or when, in extremely rare circumstances, we determine that a matter should not be communicated in our report because the adverse consequences of doing so would reasonably be expected to outweigh the public interest benefits of such communication.
The engagement partners on the audits resulting in this independent auditors’ report are Yi-Wen Wang and Done-Yuin Tseng.
Deloitte & Touche Taipei, Taiwan Republic of China
March 25, 2021
Notice to Readers
The accompanying consolidated financial statements are intended only to present the consolidated financial position, financial performance and cash flows in accordance with accounting principles and practices generally accepted in the Republic of China and not those of any other jurisdictions. The standards, procedures and practices to audit such consolidated financial statements are those generally applied in the Republic of China.
For the convenience of readers, the independent auditors’ report and the accompanying consolidated financial statements have been translated into English from the original Chinese version prepared and used in the Republic of China. If there is any conflict between the English version and the original Chinese version or any difference in the interpretation of the two versions, the Chinese-language independent auditors’ report and consolidated financial statements shall prevail.
~ 119 ~

- 6 -
KENDA RUBBER IND. CO., LTD. AND SUBSIDIARIES
CONSOLIDATED BALANCE SHEETS DECEMBER 31, 2020 AND 2019 (In Thousands of New Taiwan Dollars)
2020 2019ASSETS Amount % Amount %
CURRENT ASSETS
Cash and cash equivalents (Note 6) $ 8,485,408 20 $ 7,626,509 18 Financial assets at fair value through profit or loss - current (Note 23) 973 - 1,019 - Notes receivable, net (Notes 8 and 24) 430,967 1 315,758 1 Accounts receivable, net (Notes 8, 24 and 25) 3,413,863 8 3,372,114 8 Inventories (Notes 9 and 25) 7,689,491 18 7,930,788 19 Prepayments 409,003 1 512,559 1 Other financial assets - current (Notes 10 and 25) 1,840,620 4 3,178,117 8 Other current assets 302,148 1 203,492 -
Total current assets 22,572,473 53 23,140,356 55
NON-CURRENT ASSETS
Financial assets at fair value through other comprehensive income - non-current (Notes 7 and 23) 578,419 1 515,415 1Investments accounted for using the equity method 102,320 - 72,690 - Property, plant and equipment (Notes 12 and 25) 14,543,978 34 14,246,939 34 Right-of-use assets (Note 13) 1,534,070 4 1,737,558 4 Investment properties (Note 14) 29,186 - - - Intangible assets (Note 25) 60,826 - 74,095 - Deferred tax assets (Note 20) 613,084 2 441,892 1 Other non-current assets (Notes 10 and 12) 2,355,683 6 1,790,840 5
Total non-current assets 19,817,566 47 18,879,429 45
TOTAL $ 42,390,039 100 $ 42,019,785 100
LIABILITIES AND EQUITY
CURRENT LIABILITIES Short-term borrowings (Note 15) $ 2,399,948 6 $ 2,372,653 6 Contract liabilities - current (Note 18) 273,652 1 220,603 1 Notes payable 41,116 - 159,852 - Accounts payable (Note 24) 2,725,960 7 2,556,061 6 Lease liabilities - current (Note 13) 88,484 - 98,239 - Other payables (Note 24) 1,695,073 4 1,586,122 4 Current tax liabilities 167,673 - 72,891 - Current portion of long-term borrowings (Note 14) 2,517,453 6 1,291,805 3 Other current liabilities (Note 18) 129,160 - 115,550 -
Total current liabilities 10,038,519 24 8,473,776 20
NON-CURRENT LIABILITIES
Long-term borrowings (Note 15) 11,844,336 28 13,061,895 31 Deferred tax liabilities (Note 20) 316,927 1 547,324 1 Lease liabilities - non-current (Note 13) 363,273 1 452,527 1 Net defined benefit liabilities (Note 16) 254,583 - 251,574 1 Other non-current liabilities (Note 26) 462,674 1 449,921 1
Total non-current liabilities 13,241,793 31 14,763,241 35
Total liabilities 23,280,312 55 23,237,017 55
EQUITY ATTRIBUTABLE TO SHAREHOLDERS OF THE COMPANY (Note 17)
Share capital 9,094,100 22 8,744,300 21 Capital surplus 41 - 41 - Retained earnings
Legal reserve 3,213,262 7 3,113,042 8 Special reserve 1,330,054 3 968,955 2 Unappropriated earnings 7,073,254 17 7,286,466 17
Total retained earnings 11,616,570 27 11,368,463 27 Other equity (1,601,002) (4) (1,330,054) (3)
Equity attributable to shareholders of the parent 19,109,709 45 18,782,750 45
NON-CONTROLLING INTERESTS 18 - 18 -
Total equity 19,109,727 45 18,782,768 45
TOTAL $ 42,390,039 100 $ 42,019,785 100
The accompanying notes are an integral part of the consolidated financial statements.
~ 120 ~

- 7 -
KENDA RUBBER IND. CO., LTD. AND SUBSIDIARIES
CONSOLIDATED STATEMENTS OF COMPREHENSIVE INCOME FOR THE YEARS ENDED DECEMBER 31, 2020 AND 2019 (In Thousands of New Taiwan Dollars, Except Earnings Per Share)
2020 2019 Amount % Amount %
NET REVENUE (Notes 18 and 24) $ 30,260,185 100 $ 32,127,436 100 COST OF REVENUE (Notes 9, 19 and 24) 22,910,212 76 25,570,683 80 GROSS PROFIT 7,349,973 24 6,556,753 20 OPERATING EXPENSES (Notes 19 and 24)
Selling and marketing expenses 2,304,290 8 2,534,489 8General and administrative expenses 1,216,493 4 1,356,141 4Research and development expenses 1,326,430 4 1,403,681 4Expected credit loss (Note 8) 29,239 - 7,911 -
Total operating expenses 4,876,452 16 5,302,222 16
OTHER OPERATING INCOME AND EXPENSES
(Note 19) (937,582) (3) - - INCOME FROM OPERATIONS 1,535,939 5 1,254,531 4 NON-OPERATING INCOME AND EXPENSES
(Notes 19 and 24) Interest income 108,171 - 162,833 -Other income 250,339 1 246,543 1Other gains and losses (363,884) (1) (18,993) -Finance costs (241,442) (1) (281,907) (1)Share of profit of associates 2,340 - 3,971 -
Total non-operating income and expenses (244,476) (1) 112,447 -
PROFIT BEFORE INCOME TAX 1,291,463 4 1,366,978 4 INCOME TAX EXPENSE (Note 20) (319,238) (1) (353,419) (1) NET PROFIT FOR THE YEAR 972,225 3 1,013,559 3
(Continued)
~ 121 ~

- 9 -
KE
ND
A R
UB
BE
R IN
D. C
O.,
LT
D. A
ND
SU
BSI
DIA
RIE
S
CO
NSO
LID
AT
ED
ST
AT
EM
EN
TS
OF
CH
AN
GE
S IN
EQ
UIT
Y
FOR
TH
E Y
EA
RS
EN
DE
D D
EC
EM
BE
R 3
1, 2
020
AN
D 2
019
(In
Tho
usan
ds o
f New
Tai
wan
Dol
lars
,Exc
ept D
ivid
ends
Per
Sha
re)
Equ
ity A
ttri
buta
ble
to S
hare
hold
ers o
f the
Par
ent
Oth
er E
quity
Ret
aine
d E
arni
ngs
Exc
hang
eD
iffer
ence
s on
Tra
nsla
tion
of
the
Fina
ncia
l St
atem
ents
of
Unr
ealiz
ed
Val
uatio
n G
ain
on F
inan
cial
A
sset
s at F
air
Val
ue T
hrou
gh
Oth
er
U
napp
ropr
iate
dFo
reig
n C
ompr
ehen
sive
Non
-con
trol
ling
Sh
are
Cap
ital
Cap
ital S
urpl
us
Leg
al R
eser
veSp
ecia
l Res
erve
Ear
ning
s O
pera
tions
In
com
e
Tot
al
In
tere
sts
Tot
al E
quity
BA
LAN
CE
AT
JAN
UA
RY
1, 2
019
$
8,
744,
300
$
41
$
3,04
4,12
5 $
1,
077,
394
$
7,11
9,17
4 $
(1
,092
,360
) $
12
3,40
5
$
19,0
16,0
79
$
21
$
19,0
16,1
00
A
ppro
pria
tions
of 2
018
earn
ings
Le
gal r
eser
ve
-
-
68,9
17
-
(68,
917)
-
-
-
-
-
Spec
ial r
eser
ve
-
-
-
(108
,439
)
108,
439
-
-
-
-
-
Cas
h di
vide
nds t
o sh
areh
olde
rs -
NT$
1.00
per
shar
e
-
-
-
-
(8
74,4
30)
-
-
(874
,430
)
-
(8
74,4
30)
Net
pro
fit fo
r the
yea
r end
ed D
ecem
ber 3
1, 2
019
-
-
-
-
1,01
3,56
2
-
-
1,
013,
562
(3)
1,
013,
559
Oth
er c
ompr
ehen
sive
inco
me
(loss
) for
the
year
end
ed
Dec
embe
r 31,
201
9, n
et o
f inc
ome
tax
-
-
-
-
(11,
362)
(6
05,0
01)
24
3,90
2
(3
72,4
61)
-
(372
,461
)
To
tal c
ompr
ehen
sive
inco
me
(loss
) for
the
year
end
ed
Dec
embe
r 31,
201
9
-
-
-
-
1,
002,
200
(6
05,0
01)
24
3,90
2
64
1,10
1
(3
)
641,
098
BA
LAN
CE
AT
DEC
EMB
ER 3
1, 2
019
8,74
4,30
0
41
3,
113,
042
96
8,95
5
7,28
6,46
6
(1,6
97,3
61)
36
7,30
7
18
,782
,750
18
18
,782
,768
App
ropr
iatio
ns o
f 201
9 ea
rnin
gs
Lega
l res
erve
-
-
10
0,22
0
-
(100
,220
)
-
-
-
-
-Sp
ecia
l res
erve
-
-
-
36
1,09
9
(361
,099
)
-
-
-
-
-C
ash
divi
dend
s to
shar
ehol
ders
- N
T$0.
4 pe
r sha
re
-
-
-
-
(349
,772
)
-
-
(3
49,7
72)
-
(349
,772
)Sh
are
divi
dend
s to
shar
ehol
ders
- N
T$0.
4 pe
r sha
re
34
9,80
0
-
-
-
(349
,800
)
-
-
-
-
-
N
et in
com
e fo
r the
yea
r end
ed D
ecem
ber 3
1, 2
020
-
-
-
-
972,
225
-
-
972,
225
-
972,
225
Oth
er c
ompr
ehen
sive
inco
me
(loss
) for
the
year
end
ed
Dec
embe
r 31,
202
0, n
et o
f inc
ome
tax
-
-
-
-
(24,
546)
(3
44,8
86)
73
,938
(2
95,4
94)
-
(295
,494
)
To
tal c
ompr
ehen
sive
inco
me
(loss
) for
the
year
end
ed
Dec
embe
r 31,
202
0
-
-
-
-
94
7,67
9
(344
,886
)
73,9
38
676,
731
-
676,
731
BA
LAN
CE
AT
DEC
EMB
ER 3
1, 2
020
$
9,
094,
100
$
41
$
3,21
3,26
2 $
1,
330,
054
$
7,07
3,25
4 $
(2
,042
,247
) $
44
1,24
5
$
19,1
09,7
09
$
18
$
19,1
09,7
27
The
acco
mpa
nyin
g no
tes a
re a
n in
tegr
al p
art o
f the
con
solid
ated
fina
ncia
l sta
tem
ents
.
- 8 -
KENDA RUBBER IND. CO., LTD. AND SUBSIDIARIES
CONSOLIDATED STATEMENTS OF COMPREHENSIVE INCOME FOR THE YEARS ENDED DECEMBER 31, 2020 AND 2019 (In Thousands of New Taiwan Dollars, Except Earnings Per Share)
2020 2019 Amount % Amount %
OTHER COMPREHENSIVE INCOME (LOSS)
(Notes 16 and 20) Items that will not be reclassified subsequently to
profit or loss: Remeasurement of defined benefit plans $ (29,832) - $ (13,769) -Unrealized gain on investments in equity
instruments at fair value through other comprehensive income 73,938 - 243,902 1
Income tax related to items that will not be reclassified subsequently to profit or loss 5,286 - 2,407 -
Items that may be reclassified subsequently to profit or loss: Exchange differences on translation of the
financial statements of foreign operations (431,107) (1) (756,251) (2)Income tax related to items that may be
reclassified subsequently to profit or loss 86,221 - 151,250 -
Other comprehensive loss for the year, net of income tax (295,494) (1) (372,461) (1)
TOTAL COMPREHENSIVE INCOME FOR THE
YEAR $ 676,731 2 $ 641,098 2 NET INCOME (LOSS) ATTRIBUTABLE TO:
Shareholders of the Company $ 972,225 3 $ 1,013,562 3Non-controlling interests - - (3) -
$ 972,225 3 $ 1,013,559 3
TOTAL COMPREHENSIVE INCOME (LOSS)
ATTRIBUTABLE TO: Shareholders of the Company $ 676,731 2 $ 641,101 2Non-controlling interests - - (3) -
$ 676,731 2 $ 641,098 2
EARNINGS PER SHARE (Note 21) Basic $ 1.07 $ 1.11Diluted $ 1.07 $ 1.11
The accompanying notes are an integral part of the consolidated financial statements. (Concluded)
~ 122 ~

- 9 -
KE
ND
A R
UB
BE
R IN
D. C
O.,
LT
D. A
ND
SU
BSI
DIA
RIE
S
CO
NSO
LID
AT
ED
ST
AT
EM
EN
TS
OF
CH
AN
GE
S IN
EQ
UIT
Y
FOR
TH
E Y
EA
RS
EN
DE
D D
EC
EM
BE
R 3
1, 2
020
AN
D 2
019
(In
Tho
usan
ds o
f New
Tai
wan
Dol
lars
,Exc
ept D
ivid
ends
Per
Sha
re)
Equ
ity A
ttri
buta
ble
to S
hare
hold
ers o
f the
Par
ent
Oth
er E
quity
Ret
aine
d E
arni
ngs
Exc
hang
eD
iffer
ence
s on
Tra
nsla
tion
of
the
Fina
ncia
l St
atem
ents
of
Unr
ealiz
ed
Val
uatio
n G
ain
on F
inan
cial
A
sset
s at F
air
Val
ue T
hrou
gh
Oth
er
U
napp
ropr
iate
dFo
reig
n C
ompr
ehen
sive
Non
-con
trol
ling
Sh
are
Cap
ital
Cap
ital S
urpl
us
Leg
al R
eser
veSp
ecia
l Res
erve
Ear
ning
s O
pera
tions
In
com
e
Tot
al
In
tere
sts
Tot
al E
quity
BA
LAN
CE
AT
JAN
UA
RY
1, 2
019
$
8,
744,
300
$
41
$
3,04
4,12
5 $
1,
077,
394
$
7,11
9,17
4 $
(1
,092
,360
) $
12
3,40
5
$
19,0
16,0
79
$
21
$
19,0
16,1
00
A
ppro
pria
tions
of 2
018
earn
ings
Le
gal r
eser
ve
-
-
68,9
17
-
(68,
917)
-
-
-
-
-
Spec
ial r
eser
ve
-
-
-
(108
,439
)
108,
439
-
-
-
-
-
Cas
h di
vide
nds t
o sh
areh
olde
rs -
NT$
1.00
per
shar
e
-
-
-
-
(8
74,4
30)
-
-
(874
,430
)
-
(8
74,4
30)
Net
pro
fit fo
r the
yea
r end
ed D
ecem
ber 3
1, 2
019
-
-
-
-
1,01
3,56
2
-
-
1,
013,
562
(3)
1,
013,
559
Oth
er c
ompr
ehen
sive
inco
me
(loss
) for
the
year
end
ed
Dec
embe
r 31,
201
9, n
et o
f inc
ome
tax
-
-
-
-
(11,
362)
(6
05,0
01)
24
3,90
2
(3
72,4
61)
-
(372
,461
)
To
tal c
ompr
ehen
sive
inco
me
(loss
) for
the
year
end
ed
Dec
embe
r 31,
201
9
-
-
-
-
1,
002,
200
(6
05,0
01)
24
3,90
2
64
1,10
1
(3
)
641,
098
BA
LAN
CE
AT
DEC
EMB
ER 3
1, 2
019
8,74
4,30
0
41
3,
113,
042
96
8,95
5
7,28
6,46
6
(1,6
97,3
61)
36
7,30
7
18
,782
,750
18
18
,782
,768
App
ropr
iatio
ns o
f 201
9 ea
rnin
gs
Lega
l res
erve
-
-
10
0,22
0
-
(100
,220
)
-
-
-
-
-Sp
ecia
l res
erve
-
-
-
36
1,09
9
(361
,099
)
-
-
-
-
-C
ash
divi
dend
s to
shar
ehol
ders
- N
T$0.
4 pe
r sha
re
-
-
-
-
(349
,772
)
-
-
(3
49,7
72)
-
(349
,772
)Sh
are
divi
dend
s to
shar
ehol
ders
- N
T$0.
4 pe
r sha
re
34
9,80
0
-
-
-
(349
,800
)
-
-
-
-
-
N
et in
com
e fo
r the
yea
r end
ed D
ecem
ber 3
1, 2
020
-
-
-
-
972,
225
-
-
972,
225
-
972,
225
Oth
er c
ompr
ehen
sive
inco
me
(loss
) for
the
year
end
ed
Dec
embe
r 31,
202
0, n
et o
f inc
ome
tax
-
-
-
-
(24,
546)
(3
44,8
86)
73
,938
(2
95,4
94)
-
(295
,494
)
To
tal c
ompr
ehen
sive
inco
me
(loss
) for
the
year
end
ed
Dec
embe
r 31,
202
0
-
-
-
-
94
7,67
9
(344
,886
)
73,9
38
676,
731
-
676,
731
BA
LAN
CE
AT
DEC
EMB
ER 3
1, 2
020
$
9,
094,
100
$
41
$
3,21
3,26
2 $
1,
330,
054
$
7,07
3,25
4 $
(2
,042
,247
) $
44
1,24
5
$
19,1
09,7
09
$
18
$
19,1
09,7
27
The
acco
mpa
nyin
g no
tes a
re a
n in
tegr
al p
art o
f the
con
solid
ated
fina
ncia
l sta
tem
ents
.
~ 123 ~

- 10 -
KENDA RUBBER IND. CO., LTD. AND SUBSIDIARIES
CONSOLIDATED STATEMENTS OF CASH FLOWS FOR THE YEARS ENDED DECEMBER 31, 2020 AND 2019 (In Thousands of New Taiwan Dollars)
2020 2019 CASH FLOWS FROM OPERATING ACTIVITIES
Profit before income tax $ 1,291,463 $ 1,366,978Adjustments for:
Depreciation expense 1,469,596 1,449,512Amortization expense 23,697 19,533Expected credit loss 29,239 7,911Net (gain) loss on fair value changes of financial assets and
liabilities at fair value through profit or loss 46 (2)Finance costs 241,442 281,907Interest income (108,171) (162,833)Dividend income (53,483) (65,256)Share of profit of associates (2,340) (3,971)Net loss on disposal of property, plant and equipment 38,003 1,809Net loss on disposal of intangible assets - 55Write-down (reversal of write-down) of inventories (23,933) 45,420Impairment loss recognized on property, plant and equipment 16,040 -Net loss on foreign currency exchange 705,350 100,616
Changes in operating assets and liabilities Notes receivable (115,209) (202,687)Accounts receivable (429,009) 115,950Other receivables (33,032) 21,211Inventories (42,328) (613,002)Prepayments 103,556 (98,783)Other current assets (3,601) (14,822)Other non-current assets 140,948 (162,434)Contract liabilities 53,049 (1,636)Notes payable (118,736) (34,842)Accounts payable 169,899 (60,127)Other payables 128,638 (70,779)Other current liabilities 13,610 (11,301)Net defined benefit liabilities (26,823) (19,419)
Cash generated from operations 3,467,911 1,889,008Interest received 111,704 164,660Dividends received 53,483 65,256Interest paid (244,155) (282,612)Income tax paid (599,764) (456,959)
Net cash generated from operating activities 2,789,179 1,379,353
CASH FLOWS FROM INVESTING ACTIVITIES
Return of capital from financial assets at fair value through other comprehensive income 3,942 4,024
Increase in investments accounted for using the equity method (33,733) -Payments for property, plant and equipment (539,276) (1,023,893)Proceeds from disposal of property, plant and equipment 23,808 153,572
(Continued)
~ 124 ~

- 11 -
KENDA RUBBER IND. CO., LTD. AND SUBSIDIARIES
CONSOLIDATED STATEMENTS OF CASH FLOWS FOR THE YEARS ENDED DECEMBER 31, 2020 AND 2019 (In Thousands of New Taiwan Dollars)
2020 2019
Increase in refundable deposits $ (48,529) $ (714)Payments for intangible assets (11,075) (18,613)Decrease (increase) in other financial assets 61,535 (1,817,544)Increase in prepayments for equipment (800,969) (2,033,971)
Net cash used in investing activities (1,344,297) (4,737,139)
CASH FLOWS FROM FINANCING ACTIVITIES
Proceeds from short-term borrowings 75,347 1,177,364Proceeds from long-term borrowings 3,995,525 5,616,938Repayments of long-term borrowings (3,958,700) (4,841,945)Proceeds from guarantee deposits received 7,641 1,229Repayment of the principal portion of lease liabilities (90,763) (91,334)Cash dividends (349,772) (874,430)
Net cash generated from (used in) financing activities (320,722) 987,822
EFFECTS OF EXCHANGE RATE CHANGES ON THE BALANCE
OF CASH HELD IN FOREIGN CURRENCIES (265,261) (194,013) NET INCREASE (DECREASE) IN CASH AND CASH
EQUIVALENTS 858,899 (2,563,977) CASH AND CASH EQUIVALENTS AT THE BEGINNING OF THE
YEAR 7,626,509 10,190,486 CASH AND CASH EQUIVALENTS AT THE END OF THE YEAR $ 8,485,408 $ 7,626,509
The accompanying notes are an integral part of the consolidated financial statements. (Concluded)
~ 125 ~

- 12 -
KENDA RUBBER IND. CO., LTD. AND SUBSIDIARIES
NOTES TO CONSOLIDATED FINANCIAL STATEMENTS FOR THE YEARS ENDED DECEMBER 31, 2020 AND 2019 (In Thousands of New Taiwan Dollars, Unless Specified Otherwise)
1. GENERAL INFORMATION
Kenda Rubber Ind. Co., Ltd. (the “Company”) was incorporated in the Republic of China (ROC) in March 1962. The Company is mainly engaged in manufacturing and trading of rubber products such as inner tubes and tires of bicycles, scooters, industrial trucks and cars, and various products of carbon fiber.
The Company’s shares have been listed on the Taiwan Stock Exchange since December 20, 1990.
The consolidated financial statements of the Company and its subsidiaries (collectively referred to as the “Group”) are presented in the Company’s functional currency, the New Taiwan dollar.
2. AUTHORIZATION OF FINANCIAL STATEMENTS
The consolidated financial statements were approved by the Company’s board of directors on March 25, 2021.
3. APPLICATION OF NEW, AMENDED AND REVISED STANDARDS AND INTERPRETATIONS
a. The IFRSs endorsed by the Financial Supervisory Commission (FSC) for application starting from 2021
New IFRSs Effective Date
Announced by IASB
Amendments to IFRS 4 “Extension of the Temporary Exemption from Applying IFRS 9”
Effective immediately upon promulgation by the IASB
Amendments to IFRS 9, IAS 39, IFRS 7, IFRS 4 and IFRS 16 “Interest Rate Benchmark Reform - Phase 2”
January 1, 2021
Amendment to IFRS 16 “Covid-19-Related Rent Concessions” June 1, 2020
b. New IFRSs in issue but not yet endorsed and issued into effect by the FSC
New, Revised or Amended Standards and Interpretations Effective Date
Announced by IASB (Note 1)
“Annual Improvements to IFRS Standards 2018-2020” January 1, 2022 (Note 2) Amendments to IFRS 3 “Reference to the Conceptual Framework” January 1, 2022 (Note 3) Amendments to IFRS 10 and IAS 28 “Sale or Contribution of Assets
between an Investor and its Associate or Joint Venture” To be determined by IASB
IFRS 17 “Insurance Contracts” January 1, 2023 Amendments to IFRS 17 January 1, 2023 Amendments to IAS 1 “Classification of Liabilities as Current or
Non-current”January 1, 2023
Amendments to IAS 1 “Disclosure of Accounting Policies” January 1, 2023 (Note 6) Amendments to IAS 8 “Definition of Accounting Estimates” January 1, 2023 (Note 7)
(Continued)
~ 126 ~

- 13 -
New, Revised or Amended Standards and Interpretations Effective Date
Announced by IASB (Note 1)
Amendments to IAS 16 “Property, Plant and Equipment - Proceeds before Intended Use”
January 1, 2022 (Note 4)
Amendments to IAS 37 “Onerous Contracts - Cost of Fulfilling a Contract”
January 1, 2022 (Note 5)
(Concluded)
Note 1: Unless stated otherwise, the above New IFRSs are effective for annual reporting periods beginning on or after their respective effective dates.
Note 2: The amendments to IFRS 9 will be applied prospectively to modifications and exchanges of financial liabilities that occur on or after the annual reporting periods beginning on or after January 1, 2022. The amendments to IAS 41 “Agriculture” will be applied prospectively to the fair value measurements on or after the annual reporting periods beginning on or after January 1, 2022. The amendments to IFRS 1 “First-time Adoptions of IFRSs” will be applied retrospectively for annual reporting periods beginning on or after January 1, 2022.
Note 3: The amendments are applicable to business combinations for which the acquisition date is on or after the beginning of the annual reporting period beginning on or after January 1, 2022.
Note 4: The amendments are applicable to property, plant and equipment that are brought to the location and condition necessary for them to be capable of operating in the manner intended by management on or after January 1, 2021.
Note 5: The amendments are applicable to contracts for which the entity has not yet fulfilled all its obligations on January 1, 2022.
Note 6: The amendments will be applied prospectively for annual reporting periods beginning on or after January 1, 2023.
Note 7: The amendments are applicable to changes in accounting estimates and changes in accounting policies that occur on or after the beginning of the annual reporting period beginning on or after January 1, 2023.
As of the date the consolidated financial statements were authorized for issue, the Group is continuously assessing the possible impact that the application of other standards and interpretations will have on the Group’s financial position and financial performance and will disclose the relevant impact when the assessment is completed.
4. SUMMARY OF SIGNIFICANT ACCOUNTING POLICIES
a. Statement of compliance
The consolidated financial statements have been prepared in accordance with the Regulations Governing the Preparation of Financial Reports by Securities Issuers and IFRSs as endorsed and issued into effect by the FSC.
b. Basis of preparation
The consolidated financial statements have been prepared on the historical cost basis except for financial instruments which are measured at fair value and net defined benefit liabilities which are measured at the present value of the defined benefit obligation less the fair value of plan assets.
~ 127 ~

- 14 -
The fair value measurements, which are grouped into Levels 1 to 3 based on the degree to which the fair value measurement inputs are observable and based on the significance of the inputs to the fair value measurement in its entirety, are described as follows:
1) Level 1 inputs are quoted prices (unadjusted) in active markets for identical assets or liabilities;
2) Level 2 inputs are inputs other than quoted prices included within Level 1 that are observable for an asset or liability, either directly (i.e., as prices) or indirectly (i.e., derived from prices); and
3) Level 3 inputs are unobservable inputs for an asset or liability.
c. Classification of current and non-current assets and liabilities
Current assets include:
Assets held primarily for the purpose of trading;
Assets expected to be realized within 12 months after the reporting period; and
Cash and cash equivalents unless the asset is restricted from being exchanged or used to settle a liability for at least 12 months after the reporting period.
Current liabilities include:
Liabilities held primarily for the purpose of trading;
Liabilities due to be settled within 12 months after the reporting period; and
Liabilities for which the Group does not have an unconditional right to defer settlement for at least 12 months after the reporting period.
Assets and liabilities that are not classified as current are classified as non-current.
d. Basis of consolidation
The consolidated financial statements incorporate the financial statements of the Company and the entities controlled by the Company (i.e., its subsidiaries). Income and expenses of subsidiaries acquired or disposed of are included in the consolidated statement of comprehensive income from the effective date of acquisition and up to the effective date of disposal, as appropriate. When necessary, adjustments are made to the financial statements of subsidiaries to bring their accounting policies into line with those of the Group. All intra-group transactions, balances, income and expenses are eliminated in full upon consolidation. Total comprehensive income of subsidiaries is attributed to the shareholders of the parent and to the non-controlling interests even if this results in the non-controlling interests having a deficit balance.
Changes in the Group’s ownership interests in subsidiaries that do not result in the Group losing control over the subsidiaries are accounted for as equity transactions. The carrying amounts of the Group’s interests and the non-controlling interests are adjusted to reflect the changes in their relative interests in the subsidiaries. Any difference between the amount by which the non-controlling interests are adjusted and the fair value of the consideration paid or received is recognized directly in equity and attributed to shareholders of the parent.
See Note 11, Table 7 and Table 8 for detailed information on subsidiaries, including percentages of ownership and main businesses.
e. Foreign currencies
~ 128 ~

- 15 -
In preparing the financial statements of each individual entity, transactions in currencies other than the entity’s functional currency (i.e., foreign currencies) are recognized at the rates of exchange prevailing at the dates of the transactions.
At the end of each reporting period, monetary items denominated in foreign currencies are retranslated at the rates prevailing at that date. Exchange differences on monetary items arising from settlement or translation are recognized in profit or loss in the period in which they arise.
Non-monetary items denominated in foreign currencies that are measured at fair value are retranslated at the rates prevailing at the date when the fair value is determined. Exchange differences arising from the retranslation of non-monetary items are included in profit or loss for the period except for exchange differences arising from the retranslation of non-monetary items in respect of which gains and losses are recognized directly in other comprehensive income; in which cases, the exchange differences are also recognized directly in other comprehensive income.
For the purpose of presenting consolidated financial statements, the financial statements of the Company’s foreign operations (including subsidiaries and associates in other countries) that are prepared using functional currencies which are different from the currency of the Company are translated into the presentation currency, the New Taiwan dollar, as follows: Assets and liabilities are translated at the exchange rates prevailing at the end of the reporting period; and income and expense items are translated at the average exchange rates for the period. The resulting currency translation differences are recognized in other comprehensive income, attributed to the owners of the Company and non-controlling interests as appropriate.
On the disposal of a foreign operation, all of the exchange differences accumulated in equity in respect of that operation attributable to the owners of the Company are reclassified to profit or loss.
f. Inventories
Inventories consist of raw materials, supplies, finished goods and work in progress and are stated at the lower of cost or net realizable value. Inventory write-downs are made by item, except where it may be appropriate to group similar or related items. The net realizable value is the estimated selling price of inventories less all estimated costs of completion and costs necessary to make the sale. Inventories are recorded at the weighted-average cost on the balance sheet date.
g. Property, plant and equipment
Property, plant and equipment are initially measured at cost and subsequently measured at cost less accumulated depreciation and accumulated impairment loss.
The depreciation of property, plant and equipment is recognized using the straight-line method. Each significant part is depreciated separately. The estimated useful lives, residual values and depreciation methods are reviewed at the end of each reporting period, with the effects of any changes in the estimates accounted for on a prospective basis.
On derecognition of an item of property, plant and equipment, the difference between the sales proceeds and the carrying amount of the asset is recognized in profit or loss.
h. Investment properties
Investment properties are properties held to earn rental and/or for capital appreciation. Investment properties include right-of-use assets and properties under construction that meet the definition of investment properties.
Investment properties are initially measured at cost, including transaction costs. Subsequent to initial
~ 129 ~

- 16 -
recognition, investment properties are measured at cost less accumulated depreciation and accumulated impairment loss.
Depreciation is recognized using the straight-line method.
On derecognition of an investment property, the difference between the net disposal proceeds and the carrying amount of the asset is included in profit or loss.
i. Intangible assets
1) Intangible assets acquired separately
Intangible assets with finite useful lives that are acquired separately are initially measured at cost and subsequently measured at cost less accumulated amortization and accumulated impairment loss. Amortization is recognized on a straight-line basis. The estimated useful lives, residual values, and amortization methods are reviewed at the end of each reporting period, with the effect of any changes in the estimates accounted for on a prospective basis. Intangible assets with indefinite useful lives that are acquired separately are measured at cost less accumulated impairment loss.
2) Derecognition of intangible assets
On derecognition of an intangible asset, the difference between the net disposal proceeds and the carrying amount of the asset is recognized in profit or loss.
j. Impairment of property, plant and equipment, right-of-use asset, intangible assets other than goodwill
At the end of each reporting period, the Group reviews the carrying amounts of its property, plant and equipment, right-of-use asset and intangible assets to determine whether there is any indication that those assets have suffered an impairment loss. If any such indication exists, the recoverable amount of the asset is estimated in order to determine the extent of the impairment loss. When it is not possible to estimate the recoverable amount of an individual asset, the Group estimates the recoverable amount of the cash-generating unit to which the asset belongs.
The recoverable amount is the higher of fair value less costs to sell and value in use. If the recoverable amount of an asset or cash-generating unit is estimated to be less than its carrying amount, the carrying amount of the asset or cash-generating unit is reduced to its recoverable amount, with the resulting impairment loss recognized in profit or loss.
When an impairment loss is subsequently reversed, the carrying amount of the corresponding asset or cash-generating unit is increased to the revised estimate of its recoverable amount, but only to the extent of the carrying amount (less amortization or depreciation expense) that would have been determined had no impairment loss been recognized on the asset or cash-generating unit in prior years. A reversal of an impairment loss is recognized in profit or loss.
k. Financial instruments
Financial assets and financial liabilities are recognized when the Group becomes a party to the contractual provisions of the instruments.
Transaction costs that are directly attributable to the acquisition or issuance of financial assets and financial liabilities (other than financial assets and financial liabilities at fair value through profit or loss or “FVTPL”) are added to or deducted from the fair value of the financial assets or financial liabilities, as appropriate, on initial recognition. Transaction costs directly attributable to the acquisition of financial assets or financial liabilities at FVTPL are recognized immediately in profit or loss.
1) Financial assets
~ 130 ~

- 17 -
All regular way purchases or sales of financial assets are recognized and derecognized on a trade date basis.
a) Measurement categories
Financial assets are classified into the following categories: Financial assets at FVTPL, financial assets at amortized cost and investments in equity instruments at fair value through other comprehensive income (“FVTOCI”).
i. Financial assets at FVTPL
Financial asset is classified as at FVTPL when such a financial asset is mandatorily classified as at FVTPL. Financial assets mandatorily classified as at FVTPL include investments in equity instruments which are not designated as at FVTOCI.
Financial assets at FVTPL are subsequently measured at fair value, and any dividends and remeasurement gains or losses on such financial assets are recognized in other gains or losses. Fair value is determined in the manner described in Note 23: Financial Instruments.
ii. Financial assets at amortized cost
Financial assets that meet the following conditions are subsequently measured at amortized cost:
i) The financial assets are held within a business model whose objective is to hold financial assets in order to collect contractual cash flows; and
ii) The contractual terms of the financial assets give rise on specified dates to cash flows that are solely payments of principal and interest on the principal amount outstanding.
Subsequent to initial recognition, financial assets at amortized cost, including cash and cash equivalents, accounts receivable, notes receivable, other receivables, other financial assets and refundable deposits are measured at amortized cost, which equals the gross carrying amount determined using the effective interest method less any impairment loss. Exchange differences are recognized in profit or loss.
Interest income is calculated by applying the effective interest rate to the gross carrying amount of such a financial asset
A financial asset is credit impaired when one or more of the following events have occurred:
i) Significant financial difficulty of the issuer or the borrower;
ii) Breach of contract, such as a default;
iii) It is becoming probable that the borrower will enter bankruptcy or undergo a financial reorganization; or
iv) The disappearance of an active market for that financial asset because of financial difficulties.
~ 131 ~

- 18 -
Cash equivalents include time deposits with original maturities within 3 months from the date of acquisition, which are highly liquid, readily convertible to a known amount of cash and are subject to an insignificant risk of changes in value. These cash equivalents are held for the purpose of meeting short-term cash commitments.
iii. Investments in equity instruments at FVTOCI
On initial recognition, the Group may make an irrevocable election to designate investments in equity instruments as at FVTOCI. Designation as at FVTOCI is not permitted if the equity investment is held for trading or if it is contingent consideration recognized by an acquirer in a business combination.
Investments in equity instruments at FVTOCI are subsequently measured at fair value with gains and losses arising from changes in fair value recognized in other comprehensive income and accumulated in other equity. The cumulative gain or loss will not be reclassified to profit or loss on disposal of the equity investments; instead, it will be transferred to retained earnings.
Dividends on these investments in equity instruments are recognized in profit or loss when the Group’s right to receive the dividends is established, unless the dividends clearly represent a recovery of part of the cost of the investment.
b) Impairment of financial assets
The Group recognizes a loss allowance for expected credit losses on financial assets at amortized cost (including accounts receivable).
The Group always recognizes lifetime expected credit losses (ECLs) for trade receivables. For all other financial instruments, the Group recognizes lifetime ECLs when there has been a significant increase in credit risk since initial recognition. If, on the other hand, the credit risk on a financial instrument has not increased significantly since initial recognition, the Group measures the loss allowance for that financial instrument at an amount equal to 12-month ECLs.
Expected credit losses reflect the weighted average of credit losses with the respective risks of default occurring as the weights. Lifetime ECLs represent the expected credit losses that will result from all possible default events over the expected life of a financial instrument. In contrast, 12-month ECLs represent the portion of lifetime ECLs that is expected to result from default events on a financial instrument that are possible within 12 months after the reporting date.
For internal credit risk management purposes, the Group determines the following situations as indication that a financial asset is in default (without taking into account any collateral held by the Group):
i. Internal or external information shows that the debtor is unlikely to pay its creditors.
ii. Financial asset is more than 180 days past due unless the Group has reasonable and corroborative information to support a more lagged default criterion.
The impairment loss of all financial assets is recognized in profit or loss by a reduction in their carrying amounts through a loss allowance account.
~ 132 ~

- 19 -
c) Derecognition of financial assets
The Group derecognizes a financial asset only when the contractual rights to the cash flows from the asset expire or when it transfers the financial asset and substantially all the risks and rewards of ownership of the asset to another party.
On derecognition of a financial asset at amortized cost in its entirety, the difference between the asset’s carrying amount and the sum of the consideration received and receivable is recognized in profit or loss. However, on derecognition of an investment in an equity instrument at FVTOCI, the cumulative gain or loss which had been recognized in other comprehensive income is transferred directly to retained earnings, without recycling through profit or loss.
2) Financial liabilities
a) Subsequent measurement
Financial liabilities are measured at amortized cost using the effective interest method.
b) Derecognition of financial liabilities
The difference between the carrying amount of a financial liability derecognized and the consideration paid, including any non-cash assets transferred or liabilities assumed, is recognized in profit or loss.
l. Revenue recognition
The Group identifies contracts with customers, allocates the transaction price to the performance obligations and recognizes revenue when performance obligations are satisfied.
Revenue from the sale of goods
Revenue from the sale of goods comes from sales of tires and tubes for vehicles, and other related products. The Group recognizes revenue and accounts receivable when promised goods are delivered to the customer’s specified location or loaded on vessels at which point the customer obtains control of the goods and performance obligation is satisfied.
m. Leases
At the inception of a contract, the Group assesses whether the contract is, or contains, a lease.
1) The Group as lessor
Leases are classified as finance leases whenever the terms of a lease transfer substantially all the risks and rewards of ownership to the lessee. All other leases are classified as operating leases.
Lease payments (less any lease incentives payable) from operating leases are recognized as income on a straight-line basis over the terms of the relevant leases.
2) The Group as lessee
The Group recognizes right-of-use assets and lease liabilities for all leases at the commencement date of a lease, except for short-term leases and low-value asset leases accounted for applying a recognition exemption where lease payments are recognized as expenses on a straight-line basis over the lease period.
~ 133 ~

- 20 -
Right-of-use assets are initially measured at cost, which comprises the initial measurement of lease liabilities adjusted for lease payments made at or before the commencement date, plus any initial direct costs incurred and an estimate of costs needed to restore the underlying assets, and less any lease incentives received. Right-of-use assets are subsequently measured at cost less accumulated depreciation and impairment losses and adjusted for any remeasurement of the lease liabilities. Right-of-use assets are presented on a separate line in the consolidated balance sheets.
Right-of-use assets are depreciated using the straight-line method from the commencement dates to the earlier of the end of the useful lives of the right-of-use assets or the end of the lease terms. However, if leases transfer ownership of the underlying assets to the Group by the end of the lease terms or if the costs of right-of-use assets reflect that the Group will exercise a purchase option, the Group depreciates the right-of-use assets from the commencement dates to the end of the useful lives of the underlying assets.
Lease liabilities are initially measured at the present value of the lease payments, which comprise fixed payments, in-substance fixed payments, variable lease payments which depend on an index or a rate, residual value guarantees, the exercise price of a purchase option if the Group is reasonably certain to exercise that option, and payments of penalties for terminating a lease if the lease term reflects such termination, less any lease incentives receivable. The lease payments are discounted using the interest rate implicit in a lease, if that rate can be readily determined. If that rate cannot be readily determined, the Group uses its incremental borrowing rate.
Subsequently, lease liabilities are measured at amortized cost using the effective interest method, with interest expense recognized over the lease terms. When there is a change in the lease term, the Group remeasures the lease liabilities with a corresponding adjustment to the right-of-use-assets. However, if the carrying amount of the right-of-use assets is reduced to zero, any remaining amount of the remeasurement is recognized in profit or loss. Lease liabilities are presented on a separate line in the consolidated balance sheets.
n. Borrowing costs
Borrowing costs directly attributable to an acquisition, construction or production of qualifying assets are added to the cost of those assets, until such time as the assets are substantially ready for their intended use or sale.
Investment income earned on the temporary investment of specific borrowings pending their expenditure on qualifying assets is deducted from the borrowing costs eligible for capitalization.
Other than those stated above, all other borrowing costs are recognized in profit or loss in the period in which they are incurred.
o. Government grants
Government grants are not recognized until there is reasonable assurance that the Group will comply with the conditions attached to them and that the grants will be received.
Government grants related to income are recognized in profit or loss on a systematic basis over the periods in which the Group recognizes as expenses the related costs that the grants intend to compensate. Specifically, government grants whose primary condition is that the Group should purchase, construct or otherwise acquire non-current assets are recognized as deferred revenue and transferred to profit or loss on a systematic and rational basis over the useful lives of the related assets.
The benefit of a government loan received at a below-market rate of interest is treated as a government grant measured as the difference between the proceeds received and the fair value of the loan based on prevailing market interest rates.
~ 134 ~

- 21 -
p. Employee benefits
1) Short-term employee benefits
Liabilities recognized in respect of short-term employee benefits are measured at the undiscounted amount of the benefits expected to be paid in exchange for the related services.
2) Retirement benefits
Payments to defined contribution retirement benefit plans are recognized as expenses when employees have rendered services entitling them to the contributions.
Defined benefit costs (including service cost, net interest and remeasurement) under defined benefit retirement benefit plans are determined using the projected unit credit method. Current service cost and net interest on the net defined benefit liabilities are recognized as employee benefits expense in the period in which they occur. Remeasurement, comprising actuarial gains and losses and the return on plan assets (excluding interest), is recognized in other comprehensive income in the period in which it occurs. Remeasurement recognized in other comprehensive income is reflected immediately in retained earnings and will not be reclassified to profit or loss.
Net defined benefit liabilities represent the actual deficit in the Group’s defined benefit plans.
q. Taxation
Income tax expense represents the sum of the tax currently payable and deferred tax.
1) Current tax
Income tax payable (recoverable) is based on taxable profit (loss) for the year determined according to the applicable tax laws of each tax jurisdiction.
According to the Income Tax Act in the ROC, an additional tax on unappropriated earnings is provided for in the year the shareholders approve to retain earnings.
Adjustments of prior years’ tax liabilities are added to or deducted from the current year’s tax provision.
2) Deferred tax
Deferred tax is recognized on temporary differences between the carrying amounts of assets and liabilities and the corresponding tax bases used in the computation of taxable profit.
Deferred tax liabilities are generally recognized for all taxable temporary differences. Deferred tax assets are generally recognized for all deductible temporary differences, unused loss carryforwards and research and development expenditures to the extent that it is probable that taxable profits will be available against which those deductible temporary differences can be utilized.
Deferred tax liabilities are recognized for taxable temporary differences associated with investments in subsidiaries, except where the Group is able to control the reversal of the temporary difference and it is probable that the temporary difference will not reverse in the foreseeable future. Deferred tax assets arising from deductible temporary differences associated with such investments and interests are recognized only to the extent that it is probable that there will be sufficient taxable profits against which to utilize the benefits of the temporary differences and they are expected to reverse in the foreseeable future.
~ 135 ~

- 22 -
The carrying amount of deferred tax assets is reviewed at the end of each reporting period and reduced to the extent that it is no longer probable that sufficient taxable profits will be available to allow all or part of the assets to be recovered. A previously unrecognized deferred tax asset is also reviewed at the end of each reporting period and recognized to the extent that it has become probable that future taxable profit will allow the deferred tax asset to be recovered.
Deferred tax assets and liabilities are measured at the tax rates that are expected to apply in the period in which the liabilities are settled or the assets are realized, based on tax rates and tax laws that have been enacted or substantively enacted by the end of the reporting period. The measurement of deferred tax liabilities and assets reflects the tax consequences that would follow from the manner in which the Group expects, at the end of the reporting period, to recover or settle the carrying amount of its assets and liabilities.
3) Current and deferred taxes
Current and deferred taxes are recognized in profit or loss, except when they relate to items that are recognized in other comprehensive income or directly in equity; in which case, the current and deferred taxes are also recognized in other comprehensive income or directly in equity, respectively.
5. CRITICAL ACCOUNTING JUDGMENTS AND KEY SOURCES OF ESTIMATION UNCERTAINTY
In the application of the Group’s accounting policies, management is required to make judgments, estimations, and assumptions about the carrying amounts of assets and liabilities that are not readily apparent from other sources. The estimates and associated assumptions are based on historical experience and other factors that are considered relevant. Actual results may differ from these estimates.
The Group considers the economic implications of the COVID-19 when making its critical accounting estimates. The estimates and underlying assumptions are reviewed on an ongoing basis. Revisions to accounting estimates are recognized in the period in which the estimates are revised if the revisions affect only that period or in the period of the revisions and future periods if the revisions affect both current and future periods.
Write-down of Inventories
The net realizable value of inventories is the estimated selling price in the ordinary course of business less the estimated costs of completion and the estimated costs necessary to make the sale. The estimation of net realizable value is based on current market conditions and historical experience with product sales of a similar nature. Changes in market conditions may have a material impact on the estimation of the net realizable value.
6. CASH AND CASH EQUIVALENTS
December 31 2020 2019
Cash on hand $ 4,822 $ 12,492 Checking accounts and demand deposits 6,687,188 6,945,578 Cash equivalents (time deposits with original maturities of 3 months
or less) 1,793,398 668,439 $ 8,485,408 $ 7,626,509
~ 136 ~

- 23 -
7. FINANCIAL ASSETS AT FAIR VALUE THROUGH OTHER COMPREHENSIVE INCOME
December 31 2020 2019
Non-current Investments in equity instruments at FVTOCI
Domestic unlisted shares $ 438,814 $ 367,064 Foreign unlisted shares 139,605 148,351
$ 578,419 $ 515,415
These investments in equity instruments are held for medium-to long-term strategic purposes. Accordingly, the management elected to designate these investments in equity instruments as at FVTOCI as they believe that recognizing short-term fluctuations in these investments’ fair value in profit or loss would not be consistent with the Group’s strategy of holding these investments for long-term purposes.
8. NOTES AND ACCOUNTS RECEIVABLE
December 31 2020 2019
Notes receivable At amortized cost $ 430,967 $ 315,758 Accounts receivable At amortized cost
Gross carrying amount $ 3,504,194 $ 3,451,911 Less: Allowance for impairment loss (90,331) (79,797)
$ 3,413,863 $ 3,372,114
The credit periods of sales of goods are between 30 days and 90 days from the date of the invoice. No interest is charged on accounts receivable.
The Group measures the loss allowance for accounts receivable at an amount equal to lifetime ECLs. The expected credit losses on accounts receivable are estimated using a provision matrix approach considering the past default experience of the customer, the customer’s current financial position, economic condition of the industry in which the customer operates, as well as the GDP forecasts and industry outlook. The Group uses different provision matrixes based on customer segments by geographical region, and determines the expected credit loss rate.
The Group writes off an accounts receivable when there is evidence indicating that the debtor is in severe financial difficulty and there is no realistic prospect of recovery. For accounts receivable that have been written off, the Group continues to engage in enforcement activity to attempt to recover the receivables due. Where recoveries are made, these are recognized in profit or loss.
~ 137 ~

- 24 -
The following table details the loss allowance of accounts receivable based on the Group’s provision matrix.
December 31, 2020
Not Past Due 1 to 30 Days 31 to 60 Days 61 to 90 Days 91 to 120 Days 121 to 180 Days Over
181 Days Total Gross carrying amount $ 3,618,525 $ 193,134 $ 18,886 $ 5,229 $ 1,326 $ 3,194 $ 94,887 $ 3,935,161 Loss allowance (Lifetime
ECLs) (428 ) (1,327 ) (2,436 ) (252 ) (20 ) (443 ) (85,425 ) (90,331 ) Amortized cost $ 3,618,097 $ 191,807 $ 16,430 $ 4,977 $ 1,306 $ 2,751 $ 9,462 $ 3,844,830
December 31, 2019
Not Past Due 1 to 30 Days 31 to 60 Days 61 to 90 Days 91 to 120 Days 121 to 180 Days Over
181 Days Total Gross carrying amount $ 3,251,973 $ 318,254 $ 60,155 $ 23,930 $ 14,378 $ 11,735 $ 87,244 $ 3,767,669 Loss allowance (Lifetime
ECLs) - (3,183 ) (1,743 ) (1,198 ) (1,533 ) (3,625 ) (68,515 ) (79,797 ) Amortized cost $ 3,251,973 $ 315,071 $ 58,412 $ 22,732 $ 12,845 $ 8,110 $ 18,729 $ 3,687,872
The movements of the loss allowance of notes and accounts receivable were as follows:
For the Year Ended December 312020 2019
Balance at January 1 $ 79,797 $ 80,553 Add: Net remeasurement of loss allowance 29,569 8,675 Less: Amounts written off (19,124) (6,571) Foreign exchange gains and losses 89 (2,860) Balance at December 31 $ 90,331 $ 79,797
Refer to Note 25 for information relating to notes and accounts receivable pledged as security.
9. INVENTORIES
December 31 2020 2019
Finished goods $ 2,230,140 $ 2,582,090 Work in progress 409,782 494,585 Raw materials 2,993,420 3,337,417 Supplies 330,036 307,340 Merchandise 62,718 44,400 Inventory in transit 1,663,395 1,164,956 $ 7,689,491 $ 7,930,788
The cost of revenue associated with inventories were $22,910,212 thousand and $25,570,683 thousand, respectively, for the years ended December 31, 2020 and 2019. The cost of revenue consisted of reversal of inventory write-downs of $23,933 thousand and inventory write-downs of $45,420 thousand.
Refer to Note 25 for information relating to inventories pledged as security.
~ 138 ~

- 25 -
10. OTHER FINANCIAL ASSETS
December 31 2020 2019
Current Time deposits with original maturities more than 3 months $ 1,838,434 $ 3,101,387 Others 2,186 76,730 $ 1,840,620 $ 3,178,117 Non-current Repatriated funds $ 1,268,181 $ -
Repatriated funds refer to demand and time deposits pertinent to regulations governing repatriated offshore funds, which the use is restricted.
Refer to Note 23 for information relating to credit risk management and valuation. Refer to Note 25 for information relating to other financial assets pledged as security.
11. SUBSIDIARIES
a. Subsidiaries included in the consolidated financial statements
Proportion of Ownership
(%) December 31
Investor Investee Nature of Activities 2020 2019 Remark The Company American Kenda Rubber Ind. Co.,
Ltd. (KA) Trading and investing activities 100% 100% -
Kenda Rubber Ind. Co., (Hong Kong) Ltd. (KHK)
Trading and investing activities 100% 100% -
Kenda Rubber (Vietnam) Co., Ltd. (KV)
Manufacturing and selling of various types of tires
100% 100% -
Kenda Rubber Industrial Co. (Europe GmbH) (KE)
Marketing planning activities 100% 100% -
Kenda International Corporation Co., Ltd. (KIC)
Investing activities 100% 100% -
Kenfong Industrial Co., Ltd. (KF) Manufacturing and selling of various types of tires
100% 100% -
Pt. Kenda Rubber Indonesia (KI) Manufacturing and selling of various types of tires
99.99% 99.99% -
KA Americana Development, Inc. (ADI)
Manufacturing of rims and distribution and selling of wheels and rims
100% 100% -
KHK Kenda Rubber (Shenzhen) Ltd. (KS)
Manufacturing and selling of various types of tires
60% 60% -
Kenda Rubber (Tianjin) Co., Ltd. (KT)
Manufacturing and selling of various types of tires
13.64% 13.64% -
KIC Kenda Global Holding Co., Ltd. (KGH)
Investing activities 100% 100% -
Kenda Global Investment Corporation (KGI)
Investing activities 100% 100% -
KGI STARCO Europe A/S Investing activities 100% 100% - KGH Kenda Global (China) Investment
Corporation (KGCI) Investing activities 100% 100% -
Kenda Rubber (Shenzhen) Ltd. (KS)
Manufacturing and selling of various types of tires
40% 40% -
(Continued)
~ 139 ~

- 26 -
Proportion of Ownership
(%) December 31
Investor Investee Nature of Activities 2020 2019 Remark KGCI Kenda Rubber (Tianjin) Co., Ltd.
(KT) Manufacturing and selling of
various types of tires 86.36% 86.36% -
Kenda Rubber (China) Ltd. (KC) Manufacturing and selling of various types of tires
100% 100% -
STARCO Europe A/S STARCO GB Ltd. Distribution and selling of various types of tires and rims
100% 100% -
STARCO GmbH Distribution and selling of various types of tires and rims
100% 100% -
STARCO Polska Sp.z.o.o. Distribution and selling of various types of tires and rims
100% 100% -
STARCO NV Distribution and selling of various types of tires and rims
100% 100% -
STARCO GS AG Distribution and selling of various types of tires and rims
100% 100% -
STARCO Baltic OÜ Distribution and selling of various types of tires and rims
100% 100% -
STARCO SAS Distribution and selling of various types of tires and rims
100% 100% -
STARCO Beli Manastir d.o.o. Manufacturing of various types of rims
100% 100% -
STARCO DML Manufacturing and distribution and selling of tires and rims
100% 100% -
Jelshoj Imovina d.o.o. (STARCO Jelshoj)
Investing activities 100% 100% -
STARCO IPR GmbH Investing activities 100% 100% - (Concluded)
b. Subsidiaries excluded from the consolidated financial statements: None.
12. PROPERTY, PLANT AND EQUIPMENT
Land Buildings Machinery and
Equipment Other
Equipment
Equipment Under
Installationand
Construction in Progress Total
Cost Balance at January 1, 2020 $ 2,500,071 $ 6,934,123 $ 16,169,165 $ 2,034,339 $ 469,948 $ 28,107,646Additions - 26,276 130,620 62,901 304,350 524,147Disposals - (887 ) (632,689 ) (40,301 ) - (673,877 )Reclassification - 102,872 1,600,895 55,910 (309,910 ) 1,449,767Effects of foreign currency
exchange differences (2,122 ) (89,947 ) (184,986 ) (14,470 ) (12,997 ) (304,522 ) Balance at December 31, 2020 $ 2,497,949 $ 6,972,437 $ 17,083,005 $ 2,098,379 $ 451,391 $ 29,103,161 Accumulated depreciation and impairment
Balance at January 1, 2020 $ - $ 2,556,876 $ 9,975,407 $ 1,328,424 $ - $ 13,860,707Depreciation expense - 215,226 974,119 160,928 - 1,350,273Disposals - (621 ) (575,794 ) (35,651 ) - (612,066 )Impairment - 6,320 9,720 - - 16,040Effects of foreign currency
exchange differences - (12,152 ) (36,885 ) (6,734 ) - (55,771 )
Balance at December 31, 2020 $ - $ 2,765,649 $ 10,346,567 $ 1,446,967 $ - $ 14,559,183
Carrying amount at January 1, 2020 $ 2,500,071 $ 4,377,247 $ 6,193,758 $ 705,915 $ 469,948 $ 14,246,939
Carrying amount at
December 31, 2020 $ 2,497,949 $ 4,206,788 $ 6,736,438 $ 651,412 $ 451,391 $ 14,543,978(Continued)
~ 140 ~

- 27 -
Land Buildings Machinery and
Equipment Other
Equipment
Equipment Under
Installationand
Construction in Progress Total
Cost Balance at January 1, 2019 $ 2,504,537 $ 6,698,562 $ 15,639,129 $ 1,973,550 $ 358,387 $ 27,174,165Additions - 73,905 415,186 67,339 467,463 1,023,893Disposals - (919 ) (348,198 ) (18,559 ) - (367,676 )Reclassification - 348,067 887,175 51,197 (360,704 ) 925,735Effects of foreign currency
exchange differences (4,466 ) (185,492 ) (424,127 ) (39,188 ) 4,802 (648,471 )
Balance at December 31, 2019 $ 2,500,071 $ 6,934,123 $ 16,169,165 $ 2,034,339 $ 469,948 $ 28,107,646
Accumulated depreciation and impairment
Balance at January 1, 2019 $ - $ 2,393,223 $ 9,512,681 $ 1,203,080 $ - $ 13,108,984Depreciation expenses - 237,410 918,476 165,426 - 1,321,312Disposals - (635 ) (196,818 ) (14,842 ) - (212,295 )Reclassification - 1,379 15,963 369 - 17,711Effects of foreign currency
exchange differences - (74,501 ) (274,895 ) (25,609 ) - (375,005 )
Balance at December 31, 2019 $ - $ 2,556,876 $ 9,975,407 $ 1,328,424 $ - $ 13,860,707
Carrying amount at January 1, 2019 $ 2,504,537 $ 4,305,339 $ 6,126,448 $ 770,470 $ 358,387 $ 14,065,181
Carrying amount at
December 31, 2019 $ 2,500,071 $ 4,377,247 $ 6,193,758 $ 705,915 $ 469,948 $ 14,246,939(Concluded)
The above items of property, plant and equipment used by the Group are depreciated on a straight-line basis over their estimated useful lives as follows:
Building 10-55 yearsMachinery and equipment 3-30 yearsOther equipment 2-20 years
A portion of the land for operational use in Chongyang section of Yuanlin City and Citong Township of Yunlin County is categorized as agricultural and pasture land. The title of the land is currently registered under a related party, Mr. Chen, who is the trustee in a land trust agreement with the Company. The Company retains the certificate of title for land and the agreement stipulates that the nominal holder or trustee is prohibited from transferring the ownership to another party. The land will be registered under the Company once the category for land use has been changed.
The Group has been constructing factories in Vietnam; the prepayments for machinery and equipment of $926,507 thousand and $1,535,058 thousand as of December 31, 2020 and 2019 were presented in other non-current assets.
Property, plant and equipment pledged as collateral for borrowings are set out in Note 25.
~ 141 ~

- 28 -
13. LEASE ARRANGEMENTS
a. Right-of-use assets
December 31 2020 2019
Carrying amount Land $ 1,389,524 $ 1,513,028 Buildings 109,240 172,878 Machinery and equipment 24,058 34,795 Other equipment 11,248 16,857 $ 1,534,070 $ 1,737,558
For the Year Ended December 312020 2019
Additions to right-of-use assets $ 4,117 $ 299,745 Depreciation charge for right-of-use assets
Land $ 30,471 $ 32,022 Buildings 69,410 75,318 Machinery and equipment 10,594 12,357 Other equipment 8,569 8,503 $ 119,044 $ 128,200
b. Lease liabilities
December 31 2020 2019
Carrying amount Current $ 88,484 $ 98,239 Non-current $ 363,273 $ 452,527
Range of discount rates for lease liabilities was as follows:
December 31 2020 2019
Land 3.00% 3.00% Buildings 2.75%-3.20% 2.75%-3.20% Machinery and equipment 2.75%-3.20% 2.75%-3.20% Other equipment 2.75%-3.20% 2.75%-3.20%
c. Material leasing activities and terms
KS, KC, and KT signed land use right contracts with Longhua, Penglang, Kunshan, and Tianjin government in mainland China, respectively; the periods of the land use right contracts are between 40 and 50 years. KV signed a land use right contract with Jiangtian Industrial Zone, Dong Nai Province in Vietnam; the period of the land use right contract is between 33 and 43 years.
~ 142 ~

- 29 -
The land use right contracts stipulated that the above companies have the rights to use, to make profit from, to transfer, to sublet and have other rights to dispose, and should pay taxes associated with using the land. The land use right contracts permit lessee to construct factories, office buildings and employees’ dormitories on the land.
KI signed a land use right contract with the government of Serang, Banten Province in Indonesia. The land use right contract permits KI to construct factories, office buildings and employees’ dormitories on the land.
d. Other lease information
For the Year Ended December 312020 2019
Expenses relating to short-term leases $ 33,889 $ 32,838 Expenses relating to low-value asset leases $ 196 $ 329 Total cash outflow for leases $ 138,439 $ 140,933
All lease commitments with lease terms commencing after the balance sheet dates are as follows:
December 31 2020 2019
Lease commitments $ 613,651 $ 728,585
14. INVESTMENT PROPERTIES
Right-of-useAssets
Cost Balance at January 1, 2020 $ - Transfers from right-of-use assets 31,986 Effects of foreign currency exchange differences 607 Balance at December 31, 2020 $ 32,593 Accumulated depreciation and impairment Balance at January 1, 2020 $ - Depreciation expense 279 Transfers from right-of-use assets 3,065 Effects of foreign currency exchange differences 63 Balance at December 31, 2020 $ 3,407 Carrying amount at December 31, 2020 $ 29,186
~ 143 ~

- 30 -
Investment properties are depreciated using the straight-line method over their estimated useful lives as follows:
Right-of-use assets 40-50 years
Due to the urbanization policy of future city development in Shenzhen, KS entered into a collaboration agreement with Kaisa Urban Renewal Group (“Kaisa”) in October 2014 for the development of KS’s land use rights. According to the agreement, KS and Kaisa will jointly transform KS’s industrial land into new types of industrial (office), commercial, residential, and government subsidized buildings. The percentage of joint development and allocation of housing units is based on the agreement subject to government approval. KS is responsible of relocating the original factories, terminating employees, etc. Whereas, Kaisa is responsible for demolishing the buildings, measuring, assessing, verifying rights, planning, signing of compensation agreement, preparing and, acquiring land, construction, and development of the project. Kaisa provided a guarantee deposit of RMB100,000 thousand (approximately $436,528 thousand presented in non-current liabilities) to support KS’s financial need. The deposit will be offset against the market value of property that shall be allocated to KS.
As of December 31, 2020, KS has commenced to relocate the original factories, terminate employees and perform other related tasks and the associated right-of-use assets have been classified as investment properties.
The determination of fair value was performed by independent qualified professional valuers, and the fair value was measured using Level 3 inputs. The valuation was arrived at by reference to the Residual Land Value Method. The fair value as appraised was $5,784,537 thousand.
15. BORROWINGS
a. Short-term borrowings
December 31 2020 2019
Unsecured borrowings $ 2,303,295 $ 2,188,147 Secured borrowings (Note 25) (1) 96,653 184,506 $ 2,399,948 $ 2,372,653 Range of interest rates 0.65%-3.72% 0.65%-3.72%
b. Long-term borrowings
December 31 2020 2019
Unsecured borrowings $ 13,133,236 $ 13,296,572Secured borrowings (Note 25) (1) 807,976 674,026Project borrowing (2) 420,577 383,102 14,361,789 14,353,700Less: Current portion 2,517,453 1,291,805 Long-term borrowings $ 11,844,336 $ 13,061,895 Range of interest rates 0.00%-3.25% 0.65%-4.50% Maturity date 110-115 years 109-118 years
~ 144 ~

- 31 -
1) As stipulated in the loan agreements, the Company, KA, ADI and some of the subsidiaries of STARCO Europe A/S should pledge assets as collaterals and, additionally, maintain certain covenants related to financial ratios. There was no breach of loan agreements associated with financial covenants as of December 31, 2020.
2) The Group participated in a project of the Ministry of Economic Affairs that encouraged Taiwanese enterprises to invest locally. The Group expects to construct or expand factories, and acquire machinery and equipment in Taiwan from 2019 to 2022. Any shortage of funds would be financed via bank borrowings.
16. RETIREMENT BENEFIT PLANS
a. Defined contribution plan
The Company and its subsidiaries in Taiwan adopted a pension plan under the Labor Pension Act (LPA), which is a state-managed defined contribution plan. Under the LPA, the Company makes monthly contributions to employees’ individual pension accounts at 6% of monthly salaries and wages.
The employees of the Group’s subsidiaries in the United States, Vietnam, Indonesia, Europe and mainland China are members of state-managed retirement benefit plans operated by the governments. The subsidiaries are required to contribute specified percentages of payroll costs to the retirement benefit schemes to fund the benefits. The only obligation of the Group with respect to the retirement benefit plan is to make the specified contributions.
b. Defined benefit plans
The defined benefit plans adopted by the Company in accordance with the Labor Standards Act is operated by the government of the ROC. Pension benefits are calculated on the basis of the length of service and average monthly salaries of the 6 months before retirement. The Company contributes amounts equal to 15% of total monthly salaries and wages to a pension fund administered by the pension fund monitoring committee. Pension contributions are deposited in the Bank of Taiwan in the committee’s name. Before the end of each year, the Company assesses the balance in the pension fund. If the amount of the balance in the pension fund is inadequate to pay retirement benefits for employees who conform to retirement requirements in the next year, the Company is required to fund the difference in one appropriation that should be made before the end of March of the next year. The pension fund is managed by the Bureau of Labor Funds, Ministry of Labor (the “Bureau”); the Company has no right to influence the investment policy and strategy.
The subsidiary in Indonesia adopted a defined benefit plan and the remeasurement of the plan is carried out by qualified actuaries in compliant with the local labor standards law.
The amounts included in the consolidated balance sheets in respect of the Company’s defined benefit plans are as follows:
December 31 2020 2019
Present value of defined benefit obligation $ 648,243 $ 640,063 Fair value of plan assets (403,452) (391,876) Net defined benefit liabilities $ 244,791 $ 248,187
~ 145 ~

- 32 -
Movements in net defined benefit liabilities were as follows:
Present Value of Defined
BenefitObligation
Fair Value of the Plan Assets
Net Defined Benefit
Liabilities Balance at January 1, 2019 $ 629,357 $ (361,751) $ 267,606 Service cost
Current service cost 7,480 - 7,480 Net interest expense (income) 6,181 (3,675) 2,506
Recognized in profit or loss 13,661 (3,675) 9,986 Remeasurement
Return on plan assets (excluding amounts included in net interest) - (12,739) (12,739)
Actuarial loss - changes in demographic assumptions 108 - 108
Actuarial loss - changes in financial assumptions 15,491 - 15,491
Actuarial loss - experience adjustments 9,174 - 9,174 Recognized in other comprehensive income 24,773 (12,739) 12,034 Contributions from the employer - (41,439) (41,439) Benefits paid (27,728) 27,728 - Balance at December 31, 2019 640,063 (391,876) 248,187 Service cost
Current service cost 6,357 - 6,357 Net interest expense (income) 4,690 (2,957) 1,733
Recognized in profit or loss 11,047 (2,957) 8,090 Remeasurement
Return on plan assets (excluding amounts included in net interest) - (12,689) (12,689)
Actuarial loss - changes in demographic assumptions 124 - 124
Actuarial loss - changes in financial assumptions 27,046 - 27,046
Actuarial loss - experience adjustments 11,949 - 11,949 Recognized in other comprehensive income 39,119 (12,689) 26,430 Contributions from the employer - (37,916) (37,916) Benefits paid (41,986) 41,986 - Balance at December 31, 2020 $ 648,243 $ (403,452) $ 244,791
Through the defined benefit plans under the Labor Standards Act, the Company is exposed to the following risks:
1) Investment risk: The plan assets are invested in domestic and foreign equity and debt securities, bank deposits, etc. The investment is conducted at the discretion of the Bureau or under the mandated management. However, in accordance with relevant regulations, the return generated by plan assets shall not be below the interest rate for a 2-year time deposit with local banks.
2) Interest risk: A decrease in the government and corporate bond interest rate will increase the present value of the defined benefit obligation; however, this will be partially offset by an increase in the return on the plans’ debt investments.
~ 146 ~

- 33 -
3) Salary risk: The present value of the defined benefit obligation is calculated using the future salaries of plan participants. As such, an increase in the salaries of the plan participants will increase the present value of the defined benefit obligation.
The actuarial valuations of the present value of the defined benefit obligation were carried out by qualified actuaries. The significant assumptions used for the purposes of the actuarial valuations are as follows:
December 31 2020 2019
Discount rate 0.30% 0.75% Expected rate of salary increase 2.00% 2.00%
If possible reasonable changes in each of the significant actuarial assumptions occur and all other assumptions remain constant, the present value of the defined benefit obligation will increase (decrease) as follows:
December 31 2020 2019
Discount rates
0.25% increase $ (15,190) $ (15,496) 0.25% decrease $ 15,745 $ 16,078
Expected rates of salary increase 0.25% increase $ 15,439 $ 15,837 0.25% decrease $ (15,745) $ (15,346)
The above sensitivity analysis presented above may not be representative of the actual changes in the present value of the defined benefit obligation as it is unlikely that changes in assumptions will occur in isolation of one another as some of the assumptions may be correlated.
December 31 2020 2019
Expected contributions to the plans for the next year $ 34,436 $ 34,369 Average duration of the defined benefit obligation 9 years 9 years
17. EQUITY
a. Ordinary shares
December 31 2020 2019
Shares authorized (in thousands of shares) 910,000 880,000 Shares authorized, par value $10 (in thousands of dollars) $ 9,100,000 $ 8,800,000 Shares issued and fully paid (in thousands of shares) 909,410 874,430 Shares issued and fully paid (in thousands of dollars) $ 9,094,100 $ 8,744,300
The change in the Company’s share capital is mainly resulted from the process of converting its retained earnings into share capital via issuing new shares.
~ 147 ~

- 34 -
b. Retained earnings and dividends policy
The shareholders of the Company held their regular meeting on June 11, 2019 and in that meeting, resolved the amendments to the Company’s Articles of Incorporation (the “Articles”). The amendments explicitly stipulate that the Company’s board of directors is authorized to adopt a special resolution to distribute dividends and bonuses in cash and a report of such distribution should be submitted in the shareholders’ meeting.
Under the dividends policy as set forth in the amended Articles, the Company takes into consideration the Company’s operating environment, growth stage, future capital needs, long-term financial plans, and the shareholders’ demand for cash inflows before resolving the amount of dividends. The Company’s board of directors could propose dividends between 10% and 80% of distributable earnings which comprise of the current remaining earning and undistributed earnings from previous year. When distributing dividends via issuing shares, the motion should be submitted to shareholders’ meeting for approval. The shareholders may adjust the ratio of share dividends to reflect the profit and the adequacy of capital of the year. The cash dividends shall not be less than 10% of the total dividend declared. The board of directors is authorized to adopt a resolution to distribute dividends, bonuses, legal reserve and all or a portion of the capital surplus in cash and a report of such distribution should be submitted to the shareholders’ meeting.
Under the dividends policy as set forth in the Articles before the amendments, where the Company retains unappropriated earnings during a fiscal year, the earnings shall be first reserved for paying taxes, offsetting losses of previous years, setting aside as legal reserve at 10% of the remaining earnings, except when the legal reserve equals to the paid-in capital of the Company. The Company could appropriate or reverse a special reserve in accordance with the laws, regulations or order of competent authority, when necessary.
The Company takes into consideration of the operating environment, growth stage, future capital needs, long-term financial plans, and the shareholders’ demand for cash inflows, the Company’s board of directors could propose dividends between 10% and 80% of distributable earning which comprise of the current remaining earning and undistributed earnings from previous year. When distributing dividends via issuing shares, the motion should be submitted to shareholders meeting for approval. The cash dividends shall not be less than 10% of the total dividend declared. The shareholders may adjust the ratio and the instruments of distributions to reflect the profit and the adequacy of capital of the year. For the policies on the distribution of compensation of employees and remuneration of directors and supervisors after the amendment, refer to compensation of employees and remuneration of directors and supervisors in Note 19(g).
Appropriation of earnings to a legal reserve shall be made until the legal reserve equals the Company’s paid-in capital. The legal reserve may be used to offset deficit. If the Company has no deficit and the legal reserve has exceeded 25% of the Company’s paid-in capital, the excess may be transferred to capital or distributed in cash.
Items referred to under Rule No. 1010012865 and in the directive titled “Questions and Answers for Special Reserves Appropriated Following Adoption of IFRSs” should be appropriated to or reversed from a special reserve by the Company.
The appropriations of earnings for 2019 and 2018 were as follows:
Appropriations of Earnings Dividends Per Share (NT$) 2019 2018 2019 2018
Legal reserve $ 100,220 $ 68,917 Special reserve (reversal) 361,099 (108,439) Cash dividends 349,772 874,430 $ 0.4 $ 1.0 Share dividends 349,800 - 0.4 -
~ 148 ~
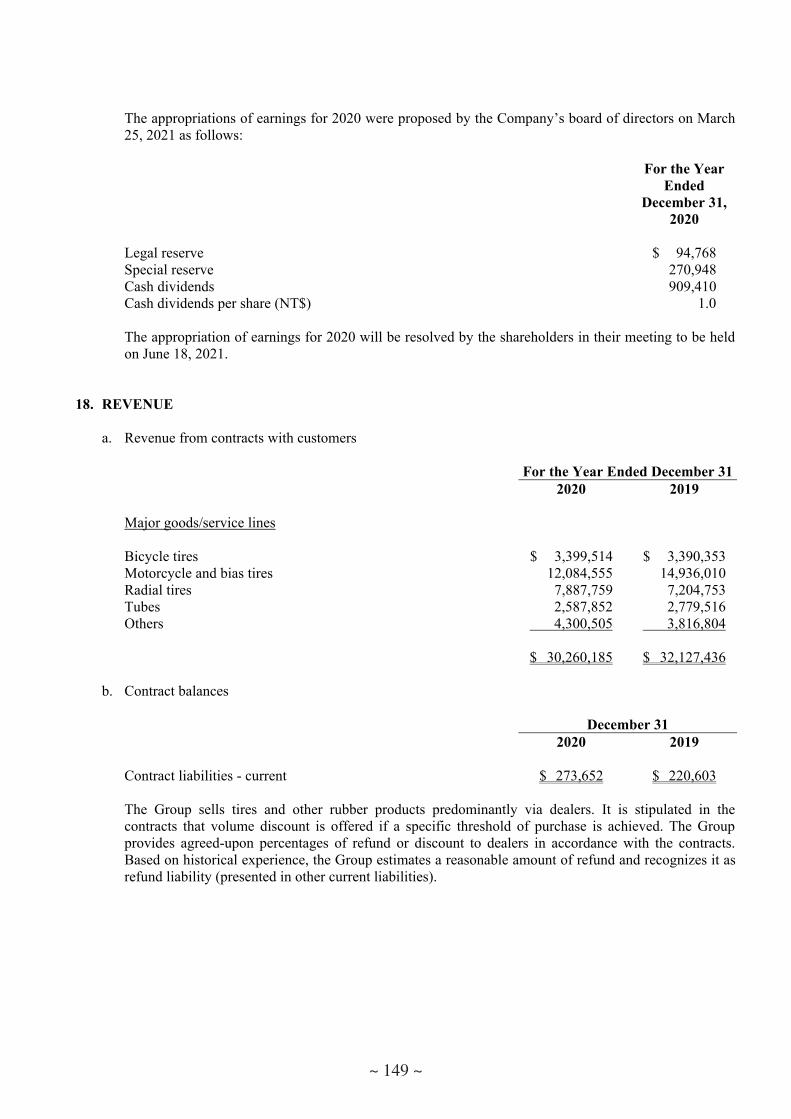
- 35 -
The appropriations of earnings for 2020 were proposed by the Company’s board of directors on March 25, 2021 as follows:
For the Year Ended
December 31, 2020
Legal reserve $ 94,768 Special reserve 270,948 Cash dividends 909,410 Cash dividends per share (NT$) 1.0
The appropriation of earnings for 2020 will be resolved by the shareholders in their meeting to be held on June 18, 2021.
18. REVENUE
a. Revenue from contracts with customers
For the Year Ended December 312020 2019
Major goods/service lines Bicycle tires $ 3,399,514 $ 3,390,353Motorcycle and bias tires 12,084,555 14,936,010Radial tires 7,887,759 7,204,753Tubes 2,587,852 2,779,516Others 4,300,505 3,816,804 $ 30,260,185 $ 32,127,436
b. Contract balances
December 31 2020 2019
Contract liabilities - current $ 273,652 $ 220,603
The Group sells tires and other rubber products predominantly via dealers. It is stipulated in the contracts that volume discount is offered if a specific threshold of purchase is achieved. The Group provides agreed-upon percentages of refund or discount to dealers in accordance with the contracts. Based on historical experience, the Group estimates a reasonable amount of refund and recognizes it as refund liability (presented in other current liabilities).
~ 149 ~
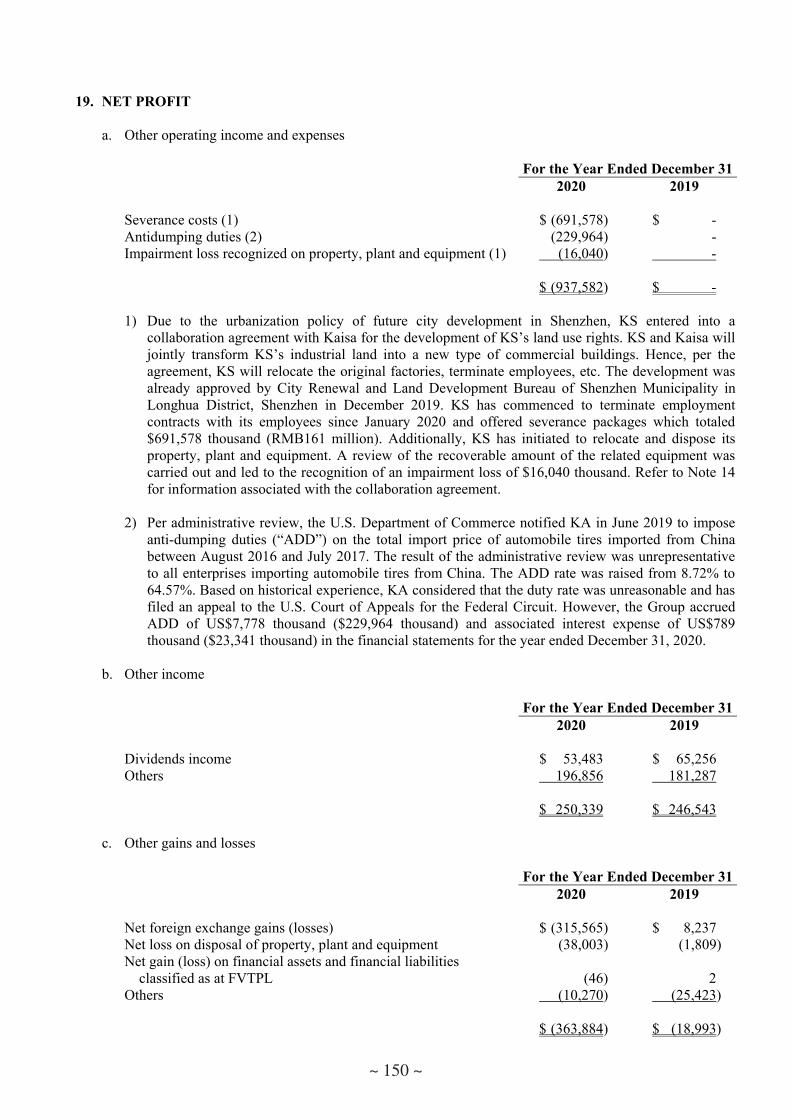
- 36 -
19. NET PROFIT
a. Other operating income and expenses
For the Year Ended December 31 2020 2019 Severance costs (1) $ (691,578) $ - Antidumping duties (2) (229,964) - Impairment loss recognized on property, plant and equipment (1) (16,040) - $ (937,582) $ -
1) Due to the urbanization policy of future city development in Shenzhen, KS entered into a collaboration agreement with Kaisa for the development of KS’s land use rights. KS and Kaisa will jointly transform KS’s industrial land into a new type of commercial buildings. Hence, per the agreement, KS will relocate the original factories, terminate employees, etc. The development was already approved by City Renewal and Land Development Bureau of Shenzhen Municipality in Longhua District, Shenzhen in December 2019. KS has commenced to terminate employment contracts with its employees since January 2020 and offered severance packages which totaled $691,578 thousand (RMB161 million). Additionally, KS has initiated to relocate and dispose its property, plant and equipment. A review of the recoverable amount of the related equipment was carried out and led to the recognition of an impairment loss of $16,040 thousand. Refer to Note 14 for information associated with the collaboration agreement.
2) Per administrative review, the U.S. Department of Commerce notified KA in June 2019 to impose anti-dumping duties (“ADD”) on the total import price of automobile tires imported from China between August 2016 and July 2017. The result of the administrative review was unrepresentative to all enterprises importing automobile tires from China. The ADD rate was raised from 8.72% to 64.57%. Based on historical experience, KA considered that the duty rate was unreasonable and has filed an appeal to the U.S. Court of Appeals for the Federal Circuit. However, the Group accrued ADD of US$7,778 thousand ($229,964 thousand) and associated interest expense of US$789 thousand ($23,341 thousand) in the financial statements for the year ended December 31, 2020.
b. Other income
For the Year Ended December 312020 2019
Dividends income $ 53,483 $ 65,256 Others 196,856 181,287 $ 250,339 $ 246,543
c. Other gains and losses
For the Year Ended December 312020 2019
Net foreign exchange gains (losses) $ (315,565) $ 8,237 Net loss on disposal of property, plant and equipment (38,003) (1,809) Net gain (loss) on financial assets and financial liabilities
classified as at FVTPL (46) 2 Others (10,270) (25,423) $ (363,884) $ (18,993)
~ 150 ~

- 37 -
d. Financial costs
For the Year Ended December 312020 2019
Interest on bank loans $ 204,827 $ 262,101 Interest on lease liabilities 13,591 16,432 Others 23,341 5,210 Less: Amounts included in the cost of qualifying assets (317) (1,836) $ 241,442 $ 281,907
e. Depreciation and amortization
For the Year Ended December 312020 2019
An analysis of depreciation by function
Operating costs $ 1,119,319 $ 1,038,555 Operating expenses 350,277 410,957
$ 1,469,596 $ 1,449,512 An analysis of amortization by function
Operating costs $ 4,678 $ 6,271 Operating expenses 19,019 13,262
$ 23,697 $ 19,533
f. Employee benefits expense
For the Year Ended December 312020 2019
Short-term benefits
Salary expense $ 4,769,041 $ 5,047,729 Labor/health insurance expense 462,176 469,621
5,231,217 5,517,350 Post-employment benefits
Defined contribution plans 247,027 338,783 Defined benefit plans 11,572 11,713
258,599 350,496 Termination benefits (see Note 19(a)) 691,578 - Other employee benefits 188,049 221,674 Total employee benefits expense $ 6,369,443 $ 6,089,520 An analysis of employee benefits expense by function
Operating costs $ 3,359,368 $ 3,644,552 Operating expenses 2,318,497 2,444,968 Other operating income and expenses 691,578 -
$ 6,369,443 $ 6,089,520
~ 151 ~

- 38 -
g. Compensation of employees and remuneration of directors
According to the Company’s Articles, the Company accrued compensation of employees and remuneration of directors at rates from 0.5% to 1% and no higher than 3%, respectively, of net profit each year. The compensation of employees and the remuneration of directors for the years ended December 31, 2020 and 2019, which were approved by the Company’s board of directors on March 25, 2021 and March 26, 2020, respectively, are as follows:
For the Year Ended December 31 2020 2019
Amount Accrual rate Amount Accrual rate Compensation of
employees $ 11,188 0.93% $ 11,040 1.00% Remuneration of directors $ 16,793 1.40% $ 16,570 1.49%
If there is a change in the amounts after the annual consolidated financial statements are authorized for issue, the differences are recorded as a change in the accounting estimate.
There is no difference between the actual amounts of compensation of employees and remuneration of directors paid and the amounts recognized in the consolidated financial statements for the years ended December 31, 2019 and 2018.
Information on the compensation of employees and remuneration of directors resolved by the Company’s board of directors is available at the Market Observation Post System website of the Taiwan Stock Exchange.
20. INCOME TAXES RELATING TO CONTINUING OPERATIONS.
a. Income tax recognized in profit or loss
Major components of income tax expense are as follows:
For the Year Ended December 312020 2019
Current tax
In respect of the current year $ 482,534 $ 484,088 Adjustments for prior year 148,706 (14,058)
631,240 470,030 Deferred tax
In respect of the current year (115,567) (114,224) Adjustments for prior year (196,435) (2,387)
(312,002) (116,611) Income tax expense recognized in profit or loss $ 319,238 $ 353,419
~ 152 ~

- 39 -
A reconciliation of accounting profit and income tax expense is as follows:
For the Year Ended December 312020 2019
Profit before tax from continuing operations $ 1,291,463 $ 1,366,978 Income tax expense calculated at the statutory rate $ 362,228 $ 517,126 Nondeductible expenses in determining taxable income (111,114) (127,311)Tax-exempt income (7,280) (7,247)Investment tax credits (16,370) (9,291)Adjustments for prior years’ tax (47,729) (16,445)Tax incentives associated with repatriation 120,114 - Others 19,389 (3,413) Income tax expense recognized in profit or loss $ 319,238 $ 353,419
b. Income tax recognized in other comprehensive income
For the Year Ended December 312020 2019
Deferred tax Remeasurement of defined benefit plans $ 5,286 $ 2,407 Translation of the financial statements of foreign operations 86,221 151,250 Total income tax recognized in other comprehensive income $ 91,507 $ 153,657
c. Deferred tax assets and liabilities
The movements of deferred tax assets and deferred tax liabilities are as follows:
For the year ended December 31, 2020
Opening Balance
Recognized in Profit or
Loss
Recognized in Other Compre- hensive Income
Exchange Differences
Closing Balance
Deferred tax assets Exchange differences on
translation of the financial statements of foreign operations $ 242,933 $ - $ 86,221 $ - $ 329,154
Loss carryforwards - 102,038 - (3,732) 98,306Property, plant and equipment 57,657 (15,677) - 377 42,357Unrealized loss on inventory 38,613 (5,750) - (992) 31,871Unrealized gains on
intercompany sales 26,584 4,663 - - 31,247Defined benefit obligations 25,470 - 5,286 - 30,756Others 50,635 (165) - (1,077) 49,393 $ 441,892 $ 85,109 $ 91,507 $ (5,424) $ 613,084
(Continued)
~ 153 ~

- 40 -
Opening Balance
Recognized in Profit or
Loss
Recognized in Other Compre- hensive Income
Exchange Differences
Closing Balance
Deferred tax liabilities Reserve for land value increment
tax $ 208,226 $ - $ - $ - $ 208,226Deferred depreciation expense 68,204 12,637 - (4,128) 76,713Share of profit of associates 246,844 (246,844) - - -Others 24,050 7,314 - 624 31,988 $ 547,324 $ (226,893) $ - $ (3,504) $ 316,927
(Concluded)
For the year ended December 31, 2019
Opening Balance
Recognized in Profit or
Loss
Recognized in Other Compre- hensive Income
Exchange Differences
Closing Balance
Deferred tax assets Exchange differences on
translation of the financial statements of foreign operations $ 91,683 $ - $ 151,250 $ - $ 246,933
Property, plant and equipment 49,903 9,915 - (2,161) 57,657Unrealized loss on inventory 37,976 1,290 - (653) 38,613Unrealized gains on
intercompany sales 19,153 7,431 - - 26,584Defined benefit obligations 23,063 - 2,407 - 25,470Others 34,117 17,572 - (1,054) 50,635 $ 255,895 $ 36,208 $ 153,657 $ (3,868) $ 441,892 Deferred tax liabilities
Share of profit of associates $ 324,009 $ (77,165) $ - $ - $ 246,844Reserve for land value increment
tax 208,226 - - - 208,226Deferred depreciation expense 46,318 23,424 - (1,538) 68,204Others 51,529 (26,662) - (817) 24,050 $ 630,082 $ (80,403) $ - $ (2,355) $ 547,324
d. Income tax assessments
The Company’s income tax returns through 2018, except 2017, have been assessed by the tax authorities. KF’s income tax returns through 2018 have been assessed by the tax authorities.
~ 154 ~

- 41 -
21. EARNINGS PER SHARE
Unit: NT$ Per Share
For the Year Ended December 312020 2019
Basic and diluted earnings per share $ 1.07 $ 1.11
The weighted average number of shares outstanding used for the earnings per share computation was adjusted retroactively for the issuance of bonus shares. The basic and diluted earnings per share adjusted retrospectively for the year ended December 31, 2019 are as follows:
Unit: NT$ Per Share
BeforeRetrospective Adjustment
AfterRetrospective Adjustment
Basic and diluted earnings per share $ 1.16 $ 1.11
The earnings and weighted average number of ordinary shares outstanding used in the computation of earnings per share from continuing operations and discontinued operations are as follows:
Net profit for the year
For the Year Ended December 312020 2019
Earnings used from continuing operations in the computation of
basic and diluted earnings per share $ 972,225 $ 1,013,562
The weighted average number of ordinary shares outstanding (in thousands of shares) is as follows:
For the Year Ended December 312020 2019
Weighted average number of ordinary shares used in the
computation of basic earnings per share 909,410 909,410 Effect of potentially dilutive ordinary shares
Compensation of employees 419 406 Weighted average number of ordinary shares used in the
computation of diluted earnings per share 909,829 909,816
The Group may settle the compensation of employees in cash or shares; therefore, the Group assumes that the entire amount of the compensation will be settled in shares, and the resulting potential shares are included in the weighted average number of shares outstanding used in the computation of diluted earnings per share, as the effect is dilutive. Such dilutive effect of the potential shares is included in the computation of diluted earnings per share until the number of shares to be distributed to employees is resolved in the following year.
~ 155 ~

- 42 -
22. CAPITAL MANAGEMENT
The Group requires to maintain an adequate level of capital to expand and optimize facilities and equipment. The Group’s capital management strategy aims to ensure that the necessary financial resources and operating plan are sufficient to meet the next 12 months’ requirements for working capital, capital expenditures, research and development expenses, debt repayment and other needs.
23. FINANCIAL INSTRUMENTS
a. Fair value of financial instruments not measured at fair value
Please refer to the information on the consolidated balance sheet. The management of the Group considered the carrying amounts of financial assets and liabilities not measured at fair value on the consolidated balance sheet approximate the fair value.
b. Fair value of financial instruments measured at fair value on a recurring basis
1) Fair value hierarchy
December 31, 2020
Level 1 Level 2 Level 3 Total Financial assets at FVTPL Domestic listed shares $ 973 $ - $ - $ 973
Financial assets at FVTOCI Investments in equity
instruments Domestic and foreign unlisted
shares $ - $ - $ 578,419 $ 578,419
December 31, 2019
Level 1 Level 2 Level 3 Total Financial assets at FVTPL Domestic listed shares $ 1,019 $ - $ - $ 1,019
Financial assets at FVTOCI Investments in equity
instruments Domestic and foreign unlisted
shares $ - $ - $ 515,415 $ 515,415
~ 156 ~
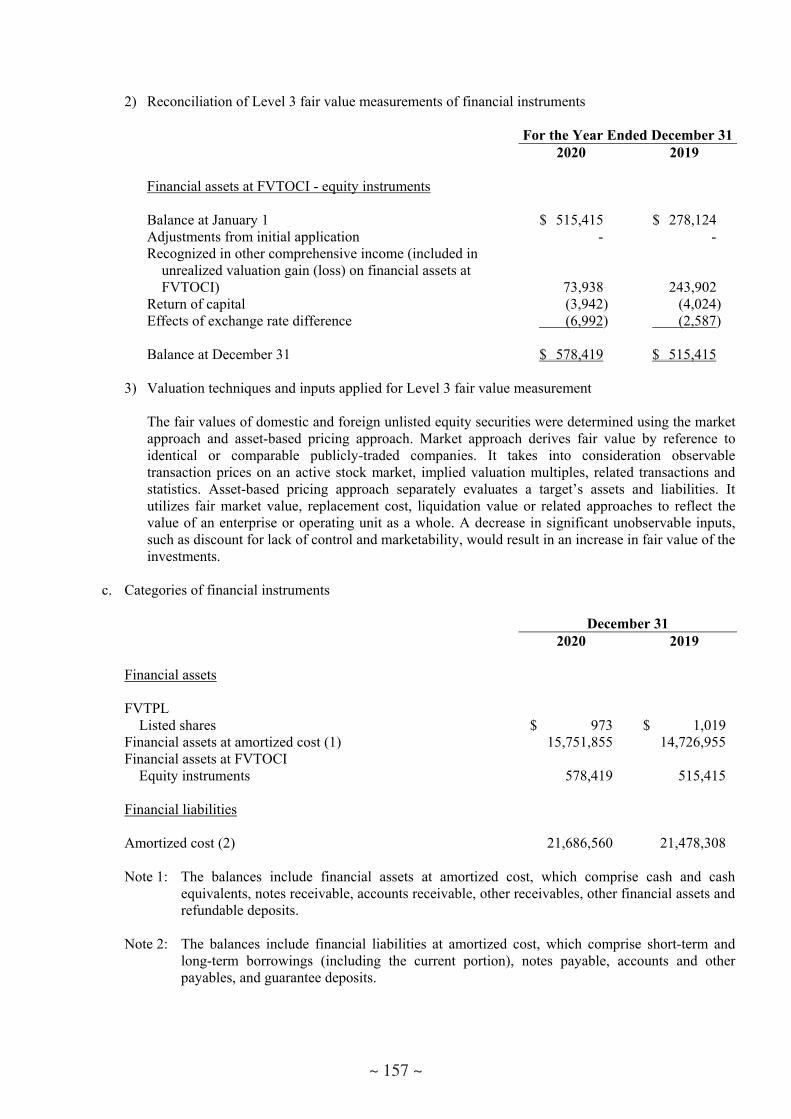
- 43 -
2) Reconciliation of Level 3 fair value measurements of financial instruments
For the Year Ended December 312020 2019
Financial assets at FVTOCI - equity instruments Balance at January 1 $ 515,415 $ 278,124 Adjustments from initial application - - Recognized in other comprehensive income (included in
unrealized valuation gain (loss) on financial assets at FVTOCI) 73,938 243,902
Return of capital (3,942) (4,024) Effects of exchange rate difference (6,992) (2,587) Balance at December 31 $ 578,419 $ 515,415
3) Valuation techniques and inputs applied for Level 3 fair value measurement
The fair values of domestic and foreign unlisted equity securities were determined using the market approach and asset-based pricing approach. Market approach derives fair value by reference to identical or comparable publicly-traded companies. It takes into consideration observable transaction prices on an active stock market, implied valuation multiples, related transactions and statistics. Asset-based pricing approach separately evaluates a target’s assets and liabilities. It utilizes fair market value, replacement cost, liquidation value or related approaches to reflect the value of an enterprise or operating unit as a whole. A decrease in significant unobservable inputs, such as discount for lack of control and marketability, would result in an increase in fair value of the investments.
c. Categories of financial instruments
December 31 2020 2019 Financial assets FVTPL
Listed shares $ 973 $ 1,019Financial assets at amortized cost (1) 15,751,855 14,726,955Financial assets at FVTOCI
Equity instruments 578,419 515,415 Financial liabilities Amortized cost (2) 21,686,560 21,478,308
Note 1: The balances include financial assets at amortized cost, which comprise cash and cash equivalents, notes receivable, accounts receivable, other receivables, other financial assets and refundable deposits.
Note 2: The balances include financial liabilities at amortized cost, which comprise short-term and long-term borrowings (including the current portion), notes payable, accounts and other payables, and guarantee deposits.
~ 157 ~

- 44 -
d. Financial risk management objectives and policies
The Group’s major financial instruments include equity investments, accounts receivable, accounts payable and borrowings. The Group’s corporate treasury function provides services to the business, coordinates access to domestic and international financial markets, and monitors and manages the financial risks relating to the operations of the Group through internal risk reports that analyze exposures by degree and magnitude of risks. These risks include market risk (including foreign currency risk, interest rate risk and other price risk), credit risk and liquidity risk.
1) Market risk
The Group’s activities exposed it primarily to the financial risks of changes in foreign currency exchange rates (see (a) below) and interest rates (see (b) below).
There has been no change to the Group’s exposure to market risks or the manner in which these risks are managed and measured.
a) Foreign currency risk
Several subsidiaries of the Company have foreign currency denominated sales and purchases, which expose the Group to foreign currency risk.
The carrying amounts of the Group’s foreign currency denominated monetary assets and monetary liabilities (including those eliminated on consolidation) are set out in Note 27.
Sensitivity analysis
The Group is mainly exposed to the currency USD, Euro, RMB and Vietnamese Dong.
The sensitivity analysis measures the effect of a 1% increase and decrease in the New Taiwan dollar (the functional currency) against the relevant foreign currencies. The sensitivity rate of 1% is used when reporting foreign currency risk internally to key management personnel and represents management’s assessment of the reasonably possible change in foreign exchange rates. The sensitivity analysis included only outstanding foreign currency denominated monetary items, and adjusts their translation at the end of the year for a 1% change in foreign currency rates. The pre-tax profit in 2020 and 2019 would have increased/decreased by $73,846 and $88,984 thousand had the New Taiwan dollar strengthened/weakened by 1% against the relevant currency.
b) Interest rate risk
The Group is exposed to interest rate risk because entities in the Group borrow funds at both fixed and floating interest rates. The risk is managed by the Group by maintaining an appropriate mix of fixed and floating rate borrowings. The Group’s interest rate risk is resulted from cash and cash equivalents. Specifically, the Group is exposed to cash flow interest rate risk by holding cash and cash equivalents at floating rate. The risk is partially mitigated by borrowings at floating rates. Holding cash and cash equivalents and borrowings at fixed rate exposes the Group to fair value interest risk. The Group considers the overall interest rate trends and adjusts the portfolio of fixed and floating rate instruments accordingly.
~ 158 ~
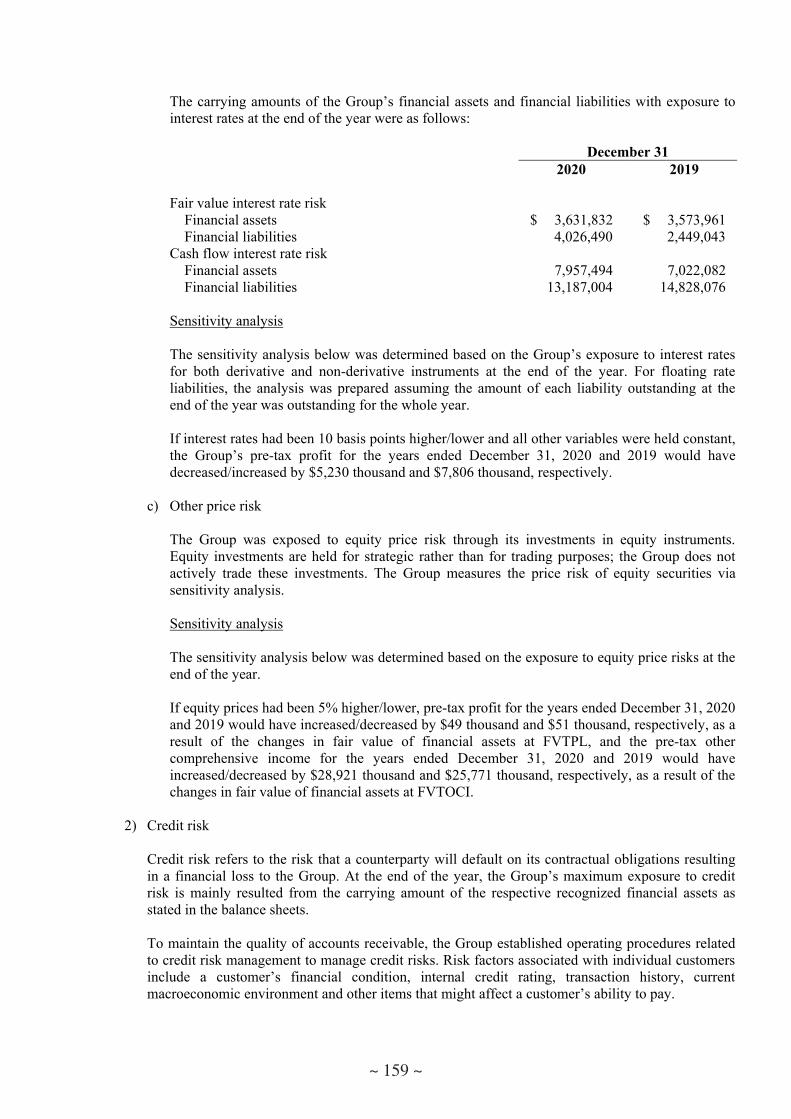
- 45 -
The carrying amounts of the Group’s financial assets and financial liabilities with exposure to interest rates at the end of the year were as follows:
December 31 2020 2019 Fair value interest rate risk
Financial assets $ 3,631,832 $ 3,573,961Financial liabilities 4,026,490 2,449,043
Cash flow interest rate risk Financial assets 7,957,494 7,022,082Financial liabilities 13,187,004 14,828,076
Sensitivity analysis
The sensitivity analysis below was determined based on the Group’s exposure to interest rates for both derivative and non-derivative instruments at the end of the year. For floating rate liabilities, the analysis was prepared assuming the amount of each liability outstanding at the end of the year was outstanding for the whole year.
If interest rates had been 10 basis points higher/lower and all other variables were held constant, the Group’s pre-tax profit for the years ended December 31, 2020 and 2019 would have decreased/increased by $5,230 thousand and $7,806 thousand, respectively.
c) Other price risk
The Group was exposed to equity price risk through its investments in equity instruments. Equity investments are held for strategic rather than for trading purposes; the Group does not actively trade these investments. The Group measures the price risk of equity securities via sensitivity analysis.
Sensitivity analysis
The sensitivity analysis below was determined based on the exposure to equity price risks at the end of the year.
If equity prices had been 5% higher/lower, pre-tax profit for the years ended December 31, 2020 and 2019 would have increased/decreased by $49 thousand and $51 thousand, respectively, as a result of the changes in fair value of financial assets at FVTPL, and the pre-tax other comprehensive income for the years ended December 31, 2020 and 2019 would have increased/decreased by $28,921 thousand and $25,771 thousand, respectively, as a result of the changes in fair value of financial assets at FVTOCI.
2) Credit risk
Credit risk refers to the risk that a counterparty will default on its contractual obligations resulting in a financial loss to the Group. At the end of the year, the Group’s maximum exposure to credit risk is mainly resulted from the carrying amount of the respective recognized financial assets as stated in the balance sheets.
To maintain the quality of accounts receivable, the Group established operating procedures related to credit risk management to manage credit risks. Risk factors associated with individual customers include a customer’s financial condition, internal credit rating, transaction history, current macroeconomic environment and other items that might affect a customer’s ability to pay.
~ 159 ~

- 46 -
In order to minimize credit risk, the management of the Group has delegated a team responsible for determining credit limits, credit approvals and other monitoring procedures to ensure that follow-up action is taken to recover overdue debts. In addition, the Group reviews the recoverable amount of each individual trade debt at the end of the reporting period to ensure that adequate allowance is made for possible irrecoverable amounts. In this regard, the management believes the Group’s credit risk was significantly reduced. The Group writes off accounts receivable when there is evidence indicating that the debtor is in severe financial difficulty and there is no realistic prospect of recovery. For accounts receivable that have been written off, the Group continues to engage in enforcement activity to attempt to recover the receivables due. Where recoveries are made, these are recognized in profit or loss.
3) Liquidity risk
The Group manages liquidity risk by monitoring and maintaining a level of cash and cash equivalents deemed adequate to finance the Group’s operations and mitigate the effects of fluctuations in cash flows. In addition, management monitors the utilization of bank borrowings and ensures compliance with loan covenants.
The Group manages liquidity risk by maintaining adequate reserves, banking facilities and reserve borrowing facilities, and continuously monitoring forecasted and actual cash flows as well as matching the maturity profiles of financial assets and liabilities. The Group had available unutilized short-term bank loan facilities set out in b) below.
a) Liquidity and interest rate risk tables for non-derivative financial liabilities
The following table details the Group’s remaining contractual maturities for its non-derivative financial liabilities with agreed upon repayment periods. The table has been drawn up based on the undiscounted cash flows of financial liabilities from the earliest date on which the Group can be required to pay. The table includes both interest and principal cash flows. Specifically, bank loans with a repayment on demand clause were included in the earliest time band regardless of the probability of the banks choosing to exercise their rights. The maturity dates for other non-derivative financial liabilities were based on the agreed upon repayment dates.
December 31, 2020
On Demand or Less than 1
Year 1-5 Years More than 5
Years Non-derivative financial liabilities Non-interest bearing $ 4,462,149 $ - $ -Lease liabilities 88,484 95,722 267,551Variable interest rate liabilities 3,384,859 10,021,810 45,136Fixed interest rate liabilities 1,737,462 1,800,139 86,253
$ 9,672,954 $ 11,917,671 $ 398,940
~ 160 ~

- 47 -
December 31, 2019
On Demand or Less than 1
Year 1-5 Years More than 5
Years Non-derivative financial liabilities Non-interest bearing $ 4,302,035 $ - $ -Lease liabilities 98,239 144,630 307,897Variable interest rate liabilities 2,263,404 12,543,465 386,642Fixed interest rate liabilities 1,588,899 298,152 33,156
$ 8,252,577 $ 12,986,247 $ 727,695
b) Financing facilities
December 31 2020 2019 Unsecured bank overdraft facilities, reviewed annually
Amount used $ 113,216 $ 38,444Amount unused 14,550 109,663
$ 127,766 $ 148,107 Secured bank overdraft facilities:
Amount used $ - $ -Amount unused - 3,101
$ - $ 3,101 Unsecured bank borrowing facilities
Amount used $ 16,042,726 $ 15,250,265Amount unused 10,064,250 13,345,325
$ 26,106,976 $ 28,595,590 Secured bank loan facilities which may be extended by
mutual agreement: Amount used $ 605,795 $ 1,437,644Amount unused 1,642,739 1,440,898
$ 2,248,534 $ 2,878,542
e. Transfers of financial assets
The Group transferred a portion of its banker’s acceptance bills in mainland China to some of its suppliers in order to settle the accounts payable to these suppliers. As the Group has transferred substantially all risks and rewards relating to these bills receivable, it derecognized the full carrying amount of the bills receivable and the associated accounts payable. However, if the derecognized bills receivable are not paid at maturity, the suppliers have the right to request that the Group pay the unsettled balance; therefore, the Group still has continuing involvement in these bills receivable.
~ 161 ~

- 48 -
The maximum exposure to loss from the Group’s continuing involvement in the derecognized bills receivable is equal to the face amounts of the transferred but unsettled bills receivable, and as of December 31, 2020 and 2019, the face amounts of these unsettled bills receivable were $501,693 thousand and $748,868 thousand, respectively. The unsettled bills receivable will be due in 6 months after December 31, 2020 and was due in 6 months after December 31, 2019. Taking into consideration the credit risk of these derecognized bills receivable, the Group estimates that the fair values of its continuing involvement are not significant.
During the years ended December 31, 2020 and 2019, the Group did not recognize any gains or losses upon the transfer of the banker’s acceptance bills. No gains or losses were recognized from the continuing involvement, both during the current year or cumulatively.
24. TRANSACTIONS WITH RELATED PARTIES
Balances and transactions between the Company and its subsidiaries, which are related parties of the Company, have been eliminated on consolidation and are not disclosed in this note. Details of transactions between the Group and other related parties are disclosed as follows.
a. Related party name and category
Related Party Name Related Party Category Kenlight Trading Corp. Other related party Jienshang Co., Ltd. Other related party Total Lubricants Taiwan Ltd. Other related party Kenstone Metal Co., Ltd. Other related party Honko Technical Lubricants (Kunshan) Co., Ltd. Other related party Kenstone Metal (K.S.) Co., Ltd. Other related party Americana Development Holding (ADH) Other related party Yang & Company, LLC (Y&C) Other related party Haro Bikes Corp. (HBC) Other related party Greentech Holding Corp. (GHC) Other related party STARCO Huanmei Associate
Other related parties refer to companies having a chairman that is within second-degree relative, the same as the Company’s chairman, or are determined as related parties in substance.
b. Revenue
For the Year Ended December 31Line Item Related Party Category 2020 2019
Sales of goods Other related parties $ 8,815 $ 13,659
c. Purchases
For the Year Ended December 31Related Party Category 2020 2019
Other related parties $ 223,743 $ 238,357 Associates 174,285 207,422 $ 398,028 $ 445,779
~ 162 ~
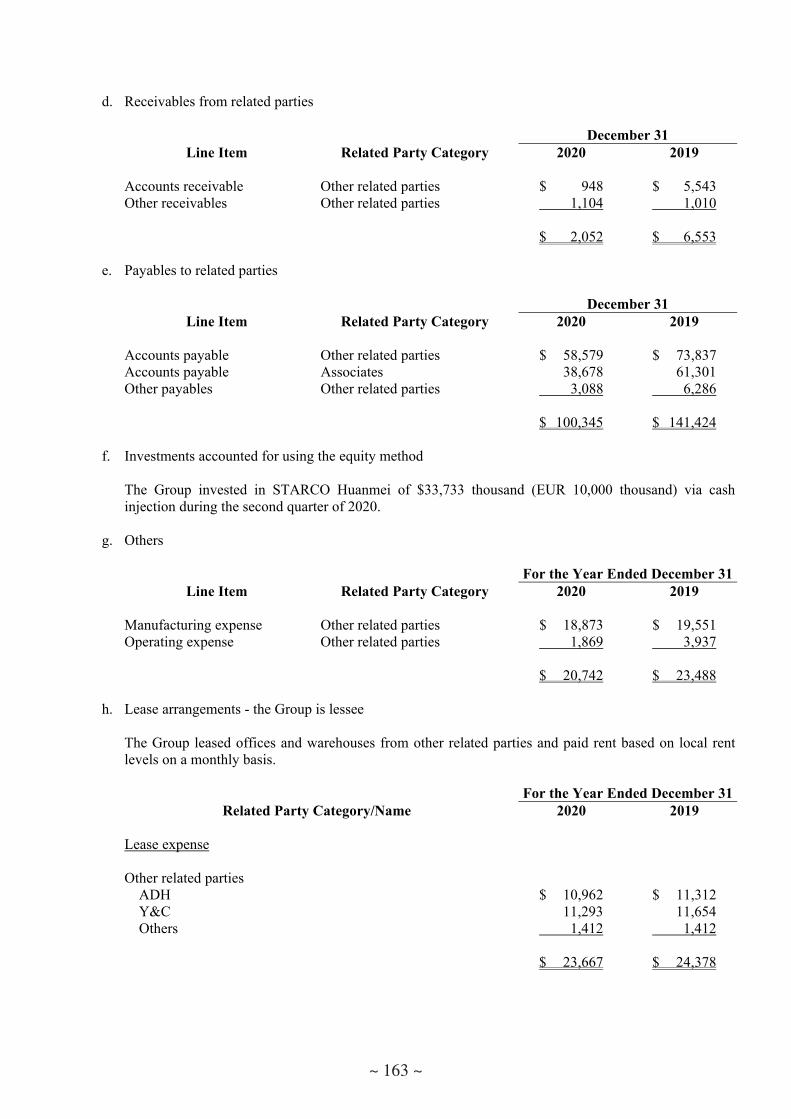
- 49 -
d. Receivables from related parties
December 31 Line Item Related Party Category 2020 2019
Accounts receivable Other related parties $ 948 $ 5,543 Other receivables Other related parties 1,104 1,010 $ 2,052 $ 6,553
e. Payables to related parties
December 31 Line Item Related Party Category 2020 2019
Accounts payable Other related parties $ 58,579 $ 73,837 Accounts payable Associates 38,678 61,301 Other payables Other related parties 3,088 6,286 $ 100,345 $ 141,424
f. Investments accounted for using the equity method
The Group invested in STARCO Huanmei of $33,733 thousand (EUR 10,000 thousand) via cash injection during the second quarter of 2020.
g. Others
For the Year Ended December 31Line Item Related Party Category 2020 2019
Manufacturing expense Other related parties $ 18,873 $ 19,551 Operating expense Other related parties 1,869 3,937 $ 20,742 $ 23,488
h. Lease arrangements - the Group is lessee
The Group leased offices and warehouses from other related parties and paid rent based on local rent levels on a monthly basis.
For the Year Ended December 31 Related Party Category/Name 2020 2019
Lease expense Other related parties
ADH $ 10,962 $ 11,312 Y&C 11,293 11,654 Others 1,412 1,412 $ 23,667 $ 24,378
~ 163 ~

- 50 -
i. Lease arrangements - Group is lessor
The Group leased warehouses to other related parties and received rent based on local rent levels on a monthly basis.
For the Year Ended December 31 Related Party Category/Name 2020 2019
Lease income Other related parties
HBC $ 2,102 $ 2,198
j. Remuneration of key management personnel
For the Year Ended December 31 2020 2019
Short-term employee benefits $ 32,622 $ 30,974 Post-employment benefits 92 84 $ 32,714 $ 31,058
25. ASSETS PLEDGED AS COLLATERAL OR FOR SECURITY
KA’s operating assets, including but not limited to cash and cash equivalents, accounts receivable, inventories, property, plant and equipment and intangible assets, were pledged as collateral for bank borrowings, and lien was placed by the banks correspondingly. The above assets were $4,927,314 thousand and $5,395,608 thousand as of December 31, 2020 and 2019, respectively.
Except as stated above, the following assets of the Group were pledged as collaterals for acceptance bills and short-term and long-term borrowings.
December 31 2020 2019
Accounts receivable $ 17,439 $ 33,687 Inventories 105,836 190,322 Property, plant and equipment 206,501 396,727 Others 11,154 76,730 $ 340,930 $ 697,466
26. SIGNIFICANT CONTINGENT LIABILITIES AND UNRECOGNIZED COMMITMENTS
In addition to those disclosed in other notes, significant contingencies and unrecognized commitments of the Group were as follows:
a. Capital expenditures contracted but yet incurred are as follows:
December 31 Item 2020 2019
Property, plant and equipment $ 325,798 $ 955,658
~ 164 ~

- 51 -
b. Contingencies
1) Products liability insurance
The Group has entered into a product liability insurance for the products manufactured by the Group and sold globally. The period of insurance agreement is from August 6, 2020 to August 6, 2021. The coverage of insurance policy is from August 6, 2004 to August 6, 2021. The maximum reparation of one single event is US$10,000 thousand.
2) The Company had entered into an exclusive agency contract with Gabjohn for the product distributed in Nigeria. Due to circumstances related to local sales, the Company switched to other agencies to distribute products in Nigeria. Consequently, Gabjohn filed a lawsuit against the Company for breach of exclusive agency contract and demanded $90,000 thousand (NGN500,000 thousand) as compensation. The Company signed an attorney agreement with Tommy & Jason International Intellectual Property Rights Co., Ltd. (collectively as Tommy & Jason), which then engaged a lawyer in the local intellectual Property Office, Adeniji Kazeem & Co., to handle the litigation and regularly reported the related proceedings. The lawsuit is currently awaiting in the High Court of Nigeria. Upon the date of issuance of the financial statements for the year ended December 31, 2020, the outcome of the dispute cannot be predicted with sufficient reliability.
27. SIGNIFICANT ASSETS AND LIABILITIES DENOMINATED IN FOREIGN CURRENCIES
The Group’s significant financial assets and liabilities denominated in foreign currencies aggregated by the foreign currencies other than functional currencies of the entities in the Group and the related exchange rates between foreign currencies and respective functional currencies were as follows:
December 31, 2020
ForeignCurrency Exchange Rate
CarryingAmount
Financial assets Monetary items
USD $ 117,941 28.48 (USD:NTD) $ 3,359,324USD 116,104 6.52 (USD:RMB) 3,306,997USD 5,030 7.75 (USD:HKD) 143,277JPY 949,674 0.06 (JPY:RMB) 261,920RMB 49,479 4.37 (RMB:NTD) 215,991EUR 6,126 8.03 (EUR:RMB) 213,240IDR (in million) 71,724 0.07 (VND:USD) 145,528
$ 7,646,277
Financial liabilities
Monetary items USD 6,989 28.48 (USD:NTD) $ 199,072USD 4,483 6.52 (USD:RMB) 127,684VND (in million) 136,912 0.04 (VND:USD) 171,414IDR (in million) 30,342 0.07 (EUR:USD) 61,563GBP 1,414 1.12 (GBP:EUR) 55,017
$ 614,750
~ 165 ~

- 52 -
December 31, 2019
ForeignCurrency Exchange Rate
CarryingAmount
Financial assets Monetary items
USD $ 83,258 30.10 (USD:NTD) $ 2,506,137USD 174,646 6.98 (USD:RMB) 5,257,017RMB 100,210 0.14 (RMB:USD) 432,386EUR 34,622 1.12 (EUR:USD) 1,167,283EUR 11,116 7.82 (EUR:RMB) 374,795VND (in million) 27,933 0.04 (VND:USD) 36,983
$ 9,774,601
Financial liabilities
Monetary items USD 5,113 30.10 (USD:NTD) $ 153,805USD 6,215 6.98 (USD:RMB) 187,073EUR 10,500 1.12 (EUR:USD) 354,011VND (in million) 136,912 0.04 (VND:USD) 181,271
$ 876,160
For the years ended December 31, 2020 and 2019, net foreign exchange gains (losses) were $(315,565) thousand and $8,237 thousand, respectively. It is impractical to disclose net foreign exchange gains (losses) by each significant foreign currency due to the variety of the foreign currency transactions and functional currencies of the entities in the Group.
28. SEPARATELY DISCLOSED ITEMS
a. Information about significant transactions and investees:
1) Financing provided to others (Table 1)
2) Endorsements/guarantees provided (Table 2)
3) Marketable securities held (Table 3)
4) Marketable securities acquired or disposed of at costs or prices of at least NT$300 million or 20% of the paid-in capital (None)
5) Acquisition of individual real estate at costs of at least NT$300 million or 20% of the paid-in capital (None)
6) Disposal of individual real estate at prices of at least NT$300 million or 20% of the paid-in capital (None)
7) Total purchases from or sales to related parties amounting to at least NT$100 million or 20% of the paid-in capital (Table 4)
~ 166 ~

- 53 -
8) Receivables from related parties amounting to at least NT$100 million or 20% of the paid-in capital (Table 5)
9) Trading in derivative instruments (None)
10) Intercompany relationships and significant intercompany transactions (Table 6)
11) Information on investees (Table 7)
b. Information on investments in mainland China
1) Information on any investee company in mainland China, showing the name, principal business activities, paid-in capital, method of investment, inward and outward remittance of funds, ownership percentage, net income of investees, investment income or loss, carrying amount of the investment at the end of the year, repatriations of investment income, and limit on the amount of investment in the mainland China area (Table 8)
2) Any of the following significant transactions with investee companies in mainland China, either directly or indirectly through a third party, and their prices, payment terms, and unrealized gains or losses:
a) The amount and percentage of purchases and the balance and percentage of the related payables at the end of the year (Table 6)
b) The amount and percentage of purchases and the balance and percentage of the related payables at the end of the year (Table 6)
c) The amount of property transactions and the amount of the resultant gains or losses (None)
d) The balance of negotiable instrument endorsements or guarantees or pledges of collateral at the end of the year and the purposes (Table 2)
e) The highest balance, the ending balance, the interest rate range, and total current period interest with respect to the financing of funds (Table 1)
f) Other transactions that have a material effect on the profit or loss for the year or on the financial position, such as the rendering or receipt of services (None)
c. Information of major shareholders: List all shareholders with ownership of 5% or greater showing the name of the shareholder, the number of shares owned, and percentage of ownership of each shareholder (Table 9)
~ 167 ~

- 54 -
29. SEGMENT INFORMATION
Information reported to the chief operating decision maker for the purpose of resource allocation and assessment of segment performance focuses on the types of goods or services delivered or provided.
a. Segment revenue and results
The following is an analysis of the Group’s revenue and results from continuing operations by reportable segments:
For the year ended December 31, 2020
AsiaRegions
Excluding Asia Others Adjustment and
Elimination Total Revenue Revenue from external customers $ 16,477,628 $ 13,782,557 $ - $ - $ 30,260,185 Segment revenue 7,923,203 86,582 - (8,009,785 ) - $ 24,400,831 $ 13,869,139 $ - $ (8,009,785 ) $ 30,260,185 Interest income $ 95,722 $ 2,087 $ 17,522 $ (7,160 ) $ 108,171 Finance costs $ 157,010 $ 93,917 $ 809 $ (10,294 ) $ 241,442 Depreciation and amortization $ 1,242,100 $ 251,177 $ 16 $ - $ 1,493,293 Segment income (excluding share of
profit of associates and other operating income and expenses) $ 2,201,153 $ 71,816 $ 76,214 $ (122,478 ) $ 2,226,705
Other operating income and expenses (937,582 )
Share of profit of associates accounted for using the equity method 2,340
Profit before tax $ 1,291,463 Total assets $ 42,390,039
For the year ended December 31, 2019
AsiaRegions
Excluding Asia Others Adjustment and
Elimination Total Revenue Revenue from external customers $ 18,467,526 $ 13,659,910 $ - $ - $ 32,127,436 Segment revenue 7,788,098 86,141 - (7,874,239 ) - $ 26,255,624 $ 13,746,051 $ - $ (7,874,239 ) $ 32,127,436 Interest income $ 171,041 $ 6,313 $ 34,609 $ (49,130 ) $ 162,833 Finance costs $ 223,275 $ 109,059 $ 1,954 $ (52,381 ) $ 281,907 Depreciation and amortization $ 1,214,328 $ 254,709 $ 8 $ - $ 1,469,045 Segment income (excluding share of
profit of associates and other operating income and expenses) $ 1,301,475 $ 54,545 $ 6,987 $ - $ 1,363,007
Share of profit of associates accounted for using the equity method 3,971
Profit before tax $ 1,366,978 Total assets $ 42,019,785
Inter-segment revenue was accounted for according to market prices.
~ 168 ~

- 55 -
Segment profit represents the profit before tax earned by each segment without share of profit of associates, other operating income and expenses and income tax expense. This was the measure reported to the chief operating decision maker for the purpose of resource allocation and assessment of segment performance.
Refer to Note 18 for information relating to revenue from contracts with customers.
b. Geographical information
The Group operates in four principal geographical areas - China, the United States, Taiwan and Vietnam.
The Group’s revenue from continuing operations from external customers by location of operations and information about its non-current assets by location of assets are detailed below.
Revenue from External Customers
For the Year Ended Non-current Assets December 31 December 31 2020 2019 2020 2019
USA $ 11,616,653 $ 11,000,911 $ 831,186 $ 962,845China 6,512,025 7,495,447 4,385,379 4,779,737Taiwan 1,603,239 1,469,835 5,796,034 4,590,260Vietnam 1,058,495 1,096,947 5,563,553 5,484,305Others 9,469,773 11,064,296 1,886,765 1,958,190 $ 30,260,185 $ 32,127,436 $ 18,462,917 $ 17,775,337
Non-current assets include property, plant and equipment, right-of-use assets, investment properties and other non-current assets.
c. Information about major customers
There is no single customers contributing 10% or more to the Group’s revenue for the years ended December 31, 2020 and 2019.
~ 169 ~

- 56
-
TA
BL
E 1
KE
ND
A R
UB
BE
R IN
D. C
O.,
LT
D. A
ND
SU
BSI
DIA
RIE
S
FIN
AN
CIN
G P
RO
VID
ED
FO
R T
HE
YE
AR
EN
DE
D D
EC
EM
BE
R 3
1, 2
020
(In
Tho
usan
ds o
f New
Tai
wan
Dol
lars
, Unl
ess S
peci
fied
Oth
erw
ise)
No.
Fi
nanc
ing
Com
pany
C
ount
erpa
rty
Fina
ncia
l St
atem
ent
Acc
ount
Rel
ated
Part
y
Max
imum
Bal
ance
for
the
Peri
od
End
ing
Bal
ance
Am
ount
Act
ually
Dra
wn
Inte
rest
R
ate
Nat
ure
for
Fina
ncin
gT
rans
actio
nA
mou
nts
Rea
son
for
Fina
ncin
gA
llow
ance
for
Bad
Deb
t
Col
late
ral
Fina
ncin
g L
imits
for
Eac
h B
orro
win
g C
ompa
ny
Fina
ncin
g C
ompa
ny’s
Tot
alFi
nanc
ing
Am
ount
L
imits
Item
V
alue
1
KG
I ST
AR
CO
Eur
ope
A/S
Fi
nanc
e re
ceiv
able
s Y
es
$ 1
,055
,325
$
-
$
-0.
7-1.
5%Th
e ne
ed fo
r sh
ort-t
erm
fin
anci
ng
-
Ope
ratin
g ca
pita
l
- -
$
-N
inet
y pe
rcen
t (9
0%) o
f the
fin
anci
ngco
mpa
ny’s
net
w
orth
, $1,
150,
664
Nin
ety
five
perc
ent
(95%
) of t
he
finan
cing
com
pany
’s n
et
wor
th, $
1,21
4,59
0
2 K
GI
STA
RC
O G
mB
H
Fina
nce
rece
ivab
les
Yes
96,7
61
-
-
1.50
00%
Th
e ne
ed fo
r sh
ort-t
erm
fin
anci
ng
-
Ope
ratin
g ca
pita
l
- -
-
Nin
ety
perc
ent
(90%
) of t
he
finan
cing
com
pany
’s n
et
wor
th, $
1,15
0,66
4
Nin
ety
five
perc
ent
(95%
) of t
he
finan
cing
com
pany
’s n
et
wor
th, $
1,21
4,59
0
3 K
GI
STA
RC
O B
altic
OÜ
Fi
nanc
e re
ceiv
able
s Y
es
13
,922
-
-1.
5000
%
The
need
for
shor
t-ter
m
finan
cing
-
Ope
ratin
g ca
pita
l
- -
-
Nin
ety
perc
ent
(90%
) of t
he
finan
cing
com
pany
’s n
et
wor
th, $
1,15
0,66
4
Nin
ety
five
perc
ent
(95%
) of t
he
finan
cing
com
pany
’s n
et
wor
th, $
1,21
4,59
0
4 ST
AR
CO
Eur
ope
A/S
ST
AR
CO
NV
Fi
nanc
e re
ceiv
able
s Y
es
17
,403
-
-3.
0000
%
The
need
for
shor
t-ter
m
finan
cing
-
Ope
ratin
g ca
pita
l
- -
-
Forty
per
cent
(40%
) of
the
finan
cing
co
mpa
ny’s
net
w
orth
, $81
,015
Sixt
y pe
rcen
t (60
%)
of th
e fin
anci
ng
com
pany
’s n
et
wor
th, $
121,
522
5
STA
RC
O E
urop
e A
/S
STA
RC
O D
ML
Fi
nanc
e re
ceiv
able
s Y
es
33
,797
33,2
40
30,3
863.
0000
%
The
need
for
shor
t-ter
m
finan
cing
-
Ope
ratin
g ca
pita
l
- -
-
Forty
per
cent
(40%
) of
the
finan
cing
co
mpa
ny’s
net
w
orth
, $81
,015
Sixt
y pe
rcen
t (60
%)
of th
e fin
anci
ng
com
pany
’s n
et
wor
th, $
121,
522
6
STA
RC
O E
urop
e A
/S
STA
RC
O G
S A
G
Fina
nce
rece
ivab
les
Yes
57,2
21
51
,026
23
,703
3.00
00%
Th
e ne
ed fo
r sh
ort-t
erm
fin
anci
ng
-
Ope
ratin
g ca
pita
l
- -
-
Forty
per
cent
(40%
) of
the
finan
cing
co
mpa
ny’s
net
w
orth
, $81
,015
Sixt
y pe
rcen
t (60
%)
of th
e fin
anci
ng
com
pany
’s n
et
wor
th, $
121,
522
7
STA
RC
O E
urop
e A
/S
STA
RC
O B
eli M
anas
tir d
.o.o
. Fi
nanc
e re
ceiv
able
s Y
es
13
,574
-
-3.
0000
%
The
need
for
shor
t-ter
m
finan
cing
-
Ope
ratin
g ca
pita
l
- -
-
Fifty
per
cent
(40%
) of
the
finan
cing
co
mpa
ny’s
net
w
orth
, $81
,015
Sixt
y pe
rcen
t (60
%)
of th
e fin
anci
ng
com
pany
’s n
et
wor
th, $
121,
522
8
STA
RC
O B
eli M
anas
tir d
.o.o
. ST
AR
CO
GS
AG
Fi
nanc
e re
ceiv
able
s Y
es
23
,042
23,0
42
3,48
13.
9600
%
The
need
for
shor
t-ter
m
finan
cing
-
Ope
ratin
g ca
pita
l
- -
-
Forty
per
cent
(40%
) of
the
finan
cing
co
mpa
ny’s
net
w
orth
, $14
4,80
8
Sixt
y pe
rcen
t (60
%)
of th
e fin
anci
ng
com
pany
’s n
et
wor
th, $
217,
212
(C
ontin
ued)
~ 170 ~

- 57
-
No.
Fi
nanc
ing
Com
pany
C
ount
erpa
rty
Fina
ncia
l St
atem
ent
Acc
ount
Rel
ated
Part
y
Max
imum
Bal
ance
for
the
Peri
od
End
ing
Bal
ance
Am
ount
Act
ually
Dra
wn
Inte
rest
R
ate
Nat
ure
for
Fina
ncin
gT
rans
actio
nA
mou
nts
Rea
son
for
Fina
ncin
gA
llow
ance
for
Bad
Deb
t
Col
late
ral
Fina
ncin
g L
imits
for
Eac
h B
orro
win
g C
ompa
ny
Fina
ncin
g C
ompa
ny’s
Tot
alFi
nanc
ing
Am
ount
L
imits
Item
V
alue
9
STA
RC
O E
urop
e A
/S
STA
RC
O G
mB
H
Fina
nce
rece
ivab
les
Yes
$
13
,922
$
-
$
-3.
0000
%
The
need
for
shor
t-ter
m
finan
cing
$
-O
pera
ting
capi
tal
$
- -
$
-Fo
rty p
erce
nt (4
0%)
of th
e fin
anci
ng
com
pany
’s n
et
wor
th, $
81,0
15
Sixt
y pe
rcen
t (60
%)
of th
e fin
anci
ng
com
pany
’s n
et
wor
th, $
121,
522
10
ST
AR
CO
Eur
ope
A/S
St
arco
SA
S.
Fina
nce
rece
ivab
les
Yes
13,9
22
13
,922
13
,922
3.00
00%
Th
e ne
ed fo
r sh
ort-t
erm
fin
anci
ng
-
Ope
ratin
g ca
pita
l
- -
-
Forty
per
cent
(40%
) of
the
finan
cing
co
mpa
ny’s
net
w
orth
, $81
,015
Sixt
y pe
rcen
t (60
%)
of th
e fin
anci
ng
com
pany
’s n
et
wor
th, $
121,
522
Not
e:
All
intra
-gro
up tr
ansa
ctio
ns a
re e
limin
ated
upo
n co
nsol
idat
ion.
(Con
clud
ed)
~ 171 ~

- 58
-
TA
BL
E 2
KE
ND
A R
UB
BE
R IN
D. C
O.,
LT
D. A
ND
SU
BSI
DIA
RIE
S
EN
DO
RSE
ME
NT
S/G
UA
RA
NT
EE
S PR
OV
IDE
D
FOR
TH
E Y
EA
R E
ND
ED
DE
CEM
BE
R 3
1, 2
020
(In
Tho
usan
ds o
f New
Tai
wan
Dol
lars
, Unl
ess S
peci
fied
Oth
erw
ise)
No.
E
ndor
sem
ent/
Gua
rant
ee P
rovi
der
Gua
rant
eed
Part
y L
imits
on
End
orse
men
ts/
Gua
rant
ees
Giv
en o
n B
ehal
f of E
ach
Part
y
Max
imum
A
mou
nt
End
orse
d/G
uara
ntee
dD
urin
g th
e Pe
riod
Out
stan
ding
End
orse
men
ts/
Gua
rant
ees a
t th
e E
nd o
f the
Pe
riod
(Not
e 4)
Act
ual A
mou
nt
Bor
row
ed
Am
ount
End
orse
d/
Gua
rant
eed
by
Col
late
ral
Rat
io o
f A
ccum
ulat
edE
ndor
sem
ents
/G
uara
ntee
s to
Net
Equ
ity in
L
ates
t Fin
anci
al
Stat
emen
ts
(%)
Agg
rega
teE
ndor
sem
ents
/ G
uara
ntee
Lim
it (N
ote
3)
End
orse
men
ts/
Gua
rant
ees
Giv
en b
y Pa
rent
on
Beh
alf o
f Su
bsid
iari
es
End
orse
men
ts/
Gua
rant
ees
Giv
en b
y Su
bsid
iari
es o
n B
ehal
f of P
aren
t
End
orse
men
t/G
uara
ntee
Giv
en o
n Be
half
of C
ompa
nies
inM
ainl
and
Chi
na
Not
e N
ame
Rel
atio
nshi
p (N
ote
1)
0
The
Com
pany
K
GI
a $
7,
451,
739
(N
ote
2)
$
1,21
8,21
8 $
-
$
- $
-
0.00
$
14,
903,
478
(N
ote
3)
Yes
N
o N
o -
AD
I a
7,
451,
739
(N
ote
2)
17
0,89
8
170,
898
11
3,93
2
-0.
92
14
,903
,478
(Not
e 3)
Y
es
No
No
-
KA
a
7,
451,
739
(N
ote
2)
17
0,89
8
170,
898
17
0,89
8
-0.
92
14
,903
,478
(Not
e 3)
Y
es
No
No
-
STA
RC
O D
ML
a
7,45
1,73
9
(Not
e 2)
569,
660
56
9,66
0
-
-3.
06
14
,903
,478
(Not
e 3)
Y
es
No
No
-
STA
RC
O G
B L
td.
a
7,
451,
739
(N
ote
2)
56
9,66
0
569,
660
-
-
3.06
14,9
03,4
78
(N
ote
3)
Yes
N
o N
o -
STA
RC
O N
V
a
7,45
1,73
9
(Not
e 2)
569,
660
56
9,66
0
-
-3.
06
14
,903
,478
(Not
e 3)
Y
es
No
No
-
STA
RC
O S
AS
a
7,45
1,73
9
(Not
e 2)
569,
660
56
9,66
0
-
-3.
06
14
,903
,478
(Not
e 3)
Y
es
No
No
-
STA
RC
O B
altic
OÜ
a
7,
451,
739
(N
ote
2)
56
9,66
0
569,
660
10
,453
-
3.06
14,9
03,4
78
(N
ote
3)
Yes
N
o N
o -
STA
RC
O G
S A
G
a
7,45
1,73
9
(Not
e 2)
569,
660
56
9,66
0
45,2
59
-3.
06
14
,903
,478
(Not
e 3)
Y
es
No
No
-
STA
RC
O G
mbH
a
7,
451,
739
(N
ote
2)
56
9,66
0
569,
660
69
,612
-
3.06
14,9
03,4
78
(N
ote
3)
Yes
N
o N
o -
STA
RC
O P
olsk
a Sp
.z.o
.o.
a
7,45
1,73
9
(Not
e 2)
569,
660
56
9,66
0
111,
653
-
3.06
14,9
03,4
78
(N
ote
3)
Yes
N
o N
o -
STA
RC
O E
urop
e A
/S
a
7,45
1,73
9
(Not
e 2)
2,44
9,19
6
2,44
9,19
6
1,27
0,42
7
-13
.15
14
,903
,478
(Not
e 3)
Y
es
No
No
-
KV
a
7,
451,
739
(N
ote
2)
2,
819,
817
2,
819,
817
72
4,75
0
-15
.14
14
,903
,478
(Not
e 3)
Y
es
No
No
-
KT
a
7,45
1,73
9
(Not
e 2)
655,
109
48
4,21
1
-
-2.
60
14
,903
,478
(Not
e 3)
Y
es
No
Yes
-
KI
a
7,45
1,73
9
(Not
e 2)
968,
422
88
2,97
3
530,
923
-
4.74
14,9
03,4
78
(N
ote
3)
Yes
N
o N
o -
1
KH
K
KS
a
888,
841
(N
ote
2)
87
3,05
6
873,
056
-
-
39.2
9
1,77
7,68
2
(Not
e 3)
N
o N
o Y
es
-
(C
ontin
ued)
~ 172 ~

- 59
-
No.
E
ndor
sem
ent/
Gua
rant
ee P
rovi
der
Gua
rant
eed
Part
y L
imits
on
End
orse
men
ts/
Gua
rant
ees
Giv
en o
n B
ehal
f of E
ach
Part
y
Max
imum
A
mou
nt
End
orse
d/G
uara
ntee
dD
urin
g th
e Pe
riod
Out
stan
ding
End
orse
men
ts/
Gua
rant
ees a
t th
e E
nd o
f the
Pe
riod
(Not
e 4)
Act
ual A
mou
nt
Bor
row
ed
Am
ount
End
orse
d/
Gua
rant
eed
by
Col
late
ral
Rat
io o
f A
ccum
ulat
edE
ndor
sem
ents
/G
uara
ntee
s to
Net
Equ
ity in
L
ates
t Fin
anci
al
Stat
emen
ts
(%)
Agg
rega
teE
ndor
sem
ents
/ G
uara
ntee
sL
imit
(Not
e 3)
End
orse
men
ts/
Gua
rant
ees
Giv
en b
y Pa
rent
on
Beh
alf o
f Su
bsid
iari
es
End
orse
men
ts/
Gua
rant
ees
Giv
en b
y Su
bsid
iari
es o
n B
ehal
f of P
aren
t
End
orse
men
t/G
uara
ntee
Giv
en o
n Be
half
of C
ompa
nies
inM
ainl
and
Chi
na
Not
e N
ame
Rel
atio
nshi
p (N
ote
1)
2
KG
CI
KS
a $
4,
057,
730
(N
ote
2)
$
3,94
2,22
4 $
3,
942,
224
$
- $
-
34.4
3 $
8,
115,
461
(N
ote
3)
No
No
Yes
-
3
STA
RC
O E
urop
e A
/S
STA
RC
O G
B L
td.
a
202,
537
(N
ote
2)
17
5,22
6
77,8
78
-
-38
.45
40
5,07
5
(Not
e 3)
N
o N
o N
o -
STA
RC
O N
V
a
202,
537
(N
ote
2)
15
6,62
8
156,
628
17
,438
-
77.3
3
405,
075
(N
ote
3)
No
No
No
-
Not
e 1:
R
elat
ions
hips
bet
wee
n th
e gu
aran
tee
prov
ider
and
gua
rant
eed
party
:
a.
A
subs
idia
ry in
whi
ch th
e C
ompa
ny h
olds
dire
ctly
and
indi
rect
ly o
ver 9
0% o
f an
equi
ty in
tere
st.
Not
e 2:
Li
mit
on e
ndor
sem
ents
to a
sing
le c
ompa
ny is
40%
of t
he C
ompa
ny’s
net
wor
th.
Lim
it on
end
orse
men
ts to
a si
ngle
com
pany
is 4
0% o
f KH
K’s
net
wor
th.
Lim
it on
end
orse
men
ts to
a si
ngle
com
pany
is 4
0% o
f KG
CI’
s net
wor
th.
Lim
it on
end
orse
men
ts to
a si
ngle
com
pany
is 1
00%
of S
TAR
CO
Eur
ope
A/S
’s n
et w
orth
.
Not
e 3:
Li
mit
on a
ggre
gate
end
orse
men
ts is
80%
of t
he C
ompa
ny’s
net
wor
th.
Lim
it on
agg
rega
te e
ndor
sem
ents
is 8
0% o
f KH
K’s
net
wor
th.
Lim
it on
agg
rega
te e
ndor
sem
ents
is 8
0% o
f KG
CI’
s net
wor
th.
Lim
it on
agg
rega
te e
ndor
sem
ents
is 2
00%
of S
TAR
CO
Eur
ope
A/S
’s n
et w
orth
.
Not
e 4:
K
GC
I and
KH
K jo
intly
pro
vide
d en
dors
emen
t/gua
rant
ee fo
r KS
of R
MB
800
mill
ion,
but
the
limit
for K
HK
is R
MB
200
mill
ion.
Not
e 5:
Th
e C
ompa
ny p
rovi
ded
shar
ed e
ndor
sem
ent/g
uara
ntee
for n
ine
subs
idia
ries
incl
udin
g ST
AR
CO
Eur
ope
A/S
, STA
RC
O G
mbH
, STA
RC
O P
olsk
a Sp
.z.o
.o.,
STA
RC
O S
AS,
STA
RC
O G
S A
G, S
TAR
CO
NV
, STA
RC
O G
B L
td, S
TAR
CO
DM
L an
d ST
AR
CO
B
altic
OÜ
. The
tota
l am
ount
of t
he sh
ared
end
orse
men
t/gua
rant
ee is
US$
20,0
00 th
ousa
nd.
(Con
clud
ed)
~ 173 ~

- 60
-
TA
BL
E 3
KE
ND
A R
UB
BE
R IN
D. C
O.,
LT
D. A
ND
SU
BSI
DIA
RIE
S
MA
RK
ET
AB
LE
SE
CU
RIT
IES
HE
LD
D
EC
EM
BE
R 3
1, 2
020
(In
Tho
usan
ds o
f New
Tai
wan
Dol
lars
, Unl
ess S
peci
fied
Oth
erw
ise)
Hol
ding
Com
pany
N
ame
Typ
e an
d N
ame
of M
arke
tabl
e Se
curi
ties
Rel
atio
nshi
p w
ith th
e H
oldi
ng
Com
pany
Fi
nanc
ial S
tate
men
t Acc
ount
D
ecem
ber
31, 2
020
Not
eSh
ares
/Uni
ts
Car
ryin
gA
mou
ntPe
rcen
tage
of
Ow
ners
hip
%Fa
ir V
alue
(N
ote
1)
Th
e C
ompa
ny
Shar
es a
nd e
quity
C
hina
Dev
elop
men
t Fin
anci
al
Hol
ding
Cor
pora
tion
- Fi
nanc
ial a
sset
s at F
VTP
L - c
urre
nt
105
$
97
3 0.
00
$
97
3 -
K
enjo
u In
d. C
o., L
td.
The
chai
rman
of K
enjo
u In
d. C
o., L
td.
and
the
chai
rman
of t
he C
ompa
ny a
re
seco
nd-d
egre
e re
lativ
es
Equi
ty in
stru
men
ts a
t FV
TOC
I - n
on-c
urre
nt
7,38
2
31
4,46
7 10
.86
314,
467
-
C
hang
Hw
a G
olf C
o., L
td.
- Eq
uity
inst
rum
ents
at F
VTO
CI -
non
-cur
rent
30
19
7 0.
08
197
-
Ou
Hua
Ven
ture
Cap
ital C
o., L
td.
- Eq
uity
inst
rum
ents
at F
VTO
CI -
non
-cur
rent
31
5
1,
880
5.15
1,
880
-
Yu
Hua
Ven
ture
Cap
ital C
o., L
td.
- Eq
uity
inst
rum
ents
at F
VTO
CI -
non
-cur
rent
14
6
49
1 2.
50
491
-
Tota
l Lub
rican
ts T
aiw
an L
td.
The
chai
rman
of T
otal
Lub
rican
ts
Taiw
an L
td. a
nd th
e ch
airm
an o
f the
C
ompa
ny a
re se
cond
-deg
ree
rela
tives
Equi
ty in
stru
men
ts a
t FV
TOC
I - n
on-c
urre
nt
81
121,
779
6.80
12
1,77
9 -
B
OM
Y (B
VI)
CO
., LT
D.
- Eq
uity
inst
rum
ents
at F
VTO
CI -
non
-cur
rent
2,
000
12,7
09
9.73
12
,709
-
K
GI
Shar
es a
nd e
quity
K
enjo
u In
vest
men
t Co.
, Ltd
. Th
e ch
airm
an o
f Ken
jou
Inve
stm
ent C
o.,
Ltd.
and
the
chai
rman
of t
he C
ompa
ny
are
seco
nd-d
egre
e re
lativ
es
Equi
ty in
stru
men
ts a
t FV
TOC
I - n
on-c
urre
nt
-
12
6,89
6 13
.00
126,
896
-
Not
e:
Fair
valu
e of
dom
estic
list
ed sh
ares
is d
eter
min
ed b
ased
on
its c
losi
ng p
rice
on D
ecem
ber 3
1, 2
020.
~ 174 ~

- 61
-
TA
BL
E 4
KE
ND
A R
UB
BE
R IN
D. C
O.,
LT
D. A
ND
SU
BSI
DIA
RIE
S
TO
TA
L P
UR
CH
ASE
S FR
OM
OR
SA
LE
S T
O R
EL
AT
ED
PA
RT
IES
AM
OU
NT
ING
TO
AT
LE
AST
NT
$100
MIL
LIO
N O
R 2
0% O
F TH
E P
AID
-IN
CA
PIT
AL
FO
R T
HE
YE
AR
EN
DE
D D
EC
EM
BE
R 3
1, 2
020
(In
Tho
usan
ds o
f New
Tai
wan
Dol
lars
, Unl
ess S
peci
fied
Oth
erw
ise)
Com
pany
Nam
e R
elat
ed P
arty
R
elat
ions
hip
Tra
nsac
tion
Det
ails
A
bnor
mal
Tra
nsac
tion
Not
es/A
ccou
nts
Rec
eiva
ble
(Pay
able
) N
ote
Purc
hase
s/
Sale
s A
mou
nt
% to
Tot
alPa
ymen
t Ter
ms
Uni
t Pri
ce
Paym
ent
Ter
ms
Am
ount
%
to T
otal
The
Com
pany
K
A
Subs
idia
ry
Sale
s
$ 1
,263
,521
23
.49
In a
ccor
danc
e w
ith m
utua
l agr
eem
ents
A
gree
d by
bot
h pa
rties
-
$
44
4,15
1 36
.34
-
KF
Subs
idia
ry
Sale
s
54
6,73
4 10
.17
In a
ccor
danc
e w
ith m
utua
l agr
eem
ents
A
gree
d by
bot
h pa
rties
-
155,
971
12.7
6 -
K
V
Subs
idia
ry
Sale
s
20
1,06
7 3.
74
In a
ccor
danc
e w
ith m
utua
l agr
eem
ents
A
gree
d by
bot
h pa
rties
-
30,5
63
2.50
-
A
DI
Indi
rect
ly o
wne
d su
bsid
iary
Sa
les
682,
643
12.6
9 In
acc
orda
nce
with
mut
ual a
gree
men
ts
Agr
eed
by b
oth
parti
es
-
24
6,46
4 20
.17
-
K
C
KA
Su
bsid
iary
of u
ltim
ate
pare
nt c
ompa
ny
Sale
s
37
0,43
3 5.
55
In a
ccor
danc
e w
ith m
utua
l agr
eem
ents
A
gree
d by
bot
h pa
rties
-
148,
422
12.8
0 -
A
DI
Subs
idia
ry o
f ulti
mat
e pa
rent
com
pany
Sa
les
253,
302
3.79
In
acc
orda
nce
with
mut
ual a
gree
men
ts
Agr
eed
by b
oth
parti
es
-
12
5,49
4 10
.82
-
STA
RC
O N
V
Subs
idia
ry o
f ulti
mat
e pa
rent
com
pany
Sa
les
179,
729
2.69
In
acc
orda
nce
with
mut
ual a
gree
men
ts
Agr
eed
by b
oth
parti
es
-
49
,934
4.
31
-
KS
Subs
idia
ry o
f ulti
mat
e pa
rent
com
pany
Sa
les
100,
143
1.50
In
acc
orda
nce
with
mut
ual a
gree
men
ts
Agr
eed
by b
oth
parti
es
-
45
,364
3.
91
-
K
V
KA
Su
bsid
iary
of u
ltim
ate
pare
nt c
ompa
ny
Sale
s
1,
775,
946
30.4
1 In
acc
orda
nce
with
mut
ual a
gree
men
ts
Agr
eed
by b
oth
parti
es
-
68
3,12
2 58
.42
-
AD
I Su
bsid
iary
of u
ltim
ate
pare
nt c
ompa
ny
Sale
s
61
0,97
3 10
.46
In a
ccor
danc
e w
ith m
utua
l agr
eem
ents
A
gree
d by
bot
h pa
rties
-
192,
971
16.5
0 -
KT
KS
Subs
idia
ry o
f ulti
mat
e pa
rent
com
pany
Sa
les
489,
728
18.0
8 In
acc
orda
nce
with
mut
ual a
gree
men
ts
Agr
eed
by b
oth
parti
es
-
13
0,43
2 21
.73
-
AD
I Su
bsid
iary
of u
ltim
ate
pare
nt c
ompa
ny
Sale
s
24
0,15
2 8.
86
In a
ccor
danc
e w
ith m
utua
l agr
eem
ents
A
gree
d by
bot
h pa
rties
-
98,6
22
16.4
3 -
STA
RC
O B
ELI M
anas
tir
d.o.
o.
STA
RC
O G
mbH
Su
bsid
iary
of u
ltim
ate
pare
nt c
ompa
ny
Sale
s
12
1,96
2 4.
06
In a
ccor
danc
e w
ith m
utua
l agr
eem
ents
A
gree
d by
bot
h pa
rties
-
23,8
91
6.35
-
STA
RC
O E
urop
e A
/S
STA
RC
O H
uanm
ei
Ass
ocia
te
Purc
hase
s
17
2,53
4 5.
75
In a
ccor
danc
e w
ith m
utua
l agr
eem
ents
A
gree
d by
bot
h pa
rties
-
(38,
678)
(1
0.29
) -
Not
e:
All
intra
-gro
up tr
ansa
ctio
ns a
re e
limin
ated
upo
n co
nsol
idat
ion.
~ 175 ~

- 62
-
TA
BL
E 5
KE
ND
A R
UB
BE
R IN
D. C
O.,
LT
D. A
ND
SU
BSI
DIA
RIE
S
RE
CE
IVA
BL
ES
FRO
M R
EL
AT
ED
PA
RT
IES
AM
OU
NT
ING
TO
AT
LE
AST
NT
$100
MIL
LIO
N O
R 2
0% O
F T
HE
PA
ID-I
N C
API
TA
L
DE
CE
MB
ER
31,
202
0 (I
n T
hous
ands
of N
ew T
aiw
an D
olla
rs, U
nles
s Spe
cifie
d O
ther
wis
e)
Com
pany
Nam
e R
elat
ed P
arty
R
elat
ions
hip
End
ing
Bal
ance
T
urno
ver
Rat
e
Ove
rdue
A
mou
nts R
ecei
ved
in S
ubse
quen
t Pe
riod
(Not
e 2)
Allo
wan
ce fo
r Im
pair
men
t Los
sA
mou
nt
Act
ions
Tak
en
Th
e C
ompa
ny
KA
Su
bsid
iary
$
444,
151
2.79
$
94,6
51
-
$
145,
284
-
AD
I In
dire
ctly
ow
ned
subs
idia
ry
246,
464
2.35
18
,620
-
177,
760
-
KF
Subs
idia
ry
155,
971
3.60
-
-
10
0,52
0 -
K
HK
Su
bsid
iary
13
0,62
6 -
- -
- -
K
IC
Subs
idia
ry
103,
552
-
-
-
-
-
KC
K
A
Subs
idia
ry o
f ulti
mat
e pa
rent
com
pany
14
8,42
2 2.
41
240
-
55
,635
-
A
DI
Subs
idia
ry o
f ulti
mat
e pa
rent
com
pany
12
5,49
4 2.
01
103
-
96
,937
-
K
V
KA
Su
bsid
iary
of u
ltim
ate
pare
nt c
ompa
ny
683,
122
2.91
-
-
27
3,97
7 -
A
DI
Subs
idia
ry o
f ulti
mat
e pa
rent
com
pany
19
2,97
1 3.
20
- -
179,
596
-
KT
KS
Subs
idia
ry o
f ulti
mat
e pa
rent
com
pany
13
0,43
2 7.
51
- -
130,
432
-
STA
RC
O IP
R G
mbH
ST
AR
CO
Eur
ope
A/S
Pa
rent
com
pany
20
0,52
6 -
200,
526
-
-
-
Not
e 1:
A
ll in
tra-g
roup
tran
sact
ions
are
elim
inat
ed u
pon
cons
olid
atio
n.
Not
e 2:
A
mou
nts r
ecei
ved
as o
f Mar
ch 1
8, 2
021.
~ 176 ~
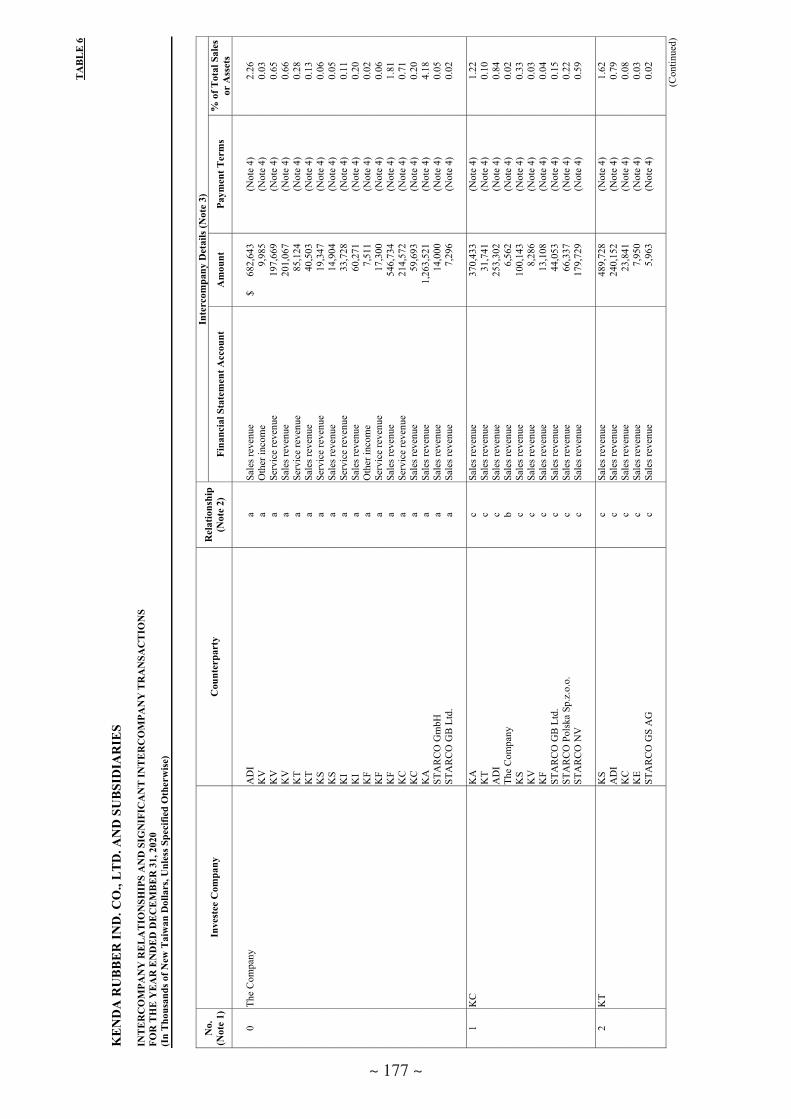
- 63
-
TA
BL
E 6
KE
ND
A R
UB
BE
R IN
D. C
O.,
LT
D. A
ND
SU
BSI
DIA
RIE
S
INT
ER
CO
MPA
NY
RE
LA
TIO
NSH
IPS
AN
D S
IGN
IFIC
AN
T IN
TE
RC
OM
PAN
Y T
RA
NSA
CT
ION
S FO
R T
HE
YE
AR
EN
DE
D D
EC
EM
BE
R 3
1, 2
020
(In
Tho
usan
ds o
f New
Tai
wan
Dol
lars
, Unl
ess S
peci
fied
Oth
erw
ise)
No.
(Not
e 1)
In
vest
ee C
ompa
ny
Cou
nter
part
y R
elat
ions
hip
(Not
e 2)
Inte
rcom
pany
Det
ails
(Not
e 3)
Fina
ncia
l Sta
tem
ent A
ccou
nt
Am
ount
Pa
ymen
t Ter
ms
% o
f Tot
al S
ales
or
Ass
ets
0 Th
e C
ompa
ny
AD
I a
Sale
s rev
enue
$ 68
2,64
3 (N
ote
4)
2.26
K
V
a O
ther
inco
me
9,98
5 (N
ote
4)
0.03
K
V
a Se
rvic
e re
venu
e
19
7,66
9 (N
ote
4)
0.65
K
V
a Sa
les r
even
ue
201,
067
(Not
e 4)
0.
66
KT
a Se
rvic
e re
venu
e
85
,124
(N
ote
4)
0.28
K
T a
Sale
s rev
enue
40
,503
(N
ote
4)
0.13
K
S a
Serv
ice
reve
nue
19,3
47
(Not
e 4)
0.
06
KS
a Sa
les r
even
ue
14,9
04
(Not
e 4)
0.
05
KI
a Se
rvic
e re
venu
e
33
,728
(N
ote
4)
0.11
K
I a
Sale
s rev
enue
60
,271
(N
ote
4)
0.20
K
F a
Oth
er in
com
e
7,
511
(Not
e 4)
0.
02
KF
a Se
rvic
e re
venu
e
17
,300
(N
ote
4)
0.06
K
F a
Sale
s rev
enue
54
6,73
4 (N
ote
4)
1.81
K
C
a Se
rvic
e re
venu
e
21
4,57
2 (N
ote
4)
0.71
K
C
a Sa
les r
even
ue
59,6
93
(Not
e 4)
0.
20
KA
a
Sale
s rev
enue
1,
263,
521
(Not
e 4)
4.
18
STA
RC
O G
mbH
a
Sale
s rev
enue
14
,000
(N
ote
4)
0.05
ST
AR
CO
GB
Ltd
. a
Sale
s rev
enue
7,
296
(Not
e 4)
0.
02
1 K
C
KA
c
Sale
s rev
enue
37
0,43
3 (N
ote
4)
1.22
K
T c
Sale
s rev
enue
31
,741
(N
ote
4)
0.10
A
DI
c Sa
les r
even
ue
253,
302
(Not
e 4)
0.
84
The
Com
pany
b
Sale
s rev
enue
6,
562
(Not
e 4)
0.
02
KS
c Sa
les r
even
ue
100,
143
(Not
e 4)
0.
33
KV
c
Sale
s rev
enue
8,
286
(Not
e 4)
0.
03
KF
c Sa
les r
even
ue
13,1
08
(Not
e 4)
0.
04
STA
RC
O G
B L
td.
c Sa
les r
even
ue
44,0
53
(Not
e 4)
0.
15
STA
RC
O P
olsk
a Sp
.z.o
.o.
c Sa
les r
even
ue
66,3
37
(Not
e 4)
0.
22
STA
RC
O N
V
c Sa
les r
even
ue
179,
729
(Not
e 4)
0.
59
2 K
T K
S c
Sale
s rev
enue
48
9,72
8 (N
ote
4)
1.62
A
DI
c Sa
les r
even
ue
240,
152
(Not
e 4)
0.
79
KC
c
Sale
s rev
enue
23
,841
(N
ote
4)
0.08
K
E c
Sale
s rev
enue
7,
950
(Not
e 4)
0.
03
STA
RC
O G
S A
G
c Sa
les r
even
ue
5,96
3 (N
ote
4)
0.02
(C
ontin
ued)
~ 177 ~

- 64
-
No.
(Not
e 1)
In
vest
ee C
ompa
ny
Cou
nter
part
y R
elat
ions
hip
(Not
e 2)
Inte
rcom
pany
Det
ails
(Not
e 3)
Fina
ncia
l Sta
tem
ent A
ccou
nt
Am
ount
Pa
ymen
t Ter
ms
% o
f Tot
al S
ales
or
Ass
ets
3 K
I K
V
c Sa
les r
even
ue
$
34,6
07
(Not
e 4)
0.
11
KT
c Sa
les r
even
ue
6,61
8 (N
ote
4)
0.02
K
S c
Sale
s rev
enue
7,
230
(Not
e 4)
0.
02
4 K
A
The
Com
pany
b
Com
mis
sion
inco
me
14,7
18
(Not
e 4)
0.
05
5 K
V
AD
I c
Sale
s rev
enue
61
0,97
3 (N
ote
4)
2.02
K
S c
Sale
s rev
enue
8,
673
(Not
e 4)
0.
03
The
Com
pany
b
Sale
s rev
enue
12
,747
(N
ote
4)
0.04
K
A
c Sa
les r
even
ue
1,77
5,94
6 (N
ote
4)
5.87
K
I c
Sale
s rev
enue
43
,388
(N
ote
4)
0.14
ST
AR
CO
GB
Ltd
. c
Sale
s rev
enue
19
,182
(N
ote
4)
0.06
6
KE
The
Com
pany
b
Serv
ice
reve
nue
81,2
19
(Not
e 4)
0.
27
7 K
GI
STA
RC
O E
urop
e A
/S
a In
tere
st in
com
e
6,
379
(Not
e 4)
0.
02
8 K
S K
C
c Sa
les r
even
ue
22,0
31
(Not
e 4)
0.
07
KC
c
Serv
ice
reve
nue
5,82
0 (N
ote
4)
0.02
K
T c
Sale
s rev
enue
15
,500
(N
ote
4)
0.05
K
I c
Serv
ice
reve
nue
8,76
1 (N
ote
4)
0.03
9
STA
RC
O E
urop
e A
/S
STA
RC
O G
B L
td.
a Sa
les r
even
ue
47,2
50
(Not
e 4)
0.
16
STA
RC
O N
V
a Sa
les r
even
ue
70,7
95
(Not
e 4)
0.
23
STA
RC
O G
mbH
a
Sale
s rev
enue
51
,128
(N
ote
4)
0.17
ST
AR
CO
Pol
ska
Sp.z
.o.o
. a
Sale
s rev
enue
42
,358
(N
ote
4)
0.14
10
ST
AR
CO
Bel
i Man
astir
d.o
.o.
STA
RC
O G
B L
td.
c Sa
les r
even
ue
64,7
28
(Not
e 4)
0.
21
STA
RC
O N
V
c Sa
les r
even
ue
9,53
9 (N
ote
4)
0.03
ST
AR
CO
Gm
bH
c Sa
les r
even
ue
121,
962
(Not
e 4)
0.
40
STA
RC
O P
olsk
a Sp
.z.o
.o.
c Sa
les r
even
ue
63,0
16
(Not
e 4)
0.
21
STA
RC
O G
S A
G
c Sa
les r
even
ue
32,1
28
(Not
e 4)
0.
11
11
STA
RC
O G
mbH
ST
AR
CO
SA
S c
Sale
s rev
enue
56
,386
(N
ote
4)
0.19
12
ST
AR
CO
NV
ST
AR
CO
SA
S c
Sale
s rev
enue
56
,996
(N
ote
4)
0.19
ST
AR
CO
Bal
tic O
Ü
c Sa
les r
even
ue
10,3
11
(Not
e 4)
0.
03
13
STA
RC
O P
olsk
a Sp
.z.o
.o.
STA
RC
O B
altic
OÜ
c
Sale
s rev
enue
84
,453
(N
ote
4)
0.28
ST
AR
CO
NV
c
Sale
s rev
enue
6,
083
(Not
e 4)
0.
02
14
STA
RC
O D
ML
STA
RC
O G
mbH
c
Sale
s rev
enue
19
,472
(N
ote
4)
0.06
(C
ontin
ued)
~ 178 ~

- 65
-
No.
(Not
e 1)
In
vest
ee C
ompa
ny
Cou
nter
part
y R
elat
ions
hip
(Not
e 2)
Inte
rcom
pany
Det
ails
(Not
e 3)
Fina
ncia
l Sta
tem
ent A
ccou
nt
Am
ount
Pa
ymen
t Ter
ms
% o
f Tot
al S
ales
or
Ass
ets
0 Th
e C
ompa
ny
AD
I a
Acc
ount
s rec
eiva
ble
$
245,
900
(Not
e 4)
0.
58
AD
I a
Oth
er re
ceiv
able
56
4 (N
ote
4)
0.00
K
V
a A
ccou
nts r
ecei
vabl
e
30
,563
(N
ote
4)
0.07
K
A
a A
ccou
nts r
ecei
vabl
e
43
9,30
2 (N
ote
4)
1.04
K
A
a O
ther
rece
ivab
le
4,84
9 (N
ote
4)
0.01
K
C
a A
ccou
nts r
ecei
vabl
e
16
,396
(N
ote
4)
0.04
K
F a
Acc
ount
s rec
eiva
ble
155,
971
(Not
e 4)
0.
37
KH
K
a O
ther
rece
ivab
le
130,
626
(Not
e 4)
0.
31
KI
a A
ccou
nts r
ecei
vabl
e
26
,981
(N
ote
4)
0.06
K
IC
a O
ther
rece
ivab
le
103,
552
(Not
e 4)
0.
24
KT
a A
ccou
nts r
ecei
vabl
e
9,
111
(Not
e 4)
0.
02
1 K
C
KA
c
Acc
ount
s rec
eiva
ble
148,
422
(Not
e 4)
0.
35
AD
I c
Acc
ount
s rec
eiva
ble
125,
494
(Not
e 4)
0.
30
KS
c A
ccou
nts r
ecei
vabl
e
45
,364
(N
ote
4)
0.11
ST
AR
CO
GB
Ltd
. c
Acc
ount
s rec
eiva
ble
14,9
81
(Not
e 4)
0.
04
STA
RC
O P
olsk
a Sp
.z.o
.o.
c A
ccou
nts r
ecei
vabl
e
26
,072
(N
ote
4)
0.06
ST
AR
CO
NV
c
Acc
ount
s rec
eiva
ble
49,9
34
(Not
e 4)
0.
12
2 K
T A
DI
c A
ccou
nts r
ecei
vabl
e
98
,622
(N
ote
4)
0.23
K
S c
Acc
ount
s rec
eiva
ble
130,
432
(Not
e 4)
0.
31
3 K
I K
V
c A
ccou
nts r
ecei
vabl
e
9,
567
(Not
e 4)
0.
02
4 K
A
The
Com
pany
c
Acc
ount
s rec
eiva
ble
20,1
11
(Not
e 4)
0.
05
5 K
IC
KG
H
a O
ther
rece
ivab
le
87,0
95
(Not
e 4)
0.
21
KG
I a
Oth
er re
ceiv
able
16
,457
(N
ote
4)
0.04
6
KV
K
A
c A
ccou
nts r
ecei
vabl
e
68
3,12
2 (N
ote
4)
1.61
A
DI
c A
ccou
nts r
ecei
vabl
e
19
2,97
1 (N
ote
4)
0.46
K
I c
Acc
ount
s rec
eiva
ble
11,0
30
(Not
e 4)
0.
03
7 K
S K
C
c A
ccou
nts r
ecei
vabl
e
7,
807
(Not
e 4)
0.
02
8 ST
AR
CO
Eur
ope
A/S
ST
AR
CO
DM
L a
Oth
er re
ceiv
able
30
,386
(N
ote
4)
0.07
ST
AR
CO
GS
AG
a
Oth
er re
ceiv
able
23
,703
(N
ote
4)
0.06
ST
AR
CO
SA
S a
Oth
er re
ceiv
able
13
,922
(N
ote
4)
0.03
ST
AR
CO
GB
Ltd
. a
Acc
ount
s rec
eiva
ble
67,6
24
(Not
e 4)
0.
16
STA
RC
O N
V
a A
ccou
nts r
ecei
vabl
e
21
,187
(N
ote
4)
0.05
ST
AR
CO
Gm
bH
a A
ccou
nts r
ecei
vabl
e
13
,710
(N
ote
4)
0.03
ST
AR
CO
Pol
ska
Sp.z
.o.o
. a
Acc
ount
s rec
eiva
ble
72,9
70
(Not
e 4)
0.
17
STA
RC
O G
S A
G
a A
ccou
nts r
ecei
vabl
e
10
,883
(N
ote
4)
0.03
(C
ontin
ued)
~ 179 ~

- 66
-
No.
(Not
e 1)
In
vest
ee C
ompa
ny
Cou
nter
part
y R
elat
ions
hip
(Not
e 2)
Inte
rcom
pany
Det
ails
(Not
e 3)
Fina
ncia
l Sta
tem
ent A
ccou
nt
Am
ount
Pa
ymen
t Ter
ms
% o
f Tot
al S
ales
or
Ass
ets
9 ST
AR
CO
Bel
i Man
astir
d.o
.o.
STA
RC
O E
urop
e A
/S
b A
ccou
nts r
ecei
vabl
e
$ 8,
292
(Not
e 4)
0.
02
STA
RC
O G
mB
H
c A
ccou
nts r
ecei
vabl
e
23
,891
(N
ote
4)
0.06
ST
AR
CO
GB
Ltd
. c
Acc
ount
s rec
eiva
ble
16,9
38
(Not
e 4)
0.
04
STA
RC
O P
olsk
a Sp
.z.o
.o.
c A
ccou
nts r
ecei
vabl
e
21
,359
(N
ote
4)
0.05
10
ST
AR
CO
Gm
bH
STA
RC
O E
urop
e A
/S
b A
ccou
nts r
ecei
vabl
e
33
,324
(N
ote
4)
0.08
ST
AR
CO
SA
S c
Acc
ount
s rec
eiva
ble
6,86
8 (N
ote
4)
0.02
11
ST
AR
CO
NV
ST
AR
CO
SA
S c
Acc
ount
s rec
eiva
ble
20,6
79
(Not
e 4)
0.
05
12
STA
RC
O P
olsk
a Sp
.z.o
.o
STA
RC
O E
urop
e A
/S
b A
ccou
nts r
ecei
vabl
e
7,
425
(Not
e 4)
0.
02
13
STA
RC
O S
AS
STA
RC
O E
urop
e A
/S
b A
ccou
nts r
ecei
vabl
e
18
,956
(N
ote
4)
0.04
14
ST
AR
CO
IPR
Gm
bH
STA
RC
O E
urop
e A
/S
b O
ther
rece
ivab
le
200,
526
(Not
e 4)
0.
47
STA
RC
O N
V
c A
ccou
nts r
ecei
vabl
e
6,
283
(Not
e 4)
0.
01
STA
RC
O G
mB
H
c A
ccou
nts r
ecei
vabl
e
33
,440
(N
ote
4)
0.08
15
ST
AR
CO
GS
AG
ST
AR
CO
Eur
ope
A/S
b
Acc
ount
s rec
eiva
ble
8,62
3 (N
ote
4)
0.02
Not
e 1:
Th
e pa
rent
com
pany
and
its s
ubsi
diar
ies a
re c
oded
as f
ollo
ws:
a.
The
pare
nt c
ompa
ny is
cod
ed a
s “0”
. b.
Su
bsid
iarie
s are
cod
ed se
quen
tially
, beg
inni
ng fr
om “
1” a
nd in
the
orde
r pre
sent
ed in
the
tabl
e ab
ove.
Not
e 2:
N
atur
e of
rela
tions
hip
is a
s fol
low
s:
a.
From
the
pare
nt c
ompa
ny to
its s
ubsi
diar
y.
b.
From
a su
bsid
iary
to th
e pa
rent
com
pany
c.
B
etw
een
subs
idia
ries.
Not
e 3:
Fo
r cal
cula
tion
of a
ccou
nt b
alan
ce ra
tio to
tota
l ass
ets,
the
num
erat
or is
the
bala
nce
shee
t acc
ount
bal
ance
and
the
deno
min
ator
is th
e to
tal a
sset
s. Fo
r cal
cula
tion
of a
ccou
nt b
alan
ce ra
tio to
tota
l sal
es, t
he n
umer
ator
is th
e in
com
e st
atem
ent
acco
unt b
alan
ce a
nd th
e de
nom
inat
or is
the
tota
l sal
es.
Not
e 4:
Te
rms a
re in
acc
orda
nce
with
mut
ual a
gree
men
ts.
(Con
clud
ed)
~ 180 ~
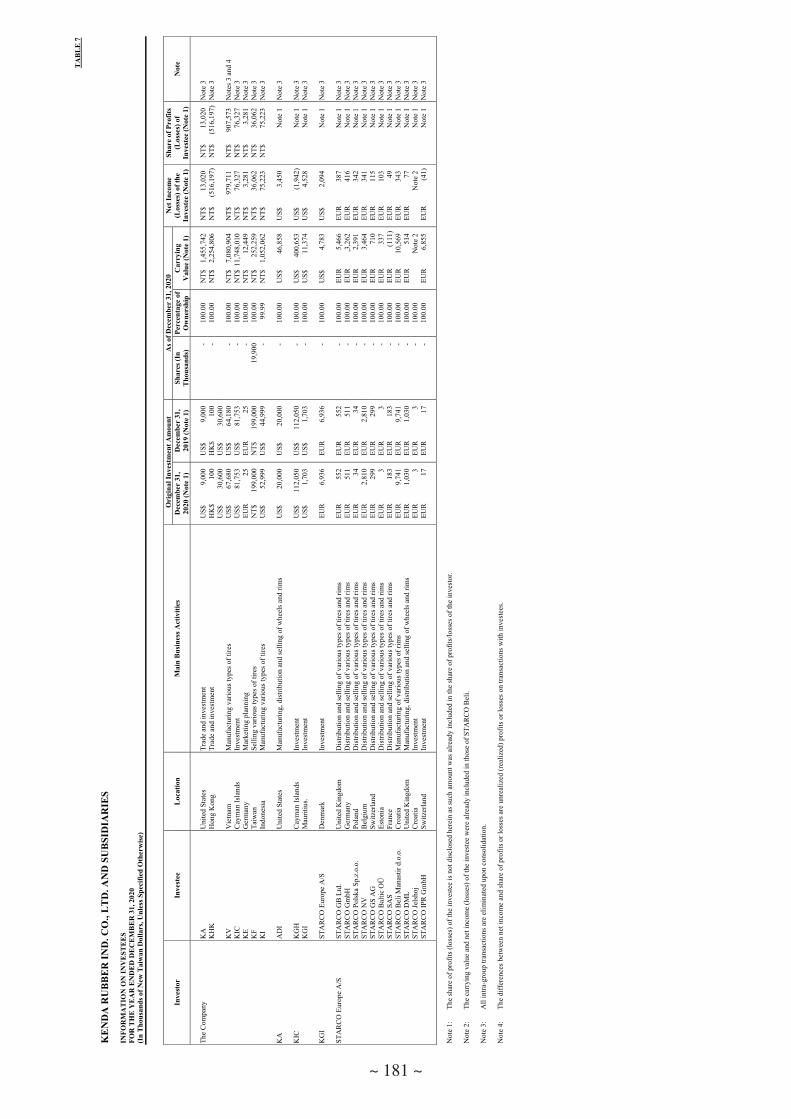
- 67
-
TA
BL
E 7
KE
ND
A R
UB
BE
R IN
D. C
O.,
LT
D. A
ND
SU
BSI
DIA
RIE
S
INFO
RM
AT
ION
ON
INV
EST
EE
S FO
R T
HE
YE
AR
EN
DE
D D
EC
EM
BE
R 3
1, 2
020
(In
Tho
usan
ds o
f New
Tai
wan
Dol
lars
, Unl
ess S
peci
fied
Oth
erw
ise)
Inve
stor
In
vest
ee
Loc
atio
n M
ain
Bus
ines
s Act
iviti
es
Ori
gina
l Inv
estm
ent A
mou
nt
As o
f Dec
embe
r 31
, 202
0 N
et In
com
e (L
osse
s) o
f the
In
vest
ee (N
ote
1)
Shar
e of
Pro
fits
(Los
ses)
of
Inve
stee
(Not
e 1)
Not
e D
ecem
ber
31,
2020
(Not
e 1)
D
ecem
ber
31,
2019
(Not
e 1)
Sh
ares
(In
Tho
usan
ds)
Perc
enta
ge o
f O
wne
rshi
p C
arry
ing
Val
ue (N
ote
1)
The
Com
pany
K
A
Uni
ted
Stat
es
Trad
e an
d in
vest
men
t
US$
9,
000
U
S$
9,00
0
-
100.
00
N
T$
1,45
5,74
2
NT$
13
,020
N
T$
13,0
20N
ote
3
KH
K
Hon
g K
ong
Trad
e an
d in
vest
men
t
HK
$ 10
0
HK
$ 10
0
-
100.
00
N
T$
2,25
4,80
6
NT$
(5
16,1
97 )
N
T$
(516
,197
)N
ote
3
US$
30
,600
U
S$
30,6
00
KV
V
ietn
am
Man
ufac
turin
g va
rious
type
s of t
ires
U
S$
67,6
80
US$
64
,180
-10
0.00
NT$
7,
080,
904
N
T$
979,
711
N
T$
907,
573
Not
es 3
and
4
K
IC
Cay
man
Isla
nds
Inve
stm
ent
U
S$
81,7
53
US$
81
,753
-10
0.00
NT$
11,
748,
010
N
T$
76,3
27
NT$
76
,327
Not
e 3
K
E G
erm
any
Mar
ketin
g pl
anni
ng
EU
R
25
EUR
25
-10
0.00
NT$
12
,449
NT$
3,
281
N
T$
3,28
1N
ote
3
KF
Taiw
an
Selli
ng v
ario
us ty
pes o
f tire
s
NT$
19
9,00
0
NT$
19
9,00
0
19
,900
100.
00
N
T$
252,
259
N
T$
36,0
62
NT$
36
,062
Not
e 3
K
I In
done
sia
Man
ufac
turin
g va
rious
type
s of t
ires
U
S$
52,9
99
US$
44
,999
-99
.99
N
T$
1,05
2,06
2
NT$
75
,223
N
T$
75,2
23N
ote
3
K
A
AD
I U
nite
d St
ates
M
anuf
actu
ring,
dis
tribu
tion
and
selli
ng o
f whe
els a
nd ri
ms
U
S$
20,0
00
US$
20
,000
-10
0.00
US$
46
,858
US$
3,
450
Not
e 1
Not
e 3
KIC
K
GH
C
aym
an Is
land
s In
vest
men
t
US$
11
2,05
0
US$
11
2,05
0
-
100.
00
U
S$
400,
653
U
S$
(1,9
42 )
Not
e 1
Not
e 3
K
GI
Mau
ritiu
s. In
vest
men
t
US$
1,
703
U
S$
1,70
3
-
100.
00
U
S$
11,3
74
U
S$
4,52
8
N
ote
1N
ote
3
K
GI
STA
RC
O E
urop
e A
/S
Den
mar
k In
vest
men
t
EUR
6,
936
EU
R
6,93
6
-
100.
00
U
S$
4,78
3
US$
2,
094
Not
e 1
Not
e 3
STA
RC
O E
urop
e A
/S
STA
RC
O G
B L
td.
Uni
ted
Kin
gdom
D
istri
butio
n an
d se
lling
of v
ario
us ty
pes o
f tire
s and
rim
s
EUR
55
2
EUR
55
2
-
100.
00
EU
R
5,46
6
EUR
38
7
N
ote
1N
ote
3
STA
RC
O G
mbH
G
erm
any
Dis
tribu
tion
and
selli
ng o
f var
ious
type
s of t
ires a
nd ri
ms
EU
R
511
EU
R
511
-10
0.00
EUR
,3
,262
EUR
41
6
N
ote
1N
ote
3
STA
RC
O P
olsk
a Sp
.z.o
.o.
Pola
nd
Dis
tribu
tion
and
selli
ng o
f var
ious
type
s of t
ires a
nd ri
ms
EU
R
34
EUR
34
-10
0.00
EUR
2,
391
EU
R
342
Not
e 1
Not
e 3
ST
AR
CO
NV
B
elgi
um
Dis
tribu
tion
and
selli
ng o
f var
ious
type
s of t
ires a
nd ri
ms
EU
R
2,81
0
EUR
2,
810
-10
0.00
EUR
3,
464
EU
R
341
Not
e 1
Not
e 3
ST
AR
CO
GS
AG
Sw
itzer
land
D
istri
butio
n an
d se
lling
of v
ario
us ty
pes o
f tire
s and
rim
s
EUR
29
9
EUR
29
9
-
100.
00
EU
R
710
EU
R
115
Not
e 1
Not
e 3
ST
AR
CO
Bal
tic O
Ü
Esto
nia
Dis
tribu
tion
and
selli
ng o
f var
ious
type
s of t
ires a
nd ri
ms
EU
R
3
EUR
3
-10
0.00
EUR
33
7
EUR
10
3
N
ote
1N
ote
3
STA
RC
O S
AS
Fran
ce
Dis
tribu
tion
and
selli
ng o
f var
ious
type
s of t
ires a
nd ri
ms
EU
R
183
EU
R
183
-10
0.00
EUR
(1
11 )
EU
R
49
N
ote
1N
ote
3
STA
RC
O B
eli M
anas
tir d
.o.o
. C
roat
ia
Man
ufac
turin
g of
var
ious
type
s of r
ims
EU
R
9,74
1
EUR
9,
741
-10
0.00
EUR
10
,569
EUR
34
3
N
ote
1N
ote
3
STA
RC
O D
ML
Uni
ted
Kin
gdom
M
anuf
actu
ring,
dis
tribu
tion
and
selli
ng o
f whe
els a
nd ri
ms
EU
R
1,03
0
EUR
1,
030
-10
0.00
EUR
51
4
EUR
77
Not
e 1
Not
e 3
ST
AR
CO
Jels
hoj
Cro
atia
In
vest
men
t
EUR
3
EU
R
3
-
100.
00
Not
e 2
Not
e 2
Not
e 1
Not
e 3
ST
AR
CO
IPR
Gm
bH
Switz
erla
nd
Inve
stm
ent
EU
R
17
EUR
17
-10
0.00
EUR
6,
855
EU
R
(41 )
Not
e 1
Not
e 3
Not
e 1:
Th
e sh
are
of p
rofit
s (lo
sses
) of t
he in
vest
ee is
not
dis
clos
ed h
erei
n as
such
am
ount
was
alre
ady
incl
uded
in th
e sh
are
of p
rofit
s/lo
sses
of t
he in
vest
or.
Not
e 2:
Th
e ca
rryi
ng v
alue
and
net
inco
me
(loss
es) o
f the
inve
stee
wer
e al
read
y in
clud
ed in
thos
e of
STA
RC
O B
eli.
Not
e 3:
A
ll in
tra-g
roup
tran
sact
ions
are
elim
inat
ed u
pon
cons
olid
atio
n.
Not
e 4:
Th
e di
ffer
ence
s bet
wee
n ne
t inc
ome
and
shar
e of
pro
fits o
r los
ses a
re u
nrea
lized
(rea
lized
) pro
fits o
r los
ses o
n tra
nsac
tions
with
inve
stee
s.
~ 181 ~

- 68
-
TA
BL
E 8
KE
ND
A R
UB
BE
R IN
D. C
O.,
LT
D. A
ND
SU
BSI
DIA
RIE
S
INFO
RM
AT
ION
ON
INV
EST
ME
NT
S IN
MA
INL
AN
D C
HIN
A
FOR
YE
AR
EN
DE
D D
EC
EM
BE
R 3
1, 2
020
(In
Tho
usan
ds o
f New
Tai
wan
Dol
lars
, Unl
ess S
peci
fied
Oth
erw
ise)
Inve
stee
Com
pany
Mai
n B
usin
esse
s and
Pro
duct
sPa
id-in
Cap
ital
Met
hod
of
Inve
stm
ent
Acc
umul
ated
Out
war
d R
emitt
ance
for
Inve
stm
ent f
rom
T
aiw
an a
s of
Janu
ary
1, 2
020
Rem
ittan
ce o
f Fun
dsA
ccum
ulat
edO
utw
ard
Rem
ittan
ce fo
r In
vest
men
t fro
m
Tai
wan
as o
f D
ecem
ber
31,
2020
Net
Inco
me
(Los
s)
of th
e In
vest
ee
%O
wne
rshi
p of
Dir
ect o
r In
dire
ct
Inve
stm
ent
Inve
stm
ent
Gai
n (L
oss)
(N
ote
3)
Car
ryin
g A
mou
nt a
s of
Dec
embe
r 31
, 20
20
Acc
umul
ated
Rep
atri
atio
n of
In
vest
men
t In
com
e as
of
Dec
embe
r 31
, 20
20
Not
eO
utw
ard
Inw
ard
KS
Man
ufac
turin
g an
d se
lling
of v
ario
us
type
s of t
ires
$
712,
075
(US$
25
,000
) N
ote
1 $
71
2,07
5 (U
S$
25,0
00)
- -
$
712,
075
(US$
25
,000
) $
(7
98,1
23)
100.
0 $
(7
88,3
74)
$
2,87
1,50
4 $
4,
994,
238
-
KC
M
anuf
actu
ring
and
selli
ng o
f var
ious
ty
pes o
f tire
s
1,99
3,81
0 (U
S$
70,0
00)
Not
es 1
and
7
1,
993,
810
(US$
70
,000
)-
-
1,99
3,81
0 (U
S$
70,0
00)
42
2,04
710
0.0
N
ote
4
N
ote
4
--
KT
Man
ufac
turin
g an
d se
lling
of v
ario
us
type
s of t
ires
6,
266,
260
(US$
22
0,00
0) N
otes
1, 2
and
7
44
4,33
5 (U
S$
15,6
00)
- -
44
4,33
5 (U
S$
15,6
00)
(1
48,4
05)
100.
0
(144
,981
)
3,94
1,79
5
--
KG
CI
Inve
stm
ent
4,
585,
763
(US$
16
1,00
0) N
otes
1 a
nd 2
--
-
-
281,
295
100.
0
281,
295
10
,270
,472
-
-
Shan
ghai
Bom
y Fo
odst
uff C
o.,
Ltd.
Man
ufac
turin
g an
d se
lling
of v
ario
us
type
s of f
oods
and
drin
ks
56
9,66
0 (U
S$
20,0
00)
Not
e 1
56
,966
(US$
2,
000)
- -
56
,966
(US$
2,
000)
-
10.0
-
12,7
09
-
-
Nin
gbo
Jing
shan
g H
uaxi
ang
Aut
o Pa
rts C
o., L
td.
Inte
rnal
and
ext
erna
l par
ts fo
r au
tom
obile
s
744,
346
(US$
26
,133
) N
ote
1
48,5
07 (U
S$
1,70
3)-
-
48,5
07 (U
S$
1,70
3)
-2.
6
-
126,
896
45
,544
-
STA
RC
O H
uanm
ei
Man
ufac
turin
g of
rim
s
69,6
12
(EU
R
2,00
0) N
ote
1
Not
e 9
- -
N
ote
9
9,54
433
.0
2,
340
10
2,32
0
-N
ote
9
Acc
umul
ated
Out
war
d R
emitt
ance
for
Inve
stm
ents
in M
ainl
and
Chi
na a
s of
Dec
embe
r 31
, 202
0
Inve
stm
ent A
mou
nt A
utho
rize
d by
th
e In
vest
men
t Com
mis
sion
, MO
EA
Upp
er L
imit
on th
e A
mou
nt o
f Inv
estm
ents
St
ipul
ated
by
the
Inve
stm
ent C
omm
issi
on, M
OE
A
(Not
e 5)
$
3,
255,
692
(U
S$
114,
303)
(N
ote
5)
$
9,
163,
879
(U
S$
319,
703)
(EU
R
1,66
0)
(Not
e 5)
Not
e 6
Not
e 1:
In
dire
ct in
vest
men
t in
mai
nlan
d C
hina
thro
ugh
a su
bsid
iary
in a
third
pla
ce.
Not
e 2:
D
iffer
ence
s bet
wee
n th
e pa
id-in
cap
ital a
nd a
ccum
ulat
ed o
utw
ard
inve
stm
ent f
rom
Tai
wan
are
resu
lted
from
div
iden
d re
inve
stm
ent a
nd c
ash
inje
ctio
n.
Not
e 3:
Th
e sh
are
of p
rofit
s (lo
sses
) is r
ecog
nize
d ba
sed
on th
e fin
anci
al st
atem
ents
aud
ited
by a
n in
tern
atio
nal a
ccou
ntin
g fir
m th
at c
olla
bora
ted
with
acc
ount
ing
firm
s in
Taiw
an.
Not
e 4:
Th
e sh
are
of p
rofit
s (lo
sses
) and
the
carr
ying
am
ount
of K
C w
ere
not d
iscl
osed
her
ein
as su
ch a
mou
nts w
ere
alre
ady
incl
uded
in th
ose
of K
GC
I.
Not
e 5:
Th
e di
ffer
ence
bet
wee
n th
e in
vest
men
t am
ount
of U
S$31
9,70
3 th
ousa
nd a
utho
rized
by
the
Inve
stm
ent C
omm
issi
on a
nd th
e ac
cum
ulat
ed o
utw
ard
rem
ittan
ce o
f US$
114,
303
thou
sand
for i
nves
tmen
ts in
mai
nlan
d C
hina
was
due
to d
ivid
end
rein
vest
men
t and
cas
h in
ject
ion.
Not
e 6:
Pe
r the
cer
tific
ate
of o
pera
tiona
l hea
dqua
rters
issu
ed b
y In
dust
rial D
evel
opm
ent B
urea
u of
MO
EA, t
he C
ompa
ny h
as n
o lim
itatio
n on
the
accu
mul
ated
rem
ittan
ce fo
r inv
estm
ents
in m
ainl
and
Chi
na.
Not
e 7:
Th
e pa
id-in
cap
ital o
f KC
and
par
t of p
aid-
in c
apita
l of K
T w
ere
incl
uded
in th
at o
f its
inve
stor
s and
, the
refo
re, t
hey
wer
e no
t inc
lude
d w
hen
calc
ulat
ing
the
inve
stm
ent a
utho
rized
and
the
inve
stm
ent r
emitt
ance
from
Tai
wan
to m
ainl
and
Chi
na.
Not
e 8:
Fo
reig
n cu
rren
cies
wer
e tra
nsla
ted
into
NTD
usi
ng sp
ot ra
tes a
s of D
ecem
ber 3
1, 2
020
or a
vera
ge e
xcha
nge
rate
s for
the
year
.
Not
e 9:
ST
AR
CO
Hua
nmei
was
indi
rect
ly a
cqui
red
via
busi
ness
com
bina
tion
and
its sh
are
capi
tal w
as in
crea
sed
thro
ugh
capi
tal i
njec
tion
of E
UR
1,00
0 th
ousa
nd b
y ST
AR
CO
Eur
ope
A/S
.
~ 182 ~

- 69 -
TABLE 9
KENDA RUBBER IND. CO., LTD. AND SUBSIDIARIES
INFORMATION OF MAJOR SHAREHOLDERS December 31, 2020
Name of Major Shareholder Shares
Number of Shares
Percentage of Ownership (%)
Yang Chi Jen 91,622,924 10.07 Yang Ying Ming 65,555,015 7.21 Fubon Life Insurance Co., Ltd. 49,416,761 5.43
~ 183 ~

Kenda Rubber Ind. Co., Ltd.
Financial Statements for the
Years Ended December 31, 2020 and 2019 and
Independent Auditors’ Report
V. Individual Consolidated Financial Statements Duly Audited
By The Certified Public Accountants In Recent Years
~ 184 ~

- 1 -
INDEPENDENT AUDITORS’ REPORT
The Board of Directors and Shareholders Kenda Rubber Ind. Co., Ltd.
Opinion
We have audited the accompanying financial statements of Kenda Rubber Ind. Co., Ltd. (the “Company”), which comprise the balance sheet as of December 31, 2020 and 2019, and the statements of comprehensive income, changes in equity and cash flows for the years then ended, and notes to the financial statements, including a summary of significant accounting policies (collectively referred to as the “financial statements”).
In our opinion, the accompanying financial statements present fairly, in all material respects, the financial position of the Company as of December 31, 2020 and 2019, and its financial performance and its cash flows for the years then ended in accordance with the Regulations Governing the Preparation of Financial Reports by Securities Issuers.
Basis for Opinion
We conducted our audits in accordance with the Regulations Governing Auditing and Attestation of Financial Statements by Certified Public Accountants and auditing standards generally accepted in the Republic of China. Our responsibilities under those standards are further described in the Auditors’ Responsibilities for the Audit of the Financial Statements section of our report. We are independent of the Company in accordance with The Norm of Professional Ethics for Certified Public Accountant of the Republic of China, and we have fulfilled our other ethical responsibilities in accordance with these requirements. We believe that the audit evidence we have obtained is sufficient and appropriate to provide a basis for our opinion.
Key Audit Matters
Key audit matters are those matters that, in our professional judgment, were of most significance in our audit of the financial statements for the year ended December 31, 2020. These matters were addressed in the context of our audit of the financial statements as a whole, and in forming our opinion thereon, and we do not provide a separate opinion on these matters.
~ 185 ~

- 2 -
The key audit matter of the Company’s financial statements for the year ended December 31, 2020 is stated as follows:
Appropriateness of the Revenue Cutoff
The Company has worldwide sales network, and the terms of sales are different by customer or geography. Revenue is recognized when performance obligations are satisfied by the transfer of the promised goods to customers but the timing of the transfer may be based on the time of actual delivery or on the time of actual receipt of the goods. The Company’s revenue recognition process involves manual inspection of relevant documents, or an estimate of arrival time of the goods shipped to customers based on historical experience to determine timing of the transfer of control of the promised goods to customers. Therefore, mistakes may occur in the evaluation process, and revenue could be recorded in the incorrect reporting period.
The main audit procedures that we performed in respect of the cutoff of revenue recognition included the following:
1. We obtained an understanding of and reviewed the sales contracts and the terms between the Company and its customers to identify the appropriate point of revenue recognition.
2. We obtained an understanding of and evaluated the process and related controls over revenue recognition.
3. We performed cutoff testing procedures covering a certain period before and after the balance sheet date and examined relevant supporting documents. We determined that revenue was recognized in the correct reporting period, as evidenced by sales terms.
Responsibilities of Management and Those Charged with Governance for the Financial Statements
Management is responsible for the preparation and fair presentation of the financial statements in accordance with the Regulations Governing the Preparation of Financial Reports by Securities Issuers, and for such internal control as management determines is necessary to enable the preparation of financial statements that are free from material misstatement, whether due to fraud or error.
In preparing the financial statements, management is responsible for assessing the Company’s ability to continue as a going concern, disclosing, as applicable, matters related to going concern and using the going concern basis of accounting unless management either intends to liquidate the Company or to cease operations, or has no realistic alternative but to do so.
Those charged with governance, including members of the audit committee, are responsible for overseeing the Company’s financial reporting process.
Auditors’ Responsibilities for the Audit of the Financial Statements
Our objectives are to obtain reasonable assurance about whether the financial statements as a whole are free from material misstatement, whether due to fraud or error, and to issue an auditors’ report that includes our opinion. Reasonable assurance is a high level of assurance, but is not a guarantee that an audit conducted in accordance with the auditing standards generally accepted in the Republic of China will always detect a material misstatement when it exists. Misstatements can arise from fraud or error and are considered material if, individually or in the aggregate, they could reasonably be expected to influence the economic decisions of users taken on the basis of these financial statements.
~ 186 ~

- 3 -
As part of an audit in accordance with the auditing standards generally accepted in the Republic of China, we exercise professional judgment and maintain professional skepticism throughout the audit. We also:
1. Identify and assess the risks of material misstatement of the financial statements, whether due to fraud or error, design and perform audit procedures responsive to those risks, and obtain audit evidence that is sufficient and appropriate to provide a basis for our opinion. The risk of not detecting a material misstatement resulting from fraud is higher than for one resulting from error, as fraud may involve collusion, forgery, intentional omissions, misrepresentations, or the override of internal control.
2. Obtain an understanding of internal control relevant to the audit in order to design audit procedures that are appropriate in the circumstances, but not for the purpose of expressing an opinion on the effectiveness of the Company’s internal control.
3. Evaluate the appropriateness of accounting policies used and the reasonableness of accounting estimates and related disclosures made by management.
4. Conclude on the appropriateness of management’s use of the going concern basis of accounting and, based on the audit evidence obtained, whether a material uncertainty exists related to events or conditions that may cast significant doubt on the Company’s ability to continue as a going concern. If we conclude that a material uncertainty exists, we are required to draw attention in our auditors’ report to the related disclosures in the financial statements or, if such disclosures are inadequate, to modify our opinion. Our conclusions are based on the audit evidence obtained up to the date of our auditors’ report. However, future events or conditions may cause the Company to cease to continue as a going concern.
5. Evaluate the overall presentation, structure and content of the financial statements, including the disclosures, and whether the financial statements represent the underlying transactions and events in a manner that achieves fair presentation.
6. Obtain sufficient and appropriate audit evidence regarding the financial information of entities or business activities within the Company to express an opinion on the financial statements. We are responsible for the direction, supervision and performance of the audit. We remain solely responsible for our audit opinion.
We communicate with those charged with governance regarding, among other matters, the planned scope and timing of the audit and significant audit findings, including any significant deficiencies in internal control that we identify during our audit.
We also provide those charged with governance with a statement that we have complied with relevant ethical requirements regarding independence, and to communicate with them all relationships and other matters that may reasonably be thought to bear on our independence, and where applicable, related safeguards.
From the matters communicated with those charged with governance, we determine those matters that were of most significance in the audit of the financial statements for the year ended December 31, 2020, and are therefore the key audit matters. We describe these matters in our auditors’ report unless law or regulation precludes public disclosure about the matter or when, in extremely rare circumstances, we determine that a matter should not be communicated in our report because the adverse consequences of doing so would reasonably be expected to outweigh the public interest benefits of such communication.
~ 187 ~

- 4 -
The engagement partners on the audits resulting in this independent auditors’ report are Yi Wen Wang and Done Yuin Tseng.
Deloitte & Touche Taipei, Taiwan Republic of China
March 25, 2021
Notice to Readers
The accompanying financial statements are intended only to present the financial position, financial performance and cash flows in accordance with accounting principles and practices generally accepted in the Republic of China and not those of any other jurisdictions. The standards, procedures and practices to audit such financial statements are those generally applied in the Republic of China.
For the convenience of readers, the independent auditors’ report and the accompanying financial statements have been translated into English from the original Chinese version prepared and used in the Republic of China. If there is any conflict between the English version and the original Chinese version or any difference in the interpretation of the two versions, the Chinese-language independent auditors’ report and financial statements shall prevail.
~ 188 ~

- 5 -
KENDA RUBBER IND. CO., LTD.
BALANCE SHEETS DECEMBER 31, 2020 AND 2019 (In Thousands of New Taiwan Dollars)
2020 2019ASSETS Amount % Amount %
CURRENT ASSETS
Cash and cash equivalents (Note 6) $ 1,393,602 4 $ 653,707 2 Financial assets at fair value through profit or loss - current (Note 7) 973 - 1,019 - Notes receivable (Notes 9 and 22) 22,802 - 10,586 - Accounts receivable from unrelated parties (Note 9) 292,808 1 263,819 1 Accounts receivable from related parties (Notes 9 and 24) 929,378 3 1,041,552 3 Other receivables (Note 24) 270,429 1 980,095 3 Inventories (Note 10) 852,900 2 791,518 2 Other current assets 16,686 - 22,098 -
Total current assets 3,779,578 11 3,764,394 11
NON-CURRENT ASSETS
Financial assets at fair value through other comprehensive income - non-current (Note 8) 451,523 1 393,435 1 Investments accounted for using the equity method (Note 11) 23,531,238 70 24,679,402 74 Property, plant and equipment (Notes 12 and 24) 4,031,537 12 4,191,659 13 Right-of-use assets (Notes 13 and 24) 21,955 - - - Intangible assets 4,969 - 10,469 - Deferred tax assets (Note 20) 419,743 1 316,811 1 Other financial assets - non-current (Note 14) 1,268,181 4 - - Other non-current assets 161,075 1 94,960 -
Total non-current assets 29,890,221 89 29,686,736 89
TOTAL $ 33,669,799 100 $ 33,451,130 100
LIABILITIES AND EQUITY
CURRENT LIABILITIES Short-term borrowings (Note 15) $ 200,000 1 $ 350,000 1 Contract liabilities - current (Note 18) 24,316 - 9,277 - Notes payable 685 - 1,003 - Accounts payable (Note 24) 376,963 1 337,139 1 Other payables (Note 24) 470,432 2 431,439 1 Current tax liabilities (Note 20) 95,441 - 9,731 - Lease liabilities (Notes 13 and 24) 5,141 - - - Current portion of long-term borrowings (Note 15) 1,795,070 5 1,276,062 4 Other current liabilities 14,422 - 13,400 -
Total current liabilities 2,982,470 9 2,428,051 7
NON-CURRENT LIABILITIES
Long-term borrowings (Note 15) 11,093,789 33 11,535,185 35 Deferred tax liabilities (Note 20) 216,190 - 456,907 1 Lease liabilities - non-current (Notes 13 and 24) 16,843 - - - Net defined benefit liabilities - non-current (Note 14) 244,791 1 248,187 1 Other non-current liabilities 6,007 - 50 -
Total non-current liabilities 11,577,620 34 12,240,329 37
Total liabilities 14,560,090 43 14,668,380 44
EQUITY ATTRIBUTABLE TO SHAREHOLDERS OF THE COMPANY (Note 17)
Share capital 9,094,100 27 8,744,300 26 Capital surplus 41 - 41 - Retained earnings
Legal reserve 3,213,262 10 3,113,042 9 Special reserve 1,330,054 4 968,955 3 Unappropriated earnings 7,073,254 21 7,286,466 22
Other equity (1,601,002) (5) (1,330,054) (4)
Total equity 19,109,709 57 18,782,750 56
TOTAL $ 33,669,799 100 $ 33,451,130 100
The accompanying notes are an integral part of the financial statements.
~ 189 ~

- 6 -
KENDA RUBBER IND. CO., LTD.
STATEMENTS OF COMPREHENSIVE INCOME FOR THE YEARS ENDED DECEMBER 31, 2020 AND 2019 (In Thousands of New Taiwan Dollars, Except Earnings Per Share)
2020 2019 Amount % Amount %
NET REVENUE (Notes 18 and 24) $ 5,946,286 100 $ 5,947,113 100 COST OF REVENUE (Notes 10, 19 and 24) 3,993,110 67 4,360,674 73 GROSS PROFIT 1,953,176 33 1,586,439 27 UNREALIZED GAIN ON TRANSACTIONS WITH
SUBSIDIARIES (23,313) - (27,111) (1) REALIZED GROSS PROFIT 1,929,863 33 1,559,328 26 OPERATING EXPENSES (Notes 19 and 24)
Selling and marketing expenses 595,528 10 590,751 10General and administrative expenses 193,162 3 204,099 4Research and development expenses 390,596 7 373,031 6Expected credit loss (Note 9) 5,959 - 4,865 -
Total operating expenses 1,185,245 20 1,172,746 20
INCOME FROM OPERATIONS 744,618 13 386,582 6 NON-OPERATING INCOME AND EXPENSES
(Notes 19 and 24) Interest income 7,947 - 4,300 -Other income 98,279 2 99,339 2Other gains and losses (149,814) (3) (18,295) -Finance costs (120,940) (2) (141,181) (2)Share of profit of subsidiaries 595,287 10 750,383 12
Total non-operating income and expenses 430,759 7 694,546 12
PROFIT BEFORE INCOME TAX 1,175,377 20 1,081,128 18 INCOME TAX EXPENSE (Note 20) 203,152 4 67,566 1 NET PROFIT FOR THE YEAR 972,225 16 1,013,562 17
(Continued)
~ 190 ~

- 7 -
KENDA RUBBER IND. CO., LTD.
STATEMENTS OF COMPREHENSIVE INCOME FOR THE YEARS ENDED DECEMBER 31, 2020 AND 2019 (In Thousands of New Taiwan Dollars, Except Earnings Per Share)
2020 2019 Amount % Amount %
OTHER COMPREHENSIVE INCOME (LOSS)
Items that will not be reclassified subsequently to profit or loss: Remeasurement of defined benefit plans (Note 16) $ (26,430) - $ (12,034) -Unrealized gain on investments in equity
instruments at fair value through other comprehensive income 62,030 1 228,127 4
Share of other comprehensive income of subsidiaries 8,506 - 14,040 -
Income tax related to items that will not be reclassified subsequently to profit or loss (Note 20) 5,286 - 2,407 -
49,392 1 232,540 4Items that may be reclassified subsequently to profit
or loss: Exchange differences on translation of the
financial statements of foreign operations (431,107) (7) (756,251) (13)Income tax related to items that may be
reclassified subsequently to profit or loss (Note 20) 86,221 1 151,250 3
(344,886) (6) (605,001) (10)
Other comprehensive loss for the year, net of income tax (295,494) (5) (372,461) (6)
TOTAL COMPREHENSIVE INCOME FOR THE
YEAR $ 676,731 11 $ 641,101 11
EARNINGS PER SHARE (Note 21) Basic $ 1.07 $ 1.11 Diluted $ 1.07 $ 1.11
The accompanying notes are an integral part of the financial statements. (Concluded)
~ 191 ~

- 8 -
KE
ND
A R
UB
BE
R IN
D. C
O.,
LT
D.
STA
TE
ME
NT
S O
F C
HA
NG
ES
IN E
QU
ITY
FO
R T
HE
YE
AR
S E
ND
ED
DE
CE
MB
ER
31,
202
0 A
ND
201
9 (I
n T
hous
ands
of N
ew T
aiw
an D
olla
rs, E
xcep
t Div
iden
ds P
er S
hare
)
Oth
er E
quity
Unr
ealiz
ed
Exc
hang
eD
iffer
ence
s on
Val
uatio
n G
ain
on F
inan
cial
Tra
nsla
tion
of
A
sset
s at F
air
T
he F
inan
cial
V
alue
Thr
ough
R
etai
ned
Ear
ning
s
Stat
emen
ts o
f
Oth
er
U
napp
ropr
iate
d
Fore
ign
Com
preh
ensi
ve
Cap
ital S
tock
Shar
e Su
rplu
sL
egal
Res
erve
Spec
ial R
eser
veE
arni
ngs
O
pera
tions
Inco
me
Tot
al E
quity
B
ALA
NC
E A
T JA
NU
AR
Y 1
, 201
9
$
8,74
4,30
0 $
41
$
3,04
4,12
5 $
1,
077,
394
$
7,11
9,17
4
$
(1,0
92,3
60)
$
12
3,40
5 $
19
,016
,079
A
ppro
pria
tions
of 2
018
earn
ings
Le
gal r
eser
ve
-
-
68,9
17
-
(68,
917)
-
-
-
Spec
ial r
eser
ve
-
-
-
(108
,439
)
108,
439
-
-
-
Cas
h di
vide
nds t
o sh
areh
olde
rs -
NT$
1.00
per
shar
e
-
-
-
-
(8
74,4
30)
-
-
(8
74,4
30)
N
et in
com
e fo
r the
yea
r end
ed D
ecem
ber 3
1, 2
019
-
-
-
-
1,01
3,56
2
-
-
1,01
3,56
2
Oth
er c
ompr
ehen
sive
inco
me
(loss
) for
the
year
end
ed D
ecem
ber 3
1, 2
019,
net
of i
ncom
e ta
x
-
-
-
-
(1
1,36
2)
(6
05,0
01)
243,
902
(3
72,4
61)
To
tal c
ompr
ehen
sive
inco
me
(loss
) for
the
year
end
ed D
ecem
ber 3
1, 2
019
-
-
-
-
1,00
2,20
0
(6
05,0
01)
243,
902
64
1,10
1
BA
LAN
CE
AT
DEC
EMB
ER 3
1, 2
019
8,74
4,30
0
41
3,11
3,04
2
968,
955
7,
286,
466
(1,6
97,3
61)
367,
307
18
,782
,750
A
ppro
pria
tions
of 2
019
earn
ings
Le
gal r
eser
ve
-
-
100,
220
-
(1
00,2
20)
-
-
-
Spec
ial r
eser
ve
-
-
-
361,
099
(3
61,0
99)
-
-
-
Cas
h di
vide
nds t
o sh
areh
olde
rs -
NT$
0.4
per s
hare
-
-
-
-
(3
49,7
72)
-
-
(3
49,7
72)
Shar
e di
vide
nds t
o sh
areh
olde
rs -
NT$
0.4
per s
hare
34
9,80
0
-
-
-
(349
,800
)
-
-
-
Net
inco
me
for t
he y
ear e
nded
Dec
embe
r 31,
202
0
-
-
-
-
97
2,22
5
-
-
972,
225
O
ther
com
preh
ensi
ve in
com
e (lo
ss) f
or th
e ye
ar e
nded
Dec
embe
r 31,
202
0, n
et o
f inc
ome
tax
-
-
-
-
(24,
546)
(344
,886
)
73
,938
(2
95,4
94)
To
tal c
ompr
ehen
sive
inco
me
(loss
) for
the
year
end
ed D
ecem
ber 3
1, 2
020,
net
of i
ncom
e ta
x
-
-
-
-
94
7,67
9
(3
44,8
86)
73,9
38
676,
731
B
ALA
NC
E A
T D
ECEM
BER
31,
202
0
$
9,09
4,10
0 $
41
$
3,21
3,26
2 $
1,
330,
054
$
7,07
3,25
4
$
(2,0
42,2
47)
$
44
1,24
5 $
19
,109
,709
The
acco
mpa
nyin
g no
tes a
re a
n in
tegr
al p
art o
f the
fina
ncia
l sta
tem
ents
.
~ 192 ~

- 9 -
KENDA RUBBER IND. CO., LTD.
STATEMENTS OF CASH FLOWS FOR THE YEARS ENDED DECEMBER 31, 2020 AND 2019 (In Thousands of New Taiwan Dollars)
2020 2019 CASH FLOWS FROM OPERATING ACTIVITIES
Profit before income tax $ 1,175,377 $ 1,081,128 Adjustments for:
Depreciation expense 302,935 282,503 Amortization expense 15,002 14,651 Expected credit loss 5,959 4,865 Net (gain) loss on fair value changes of financial assets at fair value
through profit or loss 46 (2)Finance costs 120,940 141,181 Interest income (7,947) (4,300)Dividend income (36,402) (36,237)Share of profit of subsidiaries (595,287) (750,383)Net loss (gain) on disposal of property, plant and equipment (310) 552 Write-down (reversal of write-down) of inventories (14,872) 14,507 Unrealized gain on transactions with subsidiaries 23,313 27,111 Net loss on foreign currency exchange 23,568 23,150 Transfer of prepayments for equipment to expenses 18,587 10,854
Changes in operating assets and liabilities Notes receivable (12,216) 2,961 Accounts receivable 61,806 (144,552)Other receivables 850,326 16,143 Inventories (46,510) 8,972 Prepayments 7,140 (2,548)Other current assets 2,203 (2,382)Other non-current assets (5,029) - Contract liabilities 15,039 (7,630)Notes payable (318) (730)Accounts payable 40,218 (44,266)Other payables 33,440 53,773 Other current liabilities 1,022 54 Net defined benefit liabilities (29,826) (31,453)
Cash generated from operations 1,948,204 657,922 Interest received 8,653 4,300 Dividends received 1,528,753 601,342 Interest paid (119,498) (143,244)Income tax paid (373,513) (161,233)
Net cash generated from operating activities 2,992,599 959,087
CASH FLOWS FROM INVESTING ACTIVITIES
Return of capital from financial assets at fair value through other comprehensive income 3,942 4,024
Return of capital from investments accounted for using the equity method - 669,940
Payments for property, plant and equipment (42,732) (67,245)(Continued)
~ 193 ~

- 10 -
KENDA RUBBER IND. CO., LTD.
STATEMENTS OF CASH FLOWS FOR THE YEARS ENDED DECEMBER 31, 2020 AND 2019 (In Thousands of New Taiwan Dollars)
2020 2019
Proceeds from disposal of property, plant and equipment $ 9,040 $ 6,229 Increase in refundable deposits (340) (31)Payments for intangible assets (9,083) (14,353)Decrease (increase) in other financial assets (1,268,181) 50,000 Increase in prepayments for equipment (178,486) (158,972)
Net cash generated from (used in) investing activities (1,485,840) 489,592
CASH FLOWS FROM FINANCING ACTIVITIES
Proceeds from short-term borrowings 600,000 150,000 Repayments of short-term borrowings (750,000) (350,000)Proceeds from long-term borrowings 3,779,686 5,372,720 Repayments of long-term borrowings (3,703,918) (4,773,928)Proceeds from guarantee deposits received 5,957 - Repayment of the principal portion of lease liabilities (1,660) - Cash dividends (349,772) (874,430)Acquisition of subsidiaries (347,157) (1,393,530)
Net cash used in financing activities (766,864) (1,869,168)
NET INCREASE (DECREASE) IN CASH AND CASH
EQUIVALENTS 739,895 (420,489) CASH AND CASH EQUIVALENTS AT THE BEGINNING OF THE
YEAR 653,707 1,074,196 CASH AND CASH EQUIVALENTS AT THE END OF THE YEAR $ 1,393,602 $ 653,707
The accompanying notes are an integral part of the financial statements. (Concluded)
~ 194 ~

- 11 -
KENDA RUBBER IND. CO., LTD.
NOTES TO FINANCIAL STATEMENTS FOR THE YEARS ENDED DECEMBER 31, 2020 AND 2019 (In Thousands of New Taiwan Dollars, Unless Specified Otherwise)
1. GENERAL INFORMATION
Kenda Rubber Ind. Co., Ltd. (the “Company”) was incorporated in the Republic of China (ROC) in March 1962. The Company is mainly engaged in manufacturing and trading of rubber products such as inner tubes and tires of bicycles, scooters, industrial trucks and cars, and various products of carbon fiber.
The Company’s shares have been listed on the Taiwan Stock Exchange since December 20, 1990.
The accompanying financial statements of the Company are presented in the Company’s functional currency, the New Taiwan dollar.
2. AUTHORIZATION OF FINANCIAL STATEMENTS
The accompanying financial statements were approved and authorized for issue by the Board of Directors on March 25, 2021.
3. APPLICATION OF NEW, AMENDED AND REVISED STANDARDS AND INTERPRETATIONS
a. The IFRSs endorsed by the Financial Supervisory Commission (FSC) for application starting from 2021
New IFRSs Effective Date
Announced by IASB
Amendments to IFRS 4 “Extension of the Temporary Exemption from Applying IFRS 9”
Effective immediately upon promulgation by the IASB
Amendments to IFRS 9, IAS 39, IFRS 7, IFRS 4 and IFRS 16 “Interest Rate Benchmark Reform - Phase 2”
January 1, 2021
Amendment to IFRS 16 “Covid-19 - Related Rent Concessions” June 1, 2020
~ 195 ~
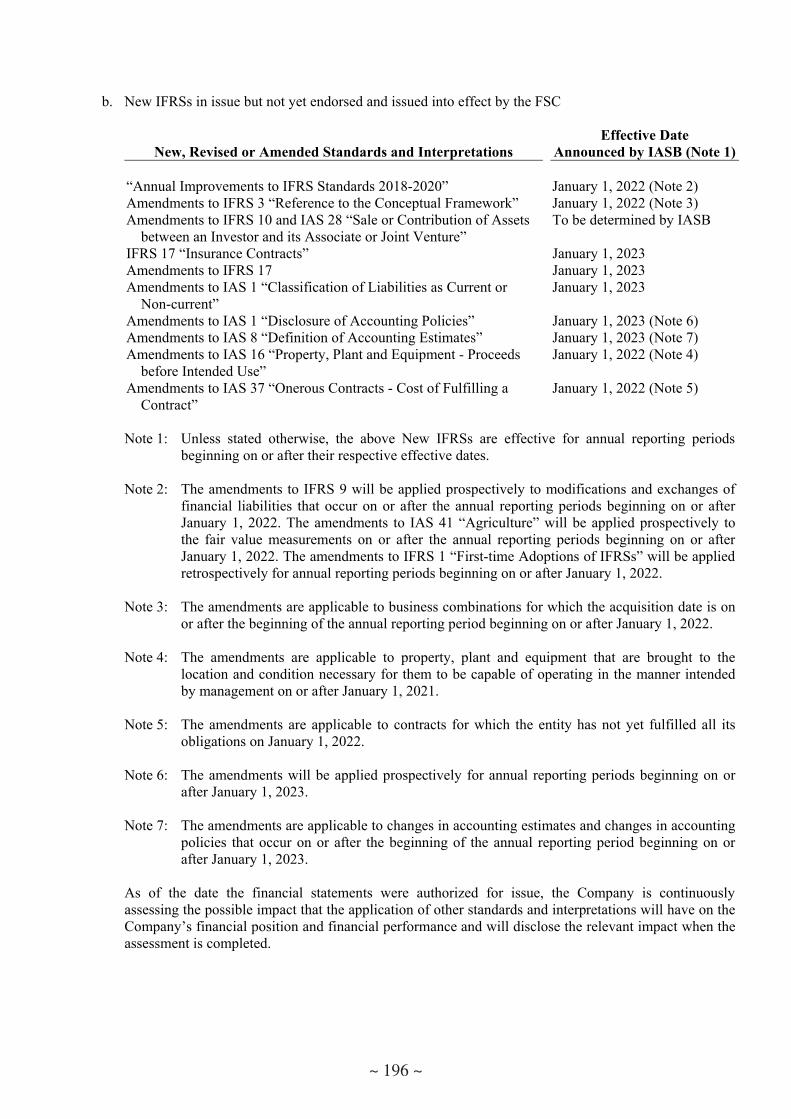
- 12 -
b. New IFRSs in issue but not yet endorsed and issued into effect by the FSC
New, Revised or Amended Standards and Interpretations Effective Date
Announced by IASB (Note 1)
“Annual Improvements to IFRS Standards 2018-2020” January 1, 2022 (Note 2) Amendments to IFRS 3 “Reference to the Conceptual Framework” January 1, 2022 (Note 3) Amendments to IFRS 10 and IAS 28 “Sale or Contribution of Assets
between an Investor and its Associate or Joint Venture” To be determined by IASB
IFRS 17 “Insurance Contracts” January 1, 2023 Amendments to IFRS 17 January 1, 2023 Amendments to IAS 1 “Classification of Liabilities as Current or
Non-current”January 1, 2023
Amendments to IAS 1 “Disclosure of Accounting Policies” January 1, 2023 (Note 6) Amendments to IAS 8 “Definition of Accounting Estimates” January 1, 2023 (Note 7) Amendments to IAS 16 “Property, Plant and Equipment - Proceeds
before Intended Use” January 1, 2022 (Note 4)
Amendments to IAS 37 “Onerous Contracts - Cost of Fulfilling a Contract”
January 1, 2022 (Note 5)
Note 1: Unless stated otherwise, the above New IFRSs are effective for annual reporting periods beginning on or after their respective effective dates.
Note 2: The amendments to IFRS 9 will be applied prospectively to modifications and exchanges of financial liabilities that occur on or after the annual reporting periods beginning on or after January 1, 2022. The amendments to IAS 41 “Agriculture” will be applied prospectively to the fair value measurements on or after the annual reporting periods beginning on or after January 1, 2022. The amendments to IFRS 1 “First-time Adoptions of IFRSs” will be applied retrospectively for annual reporting periods beginning on or after January 1, 2022.
Note 3: The amendments are applicable to business combinations for which the acquisition date is on or after the beginning of the annual reporting period beginning on or after January 1, 2022.
Note 4: The amendments are applicable to property, plant and equipment that are brought to the location and condition necessary for them to be capable of operating in the manner intended by management on or after January 1, 2021.
Note 5: The amendments are applicable to contracts for which the entity has not yet fulfilled all its obligations on January 1, 2022.
Note 6: The amendments will be applied prospectively for annual reporting periods beginning on or after January 1, 2023.
Note 7: The amendments are applicable to changes in accounting estimates and changes in accounting policies that occur on or after the beginning of the annual reporting period beginning on or after January 1, 2023.
As of the date the financial statements were authorized for issue, the Company is continuously assessing the possible impact that the application of other standards and interpretations will have on the Company’s financial position and financial performance and will disclose the relevant impact when the assessment is completed.
~ 196 ~

- 13 -
4. SUMMARY OF SIGNIFICANT ACCOUNTING POLICIES
a. Statement of compliance
The financial statements have been prepared in accordance with the Regulations Governing the Preparation of Financial Reports by Securities Issuer.
b. Basis of preparation
The financial statements have been prepared on the historical cost basis except for financial instruments which are measured at fair value and net defined benefit liabilities which are measured at the present value of the defined benefit obligation less the fair value of plan assets.
The fair value measurements, which are grouped into Levels 1 to 3 based on the degree to which the fair value measurement inputs are observable and based on the significance of the inputs to the fair value measurement in its entirety, are described as follows:
1) Level 1 inputs are quoted prices (unadjusted) in active markets for identical assets or liabilities;
2) Level 2 inputs are inputs other than quoted prices included within Level 1 that are observable for an asset or liability, either directly (i.e., as prices) or indirectly (i.e., derived from prices); and
3) Level 3 inputs are unobservable inputs for an asset or liability.
When preparing these parent company only financial statements, the Company used the equity method to account for its investments in subsidiaries. In order for the amounts of the net profit for the year, other comprehensive income for the year and total equity in the parent company only financial statements to be the same with the amounts attributable to the owners of the Company in its consolidated financial statements, adjustments arising from the differences in accounting treatments between the parent company only basis and the consolidated basis were made to investments accounted for using the equity method, the share of profit or loss of subsidiaries, the share of other comprehensive income of subsidiaries and the related equity items, as appropriate, in these parent company only financial statements.
c. Classification of current and non-current assets and liabilities
Current assets include:
Assets held primarily for the purpose of trading;
Assets expected to be realized within 12 months after the reporting period; and
Cash and cash equivalents unless the asset is restricted from being exchanged or used to settle a liability for at least 12 months after the reporting period.
Current liabilities include:
Liabilities held primarily for the purpose of trading;
Liabilities due to be settled within 12 months after the reporting period; and
Liabilities for which the Company does not have an unconditional right to defer settlement for at least 12 months after the reporting period.
Assets and liabilities that are not classified as current are classified as non-current.
~ 197 ~

- 14 -
d. Foreign currencies
In preparing the financial statements of each individual entity, transactions in currencies other than the entity’s functional currency (i.e., foreign currencies) are recognized at the rates of exchange prevailing at the dates of the transactions.
At the end of each reporting period, monetary items denominated in foreign currencies are retranslated at the rates prevailing at that date. Exchange differences on monetary items arising from settlement or translation are recognized in profit or loss in the period in which they arise.
Non-monetary items denominated in foreign currencies that are measured at fair value are retranslated at the rates prevailing at the date when the fair value is determined. Exchange differences arising from the retranslation of non-monetary items are included in profit or loss for the period except for exchange differences arising from the retranslation of non-monetary items in respect of which gains and losses are recognized directly in other comprehensive income; in which cases, the exchange differences are also recognized directly in other comprehensive income.
Non-monetary item denominated in a foreign currency and measured at historical cost is stated at the reporting currency as originally translated from the foreign currency.
e. Inventories
Inventories consist of raw materials, supplies, finished goods and work in progress and are stated at the lower of cost or net realizable value. Inventory write-downs are made by item, except where it may be appropriate to Company similar or related items. The net realizable value is the estimated selling price of inventories less all estimated costs of completion and costs necessary to make the sale. Inventories are recorded at the weighted-average cost on the balance sheet date.
f. Investments in subsidiaries
The Company uses the equity method to account for its investments in subsidiaries.
A subsidiary is an entity (including a structured entity) that is controlled by the Company.
Under the equity method, an investment in a subsidiary is initially recognized at cost and adjusted thereafter to recognize the Company’s share of the profit or loss and other comprehensive income of the subsidiary. The Company also recognizes the changes in the Company’s share of equity of subsidiaries.
Changes in the Company’s ownership interest in a subsidiary that do not result in the Company losing control of the subsidiary are accounted for as equity transactions. The Company recognizes directly in equity any difference between the carrying amount of the investment and the fair value of the consideration paid or received.
The Company assesses its investment for any impairment by comparing the carrying amount with the estimated recoverable amount as assessed based on the investee’s financial statements as a whole. Impairment loss is recognized when the carrying amount exceeds the recoverable amount. If the recoverable amount of the investment subsequently increases, the Company recognizes a reversal of the impairment loss; the adjusted post-reversal carrying amount should not exceed the carrying amount that would have been recognized (net of amortization or depreciation) had no impairment loss been recognized in prior years. An impairment loss recognized on goodwill cannot be reversed in a subsequent period.
Profit or loss resulting from downstream transactions is eliminated in full only in the parent company only financial statements. Profit and loss resulting from upstream transactions and transactions between subsidiaries is recognized only in the parent company only financial statements and only to the extent of interests in the subsidiaries that are not related to the Company.
~ 198 ~

- 15 -
g. Property, plant and equipment
Property, plant and equipment are initially measured at cost and subsequently measured at cost less accumulated depreciation and accumulated impairment loss.
The depreciation of property, plant and equipment is recognized using the straight-line method. Each significant part is depreciated separately. The estimated useful lives, residual values and depreciation methods are reviewed at the end of each reporting period, with the effects of any changes in the estimates accounted for on a prospective basis.
On derecognition of an item of property, plant and equipment, the difference between the sales proceeds and the carrying amount of the asset is recognized in profit or loss.
h. Intangible assets
1) Intangible assets acquired separately
Intangible assets with finite useful lives that are acquired separately are initially measured at cost and subsequently measured at cost less accumulated amortization and accumulated impairment loss. Amortization is recognized on a straight-line basis. The estimated useful lives, residual values, and amortization methods are reviewed at the end of each reporting period, with the effect of any changes in the estimates accounted for on a prospective basis. Intangible assets with indefinite useful lives that are acquired separately are measured at cost less accumulated impairment loss.
2) Derecognition of intangible assets
On derecognition of an intangible asset, the difference between the net disposal proceeds and the carrying amount of the asset is recognized in profit or loss.
i. Impairment of property, plant and equipment, right-of-use asset and intangible assets
At the end of each reporting period, the Company reviews the carrying amounts of its property, plant and equipment, right-of-use asset and intangible assets to determine whether there is any indication that those assets have suffered an impairment loss. If any such indication exists, the recoverable amount of the asset is estimated in order to determine the extent of the impairment loss. When it is not possible to estimate the recoverable amount of an individual asset, the Company estimates the recoverable amount of the cash-generating unit to which the asset belongs.
The recoverable amount is the higher of fair value less costs to sell and value in use. If the recoverable amount of an asset or cash-generating unit is estimated to be less than its carrying amount, the carrying amount of the asset or cash-generating unit is reduced to its recoverable amount, with the resulting impairment loss recognized in profit or loss.
When an impairment loss is subsequently reversed, the carrying amount of the corresponding asset or cash-generating unit is increased to the revised estimate of its recoverable amount, but only to the extent of the carrying amount (less amortization or depreciation expense) that would have been determined had no impairment loss been recognized on the asset or cash-generating unit in prior years. A reversal of an impairment loss is recognized in profit or loss.
j. Financial instruments
Financial assets and financial liabilities are recognized when the Company becomes a party to the contractual provisions of the instruments.
~ 199 ~

- 16 -
Transaction costs that are directly attributable to the acquisition or issuance of financial assets and financial liabilities (other than financial assets and financial liabilities at fair value through profit or loss or “FVTPL”) are added to or deducted from the fair value of the financial assets or financial liabilities, as appropriate, on initial recognition. Transaction costs directly attributable to the acquisition of financial assets or financial liabilities at FVTPL are recognized immediately in profit or loss.
1) Financial assets
All regular way purchases or sales of financial assets are recognized and derecognized on a trade date basis.
a) Measurement categories
Financial assets are classified into the following categories: Financial assets at FVTPL, financial assets at amortized cost and investments in equity instruments at fair value through other comprehensive income (“FVTOCI”).
i. Financial assets at FVTPL
Financial asset is classified as at FVTPL when such a financial asset is mandatorily classified as at FVTPL. Financial assets mandatorily classified as at FVTPL include investments in equity instruments which are not designated as at FVTOCI.
Financial assets at FVTPL are subsequently measured at fair value, and any dividends and remeasurement gains or losses on such financial assets are recognized in other gains or losses. Fair value is determined in the manner described in Note 21: Financial Instruments.
ii. Financial assets at amortized cost
Financial assets that meet the following conditions are subsequently measured at amortized cost:
i) The financial assets are held within a business model whose objective is to hold financial assets in order to collect contractual cash flows; and
ii) The contractual terms of the financial assets give rise on specified dates to cash flows that are solely payments of principal and interest on the principal amount outstanding.
Subsequent to initial recognition, financial assets at amortized cost, including cash and cash equivalents, accounts receivable, notes receivable, other receivables, other financial assets and refundable deposits are measured at amortized cost, which equals the gross carrying amount determined using the effective interest method less any impairment loss. Exchange differences are recognized in profit or loss.
Interest income is calculated by applying the effective interest rate to the gross carrying amount of such a financial asset
A financial asset is credit impaired when one or more of the following events have occurred:
i) Significant financial difficulty of the issuer or the borrower;
ii) Breach of contract, such as a default;
iii) It is becoming probable that the borrower will enter bankruptcy or undergo a financial reorganization; or
~ 200 ~

- 17 -
iv) The disappearance of an active market for that financial asset because of financial difficulties.
Cash equivalents include time deposits with original maturities within 3 months from the date of acquisition, which are highly liquid, readily convertible to a known amount of cash and are subject to an insignificant risk of changes in value. These cash equivalents are held for the purpose of meeting short-term cash commitments.
iii. Investments in equity instruments at FVTOCI
On initial recognition, the Company may make an irrevocable election to designate investments in equity instruments as at FVTOCI. Designation as at FVTOCI is not permitted if the equity investment is held for trading or if it is contingent consideration recognized by an acquirer in a business combination.
Investments in equity instruments at FVTOCI are subsequently measured at fair value with gains and losses arising from changes in fair value recognized in other comprehensive income and accumulated in other equity. The cumulative gain or loss will not be reclassified to profit or loss on disposal of the equity investments; instead, it will be transferred to retained earnings.
Dividends on these investments in equity instruments are recognized in profit or loss when the Company’s right to receive the dividends is established, unless the dividends clearly represent a recovery of part of the cost of the investment.
b) Impairment of financial assets
The Company recognizes a loss allowance for expected credit losses on financial assets at amortized cost (including accounts receivable).
The Company always recognizes lifetime expected credit losses (ECLs) for trade receivables. For all other financial instruments, the Company recognizes lifetime ECLs when there has been a significant increase in credit risk since initial recognition. If, on the other hand, the credit risk on a financial instrument has not increased significantly since initial recognition, the Company measures the loss allowance for that financial instrument at an amount equal to 12-month ECLs.
Expected credit losses reflect the weighted average of credit losses with the respective risks of default occurring as the weights. Lifetime ECLs represent the expected credit losses that will result from all possible default events over the expected life of a financial instrument. In contrast, 12-month ECLs represent the portion of lifetime ECLs that is expected to result from default events on a financial instrument that are possible within 12 months after the reporting date.
For internal credit risk management purposes, the Company determines the following situations as indication that a financial asset is in default (without taking into account any collateral held by the Company):
i. Internal or external information shows that the debtor is unlikely to pay its creditors.
ii. Financial asset is more than 180 days past due unless the Company has reasonable and corroborative information to support a more lagged default criterion.
The impairment loss of all financial assets is recognized in profit or loss by a reduction in their carrying amounts through a loss allowance account.
~ 201 ~

- 18 -
c) Derecognition of financial assets
The Company derecognizes a financial asset only when the contractual rights to the cash flows from the asset expire or when it transfers the financial asset and substantially all the risks and rewards of ownership of the asset to another party.
On derecognition of a financial asset at amortized cost in its entirety, the difference between the asset’s carrying amount and the sum of the consideration received and receivable is recognized in profit or loss. However, on derecognition of an investment in an equity instrument at FVTOCI, the cumulative gain or loss which had been recognized in other comprehensive income is transferred directly to retained earnings, without recycling through profit or loss.
2) Financial liabilities
a) Subsequent measurement
Financial liabilities are measured at amortized cost using the effective interest method.
b) Derecognition of financial liabilities
The difference between the carrying amount of a financial liability derecognized and the consideration paid, including any non-cash assets transferred or liabilities assumed, is recognized in profit or loss.
k. Revenue recognition
The Company identifies contracts with customers, allocates the transaction price to the performance obligations and recognizes revenue when performance obligations are satisfied.
Revenue from the sale of goods
Revenue from the sale of goods comes from sales of tires and tubes for vehicles, and other related products. The Company recognizes revenue and accounts receivable when promised goods are delivered to the customer’s specified location or loaded on vessels at which point the customer obtains control of the goods and performance obligation is satisfied.
l. Leases
At the inception of a contract, the Company assesses whether the contract is, or contains, a lease.
1) The Company as lessor
Leases are classified as finance leases whenever the terms of a lease transfer substantially all the risks and rewards of ownership to the lessee. All other leases are classified as operating leases.
Lease payments (less any lease incentives payable) from operating leases are recognized as income on a straight-line basis over the terms of the relevant leases.
2) The Company as lessee
The Company recognizes right-of-use assets and lease liabilities for all leases at the commencement date of a lease, except for short-term leases and low-value asset leases accounted for applying a recognition exemption where lease payments are recognized as expenses on a straight-line basis over the lease period.
~ 202 ~

- 19 -
Right-of-use assets are initially measured at cost, which comprises the initial measurement of lease liabilities adjusted for lease payments made at or before the commencement date, plus any initial direct costs incurred and an estimate of costs needed to restore the underlying assets, and less any lease incentives received. Right-of-use assets are subsequently measured at cost less accumulated depreciation and impairment losses and adjusted for any remeasurement of the lease liabilities. Right-of-use assets are presented on a separate line in the balance sheets.
Right-of-use assets are depreciated using the straight-line method from the commencement dates to the earlier of the end of the useful lives of the right-of-use assets or the end of the lease terms. However, if leases transfer ownership of the underlying assets to the Company by the end of the lease terms or if the costs of right-of-use assets reflect that the Company will exercise a purchase option, the Company depreciates the right-of-use assets from the commencement dates to the end of the useful lives of the underlying assets.
Lease liabilities are initially measured at the present value of the lease payments, which comprise fixed payments, in-substance fixed payments, variable lease payments which depend on an index or a rate, residual value guarantees, the exercise price of a purchase option if the Company is reasonably certain to exercise that option, and payments of penalties for terminating a lease if the lease term reflects such termination, less any lease incentives receivable. The lease payments are discounted using the interest rate implicit in a lease, if that rate can be readily determined. If that rate cannot be readily determined, the Company uses its incremental borrowing rate.
Subsequently, lease liabilities are measured at amortized cost using the effective interest method, with interest expense recognized over the lease terms. When there is a change in the lease term, the Company remeasures the lease liabilities with a corresponding adjustment to the right-of-use-assets. However, if the carrying amount of the right-of-use assets is reduced to zero, any remaining amount of the remeasurement is recognized in profit or loss. Lease liabilities are presented on a separate line in the balance sheets.
m. Borrowing costs
Borrowing costs directly attributable to an acquisition, construction or production of qualifying assets are added to the cost of those assets, until such time as the assets are substantially ready for their intended use or sale.
Investment income earned on the temporary investment of specific borrowings pending their expenditure on qualifying assets is deducted from the borrowing costs eligible for capitalization.
Other than those stated above, all other borrowing costs are recognized in profit or loss in the period in which they are incurred.
n. Government grants
Government grants are not recognized until there is reasonable assurance that the Company will comply with the conditions attached to them and that the grants will be received.
Government grants related to income are recognized in other income on a systematic basis over the periods in which the Company recognizes as expenses the related costs that the grants intend to compensate. Specifically, government grants whose primary condition is that the Company should purchase, construct or otherwise acquire non-current assets are recognized as deferred revenue and transferred to profit or loss on a systematic and rational basis over the useful lives of the related assets.
The benefit of a government loan received at a below-market rate of interest is treated as a government grant measured as the difference between the proceeds received and the fair value of the loan based on prevailing market interest rates.
~ 203 ~

- 20 -
o. Employee benefits
1) Short-term employee benefits
Liabilities recognized in respect of short-term employee benefits are measured at the undiscounted amount of the benefits expected to be paid in exchange for the related services.
2) Retirement benefits
Payments to defined contribution retirement benefit plans are recognized as expenses when employees have rendered services entitling them to the contributions.
Defined benefit costs (including service cost, net interest and remeasurement) under defined benefit retirement benefit plans are determined using the projected unit credit method. Current service cost and net interest on the net defined benefit liabilities are recognized as employee benefits expense in the period in which they occur. Remeasurement, comprising actuarial gains and losses and the return on plan assets (excluding interest), is recognized in other comprehensive income in the period in which it occurs. Remeasurement recognized in other comprehensive income is reflected immediately in retained earnings and will not be reclassified to profit or loss.
Net defined benefit liabilities represent the actual deficit in the Company’s defined benefit plans.
p. Taxation
Income tax expense represents the sum of the tax currently payable and deferred tax.
1) Current tax
According to the Income Tax Act in the ROC, an additional tax on unappropriated earnings is provided for in the year the shareholders approve to retain earnings.
Adjustments of prior years’ tax liabilities are added to or deducted from the current year’s tax provision.
2) Deferred tax
Deferred tax is recognized on temporary differences between the carrying amounts of assets and liabilities and the corresponding tax bases used in the computation of taxable profit.
Deferred tax liabilities are generally recognized for all taxable temporary differences. Deferred tax assets are generally recognized for all deductible temporary differences, unused loss carryforwards and research and development expenditures to the extent that it is probable that taxable profits will be available against which those deductible temporary differences can be utilized.
Deferred tax liabilities are recognized for taxable temporary differences associated with investments in subsidiaries, except where the Company is able to control the reversal of the temporary difference and it is probable that the temporary difference will not reverse in the foreseeable future. Deferred tax assets arising from deductible temporary differences associated with such investments and interests are recognized only to the extent that it is probable that there will be sufficient taxable profits against which to utilize the benefits of the temporary differences and they are expected to reverse in the foreseeable future.
~ 204 ~

- 21 -
The carrying amount of deferred tax assets is reviewed at the end of each reporting period and reduced to the extent that it is no longer probable that sufficient taxable profits will be available to allow all or part of the assets to be recovered. A previously unrecognized deferred tax asset is also reviewed at the end of each reporting period and recognized to the extent that it has become probable that future taxable profit will allow the deferred tax asset to be recovered.
Deferred tax assets and liabilities are measured at the tax rates that are expected to apply in the period in which the liabilities are settled or the assets are realized, based on tax rates and tax laws that have been enacted or substantively enacted by the end of the reporting period. The measurement of deferred tax liabilities and assets reflects the tax consequences that would follow from the manner in which the Company expects, at the end of the reporting period, to recover or settle the carrying amount of its assets and liabilities.
3) Current and deferred taxes
Current and deferred taxes are recognized in profit or loss, except when they relate to items that are recognized in other comprehensive income or directly in equity; in which case, the current and deferred taxes are also recognized in other comprehensive income or directly in equity, respectively.
5. CRITICAL ACCOUNTING JUDGMENTS AND KEY SOURCES OF ESTIMATION UNCERTAINTY
In the application of the Company’s accounting policies, management is required to make judgments, estimations, and assumptions about the carrying amounts of assets and liabilities that are not readily apparent from other sources. The estimates and associated assumptions are based on historical experience and other factors that are considered relevant. Actual results may differ from these estimates.
The Company considers the economic implications of the COVID-19 when making its critical accounting estimates. The estimates and underlying assumptions are reviewed on an ongoing basis. Revisions to accounting estimates are recognized in the period in which the estimates are revised if the revisions affect only that period or in the period of the revisions and future periods if the revisions affect both current and future periods.
Write-down of Inventories
The net realizable value of inventories is the estimated selling price in the ordinary course of business less the estimated costs of completion and the estimated costs necessary to make the sale. The estimation of net realizable value is based on current market conditions and historical experience with product sales of a similar nature. Changes in market conditions may have a material impact on the estimation of the net realizable value.
6. CASH AND CASH EQUIVALENTS
December 31 2020 2019
Cash on hand $ 427 $ 424 Checking accounts and demand deposits 1,097,978 653,283 Cash equivalents (time deposits with original maturities of 3 months
or less) 295,197 - $ 1,393,602 $ 653,707
~ 205 ~

- 22 -
7. FINANCIAL INSTRUMENTS AT FAIR VALUE THROUGH PROFIT OR LOSS
December 31 2020 2019
Financial assets at fair value through profit or loss (FVTPL) - current Financial assets mandatorily classified as at FVTPL
Non-derivative financial assets Domestic listed shares $ 973 $ 1,019
8. FINANCIAL ASSETS AT FAIR VALUE THROUGH OTHER COMPREHENSIVE INCOME
December 31 2020 2019
Non-current Investments in equity instruments at FVTOCI
Domestic unlisted shares $ 438,814 $ 367,064 Foreign unlisted shares 12,709 26,371
$ 451,523 $ 393,435
These investments in equity instruments are held for medium-to long-term strategic purposes. Accordingly, the management elected to designate these investments in equity instruments as at FVTOCI as they believe that recognizing short-term fluctuations in these investments’ fair value in profit or loss would not be consistent with the Company’s strategy of holding these investments for long-term purposes.
9. NOTES RECEIVABLE AND ACCOUNTS RECEIVABLE
December 31 2020 2019
Notes receivable Carrying amount at amortized cost $ 22,802 $ 10,586 Accounts receivable At amortized cost
Gross carrying amount $ 1,225,720 $ 1,314,253 Less: Allowance for impairment loss (3,534) (8,882)
$ 1,222,186 $ 1,305,371
The credit period of sales of goods was 30 days to 90 days from the date of the invoice. No interest is charged on accounts receivable.
~ 206 ~

- 23 -
The Company measures the loss allowance for accounts receivable at an amount equal to lifetime ECLs. The expected credit losses on accounts receivable are estimated using a provision matrix approach considering the past default experience of the customer, the customer’s current financial position, economic condition of the industry in which the customer operates, as well as the GDP forecasts and industry outlook. The Company uses different provision matrixes based on customer segments by geographical region, and determines the expected credit loss rate.
The Company writes off accounts receivable when there is information indicating that the debtor is in severe financial difficulty and there is no realistic prospect of recovery. For accounts receivable that have been written off, the Company continues to engage in enforcement activity to attempt to recover the receivables due. Where recoveries are made, these are recognized in profit or loss.
The following table details the loss allowance of accounts receivable based on the Company’s provision matrix.
December 31, 2020
Not Past Due 1 to 30 Days 31 to 60 Days 61 to 90 Days 91 to 120 Days121 to 180
Days Over
181 Days Total Gross carrying amount $ 1,126,937 $ 111,552 $ 3,780 $ 953 $ 1,865 $ - $ 3,435 $ 1,248,522 Loss allowance (Lifetime ECLs) - (37 ) (62 ) - - - (3,435 ) (3,534 ) Amortized cost $ 1,126,937 $ 111,515 $ 3,718 $ 953 $ 1,865 $ - $ - $ 1,244,988
December 31, 2019
Not Past Due 1 to 30 Days 31 to 60 Days 61 to 90 Days 91 to 120 Days121 to 180
Days Over
181 Days Total Gross carrying amount $ 1,120,919 $ 167,609 $ 22,571 $ 69 $ - $ 3,132 $ 10,539 $ 1,324,839 Loss allowance (Lifetime ECLs) - (94 ) (46 ) (2 ) - (940 ) (7,800 ) (8,882 ) Amortized cost $ 1,120,919 $ 167,515 $ 22,525 $ 67 $ - $ 2,192 $ 2,739 $ 1,315,957
The movements of the loss allowance of notes and accounts receivable were as follows:
For the Year Ended December 312020 2019
Balance at January 1 $ 8,882 $ 3,252 Add: Net remeasurement of loss allowance 6,290 5,630 Less: Amounts written off (11,638) - Balance at December 31 $ 3,534 $ 8,882
10. INVENTORIES
December 31 2020 2019
Finished goods $ 315,054 $ 365,322 Work in progress 111,544 118,741 Raw materials 226,401 153,252 Supplies 48,920 45,014 Merchandise 9,688 11,679 Inventory in transit 141,293 97,510 $ 852,900 $ 791,518
~ 207 ~

- 24 -
The cost of revenue associated with inventories were $3,749,493 thousand and $4,095,773 thousand, respectively, for the years ended December 31, 2020 and 2019. The cost of revenue consisted of reversal of inventory write-downs of $14,872 thousand and inventory write-downs of $14,507 thousand.
11. INVESTMENTS ACCOUNTED FOR USING THE EQUITY METHOD
Investment in Subsidiaries
December 31 2020 2019
Ownership OwnershipAmount (%) Amount (%)
Kenda International Corporation Co.,
Ltd. (KIC) $ 11,745,828 100.00 $ 13,043,717 100.00 Kenda Rubber (Vietnam) Co., Ltd.
(KV) 6,894,307 100.00 6,266,250 100.00 Kenda Rubber Ind. Co., (Hong Kong)
Ltd. (KHK) 2,253,786 100.00 2,903,416 100.00 American Kenda Rubber Ind. Co.,
Ltd. (KA) 1,323,172 100.00 1,413,919 100.00 Pt. Kenda Rubber Indonesia (KI) 1,049,708 99.99 796,583 99.99 Kenfong Industrial Co., Ltd. (KF) 251,988 100.00 246,737 100.00 Kenda Rubber Industrial Co. (Europe
GmbH) (KE) 12,449 100.00 8,780 100.00 $ 23,531,238 $ 24,679,402
Per administrative review, the U.S. Department of Commerce notified KA in June 2019 to impose anti-dumping duties (“ADD”) on the total import price of automobile tires imported from China between August 2016 and July 2017. The result of the administrative review was unrepresentative to all enterprises importing automobile tires from China. The ADD rate was raised from 8.72% to 64.57%. Based on historical experience, KA considered that the duty rate was unreasonable and has filed an appeal to the U.S. Court of Appeals for the Federal Circuit. However, the Company accrued ADD of US$7,778 thousand ($229,964 thousand) and associated interest expense of US$789 thousand ($23,341 thousand) in the financial statements for the year ended December 31, 2020.
The investments accounted for using the equity method and the share of profit or loss of subsidiaries were based on the financial statements audited by respective auditors for the same accounting periods.
Refer to Table 7 for the nature of activities, principal places of business and countries of incorporation of the subsidiaries.
~ 208 ~

- 25 -
12. PROPERTY, PLANT AND EQUIPMENT
Balance at January 1, 2020 Additions Disposals Reclassification
Balance at December 31,
2020
Cost Land $ 2,166,617 $ - $ - $ - $ 2,166,617Buildings 856,813 690 - 28,262 885,765Machinery 3,054,682 24,147 (28,538) 80,474 3,130,765Other equipment 716,947 4,484 (3,819) 19,328 736,940Equipment under installation and
construction in progress 39,459 21,799 - (29,330) 31,928 6,834,518 $ 51,120 $ (32,357) $ 98,734 6,952,015Accumulated depreciation
Buildings 311,257 $ 27,363 $ - $ - 338,620Machinery 1,890,233 210,797 (20,148) - 2,080,882Other equipment 441,369 63,086 (3,479) - 500,976
2,642,859 $ 301,246 $ (23,627) $ - 2,920,478 $ 4,191,659 $ 4,031,537
Balance at January 1, 2019 Additions Disposals Reclassification
Balance at December 31,
2019 Cost
Land $ 2,166,617 $ - $ - $ - $ 2,166,617Buildings 811,712 543 (894) 45,452 856,813Machinery 2,903,304 34,875 (35,498) 152,001 3,054,682Other equipment 694,044 3,779 (5,188) 24,312 716,947Equipment under installation and
construction in progress 71,692 34,025 - (66,258) 39,459 6,647,369 $ 73,222 $ (41,580) $ 155,507 6,834,518
Accumulated depreciation
Buildings 285,512 $ 26,380 $ (635) $ - 311,257Machinery 1,724,639 195,347 (29,753) - 1,890,233Other equipment 385,004 60,776 (4,411) - 441,369
2,395,155 $ 282,503 $ (34,799) $ - 2,642,859 $ 4,252,214 $ 4,191,659
A portion of the land for operational use in Chongyang section of Yuanlin City and Citong Township of Yunlin County is categorized as agricultural and pasture land. The title of the land is currently registered under a related party, Mr. Chen, who is the trustee in a land trust agreement with the Company. The Company retains the certificate of title for land and the agreement stipulates that the nominal holder or trustee is prohibited from transferring the ownership to another party. The land will be registered under the Company once the category for land use has been changed.
The above items of property, plant and equipment used by the Company are depreciated on a straight-line basis over their estimated useful lives as follows:
Building 10-55 yearsMachinery 3-30 yearsOther equipment 2-18 years
~ 209 ~

- 26 -
13. LEASE ARRANGEMENTS
a. Right-of-use assets
December 31 2020 2019
Carrying amount Buildings $ 21,955 $ -
For the Year Ended December 312020 2019
Additions to right-of-use assets $ 23,644 $ - Depreciation charge for right-of-use assets
Buildings $ 1,689 $ -
b. Lease liabilities
December 31 2020 2019
Carrying amount Current $ 5,141 $ - Non-current $ 16,843 $ -
Discount rate for lease liabilities was as follows:
December 31 2020 2019
Buildings 0.8% -
c. Material leasing activities and terms
The Company leases buildings for the use of product manufacturing with lease terms of 5 years. The Company does not have bargain purchase options to acquire the buildings at the end of the lease terms. In addition, the Company is prohibited from subleasing or transferring all or any portion of the underlying assets without the lessor’s consent.
d. Other lease information
For the Year Ended December 312020 2019
Expenses relating to short-term leases $ 1,807 $ 2,159 Expenses relating to low-value asset leases $ 156 $ 166 Total cash outflow for leases $ (3,683) $ (2,325)
The Company’s leases of certain buildings and other equipment qualify as short-term leases and leases of certain office equipment qualify as low-value asset leases. The Company has elected to apply the recognition exemption and thus, did not recognize right-of-use assets and lease liabilities for these leases.
~ 210 ~

- 27 -
14. OTHER FINANCIAL ASSETS
December 31 2020 2019
Non-current Repatriated funds $ 1,268,181 $ -
Repatriated funds refer to demand and time deposits pertinent to regulations governing repatriated offshore funds, which the use is restricted.
Refer to Note 23 for information relating to credit risk management and valuation.
15. BORROWINGS
a. Short-term borrowings
December 31 2020 2019
Unsecured borrowings $ 200,000 $ 350,000 Range of rates 0.65%-0.68% 0.765%-0.78%
b. Long-term borrowings
December 31 2020 2019
Unsecured borrowings $ 12,468,282 $ 12,428,144Project borrowings 420,577 383,103Less: Current portion (1,795,070) (1,276,062) Long-term borrowings $ 11,093,789 $ 11,535,185 Range of rates 0.35%-1.09% 0.6%-1.2876%Maturity date 110- 115 years 109-115 years
The Company participated in a project of the Ministry of Economic Affairs that encouraged Taiwanese enterprises to invest locally. The Company expects to construct or expand factories, and acquire machinery and equipment in Taiwan from 2019 to 2022. Any shortage of funds would be financed via bank borrowings.
16. RETIREMENT BENEFIT PLANS
a. Defined contribution plan
The Company adopted a pension plan under the Labor Pension Act (LPA), which is a state-managed defined contribution plan. Under the LPA, the Company makes monthly contributions to employees’ individual pension accounts at 6% of monthly salaries and wages.
~ 211 ~

- 28 -
b. Defined benefit plans
The defined benefit plans adopted by the Company in accordance with the Labor Standards Law is operated by the government of the ROC. Pension benefits are calculated on the basis of the length of service and average monthly salaries of the 6 months before retirement. The Company contributes amounts equal to 15% of total monthly salaries and wages to a pension fund administered by the pension fund monitoring committee. Pension contributions are deposited in the Bank of Taiwan in the committee’s name. Before the end of each year, the Company assesses the balance in the pension fund. If the amount of the balance in the pension fund is inadequate to pay retirement benefits for employees who conform to retirement requirements in the next year, the Company is required to fund the difference in one appropriation that should be made before the end of March of the next year. The pension fund is managed by the Bureau of Labor Funds, Ministry of Labor (the “Bureau”); the Company has no right to influence the investment policy and strategy.
The amounts included in the balance sheets in respect of the Company’s defined benefit plans are as follows:
December 31 2020 2019
Present value of defined benefit obligation $ 648,243 $ 640,063 Fair value of plan assets (403,452) (391,876) Net defined benefit liabilities $ 244,791 $ 248,187
The amounts included in the balance sheets in respect of the Company’s defined benefit plans are as follows:
Present Value of Defined
BenefitObligation
Fair Value of the Plan Assets
Net Defined Benefit
Liabilities Balance at January 1, 2019 $ 629,357 $ (361,751) $ 267,606 Service cost
Current service cost 7,480 - 7,480 Net interest expense (income) 6,181 (3,675) 2,506 Recognized in profit or loss 13,661 (3,675) 9,986 Remeasurement
Return on plan assets (excluding amounts included in net interest) - (12,739) (12,739)
Actuarial loss - changes in demographic assumptions 108 - 108
Actuarial loss - changes in financial assumptions 15,491 - 15,491
Actuarial loss - experience adjustments 9,174 - 9,174 Recognized in other comprehensive income 24,773 (12,739) 12,034 Contributions from the employer - (41,439) (41,439) Benefits paid (27,728) 27,728 - Balance at December 31, 2019 640,063 (391,876) 248,187
(Continued)
~ 212 ~

- 29 -
Present Value of Defined
BenefitObligation
Fair Value of the Plan Assets
Net Defined Benefit
Liabilities Service cost
Current service cost $ 6,656 $ - $ 6,656 Current service cost and gain on
settlements (299) - (299) Net interest expense (income) 4,690 (2,957) 1,733 Recognized in profit or loss 11,047 (2,957) 8,090 Remeasurement
Return on plan assets (excluding amounts included in net interest) - (12,689) (12,689)
Actuarial loss - changes in demographic assumptions 124 - 124
Actuarial loss - changes in financial assumptions 27,046 - 27,046
Actuarial loss - experience adjustments 11,949 - 11,949 Recognized in other comprehensive income 39,119 (12,689) 26,430 Contributions from the employer - (37,916) (37,916) Benefits paid (41,986) 41,986 - Balance at December 31, 2020 $ 648,243 $ (403,452) $ 244,791
Through the defined benefit plans under the Labor Standards Law, the Company is exposed to the following risks:
1) Investment risk: The plan assets are invested in domestic and foreign equity and debt securities, bank deposits, etc. The investment is conducted at the discretion of the Bureau or under the mandated management. However, in accordance with relevant regulations, the return generated by plan assets shall not be below the interest rate for a 2-year time deposit with local banks.
2) Interest risk: A decrease in both government and corporate bond interest rate will increase the present value of the defined benefit obligation; however, this will be partially offset by an increase in the return on the plans’ debt investments.
3) Salary risk: The present value of the defined benefit obligation is calculated using the future salaries of plan participants. As such, an increase in the salaries of the plan participants will increase the present value of the defined benefit obligation.
The actuarial valuations of the present value of the defined benefit obligation were carried out by qualified actuaries. The significant assumptions used for the purposes of the actuarial valuations are as follows:
December 31 2020 2019
Discount rates 0.30% 0.75% Expected rates of salary increase 2.00% 2.00%
~ 213 ~

- 30 -
If possible reasonable changes in each of the significant actuarial assumptions occur and all other assumptions remain constant, the present value of the defined benefit obligation will increase (decrease) as follows:
December 31 2020 2019
Discount rates
0.25% increase $ (15,190) $ (15,496) 0.25% decrease $ 15,745 $ 16,078
Expected rates of salary increase 0.25% increase $ 15,439 $ 15,837 0.25% decrease $ (14,977) $ (15,346)
The above sensitivity analysis presented above may not be representative of the actual changes in the present value of the defined benefit obligation as it is unlikely that changes in assumptions will occur in isolation of one another as some of the assumptions may be correlated.
December 31 2020 2019
Expected contributions to the plans for the next year $ 34,436 $ 34,369 Average duration of the defined benefit obligation 9 years 9 years
17. EQUITY
a. Ordinary shares
December 31 2020 2019
Shares authorized (in thousands of shares) 910,000 880,000 Shares authorized, par value $10 (in thousands of dollars) $ 9,100,000 $ 8,800,000 Shares issued and fully paid (in thousands of shares) 909,410 874,430 Shares issued and fully paid (in thousands of dollars) $ 9,094,100 $ 8,744,300
The change in the Company’s share capital is mainly resulted from the process of converting its retained earnings into share capital via issuing new shares.
b. Retained earnings and dividends policy
The shareholders of the Company held their regular meeting on June 11, 2019 and in that meeting, resolved the amendments to the Company’s Articles of Incorporation (the “Articles”). The amendments explicitly stipulate that the Company’s board of directors is authorized to adopt a special resolution to distribute dividends and bonuses in cash and a report of such distribution should be submitted in the shareholders’ meeting.
Under the dividends policy as set forth in the amended Articles, the Company takes into consideration the Company’s operating environment, growth stage, future capital needs, long-term financial plans, and the shareholders’ demand for cash inflows before resolving the amount of dividends. The Company’s board of directors could propose dividends between 10% and 80% of distributable earnings which comprise of the current remaining earning and undistributed earnings from previous year. When distributing dividends via issuing shares, the motion should be submitted to shareholders’ meeting for approval. The shareholders may adjust the ratio of share dividends to reflect the profit and the adequacy
~ 214 ~

- 31 -
of capital of the year. The cash dividends shall not be less than 10% of the total dividend declared. The board of directors is authorized to adopt a resolution to distribute dividends, bonuses, legal reserve and all or a portion of the capital surplus in cash and a report of such distribution should be submitted to the shareholders’ meeting.
Under the dividends policy as set forth in the Articles before the amendments, where the Company retains unappropriated earnings during a fiscal year, the earnings shall be first reserved for paying taxes, offsetting losses of previous years, setting aside as legal reserve at 10% of the remaining earnings, except when the legal reserve equals to the paid-in capital of the Company. The Company could appropriate or reverse a special reserve in accordance with the laws, regulations or order of competent authority, when necessary.
The Company takes into consideration of the operating environment, growth stage, future capital needs, long-term financial plans, and the shareholders’ demand for cash inflows, the Company’s board of directors could propose dividends between 10% and 80% of distributable earning which comprise of the current remaining earning and undistributed earnings from previous year. When distributing dividends via issuing shares, the motion should be submitted to shareholders meeting for approval. The cash dividends shall not be less than 10% of the total dividend declared. The shareholders may adjust the ratio and the instruments of distributions to reflect the profit and the adequacy of capital of the year. For the policies on the distribution of compensation of employees and remuneration of directors and supervisors after the amendment, refer to compensation of employees and remuneration of directors and supervisors in Note 19.
An appropriation of earnings to a legal reserve shall be made until the legal reserve equals the Company’s paid-in capital. The legal reserve may be used to offset deficits. If the Company has no deficit and the legal reserve has exceeded 25% of the Company’s paid-in capital, the excess may be transferred to capital or distributed in cash.
Items referred to under Rule No. 1010012865 and in the directive titled “Questions and Answers for Special Reserves Appropriated Following Adoption of IFRSs” should be appropriated to or reversed from a special reserve by the Company.
The appropriations of earnings for 2019 and 2018 were as follows:
Appropriations of Earnings Dividends Per Share (NT$) 2019 2018 2019 2018
Legal reserve $ 100,220 $ 68,917 Special reserve (reversal) 361,099 (108,439) Cash dividends 349,772 874,430 $ 0.4 $ 1.0 Share dividends 349,800 - 0.4 -
The appropriations of earnings for 2020 were proposed by the Company’s board of directors on March 25, 2021 as follows:
Appropriationsof Earnings
Dividends Per Share (NT$)
Legal reserve $ 94,768 Special reserve 270,947 Cash dividends 909,410 $ 1.0
The appropriation of earnings for 2020 will be resolved by the shareholders in their meeting to be held on June 18, 2021.
~ 215 ~

- 32 -
18. REVENUE
2020 2019 Revenue from contracts with customers
Revenue from the sale of goods $ 5,378,546 $ 5,331,630 Revenue from the rendering of services 567,740 615,483
$ 5,946,286 $ 5,947,113
a. Contract information
The Company sells tires and other rubber products predominantly via dealers. It is stipulated in the contracts that volume discount is offered if a specific threshold of purchase is achieved. The Company provides agreed-upon percentages of refund or discount to dealers in accordance with the contracts. Based on historical experience, the Company estimates a reasonable amount of refund and recognizes it as refund liability (presented in other current liabilities).
b. Contract balances
December 31 2020 2019
Contract liabilities - current $ 24,316 $ 9,277
c. Disaggregation of revenue
Refer to Statement 6 for information about the disaggregation of revenue.
19. NET PROFIT
a. Other income
For the Year Ended December 312020 2019
Dividends $ 36,402 $ 36,237 Rental income 9,454 8,824 Others 52,423 54,278 $ 98,279 $ 99,339
b. Other gains and losses
For the Year Ended December 312020 2019
Net gain (loss) on financial assets classified as at FVTPL $ (46) $ 2 Net gain (loss) on disposal of property, plant and equipment
(Note 22) 310 (552) Net foreign exchange losses (149,590) (17,743) Others (488) (2) $ (149,814) $ (18,295)
~ 216 ~

- 33 -
c. Financial cost
For the Year Ended December 312020 2019
Interest on bank loans $ 121,197 $ 142,097 Interest on lease liabilities 60 - Less: Amounts included in the cost of qualifying assets (317) (916) $ 120,940 $ 141,181
d. Employee benefits, depreciation and amortization expenses
OperatingCosts
OperatingExpenses Total
For the year ended December 31, 2020 Short-term benefits
Salary expense $ 742,459 $ 509,795 $ 1,252,254 Labor/health insurance expense 64,512 50,768 115,280
Post-employment benefits Defined contribution plans 28,654 20,625 49,279 Defined benefit plans 2,685 5,405 8,090
Remuneration of directors 1,866 17,077 18,943 Other employee benefit expense 13,248 11,541 24,789 Depreciation expense 231,837 71,098 302,935 Amortization expense 2,172 12,830 15,002 For the year ended December 31, 2019 Short-term benefits
Salary expense 714,657 475,309 1,189,966 Labor/health insurance expense 65,263 47,728 112,991
Post-employment benefits 33,322 13,275 46,597 Defined contribution plans 3,268 6,718 9,986 Defined benefit plans 1,960 16,735 18,695
Remuneration of directors Other employee benefit expense 12,885 9,849 22,734 Depreciation expense 218,894 63,609 282,503 Amortization expense 2,154 12,497 14,651
1) For the years ended December 31, 2020 and 2019, the Company employed 1,965 and 1,968 employees on average, respectively, which included 6 board members who did not concurrently serve as employees for both years.
2) The employment benefit expenses, on average, were $740 thousand and $705 thousand for the years ended December 31, 2020 and 2019, respectively. The average salary expense were $639 thousand and $607 thousand for the years ended December 31, 2020 and 2019, respectively. The average salary expense changed by 5.3%.
3) The Company did not have supervisors for the years ended December 31, 2020 and 2019. Therefore, no compensation to supervisors was remunerated.
~ 217 ~

- 34 -
4) In addition to the pursuit of operating results, the Company values employee salary and benefits, embraces sustainability, promotes a win-win situation between capital and labor, implements corporate governance, maximizes social responsibility, and contributes to economic prosperity. Compensation packages for directors and managers are periodically assessed and evaluated by remuneration committee. Compensation policies for employees are re-evaluated annually with consideration of industry standards to offer competitive employee salary and benefits.
e. Compensation of employees and remuneration of directors
According to the Company’s Articles, the Company accrued compensation of employees and remuneration of directors at rates from 0.5% to 1% and no higher than 3%, respectively, of net profit each year. The compensation of employees and the remuneration of directors for the years ended December 31, 2020 and 2019, which were approved by the Company’s board of directors on March 25, 2021 and March 26, 2020, respectively, are as follows:
For the Year Ended December 31 2020 2019
Amount Accrual rate Amount Accrual rate Compensation of employees $ 11,188 0.93% $ 11,040 1.00% Remuneration of directors $ 16,793 1.40% $ 16,570 1.49%
If there is a change in the amounts after the annual financial statements were authorized for issue, the differences are recorded as a change in the accounting estimate.
There is no difference between the actual amounts of compensation of employees and remuneration of directors paid and the amounts recognized in the financial statements for the years ended December 31, 2019 and 2018.
Information on the compensation of employees and remuneration of directors resolved by the Company’s board of directors is available at the Market Observation Post System website of the Taiwan Stock Exchange.
20. INCOME TAXES RELATING TO CONTINUING OPERATIONS.
a. Major Components of income tax recognized in profit or loss
For the Year Ended December 312020 2019
Current tax
In respect of the current year $ 300,423 $ 155,552 Adjustments for prior year (154,870) (2,536)
455,293 153,016 Deferred tax
In respect of the current year (55,707) (83,063) Adjustments for prior year (196,434) (2,387)
(252,141) (85,450) Income tax expense recognized in profit or loss $ 203,152 $ 67,566
~ 218 ~

- 35 -
A reconciliation of accounting profit and income tax expense is as follows:
For the Year Ended December 312020 2019
Profit before tax from continuing operations $ 1,175,377 $ 1,081,128 Income tax expense calculated at the statutory rate $ 235,075 $ 216,226 Nondeductible items in determining taxable income (113,128) (125,190)Tax-exempt income (7,280) (7,247)Unrecognized temporary differences - (2,009)Investment tax credits (9,454) (9,291)Adjustments for prior years’ tax (41,564) (4,923)Tax incentives associated with repatriation 120,114 - Others 19,389 - Income tax expense recognized in profit or loss $ 203,152 $ 67,566
b. Income tax recognized in other comprehensive income
For the Year Ended December 312020 2019
Deferred tax In respect of the current year
Translation of the financial statements of foreign operations $ 86,221 $ 151,250 Remeasurement of defined benefit plans 5,286 2,407
Total income tax recognized in other comprehensive income $ 91,507 $ 153,657
c. Deferred tax assets and liabilities
The movements of deferred tax assets and deferred tax liabilities are as follows:
For the year ended December 31, 2020
OpeningBalance
Recognized in Profit or Loss
Recognized in Other
Compre- hensiveIncome
ClosingBalance
Deferred tax assets Temporary differences
Unrealized loss on inventory $ 11,301 $ (2,974) $ - $ 8,327 Unrealized gains on
intercompany sales 26,584 4,663 - 31,247 Defined benefit obligations 25,470 - 5,286 30,756 Exchange differences on
translation of the financial statements of foreign operations 242,933 - 86,221 329,154
Others 10,523 9,736 - 20,259 $ 316,811 $ 11,424 $ 91,507 $ 419,743
(Continued)
~ 219 ~

- 37 -
OpeningBalance
Recognized in Profit or Loss
Recognized in Other
Compre- hensiveIncome
ClosingBalance
Deferred tax liabilities Temporary differences
Share of profit of subsidiaries $ 246,845 $ (246,845) $ - $ - Reserve for land value
increment tax 208,226 - - 208,226 Others 1,836 6,128 - 7,964
$ 456,907 $ (240,717) $ - $ 216,190
(Concluded)
For the year ended December 31, 2019
OpeningBalance
Recognized in Profit or Loss
Recognized in Other
Compre- hensiveIncome
ClosingBalance
Deferred tax assets Temporary differences
Unrealized loss on inventory $ 8,400 $ 2,901 $ - $ 11,301 Unrealized gains on
intercompany sales 19,153 7,431 - 26,584 Defined benefit obligations 23,063 - 2,407 25,470 Exchange differences on
translation of the financial statements of foreign operations 91,683 - 151,250 242,933
Others 10,842 (319) - 10,523 $ 153,141 $ 10,013 $ 153,657 $ 316,811 Deferred tax liabilities Temporary differences
Share of profit of associates $ 324,009 $ (77,164) $ - $ 246,845 Reserve for land value
increment tax 208,226 - - 208,226 Others 109 1,727 - 1,836
$ 532,344 $ (75,437) $ - $ 456,907
d. Income tax assessments
The Company’s income tax returns through 2018, except 2017, have been assessed by the tax authorities.
~ 220 ~

- 38 -
21. EARNINGS PER SHARE
Unit: NT$ Per Share
For the Year Ended December 312020 2019
Basic and diluted earnings per share $ 1.07 $ 1.11
The weighted average number of shares outstanding used for the earnings per share computation was adjusted retroactively for the issuance of bonus shares. The basic and diluted earnings per share adjusted retrospectively for the year ended December 31, 2019 are as follows:
Net Profit for the Year
For the Year Ended December 312020 2019
Earnings used in the computation of basic and diluted earnings per
share $ 972,225 $ 1,013,562
Unit: In Thousands of Shares
For the Year Ended December 312020 2019
Weighted average number of ordinary shares used in the
computation of basic earnings per share 909,410 909,410 Effect of potentially dilutive ordinary shares
Compensation of employees 419 406 Weighted average number of ordinary shares used in the
computation of diluted earnings per share 909,829 909,816
The Company may settle the compensation of employees in cash or shares; therefore, the Company assumes that the entire amount of the compensation will be settled in shares, and the resulting potential shares are included in the weighted average number of shares outstanding used in the computation of diluted earnings per share, as the effect is dilutive. Such dilutive effect of the potential shares is included in the computation of diluted earnings per share until the number of shares to be distributed to employees is resolved in the following year.
22. CAPITAL MANAGEMENT
The Company requires to maintain an adequate level of capital to expand and optimize facilities and equipment. The Company’s capital management strategy aims to ensure that the necessary financial resources and operating plan are sufficient to meet the next 12 months’ requirements for working capital, capital expenditures, research and development expenses, debt repayment and other needs.
~ 221 ~

- 39 -
23. FINANCIAL INSTRUMENTS
a. Fair value of financial instruments not measured at fair value
Please refer to the information on the balance sheet. The management of the Company considered the carrying amounts of financial assets and liabilities not measured at fair value on the balance sheet approximate the fair value.
b. Fair value of financial instruments measured at fair value on a recurring basis
1) Fair value hierarchy
December 31, 2020
Level 1 Level 2 Level 3 Total Financial assets at FVTPL Domestic listed shares $ 973 $ - $ - $ 973
Financial assets at FVTOCI Investments in equity
instruments Domestic and foreign unlisted
shares $ - $ - $ 451,523 $ 451,523
December 31, 2019
Level 1 Level 2 Level 3 Total Financial assets at FVTPL Domestic listed shares $ 1,019 $ - $ - $ 1,019
Financial assets at FVTOCI Investments in equity
instruments Domestic and foreign unlisted
shares $ - $ - $ 393,435 $ 393,435
2) Reconciliation of Level 3 fair value measurements of financial instruments
For the Year Ended December 312020 2019
Financial assets at FVTOCI - equity instruments Balance at January 1 $ 393,435 $ 169,332 Recognized in other comprehensive income (included in
unrealized valuation gain (loss) on financial assets at FVTOCI) 62,030 228,127
Return of capital (3,942) (4,024) Balance at December 31 $ 451,523 $ 393,435
~ 222 ~

- 40 -
3) Valuation techniques and inputs applied for Level 3 fair value measurement
The fair values of domestic and foreign unlisted equity securities were determined using the market approach and asset-based pricing approach. Market approach derives fair value by reference to identical or comparable publicly-traded companies. It takes into consideration observable transaction prices on an active stock market, implied valuation multiples, related transactions and statistics. Asset-based pricing approach separately evaluates a target’s assets and liabilities. It utilizes fair market value, replacement cost, liquidation value or related approaches to reflect the value of an enterprise or operating unit as a whole. A decrease in significant unobservable inputs, such as discount for lack of control and marketability, would result in an increase in fair value of the investments.
c. Categories of financial instruments
December 31 2020 2019 Financial assets FVTPL
Listed shares $ 973 $ 1,109Financial assets at amortized cost (1) 4,186,141 2,958,360Financial assets at FVTOCI
Equity instruments 451,523 393,435 Financial liabilities Amortized cost (2) 13,942,946 13,930,878
Note 1: The balances include financial assets at amortized cost, which comprise cash and cash equivalents, notes receivable, accounts receivable, other receivables, other financial assets and refundable deposits.
Note 2: The balances include financial liabilities at amortized cost, which comprise short-term and long-term borrowings (including the current portion), notes payable, accounts payable and other payables, and guarantee deposits.
d. Financial risk management objectives and policies
The Company’s major financial instruments include equity investments, accounts receivable, accounts payable and borrowings. The Company’s corporate treasury function provides services to the business, coordinates access to domestic and international financial markets, and monitors and manages the financial risks relating to the operations of the Company through internal risk reports that analyze exposures by degree and magnitude of risks. These risks include market risk (including foreign currency risk, interest rate risk and other price risk), credit risk and liquidity risk.
1) Market risk
The Company’s activities exposed it primarily to the financial risks of changes in foreign currency exchange rates (see (a) below) and interest rates (see (b) below).
There has been no change to the Company’s exposure to market risks or the manner in which these risks are managed and measured.
~ 223 ~

- 41 -
a) Foreign currency risk
The Company have foreign currency denominated sales and purchases, which expose the Company to foreign currency risk.
The carrying amounts of the Company’s foreign currency denominated monetary assets and monetary liabilities are set out in Note 26.
Sensitivity analysis
The Company is mainly exposed to USD.
The sensitivity analysis measures the effect of a 1% increase and decrease in the New Taiwan dollar (the functional currency) against USD. The sensitivity rate of 1% is used when reporting foreign currency risk internally to key management personnel and represents management’s assessment of the reasonably possible change in foreign exchange rates. The sensitivity analysis included only outstanding foreign currency denominated monetary items, and adjusts their translation at the end of the year for a 1% change in foreign currency rates. The pre-tax profit in 2020 and 2019 would have increased/decreased by $31,619 and $23,576 thousand had the New Taiwan dollar strengthened/weakened by 1% against USD.
b) Interest rate risk
The Company is exposed to interest rate risk because entities in the Company borrow funds at both fixed and floating interest rates. The risk is managed by the Company by maintaining an appropriate mix of fixed and floating rate borrowings. The Company’s interest rate risk is resulted from cash and cash equivalents and borrowings. Specifically, the Company is exposed to cash flow interest rate risk by holding cash and cash equivalents at floating rate. The risk is partially mitigated by borrowings at floating rates. Holding cash and cash equivalents and borrowings at fixed rate exposes the Company to fair value interest risk. The Company considers the overall interest rate trends and adjusts the portfolio of fixed and floating rate instruments accordingly.
The carrying amounts of the Company’s financial assets and financial liabilities with exposure to interest rates at the end of the year were as follows:
December 31 2020 2019 Fair value interest rate risk
Financial assets $ 926,236 $ 8,400Financial liabilities 2,719,566 350,000
Cash flow interest rate risk Financial assets 1,743,032 653,056Financial liabilities 10,391,277 12,811,247
Sensitivity analysis
The sensitivity analysis below was determined based on the Company’s exposure to interest rates for both derivative and non-derivative instruments at the end of the year. For floating rate liabilities, the analysis was prepared assuming the amount of each liability outstanding at the end of the year was outstanding for the whole year.
If interest rates had been 10 basis points higher/lower and all other variables were held constant, the Company’s pre-tax profit for the years ended December 31, 2020 and 2019 would have decreased/increased by $86,482 thousand and $121,582 thousand, respectively.
~ 224 ~

- 42 -
c) Other price risk
The Company was exposed to equity price risk through its investments in equity instrument. Equity investments are held for strategic rather than for trading purposes; the Company does not actively trade these investments. The Company measures the price risk of equity securities via sensitivity analysis.
Sensitivity analysis
The sensitivity analysis below was determined based on the exposure to equity price risks at the end of the year.
If equity prices had been 5% higher/lower, pre-tax profit for the years ended December 31, 2020 and 2019 would have both increased/decreased by $49 thousand and $51 thousand, respectively, as a result of the changes in fair value of financial assets at FVTPL, and the pre-tax other comprehensive income for the years ended December 31, 2020 and 2019 would have increased/decreased by $22,576 thousand and $19,672 thousand, respectively, as a result of the changes in fair value of financial assets at FVTOCI.
2) Credit risk
Credit risk refers to the risk that a counterparty will default on its contractual obligations resulting in a financial loss to the Company. At the end of the year, the Company’s maximum exposure to credit risk is mainly resulted from the carrying amount of the respective recognized financial assets as stated in the balance sheets.
To maintain the quality of accounts receivable, the Company established operating procedures related to credit risk management to manage credit risks. Risk factors associated with individual customers include a customer’s financial condition, internal credit rating, transaction history, current macroeconomic environment and other items that might affect a customer’s ability to pay.
In order to minimize credit risk, the management of the Company has delegated a team responsible for determining credit limits, credit approvals and other monitoring procedures to ensure that follow-up action is taken to recover overdue debts. In addition, the Company reviews the recoverable amount of each individual trade debt at the end of the reporting period to ensure that adequate allowance is made for possible irrecoverable amounts. In this regard, the management believes the Company’s credit risk was significantly reduced. The Company writes off accounts receivable when there is evidence indicating that the debtor is in severe financial difficulty and there is no realistic prospect of recovery. For accounts receivable that have been written off, the Company continues to engage in enforcement activity to attempt to recover the receivables due. Where recoveries are made, these are recognized in profit or loss.
3) Liquidity risk
The Company manages liquidity risk by monitoring and maintaining a level of cash and cash equivalents deemed adequate to finance the Company’s operations and mitigate the effects of fluctuations in cash flows. In addition, management monitors the utilization of bank borrowings and ensures compliance with loan covenants.
~ 225 ~

- 43 -
The Company manages liquidity risk by maintaining adequate reserves, banking facilities and reserve borrowing facilities, and continuously monitoring forecasted and actual cash flows as well as matching the maturity profiles of financial assets and liabilities. The Company had available unutilized short-term bank loan facilities set out in b) below.
a) Liquidity and interest rate risk tables for non-derivative financial liabilities
The following table details the Company’s remaining contractual maturities for its non-derivative financial liabilities with agreed upon repayment periods. The table has been drawn up based on the undiscounted cash flows of financial liabilities from the earliest date on which the Company can be required to pay. The table includes both interest and principal cash flows. Specifically, bank loans with a repayment on demand clause were included in the earliest time band regardless of the probability of the banks choosing to exercise their rights. The maturity dates for other non-derivative financial liabilities were based on the agreed upon repayment dates.
December 31, 2020
On Demand or Less than 1
Year 1-5 Years More than 5
Years Non-interest bearing $ 848,080 $ - $ -Lease liabilities 5,141 16,843 -Variable interest rate liabilities 1,165,300 9,350,722 45,136Fixed interest rate liabilities 931,901 1,717,616 84,632
$ 2,950,422 $ 11,085,181 $ 129,768
December 31, 2019
On Demand or Less than 1
Year 1-5 Years More than 5
Years Non-interest bearing $ 769,581 $ - $ -Variable interest rate liabilities 1,411,134 11,547,784 164,288Fixed interest rate liabilities 351,341 - - $ 2,532,056 $ 11,547,784 $ 164,288
b) Financing facilities
December 31 2020 2019 Unsecured bank overdraft facilities
Amount used $ 13,093,432 $ 13,167,664Amount unused 5,152,854 7,876,688
$ 18,246,286 $ 21,044,352
~ 226 ~

- 44 -
22. TRANSACTIONS WITH RELATED PARTIES
Details of transactions between the Company and other related parties are disclosed as follows.
a. Related party name and category
Related Party Name Related Party Category KA Subsidiary KV Subsidiary KE Subsidiary KF Subsidiary KI Subsidiary American Development, Inc. (ADI) Subsidiary Kenda Rubber (Shenzhen) Ltd. (KS) Subsidiary Kenda Rubber (Tianjin) Co., Ltd. (KT) Subsidiary Kenda Rubber (China) Ltd. (KC) Subsidiary Kenda Global (China) Investment Corporation (KGCI) Subsidiary STARCO Europe A/S Subsidiary STARCO GB Ltd. Subsidiary STARCO GmbH Subsidiary STARCO Polska Sp.z.o.o. Subsidiary STARCO NV Subsidiary STARCO GS AG Subsidiary STARCO SAS Subsidiary Kenlight Trading Corp. Other related party Jienshang Co., Ltd. Other related party Total Lubricants Taiwan Ltd. Other related party Kenstone Metal Co., Ltd. Other related party
Other related parties refer to companies having a chairman that is within second-degree relative, the same as the Company’s chairman, or are determined as related parties in substance.
b. Revenue
For the Year Ended December 31Item Related Party Category/Name 2020 2019
Sales of goods Subsidiaries KA $ 1,263,521 $ 1,332,912 ADI 682,643 796,393 KF 546,734 524,647 Others 406,265 445,584 Other related parties 8,367 7,732 $ 2,907,530 $ 3,107,268
The credit term for related parties were similar to those for non-related parties. The credit terms is between 45 and 90 days.
~ 227 ~

- 45 -
For the Year Ended December 31Item Related Party Category/Name 2020 2019
Rendering of services Subsidiaries KC $ 214,572 $ 233,836 KV 197,669 139,210 KT 85,124 77,800 KS 19,347 129,458 Others 51,028 35,178 $ 567,740 $ 615,482
Revenue from the rendering of services refers to consulting service and trademark licensing revenue.
c. Purchases
For the Year Ended December 31Related Party Category 2020 2019 Subsidiaries $ 20,945 $ 30,410 Other related parties 65,971 44,482 $ 86,916 $ 74,892
The payment terms for related parties were similar to those for non-related parties. The payment terms are between 45 and 90 days.
d. Receivables from related parties
December 31 Item Related Party Category/Name 2020 2019
Accounts receivable Subsidiaries KA $ 439,302 $ 458,107 ADI 245,900 334,883 KF 155,971 145,552 Others 87,338 100,845 Other related parties 867 2,165 $ 929,378 $ 1,041,552 Other receivables Subsidiaries KHK $ 130,626 $ 567,870 KIC 103,552 378,580 Others 14,261 13,561 $ 248,439 $ 960,011
The outstanding accounts receivable from related parties are unsecured. For the years ended December 31, 2020 and 2019, no impairment losses were recognized for accounts receivable from related parties.
~ 228 ~

- 46 -
e. Payables to related parties
December 31 Item Related Party Category/Name 2020 2019
Accounts payable Subsidiaries $ 7,322 $ 7,974 Other related parties 6,642 9,019 $ 13,964 $ 16,993 Other payables Subsidiaries KA $ 23,702 $ 13,981 Other 565 181 Other related parties 126 126 $ 24,393 $ 14,288
The outstanding accounts payable to related parties are unsecured.
f. Acquisitions of property, plant and equipment
Purchase Price For the Year Ended December 31
Related Party Category 2020 2019 Subsidiaries $ 31 $ 8,784
g. Disposals of property, plant and equipment
Proceeds Gain on Disposal For the Year Ended
December 31 For the Year Ended
December 31 Related Party Category/Name 2020 2019 2020 2019 Subsidiaries
KV $ 1,276 $ 4,137 $ 114 $ 197 KC 1,684 1,130 52 25 KI 5,381 938 457 352 Others 518 24 129 24
$ 8,859 $ 6,229 $ 752 $ 598
h. Lease arrangements
For the Year Ended December 31 Related Party Category/Name 2020 2019
Acquisition of right-of-use assets Subsidiary
KF $ 23,644 $ -
~ 229 ~

- 47 -
For the Year Ended December 31Line Item Related Party Category/Name 2020 2019
Lease liabilities Subsidiary KF $ 21,984 $ -
For the Year Ended December 31 Related Party Category/Name 2020 2019
Lease expense Subsidiary
KF $ 60 $ -
i. Endorsements and guarantees
Endorsements and guarantees provided by the Company
December 31 Related Party Category 2020 2019 Subsidiaries $ 6,977,993 $ 6,212,981
j. Others
For the Year Ended December 31Item Related Party Categories/Name 2020 2019
Service cost Subsidiary KE $ 77,771 $ 76,361 Operating expense Subsidiaries $ 16,354 $ 18,872 Other related parties 1,421 1,421 $ 17,775 $ 20,293 Other income Subsidiaries $ 16,398 $ 15,576
k. Compensation of key management personnel
For the Year Ended December 31 2020 2019
Short-term employee benefits $ 29,065 $ 27,260 Post-employment benefits 92 84 $ 29,157 $ 27,344
The remuneration of directors and key executives, as determined by the remuneration committee, was based on individual performance and market trend.
~ 230 ~

- 48 -
25. SIGNIFICANT CONTINGENT LIABILITIES AND UNRECOGNIZED COMMITMENTS
In addition to those disclosed in other notes, significant contingencies and unrecognized commitments of the Company were as follows:
a. Capital expenditures contracted but yet incurred are as follows:
December 31 Item 2020 2019
Property, plant and equipment $ 112,006 $ 77,167
b. Contingencies
1) Products liability insurance
The Company has entered into a product liability insurance for the products manufactured by the Company and sold globally. The period of insurance agreement is from August 6, 2020 to August 6, 2021. The coverage of insurance policy is from August 6, 2004 to August 6, 2021. The maximum reparation of one single event is US$10,000 thousand.
2) The Company had entered into an exclusive agency contract with Gabjohn for the product distributed in Nigeria. Due to circumstances related to local sales, the Company switched to other agencies to distribute products in Nigeria. Consequently, Gabjohn filed a lawsuit against the Company for breach of exclusive agency contract and demanded $90,000 thousand (NGN500,000 thousand) as compensation. The Company signed an attorney agreement with Tommy & Jason International Intellectual Property Rights Co., Ltd. (collectively as Tommy & Jason), which then engaged a lawyer in the local intellectual Property Office, Adeniji Kazeem & Co., to handle the litigation and regularly reported the related proceedings. The lawsuit is currently awaiting in the High Court of Nigeria. Upon the date of issuance of the financial statements for the year ended December 31, 2020, the outcome of the dispute cannot be predicted with sufficient reliability.
26. SIGNIFICANT ASSETS AND LIABILITIES DENOMINATED IN FOREIGN CURRENCIES
The Company’s significant financial assets and liabilities denominated in foreign currencies aggregated by the foreign currencies other than functional currencies of the entities in the Company and the related exchange rates between foreign currencies and respective functional currencies were as follows:
December 31, 2020
ForeignCurrency Exchange Rate
CarryingAmount
Financial assets Monetary items
USD $ 117,941 28.48 (USD:NTD) $ 3,359,924RMB 49,479 4.37 (RMB:NTD) 215,988EUR 889 34.81 (EUR:NTD) 30,938
$ 3,606,250
(Continued)
~ 231 ~

- 49 -
ForeignCurrency Exchange Rate
CarryingAmount
Non-monetary items
Investments accounted for using the equity method USD $ 826,875 28.48 (USD:NTD) $ 23,591,531
Financial liabilities
Monetary items
USD 6,931 28.48 (USD:NTD) $ 197,412(Concluded)
December 31, 2019
ForeignCurrency Exchange Rate
CarryingAmount
Financial assets Monetary items
USD $ 83,258 30.10 (USD:NTD) $ 2,506,137GBP 430 39.36 (GBP:NTD) 16,911EUR 383 33.72 (EUR:NTD) 12,916JPY 35,813 0.28 (EUR:NTD) 9,092
$ 2,545,866
Non-monetary items
Investments accounted for using the equity method USD 819,014 30.10 (USD:NTD) $ 24,653,122
Financial liabilities
Monetary items
USD 4,934 30.10 (USD:NTD) $ 148,508EUR 205 33.72 (EUR:NTD) 6,916
$ 155,424
For the years ended December 31, 2020 and 2019, net foreign exchange losses were $149,590 thousand and $17,743 thousand, respectively. It is impractical to disclose net foreign exchange gains (losses) by each significant foreign currency due to the variety of the foreign currency transactions and functional currencies of the entities in the Company.
27. SEPARATELY DISCLOSED ITEMS
a. Information about significant transactions and investees:
1) Financing provided to others (Table 1)
2) Endorsements/guarantees provided (Table 2)
~ 232 ~

- 50 -
3) Marketable securities held (excluding investments in subsidiaries and associates) (Table 3)
4) Marketable securities acquired or disposed of at costs or prices of at least NT$300 million or 20% of the paid-in capital (None)
5) Acquisition of individual real estate at costs of at least NT$300 million or 20% of the paid-in capital (None)
6) Disposal of individual real estate at prices of at least NT$300 million or 20% of the paid-in capital (None)
7) Total purchases from or sales to related parties amounting to at least NT$100 million or 20% of the paid-in capital (Table 4)
8) Receivables from related parties amounting to at least NT$100 million or 20% of the paid-in capital (Table 5)
9) Trading in derivative instruments (None)
10) Information on investees (Table 6)
b. Information on investments in mainland China
1) Information on any investee company in mainland China, showing the name, principal business activities, paid-in capital, method of investment, inward and outward remittance of funds, ownership percentage, net income of investees, investment income or loss, carrying amount of the investment at the end of the year, repatriations of investment income, and limit on the amount of investment in the mainland China area (Table 7)
2) Any of the following significant transactions with investee companies in mainland China, either directly or indirectly through a third party, and their prices, payment terms, and unrealized gains or losses.
a) The amount and percentage of purchases and the balance and percentage of the related payables at the end of the year (consolidated financial statements Table 6)
b) The amount and percentage of purchases and the balance and percentage of the related payables at the end of the year (consolidated financial statements Table 6)
c) The amount of property transactions and the amount of the resultant gains or losses (None)
d) The balance of negotiable instrument endorsements or guarantees or pledges of collateral at the end of the year and the purposes (Table 2)
e) The highest balance, the ending balance, the interest rate range, and total current period interest with respect to the financing of funds (Table 1)
f) Other transactions that have a material effect on the profit or loss for the year or on the financial position, such as the rendering or receipt of services (None)
c. Information of major shareholders: List all shareholders with ownership of 5% or greater showing the name of the shareholder, the number of shares owned, and percentage of ownership of each shareholder (Table 8)
~ 233 ~

- 51
-
TA
BL
E 1
KE
ND
A R
UB
BE
R IN
D. C
O.,
LT
D. A
ND
SU
BSI
DIA
RIE
S
FIN
AN
CIN
G P
RO
VID
ED
FO
R T
HE
YE
AR
EN
DE
D D
EC
EM
BE
R 3
1, 2
020
(In
Tho
usan
ds o
f New
Tai
wan
Dol
lars
, Unl
ess S
peci
fied
Oth
erw
ise)
No.
Fi
nanc
ing
Com
pany
C
ount
erpa
rty
Fina
ncia
l St
atem
ent
Acc
ount
Rel
ated
Part
y
Max
imum
Bal
ance
for
the
Peri
od
End
ing
Bal
ance
Am
ount
Act
ually
Dra
wn
Inte
rest
R
ate
Nat
ure
for
Fina
ncin
gT
rans
actio
nA
mou
nts
Rea
son
for
Fina
ncin
gA
llow
ance
for
Bad
Deb
t
Col
late
ral
Fina
ncin
g L
imits
for
Eac
h B
orro
win
g C
ompa
ny
Fina
ncin
g C
ompa
ny’s
Tot
alFi
nanc
ing
Am
ount
L
imits
Item
V
alue
1
KG
I ST
AR
CO
Eur
ope
A/S
Fi
nanc
e re
ceiv
able
s Y
es
$ 1
,055
,325
$
-
$
-0.
7-1.
5%Th
e ne
ed fo
r sh
ort-t
erm
fin
anci
ng
$
-O
pera
ting
capi
tal
$
- -
$
-N
inet
y pe
rcen
t (9
0%) o
f the
fin
anci
ngco
mpa
ny’s
net
w
orth
, $1,
150,
664
Nin
ety
five
perc
ent
(95%
) of t
he
finan
cing
com
pany
’s n
et
wor
th, $
1,21
4,59
0
2 K
GI
STA
RC
O G
mB
H
Fina
nce
rece
ivab
les
Yes
96,7
61
-
-
1.50
00%
Th
e ne
ed fo
r sh
ort-t
erm
fin
anci
ng
-
Ope
ratin
g ca
pita
l
- -
-
Nin
ety
perc
ent
(90%
) of t
he
finan
cing
com
pany
’s n
et
wor
th, $
1,15
0,66
4
Nin
ety
five
perc
ent
(95%
) of t
he
finan
cing
com
pany
’s n
et
wor
th, $
1,21
4,59
0
3 K
GI
STA
RC
O B
altic
OÜ
Fi
nanc
e re
ceiv
able
s Y
es
13
,922
-
-1.
5000
%
The
need
for
shor
t-ter
m
finan
cing
-
Ope
ratin
g ca
pita
l
- -
-
Nin
ety
perc
ent
(90%
) of t
he
finan
cing
com
pany
’s n
et
wor
th, $
1,15
0,66
4
Nin
ety
five
perc
ent
(95%
) of t
he
finan
cing
com
pany
’s n
et
wor
th, $
1,21
4,59
0
4 ST
AR
CO
Eur
ope
A/S
ST
AR
CO
NV
Fi
nanc
e re
ceiv
able
s Y
es
17
,403
-
-3.
0000
%
The
need
for
shor
t-ter
m
finan
cing
-
Ope
ratin
g ca
pita
l
- -
-
Forty
per
cent
(40%
) of
the
finan
cing
co
mpa
ny’s
net
w
orth
, $81
,015
Sixt
y pe
rcen
t (60
%)
of th
e fin
anci
ng
com
pany
’s n
et
wor
th, $
121,
522
5
STA
RC
O E
urop
e A
/S
STA
RC
O D
ML
Fi
nanc
e re
ceiv
able
s Y
es
33
,797
33,2
40
30,3
863.
0000
%
The
need
for
shor
t-ter
m
finan
cing
-
Ope
ratin
g ca
pita
l
- -
-
Forty
per
cent
(40%
) of
the
finan
cing
co
mpa
ny’s
net
w
orth
, $81
,015
Sixt
y pe
rcen
t (60
%)
of th
e fin
anci
ng
com
pany
’s n
et
wor
th, $
121,
522
6
STA
RC
O E
urop
e A
/S
STA
RC
O G
S A
G
Fina
nce
rece
ivab
les
Yes
57,2
21
51
,026
23
,703
3.00
00%
Th
e ne
ed fo
r sh
ort-t
erm
fin
anci
ng
-
Ope
ratin
g ca
pita
l
- -
-
Forty
per
cent
(40%
) of
the
finan
cing
co
mpa
ny’s
net
w
orth
, $81
,015
Sixt
y pe
rcen
t (60
%)
of th
e fin
anci
ng
com
pany
’s n
et
wor
th, $
121,
522
7
STA
RC
O E
urop
e A
/S
STA
RC
O B
eli M
anas
tir d
.o.o
. Fi
nanc
e re
ceiv
able
s Y
es
13
,574
-
-3.
0000
%
The
need
for
shor
t-ter
m
finan
cing
-
Ope
ratin
g ca
pita
l
- -
-
Fifty
per
cent
(40%
) of
the
finan
cing
co
mpa
ny’s
net
w
orth
, $81
,015
Sixt
y pe
rcen
t (60
%)
of th
e fin
anci
ng
com
pany
’s n
et
wor
th, $
121,
522
8
STA
RC
O B
eli M
anas
tir d
.o.o
. ST
AR
CO
GS
AG
Fi
nanc
e re
ceiv
able
s Y
es
23
,042
23,0
42
3,48
13.
9600
%
The
need
for
shor
t-ter
m
finan
cing
-
Ope
ratin
g ca
pita
l
- -
-
Forty
per
cent
(40%
) of
the
finan
cing
co
mpa
ny’s
net
w
orth
, $14
4,80
8
Sixt
y pe
rcen
t (60
%)
of th
e fin
anci
ng
com
pany
’s n
et
wor
th, $
217,
212
(C
ontin
ued)
~ 234 ~

- 52
-
No.
Fi
nanc
ing
Com
pany
C
ount
erpa
rty
Fina
ncia
l St
atem
ent
Acc
ount
Rel
ated
Part
y
Max
imum
Bal
ance
for
the
Peri
od
End
ing
Bal
ance
Am
ount
Act
ually
Dra
wn
Inte
rest
R
ate
Nat
ure
for
Fina
ncin
gT
rans
actio
nA
mou
nts
Rea
son
for
Fina
ncin
gA
llow
ance
for
Bad
Deb
t
Col
late
ral
Fina
ncin
g L
imits
for
Eac
h B
orro
win
g C
ompa
ny
Fina
ncin
g C
ompa
ny’s
Tot
alFi
nanc
ing
Am
ount
L
imits
Item
V
alue
9
STA
RC
O E
urop
e A
/S
STA
RC
O G
mB
H
Fina
nce
rece
ivab
les
Yes
$
13
,922
$
-
$
-3.
0000
%
The
need
for
shor
t-ter
m
finan
cing
$
-O
pera
ting
capi
tal
$
- -
$
-Fo
rty p
erce
nt (4
0%)
of th
e fin
anci
ng
com
pany
’s n
et
wor
th, $
81,0
15
Sixt
y pe
rcen
t (60
%)
of th
e fin
anci
ng
com
pany
’s n
et
wor
th, $
121,
522
10
ST
AR
CO
Eur
ope
A/S
St
arco
SA
S.
Fina
nce
rece
ivab
les
Yes
13,9
22
13
,922
13
,922
3.00
00%
Th
e ne
ed fo
r sh
ort-t
erm
fin
anci
ng
-
Ope
ratin
g ca
pita
l
- -
-
Forty
per
cent
(40%
) of
the
finan
cing
co
mpa
ny’s
net
w
orth
, $81
,015
Sixt
y pe
rcen
t (60
%)
of th
e fin
anci
ng
com
pany
’s n
et
wor
th, $
121,
522
Not
e:
All
intra
-gro
up tr
ansa
ctio
ns a
re e
limin
ated
upo
n co
nsol
idat
ion.
(C
oncl
uded
)
~ 235 ~

- 53
-
TA
BL
E 2
KE
ND
A R
UB
BE
R IN
D. C
O.,
LT
D. A
ND
SU
BSI
DIA
RIE
S
EN
DO
RSE
ME
NT
S/G
UA
RA
NT
EE
S PR
OV
IDE
D
FOR
TH
E Y
EA
R E
ND
ED
DE
CEM
BE
R 3
1, 2
020
(In
Tho
usan
ds o
f New
Tai
wan
Dol
lars
, Unl
ess S
peci
fied
Oth
erw
ise)
No.
E
ndor
sem
ent/
Gua
rant
ee P
rovi
der
Gua
rant
eed
Part
y
Lim
its o
n E
ndor
sem
ents
/G
uara
ntee
s G
iven
on
Beh
alf o
f Eac
h Pa
rty
Max
imum
A
mou
nt
End
orse
d/
Gua
rant
eed
Dur
ing
the
Peri
od
Out
stan
ding
E
ndor
sem
ents
/G
uara
ntee
s at
the
End
of t
he
Peri
od(N
ote
4)
Act
ual
Am
ount
B
orro
wed
Am
ount
E
ndor
sed/
G
uara
ntee
d by
Col
late
ral
Rat
io o
f A
ccum
ulat
ed
End
orse
men
ts/
Gua
rant
ees t
o N
et E
quity
in
Lat
est
Fina
ncia
l St
atem
ents
(%
)
Agg
rega
te
End
orse
men
ts/
Gua
rant
ees
Lim
it (N
ote
3) E
ndor
sem
ents
/ G
uara
ntee
s G
iven
by
Pare
nt o
n B
ehal
f of
Subs
idia
ries
End
orse
men
ts/
Gua
rant
ees
Giv
en b
y Su
bsid
iari
es
on B
ehal
f of
Pare
nt
End
orse
men
ts/
Gua
rant
ees
Giv
en o
n B
ehal
f of
Com
pani
es in
Mai
nlan
d C
hina
Not
e N
ame
Rel
atio
nshi
p (N
ote
1)
0
The
Com
pany
K
GI
a $
7,
451,
739
(N
ote
2)
$
1,21
8,21
8 $
-
$
- $
-
0.00
$
14,
903,
478
(N
ote
3)
Yes
N
o N
o -
AD
I a
7,
451,
739
(N
ote
2)
17
0,89
8
170,
898
11
3,93
2
-0.
92
14
,903
,478
(Not
e 3)
Y
es
No
No
-
KA
a
7,
451,
739
(N
ote
2)
17
0,89
8
170,
898
17
0,89
8
-0.
92
14
,903
,478
(Not
e 3)
Y
es
No
No
-
STA
RC
O D
ML
a
7,45
1,73
9
(Not
e 2)
569,
660
56
9,66
0
-
-3.
06
14
,903
,478
(Not
e 3)
Y
es
No
No
-
STA
RC
O G
B L
td.
a
7,
451,
739
(N
ote
2)
56
9,66
0
569,
660
-
-
3.06
14,9
03,4
78
(N
ote
3)
Yes
N
o N
o -
STA
RC
O N
V
a
7,45
1,73
9
(Not
e 2)
569,
660
56
9,66
0
-
-3.
06
14
,903
,478
(Not
e 3)
Y
es
No
No
-
STA
RC
O S
AS
a
7,45
1,73
9
(Not
e 2)
569,
660
56
9,66
0
-
-3.
06
14
,903
,478
(Not
e 3)
Y
es
No
No
-
STA
RC
O B
altic
OÜ
a
7,
451,
739
(N
ote
2)
56
9,66
0
569,
660
10
,453
-
3.06
14,9
03,4
78
(N
ote
3)
Yes
N
o N
o -
STA
RC
O G
S A
G
a
7,45
1,73
9
(Not
e 2)
569,
660
56
9,66
0
45,2
59
-3.
06
14
,903
,478
(Not
e 3)
Y
es
No
No
-
STA
RC
O G
mbH
a
7,
451,
739
(N
ote
2)
56
9,66
0
569,
660
69
,612
-
3.06
14,9
03,4
78
(N
ote
3)
Yes
N
o N
o -
STA
RC
O P
olsk
a Sp
.z.o
.o.
a
7,45
1,73
9
(Not
e 2)
569,
660
56
9,66
0
111,
653
-
3.06
14,9
03,4
78
(N
ote
3)
Yes
N
o N
o -
STA
RC
O E
urop
e A
/S
a
7,45
1,73
9
(Not
e 2)
2,44
9,19
6
2,44
9,19
6
1,27
0,42
7
-13
.15
14
,903
,478
(Not
e 3)
Y
es
No
No
-
KV
a
7,
451,
739
(N
ote
2)
2,
819,
817
2,
819,
817
72
4,75
0
-15
.14
14
,903
,478
(Not
e 3)
Y
es
No
No
-
KT
a
7,45
1,73
9
(Not
e 2)
655,
109
48
4,21
1
-
-2.
60
14
,903
,478
(Not
e 3)
Y
es
No
Yes
-
KI
a
7,45
1,73
9
(Not
e 2)
968,
422
88
2,97
3
530,
923
-
4.74
14,9
03,4
78
(N
ote
3)
Yes
N
o N
o -
1 K
HK
K
S a
88
8,84
1
(Not
e 2)
873,
056
87
3,05
6
-
-39
.29
1,
777,
682
(N
ote
3)
No
No
Yes
-
(C
ontin
ued)
~ 236 ~

- 54
-
No.
E
ndor
sem
ent/
Gua
rant
ee P
rovi
der
Gua
rant
eed
Part
y
Lim
its o
n E
ndor
sem
ents
/G
uara
ntee
s G
iven
on
Beh
alf o
f Eac
h Pa
rty
Max
imum
A
mou
nt
End
orse
d/
Gua
rant
eed
Dur
ing
the
Peri
od
Out
stan
ding
E
ndor
sem
ents
/G
uara
ntee
s at
the
End
of t
he
Peri
od(N
ote
4)
Act
ual
Am
ount
B
orro
wed
Am
ount
E
ndor
sed/
G
uara
ntee
d by
Col
late
ral
Rat
io o
f A
ccum
ulat
ed
End
orse
men
ts/
Gua
rant
ees t
o N
et E
quity
in
Lat
est
Fina
ncia
l St
atem
ents
(%
)
Agg
rega
te
End
orse
men
ts/
Gua
rant
ees
Lim
it (N
ote
3) E
ndor
sem
ents
/ G
uara
ntee
s G
iven
by
Pare
nt o
n B
ehal
f of
Subs
idia
ries
End
orse
men
ts/
Gua
rant
ees
Giv
en b
y Su
bsid
iari
es
on B
ehal
f of
Pare
nt
End
orse
men
ts/
Gua
rant
ees
Giv
en o
n B
ehal
f of
Com
pani
es in
Mai
nlan
d C
hina
Not
e N
ame
Rel
atio
nshi
p (N
ote
1)
2
KG
CI
KS
a $
4,
057,
730
(N
ote
2)
$
3,94
2,22
4 $
3,
942,
224
$
- $
-
34.4
3 $
8,
115,
461
(N
ote
3)
No
No
Yes
-
3
STA
RC
O E
urop
e A
/S
STA
RC
O G
B L
td.
a
202,
537
(N
ote
2)
17
5,22
6
77,8
78
-
-38
.45
40
5,07
5
(Not
e 3)
N
o N
o N
o -
STA
RC
O N
V
a
202,
537
(N
ote
2)
15
6,62
8
156,
628
17
,438
-
77.3
3
405,
075
(N
ote
3)
No
No
No
-
Not
e 1:
R
elat
ions
hips
bet
wee
n th
e gu
aran
tee
prov
ider
and
gua
rant
eed
party
:
a.
A
subs
idia
ry in
whi
ch th
e C
ompa
ny h
olds
dire
ctly
and
indi
rect
ly o
ver 9
0% o
f an
equi
ty in
tere
st.
Not
e 2:
Li
mit
on e
ndor
sem
ents
to a
sing
le c
ompa
ny is
40%
of t
he C
ompa
ny’s
net
wor
th.
Lim
it on
end
orse
men
ts to
a si
ngle
com
pany
is 4
0% o
f KH
K’s
net
wor
th.
Lim
it on
end
orse
men
ts to
a si
ngle
com
pany
is 4
0% o
f KG
CI’
s net
wor
th.
Lim
it on
end
orse
men
ts to
a si
ngle
com
pany
is 1
00%
of S
TAR
CO
Eur
ope
A/S
’s n
et w
orth
.
Not
e 3:
Li
mit
on a
ggre
gate
end
orse
men
ts is
80%
of t
he C
ompa
ny’s
net
wor
th.
Lim
it on
agg
rega
te e
ndor
sem
ents
is 8
0% o
f KH
K’s
net
wor
th.
Lim
it on
agg
rega
te e
ndor
sem
ents
is 8
0% o
f KG
CI’
s net
wor
th.
Lim
it on
agg
rega
te e
ndor
sem
ents
is 2
00%
of S
TAR
CO
Eur
ope
A/S
’s n
et w
orth
.
Not
e 4:
K
GC
I and
KH
K jo
intly
pro
vide
d en
dors
emen
t/gua
rant
ee fo
r KS
of R
MB
800
mill
ion,
but
the
limit
for K
HK
is R
MB
200
mill
ion.
Not
e 5:
Th
e C
ompa
ny p
rovi
ded
shar
ed e
ndor
sem
ent/g
uara
ntee
for n
ine
subs
idia
ries
incl
udin
g ST
AR
CO
Eur
ope
A/S
, STA
RC
O G
mbH
, STA
RCO
Pol
ska
Sp.z
.o.o
., ST
AR
CO
SA
S, S
TAR
CO
GS
AG
, STA
RC
O N
V, S
TAR
CO
GB
Ltd
., ST
AR
CO
DM
L an
d ST
AR
CO
B
altic
OÜ
. The
tota
l am
ount
of t
he sh
ared
end
orse
men
t/gua
rant
ee is
US$
20,0
00 th
ousa
nd.
(Con
clud
ed)
~ 237 ~

- 55
-
TA
BL
E 3
KE
ND
A R
UB
BE
R IN
D. C
O.,
LT
D. A
ND
SU
BSI
DIA
RIE
S
MA
RK
ET
AB
LE
SE
CU
RIT
IES
HE
LD
D
EC
EM
BE
R 3
1, 2
020
(In
Tho
usan
ds o
f New
Tai
wan
Dol
lars
, Unl
ess S
peci
fied
Oth
erw
ise)
Hol
ding
Com
pany
N
ame
Typ
e an
d N
ame
of M
arke
tabl
e Se
curi
ties
Rel
atio
nshi
p w
ith th
e H
oldi
ng
Com
pany
Fi
nanc
ial S
tate
men
t Acc
ount
D
ecem
ber
31, 2
020
Not
eSh
ares
/Uni
ts
Car
ryin
gA
mou
ntPe
rcen
tage
of
Ow
ners
hip
%Fa
ir V
alue
(N
ote)
The
Com
pany
Sh
ares
and
equ
ity
Chi
na D
evel
opm
ent F
inan
cial
H
oldi
ng C
orpo
ratio
n -
Fina
ncia
l ass
ets a
t FV
TPL
- cur
rent
10
5
$
973
0.00
$
973
-
K
enjo
u In
d. C
o., L
td.
The
chai
rman
of K
enjo
u In
d. C
o., L
td.
and
the
chai
rman
of t
he C
ompa
ny a
re
seco
nd-d
egre
e re
lativ
es
Equi
ty in
stru
men
ts a
t FV
TOC
I - n
on-c
urre
nt
7,38
2
31
4,46
7 10
.86
314,
467
-
C
hang
Hw
a G
olf C
o., L
td.
- Eq
uity
inst
rum
ents
at F
VTO
CI -
non
-cur
rent
30
19
7 0.
08
197
-
Ou
Hua
Ven
ture
Cap
ital C
o., L
td.
- Eq
uity
inst
rum
ents
at F
VTO
CI -
non
-cur
rent
31
5
1,
880
5.15
1,
880
-
Yu
Hua
Ven
ture
Cap
ital C
o., L
td.
- Eq
uity
inst
rum
ents
at F
VTO
CI -
non
-cur
rent
14
6
49
1 2.
50
491
-
Tota
l Lub
rican
ts T
aiw
an L
td.
The
chai
rman
of T
otal
Lub
rican
ts
Taiw
an L
td. a
nd th
e ch
airm
an o
f the
C
ompa
ny a
re se
cond
-deg
ree
rela
tives
Equi
ty in
stru
men
ts a
t FV
TOC
I - n
on-c
urre
nt
81
121,
779
6.80
12
1,77
9 -
B
OM
Y (B
VI)
CO
., LT
D.
- Eq
uity
inst
rum
ents
at F
VTO
CI -
non
-cur
rent
2,
000
12,7
09
9.73
12
,709
-
K
GI
Shar
es a
nd e
quity
K
enjo
u In
vest
men
t Co.
, Ltd
. Th
e ch
airm
an o
f Ken
jou
Inve
stm
ent C
o.,
Ltd.
and
the
chai
rman
of t
he C
ompa
ny
are
seco
nd-d
egre
e re
lativ
es
Equi
ty in
stru
men
ts a
t FV
TOC
I - n
on-c
urre
nt
-
12
6,89
6 13
.00
126,
896
-
Not
e:
Fair
valu
e of
dom
estic
list
ed sh
ares
is d
eter
min
ed b
ased
on
its c
losi
ng p
rice
on D
ecem
ber 3
1, 2
020.
~ 238 ~

- 56
-
TA
BL
E 4
KE
ND
A R
UB
BE
R IN
D. C
O.,
LT
D. A
ND
SU
BSI
DIA
RIE
S
TO
TA
L P
UR
CH
ASE
S FR
OM
OR
SA
LE
S T
O R
EL
AT
ED
PA
RT
IES
AM
OU
NT
ING
TO
AT
LE
AST
NT
$100
MIL
LIO
N O
R 2
0% O
F TH
E P
AID
-IN
CA
PIT
AL
FO
R T
HE
YE
AR
EN
DE
D D
EC
EM
BE
R 3
1, 2
020
(In
Tho
usan
ds o
f New
Tai
wan
Dol
lars
, Unl
ess S
peci
fied
Oth
erw
ise)
Com
pany
Nam
e R
elat
ed P
arty
R
elat
ions
hip
Tra
nsac
tion
Det
ails
A
bnor
mal
Tra
nsac
tion
Not
es/A
ccou
nts
Rec
eiva
ble
(Pay
able
) N
ote
Purc
hase
s/
Sale
s A
mou
nt
% to
Tot
alPa
ymen
t Ter
ms
Uni
t Pri
ce
Paym
ent
Ter
ms
Am
ount
%
to T
otal
The
Com
pany
K
A
Subs
idia
ry
Sale
s
$ 1
,263
,521
23
.49
In a
ccor
danc
e w
ith m
utua
l agr
eem
ents
A
gree
d by
bot
h pa
rties
-
$
44
4,15
1 36
.34
-
KF
Subs
idia
ry
Sale
s
54
6,73
4 10
.17
In a
ccor
danc
e w
ith m
utua
l agr
eem
ents
A
gree
d by
bot
h pa
rties
-
155,
971
12.7
6 -
K
V
Subs
idia
ry
Sale
s
20
1,06
7 3.
74
In a
ccor
danc
e w
ith m
utua
l agr
eem
ents
A
gree
d by
bot
h pa
rties
-
30,5
63
2.50
-
A
DI
Indi
rect
ly o
wne
d su
bsid
iary
Sa
les
682,
643
12.6
9 In
acc
orda
nce
with
mut
ual a
gree
men
ts
Agr
eed
by b
oth
parti
es
-
24
6,46
4 20
.17
-
K
C
KA
Su
bsid
iary
of u
ltim
ate
pare
nt c
ompa
ny
Sale
s
37
0,43
3 5.
55
In a
ccor
danc
e w
ith m
utua
l agr
eem
ents
A
gree
d by
bot
h pa
rties
-
148,
422
12.8
0 -
A
DI
Subs
idia
ry o
f ulti
mat
e pa
rent
com
pany
Sa
les
253,
302
3.79
In
acc
orda
nce
with
mut
ual a
gree
men
ts
Agr
eed
by b
oth
parti
es
-
12
5,49
4 10
.82
-
STA
RC
O N
V
Subs
idia
ry o
f ulti
mat
e pa
rent
com
pany
Sa
les
179,
729
2.69
In
acc
orda
nce
with
mut
ual a
gree
men
ts
Agr
eed
by b
oth
parti
es
-
49
,934
4.
31
-
KS
Subs
idia
ry o
f ulti
mat
e pa
rent
com
pany
Sa
les
100,
143
1.50
In
acc
orda
nce
with
mut
ual a
gree
men
ts
Agr
eed
by b
oth
parti
es
-
45
,364
3.
91
-
K
V
KA
Su
bsid
iary
of u
ltim
ate
pare
nt c
ompa
ny
Sale
s
1,
775,
946
30.4
1 In
acc
orda
nce
with
mut
ual a
gree
men
ts
Agr
eed
by b
oth
parti
es
-
68
3,12
2 58
.42
-
AD
I Su
bsid
iary
of u
ltim
ate
pare
nt c
ompa
ny
Sale
s
61
0,97
3 10
.46
In a
ccor
danc
e w
ith m
utua
l agr
eem
ents
A
gree
d by
bot
h pa
rties
-
192,
971
16.5
0 -
KT
KS
Subs
idia
ry o
f ulti
mat
e pa
rent
com
pany
Sa
les
489,
728
18.0
8 In
acc
orda
nce
with
mut
ual a
gree
men
ts
Agr
eed
by b
oth
parti
es
-
13
0,43
2 21
.73
-
AD
I Su
bsid
iary
of u
ltim
ate
pare
nt c
ompa
ny
Sale
s
24
0,15
2 8.
86
In a
ccor
danc
e w
ith m
utua
l agr
eem
ents
A
gree
d by
bot
h pa
rties
-
98,6
22
16.4
3 -
STA
RC
O B
ELI M
anas
tir
d.o.
o.
STA
RC
O G
mbH
Su
bsid
iary
of u
ltim
ate
pare
nt c
ompa
ny
Sale
s
12
1,96
2 4.
06
In a
ccor
danc
e w
ith m
utua
l agr
eem
ents
A
gree
d by
bot
h pa
rties
-
23,8
91
6.35
-
STA
RC
O E
urop
e A
/S
STA
RC
O H
uanm
ei
Ass
ocia
te
Purc
hase
s
17
2,53
4 5.
75
In a
ccor
danc
e w
ith m
utua
l agr
eem
ents
A
gree
d by
bot
h pa
rties
-
(38,
678)
(1
0.29
) -
Not
e:
All
intra
-gro
up tr
ansa
ctio
ns a
re e
limin
ated
upo
n co
nsol
idat
ion.
~ 239 ~

- 57
-
TA
BL
E 5
KE
ND
A R
UB
BE
R IN
D. C
O.,
LT
D. A
ND
SU
BSI
DIA
RIE
S
RE
CE
IVA
BL
ES
FRO
M R
EL
AT
ED
PA
RT
IES
AM
OU
NT
ING
TO
AT
LE
AST
NT
$100
MIL
LIO
N O
R 2
0% O
F T
HE
PA
ID-I
N C
API
TA
L
DE
CE
MB
ER
31,
202
0 (I
n T
hous
ands
of N
ew T
aiw
an D
olla
rs, U
nles
s Spe
cifie
d O
ther
wis
e)
Com
pany
Nam
e R
elat
ed P
arty
R
elat
ions
hip
End
ing
Bal
ance
T
urno
ver
Rat
e
Ove
rdue
A
mou
nts R
ecei
ved
in S
ubse
quen
t Pe
riod
(Not
e 2)
Allo
wan
ce fo
r Im
pair
men
t Los
sA
mou
nt
Act
ions
Tak
en
Th
e C
ompa
ny
KA
Su
bsid
iary
$
444,
151
2.79
$
94,6
51
-
$
145,
284
-
AD
I In
dire
ctly
ow
ned
subs
idia
ry
246,
464
2.35
18
,620
-
177,
760
-
KF
Subs
idia
ry
155,
971
3.60
-
-
10
0,52
0 -
K
HK
Su
bsid
iary
13
0,62
6 -
- -
- -
K
IC
Subs
idia
ry
103,
552
-
-
-
-
-
KC
K
A
Subs
idia
ry o
f ulti
mat
e pa
rent
com
pany
14
8,42
2 2.
41
240
-
55
,635
-
A
DI
Subs
idia
ry o
f ulti
mat
e pa
rent
com
pany
12
5,49
4 2.
01
103
-
96
,937
-
K
V
KA
Su
bsid
iary
of u
ltim
ate
pare
nt c
ompa
ny
683,
122
2.91
-
-
27
3,97
7 -
A
DI
Subs
idia
ry o
f ulti
mat
e pa
rent
com
pany
19
2,97
1 3.
20
- -
179,
596
-
KT
KS
Subs
idia
ry o
f ulti
mat
e pa
rent
com
pany
13
0,43
2 7.
51
- -
130,
432
-
STA
RC
O IP
R G
mbH
ST
AR
CO
Eur
ope
A/S
Pa
rent
com
pany
20
0,52
6 -
200,
526
-
-
-
Not
e 1:
A
ll in
tra-g
roup
tran
sact
ions
are
elim
inat
ed u
pon
cons
olid
atio
n.
Not
e 2:
A
mou
nts r
ecei
ved
as o
f Mar
ch 1
8, 2
021.
~ 240 ~

- 58
-
TA
BL
E 6
KE
ND
A R
UB
BE
R IN
D. C
O.,
LT
D. A
ND
SU
BSI
DIA
RIE
S
INFO
RM
AT
ION
ON
INV
EST
EE
S FO
R T
HE
YE
AR
EN
DE
D D
EC
EM
BE
R 3
1, 2
020
(In
Tho
usan
ds o
f New
Tai
wan
Dol
lars
, Unl
ess S
peci
fied
Oth
erw
ise)
Inve
stor
In
vest
ee
Loc
atio
n M
ain
Bus
ines
s Act
iviti
es
Ori
gina
l Inv
estm
ent A
mou
nt
As o
f Dec
embe
r 31
, 202
0 N
et In
com
e (L
osse
s) o
f the
In
vest
ee (N
ote
1)
Shar
e of
Pro
fits
(Los
ses)
of
Inve
stee
(Not
e 1)
Not
e D
ecem
ber
31,
2020
(Not
e 1)
D
ecem
ber
31,
2019
(Not
e 1)
Sh
ares
(In
Tho
usan
ds)
Perc
enta
ge o
f O
wne
rshi
p C
arry
ing
Val
ue (N
ote
1)
The
Com
pany
K
A
Uni
ted
Stat
es
Trad
e an
d in
vest
men
t
US$
9,
000
U
S$
9,00
0
-
100.
00
N
T$
1,45
5,74
2
NT$
13
,020
N
T$
13,0
20N
ote
3
KH
K
Hon
g K
ong
Trad
e an
d in
vest
men
t
HK
$ 10
0
HK
$ 10
0
-
100.
00
N
T$
2,25
4,80
6
NT$
(5
16,1
97 )
N
T$
(516
,197
)N
ote
3
US$
30
,600
U
S$
30,6
00
KV
V
ietn
am
Man
ufac
turin
g va
rious
type
s of t
ires
U
S$
67,6
80
US$
64
,180
-10
0.00
NT$
7,
080,
904
N
T$
979,
711
N
T$
907,
573
Not
es 3
and
4
K
IC
Cay
man
Isla
nds
Inve
stm
ent
U
S$
81,7
53
US$
81
,753
-10
0.00
NT$
11,
748,
010
N
T$
76,3
27
NT$
76
,327
Not
e 3
K
E G
erm
any
Mar
ketin
g pl
anni
ng
EU
R
25
EUR
25
-10
0.00
NT$
12
,449
NT$
3,
281
N
T$
3,28
1N
ote
3
KF
Taiw
an
Selli
ng v
ario
us ty
pes o
f tire
s
NT$
19
9,00
0
NT$
19
9,00
0
19
,900
100.
00
N
T$
252,
259
N
T$
36,0
62
NT$
36
,062
Not
e 3
K
I In
done
sia
Man
ufac
turin
g va
rious
type
s of t
ires
U
S$
52,9
99
US$
44
,999
-99
.99
N
T$
1,05
2,06
2
NT$
75
,223
N
T$
75,2
23N
ote
3
K
A
AD
I U
nite
d St
ates
M
anuf
actu
ring,
dis
tribu
tion
and
selli
ng o
f whe
els a
nd ri
ms
U
S$
20,0
00
US$
20
,000
-10
0.00
US$
46
,858
US$
3,
450
Not
e 1
Not
e 3
KIC
K
GH
C
aym
an Is
land
s In
vest
men
t
US$
11
2,05
0
US$
11
2,05
0
-
100.
00
U
S$
400,
653
U
S$
(1,9
42 )
Not
e 1
Not
e 3
K
GI
Mau
ritiu
s. In
vest
men
t
US$
1,
703
U
S$
1,70
3
-
100.
00
U
S$
11,3
74
U
S$
4,52
8
N
ote
1N
ote
3
K
GI
STA
RC
O E
urop
e A
/S
Den
mar
k In
vest
men
t
EUR
6,
936
EU
R
6,93
6
-
100.
00
U
S$
4,78
3
US$
2,
094
Not
e 1
Not
e 3
STA
RC
O E
urop
e A
/S
STA
RC
O G
B L
td.
Uni
ted
Kin
gdom
D
istri
butio
n an
d se
lling
of v
ario
us ty
pes o
f tire
s and
rim
s
EUR
55
2
EUR
55
2
-
100.
00
EU
R
5,46
6
EUR
38
7
N
ote
1N
ote
3
STA
RC
O G
mbH
G
erm
any
Dis
tribu
tion
and
selli
ng o
f var
ious
type
s of t
ires a
nd ri
ms
EU
R
511
EU
R
511
-10
0.00
EUR
,3
,262
EUR
41
6
N
ote
1N
ote
3
STA
RC
O P
olsk
a Sp
.z.o
.o.
Pola
nd
Dis
tribu
tion
and
selli
ng o
f var
ious
type
s of t
ires a
nd ri
ms
EU
R
34
EUR
34
-10
0.00
EUR
2,
391
EU
R
342
Not
e 1
Not
e 3
ST
AR
CO
NV
B
elgi
um
Dis
tribu
tion
and
selli
ng o
f var
ious
type
s of t
ires a
nd ri
ms
EU
R
2,81
0
EUR
2,
810
-10
0.00
EUR
3,
464
EU
R
341
Not
e 1
Not
e 3
ST
AR
CO
GS
AG
Sw
itzer
land
D
istri
butio
n an
d se
lling
of v
ario
us ty
pes o
f tire
s and
rim
s
EUR
29
9
EUR
29
9
-
100.
00
EU
R
710
EU
R
115
Not
e 1
Not
e 3
ST
AR
CO
Bal
tic O
Ü
Esto
nia
Dis
tribu
tion
and
selli
ng o
f var
ious
type
s of t
ires a
nd ri
ms
EU
R
3
EUR
3
-10
0.00
EUR
33
7
EUR
10
3
N
ote
1N
ote
3
STA
RC
O S
AS
Fran
ce
Dis
tribu
tion
and
selli
ng o
f var
ious
type
s of t
ires a
nd ri
ms
EU
R
183
EU
R
183
-10
0.00
EUR
(1
11 )
EU
R
49
N
ote
1N
ote
3
STA
RC
O B
eli M
anas
tir d
.o.o
. C
roat
ia
Man
ufac
turin
g of
var
ious
type
s of r
ims
EU
R
9,74
1
EUR
9,
741
-10
0.00
EUR
10
,569
EUR
34
3
N
ote
1N
ote
3
STA
RC
O D
ML
Uni
ted
Kin
gdom
M
anuf
actu
ring,
dis
tribu
tion
and
selli
ng o
f whe
els a
nd ri
ms
EU
R
1,03
0
EUR
1,
030
-10
0.00
EUR
51
4
EUR
77
Not
e 1
Not
e 3
ST
AR
CO
Jels
hoj
Cro
atia
In
vest
men
t
EUR
3
EU
R
3
-
100.
00
Not
e 2
Not
e 2
Not
e 1
Not
e 3
ST
AR
CO
IPR
Gm
bH
Switz
erla
nd
Inve
stm
ent
EU
R
17
EUR
17
-10
0.00
EUR
6,
855
EU
R
(41 )
Not
e 1
Not
e 3
Not
e 1:
Th
e sh
are
of p
rofit
s (lo
sses
) of t
he in
vest
ee is
not
dis
clos
ed h
erei
n as
such
am
ount
was
alre
ady
incl
uded
in th
e sh
are
of p
rofit
s or l
osse
s of t
he in
vest
or.
Not
e 2:
Th
e ca
rryi
ng v
alue
and
net
inco
me
(loss
es) o
f the
inve
stee
wer
e al
read
y in
clud
ed in
thos
e of
STA
RC
O B
eli.
Not
e 3:
A
ll in
tra-g
roup
tran
sact
ions
are
elim
inat
ed u
pon
cons
olid
atio
n.
Not
e 4:
Th
e di
ffer
ence
s bet
wee
n ne
t inc
ome
and
shar
e of
pro
fits o
r los
ses a
re u
nrea
lized
(rea
lized
) pro
fits o
r los
ses o
n tra
nsac
tions
with
inve
stee
s.
~ 241 ~

- 59
-
TA
BL
E 7
KE
ND
A R
UB
BE
R IN
D. C
O.,
LT
D. A
ND
SU
BSI
DIA
RIE
S
INFO
RM
AT
ION
ON
INV
EST
ME
NT
S IN
MA
INL
AN
D C
HIN
A
FOR
YE
AR
EN
DE
D D
EC
EM
BE
R 3
1, 2
020
(In
Tho
usan
ds o
f New
Tai
wan
Dol
lars
, Unl
ess S
peci
fied
Oth
erw
ise)
Inve
stee
Com
pany
Mai
n B
usin
esse
s and
Pro
duct
sPa
id-in
Cap
ital
Met
hod
of
Inve
stm
ent
Acc
umul
ated
Out
war
d R
emitt
ance
for
Inve
stm
ent f
rom
T
aiw
an a
s of
Janu
ary
1, 2
020
Rem
ittan
ce o
f Fun
dsA
ccum
ulat
edO
utw
ard
Rem
ittan
ce fo
r In
vest
men
t fro
m
Tai
wan
as o
f D
ecem
ber
31,
2020
Net
Inco
me
(Los
s)
of th
e In
vest
ee
%O
wne
rshi
p of
Dir
ect o
r In
dire
ct
Inve
stm
ent
Inve
stm
ent
Gai
n (L
oss)
(N
ote
3)
Car
ryin
g A
mou
nt a
s of
Dec
embe
r 31
, 20
20
Acc
umul
ated
Rep
atri
atio
n of
In
vest
men
t In
com
e as
of
Dec
embe
r 31
, 20
20
Not
eO
utw
ard
Inw
ard
KS
Man
ufac
turin
g an
d se
lling
of v
ario
us
type
s of t
ires
$
712,
075
(US$
25
,000
) N
ote
1 $
71
2,07
5 (U
S$
25,0
00)
- -
$
712,
075
(US$
25
,000
) $
(7
98,1
23)
100.
0 $
(7
88,3
74)
$
2,87
1,50
4 $
4,
994,
238
-
KC
M
anuf
actu
ring
and
selli
ng o
f var
ious
ty
pes o
f tire
s
1,99
3,81
0 (U
S$
70,0
00)
Not
es 1
and
7
1,
993,
810
(US$
70
,000
)-
-
1,99
3,81
0 (U
S$
70,0
00)
42
2,04
710
0.0
N
ote
4
N
ote
4
--
KT
Man
ufac
turin
g an
d se
lling
of v
ario
us
type
s of t
ires
6,
266,
260
(US$
22
0,00
0) N
otes
1, 2
and
7
44
4,33
5 (U
S$
15,6
00)
- -
44
4,33
5 (U
S$
15,6
00)
(1
48,4
05)
100.
0
(144
,981
)
3,94
1,79
5
--
KG
CI
Inve
stm
ent
4,
585,
763
(US$
16
1,00
0) N
otes
1 a
nd 2
--
-
-
281,
295
100.
0
281,
295
10
,270
,472
-
-
Shan
ghai
Bom
y Fo
odst
uff C
o.,
Ltd.
Man
ufac
turin
g an
d se
lling
of v
ario
us
type
s of f
oods
and
drin
ks
56
9,66
0 (U
S$
20,0
00)
Not
e 1
56
,966
(US$
2,
000)
- -
56
,966
(US$
2,
000)
-
10.0
-
12,7
09
-
-
Nin
gbo
Jing
shan
g H
uaxi
ang
Aut
o Pa
rts C
o., L
td.
Inte
rnal
and
ext
erna
l par
ts fo
r au
tom
obile
s
744,
346
(US$
26
,133
) N
ote
1
48,5
07 (U
S$
1,70
3)-
-
48,5
07 (U
S$
1,70
3)
-2.
6
-
126,
896
45
,544
-
STA
RC
O H
uanm
ei
Man
ufac
turin
g of
rim
s
69,6
12
(EU
R
2,00
0) N
ote
1
Not
e 9
- -
N
ote
9
9,54
433
.0
2,
340
10
2,32
0
-N
ote
9
Acc
umul
ated
Out
war
d R
emitt
ance
for
Inve
stm
ents
in M
ainl
and
Chi
na a
s of
Dec
embe
r 31
, 202
0
Inve
stm
ent A
mou
nt A
utho
rize
d by
th
e In
vest
men
t Com
mis
sion
, MO
EA
Upp
er L
imit
on th
e A
mou
nt o
f Inv
estm
ents
St
ipul
ated
by
the
Inve
stm
ent C
omm
issi
on, M
OE
A
(Not
e 5)
$
3,
255,
692
(U
S$
114,
303)
(N
ote
5)
$
9,
163,
879
(U
S$
319,
703)
(EU
R
1,66
0)
(Not
e 5)
Not
e 6
Not
e 1:
In
dire
ct in
vest
men
t in
mai
nlan
d C
hina
thro
ugh
a su
bsid
iary
in a
third
pla
ce.
Not
e 2:
D
iffer
ence
s bet
wee
n th
e pa
id-in
cap
ital a
nd a
ccum
ulat
ed o
utw
ard
inve
stm
ent f
rom
Tai
wan
are
resu
lted
from
div
iden
d re
inve
stm
ent a
nd c
ash
inje
ctio
n.
Not
e 3:
Th
e sh
are
of p
rofit
s (lo
sses
) is r
ecog
nize
d ba
sed
on th
e fin
anci
al st
atem
ents
aud
ited
by a
n in
tern
atio
nal a
ccou
ntin
g fir
m th
at c
olla
bora
ted
with
acc
ount
ing
firm
s in
Taiw
an.
Not
e 4:
Th
e sh
are
of p
rofit
s (lo
sses
) and
the
carr
ying
am
ount
of K
C w
ere
not d
iscl
osed
her
ein
as su
ch a
mou
nts w
ere
alre
ady
incl
uded
in th
ose
of K
GC
I.
Not
e 5:
Th
e di
ffer
ence
bet
wee
n th
e in
vest
men
t am
ount
of U
S$31
9,70
3 th
ousa
nd a
utho
rized
by
the
Inve
stm
ent C
omm
issi
on a
nd th
e ac
cum
ulat
ed o
utw
ard
rem
ittan
ce o
f US$
114,
303
thou
sand
for i
nves
tmen
ts in
mai
nlan
d C
hina
was
due
to d
ivid
end
rein
vest
men
t and
cas
h in
ject
ion.
Not
e 6:
Pe
r the
cer
tific
ate
of o
pera
tiona
l hea
dqua
rters
issu
ed b
y In
dust
rial D
evel
opm
ent B
urea
u of
MO
EA, t
he C
ompa
ny h
as n
o lim
itatio
n on
the
accu
mul
ated
rem
ittan
ce fo
r inv
estm
ents
in m
ainl
and
Chi
na.
Not
e 7:
Th
e pa
id-in
cap
ital o
f KC
and
par
t of p
aid-
in c
apita
l of K
T w
ere
incl
uded
in th
at o
f its
inve
stor
s and
, the
refo
re, t
hey
wer
e no
t inc
lude
d w
hen
calc
ulat
ing
the
inve
stm
ent a
utho
rized
and
the
inve
stm
ent r
emitt
ance
from
Tai
wan
to m
ainl
and
Chi
na.
Not
e 8:
Fo
reig
n cu
rren
cies
wer
e tra
nsla
ted
into
NTD
usi
ng sp
ot ra
tes a
s of D
ecem
ber 3
1, 2
020
or a
vera
ge e
xcha
nge
rate
s for
the
year
.
Not
e 9:
ST
AR
CO
Hua
nmei
was
indi
rect
ly a
cqui
red
via
busi
ness
com
bina
tion
and
its sh
are
capi
tal w
as in
crea
sed
thro
ugh
capi
tal i
njec
tion
of E
UR
1,00
0 th
ousa
nd b
y ST
AR
CO
Eur
ope
A/S
.
~ 242 ~

- 60 -
TABLE 8
KENDA RUBBER IND. CO., LTD. AND SUBSIDIARIES
INFORMATION OF MAJOR SHAREHOLDERS December 31, 2020
Name of Major Shareholder Shares
Number of Shares
Percentage of Ownership (%)
Yang Chi Jen 91,622,924 10.07 Yang Ying Ming 65,555,015 7.21 Fubon Life Insurance Co., Ltd. 49,416,761 5.43
~ 243 ~

- 61 -
KENDA RUBBER IND. CO., LTD.
THE CONTENTS OF STATEMENTS OF MAJOR ACCOUNTING ITEMS
Item Statement Index
Major Accounting Items in Assets, Liabilities and Equity Statement of cash and cash equivalents 1 Statement of inventories 2 Statement of changes in investments accounted for using the equity method 3 Statement of short-term borrowings 4 Statement of long-term borrowings 5
Major Accounting Items in Profit or Loss Statement of operating revenue 6 Statement of operating cost 7 Statement of manufacturing expenses 8 Statement of operating expenses 9
~ 244 ~

- 62 -
STATEMENT 1
KENDA RUBBER IND. CO., LTD.
STATEMENT OF CASH AND CASH EQUIVALENTS DECEMBER 31, 2020 (In Thousands of New Taiwan Dollars, Unless Specified Otherwise)
Item Amount Cash and cash on hand $ 427 Cash in banks
Checking accounts deposits 62 Demand deposits 157,002 Foreign deposits (1) 940,914 Time deposits (2) 295,197 $ 1,393,602
Note 1: Including US$29,111 thousand (US$1=NT$28.48), JPY15,487 thousand (JPY1=NT$0.28), GBP487 thousand (GBP1=NT$38.94), EUR731 thousand (EUR1=NT$34.81) and RMB14,456 thousand (RMB1=NT$4.37).
Note 2: Including US$5,000 thousand (US$1=NT$28.48) and RMB35,000 thousand (RMB1=NT$4.37).
~ 245 ~

- 63 -
STATEMENT 2
KENDA RUBBER IND. CO., LTD.
STATEMENT OF INVENTORIES - MANUFACTURING DECEMBER 31, 2020 (In Thousands of New Taiwan Dollars)
Amount
Item Cost Market Value
(Note) Finished goods $ 327,533 $ 456,372 Raw materials 227,197 231,666 Work in progress 134,209 233,805 Supplies 48,967 48,792 Merchandise 10,844 11,584 Inventory in transit 145,785 143,875 894,535 $ 1,126,094 Less: Allowance for impairment loss (41,635) $ 852,900
Note: Inventories are individually measured at the lower of cost or net realizable value.
~ 246 ~

- 64
-
TA
BL
E 3
KE
ND
A R
UB
BE
R IN
D. C
O.,
LT
D.
STA
TE
ME
NT
OF
CH
AN
GE
S IN
INV
EST
ME
NT
S A
CC
OU
NT
ED
FO
R U
SIN
G T
HE
EQ
UIT
Y M
ET
HO
D
FOR
TH
E Y
EA
R E
ND
ED
DE
CE
MB
ER
31,
202
0 (I
n T
hous
ands
of N
ew T
aiw
an D
olla
rs, U
nles
s Spe
cifie
d O
ther
wis
e)
Beg
inni
ng B
alan
ce
Dec
reas
e Sh
are
of P
rofit
Exc
hang
eD
iffer
ence
s on
Tra
nsla
tion
of
the
Fina
ncia
l St
atem
ents
of
Fore
ign
Oth
ers
E
ndin
g B
alan
ce
Mar
ker
Val
ue
or N
et A
sset
sN
ame
%
Am
ount
Incr
ease
(N
ote
1)
or L
oss
Ope
ratio
ns
(Not
e 2)
%
A
mou
nt
Val
ue
In
vest
men
ts a
ccou
nted
for u
sing
the
equi
ty m
etho
d
Su
bsid
iary
K
IC
10
0.00
$
13,0
43,7
17
$
-
$
(1,4
61,4
99)
$
76,3
25 $
75
,240
$
12,0
45
10
0.00
$
11,7
45,8
28 $
11
,748
,010
KV
100.
00
6,26
6,25
0
10
4,79
7
-
907,
573
(3
83,8
92)
(4
21)
10
0.00
6,
894,
307
7,
080,
904
KH
K
10
0.00
2,
903,
416
-
(152
,342
)
(516
,197
)
19,6
21
(712
)
100.
00
2,25
3,78
6
2,25
4,80
6K
A
10
0.00
1,
413,
919
-
-
13,0
20
(82,
453)
(2
1,31
4)
100.
00
1,32
3,17
2
1,45
5,74
2K
I
99.9
9
79
6,58
3
24
2,36
0
-
75,2
23
(60,
011)
(4
,447
)
99.9
9
1,
049,
708
1,
052,
068
KF
10
0.00
24
6,73
7
-
(3
0,85
3)
36,0
62
-
42
10
0.00
25
1,98
8
252,
259
KE
10
0.00
8,
780
-
-
3,28
1
388
-
10
0.00
12
,449
12
,449
$
24
,679
,402
$
347,
157
$
(1,6
44,6
94)
$
595,
287
$
(431
,107
) $
(1
4,80
7)
$
23,5
31,2
38 $
23
,856
,238
Not
e 1:
D
ecre
ase
in in
vest
men
ts re
fer t
o is
suan
ce o
f cas
h di
vide
nds a
nd re
mitt
ance
of d
ivid
ends
.
Not
e 2:
O
ther
s re
fer t
o un
real
ized
gai
ns (l
osse
s) o
n in
vest
men
ts in
equ
ity in
stru
men
ts a
t FV
TOC
I, re
mea
sure
men
t of d
efin
ed b
enef
it pl
ans
and
adju
stm
ents
for r
ealiz
ed a
nd u
nrea
lized
gai
ns (l
osse
s) o
n do
wns
tream
tran
sact
ions
with
sub
sidi
arie
s an
d as
soci
ates
.
~ 247 ~

- 65 -
STATEMENT 4
KENDA RUBBER IND. CO., LTD.
STATEMENT OF SHORT-TERM BANK BORROWINGS DECEMBER 31, 2020 (In Thousands of New Taiwan Dollars)
Creditor Type and Bank Loan Period
AnnualInterest
Rates (%) Amount Collateral or
Pledge Unsecured loans
Taipei Fubon Bank 2021.03.24 0.65 $ 100,000 None Mizuho Bank Co., Ltd. 2021.01.15 0.68 100,000 None $ 200,000
~ 248 ~

- 66 -
STATEMENT 5
KENDA RUBBER IND. CO., LTD.
STATEMENT OF LONG-TERM BANK BORROWINGS DECEMBER 31, 2020 (In Thousands of New Taiwan Dollars)
Creditor Bank Maturity Date
(Note) Amount Collateral or
Pledge Unsecured loans
The Shanghai Commercial & Saving Bank, Ltd. 2023.12.11 $ 300,000 None CTBC Bank Co., Ltd. 2024.10.04 375,150 None Mizuho Bank Co., Ltd. 2021.03.19 500,000 None O-Bank Co., Ltd. 2026.08.01 965,582 None Taipei Fubon Bank 2024.09.15 978,839 None Taishin International Bank Co., Ltd. 2022.09.27 800,000 None Bank Sinopac Company Limited 2022.09.20 262,500 None MEGA International commercial bank Co., Ltd. 2022.09.25 675,000 None Agriculture Bank of Taiwan 2022.12.25 600,000 None Bank of Taiwan 2023.08.13 1,300,000 None Hua Nan Commercial Bank, Ltd. 2026.09.20 1,398,589 None Chang Hwa commercial Bank Ltd. 2025.09.28 600,000 None Cathay United Bank 2022.09.26 1,000,000 None KGI Commercial Bank Co., Ltd. 2022.03.30 1,000,000 None HSBC Bank Taiwan Limited 2022.10.03 1,000,000 None The Export-Import Bank of the Republic of China 2026.05.22 1,133,200 None 12,888,860 Less: Current portion of long-term borrowings (1,795,070) $ 11,093,790
Note: The maturity date listed above is the last maturity date of multiple borrowings.
~ 249 ~

- 67 -
STATEMENT 6
KENDA RUBBER IND. CO., LTD.
STATEMENT OF OPERATING REVENUE FOR THE YEAR ENDED DECEMBER 31, 2020 (In Thousands of New Taiwan Dollars)
Quantity Item (Thousands) Amount
Bicycle tires 3,302 $ 496,208 Motorcycle and bias tires 1,323 1,545,362 Tubes 15,380 630,309 Radial tires 4,450 2,306,259 Others 67,313 409,549
5,387,687 Less: Sales return (205)
Sales allowance (8,936)Sales revenue 5,378,546 Service revenue 567,740
Operating revenue $ 5,946,286
~ 250 ~

- 68 -
STATEMENT 7
KENDA RUBBER IND. CO., LTD.
STATEMENT OF OPERATING COSTS FOR THE YEAR ENDED DECEMBER 31, 2020 (In Thousands of New Taiwan Dollars)
Item Amount
Cost of merchandise Merchandise at the beginning of the year $ 11,679 Purchase 117,668 Merchandise at the end of the year (9,688) Less: Inventory scraps (1,706) Others (64)
Total merchandise sold $ 117,889 Cost of goods manufactured
Raw materials at the beginning of the year 153,252 Material purchased 2,296,179 Less: Raw material at the end of the year (226,401)
Raw material sold (234,720) Others (848) Raw material consumed 1,987,462
Direct labor 563,818 Manufacturing overhead 794,414
Manufacturing cost 3,345,694 Add: Work in progress at the beginning of the year 118,741
Inventory overage 777 Others 4
Less: Work in process at the end of the year (111,544) Inventory shortage (39) Transfer to manufacturing cost (18,288) Transfer to operating expense (2,334) Others (8,708) (21,391) Cost of goods manufactured 3,324,303
Add: Finished goods at the beginning of the year 365,322 Inventory overage 34
Less: Finished goods at the end of the year (315,054) Inventory shortage (36) Inventory scraps (3,584) Transfer to operating expense (1,985) Others (2,123)
42,574 Total cost of revenue 3,484,766 Other cost of revenue
Cost of raw material sold 234,720 Cost of supplies sold 20,308
Unallocated fixed manufacturing overhead 8,630 Inventory shortage (overage) (752) Inventory scraps 5,648 Others (3,827) Total other cost of revenue 264,727 Service cost 243,617
Cost of revenue $ 3,993,110
~ 251 ~

- 69 -
STATEMENT 8
KENDA RUBBER IND. CO., LTD.
STATEMENT OF MANUFACTURING EXPENSE FOR THE YEAR ENDED DECEMBER 31, 2020 (In Thousands of New Taiwan Dollars, Unless Specified Otherwise)
Item Amount Depreciation $ 229,085 Indirect labor 140,033 Fuel expense 98,211 Utilities 112,443 Repairs and maintenance 62,986 Auxiliary materials 43,174 Others (Note) 117,112 $ 803,044
Note: The balance for each items did not exceed 5% of the account balance.
~ 252 ~

- 70 -
STATEMENT 9
KENDA RUBBER IND. CO., LTD.
STATEMENT OF OPERATING EXPENSES FOR THE YEAR ENDED DECEMBER 31, 2020 (In Thousands of New Taiwan Dollars)
Item Marketing General and
AdministrativeResearch and Development
ExpectedCredit Losses Total
Salary $ 177,271 $ 209,074 $ 274,777 $ - $ 661,122Advertisement 103,737 118 7 - 103,862Taxes 68,969 16,542 1,392 - 86,903Packing expense 67,048 - - - 67,048Depreciation 42,329 6,612 24,909 - 73,850Import/export
expense 37,329 - - - 37,329Shipping expense 32,709 - - - 32,709Insurance 25,599 16,456 21,560 - 63,615Others 54,378 45,436 84,794 5,959 190,567Service costs (13,841) (101,076) (16,843) - (131,760) $ 595,528 $ 193,162 $ 390,596 $ 5,959 $ 1,185,245
~ 253 ~

252
VI. Financial difficulty experienced by the Company or its affiliates during the most recent year and as of the print date of this annual report: none
Seven. Review and analysis of financials and financial performance and risks
I. Financial status: Main reasons and material effects of significant change in assets, liabilities and shareholder equity during the
most recent year and the responding plans going forward
Comparison and Analysis of Financial Status Unit : NTD Thousands
Year
Item 2020 2019
Difference Amount %
Current asset 22,572,473 23,140,356 (567,883) -2.45%Financial assets at FVTPL 578,419 515,415 63,004 12.22%Property, Plant and Equipment
14,543,978 14,246,939 297,039 2.08%
Intangible asset 60,826 74,095 (13,269) -17.91%Other assets 4,634,343 4,042,980 591,363 14.63%Total assets 42,390,039 42,019,785 370,254 0.88%Current liability 10,038,519 8,473,776 1,564,743 18.47%non-current liabilities 13,241,793 14,763,241 (1,521,448) -10.31%Total liabilities 23,280,312 23,237,017 43,295 0.19%Equity attributable to
shareholders of the parent 19,109,709 18,782,750 326,959 1.74%
Share capital 9,094,100 8,744,300 349,800 4.00%Additional paid-in capital 41 41 0 0.00%Retained earnings 11,616,570 11,368,463 248,107 2.18%Other equities (1,601,002) (1,330,054) (270,948) 20.37%Total Equity 19,109,727 18,782,768 326,959 1.74%
Analysis on +/- change by at least 20% Other equity: due to an increase in translation difference of overseas operations
~ 254 ~

253
II. Financial performance: Main reasons for significant change in revenues, operating profits and profits before tax during the most recent two years, expected sales and basis for the expectation, possible influence on the Company’s finance and business going forward, and responding plans
(I) Comparison and Analysis of Operating Performance Comparison and Analysis of Operating Performance
Unit: NTD Thousands
Year Item 2020 2019
Change
Amount % Operating income 30,260,185 32,127,436 (1,867,251) -5.81%Operating cost 22,910,212 25,570,683 (2,660,471) -10.40%Gross profit 7,349,973 6,556,753 793,220 12.10%Operating expenses 4,876,452 5,302,222 (425,770) -8.03%Profit from operations 1,535,939 1,254,531 281,408 22.43%Non-operating income and expense (244,476) 112,447 (356,923) -317.41%Profit before tax from continuing operations
1,291,463 1,366,978 (75,515) -5.52%
income tax expense 319,238 353,419 (34,181) -9.67%Income from continuing operation 972,225 1,013,559 (41,334) -4.08%Profit (loss) from discontinued operations 0 0 0 0.00%Current period net profit 972,225 1,013,559 (41,334) -4.08%Other comprehensive income (net of tax) (295,494) (372,461) 76,967 -20.66%Total comprehensive income in the current period
676,731 641,098 35,633 5.56%
Net profit attributable to shareholders of the parent
972,225 1,013,562 (41,337) -4.08%
Analysis on +/- change 1. Higher profits during the period primarily due to a reduction in
operating costs 2. Non-operating income and expense: primarily due to other gains or losses 3. Other comprehensive income (net of tax): lower translation difference for overseas operations
(II) Change in gross profits:gross profit affected by the reduction in operating costs less than the
reduction in revenues
~ 255 ~

254
III. Cash flows: analysis and explanation of cash flow changes during the most recent year; improvement plan for inadequate liquidity
; and cash flow liquidity for the next year
(I) Liquidity analysis for the most recent two years Unit: NTD Thousands
YearItem 2020 2019 Change (%)
Operating cash flow ratio 27.78% 16.28% 70.64%
Cash flow adequacy ratio 73.71% 80.86% -8.84%Cash re-investment ratio 5.53% 1.13% 389.38%
Analysis on +/- change
1. Higher operating cash flow ratio due to the increase in net cash flows from operating activities
greater than the increase in current liabilities
2. Higher cash re-investment ratio due to a significant increase in cash flows from operating
activities and a reduction in cash dividends
(II) Cash flow liquidity for the next year Unit: NTD Thousands
Cash balance
at the beginning
of the period
Expected
net cash flows
from
operating activities
for the year
Expected
cash outflows
for the year
Expected
cash surplus
(gap)
Measures to make up
the cash gap
Investment plan
Financingplan
8,485,408 2,924,922 2,381,161 9,029,169 - -
IV. Impact of major capital expenditures on finance and business during most recent year
~ 256 ~

255
(I) Utilization and funding sources of major capital expenditures Unit: NTD Thousands
Project Actual or expected funding sources
Actual or expected completion dates
Total amount required
Actual or expected capital utilization
2020(actual)
2021(expected)
Equipment addition and replacement
Internal capital and bank loans 2020 1,340,245 1,340,245
Equipment addition and replacement
Internal capital and bank loans 2021 5,053,603 5,053,603
(II) Expected possible benefitsIncrease of production capacity for passenger car tires, motorcycle tires, and bicycle tires in
order to boost the Company’s market shares in these markets
V. Investment policies, main causes for profit or loss and improvement plans in the most recent year and investment plans for the coming year
Investment policies in the most recent years The Company continues to invest in facility expansion for its core business in order to boost
capacity, sales and profits.
Investment plans for the coming year The Company continues to carefully evaluate investment projects and develop the global
market in line with incremental capacity, in order to grow revenues and profits.
VI. Risks
(I) Impact of interest rate changes, exchange rate changes, and inflation on the Company’s profit and loss and responding measures going forward
Exports account for 95% of the Company’s revenues and imports of raw materials and other
materials account for 97% of the total purchases. A relative high proportion of imports and
exports is in US dollars and Euro. Most of our customers are overseas. Therefore, exchange rate
~ 257 ~

256
changes affect the Company’s profits.
As a principle, the Company seeks to hedge currency risks and does not speculate. Finance
personnel keeps a close eye on movements of the currency market and change of financial
information, in order to stay on top of exchange rate directions. Meanwhile, the relation with
banks is strengthened and advice from foreign exchange banks is taken into account to ensure
reasonable currency hedging activities.
The Company regularly reviews borrowing rates and stays in close conversations with banks
to obtain favorable interest rates in the market.
(II) Policies regarding highly-risky, highly-leveraged investments, lending,
endorsements and guarantees, and derivatives trading; main reasons for related
profits or losses, and responding measures
Endorsements and guarantees are provided by the Company to indirect investees
according to the terms and conditions agreed with financial institutions. This may be dealt by a
local branch of the financial institution within the approved credit limit or with L/C loans
guaranteed by the Company from another institution designated by the lending bank.
The Company’s lending, endorsements and guarantees are in adherence to regulations set
by competent authorities and relevant management rules established internally. We are not
involved in trading of derivatives.
(III) R&D plans and expected R&D expenses
1. Establishment of a high-speed consistency and low rolling resistance system for tires
(NT$40 million)
2. Application and accreditation of green and sustainable materials (NT$30 million)
3. R&D of smart tires (NT$20 million)
4. Development of all steel STR trailer tires (NT$30 million)
5. Testing equipment for dynamic fatigue and tilting for bicycles and establishment of the
testing technology (NT$10 million)
6. Extruders for the laboratory (NT$2 million)
7. A low VOC laboratory and testing method establishment (NT$10 million)
8. Establishment of tire impact testing system and testing method (NT$10 million)
~ 258 ~

257
(IV) Impact of major policy and law changes, domestic and overseas, on the Company’s finance and business and responding measures: none
(V) Impact of technology and industry changes on the Company’s finance and business and responding measures: none
(VI) Impact of corporate image changes on the Company’s crisis management and responding measures: none
(VII) Expected benefits and potential risks of M&As ongoing, and responding measures: none
(VIII) Expected benefits and potential risks of facility expansions, and responding measures: increase of sales and operating profits
(IX) Risks associated with purchase or sales concentration and responding measures: none
(X) Impact and risk of significant transfers or change of stakes by directors, supervisors or major shareholders with at least 10% holdings, and responding measures: none
(XI) Impact and risk of change of control, and responding measures: none
(XII) Litigation or non-litigation events: It is necessary to describe major litigations, non-litigations or administrative litigations with confirmed judgments or still ongoing involved by the Company or any of its directors, supervisors, General Manager, de facto responsible persons, major shareholders with at least 10% stakes or any of the subordinated companies. If the outcome may have material influence on shareholders’ equity or securities prices, it is necessary to disclose the matters in contention, underlying amounts, start dates of the litigations, main parties involved and progress as of the print date of the annual report: none
The Company previously had an exclusive distribution agreement with Gabjohn in Nigeria.
Due to the sales condition, the trading companies commissioned by the Company switched to
other distributors in Nigeria to sell our products. Gabjohn filed a lawsuit against the Company
regarding the breach of the exclusive distribution contract and demands a compensation of
~ 259 ~

258
about NT$90 million (or NGN 500 million). For the local liaison with regard to this
litigation, the Company entered a litigation contract with Chu Mao Intellectual Property
Limited for Nigeria so that Chu Mao Intellectual Property Limited can handle the litigation
via AdenijiKazeem & Co., a local intellectual property law firm in Nigeria. According to
the regular updates from Chu Mao Intellectual Property Limited on the litigation, the case is
still with the high court. As of the publication date for 2020 financial report, it has not been
possible to reasonably estimate the possible outcome of the dispute regarding distribution
rights.
(XIII) Other important risks and responding measures Risk management policy and management guidelines
Major issues Risk assessment items
Risk management policy and management guidelines
Environment
Safety, health and environmental
risks
1. An environmental safety and health management was established according to the ISO 14001 and ISO 45001/TOSHMS (CNS 45001) standards.
2. The environmental safety and health management system (including environmental safety and health policies and targets) must be combined with factory operations and implemented in the PDCA (Plan, Do, Check and Action) cycle.
3. A COVID-19 taskforce has been established to implement and manage measures put in place by the Taiwan Centers for Disease Control.
In response to climate change
risks:
1. To ensure the supply chain security, we maintain at least two and three suppliers in different geographic locations for each material. We proactively increase inventory and look for second suppliers for the materials we rely on single suppliers, , in order to have the flexibility to respond to stock-out risks due to international situation changes, extreme climates and significant natural disaster.
2. Greenhouse gas emission reduction 3. To mitigate product transportation risks, there are safety
inventories at production sites and business premises around the world. Where we do not have presences, we coordinate with customers to ensure a safety level of inventory. These efforts aim to reduce the risk of supply shortage by flexibly responding extreme climate and major natural disasters.
~ 260 ~

259
Major issues Risk assessment items
Risk management policy and management guidelines
Social
Product risks
1. Quality meetings are convened each month for management, control and review of yield enhancements.
2. A robust channel has been established for customer complaints, so that any quality concern from existing customers and end consumers can be dealt with properly and appropriately.
3. Product liability insurance is purchased for production and selling activities, to ensure our customers in the distribution and use of our products.
4. Pursuant to relevant laws on tires, we formulate specifications for raw materials and products, in order to produce non-polluting and environmental friendly tires of lightweight, with low rolling resistance and high wet grip performance. This reduces the unit consumption of materials for tires and lowers energy consumption of vehicles and emission of greenhouse gases.
Market risk
1. We stay on top of market prices, product quality and industry trends by keeping an eye on competition, in order to stay in the game.
2. We constantly assess the financial health and default risk of customers, in order to avoid losses.
Raw material risks
1. Assessments are conducted on the demand and supply in the raw materials market, in order to avoid adverse effects on price-performance ratio due to price increases reflective of costly raw materials.
2. We screen and select suppliers based on assessment on their financial health and default risks. We carefully review whether the quality of raw materials meets regulatory standards, so as to avoid losses due to default or defect of raw materials.
Employee risks
1. Planning and implementation of a robust employee benefit policy and a retirement system
2. Asking employees to adhere to non-compete clauses and sign confidentiality agreements, to avoid risks
3. Oversight and compliance with laws and regulations and establishment of a channel for employees to communicate and complain
Corporategovernance
Legal compliance risks
1. Business units encode the laws and regulations they should comply with into internal rules and regularly conduct self-evaluations on legal compliance.
2. Decision-making is proceeded according to the hierarchical structure of authorization. Cross-functional meetings are convened when necessary.
3. Legal Department handles risk control and attorneys are hired to provide advice on legal issues.
~ 261 ~

260
Major issues Risk assessment items
Risk management policy and management guidelines
Financial risks
1. Planning and management of sufficient working capital. 2. Control of exchange rate risks and adjustment of selling prices and
transaction currencies given a certain degree of exchange rate volatility.
3. Focus on the core business, with investments only in low-risk instruments for hedging purposes. No involvement in trading of derivatives.
4. Stringent rules in place and compliant with laws regarding risks in endorsement, guarantee and lending.
Information security risks
Regulation of information access authorization; implementation of IT system control, factory access control, premise access control in order to manage the risks associated with trade secrets.
VII. Other important matters: none
~ 262 ~

Eig
ht. S
peci
al N
otes
& S
uppl
emen
tary
Info
rmat
ion
I.
Dat
a on
affi
liate
d co
mpa
nies
(I) O
rgan
izat
ion
of a
ffilia
ted
com
pani
es
1. K
enda
Rub
ber I
nd. C
o., L
td.’s
Org
aniz
atio
n C
hart
for A
ffilia
ted
Com
pani
es
Not
e A. C
ompa
nies
con
trolle
d an
d su
bord
inat
ed a
s inf
erre
d ac
cord
ing
to in
ferr
ed b
y A
rticl
e 36
9-3
of th
e C
ompa
ny A
ct
B. C
odes
exp
lain
ed:
Cod
e C
ompa
ny n
ame
Loca
tion
C
ode
Com
pany
nam
e Lo
catio
n
KD
K
END
A R
UB
BER
IND
.. C
O.,
LTD
. Ta
iwan
K
JI
KEN
JOU
INV
ESTM
ENT
CO
.LTD
. M
aurit
ius
KA
A
MER
ICA
N K
END
A R
UB
BER
IND
.. C
O.,
LTD
O
hio,
USA
K
GH
K
END
A G
LOB
AL
HO
LDIN
G C
O.,
LTD
. C
aym
an Is
.
AD
I A
MER
ICA
NA
DEV
ELO
PMEN
T, IN
C.
Ohi
o, U
SA
KG
CI
KEN
DA
GLO
BA
L H
OLD
ING
(CH
INA
) CO
., LT
D.
Kun
shan
, Jia
ngsu
KV
K
END
A R
UB
BER
(VIE
TNA
M) C
O.,
LTD
. D
ong
Nai
, Vie
tnam
K
C
KEN
DA
RU
BB
ER (C
HIN
A) C
O.,
LTD
. K
unsh
an, J
iang
su
KI
PT. K
END
A R
UB
BER
IND
ON
ESIA
In
done
sia
KS
KEN
DA
RU
BB
ER (S
HEN
ZHEN
) CO
., LT
D.
Shen
zhen
, G
uang
dong
KE
KEN
DA
RU
BB
ER IN
DU
STR
IAL
CO
, EU
RO
PE G
mbH
O
lden
burg
Ger
man
K
HK
K
END
A R
UB
BER
(HO
NG
KO
NG
) CO
., LT
D.
Hon
g K
ong
KF
KEN
FON
G IN
DU
STR
IAL
CO
., LT
D.
Ta
iwan
K
T K
END
A R
UB
BER
(TIA
NJI
N) L
IMIT
ED
Jinh
ai, T
ianj
in
KIC
K
END
A IN
TER
NAT
ION
AL
CO
RPO
RAT
ION
C
aym
an Is
. ST
AR
CO
ST
AR
CO
EU
RO
PE A
/S
Aar
hus,
Den
mar
k
KG
I K
END
A G
LOB
AL
INV
ESTM
ENT
CO
RPO
RAT
ION
M
aurit
ius
100%
13
%
100%
100%
40%
86.3
6%
13.6
4%
100%
100%
100%
100%
100%
100%
KD
KIC
KH
K
KT
KS
KC
KG
H
KG
I
KJI
KE
KF
60%
KA
KV
100%
AD
I 100%
KG
CI
KI
99.9
9%
100%
STA
RC
O
~ 263 ~

262
2. Basic data of affiliated companies Unit: Thousands
Company name Establishment date Address Paid-in Capital Main businesses or
production activities AMERICAN KENDA RUBBER IND. CO., LTD.
1991.02.11 7095 Americana Parkway Reynoldsburg, OHIO 43068 USA USD 9,000 Investment and trading
AMERICANA DEVELOPMENT,INT.
1998.11.09 Ohio USA USD 20,000
Production of wheel rims and tires
Assembly and distribution of wheel
rims
KENDA RUBBER (VIETNAM) CO., LTD.
1997.04.03
Cho Chieu Street, Ho Nai 3 Industrial Zone, Trang Bom District, Dong Nai Province, Vietnam Industrial Zone
USD 67,680 Production and sale of a variety of tires
PT. KENDA RUBBER INDONESIA
2014.12.10 J1. Raya Cikande Rangkasbitung KM.5,Desa kareo, Kec. Jawilan Serang 42177 Benten
USD 52,999 Production and sale of a variety of tires
KENDA RUBBER INDUSTRIAL CO, EUROPE GmbH
2013.04.19 Greimelstraße 28 83236 Übersee Germany EUR 25 Marketing and planning
KENFONG INDUSTRIAL CO., LTD.
2013.11.22 No. 2, Section 1,Chungshan Road, Yuanlin City, Changhua County NTD 199,000 Selling of a variety of
tires
KENDA INTERNATIONAL CORPORATION
1999.03.30
P.O.Box 31119, Grand Pavilion,Hibiscus Way,802 West Bay Road, Grand Cayman, KY1-1205,Cayman Islands
USD 81,753 Investment consultancy and trading
KENDA GLOBAL INVESTMENTCORPORATION
2003.12.11 Level 3, Alexander House,35 Cybercity,Ebene, Mauritius USD 1,703 Investment consultancy
and trading
KENDA GLOBAL HOLDING CO.,LTD.
1997.01.03
P.O.Box 31119, Grand Pavilion,Hibiscus Way,802 West Bay Road, Grand Cayman, KY1-1205,Cayman Islands
USD 112,050 Investment consultancy and trading
KENDA GLOBAL HOLDING (CHINA) CO., LTD.
2014.04.16 No. 2, Kun Jia Road, Development Zone, Kunsan City, Jiangsu Province USD 161,000 Investment and trading
KENDA RUBBER (CHINA) CO., LTD.
1994.03.25 No. 2, Kun Jia Road, Development Zone, Kunsan City, Jiangsu Province USD 70,000 Production and sale of a
variety of tires
KENDA RUBBER (SHENZHEN) CO., LTD.
1990.09.07 Gongye West Road, Dalang Sub-District, Baoan District, Shenzhen City
USD 25,000 Production and sale of a variety of tires
KENDA RUBBER (HONG KONG) CO., LTD.
1991.05.07
No. 51-63, Container Port Road, Kwai Chung, New Territories, Hong Kong Room 613, 6/F, Kwai Shun Industrial Centre
HKD 100
Investment and tradingUSD 30,600
KENDA RUBBER (TIANJIN) LIMITED
2007.12.06
South District, Jinghai Economic Development Zone, Jinghai District , Tianjin No. 6/8, Taian Dao
USD 220,000 Production and sale of a variety of tires
STARCO EUROPE A/S 2017.10.02 Sintrupvej 71B, st.tv., 8220 Brabrand DKK 10,320
Production of wheel rims and tires
Assembly and distribution of wheel
rims
3. Data inferring the same shareholders for controlling and subordinated companies: none
4. Businesses involved by the group and its affiliated companies: general investment, international trade
~ 264 ~

263
5. Names and shareholders of directors, supervisors, and General Managers of affiliated companies
Company name Title Name or representative
Shareholding
No. of shares (capital contribution)
Shares Ratio(contribution
as % of capital)
AMERICAN KENDA RUBBER IND. CO., LTD.
Director Yang, Chi-Jen Yang Shih,Ching-Huey Kenda holds 500 shares 100%
AMERICANA DEVELOPMENT, INC.
Director Yang, Chi-Jen Yang Shih,Ching-Huey American Kenda Rubber holds 1,500 shares 100%
KENDA RUBBER (VIETNAM) CO., LTD.
Director
President
Yang, Ying-Ming; Yang, Chi- Jen; Chang, Hong-Der; Chen, ChaoJung; Huang Feng-ChouHuang Feng-Chou
(Kenda contributed US$67,680,000 in capitalization) (100%)
PT. KENDA RUBBER INDONESIA
Director
Supervisor
President
Chen, Chao-Jung; Tseng, Shen -Tung; Huang, Feng Chou Yang, Ying-Ming; Yang, Chi- Jen; Chang, Hong-Der Tseng, Sheng-Tun
(Kenda contributed US$52,999,000 in capitalization) (99.99%)
KENDA RUBBER INDUSTRIAL CO, EUROPE GmbH
Director Yang, Chi-Jen (Kenda contributed €25,000 in capitalization) (100%)
KENFONG INDUSTRIAL CO., LTD.
Director
Supervisor
Yang, Ying-Ming; Yang, Chi- Jen; Chen, Cha-Jung Chang, Hong-Der
Kenda holds 19,900,000 shares 100%
KENDA INTERNATIONAL CORPORATION
Director Yang, Ying Ming Yang, Chi Jen
(Kenda contributed US$ 81,753,000 in capitalization) (100%)
KENDA GLOBAL INVESTMENTCORPORATION
Director Yang, Ying-Ming Chen, Chao-Jung
(KENDA INTERNATIONAL CORPORATION contributed
US$1,703,000 in capitalization)(100%)
KENDA GLOBAL HOLDING CO., LTD.
Director Yang, Ying-Ming Yang, Chi-Jen
(KENDA INTERNATIONAL CORPORATION contributed
US$112,050,000 in capitalization)(100%)
KENDA GLOBAL HOLDING (CHINA) CO., LTD.
Director
SupervisorPresident
Yang, Ying-Ming; Yang, Chi- Jen; Chen, Chao-Jung Chang, Hong-Der Lin, Chien-Liang
(KENDA GLOBAL HOLDING CO., LTD. contributed US$161,000,000 in
capitalization)(100%)
KENDA RUBBER (CHINA) CO., LTD.
Director
SupervisorPresident
Yang, Ying-Ming; Yang, Chi- Jen; Chang, Hong-Der Chen, Chao-Jung Lin, Chien-Liang
(KENDA GLOBAL HOLDING (CHINA) CO., LTD.contributed US$ 70,000,000 in
capitalization)(100%)
KENDA RUBBER (SHENZHEN) CO., LTD.
Director
President
Yang, Ying-Ming Yang, Chi-Jen Chen, Chao-Jung Yang, Jui-Wen
(KENDA GLOBAL HOLDING CO., LTD. contributed US$1,000,000 in capitalization) (40%)
(KENDA RUBBER (HK) CO., LTD.contributed US$1,500,000 in capitalization) (60%)
KENDA RUBBER (HONG KONG) CO., LTD.
Director Yang, Ying-Ming (Kenda contributed US$ 30,600,000 in
capitalization)Kenda contributed HK$100,000 in
capitalization)
(100%)
KENDA RUBBER (TIANJIN) LIMITED
Director
SupervisorPresident
Yang, Ying-Ming Yang, Chi-Jen Chen, Chao-Jung Chang, Hong-Der Lai, Hsi-Jung
(KENDA GLOBAL HOLDING (CHINA) CO., LTD.
contributed US$190,000,000 in capitalization)
(86.36 %)
(KENDA RUBBER (HK) CO., LTD.contributed US$30,000,000 in
capitalization)(13.64 %)
STARCO EUROPE A/S DirectorYang, Ying-Ming Yang, Chi-Jen Jeffrey Pizzola
(KENDA GLOBAL INVESTMENT CORPORATION contributed€ 6,935,916 in
capitalization)(100%)
~ 265 ~

264
6. Operational status of affiliated companies: financial standing and operational results of affiliated companies
Unit: NTD Thousands
Company name Capitalization Total assets Total liabilities Net Operating
income Operating
profitProfit or loss (net of tax)
Earningsper share
(NT$)(net of
tax)
KENDA RUBBER (SHENZHEN) CO., LTD. 714,415 3,694,516 823,012 2,871,504 1,732,106 (145,851) (798,123) (31.92)
AMERICAN KENDA RUBBER IND. CO., LTD. 268,598 5,111,904 3,656,162 1,455,742 10,773,301 260,573 12,680 1.41
KENDA RUBBER (HONG KONG) CO., LTD. 907,219 2,385,398 130,592 2,254,806 0 (113) (516,198) (16.86)
KENDA RUBBER (CHINA) CO., LTD. 2,252,262 7,579,000 1,134,521 6,444,479 6,677,025 549,115 422,048 6.03
KENDA GLOBAL HOLDING CO., LTD. 3,578,118 11,499,383 87,570 11,411,813 0 (2,140) (57,414) (0.51)
KENDA RUBBER (VIETNAM) CO., LTD. 2,121,380 8,893,650 1,812,747 7,080,903 5,839,743 1,128,366 979,711 14.41
KENDA INTERNATIONAL CORPORATION 2,454,785 11,851,562 103,552 11,748,010 0 (219) 76,327 0.93
KENDA GLOBAL INVESTMENTCORPORATION
55,293 340,429 16,457 323,972 0 (1,718) 133,863 78.60
KENDA RUBBER (TIANJIN) LIMITED 6,870,512 4,493,851 552,056 3,941,795 2,709,303 (162,062) (148,405) (0.67)
KENDA RUBBER INDUSTRIAL CO, EUROPE GmbH
976 19,392 6,943 12,449 93,310 2,320 3,281 131.23
KENFONG INDUSTRIAL CO., LTD. 199,000 457,201 204,942 252,259 679,355 43,037 36,062 0.18
KENDA GLOBAL HOLDING (CHINA) CO., LTD. 5,057,582 10,271,123 652 10,270,471 0 (437) 281,295 1.75
PT. KENDA RUBBER INDONESIA 1,660,346 1,745,997 693,911 1,052,086 817,013 (9,303) 75,224 1.42
STARCO EUROPE A/S 49,563 2,661,475 2,410,701 250,774 3,002,528 83,597 61,985 38.03
Note: All the above numbers are converted at exchange rates on the year-end reporting date.
~ 266 ~

265
(II) Consolidated financial statements of affiliated companies For the Company in 2020 (from January 1, 2020 to December 31, 2020), the entities to be
included in the consolidated financial statements of affiliated companies according to the Criteria Governing Preparation of Affiliation Reports, Consolidated Business Reports and Consolidated Financial Statements of Affiliated Enterprises are identical with the entities to be included in the parent’s consolidated financial statements under the International Financial Reporting Standards (IFRS) 10. As the consolidated financial statements of affiliated companies are disclosed in the parent’s consolidated financial statements, the consolidated financial statements of affiliated companies are not separately prepared. (As above the statement for consolidated financials of affiliated companies)
(III) Relation reports: none
II. Private placement of marketable securities during the most recent year and as of the print date of this annual report: None
III. Possession or disposal of the Company’s shares by subsidiaries during the most recent year and as of the print date of this annual report: none
IV. Other required supplementary information The Company does not invest in financial instruments other than shares and depositary receipts.
Therefore, hedge accounting is not required.
~ 267 ~

CHAIRMANYANG, CHI-JEN
★Spokesperson Name: Kuei-Chun LiuTitle: Assistant Vice President, FinanceTelephone: (04) 8345171E-mail:[email protected]
★Deputy Spokesperson Name: Ching-Hui WuTitle: Finance ManagerTelephone: (04) 8345171E-mail:[email protected]
★Addresses and telephone numbers of Headquarters and factory sites:Headquarters: No. 146, Section 1, Chung Shan Road, Yuanlin City, Changhua CountyTelephone: (04) 8345171-82 Fax: (04) 8331865Website: http://www.kendatire.comMain Factory: No. 146, Section 1, Zhongshan Road, Yuanlin City, Changhua CountyTelephone: (04) 8345171-82 Fax: (04) 8331865Yunlin Factory: No. 50, Yanping Road, Citong Village, Citong Township, Yunlin County Telephone: (05) 5845271-2 Fax: (05) 5849325Taipei Office: 11F, Rear Building, No. 201-24, Dunhua North Road, Taipei City Telephone: (02) 27153125-7 Fax: (02) 27198900
★Stock transfer agentName: Transfer Agency Department, CTBC BankAddress: 5F, No. 83, Section 1, Chongqing South Rd., Zhongzheng Dist., Taipei City Telephone: (02) 6636-5566 Website: https://www.ctbcbank.com
★Financial statements auditors for the most recent year Accounting firm: Deloitte & Touche TaiwanAuditors: Wang, Yi-Wen and Tseng, Done-Yuin, CPA Address: 20F, No. 100, Songren Road, Taipei City Telephone: (02)2725-9988Website: https:// www.deloitte.com.tw
KENDA RUBBER IND.CO., LTD.


