Embed Size (px)
Citation preview
Patubas December 2019
Patubas is a Hiligaynon word for
“product” or “fruit”. It is a fitting description for this multidisciplinary research journal which is indeed, a product or fruit of labors of research “seekers” of truth in its varied dimensions.
Patubas December 2019
Patubas
MULTIDISCIPLINARY RESEARCH JOURNAL CENTRAL PHILIPPINE UNIVERSITY
ILOILO CITY, PHILIPPINES Volume 14, Number 1, December 2019
Editorial Board
Chairperson: Merle L. Junsay, Ph.D.
Members: Ilda G. Borlongan, Ph.D.
Jaime C. Cabarles, Jr., Ph.D. Reynaldo N. Dusaran, D.R.Dev. Nicolas G. Guanzon, Jr., Ph.D.
Hope G. Patricio, MSS Aries Roda D. Romallosa, Ph.D.
Mary O’ T. Penetrante, D.M.
Director
Ma. Ligaya Villarias-Caniel
Secretary
Patubas December 2019
BOARD OF REFEREES
ROLANDO A. ALIMEN, Ph. D. John B. Lacson Foundation Maritime University, Molo, Iloilo City
ROSANA GRACE BELO-DELARIARTE, Ed. D. West Visayas State University, Lapaz, Iloilo City
EDGARDO D. CRUZ, Ph.D. University of Southern Philippines, Davao City
JOEL M. DURBAN, Ph.D.
SABYASACHI MAJUNDAR, Ph. D. Country Head, GEIST International Foundation, India Chapter Guest Faculty, West Bengal University, Barasat, Kolkata, India
VICENTE C. HANDA, Ph.D. Research, Extension and Training
West Visayas State University, Lapaz, Iloilo City
MANUEL C. PALADA, Ph. D. ASHS-2005 Outstanding International Horticulturist
Visiting Professor, Central Philippine University, Jaro, Iloilo City
Patubas December 2019
TABLE OF CONTENTS
PERCEPTIONS OF THE APPLICATIONS OF
LEADERSHIP STYLES ACROSS SUB-SAHARAN AFRICA
George R. West and Tariku Fufa Gemechu Page 1
NITRITE CONTENT OF PROCESSED MEAT PURCHASED IN
PUBLIC MARKETS AND GROCERY STORES AROUND
ILOILO CITY
Jun Ozbert M. Haguisan and Ann Marie P. Alguidano Page 32
PHENOMENOLOGICAL STUDY ON INFANT CARE AMONG TEENAGE MOTHERS
Julieta H. Boteros and Novie Joy C. Soledad Page 56
AWARENESS, AVAILMENT, ASSESSMENT AND
IMPORTANCE OF STUDENT SERVICES
Margen A. Java, Maredil R. Ambos, Gift D. Tragico, Betty C. Ermitaño, Eunice G. Alayon and
Cheyenne Rouella C. Aberia Page 71
Patubas December 2019
1
PERCEPTIONS OF THE APPLICATIONS OF
LEADERSHIP STYLES ACROSS
SUB-SAHARAN AFRICA
GEORGE R. WEST, Ph.D., Central Philippine University
TARIKU FUFA GEMECHU, Ph.D., Regent University
ABSTRACT
Although some observers have argued that leadership has
improved in Africa, since the end of colonial times, others
have suggested that leadership problems have remained the
root causes of Africa’s multifaceted challenges (Adadevoh,
2006; Musekura & Ntamushobora, 2004). Still, others have
suggested that any continued leadership problems might
actually stem from less than adequate programs in African
higher education that have limited the number and types of
quality outputs (Haruna, 2009). This has resulted in a
subsequent call for university-industry interactions and quality
involvement in program development and education
management throughout the continent. Based on these, we
evaluated the perception of African stakeholders, from 11
different countries, regarding organizational applications, by
leaders, of Servant Leadership (Winston & Fields, 2015),
Leader Member Exchange (Graen & Uhl-Bien, 1995),
Contingent Reward Leadership (Reitz, 1971), and Autocratic
Leadership Style (Lewin, Lippit &White, 1939). We found that
perceptions of students and professionals differ, regarding
servant leadership and autocratic leadership. We also
evaluated the perceptions of stakeholders, regarding the
quantity and quality of professionals’ general involvement with
universities and in teaching and educational development of
university students. In these areas, we found that perceptions

Patubas December 2019
2
of students and professionals differ, regarding professionals’
general involvement with universities.
Key Words: African Leadership, African Management,
Servant Leadership, LMX, Contingent Reward, Autocratic
Leadership
Patubas December 2019
3
Perceptions of the Applications of Leadership Styles across
Africa
The continent of Africa reflects paradox (Adeyemo,
2009; Mamiru, 2012). It has received blessings that include
thousands of lakes and rivers, large amount of mineral
resources, a variety of domestic and wild animals, year-round
sunshine, and other favorable weather conditions, along with
vast amounts of fertile and arable lands (Chazan, Peter,
Robert, Donald, & John, 1999; Meredith, 2006; Wangari,
2009). Yet, what has come to the minds of some people, when
the word "… Africa is mentioned, is struggle, poverty, under-
development, socio-political instability, third world, dark
continent, and HIV/AIDS…" (Bilong, 2008, p. 16). Indeed,
many African people live in abject poverty (Kiruhi, 2013),
unbearable sufferings (Bilong, 2008), enormous pains (Tutu,
1999), and unexplainable brokenness (Chazan et al., 1999),
when compared to many other parts of the world.
Some theorists and researchers have argued that the
abundance of challenges facing Africans would not exist if
only leaders would have applied responsible leadership on
the continent (Adadevoh, 2006; Adeyemo, 2009; Kiruhi, 2013;
Mamiru, 2012). While some have argued that the behaviors
of African leaders, derived from their indigenous cultural
values, have served to overcome negative outcomes
(Wanasika, Howell, Littrell, & Dorfman, 2011), others have
proposed that leadership problems remain the root causes of
Africa’s multifaceted challenges (Adadevoh, 2006; Musekura
& Ntamushobora, 2004); and that these causes have resulted
from negative leadership values such as selfishness,
greediness, nepotism, tribalism, corruption, embezzlement,
favoritism, insecurity, hatred, wickedness, malice, and
deception (Addai, 2009; Kiruhi, 2013; Mamiru, 2012).
Patubas December 2019
4
Arguably, higher education has played an important
role in helping to achieve economic and social development
in Africa (Adekanmbi, 2015). However, African education
might require improvements, in order to achieve the desired
outcomes associated with addressing current and potential
future challenges (Nkomo, 2015). Specifically, African
institutions of higher education have taught contents and
learning methods, dependent on sources with non-African
contexts and realities (Coyne, 2015; Amadi-Echendu, Phillips,
Chodokufa, & Visser, 2016). For example, in a study of the
political economy of contemporary Africa, Amin (2014)
suggested that the World Bank and similar, allied
organizations have programmed social sciences curricula in
African universities. Africans have subsequently taught those
methods in African universities and applied them in
organizations of all types throughout the continent. Some
people have subsequently questioned if the African use of
Western leadership theories have applied well and can
effectively apply within the African paradigm (Haruna, 2009).
Similar questions have also persisted, regarding the cultural
fit of Western leadership methods, specifically questioning if
African agency would result in better fits for African contexts
(Oginde, 2013). Regarding African agency, Achieng (2014)
especially argued that Africans should seek to continue to
develop and maintain their own "... African agency in
tackling... economic [and] corporate... deficiencies" (p. 49).
Achieng' further suggested that such African agency would
necessarily result in "... processes and mechanisms that can
well be appreciated as African solutions to Africa’s problems"
(p. 51).
Similar to what Amin (2014) and Achieng (2014)
suggested, regarding transformation to overall African-led
Patubas December 2019
5
paradigms, Aina (2010) specifically argued for the total
transformation of African higher education. Aina suggested
that African stakeholders should "... collectively and
autonomously own their universities and the higher education
sector, and... make them work in their national interests and
for the benefit of their countries and their people..." (p. 24);
and further suggested that no outside donors or other entities
could do this for African countries.
Problem Statement, Research Questions, and Purpose
Barouni and Broecke (2014) suggested that higher
education in Africa lacks content relevance, which has
continued to impede the efficiency and effectiveness of
educational outputs in business management. Additionally,
African institutions of higher education have yet to present
success stories of meeting continental needs with relevant,
solution-oriented outputs (Nell & Cant, 2014). However,
members of various sectors of society have begun to consider
that higher education has resulted in positive economic
results and therefore, they have begun to increasingly invest
in it (Tsegaye, 2015). Because of the perceived lack of content
relevance, it remains unclear what level of positive
contribution African education objectively makes, in
developing business leadership and management in Africa
(Odhiambo, 2014). These arguments point to the overarching
problem of not knowing whether Western leadership methods
apply in African contexts and if any of them do, which ones
and with whom.
In the area of leadership education, several research
questions emerge, including: (a) what leadership styles do
Africans, currently in the workforce, perceive that their leaders
Patubas December 2019
6
use most; (b) what leadership styles do Africans, currently in
universities, perceive that leaders in the workforce will use
most; (c) do universities design and teach relevant curricula
and content that address current African realities; and (d)
what perceptions and practices regarding university-industry
interactions and stakeholder involvement, in teaching and
educational development, across Africa, do stakeholders
(students and professionals) in Africa have?
The purpose of this study includes determining the
perceptions of stakeholders, regarding the comparative
magnitudes of applications and potential applications of
leadership styles; and to determine comparative amount and
quality of industry and university interactions.
LITERATURE REVIEW
In this section, we present an overview of the relevant
literature of the factors considered. These factors include
servant leadership, contingent reward leadership, leader-
member exchange leadership, autocratic leadership, and
quantity and quality of industry-university interactions. We
also include theoretical foundations of relationships between
variables, in order to justify the use of research analyses.
Servant Leadership
Greenleaf (1977) first coined the concept of servant leadership. The distinctive qualities and essential focuses of the servant leadership construct include agapao love, humility, altruism, vision, trust, empowerment, and service (Bekker, 2007; Greenleaf, 1977; Northouse, 2015; , Patterson, 2003; Winston, 2002). By design, servant leaders
Patubas December 2019
7
put followers’ interests first and servant leaders serve followers to meet the followers’ needs (Northouse, 2015). People regard servant leaders as servant first (Greenleaf, 1977). Additionally, many theorists and practitioners have considered servant leaders as ethical. This could reflect one reason why the servant leadership concept has attracted attention from people and organizations (Liden, Wayne, Zhao, & Henderson, 2008).
Theorists have suggested that servant leaders meet
long-term organizational goals, as they facilitate the growth,
development, and well-being of employees, matters of top
priority (Spears, 2002). Servant leadership underscores
attentiveness to followers’ concerns, empathy of followers,
care for followers and nurturing of followers (Northouse,
2015). The stated best test of servant leadership includes
realizing that beneficiaries grow, become healthier, wiser,
freer, more autonomous, and more able to become servant
leaders, themselves, because of the service that they have
received from the leader (Greenleaf & Spears, 2002).
Contingent Reward Leadership
Contingent reward leadership applies recognition and
rewards for goals as motivating factors for organizational
members (Riggio & Bass, 2006). Effective leaders, who use
the contingent reward style, encourage the hearts of the
people that they lead by providing those followers with
justified rewards (Kouzes & Posner, 2012). Contingent reward
leadership occurs when "someone possesses a resource that
another person wants and is willing to exchange that resource
in return for certain behavior" (Konopaske, Ivancevich, &
Matteson, 2013, p.338). Behavioral conditions that attract
contingent rewards include compliance with orders,
responding to requests, and following directions (Brown &
Patubas December 2019
8
Moshavi, 2002). Contingent rewards may come to followers in
various forms, such as public recognition, pay, leave, job
assignments, pay raises, developmental opportunities, and
meeting felt needs (Bass, 1997; Day & Antonakis, 2011; Yukl,
2013).
Contingent reward leadership also reflects some
aspect of political leadership. This political leadership
involves exchange tactics, designed to gain follower support
by pledging something as a reward or benefit, in return for
their future compliance or reminding them of continued
support for prior favors (Konopaske, Ivancevich & Matteson,
2013).
Leader-Member Exchange (LMX)
Researchers focused on the dyadic relationships between leaders and followers as the basis of the Leader-Member Exchange (LMX) theory. They did so, because focusing on leaders alone would not provide enough information for them to understand the relational factors in organizations and the impacts of those factors on organizational outcomes (Oz, Derekoylu, Buyukbay & Yildiz, 2013). LMX serves as a relationship-based approach to organizational leadership (Yukl, 2013). LMX displays three dimensions: respect, trust, and obligation. Research has shown that these three constructs trigger the development and maintenance of mature leadership relationships between leaders and followers (Graen & Uhl-Bien, 1995). LMX theorists have further suggested that mutual respect and responsible care on the parts of both leaders and followers influence and guide the interactions and qualities of the associated dyadic relationships (Oz et al., 2013).
Within organizational work units, followers become part
of "in-groups" or "out-groups" based on how well they and
Patubas December 2019
9
their leaders work with each other (Northouse, 2016).
Determinants for working together include the quality of the
exchange relationship, typically based on followers’
competence levels and their display of values and attitudes
similar to those of their associated leaders (Yukl, 2013). By
design, LMX addresses dyadic relationships associated with
work, as opposed to those typically associated with friendship
or other personal relationships (Graen & Uhl-Bien, 1995).
Autocratic Leadership
Autocratic leaders often make decisions alone, with little or no input from the rest of their teams (Belias & Koustelios, 2014). Sometimes, autocratic leaders act to secure inputs from other leaders or their followers, but then they make the decisions alone (Konopaske, Ivancevich & Matteson, 2013). Similarly, autocratic leaders usually discourage the participation of followers in organizational decision-making processes (Day & Antonakis, 2011). An environment of fear and culture of tyranny may prevail in the organization where an "…autocratic executive team" drives things their way (Konopaske, Ivancevich, & Matteson, 2013, p.239).
Autocratic leadership has proven useful in
circumstances where urgency existed in decision-making
efforts (Bhatti, Maitlo, Shaikh, Hashmi, & Shaikh, 2012). It has
also proven beneficial in times of confusion and chaos,
wherein people have generally lost control. In those times,
researchers have shown that people "…look for decisive
leaders" and find comfort in the leaders’ decisiveness (Day &
Antonakis, 2011, p.514). Similarly, in extreme conflict
situations that include followers’ perceptions of imminent
threat or danger, followers appreciate autocratic leaders who
can provide authoritative direction (Konopaske, Ivancevich &
Patubas December 2019
10
Matteson, 2013). Hofstede (1991) also suggested that
autocratic leadership works well (normatively) in Sub-Saharan
African culture, as people in high power distance cultural
dimensions prefer that style. Legitimacy represents the
source of power for autocratic leaders (Lewin, Lippit &White,
1939). Therefore, autocratic leadership relies heavily on
formalized structure and position in given organizations
(Howell & Costley, 2001). Notwithstanding Hofstede’s
position, though, other researchers have suggested that
regardless of power distance, the autocratic leadership style
often represents controlling, bossy, and dictatorial behaviors,
across all cultures (Belias & Koustelios, 2014).
University-Industry Relationships
University-industry relationships have proven
measurable, by standards of quantity and quality of
interactions (Steinmo, 2015). Both quantity and quality of
those relationships can prove weak. Specifically, Steinmo
also noted that differences in goals and approaches have
often differed between universities and organizations in
industry. Furthermore, Williams, Moser, Youngblood & Singer
(2015) made the prediction that "without systemic and
relevant changes to traditional methods instruction and
workplace readiness, higher education may lose its viability
as an educational partner to industry" (p. 50). Similarly,
regarding Sub-Saharan Africa, Thamae, Thamae, & Thamae
(2016) implied that fundamental differences exist between
what universities provide and what potential industry partners
can absorb. Additionally, in a study in Spain, D'Este, Llopis,
Rentocchini, and Yegros (2016) also found that providing
particular academic solutions, without having pre-existing
relationships with industry partners, resulted in little positive
Patubas December 2019
11
impact regarding the associated projects.
That said, both quantity and quality of university-
industry relationships can improve, through goal alignment
and relationship building. Steinmo (2015) suggested that"...
common goals and understandings regarding the
collaboration and the creation of personal relationships
between the employees of firms and universities... " (p. 597)
can help to overcome associated challenges. Similarly,
D'Este, et al. (2016) also found that "... interdisciplinary
research has a strong positive impact on the two
entrepreneurial-related modes: firm creation and technology
transfer" (p. 1). Thamae, Thamae, and Thamae (2016) further
suggested that universities must take the initiative to
implement strategic projects that will develop the interests of
people in industry, in order to begin to build university-industry
relationships.
Hypotheses
In this section, we present eight hypotheses, based
on the theoretical support, as follows:
H1a. Students’ perceptions of their likely workforce
leader’s servant leadership differ from
professionals’ (including pastors’) perceptions
of their actual workforce leader’s servant
leadership.
H1b. Students’ perceptions of their likely workforce
leader’s contingent reward leadership differ
from professionals’ (including pastors’)
perceptions of their actual workforce leader’s
contingent reward leadership.
Patubas December 2019
12
H1c. Students’ perceptions of their likely workforce
leader’s leader member exchange leadership
differ from professionals’ (including pastors’)
perceptions of their actual workforce leader’s
leader member exchange leadership.
H1d. Students’ perceptions of their likely workforce
leader’s autocratic leadership differ from
professionals’ (including pastors’) perceptions
of their workforce leader’s actual autocratic
leadership.
H2a. Students consider the quantity of professionals’
university interactions of a different value than
professionals and pastors do.
H2b. Students consider the quality of professionals’
university interactions of a different value than
professionals and pastors do.
H2c. Students consider the quantity of professionals’
involvement in teaching and educational
development of university students of a
different value than professionals and pastors
do.
H2d. Students consider the quality of professionals’
involvement in teaching and educational
development of university students of a
different value than professionals and pastors
do.
Patubas December 2019
13
METHODS
In this section, we present the quantitative research
methods that we used in data collection and analyses.
Specifically, in this section, we describe the research design,
target population, sampling procedures, instrumentation
used, and the procedures of data analyses.
Research Design
In this research project, we conducted a cross-
sectional, non-experimental study, wherein we intentionally
sampled a particular population using the questionnaire
method (Creswell, 2008). In research that employs the cross-
sectional method, researchers sample members of a greater
population and study them "… at only one point in time"
(Cozby & Bates, 2014, p.234). As with typical forms of
research, we used a research problem to dictate the choice of
the design (Creswell, 2008). In this case, we selected the
survey design, as it appeared to best apply in answering the
research question.
Population and Sample
For our sample, we chose to survey members of
Campus Crusade for Christ. Members of this organization, in
Southern and Eastern Africa, serve as faith-based
representatives of this Christian organization. The
organization exists to fulfill the Great Commission, as
mandated by Jesus Christ in Matthew 28:16-20 (SEA, 2010).
The Campus Crusade for Christ works in 24 countries of the
southern and eastern Africa. Its members include students of
Christian, private, and state-run institutions of education,
Patubas December 2019
14
marketplace leaders (professionals) and church
representatives (SEA, 2010). The 2015 ministry report
showed that the organization had a population of over 10,000
engaged disciples, representing multiple, industry-related
vocational categories, with whom the organization works to
accomplish organizational goals. We used a stratified
probability sampling technique to give equal chances to
students, professionals, and pastors to participate in this
research. This technique facilitates improved accuracy of
results over convenience sampling (Cozby & Bates, 2014). To
achieve a representative cross-section of responses, we
invited 750 potential respondents from ten countries to
participate.
Instrumentation
For this study, we used a 5-point Likert-type scale that
ranged from 1= strongly disagree to 5=strongly agree, to
record all responses of participants. The instruments for
servant leadership, contingent reward leadership, leader
member exchange leadership, autocratic leadership,
included:
Servant Leadership: measured using the 10-item New
Parsimonious Measure of Servant Leadership Behaviors
(Winston & Fields, 2015) to assess servant leadership
perceptions of followers. Fields and Winston (2010)
previously reported an internal reliability Cronbach coefficient
alpha, for the scale, of 0.96.
Contingent reward leadership: measured using the 20-
item Contingency Questionnaire (Reitz, 1971) to assess
contingent reward leadership perceptions of followers.
Patubas December 2019
15
Leader Member Exchange (LMX): measured using the
7-item LMX7 Questionnaire (Graen & Uhl-Bien, 1995) to
assess LMX leadership perceptions of followers.
Autocratic leadership: measured using the 18-item
Leadership Styles Questionnaire (Sagepub.com). The
leadership style chosen for this study is authoritarian
leadership. The items for authoritarian leadership include
items 1, 4, 7, 10, 13 and 16 (Sagepub.com).
Interaction quantity and quality: measured by four
items that asked students to rate professionals (including
pastors) and professionals to rate themselves, regarding the
quantity and quality of interactions with their universities and
their involvement in teaching and educational development of
university students.
Data Collection Procedures
We sent questionnaires, via email and in English, to
750 students, professionals, and pastors who work with
Campus Crusade for Christ in ten countries of Africa. These
countries include Malawi, Mauritius, Lesotho, Swaziland,
Botswana, Zimbabwe, Zambia, Ethiopia, Rwanda, and
Kenya. Research teams of three people per country assisted
in printing, disseminating, proctoring, collecting, and returning
hard copy versions of the questionnaires.
Analysis Plan
We recorded the raw data directly into SPSS (v. 24)
and performed all analyses therewith. We first ran Cronbach’s
alpha tests to determine the internal reliability of the listed
variables. We next conducted a Pearson’s Product Moment
Correlation between the leadership variables, in order to
Patubas December 2019
16
determine if any relationships exist between the followers’
perceptions of those variables. We then conducted
independent variables t-tests to compare perceptions of
leadership styles and university-industry interactions and
involvement among students, professionals and pastors.
Finally, we conducted a multiple ANOVA, in order to
understand the variances of interactions and involvement
among the stakeholders (Girden & Kabacoff, 2011; Green &
Salkind, 2013; Pallant, 2016; Williams & Monge, 2001).
RESULTS
This section displays the results of the study, including
descriptive statistics, correlations, and t-tests.
Descriptive Statistics
A total of 619 respondents participated in the study and
617 responses met the criteria for inclusion in the study. The
demographics of these 617 included: 316 students, 143
pastors, and 158 other professionals; 281 women and 336
men; and numbers of participants, by country, included: (a)
Botswana – 23, (b) Ethiopia – 84, (c) Kenya – 60, (d) Lesotho
– 97, (e) Malawi – 34, (f) Mauritius – 24, (g) Rwanda – 41, (h)
Swaziland – 89, (i) Zambia – 82; and (j) Zimbabwe – 83. The
majority of respondents reported having 1 to 5 years of tenure,
while 143 respondents reported having 6 or more years of
tenure.
Patubas December 2019
17
Comparative Analyses
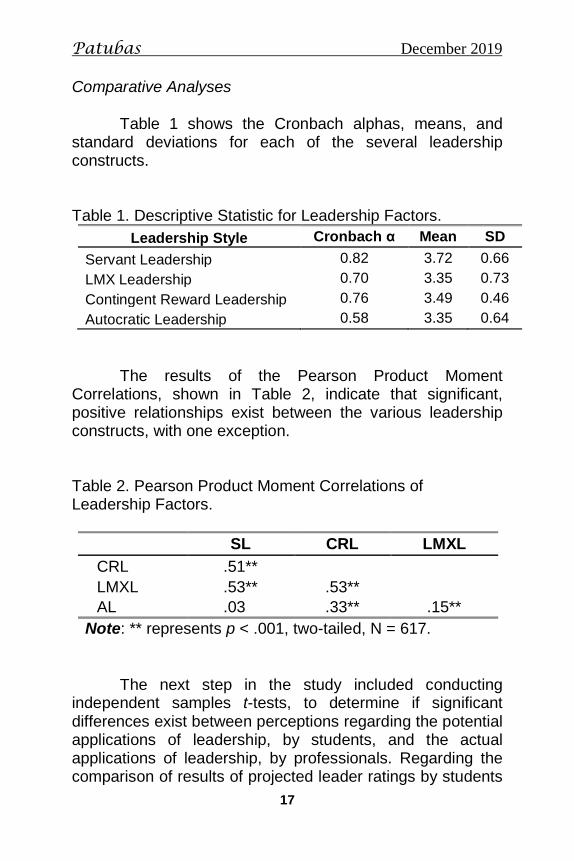
Table 1 shows the Cronbach alphas, means, and standard deviations for each of the several leadership constructs.
Table 1. Descriptive Statistic for Leadership Factors.
Leadership Style Cronbach α Mean SD
Servant Leadership 0.82 3.72 0.66
LMX Leadership 0.70 3.35 0.73
Contingent Reward Leadership 0.76 3.49 0.46
Autocratic Leadership 0.58 3.35 0.64
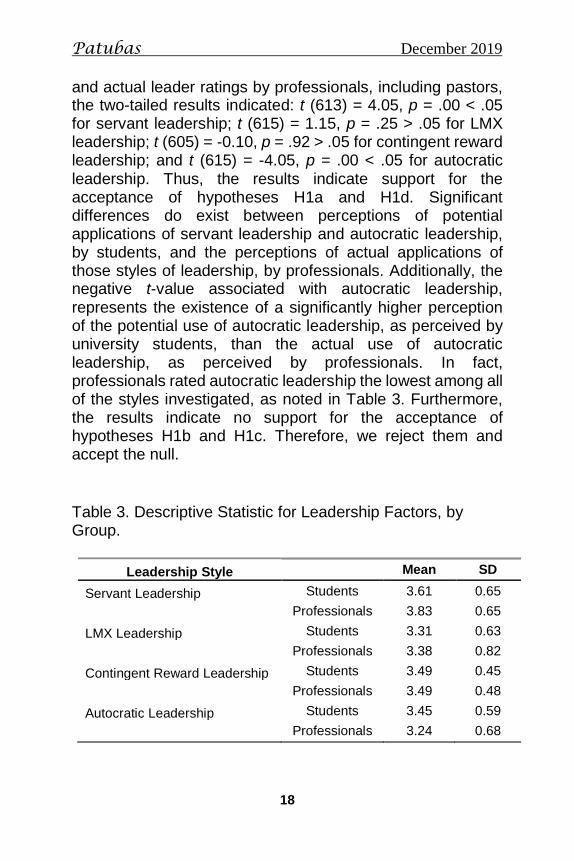
The results of the Pearson Product Moment
Correlations, shown in Table 2, indicate that significant, positive relationships exist between the various leadership constructs, with one exception.
Table 2. Pearson Product Moment Correlations of Leadership Factors.
SL CRL LMXL
CRL .51**
LMXL .53** .53**
AL .03** .33** .15**
Note: ** represents p < .001, two-tailed, N = 617.
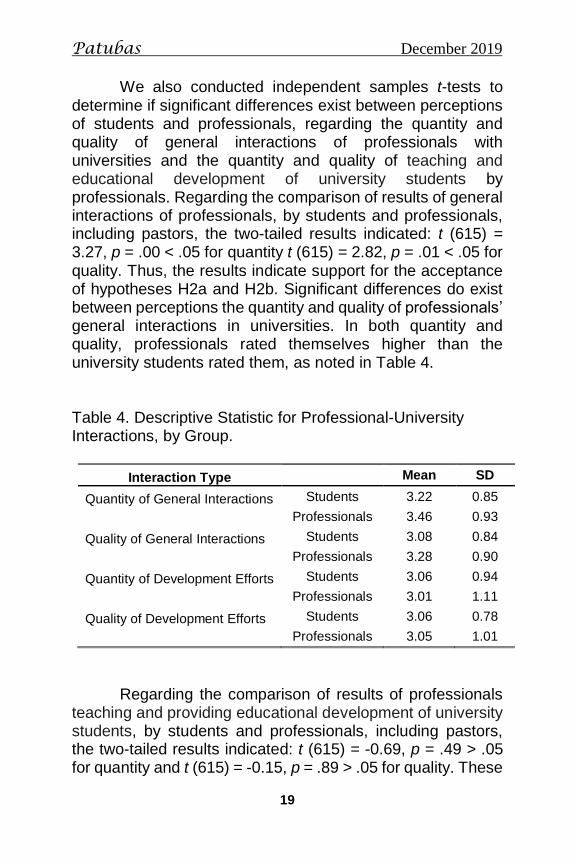
The next step in the study included conducting independent samples t-tests, to determine if significant differences exist between perceptions regarding the potential applications of leadership, by students, and the actual applications of leadership, by professionals. Regarding the comparison of results of projected leader ratings by students
Patubas December 2019
18
and actual leader ratings by professionals, including pastors, the two-tailed results indicated: t (613) = 4.05, p = .00 < .05 for servant leadership; t (615) = 1.15, p = .25 > .05 for LMX leadership; t (605) = -0.10, p = .92 > .05 for contingent reward leadership; and t (615) = -4.05, p = .00 < .05 for autocratic leadership. Thus, the results indicate support for the acceptance of hypotheses H1a and H1d. Significant differences do exist between perceptions of potential applications of servant leadership and autocratic leadership, by students, and the perceptions of actual applications of those styles of leadership, by professionals. Additionally, the negative t-value associated with autocratic leadership, represents the existence of a significantly higher perception of the potential use of autocratic leadership, as perceived by university students, than the actual use of autocratic leadership, as perceived by professionals. In fact, professionals rated autocratic leadership the lowest among all of the styles investigated, as noted in Table 3. Furthermore, the results indicate no support for the acceptance of hypotheses H1b and H1c. Therefore, we reject them and accept the null.
Table 3. Descriptive Statistic for Leadership Factors, by Group.
Leadership Style Mean SD
Servant Leadership Students 3.61 0.65
Professionals 3.83 0.65
LMX Leadership Students 3.31 0.63
Professionals 3.38 0.82
Contingent Reward Leadership Students 3.49 0.45
Professionals 3.49 0.48
Autocratic Leadership Students 3.45 0.59
Professionals 3.24 0.68
Patubas December 2019
19
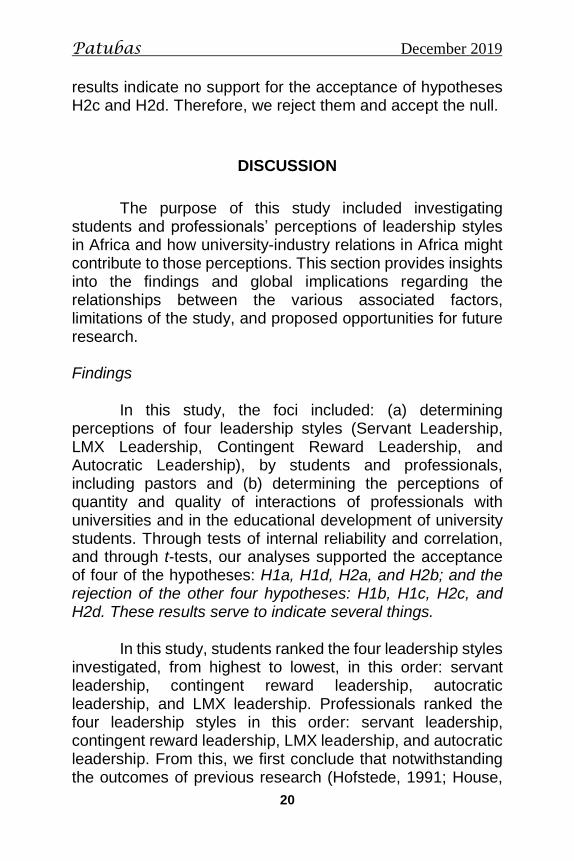
We also conducted independent samples t-tests to determine if significant differences exist between perceptions of students and professionals, regarding the quantity and quality of general interactions of professionals with universities and the quantity and quality of teaching and educational development of university students by professionals. Regarding the comparison of results of general interactions of professionals, by students and professionals, including pastors, the two-tailed results indicated: t (615) = 3.27, p = .00 < .05 for quantity t (615) = 2.82, p = .01 < .05 for quality. Thus, the results indicate support for the acceptance of hypotheses H2a and H2b. Significant differences do exist between perceptions the quantity and quality of professionals’ general interactions in universities. In both quantity and quality, professionals rated themselves higher than the university students rated them, as noted in Table 4.
Table 4. Descriptive Statistic for Professional-University Interactions, by Group.
Interaction Type Mean SD
Quantity of General Interactions Students 3.22 0.85
Professionals 3.46 0.93
Quality of General Interactions Students 3.08 0.84
Professionals 3.28 0.90
Quantity of Development Efforts Students 3.06 0.94
Professionals 3.01 1.11
Quality of Development Efforts Students 3.06 0.78
Professionals 3.05 1.01
Regarding the comparison of results of professionals teaching and providing educational development of university students, by students and professionals, including pastors, the two-tailed results indicated: t (615) = -0.69, p = .49 > .05 for quantity and t (615) = -0.15, p = .89 > .05 for quality. These
Patubas December 2019
20
results indicate no support for the acceptance of hypotheses H2c and H2d. Therefore, we reject them and accept the null.
DISCUSSION
The purpose of this study included investigating students and professionals’ perceptions of leadership styles in Africa and how university-industry relations in Africa might contribute to those perceptions. This section provides insights into the findings and global implications regarding the relationships between the various associated factors, limitations of the study, and proposed opportunities for future research.
Findings
In this study, the foci included: (a) determining perceptions of four leadership styles (Servant Leadership, LMX Leadership, Contingent Reward Leadership, and Autocratic Leadership), by students and professionals, including pastors and (b) determining the perceptions of quantity and quality of interactions of professionals with universities and in the educational development of university students. Through tests of internal reliability and correlation, and through t-tests, our analyses supported the acceptance of four of the hypotheses: H1a, H1d, H2a, and H2b; and the rejection of the other four hypotheses: H1b, H1c, H2c, and H2d. These results serve to indicate several things.
In this study, students ranked the four leadership styles
investigated, from highest to lowest, in this order: servant leadership, contingent reward leadership, autocratic leadership, and LMX leadership. Professionals ranked the four leadership styles in this order: servant leadership, contingent reward leadership, LMX leadership, and autocratic leadership. From this, we first conclude that notwithstanding the outcomes of previous research (Hofstede, 1991; House,
Patubas December 2019
21
Hanges, Javidian, Dorfman & Gupta 2004), either power distance has decreased in Africa, between leaders and followers, or it no longer necessarily presents as the previously observed predictor of autocratic leadership, in African contexts. Power distance reflects the "... degree to which members of a collective expect power to be distributed equally" (Gemechu, 2015, p. 8). The greater the amount of power distance, the greater the amount of gap between the perceived or felt power between leaders and followers. Gemechu (2015) further suggested that in high power distance cultures, people generally expect followers to adhere to the instructions of their leaders, in most cases, without question. Both students and professionals in this current study cited servant leadership as the style of greater predicted use and actual use, respectively, and by significant margins. In fact, post hoc t-tests of the data revealed differences between servant leadership and autocratic leadership of: t (315) = 3.50, p = .00 < .05 for students and t (300) = 11.20, p = .00 < .05 for professionals. This clearly indicates that, by some measures, leaders in African organizations have adopted the use of servant leadership, in praxis, and students have come to expect that their future leaders will gravitate toward the use of that style, as well.
Next, the results of this study suggest that perceptions
differ between the levels of servant leadership and autocratic leadership that students anticipate that their leaders will use and the levels of those styles that professionals actually experience in businesses and other organizations. On average, students anticipate experiencing more autocratic leadership and less servant leadership, in the workforce, than what professionals perceive that they actually experience. These differences suggest that, at least to some degree, the leadership preparations provided by university programs do not correlate with real-world dynamics, in African contexts. This also parallels with the findings of Kolk and Rivera-Santos (in press) that: "... scholars need to better understand the opportunities of Africa as a context for Africa-bound, Africa-
Patubas December 2019
22
specific, and universal research not only in areas related to business and society issues but also for the broader management literature" (p. 14).
Finally, the results of this study suggest that students
and professionals generally agree on the nominal quantity and quality of professional engagement in teaching and development efforts of university students. However, they do not agree in their perceptions regarding the quantity and quality of general interactions that professionals have with universities. In both quantity and quality, professionals consider that they generally interact with universities significantly more than students perceive that they do. Of course, students do not necessarily have access to or knowledge of all of the interactions in which professionals and universities engage. However, if perceptions serve as peoples' realities, university graduates will likely enter the workforce with relatively lower expectations of maintaining university-industry relations than the level that currently exists. Researchers from several countries have argued the need for more and higher quality interactions between industry and universities, in order to meet global demands, into the remainder of the 21st century (Culkin & Mallick, 2011; Williams et al., 2015). Undoubtedly, some responsibility lies with university leadership educators and administrators, to perform needs assessments and to tailor their programs to industry needs. However, we posit that professionals in industry and other organizations also have vested interests in ensuring that graduating university students, at all levels, receive the knowledge and develop the skills that they will need, upon entering the workforce. To that end Velasco (2016) concluded that: "business schools must work hand in hand with local... industries to equip students with more recent industry trends and practical, realistic approaches to business ventures" (p. 81). Arguably, both members of universities and professionals in industry and other organizations should take opportunities to initiate visible working relationships, in order to accomplish the ends that both groups seek.
Patubas December 2019
23
Limitations of the Study
Several potential limitations exist within this study. First, the test of the autocratic leadership variable, for internal reliability, scored well below the standard rule of thumb (Girden & Kabacoff, 2011; Williams & Monge, 2001) Cronbach's alpha of .70. This proved consistent among the results for both students and professionals. Neither would removing any items have significantly raised this Cronbach's alpha score. This causes us to conclude that differences likely exist between the generally accepted theory of autocratic leadership (arguably, the oldest theory tested in this study) and the perceptions of the actual applications of autocratic leadership, in African contexts. If these differences prove to exist, it further confirms that at least some standard Western leadership theories do not and likely cannot apply, as written, in African contexts. Next, the population considered, might not well represent all Africans. Some theorists and researchers have suggested that a relationship exists between Christianity and servant leadership (Dearth & West, 2014; Hale & Fields, 2007). If this relationship proves to exist, then, as the population sampled in this study mainly consisted of professing Christians, biases may have existed toward employment and participation in organizations predisposed to exercising servant leadership, over the use of other forms of leadership. Finally, we recognize that students, professionals, and pastors, although arguably serving as principals, do not represent all of the stakeholders involved in university-industry relationships.
Opportunities for Future Research
The results of this current study cause us to suggest the need for further research. One of the first questions to answer includes whether the results regarding the preferences shown for servant leadership, over the other styles, remains constant when considering African populations with representative ratios of various religious
Patubas December 2019
24
beliefs (and non-beliefs) found throughout African society. Next, because we only studied the perceptions of students, professionals, and pastors in this present study, we recommend that researchers similarly investigate the perspectives of university administrators and faculty members, as well as any other relevant stakeholders (e.g., affiliated representatives from various governmental agencies and non-governmental organizations, etc.).
Conclusion
Even though Africa possesses rich natural resources and has made great strides in development since the colonial period, some people still note Africa for and as: "… struggle, poverty, under-development, socio-political instability, third world, dark continent, and HIV/AIDS…" (Bilong, 2008, p.16). Education can perform a significant role in helping to further improve economic and social developments (Adekanmbi, 2015). However, especially in the subject area of leadership, higher education in Africa lacks content relevancy. This lack of content relevancy impedes efficiency and effectiveness of educational outputs, regarding leadership, both in businesses and in other organizations (Barouni & Broecke, 2014). This suggests the need for better university-industry interactions and more quality involvement in higher education processes, by professionals, in Africa.
Specifically, in order to better align theory with reality,
university faculty should modify their leadership curricula.
Additionally, theorists, researchers, curriculum developers
and faculty members should focus more on stressing the
applicable, increased uses of servant leadership behaviors.
They should also further investigate the actual dynamics
associated with autocratic leadership and then determine the
appropriate levels and constructs of that style to use, in
African contexts.
Patubas December 2019
25
REFERENCES Adadevoh, D. (2006). Leading transformation in Africa.
Orlando, FL: International Leadership Foundation. Addai, J. W. (2009). Reforming leadership across Africa.
Fontana, CA.
Adekanmbi, G. (2015). Tackling inequalities through tertiary distance education in sub-Saharan Africa: A general overview. International Journal of Continuing Education & Lifelong Learning, 8(1), 1-23.
Adeyemo, T. (2009). Is Africa cursed? A vision for the
radical transformation of an ailing continent. Nairobi, Kenya: Word Alive.
Amadi-Echendu, A. P., Phillips, M., Chodokufa, K., & Visser,
T. (2016). Entrepreneurial Education in a Tertiary Context: A Perspective of the University of South Africa. International Review of Research in Open and Distributed Learning, 17(4), 21-35.
Barouni, M., & Broecke, S. (2014). The Returns to Education
in Africa: Some New Estimates. Journal of Development Studies, 50(12), 1593-1613.
Bass, B. M. (1997). Does the transactional/ transformational
leadership paradigm transcend organizational and national boundaries? American Psychologist, 52, 130– 139.
Belias, D., & Koustelios, A. (2014). Leadership and job
satisfaction – a review . European Scientific Journal , 10(8), 24-46.
Patubas December 2019
26
Bhatti, N., Maitlo, G. M., Shaikh, N., Hashmi, M. A., & Shaikh, F. M. (2012). The impact of autocratic and democratic leadership style on job satisfaction . International Business Research, 5(2), 192-201, doi:10.5539/ibr.v5n2p192.
Bilong, B. E. (2008). The key to Africa's true independence.
Bophirima print & marketing.
Brown, F. W., & Moshavi, D. (2002). Herding academic cats: Faculty reactions to transfromational and contingent reward leadership by department chairs. Montana State University. Journal of Leadership & Organizational Studies, 83 (3), 79-93.
Chazan, N., Peter, L., Robert, M., Donald, R., & John, S.S.,
(1999). Poltics and society in contemporary Africa. (3rd ed.). Colorado: Lynne Rienner.
Cozby, P. C., & Bates, S. C. (2014). Methods in behavioral research (12th ed.). New York, NY: McGraw-Hill.
Creswell, J. W. (2008). Research design: Qualitative, quantitative, and mixed methods approaches. Thousand Oaks, CA: SAGE.
Coyne, G. (2015). Language Education Policies and Inequality in Africa: Cross-National Empirical Evidence. Comparative Education Review, 59(4), 619-637.
Culkin, N., & Mallick, S. (2011). Producing work-ready
graduates. International Journal of Market Research, 53(3), 347-368. doi: 10.2501/ijmr-53-3-347-368.
Day, D. V., & Antonakis, J. (2011). The nature of leadership.
Thousand Oaks, CL: SAGE.
Patubas December 2019
27
Dearth, J., & West, G. R. (2014). The use of servant leadership in the United Methodist Church. Interdisciplinary Journal of Research on Religion, 10(5), 1-26. Retrieved from http://www.religjournal.com/articles/article_view.php?id=86.
Fields, D. L. (2002). Taking the measure of work: A guide to
validated scales for organizational research and diagnosis. Thousand Oaks, CA: SAGE.
Gemechu, T. F. (2015). Leading across cultures: Studying,
comparing and contrasting the application of charismatic, team-oriented, and self-protective leadership within the power distance, humane orientation and gender egalitarianism cultures. Unpublished manuscript. School of Business and Leadership, Regent University. Virginia Beach, VA.
Girden, E. R., Kabacoff, R. I. (2011). Evaluating research
articles from start to finish (3rd ed.). Thousand Oaks, CA: Sage.
Green, S., & Salkind, N. J. (2013). Using SPSS for Windows
and Mac analyzing and understanding data. Pearson. Greenleaf, R. K. (1977). Servant leadership: A journey into
the nature of legitimate power and greatness. New York, NY: Paulist Press.
Greenleaf, R. K. & Spears, L. C. (2002). Servant leadership:
A journey into the nature of legitimate power and greatness. Mahwah, NJ: Paulist Press.
Hale, J. R., & Fields, D. L. (2007). Exploring servant
leadership across cultures: A study of followers in Ghana and the USA. Leadership, 3(4), 397-417. doi: 10.1177/1742715007082964
Patubas December 2019
28
Hofstede, G. (1991). Cultures and organizations. NY: McGraw-Hill.
House, J. R., Hanges, J. P., Javidian, M., Dorfman, P. W., & Gupta, V. (2004). Culture, leadership, and organizations: The GLOBE study of 62 societies. Thousand Oaks, CA: Sage.
Howell, J. P., & Costley, D. L. (2001). Understanding behaviors for effective leadership (1st edition). Upper Saddle River, NJ: Prentice Hall.
Kiruhi, T. M. (2013). Towards holistic leadership
development in Africa: Insights from exemplary Kenyan public leaders (Order No. 3578592). Available from Dissertations & Theses @ Regent University. (1499825397). Retrieved from http://0-search.proquest.com.library.regent.edu/docview/ 1499825397?accountid=13479
Kolk, A., & Rivera-Santos, M. (in press). The state of
research on Africa in business and management: Insights from a systematic review of key international journals. Business and Society. doi: 10.1177/0007650316629129.
Mamiru, B. S. (2012). Emerging Leaders Initiative (Eli): A
manual for developing transformational leaders in the Ethiopian context. PhD Thesis, Bakke Graduate University. Retrieved from http://www.mediafire.com/file/4cj4hbo9mb9spjv/Shanko-Dissertation.pdf.
Meredith, M. (2006). The state of Africa: a history of fifty
years of independence. Simon & Schuster.
Patubas December 2019
29
Musekura, C., & Ntamushobora, F. (2004). Mentoring: A remedy for the leadership crisis in Africa. Nairobi, Kenya: ALARM.
Nell, C. E., & Cant, M. C. (2014). Determining Student Perceptions regarding the Most Important Service Features and Overall Satisfaction with the Service Quality of a Higher Education Institution. Management, 19(2), 63-87.
Nkomo, S. M. (2015). Challenges for Management and Business Education in a "Developmental" State: The Case of South Africa. Academy of Management Learning & Education, 14(2), 242-258. doi:10.5465/amle.2014.0323.
Northouse, P. G. (2015). Leadership: Theory and practice (7th ed.). Thousand Oaks, California: Sage.
Odhiambo, G. (2014). The Challenges and Future of Public
Higher Education Leadership in Kenya. Journal of Higher Education Policy and Management, 36(2), 183-195.
Oz, E., Derekoylu, T., Buyukbay, S., & Yildiz, D. (2013). What has job satisfaction got to do with employee commitment? A research study on LMX and work attitudes. Journal of Global Strategic Management, 7(1), 79-94, doi:10.20460/JGSM.2013715677.
Pallant, J. (2016). SPSS Survival Manual. Open University
Press.
Patterson, K. A. (2003). Servant leadership: A theoretical model (Order No. 3082719). Available from Dissertations & Theses @ Regent University. (305234239). Retrieved from http://0-search.proquest.com.library.regent.edu/ docview/305234239?accountid=13479.
Patubas December 2019
30
Reitz, H. J. (1971). Managerial attitudes and perceived contingencies between performance and organizational response. Academy of Management Proceedings, 227.doi:10.5465/AMBPP.1971.4981020.
Riggio, R. E., & Bass, B. M. (2006). Transformational
leadership (2nd ed.). Mahwah, NJ: Taylor and Francis.
SEA. (2010). SEA 2020: Strategic direction. Campus
Crusade for Christ Southern and Eastern Africa. An internal document. Harare, Zimbabwe.
Spears, L. C. (2002). Tracing the past, present, and future of
servant-leadership. In L. C. Spears & M. Lawrence (Eds.), Focus on leadership: Servant-leadership for the 21st century (Loc. 116– 152). New York: Wiley.
Tsegaye, K. K. (2015). The Place of Private Higher
Education in Regional Institutions in Africa: The Case of the OAU/AU and the Intergovernmental Authority on Development. Journal of Pan African Studies, 8(7), 74-89.
Tutu, D. (1999). No future without forgiveness. Rider an
imprint of Ebury Press, Random House. Velasco, R. M. (2016). The making of an entrepreneur:
Aligning institutional paradigm to the industry needs. Journal of Business & Retail Management Research, 10(3), 81-92.
Wangari, M. (2009). The challenge for Africa: A new vision.
London: William Heinemann.
Patubas December 2019
31
West, G. R., & Bocarnea, M. (2008). Servant leadership and organizational outcomes: Relationships in United States and Filipino higher educational settings. Servant Leadership Research Roundtable. Regent University.
Williams, M., Moser, T., Youngblood II, J., & Singer, M.
(2015). Competency-based learning: Proof of professionalism. Academy of Business Journal, 1, 50-61.
Williams, F., & Monge, P. (2001). Reasoning with statistics:
How to read quantitative research (5th ed.). Boston, MA: Earl McPeek.
Winston, B. E., & Fields, D. (2015). Seeking and measuring
the essential behaviors of servant leadership. Leadership & Organization Development Journal, 36(4), 413-434. doi:10.1108/LODJ-10-2013-0135.
Yukl, G. (2013). Leadership in organizations (8th ed.). Upper
Saddle River, New Jersey: Pearson.
Patubas December 2019
32
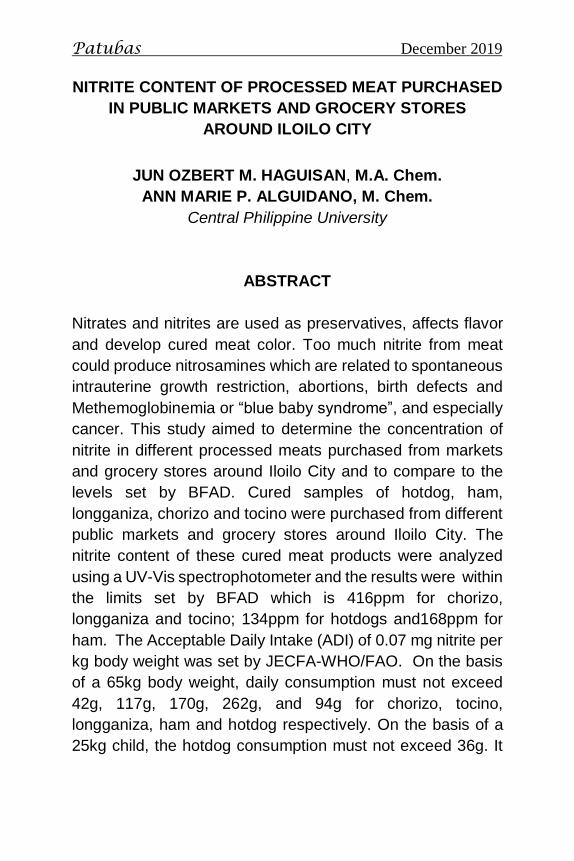
NITRITE CONTENT OF PROCESSED MEAT PURCHASED
IN PUBLIC MARKETS AND GROCERY STORES
AROUND ILOILO CITY
JUN OZBERT M. HAGUISAN, M.A. Chem.
ANN MARIE P. ALGUIDANO, M. Chem.
Central Philippine University
ABSTRACT
Nitrates and nitrites are used as preservatives, affects flavor
and develop cured meat color. Too much nitrite from meat
could produce nitrosamines which are related to spontaneous
intrauterine growth restriction, abortions, birth defects and
Methemoglobinemia or “blue baby syndrome”, and especially
cancer. This study aimed to determine the concentration of
nitrite in different processed meats purchased from markets
and grocery stores around Iloilo City and to compare to the
levels set by BFAD. Cured samples of hotdog, ham,
longganiza, chorizo and tocino were purchased from different
public markets and grocery stores around Iloilo City. The
nitrite content of these cured meat products were analyzed
using a UV-Vis spectrophotometer and the results were within
the limits set by BFAD which is 416ppm for chorizo,
longganiza and tocino; 134ppm for hotdogs and168ppm for
ham. The Acceptable Daily Intake (ADI) of 0.07 mg nitrite per
kg body weight was set by JECFA-WHO/FAO. On the basis
of a 65kg body weight, daily consumption must not exceed
42g, 117g, 170g, 262g, and 94g for chorizo, tocino,
longganiza, ham and hotdog respectively. On the basis of a
25kg child, the hotdog consumption must not exceed 36g. It
Patubas December 2019
33
is advised to eat cured meats in moderation to prevent the bad
effects of nitrite consumption.
Keywords: nitrate, nitrite, nitrosamines, carcinogenic,
processed meat, UV-Vis spectrophotometer, Acceptable
Daily Intake (ADI)
Patubas December 2019
34
INTRODUCTION
Background and Rationale
Meats are flesh taken from dead animals used as food.
This product is perishable due to microorganisms like
bacteria, yeasts, or molds which are present in the
environment (Ray, 2017). Meat curing is the addition of salt,
coloring ingredients, and seasoning in order to impart unique
properties to the product. Nitrates and nitrites of either
potassium or sodium are used to cure meat. They give a bright
reddish or pink color which attribute for consumer acceptance
(Cornforth and Jayasingh, 2004). More nitrites are required
to prevent rapid fading and non-uniform curing while also
maintaining its cured color throughout an extended shelf life
(Sebranek and Bacus, 2007). In a series of normal reactions,
nitrite is converted into nitric oxide which combines with
myoglobin, the pigment responsible for the natural red color
of uncured meat. They form nitric oxide myoglobin, which has
a deep red color that changes to the characteristic bright pink
normally associated with cured and smoked meat when
heated during the smoking process. (Epley, Addis, and
Warthesen, 1992). When nitrite is added to meat systems, it
reacts with a number of chemical components such as protein
(Cassens, 1997). Nitrites further affect flavor by acting as
powerful antioxidants (Ray, 2017). Sodium nitrite prevents
the growth of a microorganism known as Clostridium
botulinum, the bacteria that causes botulism. Nitrites are
considered to be more effective against gram- positive
bacteria (Bauermann, 1979).
Nitrites must be used with caution during curing.
Nitroso compounds have the potential to yield carcinogenic
nitrosamines (Cassens, 1990, 1997). Nitrite is a toxic
Patubas December 2019
35
inorganic contaminant that is hazardous to the health of
humans and other organisms. High nitrite concentrations
have been associated with methemoglobinemia or “blue baby
syndrome” in infants (Titov and Petrenko, 2005), carcinogenic
nitrosamine (Li, et. al, 2012), gastric cancer (Jakszyn and
Gonzalez, 2006), spontaneous intrauterine growth restriction
(Lyall et. al., 1996), abortions (Aschengrau, Zierler, and
Cohen, 1989) and birth defects in the central nervous system
(Brender et. al., 2004). The International Agency for Research
on Cancer (IARC) found that eating 50 grams of processed
meat every day will increase the risk of colorectal cancer by
18% and classified processed meat as carcinogen (IARC,
2015). Santarelli, Pierre and Corpet (2008) concluded that
those eating processed meat have an increased risk of having
colorectal cancer by 20-50% compared with non- processed
meat eaters. Parnaud and Corpet (1997) showed a correlation
between meat consumption and colorectal cancer incidence.
According to UK Biobank, consuming processed meat may
increase the risk of breast cancer (Anderson, et al. 2017).
Larsson, Orsini and Wolk in 2006 concluded that increased
consumption of processed meat can be associated with an
increased risk of stomach cancer. Hu et al. (2011) found that
processed meat was significantly related to the risk of the
stomach, colon, rectum, pancreas, lung, prostate, testis,
kidney and bladder, including cancer and leukemia. Zhu et al.
in 2013 indicated that consumption of red meat may increase
the risk of gastric cancer. Norat et al. in 2005 associated the
intake of red and processed meat to colon cancer while
inversely associated fish intake to colon cancer. Oba et al. in
2006 concluded that men with high consumption of processed
meat may increase their risk of colon cancer compared to
those with low processed meat consumption. A 14%
colorectal cancer risk increase for every 100g/day
Patubas December 2019
36
consumption of processed meat, 25% in colon cancer, and
31% in rectal cancer was analyzed by Chan et al. in 2011.
English et al. in 2004 concluded that consumption of red and
processed meat is associated with an increased risk of rectal
cancer while consumption of chicken and fish has no risk
increase. In an episode of Salamat Dok (2015), Dr. Earle
Castillo of UP-PGH reiterated that consuming three hotdogs
is like having the effects of smoking one pack of cigar.
Demeyer et al. (2016) found that when heme protein is broken
down in the gut, N-nitroso chemicals are formed. These
chemicals have been found to damage the cells in the bowel
lining, leading to bowel cancer. These N-nitroso chemicals
also form when processed meat is digested. In addition, the
nitrite and nitrate added as meat preservatives produce these
same N-nitroso chemicals. Pure nitrite, if consumed at levels
of 3-5 grams can be very dangerous and can cause death
because it binds to oxygen in the body stronger than the
hemoglobin-oxygen binding in the blood thus, not allowing
oxygen to reach several important organs (Sindelar &
Milkowski, 2011).
Due to the damage caused by nitrite to human health,
the World Health Organization (WHO) recommends an
acceptable daily intake of nitrite concentration in meat
products at 200 ppm. The JECFA-WHO/FAO (2002)
Acceptable Daily Intake is 0.07 mg nitrite per kg body weight.
A 50 kilogram person should not consume more than 3.5 mg
nitrite a day from foods containing nitrite. The Bureau of Food
and Drugs under the Department of Health indicated that for
tocino, beef tapa, longganisa and chorizo, the maximum
allowable limit is 416 mg/kg of nitrite. For ham, the BFAD has
approved an allowable daily limit of 168 mg/kg. Hotdog,
corned beef, Vienna sausage, luncheon meat, beef and meat
Patubas December 2019
37
loaf have a BFAD allowable daily limit of 134 mg/kg (DOH-
BFAD, 2006).
Significance of the Study This study will be beneficial to all consumers who are eating processed meats as they will be aware of the amount of nitrites present in these foods. They could adjust their consumption of processed foods based on this study. In the future, government agencies like BFAD may tap the University Research Center for other researches regarding processed meat products.
Objectives This study determined the levels of nitrite in different processed meat purchased in markets and grocery stores around Iloilo City and compare them to the levels of nitrite set by DOH-BFAD for allowable consumption.
Hypothesis
1. There is no significant difference in the amount of
nitrites from the processed meat samples purchased in public
markets and grocery stores around Iloilo City.
2. The cured meat samples purchased in public
markets and grocery stores around Iloilo City passed the limits
set by DOH-BFAD.
Scope and Limitations
This study only measured the concentrations of nitrites
in different brands of processed meat products purchased
around Iloilo City. The samples were limited only to processed
pork meats that are locally produced and commercially
available in the markets and in grocery stores around Iloilo

Patubas December 2019
38
City. Chorizo, ham, hotdog, longanisa and tocino were
considered as samples. The concentration of nitrites in these
cured meat samples were measured using a UV-Vis
Spectrophotometer. This study did not include the common
practices for the preparation and processing of cured meat as
it is against research ethics.
MATERIALS AND METHODS
Collection of Samples
The cured pork meat samples were taken from
different markets and grocery stores located within Iloilo City
based on Figure 1. Sampling was done in the month of
December 2018. One kilogram of cured pork meat was
purchased for every kind of product in all markets and grocery
stores included in the study.
Patubas December 2019
39
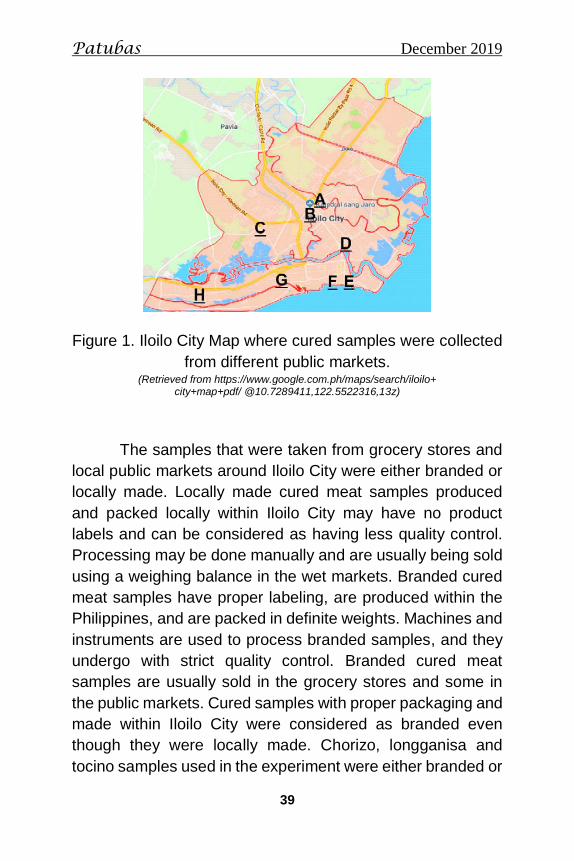
Figure 1. Iloilo City Map where cured samples were collected
from different public markets. (Retrieved from https://www.google.com.ph/maps/search/iloilo+
city+map+pdf/ @10.7289411,122.5522316,13z)
The samples that were taken from grocery stores and
local public markets around Iloilo City were either branded or
locally made. Locally made cured meat samples produced
and packed locally within Iloilo City may have no product
labels and can be considered as having less quality control.
Processing may be done manually and are usually being sold
using a weighing balance in the wet markets. Branded cured
meat samples have proper labeling, are produced within the
Philippines, and are packed in definite weights. Machines and
instruments are used to process branded samples, and they
undergo with strict quality control. Branded cured meat
samples are usually sold in the grocery stores and some in
the public markets. Cured samples with proper packaging and
made within Iloilo City were considered as branded even
though they were locally made. Chorizo, longganisa and
tocino samples used in the experiment were either branded or
Patubas December 2019
40
locally produced. Ham and hotdog samples used in the
experiment were all branded as there are no locally produced
products being made in Iloilo City.
Preparation of the Sample/Test Portion
A one kilogram sample was cut into smaller pieces and
quartered. From the quartered sample, five grams of the
homogeneous sample was used for deproteination and color
reaction. The remaining samples were kept in an air-tight,
closed container under refrigeration for 4oC for storage.
Deproteination
The test portion was quantitatively transferred into a
250-ml beaker and added with 5 ml of saturated borax solution
and 100 ml of hot water. The beaker was heated for 15 min
on a boiling water bath and shaken repeatedly. The beaker
and its contents were allowed to cool to room temperature and
added with 2 ml each of Carrez I and Carrez II solutions. It
was mixed thoroughly after each addition and then filtered.
The filtrates were placed into a 250 ml volumetric flask, diluted
to the mark with distilled water, and mixed. The flask was
allowed to stand for 30 minutes at room temperature (ISO
2918-1975, 2007).
Determination of nitrite Principle
The nitrite in the sample was determined through
formation of a reddish purple azo dye produced at pH 2.0 to
2.5 by coupling diazotized sulfanilic acid solution with Alpha-
Patubas December 2019
41
napthylamine. The method for nitrite analysis was based on
ISO 2918-1975 (2007) Meat and meat products –
Determination of nitrite content and on AOAC 973.31 Nitrite in
Cured Meat – Colorimetric Method (2000).
Color Reaction and Instrumentation
Five milliliters portion of the filtrate was pipetted into a
test tube. A 0.2 ml of Alpha-napthylamine solution and 0.2 ml
of Sulfanilic acid solution were then added. The solution was
mixed and allowed to stand for 10 min at room temperature.
The absorbance of the solution was measured in a 1 cm cell
using a spectrophotometer set at a wavelength of 538 nm.
The UV-Vis spectrophotometer was used to determine the
concentration of nitrite in cured meat samples. It required
standards with known nitrite content to establish the relation
between the measured absorbance and the nitrite
concentration which relied on the Beer-Lambert Law.
Analysis of Nitrite Using UV-Vis Spectrophotometer
The instrument was warmed up for 15 min for electrical
current stability. The instrument parameters for the nitrite
analysis were set. The wavelength was set at 538nm. Distilled
water was added with 0.2ml of Alpha-napthylamine solution
and 0.2ml of Sulfanilic acid solution. This solution was used
to auto zero the instrument and used as 0 ppm. The standard
solutions were measured according to the increasing order of
concentration. The instrument gave an absorbance result
when a standard or a sample solution was introduced to it via
a 1 cm cuvette cell. These absorbance results were recorded.
Plotting the prepared concentration with its corresponding
Patubas December 2019
42
absorbance produced a straight line. This line followed the
line equation: y=mx+b where y is the absorbance given by the
instrument, m is the slope of the line, b is the line intercept and
x is the unknown concentration. Rearranging this equation to
determine the concentration of the unknown would have:
x=(y-b)/m. Once a standard curve was established, the blank
and the sample were measured. The nitrite content of the
cured meat samples and allowable daily intake were
determined using this formula:
ppm NO2
- = concentration obtained
x 250 ml total volume
from line equation in µ/ml weight of sample in
grams
Allowable daily
intake of nitrite =
0.07mg NO2-
x kg body weight
x
kg food
kg body weight value of NO2-
in mg
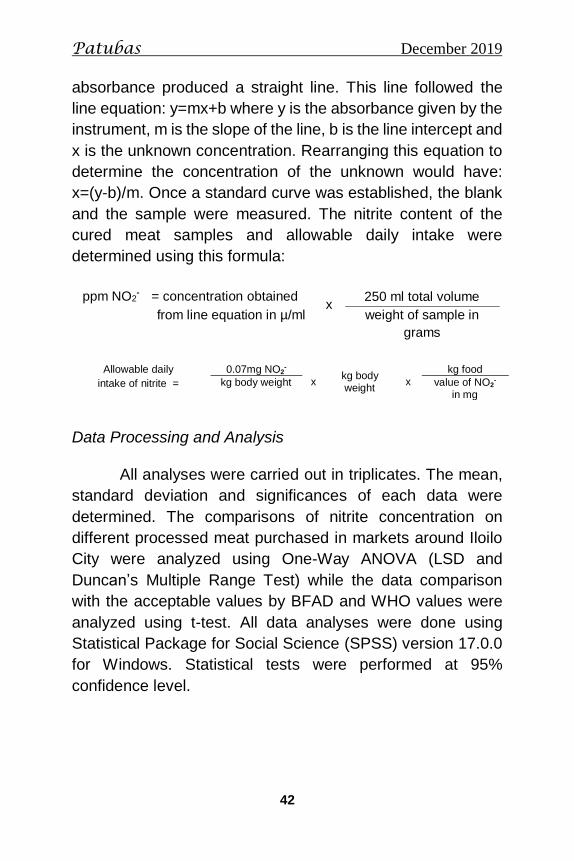
Data Processing and Analysis
All analyses were carried out in triplicates. The mean,
standard deviation and significances of each data were
determined. The comparisons of nitrite concentration on
different processed meat purchased in markets around Iloilo
City were analyzed using One-Way ANOVA (LSD and
Duncan’s Multiple Range Test) while the data comparison
with the acceptable values by BFAD and WHO values were
analyzed using t-test. All data analyses were done using
Statistical Package for Social Science (SPSS) version 17.0.0
for Windows. Statistical tests were performed at 95%
confidence level.
Patubas December 2019
43
RESULTS AND DISCUSSION
The nitrite contents of chorizo, tocino and longganisa
are shown in Table 1. Results showed that all of the chorizo,
tocino and longganisa samples purchased on the local
markets and on the grocery stores around Iloilo City were
within the limits set by BFAD.
Chorizo is a Filipino sweet sausage, brought by the
Spaniards and originated from Mexico. It is typically made with
a highly seasoned ground pork. It is usually fermented, cured
or smoked and wrapped in a casing of pig’s intestines. In the
Philippines, the chorizo is rounded and it contains spices that
were mixed with the ground pork. The color of the product
depends on the amount of spices placed inside and the cured
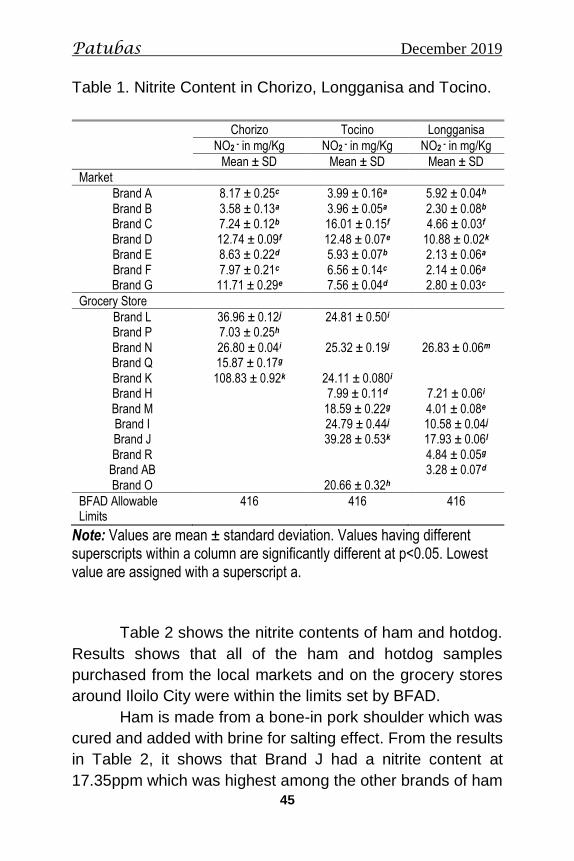
meat. Based on the results obtained in Table 1, Brand K
contained more nitrite compared to other chorizo brands while
Brand B contained the least amount of nitrite. Eventhough
Brand K is a branded product which underwent strict quality
control, its ingredients indicated that it contained more nitrite
salts than other chorizo products. It can be noted that only two
locally made products have nitrite concentrations above ten
ppm while all the branded samples have concentrations
higher than 10 ppm. All of the chorizo products were within
the safe limits imposed by BFAD which is 416 ppm.
Tocino means bacon in Spanish. It is made of pork fat,
salt, vinegar, minced garlic, onion powder, soy sauce; sodium
nitrite as preservative and food coloring as optional (Joven,
2011). Based on the result, Brand J had the highest nitrite
content of 39.28ppm while Brand C had the lowest nitrite
content of 3.96ppm. Compared to locally made tocino which
can be bought in the markets around Iloilo City, Brand J added
Patubas December 2019
44
more nitrite salts to their products compared to other tocino
products. Tocino samples from the markets have very low
nitrite content except for Brands C and D which have
concentrations above 10ppm. Only one brand from the
grocery store had a concentration of less than 10ppm while
other brands were above 10pm. All of the tocino samples
purchased were within the limits of BFAD.
Longganisa is also a Filipino sweet sausage which
originated from Spain. The difference between longganisa
and chorizo is that longganisa is longer, made with minced
meat and seasoned with paprika, cinnamon, aniseed, garlic
and vinegar (Tan, 2016). Based on Table 1 results on
longganisa, Brand N had the highest nitrite content at
26.83ppm while Brand E had the lowest nitrite content at
2.13ppm. Brand N has added more nitrite salts in its
longganisa than other longganisa products that were sold in
Iloilo City. The concentrations of nitrite in all markets and
branded longganisa products were almost equal. From the
result, all of the longganisa products purchased were within
limits set by BFAD.
It can be noted that tocino, chorizo and longganisa
branded samples contain more nitrite salts compared to their
locally made counterparts. Adding more nitrite salts would
increase the shelf life as they are sold around Philippines.
Local products of tocino, longganisa and tocino samples have
an average nitrite concentrations of less than 10ppm while
their branded samples have an average nitrite concentrations
of more than 10ppm.
Patubas December 2019
45
Table 1. Nitrite Content in Chorizo, Longganisa and Tocino.
Chorizo Tocino Longganisa
NO2 - in mg/Kg NO2
- in mg/Kg NO2 - in mg/Kg
Mean ± SD Mean ± SD Mean ± SD
Market
Brand A 8.17 ± 0.25c 3.99 ± 0.16a 5.92 ± 0.04h Brand B 3.58 ± 0.13a 3.96 ± 0.05a 2.30 ± 0.08b Brand C 7.24 ± 0.12b 16.01 ± 0.15f 4.66 ± 0.03f Brand D 12.74 ± 0.09f 12.48 ± 0.07e 10.88 ± 0.02k Brand E 8.63 ± 0.22d 5.93 ± 0.07b 2.13 ± 0.06a Brand F 7.97 ± 0.21c 6.56 ± 0.14c 2.14 ± 0.06a Brand G 11.71 ± 0.29e 7.56 ± 0.04d 2.80 ± 0.03c
Grocery Store
Brand L 36.96 ± 0.12j 24.81 ± 0.50i Brand P 7.03 ± 0.25h Brand N 26.80 ± 0.04i 25.32 ± 0.19j 26.83 ± 0.06m Brand Q 15.87 ± 0.17g Brand K 108.83 ± 0.92k 24.11 ± 0.080i Brand H 7.99 ± 0.11d 7.21 ± 0.06i Brand M 18.59 ± 0.22g 4.01 ± 0.08e Brand I 24.79 ± 0.44j 10.58 ± 0.04j Brand J 39.28 ± 0.53k 17.93 ± 0.06l Brand R 4.84 ± 0.05g
Brand AB 3.28 ± 0.07d Brand O 20.66 ± 0.32h
BFAD Allowable Limits
416 416 416
Note: Values are mean ± standard deviation. Values having different superscripts within a column are significantly different at p<0.05. Lowest value are assigned with a superscript a.
Table 2 shows the nitrite contents of ham and hotdog.
Results shows that all of the ham and hotdog samples
purchased from the local markets and on the grocery stores
around Iloilo City were within the limits set by BFAD.
Ham is made from a bone-in pork shoulder which was
cured and added with brine for salting effect. From the results
in Table 2, it shows that Brand J had a nitrite content at
17.35ppm which was highest among the other brands of ham
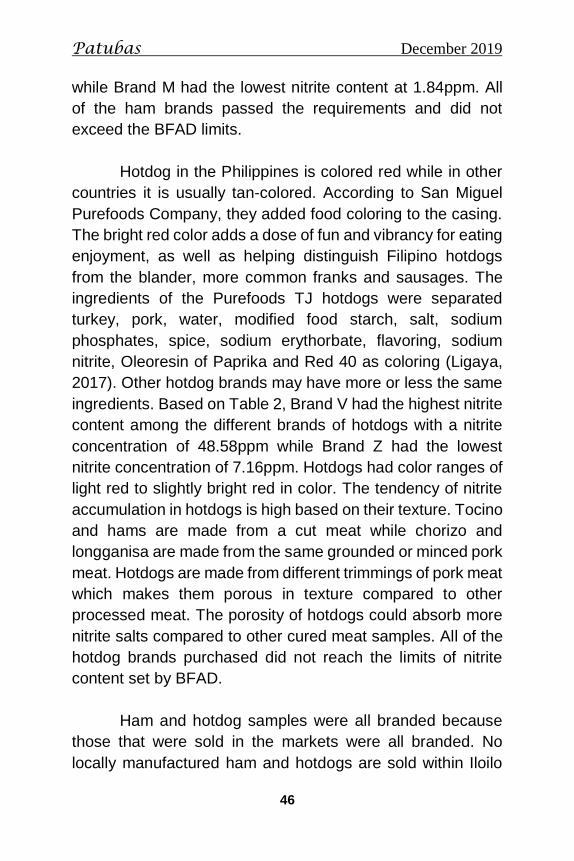
Patubas December 2019
46
while Brand M had the lowest nitrite content at 1.84ppm. All
of the ham brands passed the requirements and did not
exceed the BFAD limits.
Hotdog in the Philippines is colored red while in other
countries it is usually tan-colored. According to San Miguel
Purefoods Company, they added food coloring to the casing.
The bright red color adds a dose of fun and vibrancy for eating
enjoyment, as well as helping distinguish Filipino hotdogs
from the blander, more common franks and sausages. The
ingredients of the Purefoods TJ hotdogs were separated
turkey, pork, water, modified food starch, salt, sodium
phosphates, spice, sodium erythorbate, flavoring, sodium
nitrite, Oleoresin of Paprika and Red 40 as coloring (Ligaya,
2017). Other hotdog brands may have more or less the same
ingredients. Based on Table 2, Brand V had the highest nitrite
content among the different brands of hotdogs with a nitrite
concentration of 48.58ppm while Brand Z had the lowest
nitrite concentration of 7.16ppm. Hotdogs had color ranges of
light red to slightly bright red in color. The tendency of nitrite
accumulation in hotdogs is high based on their texture. Tocino
and hams are made from a cut meat while chorizo and
longganisa are made from the same grounded or minced pork
meat. Hotdogs are made from different trimmings of pork meat
which makes them porous in texture compared to other
processed meat. The porosity of hotdogs could absorb more
nitrite salts compared to other cured meat samples. All of the
hotdog brands purchased did not reach the limits of nitrite
content set by BFAD.
Ham and hotdog samples were all branded because
those that were sold in the markets were all branded. No
locally manufactured ham and hotdogs are sold within Iloilo
Patubas December 2019
47
City. On the average, ham products contain less nitrite salts
as compared to hotdogs. An average of more than 10ppm
nitrite concentrations can be found in hotdogs.
Table 2. Nitrite Content in Ham and Hotdog.
Brand
Ham Hotdog
NO2 - in mg/Kg NO2
- in mg/Kg
Mean ± SD Mean ± SD
Brand L 4.97 ± 0.05e 35.50 ± 0.07f Brand H 3.66 ± 0.05b 8.87 ± 0.05c Brand N 12.43 ± 0.06g Brand R 6.79 ± 003f Brand I 13.47 ± 0.08h Brand P 4.00 ± 0.04c Brand S 4.64 ± 0.06d Brand J 17.35 ± 0.08j Brand T 14.80 ± 0.05i Brand M 1.84 ± 0.08a Brand U 11.53 ± 0.05d Brand V 48.58 ± 0.06h Brand W 29.58 ± 0.08e Brand X 48.28 ± 0.06g Brand Y 8.38 ± 0.07b Brand Z 7.16 ± 0.03a
BFAD Allowable Limits
168 134
Note: Values are mean ± standard deviation. Values having different superscripts within a column are significantly different at p<0.05. Lowest value are assigned with a superscript a.
Based on the results, all of the cured meat samples
passed the BFAD approved limits. It can be noted that
consuming more than the recommended amount may have
adverse effects on our body. Locally produced cured meat
products contain less nitrite salts than branded ones as they
are usually meant to be consumed within a week. More nitrite
salts are added for branded products for the purpose of having
a longer shelf life while being sold around the Philippines.
Patubas December 2019
48
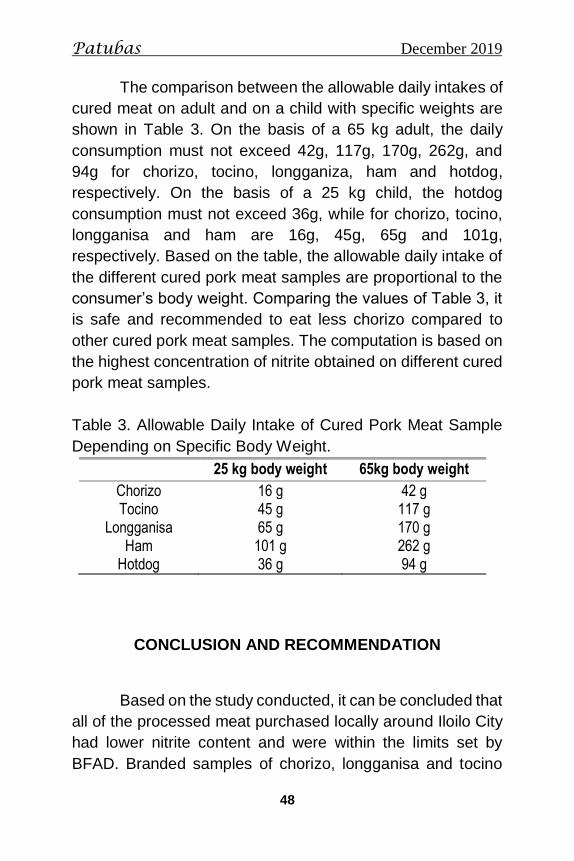
The comparison between the allowable daily intakes of
cured meat on adult and on a child with specific weights are
shown in Table 3. On the basis of a 65 kg adult, the daily
consumption must not exceed 42g, 117g, 170g, 262g, and
94g for chorizo, tocino, longganiza, ham and hotdog,
respectively. On the basis of a 25 kg child, the hotdog
consumption must not exceed 36g, while for chorizo, tocino,
longganisa and ham are 16g, 45g, 65g and 101g,
respectively. Based on the table, the allowable daily intake of
the different cured pork meat samples are proportional to the
consumer’s body weight. Comparing the values of Table 3, it
is safe and recommended to eat less chorizo compared to
other cured pork meat samples. The computation is based on
the highest concentration of nitrite obtained on different cured
pork meat samples.
Table 3. Allowable Daily Intake of Cured Pork Meat Sample
Depending on Specific Body Weight.
25 kg body weight 65kg body weight
Chorizo 16 g 42 g Tocino 45 g 117 g
Longganisa 65 g 170 g Ham 101 g 262 g
Hotdog 36 g 94 g
CONCLUSION AND RECOMMENDATION
Based on the study conducted, it can be concluded that
all of the processed meat purchased locally around Iloilo City
had lower nitrite content and were within the limits set by
BFAD. Branded samples of chorizo, longganisa and tocino
Patubas December 2019
49
contain an average higher amount of nitrite compared to
locally made products. There were significant differences
among groups of processed meats in terms of nitrite content
and the BFAD allowable limits.
The allowable daily intake of nitrite from cured pork
meat samples depends on the person’s body weight. Chorizo
must be consumed in moderation and awareness as it has the
highest level of nitrite content compared to other cured pork
meat samples.
It is recommended to notify the Regional Office of
BFAD about this study that the processed meat purchased in
public markets and grocery stores around Iloilo City are within
the limits set by their department. Since the Regional Office
of BFAD does not monitor nor test any processed food which
may contain nitrite, it can be recommended that the University
Research Center may be tapped by BFAD and have a
memorandum of agreement that we will be the one to analyze
the nitrite content of any processed meat submitted to them.
The nitrite content of these processed meats should
not be the only basis for food safety, but it is recommended
that other parameters like percent fat, calorie content, and
among other tests be made for awareness and food safety. It
is advised to eat cured meats in moderation to prevent the bad
effects of nitrite consumption. It is recommended that any food
intake must be done in moderation.
Patubas December 2019
50
REFERENCES
AOAC Official Methods of Analysis. (2000). 17thedition, Nitrites in cured meats- colorimetric methods. Association of Official Analytical Chemists. 973.31. Arlington, Virginia.
Anderson, J. J, Darwis, N., Mackay, D., Celis-Morales, C.,
Lyall, D., Sattar, N., Gill, J. & Pell, J. (2017). Red and processed meat consumption and breast cancer: UK Biobank cohort study and meta-analysis. EJC European Journal of Cancer. 90, 73–82.
Aschengrau, A., Zierler, S., & Cohen, A. (1989). Quality of
community drinking water and the occurrence of spontaneous abortion. Archives of Environmental Health. 44, 283.
Bauermann, J. F. (1979). Processing of poultry products with
and without sodium nitrite. Food Technology. 33:42-43.
Brender, J.D., Olive, J.M., Felkner, M., Suarez, L.,
Marckwardt, W., & Hendricks, K.A. (2004). Prenatal nitrate intake from drinking water and selected birth defects in offspring of participants in the national birth defects prevention study. Epidemiology. 15, 330.
Cassens, R.G. (1997). Residual nitrite in cured meat. Food
Technology. 51:53–55. Cassens, R.G. (1990). Nitrite-Cured Meat. Food and
Nutrition Press Inc., Trumbull, CT. pp. 3–36. Chan, D., Lau R., Aune, D., Vieira, R., Greenwood, D.,
Kampman, E. & Norat, T. (2011). Red and processed meat and colorectal cancer incidence: Meta-analysis of prospective studies. PLoS ONE 6(6): e20456.
Patubas December 2019
51
Cornforth, D.P., & Jayasingh, P. (2004). Colour and pigment. Encyclopedia of Meat Sciences. Vol. 1:249-256.
Demeyer, D., Mertens, B., De Smet, S. & Ulens, M. (2016).
Mechanisms linking colorectal cancer to the Consumption of (Processed) red meat: A review. Critical Review in Food Science and Nutrition. 56(16):2747-2766. doi: 10.1080/10408398.2013.873886.
Department of Health-Bureau of Food and Drugs (2006).
Bureau Circular No. 2006-015, Updated List of Food Additives.
English, D., MacInnis, R., Hodge, A., Hopper, J., Haydon, A.
& Giles, G. (2004). Red meat, Cchicken, and fish consumption and risk of colorectal cancer. Cancer Epidemiology Biomarkers and Prevention. 13(9):1509-14.
Epley, R.J., Addis, P.B., & Warthesen, J.J., (1992). Nitrite in
meat, educational development system, Minnesota Extension Service, University of Minnesota. AG-FS0974-A.
Hu, J., Carlo, L.V., Morrison, H., Negri, E., & Mery, L. (2011).
Salt, processed meat and the risk of cancer. European Journal of Cancer Prevention. 20(2):132–139 doi: 10.1097/CEJ.0b013e3283429e32
International Agency for Research on Cancer (IARC),
(2015). Carcinogenicity of consumption of red and processed meat. The Lancet Oncology. 16:1599-1600.
Patubas December 2019
52
ISO 2918-1975. (2007). Meat and meat products – Determination of nitrite content (reference method), international organization for standardization standards catalogue. Distributed through American National Standards Institute (ANSI) (23 August 2007).
JECFA-WHO/FAO (2002). Evaluations of the joint
FAO/WHO expert committee on food additives (JECFA). Nitrate. TRS 913-JECFA 59/26.
Joven, E. (2011). Pork tocino (Sweetened Cured Pork)
recipe. Retrieved from https://www.pinoyrecipe.net/pork-tocino-sweetened-cured-pork-recipe/.
Joven, E. (2011). Pork tocino (Sweetened Cured Pork)
recipe. Retrieved from https://www.wikihow. com/Make-Tocino#article_info_section.
Larsson, S., Orsini, N. & Wolk, A. (2006). Processed meat
consumption and stomach cancer risk: A meta-analysis. JNCI: Journal of the National Cancer Institute, 98(15),1078–1087.
Ligaya. (2017). Purefoods tender juicy hotdog. Retrieved
from https://www.aboutfilipinofood.com/san-miguel-purefoods-tender-juicy-hotdogs/
Li, L., Wang, P., Xu, X.L., & Zhou, G.H. (2012).
Electrochemical and other methods for detection and determination of dissolved nitrite: A review. Journal of Food Science. 77, C560.
Lyall, F., Greer, I.A., Young, A., & Myatt, L. (1996). Nitric
oxide concentrations are increased in the feto-placental circulation in intrauterine growth restriction Placenta. 17,165.
Patubas December 2019
53
Norat, T., Bingham, S., Ferrari, P., Slimani, N., Jena,b M., Mazuir, M., Overvad, K., Olsen, A., Tjønneland, A., Clavel, F., Bergmann, M., Nieters, A., Trichopoulou, A., Tountas, Y., Berrino, F., Palli, D., Panico, S., Tumino, R., Vineis, P., Engeset, D., Lund, E., Skeie, G., Ardanaz, E., González, C., Navarro, C., Quirós, J.R., Sanchez, M.J., Berglund, G., Palmqvist, R., Day, N., Khaw, K.T., Key ,T., San Joaquin, M., Hémon, B., Saracci, R., Kaaks, R. & Riboli, E. (2005). Meat, fish, and colorectal cancer risk: The European prospective investigation into cancer and nutrition. JNCI: Journal of the National Cancer Institute, 97(12), 906–916.
Oba, S., Shimizu, N., Nagata, C., Shimizu, H., Kametani, M.,
Takeyama, N., Ohnuma, T., & Matsushita, S. (2006). The relationship between the consumption of meat, fat, and coffee and the risk of colon cancer: A prospective study in Japan. Cancer Letters, 244(2), 260-267.
Parnaud, G. & Corpet, D.E. (1997). Colorectal cancer:
controversial role of meat consumption. Bulletin du Cancer, John Libbey Eurotext, 84 (9), pp. 899-911.
Ray, F.K. (2017). Meat curing. ANSI-3994. Oklahoma
cooperative extension service. Salamat Dok. Aired episode on November 15, 2015.
Processed foods: SANHI ng KANSER? Segment host: Jing Castañeda. Expert: Earle Castillo, MD | Clinical Toxicologist, UP-PGH.
Santarelli, RL, Pierre, F, & Corpet, DE. (2008). Processed
meat and colorectal cancer: a review of epidemiologic and experimental evidence. Nutrition and Cancer. 2008; 60 (2):131-144.doi: 10.1080/01635580701684872.
Patubas December 2019
54
Sebranek, J. G., & Bacus, J.N. (2007). Cured meat products without direct addition of nitrate ornitrite: What are the issues? Meat Science. 77:136–147.
Sindelar, J.J. & Milkowski, A.L. (2011). Sodium nitrite in
processed meat and poultry meats: A review of curing and examining the risk/benefit of Its use, American Science Meat Association White Paper Series, Number 3. 1-14.
Tan, J. (2016). Longganisa: What to know about the
Philippines’ favorite sausage. Retrieved from https://waytogo.cebupacificair.com/longganisa/
Titov, V.Y. & Petrenko, Y.M. (2005). Proposed mechanism of
nitrite-induced methemoglobinemia. Biochemistry-Moscow. 70,473-483.
Vasavada, M. N., & Cornforth, D. P.. (2005). Evaluation of
milk mineral antioxidant activity in meat balls and nitrite-cured sausage. Journal of Food Science. 70:250–253.
Zhu, H., Yang X., Zhang, C., Guangzhou, T., Zhao, L., Tang,
S., Shu, Z., Cai, J., Dai, S., Qin ,Q., Xu L., Cheng, H. & Su,n X. (2013). Red and processed meat intake is associated with higher gastric cancer risk: A meta-analysis of epidemiological observational studies. PLoS ONE 8(8): e70955. Retrieved from https://journals.plos.org/plosone/article?id=10.1371/journal.pone.0070955.
Patubas December 2019
55
ACKNOWLEDGMENT
The researchers’ curiosity on the amount of nitrite in
cured meat products has led to this research. The researchers would like to thank the following persons for making this research possible: Dr. Ilda G. Borlongan for her mentoring and unending support; Dr. Mary O’ T. Penetrante and Dr. Stella G. Fernandez for their suggestions and recommendations for the improvement of this research; Chemistry Department for the use of their facilities and equipment; work students Michael and Aljun for technical assistance; Ms. Ma. Ligaya Villarias-Caniel for facilitating the formatting of this research; The researchers’ respective families for their love and encouragement, and above all, to GOD for giving the researchers everything to finish this research for food safety.
To GOD be the glory!
Patubas December 2019
56
PHENOMENOLOGICAL STUDY ON INFANT CARE
AMONG TEENAGE MOTHERS
JULIETA H. BOTEROS, M.A.N.
NOVIE JOY C. SOLEDAD, M.N.
Central Philippine University
ABSTRACT
This study, using the descriptive phenomenological approach,
explored the infant care experience of teenage mothers using a
descriptive. Seven teenage mothers, ages 15-19 years old, were
interviewed. These participants came from diverse educational,
socio- economic, and geopolitical backgrounds, who were
primary caregivers of their children 0-12 months old at the time
of the interview and delivered termed babies without any
congenital disorders regardless of the method of delivery. The
interview with teenage mothers was recorded using a digital
recorder and was transcribed using Hycner’s (1985) method.
Findings of the study showed that essence of the infant care
experience of teenage mothers is characterized by four major
themes: adapting to infant care routines, facing challenges in
infant care, adjusting to become a teenage mother, and feeling
of fulfillment of motherhood experience. These teen mothers
cared for their babies with support from their families, partners
and significant others. Some of them regretted becoming
mothers at an early age and deprived of social life, sleep, and
time for self. They desired for self-improvement and tried to
manage time. They may be young, but they feel happy and
fulfilled seeing their babies grow.
Keywords: phenomenological research, infant care, teenage
mothers, caregivers motherhood
Patubas December 2019
57
INTRODUCTION
Adolescence is often a turbulent time. Being in a period
between childhood and adulthood, adolescents face some
unique problems (Coon, 2002). Those who fail to develop
sense of identity suffer role confusion as described by Ericson
(1968). At this time, they must have identified themselves as
one unique individual.
Data from the Philippine Statistical Authority (PSA,
2014) reveal that every hour, 24 babies are delivered by
teenage mothers. According to the 2014 Young Adult Fertility
and Sexuality (YAFS) study, around 14 percent of Filipino girls
aged 15 to 19 are either pregnant for the first time or are
already mothers-more than twice the rate recorded in 2002.
These teenage mothers live with their mothers, parents, or
relatives. In most cases, the father is usually a teenage boy.
Reasons for becoming pregnant among teenagers include:
unplanned sexual encounters (“getting caught up in the
moment”) and peer pressure; lack of information on safe sex;
breakdown of family life and lack of good female role models
in the family; and absence of accessible, adolescent-friendly
clinics.
Unfortunately, these teenagers are not ready to
become mothers. In view of this, large numbers of teenagers
who plunged into unexpected pregnancies, according to
Pungbangkadee (2007) face difficulties by devoting
themselves to serve the needs of their infant before serving
their own. As a consequence, teenage mothers face difficult
conditions that can cause stress and conflict between their
roles of being a teenager and being a mother.
Patubas December 2019
58
Parents are the main caregivers of young children, the
extent and quality of their parenting knowledge is often
considered vital to improving children’s development and
health.
The purpose of the study is to examine and understand
the infant-care experiences of teenage mothers who are
taking care of their baby from birth up to one year. This
investigation focuses on answering the central question “What
is it like to care for infants as a teenage mother?”
The result of the study is expected to be beneficial to
teenagers and their families, educators and health providers,
policy makers and program implementers, counselors, and
future researchers.
Philosophical Underpinning
The philosophy and science of caring has four major
concepts: human being, health, environment/ society, and
nursing, according to Jean Watson (2008).
Watson refers to the human being as “a valued person
in and of him or herself to be cared for, respected, nurtured,
understood and assisted; in general a philosophical view of a
person as a fully functional integrated self. The human person
is viewed as greater than and different from the sum of his or
her parts.”
Health is defined by Watson as a high level of overall
physical, mental and social functioning; a general adaptive-
maintenance level of daily functioning and absence of illness
or the presence of efforts leading to the absence of illness.
Patubas December 2019
59
One of the assumptions of Watson’s model is that
caring can be effectively demonstrated and practiced only
interpersonally. Relationship management is important to
teenagers and their families. Relational caring of self and
others can change self, others, as well as family. According
to Namit Sharma in Quora.com (2019), “the most caring
person I’ve known till now is one and only my Mom”.
METHODOLOGY
This study explored the infant care experience of
teenage mothers using the descriptive phenomenological
approach. The researchers of the study would like to know
what it means to live as a teenage mother, most especially on
how they take care of their infants. This study attempted to
break from inherited understanding about infant care (e.g.,
from the literature, cultural conceptions, among others) and
delve on the “lived experience” (Wolff, 2007 p. 97) by looking
at the essential structures of the infant-care experiences
among teenage mothers. This phenomenological study
approached the research questions on infant-care experience
of teenage mothers using Hychner (1985) notions of
phenomenological research. The researchers explored infant-
care experience as it presents itself in the consciousness of
teenage mothers, extracted the essence of the experience,
described the experience as lived experience, and attended
to the nature and composition of the experience by setting
aside previous understandings, preconceived judgments, and
inherited theoretical ideas.
Patubas December 2019
60
Since the researchers of this study are nurse educators
who have rich theoretical ideas on infant care, these
preconceived ideas, judgments, and knowledge were
bracketed and consciously examined in order not to cloud the
researchers’ interpretation of the research participants.
This study was conducted in one of cities in the
Philippines. Participants generally live in a highly urbanized
and industrialized city in the Philippines. It is the capital city of
the province and center of the only officially recognized
Metropolitan Area in the region. Interview location and time
were dependent on the participants’ privacy and preference,
as well as on agreement between the participants and the
researchers (Holloway & Wheeler, 2010).
Eight teenage mothers served as research
participants; however, seven (7) were only included in the
analysis because the researchers felt that this was the
saturation point. This study only included mothers who
were15-19 years old and primary caregivers of their children
who were 0-12 months old at the time of the interview. This
study only included teenage mothers who delivered termed
babies without any congenital disorders. All of them were
currently enrolled in school during interview. They are living
with parents and come from middle class families.
The researchers, upon initial contact, established
rapport with the respondents to gain their sense of trust and
to determine if they were ready for the interview. Verbal
consents were sought from the participants prior to the actual
interview. Written informed consents were secured prior to the
commencement of the interview. They were informed of the
purpose, style and procedure of the research as well as their
Patubas December 2019
61
rights as research participants. Participants were assigned
initials to ensure anonymity (Holloway & Wheeler, 2010).
Hence during the interview session, the participants were
encouraged to describe and express their stories freely. Each
interview lasted for 30-45 minutes.
Units of general meaning of the participant’s responses
were identified. Four themes, nine categories and 33
subcategories were identified describing the teenage
mother’s infant care experiences of their infants aging three
months to 12 months old. Data processing and analysis was
done using Hycner’s Method (1985).
RESULTS AND DISCUSSION
Findings of the study showed that essence of the infant
care experience of teenage mothers is characterized by four
major themes, namely, adapting to infant care routines, facing
challenges in infant care, adjusting to become a teenage
mother; and feeling of fulfillment of motherhood experience.
Adapting to infant care can be described as confidence
in doing infant care. Most of these teenage mothers
verbalized that they are not so confident in doing infant care;
however, they were supported by their partner, mother, father
and siblings. Some of them have previous experiences in
child rearing from their younger sibling or neighbor’s infant
such gave them the idea on how to do infant care.
Being young poses difficulty in doing infant care. Some
had regrets on becoming a mother at an early age. Teen
parents often find that caring for a child makes it difficult for
Patubas December 2019
62
them to continue their schooling (Slocum 2015). They cannot
go out anytime they want. They feel that they have lost their
freedom and when asked what they want to tell other
teenagers, they usually say, not to do what they have done.
All of these young mothers want to finish their studies, find a
good job in order to give their children a good future.
For those who are schooling, their children are their
motivation. They experience sleepless nights, lack of sleep,
they need balance things between household chores and
caring for their babies. However, despite these difficulties,
they still continue their studies.
Most of these teenage mothers are supported
financially by their family. They are not prepared for
employment, being young and schooling and with an infant to
take care of. One of the mothers is not getting financial
support from her family but instead her partner is solely
supporting their financial needs.
Most often, they are dependent on their parents or
significant others. Having a baby placed them in a situation
where they are forced to learn to manage time between their
baby, household chores and schooling. So far, these teen
mothers try hard to balance their time.
Preparing for parenthood is important. Teenagers, too,
may want to become good mothers; however, they do not
actively look for information about infant care and
development. (McKinney et al., 2013). They even delay their
prenatal check-up, they may not know they are pregnant.
Some deny that they are pregnant; they do not realize how
important prenatal care is to themselves and to their baby and
Patubas December 2019
63
to the care of their babies later on. They have little information
about the physiologic needs of the body such as increase for
nutrients, which pregnancy and breastfeeding impose on their
bodies.
Most of the teenage mothers verbalized they became
more responsible after having a baby. Most of them attended
their baby’s needs and also attend school at the same time.
To be a mother at this time means a more crucial time
for them. They may stop schooling; they lack sleep because
they take care of the baby even at night. Their social life is
also deprived. Some teenagers lack time for themselves.
They need extra attention and assistance to care for the baby.
Health providers and parents need to provide enough
guidance and health teaching.
Most teenage mothers claimed their baby made them
become a better person. They were able to adjust to the
routine imposed to a young mother. They are caring and
loving just like any other mothers only much younger and still
learning.
Motherhood has brought happiness for many of the
young women. There is an associated sense of maturity and
responsibility. Many young mothers have developed a
personal sense of stability, identity, purpose, and
responsibility following early motherhood, a finding similar to
other studies of teenage pregnancy and parenthood (Ngum
Chi Watts et al., 2015).
Patubas December 2019
64
Conclusion
Based on the analysis of this study, the teenage
mothers need a lot of help from parents, significant others and
their partners. They also needs psychological and social help
on top of the financial and material need of both the teenager
and the child. Most of these teenage mothers had positive
attitude of being a mother, but they face a lot of changes and
challenges that have affected their lives. These girls
verbalized they do not recommend early pregnancy and
motherhood after the difficulties and hindrances they have
encountered starting from pregnancy, delivery of their babies,
and in the taking care of the baby.
Parents and significant others should advise their
teenager to go back to school if possible and support them on
caring for the babies.
The health provider should include family planning in
their mothers’ class to prevent further unplanned pregnancies,
since most of them have live-in partners.
Recommendations and Implications
Parents and significant others have a great role in
preventing pregnancy. An open communication between
them and their children will bridge the gap between them. The
teenagers listen to their parents when their parents
understand and listen to them.
The health provider should include family planning in
their mothers’ class to prevent further unplanned pregnancies,
since some of them have live-in partners. A non-judgmental
Patubas December 2019
65
counseling program, should be provided, including all options
of family planning and safe sex.
Adolescents should be taught sexuality at school and
the responsibility that goes with it. The value of education
should be reinforced.
Advocacy for evidence-based programs to support
teenage mothers should be encouraged. They need financial
support for their laboratories, medicines, and ultrasound.
Young mothers should be encouraged to return to
school and continue a healthy lifestyle. Nutritional adequacy,
particularly of breastfeeding mothers, should be assessed.
Young pregnant woman should likewise be
encouraged to get appropriate healthcare intervention,
including non-judgmental medical and psychosocial support.
It will provide a good outcome for both the young parent and
the child. Teenage fathers can also participate in the care of
their partner and the baby.
This study may also encourage future researchers to
conduct further related studies. This may also serve as their
source of ideas, concepts, and reference for further studies.
Patubas December 2019
66
REFERENCES
Bornstein, M. H., Cote, L. R., Haynes, O. M., Hahn, C., & Park, Y. (2010). Parenting knowledge: Experiential and socio-demographic factors in European American mothers of too young children. Retrieved from https://www.ncbi.nlm.nih.gov/ pmc/articles/PMC3412549/.
Coon, D., (2002). Psychology a journey. (1st ed). Wadsworth
Goup, CA. Retrieved from https://www.amazon.com/Psychology-Journey-Dennis-Coon/dp/0534568726.
Handa, V. (2016). Phenomenology as a theoretical research
perspective and as a research methodology: Seminar workshop on demystifying qualitative research: Connecting theory and practice. Unpublished research report to Central Philippine University, Jaro, Iloilo City, Philippines.
Hycner (1985). Phenomenological analysis of interview data.
Retrieved form https://philpapers.org/rec/HYCSGF. Liefer, G., (2007). Introduction to maternity and pediatric
nursing. (5th ed). Saunders, Elsevier. Retrieved from https://www.amazon.com/Introduction-Maternity-Pediatric-Nursing-5TH/dp/B0042NJZN4.
Littleton, L. Y. & Engebretson, J.C. (2002). Maternal,
neonatal, and women’s health nursing. Retrieved from https://trove.nla.gov.au/ work/12890417? q&versionId=46498691.
Marino, J.L., Lewis, L.N., Bateson, D., Hickey, M., & Skinner,
S. (2016). Teenage mothers. Retrieved https://search.informit.com.au/documentSummary; dn=376943452778983;res=IELIAC.
Patubas December 2019
67
McKinney, E.S., James, S.R., Murray, S.S., Nelson, K. & Ashwill, J. (2013). Maternal- child nursing. (4th ed). Retrieved from https://www.amazon.com/ Maternal-Child-Nursing-Emily-Slone-McKinney/dp/1437727751.
Nall, R. (2016). What are the effects of teenage pregnancy?
Retrieved from https://www.healthline.com/health/pregnancy/teenage-pregnancy-effects.
Ngum Chi Watts, M.C., Liamputtong, P. & Mcmichael C.
( 2015). Early Motherhood: a qualitative study exploring the experiences of African Australian teenage mothers in greater Melbourne, Australia. Retrieved from https://bmcpublichealth. biomedcentral.com/articles/10.1186/s12889-015-2215-2
One in ten young Filipino women age 15 to 19 is already a
mother or pregnant with first child (Final Results from the 2013 National Demographic and Health Survey) (Ref. No. 2014-057, August 2014). Retrieved from https://psa.gov.ph/content/one-ten-young-filipino-women-age-15-19-already-mother-or-pregnant-first-child-final-results.
Pillitteri, A. (2014). Maternal & child health nursing: Care of
the childbearing family. (7th ed.). Wolters Kluwer Health/Lippincott Williams & Wilkins, 2014. Retrieved from https://books.google.com.ph/ books/about/Maternal_Child_Health_Nursing.html?id=rw7clAEACAAJ&redir_esc=y.
Slocum, M. (2015). The problems faced by teen parents.
Retrieved from http://www.livestrong.com/ article/146370-the-problems-faced-by-teen-parents/.
Patubas December 2019
68
Stages of adolescence. Retrieved from https://www.psychologytoday.com/blog/decisions-teens-make/201704/it-s-time-talk.
Teenage pregnancy among today’s Filipino youth
INQUIRER.net. (n.d.). Retrieved from http://opinion.inquirer.net/74517/teenage-pregnancy-among-todays-filipino-youth.
Tomereli, K.R. & Horizonte, R.B. (2008). General practice of
teenage mothers caring for their children. Retrieved from http://www.scielo.br/scielo.php? pid=S0103-1002009000300006&script= sci_arttext&tlng=en.
Wallace, S. (2017). The power of parenting. Retrieved
fromhttps://www.psychology today.com/ blog/decisions-teens-make/201704/it-s-time-talk.
Watson’s philosophy and science of caring. Retrieved from
https://nursing-theory.org/theories-and-models/watson-philosophy-and-science-of-caring.php.
When your teen is having a baby. Retrieved from
http://kidshealth.org/en/parents/teen-pregnancy.html#.
Patubas December 2019
69
ACKNOWLEDGMENT
This study will not be possible without the combined
effort of the researchers, participants and those who provided
their time and expertise in various aspects of the research.
The Researchers would like to extend their deepest
gratitude to the following:
The Almighty Father, for the wisdom, guidance,
provision, and support.
Dr. Vicente Handa, our adviser, for demystifying
qualitative research to the Faculty of the College of Nursing.
His patience and guidance is deeply appreciated;
Prof. Lily Lynn V. Somo and Atty. Salex E. Alibogha,
our Deans, for the encouragement to conduct and finish this
study;
Dr. Carielle V. Rio, Dr. Irene Malaga, and Dr. Perry
Paul Espinosa, for their deep knowledge, editing, feedback
and advice;
The Participants, who trusted the Researchers with
their experiences and time. For their parents and guardians
who consented for them to participate in this study;
Prof. Melba Sale, for the constant reminder and
encouragement to finish this study;
Central Philippine University – University Research
Center, for the support, approval, and funding of this study;

Patubas December 2019
70
Our colleagues and those who are not mentioned but
in many ways helped in making this study a success; and,
Our families, the Boteros Family-Sunshine, Wewe,
Gel, Ena Sugar and Auntie Peggy and the Soledads- Jons,
Nico and Nathan, who were our main support, for the love and
encouragement.
To God be the Glory!
Patubas December 2019
71
AWARENESS, AVAILMENT, ASSESSMENT AND IMPORTANCE OF STUDENT SERVICES
MARGEN A. JAVA, EdD, RGC MAREDIL E. AMBOS, Ed.D.
GIFT D. TRAGICO, MAEd, RGC BETTY C. ERMITAÑO, MAEd, RGC. EUNICE G. ALAYON, MSGC, RGC
ROUELLA CHEYENNE C. ABERIA, AB Central Philippine University
ABSTRACT
This descriptive-relational study was conducted to determine
the awareness, availment, assessment, and importance of
student services among the 361 students of Central Philippine
University during the School Year 2018 - 2019. A revised duly
validated and reliability tested questionnaire was used and
ethical considerations for the study were followed. Data were
analyzed using frequency count, percentages, Chi Square,
Cramer’s V, and Gamma. The findings are: the profile of the
respondents shows that there are more females than males;
younger group; Roman Catholics; first and fourth year
students from the Colleges of Business and Accountancy,
Engineering and Arts and Sciences; coming from barangays;
graduated from either public or private high schools either
located in the cities or towns; and are living with their parents
in their own house while studying in the university. The
respondents are very much aware of the existence of the
student services and programs of the university during the two
school years of the survey (2015 and 2018); have attached a
great value upon the existence of these student services and
programs in the university; are aware and have availed of the
services and programs under the VPSA. Based on the
Patubas December 2019
72
findings of the study, the following conclusions are drawn: the
respondents’ place of origin is significantly related to the
importance they attach to student services and programs in
general of the university. The respondents’ awareness of
student services and programs under the Office of the Vice
President for Student Affairs is significantly related to their
availment and assessment of these services and programs.
Patubas December 2019
73
INTRODUCTION
It is the mandate for all higher education institutions
(HEIs) like Central Philippine University to protect and
promote the rights of all Filipino citizens to quality education
at all levels and shall take appropriate steps to make
education accessible to all (Philippine Constitution, 1987) and
that the state shall establish, maintain and support a
complete, adequate, and integrated system of education
relevant to the needs of the people and society (CHED
Memorandum Order No. 09, Series of 2013). It is stated in this
memorandum that the Student Affairs and Services are the
services and programs in higher education institutions that are
concerned with academic support experiences of students to
attain holistic student development. This is the office that is
devoted to creating an integrated learning experience that will
help students reach their educational, social, personal, and
professional aspirations. In consonance with the institution’s
vision, mission, it aims to provide occasions for growth and
advancement through cultural, spiritual, athletic, co-curricular,
and extra-curricular activities with the end in view that
students may develop into well-rounded individuals. It
endeavors to nurture a campus environment where academic
and non-academic pursuits are balanced thereby making
campus life more enriching, interesting, and worthwhile for
students (http://www.cefi.edu.ph/index.php?option=com
content&view=article&id=78&Itemid=82 as cited by Java,
2015).
Central Philippine University has been known as a
university purposed to provide Exemplary Christian Education
for Life which will be responsive to the needs of the total
person and the world and offer a holistic education for her
Patubas December 2019
74
students (Java, 2015). Are the students aware of these
student services and programs? Can they feel these
programs? Are they availing them? If so, to what extent are
they availing them? Yes, because students come and go
every year and may have varying experiences regarding the
reach of the student services of the university. However, in
order that the results of this study could be used for
management review, there is a need to conduct such study
every two years. Hence, this study was conducted.
Objectives and Hypotheses of the Study
This study was conducted to determine the awareness,
availment, assessment and importance of student services
among students of Central Philippine University. Specifically,
this study aimed to:
1. describe the profile of the respondents as to age,
sex, college, religion, type of high school graduated from,
place of high school graduated from, place of residence, and
living arrangement while in school;
2. determine the respondents’ awareness and
assessment of the importance of the student programs and
services offered by the university and the offices/services
under the Office of the Vice President for Student Affairs;
3. determine the respondents’ availment and
assessment of the offices/services under the Office of the Vice
President for Student Affairs;
4. determine the relationship between the
respondents’ profile and awareness of student programs and
services;
5. determine the relationship between the
respondents’ awareness of the offices/services under the
Patubas December 2019
75
Office of the Vice President for Student Affairs and their
availment, assessment and importance of these
offices/services;
6. determine the relationship between the
respondents’ availment of the offices/services under the
Office of the Vice President for Student Affairs and their
assessment and importance of these offices/services; and
7. determine the relationship between the
respondents’ assessment of the offices/services under the
Office of the Vice President for Student Affairs and the
importance of these offices/services.
Hypotheses of the Study
Based on the objectives given, it was hypothesized
that:
1. there is a significant relationship between the
respondents’ profile and awareness of student programs and
services;
2. there is a significant relationship between the
respondents’ awareness of the offices/services under the
Office of the Vice President for Student Affairs and their
availment, assessment and importance of these
offices/services;
3. there is a significant relationship between the
respondents’ availment of the offices/services under the
Office of the Vice President for Student Affairs and their
assessment and importance of these offices/services; and
4. there is a significant relationship between the
respondents’ assessment of the offices/services under the
Office of the Vice President for Student Affairs and the
importance of these offices/services.
Patubas December 2019
76
Theoretical/Conceptual Framework and Hypotheses
This study was anchored on the Contingency
Approach of Luthans (2008) and the Individual Differences in
psychology by Newstrom (2007).The “Contingency Approach”
contends that certain practices work better than others for
certain people and certain jobs while individual differences in
psychology states that people differ in their personalities,
needs, demographic factors, past experiences, or even find
themselves in different physical settings, time periods, or
social surroundings (Bedia, 2012) as cited by Java (2015).
According to Luthans (2008), clients’ expectations are
highly individualized by age, gender, personality, occupation,
location, socio-economic class, past experiences and many
other factors. Older clients may tend to have higher
awareness and availments of services than younger clients
because they are more responsible and reliable. Female
clients may have greater awareness and availment of
services than the male clients because they are more
interested in their work (Bedia, 2012) as cited by Java (2015).
There are several factors that may contribute to clients’
satisfaction with quality of services, such as, awareness and
availment of services and extent of utilization and satisfaction
of these services. If the clients are aware and avail of these
services, the level of satisfaction and their assessment may
tend to be higher than those who are not aware and have not
availed at all. Likewise, clients who have availed and utilized
these services may have high level of satisfaction and
assessment of these than those who have not.
Patubas December 2019
77
Clients may differ in the way they are satisfied
depending on their access to the services and their utilization
of them. One may have satisfaction, with the access to these
services, but may be dissatisfied if he or she had already
utilized them. This observation is in accord with the law of
individual differences in psychology, upholding a belief that all
people are different from all others. People differ in their
personalities, needs, demographic factors, past experiences,
or even find themselves in different physical settings, time
periods, or social surroundings” (Newstrom 2007) as cited by
Java (2015).
In line with these discussions, it could be deduced that
the respondent’s age, sex, religion, college, place of origin,
type of high graduated from, place of high school graduated
from, living arrangement while in school, which are
considered as antecedent variables, may influence his/her
awareness and importance of student services, as well as
his/her awareness, availment, assessment and importance of
offices/student services and programs under the Office of the
Vice President for Student Affairs which are considered to be
the independent and dependent variables respectively.
To further illustrate the interplay of the variables in the
study, the following diagram is presented to show the
relationship of the variables in the study:
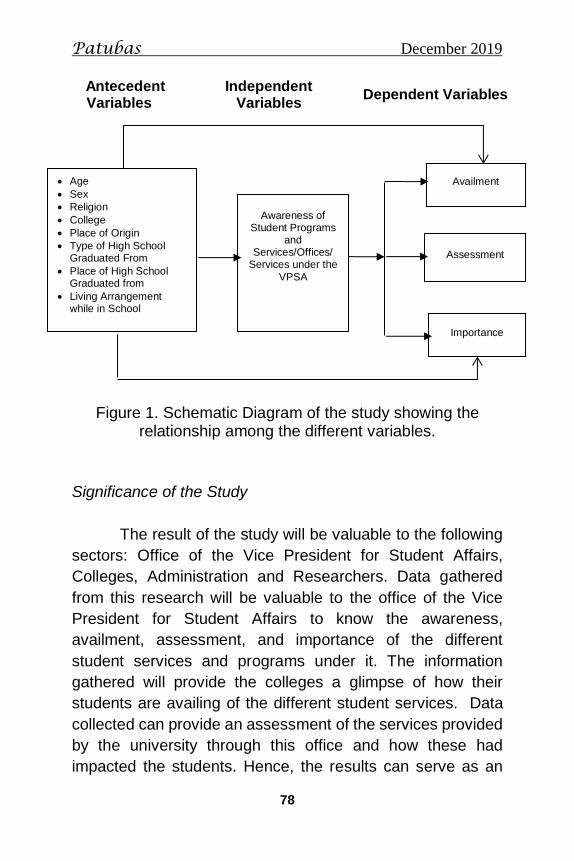
Patubas December 2019
78
Antecedent Variables
Independent Variables
Dependent Variables
Figure 1. Schematic Diagram of the study showing the relationship among the different variables.
Significance of the Study
The result of the study will be valuable to the following
sectors: Office of the Vice President for Student Affairs,
Colleges, Administration and Researchers. Data gathered
from this research will be valuable to the office of the Vice
President for Student Affairs to know the awareness,
availment, assessment, and importance of the different
student services and programs under it. The information
gathered will provide the colleges a glimpse of how their
students are availing of the different student services. Data
collected can provide an assessment of the services provided
by the university through this office and how these had
impacted the students. Hence, the results can serve as an
Age
Sex
Religion
College
Place of Origin
Type of High School Graduated From
Place of High School Graduated from
Living Arrangement while in School
Awareness of Student Programs
and Services/Offices/
Services under the
VPSA
Availment
Assessment
Importance
Patubas December 2019
79
indicator of how the administration is implementing these
services and in turn how these can help the university realize
her vision, mission, and goal. Other groups or individuals may
benefit from the data gathered by getting inspiration to
conduct their own study for their institutions or use this as
springboard for further and detailed studies.
Scope, Limitations and Applicable Definitions of the Study
This study focused on the awareness, availment,
assessment, and importance of student services obtained
through one-shot survey using a researcher-made
questionnaire administered in the SEAL classes of the college
freshmen-respondents while those in the higher years were
contacted either through their classes or by using all means
of communication like Facebook, Yahoo Messenger, text
message or through their classmates and friends. Second
coursers like those enrolled in the Colleges of Law, Medicine
and Graduate Studies and Bachelor of Science in Respiratory
Therapy, who are having their OJT in Manila were excluded
as respondents of the study.
The following are the operational definition of terms as
used in this research:
Awareness of student services. This refers to the
students’ knowledge of the existence of the different student
services and programs available to students in the university.
This was measured by the 20-item questions answerable by
yes or no. Each yes answer gets one point. Based on the
total number of yes responses, the respondent’s awareness
of student services can be classified as “high” (14 – 20),
“average” (7 – 13), and “low” (0 – 6) or “no” answers (0). In
Patubas December 2019
80
the case of awareness of offices/services under the VPSA,
this was measured by a 10-item questions answerable by yes
or no. Each yes answer gets one point. Based on the total
number of yes responses, the respondent’s awareness of
student services under the VPSA can be classified as “high”
(8 - 10), “average” (5 – 7), and “low” (0 – 4) or “no” answers
(0).
Availment of Student Services under the VPSA . This
refers to the number of times the students had benefited from
the student services and programs offered by the University
through the office of the VPSA. The availment of student
services and programs was determined by the total “availed”
response the respondents answered out of the 10-item
instrument. Based on the total number of “availed”
responses, the respondent’s availment of student services
and programs are classified as “high” (8 – 10), “average” (5 –
7), and “low” (0 – 4) or “no” answers (0).
Assessment of Student Services and Programs under
the VPSA. This refers to the students’ level of contentment
with the utilization/availment of student services and
programs offered by the University through the Office of the
VPSA. The level of satisfaction with student services and
programs was measured by the 10-item instrument using the
following responses: definitely satisfied – 5; satisfied – 4;
neither satisfied nor dissatisfied – 3; dissatisfied – 2; and
definitely dissatisfied – 1. The average measure was
computed and based in the obtained value; the respondents’
level of satisfaction with student services and programs was
categorized as follows: Definitely Satisfied =41 – 50; Satisfied
= 31 – 40; Neither Satisfied or Dissatisfied =21 – 30;
Dissatisfied =11 – 20; and Definitely Dissatisfied =1- 10.
Patubas December 2019
81
Importance of student services. This refers to the value
the student will attach to student services and programs in
his/her life as a student. This was measured by the 20-item
questions answerable by the following: very important – 5;
important – 4; neither important nor unimportant – 3; not
important – 2; and, not at all important – 1. The total answer
was added and was given the following categories: Very
Important = 81 – 100; Important = 61 – 80; Neither Important
or Unimportant = 41 – 60; Not Important =21 – 40; and Not at
all Important=1 – 20.
In the case of importance of offices/services under the
VPSA, this was measured by a 10-item question answerable
by the following: very important – 5; important – 4; neither
important nor unimportant – 3; not important – 2; and not at
all important – 1. The total answer was added and was given
the following categories: Very Important = 41 – 50; Important
= 31 – 40; Neither Important or Unimportant = 21 – 30; Not
Important =11 – 20; and Not at all Important =1 – 10.
The definition of the following terms/phrases: student
services, orientation service, guidance service, placement
services, student organizations, leadership training, student
government, student discipline, admission services,
scholarship and financial assistance, food services, health
services, safety and security services, student housing and
residential services, international student services, services
for student with special needs and personal with disabilities,
cultural and arts program, sports development programs and
social and community involvement programs were adapted
from CHED Memo No. 09, Series of 2013.
Patubas December 2019
82
Related Literature/Studies
Many studies have been conducted about student
services in general, and about the awareness, availment,
assessment and importance of these services in particular.
Reviewed in this section are some studies which have direct
bearing on the present study on awareness, availment,
assessment and importance of student services.
According to Berstein and Cunanan (2008), and
Bedia (2012) effective access to services must be drawn from
all resources of the school community, be made available to
all students, and provided to meet their basic need. Provision
of these services must be coordinated to ensure that all
students receive the necessary services. However, students
have various expectations in terms of quality of services
provided by the university. If students’ expectations are met,
delivery of service can be perceived to be satisfactory. On the
other hand, there are several factors that may contribute to
students’ satisfaction with quality of services offered to them
such as awareness and access to the services and the extent
of utilization/availment of these services. If the students have
access to or are aware of these services, the level of
satisfaction may tend to be higher than those who have no
access at all. Similarly, students who have utilized these
services may have a higher level of satisfaction than those
who have not (Java, 2015).
Moreover, satisfaction according to Deming (Sallie,
1998 in Bedia, 2012 as cited by Java, 2015) is the measure
of quality of services. The satisfaction levels of clients largely
depend on how the services are provided to them in terms of
quality. In case of client evaluations, Stipak (2001) in Bedia
Patubas December 2019
83
(2012) as cited by Java (2015) had pointed out that the
accuracy of client perception of service conditions can be
affected by some factors like the degree of interaction
between the agency and the clients, and other client variables
and experiences. Clients can also be more satisfied if they
participate in the evaluation of the services provided by the
institution. They may differ in the way they are satisfied
depending on their access to the services and on how they
utilize these services. One may have satisfaction, with the
access to these services, but may be dissatisfied if he or she
had already utilized them. In the same manner, a study
conducted by Roxas (2003), and Cortel (2004) as cited by
Java (2015) yielded a result that all of the units of student
services including guidance office fall short of the expectation
of students.
METHODOLOGY
This is a descriptive-relational study. A one-shot survey
design was used to answer the objectives of the study. The
study area and the study population included the 6,938
college students of Central Philippine University for the First
Semester of School Year 2018- 2019 excluding the students
enrolled in Medicine Proper, College of Law and School of
Graduate Studies who are already second coursers. The
computed sample size is 364 but the final sample size was
361 for the BS Respiratory Therapy students could not be
reached while they were having their OJT in Manila during the
conduct of the study.
Patubas December 2019
84
RESULTS AND DISCUSSION
Profile of Respondents as to age, sex, college, religion, year
level, place of origin, type and place of high school graduated
from and living arrangement while studying at CPU.
The profile of the respondents according to age, sex,
college, religion, year level, place of origin, type and place of
high school graduated from and living arrangement while
studying at CPU is presented in Table 1. In terms of their age,
more than four-fifths are aged 20 years old and younger
(82.5%) while less than two-fifths are aged 21 years old and
older (17.5%) Their mean age is 19.72 years. These data
support the results of the same study conducted in 2015
wherein there are more young respondents compared to the
older ones and also the study of Java and Java (2015) while
contradicts the findings of the study of Java, et. al (2018)
wherein majority of their respondents belonged to the older
group . In terms of their sex, the data show that the females
are twice more than the males (67.0% vs. 33.0%) just like the
ratio during the conduct of the study in 2015 (77.3% vs.
22.7%).These data in terms of their sex, wherein there are
more females than males are in consonance with the findings
of Java, et. al. (2018) in their study about student leaders;
Java and Java (2015) in their study with regards to
awareness of CPU students, attitudes towards and
involvement in spiritual programs; Java (2014) in her study
with regards to CPU entrance scholars and Aberia and Java
(2011) in their study about employability of graduates of CPU.
As to religion, a greater majority are Roman Catholic (76.7%
vs. 72.6% in the previous study in 2015) and a little over one
fifth (23.3% vs. 22.7% in the previous study in 2015) are
Protestant composed of different Baptist denominations and
Patubas December 2019
85
other religions such as Baptists, Born Again, Latter Day
Saints, Seventh Day Adventist, Aglipay, Iglesia ni Kristo, and
Islam.
As to the college of the respondents belong to the top
three of the colleges where they belonged are: Business and
Accountancy ( 25.5%); Engineering (13.9%) and Arts and
Sciences (11.9%) which is in consonance with the data of the
findings of Java (2014) wherein the biggest chunk of the
respondents (entrance scholars) came from the College of
Business and Accountancy.
As to year level, there is an equal number of
respondents from the first year and fourth year group (42.9%
each respectively) which gives a true picture of the effect of
the implementation of the K-12 program. As to place of origin,
majority (77.0%) of them came from barangays which was
quite different from the previous survey conducted (47.3%).
As to type of high school graduated from, more or less there
is the same number of respondents from public high school
and from private high school (public = 47.1% vs. private =
42.9%). These data that show that most of the respondents’
type of high school graduated from are public high schools are
in agreement with the findings of Java and Java (2015) and
Java (2014), wherein most of the respondents who
participated in the study on spirituality and entrance scholars
were graduates of public high schools.
As to the location of high school graduated from, the
data reveal that there is a little disparity in the number of
respondents who graduated from high schools either located
in the cities (44.9%) or towns (43.8%) while a little over one-
tenth of them (11.4%) graduated from high schools located in
Patubas December 2019
86
barangays. This location of the high school where the
respondents graduated from is a reflection also of the type of
high school where they came from. Again, these data are in
consonance with the findings of the previous study on student
services of Java (2015) and Java and Java (2015) in their
study, wherein almost the same number of respondents
graduated from high schools either located in the cities or
towns while almost one-tenth of them graduated from high
schools located in barangays.
As to living arrangement while studying at CPU, a little
over one-half of the respondents are living with their parents
in their own house (52.6%), less than one-fourth of them are
either staying in boarding houses or living with relatives
(17.7% vs. 12.2%). This result is also in consonance with the
findings of Java (2015) in her previous study regarding
student services and of Java and Java (2015) regarding the
living arrangement while studying at CPU of those student-
respondents who participated in their study.
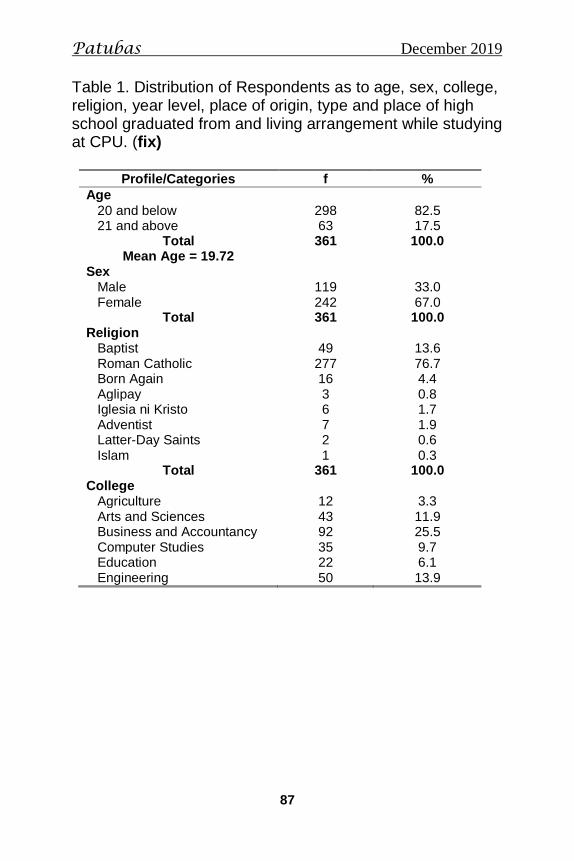
Patubas December 2019
87
Table 1. Distribution of Respondents as to age, sex, college, religion, year level, place of origin, type and place of high school graduated from and living arrangement while studying at CPU. (fix)
Profile/Categories f %
Age 20 and below 298 82.5 21 and above 63 17.5
Total 361 100.0 Mean Age = 19.72
Sex Male 119 33.0 Female 242 67.0
Total 361 100.0 Religion Baptist 49 13.6 Roman Catholic 277 76.7 Born Again 16 4.4 Aglipay 3 0.8 Iglesia ni Kristo 6 1.7 Adventist 7 1.9 Latter-Day Saints 2 0.6 Islam 1 0.3
Total 361 100.0 College Agriculture 12 3.3 Arts and Sciences 43 11.9 Business and Accountancy 92 25.5 Computer Studies 35 9.7 Education 22 6.1 Engineering 50 13.9
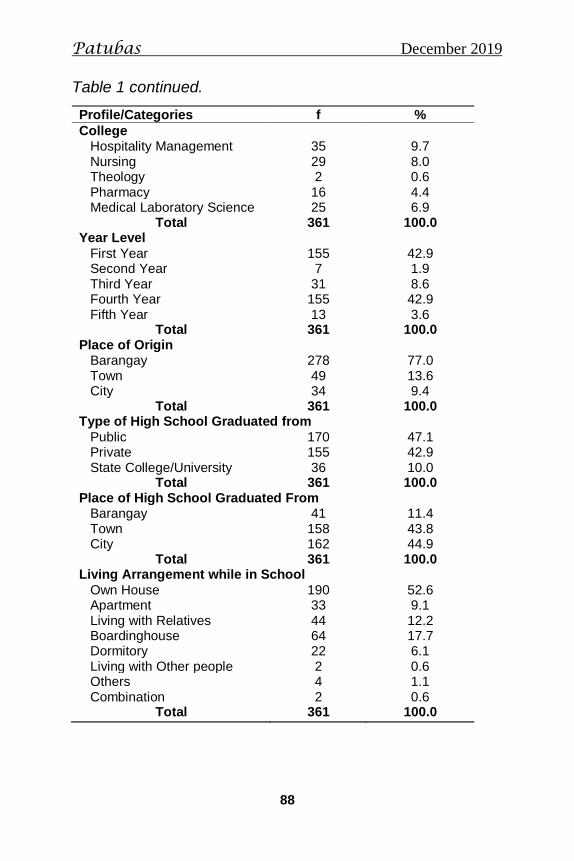
Patubas December 2019
88
Table 1 continued.
Profile/Categories f %
College Hospitality Management 35 9.7 Nursing 29 8.0 Theology 2 0.6 Pharmacy 16 4.4 Medical Laboratory Science 25 6.9
Total 361 100.0 Year Level
First Year 155 42.9 Second Year 7 1.9 Third Year 31 8.6 Fourth Year 155 42.9 Fifth Year 13 3.6
Total 361 100.0 Place of Origin Barangay 278 77.0 Town 49 13.6 City 34 9.4
Total 361 100.0 Type of High School Graduated from
Public 170 47.1 Private 155 42.9 State College/University 36 10.0
Total 361 100.0 Place of High School Graduated From Barangay 41 11.4 Town 158 43.8 City 162 44.9
Total 361 100.0 Living Arrangement while in School
Own House 190 52.6 Apartment 33 9.1 Living with Relatives 44 12.2 Boardinghouse 64 17.7 Dormitory 22 6.1 Living with Other people 2 0.6 Others 4 1.1 Combination 2 0.6
Total 361 100.0
Patubas December 2019
89
Awareness of Student Services and Programs in General
The data in Table 2 provide an affirmation that the
students are very much aware of the presence or existence of
the twenty different student services and programs of the
university through the years. Looking closely at their scores
reveal that majority of them are aware of all twenty different
student services and programs offered by the University
(lowest is Services for Student with Special Needs and
Persons with Disabilities = 73.4% in 2015 and Chaplaincy
Program = 82.3% in 2018 and highest is Health Services =
97.4% in 2015 and Orientation Services = 96.7% in 2018).
The top student services and programs that the respondents
are aware of at present (2018) and in 2015 are: Orientation
Services (96.7% vs. 97.1%); Safety and Security Services
(96.4% vs. 97.7%) and Admission Services ( 95.8% vs.
96.1%).
The services and programs which received the lowest
percentages of awareness among the respondents in 2015,
namely, Services for Students with Special Needs and
Persons with Disabilities and International Student Services
had increased in 2018 ( 26.6% vs. 16.9% and 12.3% vs.
10.8% respectively for those students who are not aware of
these services).
Again, this result is an affirmation of the finding that
every service that the student services office provides must
be visible and accessible to every individual student within the
campus (Bedia, 2012).
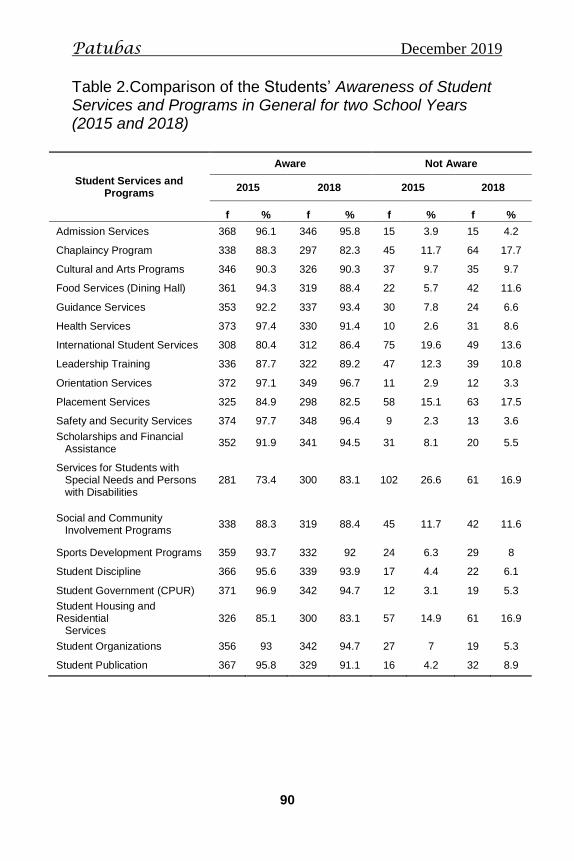
Patubas December 2019
90
Table 2.Comparison of the Students’ Awareness of Student Services and Programs in General for two School Years (2015 and 2018)
Student Services and Programs
Aware Not Aware
2015 2018 2015 2018
f % f % f % f %
Admission Services 368 96.1 346 95.8 15 3.9 15 4.2
Chaplaincy Program 338 88.3 297 82.3 45 11.7 64 17.7
Cultural and Arts Programs 346 90.3 326 90.3 37 9.7 35 9.7
Food Services (Dining Hall) 361 94.3 319 88.4 22 5.7 42 11.6
Guidance Services 353 92.2 337 93.4 30 7.8 24 6.6
Health Services 373 97.4 330 91.4 10 2.6 31 8.6
International Student Services 308 80.4 312 86.4 75 19.6 49 13.6
Leadership Training 336 87.7 322 89.2 47 12.3 39 10.8
Orientation Services 372 97.1 349 96.7 11 2.9 12 3.3
Placement Services 325 84.9 298 82.5 58 15.1 63 17.5
Safety and Security Services 374 97.7 348 96.4 9 2.3 13 3.6
Scholarships and Financial Assistance
352 91.9 341 94.5 31 8.1 20 5.5
Services for Students with Special Needs and Persons with Disabilities
281 73.4 300 83.1 102 26.6 61 16.9
Social and Community Involvement Programs
338 88.3 319 88.4 45 11.7 42 11.6
Sports Development Programs 359 93.7 332 92 24 6.3 29 8
Student Discipline 366 95.6 339 93.9 17 4.4 22 6.1
Student Government (CPUR) 371 96.9 342 94.7 12 3.1 19 5.3
Student Housing and Residential Services
326 85.1 300 83.1 57 14.9 61 16.9
Student Organizations 356 93 342 94.7 27 7 19 5.3
Student Publication 367 95.8 329 91.1 16 4.2 32 8.9
Patubas December 2019
91
Importance of Student Services and Programs in General
The data in Table 3 show that the respondents have
attached a great value on the presence or existence of the
twenty different student services and programs in the
university during the surveys conducted in 2015 and 2018 (
Overall Mean = 4.53 (2015); 4.57 (2018) . The top three
student services and programs that the respondents have
attached great value and importance to are: Safety and
Security Services (very important = 82.3% (2018), and 77.0%
(2015) and mean score = 4.72 versus 4.80;Health Services
(very important = 77.6% (2018) and 74.2% (2015) and mean
score = 4.64 versus 4.74; and Orientation Services (very
important = 75.9% (2018), and 77.3% (2015) and mean score
= 4.75 versus 4.73. Although they have also attached great
value or importance to the presence of International Student
Services (Very important = 49.3% (2018), and 42.3% (2015))
and Student Housing and Residential Services (very
important = 49.6% (2018), and 46.0% (2015), the percentages
of these are quite low compared to the value they had
attached to the other services and programs.
There are very minimal decreases in the mean score
of importance of the following student services and programs,
namely: Chaplaincy program (from 4.54 to 4.50), Orientation
services (from 4.75 to 4.73), Placement services (from 4.57 to
4.33), Social and community involvement programs (from
4,48 to 4.47),Student government (from 4.53 to 4.47),
Student organizations ( from 4.49 to 4.47). The minimal drop
in their mean scores in these student services and programs
may be explained by the fact that there was a recess of having
freshmen for two school years because of the implementation
of the K-12 program and also because the respondents for the
Patubas December 2019
92
year 2018 involved the sample from the whole population, that
is, from first year until fourth year unlike in the year 2015,
wherein the respondents were all graduating students.
Overall, it could be said that these results simply show
that students, through the years, still give importance to and
value their safety and security, and health by the values they
had attached to these program and services. Moreover, that
they believed that there is a need for them to be aware of all
these programs and services that is why they had attached
also a high value to the orientation services, wherein through
this service, they will be made aware of all these programs
and activities.
Patubas December 2019
95
Availment of Offices/Student Services and Programs under
the Vice President for Student Affairs (SY 2018 – 2019)
The data presented in the Table 5 show the availment
of the respondents of the services and programs under the
Vice President for Student Affairs. The data show the student
services and programs which are meant for all students were
availed by the students, namely: Guidance Services Center
(82.3%); Medical Clinic (82.0%); Clinical Laboratory (77.3%);
and Swimming Pool (75.1%). However, the Dental Clinic
which is meant for all students were availed by a little less
than two-fifths of the studentry
(38.0%).
The other services and programs were availed by more
or less one-fourth to around three fifths of the students
because of the nature of their service or program which is not
meant for all students. For example, Dormitories (25.8%) is
not meant for all for the dormitories of the university cannot
cater to all students. Thus, there is a need for the university to
build state of the art dormitories which could accommodate
many students. The Sports and Athletics (43.5%) also caters
only to the athletes of the university, thus, all other students
are not aware of its services. The Career and Placement
Office is meant to help the graduating students or graduates
of the university, hence, underclassmen of the university are
not aware of its services also. Student Discipline (48.8%)
caters to those students who have done mistakes and meant
for the security of the students, hence, if a student is a law-
abiding citizen, he/she will not come into contact with this
office or program. Student Development and Programs
caters most likely to scholars and student-leaders, hence, if a
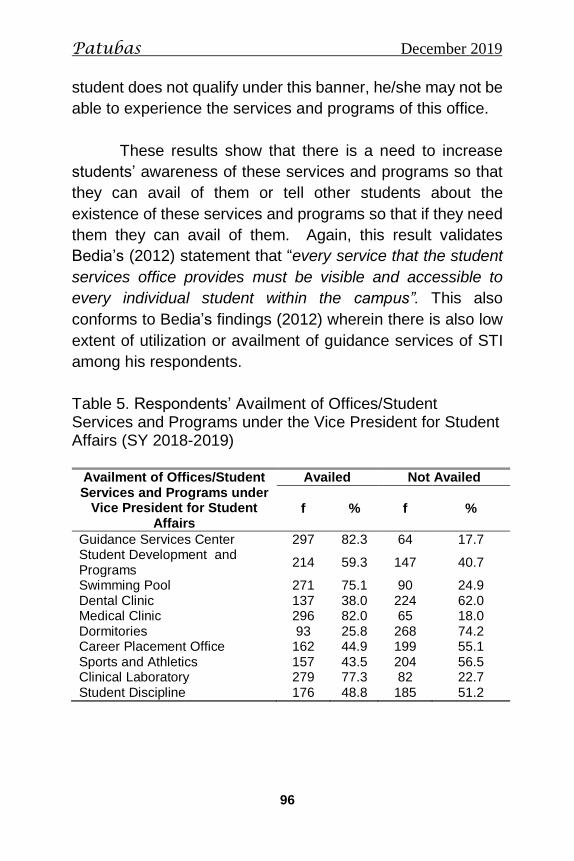
Patubas December 2019
96
student does not qualify under this banner, he/she may not be
able to experience the services and programs of this office.
These results show that there is a need to increase
students’ awareness of these services and programs so that
they can avail of them or tell other students about the
existence of these services and programs so that if they need
them they can avail of them. Again, this result validates
Bedia’s (2012) statement that “every service that the student
services office provides must be visible and accessible to
every individual student within the campus”. This also
conforms to Bedia’s findings (2012) wherein there is also low
extent of utilization or availment of guidance services of STI
among his respondents.
Table 5. Respondents’ Availment of Offices/Student Services and Programs under the Vice President for Student Affairs (SY 2018-2019)
Availment of Offices/Student Services and Programs under
Vice President for Student Affairs
Availed Not Availed
f % f %
Guidance Services Center 297 82.3 64 17.7 Student Development and Programs
214 59.3 147 40.7
Swimming Pool 271 75.1 90 24.9 Dental Clinic 137 38.0 224 62.0 Medical Clinic 296 82.0 65 18.0 Dormitories 93 25.8 268 74.2 Career Placement Office 162 44.9 199 55.1 Sports and Athletics 157 43.5 204 56.5 Clinical Laboratory 279 77.3 82 22.7 Student Discipline 176 48.8 185 51.2
Patubas December 2019
97
Assessment of Offices/Student Services and Programs
under Vice President for Student Affairs
The assessment of offices/student services and
programs under the VPSA is found in Table 6. The data show
that around one-fifth to more than two-fifths of the
respondents were not able to avail of the offices/student
services and programs under the VPSA (Guidance Services
Center = 17.7% and Dormitories = 74.2%). It follows that one
cannot assess what one had not availed of. However, for
those who had availed and had assessed these services and
programs, the net score of the degree of satisfaction of their
availment of these offices/student services and programs
under the VPSA ranged from 75.1% of the Medical Clinic) up
to 91.6% of the Student development and programs which are
all higher than 70.0% which is equivalent to excellent. This
means that all the respondents, regardless of the degree of
satisfaction of their availment of these services and programs
under the VPSA, felt than they were satisfied of all the
services they had availed of. The two offices that received
barely 75.0% net score of satisfaction are: Medical Clinic
(75.1%) with 4.4% or 13 respondents who were dissatisfied
and 8.0% or 29 respondents who were neither satisfied nor
dissatisfied of its services and Swimming Pool (75.5%) with
3.4% or 12 respondents who were dissatisfied and 8.9% or 32
respondents who were neither satisfied nor dissatisfied of its
services. A close look of the comments and suggestions for
these offices which had incurred below 76.0% net score of
satisfaction prove that something should be done by the
management about these services. Some of the comments
and suggestions for the Medical Clinic are as follows:
“improve their services”, “the doctors and working students
should be more friendly, approachable and polite, and not
Patubas December 2019
98
grumpy and rude”. Some of the negative comments and
feedbacks regarding the Swimming Pool are as follows: “the
staff should be more approachable and not so strict”, facilities
must be improved and maintained like locker rooms,
bathroom and comfort room”, “maintain cleanliness of the pool
and surrounding area.”
Once again, these results prove that there is a need to
increase students’ awareness of these services and programs
so that they can avail of them or tell other students about the
existence of these services and programs so that if they need
them they can avail of them which was the findings of Bedia
(2012) and that they will be satisfied of their availment of such
services.
Table 6. Respondents’ Assessment of Offices/Student
Services and Programs under Vice President for Student
Affairs
Assessment of Offices/Student
Services and Programs under Vice President for Student
Affairs
NA Definitely Dissatisfi
ed
Dissatisfied
Neither Satisfied
nor Dissatisfied
Satisfied Definitely Satisfied
Net Score
for Satisfacti
on
f % f % f % f % f % f % %
Guidance Services Center
64 17.7 1 0.3 15 4.2 97 26.9 184 51.0 91.1
Student Development and Programs
147 40.7 1 0.3 14 3.9 69 19.1 130 36.0 91.6
Swimming Pool 90 24.9 2 0.6 10 2.8 32 8.9 114
31.6 113 31.3 75.5
Dental Clinic 224 62.0 1 0.3 2 0.6 26 7.2 41 11.4 67 18.6 83.9
Medical Clinic 65 18.0 4 1.1 12 3.3 29 8.0 91 25.2 160 44.3 75.1
Dormitories 268 74.2 2 0.6 3 0.8 16 4.4 38 10.5 34 9.4 88.3
Career Placement Office
198 54.8 2 0.6 16 4.4 62 17.2 83 23.0 90.0
Sports and Athletics 203 56.2 1 0.3 6 1.7 16 4.4 65 18.0 70 19.4 87.2
Clinical Laboratory 81 22.4 3 0.8 6 1.7 28 7.8 99 27.4 144 39.9 79.4
Student Discipline 184 51.0 2 0.6 2 0.6 15 4.2 60 16.6 98 27.1 76.9
Patubas December 2019
99
Assessment of Importance of Offices/Student Services and
Programs under Vice President for Student Affairs
The assessment of the importance of offices/ student
services and programs under the Vice President for Student
Affairs is found in Table 7. It could be seen in the data that all
the respondents had attached great importance to all the
offices/ student services and programs under the Vice
President for Student Affairs ( combined Important and Very
Important rating ranges from 88.6% for the Dormitories and
the highest is Guidance Services Center, 98.4%). It followed
that among the offices/student services under the VPSA,
some of the respondents felt that the dormitories again are not
that important (combined percentage of not at all important,
not important and neither important or unimportant is 11.3%
or a total of 41 students out of the 364 respondents).
Moreover, the net score of the degree of importance of the
presence of the offices/student services and programs under
the VPSA ranged from 77.3% of the Dormitories) up to 96.7%
of the Guidance Services Center which are all higher than
70.0% which is equivalent to excellent. This means that all the
respondents, regardless of the degree of importance they had
attached to these services and programs under the VPSA, felt
than these are all important in their lives.
Patubas December 2019
100
Table 11. Respondent’s Assessment of Importance of
Offices/Student Services and Programs under Vice
President for Student Affairs
Importance of
Offices/Student Services and
Programs under Vice President for Student
Affairs
Not at All Important
Not Importa
nt
Neither Important
or Unimport
ant
Important Very
Important
Net
Score of Importa
nce
f % f % f % f % f % %
Guidance Services Center
6 1.7 45 12.5 310 85.9 96.7
Student Development and Programs
1 0.3 9 2.5 58 16.1 293 81.2 94.5
Swimming Pool 3 0.8 27 7.5 108 29.9 223 61.8 83.4 Dental Clinic 3 0.8 21 5.8 76 21.1 261 72.3 86.8 Medical Clinic 2 0.6 1 0.3 10 2.8 55 15.2 293 81.2 92.7 Dormitories 3 0.8 3 0.8 35 9.7 99 27.4 221 61.2 77.3
Career Placement Office
1 0.3 1 0.3 22 6.1 96 26.6 241 66.8 86.7
Sports and Athletics 2 0.6 28 7.8 98 27.1 233 64.5 83.2 Clinical Laboratory 1 0.3 10 2.8 66 18.3 284 78.7 93.9 Student Discipline 1 0.3 1 0.3 14 3.9 56 15.5 289 80.1 91.1
Respondents’ Awareness and Availment of Student Services and Programs under the Office of the Vice President for Student Affairs
The relationship between the respondents’ awareness
of student services and programs under the Office of the
VPSA and their availment of these programs is found in Table
8. The data show that those respondents who have high level
of awareness of student services and programs also have
high availment of these services and programs. This truth is
supported by the Gamma test of association between these
two variables which yielded the value of 0. 601 with p value of
0.000 which is significant. Hence, it could be said that those
who have high awareness of the presence of student services
and programs under the office of the Vice President for
Student Affairs of the university are more likely to have high
availment of such programs and services.
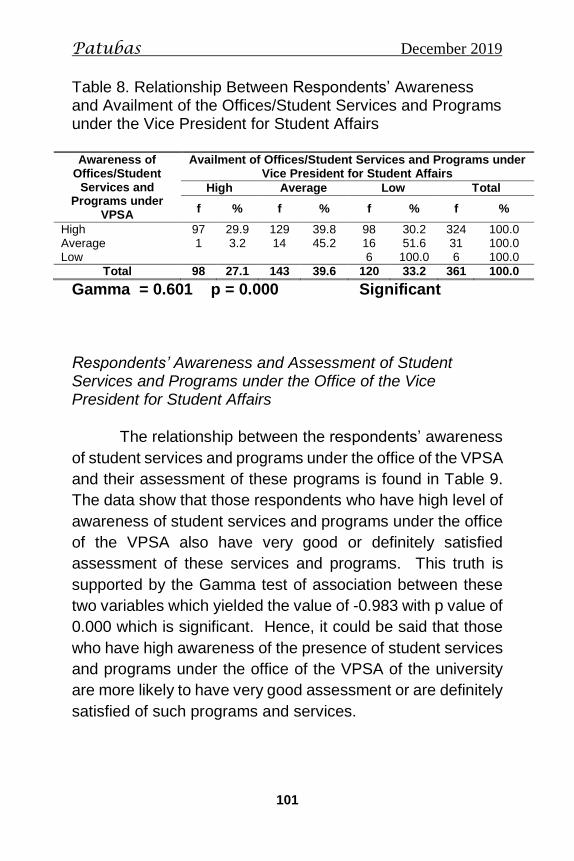
Patubas December 2019
101
Table 8. Relationship Between Respondents’ Awareness and Availment of the Offices/Student Services and Programs under the Vice President for Student Affairs Awareness of
Offices/Student Services and
Programs under VPSA
Availment of Offices/Student Services and Programs under Vice President for Student Affairs
High Average Low Total
f % f % f % f %
High 97 29.9 129 39.8 98 30.2 324 100.0 Average 1 3.2 14 45.2 16 51.6 31 100.0 Low 6 100.0 6 100.0
Total 98 27.1 143 39.6 120 33.2 361 100.0
Gamma = 0.601 p = 0.000 Significant Respondents’ Awareness and Assessment of Student Services and Programs under the Office of the Vice President for Student Affairs
The relationship between the respondents’ awareness
of student services and programs under the office of the VPSA
and their assessment of these programs is found in Table 9.
The data show that those respondents who have high level of
awareness of student services and programs under the office
of the VPSA also have very good or definitely satisfied
assessment of these services and programs. This truth is
supported by the Gamma test of association between these
two variables which yielded the value of -0.983 with p value of
0.000 which is significant. Hence, it could be said that those
who have high awareness of the presence of student services
and programs under the office of the VPSA of the university
are more likely to have very good assessment or are definitely
satisfied of such programs and services.
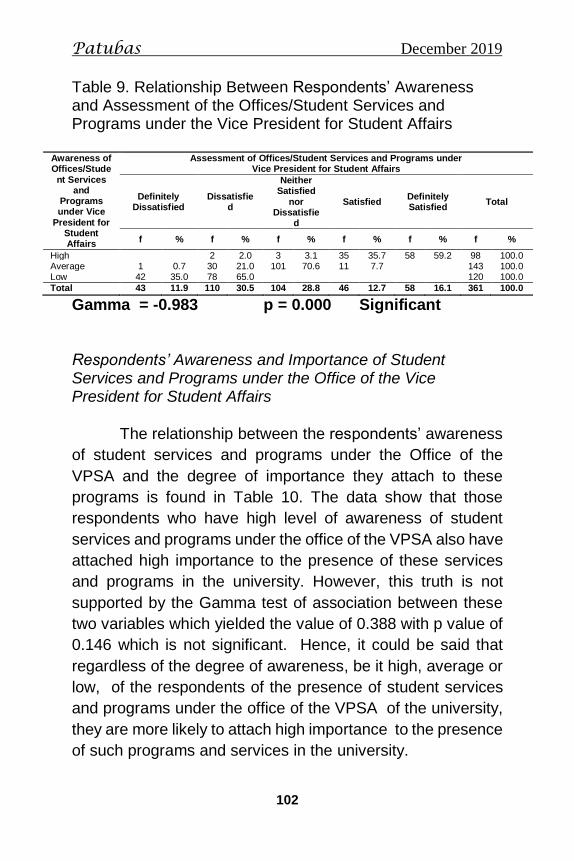
Patubas December 2019
102
Table 9. Relationship Between Respondents’ Awareness and Assessment of the Offices/Student Services and Programs under the Vice President for Student Affairs
Awareness of Offices/Stude
nt Services and
Programs under Vice
President for Student Affairs
Assessment of Offices/Student Services and Programs under Vice President for Student Affairs
Definitely Dissatisfied
Dissatisfied
Neither Satisfied
nor Dissatisfie
d
Satisfied Definitely Satisfied
Total
f % f % f % f % f % f %
High 2 2.0 3 3.1 35 35.7 58 59.2 98 100.0 Average 1 0.7 30 21.0 101 70.6 11 7.7 143 100.0 Low 42 35.0 78 65.0 120 100.0
Total 43 11.9 110 30.5 104 28.8 46 12.7 58 16.1 361 100.0
Gamma = -0.983 p = 0.000 Significant Respondents’ Awareness and Importance of Student Services and Programs under the Office of the Vice President for Student Affairs
The relationship between the respondents’ awareness
of student services and programs under the Office of the
VPSA and the degree of importance they attach to these
programs is found in Table 10. The data show that those
respondents who have high level of awareness of student
services and programs under the office of the VPSA also have
attached high importance to the presence of these services
and programs in the university. However, this truth is not
supported by the Gamma test of association between these
two variables which yielded the value of 0.388 with p value of
0.146 which is not significant. Hence, it could be said that
regardless of the degree of awareness, be it high, average or
low, of the respondents of the presence of student services
and programs under the office of the VPSA of the university,
they are more likely to attach high importance to the presence
of such programs and services in the university.
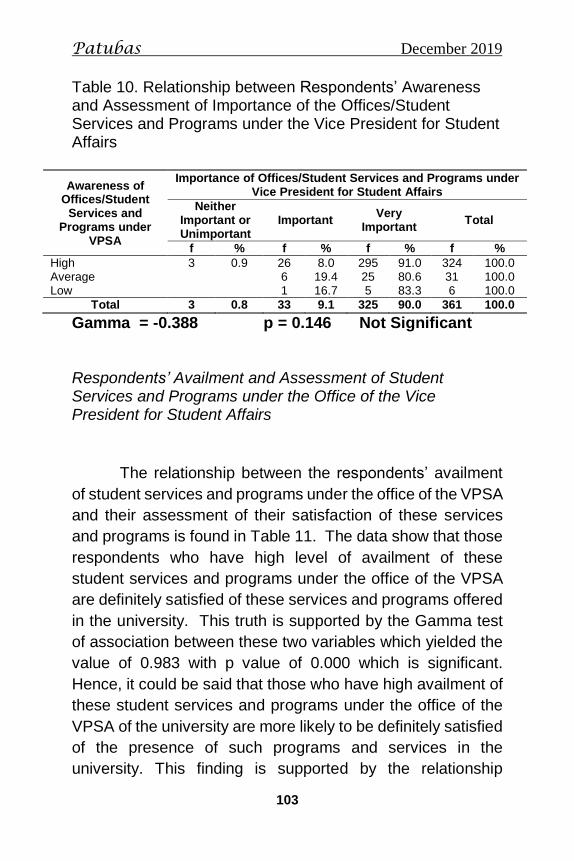
Patubas December 2019
103
Table 10. Relationship between Respondents’ Awareness and Assessment of Importance of the Offices/Student Services and Programs under the Vice President for Student Affairs
Awareness of Offices/Student
Services and Programs under
VPSA
Importance of Offices/Student Services and Programs under Vice President for Student Affairs
Neither Important or Unimportant
Important Very
Important Total
f % f % f % f %
High 3 0.9 26 8.0 295 91.0 324 100.0 Average 6 19.4 25 80.6 31 100.0 Low 1 16.7 5 83.3 6 100.0
Total 3 0.8 33 9.1 325 90.0 361 100.0
Gamma = -0.388 p = 0.146 Not Significant Respondents’ Availment and Assessment of Student Services and Programs under the Office of the Vice President for Student Affairs
The relationship between the respondents’ availment
of student services and programs under the office of the VPSA
and their assessment of their satisfaction of these services
and programs is found in Table 11. The data show that those
respondents who have high level of availment of these
student services and programs under the office of the VPSA
are definitely satisfied of these services and programs offered
in the university. This truth is supported by the Gamma test
of association between these two variables which yielded the
value of 0.983 with p value of 0.000 which is significant.
Hence, it could be said that those who have high availment of
these student services and programs under the office of the
VPSA of the university are more likely to be definitely satisfied
of the presence of such programs and services in the
university. This finding is supported by the relationship
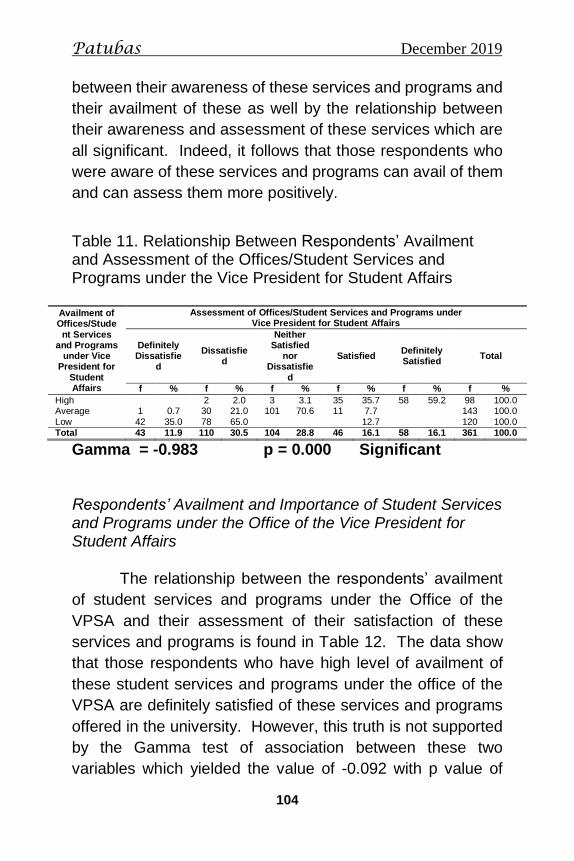
Patubas December 2019
104
between their awareness of these services and programs and
their availment of these as well by the relationship between
their awareness and assessment of these services which are
all significant. Indeed, it follows that those respondents who
were aware of these services and programs can avail of them
and can assess them more positively.
Table 11. Relationship Between Respondents’ Availment and Assessment of the Offices/Student Services and Programs under the Vice President for Student Affairs
Availment of Offices/Stude
nt Services and Programs
under Vice President for
Student Affairs
Assessment of Offices/Student Services and Programs under Vice President for Student Affairs
Definitely Dissatisfie
d
Dissatisfied
Neither Satisfied
nor Dissatisfie
d
Satisfied Definitely Satisfied
Total
f % f % f % f % f % f %
High 2 2.0 3 3.1 35 35.7 58 59.2 98 100.0 Average 1 0.7 30 21.0 101 70.6 11 7.7 143 100.0 Low 42 35.0 78 65.0 12.7 120 100.0 Total 43 11.9 110 30.5 104 28.8 46 16.1 58 16.1 361 100.0
Gamma = -0.983 p = 0.000 Significant Respondents’ Availment and Importance of Student Services and Programs under the Office of the Vice President for Student Affairs The relationship between the respondents’ availment
of student services and programs under the Office of the
VPSA and their assessment of their satisfaction of these
services and programs is found in Table 12. The data show
that those respondents who have high level of availment of
these student services and programs under the office of the
VPSA are definitely satisfied of these services and programs
offered in the university. However, this truth is not supported
by the Gamma test of association between these two
variables which yielded the value of -0.092 with p value of
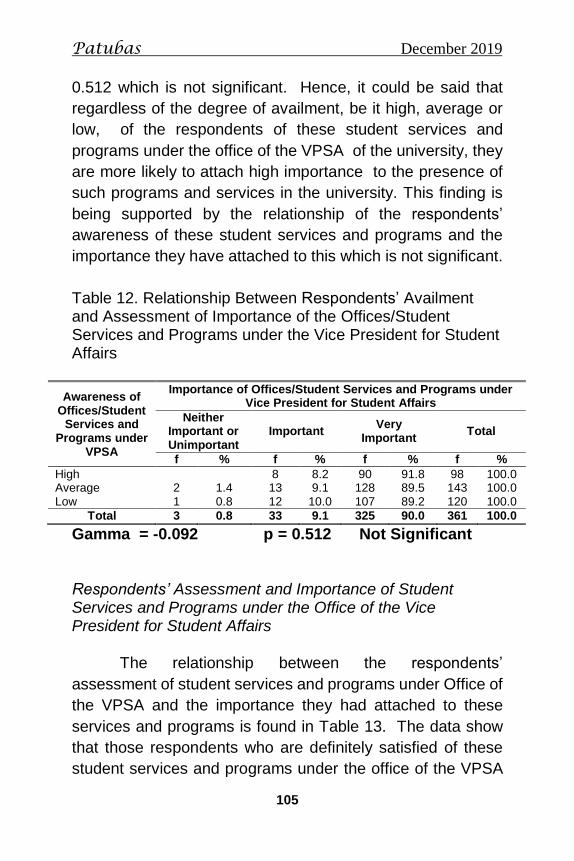
Patubas December 2019
105
0.512 which is not significant. Hence, it could be said that
regardless of the degree of availment, be it high, average or
low, of the respondents of these student services and
programs under the office of the VPSA of the university, they
are more likely to attach high importance to the presence of
such programs and services in the university. This finding is
being supported by the relationship of the respondents’
awareness of these student services and programs and the
importance they have attached to this which is not significant.
Table 12. Relationship Between Respondents’ Availment and Assessment of Importance of the Offices/Student Services and Programs under the Vice President for Student Affairs
Awareness of Offices/Student
Services and Programs under
VPSA
Importance of Offices/Student Services and Programs under Vice President for Student Affairs
Neither Important or Unimportant
Important Very
Important Total
f % f % f % f %
High 8 8.2 90 91.8 98 100.0 Average 2 1.4 13 9.1 128 89.5 143 100.0 Low 1 0.8 12 10.0 107 89.2 120 100.0
Total 3 0.8 33 9.1 325 90.0 361 100.0
Gamma = -0.092 p = 0.512 Not Significant Respondents’ Assessment and Importance of Student Services and Programs under the Office of the Vice President for Student Affairs The relationship between the respondents’
assessment of student services and programs under Office of
the VPSA and the importance they had attached to these
services and programs is found in Table 13. The data show
that those respondents who are definitely satisfied of these
student services and programs under the office of the VPSA
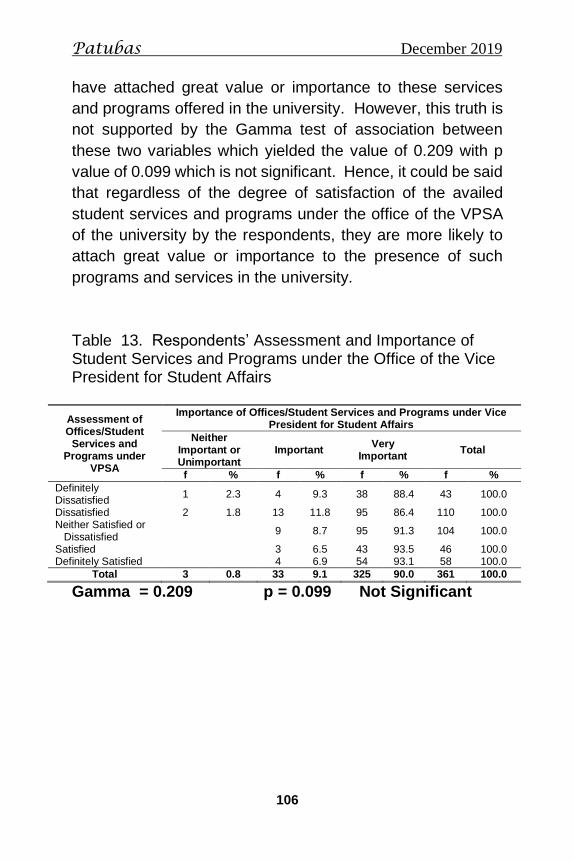
Patubas December 2019
106
have attached great value or importance to these services
and programs offered in the university. However, this truth is
not supported by the Gamma test of association between
these two variables which yielded the value of 0.209 with p
value of 0.099 which is not significant. Hence, it could be said
that regardless of the degree of satisfaction of the availed
student services and programs under the office of the VPSA
of the university by the respondents, they are more likely to
attach great value or importance to the presence of such
programs and services in the university.
Table 13. Respondents’ Assessment and Importance of Student Services and Programs under the Office of the Vice President for Student Affairs
Assessment of Offices/Student
Services and Programs under
VPSA
Importance of Offices/Student Services and Programs under Vice President for Student Affairs
Neither Important or Unimportant
Important Very
Important Total
f % f % f % f %
Definitely Dissatisfied
1 2.3 4 9.3 38 88.4 43 100.0
Dissatisfied 2 1.8 13 11.8 95 86.4 110 100.0 Neither Satisfied or Dissatisfied
9 8.7 95 91.3 104 100.0
Satisfied 3 6.5 43 93.5 46 100.0 Definitely Satisfied 4 6.9 54 93.1 58 100.0
Total 3 0.8 33 9.1 325 90.0 361 100.0
Gamma = 0.209 p = 0.099 Not Significant
Patubas December 2019
107
DISCUSSION
On the whole, this descriptive-relational study which
made use of the one-shot survey design had determined the
awareness, availment, assessment and importance of student
services in the lives of students at Central Philippine
University. The study found out that majority of the
respondents are young, females, Roman Catholics, first and
fourth year levels from the College of Business and
Accountancy who graduated from public and private high
schools located in the cities and towns and living with their
parents while studying in the university; they are very much
aware of the presence or existence of the twenty different
student services and programs of the university during the two
school years of the survey (2015 and 2018) and have
attached a great value upon the presence or existence of
these different student services and programs in the
university; and majority of them are aware and had availed of
the services and programs under the Vice President for
Student Affairs, specially, Medical Clinic; Clinical Laboratory;
and Guidance Services Center. Again, this result validates
Bedia’s (2012) statement that “every service that the student
services office provides must be visible and accessible to
every individual student within the campus”.
The respondents’ place of origin is significantly related
to the importance they attach to student services and
programs in general of the university. This means that
students who came from barangays are more likely to attach
more importance to these student services and programs
compared to students who came from towns and cities. Also,
their awareness of student services and programs under the
Office of the Vice President for Student Affairs is significantly
Patubas December 2019
108
related to their availment and assessment of these services
and programs. Hence, it could be said that those who have
high awareness of the presence of student services and
programs under the Office of the Vice President for Student
Affairs of the university are more likely to have high availment
of such programs and services and are more likely to have
very good assessment or are definitely satisfied of such
programs and services. However, the respondents’ availment
of student services and programs under the Office of the Vice
President for Student Affairs is not significantly related to the
assessment and degree of importance they attach to these
programs and services. Hence, it could be said that
regardless of the degree of availment, be it high, average or
low, of the respondents of these student services and
programs under the Office of the VPSA of the university, they
are more likely to attach high importance to the presence of
such programs and services in the university.
CONCLUSIONS AND RECOMMENDATIONS
Conclusions
Based on the findings of the study, the following
conclusions are drawn:
1. Majority of the respondents are young, females, Roman
Catholics, first and fourth year levels from the College of
Business and Accountancy who graduated from public
and private high schools located in the cities and towns
and living with their parents while studying in the
university.
2. The respondents are very much aware of the presence or
existence of the twenty different student services and
Patubas December 2019
109
programs of the university during the two school years of
the survey (2015 and 2018) and have attached a great
value on the presence or existence of these different
student services and programs in the university.
Comparing the results, it could be seen that the lowest is
Services for Student with Special Needs and Persons with
Disabilities in 2015 and Chaplaincy Program in 2018 and
the highest is Health Services in 2015 and Orientation
Services in 2018. The top student services and programs
that the respondents are aware of at present (2018) and in
2015 are: Orientation Services; Safety and Security
Services and Admission Services. The services and
programs which received the lowest percentages of
awareness among the respondents in 2015, namely,
Services for Students with Special Needs and Persons
with Disabilities and International Student Services had
increased a little in 2018. The top three student services
and programs that the respondents have attached great
value and importance are: Safety and Security Services,
Health Services, and Orientation Services. Although they
have also attached great value or importance to the
presence of Placement Services (46.0%), International
Student Services and Student Housing and Residential
Services, the percentages of these are quite low
compared to the value they had attached to the other
services and programs.
3. Majority of the respondents are aware and had availed of
the services and programs under the Vice President for
Student Affairs. The top three services and programs
under the VPSA that the students are aware of are:
Medical Clinic; Clinical Laboratory; and Guidance Services
Center. This result is understandable because majority of
the respondents are freshmen and their present
Patubas December 2019
110
experience is with these services when they underwent
physical examination and with their SEAL (Self
Enhancement Activities for Life) classes with the Guidance
Services Center. Moreover, low percentage of awareness
of the Career Placement Office is due to the fact that these
students had not availed yet of the services of the said
office. The student services and programs which are
meant for all students were availed by the majority of
students, namely: Guidance Services Center; Medical
Clinic; Clinical Laboratory; and Swimming Pool. However,
the Dental Clinic which is meant for all students were
availed by a little less than two-fifths of the studentry only.
Moreover, the other services and programs were availed
by more or less one-fourth to around three fifths of the
students because of the nature of their service or program
which is not meant for all students like the Dormitories; the
Sports and Athletics also caters only to the athletes of the
university; the Career and Placement Office which is
meant to help the graduating students or graduates of the
of the university; Student Discipline which caters to those
students who have done mistakes and meant for the
security of the students; and, Student Development and
Programs which caters most likely to scholars and
student-leaders. These results show that there is a need
to increase students’ awareness of these services and
programs so that they can avail of them or tell other
students about the existence of these services and
programs so that if they need them they can avail of them.
Again, this result validates Bedia’s (2012) statement that
“every service that the student services office provides
must be visible and accessible to every individual student
within the campus”. This also conforms to Bedia’s findings
(2012) wherein there is also low extent of utilization or
Patubas December 2019
111
availment of guidance services of STI among his
respondents.
4. The respondents’ characteristics such as age, sex,
college, religion, type of high school graduated from, place
of high school graduated from, place of origin, and living
arrangement while in school are not significantly related to
their awareness of the student services and programs in
general of the university. This means that regardless of
their characteristics, they are much aware of the student
services and programs in general of the university. These
results is the same with the results of the survey conducted
in 2015.
5. The respondents’ place of origin is significantly related to
the importance they attach to student services and
programs in general of the university. This means that
students who came from barangays are more likely to
attach more importance to these student services and
programs compared to students who came from towns
and cities. On the other hand, the respondents’
characteristics such as age, sex, college, religion, type of
high school graduated from, place of high school
graduated from, and living arrangement while in school
are not significantly related to the importance they attach
to these student services and programs.
6. The respondents’ awareness of student services and
programs under the Office of the Vice President for
Student Affairs is significantly related to their availment
and assessment of these services and programs. Hence,
it could be said that those who have high awareness of the
presence of student services and programs under the
office of the Vice President for Student Affairs of the
Patubas December 2019
112
university are more likely to have high availment of such
programs and services and are more likely to have very
good assessment or are definitely satisfied of such
programs and services.
7. The respondents’ availment of student services and
programs under the Office of the Vice President for
Student Affairs is not significantly related to the
assessment and degree of importance they attach to
these programs and services. Hence, it could be said that
regardless of the degree of availment, be it high, average
or low, of the respondents of these student services and
programs under the office of the VPSA of the university,
they are more likely to attach high importance to the
presence of such programs and services in the university.
Recommendations
Based on the findings and conclusions of the study, the
following are hereby recommended:
1. Since the students had expressed their need by attaching
great importance to these institutional services, it is hereby
recommended that the university should maintain the
quality services that it offers to students. This is true for the
general student services and programs as well as the
student services and programs offered under the office of
the Vice President for Student Affairs.
2. Moreover, since students come and go, there is a need to
conduct this study preferably every two years to know the
sentiment of the present students so as their needs could
be catered to.
Patubas December 2019
113
3. Specific comments and suggestions given by the
respondents for each office/student services and
programs under the VPSA should be looked into by the
concerned unit for further improvement of the delivery of
services to the students.
Patubas December 2019
114
REFERENCES
Bedia, N.D. (2012). Access to extent of utilization and level of satisfaction with guidance services of STI Colleges in Western Visayas. Unpublished Thesis, Central Philippine University.
Bernstein, C. and Cunanan, E. (2008). Improving student
services in secondary school. Office of Student Services Brief. 7(2).
CHED Memorandum Order No. 09 Series of 2013. Cortel. A.G. (2004). A client-assessment of the service
effectiveness of the selected support services at Filamer Christian College. Unpublished Thesis, Central Philippine University.
Dryfoos, J. (1993). School as a place for health, mental
health, and social services: Teachers College, Columbia University, NY.
Garcesa, R.M. (2003). Clients’ access to and utilization of
services in COPRISA tertiary institutions: Their influence on their level of satisfaction with the quality of services. Unpublished Dissertation, Central Philippine University.
Java, M.A. (2015). Awareness, availment, assessment and
importance of student services. A research report submitted to the University Research Center, Central Philippine University, Jaro, Iloilo City, Philippines.
Java, M.A. (2014). CPU Entrance scholars: where and how
are they now? A research report submitted to the University Research Center, Central Philippine University, Jaro, Iloilo City, Philippines.
Patubas December 2019
115
Luthans, F. (2008). Organizational behavior. Singapore, Mc-Graw Hill Book Co.
Newstrom, J.W. (2007). Organizational behavior: Human
behavior at work. Philippines.Mc-Graw Hill Book Companies, Inc.
Roxas, H.G. (2003). Quality of student services of the
Ateneo de Davao University. Unpublished Thesis. The University of Southern Philippines, Davao City.
Stipak, B. (2001). Satisfaction with urban services: Potential
misuse as a performance indicator. Public Administration Review Annual 39, 46 – 52. Reprinted in Evaluation Studies Review. (1982). Sechrest, editor. Beverly Hills, London, Sage Publication.
Sallie, E. (1998). Total quality management in education.
Kigan Page, London.
Patubas December 2019
116
ACKNOWLEDGMENT
First and foremost, we would like to praise and thank
God that we were able to finish this research work. To the
people who, in one way or another, extended help to this work,
we say thank you to:
Central Philippine University, University Research
Center for giving us this opportunity to be able to conduct this
study;
Dr. Mary O’ Penetrante, Director of the University
Research Center for her suggestions;
Rev. Joniel Howard H. Gico, Vice President for Student
Affairs for his trust and confidence in our capability to do
research work;
The panel of examiners for their comments and
suggestions which greatly
helped improve the quality of our written work;
Mrs. Ma. Jean R. Dagohoy-Palomata, for her patience
in doing the
statistical and clerical work;
Ciara and Tala who helped us contact the respondents
by all means especially through text, facebook and
messenger.
Once again, thank you to all of you, and indeed, to God
be the glory!


