Embed Size (px)
Citation preview
i
UNIVERSITY OF GHANA, LEGON
CENTRE FOR MIGRATION STUDIES
EXPERIENCES AND PERCEPTIONS OF YOUTH OUT-MIGRATION AND FOOD
SUPPLY IN AGRICULTURAL HOUSEHOLDS IN HOHOE MUNICIPALITY
BY
FRITZ KOSI EXORNAM ADOM
(10053651)
THIS DISSERTATION IS SUBMITTED TO THE UNIVERSITY OF GHANA, LEGON
IN PATIAL FULFILLMENT OF THE REQUIREMENT FOR THE AWARD OF MA
MIGRATION STUDIES DEGREE
JULY, 2017
University of Ghana http://ugspace.ug.edu.gh

ii
DECLARATION
I, Fritz Kosi Exornam Adom, hereby declare that this dissertation is an outcome of an original
research work done by me under the supervision of Professor Christina A. Nti of College of
Basic and Applied Sciences, Department of Family and Consumer Sciences. I therefore declare
that no part of this work has been submitted anywhere for an award of a degree. All references to
other people’s work have been dully acknowledged.
Signed..................…………… DATE…………………………..
Fritz Kosi Exornam Adom
(STUDENT)
Prof. Christina A. Nti
SIGNED.........………………….. DATE……………………………. (SUPERVISOR)
University of Ghana http://ugspace.ug.edu.gh

iii
DEDICATION
This work is dedicated to the Creator of the universe, Mrs. Comfort Adom my wife and children
as well as my mother, Mrs. Alice Adom for your sacrifices. God richly bless you.
University of Ghana http://ugspace.ug.edu.gh

iv
ACKNOWLEDGEMENT
Unto the Lord be the glory. My sincerest thanks goes to my supervisor, Prof. Christiana A Nti for
her immense contributions that has seen this work come to fruition. I am most grateful to my
supervisor for her advice, corrections and the insightful comments. May God richly bless you.
I am also grateful to the Head of department, Dr. (Mrs) Badasu of Centre for Migration Studies
for her numerous contributions towards the realisation of my dreams.
Pride of place is also given to my wonderful lectures, most importantly, Dr. Kandilige, Dr.
Setrana and Dr. Joseph Teye under whose tutelage I received knowledge, direction, inspiration
and insight. You are wonderful!
My thanks also goes to my department, Ghana Statistical Service for their support.
I also thank Mr. George Agbenu, of Ghana Statistical Service, Mr. Gideon Selorm Hosu-Porbley,
Madam Alberta Teye, Lionel Sakyi for their guidance.
My sincere thanks go to all my siblings for their moral support and encouragements.
Finally, I thank all the staff members of the center, colleagues, and national service personnel
(2017).
I love you all.
University of Ghana http://ugspace.ug.edu.gh
v
ABSTRACT
Looking at the increasing number of the youth migrating from the rural areas to an urban areas
and bearing in mind the implications of rural-urban migration on the origin communities and
destinations, this study sought to explore the challenges the rural folks face with regards to rural-
urban migration particularly its effects on agricultural productivity. The objectives of the study
were to: (i) describe the characteristics of household heads in the study area, (ii) find out about
youth out-migration if any, (iii) examine communities ‘viewpoints about rural-urban migration
among the youth, describe the food supply situation in the households and examine
communities’ perception of the effects of youth out-migration on agricultural productivity.
Adopting quantitative and qualitative research designs for complementarity, one hundred
respondents from four agricultural communities were interviewed using a survey questionnaire.
Four focus group discussions (FGDs) were held (2 female groups, 2 male groups). In each group
there were eight (8) members. The findings for the study indicate that, about a third of the
household heads interviewed fall between the ages of 55-59 years of age. Similarly in terms of
gender, overwhelming majority (81%) of the heads of households interviewed were males.
Majority (93%) of the household heads interviewed affirmed that there has been an out-
migration of the youth annually and their preferred destination is outside the region, specifically
Accra, Kumasi and Ashiaman. Most of the youth (68%) migrate because of lack of jobs in the
area. On the views of the study respondents on the effects of youth out-migration on agricultural
productivity, majority (94%) of the respondents also affirmed that migration of the youth affects
agricultural productivity and to some extent food supply in the households. The study therefore
recommended that since the basis of the youth out-migration is lack of job opportunities in the
rural communities, government should set up cottage industries that would provide jobs for the
University of Ghana http://ugspace.ug.edu.gh

vi
rural youth in the Hohoe Municipality. By so doing, a number of the youth will not migrate to
urban areas for non-existing jobs.
University of Ghana http://ugspace.ug.edu.gh

vii
TABLE OF CONTENT
DECLARATION......................................................................................................................................... ii
DEDICATION............................................................................................................................................ iii
ABSTRACT ................................................................................................................................................. v
TABLE OF CONTENT ............................................................................................................................ vii
LIST OF TABLES ...................................................................................................................................... x
LIST OF FIGURES ................................................................................................................................... xi
ABBREVIATIONS ................................................................................................................................... xii
CHAPTER ONE ......................................................................................................................................... 1
BACKGROUND ......................................................................................................................................... 1
1.0 Introduction ....................................................................................................................................... 1
1.1 Background to the study .................................................................................................................. 1
1.2 Statement of the problem ............................................................................................................... 2
1.3 Objectives of the study ...................................................................................................................... 4
1.4 Research question ............................................................................................................................. 5
1.5 Justification of the study/Significance of the study ........................................................................ 5
1.6 Definition of terms ............................................................................................................................ 6
1.7 Organization of the study ................................................................................................................. 7
CHAPTER TWO ........................................................................................................................................ 8
LITERATURE REVIEW .......................................................................................................................... 8
2.0 Introduction ....................................................................................................................................... 8
2.1 Classification of urban and rural communities .............................................................................. 8
2.2 Agriculture in Ghana ........................................................................................................................ 9
2.3 Agriculture, youth employment and challenges in Sub Saharan Africa .................................... 11
University of Ghana http://ugspace.ug.edu.gh
viii
2.4 Migration trends in Ghana........................................................................................................... 13
2.5 Migration and development ........................................................................................................... 16
2.6 Migration and its effect on agriculture productivity ................................................................... 18
2.7 Effects of out migration on rural and urban communities ......................................................... 20
2.8 Livelihoods ....................................................................................................................................... 22
2.9 The nature of rural livelihood strategies in Ghana ...................................................................... 22
2.10 Effects of climate change on agricultural production ................................................................ 23
2.11 Theoretical framework ................................................................................................................. 24
2.11.1 “Push Pull” theory ................................................................................................................. 24
2.11.2 The neo-classical theory ......................................................................................................... 26
2.12 Conceptual framework: causes of migration and its effects on agricultural ........................... 27
CHAPTER THREE .................................................................................................................................. 31
METHODOLOGY ................................................................................................................................... 31
3.0 Introduction ..................................................................................................................................... 31
3.1 The study area ................................................................................................................................. 31
3.2 Study design ..................................................................................................................................... 33
3.3 Target population ............................................................................................................................ 33
3.4 Sample size and sampling technique ............................................................................................. 34
3.5 Survey techniques ........................................................................................................................... 34
3.6 Instrumentation and pretesting ..................................................................................................... 34
3.7 Procedure for data collection ......................................................................................................... 35
3.8 Data analysis and presentation ...................................................................................................... 36
3.9 Ethical considerations ..................................................................................................................... 37
CHAPTER FOUR ..................................................................................................................................... 38
RESULTS AND DISCUSSION ............................................................................................................... 38
4.0 Introduction ..................................................................................................................................... 38
4.1 Socio-demographic and economic characteristics of the respondents ....................................... 38
4.1.1 The socio-demographic characteristics of household heads ................................................. 38
4.1.2 Socio-demographic characteristics of focus group participants. ......................................... 43
4.2 Migrants information from household heads ............................................................................... 46
4.3 Knowledge and evidence of out-migration of participants in the study area. ........................... 49
University of Ghana http://ugspace.ug.edu.gh
ix
4.3.1 Frequency of migration ........................................................................................................... 49
4.3.2 Distribution of preferred destination of migrants. ................................................................ 50
4.3.3 Distribution of the number of migrants from the households surveyed ............................. 52
4.3.4 Distribution of reasons for migration ..................................................................................... 53
4.4 Household characteristics and availability of food surplus ......................................................... 55
4.5 Availability of food surplus in the households from previous year’s planting season. ............. 58
4.6 Respondents views on implications of out-migration on agricultural productivity .................. 59
CHAPTER 5 .............................................................................................................................................. 61
SUMMARY, CONCLUSION AND RECOMMENDATIONS ............................................................. 61
5.0 Introduction ..................................................................................................................................... 61
5.1 Summary of the study ..................................................................................................................... 61
5.2 Conclusion ....................................................................................................................................... 63
5.3 Recommendations ........................................................................................................................... 64
REFERENCES .......................................................................................................................................... 66
APPENDIX A ............................................................................................................................................ 79
APPENDIX B ............................................................................................................................................ 87
APPENDIX C: ........................................................................................................................................... 90
APPENDIX D: ........................................................................................................................................... 98
University of Ghana http://ugspace.ug.edu.gh
x
LIST OF TABLES
Table 4. 1: Age distribution of household heads by age .............................................................. 40
Table 4. 2: Percentage distribution of household heads by level of education ............................ 42
Table 4. 3: Socio-demographic of focus group participants ....................................................... 45
Table 4. 4: Migrants information from household heads ............................................................. 48
Table 4. 5: Percentage distribution of reasons for migration ....................................................... 54
Table 4. 6: Household characteristics and availability of food surplus ....................................... 57
University of Ghana http://ugspace.ug.edu.gh
xi
LIST OF FIGURES
Figure 4. 1: Percentage distributions of household heads by sex ........................................... 41
Figure 4. 2: Percentage distributions of household members by marital status ................... 43
Figure 4. 3: Percentage distribution of frequency of migration. ............................................ 50
Figure 4. 4: Percentage distribution of preferred destination of migrants ........................... 51
Figure 4. 5: Percentage distribution of the number of migrants from each household ....... 52
Figure 4. 6: Percentage distribution of households food supply from the last year’s planting
season ........................................................................................................................................... 58
Figure 4. 7: Percentage distribution of migration implications on agricultural productivity
....................................................................................................................................................... 60
University of Ghana http://ugspace.ug.edu.gh
xii
ABBREVIATIONS
IFAD International Fund for Agricultural Development
UN United Nations
NELM New Economics of Labour
SSA Sub Saharan Africa
GDP Gross Domestic Product
SPSS Statistical Package for Social Science
MOFA Ministry of Food and Agriculture
P4P Purchase for Progress
GSS Ghana Statistical Service
GLSS Ghana Living Standards Survey
FGD Focus group discussion
NGO Non-Governmental Organization
University of Ghana http://ugspace.ug.edu.gh
1
CHAPTER ONE
BACKGROUND
1.0 Introduction
This introductory chapter presents the background to the study, as an attempt to situate the
research in the right perspective. This foundational data presentation also include the
discussions on the research problem, research questions and objectives, as well as the
significance of the study and the organisation of chapters.
1.1 Background to the study
One of the most remarkable demographic issues confronting many developing countries in
the world is the shortage of labour and food insecurity, and the rapid population growth in the
urban centres, which is largely caused by the incidence of rural-urban migration (Agesa &
Kim, 2001). According to Dugbazah (2007), migration is a wide spread phenomenon, that
any study made on an urban centre in Sub- Saharan Africa (SSA) of which Ghana is part, will
ever, deal largely with a population that was not born in the place. Bahns (2005) contends
that about half of the population in the world lives in cities and urban areas and the
population are conjectured to be around 1 million every year. Most of these people have
migrated from other parts of the country mostly from the rural areas. The current rate of
urban population growth has reached up to 6% in many African countries including Ghana
(Accra), Nigeria (Lagos), and Kenya (Nairobi), (Dao, 2002). Globally, rural-urban migration
has been a thorny issue for policy makers and or governments particularly in developing
countries. The effect of out-migration of labour on rural livelihoods is an arguable subject.
Out-migration of labour from the rural communities may result in the reduction of total
cropped area vis-à-vis the quality of work leading to reduction in food production as well as
household income. This can result in increased vulnerability in many rural areas which may,
bring about food insecurity.
University of Ghana http://ugspace.ug.edu.gh
2
According Adepoju (2008) and Bull, 2001 the rural-urban pattern of migration takes more
young men than women out of rural areas, resulting in many women becoming the heads of
households and being responsible for agriculture production. This view is however changing
these days as more rural young women are also migrating from rural areas to urban areas. For
example, according to the Ghana Living Standards Survey (GLSS 5), round five survey data,
which was conducted between 2005 and 2006, 47 percent of females in the rural savannah
over the age of seven had migrated at least once in their lifetimes, as compared with 37.6
percent of their male counterparts in the same age-bracket. As more youth are migrating to
urban communities, more aged people are now left to undertake the herculean tasks
associated with farming, specially the tasks which are earmarked for the youths. Therefore,
there is no doubt that the additional responsibilities will decrease the agricultural productivity
Basil & Olumide, (2013). The present study therefore investigated rural urban migration and
its implication (s) on agricultural productivity in the Hohoe Municipality of the Volta Region.
1.2 Statement of the problem
Several factors are responsible for out-migration of labour out of agriculture from the rural-
areas of Ghana to urban centers (Lee, 1966). Among these are poverty, lack of jobs,
intermittent rainfall patterns (Adefolanu Do, 2000) and declining soil fertility, coupled with
adversarial climatic variations among others (World Bank, 2010). This continuous direction
of flow of labour force have impacted negatively on food production causing food insecurity
and low income levels (Barrios et al., 2003).
The Hohoe Municipality consists of a number of farming communities. Some of the major
crops cultivated by farmers in the area are cassava, maize, rice, yam, plantain, and cocoa,
among others. Over the years, the Municipality has been confronted with out-migration of its
labour force, most importantly the youth (Foresight, 2011, Salvador, Luisito, and Strobl,
2006).The out-migration of labour from these farming communities in the Municipality is
perceived to be responsible for the reduction in agricultural productivity, specifically a
University of Ghana http://ugspace.ug.edu.gh
3
decline in food production. The out-migration of the youth is also responsible for disturbance
of the population structure.
Over the years, several interventions have been rolled out by successive governments through
its agencies such as Ministry of Food and Agriculture (MOFA) and Cocoa Board to render
services such as increase seed production to food crop farmers, livestock production,
Agriculture extension services, distribution of free fertilizers and the distribution of free
cocoa seedlings to farmers in the Hohoe Municipality in order to increase food production.
Aside the effort of governments, various Non-Governmental Organizations (NGOs) in Ghana
have also contributed immensely towards the agricultural productivity. One of such NGOs is
World Food Programme. Purchase for Progress (P4P) is one of the World Food Programme
that connects smallholder farmers to markets, giving them opportunity to grow their
businesses and their lives and those of their entire communities. This Programme also
promotes food security by providing storage facilities to farming groups in some deprived
communities to enable them overcome post-harvest losses.
In spite of all these interventions, most farmers in Ghana and in the Hohoe Municipality have
not been able to produce enough food to feed themselves and also create wealth leading to
poverty. This is largely due to out-migration of the youth which constitute the labour force
(Lewis, 1986 and Penninx, 1982). Similarly, some of these youth are well educated and
capable of embracing modern agricultural technology but have migrated to the urban centres.
Several studies have assessed the impact of rural-urban migration on agricultural productivity
and also on its impact on the urban population. Among these are: Awumbila et al (2008),
Awumbila et al.,(2016), Yeboah (2008), Chang (2003), Badasu, (2004), Chang and Brada
(2002), Seeborg et al., (2002) and Long, (1988). However, these studies did not focus much
attention on the rural areas, specifically, Hohoe Municipality although it has challenges
similar to the issues discussed in literature. Per the 2010 Population and Housing census of
Ghana Statistical Service, about 91.1 percent of agricultural households in Hohoe
University of Ghana http://ugspace.ug.edu.gh
4
Municipality are engaged in crop farming. According to literature, those who are likely to
migrate are the youth. This therefore suggests that if this number of people migrate, food
production in the district will be greatly affected. Again, the 2010 census report of Hohoe has
it that, majority of the economically active population (15-64 years) are engaged in primary
industries, particularly, agriculture, forestry and fishing. Data from the Ghana Living
Standard Survey Round 4, 5, and 6 showed that people in this sector of the economy are
mostly poor. One of the push factors in migration is poverty. This statistics therefore suggests
that a lot of the people in this municipality are liable to migrate if measures are not taken to
assist them financially. According to migration literature those who are likely to migrate to
urban towns are those who have human capital. Education in the Hohoe Municipality per the
2010 Census of Ghana Statistical Service has it that about 88.3 percent of the population is
literate. Looking at the gendered dimension, males (92.8%) are more literate than females
(84.3%). Again, the active population (15-35) in the Hohoe Municipality are either in school
or have completed a particular level. A number of these school leavers have their own farms.
Likewise, some of those in schools assist their parents on their farms. This also suggests that
a number of such persons, who have attained some level of education and skills in the district,
are the first to migrate if the opportunity presents itself. This has therefore prompted the
assessment of the dynamics of the implications of rural urban migration in the Hohoe
Municipality. This study therefore extends the literature on rural-urban migration detailing
the influence of out-migration on agricultural productivity in the Hohoe Municipality.
1.3 Objectives of the study
The general objective of the study was to investigate the experiences and perception of youth
out-migration and food supply in agricultural households. The specific objectives were to:
i. Describe the characteristics of household heads in the study area.
ii. Find out about youth out-migration, if any, in the study community.
iii. Examine communities’ viewpoints about rural-urban migration among the youth.
University of Ghana http://ugspace.ug.edu.gh
5
iv. Describe the food supply situation in the households.
v. Examine communities’ perception of the effects of youth out-migration on
agricultural productivity.
1.4 Research question
The central question of this assessment was how out-migration has affected agricultural
productivity in the Hohoe Municipality. The research questions were:
i. What is the household heads characteristics in the study area?
ii. Is youth out-migration evident in the study community?
iii. What is the study communities’ views about rural-urban migration?
iv. How is the food supply situation and its effect on the households?
v. What are communities’ perception of the effects of youth out-migration on
agricultural productivity?
1.5 Justification of the study/Significance of the study
The important role of agriculture in the economy of developing countries cannot be under-
estimated. Agriculture is the mainstay of Ghana’s economy providing food and raw materials
for industries. The sector is therefore considered as the backbone of the economy, given that
over 60% of the population depends on it for their livelihood. Rural livelihood in Ghana is
largely dependent on agriculture (World Bank, 2014). Since the rural areas are agrarian
economies (GSS 2010) any attempt to stifle the labour force of the rural areas will likely lead
to under-development of the rural areas. The outcome of this study therefore provides helpful
insight into the implications of rural-urban migration on production of food crop, food
security and livelihood so as to adopt measures in de-accelerating rural-urban migration and
also boost agricultural productivity in Ghana, particularly in the Hohoe Municipality. The
study also provides helpful insight to policy makers in government (e.g. Ministry of Food and
University of Ghana http://ugspace.ug.edu.gh
6
Agriculture) and Non- Governmental Organizations (NGOs) such as the World Food
Programme (WFP) as to how best to address the problems of rural-urban migration.
Similarly, the study unearths new approaches of making agricultural more appealing to the
youth in order to boost agricultural production in rural communities and improve household
incomes. Lastly, the study helps to fill in the existing knowledge gap on the economic
impacts of rural-urban migration on rural communities, specifically rural communities within
the Hohoe Municipality.
1.6 Definition of terms
Migration: Movement of a person or a group of persons, either across an international border,
or within a State for a period of time (Perruchoud, 2004).
Rural-Urban Migration: The movement of people from the rural areas to urban centers for a
specified period of time.
Agricultural Household: Agricultural household refers to a household where at least one
member of a of the household is involved in a farming activity, namely, crop farming, tree
planting, livestock rearing and fish farming (2010, GSS)
Migrants: A person who has relocated to his or her current place of residence for a period of
one or more (GSS, 2008)
Agricultural Productivity: Agricultural productivity can be defined as a measure of
efficiency in an agricultural production system which employs land, labour, capital and
other related resources (Dewett et al., 1966, p. 66)
The youth: For this study, anybody from age 15 years to 35 years is considered as a youth. In
spite of the fact that the minimum limit of adult age in Ghana starts at age 18, the researcher
considered age 15 as to 35 because, per the United Nation the youth cohort fall between the
ages of 15 – 24 years (United Nation, 1981). Also, the National Youth Policy classifies all
persons 15 - 35 years as the youthful population (Republic of Ghana, 2010). But because the
University of Ghana http://ugspace.ug.edu.gh
7
research is going to be conducted in a Ghanaian setting, the definition by the National youth
Policy will be the most appropriate (youthful population 15 – 35 years).
1.7 Organization of the study
This dissertation is structured into five chapters. Chapter one presents the background to the
study on labour migration which results in the shortage of agricultural labour and its
implication food production, the problem the research attempts to solved, objectives of the
study and the justification or the significance of the study. Chapter two presents the literature
review which covers topics such as classification of rural and urban communities, migration
and development, theoretical framework, consequences of rural rural-urban migration on
agricultural productivity, effects of climate change on agricultural production, variations of
agricultural activities and migration trends in Ghana. Chapter three touches on the
methodology, procedures of data analysis, the study area, sampling techniques, data
collection and the use of statistical software to analyse data. Chapter four shows results and
discussion. Chapter five presents a summary of key findings, policy recommendations and
conclusions.
University of Ghana http://ugspace.ug.edu.gh
8
CHAPTER TWO
LITERATURE REVIEW
2.0 Introduction
This chapter presents a review of some literature important to the topic. It shows broad
themes including the classification of rural and urban communities, agricultural in Ghana,
agriculture, youth employment and its challenges in Sub-Saharan Africa, migration and its
effects on agriculture, and effects of out-migration on rural and urban communities,
livelihood, and the nature of livelihood strategies in Ghana. It also includes issues on
migration and development, and effects of climate change on agricultural production.
2.1 Classification of urban and rural communities
Globally, classification of communities into rural or urban status varies from country to
country. This is because different countries consider a number of factors when classifying
communities into urban and rural status (Tacoli, 1998). According to Tacoli (1998),
demographic and economic criteria on which definitions of urban and rural areas are based
can vary widely between different nations, making generalizations problematic.
In a work done by Cloke (1985), in an attempt to examine and define rural locality, he
concluded that a further research has to be done before the subject matter can be determined.
A similar assertion was made by Falk and Pinhey, (1978) and, much earlier by Bealer et al;
(1965). Continents such as Africa (Angola, Ethiopia) and Latin America (Argentina) all
localities of a population of 2002 or more inhabitants are considered as urban localities, while
in Benin only localities with 10,000 people or more are classified as urban. In yet other cases,
urban boundaries are drawn up based on a mixture of population size or density and various
economic or social indicators. In Botswana, for example, an agglomeration of 5,000 or more
people where 75 percent of the economic activity is non-agricultural would be considered
urban (United Nations, 2001). Ghana Statistical Service in the 2010 Population and Housing
Census exercise, categorized rural or urban communities on the basis of its population size.
University of Ghana http://ugspace.ug.edu.gh
9
Localities with 5,000 population or more are categorized as urban whereas communities
having population less than 5,000 people are categorized as rural. In the Philippines, the
National Census defines all areas with a population density of about 500 persons per square
kilometres` as urban localities. Per the 2010 Census, more than fifty percent (50.9%) of
Ghana’s population currently live in urban communities while 49.1% live in rural areas
(GSS, 2010). Despite the recent spate of urbanization in Ghana, most of the youth from rural
areas are still migrating to urban areas in search of employment (Ghana Statistical Service
2010 Census Report).
2.2 Agriculture in Ghana
Agriculture has been the mainstay of Ghana’s economy throughout the era of post –
independence history (McKay and Aryeetey, 2004). Although government policy and
political failure has resulted in per capita GDP growth reducing until 1980s, the agricultural
sector had remained resilient as compared to the non-agricultural sector. This is due to the
fact the agriculture sector was less interfered by government than the non-agricultural sector
and its growth is largely being controlled by the smallholders for subsistence purpose of
production.
Figure 1 presents GDP shares of agriculture, industry, manufacturing (as part of industry) and
services between 1965 and 2008.
University of Ghana http://ugspace.ug.edu.gh
10
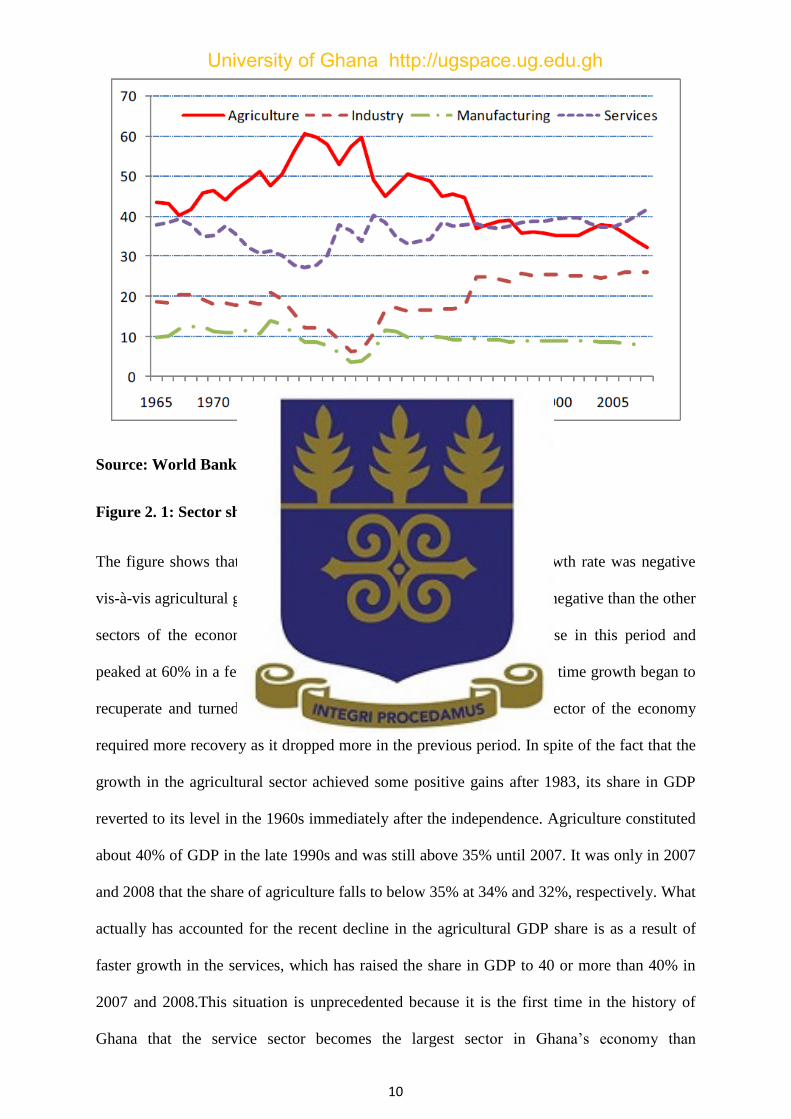
Source: World Bank, 2009
Figure 2. 1: Sector share of GDP (1965-2008)
The figure shows that, prior to the late 1980s when the economy growth rate was negative
vis-à-vis agricultural growth rate, the agricultural growth rate was less negative than the other
sectors of the economy. Consequently, GDP share of agriculture rose in this period and
peaked at 60% in a few years in the late 1970s and early 1980s. At the time growth began to
recuperate and turned into positive after 1983, the non-agricultural sector of the economy
required more recovery as it dropped more in the previous period. In spite of the fact that the
growth in the agricultural sector achieved some positive gains after 1983, its share in GDP
reverted to its level in the 1960s immediately after the independence. Agriculture constituted
about 40% of GDP in the late 1990s and was still above 35% until 2007. It was only in 2007
and 2008 that the share of agriculture falls to below 35% at 34% and 32%, respectively. What
actually has accounted for the recent decline in the agricultural GDP share is as a result of
faster growth in the services, which has raised the share in GDP to 40 or more than 40% in
2007 and 2008.This situation is unprecedented because it is the first time in the history of
Ghana that the service sector becomes the largest sector in Ghana’s economy than
University of Ghana http://ugspace.ug.edu.gh
11
agricultural sector. On the contrary, industrial sector share in GDP has not altered much after
1990s and that of the manufacturing sector has even dropped to less than 10% of GDP in the
recent ten years. The kind of growth patterns exhibited in the non-agricultural sector are not
consistent with the transformation theory vis-à-vis the experience of other developing
countries in which the role of industry, particularly that of manufacturing has increased in the
development process (Breisinger and Diao, 2008).
The structure of agricultural and agricultural GDP distribution based on regional levels
significantly differ across Ghana’s agro-ecological zones. These regional variations have
significant implications for sub-sector-level agricultural growth strategies. The Forest
ecological Zone remains the leading agricultural producer, representing 43% of agricultural
GDP, compared to about 10% in the Coastal Zone, and 26.5% and 20.5% in the Southern and
Northern Savannah Zones, respectively (Breisinger et al. 2008). In terms of cereals and
livestock the Northern Savannah zone is noted for that. About more than 70% of Ghana’s
cereals such as sorghum, millet, cowpeas and groundnuts as well as livestock come from that
enclave. The Forest Zone also is noted for the supply of a large quantity of higher-value
products, such as cocoa and livestock (mainly commercial poultry). The varied nature of
agricultural production in the country is also an indication of differences in the agricultural
income structure across regions. The Forest Zone alone produces about half its agricultural
revenue from two of Ghana’s major export goods (cocoa and forestry). In addition to
nontraditional exports and fishery, export agriculture likewise plays a vital role in total
agricultural income for the Coastal and Southern Savannah Zones. In contrast, 90% of
income realized from agricultural in the Northern Zone comes from staple crops and
livestock.
2.3 Agriculture, youth employment and challenges in Sub Saharan Africa
Agriculture sector remains the largest employer for most African countries. The sector
employs about 65% of the total work labour force in the Sub Saharan Africa. In spite of the
University of Ghana http://ugspace.ug.edu.gh
12
fact that there has been some decline in the relative number of agricultural workers, the
sector still account for the greater number of the working population in the region. It is
therefore reasonable to focus on the agricultural sector when policies are being designed to
provide jobs for the youth. “Efforts to accelerate agricultural growth and improve food
security have often been separated conceptually from efforts to create jobs for young people.
Agriculture, already Africa’s largest employer, is the most immediate means of catalyzing
economic growth and employment for young people” (African Agricultural Status Report,
2015). According to Christiansen, Demery and Kuhl (2011), a 1% increase in agricultural per
capita in other sectors, mostly among the poorest people in sub Saharan Africa (SSA).
Agricultural is therefore a pro-poor, income-generating and job-creating sector for the most
SSA economies.
The average contribution of agriculture to GDP in several African countries has been
dwindling or static at around 30% since early 1980. The percentage of exports of farm
products and food fell from 10% in the 1960s to about 4% in 2005. With the large number of
youth the Sub- Saharan African countries have coupled with the high demand of food and
farm products in the national, regional and global markets, SAA countries should be able to
redirect and make available the skills and knowledge the youth require so as to engage in
productive, economically sustainable agriculture. Currently, it has been projected that,
Africa’s food markets will grow from USD 313billion in 2010 to USD 1 trillion in 2030
(World Bank, 2013). Food imports have surpassed exports since 2003. There are
opportunities for the youth to become producers as well food suppliers so as to meet the
demand created by Africa as a result of expanding its domestic market. Likewise, the demand
in international food markets is rising and the upsurge in global food prices hold the promise
of higher rates of return on investments in high-value agricultural products. More than two-
thirds of the rural youth are already engaged in agriculture and there is still supply of
abundant land. Agriculture is a sector of opportunities for rural youth. In spite of
opportunities for youth in the food supply chain, there are major challenges and constraints
University of Ghana http://ugspace.ug.edu.gh
13
when it comes to agriculture and youth in SSA. Notable among them being the land tenure
system which makes it difficult for individuals to have access to large track of agricultural
land for commercial agriculture. Similarly, lack of credit facilities and capital is one of the
major challenges confronting farmers in SSA countries. Furthermore, farmers in SSA have
difficulty in having access to international and regional markets to sell their farm produce.
More so, public and private sectors find it very difficult to invest in agricultural
infrastructure, extension services, farming inputs such as improved seeds, organic and
inorganic fertilizers that will make farming more appealing to the youth. In spite of all these
challenges enumerated, if only proper policies are put in place by governments, for example
public and private sector strategic interventions, proper technologies, and access to
innovative agriculture financing, the youth will take advantage of it and contribute
meaningfully to the economies of their respective countries and by so doing enhance their
livelihood as well as reduce poverty.
2.4 Migration trends in Ghana
Throughout history Ghana has been altering from an immigration towards an emigration
country (Nieswand, 2008; Anarfi et al, 2003; Tsikata and Seini, 2004; Hardus, 2010). From
the era of the pre-colonial up to the early 1970s, there were self-employed traders coming
into the country to trade. There were also labour prospects in the mines and cocoa farms
which attracted the youth especially the young unmarried men from the neighbouring
countries into Ghana (Anarfi et al, 2003). Ghana in the 1960s had a relative economic
prosperity. As a result, immigration was the leading trend throughout colonial times.
Migration at the time was largely internal. However, some few high skilled migrants
migrated mostly towards England due to the language, and also as a result of the colonial ties.
Migration trends within Ghana during the colonial era were driven by economic prospects.
During this era, the Colonialists were actively recruiting labourers in the North to construct
roads, rail lines and also to work in the mines and the cocoa growing areas in the South. This
University of Ghana http://ugspace.ug.edu.gh
14
is because migration trends within Ghana have usually been from the north to south. The
north at the time was considered as a labour reservoir to the south. Migrants also came from
the less developed rural areas to the relatively developed urban areas, serving as growth
poles. The migration from north to south was often seasonal in character; migrants returned
during the harvesting season which happens once a year (Anarfi et al., 2003). After
independence (1960 to 1970), urban growth trend increased rapidly in all regions. This has
been largely due to inter-regional migration following the lessening of colonial laws that
restricted rural-urban migration (Ghana Statistical Service, 2005). Natural growth and
migration can be as a result of distribution and redistribution of population (Ghana Statistical
Service, 2010). However, migration literature has it that urban towns grow faster by
migration than by natural growth (Ravenstein, 1885; 1889). Demography, geographic and
socio-economic factors are some of the factors that underpin redistribution of population
through migration. These include the distribution and utilization of natural resources and
infrastructural development, which results from local factors as well as policies, and
programmes of government and non-government agencies. One outcome of the movement is
urbanization (Ghana Statistical Service, 2010). The percentage of urban population increased
from 23.1 in 1960 to 50.9 in 2010 (Ghana Statistical Service, 2010). Statistics showing the
proportion of urban and annual growth rate from 1960 to 2010 have this to show: 1960
(23.1%), 1970 (28.9%), 1984 (32.1%), 2000 (43.8%) and 2010 (50.9%).This can be
explained in terms of the fact that while at the national level, the growth of the population is
the result of dwindling but still high fertility and decreasing mortality, movement of the
population nationwide from the rural areas to urban areas redistributes the population
internally and affects the process of urbanization in the country (Ghana Statistical Service,
2010). This also supports the assertion that, urban towns grow faster by migration than by
natural growth (Ravenstein, 1885; 1889). Similarly, migration literature has it that people
mostly migrate from agricultural to industrial areas (Ravestien, 1885; 1889).
University of Ghana http://ugspace.ug.edu.gh
15
According to the Ghana Living Standards Survey (GLSS 7) report, age and gender
differentials in migration statistics, indicate that those between the ages of 25-29 of the
population who also constitute the youth, are more mobile. This also suggests that when it
comes to migration, the older people and parents with school-going children are less likely to
migrate. If this is the case, then the migration of the youth from the rural communities to
urban communities will lead to loss of labour which will also result in low agricultural
productivity at the source region (Azeez & Opoola, 2011). Conversely, the loss of labour
which largely involves male youth will lead to a situation where many, women becoming the
heads of households and being responsible for agriculture production (Bull, 2001).The
massive exodus of the youth, strong men and women from the rural communities is usually
attributed to causing an acute shortage of agricultural and other labour, robing rural areas of
their most valued labour force (Lewis, 1986). In terms of sex composition of the migrants in
Ghana, statistics have shown that internally, 35% of Ghanaians migrated in 2014. Greater
Accra alone recorded 40.7%. Surprisingly, females far outstripped males in intra- regional
migration at both the rural and urban levels. In the inter-regional migration however, males
outnumbered females (Ghana Statistical Service, 2014). This also supports the assertion that
women migrate for shorter distances while men migrate for longer distances (Ravenstein
1885; 1889).
The 2010 Population and Housing Census report has it that, Ghana is becoming progressively
urbanized. Also per the 2010 census report, Ghana’s urban population grew from 8.3 million
in 2000 to 12.5 million in 2010, showing a growth rate of 4.2 percent per annum during the
period, higher than the national average of 2.5 percent. The level of urbanization in Ghana
increased from 43.8 percent in 2000 to 50.9 percent in 2010, an increase of 7.1 percentage
points during that period. Thus, the country became more urban than rural as at 2010.
Currently, the number of people living in urban centers surpasses the total of rural areas, the
results of rural–urban migration, natural population increase in towns and cities, and the
reclassification of rural jurisdictions to urban once, exceed the threshold populations of 5,000
University of Ghana http://ugspace.ug.edu.gh

16
(GSS, 2013; World Bank, 2014). Indeed, if current trend of population growth continues
through 2030, Ghana’s population will surpass 33 million, with almost two thirds residing in
urban areas, and nearly doubling the share of urban residents in 1984. According to the
Ghana Living Standards Survey, round six report, the percentage of the migrants’ population
from other urban centres in Accra alone stands at 81.7% (GSS, 2014). The current trend in
migration so far has been that a significant number of individuals as well as households
continue to migrate from the rural communities to urban centres in order to enhance their
standard of living. A number of migration experts have touched on the various facets of
these persistent phenomena. Notable among these scholars are Ravenstine (1885) and Lee
(1966) showing the patterns of migration and Todaro (1969), giving the rational why people
migrate. The prominence placed on rural-urban migration as demonstrated by these scholars
only demonstrate the speed at which communities in most developing countries are becoming
urbanized, typifying the nexus between rural and urban centres.
2.5 Migration and development
Globally, the link between migration and development has remained an issue under serious
academic argument (Adams, 2006; De Haas, 2006). According to Papademetrious and Martin
(1991), the nexus between migration and development discourse is unsettled. Ellerman
(2003) also said the issue is unsettled and unresolved, Appeleyard (1992) said the issue is
unresolved. Newland (2007) has it that the link between migration and development is still
very weak whereas Castles (2009) concludes that the evidence on all aspects of the mantra is
uneven and contested. Despite all these assertions, migration has always been closely related
to economic and social development throughout history (Nyberg-Sorensen et al., 2002). It is
often perceived as the outcome of differences in development, but also as a catalyst to
development. A thorough examination of the subject as presented in most migration literature
on the effects of migration on development indicates that, the parameters have altered over
time (Nyberg-Sorensen et al, 2002). In some instances, migration has been perceived as
University of Ghana http://ugspace.ug.edu.gh
17
beneficial to development and at times as disadvantageous to development depending on the
historical antecedents and prevailing conditions. These variations have also resulted in a
change in migration policies by different countries. (Nyberg-Sorensen et al, 2002). Since
migration has positives as well as negatives for both the sending and the destination regions,
a crucial question therefore that can be asked is, to what extent is migration beneficial
particularly to the origin and how best can the positives be harnessed for the development at
the origin?
The first benefit that comes to mind is remittances. Migrants remit home when they travel
outside their place of origin. These remittances can take different forms, tangible and
intangible. The tangible ones are largely in the form of money. The intangible once could be
in the form of new skills acquired, new ideas, food remittances (Andersson, 2002), and even
in the form of different cultures. Remittances send in the form of money are spent on items
such as land, houses, education, transport, food, jewelry and in the case of agrarian
communities, to expand on agricultural production (Russell, 1992). According to Castles and
Miller (2009), there is a colossal transfer of monies by migrants from all over the world
which become a conduit through which families and communities especially those in the
developing countries use to develop. This is the reason why Heinemeijar et al. (1977)
described migration from the Morocan rural areas to Europe as a livelihood strategy which
validates with the New Economics of Labour Migration (NELM) and livelihood view of
migration and development.
Remittances are also attracting the attention of both the media and researchers as huge sums
of monies are being transferred to developing countries (Burman, 2002, Orozco 2007, Ratha,
2007, Ratha and Shaw 2007 and Sorensen, 2004). Official remittances received from
migrants living outside Ghana according to the Bank of Ghana report (2015) totalled 4.9
billion dollars. This shows how remittances contribute greatly to the livelihood of people in
the developing countries.
University of Ghana http://ugspace.ug.edu.gh
18
2.6 Migration and its effect on agriculture productivity
Nearly 75% of the world’s population resides in rural communities and are heavily reliant on
agricultural activities for survival (IFAD, 2016; 2007). Although they are often very context
specific, the root causes of poverty and food shortages in rural areas are natural disasters such
as drought and flooding etc), civil conflict and structural inequalities. Such occurrences
inhibit the rural populations’ access to resources and prospects to secure a sustainable
livelihood. When home-grown solutions are rare, poor families residing in rural localities will
adjust to the situation by frequently sending a family member to a nearby urban communities
or abroad in search of paid jobs. The agreement in the literature about the nexus between
migration and rural development remains thin. The findings suggest that generally, migration
does not lead to radical transformation of rural agriculture but that it often occupies a central
part in the maintenance of rural people’s livelihoods (De Haan, 1999).
The discourse in the migration literature has been that both internal migration and
international migration one way or the other have contributed to a decline in agriculture and
a general disaffection with small-scale peasantry. A research done by Aworemi, Abdul-Azeez
& Opoola (2011) in Nigeria indicates that rural-urban migration is a double-edge problem
affecting the rural locality vis-à-vis the urban centres. They contend that rural communit
suffers because the youth and adults that are expected to remain in the community and
promote agricultural production as well helping in the development of the community have
abandoned the rural areas to urban areas. They move to urban centres in pursuit of non-
existent greener pastures and leave the farming activities which they consider less rewarding
as compared with what they will achieve in the urban destinations. Consequently, this results
in the decrease in agricultural production and food shortages in the origin communities. The
‘lost labour’ of able-bodied (migrated) men and women significantly play an important role
in the process of agricultural decline. Fascinatingly, internal migration is linked more often
with rural and agricultural stagnation or even decline (Regmi and Tisdell, 2002; De Haas,
1998) than with international migration to affluent countries, where much higher remittances
University of Ghana http://ugspace.ug.edu.gh
19
enable households to exchange the lost labour by investing in agricultural production as well
as investing in other sectors of the economy.
The mass movement of the rural labour force is supposed to be the course of reduction in
agricultural production or even leaving agriculture sector altogether (De Mas, 1990; Ferry
and Toutain, 1990; Kerbout, 1990). This situation does not speak well for agricultural
production because the exiting of the youth and the abled-bodied men and women from the
rural areas will result in a situation where the aged will now have to do the tedious
agricultural work which should have been done by the youth (Angba, 2003). Once these
migrant youth have left, households in the rural communities will have less labour to engage
in agricultural activities. If a migrant household’s marginal product on the farm is positive,
crop production will reduce when the household sends out a migrant(s). Taylor et al. (2003)
note that the adverse effect of loss of labour may be high since those who normally migrate
are the able bodied youth who are also better educated than the average rural labourer.
Rozelle et al. (1999) report a significant and adverse effect of loss of labour on yields, but
Taylor et al., (2003) using the data collected by Rozelle et al., (1999) in another paper
discovered that though loss of labour to migration has a negative consequence on household
cropping income, the general effect of migration on crop yields is positive. The reduction in
agricultural production as a result of the youth migrating out of agriculture may be
compensated for (partially) by remittances received from the migrant(s) (see Awumbila et al,
2014),which are used to buy more agricultural inputs or rent substitutes for labour in
cropping. Instead of investing, it has been contended that migrant households tend to
withdraw partly or totally from agriculture. This is because the remittances sent by migrants
raise the economic status of migrant household to a higher level where they can diversify
their economy hence leaving primary production. Those return migrants who even invest in
agriculture often do so, not out of rational economic reasons, but because of their strong
emotional attachment towards agriculture. Bonnet and Bossard (1973) observed in the early
1970s, that remittances had made it possible for the expansion of agriculture in the Sous
University of Ghana http://ugspace.ug.edu.gh
20
region. In other migrant-sending communities, too, migrants have played important
innovative roles in contributing immensely to the advancement of subsistence and
commercial agriculture whereby they buy land, new agriculture tools, such as water pumps,
tractors, introduction of improve seedlings and new methods of farming as well as
establishment of new farms. Migrants show a particular liking for investments in the
advancement of new irrigated agriculture (Bencherifa, 1993; Bencherifa and Popp, 2000; De
Haas, 2001; Popp, 1999).
Pascon (1985) saw that investments in wells and water pumps by international migrants have
lessened the effects of the severe drought that had occurred in the mid-1970s. This apparent
inconsistency in the literature can be partially resolved by knowing that the impacts of
migration are not the same for diverse areas across time and space. There are signs that the
initial consequence of migration on agricultural productivity might indeed have been bad,
because of a drastic reduction in family labour. This is likely because, at the initially stages it
is difficult for migrants to send remittances due to the fact that they have yet settled.
Nevertheless as they settle and have established well in the destination areas they send
remittances which the family eventually uses to expand on agricultural production as well as
compensating for lost labour in (De Haas, 2001).
2.7 Effects of out migration on rural and urban communities
There are several implications for both the origin and destination communities when rural-
urban migration takes place in the rural communities (De Haas, 2010). These effects will be
either positive or negative. For the origin, out-migration from agricultural by the youth will
have dire consequences for the rural farming communities in the Hohoe Municipality. One of
such challenges will be shortage of labour. This is because when migration occurs, it is the
able-bodied persons who leave. Its implications therefore are that there will be a reduction in
agricultural production because the herculean task of farming will be done by the women and
University of Ghana http://ugspace.ug.edu.gh
21
their children as well as the aged at the origin. The immediate effect will be that, food prices
will increase, and rural livelihood will be greatly affected.
In comparism with the rural areas, urban areas are still seen as offering opportunities for
improvement in livelihoods and an escape route out of poverty. (Awumbila et al, 2014). Even
when formal employment figures dwindle, urban communities still offer more opportunities
in their huge informal labour markets (Songsore, 2003). Similarly, there exist vast differences
in income and living standards between places (Awumbila et al. 2011b; Murrugarra et al.
2011). It is on the basis of the affore-mentioned assertions that rural dwellers, specifically the
youth migrate to urban areas. However, there are challenges in the urban areas. One of such
challenges will be that those rural youth who have migrated from rural areas to urban centres,
will be competing with the urban dwellers with the limited jobs. If these rural youth find jobs
they will also earn wages. This will inure to the benefit of the origin because they will receive
remittances from the migrants. The remittances received will be used to hire labour to replace
the lost labour in order to expand on agricultural production. This will eventually boost food
production and also impact positively on the livelihood of the left behind. However, if the
rural migrants are not able to secure urban jobs it will have serious consequences for urban
dwellers. One of such problems will be that there will be pressure on the limited urban
amenities. Slum areas will therefore spring up at different locations in the urban communities
as a number of such migrants cannot afford decent accommodation. UN Habitat report
(2006), has it that 66% of urban Ghanaians live in a slum neighborhood. Old Fadama in
Accra for example is a slum community. It is one of the largest informal settlements in Accra
(Afenah, 2010). This slum community can lead to outbreak of communicable diseases as a
result of overcrowding. There will also be petty crime as well as armed robbery. According to
Muggah (2012), environments that are underdeveloped, coupled with governance structures
that are weak, high population densities, and inherently higher intensity of direct competition
for limited resources largely seem to bring about higher levels of violence and crime. In the
University of Ghana http://ugspace.ug.edu.gh
22
long run, there will be high food prices in urban communities due to food shortage which has
come about as a result of out-migration of labour from the rural areas.
2.8 Livelihoods
The term livelihood to a lay person is described as “making a living”. This terminology is
well accepted as humans naturally advance and put into action plans to make sure that they
survive (Chambers & Conway, 1991). Some of these capabilities and properties are perceived
by section of the people to also include material and social resources.
2.9 The nature of rural livelihood strategies in Ghana
Rural Ghana has witnessed major economic changes, as households increasingly add value to
their livelihoods by both increased migration and more local non-farm employment (Lay et
al., 2007). Aduse-Poku et al. (2003) also give credence to the assertion that, rural livelihood
options identified in Ghana include farming (crop production and animal rearing), gathering,
hunting, trading, craft making, and public or civil service. Crop production however has
become unexciting to most farmers in Ghana since getting market for the produce is a
problem for the rural dweller. In the rural communities in Ghana, animals are mostly reared
on free range basis and they are also reared on a small scale basically for home consumption.
Some people however engage in it for commercially purpose. The main issue hampering
commercial animal production is attributed to the high start-up capital for building up
structures, acquisition of veterinary products and high cost of feed to keep the animals.
Fishing is another vital source of livelihood for people who are close to water bodies such as
rivers, lakes and ponds to produce fish for their personal consumption as well as for
commercial purposes. Unfortunately, fishing has become unsustainable since there have been
an over exploitation of these water sources.
According to Aduse-Poku et al. (2003), with the introduction of “commercialization”, trading
has become very common in most rural economies in Ghana. Items sold included food crops,
University of Ghana http://ugspace.ug.edu.gh
23
local and imported products. Initially, selling was being done by women, children and the
youth. The trend ever since has changed as more men are now getting involved in the trading
business. In some rural communities and towns, cottage industries such as pottery,
woodcarving, soap making, basket weaving, palm oil extraction and food processing are
found. In addition rural inhabitants that have received some form of formal training are also
employed in the public services such as teaching, nursing, or in providing services to the
public. Such educated elites however may be few as a result of lower levels of education in
the rural areas.
2.10 Effects of climate change on agricultural production
Climatic conditions are also having a toll on agricultural activities. It has been observed
recently that rainfall pattern in Africa has in general, been on a decline since its relative peak
in the 1960s; see, for instance, (Nicholson 1994; 2001). Unlike the developed countries,
agricultural activities in the sub-Saharan Africa is heavily reliant on rainfall which activates
the potential effect of rainfall variations on economic activity (Barrios et al., 2003).These
impacts are particularly pronounced in the rural areas which are usually agrarian communities
and thus potentially triggers rural-urban migration patterns (Salvador Barrios et al., 2006).
Climate change in modern time has caught the attention of several nations due to its dire
consequences on societies, most importantly agrarian communities. It has therefore been seen
as a global threat (Foresight 2011; Salvador et al., 2006). The effects of climate change are
many. Some of these effects are high tidal waves, excessive heat, and long periods of
droughts which eventually lead to sparse vegetation. Similarly, crops are stressed by climate
change and therefore predisposing them to damaging pests and diseases (Porter et al., 1991).
The resultant effects of this situation is the movement of people from agrarian societies to
areas where conditions are favourable for farming (Van der Geest et al, 2010). Warner and
Afifi (2014) contended that, climate change tend to have a dire consequences on the poor and
marginalized groups in society because of their incapacity to mobilize the required resources
University of Ghana http://ugspace.ug.edu.gh

24
to combat this menace. In an effort to overcome this condition in Ghana, several people tend
to migrate from the rural areas particularly those within some ecological zones to urban areas
as a safety valve (Van der Geest 2011; Yaro et al., 2015). Climate change also affects animal
husbandry. This is because, changes in climatic conditions can affect pasture and forage crop
yield leading to high price of feed grain. For instance, excessive heat will kill poultry and this
will lead to a reduction in milk production in cows. In addition, climate controls the
distribution of livestock pests and diseases (Rotter et al., 1999). The impacts of climate
change on food security is also perceived to be responsible for the migration of people from
the agrarian communities to urban centres. A study conducted by Richard et al., (2015) in
Kalusa District in Western Tanzania shows how climate change impacts negatively on food
security. The findings of this study show the percentage of households in Nyakimue and
Shunga villages that experienced food shortage in a farming year. The findings have it that an
average of 68% of households sampled reported to experience food insecurity sometimes in a
normal year, with only 24% reporting to be self- sufficient in food supply all year round.
Nevertheless, during dry season, the greater part of the households in the two village
experience shortages of food as expressed by 76.8% and 79.8% of respondents in Nyakimue
and Shunga villages respectively. This study demonstrates clearly that, there is a nexus
between climate change and food insecurity. As people’s livelihood is threatened, they have
no other choice than to migrate to areas where climatic conditions are favourable.
2.11 Theoretical framework
2.11.1 “Push Pull” theory
There are several reasons accounting for the out-migration of labour from the rural
communities to the urban centres. The traditional push-pull theory of migration by Lee
(1966) explains the reasons why people in the rural communities migrate to urban areas.
According to Lee, there are several factors responsible for the migration process. Similarly,
most researchers who used the push-pull hypothesis presumed that different economic,
University of Ghana http://ugspace.ug.edu.gh
25
environmental and demographic factors play a pivotal role when in migration decision
making (Awumbila et al., 2011). These factors can also be looked at three different levels:
factors associated with the source region, factors associated with the destination as well as
personal factors. The push factors are those uncomfortable conditions at the origin which
compel potential migrants to migrate to areas where favourable conditions exist. Similarly,
the pull factors are those conditions at the destination, such as relatively high urban wages,
good schools and good drinking water which attract migrants to the urban areas (Afsher,
2003). The main push factors motivating people to migrate from rural communities to urban
areas are: limited employment opportunities, lack of social amenities such as good health
facilities, good schools, good roads, good drinking water, ‘bright lights’ of the cities or the
cornucopia of western commodities. These factors act as a bait enticing peasants to migrate to
urban communities (Kinuthia, 2003; Yeboah, 2008). Other push factors are urban
programmes, including food policies which tend to work against agriculture and the rural
localities, encourage migration from rural communities to urban communities (Anarfi et al.,
2003). According to Afshar (2003), the inadequacy of earnings, absence of paid work in
addition to poverty in the rural areas, have compelled people to move out of their villages in
search of better sources of livelihoods in the urban communities. One of the amazing thing
about most of these rural migrants is that, a number of them seem not to have the requisite
academic qualification and skills needed to secure employment in the formal sector in urban
communities (Anaglo et al, 2014). The resultant effect is that, most of them end up not
realizing the purpose of which they have migrated. A significant point about this theory is the
fact that, largely an individual takes the decision to migrate. The main reason has always
been an economic factor. Similarly, according to the push and pull theory, more often than
not, it is the high skilled individuals who are more likely to migrate. This situation could lead
to brain drain as well as brawn drain which may impact negatively at the source region.
University of Ghana http://ugspace.ug.edu.gh

26
2.11.2 The neo-classical theory
Another important theory that explains why people migrate is the neo-classical theory
(Castles, De Haas & Miller, 2013).This theory explains migration decisions at two levels,
macro and micro. At the macro level, migration occurs as a result of uneven spatial
distribution of labour and other factors of production especially capital. At the origin, there is
surplus of labour but wages are low. Conversely at the destination, labour is scarce but wages
are high. This situation therefore creates an enabling environment for surplus labour to move
in the opposite direction of where there is scarce labour as well as high wages. Capital will
now flow in the opposite direction, from the destination where there is high wages but scarce
labour to the origin where there is abundant labour but low wages. This will continue until a
time where there will be shortage of labour at the origin due to continues migration of labour
from the origin until such a time that there will be abundance of labour at the destination and
shortage of labour at the origin. As capital continues to flow to the origin, factor price
equalization will be attained and migration will finally seize. On the basis of this assumption,
at micro level, an individual is considered as a rational actor who does cost benefit analysis.
If an individual after calculating the pluses and minuses realizes that his pluses are more than
the minuses he will migrate to an area where he thinks he can maximize a higher return on his
investment. This is the situation of people in the rural areas where there is abundance of
labour but wages are very low due to unattractive prices they receive for the sale of their farm
produce. Rural dwellers therefore perceive urban areas as areas where higher wages exist as a
result of availability of factories and other urban jobs that attract high wages. The work of
Todaro also gives credence to this neo-economics of labour theory. Todaro’s ideal
demonstrated clearly that the rate of unemployment of an area is reliant on the job creation
and income disparity in the area. It further shows the contradictory result that the creation of
more job opportunities in the cities can lead to more unemployment by encouraging more
migration (Todaro, 1969).
University of Ghana http://ugspace.ug.edu.gh
27
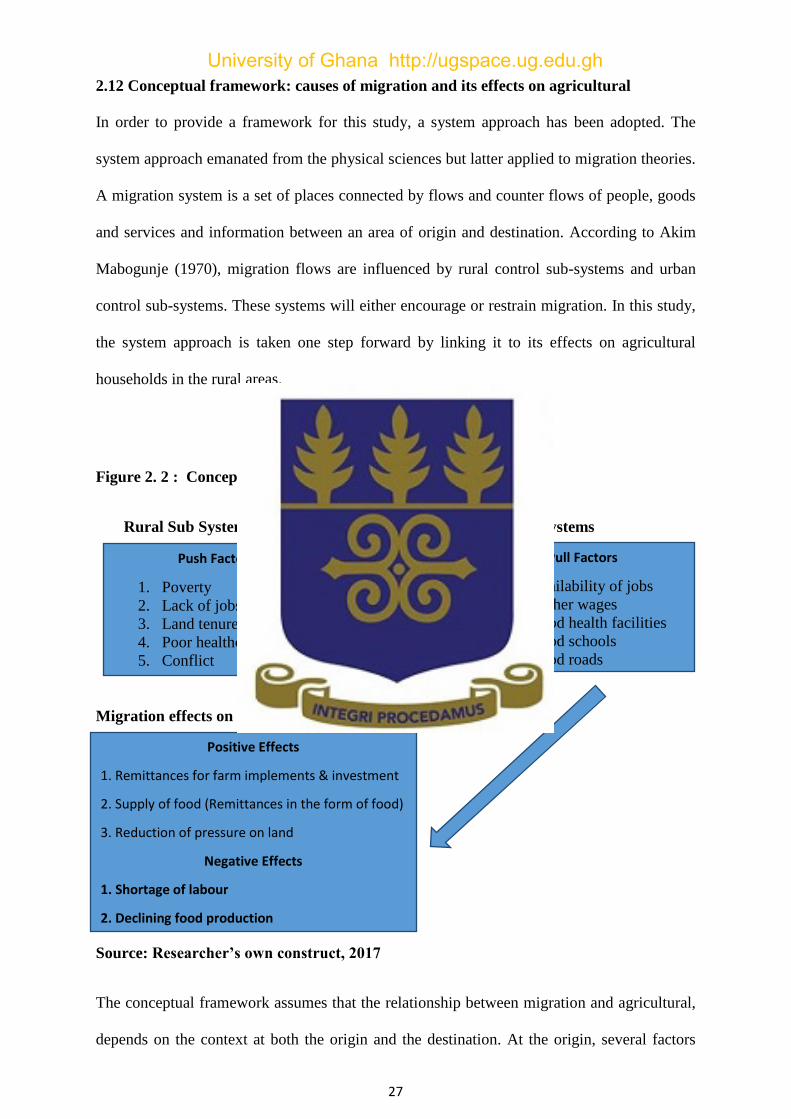
2.12 Conceptual framework: causes of migration and its effects on agricultural
In order to provide a framework for this study, a system approach has been adopted. The
system approach emanated from the physical sciences but latter applied to migration theories.
A migration system is a set of places connected by flows and counter flows of people, goods
and services and information between an area of origin and destination. According to Akim
Mabogunje (1970), migration flows are influenced by rural control sub-systems and urban
control sub-systems. These systems will either encourage or restrain migration. In this study,
the system approach is taken one step forward by linking it to its effects on agricultural
households in the rural areas.
Figure 2. 2 : Conceptual Framework
Rural Sub Systems Urban Sub Systems
Migration effects on agriculture
Source: Researcher’s own construct, 2017
The conceptual framework assumes that the relationship between migration and agricultural,
depends on the context at both the origin and the destination. At the origin, several factors
Push Factors
1. Poverty
2. Lack of jobs
3. Land tenure system
4. Poor healthcare
5. Conflict
Pull Factors
1. Availability of jobs
2. Higher wages
3. Good health facilities
4. Good schools
5. Good roads
Positive Effects
1. Remittances for farm implements & investment
2. Supply of food (Remittances in the form of food)
3. Reduction of pressure on land
Negative Effects
1. Shortage of labour
2. Declining food production
University of Ghana http://ugspace.ug.edu.gh
28
may contribute to out-migration. Based on the migration literature (see de Haas, 2008)
different factors account for the out-migration of people from rural areas to an urban areas.
The traditional push-pull theory by Lee (1966) explains the reasons why people migrate from
the rural areas to urban areas notable among them being poverty, poor educational facilities,
low wages, lack of jobs and bad roads. Sex and age are also determining factors in migration
decision making. According to Adepoju (2008), in Africa, migration is being dominated by
males although it is being ferminised (Awumbila, 2015). The neo-classical theory on the
other hand explains migration decisions at two levels, macro and micro. At the macro level,
migration occurs as a result of uneven spatial distribution of labour and other factors of
production especially capital. At the origin, there is surplus of labour but wages are low.
Conversely at the destination, labour is scarce but wages are high. This situation therefore
creates an enabling environment for surplus labour to move in the opposite direction of where
there is scarce labour as well as high wages. On the basis of this assumption, at micro level,
an individual is considered as a rational actor (being) who does cost-benefit analysis. If an
individual after calculating the pluses and the minuses realizes that his pluses are more than
the minuses, he will migrate to an area where he thinks he can maximize a higher return on
his investment. This is the situation of people in the rural areas where there is abundance of
labour but wages are very low due to unattractive prices they receive for the sale of their farm
produce. Rural dwellers therefore perceive urban areas as places where higher wages exist as
a result of availability of factories and other urban jobs that attract high wages. Unlike the
neo-classical theory where migration decisions are taken by an individual, joint decisions are
taken by households, families and sometimes communities when it comes to matters relating
to migration decision making (Massey et al., 1998). The rationale behind households taking
such decisions is about maximizing profit, risk aversion or risk sharing (Stark & Levhari,
1982). Households appear to diversify resources such as labour better than an individual in
order to reduce risk. Who to send and where that person should go then becomes a matter of
concern to the decision makers. In the system theory, Mabogunje (1971) provides one of the
University of Ghana http://ugspace.ug.edu.gh
29
best famous applications of the migration system theory. Mabogunje places migration into
social and economic perspective as part of an inter-related system connecting areas of origin
and destination. He perceived migration as a circular, inter-dependent and self-regulating
system in which the effects of in one part of the system can have an effect on the entire
system.
Since the study area is rural communities within Hohoe Municipality, the study assumes that
the dominant push factors in the Municipality are poverty, unemployment, low wages, land
tenure system, poor health facilities, and bad road networks among others (see Figure 2.1).
These factors are assumed to push the youth from Hohoe Municipality to urban communities.
On the other hand, certain factors at the destination attract these rural youth. These
destinations are however different. In the sense that some are urban destinations and some are
rural destinations. Those migrants going to the rural areas are attracted by factors such as
fertile agricultural lands, cash crop economy, good rainfall patterns and good climatic
conditions. Migrants going to these rural destinations are therefore not bothered with
availability of lights or entertainment centres. On the other hand, migrants going to urban
destination centres are however attracted by good things in the urban sub-system such as
availability of jobs, good schools, electricity, portable water, good health facilities as well as
copiousness of western commodities.
The framework assumes the effects can be both positive and negative for agricultural. Some
of the positives are remittances. For example, when migrants in the cities get good jobs, they
experience improve social status and they send money home which could be used to buy
resources such as fertilizers, improve seeds and other farm equipments that can be used to
expand on agricultural production. Lack of credit facilities and capital is one of the major
challenges facing farmers in rural Ghana (Massey et al., 1993). The sending of cash
remittances can therefore help households to have access to some form of capital which they
can use to expand on agricultural production. Again, remittances is not only in the form of
cash but in-kind as well such as food remittances (Andersson, 2002) which those left behind
University of Ghana http://ugspace.ug.edu.gh

30
can use to feed themselves so as to get more energy to do farm work. For that matter if these
migrants send money or in-kind remittances home, the result will be positive.
Similarly, remittances received from migrants can be used to substitute for loss labour by
using the money to either hire farm labour, weedicides or even hiring tractors to plough the
land. It is also possible for migrants to get jobs and money but do not have a link with the
rural communities again. If this happens then it is probable that those migrants will not send
any remittances. This will mean that even though they may be doing well, they are not
sending to improve. If that is the situation it can still be said that there are circumstances
under which that can improve agricultural.in the sense that if the local community is facing
land shortage, the fact that people have left the rural communities will mean that there will be
less pressure on land. Land fragmentation or use of the land for housing will reduce making
land more available for farming. Furthermore, remittances can be used to pay school fees for
the children or younger siblings left behind.
On the other hand, migration could be detrimental to the origin. The first thing that comes to
mind is shortage of labour. Normally those who migrate are the male youth. (Adepoju 2008).
When this happens, the agricultural work will suffer because the herculean task of farming
will be left on women and the aged. The consequences will be that agricultural production
would suffer. Migration can also result in declining food production. As more and more rural
youth migrate, it will lead to shortage of agricultural labour. Labour therefore will become
scarce which would eventually affect food production.
Therefore this conceptual framework implies that, the effects of the migration can be both
positive and negative depending on the rural and the urban context and that is what the study
is seeking to investigate.
University of Ghana http://ugspace.ug.edu.gh
31
CHAPTER THREE
METHODOLOGY
3.0 Introduction
This chapter presents data on the general research method adopted in undertaking this study.
The topics discussed are the study design adopted, the study area, the target population as
well as the population size and the sampling technique adopted, and pretesting of
instruments, data collection procedures, Data analysis and presentation and ethical
considerations.
3.1 The study area
Hohoe Municipality is the study area. The Municipality is one of the twenty-five (25)
districts in the Volta Region (GSS 2014). The administrative district Capital is Hohoe and is
made up of 78 localities (GSS 2010). Total number of households in the Municipality
according to the 2010 Census stands at 43,329. Out of this number, 23,796 are agricultural
households. The total population of the Municipality in 2010 stood at 167,016. Males formed
47.9 percent and 52.1 percent are females. The population density of the Municipality in
2000 was 211.9 persons per square kilometers and reduced to 196.0 persons per square
kilometers in 2010.The Municipality covers a total land area of 1, 172km2. (GSS 2014) and
is situated almost in the centre of the Region (GSS 2014). From the nation’s capital, Accra to
Hohoe the administrative capital covers a distance of about 220km (GSS 2014). This is
higher than both the national and regional estimates of 103.4 persons per square kilometers
and 103.0 persons per square kilometers, respectively (GSS 2014). 52.6 percent of the
population in the Hohoe Municipality live in urban locality while 47.4 percent live in rural
locality. (GSS 2010). The Municipality lies in the west semi-equatorial climatic zone. The
Municipality has an annual rainfall of between 1,061mm-1,210mm. It has a dry season which
lasts for 4-5 months. The municipality lies within the forest-savannah transitional ecological
University of Ghana http://ugspace.ug.edu.gh
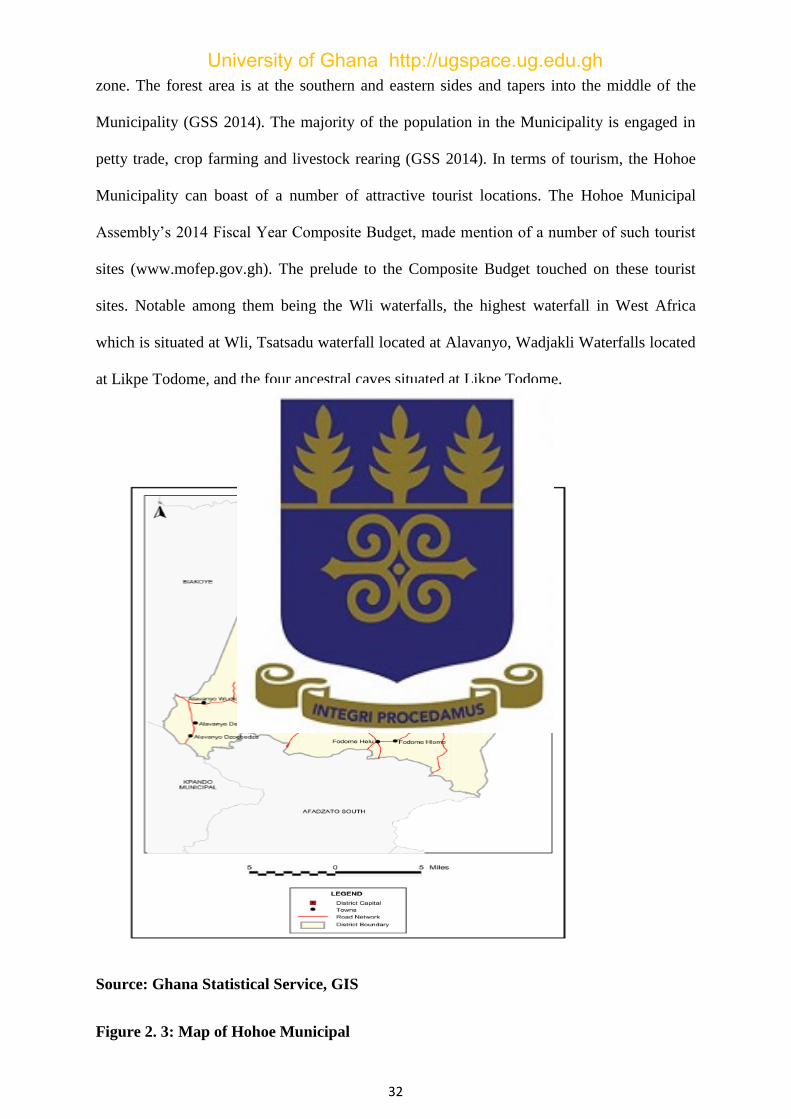
32
zone. The forest area is at the southern and eastern sides and tapers into the middle of the
Municipality (GSS 2014). The majority of the population in the Municipality is engaged in
petty trade, crop farming and livestock rearing (GSS 2014). In terms of tourism, the Hohoe
Municipality can boast of a number of attractive tourist locations. The Hohoe Municipal
Assembly’s 2014 Fiscal Year Composite Budget, made mention of a number of such tourist
sites (www.mofep.gov.gh). The prelude to the Composite Budget touched on these tourist
sites. Notable among them being the Wli waterfalls, the highest waterfall in West Africa
which is situated at Wli, Tsatsadu waterfall located at Alavanyo, Wadjakli Waterfalls located
at Likpe Todome, and the four ancestral caves situated at Likpe Todome.
Source: Ghana Statistical Service, GIS
Figure 2. 3: Map of Hohoe Municipal
University of Ghana http://ugspace.ug.edu.gh
33
3.2 Study design
The study employed a mixed method approach whereby both quantitative and qualitative
methods were used to generate data for the research to ensure complementarity (Sale et al.,
2002, Silva and Wright, 2008). A combination of quantitative and qualitative data was
needed to ensure a full investigation of issues that were examined without living out any
salient points, different viewpoints as well as statistics (Bryman, 2004; Chambers, 2004).
The quantitative data focused on socio-demographic characteristics of household heads in the
study area as well as getting a wider respondents in order to find out their perception about
the youth out-migration and its implications on agricultural production in the Hohoe
Municipality. The qualitative data focused on focus groups especially the youth who are
considered to have an in-depth knowledge in the study area and why the youth migrate.
It is on the basis of the above assertions that the researcher considered the mixed method as
the most suitable for the study.
3.3 Target population
The target population of the study included agricultural households that people have migrated
from in four of agricultural communities within the Hohoe Municipality. Heads of these
households were interviewed because they have accurate information about each individual
member of their households. Non-migrant youth between the ages of 15 to 35 in all the four
sample communities were also interviewed because the topic under investigation is about the
youth. For that matter, the youth are the best people to understand the underpinning factors
responsible for the out-migration of the youth from agriculture. This approach validates the
use of mixed method (Sale et al., 2002).
University of Ghana http://ugspace.ug.edu.gh
34
3.4 Sample size and sampling technique
Four agricultural communities in the Municipality namely Santrokofi Benua, Lolobi
Ashiambi, Likpe Bakua and Gbi- Kledzo were purposively selected for the study. Reason
being that, these communities served as a food basket for the Municipality because these
areas lie within forest-savannah transitional ecological zone (GSS, 2010). Also, these
communities are traditionally migratory in nature. Furthermore, these areas are rural
agricultural areas per the 2010 Population and Hosing Census report (GSS, 2010). Hundred
(100) quantitative questionnaires were administered to migrant household heads using
snowballing for the selection. The researcher admits that, purposive and snow ball sampling
techniques may not be a strong scientific technique for quantitative analysis. However, the
study considers it the most appropriate technique since its study population is strictly migrant
agricultural household and also considering the time constraint on the part of the researcher.
The selection was done with nodes to achieve equal representation from the communities
3.5 Survey techniques
The survey was conducted in four agricultural communities within the Hohoe Municipality.
In each of the four communities, a questionnaire was administered to agricultural households
that their members migrated from. The questions in the questionnaires are structured under
three sections. These are data on socio demographic characteristics of the household,
knowledge and evidence of out-migration in the study area, the communities’ perceptions on
the effects of out-migration on agricultural productivity. The questions were asked the heads
of the selected households as well as the focus group participants.
3.6 Instrumentation and pretesting
The researcher used questionnaires and interview guides. The questionnaires were used for
the household interviews whereas interview guides were used for the focus group discussions
University of Ghana http://ugspace.ug.edu.gh
35
(FGD). The structure of the questions in the quantitative instrument was in three sections.
Section A containing demographic characteristics of respondents, such as age, sex, marital
status, education among others. Section B has questions related to knowledge and evidence of
out-migration in the study area, while Section C has questions relating to the communities
perceptions on the implications of out-migration of the youth on agricultural production.
Prior to the main field work in the selected communities, a pretesting of the data collection
instruments was carried out at Gbi- Avegah, a community that was not earmarked for the
study. This involved household questionnaire administration and the use of the interview
guides for the focus group discussions. . The rationale behind the pretesting was to check
errors, inconsistencies and also to ascertain whether the respondents understand the questions
contained in the research instruments. The necessary editing was done and the instruments
were duly modified before the actual kick-start of the main field work.
3.7 Procedure for data collection
Questionnaires and interview guides were used. The questionnaires were used for the
household interviews whereas interview guide was used to conduct focus group discussions.
The focus group discussion time was to allow the participants to give out vital information
needed for the study while the interviewer also had ample time to probe responses given by
the participants. The interview guide and the household questionnaires were written in
English but the interviews with the household heads and participants for the focus group
discussions was conducted in Ewe since the household heads and the participants were more
comfortable expressing themselves in Ewe language than English which also happens to be
the mother tongue of the researcher. With regards to how the participants were selected for
the focus group discussions, the researcher had a prior meeting with the Assemblymen or
Unit committee members of the selected communities who informed the youth groups and
also organized the youth for the focus group discussions. After they had agreed to participate
University of Ghana http://ugspace.ug.edu.gh
36
in the study, an interview was then requested by the researcher at a time and venue suitable
for them. Their participation in the exercise however was voluntary. In addition, the rationale
behind the study was clarified to the participants. The participants were however guaranteed
of confidentiality and anonymity regarding the responses they provided. With the permission
from the participants the interviews were audio-taped with the aid of a recorder. Each of the
interviews lasted for a maximum period of about an hour.
3.8 Data analysis and presentation
According to Levine (1997), data analysis involves a form of methods that help to describe
facts, identify patterns, come up with explanations, and test theories. On the basis of the
above assertion, the field data gathered was cleaned and edited to check whether every
question has been answered and filled. The quantitative data was manually coded and the
coded data was entered into Statistical package for social science software (SPSS) and run for
analysis were generated and the findings presented using Tables and Figures. For the
qualitative data, the audio-taped data were downloaded on a computer to serve as backup.
The recorded files were played severally for the researcher to acquaint himself with the
information recorded, and also paying a particular attention to the emerging themes. The
researcher went ahead to transcribe verbatim from the audio recorded files to a text form.
After the transcription was done, the researcher read through the script making sure that
every vital information and themes were captured. The emerging themes were written down
and codes were assigned to the themes. The themes were termed, confirmed and matched
against the data sets. Here the researcher sought to find out if the themes consistently tell the
full story as captured in the data sets. In addition, the researcher defined and elucidated the
themes identified and looked for where they fit in the texts, which parts of the data are
captured and whether the themes met the set objectives of the study. These processes were
followed so as to conform to the six steps identified in qualitative data analysis by Attride-
Stirling, (2001). The report was then written based on the themes identified. Portions of the
University of Ghana http://ugspace.ug.edu.gh
37
raw data were also quoted intermittently to support the themes to further give credence to the
analysis done. Similarly, all the notes taken throughout the interviews as well as the field
observations regarding the respondents and his or her environment were all factored into the
data analyses.
3.9 Ethical considerations
All the ethical issues involved in research were strictly followed. As part of community entry
procedure, the researcher paid a courtesy call on the overlords of these communities to
announce his presence in their community and sought their permission to conduct the
research. The rational of the study was also explained to both the opinion leaders and the
respondents as well. The respondents were not coerced to give responses and were also made
aware to withdraw from the interview at any stage that they think were not comfortable. As a
way of seeking the consent of the respondents, they signed or thumb printed a consent form.
The respondents were assured of confidentiality and anonymity to ensure that their identity
and responses were not disclosed to the third party. They were also assured that their
responses will be aggregated and no individual’s identity would be revealed. It was on the
basis of this that in reporting the findings of the study, the researcher used pseudonyms
instead of the actual names of the respondents. Permission was also sought from the
respondents to use pictures taken in the research. The researcher throughout the interviews
made sure that the interview with the female respondents was held at an open space in the full
view of the other occupants of the house. However, the principle of confidentiality was
strictly adhered to in order not to allow for intruders. Finally, at the end of every interview
session, the researcher expressed his gratitude to all the respondents.
University of Ghana http://ugspace.ug.edu.gh
38
CHAPTER FOUR
RESULTS AND DISCUSSION
4.0 Introduction
This chapter presents results and discussions of the analysis carried out based on the stated
objectives of the research. The chapter covers demographic characteristics of the respondents.
Variables such as age, sex, level of education and marital status were considered. In addition,
the chapter also considers, knowledge of research participants and evidence of out migration
in the study area, which looks at how often migrants move from the study area, the preferred
destination of migrants, number of migrants from each household, reasons for migration,
migrant information from household heads, household characteristics, availability of food
surplus and effect on agricultural productivity.
4.1 Socio-demographic and economic characteristics of the respondents
This segment presents the findings of the socio-demographic characteristics of respondents of
the study. The section (4.1) is divided into two subsections (4.1.1 and 4.1.2). The first
subsection (4.1.1) under this section presents the socio-demographic characteristics of
household heads who responded to the survey questionnaires. The second subsection (4.1.2)
presents the socio-demographic characteristics of the focus group participants from all the
study communities.
4.1.1 The socio-demographic characteristics of household heads
This first section presents the demographic characteristics of the household heads and it
covered the age, sex, education and marital status of the respondents.
University of Ghana http://ugspace.ug.edu.gh
39
4.1.1.1 Distribution of household heads by age
The age of study respondents is critical in analysing issues related to migration. It is a major
factor that can influence migration intentions, decisions and actual migratory movement.
According to Piracha and Saraogi (2013), the youth are more migratory than the aged. Table
4.1 shows the age distribution of household heads that responded to the survey questionnaire.
The ages of the household heads ranged between 34 years and 78 years. The ages have been
re-categorized into five years’ age groupings, starting from 30-34 to 75+. Table 4.1 shows
that a greater proportion (27%) of the household heads is within the ages of 50-54. Closely
related to this is the 45-49 cohort (19%) and 55-59 age group (18%) respectively. The least
(1.0%) of the household heads who responded to the household questionnaires were between
the ages of 30-34 and 75+ respectively. Most of the household heads interviewed (77%) were
between age groupings of 50-64.
University of Ghana http://ugspace.ug.edu.gh
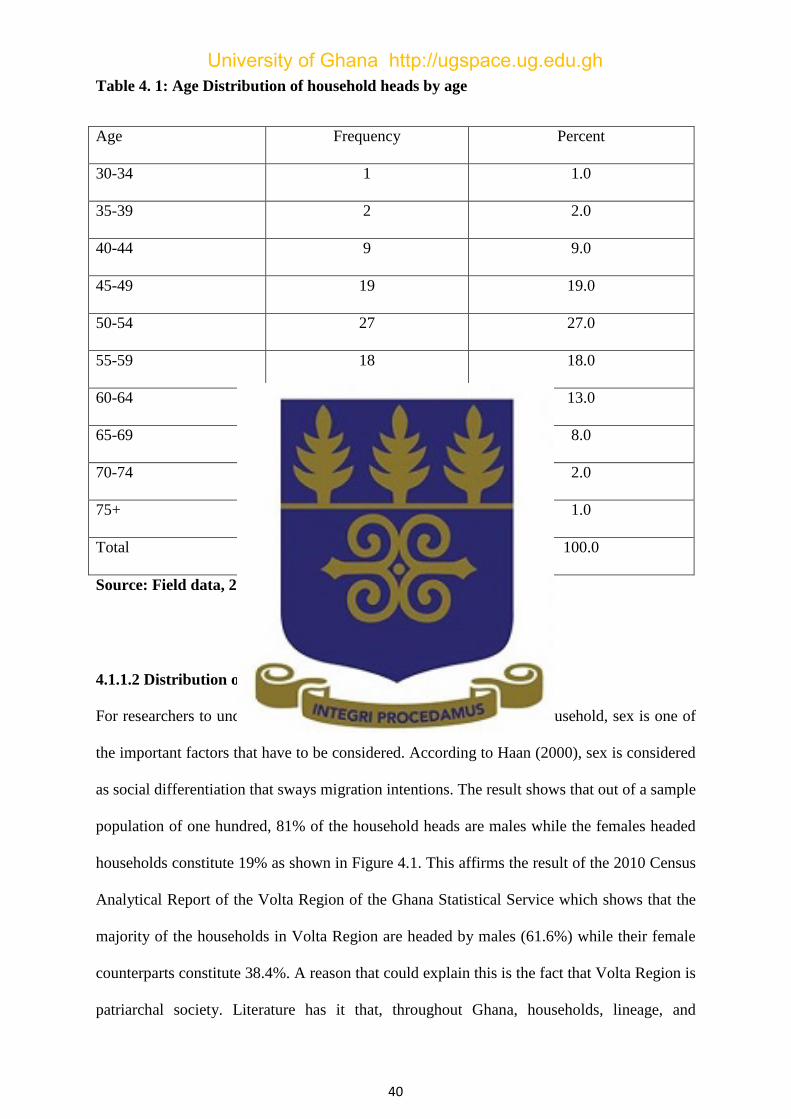
40
Table 4. 1: Age Distribution of household heads by age
Age Frequency Percent
30-34 1 1.0
35-39 2 2.0
40-44 9 9.0
45-49 19 19.0
50-54 27 27.0
55-59 18 18.0
60-64 13 13.0
65-69 8 8.0
70-74 2 2.0
75+ 1 1.0
Total 100 100.0
Source: Field data, 2017
4.1.1.2 Distribution of household heads by sex
For researchers to understand the dynamics of the composition of a household, sex is one of
the important factors that have to be considered. According to Haan (2000), sex is considered
as social differentiation that sways migration intentions. The result shows that out of a sample
population of one hundred, 81% of the household heads are males while the females headed
households constitute 19% as shown in Figure 4.1. This affirms the result of the 2010 Census
Analytical Report of the Volta Region of the Ghana Statistical Service which shows that the
majority of the households in Volta Region are headed by males (61.6%) while their female
counterparts constitute 38.4%. A reason that could explain this is the fact that Volta Region is
patriarchal society. Literature has it that, throughout Ghana, households, lineage, and
University of Ghana http://ugspace.ug.edu.gh
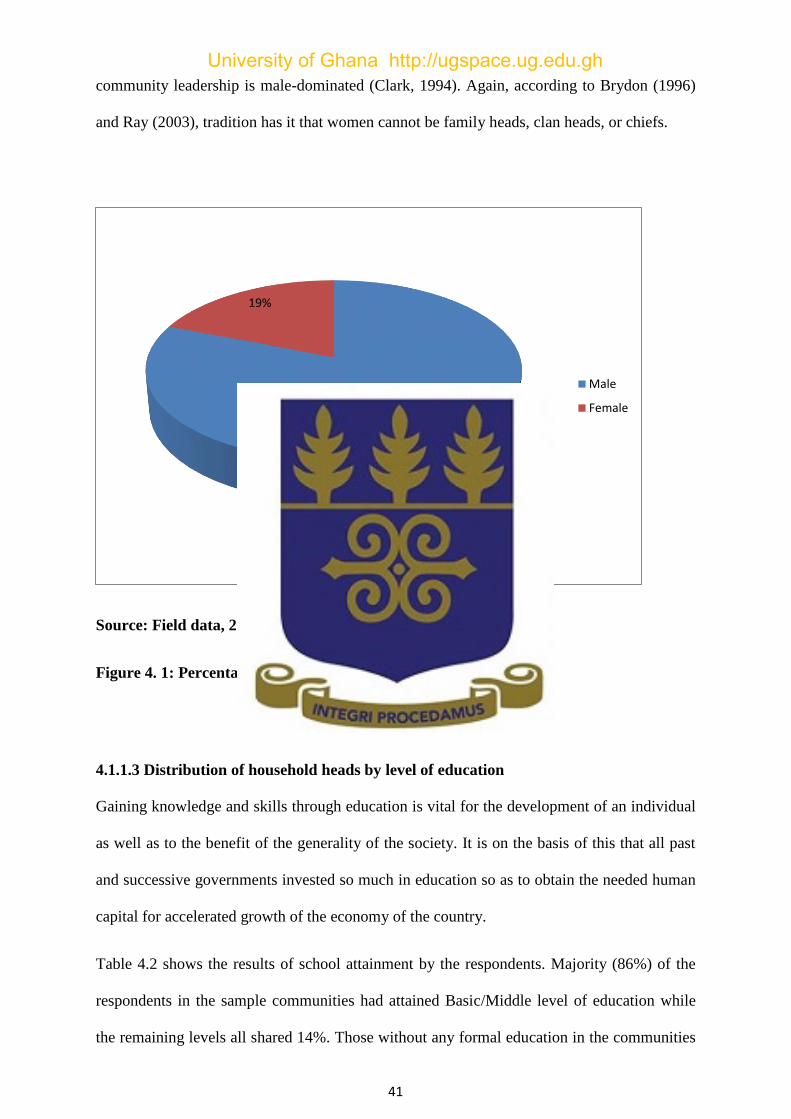
41
community leadership is male-dominated (Clark, 1994). Again, according to Brydon (1996)
and Ray (2003), tradition has it that women cannot be family heads, clan heads, or chiefs.
Source: Field data, 2017
Figure 4. 1: Percentage distributions of household heads by sex
4.1.1.3 Distribution of household heads by level of education
Gaining knowledge and skills through education is vital for the development of an individual
as well as to the benefit of the generality of the society. It is on the basis of this that all past
and successive governments invested so much in education so as to obtain the needed human
capital for accelerated growth of the economy of the country.
Table 4.2 shows the results of school attainment by the respondents. Majority (86%) of the
respondents in the sample communities had attained Basic/Middle level of education while
the remaining levels all shared 14%. Those without any formal education in the communities
81%
19%
Male
Female
University of Ghana http://ugspace.ug.edu.gh
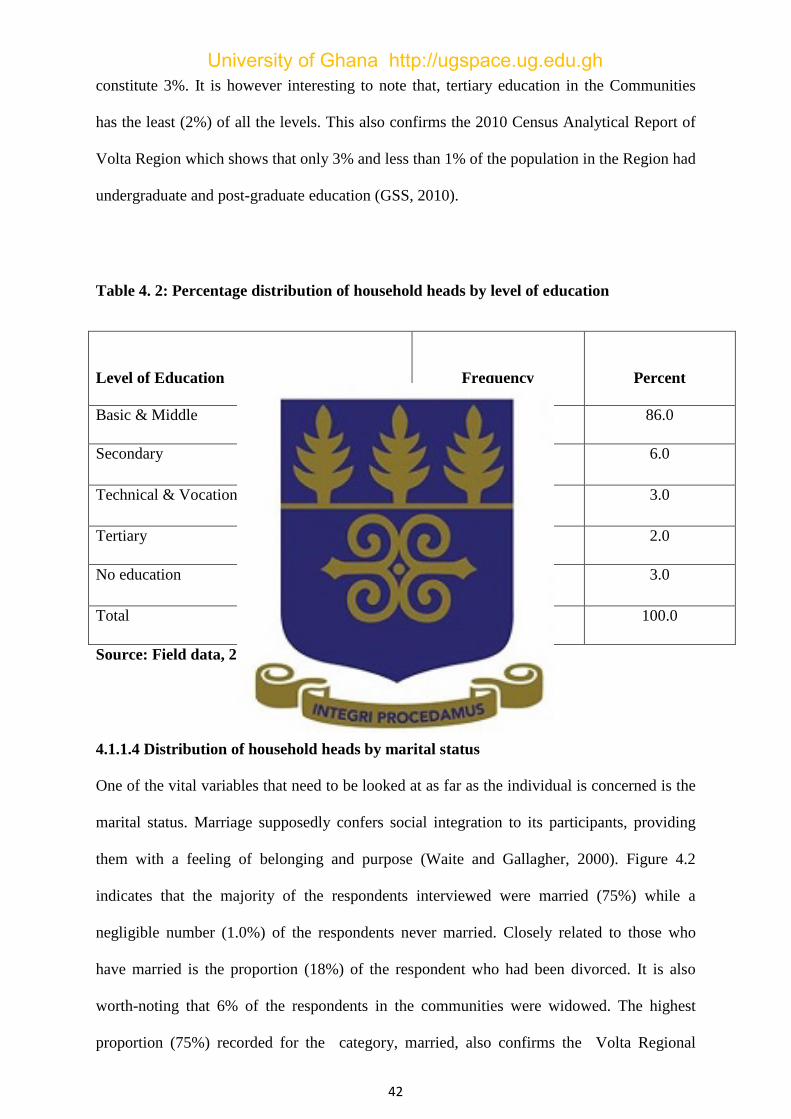
42
constitute 3%. It is however interesting to note that, tertiary education in the Communities
has the least (2%) of all the levels. This also confirms the 2010 Census Analytical Report of
Volta Region which shows that only 3% and less than 1% of the population in the Region had
undergraduate and post-graduate education (GSS, 2010).
Table 4. 2: Percentage distribution of household heads by level of education
Level of Education
Frequency
Percent
Basic & Middle 86 86.0
Secondary 6 6.0
Technical & Vocational 3 3.0
Tertiary 2 2.0
No education 3 3.0
Total 100 100.0
Source: Field data, 2017
4.1.1.4 Distribution of household heads by marital status
One of the vital variables that need to be looked at as far as the individual is concerned is the
marital status. Marriage supposedly confers social integration to its participants, providing
them with a feeling of belonging and purpose (Waite and Gallagher, 2000). Figure 4.2
indicates that the majority of the respondents interviewed were married (75%) while a
negligible number (1.0%) of the respondents never married. Closely related to those who
have married is the proportion (18%) of the respondent who had been divorced. It is also
worth-noting that 6% of the respondents in the communities were widowed. The highest
proportion (75%) recorded for the category, married, also confirms the Volta Regional
University of Ghana http://ugspace.ug.edu.gh
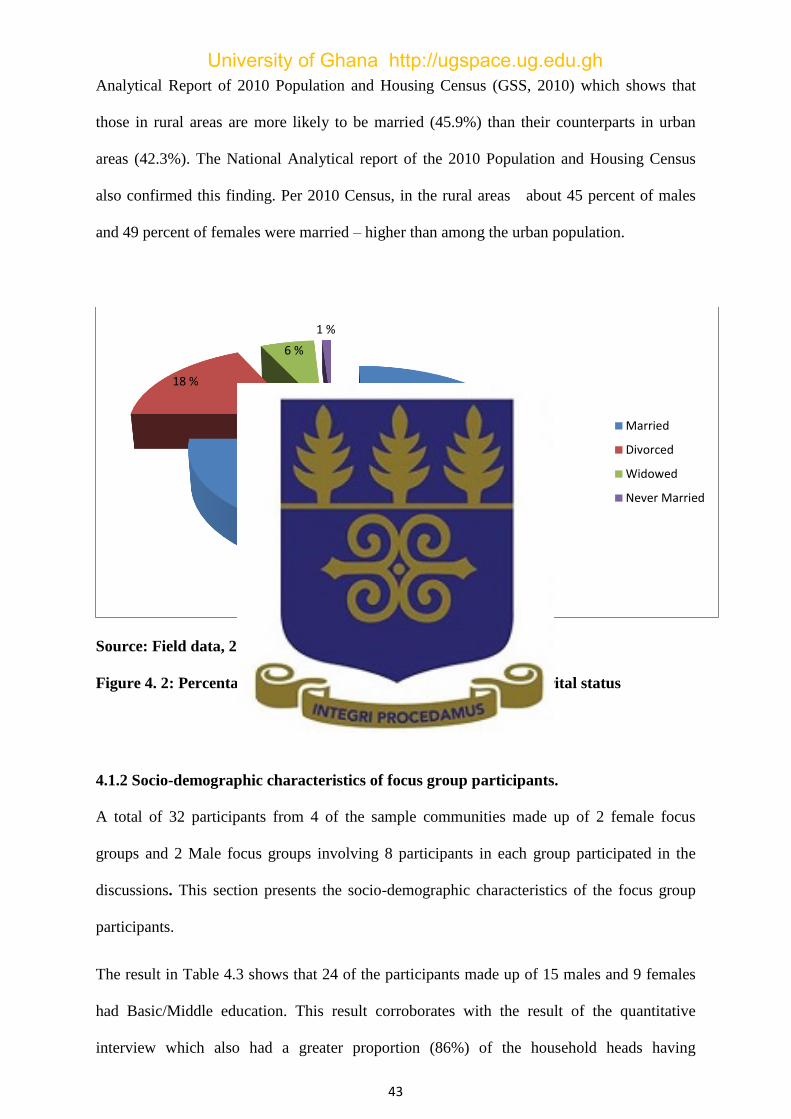
43
Analytical Report of 2010 Population and Housing Census (GSS, 2010) which shows that
those in rural areas are more likely to be married (45.9%) than their counterparts in urban
areas (42.3%). The National Analytical report of the 2010 Population and Housing Census
also confirmed this finding. Per 2010 Census, in the rural areas about 45 percent of males
and 49 percent of females were married – higher than among the urban population.
Source: Field data, 2017
Figure 4. 2: Percentage distributions of household members by marital status
4.1.2 Socio-demographic characteristics of focus group participants.
A total of 32 participants from 4 of the sample communities made up of 2 female focus
groups and 2 Male focus groups involving 8 participants in each group participated in the
discussions. This section presents the socio-demographic characteristics of the focus group
participants.
The result in Table 4.3 shows that 24 of the participants made up of 15 males and 9 females
had Basic/Middle education. This result corroborates with the result of the quantitative
interview which also had a greater proportion (86%) of the household heads having
75 %
18 %
6 %
1 %
Married
Divorced
Widowed
Never Married
University of Ghana http://ugspace.ug.edu.gh
44
Basic/Middle school education. Five of the participants made up of 1 male and 4 females also
had secondary/SHS education while 3 participants, involving 2 males and 1 female had
tertiary education. Three of the participants involving 2 males and 1 female had Tertiary
education while 1 female had Diploma in education. One female participant had no formal
education. The analysis again shows that, 12 participants made up of 6 males and 6 females
were engaged in some form of economic activities as self-employed while 4 female
participants were unemployed at the time of the focus group discussions. In terms of marital
status, more males 9 than female 6 were married while one female was divorced.
University of Ghana http://ugspace.ug.edu.gh
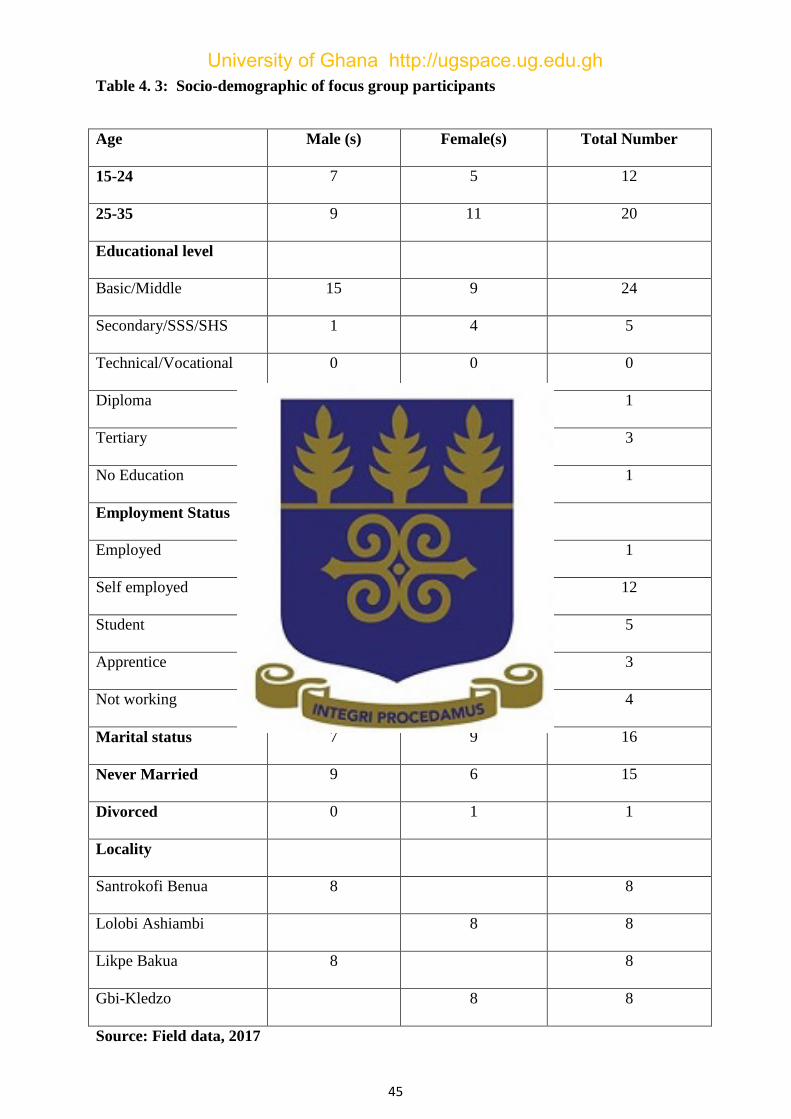
45
Table 4. 3: Socio-demographic of focus group participants
Source: Field data, 2017
Age Male (s) Female(s) Total Number
15-24 7 5 12
25-35 9 11 20
Educational level
Basic/Middle 15 9 24
Secondary/SSS/SHS 1 4 5
Technical/Vocational 0 0 0
Diploma 0 1 1
Tertiary 2 1 3
No Education 0 1 1
Employment Status
Employed 0 1 1
Self employed 6 6 12
Student 2 3 5
Apprentice 2 1 3
Not working 0 4 4
Marital status 7 9 16
Never Married 9 6 15
Divorced 0 1 1
Locality
Santrokofi Benua 8 8
Lolobi Ashiambi 8 8
Likpe Bakua 8 8
Gbi-Kledzo 8 8
University of Ghana http://ugspace.ug.edu.gh
46
4.2 Migrants information from household heads
Table 4.4 presents information from the household heads regarding the youth who migrated
from the households, their ages, sex and year of migration. The result shows that, about 54%
of the migrants were between the ages of 25-35 while those who belong to the age cohort 15-
24 represent 46%. This confirms the a scholarly work done by Flynn et al.,(2016) which
indicates that youth unemployment is one of the contributing factors in Sub-Sharan Africa
that drives migration of the youth out of Africa, and adds to conflict on African continent.
Again according to the GLSS 7 report of Ghana Statistical Service, age and gender
differentials in migration statistics, indicate that those between the ages of 25-29 of the
population who also constitute the youth, are more mobile. This also confirms the earlier
work done in literature by Piracha and Saraogi (2013) which also indicates that the youth are
more migratory than the aged, akin to earlier results stated elsewhere (see GSS, 2008; Ackah
and Medvedev, 2010), young adults, aged 25 to 29 years, form the largest percentage of
migrants.
With regard to their educational levels, those who attended Senior high school or secondary
school recorded a higher percentage of 59%. This is followed by Basic/Middle School
Leavers (38%), while the least (3.2%) recorded level is Technical/ Vocational. In terms of
gender, the male dominated the Secondary/S.H.S level (62%) while the female recorded a
higher percentage for both Basic/Middle School (45%) and Technical/Vocational levels
(3.2%) respectively. This result also confirms what is in the migration literature which says
that those who normally migrate are younger and better educated than the average rural
dwellers (Taylor et al. 2003).
In terms of gender, the male proportion (63%) is higher than their female counterparts (36%).
This suggests that the rate at which women migrate is different from their male counterparts.
University of Ghana http://ugspace.ug.edu.gh
47
This also is in line with Adepoju’s assertion that in Sub Saharan Africa, migration is being
dominated by males although it is being ferminised (Adepoju 2008). The result also shows
information received from the household heads regarding those who migrated from the rural
communities to urban areas. The result indicates the trend of migration from the Municipality
from 2010 to 2016.
The results show that the least number of people (3 persons) migrated at a rate of 1% in 2010.
The figure jumped to 79 people in 2014 at a rate of 29%, the highest rate recorded, and then
decreased again in 2016 at a rate of 27%.
University of Ghana http://ugspace.ug.edu.gh
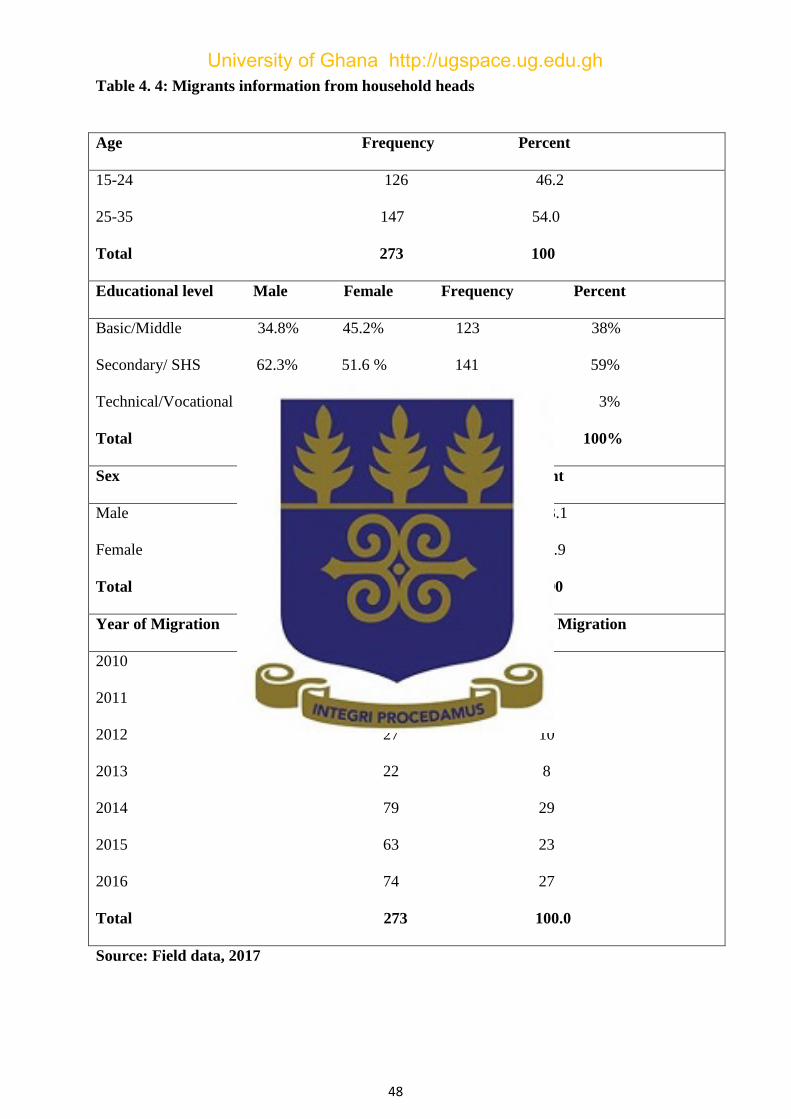
48
Table 4. 4: Migrants information from household heads
Source: Field data, 2017
Age Frequency Percent
15-24 126 46.2
25-35 147 54.0
Total 273 100
Educational level Male Female Frequency Percent
Basic/Middle 34.8% 45.2% 123 38%
Secondary/ SHS 62.3% 51.6 % 141 59%
Technical/Vocational 2.9% 3.2 % 9 3%
Total 100% 100% 273 100%
Sex Frequency Percent
Male 188 63.1
Female 84 36.9
Total 273 100
Year of Migration Frequency Rate of Migration
2010 3 1
2011 5 2
2012 27 10
2013 22 8
2014 79 29
2015 63 23
2016 74 27
Total 273 100.0
University of Ghana http://ugspace.ug.edu.gh
49
4.3 Knowledge and evidence of out-migration of participants in the study area.
This section presents the knowledge of the study participants and evidence of migration in the
communities. Distributions of frequencies are used to demonstrate the number of occurrences
of responses from respondents. However, Sample quotes under various basic themes have
been provided for easy understanding of what the themes meant which were extracted from
transcripts of interviews conducted by the researcher with respondents.
4.3.1 Frequency of migration
Figure 4.3 below shows frequency of migration. When the respondents were asked how often
the youth migrate from the communities, an overwhelming majority (93%) of the household
heads said the youth migrate annually while 3% of the respondents said weekly and monthly
respectively. Those respondents who said daily were the least (1%).
Also, almost all the participants in the qualitative study showed an understanding of
migration. Most of the respondents in the 4 focus groups understood migration as the
movement of a person or a group of persons from one place to another. The movements they
described were further characterised by the duration or length of stay of migrants. Thus,
respondents explained that such movements are characterised by at least a year or two years
of stay in the place of destination. There was an almost consensus amongst all the Focus
Groups that there was an increasing out-migration of the youth into other parts of Ghana.
Below are some quotes extracted from the transcripts:
“When you move from one town to a new town as your home.” FGD3-R3
“As for me I understand it as when people move from where they stay to another
area”FGD4-R3
“Migration is for instance I am from Lolobi and I go and settle at another place for more
than a period of three month it means that I have migrated.”FGD3-R7
University of Ghana http://ugspace.ug.edu.gh
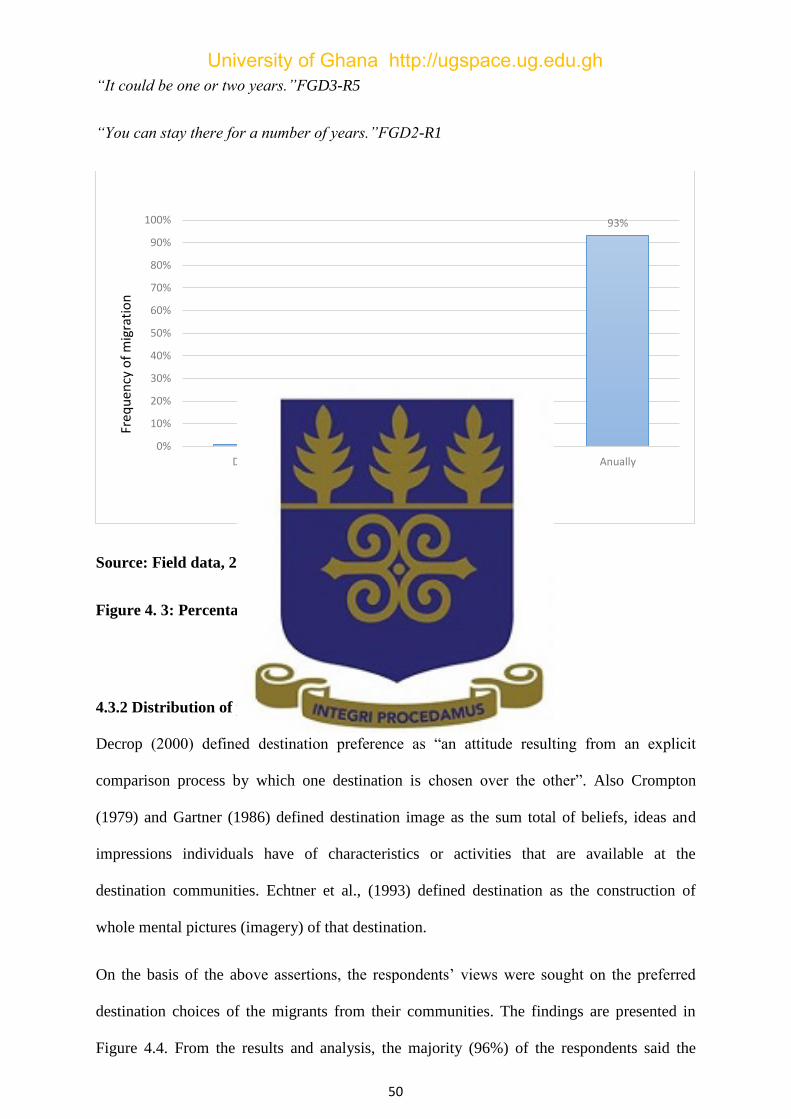
50
“It could be one or two years.”FGD3-R5
“You can stay there for a number of years.”FGD2-R1
Source: Field data, 2017
Figure 4. 3: Percentage distribution of frequency of migration.
4.3.2 Distribution of preferred destination of migrants.
Decrop (2000) defined destination preference as “an attitude resulting from an explicit
comparison process by which one destination is chosen over the other”. Also Crompton
(1979) and Gartner (1986) defined destination image as the sum total of beliefs, ideas and
impressions individuals have of characteristics or activities that are available at the
destination communities. Echtner et al., (1993) defined destination as the construction of
whole mental pictures (imagery) of that destination.
On the basis of the above assertions, the respondents’ views were sought on the preferred
destination choices of the migrants from their communities. The findings are presented in
Figure 4.4. From the results and analysis, the majority (96%) of the respondents said the
1% 3% 3%
93%
0%
10%
20%
30%
40%
50%
60%
70%
80%
90%
100%
Daily weekly monthly Anually
Period of Migration
Freq
uen
cy o
f m
igra
tio
n
University of Ghana http://ugspace.ug.edu.gh
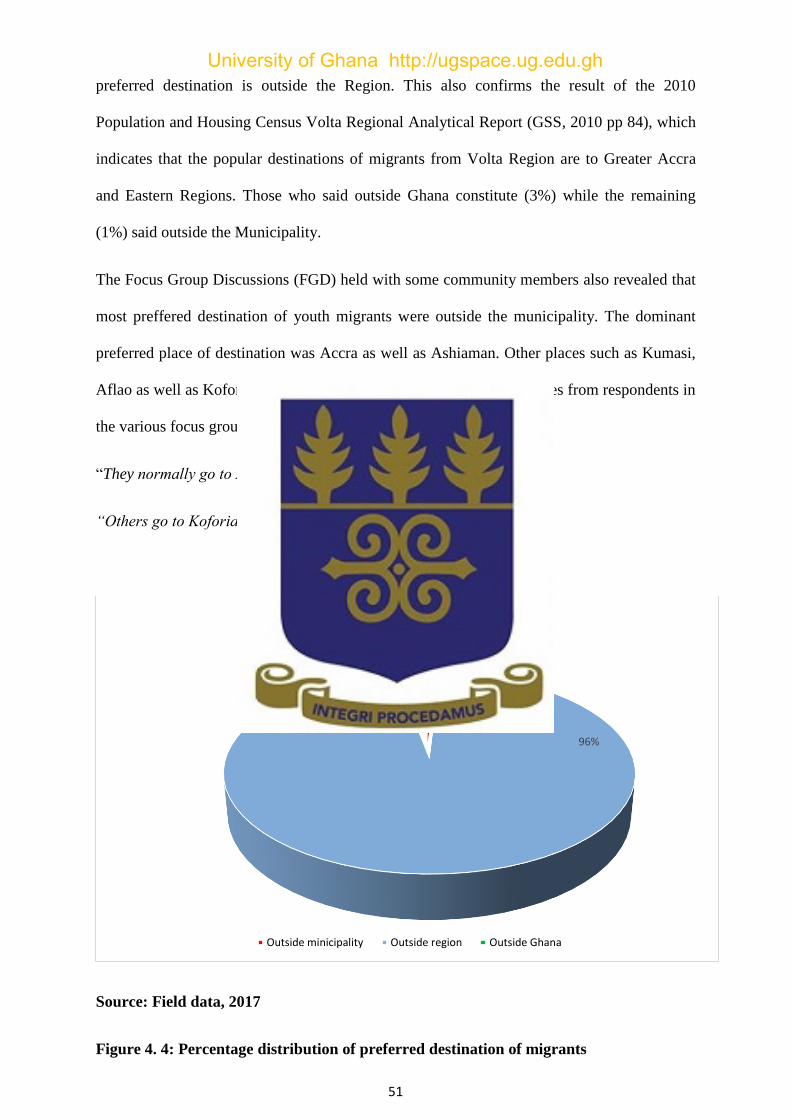
51
preferred destination is outside the Region. This also confirms the result of the 2010
Population and Housing Census Volta Regional Analytical Report (GSS, 2010 pp 84), which
indicates that the popular destinations of migrants from Volta Region are to Greater Accra
and Eastern Regions. Those who said outside Ghana constitute (3%) while the remaining
(1%) said outside the Municipality.
The Focus Group Discussions (FGD) held with some community members also revealed that
most preffered destination of youth migrants were outside the municipality. The dominant
preferred place of destination was Accra as well as Ashiaman. Other places such as Kumasi,
Aflao as well as Koforidua were all mentioned. Below are sample quotes from respondents in
the various focus groups.
“They normally go to Accra.” FGD3-R7
“Others go to Koforidua.” FGD1-R2
Source: Field data, 2017
Figure 4. 4: Percentage distribution of preferred destination of migrants
1%
96%
3%
Outside minicipality Outside region Outside Ghana
University of Ghana http://ugspace.ug.edu.gh
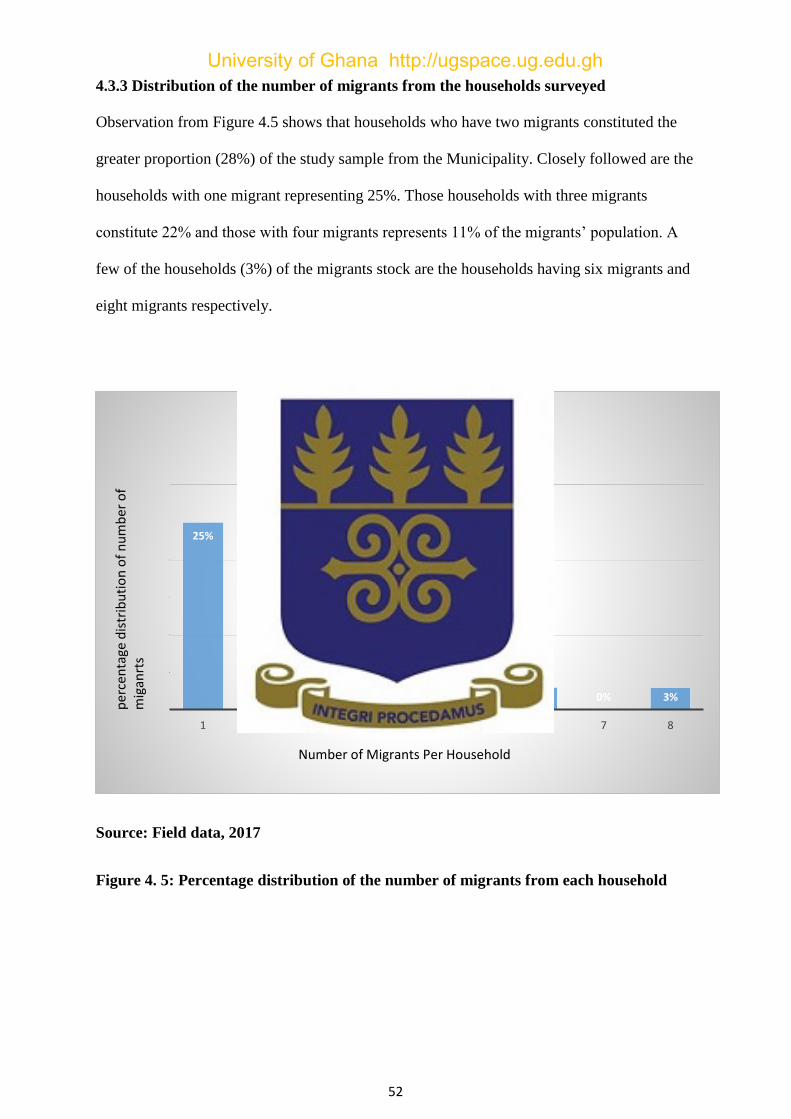
52
4.3.3 Distribution of the number of migrants from the households surveyed
Observation from Figure 4.5 shows that households who have two migrants constituted the
greater proportion (28%) of the study sample from the Municipality. Closely followed are the
households with one migrant representing 25%. Those households with three migrants
constitute 22% and those with four migrants represents 11% of the migrants’ population. A
few of the households (3%) of the migrants stock are the households having six migrants and
eight migrants respectively.
Source: Field data, 2017
Figure 4. 5: Percentage distribution of the number of migrants from each household
25%
28%
22%
11%
8%
3% 0% 3%
1 2 3 4 5 6 7 8
Number of Migrants Per Household
per
cen
tage
dis
trib
uti
on
of
nu
mb
er o
f m
igan
rts
University of Ghana http://ugspace.ug.edu.gh
53
4.3.4 Distribution of reasons for migration
Several factors accounted for out-migration of people from the rural areas to urban areas as
discussed in migration literature. These factors are well captured in Lee (1966) traditional
push-pull theory. According to Lee, the push factors are those unfavourable conditions that
are present at the origin that push rural dwellers from rural areas to the destination areas. The
pull factors on the other hand are those favourable conditions that attract the migrants to the
destination areas. Table 4.5 presents the findings of the reasons for out-migration of the
youth. Out of the several factors responsible for out-migration of the youth, lack of jobs and
to look for jobs in the rural communities came up as the highest (80%) compelling reason
why the youth migrate. This supports the assertion of Ravenstein (1885) which says the
major motivating factor for people migrating is for economic reasons. This also confirms the
(GLSS 6) report where to look for jobs came up as the third highest (13.6) reason why people
migrate in Ghana. This is followed by reason to learn a trade (6%) while seven of the options
given accounted for the least (1%) reasons why the youth migrate.
Focus group discussions also supported many of the reasons provided in the quantitative
analysis. The reasons provided for the out-migration of the youth by the respondents in the
various FGDs include schooling and seeking employment. Below are samples of quotes that
collaborate the findings emanated from the quantitative data.
“Some of them have no one to look after them when they are done with school so they ask
their friends to find work for them then they also follow them.” FGD4-R1
“Lack of job opportunities around the communities especially the villages around. There are
no factories, no work. We only depend on the farming activities. Some do not like farming so
they want to go and trade and do other things in the big towns.”FGD1-R3
“Sometimes it is because of school. Because there are no schools in this community, when the
person finishes school here their parents take them to the big cities to school. It has to do
with where they are going to get school.”FGD2-R8
University of Ghana http://ugspace.ug.edu.gh
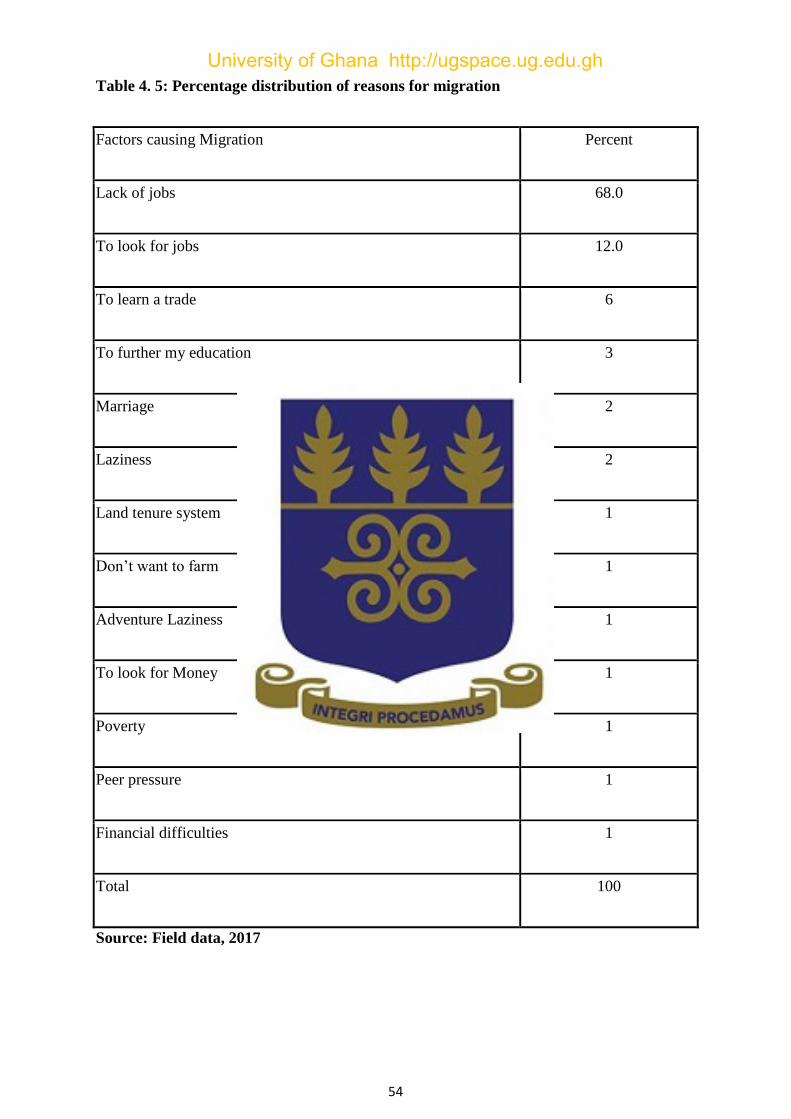
54
Table 4. 5: Percentage distribution of reasons for migration
Factors causing Migration Percent
Lack of jobs 68.0
To look for jobs 12.0
To learn a trade 6
To further my education 3
Marriage 2
Laziness 2
Land tenure system 1
Don’t want to farm 1
Adventure Laziness 1
To look for Money 1
Poverty 1
Peer pressure 1
Financial difficulties 1
Total 100
Source: Field data, 2017
University of Ghana http://ugspace.ug.edu.gh
55
4.4 Household characteristics and availability of food surplus
Though the sample size may be too small to make any generalisation, a cross tabulation of
some background characteristics of the household heads (age, sex, and marital status) and the
availability of food surplus from the previous planting season, is shown in Table 4.6.
From the analysis, 79% of households that have less than 5 of its members (1-4) migrating
said they have surplus food from the last year’s planting seasons while relatively lower
percentage (5%) of the households that have more than 4 people (5-8) migrating said they
have food surplus from the last year’s planting season. With regards to those who responded
that they had no surplus food from last year’s planting season, 9% of households that have
above 5 (5-8) members migrating said they had no surplus food from last year’s planting
season while 7% of households that have less than 5 (1-4) members migrating said they had
no food surplus from last year’s planting season.
A cross tabulation of the sex of the household heads with the availability of food surplus from
last year’s planting season revealed that 71% of male headed households have surplus food
from the last season’s planting seasons while a relatively small percentage (13%) of female
headed households have food surplus from the last season. . In terms of sex, more males
constituting (10%) said they have no food surplus while their female counterparts forms (6%)
said they have no surplus food. With regards to age, 50% of those household heads between
the ages of 30-54 said they had more surplus food remaining from last year’s planting season
while those between the brackets, 54-79, representing 34% said they have surplus food from
last year’s planting season. Those who said they had no surplus food from last year planting
season constituted 8% respectively for all the age group categories. It is evident from table
4.6 that about 72% of married population said they have surplus food from last year’s
planting season while 10% of those who never married said they have surplus food from last
years’ harvest. For those who said they have no surplus food from last year’s planting
season, the married category constitute 3% while the never married who said they had no
surplus food from last year planting season constitute 8%. The least (2%) of those who had
University of Ghana http://ugspace.ug.edu.gh
56
surplus food from last year’s planting season belongs to the widowed category. On the other
hand, those widowed who said they had no surplus food remaining from last year’s planting
season constituted 4% of the all the categories while the least (1%) of those who said they
had no surplus food from last year’s planting season were the divorced. They however did not
give any response for having a surplus food from last year’s planting season.
One of the themes that emerged from the Focus Group Discussions (FGDs) in the various
towns was how the youth migration affected the livelihoods of the household members left
behind. Some members of the various (FGDs) explained that the migration of the youth leads
to difficult standard of living since it reduces the family income. However, some of the youth
in the focus group discussions were of the view that migration also brings about some
benefits to the households. This assertion by the youth contradicts what was discussed in
most migration literature which only highlights the negative side of migration. Mention was
made of remittances received from migrants which was used to plough the land, food
remittances received from the migrants, remittances received to buy fertilizers and chemicals
to spay the farms, increasing family social status, sponsoring of education of siblings left
behind, building of new houses for parents or renovating old family buildings, sending
money for developmental projects in the communities (Orozco, 2007), and reduced pressure
on land. Here are quotes extracted from some of the transcripts:
“Migration can affect the livelihood of people. Assuming my father farms and my mother
sells it in order to earn an income for the family. Assuming that my father leaves, the farm
will grow weeds. My mother on the other hand, will not get anything to sell and thus reduces
family’s income. So it can affect the families.”FGD2-R6
“When they are with their parents they all farm together. And the youth put the maximum
effort because they are young and strong. But when they leave their parent, the sale reduces
because they do not have the strength to do it on large scale. So it will affect their
livelihood.”FGD1-8
University of Ghana http://ugspace.ug.edu.gh
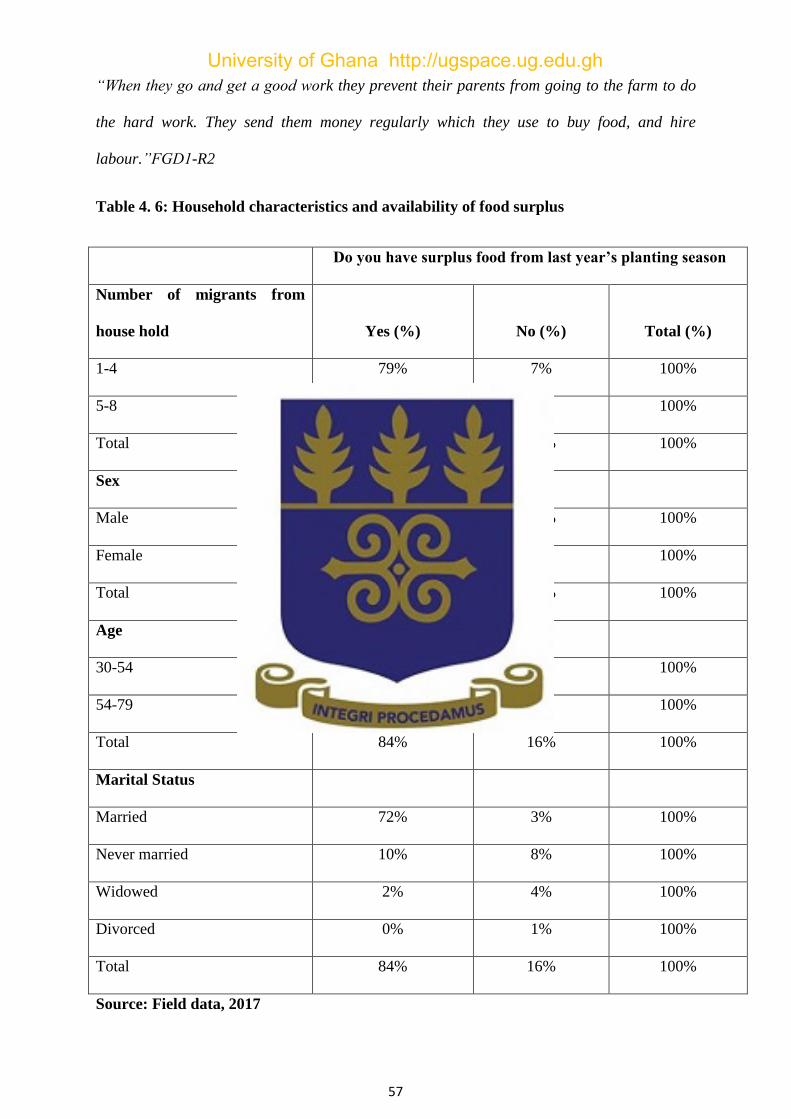
57
“When they go and get a good work they prevent their parents from going to the farm to do
the hard work. They send them money regularly which they use to buy food, and hire
labour.”FGD1-R2
Table 4. 6: Household characteristics and availability of food surplus
Do you have surplus food from last year’s planting season
Number of migrants from
house hold Yes (%) No (%) Total (%)
1-4 79% 7% 100%
5-8 5% 9% 100%
Total 84% 16% 100%
Sex
Male 71% 10% 100%
Female 13% 6% 100%
Total 84% 16% 100%
Age
30-54 50% 8% 100%
54-79 34% 8% 100%
Total 84% 16% 100%
Marital Status
Married 72% 3% 100%
Never married 10% 8% 100%
Widowed 2% 4% 100%
Divorced 0% 1% 100%
Total 84% 16% 100%
Source: Field data, 2017
University of Ghana http://ugspace.ug.edu.gh
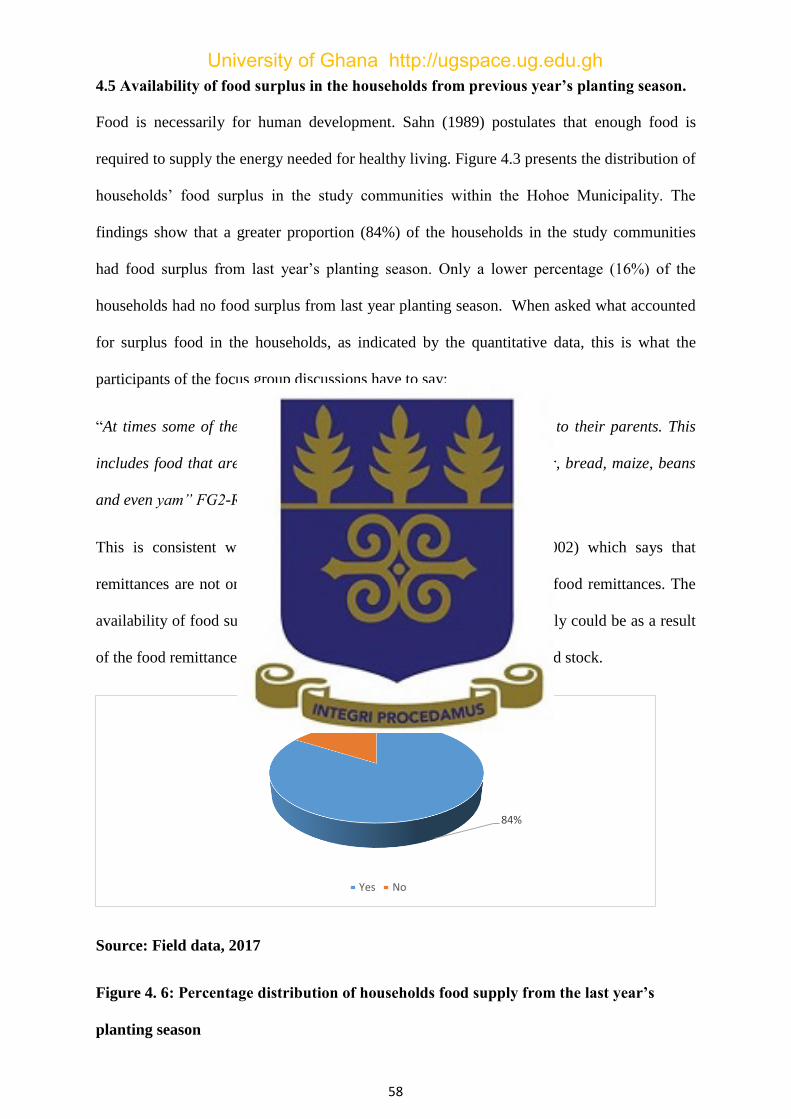
58
4.5 Availability of food surplus in the households from previous year’s planting season.
Food is necessarily for human development. Sahn (1989) postulates that enough food is
required to supply the energy needed for healthy living. Figure 4.3 presents the distribution of
households’ food surplus in the study communities within the Hohoe Municipality. The
findings show that a greater proportion (84%) of the households in the study communities
had food surplus from last year’s planting season. Only a lower percentage (16%) of the
households had no food surplus from last year planting season. When asked what accounted
for surplus food in the households, as indicated by the quantitative data, this is what the
participants of the focus group discussions have to say:
“At times some of the youth who migrate send foodstuffs from Accra to their parents. This
includes food that are easily packaged, such as rice, milo, milk, sugar, bread, maize, beans
and even yam” FG2-R1.
This is consistent with earlier research findings by Andersson (2002) which says that
remittances are not only in the form of cash but also in kind such as food remittances. The
availability of food surplus in most households per the findings probably could be as a result
of the food remittances being received to supplement the household food stock.
Source: Field data, 2017
Figure 4. 6: Percentage distribution of households food supply from the last year’s
planting season
84%
16%
Yes No
University of Ghana http://ugspace.ug.edu.gh
59
4.6 Respondents views on implications of out-migration on agricultural productivity
Agriculture is the mainstay of Ghana economy. Volta Region’s economy is mainly reliant on
on agriculture which offers about 74% (GSS, 2010) of jobs for the rural youth in the Region.
It is at the backdrop of this that any attempt to stifle the labour force of the Region will be of
a great concern. The results presented in Figure 4.6 indicate that, an overwhelming majority
(94%) of the respondents assert that migration affects agriculture productivity. Only 6% of
respondents indicated that migration does not impact on agriculture.
Respondents from FGD3 pointed out that out-migration of the youth reduce the scale of their
farms. This is because of the old age of the family that stay behind and their inability to hire
people to work on their farms. The out-migration of the youth therefore leads to reduction in
the productivity level of their farm produce. Discussions with FGD2 members also revealed
that youth migration, particularly those in farming, causes food shortage in the household due
to the shortage in labour. Below are some of the quotes from participants.
“For instance you are a farmer and you have planted five acres of cocoa and in about 3
years when the cocoa is bearing fruits, you are called for work in Accra so you leave. Maybe
your parents are also old and they cannot go to farm regularly. They also do not have money
to hire workers to weed the farm for them. So when the weeds grow it will kill the cocoa
trees. When this happens it can affect agriculture productivity.” FGD2-R5
“We do rice farming and the people who will do the work are the young ones. But when they
leave, it limits the scale of the farms and also because they will not get enough money to hire
people to weed the farm. So they will do the farm to the level of their strength. But if they are
around they would have helped them do the farm on a large scale so that when they sell they
will also get enough money and food to give to them.” FGD3-R4
“Most of our agricultural land here are left fallow when the youth migrate because they are
the strong ones to cultivate the land, this reduces agricultural production because their
parents who are old cannot farm like them. Also some of the farm lands are family lands for
University of Ghana http://ugspace.ug.edu.gh
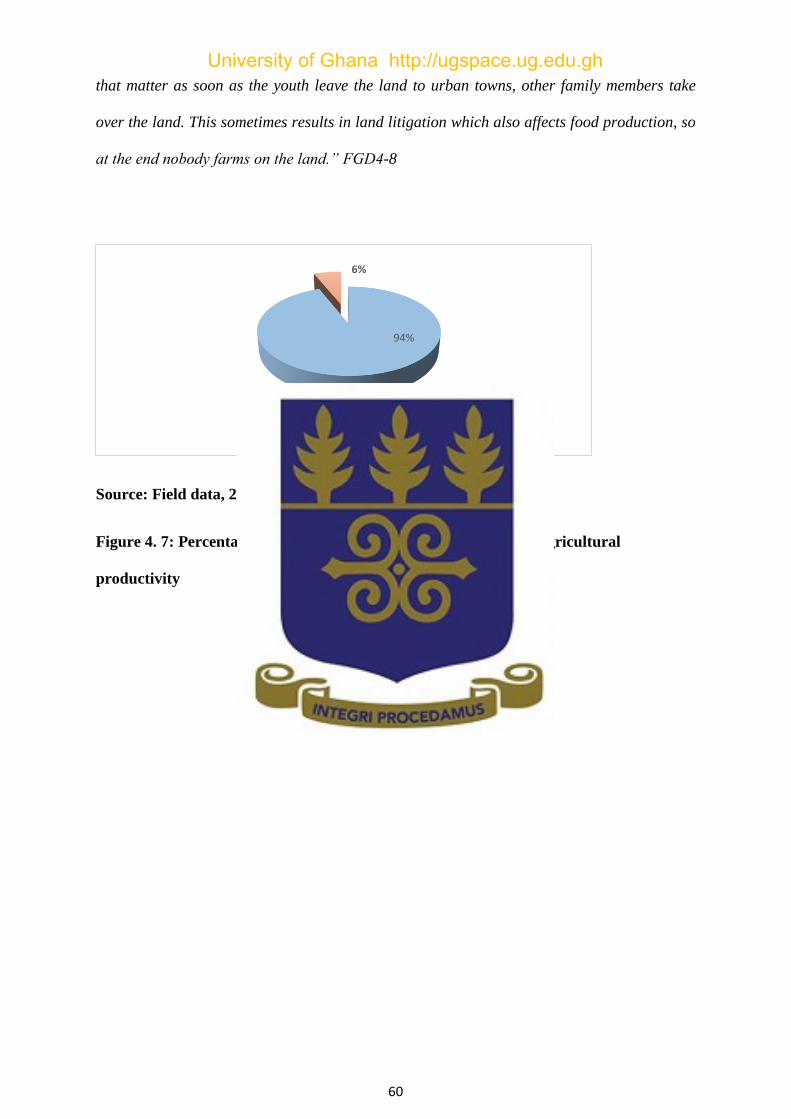
60
that matter as soon as the youth leave the land to urban towns, other family members take
over the land. This sometimes results in land litigation which also affects food production, so
at the end nobody farms on the land.” FGD4-8
Source: Field data, 2017
Figure 4. 7: Percentage distribution of migration implications on agricultural
productivity
94%
6%
Yes No
University of Ghana http://ugspace.ug.edu.gh
61
CHAPTER 5
SUMMARY, CONCLUSION AND RECOMMENDATIONS
5.0 Introduction
This chapter presents the summary of the study, conclusion and some recommendations
based on the findings as well as conclusions drawn from the study.
5.1 Summary of the study
The specific objectives of this study were to describe the characteristics of household heads
in the study area, find out about youth out-migration, if any, in the study community,
examine communities’ viewpoints about rural-urban migration among the youth, describe the
food supply situation in the study in the households and examine communities’ perception of
the effects of youth out-migration on agricultural productivity.
With regard to the demographic characteristics of the study respondents, the findings
revealed that, about a third (27%) of the household heads interviewed were between the ages
of 55-59 years of age. Similarly in terms of gender, the study revealed that an overwhelming
majority (81%) of the heads of households interviewed were headed by males. This finding
affirms the result of the 2010 Census Analytical Report of the Volta Region of the Ghana
Statistical Service which shows that the majority of the households in Volta Region are
headed by males (61.6%) while their female counterparts constitute (38.4%). A reason that
could explain this is the fact that Volta Region is patriarchal society. Literature has it that,
throughout Ghana, households, lineage, and community leadership is male-dominated (Clark,
1994). Again, according to Brydon (1996) and Ray (2003), tradition has it that women cannot
be family heads, clan heads, or chiefs.
On the issue of the level of education in the Municipality, the results indicated that,
educational level of the people was that of a diverse one. These levels ranged from
basic/middle to tertiary level education. It was found out that, those with Basic/Middle
School were in the majority (86%). It is however interesting to note that, tertiary education in
University of Ghana http://ugspace.ug.edu.gh
62
the study Communities in the Municipality has the least (2%) proportion of all the levels.
This also confirms the 2010 Census Analytical Report of Volta Region which shows that only
(3%) and less than (1%) of the population in the Region had undergraduate and post-graduate
education (GSS, 2010).
Equally important finding was the marital status of the people in the study communities. The
majority (75%) of the people were married while (18%) of them were divorced. The
proportion (18%) of the divorcee in the study communities is about three times higher than
the Volta Regional figure (3.4%) per 2010 Analytical Report (GSS, 2010).
On the knowledge and evidence of youth out-migration in the study area, it was evident that
the respondents have an in-depth knowledge in the out-migration of the youth in the study
communities. Majority (93%) of the respondents interviewed affirmed that there has been
out-migration of the youth annually in the communities mostly to the urban areas. This
finding fits well into the assertion in literature that, much larger numbers of the youth like
migrating into the urban areas than the rural areas (Johnson, 2006; Johnson et al.; 2005).
It was also found out that an overwhelming majority (96%) of the respondents indicated the
preferred destination of the youth was outside the region while the least (1%) of the youth
migrate outside the Municipality. This view was supported during the focus group
discussions with these quotes from some of the participants: “They normally go to Accra.”
FGD3-R7
“Others go to Koforidua.” FGD1-R2
This again is in line with the report of the 2010 Census of the Volta Region where the
preferred destination of the people from Volta Region is to Greater Accra and Eastern
Region. As indicated, it is interesting to note that international migration in the region was on
the low side (3%).
Concerning the food supply situation in the households, a greater proportion (84%) of the
household heads said they had surplus food from the previous season. Only 16% of the
University of Ghana http://ugspace.ug.edu.gh
63
household heads alluded to the fact that they had no surplus food from the previous planting
season. The reason given by the participants of the focus group discussions for the surplus
food realized in most households was as a result of food remittances received from family
members who have migrated. This is a quote from one focus group member:
. “But at times some of the youth who migrated send foodstuff from Accra to their parents.
This includes food that are easily packaged, such as rice, maize, milo, bread, beans and even
yam” FG2-R1
Majority (94%) of the respondents in the study communities however assert that the youth
out-migration affects food crop product and agricultural in general. Only 6% felt otherwise.
5.2 Conclusion
The study examined the experiences and perceptions of youth out-migration and food supply
in agricultural households in Hohoe Municipality. Based on the results of the study, some
deductions have been drawn. Firstly, it is concluded that the greater percentage of the
household heads are male dominated and most of the household heads were between the ages
of 50-54. This is in line with the earlier work by Clark (1994) which says that leadership is
male dominated. Again, Bradon (1996) and Ray (2003) have it that, most traditions in Ghana
do not allow women to be family heads, clan heads or chiefs. In terms of education, it was
concluded that the greater number of the people interviewed had low levels of education.
Only a small number of the people in the Municipality had tertiary education.
One of the main reasons why the youth migrate from the rural communities is unavailability
of jobs. The unavailability of jobs can pose dire consequences for both the origin and the
destination areas. At the origin, there will be loss of labour as more of the youth will migrate
while the destination areas would also realize an increase in population. This movement of
the youth however, is in consonance with migration literature, the push and pull theories as
well as the neo-classical theory.
University of Ghana http://ugspace.ug.edu.gh
64
Additionally, members of the communities had an in-depth knowledge in the concept of
migration. They were able to link migration of the youth to low food crop production as well
as creating shortage of labour needed for the community development.
Also per the findings of the study, it is concluded that majority of the households in the study
area had food surplus from the previous year’s planting season. This was mainly due to food
supply received as food remittances but not necessarily through farming.
With regard to the study communities’ perceptions of the effects of out-migration of the
youth on agriculture, the general perception is that out-migration of the youth affects
agricultural productivity.
5.3 Recommendations
Per the findings of the study, some recommendations have been made. These
recommendations, when observed and followed rationally, would curb the flow of rural youth
into an urban communities and also boost agricultural production in the Hohoe Municipality.
Since the basis of the youth out-migration is lack of job opportunities in the rural
communities per the findings of the study, it is recommended that government should set up
cottage industries that would provide jobs for the rural youths in the Hohoe Municipality. By
so doing, a number of the youth will not migrate to urban areas for non-existing jobs.
It also came to light that the youth see farming as a difficult venture and also less rewarding,
for that matter farming has become so unattractive to the youth in the rural communities. For
the youth to be actively involved in farming, it is recommended that, government should
mechanize agriculture in order to make it more appealing to farmers, most importantly the
rural youth so as to stay back and contribute to the development of their communities.
From the interaction with both the respondents and the participants, it was evident that,
another compelling reason why the youth migrate from the study communities to the urban
centres is lack of employable skills. It is therefore recommended that youth training centres
University of Ghana http://ugspace.ug.edu.gh

65
should be set up by government to train the youth so as to acquire the needed skills for job
placements.
Furthermore from the study it came out clearly that, for some youth it does not matter
whatever investment has been made in agriculture, they would still not farm. Similarly, the
majority of the people in the rural communities as the study shows have low levels of
education. For such groups of people, skills development training centres should be
established by the government, NGOs or churches in the rural communities that would
empower such youths with employable skills which they can use to establish their own
businesses. Furthermore, per the findings, one of the reasons given why the youth migrate is
to acquire higher education. This was evident in the low tertiary education levels in the
Municipality. For this problem to be resolved, the study recommended that more tertiary
institutions should be established by both the government and the private sector in the
Municipality so as to curb the flow of the youth to urban centres in search of higher
education.
On the effects of out-migration of the youth on agricultural productivity, per the findings, it
was evident that the youth migration results in food shortage as the herculean task of farming
is left on the aged. The plausible reason could be the unattractive nature of farming. It is
therefore recommended that government should mechanize agriculture so as to make it more
appealing to the youth.
University of Ghana http://ugspace.ug.edu.gh
66
REFERENCES
Ackah Charles & Denis Medvedev (2012) "Internal migration in Ghana: determinants and
welfare impacts", International Journal of Social Economics, Vol. 39 Issue:
10, pp.764-78
Adams R. H. (2006). “Remittance and poverty in Ghana,” Working Paper 3838, World Bank
Policy Research.
Adepoju, A. (2008). Migration in sub-Saharan Africa. Nordiska Afrikainstitutet.
Aduse-Poku, K. et al. (2003). Improving Rural Livelihoods within the contxt of Sustainable
Development. Case Study of Goaso District.
Afenah, A. (2010). (Re) claiming citizenship rights in Accra, Ghana. Community
mobilization against the illegal forced eviction of residents in the Old
Fadama settlement (General Secretariat / Ana Sugranyes Santiago Bueras
142, Of.22, Santiago) Retrieved from www.hic-net.org/
Afshar, R. (2003). “Dynamics of Poverty, Development and Population Mobility: The
Bangladesh case Adhoc Expert Group Meeting on Migration and
Development, organized by the Economic and Social Commission for Asia
and the Pacific, Bangkok, 27-29 August. America.
Agesa, R&Kim, S.( 2001) Rural to Urban Migration as Household Decision: Evidence from
Kenya. Review of Development Economics. (5) 60-75.
Alo, E. B., et al (2015). The Prevalence of GastroIntestinal Parasites of Small Ruminants in
Madagali Local Government Area, Adamawa State, Nigeria. Journal of
Agriculture and veterinary science. 8(5): 86-89.
University of Ghana http://ugspace.ug.edu.gh
67
Anarfi, J. et al. (2003) Migration from and to Ghana: A Background Paper, Development
Research Centre on Migration, Globalisation and Poverty, University of
Sussex.
Anarfi, J., Kwankye, S., Ofosu-Mensah, A., Tiemoko, R. (2003). Migration from and to
Ghana: A Background Paper. Ghana.
Andersson, A. (2002) in press. ‘Maize remittances, market participation and consumption
among smallholders in Africa’, in Djurfeldt et al., eds. African
Smallholders.
Angba, A. O. (2003). Effect of rural-urban migration of youths on agricultural labour supply
in Umuahia north local government area of Abia State, Nigeria. “Journal of
Agriculture and Social Research (JASR) 3.2 (2003): 77-83
Appleyard, R. (1992) ‘International migration and development—an unresolved
relationship’, International Migration 30(3&4):251–266
Arango, J., et al. (1993). Theories of international migration: A review and appraisal.
Population and development review, 431-466.
Aryeetey, E., & McKay, A. D. (2004). Operationalizing pro-poor growth: Ghana case study.
University of Ghana.
Assembly for the 2014 Fiscal Year. Available at www.mofep.gov.gh
Attride-Stirling, J. (2001). Thematic networks: an analytic tool for qualitative research.
Qualitative research, 1(3), 385-405.
Aworemi, J. R, Abdul-Azeez, I. A. & Opoola, N. A. (2011). An Appraisal of the Factors
Influencing Rural-Urban Migration in Some Selected Local Government
Areas of Lagos State Nigeria. Journal of Sustainable Development. 4 (3).
University of Ghana http://ugspace.ug.edu.gh
68
Awumbila, M, Alhassan, O., Badasu, D., Bosiakoh, A. T and Dankyi, K. E (2011) ‘Socio-
cultural Dimensions of Migration in Ghana’(Technical Paper No. 3). Centre
for Migration Studies, University of Ghana: Woeli Publishing Services
Awumbila, M. (2015). Women Moving Within Borders: Gender and Internal Migration
dynamics in Ghana. Ghana Journal of Geography, 7(2), 132-145.
Awumbila, M., Owusu, G. and Teye, J.K. (2014) Can Rural-Urban Migration Contribute to
Poverty Reduction? Evidence from Ghana. MOP Working Paper 13 April,
London, University of Sussex
Bahns, M. K. (2005). Rural to Urban migration in Developing Countries: TheApplicability of
Harris Torado Model with a Special Focus on The Chinese Economy.
Dissertation Zur Enlangaung des akademischen Grades de Doktors de
Wirschaften an der Universit at Konstanz.
Barrios S. et al. (2006). Climatic change and rural urban migration: The case of sub- Sahara
Africa. Journal of Urban Economics 60. 357–371.
Barrios, S. et al. (2006) Climatic change and rural urban migration: The case of sub- Sahara
Africa. Journal of Urban Economics 60 357–371.
Barrios, S., Bertinelli, L., Strobl, E. (2003). Dry times in Africa: Rainfall and Africa’s growth
performance, Discussion paper 61, Center for Operations Research and
Econometrics (CORE).
Basil, U., & Olumide, O. (2013). evaluating the impacts of rural-urban migration on
agricultural productivity in akoko south west local government area of ondo
state, south western nigeria.
University of Ghana http://ugspace.ug.edu.gh
69
Bealer, R.C., F.K. Willits, and W.P. Kuvlesky. (1965). “The Meaning of ‘Rurality’ in
American Society: Some Implications of Alternative Definitions.” Rural
Sociology 30:255–66.
Bencherifa, A. & Herbert, P. (2000). Remigration Nador III. Passau: L.I.S. Verlag GmbH.
Bencherifa, A. (1993). Migration Exterieure et Developpement Agricole au Maroc. Revue de
Géographie du Maroc, 15(1/2), 51-91.
Bonnet, J. and R. Bossard (1973) “Aspects géographiques de l’emigration Marocaine vers
l’Europe”, Revue de Géographie du Maroc, 23-24: 5-50.
Brazil, K., Lohfeld, L. H. & Sale, J. E. (2002). Revisiting the quantitative-qualitative debate:
Implications for mixed-methods research. Quality and quantity, 36(1), 43-
53.
Breisinger, C., Diao, X., Thurlow, J., & Al-Hassan, R. M. (2008). Agriculture for
development in Ghana: New opportunities and challenges. Intl Food Policy
Res Inst.
Breisinger, C., X. Diao, J. Thurlow, B. Yu, and S. Kolavalli. (2008). Accelerating Growth
and Structural Transformation: Ghana's Options for Reaching Middle-
Income Country Status. IFPRI Discussion Paper 00750. Washington, DC:
IFPRI.
Brydon, L. (1996). “Women Chiefs and Power in the Volta Region of Ghana.” Journal of
Legal Pluralism 37–38: 227–247.
Bryman, A. (2004). Research methods in the study of leadership. The SAGE handbook of
leadership, 15-28.
Bull. (2001). Migration from Rural Areas, the Evidenceform Village Studies Oxford
University Press, Delhi, pp. 45-58.
University of Ghana http://ugspace.ug.edu.gh
70
Burman, J. (2002). Remittance or, Diasporic Economies of Yearning, Small Axe - Number
12 (Volume 6, Number 2), pp. 49-71
Castles, S. (2009). Development and migration—migration and development: What comes
first? Global perspective and African experiences. Theoria, 56(121), 1-31.
Castles, S. and Miller M.J. (2009). The age of migration, international population movements
in the modern world, Palgrave MacMillan. 4th edition
Castles, S., De Haas, H., & Miller, M. J. (2013). The age of migration: International
population movements in the modern world. Palgrave Macmillan.
Chambers, R. & Conway, G. (1991). Sustainable Rural Livelihoods: Practical Concepts for
the 21st Century. IDS Discussion Paper, no. 296. Falmer, Brighton.
Chambers, R., & Conway, G. (1991). Sustainable livelihood-chambers and conway1991. pdf.
Christiaensen, Luc; Demery, Lionel; Kuhl, Jesper. (2006). The role of agriculture in poverty
reduction an empirical perspective. Policy, Research working paper; no.
WPS 4013. Washington, DC: World Bank.
Cloke, P.J. (1985). Whither rural studies? Journal of Rural Studies 1, l-9.
Common, R., Flynn, N., & Mellon, E. (2016). Managing public services: Competition and
decentralization. Elsevier.
Crompton, J. (1979) Motivations for pleasure vacation. Annals of Tourism Research 6(4),
408-424.
Dao, M. (2002).Determinants of Internal Migration in Developing Countries. Study
Economics,77, 35-51. Eastern Illinois University.
University of Ghana http://ugspace.ug.edu.gh
71
De Brauw, A., Rozelle, S. & Taylor, J.E., (2003). Migration and incomes in Source
Communities: a new economics of migration perspective from China.
Economic Development and Cultural Change, 52 (1) 75-101.
De Haas H. (2006). Engaging Diasporas How Governments and Development Agencies Can
Support Diaspora Involvement in the Development of Origin Countries, A
Study for Oxfam Novib, Oxfam Novib, Den Haag, The Netherlands,
De Haas, H. (1998). Socio-Economic Transformations and Oasis Agriculture in Southern
Morocco. L. de Haan and P. Blaikie eds., Looking at Maps in the Dark.
Utrecht/Amsterdam: KNAG/FRW UvA, 65-78.
De Haas, H. (2001). Migration and Agricultural Transformations in the oases of
Demography, Vol. 26.No. 1, pp. 1-14
De Haas, H. (2010). Migration and development: A theoretical perspective. International
migration review, 44(1), 227-264.
De Mas, P. (1990). Overlevingsdynamiek in het Marokkaanse Rif-Gebergte. Geografisch
Tijdschrift, XXIV(1), 73-86.
Decrop, A. (2000). Personal aspects of vacationers' decision making processes: An
interpretivist approach. Journal of Travel & Tourism Marketing, 8(4), 59-
68.
Dewett, K.K. and Singh, G. (1966). Indian Economics, Delhi, p. 66.
Dugbadza J.E.D (2007). Gender, Migration and Rural Livelihoods in Ghana: A case of Ho
District. Unpublished PhD Thesis. The University of Birmingham, U. K.
Ellerman D. (2003). Policy Research on Migration and Development, World Bank,
Washington, DC.
University of Ghana http://ugspace.ug.edu.gh
72
Engberg–Pedersen, P., Hear, N. V. & Ninna Nyberg–Sørensen, N., (2002). The migration–
development nexus evidence and policy options state–of–the–art overview.
International Migration, 40(5), 3-47.
Falk, W. and Pinhey, T. (1978). Making sense of the concept rural and doing rural sociology:
an interpretive perspective. Rural Sociology 43, 547-558.
Fei, J.C.H., Ranis, G., (1961). A theory of economic development. The American for
Migration Research.
Ferry, M. & G. Toutain (1990) Concurrence et Complementarite des Especes Vegetales dans
les Oasis. Les Systèmes Agricoles Oasiens. Options Mediterraneennes.
Serie A, No 11. Paris: CIHEAM.
Foresight, (2011). Migration and global environmental change. Final project report. London:
The Government Office for Science.
Gallagher, M. & Waite, L. (2000). A case for marriage. New York: Doubleday. Centre.
Geest, K. (2010). Rural youth employment in developing countries: A global view.
Ghana Statistical Service (2008). Ghana Living Standards Survey Round Five (GLSS5) –
Data User’s Guide. Accra, Ghana.Ghana Statistical Service (2007). Pattern
and Trends of poverty in Ghana, 1991-2006. GSS April, 2007.
Ghana Statistical Service (2008). Pattern and Trends of poverty in Ghana, 1991-2006. GSS
April, 2008.
Ghana Statistical Service (2010). Population Census of Ghana, Analytical Report: Proportion
of Urban Population by Regions, 1960-2010.
Ghana Statistical Service (2010). Regional Analytical Report, Volta Region.
University of Ghana http://ugspace.ug.edu.gh
73
Ghana Statistical Service (2014). Population and housing census, District analytical report
Hohoe Municipality
Ghana Statistical Service GLSS (2014). Ghana Living Standards Survey round 6 main report.
Hardus, S. (2010). Ghana`s Traders. Lumberjacks and Fortune Strikers, PCD in Practice: the
Impact of European Policies on Development in Ghana, Evert Vermeer
Foundation, Amsterdam.
Heinemeijer, Willem F., Raphaël den Haan., & Van Amersfoort J. M. M., (1977). Partir pour
Rester: une enquête sur les incidences de l'émigration ouvrière à la
campagne marocaine. Imwoo/Nuffic: projets Remplod.
IFAD: (2016). Rural Development report 2016, fostering inclusive rural transformation.
www.ifad.org/web/rdr/report. Accessed 25-12-2017
Johnson, K. M. (2006). “Rural America Undergoing a Diversity of Demographic Change.”
Population Reference Bureau. Washington, D.C. Retrieved June 4, 2008.
Johnson, K. M., Voss, P. R., Hammer, R. B. Fuguitt, G. V., & McNiven, S. (2005). Temporal
and Spatial Variation in Age-Specific Net Migration in the United States.
Demography, 42(4), 791-812.
Juma, C. (2015). The new harvest: agricultural innovation in Africa. Oxford University Press.
Kerbout, M. (1990). Les Mutations des Campagnes du Moyen Atlas Oriental. A.
Bencherifaand H. Popp eds., Le Maroc: Espace et Société. Passau:
Passavia Universitätsverlag
Kinuthia, M. (2003). Migration in Kenya and Its Impact on the Labor Market .Paper prepared
for Conference on African Migration in Comparative Perspective,nesburg,
South Africa, 4-7 June American University United States of America.
University of Ghana http://ugspace.ug.edu.gh
74
Larrison, J. Murrugarra, E., and Sasin, J. (eds.) (2011). Migration and Poverty: Towards
Better Opportunities for the Poor. World Bank.
Lay J., Schuler D. (2007). Income and Diversification and Poverty in a Growing Agricultural
Economy: The Case of Ghana. University of Gottingen, pp 3-4
Lee, E. (1966). “A theory of migration”. Demography 3(1): 47-57
Levine, R. (1997). Financial development and economic growth: views and agenda. Journal
of economic literature, 35(2), 688-726.
Lewis, J.R. (1986). “International labour migration and uneven regional development in
labour exporting countries.” Tijdschrift voor Economische en Sociale
Geografie,77
Mabogunje, A. L. (1970). Systems approach to a theory of rural‐ urban migration.
Geographical analysis, 2(1), 1-18.
Massey, D. S. et al. (1998), Worlds in Motion: Understanding International Migration at the
End of the Millennium. Oxford: Clarendon Press.
McGranahan, G., Satterthwaite, D. &Tacoli, C. (2015). Urbanisation, rural-urban migration
and urban poverty. London: IIED
Muggah, R. (2012). Researching the urban Dilemma: Urbanization, Poverty and violence,
Ottawa, Canada: IDRC. of Migration in Ghana, No. 3. out of Poverty?,
International Workshop on Migration and Poverty in West Africa, Sussex
Centre
Newland, K. (2007). A new surge of interest in migration and development. Migration
Information Source (Special Issue on Migration and Development).
University of Ghana http://ugspace.ug.edu.gh
75
Nicholson, S.E. (1994). Recent rainfall fluctuations in Africa and their relationship to past
conditions over the continent, The Holocene 4 121–131.
Nicholson, S.E. (2001). Climatic and environmental change in Africa during the last two
centuries, Climate Research 17. 123–144.
Nieswand, B. (2008). Development and Diaspora: Ghana and its Migrants, Max-Planck-
Institut zur Erforschung multireligiöserund multiethnischer Gesellschaften,
Göttingen.
Orozco, M. (2007). Remittances and Development: Issues and Policy Opportunities. Global
Forum on Migration and Development: Brussels: Civil Society Day, P.66.
Orozco, M. (2007). Remittances and Development: Issues and Policy Opportunities. Global
Forum on Migration and Development: Brussels: Civil Society Day.
Papademetriou, D. G. and Martin P. L. (eds.) (1991). The Unsettled Relationship: Labour
Migration and Economic Development, Westport, CN: Greenwood Press.
Pascon, P. (1985). La maison d'Iligh et l'histoire sociale de Tazerwalt. Rabat: SMER.
Penninx, R. (1982), A Critical Review of Theory and Practice: The Case of Turkey.
International Migration Review 16(4):781–818.
Penninx, R. (1982), A Critical Review of Theory and Practice: The Case of Turkey.
International Migration Review 16(4):781–818.
Perruchoud, R. (2004). International migration law: Glossary on migration. International
organization for migration
University of Ghana http://ugspace.ug.edu.gh
76
Popp, H. (1999). Les Effets de la Rémigration sur l'Agriculture Irriguée: Etude de Cas dansla
Plaine de Zébra. M. Berriane and H. Popp eds Migrations Internationales
entre le Maghreb et l'Europe. Rabat, Université Mohammed V: 189-196.
Porter J. H, Parry M. L, Carter T. R (1991). The Potential Effects of Climate Change on
Agriculture Insect Pests. Agr Forest Meteorol 57:221-240.
Ratha, D. (2007). Leveraging remittances for development. Migration Information Source.
Ratha, D., & Shaw, W. (2007). South-South migration and remittances (No. 102). World
Bank Publications.
Ravenstein, E. G. (1889). The laws of migration. Journal of the royal statistical society,
52(2), 241-305.
Ravenstien, E.G.(1885). The Laws of Migration, Journal of the Statistical Society of London,
48(2),pp 167-235)
Ray, P. D. (2003). Effects of labour migration on agriculture production in Mahottari
District. Unpublished M.Sc. thesis, Department of Agricultural Extension
and Rural Sociology. Rampur, Chitwan, Nepal.
Regmi, G. & Tisdell, C. (2002). “Remitting behaviour of Nepalese rural-to-urban migrants:
Implications for theory and policy.” Journal of Development Studies, 38(3)
76–94.
Richard, P., Viljanen, K., & Penttilä, M. (2015). Overexpression of PAD1 and FDC1 results
in significant cinnamic acid decarboxylase activity in Saccharomyces
cerevisiae. AMB Express, 5(1), 12.
Rotter R, Van de Geijn S. C. (1999). Climate Change Effects on Plant Growth, Crop Yield
and livestock. Climatic Change 43:651-681).
University of Ghana http://ugspace.ug.edu.gh
77
Rozelle, S., Taylor, J.E. & De Brauw, A., (1999). Migration, remittances, and agricultural
productivity in China. American Economic Review, 89 (2), 287-291.]
Russell, S. (1992). “Migrant Remittances and Development.” International Migration,
30(3/4), 267-87.
Sanders, E. B. N., & Stappers, P. J. (2008). Co-creation and the new opportunities in
agriculture and landscapes of design. Co-design, 4(1), 5-18.
Seini, W. and Tsikata, D (2004) Identities, Inequalities and Conflicts in Ghana, Centre for
Research on Inequality Human Security and Ethnicity, University of
Oxford UN General Assembly Resolutions.
Silva, E. D., & Wright, D. (2008). Researching cultural capital: Complexities in mixing
methods. Methodological Innovations Online, 2(3), 50-62.
Songsore, J. (2003). ‘The urban housing crisis in Ghana: Capital, the state versus the people’,
Ghana Social Science Journal, 2(1): 1-31.
Sorensen, N. (2004). The Development Dimension of Migrant Remittances. IOM Migration
Policy Research Working Paper, Series No. 1. Geneva: International
Organization for Migration
States: A Statistical Profile, 1993-94. Washington, DC: U.S. Department of Education,
National Center for Education Statistics. NCES 96-124.
Tacoli C. (1998). Rural-urban interactions: a guide to the literature pp 147-148.
Todaro, Michael P (1969) A Model of Labor Migration and Urban Unemployment in Less
Developed Countries. American Economic Review, 59 (1): 138-148.
UN Habitat (2006). State of the world’s cities 2006/7. New York: United Nations.
University of Ghana http://ugspace.ug.edu.gh
78
United Nations (2001) World Population Prospects: The 2000 Revision. Population database.
New York: United Nations, Population Division of the Department of
Economic and Social Affairs of the United Nations Secretariat
Van der Geest K., (2011). The Dagara farmer at home and away. Migration, environment and
development in Ghana (PhD Dissertation, University of Amsterdam):
African Studies
Warner, K., & Afifi, T. (2014). Where the rain falls: Evidence from 8 countries on how
vulnerable households use migration to manage the risk of rainfall
variability and food insecurity. Climate and Development, 6(1), 1-17.
World Bank ( 2014) World Development Report: Agriculture and Economic Development.
Washington, DC: Oxford University Press for the World Bank.
World Bank (2010). Globalization, Growth, and Poverty. World Bank, Washington, DC.
World Bank (2013). Ending poverty and hunger by 2030: an agenda for the global food
system. Washington, DC: World Bank Group.
Yeboah, M. A. (2008). Gender and Livelihoods: Mapping the Economic Strategies of Porters
in Accra, Ghana. Unpublished PhD Thesis. Department of Geology and
Geography, Morgantown, West Virginia.
University of Ghana http://ugspace.ug.edu.gh
79
APPENDIX A
QUESTIONARE FOR AGULTURAL HOUSEHOLDS
CENTRE FOR MIGRATION STUDIES, UNIVERSITY OF GHANA- LEGON
My name is Fritz Kosi Exornam Adom, a Postgraduate student from the University of Ghana
(Centre for Migration Studies), conducting a research on the topic: “The Implications of
rural-urban Migration on Agricultural Productivity: A case study of Hohoe Municipality”.
This field study is in partial fulfilment of the University’s requirement for award of Master’s
Degree. Data from this research will be confidential and will only be used for academic
purposes. Thank you.
The questionnaire to be administered to agricultural households that persons migrated
from.
IDENTIFICATION
REGION………………………………………………………………..
DISTRICT……………………………………………………………….
LOCALITY…………………………………………………………………………
HOUSEHOLD NUMBER (If applicable)
…………………………………………………………………………………………………
……
NAMEOF
INTERVIEWER…………………………………SIGNATURE………………………
NAME OF RESPONDENT………………………………………...................
DATE…………………………………………………………………………………………
…
University of Ghana http://ugspace.ug.edu.gh
80
TIME STARTED……………………………………………………………………………….
TIME
COMPLETED……………………………………………………………………………
DURATION OF INTERVIEW…………………………………………………………………
SECTION A: SOCIO-DEMOGRAPHIC CHARACTERISTICS INFORMATION
1. Sex: 1=Male 2=Female
2. Age (COMPLETED YEARS/AGE ON LAST BIRTHDAY)…………
3. What is the highest level of school (Name) attended?
01= Basic/Middle 02= Secondary 03= Technical/ vocational 04= Diploma
05= Tertiary
4. Marital Status: 01= Married 02= Consensual Union 03= Separated 04=
Divorced
05=Widowed 06= Never Married
5. Household Size: 01= Adult 02= Children
6. What do you do for a living? ( Please indicate the main work)
01=Farming 02= Teaching 03=Trading 04= Others (Specify)………
7. Can you please give reasons for the choice of the particular work that you undertake?
..........................................................................................................................................
..........................................................................................................................................
..........................................................................................................................................
..................
University of Ghana http://ugspace.ug.edu.gh

81
8. If farming is selected as the option in Q 7, which particular type of farming you are
engaged in?
01= Food crop farming 02= Poultry 03= livestock
04= Other (Specify)………………………….
9. Are you satisfied with this particular agricultural activity?
01= YES 02= NO
10. If yes to Q 10, please give reasons.
…………………………………………………………………………………………………
…………………………………..................................................................................................
..............
…………………………………………………………………………………………………
…………………………………………………………………………………………………
…………
11. If NO, please give reasons.
…………………………………………………………………………………………………
…………………………………………………………………………………………………
…………………………………………………………………………………………………..
......................
12. Giving the chance, will you have opted for another agricultural activity other than
what you are currently doing?
01=Yes 02= NO
University of Ghana http://ugspace.ug.edu.gh
82
SECTION B: KNOWLEDGE AND EVIDENCE OF OUT-MIGRATION IN THE
STUDY AREA
13. How long (in years) have you been living in this
Municipality………………………………………
14. Do people in this community migrate?
15. How often do they migrate?
01= Daily 02= Weekly 03= Monthly 04= Quarterly 05= Annually
16. Where is the preferred destination?
01= City/Town within Municipality 02= City/Town Outside Municipality
03= City/Town Outside the Region 04= Outside Ghana
17. How many people from your household migrated into the town/city?
Please indicate number………………
18. Can you please provide the following information about those who have migrated
from this household in the table below?
University of Ghana http://ugspace.ug.edu.gh
83
S/N SEX AGE LEVEL OF EDUCATION YEAR OF MIGRATION
19. In your view, what do you think made him/her migrate?
01= Lack of fertile agricultural land 02= Climate change 03= Land tenure
system
04= Other (Specify)……………………………………………………
SECTION C: COMMUNITIES PERCEPTIONS ON THE EFFECTS OF OUT-
MIGRATION OF ON AGRICULTURAL PRODUCTIVITY
20. Can you please tell me your household’s sources of labour? ( Multiple response)
01= Hire labour 02= Family labour 03= Communal labour
04= Other (Specify)…………………………..
21. Does your household still have surplus food remaining from last year’s planting
season?
01= YES 02= NO
22. If yes to Q 22, how many more weeks do you expect the excess food to last?
University of Ghana http://ugspace.ug.edu.gh
84
…………………………………………………………………………………………………
…………………………………………………………………………………………………
…………
23. If NO to Q 22, what month did the excess food run out?
…………………………………………………………………………………………………
…………………………………………………………………………………………………
…………
24. Please is your household able to produce enough food to feed themselves?
01= YES 02= NO 03= Sometimes
25. What about able to produce enough food for sale?
01= YES 02= NO 03= Sometimes
26. What do you think are the factors that accounted for low food crop production?
01= Drought 02= Poor soil fertility 03= Shortage of farm labour
04=Lack of agricultural land 05= Other (Specify)………………………
27. Do you think the youth out-migration in the Municipality affect agricultural
productivity?
01= YES 02= NO (Please, give reason(s) for your answer).
…………………………………………………………………………………………………
…………………………………………………………………………………………………
…………………………………………………………………………………………………
University of Ghana http://ugspace.ug.edu.gh

85
…………………………………………………………………………………………………
…………………………………………………………………………………………..............
28. Are you concerned about the current trend of out migration of the youth from
agriculture?
01= YES 02= NO
29. Please give reasons for your answer.
…………………………………………………………………………………………………
…………………………………………………………………………………………………
…………………………………………………………………………………………………
…………………………………………………………………………………………………
…………………………………………………………………………………………………
Do you think the issue of youth labour out-migration and its effects on agricultural
productivity can be addressed in anyway?
01= YES 02= NO
30. If yes, to Q 30, please suggest two ways by which this issue can be addressed.
…………………………………………………………………………………………………
…………………………………………………………………………………………………
…………………………………………………………………………………………………
…………………………………………………………………………………………………
…………………………………………………………………………………………………
…………………………………………………………………………………………………
Is there any further comments you will like to add?
University of Ghana http://ugspace.ug.edu.gh

86
…………………………………………………………………………………………………
…………………………………………………………………………………………………
…………………………………………………………………………………………………
…………………………………………………………………………………………………
THANK YOU
University of Ghana http://ugspace.ug.edu.gh
87
APPENDIX B
INTERVIEW GUIDE
Introduction
My name is Fritz Kosi Exornam Adom, a postgraduate student from the University of Ghana
(Centre for Migration Studies), conducting a research on the topic: “The Implications of
rural-urban Migration on Agricultural Productivity: A case study of Hohoe Municipality”.
This field study is in partial fulfilment of the University’s requirement for award of Master’s
Degree.
Data from this research will be confidential and will only be used for academic purposes.
Thank you.
Instruction to the Interviewer: Please take not of these details before commencement of the
interview. Interview Details: Date of interview: Start Time, Date, Locality (Physical
Address), and Time interview completed.
Section A: Socio- Demographic Characteristics of Participants.
1. Can you please tell me something about yourself? (Probe for name, age, level of education,
marital status, occupation etc.)
2. Please how long have you been living in this community?
Consent Note:
Having explained the rationale behind this study to me and guaranteeing me of
total confidentiality, I hereby give my consent to partake in this interview. You
can proceed now and Interview me and record my voice.
………………………………………………………………………….Signature
or ……………………………………………….…Thumb print.
University of Ghana http://ugspace.ug.edu.gh
88
Section B: Knowledge and evidence of out-migration of the youth in the study
community
3. Please, what is your understanding about the concept of migration? (Probe for what
migration is, the duration, and intentions of people to migrate).
4. With the explanation provided above, will you say the youth in this community migrate?
5. Please, how often do they migrate? (Probe. i.e. daily, weekly, monthly, yearly etc.)
6. Please, where do they usually go to? (Probe for preferred destination i.e. town/city)
7. Please in your views, what do you think are the factors responsible for out-migration of the
youth from your community?
Section C: Communities’ perceptions on the effects of out-migration on agricultural
productivity
8. Please, I will like to know from you whether migration out of agricultural has improved
households economic status. (Probe for the various ways it has improved economic status).
9. Please do you also think that migration has enabled households to achieve some basic
needs of live that they would otherwise not have achieved? (Kindly describe it).
10. Please from the above answers given, in your personal view(S), has migration lowered or
enhanced the social status people assign to households in your community? (Probe for
increase status, decrease status, no change in status etc.).
11. Do you also think migration out of agriculture by the youth can affect agricultural
productivity? (Probe for how it can affect it).
12. Can you say your households have food surplus from last year’s farming season?
13. Do you think household’s inability to have surplus food is as a result of youth out-
migration?
University of Ghana http://ugspace.ug.edu.gh

89
14. Please, can agricultural livelihood of the people be affected due to migration? (Probe for
their understanding of livelihood and how it can be affected by migration).
15. Please, is there any way you think out-migration of the youth can be addressed?
16. Please any suggested reasons by which the issue can be addressed?
University of Ghana http://ugspace.ug.edu.gh
90
APPENDIX C:
Sample of Transcript
Experiences and Perceptions of Youth Out-Migration and Food Supply in Agricultural
Households in Hohoe Municipalities
Transcript
Focus group discussion
Date: 18th June, 2017.
Location: Likpe Bakua
Interviewer: Fritz Kosi Exornam Adom
Respondents: FGD2
Likpa Bakua -Male
In: when they say migration, how do we understand it?
Res 1: like moving from one place to another.
In: for example
Res1: Like you are in a village and then you travel to Hohoe or Accra.
In: is there any period attached to this?
Res 1: the person can be there for about 10 to 15 years.
In: what if it is less than that?
Res1: it is also migration
In: who else have any other idea?
Res 2: We understand that you move from one place to go and settle at another place
University of Ghana http://ugspace.ug.edu.gh
91
In: for how long?
Res 2: anytime
In: can I say when I leave for about one week I have migrated?
Res 2: No, for about a year going
In: what if it is less than a year…okay any other opinion?
Res 3: Like how I travel from Dzodze to Bakua.
In: do the youth in the community migrate?
Res (all): Yes
In: how often do they migrate? In which period do they migrate?
Res 1: mostly migrate after examination. When they write BECE and also, when they are
done with farming.
In: when they leave this place where do they go?
Res (all): most of them leave for Accra, Ho, Kumasi, Awudome.
In: In your view, what do you think are the factors responsible for out migration of the youth
from the community?
Res 3: they want to go and find money.
Res 4: some go and find work.
Res 5: Some go and stay with either their mother or their father who happens to be in Accra
because staying in the village has become bring to them.
Res: 1 some go and find some work to do.
Res 2: some go and marry over there.
Res 6: some of them go and stay with somebody.
University of Ghana http://ugspace.ug.edu.gh

92
Res 7: some go and find money.
In: what do you think can be done to prevent them from going?
Res 3: when some people leave and they come back they do not have any money. Sometimes
too when they are going back, they sell their things before they are able to go back. When we
all unite and do the farming we will be much better off than the one who claims he has gone
to Accra.
In: What can be done to prevent them from going?
Res 3: we are in the village, so what they have to do to support is to provide us with farm
tools and materials. In this recent moment farming is our only source of income.
In: what kind of support do you want to be given to the youth?
Res 3: we have the lands so if you want to farm you have to get fertilizers and other farm
materials. So if they will give fertilizers and pesticides you will be able to do it on the scale
you want.
Res 6: The reason why they are leaving is that they want work so if they can provide work in
the community, the youth would not leave.
Res 7: I think that if I stay here and do the farming, it is much beneficial because when I am
working in the big cities, the money I will get will just be used for only food and that will be
it. So when I farm here I can sell and use it for something.
Res 6: when you help those of us who want to do the farming, it will encourage others to
come and stay and also do the farming and we will not lack in terms of money.
In: so what kind of help do you want?
Res 6: Pesticides
Res 1: assuming my uncle who is in Accra wants to build a house in the village. He won’t
inform the masons and the labourers in the village but rather bring people from Accra to
University of Ghana http://ugspace.ug.edu.gh
93
come and do the work while there are qualified people in the village who are looking for
work. So I will also think there is work out there and I will also go. What the person should
have done is to come and ask whether there is any mason in the village who can do the work.
Res 4: they should build a factory in this village so that the youth will not leave to the big
cities.
In: Do you accept or think that when the youth migrate, it improves the economic status of
the family
Res 3: most of the youth when they leave it doesn’t improve the condition or the status of
their family because they normally help their families in the farms
Res 2: it improves because when you get money you can come back and help with the health
needs of your parents or even build a house in your hometown.
Res 1: Most of them when they succeed they do not use it for anything. For example we the
iron guys, when we get money what we only think of are to buy expensive phones and
dresses. We do not think about investing it well so that in the future when we do not have we
will go for it.
Res 5: With some of us when our houses get destroyed. The youth outside will send money to
reconstruct it.
Res 6: with some of us, the youth who go and succeed are able to send money for a
businesses to be established and also those who want to do the farming, monies will be sent
to them for their farms. I can even give money to my siblings to farm for me so that when I
come I will continue.
Res 7: some of them when they go, they are able to find themselves a white-collar job. This
makes them invite their siblings to work as a labourers in the company. Or it can help them
get employed in any of the service.
In: Does migration help the household get their basic necessities?
University of Ghana http://ugspace.ug.edu.gh
94
Res 2: when some people migrate and they return they are able to buy fridge.
In: what do they use the fridge for?
Res 2: to sell iced cream.
Res 6: some of them the mattress their mothers’ sleep on are not good so when coming back
they are able to buy mattresses for them.
Res 4: some of them their fathers’ houses are not in good condition so when they come back
they are able to buy cement to renovate the house.
Res 7: When they migrate they get enough money to build houses where they are and also
basic needs would not be a problem for them anymore.
Res 1: When they migrate and they succeed they are able to build a family house in the
village so that the families will be able to live in it.
Res 8: maybe there is no money in the family so when I succeed I will be able to help them in
school.
In: As a result of migration has the household social status changed?
Res 4: when they migrate the population in the family will decrease. Maybe the person might
not get any money when he/she migrates and that brings a lot of burden to the family.
Res 1: when some people migrate they are able to get in touch with good people who can
help them. They even help them travel abroad and they get enough money to help their
families. On the other hand, when some people migrate they join bad companies and they end
up being jailed. Their parents must then find money to go and bail them and then bring them
back to their home.
In: In your view has migration lowered or enhanced the social status people ascribe to
households in this community?
University of Ghana http://ugspace.ug.edu.gh

95
Res 1: with some people you won’t see any sign. However, with others when they were in the
village they were far better than when they went to the big cities and have returned. Some
people even go and learn how to drink at Accra but alcohol is produce here and not in Accra.
You only hear rumours that the person is a drunkard in Accra and truly when the person
comes to the village the story is never different.
In: do you think migration out of agriculture by the youth will affect agricultural
productivity?
Res 2: for instance you are a farmer and you have planted five acres of cocoa and in about the
3 years when the cocoa is bearing fruits, you are called for work in Accra so you leave.
Maybe your parents are also old and they cannot go to the farm regularly. They also do not
have money to hire workers to weed the farm for them. So when the weeds grow it will kill
the cocoa trees. When this happens it can affect agriculture productivity.
Res 4: At other places I will say migration can affect agricultural productivity but at our place
those who leave here to Accra do not engage in any agricultural activity here. So it does not
affect anything in the area here
Res 7: From my point of view when the youth leave the community there will be shortage of
labour that will be needed for the production of agricultural goods to increase. You will
realise that agriculture will be decreasing.
Res 6: when I was in my home town working, I only go to the cassava farm, harvest, sell
some and eat some. It is better than being in Accra. For in instance when I buy cassava dough
it wouldn’t be enough for me. But I also have children. So when I am in the village farming I
will get profit than being in the big city.
Res 1: from my point of view, when the youth go it will be a burden on the parents because
they won’t get enough labour. Food will also be less but if the youth were around they will be
able to do it.
University of Ghana http://ugspace.ug.edu.gh
96
In: Can you say your households have food surplus from last year’s farming season?
Res 1: no, we even buy food
Res 4: no, we don’t even have money, so the little we get we sell them. We don’t even have
food let alone surplus.
In: do you think household’s inability to have surplus food is as a result of youth out-
migration?
Res: (all) yes to some extent.
Res 1: But at times some of the youth who migrated send foodstuff from Accra to their
parents. This includes food that are easily packaged, such as rice, maize, milo bread, beans
and even yam.
In: Can migration out of agriculture affect the livelihood of the households?
Res 6: when people migrate, it affects the status of the families negatively.
Res 1: Migration can affect the livelihood of people. Assuming my father farms and my
mother sells it in order to have an income for the family. My father happens to leave and the
farm grows weeds. My mother on the other hand, does not get anything to sell and that
reduces the family’s income. So it can affect the families.
Res 7: Assuming we are a lot in the family and we are all lazy however there is no money in
the family. We have to farm in order to eat but we are unable to do the farming. Hence, we
are all poor.
Res 5: some parents farm to help their children succeed. Nowadays, most youth do not want
to farm but rather want to go to Accra in order to succeed and that brings a lot of hardships to
their households.
In: Is there any way you think out-migration of the youth can be addressed?
Re: (all) yes
University of Ghana http://ugspace.ug.edu.gh

97
Re 4: our major problem in this village is lack of jobs, so if the government can assist us with
jobs, the youth will stay.
Re 6: Some of us, we need skill training. As for me I need special training so as to acquire
some special skills, so if the government can set up skill training for us, we will be happy and
will not migrate.
Re 7: As for me I will want government to give our farmers tractors to farm because farming
is a difficult work.
Re 3: Some of the youth in this community also migrate because they want to go to big
schools so if we also have the big schools here, they will stay here and school.
In: Thank you
University of Ghana http://ugspace.ug.edu.gh
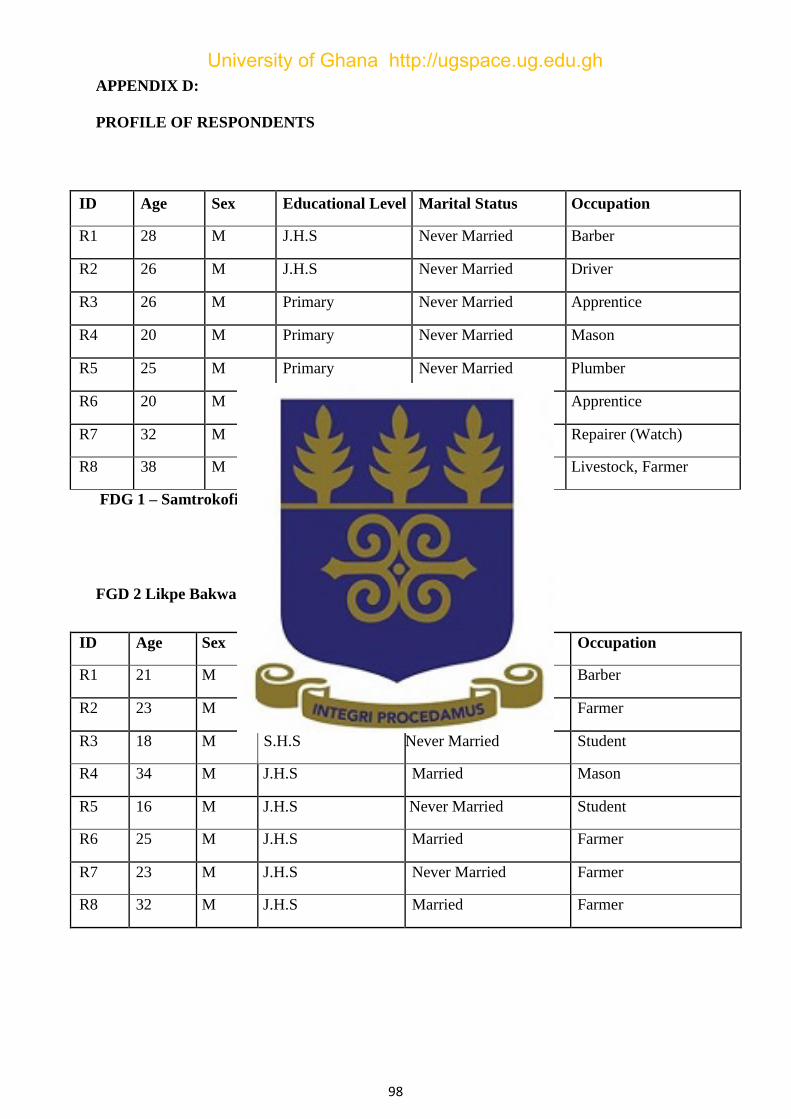
98
APPENDIX D:
PROFILE OF RESPONDENTS
FDG 1 – Samtrokofi Benne
FGD 2 Likpe Bakwa
ID Age Sex Educational Level Marital Status Occupation
R1 21 M J.H.S Married Barber
R2 23 M J.H.S Married Farmer
R3 18 M S.H.S Never Married Student
R4 34 M J.H.S Married Mason
R5 16 M J.H.S Never Married Student
R6 25 M J.H.S Married Farmer
R7 23 M J.H.S Never Married Farmer
R8 32 M J.H.S Married Farmer
ID Age Sex Educational Level Marital Status Occupation
R1 28 M J.H.S Never Married Barber
R2 26 M J.H.S Never Married Driver
R3 26 M Primary Never Married Apprentice
R4 20 M Primary Never Married Mason
R5 25 M Primary Never Married Plumber
R6 20 M J.H.S Married Apprentice
R7 32 M J.H.S Never Married Repairer (Watch)
R8 38 M J.H.S Married Livestock, Farmer
University of Ghana http://ugspace.ug.edu.gh
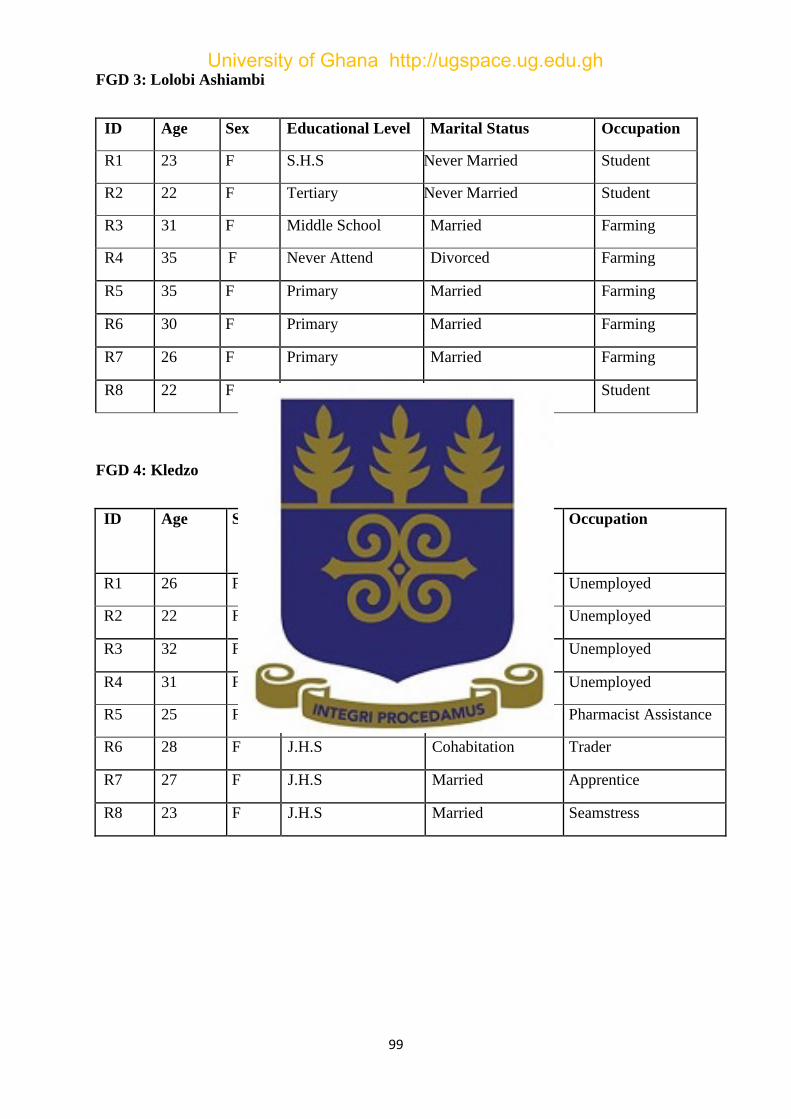
99
FGD 3: Lolobi Ashiambi
ID Age Sex Educational Level Marital Status Occupation
R1 23 F S.H.S Never Married Student
R2 22 F Tertiary Never Married Student
R3 31 F Middle School Married Farming
R4 35 F Never Attend Divorced Farming
R5 35 F Primary Married Farming
R6 30 F Primary Married Farming
R7 26 F Primary Married Farming
R8 22 F S.H.S Never Married Student
FGD 4: Kledzo
ID Age Sex Educational Marital Occupation
Level Status
R1 26 F Primary Never Married Unemployed
R2 22 F S.H.S Cohabitation Unemployed
R3 32 F J.H.S Married Unemployed
R4 31 F S.H.S Never Married Unemployed
R5 25 F Certificate Diploma Never Married Pharmacist Assistance
R6 28 F J.H.S Cohabitation Trader
R7 27 F J.H.S Married Apprentice
R8 23 F J.H.S Married Seamstress
University of Ghana http://ugspace.ug.edu.gh