Embed Size (px)
Citation preview
NOAA Grant No: NA15NOS4000200 Reporting Period: 01/01/2020–12/31/2020
Principal Investigator: Larry A. Mayer
UNH/NOAA Joint Hydrographic Center2020 Performance and Progress Report
JHC Performance Report2
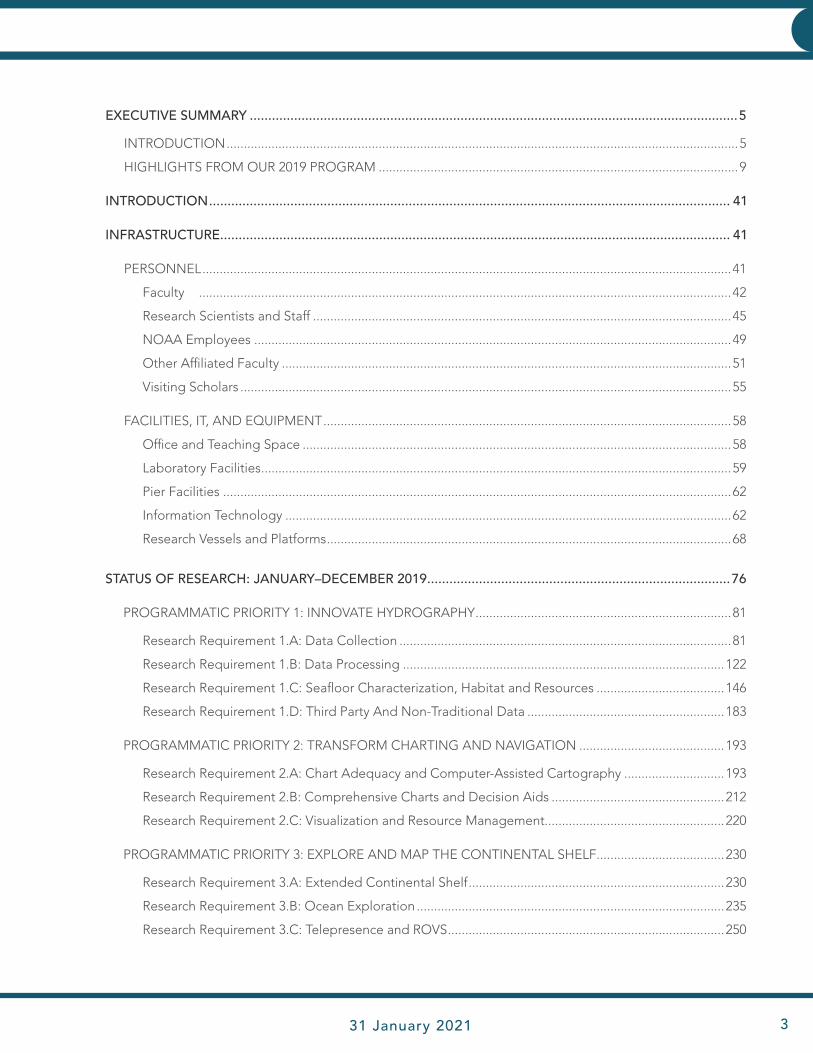
Flyers from the 2020 JHC/CCOM – UNH Dept. of Ocean Engineering Seminar Series.
TABLE OF CONTENTS
JHC Performance Report 31 January 2021 3
EXECUTIVE SUMMARY ....................................................................................................................................5
INTRODUCTION ....................................................................................................................................................5
HIGHLIGHTS FROM OUR 2019 PROGRAM ........................................................................................................9
INTRODUCTION ............................................................................................................................................. 41
INFRASTRUCTURE .......................................................................................................................................... 41
PERSONNEL .........................................................................................................................................................41
Faculty ..........................................................................................................................................................42
Research Scientists and Staff .........................................................................................................................45
NOAA Employees ..........................................................................................................................................49
Other Affiliated Faculty ..................................................................................................................................51
Visiting Scholars ..............................................................................................................................................55
FACILITIES, IT, AND EQUIPMENT ......................................................................................................................58
Office and Teaching Space ............................................................................................................................58
Laboratory Facilities ........................................................................................................................................59
Pier Facilities ...................................................................................................................................................62
Information Technology .................................................................................................................................62
Research Vessels and Platforms .....................................................................................................................68
STATUS OF RESEARCH: JANUARY–DECEMBER 2019 ..................................................................................76
PROGRAMMATIC PRIORITY 1: INNOVATE HYDROGRAPHY ..........................................................................81
Research Requirement 1.A: Data Collection ................................................................................................81
Research Requirement 1.B: Data Processing .............................................................................................122
Research Requirement 1.C: Seafloor Characterization, Habitat and Resources .....................................146
Research Requirement 1.D: Third Party And Non-Traditional Data .........................................................183
PROGRAMMATIC PRIORITY 2: TRANSFORM CHARTING AND NAVIGATION ..........................................193
Research Requirement 2.A: Chart Adequacy and Computer-Assisted Cartography .............................193
Research Requirement 2.B: Comprehensive Charts and Decision Aids ..................................................212
Research Requirement 2.C: Visualization and Resource Management....................................................220
PROGRAMMATIC PRIORITY 3: EXPLORE AND MAP THE CONTINENTAL SHELF .....................................230
Research Requirement 3.A: Extended Continental Shelf ..........................................................................230
Research Requirement 3.B: Ocean Exploration .........................................................................................235
Research Requirement 3.C: Telepresence and ROVS ................................................................................250
TABLE OF CONTENTS
JHC Performance Report4
PROGRAMMATIC PRIORITY 4: HYDROGRAPHIC EXPERTISE ......................................................................252
Research Requirement 4.A: Education .......................................................................................................252
Research Requirement 4.B: Acoustic Propagation and Marine Mammals ..............................................262
Research Requirement 4.C: Publications and R2O ....................................................................................271
Research Requirement 4.D: Outreach .........................................................................................................271
APPENDIX A: GRADUATE DEGREES IN OCEAN MAPPING ......................................................................289
APPENDIX B: FIELD PROGRAMS.................................................................................................................293
APPENDIX C: PARTNERSHIPS AND ANCILLARY PROGRAMS ...................................................................295
APPENDIX D: PUBLICATIONS ......................................................................................................................299
APPENDIX E: TECHNICAL PRESENTATIONS AND INVITED SEMINARS ...................................................304
TABLE OF CONTENTS EXECUTIVE SUMMARY
JHC Performance Report 31 January 2021 5
TABLE OF CONTENTS
he NOAA-UNH Joint Hydrographic Center (JHC/CCOM) was founded twenty-one years ago with the objective of developing tools and offering training that would help NOAA and others to meet the challenges posed by the rapid transition from the sparse measurements of depth offered by traditional sounding techniques (lead lines and single-beam echo sounders) to the massive amounts of data collected by the new generation of multibeam echo sounders. Over the years, the focus of research at the Center has expanded and now encompasses a broad range of ocean mapping technologies and applications, but at its roots, the Center continues to serve NOAA and the nation through the development of tools and approaches that support safe navigation, increase the efficiency of surveying, offer a range of value-added ocean mapping products, and ensure that new generations of hydrographers and ocean mappers receive state-of-the-art training.
An initial goal of the Center was to find ways to process the massive amounts of data generated by multibeam and sidescan sonar systems at rates commensurate with data collection; that is, to make the data ready for chart production as rapidly as the data were collected. We have made great progress over the years in attaining, and now far surpassing this goal, and while we continue our efforts on data processing in support of safe navigation, our attention has also turned to the opportunities provided by this huge flow of information to create a wide range of products that meet needs beyond safe navigation, as well as meet the goals of the National Ocean Mapping Exploration and Characterization Strategy (e.g., marine habitat assessments, gas seep detection, fisher-ies management, disaster mitigation, and national security). Our approach to extracting “value added” from data collected in support of safe navigation was formalized with the enactment on the 30th of March 2009 of the Ocean and Coastal Mapping Integration Act (IOCM). In 2010, the concept of IOCM was clearly demonstrated when we were able to quickly and successfully apply tools and techniques developed for hydrographic and fisher-ies applications to the Deepwater Horizon oil spill crisis.
In the time since our establishment, we have built a vibrant Center with an international reputation as the place, “where the cutting edge of hydrography is now located” (Adam Kerr, Past Director of the International Hydro-graphic Organization in Hydro International). In the words of Pat Sanders, then President of HYPACK Inc., a lead-ing provider of hydrographic software to governments and the private sector:
JHC/CCOM has been THE WORLD LEADER in developing new processing techniques for hydro-graphic data. JHC/CCOM has also shown that they can quickly push new developments out into the marketplace, making both government and private survey projects more efficient and cost effective.”
Since our inception, we have worked on the development of automated and statistically robust approaches to multibeam sonar data processing. These efforts came to fruition when our automated processing algorithm (CUBE) and our new database approach (The Navigation Surface) were, after careful verification and evaluation, accepted by NOAA, the Naval Oceanographic Office, and many other hydrographic agencies, as part of their standard processing protocols. Today, almost every hydrographic software manufacturer has incorporated these approaches into their products. It is not an overstatement to say that these techniques have revolutionized the way NOAA and others in the ocean mapping community are doing hydrography. These new techniques can reduce data processing time by a factor of 30 to 70 and provide a quantification of uncertainty that has never before been achievable in hydrographic data. The result has been: “gained efficiency, reduced costs, improved data quality and consistency, and the ability to put products in the hands of our customers faster,” (Capt. Roger Parsons, former NOAA IOCM Coordinator and Director of NOAA’s Office of Coast Survey).
The acceptance of CUBE and the Navigation Surface represents a paradigm shift for the hydrographic commu-nity—from dealing with individual soundings (reasonable in a world of lead line and single-beam sonar measure-ments) to the acceptance of gridded depth estimates (with associated uncertainty values) as a starting point for hydrographic products. The research needed to support this paradigm shift has been a focus of the Center since its inception and to see it accepted now is truly rewarding. It is also indicative of the role that the Center has played, and will continue to play, in establishing new directions in hydrography and ocean mapping. The next generation of CUBE, CHRT (CUBE with Hierarchical Resolution Techniques) which supports the newly evolving concept of variable resolution grids, has been introduced to the hydrographic community and the innovative approach that CUBE and CHRT offer are now being applied to high-density bathytopo lidar data.
T
“
EXECUTIVE SUMMARY
JHC Performance Report6
EXECUTIVE SUMMARY
Another long-term theme of our research efforts has been our desire to extract information beyond depth (bathymetry) from the mapping systems used by NOAA and others. We have developed a simple-to-use tool (GeoCoder) that generates a sidescan-sonar, or backscatter “mosaic,” a critical first step in the analysis of seafloor character. NOAA and many of our industrial partners have now incorporated GeoCoder into their software prod-ucts. Like CUBE’s role in bathymetric processing, GeoCoder has become the standard approach to backscatter processing. An email from a member of the Biogeography Team of NOAA’s Center for Coastal Monitoring and Assessment said:
We are so pleased with GeoCoder! We jumped in with both feet and made some impressive mosaics. Thanks so much for all the support.”
While GeoCoder is focused on creating backscatter mosaics, BRESS (Bathymetry and Reflectance Based Approach for Seafloor Segmentation) provides tools for the segmentation and analysis of co-located bathymetry and backscatter, dividing the seafloor into a limited number of contiguous areas of similar morphology (land- or geoforms) and backscatter. This tool has found broad application in NOAA and others interested in defining seafloor habitat. BRESS is one of many tools developed at the Center that now form part of HydrOffice—an open-source collaborative effort led by the Center, in collaboration with NOAA, to develop a research software environment with applications to facilitate all phases of the ping-to-chart process. The environment facilitates the creation of new tools for researchers, students, and in the field and speeds up both algorithm testing and the transfer from Research-to-Operation (R2O). Many of these tools are in daily use by NOAA field units, as well as scientists and researchers world-wide.
Beyond GeoCoder, BRESS and the other HydrOffice tools, our efforts to support the IOCM concept of "map once, use many times" are also coming to fruition. Software developed by the Center’s researchers has been in-stalled on several NOAA fisheries vessels equipped with Simrad ME70 fisheries multibeam echo sounders. These sonars were originally designed for mapping pelagic fish schools but, using our software, the sonars are now being used for multiple seabed mapping purposes. For example, data collected on the NOAA Ship Oscar Dyson during an acoustic-trawl survey for walleye pollock was opportunistically processed for seabed characterization in support of essential fish habitat (EFH) and also in support of safety of navigation, including submission for charts and identification of a Danger to Navigation. Seafloor mapping data from the ME70 was used by fisheries scientists to identify optimal sites for fish-traps during a red snapper survey. Scientists on board ship said that the seafloor data provided by Center software was, "invaluable in helping accomplish our trapping objectives on this trip." These tools are now being transitioned to our industrial partners so that fully-supported commercial-grade versions of the software are available to NOAA. All of these examples (CUBE, GeoCoder, and our fisheries sonar tools) are tangible examples of our (and NOAA’s) goal of bringing our research efforts to operational practice (Research to Operations—R2O).
Ed Saade, President of Fugro (USA) Inc., in a statement for the record to the House Transportation and Infrastruc-ture Subcommittee on Coast Guard and Maritime Transportation and Water Resources and Environment1, stated:
…R&D/Innovation initiatives at UNH CCOM JHC, have combined to be the leading technologies creators, developing Multibeam Echo Sounder (MBES) and related applications and improve-ments that have ultimately been adopted and applied, and which have extensively benefitted industry applications. Since the early 2000s, a small sampling list of such applications includes TrueHeave™, MBES Snippets, and Geocoder. This small sampling of applications integrated, into various seabed mapping industries in the United States alone, directly benefits more than $200 million of mapping services annually.“
The tools and products of the Center were also called upon to help with an international disaster—the mysteri-ous loss of Air Malaysia Flight MH370. As part of our GEBCO/Nippon Foundation Bathymetric Training Program, researchers and students in the Center are compiling all available bathymetric data from the Indian Ocean. When
“
“
1Hearing on Federal Maritime Navigation Programs: Interagency Cooperation and Technological Change 19 September 2016. Fugro is the world’s largest survey company with more than 11,000 employees worldwide.
JHC Performance Report 31 January 2021 7
EXECUTIVE SUMMARY
MH370 was lost, the Government of Australia and several major media outlets came to the Center for the best available representations of the seafloor in the vicinity of the crash. The data we provided were used during the search and were displayed both on TV and in print media.
In the last few years, a new generation of multibeam sonars has been developed (in part, as an outgrowth of research done at the Center) that have the capability of mapping targets in the water-column as well as the seafloor. We have been developing visualization tools that allow this water-column data to be viewed in 3D in real-time. Although the ability to map 3D targets in a wide swath around a survey vessel has obvious applica-tions in terms of fisheries targets (and we are working with fisheries scientists to exploit these capabilities), it also allows careful identification of shallow hazards in the water column and may obviate the need for wire sweeps or diver examinations to verify least depths in hydrographic surveys. These water-column mapping tools were a key component to our efforts to map submerged oil and gas seeps and monitor the integrity of the Macondo 252 wellhead as part of the national response to the Deepwater Horizon oil spill. The Center’s seep-mapping efforts continue to be of national and international interest as we begin to use them to help quantify the flux of meth-ane into the ocean and atmosphere and expand them to provide details of subtle, but critical, oceanographic phenomena. The initial water-column studies funded by this grant have led to many new opportunities including follow-up work that has been funded by the National Science Foundation, the Office of Naval Research, the Dept. of Energy, and the Sloan Foundation.
The tools and techniques that we had to quickly develop to find oil and gas in the water column during the Deep-water Horizon disaster have led to important spinoffs in the industrial sector. Again, citing Ed Saade’s statement for the record to the House Transportation and Infrastructure Subcommittees:
More recently, the most significant ground-breaking technology discovery is based on the com-bination of MBES bathymetry, backscatter, and water column collection/detection applications. Initial applications were for a variety of reasons and disciplines, mostly scientific in nature as led by UNH CCOM JHC. These capabilities were quickly recognized by industry experts as new technologies with a variety of applications in the ocean mapping industry, including fisheries, aggregate materials surveys, various engineering design studies, and oil and gas exploration applications.
An initial cost-benefit analysis of the impact in just the oil and gas exploration industry yields the following findings:
• Detection of Seabed Seeps of Hydrocarbons: During the past decade, the utilization of MBES for bathymetry, backscatter, and water column mapping has been directly applied to the detection, precise location, and analysis of seabed gas and oil seeps, mostly in deep water hydrocarbon basins and frontier areas. This scientific application of the methods discovered and perfected under the leadership of NOAA NOS OCS and the CCOM/JHC has been embraced and applied by companies and projects in the United States specifically to aide in the successful exploration and development of oil and gas reserves in water depths exceeding 10,000 feet. These studies provide a service to find seeps, evaluate the seeps chemistry, and determine if the seeps are associated with significant reservoir potential in the area of interest. This information is especially useful as a means to “de-risk” the wildcat well approach and ensure a greater possibility of success. It should be noted that many of the early terrestrial fields used oil seeps and geochemistry to help find the commercial payoffs. This was the original method of finding oil globally in the first half of the 20th century onshore and along the coastline. Estimates run into the millions of barrels (billions of dollars) of oil directly related to, and confirmed by, the modern MBES based seep hunting methodology.
• It is estimated that the current USA-based annual revenue directly related to operating this mapping technology is $70 million per year. Note that this high level of activity continues today, despite the current extreme downturn in the offshore oil and gas industry. The seeps-related industry is expected to grow at an annualized rate of 25% per year. Globally, this value projects to be nearly double, or approximately $130 million per year.”
“
“
JHC Performance Report8
EXECUTIVE SUMMARY
Our ability to image targets in the water column has now gone beyond mapping fish and gas seeps. In the past few years, we have demonstrated the ability of both multibeam and broad-band single beam echo-sounders to image fine-scale oceanographic structure including thermohaline steps (an indicator of the process of mixing between two water masses with different properties and an important mechanism of heat transfer in the ocean), internal waves, turbulence, and the depth of the mixed layer (the thermocline). Most recently, our water column imaging tools have been able to map the depth of the oxygen minimum in the Baltic Sea. This opening of a new world of “acoustic oceanography” with its ability to map ocean structure over long-distance from a vessel while underway, has important ramifications for our ability to understand and model processes of heat transfer in the ocean, as well as our understanding of the impact of the water column structure on seafloor mapping.
As technology evolves, the tools needed to process the data and the range of applications that the data can address will also change. We are now exploring Autonomous Surface Vehicles (ASVs) as platforms for hydro-graphic and other mapping surveys and are looking closely at the capabilities and limitations of Airborne Laser Bathymetry (lidar) and Satellite-Derived Bathymetry (SDB) in shallow-water coastal mapping applications. To further address the critical very-shallow-water regimes we are also looking at the use of small personal water-craft and aerial imagery as tools to measure bathymetry in that difficult zone between zero and ten meters water depth. The Center is also bringing together many of the tools and visualization techniques we have developed to explore what the “Chart of the Future” may look like.
The value of our visualization, water column mapping, and chart of the future capabilities have also been demon-strated by our work with Stellwagen Bank National Marine Sanctuary aimed at facilitating an adaptive approach to reducing the risk of collisions between ships and endangered North American Right Whales in the sanctuary. We have developed 4D (space and time) visualization tools to monitor the underwater behavior of whales as well as to notify vessels of the presence of whales in the shipping lanes and to monitor and analyze vessel traffic patterns. Describing our interaction with this project, the director of the Office of National Marine Sanctuaries, said:
…I am taking this opportunity to thank you for the unsurpassed support and technical expertise that the University of New Hampshire’s Center for Coastal and Ocean Mapping/NOAA-UNH Joint Hydrographic Center provides NOAA’s Office of National Marine Sanctuaries. Our most recent collaboration to produce the innovative marine conservation tool WhaleAlert is a prime example of the important on-going relationship between our organizations. WhaleAlert is a software program that displays all mariner-relevant right whale conservation measures on NOAA nautical charts via iPad and iPhone devices. The North American right whale is one of the world’s most endangered large animals, and its protection is a major NOAA and ONMS responsibility. The creation of WhaleAlert is a major accomplishment as NOAA works to reduce the risk of colli-sion between commercial ships and whales, a major cause of whale mortality.
…WhaleAlert brings ONMS and NOAA into the 21st century of marine conservation. Its develop-ment has only been possible because of the vision, technical expertise, and cooperative spirit that exists at CCOM/JHC and the synergies that such an atmosphere creates. CCOM/JHC represents the best of science and engineering, and I look forward to continuing our highly productive relationship.”
Understanding concerns about the potential impact of anthropogenic sound on the marine environment, we have undertaken a series of studies aimed at quantifying the radiation patterns of our mapping systems. These experiments, carried out at U.S. Navy acoustic ranges, have allowed us to determine the ensonification patterns of our sonars, but also, using the hydrophone arrays at the ranges, to quantitatively track the feeding behavior of sensitive marine mammals (Cuvier beaked whales) during the mapping operations. The results of these studies, now published in peer-reviewed journals, have offered evidence that the mapping sonars we used do not change the feeding behavior of these marine mammals or displace them from the local area. Hopefully, these studies will provide important science-based empirical information for guiding future regulatory regimes.
“
“

JHC Performance Report 31 January 2021 9
EXECUTIVE SUMMARY
Statements from senior NOAA managers and the actions of other hydrographic agencies and the industrial sector provide clear evidence that we are making a real contribution to NOAA, the nation, and the international commu-nity. We will certainly not stop there. CUBE, the Navigation Surface, GeoCoder, water column mapping, the Chart of the Future, our ASV efforts, and HyrdOffice offer frameworks upon which innovations are being built, and new efficiencies gained. Additionally, these achievements provide a starting point for the delivery of a range of hydro-graphic and non-hydrographic mapping products that set the scene for many future research efforts.
Since 2005, the Center has been funded through a series of competitively awarded Cooperative Agreements with NOAA. The most recent of these, which was the result of a national competition, funded the Center for the period of 1 January 2016 until December 2020. This document summarizes the highlights of this NOAA-funded effort during calendar year 2020. While nominally this should represent the final year of the effort on this grant, the unique circumstances of the COVID-19 pandemic have resulted in the request for a No-Cost Extension (NCE) of the grant and thus the final report will be submitted during 2021. Detailed progress reports from this and previous grants can be found at our website http://ccom.unh.edu/reports.
Highlights from Our 2020 ProgramOur efforts in 2020 represent the fifth year of our work in response to a Federal Funding Opportunity (FFO) that defined four programmatic priorities:
Innovate Hydrography Transform Charting and Change NavigationExplore and Map the Continental ShelfDevelop and Advance Hydrographic and Nautical Charting Expertise
Under these, 14 specific research requirements were prescribed (our short name for each research requirement follows the description, highlighted in bold):
Innovate Hydrography
1. Improvement in the effectiveness, efficiency, and data quality of acoustic and lidar bathymetry systems, their associated vertical and horizontal positioning and orientation systems, and other sensor technol-ogy for hydrographic surveying and ocean and coastal mapping, including autonomous data acquisition systems and technology for unmanned vehicles, vessels of opportunity, and trusted partner organizations. Data Collection
2. Improvement in technology and methods for more efficient data processing, quality control, and quality assurance, including the determination and application of measurement uncertainty, of hydrographic and ocean and coastal mapping sensor and ancillary sensor data, and data supporting the identification and mapping of fixed and transient features of the seafloor and in the water column. Data Processing
3. Adaption and improvement of hydrographic survey and ocean mapping technologies for improved coast-al resilience and the location, characterization, and management of critical marine habitat and coastal and continental shelf marine resources. Tools for Seafloor Characterization, Habitat, and Resources
4. Development of improved tools and processes for assessment and efficient application to nautical charts and other hydrographic and ocean and coastal mapping products of data from both authoritative and non-traditional sources. Third Party and Non-traditional Data
JHC Performance Report10
EXECUTIVE SUMMARY
Transform Charting and Change Navigation1. Development of improved methods for managing hydrographic data and transforming hydrographic data
and data in enterprise GIS databases to electronic navigational charts and other operational navigation products. New approaches for the application of GIS and spatial data technology to hydrographic, ocean, and coastal mapping, and nautical charting processes and products. Chart Adequacy and Computer-Assisted Cartography
2. Development of innovative approaches and concepts for electronic navigation charts and for other tools and techniques supporting marine navigation situational awareness, such as prototypes that are real-time and predictive, are comprehensive of all navigation information (e.g., charts, bathymetry, models, currents, wind, vessel traffic, etc.), and support the decision process (e.g., under-keel clearance manage-ment). Comprehensive Charts and Decision Aids
3. Improvement in the visualization, presentation, and display of hydrographic and ocean and coastal mapping data, including four-dimensional high-resolution visualization, real-time display of mapping data, and mapping and charting products for marine navigation as well as coastal and ocean resource management and coastal resilience. Visualization
Explore and Map the Continental Shelf1. Advancements in planning, acquisition, understanding, and interpretation of continental shelf, slope, and
rise seafloor mapping data, particularly for the purpose of delimiting the U.S. Extended Continental Shelf. Extended Continental Shelf
2. Development of new technologies and approaches for integrated ocean and coastal mapping, including technology for creating new products for non-traditional applications and uses of ocean and coastal mapping. Ocean Exploration Technologies and IOCM
3. Improvements in technology for integration of ocean mapping with other deep ocean and littoral zone technologies such as remotely operated vehicles and telepresence-enhanced exploration missions at sea. Telepresence and ROVs
Develop and Advance Hydrographic and Nautical Charting Expertise1. Development, maintenance, and delivery of advanced curricula and short courses in hydrographic and
ocean mapping science and engineering at the graduate education level—leveraging to the maximum extent the proposed research program, and interacting with national and international professional bodies—to bring the latest innovations and standards into the graduate educational experience for both full-time education and continuing professional development. Education
2. Development, evaluation, and dissemination of improved models and visualizations for describing and delineating the propagation and levels of sound from acoustic devices including echo sounders, and for modeling the exposure of marine animals to propagated echo sounder energy. Acoustic Propagation and Marine Mammals
3. Effective delivery of research and development results through scientific and technical journals and forums and transition of research and development results to an operational status through direct and indirect mechanisms including partnerships with public and private entities. Publications and R2O
4. Public education and outreach to convey the aims and enhance the application of hydrography, nautical charting, and ocean and coastal mapping to safe and efficient marine navigation and coastal resilience. Outreach
To address the four programmatic priorities and 14 research requirements, the Center divided the research requirements into themes and sub-themes and responded with 60 individual research tasks, each with an identi-fied investigator, or group of investigators, as the lead. As our research progresses and evolves, the boundaries between the themes, programmatic priorities, research requirements, and tasks, sometimes become blurred. For example, from an initial focus on sonar sensors, we have expanded our efforts to include lidar and satellite imag-

JHC Performance Report 31 January 2021 11
EXECUTIVE SUMMARY
ery. Our data-processing tools are finding applications in habitat characterization, mid-water mapping, and IOCM efforts. The data-fusion and visualization projects are also blending with our seafloor characterization, habitat, and Chart of the Future efforts as we begin to define new sets of “non-traditional” products. This blending is a natural (and desirable) evolution that slowly evolves the nature of the programs and the details of our efforts. This evolu-tion is constantly being reviewed by Center management, and the Program Manager, and tasks are adjusted as they are completed, merge, or are modified due to changes in personnel (e.g., the loss of Shachak Pe’eri from the Center faculty when he became a NOAA employee and moved to Silver Spring, or the loss of David Mosher due to his election to the Committee on the Limits of the Continental Shelf). This process is essential to allow innova-tion to flourish under the cooperative agreement.
As we complete the fifth year of effort, the updated tasks are presented in Figure ES-1. Note that when tasks are closed out, merged or completed, we have chosen not to renumber the other tasks so that there is continuity of reporting throughout the duration of the grant.
Figure ES-1. Current breakdown of Programmatic Priorities and Research Requirements of FFO into individual projects or tasks.
JHC Performance Report12
EXECUTIVE SUMMARY
There can be no question that 2020 was a very different and taxing year with respect to carrying on our research efforts. For much of the year, the University was locked down and travel (and thus field programs) banned with inevitable consequences on research productivity (these are detailed on a project-by-project basis in the full progress report). Nonetheless, to the great credit of the JHC faculty, staff, and students, research efforts were carried on from home and through endless virtual gatherings, and there is still much to report and be proud of. This executive summary offers an overview of just a few of the Center’s 2020 efforts through the presentation of a subset of ongoing tasks within the context of the four major programmatic priorities; the complete progress report with descriptions of all efforts and the Center’s facilities can be found at http://ccom.unh.edu/reports.
Figure ES-2. A typical class in 2020.

JHC Performance Report 31 January 2021 13
EXECUTIVE SUMMARY
Programmatic Priority 1: Innovate Hydrography
Data Collectionand frequencies. However, the backscatter data collected by multibeam echosounders is typically uncalibrated, limiting its useability to qualitative data products. Multibeam echosounder calibration is not a trivial task and continues to be a difficult hurdle in obtaining accurate and repeatable backscatter mea-surements. Towards this end, the Center continues to leverage its state-of-the art-facilities to develop and test new backscatter calibration methodologies.
The Center undertook an extensive series of calibra-tions of a Reson T50P multibeam sonar at multiple frequencies using an extended chain calibration target approach developed by Tom Weber and graduate student John Heaton. Backscatter from the chain target is collected with the calibrated EK80 echo-sounders to determine the chain target’s frequency-dependent backscattering cross section, at which point the chain target becomes ‘calibrated’ itself. The now-calibrated chain target is then en-sonified by a Reson T50-P at frequencies between 200 and 400 kHz, in 50 kHz steps, and at angles between ±70 degrees (Figure ES-3). This results in frequency- and angle-dependent calibration curves for the T50-P, which can then be applied to seafloor backscatter collected during field work. There are two key advantages of this type of calibration—each of the steps requires an hour or two in the tank, requir-
State-of-the-Art Sonar Calibration FacilityWe continue to work closely with NOAA and the manufacturers of sonar and lidar systems to better understand and calibrate the behavior of the sensors used to make the hydrographic and other measure-ments used for ocean mapping. Many of these take advantage of our unique acoustic test tank facil-ity, the largest of its kind in New England, and now equipped with state-of-the-art test and calibration facilities. Upgrades to the calibration facility made by the Center include continuous monitoring of tem-perature and sound speed, a computer-controlled standard-target positioning system (z-direction), a custom-built vertical positioning system for the stan-dard reference hydrophone, and the capability for performing automated 2D beam-pattern measure-ments.
The facility is routinely used by Center research-ers, and others, for now-routine measurements of beam pattern, driving-point impedance, transmitting voltage response (TVR), and receive sensitivity (RS). In 2020, most operations at the acoustic tank were suspended for a long period due to the COVID-19 pandemic. A few operations considered essential research were allowed after safety protocols were established, including measurements of impedance and performance evaluation of an MSI High Frequen-cy - Constant Beam Width (HF- CBW) transducer; beam pattern measure-ments of a hydrophone array from Mitre Corporation, and beam pattern, impedance, and TVR measurements of a semi-circular projector prototype from Edgetech.
Backscatter CalibrationThe collection of acoustic backscatter data continues to be an area of active interest across the research and indus-trial communities for its ability to infer characteristics of the seafloor. The large swaths and wide bandwidths of modern multibeam echosounders (MBES) permits the user to efficiently collect co-registered bathymetry and seafloor backscatter at many angles
Figure ES-3. The calibration procedure associated with the chain target. From left to right: sphere calibration of the EK80; chain target calibration with the EK80; Reson T50P calibration with the chain target; field data collection with a calibrated multibeam echo sounder.
JHC Performance Report14
EXECUTIVE SUMMARY
ing a total of a few days' work when calibrating all five frequencies (200, 250, 300, 350, 400 kHz) rather than the weeks required for standard calibra-tion; and the chain target acts as an extended target similar to the seafloor and, consequently, incorporates both system transmit/receive sensitivities AND errors in assumed beamwidth/pulse length that are used for ensoni-fied area calculations. The approaches developed here can be applied to any other multibeam system that can be brought into the tank and open up important new possibilities for the collection of truly calibrated seafloor backscatter data.
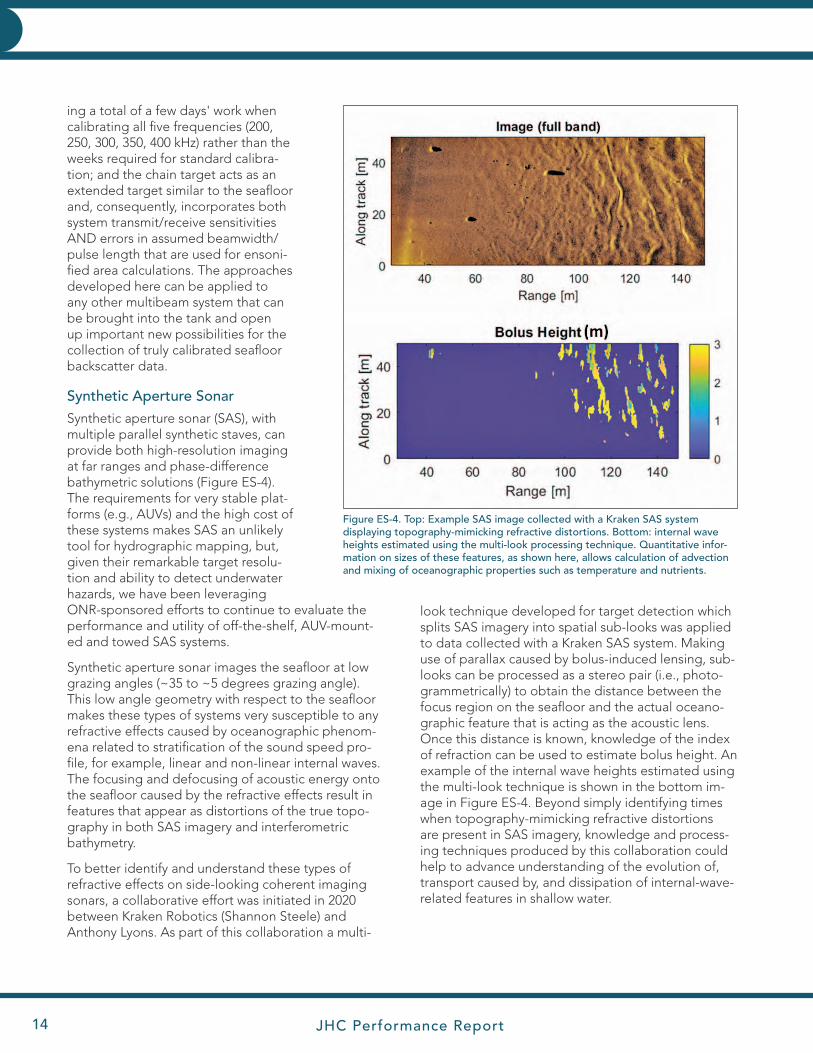
Synthetic Aperture SonarSynthetic aperture sonar (SAS), with multiple parallel synthetic staves, can provide both high-resolution imaging at far ranges and phase-difference bathymetric solutions (Figure ES-4). The requirements for very stable plat-forms (e.g., AUVs) and the high cost of these systems makes SAS an unlikely tool for hydrographic mapping, but, given their remarkable target resolu-tion and ability to detect underwater hazards, we have been leveraging ONR-sponsored efforts to continue to evaluate the performance and utility of off-the-shelf, AUV-mount-ed and towed SAS systems.
Synthetic aperture sonar images the seafloor at low grazing angles (~35 to ~5 degrees grazing angle). This low angle geometry with respect to the seafloor makes these types of systems very susceptible to any refractive effects caused by oceanographic phenom-ena related to stratification of the sound speed pro-file, for example, linear and non-linear internal waves. The focusing and defocusing of acoustic energy onto the seafloor caused by the refractive effects result in features that appear as distortions of the true topo-graphy in both SAS imagery and interferometric bathymetry.
To better identify and understand these types of refractive effects on side-looking coherent imaging sonars, a collaborative effort was initiated in 2020 between Kraken Robotics (Shannon Steele) and Anthony Lyons. As part of this collaboration a multi-
look technique developed for target detection which splits SAS imagery into spatial sub-looks was applied to data collected with a Kraken SAS system. Making use of parallax caused by bolus-induced lensing, sub-looks can be processed as a stereo pair (i.e., photo-grammetrically) to obtain the distance between the focus region on the seafloor and the actual oceano-graphic feature that is acting as the acoustic lens. Once this distance is known, knowledge of the index of refraction can be used to estimate bolus height. An example of the internal wave heights estimated using the multi-look technique is shown in the bottom im-age in Figure ES-4. Beyond simply identifying times when topography-mimicking refractive distortions are present in SAS imagery, knowledge and process-ing techniques produced by this collaboration could help to advance understanding of the evolution of, transport caused by, and dissipation of internal-wave-related features in shallow water.
Figure ES-4. Top: Example SAS image collected with a Kraken SAS system displaying topography-mimicking refractive distortions. Bottom: internal wave heights estimated using the multi-look processing technique. Quantitative infor-mation on sizes of these features, as shown here, allows calculation of advection and mixing of oceanographic properties such as temperature and nutrients.
JHC Performance Report 31 January 2021 15
EXECUTIVE SUMMARY
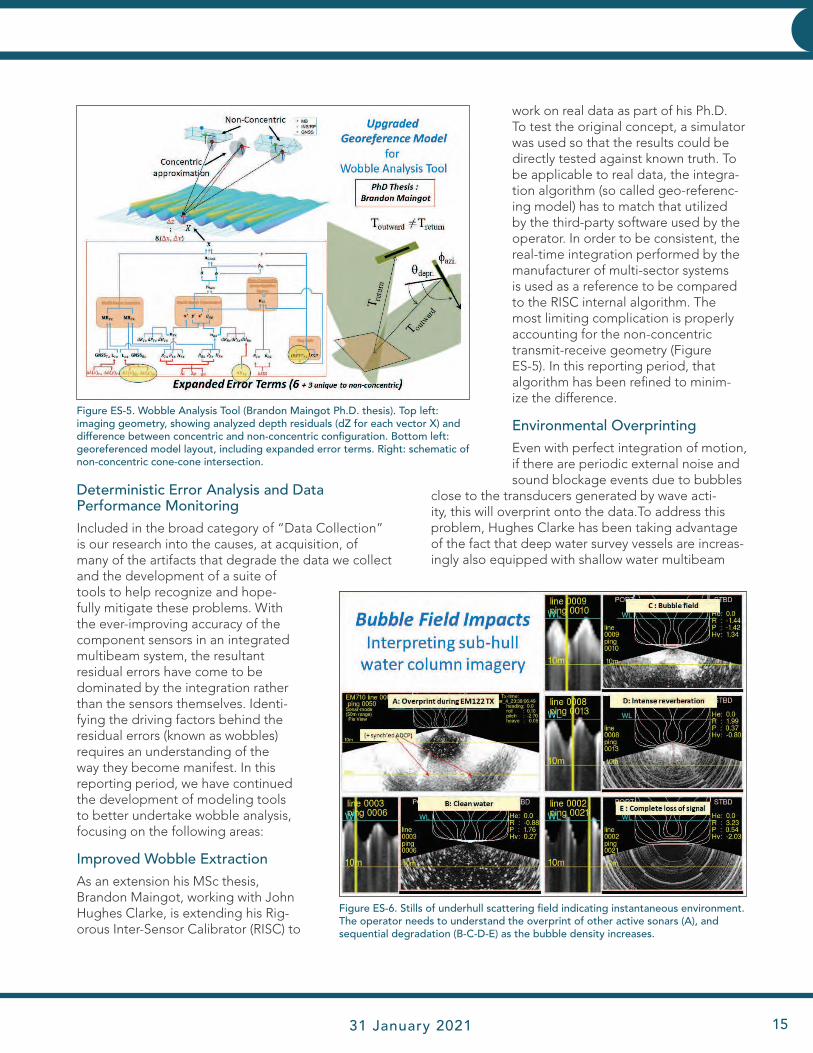
Deterministic Error Analysis and Data Performance MonitoringIncluded in the broad category of “Data Collection” is our research into the causes, at acquisition, of many of the artifacts that degrade the data we collect and the development of a suite of tools to help recognize and hope-fully mitigate these problems. With the ever-improving accuracy of the component sensors in an integrated multibeam system, the resultant residual errors have come to be dominated by the integration rather than the sensors themselves. Identi-fying the driving factors behind the residual errors (known as wobbles) requires an understanding of the way they become manifest. In this reporting period, we have continued the development of modeling tools to better undertake wobble analysis, focusing on the following areas:
Improved Wobble ExtractionAs an extension his MSc thesis, Brandon Maingot, working with John Hughes Clarke, is extending his Rig-orous Inter-Sensor Calibrator (RISC) to
work on real data as part of his Ph.D. To test the original concept, a simulator was used so that the results could be directly tested against known truth. To be applicable to real data, the integra-tion algorithm (so called geo-referenc-ing model) has to match that utilized by the third-party software used by the operator. In order to be consistent, the real-time integration performed by the manufacturer of multi-sector systems is used as a reference to be compared to the RISC internal algorithm. The most limiting complication is properly accounting for the non-concentric transmit-receive geometry (Figure ES-5). In this reporting period, that algorithm has been refined to minim- ize the difference.
Environmental OverprintingEven with perfect integration of motion, if there are periodic external noise and sound blockage events due to bubbles
close to the transducers generated by wave acti-ity, this will overprint onto the data.To address this problem, Hughes Clarke has been taking advantage of the fact that deep water survey vessels are increas-ingly also equipped with shallow water multibeam
Figure ES-5. Wobble Analysis Tool (Brandon Maingot Ph.D. thesis). Top left: imaging geometry, showing analyzed depth residuals (dZ for each vector X) and difference between concentric and non-concentric configuration. Bottom left: georeferenced model layout, including expanded error terms. Right: schematic of non-concentric cone-cone intersection.
Figure ES-6. Stills of underhull scattering field indicating instantaneous environment. The operator needs to understand the overprint of other active sonars (A), and sequential degradation (B-C-D-E) as the bubble density increases.
JHC Performance Report16
EXECUTIVE SUMMARY
sonars. While this second sonar cannot track the bottom in deep water, it can be set to “sonar mode” in order to image the volume scattering field within a few 10s to 100s of meters below the hull (Figure ES-6). This was originally developed in 2016 to look at the shallow oceanographic layering to view evidence of internal wave activity of other structural changes in the thermocline. What became apparent however, is that the method was also capable of seeing bubble clouds and understanding their impact on multibeam sonar products.
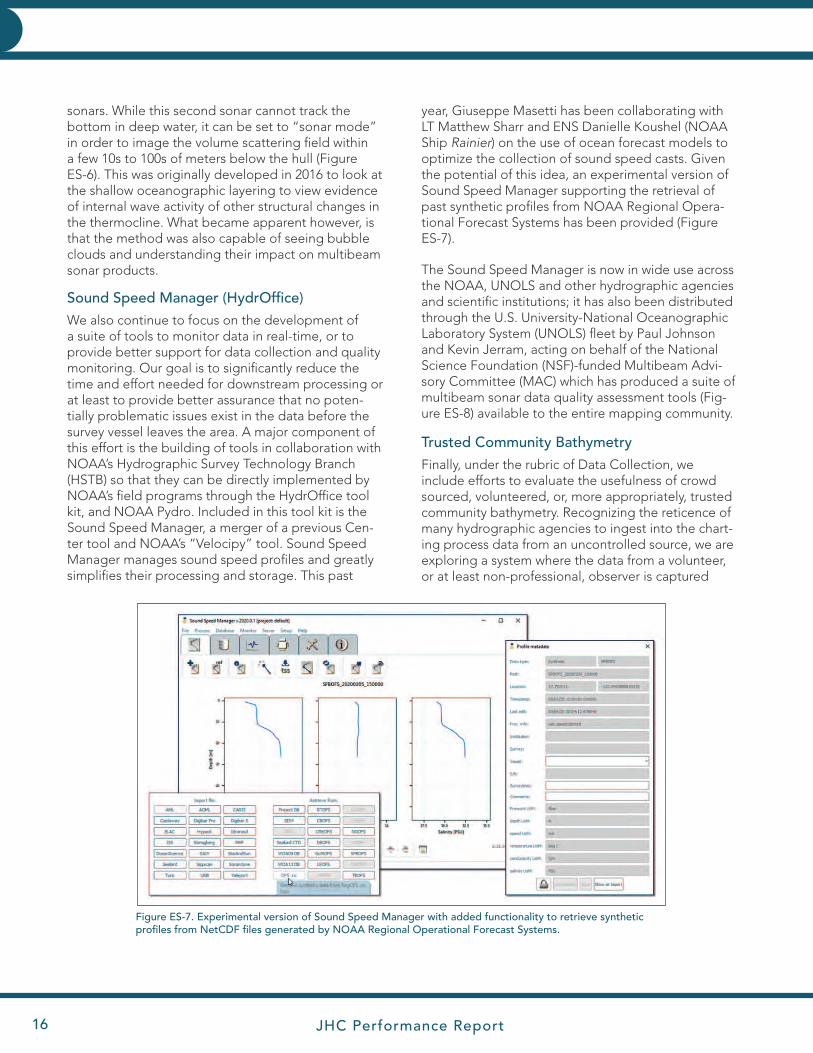
Sound Speed Manager (HydrOffice)We also continue to focus on the development of a suite of tools to monitor data in real-time, or to provide better support for data collection and quality monitoring. Our goal is to significantly reduce the time and effort needed for downstream processing or at least to provide better assurance that no poten-tially problematic issues exist in the data before the survey vessel leaves the area. A major component of this effort is the building of tools in collaboration with NOAA’s Hydrographic Survey Technology Branch (HSTB) so that they can be directly implemented by NOAA’s field programs through the HydrOffice tool kit, and NOAA Pydro. Included in this tool kit is the Sound Speed Manager, a merger of a previous Cen-ter tool and NOAA’s “Velocipy” tool. Sound Speed Manager manages sound speed profiles and greatly simplifies their processing and storage. This past
year, Giuseppe Masetti has been collaborating with LT Matthew Sharr and ENS Danielle Koushel (NOAA Ship Rainier) on the use of ocean forecast models to optimize the collection of sound speed casts. Given the potential of this idea, an experimental version of Sound Speed Manager supporting the retrieval of past synthetic profiles from NOAA Regional Opera-tional Forecast Systems has been provided (Figure ES-7).
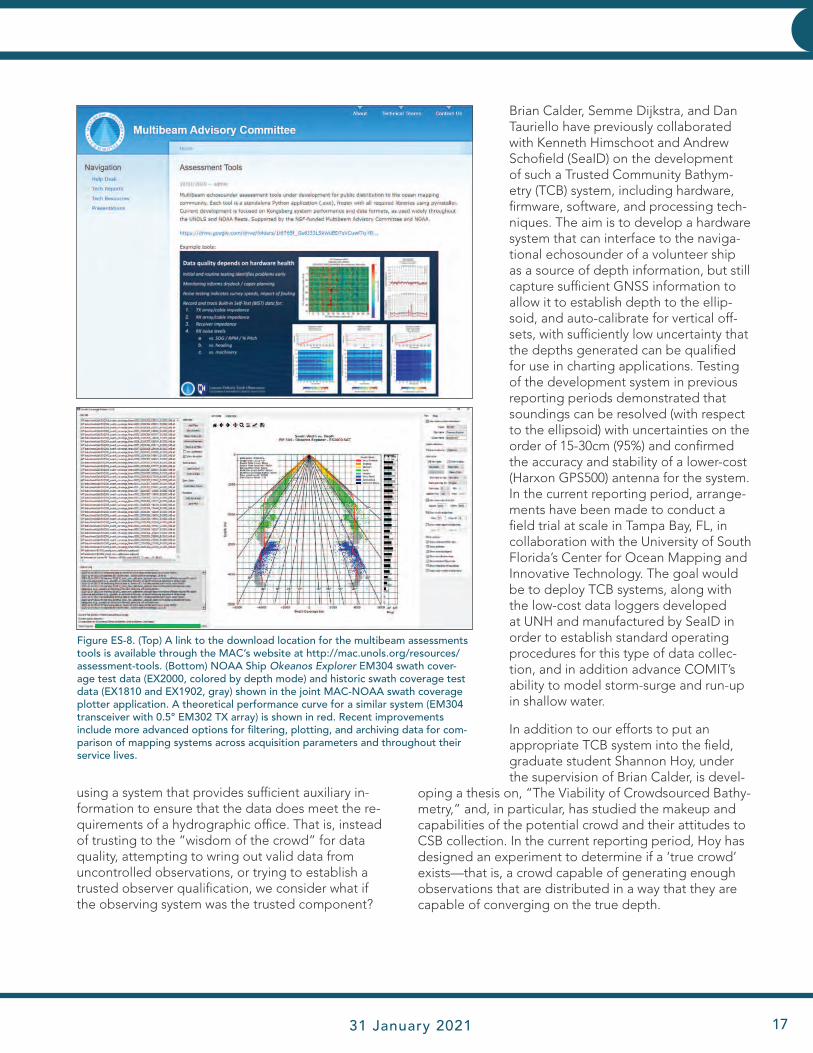
The Sound Speed Manager is now in wide use across the NOAA, UNOLS and other hydrographic agencies and scientific institutions; it has also been distributed through the U.S. University-National Oceanographic Laboratory System (UNOLS) fleet by Paul Johnson and Kevin Jerram, acting on behalf of the National Science Foundation (NSF)-funded Multibeam Advi-sory Committee (MAC) which has produced a suite of multibeam sonar data quality assessment tools (Fig-ure ES-8) available to the entire mapping community.
Trusted Community BathymetryFinally, under the rubric of Data Collection, we include efforts to evaluate the usefulness of crowd sourced, volunteered, or, more appropriately, trusted community bathymetry. Recognizing the reticence of many hydrographic agencies to ingest into the chart-ing process data from an uncontrolled source, we are exploring a system where the data from a volunteer, or at least non-professional, observer is captured
Figure ES-7. Experimental version of Sound Speed Manager with added functionality to retrieve synthetic profiles from NetCDF files generated by NOAA Regional Operational Forecast Systems.
JHC Performance Report 31 January 2021 17
EXECUTIVE SUMMARY
using a system that provides sufficient auxiliary in-formation to ensure that the data does meet the re-quirements of a hydrographic office. That is, instead of trusting to the “wisdom of the crowd” for data quality, attempting to wring out valid data from uncontrolled observations, or trying to establish a trusted observer qualification, we consider what if the observing system was the trusted component?
Brian Calder, Semme Dijkstra, and Dan Tauriello have previously collaborated with Kenneth Himschoot and Andrew Schofield (SeaID) on the development of such a Trusted Community Bathym-etry (TCB) system, including hardware, firmware, software, and processing tech-niques. The aim is to develop a hardware system that can interface to the naviga-tional echosounder of a volunteer ship as a source of depth information, but still capture sufficient GNSS information to allow it to establish depth to the ellip-soid, and auto-calibrate for vertical off-sets, with sufficiently low uncertainty that the depths generated can be qualified for use in charting applications. Testing of the development system in previous reporting periods demonstrated that soundings can be resolved (with respect to the ellipsoid) with uncertainties on the order of 15-30cm (95%) and confirmed the accuracy and stability of a lower-cost (Harxon GPS500) antenna for the system. In the current reporting period, arrange-ments have been made to conduct a field trial at scale in Tampa Bay, FL, in collaboration with the University of South Florida’s Center for Ocean Mapping and Innovative Technology. The goal would be to deploy TCB systems, along with the low-cost data loggers developed at UNH and manufactured by SeaID in order to establish standard operating procedures for this type of data collec-tion, and in addition advance COMIT’s ability to model storm-surge and run-up in shallow water.
In addition to our efforts to put an appropriate TCB system into the field, graduate student Shannon Hoy, under the supervision of Brian Calder, is devel-
oping a thesis on, “The Viability of Crowdsourced Bathy-metry,” and, in particular, has studied the makeup and capabilities of the potential crowd and their attitudes to CSB collection. In the current reporting period, Hoy has designed an experiment to determine if a ‘true crowd’ exists—that is, a crowd capable of generating enough observations that are distributed in a way that they are capable of converging on the true depth.
Figure ES-8. (Top) A link to the download location for the multibeam assessments tools is available through the MAC’s website at http://mac.unols.org/resources/assessment-tools. (Bottom) NOAA Ship Okeanos Explorer EM304 swath cover-age test data (EX2000, colored by depth mode) and historic swath coverage test data (EX1810 and EX1902, gray) shown in the joint MAC-NOAA swath coverage plotter application. A theoretical performance curve for a similar system (EM304 transceiver with 0.5° EM302 TX array) is shown in red. Recent improvements include more advanced options for filtering, plotting, and archiving data for com-parison of mapping systems across acquisition parameters and throughout their service lives.

JHC Performance Report18
EXECUTIVE SUMMARY
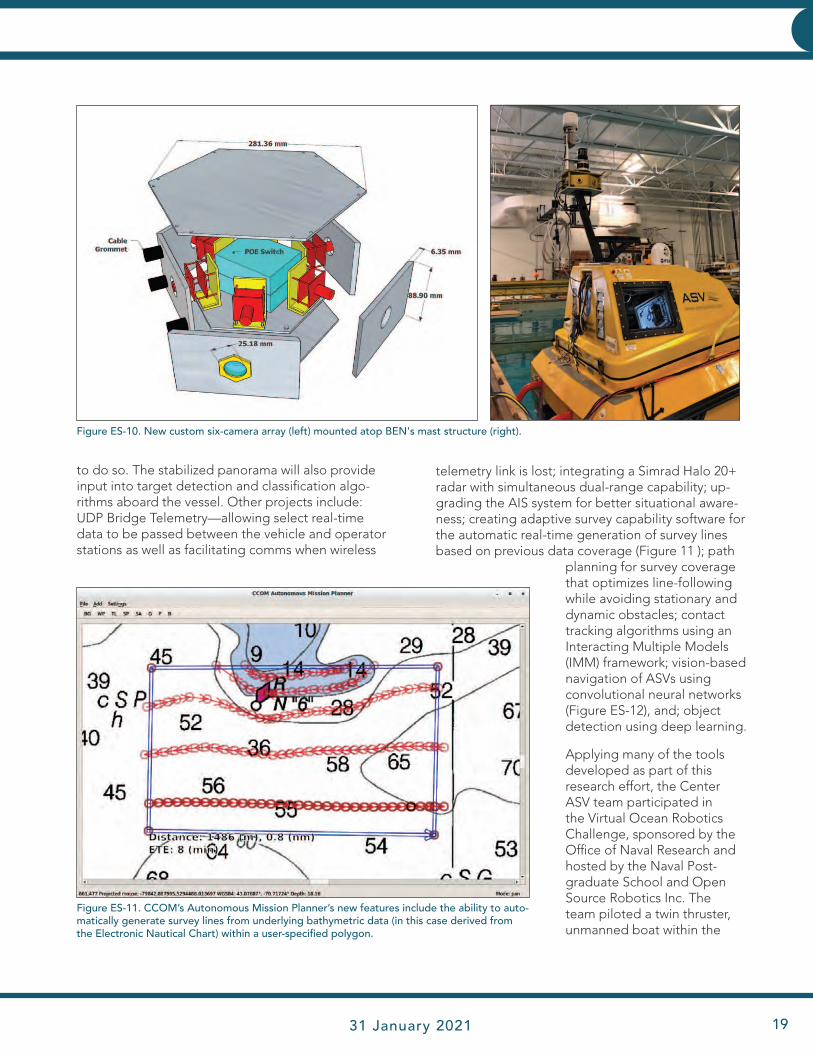
The marine autonomy group within the Center focuses on the practical use of robotic systems for marine science, particularly seafloor survey. Practi-cal autonomy is defined here as the engineering of systems and processes that make operation of robotic vehicles safe, effective, and efficient. These systems and processes are designed to mitigate the operational risk of an operation by increasing the autonomy and reliability of its sensors and algo-rithms. Practical autonomy is viewed in a holistic way, including not only the safe navigation of the vehicle through the environment, but also the systems and processes that allow for unattended operation of sonars, data quality monitoring, and even data pro-cessing, and allow for operator-guided operation of these systems when necessary. Efforts this past year have included- development of 360-degree camera system (Figure ES-10) and algorithms for stabiliza-tion of panoramic images to provide an operator with a low latency, real-time, 360-degree image free from the rolling and pitching of the vehicle, while simultaneously reducing the necessary bandwidth
Use of Autonomous Surface Vessels for HydrographyIn our efforts to explore approaches to increas-ing operational survey efficiency and the quality of hydrographic survey data, the Center has embarked on a major research effort focused on evaluating the promise of autonomous surface vehicles (ASVs) for seafloor survey, and to add capability and practical functionality to these vehicles with respect to hydro-graphic applications. In support of this effort, the Center has acquired, through purchase, donation, or loan, several ASVs. The Bathymetric Explorer and Navigator (BEN), a C-Worker 4 model vehicle, was the result of collaborative design efforts between the Center and ASV Global LLC beginning in 2015 and was delivered in 2016. Teledyne Oceanscience donat-ed a Z-boat ASV, also in 2016, and Seafloor Systems donated an Echoboat in early 2018. A Hydronaulix EMILY boat, donated by NOAA, is in the process of a refit and, most recently, through the Center’s indus-trial partnership program, the Center has acquired access to a new iXblue DriX ASV (Figure ES-9).
Figure ES-9. The Center’s fleet of Autonomous Surface Vessels.
ASV Global W-4Bathymetric Explorer and Navigator - BEN
IXBlue DriX
Seafloor Systems Echoboat
Teledyne Oceansciences Z-Boat
Hydronalix EMILY Boat
JHC Performance Report 31 January 2021 19
EXECUTIVE SUMMARY
to do so. The stabilized panorama will also provide input into target detection and classification algo-rithms aboard the vessel. Other projects include: UDP Bridge Telemetry—allowing select real-time data to be passed between the vehicle and operator stations as well as facilitating comms when wireless
telemetry link is lost; integrating a Simrad Halo 20+ radar with simultaneous dual-range capability; up-grading the AIS system for better situational aware-ness; creating adaptive survey capability software for the automatic real-time generation of survey lines based on previous data coverage (Figure 11 ); path
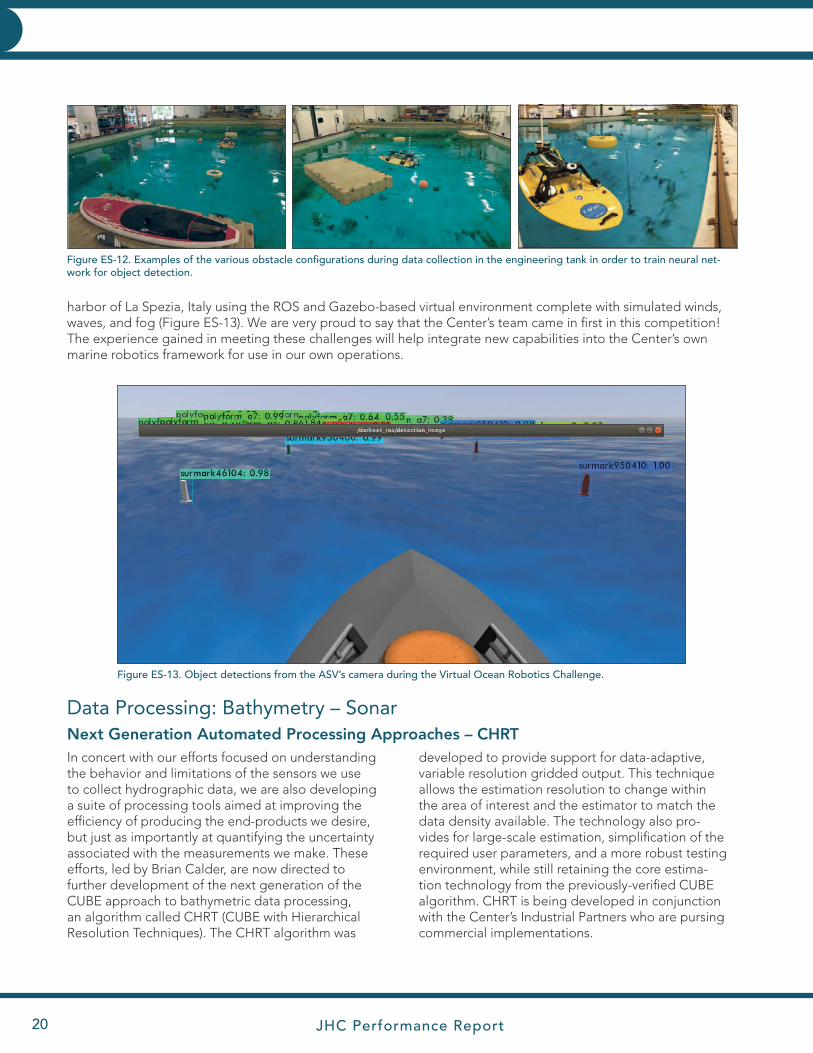
planning for survey coverage that optimizes line-following while avoiding stationary and dynamic obstacles; contact tracking algorithms using an Interacting Multiple Models (IMM) framework; vision-based navigation of ASVs using convolutional neural networks (Figure ES-12), and; object detection using deep learning.
Applying many of the tools developed as part of this research effort, the Center ASV team participated in the Virtual Ocean Robotics Challenge, sponsored by the Office of Naval Research and hosted by the Naval Post- graduate School and Open Source Robotics Inc. The team piloted a twin thruster, unmanned boat within the
Figure ES-10. New custom six-camera array (left) mounted atop BEN's mast structure (right).
Figure ES-11. CCOM’s Autonomous Mission Planner’s new features include the ability to auto-matically generate survey lines from underlying bathymetric data (in this case derived from the Electronic Nautical Chart) within a user-specified polygon.
JHC Performance Report20
EXECUTIVE SUMMARY
harbor of La Spezia, Italy using the ROS and Gazebo-based virtual environment complete with simulated winds, waves, and fog (Figure ES-13). We are very proud to say that the Center’s team came in first in this competition! The experience gained in meeting these challenges will help integrate new capabilities into the Center’s own marine robotics framework for use in our own operations.
Data Processing: Bathymetry – SonarNext Generation Automated Processing Approaches – CHRT
Figure ES-13. Object detections from the ASV’s camera during the Virtual Ocean Robotics Challenge.
Figure ES-12. Examples of the various obstacle configurations during data collection in the engineering tank in order to train neural net-work for object detection.
In concert with our efforts focused on understanding the behavior and limitations of the sensors we use to collect hydrographic data, we are also developing a suite of processing tools aimed at improving the efficiency of producing the end-products we desire, but just as importantly at quantifying the uncertainty associated with the measurements we make. These efforts, led by Brian Calder, are now directed to further development of the next generation of the CUBE approach to bathymetric data processing, an algorithm called CHRT (CUBE with Hierarchical Resolution Techniques). The CHRT algorithm was
developed to provide support for data-adaptive, variable resolution gridded output. This technique allows the estimation resolution to change within the area of interest and the estimator to match the data density available. The technology also pro-vides for large-scale estimation, simplification of the required user parameters, and a more robust testing environment, while still retaining the core estima-tion technology from the previously-verified CUBE algorithm. CHRT is being developed in conjunction with the Center’s Industrial Partners who are pursing commercial implementations.
JHC Performance Report 31 January 2021 21
EXECUTIVE SUMMARY
Although the core CHRT algorithm is in principle complete and has been licensed to Center Industrial Partners for im-plementation, modifications—some significant—continue to be made as the research progresses. In the current report-ing period for example, we have undertaken a collaboration with two industrial partners (QPS and iXblue) to prototype a CHRT-enabled processing scheme loosely coupled to Qimera. The goal of the project is to allow iXblue to explore and develop processing workflows that allow them to use CHRT for hydrographic surveys. In addition, a distributed version of the CHRT algorithm has been demonstrated and is undergoing testing and we have opened discussions with several providers of cloud-based hydrographic data services on the potential for a proof-of-concept demonstration of CHRT in the cloud and, in collaboration with the Seabed 2030 program, have begun investigation of methods and architectures for cloud-native processing for bathymetric data. Finally, we are beginning to apply machine and deep learning techniques originally developed for lidar data pro-cessing (see below) to bathymetric data processing.
Streamlining the NOAA Hydrographic Processing Workflow: HydrOffice
We continue to work closely with NOAA Office of Coast Survey (OCS) to identify challenges and needs, both in the field and in the office, facing those doing hydrographic pro-cessing using current NOAA tools. Since 2015, the Center has collaborated with NOAA HSTB personnel to develop a suite of analysis tools designed specifically to address quality control of problems discovered in the NOAA hydro-graphic workflow. Built within the HydrOffice tool-support framework (https://www.hydroffice.org), the resulting QC Tools were released in June 2016, and have since been en-thusiastically adopted by NOAA field units and processing branches. Yearly updates and edits to NOAA’s Hydrographic Survey Specifications and Deliverables are now made with an eye toward automation, anticipating implementation via QC Tools.
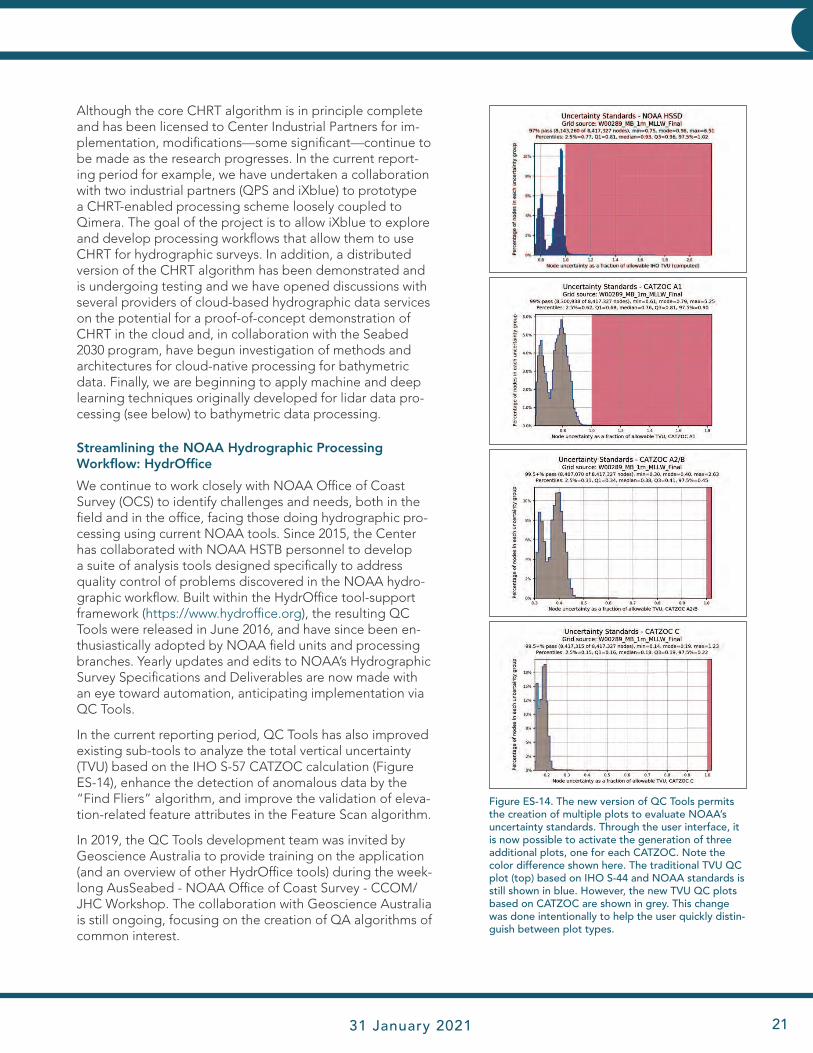
In the current reporting period, QC Tools has also improved existing sub-tools to analyze the total vertical uncertainty (TVU) based on the IHO S-57 CATZOC calculation (Figure ES-14), enhance the detection of anomalous data by the “Find Fliers” algorithm, and improve the validation of eleva-tion-related feature attributes in the Feature Scan algorithm.
In 2019, the QC Tools development team was invited by Geoscience Australia to provide training on the application (and an overview of other HydrOffice tools) during the week-long AusSeabed - NOAA Office of Coast Survey - CCOM/JHC Workshop. The collaboration with Geoscience Australia is still ongoing, focusing on the creation of QA algorithms of common interest.
Figure ES-14. The new version of QC Tools permits the creation of multiple plots to evaluate NOAA’s uncertainty standards. Through the user interface, it is now possible to activate the generation of three additional plots, one for each CATZOC. Note the color difference shown here. The traditional TVU QC plot (top) based on IHO S-44 and NOAA standards is still shown in blue. However, the new TVU QC plots based on CATZOC are shown in grey. This change was done intentionally to help the user quickly distin-guish between plot types.
JHC Performance Report22
EXECUTIVE SUMMARY
Data Processing: Bathymetry - LidarWe have long recognized that one of the greatest challenges presented to the hydrographic commu-nity is the need to map very shallow coastal regions where multibeam echosounding systems become less efficient. New-generation topographic-bathy-metric (“topobathy”) lidar systems have the potential to radically change the way that lidar data is used for hydrographic mapping. Specifically, they gener-ate relatively dense data (compared to traditional airborne bathymetric lidars) resulting in improved data and product resolution, better compatibility with modern data processing methods, and the potential to fill in detail in the shallow regions where acoustic systems are least efficient. Routine ingestion of topobathy data into the hydrographic charting pipeline is problematic. In addition to large volumes of data being generated, which makes processing time-consuming and many tools ineffective, the topo-bathy data lacks a robust total propagated uncer-tainty model that accounts for the aircraft trajectory and laser beam ranging uncertainties as well as the behavior of the laser beam in response to waves and the water column.
In conjunction with NOAA’s Remote Sensing Divi-sion (RSD) and colleagues at Oregon State University (OSU), the Center is developing tools to understand and predict the sensor uncertainty of typical topo-bathy lidar systems, and adaptations of current-generation data processing tools to the lidar data processing problem.
A Total Propagated Uncertainty (TPU) model for lidars flown by RSD among others was developed (cBLUE•Comprehensive Bathymetric Lidar Uncer-tainty Estimator) and delivered to NOAA/NGS in 2018. Additional lidar training, including cBLUE train-ing was conducted by Chris Parrish at NOAA RSD in 2019. As the models and concepts of TPU are now starting to be supported within the bathymetric lidar community, standardization and validation of models, and best practices, is seen to be very important with respect to vendor and client adoption. OSU, and the Center, are therefore helping to support develop-ment and documentation of best practices through stakeholder meetings and interaction with the Ameri-can Society for Photogrammetry and Remote Sens-ing. While initial efforts focused around a single lidar system (Riegl-VQ-880-G), this year’s efforts focused on extending the functionality of the tool to support additional topobathymetric lidar systems being used
by NOAA, partner agencies, and data acquisition contractors, including the Leica/AHAB Chiroptera 4X, the Teledyne/Optech CZMIL and CZMIL Nova.
The volume of data generated by modern topobathy lidar systems is immense. Any particular flight could entail collection of perhaps three billion observa-tions (at the lowest capture rate available), which are recorded as several hundred gigabytes of digital records. Brian Calder and Kim Lowell have begun to adopt the CHRT processing approach to the topo-bathy lidar and have demonstrated that it was pos-sible to extend the basic algorithm with a new “level of aggregation” approach to resolution determina-tion and machine learning to provide clean first-pass estimates of depth from raw data. In addition to being objective, this approach significantly reduces the user interaction time, and provides an acoustic-compatible workflow for lidar. The machine learning approach being developed seeks to assign to each return an a priori probability of being bathymetry that is incorporated into the disambiguation rules of CHRT. This “certainty index” will ultimately be used within CHRT to influence the decision about which hypothesis for a grid point is considered most likely.
Processing Backscatter DataSeafloorAlong with bathymetry data, our sonar systems also collect backscatter (amplitude) data. Previous prog-ress reports have discussed many of our efforts to understand and quantify the sources of uncertainty in backscatter. We continue to develop techniques to appropriately correct backscatter for instrumental and environmental factors including the development of approaches to correct for sector beam pattern arti-facts and to correct backscatter mosaics from drop-outs due to bubble wash beneath the transducers. Once these corrections are applied, the backscatter data are much more suitable for quantitative analy-ses that may lead to the long-sought goal of remote characterization of the seafloor.
With an ever-growing array of multibeam sonars operating at different frequencies (and individual systems, displaying greater bandwidth), John Hughes Clarke has been exploring ways to exploit the fre-quency dependence of seafloor scattering. He has addressed this by looking at inter-frequency offsets and/or changes in the shape of the angular response
JHC Performance Report 31 January 2021 23
EXECUTIVE SUMMARY
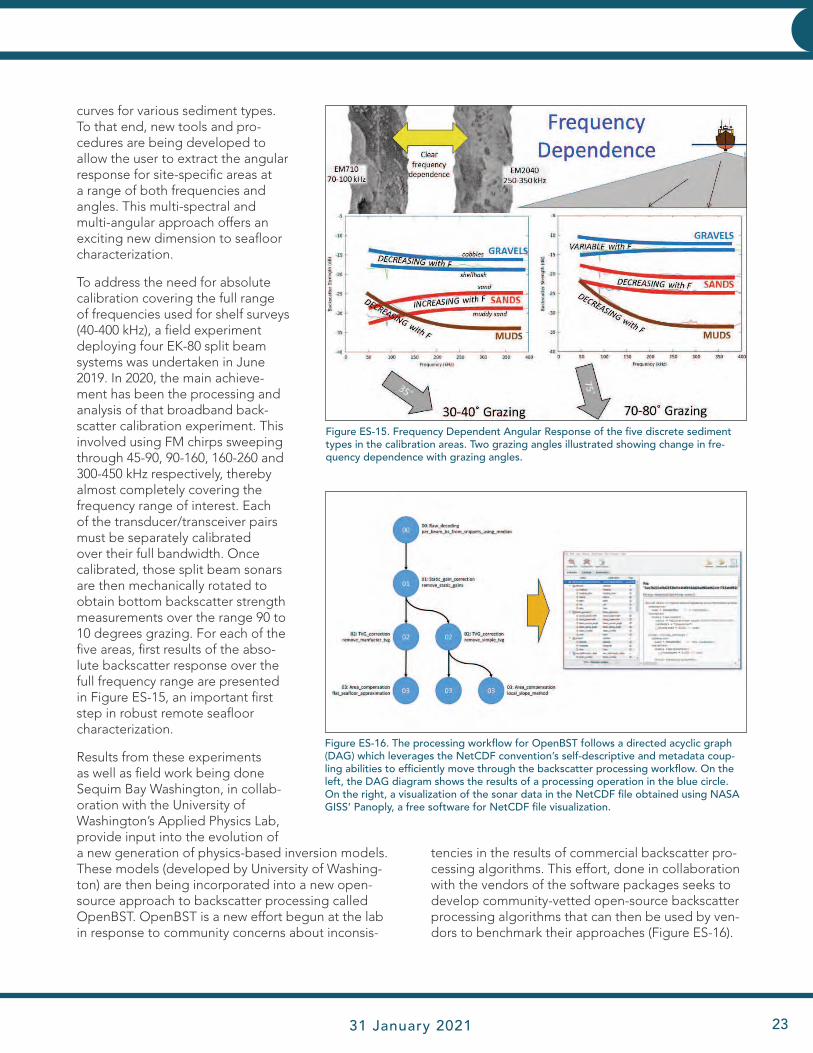
curves for various sediment types. To that end, new tools and pro-cedures are being developed to allow the user to extract the angular response for site-specific areas at a range of both frequencies and angles. This multi-spectral and multi-angular approach offers an exciting new dimension to seafloor characterization.
To address the need for absolute calibration covering the full range of frequencies used for shelf surveys (40-400 kHz), a field experiment deploying four EK-80 split beam systems was undertaken in June 2019. In 2020, the main achieve-ment has been the processing and analysis of that broadband back-scatter calibration experiment. This involved using FM chirps sweeping through 45-90, 90-160, 160-260 and 300-450 kHz respectively, thereby almost completely covering the frequency range of interest. Each of the transducer/transceiver pairs must be separately calibrated over their full bandwidth. Once calibrated, those split beam sonars are then mechanically rotated to obtain bottom backscatter strength measurements over the range 90 to 10 degrees grazing. For each of the five areas, first results of the abso-lute backscatter response over the full frequency range are presented in Figure ES-15, an important first step in robust remote seafloor characterization.
Results from these experiments as well as field work being done Sequim Bay Washington, in collab-oration with the University of Washington’s Applied Physics Lab, provide input into the evolution of a new generation of physics-based inversion models. These models (developed by University of Washing-ton) are then being incorporated into a new open-source approach to backscatter processing called OpenBST. OpenBST is a new effort begun at the lab in response to community concerns about inconsis-
Figure ES-16. The processing workflow for OpenBST follows a directed acyclic graph (DAG) which leverages the NetCDF convention’s self-descriptive and metadata coup-ling abilities to efficiently move through the backscatter processing workflow. On the left, the DAG diagram shows the results of a processing operation in the blue circle. On the right, a visualization of the sonar data in the NetCDF file obtained using NASA GISS’ Panoply, a free software for NetCDF file visualization.
Figure ES-15. Frequency Dependent Angular Response of the five discrete sediment types in the calibration areas. Two grazing angles illustrated showing change in fre-quency dependence with grazing angles.
tencies in the results of commercial backscatter pro-cessing algorithms. This effort, done in collaboration with the vendors of the software packages seeks to develop community-vetted open-source backscatter processing algorithms that can then be used by ven-dors to benchmark their approaches (Figure ES-16).
JHC Performance Report24
EXECUTIVE SUMMARY
Seafloor Characterization and Habitat MappingOur efforts to produce more quantitative and consis-tent backscatter data stem from the great potential of backscatter to be used for the remote character-ization of the seafloor and the determination of ben-thic habitat. To address this issue, Masetti and others have developed an approach to seafloor character-ization that first evaluates the context of the area, attempting to take full advantage of both bathymet-ric and backscatter data to create a bathymetry- and reflectivity-based estimator for seafloor segmentation (BRESS). The initial phase of the algorithm performs a segmentation of the bathymetry surface through the identification of contiguous regions of similar mor-phology, for example valleys or edges. The backscat-ter for these regions is then analyzed to derive final seafloor segments by merging or splitting the regions
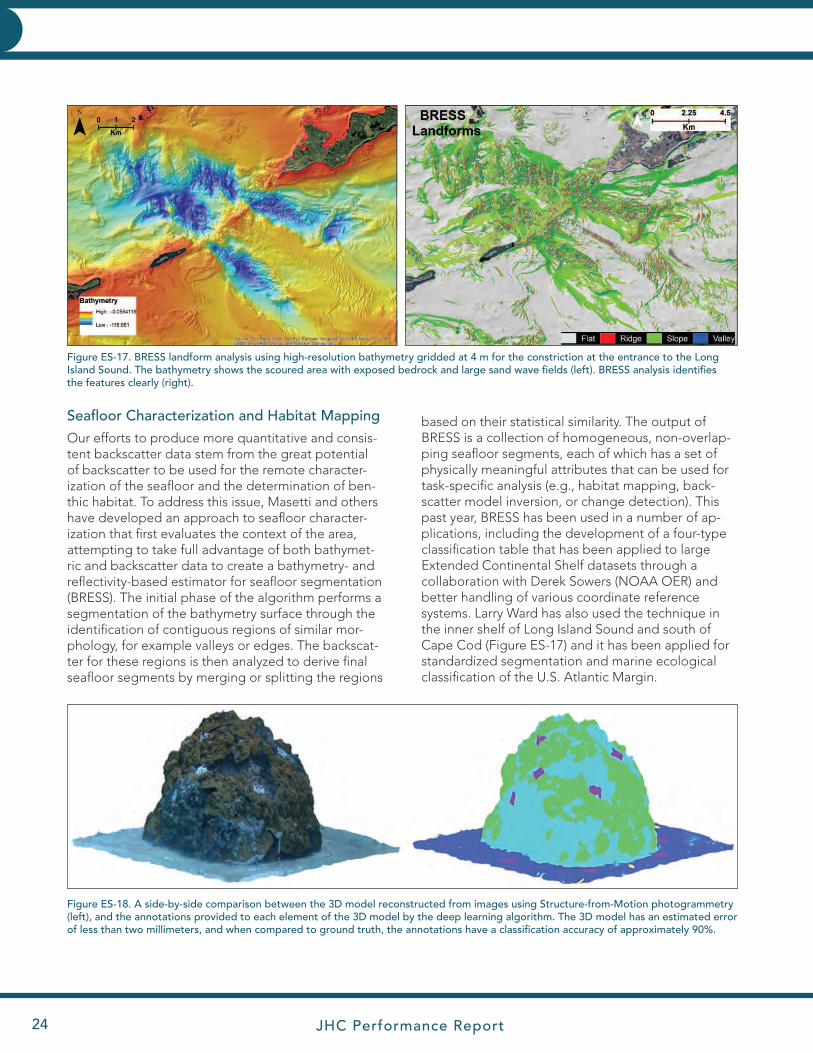
based on their statistical similarity. The output of BRESS is a collection of homogeneous, non-overlap-ping seafloor segments, each of which has a set of physically meaningful attributes that can be used for task-specific analysis (e.g., habitat mapping, back-scatter model inversion, or change detection). This past year, BRESS has been used in a number of ap-plications, including the development of a four-type classification table that has been applied to large Extended Continental Shelf datasets through a collaboration with Derek Sowers (NOAA OER) and better handling of various coordinate reference systems. Larry Ward has also used the technique in the inner shelf of Long Island Sound and south of Cape Cod (Figure ES-17) and it has been applied for standardized segmentation and marine ecological classification of the U.S. Atlantic Margin.
Figure ES-18. A side-by-side comparison between the 3D model reconstructed from images using Structure-from-Motion photogrammetry (left), and the annotations provided to each element of the 3D model by the deep learning algorithm. The 3D model has an estimated error of less than two millimeters, and when compared to ground truth, the annotations have a classification accuracy of approximately 90%.
Figure ES-17. BRESS landform analysis using high-resolution bathymetry gridded at 4 m for the constriction at the entrance to the Long Island Sound. The bathymetry shows the scoured area with exposed bedrock and large sand wave fields (left). BRESS analysis identifies the features clearly (right).
JHC Performance Report 31 January 2021 25
EXECUTIVE SUMMARY
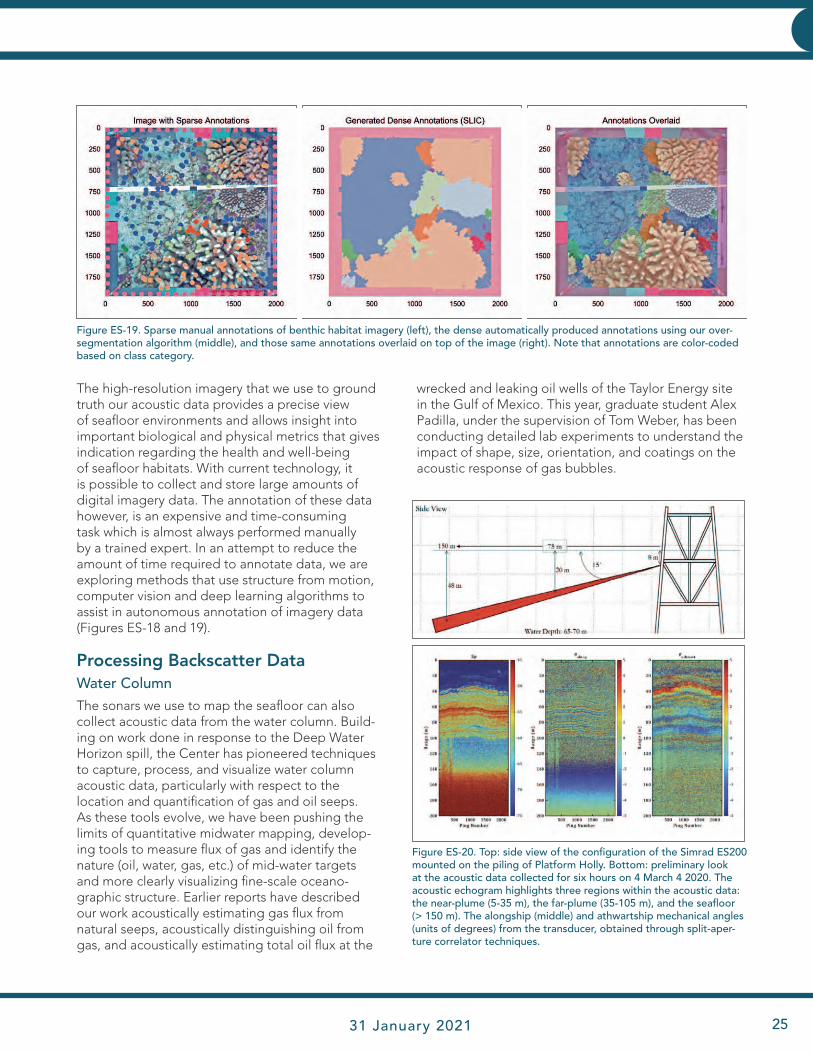
The high-resolution imagery that we use to ground truth our acoustic data provides a precise view of seafloor environments and allows insight into important biological and physical metrics that gives indication regarding the health and well-being of seafloor habitats. With current technology, it is possible to collect and store large amounts of digital imagery data. The annotation of these data however, is an expensive and time-consuming task which is almost always performed manually by a trained expert. In an attempt to reduce the amount of time required to annotate data, we are exploring methods that use structure from motion, computer vision and deep learning algorithms to assist in autonomous annotation of imagery data (Figures ES-18 and 19).
Processing Backscatter DataWater ColumnThe sonars we use to map the seafloor can also collect acoustic data from the water column. Build-ing on work done in response to the Deep Water Horizon spill, the Center has pioneered techniques to capture, process, and visualize water column acoustic data, particularly with respect to the location and quantification of gas and oil seeps. As these tools evolve, we have been pushing the limits of quantitative midwater mapping, develop-ing tools to measure flux of gas and identify the nature (oil, water, gas, etc.) of mid-water targets and more clearly visualizing fine-scale oceano-graphic structure. Earlier reports have described our work acoustically estimating gas flux from natural seeps, acoustically distinguishing oil from gas, and acoustically estimating total oil flux at the
wrecked and leaking oil wells of the Taylor Energy site in the Gulf of Mexico. This year, graduate student Alex Padilla, under the supervision of Tom Weber, has been conducting detailed lab experiments to understand the impact of shape, size, orientation, and coatings on the acoustic response of gas bubbles.
Figure ES-19. Sparse manual annotations of benthic habitat imagery (left), the dense automatically produced annotations using our over-segmentation algorithm (middle), and those same annotations overlaid on top of the image (right). Note that annotations are color-coded based on class category.
Figure ES-20. Top: side view of the configuration of the Simrad ES200 mounted on the piling of Platform Holly. Bottom: preliminary look at the acoustic data collected for six hours on 4 March 4 2020. The acoustic echogram highlights three regions within the acoustic data: the near-plume (5-35 m), the far-plume (35-105 m), and the seafloor (> 150 m). The alongship (middle) and athwartship mechanical angles (units of degrees) from the transducer, obtained through split-aper-ture correlator techniques.
JHC Performance Report26
EXECUTIVE SUMMARY
An opportunity to extend these lab and theoretical results to a natural hydrocarbon seep field located in the Coal Oil Point seep field was presented in 2019, where an abandoned oil platform (Platform Holly) was used to mount a Simrad ES200 sonar on a pan-and-tilt system allowing it to ensonify the natural seep (Figure ES-20). The team is now work-ing on converting the acoustic measurements into estimates of gas flux as a function of time. The resulting time series estimates of gas flux in the vicinity of Platform Holly will be compared to time series of environmental data (e.g., wind speed, wind direction, water level, currents, and seismic activity) to determine if there is any correlation between the spatial and temporal variability of seepage activity to physical environmental processes.
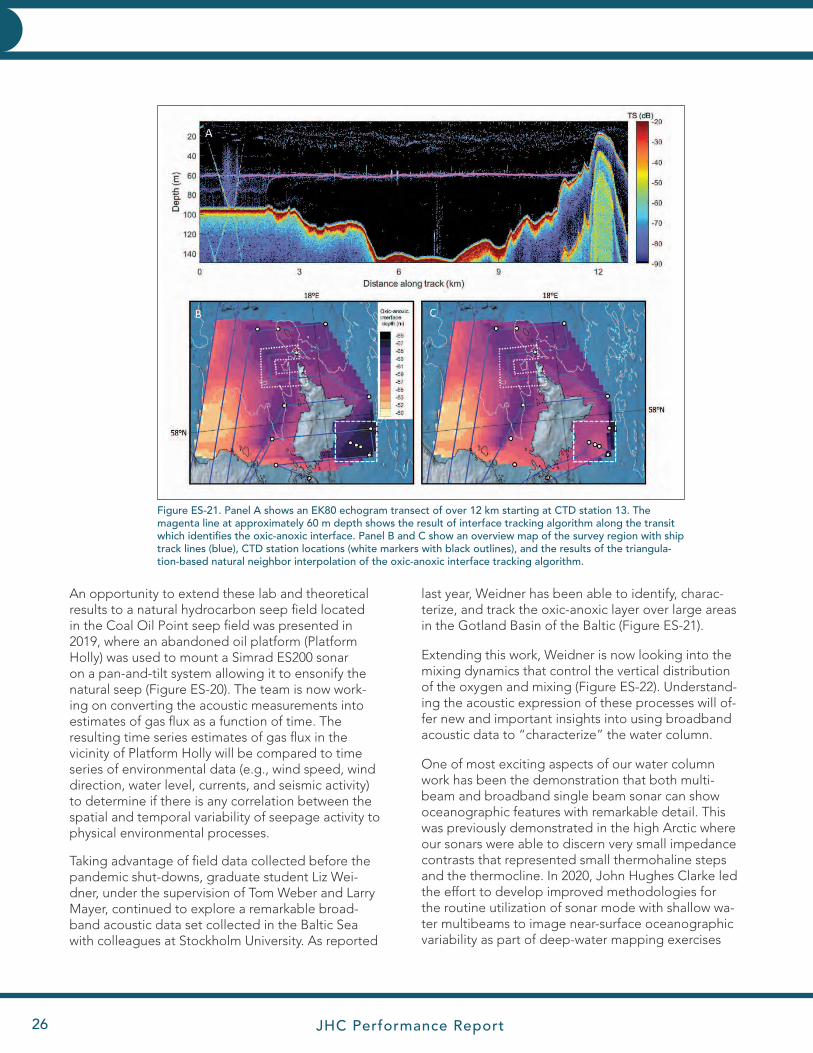
Taking advantage of field data collected before the pandemic shut-downs, graduate student Liz Wei-dner, under the supervision of Tom Weber and Larry Mayer, continued to explore a remarkable broad-band acoustic data set collected in the Baltic Sea with colleagues at Stockholm University. As reported
last year, Weidner has been able to identify, charac-terize, and track the oxic-anoxic layer over large areas in the Gotland Basin of the Baltic (Figure ES-21).
Extending this work, Weidner is now looking into the mixing dynamics that control the vertical distribution of the oxygen and mixing (Figure ES-22). Understand-ing the acoustic expression of these processes will of-fer new and important insights into using broadband acoustic data to “characterize” the water column.
One of most exciting aspects of our water column work has been the demonstration that both multi-beam and broadband single beam sonar can show oceanographic features with remarkable detail. This was previously demonstrated in the high Arctic where our sonars were able to discern very small impedance contrasts that represented small thermohaline steps and the thermocline. In 2020, John Hughes Clarke led the effort to develop improved methodologies for the routine utilization of sonar mode with shallow wa-ter multibeams to image near-surface oceanographic variability as part of deep-water mapping exercises
Figure ES-21. Panel A shows an EK80 echogram transect of over 12 km starting at CTD station 13. The magenta line at approximately 60 m depth shows the result of interface tracking algorithm along the transit which identifies the oxic-anoxic interface. Panel B and C show an overview map of the survey region with ship track lines (blue), CTD station locations (white markers with black outlines), and the results of the triangula-tion-based natural neighbor interpolation of the oxic-anoxic interface tracking algorithm.

JHC Performance Report 31 January 2021 27
EXECUTIVE SUMMARY
(Figure ES-22). The long-term aim is to have a scrolling real-time tool that allows the field operator rapid access to volume sections as an aid to environmental assessment. With training and familiarization, such scrolling displays would significantly aid the hydrographer in making near real-time decisions on the need to update sound speed measurements and to better understand potential degradation to bathymetric data collection.
Figure ES-22. Examples of thermohaline staircase features in the Baltic Sea. The left is a set of fully-formed staircase features which have flat spectra (no frequency dependence). The right is in areas of relative smooth gradients where staircases appear to be evolving. The spectra of the volume scattering regions have a weakly negative frequency dependence.
Figure ES-23. 150 nm long oceanic section, Sargasso Sea, east of the Bahamas. Twelve hours of combined EM122 and EM710 water column imaging illustrate the inability of the EM122 to track the shallow (<500m) thermocline structure, compared to the EM710 operating in sonar mode, imaging the upper 500m. All data presented here was collected during daylight hours to avoid DSL ascent/descent.
JHC Performance Report28
EXECUTIVE SUMMARY
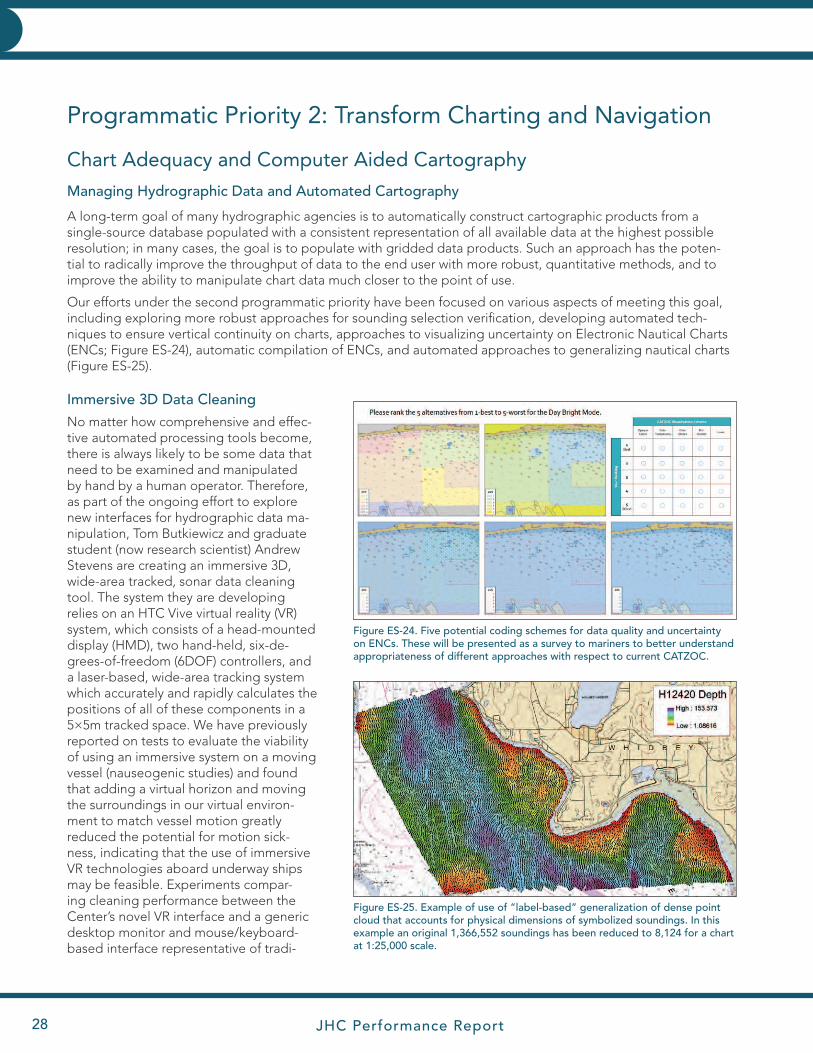
A long-term goal of many hydrographic agencies is to automatically construct cartographic products from a single-source database populated with a consistent representation of all available data at the highest possible resolution; in many cases, the goal is to populate with gridded data products. Such an approach has the poten-tial to radically improve the throughput of data to the end user with more robust, quantitative methods, and to improve the ability to manipulate chart data much closer to the point of use.
Our efforts under the second programmatic priority have been focused on various aspects of meeting this goal, including exploring more robust approaches for sounding selection verification, developing automated tech-niques to ensure vertical continuity on charts, approaches to visualizing uncertainty on Electronic Nautical Charts (ENCs; Figure ES-24), automatic compilation of ENCs, and automated approaches to generalizing nautical charts (Figure ES-25).
Immersive 3D Data CleaningNo matter how comprehensive and effec-tive automated processing tools become, there is always likely to be some data that need to be examined and manipulated by hand by a human operator. Therefore, as part of the ongoing effort to explore new interfaces for hydrographic data ma-nipulation, Tom Butkiewicz and graduate student (now research scientist) Andrew Stevens are creating an immersive 3D, wide-area tracked, sonar data cleaning tool. The system they are developing relies on an HTC Vive virtual reality (VR) system, which consists of a head-mounted display (HMD), two hand-held, six-de-grees-of-freedom (6DOF) controllers, and a laser-based, wide-area tracking system which accurately and rapidly calculates the positions of all of these components in a 5×5m tracked space. We have previously reported on tests to evaluate the viability of using an immersive system on a moving vessel (nauseogenic studies) and found that adding a virtual horizon and moving the surroundings in our virtual environ-ment to match vessel motion greatly reduced the potential for motion sick-ness, indicating that the use of immersive VR technologies aboard underway ships may be feasible. Experiments compar-ing cleaning performance between the Center’s novel VR interface and a generic desktop monitor and mouse/keyboard-based interface representative of tradi-
Programmatic Priority 2: Transform Charting and Navigation
Chart Adequacy and Computer Aided Cartography
Managing Hydrographic Data and Automated Cartography
Figure ES-25. Example of use of “label-based” generalization of dense point cloud that accounts for physical dimensions of symbolized soundings. In this example an original 1,366,552 soundings has been reduced to 8,124 for a chart at 1:25,000 scale.
Figure ES-24. Five potential coding schemes for data quality and uncertainty on ENCs. These will be presented as a survey to mariners to better understand appropriateness of different approaches with respect to current CATZOC.

JHC Performance Report 31 January 2021 29
EXECUTIVE SUMMARY
Comprehensive Charts and Decision AidsThe Visualization Lab at the Center has long sought to develop innovative approaches for the intuitive display and the development of tools for the interpretation of the many types of supplemental data needed to support marine navigation. Adding to the complexity of this task is the need to ensure that whatever tools are developed are compatible with the constraints of ENC systems. Current efforts include Briana Sullivan’s work with the IHO’s Tides, Water-Level and Currents Working Group and the imple-mentation of several Center-originated concepts within IHO standards. We continue our efforts, working with ENC and PPU manufacturers, hoping to implement streamline-based visualizations, producing “risk maps” that include high-resolution bathymetry, tides, current and flow mod-els, developing approaches for the automatic extraction of Nautical Textual Information from products like Sailing Directions, the Coast Pilot and Notices to Mariners hoping to turn these into dynamic digital products (Figure ES-27).
tional software packages showed a clear advantage when using the VR inter-face with regard to com-pletion time, while errors were generally equivalent between the interfaces.
However, because users can be reluctant to use immersive interfaces and wear head-mounted displays for long periods of time, we have also devel-oped a desktop monitor-based, non-immersive ver-sion of our editing software (Figure ES-26). While users do not get the same depth perception and head cou-pling benefits, the handheld six-degrees-of-freedom controllers are still a better interface than a mouse for the inherently 3D task, which preserves many of the benefits our immersive system presents over traditional interfaces. However, a significant disad-vantage of using these types of handheld 3D con-trollers is that their usage repeatedly interrupts the user’s workflow by requiring them to change devices, switching back-and-forth between a standard desk-top mouse and the more specialized 3D controllers. Effort during this reporting period focused on directly
Figure ES-26. Left: Interactive point cloud editor being used on a standard 2D desktop monitor, where the 6DOF handheld controllers can be used to “reach into the screen” and edit, manipulate, reposition, and scale data similar to the immersive mode. Right: Newly developed hybrid mouse/controller that allows interactive editing and full mouse controls with same hand.
addressing this inefficiency by creating a custom, 3D-printed tracking module which attaches to a standard wireless desktop mouse to create a hybrid device that behaves like a normal mouse when used on the desk’s surface, but seamlessly switches to a 3D input device when lifted off the desk (Figure ES-24). A proof-of-concept application was developed to demonstrate this functionality, using the Visualiza-tion Lab’s point cloud cleaning software within the context of a Qimera-style interface.
Figure ES-27. ICPilot prototype showing S-111 surface current data in conjunction with related Coast Pilot textual data.

JHC Performance Report30
EXECUTIVE SUMMARY
Augmented Reality for Marine NavigationIn concert with our activities to extend and enhance current charts and navigational support tools (like the Coast Pilot), we are also exploring how new devel-opments in interactive data visualization, including augmented and virtual reality, may play a role in the future of marine navigation. Augmented Reality (AR), which is the superimposition of digital content directly over a user’s real-world view, is an emerging technology that may have great potential for aiding safe marine navigation.
Tom Butkiewicz has continued to develop a dynamic and flexible bridge simulation for experimenting with a range of possible AR devices and information overlays—across different times-of-day, visibility, and sea-state/weather—allowing for safe evaluation in a more diverse set of conditions than available on our research vessel. The project’s goals include identify-ing the technical specifications required for future AR
devices to be useful for navigation, the information most beneficial to display, and the types of visual representations best for conveying that information. Butkiewicz has completed a physical interface for piloting the virtual boat. The controls include a full-size ship’s wheel that provides realistic force feedback and a throttle. These are mounted to a portable platform with an integrated tracker, which keeps the virtual bridge’s controls and real controls perfectly aligned, such that one can always reach out and grab them within the simulator (Figure ES-28).
In the past year we have been using the semi-im-mersive large format tiled display (vis wall) to display imagery from the new bridge simulation described in the following section (Task 45). In addition to display-ing the navigational overlays seen in our previous projects, there is a new focus on precision navigation information. A new feature currently being developed
Figure ES-29. Left: Real photo of the Crescent City Connection bridge in New Orleans on a foggy day. Right: View of a colored point cloud from a lidar scan of the bridge, which could be displayed in AR to enable “seeing through” the fog.
Figure ES-28. Simulated augmented reality overlay of nautical chart information.
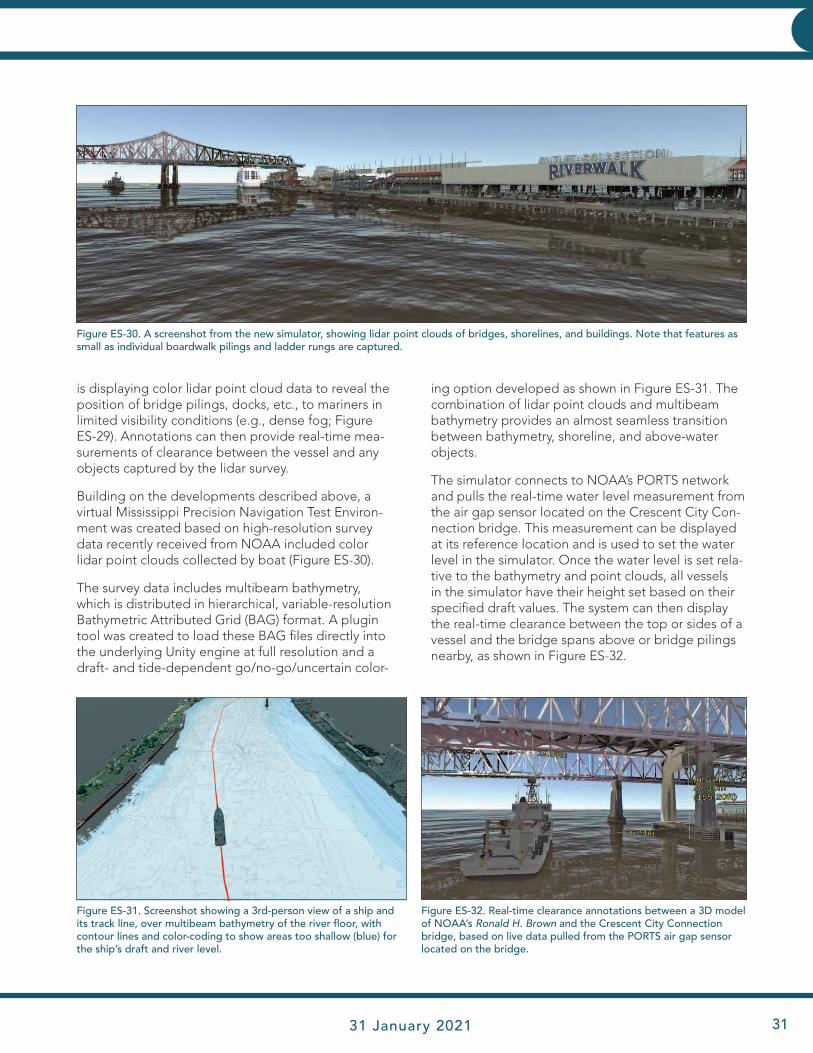
JHC Performance Report 31 January 2021 31
EXECUTIVE SUMMARY
is displaying color lidar point cloud data to reveal the position of bridge pilings, docks, etc., to mariners in limited visibility conditions (e.g., dense fog; Figure ES-29). Annotations can then provide real-time mea-surements of clearance between the vessel and any objects captured by the lidar survey.
Building on the developments described above, a virtual Mississippi Precision Navigation Test Environ-ment was created based on high-resolution survey data recently received from NOAA included color lidar point clouds collected by boat (Figure ES-30).
The survey data includes multibeam bathymetry, which is distributed in hierarchical, variable-resolution Bathymetric Attributed Grid (BAG) format. A plugin tool was created to load these BAG files directly into the underlying Unity engine at full resolution and a draft- and tide-dependent go/no-go/uncertain color-
ing option developed as shown in Figure ES-31. The combination of lidar point clouds and multibeam bathymetry provides an almost seamless transition between bathymetry, shoreline, and above-water objects.
The simulator connects to NOAA’s PORTS network and pulls the real-time water level measurement from the air gap sensor located on the Crescent City Con-nection bridge. This measurement can be displayed at its reference location and is used to set the water level in the simulator. Once the water level is set rela-tive to the bathymetry and point clouds, all vessels in the simulator have their height set based on their specified draft values. The system can then display the real-time clearance between the top or sides of a vessel and the bridge spans above or bridge pilings nearby, as shown in Figure ES-32.
Figure ES-30. A screenshot from the new simulator, showing lidar point clouds of bridges, shorelines, and buildings. Note that features as small as individual boardwalk pilings and ladder rungs are captured.
Figure ES-32. Real-time clearance annotations between a 3D model of NOAA’s Ronald H. Brown and the Crescent City Connection bridge, based on live data pulled from the PORTS air gap sensor located on the bridge.
Figure ES-31. Screenshot showing a 3rd-person view of a ship and its track line, over multibeam bathymetry of the river floor, with contour lines and color-coding to show areas too shallow (blue) for the ship’s draft and river level.
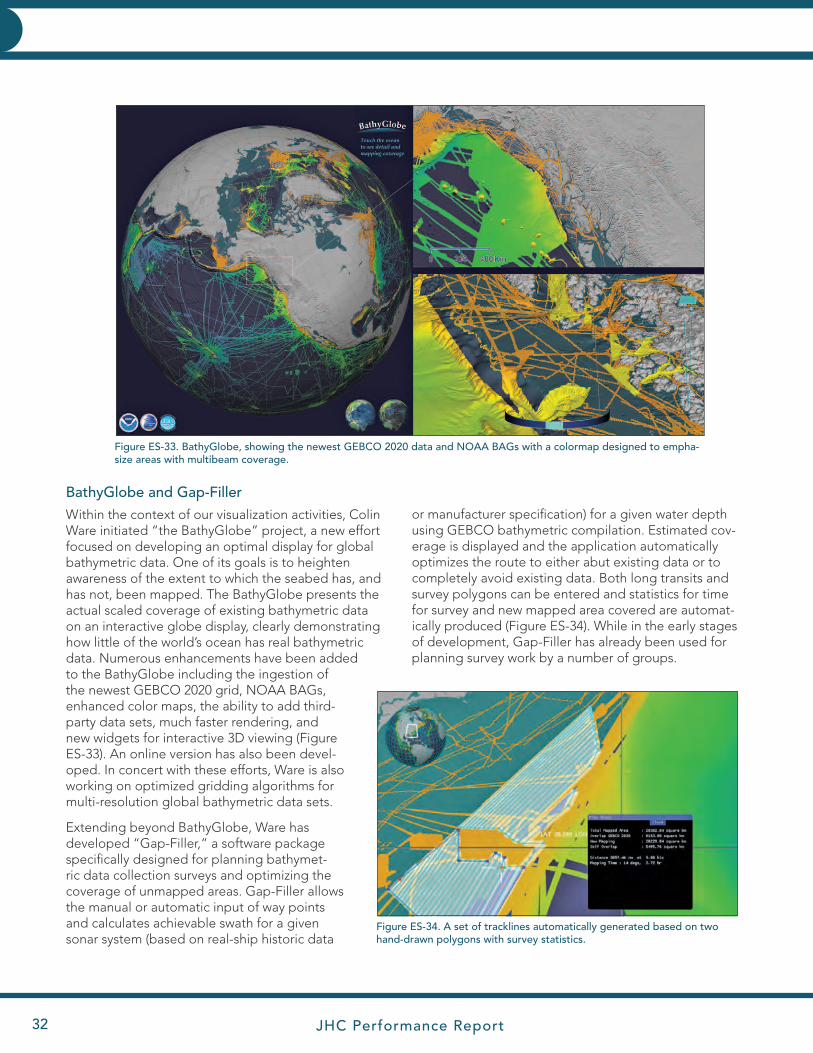
JHC Performance Report32
EXECUTIVE SUMMARY
BathyGlobe and Gap-FillerWithin the context of our visualization activities, Colin Ware initiated “the BathyGlobe” project, a new effort focused on developing an optimal display for global bathymetric data. One of its goals is to heighten awareness of the extent to which the seabed has, and has not, been mapped. The BathyGlobe presents the actual scaled coverage of existing bathymetric data on an interactive globe display, clearly demonstrating how little of the world’s ocean has real bathymetric data. Numerous enhancements have been added to the BathyGlobe including the ingestion of the newest GEBCO 2020 grid, NOAA BAGs, enhanced color maps, the ability to add third-party data sets, much faster rendering, and new widgets for interactive 3D viewing (Figure ES-33). An online version has also been devel-oped. In concert with these efforts, Ware is also working on optimized gridding algorithms for multi-resolution global bathymetric data sets.
Extending beyond BathyGlobe, Ware has developed “Gap-Filler,” a software package specifically designed for planning bathymet-ric data collection surveys and optimizing the coverage of unmapped areas. Gap-Filler allows the manual or automatic input of way points and calculates achievable swath for a given sonar system (based on real-ship historic data
Figure ES-33. BathyGlobe, showing the newest GEBCO 2020 data and NOAA BAGs with a colormap designed to empha-size areas with multibeam coverage.
Figure ES-34. A set of tracklines automatically generated based on two hand-drawn polygons with survey statistics.
or manufacturer specification) for a given water depth using GEBCO bathymetric compilation. Estimated cov-erage is displayed and the application automatically optimizes the route to either abut existing data or to completely avoid existing data. Both long transits and survey polygons can be entered and statistics for time for survey and new mapped area covered are automat-ically produced (Figure ES-34). While in the early stages of development, Gap-Filler has already been used for planning survey work by a number of groups.

JHC Performance Report 31 January 2021 33
EXECUTIVE SUMMARY
Current year activities focused on writing several papers describing results from ECS cruises, con-tinuing to support the ECS Program Office with the provision of data sets and analyses, continuing to update the Center’s ECS website including a transfer to ArcGIS Pro and an enterprise online GIS solu-tion, https://maps.ccom.unh.edu/portal/home, and participating in numerous ECS conference calls, videoconferences, and meetings—including several key virtual meetings to review U.S. submissions with former and current CLCS commissioners (in early June) and critical meetings with our Russian counter-parts to discuss potential revisions to their submis-sion (in September). These meetings were attended by Mayer and Armstrong.
With the collection of new data for ECS winding down, we are now focusing on demonstrating the “value-added” of the more than 3.1 million square miles of high-resolution multibeam bathymetry and backscatter that have been collected. Our initial focus has been on evaluating the data from the U.S. Atlantic margin and determining if data that is useful for ecosystem-based management (EBM) can be extracted from it. The goal is to interpret the ECS data using novel classification approaches devel-oped at the Center, in combination with existing
Programmatic Priority 3: Explore and Map the Continental Shelf
Figure ES-35. Summary of Law of the Sea multibeam sonar surveys mapped by the Center. Total areas mapped represents more than 3.1 million square kilometers since 2003.
ground-truth data, to gain insights into predicted substrate types of the seafloor and to characterize the geomorphic features of the seafloor consistent with the Coastal and Marine Ecological Classification Standard (CMECS).
Under the leadership of Jenn Dijkstra and Derek Sowers, and using data from Gosnold Seamount and the Atlantic Margin canyons, we have already demonstrated that interpretation of the morphology using our BRESS approach produces a consistent and reproducible habitat classification approach for large regions. Key benefits of the study’s semi-auto-mated approach included high speed classification of terrain over very large areas and complex terrain, reduced subjectivity of delineation relative to manual interpretation of landforms, transparency and repro-ducibility of the methods, and the ability to apply the same methods to large regions with consistent results. In this reporting period, the team compared the composition of benthic communities observed in canyons and seamounts in the Northwestern Atlan-tic, and correlated environmental variables to com-munities and the spatial distribution of species to better understand the environmental factors respon-sible for the differences.
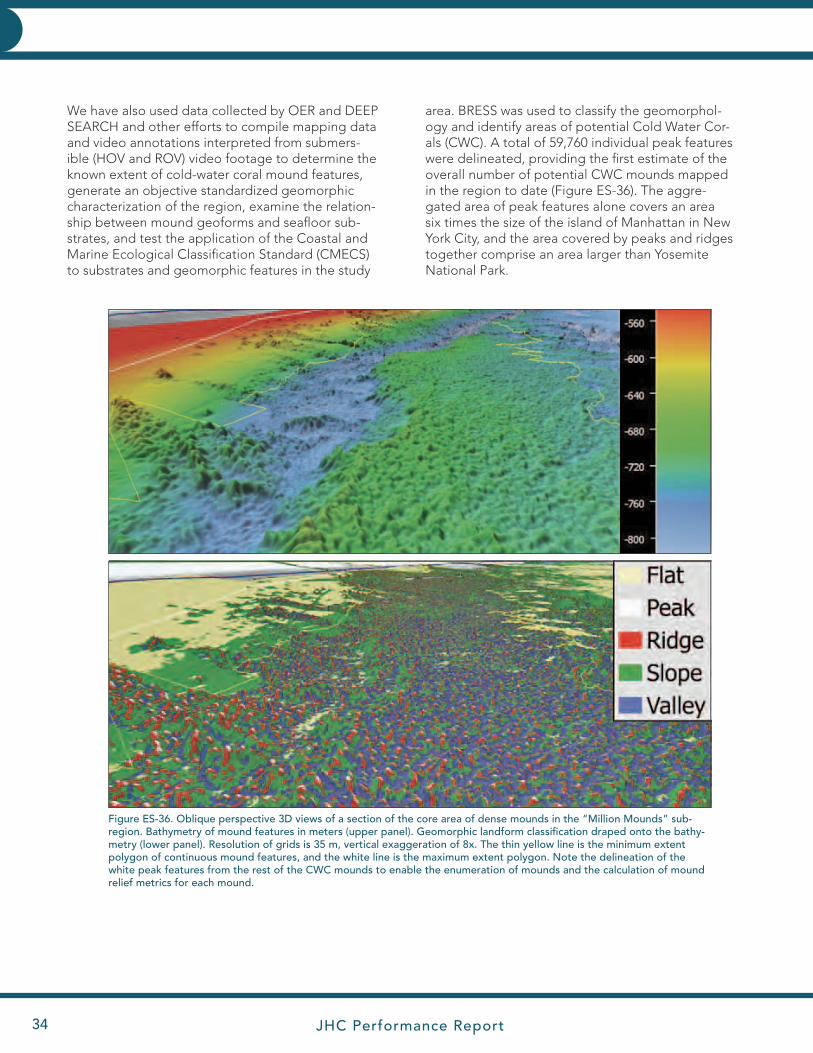
JHC Performance Report34
EXECUTIVE SUMMARY
We have also used data collected by OER and DEEP SEARCH and other efforts to compile mapping data and video annotations interpreted from submers-ible (HOV and ROV) video footage to determine the known extent of cold-water coral mound features, generate an objective standardized geomorphic characterization of the region, examine the relation-ship between mound geoforms and seafloor sub-strates, and test the application of the Coastal and Marine Ecological Classification Standard (CMECS) to substrates and geomorphic features in the study
Figure ES-36. Oblique perspective 3D views of a section of the core area of dense mounds in the “Million Mounds” sub-region. Bathymetry of mound features in meters (upper panel). Geomorphic landform classification draped onto the bathy-metry (lower panel). Resolution of grids is 35 m, vertical exaggeration of 8x. The thin yellow line is the minimum extent polygon of continuous mound features, and the white line is the maximum extent polygon. Note the delineation of the white peak features from the rest of the CWC mounds to enable the enumeration of mounds and the calculation of mound relief metrics for each mound.
area. BRESS was used to classify the geomorphol-ogy and identify areas of potential Cold Water Cor-als (CWC). A total of 59,760 individual peak features were delineated, providing the first estimate of the overall number of potential CWC mounds mapped in the region to date (Figure ES-36). The aggre-gated area of peak features alone covers an area six times the size of the island of Manhattan in New York City, and the area covered by peaks and ridges together comprise an area larger than Yosemite National Park.
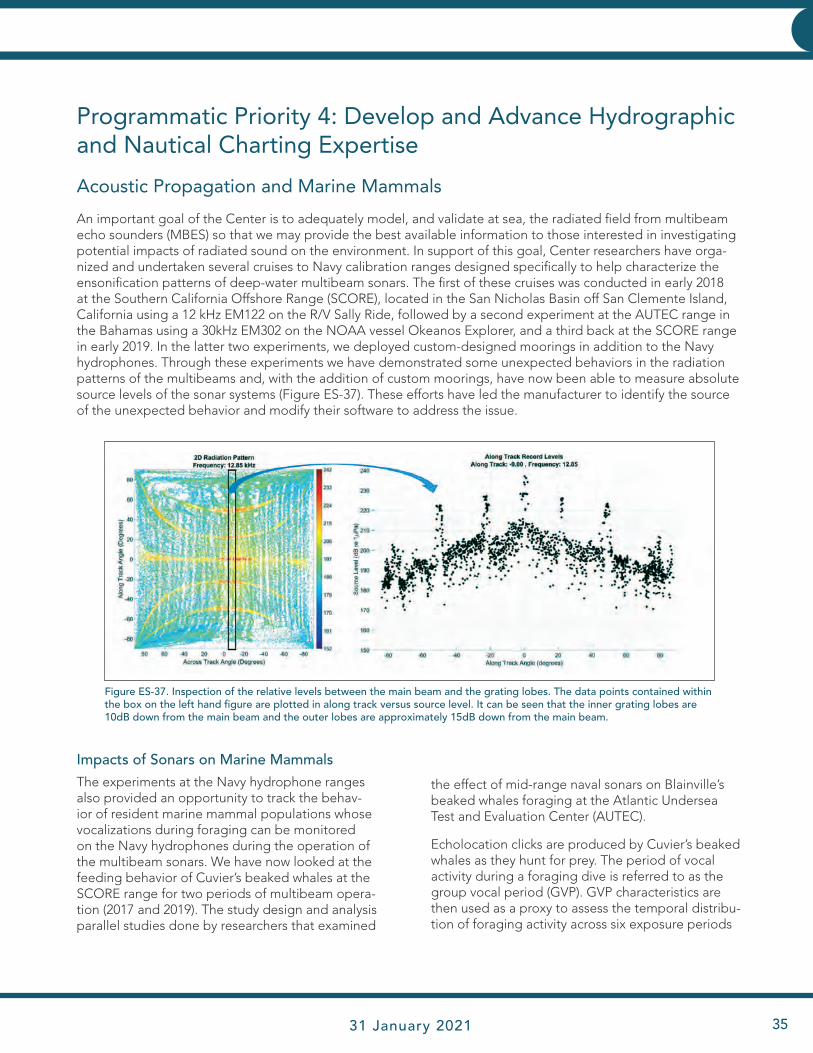
JHC Performance Report 31 January 2021 35
EXECUTIVE SUMMARY
An important goal of the Center is to adequately model, and validate at sea, the radiated field from multibeam echo sounders (MBES) so that we may provide the best available information to those interested in investigating potential impacts of radiated sound on the environment. In support of this goal, Center researchers have orga-nized and undertaken several cruises to Navy calibration ranges designed specifically to help characterize the ensonification patterns of deep-water multibeam sonars. The first of these cruises was conducted in early 2018 at the Southern California Offshore Range (SCORE), located in the San Nicholas Basin off San Clemente Island, California using a 12 kHz EM122 on the R/V Sally Ride, followed by a second experiment at the AUTEC range in the Bahamas using a 30kHz EM302 on the NOAA vessel Okeanos Explorer, and a third back at the SCORE range in early 2019. In the latter two experiments, we deployed custom-designed moorings in addition to the Navy hydrophones. Through these experiments we have demonstrated some unexpected behaviors in the radiation patterns of the multibeams and, with the addition of custom moorings, have now been able to measure absolute source levels of the sonar systems (Figure ES-37). These efforts have led the manufacturer to identify the source of the unexpected behavior and modify their software to address the issue.
Programmatic Priority 4: Develop and Advance Hydrographic and Nautical Charting Expertise
Acoustic Propagation and Marine Mammals
Figure ES-37. Inspection of the relative levels between the main beam and the grating lobes. The data points contained within the box on the left hand figure are plotted in along track versus source level. It can be seen that the inner grating lobes are 10dB down from the main beam and the outer lobes are approximately 15dB down from the main beam.
Impacts of Sonars on Marine MammalsThe experiments at the Navy hydrophone ranges also provided an opportunity to track the behav-ior of resident marine mammal populations whose vocalizations during foraging can be monitored on the Navy hydrophones during the operation of the multibeam sonars. We have now looked at the feeding behavior of Cuvier’s beaked whales at the SCORE range for two periods of multibeam opera-tion (2017 and 2019). The study design and analysis parallel studies done by researchers that examined
the effect of mid-range naval sonars on Blainville’s beaked whales foraging at the Atlantic Undersea Test and Evaluation Center (AUTEC).
Echolocation clicks are produced by Cuvier’s beaked whales as they hunt for prey. The period of vocal activity during a foraging dive is referred to as the group vocal period (GVP). GVP characteristics are then used as a proxy to assess the temporal distribu-tion of foraging activity across six exposure periods
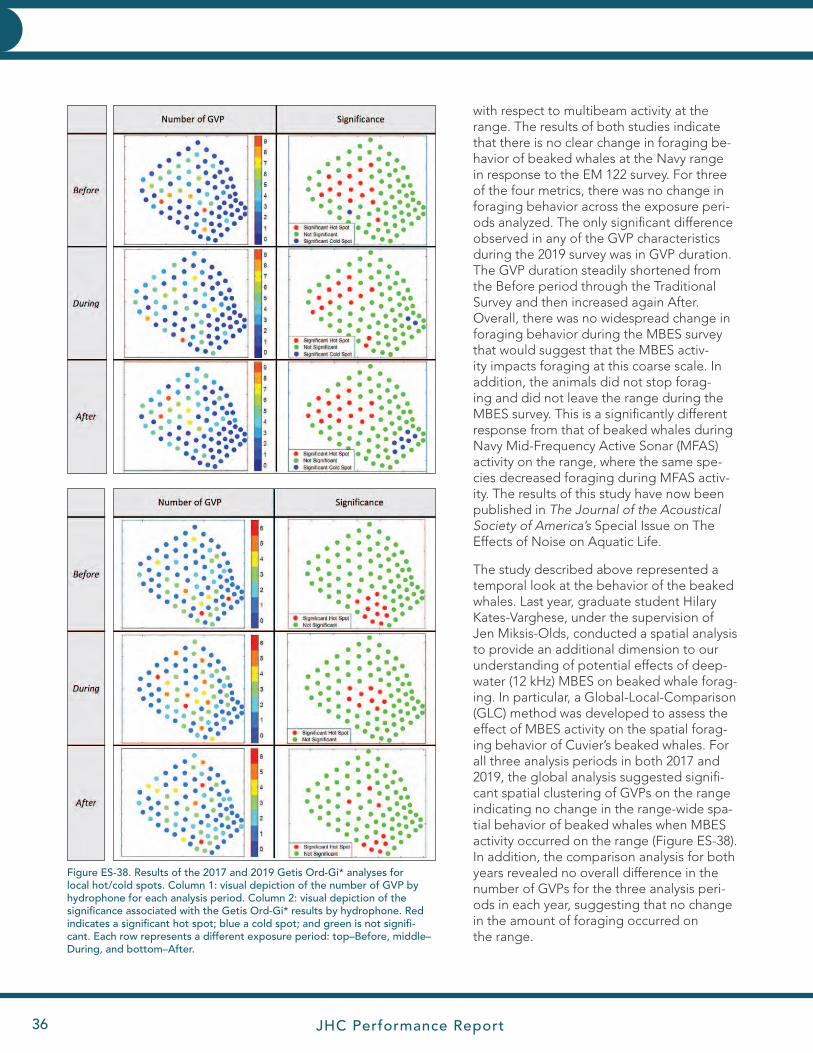
JHC Performance Report36
EXECUTIVE SUMMARY
with respect to multibeam activity at the range. The results of both studies indicate that there is no clear change in foraging be-havior of beaked whales at the Navy range in response to the EM 122 survey. For three of the four metrics, there was no change in foraging behavior across the exposure peri-ods analyzed. The only significant difference observed in any of the GVP characteristics during the 2019 survey was in GVP duration. The GVP duration steadily shortened from the Before period through the Traditional Survey and then increased again After. Overall, there was no widespread change in foraging behavior during the MBES survey that would suggest that the MBES activ-ity impacts foraging at this coarse scale. In addition, the animals did not stop forag-ing and did not leave the range during the MBES survey. This is a significantly different response from that of beaked whales during Navy Mid-Frequency Active Sonar (MFAS) activity on the range, where the same spe-cies decreased foraging during MFAS activ-ity. The results of this study have now been published in The Journal of the Acoustical Society of America’s Special Issue on The Effects of Noise on Aquatic Life.
The study described above represented a temporal look at the behavior of the beaked whales. Last year, graduate student Hilary Kates-Varghese, under the supervision of Jen Miksis-Olds, conducted a spatial analysis to provide an additional dimension to our understanding of potential effects of deep-water (12 kHz) MBES on beaked whale forag-ing. In particular, a Global-Local-Comparison (GLC) method was developed to assess the effect of MBES activity on the spatial forag-ing behavior of Cuvier’s beaked whales. For all three analysis periods in both 2017 and 2019, the global analysis suggested signifi-cant spatial clustering of GVPs on the range indicating no change in the range-wide spa- tial behavior of beaked whales when MBES activity occurred on the range (Figure ES-38). In addition, the comparison analysis for both years revealed no overall difference in the number of GVPs for the three analysis peri-ods in each year, suggesting that no change in the amount of foraging occurred on the range.
Figure ES-38. Results of the 2017 and 2019 Getis Ord-Gi* analyses for local hot/cold spots. Column 1: visual depiction of the number of GVP by hydrophone for each analysis period. Column 2: visual depiction of the significance associated with the Getis Ord-Gi* results by hydrophone. Red indicates a significant hot spot; blue a cold spot; and green is not signifi-cant. Each row represents a different exposure period: top–Before, middle–During, and bottom–After.
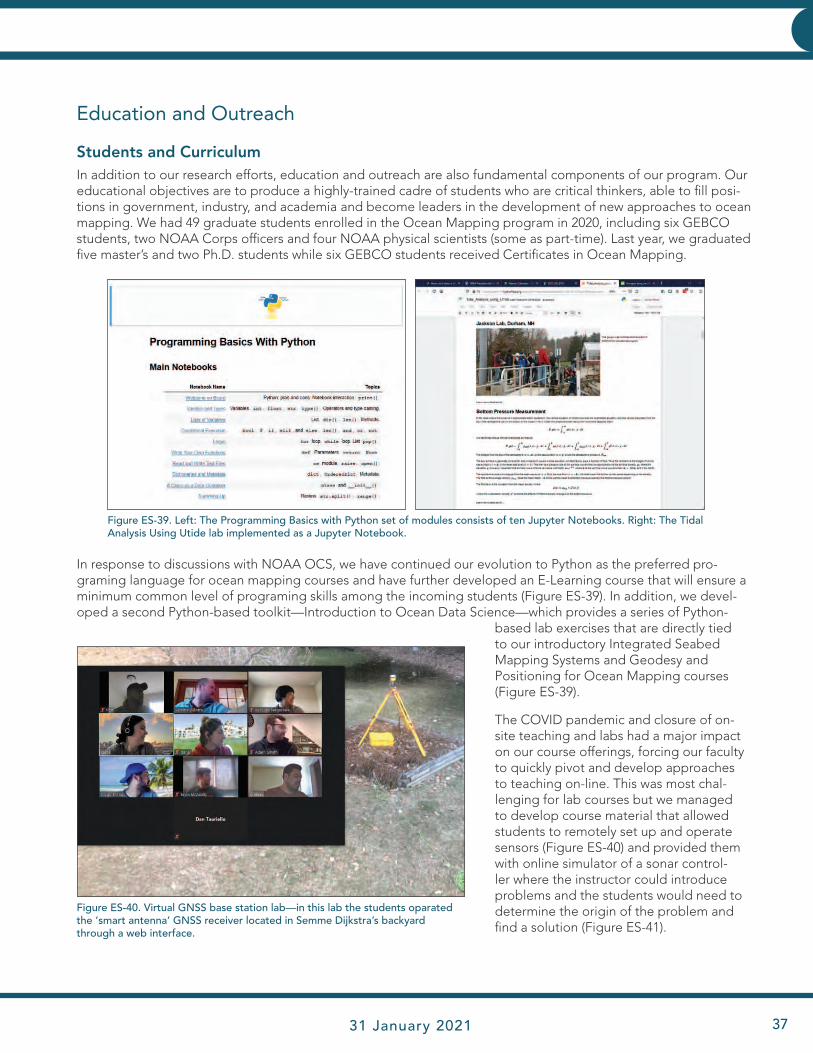
JHC Performance Report 31 January 2021 37
EXECUTIVE SUMMARY
In response to discussions with NOAA OCS, we have continued our evolution to Python as the preferred pro-graming language for ocean mapping courses and have further developed an E-Learning course that will ensure a minimum common level of programing skills among the incoming students (Figure ES-39). In addition, we devel-oped a second Python-based toolkit—Introduction to Ocean Data Science—which provides a series of Python-
based lab exercises that are directly tied to our introductory Integrated Seabed Mapping Systems and Geodesy and Positioning for Ocean Mapping courses (Figure ES-39).
The COVID pandemic and closure of on-site teaching and labs had a major impact on our course offerings, forcing our faculty to quickly pivot and develop approaches to teaching on-line. This was most chal-lenging for lab courses but we managed to develop course material that allowed students to remotely set up and operate sensors (Figure ES-40) and provided them with online simulator of a sonar control-ler where the instructor could introduce problems and the students would need to determine the origin of the problem and find a solution (Figure ES-41).
Education and Outreach
Students and CurriculumIn addition to our research efforts, education and outreach are also fundamental components of our program. Our educational objectives are to produce a highly-trained cadre of students who are critical thinkers, able to fill posi-tions in government, industry, and academia and become leaders in the development of new approaches to ocean mapping. We had 49 graduate students enrolled in the Ocean Mapping program in 2020, including six GEBCO students, two NOAA Corps officers and four NOAA physical scientists (some as part-time). Last year, we graduated five master’s and two Ph.D. students while six GEBCO students received Certificates in Ocean Mapping.
Figure ES-39. Left: The Programming Basics with Python set of modules consists of ten Jupyter Notebooks. Right: The Tidal Analysis Using Utide lab implemented as a Jupyter Notebook.
Figure ES-40. Virtual GNSS base station lab—in this lab the students oparated the ‘smart antenna’ GNSS receiver located in Semme Dijkstra’s backyard through a web interface.
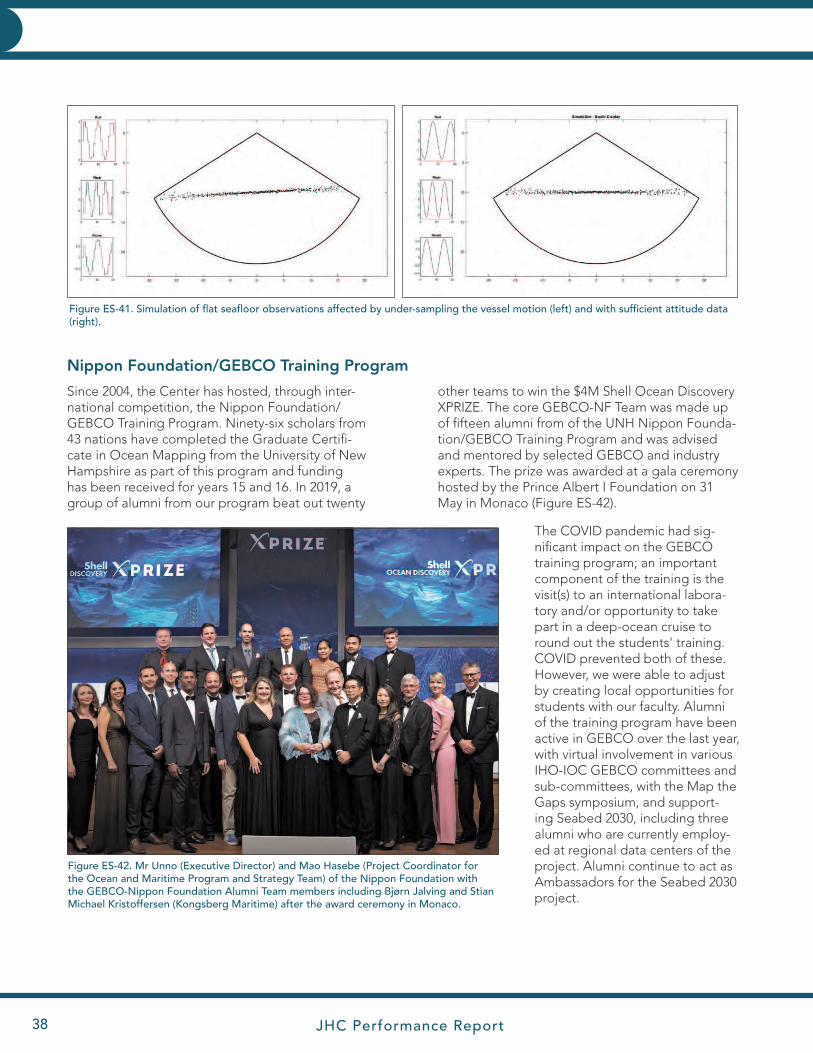
JHC Performance Report38
EXECUTIVE SUMMARY
Nippon Foundation/GEBCO Training Program
Since 2004, the Center has hosted, through inter-national competition, the Nippon Foundation/GEBCO Training Program. Ninety-six scholars from 43 nations have completed the Graduate Certifi-cate in Ocean Mapping from the University of New Hampshire as part of this program and funding has been received for years 15 and 16. In 2019, a group of alumni from our program beat out twenty
other teams to win the $4M Shell Ocean Discovery XPRIZE. The core GEBCO-NF Team was made up of fifteen alumni from of the UNH Nippon Founda-tion/GEBCO Training Program and was advised and mentored by selected GEBCO and industry experts. The prize was awarded at a gala ceremony hosted by the Prince Albert I Foundation on 31 May in Monaco (Figure ES-42).
The COVID pandemic had sig-nificant impact on the GEBCO training program; an important component of the training is the visit(s) to an international labora-tory and/or opportunity to take part in a deep-ocean cruise to round out the students' training.COVID prevented both of these. However, we were able to adjust by creating local opportunities for students with our faculty. Alumni of the training program have been active in GEBCO over the last year, with virtual involvement in various IHO-IOC GEBCO committees and sub-committees, with the Map the Gaps symposium, and support-ing Seabed 2030, including three alumni who are currently employ-ed at regional data centers of the project. Alumni continue to act as Ambassadors for the Seabed 2030 project.
Figure ES-41. Simulation of flat seafloor observations affected by under-sampling the vessel motion (left) and with sufficient attitude data (right).
Figure ES-42. Mr Unno (Executive Director) and Mao Hasebe (Project Coordinator for the Ocean and Maritime Program and Strategy Team) of the Nippon Foundation with the GEBCO-Nippon Foundation Alumni Team members including Bjørn Jalving and Stian Michael Kristoffersen (Kongsberg Maritime) after the award ceremony in Monaco.

JHC Performance Report 31 January 2021 39
EXECUTIVE SUMMARY
OutreachWe also recognize the interest that the public takes in our work and our responsibility to explain the importance of what we do to those who ultimately bear the cost of our work. One of the primary meth-ods of this communication is our website (Figure ES-43, http://ccom.unh.edu). We had 107,191 views from 33,260 unique visits to the site in 2020 from 169 different countries. We also recognize the impor-tance of engaging young people in our activities to ensure that we will have a steady stream of highly skilled workers in the field. To this end, we have also upgraded other aspects of our web presence includ-ing a Flickr stream, Vimeo site, Twitter feed, LinkedIn page, and a Facebook presence. Our Flickr stream currently has 2,525 photos and our 141 videos have been viewed a total of 52,000 times (2564 in 2020). Our seminar series (31 seminars featured in 2020) is widely advertised and webcast, allowing NOAA employees and our Industrial Partners around the world to listen and participate in the seminars. Our seminars are also recorded and uploaded to Vimeo.
Along with our digital and social media presence, we also maintain an active “hands-on” outreach program of tours and activities for school children and the general public. Under the supervision of our full-time outreach coordinator, Tara Hicks-Johnson, several large and specialized events are normally or-ganized by the Center outreach team, including nu-merous SeaPerch ROV events and the annual UNH “Ocean Discovery Days.” These, of course, were totally impacted by the COVID pandemic, though we did have visits from 270 K-12 students before the shut-down of the University in March. The large Ocean Discovery Day event (attracting thousands of people to the lab over a weekend) was cancelled this year, as were the official SeaPerch Competitions. We did, however arrange with a local middle-school, to do a virtual SeaPerch ROV build. Kits were distrib-uted to the children and mentors led the build virtu-ally (Figure ES-44). Students then took their ROVs to local ponds and rivers to test them out.
Figure ES-43. The homepage of the Center’s website.
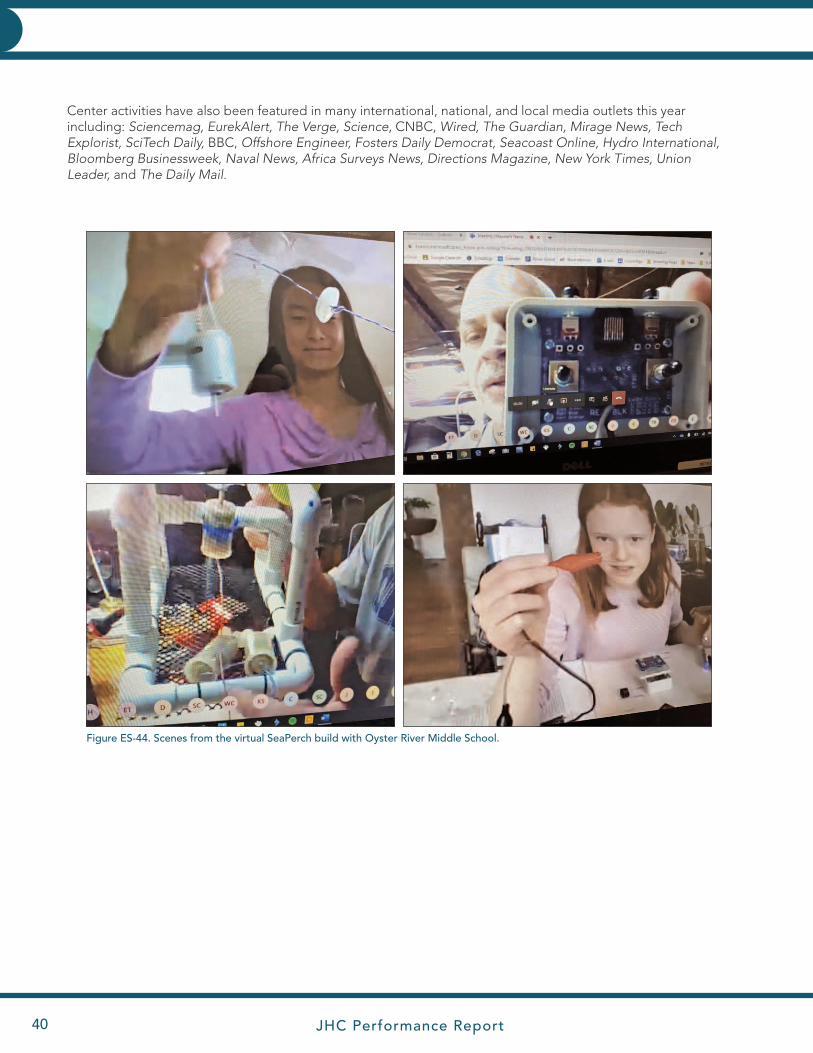
JHC Performance Report40
INTRODUCTIONEXECUTIVE SUMMARY
Figure ES-44. Scenes from the virtual SeaPerch build with Oyster River Middle School.
Center activities have also been featured in many international, national, and local media outlets this year including: Sciencemag, EurekAlert, The Verge, Science, CNBC, Wired, The Guardian, Mirage News, Tech Explorist, SciTech Daily, BBC, Offshore Engineer, Fosters Daily Democrat, Seacoast Online, Hydro International, Bloomberg Businessweek, Naval News, Africa Surveys News, Directions Magazine, New York Times, Union Leader, and The Daily Mail.
JHC Performance Report 31 January 2021 41
n 4 June 1999, the Administrator of NOAA and the President of the University of New Hampshire signed a memorandum of understanding that established a Joint Hydrographic Center (JHC) at the University of New
Hampshire. On 1 July 1999, a cooperative agreement was awarded to the University of New Hampshire that provid-ed the initial funding for the establishment of the Joint Hydrographic Center. This Center, the first of its kind to be established in the United States, was formed as a national resource for the advancement of research and education in the hydrographic and ocean-mapping sciences. In the broadest sense, the activities of the Center are focused on two major themes: a research theme aimed at the development and evaluation of a wide range of state-of-the-art hydrographic and ocean-mapping technologies and applications, and an educational theme aimed at the establishment of a learning center that promotes and fosters the education of a new generation of hydrographers and ocean-mapping scientists to meet the growing needs of both government agencies and the private sector. In concert with the Joint Hydrographic Center, the Center for Coastal and Ocean Mapping was also formed in order to provide a mechanism whereby a broader base of support (from the private sector and other government agencies) could be established for ocean-mapping activities.
The Joint Hydrographic Center was funded by annual cooperative agreements from July 1999 until 31 December 2005. In 2005, a five-year cooperative agreement was awarded with an ending date of 31 December 2010. In January 2010, a Federal Funding Opportunity was announced for the continuation of a Joint Hydrographic Center beyond 2010. After a national competition, the University of New Hampshire was selected as the recipient of a five-year award, funding the Center for the period of 1 July 2010 until 30 December 2015. In March 2016, a Federal Funding Opportunity was announced for the continuation of a Joint Hydrographic Center beyond 2015. Again, after a national competition, the University of New Hampshire was selected as the recipient of a five-year award, funding the Center for the period of 1 January 2016 until 31 December 2020. This report represents the progress on the fifth year of effort on this latest grant (NA15NOS4000200).
This report is the twenty-sixth in a series of what were, until December 2002, semi-annual progress reports. Written reports have been produced annually since December 2002. Copies of previous reports (from the last grant— NA10NOS4000073—and all previous grants to the Joint Hydrographic Center) and more in-depth information about the Center can be found on the Center’s website, http://www.ccom.unh.edu. More detailed descriptions of many of the research efforts described herein can be found in the individual progress reports of Center researchers, which are available on request. While nominally this should represent the final year of the effort on this grant, the unique circumstances of the COVID-19 pandemic have resulted in the request for a No-Cost Extension (NCE) of the grant and thus the final report will be submitted during 2021. In the spring of 2020, a new Notice of Funding Opportunity (NFO) was issued by NOAA for the operation and maintenance of a Joint Hydrographic Center as authorized in the Ocean and Coastal Mapping Integration Act and the Hydrographic Services Improvement Act. The University of New Hampshire submitted a proposal under this solicitation and was informed in the fall of 2020 that they were selected to continue to operate the Joint Hydrographic Center for the period of 2021 to 2025.
InfrastructurePersonnel Over the past 20 years, the Center has grown from an original complement of 18 people to more than 90 faculty, staff, and students. Our faculty and staff have been remarkably stable over the years, but as with any large organi-zation, inevitably, there are changes. In 2020, we saw several of these changes. After almost 20 years at the Center (which followed more than 30 years with the U.S. Geological Survey), Jim Gardner, one the nation’s preeminent marine geologists, will retire. While we will sorely miss Jim, he maintains an emeritus status with the University and will continue to be a source of sage advice and guidance. Additions to the team include Gabriel Venegas, who has joined us as a Post-Doctoral Scholar in acoustics, and Anna Botts, who has joined our IT Staff. We also had several changes in status this year. Dan Tauriello has become a Seagoing Laboratory Specialist, Christos Kastrisios has become a Research Assistant Professor, Giuseppe Masetti, with his move to the Danish Hydrographic Service and reduction to part-time at the Center, has become an Adjunct Assistant Research Professor, Briana Sullivan has been reclassified as a Nautical Information Specialist, Chris Schwartz as a Desktop Administrator, Mike Smith as an Acoustic and Scientific Software Engineer, and Semme Dijkstra had his position changed to Clinical Professor.
O
INTRODUCTION
JHC Performance Report42
INFRASTRUCTURE INFRASTRUCTURE
Faculty
Thomas Butkiewicz received a Bachelor of Science degree in computer science in 2005 from Ithaca College where he focused on computer graphics and virtual reality research. During his graduate studies at The University of North Carolina at Charlotte, he designed and developed new interactive geospatial visualization techniques, receiving a master’s degree in computer science in 2007 and a Ph.D. in computer science in 2010. After a year as a research scientist at the Charlotte Visualization Center, he joined the Center as a post-doctoral research fellow in 2011. In 2012, he joined the faculty as a research assistant professor. Tom specializes in creating highly inter-active visualizations that allow users to perform complex visual analysis on geospatial datasets through unique, intuitive exploratory techniques. His research interests also include multi-touch and natural interfaces, virtual reality, stereoscopic displays, and image processing/computer vision. His current research projects include visual analysis of 4D dynamic ocean simulations, using Microsoft’s Kinect device to enhance multi-touch screens and provide new interaction methods, multi-touch gesture research, and developing new interface approaches for sonar data cleaning.
Brian Calder graduated with an M.Eng. (Merit) and a Ph.D. in electrical and electronic engineering in 1994 and 1997, respectively, from Heriot-Watt University in Scotland. His doctoral research was in Bayesian statistical meth-ods applied to processing of sidescan sonar and other data sources, and his post-doctoral research included the investigation of high-resolution seismic reconstruction, infrared data simulation, high-resolution acoustic propaga-tion modeling and real-time assessment of pebble size distributions for mining potential assessment. Brian joined the Center as a founding member in 2000, where his research has focused mainly on understanding, utilizing and portraying the uncertainty inherent in bathymetric data, and in efficient semi-automatic processing of high-density multibeam echosounder data. He is a research professor and associate director of the Center, the chair of the Open Navigation Surface Working Group, and a past associate editor of IEEE Journal of Oceanic Engineering.
Jenn Dijkstra received her Ph.D. in zoology in 2007 at the University of New Hampshire, has a B.A. from the University of New Brunswick (Canada), and an M.S. in marine biology from the University of Bremen (Germany). She has conducted research in a variety of geographical areas and habitats, from polar to tropical and from inter-tidal to deep-water. Her research incorporates observation and experimental approaches to address questions centered around the ecological causes and consequences of human-mediated effects on benthic and coastal communities. Her research at the Center focuses on the use of remote sensing (video and multibeam) to detect and characterize benthic communities.
Semme Dijkstra is a hydrographer from the Netherlands with hydrographic experience in both the Dutch Navy and industry. He completed his Ph.D. at the University of New Brunswick, Canada, where his thesis work involved artifact removal from multibeam-sonar data and development of an echosounder processing and sediment class-ification system. From 1996 to 1999, Semme worked at the Alfred Wegner Institute in Germany where he was in charge of their multibeam echosounder data acquisition and processing. Semme’s current research focuses on applications of single-beam sonars for seafloor characterization, small object detection and fisheries habitat mapping. In 2008, Semme was appointed a full-time instructor and took a much larger role in evaluating the overall Center curriculum, the development of courses and teaching. In 2016, the University re-classified Semme’s position to Research Scientist, but he maintains his active role in teaching and curriculum development. In 2020, the University re-classified Semme’s position to that of Clinical Professor, recognizing his active role in teaching and curriculum development.
Jim Gardner is a marine geologist focused on seafloor mapping, marine sedimentology, and paleoceanography. He received his Ph.D. in marine geology from the Lamont Doherty Earth Observatory of Columbia University in 1973. He worked for 30 years with the Branch of Pacific Marine Geology at the U.S. Geological Survey in Menlo Park, CA where he studied a wide variety of marine sedimentological and paleoceanographic problems in the Bering Sea, North and South Pacific Ocean, northeast Atlantic Ocean, Gulf of Mexico, Caribbean and Mediter-ranean Seas, and the Coral Sea. He conceived, organized, and directed the eight-year EEZ-SCAN mapping of the U.S. Exclusive Economic Zone using GLORIA long-range sidescan sonar in the 1980s; participated in four Deep
JHC Performance Report 31 January 2021 43
INFRASTRUCTURE INFRASTRUCTURE
Sea Drilling Project cruises, one as co-chief scientist; participated in more than 50 research cruises, and was Chief of Pacific Seafloor Mapping from 1995 to 2003, a project that used high-resolution multibeam echosounders to map portions of the U.S. continental shelves and margins. He also mapped Lake Tahoe in California and Crater Lake in Oregon. Jim was the first USGS Mendenhall Lecturer, received the Department of Interior Meritorious Service Award and received two USGS Shoemaker Awards. He has published more than 200 scientific papers and given an untold number of talks and presentations all over the world. Jim retired from the U.S. Geological Survey in 2003 to join the Center.
Jim was an adjunct professor at the Center from its inception until he moved to UNH in 2003 when he became a research professor affiliated with the Earth Science Dept. At the Center, Jim is in charge of all non-Arctic U.S. Law of the Sea bathymetry mapping cruises and is involved in research methods to extract meaningful geological information from multibeam acoustic backscatter through ground truth and advanced image analysis methods. Jim was awarded the 2012 Francis P. Shepard Medal for Sustained Excellence in Marine Geology by the SEPM Society of Sedimentary Geology. Jim has taught Geological Oceanography (ESCI 759/859) and the Geological Oceanography module of Fundamentals of Ocean Mapping (ESCI 874/OE 874.01). In 2013, Jim reduced his effort to half-time. Jim will officially retire at end of 2020 but remain an Emeritus Research Professor.
John Hughes Clarke is a professor jointly appointed in the departments of Earth Sciences and Mechanical Engineering. For 15 years before joining the Center, John held the Chair in Ocean Mapping at the University of New Brunswick in Canada where he was a Professor in the Department of Geodesy and Geomatics Engineering. During that period, he also ran the scientific seabed mapping program on board the CCGS Amundsen under-taking seabed surveys of the Canadian Arctic Archipelago. As a complement to his research and teaching, he has acted as a consultant, formally assessing the capability of the hydrographic survey vessels of the New Zealand, Australian, British and Dutch Navies as well as the U.S. Naval Oceanographic Office TAGS fleet. For the past 21 years, John, together with Larry Mayer, Tom Weber, and Dave Wells, has delivered the Multibeam Training Course that is presented globally three times per year. This is the world’s leading training course in seabed survey and is widely attended by international government and commercial offshore survey personnel as well as academics. John was formally trained in geology and oceanography in the UK and Canada (Oxford, Southampton, and Dalhousie). He has spent the last 27 years, however, focusing on ocean mapping methods. His underlying interest lies in resolving seabed sediment transport mechanisms.
Jim Irish received his Ph.D. from Scripps Institution of Oceanography in 1971 and worked many years at the Woods Hole Oceanographic Institution where he is still an Oceanographer Emeritus. He is currently a research professor of ocean engineering at UNH and has also joined the Center team. Jim’s research focuses on ocean instruments, their calibration, response and the methodology of their use; buoys, moorings and modeling of moored observing systems; physical oceanography of the coastal ocean, including waves, tides, currents and water-mass property observations and analysis; and acoustic instrumentation for bottom sediment and bedload transport for remote observations of sediment and for fish surveys.
Christos Kastrisios graduated from the Hellenic Naval Academy (HNA) in 2001 as an Ensign of the Hellenic Navy Fleet with a BSc in Naval Science. After his graduation, he served aboard Frigate HS Aegean and Submarines HS Protefs and HS Poseidon, mostly as the Navigator and Sonar Officer, and participated in several deployments at sea. In 2008 he was appointed to the Hellenic Navy Hydrographic Service (HNHS) where he served in various positions including that of deputy chief of the Hydrography Division and the Head of the Geospatial Policy Office; he also represented his country at international committees and working groups. In 2013 he received a master’s degree in GIS from the University of Maryland at College Park; in 2015 he graduated from the Hellenic Naval War College; and in 2017 he was awarded a Ph.D. in Cartography from the National Technical University of Athens (NTUA) for his work on the scientific aspects of the Law of the Sea Convention. From 2014 to 2017 he worked as a part-time lecturer in GIS and Cartography at the HNA and NTUA. In September 2017 he started employment at the Center as a post-doc researcher focusing on data generalization, chart adequacy, and computer-assisted nautical cartography. He joined the Center’s full-time staff as a Research Scientist in 2018 and became an Assistant Research Professor in 2020.
JHC Performance Report44
INFRASTRUCTURE INFRASTRUCTURE
Tom Lippmann is an Associate Professor with affiliation in the Department of Earth Sciences, Marine Program, and Ocean Engineering Graduate Program, and is currently the Director of the Oceanography Graduate Program. He received a B.A. in Mathematics and Biology from Linfield College (1985), and an M.S. (1989) and Ph.D. (1992) in Oceanography at Oregon State University. His dissertation research conducted within the Geological Oceano-graphy Department was on shallow water physical oceanography and large-scale coastal behavior. He went on to do a post doc at the Naval Postgraduate School (1992-1995) in Physical Oceanography. He worked as a Research Oceanographer at Scripps Institution of Oceanography (1995-2003) in the Center for Coastal Studies. He was then a Research Scientist at Ohio State University (1999-2008) jointly in the Byrd Polar Research Center and the Depart-ment of Civil and Environmental Engineering & Geodetic Science. Tom’s research is focused on shallow water oceanography, hydrography, and bathymetric evolution in coastal waters spanning the inner continental shelf, surf zone, and inlet environments. Research questions are collaboratively addressed with a combination of experi-mental, theoretical, and numerical approaches. He has participated in 20 nearshore field experiments and spent more than two years in the field.
Anthony P. Lyons received a B.S. degree (summa cum laude) in physics from the Henderson State University, Arkadelphia, AR, in 1988 and M.S. and Ph.D. degrees in oceanography from Texas A&M University, College Station, TX, in 1991 and 1995, respectively. He was a scientist at the SACLANT Undersea Research Centre, La Spezia, Italy, from 1995 to 2000, where he was involved in a variety of projects in the area of environmental acoustics. Tony was awarded, with the recommendation of the Acoustical Society of America, the Institute of Acoustics’ (U.K.) A.B. Wood Medal in 2003. He is a Fellow of the Acoustical Society of America and a member of the IEEE Oceanic Engineering Society. He is also currently an Associate Editor for the Journal of the Acoustical Society of America and is on the Editorial Board for the international journal Methods in Oceanography. Tony conducts research in the field of underwater acoustics and acoustical oceanography. His current areas of interest include high-frequency acoustic propagation and scattering in the ocean environment, acoustic characterization of the seafloor, and quantitative studies using synthetic aperture sonar.
Giuseppe Masetti received an M.Eng. in ocean engineering (ocean mapping option) from the University of New Hampshire in 2012, and a master’s degree in marine geomatics (with honors) and a Ph.D. degree in system monitoring and environmental risk management from the University of Genoa, Italy, in 2008 and 2013, respective-ly. In addition, he graduated (with honors) in Political Sciences from the University of Pisa, Italy, in 2003 and in Diplomatic and International Sciences from the University of Trieste, Italy, in 2004. Giuseppe achieved the FIG/IHO Category A certification in 2010, and is a member of IEEE and The Hydrographic Society of America. He served with the Italian Navy from 1999 and has been Operations Officer aboard the hydrographic vessels ITN Aretusa and ITN Magnaghi. From August 2013, he was a Tyco Post-Doctoral Fellow with the Center, where he focused on signal processing for marine target detection. He joined the faculty as a Research Assistant Professor in January 2016 and in 2020 moved to the Danish Hydrographic Service. Giuseppe retains his affiliation and continues to work closely with the Center as an Adjunct Assistant Research Professor.
Larry Mayer is the founding Director of the Center for Coastal and Ocean Mapping and Co-Director of the Joint Hydrographic Center. Larry’s faculty position is split between the Ocean Engineering and Earth Science Depart-ments. His Ph.D. is from the Scripps Institution of Oceanography (1979), and he has a background in marine geology and geophysics with an emphasis on seafloor mapping, innovative use of visualization techniques, and the remote identification of seafloor properties from acoustic data. Before coming to New Hampshire, he was the NSERC Chair of Ocean Mapping at the University of New Brunswick where he led a team that developed a world-wide reputation for innovative approaches to ocean mapping problems.
Jennifer Miksis-Olds is the Associate Director of Research and Research Professor in the School of Marine Science and Ocean Engineering at the University of New Hampshire, and holds a research position in the Center for Coastal and Ocean Mapping. Jenn is the university Member Representative and on the Board of Trustees of the Consortium for Ocean Leadership. She is a member of the Scientific Committee of the International Quiet Ocean Experiment Program and serves as a Scientific Advisor to the Sound and Marine Life Joint Industry
JHC Performance Report 31 January 2021 45
INFRASTRUCTURE INFRASTRUCTURE
Program (International Oil & Gas Producers) which is devoted to the study of effects of sound on marine organ-isms. Jenn was the recipient of an Office of Naval Research Young Investigator Program award in 2011 and the Presidential Early Career Award in Science and Engineering in 2013. She is also a newly elected Fellow in the Acoustical Society of America. Jenn received her A.B. cum laude in Biology from Harvard University, her M.S. in Biology from the University of Massachusetts Dartmouth; she was a guest student at Woods Hole Oceanographic Institution, and then received her Ph.D. in Biological Oceanography from the University of Rhode Island.
Yuri Rzhanov, a Research Professor, has a Ph.D. in physics and mathematics from the Russian Academy of Sciences. He completed his thesis on nonlinear phenomena in solid-state semiconductors in 1983. Since joining the Center in 2000, he has worked on a number of signal processing problems, including construction of large-scale mosaics from underwater imagery, automatic segmentation of acoustic backscatter mosaics, and accurate measurements of underwater objects from stereo imagery. His research interests include the development of algorithms and their implementation in software for 3D reconstruction of underwater scenes, and automatic detection and abundance estimation of various marine species from imagery acquired from ROVs, AUVs, and aerial platforms.
Larry Ward has an M.S. (1974) and a Ph.D. (1978) from the University of South Carolina in Geology. He has more than 30 years’ experience conducting research in shallow water marine systems. Primary interests include es-tuarine, coastal, and inner shelf morphology and sedimentology. His most recent research focuses on seafloor characterization and the sedimentology, stratigraphy and Holocene evolution of nearshore marine systems. Larry's present teaching includes a course in Nearshore Processes and a Geological Oceanography module.
Colin Ware received a Ph.D. in psychology from the University of Toronto in 1980 an M.Math in computer science from the University of Waterloo in 1982. He is professor (emeritus) of computer science and the Director of the Data Visualization Research Lab at the Center for Coastal and Ocean Mapping. He is the author of Visual Thinking for Design (2008) which discusses the science of visualization and has published more than 140 research articles on subject of data visualization. His other book, Information Visualization: Perception for Design (4th Edition 2020) has become the standard reference in the field. Fledermaus, a visualization package initially developed by him and his students, is now the leading 3D visualization package used in ocean mapping applications. He currently works on methods and tools for visualizing ocean and littoral data, including the representation of wind, wave and current information on electronic chart displays, the visualization of the state of global seafloor mapping to support the Seabed 2030 project, and methods for improving the processing of multibeam sonar data.
Tom Weber received his Ph.D. in acoustics at The Pennsylvania State University in 2006 and has B.S. (1997) and M.S. (2000) degrees in ocean engineering from the University of Rhode Island. After joining the Center in 2006, he joined the UNH Mechanical Engineering Department as an assistant professor in 2012. Tom conducts research in the field of underwater acoustics and acoustical oceanography. His specific areas of interest include acoustic propagation and scattering in fluids containing gas bubbles, the application of acoustic technologies to fisheries science, high-frequency acoustic characterization of the seafloor, and sonar engineering.
Research Scientists and Staff
Roland Arsenault joined the Center in 2000 after receiving his Bachelor's degree in Computer Science and work-ing as a research assistant with the Human Computer Interaction Lab at the Department of Computer Science at the University of New Brunswick. A longtime member of the Center's Data Visualization Research Lab, Roland combines his expertise with interactive 3D graphics with his experience working with various mapping-related technologies to help provide a unique perspective on some of the challenges undertaken at the Center. With the Center’s addition of Autonomous Surface Vehicles (ASVs), Arsenault has become the ASV lab’s chief software engineer developing a cross-platform ocean mapping focused framework for the Center’s ASV fleet.
JHC Performance Report46
INFRASTRUCTURE INFRASTRUCTURE
KG Fairbarn holds a B.A. in geography from UC Santa Barbara and an M.S. in remote sensing intelligence from the Naval Postgraduate School. He has worked extensively at sea as a researcher, marine technician, captain, and research diver. He most recently worked as the oceanographic specialist aboard the University of Delaware’s R/V Hugh R. Sharp. At UNH, KG works as an engineer on the autonomous surface vehicle project and will assist with the multibeam advisory committee duties.
Will Fessenden is the Center's Systems Manager. He has provided workstation, server, and backup support for the Center since 2005, and has over 15 years of experience in information technology. He previously worked for the University of New Hampshire's Information Technology Department in both retail and support capacities. In addition to holding industry certifications for Microsoft, Apple, Dell and other platforms, Fessenden has a B.A. in Political Science from the University of New Hampshire.
Tara Hicks Johnson has a B.S. in geophysics from the University of Western Ontario, and an M.S. in geology and geophysics from the University of Hawaii at Manoa where she studied meteorites. In June 2011, Tara moved to New Hampshire from Honolulu, Hawaii, where she was the Outreach Specialist for the School of Ocean and Earth Science and Technology at the University of Hawaii at Manoa. While there, she organized educational and community events for the school, including the biennial Open House event, and ran the Hawaii Ocean Sciences Bowl, the Aloha Bowl. She also handled media relations for the School and coordinated television production projects. Tara also worked with the Bishop Museum in Honolulu developing science exhibits, and at the Canadian Broadcasting Corporation in Toronto (where she was born and raised).
Tianhang Hou was a research associate with the University of New Brunswick Ocean Mapping for six years before coming to UNH. He has significant experience with the UNB/OMG multibeam processing tools and has taken part in several offshore surveys. He is currently working with Briana Sullivan on the Chart of the Future project.
Jon Hunt, a UNH alumnus who studied economics and oceanography while a student at the university, is now a research technician at the Center. Under the supervision of Tom Lippmann, Jon has built a survey vessel which is capable of undertaking both multibeam sonar surveys and the measurements of currents. Hunt is a certified research scuba diver and has been a part of many field work projects for the Center.
Kevin Jerram completed his M.S. in ocean engineering (ocean mapping option) in 2014 through the UNH Center for Coastal and Ocean Mapping, where his research focused on detection and characterization of marine gas seeps using a split-beam scientific echosounder. He has participated in seafloor and midwater mapping expedi-tions throughout the Atlantic, Pacific, and Arctic Oceans in support of Center projects, and works with the NSF-funded Multibeam Advisory Committee to enhance mapping data quality across the U.S. academic fleet. Before joining the Center, he received a B.S. in mechanical engineering from UNH and worked in engineering positions for Shoals Marine Laboratory and Ocean Classroom Foundation.
Paul Johnson has an M.S. in geology and geophysics from the University of Hawaii at Manoa where he studied the tectonics and kinematics of the fastest spreading section of the East Pacific Rise. Since finishing his master's, he has spent time in the remote sensing industry processing, managing, and visualizing hyperspectral data associated with coral reefs, forestry, and research applications. More recently, he was the interim director of the Hawaii Mapping Research Group at the University of Hawaii where he specialized in the acquisition, processing, and visualization of data from both multibeam mapping systems and towed near bottom mapping systems. Paul came to UNH in June of 2011 as the Center's data manager. When not working on data-related issues for the Center, he is aiding in the support of multibeam acquisition for the U.S. Academic Research Fleet through the National Science Foundation's Multibeam Advisory Committee.
Tomer Ketter is the former hydrographer of the National Oceanographic Institute of Israel. He spent the last three years as Chief Surveyor aboard the R/V Bat-Galim and led the mapping of the Israel EEZ. Prior to joining the Center, Ketter was part of the GNFA team on the Ocean Discovery XPrize contest. He holds a B.Sc. in Marine and
JHC Performance Report 31 January 2021 47
INFRASTRUCTURE INFRASTRUCTURE
Environmental Sciences and an M.Sc. in Marine Geosciences, as well as IHO/FIG/ICA Category A Hydrography certification from the GEBCO-Nippon Foundation ocean mapping program at the Center. He now contributes to the Seabed 2030 network and to the Multibeam Advisory Committee at the Center.
Carlo Lanzoni received a master’s degree in ocean engineering from the University of New Hampshire. His master’s research was the design of a methodology for field calibration of multibeam echo sounders using a split-beam sonar system and a standard target. He also has an M.S. and a B.S. in electrical engineering from the University of New Hampshire. Lanzoni has worked with different calibration methodologies applied to a variety of sonar systems. He is responsible for the operation, maintenance, and development of test equipment used in acoustic calibrations of echo sounders at the acoustic tank in the Chase Ocean Engineering Lab. His research focuses on the field calibration methodology for multibeam echo sounders.
Kim Lowell is a research scientist at the Center, as well as an adjunct professor in analytics and data science, and an affiliate research professor in the Earth Systems Research Center. His primary focus at the Center is the application of machine learning, deep learning, and other data analytics techniques to improve the accuracy of bathymetric charts. He has considerable experience in the analysis of geospatial information to address land management issues using GIS, spatial statistics, and optical, radar, and lidar imagery while also accounting for uncertainties inherent in those data. Prior to joining the Center, he was a program manager for a nationwide (Australian) collaborative geospatial research consortium whose members included private companies, govern-ment agencies, and universities. He also has been the director of a group of hydrologically-based landscape mod-elers for a state Department of Primary Industries (Victoria, Australia). Prior to that, he was a tenured full professor in the Faculty of Forestry and Geomatic Engineering at Université Laval (Québec, Canada). Lowell has an M.Sc. (University of Vermont, USA) and a Ph.D. (Canterbury University, New Zealand) in forest biometrics, and an M.Sc. in data science and analytics (University of New Hampshire).
Zachary McAvoy received a B.S. in geology from the University of New Hampshire in 2011. His background is in geochemistry, geology, and GIS. Since graduating, he has worked on various environmental and geoscience-relat-ed projects for the Earths Systems Research Center and Ocean Process Analysis Laboratory at UNH; as well as the New Hampshire DOT and Geological Survey. Zach is currently a research technician working for Dr. Larry Ward. As part of a BOEM beach nourishment study, he is using geologic and geospatial datasets for synthesis in GIS and mapping the geomorphology of the New Hampshire inner continental shelf.
Andy McLeod received his B.S. in ocean studies from Maine Maritime Academy in 1998. His duties at the Center include supporting autonomous vehicle projects from conception and pre-production through to completion, providing technical support, managing project budgets, overseeing maintenance and operations, completion of documentation, producing test plans and reports, preparing contract documentation for procurement services and materials, and carrying out effective liaison with research partners.
Kristen Mello is a UNH alumnus with a B.Sc. in zoology. She obtained a Rutman Fellowship from the Shoals Marine Laboratory to study invasive macroalgae species at the Isles of the Shoals. Soon after completing her fellowship, she began working as a research technician at the Center focusing on mapping temporal and spatial distribution of macroalgae and fine-scale distribution of deep sea coral habitats in the Northwest Atlantic Ocean. As a project research specialist, she continues to work on various topics such as invasive macroalgae, and fine-scale habitat mapping in local subtidal, tropical subtidal, and deep sea environments. Kristen specializes in all SCUBA diving-related tasks including planning, executing, and analyzing data collected during dives.
Colleen Mitchell earned a B.A. in English from Nyack College in Nyack, NY and a master's in education from the State University of New York at Plattsburgh. She began working for the Environmental Research Group (ERG) at UNH in 1999. In 2009, Mitchell joined the Center as a graphic designer where she is responsible for the Center's graphic identity and creates ways to visually communicate the Center’s message in print and digital media. In addition, Colleen manages the Center's website and develops content for the Center's social media platforms.
JHC Performance Report48
INFRASTRUCTURE INFRASTRUCTURE
Matthew Rowell joined Center staff in 2017 as the captain of the R/V Gulf Surveyor. Capt. Rowell first came to the University of New Hampshire in 2011 to pursue a graduate degree in mechanical engineering with a focus on hydrokinetic energy. Upon completion of his master’s degree, he filled a research project engineering position at UNH in the Ocean Engineering Department and, in that capacity, was instrumental in the design and construction of the R/V Gulf Surveyor. Prior to UNH, Capt. Rowell studied mechanical engineering at Clarkson University and spent eight years as an officer in the U.S. Navy studying surface warfare and nuclear power.
Val Schmidt received his bachelor’s degree in physics from the University of the South, Sewanee, TN in 1994. During his junior undergraduate year, he joined the Navy and served as an officer in the submarine fleet aboard the USS Hawkbill from 1994 to 1999. In 1998 and 1999, the USS Hawkbill participated in two National Science Foundation sponsored “SCICEX” missions to conduct seafloor mapping from the submarine under the Arctic ice sheet. Schmidt served as Sonar and Science Liaison Officer during these missions. He left the Navy in 1999 and worked for Qwest Communications as a telecommunications and Voice over IP engineer from 2000 to 2002. Schmidt began work in 2002 as a research engineer for the Lamont Doherty Earth Observatory of Columbia University where he provided science-engineering support both on campus and to several research vessels in the U.S. academic research fleet. He acted as a technical lead aboard the U.S. Coast Guard Icebreaker Healy for several summer cruises in this role. Schmidt completed his master’s degree in ocean engineering in 2008 at the Center. His thesis involved development of an underwater acoustic positioning system for whales that had been tagged with an acoustic recording sensor package. He continues to work as an engineer for the Center where his research focuses on hydrographic applications of ASVs, AUVs, and Phase Measuring Bathymetric sonars.
Chris Schwartz has been newly appointed as a Desktop Administrator in our IT group which he has been part of since the beginning of summer 2017. His responsibilities include maintaince, upgrades and trouble shooting of computers and associated software for the large array of desktop and laptop systems and software packages scat-tered throughout the lab.
Erin Selner has worked in research support roles for UNH since 2000. Her background includes research admin-istration and accounting, as well as conference administration and project support. She received a B.A. from the College of William and Mary in Virginia.
Michael Sleep is a systems administrator with nine years of IT experience. His focus is on providing automation and wrangling linux-based systems, network monitoring, and providing support to the Center's faculty, staff, and students. He is working towards becoming a certified Red Hat Linux systems administrator.
Michael Smith joined the Center in 2016 as a master’s student in ocean engineering/ocean mapping where his master’s thesis focused on quantifying the radiation patterns of deep water multibeam echosounders for calibra-tion and impact assessment. Prior to joining the Center, Michael had graduated from the University of Rhode Island’s International Engineering Program (IEP) with a B.S. in ocean engineering and a B.A. in Spanish. His time in IEP placed him in internships aboard the E/V Nautilus and the University of Las Palmas AUV team. At the Center, Michael is involved with a number of projects related to deep and shallow water multibeam echosounders. His work includes the development of open-source software solutions for hydrographic surveying and MBES back-scatter processing. He continues to expand his thesis work on deep-water multibeam sound source verification and assessment. Michael has also worked on shallow water multibeam echosounder calibration methodologies, both in the acoustic tank and in the field. Michael greatly enjoys time out at sea, having participated in a number of research and mapping cruises.
Briana Sullivan received a B.S. in computer science from UMASS, Lowell and an M.S. in computer science from UNH, under the supervision of Dr. Colin Ware. Her master’s thesis involved linking audio and visual information in a virtual underwater kiosk display that resulted in an interactive museum exhibit at the Seacoast Science Center. Sullivan was hired in July 2005 as a research scientist for the Center. She works on the Chart of the Future project which involves things such as the Local Notice to Mariners, ship sensors, the CoastPilot, and other marine-related topics. Her focus is on web technologies and mobile environments.
JHC Performance Report 31 January 2021 49
INFRASTRUCTURE INFRASTRUCTURE
Dan Tauriello graduated from UNH in 2014 with a B.S in marine biology and a minor in ocean engineering. At the Center, he wears many hats including graduate student, IT technician, and first mate aboard the Center’s research vessels. As a master's student in Earth Science/Ocean Mapping, he is focused on hardware testing and develop-ment related to system design for a trusted method of collecting crowdsourced bathymetric data. In the past, he has served as an Explorer in Training aboard NOAA Ship Okeanos Explorer, and ran a variety of experimental aquaculture projects in the Portsmouth Harbor area.
Emily Terry joined the Center as Relief Captain in 2009, and was promoted to research vessel captain in 2014. She came to the Center from the NOAA Ship Fairweather where she worked for three years as a member of the deck department, separating from the ship as a Seaman Surveyor. Prior to working for NOAA, she spent five years working aboard traditional sailing vessels. Capt. Terry holds a USCG 100 ton near coastal license.
Rochelle Wigley has a mixed hard rock/soft rock background with an M.Sc. in igneous geochemistry (focusing on dolerite dyke swarms) and a Ph.D. in sedimentology/sediment chemistry, where she integrated geochemistry and geochronology into marine sequence stratigraphic studies of a condensed sediment record in order to improve the understanding of continental shelf evolution along the western margin of southern Africa. Phosphorites and glauconite have remained as a research interest where these marine authigenic minerals are increasingly the focus of offshore mineral exploration programs. She was awarded a Graduate Certificate in Ocean Mapping from UNH in 2008. Rochelle concentrated largely on understanding the needs and requirements of all end-users within the South African marine sectors on her return home, as she developed a plan for a national offshore mapping pro-gram from 2009 through 2012. As project director of the GEBCO Nippon Foundation Indian Ocean Project, she is involved in the development of an updated bathymetric grid for the Indian Ocean and management of a project working to train other Nippon Foundation GEBCO scholars. In 2014, Rochelle took on the responsibility of the director of the Nippon Foundation GEBCO training program at the Center.
In addition to the academic, research and technical staff, our administrative support staff, Wendy Monroe, Renee Blinn, and Kris Tonkin ensure the smooth running of the organization.
NOAA EmployeesNOAA has demonstrated its commitment to the Center by assigning fourteen NOAA employees (or contractors) to the Center.
Capt. Andrew Armstrong, founding co-director of the JHC, retired as an officer in the National Oceanic and Atmospheric Administration Commissioned Officer Corps in 2001 and is now assigned to the Center as a civilian NOAA employee. Capt. Armstrong has specialized in hydrographic surveying and served on several NOAA hydrographic ships, including the NOAA Ship Whiting where he was Commanding Officer and Chief Hydro-grapher. Before his appointment as Co-Director of the NOAA/UNH Joint Hydrographic Center, Capt. Armstrong was the Chief of NOAA’s Hydrographic Surveys Division, directing all of the agency’s hydrographic survey activi-ties. Capt. Armstrong has a B.S. in geology from Tulane University and an M.S. in technical management from the Johns Hopkins University. Capt. Armstrong oversees the hydrographic training program at UNH and organized our successful Category A certification submission to the International Hydrographic Organization in 2018.
Sam Candio is a physical scientist with the NOAA Office of Ocean Exploration and Research (OER). He splits his time between conducting field operations aboard the NOAA Ship Okeanos Explorer as an expedition coordi-nator/mapping lead, and conducting shoreside responsibilities at the Center including mission planning, data QC, and data archival. Sam received his Bachelor of Science degree in marine biology from the University of North Carolina, Wilmington, with minors in environmental science and oceanography. Following graduation, he worked as an instructor for UNCW’s MarineQuest, leading a suite of marine science experiential learning pro-grams ranging from the generation of biodiesel from algae to the operation of side scan sonars and ROVs. Prior to signing on with OER, Sam spent four years aboard the NOAA Ship Fairweather, serving as the chief hydro-graphic survey technician leading coastal bathymetric surveys ranging from the Alaskan Arctic to the Channel Islands in California.
JHC Performance Report50
INFRASTRUCTURE INFRASTRUCTURE
Jason Greenlaw is a software developer for ERT, Inc., working as a contractor for NOAA/National Ocean Service’s Coast Survey Development Laboratory in the Marine Modeling and Analysis Programs (MMAP) branch. He works primarily on the development of NOAA’s nowCOAST project (http://nowcoast.noaa.gov), but also works closely with MMAP modelers to assist in the development of oceanographic forecast systems and the visualiza-tion of model output. Jason is a native of Madbury, NH and graduated in May 2006 from the University of New Hampshire with a B.S. in computer science.
Shannon Hoy is a physical scientist with the NOAA Office of Ocean Exploration and Research (OER). She assists in both field operations aboard the NOAA Ship Okeanos Explorer as a mapping coordinator and with shoreside responsibilities, such as mission planning and data archiving. Shannon has a multidisciplinary background, having received a Bachelor of Science degree in marine biology from the College of Charleston, and having worked with the Submarine Geohazards Group at the U.S. Geological Survey. She will soon complete her master’s degree in ocean mapping at the University of New Hampshire’s Center for Coastal and Ocean Mapping (CCOM). Shannon began mapping the seafloor in 2009 and has since participated with numerous expeditions. Prior to her position with OER, the majority of her time at sea was spent as a mapping lead for University of Bristol’s (UK) palaeocean-ographic group, where she implemented multiple habitat mapping technologies and methodologies to search for deep-sea corals.
Carl Kammerer is an oceanographer with the National Ocean Service’s Center for Operational Oceanographic Products and Services (CO-OPS), now seconded to the Center. He is a specialist in estuarine and near-shore cur-rents and has been project manager for current surveys throughout the United States and its territories. His pres-ent project is a two-year survey of currents in the San Francisco Bay region. He acts as a liaison between CO-OPS and the JHC and provides expertise and assistance in the analysis and collection of tides. He has a B.Sc in ocean-ography from the University of Washington and an MBA from the University of Maryland University College.
John G.W. Kelley is a research meteorologist and coastal modeler with NOAA/National Ocean Service’s Marine Modeling and Analysis Programs within the Coast Survey Development Lab. Kelley has a Ph.D. in atmospheric sciences from Ohio State University. He is involved in the development and implementation of NOS’s opera- tional numerical ocean forecast models for estuaries, the coastal ocean and the Great Lakes. He is also the PI for a NOAA web-mapping portal to real-time coastal observations and forecasts. John works with Center per- sonnel on developing the capability to incorporate NOAA’s real-time gridded digital atmospheric and oceano-graphic forecast into the next generation of NOS nautical charts.
Elizabeth “Meme” Lobecker is a Physical Scientist for the Okeanos Explorer program within the NOAA Office of Ocean Exploration and Research (OER). She organizes and leads mapping exploration cruises aboard the NOAA Ship Okeanos Explorer. She has spent the last ten years mapping the global ocean floor for an array of purposes, ranging from shallow water hydrography for NOAA charting and habitat management purposes in U.S. waters from Alaska to the Gulf of Maine, cable and pipeline inspection and pre-lay surveys in the Eastern Atlantic Ocean, the North Sea and Mediterranean Sea, and most recently as a Physical Scientist for OER sailing on Okeanos Explorer as it explores the U.S. and international waters. So far this has included mapping in Indonesia, Guam, Hawaii, California, the Galapagos Spreading Center, the Mid-Cayman Rise, the Gulf of Mexico, and the U.S. Atlantic continental margin. Lobecker obtained a Master of Marine Affairs degree from the University of Rhode Island in 2008, and a Bachelor of Arts in environmental studies from The George Washington University in 2000. Her interests in her current position include maximizing offshore operational efficiency in order to provide large amounts of high-quality data to the public to enable further exploration, focused research, and wise management of U.S. and global ocean resources.
Erin Nagel focused her undergraduate studies at the University of Colorado at Boulder on geographic informa-tion systems and atmospheric and oceanic sciences and worked as a physical scientist for the U.S. Army Corps of Engineers and with NOAA’s Atlantic Hydrographic Branch for the Office of Coast Survey before joining the Center in 2014. She has supported USACE and FEMA in emergency operations during Super Storm Sandy and Irene with emergency response mapping and pre- and post-storm analysis of bathymetry and lidar. Erin joined the now-COAST effort in 2017, working as a Scientific Programmer focusing on surface current data.
JHC Performance Report 31 January 2021 51
INFRASTRUCTURE INFRASTRUCTURE
Glen Rice started with the Center as a Lieutenant (Junior Grade) in the NOAA Corps stationed with the Joint Hydrographic Center as Team Lead of the Integrated Ocean and Coastal Mapping Center. He had previously served aboard the NOAA Hydrographic Ships Rude and Fairweather along the coasts of Virginia and Alaska after receiving an M.Sc. in ocean engineering at the University of New Hampshire. In 2013, Glen left the NOAA Corps and became a civilian contractor to NOAA. In 2014, he became a permanent physical scientist with NOAA. He maintains his position as Team Lead of the IOCM Center at UNH.
Derek Sowers works as a physical scientist with the NOAA Office of Ocean Exploration and Research (OER) supporting ocean mapping efforts of the NOAA Ship Okeanos Explorer. This work involves overseeing other so-nar scientists shore-side at the Center. Derek is also a part-time oceanography Ph.D. student with interests in sea-floor characterization, ocean habitat mapping, and marine conservation. He has a B.S. in environmental science from the University of New Hampshire (1995) and holds an M.S. in marine resource management from Oregon State University (2000) where he completed a NOAA-funded assessment of the “Benefits of Geographic Informa-tion Systems for State and Regional Ocean Management.” Derek has thirteen years of previous coastal research and management experience working for NOAA’s National Estuarine Research Reserve network and EPA’s National Estuary Program in both Oregon and New Hampshire and has participated in ocean research expeditions in the Arctic Ocean, Gulf of Maine, and Pacific Northwest continental shelf.
Michael White has a B.A in geological sciences from SUNY Geneseo and an M.S. from the School of Marine and Atmospheric Sciences at Stony Brook University where his graduate work focused on the processing of multibeam sonar and the relationship between backscatter and the physical characteristics of the seafloor for the purposes of habitat mapping. He also has an Advanced Graduate Certificate in Geospatial Science from the Department of Sustainability at Stony Brook University. At the Center, White works with the NOAA Office of Ocean Exploration and Research (OER) as a Physical Scientist in the NOAA Ship Okeanos Explorer program.
Katrina Wiley is part of NOAA’s Office of Coast Survey, Hydrographic Surveys Division, Operations Branch. Prior to Operations Branch, Katrina served as Chief of Survey Section at U.S. Army Corps of Engineers New England District in Concord, MA and also previously worked for NOAA’s Hydrographic Surveys Division Operations Branch in Silver Spring, MD and Atlantic Hydrographic Branch in Norfolk, VA. She has a B.S. in marine biology from the College of Charleston and an M.S. in Earth sciences from University of New Hampshire.
Sarah Wolfskehl is a Hydrographic Data Analyst with NOAA’s Sandy IOCM Center. She is located at the Joint Hydrographic Center to utilize the Center’s research to improve and diversify the use of hydrographic data across NOAA in support of Integrated Ocean and Coastal Mapping projects. Previously, she worked as a Physical Scien-tist for NOAA’s Office of Coast Survey in Seattle, WA. Wolfskehl has a B.A. in biology from Colorado College.
Other Affiliated FacultyLee Alexander is a research associate professor emeritus. He was previously a research scientist with the U.S. Coast Guard, and a Visiting Scientist with the Canadian Hydrographic Service. His area of expertise is applied Research, Development, Test and Evaluation (RDT&E) on electronic charting and e-Navigation-related technolo-gies for safety-of-navigation and marine environmental protection. Lee has published over 150 papers and reports on shipborne and shore-based navigation systems/technologies, and is a co-author of a textbook on Electronic Charting. He received an M.S. degree from the University of New Hampshire, and a Ph.D. from Yale University. He is also a Captain (now retired) in the U.S. Navy Reserve.
Brad Barr received a B.S. from the University of Maine, an M.S. from the University of Massachusetts, and a Ph.D. from the University of Alaska. He is currently a senior policy advisor in the NOAA Office of National Marine Sanctuaries, affiliate professor at the School of Marine Sciences and Ocean Engineering at the University of New Hampshire, and a visiting professor at the University Center of the Westfjords in Iceland. He is a member of the IUCN World Commission on Protected Areas, the International Committee on Marine Mammal Protected Areas/IUCN Marine Mammal Protected Areas Task Force. He has served on the Boards of Directors of the George Wright Society in the U.S., the Science and Management of Protected Areas Association (SAMPAA) in Canada, and, currently, on the Board of Directors of the Coastal Zone Canada Association (CZCA). He also serves

JHC Performance Report52
INFRASTRUCTURE INFRASTRUCTURE
on the Editorial Board of the World Maritime University Journal of Maritime Affairs. He has published extensively on marine protected areas science and management, whaling and maritime heritage preservation, with a primary research focus on the identification and management of ocean wilderness.
Jonathan Beaudoin earned his undergraduate degrees in geomatics engineering and computer science from the University of New Brunswick (UNB) in Fredericton, NB, Canada. He continued his studies at UNB under the supervision of Dr. John Hughes Clarke of the Ocean Mapping Group, and after completing his Ph.D. studies in the field of refraction related echo sounding uncertainty, Dr. Beaudoin took a research position at JHC/CCOM in 2010. While there, he carried on in the field of his Ph.D. research and joined the ongoing seabed imaging and characterization efforts. He also played a leading role in establishing the Multibeam Advisory Committee, an NSF-funded effort to provide technical support to seabed mapping vessels in the U.S. academic fleet. Jonathan returned to Canada in late 2013 where he joined the Fredericton, NB office of QPS.
Ann E. A. Blomberg received her M.Sc. and Ph.D. degrees in signal processing from the University of Oslo, Norway, in 2005 and 2012, respectively. From 2005 to 2008, she worked as a processing geo-physicist at CGGVeritas in Norway. In 2012, she was at the Centre for Geobiology (CGB) at the University of Bergen, working with sonar and seismic data acquisition, processing, and interpretation. She is currently a postdoc at the University of Oslo, working on a project entitled, "Advanced sonar methods for detecting and monitoring marine gas seeps."
Margaret Boettcher received a Ph.D. in geophysics from the MIT/WHOI Joint Program in Oceanography in 2005. She joined JHC/CCOM in 2008 as a post-doctoral scholar after completing a Mendenhall Postdoctoral Fellowship at the U.S. Geological Survey. Although she continues to collaborate with scientists at the Center, Margaret has been a member of the faculty in the Earth Science Department at UNH since 2009. Margaret’s research focuses on the physics of earthquakes and faulting and she approaches these topics from the perspectives of seismology, rock mechanics, and numerical modeling. Margaret seeks to better understand slip accommodation on oceanic transform faults. Recently she has been delving deeper into the details of earthquake source processes by looking at very small earthquakes in deep gold mines in South Africa.
David Bradley received bachelor’s and master’s degrees in physics from Michigan Technological University in Houghton in 1960 and 1963, respectively, and a doctorate in mechanical engineering from the Catholic University of America in 1970. He served as director of the NATO Underwater Research Center, La Spezia, Italy; superinten-dent of the Acoustics Division of the Naval Research Laboratory; and mine warfare technical adviser to the Chief of Naval Operations. His seminal contributions to the field of acoustics have been recognized with many awards and leadership positions within the ASA. They include the Meritorious Civilian Service Award in 1982, and the Superior Civilian Service Award in 1993 from the Department of the Navy. He recently retired as a Professor of Acoustics at Penn State University and started as an Affiliate Faculty member with the Center in 2017.
Dale Chayes has been an active instrument developer, troubleshooter, and operator in the oceanographic com-munity since 1973 and has participated in well over 150 field events. He has worked on many projects, including hull-mounted multibeams, submarine (SCAMP) and deep-towed mapping sonars (SeaMARC I), real-time wireless data systems, database infrastructure for digital libraries (DLESE) and marine geoscience data (MDS), satellite IP connectivity solutions (SeaNet), GPS geodesy, trace gas water samplers, precision positioning systems, and backpack mounted particle samplers. In his spare time, he is a licensed amateur radio operator, Wilderness EMT/NREMT and is in training (with his dog Frodo) for K9 wilderness search and rescue.
Vicki Ferrini has a Ph.D. in coastal oceanography (2004) and a master's degree in marine environmental science (1998), both from Stony Brook University. Over the past 20+ years, she has worked in environments from shallow water coastal areas to the deep sea, using ships, boats, submersibles, and towed platforms to map the seafloor at a variety of resolutions. Vicki is also heavily involved in the fields of geoinformatics and data management. She is a research scientist at Columbia University’s Lamont-Doherty Earth Observatory where she spends much of her time working on projects focused on making high-quality marine geoscience research data publicly accessible.
JHC Performance Report 31 January 2021 53
INFRASTRUCTURE INFRASTRUCTURE
Denis Hains is the Founder, President and CEO of H2i (Hains HYDROSPATIAL international inc.); the representa-tive appointed by the United States and Canada Hydrographic Commission (USCHC) on the International Hydro-graphic Review (IHR) Editorial Board of the International Hydrographic Organization (IHO); Vice President of the Board of Directors of the Interdisciplinary Center for Ocean Mapping Development (CIDCO) in Rimouski, Canada; and is also an active member of the Canadian Hydrographic Association (CHA), and the Association of Profession-al Executives of the Public Service of Canada (APEX). Denis holds a B.Sc. in geodetic science from Laval University in Québec City, Canada. He is a Retired Québec Land Surveyor and had a successful 35+ year career with the Public Service of Canada, where he worked for 20 years for Fisheries and Oceans Canada at the Canadian Hydro-graphic Service (CHS) in Mont-Joli and Ottawa, including two years with the Canadian Coast Guard. He also spent 15 years with Natural Resources Canada, particularly as the National Executive Director of the Canadian Geodetic Survey (CGS). He retired in 2018 as Director-General of the CHS and Hydrographer General of Canada in Ottawa, Canada.
John Hall spent his sabbatical from the Geological Survey of Israel with the Center. Dr. Hall has been a major influence in the IBCM and GEBCO compilations of bathymetric data in the Mediterranean, Red, Black, and Caspian Seas and is working with the Center on numerous data sets including multibeam-sonar data collected in the high Arctic in support of our Law of the Sea work. He is also archiving the 1962 through 1974 data collected from Fletcher’s Ice Island (T-3).
Martin Jakobsson joined the Center in August of 2000 as a Post-Doctoral Fellow. Martin completed a Ph.D. at the University of Stockholm where he combined modern multibeam sonar data with historical single-beam and other data to produce an exciting new series of charts for the Arctic Ocean. Dr. Jakobsson has been developing robust techniques for combining historical data sets and tracking uncertainty as well as working on developing approaches for distributed database management and Law of the Sea issues. In April 2004, he returned to a prestigious professorship in his native Sweden but remains associated with the Center.
John G.W. Kelley—see Dr. Kelley's bio under NOAA Employees.
Scott Loranger defended his Ph.D. in Oceanography from the University of New Hampshire in November 2018. He is interested in acoustical oceanography and specifically in the use of broadband acoustics to understand physical and biological processes in the water column. His current position is with a project called ACT4Storage: Acoustic and Chemical Technologies for environmental monitoring of geological carbon storage. Geological carbon storage has emerged as a promising method for reducing greenhouse gas emissions and reaching inter-national climate goals. The ACT4Storage project is a collaborative effort aimed at improving the cost-efficiency and effectiveness of environmental monitoring of offshore geological carbon storage sites. Scott's role is in using broadband acoustic systems to detect and quantify potential leaks from storage sites.
Xavier Lurton graduated in Physics in 1976 (Universite de Bretagne Occidentale, Brest) and received a Ph.D. in Applied Acoustics in 1979 (Universite du Maine, Le Mans), specializing first in the physics of brass musical instru-ments. After spending two years of national service as a high-school teacher in the Ivory Coast, he was hired by Thomson-Sintra (the leading French manufacturer in the field of military sonar systems—today Thales Underwa-ter Systems) as an R&D engineer and specialized in underwater propagation modeling and system performance analysis. In 1989 he joined IFREMER (the French government agency for Oceanography) in Brest, where he first participated in various projects in underwater acoustics applied to scientific activities (e.g., data transmission, fish-eries sonar, and ocean tomography). Over the years, he specialized more specifically in seafloor-mapping sonars, both through his own technical research activity (in physical modeling and sonar engineering) and through several development projects with sonar manufacturers (Kongsberg, Reson); in this context he has participated in tens of technological trial cruises on research vessels. He has been teaching underwater acoustics for 20 years in several French universities, and consequently wrote An Introduction to Underwater Acoustics (Springer), heavily based on his own experience as a teacher.
JHC Performance Report54
INFRASTRUCTURE INFRASTRUCTURE
David Mosher is a Professor in the Dept. of Earth Sciences and the Center for Coastal and Ocean Mapping at the University of New Hampshire. He graduated with a Ph.D. in geophysics from the Oceanography Department at Dalhousie University in 1993, following an M.Sc. in Earth Sciences from Memorial University of Newfoundland in 1987 and a B.Sc. at Acadia in 1983. In 1993, he commenced work on Canada’s West Coast at the Institute of Ocean Sciences, in Sidney on Vancouver Island, studying marine geology and neotectonics in the inland waters of British Columbia. In 2000, he took a posting at Bedford Institute of Oceanography. His research focus was studying the geology of Canada’s deep-water margins, focusing on marine geohazards using geophysical and geotechnical techniques. From 2008 to 2015, he was involved in preparing Canada’s submission for an extended continental shelf under the Law of the Sea (UNCLOS) and, in this capacity, he led four expeditions to the high Arctic. In 2011, he became manager of this program and was acting Director from 2014. In 2015, he joined UNH to conduct research in all aspects of ocean mapping, focusing on marine geohazards and marine geoscience applications in Law of the Sea. He has participated in over 45 sea-going expeditions and was chief scientist on 27 of these. In 2018 David took a leave of absence from UNH to represent Canada as a Commissioner on the Limits of the Continental Shelf.
Christopher Parrish holds a Ph.D. in civil and environmental engineering with an emphasis in geospatial inform-ation engineering from the University of Wisconsin-Madison and an M.S. in civil and coastal engineering with an emphasis in geomatics from the University of Florida. His research focuses on full-waveform lidar, topographic-bathymetric LIDAR, hyperspectral imagery, uncertainty modeling, and UAVs for coastal applications. Dr. Parrish is the Director of the American Society for Photogrammetry and Remote Sensing (ASPRS) Lidar Division and an associate editor of the journal Marine Geodesy. Prior to joining Oregon State University, Dr. Parrish served as lead physical scientist in the Remote Sensing Division of NOAA’s National Geodetic Survey and as an affiliate professor at the Center.
Shachak Pe’eri received his Ph.D. degree in geophysics from the Tel Aviv University, Israel. In 2005, he started his post-doctoral work at the Center with a Tyco post-doctoral fellowship award. His research interests are in optical remote sensing in the littoral zone with a focus on experimental and theoretical studies of LIDAR remote sensing (airborne lidar bathymetry, topographic lidar, and terrestrial laser scanning), hyperspectral remote sensing, and sensor fusion. Shachak is a member of the American Geophysical Union (AGU), the Ocean Engineering (OE) and Geoscience and Remote Sensing (GRS) societies of IEEE, and of The Hydrographic Society of America (THSOA). Dr. Pe'eri moved to a position with NOAA’s Marine Chart Division in 2016.
Kurt Schwehr received his Ph.D. from Scripps Institution of Oceanography studying marine geology and geo-physics. Before joining the Center, he worked at JPL, NASA Ames, the Field Robotics Center at Carnegie Mellon, and the USGS Menlo Park. His research has included components of computer science, geology, and geophys-ics. He looks to apply robotics, computer graphics, and real-time systems to solve problems in marine and space exploration environments. He has been on the mission control teams for the Mars Pathfinder, Mars Polar Lander, Mars Exploration Rovers and Mars Science Laboratory. He has designed computer vision, 3D visualization, and on-board driving software for NASA’s Mars exploration program. Fieldwork has taken him from Yellowstone National Park to Antarctica. At the Center, he worked on a range of projects including the Chart of the Future, visualization techniques for underwater and space applications, and sedimentary geology. He has been particu-larly active in developing hydrographic applications of AIS data. Kurt is currently Head of Ocean Engineering at Google and an affiliate faculty member of the Center.
Arthur Trembanis is the director of the Coastal Sediments, Hydrodynamics and Engineering Laboratory (CSHEL) in the College of Earth, Ocean, and Environment at the University of Delaware. The work of CSHEL involves the development and utilization of advanced oceanographic instrumentation, particularly autonomous underwater vehicles for seafloor mapping and benthic habitat characterization. He received a bachelor's degree in geology from Duke University in 1998, a Fulbright Fellowship at the University of Sydney in 1999, and a Ph.D. in marine sciences from the Virginia Institute of Marine Sciences in 2004. He is presently a visiting professor at the University of Ferrara.
JHC Performance Report 31 January 2021 55
INFRASTRUCTURE INFRASTRUCTURE
Lysandros Tsoulos is an associate professor of cartography at the National Technical University of Athens. Lysandros is internationally known for his work in digital mapping, geoinformatics, expert systems in cartography, and the theory of error in cartographic databases. At the Center, Lysandros worked with NOAA student Nick Forfinski exploring new approaches to the generalization of dense bathymetric data sets.
Dave Wells is world-renowned in hydrographic circles. Dave is an expert in GPS and other aspects of position-ing, providing geodetic science support to the Center. Along with his time at UNH, Dave also spends time at the University of New Brunswick and at the University of Southern Mississippi where he is participating in their hydro-graphic program. Dave also helps UNH in its continuing development of the curriculum in hydrographic training.
Neil Weston’s research appointment serves as a way to strengthen the academic and research ties between the Center and the Office of Coast Survey, NOAA. His focus will be to collaborate on research activities related to GNSS/GPS positioning, geophysical phenomena affecting land/ocean interfaces, data visualization, digital signal processing, and modeling. Dr. Weston is also interested in advising and mentoring graduate students, giving in-vited talks and seminars, promoting OCS, NOS and NOAA scientific and technological endeavors, and strength-ening high-level collaborations between the academic community and NOAA. Neil received his doctorate from Catholic University of America in 2007 in biomedical engineering and physics, and has master's degrees from Johns Hopkins University in physics (sensor systems) and the University of South Florida in physics (laser optics and quantum electronics). He also holds positions as a Science/Technical Advisor with the U.S. State Department and as a Technical Advisor for the United Nations.
Visiting Scholars
Since the end of its first year, the Center has had a program of visiting scholars that allows us to bring some of the top people in various fields to interact with Center staff for periods of between several months and one year.
Jorgen Eeg (October–December 2000) is a senior researcher with the Royal Danish Administration of Navigation and Hydrography and was selected as our first visiting scholar. Jorgen brought a wealth of experience apply-ing sophisticated statistical algorithms to problems of outlier detection and automated cleaning techniques for hydrographic data.
Donald House (January–July 2001) spent his sabbatical with our visualization group. He is a professor at Texas A&M University where he is part of the TAMU Visualization Laboratory. He is interested in many aspects of the field of computer graphics, both 3D graphics and 2D image manipulation. Recently his research has been in the area of physically based modeling. He is currently working on the use of transparent texture maps on surfaces.
Rolf Doerner (March–September 2002) worked on techniques for creating self-organizing data sets using meth-ods from behavioral animation. The method, called “Analytic Stimulus Response Animation,” has objects operat-ing according to simple behavioral rules that cause similar data objects to seek one another and dissimilar objects to avoid one another.
Ron Boyd (July–December 2003) spent his sabbatical at the Center. At the time, Ron was a professor of marine geology at the University of Newcastle in Australia and an internationally recognized expert on coastal geology and processes. He is now an employee of Conoco-Phillips Petroleum in Houston. Ron’s efforts at the Center focused on helping us interpret the complex, high-resolution repeat survey data collected off Martha’s Vineyard as part of the ONR Mine Burial Experiment.
John Hall (August 2003–October 2004). See Dr. Hall’s biography under Affiliate Faculty.
JHC Performance Report56
INFRASTRUCTURE INFRASTRUCTURE
LCDR Anthony Withers (July–December 2005) was the Commanding Officer of the HMAS Ships Leeuwin and Melville after being officer in charge of the RAN Hydrographic School in Sydney, Australia. He also has a Master of Science and Technology in GIS Technology and a Bachelor of Science from the University of New South Wales. LCDR Withers joined us at sea for the Law of the Sea Survey in the Gulf of Alaska and upon returning to the Center focused his efforts on developing uncertainty models for phase-comparison sonars.
Walter Smith (November 2005–July 2006) received his Ph.D. in Geophysics from Columbia University’s Lamont-Doherty Earth Observatory in 1990. While at Lamont, he began development of the GMT data analysis and graphics software. From 1990-1992 he held a post-doctoral scholarship at the University of California, San Diego’s Scripps Institution of Oceanography in the Institute for Geophysics and Planetary Physics He joined NOAA in 1992 and has also been a lecturer at the Johns Hopkins University, teaching Data Analysis and Inverse Theory. Walter’s research interests include the use of satellites to map the Earth’s gravity field, and the use of gravity data to determine the structure of the sea floor and changes in the Earth’s oceans and climate.
Lysandros Tsoulos (January-August 2007). See Dr. Tsoulos's biography under Affiliate Faculty.
Jean-Marie Augustin (2010) is a senior engineer at the Acoustics and Seismics Department of IFREMER focusing on data processing and software development for oceanographic applications and specializing in sonar image and bathymetry processing. His main interests include software development for signal, data and image process-ing applied to seafloor-mapping sonars, featuring bathymetry computation algorithms and backscatter reflectivity analysis. He is the architect, designer and main developer of the software suite, SonarScope.
Xabier Guinda (2010) is a postdoctoral research fellow at the Environmental Hydraulics Institute of the University of Cantabria in Spain. He received a Ph.D. from the University of Cantabria. His main research topics are related to marine benthic ecology (especially macroalgae), water quality monitoring and environmental assessment of anthropogenically disturbed sites as well as the use of remote sensing hydroacoustic and visual techniques for mapping of the seafloor and associated communities. His tenure at the Center was sponsored by the Spanish government.
Sanghyun Suh (2010) is a Senior Research Scientist at the Maritime and Ocean Engineering Research Institute (MOERI) at the Korea Ocean Research and Development Institute (KORDI) in Daejeon, Republic of Korea (South Korea). Dr. Suh received his Ph.D. from the University of Michigan in GIS and Remote Sensing. He worked with Dr. Lee Alexander on e-Navigation research and development (R&D) related to real-time and forecasted tidal infor-mation that can be broadcast via AIS binary application-specific messages to ship-borne and shore-based users for situational awareness and decision-support.
Xavier Lurton (August 2010–March 2012). See Dr. Lurton's biography under Affiliate Faculty.
Seojeong Lee (April 2012–April 2013) received her Ph.D. in computer science with an emphasis on software engineering from Sookmyung Women’s University in South Korea. She completed an expert course on software quality at Carnegie Mellon University. With this software engineering background, she has worked at the Korea Maritime University as an Associate Professor since 2005 where her research has been focused on software eng-ineering and software quality issues in the maritime area. As a Korean delegate of the IMO NAV sub-committee and IALA e-NAV committee, she contributes to the development of e-navigation. Her current research topic is software quality assessment of e-navigation, and development of e-navigation portrayal guidelines. She is also interested in AIS ASM and improvement of NAVTEX message.
Gideon Tibor (April 2012–November 2012) was a visiting scholar from the Israel Oceanographic and Limnological Research Institute and the Leon H. Charney School of Marine Sciences in the University of Haifa. Gideon received his Ph.D. in geophysics and planetary sciences from Tel-Aviv University. His main research interest is the develop-ment and application of high-resolution marine geophysics and remote sensing using innovative methods in the
JHC Performance Report 31 January 2021 57
INFRASTRUCTURE INFRASTRUCTURE
study of phenomena that influence the marine environment and natural resources. By means of international and local competitive research grants, he uses a multi-disciplinary approach for studying the Holocene evolution of the Levant margin, the Sea of Galilee, and the northern Gulf of Eilat/Aqaba.
Anne E.A. Blomberg (December 2014–February 2015). See Dr. Blomberg's biography under Affiliate Faculty.
Tor Inge Lønmo (June 2016–December 2016) received a master's degree in mathematics and physics at the Norwegian University of Science and Technology in 2012. His thesis was done in cooperation with the Norwegian Defence Research Establishment (FFI). Shortly after, he started working for Kongsberg Maritime in Horten. He is currently working on improving the beam forming for the EM2040 multibeam echo sounder through a Ph.D. at the University of Oslo.
Christian Stranne (January 2017–December 2017) received his Ph.D. in 2013 in physical oceanography from the University of Gothenburg, where he studied large-scale Arctic sea ice dynamics and coupled ocean-sea ice-atmosphere interactions. He has held a two-year postdoc position at Stockholm University, focusing on methane hydrate dynamics and numerical modelling of multiphase flow in hydrate-bearing marine sediments. Dr. Stranne is funded by the Swedish Research Council for a three-year research project of which two years are based at the Center. The project involves the modelling of methane gas migration within marine sediments, and studies of the interaction between gas bubbles and sea water in the ocean column with an over-arching aim to set up a coupled model for methane transport within the sediment-ocean column system. He is also involved in a project evaluating water column multibeam and single-beam sonar data for its potential of revealing detailed oceano-graphic structure.
Kelly Hogan (January 2018–March 2018) is a marine geophysicist with the British Antarctic Survey in Cambridge England who specializes in reconstructing past Arctic and Antarctic ice sheets. Specifically, Dr. Hogan uses glacial geomorphology and sedimentary processes at the seafloor (imaged and sampled from ships) to determine past patterns of ice flow and how quickly the ice retreated since the last glacial some 20,000 years ago. She links these results to past, natural changes in climate helping to improve our understanding of the response of the Cryo-sphere to future climatic change. At the Center, Dr. Hogan worked with Larry Mayer and graduate student Erin Heffron on the interpretation of multibeam, sub-bottom and water column data from the Arctic Ocean.

JHC Performance Report58
INFRASTRUCTURE INFRASTRUCTURE
The Center now has approximately 20,000 sq. ft., of dedicated space, of which approximately 4,000 sq. ft. are devoted to teaching purposes and 16,000 sq. ft. to research and outreach, including office space. This does not include the new lab or seminar space which are shared with the Center for Ocean Engineering and the B.Sc. program in Ocean Engineering. Our
dedicated teaching class-room can seat 45 students and has a high-resolution LCD projector capable of widescreen display. There are now 43 faculty or staff offices. With the influx of NOAA OER, IOCM and NOAA contractors, the Center is now providing office space, under a sepa-rate contract with NOAA, for 14 NOAA personnel. In 2016, graduate student space was upgraded to accommodate 31 student cubicles plus an additional seven seats for the GEBCO students including space for up to three NOAA students. Two additional NOAA cubicles are avail-able for NOAA Marine Operations Center employ-ees at the pier support facility in New Castle, NH (see below).
Facilities, IT and Equipment
Office and Teaching Space
The Joint Hydrographic Center has been fortunate to have equipment and facilities that are unsurpassed in the academic hydrographic community. Upon the initial establishment of the Center at UNH, the University constructed an 8,000 square foot building dedicated to JHC/CCOM and attached to the unique Ocean Engineering high-bay and tank facilities already at UNH. Since that time, a 10,000-square-foot addition has been constructed (through NOAA funding), resulting in 18,000 sq. ft. of space dedi-cated to Center research, instruction, education, and outreach activities. In 2016, construction began on 12,000-square-foot expansion to the building that was completed in September 2017 (Fig-ure I-1). This includes six large labs and office space for the undergraduate ocean engineering program, nine new offices (1,600 sq. ft.) dedicated for Center personnel, and a new shared 84-seat amphitheater-style class/seminar room with the latest in projection facilities (Figures I-2 and Figure I-3).
Figure I-2. The exteriorof Chase Ocean Engineering Lab's 84-seat seminar classroom.
Figure I-1. An early morning drone shot of Chase Ocean Engineering Lab.
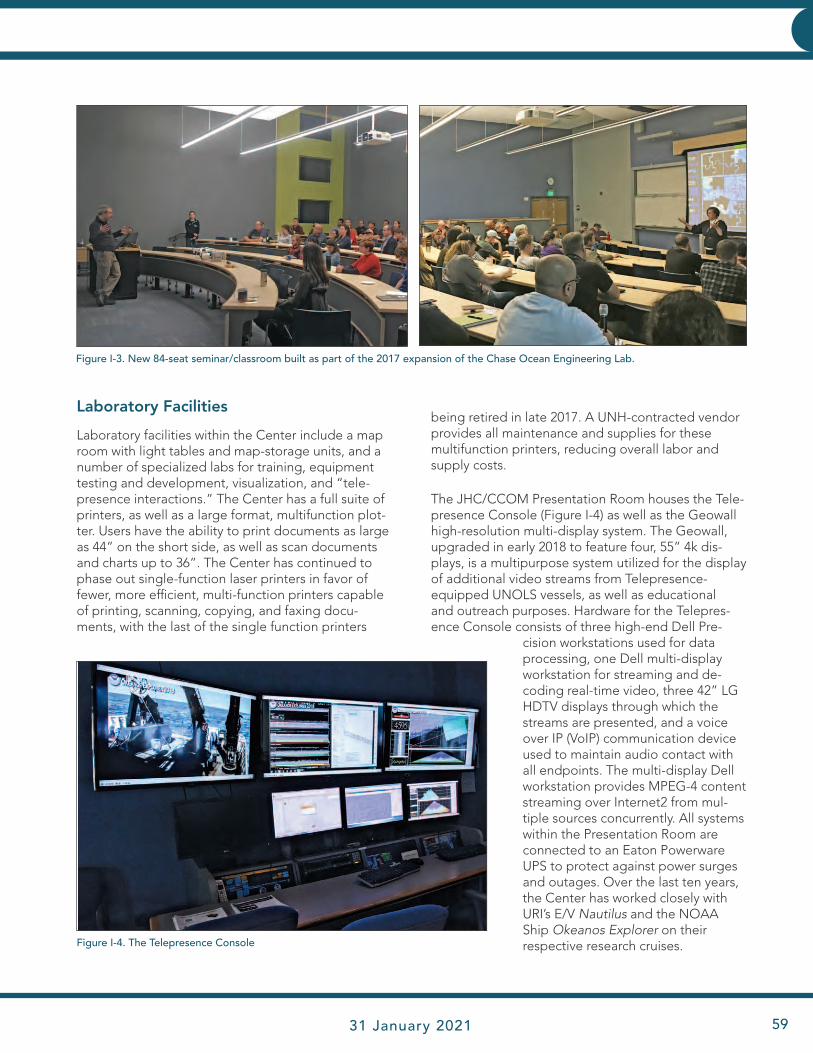
JHC Performance Report 31 January 2021 59
INFRASTRUCTURE INFRASTRUCTURE
Laboratory Facilities
Laboratory facilities within the Center include a map room with light tables and map-storage units, and a number of specialized labs for training, equipment testing and development, visualization, and “tele-presence interactions.” The Center has a full suite of printers, as well as a large format, multifunction plot-ter. Users have the ability to print documents as large as 44” on the short side, as well as scan documents and charts up to 36”. The Center has continued to phase out single-function laser printers in favor of fewer, more efficient, multi-function printers capable of printing, scanning, copying, and faxing docu-ments, with the last of the single function printers
being retired in late 2017. A UNH-contracted vendor provides all maintenance and supplies for these multifunction printers, reducing overall labor and supply costs.
The JHC/CCOM Presentation Room houses the Tele-presence Console (Figure I-4) as well as the Geowall high-resolution multi-display system. The Geowall, upgraded in early 2018 to feature four, 55” 4k dis-plays, is a multipurpose system utilized for the display of additional video streams from Telepresence-equipped UNOLS vessels, as well as educational and outreach purposes. Hardware for the Telepres-ence Console consists of three high-end Dell Pre-
cision workstations used for data processing, one Dell multi-display workstation for streaming and de-coding real-time video, three 42” LG HDTV displays through which the streams are presented, and a voice over IP (VoIP) communication device used to maintain audio contact with all endpoints. The multi-display Dell workstation provides MPEG-4 content streaming over Internet2 from mul-tiple sources concurrently. All systems within the Presentation Room are connected to an Eaton Powerware UPS to protect against power surges and outages. Over the last ten years, the Center has worked closely with URI’s E/V Nautilus and the NOAA Ship Okeanos Explorer on their respective research cruises. Figure I-4. The Telepresence Console
Figure I-3. New 84-seat seminar/classroom built as part of the 2017 expansion of the Chase Ocean Engineering Lab.
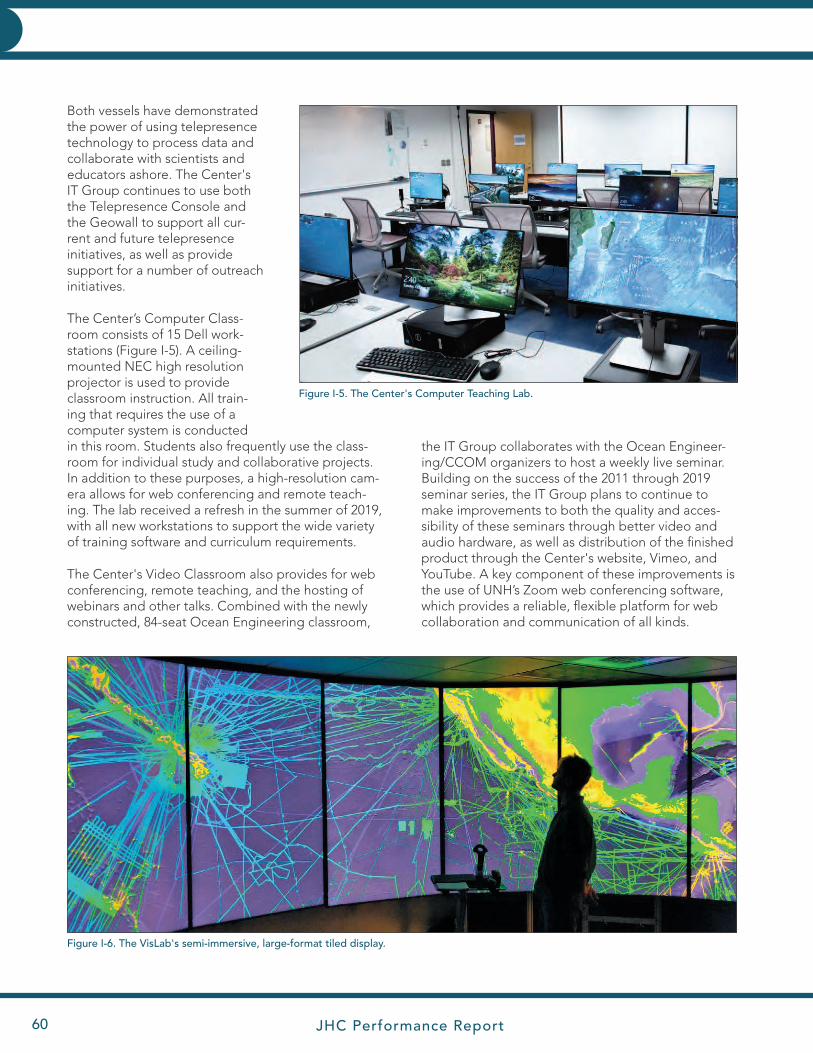
JHC Performance Report60
INFRASTRUCTURE INFRASTRUCTURE
Both vessels have demonstrated the power of using telepresence technology to process data and collaborate with scientists and educators ashore. The Center's IT Group continues to use both the Telepresence Console and the Geowall to support all cur-rent and future telepresence initiatives, as well as provide support for a number of outreach initiatives.
The Center’s Computer Class-room consists of 15 Dell work-stations (Figure I-5). A ceiling-mounted NEC high resolution projector is used to provide classroom instruction. All train-ing that requires the use of a computer system is conducted in this room. Students also frequently use the class-room for individual study and collaborative projects. In addition to these purposes, a high-resolution cam-era allows for web conferencing and remote teach-ing. The lab received a refresh in the summer of 2019, with all new workstations to support the wide variety of training software and curriculum requirements.
The Center's Video Classroom also provides for web conferencing, remote teaching, and the hosting of webinars and other talks. Combined with the newly constructed, 84-seat Ocean Engineering classroom,
the IT Group collaborates with the Ocean Engineer-ing/CCOM organizers to host a weekly live seminar. Building on the success of the 2011 through 2019 seminar series, the IT Group plans to continue to make improvements to both the quality and acces-sibility of these seminars through better video and audio hardware, as well as distribution of the finished product through the Center's website, Vimeo, and YouTube. A key component of these improvements is the use of UNH’s Zoom web conferencing software, which provides a reliable, flexible platform for web collaboration and communication of all kinds.
Figure I-6. The VisLab's semi-immersive, large-format tiled display.
Figure I-5. The Center's Computer Teaching Lab.
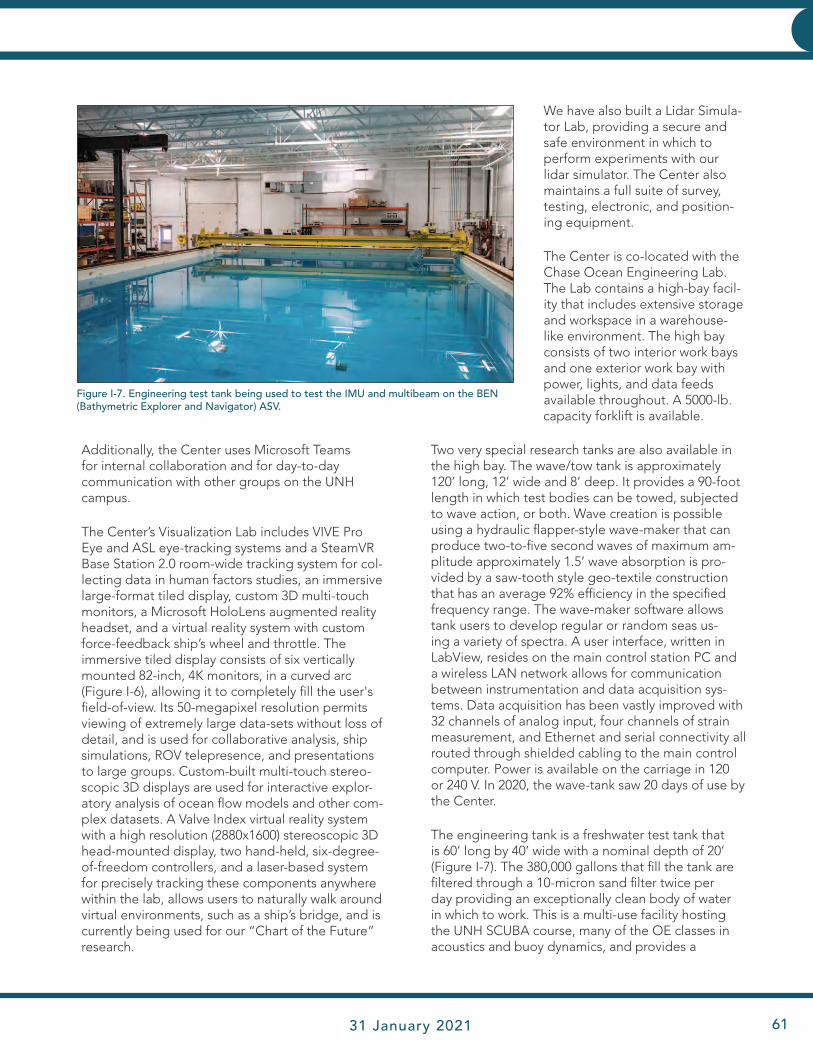
JHC Performance Report 31 January 2021 61
INFRASTRUCTURE INFRASTRUCTURE
Additionally, the Center uses Microsoft Teams for internal collaboration and for day-to-day communication with other groups on the UNH campus.
The Center’s Visualization Lab includes VIVE Pro Eye and ASL eye-tracking systems and a SteamVR Base Station 2.0 room-wide tracking system for col-lecting data in human factors studies, an immersive large-format tiled display, custom 3D multi-touch monitors, a Microsoft HoloLens augmented reality headset, and a virtual reality system with custom force-feedback ship’s wheel and throttle. The immersive tiled display consists of six vertically mounted 82-inch, 4K monitors, in a curved arc (Figure I-6), allowing it to completely fill the user's field-of-view. Its 50-megapixel resolution permits viewing of extremely large data-sets without loss of detail, and is used for collaborative analysis, ship simulations, ROV telepresence, and presentations to large groups. Custom-built multi-touch stereo-scopic 3D displays are used for interactive explor-atory analysis of ocean flow models and other com-plex datasets. A Valve Index virtual reality system with a high resolution (2880x1600) stereoscopic 3D head-mounted display, two hand-held, six-degree-of-freedom controllers, and a laser-based system for precisely tracking these components anywhere within the lab, allows users to naturally walk around virtual environments, such as a ship’s bridge, and is currently being used for our “Chart of the Future” research.
We have also built a Lidar Simula-tor Lab, providing a secure and safe environment in which to perform experiments with our lidar simulator. The Center also maintains a full suite of survey, testing, electronic, and position-ing equipment.
The Center is co-located with the Chase Ocean Engineering Lab. The Lab contains a high-bay facil-ity that includes extensive storage and workspace in a warehouse-like environment. The high bay consists of two interior work bays and one exterior work bay with power, lights, and data feeds available throughout. A 5000-lb. capacity forklift is available.
Two very special research tanks are also available in the high bay. The wave/tow tank is approximately 120’ long, 12’ wide and 8’ deep. It provides a 90-foot length in which test bodies can be towed, subjected to wave action, or both. Wave creation is possible using a hydraulic flapper-style wave-maker that can produce two-to-five second waves of maximum am-plitude approximately 1.5’ wave absorption is pro-vided by a saw-tooth style geo-textile construction that has an average 92% efficiency in the specified frequency range. The wave-maker software allows tank users to develop regular or random seas us-ing a variety of spectra. A user interface, written in LabView, resides on the main control station PC and a wireless LAN network allows for communication between instrumentation and data acquisition sys-tems. Data acquisition has been vastly improved with 32 channels of analog input, four channels of strain measurement, and Ethernet and serial connectivity all routed through shielded cabling to the main control computer. Power is available on the carriage in 120 or 240 V. In 2020, the wave-tank saw 20 days of use by the Center.
The engineering tank is a freshwater test tank that is 60’ long by 40’ wide with a nominal depth of 20’ (Figure I-7). The 380,000 gallons that fill the tank are filtered through a 10-micron sand filter twice per day providing an exceptionally clean body of water in which to work. This is a multi-use facility hosting the UNH SCUBA course, many of the OE classes in acoustics and buoy dynamics, and provides a
Figure I-7. Engineering test tank being used to test the IMU and multibeam on the BEN (Bathymetric Explorer and Navigator) ASV.

JHC Performance Report62
INFRASTRUCTURE INFRASTRUCTURE
Pier Facilities
In support of the Center and other UNH and NOAA vessels, the University constructed a pier facility in New Castle, NH in 2008. The pier is a 328’ long and 25’ wide concrete structure with approximately 15’ of water alongside. The pier can accommodate UNH ves-sels and, in 2013, became the homeport for the NOAA Ship Ferdinand R. Hassler, a 124-foot LOA, 60-foot breadth, Small Waterplane Area Twin Hull (SWATH) Coastal Mapping Vessel (CMV)—the first of its kind to be constructed for NOAA. Services provided on the new pier include 480V-400A and 208V- 50A power with TV and telecommunications panel, potable water and sewerage connections. In addition to the new pier, the University constructed a pier support facility, approxi-mately 4,500 sq. ft. of air-conditioned interior space in-cluding offices, a dive locker, a workshop, and storage. Two additional buildings (1,100 sq. ft. and 1,300 sq. ft.) are available to store the variety of equipment and supplies typically associated with marine operations.
Information Technology
The IT Group currently consists of four full-time staff members and two part-time helpdesk staff. Will Fes-senden fills the role of Systems Manager and deals primarily with the day-to-day administration of the JHC/CCOM network and server infrastructure. Ap-pointed in March of 2018 and having previously served as Systems Administrator for over 10 years, he is also responsible for leading the development of the Infor-mation Technology strategy for the Center. Paul John-son, JHC/CCOM’s Data Manager, is responsible for organizing and cataloging the Center’s electronic data stores. Paul is currently exploring different methods and products for managing data, and verifying that all metadata meets industry and international standards. Systems Administrator Michael Sleep joined the IT staff in December of 2018, and serves as the IT Group’s primary Linux administrator, as well as the backup for many other system administration roles. The role of Desktop Administrator position was recently filled by recent UNH grad and former hourly Christopher Schwartz, as technician Daniel Tauriello transitioned exclusively into a marine and a lab support role in May. While Daniel longer works directly for the IT Group, Dan continues to serve as the technology liaison for the Center’s launches and lab facilities.
IT facilities within Chase Ocean Engineering Lab consist of a primary data center, two network closets, a laboratory, the Presentation Room, a computer teach-ing classroom, and several staff offices. The primary
controlled environment for research projects ranging from AUVs to zebra mussels. Mounted at the cor-ner of the Engineering Tank is a 20-foot span, wall-cantilevered jib crane. This crane can lift up to two tons with a traveling electric motor controlled from a hand unit at the base of the crane. In 2003, with funding from NSF and NOAA, an acoustic calibra-tion facility was added to the engineering tank. The acoustic test-tank facility is equipped to do standard measurements for hydrophones, projectors, and sonar systems. Common measurements include transducer impedance, free-field voltage sensitivity (receive sensitivity), transmit voltage response (trans-mit sensitivity), source-level measurements and beam patterns. The standard mounting platform is capable of a computer-controlled full 360-degree sweep with 0.1-degree resolution. We believe that this tank is the largest acoustic calibration facility in the Northeast and is well suited to measure high-frequency, large-aperture sonars when far-field measurements are desired. In 2020, the engineering tank had 55 days of use by the Center.
Several other specialized facilities are available in the Chase Ocean Engineering Lab to meet the needs of our researchers and students. A 720 sq. ft. machine shop equipped with a milling machine, a tool-room lathe, a heavy-duty drill press, large vertical and horizontal band saws, sheet metal shear and standard and arc welding capability are available for students and researchers. A 12’ x 12’ overhead door facilitates the entry and exit of large fabricated items; a master machinist/engineer is on staff to support fabrica-tion activities. Since 2015, dedicated space has been made available to support our autonomous vehicle activities. Since 2018, the Center has also leased 1,600 sq. ft. of secure warehouse space at an offsite facility near the campus (GOSS Building) to support the new iXblue DriX Autonomous Surface Vehicle which is made available to the Center in collabora-tion with NOAA and iXblue to explore the viability of this new system for hydrographic surveys. To sup-port these activities, we built a 30’ x 60’ cage with biometric and network monitored security, electrical power, workstation space, workbenches, tools, and tool storage. The facility also boasts overhead later-ally translating cranes with lift capacity of 5 and 10 tons per bridge to allow the maneuvering of the DriX ASV—with its launch and recovery system—in and out of this facility and onto and off of the dedicated 26’ flatbed. Additionally, the cranes are able to move the 40’ custom-built container into this facility for protec-tion from weather.
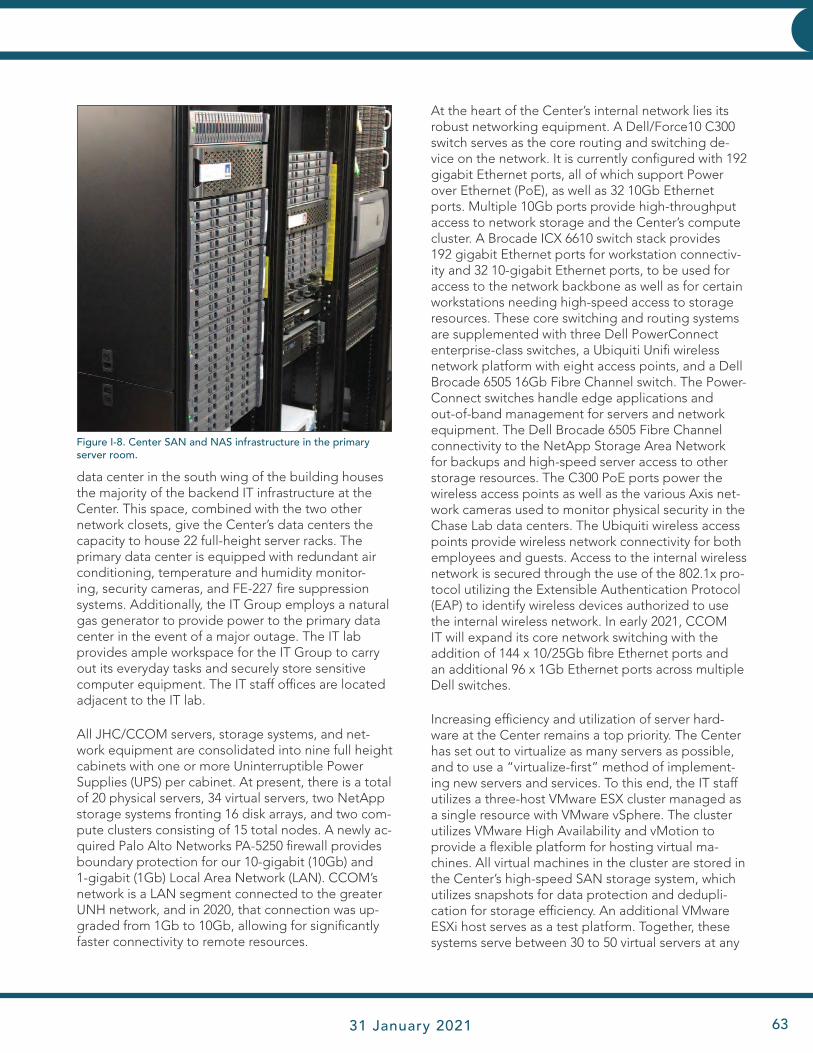
JHC Performance Report 31 January 2021 63
INFRASTRUCTURE INFRASTRUCTURE
At the heart of the Center’s internal network lies its robust networking equipment. A Dell/Force10 C300 switch serves as the core routing and switching de-vice on the network. It is currently configured with 192 gigabit Ethernet ports, all of which support Power over Ethernet (PoE), as well as 32 10Gb Ethernet ports. Multiple 10Gb ports provide high-throughput access to network storage and the Center’s compute cluster. A Brocade ICX 6610 switch stack provides 192 gigabit Ethernet ports for workstation connectiv-ity and 32 10-gigabit Ethernet ports, to be used for access to the network backbone as well as for certain workstations needing high-speed access to storage resources. These core switching and routing systems are supplemented with three Dell PowerConnect enterprise-class switches, a Ubiquiti Unifi wireless network platform with eight access points, and a Dell Brocade 6505 16Gb Fibre Channel switch. The Power-Connect switches handle edge applications and out-of-band management for servers and network equipment. The Dell Brocade 6505 Fibre Channel connectivity to the NetApp Storage Area Network for backups and high-speed server access to other storage resources. The C300 PoE ports power the wireless access points as well as the various Axis net-work cameras used to monitor physical security in the Chase Lab data centers. The Ubiquiti wireless access points provide wireless network connectivity for both employees and guests. Access to the internal wireless network is secured through the use of the 802.1x pro-tocol utilizing the Extensible Authentication Protocol (EAP) to identify wireless devices authorized to use the internal wireless network. In early 2021, CCOM IT will expand its core network switching with the addition of 144 x 10/25Gb fibre Ethernet ports and an additional 96 x 1Gb Ethernet ports across multiple Dell switches.
Increasing efficiency and utilization of server hard-ware at the Center remains a top priority. The Center has set out to virtualize as many servers as possible, and to use a “virtualize-first” method of implement-ing new servers and services. To this end, the IT staff utilizes a three-host VMware ESX cluster managed as a single resource with VMware vSphere. The cluster utilizes VMware High Availability and vMotion to provide a flexible platform for hosting virtual ma-chines. All virtual machines in the cluster are stored in the Center’s high-speed SAN storage system, which utilizes snapshots for data protection and dedupli-cation for storage efficiency. An additional VMware ESXi host serves as a test platform. Together, these systems serve between 30 to 50 virtual servers at any
data center in the south wing of the building houses the majority of the backend IT infrastructure at the Center. This space, combined with the two other network closets, give the Center’s data centers the capacity to house 22 full-height server racks. The primary data center is equipped with redundant air conditioning, temperature and humidity monitor-ing, security cameras, and FE-227 fire suppression systems. Additionally, the IT Group employs a natural gas generator to provide power to the primary data center in the event of a major outage. The IT lab provides ample workspace for the IT Group to carry out its everyday tasks and securely store sensitive computer equipment. The IT staff offices are located adjacent to the IT lab.
All JHC/CCOM servers, storage systems, and net-work equipment are consolidated into nine full height cabinets with one or more Uninterruptible Power Supplies (UPS) per cabinet. At present, there is a total of 20 physical servers, 34 virtual servers, two NetApp storage systems fronting 16 disk arrays, and two com-pute clusters consisting of 15 total nodes. A newly ac-quired Palo Alto Networks PA-5250 firewall provides boundary protection for our 10-gigabit (10Gb) and 1-gigabit (1Gb) Local Area Network (LAN). CCOM’s network is a LAN segment connected to the greater UNH network, and in 2020, that connection was up-graded from 1Gb to 10Gb, allowing for significantly faster connectivity to remote resources.
Figure I-8. Center SAN and NAS infrastructure in the primary server room.
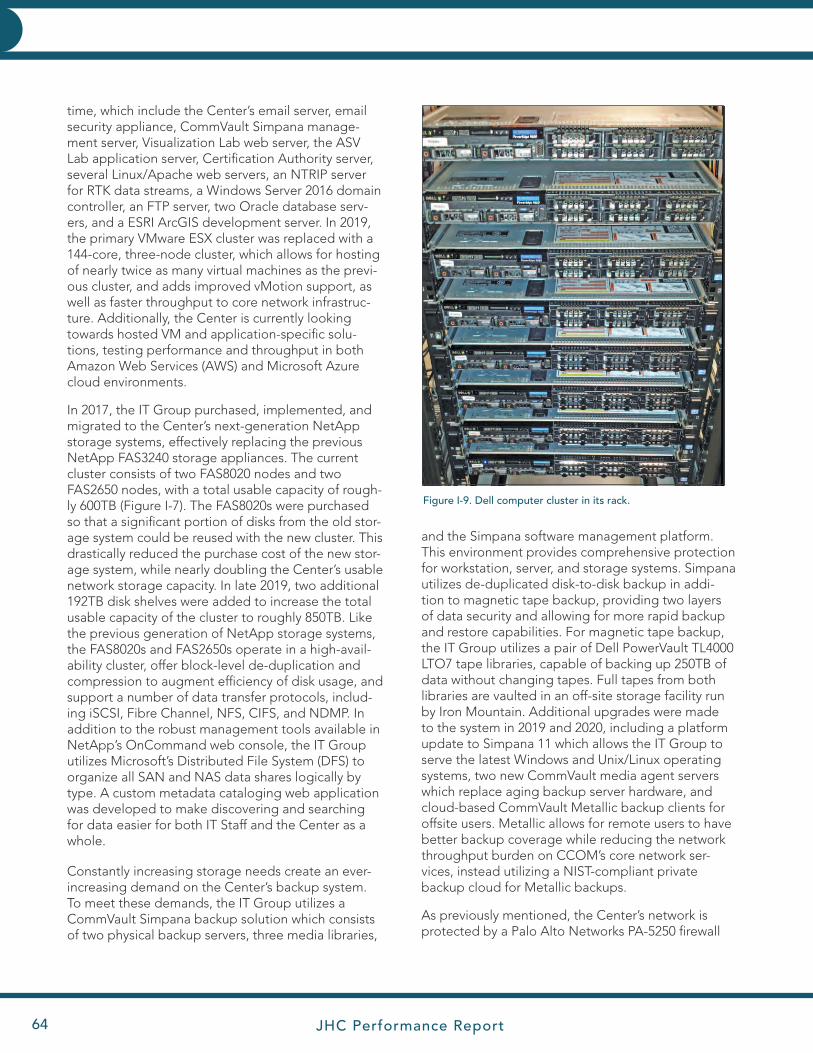
JHC Performance Report64
INFRASTRUCTURE INFRASTRUCTURE
and the Simpana software management platform. This environment provides comprehensive protection for workstation, server, and storage systems. Simpana utilizes de-duplicated disk-to-disk backup in addi-tion to magnetic tape backup, providing two layers of data security and allowing for more rapid backup and restore capabilities. For magnetic tape backup, the IT Group utilizes a pair of Dell PowerVault TL4000 LTO7 tape libraries, capable of backing up 250TB of data without changing tapes. Full tapes from both libraries are vaulted in an off-site storage facility run by Iron Mountain. Additional upgrades were made to the system in 2019 and 2020, including a platform update to Simpana 11 which allows the IT Group to serve the latest Windows and Unix/Linux operating systems, two new CommVault media agent servers which replace aging backup server hardware, and cloud-based CommVault Metallic backup clients for offsite users. Metallic allows for remote users to have better backup coverage while reducing the network throughput burden on CCOM’s core network ser- vices, instead utilizing a NIST-compliant private backup cloud for Metallic backups.
As previously mentioned, the Center’s network is protected by a Palo Alto Networks PA-5250 firewall
Figure I-9. Dell computer cluster in its rack.
time, which include the Center’s email server, email security appliance, CommVault Simpana manage-ment server, Visualization Lab web server, the ASV Lab application server, Certification Authority server, several Linux/Apache web servers, an NTRIP server for RTK data streams, a Windows Server 2016 domain controller, an FTP server, two Oracle database serv-ers, and a ESRI ArcGIS development server. In 2019, the primary VMware ESX cluster was replaced with a 144-core, three-node cluster, which allows for hosting of nearly twice as many virtual machines as the previ-ous cluster, and adds improved vMotion support, as well as faster throughput to core network infrastruc-ture. Additionally, the Center is currently looking towards hosted VM and application-specific solu-tions, testing performance and throughput in both Amazon Web Services (AWS) and Microsoft Azure cloud environments.
In 2017, the IT Group purchased, implemented, and migrated to the Center’s next-generation NetApp storage systems, effectively replacing the previous NetApp FAS3240 storage appliances. The current cluster consists of two FAS8020 nodes and two FAS2650 nodes, with a total usable capacity of rough-ly 600TB (Figure I-7). The FAS8020s were purchased so that a significant portion of disks from the old stor-age system could be reused with the new cluster. This drastically reduced the purchase cost of the new stor-age system, while nearly doubling the Center’s usable network storage capacity. In late 2019, two additional 192TB disk shelves were added to increase the total usable capacity of the cluster to roughly 850TB. Like the previous generation of NetApp storage systems, the FAS8020s and FAS2650s operate in a high-avail-ability cluster, offer block-level de-duplication and compression to augment efficiency of disk usage, and support a number of data transfer protocols, includ-ing iSCSI, Fibre Channel, NFS, CIFS, and NDMP. In addition to the robust management tools available in NetApp’s OnCommand web console, the IT Group utilizes Microsoft’s Distributed File System (DFS) to organize all SAN and NAS data shares logically by type. A custom metadata cataloging web application was developed to make discovering and searching for data easier for both IT Staff and the Center as a whole.
Constantly increasing storage needs create an ever-increasing demand on the Center’s backup system. To meet these demands, the IT Group utilizes a CommVault Simpana backup solution which consists of two physical backup servers, three media libraries,

JHC Performance Report 31 January 2021 65
INFRASTRUCTURE INFRASTRUCTURE
and threat prevention appliance. The firewall pro-vides for high-performance packet filtering, intrusion prevention, malware detection, and malicious URL filtering. Additionally, that Palo Alto appliance also serves as an SSL VPN portal, which permits access to the Center’s network services remotely. In conjunction with the recent upgrade to the Center’s upgraded WAN connection, the IT Group expects to upgrade our Cisco-based VPN servers to Palo Alto solutions in 2021 – these Cisco servers currently provide a point-to-point VPN service to the UNH/NOAA Judd Gregg Marine Complex. The updated Palo Alto hardware will provide faster throughput and better security for our remote endpoints.
The IT staff maintains two modern compute clusters: an eight-node, 160-core Dell compute cluster, run-ning Windows HPC Server 2012 (Figure I-8), and a four-node, 96-core custom built cluster, running Cen-tOS Linux. The Dell cluster utilizes eight enterprise-class servers with 20 CPU cores and 64 GB of RAM per system, totaling 160 CPU cores and 512 GB of RAM. The custom-built cluster has 24 cores and 64GB of RAM per system, but specializes in GPU-based data processing, employing 2x RTX-based Nvidia video cards per node. Presently, the Dell cluster serves as a platform for development of Windows cluster-based applications, while also running MAT-LAB DCS for both academic and research purposes. The Linux cluster also serves as a development platform, but also runs Agisoft Metashape software for photogrammetry and other image processing. Additionally, a legacy Dell cluster hardware, installed in 2008 and consisting of seven nodes, sees contin-ued use as a test environment for a variety of parallel processing applications. In 2020, we have seen an increase in the use of AWS for project-specific work, and in 2021, the IT Group will be evaluating perfor-mance and cost benefits of utilizing cloud-based data processing over the use of local computer cluster resources.
The Center has continued to upgrade end users’ primary workstations, as both computing power requirements and the number of employees and students have increased. There are currently 292 high-end Windows and Linux desktops/laptops, as well as 23 Apple computers that serve as faculty, staff, and student workstations. All Windows workstations at the Center are running Windows 10 Professional. With Microsoft ending support for Windows 7 in early 2020, the Center’s IT staff has completed the update process for all critical workstations to Windows 10,
with a few Windows 7 computers remaining in opera-tion for off-network, Legacy applications. On the Apple side, macOS versions 10.14,10.15 and 10.16 are in use throughout the Center. Linux servers are a mix of CentOS 7/8, with the Center’s Linux desktop environment primarily using Ubuntu 16.04/18.04 LTS. Like Windows 7, support for CentOS 6 ended in 2020, and the CCOM IT migrated several of our application servers (notably FTP and webmail) to CentOS 8.
Information security is of paramount importance for the IT Group. For the last several years, members of the JHC/CCOM staff have been working with NOS and OCS IT personnel to develop and maintain a comprehensive security program for both NOAA and JHC/CCOM systems. The security program is cen-tered on identifying systems and data that must be secured, implementing strong security baselines and controls, and proactively monitoring and respond-ing to security incidents. Recent measures taken to enhance security include the installation of a virtual appliance-based email security gateway, designed to reduce the amount of malicious and spam email reaching end users. The aforementioned Palo Alto firewall was installed in 2020 to replace the Center’s legacy Palo Alto threat prevention hardware. The Center also utilizes Windows Defender and Eset antivirus protection on Windows and MacOS sys-tems at the Center, with Clam AV being utilized on Linux workstations and servers. Microsoft Windows Server Update Services (WSUS), upgraded to version 10 in 2019, is used to provide a central location for JHC/CCOM workstations and servers to download Microsoft updates. WSUS allows the IT staff to track the status of updates on a per-system basis, greatly improving the consistent deployment of updates to all systems.
In an effort to tie many of these security measures together, the IT Group utilizes Nagios for general network and service monitoring. Nagios not only provides for enhanced availability of services for internal JHC/CCOM systems, but has been a boon for external systems that are critical pieces of several research projects, including AIS ship tracking for the U.S. Coast Guard. External monitoring of CCOM network uptime is also accomplished using a service called Uptime Robot, which serves as an offsite-redundant check on systems hosted on CCOM and UNH networks. In addition to Nagios and Uptime Robot, a security event management system, utilizing Open Source Security (OSSEC) and Splunk, is utilized for security event monitoring and reporting. OS-
JHC Performance Report66
INFRASTRUCTURE INFRASTRUCTURE
in its environment to Windows Server 2016, and is expected to migrate the domain to a functional 2016 domain level in early 2021, which will allow for advanced security and management options.
JHC/CCOM utilizes Bitbucket to facilitate software collaboration between its own members as well as industrial partners and other academic colleagues. Bitbucket is a source control management solution that hosts Mercurial and Git software repositories. Atlassian, the company behind Bitbucket, states that Bitbucket is SAS70 Type II compliant and is also com-pliant with the Safe Harbor Privacy Policy put forth by the U.S. Department of Commerce. Given Bitbucket’s flexibility and ease-of-use, the IT Group has migrated its local SVN/Mercurial repositories hosted locally to the Bitbucket platform in 2018. This move reduces the administrative overhead while giving users more options for collaboration.
The Center’s website, http://ccom.unh.edu, utilizes the Drupal content management system. Drupal allows content creators within the Center to make changes and updates with limited assistance from web developers. Drupal also allows the creation of a more robust platform for multimedia and other rich content, enhancing the user experience of site visitors.
Work also continues on several other web-based platforms, providing services for users within the Center, as well as for the general public. The Cen-ter continues to utilize an Intranet services platform using Drupal content management software. The Intranet provides a centralized framework for a variety of information management tools, including the Center’s wiki, purchase tracking, library, data catalog, and progress reporting systems. The progress report-ing system is now in its eighth reporting period and has been an instrumental tool in the compilation of this JHC annual report. Launched in 2019, the Cen-ter’s ePOM platform now provides current and future students with educational resources for learning the Python programming language, which is an impor-tant component of the Center’s academic program. Additionally, development and deployment of the Center’s upgraded ArcGIS data services was recently completed, with a new GIS web server launched in November of 2018. This platform now serves data more efficiently than the two legacy servers it re-placed. As all of these web resources evolve, more web services may be brought online to assist in the search for Center-hosted data and access to this data
SEC performs threat identification, and log analysis. Splunk is used for data mining and event correlation across systems and platforms.
Where physical security is concerned, the JHC/CCOM wing at Chase Ocean Engineering Lab utilizes an electronic door access system, which provides 24/7 monitoring and alerting of external doors and sensitive IT areas within the facility. This system was updated in 2019 to include additional security fea-tures, and to monitor additional entry and exit points. The primary data center utilizes two-factor authen-tication to control physical access. Security cameras monitor the data center as well as the primary net-work closet in the building. Redundant environment monitoring systems, one managed internally at the Center and another centrally through UNH Campus Energy, keep tabs on the temperature and humidity sensors in the data center and network closet.
The IT Group utilizes Request Tracker, a helpdesk ticket tracking software published by Best Practical. The Center’s staff, students, and faculty have sub-mitted over 24,000 Request Tracker tickets since its inception in mid-2009. Through mid-2020, the IT Staff was able to resolve over 90% of tickets within three business days. The software is also used for issue tracking by the Center administrative staff, lab and facilities support team, web development team, and scientists supporting the NSF Multibeam Advisory Committee (MAC) project.
The Center continues to operate within a functional Windows 2012 Active Directory domain environment. This allows the IT Group to take advantage of many modern security and management features available in Windows 8.1 and later operating systems. The Active Directory environment also provide DHCP, DNS, and DFS services. Configurations can be de-ployed via Active Directory objects to many comput-ers at once through Group Policies, thus reducing the IT administrative costs in supporting workstations and servers. This also allows each member of the Center to have a single user account, regardless of computer platform and/or operating system, reduc-ing the overall administrative cost in managing users. In addition, the JHC/CCOM IT Group maintains all NOAA computers in accordance with OCS standards. This provides the NOAA-based employees located at the JHC with enhanced security and data protection. With the end of support for Windows Server 2008 R2 and Windows 7 in January 2020. The IT Group has migrated all AD, DNS and DHCP, and DFS services
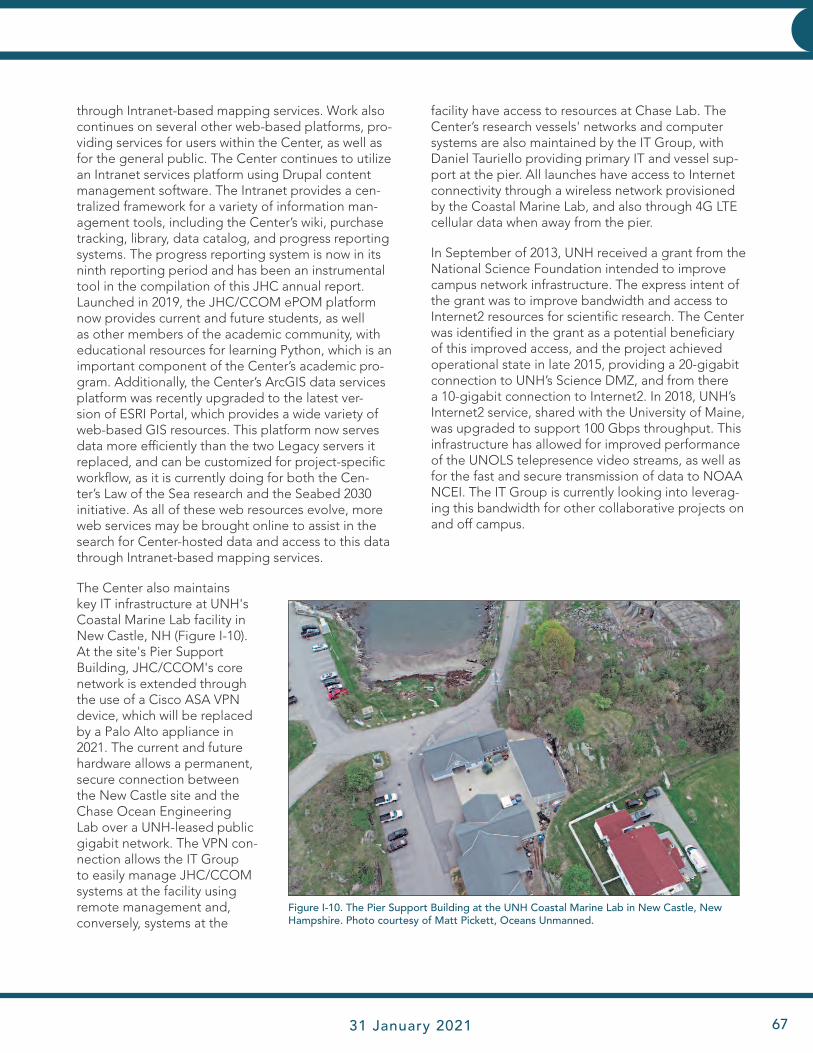
JHC Performance Report 31 January 2021 67
INFRASTRUCTURE INFRASTRUCTURE
through Intranet-based mapping services. Work also continues on several other web-based platforms, pro-viding services for users within the Center, as well as for the general public. The Center continues to utilize an Intranet services platform using Drupal content management software. The Intranet provides a cen-tralized framework for a variety of information man-agement tools, including the Center’s wiki, purchase tracking, library, data catalog, and progress reporting systems. The progress reporting system is now in its ninth reporting period and has been an instrumental tool in the compilation of this JHC annual report. Launched in 2019, the JHC/CCOM ePOM platform now provides current and future students, as well as other members of the academic community, with educational resources for learning Python, which is an important component of the Center’s academic pro-gram. Additionally, the Center’s ArcGIS data services platform was recently upgraded to the latest ver-sion of ESRI Portal, which provides a wide variety of web-based GIS resources. This platform now serves data more efficiently than the two Legacy servers it replaced, and can be customized for project-specific workflow, as it is currently doing for both the Cen-ter’s Law of the Sea research and the Seabed 2030 initiative. As all of these web resources evolve, more web services may be brought online to assist in the search for Center-hosted data and access to this data through Intranet-based mapping services.
The Center also maintains key IT infrastructure at UNH's Coastal Marine Lab facility in New Castle, NH (Figure I-10). At the site's Pier Support Building, JHC/CCOM's core network is extended through the use of a Cisco ASA VPN device, which will be replaced by a Palo Alto appliance in 2021. The current and future hardware allows a permanent, secure connection between the New Castle site and the Chase Ocean Engineering Lab over a UNH-leased public gigabit network. The VPN con-nection allows the IT Group to easily manage JHC/CCOM systems at the facility using remote management and, conversely, systems at the
facility have access to resources at Chase Lab. The Center’s research vessels' networks and computer systems are also maintained by the IT Group, with Daniel Tauriello providing primary IT and vessel sup-port at the pier. All launches have access to Internet connectivity through a wireless network provisioned by the Coastal Marine Lab, and also through 4G LTE cellular data when away from the pier.
In September of 2013, UNH received a grant from the National Science Foundation intended to improve campus network infrastructure. The express intent of the grant was to improve bandwidth and access to Internet2 resources for scientific research. The Center was identified in the grant as a potential beneficiary of this improved access, and the project achieved operational state in late 2015, providing a 20-gigabit connection to UNH’s Science DMZ, and from there a 10-gigabit connection to Internet2. In 2018, UNH’s Internet2 service, shared with the University of Maine, was upgraded to support 100 Gbps throughput. This infrastructure has allowed for improved performance of the UNOLS telepresence video streams, as well as for the fast and secure transmission of data to NOAA NCEI. The IT Group is currently looking into leverag-ing this bandwidth for other collaborative projects on and off campus.
Figure I-10. The Pier Support Building at the UNH Coastal Marine Lab in New Castle, New Hampshire. Photo courtesy of Matt Pickett, Oceans Unmanned.
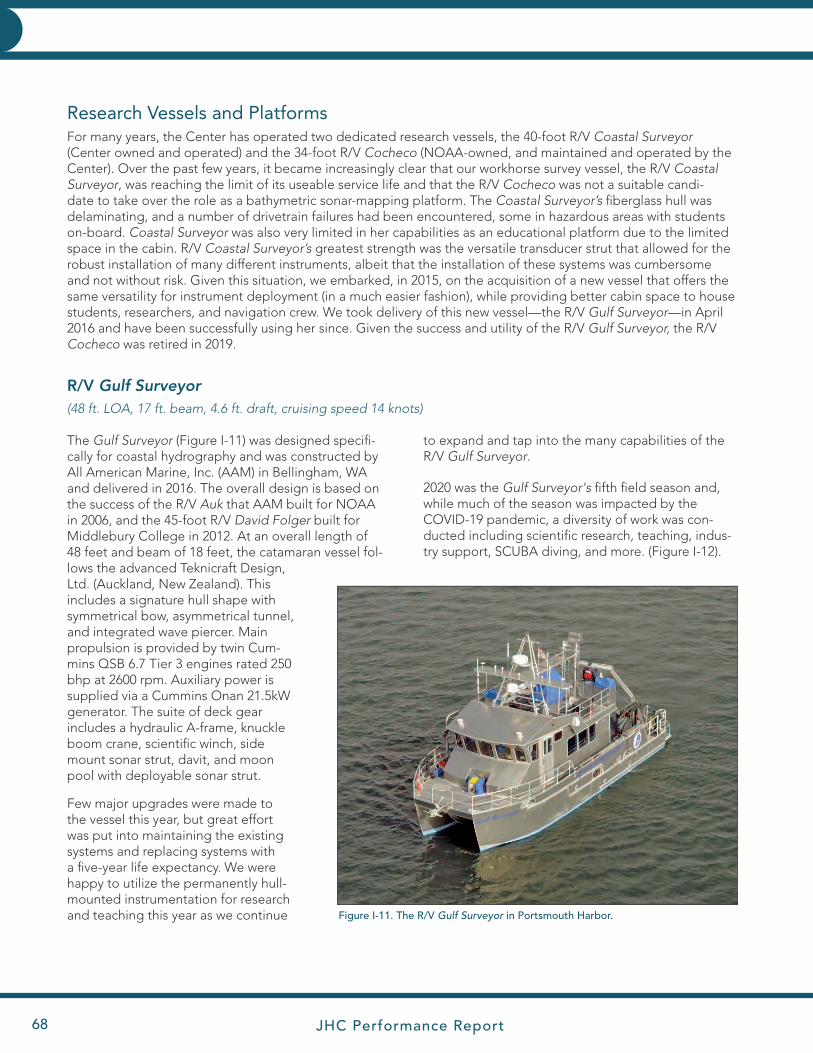
JHC Performance Report68
INFRASTRUCTURE INFRASTRUCTURE
to expand and tap into the many capabilities of the R/V Gulf Surveyor.
2020 was the Gulf Surveyor's fifth field season and, while much of the season was impacted by the COVID-19 pandemic, a diversity of work was con-ducted including scientific research, teaching, indus-try support, SCUBA diving, and more. (Figure I-12).
Research Vessels and PlatformsFor many years, the Center has operated two dedicated research vessels, the 40-foot R/V Coastal Surveyor (Center owned and operated) and the 34-foot R/V Cocheco (NOAA-owned, and maintained and operated by the Center). Over the past few years, it became increasingly clear that our workhorse survey vessel, the R/V Coastal Surveyor, was reaching the limit of its useable service life and that the R/V Cocheco was not a suitable candi-date to take over the role as a bathymetric sonar-mapping platform. The Coastal Surveyor’s fiberglass hull was delaminating, and a number of drivetrain failures had been encountered, some in hazardous areas with students on-board. Coastal Surveyor was also very limited in her capabilities as an educational platform due to the limited space in the cabin. R/V Coastal Surveyor’s greatest strength was the versatile transducer strut that allowed for the robust installation of many different instruments, albeit that the installation of these systems was cumbersome and not without risk. Given this situation, we embarked, in 2015, on the acquisition of a new vessel that offers the same versatility for instrument deployment (in a much easier fashion), while providing better cabin space to house students, researchers, and navigation crew. We took delivery of this new vessel—the R/V Gulf Surveyor—in April 2016 and have been successfully using her since. Given the success and utility of the R/V Gulf Surveyor, the R/V Cocheco was retired in 2019.
The Gulf Surveyor (Figure I-11) was designed specifi-cally for coastal hydrography and was constructed by All American Marine, Inc. (AAM) in Bellingham, WA and delivered in 2016. The overall design is based on the success of the R/V Auk that AAM built for NOAA in 2006, and the 45-foot R/V David Folger built for Middlebury College in 2012. At an overall length of 48 feet and beam of 18 feet, the catamaran vessel fol-lows the advanced Teknicraft Design, Ltd. (Auckland, New Zealand). This includes a signature hull shape with symmetrical bow, asymmetrical tunnel, and integrated wave piercer. Main propulsion is provided by twin Cum-mins QSB 6.7 Tier 3 engines rated 250 bhp at 2600 rpm. Auxiliary power is supplied via a Cummins Onan 21.5kW generator. The suite of deck gear includes a hydraulic A-frame, knuckle boom crane, scientific winch, side mount sonar strut, davit, and moon pool with deployable sonar strut.
Few major upgrades were made to the vessel this year, but great effort was put into maintaining the existing systems and replacing systems with a five-year life expectancy. We were happy to utilize the permanently hull-mounted instrumentation for research and teaching this year as we continue
R/V Gulf Surveyor(48 ft. LOA, 17 ft. beam, 4.6 ft. draft, cruising speed 14 knots)
Figure I-11. The R/V Gulf Surveyor in Portsmouth Harbor.
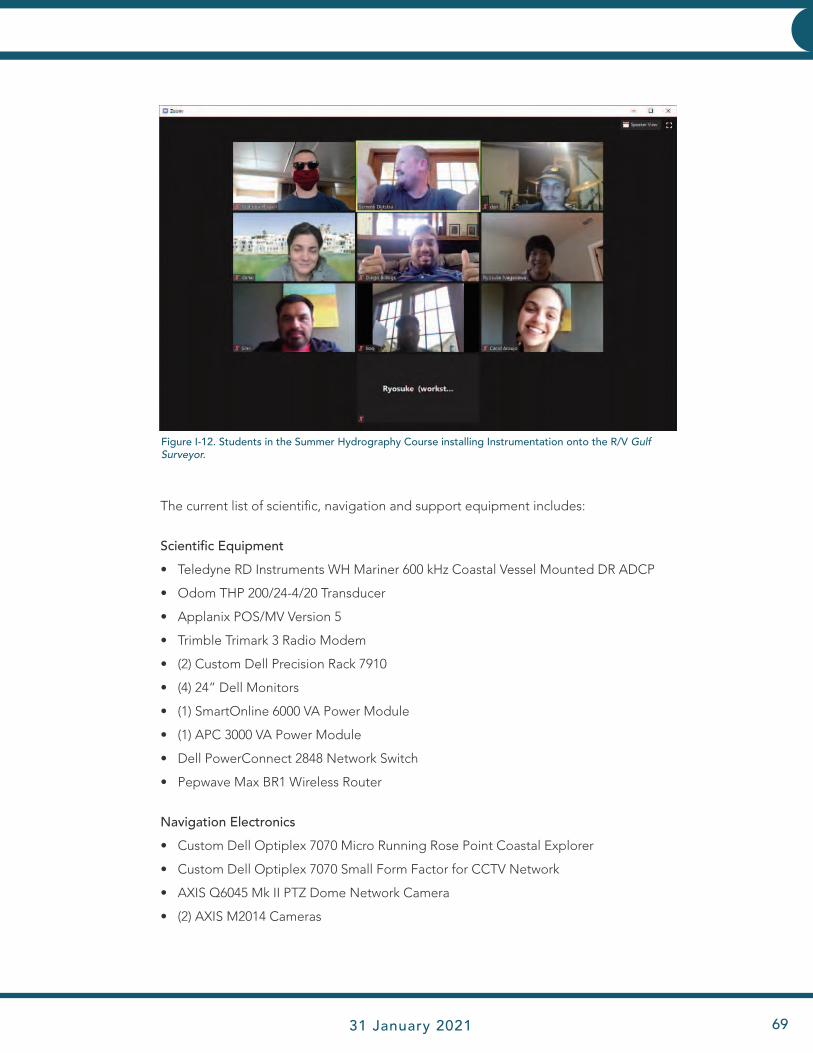
JHC Performance Report 31 January 2021 69
INFRASTRUCTURE INFRASTRUCTURE
The current list of scientific, navigation and support equipment includes:
Scientific Equipment
• Teledyne RD Instruments WH Mariner 600 kHz Coastal Vessel Mounted DR ADCP
• Odom THP 200/24-4/20 Transducer
• Applanix POS/MV Version 5
• Trimble Trimark 3 Radio Modem
• (2) Custom Dell Precision Rack 7910
• (4) 24” Dell Monitors
• (1) SmartOnline 6000 VA Power Module
• (1) APC 3000 VA Power Module
• Dell PowerConnect 2848 Network Switch
• Pepwave Max BR1 Wireless Router
Navigation Electronics
• Custom Dell Optiplex 7070 Micro Running Rose Point Coastal Explorer
• Custom Dell Optiplex 7070 Small Form Factor for CCTV Network
• AXIS Q6045 Mk II PTZ Dome Network Camera
• (2) AXIS M2014 Cameras
Figure I-12. Students in the Summer Hydrography Course installing Instrumentation onto the R/V Gulf Surveyor.
JHC Performance Report70
INFRASTRUCTURE INFRASTRUCTURE
• FLIR M324S Stabilized Thermal Camera
• Standard Horizon VLH-3000 Loud Hailer
• Airmar 200WX Weather Station
• (2) UTEK 4-port RS-485/422 serial to USB converters
• (2) ICOM M-4240 radios
• 8x8 Black Box HDMI matrix switch
• (4) 19” Dell Monitors
Simrad Systems
• DX64s Radar
• Broadband 4G Radar
• AP70 Autopilot
• AC80S Autopilot Processor
• RF45X Rudder Feedback Unit
• (2) QS80 Remote Steering Control
• NSO evo2 Processor
• NSO OP40 Controller
• (2) MO19T Monitors
• GS25 GPS Antennae
• RC42 Rate Compass
• RI10 Radar Junction Box
Garmin Systems
• GNX 21 data display
• GSD 25 Sonar Module
• GT51M-TH Transducer
• GPSMAP 8500 Processor
• GRID Remote Input Device
• GPSmap 840xs
• GCV 10 Transducer
Various multibeam sonar systems have been deployed efficiently through the moon pool using the custom designed strut for the Gulf Surveyor.
Scientific Equipment on Extended Load from Industrial Partners
• EdgeTech 6205 Combined Bathymetry & Side Scan Sonar
• Teledyne Oceanscience RapidCAST Underway Sound Velocity Profiler
JHC Performance Report 31 January 2021 71
INFRASTRUCTURE INFRASTRUCTURE
R/V Gulf Surveyor - Research and Education Operations for 2020
DayMonth Days User Count
Jan 8-10 Casey O'Heran - UAV Survey 3
Jan 17, 22, 23 BAE UUV 3
Jan 24 Jenn Djikstra - Diving 1
Jan 28 Semme - Class 1
Jan 31 Instrument Install - Sidescan 1
Feb 3-6 Klein - Sidescan 4
Feb 11, 18, 25 Semme - Class 3
Feb 14, 19, 21 Klein 3
Feb 17 Jenn Djikstra - Diving 1
Feb 20 BAE UUV 1
Mar 3 Klein 1
Apr 17 USCG Inspection 1
Jun 8 Summer Hydro Virtual Mobilization 1
Jul 28, 31 Diving with Jenn Dijkstra 2
Aug 5 Vessel Tour 1
Sep 9, 16, 23, 30 Lab 4
Sep 24, 25 ASV Support 2
Oct 7, 14 Lab 2
Oct 15 Instrument Setup - John Hughes Clark 1
Oct 19–26 Haulout and Maintenance 8
Oct 27, 28 ASV Support 2
Nov 12 Diving with Jenn Dijkstra 1
Nov 23 Instrument Setup - John Hughes Clark 1
Nov 30 Crew Training Day 1
Dec 3 USCG Inspection 1
Dec 14, 16, 18 Instrument Setup - John Hughes Clark 3
TOTAL 53

JHC Performance Report72
INFRASTRUCTURE INFRASTRUCTURE
ZEGO Boat—Very Shallow Water Mapping System
The Zego Boat Hydrographic Survey Sys-tem is a 2nd generation shallow water mapping research vessel (Figure I-13). The Zego Boat is a twin-hulled catamaran with a 30 hp outboard motor constructed in New Zealand with durable plastic material (dis-tributed in the U.S. by Higgs Hydrographic, Inc.). The vessel has a very shallow draft allowing it to operate in depths as little as 40-50 cm and is very stable in the presence of both waves (breaking and nonbreaking) and strong current conditions. The vessel has a front ram assembly that allows testing and integrating of equipment much easier than possible for other vessels of this size (such as waverunner-based systems like the Center’s Coastal Bathymetry Survey Sys-tem; CBASS). Central to the system is an Applanix POS-MV 320 for highly accurate positioning, heading and attitude that can be integrated with a variety of multibeam echo sounders. Additional instrumenta-tion integrated into the hulls of the ves-sel includes an Imagenex Delta-T MBES, Teledyne Odom Echotrac CV-100 SBES with dual frequency (200 & 24 kHz) Airmar transducer, and modular portal for a variety of RD Instruments acoustic Doppler current profilers. System displays (Figure 1-14) are provided by two waterproof touch-screen monitors and with navigation by supported by Hypack.
Autonomous Surface Vessels
ASV BEN
In its effort to explore new and more efficient ways of collecting hydrographic data, the Center ac-quired a C-Worker 4 (named BEN—Benthic Ex-plorer and Navigator—in honor of Capt. Ben Smith) auto-nomous surface vehicle from ASV Global Ltd. (Figure I-15). The C-Worker 4 is the result of a design collaboration with ASV Global with the goal of creat-ing a platform whose sea keeping, endurance, and payload capacity are suitable for production survey operations and whose interfaces are adaptable for academic research. The vessel is approximately 4 m in length, is powered by a diesel jet drive, has a 16-hour design endurance, a 1kW electrical payload,
Figure I-13. The JHC Zego Boat, a highly maneuverable and stable twin-hulled catamaran that is being outfitted into a state-of-the-art shallow water survey vessel with MBES, SBES, and ADCP capabilities.
Figure I-14. System displays on JHC Zego Boat.
and is outfitted with a central seachest with a retract-able sonar mount.
An Applanix POS/MV GNSS aided IMU system has been installed to provide precise positioning and attitude, and a Kongsberg EM2040P multibeam echo-sounder, graciously provided by Kongsberg through the Center’s industrial partnership program (Appendix C), has been installed for seafloor survey. Beyond the factory sensors listed below, numerous other sensors, hardware, and software systems have been integrated into BEN. These will be discussed further under Task 11.

JHC Performance Report 31 January 2021 73
INFRASTRUCTURE INFRASTRUCTURE
ASV BEN Specifications
Physical
• Length overall: 3.95 m (13’)
• Beam overall: 1.58 m (5’2”)
• Draft: 0.4 m approx. (1’4”)
• Full load displacement: 1,900 lbs (approx.)
• Central payload seachest: 80 cm x 55 cm x 34 cm
• Hull material: 5083 marine grade aluminum with fiberglass composite hatch/superstructure
• Hull color: Signal Yellow
Payload and Sensors (Factory)
• Navigation lights
• AIS Transceiver
• Simrad Marine-band radar
• Axis forward-looking color camera.
• Six color-camera array with 360 degree coverage.
• FLIR (TAU2) forward-looking infrared camera
• FLIR (AX-8) Engine Room observation camera
• Removable UW GoPro Hero7 cameras mounted to sonar plate
• Velodyne VLP-16 hi-res PUCK lidar
• Speed through water and water temperature sensor
• Electrically actuated sonar pole mount into center seachest
• Windows and Linux computers for payload and back-seat driver support
• 24V 1kW electrical payload with current monitor-ing and remote switching
Telemetry
• 35W UHF RS232 Satel Radio Modem for low level communications and watchdog timer (watchdog timer secures fuel to engine when link is broken); functional range is 8-10 km
• Cobham COFDM IP Radio (5Mbps) Functional range: 2 nmi at 6 m base antenna height, 4 nmi at 8 m base antenna height—installed but not currently in use
• 802.11 b/g Wifi (2.4GHz) (11 Mbps/56Mbps) Func-tional range: 300 m
• Iridium Short-Burst Data. Basic telemetry updates can be provided through this system at 10-20 m intervals—installed but not currently configured
Propulsion
• 30 hp Yanmar 3YM30 diesel engine
• Almarin water jet drive system with centrifugal clutch
• Hydraulic steering system
• Fuel capacity: 100 liters
• Endurance: 16 hrs at 5.5 knots
• Top speed: 5.5 knots (speed through water)
Electrical
• 1.5kW 24V Alternator
• 120 Ah 24V DC Hotel Battery Bank
• 12V Starter battery
• Filtered electrical payload capacity: 1kW
Figure I-15. The Bathymetric Explorer and Navigator (BEN), CWorker-4 model vehicle operating in the vicinity of Portsmouth Harbor, Portsmouth, NH.
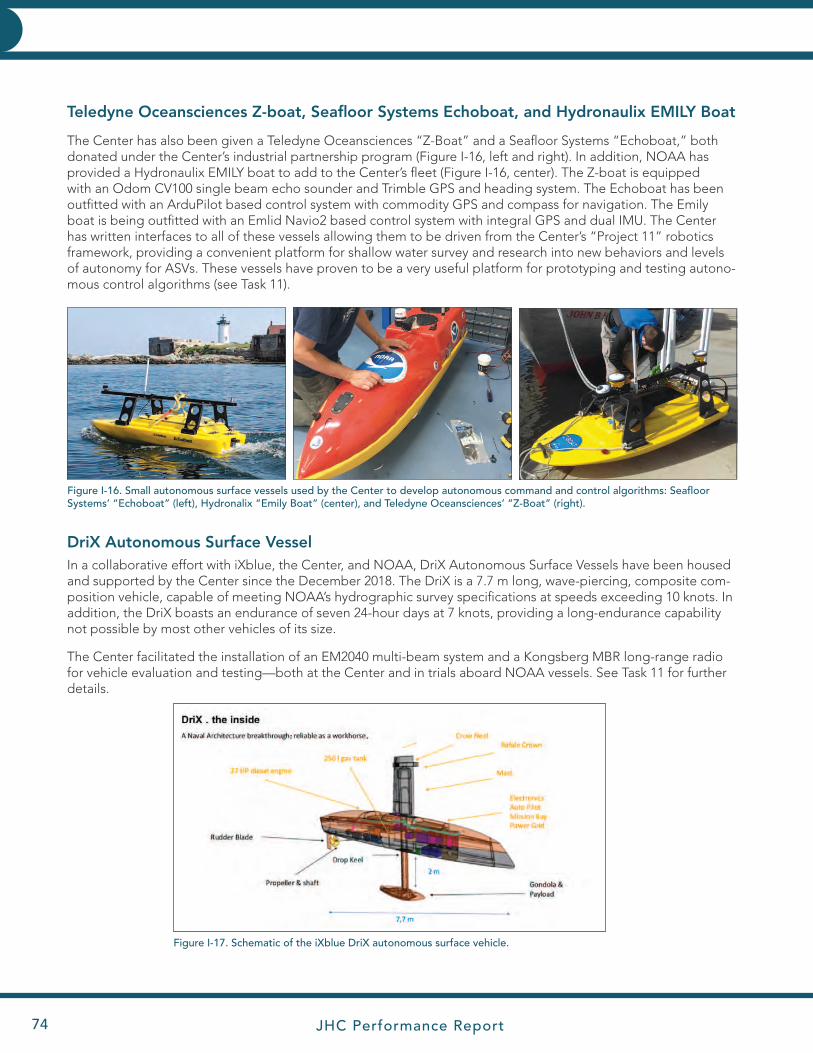
JHC Performance Report74
INFRASTRUCTURE INFRASTRUCTURE
DriX Autonomous Surface VesselIn a collaborative effort with iXblue, the Center, and NOAA, DriX Autonomous Surface Vessels have been housed and supported by the Center since the December 2018. The DriX is a 7.7 m long, wave-piercing, composite com-position vehicle, capable of meeting NOAA’s hydrographic survey specifications at speeds exceeding 10 knots. In addition, the DriX boasts an endurance of seven 24-hour days at 7 knots, providing a long-endurance capability not possible by most other vehicles of its size.
The Center facilitated the installation of an EM2040 multi-beam system and a Kongsberg MBR long-range radio for vehicle evaluation and testing—both at the Center and in trials aboard NOAA vessels. See Task 11 for further details.
Figure I-17. Schematic of the iXblue DriX autonomous surface vehicle.
Figure I-16. Small autonomous surface vessels used by the Center to develop autonomous command and control algorithms: Seafloor Systems’ “Echoboat” (left), Hydronalix “Emily Boat” (center), and Teledyne Oceansciences’ “Z-Boat” (right).
Teledyne Oceansciences Z-boat, Seafloor Systems Echoboat, and Hydronaulix EMILY Boat
The Center has also been given a Teledyne Oceansciences “Z-Boat” and a Seafloor Systems “Echoboat,” both donated under the Center’s industrial partnership program (Figure I-16, left and right). In addition, NOAA has provided a Hydronaulix EMILY boat to add to the Center’s fleet (Figure I-16, center). The Z-boat is equipped with an Odom CV100 single beam echo sounder and Trimble GPS and heading system. The Echoboat has been outfitted with an ArduPilot based control system with commodity GPS and compass for navigation. The Emily boat is being outfitted with an Emlid Navio2 based control system with integral GPS and dual IMU. The Center has written interfaces to all of these vessels allowing them to be driven from the Center’s “Project 11” robotics framework, providing a convenient platform for shallow water survey and research into new behaviors and levels of autonomy for ASVs. These vessels have proven to be a very useful platform for prototyping and testing autono-mous control algorithms (see Task 11).

JHC Performance Report 31 January 2021 75
INFRASTRUCTURE INFRASTRUCTURE
DriX Specifications
Physical
• Length overall: 7.7 m
• Beam overall: 0.8 m
• Draft: 2.0 m
Propulsion
• Engine: 37 Hp Nanni Diesel
• Prop-driven
• Fuel capacity: 250 liters
• Endurance: Seven 24-hour days at 7 knots
• Top speed: >12 knots
Electrial
• 24V system
• 900 W AC for survey payload
Telemetry
• Kongsberg Marine Broadband Radio
• Wifi
Payload
• Kongsberg EM2040
• iXblue PHINS AHRS with Septentrio GPS (LARS)
Figure I-18. Clockwise from left: the iXblue DriX autonomous surface vehicle in its Launch and Recovery System (LARS) being lowered into the water at the UNH Marine Pier in New Castle, NH; running alongside the R/V Gulf Surveyor; and undergoing testing in Portsmouth Harbor, NH.
JHC Performance Report76
STATUS OF RESEARCH
Status of Research: January–December 2020The Federal Funding Opportunity (FFO) for the current grant, NA15NOS4000200, competitively awarded to the Center for the period of 2016-2020, defined four programmatic priorities:
Innovate Hydrography
Transform Charting and Change Navigation
Explore and Map the Continental Shelf
Develop and Advance Hydrographic and Nautical Charting Expertise
Under these, 14 specific research requirements were prescribed (our short name for each research requirement follows the description, highlighted in bold):
Innovate Hydrography
1. Improvement in the effectiveness, efficiency, and data quality of acoustic and LIDAR bathymetry sys-tems, their associated vertical and horizontal positioning and orientation systems, and other sensor technology for hydrographic surveying and ocean and coastal mapping, including autonomous data acquisition systems and technology for unmanned vehicles, vessels of opportunity, and trusted partner organizations—Data Collection.
2. Improvement in technology and methods for more efficient data processing, quality control, and quality assurance, including the determination and application of measurement uncertainty, of hydrographic and ocean and coastal mapping sensor and ancillary sensor data, and data supporting the identification and mapping of fixed and transient features of the seafloor and in the water column—Data Processing.
3. Adaption and improvement of hydrographic survey and ocean mapping technologies for improved coastal resilience and the location, characterization, and management of critical marine habitat and coastal and continental shelf marine resources—Tools for Seafloor Characterization, Habitat, and Resources.
4. Development of improved tools and processes for assessment and efficient application to nautical charts and other hydrographic and ocean and coastal mapping products of data from both authorita-tive and non-traditional sources—Third Party and Non-traditional Data.
Transform Charting and Change Navigation
1. Development of improved methods for managing hydrographic data and transforming hydrographic data and data in enterprise GIS databases to electronic navigational charts and other operational navigation products. New approaches for the application of GIS and spatial data technology to hydro-graphic, ocean, and coastal mapping, and nautical charting processes and products—Chart Adequacy and Computer-Assisted Cartography.
2. Development of innovative approaches and concepts for electronic navigation charts and for other tools and techniques supporting marine navigation situational awareness, such as prototypes that are real-time and predictive, are comprehensive of all navigation information (e.g., charts, bathymetry, models, currents, wind, vessel traffic, etc.), and support the decision process (e.g., under-keel clearance manage-ment)—Comprehensive Charts and Decision Aids.
STATUS OF RESEARCH
JHC Performance Report 31 January 2021 77
3. Improvement in the visualization, presentation, and display of hydrographic and ocean and coastal mapping data, including four-dimensional high resolution visualization, real-time display of mapping data, and mapping and charting products for marine navigation as well as coastal and ocean resource management and coastal resilience—Visualization.
Explore and Map the Continental Shelf
1. Advancements in planning, acquisition, understanding, and interpretation of continental shelf, slope, and rise seafloor mapping data, particularly for the purpose of delimiting the U.S. Extended Continental Shelf—Extended Continental Shelf.
2. Development of new technologies and approaches for integrated ocean and coastal mapping, includ-ing technology for creating new products for non-traditional applications and uses of ocean and coastal mapping—Ocean Exploration Technologies and IOCM.
3. Improvements in technology for integration of ocean mapping with other deep ocean and littoral zone technologies such as remotely operated vehicles and telepresence-enhanced exploration missions at sea—Telepresence and ROVs.
Develop and Advance Hydrographic and Nautical Charting Expertise
1. Development, maintenance, and delivery of advanced curricula and short courses in hydrographic and ocean mapping science and engineering at the graduate education level—leveraging to the maximum extent the proposed research program, and interacting with national and international professional bodies—to bring the latest innovations and standards into the graduate educational experience for both full-time education and continuing professional development—Education.
2. Development, evaluation, and dissemination of improved models and visualizations for describing and delineating the propagation and levels of sound from acoustic devices including echo sounders, and for modeling the exposure of marine animals to propagated echo sounder energy—Acoustic Propagation and Marine Mammals.
3. Effective delivery of research and development results through scientific and technical journals and forums and transition of research and development results to an operational status through direct and indirect mechanisms including partnerships with public and private entities—Publications and R2O.
4. Public education and outreach to convey the aims and enhance the application of hydrography, nautical charting, and ocean and coastal mapping to safe and efficient marine navigation and coastal resilience—Outreach.
These programmatic priorities and research requirements are not radically different from those prescribed under earlier grants and thus much of the research being conducted under the 2016-2020 grant represents a continuation of research. Several of the requirements, particularly those involved with cartographic issues and marine mammals represent new directions for the lab.
To address the four programmatic priorities and 14 research requirements, the Center divided the research requirements into themes and sub-themes, and responded with 60 individual research projects or research tasks, each with an identified investigator or group of investigators as the lead (Figure I-20).
STATUS OF RESEARCHSTATUS OF RESEARCH

JHC Performance Report78
STATUS OF RESEARCH
These research tasks are constantly being reviewed by Center management and the Program Manager and are adjusted as tasks are completed, merged as we learn more about the problem, or are modified due to changes in personnel (e.g., the loss of Shachak Pe’eri from the Center faculty when he became a NOAA employee and moved to Silver Spring or the loss of David Mosher due to his election to the Committee on the Limits of the Continental Shelf, the loss of Firat Eren in his return to Turkey and most recently Giuseppe Masetti’s reduction to part-time associated with his move to the Danish Hydrographic Service). In response to these changes we have made the following adjustments to our research tasks in consultation with the NOAA Program Manager:
1. We have de-emphasized the tasks associated with Phase Measuring Bathymetric Systems (Tasks 2 and 16) in response to limited use of these systems by NOAA OCS. We will monitor future developments with these systems and re-evaluate if necessary.
2. With the departure of Firat Erin and our inability to find a replacement for him, some lidar tasks (Task 5 and 29) will phased out. However, we will continue our collaboration with Chris Parrish at OSU with respect to lidar issues, and Brian Calder and Kim Lowell are working on lidar data analysis (Task 17), with impact on Tasks 34 and 35).
3. With the departure of Shachak Pe’eri, Task 6—Distributed Temperature Sensing—was dropped from our task list. This effort is continuing through an SBIR with NOAA.
STATUS OF RESEARCH
Figure I-20. Original breakdown of Programmatic Priorities and Research Requirements of FFO into individual projects or tasks.
JHC Performance Report 31 January 2021 79
STATUS OF RESEARCH
4. We have completed the Autonomous Vehicle Boot Camp efforts (Task 10) with several successful Boot Camps.
5. We have greatly expanded our Autonomous Surface Vehicles efforts (Task 11) with upgrades to the CWorker-4 (BEN) and the arrival of the DriX autonomous surface vessel.
6. Calder has replaced Pe’eri as the lead for Task 17—Processing for Topo-Bathy Lidar.
7. With the completion of early work on single beam seafloor characterization (Task 23), this effort has been de-emphasized given limited use by OCS.
8. Tasks 26—Single Beam Seafloor Characterization—and 28—Object-Based Image Analysis—have been deemed unproductive and their resources assigned to Tasks 33 and 31 respectively, with the approval of the Program Manager.
9. Task 28—Margin-wide Habitat Analysis—has merged with Task 50—ECS Data for Ecosystem Manage-ment—since they are basically two parts of the same task. For reporting purposes, 28 will be dropped and 50 used instead.
10. The efforts of Task 29—Shoreline Change—have been picked up by NOAA OCS.
11. Coincident with the departure of Pe’eri, the research associated with Task 36—Development of Tech-niques for Satellite-Derived Bathymetry—was completed, and the project is in transition to operations at NOAA.
12. Task 40—Visualizing Currents Waves and Weather—has been combined with Task 42—Ocean Flow Mod-eling Visualization—and will just be referred to as Task 40.
13. Task 45—Tools for Visualizing Complex Ocean Data—has been combined with Task 46—New Interaction Techniques—and will just be referred to as Task 45.
As we complete the fifth year of effort, the updated tasks are presented in Figure I-21. Note that we have chosen not to renumber the tasks so that there is continuity of reporting throughout the duration of the grant. This and subsequent progress reports for Grant NA15NOS4000200 will address progress on a task-by-task basis. It must be noted, however, that the grant extends over five years (2016-2020) and there will not necessarily be progress on every task every year. It should also be noted that as our research develops, we may find that some tasks do not warrant continuation while new directions or combinations of efforts may evolve that lead to changes in emphasis or the evolution of new tasks within the same scope of effort. This will be essential to allow innovation to flourish under this cooperative agreement.
Impact of COVID PandemicAffecting most every aspect of life in 2020, the COVID-19 pandemic has had significant impact on the ability of the Center to meet its obligations under the grant. Beginning in mid-March of 2020, the University of New Hampshire began to shut down the campus, with all teaching done on-line, closing buildings and facilities to all research activities except those deemed “essential” (i.e., essential to maintain living specimens, critical time-series mea-surements, etc.). By September, the University opened up the campus for some classes but kept the restrictions on access for research purposes. The Center IT staff was able to quickly adapt and ensure that all Center research-ers had the needed connectivity and resources to work from home. This allowed those in the Center charged with teaching to carry on with courses (albeit with serious adjustments made to labs) and those able to carry on their research efforts from home to do so with minimum interruption. A remarkable effort on the part of our IT staff also allowed us to virtually conduct our annual NOAA Site Review and Industrial Partner Visit in July with more than 120 participants. We were thus able to continue to teach, continue to graduate students, run seminars, and achieve many of our research goals. Many activities, however, particularly those involving seagoing experiments
STATUS OF RESEARCH
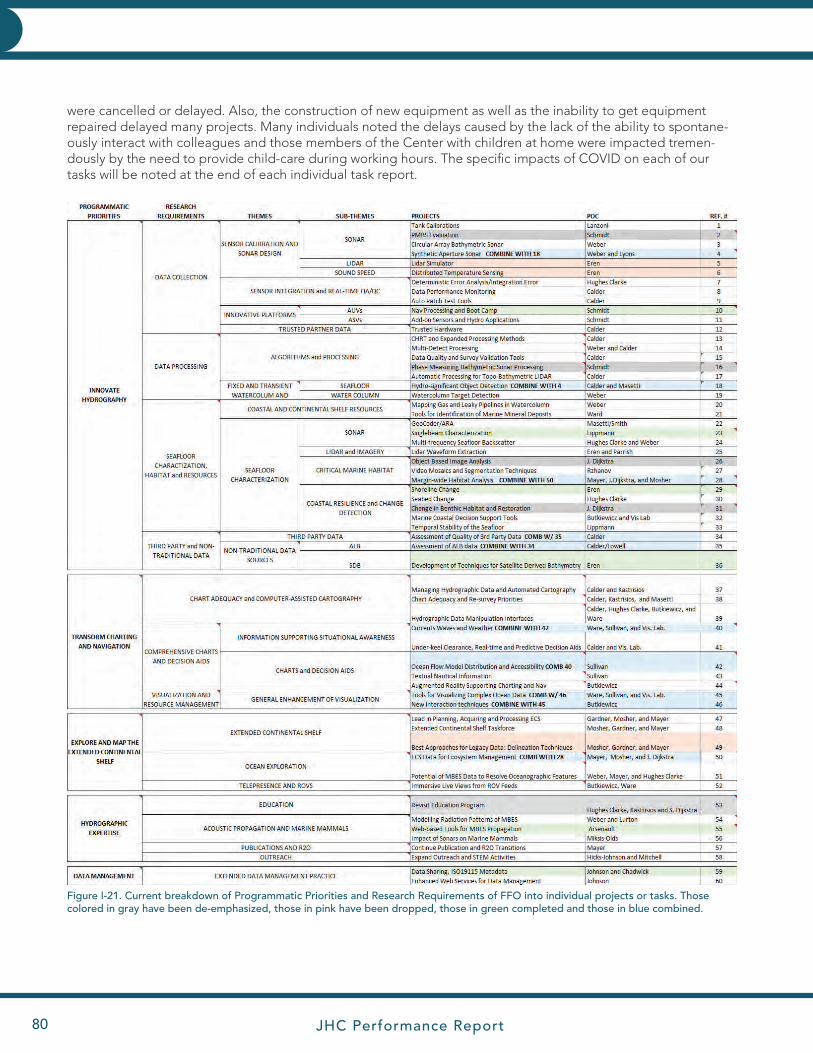
JHC Performance Report80
INNOVATIVE HYDROGRAPHY
Figure I-21. Current breakdown of Programmatic Priorities and Research Requirements of FFO into individual projects or tasks. Those colored in gray have been de-emphasized, those in pink have been dropped, those in green completed and those in blue combined.
STATUS OF RESEARCH
were cancelled or delayed. Also, the construction of new equipment as well as the inability to get equipment repaired delayed many projects. Many individuals noted the delays caused by the lack of the ability to spontane-ously interact with colleagues and those members of the Center with children at home were impacted tremen-dously by the need to provide child-care during working hours. The specific impacts of COVID on each of our tasks will be noted at the end of each individual task report.
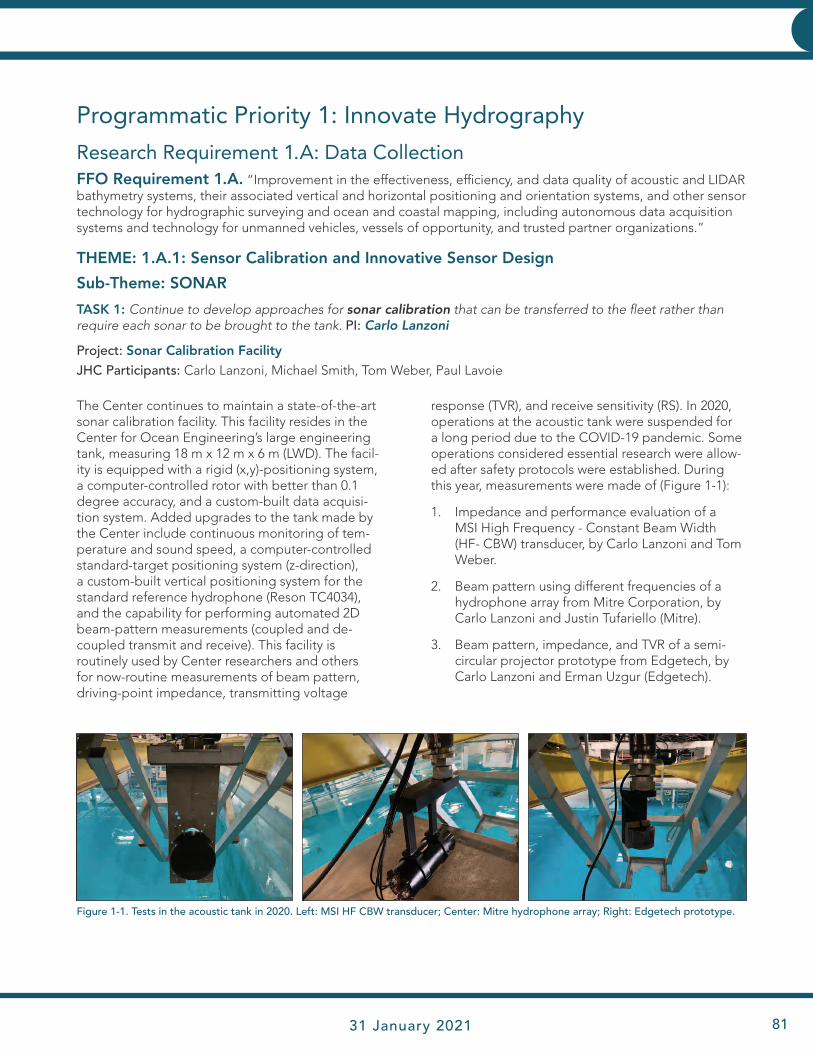
JHC Performance Report 31 January 2021 81
INNOVATIVE HYDROGRAPHY
Programmatic Priority 1: Innovate Hydrography
Research Requirement 1.A: Data Collection FFO Requirement 1.A. “Improvement in the effectiveness, efficiency, and data quality of acoustic and LIDAR bathymetry systems, their associated vertical and horizontal positioning and orientation systems, and other sensor technology for hydrographic surveying and ocean and coastal mapping, including autonomous data acquisition systems and technology for unmanned vehicles, vessels of opportunity, and trusted partner organizations.”
THEME: 1.A.1: Sensor Calibration and Innovative Sensor Design
Sub-Theme: SONAR
TASK 1: Continue to develop approaches for sonar calibration that can be transferred to the fleet rather than require each sonar to be brought to the tank. PI: Carlo Lanzoni
Project: Sonar Calibration Facility
JHC Participants: Carlo Lanzoni, Michael Smith, Tom Weber, Paul Lavoie
Figure 1-1. Tests in the acoustic tank in 2020. Left: MSI HF CBW transducer; Center: Mitre hydrophone array; Right: Edgetech prototype.
The Center continues to maintain a state-of-the-art sonar calibration facility. This facility resides in the Center for Ocean Engineering’s large engineering tank, measuring 18 m x 12 m x 6 m (LWD). The facil-ity is equipped with a rigid (x,y)-positioning system, a computer-controlled rotor with better than 0.1 degree accuracy, and a custom-built data acquisi-tion system. Added upgrades to the tank made by the Center include continuous monitoring of tem-perature and sound speed, a computer-controlled standard-target positioning system (z-direction), a custom-built vertical positioning system for the standard reference hydrophone (Reson TC4034), and the capability for performing automated 2D beam-pattern measurements (coupled and de- coupled transmit and receive). This facility is routinely used by Center researchers and others for now-routine measurements of beam pattern, driving-point impedance, transmitting voltage
response (TVR), and receive sensitivity (RS). In 2020, operations at the acoustic tank were suspended for a long period due to the COVID-19 pandemic. Some operations considered essential research were allow-ed after safety protocols were established. During this year, measurements were made of (Figure 1-1):
1. Impedance and performance evaluation of a MSI High Frequency - Constant Beam Width (HF- CBW) transducer, by Carlo Lanzoni and Tom Weber.
2. Beam pattern using different frequencies of a hydrophone array from Mitre Corporation, by Carlo Lanzoni and Justin Tufariello (Mitre).
3. Beam pattern, impedance, and TVR of a semi-circular projector prototype from Edgetech, by Carlo Lanzoni and Erman Uzgur (Edgetech).
STATUS OF RESEARCH

JHC Performance Report82
INNOVATIVE HYDROGRAPHY INNOVATIVE HYDROGRAPHY
Project: Innovative Field Calibration Procedures
JHC Participants: Carlo Lanzoni, Tom Weber, Paul Lavoie
We continue to work toward developing approach-es for an absolute field-calibration using standard target spheres (e.g., tungsten carbide ball bear-ings). This approach has been previously demon-strated by Lanzoni, using a split-beam echo sound-er to aid in sphere localization within the MBES reference frame. One of the challenges of this approach is in the mechanical deployment of the sphere which, due to the wide swath of the MBES, required very large and cumbersome outriggers. To address this concern, the next development has included the design, construction, and testing of a more portable positioning mechanism for the calibration sphere. This approach uses a sphere suspended in the water column from monofilament lines connected to two remote-controlled thrusted
Figure 1-3. Remote controlled thrusted buoy. Left: Control system block diagram; Right: Second buoy prototype.
Figure 1-2. Left: Target positioning mechanism using remote-controlled buoys; Center: Location system setup on vessel; Right: Real time location of tagged buoys using radio transceivers diagram.
buoys that move continuously to position the acous-tic target throughout the entire swath of the MBES sonar systems.
Each of the two buoys employs thrusters controlled via radio frequency from a command and control sys-tem on the vessel. A system to provide buoy position (relative to the vessel) in real-time has been designed and prototyped using wireless radio transceivers for real-time location with a precision of 10 cm at ranges of up to 300 m. In the prototype system, four radio transceiver modules fixed on the vessel (base sta-tions) exchange signals with each of the two radio transceiver modules installed on the buoys (tags) to obtain 2-D coordinates for each buoy using trilatera-tion (Figure 1-2).
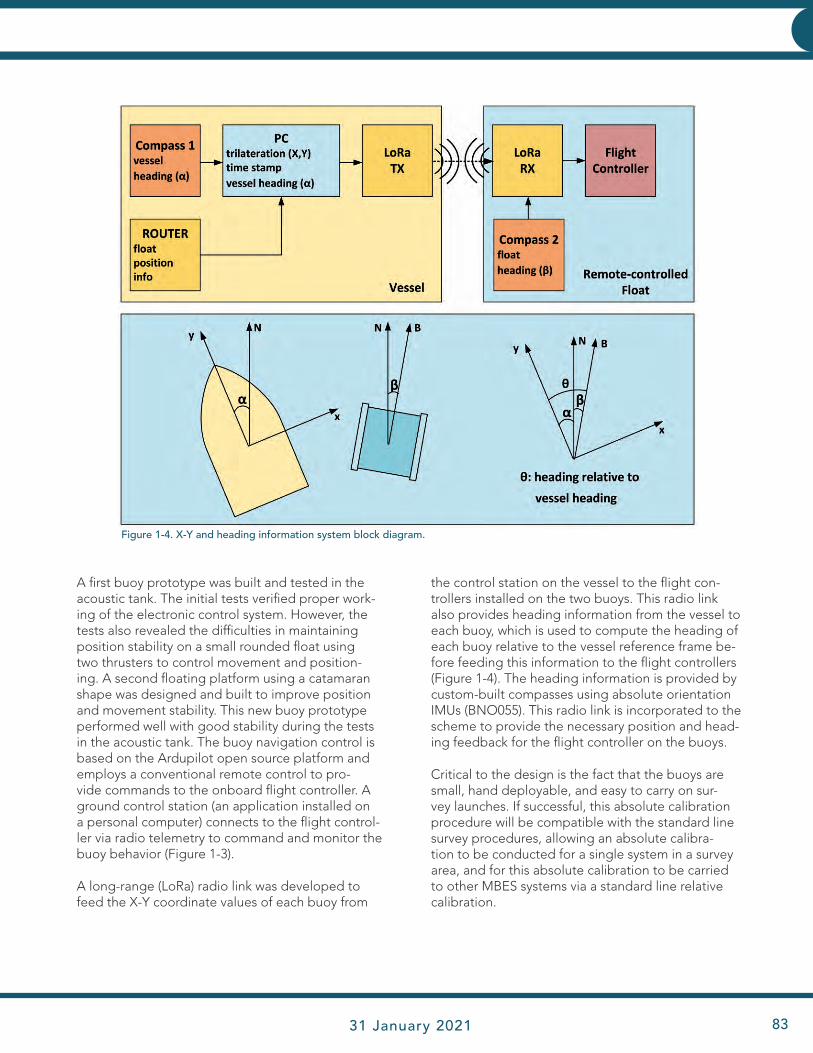
JHC Performance Report 31 January 2021 83
INNOVATIVE HYDROGRAPHY
A first buoy prototype was built and tested in the acoustic tank. The initial tests verified proper work-ing of the electronic control system. However, the tests also revealed the difficulties in maintaining position stability on a small rounded float using two thrusters to control movement and position-ing. A second floating platform using a catamaran shape was designed and built to improve position and movement stability. This new buoy prototype performed well with good stability during the tests in the acoustic tank. The buoy navigation control is based on the Ardupilot open source platform and employs a conventional remote control to pro-vide commands to the onboard flight controller. A ground control station (an application installed on a personal computer) connects to the flight control-ler via radio telemetry to command and monitor the buoy behavior (Figure 1-3).
A long-range (LoRa) radio link was developed to feed the X-Y coordinate values of each buoy from
the control station on the vessel to the flight con-trollers installed on the two buoys. This radio link also provides heading information from the vessel to each buoy, which is used to compute the heading of each buoy relative to the vessel reference frame be-fore feeding this information to the flight controllers (Figure 1-4). The heading information is provided by custom-built compasses using absolute orientation IMUs (BNO055). This radio link is incorporated to the scheme to provide the necessary position and head-ing feedback for the flight controller on the buoys.
Critical to the design is the fact that the buoys are small, hand deployable, and easy to carry on sur-vey launches. If successful, this absolute calibration procedure will be compatible with the standard line survey procedures, allowing an absolute calibra-tion to be conducted for a single system in a survey area, and for this absolute calibration to be carried to other MBES systems via a standard line relative calibration.
Figure 1-4. X-Y and heading information system block diagram.
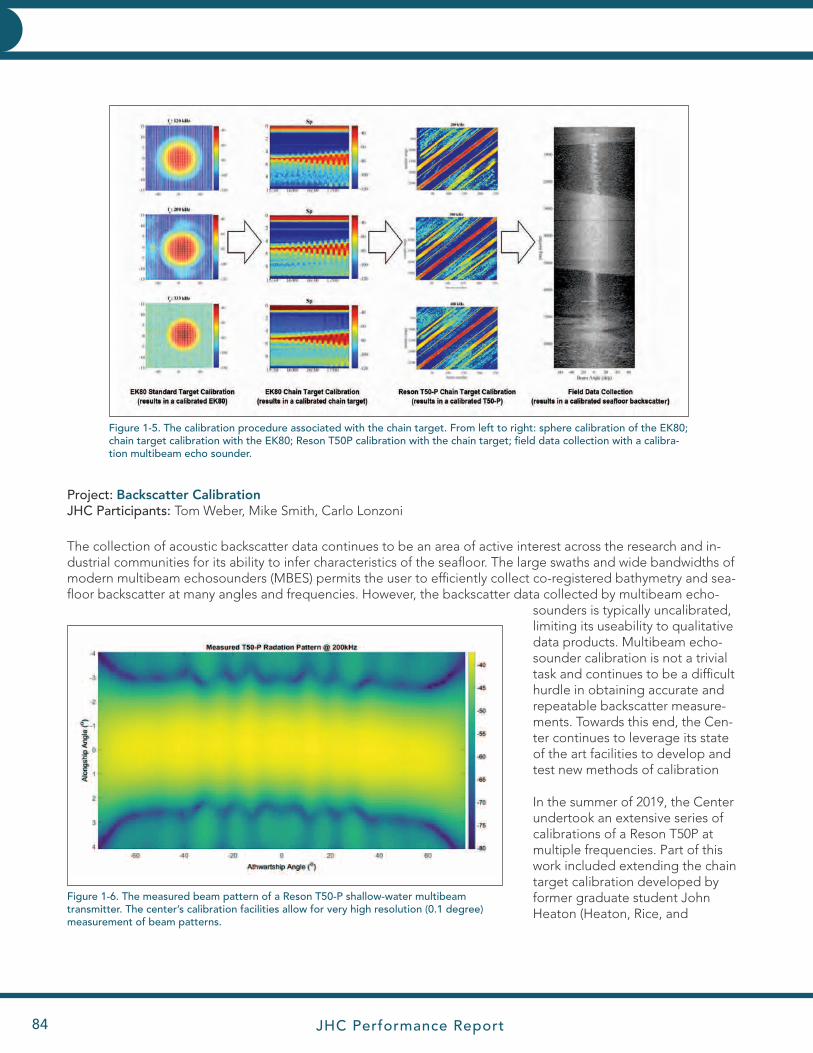
JHC Performance Report84
INNOVATIVE HYDROGRAPHY INNOVATIVE HYDROGRAPHY
Project: Backscatter CalibrationJHC Participants: Tom Weber, Mike Smith, Carlo Lonzoni
Figure 1-5. The calibration procedure associated with the chain target. From left to right: sphere calibration of the EK80; chain target calibration with the EK80; Reson T50P calibration with the chain target; field data collection with a calibra-tion multibeam echo sounder.
The collection of acoustic backscatter data continues to be an area of active interest across the research and in-dustrial communities for its ability to infer characteristics of the seafloor. The large swaths and wide bandwidths of modern multibeam echosounders (MBES) permits the user to efficiently collect co-registered bathymetry and sea-floor backscatter at many angles and frequencies. However, the backscatter data collected by multibeam echo-
sounders is typically uncalibrated, limiting its useability to qualitative data products. Multibeam echo-sounder calibration is not a trivial task and continues to be a difficult hurdle in obtaining accurate and repeatable backscatter measure-ments. Towards this end, the Cen-ter continues to leverage its state of the art facilities to develop and test new methods of calibration
In the summer of 2019, the Center undertook an extensive series of calibrations of a Reson T50P at multiple frequencies. Part of this work included extending the chain target calibration developed by former graduate student John Heaton (Heaton, Rice, and
Figure 1-6. The measured beam pattern of a Reson T50-P shallow-water multibeam transmitter. The center’s calibration facilities allow for very high resolution (0.1 degree) measurement of beam patterns.
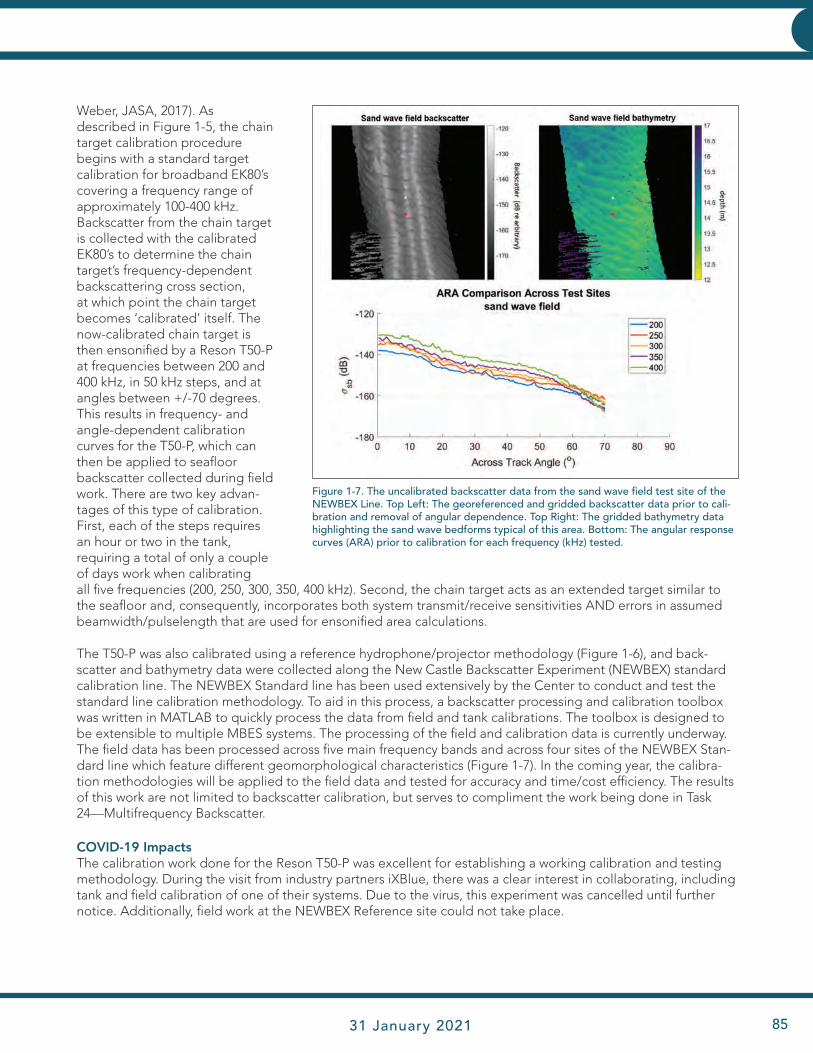
JHC Performance Report 31 January 2021 85
INNOVATIVE HYDROGRAPHY
Weber, JASA, 2017). As described in Figure 1-5, the chain target calibration procedure begins with a standard target calibration for broadband EK80’s covering a frequency range of approximately 100-400 kHz. Backscatter from the chain target is collected with the calibrated EK80’s to determine the chain target’s frequency-dependent backscattering cross section, at which point the chain target becomes ‘calibrated’ itself. The now-calibrated chain target is then ensonified by a Reson T50-P at frequencies between 200 and 400 kHz, in 50 kHz steps, and at angles between +/-70 degrees. This results in frequency- and angle-dependent calibration curves for the T50-P, which can then be applied to seafloor backscatter collected during field work. There are two key advan-tages of this type of calibration. First, each of the steps requires an hour or two in the tank, requiring a total of only a couple of days work when calibrating all five frequencies (200, 250, 300, 350, 400 kHz). Second, the chain target acts as an extended target similar to the seafloor and, consequently, incorporates both system transmit/receive sensitivities AND errors in assumed beamwidth/pulselength that are used for ensonified area calculations.
The T50-P was also calibrated using a reference hydrophone/projector methodology (Figure 1-6), and back-scatter and bathymetry data were collected along the New Castle Backscatter Experiment (NEWBEX) standard calibration line. The NEWBEX Standard line has been used extensively by the Center to conduct and test the standard line calibration methodology. To aid in this process, a backscatter processing and calibration toolbox was written in MATLAB to quickly process the data from field and tank calibrations. The toolbox is designed to be extensible to multiple MBES systems. The processing of the field and calibration data is currently underway. The field data has been processed across five main frequency bands and across four sites of the NEWBEX Stan-dard line which feature different geomorphological characteristics (Figure 1-7). In the coming year, the calibra-tion methodologies will be applied to the field data and tested for accuracy and time/cost efficiency. The results of this work are not limited to backscatter calibration, but serves to compliment the work being done in Task 24—Multifrequency Backscatter.
COVID-19 ImpactsThe calibration work done for the Reson T50-P was excellent for establishing a working calibration and testing methodology. During the visit from industry partners iXBlue, there was a clear interest in collaborating, including tank and field calibration of one of their systems. Due to the virus, this experiment was cancelled until further notice. Additionally, field work at the NEWBEX Reference site could not take place.
Figure 1-7. The uncalibrated backscatter data from the sand wave field test site of the NEWBEX Line. Top Left: The georeferenced and gridded backscatter data prior to cali-bration and removal of angular dependence. Top Right: The gridded bathymetry data highlighting the sand wave bedforms typical of this area. Bottom: The angular response curves (ARA) prior to calibration for each frequency (kHz) tested.
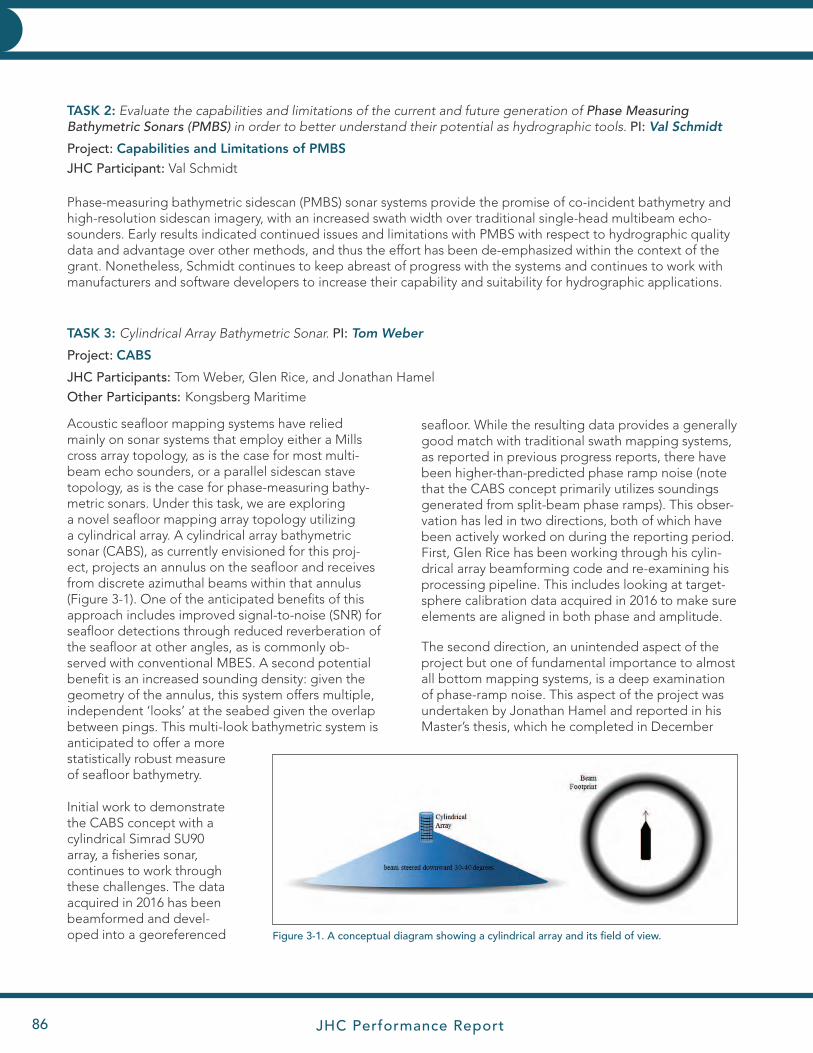
JHC Performance Report86
INNOVATIVE HYDROGRAPHY INNOVATIVE HYDROGRAPHY
seafloor. While the resulting data provides a generally good match with traditional swath mapping systems, as reported in previous progress reports, there have been higher-than-predicted phase ramp noise (note that the CABS concept primarily utilizes soundings generated from split-beam phase ramps). This obser-vation has led in two directions, both of which have been actively worked on during the reporting period. First, Glen Rice has been working through his cylin-drical array beamforming code and re-examining his processing pipeline. This includes looking at target-sphere calibration data acquired in 2016 to make sure elements are aligned in both phase and amplitude.
The second direction, an unintended aspect of the project but one of fundamental importance to almost all bottom mapping systems, is a deep examination of phase-ramp noise. This aspect of the project was undertaken by Jonathan Hamel and reported in his Master’s thesis, which he completed in December
TASK 3: Cylindrical Array Bathymetric Sonar. PI: Tom Weber
Project: CABS
JHC Participants: Tom Weber, Glen Rice, and Jonathan Hamel
Other Participants: Kongsberg Maritime
TASK 2: Evaluate the capabilities and limitations of the current and future generation of Phase Measuring Bathymetric Sonars (PMBS) in order to better understand their potential as hydrographic tools. PI: Val Schmidt
Project: Capabilities and Limitations of PMBS
JHC Participant: Val Schmidt
Phase-measuring bathymetric sidescan (PMBS) sonar systems provide the promise of co-incident bathymetry and high-resolution sidescan imagery, with an increased swath width over traditional single-head multibeam echo-sounders. Early results indicated continued issues and limitations with PMBS with respect to hydrographic quality data and advantage over other methods, and thus the effort has been de-emphasized within the context of the grant. Nonetheless, Schmidt continues to keep abreast of progress with the systems and continues to work with manufacturers and software developers to increase their capability and suitability for hydrographic applications.
Acoustic seafloor mapping systems have relied mainly on sonar systems that employ either a Mills cross array topology, as is the case for most multi-beam echo sounders, or a parallel sidescan stave topology, as is the case for phase-measuring bathy-metric sonars. Under this task, we are exploring a novel seafloor mapping array topology utilizing a cylindrical array. A cylindrical array bathymetric sonar (CABS), as currently envisioned for this proj-ect, projects an annulus on the seafloor and receives from discrete azimuthal beams within that annulus (Figure 3-1). One of the anticipated benefits of this approach includes improved signal-to-noise (SNR) for seafloor detections through reduced reverberation of the seafloor at other angles, as is commonly ob-served with conventional MBES. A second potential benefit is an increased sounding density: given the geometry of the annulus, this system offers multiple, independent ‘looks’ at the seabed given the overlap between pings. This multi-look bathymetric system is anticipated to offer a more statistically robust measure of seafloor bathymetry.
Initial work to demonstrate the CABS concept with a cylindrical Simrad SU90 array, a fisheries sonar, continues to work through these challenges. The data acquired in 2016 has been beamformed and devel-oped into a georeferenced Figure 3-1. A conceptual diagram showing a cylindrical array and its field of view.
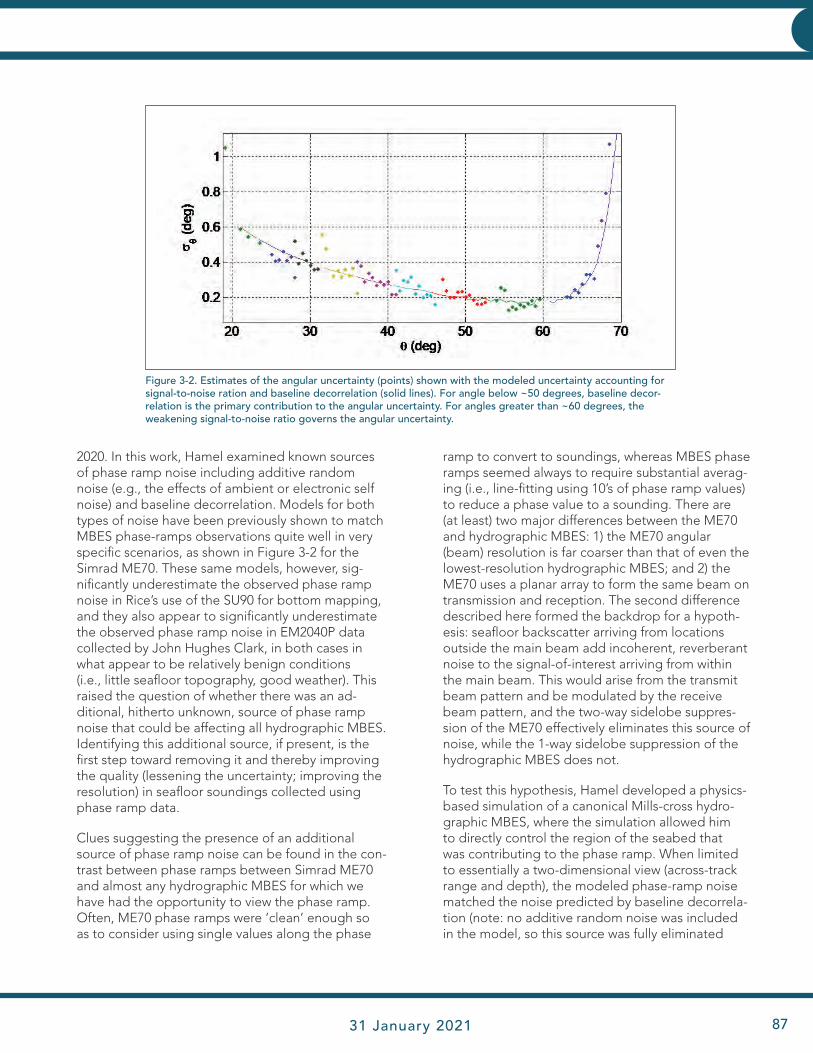
JHC Performance Report 31 January 2021 87
INNOVATIVE HYDROGRAPHY
2020. In this work, Hamel examined known sources of phase ramp noise including additive random noise (e.g., the effects of ambient or electronic self noise) and baseline decorrelation. Models for both types of noise have been previously shown to match MBES phase-ramps observations quite well in very specific scenarios, as shown in Figure 3-2 for the Simrad ME70. These same models, however, sig-nificantly underestimate the observed phase ramp noise in Rice’s use of the SU90 for bottom mapping, and they also appear to significantly underestimate the observed phase ramp noise in EM2040P data collected by John Hughes Clark, in both cases in what appear to be relatively benign conditions (i.e., little seafloor topography, good weather). This raised the question of whether there was an ad-ditional, hitherto unknown, source of phase ramp noise that could be affecting all hydrographic MBES. Identifying this additional source, if present, is the first step toward removing it and thereby improving the quality (lessening the uncertainty; improving the resolution) in seafloor soundings collected using phase ramp data.
Clues suggesting the presence of an additional source of phase ramp noise can be found in the con-trast between phase ramps between Simrad ME70 and almost any hydrographic MBES for which we have had the opportunity to view the phase ramp. Often, ME70 phase ramps were ‘clean’ enough so as to consider using single values along the phase
ramp to convert to soundings, whereas MBES phase ramps seemed always to require substantial averag-ing (i.e., line-fitting using 10’s of phase ramp values) to reduce a phase value to a sounding. There are (at least) two major differences between the ME70 and hydrographic MBES: 1) the ME70 angular (beam) resolution is far coarser than that of even the lowest-resolution hydrographic MBES; and 2) the ME70 uses a planar array to form the same beam on transmission and reception. The second difference described here formed the backdrop for a hypoth-esis: seafloor backscatter arriving from locations outside the main beam add incoherent, reverberant noise to the signal-of-interest arriving from within the main beam. This would arise from the transmit beam pattern and be modulated by the receive beam pattern, and the two-way sidelobe suppres-sion of the ME70 effectively eliminates this source of noise, while the 1-way sidelobe suppression of the hydrographic MBES does not.
To test this hypothesis, Hamel developed a physics-based simulation of a canonical Mills-cross hydro-graphic MBES, where the simulation allowed him to directly control the region of the seabed that was contributing to the phase ramp. When limited to essentially a two-dimensional view (across-track range and depth), the modeled phase-ramp noise matched the noise predicted by baseline decorrela-tion (note: no additive random noise was included in the model, so this source was fully eliminated
Figure 3-2. Estimates of the angular uncertainty (points) shown with the modeled uncertainty accounting for signal-to-noise ration and baseline decorrelation (solid lines). For angle below ~50 degrees, baseline decor-relation is the primary contribution to the angular uncertainty. For angles greater than ~60 degrees, the weakening signal-to-noise ratio governs the angular uncertainty.

JHC Performance Report88
INNOVATIVE HYDROGRAPHY INNOVATIVE HYDROGRAPHY
by design). But as the third, along track, dimension was slowly added to the model, the phase-ramp noise increased substantially. Importantly, it was possible to modulate this added phase-ramp noise through selection of various transmit shading functions (Figure 3-3), meaning that there ap-peared to be a path toward reduc-ing this unwanted phase ramp noise through basic sonar design choices. To complete this study, the hypo- thesis still needs to be verified in a field study with an actual (as opposed to modeled) MBES, and in the last part of his thesis Hamel helped lay the groundwork for doing such a study with the highly configurable ME70.
COVID ImpactsAt a winter meeting with Kongsberg, field tests to examine phase ramp noise were discussed and tentatively planned for summer 2020. These field tests have been placed on indefinite hold during the pandemic.
Figure 3-3. Result from Hamel’s MBES simulation. The observed phase ramp noise from the model is plotted as a function of the along track seabed length used in the simulation. Each point on the plot represents the average of 250 iterations. Baseline decorrelation places a lower limit on the phase ramp noise, and is found to accu-rately represent the data in a 2D-view (across-track and depth) of the world, but to underestimate the data when the third dimension (along-track) is added.
TASK 4: Synthetic Aperture Sonar: Deriving Hydrographic-Quality Phase Difference Bathymetric Solutions with Parallel Synthetic Staves. PIs: Anthony Lyons and Tom Weber
Project: Evaluating Synthetic Aperture Sonar
JHC Participants: Anthony Lyons and Tom WeberOther Participants: Shannon Steele and Kraken Robotics
Synthetic aperture sonar (SAS), with multiple paral-lel synthetic staves, can provide both high-resolution imaging at far ranges and phase-difference bathy-metric solutions. The requirements for very stable platforms (e.g., AUVs) and the high cost of these systems makes SAS an unlikely tool for hydrographic mapping. However, the high resolution of these sys-tems may provide some benefit for the detection and localization of small underwater hazards and targets of interest. We continue to evaluate the performance and utility of off-the-shelf AUV mounted and towed SAS systems.
Synthetic aperture sonar images the seafloor at low grazing angles (~35 to ~5 degrees grazing angle). This low angle geometry with respect to the seafloor
makes these types of systems very susceptible to any refractive effects caused by oceanographic phe-nomena related to stratification of the sound speed profile, for example, linear and non-linear internal waves. The focusing and defocusing of acoustic energy onto the seafloor caused by the refractive effects result in features that appear as distortions of the true topography in both SAS imagery and inter-ferometric bathymetry. In a technical demonstration of the Kraken towed SAS that took place aboard the Okeanos Explorer from July 18 to July 24, 2019, these types of distortions caused by refraction through internal waves were ubiquitous. An example of this type of distortion can be seen as large ripples in the top image of Figure 4-1.
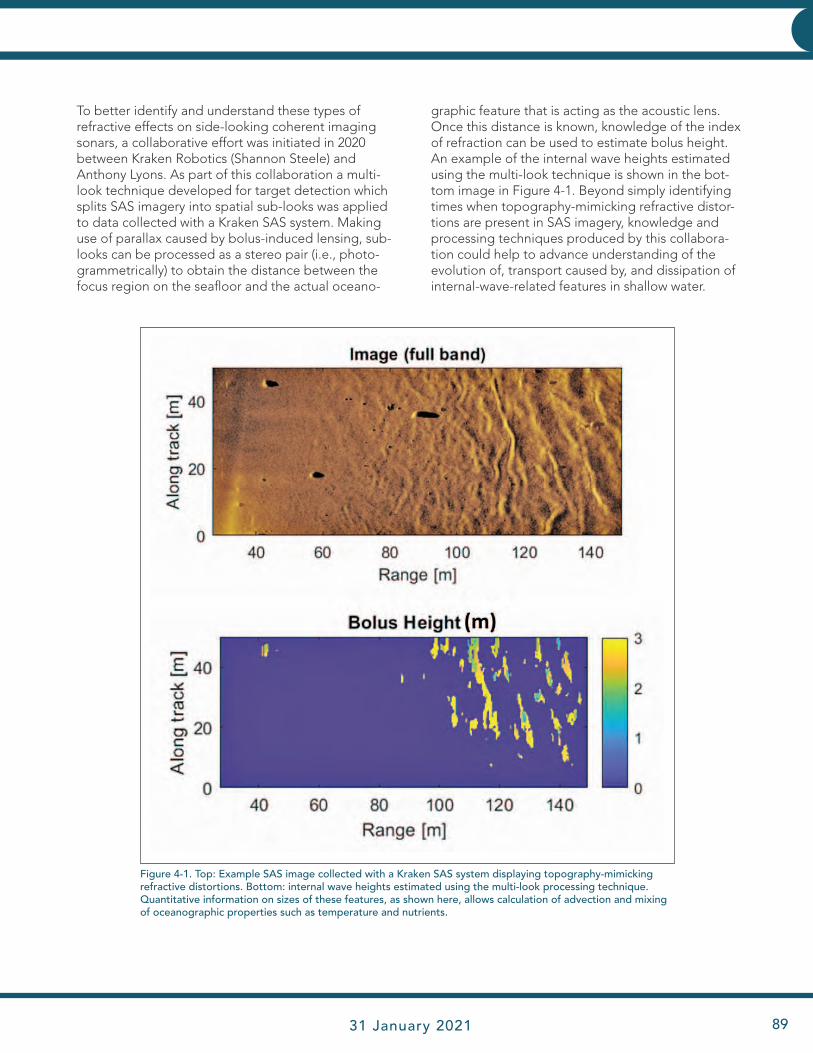
JHC Performance Report 31 January 2021 89
INNOVATIVE HYDROGRAPHY
To better identify and understand these types of refractive effects on side-looking coherent imaging sonars, a collaborative effort was initiated in 2020 between Kraken Robotics (Shannon Steele) and Anthony Lyons. As part of this collaboration a multi-look technique developed for target detection which splits SAS imagery into spatial sub-looks was applied to data collected with a Kraken SAS system. Making use of parallax caused by bolus-induced lensing, sub-looks can be processed as a stereo pair (i.e., photo-grammetrically) to obtain the distance between the focus region on the seafloor and the actual oceano-
graphic feature that is acting as the acoustic lens. Once this distance is known, knowledge of the index of refraction can be used to estimate bolus height. An example of the internal wave heights estimated using the multi-look technique is shown in the bot-tom image in Figure 4-1. Beyond simply identifying times when topography-mimicking refractive distor-tions are present in SAS imagery, knowledge and processing techniques produced by this collabora-tion could help to advance understanding of the evolution of, transport caused by, and dissipation of internal-wave-related features in shallow water.
Figure 4-1. Top: Example SAS image collected with a Kraken SAS system displaying topography-mimicking refractive distortions. Bottom: internal wave heights estimated using the multi-look processing technique. Quantitative information on sizes of these features, as shown here, allows calculation of advection and mixing of oceanographic properties such as temperature and nutrients.

JHC Performance Report90
INNOVATIVE HYDROGRAPHY INNOVATIVE HYDROGRAPHY
THEME: 1.A.2 Sensor Integration and Real-Time Qa/Qc
TASK 7: Deterministic Error Analysis Tools: Further develop a suite of real-time and post-processing analysis tools to help operators see systematic integration problems in their configuration, e.g., wobble analysis tools including separating motion latency/scaling issues from surface and near-surface sound speed modulations, the use of water column information as a tool for identifying interference, noise sources, and bottom-detection issues. Improved low grazing angle bottom detection for more robust target detection, and tools to assure optimal qual-ity of backscatter data, as well as tools to extract angular response curves that feed into our seafloor characteriza-tion developments. PI: John Hughes Clarke
JHC Participants: John Hughes Clarke, Brandon Maingot, and Brian Calder
NOAA Collaborators: Lt. Steve Wall FOO, NOAA Ship Ferdinand R. Hassler, and Glen Rice, NOAA-HSTP
Other Collaborators: Rebecca Martinolich, Dave Fabre, NAVOCEANO; Ken Fitzgerald, Glostens; Ian Church, UNB OMG
This task seeks improved means of assessing per-formance degradation of swath sonar systems by looking at correlations between the acquired bathy-metric data and the external driving forces (trajectory, rotations and sea-state). The two main reasons for performance degradation are 1) imperfect integration of the observed position and orientation (internal) and 2) environmental overprinting due to oceanogra-phy and sea-state limitations (external).
Imperfect IntegrationWith the ever-improving accuracy of the com-ponent sensors in an integrated multibeam system, the resultant residual errors have come to be dominated by the integration rather than the sensors themselves. Identifying the driving fac-tors behind the residual errors (the periodic ones routinely referred to as “wobbles”), requires an understanding of the way they become manifest. As the OCS fleet increasingly switches to multi-sector multi-swath sonar to im-prove operational perfor-mance, there is a growing need to rapidly identify integration errors in these complex systems. In this reporting period, model-
ing tools have continued to be developed to better undertake wobble analysis (Figures 7-1 and 7-2) and image bubble clouds (Figures 7-3 and 7-4).
Switch from Simulated to Real DataAs an extension of the M.Sc. thesis topic of Brandon Maingot, his Rigorous Inter-Sensor Calibrator (RISC) tool is in the process of being adapted to work on real data as part of his Ph.D. To test the original
Figure 7-1. Wobble Analysis Tool (Brandon Maingot Ph.D. Thesis)–top left–imaging geometry, showing analyzed depth residuals (dZ for each vector X) and difference between concentric and non-concentric configuration. Bottom left–georeferenced model layout, including expanded error terms, right–schematic of non-concentric cone-cone intersection.
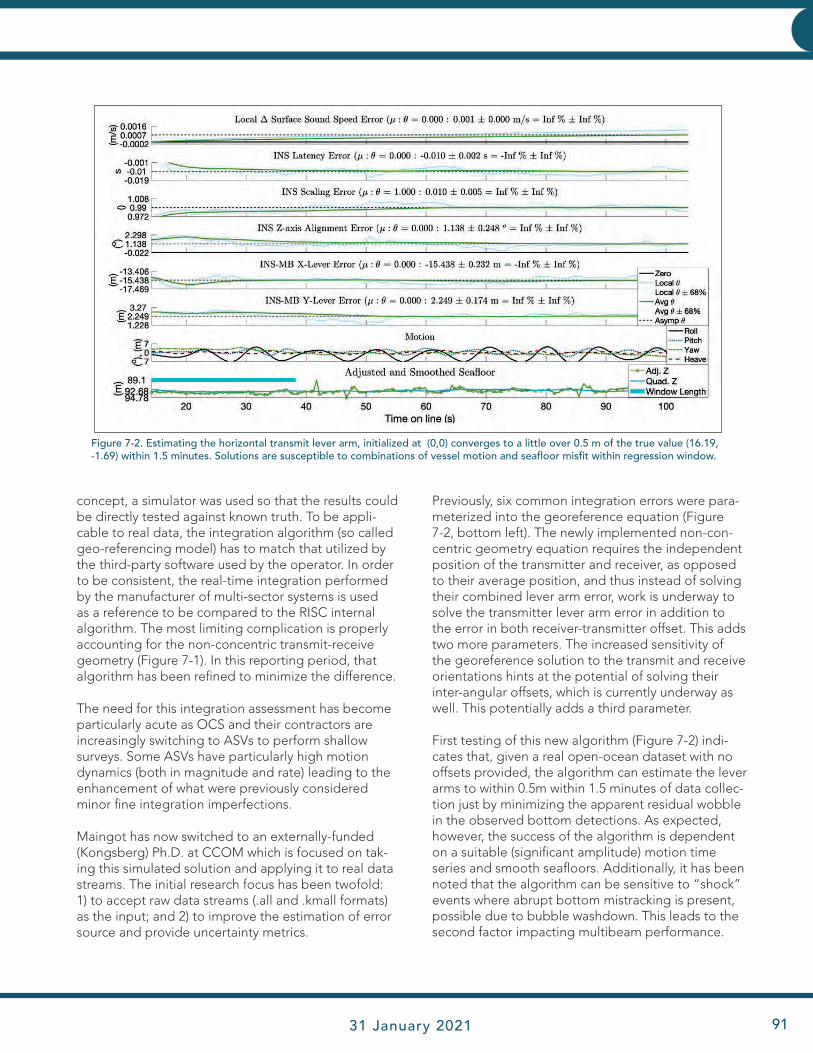
JHC Performance Report 31 January 2021 91
INNOVATIVE HYDROGRAPHY
concept, a simulator was used so that the results could be directly tested against known truth. To be appli-cable to real data, the integration algorithm (so called geo-referencing model) has to match that utilized by the third-party software used by the operator. In order to be consistent, the real-time integration performed by the manufacturer of multi-sector systems is used as a reference to be compared to the RISC internal algorithm. The most limiting complication is properly accounting for the non-concentric transmit-receive geometry (Figure 7-1). In this reporting period, that algorithm has been refined to minimize the difference.
The need for this integration assessment has become particularly acute as OCS and their contractors are increasingly switching to ASVs to perform shallow surveys. Some ASVs have particularly high motion dynamics (both in magnitude and rate) leading to the enhancement of what were previously considered minor fine integration imperfections.
Maingot has now switched to an externally-funded (Kongsberg) Ph.D. at CCOM which is focused on tak-ing this simulated solution and applying it to real data streams. The initial research focus has been twofold: 1) to accept raw data streams (.all and .kmall formats) as the input; and 2) to improve the estimation of error source and provide uncertainty metrics.
Previously, six common integration errors were para-meterized into the georeference equation (Figure 7-2, bottom left). The newly implemented non-con-centric geometry equation requires the independent position of the transmitter and receiver, as opposed to their average position, and thus instead of solving their combined lever arm error, work is underway to solve the transmitter lever arm error in addition to the error in both receiver-transmitter offset. This adds two more parameters. The increased sensitivity of the georeference solution to the transmit and receive orientations hints at the potential of solving their inter-angular offsets, which is currently underway as well. This potentially adds a third parameter.
First testing of this new algorithm (Figure 7-2) indi-cates that, given a real open-ocean dataset with no offsets provided, the algorithm can estimate the lever arms to within 0.5m within 1.5 minutes of data collec-tion just by minimizing the apparent residual wobble in the observed bottom detections. As expected, however, the success of the algorithm is dependent on a suitable (significant amplitude) motion time series and smooth seafloors. Additionally, it has been noted that the algorithm can be sensitive to “shock” events where abrupt bottom mistracking is present, possible due to bubble washdown. This leads to the second factor impacting multibeam performance.
Figure 7-2. Estimating the horizontal transmit lever arm, initialized at (0,0) converges to a little over 0.5 m of the true value (16.19, -1.69) within 1.5 minutes. Solutions are susceptible to combinations of vessel motion and seafloor misfit within regression window.

JHC Performance Report92
INNOVATIVE HYDROGRAPHY INNOVATIVE HYDROGRAPHY
Environmental OverprintingEven with excellent control on latencies, offsets, and alignments, oceanographic environmental issues can plague multibeam performance. The two common components are sound speed fluctuations, both at the array and on non-horizontal deeper veloclines, and intermittent fields of bubbles being advected down to and in front of the sonar arrays.
Rapid Sound Speed FluctuationsIn previous reporting periods, the impact of discon-tinuous non-horizontal veloclines due to internal waves and turbulence has been investigated and re-ported. These produce very characteristic outer beam coherent undulations. Given our inability to correct for these, the main mitigation strategy is to recognize their presence and Task 51 focuses on the develop-ment of tools to undertake near real-time examina-tion of the water column scattering.
Bubble WashdownEven with perfect integration of motion, if there are periodic external noise and sound blockage events due to bubbles close to the transducers generated by wave activity, this will overprint onto the data. Such
extreme sea-state related issues are generally the reason why surveys are paused. While there has been much speculation as to the origin and reason for these bubble washdown events, there has been little direct investigation of the phenomena.
Building on the tools developed by Hughes Clarke to investigate oceanographic phenomena using water column imaging (Task 51), near-hull subsets of data are now being used to investigate anomalous scattering events close to the arrays. To do so, however, requires that the sonar use high range resolution and minimal blanking periods. This is not a problem with continen-tal shelf sonars but is not practical using deep water systems.
To address this problem, Hughes Clarke has been tak-ing advantage of the fact that increasingly, deep water survey vessels are also equipped with shallow water multibeam sonars. While this second sonar cannot track the bottom in deep water, it can be set to “sonar mode” in order to image the volume scattering field within a few 10s to 100s of meters below the hull. This was originally developed in 2016 to look at the shallow oceanographic layering to view evidence of internal
Figure 7-3. Stills of underhull scattering field indicating instantaneous environment. The operator needs to understand the overprint of other active sonars (A), and sequential degradation (B-C-D-E) as the bubble density increases.
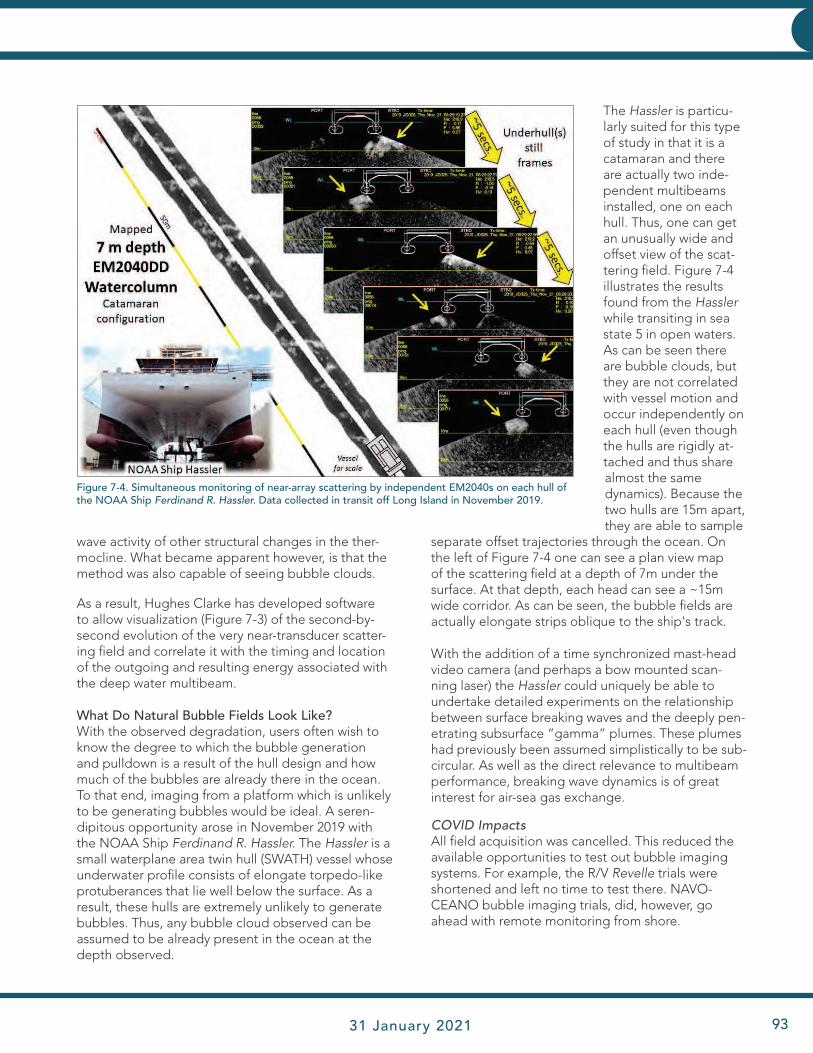
JHC Performance Report 31 January 2021 93
INNOVATIVE HYDROGRAPHY
wave activity of other structural changes in the ther-mocline. What became apparent however, is that the method was also capable of seeing bubble clouds.
As a result, Hughes Clarke has developed software to allow visualization (Figure 7-3) of the second-by-second evolution of the very near-transducer scatter-ing field and correlate it with the timing and location of the outgoing and resulting energy associated with the deep water multibeam.
What Do Natural Bubble Fields Look Like? With the observed degradation, users often wish to know the degree to which the bubble generation and pulldown is a result of the hull design and how much of the bubbles are already there in the ocean. To that end, imaging from a platform which is unlikely to be generating bubbles would be ideal. A seren-dipitous opportunity arose in November 2019 with the NOAA Ship Ferdinand R. Hassler. The Hassler is a small waterplane area twin hull (SWATH) vessel whose underwater profile consists of elongate torpedo-like protuberances that lie well below the surface. As a result, these hulls are extremely unlikely to generate bubbles. Thus, any bubble cloud observed can be assumed to be already present in the ocean at the depth observed.
The Hassler is particu-larly suited for this type of study in that it is a catamaran and there are actually two inde-pendent multibeams installed, one on each hull. Thus, one can get an unusually wide and offset view of the scat-tering field. Figure 7-4 illustrates the results found from the Hassler while transiting in sea state 5 in open waters. As can be seen there are bubble clouds, but they are not correlated with vessel motion and occur independently on each hull (even though the hulls are rigidly at-tached and thus share almost the same dynamics). Because the two hulls are 15m apart, they are able to sample
separate offset trajectories through the ocean. On the left of Figure 7-4 one can see a plan view map of the scattering field at a depth of 7m under the surface. At that depth, each head can see a ~15m wide corridor. As can be seen, the bubble fields are actually elongate strips oblique to the ship's track.
With the addition of a time synchronized mast-head video camera (and perhaps a bow mounted scan-ning laser) the Hassler could uniquely be able to undertake detailed experiments on the relationship between surface breaking waves and the deeply pen-etrating subsurface “gamma” plumes. These plumes had previously been assumed simplistically to be sub-circular. As well as the direct relevance to multibeam performance, breaking wave dynamics is of great interest for air-sea gas exchange.
COVID ImpactsAll field acquisition was cancelled. This reduced the available opportunities to test out bubble imaging systems. For example, the R/V Revelle trials were shortened and left no time to test there. NAVO-CEANO bubble imaging trials, did, however, go ahead with remote monitoring from shore.
Figure 7-4. Simultaneous monitoring of near-array scattering by independent EM2040s on each hull of the NOAA Ship Ferdinand R. Hassler. Data collected in transit off Long Island in November 2019.

JHC Performance Report94
INNOVATIVE HYDROGRAPHY INNOVATIVE HYDROGRAPHY
Sound Speed Manager (HydrOffice)The execution of a modern survey using acoustic sensors necessitates an accurate environmental characterization of the water column. In particular, the selected sound speed profile is critical for ray tracing, while knowing the temperature and salinity variability
are crucial in the calculation of absorption coeffi-cients, which are important for gain setting in acous-tic sensors and compensation of backscatter records.
Since 2016, Giuseppe Masetti and Brian Calder have been collaborating with NOAA Hydrographic Sys-
TASK 8: Data Performance Monitoring: Investigate algorithms that could be used for real-time, or near real-time, monitoring of multibeam data, including methods for establishing a baseline performance metric for a class of systems, comparison methods for individual systems, and means to allow tracking of performance over time. We will also consider common methods pioneered through our NSF-funded Multibeam Advisory Committee for adaptation into shallow water environments, and visual feedback mechanisms that allow for clarity of real-time alerts for the operator. PI: Brian Calder
JHC Participants: Giuseppe Masetti, Paul Johnson, Kevin Jerram, Michael Smith, and Larry MayerOther Collaborators: Andrew Armstrong (NOAA OCS); Matthew Sharr, Daniel Koushel, (NOAA, OCS); Tyanne Faulkes (NOAA PHB); Shelley Deveraux, Barry Gallagher, and Chen Zhang (NOAA HSTB); John Kelley, and Jason Greenlaw (NOAA NOS)
An alternative approach to more sophisticated data processing techniques is to collect better qualified data earlier in the process: it is important to consider the “total cost of ownership” (TCO) for hydrographic data, which includes not only the physical cost of collecting the data, but also the processing costs subsequent to initial col-lection. A characteristic of hydrographic and ocean mapping data seems to be that the cost to correct a problem increases the further from the point of collection it is detected. Consequently, tools to monitor data in real-time, or to provide better support for data collection and quality monitoring have the potential to significantly reduce the TCO, or at least provide better assurance that no potentially problematic issues exist in the data before the survey vessel leaves the vicinity.
Figure 8-1. On the left, the Sound Speed Manager front-end GUI, showing an expendable bathythermograph (XBT) profile being reprocessed with salinity from an oceanographic climatology (i.e., the NOAA World Ocean Atlas 2013). On the right, a Kongsberg SIS emulator created to facilitate SSM development and testing.
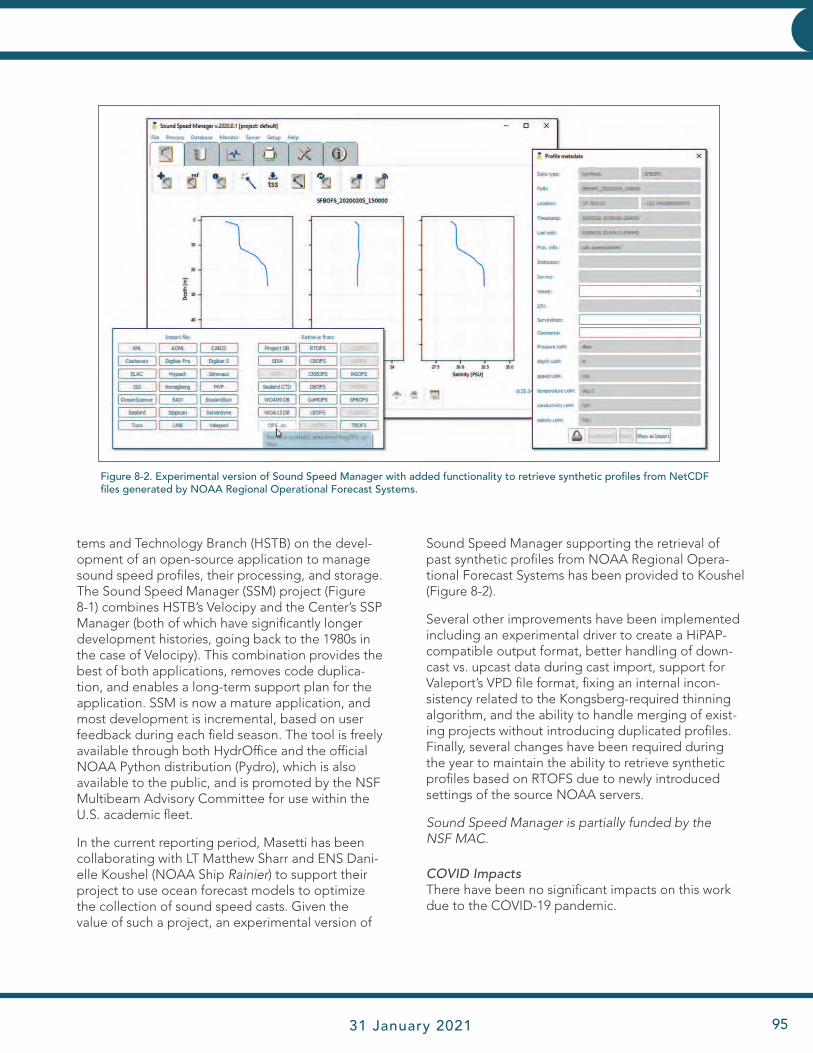
JHC Performance Report 31 January 2021 95
INNOVATIVE HYDROGRAPHY
tems and Technology Branch (HSTB) on the devel-opment of an open-source application to manage sound speed profiles, their processing, and storage. The Sound Speed Manager (SSM) project (Figure 8-1) combines HSTB’s Velocipy and the Center’s SSP Manager (both of which have significantly longer development histories, going back to the 1980s in the case of Velocipy). This combination provides the best of both applications, removes code duplica-tion, and enables a long-term support plan for the application. SSM is now a mature application, and most development is incremental, based on user feedback during each field season. The tool is freely available through both HydrOffice and the official NOAA Python distribution (Pydro), which is also available to the public, and is promoted by the NSF Multibeam Advisory Committee for use within the U.S. academic fleet.
In the current reporting period, Masetti has been collaborating with LT Matthew Sharr and ENS Dani-elle Koushel (NOAA Ship Rainier) to support their project to use ocean forecast models to optimize the collection of sound speed casts. Given the value of such a project, an experimental version of
Sound Speed Manager supporting the retrieval of past synthetic profiles from NOAA Regional Opera-tional Forecast Systems has been provided to Koushel (Figure 8-2).
Several other improvements have been implemented including an experimental driver to create a HiPAP-compatible output format, better handling of down-cast vs. upcast data during cast import, support for Valeport’s VPD file format, fixing an internal incon-sistency related to the Kongsberg-required thinning algorithm, and the ability to handle merging of exist-ing projects without introducing duplicated profiles. Finally, several changes have been required during the year to maintain the ability to retrieve synthetic profiles based on RTOFS due to newly introduced settings of the source NOAA servers.
Sound Speed Manager is partially funded by the NSF MAC.
COVID ImpactsThere have been no significant impacts on this work due to the COVID-19 pandemic.
Figure 8-2. Experimental version of Sound Speed Manager with added functionality to retrieve synthetic profiles from NetCDF files generated by NOAA Regional Operational Forecast Systems.

JHC Performance Report96
INNOVATIVE HYDROGRAPHY INNOVATIVE HYDROGRAPHY
NOAA and MAC personnel continue to collabora-tively develop more user-friendly, Python-based graphical user interfaces (GUIs) for these software tools with the aim of empowering multibeam opera-tors to take an active role in monitoring indicators of system performance. Operator engagement and early detection of complications translate to improved data quality and operational efficiency. Compared to existing commercial software tools used for multibeam processing (which may not be freely available for all operators), the GUIs under development are geared toward simplicity of use and improved control over filtering, plotting, ar-chiving, and comparing data for each system to itself and to similar systems throughout their service lives. The Python tools are available for download through a link on the MAC website, http://mac.unols.org/resources/assessment-tools (Figure 8-3), with new versions uploaded as development continues.
A number of improvements were made to the assessment tools in 2020. The swath coverage (Figure 8-4) and swath accuracy (Figure 8-5) tools now employ Val Schmidt’s Python KMAll module to
Multibeam Advisory Committee ToolsThe Multibeam Advisory Committee (MAC), spon-sored by NSF, is an on-going project dedicated to providing fleet-wide expertise in systems accep-tance, calibration, and performance monitoring of the UNOLS fleet’s multibeam mapping systems. Since 2011, the MAC has performed systems accep-tance and routine quality assurance tests, configura-tion checks, software maintenance, and self-noise testing for the U.S. academic fleet. These processes are also applicable to many of the mapping systems in the NOAA fleet, as well as those installed aboard commercial and non-profit survey and exploration vessels. In 2020, the MAC has continued develop-ment of software tools for assessing performance and tracking hardware health. These tools have been applied to Center, UNOLS, and NOAA multibeam activities, including comprehensive quality assur-ance test planning for the dual-EM2040 installation aboard NOAA Ship Ferdinand Hassler in February, sea acceptance testing of the first EM304 transceiver upgrade in the U.S. aboard NOAA Ship Okeanos Explorer in March, and quality assurance testing of the EM302 operated by E/V Nautilus.
Figure 8-3. A link to the download location for the multibeam assessments tools is available through the MAC’s website at http://mac.unols.org/resources/assessment-tools.
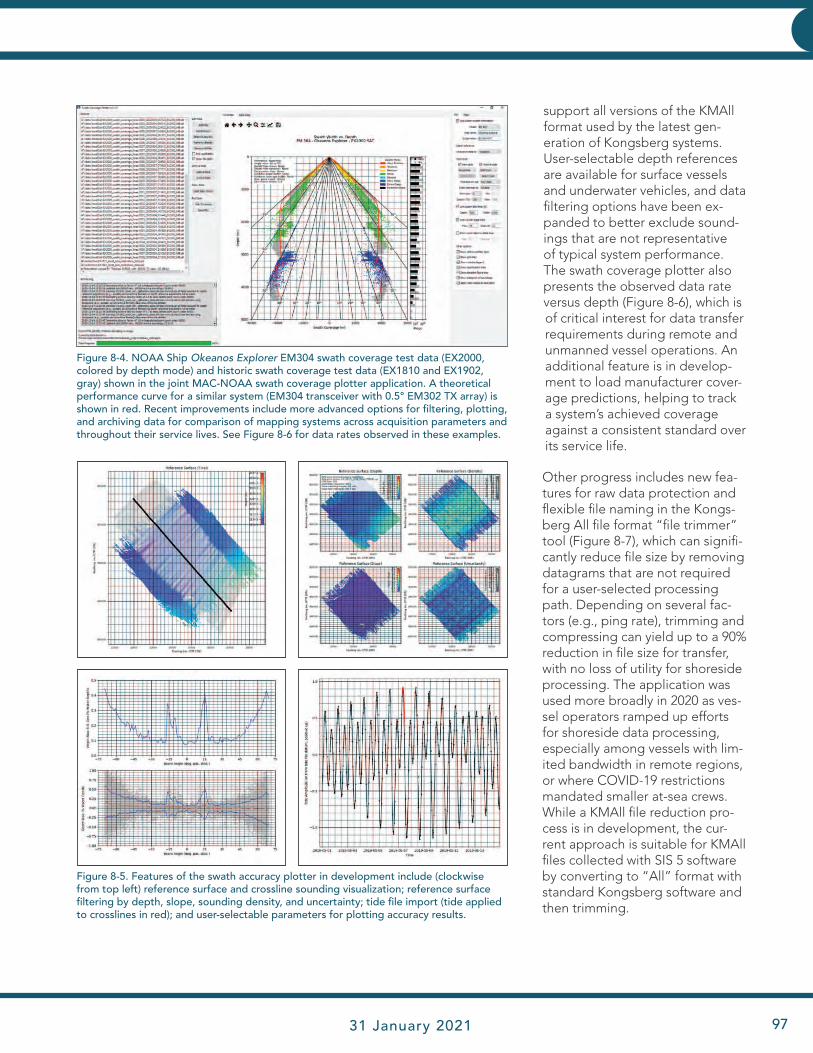
JHC Performance Report 31 January 2021 97
INNOVATIVE HYDROGRAPHY
Figure 8-4. NOAA Ship Okeanos Explorer EM304 swath coverage test data (EX2000, colored by depth mode) and historic swath coverage test data (EX1810 and EX1902, gray) shown in the joint MAC-NOAA swath coverage plotter application. A theoretical performance curve for a similar system (EM304 transceiver with 0.5° EM302 TX array) is shown in red. Recent improvements include more advanced options for filtering, plotting, and archiving data for comparison of mapping systems across acquisition parameters and throughout their service lives. See Figure 8-6 for data rates observed in these examples.
support all versions of the KMAll format used by the latest gen-eration of Kongsberg systems. User-selectable depth references are available for surface vessels and underwater vehicles, and data filtering options have been ex-panded to better exclude sound-ings that are not representative of typical system performance. The swath coverage plotter also presents the observed data rate versus depth (Figure 8-6), which is of critical interest for data transfer requirements during remote and unmanned vessel operations. An additional feature is in develop-ment to load manufacturer cover-age predictions, helping to track a system’s achieved coverage against a consistent standard over its service life.
Other progress includes new fea-tures for raw data protection and flexible file naming in the Kongs-berg All file format “file trimmer” tool (Figure 8-7), which can signifi-cantly reduce file size by removing datagrams that are not required for a user-selected processing path. Depending on several fac-tors (e.g., ping rate), trimming and compressing can yield up to a 90% reduction in file size for transfer, with no loss of utility for shoreside processing. The application was used more broadly in 2020 as ves-sel operators ramped up efforts for shoreside data processing, especially among vessels with lim-ited bandwidth in remote regions, or where COVID-19 restrictions mandated smaller at-sea crews. While a KMAll file reduction pro-cess is in development, the cur-rent approach is suitable for KMAll files collected with SIS 5 software by converting to “All” format with standard Kongsberg software and then trimming.
Figure 8-5. Features of the swath accuracy plotter in development include (clockwise from top left) reference surface and crossline sounding visualization; reference surface filtering by depth, slope, sounding density, and uncertainty; tide file import (tide applied to crosslines in red); and user-selectable parameters for plotting accuracy results.
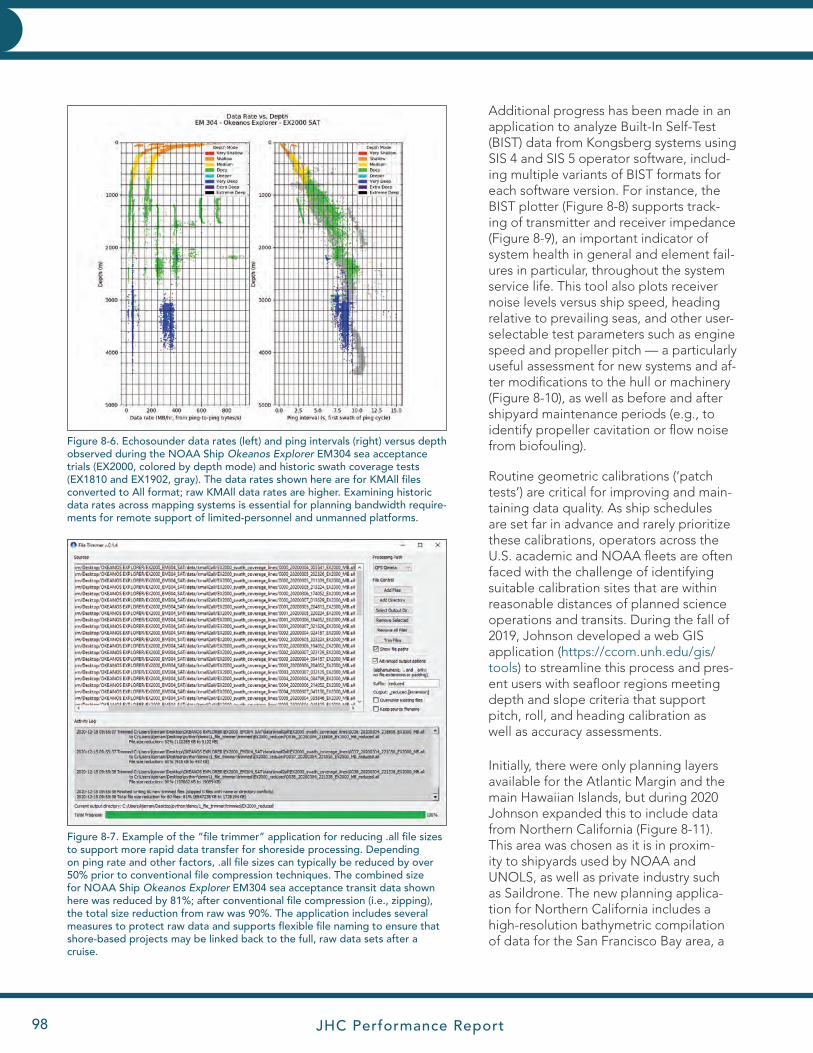
JHC Performance Report98
INNOVATIVE HYDROGRAPHY INNOVATIVE HYDROGRAPHY
Additional progress has been made in an application to analyze Built-In Self-Test (BIST) data from Kongsberg systems using SIS 4 and SIS 5 operator software, includ-ing multiple variants of BIST formats for each software version. For instance, the BIST plotter (Figure 8-8) supports track-ing of transmitter and receiver impedance (Figure 8-9), an important indicator of system health in general and element fail-ures in particular, throughout the system service life. This tool also plots receiver noise levels versus ship speed, heading relative to prevailing seas, and other user-selectable test parameters such as engine speed and propeller pitch — a particularly useful assessment for new systems and af-ter modifications to the hull or machinery (Figure 8-10), as well as before and after shipyard maintenance periods (e.g., to identify propeller cavitation or flow noise from biofouling).
Routine geometric calibrations (‘patch tests’) are critical for improving and main-taining data quality. As ship schedules are set far in advance and rarely prioritize these calibrations, operators across the U.S. academic and NOAA fleets are often faced with the challenge of identifying suitable calibration sites that are within reasonable distances of planned science operations and transits. During the fall of 2019, Johnson developed a web GIS application (https://ccom.unh.edu/gis/tools) to streamline this process and pres-ent users with seafloor regions meeting depth and slope criteria that support pitch, roll, and heading calibration as well as accuracy assessments.
Initially, there were only planning layers available for the Atlantic Margin and the main Hawaiian Islands, but during 2020 Johnson expanded this to include data from Northern California (Figure 8-11). This area was chosen as it is in proxim-ity to shipyards used by NOAA and UNOLS, as well as private industry such as Saildrone. The new planning applica-tion for Northern California includes a high-resolution bathymetric compilation of data for the San Francisco Bay area, a
Figure 8-6. Echosounder data rates (left) and ping intervals (right) versus depth observed during the NOAA Ship Okeanos Explorer EM304 sea acceptance trials (EX2000, colored by depth mode) and historic swath coverage tests (EX1810 and EX1902, gray). The data rates shown here are for KMAll files converted to All format; raw KMAll data rates are higher. Examining historic data rates across mapping systems is essential for planning bandwidth require-ments for remote support of limited-personnel and unmanned platforms.
Figure 8-7. Example of the “file trimmer” application for reducing .all file sizes to support more rapid data transfer for shoreside processing. Depending on ping rate and other factors, .all file sizes can typically be reduced by over 50% prior to conventional file compression techniques. The combined size for NOAA Ship Okeanos Explorer EM304 sea acceptance transit data shown here was reduced by 81%; after conventional file compression (i.e., zipping), the total size reduction from raw was 90%. The application includes several measures to protect raw data and supports flexible file naming to ensure that shore-based projects may be linked back to the full, raw data sets after a cruise.
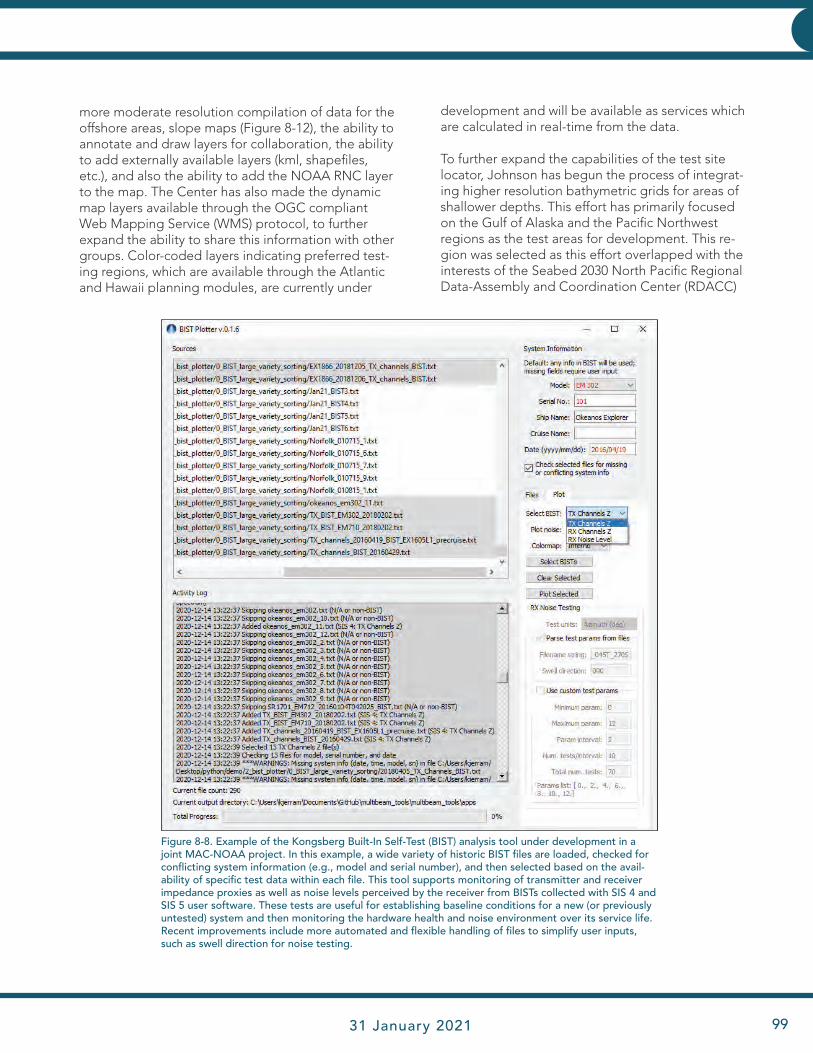
JHC Performance Report 31 January 2021 99
INNOVATIVE HYDROGRAPHY
Figure 8-8. Example of the Kongsberg Built-In Self-Test (BIST) analysis tool under development in a joint MAC-NOAA project. In this example, a wide variety of historic BIST files are loaded, checked for conflicting system information (e.g., model and serial number), and then selected based on the avail-ability of specific test data within each file. This tool supports monitoring of transmitter and receiver impedance proxies as well as noise levels perceived by the receiver from BISTs collected with SIS 4 and SIS 5 user software. These tests are useful for establishing baseline conditions for a new (or previously untested) system and then monitoring the hardware health and noise environment over its service life. Recent improvements include more automated and flexible handling of files to simplify user inputs, such as swell direction for noise testing.
more moderate resolution compilation of data for the offshore areas, slope maps (Figure 8-12), the ability to annotate and draw layers for collaboration, the ability to add externally available layers (kml, shapefiles, etc.), and also the ability to add the NOAA RNC layer to the map. The Center has also made the dynamic map layers available through the OGC compliant Web Mapping Service (WMS) protocol, to further expand the ability to share this information with other groups. Color-coded layers indicating preferred test-ing regions, which are available through the Atlantic and Hawaii planning modules, are currently under
development and will be available as services which are calculated in real-time from the data.
To further expand the capabilities of the test site locator, Johnson has begun the process of integrat-ing higher resolution bathymetric grids for areas of shallower depths. This effort has primarily focused on the Gulf of Alaska and the Pacific Northwest regions as the test areas for development. This re-gion was selected as this effort overlapped with the interests of the Seabed 2030 North Pacific Regional Data-Assembly and Coordination Center (RDACC)
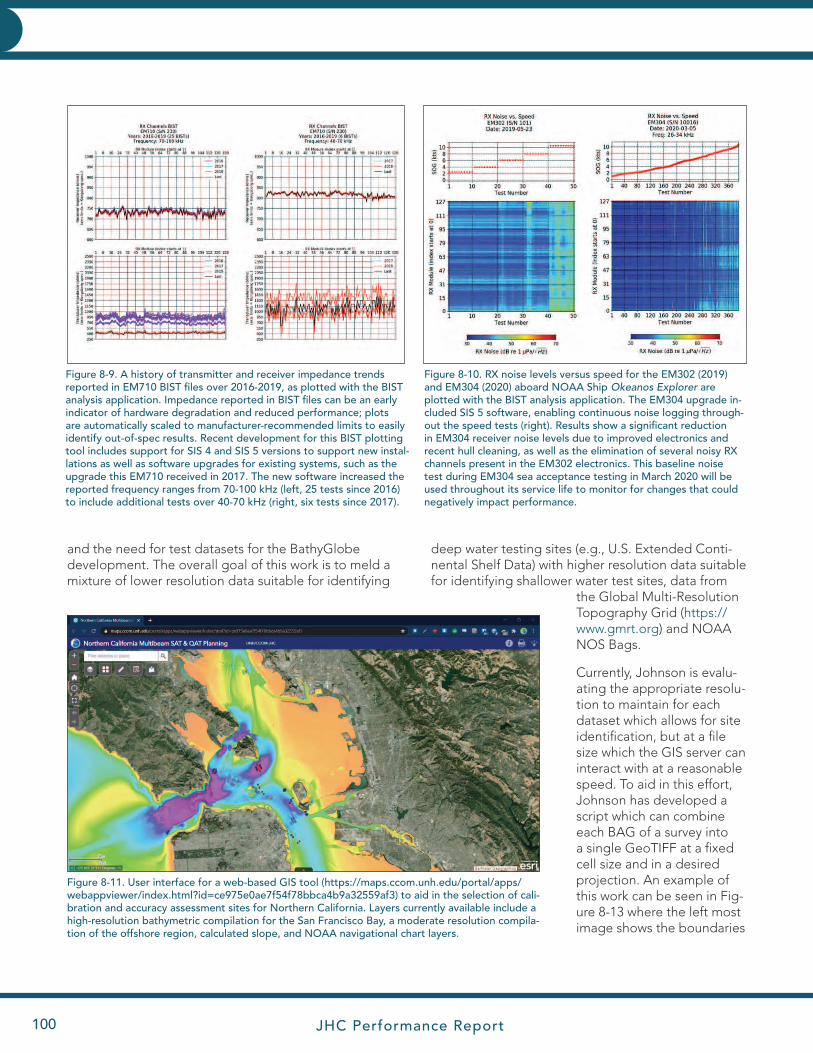
JHC Performance Report100
INNOVATIVE HYDROGRAPHY INNOVATIVE HYDROGRAPHY
Figure 8-9. A history of transmitter and receiver impedance trends reported in EM710 BIST files over 2016-2019, as plotted with the BIST analysis application. Impedance reported in BIST files can be an early indicator of hardware degradation and reduced performance; plots are automatically scaled to manufacturer-recommended limits to easily identify out-of-spec results. Recent development for this BIST plotting tool includes support for SIS 4 and SIS 5 versions to support new instal-lations as well as software upgrades for existing systems, such as the upgrade this EM710 received in 2017. The new software increased the reported frequency ranges from 70-100 kHz (left, 25 tests since 2016) to include additional tests over 40-70 kHz (right, six tests since 2017).
and the need for test datasets for the BathyGlobe development. The overall goal of this work is to meld a mixture of lower resolution data suitable for identifying
Figure 8-11. User interface for a web-based GIS tool (https://maps.ccom.unh.edu/portal/apps/ webappviewer/index.html?id=ce975e0ae7f54f78bbca4b9a32559af3) to aid in the selection of cali-bration and accuracy assessment sites for Northern California. Layers currently available include a high-resolution bathymetric compilation for the San Francisco Bay, a moderate resolution compila-tion of the offshore region, calculated slope, and NOAA navigational chart layers.
Figure 8-10. RX noise levels versus speed for the EM302 (2019) and EM304 (2020) aboard NOAA Ship Okeanos Explorer are plotted with the BIST analysis application. The EM304 upgrade in-cluded SIS 5 software, enabling continuous noise logging through-out the speed tests (right). Results show a significant reduction in EM304 receiver noise levels due to improved electronics and recent hull cleaning, as well as the elimination of several noisy RX channels present in the EM302 electronics. This baseline noise test during EM304 sea acceptance testing in March 2020 will be used throughout its service life to monitor for changes that could negatively impact performance.
deep water testing sites (e.g., U.S. Extended Conti-nental Shelf Data) with higher resolution data suitable for identifying shallower water test sites, data from
the Global Multi-Resolution Topography Grid (https://www.gmrt.org) and NOAA NOS Bags.
Currently, Johnson is evalu-ating the appropriate resolu-tion to maintain for each dataset which allows for site identification, but at a file size which the GIS server can interact with at a reasonable speed. To aid in this effort, Johnson has developed a script which can combine each BAG of a survey into a single GeoTIFF at a fixed cell size and in a desired projection. An example of this work can be seen in Fig-ure 8-13 where the left most image shows the boundaries
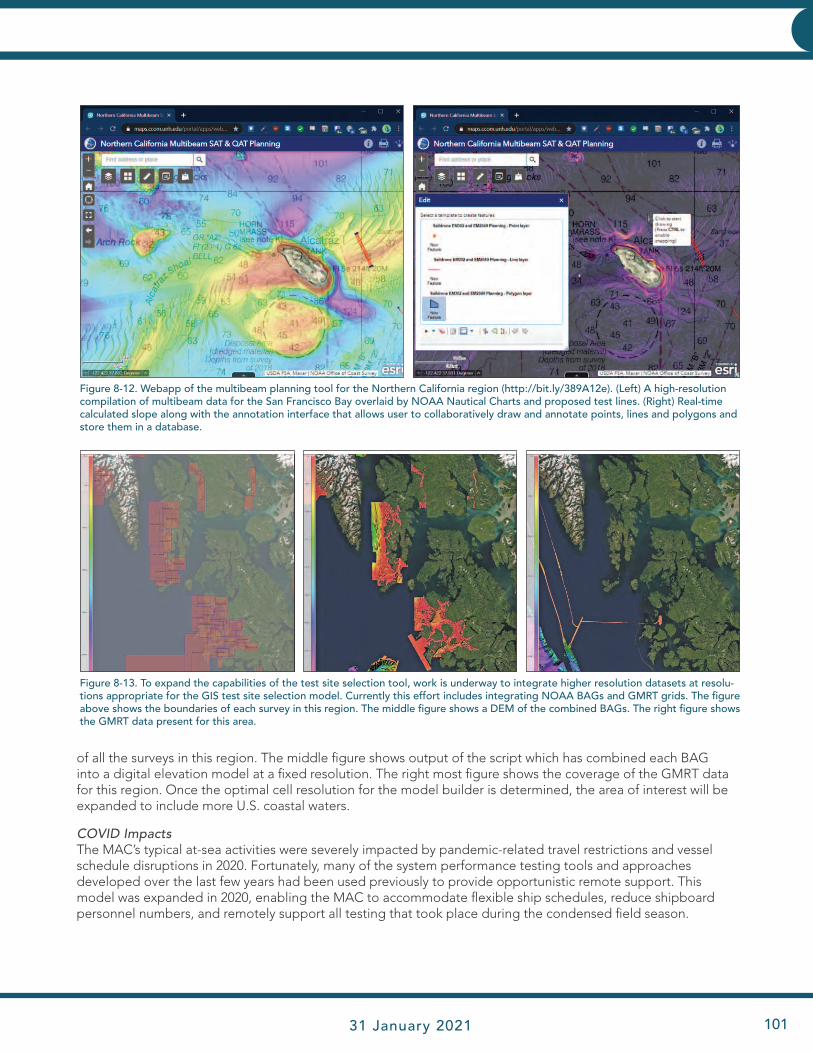
JHC Performance Report 31 January 2021 101
INNOVATIVE HYDROGRAPHY
of all the surveys in this region. The middle figure shows output of the script which has combined each BAG into a digital elevation model at a fixed resolution. The right most figure shows the coverage of the GMRT data for this region. Once the optimal cell resolution for the model builder is determined, the area of interest will be expanded to include more U.S. coastal waters.
COVID ImpactsThe MAC’s typical at-sea activities were severely impacted by pandemic-related travel restrictions and vessel schedule disruptions in 2020. Fortunately, many of the system performance testing tools and approaches developed over the last few years had been used previously to provide opportunistic remote support. This model was expanded in 2020, enabling the MAC to accommodate flexible ship schedules, reduce shipboard personnel numbers, and remotely support all testing that took place during the condensed field season.
Figure 8-13. To expand the capabilities of the test site selection tool, work is underway to integrate higher resolution datasets at resolu-tions appropriate for the GIS test site selection model. Currently this effort includes integrating NOAA BAGs and GMRT grids. The figure above shows the boundaries of each survey in this region. The middle figure shows a DEM of the combined BAGs. The right figure shows the GMRT data present for this area.
Figure 8-12. Webapp of the multibeam planning tool for the Northern California region (http://bit.ly/389A12e). (Left) A high-resolution compilation of multibeam data for the San Francisco Bay overlaid by NOAA Nautical Charts and proposed test lines. (Right) Real-time calculated slope along with the annotation interface that allows user to collaboratively draw and annotate points, lines and polygons and store them in a database.
JHC Performance Report102
INNOVATIVE HYDROGRAPHY INNOVATIVE HYDROGRAPHY
TASK 9: Automated Patch Test Tools: Investigate the development of automated patch-test procedures includ-ing the estimation of the uncertainty inherent in the parameters estimated. PI: Brian Calder
JHC Participants: Brandon Maingot, John Hughes Clarke
A rigorous means of estimating the patch test cali-bration parameters for a multibeam echosounder is essential for hydrographic practice. Standard meth-ods exist for a static patch test, and several ap-proaches to computing a patch test automatically have been reported in the literature. They typically, however, rely on carefully collected or selected data for success. This provides a static check at an in-stant in time on the performance of the system but is not ideal for real-time monitoring of the system’s health as it develops over time. For that, a dynamic patch test is required.
In order to investigate how a dynamic patch test might be implemented, John Hughes Clarke and Brandon Maingot are adapting a method for rigorous estimation of the subtler integration error sources remaining in swath systems (wobbles, see Task 7) to this task.
The core research is designing an analytical equa-tion, based on typical georeferencing models, which incorporates the geometric influence of the various potential unknowns (roll, pitch, heading,
and time biases). This provides a means of defining the relationship between the relevant input (com-ponent position, orientation and their rates), the patch test parameters, and the integrated sounding positions.
Research associated with Task 7 saw the sensitiv-ity of calibration parameters (integration errors), estimated by iterative least squares, to vessel mo-tion and seafloor misfit when using simulated data. This sensitivity is expected only to increase when processing noisy field data. In the current report-ing period, in addition to more robust estimation techniques, research has been conducted into a more sophisticated georeferencing model that bet-ter replicates Kongsberg’s proprietary solutions (see Task 7) which is required to adequately reduce bias in calibration estimates.
COVID ImpactsThere have been no significant impacts on this work due to the COVID-19 pandemic.
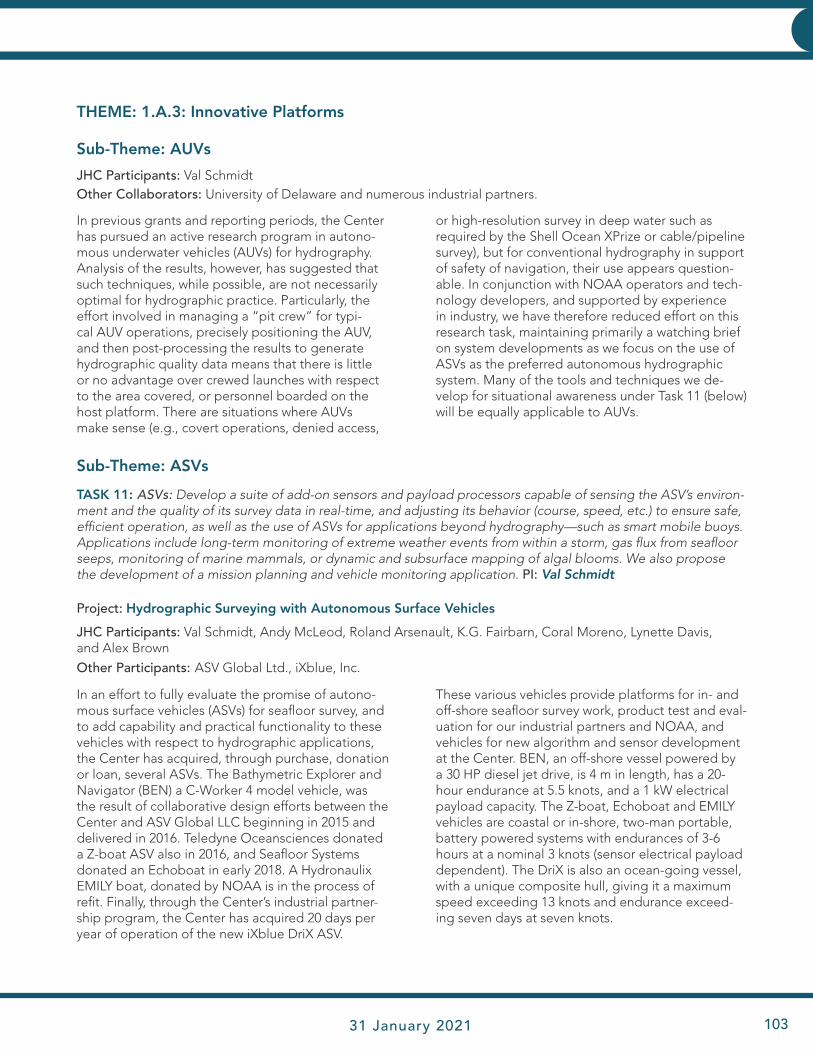
JHC Performance Report 31 January 2021 103
INNOVATIVE HYDROGRAPHY
THEME: 1.A.3: Innovative Platforms
Sub-Theme: AUVs
JHC Participants: Val SchmidtOther Collaborators: University of Delaware and numerous industrial partners.
In an effort to fully evaluate the promise of autono-mous surface vehicles (ASVs) for seafloor survey, and to add capability and practical functionality to these vehicles with respect to hydrographic applications, the Center has acquired, through purchase, donation or loan, several ASVs. The Bathymetric Explorer and Navigator (BEN) a C-Worker 4 model vehicle, was the result of collaborative design efforts between the Center and ASV Global LLC beginning in 2015 and delivered in 2016. Teledyne Oceansciences donated a Z-boat ASV also in 2016, and Seafloor Systems donated an Echoboat in early 2018. A Hydronaulix EMILY boat, donated by NOAA is in the process of refit. Finally, through the Center’s industrial partner-ship program, the Center has acquired 20 days per year of operation of the new iXblue DriX ASV.
These various vehicles provide platforms for in- and off-shore seafloor survey work, product test and eval-uation for our industrial partners and NOAA, and vehicles for new algorithm and sensor development at the Center. BEN, an off-shore vessel powered by a 30 HP diesel jet drive, is 4 m in length, has a 20-hour endurance at 5.5 knots, and a 1 kW electrical payload capacity. The Z-boat, Echoboat and EMILY vehicles are coastal or in-shore, two-man portable, battery powered systems with endurances of 3-6 hours at a nominal 3 knots (sensor electrical payload dependent). The DriX is also an ocean-going vessel, with a unique composite hull, giving it a maximum speed exceeding 13 knots and endurance exceed-ing seven days at seven knots.
In previous grants and reporting periods, the Center has pursued an active research program in autono-mous underwater vehicles (AUVs) for hydrography. Analysis of the results, however, has suggested that such techniques, while possible, are not necessarily optimal for hydrographic practice. Particularly, the effort involved in managing a “pit crew” for typi-cal AUV operations, precisely positioning the AUV, and then post-processing the results to generate hydrographic quality data means that there is little or no advantage over crewed launches with respect to the area covered, or personnel boarded on the host platform. There are situations where AUVs make sense (e.g., covert operations, denied access,
or high-resolution survey in deep water such as required by the Shell Ocean XPrize or cable/pipeline survey), but for conventional hydrography in support of safety of navigation, their use appears question-able. In conjunction with NOAA operators and tech-nology developers, and supported by experience in industry, we have therefore reduced effort on this research task, maintaining primarily a watching brief on system developments as we focus on the use of ASVs as the preferred autonomous hydrographic system. Many of the tools and techniques we de-velop for situational awareness under Task 11 (below) will be equally applicable to AUVs.
Sub-Theme: ASVs
TASK 11: ASVs: Develop a suite of add-on sensors and payload processors capable of sensing the ASV’s environ-ment and the quality of its survey data in real-time, and adjusting its behavior (course, speed, etc.) to ensure safe, efficient operation, as well as the use of ASVs for applications beyond hydrography—such as smart mobile buoys. Applications include long-term monitoring of extreme weather events from within a storm, gas flux from seafloor seeps, monitoring of marine mammals, or dynamic and subsurface mapping of algal blooms. We also propose the development of a mission planning and vehicle monitoring application. PI: Val Schmidt
Project: Hydrographic Surveying with Autonomous Surface Vehicles
JHC Participants: Val Schmidt, Andy McLeod, Roland Arsenault, K.G. Fairbarn, Coral Moreno, Lynette Davis, and Alex Brown
Other Participants: ASV Global Ltd., iXblue, Inc.
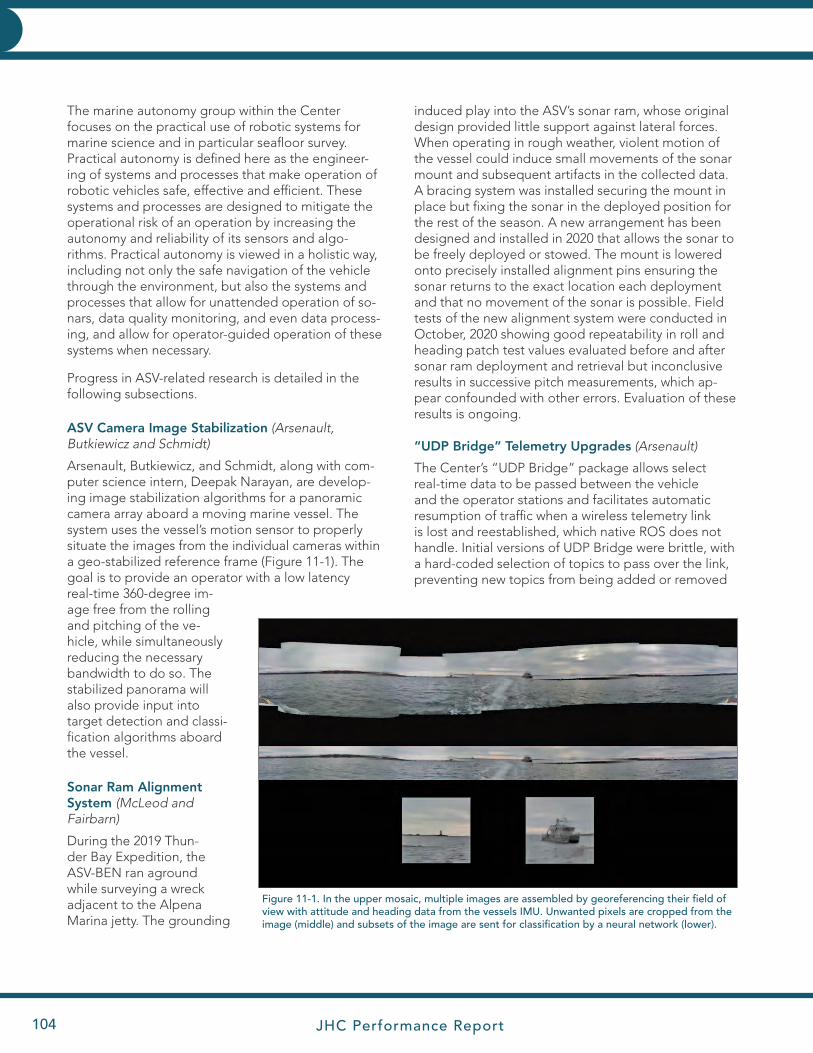
JHC Performance Report104
INNOVATIVE HYDROGRAPHY INNOVATIVE HYDROGRAPHY
The marine autonomy group within the Center focuses on the practical use of robotic systems for marine science and in particular seafloor survey. Practical autonomy is defined here as the engineer-ing of systems and processes that make operation of robotic vehicles safe, effective and efficient. These systems and processes are designed to mitigate the operational risk of an operation by increasing the autonomy and reliability of its sensors and algo-rithms. Practical autonomy is viewed in a holistic way, including not only the safe navigation of the vehicle through the environment, but also the systems and processes that allow for unattended operation of so-nars, data quality monitoring, and even data process-ing, and allow for operator-guided operation of these systems when necessary.
Progress in ASV-related research is detailed in the following subsections.
ASV Camera Image Stabilization (Arsenault, Butkiewicz and Schmidt)
Arsenault, Butkiewicz, and Schmidt, along with com-puter science intern, Deepak Narayan, are develop-ing image stabilization algorithms for a panoramic camera array aboard a moving marine vessel. The system uses the vessel’s motion sensor to properly situate the images from the individual cameras within a geo-stabilized reference frame (Figure 11-1). The goal is to provide an operator with a low latency real-time 360-degree im-age free from the rolling and pitching of the ve-hicle, while simultaneously reducing the necessary bandwidth to do so. The stabilized panorama will also provide input into target detection and classi-fication algorithms aboard the vessel.
Sonar Ram Alignment System (McLeod and Fairbarn)
During the 2019 Thun-der Bay Expedition, the ASV-BEN ran aground while surveying a wreck adjacent to the Alpena Marina jetty. The grounding
induced play into the ASV’s sonar ram, whose original design provided little support against lateral forces. When operating in rough weather, violent motion of the vessel could induce small movements of the sonar mount and subsequent artifacts in the collected data. A bracing system was installed securing the mount in place but fixing the sonar in the deployed position for the rest of the season. A new arrangement has been designed and installed in 2020 that allows the sonar to be freely deployed or stowed. The mount is lowered onto precisely installed alignment pins ensuring the sonar returns to the exact location each deployment and that no movement of the sonar is possible. Field tests of the new alignment system were conducted in October, 2020 showing good repeatability in roll and heading patch test values evaluated before and after sonar ram deployment and retrieval but inconclusive results in successive pitch measurements, which ap-pear confounded with other errors. Evaluation of these results is ongoing.
“UDP Bridge” Telemetry Upgrades (Arsenault)
The Center’s “UDP Bridge” package allows select real-time data to be passed between the vehicle and the operator stations and facilitates automatic resumption of traffic when a wireless telemetry link is lost and reestablished, which native ROS does not handle. Initial versions of UDP Bridge were brittle, with a hard-coded selection of topics to pass over the link, preventing new topics from being added or removed
Figure 11-1. In the upper mosaic, multiple images are assembled by georeferencing their field of view with attitude and heading data from the vessels IMU. Unwanted pixels are cropped from the image (middle) and subsets of the image are sent for classification by a neural network (lower).
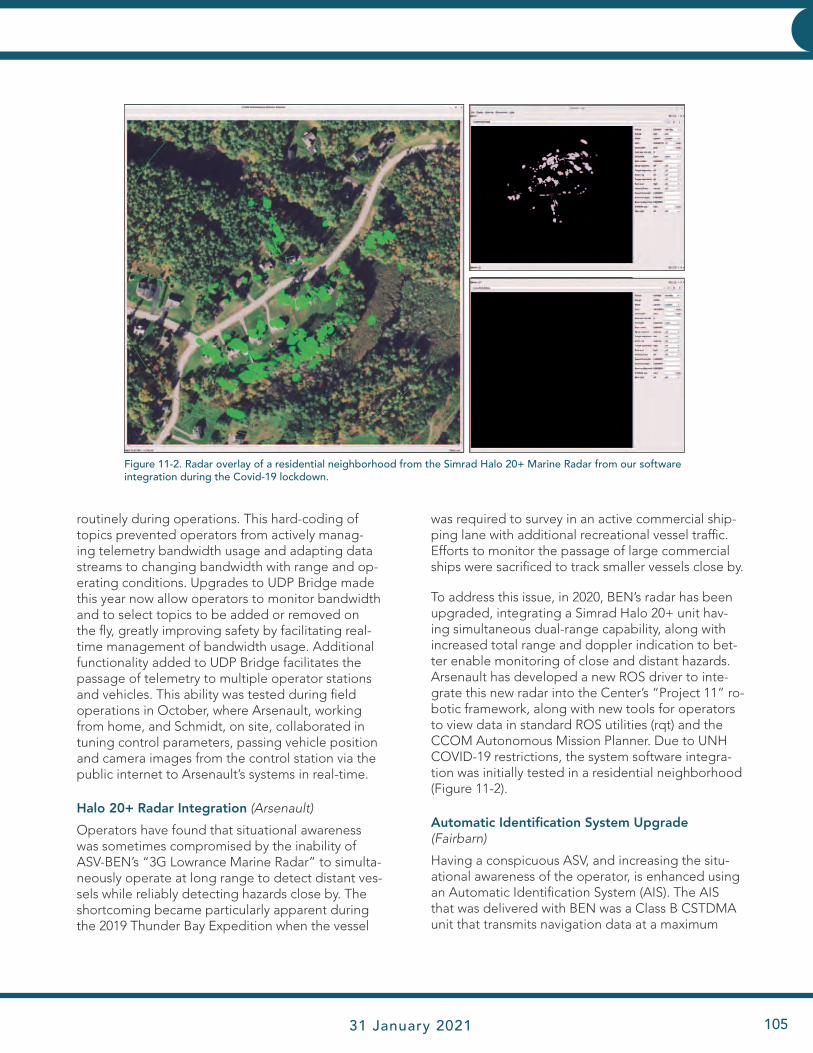
JHC Performance Report 31 January 2021 105
INNOVATIVE HYDROGRAPHY
was required to survey in an active commercial ship-ping lane with additional recreational vessel traffic. Efforts to monitor the passage of large commercial ships were sacrificed to track smaller vessels close by.
To address this issue, in 2020, BEN’s radar has been upgraded, integrating a Simrad Halo 20+ unit hav- ing simultaneous dual-range capability, along with increased total range and doppler indication to bet-ter enable monitoring of close and distant hazards. Arsenault has developed a new ROS driver to inte-grate this new radar into the Center’s “Project 11” ro-botic framework, along with new tools for operators to view data in standard ROS utilities (rqt) and the CCOM Autonomous Mission Planner. Due to UNH COVID-19 restrictions, the system software integra-tion was initially tested in a residential neighborhood (Figure 11-2).
Automatic Identification System Upgrade (Fairbarn)
Having a conspicuous ASV, and increasing the situ-ational awareness of the operator, is enhanced using an Automatic Identification System (AIS). The AIS that was delivered with BEN was a Class B CSTDMA unit that transmits navigation data at a maximum
routinely during operations. This hard-coding of topics prevented operators from actively manag-ing telemetry bandwidth usage and adapting data streams to changing bandwidth with range and op-erating conditions. Upgrades to UDP Bridge made this year now allow operators to monitor bandwidth and to select topics to be added or removed on the fly, greatly improving safety by facilitating real-time management of bandwidth usage. Additional functionality added to UDP Bridge facilitates the passage of telemetry to multiple operator stations and vehicles. This ability was tested during field operations in October, where Arsenault, working from home, and Schmidt, on site, collaborated in tuning control parameters, passing vehicle position and camera images from the control station via the public internet to Arsenault’s systems in real-time.
Halo 20+ Radar Integration (Arsenault)
Operators have found that situational awareness was sometimes compromised by the inability of ASV-BEN’s “3G Lowrance Marine Radar” to simulta-neously operate at long range to detect distant ves-sels while reliably detecting hazards close by. The shortcoming became particularly apparent during the 2019 Thunder Bay Expedition when the vessel
Figure 11-2. Radar overlay of a residential neighborhood from the Simrad Halo 20+ Marine Radar from our software integration during the Covid-19 lockdown.
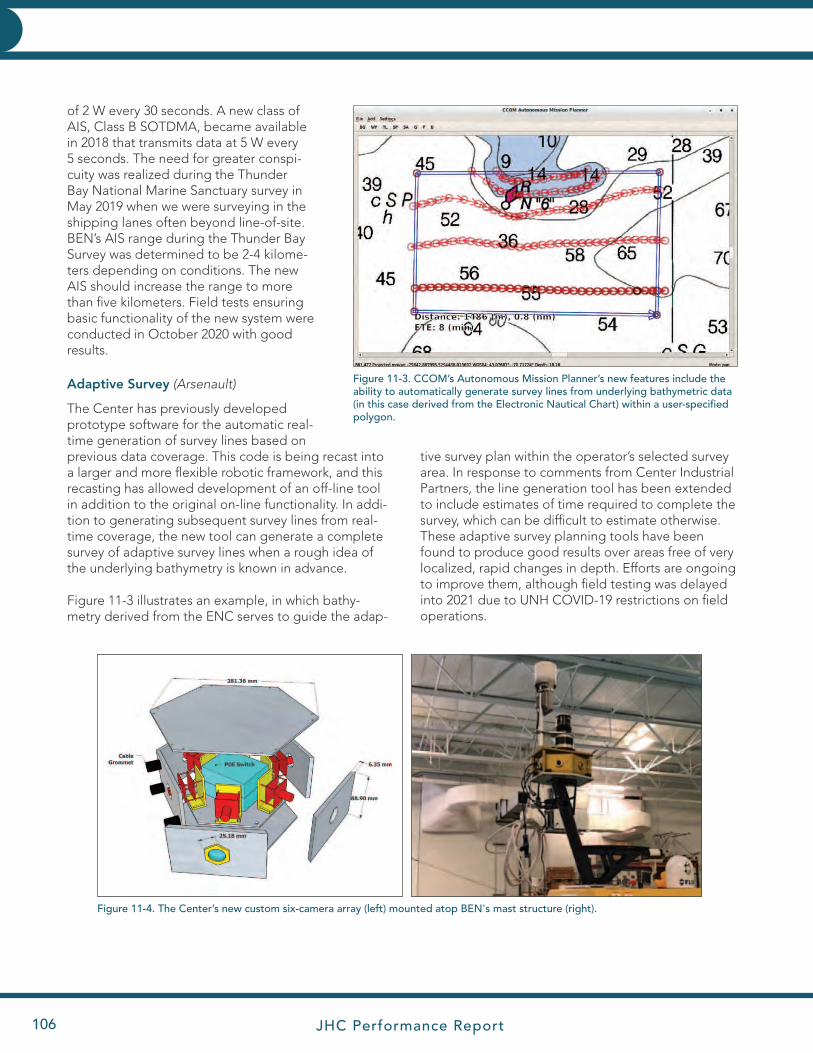
JHC Performance Report106
INNOVATIVE HYDROGRAPHY INNOVATIVE HYDROGRAPHY
of 2 W every 30 seconds. A new class of AIS, Class B SOTDMA, became available in 2018 that transmits data at 5 W every 5 seconds. The need for greater conspi-cuity was realized during the Thunder Bay National Marine Sanctuary survey in May 2019 when we were surveying in the shipping lanes often beyond line-of-site. BEN’s AIS range during the Thunder Bay Survey was determined to be 2-4 kilome-ters depending on conditions. The new AIS should increase the range to more than five kilometers. Field tests ensuring basic functionality of the new system were conducted in October 2020 with good results.
Adaptive Survey (Arsenault)
The Center has previously developed prototype software for the automatic real-time generation of survey lines based on previous data coverage. This code is being recast into a larger and more flexible robotic framework, and this recasting has allowed development of an off-line tool in addition to the original on-line functionality. In addi-tion to generating subsequent survey lines from real-time coverage, the new tool can generate a complete survey of adaptive survey lines when a rough idea of the underlying bathymetry is known in advance.
Figure 11-3 illustrates an example, in which bathy- metry derived from the ENC serves to guide the adap-
tive survey plan within the operator’s selected survey area. In response to comments from Center Industrial Partners, the line generation tool has been extended to include estimates of time required to complete the survey, which can be difficult to estimate otherwise. These adaptive survey planning tools have been found to produce good results over areas free of very localized, rapid changes in depth. Efforts are ongoing to improve them, although field testing was delayed into 2021 due to UNH COVID-19 restrictions on field operations.
Figure 11-3. CCOM’s Autonomous Mission Planner’s new features include the ability to automatically generate survey lines from underlying bathymetric data (in this case derived from the Electronic Nautical Chart) within a user-specified polygon.
Figure 11-4. The Center’s new custom six-camera array (left) mounted atop BEN's mast structure (right).

JHC Performance Report 31 January 2021 107
INNOVATIVE HYDROGRAPHY
360-Degree Camera System (McLeod, Fairbarn, and Schmidt)
In 2019 the Center installed five additional cameras aboard BEN to improve situational awareness pro-vided by the single forward-facing, factory-provided camera. The additional cameras were found to provide great utility, but their individual mounting proved prone to failure and difficult to calibrate for image processing applications. In 2020 a new six-camera panoramic array was designed and manu-factured. The new array is composed of inexpensive Power Over Ethernet surveillance cameras spaced at 60° intervals around a common center, and mounted alongside gigabit ethernet switches inside a robust, custom, weatherproof, aluminum housing. The camera/lens/format combo provides a 90° horizontal field of view that results in 15° overlap with adjacent cameras to each side, ensuring complete coverage with sufficient overlap to facilitate image blending. The entire housing mounts to the C-Worker 4's mast assembly and can be removed with just three bolts (Figure 11-4).
Testing of the camera system in 2019 and 2020 with a surveillance camera video monitoring tool (iSpy) has allowed simultaneous viewing of the multiple video streams and facilitated tuning to optimize their utility within necessary bandwidth constraints. It was found that with a minimum 5 Hz frame rate, (which was a requirement for safety during field operations), compression can be adjusted to provide a constant bit rate of just 500 kb/s per video stream.
ASV Qualification Card (Schmidt, McLeod, Arse-nault, Davis, and Brown)
The ASV Group has taken advantage of COVID-19 restrictions precluding field time to begin develop-ment of an ASV Training Qualification Card. This document would provide a topical guide for gradu-ate students and new employees to demonstrate understanding of topics and technologies required to maintain and operate the Center’s ASVs. Built on the U.S. Navy model, the qualification card includes both theoretical topics and practical evolutions, which when demonstrated satisfactorily are “signed off.” Graduate student and employees successfully completing the qualification card would have the requisite knowledge for basic maintenance, trouble-shooting, and safe field operation of the Center’s ASVs.
Path Planning for Survey Coverage (Brown, Wissow, Ruml, and Schmidt)
The Center has been collaborating with computer science graduate student Alex Brown, and his advi-sor, Dr. Wheeler Ruml, since September 2018 to build a system for ASV path planning that optimizes line following for seafloor survey, while avoiding station-ary and dynamic obstacles (Figure 11-5). Brown was brought on full time as a graduate research assistant in May 2019.
Brown and Ruml designed a real-time motion plan-ning algorithm for ASVs which optimizes for driving along survey lines while avoiding potential collisions. When integrated with the other software systems the Center has developed for controlling ASVs, an operator can specify a survey line or pattern through an intuitive graphical interface and a planner run-ning the algorithm will determine the best trajectory, out to a time bound, which follows the line without getting too close to any obstacles, and will update it every second. Brown and Ruml also worked with
Figure 11-5. Illustration of path planning for survey coverage, in which the ASV considers many possible paths choosing ones that are safe, but also optimize the desired survey coverage.
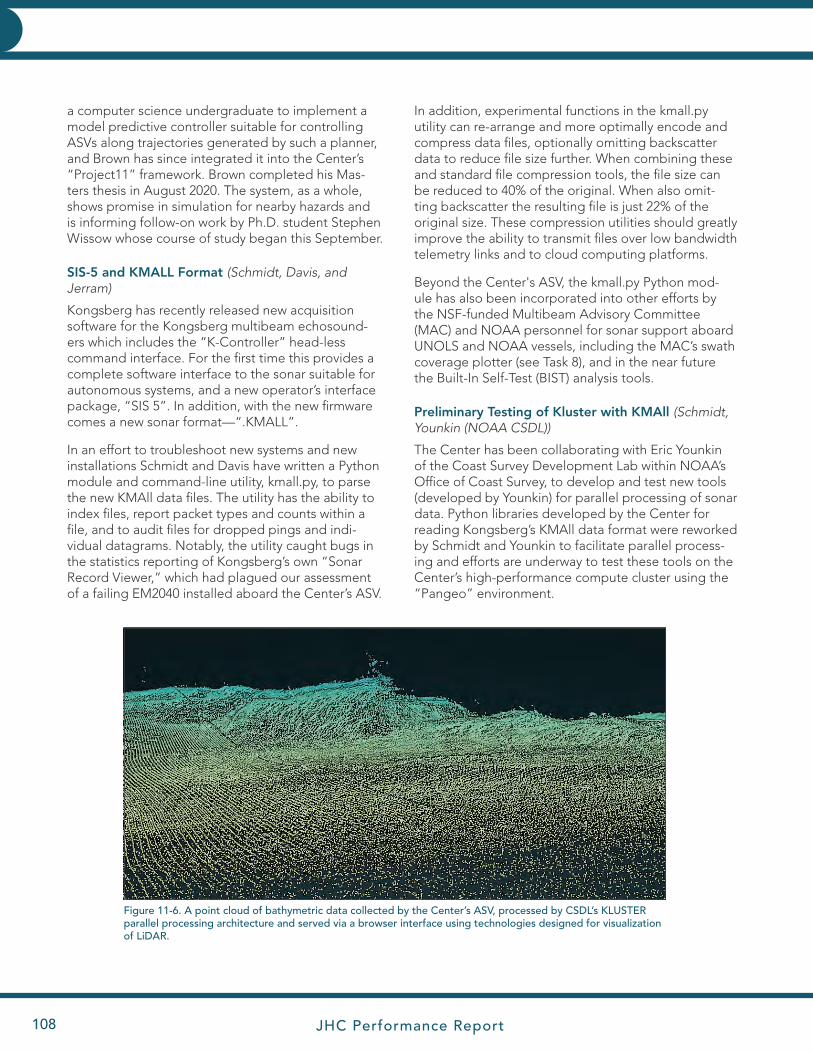
JHC Performance Report108
INNOVATIVE HYDROGRAPHY INNOVATIVE HYDROGRAPHY
a computer science undergraduate to implement a model predictive controller suitable for controlling ASVs along trajectories generated by such a planner, and Brown has since integrated it into the Center’s “Project11” framework. Brown completed his Mas-ters thesis in August 2020. The system, as a whole, shows promise in simulation for nearby hazards and is informing follow-on work by Ph.D. student Stephen Wissow whose course of study began this September.
SIS-5 and KMALL Format (Schmidt, Davis, and Jerram)
Kongsberg has recently released new acquisition software for the Kongsberg multibeam echosound-ers which includes the “K-Controller” head-less command interface. For the first time this provides a complete software interface to the sonar suitable for autonomous systems, and a new operator’s interface package, “SIS 5”. In addition, with the new firmware comes a new sonar format—“.KMALL”.
In an effort to troubleshoot new systems and new installations Schmidt and Davis have written a Python module and command-line utility, kmall.py, to parse the new KMAll data files. The utility has the ability to index files, report packet types and counts within a file, and to audit files for dropped pings and indi-vidual datagrams. Notably, the utility caught bugs in the statistics reporting of Kongsberg’s own “Sonar Record Viewer,” which had plagued our assessment of a failing EM2040 installed aboard the Center’s ASV.
In addition, experimental functions in the kmall.py utility can re-arrange and more optimally encode and compress data files, optionally omitting backscatter data to reduce file size further. When combining these and standard file compression tools, the file size can be reduced to 40% of the original. When also omit-ting backscatter the resulting file is just 22% of the original size. These compression utilities should greatly improve the ability to transmit files over low bandwidth telemetry links and to cloud computing platforms.
Beyond the Center's ASV, the kmall.py Python mod- ule has also been incorporated into other efforts by the NSF-funded Multibeam Advisory Committee (MAC) and NOAA personnel for sonar support aboard UNOLS and NOAA vessels, including the MAC’s swath coverage plotter (see Task 8), and in the near future the Built-In Self-Test (BIST) analysis tools.
Preliminary Testing of Kluster with KMAll (Schmidt, Younkin (NOAA CSDL))
The Center has been collaborating with Eric Younkin of the Coast Survey Development Lab within NOAA’s Office of Coast Survey, to develop and test new tools (developed by Younkin) for parallel processing of sonar data. Python libraries developed by the Center for reading Kongsberg’s KMAll data format were reworked by Schmidt and Younkin to facilitate parallel process-ing and efforts are underway to test these tools on the Center’s high-performance compute cluster using the “Pangeo” environment.
Figure 11-6. A point cloud of bathymetric data collected by the Center’s ASV, processed by CSDL’s KLUSTER parallel processing architecture and served via a browser interface using technologies designed for visualization of LiDAR.
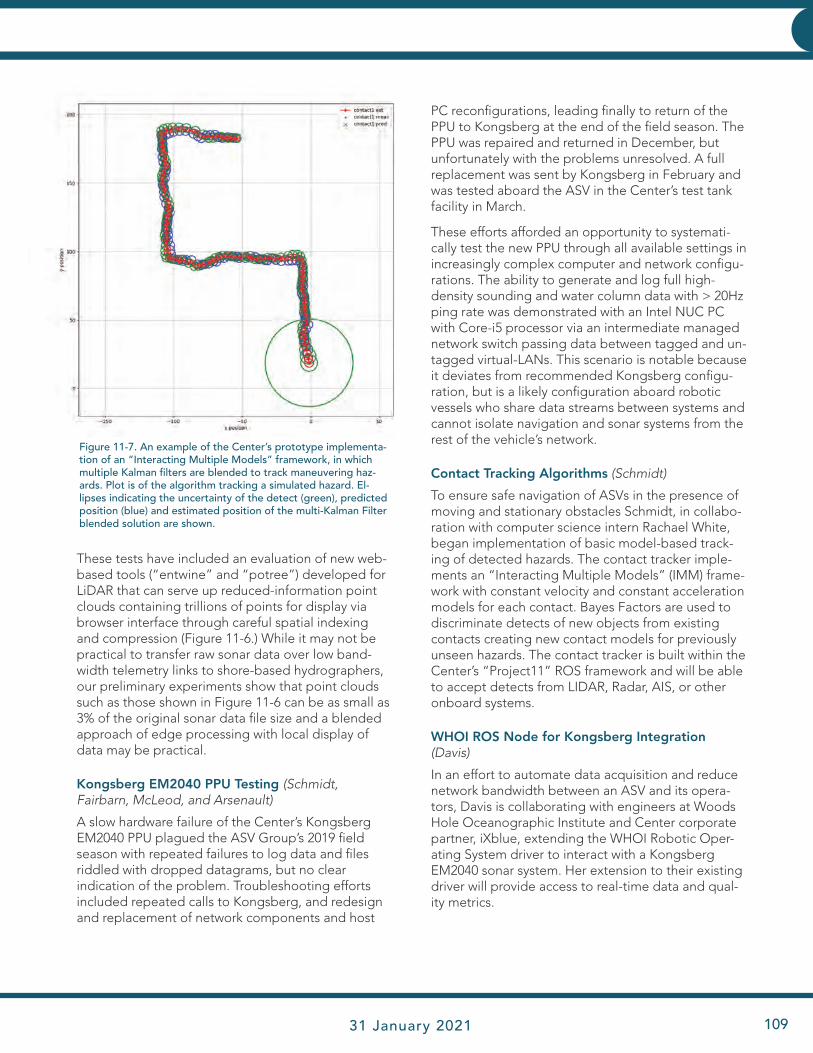
JHC Performance Report 31 January 2021 109
INNOVATIVE HYDROGRAPHY
These tests have included an evaluation of new web-based tools (“entwine” and “potree”) developed for LiDAR that can serve up reduced-information point clouds containing trillions of points for display via browser interface through careful spatial indexing and compression (Figure 11-6.) While it may not be practical to transfer raw sonar data over low band-width telemetry links to shore-based hydrographers, our preliminary experiments show that point clouds such as those shown in Figure 11-6 can be as small as 3% of the original sonar data file size and a blended approach of edge processing with local display of data may be practical.
Kongsberg EM2040 PPU Testing (Schmidt, Fairbarn, McLeod, and Arsenault)
A slow hardware failure of the Center’s Kongsberg EM2040 PPU plagued the ASV Group’s 2019 field season with repeated failures to log data and files riddled with dropped datagrams, but no clear indication of the problem. Troubleshooting efforts included repeated calls to Kongsberg, and redesign and replacement of network components and host
PC reconfigurations, leading finally to return of the PPU to Kongsberg at the end of the field season. The PPU was repaired and returned in December, but unfortunately with the problems unresolved. A full replacement was sent by Kongsberg in February and was tested aboard the ASV in the Center’s test tank facility in March.
These efforts afforded an opportunity to systemati-cally test the new PPU through all available settings in increasingly complex computer and network configu-rations. The ability to generate and log full high-density sounding and water column data with > 20Hz ping rate was demonstrated with an Intel NUC PC with Core-i5 processor via an intermediate managed network switch passing data between tagged and un-tagged virtual-LANs. This scenario is notable because it deviates from recommended Kongsberg configu-ration, but is a likely configuration aboard robotic vessels who share data streams between systems and cannot isolate navigation and sonar systems from the rest of the vehicle’s network.
Contact Tracking Algorithms (Schmidt)
To ensure safe navigation of ASVs in the presence of moving and stationary obstacles Schmidt, in collabo-ration with computer science intern Rachael White, began implementation of basic model-based track-ing of detected hazards. The contact tracker imple-ments an “Interacting Multiple Models” (IMM) frame-work with constant velocity and constant acceleration models for each contact. Bayes Factors are used to discriminate detects of new objects from existing contacts creating new contact models for previously unseen hazards. The contact tracker is built within the Center’s “Project11” ROS framework and will be able to accept detects from LIDAR, Radar, AIS, or other onboard systems.
WHOI ROS Node for Kongsberg Integration (Davis)
In an effort to automate data acquisition and reduce network bandwidth between an ASV and its opera-tors, Davis is collaborating with engineers at Woods Hole Oceanographic Institute and Center corporate partner, iXblue, extending the WHOI Robotic Oper-ating System driver to interact with a Kongsberg EM2040 sonar system. Her extension to their existing driver will provide access to real-time data and qual-ity metrics.
Figure 11-7. An example of the Center’s prototype implementa-tion of an “Interacting Multiple Models” framework, in which multiple Kalman filters are blended to track maneuvering haz- ards. Plot is of the algorithm tracking a simulated hazard. El-lipses indicating the uncertainty of the detect (green), predicted position (blue) and estimated position of the multi-Kalman Filter blended solution are shown.

JHC Performance Report110
INNOVATIVE HYDROGRAPHY INNOVATIVE HYDROGRAPHY
Increasing Mechanical Reliability and Field Maintainability of ASVs (Fairbarn and McLeod)
Several mechanical issues with the Center’s C-Worker 4 ASV highlight the continued need for at-sea opera-tions with constant feedback and engineering design iterations for ASVs to gain sufficient reliability to be practical.
Motor Controller UpgradeIn the Center’s five years of ASV operations, the C-Worker 4 has occasionally suffered a complete loss of steering when working in high seas. The events were unpredictable and caused great concern for safety of operations. It was determined that, although rated to more than twice the required amperage, the motor-controller driving the electric motor for the hydraulic steering system was over-heating. When the problem reoccurred during the 2019 Thunder Bay Expedi-tion, the faulty motor controller was replaced, but the problem resurfaced while surveying Nikumaroro Island later that summer. In the 2020 off-season a motor con-troller with more than four times the current rating has been installed with thermal coupling to a marine rated aluminum enclosure. The larger controller will tolerate and generate less heat, and the aluminum enclosure will remove more heat than the original plastic one. The new motor controllers were field tested in Octo-ber and thus far have performed without failure. Feed-back has been provided to ASV Global to improve future designs.
ASV-BEN Trailer ReinforcementsBEN is very heavy (nearly 2000 lbs) when compared with other vessels of its size. Thus commercial-off-the-shelf trailer solutions have proved insufficiently robust to accommodate the weight. Modifications were made to a stock trailer system, including eventual addition of a second axle in 2017. In 2020, the bolt-on “bunks” on which the vessel rests were replaced with custom welded mounts and conformal 4x4 supports.
CCOM Mobile Command Center EnhancementsIn preparation for a May expedition to Thunder Bay National Marine Sanctuary (subsequently canceled for this field season due to COVID), McLeod and Hunt improved the Center’s mobile command center, in-stalling new custom benches and wall monitor mounts to provide space for two ASV operating teams. Plans were in place to operate both BEN and an iXblue DriX vehicle for training during this event, and these upgrades will support both operator teams.
ASV Status Indicator System (McLeod, Fairbarn, and Schmidt)
Operators have found that the status of BEN’s internal systems can be difficult to infer visually. For example, deck hands retrieving the ASV on a ship at sea cannot easily assess whether or not the clutch is engaged, or if the engine is running. Similarly, when the ASV maneuvers in proximity to the operator’s ship, the ship’s captain cannot immediately discern if the maneuver was intentional or the result of a control failure. For ASV operators basic visual indica-tion of the health of the vehicle can provide great comfort when managing multiple vessels, hazards, and sensor systems.
To provide this kind of indication undergraduate intern Joe Marcinuk, under the tutelage of McLeod, Fairbarn, and Schmidt (and Marcinuk’s father who is a design engineer), has designed a visual lighting system which will be mounted atop BEN’s commu-nications mast. A prototype design, Figure 11-8, will provide 360 degree indication with programmable high-intensity LED emergency vehicle lighting. Colors will be chosen to deconflict with U.S. Coast Regulations and the system will signal engine status, positioning system health, navigation system health, and emergency conditions.
Figure 11-8. Preliminary design of a light indicator system for ASVs to provide visual indication of vehicle status.
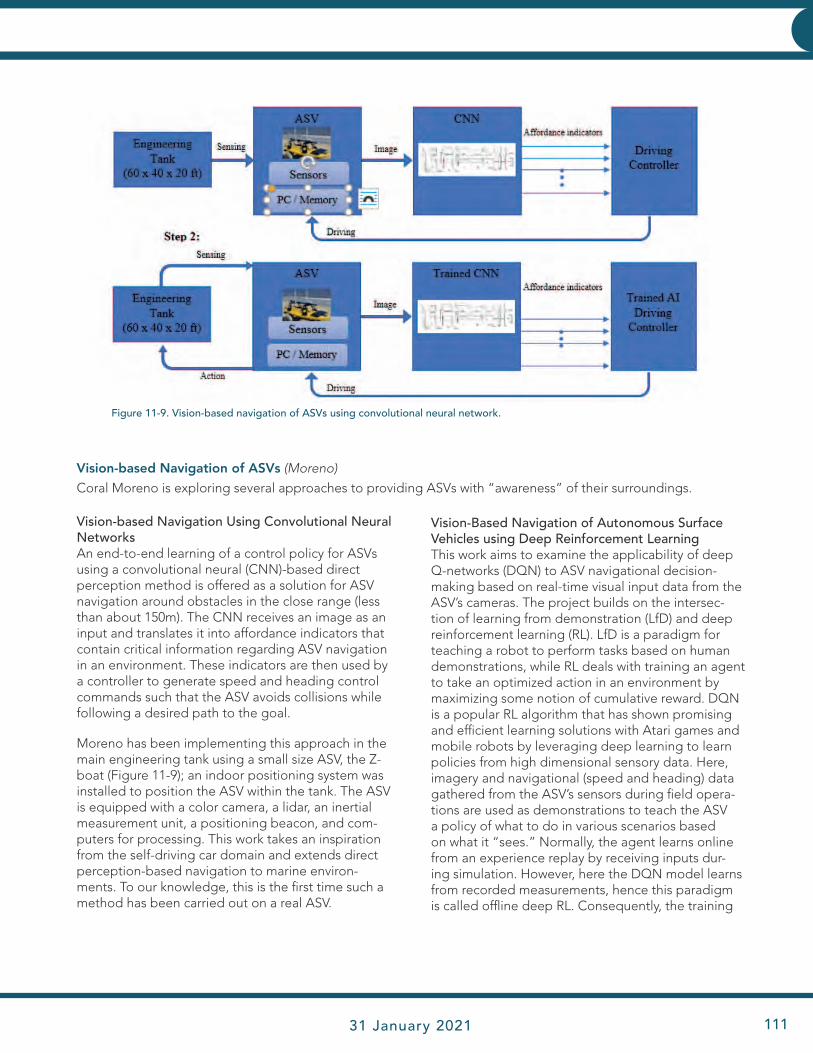
JHC Performance Report 31 January 2021 111
INNOVATIVE HYDROGRAPHY
Vision-based Navigation of ASVs (Moreno)Coral Moreno is exploring several approaches to providing ASVs with “awareness” of their surroundings.
Vision-Based Navigation of Autonomous Surface Vehicles using Deep Reinforcement LearningThis work aims to examine the applicability of deep Q-networks (DQN) to ASV navigational decision-making based on real-time visual input data from the ASV’s cameras. The project builds on the intersec-tion of learning from demonstration (LfD) and deep reinforcement learning (RL). LfD is a paradigm for teaching a robot to perform tasks based on human demonstrations, while RL deals with training an agent to take an optimized action in an environment by maximizing some notion of cumulative reward. DQN is a popular RL algorithm that has shown promising and efficient learning solutions with Atari games and mobile robots by leveraging deep learning to learn policies from high dimensional sensory data. Here, imagery and navigational (speed and heading) data gathered from the ASV’s sensors during field opera-tions are used as demonstrations to teach the ASV a policy of what to do in various scenarios based on what it “sees.” Normally, the agent learns online from an experience replay by receiving inputs dur-ing simulation. However, here the DQN model learns from recorded measurements, hence this paradigm is called offline deep RL. Consequently, the training
Figure 11-9. Vision-based navigation of ASVs using convolutional neural network.
Vision-based Navigation Using Convolutional Neural Networks An end-to-end learning of a control policy for ASVs using a convolutional neural (CNN)-based direct perception method is offered as a solution for ASV navigation around obstacles in the close range (less than about 150m). The CNN receives an image as an input and translates it into affordance indicators that contain critical information regarding ASV navigation in an environment. These indicators are then used by a controller to generate speed and heading control commands such that the ASV avoids collisions while following a desired path to the goal.
Moreno has been implementing this approach in the main engineering tank using a small size ASV, the Z-boat (Figure 11-9); an indoor positioning system was installed to position the ASV within the tank. The ASV is equipped with a color camera, a lidar, an inertial measurement unit, a positioning beacon, and com-puters for processing. This work takes an inspiration from the self-driving car domain and extends direct perception-based navigation to marine environ-ments. To our knowledge, this is the first time such a method has been carried out on a real ASV.
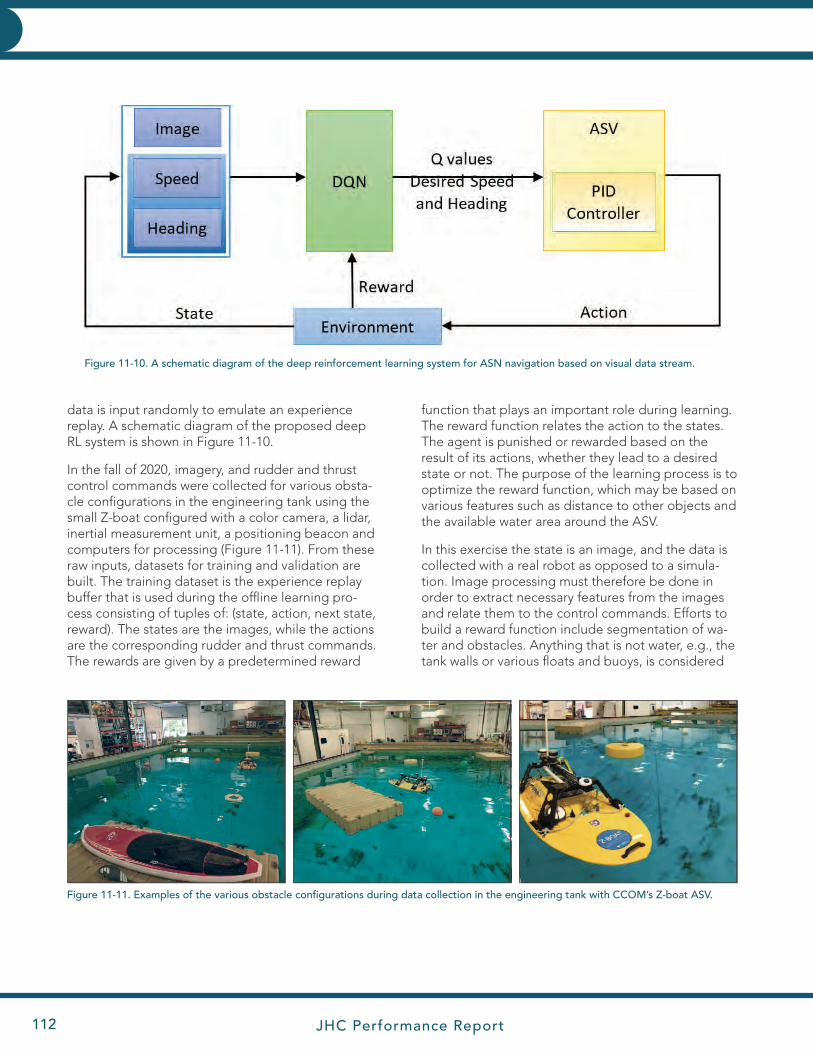
JHC Performance Report112
INNOVATIVE HYDROGRAPHY INNOVATIVE HYDROGRAPHY
function that plays an important role during learning. The reward function relates the action to the states. The agent is punished or rewarded based on the result of its actions, whether they lead to a desired state or not. The purpose of the learning process is to optimize the reward function, which may be based on various features such as distance to other objects and the available water area around the ASV.
In this exercise the state is an image, and the data is collected with a real robot as opposed to a simula-tion. Image processing must therefore be done in order to extract necessary features from the images and relate them to the control commands. Efforts to build a reward function include segmentation of wa-ter and obstacles. Anything that is not water, e.g., the tank walls or various floats and buoys, is considered
data is input randomly to emulate an experience replay. A schematic diagram of the proposed deep RL system is shown in Figure 11-10.
In the fall of 2020, imagery, and rudder and thrust control commands were collected for various obsta-cle configurations in the engineering tank using the small Z-boat configured with a color camera, a lidar, inertial measurement unit, a positioning beacon and computers for processing (Figure 11-11). From these raw inputs, datasets for training and validation are built. The training dataset is the experience replay buffer that is used during the offline learning pro-cess consisting of tuples of: (state, action, next state, reward). The states are the images, while the actions are the corresponding rudder and thrust commands. The rewards are given by a predetermined reward
Figure 11-10. A schematic diagram of the deep reinforcement learning system for ASN navigation based on visual data stream.
Figure 11-11. Examples of the various obstacle configurations during data collection in the engineering tank with CCOM’s Z-boat ASV.
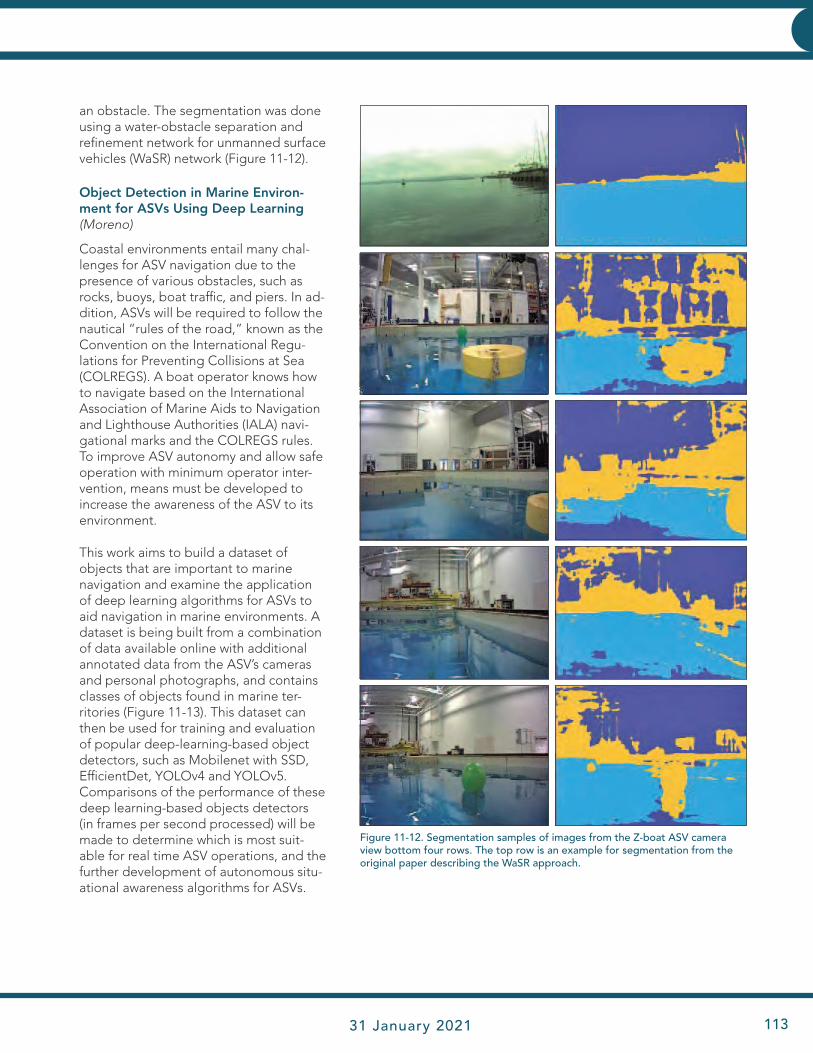
JHC Performance Report 31 January 2021 113
INNOVATIVE HYDROGRAPHY
an obstacle. The segmentation was done using a water-obstacle separation and refinement network for unmanned surface vehicles (WaSR) network (Figure 11-12).
Object Detection in Marine Environ-ment for ASVs Using Deep Learning (Moreno)
Coastal environments entail many chal-lenges for ASV navigation due to the presence of various obstacles, such as rocks, buoys, boat traffic, and piers. In ad-dition, ASVs will be required to follow the nautical “rules of the road,” known as the Convention on the International Regu-lations for Preventing Collisions at Sea (COLREGS). A boat operator knows how to navigate based on the International Association of Marine Aids to Navigation and Lighthouse Authorities (IALA) navi-gational marks and the COLREGS rules. To improve ASV autonomy and allow safe operation with minimum operator inter-vention, means must be developed to increase the awareness of the ASV to its environment.
This work aims to build a dataset of objects that are important to marine navigation and examine the application of deep learning algorithms for ASVs to aid navigation in marine environments. A dataset is being built from a combination of data available online with additional annotated data from the ASV’s cameras and personal photographs, and contains classes of objects found in marine ter-ritories (Figure 11-13). This dataset can then be used for training and evaluation of popular deep-learning-based object detectors, such as Mobilenet with SSD, EfficientDet, YOLOv4 and YOLOv5. Comparisons of the performance of these deep learning-based objects detectors (in frames per second processed) will be made to determine which is most suit-able for real time ASV operations, and the further development of autonomous situ-ational awareness algorithms for ASVs.
Figure 11-12. Segmentation samples of images from the Z-boat ASV camera view bottom four rows. The top row is an example for segmentation from the original paper describing the WaSR approach.

JHC Performance Report114
INNOVATIVE HYDROGRAPHY INNOVATIVE HYDROGRAPHY
The Virtual Ocean Robotics Challenge (Arsenault, Schmidt and Moreno)
In November and December, the Center’s ASV Group participated in the Virtual Ocean Robotics Challenge, spon-sored by the Office of Naval Research and hosted by the Naval Postgraduate School and Open Source Robotics Inc. The Center’s team was led by Roland Arsenault. He, along with Val Schmidt and Coral Moreno programed the virtual vessel within the ROS and Gazebo-based virtual environment. The simulation included a twin thruster unmanned boat within the harbor of La Spezia, Italy, complete with simulated winds, waves, and fog. The simu-lated boat provided data feeds for forward looking stereo cameras, a 360-degree lidar, GNSS, and motion sensor. The tasks assigned were station-keeping, navigating to predefined waypoints, identifying buoys and markers, and locating an underwater pinger in an area with obstacles (Figure 11-14). Submissions were made by five teams from US and international institutions. We are very proud to say that the Center team came in first in this competition! The experience gained in meeting these challenges will help integrate new capabilities into the Center’s own marine robotics framework for use in our own operations.
Figure 11-13. Training images (above) and detections (below).

JHC Performance Report 31 January 2021 115
INNOVATIVE HYDROGRAPHY
COVID ImpactsCOVID has had significant impacts on the ASV Group at the Center. Field deployments of BEN and DriX vehicles to Thunder Bay National Marine Sanc-tuary were indefinitely postponed. DriX trials aboard NOAA Ship Thomas Jefferson were also canceled. Efforts to troubleshoot and upgrade systems were hampered by an inability to physically access the lab until August and then only in a limited capacity. Field testing of repaired or replaced systems was post-poned until fall and limited to a single field event.
Morale of our group also suffered. Some team mem-bers struggle when unable to physically interact with equipment and colleagues, leading to short atten-tion spans and a general lack of focus.
Even with the best of efforts, the need to support other family members, whether spouses or children
Figure 11-14. Object detections from ASV’s camera during the Virtual Ocean Robotics Challenge.
not in school or child care, also detracted from our ability to accomplish goals. Two of our team mem-bers have been providing nearly full time child care for their toddler age children at home for much of the summer and fall.
There were some notable achievements that were made possible as a result of COVID however. The group took the opportunity to improve the simula-tion capability of our robotic vessels, participating in the Virtual Ocean Robotic Challenge in November and December. This will greatly improve our ability to develop algorithms when access to the vehicles is infeasible. Team members also took the on-line portion of the DriX Supervisor Training, and began development of a qualification standard for ASV operators.

JHC Performance Report116
INNOVATIVE HYDROGRAPHY INNOVATIVE HYDROGRAPHY
THEME: 1.A.4: Trusted Partner Data
TASK 12: Develop a portable “trusted system” capable of generating qualified data using an incremental approach to the problem that would start with a desktop study of capabilities and requirements, followed by the design and build of an appropriate prototype system, and then a demonstration of its ability to inter-face with appropriate data repositories. PI: Brian Calder
JHC Participants: Brian Calder, Semme Dijkstra, Casey O'Heran, and Dan Tauriello
Other Collaborators: Kenneth Himschoot and Andrew Schofield, SeaID
While it is tempting to assume that a bathymetrically capable crowd of observers will emerge spontane-ously for any given area (c.f. Task 34), and that there is a bathymetric equivalent of Linus’s Law, most hydro-graphic agencies appear to be quite resistant to the idea of including what is variously termed “outside source,” “third party,” or “volunteered geographic” data in their charting product. Most commonly, liabil-ity issues are cited.
This is not to say that such data cannot be used for other purposes, or even for the production of “not for navigation” depth products (e.g., customer-up-dated depth grids in recreational chart plotters from, inter alia, Garmin and Navionics). Such things can and do exist. It does however appear that volunteered geographic information (VGI) is unlikely to be fully acceptable for hydrographic charting purposes in the near future.
As an alternative, consider a system where the data from a volunteer, or at least non-professional, ob-server is captured using a system which provides sufficient auxiliary information to ensure that the data does meet the requirements of a hydrographic office. That is, instead of trusting to the “wisdom of the crowd” for data quality, attempting to wring out valid data from uncontrolled observations, what if the observing system was the trusted component?
Brian Calder, Semme Dijkstra, and Dan Tauriello have previously collaborated with Kenneth Himschoot and Andrew Schofield (SeaID) on the development of such a Trusted Community Bathymetry (TCB) system, including hardware, firmware, software, and process-ing techniques. The aim is to develop a hardware system that can interface to the navigational echo-sounder of a volunteer ship as a source of depth information, but capture sufficient GNSS information to allow it to establish depth to the ellipsoid, and auto-calibrate for vertical offsets, with sufficiently low uncertainty that the depths generated can be quali-
fied for use in charting applications. Testing of the development system in previous reporting periods demonstrated that soundings can be resolved (with respect to the ellipsoid) with uncertainties on the order of 15-30cm (95%) and confirmed the accuracy and stability of a lower-cost (Harxon GPS500) antenna for the system. In the current reporting period, Calder and Dijkstra have started discussions with Himschoot and the University of Southern Florida Center for Ocean Mapping and Innovative Technology (USF-COMIT) to extend this development work to a field trial at scale in Tampa Bay, FL. The goal would be to deploy TCB systems, along with the low-cost data loggers developed at the Center and manufactured by SeaID (see Task 34) in order to establish standard operating procedures for this type of data collection, and in addition advance COMIT’s ability to model storm-surge and run-up in shallow water.
Hardware research in this area is on-going, and in the current reporting period has been focused on exten-sions of the system for auxiliary sensors, and observer ship horizontal offset calibration.
Auxiliary Sensors
Having demonstrated the basic capabilities of the TCB system, expansions of the technique are now being considered. One very interesting research line is to consider auxiliary sensors that might potentially provide more useful information for hydrographic office use. Recent developments in the recreational sonar market have made available low-cost sidescan sonar systems, which might potentially allow for hy-drographic offices to benefit from imagery of targets and obstructions in the vicinity of TCB observers, and even to have the system automatically log imagery in the vicinity of targets of interest specified by the hydrographic office and disseminated to the TCB system during data exchanges. Additionally, the avail-ability of high-resolution sidescan imagery may pro-vide valuable datasets for habitat mapping, geologi-
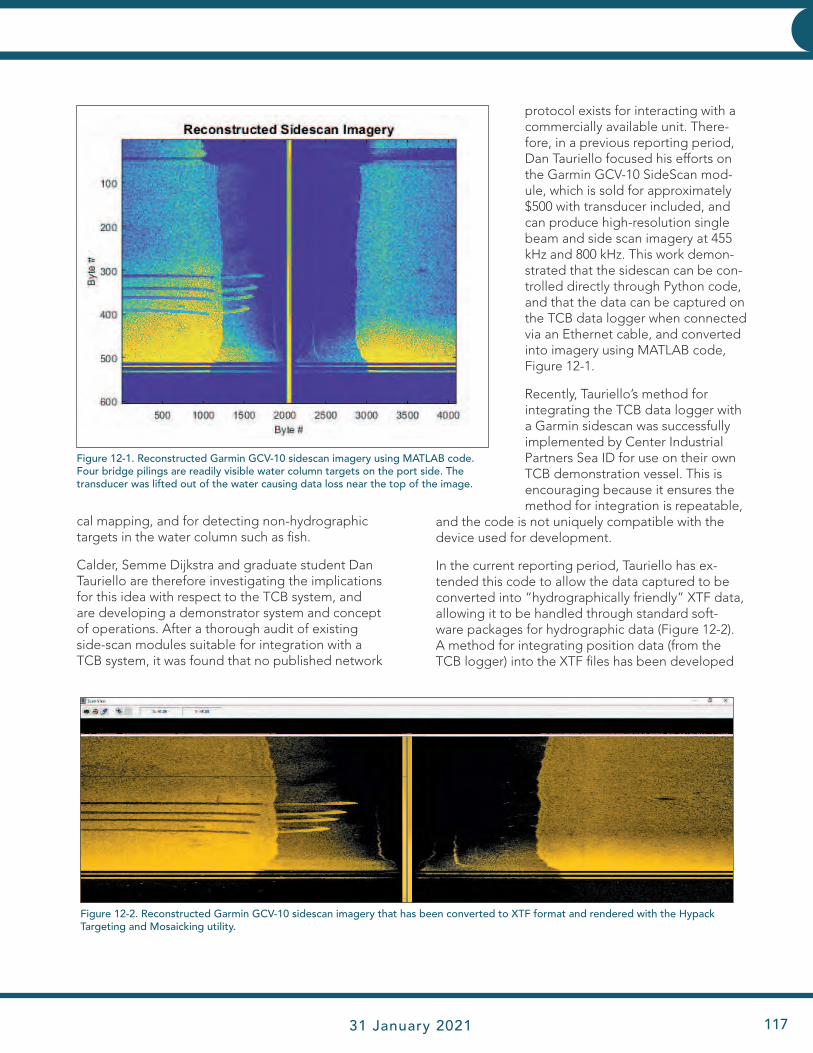
JHC Performance Report 31 January 2021 117
INNOVATIVE HYDROGRAPHY
cal mapping, and for detecting non-hydrographic targets in the water column such as fish.
Calder, Semme Dijkstra and graduate student Dan Tauriello are therefore investigating the implications for this idea with respect to the TCB system, and are developing a demonstrator system and concept of operations. After a thorough audit of existing side-scan modules suitable for integration with a TCB system, it was found that no published network
protocol exists for interacting with a commercially available unit. There-fore, in a previous reporting period, Dan Tauriello focused his efforts on the Garmin GCV-10 SideScan mod-ule, which is sold for approximately $500 with transducer included, and can produce high-resolution single beam and side scan imagery at 455 kHz and 800 kHz. This work demon-strated that the sidescan can be con-trolled directly through Python code, and that the data can be captured on the TCB data logger when connected via an Ethernet cable, and converted into imagery using MATLAB code, Figure 12-1.
Recently, Tauriello’s method for integrating the TCB data logger with a Garmin sidescan was successfully implemented by Center Industrial Partners Sea ID for use on their own TCB demonstration vessel. This is encouraging because it ensures the method for integration is repeatable,
and the code is not uniquely compatible with the device used for development.
In the current reporting period, Tauriello has ex-tended this code to allow the data captured to be converted into “hydrographically friendly” XTF data, allowing it to be handled through standard soft-ware packages for hydrographic data (Figure 12-2). A method for integrating position data (from the TCB logger) into the XTF files has been developed
Figure 12-1. Reconstructed Garmin GCV-10 sidescan imagery using MATLAB code. Four bridge pilings are readily visible water column targets on the port side. The transducer was lifted out of the water causing data loss near the top of the image.
Figure 12-2. Reconstructed Garmin GCV-10 sidescan imagery that has been converted to XTF format and rendered with the Hypack Targeting and Mosaicking utility.
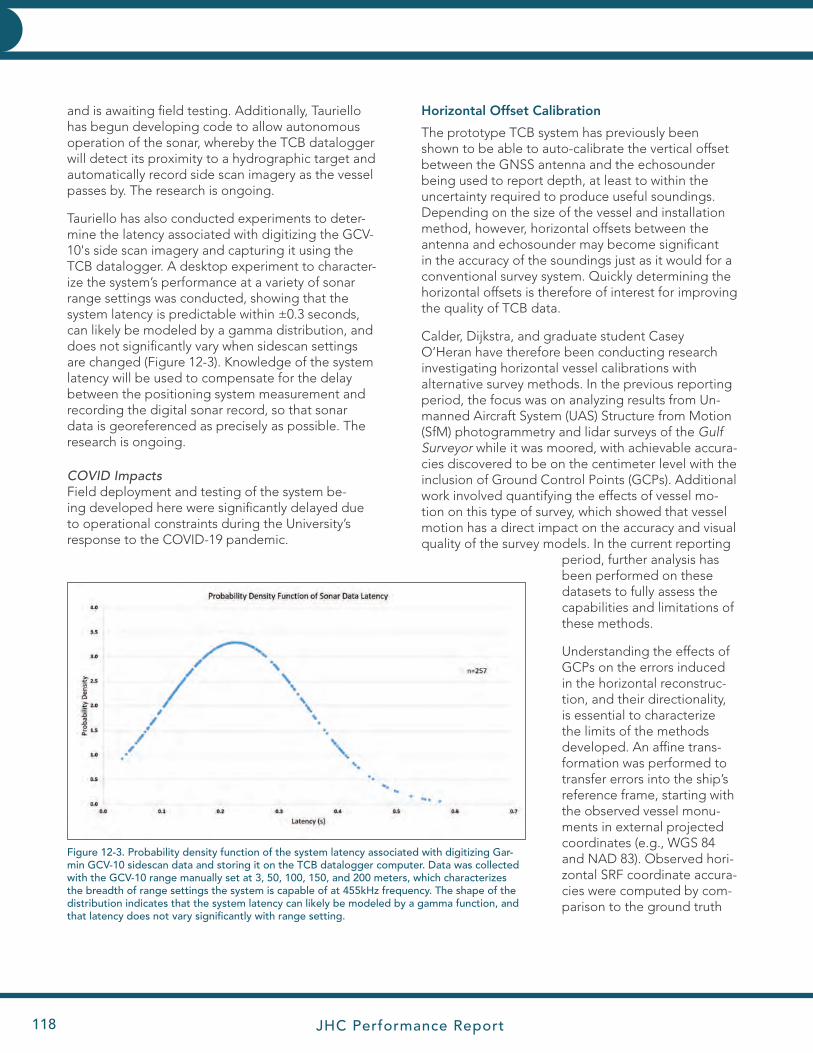
JHC Performance Report118
INNOVATIVE HYDROGRAPHY INNOVATIVE HYDROGRAPHY
and is awaiting field testing. Additionally, Tauriello has begun developing code to allow autonomous operation of the sonar, whereby the TCB datalogger will detect its proximity to a hydrographic target and automatically record side scan imagery as the vessel passes by. The research is ongoing.
Tauriello has also conducted experiments to deter-mine the latency associated with digitizing the GCV-10's side scan imagery and capturing it using the TCB datalogger. A desktop experiment to character-ize the system’s performance at a variety of sonar range settings was conducted, showing that the system latency is predictable within ±0.3 seconds, can likely be modeled by a gamma distribution, and does not significantly vary when sidescan settings are changed (Figure 12-3). Knowledge of the system latency will be used to compensate for the delay between the positioning system measurement and recording the digital sonar record, so that sonar data is georeferenced as precisely as possible. The research is ongoing.
COVID ImpactsField deployment and testing of the system be-ing developed here were significantly delayed due to operational constraints during the University’s response to the COVID-19 pandemic.
Horizontal Offset Calibration
The prototype TCB system has previously been shown to be able to auto-calibrate the vertical offset between the GNSS antenna and the echosounder being used to report depth, at least to within the uncertainty required to produce useful soundings. Depending on the size of the vessel and installation method, however, horizontal offsets between the antenna and echosounder may become significant in the accuracy of the soundings just as it would for a conventional survey system. Quickly determining the horizontal offsets is therefore of interest for improving the quality of TCB data.
Calder, Dijkstra, and graduate student Casey O’Heran have therefore been conducting research investigating horizontal vessel calibrations with alternative survey methods. In the previous reporting period, the focus was on analyzing results from Un-manned Aircraft System (UAS) Structure from Motion (SfM) photogrammetry and lidar surveys of the Gulf Surveyor while it was moored, with achievable accura-cies discovered to be on the centimeter level with the inclusion of Ground Control Points (GCPs). Additional work involved quantifying the effects of vessel mo-tion on this type of survey, which showed that vessel motion has a direct impact on the accuracy and visual quality of the survey models. In the current reporting
period, further analysis has been performed on these datasets to fully assess the capabilities and limitations of these methods.
Understanding the effects of GCPs on the errors induced in the horizontal reconstruc-tion, and their directionality, is essential to characterize the limits of the methods developed. An affine trans-formation was performed to transfer errors into the ship’s reference frame, starting with the observed vessel monu-ments in external projected coordinates (e.g., WGS 84 and NAD 83). Observed hori-zontal SRF coordinate accura-cies were computed by com-parison to the ground truth
Figure 12-3. Probability density function of the system latency associated with digitizing Gar-min GCV-10 sidescan data and storing it on the TCB datalogger computer. Data was collected with the GCV-10 range manually set at 3, 50, 100, 150, and 200 meters, which characterizes the breadth of range settings the system is capable of at 455kHz frequency. The shape of the distribution indicates that the system latency can likely be modeled by a gamma function, and that latency does not vary significantly with range setting.
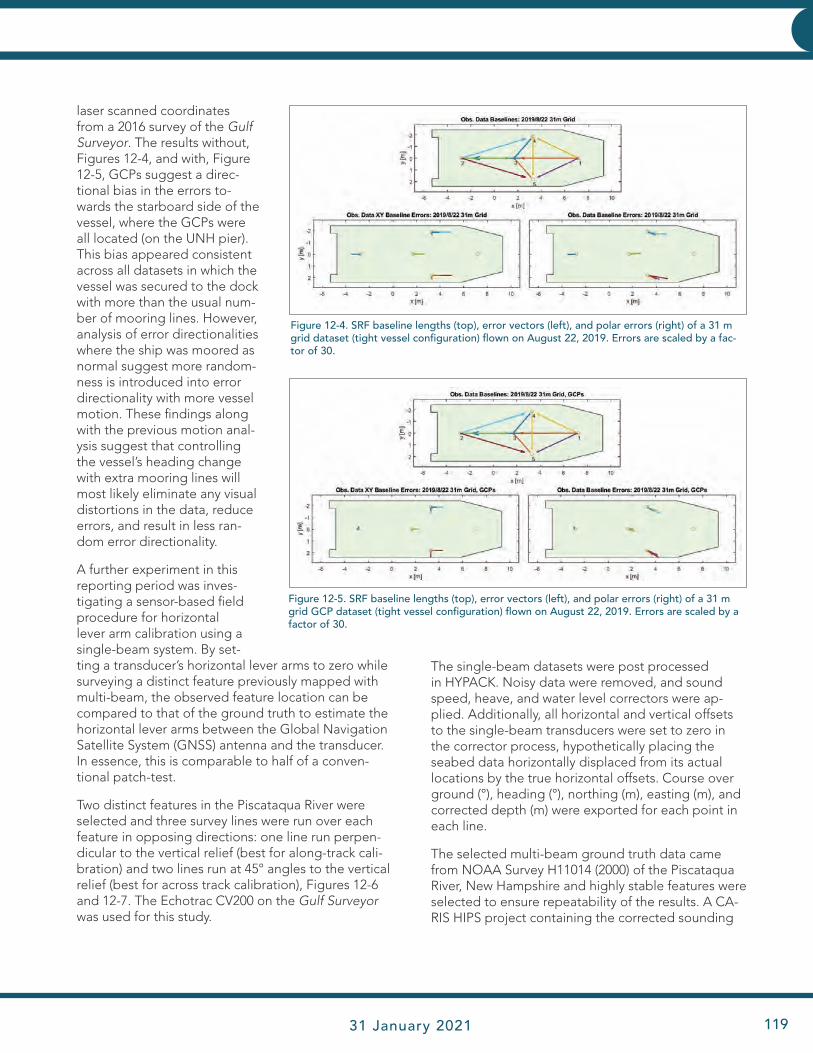
JHC Performance Report 31 January 2021 119
INNOVATIVE HYDROGRAPHY
laser scanned coordinates from a 2016 survey of the Gulf Surveyor. The results without, Figures 12-4, and with, Figure 12-5, GCPs suggest a direc-tional bias in the errors to-wards the starboard side of the vessel, where the GCPs were all located (on the UNH pier). This bias appeared consistent across all datasets in which the vessel was secured to the dock with more than the usual num-ber of mooring lines. However, analysis of error directionalities where the ship was moored as normal suggest more random-ness is introduced into error directionality with more vessel motion. These findings along with the previous motion anal-ysis suggest that controlling the vessel’s heading change with extra mooring lines will most likely eliminate any visual distortions in the data, reduce errors, and result in less ran-dom error directionality.
A further experiment in this reporting period was inves-tigating a sensor-based field procedure for horizontal lever arm calibration using a single-beam system. By set-ting a transducer’s horizontal lever arms to zero while surveying a distinct feature previously mapped with multi-beam, the observed feature location can be compared to that of the ground truth to estimate the horizontal lever arms between the Global Navigation Satellite System (GNSS) antenna and the transducer. In essence, this is comparable to half of a conven-tional patch-test.
Two distinct features in the Piscataqua River were selected and three survey lines were run over each feature in opposing directions: one line run perpen-dicular to the vertical relief (best for along-track cali-bration) and two lines run at 45° angles to the vertical relief (best for across track calibration), Figures 12-6 and 12-7. The Echotrac CV200 on the Gulf Surveyor was used for this study.
The single-beam datasets were post processed in HYPACK. Noisy data were removed, and sound speed, heave, and water level correctors were ap-plied. Additionally, all horizontal and vertical offsets to the single-beam transducers were set to zero in the corrector process, hypothetically placing the seabed data horizontally displaced from its actual locations by the true horizontal offsets. Course over ground (°), heading (°), northing (m), easting (m), and corrected depth (m) were exported for each point in each line.
The selected multi-beam ground truth data came from NOAA Survey H11014 (2000) of the Piscataqua River, New Hampshire and highly stable features were selected to ensure repeatability of the results. A CA-RIS HIPS project containing the corrected sounding
Figure 12-4. SRF baseline lengths (top), error vectors (left), and polar errors (right) of a 31 m grid dataset (tight vessel configuration) flown on August 22, 2019. Errors are scaled by a fac-tor of 30.
Figure 12-5. SRF baseline lengths (top), error vectors (left), and polar errors (right) of a 31 m grid GCP dataset (tight vessel configuration) flown on August 22, 2019. Errors are scaled by a factor of 30.

JHC Performance Report120
INNOVATIVE HYDROGRAPHY INNOVATIVE HYDROGRAPHY
data from this survey was used to generate individual gridded surfaces for Cod Rock and Henderson Point at 1m resolution. To visually compare the reference surfaces to the observed single-beam points, all relevant files were brought into Fledermaus. Before attempting estimation of the horizontal vessel offsets, the offset tool in Fledermaus was utilized to resolve any vertical displacements between the ground truth and observed datasets. Thus, this left just horizontal offsets between the datasets, Figure 12-8.
The reference surfaces were then interpolated, enabling direct comparison to 3D coordinates of the observed single-beam points. Grid search optimiza-tion, an algorithm that methodically evaluates com-binations of estimated parameters in a grid format, was created to estimate the offsets by looking for the lowest error in comparison for a range of offsets.
Errors in lever arm approximations were obtained by subtracting the ground truth SRF lever arms of
Figure 12-6. Survey lines performed over Cod Rock in the Piscataqua River with black lines representing the y-axis offset calibration and the white line representing the x-axis offset calibration.
Figure 12-7. Survey lines performed over Henderson Point in the Piscataqua River with black lines representing the y-axis offset calibration and the white line representing the x-axis offset calibration.
Figure 12-8. The Cod Rock reference surface overlaid with the horizontally displaced observed single-beam data (white).

JHC Performance Report 31 January 2021 121
INNOVATIVE HYDROGRAPHY
the single-beam transducer, known to be (x,y) = (2.345, 1.294) m from the reference survey, to the estimated offsets. Results from this technique proved to be inconsistent as errors were on the meter level, Figures 12-9 and 12-10. Both x and y calibration lines rarely resulted in accurate or precise horizontal offset estimations. These results suggest that this type of horizontal offset estimation technique may be better suited for vessels with longer lever arms as the meter-level accuracy may fail to help make bathymetric data more accurate for vessels with shorter lever arms.
These pathfinder experiments of alternative hori-zontal calibration methods enabled comparisons between the three investigated methods. The results from the UAS methods have much lower uncertainty and are more consistent than those of the single-beam seafloor reference method, which showed estimates ranging from 0-2.5m. UAS SfM photogram-metry datasets experienced decimeter level and occasionally centimeter level deviation estimates without ground control, but adding GCP processing
led to consistent centimeter level results, even with just three or four GCPs. UAS lidar also experienced errors on the centimeter level.
This work has shown that to optimize the UAS ac-curacies for this application, the survey(s) must be performed at high or low tide with the vessel tightly secured using extra mooring lines. A cost/quality analysis of the two UAS methods indicate that SfM photogrammetry will result in comparable accura-cies as UAS lidar, at a lower cost. Standard operating procedures (SOPs) for the investigated methods have been created based on the workflows established in this study, allowing for others to reimplement these techniques in the field, and a paper on the project has been submitted to Marine Geodesy, where it is currently in late-stage review.
COVID ImpactsThere have been no significant impacts on this work due to the COVID-19 pandemic.
Figure 12-9. Estimation of x and y vessel offsets using an x calibra-tion line at Henderson Point on January 9, 2020, with the color bar representing sum of the squares of the residuals values between ground truth and observed elevations. Lines 1-1 and 1-2 are the same line performed in opposing directions.
Figure 12-10. Estimation of x and y vessel offsets using a y cali-bration line at Cod Rock on January 9, 2020, with the color bar representing sum of the squares of the residuals values between ground truth and observed elevations. Lines 16-1 and 16-2 are the same line performed in opposing directions.

JHC Performance Report122
INNOVATIVE HYDROGRAPHY INNOVATIVE HYDROGRAPHY
Research Requirement 1.B: Data Processing
FFO Requirement 1.B: “Improvement in technology and methods for more efficient data processing, quality control, and quality assurance, including the determination and application of measurement uncertainty, of hydro-graphic and ocean and coastal mapping sensor and ancillary sensor data, and data supporting the identification and mapping of fixed and transient features of the seafloor and in the water column.”
Theme: 1.B.1: Algorithms and ProcessingSub-Theme: Bathymetric Processing
TASK 13: Continued development of CHRT and like algorithms, with particular attention to the use of slope information, correlations between measurements, and refinement techniques for variable resolution grids. For alternative bathymetric data processing techniques, we will explore non-parametric methods, non-uniform sampling methods, and non-local context for decision-making. We will also continue our development of parallel and distrib-uted processing schemes, with particular emphasis on practical application of local-network distributed-computing, distributed-storage, and cloud-based environments. Finally, we will investigate better user-level algorithm com-pleteness and skill metrics that provide stable, reliable, and visually impactful feedback for data quality assurance. These efforts will be coordinated with our visualization team to ensure that the final products impart data quality parameters in a manner that is easily interpretable. PI: Brian Calder
JHC Participants: Matt Plumlee, and Kim Lowell
the research progresses. In the current reporting period, for example, we have undertaken a collabo-ration with two industrial partners (QPS and iXblue) to prototype a CHRT-enabled processing scheme loosely coupled to Qimera. The goal of the project is to allow iXblue to explore and develop processing workflows that allow them to use CHRT for hydro-graphic surveys in Australia and New Zealand, and thereby enable them to demonstrate the benefits of the CHRT approach to data processing for their clients, and for QPS. As an initial step, Brian Calder and Matt Plumlee assisted in the creation of a plug-in for CHRT that allows QPS database files to be read into CHRT directly, and built an output module that writes results in a format that can be read into Qimera’s new point-cloud display. The results are now being tested by QPS.
In addition, the Level of Aggregation analysis tech-nique (previously reported for lidar data), used to estimate the correct resolution at which to process a wide variety of data in all depth ranges, is being in-tegrated into the stock CHRT algorithm. This entails a significant modification of the code base, which is currently being tested. When complete, this will result in an algorithm implementation that has fewer dependencies on external libraries, is much more flexible in terms of the data (including random point data) which can be accepted for processing, and
Despite advances in processing techniques and technology in the last decade, processing of large-scale, high-density, shallow-water hydrographic datasets are still a challenging task. JHC/CCOM has pioneered a number of techniques to improve on the processing times achievable, and new technolo-gies that have conceptually redefined what we con-sider as the output of a hydrographic survey. There is, however, still some way to go.
The CHRT (CUBE with Hierarchical Resolution Tech-niques) algorithm was developed to provide sup-port for data-adaptive, variable resolution gridded output. This technique provides for the estimation resolution to change within the area of interest, allowing the estimator to match the data density available. The technology also provides for large-scale estimation, simplification of the required user parameters, and a more robust testing environment, while still retaining the core estimation technology from the previously verified CUBE algorithm. CHRT is being developed in conjunction with the Center’s Industrial Partners who are pursing commercial implementations.
Although the core of the base CHRT algorithm is in principle complete and has been licensed to Center Industrial Partners for implementation, modifica-tions, some significant, continue to be made as
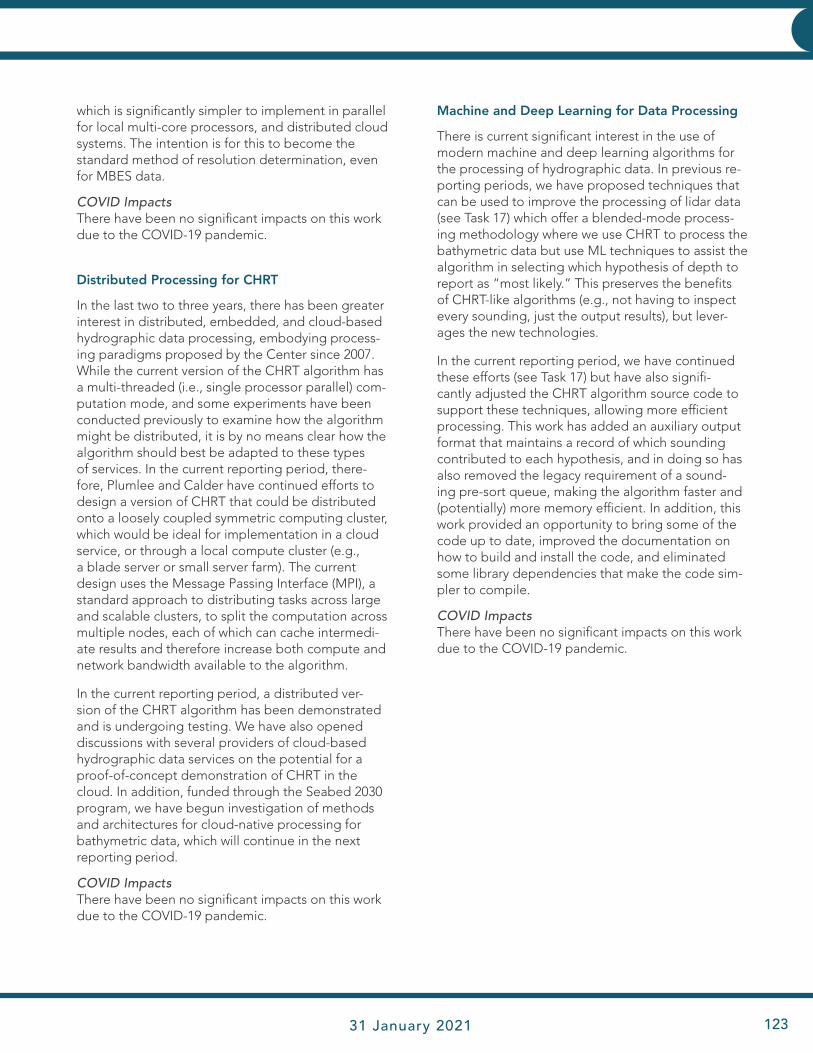
JHC Performance Report 31 January 2021 123
INNOVATIVE HYDROGRAPHY
which is significantly simpler to implement in parallel for local multi-core processors, and distributed cloud systems. The intention is for this to become the standard method of resolution determination, even for MBES data.
COVID ImpactsThere have been no significant impacts on this work due to the COVID-19 pandemic.
Distributed Processing for CHRT
In the last two to three years, there has been greater interest in distributed, embedded, and cloud-based hydrographic data processing, embodying process-ing paradigms proposed by the Center since 2007. While the current version of the CHRT algorithm has a multi-threaded (i.e., single processor parallel) com-putation mode, and some experiments have been conducted previously to examine how the algorithm might be distributed, it is by no means clear how the algorithm should best be adapted to these types of services. In the current reporting period, there-fore, Plumlee and Calder have continued efforts to design a version of CHRT that could be distributed onto a loosely coupled symmetric computing cluster, which would be ideal for implementation in a cloud service, or through a local compute cluster (e.g., a blade server or small server farm). The current design uses the Message Passing Interface (MPI), a standard approach to distributing tasks across large and scalable clusters, to split the computation across multiple nodes, each of which can cache intermedi-ate results and therefore increase both compute and network bandwidth available to the algorithm.
In the current reporting period, a distributed ver-sion of the CHRT algorithm has been demonstrated and is undergoing testing. We have also opened discussions with several providers of cloud-based hydrographic data services on the potential for a proof-of-concept demonstration of CHRT in the cloud. In addition, funded through the Seabed 2030 program, we have begun investigation of methods and architectures for cloud-native processing for bathymetric data, which will continue in the next reporting period.
COVID ImpactsThere have been no significant impacts on this work due to the COVID-19 pandemic.
Machine and Deep Learning for Data Processing
There is current significant interest in the use of modern machine and deep learning algorithms for the processing of hydrographic data. In previous re-porting periods, we have proposed techniques that can be used to improve the processing of lidar data (see Task 17) which offer a blended-mode process-ing methodology where we use CHRT to process the bathymetric data but use ML techniques to assist the algorithm in selecting which hypothesis of depth to report as “most likely.” This preserves the benefits of CHRT-like algorithms (e.g., not having to inspect every sounding, just the output results), but lever-ages the new technologies.
In the current reporting period, we have continued these efforts (see Task 17) but have also signifi-cantly adjusted the CHRT algorithm source code to support these techniques, allowing more efficient processing. This work has added an auxiliary output format that maintains a record of which sounding contributed to each hypothesis, and in doing so has also removed the legacy requirement of a sound-ing pre-sort queue, making the algorithm faster and (potentially) more memory efficient. In addition, this work provided an opportunity to bring some of the code up to date, improved the documentation on how to build and install the code, and eliminated some library dependencies that make the code sim-pler to compile.
COVID ImpactsThere have been no significant impacts on this work due to the COVID-19 pandemic.
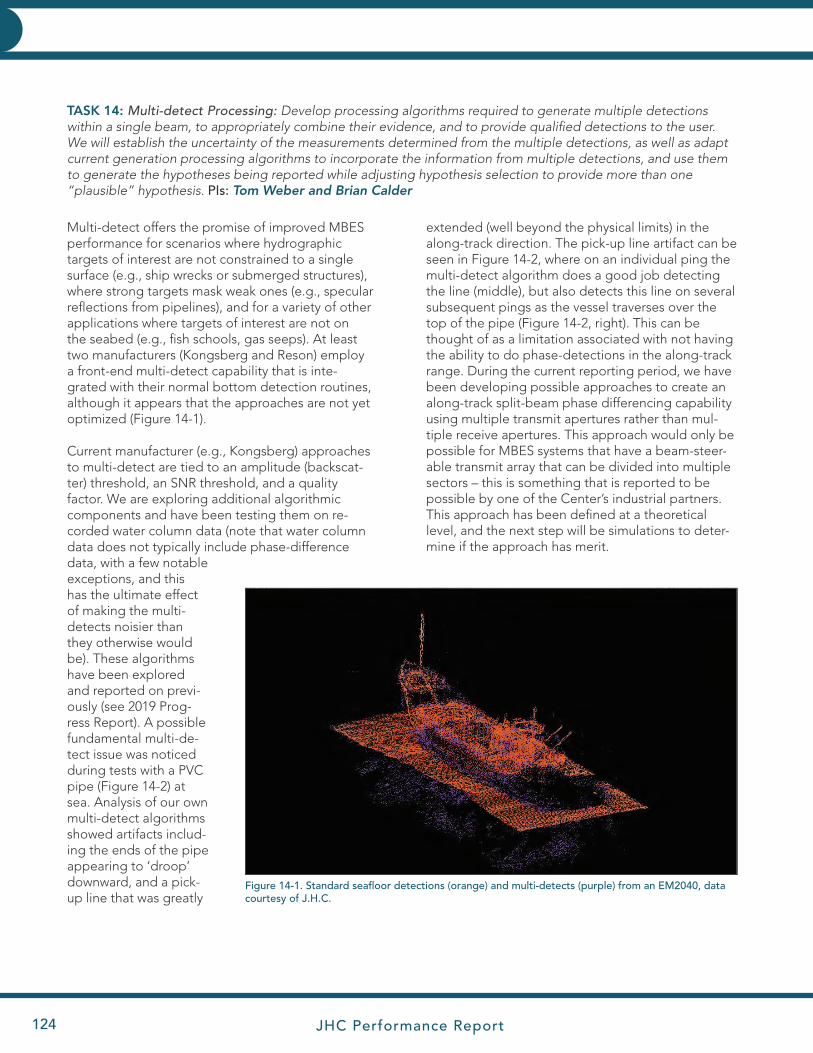
JHC Performance Report124
INNOVATIVE HYDROGRAPHY INNOVATIVE HYDROGRAPHY
TASK 14: Multi-detect Processing: Develop processing algorithms required to generate multiple detections within a single beam, to appropriately combine their evidence, and to provide qualified detections to the user. We will establish the uncertainty of the measurements determined from the multiple detections, as well as adapt current generation processing algorithms to incorporate the information from multiple detections, and use them to generate the hypotheses being reported while adjusting hypothesis selection to provide more than one “plausible” hypothesis. PIs: Tom Weber and Brian Calder
Multi-detect offers the promise of improved MBES performance for scenarios where hydrographic targets of interest are not constrained to a single surface (e.g., ship wrecks or submerged structures), where strong targets mask weak ones (e.g., specular reflections from pipelines), and for a variety of other applications where targets of interest are not on the seabed (e.g., fish schools, gas seeps). At least two manufacturers (Kongsberg and Reson) employ a front-end multi-detect capability that is inte-grated with their normal bottom detection routines, although it appears that the approaches are not yet optimized (Figure 14-1).
Current manufacturer (e.g., Kongsberg) approaches to multi-detect are tied to an amplitude (backscat-ter) threshold, an SNR threshold, and a quality factor. We are exploring additional algorithmic components and have been testing them on re-corded water column data (note that water column data does not typically include phase-difference data, with a few notable exceptions, and this has the ultimate effect of making the multi-detects noisier than they otherwise would be). These algorithms have been explored and reported on previ-ously (see 2019 Prog-ress Report). A possible fundamental multi-de-tect issue was noticed during tests with a PVC pipe (Figure 14-2) at sea. Analysis of our own multi-detect algorithms showed artifacts includ-ing the ends of the pipe appearing to ‘droop’ downward, and a pick-up line that was greatly
extended (well beyond the physical limits) in the along-track direction. The pick-up line artifact can be seen in Figure 14-2, where on an individual ping the multi-detect algorithm does a good job detecting the line (middle), but also detects this line on several subsequent pings as the vessel traverses over the top of the pipe (Figure 14-2, right). This can be thought of as a limitation associated with not having the ability to do phase-detections in the along-track range. During the current reporting period, we have been developing possible approaches to create an along-track split-beam phase differencing capability using multiple transmit apertures rather than mul-tiple receive apertures. This approach would only be possible for MBES systems that have a beam-steer-able transmit array that can be divided into multiple sectors – this is something that is reported to be possible by one of the Center’s industrial partners. This approach has been defined at a theoretical level, and the next step will be simulations to deter-mine if the approach has merit.
Figure 14-1. Standard seafloor detections (orange) and multi-detects (purple) from an EM2040, data courtesy of J.H.C.
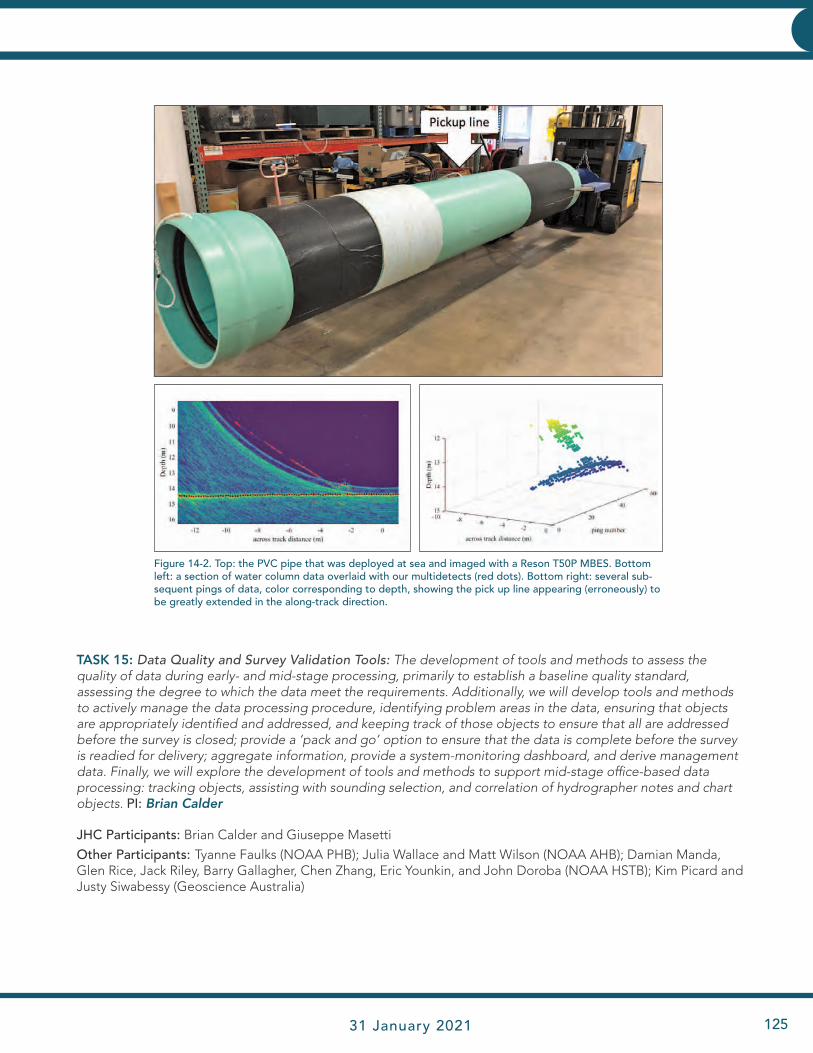
JHC Performance Report 31 January 2021 125
INNOVATIVE HYDROGRAPHY
Figure 14-2. Top: the PVC pipe that was deployed at sea and imaged with a Reson T50P MBES. Bottom left: a section of water column data overlaid with our multidetects (red dots). Bottom right: several sub-sequent pings of data, color corresponding to depth, showing the pick up line appearing (erroneously) to be greatly extended in the along-track direction.
TASK 15: Data Quality and Survey Validation Tools: The development of tools and methods to assess the quality of data during early- and mid-stage processing, primarily to establish a baseline quality standard, assessing the degree to which the data meet the requirements. Additionally, we will develop tools and methods to actively manage the data processing procedure, identifying problem areas in the data, ensuring that objects are appropriately identified and addressed, and keeping track of those objects to ensure that all are addressed before the survey is closed; provide a ‘pack and go’ option to ensure that the data is complete before the survey is readied for delivery; aggregate information, provide a system-monitoring dashboard, and derive management data. Finally, we will explore the development of tools and methods to support mid-stage office-based data processing: tracking objects, assisting with sounding selection, and correlation of hydrographer notes and chart objects. PI: Brian Calder
JHC Participants: Brian Calder and Giuseppe Masetti
Other Participants: Tyanne Faulks (NOAA PHB); Julia Wallace and Matt Wilson (NOAA AHB); Damian Manda, Glen Rice, Jack Riley, Barry Gallagher, Chen Zhang, Eric Younkin, and John Doroba (NOAA HSTB); Kim Picard and Justy Siwabessy (Geoscience Australia)
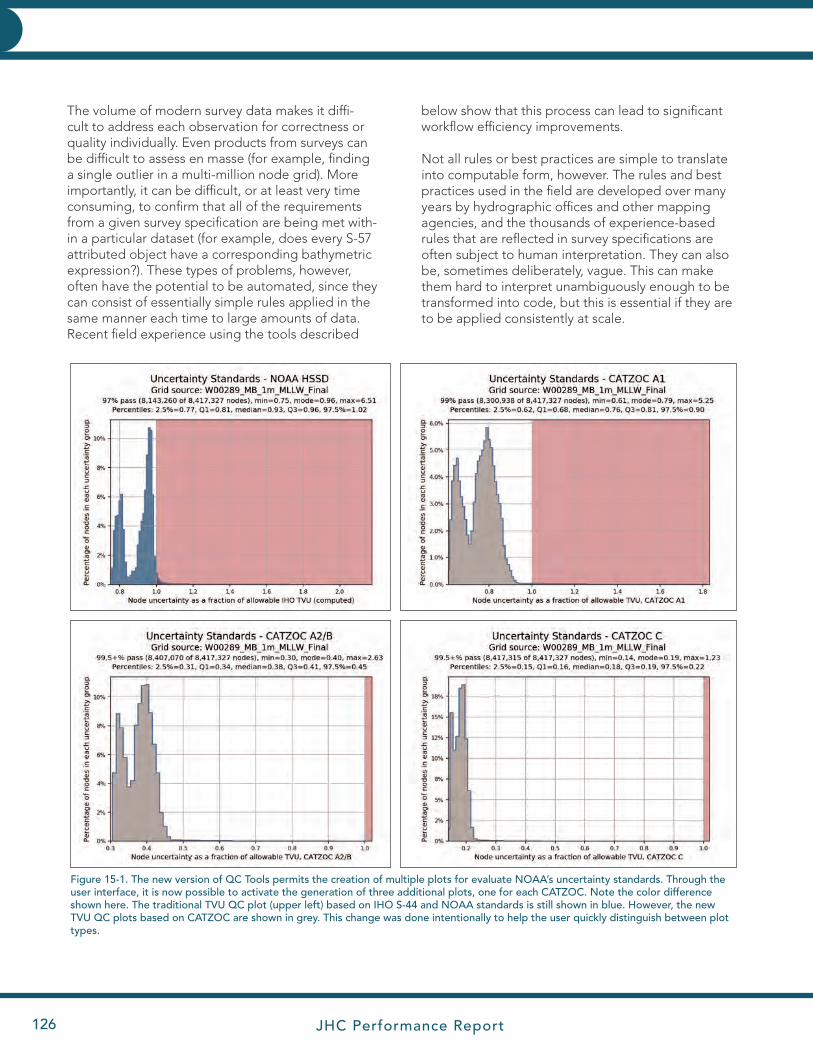
JHC Performance Report126
INNOVATIVE HYDROGRAPHY INNOVATIVE HYDROGRAPHY
The volume of modern survey data makes it diffi-cult to address each observation for correctness or quality individually. Even products from surveys can be difficult to assess en masse (for example, finding a single outlier in a multi-million node grid). More importantly, it can be difficult, or at least very time consuming, to confirm that all of the requirements from a given survey specification are being met with-in a particular dataset (for example, does every S-57 attributed object have a corresponding bathymetric expression?). These types of problems, however, often have the potential to be automated, since they can consist of essentially simple rules applied in the same manner each time to large amounts of data. Recent field experience using the tools described
below show that this process can lead to significant workflow efficiency improvements.
Not all rules or best practices are simple to translate into computable form, however. The rules and best practices used in the field are developed over many years by hydrographic offices and other mapping agencies, and the thousands of experience-based rules that are reflected in survey specifications are often subject to human interpretation. They can also be, sometimes deliberately, vague. This can make them hard to interpret unambiguously enough to be transformed into code, but this is essential if they are to be applied consistently at scale.
Figure 15-1. The new version of QC Tools permits the creation of multiple plots for evaluate NOAA’s uncertainty standards. Through the user interface, it is now possible to activate the generation of three additional plots, one for each CATZOC. Note the color difference shown here. The traditional TVU QC plot (upper left) based on IHO S-44 and NOAA standards is still shown in blue. However, the new TVU QC plots based on CATZOC are shown in grey. This change was done intentionally to help the user quickly distinguish between plot types.
JHC Performance Report 31 January 2021 127
INNOVATIVE HYDROGRAPHY
The projects in this task, therefore, are considering how to translate these rules into computable form, and how to prompt careful re-formulation of the rules where required in order to obtain a computable interpretation. This is not to suggest that all rules can be so transformed: some will always require the “judgment of an expert hydrographer.” However even identifying this subset is, in itself, a useful en-deavor since it informs the potential for automation: the more rules require human intervention, the less automation is possible. Understanding the extent to which this is the case will also help to inform deci-sions about the future structure of survey workflows.
QC Tools (HydrOffice)
Since 2015, the Center has collaborated with NOAA HSTB personnel to develop a suite of analysis tools designed specifically to address quality control of problems discovered in the NOAA hydrographic workflow. Built within the HydrOffice tool-support framework (https://www.hydroffice.org), the resulting QC Tools were released in June 2016, and have since been enthusiastically adopted by NOAA field units and processing branches. Indeed, yearly updates and edits to NOAA’s Hydrographic Survey Specifications and Deliverables are now made with an eye toward automation, anticipating implementation via QC Tools.
In the current reporting period, Giuseppe Masetti, Tyanne Faulkes (NOAA PHB), Julia Wallace, and Mat-thew Wilson (NOAA AHB) have continued, in col-laboration with NOAA HSTB personnel, to develop the toolset.
The application, which aggregates a number of tools within a single GUI is available through NOAA Pydro (which delivers software to the NOAA hydrographic units) and through the HydrOffice website for non-NOAA users. A number of mapping agencies, NOAA contractors, and other professionals have adopted some of these tools as part of their processing work-flow. QC Tools is in active use with the NOAA field units, which are a valuable source of feedback and suggestions.
In the current reporting period, QC Tools has also improved existing sub-tools to analyze the total verti-cal uncertainty (TVU) based on the IHO S-57 CATZOC calculation (Figure 15-1), enhance the detection of anomalous data by the “Find Fliers” algorithm and
improve the validation of elevation-related feature attributes in the Feature Scan algorithm.
The QC Tools application is supported by publicly available documentation as well as NOAA-generated instructional videos, available through the HydrOf-fice website, or directly via YouTube. In 2019, the QC Tools development team was invited by Geoscience Australia to provide training on the application (and an overview of other HydrOffice tools) during the week-long AusSeabed - NOAA Office of Coast Sur-vey - CCOM/JHC Workshop “Effective Seabed Map-ping Workflow.” The collaboration with Geoscience Australia is still ongoing, focusing on the creation of QA algorithms of common interest.
COVID Impacts
There have been no significant impacts on this work due to the COVID-19 pandemic.
Open Navigation Surface Working Group (BAG Data Transfer Format)
A key component in assessment of data quality and workflow assurance is ensuring that the data has a safe place to go, and that the quality metrics attribut-ed are not lost as part of the processing effort. Since its inception in 2003, the Bathymetric Attributed Grid (BAG) data transfer format has provided a stan-dard method for representation of fixed (and since 2015, variable) resolution gridded bathymetric data, along with metadata and an uncertainty estimate at the same resolution as the bathymetry. The Open Navigation Surface Working Group project, which maintains the BAG specification and access library, is hosted by the Center.
In the current reporting period, the Open Naviga-tion Surface library (http://www.opennavsurf.org) has benefited from re-organization of the library to remove larger sub-projects into sub-repositories, which necessitated transition to GitHub as a reposi-tory hosting service. The project also adopted a BSD three-term license, accepted a proposal from NOAA for an auxiliary metadata layer to support their com-posite BAG structure required for the National Bathy-metric Database, converted the File Specification Document into a wiki on the GitHub repository for better access and currency, and updated the project website to support better visibility of the participants in the project.
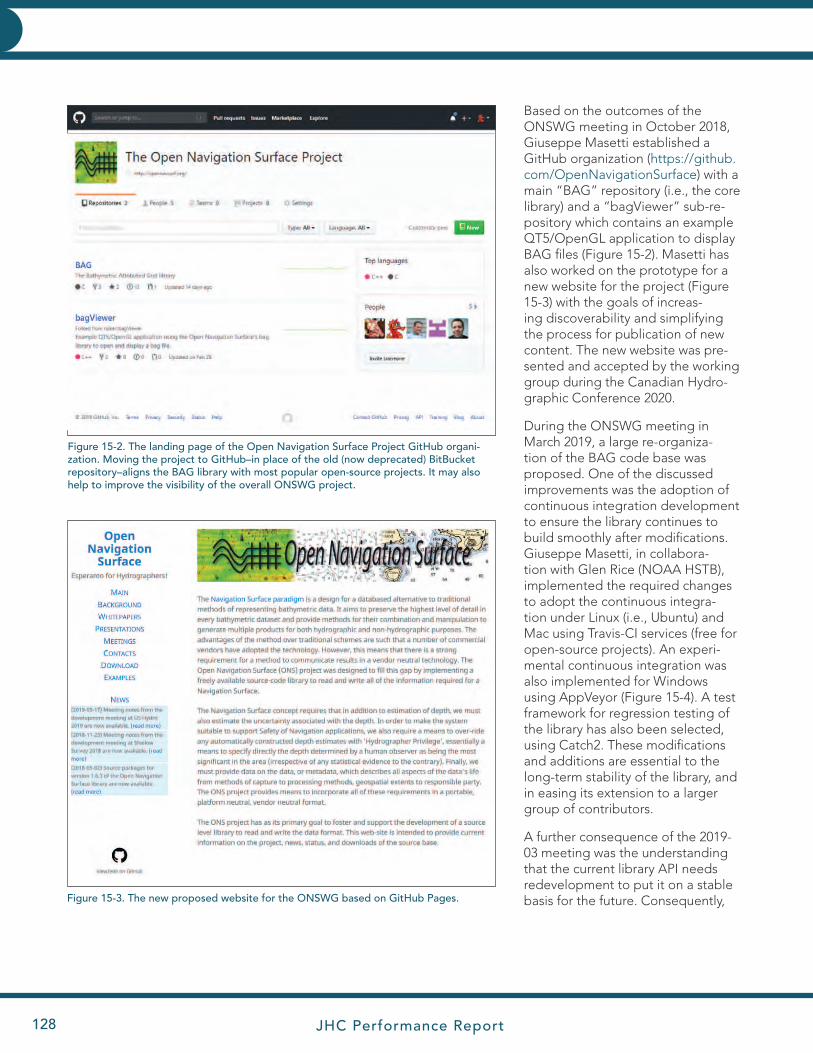
JHC Performance Report128
INNOVATIVE HYDROGRAPHY INNOVATIVE HYDROGRAPHY
Based on the outcomes of the ONSWG meeting in October 2018, Giuseppe Masetti established a GitHub organization (https://github.com/OpenNavigationSurface) with a main “BAG” repository (i.e., the core library) and a “bagViewer” sub-re-pository which contains an example QT5/OpenGL application to display BAG files (Figure 15-2). Masetti has also worked on the prototype for a new website for the project (Figure 15-3) with the goals of increas-ing discoverability and simplifying the process for publication of new content. The new website was pre-sented and accepted by the working group during the Canadian Hydro-graphic Conference 2020.
During the ONSWG meeting in March 2019, a large re-organiza-tion of the BAG code base was proposed. One of the discussed improvements was the adoption of continuous integration development to ensure the library continues to build smoothly after modifications. Giuseppe Masetti, in collabora-tion with Glen Rice (NOAA HSTB), implemented the required changes to adopt the continuous integra-tion under Linux (i.e., Ubuntu) and Mac using Travis-CI services (free for open-source projects). An experi-mental continuous integration was also implemented for Windows using AppVeyor (Figure 15-4). A test framework for regression testing of the library has also been selected, using Catch2. These modifications and additions are essential to the long-term stability of the library, and in easing its extension to a larger group of contributors.
A further consequence of the 2019-03 meeting was the understanding that the current library API needs redevelopment to put it on a stable basis for the future. Consequently,
Figure 15-2. The landing page of the Open Navigation Surface Project GitHub organi-zation. Moving the project to GitHub–in place of the old (now deprecated) BitBucket repository–aligns the BAG library with most popular open-source projects. It may also help to improve the visibility of the overall ONSWG project.
Figure 15-3. The new proposed website for the ONSWG based on GitHub Pages.
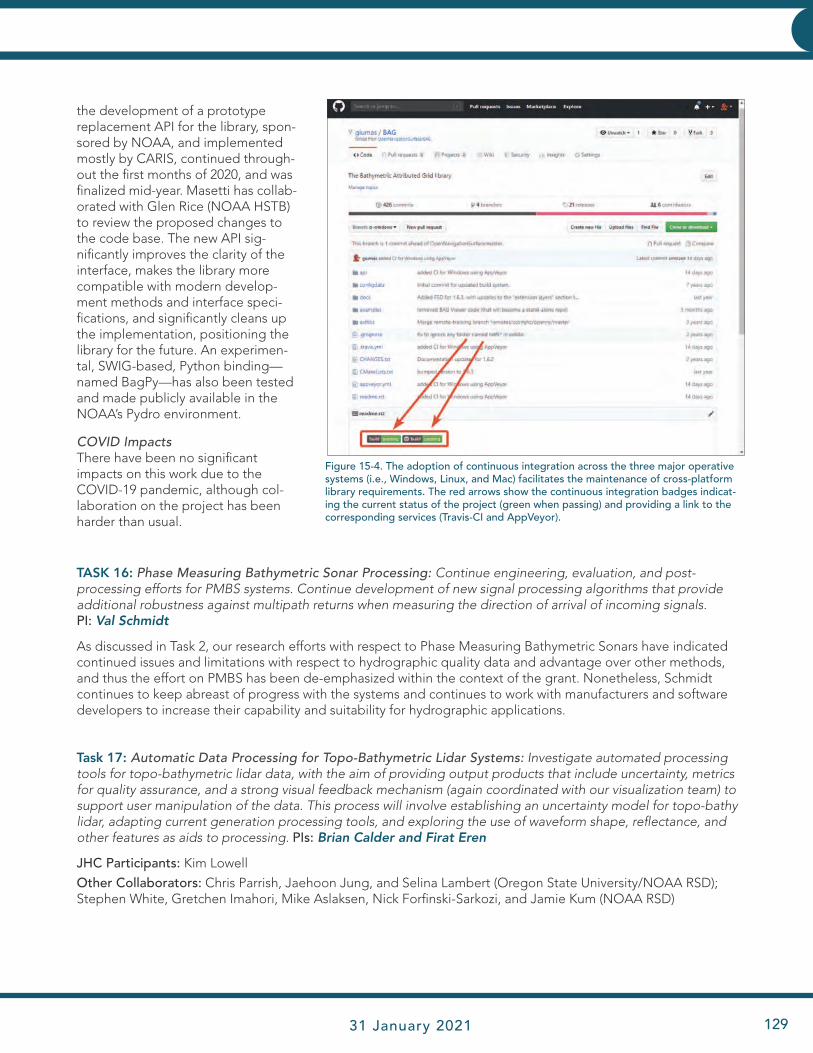
JHC Performance Report 31 January 2021 129
INNOVATIVE HYDROGRAPHY
the development of a prototype replacement API for the library, spon-sored by NOAA, and implemented mostly by CARIS, continued through-out the first months of 2020, and was finalized mid-year. Masetti has collab-orated with Glen Rice (NOAA HSTB) to review the proposed changes to the code base. The new API sig-nificantly improves the clarity of the interface, makes the library more compatible with modern develop-ment methods and interface speci-fications, and significantly cleans up the implementation, positioning the library for the future. An experimen-tal, SWIG-based, Python binding—named BagPy—has also been tested and made publicly available in the NOAA’s Pydro environment.
COVID ImpactsThere have been no significant impacts on this work due to the COVID-19 pandemic, although col-laboration on the project has been harder than usual.
Figure 15-4. The adoption of continuous integration across the three major operative systems (i.e., Windows, Linux, and Mac) facilitates the maintenance of cross-platform library requirements. The red arrows show the continuous integration badges indicat-ing the current status of the project (green when passing) and providing a link to the corresponding services (Travis-CI and AppVeyor).
Task 17: Automatic Data Processing for Topo-Bathymetric Lidar Systems: Investigate automated processing tools for topo-bathymetric lidar data, with the aim of providing output products that include uncertainty, metrics for quality assurance, and a strong visual feedback mechanism (again coordinated with our visualization team) to support user manipulation of the data. This process will involve establishing an uncertainty model for topo-bathy lidar, adapting current generation processing tools, and exploring the use of waveform shape, reflectance, and other features as aids to processing. PIs: Brian Calder and Firat Eren
JHC Participants: Kim Lowell
Other Collaborators: Chris Parrish, Jaehoon Jung, and Selina Lambert (Oregon State University/NOAA RSD); Stephen White, Gretchen Imahori, Mike Aslaksen, Nick Forfinski-Sarkozi, and Jamie Kum (NOAA RSD)
TASK 16: Phase Measuring Bathymetric Sonar Processing: Continue engineering, evaluation, and post- processing efforts for PMBS systems. Continue development of new signal processing algorithms that provide additional robustness against multipath returns when measuring the direction of arrival of incoming signals. PI: Val Schmidt
As discussed in Task 2, our research efforts with respect to Phase Measuring Bathymetric Sonars have indicated continued issues and limitations with respect to hydrographic quality data and advantage over other methods, and thus the effort on PMBS has been de-emphasized within the context of the grant. Nonetheless, Schmidt continues to keep abreast of progress with the systems and continues to work with manufacturers and software developers to increase their capability and suitability for hydrographic applications.

JHC Performance Report130
INNOVATIVE HYDROGRAPHY INNOVATIVE HYDROGRAPHY
Total Propagated Uncertainty Model for Topobathy Lidar Systems
Researchers at CCOM-JHC and Oregon State Uni-versity have developed a robust total propagated uncertainty (TPU) model for topobathymetric lidar, facilitating the growing use of lidar in hydrographic surveying workflows. The project team’s cumulative accomplishments over the past three years include multiple conference presentations and one peer-re-viewed journal publication (Eren et al., 2019) detailing the development of the model, as well as the devel-opment of production software for running the TPU tool. Termed the comprehensive Bathymetric Lidar Uncertainty Estimator (cBLUE), the software (Figure 17-1), which is implemented in Python and dissemi-nated via a GitHub repository (https://github.com/noaa-rsd/cBLUE.github.io), is currently being used operationally by NOAA/NGS and topobathymetric lidar acquisition contractors. However, prior to this year, the TPU tool supported only one topobathy-metric lidar system, the Riegl VQ-880-G. The project team’s work in the current reporting period focused on extending the functionality of the tool to support additional topobathymetric lidar systems being used by NOAA, partner agencies, and data acquisition contractors. The primary goal was to add support for the Leica/AHAB Chiroptera 4X, followed by the Teledyne/Optech CZMIL and CZMIL Nova.
An initial task in extending the topobathymetric lidar TPU tool to additional systems was to compile avail able system specifications (Table 17-1). A key para-
New generation topobathymetric (“topobathy”) lidar systems have the potential to radically change the way that lidar data is used for hydrographic map-ping. Specifically, they generate significantly denser data, albeit generally in shallower water depths, resulting in improved data and product resolution, better compatibility with modern data processing methods, and the potential to fill in detail in the shallow regions where acoustic systems are least efficient.
NOAA’s National Geodetic Survey, Remote Sensing Division (RSD) routinely uses topobathy lidar data in updating the National Shoreline, and these systems are also useful for regional sediment transport stud-ies, flood risk estimates, and emergency manage-ment. Routine ingestion of topobathy data into the hydrographic charting pipeline is, however, prob-lematic. In addition to large volumes of data being generated, which makes processing time-consuming and many tools ineffective, the topobathy data lacks a robust total propagated uncertainty model that accounts for the aircraft trajectory and laser beam ranging uncertainties as well as the behavior of the laser beam in response to waves and the water column.
In conjunction with RSD and colleagues at Oregon State University (OSU), the Center is developing tools to understand and predict the sensor uncer-tainty of typical topobathy lidar systems, and adap-tations of current-generation data processing tools to the lidar data processing problem.
Figure 17-1. Production version of topobathymetric lidar TPU tool: the comprehensive bathymetry lidar uncertainty estimator (cBLUE).

JHC Performance Report 31 January 2021 131
INNOVATIVE HYDROGRAPHY
meter for topobathymetric lidar systems is the maxi-mum depth range, Dmax. This parameter is highly system-specific, but, for all systems, varies as a func-tion of water clarity, which is often quantified by the diffuse attenuation coefficient of downwelling irradi-ance, Kd. Previous versions of the TPU tool assumed a constant value of Dmax and performed simulations to that assumed depth. In extending the TPU tool to new systems, an important enhancement was to pre-compute Dmax as a function of system and Kd. This enhancement serves two key purposes. First, it enables the software to display a warning to users when they input a file containing depths that are deeper than the expected maximum depth for a particular system and water clarity setting. Second, it improves the model by ensur-ing that all simulations are performed over the expected depth range. This pre-vents extrapolation of model parameters, avoids overfitting, and improves efficiency in the modeling process.
The TPU model is divided into two components: a subaerial component, which covers the airborne sensor to the top of the water surface, and a subaque-ous portion, which covers the water surface to seafloor. In extending the tool to additional systems, both components required updating. Due to the difficulty in analytically modeling the complex interactions of the laser pulse with the water surface and water column constitu-ents, the subaqueous portion utilizes a
Monte Carlo ray tracing approach. This portion of the model is illustrated conceptually in Figure 17-2. For a specified wind speed, a model of the water surface is created, and a large number of simulated rays intersect this water surface model and are refracted. Each individual ray may then undergo scattering and absorption within the water column. The subaque-ous uncertainty is modeled by the spread in the 3D spatial coordinates of rays reaching, and reflected by, the seafloor.
Table 17-1. System parameters for lidar systems to be supported by the topobathymetric lidar TPU tool. For each system, the maximum depth range is specified as a function of the diffuse attenuation coefficient of downwelling irradiance, Kd.
Figure 17-2. Conceptual overview of Monte Carlo ray tracing approach to sub-aqueous uncertainty modeling.
Riegl VQ-880-G Optech CZMILOptech CZMIL NOVA
Leica Chiroptera II
Leica Chiroptera 4X
Lidar Scan Angle
20 deg 20 deg 20 deg 14-20 deg 20 deg (left-right)
Half Beam Divergence Angle
1 mrad 3.5 mrad 3.5 mrad 1.5 mrad 2.375 mrad
Flight Altitude
600 m 400 m 400m 300 – 600m 400-600m
Max Depth Range
~2.6/Kd 3.75/Kd 2/Kd (shallow) 4.3/Kd (deep)
~2.4/Kd 2.7/Kd
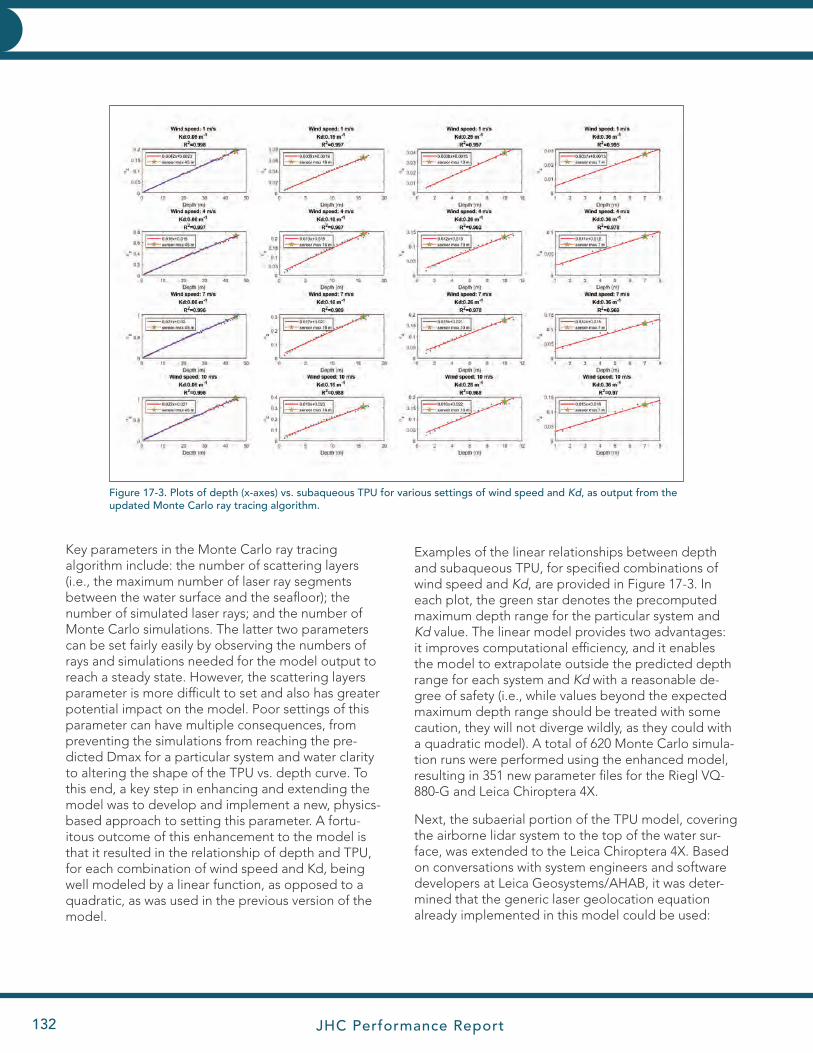
JHC Performance Report132
INNOVATIVE HYDROGRAPHY INNOVATIVE HYDROGRAPHY
Key parameters in the Monte Carlo ray tracing algorithm include: the number of scattering layers (i.e., the maximum number of laser ray segments between the water surface and the seafloor); the number of simulated laser rays; and the number of Monte Carlo simulations. The latter two parameters can be set fairly easily by observing the numbers of rays and simulations needed for the model output to reach a steady state. However, the scattering layers parameter is more difficult to set and also has greater potential impact on the model. Poor settings of this parameter can have multiple consequences, from preventing the simulations from reaching the pre-dicted Dmax for a particular system and water clarity to altering the shape of the TPU vs. depth curve. To this end, a key step in enhancing and extending the model was to develop and implement a new, physics-based approach to setting this parameter. A fortu-itous outcome of this enhancement to the model is that it resulted in the relationship of depth and TPU, for each combination of wind speed and Kd, being well modeled by a linear function, as opposed to a quadratic, as was used in the previous version of the model.
Examples of the linear relationships between depth and subaqueous TPU, for specified combinations of wind speed and Kd, are provided in Figure 17-3. In each plot, the green star denotes the precomputed maximum depth range for the particular system and Kd value. The linear model provides two advantages: it improves computational efficiency, and it enables the model to extrapolate outside the predicted depth range for each system and Kd with a reasonable de-gree of safety (i.e., while values beyond the expected maximum depth range should be treated with some caution, they will not diverge wildly, as they could with a quadratic model). A total of 620 Monte Carlo simula-tion runs were performed using the enhanced model, resulting in 351 new parameter files for the Riegl VQ-880-G and Leica Chiroptera 4X.
Next, the subaerial portion of the TPU model, covering the airborne lidar system to the top of the water sur-face, was extended to the Leica Chiroptera 4X. Based on conversations with system engineers and software developers at Leica Geosystems/AHAB, it was deter-mined that the generic laser geolocation equation already implemented in this model could be used:
Figure 17-3. Plots of depth (x-axes) vs. subaqueous TPU for various settings of wind speed and Kd, as output from the updated Monte Carlo ray tracing algorithm.
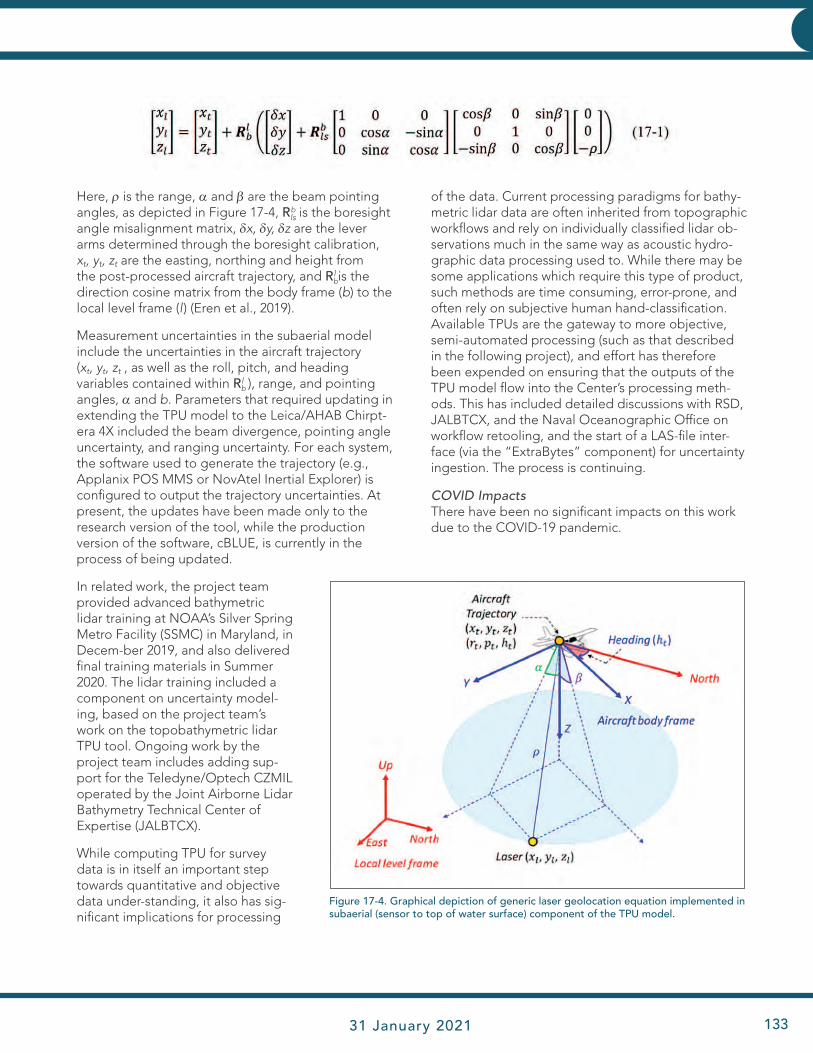
JHC Performance Report 31 January 2021 133
INNOVATIVE HYDROGRAPHY
Here, r is the range, a and b are the beam pointing angles, as depicted in Figure 17-4, Rls
b is the boresight angle misalignment matrix, dx, dy, dz are the lever arms determined through the boresight calibration, xt, yt, zt are the easting, northing and height from the post-processed aircraft trajectory, and Rb
l is the direction cosine matrix from the body frame (b) to the local level frame (l) (Eren et al., 2019).
Measurement uncertainties in the subaerial model include the uncertainties in the aircraft trajectory (xt, yt, zt , as well as the roll, pitch, and heading variables contained within Rb
l ), range, and pointing angles, a and b. Parameters that required updating in extending the TPU model to the Leica/AHAB Chirpt-era 4X included the beam divergence, pointing angle uncertainty, and ranging uncertainty. For each system, the software used to generate the trajectory (e.g., Applanix POS MMS or NovAtel Inertial Explorer) is configured to output the trajectory uncertainties. At present, the updates have been made only to the research version of the tool, while the production version of the software, cBLUE, is currently in the process of being updated.
In related work, the project team provided advanced bathymetric lidar training at NOAA’s Silver Spring Metro Facility (SSMC) in Maryland, in Decem-ber 2019, and also delivered final training materials in Summer 2020. The lidar training included a component on uncertainty model-ing, based on the project team’s work on the topobathymetric lidar TPU tool. Ongoing work by the project team includes adding sup-port for the Teledyne/Optech CZMIL operated by the Joint Airborne Lidar Bathymetry Technical Center of Expertise (JALBTCX).
While computing TPU for survey data is in itself an important step towards quantitative and objective data under-standing, it also has sig-nificant implications for processing
of the data. Current processing paradigms for bathy-metric lidar data are often inherited from topographic workflows and rely on individually classified lidar ob-servations much in the same way as acoustic hydro-graphic data processing used to. While there may be some applications which require this type of product, such methods are time consuming, error-prone, and often rely on subjective human hand-classification. Available TPUs are the gateway to more objective, semi-automated processing (such as that described in the following project), and effort has therefore been expended on ensuring that the outputs of the TPU model flow into the Center’s processing meth-ods. This has included detailed discussions with RSD, JALBTCX, and the Naval Oceanographic Office on workflow retooling, and the start of a LAS-file inter-face (via the “ExtraBytes” component) for uncertainty ingestion. The process is continuing.
COVID ImpactsThere have been no significant impacts on this work due to the COVID-19 pandemic.
Figure 17-4. Graphical depiction of generic laser geolocation equation implemented in subaerial (sensor to top of water surface) component of the TPU model.
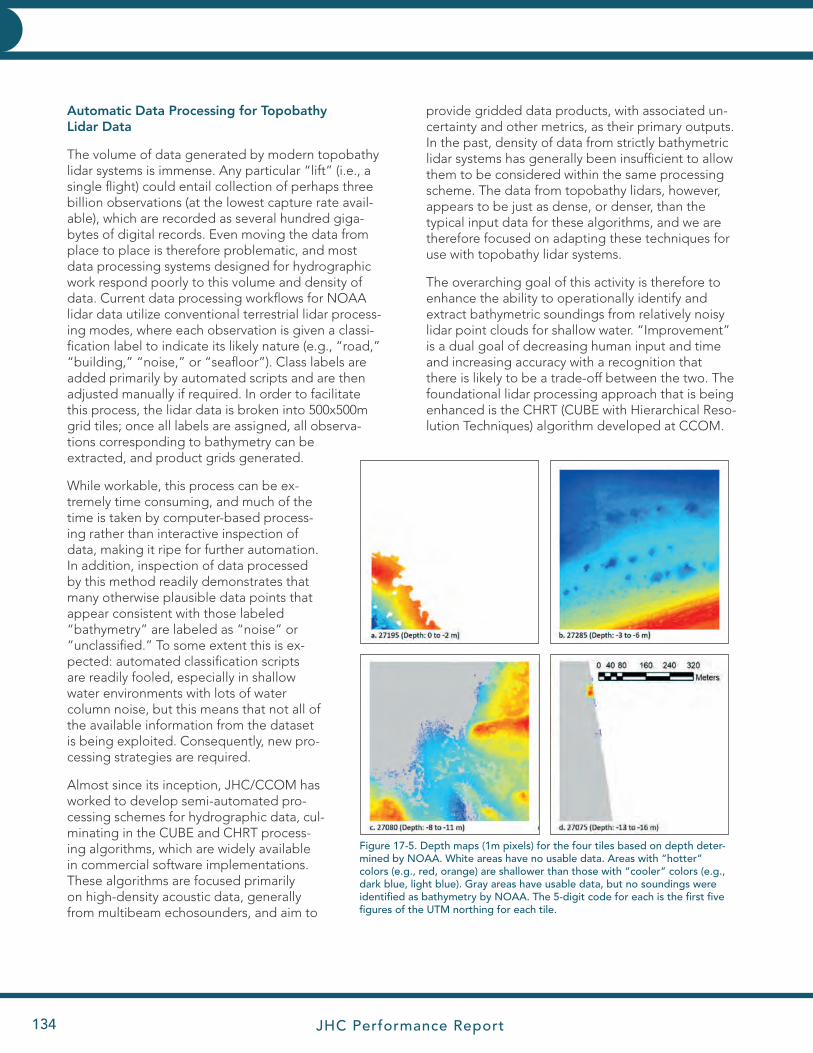
JHC Performance Report134
INNOVATIVE HYDROGRAPHY INNOVATIVE HYDROGRAPHY
provide gridded data products, with associated un-certainty and other metrics, as their primary outputs. In the past, density of data from strictly bathymetric lidar systems has generally been insufficient to allow them to be considered within the same processing scheme. The data from topobathy lidars, however, appears to be just as dense, or denser, than the typical input data for these algorithms, and we are therefore focused on adapting these techniques for use with topobathy lidar systems.
The overarching goal of this activity is therefore to enhance the ability to operationally identify and extract bathymetric soundings from relatively noisy lidar point clouds for shallow water. “Improvement” is a dual goal of decreasing human input and time and increasing accuracy with a recognition that there is likely to be a trade-off between the two. The foundational lidar processing approach that is being enhanced is the CHRT (CUBE with Hierarchical Reso-lution Techniques) algorithm developed at CCOM.
Automatic Data Processing for Topobathy Lidar Data
The volume of data generated by modern topobathy lidar systems is immense. Any particular “lift” (i.e., a single flight) could entail collection of perhaps three billion observations (at the lowest capture rate avail-able), which are recorded as several hundred giga-bytes of digital records. Even moving the data from place to place is therefore problematic, and most data processing systems designed for hydrographic work respond poorly to this volume and density of data. Current data processing workflows for NOAA lidar data utilize conventional terrestrial lidar process-ing modes, where each observation is given a classi-fication label to indicate its likely nature (e.g., “road,” “building,” “noise,” or “seafloor”). Class labels are added primarily by automated scripts and are then adjusted manually if required. In order to facilitate this process, the lidar data is broken into 500x500m grid tiles; once all labels are assigned, all observa-tions corresponding to bathymetry can be extracted, and product grids generated.
While workable, this process can be ex-tremely time consuming, and much of the time is taken by computer-based process-ing rather than interactive inspection of data, making it ripe for further automation. In addition, inspection of data processed by this method readily demonstrates that many otherwise plausible data points that appear consistent with those labeled “bathymetry” are labeled as “noise” or “unclassified.” To some extent this is ex-pected: automated classification scripts are readily fooled, especially in shallow water environments with lots of water column noise, but this means that not all of the available information from the dataset is being exploited. Consequently, new pro-cessing strategies are required.
Almost since its inception, JHC/CCOM has worked to develop semi-automated pro-cessing schemes for hydrographic data, cul-minating in the CUBE and CHRT process-ing algorithms, which are widely available in commercial software implementations. These algorithms are focused primarily on high-density acoustic data, generally from multibeam echosounders, and aim to
Figure 17-5. Depth maps (1m pixels) for the four tiles based on depth deter-mined by NOAA. White areas have no usable data. Areas with “hotter” colors (e.g., red, orange) are shallower than those with “cooler” colors (e.g., dark blue, light blue). Gray areas have usable data, but no soundings were identified as bathymetry by NOAA. The 5-digit code for each is the first five figures of the UTM northing for each tile.

JHC Performance Report 31 January 2021 135
INNOVATIVE HYDROGRAPHY
As described in previous reporting periods, the gen-eral approach is the incorporation of machine learn-ing and/or artificial intelligence (ML/AI) technique to produce a “CHRT-ML” workflow. The focus of the ML/AI approach continues to be the use of lidar sounding metadata routinely collected during data acquisition (e.g., intensity of sounding return, sounding acquired via fore or aft scan) but that currently is used for no analytical purpose, making it an adjunct to current techniques and data sources, rather than being redundant. This technique targets generation of a binary classification of data points into “bathy- metry” and “not-bathymetry,” which can then be used to augment the CHRT algorithm’s computations and decision-making process for bathymetric esti-mates of depth.
Research in the current reporting period has focused on developing an operational CHRT-ML workflow independent of NOAA procedures for identifying bathymetric lidar soundings. Four primary tasks have been undertaken during this reporting period to achieve this:
1. Finalization of procedures for fitting ML models to specific 500m x 500m tiles of raw LAS-formatted lidar data (a standard NOAA processing quantum of data).
2. Development of an independent Bathy/NotBathy sounding classification.
3. Streamlining and linking existing Python programs used for experimentation.
4. Application of streamlined software to numerous lidar tiles.
The testbed for the first three tasks are, as described in previous reporting periods, four 2016 NOAA lidar tiles from the Florida Keys whose depth ranged from 0.5 m to 20 m (the limit of lidar penetration) (Figure 17-5). The fourth task necessarily extends the work to other tiles in the 2016 NOAA lidar tiles as discussed subsequently.
Sub-task 1: Finalization of Procedures for Fitting ML Models Specific to a Single Tile
In previous reporting periods (see the Center’s 2019 Progress Report, (http://www.ccom.unh.edu/reports), it had been established that sounding metadata con-tain considerable bathymetric signal that is extract-able using ML models. It had been determined that a suite of 13 sounding metadata variables produce ML models that classify soundings as bathymetry with about 90% accuracy, and that tree-based extreme gradient boosting (XGB) is the preferred ML model-fitting technique (over logistic regression and neural networks).
Not evaluated, however, was the ability of the 13 metadata variables to improve the identification of Bathy soundings relative to only using the depth of each sounding. Three XGB models to classify sound-ings as Bathy/NotBathy have been developed using: depth alone; the 13 metadata variables alone; and the combination of depth and the metadata vari-ables. Not surprisingly, depth alone was a better in-
Figure 17-6. Left: The global accuracy, true positive rate (TPR), and true negative rate (TNR). Right: False negative rate (FNR) and false positive rate (FPR). Note that the p(Bathy) from the XGB models is classified into Bathy/NotBathy using an optimal decision threshold that addresses (sometimes severe) class imbalance as explained in the previous progress report. This has the effect of making the global accuracy, TPR, and TNR equal, and making the FPR and FNR equal.
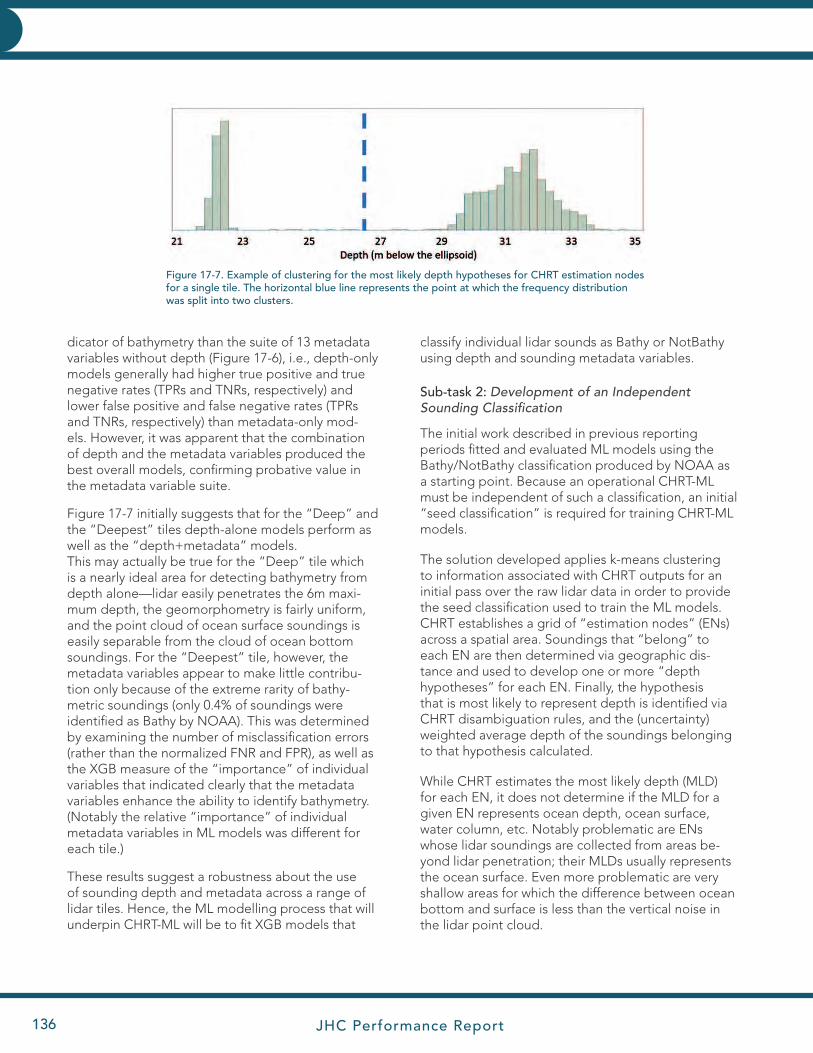
JHC Performance Report136
INNOVATIVE HYDROGRAPHY INNOVATIVE HYDROGRAPHY
classify individual lidar sounds as Bathy or NotBathy using depth and sounding metadata variables.
Sub-task 2: Development of an Independent Sounding Classification
The initial work described in previous reporting periods fitted and evaluated ML models using the Bathy/NotBathy classification produced by NOAA as a starting point. Because an operational CHRT-ML must be independent of such a classification, an initial “seed classification” is required for training CHRT-ML models.
The solution developed applies k-means clustering to information associated with CHRT outputs for an initial pass over the raw lidar data in order to provide the seed classification used to train the ML models. CHRT establishes a grid of “estimation nodes” (ENs) across a spatial area. Soundings that “belong” to each EN are then determined via geographic dis-tance and used to develop one or more “depth hypotheses” for each EN. Finally, the hypothesis that is most likely to represent depth is identified via CHRT disambiguation rules, and the (uncertainty) weighted average depth of the soundings belonging to that hypothesis calculated.
While CHRT estimates the most likely depth (MLD) for each EN, it does not determine if the MLD for a given EN represents ocean depth, ocean surface, water column, etc. Notably problematic are ENs whose lidar soundings are collected from areas be-yond lidar penetration; their MLDs usually represents the ocean surface. Even more problematic are very shallow areas for which the difference between ocean bottom and surface is less than the vertical noise in the lidar point cloud.
dicator of bathymetry than the suite of 13 metadata variables without depth (Figure 17-6), i.e., depth-only models generally had higher true positive and true negative rates (TPRs and TNRs, respectively) and lower false positive and false negative rates (TPRs and TNRs, respectively) than metadata-only mod-els. However, it was apparent that the combination of depth and the metadata variables produced the best overall models, confirming probative value in the metadata variable suite.
Figure 17-7 initially suggests that for the “Deep” and the “Deepest” tiles depth-alone models perform as well as the “depth+metadata” models. This may actually be true for the “Deep” tile which is a nearly ideal area for detecting bathymetry from depth alone—lidar easily penetrates the 6m maxi-mum depth, the geomorphometry is fairly uniform, and the point cloud of ocean surface soundings is easily separable from the cloud of ocean bottom soundings. For the “Deepest” tile, however, the metadata variables appear to make little contribu-tion only because of the extreme rarity of bathy-metric soundings (only 0.4% of soundings were identified as Bathy by NOAA). This was determined by examining the number of misclassification errors (rather than the normalized FNR and FPR), as well as the XGB measure of the “importance” of individual variables that indicated clearly that the metadata variables enhance the ability to identify bathymetry. (Notably the relative “importance” of individual metadata variables in ML models was different for each tile.)
These results suggest a robustness about the use of sounding depth and metadata across a range of lidar tiles. Hence, the ML modelling process that will underpin CHRT-ML will be to fit XGB models that
Figure 17-7. Example of clustering for the most likely depth hypotheses for CHRT estimation nodes for a single tile. The horizontal blue line represents the point at which the frequency distribution was split into two clusters.
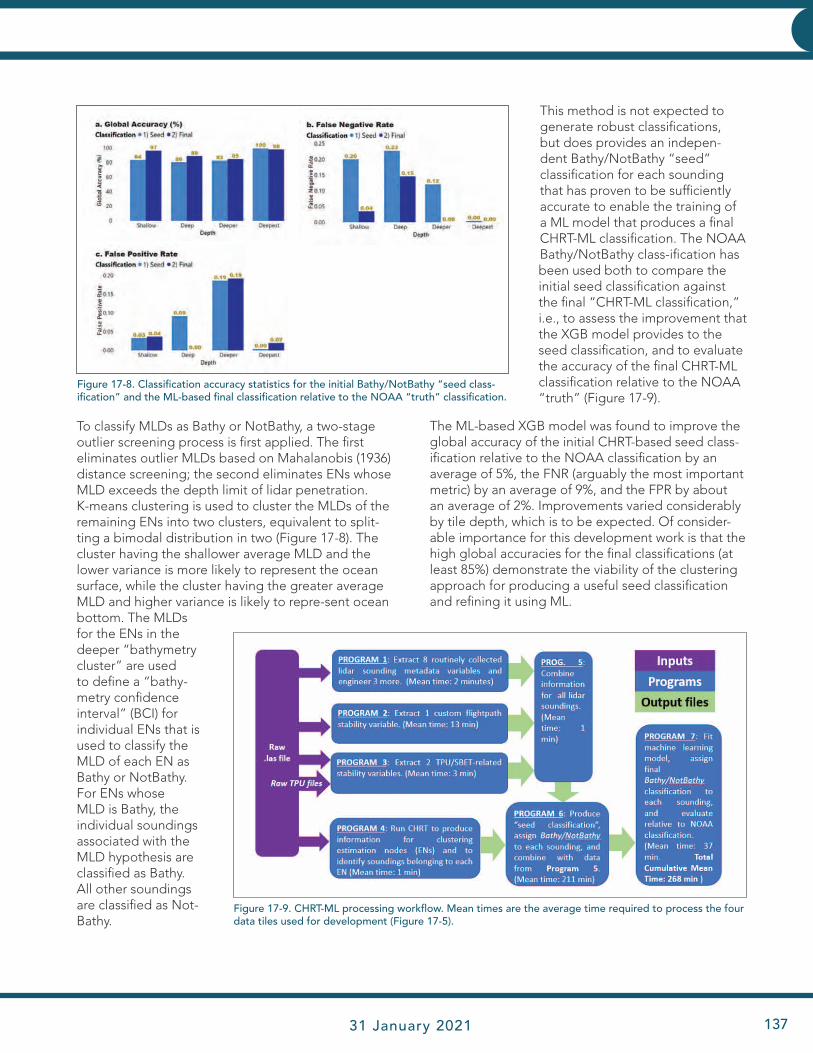
JHC Performance Report 31 January 2021 137
INNOVATIVE HYDROGRAPHY
To classify MLDs as Bathy or NotBathy, a two-stage outlier screening process is first applied. The first eliminates outlier MLDs based on Mahalanobis (1936) distance screening; the second eliminates ENs whose MLD exceeds the depth limit of lidar penetration. K-means clustering is used to cluster the MLDs of the remaining ENs into two clusters, equivalent to split-ting a bimodal distribution in two (Figure 17-8). The cluster having the shallower average MLD and the lower variance is more likely to represent the ocean surface, while the cluster having the greater average MLD and higher variance is likely to repre-sent ocean bottom. The MLDs for the ENs in the deeper “bathymetry cluster” are used to define a “bathy-metry confidence interval” (BCI) for individual ENs that is used to classify the MLD of each EN as Bathy or NotBathy. For ENs whose MLD is Bathy, the individual soundings associated with the MLD hypothesis are classified as Bathy. All other soundings are classified as Not-Bathy.
This method is not expected to generate robust classifications, but does provides an indepen-dent Bathy/NotBathy “seed” classification for each sounding that has proven to be sufficiently accurate to enable the training of a ML model that produces a final CHRT-ML classification. The NOAA Bathy/NotBathy class-ification has been used both to compare the initial seed classification against the final “CHRT-ML classification,” i.e., to assess the improvement that the XGB model provides to the seed classification, and to evaluate the accuracy of the final CHRT-ML classification relative to the NOAA “truth” (Figure 17-9).
The ML-based XGB model was found to improve the global accuracy of the initial CHRT-based seed class-ification relative to the NOAA classification by an average of 5%, the FNR (arguably the most important metric) by an average of 9%, and the FPR by about an average of 2%. Improvements varied considerably by tile depth, which is to be expected. Of consider-able importance for this development work is that the high global accuracies for the final classifications (at least 85%) demonstrate the viability of the clustering approach for producing a useful seed classification and refining it using ML.
Figure 17-8. Classification accuracy statistics for the initial Bathy/NotBathy “seed class- ification” and the ML-based final classification relative to the NOAA “truth” classification.
Figure 17-9. CHRT-ML processing workflow. Mean times are the average time required to process the four data tiles used for development (Figure 17-5).
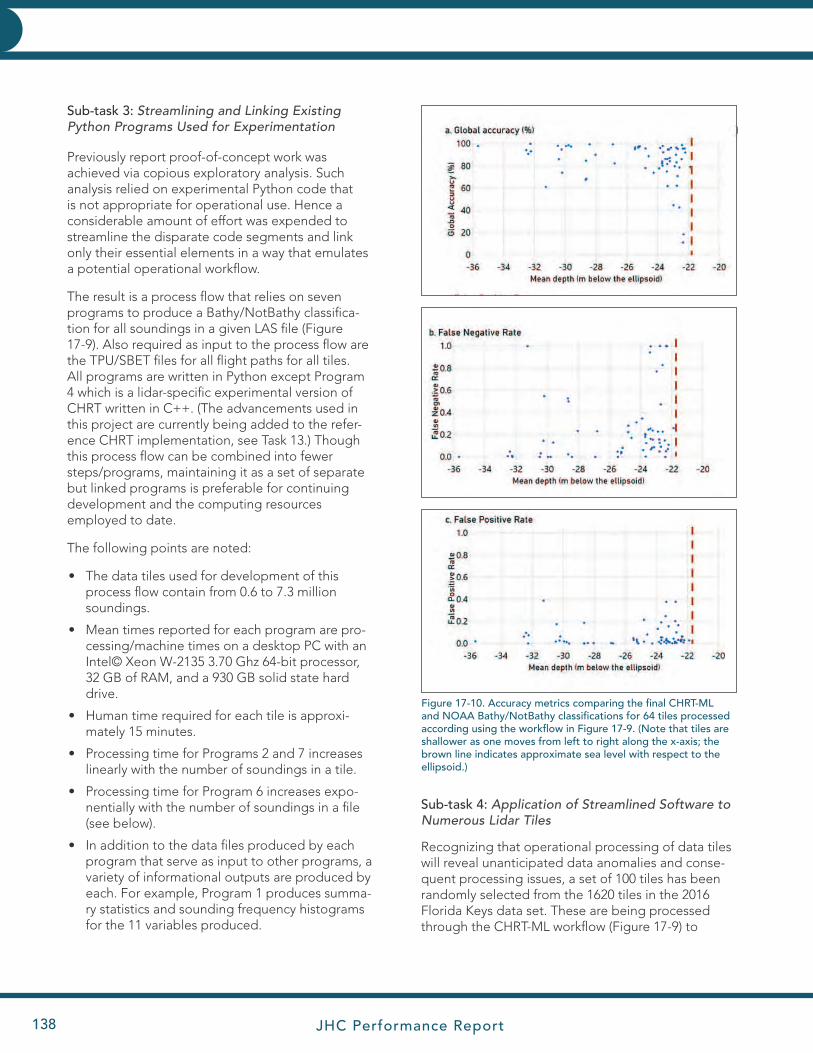
JHC Performance Report138
INNOVATIVE HYDROGRAPHY INNOVATIVE HYDROGRAPHY
Sub-task 3: Streamlining and Linking Existing Python Programs Used for Experimentation
Previously report proof-of-concept work was achieved via copious exploratory analysis. Such analysis relied on experimental Python code that is not appropriate for operational use. Hence a considerable amount of effort was expended to streamline the disparate code segments and link only their essential elements in a way that emulates a potential operational workflow.
The result is a process flow that relies on seven programs to produce a Bathy/NotBathy classifica-tion for all soundings in a given LAS file (Figure 17-9). Also required as input to the process flow are the TPU/SBET files for all flight paths for all tiles. All programs are written in Python except Program 4 which is a lidar-specific experimental version of CHRT written in C++. (The advancements used in this project are currently being added to the refer-ence CHRT implementation, see Task 13.) Though this process flow can be combined into fewer steps/programs, maintaining it as a set of separate but linked programs is preferable for continuing development and the computing resources employed to date.
The following points are noted:
• The data tiles used for development of this process flow contain from 0.6 to 7.3 million soundings.
• Mean times reported for each program are pro-cessing/machine times on a desktop PC with an Intel© Xeon W-2135 3.70 Ghz 64-bit processor, 32 GB of RAM, and a 930 GB solid state hard drive.
• Human time required for each tile is approxi-mately 15 minutes.
• Processing time for Programs 2 and 7 increases linearly with the number of soundings in a tile.
• Processing time for Program 6 increases expo-nentially with the number of soundings in a file (see below).
• In addition to the data files produced by each program that serve as input to other programs, a variety of informational outputs are produced by each. For example, Program 1 produces summa-ry statistics and sounding frequency histograms for the 11 variables produced.
Figure 17-10. Accuracy metrics comparing the final CHRT-ML and NOAA Bathy/NotBathy classifications for 64 tiles processed according using the workflow in Figure 17-9. (Note that tiles are shallower as one moves from left to right along the x-axis; the brown line indicates approximate sea level with respect to the ellipsoid.)
Sub-task 4: Application of Streamlined Software to Numerous Lidar Tiles
Recognizing that operational processing of data tiles will reveal unanticipated data anomalies and conse-quent processing issues, a set of 100 tiles has been randomly selected from the 1620 tiles in the 2016 Florida Keys data set. These are being processed through the CHRT-ML workflow (Figure 17-9) to

JHC Performance Report 31 January 2021 139
INNOVATIVE HYDROGRAPHY
identify those anomalies and data issues, assess method accuracy beyond the four tiles used for development, and gain insight into the robustness of the methodology. At the time of reporting, 60 tiles plus the four tiles used for development had been processed.
The final CHRT-ML Bathy/NotBathy classification generally has produced a global accuracy above 75% compared to the NOAA “truth” (Figure 17-10a). The FNR (Figure 17-10b) is generally below 0.25, although for some tiles, the FNR is 1.0 indicating that no Bathy soundings have been correctly classified; this will be discussed shortly. Generally, the FPR (Figure 17-10c) is below 0.20. Other than a somewhat expected tendency for the CHRT-ML method to perform most poorly in areas less than 2 m deep (between ap-proximately -22 and -24 m, relative to the ellipsoid, in Figure 17-10), no clear relationship between accuracy and depth has manifested itself.
A preliminary examination of the CHRT-ML errors has begun. For example, two of the tiles having a FNR of 1.0 (i.e., 0% of NOAA Bathy soundings correctly iden-tified) were found to be comprised at least 99.997% of NotBathy soundings; such tiles are problematic re-gardless of the processing methodology. Proximity to human infrastructure, substrate, and geomorphom-etry are additional potential problems identified. As visual examples, the tiles in Figure 17-11 have high FNRs – 0.998 (left), 1.0 (middle) and 0.77 (right). In Figure 17-11 (left) there is a clear mismatch between NOAA’s (red) and CHRT-ML’s (gold) Bathy soundings apparently due to different processing procedures in proximity to human infrastructure. The substrate of the middle and right tiles appears to be coral reef
which may change the characteristics of lidar returns. The tile on the right has the compounding problem of containing a channel that probably causes a rapid increase in depth at channel edge which the current CHRT-ML method of classifying soundings as Bathy or NotBathy is poorly equipped to handle.
To facilitate improvement of CHRT-ML and identify such issues, also developed during this reporting period is a way to examine the spatial structure of misclassifications. Figure 17-12 is for the “Deeper” tile (Figure 17-5c). It identifies areas of higher- (brown) and lower-than-expected (green) misclassification errors. It is produced by comparing NOAA’s Bathy/NotBathy classification with CHRT-ML’s. For this tile, comparison with depth (Figure 17-5c) indicates that the cluster of FNs (undetected bathymetry) in the west-central por-tion of the tile (Figure 17-12a) is associated with shal-low depths. This type of insight will prove invaluable for improving CHRT-ML.
Cursory examination of individual soundings has also suggested there are gradations of “errors” by CHRT-ML. Though some FNs and FPs are clearly er-rors, others are not, e.g., soundings close in depth and geographic proximity to NOAA-identified Bathy soundings, but that NOAA has identified as NotBathy. Rigorously assessing how many CHRT-ML FNs and FPs are such “understandable” errors will be useful for better understanding if CHRT-ML performs within an acceptable range for operational use.
Finally, because the goal of this task is operational im-provement of processing, human and processing time has been examined. Human time per tile is a reason-ably modest 15 minutes. Machine processing time,
Figure 17-11. Examples of tiles (approximate outline in white) for which the false negative rate is high due to (presumably) non-standard NOAA lidar processing (left), substrate (middle), and substrate and geomorphometry (right). (In the left-most fig-ure, NOAA Bathy soundings are red and CHRT-ML soundings are orange. Soundings have been thinned via random sampling for clarity.)
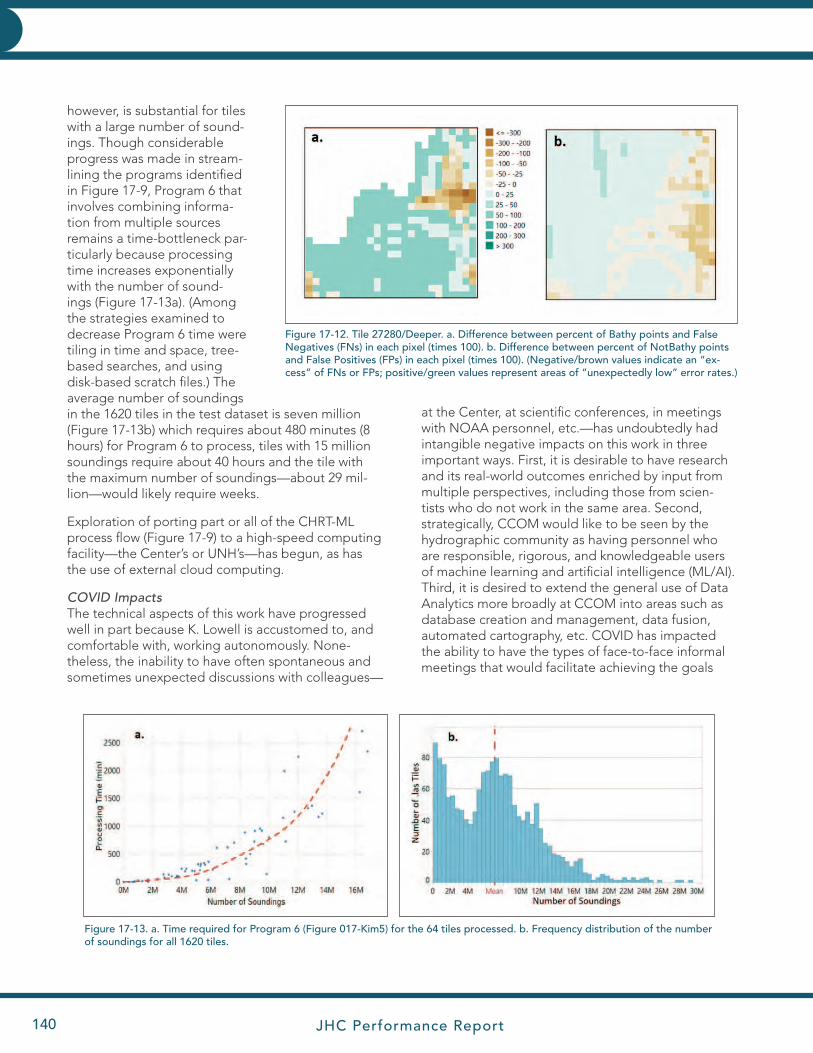
JHC Performance Report140
INNOVATIVE HYDROGRAPHY INNOVATIVE HYDROGRAPHY
however, is substantial for tiles with a large number of sound-ings. Though considerable progress was made in stream-lining the programs identified in Figure 17-9, Program 6 that involves combining informa-tion from multiple sources remains a time-bottleneck par-ticularly because processing time increases exponentially with the number of sound-ings (Figure 17-13a). (Among the strategies examined to decrease Program 6 time were tiling in time and space, tree-based searches, and using disk-based scratch files.) The average number of soundings in the 1620 tiles in the test dataset is seven million (Figure 17-13b) which requires about 480 minutes (8 hours) for Program 6 to process, tiles with 15 million soundings require about 40 hours and the tile with the maximum number of soundings—about 29 mil-lion—would likely require weeks.
Exploration of porting part or all of the CHRT-ML process flow (Figure 17-9) to a high-speed computing facility—the Center’s or UNH’s—has begun, as has the use of external cloud computing.
COVID ImpactsThe technical aspects of this work have progressed well in part because K. Lowell is accustomed to, and comfortable with, working autonomously. None-theless, the inability to have often spontaneous and sometimes unexpected discussions with colleagues—
at the Center, at scientific conferences, in meetings with NOAA personnel, etc.—has undoubtedly had intangible negative impacts on this work in three important ways. First, it is desirable to have research and its real-world outcomes enriched by input from multiple perspectives, including those from scien-tists who do not work in the same area. Second, strategically, CCOM would like to be seen by the hydrographic community as having personnel who are responsible, rigorous, and knowledgeable users of machine learning and artificial intelligence (ML/AI). Third, it is desired to extend the general use of Data Analytics more broadly at CCOM into areas such as database creation and management, data fusion, automated cartography, etc. COVID has impacted the ability to have the types of face-to-face informal meetings that would facilitate achieving the goals
Figure 17-13. a. Time required for Program 6 (Figure 017-Kim5) for the 64 tiles processed. b. Frequency distribution of the number of soundings for all 1620 tiles.
Figure 17-12. Tile 27280/Deeper. a. Difference between percent of Bathy points and False Negatives (FNs) in each pixel (times 100). b. Difference between percent of NotBathy points and False Positives (FPs) in each pixel (times 100). (Negative/brown values indicate an “ex-cess” of FNs or FPs; positive/green values represent areas of “unexpectedly low” error rates.)
JHC Performance Report 31 January 2021 141
INNOVATIVE HYDROGRAPHY
THEME 1.B.2: Identification and Mapping of Fixed and Transient Features of the Seafloor and Water Column
Sub-Theme: SEAFLOOR
TASK 18: Hydro-Significant Object Detection: Develop algorithms to automatically detect objects attached to the seafloor that might be hydrographically significant and, if possible, to determine their character (e.g., natural or anthropogenic) using all available sources of data, including information about the local environment. Provide directed visual feedback to the user, ideally in a quantitative manner, on the objects in the area that might be hydrographically significant, preferably in order from most significant to least; and to seed geodatabases with the information in a manner that addresses downstream use of the detections. Investigate the development of tools that address the issue of correlation between different data sources for the objects detected, both algorithmically and visually, so that objects can be tracked over time and compared with prior information on location. PIs: Brian Calder and Giuseppe Masetti
JHC Participants: Larry Mayer, Larry Ward, and Zach McAvoy
Other Collaborators: Derek Sowers (NOAA OER)
Detection and management of objects in a hydro-graphic workflow can be a significant resource burden. Hydrographically significant objects are often small and close to the skin-of-the-earth bathymetric surface and are therefore difficult to identify in survey data. In addition, once potential objects are identified, they have to be correlated to other sources of information and then managed throughout the processing lifetime of the survey. Algorithms to identify, classify, and man-age such objects are therefore beneficial to efficient survey operations and down-stream data processing.
In the context of the QC Tools project (see Task 15), JHC/CCOM have developed a number of algorithms to detect “fliers” in bathymetric data, defined as points in the bathymetric surface that are not consis-tent with the surrounding terrain. Although the intent is different, there is an obvious similarity between this process and identification of “objects,” and adapta-tion of such techniques of object detection may be a fruitful line of exploration.
Background Seafloor Segmentation
Recognizing that spatial context in detection is likely to be important in the development of future object detection algorithms, Giuseppe Masetti, Larry Mayer, and Larry Ward have recently started a project to automatically segment the seafloor in homogeneous areas through a combination of information from both backscatter and bathymetric observations. The perfor-mance of detection algorithms for objects (e.g., in the mine countermeasures community) is known to often be data-set specific. That is, algorithms that work well in the context of one dataset may not translate well to
another without at least re-estimation of parameters. A robust algorithm, therefore, needs to be able to un-derstand its background in order to adapt; in essence, the algorithm needs to be taught what the different haystacks look like before trying to find the needles.
The proposed method attempts to mimic the ap-proach taken by a skilled analyst, that first evaluates the context of the area, attempting to take full ad-vantage of both bathymetric and reflectivity products rather than focusing on small-scale geomorphometric variability (e.g., local rugosity). The result is a bathy-metry- and reflectivity-based estimator for seafloor segmentation (BRESS) that models these positive aspects of the analyst’s segmentation methods but avoids the inherent deficiencies such as subjectivity, processing time, and lack of reproducibility.
BRESS has been used in a number of applications, in-cluding development of a four-type classification table that has been applied to large Extended Continental Shelf datasets through a collaboration with Derek Sowers (NOAA OER) and better handling of various coordinate reference systems. In the current reporting period, Ward has also used the technique in the inner shelf of Long Island Sound, and south of Cape Cod (see Task 21). An article on the use of BRESS, “Stan-dardized Geomorphic Classification of Seafloor within the United States Atlantic Canyons and Continental Margin,” containing the latest BRESS improvements, has been published in Frontiers in Marine Sciences (http://dx.doi.org/10.3389/ fmars.2020.00009). Finally, a paper describing the application of BRESS for stan-dardized segmentation and marine ecological classifi-cation of the U.S. Atlantic Margin (Figure 18-1) is in the

JHC Performance Report142
INNOVATIVE HYDROGRAPHY INNOVATIVE HYDROGRAPHY
final preparation phase for submission. See Task 50 for more details on these applications of BRESS.
Detection of Anomalies in Backscatter Mosaics
Hydrographically significant objects are often de-tected in sidescan or backscatter imagery, rather than through bathymetry, depending on the survey modal-ity. Graduate student Jordan Pierce, therefore, has been conducting research to show how deep learn-ing and computer vision algorithms could be used to detect and classify anomalies within backscatter when represented as an image. Specifically, the project used the backscatter mosaic of NOAA survey H12642, along with the manually annotated anomalies found within it to train deep learning models to accomplish three different computer vision tasks: image classifica-tion, object detection, and semantic segmentation.
The ground-truth location for each anomaly was used to create a dataset consisting of images and their cor-responding labels consistent with each of the com-puter vision tasks. For image classification, positive samples were created by cropping image patches (60 pixels x 60 pixels) centered on each anomaly, while negative samples were created by randomly cropping the remainder of the image. For object detection, the open-source image annotation tool LabelImg was
used to create bounding box annotations for each anomaly which were later converted into per-pixel annotations to serve as the labels required for semantic segmentation.
All deep learning models used the ResNet-50 encoder as the core feature extractor and were initialized with pre-trained weights learned from the ImageNet dataset. For image classification a con-volutional neural network (CNN) was trained; a Mask-RCNN algorithm was trained for object detection, and a UNet algorithm for semantic segmentation. Training included various regular- ization techniques such as random dropout and image augmentation causing models to work harder to learn key features associated with anomalies.
From the results, the CNN trained as an image class-ifier did the best at determining whether an image patch was an anomaly or just bare surface and obtained a classification accuracy of 97% on the test set (N = 2500). Unfortunately, in its current state it lacks the ability to efficiently locate an anomaly within an image. However, when equipped with such a region proposal system, the Mask-RCNN performs less reliably at identifying all the anomalies within a given image (Figure 18-2).
Figure 18-1. Maps showing graduated vertical mound relief symbols (left panels) and landform classifications draped on bathymetry (right panels) for Jellyfish Mounds (A) and Richardson Mounds (B).
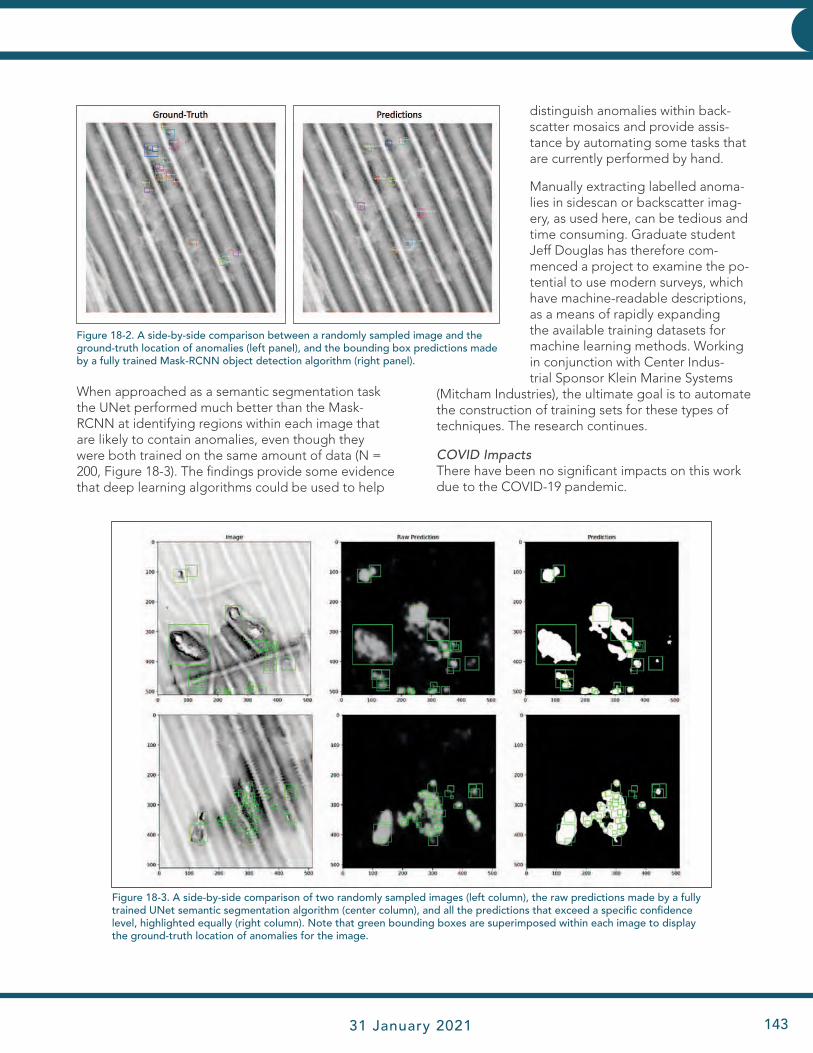
JHC Performance Report 31 January 2021 143
INNOVATIVE HYDROGRAPHY
When approached as a semantic segmentation task the UNet performed much better than the Mask-RCNN at identifying regions within each image that are likely to contain anomalies, even though they were both trained on the same amount of data (N = 200, Figure 18-3). The findings provide some evidence that deep learning algorithms could be used to help
distinguish anomalies within back-scatter mosaics and provide assis-tance by automating some tasks that are currently performed by hand.
Manually extracting labelled anoma-lies in sidescan or backscatter imag-ery, as used here, can be tedious and time consuming. Graduate student Jeff Douglas has therefore com-menced a project to examine the po-tential to use modern surveys, which have machine-readable descriptions, as a means of rapidly expanding the available training datasets for machine learning methods. Working in conjunction with Center Indus-trial Sponsor Klein Marine Systems
(Mitcham Industries), the ultimate goal is to automate the construction of training sets for these types of techniques. The research continues.
COVID ImpactsThere have been no significant impacts on this work due to the COVID-19 pandemic.
Figure 18-2. A side-by-side comparison between a randomly sampled image and the ground-truth location of anomalies (left panel), and the bounding box predictions made by a fully trained Mask-RCNN object detection algorithm (right panel).
Figure 18-3. A side-by-side comparison of two randomly sampled images (left column), the raw predictions made by a fully trained UNet semantic segmentation algorithm (center column), and all the predictions that exceed a specific confidence level, highlighted equally (right column). Note that green bounding boxes are superimposed within each image to display the ground-truth location of anomalies for the image.
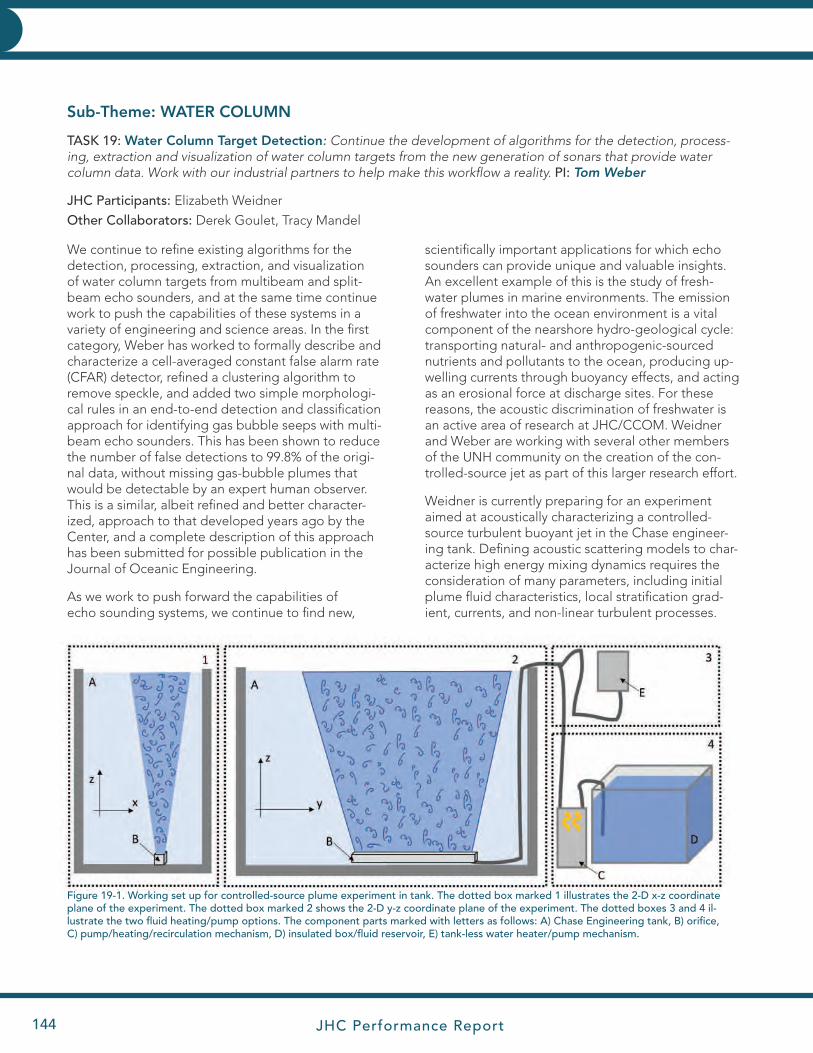
JHC Performance Report144
INNOVATIVE HYDROGRAPHY INNOVATIVE HYDROGRAPHY
Sub-Theme: WATER COLUMN
TASK 19: Water Column Target Detection: Continue the development of algorithms for the detection, process-ing, extraction and visualization of water column targets from the new generation of sonars that provide water column data. Work with our industrial partners to help make this workflow a reality. PI: Tom Weber
JHC Participants: Elizabeth Weidner
Other Collaborators: Derek Goulet, Tracy Mandel
We continue to refine existing algorithms for the detection, processing, extraction, and visualization of water column targets from multibeam and split-beam echo sounders, and at the same time continue work to push the capabilities of these systems in a variety of engineering and science areas. In the first category, Weber has worked to formally describe and characterize a cell-averaged constant false alarm rate (CFAR) detector, refined a clustering algorithm to remove speckle, and added two simple morphologi-cal rules in an end-to-end detection and classification approach for identifying gas bubble seeps with multi-beam echo sounders. This has been shown to reduce the number of false detections to 99.8% of the origi-nal data, without missing gas-bubble plumes that would be detectable by an expert human observer. This is a similar, albeit refined and better character-ized, approach to that developed years ago by the Center, and a complete description of this approach has been submitted for possible publication in the Journal of Oceanic Engineering.
As we work to push forward the capabilities of echo sounding systems, we continue to find new,
scientifically important applications for which echo sounders can provide unique and valuable insights. An excellent example of this is the study of fresh-water plumes in marine environments. The emission of freshwater into the ocean environment is a vital component of the nearshore hydro-geological cycle: transporting natural- and anthropogenic-sourced nutrients and pollutants to the ocean, producing up-welling currents through buoyancy effects, and acting as an erosional force at discharge sites. For these reasons, the acoustic discrimination of freshwater is an active area of research at JHC/CCOM. Weidner and Weber are working with several other members of the UNH community on the creation of the con-trolled-source jet as part of this larger research effort.
Weidner is currently preparing for an experiment aimed at acoustically characterizing a controlled-source turbulent buoyant jet in the Chase engineer-ing tank. Defining acoustic scattering models to char-acterize high energy mixing dynamics requires the consideration of many parameters, including initial plume fluid characteristics, local stratification grad-ient, currents, and non-linear turbulent processes.
Figure 19-1. Working set up for controlled-source plume experiment in tank. The dotted box marked 1 illustrates the 2-D x-z coordinate plane of the experiment. The dotted box marked 2 shows the 2-D y-z coordinate plane of the experiment. The dotted boxes 3 and 4 il-lustrate the two fluid heating/pump options. The component parts marked with letters as follows: A) Chase Engineering tank, B) orifice, C) pump/heating/recirculation mechanism, D) insulated box/fluid reservoir, E) tank-less water heater/pump mechanism.
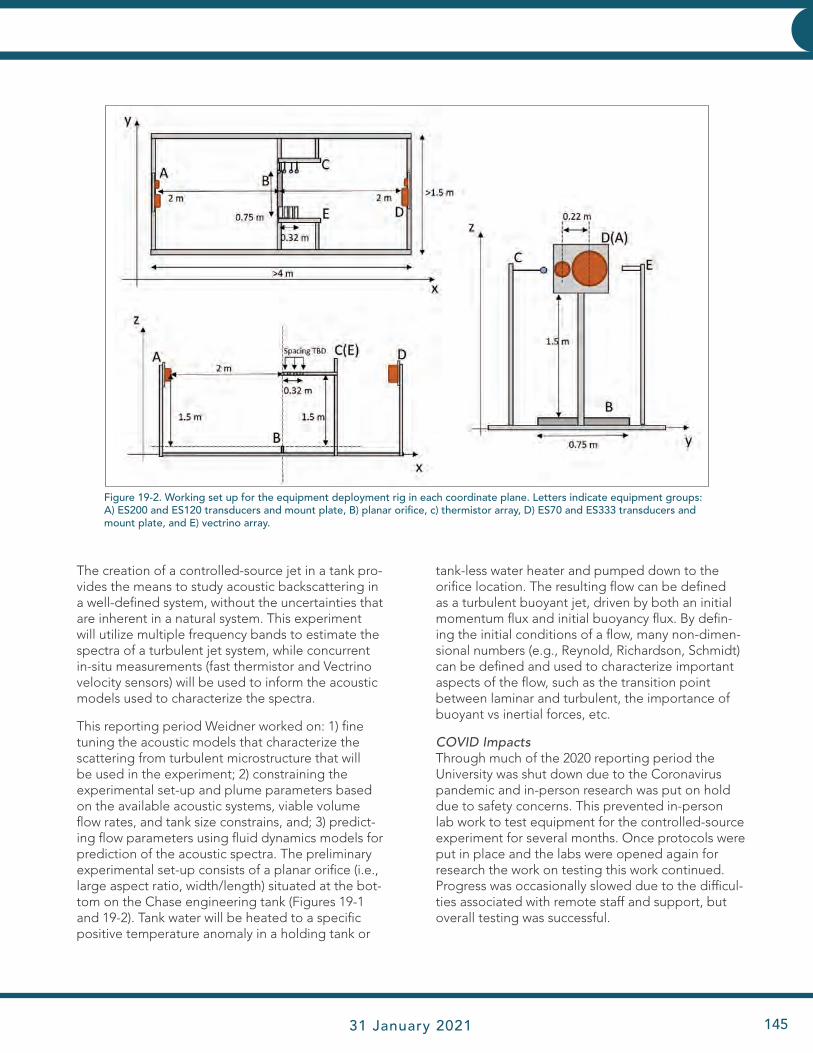
JHC Performance Report 31 January 2021 145
INNOVATIVE HYDROGRAPHY
The creation of a controlled-source jet in a tank pro-vides the means to study acoustic backscattering in a well-defined system, without the uncertainties that are inherent in a natural system. This experiment will utilize multiple frequency bands to estimate the spectra of a turbulent jet system, while concurrent in-situ measurements (fast thermistor and Vectrino velocity sensors) will be used to inform the acoustic models used to characterize the spectra.
This reporting period Weidner worked on: 1) fine tuning the acoustic models that characterize the scattering from turbulent microstructure that will be used in the experiment; 2) constraining the experimental set-up and plume parameters based on the available acoustic systems, viable volume flow rates, and tank size constrains, and; 3) predict-ing flow parameters using fluid dynamics models for prediction of the acoustic spectra. The preliminary experimental set-up consists of a planar orifice (i.e., large aspect ratio, width/length) situated at the bot-tom on the Chase engineering tank (Figures 19-1 and 19-2). Tank water will be heated to a specific positive temperature anomaly in a holding tank or
tank-less water heater and pumped down to the orifice location. The resulting flow can be defined as a turbulent buoyant jet, driven by both an initial momentum flux and initial buoyancy flux. By defin-ing the initial conditions of a flow, many non-dimen-sional numbers (e.g., Reynold, Richardson, Schmidt) can be defined and used to characterize important aspects of the flow, such as the transition point between laminar and turbulent, the importance of buoyant vs inertial forces, etc.
COVID ImpactsThrough much of the 2020 reporting period the University was shut down due to the Coronavirus pandemic and in-person research was put on hold due to safety concerns. This prevented in-person lab work to test equipment for the controlled-source experiment for several months. Once protocols were put in place and the labs were opened again for research the work on testing this work continued. Progress was occasionally slowed due to the difficul-ties associated with remote staff and support, but overall testing was successful.
Figure 19-2. Working set up for the equipment deployment rig in each coordinate plane. Letters indicate equipment groups: A) ES200 and ES120 transducers and mount plate, B) planar orifice, c) thermistor array, D) ES70 and ES333 transducers and mount plate, and E) vectrino array.

JHC Performance Report146
INNOVATIVE HYDROGRAPHY INNOVATIVE HYDROGRAPHY
Gas bubbles in liquid mediums play an important role in many areas of active research, such as bio-medical applications, industrial processes, resource extraction, fisheries science, and climate change. Our interest is in studying methane gas bubbles that are released into the ocean through the sea floor. Acoustic methods have been employed for several decades to assess the temporal and spatial distribution of methane gas seeps in the ocean. Acoustic technology has advanced to facilitate the inversion of the acoustic response of gas bubbles
in the ocean into estimates of physical parameters of the gas bubbles (i.e., rise velocity, rise trajec-tory, bubble size, etc.). These inversion techniques relate estimates of the backscattering cross-section of the gas bubble to existing analytical models of gas bubble scattering in liquid mediums. However, these analytical scattering models assume that the gas bubbles are spherical in shape and that their size is much smaller than the ensonified wave-length. Therefore, if one or more of these assump-tions are violated, there could be potential errors in the acoustic inversion results.
Graduate student Alex Padilla’s work focuses on understanding how non-sphericity and surface coatings of gas bubbles affect the acoustic scatter-ing properties of gas bubbles. Padilla conducted two tank experiments to ensonify non-spherical bubbles (Figure 20-1) over 8-20 kHz and 90-260 kHz to observe the broadband frequency response of these bubbles and compare them to several analytical scattering bubble models (Figure 20-2). The results of this study have shown that the variability in acoustic backscattering of single gas bubbles can be partially explained by variations in the shape, size, and orientation of the gas bubble as it rises through the water column. In addition, these results will provide insight on the limitations and levels of uncertainty when using these analyti-cal models for acoustic inversion techniques for
Research Requirement 1.C: Seafloor Characterization, Habitat, and Resources
FFO Requirement 1.C: “Adaption and improvement of hydrographic survey and ocean mapping technolo-gies for improved coastal resilience and the location, characterization, and management of critical marine habitat and coastal and continental shelf marine resources.”
THEME: 1.C.1 Coastal and Continental Shelf ResourcesSub-Theme: RESOURCES
TASK 20: Mapping Gas and Leaky Pipelines in the Water Column: Refine and enhance water column mapping tools to better understand our ability to map/monitor leaky systems and dispersed clouds of oil, with a focus on high frequency shelf-mapping systems, which present a more challenging environment with respect to volume reverberation. PI: Tom Weber
Project: Broadband Acoustic Measurements of Liquid Hydrocarbon Droplets and Gas in the Water Column
JHC Participants: Alexandra Padilla, Elizabeth Weidner, and Larry Mayer
Funding: This work has been funded by a combination of the JHC grant, BSEE (DOI), and NSF
Figure 20-1. High-resolution images of non-spherical gas bubbles that were analyzed acoustical during laboratory experiments con-ducted in 2019.
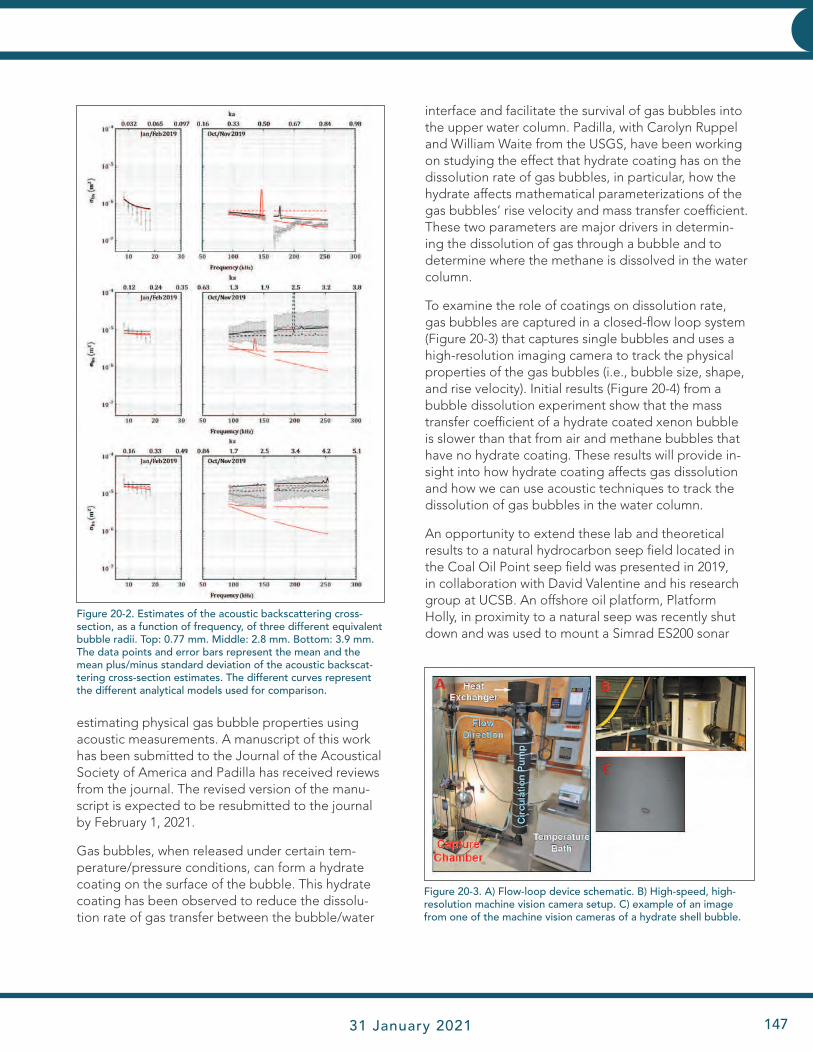
JHC Performance Report 31 January 2021 147
INNOVATIVE HYDROGRAPHY
estimating physical gas bubble properties using acoustic measurements. A manuscript of this work has been submitted to the Journal of the Acoustical Society of America and Padilla has received reviews from the journal. The revised version of the manu-script is expected to be resubmitted to the journal by February 1, 2021.
Gas bubbles, when released under certain tem-perature/pressure conditions, can form a hydrate coating on the surface of the bubble. This hydrate coating has been observed to reduce the dissolu-tion rate of gas transfer between the bubble/water
Figure 20-2. Estimates of the acoustic backscattering cross-section, as a function of frequency, of three different equivalent bubble radii. Top: 0.77 mm. Middle: 2.8 mm. Bottom: 3.9 mm. The data points and error bars represent the mean and the mean plus/minus standard deviation of the acoustic backscat-tering cross-section estimates. The different curves represent the different analytical models used for comparison.
interface and facilitate the survival of gas bubbles into the upper water column. Padilla, with Carolyn Ruppel and William Waite from the USGS, have been working on studying the effect that hydrate coating has on the dissolution rate of gas bubbles, in particular, how the hydrate affects mathematical parameterizations of the gas bubbles’ rise velocity and mass transfer coefficient. These two parameters are major drivers in determin-ing the dissolution of gas through a bubble and to determine where the methane is dissolved in the water column.
To examine the role of coatings on dissolution rate, gas bubbles are captured in a closed-flow loop system (Figure 20-3) that captures single bubbles and uses a high-resolution imaging camera to track the physical properties of the gas bubbles (i.e., bubble size, shape, and rise velocity). Initial results (Figure 20-4) from a bubble dissolution experiment show that the mass transfer coefficient of a hydrate coated xenon bubble is slower than that from air and methane bubbles that have no hydrate coating. These results will provide in-sight into how hydrate coating affects gas dissolution and how we can use acoustic techniques to track the dissolution of gas bubbles in the water column.
An opportunity to extend these lab and theoretical results to a natural hydrocarbon seep field located in the Coal Oil Point seep field was presented in 2019, in collaboration with David Valentine and his research group at UCSB. An offshore oil platform, Platform Holly, in proximity to a natural seep was recently shut down and was used to mount a Simrad ES200 sonar
Figure 20-3. A) Flow-loop device schematic. B) High-speed, high-resolution machine vision camera setup. C) example of an image from one of the machine vision cameras of a hydrate shell bubble.
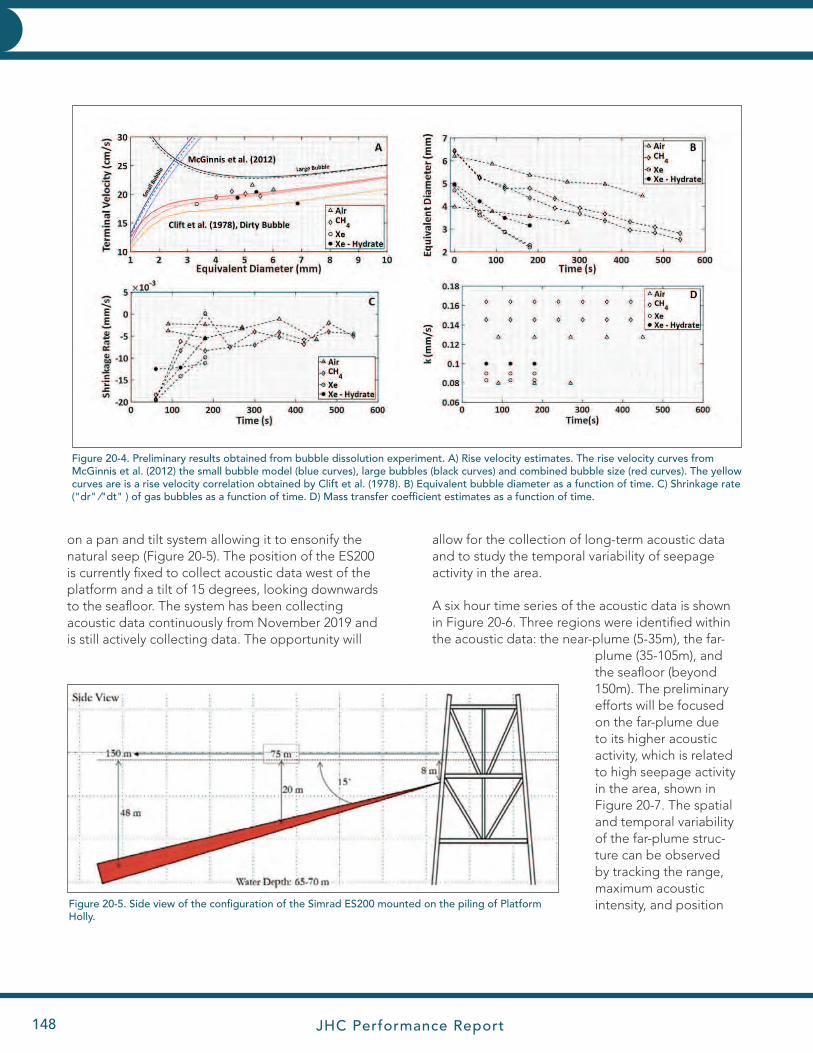
JHC Performance Report148
INNOVATIVE HYDROGRAPHY INNOVATIVE HYDROGRAPHY
on a pan and tilt system allowing it to ensonify the natural seep (Figure 20-5). The position of the ES200 is currently fixed to collect acoustic data west of the platform and a tilt of 15 degrees, looking downwards to the seafloor. The system has been collecting acoustic data continuously from November 2019 and is still actively collecting data. The opportunity will
allow for the collection of long-term acoustic data and to study the temporal variability of seepage activity in the area.
A six hour time series of the acoustic data is shown in Figure 20-6. Three regions were identified within the acoustic data: the near-plume (5-35m), the far-
plume (35-105m), and the seafloor (beyond 150m). The preliminary efforts will be focused on the far-plume due to its higher acoustic activity, which is related to high seepage activity in the area, shown in Figure 20-7. The spatial and temporal variability of the far-plume struc-ture can be observed by tracking the range, maximum acoustic intensity, and position
Figure 20-4. Preliminary results obtained from bubble dissolution experiment. A) Rise velocity estimates. The rise velocity curves from McGinnis et al. (2012) the small bubble model (blue curves), large bubbles (black curves) and combined bubble size (red curves). The yellow curves are is a rise velocity correlation obtained by Clift et al. (1978). B) Equivalent bubble diameter as a function of time. C) Shrinkage rate ("dr" ⁄"dt" ) of gas bubbles as a function of time. D) Mass transfer coefficient estimates as a function of time.
Figure 20-5. Side view of the configuration of the Simrad ES200 mounted on the piling of Platform Holly.
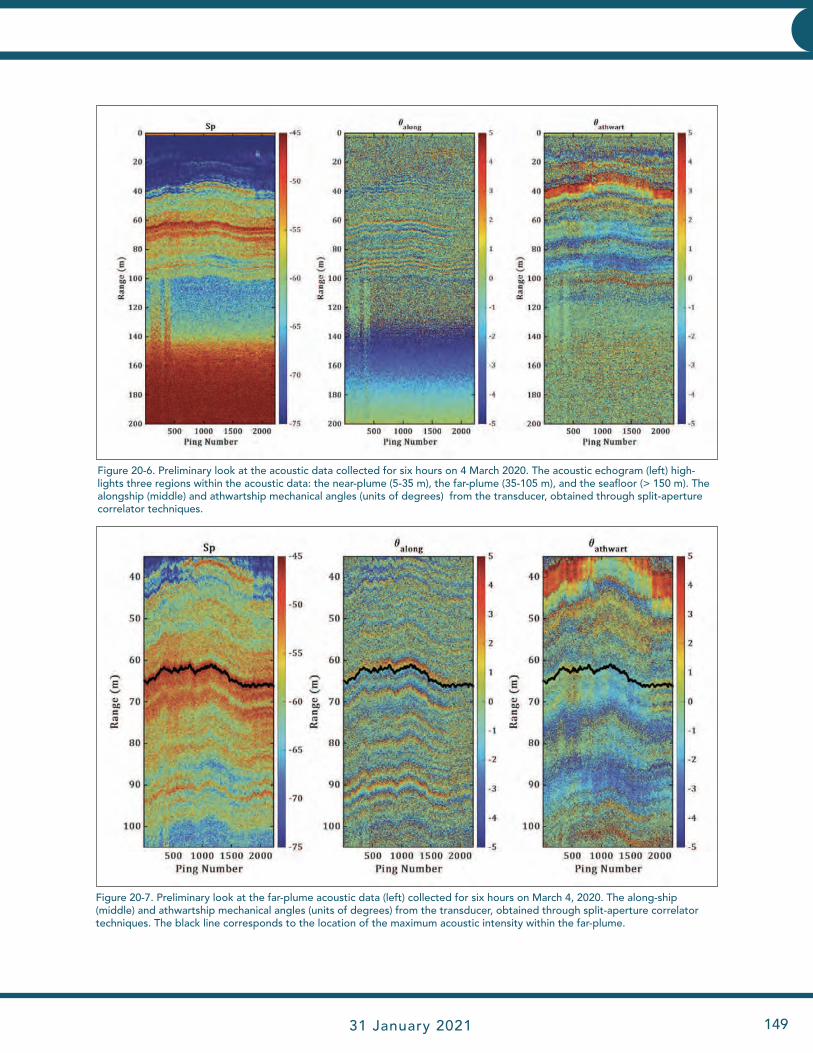
JHC Performance Report 31 January 2021 149
INNOVATIVE HYDROGRAPHY
Figure 20-6. Preliminary look at the acoustic data collected for six hours on 4 March 2020. The acoustic echogram (left) high-lights three regions within the acoustic data: the near-plume (5-35 m), the far-plume (35-105 m), and the seafloor (> 150 m). The alongship (middle) and athwartship mechanical angles (units of degrees) from the transducer, obtained through split-aperture correlator techniques.
Figure 20-7. Preliminary look at the far-plume acoustic data (left) collected for six hours on March 4, 2020. The along-ship (middle) and athwartship mechanical angles (units of degrees) from the transducer, obtained through split-aperture correlator techniques. The black line corresponds to the location of the maximum acoustic intensity within the far-plume.
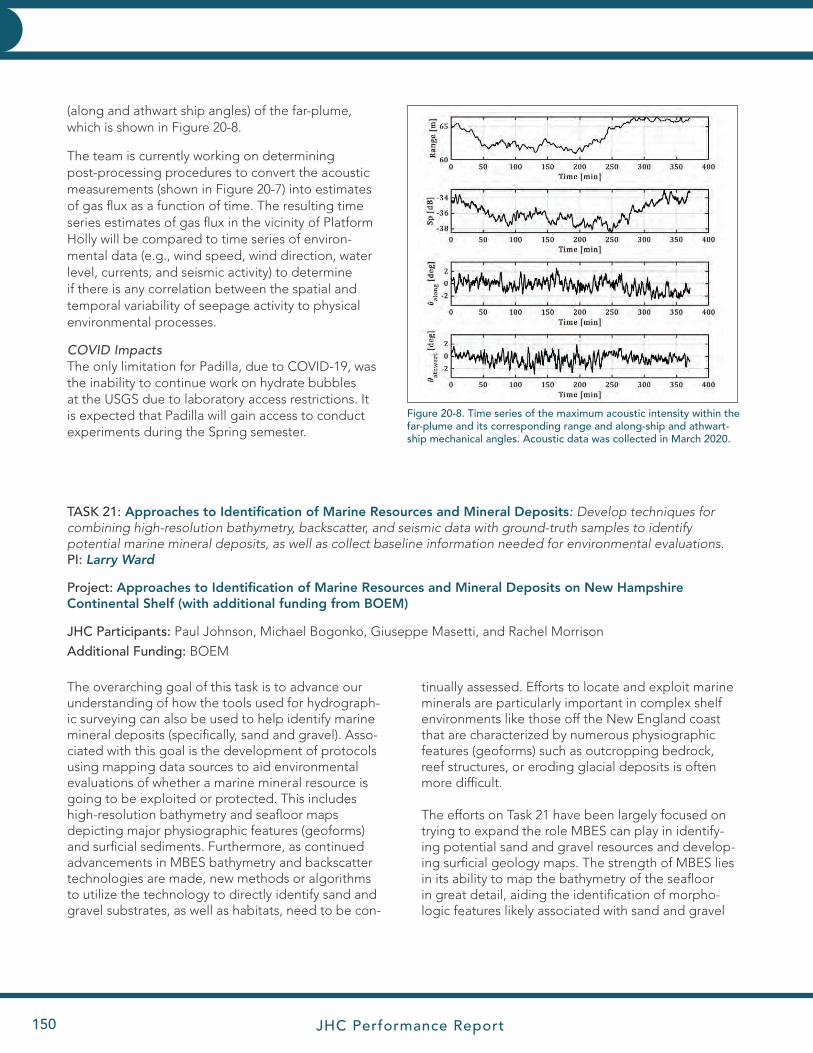
JHC Performance Report150
INNOVATIVE HYDROGRAPHY INNOVATIVE HYDROGRAPHY
TASK 21: Approaches to Identification of Marine Resources and Mineral Deposits: Develop techniques for combining high-resolution bathymetry, backscatter, and seismic data with ground-truth samples to identify potential marine mineral deposits, as well as collect baseline information needed for environmental evaluations. PI: Larry Ward
Project: Approaches to Identification of Marine Resources and Mineral Deposits on New Hampshire Continental Shelf (with additional funding from BOEM)
JHC Participants: Paul Johnson, Michael Bogonko, Giuseppe Masetti, and Rachel Morrison
Additional Funding: BOEM
(along and athwart ship angles) of the far-plume, which is shown in Figure 20-8.
The team is currently working on determining post-processing procedures to convert the acoustic measurements (shown in Figure 20-7) into estimates of gas flux as a function of time. The resulting time series estimates of gas flux in the vicinity of Platform Holly will be compared to time series of environ-mental data (e.g., wind speed, wind direction, water level, currents, and seismic activity) to determine if there is any correlation between the spatial and temporal variability of seepage activity to physical environmental processes.
COVID ImpactsThe only limitation for Padilla, due to COVID-19, was the inability to continue work on hydrate bubbles at the USGS due to laboratory access restrictions. It is expected that Padilla will gain access to conduct experiments during the Spring semester.
Figure 20-8. Time series of the maximum acoustic intensity within the far-plume and its corresponding range and along-ship and athwart-ship mechanical angles. Acoustic data was collected in March 2020.
The overarching goal of this task is to advance our understanding of how the tools used for hydrograph-ic surveying can also be used to help identify marine mineral deposits (specifically, sand and gravel). Asso-ciated with this goal is the development of protocols using mapping data sources to aid environmental evaluations of whether a marine mineral resource is going to be exploited or protected. This includes high-resolution bathymetry and seafloor maps depicting major physiographic features (geoforms) and surficial sediments. Furthermore, as continued advancements in MBES bathymetry and backscatter technologies are made, new methods or algorithms to utilize the technology to directly identify sand and gravel substrates, as well as habitats, need to be con-
tinually assessed. Efforts to locate and exploit marine minerals are particularly important in complex shelf environments like those off the New England coast that are characterized by numerous physiographic features (geoforms) such as outcropping bedrock, reef structures, or eroding glacial deposits is often more difficult.
The efforts on Task 21 have been largely focused on trying to expand the role MBES can play in identify-ing potential sand and gravel resources and develop-ing surficial geology maps. The strength of MBES lies in its ability to map the bathymetry of the seafloor in great detail, aiding the identification of morpho-logic features likely associated with sand and gravel
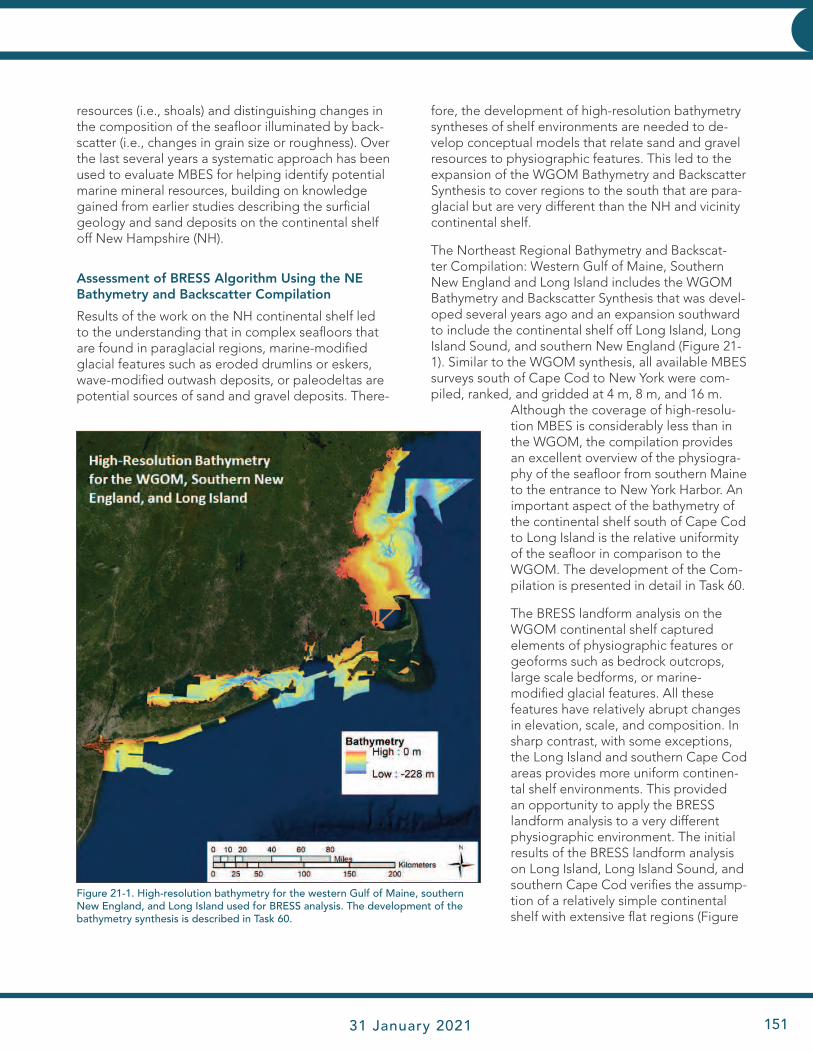
JHC Performance Report 31 January 2021 151
INNOVATIVE HYDROGRAPHY
resources (i.e., shoals) and distinguishing changes in the composition of the seafloor illuminated by back-scatter (i.e., changes in grain size or roughness). Over the last several years a systematic approach has been used to evaluate MBES for helping identify potential marine mineral resources, building on knowledge gained from earlier studies describing the surficial geology and sand deposits on the continental shelf off New Hampshire (NH).
Assessment of BRESS Algorithm Using the NE Bathymetry and Backscatter Compilation
Results of the work on the NH continental shelf led to the understanding that in complex seafloors that are found in paraglacial regions, marine-modified glacial features such as eroded drumlins or eskers, wave-modified outwash deposits, or paleodeltas are potential sources of sand and gravel deposits. There-
fore, the development of high-resolution bathymetry syntheses of shelf environments are needed to de-velop conceptual models that relate sand and gravel resources to physiographic features. This led to the expansion of the WGOM Bathymetry and Backscatter Synthesis to cover regions to the south that are para-glacial but are very different than the NH and vicinity continental shelf.
The Northeast Regional Bathymetry and Backscat-ter Compilation: Western Gulf of Maine, Southern New England and Long Island includes the WGOM Bathymetry and Backscatter Synthesis that was devel-oped several years ago and an expansion southward to include the continental shelf off Long Island, Long Island Sound, and southern New England (Figure 21-1). Similar to the WGOM synthesis, all available MBES surveys south of Cape Cod to New York were com-piled, ranked, and gridded at 4 m, 8 m, and 16 m.
Although the coverage of high-resolu-tion MBES is considerably less than in the WGOM, the compilation provides an excellent overview of the physiogra-phy of the seafloor from southern Maine to the entrance to New York Harbor. An important aspect of the bathymetry of the continental shelf south of Cape Cod to Long Island is the relative uniformity of the seafloor in comparison to the WGOM. The development of the Com-pilation is presented in detail in Task 60.
The BRESS landform analysis on the WGOM continental shelf captured elements of physiographic features or geoforms such as bedrock outcrops, large scale bedforms, or marine-modified glacial features. All these features have relatively abrupt changes in elevation, scale, and composition. In sharp contrast, with some exceptions, the Long Island and southern Cape Cod areas provides more uniform continen-tal shelf environments. This provided an opportunity to apply the BRESS landform analysis to a very different physiographic environment. The initial results of the BRESS landform analysis on Long Island, Long Island Sound, and southern Cape Cod verifies the assump-tion of a relatively simple continental shelf with extensive flat regions (Figure
Figure 21-1. High-resolution bathymetry for the western Gulf of Maine, southern New England, and Long Island used for BRESS analysis. The development of the bathymetry synthesis is described in Task 60.

JHC Performance Report152
INNOVATIVE HYDROGRAPHY INNOVATIVE HYDROGRAPHY
21-2). A simplified four landform classification was used in this preliminary assessment. An exception to the relatively flat and featureless continental shelf occurs near the entrance to Long Island Sound where the constriction causes higher currents, relatively deep scours, extensive bedforms, and shoals (Figure 21-3). The BRESS algorithm performed very well with the higher resolution bathymetry, identifying bedform ridges and other relatively small features. It should be noted that an original goal was to apply the BRESS landform analysis to the entire region covered by the Compilation at the 4 m, 8 m and 16 m resolutions and perform statistical analysis (after Sowers et al., 2020). However, due to limitations in computing power this reporting period this was not feasible, and the algorithm was applied to smaller areas. At this time the initial assessment of BRESS is completed. The landform algorithm is shown to be valuable and will be part of the routine tools used for seafloor map-ping along with MBES derivatives. The segmentation algorithm can be helpful with the improvements in the collection and processing of backscatter that are occurring and will be revisited in the future.
Web Serving of the New Hampshire and Vicinity Geophysical Database
Over the past ten years a significant amount of research has been done in the WGOM by the Cen-ter. In an effort to make the databases widely avail-able to the scientific community, government agen-cies, and the general public, several websites have been developed. To date, the following databases are served on the Center’s website.
“High-Resolution Bathymetry, Surficial Sediment Maps and Interactive Database: Jeffreys Ledge and Vicinity.” The database includes bottom sediment grain size data at 124 stations and seafloor photo-graphs at 141 stations centered in a 515 km2 area at Jeffreys Ledge. Also included is a bottom clas-sification based on grain size data and photographs adapted for gravel substrates. The site has been ac-tive since 2015 but has been updated several times. (Recommended citation: “Ward, L.G., R. Grizzle and P. Johnson. 2019. High-Resolution Seafloor Bathy-metry, Surficial Sediment Maps, and Interactive Data-base: Jeffreys Ledge and Vicinity. University of New Hampshire Center for Coastal and Ocean Mapping and Joint Hydrographic Center, Durham.” http://ccom.unh.edu/project/jeffreys-ledge).
“Western Gulf of Maine Bathymetry and Backscatter Synthesis.” The synthesis brings together all available high-resolution bathymetry in the Western Gulf of Maine gridded at the highest resolution reasonable. Also included is a backscatter mosaic of a subset of the MBES surveys. The site has been active since 2015 (Center Report 2015) (http://ccom.unh.edu/gis/maps/wgom/).
“Northeast Regional Bathymetry and Backscatter Compilation: Western Gulf of Maine, Southern New England and Long Island”. The Compilation is a major expansion of the Western Gulf of Maine Bathy-metry and Backscatter Synthesis to include new surveys in Maine, southern New England and Long Island. Although the number of high-resolution MBES surveys is less than expected, the compilation is a
Figure 21-2. BRESS landform analysis applied to the high-resolution MBES synthesis for Long Island and southern New England (left). BRESS analysis shows much of the shelf is very flat apart from the constriction in the narrows at the entrance of Long Island Sound (right).

JHC Performance Report 31 January 2021 153
INNOVATIVE HYDROGRAPHY
valuable addition. Backscatter surveys, where available and of reasonable quality, are also presented. Finally, the site includes the Center’s Hydrograph-ic Field Course MBES bathymetry and backscatter surveys. (Recommended citation: “Ward, L.G., M. Bogonko, and P. Johnson. 2020. Northeastern U.S. Bathymetry and Backscatter Compilation: Western Gulf of Maine, Southern New England and Long Island. University of New Hampshire Center for Coastal and Ocean Map-ping and Joint Hydrographic Center, Durham”). This effort is described in more detail in Task 60 of this report.
A final web site is in progress and will be completed during the next report-ing period: “High-Resolution Seafloor Mapping and Interactive Database: New Hampshire Continental Shelf to Jeffreys Ledge.” The web page will include surficial geology maps using CMECS for an ~3200 km area off NH, extensive bottom sediment grain size data, and seafloor photographs. (Recommended citation: Ward, L.G., McAvoy, Z.S., Johnson, P. and Morri-son, R. 2020, High-Resolution Seafloor Mapping and Interactive Database: New Hampshire Continental Shelf to Jeffreys Ledge. University of New Hampshire Center for Coastal and Ocean Mapping and Joint Hydro-graphic Center, Durham.
COVID ImpactsMoving the program from Chase Ocean Engineering Lab to a remote setting (personal residence) for an extended period (9 months) created several major difficulties that ham-pered progress on research and writing. Although the Center IT worked diligently to provide the same level of computing power, communications and support, it was not equivalent to normal operations. More importantly, the major challenge was, and still is, the lack of frequent and personal interactions that makes learning new methods and concepts as well as trying new ideas slower and more difficult. Essentially, not
being able to bounce ideas off colleagues or get their insights is lost and it is not easily duplicated remotely. In addition, not being able to communicate and interact with direct employees causes a loss of productivity. However, since it is absolutely neces-sary to work remotely at this time, and the Center has done everything possible to minimize the disruption.
Figure 21-3. BRESS landform analysis using high-resolution bathymetry gridded at 4 m for the constriction at the entrance to the Long Island Sound. The bathymetry shows the scoured area with exposed bedrock and large sand wave fields (upper). BRESS analysis identifies the features clearly (lower).

JHC Performance Report154
INNOVATIVE HYDROGRAPHY INNOVATIVE HYDROGRAPHY
Sub-Theme: SONAR
TASK 22: GeoCoder/ARA: Renew efforts in the future development of ARA characterization algorithms, up- dating the code so that it uses stand-alone modern C++ libraries for mosaicking and seafloor characterization and allowing it to handle “theme” based characterization and incorporate of data from different sensors through the integration of backscatter processing libraries with HUDDL. PI: Giuseppe Masetti
Project: GeoCoder/ARA – Seafloor Characterization
Center Participants: Michael Smith, Larry Mayer, Anthony Lyons, Tom Weber, and Larry Ward
NOAA Participants: Glen Rice (NOAA OCS HSTB), Mashkoor Malik (NOAA OER)
Other Participants: Alexandre Schimel (NIWA, New Zealand), Marc Roche (ECONOMIE, Belgium), Julian Le Deunf (SHOM, France), Margaret Dolan (NGU, Norway)
While the efforts of this task were originally focused on further development of the ARA algorithm, discov-ery of inconsistencies in the way in which backscatter is reported by common processing software has refo-cused the effort on trying to understand where these inconsistencies come from. These inconsistencies se-verely limit the use of acoustic backscatter for quanti-tative analysis (e.g., monitoring seafloor change over time, or remote characterization of seafloor charac-teristics) and other commonly attempted tasks (e.g., merging mosaics from different origins) and has thus prompted the refocus of this task.
Acoustic backscatter processing involves a complex sequence of steps, but since commercial software packages mainly provide end-results, comparisons between those results offer little insights into where in the workflow the differences are generated—com-mercial software packages tend to be a ‘black-box’ with only a few user-defined parameters. This can be seen as an advantage, making these technologies available to a large community, but it also engenders the potential for lack of data reproducibility. Currently, it is a challenge to ‘properly’ merge backscatter-based products from different vendors (sometimes
Figure 22-1. Plots showing BL0 (a, c) and BL3 (b, d) from CARIS SIPS, FMGT, and SonarScope for the EM 302 data. The plots on top (a, b) show the average over the entire survey line for all pings reported at each beam. The lower plots (c, d) show the average of all beams for each ping. BL0 represents the backscatter values retrieved from the raw data file; BL3 is the value obtained after all the corrections have been applied (before mosaicking). Intermediate pro-cessing stages have provided insights into differences between software outputs. In particular, the differences in BL0 values were not anticipated.

JHC Performance Report 31 January 2021 155
INNOVATIVE HYDROGRAPHY
Figure 22-2. Pane ‘a’ shows the initial reflectivity values calculated by three software packages (and retrieved from the same raw data file) in a ping-beam geometry. Pane ‘b’ plots, for each package, the average value per beam across the whole survey line. Similarly, pane ‘c’ displays the number of no data values per beam. Finally, pane ‘d’ compares the resulting histograms for the three software packages highlighting how the resulting statistical characteristics starts to diverge since the very first processing step.
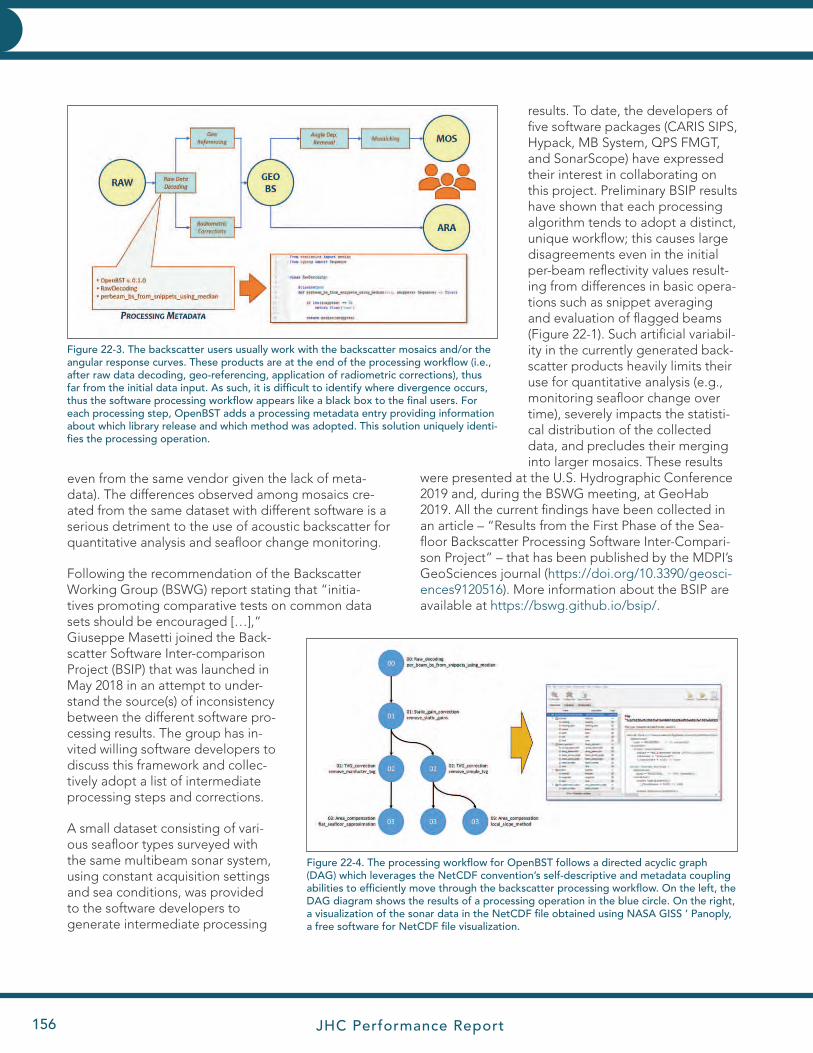
JHC Performance Report156
INNOVATIVE HYDROGRAPHY INNOVATIVE HYDROGRAPHY
even from the same vendor given the lack of meta-data). The differences observed among mosaics cre-ated from the same dataset with different software is a serious detriment to the use of acoustic backscatter for quantitative analysis and seafloor change monitoring.
Following the recommendation of the Backscatter Working Group (BSWG) report stating that “initia-tives promoting comparative tests on common data sets should be encouraged […],” Giuseppe Masetti joined the Back-scatter Software Inter-comparison Project (BSIP) that was launched in May 2018 in an attempt to under-stand the source(s) of inconsistency between the different software pro-cessing results. The group has in-vited willing software developers to discuss this framework and collec-tively adopt a list of intermediate processing steps and corrections.
A small dataset consisting of vari-ous seafloor types surveyed with the same multibeam sonar system, using constant acquisition settings and sea conditions, was provided to the software developers to generate intermediate processing
results. To date, the developers of five software packages (CARIS SIPS, Hypack, MB System, QPS FMGT, and SonarScope) have expressed their interest in collaborating on this project. Preliminary BSIP results have shown that each processing algorithm tends to adopt a distinct, unique workflow; this causes large disagreements even in the initial per-beam reflectivity values result-ing from differences in basic opera-tions such as snippet averaging and evaluation of flagged beams (Figure 22-1). Such artificial variabil-ity in the currently generated back-scatter products heavily limits their use for quantitative analysis (e.g., monitoring seafloor change over time), severely impacts the statisti-cal distribution of the collected data, and precludes their merging into larger mosaics. These results
were presented at the U.S. Hydrographic Conference 2019 and, during the BSWG meeting, at GeoHab 2019. All the current findings have been collected in an article – “Results from the First Phase of the Sea-floor Backscatter Processing Software Inter-Compari-son Project” – that has been published by the MDPI’s GeoSciences journal (https://doi.org/10.3390/geosci-ences9120516). More information about the BSIP are available at https://bswg.github.io/bsip/.
Figure 22-3. The backscatter users usually work with the backscatter mosaics and/or the angular response curves. These products are at the end of the processing workflow (i.e., after raw data decoding, geo-referencing, application of radiometric corrections), thus far from the initial data input. As such, it is difficult to identify where divergence occurs, thus the software processing workflow appears like a black box to the final users. For each processing step, OpenBST adds a processing metadata entry providing information about which library release and which method was adopted. This solution uniquely identi-fies the processing operation.
Figure 22-4. The processing workflow for OpenBST follows a directed acyclic graph (DAG) which leverages the NetCDF convention’s self-descriptive and metadata coupling abilities to efficiently move through the backscatter processing workflow. On the left, the DAG diagram shows the results of a processing operation in the blue circle. On the right, a visualization of the sonar data in the NetCDF file obtained using NASA GISS ’ Panoply, a free software for NetCDF file visualization.

JHC Performance Report 31 January 2021 157
INNOVATIVE HYDROGRAPHY
This situation is far from ideal (Figure 22-2), and resolution may require a shift from the closed-source software approach that has caused it. Thus, Masetti, Michael Smith, and Larry Mayer are collaborating with Ifremer and NOAA OCS/OER colleagues on the Open Backscatter Toolchain (OpenBST) project, with the overall goal of providing the community with an open-source and metadata-rich modular implementa-tion of a toolchain dedicated to acoustic backscatter processing (Figure 22-3). The long-term goal is not to create processing tools that would compete with available commercial solutions, but rather to create a set of open-source, community-vetted, reference algorithms usable by both developers and users for benchmarking their processing algorithms.
In order to ease the access to OpenBST open-source code, the project is written in Python (a popular and free programming language) and is maintained on GitHub within the HydrOffice Framework. One of the primary hallmarks of the project is its use of NetCDF files as a data storage and management system. The NetCDF convention is a very popular scientific data format that is self-descriptive, and easily allows for metadata coupling (Figure 22-4). The format can be interfaced with a variety of third-party software, en-couraging data sharing and inspection. The project is
also exploring the use of interactive computing and development environments such as Jupyter Note-books, and more recently JupyterLab, to allow the user to interact with the data processing chain with-out third-party software. The project was presented in February at the 2020 Canadian Hydrographic conference. The Python library continues to be improved with recent updates including improved raytracing methods and sounding geolocation. Ad-ditionally, the project is leveraging the mature geo-spatial data abstraction library (GDAL) for gridding and image creation, and methods for visualizing angular response curves have been added.
Once artifacts and software- or hardware-created differences in backscatter values have been re-moved, a critical next step for automated seafloor characterization algorithms is to attempt to segment the seafloor into regions of common seafloor type. Typically, this is done either by looking at the mor-phology or the backscatter, but rarely are backscat-ter and morphology used simultaneously. To address this, Masetti, Mayer, and Larry Ward are working on a project to automatically segment the seafloor into homogeneous areas through a combination of infor-mation from both and bathymetric observations (see Tasks 18 and 21).
Figure 22-5. An example of Jupyter notebook using the OpenBST backend to explore backscatter data and the related corrections.
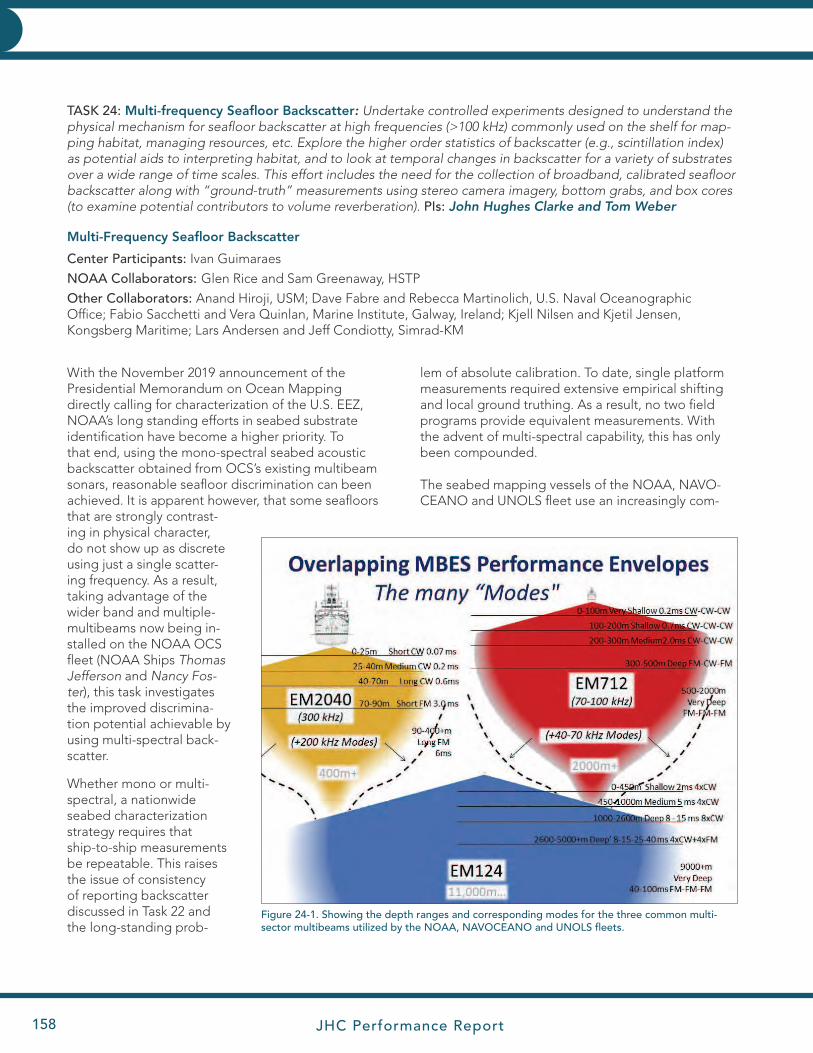
JHC Performance Report158
INNOVATIVE HYDROGRAPHY INNOVATIVE HYDROGRAPHY
TASK 24: Multi-frequency Seafloor Backscatter: Undertake controlled experiments designed to understand the physical mechanism for seafloor backscatter at high frequencies (>100 kHz) commonly used on the shelf for map-ping habitat, managing resources, etc. Explore the higher order statistics of backscatter (e.g., scintillation index) as potential aids to interpreting habitat, and to look at temporal changes in backscatter for a variety of substrates over a wide range of time scales. This effort includes the need for the collection of broadband, calibrated seafloor backscatter along with “ground-truth” measurements using stereo camera imagery, bottom grabs, and box cores (to examine potential contributors to volume reverberation). PIs: John Hughes Clarke and Tom Weber
Multi-Frequency Seafloor Backscatter
Center Participants: Ivan Guimaraes
NOAA Collaborators: Glen Rice and Sam Greenaway, HSTP
Other Collaborators: Anand Hiroji, USM; Dave Fabre and Rebecca Martinolich, U.S. Naval Oceanographic Office; Fabio Sacchetti and Vera Quinlan, Marine Institute, Galway, Ireland; Kjell Nilsen and Kjetil Jensen, Kongsberg Maritime; Lars Andersen and Jeff Condiotty, Simrad-KM
With the November 2019 announcement of the Presidential Memorandum on Ocean Mapping directly calling for characterization of the U.S. EEZ, NOAA’s long standing efforts in seabed substrate identification have become a higher priority. To that end, using the mono-spectral seabed acoustic backscatter obtained from OCS’s existing multibeam sonars, reasonable seafloor discrimination can been achieved. It is apparent however, that some seafloors that are strongly contrast-ing in physical character, do not show up as discrete using just a single scatter-ing frequency. As a result, taking advantage of the wider band and multiple-multibeams now being in-stalled on the NOAA OCS fleet (NOAA Ships Thomas Jefferson and Nancy Fos-ter), this task investigates the improved discrimina-tion potential achievable by using multi-spectral back-scatter.
Whether mono or multi-spectral, a nationwide seabed characterization strategy requires that ship-to-ship measurements be repeatable. This raises the issue of consistency of reporting backscatter discussed in Task 22 and the long-standing prob-
lem of absolute calibration. To date, single platform measurements required extensive empirical shifting and local ground truthing. As a result, no two field programs provide equivalent measurements. With the advent of multi-spectral capability, this has only been compounded.
The seabed mapping vessels of the NOAA, NAVO-CEANO and UNOLS fleet use an increasingly com-
Figure 24-1. Showing the depth ranges and corresponding modes for the three common multi-sector multibeams utilized by the NOAA, NAVOCEANO and UNOLS fleets.
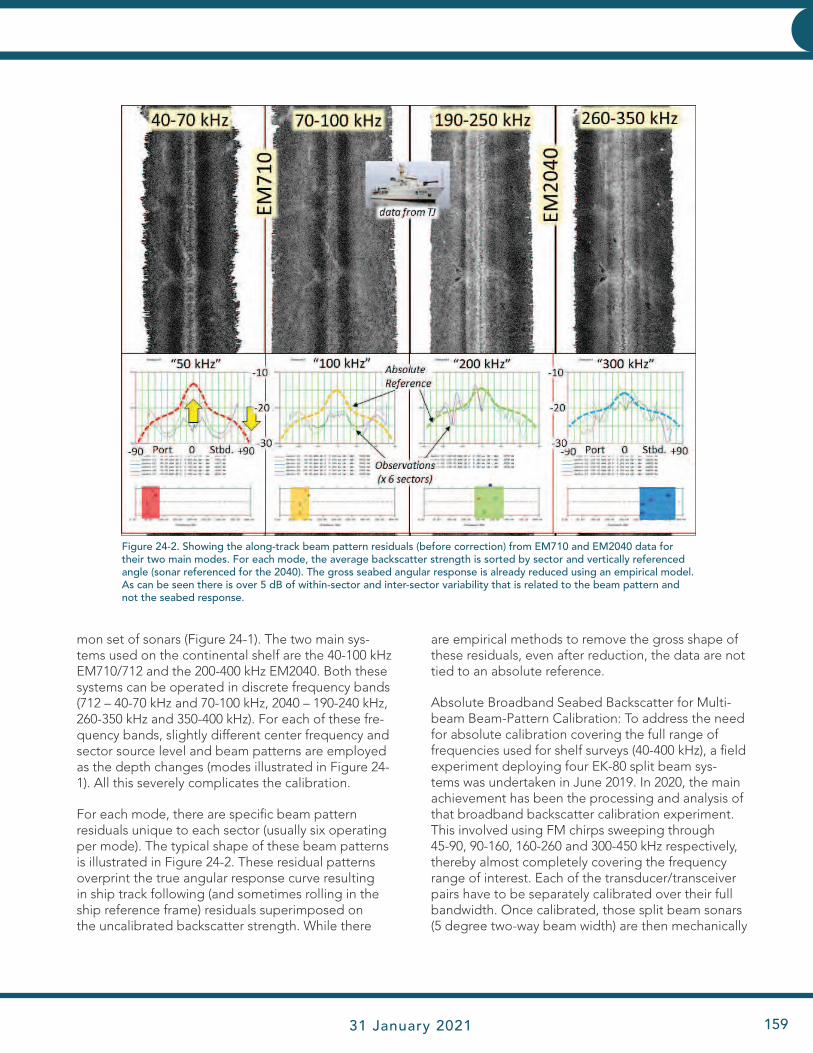
JHC Performance Report 31 January 2021 159
INNOVATIVE HYDROGRAPHY
mon set of sonars (Figure 24-1). The two main sys-tems used on the continental shelf are the 40-100 kHz EM710/712 and the 200-400 kHz EM2040. Both these systems can be operated in discrete frequency bands (712 – 40-70 kHz and 70-100 kHz, 2040 – 190-240 kHz, 260-350 kHz and 350-400 kHz). For each of these fre-quency bands, slightly different center frequency and sector source level and beam patterns are employed as the depth changes (modes illustrated in Figure 24-1). All this severely complicates the calibration.
For each mode, there are specific beam pattern residuals unique to each sector (usually six operating per mode). The typical shape of these beam patterns is illustrated in Figure 24-2. These residual patterns overprint the true angular response curve resulting in ship track following (and sometimes rolling in the ship reference frame) residuals superimposed on the uncalibrated backscatter strength. While there
are empirical methods to remove the gross shape of these residuals, even after reduction, the data are not tied to an absolute reference.
Absolute Broadband Seabed Backscatter for Multi-beam Beam-Pattern Calibration: To address the need for absolute calibration covering the full range of frequencies used for shelf surveys (40-400 kHz), a field experiment deploying four EK-80 split beam sys-tems was undertaken in June 2019. In 2020, the main achievement has been the processing and analysis of that broadband backscatter calibration experiment. This involved using FM chirps sweeping through 45-90, 90-160, 160-260 and 300-450 kHz respectively, thereby almost completely covering the frequency range of interest. Each of the transducer/transceiver pairs have to be separately calibrated over their full bandwidth. Once calibrated, those split beam sonars (5 degree two-way beam width) are then mechanically
Figure 24-2. Showing the along-track beam pattern residuals (before correction) from EM710 and EM2040 data for their two main modes. For each mode, the average backscatter strength is sorted by sector and vertically referenced angle (sonar referenced for the 2040). The gross seabed angular response is already reduced using an empirical model. As can be seen there is over 5 dB of within-sector and inter-sector variability that is related to the beam pattern and not the seabed response.
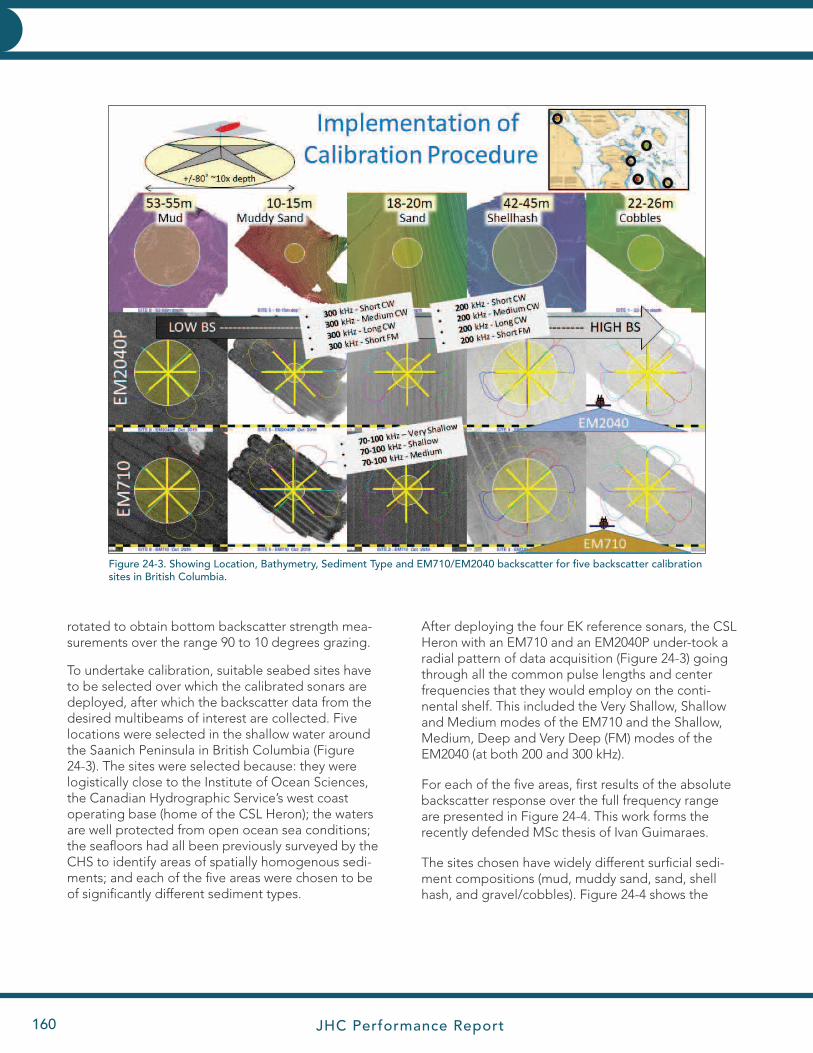
JHC Performance Report160
INNOVATIVE HYDROGRAPHY INNOVATIVE HYDROGRAPHY
rotated to obtain bottom backscatter strength mea-surements over the range 90 to 10 degrees grazing.
To undertake calibration, suitable seabed sites have to be selected over which the calibrated sonars are deployed, after which the backscatter data from the desired multibeams of interest are collected. Five locations were selected in the shallow water around the Saanich Peninsula in British Columbia (Figure 24-3). The sites were selected because: they were logistically close to the Institute of Ocean Sciences, the Canadian Hydrographic Service’s west coast operating base (home of the CSL Heron); the waters are well protected from open ocean sea conditions; the seafloors had all been previously surveyed by the CHS to identify areas of spatially homogenous sedi-ments; and each of the five areas were chosen to be of significantly different sediment types.
After deploying the four EK reference sonars, the CSL Heron with an EM710 and an EM2040P under-took a radial pattern of data acquisition (Figure 24-3) going through all the common pulse lengths and center frequencies that they would employ on the conti-nental shelf. This included the Very Shallow, Shallow and Medium modes of the EM710 and the Shallow, Medium, Deep and Very Deep (FM) modes of the EM2040 (at both 200 and 300 kHz).
For each of the five areas, first results of the absolute backscatter response over the full frequency range are presented in Figure 24-4. This work forms the recently defended MSc thesis of Ivan Guimaraes.
The sites chosen have widely different surficial sedi-ment compositions (mud, muddy sand, sand, shell hash, and gravel/cobbles). Figure 24-4 shows the
Figure 24-3. Showing Location, Bathymetry, Sediment Type and EM710/EM2040 backscatter for five backscatter calibration sites in British Columbia.
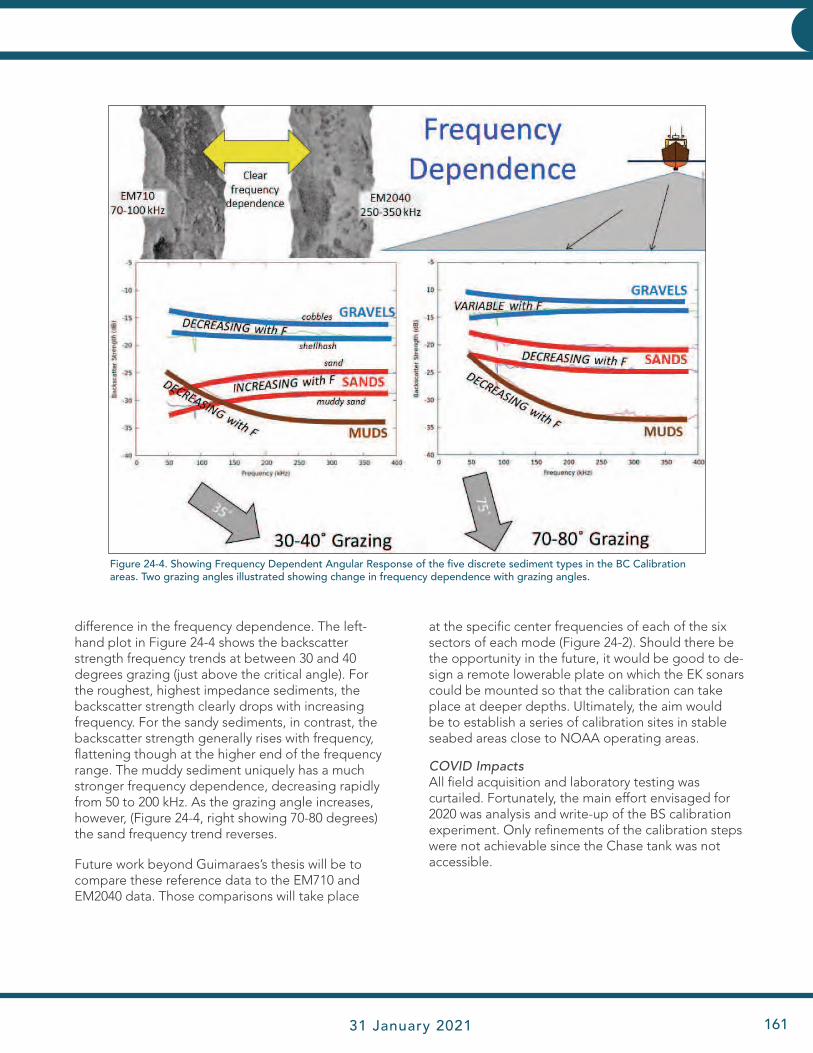
JHC Performance Report 31 January 2021 161
INNOVATIVE HYDROGRAPHY
difference in the frequency dependence. The left-hand plot in Figure 24-4 shows the backscatter strength frequency trends at between 30 and 40 degrees grazing (just above the critical angle). For the roughest, highest impedance sediments, the backscatter strength clearly drops with increasing frequency. For the sandy sediments, in contrast, the backscatter strength generally rises with frequency, flattening though at the higher end of the frequency range. The muddy sediment uniquely has a much stronger frequency dependence, decreasing rapidly from 50 to 200 kHz. As the grazing angle increases, however, (Figure 24-4, right showing 70-80 degrees) the sand frequency trend reverses.
Future work beyond Guimaraes’s thesis will be to compare these reference data to the EM710 and EM2040 data. Those comparisons will take place
at the specific center frequencies of each of the six sectors of each mode (Figure 24-2). Should there be the opportunity in the future, it would be good to de-sign a remote lowerable plate on which the EK sonars could be mounted so that the calibration can take place at deeper depths. Ultimately, the aim would be to establish a series of calibration sites in stable seabed areas close to NOAA operating areas.
COVID ImpactsAll field acquisition and laboratory testing was curtailed. Fortunately, the main effort envisaged for 2020 was analysis and write-up of the BS calibration experiment. Only refinements of the calibration steps were not achievable since the Chase tank was not accessible.
Figure 24-4. Showing Frequency Dependent Angular Response of the five discrete sediment types in the BC Calibration areas. Two grazing angles illustrated showing change in frequency dependence with grazing angles.
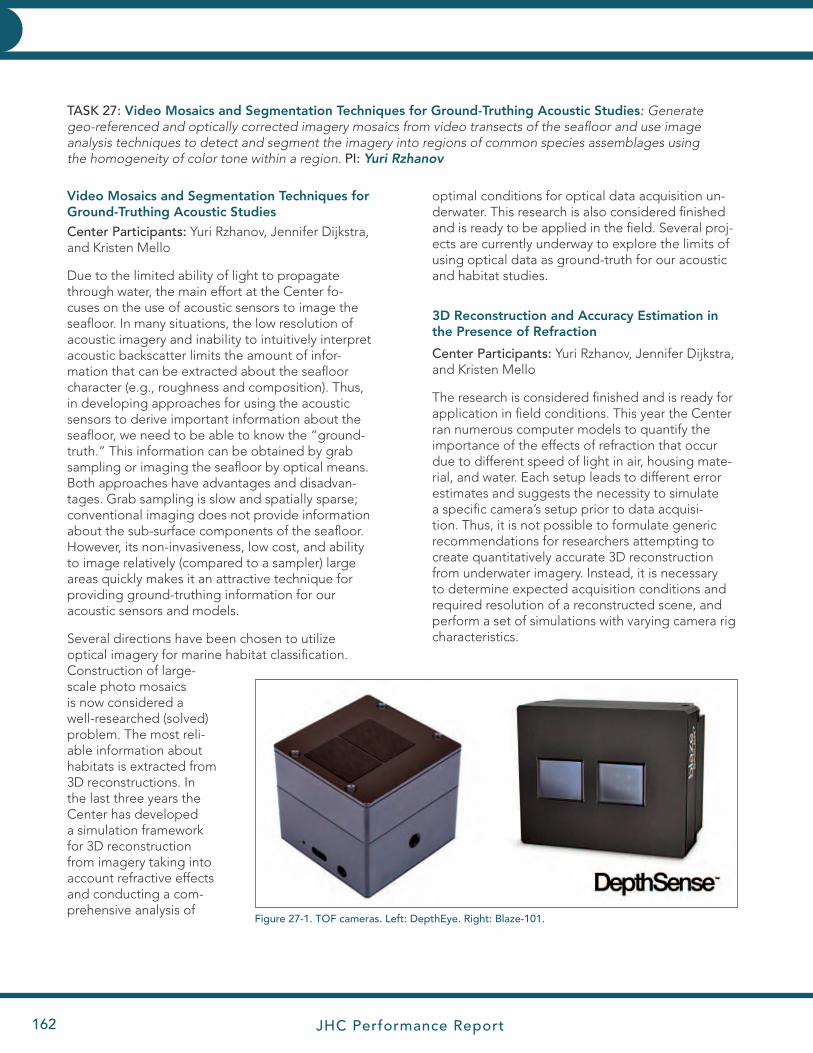
JHC Performance Report162
INNOVATIVE HYDROGRAPHY INNOVATIVE HYDROGRAPHY
TASK 27: Video Mosaics and Segmentation Techniques for Ground-Truthing Acoustic Studies: Generate geo-referenced and optically corrected imagery mosaics from video transects of the seafloor and use image analysis techniques to detect and segment the imagery into regions of common species assemblages using the homogeneity of color tone within a region. PI: Yuri Rzhanov
Video Mosaics and Segmentation Techniques for Ground-Truthing Acoustic Studies
Center Participants: Yuri Rzhanov, Jennifer Dijkstra, and Kristen Mello
Due to the limited ability of light to propagate through water, the main effort at the Center fo-cuses on the use of acoustic sensors to image the seafloor. In many situations, the low resolution of acoustic imagery and inability to intuitively interpret acoustic backscatter limits the amount of infor-mation that can be extracted about the seafloor character (e.g., roughness and composition). Thus, in developing approaches for using the acoustic sensors to derive important information about the seafloor, we need to be able to know the “ground-truth.” This information can be obtained by grab sampling or imaging the seafloor by optical means. Both approaches have advantages and disadvan-tages. Grab sampling is slow and spatially sparse; conventional imaging does not provide information about the sub-surface components of the seafloor. However, its non-invasiveness, low cost, and ability to image relatively (compared to a sampler) large areas quickly makes it an attractive technique for providing ground-truthing information for our acoustic sensors and models.
Several directions have been chosen to utilize optical imagery for marine habitat classification. Construction of large-scale photo mosaics is now considered a well-researched (solved) problem. The most reli-able information about habitats is extracted from 3D reconstructions. In the last three years the Center has developed a simulation framework for 3D reconstruction from imagery taking into account refractive effects and conducting a com-prehensive analysis of
optimal conditions for optical data acquisition un-derwater. This research is also considered finished and is ready to be applied in the field. Several proj-ects are currently underway to explore the limits of using optical data as ground-truth for our acoustic and habitat studies.
3D Reconstruction and Accuracy Estimation in the Presence of Refraction
Center Participants: Yuri Rzhanov, Jennifer Dijkstra, and Kristen Mello
The research is considered finished and is ready for application in field conditions. This year the Center ran numerous computer models to quantify the importance of the effects of refraction that occur due to different speed of light in air, housing mate-rial, and water. Each setup leads to different error estimates and suggests the necessity to simulate a specific camera’s setup prior to data acquisi-tion. Thus, it is not possible to formulate generic recommendations for researchers attempting to create quantitatively accurate 3D reconstruction from underwater imagery. Instead, it is necessary to determine expected acquisition conditions and required resolution of a reconstructed scene, and perform a set of simulations with varying camera rig characteristics.
Figure 27-1. TOF cameras. Left: DepthEye. Right: Blaze-101.

JHC Performance Report 31 January 2021 163
INNOVATIVE HYDROGRAPHY
The advantage of the Dep-thEye is its smaller form factor. However, it can be connected to a computer only by USB cable, while the Blaze-101 exists in two configurations – with a USB connector and an Ethernet connector. The latter allows for keeping the computer on the top-side and lower-ing underwater a smaller pressure housing with the camera only.
Both cameras allow for acquisition of full-frame im-agery at 30 frames/second. Thus, a platform moving at
a speed of 1 m/s provides nearly 98 percent overlap between successive frames, which guarantees reli-able matching of acquired point clouds. Typically, robust matching can be achieved with just 60 per-cent overlap, so a platform with a TOF camera can move as fast as 25 m/s (50 knots). Processing of the acquired data requires refraction-related corrections that were developed in previous work.
Collection of Bathymetric Measurements on Sub-Centimeter Scale
Center Participants: Yuri Rzhanov and Carlo Lanzoni
This project seeks to develop an approach to mak-ing very high-resolution 3D imagery of the seafloor with an inexpensive sensor. Short-range depth mea-surements can be performed using Time-of-Flight (TOF) sensors similar to the widely known Kinect-2. Unfortunately, all currently available TOF sensors use infrared light that is strongly absorbed in water. Sub-stitution of the IR light source with a green or blue laser would allow for reliable underwater sensing with ranges up to five meters and sub-centimeter resolution. The main advantage of TOF sensors is that they simultaneously acquire a two-dimensional array of measurements – frame pseudo-imagery, unlike a conventional lidar. Redundancy in measure-ments due to the overlap of the frames permits the elimination of inaccuracies in platform position-ing and allows for the application of Simultaneous Localization and Mapping (SLAM) techniques to improve the derivation of a digital elevation model. TOF technology is developing rapidly, with the largest sensors being a Bora sensor with resolution 1280 x 1024, manufactured by Teledyne. Due to the high cost of the Bora evaluation kit (~$20K), the Center concentrated on two smaller sensors with VGA resolution (640 x 480): DepthEye manufactured by Seeed ($600) and Blaze-101 by Basler AG ($1700) (Figure 27-1). Both utilize a Sony IMX556PLR sensor (Figure 27-2). Software support for both investigated cameras are in the development stage.
Figure 27-2. Sensitivity curve of Sony IMX556PLR sensor. Arrow shows the wavelength used for sensing.
Figure 27-3. Wiggling effect in range measurements for Depth-Eye ToF camera. Blue: measured values; red: linear trendline.
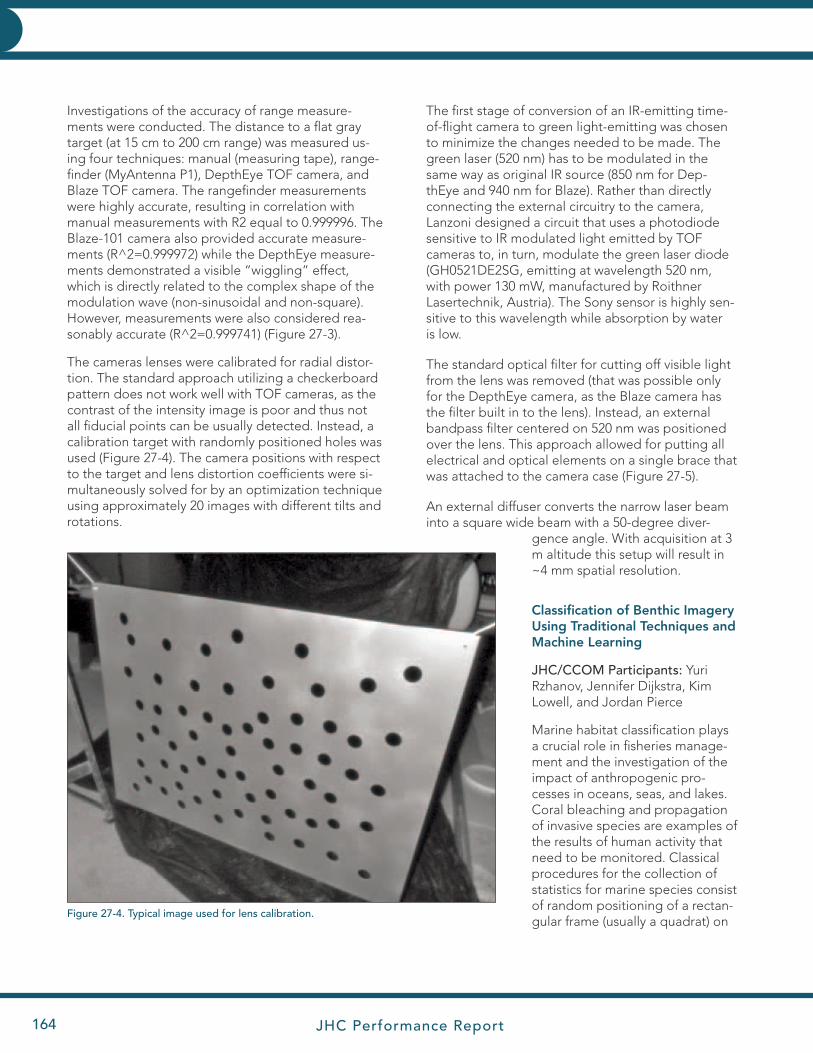
JHC Performance Report164
INNOVATIVE HYDROGRAPHY INNOVATIVE HYDROGRAPHY
Investigations of the accuracy of range measure-ments were conducted. The distance to a flat gray target (at 15 cm to 200 cm range) was measured us-ing four techniques: manual (measuring tape), range-finder (MyAntenna P1), DepthEye TOF camera, and Blaze TOF camera. The rangefinder measurements were highly accurate, resulting in correlation with manual measurements with R2 equal to 0.999996. The Blaze-101 camera also provided accurate measure-ments (R^2=0.999972) while the DepthEye measure-ments demonstrated a visible “wiggling” effect, which is directly related to the complex shape of the modulation wave (non-sinusoidal and non-square). However, measurements were also considered rea-sonably accurate (R^2=0.999741) (Figure 27-3).
The cameras lenses were calibrated for radial distor-tion. The standard approach utilizing a checkerboard pattern does not work well with TOF cameras, as the contrast of the intensity image is poor and thus not all fiducial points can be usually detected. Instead, a calibration target with randomly positioned holes was used (Figure 27-4). The camera positions with respect to the target and lens distortion coefficients were si-multaneously solved for by an optimization technique using approximately 20 images with different tilts and rotations.
The first stage of conversion of an IR-emitting time-of-flight camera to green light-emitting was chosen to minimize the changes needed to be made. The green laser (520 nm) has to be modulated in the same way as original IR source (850 nm for Dep-thEye and 940 nm for Blaze). Rather than directly connecting the external circuitry to the camera, Lanzoni designed a circuit that uses a photodiode sensitive to IR modulated light emitted by TOF cameras to, in turn, modulate the green laser diode (GH0521DE2SG, emitting at wavelength 520 nm, with power 130 mW, manufactured by Roithner Lasertechnik, Austria). The Sony sensor is highly sen-sitive to this wavelength while absorption by water is low.
The standard optical filter for cutting off visible light from the lens was removed (that was possible only for the DepthEye camera, as the Blaze camera has the filter built in to the lens). Instead, an external bandpass filter centered on 520 nm was positioned over the lens. This approach allowed for putting all electrical and optical elements on a single brace that was attached to the camera case (Figure 27-5).
An external diffuser converts the narrow laser beam into a square wide beam with a 50-degree diver-
gence angle. With acquisition at 3 m altitude this setup will result in ~4 mm spatial resolution.
Classification of Benthic Imagery Using Traditional Techniques and Machine Learning
JHC/CCOM Participants: Yuri Rzhanov, Jennifer Dijkstra, Kim Lowell, and Jordan Pierce
Marine habitat classification plays a crucial role in fisheries manage-ment and the investigation of the impact of anthropogenic pro-cesses in oceans, seas, and lakes. Coral bleaching and propagation of invasive species are examples of the results of human activity that need to be monitored. Classical procedures for the collection of statistics for marine species consist of random positioning of a rectan-gular frame (usually a quadrat) on
Figure 27-4. Typical image used for lens calibration.

JHC Performance Report 31 January 2021 165
INNOVATIVE HYDROGRAPHY
the seafloor, taking a photo image of it, and manually annotating everything within a frame. The last step is the most time-consuming and may take more than 100 times longer than the image acquisition (including travel to and from the site and divers’ deployment). The most popular annotation method for seascapes is CPCe, where the annotator manually classifies a certain number of randomly dis-tributed points within a quadrat.
Unlike annotation of images for the presence or absence of well-defined fauna (starfish, scallops, lobsters, etc.) or man-made ob-jects (plastic/glass bottles, cans, etc.), automation of annotation of images of colonies (like corals or bacterial mats) is significantly more difficult, as it cannot be achieved by extraction of distinct features but requires a recognition of textures. Texture is an intuitively clear concept that is difficult to formalize. It is however an important visual cue and texture classification is a fun-damental issue in computer vision essential for a very wide range of applications. Texture cannot refer to a single element like a pixel; rather it is a property of an image patch, which leaves open questions about the patch size and its homogeneity. Texture classification has been an active research topic for more than five decades but has received renewed interest with the development of novel image processing techniques like deep learning. It has recently been demonstrated that convolutional neural networks (CNNs) originally designed for recognition of specific objects are in fact extremely responsive to the presence of textures in the training sets of images.
After thorough investigation of traditional approach utilizing textural descriptors it was decided that al-though these techniques perform well on the stan-dard textural databases (Brodatz, CUReT, KTH_TIPS, UIUC, Kylberg), the diversity of real marine life does not favor “handcrafted” features (formulated as a set of rules based on common sense). Deep learning using convolutional neural networks results in better classification, so further efforts were concentrated on CNNs. The application of this work is described in detail in Task 31.
Figure 27-5. Camera with the brace over the case. Green laser is not attached to the brace.
Device for Fault-Proof Collection of Imagery for Underwater Survey
JHC/CCOM Participants: Yuri Rzhanov
The University has applied for a patent (application number 16/667,390) for a device guaranteeing an optimal coverage for an underwater video survey. A set of experiments in the Ocean Engineering wave tank verified the statements made in the patent applica-tion. Automatic registration of frames acquired in these experiments allowed for the global registration of the whole mosaic and led to an almost perfect result. The research is considered to be completed and is ready for real survey application.
COVID ImpactsPractically all hardware-related activities have been affected by the restrictions imposed due to the CO-VID-19 pandemic, mainly due to logistics in arranging for transfer of equipment out of the lab. Preparation of the calibration target took four months, while in normal circumstances it would take not more than a week. Collaboration with Center staff on development of the braces for two TOF cameras was at least five times slower than expected.

JHC Performance Report166
INNOVATIVE HYDROGRAPHY INNOVATIVE HYDROGRAPHY
TASK 30: Seabed Change Detection: Continue our efforts to understand the limits to which we can detect changes through understanding of the theoretical limits of both bathymetric and backscatter resolution as deter-mined by sensor characteristics, system integration, and appropriate calibrations and compensations. We will also look at the mobility (or transport) of both inshore and offshore sediments in an effort to better understand the need for re-surveying in different areas. PI: John Hughes Clarke
Project: Seabed Change Detection
Other JHC Participant: Leonardo Araujo
NOAA Collaborators: Glen Rice, NOAA-HSTP
Other Collaborators: Ian Church (Ocean Mapping Group, UNB); Kjetil Jensen and Kjell Nielson (Kongsberg Maritime); Gwynn Lintern and Cooper Stacey (Geological Survey of Canada); Peter Talling and Matthieu Cartigny (Durham University, UK); Juan Fedele and David Hoyal (ExxonMobil Upstream Research Center); and Alex Hay (Dalhousie University, Canada)
Figure 30-1. The equivalence of the hydrophone spectrum to the current velocities measured at the adjacent ADCP mooring is shown. The hydrophone is suspended outside the channel, about 50m off the seabed. It thus is never damaged by the flows—unlike the ADCP moorings which are routinely damaged. About 7 kilometers of the turbidity current path is illustrated as it flowed from depths of about 100m to 250m. Three hydrophones were deployed along its path, each recording the sound as it passed.
As every mariner knows, seabed morphology can change, especially in areas of strong currents and unconsolidated sediment such as river mouths and shallow tidal seas. As part of NOAA’s mandate to both maintain chart veracity and to monitor dynamic seabed environments, change monitoring is therefore a fundamental requirement. Separating real change from residual biases or intermittent bottom track-ing errors in the survey data, however, is a major limiting factor in confidently identify-ing such change. This is the survey challenge that this task addresses.
The seabed change project this year has focused on detecting smaller changes in both shallow tidal channels as well as on the fjord bottom at much greater depths (Figure 30-1). There is a long history of monitoring bedform migra-tion on the Squamish estu-ary and pro-delta in British Columbia. The site is chosen because the field surveys are all funded by other agencies (Natural Resources Canada, Kongsberg, ExxonMobil). The processes observed, however, are equally active in Alaskan and Washington State fjords and in numerous shallow tidal inlets and estuaries around the U.S. coastline.
Turbidity Current Activity in Deep-Water Channels
The original focus of the program was on the seabed change occurring in low relief channels in 100-250m depths due to the very irregular passage of high ve-locity (3-8+ m/s) turbidity currents. Resulting seabed change is typically at the 0.1 to 0.3 % of depth (0.2 to 0.6m in 200m) scale.
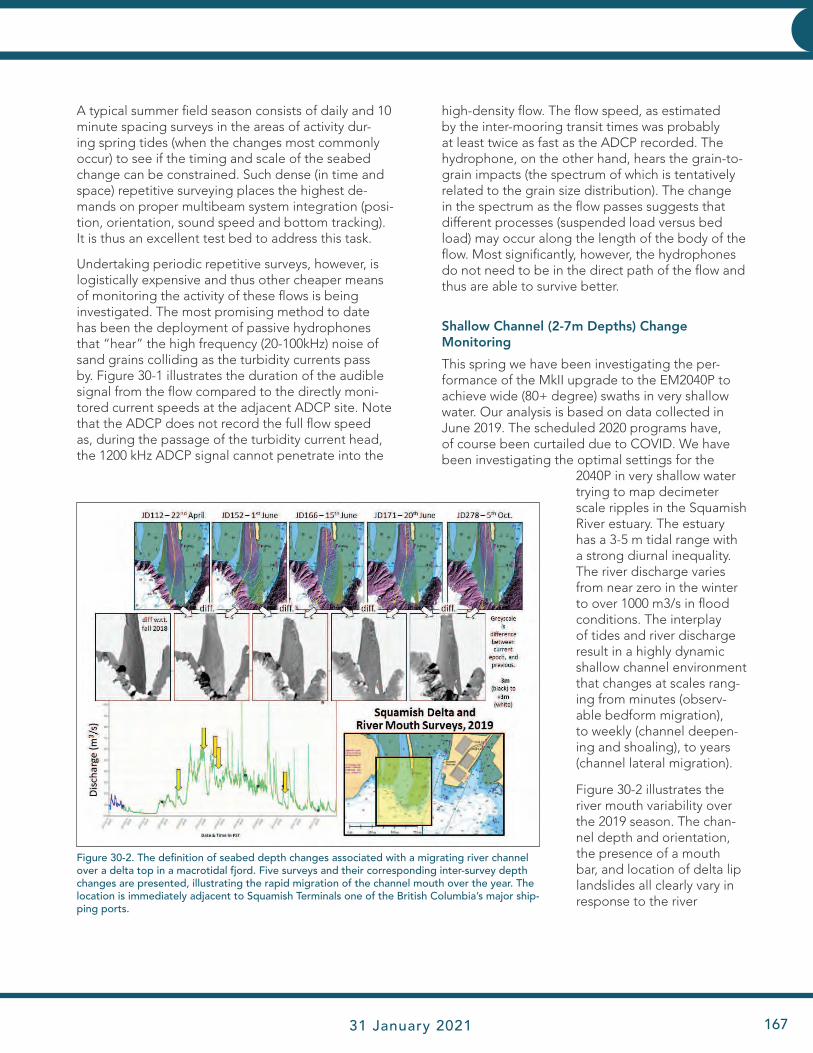
JHC Performance Report 31 January 2021 167
INNOVATIVE HYDROGRAPHY
A typical summer field season consists of daily and 10 minute spacing surveys in the areas of activity dur-ing spring tides (when the changes most commonly occur) to see if the timing and scale of the seabed change can be constrained. Such dense (in time and space) repetitive surveying places the highest de-mands on proper multibeam system integration (posi-tion, orientation, sound speed and bottom tracking). It is thus an excellent test bed to address this task.
Undertaking periodic repetitive surveys, however, is logistically expensive and thus other cheaper means of monitoring the activity of these flows is being investigated. The most promising method to date has been the deployment of passive hydrophones that “hear” the high frequency (20-100kHz) noise of sand grains colliding as the turbidity currents pass by. Figure 30-1 illustrates the duration of the audible signal from the flow compared to the directly moni-tored current speeds at the adjacent ADCP site. Note that the ADCP does not record the full flow speed as, during the passage of the turbidity current head, the 1200 kHz ADCP signal cannot penetrate into the
high-density flow. The flow speed, as estimated by the inter-mooring transit times was probably at least twice as fast as the ADCP recorded. The hydrophone, on the other hand, hears the grain-to-grain impacts (the spectrum of which is tentatively related to the grain size distribution). The change in the spectrum as the flow passes suggests that different processes (suspended load versus bed load) may occur along the length of the body of the flow. Most significantly, however, the hydrophones do not need to be in the direct path of the flow and thus are able to survive better.
Shallow Channel (2-7m Depths) Change Monitoring
This spring we have been investigating the per-formance of the MkII upgrade to the EM2040P to achieve wide (80+ degree) swaths in very shallow water. Our analysis is based on data collected in June 2019. The scheduled 2020 programs have, of course been curtailed due to COVID. We have been investigating the optimal settings for the
2040P in very shallow water trying to map decimeter scale ripples in the Squamish River estuary. The estuary has a 3-5 m tidal range with a strong diurnal inequality. The river discharge varies from near zero in the winter to over 1000 m3/s in flood conditions. The interplay of tides and river discharge result in a highly dynamic shallow channel environment that changes at scales rang-ing from minutes (observ-able bedform migration), to weekly (channel deepen-ing and shoaling), to years (channel lateral migration).
Figure 30-2 illustrates the river mouth variability over the 2019 season. The chan-nel depth and orientation, the presence of a mouth bar, and location of delta lip landslides all clearly vary in response to the river
Figure 30-2. The definition of seabed depth changes associated with a migrating river channel over a delta top in a macrotidal fjord. Five surveys and their corresponding inter-survey depth changes are presented, illustrating the rapid migration of the channel mouth over the year. The location is immediately adjacent to Squamish Terminals one of the British Columbia’s major ship-ping ports.
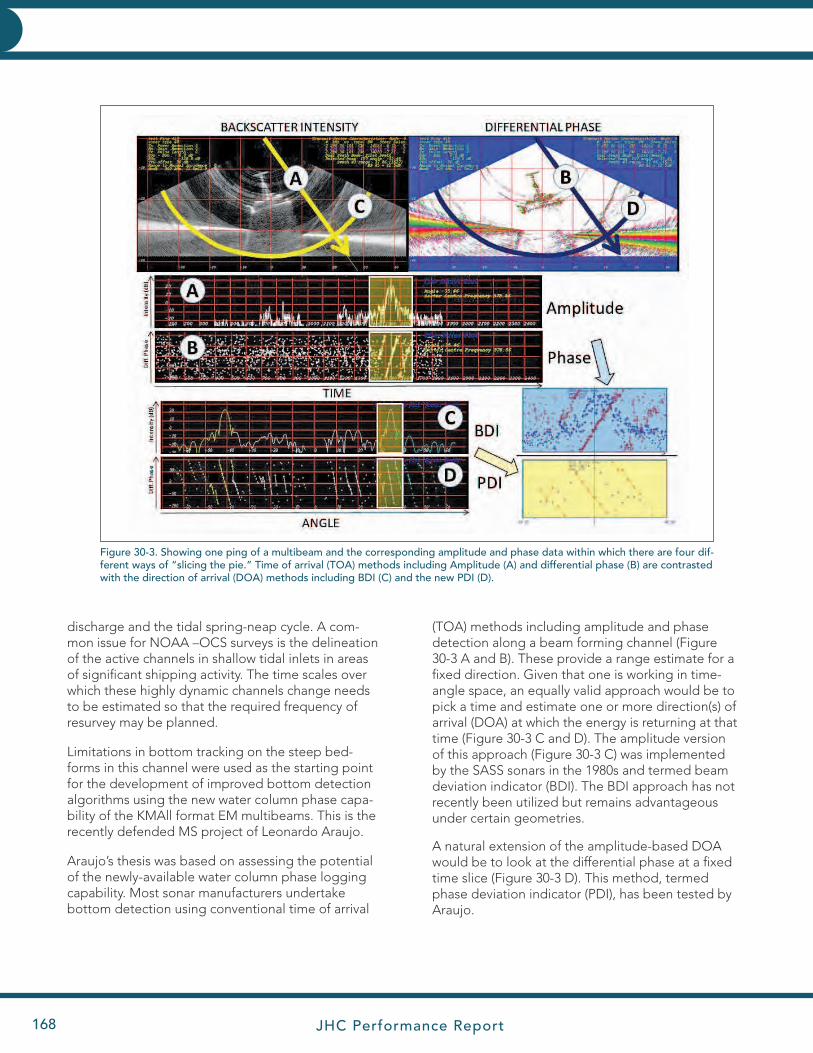
JHC Performance Report168
INNOVATIVE HYDROGRAPHY INNOVATIVE HYDROGRAPHY
discharge and the tidal spring-neap cycle. A com-mon issue for NOAA –OCS surveys is the delineation of the active channels in shallow tidal inlets in areas of significant shipping activity. The time scales over which these highly dynamic channels change needs to be estimated so that the required frequency of resurvey may be planned.
Limitations in bottom tracking on the steep bed-forms in this channel were used as the starting point for the development of improved bottom detection algorithms using the new water column phase capa-bility of the KMAll format EM multibeams. This is the recently defended MS project of Leonardo Araujo.
Araujo’s thesis was based on assessing the potential of the newly-available water column phase logging capability. Most sonar manufacturers undertake bottom detection using conventional time of arrival
Figure 30-3. Showing one ping of a multibeam and the corresponding amplitude and phase data within which there are four dif-ferent ways of “slicing the pie.” Time of arrival (TOA) methods including Amplitude (A) and differential phase (B) are contrasted with the direction of arrival (DOA) methods including BDI (C) and the new PDI (D).
(TOA) methods including amplitude and phase detection along a beam forming channel (Figure 30-3 A and B). These provide a range estimate for a fixed direction. Given that one is working in time-angle space, an equally valid approach would be to pick a time and estimate one or more direction(s) of arrival (DOA) at which the energy is returning at that time (Figure 30-3 C and D). The amplitude version of this approach (Figure 30-3 C) was implemented by the SASS sonars in the 1980s and termed beam deviation indicator (BDI). The BDI approach has not recently been utilized but remains advantageous under certain geometries.
A natural extension of the amplitude-based DOA would be to look at the differential phase at a fixed time slice (Figure 30-3 D). This method, termed phase deviation indicator (PDI), has been tested by Araujo.
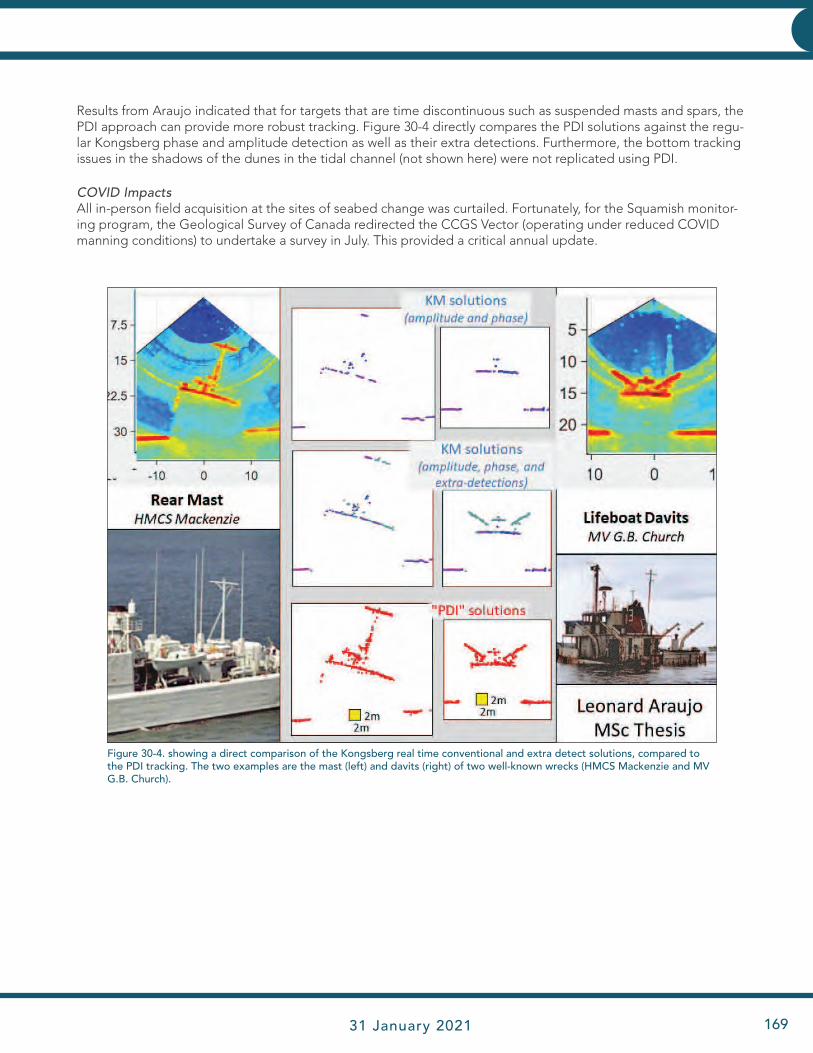
JHC Performance Report 31 January 2021 169
INNOVATIVE HYDROGRAPHY
Figure 30-4. showing a direct comparison of the Kongsberg real time conventional and extra detect solutions, compared to the PDI tracking. The two examples are the mast (left) and davits (right) of two well-known wrecks (HMCS Mackenzie and MV G.B. Church).
Results from Araujo indicated that for targets that are time discontinuous such as suspended masts and spars, the PDI approach can provide more robust tracking. Figure 30-4 directly compares the PDI solutions against the regu-lar Kongsberg phase and amplitude detection as well as their extra detections. Furthermore, the bottom tracking issues in the shadows of the dunes in the tidal channel (not shown here) were not replicated using PDI.
COVID ImpactsAll in-person field acquisition at the sites of seabed change was curtailed. Fortunately, for the Squamish monitor-ing program, the Geological Survey of Canada redirected the CCGS Vector (operating under reduced COVID manning conditions) to undertake a survey in July. This provided a critical annual update.
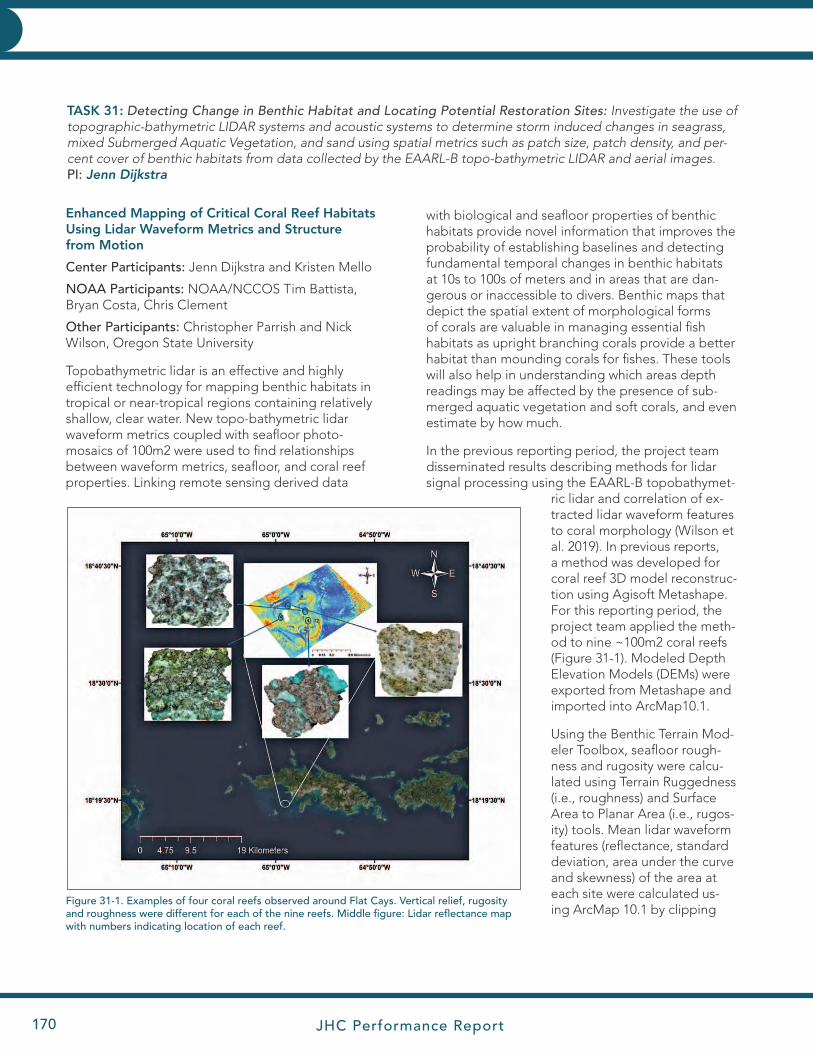
JHC Performance Report170
INNOVATIVE HYDROGRAPHY INNOVATIVE HYDROGRAPHY
TASK 31: Detecting Change in Benthic Habitat and Locating Potential Restoration Sites: Investigate the use of topographic-bathymetric LIDAR systems and acoustic systems to determine storm induced changes in seagrass, mixed Submerged Aquatic Vegetation, and sand using spatial metrics such as patch size, patch density, and per-cent cover of benthic habitats from data collected by the EAARL-B topo-bathymetric LIDAR and aerial images. PI: Jenn Dijkstra
Enhanced Mapping of Critical Coral Reef Habitats Using Lidar Waveform Metrics and Structure from Motion
Center Participants: Jenn Dijkstra and Kristen Mello
NOAA Participants: NOAA/NCCOS Tim Battista, Bryan Costa, Chris Clement
Other Participants: Christopher Parrish and Nick Wilson, Oregon State University
Topobathymetric lidar is an effective and highly efficient technology for mapping benthic habitats in tropical or near-tropical regions containing relatively shallow, clear water. New topo-bathymetric lidar waveform metrics coupled with seafloor photo-mosaics of 100m2 were used to find relationships between waveform metrics, seafloor, and coral reef properties. Linking remote sensing derived data
Figure 31-1. Examples of four coral reefs observed around Flat Cays. Vertical relief, rugosity and roughness were different for each of the nine reefs. Middle figure: Lidar reflectance map with numbers indicating location of each reef.
with biological and seafloor properties of benthic habitats provide novel information that improves the probability of establishing baselines and detecting fundamental temporal changes in benthic habitats at 10s to 100s of meters and in areas that are dan-gerous or inaccessible to divers. Benthic maps that depict the spatial extent of morphological forms of corals are valuable in managing essential fish habitats as upright branching corals provide a better habitat than mounding corals for fishes. These tools will also help in understanding which areas depth readings may be affected by the presence of sub-merged aquatic vegetation and soft corals, and even estimate by how much.
In the previous reporting period, the project team disseminated results describing methods for lidar signal processing using the EAARL-B topobathymet-
ric lidar and correlation of ex-tracted lidar waveform features to coral morphology (Wilson et al. 2019). In previous reports, a method was developed for coral reef 3D model reconstruc-tion using Agisoft Metashape. For this reporting period, the project team applied the meth-od to nine ~100m2 coral reefs (Figure 31-1). Modeled Depth Elevation Models (DEMs) were exported from Metashape and imported into ArcMap10.1.
Using the Benthic Terrain Mod-eler Toolbox, seafloor rough-ness and rugosity were calcu-lated using Terrain Ruggedness (i.e., roughness) and Surface Area to Planar Area (i.e., rugos-ity) tools. Mean lidar waveform features (reflectance, standard deviation, area under the curve and skewness) of the area at each site were calculated us-ing ArcMap 10.1 by clipping

JHC Performance Report 31 January 2021 171
INNOVATIVE HYDROGRAPHY
the lidar feature of the area at each site. This enabled a direct comparison between lidar fea-tures, roughness and rugosity. Once calculated, mean roughness and rugosity were correlated to four waveform features (reflectance, area under the curve, standard deviation and skew). Lidar reflectance (amplitude) strongly correlated with roughness (Figure 31-2) while two differ-ent dimensions of the return waveform shape, reflectance, and standard deviation (measure of the width of the bottom return pulse) strongly correlated with rugosity (Figure 31-3, Figure 31-4). These results indicate lidar waveform metrics can be used to monitor changes in the structural characteristics of coral reefs.
Evaluating the Use of Photomosaics for Fine-Scale Mapping of Habitat use by Commercially Valuable Species
Center Participants: Jenn Dijkstra, Kristen Mello, Yuri Rzhanov
Other: Nathan Furey, UNH
The coastal ocean floor is seeing a marked decline in tall, leafy native kelp forests and an inundation of short, shrub-like invasive sea-weeds. These near-shore coastal ecosystems are designated as Essential Fish Habitat for a variety of fishes and crustaceans and are con-sidered a sentinel for ecosystem change. In other areas of the world where there have been similarly drastic declines in kelp, the results have been reduced diversity of species and in some cases a total collapse of commercial fisheries. The loss of kelp in the Gulf of Maine to com-mercially valuable species is not known but may be a significant problem for the region’s coastal economy and the health of its coastal ecosys-tem. To understand how lobsters and crabs utilize habitats, fine-scale mapping of habitat was coupled with tracking of tagged lobsters and crabs. The team collected underwater video footage in June/July of 2019 of a 1,200m-2 area over six dives using two GoPro Hero Black 7s; in this reporting period, the team has completed stitching the footage together to form a single photomosaic of the seafloor. The photomosaic was georeferenced and imported into Arc-Map along with the acoustic receiver data that recorded fine-scale movement of lobsters and crabs in the habitat.
Figure 31-2. Negative correlation between roughness and lidar reflec-tance.
Figure 31-3. Strong negative correlation between rugosity and lidar reflectance.
Figure 31-4. Positive correlation between rugosity and standard devia-tion of the lidar return pulse.
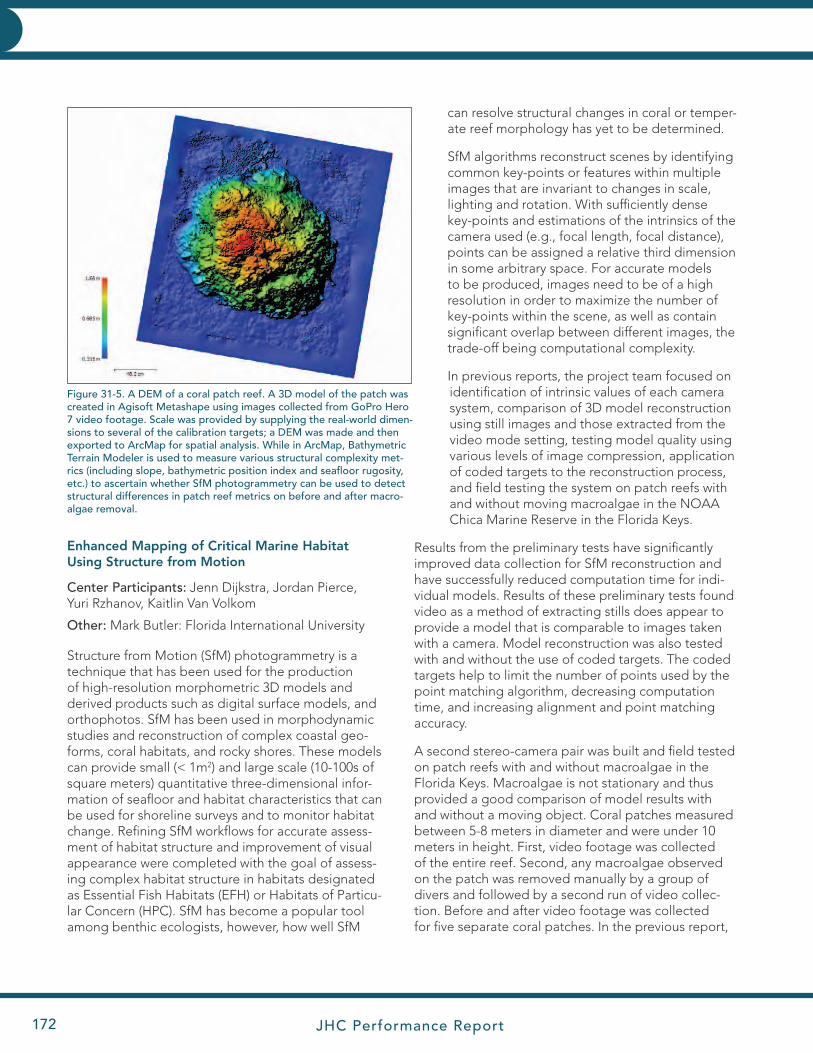
JHC Performance Report172
INNOVATIVE HYDROGRAPHY INNOVATIVE HYDROGRAPHY
Enhanced Mapping of Critical Marine Habitat Using Structure from Motion
Center Participants: Jenn Dijkstra, Jordan Pierce, Yuri Rzhanov, Kaitlin Van Volkom
Other: Mark Butler: Florida International University
Structure from Motion (SfM) photogrammetry is a technique that has been used for the production of high-resolution morphometric 3D models and derived products such as digital surface models, and orthophotos. SfM has been used in morphodynamic studies and reconstruction of complex coastal geo-forms, coral habitats, and rocky shores. These models can provide small (< 1m2) and large scale (10-100s of square meters) quantitative three-dimensional infor-mation of seafloor and habitat characteristics that can be used for shoreline surveys and to monitor habitat change. Refining SfM workflows for accurate assess-ment of habitat structure and improvement of visual appearance were completed with the goal of assess-ing complex habitat structure in habitats designated as Essential Fish Habitats (EFH) or Habitats of Particu-lar Concern (HPC). SfM has become a popular tool among benthic ecologists, however, how well SfM
Figure 31-5. A DEM of a coral patch reef. A 3D model of the patch was created in Agisoft Metashape using images collected from GoPro Hero 7 video footage. Scale was provided by supplying the real-world dimen-sions to several of the calibration targets; a DEM was made and then exported to ArcMap for spatial analysis. While in ArcMap, Bathymetric Terrain Modeler is used to measure various structural complexity met-rics (including slope, bathymetric position index and seafloor rugosity, etc.) to ascertain whether SfM photogrammetry can be used to detect structural differences in patch reef metrics on before and after macro-algae removal.
can resolve structural changes in coral or temper-ate reef morphology has yet to be determined.
SfM algorithms reconstruct scenes by identifying common key-points or features within multiple images that are invariant to changes in scale, lighting and rotation. With sufficiently dense key-points and estimations of the intrinsics of the camera used (e.g., focal length, focal distance), points can be assigned a relative third dimension in some arbitrary space. For accurate models to be produced, images need to be of a high resolution in order to maximize the number of key-points within the scene, as well as contain significant overlap between different images, the trade-off being computational complexity.
In previous reports, the project team focused on identification of intrinsic values of each camera system, comparison of 3D model reconstruction using still images and those extracted from the video mode setting, testing model quality using various levels of image compression, application of coded targets to the reconstruction process, and field testing the system on patch reefs with and without moving macroalgae in the NOAA Chica Marine Reserve in the Florida Keys.
Results from the preliminary tests have significantly improved data collection for SfM reconstruction and have successfully reduced computation time for indi-vidual models. Results of these preliminary tests found video as a method of extracting stills does appear to provide a model that is comparable to images taken with a camera. Model reconstruction was also tested with and without the use of coded targets. The coded targets help to limit the number of points used by the point matching algorithm, decreasing computation time, and increasing alignment and point matching accuracy.
A second stereo-camera pair was built and field tested on patch reefs with and without macroalgae in the Florida Keys. Macroalgae is not stationary and thus provided a good comparison of model results with and without a moving object. Coral patches measured between 5-8 meters in diameter and were under 10 meters in height. First, video footage was collected of the entire reef. Second, any macroalgae observed on the patch was removed manually by a group of divers and followed by a second run of video collec-tion. Before and after video footage was collected for five separate coral patches. In the previous report,
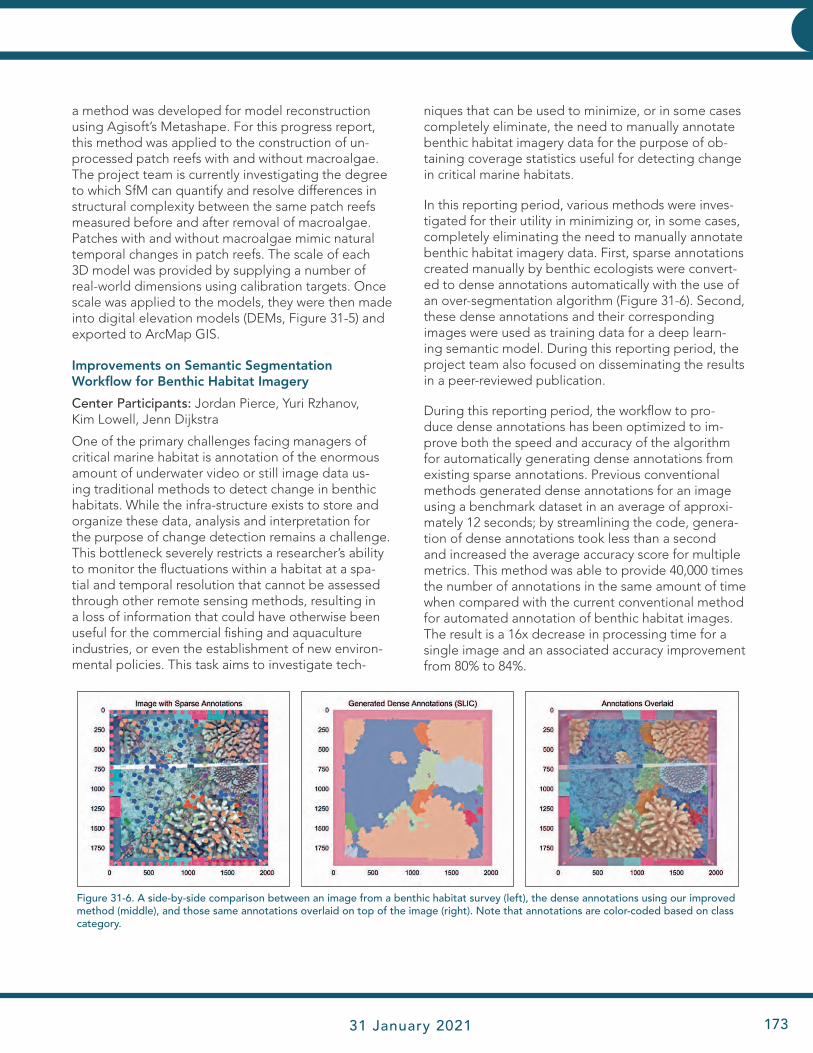
JHC Performance Report 31 January 2021 173
INNOVATIVE HYDROGRAPHY
a method was developed for model reconstruction using Agisoft’s Metashape. For this progress report, this method was applied to the construction of un-processed patch reefs with and without macroalgae. The project team is currently investigating the degree to which SfM can quantify and resolve differences in structural complexity between the same patch reefs measured before and after removal of macroalgae. Patches with and without macroalgae mimic natural temporal changes in patch reefs. The scale of each 3D model was provided by supplying a number of real-world dimensions using calibration targets. Once scale was applied to the models, they were then made into digital elevation models (DEMs, Figure 31-5) and exported to ArcMap GIS.
Improvements on Semantic Segmentation Workflow for Benthic Habitat Imagery
Center Participants: Jordan Pierce, Yuri Rzhanov, Kim Lowell, Jenn Dijkstra
One of the primary challenges facing managers of critical marine habitat is annotation of the enormous amount of underwater video or still image data us-ing traditional methods to detect change in benthic habitats. While the infra-structure exists to store and organize these data, analysis and interpretation for the purpose of change detection remains a challenge. This bottleneck severely restricts a researcher’s ability to monitor the fluctuations within a habitat at a spa-tial and temporal resolution that cannot be assessed through other remote sensing methods, resulting in a loss of information that could have otherwise been useful for the commercial fishing and aquaculture industries, or even the establishment of new environ-mental policies. This task aims to investigate tech-
niques that can be used to minimize, or in some cases completely eliminate, the need to manually annotate benthic habitat imagery data for the purpose of ob-taining coverage statistics useful for detecting change in critical marine habitats.
In this reporting period, various methods were inves-tigated for their utility in minimizing or, in some cases, completely eliminating the need to manually annotate benthic habitat imagery data. First, sparse annotations created manually by benthic ecologists were convert-ed to dense annotations automatically with the use of an over-segmentation algorithm (Figure 31-6). Second, these dense annotations and their corresponding images were used as training data for a deep learn-ing semantic model. During this reporting period, the project team also focused on disseminating the results in a peer-reviewed publication.
During this reporting period, the workflow to pro- duce dense annotations has been optimized to im-prove both the speed and accuracy of the algorithm for automatically generating dense annotations from existing sparse annotations. Previous conventional methods generated dense annotations for an image using a benchmark dataset in an average of approxi-mately 12 seconds; by streamlining the code, genera-tion of dense annotations took less than a second and increased the average accuracy score for multiple metrics. This method was able to provide 40,000 times the number of annotations in the same amount of time when compared with the current conventional method for automated annotation of benthic habitat images. The result is a 16x decrease in processing time for a single image and an associated accuracy improvement from 80% to 84%.
Figure 31-6. A side-by-side comparison between an image from a benthic habitat survey (left), the dense annotations using our improved method (middle), and those same annotations overlaid on top of the image (right). Note that annotations are color-coded based on class category.
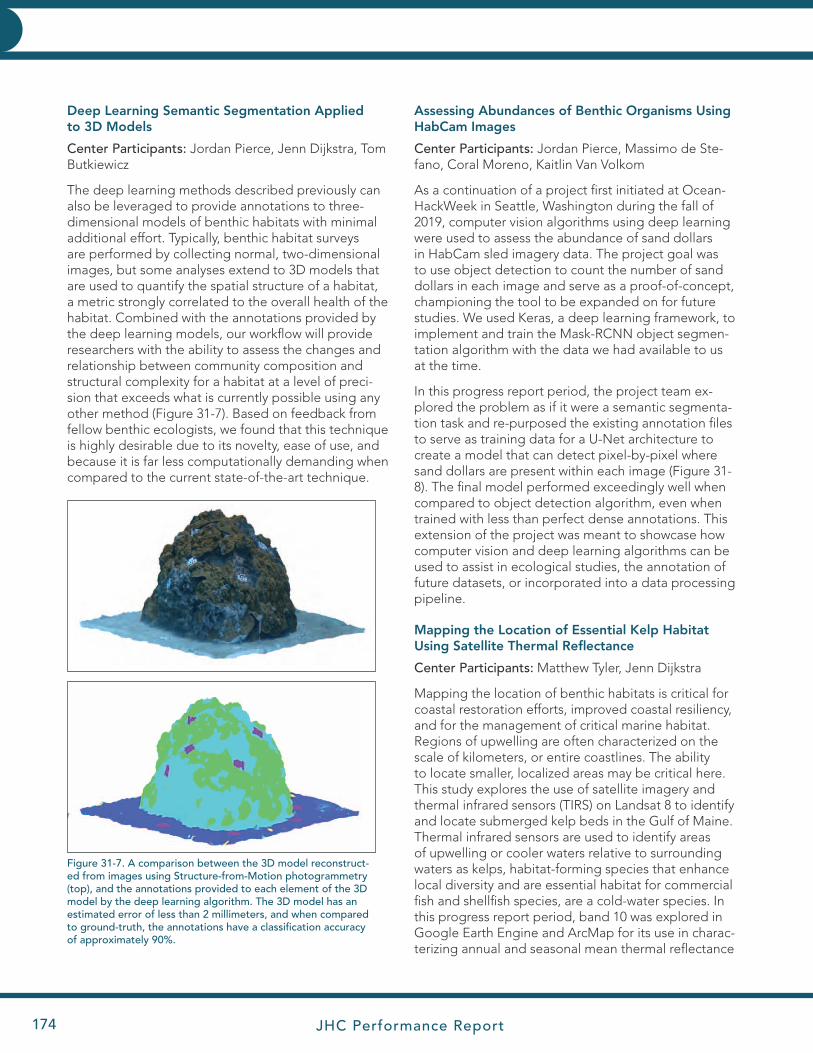
JHC Performance Report174
INNOVATIVE HYDROGRAPHY INNOVATIVE HYDROGRAPHY
Deep Learning Semantic Segmentation Applied to 3D Models
Center Participants: Jordan Pierce, Jenn Dijkstra, Tom Butkiewicz
The deep learning methods described previously can also be leveraged to provide annotations to three-dimensional models of benthic habitats with minimal additional effort. Typically, benthic habitat surveys are performed by collecting normal, two-dimensional images, but some analyses extend to 3D models that are used to quantify the spatial structure of a habitat, a metric strongly correlated to the overall health of the habitat. Combined with the annotations provided by the deep learning models, our workflow will provide researchers with the ability to assess the changes and relationship between community composition and structural complexity for a habitat at a level of preci-sion that exceeds what is currently possible using any other method (Figure 31-7). Based on feedback from fellow benthic ecologists, we found that this technique is highly desirable due to its novelty, ease of use, and because it is far less computationally demanding when compared to the current state-of-the-art technique.
Assessing Abundances of Benthic Organisms Using HabCam Images
Center Participants: Jordan Pierce, Massimo de Ste-fano, Coral Moreno, Kaitlin Van Volkom
As a continuation of a project first initiated at Ocean-HackWeek in Seattle, Washington during the fall of 2019, computer vision algorithms using deep learning were used to assess the abundance of sand dollars in HabCam sled imagery data. The project goal was to use object detection to count the number of sand dollars in each image and serve as a proof-of-concept, championing the tool to be expanded on for future studies. We used Keras, a deep learning framework, to implement and train the Mask-RCNN object segmen-tation algorithm with the data we had available to us at the time.
In this progress report period, the project team ex-plored the problem as if it were a semantic segmenta-tion task and re-purposed the existing annotation files to serve as training data for a U-Net architecture to create a model that can detect pixel-by-pixel where sand dollars are present within each image (Figure 31-8). The final model performed exceedingly well when compared to object detection algorithm, even when trained with less than perfect dense annotations. This extension of the project was meant to showcase how computer vision and deep learning algorithms can be used to assist in ecological studies, the annotation of future datasets, or incorporated into a data processing pipeline.
Mapping the Location of Essential Kelp Habitat Using Satellite Thermal Reflectance
Center Participants: Matthew Tyler, Jenn Dijkstra
Mapping the location of benthic habitats is critical for coastal restoration efforts, improved coastal resiliency, and for the management of critical marine habitat. Regions of upwelling are often characterized on the scale of kilometers, or entire coastlines. The ability to locate smaller, localized areas may be critical here. This study explores the use of satellite imagery and thermal infrared sensors (TIRS) on Landsat 8 to identify and locate submerged kelp beds in the Gulf of Maine. Thermal infrared sensors are used to identify areas of upwelling or cooler waters relative to surrounding waters as kelps, habitat-forming species that enhance local diversity and are essential habitat for commercial fish and shellfish species, are a cold-water species. In this progress report period, band 10 was explored in Google Earth Engine and ArcMap for its use in charac-terizing annual and seasonal mean thermal reflectance
Figure 31-7. A comparison between the 3D model reconstruct-ed from images using Structure-from-Motion photogrammetry (top), and the annotations provided to each element of the 3D model by the deep learning algorithm. The 3D model has an estimated error of less than 2 millimeters, and when compared to ground-truth, the annotations have a classification accuracy of approximately 90%.
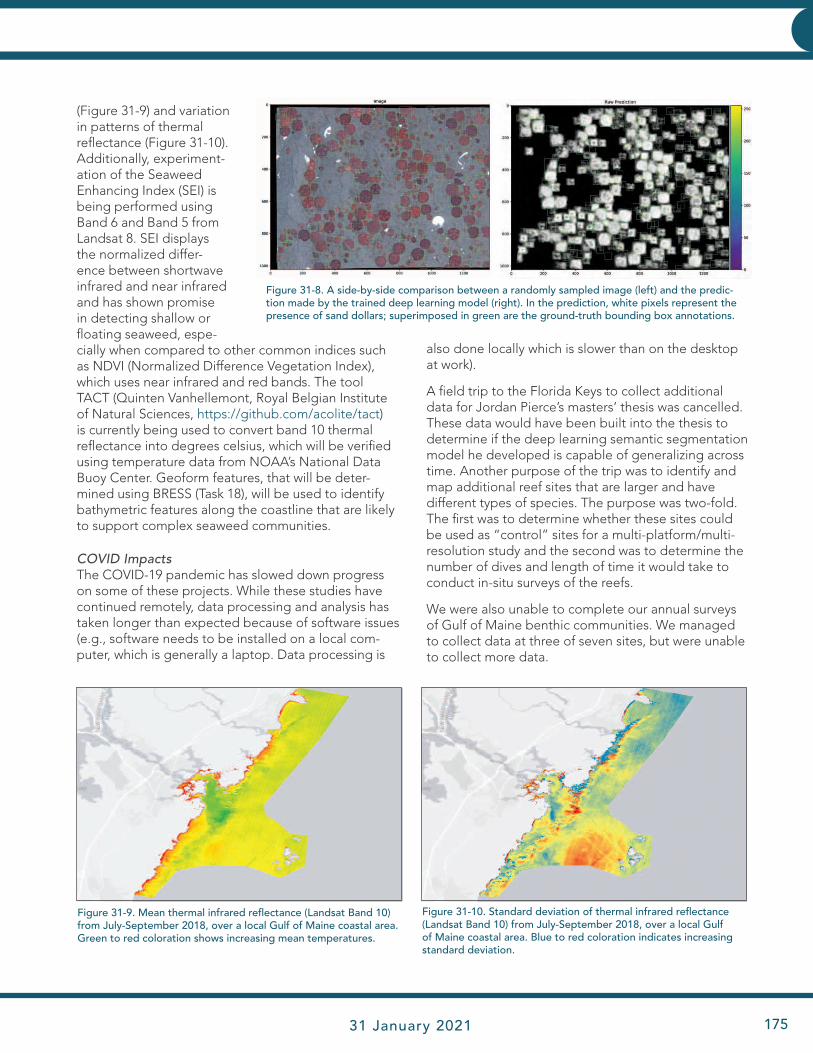
JHC Performance Report 31 January 2021 175
INNOVATIVE HYDROGRAPHY
(Figure 31-9) and variation in patterns of thermal reflectance (Figure 31-10). Additionally, experiment-ation of the Seaweed Enhancing Index (SEI) is being performed using Band 6 and Band 5 from Landsat 8. SEI displays the normalized differ-ence between shortwave infrared and near infrared and has shown promise in detecting shallow or floating seaweed, espe-cially when compared to other common indices such as NDVI (Normalized Difference Vegetation Index), which uses near infrared and red bands. The tool TACT (Quinten Vanhellemont, Royal Belgian Institute of Natural Sciences, https://github.com/acolite/tact) is currently being used to convert band 10 thermal reflectance into degrees celsius, which will be verified using temperature data from NOAA’s National Data Buoy Center. Geoform features, that will be deter-mined using BRESS (Task 18), will be used to identify bathymetric features along the coastline that are likely to support complex seaweed communities.
COVID ImpactsThe COVID-19 pandemic has slowed down progress on some of these projects. While these studies have continued remotely, data processing and analysis has taken longer than expected because of software issues (e.g., software needs to be installed on a local com-puter, which is generally a laptop. Data processing is
also done locally which is slower than on the desktop at work).
A field trip to the Florida Keys to collect additional data for Jordan Pierce’s masters’ thesis was cancelled. These data would have been built into the thesis to determine if the deep learning semantic segmentation model he developed is capable of generalizing across time. Another purpose of the trip was to identify and map additional reef sites that are larger and have different types of species. The purpose was two-fold. The first was to determine whether these sites could be used as “control” sites for a multi-platform/multi-resolution study and the second was to determine the number of dives and length of time it would take to conduct in-situ surveys of the reefs.
We were also unable to complete our annual surveys of Gulf of Maine benthic communities. We managed to collect data at three of seven sites, but were unable to collect more data.
Figure 31-8. A side-by-side comparison between a randomly sampled image (left) and the predic-tion made by the trained deep learning model (right). In the prediction, white pixels represent the presence of sand dollars; superimposed in green are the ground-truth bounding box annotations.
Figure 31-9. Mean thermal infrared reflectance (Landsat Band 10) from July-September 2018, over a local Gulf of Maine coastal area. Green to red coloration shows increasing mean temperatures.
Figure 31-10. Standard deviation of thermal infrared reflectance (Landsat Band 10) from July-September 2018, over a local Gulf of Maine coastal area. Blue to red coloration indicates increasing standard deviation.
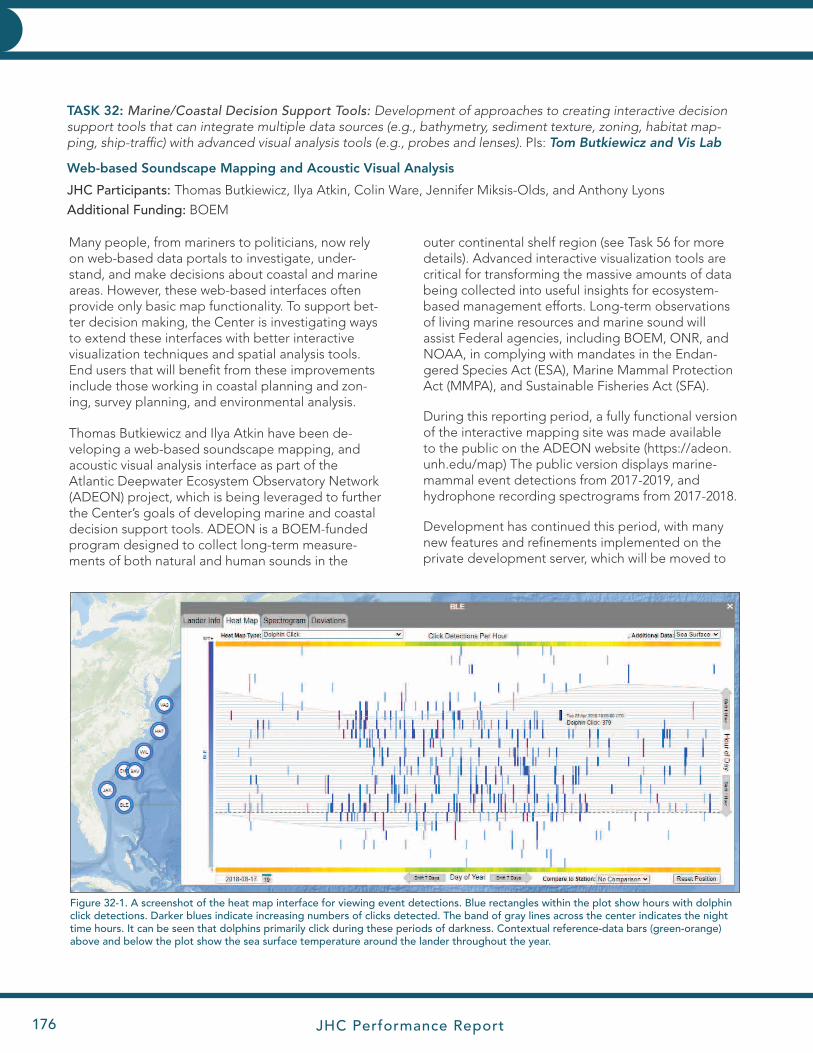
JHC Performance Report176
INNOVATIVE HYDROGRAPHY INNOVATIVE HYDROGRAPHY
Many people, from mariners to politicians, now rely on web-based data portals to investigate, under-stand, and make decisions about coastal and marine areas. However, these web-based interfaces often provide only basic map functionality. To support bet-ter decision making, the Center is investigating ways to extend these interfaces with better interactive visualization techniques and spatial analysis tools. End users that will benefit from these improvements include those working in coastal planning and zon-ing, survey planning, and environmental analysis.
Thomas Butkiewicz and Ilya Atkin have been de-veloping a web-based soundscape mapping, and acoustic visual analysis interface as part of the Atlantic Deepwater Ecosystem Observatory Network (ADEON) project, which is being leveraged to further the Center’s goals of developing marine and coastal decision support tools. ADEON is a BOEM-funded program designed to collect long-term measure-ments of both natural and human sounds in the
outer continental shelf region (see Task 56 for more details). Advanced interactive visualization tools are critical for transforming the massive amounts of data being collected into useful insights for ecosystem-based management efforts. Long-term observations of living marine resources and marine sound will assist Federal agencies, including BOEM, ONR, and NOAA, in complying with mandates in the Endan-gered Species Act (ESA), Marine Mammal Protection Act (MMPA), and Sustainable Fisheries Act (SFA).
During this reporting period, a fully functional version of the interactive mapping site was made available to the public on the ADEON website (https://adeon.unh.edu/map) The public version displays marine-mammal event detections from 2017-2019, and hydrophone recording spectrograms from 2017-2018.
Development has continued this period, with many new features and refinements implemented on the private development server, which will be moved to
TASK 32: Marine/Coastal Decision Support Tools: Development of approaches to creating interactive decision support tools that can integrate multiple data sources (e.g., bathymetry, sediment texture, zoning, habitat map-ping, ship-traffic) with advanced visual analysis tools (e.g., probes and lenses). PIs: Tom Butkiewicz and Vis Lab
Web-based Soundscape Mapping and Acoustic Visual Analysis
JHC Participants: Thomas Butkiewicz, Ilya Atkin, Colin Ware, Jennifer Miksis-Olds, and Anthony Lyons
Additional Funding: BOEM
Figure 32-1. A screenshot of the heat map interface for viewing event detections. Blue rectangles within the plot show hours with dolphin click detections. Darker blues indicate increasing numbers of clicks detected. The band of gray lines across the center indicates the night time hours. It can be seen that dolphins primarily click during these periods of darkness. Contextual reference-data bars (green-orange) above and below the plot show the sea surface temperature around the lander throughout the year.
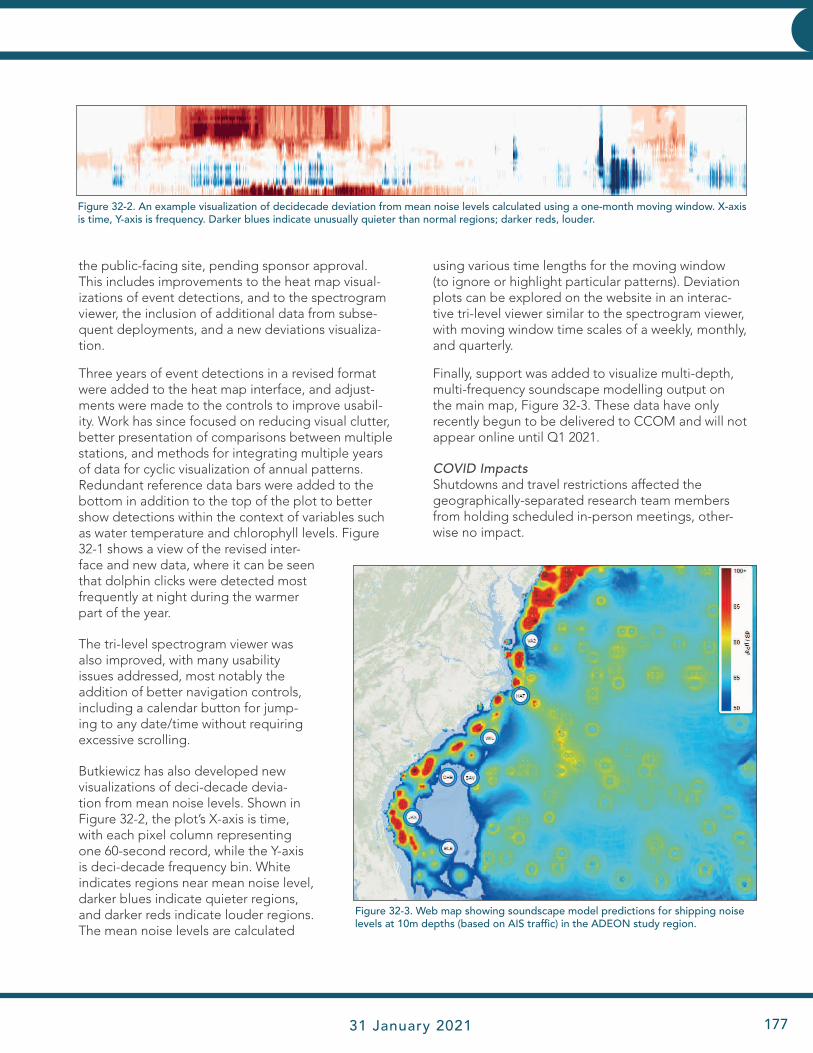
JHC Performance Report 31 January 2021 177
INNOVATIVE HYDROGRAPHY
the public-facing site, pending sponsor approval. This includes improvements to the heat map visual-izations of event detections, and to the spectrogram viewer, the inclusion of additional data from subse-quent deployments, and a new deviations visualiza-tion.
Three years of event detections in a revised format were added to the heat map interface, and adjust-ments were made to the controls to improve usabil-ity. Work has since focused on reducing visual clutter, better presentation of comparisons between multiple stations, and methods for integrating multiple years of data for cyclic visualization of annual patterns. Redundant reference data bars were added to the bottom in addition to the top of the plot to better show detections within the context of variables such as water temperature and chlorophyll levels. Figure 32-1 shows a view of the revised inter-face and new data, where it can be seen that dolphin clicks were detected most frequently at night during the warmer part of the year.
The tri-level spectrogram viewer was also improved, with many usability issues addressed, most notably the addition of better navigation controls, including a calendar button for jump-ing to any date/time without requiring excessive scrolling.
Butkiewicz has also developed new visualizations of deci-decade devia-tion from mean noise levels. Shown in Figure 32-2, the plot’s X-axis is time, with each pixel column representing one 60-second record, while the Y-axis is deci-decade frequency bin. White indicates regions near mean noise level, darker blues indicate quieter regions, and darker reds indicate louder regions. The mean noise levels are calculated
using various time lengths for the moving window (to ignore or highlight particular patterns). Deviation plots can be explored on the website in an interac-tive tri-level viewer similar to the spectrogram viewer, with moving window time scales of a weekly, monthly, and quarterly.
Finally, support was added to visualize multi-depth, multi-frequency soundscape modelling output on the main map, Figure 32-3. These data have only recently begun to be delivered to CCOM and will not appear online until Q1 2021.
COVID ImpactsShutdowns and travel restrictions affected the geographically-separated research team members from holding scheduled in-person meetings, other-wise no impact.
Figure 32-2. An example visualization of decidecade deviation from mean noise levels calculated using a one-month moving window. X-axis is time, Y-axis is frequency. Darker blues indicate unusually quieter than normal regions; darker reds, louder.
Figure 32-3. Web map showing soundscape model predictions for shipping noise levels at 10m depths (based on AIS traffic) in the ADEON study region.
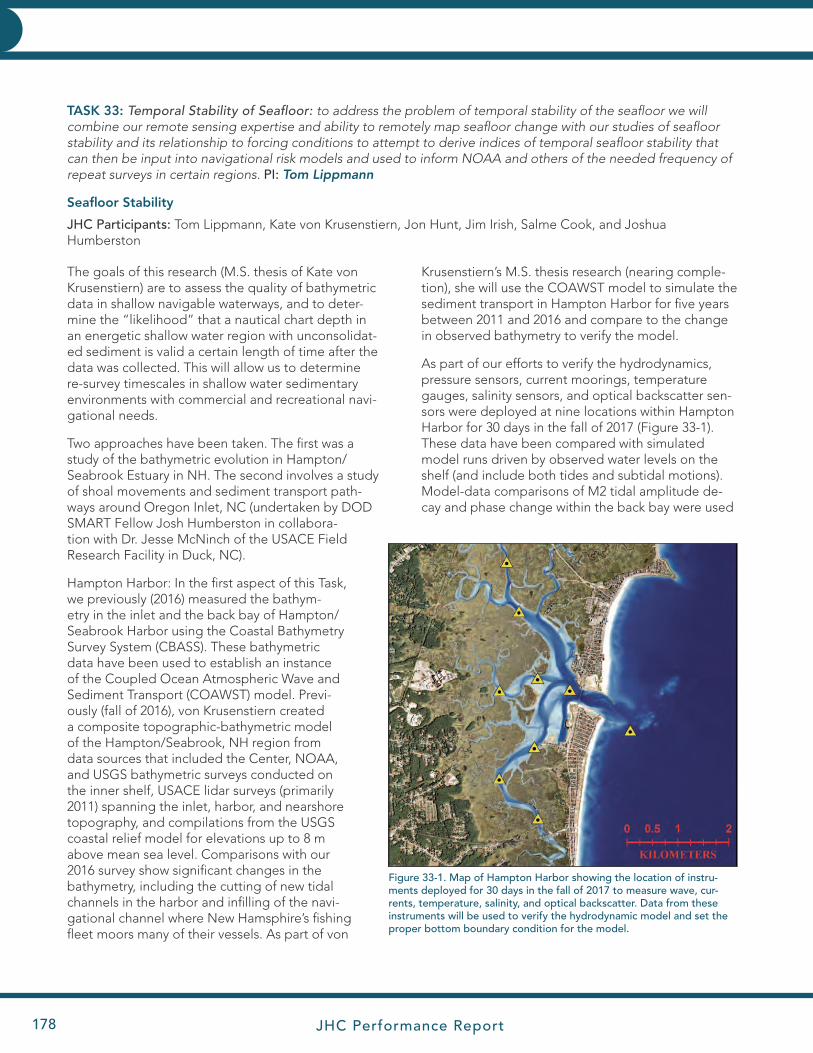
JHC Performance Report178
INNOVATIVE HYDROGRAPHY INNOVATIVE HYDROGRAPHY
Figure 33-1. Map of Hampton Harbor showing the location of instru-ments deployed for 30 days in the fall of 2017 to measure wave, cur-rents, temperature, salinity, and optical backscatter. Data from these instruments will be used to verify the hydrodynamic model and set the proper bottom boundary condition for the model.
TASK 33: Temporal Stability of Seafloor: to address the problem of temporal stability of the seafloor we will combine our remote sensing expertise and ability to remotely map seafloor change with our studies of seafloor stability and its relationship to forcing conditions to attempt to derive indices of temporal seafloor stability that can then be input into navigational risk models and used to inform NOAA and others of the needed frequency of repeat surveys in certain regions. PI: Tom Lippmann
Seafloor Stability
JHC Participants: Tom Lippmann, Kate von Krusenstiern, Jon Hunt, Jim Irish, Salme Cook, and Joshua Humberston
The goals of this research (M.S. thesis of Kate von Krusenstiern) are to assess the quality of bathymetric data in shallow navigable waterways, and to deter-mine the “likelihood” that a nautical chart depth in an energetic shallow water region with unconsolidat-ed sediment is valid a certain length of time after the data was collected. This will allow us to determine re-survey timescales in shallow water sedimentary environments with commercial and recreational navi-gational needs.
Two approaches have been taken. The first was a study of the bathymetric evolution in Hampton/Seabrook Estuary in NH. The second involves a study of shoal movements and sediment transport path-ways around Oregon Inlet, NC (undertaken by DOD SMART Fellow Josh Humberston in collabora-tion with Dr. Jesse McNinch of the USACE Field Research Facility in Duck, NC).
Hampton Harbor: In the first aspect of this Task, we previously (2016) measured the bathym-etry in the inlet and the back bay of Hampton/Seabrook Harbor using the Coastal Bathymetry Survey System (CBASS). These bathymetric data have been used to establish an instance of the Coupled Ocean Atmospheric Wave and Sediment Transport (COAWST) model. Previ-ously (fall of 2016), von Krusenstiern created a composite topographic-bathymetric model of the Hampton/Seabrook, NH region from data sources that included the Center, NOAA, and USGS bathymetric surveys conducted on the inner shelf, USACE lidar surveys (primarily 2011) spanning the inlet, harbor, and nearshore topography, and compilations from the USGS coastal relief model for elevations up to 8 m above mean sea level. Comparisons with our 2016 survey show significant changes in the bathymetry, including the cutting of new tidal channels in the harbor and infilling of the navi-gational channel where New Hamsphire’s fishing fleet moors many of their vessels. As part of von
Krusenstiern’s M.S. thesis research (nearing comple-tion), she will use the COAWST model to simulate the sediment transport in Hampton Harbor for five years between 2011 and 2016 and compare to the change in observed bathymetry to verify the model.
As part of our efforts to verify the hydrodynamics, pressure sensors, current moorings, temperature gauges, salinity sensors, and optical backscatter sen-sors were deployed at nine locations within Hampton Harbor for 30 days in the fall of 2017 (Figure 33-1). These data have been compared with simulated model runs driven by observed water levels on the shelf (and include both tides and subtidal motions). Model-data comparisons of M2 tidal amplitude de-cay and phase change within the back bay were used
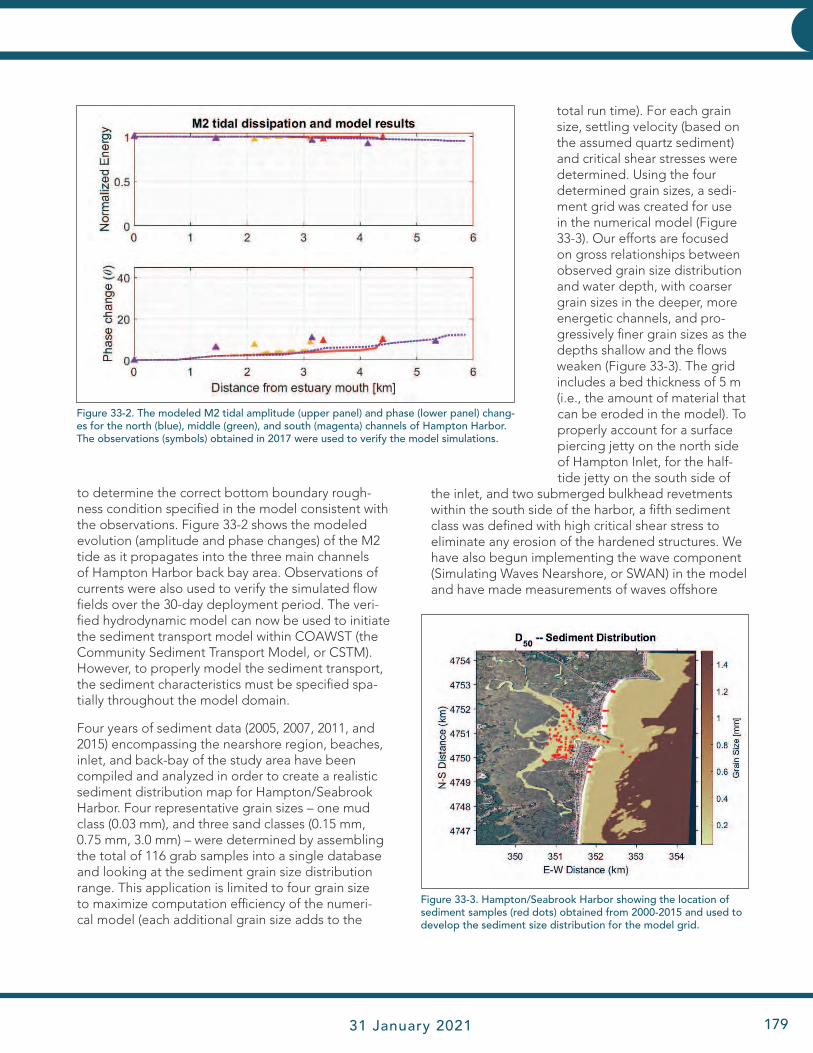
JHC Performance Report 31 January 2021 179
INNOVATIVE HYDROGRAPHY
to determine the correct bottom boundary rough-ness condition specified in the model consistent with the observations. Figure 33-2 shows the modeled evolution (amplitude and phase changes) of the M2 tide as it propagates into the three main channels of Hampton Harbor back bay area. Observations of currents were also used to verify the simulated flow fields over the 30-day deployment period. The veri-fied hydrodynamic model can now be used to initiate the sediment transport model within COAWST (the Community Sediment Transport Model, or CSTM). However, to properly model the sediment transport, the sediment characteristics must be specified spa-tially throughout the model domain.
Four years of sediment data (2005, 2007, 2011, and 2015) encompassing the nearshore region, beaches, inlet, and back-bay of the study area have been compiled and analyzed in order to create a realistic sediment distribution map for Hampton/Seabrook Harbor. Four representative grain sizes – one mud class (0.03 mm), and three sand classes (0.15 mm, 0.75 mm, 3.0 mm) – were determined by assembling the total of 116 grab samples into a single database and looking at the sediment grain size distribution range. This application is limited to four grain size to maximize computation efficiency of the numeri-cal model (each additional grain size adds to the
total run time). For each grain size, settling velocity (based on the assumed quartz sediment) and critical shear stresses were determined. Using the four determined grain sizes, a sedi-ment grid was created for use in the numerical model (Figure 33-3). Our efforts are focused on gross relationships between observed grain size distribution and water depth, with coarser grain sizes in the deeper, more energetic channels, and pro-gressively finer grain sizes as the depths shallow and the flows weaken (Figure 33-3). The grid includes a bed thickness of 5 m (i.e., the amount of material that can be eroded in the model). To properly account for a surface piercing jetty on the north side of Hampton Inlet, for the half-tide jetty on the south side of
the inlet, and two submerged bulkhead revetments within the south side of the harbor, a fifth sediment class was defined with high critical shear stress to eliminate any erosion of the hardened structures. We have also begun implementing the wave component (Simulating Waves Nearshore, or SWAN) in the model and have made measurements of waves offshore
Figure 33-2. The modeled M2 tidal amplitude (upper panel) and phase (lower panel) chang-es for the north (blue), middle (green), and south (magenta) channels of Hampton Harbor. The observations (symbols) obtained in 2017 were used to verify the model simulations.
Figure 33-3. Hampton/Seabrook Harbor showing the location of sediment samples (red dots) obtained from 2000-2015 and used to develop the sediment size distribution for the model grid.
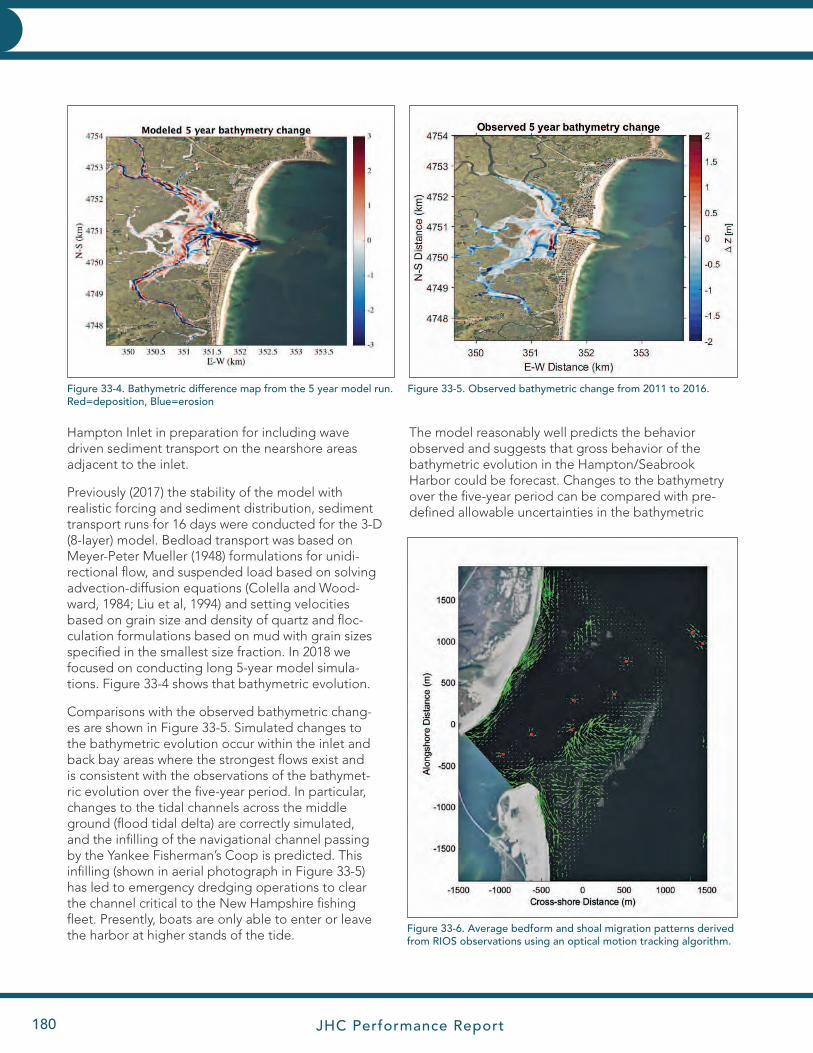
JHC Performance Report180
INNOVATIVE HYDROGRAPHY INNOVATIVE HYDROGRAPHY
Hampton Inlet in preparation for including wave driven sediment transport on the nearshore areas adjacent to the inlet.
Previously (2017) the stability of the model with realistic forcing and sediment distribution, sediment transport runs for 16 days were conducted for the 3-D (8-layer) model. Bedload transport was based on Meyer-Peter Mueller (1948) formulations for unidi-rectional flow, and suspended load based on solving advection-diffusion equations (Colella and Wood-ward, 1984; Liu et al, 1994) and setting velocities based on grain size and density of quartz and floc-culation formulations based on mud with grain sizes specified in the smallest size fraction. In 2018 we focused on conducting long 5-year model simula-tions. Figure 33-4 shows that bathymetric evolution.
Comparisons with the observed bathymetric chang-es are shown in Figure 33-5. Simulated changes to the bathymetric evolution occur within the inlet and back bay areas where the strongest flows exist and is consistent with the observations of the bathymet-ric evolution over the five-year period. In particular, changes to the tidal channels across the middle ground (flood tidal delta) are correctly simulated, and the infilling of the navigational channel passing by the Yankee Fisherman’s Coop is predicted. This infilling (shown in aerial photograph in Figure 33-5) has led to emergency dredging operations to clear the channel critical to the New Hampshire fishing fleet. Presently, boats are only able to enter or leave the harbor at higher stands of the tide.
The model reasonably well predicts the behavior observed and suggests that gross behavior of the bathymetric evolution in the Hampton/Seabrook Harbor could be forecast. Changes to the bathymetry over the five-year period can be compared with pre-defined allowable uncertainties in the bathymetric
Figure 33-4. Bathymetric difference map from the 5 year model run. Red=deposition, Blue=erosion
Figure 33-5. Observed bathymetric change from 2011 to 2016.
Figure 33-6. Average bedform and shoal migration patterns derived from RIOS observations using an optical motion tracking algorithm.
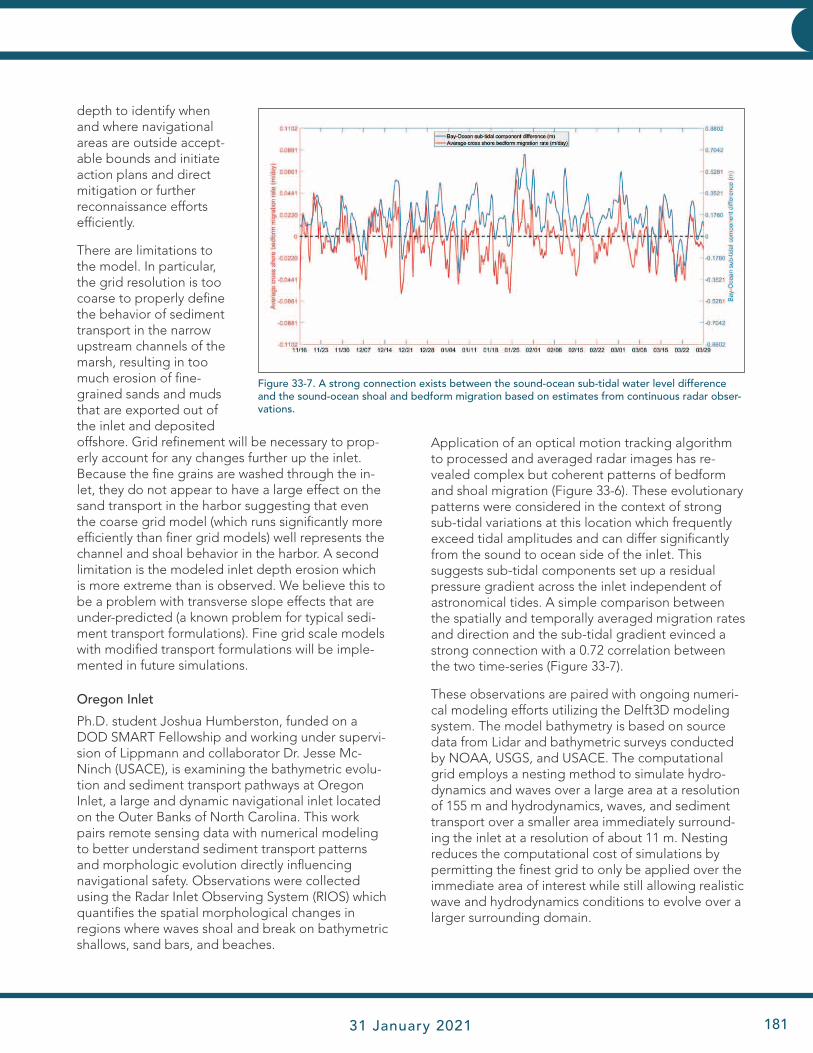
JHC Performance Report 31 January 2021 181
INNOVATIVE HYDROGRAPHY
depth to identify when and where navigational areas are outside accept-able bounds and initiate action plans and direct mitigation or further reconnaissance efforts efficiently.
There are limitations to the model. In particular, the grid resolution is too coarse to properly define the behavior of sediment transport in the narrow upstream channels of the marsh, resulting in too much erosion of fine-grained sands and muds that are exported out of the inlet and deposited offshore. Grid refinement will be necessary to prop-erly account for any changes further up the inlet. Because the fine grains are washed through the in-let, they do not appear to have a large effect on the sand transport in the harbor suggesting that even the coarse grid model (which runs significantly more efficiently than finer grid models) well represents the channel and shoal behavior in the harbor. A second limitation is the modeled inlet depth erosion which is more extreme than is observed. We believe this to be a problem with transverse slope effects that are under-predicted (a known problem for typical sedi-ment transport formulations). Fine grid scale models with modified transport formulations will be imple-mented in future simulations.
Oregon Inlet
Ph.D. student Joshua Humberston, funded on a DOD SMART Fellowship and working under supervi-sion of Lippmann and collaborator Dr. Jesse Mc-Ninch (USACE), is examining the bathymetric evolu-tion and sediment transport pathways at Oregon Inlet, a large and dynamic navigational inlet located on the Outer Banks of North Carolina. This work pairs remote sensing data with numerical modeling to better understand sediment transport patterns and morphologic evolution directly influencing navigational safety. Observations were collected using the Radar Inlet Observing System (RIOS) which quantifies the spatial morphological changes in regions where waves shoal and break on bathymetric shallows, sand bars, and beaches.
Application of an optical motion tracking algorithm to processed and averaged radar images has re-vealed complex but coherent patterns of bedform and shoal migration (Figure 33-6). These evolutionary patterns were considered in the context of strong sub-tidal variations at this location which frequently exceed tidal amplitudes and can differ significantly from the sound to ocean side of the inlet. This suggests sub-tidal components set up a residual pressure gradient across the inlet independent of astronomical tides. A simple comparison between the spatially and temporally averaged migration rates and direction and the sub-tidal gradient evinced a strong connection with a 0.72 correlation between the two time-series (Figure 33-7).
These observations are paired with ongoing numeri-cal modeling efforts utilizing the Delft3D modeling system. The model bathymetry is based on source data from Lidar and bathymetric surveys conducted by NOAA, USGS, and USACE. The computational grid employs a nesting method to simulate hydro-dynamics and waves over a large area at a resolution of 155 m and hydrodynamics, waves, and sediment transport over a smaller area immediately surround-ing the inlet at a resolution of about 11 m. Nesting reduces the computational cost of simulations by permitting the finest grid to only be applied over the immediate area of interest while still allowing realistic wave and hydrodynamics conditions to evolve over a larger surrounding domain.
Figure 33-7. A strong connection exists between the sound-ocean sub-tidal water level difference and the sound-ocean shoal and bedform migration based on estimates from continuous radar obser-vations.
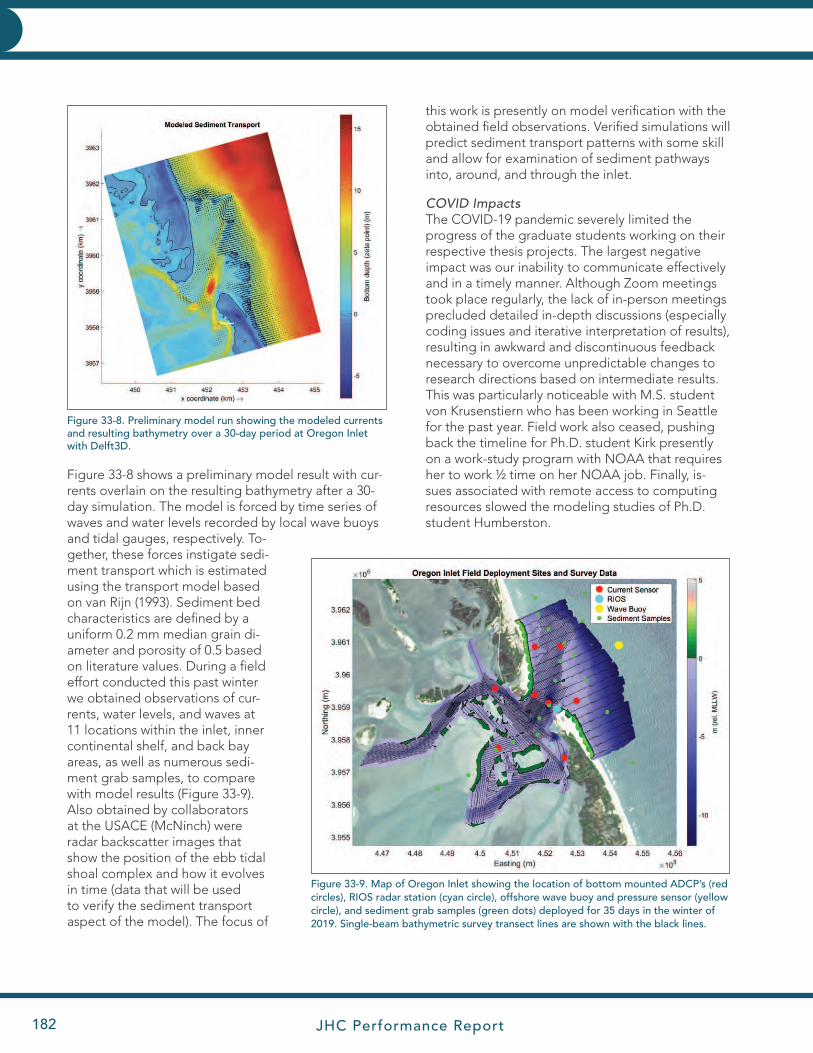
JHC Performance Report182
INNOVATIVE HYDROGRAPHY INNOVATIVE HYDROGRAPHY
Figure 33-8 shows a preliminary model result with cur-rents overlain on the resulting bathymetry after a 30-day simulation. The model is forced by time series of waves and water levels recorded by local wave buoys and tidal gauges, respectively. To-gether, these forces instigate sedi-ment transport which is estimated using the transport model based on van Rijn (1993). Sediment bed characteristics are defined by a uniform 0.2 mm median grain di-ameter and porosity of 0.5 based on literature values. During a field effort conducted this past winter we obtained observations of cur-rents, water levels, and waves at 11 locations within the inlet, inner continental shelf, and back bay areas, as well as numerous sedi-ment grab samples, to compare with model results (Figure 33-9). Also obtained by collaborators at the USACE (McNinch) were radar backscatter images that show the position of the ebb tidal shoal complex and how it evolves in time (data that will be used to verify the sediment transport aspect of the model). The focus of
this work is presently on model verification with the obtained field observations. Verified simulations will predict sediment transport patterns with some skill and allow for examination of sediment pathways into, around, and through the inlet.
COVID Impacts The COVID-19 pandemic severely limited the progress of the graduate students working on their respective thesis projects. The largest negative impact was our inability to communicate effectively and in a timely manner. Although Zoom meetings took place regularly, the lack of in-person meetings precluded detailed in-depth discussions (especially coding issues and iterative interpretation of results), resulting in awkward and discontinuous feedback necessary to overcome unpredictable changes to research directions based on intermediate results. This was particularly noticeable with M.S. student von Krusenstiern who has been working in Seattle for the past year. Field work also ceased, pushing back the timeline for Ph.D. student Kirk presently on a work-study program with NOAA that requires her to work ½ time on her NOAA job. Finally, is-sues associated with remote access to computing resources slowed the modeling studies of Ph.D. student Humberston.
Figure 33-9. Map of Oregon Inlet showing the location of bottom mounted ADCP’s (red circles), RIOS radar station (cyan circle), offshore wave buoy and pressure sensor (yellow circle), and sediment grab samples (green dots) deployed for 35 days in the winter of 2019. Single-beam bathymetric survey transect lines are shown with the black lines.
Figure 33-8. Preliminary model run showing the modeled currents and resulting bathymetry over a 30-day period at Oregon Inlet with Delft3D.
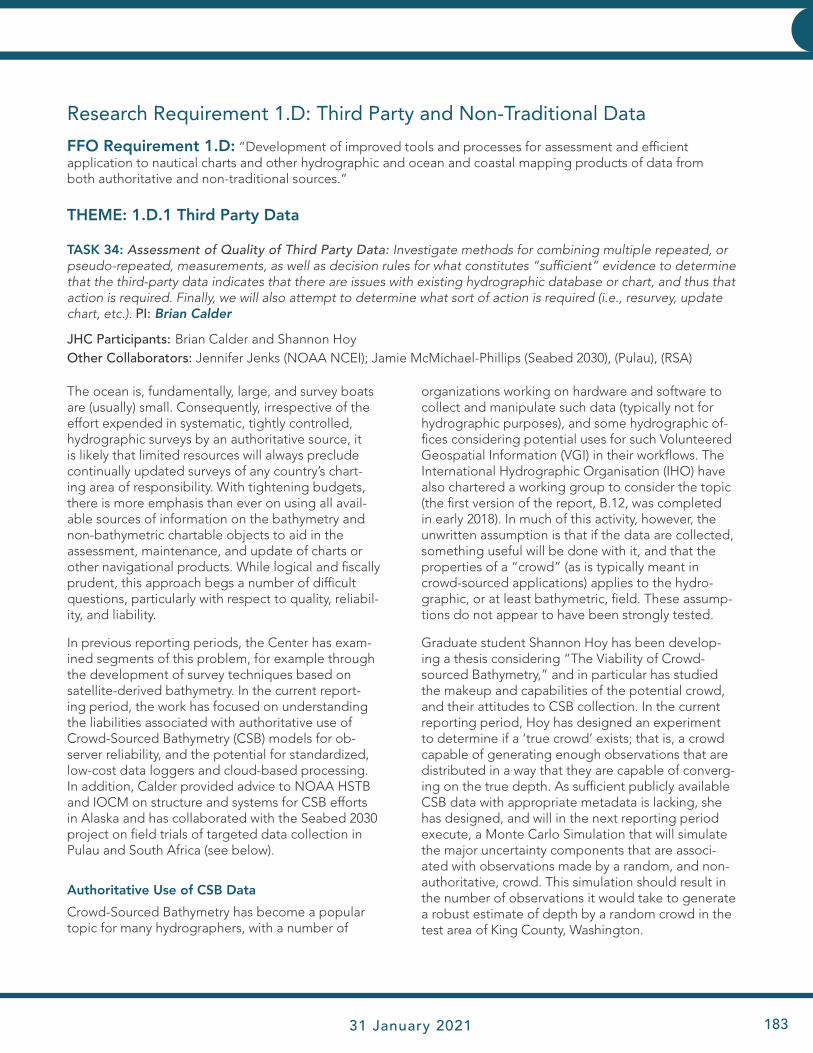
JHC Performance Report 31 January 2021 183
INNOVATIVE HYDROGRAPHY
Research Requirement 1.D: Third Party and Non-Traditional Data
FFO Requirement 1.D: “Development of improved tools and processes for assessment and efficient application to nautical charts and other hydrographic and ocean and coastal mapping products of data from both authoritative and non-traditional sources.”
THEME: 1.D.1 Third Party Data
TASK 34: Assessment of Quality of Third Party Data: Investigate methods for combining multiple repeated, or pseudo-repeated, measurements, as well as decision rules for what constitutes “sufficient” evidence to determine that the third-party data indicates that there are issues with existing hydrographic database or chart, and thus that action is required. Finally, we will also attempt to determine what sort of action is required (i.e., resurvey, update chart, etc.). PI: Brian Calder
JHC Participants: Brian Calder and Shannon HoyOther Collaborators: Jennifer Jenks (NOAA NCEI); Jamie McMichael-Phillips (Seabed 2030), (Pulau), (RSA)
The ocean is, fundamentally, large, and survey boats are (usually) small. Consequently, irrespective of the effort expended in systematic, tightly controlled, hydrographic surveys by an authoritative source, it is likely that limited resources will always preclude continually updated surveys of any country’s chart-ing area of responsibility. With tightening budgets, there is more emphasis than ever on using all avail-able sources of information on the bathymetry and non-bathymetric chartable objects to aid in the assessment, maintenance, and update of charts or other navigational products. While logical and fiscally prudent, this approach begs a number of difficult questions, particularly with respect to quality, reliabil-ity, and liability.
In previous reporting periods, the Center has exam-ined segments of this problem, for example through the development of survey techniques based on satellite-derived bathymetry. In the current report-ing period, the work has focused on understanding the liabilities associated with authoritative use of Crowd-Sourced Bathymetry (CSB) models for ob-server reliability, and the potential for standardized, low-cost data loggers and cloud-based processing. In addition, Calder provided advice to NOAA HSTB and IOCM on structure and systems for CSB efforts in Alaska and has collaborated with the Seabed 2030 project on field trials of targeted data collection in Pulau and South Africa (see below).
Authoritative Use of CSB Data
Crowd-Sourced Bathymetry has become a popular topic for many hydrographers, with a number of
organizations working on hardware and software to collect and manipulate such data (typically not for hydrographic purposes), and some hydrographic of-fices considering potential uses for such Volunteered Geospatial Information (VGI) in their workflows. The International Hydrographic Organisation (IHO) have also chartered a working group to consider the topic (the first version of the report, B.12, was completed in early 2018). In much of this activity, however, the unwritten assumption is that if the data are collected, something useful will be done with it, and that the properties of a “crowd” (as is typically meant in crowd-sourced applications) applies to the hydro-graphic, or at least bathymetric, field. These assump-tions do not appear to have been strongly tested.
Graduate student Shannon Hoy has been develop-ing a thesis considering “The Viability of Crowd-sourced Bathymetry,” and in particular has studied the makeup and capabilities of the potential crowd, and their attitudes to CSB collection. In the current reporting period, Hoy has designed an experiment to determine if a ‘true crowd’ exists; that is, a crowd capable of generating enough observations that are distributed in a way that they are capable of converg-ing on the true depth. As sufficient publicly available CSB data with appropriate metadata is lacking, she has designed, and will in the next reporting period execute, a Monte Carlo Simulation that will simulate the major uncertainty components that are associ-ated with observations made by a random, and non-authoritative, crowd. This simulation should result in the number of observations it would take to generate a robust estimate of depth by a random crowd in the test area of King County, Washington.
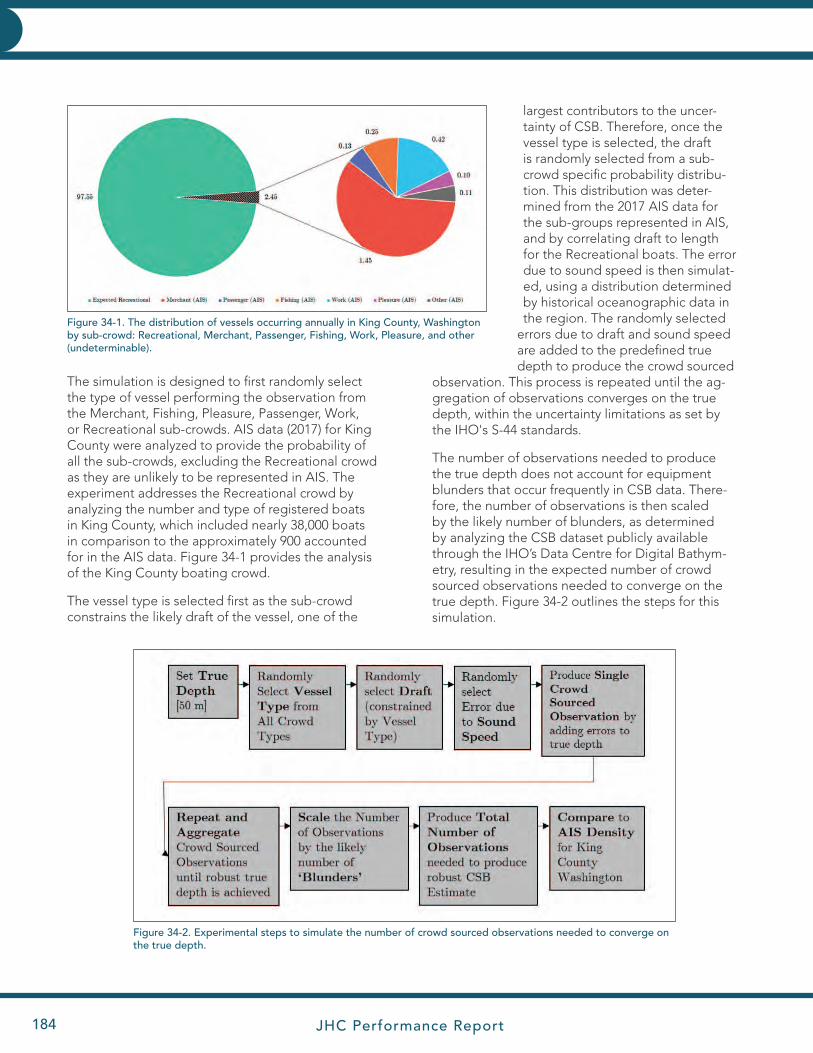
JHC Performance Report184
INNOVATIVE HYDROGRAPHY INNOVATIVE HYDROGRAPHY
The simulation is designed to first randomly select the type of vessel performing the observation from the Merchant, Fishing, Pleasure, Passenger, Work, or Recreational sub-crowds. AIS data (2017) for King County were analyzed to provide the probability of all the sub-crowds, excluding the Recreational crowd as they are unlikely to be represented in AIS. The experiment addresses the Recreational crowd by analyzing the number and type of registered boats in King County, which included nearly 38,000 boats in comparison to the approximately 900 accounted for in the AIS data. Figure 34-1 provides the analysis of the King County boating crowd.
The vessel type is selected first as the sub-crowd constrains the likely draft of the vessel, one of the
largest contributors to the uncer-tainty of CSB. Therefore, once the vessel type is selected, the draft is randomly selected from a sub-crowd specific probability distribu-tion. This distribution was deter-mined from the 2017 AIS data for the sub-groups represented in AIS, and by correlating draft to length for the Recreational boats. The error due to sound speed is then simulat-ed, using a distribution determined by historical oceanographic data in the region. The randomly selected
errors due to draft and sound speed are added to the predefined true depth to produce the crowd sourced
observation. This process is repeated until the ag-gregation of observations converges on the true depth, within the uncertainty limitations as set by the IHO's S-44 standards.
The number of observations needed to produce the true depth does not account for equipment blunders that occur frequently in CSB data. There-fore, the number of observations is then scaled by the likely number of blunders, as determined by analyzing the CSB dataset publicly available through the IHO’s Data Centre for Digital Bathym-etry, resulting in the expected number of crowd sourced observations needed to converge on the true depth. Figure 34-2 outlines the steps for this simulation.
Figure 34-1. The distribution of vessels occurring annually in King County, Washington by sub-crowd: Recreational, Merchant, Passenger, Fishing, Work, Pleasure, and other (undeterminable).
Figure 34-2. Experimental steps to simulate the number of crowd sourced observations needed to converge on the true depth.
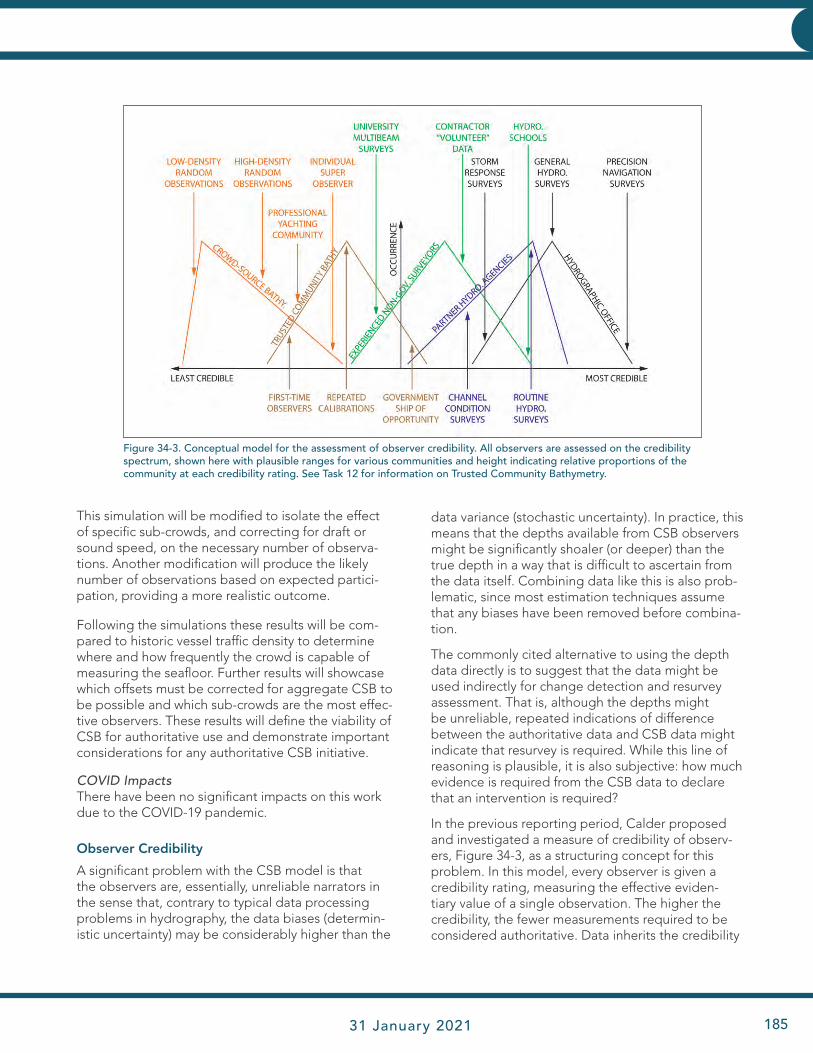
JHC Performance Report 31 January 2021 185
INNOVATIVE HYDROGRAPHY
This simulation will be modified to isolate the effect of specific sub-crowds, and correcting for draft or sound speed, on the necessary number of observa-tions. Another modification will produce the likely number of observations based on expected partici-pation, providing a more realistic outcome.
Following the simulations these results will be com-pared to historic vessel traffic density to determine where and how frequently the crowd is capable of measuring the seafloor. Further results will showcase which offsets must be corrected for aggregate CSB to be possible and which sub-crowds are the most effec-tive observers. These results will define the viability of CSB for authoritative use and demonstrate important considerations for any authoritative CSB initiative.
COVID ImpactsThere have been no significant impacts on this work due to the COVID-19 pandemic.
Observer Credibility
A significant problem with the CSB model is that the observers are, essentially, unreliable narrators in the sense that, contrary to typical data processing problems in hydrography, the data biases (determin-istic uncertainty) may be considerably higher than the
data variance (stochastic uncertainty). In practice, this means that the depths available from CSB observers might be significantly shoaler (or deeper) than the true depth in a way that is difficult to ascertain from the data itself. Combining data like this is also prob-lematic, since most estimation techniques assume that any biases have been removed before combina-tion.
The commonly cited alternative to using the depth data directly is to suggest that the data might be used indirectly for change detection and resurvey assessment. That is, although the depths might be unreliable, repeated indications of difference between the authoritative data and CSB data might indicate that resurvey is required. While this line of reasoning is plausible, it is also subjective: how much evidence is required from the CSB data to declare that an intervention is required?
In the previous reporting period, Calder proposed and investigated a measure of credibility of observ-ers, Figure 34-3, as a structuring concept for this problem. In this model, every observer is given a credibility rating, measuring the effective eviden-tiary value of a single observation. The higher the credibility, the fewer measurements required to be considered authoritative. Data inherits the credibility
Figure 34-3. Conceptual model for the assessment of observer credibility. All observers are assessed on the credibility spectrum, shown here with plausible ranges for various communities and height indicating relative proportions of the community at each credibility rating. See Task 12 for information on Trusted Community Bathymetry.

JHC Performance Report186
INNOVATIVE HYDROGRAPHY INNOVATIVE HYDROGRAPHY
of the observer but may then diverge over time as new observations are made, allowing older data, or that in areas with actual change, to be decayed out of use over time.
In the current reporting period, Calder has contin-ued to formulate this method. The ultimate goal is to assess whether an observer, given the estimated uncertainty of the observation, agrees with the estimate of depth that is available in the reference dataset. If so, the credibility of the observer should be strengthened, and more so if this continues over time; if not, the credibility of the observer should be reduced. For single-beam observations, the model is shown in Figure 34-4. This model has a number of unknowns (marked in red), although it is generally relatively simple to estimate the uncertainty com-ponents (e.g., for water level, motion, and measure-ment uncertainty); it is much more difficult, however, to estimate the potential bias of the observer, b(z).
The observer’s bias is generally unknown. If, howev-er, each observer’s soundings are corrected for wa-ter level, and there are sufficiently good reference depths in the area, a time-series of observations, Figure 34-5, can be used to estimate the probabil-ity distribution of the offset as a function of depth, Figure 34-6, which also captures the effects of sound
Figure 34-4. Fundamental model for computing credibility of obser-vations: does the observer’s depth estimate, given the uncertainty, match the reference? Unknowns are shown in red.
Figure 34-5. Observations from a volunteer observer in Puget Sound, WA, as extracted from the IHO Data Center for Digital Bathymetry database for 2016. The observer is shoal biased with respect to the reference depths (from OCS BAG files, also from NCEI Boulder), with uncertainties as shown in the lower panel. Simple differences can be computed to accumulate statistics on the bias as a function of depth.
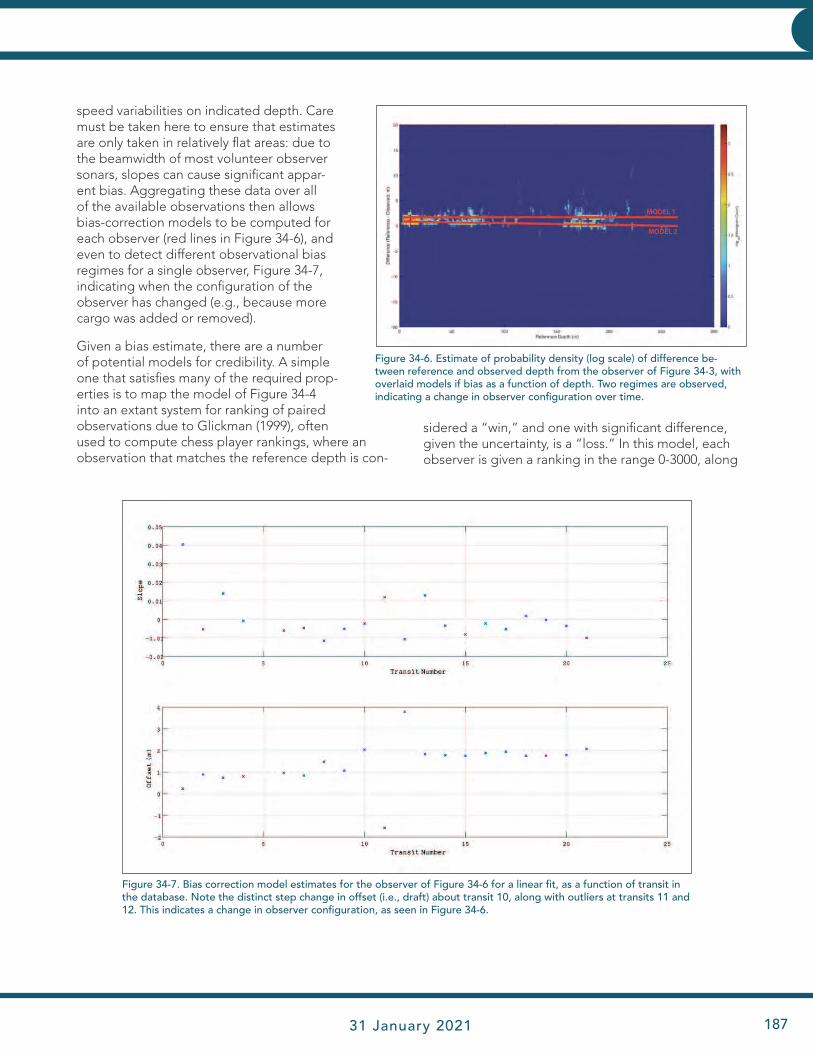
JHC Performance Report 31 January 2021 187
INNOVATIVE HYDROGRAPHY
speed variabilities on indicated depth. Care must be taken here to ensure that estimates are only taken in relatively flat areas: due to the beamwidth of most volunteer observer sonars, slopes can cause significant appar-ent bias. Aggregating these data over all of the available observations then allows bias-correction models to be computed for each observer (red lines in Figure 34-6), and even to detect different observational bias regimes for a single observer, Figure 34-7, indicating when the configuration of the observer has changed (e.g., because more cargo was added or removed).
Given a bias estimate, there are a number of potential models for credibility. A simple one that satisfies many of the required prop-erties is to map the model of Figure 34-4 into an extant system for ranking of paired observations due to Glickman (1999), often used to compute chess player rankings, where an observation that matches the reference depth is con-
sidered a “win,” and one with significant difference, given the uncertainty, is a “loss.” In this model, each observer is given a ranking in the range 0-3000, along
Figure 34-6. Estimate of probability density (log scale) of difference be-tween reference and observed depth from the observer of Figure 34-3, with overlaid models if bias as a function of depth. Two regimes are observed, indicating a change in observer configuration over time.
Figure 34-7. Bias correction model estimates for the observer of Figure 34-6 for a linear fit, as a function of transit in the database. Note the distinct step change in offset (i.e., draft) about transit 10, along with outliers at transits 11 and 12. This indicates a change in observer configuration, as seen in Figure 34-6.
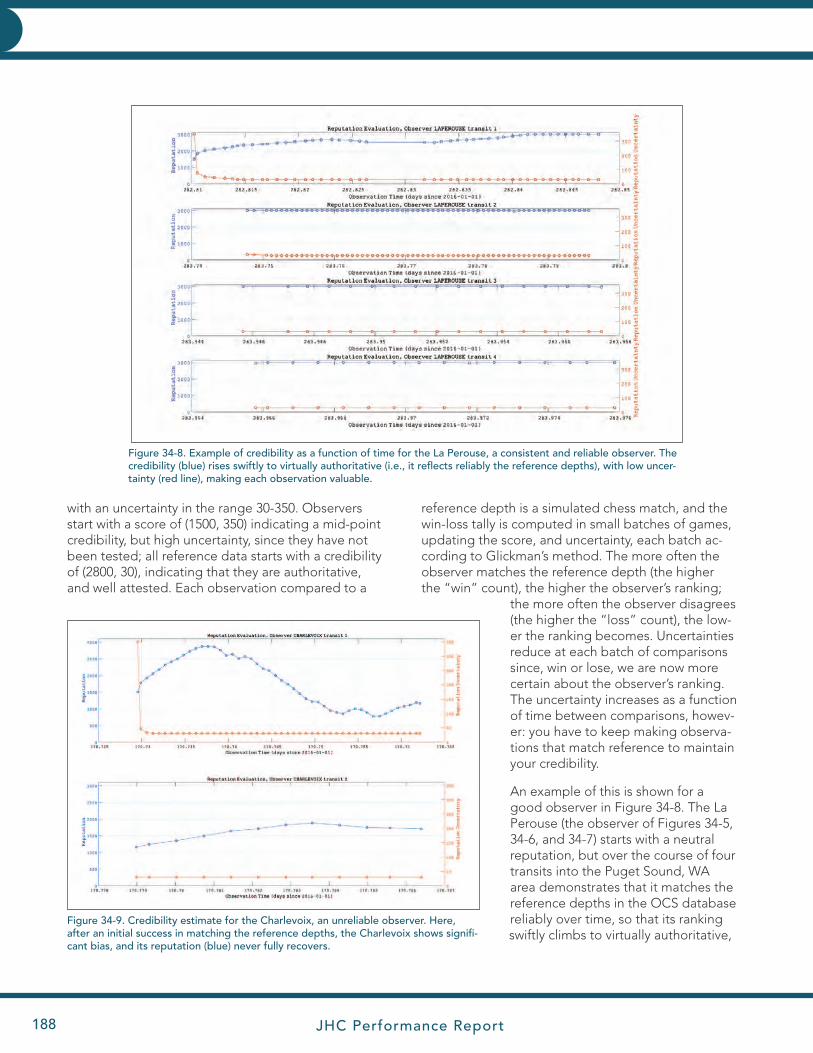
JHC Performance Report188
INNOVATIVE HYDROGRAPHY INNOVATIVE HYDROGRAPHY
with an uncertainty in the range 30-350. Observers start with a score of (1500, 350) indicating a mid-point credibility, but high uncertainty, since they have not been tested; all reference data starts with a credibility of (2800, 30), indicating that they are authoritative, and well attested. Each observation compared to a
reference depth is a simulated chess match, and the win-loss tally is computed in small batches of games, updating the score, and uncertainty, each batch ac-cording to Glickman’s method. The more often the observer matches the reference depth (the higher the “win” count), the higher the observer’s ranking;
the more often the observer disagrees (the higher the “loss” count), the low-er the ranking becomes. Uncertainties reduce at each batch of comparisons since, win or lose, we are now more certain about the observer’s ranking. The uncertainty increases as a function of time between comparisons, howev-er: you have to keep making observa-tions that match reference to maintain your credibility.
An example of this is shown for a good observer in Figure 34-8. The La Perouse (the observer of Figures 34-5, 34-6, and 34-7) starts with a neutral reputation, but over the course of four transits into the Puget Sound, WA area demonstrates that it matches the reference depths in the OCS database reliably over time, so that its ranking swiftly climbs to virtually authoritative,
Figure 34-8. Example of credibility as a function of time for the La Perouse, a consistent and reliable observer. The credibility (blue) rises swiftly to virtually authoritative (i.e., it reflects reliably the reference depths), with low uncer-tainty (red line), making each observation valuable.
Figure 34-9. Credibility estimate for the Charlevoix, an unreliable observer. Here, after an initial success in matching the reference depths, the Charlevoix shows signifi-cant bias, and its reputation (blue) never fully recovers.
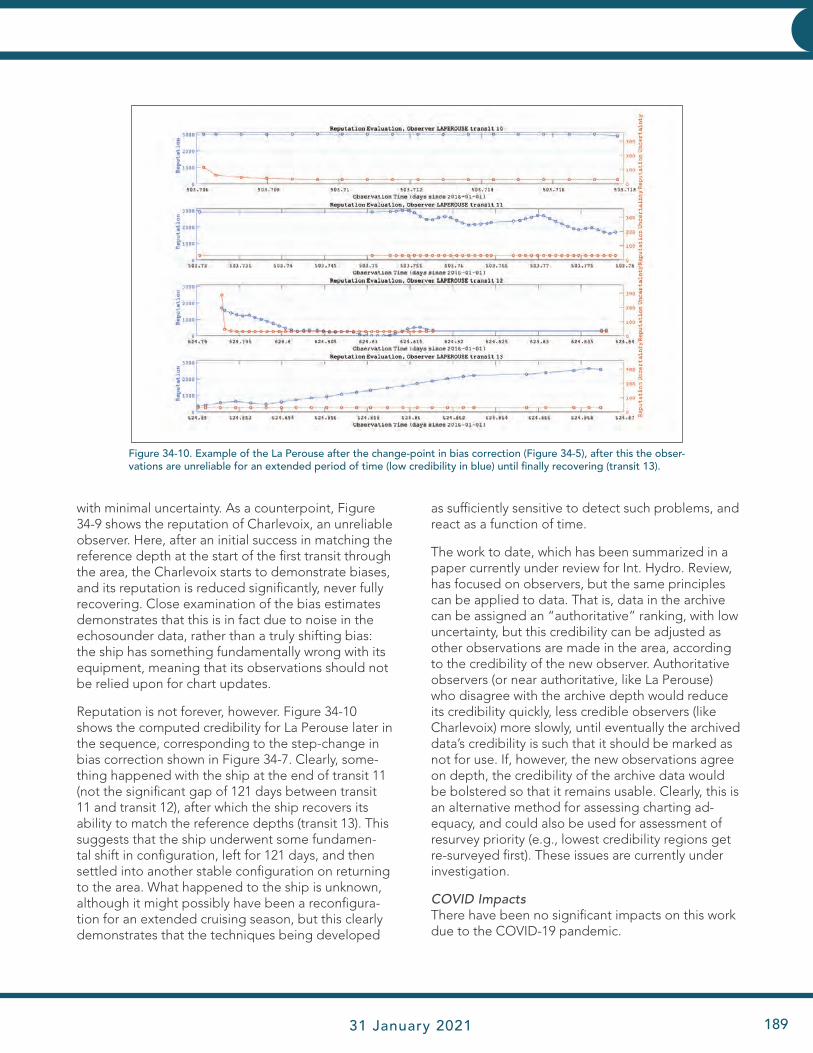
JHC Performance Report 31 January 2021 189
INNOVATIVE HYDROGRAPHY
with minimal uncertainty. As a counterpoint, Figure 34-9 shows the reputation of Charlevoix, an unreliable observer. Here, after an initial success in matching the reference depth at the start of the first transit through the area, the Charlevoix starts to demonstrate biases, and its reputation is reduced significantly, never fully recovering. Close examination of the bias estimates demonstrates that this is in fact due to noise in the echosounder data, rather than a truly shifting bias: the ship has something fundamentally wrong with its equipment, meaning that its observations should not be relied upon for chart updates.
Reputation is not forever, however. Figure 34-10 shows the computed credibility for La Perouse later in the sequence, corresponding to the step-change in bias correction shown in Figure 34-7. Clearly, some-thing happened with the ship at the end of transit 11 (not the significant gap of 121 days between transit 11 and transit 12), after which the ship recovers its ability to match the reference depths (transit 13). This suggests that the ship underwent some fundamen-tal shift in configuration, left for 121 days, and then settled into another stable configuration on returning to the area. What happened to the ship is unknown, although it might possibly have been a reconfigura-tion for an extended cruising season, but this clearly demonstrates that the techniques being developed
as sufficiently sensitive to detect such problems, and react as a function of time.
The work to date, which has been summarized in a paper currently under review for Int. Hydro. Review, has focused on observers, but the same principles can be applied to data. That is, data in the archive can be assigned an “authoritative” ranking, with low uncertainty, but this credibility can be adjusted as other observations are made in the area, according to the credibility of the new observer. Authoritative observers (or near authoritative, like La Perouse) who disagree with the archive depth would reduce its credibility quickly, less credible observers (like Charlevoix) more slowly, until eventually the archived data’s credibility is such that it should be marked as not for use. If, however, the new observations agree on depth, the credibility of the archive data would be bolstered so that it remains usable. Clearly, this is an alternative method for assessing charting ad-equacy, and could also be used for assessment of resurvey priority (e.g., lowest credibility regions get re-surveyed first). These issues are currently under investigation.
COVID ImpactsThere have been no significant impacts on this work due to the COVID-19 pandemic.
Figure 34-10. Example of the La Perouse after the change-point in bias correction (Figure 34-5), after this the obser-vations are unreliable for an extended period of time (low credibility in blue) until finally recovering (transit 13).
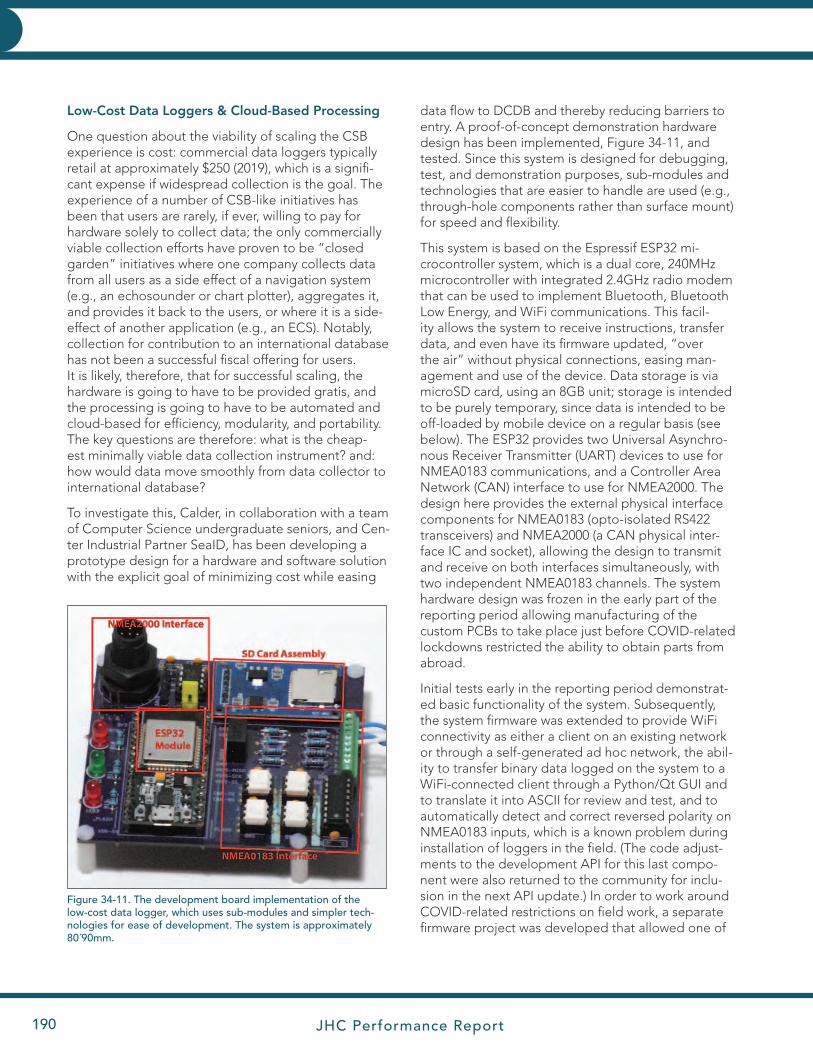
JHC Performance Report190
INNOVATIVE HYDROGRAPHY INNOVATIVE HYDROGRAPHY
Low-Cost Data Loggers & Cloud-Based Processing
One question about the viability of scaling the CSB experience is cost: commercial data loggers typically retail at approximately $250 (2019), which is a signifi-cant expense if widespread collection is the goal. The experience of a number of CSB-like initiatives has been that users are rarely, if ever, willing to pay for hardware solely to collect data; the only commercially viable collection efforts have proven to be “closed garden” initiatives where one company collects data from all users as a side effect of a navigation system (e.g., an echosounder or chart plotter), aggregates it, and provides it back to the users, or where it is a side-effect of another application (e.g., an ECS). Notably, collection for contribution to an international database has not been a successful fiscal offering for users. It is likely, therefore, that for successful scaling, the hardware is going to have to be provided gratis, and the processing is going to have to be automated and cloud-based for efficiency, modularity, and portability. The key questions are therefore: what is the cheap-est minimally viable data collection instrument? and: how would data move smoothly from data collector to international database?
To investigate this, Calder, in collaboration with a team of Computer Science undergraduate seniors, and Cen-ter Industrial Partner SeaID, has been developing a prototype design for a hardware and software solution with the explicit goal of minimizing cost while easing
data flow to DCDB and thereby reducing barriers to entry. A proof-of-concept demonstration hardware design has been implemented, Figure 34-11, and tested. Since this system is designed for debugging, test, and demonstration purposes, sub-modules and technologies that are easier to handle are used (e.g., through-hole components rather than surface mount) for speed and flexibility.
This system is based on the Espressif ESP32 mi-crocontroller system, which is a dual core, 240MHz microcontroller with integrated 2.4GHz radio modem that can be used to implement Bluetooth, Bluetooth Low Energy, and WiFi communications. This facil-ity allows the system to receive instructions, transfer data, and even have its firmware updated, “over the air” without physical connections, easing man-agement and use of the device. Data storage is via microSD card, using an 8GB unit; storage is intended to be purely temporary, since data is intended to be off-loaded by mobile device on a regular basis (see below). The ESP32 provides two Universal Asynchro-nous Receiver Transmitter (UART) devices to use for NMEA0183 communications, and a Controller Area Network (CAN) interface to use for NMEA2000. The design here provides the external physical interface components for NMEA0183 (opto-isolated RS422 transceivers) and NMEA2000 (a CAN physical inter-face IC and socket), allowing the design to transmit and receive on both interfaces simultaneously, with two independent NMEA0183 channels. The system hardware design was frozen in the early part of the reporting period allowing manufacturing of the custom PCBs to take place just before COVID-related lockdowns restricted the ability to obtain parts from abroad.
Initial tests early in the reporting period demonstrat-ed basic functionality of the system. Subsequently, the system firmware was extended to provide WiFi connectivity as either a client on an existing network or through a self-generated ad hoc network, the abil-ity to transfer binary data logged on the system to a WiFi-connected client through a Python/Qt GUI and to translate it into ASCII for review and test, and to automatically detect and correct reversed polarity on NMEA0183 inputs, which is a known problem during installation of loggers in the field. (The code adjust-ments to the development API for this last compo-nent were also returned to the community for inclu-sion in the next API update.) In order to work around COVID-related restrictions on field work, a separate firmware project was developed that allowed one of
Figure 34-11. The development board implementation of the low-cost data logger, which uses sub-modules and simpler tech-nologies for ease of development. The system is approximately 80´90mm.

JHC Performance Report 31 January 2021 191
INNOVATIVE HYDROGRAPHY
the prototype modules to act as a hardware data simulator for both NMEA0183 and NMEA2000 traf-fic, allowing for non-deterministic testing of the log-ger. All of the source code for the project, and the CAD files for the prototype hardware are available through a BitBucket repository, which is available to the public as an Open Hardware project.
In collaboration with Center Industrial Partner SeaID, a production-ready design has been developed, and the first test run (“Rev.A”) boards have been produced, Figure 34-12. These systems have been extended from the prototype to include both a six-degree of free-dom motion sensor and flash eMMC memory (for speed of access), but limited to allow only reception of NMEA0183 for simplicity and cost purposes. Testing is ongoing and the production costs will not be fully determined until the first produc-tion run, but the base manufactur-ing cost for a board capable of both NMEA0183 and NMEA2000 reception is expected to be over $40 (2020) for short runs, less for larger-scale production or if only one interface is supported.
Through collaboration with a team of four UNH Computer Science students, a prototype of the software infrastruc-
ture to support this logger has also been de-veloped, Figure 34-13. The system consists of a mobile app (currently for Android) that can inter-face with the data logger via Bluetooth or WiFi to extract and aggregate data from multiple log-gers, and then upload the aggregated data via a faster internet connection to an Amazon Web Services (AWS) Simple Storage Service (S3) data bucket. Once there, a serverless AWS Lambda code fragment is triggered to unpack the binary data format from the logger, timestamp the data with whatever source information is available, and then re-format into GeoJSON for delivery to IHO DCDB. Once complete, a second AWS Lambda is triggered on the intermediate data file to transmit the data to the S3 bucket used by DCDB for data submission; the data transfer is authenticated by a unique ID provided to the project team by DCDB developers. An end-to-end demonstration of the system (albeit using simulated data due to the COVID-19 response
restrictions on field work) was completed in May 2020.
This design allows the system to be modular. For ex-ample, some implementations might want to maintain a copy of the intermediate data in the cloud for further aggregation or processing, rather than pushing it im-mediately to DCDB; some sponsoring organizations might require a copy of all of the data being provided for their own use, or for some inspection stage before it is released to DCDB. The design for the system allows for these, and other, specializations without having to redesign the entire system.
Figure 34-12. First production board based on the prototype low-cost data logger, called “NEMO 30,” which includes motion sensor and flash eMMC memory. Approximately 80´50mm.
Figure 34-13. Outline structure for data workflow in the proposed system. Data is aggregated by the local support person using a mobile app and device (e.g., a cell-phone), and then uploaded when high-bandwidth connection is available to Amazon Web Services for processing. The data is then transferred directly to DCDB via their AWS ingestion scheme.
JHC Performance Report192
CHARTING AND NAVIGATION
The hardware and software portions of this project are maintained in Git repositories in BitBucket. The hardware will be released as an Open Hardware project under the MIT license after testing; the mobile app and cloud processing software is dual licensed with the MIT license for non-commercial use, but a custom (UNH) commercial license where that is not appropriate.
COVID ImpactsThe primary hardware development work for this project was delayed somewhat by COVID-19 re-strictions, although local manufacturing and careful sourcing of parts allowed for this effect to be amelio-rated. Field testing of the equipment was complete-ly curtailed by the University’s pandemic response protocols, although work with a hardware simulator allow for bench testing to partially offset this issue. Otherwise, there were no significant delays or im-pacts due to the pandemic response.
Data Logger Evaluation and Field Trial
Through a request from NOAA National Centers for Environmental Information, specifically the IHO Data Center for Digital Bathymetry, Calder, in collabora-tion with Jennifer Jencks (NOAA NCEI), has been investigating the field of data loggers available for CSB observations at scale. This request initiated with the GEBCO-Nippon Foundation Seabed 2030 Initiative, where CSB is seen as one of the tools to address the overall goal of mapping the entire world ocean by 2030.
The ultimate goal of the request is to provide data loggers, funded by Seabed 2030, to one or more areas around the world which suffer from limited data availability and assess how to operationalize CSB data collection at a scale that can make a posi-tive impact on charting, or at least depth determi-nation (see previous project), within the area. The implementation plan involves a development of the work carried out by Dr. Robin Beaman (James Cook University) in the Great Barrier Reef, which demon-strated the value of local contact personnel to drive/administer data collection, and feedback mecha-nisms to retain the recruited observers.
In the immediately previous reporting period, a selection of commercial data loggers were exam-ined, and the Center provided recommendations on a data logger for NMEA0183 data capture, and another for NMEA2000 data capture. In the current reporting period, based on these recommendations,
the Seabed 2030 project, funded by the Nippon Foundation, has funded the purchase of a significant number of loggers (order 100 per location) for field trials of targeted data collection, as outlined above.
After discussions with Palau (Levan Akitaya) and South Africa (Institute for Maritime Technology [Benita Maritz] and South Africa Navy Hydrographic Service), loggers have been delivered to these countries, with the intent of a field trial as soon as possible given delays to manufacturing, supply-chain disruptions, and limitations on field work due to COVID-19 restrictions. Both locales have agreed to provide local support personnel to manage the distribution of the loggers, collection of the data, and onward transmission to the IHO Data Center for Digital Bathymetry at NCEI Boulder. Calder and Dan Tauriello will provide support to these efforts remotely, primarily through advice for logger con-figuration and deployment, and processing options. The ultimate goal is to combine this effort with the low-cost loggers outlined above to allow for signifi-cantly larger scale of data collection within targeted international regions, most likely through further collaboration with the Seabed 2030 initiative. Calder has therefore begun discussions with Seabed 2030 on the capabilities and limitations of the low-cost data loggers.
In addition to these trials, Calder and S. Dijkstra have also been in discussion with researchers at the Uni-versity of Southern Florida’s newly formed Center for Ocean Mapping and Innovative Technology (COMIT) about the possibility of a field trial of Trusted Com-munity Bathymetry loggers (Task 12) and low-cost data loggers (as above) in Tampa Bay, FL in 2021. The goal of the trial is to evaluate the performance of the loggers, to examine the attitudes of the local marine community to this sort of endeavor, and to work out logistics for this sort of hybrid volunteer data collection (i.e., where calibrated TCB systems provide cross-calibration for CSB systems) at scale. Although at an early stage, this has the potential to provide insight into scaling data collections of this type for global implementation.
COVID ImpactsProcurement and distribution of loggers for this project was severely impacted by the COVID-19 pan-demic, since supply chains from China were heavily disrupted. Restrictions on travel and local or national lockdowns around the world also significantly limited the ability of the parties to interact, or get into the field for testing and distribution of loggers.
INNOVATIVE HYDROGRAPHY

JHC Performance Report 31 January 2021 193
Programmatic Priority 2: Transform Charting and Navigation
Research Requirement 2.A: Chart Adequacy and Computer-Assisted Cartography
FFO Requirement 2.A: “Development of improved methods for managing hydrographic data and transform-ing hydrographic data and data in enterprise GIS databases to electronic navigational charts and other operational navigation products. New approaches for the application of GIS and spatial data technology to hydrographic, ocean, and coastal mapping, and nautical charting processes and products.”
TASK 37: Managing Hydrographic Data and Automated Cartography: Investigate algorithms for the appropriate interpolation of data from sparse sources for use in populating a single-source database product, and to combine these products in a consistent and objective manner so as to provide, on demand, the best available data for the area, with associated uncertainty. Investigate methods for rasterization of vector product charts that better reflect the “style” of the current printed chart and develop methods to tackle the generalization problem for nautical cartography using both gridded bathymetric source and vector products for other chart components, with the ulti-mate goal of providing a vector product that can be rasterized at any given scale and still reflect the “style” of current charts. PIs: Brian Calder and Christos Kastrisios
JHC Participants: Lee Alexander, Andy Armstrong, Michael Bogonko, Tom Butkiewicz, Paul Johnson, Juliet Kinney, Giuseppe Masetti, Tamer Nada, Val Schmidt, Colin Ware, and Sara Wolfskehl
Other Collaborators: Edward Owens (NOAA AHB), Grant Froelich, Olivia Hauser, and Peter Holmberg (NOAA PHB), Megan Bartlett,Noel Dyer, Christie Ence, and Brian Martinez, (NOAA MCD), Craig Greece (ESRI), Rogier Broekman (Royal Netherlands Navy Hydrographic Service), Leila De Floriani (University of Maryland), Mathieu Rondeau (Canadian Hydrographic Service), and Jose Cordero (Lund University), Matthew Eager, Amith Kashyap, Sean Kohlbrenner, and Nilan Phommachanh (UNH/CS)
A long-term goal of many hydrographic agencies is to automatically construct cartographic products from a single-source database populated with a consistent representation of all available data at the highest possible resolution; in many cases, the goal is to populate with gridded data products. Such an approach has the potential to radically improve throughput of data to the end user, with more robust, quantitative, methods, and to improve the ability of charting data to be manipulated much closer to the point of use.
The primary problems in achieving this goal are the development of methods to populate the database and maintain its consistency; and methods to gener-ate cartographic products reliably from the database that are acceptable to human cartographers for depiction in a chart product.
Creating a fully-gridded database is nominally simple. In practice, however, legacy sparse data, high-volume modern data, and the logic of how to splice together overlapping datasets make the practice much more challenging. Although many of the issues, such as the requirement for an uncertainty
value associated with the depths, are understood, there are many subtle interactions with the data that are hard to foresee directly. It seems likely, therefore, that the only way to truly understand all of the issues is to build an example database and examine the interactions directly in practice.
While many advances have been made, nautical cartography still requires the manipulation of massive data sets, the process of which is often monotonous, time consuming, and prone to human error. Tasks performed manually for years by cartographers have been described algorithmically and implemented in software environments, but while automation has fac-ilitated the cartographers’ work, many of the existing algorithms fail to implement cartographic practices in their entirety and, thus, they do not perform consis-tently and satisfactorily in every geographic situation. Moreover, when cartographic products are automatic-ally generated, they are often judged as crude, or unsuitable, by experienced cartographers. Therefore, in addition to improved tools with more geographic robustness, it is essential to understand the character-istics of current charts in order to determine what it is that cartographers look for in a final product.
CHARTING AND NAVIGATION
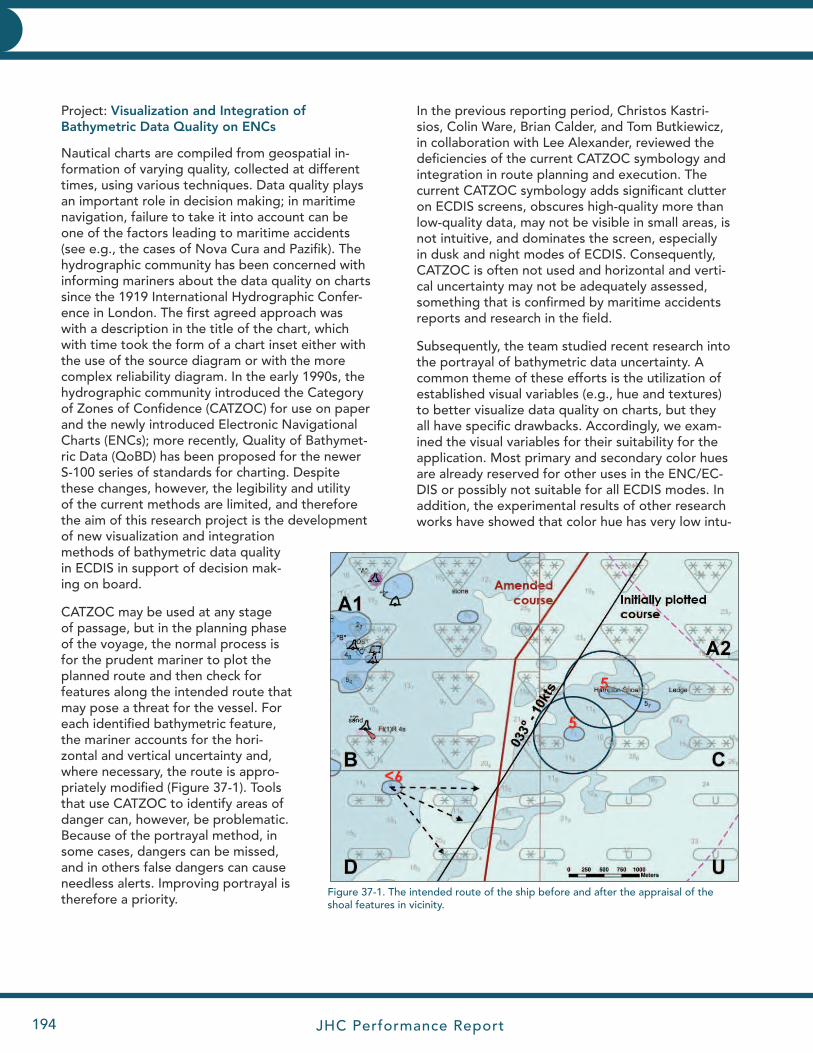
JHC Performance Report194
CHARTING AND NAVIGATIONCHARTING AND NAVIGATION
Project: Visualization and Integration of Bathymetric Data Quality on ENCs
Nautical charts are compiled from geospatial in-formation of varying quality, collected at different times, using various techniques. Data quality plays an important role in decision making; in maritime navigation, failure to take it into account can be one of the factors leading to maritime accidents (see e.g., the cases of Nova Cura and Pazifik). The hydrographic community has been concerned with informing mariners about the data quality on charts since the 1919 International Hydrographic Confer-ence in London. The first agreed approach was with a description in the title of the chart, which with time took the form of a chart inset either with the use of the source diagram or with the more complex reliability diagram. In the early 1990s, the hydrographic community introduced the Category of Zones of Confidence (CATZOC) for use on paper and the newly introduced Electronic Navigational Charts (ENCs); more recently, Quality of Bathymet-ric Data (QoBD) has been proposed for the newer S-100 series of standards for charting. Despite these changes, however, the legibility and utility of the current methods are limited, and therefore the aim of this research project is the development of new visualization and integration methods of bathymetric data quality in ECDIS in support of decision mak-ing on board.
CATZOC may be used at any stage of passage, but in the planning phase of the voyage, the normal process is for the prudent mariner to plot the planned route and then check for features along the intended route that may pose a threat for the vessel. For each identified bathymetric feature, the mariner accounts for the hori-zontal and vertical uncertainty and, where necessary, the route is appro-priately modified (Figure 37-1). Tools that use CATZOC to identify areas of danger can, however, be problematic. Because of the portrayal method, in some cases, dangers can be missed, and in others false dangers can cause needless alerts. Improving portrayal is therefore a priority.
In the previous reporting period, Christos Kastri-sios, Colin Ware, Brian Calder, and Tom Butkiewicz, in collaboration with Lee Alexander, reviewed the deficiencies of the current CATZOC symbology and integration in route planning and execution. The current CATZOC symbology adds significant clutter on ECDIS screens, obscures high-quality more than low-quality data, may not be visible in small areas, is not intuitive, and dominates the screen, especially in dusk and night modes of ECDIS. Consequently, CATZOC is often not used and horizontal and verti-cal uncertainty may not be adequately assessed, something that is confirmed by maritime accidents reports and research in the field.
Subsequently, the team studied recent research into the portrayal of bathymetric data uncertainty. A common theme of these efforts is the utilization of established visual variables (e.g., hue and textures) to better visualize data quality on charts, but they all have specific drawbacks. Accordingly, we exam-ined the visual variables for their suitability for the application. Most primary and secondary color hues are already reserved for other uses in the ENC/EC-DIS or possibly not suitable for all ECDIS modes. In addition, the experimental results of other research works have showed that color hue has very low intu-
Figure 37-1. The intended route of the ship before and after the appraisal of the shoal features in vicinity.
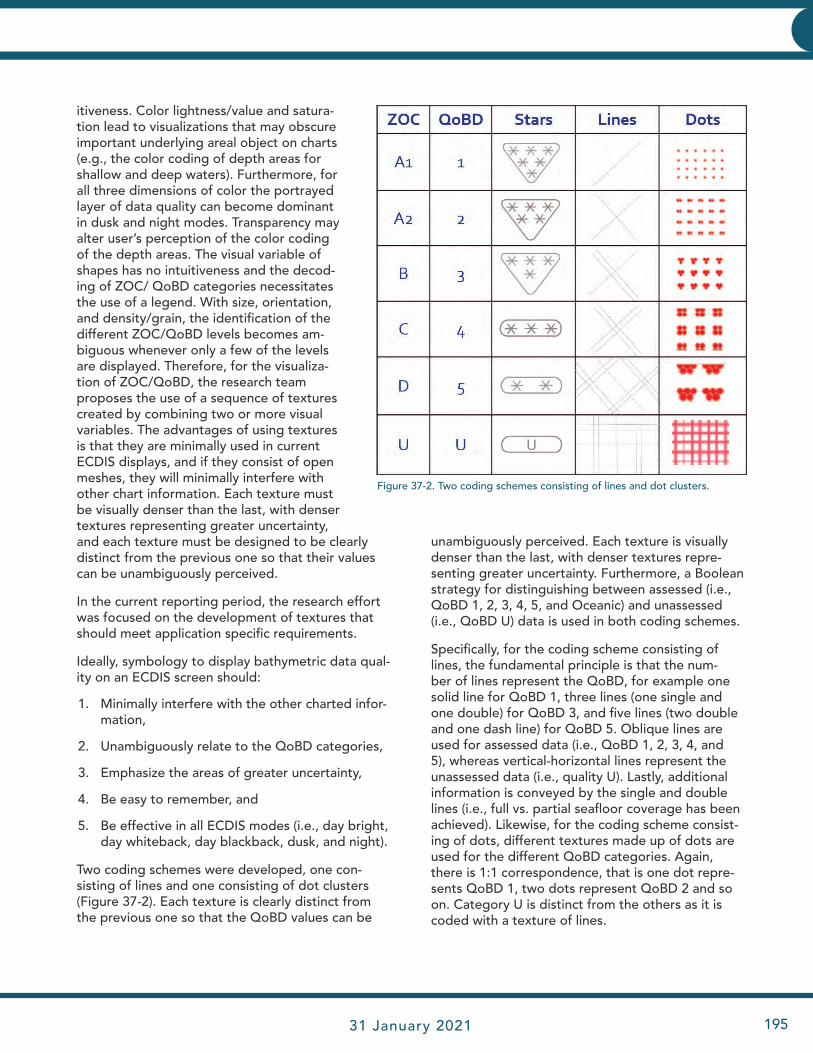
JHC Performance Report 31 January 2021 195
CHARTING AND NAVIGATIONCHARTING AND NAVIGATION
itiveness. Color lightness/value and satura-tion lead to visualizations that may obscure important underlying areal object on charts (e.g., the color coding of depth areas for shallow and deep waters). Furthermore, for all three dimensions of color the portrayed layer of data quality can become dominant in dusk and night modes. Transparency may alter user’s perception of the color coding of the depth areas. The visual variable of shapes has no intuitiveness and the decod-ing of ZOC/ QoBD categories necessitates the use of a legend. With size, orientation, and density/grain, the identification of the different ZOC/QoBD levels becomes am-biguous whenever only a few of the levels are displayed. Therefore, for the visualiza-tion of ZOC/QoBD, the research team proposes the use of a sequence of textures created by combining two or more visual variables. The advantages of using textures is that they are minimally used in current ECDIS displays, and if they consist of open meshes, they will minimally interfere with other chart information. Each texture must be visually denser than the last, with denser textures representing greater uncertainty, and each texture must be designed to be clearly distinct from the previous one so that their values can be unambiguously perceived.
In the current reporting period, the research effort was focused on the development of textures that should meet application specific requirements.
Ideally, symbology to display bathymetric data qual-ity on an ECDIS screen should:
1. Minimally interfere with the other charted infor-mation,
2. Unambiguously relate to the QoBD categories,
3. Emphasize the areas of greater uncertainty,
4. Be easy to remember, and
5. Be effective in all ECDIS modes (i.e., day bright, day whiteback, day blackback, dusk, and night).
Two coding schemes were developed, one con-sisting of lines and one consisting of dot clusters (Figure 37-2). Each texture is clearly distinct from the previous one so that the QoBD values can be
unambiguously perceived. Each texture is visually denser than the last, with denser textures repre-senting greater uncertainty. Furthermore, a Boolean strategy for distinguishing between assessed (i.e., QoBD 1, 2, 3, 4, 5, and Oceanic) and unassessed (i.e., QoBD U) data is used in both coding schemes.
Specifically, for the coding scheme consisting of lines, the fundamental principle is that the num-ber of lines represent the QoBD, for example one solid line for QoBD 1, three lines (one single and one double) for QoBD 3, and five lines (two double and one dash line) for QoBD 5. Oblique lines are used for assessed data (i.e., QoBD 1, 2, 3, 4, and 5), whereas vertical-horizontal lines represent the unassessed data (i.e., quality U). Lastly, additional information is conveyed by the single and double lines (i.e., full vs. partial seafloor coverage has been achieved). Likewise, for the coding scheme consist-ing of dots, different textures made up of dots are used for the different QoBD categories. Again, there is 1:1 correspondence, that is one dot repre-sents QoBD 1, two dots represent QoBD 2 and so on. Category U is distinct from the others as it is coded with a texture of lines.
Figure 37-2. Two coding schemes consisting of lines and dot clusters.
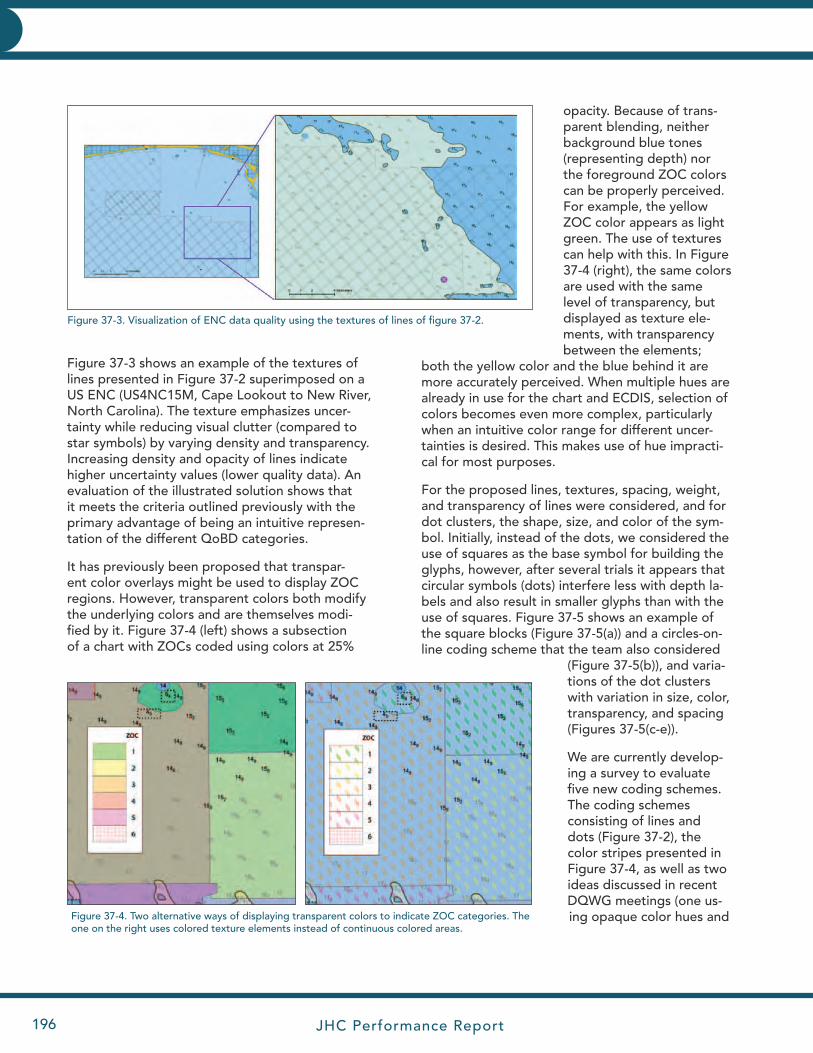
JHC Performance Report196
CHARTING AND NAVIGATIONCHARTING AND NAVIGATION
Figure 37-3 shows an example of the textures of lines presented in Figure 37-2 superimposed on a US ENC (US4NC15M, Cape Lookout to New River, North Carolina). The texture emphasizes uncer-tainty while reducing visual clutter (compared to star symbols) by varying density and transparency. Increasing density and opacity of lines indicate higher uncertainty values (lower quality data). An evaluation of the illustrated solution shows that it meets the criteria outlined previously with the primary advantage of being an intuitive represen-tation of the different QoBD categories.
It has previously been proposed that transpar-ent color overlays might be used to display ZOC regions. However, transparent colors both modify the underlying colors and are themselves modi-fied by it. Figure 37-4 (left) shows a subsection of a chart with ZOCs coded using colors at 25%
opacity. Because of trans-parent blending, neither background blue tones (representing depth) nor the foreground ZOC colors can be properly perceived. For example, the yellow ZOC color appears as light green. The use of textures can help with this. In Figure 37-4 (right), the same colors are used with the same level of transparency, but displayed as texture ele-ments, with transparency between the elements;
both the yellow color and the blue behind it are more accurately perceived. When multiple hues are already in use for the chart and ECDIS, selection of colors becomes even more complex, particularly when an intuitive color range for different uncer-tainties is desired. This makes use of hue impracti-cal for most purposes.
For the proposed lines, textures, spacing, weight, and transparency of lines were considered, and for dot clusters, the shape, size, and color of the sym-bol. Initially, instead of the dots, we considered the use of squares as the base symbol for building the glyphs, however, after several trials it appears that circular symbols (dots) interfere less with depth la-bels and also result in smaller glyphs than with the use of squares. Figure 37-5 shows an example of the square blocks (Figure 37-5(a)) and a circles-on-line coding scheme that the team also considered
(Figure 37-5(b)), and varia-tions of the dot clusters with variation in size, color, transparency, and spacing (Figures 37-5(c-e)).
We are currently develop-ing a survey to evaluate five new coding schemes. The coding schemes consisting of lines and dots (Figure 37-2), the color stripes presented in Figure 37-4, as well as two ideas discussed in recent DQWG meetings (one us-ing opaque color hues and Figure 37-4. Two alternative ways of displaying transparent colors to indicate ZOC categories. The
one on the right uses colored texture elements instead of continuous colored areas.
Figure 37-3. Visualization of ENC data quality using the textures of lines of figure 37-2.
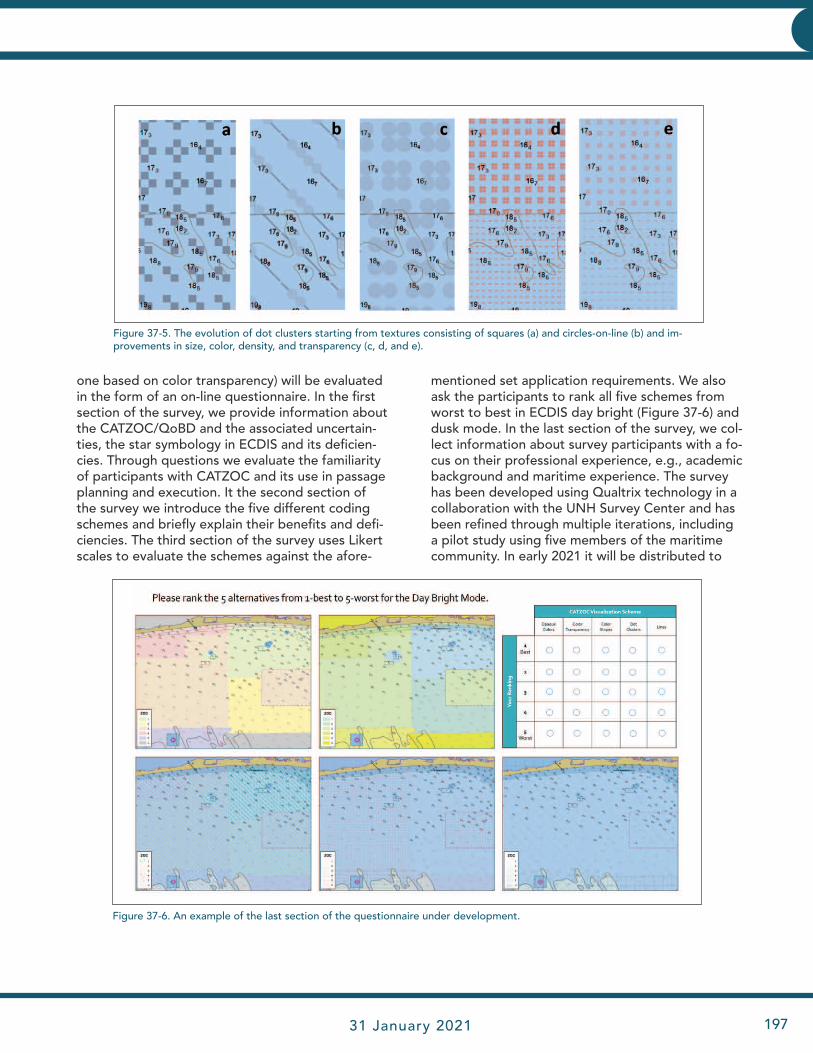
JHC Performance Report 31 January 2021 197
CHARTING AND NAVIGATIONCHARTING AND NAVIGATION
one based on color transparency) will be evaluated in the form of an on-line questionnaire. In the first section of the survey, we provide information about the CATZOC/QoBD and the associated uncertain-ties, the star symbology in ECDIS and its deficien-cies. Through questions we evaluate the familiarity of participants with CATZOC and its use in passage planning and execution. It the second section of the survey we introduce the five different coding schemes and briefly explain their benefits and defi-ciencies. The third section of the survey uses Likert scales to evaluate the schemes against the afore-
mentioned set application requirements. We also ask the participants to rank all five schemes from worst to best in ECDIS day bright (Figure 37-6) and dusk mode. In the last section of the survey, we col-lect information about survey participants with a fo-cus on their professional experience, e.g., academic background and maritime experience. The survey has been developed using Qualtrix technology in a collaboration with the UNH Survey Center and has been refined through multiple iterations, including a pilot study using five members of the maritime community. In early 2021 it will be distributed to
Figure 37-5. The evolution of dot clusters starting from textures consisting of squares (a) and circles-on-line (b) and im-provements in size, color, density, and transparency (c, d, and e).
Figure 37-6. An example of the last section of the questionnaire under development.
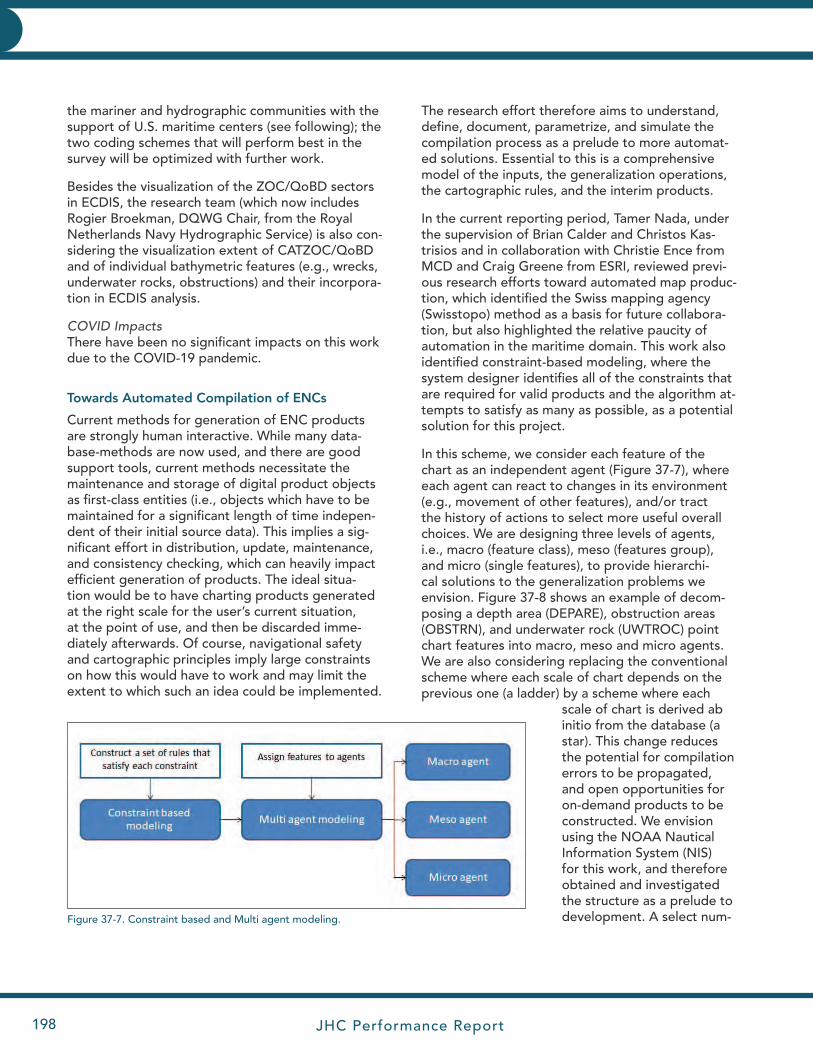
JHC Performance Report198
CHARTING AND NAVIGATIONCHARTING AND NAVIGATION
the mariner and hydrographic communities with the support of U.S. maritime centers (see following); the two coding schemes that will perform best in the survey will be optimized with further work.
Besides the visualization of the ZOC/QoBD sectors in ECDIS, the research team (which now includes Rogier Broekman, DQWG Chair, from the Royal Netherlands Navy Hydrographic Service) is also con-sidering the visualization extent of CATZOC/QoBD and of individual bathymetric features (e.g., wrecks, underwater rocks, obstructions) and their incorpora-tion in ECDIS analysis.
COVID ImpactsThere have been no significant impacts on this work due to the COVID-19 pandemic.
Towards Automated Compilation of ENCs
Current methods for generation of ENC products are strongly human interactive. While many data-base-methods are now used, and there are good support tools, current methods necessitate the maintenance and storage of digital product objects as first-class entities (i.e., objects which have to be maintained for a significant length of time indepen-dent of their initial source data). This implies a sig-nificant effort in distribution, update, maintenance, and consistency checking, which can heavily impact efficient generation of products. The ideal situa-tion would be to have charting products generated at the right scale for the user’s current situation, at the point of use, and then be discarded imme-diately afterwards. Of course, navigational safety and cartographic principles imply large constraints on how this would have to work and may limit the extent to which such an idea could be implemented.
The research effort therefore aims to understand, define, document, parametrize, and simulate the compilation process as a prelude to more automat-ed solutions. Essential to this is a comprehensive model of the inputs, the generalization operations, the cartographic rules, and the interim products.
In the current reporting period, Tamer Nada, under the supervision of Brian Calder and Christos Kas-trisios and in collaboration with Christie Ence from MCD and Craig Greene from ESRI, reviewed previ-ous research efforts toward automated map produc-tion, which identified the Swiss mapping agency (Swisstopo) method as a basis for future collabora-tion, but also highlighted the relative paucity of automation in the maritime domain. This work also identified constraint-based modeling, where the system designer identifies all of the constraints that are required for valid products and the algorithm at-tempts to satisfy as many as possible, as a potential solution for this project.
In this scheme, we consider each feature of the chart as an independent agent (Figure 37-7), where each agent can react to changes in its environment (e.g., movement of other features), and/or tract the history of actions to select more useful overall choices. We are designing three levels of agents, i.e., macro (feature class), meso (features group), and micro (single features), to provide hierarchi-cal solutions to the generalization problems we envision. Figure 37-8 shows an example of decom-posing a depth area (DEPARE), obstruction areas (OBSTRN), and underwater rock (UWTROC) point chart features into macro, meso and micro agents. We are also considering replacing the conventional scheme where each scale of chart depends on the previous one (a ladder) by a scheme where each
scale of chart is derived ab initio from the database (a star). This change reduces the potential for compilation errors to be propagated, and open opportunities for on-demand products to be constructed. We envision using the NOAA Nautical Information System (NIS) for this work, and therefore obtained and investigated the structure as a prelude to development. A select num-Figure 37-7. Constraint based and Multi agent modeling.
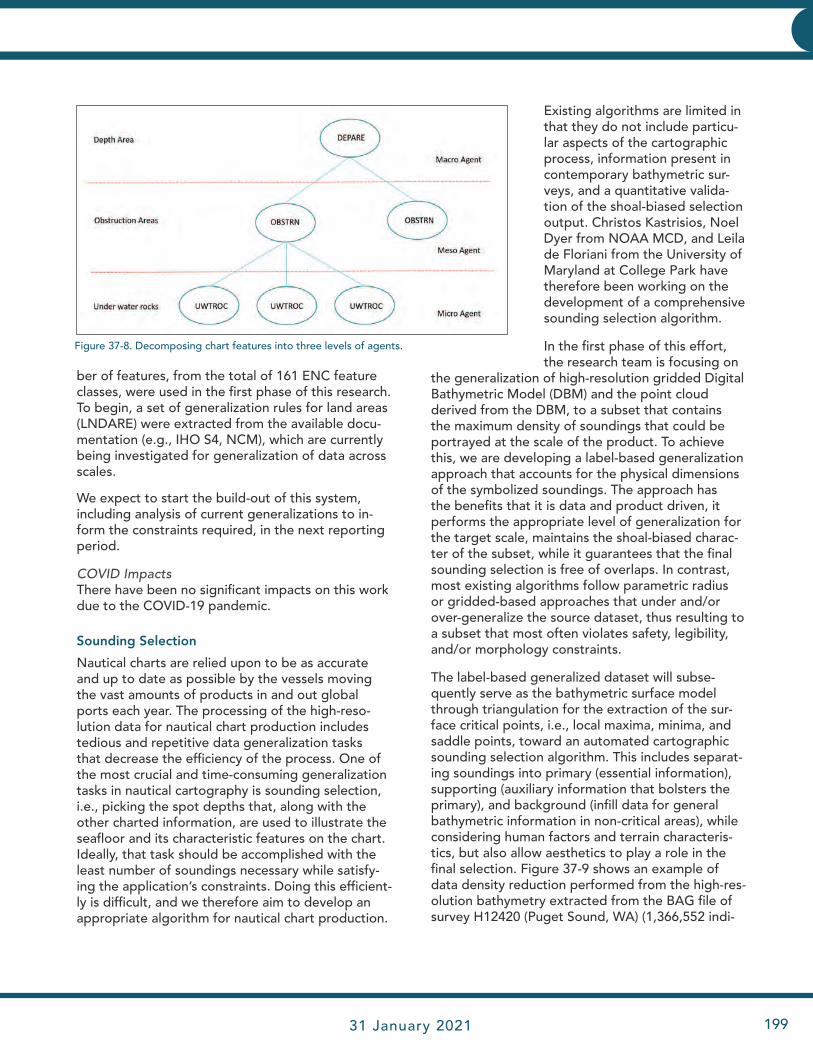
JHC Performance Report 31 January 2021 199
CHARTING AND NAVIGATIONCHARTING AND NAVIGATION
ber of features, from the total of 161 ENC feature classes, were used in the first phase of this research. To begin, a set of generalization rules for land areas (LNDARE) were extracted from the available docu-mentation (e.g., IHO S4, NCM), which are currently being investigated for generalization of data across scales.
We expect to start the build-out of this system, including analysis of current generalizations to in-form the constraints required, in the next reporting period.
COVID ImpactsThere have been no significant impacts on this work due to the COVID-19 pandemic.
Sounding Selection
Nautical charts are relied upon to be as accurate and up to date as possible by the vessels moving the vast amounts of products in and out global ports each year. The processing of the high-reso-lution data for nautical chart production includes tedious and repetitive data generalization tasks that decrease the efficiency of the process. One of the most crucial and time-consuming generalization tasks in nautical cartography is sounding selection, i.e., picking the spot depths that, along with the other charted information, are used to illustrate the seafloor and its characteristic features on the chart. Ideally, that task should be accomplished with the least number of soundings necessary while satisfy-ing the application’s constraints. Doing this efficient-ly is difficult, and we therefore aim to develop an appropriate algorithm for nautical chart production.
Existing algorithms are limited in that they do not include particu-lar aspects of the cartographic process, information present in contemporary bathymetric sur-veys, and a quantitative valida-tion of the shoal-biased selection output. Christos Kastrisios, Noel Dyer from NOAA MCD, and Leila de Floriani from the University of Maryland at College Park have therefore been working on the development of a comprehensive sounding selection algorithm.
In the first phase of this effort, the research team is focusing on
the generalization of high-resolution gridded Digital Bathymetric Model (DBM) and the point cloud derived from the DBM, to a subset that contains the maximum density of soundings that could be portrayed at the scale of the product. To achieve this, we are developing a label-based generalization approach that accounts for the physical dimensions of the symbolized soundings. The approach has the benefits that it is data and product driven, it performs the appropriate level of generalization for the target scale, maintains the shoal-biased charac-ter of the subset, while it guarantees that the final sounding selection is free of overlaps. In contrast, most existing algorithms follow parametric radius or gridded-based approaches that under and/or over-generalize the source dataset, thus resulting to a subset that most often violates safety, legibility, and/or morphology constraints.
The label-based generalized dataset will subse-quently serve as the bathymetric surface model through triangulation for the extraction of the sur-face critical points, i.e., local maxima, minima, and saddle points, toward an automated cartographic sounding selection algorithm. This includes separat-ing soundings into primary (essential information), supporting (auxiliary information that bolsters the primary), and background (infill data for general bathymetric information in non-critical areas), while considering human factors and terrain characteris-tics, but also allow aesthetics to play a role in the final selection. Figure 37-9 shows an example of data density reduction performed from the high-res-olution bathymetry extracted from the BAG file of survey H12420 (Puget Sound, WA) (1,366,552 indi-
Figure 37-8. Decomposing chart features into three levels of agents.
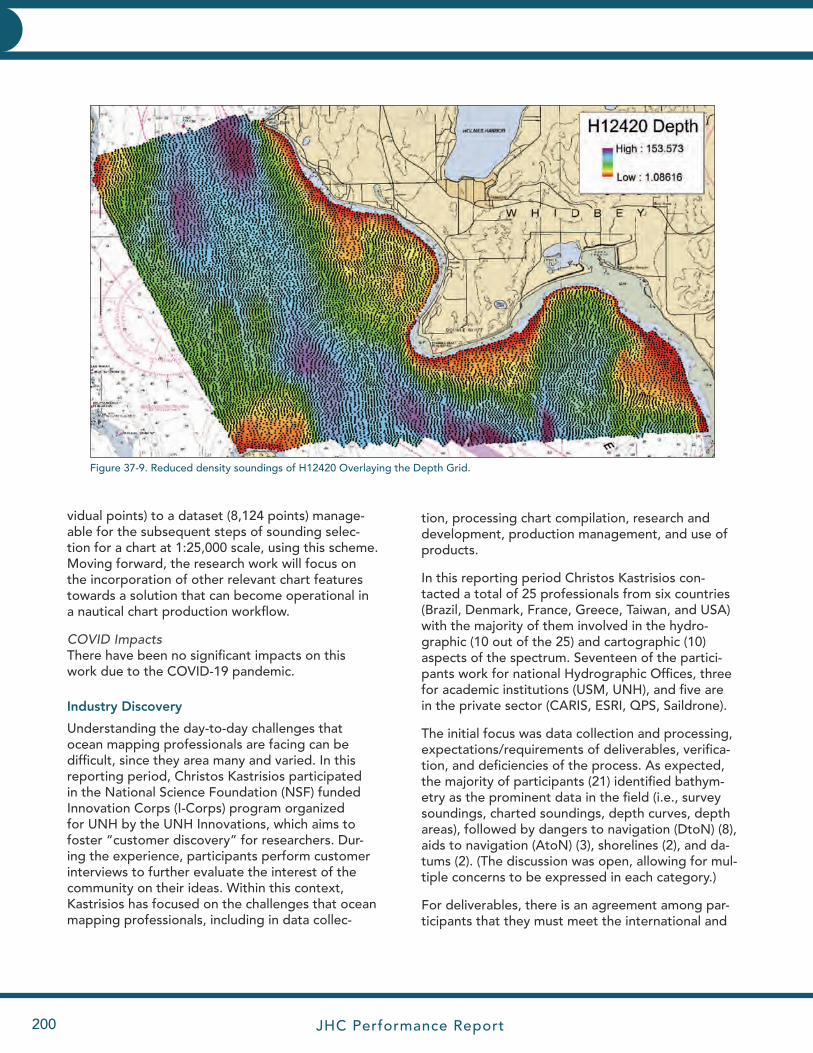
JHC Performance Report200
CHARTING AND NAVIGATIONCHARTING AND NAVIGATION
vidual points) to a dataset (8,124 points) manage-able for the subsequent steps of sounding selec-tion for a chart at 1:25,000 scale, using this scheme. Moving forward, the research work will focus on the incorporation of other relevant chart features towards a solution that can become operational in a nautical chart production workflow.
COVID ImpactsThere have been no significant impacts on this work due to the COVID-19 pandemic.
Industry Discovery
Understanding the day-to-day challenges that ocean mapping professionals are facing can be difficult, since they area many and varied. In this reporting period, Christos Kastrisios participated in the National Science Foundation (NSF) funded Innovation Corps (I-Corps) program organized for UNH by the UNH Innovations, which aims to foster “customer discovery” for researchers. Dur-ing the experience, participants perform customer interviews to further evaluate the interest of the community on their ideas. Within this context, Kastrisios has focused on the challenges that ocean mapping professionals, including in data collec-
tion, processing chart compilation, research and development, production management, and use of products.
In this reporting period Christos Kastrisios con-tacted a total of 25 professionals from six countries (Brazil, Denmark, France, Greece, Taiwan, and USA) with the majority of them involved in the hydro-graphic (10 out of the 25) and cartographic (10) aspects of the spectrum. Seventeen of the partici-pants work for national Hydrographic Offices, three for academic institutions (USM, UNH), and five are in the private sector (CARIS, ESRI, QPS, Saildrone).
The initial focus was data collection and processing, expectations/requirements of deliverables, verifica-tion, and deficiencies of the process. As expected, the majority of participants (21) identified bathym-etry as the prominent data in the field (i.e., survey soundings, charted soundings, depth curves, depth areas), followed by dangers to navigation (DtoN) (8), aids to navigation (AtoN) (3), shorelines (2), and da-tums (2). (The discussion was open, allowing for mul-tiple concerns to be expressed in each category.)
For deliverables, there is an agreement among par-ticipants that they must meet the international and
Figure 37-9. Reduced density soundings of H12420 Overlaying the Depth Grid.
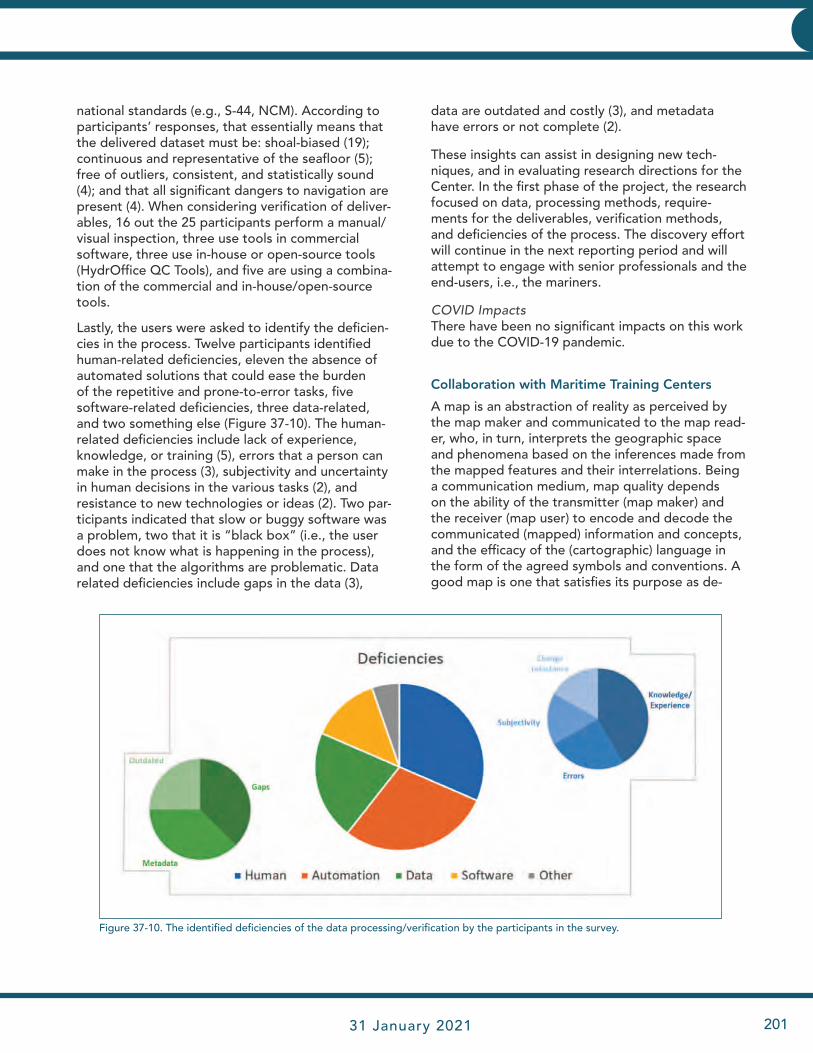
JHC Performance Report 31 January 2021 201
CHARTING AND NAVIGATIONCHARTING AND NAVIGATION
national standards (e.g., S-44, NCM). According to participants’ responses, that essentially means that the delivered dataset must be: shoal-biased (19); continuous and representative of the seafloor (5); free of outliers, consistent, and statistically sound (4); and that all significant dangers to navigation are present (4). When considering verification of deliver-ables, 16 out the 25 participants perform a manual/visual inspection, three use tools in commercial software, three use in-house or open-source tools (HydrOffice QC Tools), and five are using a combina-tion of the commercial and in-house/open-source tools.
Lastly, the users were asked to identify the deficien-cies in the process. Twelve participants identified human-related deficiencies, eleven the absence of automated solutions that could ease the burden of the repetitive and prone-to-error tasks, five software-related deficiencies, three data-related, and two something else (Figure 37-10). The human-related deficiencies include lack of experience, knowledge, or training (5), errors that a person can make in the process (3), subjectivity and uncertainty in human decisions in the various tasks (2), and resistance to new technologies or ideas (2). Two par-ticipants indicated that slow or buggy software was a problem, two that it is “black box” (i.e., the user does not know what is happening in the process), and one that the algorithms are problematic. Data related deficiencies include gaps in the data (3),
data are outdated and costly (3), and metadata have errors or not complete (2).
These insights can assist in designing new tech-niques, and in evaluating research directions for the Center. In the first phase of the project, the research focused on data, processing methods, require-ments for the deliverables, verification methods, and deficiencies of the process. The discovery effort will continue in the next reporting period and will attempt to engage with senior professionals and the end-users, i.e., the mariners.
COVID ImpactsThere have been no significant impacts on this work due to the COVID-19 pandemic.
Collaboration with Maritime Training Centers
A map is an abstraction of reality as perceived by the map maker and communicated to the map read-er, who, in turn, interprets the geographic space and phenomena based on the inferences made from the mapped features and their interrelations. Being a communication medium, map quality depends on the ability of the transmitter (map maker) and the receiver (map user) to encode and decode the communicated (mapped) information and concepts, and the efficacy of the (cartographic) language in the form of the agreed symbols and conventions. A good map is one that satisfies its purpose as de-
Figure 37-10. The identified deficiencies of the data processing/verification by the participants in the survey.
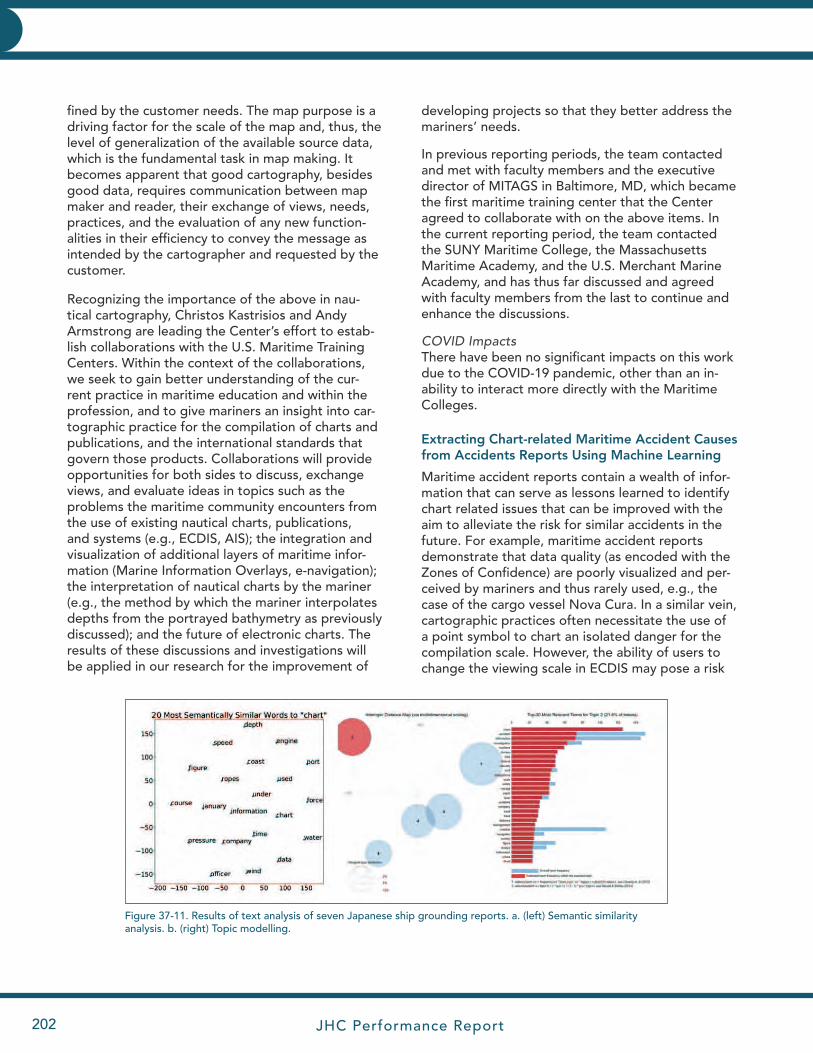
JHC Performance Report202
CHARTING AND NAVIGATIONCHARTING AND NAVIGATION
fined by the customer needs. The map purpose is a driving factor for the scale of the map and, thus, the level of generalization of the available source data, which is the fundamental task in map making. It becomes apparent that good cartography, besides good data, requires communication between map maker and reader, their exchange of views, needs, practices, and the evaluation of any new function-alities in their efficiency to convey the message as intended by the cartographer and requested by the customer.
Recognizing the importance of the above in nau-tical cartography, Christos Kastrisios and Andy Armstrong are leading the Center’s effort to estab-lish collaborations with the U.S. Maritime Training Centers. Within the context of the collaborations, we seek to gain better understanding of the cur-rent practice in maritime education and within the profession, and to give mariners an insight into car-tographic practice for the compilation of charts and publications, and the international standards that govern those products. Collaborations will provide opportunities for both sides to discuss, exchange views, and evaluate ideas in topics such as the problems the maritime community encounters from the use of existing nautical charts, publications, and systems (e.g., ECDIS, AIS); the integration and visualization of additional layers of maritime infor-mation (Marine Information Overlays, e-navigation); the interpretation of nautical charts by the mariner (e.g., the method by which the mariner interpolates depths from the portrayed bathymetry as previously discussed); and the future of electronic charts. The results of these discussions and investigations will be applied in our research for the improvement of
developing projects so that they better address the mariners’ needs.
In previous reporting periods, the team contacted and met with faculty members and the executive director of MITAGS in Baltimore, MD, which became the first maritime training center that the Center agreed to collaborate with on the above items. In the current reporting period, the team contacted the SUNY Maritime College, the Massachusetts Maritime Academy, and the U.S. Merchant Marine Academy, and has thus far discussed and agreed with faculty members from the last to continue and enhance the discussions.
COVID ImpactsThere have been no significant impacts on this work due to the COVID-19 pandemic, other than an in-ability to interact more directly with the Maritime Colleges.
Extracting Chart-related Maritime Accident Causes from Accidents Reports Using Machine Learning
Maritime accident reports contain a wealth of infor-mation that can serve as lessons learned to identify chart related issues that can be improved with the aim to alleviate the risk for similar accidents in the future. For example, maritime accident reports demonstrate that data quality (as encoded with the Zones of Confidence) are poorly visualized and per-ceived by mariners and thus rarely used, e.g., the case of the cargo vessel Nova Cura. In a similar vein, cartographic practices often necessitate the use of a point symbol to chart an isolated danger for the compilation scale. However, the ability of users to change the viewing scale in ECDIS may pose a risk
Figure 37-11. Results of text analysis of seven Japanese ship grounding reports. a. (left) Semantic similarity analysis. b. (right) Topic modelling.

JHC Performance Report 31 January 2021 203
CHARTING AND NAVIGATIONCHARTING AND NAVIGATION
since point symbols scale with scale changes (see, e.g., the case of the LPG tanker Pazifik). The aim of this project is to identify nautical cartography-related issues that have led to maritime accidents and the ways that nautical charting could be improved to decrease the associated risks for marine navigation. In the current reporting period, Christos Kastrisios and Kim Lowell investigated methods to automate the study of accident reports and the extraction of the required information from them. The team ap-plied two types of automated text analysis, semantic similarity analysis (SSA), and Latent Dirichlet Alloca-tion (LDA) to accident reports published in English by the Japan Transport Safety Board).
SSA identifies the user-specified n words that are semantically most similar to a target word such as “chart” (Figure 37-11a). Semantic similarity is usu-ally determined by proximity of words to the target word within a sentence or paragraph. This informa-tion may assist subjective human analysis of accident reports, though the meaning of these words relative to accidents and maritime cartography must then be discerned.
LDA identifies a user-specified number of “topics” and then assigns each word to one of the topics based on their semantic similarity determined by mu-tual presence across sentences, paragraphs, sections, or whole documents. LDA is conceptually comparable to numerical clustering techniques such as k-means. In Figure 37.11b, Topic 2 in orange clearly relates to cartography – “chart” is the most important word in Topic 2 and all 125 occurrences of “chart” in the test dataset have been assigned to Topic 2. Topic 2 is also semantically isolated, i.e., distinct from the circles for the other four topics, suggesting that “charts” are not relevant to the other topics identified. LDA potentially provides information about the role of cartography in ship groundings but, based on the preliminary result, it is clear that, as with SSA, human interpretation (and method refinement) is required.
For future work, the team considers it would be ben-eficial to rigorously study a larger number of ground-ing accident reports, refine the words analyzed, remove sections of the accident reports from the textual analysis, and examine results from multiple countries and languages.
COVID ImpactsThere have been no significant impacts on this work due to the COVID-19 pandemic.
Sounding Selection Verification Methods
Depth curves and soundings are two of the most important features on nautical charts which are used for the representation of submarine relief. They are derived from more detailed (source) data-sets, either survey data and/or larger scale charts, through generalization. The process is a continuous compromise among the chart legibility, topology, morphology, and safety constraints as they are often incompatible with each other. Once depth curves are created, the cartographer, following established cartographic practice rules, makes the selection of the soundings that will be charted. The selection (as well as the depth curves’ compilation) is performed either fully manually and/or with using one of the existing software solutions. The initial selection is then evaluated and corrected where necessary to meet the fundamental constraint of safety, i.e., that the expected water depth based on the charted bathymetric information should not appear, at any location, deeper than the source information. According to the IHO S-4 Chart Speci-fications, the “shoal-biased pattern” of selection for the charted soundings is achieved through the “triangular method of selection,” and more specifi-cally through two tests, known as the Triangle and Edge Tests. For the triangle test the cartographer is called upon to verify that no actual (source) sounding exists within a triangle of selected sound-ings which is shallower than the least depth of the soundings forming the triangle. Likewise, for the edge test, no source sounding may exist between two adjacent selected soundings shallower than the least of the two selected soundings forming an edge of the triangle.
In previous reporting periods, Christos Kastrisios, Brian Calder, and Giuseppe Masetti, in collabora-tion with Pete Holmberg (NOAA PHB) and Brian Martinez (NOAA MCD), developed an algorithmic implementation of the triangle test with increased performance near and within depth curves and coastlines, and the first automated implementation of the edge test described in the literature. The work showed the significance of the edge test in the validation process, where it may identify shoals that the triangle test fails to identify. The research work documented individual limitations of the two tests, and revealed a fundamental, “intrinsic,” limitation that prevents the construction of a fully automated solution based solely on them. The fundamental limitation is considered “intrinsic”
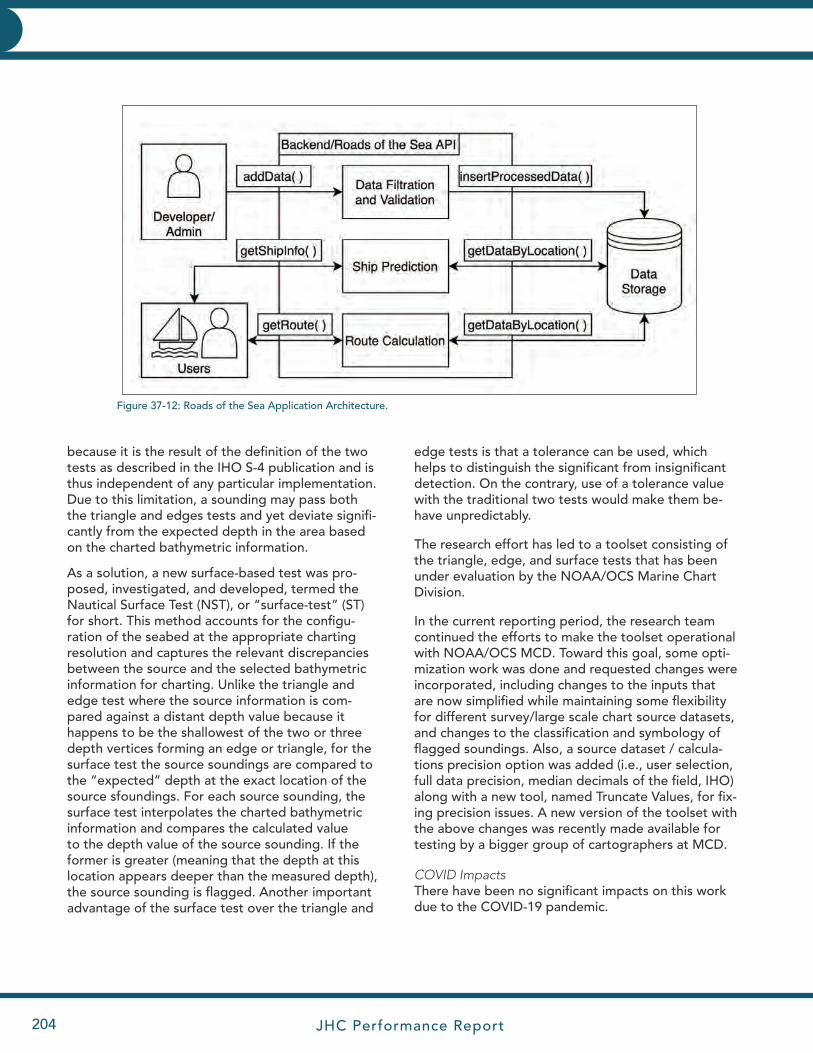
JHC Performance Report204
CHARTING AND NAVIGATIONCHARTING AND NAVIGATION
because it is the result of the definition of the two tests as described in the IHO S-4 publication and is thus independent of any particular implementation. Due to this limitation, a sounding may pass both the triangle and edges tests and yet deviate signifi-cantly from the expected depth in the area based on the charted bathymetric information.
As a solution, a new surface-based test was pro-posed, investigated, and developed, termed the Nautical Surface Test (NST), or “surface-test” (ST) for short. This method accounts for the configu-ration of the seabed at the appropriate charting resolution and captures the relevant discrepancies between the source and the selected bathymetric information for charting. Unlike the triangle and edge test where the source information is com-pared against a distant depth value because it happens to be the shallowest of the two or three depth vertices forming an edge or triangle, for the surface test the source soundings are compared to the “expected” depth at the exact location of the source sfoundings. For each source sounding, the surface test interpolates the charted bathymetric information and compares the calculated value to the depth value of the source sounding. If the former is greater (meaning that the depth at this location appears deeper than the measured depth), the source sounding is flagged. Another important advantage of the surface test over the triangle and
edge tests is that a tolerance can be used, which helps to distinguish the significant from insignificant detection. On the contrary, use of a tolerance value with the traditional two tests would make them be-have unpredictably.
The research effort has led to a toolset consisting of the triangle, edge, and surface tests that has been under evaluation by the NOAA/OCS Marine Chart Division.
In the current reporting period, the research team continued the efforts to make the toolset operational with NOAA/OCS MCD. Toward this goal, some opti-mization work was done and requested changes were incorporated, including changes to the inputs that are now simplified while maintaining some flexibility for different survey/large scale chart source datasets, and changes to the classification and symbology of flagged soundings. Also, a source dataset / calcula-tions precision option was added (i.e., user selection, full data precision, median decimals of the field, IHO) along with a new tool, named Truncate Values, for fix-ing precision issues. A new version of the toolset with the above changes was recently made available for testing by a bigger group of cartographers at MCD.
COVID ImpactsThere have been no significant impacts on this work due to the COVID-19 pandemic.
Figure 37-12: Roads of the Sea Application Architecture.
JHC Performance Report 31 January 2021 205
CHARTING AND NAVIGATIONCHARTING AND NAVIGATION
Roads of The Sea
The ocean does not have roads such as those on land, which means there are countless differ-ent routes a ship can take to get from point A to point B. However, most ships tend to follow their previously used routes as good practice. When a ship takes a route for the first time or strays from its planned route (e.g., due to weather) it is at its greatest risk for grounding. Having a system to inform mariners if the new route has been travelled by similar size vessels would help alleviate that risk. Also, one of the main challenges for mariners on the bridge is target avoidance. ARPA and AIS have been a great advancement as they provide information about the current speed and course of the close ships, but the officer of the watch is often called to predict the other vessels’ course changes due to their most likely route/destination for the area. Such a route prediction is currently impos-sible for autonomous vessels, hence, they are often forced to steer for almost every course change of the other vessels in the area and re-calculate their own path.
The aim of this project is the incorporation of AIS and chart data for the development of a weighted graph of the routes that ships commonly use, the junctions and the global ports. Roads will be clas-sified from small to major based on the traffic den-sity and the type of the vessel that can safely follow them. The graph will be utilized for the develop-ment of a route suggestion system, where, based on the ship characteristics, the system will calculate the recommended route; and for a ship predic-tion system, where, given a ship’s location and its proximity to the network, it will predict the ship’s most likely route. At the end of the first phase of the project the above functionalities will be made available in the form of a web map service (Figure 37-12), but, ultimately, their incorporation in USVs and ECDIS will be pursued. The system of roads is also expected to be utilized in other research efforts, such as the evaluation of existing charts, setting survey priorities, and the need for the es-tablishment of new traffic separation schemes.
In the current reporting period, Christos Kastri-sios and Val Schmidt, in collaboration with Sean Kohlbrenner, Matthew Eager, Amith Kashyap, and Nilan Phommachanh, senior students majoring in computer sciences, started with processing AIS
data and planning for the future requirements. That includes defining good and bad data (e.g., data with issues with the MMSI, speed, location), filtering out invalid AIS data, researching optimal data compres-sion and merging methods, exploring capabilities to read compressed data to increase efficiency of the planned product, investigating available libraries to process the data, visualizing data, creating heat maps, and designing the route planning and ship prediction algorithms to account for future requirements.
COVID ImpactsThere have been no significant impacts on this work due to the COVID-19 pandemic.
Free and Open-Source Software for Ocean Mapping
The use of Free and Open-Source Software for Geospatial Applications (FOSS4G) is widespread in industry, academia, and among individual users. When applied to ocean mapping, the use of FOSS4G by seabed mapping agencies is limited as they mostly rely on commercial software for their workflows. Sev-eral reasons can be identified: the performance and reliability of the commercial software packages, the customer support, the familiarity of users with specific software, and the liability exposure in charting, to name a few. Furthermore, the lack of awareness of the availability of FOSS4G that could be implemented in the ocean mapping workflow is high since there is an absence of a comprehensive study on their features and their performance compared to the commercial software.
This project aims to discover the FOSS4G that may be used in ocean mapping (hereinafter, Free and Open-Source Software for Ocean Mapping (FOSSOM)), evaluate their features, compare their performance against commercial software, to identify if and how they can complement the latter, and, lastly, investi-gate the viability of a workflow based on FOSSOM.
In the current reporting period, Christos Kastrisios, in collaboration with Jose Cordero from Lund University, conducted an online discovery of the available tools by marine research centers, ocean related academic institutions, hydrographic offices, regional mapping initiatives, the Open Source Geospatial Foundation, and popular repositories and research supporting websites, such as GitHub and ResearchGate; a total of 110 relevant software packages of potential FOSSOM were identified (Figure 37-13).
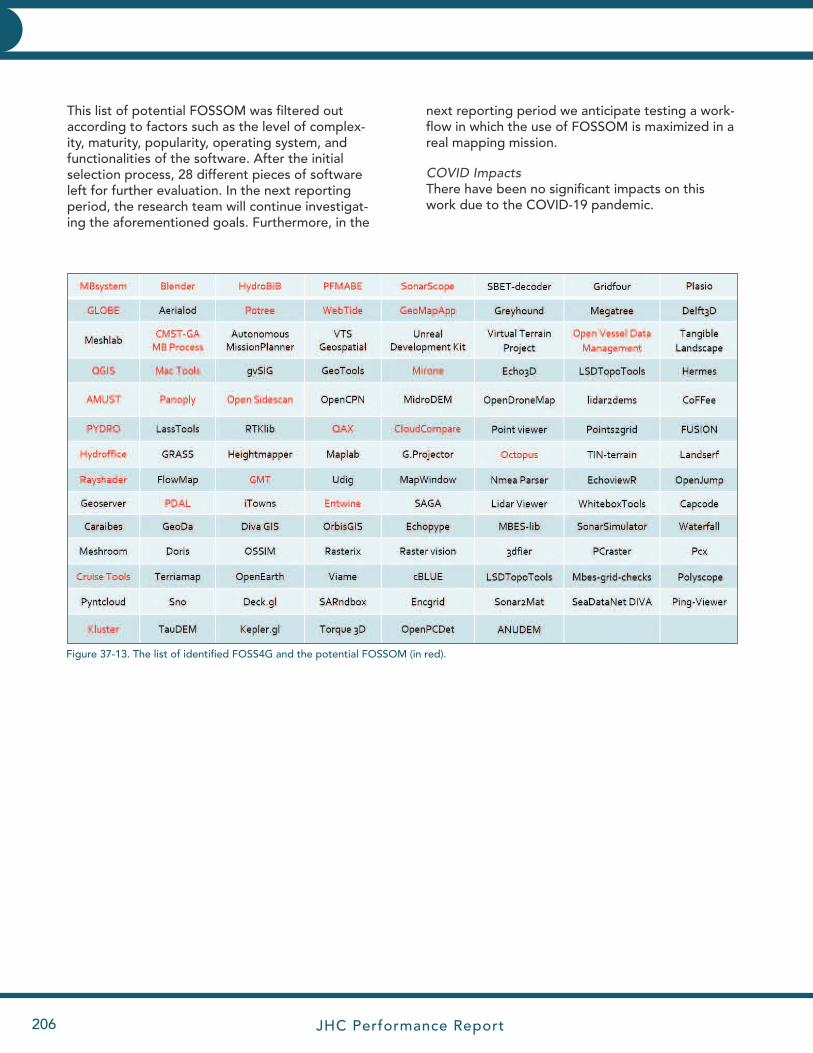
JHC Performance Report206
CHARTING AND NAVIGATIONCHARTING AND NAVIGATION
Figure 37-13. The list of identified FOSS4G and the potential FOSSOM (in red).
This list of potential FOSSOM was filtered out according to factors such as the level of complex-ity, maturity, popularity, operating system, and functionalities of the software. After the initial selection process, 28 different pieces of software left for further evaluation. In the next reporting period, the research team will continue investigat-ing the aforementioned goals. Furthermore, in the
next reporting period we anticipate testing a work-flow in which the use of FOSSOM is maximized in a real mapping mission.
COVID ImpactsThere have been no significant impacts on this work due to the COVID-19 pandemic.
JHC Performance Report 31 January 2021 207
CHARTING AND NAVIGATIONCHARTING AND NAVIGATION
TASK 38: Chart Adequacy and Re-survey Priorities: Investigate methods to formally assess the adequacy of a chart based on many factors, weighting the strength of each so as to determine a metric that can be normalized over many charts or chart areas, so that it can be used to rank areas in order of resurvey need. In addition, there is a requirement to determine the value of a survey in any given area, defined as the benefit to the adequacy of the chart that is derived from conducting a survey (i.e., if we resurvey an area, how much better does the chart be-come?) and we, therefore, propose to investigate methods to assess survey benefit as an economic driver in the resurvey priority decision. Linked together, these two methods may provide a schema to rationalize the setting of resurvey priorities beyond the “Critical Area.” These efforts are clearly linked to our seafloor change analyses and risk model efforts (Task 30 and Task 41). PIs: Brian Calder, Christos Kastrisios, and Giuseppe Masetti
Assessing the adequacy (suitably defined) of current charts, for decisions on either chart replacement or resur-vey priority, has become a common theme for many hydrographic agencies faced with large chart portfolios and limited resources. One approach to this problem is to focus on the data represented by the chart, rather than the chart itself, and assess the risk experienced by surface traffic in any given area. In doing so, special attention must be paid to the assumptions inherent in that data (e.g., of survey completeness and object detection) which might not be explicitly provided on the chart. In a previous reporting period, Brian Calder developed a risk model that could be applied in a variety of circumstances to provide assessments for general shipping traffic, address-ing specifically bathymetric information and the potential for incomplete surveys to affect the risk estimated. In the 2016 reporting period, Calder adapted this model to assess resurvey priority, and applied it to an area in the Chesapeake Bay. The results of the analysis agreed with intuition on data quality, completeness, and risk, but also suggested some counter-intuitive notions on what type of resurvey might be appropriate in the area.
No further effort was committed to this task during the current reporting period.
TASK 39: Hydrographic Data Manipulation Interfaces: Investigate interfaces, interaction methods, and visualiza-tion techniques for the inspection, analysis, and remediation of hydrographic data problems, with particular emphasis on novel interaction methods and computer-assisted depiction of problem areas. Specifically investi-gate visualization techniques for point-wise hydrographic data, and variable-resolution gridded data, with parti-cular emphasis on clear depiction of the data within hydrographic constraints as well as gesture-based interaction, stereo imaging, and multi-touch capable displays. PIs: Brian Calder, Giuseppe Masetti, Tom Butkiewicz, and Colin Ware
Project: Immersive 3D Data Cleaning
Center: Participants: Tom Butkiewicz, Andrew Stevens, and Colin Ware
No matter how comprehensive, and effective, automated processing tools become, there is always likely to be some data that needs to be examined, and manipulated, by a human operator, by hand. The efficiency of interaction with the data is, therefore, an essential component of the overall efficiency of the data processing pipeline, since the human interaction cannot otherwise be acceler-ated with faster machines. As part of the ongoing effort to explore new interfaces for hydrographic data manipulation, Thomas Butkiewicz and gradu-ate student Andrew Stevens created, and continue to develop, advanced interfaces for cleaning sonar and lidar point cloud data with handheld 3D inter-action devices.
Previously, Butkiewicz and Stevens experimen-tally compared point cloud cleaning performance
between The Center’s novel immersive VR inter-face and a generic desktop monitor and mouse/keyboard-based interface representative of tradi-tional software packages. The study showed a clear advantage when using the VR interface with regard to completion time, while errors were generally equivalent between the interfaces.
However, because users can be reluctant to use im-mersive interfaces and wear head mounted displays, a desktop monitor based, a non-immersive version of the editing software was developed (Figure 39-1). While users do not get the same depth perception and head coupling benefits, the handheld control-lers are still a better interface than a mouse for the inherently 3D task, and a follow-up study confirmed that this configuration preserves much of the bene-fits over traditional mouse-based interfaces.
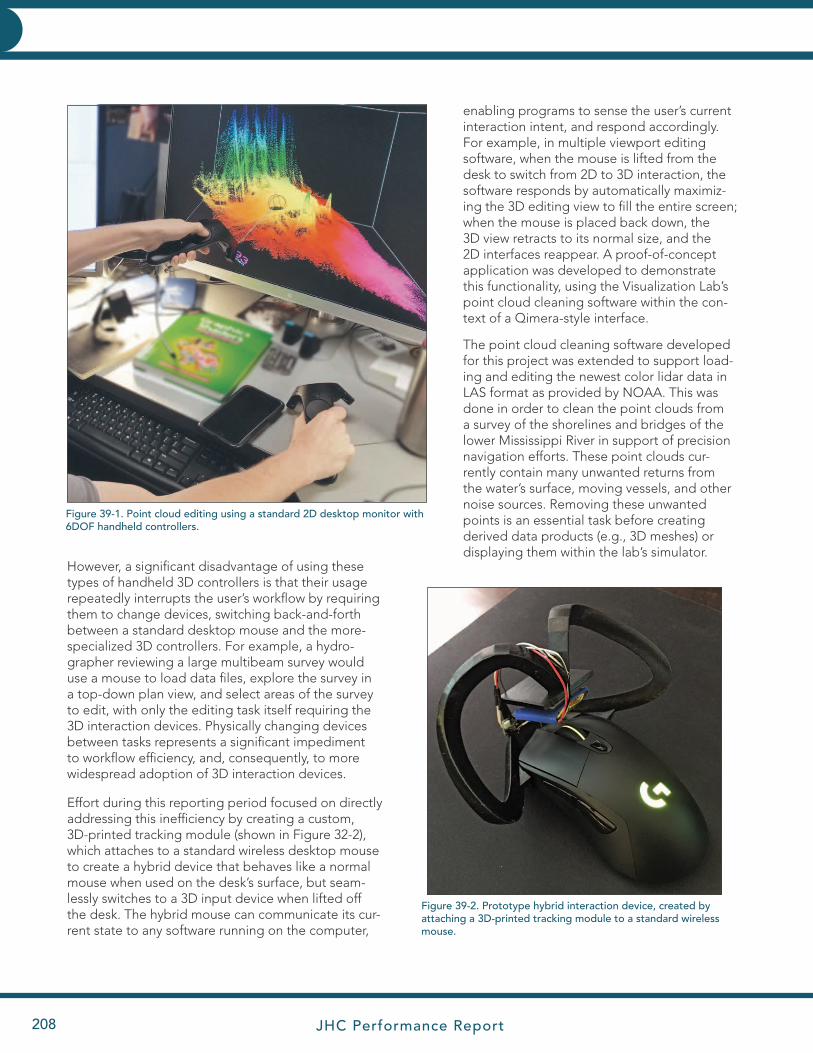
JHC Performance Report208
CHARTING AND NAVIGATIONCHARTING AND NAVIGATION
However, a significant disadvantage of using these types of handheld 3D controllers is that their usage repeatedly interrupts the user’s workflow by requiring them to change devices, switching back-and-forth between a standard desktop mouse and the more-specialized 3D controllers. For example, a hydro-grapher reviewing a large multibeam survey would use a mouse to load data files, explore the survey in a top-down plan view, and select areas of the survey to edit, with only the editing task itself requiring the 3D interaction devices. Physically changing devices between tasks represents a significant impediment to workflow efficiency, and, consequently, to more widespread adoption of 3D interaction devices.
Effort during this reporting period focused on directly addressing this inefficiency by creating a custom, 3D-printed tracking module (shown in Figure 32-2), which attaches to a standard wireless desktop mouse to create a hybrid device that behaves like a normal mouse when used on the desk’s surface, but seam-lessly switches to a 3D input device when lifted off the desk. The hybrid mouse can communicate its cur-rent state to any software running on the computer,
enabling programs to sense the user’s current interaction intent, and respond accordingly. For example, in multiple viewport editing software, when the mouse is lifted from the desk to switch from 2D to 3D interaction, the software responds by automatically maximiz-ing the 3D editing view to fill the entire screen; when the mouse is placed back down, the 3D view retracts to its normal size, and the 2D interfaces reappear. A proof-of-concept application was developed to demonstrate this functionality, using the Visualization Lab’s point cloud cleaning software within the con-text of a Qimera-style interface.
The point cloud cleaning software developed for this project was extended to support load-ing and editing the newest color lidar data in LAS format as provided by NOAA. This was done in order to clean the point clouds from a survey of the shorelines and bridges of the lower Mississippi River in support of precision navigation efforts. These point clouds cur-rently contain many unwanted returns from the water’s surface, moving vessels, and other noise sources. Removing these unwanted points is an essential task before creating derived data products (e.g., 3D meshes) or displaying them within the lab’s simulator.
Figure 39-1. Point cloud editing using a standard 2D desktop monitor with 6DOF handheld controllers.
Figure 39-2. Prototype hybrid interaction device, created by attaching a 3D-printed tracking module to a standard wireless mouse.
JHC Performance Report 31 January 2021 209
CHARTING AND NAVIGATIONCHARTING AND NAVIGATION
To support a wider range of interaction devices, headsets, and displays, this point cloud data clean-ing project is being transitioned to the Unity engine, away from a custom application which was hard-coded to work with a single, now-deprecated VR API. In addition to supporting newer VR devices, transi-tioning to Unity can enable support for AR headsets such as HoloLens 2. It also enables sharing and reuse of assets between other Unity-based VisLab projects, and the integration of third-party software packages, such as optimized graphics shaders and spatial data structures.
Finally, Butkiewicz and Stevens have designed a new stereoscopic desktop editing system, and plan to construct it once COVID-19 restrictions on lab access are lifted in 2021.
COVID ImpactsLab access restrictions and social distancing mea-sures precluded our plans to conduct evaluations of our hybrid mouse prototype in the lab.
Project: Constrained 2D/3D Data Manipulation Interfaces
Center Participants: Colin Ware, Brian Calder, and Giuseppe Masetti
As another alternative to an immersive 3D interface, Ware, Brian Calder, and Giuseppe Masetti have continued efforts to develop a “conventional,” but more efficient user interface for handling data from the CUBE and CHRT algorithms. That is, assuming you start with a conventional data processing system, what could be changed in the interactions to improve the usability, speed, and accuracy? A particular dif-ficulty recognized by all users of current data process-ing interfaces is that they are poorly adapted to the data, and demand a great deal from the operator, which makes their use slow and problematic. Specific examples include a continuously variable scale with ill-designed sub-sampling schemes, which can ob-scure significant cues to data problems, and the use of a pseudo-3D interface with 2D interaction tools.
Most existing interfaces for sounding data approach the problem as a simple 3D display of points, or color-coded, sun-illuminated, bathymetry. The user can freely zoom the display and rotate the points to identify which soundings are causing problems for the underlying algorithm that is estimating depth, after which a simple (2D) lasso tool is used to select
points for removal. Unfortunately, however, once the interface stops moving, the illusion of 3D perspective mostly disappears, and 2D lasso tools make it difficult to select just the points required (i.e., it is relatively easy to select “background” points). Consequently, many operators spend a great deal more time ma-neuvering the data into the right positions in which to conduct edits than they do actually editing.
The basic idea for the BathyEditor prototype is to provide scientifically rigorous perceptual and cogni-tively optimized visualizations and interaction meth-ods for the data. For example, rather than providing a very flexible display that is perhaps more suited to final product visualization, we limit the user’s ability to adjust the scale of the display, such that they are able to better focus on their actual task. The design strategy for the new tool is therefore to provide an interface that allows operators to rapidly home in on areas where there may be problems with the data; once such a region has been identified and selected, a complete array of all the necessary data editing task-relevant views are immediately provided with easy-to-use controls for data editing. A proof-of-con-cept application has been developed incorporating the following principles:
Main View and Information Scent
The main overview display panel provides the best possible information scent leading to areas that should be checked and possibly edited by the operator. “Information scent” is a term from the user interface design literature referring to visual cues provided in high-level displays that can reliably lead to useful information obtainable via drill-down operations. One way of providing information scent is through color-coded bathymetry as illustrated in Fig-ure 39-3. A colormap has been designed to ensure that a designated deviation in the bathymetric sur-face (possibly representing a flier) is visible. This also requires that the bathymetric surface be displayed at an appropriate scale. Since a fixed colormap may not be adequate to accomplish this goal in cases where there is a large depth range, it is adjusted to give an appropriate color range for each selected region.
Linked Views
When a region that may require editing is identified, selecting it results in all related information appear-ing immediately in linked views. This provides a cog-nitive benefit by greatly reducing working memory
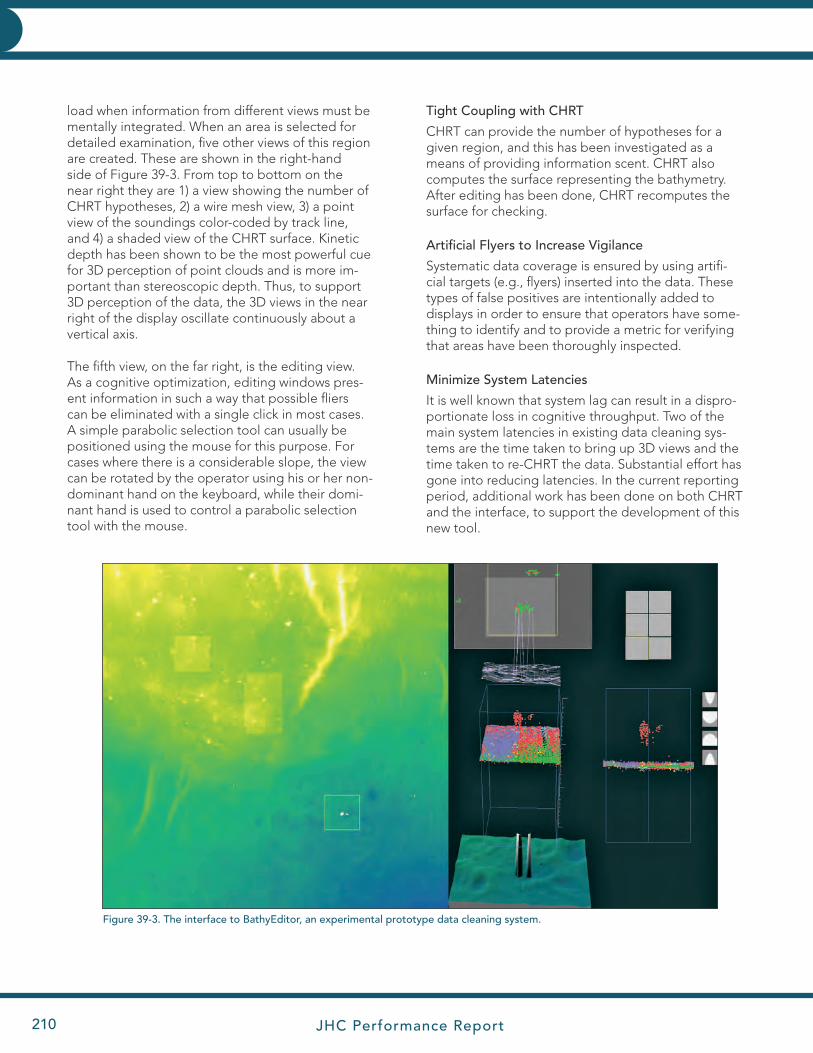
JHC Performance Report210
CHARTING AND NAVIGATIONCHARTING AND NAVIGATION
load when information from different views must be mentally integrated. When an area is selected for detailed examination, five other views of this region are created. These are shown in the right-hand side of Figure 39-3. From top to bottom on the near right they are 1) a view showing the number of CHRT hypotheses, 2) a wire mesh view, 3) a point view of the soundings color-coded by track line, and 4) a shaded view of the CHRT surface. Kinetic depth has been shown to be the most powerful cue for 3D perception of point clouds and is more im-portant than stereoscopic depth. Thus, to support 3D perception of the data, the 3D views in the near right of the display oscillate continuously about a vertical axis.
The fifth view, on the far right, is the editing view. As a cognitive optimization, editing windows pres-ent information in such a way that possible fliers can be eliminated with a single click in most cases. A simple parabolic selection tool can usually be positioned using the mouse for this purpose. For cases where there is a considerable slope, the view can be rotated by the operator using his or her non-dominant hand on the keyboard, while their domi-nant hand is used to control a parabolic selection tool with the mouse.
Tight Coupling with CHRT
CHRT can provide the number of hypotheses for a given region, and this has been investigated as a means of providing information scent. CHRT also computes the surface representing the bathymetry. After editing has been done, CHRT recomputes the surface for checking.
Artificial Flyers to Increase Vigilance
Systematic data coverage is ensured by using artifi-cial targets (e.g., flyers) inserted into the data. These types of false positives are intentionally added to displays in order to ensure that operators have some-thing to identify and to provide a metric for verifying that areas have been thoroughly inspected.
Minimize System Latencies
It is well known that system lag can result in a dispro-portionate loss in cognitive throughput. Two of the main system latencies in existing data cleaning sys-tems are the time taken to bring up 3D views and the time taken to re-CHRT the data. Substantial effort has gone into reducing latencies. In the current reporting period, additional work has been done on both CHRT and the interface, to support the development of this new tool.
Figure 39-3. The interface to BathyEditor, an experimental prototype data cleaning system.
JHC Performance Report 31 January 2021 211
CHARTING AND NAVIGATIONCHARTING AND NAVIGATION
The prototype now loads the following from CHRT:
• Individual soundings in a designated area. These are attributed by line (file), ping, and beam.
• The estimated depth surface
• The number of hypotheses at each point on the grid.
BathyEditor’s proposed interface is a significant de-parture from the accepted norm of hydrographic data processing methods, and will, therefore, require care-ful calibration and validation through user interaction studies.
A process of iterative development of BathyEditor began in late 2019 and has continued. The proto-type editor is being evaluated in comparison with Teledyne CARIS HIPS 10.4 for processing times and accuracy. We had initially planned a formal controlled study but this has evolved to a process of iterative refinement for reasons given below.
The data set being used in the evaluation is from a survey carried out by the NOAA Ship Whiting in the vicinity of Woods Hole, Massachusetts (the same dataset was used as part of the original acceptance testing for the CUBE algorithm). Two equally sized regions (designated A and B) have been identified for cleaning. Together these represent approximately half of the survey area. A formal within-subjects design was initially planned, meaning that all partici-pants would use both interfaces, either processing area A with the BathyEditor and area B with HIPS, or the reverse. Half the subjects will process with HIPS first and half with BathyEditor first.
In the early part of the current reporting period, a pilot study was initiated and two participants were run through the protocol. One of them, Jeff Douglas, is a NOAA hydrographer who has trained other hydrog-raphers in the use of CARIS software. The other, Anne Harwell, is a novice, only having used the software as part of a training course.
There were a number of interesting results from this exercise.
1) Douglas only achieved a rough cleaning of the designated area using HIPS software in an hour. He estimated that it would take another 4 hours to fully clean the region. This length of time re-
quires too much commitment to be feasible for a formal experiment with many participants.
2) Douglas cleaned a second area using Bathy-Editor in approximately 45 minutes.
3) During the HIPS session, he mentioned that part of their on-board process is to use the Flyer Finder software developed by Wilson, et al., at the Center following initial cleaning with HIPS. After this a second pass is done using HIPS to address any problems that were identified.
4) Hartwell had great difficulty, using HIPS and only did minimal cleaning. However, with 15 minutes of instruction she was able to clean the designated area using BathyEditor in less than an hour.
Based on the pilot study results, we made the fol-lowing determinations:
1) Due to the difficulty of getting study partici-pants to use Caris HIPS in a consistent way, and because it takes too long to clean a meaning-fully sized area, an experiment to do a direct comparison between BathyEditor and HIPS is not feasible. We instead decided on less formal ‘iterative refinement’ approach. We propose to run more study participants through BathyEdi-tor and evaluate both the accuracy and the time taken. But, equal weight will be given to anec-dotal comments on features and capabilities.
2) A substantial design change came from the first iteration with Douglas. We determined that the primary “information scent” in BathyEditor should be based on a Flyer-Finder like filter, or set of filters instead of the number of hypoth-eses. Implementing this has resulted in a much smaller set of target areas requiring inspection, and this should greatly speed up cleaning with BathyEditor.
COVID ImpactsThe evaluation process involves in-person interac-tions with an experimenter taking a study partici-pant through a detailed protocol. This is done on a computer configured for this purpose in the CCOM VisLab. Access to the VisLab has been severely lim-ited due to the COVID lockdown and so evaluation work ceased early in the year.
JHC Performance Report212
CHARTING AND NAVIGATIONCHARTING AND NAVIGATION
Research Requirement 2.B: Comprehensive Charts and Decision AidsFFO Requirement 2.B: “Development of innovative approaches and concepts for electronic navigation charts and for other tools and techniques supporting marine navigation situational awareness, such as proto- types that are real-time and predictive, are comprehensive of all navigation information (e.g., charts, bathy- metry, models, currents, wind, vessel traffic, etc.), and support the decision process (e.g., under-keel clearance management).”
THEME: 2.B.1: Information Supporting Situational Awareness
TASK 40: Currents, Waves and Weather: Improve navigation planning systems by the development of methods showing forecast ocean currents, sea state, and surface winds, and specifically to demonstrate methods for high quality portrayal of ocean and near-shore currents, sea state and weather information on electronic chart displays; investigate animated portrayals of the same variables; and investigate the use of multi-slice profile views to show current speed, salinity and temperature distributions. We propose to design, build, and evaluate prototype displays based on sound perceptual principles. We will work with NOAA and appropriate IHO com-mittees (e.g., Tides, Water-levels and Currents Working Group – TWCWG) to evaluate these products and help establish standards for the portrayal of this information. PIs: Colin Ware, Briana Sullivan, and Vis Lab
Project: S-111 Surface Currents ECDIS Implementation
Center Participants: Colin Ware, Roland Arsenault, Briana Sullivan, and Tom Butkiewicz
The future of electronic charting cannot leave behind the supplementary data that aids the mariner in the decision-making process. The elements that surround the mariner in the marine environment all contribute to the story of what kind of journey will unfold. Un-derstanding their contribution in both planning and while underway is important to safety and efficiency. One significant component is surface currents, encom-passed in the S-111 IHO standard.
Briana Sullivan’s prior work with the IHO’s Tides, Water-levels, and Currents Working Group (TWCWG) resulted in the S-111 Surface Currents Product Speci-fication containing an arrow design and color scheme developed by the Center and tested by the Visualiza-tion Lab. This R2O project has been in development since the inception of the SCWG (Surface Current Working Group), a TWCWG sub-group, in 2014. Last year, the TWCWG requested that the next version of S-111 contain a standard for displaying the data as streamlines as well; a method Colin Ware, Roland Arsenault and Briana Sullivan created to improve upon the gridded arrows.
Despite the availability of surface current data prod-ucts, and the Center’s publications on methods of ef-fective surface current visualization, few manufacturers have actually implemented satisfactory surface current visualization capabilities in their ECDIS/PPU products. Getting industry to adopt new visualization techniques has been a longstanding challenge. To promote adop-tion, we have begun a new project to develop and test our techniques within the context of an actual com-mercial ECDIS/PPU environment.
Butkiewicz has worked with industrial partner SevenCs to implement our S-111 streamline-based visualiza-tions within their S-100 complaint Nautilus ECDIS Kernel software development kit. The software under development has been able to load surface current data from the Chesapeake Bay Operational Forecast System in the new regridded HDF5 format that NOAA is distributing. Arsenault’s previously developed C++ library generates the geometry for the S-111 stream-lines, which are then drawn as a toggleable overlay on top of the SevenCs ECDIS interface.
Changes in the underlying OpenGL graphics imple-mentations on modern video cards have largely dep-recated the ability to control line width, necessitating a move from line-based streamlines to triangle-strip-based streamlines. Whereas previous implementations drew streamlines and arrows separately on top of each other, Butkiewicz has been developing a new algo-rithm to draw the streamline and arrows seamlessly as a single triangle-strip. This required switching devel-opment to a new version of the Nautilus SDK, which uses updated graphics painters that should be more compatible with the modern graphics calls necessary for this approach.
There have also been discussions with other ECIDS/PPU manufacturers in pursuit of similar partnerships that can potentially help push adoption of Visualiza-tion Lab techniques.
COVID ImpactsThere have been no significant impacts on this work due to the COVID-19 pandemic.
JHC Performance Report 31 January 2021 213
CHARTING AND NAVIGATIONCHARTING AND NAVIGATION
TASK 41: Under-Keel Clearance, Real-time and Predictive Decision Aids: Develop methods to assess the input parameterization for real-time under-keel own-ship models, and then to apply these models to form real-time interactive decision-support tools, with off-line planning modes, allowing the user to choose the most appropriate method for the task in hand. Specifically, investigate and develop methods for the assessment of geological and anthropogenic variability in a survey area, with the aim of providing calibration constants for risk-based under-keel clearance models. Investigate methods for establishing the own-ship calibration constants as well as methods for adapting real-time and predictive environmental models for use in the appropriate segments of the risk-based under-keel clearance model. In visualizing the results of this model, we will investigate methods for portraying the uncertainties and risk associated with this information in a fashion most meaningful to the mariner. PIs: Brian Calder and Vis Lab
Center Participants: Tom Butkiewicz, Christos Kastrisios, and Briana Sullivan
In past (and indeed present) hydrographic practice, the ability of the hydrographer to express to the end user the degree of uncertainty, writ large, of the data being presented for navigational purposes has been extremely limited. Methods such as source or reliability diagrams on two dimensional products, or CATZOC objects in electronic navigational charts, have attempt-ed to convey some of the uncertainty. These methods, however, mostly represent what was done during the survey effort that provided the data, rather than what the mariner may safely infer from the chart about the potential for difficulties in sailing through any given area.
One approach to this problem is to focus on the risk engendered to surface traffic of transiting through a given area, taking into account such issues as ship parameters, environmental conditions (e.g., wind and wave effects), and especially the completeness and uncertainty of the bathymetric data available. Given a sufficiently general model, it would be possible to assess the potential risk for a specific ship following a planned course (e.g., during passage planning), moving through (or anchoring) in an area (e.g., to assess a ge-neric “risk map” to be provided as a static or dynamic overlay on a charting interface), or to provide predictive guidance for the mariner in real time of the risk associ-ated with changing the ship’s direction in reaction to developing conditions. In the simplest case, the risk could be assessed as the potential to ground the ship, but more complex scenarios with costs associated (e.g., taking into account the potential cost of clean-up, or of damage to a protected environment) could also be considered.
Moving towards this goal, in the current reporting period, we have continued working on researching new ways to make use of modern high-resolution data products, including bathymetry (e.g., S-102) and tides, currents, and flow models (e.g., Operational Forecast Systems). Still in the early development stages, this group of projects focuses on how to use these data products to support precision navigation in the voy-age planning stage. This includes presenting mariners
with tide-aware underkeel clearance information in go/no-go areas, timing passages under bridges to match low-tides, and avoiding dangerous cross currents. To support this, Thomas Butkiewicz has continued work-ing with industrial partner SevenCs to use their Nautilus SDK along with their ORCA MASTER G2 ECDIS and ORCA PILOT X PPU software packages to experiment with creating new precision navigation visualizations.
We have also been investigating how to integrate the ORCA ECDIS/PPU platform within our existing virtual reality ship simulator, allowing for the ECDIS/PPU to be both viewed and interacted with entirely from within the simulation, just as it would be on a real ship’s bridge. This should enable us to conduct user evaluations in a range of simulated scenarios. In the current report-ing period, we have begun building a simulation of the lower Mississippi around the Port of New Orleans, using newly collected multibeam sonar surveys and color lidar point clouds received from NOAA. Scenarios being constructed include passage under the bridge with overhead clearance issues and integration of data from a physical airgap sensor, navigation of a sharp corner with strong currents, and docking a large vessel (e.g., a cruise ship) in low visibility/fog conditions. Unlike our previous virtual reality-based simulator, this version is intended for use on our semi-immersive large format tiled display, such that multiple people can be in it si-multaneously, and actual augmented reality devices can be tested within it (as opposed to the simulated-AR we used in previous experiments).
COVID ImpactsThe move to remote working has severely impacted progress on development of the new ship simulator and AR system, as it requires the use of the Visualization Lab’s wide-area tracking system and semi-immersive tiled display. The AR headset we ordered in early 2020 has still not been delivered, due to COVID impacts on the manufacturer.
Further development is expected in the following reporting period.
JHC Performance Report214
CHARTING AND NAVIGATIONCHARTING AND NAVIGATION
THEME: 2.B.2: Charts and Decision Aids
TASK 42: Ocean Flow Model Distribution and Accessibility: Continue working with the TWCWG to develop S100 specifications for how to disseminate, visualize, and make use of ocean flow data from observation and simulation to end-users. This includes feature-aware compression of immense data sets into smaller and thus more easily transmittable snippets, 2D visualization methods that integrate into existing charting environments, and analysis tools to increase the usefulness of this data for users. PI: Briana Sullivan
Owing to Sullivan’s extended leave of absence, no major milestones have been accomplished in this reporting period.
TASK 43: Chart Update Mashup (ChUM)—Modernization of Data Set Maintenance: Continue and enhance the Chart Update Mashup effort by integrating other supplemental data with the chart including Coast Pilot data. Continue Digital 3-D Coast Pilot prototype efforts with a focus on using the database from Coast Pilot Branch at OCS and displaying the structured results in a web-based prototype using Google Maps. PI: Briana Sullivan
Nautical Textual Information
Our Chart Update Mashup efforts (see previous progress reports) have evolved over the years to the broader topic of Nautical Textual Information. Nauti-cal Textual Information includes publications such as the US Coast Pilot, Sailing Directions, and Notice to Mariners. These textual aids to navigators have long been a static analog product distributed in print or as PDFs, and are unable to take full advantage of the richly georeferenced data sets they include. These analog versions can be likened to “lead lines” before multibeam soundings. The goal of this work is to move Nautical Textual Information (NTI) into a truly dynamic digital “multibeam” realm. Doing this means separating the data into basic elements so that it can be stored in a format that is useful for many things.
We strive to determine how this information can be used to benefit mariners while reducing cognitive load, aiding in situational awareness, and allowing for effortless collation and intuitive viewing of the data. Which presents the following research questions:
1. How does NTI best support the chart?
2. How can NTI best be viewed along with a chart?
3. How else can NTI be used?
4. How will NTI be created in the new format using the old system? What will need to change?
5. How will the NTI interoperate with other data such as an ENC, surface currents, weather over-lays, etc.?
6. Is there NTI that is no longer needed (thereby reducing the production workload)?
7. Is there NTI that is useful to the mariner, but does not necessarily need to be directly display to the mariner via text? Could this information instead highlight specific features on a chart that need more attention?
8. How to best reuse or link to existing S-100 data structures, and how to address data not repre-sented in existing data structures?
The data within Coast Pilot and Sailing Directions has been identified within the IHO Nautical Informa-tion Provisions Working Group (NIPWG) as various individual products that will become layers within the Electronic Charting system. These layers are as follows:
• S-122 – Marine Protected Areas (version 1 re-leased)
• S-126 – Marine Physical Environment (in develop-ment)
• S-127 – Marine Traffic Services (version 1 released)
• S-131 – Marine Harbor Infrastructure (in develop-ment)
The data within Notice to Mariners has been slated for the S-125 standard that is still undergoing discus-sion on its content and usefulness. Progress on each of these sources of NTI is reported in this section.
JHC Performance Report 31 January 2021 215
CHARTING AND NAVIGATIONCHARTING AND NAVIGATION
Project: S-126 NIPWG/Marine Physical Environ-ment
Center Participants: Briana Sullivan, Tianhang Hou, and Kim Lowell
Other Participants: Charlene Gifford (CHS), Hugh Astle (CARIS)
One of the layers of data within the NIPWG purview is the S-126 standard for the Marine Physical Envi-ronment. S-126 is responsible for describing marine and terrestrial topography, prevailing, seasonal, and hazardous currents, tides, weather, and other environ-mental conditions.
In previous years, we reported on the development of a proof-of-concept digital version of a web-based interactive Coast Pilot called iCPilot. It demonstrated the initial benefits of having a digital version of the data that would enable the user to filter data ac-cording to specific tasks. The S-126 Marine Physical Environment data has now been identified from the contents of Coast Pilot and Sailing Directions and is in the process of being modeled into an S-100 frame-work.
Earlier this year Kim Lowell used text analysis, ma-chine learning, and artificial intelligence (ML/AI) to identify terminology to be standardized across the Coast Pilot, and to develop efficient and objective ways to have the Coast Pilot conform to being struc-tured data. Since then, Briana Sullivan has identified
that the key to the Coast Pilot data modelling pro-cess is held within the Coast Pilot Manual, which ex-plains how to represent data for the mariner. Lowell’s work can then be used to compare against the Coast Pilot manual to verify how well his system works and to identify any details which the Coast Pilot manual might have missed describing. With this foundation and a collaboration with CHS and CARIS, Sullivan is working on the basic components for the S-126, which will be presented to the NIPWG in 2021.
Project: S-127, Marine Traffic Management/Pilot Services Focus
Center Participants: Briana Sullivan, Tianhang Hou, Thomas Butkiewicz, Ilya Atkin, and Kim Lowell
Other Participants: Hugh Astle and Jeff Dean (CARIS)
Last year, Briana Sullivan completed a GML S-127 Marine Traffic Management product (with Pilot Servic-es only), following the newly released IHO standard. This year a partnership with CARIS HPD was formed and the S-127 GML was shared and tested within the HPD environment. (Figure 43-1)
The test proved successful with a few minor changes to accommodate the CARIS system that will then be reported to the NIPWG in 2021 to help improve the S-127 format. In the coming year, more S-127 data will be created from the Coast Pilot and displayed within the CARIS environment.
Figure 43-1. S-127 data created by UNH displayed inside of CARIS HPD (image courtesy of CARIS).

JHC Performance Report216
CHARTING AND NAVIGATIONCHARTING AND NAVIGATION
To help aid in the data creation process, Kim Lowell evaluated an AI-based commercial software product for text annotation. Prodigy™ allows one to mark text as identifying a specific type of “en-tity;” for the Coast Pilot entities were things such as “ENC Feature” and “Warning Note” (Figure 43-2). Initially, all ENC Features (and Warning Notes), for example, must be identified by a human interpreter. As each ENC Feature is added to the exemplar databases, however, Prodigy “learns” what an ENC Feature “looks like.” The underlying AI model can eventually identify and suggest new ENC Features to the human operator thereby sav-ing considerable time and decreasing errors. The initial evaluation of this approach suggested that a training data set larger than the Coast Pilot may be necessary to provide substantive time savings. For this reason, this analysis was not pursued fur-ther. Instead, Sullivan has designed a web-based system that will take in textual information and the S-127 XSD schema file and provide an intuitive in-terface for marking-up the text and exporting it to the S-127 GML format. New hourly hire Ilya Atkin is in the process of implementing and testing this system (shown in Figure 43-2)
Figure 43-2. Web-based text annotation to GML tool.
Project: S-131, Marine Harbor Infrastructure
Center Participants: Briana SullivanOther Participants: Jonathan Pritchard (IIC)
The Harbour Masters Association in the Netherlands approached NIPWG to create a data layer specific to the needs of the Harbour Masters. This would include detailed berthing information, as well as services re-lated to harbor activities. Jonathan Pritchard and Bri-ana Sullivan have been working together this year to form the foundation of this new standard with input from NIPWG and the Harbour Masters (Figure 43-3). This information is readily available within Coast Pilot, and parallels work Sullivan is doing with the S-126 Marine Physical Environment.
Project: S-125, Notices to Mariner / S-101 ENC, S-201 List of Lights and USCG Data
Center Participants: Briana Sullivan, Tianhang Hou
NOAA Participants: Sean Leeger
Other Participants: David Lewald and Marie Sudek (U.S. Coast Guard)
Sullivan has been collaborating with David Lewald and Sean Leeger about the data exchange process
JHC Performance Report 31 January 2021 217
CHARTING AND NAVIGATIONCHARTING AND NAVIGATION
Figure 43-3. S-131 proposed layout. Figure 43-4. XML DB tables generated from the NIPWG common NTM XSD schema file.
between the USCG and NOAA for the chart updat-ing process based on the local Notice to Mariners (NTM). USCG is looking to modernize their data exchange from CSV files generated from their ATO-NIS (Aids TO Navigation Information System) Oracle database into an S-100 standard format. Sullivan has developed a two-part system that will ingest an XSD schema file to automatically create Python classes that will produce the desired XML. The second part of the system, on which Tianhang Hou is working, uses the XSD file to automatically set up XML data-base tables in Oracle that will store the XML data na-tively for access (Figure 43-4). Linking the database to the Python classes is the final step in generating the XML. Once this system is in place, we will be able to set up the NIPWG common NTM format, the S-101, and the S-201 XML data.
This system will be the foundation for using the Python classes and a connection to ATONIS to
generate new formats for the Notice to Mariners (NTM). The NIPWG has a common NTM.xml format that is ready for use and exchange. This project will generate this format automatically from the ATONIS database as well. Currently, the PDF version of the NTM is being mapped to the ATONIS database and the NIPWG common NTM format to be able to produce the desired XML files. With input from Lewald, the resulting system will then be presented to the NIPWG in 2021, and will help in identifying the foundation for a possible S-125 Notice to Mari-ner product.
COVID ImpactsThe impact of COVID for this project has been no face-to-face meetings, yet more frequent online video meetings and calls. And not having IT avail-able physically to help solve networking issues has slowed progress.
JHC Performance Report218
CHARTING AND NAVIGATIONCHARTING AND NAVIGATION
TASK 44: Augmented Reality in Electronic Charting and Navigation: Research on how to utilize augmented reality devices in support of enhanced navigation. Expand and modify to provide a range of scenarios (collision avoidance, harbor entry, etc.) using our virtual ship simulator. PIs: Tom Butkiewicz and Vis Lab
Project: Augmented Reality for Marine Navigation
JHC Participants: Tom Butkiewicz, Andrew Stevens, and Colin Ware
Augmented reality (AR) is an emerging technology that superimposes digital information directly on top of a user’s real-world view (Figure 44-1). The Center’s Visualization Lab evaluated first-generation com-mercial AR devices (e.g., Microsoft HoloLens and Magic Leap) and found significant limitations that made them impractical for marine use. However, the Center was able to research the potential of AR for marine navigation by creating a virtual reality-based bridge simulation that permitted experimentation with a wide range of possible AR devices and infor-mation overlays. Through user studies conducted in this simulator, the Center identified future hardware requirements and demonstrated AR’s potential for aiding safe marine navigation. Recently, a number of companies have started developing their own AR marine navigation systems, though most are actually annotated video and not true AR.
The most concerning limitations of current AR hardware are limited field-of-view and brightness. The Visualization Lab’s most recent study focused on the effects of field-of-view (FoV) on AR’s usefulness for marine navigation. It found that while increas-ing FoV was beneficial, the effects were less signifi-cant than expected. The most important benefits provided by AR are keeping mariners’ eyes on the water and eliminating the cognitive load of mak-ing spatial transformations between data on a chart and the real world. These benefits were found to be
significant regardless of the FoV at which they were presented. The full results of the study are available in the paper “Evaluation of the effects of field-of-view in augmented reality for marine navigation,” which was published and presented during this reporting period.
Butkiewicz discussed these findings with engineers from a major defense contractor, who were working on a marine AR system and came to similar conclu-sions, identifying brightness as a more significant concern than FoV. Indeed, the two variables are often inversely proportional, as wider fields-of-view spread a light source out over a larger area. Reflecting their experience with aircraft heads-up-displays, their preferred solution was a monochrome display that sacrifices color for brightness.
Discussions about AR brightness with optical engi-neers from Magic Leap focused on unavoidable limi-tations of the underlying optical waveguide technolo-gy used in many AR devices (including HoloLens and Magic Leap). These waveguides have poor optical efficiency, i.e., while the light sources are extremely bright, relatively little of that light actually ends up en-tering the eyes. Light sources are unlikely to become significantly brighter, due to the power consumption and heat dissipation limitations of head mounted sys-tems, thus it was recommended that the lab instead investigate devices with “birdbath” optics.
Figure 44-1. Simulated augmented reality overlay of nautical chart information.
JHC Performance Report 31 January 2021 219
CHARTING AND NAVIGATIONCHARTING AND NAVIGATION
COVID ImpactsThis project was severely impacted by the COVID-19 pandemic. Our original plans in early 2020 were to get our new AR glasses in Feb/March, then build a working prototype with them that could be demon-strated during the July site visit event. The pandemic shut down the factory, and our order has still not been delivered, with the manufacturer saying there were ongoing COVID related disruptions. We also planned to develop the software for use with the large semi-immersive display and wide-area tracking system in the visualization lab, which we have not had access to since March 2020.
Nreal’s Light AR glasses were identified as the most promising candidate for the Visualization Lab to employ in moving forward with its plans to create a working pro-totype AR navigation system. The Nreal glasses use birdbath optics and claim a brightness almost twice what HoloLens 2 offers (and ~7x the lab’s measurement of the origi-nal HoloLens). The Nreal device offloads the battery and processor to a smartphone clipped to a belt or stored in a pocket. While this adds a potentially annoying wire, it significantly reduces the size, weight, and obtrusiveness of the display, making it resemble a bulky pair of sunglasses. Their cost is also significantly less than HoloLens or Magic Leap devices. A set of Nreal Light glasses and development kit was ordered in February 2020, but COVID-19 shut down their manufac-turing facility; and as of December, we still have not received delivery of our glasses, and are considering alternatives.
While physical delivery of the glass-es is delayed, work on the software has begun using the software devel-opment kit and hardware emulator provided by the manufacturer. The new AR prototype is being de-signed to work both out in the field on our research vessel, as well as in the lab, using the semi-immersive large format tiled display (vis wall) to display imagery from the new bridge simulation de-scribed in the following section (Task 45). In addition to displaying the navigational overlays seen in our previous projects, there is a new focus on precision navigation information. A new feature currently being developed is displaying color lidar point cloud data to reveal the position of bridge pilings, docks, etc., to mariners in limited visibility conditions (e.g., dense fog; Figure 44-2). Annotations can then provide real-time measurements of clearance between the vessel and any objects captured by the lidar survey.
Figure 44-2. (top) Real photo of the Crescent City Connection bridge in New Orleans on a foggy day. (bottom) View of a colored point cloud from a lidar scan of the bridge, which could be displayed in AR to enable “seeing through” the fog.

JHC Performance Report220
CHARTING AND NAVIGATIONCHARTING AND NAVIGATION
Research Requirement 2.C: Visualization and Resource Management
FFO Requirement 2.C: “Improvement in the visualization, presentation, and display of hydrographic and ocean and coastal mapping data, including 4-dimensional high resolution visualization, real-time display of mapping data, and mapping and charting products for marine navigation as well as coastal and ocean resource management and coastal resilience.”
THEME: 2.C.1: General Enhancement of Visualization
TASK 45: Tools for Visualizing Complex Ocean Data: Continue our work producing novel 2D, 3D, and 4D visualization solutions that address the unique needs of coastal and ocean applications. This work will focus on: developing novel visualization and interaction techniques; conducting human factors studies to understand the perceptual issues critical to creating successful visualizations, and; improving existing marine data visualization applications based on these findings. PIs: Colin Ware, Tom Butkiewicz, and Vis Lab
Project: Interactive 4D Flow Visualization
Center Participants: Drew Stevens, Colin Ware, Thomas Butkiewicz
The Visualization Lab has created a new flow visualiza-tion tool incorporating the perceptual research per-formed by the lab during the grant period. This tool uses a combination of techniques that were identified as being perceptually optimal through the lab’s series of “Hairy Slices” experiments. As part of his Ph.D. dissertation, graduate student Andrew Stevens developed this tool by taking his previous proof-of-concept research code and re-implementing it as a more general tool for use within the widely used Unity engine.
Unity supports the creation of cross-platform visualization tools, which can be easily deployed across a wide variety of differ-ent computing and visualization hardware. Unity’s maturity as a product, permissive licensing for non-commercial use, and vibrant user groups make it ideal for implementing tools that can be accessed by the larger research and educational communities. The lab’s interactive flow visualization tools have been created as pack-ages that can easily be imported into anyone’s Unity projects to
explore flow fields and create high-quality visualiza-tion products that incorporate state-of-the-art per-ceptual research.
The flow visualizations start by distributing seeding points within a flow field. A seeding point is a point from which a single element of the flow visualiza-
Figure 45-1. Flow visualization of a swirling pattern within a tidal simulation.
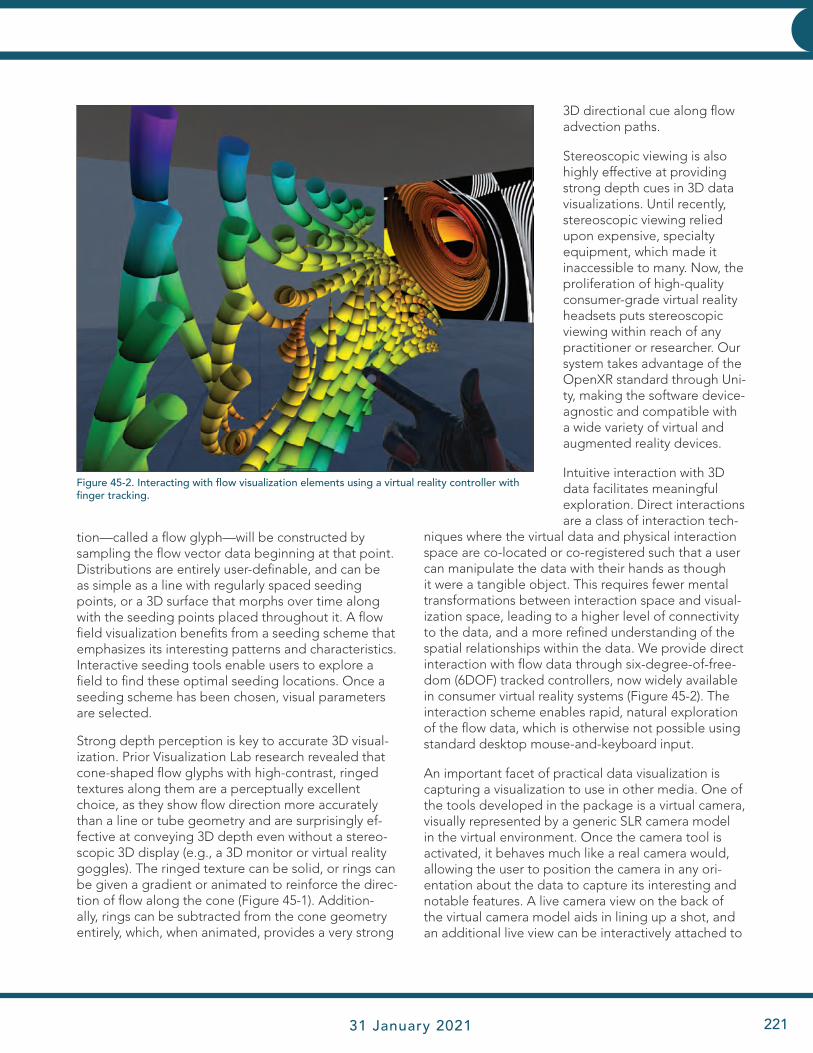
JHC Performance Report 31 January 2021 221
CHARTING AND NAVIGATIONCHARTING AND NAVIGATION
tion—called a flow glyph—will be constructed by sampling the flow vector data beginning at that point. Distributions are entirely user-definable, and can be as simple as a line with regularly spaced seeding points, or a 3D surface that morphs over time along with the seeding points placed throughout it. A flow field visualization benefits from a seeding scheme that emphasizes its interesting patterns and characteristics. Interactive seeding tools enable users to explore a field to find these optimal seeding locations. Once a seeding scheme has been chosen, visual parameters are selected.
Strong depth perception is key to accurate 3D visual-ization. Prior Visualization Lab research revealed that cone-shaped flow glyphs with high-contrast, ringed textures along them are a perceptually excellent choice, as they show flow direction more accurately than a line or tube geometry and are surprisingly ef-fective at conveying 3D depth even without a stereo-scopic 3D display (e.g., a 3D monitor or virtual reality goggles). The ringed texture can be solid, or rings can be given a gradient or animated to reinforce the direc-tion of flow along the cone (Figure 45-1). Addition-ally, rings can be subtracted from the cone geometry entirely, which, when animated, provides a very strong
3D directional cue along flow advection paths.
Stereoscopic viewing is also highly effective at providing strong depth cues in 3D data visualizations. Until recently, stereoscopic viewing relied upon expensive, specialty equipment, which made it inaccessible to many. Now, the proliferation of high-quality consumer-grade virtual reality headsets puts stereoscopic viewing within reach of any practitioner or researcher. Our system takes advantage of the OpenXR standard through Uni-ty, making the software device-agnostic and compatible with a wide variety of virtual and augmented reality devices.
Intuitive interaction with 3D data facilitates meaningful exploration. Direct interactions are a class of interaction tech-
niques where the virtual data and physical interaction space are co-located or co-registered such that a user can manipulate the data with their hands as though it were a tangible object. This requires fewer mental transformations between interaction space and visual-ization space, leading to a higher level of connectivity to the data, and a more refined understanding of the spatial relationships within the data. We provide direct interaction with flow data through six-degree-of-free-dom (6DOF) tracked controllers, now widely available in consumer virtual reality systems (Figure 45-2). The interaction scheme enables rapid, natural exploration of the flow data, which is otherwise not possible using standard desktop mouse-and-keyboard input.
An important facet of practical data visualization is capturing a visualization to use in other media. One of the tools developed in the package is a virtual camera, visually represented by a generic SLR camera model in the virtual environment. Once the camera tool is activated, it behaves much like a real camera would, allowing the user to position the camera in any ori-entation about the data to capture its interesting and notable features. A live camera view on the back of the virtual camera model aids in lining up a shot, and an additional live view can be interactively attached to
Figure 45-2. Interacting with flow visualization elements using a virtual reality controller with finger tracking.

JHC Performance Report222
CHARTING AND NAVIGATIONCHARTING AND NAVIGATION
a controller or placed within the virtual environment for a better view of the snapshot to be saved. The snapshot camera can be set to only capture visual elements from the flow visualization, i.e., excluding the virtual environment and/or the user from snap-shots. When the user is satisfied with the visualization and camera settings, the user can capture and store the high-resolution image or video sequence on their computer, or they can save the entire virtual environ-ment and visualization state to be recalled later.
These tools support an intuitive and powerful inter-active flow visualization system that combines practi-cal use with perceptual best practices. The system is easy enough for the average researcher to use, but robust in its ability to create compelling, superior flow visualizations backed by perceptual research. The Visualization Lab intends to make the system freely available on the Center’s website, so that others can utilize it within their own Unity projects or use it to explore their flow datasets.
COVID ImpactsNo impact other than not being able to test and share with others in the lab for feedback.
Project: Bathymetry Tools for Unity
Center Participants: Kindrat Beregovyi, Thomas Butkiewicz
The Visualization Lab has been increasingly using the Unity engine for various 3D visualization projects in-stead of coding applications from scratch. Unity pres-ents three major benefits for our research and devel-opment: First, it provides access to a vast repository of built-in and third-party implementations of com-monly required computer graphics and interaction algorithms/techniques that can be time-consuming to implement (e.g., lighting calculations and physics sim-ulation). This lets us focus on experimenting with new ideas, instead of wasting time reinventing the wheel. Secondly, it is cross-platform and device-agnostic, which means we can easily build our applications for use with a wide variety of systems and hardware devices (e.g., VR and AR headsets). Previously, many of our research projects were hard-coded to work with specific display or interaction hardware, and this significantly limited their adoptability outside the lab. Finally, the tools and assets we develop within Unity are highly modular: once created, they can easily be dropped into our other projects, or shared with the public and outside researchers.
Owing to its roots as a game engine, Unity pro-vides a terrain package, which can efficiently render large swaths of land using optimized GPU-based code and a view-dependent level-of-detail system. However, the terrain package was never intended for actual geospatial usage. It only supports load-ing raw, grayscale-image height maps, and provides no georeferencing features. This was a significant impediment to progress in our Virtual Mississippi and ROV telepresence/mission playback projects (see below). Bathymetry files had to be manually cropped and converted to grayscale images by a GIS expert, and then manipulated in Adobe Photoshop to get a raw file that could be imported into Unity, geospatial coordinates then had to be manually converted and entered to position the terrain objects.
To address these shortcomings, a Unity plugin was created to streamline the entire process of loading and visualizing bathymetry files in Unity. Importing the plugin package adds a new menu bar to the Unity editor interface, which opens the tool. The tool uses GDAL (Geospatial Data Abstraction Library) to load bathymetry files in the standardized BAG (Bathymet-ric Attributed Grid) format developed by the Center and the Open Navigation Surface group. This makes it possible to download bathymetric survey data from sources such as NOAA’s NCEI Bathymetric Data Viewer, and directly import it into Unity without using expensive hydrographic software to perform interme-diate conversions (Figure 45-3).
Once a BAG file is loaded in the tool, it presents the user with a visual preview of the spatial extent of the data, and details regarding the type, size, and resolu-tion of the data. Because Unity’s terrain package uses GPU textures to store terrain heights, it requires data be imported in square chunks with power-of-two sizes. The tool allows users to choose a final power-of-two size (as appropriate for the GPU resources available) and whether to load either the entire da-taset (interpolated down to the desired resolution if necessary) or to select a subset to load at full resolu-tion. The tool then generates a Unity terrain object containing the desired data.
The tool supports loading the newer, variable-res-olution BAG files. These previously proved to be a significant challenge to work, as many software pack-ages do not properly support this format properly. (Many we tried only loaded the 1024x1024 supergrid, but not the higher-resolution subcells.) GDAL sup-
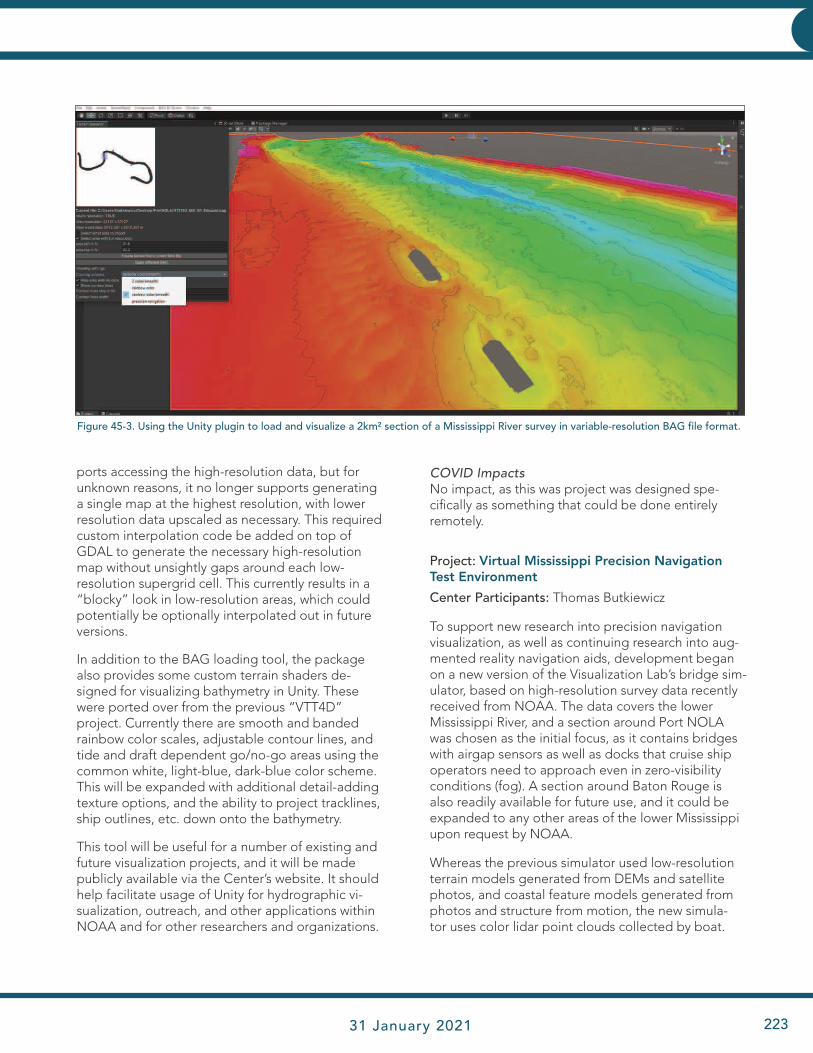
JHC Performance Report 31 January 2021 223
CHARTING AND NAVIGATIONCHARTING AND NAVIGATION
ports accessing the high-resolution data, but for unknown reasons, it no longer supports generating a single map at the highest resolution, with lower resolution data upscaled as necessary. This required custom interpolation code be added on top of GDAL to generate the necessary high-resolution map without unsightly gaps around each low-resolution supergrid cell. This currently results in a “blocky” look in low-resolution areas, which could potentially be optionally interpolated out in future versions.
In addition to the BAG loading tool, the package also provides some custom terrain shaders de-signed for visualizing bathymetry in Unity. These were ported over from the previous “VTT4D” project. Currently there are smooth and banded rainbow color scales, adjustable contour lines, and tide and draft dependent go/no-go areas using the common white, light-blue, dark-blue color scheme. This will be expanded with additional detail-adding texture options, and the ability to project tracklines, ship outlines, etc. down onto the bathymetry.
This tool will be useful for a number of existing and future visualization projects, and it will be made publicly available via the Center’s website. It should help facilitate usage of Unity for hydrographic vi-sualization, outreach, and other applications within NOAA and for other researchers and organizations.
COVID ImpactsNo impact, as this was project was designed spe-cifically as something that could be done entirely remotely.
Project: Virtual Mississippi Precision Navigation Test Environment
Center Participants: Thomas Butkiewicz
To support new research into precision navigation visualization, as well as continuing research into aug-mented reality navigation aids, development began on a new version of the Visualization Lab’s bridge sim-ulator, based on high-resolution survey data recently received from NOAA. The data covers the lower Mississippi River, and a section around Port NOLA was chosen as the initial focus, as it contains bridges with airgap sensors as well as docks that cruise ship operators need to approach even in zero-visibility conditions (fog). A section around Baton Rouge is also readily available for future use, and it could be expanded to any other areas of the lower Mississippi upon request by NOAA.
Whereas the previous simulator used low-resolution terrain models generated from DEMs and satellite photos, and coastal feature models generated from photos and structure from motion, the new simula-tor uses color lidar point clouds collected by boat.
Figure 45-3. Using the Unity plugin to load and visualize a 2km² section of a Mississippi River survey in variable-resolution BAG file format.
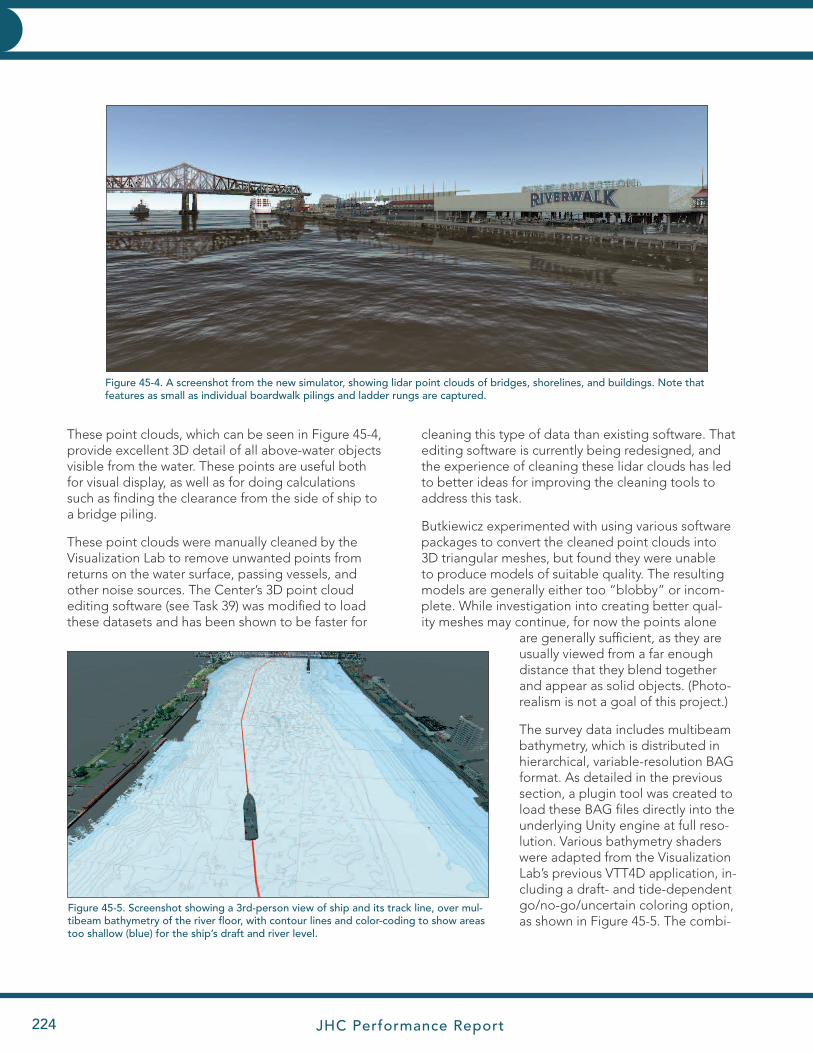
JHC Performance Report224
CHARTING AND NAVIGATIONCHARTING AND NAVIGATION
These point clouds, which can be seen in Figure 45-4, provide excellent 3D detail of all above-water objects visible from the water. These points are useful both for visual display, as well as for doing calculations such as finding the clearance from the side of ship to a bridge piling.
These point clouds were manually cleaned by the Visualization Lab to remove unwanted points from returns on the water surface, passing vessels, and other noise sources. The Center’s 3D point cloud editing software (see Task 39) was modified to load these datasets and has been shown to be faster for
cleaning this type of data than existing software. That editing software is currently being redesigned, and the experience of cleaning these lidar clouds has led to better ideas for improving the cleaning tools to address this task.
Butkiewicz experimented with using various software packages to convert the cleaned point clouds into 3D triangular meshes, but found they were unable to produce models of suitable quality. The resulting models are generally either too “blobby” or incom-plete. While investigation into creating better qual-ity meshes may continue, for now the points alone
are generally sufficient, as they are usually viewed from a far enough distance that they blend together and appear as solid objects. (Photo-realism is not a goal of this project.)
The survey data includes multibeam bathymetry, which is distributed in hierarchical, variable-resolution BAG format. As detailed in the previous section, a plugin tool was created to load these BAG files directly into the underlying Unity engine at full reso-lution. Various bathymetry shaders were adapted from the Visualization Lab’s previous VTT4D application, in-cluding a draft- and tide-dependent go/no-go/uncertain coloring option, as shown in Figure 45-5. The combi-
Figure 45-4. A screenshot from the new simulator, showing lidar point clouds of bridges, shorelines, and buildings. Note that features as small as individual boardwalk pilings and ladder rungs are captured.
Figure 45-5. Screenshot showing a 3rd-person view of ship and its track line, over mul-tibeam bathymetry of the river floor, with contour lines and color-coding to show areas too shallow (blue) for the ship’s draft and river level.

JHC Performance Report 31 January 2021 225
CHARTING AND NAVIGATIONCHARTING AND NAVIGATION
nation of lidar point clouds and multibeam bathymetry provides an almost seamless transition between bathymetry, shoreline, and above-water objects.
The simulator connects to NO-AA’s PORTS network and pulls the real-time water level mea-surement from the air gap sen-sor located on the Crescent City Connection bridge. This mea-surement can be displayed at its reference location (as shown in Figure 45-6), and is used to set the water level in the simulator. Once the water level is set rela-tive to the bathymetry and point clouds, all vessels in the simula-tor have their height set based on their specified draft values. The system can then display the real-time clearance between the top or sides of a vessel and the bridge spans above or bridge pilings nearby, as shown in Figure 45-6.
Because lidar data consists of large numbers of points, searching for closest points to ship sides/masts can be com-putationally intensive. A spatial index data structure (R-Tree) is able to make clearance calculations more efficient. A unique approach is also being investigated: the point cloud is filtered by height, and remain-ing points are projected onto a 2D grid. Then image processing algorithms find the boundaries between unobstructed open water and shorelines/ obstacles. These boundary lines can then be simpli-fied through vertex contraction, using a permission grid to ensure all obstacle points remain on the outside of boundary lines. These boundary lines can then be extruded vertically into planes. Thus, a point cloud of a shoreline could be reduced from millions of points to a few hundred planes. The resulting point-to-plane distance calculations would be very fast, and the planes themselves could potentially
have other uses (e.g., shoreline visualization, input for autonomous vehicle navigation).
By using multiple virtual cameras with different view-points and projection settings, visualizations can be generated which present navigational scenarios in different ways. For example, as shown in Figure 45-7, an orthographic camera (as opposed to perspective) can follow the vessel, providing a simplified view of clearances to the sides and above. These supple-
Figure 45-6. Real-time clearance annotations between a 3D model of NOAA’s Ronald H. Brown and the Crescent City Connection bridge, based on live data pulled from the PORTS air gap sensor located on the bridge.
Figure 45-7. Orthographic camera view of a planned transit under a bridge, showing clear-ances to bridge span and piling.
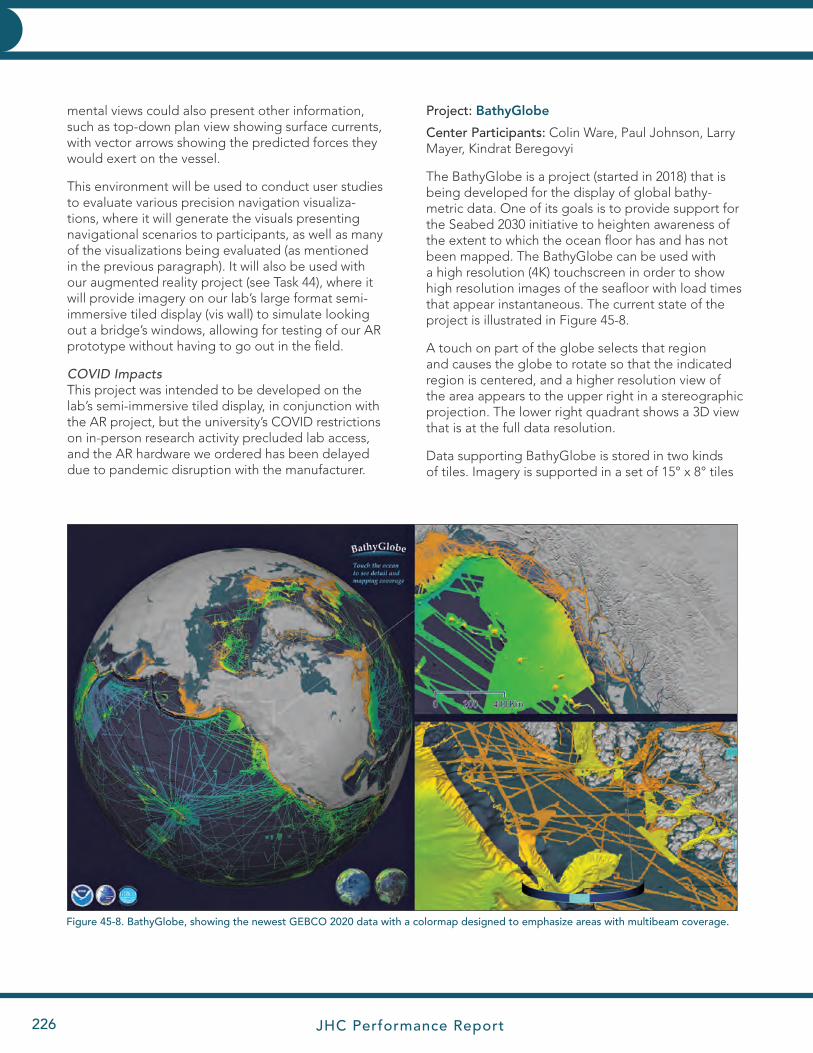
JHC Performance Report226
CHARTING AND NAVIGATIONCHARTING AND NAVIGATION
Figure 45-8. BathyGlobe, showing the newest GEBCO 2020 data with a colormap designed to emphasize areas with multibeam coverage.
mental views could also present other information, such as top-down plan view showing surface currents, with vector arrows showing the predicted forces they would exert on the vessel.
This environment will be used to conduct user studies to evaluate various precision navigation visualiza-tions, where it will generate the visuals presenting navigational scenarios to participants, as well as many of the visualizations being evaluated (as mentioned in the previous paragraph). It will also be used with our augmented reality project (see Task 44), where it will provide imagery on our lab’s large format semi-immersive tiled display (vis wall) to simulate looking out a bridge’s windows, allowing for testing of our AR prototype without having to go out in the field.
COVID ImpactsThis project was intended to be developed on the lab’s semi-immersive tiled display, in conjunction with the AR project, but the university’s COVID restrictions on in-person research activity precluded lab access, and the AR hardware we ordered has been delayed due to pandemic disruption with the manufacturer.
Project: BathyGlobe
Center Participants: Colin Ware, Paul Johnson, Larry Mayer, Kindrat Beregovyi
The BathyGlobe is a project (started in 2018) that is being developed for the display of global bathy- metric data. One of its goals is to provide support for the Seabed 2030 initiative to heighten awareness of the extent to which the ocean floor has and has not been mapped. The BathyGlobe can be used with a high resolution (4K) touchscreen in order to show high resolution images of the seafloor with load times that appear instantaneous. The current state of the project is illustrated in Figure 45-8.
A touch on part of the globe selects that region and causes the globe to rotate so that the indicated region is centered, and a higher resolution view of the area appears to the upper right in a stereographic projection. The lower right quadrant shows a 3D view that is at the full data resolution.
Data supporting BathyGlobe is stored in two kinds of tiles. Imagery is supported in a set of 15° x 8° tiles
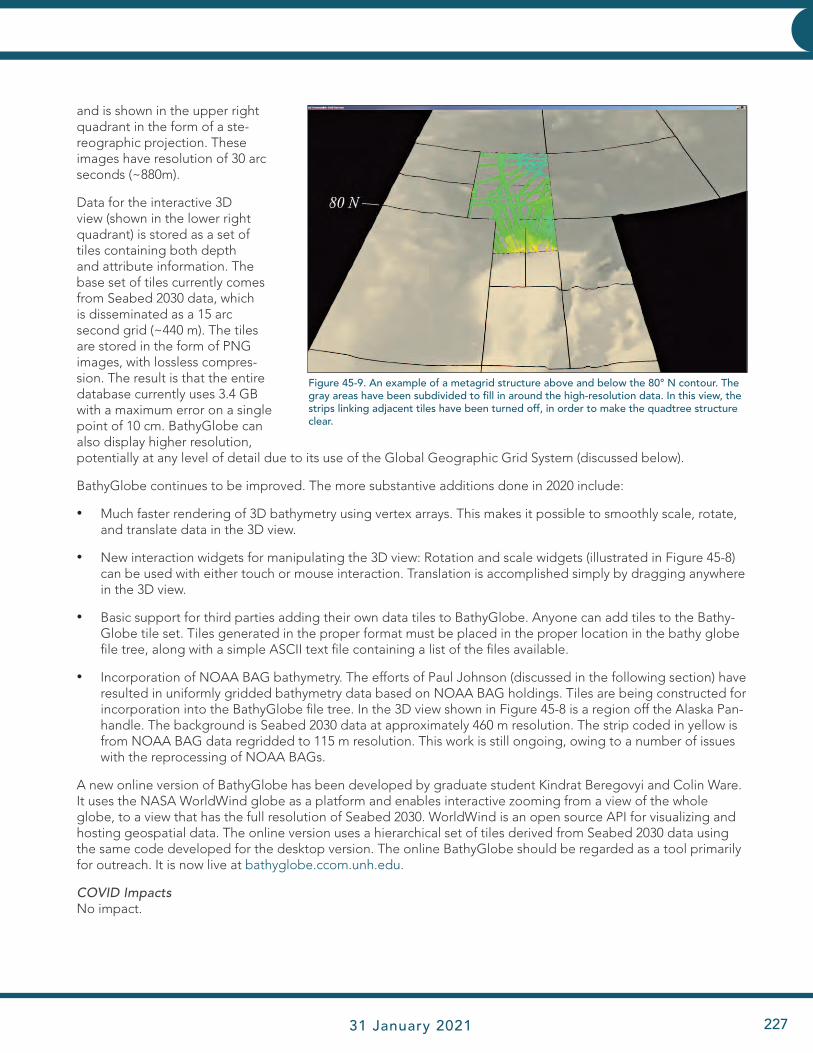
JHC Performance Report 31 January 2021 227
CHARTING AND NAVIGATIONCHARTING AND NAVIGATION
and is shown in the upper right quadrant in the form of a ste-reographic projection. These images have resolution of 30 arc seconds (~880m).
Data for the interactive 3D view (shown in the lower right quadrant) is stored as a set of tiles containing both depth and attribute information. The base set of tiles currently comes from Seabed 2030 data, which is disseminated as a 15 arc second grid (~440 m). The tiles are stored in the form of PNG images, with lossless compres-sion. The result is that the entire database currently uses 3.4 GB with a maximum error on a single point of 10 cm. BathyGlobe can also display higher resolution, potentially at any level of detail due to its use of the Global Geographic Grid System (discussed below).
BathyGlobe continues to be improved. The more substantive additions done in 2020 include:
• Much faster rendering of 3D bathymetry using vertex arrays. This makes it possible to smoothly scale, rotate, and translate data in the 3D view.
• New interaction widgets for manipulating the 3D view: Rotation and scale widgets (illustrated in Figure 45-8) can be used with either touch or mouse interaction. Translation is accomplished simply by dragging anywhere in the 3D view.
• Basic support for third parties adding their own data tiles to BathyGlobe. Anyone can add tiles to the Bathy-Globe tile set. Tiles generated in the proper format must be placed in the proper location in the bathy globe file tree, along with a simple ASCII text file containing a list of the files available.
• Incorporation of NOAA BAG bathymetry. The efforts of Paul Johnson (discussed in the following section) have resulted in uniformly gridded bathymetry data based on NOAA BAG holdings. Tiles are being constructed for incorporation into the BathyGlobe file tree. In the 3D view shown in Figure 45-8 is a region off the Alaska Pan-handle. The background is Seabed 2030 data at approximately 460 m resolution. The strip coded in yellow is from NOAA BAG data regridded to 115 m resolution. This work is still ongoing, owing to a number of issues with the reprocessing of NOAA BAGs.
A new online version of BathyGlobe has been developed by graduate student Kindrat Beregovyi and Colin Ware. It uses the NASA WorldWind globe as a platform and enables interactive zooming from a view of the whole globe, to a view that has the full resolution of Seabed 2030. WorldWind is an open source API for visualizing and hosting geospatial data. The online version uses a hierarchical set of tiles derived from Seabed 2030 data using the same code developed for the desktop version. The online BathyGlobe should be regarded as a tool primarily for outreach. It is now live at bathyglobe.ccom.unh.edu.
COVID ImpactsNo impact.
Figure 45-9. An example of a metagrid structure above and below the 80° N contour. The gray areas have been subdivided to fill in around the high-resolution data. In this view, the strips linking adjacent tiles have been turned off, in order to make the quadtree structure clear.
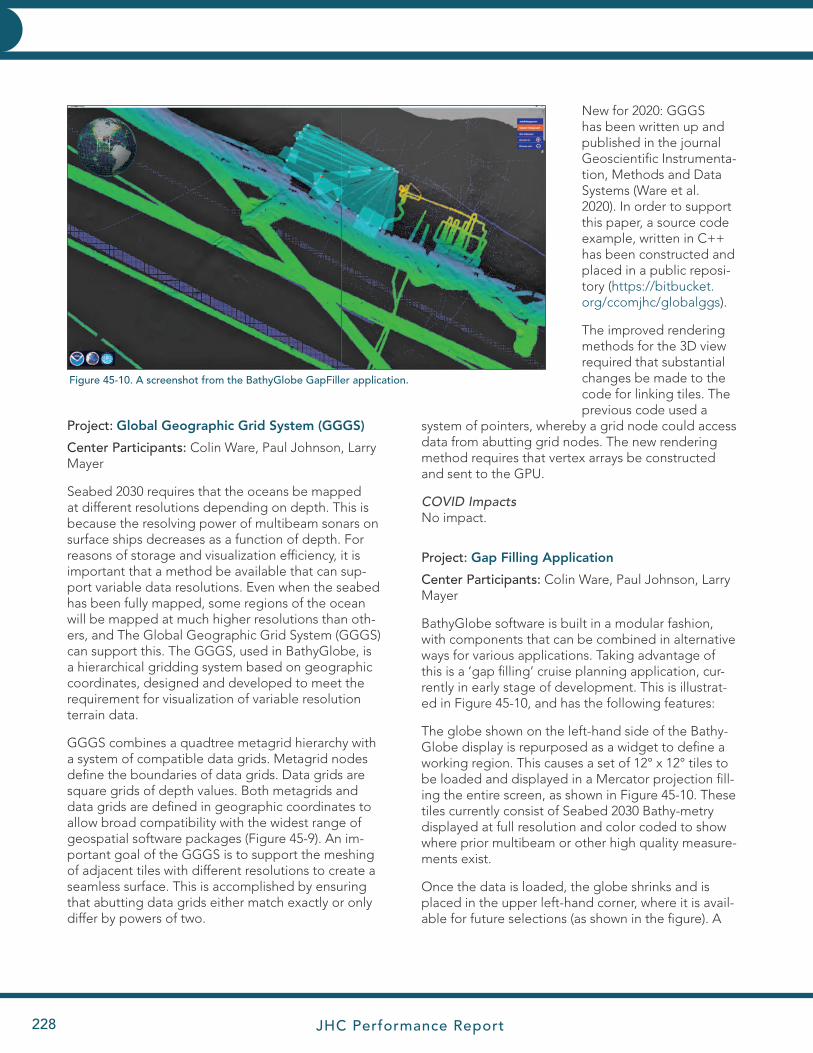
JHC Performance Report228
CHARTING AND NAVIGATIONCHARTING AND NAVIGATION
Project: Global Geographic Grid System (GGGS)
Center Participants: Colin Ware, Paul Johnson, Larry Mayer
Seabed 2030 requires that the oceans be mapped at different resolutions depending on depth. This is because the resolving power of multibeam sonars on surface ships decreases as a function of depth. For reasons of storage and visualization efficiency, it is important that a method be available that can sup-port variable data resolutions. Even when the seabed has been fully mapped, some regions of the ocean will be mapped at much higher resolutions than oth-ers, and The Global Geographic Grid System (GGGS) can support this. The GGGS, used in BathyGlobe, is a hierarchical gridding system based on geographic coordinates, designed and developed to meet the requirement for visualization of variable resolution terrain data.
GGGS combines a quadtree metagrid hierarchy with a system of compatible data grids. Metagrid nodes define the boundaries of data grids. Data grids are square grids of depth values. Both metagrids and data grids are defined in geographic coordinates to allow broad compatibility with the widest range of geospatial software packages (Figure 45-9). An im-portant goal of the GGGS is to support the meshing of adjacent tiles with different resolutions to create a seamless surface. This is accomplished by ensuring that abutting data grids either match exactly or only differ by powers of two.
New for 2020: GGGS has been written up and published in the journal Geoscientific Instrumenta-tion, Methods and Data Systems (Ware et al. 2020). In order to support this paper, a source code example, written in C++ has been constructed and placed in a public reposi-tory (https://bitbucket.org/ccomjhc/globalggs).
The improved rendering methods for the 3D view required that substantial changes be made to the code for linking tiles. The previous code used a
system of pointers, whereby a grid node could access data from abutting grid nodes. The new rendering method requires that vertex arrays be constructed and sent to the GPU.
COVID ImpactsNo impact.
Project: Gap Filling Application
Center Participants: Colin Ware, Paul Johnson, Larry Mayer
BathyGlobe software is built in a modular fashion, with components that can be combined in alternative ways for various applications. Taking advantage of this is a ‘gap filling’ cruise planning application, cur-rently in early stage of development. This is illustrat-ed in Figure 45-10, and has the following features:
The globe shown on the left-hand side of the Bathy-Globe display is repurposed as a widget to define a working region. This causes a set of 12° x 12° tiles to be loaded and displayed in a Mercator projection fill-ing the entire screen, as shown in Figure 45-10. These tiles currently consist of Seabed 2030 Bathy-metry displayed at full resolution and color coded to show where prior multibeam or other high quality measure-ments exist.
Once the data is loaded, the globe shrinks and is placed in the upper left-hand corner, where it is avail-able for future selections (as shown in the figure). A
Figure 45-10. A screenshot from the BathyGlobe GapFiller application.
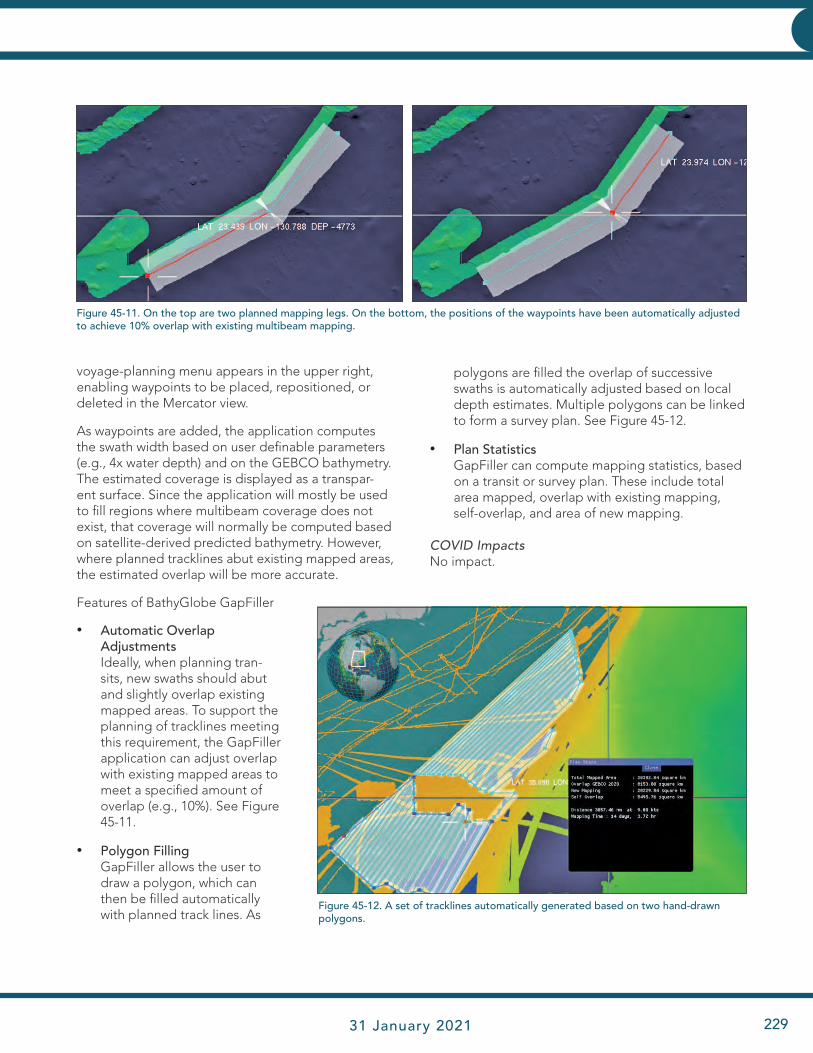
JHC Performance Report 31 January 2021 229
CHARTING AND NAVIGATIONCHARTING AND NAVIGATION
Figure 45-11. On the top are two planned mapping legs. On the bottom, the positions of the waypoints have been automatically adjusted to achieve 10% overlap with existing multibeam mapping.
voyage-planning menu appears in the upper right, enabling waypoints to be placed, repositioned, or deleted in the Mercator view.
As waypoints are added, the application computes the swath width based on user definable parameters (e.g., 4x water depth) and on the GEBCO bathymetry. The estimated coverage is displayed as a transpar-ent surface. Since the application will mostly be used to fill regions where multibeam coverage does not exist, that coverage will normally be computed based on satellite-derived predicted bathymetry. However, where planned tracklines abut existing mapped areas, the estimated overlap will be more accurate.
Features of BathyGlobe GapFiller
• Automatic Overlap Adjustments Ideally, when planning tran-sits, new swaths should abut and slightly overlap existing mapped areas. To support the planning of tracklines meeting this requirement, the GapFiller application can adjust overlap with existing mapped areas to meet a specified amount of overlap (e.g., 10%). See Figure 45-11.
• Polygon Filling GapFiller allows the user to draw a polygon, which can then be filled automatically with planned track lines. As
polygons are filled the overlap of successive swaths is automatically adjusted based on local depth estimates. Multiple polygons can be linked to form a survey plan. See Figure 45-12.
• Plan Statistics GapFiller can compute mapping statistics, based on a transit or survey plan. These include total area mapped, overlap with existing mapping, self-overlap, and area of new mapping.
COVID ImpactsNo impact.
Figure 45-12. A set of tracklines automatically generated based on two hand-drawn polygons.

JHC Performance Report230
EXPLORE AND MAPEXPLORE AND MAP
Programmatic Priority 3: Explore and Map the Continental Shelf
Recognition that the implementation of the United Nations Convention on the Law of the Sea (UN-CLOS) Article 76 could confer sovereign rights to resources over large areas of the seabed beyond the current U.S. 200 nautical mile (nmi) Exclusive Eco-nomic Zone (EEZ) focused interest in the potential for U.S. accession to the Law of the Sea Treaty. In this context, Congress, through NOAA, funded the Center to evaluate the content and completeness of the nation’s existing bathymetric and geophysical data holdings in areas surrounding the nation’s EEZ
with an emphasis on determining the usefulness of existing data to substantiate the extension of sov-ereign rights over the resource of the seafloor and subsurface beyond the present 200 nmi EEZ limit into the UNCLOS-defined Extended Continental Shelf (ECS). This report was submitted to Congress on 31 May 2002.
Following up on the recommendations made in the above report, the Center was funded (through NOAA) to collect new multibeam sonar (MBES) data
Research Requirement 3.A: Extended Continental Shelf
FFO Requirement 3.A: “Advancements in planning, acquisition, understanding, and interpretation of con-tinental shelf, slope, and rise seafloor mapping data, particularly for the purpose of delimiting the U.S. Extended Continental Shelf.”
TASK 47: Lead in Planning, Acquiring and Processing ECS Bathymetric Data: Maintain role as lead in the planning, acquisition, and interpretation of ECS bathymetric and backscatter data, applying advances in acoustic system calibration and operational “best practices” developed in support of other Program Priorities to improve the quality of data collected on the continental shelf, slope, and rise, with particular regard for the Center’s involvement in ocean exploration campaigns aboard the NOAA Ship Okeanos Explorer (both at sea and via telepresence) and other ECS mapping projects. PIs: Jim Gardner and Larry Mayer
Project: Planning and Acquiring ECS Data
JHC Participants: Jim Gardner, Larry Mayer, Brian Calder, and Paul Johnson
NOAA Collaborators: Andy Armstrong (OCS), Margot Bohan (OER), and Meridith Westington (NOS)
Figure 47-1. Locations of ECS multibeam sonar surveys conducted by the Center.
JHC Performance Report 31 January 2021 231
EXPLORE AND MAPEXPLORE AND MAP
TASK 48: Extended Continental Shelf Task Force: Continue to play an active role in ECS Taskforce activities, as well as to work on the analysis and documentation needed to delineate the U.S. Extended Continental Shelf and continue to publish geologic and morphologic interpretations of the mapped regions in the peer-reviewed scientific literature. PIs: Jim Gardner, Larry Mayer, and David Mosher
Project: 2020 ECS Meetings, Manuscripts, and Analyses
JHC Participants: Jim Gardner, Larry Mayer, David Mosher, Paul Johnson, and Brian Calder
NOAA Collaborators: Andy Armstrong (OCS), Margot Bohan (OER), Elliot Lim and Jennifer Jencks (NCEI), and Meredith Westington, (NOS)
Other Participants: Brian van Pay and Kevin Baumert (U.S. State Department)
Numerous ECS conference calls, videoconferences, and meetings occurred throughout the year. Monthly ECS Working Group conference calls were scheduled to review overall ECS progress, supported by unscheduled phone calls and videoconferences to discuss specific regional details. COVID restrictions curtailed any of the in-person meetings but several key virtual meetings were held this year including the annual review of U.S. submis-sions with former and current CLCS commissioners (in early June) and critical meetings with our Russian counter-parts discussing potential revisions to their submission (in September). These meetings were attended by Mayer and Armstrong.
Review of ECS Project Office Documents
Mayer, Armstrong, and Gardner spent much time reviewing draft U.S. submissions for the Mariana Island, Eastern Gulf of Mexico, Mendocino, Bering Sea and Atlantic regions written by the ECS Project Office. Feedback was provided on each of these documents to the Project Office.
Manuscript Writing
The team has published or submitted several papers this year either directly about Law of the Sea issues or using data sets collected in support of our ECS mapping efforts. These papers include:
Gardner, J.V., Peakall, J, Armstrong, A., and Calder B.R., 2020, The Geomorphology of Submarine channel sys-tems of the northern Line Islands Ridge, central equatorial Pacific Ocean, Frontiers in Earth Science, doi: 10.3389/feart.2020.0008).
in support of a potential ECS claim under UNCLOS Article 76. Mapping efforts started in 2003 and since then the Center has collected more than 3.1 million square kilometers of new high-resolution multibeam sonar data on 35 dedicated cruises that include nine in the Arctic, five in the Atlantic, one in the Gulf of Mexico, one in the Bering Sea, three in the Gulf of Alaska, three in the Necker Ridge area off Hawaii, three off Kingman Reef and Palmyra Atoll in the central Pacific, five in the Marianas region of the western Pacific and two on Mendocino Fracture Zone in the eastern Pacific (Figure 47-1). Summaries of each of these cruises can be found in previous annual reports and detailed descriptions and access to the data and derivative products can be found at www.ccom.unh.edu/law_of_the_sea. The raw data and derived grids are archived at NOAA’s National Center for Environmental Information (NCEI) in Boulder, CO and other public repositories within
months of data collection and provide a wealth of information for scientific studies for years to come.
2020 Law of the Sea Extended Continental Shelf Activities
Dr. James Gardner reduced his time to 50% as he approaches full retirement at the end of Decem-ber 2020, ending a 50+ year career in marine geology. His ECS activities for 2020 focused on: re-viewing documents generated by the ECS Project Office; completing two peer-reviewed manuscripts and drafting a new manuscript on data collected by the Center in the U.S. ECS; updating and revi-sion of the Center’s Law of the Sea website; and supporting the ECS Program Office through re-quests and conference calls. No ECS cruises were run during 2020 and none are envisioned for the immediate future.
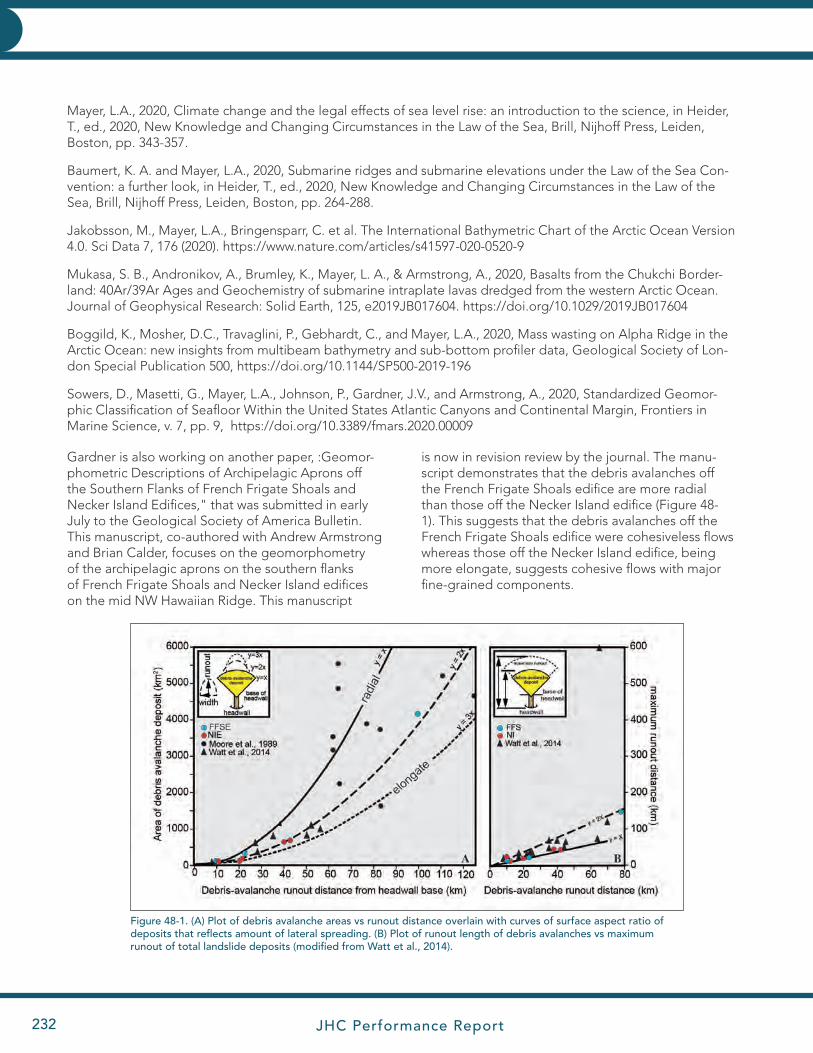
JHC Performance Report232
EXPLORE AND MAPEXPLORE AND MAP
Mayer, L.A., 2020, Climate change and the legal effects of sea level rise: an introduction to the science, in Heider, T., ed., 2020, New Knowledge and Changing Circumstances in the Law of the Sea, Brill, Nijhoff Press, Leiden, Boston, pp. 343-357.
Baumert, K. A. and Mayer, L.A., 2020, Submarine ridges and submarine elevations under the Law of the Sea Con-vention: a further look, in Heider, T., ed., 2020, New Knowledge and Changing Circumstances in the Law of the Sea, Brill, Nijhoff Press, Leiden, Boston, pp. 264-288.
Jakobsson, M., Mayer, L.A., Bringensparr, C. et al. The International Bathymetric Chart of the Arctic Ocean Version 4.0. Sci Data 7, 176 (2020). https://www.nature.com/articles/s41597-020-0520-9
Mukasa, S. B., Andronikov, A., Brumley, K., Mayer, L. A., & Armstrong, A., 2020, Basalts from the Chukchi Border-land: 40Ar/39Ar Ages and Geochemistry of submarine intraplate lavas dredged from the western Arctic Ocean. Journal of Geophysical Research: Solid Earth, 125, e2019JB017604. https://doi.org/10.1029/2019JB017604
Boggild, K., Mosher, D.C., Travaglini, P., Gebhardt, C., and Mayer, L.A., 2020, Mass wasting on Alpha Ridge in the Arctic Ocean: new insights from multibeam bathymetry and sub-bottom profiler data, Geological Society of Lon-don Special Publication 500, https://doi.org/10.1144/SP500-2019-196
Sowers, D., Masetti, G., Mayer, L.A., Johnson, P., Gardner, J.V., and Armstrong, A., 2020, Standardized Geomor-phic Classification of Seafloor Within the United States Atlantic Canyons and Continental Margin, Frontiers in Marine Science, v. 7, pp. 9, https://doi.org/10.3389/fmars.2020.00009
Gardner is also working on another paper, :Geomor-phometric Descriptions of Archipelagic Aprons off the Southern Flanks of French Frigate Shoals and Necker Island Edifices," that was submitted in early July to the Geological Society of America Bulletin. This manuscript, co-authored with Andrew Armstrong and Brian Calder, focuses on the geomorphometry of the archipelagic aprons on the southern flanks of French Frigate Shoals and Necker Island edifices on the mid NW Hawaiian Ridge. This manuscript
Figure 48-1. (A) Plot of debris avalanche areas vs runout distance overlain with curves of surface aspect ratio of deposits that reflects amount of lateral spreading. (B) Plot of runout length of debris avalanches vs maximum runout of total landslide deposits (modified from Watt et al., 2014).
is now in revision review by the journal. The manu-script demonstrates that the debris avalanches off the French Frigate Shoals edifice are more radial than those off the Necker Island edifice (Figure 48-1). This suggests that the debris avalanches off the French Frigate Shoals edifice were cohesiveless flows whereas those off the Necker Island edifice, being more elongate, suggests cohesive flows with major fine-grained components.
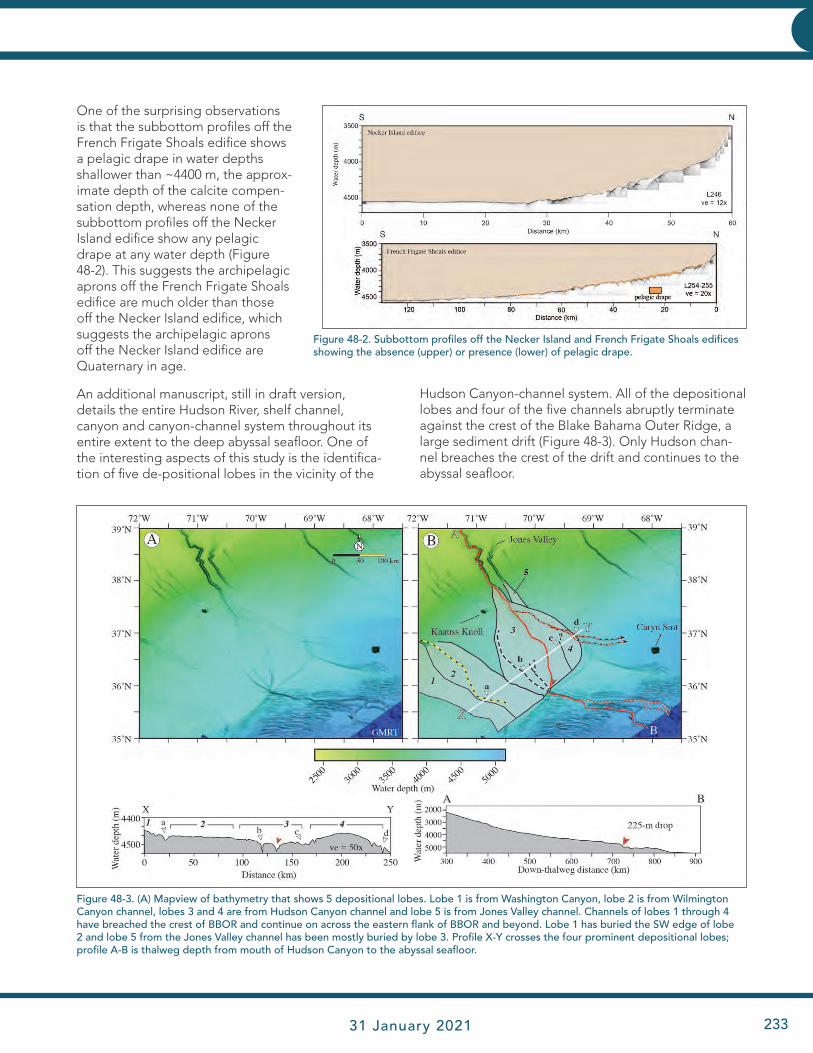
JHC Performance Report 31 January 2021 233
EXPLORE AND MAPEXPLORE AND MAP
One of the surprising observations is that the subbottom profiles off the French Frigate Shoals edifice shows a pelagic drape in water depths shallower than ~4400 m, the approx-imate depth of the calcite compen-sation depth, whereas none of the subbottom profiles off the Necker Island edifice show any pelagic drape at any water depth (Figure 48-2). This suggests the archipelagic aprons off the French Frigate Shoals edifice are much older than those off the Necker Island edifice, which suggests the archipelagic aprons off the Necker Island edifice are Quaternary in age.
An additional manuscript, still in draft version, details the entire Hudson River, shelf channel, canyon and canyon-channel system throughout its entire extent to the deep abyssal seafloor. One of the interesting aspects of this study is the identifica-tion of five de-positional lobes in the vicinity of the
Hudson Canyon-channel system. All of the depositional lobes and four of the five channels abruptly terminate against the crest of the Blake Bahama Outer Ridge, a large sediment drift (Figure 48-3). Only Hudson chan-nel breaches the crest of the drift and continues to the abyssal seafloor.
Figure 48-2. Subbottom profiles off the Necker Island and French Frigate Shoals edifices showing the absence (upper) or presence (lower) of pelagic drape.
Figure 48-3. (A) Mapview of bathymetry that shows 5 depositional lobes. Lobe 1 is from Washington Canyon, lobe 2 is from Wilmington Canyon channel, lobes 3 and 4 are from Hudson Canyon channel and lobe 5 is from Jones Valley channel. Channels of lobes 1 through 4 have breached the crest of BBOR and continue on across the eastern flank of BBOR and beyond. Lobe 1 has buried the SW edge of lobe 2 and lobe 5 from the Jones Valley channel has been mostly buried by lobe 3. Profile X-Y crosses the four prominent depositional lobes; profile A-B is thalweg depth from mouth of Hudson Canyon to the abyssal seafloor.
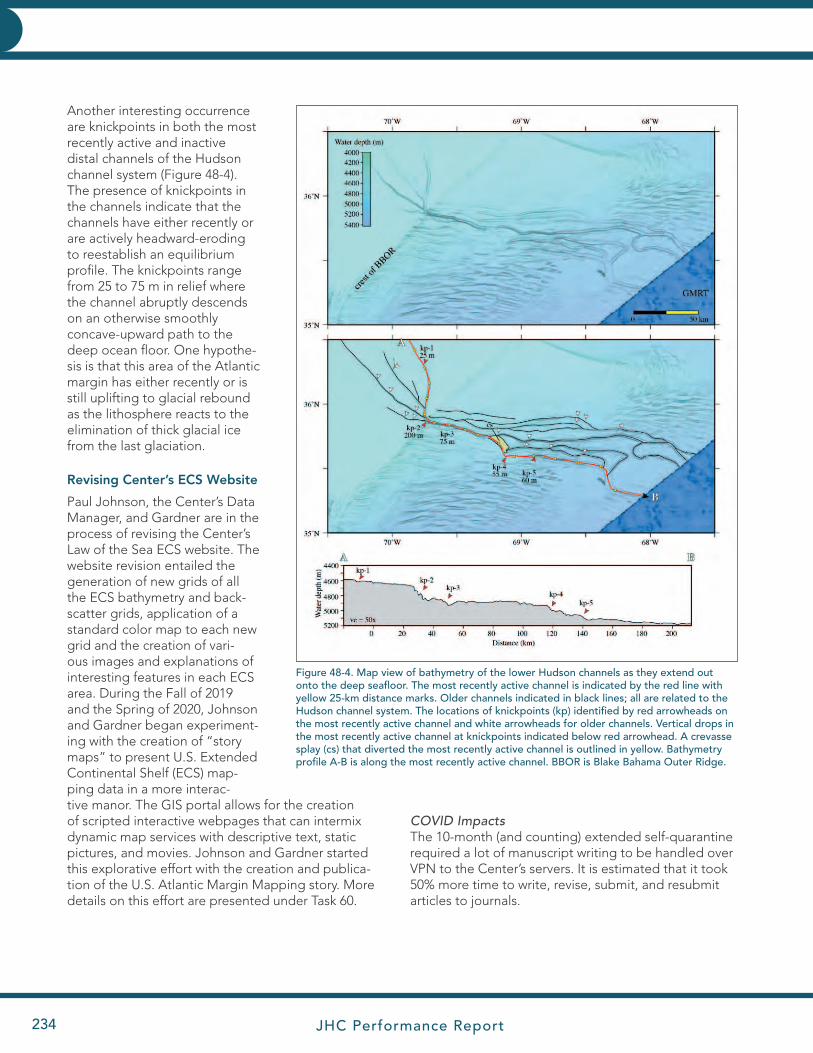
JHC Performance Report234
EXPLORE AND MAPEXPLORE AND MAP
Another interesting occurrence are knickpoints in both the most recently active and inactive distal channels of the Hudson channel system (Figure 48-4). The presence of knickpoints in the channels indicate that the channels have either recently or are actively headward-eroding to reestablish an equilibrium profile. The knickpoints range from 25 to 75 m in relief where the channel abruptly descends on an otherwise smoothly concave-upward path to the deep ocean floor. One hypothe-sis is that this area of the Atlantic margin has either recently or is still uplifting to glacial rebound as the lithosphere reacts to the elimination of thick glacial ice from the last glaciation.
Revising Center’s ECS Website
Paul Johnson, the Center’s Data Manager, and Gardner are in the process of revising the Center’s Law of the Sea ECS website. The website revision entailed the generation of new grids of all the ECS bathymetry and back-scatter grids, application of a standard color map to each new grid and the creation of vari-ous images and explanations of interesting features in each ECS area. During the Fall of 2019 and the Spring of 2020, Johnson and Gardner began experiment-ing with the creation of “story maps” to present U.S. Extended Continental Shelf (ECS) map-ping data in a more interac-tive manor. The GIS portal allows for the creation of scripted interactive webpages that can intermix dynamic map services with descriptive text, static pictures, and movies. Johnson and Gardner started this explorative effort with the creation and publica-tion of the U.S. Atlantic Margin Mapping story. More details on this effort are presented under Task 60.
COVID ImpactsThe 10-month (and counting) extended self-quarantine required a lot of manuscript writing to be handled over VPN to the Center’s servers. It is estimated that it took 50% more time to write, revise, submit, and resubmit articles to journals.
Figure 48-4. Map view of bathymetry of the lower Hudson channels as they extend out onto the deep seafloor. The most recently active channel is indicated by the red line with yellow 25-km distance marks. Older channels indicated in black lines; all are related to the Hudson channel system. The locations of knickpoints (kp) identified by red arrowheads on the most recently active channel and white arrowheads for older channels. Vertical drops in the most recently active channel at knickpoints indicated below red arrowhead. A crevasse splay (cs) that diverted the most recently active channel is outlined in yellow. Bathymetry profile A-B is along the most recently active channel. BBOR is Blake Bahama Outer Ridge.
JHC Performance Report 31 January 2021 235
EXPLORE AND MAPEXPLORE AND MAP
Research Requirement 3.B: Ocean ExplorationFFO Requirement 3.B: “Development of new technologies and approaches for integrated ocean and coastal mapping, including technology for creating new products for non-traditional applications and uses of ocean and coastal mapping.”
TASK 49: IOCM: Maintain an Integrated Ocean and Coastal Mapping Processing Center to support NOAA’s IOCM efforts while developing new tools and protocols for multiple applications of seafloor mapping data. PIs: IOCM Team
A critical component of the Center’s effort has been to host an Integrated Ocean and Coastal Mapping Processing Center that supports NOAA’s focused efforts on Integrated Ocean and Coastal Mapping as outlined in the Coastal and Ocean Mapping Integration Act of PL 111-11. The IOCM Center brings to fruition years of effort to demonstrate to the hydrographic community that the data collected in support of safe navigation may have tremendous value for other purposes. It is the tangible expres-sion of a mantra we have long espoused; “map once–use many times.” The fundamental purpose of the Center is to develop protocols that turn data collected for safety of navigation into products useful for fisheries habitat, environmental studies, archeological investigations and many other pur-poses, and conversely, to establish ways to ensure that data collected for non-hydrographic purposes (e.g., fisheries, ocean exploration, etc.) will be useful for charting. Our goal is to have NOAA employees from several different NOAA lines and divisions (NOS Coast Survey, Sanctuaries, Fisheries, Ocean Exploration, etc.) at the Center and have them work hand-in-hand with Center researchers to ensure that the products we develop at the Center meet NOAA needs. The NOAA employees will develop skills in the use of these products so that they can return to
their respective divisions or the field as knowledgeable and experienced users.
Juliet Kinney has been working with a number of Cen-ter staff members to design workflows for IOCM prod-ucts and to provide a direct and knowledgeable inter-face with the NOAA fleet to ensure that we address high-priority issues and that the tools we develop are relevant for fleet use. This effort received a boost from a separate grant and contract directed to look at the impact of Super Storm Sandy and brings much greater depth to our IOCM efforts as almost all of the work of the Super Storm Sandy (now the IOCM Team) team fits well within the context of the IOCM theme. This pairing epitomizes the concept of IOCM and of bringing research to operations. The team built on research already being done in the Center to develop algorithms and protocols specifically designed for the Super Storm Sandy effort. The IOCM Team continues to apply these tools to produce a series of products of direct relevance to NOAA charting through a separate NOAA contract. The Center provides physical space and logistical support for NOAA ICOM personal and Center personnel continually interact with NOAA per-sonnel assigned to the IOCM Processing Center, but reports on the efforts of the NOAA IOCM Team are not included in this submission.
TASK 50: ECS Data for Ecosystem Management: Explore the applicability of ECS data for the mapping of re-gional habitat in support of ecosystem-based management. Attempt to generate marine ecological classification and habitat prediction maps with close attention to Habitats of Particular Concern (HAPCs) such as deep-water corals. The protocols developed for analyzing the Atlantic ECS data will then be available for application to other ECS data sets. PIs: Jenn Dijkstra and Larry Mayer
Project: Standardized Geomorphic Classification of Seafloor within the United States Atlantic Canyons and Potential Extended Continental Shelf Region
Center Participants: Derek Sowers, Jenn Dijkstra, Giuseppe Massetti, Larry Mayer, Andrew Armstrong, James Gardner, Paul JohnsonNOAA Participants: Derek Sowers
The Center has led in the acquisition of more than 3.1 million square kilometers of high-resolution multibeam bathymetry and backscatter data in areas of potential U.S. Extended Continental Shelf (ECS). There is strong inter-est from NOAA in providing additional value-added utility to the ECS datasets by extracting further information
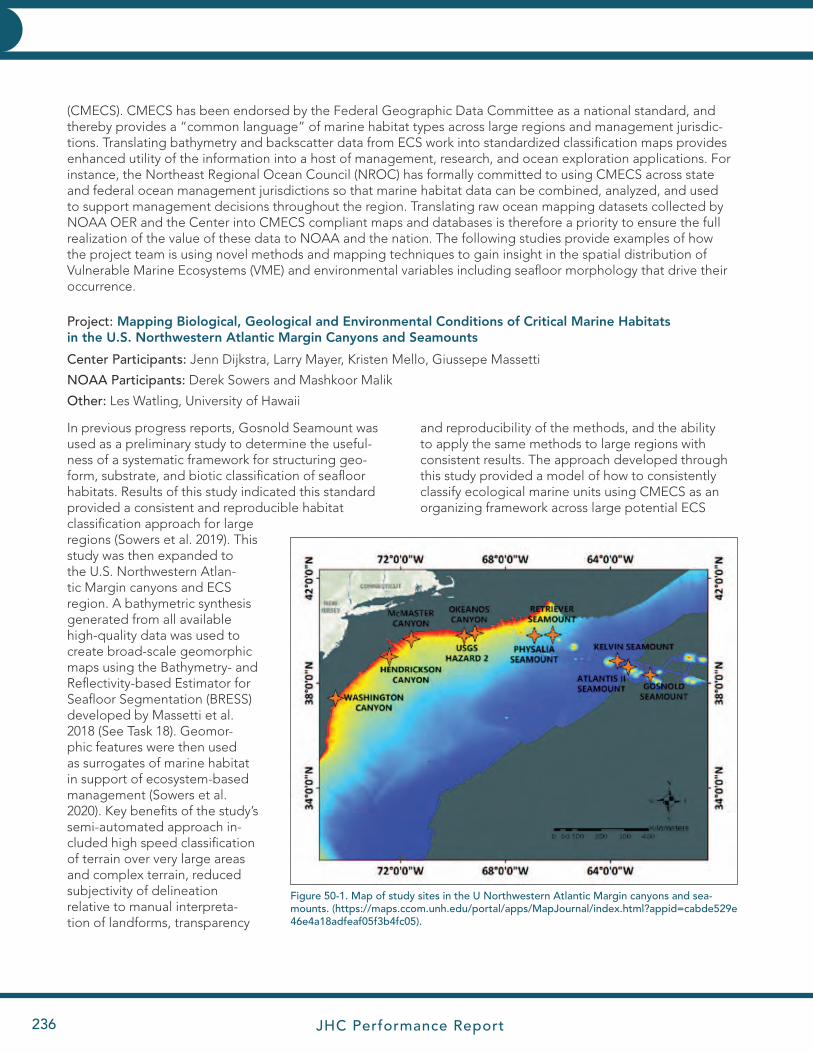
JHC Performance Report236
EXPLORE AND MAPEXPLORE AND MAP
In previous progress reports, Gosnold Seamount was used as a preliminary study to determine the useful-ness of a systematic framework for structuring geo-form, substrate, and biotic classification of seafloor habitats. Results of this study indicated this standard provided a consistent and reproducible habitat classification approach for large regions (Sowers et al. 2019). This study was then expanded to the U.S. Northwestern Atlan-tic Margin canyons and ECS region. A bathymetric synthesis generated from all available high-quality data was used to create broad-scale geomorphic maps using the Bathymetry- and Reflectivity-based Estimator for Seafloor Segmentation (BRESS) developed by Massetti et al. 2018 (See Task 18). Geomor-phic features were then used as surrogates of marine habitat in support of ecosystem-based management (Sowers et al. 2020). Key benefits of the study’s semi-automated approach in-cluded high speed classification of terrain over very large areas and complex terrain, reduced subjectivity of delineation relative to manual interpreta-tion of landforms, transparency
Project: Mapping Biological, Geological and Environmental Conditions of Critical Marine Habitats in the U.S. Northwestern Atlantic Margin Canyons and Seamounts
Center Participants: Jenn Dijkstra, Larry Mayer, Kristen Mello, Giussepe Massetti
NOAA Participants: Derek Sowers and Mashkoor Malik
Other: Les Watling, University of Hawaii
(CMECS). CMECS has been endorsed by the Federal Geographic Data Committee as a national standard, and thereby provides a “common language” of marine habitat types across large regions and management jurisdic-tions. Translating bathymetry and backscatter data from ECS work into standardized classification maps provides enhanced utility of the information into a host of management, research, and ocean exploration applications. For instance, the Northeast Regional Ocean Council (NROC) has formally committed to using CMECS across state and federal ocean management jurisdictions so that marine habitat data can be combined, analyzed, and used to support management decisions throughout the region. Translating raw ocean mapping datasets collected by NOAA OER and the Center into CMECS compliant maps and databases is therefore a priority to ensure the full realization of the value of these data to NOAA and the nation. The following studies provide examples of how the project team is using novel methods and mapping techniques to gain insight in the spatial distribution of Vulnerable Marine Ecosystems (VME) and environmental variables including seafloor morphology that drive their occurrence.
Figure 50-1. Map of study sites in the U Northwestern Atlantic Margin canyons and sea-mounts. (https://maps.ccom.unh.edu/portal/apps/MapJournal/index.html?appid=cabde529e46e4a18adfeaf05f3b4fc05).
and reproducibility of the methods, and the ability to apply the same methods to large regions with consistent results. The approach developed through this study provided a model of how to consistently classify ecological marine units using CMECS as an organizing framework across large potential ECS
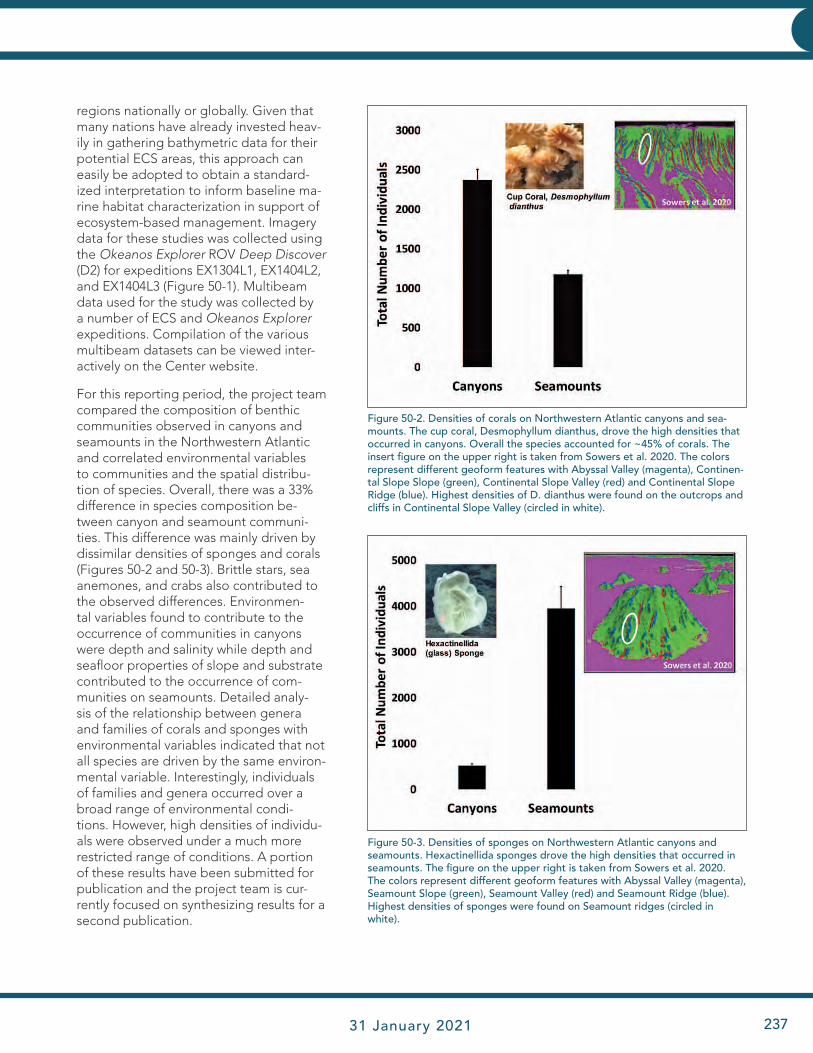
JHC Performance Report 31 January 2021 237
EXPLORE AND MAPEXPLORE AND MAP
regions nationally or globally. Given that many nations have already invested heav-ily in gathering bathymetric data for their potential ECS areas, this approach can easily be adopted to obtain a standard-ized interpretation to inform baseline ma-rine habitat characterization in support of ecosystem-based management. Imagery data for these studies was collected using the Okeanos Explorer ROV Deep Discover (D2) for expeditions EX1304L1, EX1404L2, and EX1404L3 (Figure 50-1). Multibeam data used for the study was collected by a number of ECS and Okeanos Explorer expeditions. Compilation of the various multibeam datasets can be viewed inter-actively on the Center website.
For this reporting period, the project team compared the composition of benthic communities observed in canyons and seamounts in the Northwestern Atlantic and correlated environmental variables to communities and the spatial distribu-tion of species. Overall, there was a 33% difference in species composition be-tween canyon and seamount communi-ties. This difference was mainly driven by dissimilar densities of sponges and corals (Figures 50-2 and 50-3). Brittle stars, sea anemones, and crabs also contributed to the observed differences. Environmen-tal variables found to contribute to the occurrence of communities in canyons were depth and salinity while depth and seafloor properties of slope and substrate contributed to the occurrence of com-munities on seamounts. Detailed analy-sis of the relationship between genera and families of corals and sponges with environmental variables indicated that not all species are driven by the same environ-mental variable. Interestingly, individuals of families and genera occurred over a broad range of environmental condi-tions. However, high densities of individu-als were observed under a much more restricted range of conditions. A portion of these results have been submitted for publication and the project team is cur-rently focused on synthesizing results for a second publication.
Figure 50-2. Densities of corals on Northwestern Atlantic canyons and sea-mounts. The cup coral, Desmophyllum dianthus, drove the high densities that occurred in canyons. Overall the species accounted for ~45% of corals. The insert figure on the upper right is taken from Sowers et al. 2020. The colors represent different geoform features with Abyssal Valley (magenta), Continen-tal Slope Slope (green), Continental Slope Valley (red) and Continental Slope Ridge (blue). Highest densities of D. dianthus were found on the outcrops and cliffs in Continental Slope Valley (circled in white).
Figure 50-3. Densities of sponges on Northwestern Atlantic canyons and seamounts. Hexactinellida sponges drove the high densities that occurred in seamounts. The figure on the upper right is taken from Sowers et al. 2020. The colors represent different geoform features with Abyssal Valley (magenta), Seamount Slope (green), Seamount Valley (red) and Seamount Ridge (blue). Highest densities of sponges were found on Seamount ridges (circled in white).
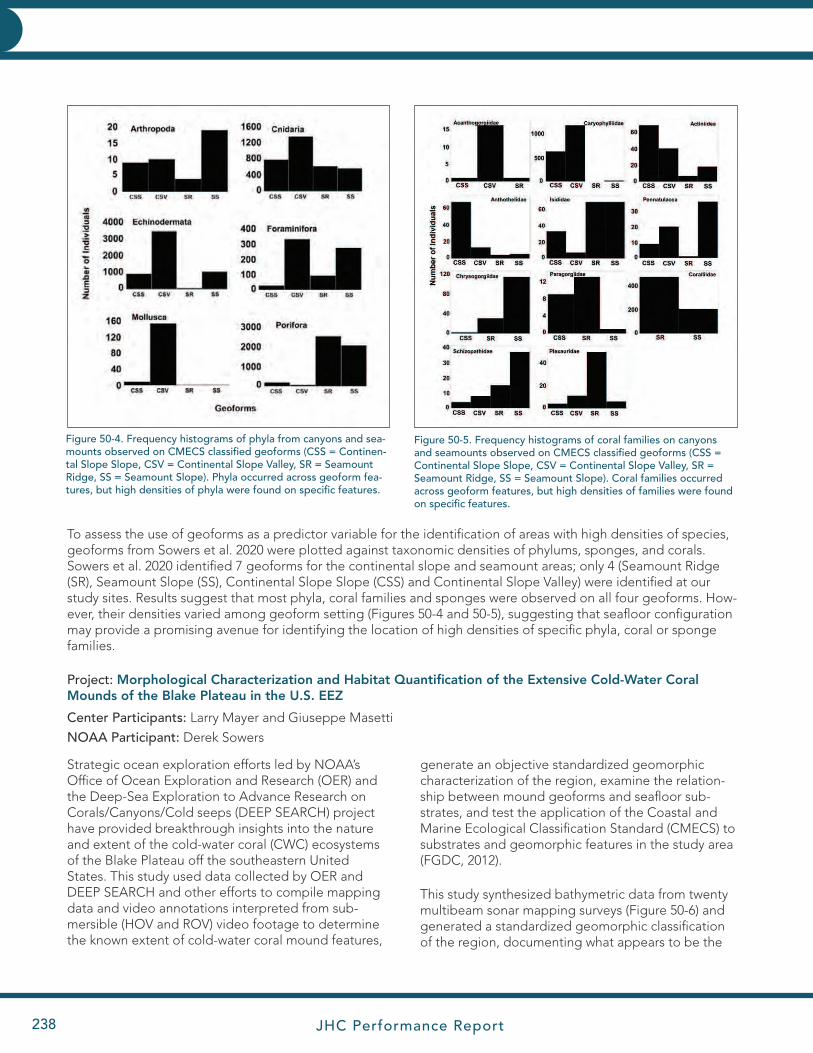
JHC Performance Report238
EXPLORE AND MAPEXPLORE AND MAP
Figure 50-4. Frequency histograms of phyla from canyons and sea-mounts observed on CMECS classified geoforms (CSS = Continen-tal Slope Slope, CSV = Continental Slope Valley, SR = Seamount Ridge, SS = Seamount Slope). Phyla occurred across geoform fea-tures, but high densities of phyla were found on specific features.
Figure 50-5. Frequency histograms of coral families on canyons and seamounts observed on CMECS classified geoforms (CSS = Continental Slope Slope, CSV = Continental Slope Valley, SR = Seamount Ridge, SS = Seamount Slope). Coral families occurred across geoform features, but high densities of families were found on specific features.
To assess the use of geoforms as a predictor variable for the identification of areas with high densities of species, geoforms from Sowers et al. 2020 were plotted against taxonomic densities of phylums, sponges, and corals. Sowers et al. 2020 identified 7 geoforms for the continental slope and seamount areas; only 4 (Seamount Ridge (SR), Seamount Slope (SS), Continental Slope Slope (CSS) and Continental Slope Valley) were identified at our study sites. Results suggest that most phyla, coral families and sponges were observed on all four geoforms. How-ever, their densities varied among geoform setting (Figures 50-4 and 50-5), suggesting that seafloor configuration may provide a promising avenue for identifying the location of high densities of specific phyla, coral or sponge families.
Project: Morphological Characterization and Habitat Quantification of the Extensive Cold-Water Coral Mounds of the Blake Plateau in the U.S. EEZ
Center Participants: Larry Mayer and Giuseppe Masetti
NOAA Participant: Derek Sowers
Strategic ocean exploration efforts led by NOAA’s Office of Ocean Exploration and Research (OER) and the Deep-Sea Exploration to Advance Research on Corals/Canyons/Cold seeps (DEEP SEARCH) project have provided breakthrough insights into the nature and extent of the cold-water coral (CWC) ecosystems of the Blake Plateau off the southeastern United States. This study used data collected by OER and DEEP SEARCH and other efforts to compile mapping data and video annotations interpreted from sub-mersible (HOV and ROV) video footage to determine the known extent of cold-water coral mound features,
generate an objective standardized geomorphic characterization of the region, examine the relation-ship between mound geoforms and seafloor sub-strates, and test the application of the Coastal and Marine Ecological Classification Standard (CMECS) to substrates and geomorphic features in the study area (FGDC, 2012).
This study synthesized bathymetric data from twenty multibeam sonar mapping surveys (Figure 50-6) and generated a standardized geomorphic classification of the region, documenting what appears to be the
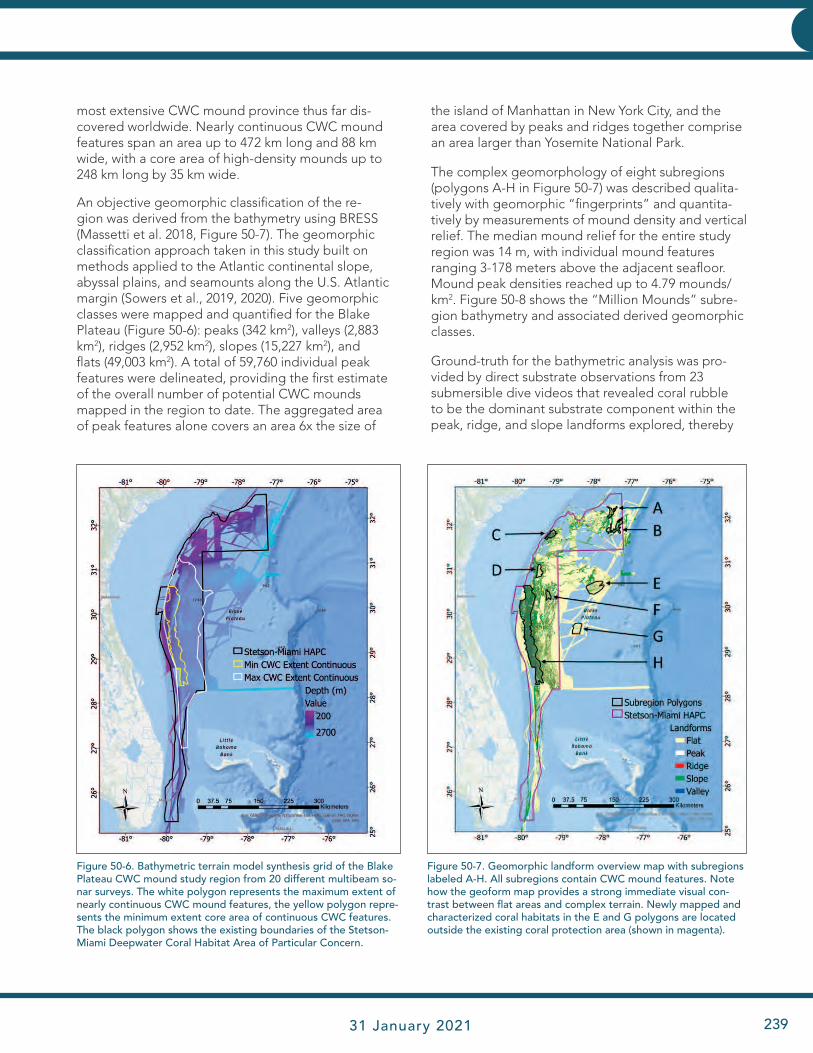
JHC Performance Report 31 January 2021 239
EXPLORE AND MAPEXPLORE AND MAP
most extensive CWC mound province thus far dis-covered worldwide. Nearly continuous CWC mound features span an area up to 472 km long and 88 km wide, with a core area of high-density mounds up to 248 km long by 35 km wide.
An objective geomorphic classification of the re-gion was derived from the bathymetry using BRESS (Massetti et al. 2018, Figure 50-7). The geomorphic classification approach taken in this study built on methods applied to the Atlantic continental slope, abyssal plains, and seamounts along the U.S. Atlantic margin (Sowers et al., 2019, 2020). Five geomorphic classes were mapped and quantified for the Blake Plateau (Figure 50-6): peaks (342 km2), valleys (2,883 km2), ridges (2,952 km2), slopes (15,227 km2), and flats (49,003 km2). A total of 59,760 individual peak features were delineated, providing the first estimate of the overall number of potential CWC mounds mapped in the region to date. The aggregated area of peak features alone covers an area 6x the size of
the island of Manhattan in New York City, and the area covered by peaks and ridges together comprise an area larger than Yosemite National Park.
The complex geomorphology of eight subregions (polygons A-H in Figure 50-7) was described qualita-tively with geomorphic “fingerprints” and quantita-tively by measurements of mound density and vertical relief. The median mound relief for the entire study region was 14 m, with individual mound features ranging 3-178 meters above the adjacent seafloor. Mound peak densities reached up to 4.79 mounds/km2. Figure 50-8 shows the “Million Mounds” subre-gion bathymetry and associated derived geomorphic classes.
Ground-truth for the bathymetric analysis was pro-vided by direct substrate observations from 23 submersible dive videos that revealed coral rubble to be the dominant substrate component within the peak, ridge, and slope landforms explored, thereby
Figure 50-6. Bathymetric terrain model synthesis grid of the Blake Plateau CWC mound study region from 20 different multibeam so-nar surveys. The white polygon represents the maximum extent of nearly continuous CWC mound features, the yellow polygon repre-sents the minimum extent core area of continuous CWC features. The black polygon shows the existing boundaries of the Stetson-Miami Deepwater Coral Habitat Area of Particular Concern.
Figure 50-7. Geomorphic landform overview map with subregions labeled A-H. All subregions contain CWC mound features. Note how the geoform map provides a strong immediate visual con-trast between flat areas and complex terrain. Newly mapped and characterized coral habitats in the E and G polygons are located outside the existing coral protection area (shown in magenta).
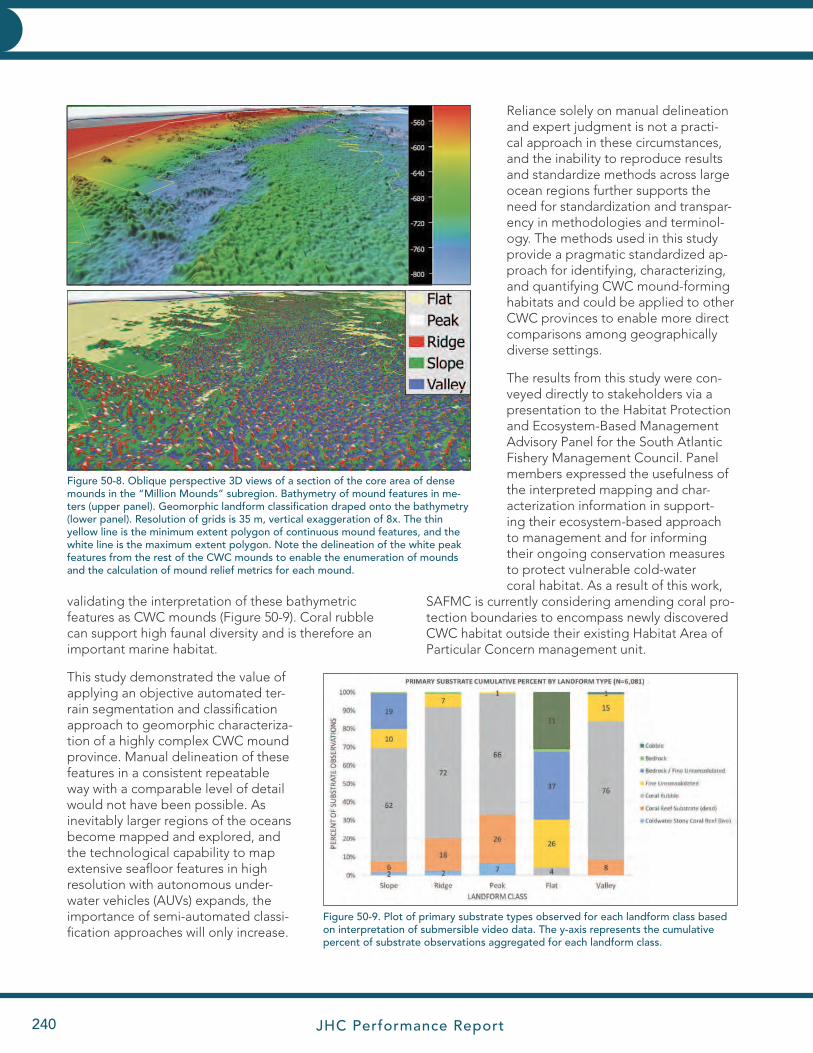
JHC Performance Report240
EXPLORE AND MAPEXPLORE AND MAP
validating the interpretation of these bathymetric features as CWC mounds (Figure 50-9). Coral rubble can support high faunal diversity and is therefore an important marine habitat.
This study demonstrated the value of applying an objective automated ter-rain segmentation and classification approach to geomorphic characteriza-tion of a highly complex CWC mound province. Manual delineation of these features in a consistent repeatable way with a comparable level of detail would not have been possible. As inevitably larger regions of the oceans become mapped and explored, and the technological capability to map extensive seafloor features in high resolution with autonomous under-water vehicles (AUVs) expands, the importance of semi-automated classi-fication approaches will only increase.
Reliance solely on manual delineation and expert judgment is not a practi-cal approach in these circumstances, and the inability to reproduce results and standardize methods across large ocean regions further supports the need for standardization and transpar-ency in methodologies and terminol-ogy. The methods used in this study provide a pragmatic standardized ap-proach for identifying, characterizing, and quantifying CWC mound-forming habitats and could be applied to other CWC provinces to enable more direct comparisons among geographically diverse settings.
The results from this study were con-veyed directly to stakeholders via a presentation to the Habitat Protection and Ecosystem-Based Management Advisory Panel for the South Atlantic Fishery Management Council. Panel members expressed the usefulness of the interpreted mapping and char-acterization information in support-ing their ecosystem-based approach to management and for informing their ongoing conservation measures to protect vulnerable cold-water coral habitat. As a result of this work,
SAFMC is currently considering amending coral pro-tection boundaries to encompass newly discovered CWC habitat outside their existing Habitat Area of Particular Concern management unit.
Figure 50-8. Oblique perspective 3D views of a section of the core area of dense mounds in the “Million Mounds” subregion. Bathymetry of mound features in me-ters (upper panel). Geomorphic landform classification draped onto the bathymetry (lower panel). Resolution of grids is 35 m, vertical exaggeration of 8x. The thin yellow line is the minimum extent polygon of continuous mound features, and the white line is the maximum extent polygon. Note the delineation of the white peak features from the rest of the CWC mounds to enable the enumeration of mounds and the calculation of mound relief metrics for each mound.
Figure 50-9. Plot of primary substrate types observed for each landform class based on interpretation of submersible video data. The y-axis represents the cumulative percent of substrate observations aggregated for each landform class.
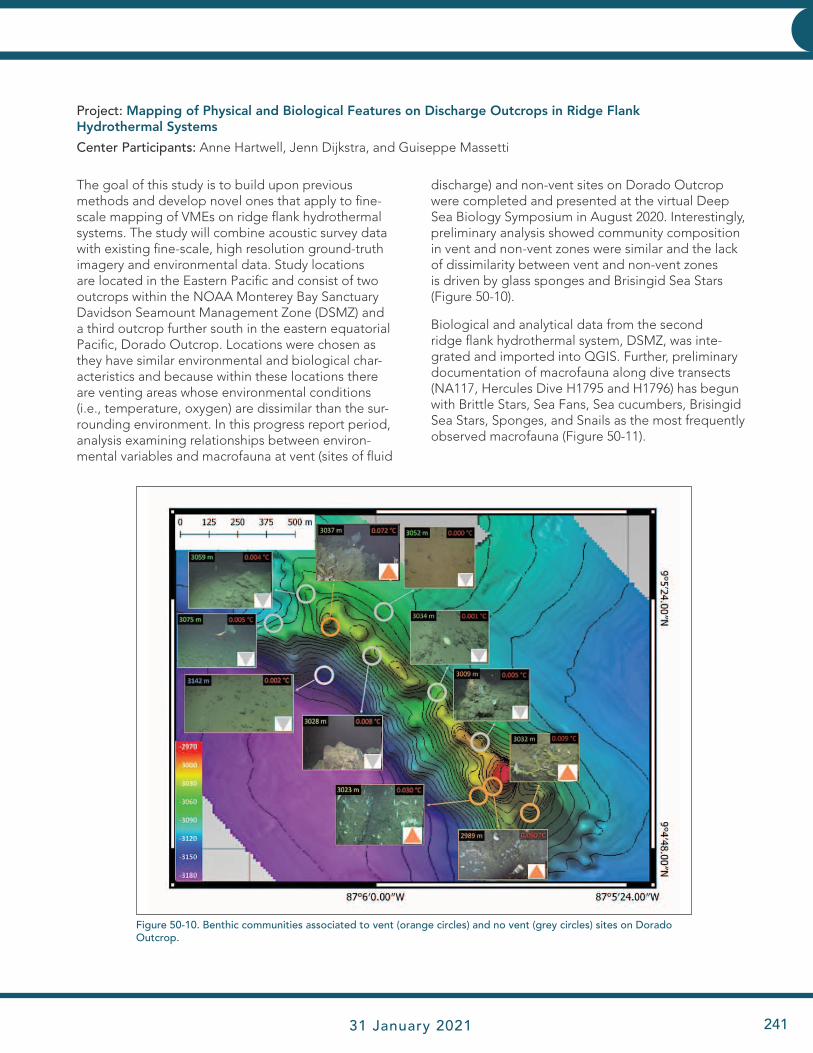
JHC Performance Report 31 January 2021 241
EXPLORE AND MAPEXPLORE AND MAP
Figure 50-10. Benthic communities associated to vent (orange circles) and no vent (grey circles) sites on Dorado Outcrop.
Project: Mapping of Physical and Biological Features on Discharge Outcrops in Ridge Flank Hydrothermal Systems
Center Participants: Anne Hartwell, Jenn Dijkstra, and Guiseppe Massetti
The goal of this study is to build upon previous methods and develop novel ones that apply to fine-scale mapping of VMEs on ridge flank hydrothermal systems. The study will combine acoustic survey data with existing fine-scale, high resolution ground-truth imagery and environmental data. Study locations are located in the Eastern Pacific and consist of two outcrops within the NOAA Monterey Bay Sanctuary Davidson Seamount Management Zone (DSMZ) and a third outcrop further south in the eastern equatorial Pacific, Dorado Outcrop. Locations were chosen as they have similar environmental and biological char-acteristics and because within these locations there are venting areas whose environmental conditions (i.e., temperature, oxygen) are dissimilar than the sur-rounding environment. In this progress report period, analysis examining relationships between environ-mental variables and macrofauna at vent (sites of fluid
discharge) and non-vent sites on Dorado Outcrop were completed and presented at the virtual Deep Sea Biology Symposium in August 2020. Interestingly, preliminary analysis showed community composition in vent and non-vent zones were similar and the lack of dissimilarity between vent and non-vent zones is driven by glass sponges and Brisingid Sea Stars (Figure 50-10).
Biological and analytical data from the second ridge flank hydrothermal system, DSMZ, was inte-grated and imported into QGIS. Further, preliminary documentation of macrofauna along dive transects (NA117, Hercules Dive H1795 and H1796) has begun with Brittle Stars, Sea Fans, Sea cucumbers, Brisingid Sea Stars, Sponges, and Snails as the most frequently observed macrofauna (Figure 50-11).

JHC Performance Report242
EXPLORE AND MAPEXPLORE AND MAP
TASK 51: Potential of MBES Data to Resolve Oceanographic Features: Explore the possibility of mapping fine-scale structure in the water column with MBES and fisheries sonars. Work with our sonar manufacturer part-ners to see if certain data acquisition parameters can be optimized for revealing water mass structure and, in particular, evaluate the potential of broadband or multi-frequency data for these sorts of studies. PIs: John Hughes Clarke, Larry Mayer, and Tom Weber
Project: Shallow Water Imaging of Internal Waves and Mixing—Impacts on Survey Quality
Center Participants: John Hughes Clarke, Indra Prasetyawan, Larry Mayer, Tom Weber, Shannon, Erin Heffron, Shannon Hoy, and Ryosuke Nagasawa
NOAA Participant: Lt. Steve Wall, NOAA Ship Hassler
Other Collaborators: Rebecca Martinolich, Dave Fabre NAVOCEANO, Lindsay Gee Ocean Exploration Trust, Ian Church, OMG/UNB
Additional Funding: NAVOCEANO
While OCS’s focus remains on nautical charting, the quality of their product is often hampered by the pres-ence of rapid sound speed variability. Such variability is a result of local spatial or temporal changes in the oceanographic environment. Such rapid changes are often characterized by variations in the daily or seasonal thermocline, often resulting in internal waves and turbulence. This task addresses the potential to image these phenomena in real time so that the operational staff can adapt their surveys or sampling programs to minimize the impact. As an aside, those oceanographic phenomena are of high interest to NMFS as they often represent areas of enhanced biological activity
This study is ongoing with the intent to create a fine-scale habitat map of biological and physical factors and then use physical factors to create a predictive model of species and communities observed at Dorado Out-crop. Further, the community observed on Dorado will be compared to that of the outcrops in DSMZ Marine National Sanctuary, whose physical properties are similar to that of Dorado. As the community on Dorado Outcrop and Davidson Seamount likely reflects the community structure on many low temperature discharge locations in the deep sea, results of this study can be extrapolated to enhance predictive mapping capabilities of deep-sea habitats.
COVID ImpactsThe COVID-19 pandemic has slowed down progress on some of these projects. While these studies have con-tinued remotely, data processing and analysis has taken longer than expected because of software issues (e.g., software needs to be installed on a local computer, which is generally a laptop. Data processing is also done locally in which is slower than on the desktop at work).
Figure 50-11. Example of macrofauna along ROV transects in DSMZ. Left: Sea Cucumber and two different Sea Fan species. Right: Muusoctopus Sp. and broken egg-casings surrounded by 10’s of Snails; a single Brittle Star is visible in the far right of the image.
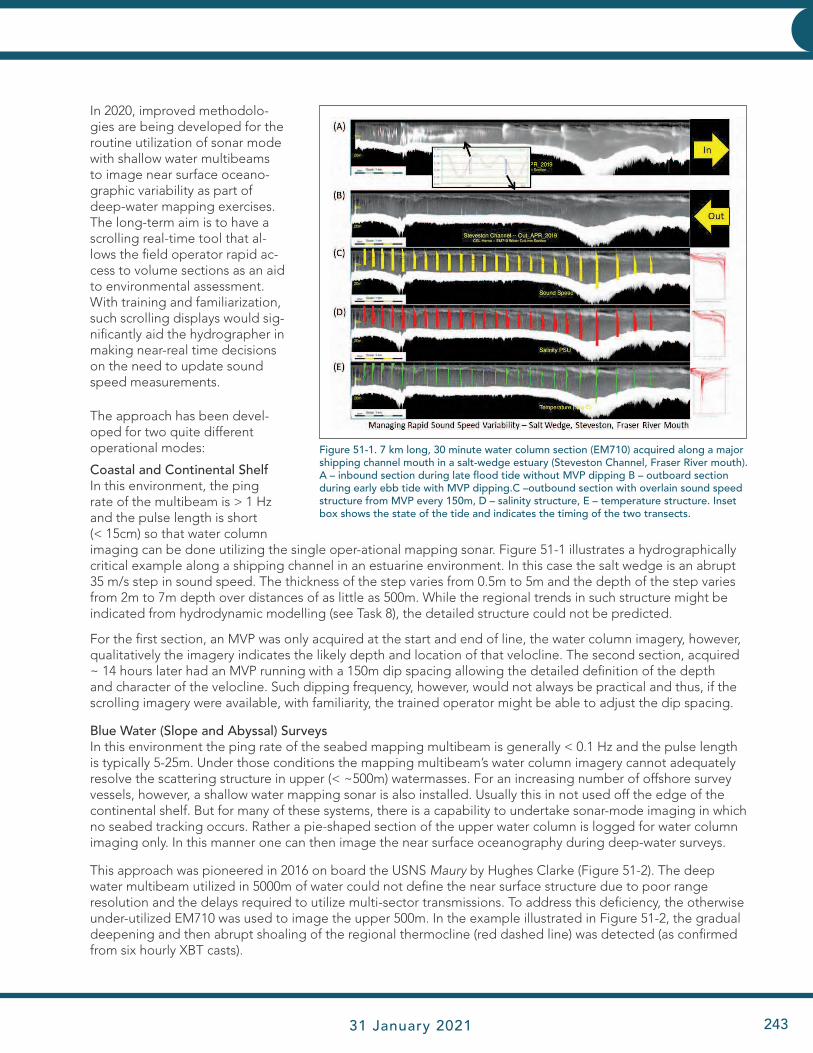
JHC Performance Report 31 January 2021 243
EXPLORE AND MAPEXPLORE AND MAP
In 2020, improved methodolo-gies are being developed for the routine utilization of sonar mode with shallow water multibeams to image near surface oceano-graphic variability as part of deep-water mapping exercises. The long-term aim is to have a scrolling real-time tool that al-lows the field operator rapid ac-cess to volume sections as an aid to environmental assessment. With training and familiarization, such scrolling displays would sig-nificantly aid the hydrographer in making near-real time decisions on the need to update sound speed measurements.
The approach has been devel-oped for two quite different operational modes:
Coastal and Continental Shelf In this environment, the ping rate of the multibeam is > 1 Hz and the pulse length is short (< 15cm) so that water column imaging can be done utilizing the single oper-ational mapping sonar. Figure 51-1 illustrates a hydrographically critical example along a shipping channel in an estuarine environment. In this case the salt wedge is an abrupt 35 m/s step in sound speed. The thickness of the step varies from 0.5m to 5m and the depth of the step varies from 2m to 7m depth over distances of as little as 500m. While the regional trends in such structure might be indicated from hydrodynamic modelling (see Task 8), the detailed structure could not be predicted.
For the first section, an MVP was only acquired at the start and end of line, the water column imagery, however, qualitatively the imagery indicates the likely depth and location of that velocline. The second section, acquired ~ 14 hours later had an MVP running with a 150m dip spacing allowing the detailed definition of the depth and character of the velocline. Such dipping frequency, however, would not always be practical and thus, if the scrolling imagery were available, with familiarity, the trained operator might be able to adjust the dip spacing.
Blue Water (Slope and Abyssal) Surveys In this environment the ping rate of the seabed mapping multibeam is generally < 0.1 Hz and the pulse length is typically 5-25m. Under those conditions the mapping multibeam’s water column imagery cannot adequately resolve the scattering structure in upper (< ~500m) watermasses. For an increasing number of offshore survey vessels, however, a shallow water mapping sonar is also installed. Usually this in not used off the edge of the continental shelf. But for many of these systems, there is a capability to undertake sonar-mode imaging in which no seabed tracking occurs. Rather a pie-shaped section of the upper water column is logged for water column imaging only. In this manner one can then image the near surface oceanography during deep-water surveys.
This approach was pioneered in 2016 on board the USNS Maury by Hughes Clarke (Figure 51-2). The deep water multibeam utilized in 5000m of water could not define the near surface structure due to poor range resolution and the delays required to utilize multi-sector transmissions. To address this deficiency, the otherwise under-utilized EM710 was used to image the upper 500m. In the example illustrated in Figure 51-2, the gradual deepening and then abrupt shoaling of the regional thermocline (red dashed line) was detected (as confirmed from six hourly XBT casts).
Figure 51-1. 7 km long, 30 minute water column section (EM710) acquired along a major shipping channel mouth in a salt-wedge estuary (Steveston Channel, Fraser River mouth). A – inbound section during late flood tide without MVP dipping B – outboard section during early ebb tide with MVP dipping.C –outbound section with overlain sound speed structure from MVP every 150m, D – salinity structure, E – temperature structure. Inset box shows the state of the tide and indicates the timing of the two transects.
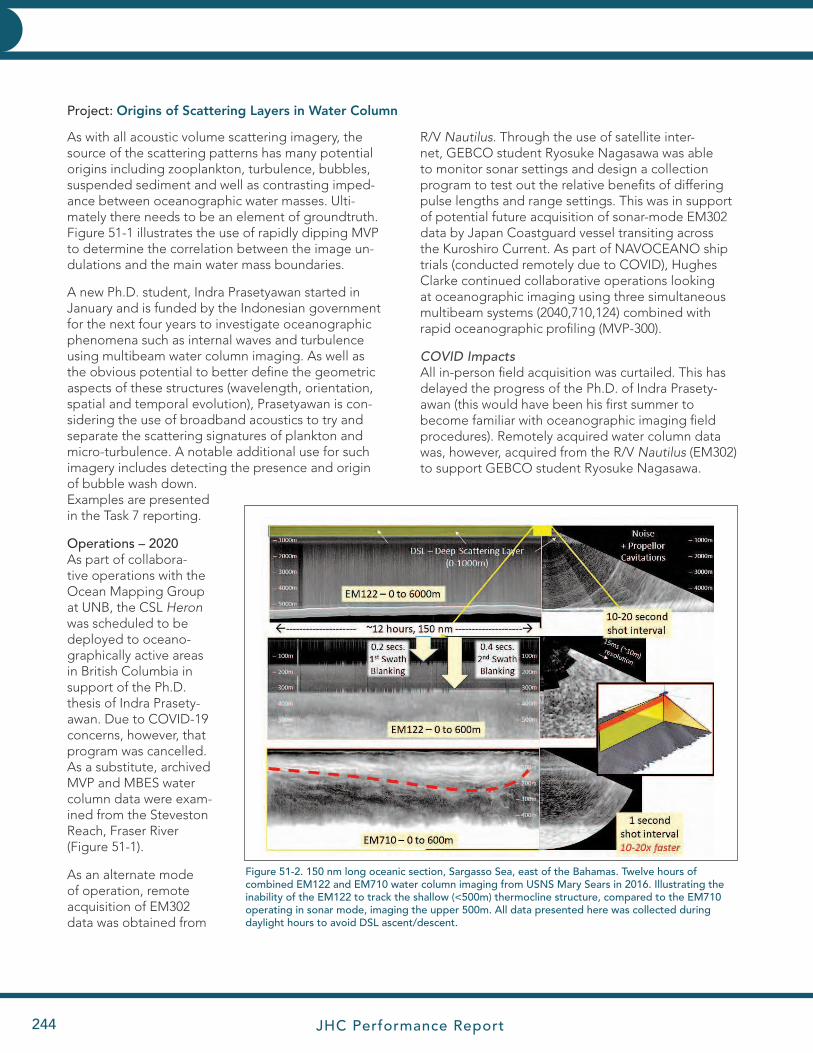
JHC Performance Report244
EXPLORE AND MAPEXPLORE AND MAP
As with all acoustic volume scattering imagery, the source of the scattering patterns has many potential origins including zooplankton, turbulence, bubbles, suspended sediment and well as contrasting imped-ance between oceanographic water masses. Ulti-mately there needs to be an element of groundtruth. Figure 51-1 illustrates the use of rapidly dipping MVP to determine the correlation between the image un-dulations and the main water mass boundaries.
A new Ph.D. student, Indra Prasetyawan started in January and is funded by the Indonesian government for the next four years to investigate oceanographic phenomena such as internal waves and turbulence using multibeam water column imaging. As well as the obvious potential to better define the geometric aspects of these structures (wavelength, orientation, spatial and temporal evolution), Prasetyawan is con-sidering the use of broadband acoustics to try and separate the scattering signatures of plankton and micro-turbulence. A notable additional use for such imagery includes detecting the presence and origin of bubble wash down. Examples are presented in the Task 7 reporting.
Operations – 2020 As part of collabora-tive operations with the Ocean Mapping Group at UNB, the CSL Heron was scheduled to be deployed to oceano-graphically active areas in British Columbia in support of the Ph.D. thesis of Indra Prasety-awan. Due to COVID-19 concerns, however, that program was cancelled. As a substitute, archived MVP and MBES water column data were exam-ined from the Steveston Reach, Fraser River (Figure 51-1).
As an alternate mode of operation, remote acquisition of EM302 data was obtained from
Figure 51-2. 150 nm long oceanic section, Sargasso Sea, east of the Bahamas. Twelve hours of combined EM122 and EM710 water column imaging from USNS Mary Sears in 2016. Illustrating the inability of the EM122 to track the shallow (<500m) thermocline structure, compared to the EM710 operating in sonar mode, imaging the upper 500m. All data presented here was collected during daylight hours to avoid DSL ascent/descent.
R/V Nautilus. Through the use of satellite inter-net, GEBCO student Ryosuke Nagasawa was able to monitor sonar settings and design a collection program to test out the relative benefits of differing pulse lengths and range settings. This was in support of potential future acquisition of sonar-mode EM302 data by Japan Coastguard vessel transiting across the Kuroshiro Current. As part of NAVOCEANO ship trials (conducted remotely due to COVID), Hughes Clarke continued collaborative operations looking at oceanographic imaging using three simultaneous multibeam systems (2040,710,124) combined with rapid oceanographic profiling (MVP-300).
COVID ImpactsAll in-person field acquisition was curtailed. This has delayed the progress of the Ph.D. of Indra Prasety-awan (this would have been his first summer to become familiar with oceanographic imaging field procedures). Remotely acquired water column data was, however, acquired from the R/V Nautilus (EM302) to support GEBCO student Ryosuke Nagasawa.
Project: Origins of Scattering Layers in Water Column
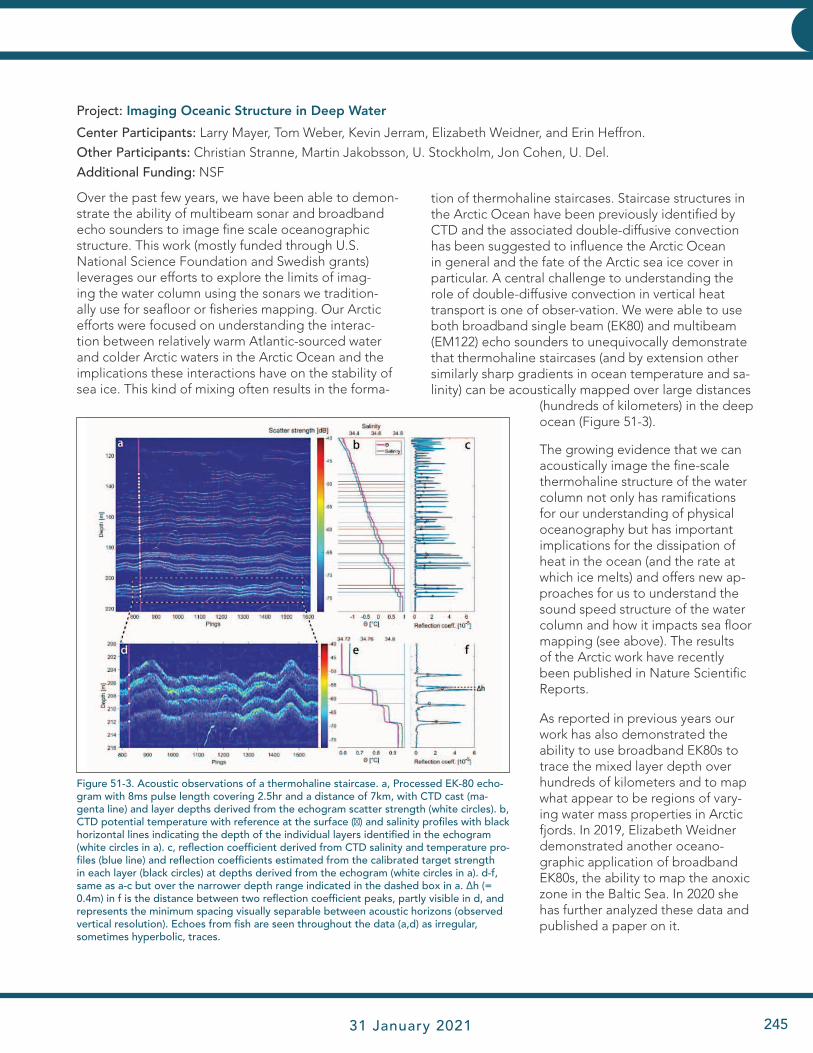
JHC Performance Report 31 January 2021 245
EXPLORE AND MAPEXPLORE AND MAP
Project: Imaging Oceanic Structure in Deep Water
Center Participants: Larry Mayer, Tom Weber, Kevin Jerram, Elizabeth Weidner, and Erin Heffron.
Other Participants: Christian Stranne, Martin Jakobsson, U. Stockholm, Jon Cohen, U. Del.
Additional Funding: NSF
Figure 51-3. Acoustic observations of a thermohaline staircase. a, Processed EK-80 echo-gram with 8ms pulse length covering 2.5hr and a distance of 7km, with CTD cast (ma-genta line) and layer depths derived from the echogram scatter strength (white circles). b, CTD potential temperature with reference at the surface (Θ) and salinity profiles with black horizontal lines indicating the depth of the individual layers identified in the echogram (white circles in a). c, reflection coefficient derived from CTD salinity and temperature pro-files (blue line) and reflection coefficients estimated from the calibrated target strength in each layer (black circles) at depths derived from the echogram (white circles in a). d-f, same as a-c but over the narrower depth range indicated in the dashed box in a. ∆h (= 0.4m) in f is the distance between two reflection coefficient peaks, partly visible in d, and represents the minimum spacing visually separable between acoustic horizons (observed vertical resolution). Echoes from fish are seen throughout the data (a,d) as irregular, sometimes hyperbolic, traces.
Over the past few years, we have been able to demon-strate the ability of multibeam sonar and broadband echo sounders to image fine scale oceanographic structure. This work (mostly funded through U.S. National Science Foundation and Swedish grants) leverages our efforts to explore the limits of imag-ing the water column using the sonars we tradition-ally use for seafloor or fisheries mapping. Our Arctic efforts were focused on understanding the interac-tion between relatively warm Atlantic-sourced water and colder Arctic waters in the Arctic Ocean and the implications these interactions have on the stability of sea ice. This kind of mixing often results in the forma-
tion of thermohaline staircases. Staircase structures in the Arctic Ocean have been previously identified by CTD and the associated double-diffusive convection has been suggested to influence the Arctic Ocean in general and the fate of the Arctic sea ice cover in particular. A central challenge to understanding the role of double-diffusive convection in vertical heat transport is one of obser-vation. We were able to use both broadband single beam (EK80) and multibeam (EM122) echo sounders to unequivocally demonstrate that thermohaline staircases (and by extension other similarly sharp gradients in ocean temperature and sa-linity) can be acoustically mapped over large distances
(hundreds of kilometers) in the deep ocean (Figure 51-3).
The growing evidence that we can acoustically image the fine-scale thermohaline structure of the water column not only has ramifications for our understanding of physical oceanography but has important implications for the dissipation of heat in the ocean (and the rate at which ice melts) and offers new ap-proaches for us to understand the sound speed structure of the water column and how it impacts sea floor mapping (see above). The results of the Arctic work have recently been published in Nature Scientific Reports.
As reported in previous years our work has also demonstrated the ability to use broadband EK80s to trace the mixed layer depth over hundreds of kilometers and to map what appear to be regions of vary-ing water mass properties in Arctic fjords. In 2019, Elizabeth Weidner demonstrated another oceano-graphic application of broadband EK80s, the ability to map the anoxic zone in the Baltic Sea. In 2020 she has further analyzed these data and published a paper on it.

JHC Performance Report246
EXPLORE AND MAPEXPLORE AND MAP
Project: Baltic Sea Broadband Oxic-Anoxic Interface Investigation and Mapping
Center Participants: Elizabeth Weidner, Tom Weber, and Larry Mayer
Other Participants: Christian Stranne and Martin Jakobsson
speed rapidly increase, resulting in a strong acous-tic impedance contrast. The stratification interface can be tracked using acoustics, enabled by the high signal to noise ratio and vertical range resolution of processed broadband data.
In June 2018 Weidner participated on a research cruise on R/V Electra, collecting acoustic data and a series of CTD profiles in the Gotland Basin (Fig-ure 51-4). Broadband acoustic water column data were collected with a Simrad ES70 (45-90 kHz) and ES200 (80-150 kHz). During operations a scattering interface was observed in the acoustic data between depths of 50-70 meters, which matches the reported depth of the permanent halocline in the Gotland Basin from previous studies.
This reporting period Weidner completed a project using broadband acoustics to identify, characterize, and track the oxic-anoxic water column transition in the Gotland Basin of the Baltic Sea. This work was published in the ICES Journal of Marine Science in November of 2020.
The Gotland Basin is a region prone to bottom water anoxic conditions (complete lack of dissolved oxygen), due to a combination of limited water exchange and heavy freshwater and nutrient inflow from riverine sources. These characteristics set up strong salinity-driven stratification and preventing regular ventilation of deep water. The stratification represents both the interface between oxic and anoxic waters and a region where density and sound
Figure 51-4. Overview image of the Baltic Sea (a). The inset panel b shows the Western Gotland Basin and survey area. Panel b shows the survey ship track lines (blue), and positions of ground truth stations (white circles) from survey operations.
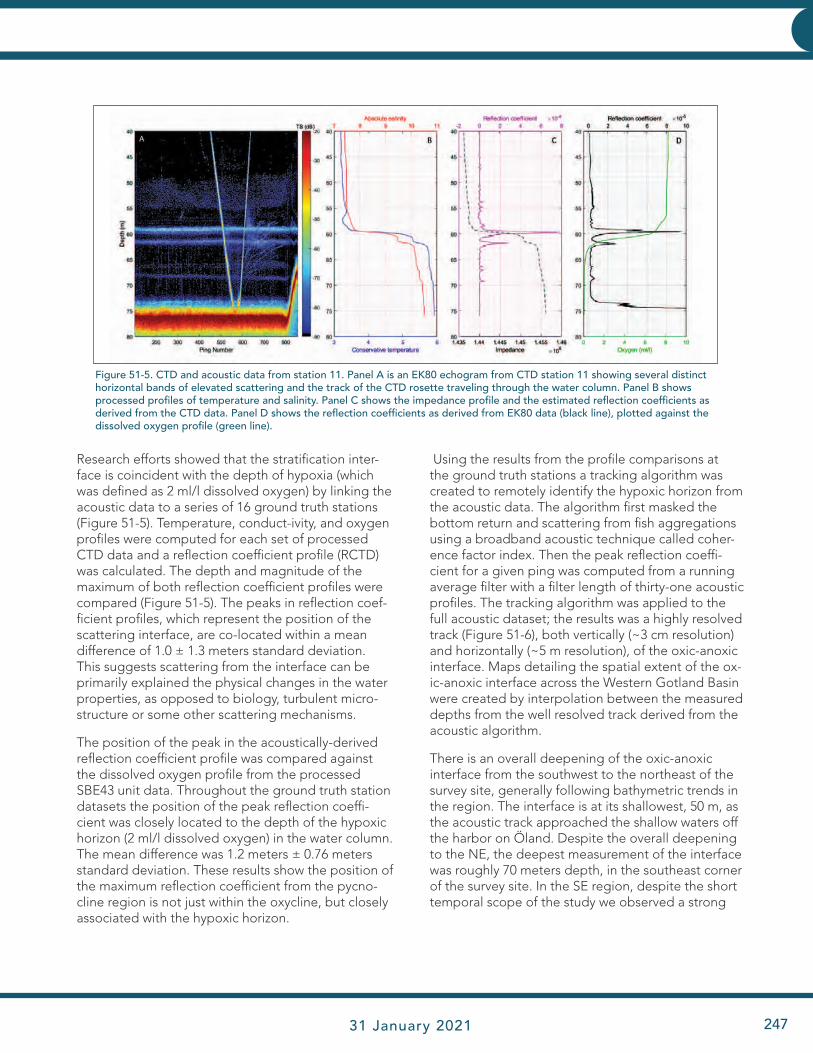
JHC Performance Report 31 January 2021 247
EXPLORE AND MAPEXPLORE AND MAP
Research efforts showed that the stratification inter-face is coincident with the depth of hypoxia (which was defined as 2 ml/l dissolved oxygen) by linking the acoustic data to a series of 16 ground truth stations (Figure 51-5). Temperature, conduct-ivity, and oxygen profiles were computed for each set of processed CTD data and a reflection coefficient profile (RCTD) was calculated. The depth and magnitude of the maximum of both reflection coefficient profiles were compared (Figure 51-5). The peaks in reflection coef-ficient profiles, which represent the position of the scattering interface, are co-located within a mean difference of 1.0 ± 1.3 meters standard deviation. This suggests scattering from the interface can be primarily explained the physical changes in the water properties, as opposed to biology, turbulent micro-structure or some other scattering mechanisms.
The position of the peak in the acoustically-derived reflection coefficient profile was compared against the dissolved oxygen profile from the processed SBE43 unit data. Throughout the ground truth station datasets the position of the peak reflection coeffi-cient was closely located to the depth of the hypoxic horizon (2 ml/l dissolved oxygen) in the water column. The mean difference was 1.2 meters ± 0.76 meters standard deviation. These results show the position of the maximum reflection coefficient from the pycno-cline region is not just within the oxycline, but closely associated with the hypoxic horizon.
Using the results from the profile comparisons at the ground truth stations a tracking algorithm was created to remotely identify the hypoxic horizon from the acoustic data. The algorithm first masked the bottom return and scattering from fish aggregations using a broadband acoustic technique called coher-ence factor index. Then the peak reflection coeffi-cient for a given ping was computed from a running average filter with a filter length of thirty-one acoustic profiles. The tracking algorithm was applied to the full acoustic dataset; the results was a highly resolved track (Figure 51-6), both vertically (~3 cm resolution) and horizontally (~5 m resolution), of the oxic-anoxic interface. Maps detailing the spatial extent of the ox-ic-anoxic interface across the Western Gotland Basin were created by interpolation between the measured depths from the well resolved track derived from the acoustic algorithm.
There is an overall deepening of the oxic-anoxic interface from the southwest to the northeast of the survey site, generally following bathymetric trends in the region. The interface is at its shallowest, 50 m, as the acoustic track approached the shallow waters off the harbor on Öland. Despite the overall deepening to the NE, the deepest measurement of the interface was roughly 70 meters depth, in the southeast corner of the survey site. In the SE region, despite the short temporal scope of the study we observed a strong
Figure 51-5. CTD and acoustic data from station 11. Panel A is an EK80 echogram from CTD station 11 showing several distinct horizontal bands of elevated scattering and the track of the CTD rosette traveling through the water column. Panel B shows processed profiles of temperature and salinity. Panel C shows the impedance profile and the estimated reflection coefficients as derived from the CTD data. Panel D shows the reflection coefficients as derived from EK80 data (black line), plotted against the dissolved oxygen profile (green line).

JHC Performance Report248
EXPLORE AND MAPEXPLORE AND MAP
temporal variation in the depth of the anoxic zone, with a deepening of more than 10 meters between the 12th and the 14th of June due to a wind-driven event. Overall, the interface showed lateral continuity over the survey area.
As noted in the results, the depth of the oxic-anoxic interface as measured by the dissolved oxygen profiles at the ground truth stations agrees well with the acoustically-derived results. A CTD-based inter-polated map of the survey region would have shown an oxic-anoxic interface of relatively constant depth between approximately 60-62 meter. However, it is clear from our interpolated maps that the discrete
CTD stations fail to identify many of the details in the interface extent; specifically, the shallowest and deepest extents of the anoxic zone. These differenc-es in resolution and detail highlight the importance of using acoustic data as part of low-oxygen track-ing and monitoring efforts. Furthermore, the spatial coverage of the ground truth stations is significantly less than that of the acoustic survey due to timing constrains during operations. Although the acoustic tracking method depends on ground truth CTD data, running acoustic systems during all survey operations is inexpensive and efficient, providing spatial resolu-tion orders of magnitude higher than that of CTD operations alone.
Figure 51-6. Panel A shows an EK80 echogram transect of over 12 km starting at CTD station 13. The magenta line at approxi-mately 60 m depth shows the result of interface tracking algorithm along the transit which identifies the oxic-anoxic interface. Panel B and C show an overview map of the survey region with ship track lines (blue), CTD station locations (white markers with black outlines), and the results of the triangulation-based natural neighbor interpolation of the oxic-anoxic interface tracking algorithm. The interpolation map shown in Panel B consists of data from June 11th, 13th, 14th, and 15th. The panel C interpo-lation map consists of data from June 11th, 12th, 13th, and 15th. Data from the 12th and 14th cover the same region, in the southeast corner of the survey area and show significantly different interface depths (dashed box highlights this region). The is the results of suspected down-welling, which is discussed in section 4.1.2.Additionally, the position of the echogram from Panel A is denoted with the dotted box in the middle of the interpolated maps.

JHC Performance Report 31 January 2021 249
EXPLORE AND MAPEXPLORE AND MAP
Project: Investigation of Mixing Dynamics at Double Diffusive Interfaces
The staircases observed in the study site (Figure 51-7) are characterized by one to three step features, with thicknesses between 0.5-2.0 meters, salinity gradients of 0.5-3.0 g kg-1 across interfaces, and temperature gradients of 0.4-2.0 °C across interfaces. The makeup of the staircases was not homogenous over the survey area; in some regions, staircases were well defined and discrete, while in others profiles there was a rela-tively smooth gradient between water masses with indications of not quite formed staircases, potentially representing the formation and/or deterioration of staircases in the smooth profiles. Heterogeneity sug-gests the potential for different mixing rates across the survey area and thus, different controls on the vertical profiles of dissolved oxygen.
Future broadband research will focus on determining the spatial variability of these staircase structures, to estimate the rates of mixing associated with them, and to study their effect on the dissolved oxygen distribution in the Gotland Basin.
Figure 51-7. Examples of thermohaline staircase features in the Baltic Sea. The left is a set of fully-formed staircase features which have flat spectra (no frequency dependence). The right is in areas of relative smooth gradients where staircases appear to be evolving. The spectra of the volume scattering regions have a weakly negative frequency dependence
Extending on her work acoustically identifying the halocline and oxygen minimum in the Baltic, Wei-dner continues to work with the broadband acoustic dataset to investigate the mixing dynamics that control the vertical distribution of the oxygen. The scattering interface that was tracked as part of the research described above, evolved dramatically along the ship track. Interface layers were observed merging, splitting, appearing, and disappearing. Closer inspection of the CTD profiles revealed a double-diffusive convective mixing regime driven by the water column structure near the stratification interface with cold, fresher water siting over denser warm, salty water. In such situations, the difference in the diffusivities of heat and salt give rise to step-like structures in the water column. These structures, often referred to as “thermohaline staircases,” have been well described in existing literature and have been observed in many regions, including some parts of the Baltic Sea, although not before in the Western Gotland Basin.
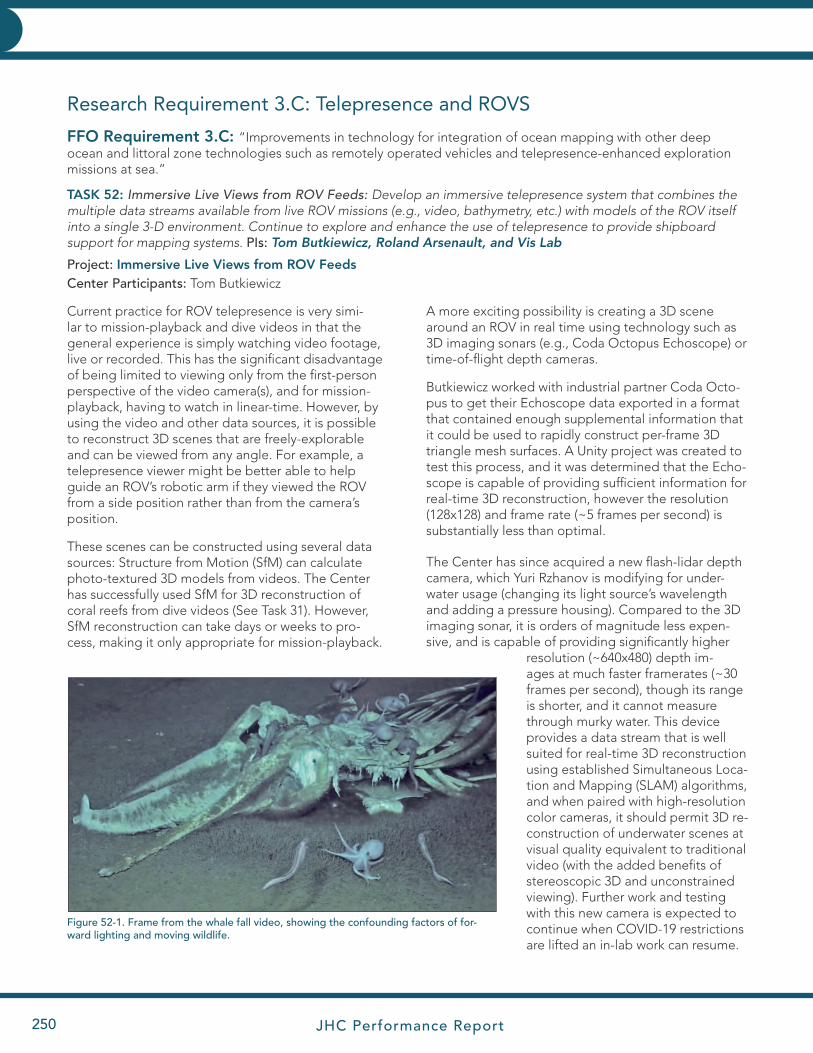
JHC Performance Report250
EXPLORE AND MAPEXPLORE AND MAP
Research Requirement 3.C: Telepresence and ROVS
FFO Requirement 3.C: “Improvements in technology for integration of ocean mapping with other deep ocean and littoral zone technologies such as remotely operated vehicles and telepresence-enhanced exploration missions at sea.”
TASK 52: Immersive Live Views from ROV Feeds: Develop an immersive telepresence system that combines the multiple data streams available from live ROV missions (e.g., video, bathymetry, etc.) with models of the ROV itself into a single 3-D environment. Continue to explore and enhance the use of telepresence to provide shipboard support for mapping systems. PIs: Tom Butkiewicz, Roland Arsenault, and Vis Lab
Project: Immersive Live Views from ROV FeedsCenter Participants: Tom Butkiewicz
Current practice for ROV telepresence is very simi-lar to mission-playback and dive videos in that the general experience is simply watching video footage, live or recorded. This has the significant disadvantage of being limited to viewing only from the first-person perspective of the video camera(s), and for mission-playback, having to watch in linear-time. However, by using the video and other data sources, it is possible to reconstruct 3D scenes that are freely-explorable and can be viewed from any angle. For example, a telepresence viewer might be better able to help guide an ROV’s robotic arm if they viewed the ROV from a side position rather than from the camera’s position.
These scenes can be constructed using several data sources: Structure from Motion (SfM) can calculate photo-textured 3D models from videos. The Center has successfully used SfM for 3D reconstruction of coral reefs from dive videos (See Task 31). However, SfM reconstruction can take days or weeks to pro-cess, making it only appropriate for mission-playback.
A more exciting possibility is creating a 3D scene around an ROV in real time using technology such as 3D imaging sonars (e.g., Coda Octopus Echoscope) or time-of-flight depth cameras.
Butkiewicz worked with industrial partner Coda Octo-pus to get their Echoscope data exported in a format that contained enough supplemental information that it could be used to rapidly construct per-frame 3D triangle mesh surfaces. A Unity project was created to test this process, and it was determined that the Echo-scope is capable of providing sufficient information for real-time 3D reconstruction, however the resolution (128x128) and frame rate (~5 frames per second) is substantially less than optimal.
The Center has since acquired a new flash-lidar depth camera, which Yuri Rzhanov is modifying for under-water usage (changing its light source’s wavelength and adding a pressure housing). Compared to the 3D imaging sonar, it is orders of magnitude less expen-sive, and is capable of providing significantly higher
resolution (~640x480) depth im-ages at much faster framerates (~30 frames per second), though its range is shorter, and it cannot measure through murky water. This device provides a data stream that is well suited for real-time 3D reconstruction using established Simultaneous Loca-tion and Mapping (SLAM) algorithms, and when paired with high-resolution color cameras, it should permit 3D re-construction of underwater scenes at visual quality equivalent to traditional video (with the added benefits of stereoscopic 3D and unconstrained viewing). Further work and testing with this new camera is expected to continue when COVID-19 restrictions are lifted an in-lab work can resume.
Figure 52-1. Frame from the whale fall video, showing the confounding factors of for-ward lighting and moving wildlife.

JHC Performance Report 31 January 2021 251
EXPLORE AND MAPEXPLORE AND MAP
To further explore the limits of Structure from Mo-tion for ROV mission playback, Andrew Stevens experimented with applying SfM reconstruction to whale fall footage provided by the OET and captured during an E/V Nautilus expedition in the summer of 2019 (Figure 52-1). Despite having a high-quality video source and incredibly thorough visual coverage of the entire whale fall, the SfM software was unable to reconcile the dynamic lighting of the scene from the ROV’s forward light and could not produce a 3D model of the subject. Another complicating factor affecting the reconstruction was various scavenging animals moving about the carcass over the course of the video, and filamentous algae which undulate with the current. For these reasons, and despite our success with shallow coral reef subjects, current com-mercial SfM software was determined to be incapable of reconstructing artificially lit deep-water scenes, reinforcing the need for real-time, direct depth sens-ing technologies such as flash-lidar cameras and 3D imaging sonars.
As part of a project with the ASV team, Butkiewicz implemented a Unity-based immersive telepresence application to explore the feasibility of presenting live video feeds from underway surface vessels to shore-side viewers using virtual reality headsets. The ASV project focuses on stitching multiple camera feeds together on the boat to form a single 360° panoramic image. There is limited bandwidth available between the ASV and the shore-side operators, which currently limits the resolution of the images being sent from all of the five cameras. The goal of the project is to be able to send higher resolution video through the lim-ited bandwidth by only sending a single video feed, which contains just the portion of the panorama that the user is currently interested in looking at.
By using a head-tracked VR interface, the system always knows which direction the user is looking, and these look directions can be sent to the ASV to up-date the direction of the high-resolution video feed. On paper this seems like a great solution, however in practice, the latency inherent in the networking and video compression/decompression presented signifi-cant issues. In the test system, there was a 1s to 1.5s delay between image capture on a remote camera, and final display in the headset. This meant that when a user turned to a different direction it took a second or two for the high-resolution video stream to adjust position. To prevent motion sickness, the viewing application renders the interface at upwards of 90 frames per second, independently of how fast video frames are received. While this prevents the latency
from limiting the application, the experience of turn-ing you head into a black void (that does not fill in for a second or two) is still jarring.
To address this issue, a solution was considered that uses two video streams: the high-resolution look direction stream, and a low-resolution stream of the entire panorama. This can fix the issue, by ensuring there is always visual content no matter how quickly a user turns their head, but it complicates the system, increases compression/decompression overhead, wastes bandwidth sending redundant imagery, and the two streams could potentially get out of sync.
A potential solution has been identified: a recently released video standard called MPEG-OMAF (Omni-directional Media Format). This technique takes each frame of a 360° panoramic video stream, converts it to a cubemap, and then subdivides the six cubemap faces into multiple sub-faces. These sub-faces are then packed (tiled) into a single standard widescreen video frame, with sub-faces nearest the look direc-tion being stored as large tiles, taking up relatively larger portions of the video frame, and sub-faces that are behind or away from the look direction being stored as smaller tiles, taking up much smaller por-tions of the video frame. The single video frame is then compressed as if it were any other video source, and then sent to the viewer. The viewing application then decodes the single frame as normal and uses metadata to unpack the variously sized tiles back into the original cubemap, which now has high-resolution content preserved around where the user is look-ing, but has lower resolution content away from the look direction. This solution eliminates much of the overhead involved with multiple video streams and permits users to turn their heads as fast as desired with minimal impact from latency. The OMAFv2 stan-dard also includes support for overlays, which could be used to embed augmented reality navigation aids (such as those previously developed by the Center) directly into the OMAF video stream.
While latency and bandwidth issues are less signifi-cant with tethered ROV missions when it comes to on-board operators, telepresence for any remote, onshore operators or viewers should benefit greatly from using this strategy.
COVID Impacts Minimal impact, related to not being able to work to-gether in person, modify and test devices in the lab, and use the lab’s superior VR and wide-area tracking system.

JHC Performance Report252
HYDROGRAPHIC AND CHARTING EXPERTISEHYDROGRAPHIC AND CHARTING EXPERTISE
Programmatic Priority 4: Hydrographic Expertise
Research Requirement 4.A: Education
FFO Requirement 4.A: “Development, maintenance, and delivery of advanced curricula and short courses in hydrographic and ocean mapping science and engineering at the graduate education level—leveraging to the maximum extent the proposed research program, and interacting with national and international professional bodies—to bring the latest innovations and standards into the graduate educational experience for both full-time education and continuing professional development.”
TASK 53: Upgrade of Education Program and Update Ocean Mapping Curriculum: Modify courses and labs as needed. Develop short courses in collaboration with NOAA and others. PIs: John Hughes Clarke, Semme Dijkstra, and Center Faculty
Project: FIG/IHO/ICA Category A Accreditation
The content, sequence, and delivery of the ocean mapping training at CCOM is continuously being updated to represent current developments. Careful attention is paid to ensuring that the FIG/IHO/ICA Category A course standards continue to be met: The curriculum in Ocean Mapping offered through the Center is one of the key components of the NOAA grant. NOAA staff are routinely assigned to UNH for graduate and diploma-based training. Maintaining Category A accreditation is an essential part of ensuring the quality of the educational pro-gram.
On April 10, 2020 we notified the FIG/IHO/ICA educational board (IBSC) of our response to the COVID-19 pan-demic. The center was notified that the response is deemed satisfactory by the board in a letter received on April 19, 2020.
Project: Curriculum Upgrades and Development
Center Participants: Brian Calder, John Hughes Clarke, Semme Dijkstra, Larry Mayer, Larry Ward, Rochelle Wigley, Giuseppe Masetti, and Juliet Kinney
NOAA Collaborators: Andy Armstrong
Adoption of Python as the Preferred Programming Language
In November 2018, the Center decided to switch from Matlab to Python as the preferred program-ming language for the ocean mapping courses. Among many reasons for this switch, a few stand out: Python is freely available to students before, during, and after their tenure at the Center; Coast Survey manages and uses Pydro – a suite of software tools mainly implemented in Python – at many steps of the data acquisition and processing workflows; and, Python is increasingly popular within the scien-tific community. Our students are still free to use a programming of their choice, but can expect better support when using Python.
As of the spring of 2020, all lab exercises in the courses that form the Ocean Mapping curriculum and involving programming tasks are presented in
the form of Jupyter notebooks. Jupyter Notebooks integrate live code, equations, images, and text. The benefit of this approach that this is consistent with the form and format of the e-learning modules used to introduce our students to programming with Python (ePOM). Note that even some of the labs that do not involve programming are presented in the form of Jupyter notebooks in order to provide consistency.
E-Learning Python for Ocean Mapping
Students at the Center need to have a minimum level of programing skills to successfully complete many of their assignments. Historically, a significant amount of time was required to teach the students the program-ming skills required. Thus, the decision was made to create e-learning courses to ensure a minimum com-mon level of programming skills among the incoming students. At the same time, in order to provide com-
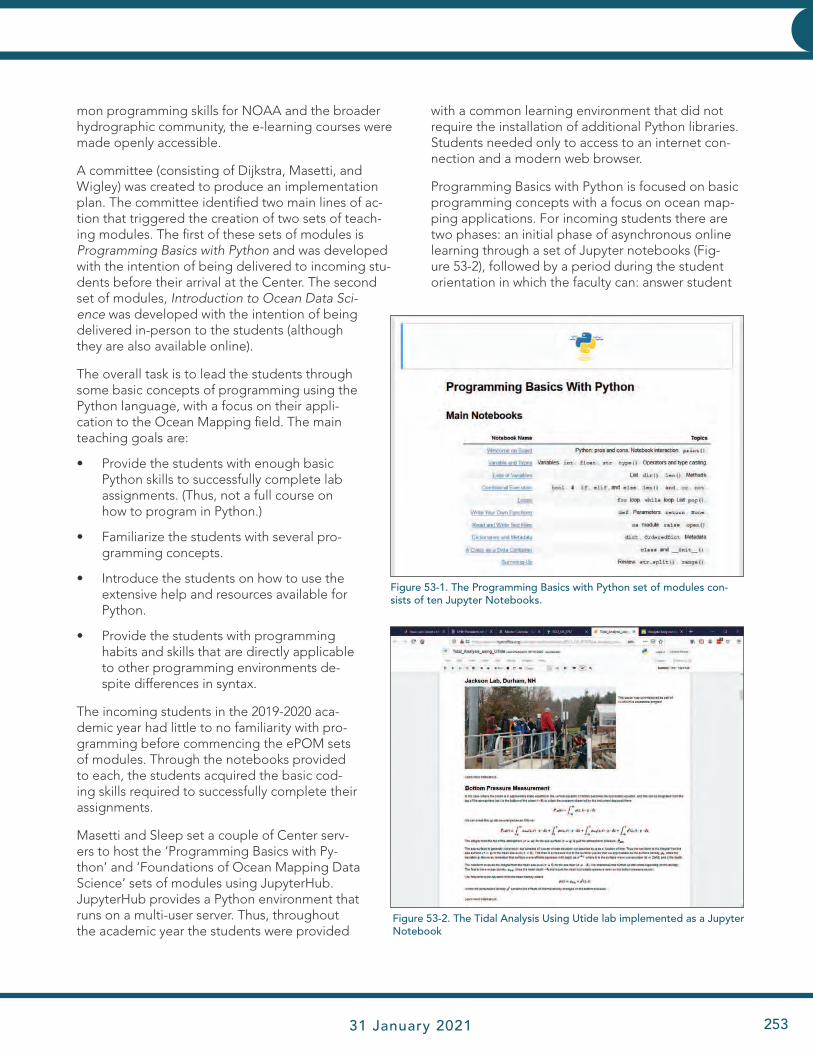
JHC Performance Report 31 January 2021 253
HYDROGRAPHIC AND CHARTING EXPERTISEHYDROGRAPHIC AND CHARTING EXPERTISE
mon programming skills for NOAA and the broader hydrographic community, the e-learning courses were made openly accessible.
A committee (consisting of Dijkstra, Masetti, and Wigley) was created to produce an implementation plan. The committee identified two main lines of ac-tion that triggered the creation of two sets of teach-ing modules. The first of these sets of modules is Programming Basics with Python and was developed with the intention of being delivered to incoming stu-dents before their arrival at the Center. The second set of modules, Introduction to Ocean Data Sci-ence was developed with the intention of being delivered in-person to the students (although they are also available online).
The overall task is to lead the students through some basic concepts of programming using the Python language, with a focus on their appli-cation to the Ocean Mapping field. The main teaching goals are:
• Provide the students with enough basic Python skills to successfully complete lab assignments. (Thus, not a full course on how to program in Python.)
• Familiarize the students with several pro-gramming concepts.
• Introduce the students on how to use the extensive help and resources available for Python.
• Provide the students with programming habits and skills that are directly applicable to other programming environments de-spite differences in syntax.
The incoming students in the 2019-2020 aca-demic year had little to no familiarity with pro-gramming before commencing the ePOM sets of modules. Through the notebooks provided to each, the students acquired the basic cod-ing skills required to successfully complete their assignments.
Masetti and Sleep set a couple of Center serv-ers to host the ‘Programming Basics with Py-thon’ and ‘Foundations of Ocean Mapping Data Science’ sets of modules using JupyterHub. JupyterHub provides a Python environment that runs on a multi-user server. Thus, throughout the academic year the students were provided
with a common learning environment that did not require the installation of additional Python libraries. Students needed only to access to an internet con-nection and a modern web browser.
Programming Basics with Python is focused on basic programming concepts with a focus on ocean map-ping applications. For incoming students there are two phases: an initial phase of asynchronous online learning through a set of Jupyter notebooks (Fig-ure 53-2), followed by a period during the student orientation in which the faculty can: answer student
Figure 53-1. The Programming Basics with Python set of modules con-sists of ten Jupyter Notebooks.
Figure 53-2. The Tidal Analysis Using Utide lab implemented as a Jupyter Notebook
JHC Performance Report254
HYDROGRAPHIC AND CHARTING EXPERTISEHYDROGRAPHIC AND CHARTING EXPERTISE
questions, evaluate the students’ understanding of concepts and, encourage collaboration among the students. A key element of Foundation of Ocean Mapping Science is that it acts as a connector to the ‘Ocean Mapping Option’ core courses and consists of four modules that are taught by Masetti as part of the Tools for Ocean Mapping Course.
Because these tools were provided to students in their initial phase of training, the 2019-2020 incom-ing students were able to start on the more complex programming tasks required by the lab courses much earlier in the year. The greater programming exper-tise also allowed the instructors to put added em-phasis on the concepts presented in the labs, rather than addressing programming questions. Feedback from the students was overwhelmingly positive. Some of the students lamented at the end of the year that they would have spent more time on the modules had they realized how relevant the contents were to their educational experience at the Center.
Development on the Notebooks for both Program-ming Basics with Python and Foundation of Ocean Mapping Science has been completed and are available online. Both sets of notebooks have been made available in Pydro with the assistance of Tyanne Faulks (NOAA PHB) and Barry Gallagher (NOAA HSTB). Accounts have been created for incoming students as well as other interested parties, including NOAA personnel.
The findings and results of the first cycle of the ePOM initiative were shared with the hydrographic com-munity at the 2020 Canadian Hydrographic Confer-ence. In particular, a video in which ePOM students share insights from their learning experience was well received by the conference attendants (Masetti, Dijkstra, Wigley and Roperez).
COURSE: Integrated Seabed Mapping SystemsHughes Clarke teaches the majority of this course, with significant contributions by Dijkstra (field and lab exercises and motion sensors) and Calder (digital fil-tering). In 2020 the integrated Seabed Mapping class was offered for a 5th time. A major change was the presentation of all lectures as pre-recorded lectures. Class period was then used to discuss the content of the video lecture.
COVID ImpactsDue to this being a fall course the course classes were taught online in their entirety. Pre-recorded video lectures were created. The students were asked
to watch the video before class, and class time was used to discuss the content of the video lectures. In person labs were offered on board R/V Gulf Surveyor, but with the number of students limited to two at a time and adhering to all the UNH COVID-19 standard protocols.
COURSE: Advanced Topics in Ocean MappingThis course was renamed from ‘Fundamentals of Ocean Mapping-II’ to better represent its place within the curriculum. Dijkstra teaches the majority of this course, with significant contributions by Armstrong (Tides), and Mayer (Seafloor Characterization). A major change was the presentation of all the labs to Jupyter notebooks by Dijkstra.
Future Intentions:. To implement the labs in Python Notebooks where appropriate.
COVID ImpactsNormally during our course work, a number of visits to the R/V Gulf Surveyor (RVGS) are made. When the potential impacts of COVID-19 became apparent in February Dijkstra decided to visit the vessel and do a practical lab exercise during each remaining available lab period. The reason for this was twofold: 1) to com-plete all required practical exercises, and; 2) to ensure that the students would reach the level of familiarity with the vessel required to allow them to imagine the environment in possible virtual scenarios. Though this approach has the disadvantage that some of the labs preceded the formal introduction of subjects in class it ensured that all labs, with the exception of a new for 2020 magnetic surveying lab, were successfully ex-ecuted. The student feedback went from initial skepti-cism to being very positive once it became clear that they would not be returning from online learning for the remainder of the academic year. It is the intention that the students will complete the magnetic survey lab in the summer of 2021 as part of the completion of the hydrographic surveying field course.
After March 23 all classes were presented online in a Zoom meeting format. The teaching materials needed only minor updates for this alteration in format.
COURSE: Marine Geology/Geophysics Curriculum: Marine Geology and Geophysics for Hydrographic SurveyorsMarine Geology and Geophysics for Hydrographic Surveyors was taught for the third time with some minor alteration based on student feedback. The two credit hour course was taught by Ward, Hughes Clark, and Wigley.

JHC Performance Report 31 January 2021 255
HYDROGRAPHIC AND CHARTING EXPERTISEHYDROGRAPHIC AND CHARTING EXPERTISE
COVID ImpactsAfter March 23, all classes were presented online in a Zoom meeting format. The teaching materials needed only minor updates for this alteration in format.
COURSE: Oceanography for HydrographyIn January 2019 the oceanography course was pre-sented for the third time. The course contents and presentation were left unchanged after the positive reception by the students of the first courses. The course was taught by John Hughes Clarke in the J- term in January 2019.
COVID ImpactsDue to its placement within the academic year in this reporting period the COVID-19 pandemic did not impact the course
COURSE: Geodesy & Positioning for Ocean MappingFor the academic year 2019-2020 the course con-tents remained largely unaltered, but all of the labs are now encapsulated in Python Notebooks. Sig-nificant progress has been made in converting all the class materials to Python notebooks as Dijkstra feels that due to the computational nature of the course significant gains can be made. Embedding live examples of coordinate transformations, least square adjustments, Kalman filtering, etc. in the course materials significantly reduces the gap in the theoretical presentation of the materials in class and their practical application in labs.
Future Intentions: To fully encapsulate the course materials in Python Notebooks and provide relevant code examples where appropriate.
COVID ImpactsRather than using PowerPoint slides Dijkstra switched to presenting all the class materials using the ‘white-board’ provided by the Zoom software used for teaching. This was at the request of the students who preferred this over a mix of slides and whiteboard us-age in an online setting.
Normally several labs are conducted using optical survey equipment and/or GNSS receivers. When the potential impacts of COVID-19 became apparent in February, Dijkstra decided to do a practical lab exercise during each remaining available lab period. The reason for this was twofold: 1) to complete all required practical exercises, and; 2) to ensure that the students would reach the level of familiarity with the instruments required to allow them to imagine their use in possible virtual scenarios. Though this approach has the disadvantage that some of the labs preceded the formal introduction of subjects in class it ensured that all labs with the exception of a closed loop traverse and a GNSS survey, were successfully completed. The student feedback went from initial skepticism to being very positive once it became clear that they would not be returning from online learning for the remainder of the academic year.
The missed GNSS survey was made up online using GNSS receivers with a web interface that were newly acquired (Figure 53-3). These receivers allowed the students to undertake all the steps normally included
Figure 53-3. Virtual GNSS base station lab—in this lab the students operated the ‘smart antenna’ GNSS receiver located in Dijkstra’s backyard through a web interface.
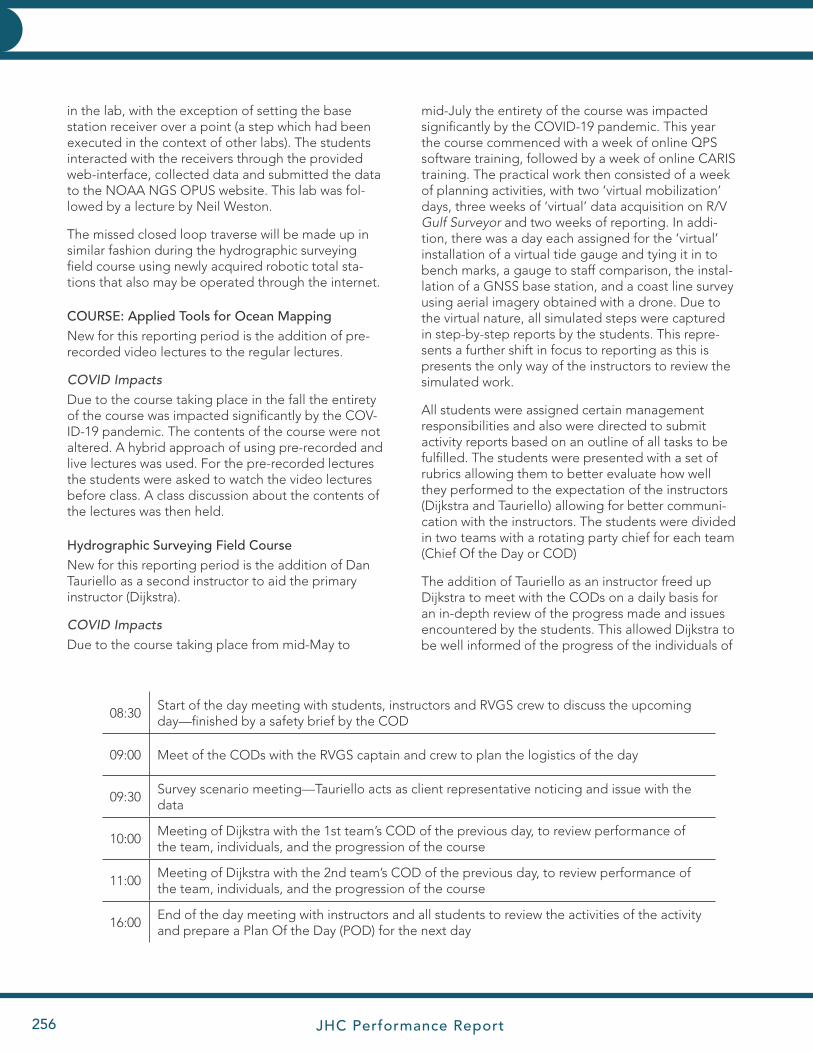
JHC Performance Report256
HYDROGRAPHIC AND CHARTING EXPERTISEHYDROGRAPHIC AND CHARTING EXPERTISE
in the lab, with the exception of setting the base station receiver over a point (a step which had been executed in the context of other labs). The students interacted with the receivers through the provided web-interface, collected data and submitted the data to the NOAA NGS OPUS website. This lab was fol-lowed by a lecture by Neil Weston.
The missed closed loop traverse will be made up in similar fashion during the hydrographic surveying field course using newly acquired robotic total sta-tions that also may be operated through the internet.
COURSE: Applied Tools for Ocean MappingNew for this reporting period is the addition of pre-recorded video lectures to the regular lectures.
COVID ImpactsDue to the course taking place in the fall the entirety of the course was impacted significantly by the COV-ID-19 pandemic. The contents of the course were not altered. A hybrid approach of using pre-recorded and live lectures was used. For the pre-recorded lectures the students were asked to watch the video lectures before class. A class discussion about the contents of the lectures was then held.
Hydrographic Surveying Field CourseNew for this reporting period is the addition of Dan Tauriello as a second instructor to aid the primary instructor (Dijkstra).
COVID ImpactsDue to the course taking place from mid-May to
mid-July the entirety of the course was impacted significantly by the COVID-19 pandemic. This year the course commenced with a week of online QPS software training, followed by a week of online CARIS training. The practical work then consisted of a week of planning activities, with two ‘virtual mobilization’ days, three weeks of ‘virtual’ data acquisition on R/V Gulf Surveyor and two weeks of reporting. In addi-tion, there was a day each assigned for the ‘virtual’ installation of a virtual tide gauge and tying it in to bench marks, a gauge to staff comparison, the instal-lation of a GNSS base station, and a coast line survey using aerial imagery obtained with a drone. Due to the virtual nature, all simulated steps were captured in step-by-step reports by the students. This repre-sents a further shift in focus to reporting as this is presents the only way of the instructors to review the simulated work.
All students were assigned certain management responsibilities and also were directed to submit activity reports based on an outline of all tasks to be fulfilled. The students were presented with a set of rubrics allowing them to better evaluate how well they performed to the expectation of the instructors (Dijkstra and Tauriello) allowing for better communi-cation with the instructors. The students were divided in two teams with a rotating party chief for each team (Chief Of the Day or COD)
The addition of Tauriello as an instructor freed up Dijkstra to meet with the CODs on a daily basis for an in-depth review of the progress made and issues encountered by the students. This allowed Dijkstra to be well informed of the progress of the individuals of
08:30Start of the day meeting with students, instructors and RVGS crew to discuss the upcoming day—finished by a safety brief by the COD
09:00 Meet of the CODs with the RVGS captain and crew to plan the logistics of the day
09:30Survey scenario meeting—Tauriello acts as client representative noticing and issue with the data
10:00Meeting of Dijkstra with the 1st team’s COD of the previous day, to review performance of the team, individuals, and the progression of the course
11:00Meeting of Dijkstra with the 2nd team’s COD of the previous day, to review performance of the team, individuals, and the progression of the course
16:00End of the day meeting with instructors and all students to review the activities of the activity and prepare a Plan Of the Day (POD) for the next day
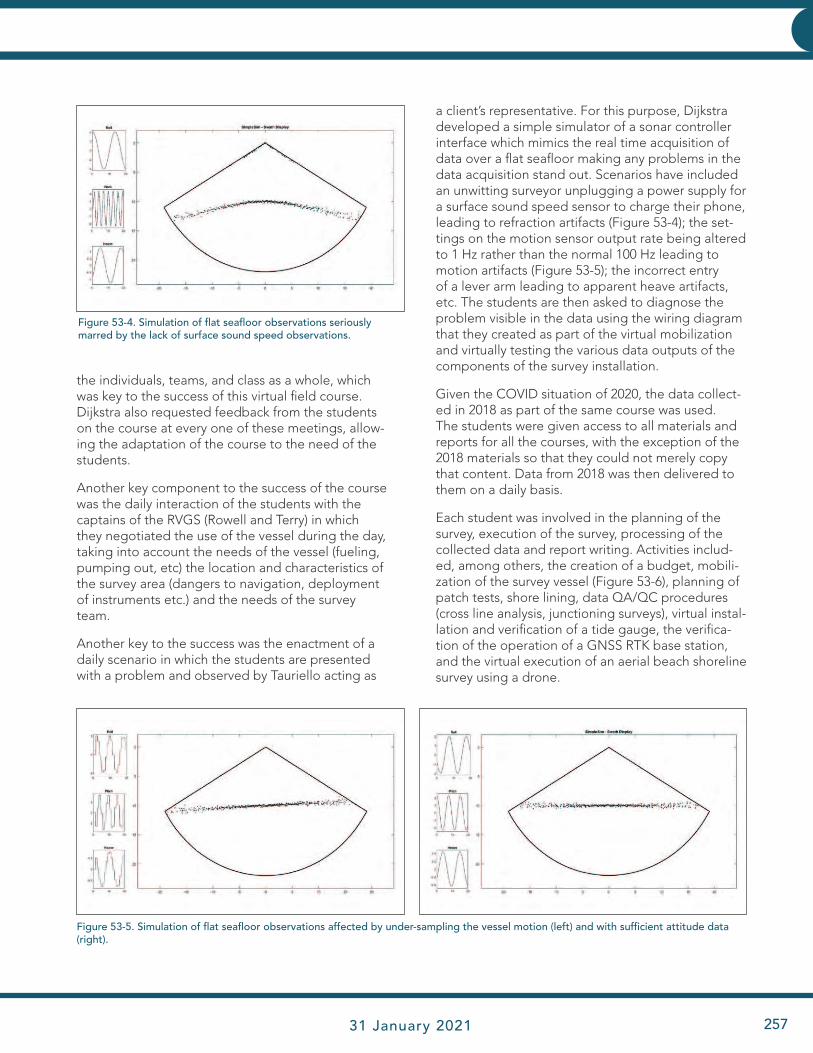
JHC Performance Report 31 January 2021 257
HYDROGRAPHIC AND CHARTING EXPERTISEHYDROGRAPHIC AND CHARTING EXPERTISE
the individuals, teams, and class as a whole, which was key to the success of this virtual field course. Dijkstra also requested feedback from the students on the course at every one of these meetings, allow-ing the adaptation of the course to the need of the students.
Another key component to the success of the course was the daily interaction of the students with the captains of the RVGS (Rowell and Terry) in which they negotiated the use of the vessel during the day, taking into account the needs of the vessel (fueling, pumping out, etc) the location and characteristics of the survey area (dangers to navigation, deployment of instruments etc.) and the needs of the survey team.
Another key to the success was the enactment of a daily scenario in which the students are presented with a problem and observed by Tauriello acting as
a client’s representative. For this purpose, Dijkstra developed a simple simulator of a sonar controller interface which mimics the real time acquisition of data over a flat seafloor making any problems in the data acquisition stand out. Scenarios have included an unwitting surveyor unplugging a power supply for a surface sound speed sensor to charge their phone, leading to refraction artifacts (Figure 53-4); the set-tings on the motion sensor output rate being altered to 1 Hz rather than the normal 100 Hz leading to motion artifacts (Figure 53-5); the incorrect entry of a lever arm leading to apparent heave artifacts, etc. The students are then asked to diagnose the problem visible in the data using the wiring diagram that they created as part of the virtual mobilization and virtually testing the various data outputs of the components of the survey installation.
Given the COVID situation of 2020, the data collect-ed in 2018 as part of the same course was used. The students were given access to all materials and reports for all the courses, with the exception of the 2018 materials so that they could not merely copy that content. Data from 2018 was then delivered to them on a daily basis.
Each student was involved in the planning of the survey, execution of the survey, processing of the collected data and report writing. Activities includ-ed, among others, the creation of a budget, mobili-zation of the survey vessel (Figure 53-6), planning of patch tests, shore lining, data QA/QC procedures (cross line analysis, junctioning surveys), virtual instal-lation and verification of a tide gauge, the verifica-tion of the operation of a GNSS RTK base station, and the virtual execution of an aerial beach shoreline survey using a drone.
Figure 53-5. Simulation of flat seafloor observations affected by under-sampling the vessel motion (left) and with sufficient attitude data (right).
Figure 53-4. Simulation of flat seafloor observations seriously marred by the lack of surface sound speed observations.
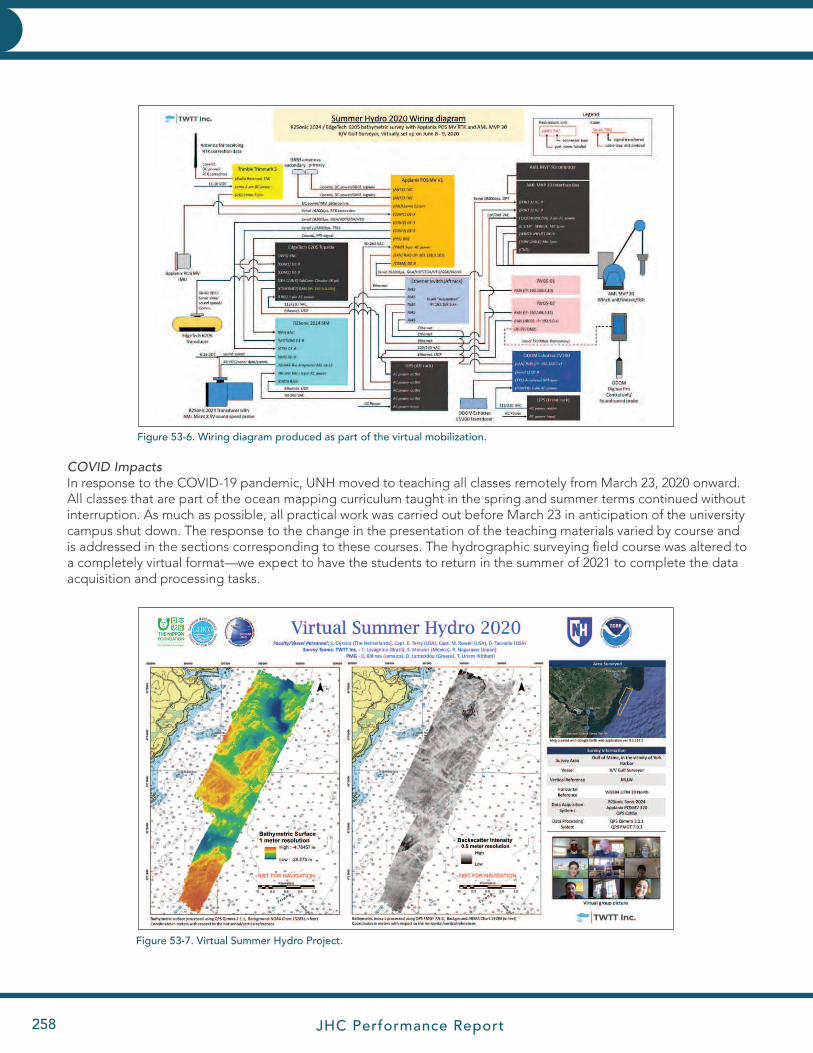
JHC Performance Report258
HYDROGRAPHIC AND CHARTING EXPERTISEHYDROGRAPHIC AND CHARTING EXPERTISE
COVID ImpactsIn response to the COVID-19 pandemic, UNH moved to teaching all classes remotely from March 23, 2020 onward. All classes that are part of the ocean mapping curriculum taught in the spring and summer terms continued without interruption. As much as possible, all practical work was carried out before March 23 in anticipation of the university campus shut down. The response to the change in the presentation of the teaching materials varied by course and is addressed in the sections corresponding to these courses. The hydrographic surveying field course was altered to a completely virtual format—we expect to have the students to return in the summer of 2021 to complete the data acquisition and processing tasks.
Figure 53-6. Wiring diagram produced as part of the virtual mobilization.
Figure 53-7. Virtual Summer Hydro Project.
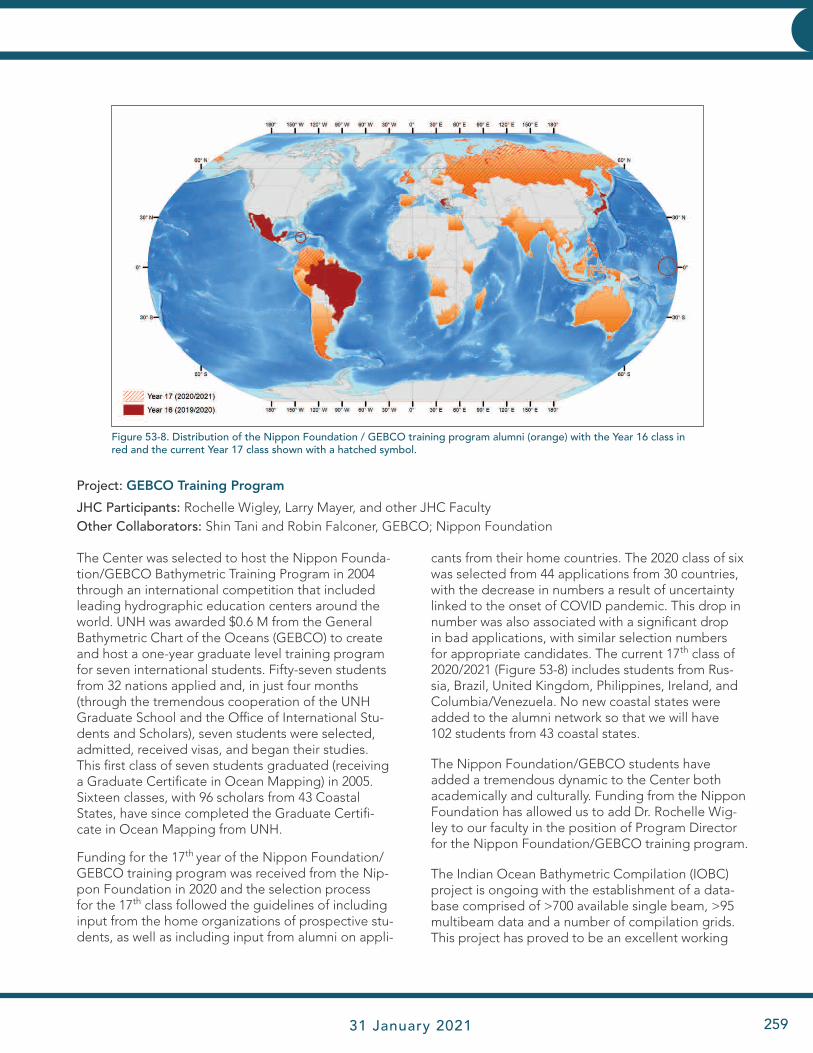
JHC Performance Report 31 January 2021 259
HYDROGRAPHIC AND CHARTING EXPERTISEHYDROGRAPHIC AND CHARTING EXPERTISE
Project: GEBCO Training Program
JHC Participants: Rochelle Wigley, Larry Mayer, and other JHC FacultyOther Collaborators: Shin Tani and Robin Falconer, GEBCO; Nippon Foundation
cants from their home countries. The 2020 class of six was selected from 44 applications from 30 countries, with the decrease in numbers a result of uncertainty linked to the onset of COVID pandemic. This drop in number was also associated with a significant drop in bad applications, with similar selection numbers for appropriate candidates. The current 17th class of 2020/2021 (Figure 53-8) includes students from Rus-sia, Brazil, United Kingdom, Philippines, Ireland, and Columbia/Venezuela. No new coastal states were added to the alumni network so that we will have 102 students from 43 coastal states.
The Nippon Foundation/GEBCO students have added a tremendous dynamic to the Center both academically and culturally. Funding from the Nippon Foundation has allowed us to add Dr. Rochelle Wig-ley to our faculty in the position of Program Director for the Nippon Foundation/GEBCO training program.
The Indian Ocean Bathymetric Compilation (IOBC) project is ongoing with the establishment of a data-base comprised of >700 available single beam, >95 multibeam data and a number of compilation grids. This project has proved to be an excellent working
Figure 53-8. Distribution of the Nippon Foundation / GEBCO training program alumni (orange) with the Year 16 class in red and the current Year 17 class shown with a hatched symbol.
The Center was selected to host the Nippon Founda-tion/GEBCO Bathymetric Training Program in 2004 through an international competition that included leading hydrographic education centers around the world. UNH was awarded $0.6 M from the General Bathymetric Chart of the Oceans (GEBCO) to create and host a one-year graduate level training program for seven international students. Fifty-seven students from 32 nations applied and, in just four months (through the tremendous cooperation of the UNH Graduate School and the Office of International Stu-dents and Scholars), seven students were selected, admitted, received visas, and began their studies. This first class of seven students graduated (receiving a Graduate Certificate in Ocean Mapping) in 2005. Sixteen classes, with 96 scholars from 43 Coastal States, have since completed the Graduate Certifi-cate in Ocean Mapping from UNH.
Funding for the 17th year of the Nippon Foundation/GEBCO training program was received from the Nip-pon Foundation in 2020 and the selection process for the 17th class followed the guidelines of including input from the home organizations of prospective stu-dents, as well as including input from alumni on appli-
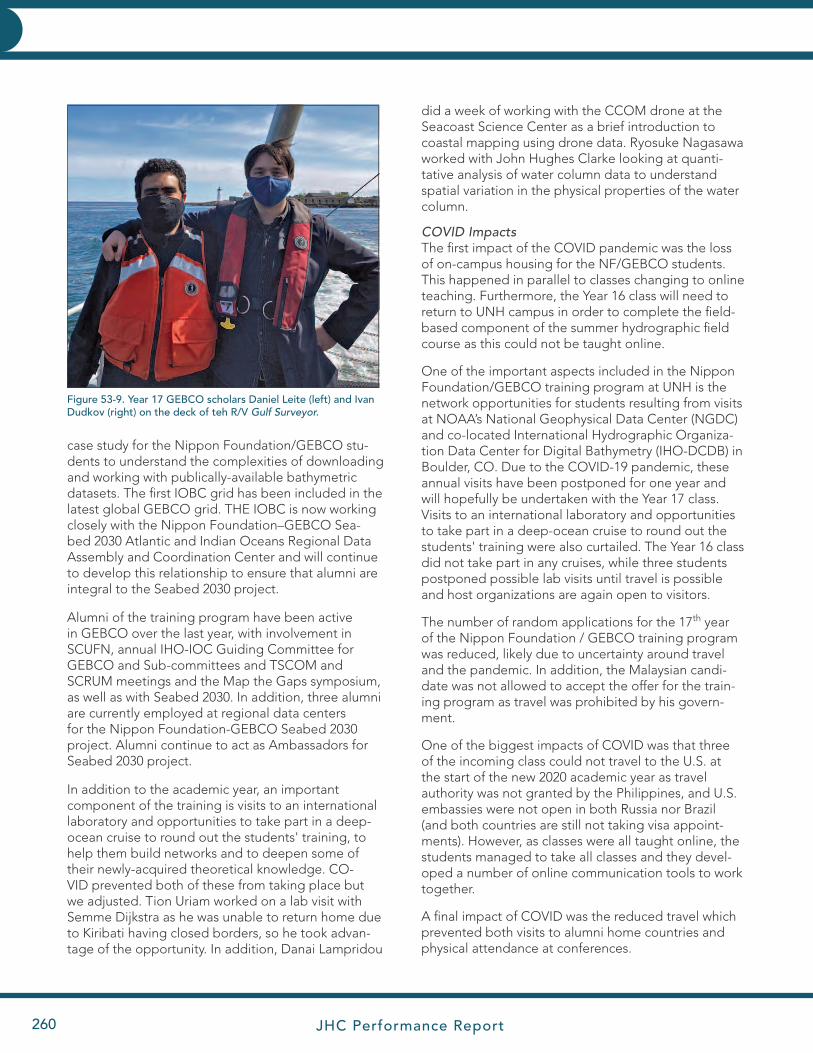
JHC Performance Report260
HYDROGRAPHIC AND CHARTING EXPERTISEHYDROGRAPHIC AND CHARTING EXPERTISE
case study for the Nippon Foundation/GEBCO stu-dents to understand the complexities of downloading and working with publically-available bathymetric datasets. The first IOBC grid has been included in the latest global GEBCO grid. THE IOBC is now working closely with the Nippon Foundation–GEBCO Sea-bed 2030 Atlantic and Indian Oceans Regional Data Assembly and Coordination Center and will continue to develop this relationship to ensure that alumni are integral to the Seabed 2030 project.
Alumni of the training program have been active in GEBCO over the last year, with involvement in SCUFN, annual IHO-IOC Guiding Committee for GEBCO and Sub-committees and TSCOM and SCRUM meetings and the Map the Gaps symposium, as well as with Seabed 2030. In addition, three alumni are currently employed at regional data centers for the Nippon Foundation-GEBCO Seabed 2030 project. Alumni continue to act as Ambassadors for Seabed 2030 project.
In addition to the academic year, an important component of the training is visits to an international laboratory and opportunities to take part in a deep-ocean cruise to round out the students' training, to help them build networks and to deepen some of their newly-acquired theoretical knowledge. CO-VID prevented both of these from taking place but we adjusted. Tion Uriam worked on a lab visit with Semme Dijkstra as he was unable to return home due to Kiribati having closed borders, so he took advan-tage of the opportunity. In addition, Danai Lampridou
did a week of working with the CCOM drone at the Seacoast Science Center as a brief introduction to coastal mapping using drone data. Ryosuke Nagasawa worked with John Hughes Clarke looking at quanti-tative analysis of water column data to understand spatial variation in the physical properties of the water column.
COVID ImpactsThe first impact of the COVID pandemic was the loss of on-campus housing for the NF/GEBCO students. This happened in parallel to classes changing to online teaching. Furthermore, the Year 16 class will need to return to UNH campus in order to complete the field-based component of the summer hydrographic field course as this could not be taught online.
One of the important aspects included in the Nippon Foundation/GEBCO training program at UNH is the network opportunities for students resulting from visits at NOAA’s National Geophysical Data Center (NGDC) and co-located International Hydrographic Organiza-tion Data Center for Digital Bathymetry (IHO-DCDB) in Boulder, CO. Due to the COVID-19 pandemic, these annual visits have been postponed for one year and will hopefully be undertaken with the Year 17 class. Visits to an international laboratory and opportunities to take part in a deep-ocean cruise to round out the students' training were also curtailed. The Year 16 class did not take part in any cruises, while three students postponed possible lab visits until travel is possible and host organizations are again open to visitors.
The number of random applications for the 17th year of the Nippon Foundation / GEBCO training program was reduced, likely due to uncertainty around travel and the pandemic. In addition, the Malaysian candi-date was not allowed to accept the offer for the train-ing program as travel was prohibited by his govern-ment.
One of the biggest impacts of COVID was that three of the incoming class could not travel to the U.S. at the start of the new 2020 academic year as travel authority was not granted by the Philippines, and U.S. embassies were not open in both Russia nor Brazil (and both countries are still not taking visa appoint-ments). However, as classes were all taught online, the students managed to take all classes and they devel-oped a number of online communication tools to work together.
A final impact of COVID was the reduced travel which prevented both visits to alumni home countries and physical attendance at conferences.
Figure 53-9. Year 17 GEBCO scholars Daniel Leite (left) and Ivan Dudkov (right) on the deck of teh R/V Gulf Surveyor.
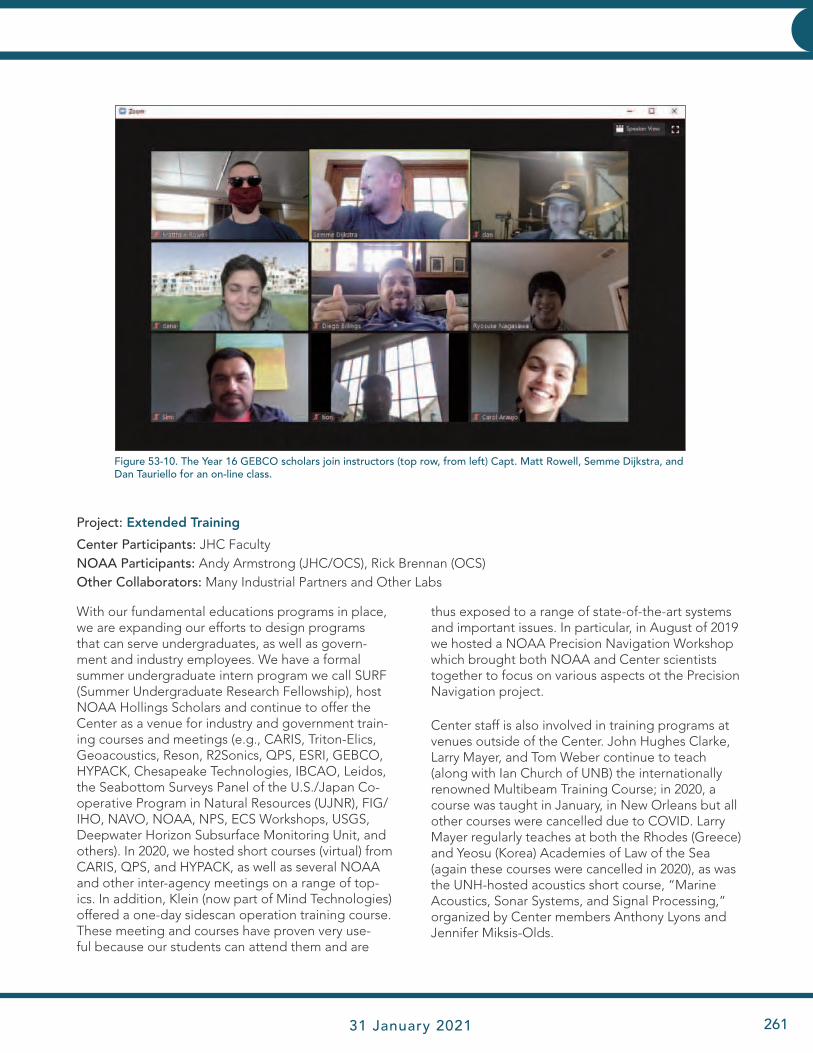
JHC Performance Report 31 January 2021 261
HYDROGRAPHIC AND CHARTING EXPERTISEHYDROGRAPHIC AND CHARTING EXPERTISE
With our fundamental educations programs in place, we are expanding our efforts to design programs that can serve undergraduates, as well as govern-ment and industry employees. We have a formal summer undergraduate intern program we call SURF (Summer Undergraduate Research Fellowship), host NOAA Hollings Scholars and continue to offer the Center as a venue for industry and government train-ing courses and meetings (e.g., CARIS, Triton-Elics, Geoacoustics, Reson, R2Sonics, QPS, ESRI, GEBCO, HYPACK, Chesapeake Technologies, IBCAO, Leidos, the Seabottom Surveys Panel of the U.S./Japan Co-operative Program in Natural Resources (UJNR), FIG/IHO, NAVO, NOAA, NPS, ECS Workshops, USGS, Deepwater Horizon Subsurface Monitoring Unit, and others). In 2020, we hosted short courses (virtual) from CARIS, QPS, and HYPACK, as well as several NOAA and other inter-agency meetings on a range of top-ics. In addition, Klein (now part of Mind Technologies) offered a one-day sidescan operation training course. These meeting and courses have proven very use-ful because our students can attend them and are
thus exposed to a range of state-of-the-art systems and important issues. In particular, in August of 2019 we hosted a NOAA Precision Navigation Workshop which brought both NOAA and Center scientists together to focus on various aspects ot the Precision Navigation project.
Center staff is also involved in training programs at venues outside of the Center. John Hughes Clarke, Larry Mayer, and Tom Weber continue to teach (along with Ian Church of UNB) the internationally renowned Multibeam Training Course; in 2020, a course was taught in January, in New Orleans but all other courses were cancelled due to COVID. Larry Mayer regularly teaches at both the Rhodes (Greece) and Yeosu (Korea) Academies of Law of the Sea (again these courses were cancelled in 2020), as was the UNH-hosted acoustics short course, “Marine Acoustics, Sonar Systems, and Signal Processing,” organized by Center members Anthony Lyons and Jennifer Miksis-Olds.
Project: Extended Training
Center Participants: JHC FacultyNOAA Participants: Andy Armstrong (JHC/OCS), Rick Brennan (OCS)Other Collaborators: Many Industrial Partners and Other Labs
Figure 53-10. The Year 16 GEBCO scholars join instructors (top row, from left) Capt. Matt Rowell, Semme Dijkstra, and Dan Tauriello for an on-line class.
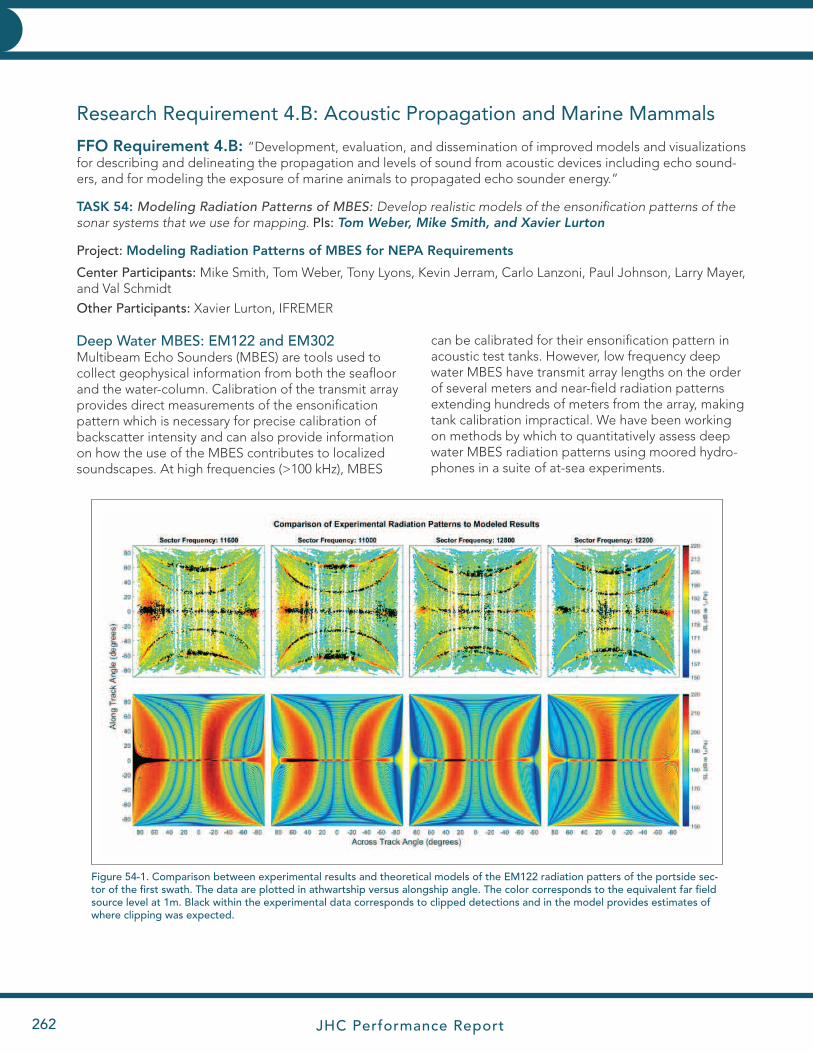
JHC Performance Report262
HYDROGRAPHIC AND CHARTING EXPERTISEHYDROGRAPHIC AND CHARTING EXPERTISE
Research Requirement 4.B: Acoustic Propagation and Marine Mammals
FFO Requirement 4.B: “Development, evaluation, and dissemination of improved models and visualizations for describing and delineating the propagation and levels of sound from acoustic devices including echo sound-ers, and for modeling the exposure of marine animals to propagated echo sounder energy.”
TASK 54: Modeling Radiation Patterns of MBES: Develop realistic models of the ensonification patterns of the sonar systems that we use for mapping. PIs: Tom Weber, Mike Smith, and Xavier Lurton
Project: Modeling Radiation Patterns of MBES for NEPA Requirements
Center Participants: Mike Smith, Tom Weber, Tony Lyons, Kevin Jerram, Carlo Lanzoni, Paul Johnson, Larry Mayer, and Val Schmidt
Other Participants: Xavier Lurton, IFREMER
Deep Water MBES: EM122 and EM302Multibeam Echo Sounders (MBES) are tools used to collect geophysical information from both the seafloor and the water-column. Calibration of the transmit array provides direct measurements of the ensonification pattern which is necessary for precise calibration of backscatter intensity and can also provide information on how the use of the MBES contributes to localized soundscapes. At high frequencies (>100 kHz), MBES
can be calibrated for their ensonification pattern in acoustic test tanks. However, low frequency deep water MBES have transmit array lengths on the order of several meters and near-field radiation patterns extending hundreds of meters from the array, making tank calibration impractical. We have been working on methods by which to quantitatively assess deep water MBES radiation patterns using moored hydro-phones in a suite of at-sea experiments.
Figure 54-1. Comparison between experimental results and theoretical models of the EM122 radiation patters of the portside sec-tor of the first swath. The data are plotted in athwartship versus alongship angle. The color corresponds to the equivalent far field source level at 1m. Black within the experimental data corresponds to clipped detections and in the model provides estimates of where clipping was expected.
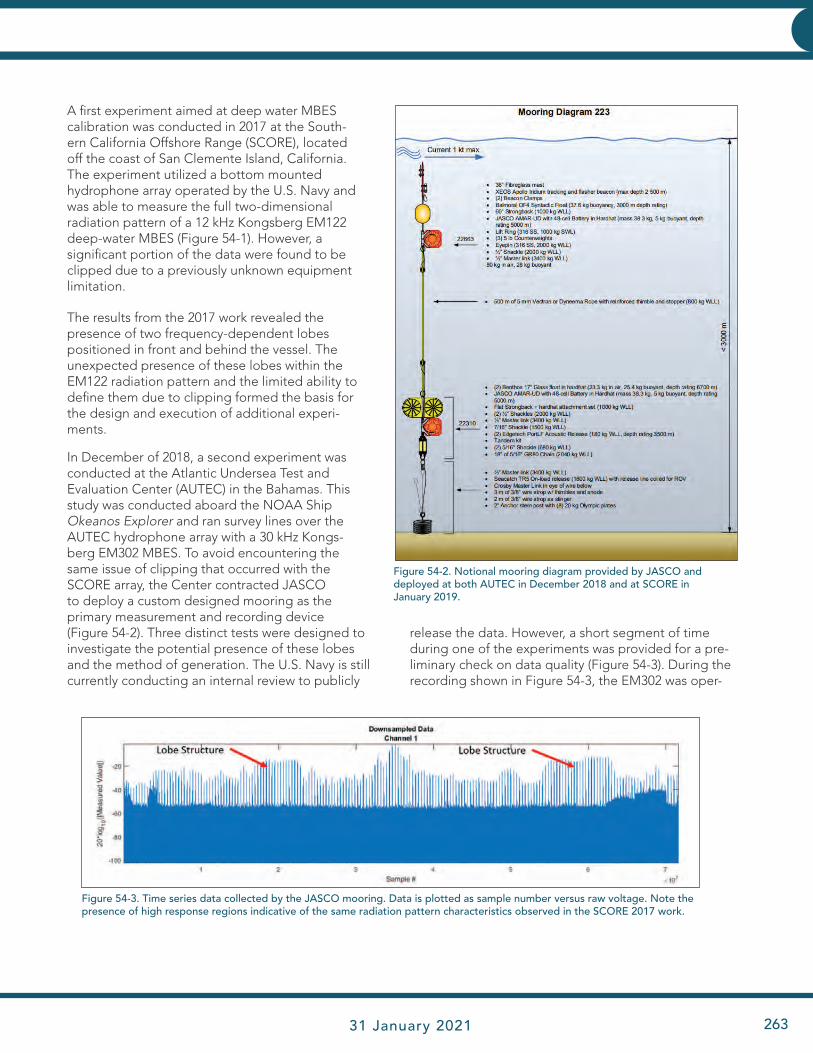
JHC Performance Report 31 January 2021 263
HYDROGRAPHIC AND CHARTING EXPERTISEHYDROGRAPHIC AND CHARTING EXPERTISE
A first experiment aimed at deep water MBES calibration was conducted in 2017 at the South-ern California Offshore Range (SCORE), located off the coast of San Clemente Island, California. The experiment utilized a bottom mounted hydrophone array operated by the U.S. Navy and was able to measure the full two-dimensional radiation pattern of a 12 kHz Kongsberg EM122 deep-water MBES (Figure 54-1). However, a significant portion of the data were found to be clipped due to a previously unknown equipment limitation.
The results from the 2017 work revealed the presence of two frequency-dependent lobes positioned in front and behind the vessel. The unexpected presence of these lobes within the EM122 radiation pattern and the limited ability to define them due to clipping formed the basis for the design and execution of additional experi-ments.
In December of 2018, a second experiment was conducted at the Atlantic Undersea Test and Evaluation Center (AUTEC) in the Bahamas. This study was conducted aboard the NOAA Ship Okeanos Explorer and ran survey lines over the AUTEC hydrophone array with a 30 kHz Kongs-berg EM302 MBES. To avoid encountering the same issue of clipping that occurred with the SCORE array, the Center contracted JASCO to deploy a custom designed mooring as the primary measurement and recording device (Figure 54-2). Three distinct tests were designed to investigate the potential presence of these lobes and the method of generation. The U.S. Navy is still currently conducting an internal review to publicly
release the data. However, a short segment of time during one of the experiments was provided for a pre-liminary check on data quality (Figure 54-3). During the recording shown in Figure 54-3, the EM302 was oper-
Figure 54-2. Notional mooring diagram provided by JASCO and deployed at both AUTEC in December 2018 and at SCORE in January 2019.
Figure 54-3. Time series data collected by the JASCO mooring. Data is plotted as sample number versus raw voltage. Note the presence of high response regions indicative of the same radiation pattern characteristics observed in the SCORE 2017 work.
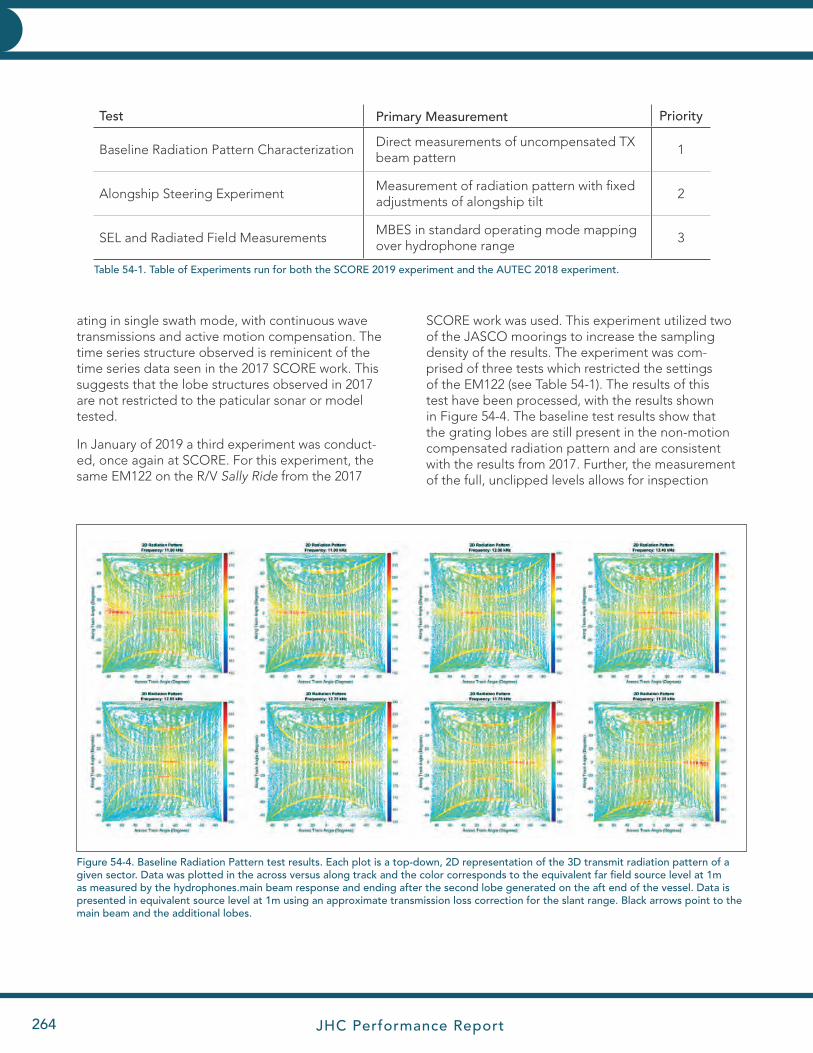
JHC Performance Report264
HYDROGRAPHIC AND CHARTING EXPERTISEHYDROGRAPHIC AND CHARTING EXPERTISE
ating in single swath mode, with continuous wave transmissions and active motion compensation. The time series structure observed is reminicent of the time series data seen in the 2017 SCORE work. This suggests that the lobe structures observed in 2017 are not restricted to the paticular sonar or model tested.
In January of 2019 a third experiment was conduct-ed, once again at SCORE. For this experiment, the same EM122 on the R/V Sally Ride from the 2017
Figure 54-4. Baseline Radiation Pattern test results. Each plot is a top-down, 2D representation of the 3D transmit radiation pattern of a given sector. Data was plotted in the across versus along track and the color corresponds to the equivalent far field source level at 1m as measured by the hydrophones.main beam response and ending after the second lobe generated on the aft end of the vessel. Data is presented in equivalent source level at 1m using an approximate transmission loss correction for the slant range. Black arrows point to the main beam and the additional lobes.
Test Primary Measurement Priority
Baseline Radiation Pattern CharacterizationDirect measurements of uncompensated TX beam pattern
1
Alongship Steering ExperimentMeasurement of radiation pattern with fixed adjustments of alongship tilt
2
SEL and Radiated Field MeasurementsMBES in standard operating mode mapping over hydrophone range
3
Table 54-1. Table of Experiments run for both the SCORE 2019 experiment and the AUTEC 2018 experiment.
SCORE work was used. This experiment utilized two of the JASCO moorings to increase the sampling density of the results. The experiment was com-prised of three tests which restricted the settings of the EM122 (see Table 54-1). The results of this test have been processed, with the results shown in Figure 54-4. The baseline test results show that the grating lobes are still present in the non-motion compensated radiation pattern and are consistent with the results from 2017. Further, the measurement of the full, unclipped levels allows for inspection
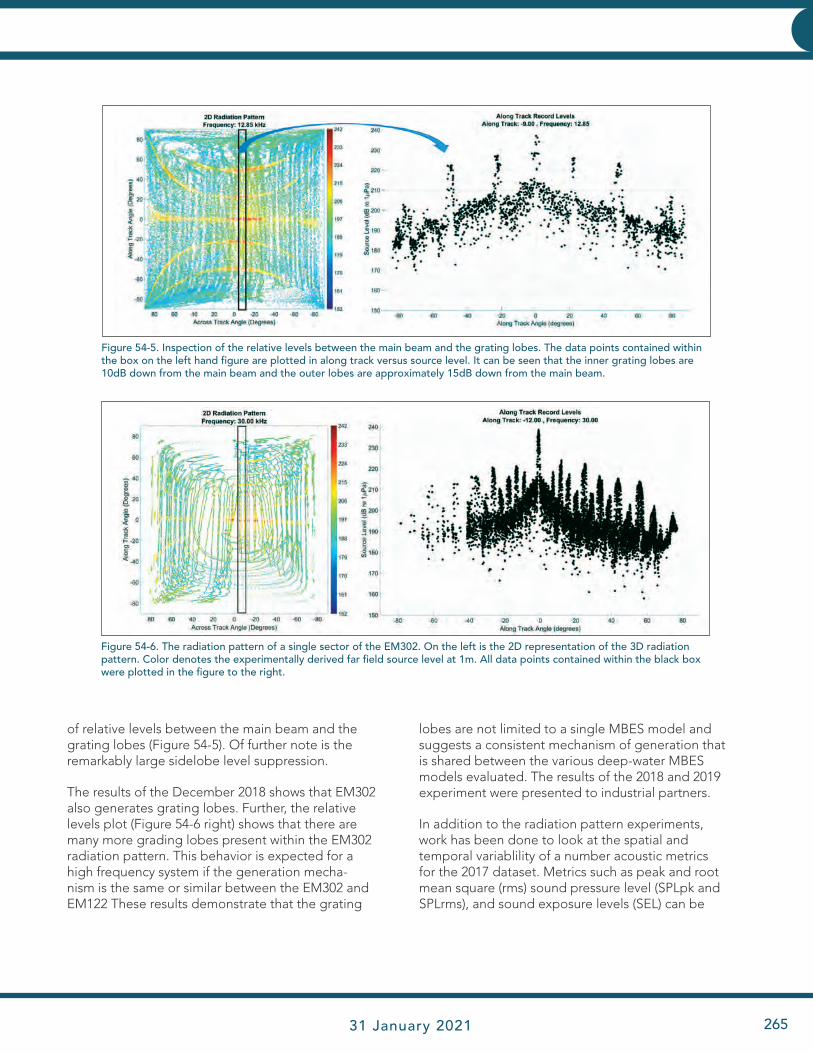
JHC Performance Report 31 January 2021 265
HYDROGRAPHIC AND CHARTING EXPERTISEHYDROGRAPHIC AND CHARTING EXPERTISE
Figure 54-5. Inspection of the relative levels between the main beam and the grating lobes. The data points contained within the box on the left hand figure are plotted in along track versus source level. It can be seen that the inner grating lobes are 10dB down from the main beam and the outer lobes are approximately 15dB down from the main beam.
Figure 54-6. The radiation pattern of a single sector of the EM302. On the left is the 2D representation of the 3D radiation pattern. Color denotes the experimentally derived far field source level at 1m. All data points contained within the black box were plotted in the figure to the right.
of relative levels between the main beam and the grating lobes (Figure 54-5). Of further note is the remarkably large sidelobe level suppression.
The results of the December 2018 shows that EM302 also generates grating lobes. Further, the relative levels plot (Figure 54-6 right) shows that there are many more grading lobes present within the EM302 radiation pattern. This behavior is expected for a high frequency system if the generation mecha-nism is the same or similar between the EM302 and EM122 These results demonstrate that the grating
lobes are not limited to a single MBES model and suggests a consistent mechanism of generation that is shared between the various deep-water MBES models evaluated. The results of the 2018 and 2019 experiment were presented to industrial partners.
In addition to the radiation pattern experiments, work has been done to look at the spatial and temporal variablility of a number acoustic metrics for the 2017 dataset. Metrics such as peak and root mean square (rms) sound pressure level (SPLpk and SPLrms), and sound exposure levels (SEL) can be
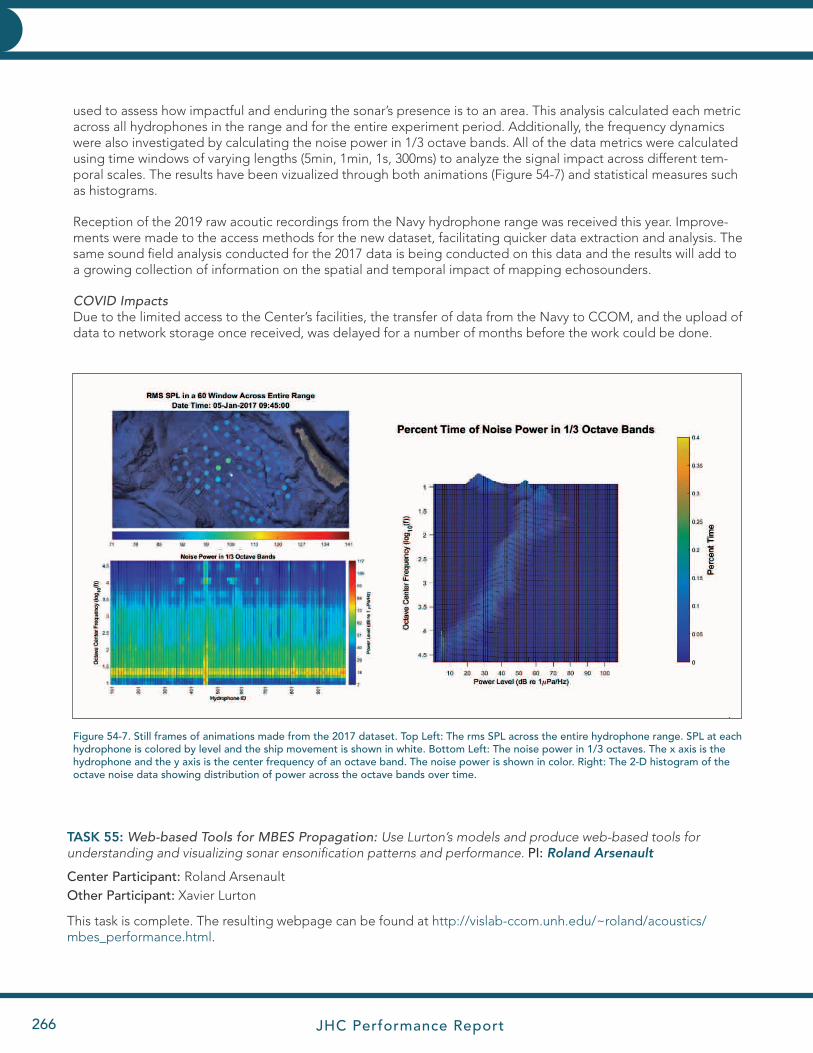
JHC Performance Report266
HYDROGRAPHIC AND CHARTING EXPERTISEHYDROGRAPHIC AND CHARTING EXPERTISE
used to assess how impactful and enduring the sonar’s presence is to an area. This analysis calculated each metric across all hydrophones in the range and for the entire experiment period. Additionally, the frequency dynamics were also investigated by calculating the noise power in 1/3 octave bands. All of the data metrics were calculated using time windows of varying lengths (5min, 1min, 1s, 300ms) to analyze the signal impact across different tem-poral scales. The results have been vizualized through both animations (Figure 54-7) and statistical measures such as histograms.
Reception of the 2019 raw acoutic recordings from the Navy hydrophone range was received this year. Improve-ments were made to the access methods for the new dataset, facilitating quicker data extraction and analysis. The same sound field analysis conducted for the 2017 data is being conducted on this data and the results will add to a growing collection of information on the spatial and temporal impact of mapping echosounders.
COVID ImpactsDue to the limited access to the Center’s facilities, the transfer of data from the Navy to CCOM, and the upload of data to network storage once received, was delayed for a number of months before the work could be done.
TASK 55: Web-based Tools for MBES Propagation: Use Lurton’s models and produce web-based tools for understanding and visualizing sonar ensonification patterns and performance. PI: Roland Arsenault
Center Participant: Roland ArsenaultOther Participant: Xavier Lurton
This task is complete. The resulting webpage can be found at http://vislab-ccom.unh.edu/~roland/acoustics/mbes_performance.html.
Figure 54-7. Still frames of animations made from the 2017 dataset. Top Left: The rms SPL across the entire hydrophone range. SPL at each hydrophone is colored by level and the ship movement is shown in white. Bottom Left: The noise power in 1/3 octaves. The x axis is the hydrophone and the y axis is the center frequency of an octave band. The noise power is shown in color. Right: The 2-D histogram of the octave noise data showing distribution of power across the octave bands over time.
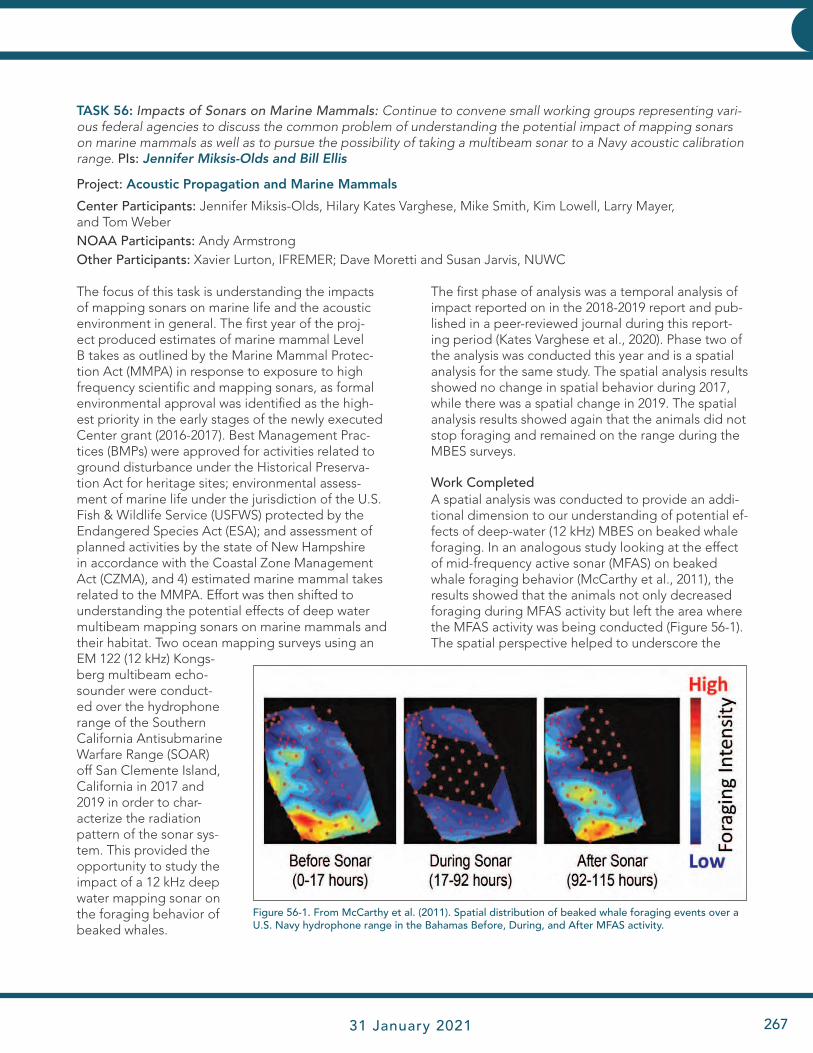
JHC Performance Report 31 January 2021 267
HYDROGRAPHIC AND CHARTING EXPERTISEHYDROGRAPHIC AND CHARTING EXPERTISE
TASK 56: Impacts of Sonars on Marine Mammals: Continue to convene small working groups representing vari-ous federal agencies to discuss the common problem of understanding the potential impact of mapping sonars on marine mammals as well as to pursue the possibility of taking a multibeam sonar to a Navy acoustic calibration range. PIs: Jennifer Miksis-Olds and Bill Ellis
Project: Acoustic Propagation and Marine Mammals
Center Participants: Jennifer Miksis-Olds, Hilary Kates Varghese, Mike Smith, Kim Lowell, Larry Mayer, and Tom WeberNOAA Participants: Andy ArmstrongOther Participants: Xavier Lurton, IFREMER; Dave Moretti and Susan Jarvis, NUWC
The focus of this task is understanding the impacts of mapping sonars on marine life and the acoustic environment in general. The first year of the proj-ect produced estimates of marine mammal Level B takes as outlined by the Marine Mammal Protec-tion Act (MMPA) in response to exposure to high frequency scientific and mapping sonars, as formal environmental approval was identified as the high-est priority in the early stages of the newly executed Center grant (2016-2017). Best Management Prac-tices (BMPs) were approved for activities related to ground disturbance under the Historical Preserva-tion Act for heritage sites; environmental assess-ment of marine life under the jurisdiction of the U.S. Fish & Wildlife Service (USFWS) protected by the Endangered Species Act (ESA); and assessment of planned activities by the state of New Hampshire in accordance with the Coastal Zone Management Act (CZMA), and 4) estimated marine mammal takes related to the MMPA. Effort was then shifted to understanding the potential effects of deep water multibeam mapping sonars on marine mammals and their habitat. Two ocean mapping surveys using an EM 122 (12 kHz) Kongs-berg multibeam echo-sounder were conduct-ed over the hydrophone range of the Southern California Antisubmarine Warfare Range (SOAR) off San Clemente Island, California in 2017 and 2019 in order to char-acterize the radiation pattern of the sonar sys-tem. This provided the opportunity to study the impact of a 12 kHz deep water mapping sonar on the foraging behavior of beaked whales.
The first phase of analysis was a temporal analysis of impact reported on in the 2018-2019 report and pub-lished in a peer-reviewed journal during this report-ing period (Kates Varghese et al., 2020). Phase two of the analysis was conducted this year and is a spatial analysis for the same study. The spatial analysis results showed no change in spatial behavior during 2017, while there was a spatial change in 2019. The spatial analysis results showed again that the animals did not stop foraging and remained on the range during the MBES surveys.
Work CompletedA spatial analysis was conducted to provide an addi-tional dimension to our understanding of potential ef-fects of deep-water (12 kHz) MBES on beaked whale foraging. In an analogous study looking at the effect of mid-frequency active sonar (MFAS) on beaked whale foraging behavior (McCarthy et al., 2011), the results showed that the animals not only decreased foraging during MFAS activity but left the area where the MFAS activity was being conducted (Figure 56-1). The spatial perspective helped to underscore the
Figure 56-1. From McCarthy et al. (2011). Spatial distribution of beaked whale foraging events over a U.S. Navy hydrophone range in the Bahamas Before, During, and After MFAS activity.
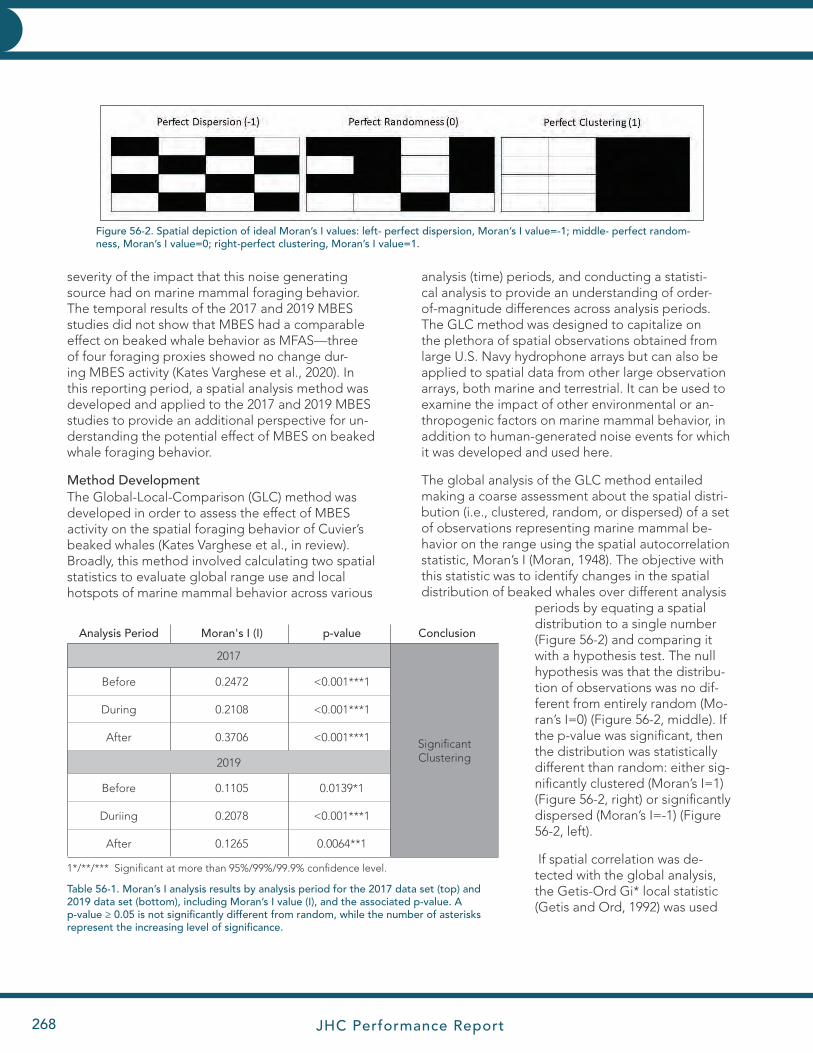
JHC Performance Report268
HYDROGRAPHIC AND CHARTING EXPERTISEHYDROGRAPHIC AND CHARTING EXPERTISE
severity of the impact that this noise generating source had on marine mammal foraging behavior. The temporal results of the 2017 and 2019 MBES studies did not show that MBES had a comparable effect on beaked whale behavior as MFAS—three of four foraging proxies showed no change dur-ing MBES activity (Kates Varghese et al., 2020). In this reporting period, a spatial analysis method was developed and applied to the 2017 and 2019 MBES studies to provide an additional perspective for un-derstanding the potential effect of MBES on beaked whale foraging behavior.
Method DevelopmentThe Global-Local-Comparison (GLC) method was developed in order to assess the effect of MBES activity on the spatial foraging behavior of Cuvier’s beaked whales (Kates Varghese et al., in review). Broadly, this method involved calculating two spatial statistics to evaluate global range use and local hotspots of marine mammal behavior across various
analysis (time) periods, and conducting a statisti-cal analysis to provide an understanding of order-of-magnitude differences across analysis periods. The GLC method was designed to capitalize on the plethora of spatial observations obtained from large U.S. Navy hydrophone arrays but can also be applied to spatial data from other large observation arrays, both marine and terrestrial. It can be used to examine the impact of other environmental or an-thropogenic factors on marine mammal behavior, in addition to human-generated noise events for which it was developed and used here.
The global analysis of the GLC method entailed making a coarse assessment about the spatial distri-bution (i.e., clustered, random, or dispersed) of a set of observations representing marine mammal be-havior on the range using the spatial autocorrelation statistic, Moran’s I (Moran, 1948). The objective with this statistic was to identify changes in the spatial distribution of beaked whales over different analysis
periods by equating a spatial distribution to a single number (Figure 56-2) and comparing it with a hypothesis test. The null hypothesis was that the distribu-tion of observations was no dif-ferent from entirely random (Mo-ran’s I=0) (Figure 56-2, middle). If the p-value was significant, then the distribution was statistically different than random: either sig-nificantly clustered (Moran’s I=1) (Figure 56-2, right) or significantly dispersed (Moran’s I=-1) (Figure 56-2, left).
If spatial correlation was de-tected with the global analysis, the Getis-Ord Gi* local statistic (Getis and Ord, 1992) was used
Figure 56-2. Spatial depiction of ideal Moran’s I values: left- perfect dispersion, Moran’s I value=-1; middle- perfect random-ness, Moran’s I value=0; right-perfect clustering, Moran’s I value=1.
Table 56-1. Moran’s I analysis results by analysis period for the 2017 data set (top) and 2019 data set (bottom), including Moran’s I value (I), and the associated p-value. A p-value ≥ 0.05 is not significantly different from random, while the number of asterisks represent the increasing level of significance.
Analysis Period Moran's I (I) p-value Conclusion
2017
SignificantClustering
Before 0.2472 <0.001***1
During 0.2108 <0.001***1
After 0.3706 <0.001***1
2019
Before 0.1105 0.0139*1
Duriing 0.2078 <0.001***1
After 0.1265 0.0064**1
1*/**/*** Significant at more than 95%/99%/99.9% confidence level.
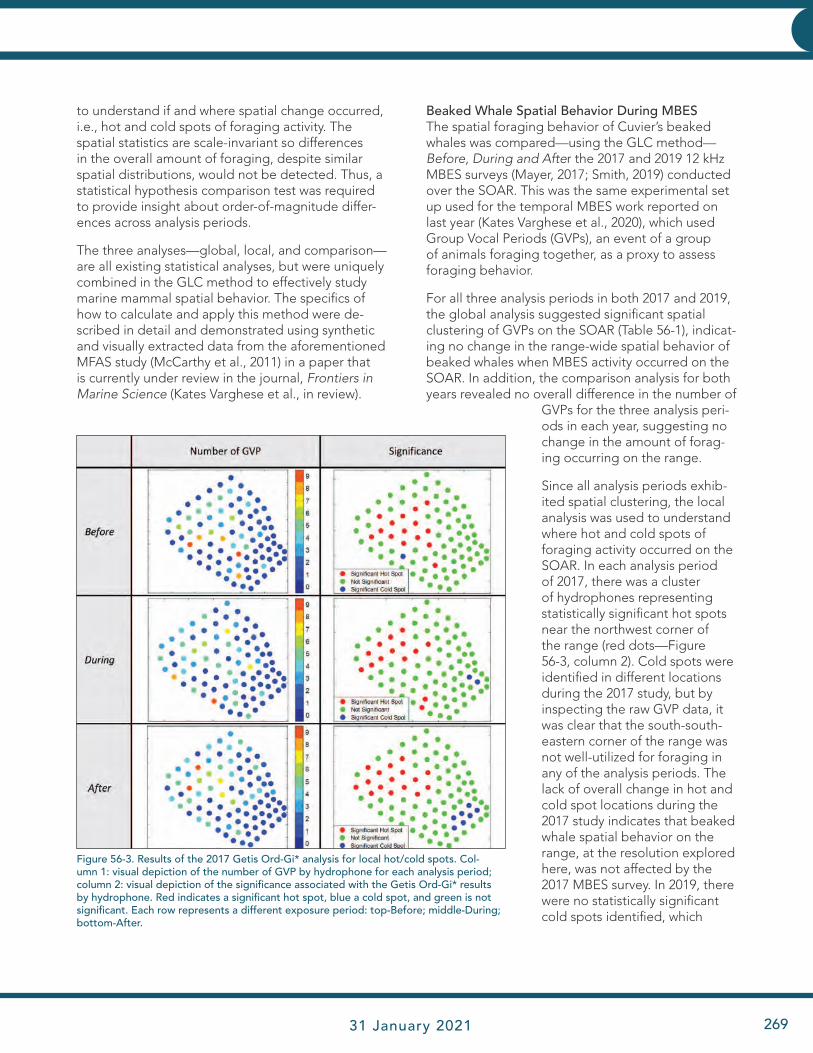
JHC Performance Report 31 January 2021 269
HYDROGRAPHIC AND CHARTING EXPERTISEHYDROGRAPHIC AND CHARTING EXPERTISE
to understand if and where spatial change occurred, i.e., hot and cold spots of foraging activity. The spatial statistics are scale-invariant so differences in the overall amount of foraging, despite similar spatial distributions, would not be detected. Thus, a statistical hypothesis comparison test was required to provide insight about order-of-magnitude differ-ences across analysis periods.
The three analyses—global, local, and comparison—are all existing statistical analyses, but were uniquely combined in the GLC method to effectively study marine mammal spatial behavior. The specifics of how to calculate and apply this method were de-scribed in detail and demonstrated using synthetic and visually extracted data from the aforementioned MFAS study (McCarthy et al., 2011) in a paper that is currently under review in the journal, Frontiers in Marine Science (Kates Varghese et al., in review).
Figure 56-3. Results of the 2017 Getis Ord-Gi* analysis for local hot/cold spots. Col-umn 1: visual depiction of the number of GVP by hydrophone for each analysis period; column 2: visual depiction of the significance associated with the Getis Ord-Gi* results by hydrophone. Red indicates a significant hot spot, blue a cold spot, and green is not significant. Each row represents a different exposure period: top-Before; middle-During; bottom-After.
Beaked Whale Spatial Behavior During MBESThe spatial foraging behavior of Cuvier’s beaked whales was compared—using the GLC method—Before, During and After the 2017 and 2019 12 kHz MBES surveys (Mayer, 2017; Smith, 2019) conducted over the SOAR. This was the same experimental set up used for the temporal MBES work reported on last year (Kates Varghese et al., 2020), which used Group Vocal Periods (GVPs), an event of a group of animals foraging together, as a proxy to assess foraging behavior.
For all three analysis periods in both 2017 and 2019, the global analysis suggested significant spatial clustering of GVPs on the SOAR (Table 56-1), indicat-ing no change in the range-wide spatial behavior of beaked whales when MBES activity occurred on the SOAR. In addition, the comparison analysis for both years revealed no overall difference in the number of
GVPs for the three analysis peri-ods in each year, suggesting no change in the amount of forag-ing occurring on the range.
Since all analysis periods exhib-ited spatial clustering, the local analysis was used to understand where hot and cold spots of foraging activity occurred on the SOAR. In each analysis period of 2017, there was a cluster of hydrophones representing statistically significant hot spots near the northwest corner of the range (red dots—Figure 56-3, column 2). Cold spots were identified in different locations during the 2017 study, but by inspecting the raw GVP data, it was clear that the south-south-eastern corner of the range was not well-utilized for foraging in any of the analysis periods. The lack of overall change in hot and cold spot locations during the 2017 study indicates that beaked whale spatial behavior on the range, at the resolution explored here, was not affected by the 2017 MBES survey. In 2019, there were no statistically significant cold spots identified, which
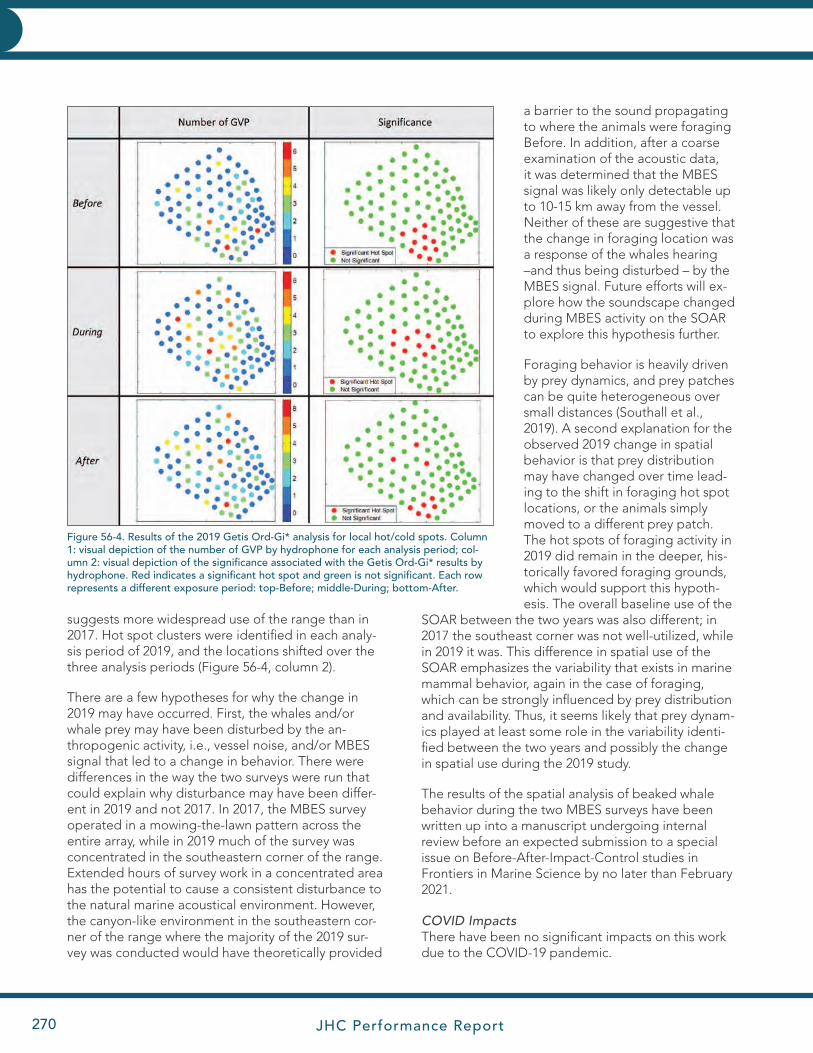
JHC Performance Report270
HYDROGRAPHIC AND CHARTING EXPERTISEHYDROGRAPHIC AND CHARTING EXPERTISE
suggests more widespread use of the range than in 2017. Hot spot clusters were identified in each analy-sis period of 2019, and the locations shifted over the three analysis periods (Figure 56-4, column 2).
There are a few hypotheses for why the change in 2019 may have occurred. First, the whales and/or whale prey may have been disturbed by the an-thropogenic activity, i.e., vessel noise, and/or MBES signal that led to a change in behavior. There were differences in the way the two surveys were run that could explain why disturbance may have been differ-ent in 2019 and not 2017. In 2017, the MBES survey operated in a mowing-the-lawn pattern across the entire array, while in 2019 much of the survey was concentrated in the southeastern corner of the range. Extended hours of survey work in a concentrated area has the potential to cause a consistent disturbance to the natural marine acoustical environment. However, the canyon-like environment in the southeastern cor-ner of the range where the majority of the 2019 sur-vey was conducted would have theoretically provided
a barrier to the sound propagating to where the animals were foraging Before. In addition, after a coarse examination of the acoustic data, it was determined that the MBES signal was likely only detectable up to 10-15 km away from the vessel. Neither of these are suggestive that the change in foraging location was a response of the whales hearing –and thus being disturbed – by the MBES signal. Future efforts will ex-plore how the soundscape changed during MBES activity on the SOAR to explore this hypothesis further.
Foraging behavior is heavily driven by prey dynamics, and prey patches can be quite heterogeneous over small distances (Southall et al., 2019). A second explanation for the observed 2019 change in spatial behavior is that prey distribution may have changed over time lead-ing to the shift in foraging hot spot locations, or the animals simply moved to a different prey patch. The hot spots of foraging activity in 2019 did remain in the deeper, his-torically favored foraging grounds, which would support this hypoth-esis. The overall baseline use of the
SOAR between the two years was also different; in 2017 the southeast corner was not well-utilized, while in 2019 it was. This difference in spatial use of the SOAR emphasizes the variability that exists in marine mammal behavior, again in the case of foraging, which can be strongly influenced by prey distribution and availability. Thus, it seems likely that prey dynam-ics played at least some role in the variability identi-fied between the two years and possibly the change in spatial use during the 2019 study.
The results of the spatial analysis of beaked whale behavior during the two MBES surveys have been written up into a manuscript undergoing internal review before an expected submission to a special issue on Before-After-Impact-Control studies in Frontiers in Marine Science by no later than February 2021.
COVID ImpactsThere have been no significant impacts on this work due to the COVID-19 pandemic.
Figure 56-4. Results of the 2019 Getis Ord-Gi* analysis for local hot/cold spots. Column 1: visual depiction of the number of GVP by hydrophone for each analysis period; col-umn 2: visual depiction of the significance associated with the Getis Ord-Gi* results by hydrophone. Red indicates a significant hot spot and green is not significant. Each row represents a different exposure period: top-Before; middle-During; bottom-After.

JHC Performance Report 31 January 2021 271
HYDROGRAPHIC AND CHARTING EXPERTISEHYDROGRAPHIC AND CHARTING EXPERTISE
Research Requirement 4.C: Publications and R2OFFO Requirement 4.C: “Effective delivery of research and development results through scientific and techni-cal journals and forums and transition of research and development results to an operational status through direct and indirect mechanisms including partnerships with public and private entities.”
TASK 57: Continue to Publish, Make Presentations and Promote R2O Transitions. PIs: Lab-wide
Members of the Center continue to actively publish their results in refereed and other journals, make numerous presentations and transition their research to NOAA and others. A complete list of Center publications, confer-ence and other presentations, reports, and theses can be found in Appendices D and E.
Research Requirement 4.D: OutreachFFO Requirement 4.D: “Public education and outreach to convey the aims and enhance the application of hydrography, nautical charting, and ocean and coastal mapping to safe and efficient marine navigation and coastal resilience.”
TASK 58: Expand Outreach and STEM Activities
Expand our activities including participation in the Ocean Exploration Trust’s Community-Based STEM Initiative, working with the Marine Advanced Technology Education (MATE) Center (designed to train a marine technology workforce) and developing closer ties with the Shoals Marine Lab. PI: Tara Hicks-Johnson
Keep the public informed about our research and activities, and maintain a repository of technical and scientific resources. PI: Colleen Mitchell
In addition to our research efforts, we recognize the interest that the public takes our work and our responsibility to explain the importance of what we do to those who ultimately fund our work. We also recognize the importance of engaging young people in our activities to encourage a steady stream of highly skilled workers in the field. To this end, we have upgraded our web presence and expanded our outreach activities. Outreach Specialist Tara Hicks-Johnson joined our staff in 2011. She coordinates Center-related events, represents the Center on
committees and at meetings, and is the friendly face the Center presents to the public. Graphic Designer Colleen Mitchell, who joined the Center in 2009, is responsible for the communications side of outreach, managing the Center’s website and social media, and using her design skills to translate the Center’s mis-sion through print and digital mediums.
The Center continued to attract significant media at-tention during this reporting period, including articles in The New York Times, Science, and the BBC.
JHC/CCOM Media CoverageJanuary–December 2020
Jan. 7 “One of the Most Successful Expeditions” Swedish Polar Research Secretariat
Jan. 16 Larry Mayer Selected as First Recipient of Walter Munk Medal UNH Today
Jan. 21 Larry Mayer Selected as Recipient of the Walter Munk Medal Sciencemag
Feb. 21 Larry Mayer Selected as Recipient of the Walter Munk Medal EurekAlert!
Mar. 5 The Drone Boat of "Shipwreck Alley" The Verge
Apr. 14 Ice-Tracking Space Laser Could Also Map Sea Floor and Monitor Health of Coral Reefs
Science
Jun. 6 Underwater Drones Join Hunt for Trillions in Mineral Riches Trapped on Ocean’s Floor
CNBC
JHC Performance Report272
HYDROGRAPHIC AND CHARTING EXPERTISEHYDROGRAPHIC AND CHARTING EXPERTISE
Jun. 8 Underwater Drones Encouraging Providers in Mining Ocean’s Floor Sprout Wired
Jun. 30 Earth's Final Frontier: The Global Race to Map the Entire Ocean Floor The Guardian
Jul. 20 UNH Joint Hydrographic Centers Hosts Annual Review NOAA Coast Survey Biweekly Newsletter
Jul. 23 New Depth Map of Arctic Ocean Mirage News
Jul. 28 Most Detailed Submarine Map of the Arctic Ocean Directions Magazine
Aug. 10 The IBCAO 4.0 Bathymetric Chart: New Depth Map of the Arctic Ocean SciTechDaily
Aug. 15 Robot Boat Completes Three-Week Atlantic Mission BBC
Aug. 18 Sea-Kit's Uncrewed Surface Vessel Ends 22-Day Offshore Mission Offshore Engineer
Aug. 27 UNH Gets $38.5 Million Federal Grant for Coastal Mapping Center Foster's Daily Democrat
Aug. 27 UNH Gets $38.5 Million Federal Grant for Coastal Mapping Center Seacoastonline.com
Aug. 28 NH Delegation Announces $38.5 Million in NOAA Funding for UNH/NOAA Joint Hydrographic Center
Industry Updates 24
Aug. 28 Charting a Course Ahead UNH Today
Aug. 28 NOAA Awards Cooperative Agreement to UNH/NOAA Joint Hydrographic Center
NOAA Office of Coast Survey
Sep. 1 A Better View Below UNH Today
Sep. 15 The IBCAO 4.0 Bathymetric Chart: New Depth Map of the Arctic Ocean Hydro International
Oct. 6 NOAA Releases Manual to Inform Deepwater Exploration Mapping NOAA Research News
Oct. 20 England’s Sea-Kit Leads Rivals in Race to Map Earth’s Seabed Bloomberg Businessweek
Nov. 5 NOAA Chooses DriX USV As Next Gen Ocean Exploration System Naval News
Nov. 6 NOAA’ Ocean Exploration Cooperative Institute chooses DriX USV to Help Build the Next Generation Ocean Exploration System
Africa Surveyors News
Nov. 9 Data from Uncharted Waters Provides Key Insights into Glacial Melting Pro-cesses
Directions Magazine
Nov. 11 Could Listening to the Deep Sea Help Save It? New York Times
Nov. 19 Geophysical Fellows UNH Today
Nov. 27 UNH Professors Receive Prestigious Honors Foster's Daily Democrat
Nov. 30 Faculty Members from UNH Named as Fellows by Science Organizations Union Leader
Dec. 2 Hydrographic Honor UNH Today
Dec. 10 Dying Coral Reefs Could Be Saved by Seaweed-Eating CRABS that Devour Overgrown Vegetation Threatening the Reefs, Researchers Found
Daily Mail

JHC Performance Report 31 January 2021 273
HYDROGRAPHIC AND CHARTING EXPERTISEHYDROGRAPHIC AND CHARTING EXPERTISE
Outreach EventsThe facilities at the Center provide a wonderful opportunity to engage students and the public in the types of research that we do (Figure 58-1). Overall, in 2020, we had several hundred students in the Center, all pre-COVID. With the emergence of COVID-19 and the closing of campus in March, the number of visits is much smaller this year, but we have found ways to virtually reach as many students and members of the public as possible. In the first part of 2020, the Center provided individual tours for these students and individuals from a number of schools and organizations (see list below):
January–December 2020
School or Number of Students Community Group or Participants
Girls in Technology Day 30
UNH Kinesiology Students 20
Hollis Brookline School 7th Grade 200
Brewster Academy 20
Total for January – March 2020 270
Figure 58-1. Girls in Technology Day participants tour the Center.
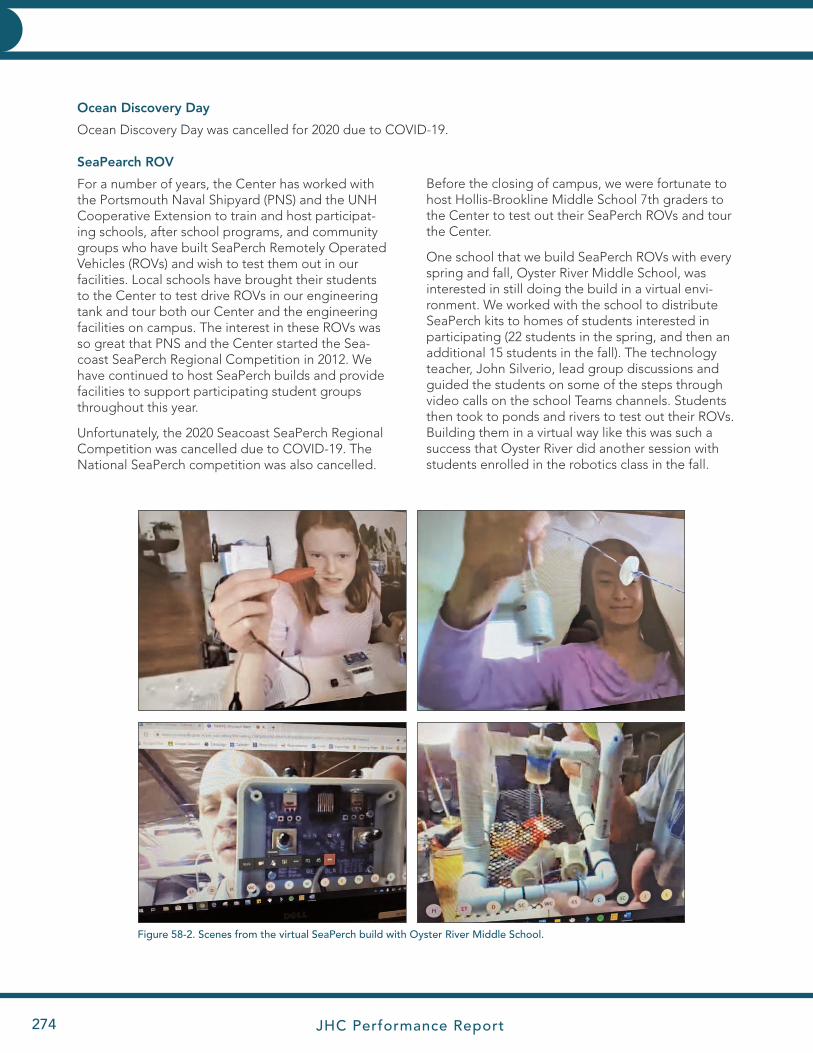
JHC Performance Report274
HYDROGRAPHIC AND CHARTING EXPERTISEHYDROGRAPHIC AND CHARTING EXPERTISE
Figure 58-2. Scenes from the virtual SeaPerch build with Oyster River Middle School.
Ocean Discovery Day
Ocean Discovery Day was cancelled for 2020 due to COVID-19.
SeaPearch ROV
For a number of years, the Center has worked with the Portsmouth Naval Shipyard (PNS) and the UNH Cooperative Extension to train and host participat-ing schools, after school programs, and community groups who have built SeaPerch Remotely Operated Vehicles (ROVs) and wish to test them out in our facilities. Local schools have brought their students to the Center to test drive ROVs in our engineering tank and tour both our Center and the engineering facilities on campus. The interest in these ROVs was so great that PNS and the Center started the Sea-coast SeaPerch Regional Competition in 2012. We have continued to host SeaPerch builds and provide facilities to support participating student groups throughout this year.
Unfortunately, the 2020 Seacoast SeaPerch Regional Competition was cancelled due to COVID-19. The National SeaPerch competition was also cancelled.
Before the closing of campus, we were fortunate to host Hollis-Brookline Middle School 7th graders to the Center to test out their SeaPerch ROVs and tour the Center.
One school that we build SeaPerch ROVs with every spring and fall, Oyster River Middle School, was interested in still doing the build in a virtual envi-ronment. We worked with the school to distribute SeaPerch kits to homes of students interested in participating (22 students in the spring, and then an additional 15 students in the fall). The technology teacher, John Silverio, lead group discussions and guided the students on some of the steps through video calls on the school Teams channels. Students then took to ponds and rivers to test out their ROVs. Building them in a virtual way like this was such a success that Oyster River did another session with students enrolled in the robotics class in the fall.
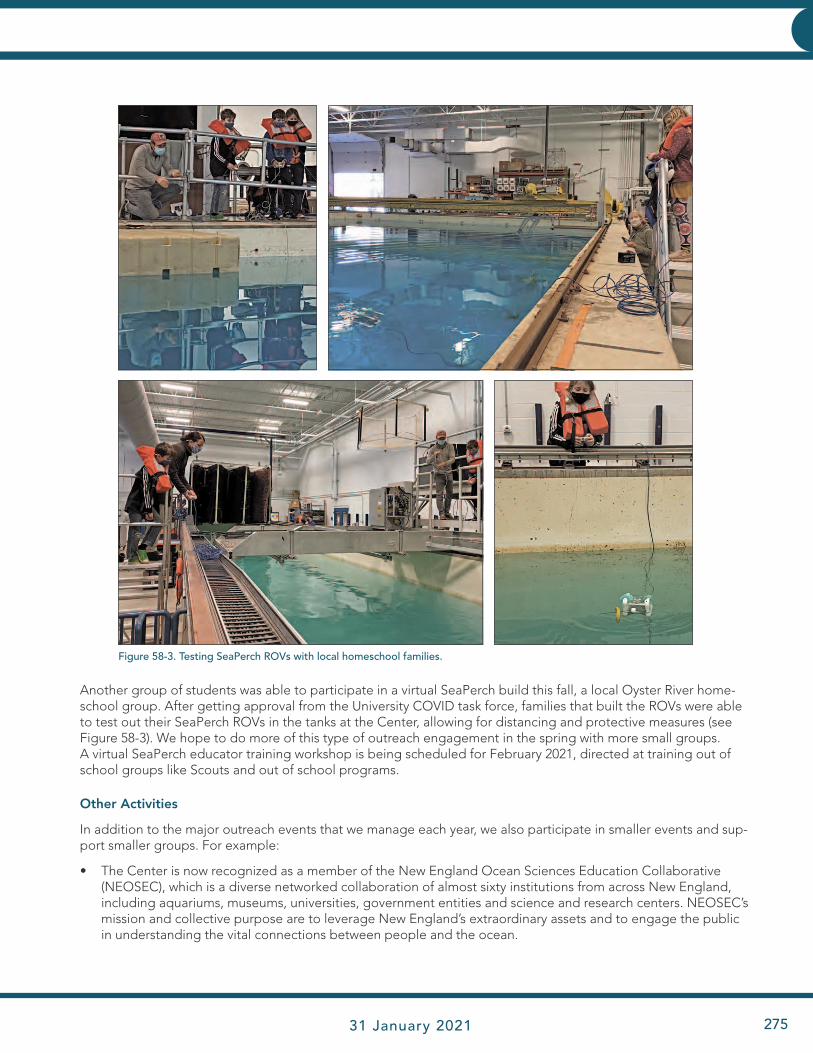
JHC Performance Report 31 January 2021 275
HYDROGRAPHIC AND CHARTING EXPERTISEHYDROGRAPHIC AND CHARTING EXPERTISE
Another group of students was able to participate in a virtual SeaPerch build this fall, a local Oyster River home-school group. After getting approval from the University COVID task force, families that built the ROVs were able to test out their SeaPerch ROVs in the tanks at the Center, allowing for distancing and protective measures (see Figure 58-3). We hope to do more of this type of outreach engagement in the spring with more small groups. A virtual SeaPerch educator training workshop is being scheduled for February 2021, directed at training out of school groups like Scouts and out of school programs.
Other Activities
In addition to the major outreach events that we manage each year, we also participate in smaller events and sup-port smaller groups. For example:
• The Center is now recognized as a member of the New England Ocean Sciences Education Collaborative (NEOSEC), which is a diverse networked collaboration of almost sixty institutions from across New England, including aquariums, museums, universities, government entities and science and research centers. NEOSEC’s mission and collective purpose are to leverage New England’s extraordinary assets and to engage the public in understanding the vital connections between people and the ocean.
Figure 58-3. Testing SeaPerch ROVs with local homeschool families.

JHC Performance Report276
HYDROGRAPHIC AND CHARTING EXPERTISEHYDROGRAPHIC AND CHARTING EXPERTISE
• Outreach activities and Center programs were also highlighted at the Ocean Sciences Meeting in San Diego, CA in February (Figure 58-4).
• UNH had a virtual booth at the Virtual AGU Fall Meeting, where we showcased videos and materials related to our research and academic programs and was available to chat with any interested researcher or prospective students (see Figure 58-5).
Figure 58-5. UNH’s booth at the Virtual AGU Fall Meeting.
Figure 58-4. Left: An attendee of the AGU Ocean Sciences Meeting tests out the VR Demonstration with the help of Center Ph.D. student Drew Stevens. Right: Tara Hicks Johnson and Center students promote the educational programs and research at the Center at the AGU Ocean Sciences UNH School of Marine Sciences and Ocean Engineering booth.
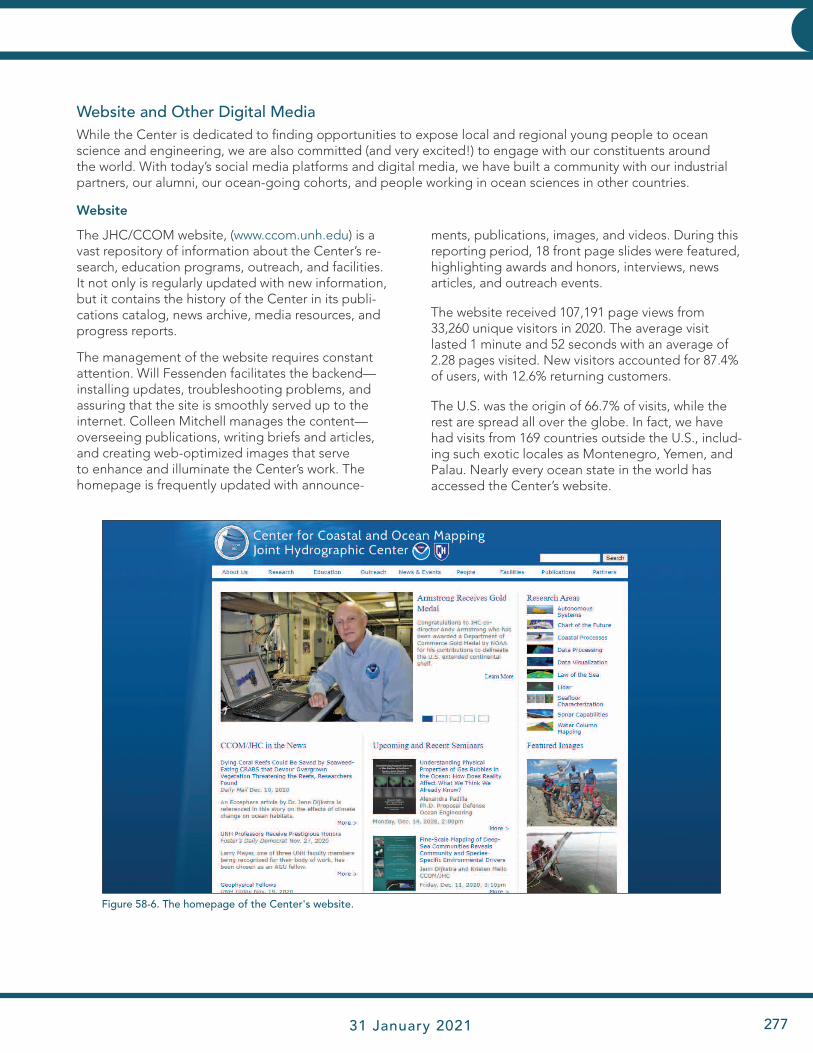
JHC Performance Report 31 January 2021 277
HYDROGRAPHIC AND CHARTING EXPERTISEHYDROGRAPHIC AND CHARTING EXPERTISE
Website and Other Digital MediaWhile the Center is dedicated to finding opportunities to expose local and regional young people to ocean science and engineering, we are also committed (and very excited!) to engage with our constituents around the world. With today’s social media platforms and digital media, we have built a community with our industrial partners, our alumni, our ocean-going cohorts, and people working in ocean sciences in other countries.
Website
The JHC/CCOM website, (www.ccom.unh.edu) is a vast repository of information about the Center’s re-search, education programs, outreach, and facilities. It not only is regularly updated with new information, but it contains the history of the Center in its publi-cations catalog, news archive, media resources, and progress reports.
The management of the website requires constant attention. Will Fessenden facilitates the backend—installing updates, troubleshooting problems, and assuring that the site is smoothly served up to the internet. Colleen Mitchell manages the content—overseeing publications, writing briefs and articles, and creating web-optimized images that serve to enhance and illuminate the Center’s work. The homepage is frequently updated with announce-
ments, publications, images, and videos. During this reporting period, 18 front page slides were featured, highlighting awards and honors, interviews, news articles, and outreach events.
The website received 107,191 page views from 33,260 unique visitors in 2020. The average visit lasted 1 minute and 52 seconds with an average of 2.28 pages visited. New visitors accounted for 87.4% of users, with 12.6% returning customers.
The U.S. was the origin of 66.7% of visits, while the rest are spread all over the globe. In fact, we have had visits from 169 countries outside the U.S., includ-ing such exotic locales as Montenegro, Yemen, and Palau. Nearly every ocean state in the world has accessed the Center’s website.
Figure 58-6. The homepage of the Center's website.

JHC Performance Report278
HYDROGRAPHIC AND CHARTING EXPERTISEHYDROGRAPHIC AND CHARTING EXPERTISE
A plot offered by Google Analytics illustrates web access by city. People from 5,479 cities around the world have visited our website. Hovering over the marked cities reveals the exact number of visitors, such as the 514 users in New York City, the 21 users in Reykjavik, or the 12 users in Tianjin, China (Figure 58-7). A report on page views shows that our homepage is the most popular landing page, followed by the Jeffreys Ledge project page, the People directory page, the Lidar Theme page, etc. (Figure 58-8).
Social MediaWhile dealing with the isolation of the Covid-19 lockdown, opportunities to engage are more important than ever. We have encouraged our students in particular to make use of our social media platforms to stay informed and connected.
Figure 58-7. Google Analytics plot of Center website visitors by city. Figure 58-8. Google Analytics chart of Center web-site visitors’ destinations.
Figure 58-9. The Center’s Facebook Page. Figure 58-10. Charts showing the Center’s Facebook post reactions, comments, and shares (top) and the “reach” of posts (bottom) in 2020.
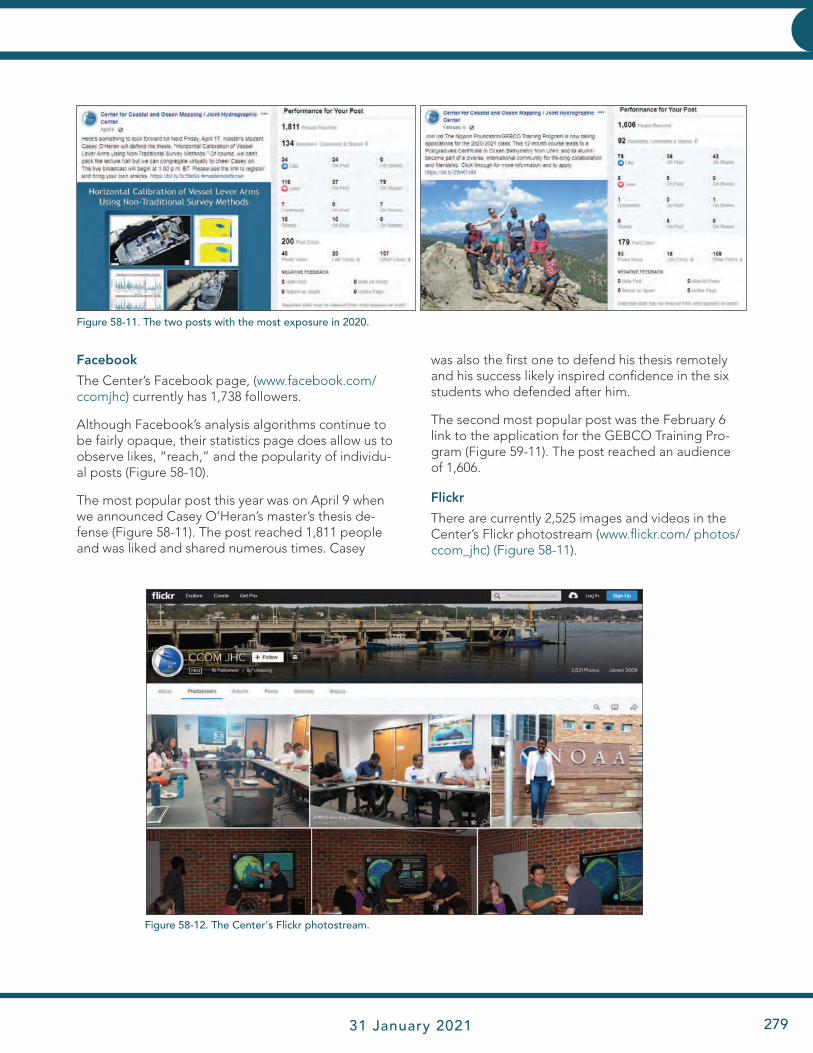
JHC Performance Report 31 January 2021 279
HYDROGRAPHIC AND CHARTING EXPERTISEHYDROGRAPHIC AND CHARTING EXPERTISE
The Center’s Facebook page, (www.facebook.com/ccomjhc) currently has 1,738 followers.
Although Facebook’s analysis algorithms continue to be fairly opaque, their statistics page does allow us to observe likes, “reach,” and the popularity of individu-al posts (Figure 58-10).
The most popular post this year was on April 9 when we announced Casey O’Heran’s master’s thesis de-fense (Figure 58-11). The post reached 1,811 people and was liked and shared numerous times. Casey
was also the first one to defend his thesis remotely and his success likely inspired confidence in the six students who defended after him.
The second most popular post was the February 6 link to the application for the GEBCO Training Pro-gram (Figure 59-11). The post reached an audience of 1,606.
Flickr
There are currently 2,525 images and videos in the Center’s Flickr photostream (www.flickr.com/ photos/ccom_jhc) (Figure 58-11).
Figure 58-11. The two posts with the most exposure in 2020.
Figure 58-12. The Center's Flickr photostream.
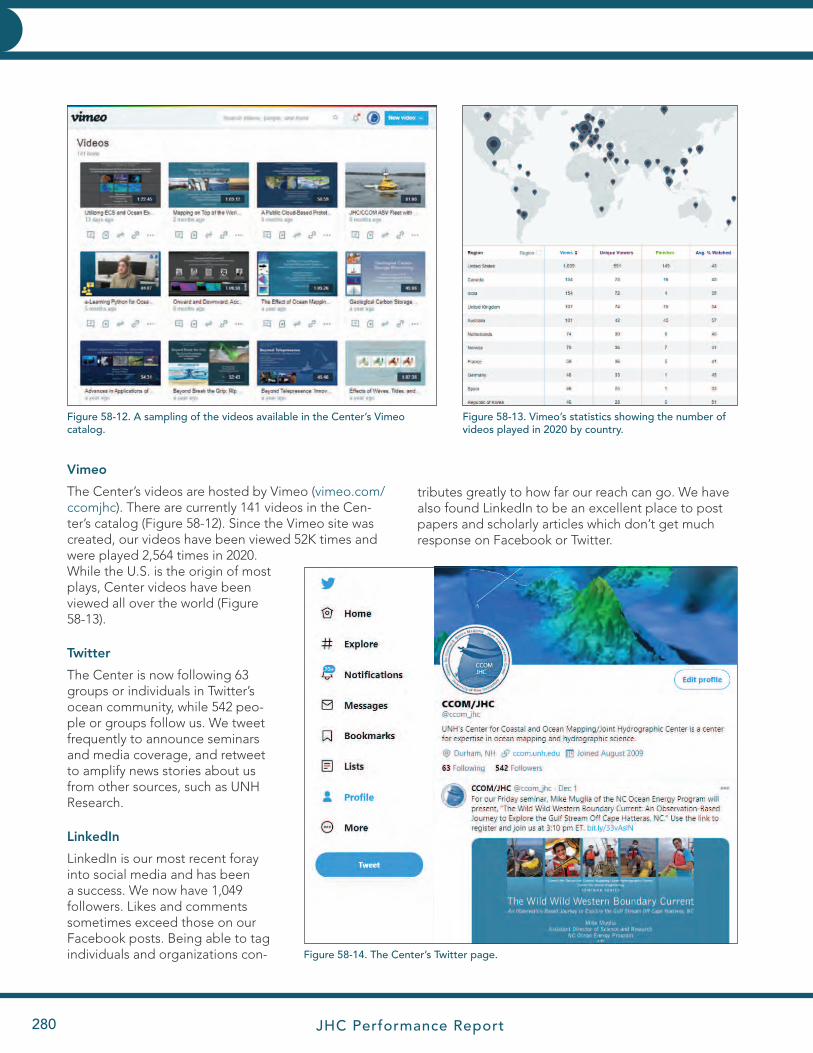
JHC Performance Report280
HYDROGRAPHIC AND CHARTING EXPERTISEHYDROGRAPHIC AND CHARTING EXPERTISE
Vimeo
The Center’s videos are hosted by Vimeo (vimeo.com/ccomjhc). There are currently 141 videos in the Cen-ter’s catalog (Figure 58-12). Since the Vimeo site was created, our videos have been viewed 52K times and were played 2,564 times in 2020. While the U.S. is the origin of most plays, Center videos have been viewed all over the world (Figure 58-13).
The Center is now following 63 groups or individuals in Twitter’s ocean community, while 542 peo-ple or groups follow us. We tweet frequently to announce seminars and media coverage, and retweet to amplify news stories about us from other sources, such as UNH Research.
LinkedIn is our most recent foray into social media and has been a success. We now have 1,049 followers. Likes and comments sometimes exceed those on our Facebook posts. Being able to tag individuals and organizations con-
tributes greatly to how far our reach can go. We have also found LinkedIn to be an excellent place to post papers and scholarly articles which don’t get much response on Facebook or Twitter.
Figure 58-12. A sampling of the videos available in the Center’s Vimeo catalog.
Figure 58-13. Vimeo’s statistics showing the number of videos played in 2020 by country.
Figure 58-14. The Center’s Twitter page.
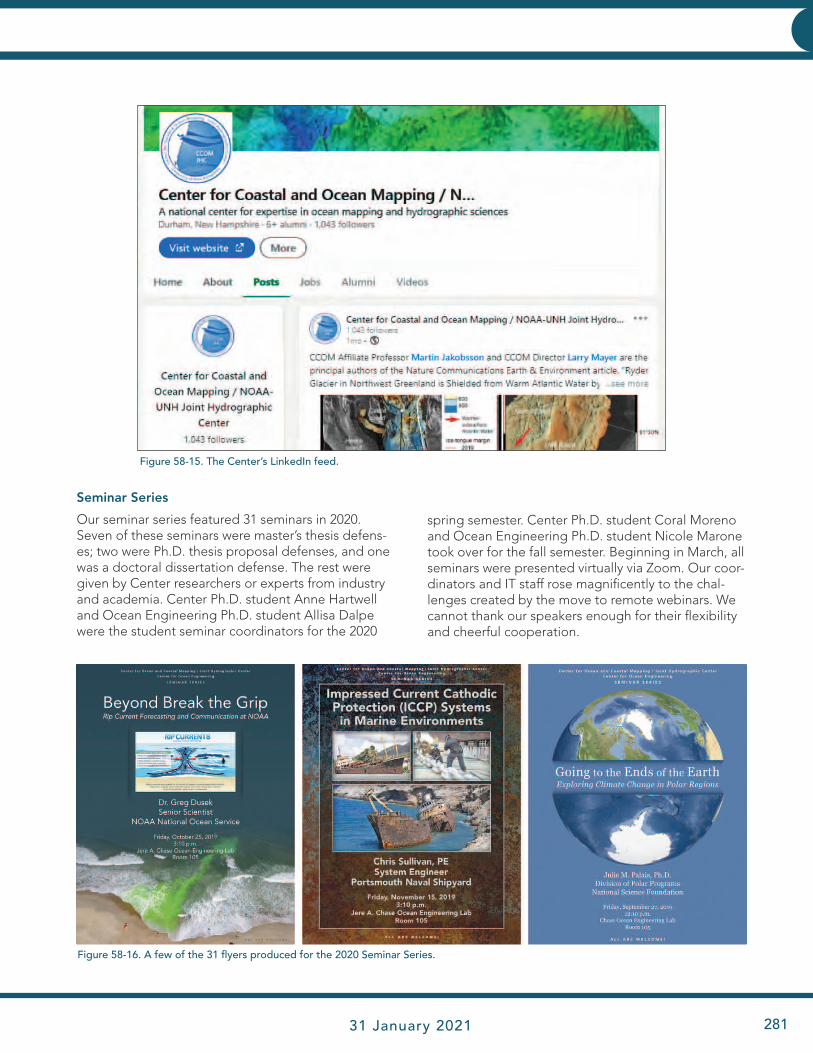
JHC Performance Report 31 January 2021 281
HYDROGRAPHIC AND CHARTING EXPERTISEHYDROGRAPHIC AND CHARTING EXPERTISE
Seminar Series
Our seminar series featured 31 seminars in 2020. Seven of these seminars were master’s thesis defens-es; two were Ph.D. thesis proposal defenses, and one was a doctoral dissertation defense. The rest were given by Center researchers or experts from industry and academia. Center Ph.D. student Anne Hartwell and Ocean Engineering Ph.D. student Allisa Dalpe were the student seminar coordinators for the 2020
spring semester. Center Ph.D. student Coral Moreno and Ocean Engineering Ph.D. student Nicole Marone took over for the fall semester. Beginning in March, all seminars were presented virtually via Zoom. Our coor-dinators and IT staff rose magnificently to the chal-lenges created by the move to remote webinars. We cannot thank our speakers enough for their flexibility and cheerful cooperation.
Figure 58-15. The Center’s LinkedIn feed.
Figure 58-16. A few of the 31 flyers produced for the 2020 Seminar Series.

JHC Performance Report282
HYDROGRAPHIC AND CHARTING EXPERTISEHYDROGRAPHIC AND CHARTING EXPERTISE
Data Management
TASK 59: Data Sharing ISO19115 Metadata: Transition from the FGDC format to the ISO 19115 format. PI: Paul Johnson
Center Participant: Paul Johnson
The U.S. government has been encouraging research-ers and groups who collect and distribute data to transition from the FGDC Content Standard for Digi-tal Geospatial Metadata (CSDGM) format to the ISO 19115-02 metadata format. The Center had already developed robust scripts used to data mine content out of raw data files, such as Kongsberg .all files and Knudsen .segy files, and to transform this information into well-formed and validated FGDC metadata. We have created a series of Python scripts and crosswalks to transform these records into ISO19115-02 meta-data records, though this approach is not as efficient as it could be. Following on from this, as part of the DOI and data discussions with NCEI (see Task 48) regarding ECS data, NCEI has agreed to help us work
on a crosswalk from our raw harvested file information to the ISO format, but at this point we are still waiting for input from NCEI. This past year, we did have suc-cess working the University of New Hampshire library to successfully mint DOIs for the KM1811 ECS cruise in the Gulf of Alaska and them incorporate them into ISO19115-2 metadata record which were submitted to the NCEI this past summer.
COVID ImpactsCOVID had very little to no impact on the tasks as the Center provided easy access to computing, storage, and serving resources which is all that was required to work on them.
TASK 60: Enhanced Web Services for Data Management: Build upon state-of-the-art web services for the management and distribution of complex data sets. PI: Paul Johnson
Project: Enhanced Web Services for Data Management
Center Participants: Paul Johnson, Tomer Ketter, Jim Gardner, and IT Staff
GIS Server and Portal
The center’s current online GIS presence, available at https://maps.ccom.unh.edu (Figure 60-1), has been up and running since the fall of 2018 using an ESRI
Figure 60-1. Current home page of the Center’s GIS portal (https://maps.ccom.unh.edu) which highlights some of the online services that have been developed over the last two years.
Enterprise deployment. This deployment consists of a combination of Server, Portal, and Datastore software installed on high performance enterprise
grade hardware located in the Center’s server room. When initially deployed, the Portal hosted only a small set of interactive web services, which were mainly created to test the stability and capabilities of the software and hardware. Through 2019 and 2020 many additional services were added to the Portal, including services for the Center’s extended continental shelf map-ping program, the Center’s Gulf of Maine mapping synthesis, and products from the Seabed 2030 project. Further accelerating the creation of new web services was the transition from using ESRI’s ArcGIS Desk-top software to ArcGIS Pro. This transition simplified the process of creating new web services and unlocked additional capabili-ties of the published services that had not been easily available previously.
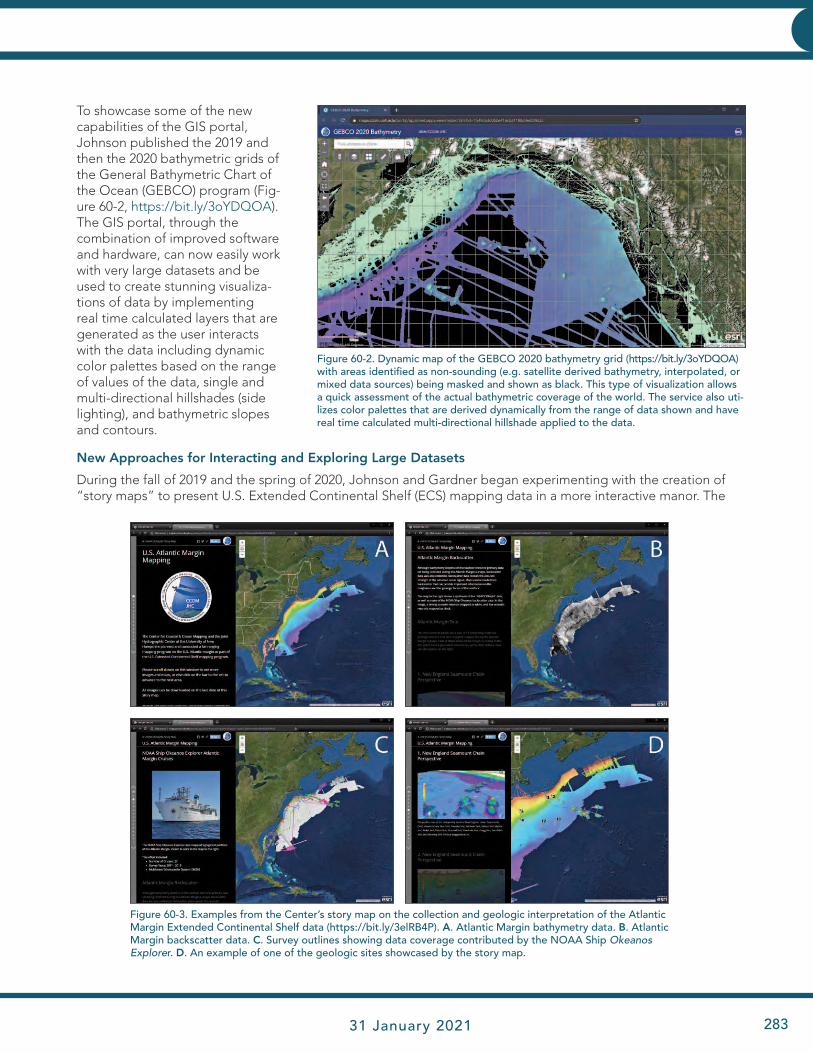
JHC Performance Report 31 January 2021 283
HYDROGRAPHIC AND CHARTING EXPERTISEHYDROGRAPHIC AND CHARTING EXPERTISE
To showcase some of the new capabilities of the GIS portal, Johnson published the 2019 and then the 2020 bathymetric grids of the General Bathymetric Chart of the Ocean (GEBCO) program (Fig-ure 60-2, https://bit.ly/3oYDQOA). The GIS portal, through the combination of improved software and hardware, can now easily work with very large datasets and be used to create stunning visualiza-tions of data by implementing real time calculated layers that are generated as the user interacts with the data including dynamic color palettes based on the range of values of the data, single and multi-directional hillshades (side lighting), and bathymetric slopes and contours.
New Approaches for Interacting and Exploring Large Datasets
During the fall of 2019 and the spring of 2020, Johnson and Gardner began experimenting with the creation of “story maps” to present U.S. Extended Continental Shelf (ECS) mapping data in a more interactive manor. The
Figure 60-2. Dynamic map of the GEBCO 2020 bathymetry grid (https://bit.ly/3oYDQOA) with areas identified as non-sounding (e.g. satellite derived bathymetry, interpolated, or mixed data sources) being masked and shown as black. This type of visualization allows a quick assessment of the actual bathymetric coverage of the world. The service also uti-lizes color palettes that are derived dynamically from the range of data shown and have real time calculated multi-directional hillshade applied to the data.
Figure 60-3. Examples from the Center’s story map on the collection and geologic interpretation of the Atlantic Margin Extended Continental Shelf data (https://bit.ly/3elRB4P). A. Atlantic Margin bathymetry data. B. Atlantic Margin backscatter data. C. Survey outlines showing data coverage contributed by the NOAA Ship Okeanos Explorer. D. An example of one of the geologic sites showcased by the story map.
JHC Performance Report284
HYDROGRAPHIC AND CHARTING EXPERTISEHYDROGRAPHIC AND CHARTING EXPERTISE
GIS portal allows for the creation of scripted inter-active webpages that can intermix dynamic map ser-vices with descriptive text, static pictures, and mov-ies. Johnson and Gardner started this explorative effort with the creation and publication of the U.S. Atlantic Margin Mapping story (Figure 60-3, https://bit.ly/3elRB4P). This region was chosen as it allowed Johnson and Gardner to highlight the bathymetry and backscatter data collected through the tremen-dous time and efforts of the faculty and staff at the Center, and by the crew and staff of the NOAA Ship Okeanos Explorer. Through the story map interface, Gardner and Johnson were able to create an inter-active geologic tour of the remarkable discoveries made during the mapping of the Atlantic Margin. Currently the plan is to generate similar interfaces for each of the primary ECS mapping areas.
Data Management and Collaborative Data Product Assessment
As members of the Seabed 2030 project through the Arctic and North Pacific Ocean Regional Center, both Ketter and Johnson have been heavily involved with the last two releases of the GEBCO Bathymetric Grid in the spring of 2019 and 2020. For the 2020 pre-release data assessment of the grid, Johnson assembled a data visualization and annotation tool using the Center’s GIS portal. This tool allowed the worldwide team working on the GEBCO grid to interact with and comment on each draft release of the bathymetric grid (Figure 60-4).
Through a secure web application, allowing only authorized users with the necessary credentials,
Figure 60-4. Interactive data quality assessment tool for the spring GEBCO 2020 bathymetric grid. Through a secure portal, users were able to login and interactively identify and annotate potential data issues with each the draft releases of the grid. A. Shows the ability of drawing regions on the grid which can be logged with metadata. B. Shows the interactive attribute data associated with the comments made on the data.
members of the Seabed 2030 team were able to vi-sually assess data quality of the bathymetric grid and to also examine the type identifier grid (TID) for each draft release. Within the webapp, the bathymetric data was dynamically drawn with a range adjusting color palette and multidirectional hillshades to aid in the identification of potential problem areas within the grid. After identifying an area needing further in-spection, users were able to draw a polygon on the grid (Figure 60-4, left) and enter basic information for that polygon such as the reviewer’s name, the type of data issue identified, and any comments they wished to add. This information was then displayed through the webapp’s attribute table or through pop-ups on the map (Figure 60-4, right). The data was also exported to a shapefile and distributed to the assembly groups when requested. This work greatly sped up the assessment of the grid data and allowed for a global group to work together on the review.
As part of the Seabed 2030 effort, Johnson also pub-lished a North Pacific data management application (Figure 60-5, https://bit.ly/2QqBE2X) through the Center’s GIS portal. This app brings together sourc-es published directly through the Center’s servers, including the 2014 and 2020 releases of the GEBCO bathymetry and TID grids, as well as aggregating outside web resources including services from the Data Centre for Digital Bathymetry (DCDB). By unit-ing these web services into a single interface Ketter and Johnson are quickly able to perform useful tasks such as searching for new data from the DCDB by looking up when a data was incorporated into the NCEI holdings and if that dataset is in area of inter-
JHC Performance Report 31 January 2021 285
HYDROGRAPHIC AND CHARTING EXPERTISEHYDROGRAPHIC AND CHARTING EXPERTISE
Figure 60-5. The North Pacific data management web application (https://bit.ly/2QqBE2X). This webapp brings together services hosted both through the Center’s GIS portal and those available publicly. The upper figure shows the ability to search through the DCDB’s holding by looking for cruises that fall within a defined area and to sort those cruises by date. The lower-left figure shows the 2020 TID overlaid on top of the SRTM+ SID. The lower-right figure shows the ability to query DCDB holdings (multibeam in green, single beam in red).
est (Figure 60-5, upper), examining grid sources and the types of data in the grid (Figure 60-5, lower left), and to query and identify sources by simply clicking on the dynamic map (Figure 60-5, lower right). While this application was initially developed for inhouse use, it has proven very useful in corresponding and explaining data sources with users from outside the center.
Multibeam Test Site Locator
As was initially discussed in the 2019 Progress Report, Johnson has been creating new tools aimed at easing the determination of where to conduct
multibeam calibration and system testing based on seafloor depths, slopes, and the frequency of the system being tested. These tools, which are also discussed as part of Task 8, utilize large area bathy-metric grids such as the Center’s Atlantic Margin extended continental shelf grid and the University of Hawaii’s Main Hawaiian Islands synthesis to iden-tify possible testing locations by calculating depth ranges optimized for shallow water MBES (70-100 kHz), medium (30 kHz), and deep (12 kHz) systems defined by swath performance curves; and within each of these depth ranges classifying the seafloor with proper slopes for pitch and heading lines (15°–

JHC Performance Report286
HYDROGRAPHIC AND CHARTING EXPERTISEHYDROGRAPHIC AND CHARTING EXPERTISE
30° slopes) and roll and accuracy lines (0°– 2° slopes). Web applications showing the results of this seafloor classification are either available through the Center’s GIS portal interface at https://maps.ccom.unh.edu or directly through http://bit.ly/2qx4oxU for the Atlantic Site and http://bit.ly/2OUFm59 for the Hawaii site.
Johnson continued to work on these tools in 2020 by improving the services and adding a new planning region, Northern California (Figure 60-6, http://bit.ly/389A12e), to the GIS portal. For the new region, Johnson compiled data collected or provided by the California Seafloor Mapping Program (CSMP), NOAA, USGS, and the Global Multi-Resolution Topography (GMRT) synthesis to create a moderate offshore reso-lution bathymetric grid, and a high-resolution grid of the San Francisco bay. Johnson then imported his-
toric track lines of previously used test sites, provided by John Hughes Clarke, and implemented a real-time calculated slope layer to the test site webapp. This application has already proven useful for planning an upcoming Shipboard Acceptance Test (SAT) of an EM304 and an EM2040 system on a Saildrone vehicle. For more information on this webapp please see Task 8 of the report.
As also documented as part of Task 8, Johnson began the process during 2020 of expanding the test site selection tools to work with additional types of data. Currently, Johnson is assessing how to best integrate very high-resolution datasets into the test site models, which had been initially designed to be more ap-propriate for medium and deep-water test site selec-tion. This undertaking also aligned with the needs for
Figure 60-6. The Northern California multibeam planning site webapp (http://bit.ly/389A12e). This tool hosts a compilation of high resolu-tion bathymetry for the San Francisco bay, a moderate resolution compilation for the Northern California coast, and tracklines for historic testing sites. The figure to the left shows the large area covered for test site determination, while the figure to the right shows a zoom in on some of the high resolution details present in the compilation.
Figure 60-7. Left shows the boundary boxes of the 739 surveys conducted through the Pacific Northwest, the Gulf of Alaska, and the Ber-ing Sea. Right shows a compilation of that data around the Alaska Peninsula region.
JHC Performance Report 31 January 2021 287
HYDROGRAPHIC AND CHARTING EXPERTISEHYDROGRAPHIC AND CHARTING EXPERTISE
further data integration for the visualization efforts undertaken by Ware for BathyGlobe development and by Johnson and Ketter for the Seabed 2030 North Pacific effort. Ketter, working with personnel at the National Center for Environmental Information (Boulder) identified and downloaded 3,317 individual BAGs for the Pacific Northwest/Gulf of Alaska/Ber-ing Sea area (Figure 60-6). Johnson has since been working with this large collection of data to identify
appropriate cell sizes, projections, and data product types which optimizes the data for inclusion into each of these different programs that require it. To do this, Johnson developed a script that validates each BAG, assembles and samples the data to a desired cell size appropriate for the application, projects the data into the desired projection (if necessary), and then trans-forms the data into a format compatible for ingestion to the application.
Project: Development of the Northeast Bathymetry and Backscatter Compilation: Western Gulf of Maine, Southern New England and Long Island
Center Participants: Paul Johnson, Larry Ward, and Michael Bogonko
The Center’s Western Gulf of Maine (WGOM) Bathymetry and Backscatter Synthesis (https://bit.ly/3e2aMB0) began development numerous years ago but has not been updated with any additional surveys since 2018. Starting in 2019 and continuing through 2020 Bogonko, Ward, and Johnson began the process of significantly expanding the WGOM synthesis to include additional new surveys that had not been available during the last assembly, as well as expanding the area covered by the synthesis to now include data from southern New England, Long Island Sound, and Long Island as far as the entrance to New York Harbor. This new synthesis, now named the “Northeast
Figure 60-8. The new Northeast Bathymetry and Backscatter Compilation: Western Gulf of Maine, Southern New England, and Long Island (http://bit.ly/3alaJks) compiles 196 surveys to generate a high-resolution bathymetric grid (upper left), a regional bathymetric grid (upper right), and a back-scatter assembly (lower left). All surveys included into the compilation are documented with associated metadata with a “footprints” layer (lower right).
JHC Performance Report288
APPENDIX A
Bathymetry and Backscatter Compilation: Western Gulf of Maine, Southern New England and Long Island” brings together surveys for the U.S. Northeast with the primary goal of presenting a synthesis of all publicly available high-resolution bathymetry in a single gridded surface (Figure 60-8 upper left, http://bit.ly/3alaJks). The effort also generated a lower resolution regional bathymetry grid (Figure 60-8 up-per right), and assembled all available backscatter, deemed of sufficient quality, into a product suitable for viewing (Figure 60-8, lower left).
One hundred and ninety-six surveys, conducted by multiple agencies, were used to construct the new bathymetric compilations. The major agencies and groups include: National Ocean and Atmospheric Administration (NOAA) National Ocean Survey (NOS); United States Geological Survey (USGS); UNH CCOM/JHC; Gulf of Maine Mapping Initiative (GOMMI); United States Army Corps of Engineers (USACE); Maine Coastal Mapping Initiative; and private organizations (e.g., Science Applications International Corporation, Inc., SAIC, now Leidos). The survey source, original gridding, and other relevant information are included in the metadata for each survey which can be accessed directly from
the gridded surfaces by displaying the “Footprints” (Figure 60-8 lower right) and moving the cursor over the survey area. To generate the compilation, all new publicly available surveys were identified, cataloged, and retrieved, primarily from the National Center for Environmental Information (Boulder). Each new survey’s bathymetry and backscatter (when available) were then assessed for suitability of inclusion into the compilation and then combined with the existing WGOM datasets to construct the new data products. To increase the visibility and usage of these products, new web interfaces were made through the Center’s GIS portal including a traditional dynamic map viewer (Figure 60-8, http://bit.ly/3alaJks) and a new compari-son viewer showing the high resolution bathymetry in one window and the backscatter data in a second (Figure 60-9, https://bit.ly/3h06kEE). The Northeast Regional Bathymetry and Backscatter Compilation is also currently being used to assess the performance of the BRESS landform algorithm (see Task 21).
COVID ImpactsCOVID had very little to no impact on the tasks as the Center provided easy access to computing, storage, and serving resources which is all that was required to work on them.
Figure 60-9. The side-by-side bathymetry and backscatter viewer for the Northeast Bathymetry and Backscatter Compilation: Western Gulf of Maine, Southern New England and Long Island. This viewer allows users to examine the high-resolution bathymetry grid and com-pare what they see to the backscatter data. The viewer links the 2 datasets together so that when one data set is either zoomed in or out, or panned data will show the same view.
INNOVATIVE HYDROGRAPHY
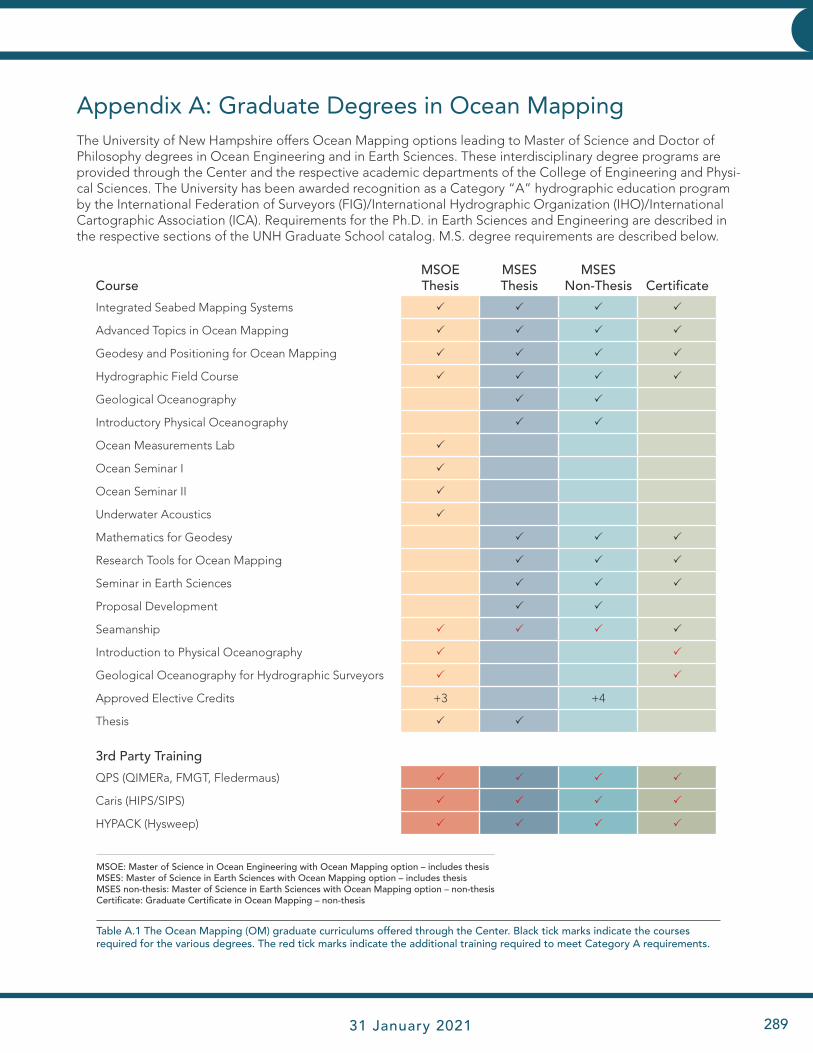
JHC Performance Report 31 January 2021 289
Appendix A: Graduate Degrees in Ocean Mapping The University of New Hampshire offers Ocean Mapping options leading to Master of Science and Doctor of Philosophy degrees in Ocean Engineering and in Earth Sciences. These interdisciplinary degree programs are provided through the Center and the respective academic departments of the College of Engineering and Physi-cal Sciences. The University has been awarded recognition as a Category “A” hydrographic education program by the International Federation of Surveyors (FIG)/International Hydrographic Organization (IHO)/International Cartographic Association (ICA). Requirements for the Ph.D. in Earth Sciences and Engineering are described in the respective sections of the UNH Graduate School catalog. M.S. degree requirements are described below.
APPENDIX A
CourseMSOE Thesis
MSESThesis
MSESNon-Thesis Certificate
Integrated Seabed Mapping Systems P P P P
Advanced Topics in Ocean Mapping P P P P
Geodesy and Positioning for Ocean Mapping P P P P
Hydrographic Field Course P P P P
Geological Oceanography P P
Introductory Physical Oceanography P P
Ocean Measurements Lab P
Ocean Seminar I P
Ocean Seminar II P
Underwater Acoustics P
Mathematics for Geodesy P P P
Research Tools for Ocean Mapping P P P
Seminar in Earth Sciences P P P
Proposal Development P P
Seamanship P P P P
Introduction to Physical Oceanography P P
Geological Oceanography for Hydrographic Surveyors P P
Approved Elective Credits +3 +4
Thesis P P
3rd Party Training
QPS (QIMERa, FMGT, Fledermaus) P P P P
Caris (HIPS/SIPS) P P P P
HYPACK (Hysweep) P P P P
MSOE: Master of Science in Ocean Engineering with Ocean Mapping option – includes thesisMSES: Master of Science in Earth Sciences with Ocean Mapping option – includes thesisMSES non-thesis: Master of Science in Earth Sciences with Ocean Mapping option – non-thesisCertificate: Graduate Certificate in Ocean Mapping – non-thesis
Table A.1 The Ocean Mapping (OM) graduate curriculums offered through the Center. Black tick marks indicate the courses required for the various degrees. The red tick marks indicate the additional training required to meet Category A requirements.

JHC Performance Report290
APPENDIX A
Master of Science in Ocean EngineeringOcean Mapping Option
Core Requirements Instructor Credit Hours
OE 810 Ocean Measurements Lab Lippmann 4
OE 874 Integrated Seabed Mapping Systems Dijkstra/Hughes Clarke/Calder 4
OE 875 Advanced Topics in Ocean Mapping Dijkstra/Mayer/Armstrong 4
OE 871 Geodesy and Positioning for Ocean Mapping Dijkstra 4
OE 865 Underwater Acoustics Weber 3
OE 972 Hydrographic Field Course Dijkstra 4
OE 990 Ocean Seminar I Mayer 1
OE 991 Ocean Seminar II Mayer 1
OE 899 Thesis 6
At Least Three Additional Credits from the Electives Below
OE 854 Ocean Waves and Tides Swift 4
OE 857 Coastal Engineering and Processes Foster 3
OE 864 Spectral Analysis of Geophysical Time Lippmann 4 Series Data
OE 895 Special Topics Staff 1-4
ECE 814 Introduction to Digital Signal Processing Smith 4
ESCI 858 Introduction to Physical Oceanography Pringle 3
ESCI 896 Special Topics Staff 1-4
Where a course of equivalent content has been successfully completed as an undergraduate, an approved elective may be substituted.
Master of Science in Earth SciencesOcean Mapping Option
Core Requirements Instructor Credit Hours
ESCI 858 Introductory Physical Oceanography Pringle 3
OE 859 Geological Oceanography Johnson 4
OE 871 Geodesy and Positioning for Ocean Mapping Dijkstra 4
OE 872 Applied Tools for Ocean Mapping Dijkstra 2
OE 874 Integrated Seabed Mapping Systems Dijkstra/Hughes Clarke/Calder 4
OE 875 Advanced Topics in Ocean Mapping Dijkstra 4
OE 972 Hydrographic Field Course Dijkstra 4
MATH 831 Mathematics for Geodesy Wineberg 3
ESCI 997 Seminar in Earth Sciences Hughes Clarke 1
ESCI 998 Proposal Development Palace 1
ESCI 899 Master’s Thesis 1-6
Additional elective courses must be taken to meet graduate credit requirements (with approval).
APPENDIX A

JHC Performance Report 31 January 2021 291
Master of Science in Earth Sciences (Non-Thesis Option)Ocean Mapping Option
Core Requirements Instructor Credit Hours
ESCI 858 Introductory Physical Oceanography Pringle 3
OE 859 Geological Oceanography Johnson 4
OE 871 Geodesy and Positioning for Ocean Mapping Dijkstra 4
OE 872 Applied Tools for Ocean Mapping Dijkstra 2
OE 874 Integrated Seabed Mapping Systems Dijkstra/Hughes Clarke/Calder 4
OE 875 Advanced Topics in Ocean Mapping Dijkstra 4
OE 972 Hydrographic Field Course Dijkstra 4
MATH 831 Mathematics for Geodesy Wineberg 3
ESCI 997 Seminar in Earth Sciences Hughes Clarke 1
ESCI 998 Proposal Development Palace 1
ESCI 898 Directed Research 2
Additional elective courses must be taken to meet graduate credit requirements (with approval).
Where a course of equivalent content has been successfully completed as an undergraduate, an approved elective may be substituted.
Graduate Certificate in Ocean Mapping
Core Requirements Instructor Credit Hours
OE 871 Geodesy and Positioning for Ocean Mapping Dijkstra 3
OE 872 Applied Tools for Ocean Mapping Dijkstra 2
MATH 831 Mathematics for Geodesy Wineberg 3
OE 874 Integrated Seabed Mapping Systems Dijkstra/Hughes Clarke/Calder 4
OE 875 Advanced Topics in Ocean Mapping Dijkstra 4
OE 972 Hydrographic Field Course Dijkstra 4
OE 677 Seamanship and Marine Weather Armstrong 2
ESCI 896.2 Physical Oceanography for Hydrographers Hughes Clarke 2
ESCI 896.4 Geological Oceanography for Hydrographers Hughes Clarke/Wigley/Ward 2
Additional elective courses must be taken to meet graduate credit requirements (with approval).
Where a course of equivalent content has been successfully completed as an undergraduate, an approved elective may be substituted.
APPENDIX AAPPENDIX A
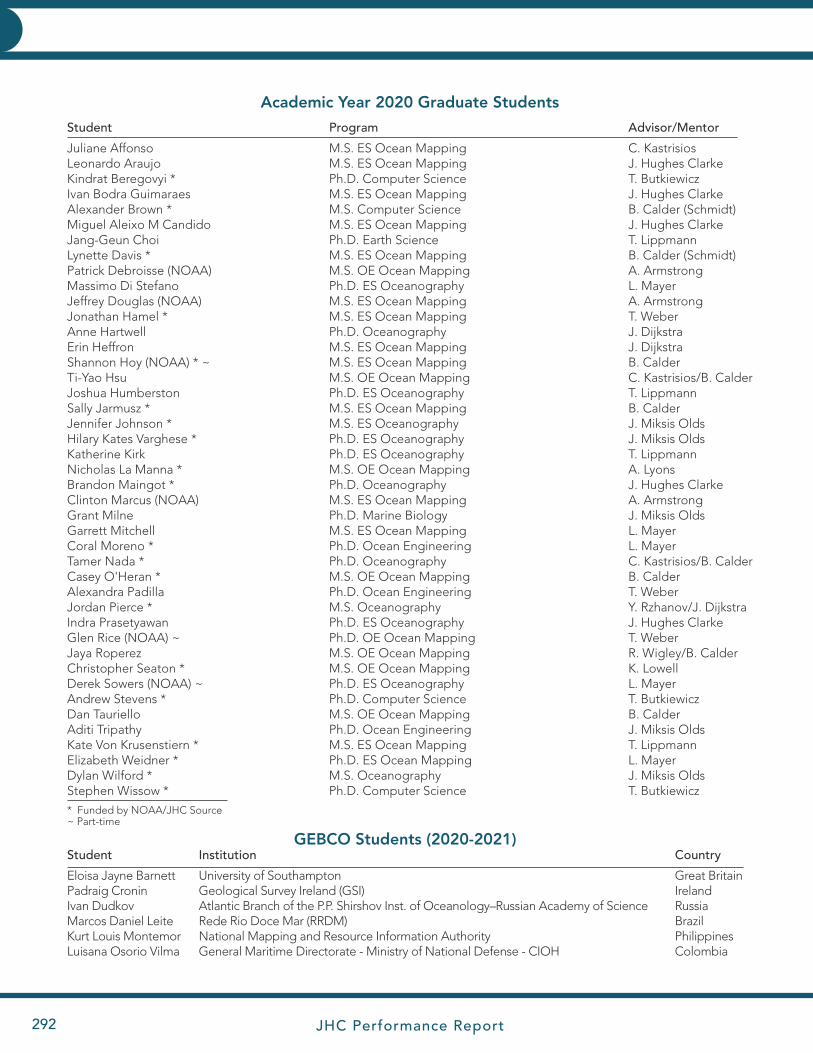
JHC Performance Report292
APPENDIX B
* Funded by NOAA/JHC Source~ Part-time
APPENDIX A
Academic Year 2020 Graduate Students
Student Program Advisor/Mentor
Juliane Affonso M.S. ES Ocean Mapping C. KastrisiosLeonardo Araujo M.S. ES Ocean Mapping J. Hughes ClarkeKindrat Beregovyi * Ph.D. Computer Science T. ButkiewiczIvan Bodra Guimaraes M.S. ES Ocean Mapping J. Hughes ClarkeAlexander Brown * M.S. Computer Science B. Calder (Schmidt)Miguel Aleixo M Candido M.S. ES Ocean Mapping J. Hughes ClarkeJang-Geun Choi Ph.D. Earth Science T. LippmannLynette Davis * M.S. ES Ocean Mapping B. Calder (Schmidt)Patrick Debroisse (NOAA) M.S. OE Ocean Mapping A. ArmstrongMassimo Di Stefano Ph.D. ES Oceanography L. MayerJeffrey Douglas (NOAA) M.S. ES Ocean Mapping A. ArmstrongJonathan Hamel * M.S. ES Ocean Mapping T. WeberAnne Hartwell Ph.D. Oceanography J. DijkstraErin Heffron M.S. ES Ocean Mapping J. DijkstraShannon Hoy (NOAA) * ~ M.S. ES Ocean Mapping B. CalderTi-Yao Hsu M.S. OE Ocean Mapping C. Kastrisios/B. CalderJoshua Humberston Ph.D. ES Oceanography T. LippmannSally Jarmusz * M.S. ES Ocean Mapping B. CalderJennifer Johnson * M.S. ES Oceanography J. Miksis OldsHilary Kates Varghese * Ph.D. ES Oceanography J. Miksis OldsKatherine Kirk Ph.D. ES Oceanography T. LippmannNicholas La Manna * M.S. OE Ocean Mapping A. LyonsBrandon Maingot * Ph.D. Oceanography J. Hughes ClarkeClinton Marcus (NOAA) M.S. ES Ocean Mapping A. ArmstrongGrant Milne Ph.D. Marine Biology J. Miksis OldsGarrett Mitchell M.S. ES Ocean Mapping L. MayerCoral Moreno * Ph.D. Ocean Engineering L. MayerTamer Nada * Ph.D. Oceanography C. Kastrisios/B. CalderCasey O'Heran * M.S. OE Ocean Mapping B. CalderAlexandra Padilla Ph.D. Ocean Engineering T. WeberJordan Pierce * M.S. Oceanography Y. Rzhanov/J. DijkstraIndra Prasetyawan Ph.D. ES Oceanography J. Hughes ClarkeGlen Rice (NOAA) ~ Ph.D. OE Ocean Mapping T. WeberJaya Roperez M.S. OE Ocean Mapping R. Wigley/B. CalderChristopher Seaton * M.S. OE Ocean Mapping K. LowellDerek Sowers (NOAA) ~ Ph.D. ES Oceanography L. MayerAndrew Stevens * Ph.D. Computer Science T. ButkiewiczDan Tauriello M.S. OE Ocean Mapping B. CalderAditi Tripathy Ph.D. Ocean Engineering J. Miksis OldsKate Von Krusenstiern * M.S. ES Ocean Mapping T. LippmannElizabeth Weidner * Ph.D. ES Ocean Mapping L. MayerDylan Wilford * M.S. Oceanography J. Miksis OldsStephen Wissow * Ph.D. Computer Science T. Butkiewicz
GEBCO Students (2020-2021)Student Institution Country
Eloisa Jayne Barnett University of Southampton Great BritainPadraig Cronin Geological Survey Ireland (GSI) IrelandIvan Dudkov Atlantic Branch of the P.P. Shirshov Inst. of Oceanology–Russian Academy of Science RussiaMarcos Daniel Leite Rede Rio Doce Mar (RRDM) BrazilKurt Louis Montemor National Mapping and Resource Information Authority PhilippinesLuisana Osorio Vilma General Maritime Directorate - Ministry of National Defense - CIOH Colombia
JHC Performance Report 31 January 2021 293
Appendix B: Field ProgramsAR42 ADEON Lander Recovery Cruise, January 3–December 25. ADEON lander recovery cruise. (Jennifer Miksis-Olds)
Seafloor Reference Experiment, January 8–10. The R/V Gulf Surveyor was configured to run two individually operating single-beam systems for the purpose of investigating in-field horizontal lever arm calibrations. (Semme J. Dijkstra, Daniel Tauriello, Matthew Rowell, Emily Terry, Casey O'Heran)
KM2008B R/V Kilo Moana EM122 and EM710 Quality Assurance Testing, February 1–July 31. The Multibeam Advisory Committee (MAC) provided system configuration review, planning services, and remote assessment of calibration (‘patch test’), hardware health, and noise level data during opportunistic quality assurance testing of the EM122 and EM710 installed aboard R/V Kilo Moana. Calibration plans were developed with sites used previously by the R/V Marcus G. Langseth and R/V Falkor off the coast of Oregon. The QAT included pre- and post-shipyard data collection, spanning several interactions over February–July 2020. The report for this field program is available on the MAC website. (Paul Johnson, Kevin Jerram)
OE/ESCI 875 Labs, R/V Gulf Surveyor, February 4. Repeating Tuesday labs. (Emily Terry, Matthew Rowell, Daniel Tauriello, Semme J. Dijkstra)
EM2040 Quality Assurance Testing, February 6. Jerram and Johnson reviewed system geometry and planned a full series of quality assurance tests for the two EM2040s installed aboard NOAA Ship Ferdinand R. Hassler. Tests were intended to confirm pre-season system readiness, including geometric calibrations (‘patch tests’), reference surface surveys and accuracy assessments across all operational modes, swath coverage testing, and speed-noise testing near the Isles of Shoals. (Paul Johnson, Kevin Jerram)
AR42 R/V Neil Armstrong EM122 and EM710 calibrations, February 26–27. Jerram and Johnson reviewed system geometry and planned calibrations (‘patch tests’) for the EM122 and EM710 installed aboard R/V Neil Arm-strong. Sites were selected opportunistically along the vessel’s post-shipyard transit through the Gulf of Mexico. Jerram and Johnson provided remote data analysis and reporting to support pre-season readiness. (Paul John-son, Kevin Jerram)
EX2000 EM304 Sea Acceptance Trials, March 3–8. Sea acceptance testing of a new EM304 transceiver upgrade aboard NOAA Ship Okeanos Explorer in the Gulf of Mexico. Activities included geometry review, impedance testing, POS MV GAMS calibration, EM304 calibration (patch test), accuracy testing, speed-noise testing, swath coverage assessment, and troubleshooting with Kongsberg and QPS engineers. See EM304 SAT report pro-vided to NOAA OER personnel and hosted for reference on MAC website (mac.unols.org). (Shannon Hoy, Kevin Jerram)
Sarah Long Bridge MECC, March 9–10. Cross-river ADCP surveys for Cam Carbone (Undergrad) and MECC OE Team. (Jon Hunt, Tom Lippmann)
SKQ202008S R/V Sikuliaq EM302 and EM710 calibrations, June 16. In April 2020, the Multibeam Advisory Com-mittee (MAC) planned a series of geometric calibrations ('patch tests') at new sites near Seward, AK for the EM302 and EM710 systems aboard R/V Sikuliaq. The vessel completed data collection in mid-June and the MAC provided remote data analysis and reporting to support field season readiness. (Paul Johnson, Kevin Jerram)
Survey in Bear Creek Errol, June 16–18. Survey Bear Creek with Zego Boat and deploy/recover two ADCPs as part of Tom Ballestero’s logjam project. (Jon Hunt, Tom Lippmann)
Seaweed 3D Mapping, July 1–August 15. Collected underwater stereo imagery at three sites at the Isles of Shoals, NH. (Jenn Dijkstra)
APPENDIX BAPPENDIX A
JHC Performance Report294
APPENDIX C
HLY20TC USCGC Healy EM122 Quality Assurance Testing, July 13–19. The Multibeam Advisory Committee pro-vided system configuration review, planning services, and remote assessment of calibration data collected with both navigation systems during USCGC Healy seasonal testing, in coordination with UCSD/STARC personnel. Additional testing included system hardware health, swath coverage, and noise testing collected and assessed opportunistically. The report for this field program is available on the MAC website. (Paul Johnson, Kevin Jer-ram)
AR 2020 Remote Support R/V Neil Armstrong RX Noise and Swath Coverage Testing, July 30–October 5, In July and October 2020, the Multibeam Advisory Committee (MAC) worked with technicians aboard R/V Neil Armstrong to conduct opportunistic swath coverage and noise testing using MAC tools to assess the potential impacts of fairing degradation observed near the transducer arrays. (Paul Johnson, Kevin Jerram)
NA118 E/V Nautilus EM302 Quality Assurance Test, August 20–26. The yearly Quality Assurance test of the E/V Nautilus's EM302 multibeam echosounder system. These tests were conducted around the Channel Islands off of California, using tests sites previous occupied during other QATs. Johnson planned, executed, and reported on the results of the test. (Paul Johnson)
RR2002 R/V Roger Revelle EM124 and EM712 Sea Acceptance Testing, October 18–25, The Multibeam Advi-sory Committee (MAC) provided full remote support for sea acceptance testing of the R/V Roger Revelle’s new Seapath navigation system and EM124 and EM712 multibeam echosounders, including planning and round-the-clock shore-side processing and troubleshooting throughout the condensed SAT schedule. At-sea data collection with near-real-time shore-side processing included noise and hardware health testing, calibration and verification of angular offsets (‘patch tests’), swath coverage assessment, and reference surface surveys and accuracy crossline testing for both systems. The MAC is providing follow-up planning for additional data collec-tion throughout the winter 2020-21 field season to complete the SAT characterization of baseline performance. The report for this field program will be available on the MAC website after completion of remaining SAT data collection in late 2020 / early 2021. (Paul Johnson, Kevin Jerram)
ASV-BEN October Field Testing, October 19–30. Daily operations of ASV-BEN to field test numerous repairs and upgrades including new sonar ram, new radar, replaced MBR 144, new steering motor controllers, new net-work infrastructure, new multi-camera array and new telemetry algorithms. (Kenneth G. Fairbarn, Andy McLeod, Roland Arsenault, Lynette Davis, Steve Wissow, Val E. Schmidt)
AR49 ADEON Cruise 5 , R/V Armstrong, December 2–21. This expedition is the last of five cruises for this project focused on recovery of ADEON landers at six sites, redeployment of new bottom landers at three sites along the outer continental shelf (OCS) of the United States east coast. In addition to the lander work, station sampling will occur at each location consisting of CTD profiles, net trawls for biological specimens, and a fine-scale, lawnmower pattern active acoustic survey using the hull-mounted echo sounder on the R/V Armstrong. ROV Jason is joining the cruise to aid in recovering a lost lander at the ADEON JAX site that was not recovered during the AR040 cruise is November 2019. ROV Jason will be performing two engineering dives within the cruise schedule following its Fall 2020 overhaul. This project is a collaboration among four federal agencies: National Science Foundation, Bureau of Ocean Energy Management (BOEM), NOAA, and the Office of Naval Research (ONR). Data gathered during this mission in support of the ADEON project will help inform multiple management issues concerning this region. (Grant Milne, Anthony Lyons, Jennifer Miksis-Olds)
APPENDIX B
JHC Performance Report 31 January 2021 295
Appendix C: Partnerships and Ancillary ProgramsOne of the goals of the Joint Hydrographic Center is, through its partner organization the Center for Coastal and Ocean Mapping, to establish collaborative arrangements with private sector and other government organizations. Our involvement with Tyco has been instrumental in the University securing a $5 million endowment; $1 million of this endowment has been earmarked for support of post-doctoral fellows at the Center for Coastal and Ocean Mapping. Industrial Partner Kongsberg Maritime has also provided $1 million to support the research of John Hughes Clarke. Our interaction with the private sector has been formalized into an industrial partner program that is continually growing.
• Acoustic Imaging Pty, Ltd.
• AML Oceanographic
• Anthropocene Institute ("ProtectedSeas")
• Applanix
• AusSeaBed
• BAE Systems
• Bedrock Ocean Exploration PBC
• Chesapeake Technology, Inc.
• Clearwater Seafoods
• David Evans & Associates
• Earth Analytic, Inc.
• Edgetech
• EIVA Marine Survey Solutions
• Environmental Systems Research Institute (ESRI)
• Euclideon International Pty, Ltd.
• Exocetus Autonomous Systems
• Farsounder, Inc.
• Foreshore Technology Ltd.
• Fugro USA Marine, Inc.
• Higgs Hydrographic Teck
• Huntington Ingalls Industries (formerly Hydroid)
• Hypack, A Xylem Brand
• Ifremer
• IIC Technologies
• iXblue
• Jasco Applied Sciences (Canada) Ltd.
• Kongsberg Underwater Technology (KUTI)
• Kraken Sonar
• L3Harris
• Leidos
APPENDIX C
• Marine Advance Robotics, Inc.
• Mitcham Industries
• NLA International
• Norbit SubSea
• Ocean Exploration Trust
• Ocean High Technology Institute Inc.
• OceanX
• Phoenix International
• PingDSP
• Quality Positioning Services B.V.
• R2Sonic
• Saildrone
• Sea ID Ltd.
• Sea Machines Robotics
• Seismic Micro Technology Kingdom (SMT)
• SevenCs
• SPG Systems
• SubCom (Tyco)
• SubSeaSail LLC
• Substructure
• Teledyne Benthos Inc.
• Teledyne Caris
• Teledyne Marine
• Teledyne OceanScience
• Teledyne Odom Hydrographic
• Teledyne Optech
• Teledyne RDI
• Teledyne Reson
• ThayerMahan Inc.
• Woolpert, Inc.
APPENDIX B
JHC Performance Report296
APPENDIX CAPPENDIX C
In addition, grants are in place with:
• Department of Commerce, NOAA
• Department of Defense, Office of Naval Research
• Department of Energy, Los Alamos National Laboratory
• Department of the Interior, BOEM
• Exxon Corporation
• Kongsberg Maritime
• National Science Foundation
• New Hampshire Dept of Environmental Services (from NOAA)
• Nippon Foundation/GEBCO
• Ocean Exploration Trust
• Regional Association for Research on Gulf of Maine
• Stockholm University (from GEBCO-Nippon Foundation)
• TDI Brooks (from U.S. Dept of the Interior)
• TE Connectivity
• TYCO
• University of California at Santa Barbara (from CA State Lands Commission)
• University of New Hampshire ADVANCE Collaborative
• University of Rhode Island (from U.S. Dept of Commerce, NOAA)
• Virginia Polytechnic Institute and State University (from U.S. Dept of Defense, Navy)
• Wells National Estuarine Research Reserve (from U.S. Dept of Commerce, NOAA)
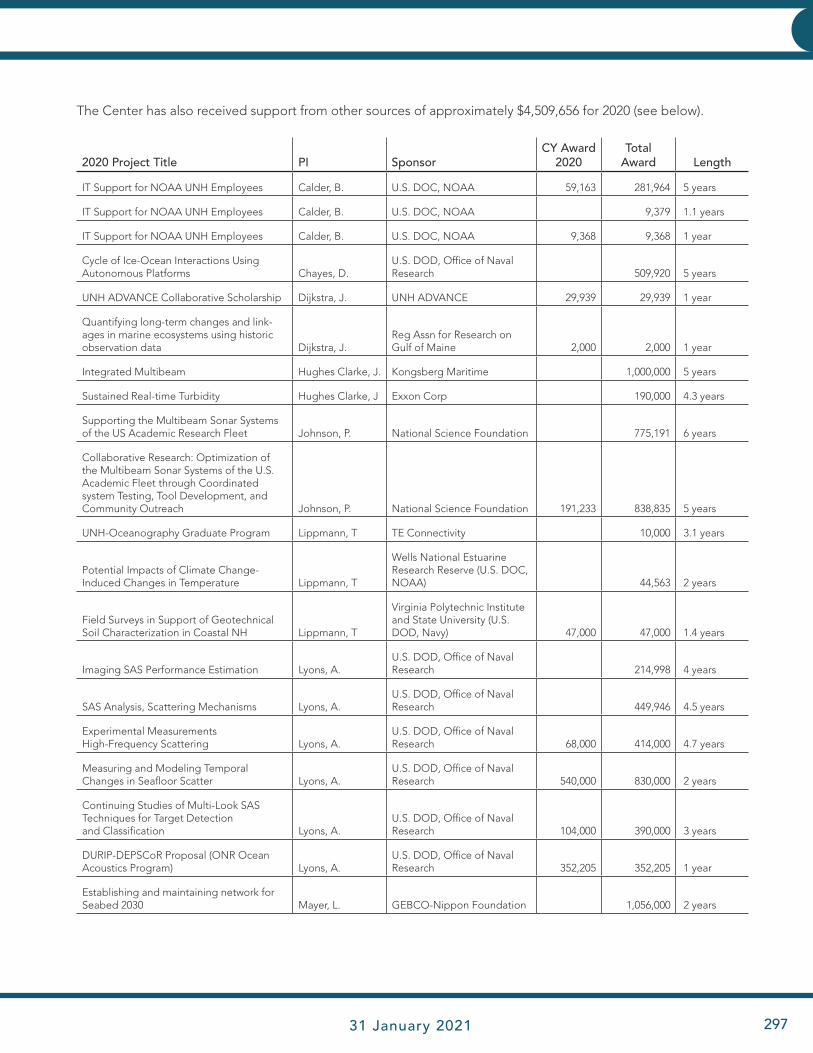
JHC Performance Report 31 January 2021 297
The Center has also received support from other sources of approximately $4,509,656 for 2020 (see below).
2020 Project Title PI SponsorCY Award
2020Total
Award Length
IT Support for NOAA UNH Employees Calder, B. U.S. DOC, NOAA 59,163 281,964 5 years
IT Support for NOAA UNH Employees Calder, B. U.S. DOC, NOAA 9,379 1.1 years
IT Support for NOAA UNH Employees Calder, B. U.S. DOC, NOAA 9,368 9,368 1 year
Cycle of Ice-Ocean Interactions Using Autonomous Platforms Chayes, D.
U.S. DOD, Office of Naval Research
509,920 5 years
UNH ADVANCE Collaborative Scholarship Dijkstra, J. UNH ADVANCE 29,939 29,939 1 year
Quantifying long-term changes and link-ages in marine ecosystems using historic observation data Dijkstra, J.
Reg Assn for Research on Gulf of Maine
2,000
2,000 1 year
Integrated Multibeam Hughes Clarke, J. Kongsberg Maritime 1,000,000 5 years
Sustained Real-time Turbidity Hughes Clarke, J Exxon Corp 190,000 4.3 years
Supporting the Multibeam Sonar Systems of the US Academic Research Fleet Johnson, P. National Science Foundation
775,191 6 years
Collaborative Research: Optimization of the Multibeam Sonar Systems of the U.S. Academic Fleet through Coordinated system Testing, Tool Development, and Community Outreach Johnson, P. National Science Foundation
191,233
838,835 5 years
UNH-Oceanography Graduate Program Lippmann, T TE Connectivity 10,000 3.1 years
Potential Impacts of Climate Change-Induced Changes in Temperature Lippmann, T
Wells National Estuarine Research Reserve (U.S. DOC, NOAA)
44,563 2 years
Field Surveys in Support of Geotechnical Soil Characterization in Coastal NH Lippmann, T
Virginia Polytechnic Institute and State University (U.S. DOD, Navy)
47,000
47,000 1.4 years
Imaging SAS Performance Estimation Lyons, A.U.S. DOD, Office of Naval Research
214,998 4 years
SAS Analysis, Scattering Mechanisms Lyons, A.U.S. DOD, Office of Naval Research
449,946 4.5 years
Experimental Measurements High-Frequency Scattering Lyons, A.
U.S. DOD, Office of Naval Research
68,000
414,000 4.7 years
Measuring and Modeling Temporal Changes in Seafloor Scatter Lyons, A.
U.S. DOD, Office of Naval Research
540,000
830,000 2 years
Continuing Studies of Multi-Look SAS Techniques for Target Detection and Classification Lyons, A.
U.S. DOD, Office of Naval Research
104,000
390,000 3 years
DURIP-DEPSCoR Proposal (ONR Ocean Acoustics Program) Lyons, A.
U.S. DOD, Office of Naval Research
352,205
352,205 1 year
Establishing and maintaining network for Seabed 2030 Mayer, L. GEBCO-Nippon Foundation
1,056,000 2 years
APPENDIX CAPPENDIX C

JHC Performance Report298
APPENDIX D
Seabed 2030: Complete Mapping of the Ocean Floor by 2030 Mayer, L.
Stockholm Univ., (GEBCO-Nippon Foundation)
122,150 3.3 years
NF GEBCO Years 15 & 16 Project and Travel Mayer, L GEBCO Nippon-Foundation
1,474,397 3 years
Indian Ocean Project Mayer, L. GEBCO Nippon-Foundation 245,269 9.4 years
NF GEBCO Ambassador Mayer, L. GEBCO Nippon-Foundation 40,500 6 years
NF GEBCO Training Program Yr 17 Mayer, L. GEBCO Nippon-Foundation 705,369 705,369 1 year
Ocean Exploration Cooperative Institute (OECI) Mayer, L.
Univ of Rhode Island (U.S.DOC, NOAA)
1,302,228
7,288,485 2 years
ASV Exploration Mayer, L. Ocean Exploration Trust 166,227 1.3 years
Tyco Endowment Mayer, L. TYCO 52,498 in perpetuity
Saildrone Surveyor: Autonomous Mapping & Environmental Characterization Using Deep Ocean ASV Mayer, L. U.S. DOC, NOAA
999,852 3 years
Monitoring Odontocete Shifts Miksis-Olds, J.U.S. DOD, Office of Naval Research
800,000 5.4 years
Exploitation of the CTBTO Hydro-Acoustic Array Data Bases Miksis-Olds, J.
U.S. DOD, Office of Naval Research
40,000
120,000 4 years
SeaBASS 2018: BioAcoustic Summer School Miksis-Olds, J. U.S. DOC, NOAA
30,500 4 years
ADEON: Atlantic Deepwater Ecosystem Observatory Network Miksis-Olds, J.
U.S. DOI, Dept. of the Interior
715,191
6,092,513 5 years
Deep Water Atlantic Habitats Miksis-Olds, J.TDI Brooks (Dept.of the Interior)
179,210
383,911 4.5 years
NH Beach Volunteer Beach Profiling YR 4 Ward, L. NH DES (NOAA) 20,573 1 year
NH Beach Volunteer Beach Profiling YR 5, 6 Ward, L. NH DES (NOAA) 28,420 28,420 1 year
Assessment of Offshore Sources -Extension Ward, L. U.S. DOI, BOEM 499,997 6.8 years
Continuously-Running, Asynchronous Sampling Engine Ware, C.
U.S. DOE, Los Alamos National Laboratory 180,000 2.5 years
Development of a Broadband Weber, T. National Science Foundation 690,785 6 years
Platform Holly Seep Acoustic Observatory Weber, T.UC Santa Barbara (CA State Lands Commission)
83,832
211,995 3 years
GEBCO-NF Team Participation in the Shell Ocean Discovery XPRIZE Wigley, R. GEBCO-Nippon Foundation
3,362,581 4.3 years
GEBCO-NF Shell Ocean Discovery Xprize round 2 Wigley, R. GEBCO-Nippon Foundation
3,092,801 3.3 years
TOTALS 4,509,656 34,011,633
APPENDIX C
JHC Performance Report 31 January 2021 299
APPENDIX D
Appendix D: Publications
Book Ware, C., Information Visualization: Perception for Design, 4th ed., Elsevier, 2020, p. 560.
Book SectionsBaumert, K.A and Mayer, L.A., “Submarine Ridges and Submarine Elevations under the Law of the Sea Conven-tion: A Further Look,” in New Knowledge and Changing Circumstances in the Law of the Sea, T. Heidar, Ed. Brill Nijhoff Press, 2020, pp. 264–288.
Di Stefano, M. and Mayer, L.A., “Geomorphology and Microhabitats of Large, Isolated, Immobile Bedforms in the Great South Channel, Northwest Atlantic Ocean,” in Seafloor Geomorphology as Benthic Habitat, 2nd ed., P. Harris and Baker, E., Eds. 2020, pp. 503-518.
Mayer, L.A., “Climate Change and the Legal Effects of Sea Level Rise: An Introduction to the Science,” in New Knowledge and Changing Circumstances in the Law of the Sea, T. Heidar, Ed. Brill Nijhoff Press, 2020, pp. 343-357.
Sowers, D., Dijkstra, J.A., Mello, K., Masetti, G., Malik, M.A., and Mayer, L.A., “Application of the Coastal and Marine Ecological Classification Standard to Gosnold Seamount, North Atlantic Ocean,” in Seafloor Geomorph-ology as Benthic Habitat, 2nd ed., P. Harris and Baker, E., Eds. Elsevier, 2020, pp. 903-916.
Conference AbstractsArsenault, R. and Schmidt, V.E., “A Mapping Focused Open-Sourced Software Framework for Autonomous Sur-face Vehicles,” Canadian Hydrographic Conference. Quebec City, Quebec, Canada, 2020.
Guimaraes, I.B. and Hughes Clarke, J.E., “Calibrating Broadband Multibeam Seabed Backscatter,” Canadian Hydrographic Conference. Quebec City, Quebec, Canada, 2020.
Hamel, J., Rice, G.A., and Weber, T.C., “Transmission Array Sidelobe Interference in Multibeam Phase Ramps,” Canadian Hydrographic Conference. Quebec City, Quebec, Canada, 2020.
Hartwell, A.M. and Dijkstra, J.A., “Fine-Scale Natural Variability of Community Distribution on a Low Tempera-ture Discharge Outcrop of a Ridge Flank Hydrothermal System,” 2020 Ocean Sciences Meeting. San Diego, CA, 2020.
Hughes, J.E. Clarke, Fitzgerald, K., Leach, T., Wang, H., Cheng, T., Hoy, S., Hagg, R., and Walker, K., “Monitoring Bubble Washdown Over a Deep-Water Multibeam Ping Cycle,” Canadian Hydrographic Conference. Canadian Hydrographic Association, Quebec City, Quebec, Canada, 2020.
Kastrisios, C., Ware, C., Calder, B.R., Butkiewicz, T., Alexander, L., and Hauser, O., “Nautical Chart Data Uncer-tainty Visualization as the Means for Integrating Bathymetric, Meteorological, and Oceanographic Information in Support of Coastal Navigation,” American Meteorological Society 100th Meeting. Boston, MA, 2020.
Kelley, J.G., Nagel, E., Greenlaw, J., Gibbons, A.M., Seroka, G., Weston, N., Powell, J., and Myers, E., “Modern-izing Marine Navigation using S-111 Surface Current Forecast Guidance Derived from NOS Operational Oceano-graphic Forecast Systems,” 2020 Fall Meeting American Geological Union. 2020.
APPENDIX C

JHC Performance Report300
APPENDIX D
Moghimi, S., Myers, E., Funakoshi, Y., Calzada, J., Seroka, G., Burnett, Z., Velissariou, P., Britzolakis, G., Burke, P., Snowden, D., Weston, N., and Pe'eri, S., “Coastal Ocean Modelling Infrastructure Development at the National Ocean Service in Support of Disaster Mitigation and Marine Navigation,” 2020 Fall Meeting American Geologi-cal Union. 2020.
Powell, J., Greenlaw, J., Hess, K., Nagel, E., Seroka, G., Weston, N., and Kelley, J.G., “The World of S-100: Data Standards for Navigation Systems and Beyond,” 100th AMS Annual Meeting. Boston, MA, 2020.
Seroka, G., Greenlaw, J., Hess, K., Kelley, J.G., Nagel, E., Powell, J., and Weston, N., “Encoding Hydrodynamic Model Guidance from NOAA's Operational Forecast Systems in S-111 and S-104 International Standards to Sup-port Precision Navigation,” 100th AMS Annual Meeting. Boston, MA, 2020.
Weidner, E., Stranne, C., and Sundberg, J. Henati, “A Broadband Acoustic Study of the Spatiotemporal Variabil-ity of the Baltic Sea Anoxic Zone,” 2020 Ocean Sciences Meeting. San Diego, CA, 2020.
Conference ProceedingsButkiewicz, T. and Stevens, A.H., “Evaluation of the Effects of Field-of-View in Augmented Reality for Marine Navigation,” SPIE Augmented, Virtual, and Mixed Reality, vol. 11310. SPIE, San Francisco, CA, p. 12, 2020.
Calder, B.R., “BAG 2.0: Continuing Development of an Open, Grid-based Data Transfer Format,” Canadian Hy-drographic Conference. Canadian Hydrographic Association, Quebec City, Quebec, Canada, 2020.
Calder, B.R. and Hoy, S., “Estimating Crowdsourced, Authoritative Observer, and Data Reputation,” Canadian Hydrographic Conference. Canadian Hydrographic Association, Quebec City, Quebec, Canada, 2020.
Cordero Ros, J.M. and Kastrisios, C., “Characterizing Free and Open-Source Tools for Ocean-Mapping,” 6th Hydrographic Engineering Conference. Lisbon, Portugal, pp. 53-56, 2020.
Kastrisios, C., Calder, B.R., and Bartlett, M., “ENC Depth Areas: Quality Control of Sea-bottom Surface Continu-ity and Error Fixes,” 2020 Canadian Hydrographic Conference. Quebec City, Quebec, Canada, 2020.
Kastrisios, C., Ware, C., Calder, B.R., Butkiewicz, T., Alexander, L., and Broekman, R., “Improved Techniques for Depth Quality Information on Navigational Charts,” 8th International Conference on Cartography and GIS, vol. 1. Nessebar, Bulgaria, pp. 73-80, 2020.
Kastrisios, C., Calder, B.R., and Bartlett, M., “Inspection and Error Remediation of Bathymetric Relationships of Adjoining Geo-Objects in Electronic Navigational Charts,” 8th International Conference on Cartography and GIS, vol. 1. Nessebar, Bulgaria, pp. 116-123, 2020.
Kastrisios, C., Calder, B.R., Masetti, G., Martinez, B., and Holmberg, P., “Soundings Validation: Toolbox Research to Operations,” 2020 Canadian Hydrographic Conference. Quebec City, Quebec, Canada, 2020.
Lowell, K., Calder, B.R., and Lyons, A.P., “Developing Machine Learning Models for Quality Assurance and Con-tinuous Improvement of Bathymetry Extraction from Lidar Point Clouds,” Canadian Hydrographic Conference. Quebec City, Quebec, Canada, 2020.
Masetti, G., Mayer, L.A., Johnson, P., and Kelley, J.G., “Leveraging Predictions from NOAA’s Oceanographic Forecast Models to Increase Environmental Variability Awareness in Ocean Mapping,” American Meteorological Society 100th Meeting. Boston, MA, 2020.
Masetti, G., Dijkstra, S.J., Wigley, R., Greenaway, S.F., Manda, D., Armstrong, A.A., and Mayer, L.A., “The e-Learn-ing Python for Ocean Mapping project - Empowering the Next Generation of Ocean Mappers with Effective Programming Skills,” 2020 Canadian Hydrographic Conference. Quebec City, Quebec, Canada, 2020.
APPENDIX D
JHC Performance Report 31 January 2021 301
APPENDIX D
O'Heran, C. and Calder, B.R., “Horizontal Calibration of Vessel Lever Arms Using Unmanned Aircraft Systems (UASs),” Canadian Hydrographic Conference. Quebec City, Quebec, Canada, 2020.
Smith, M., Masetti, G., Mayer, L.A., Malik, M.A., Augustin, J.-M., Poncelet, C., and Parnum, I., “Open Backscatter Toolchain (OpenBST) - A Community-Vetted Workflow for Backscatter Processing,” 2020 Canadian Hydrographic Conference. Quebec City, Quebec, Canada, 2020.
Stevens, A.H. and Butkiewicz, T., “Faster Multibeam Sonar Data Cleaning: Evaluation of Editing 3D Point Clouds Using Immersive VR,” IEEE Oceans. IEEE, Seattle, WA, p. 10, 2020.
Ware, C., Samsel, F., Rogers, D., and Navratil, P., “Designing Pairs of Colormaps for Visualizing Bivariate Scalar Fields,” Eurographics Conference on Visualization. Eurovis Confererence Proceedings, Norrköping, Sweden, 2020.
Journal ArticlesAuscavitch, S., Pockalny, R., Konrad, K., Humphreys, J., Clark, T.B., Heffron, E., and Fundis, A., “Deepwater Explo-ration of Kingman Reef, Palmyra Atoll, and Jarvis Island,” Oceanography, vol. 33(1). The Oceanography Society, pp. 38-39, 2020.
Barker, L.D.L., Jakuba, M., Bowen, A., German, C. R., Maksym, T., Mayer, L.A., Boetius, A., Dutrieux, P., and Whit-comb, L.L., “Scientific Challenges and Present Capabilities in Underwater Robotic Vehicle Design and Navigation for Oceanographic Exploration Under-Ice,” Remote Sensing, vol. 12(16):2588. 2020.
Bassett, C., Lavery, A., Lyons, A.P., Wilkinson, J., and Maksym, T., “Direct Inference of First-Year Sea Ice Thickness Using Broadband Acoustic Backscattering,” Journal of the Acoustical Society of America, vol. 147. American Insti-tute of Physics, pp. 824-838, 2020.
Boggild, K., Mosher, D.C., Travaglini, P.G., Gebhardt, C., and Mayer, L.A., “Mass Wasting on Alpha Ridge in the Arctic Ocean: New Insights from Multibeam Bathymetry and Sub-bottom Profiler Data,” Geological Society of London, Special Publication, vol. 500. pp. 323-340, 2020.
Calder, B.R. and Dijkstra, S.J., “A Design for a Trusted Community Bathymetry System,” Marine Geodesy, Taylor and Francis, 2020.
Cushing, C.W. and Weidner, E., “Student and Regional Chapters: The Grass Roots of the ASA,” Acoustics Today, vol. 16(4). Acoustical Society of America, Melville, NY, p. 3, 2020.
Dudkov, I. and Dorokhova, E., “Multibeam Bathymetry Data of Discovery Gap in the Eastern North Atlantic,” Data in Brief, vol. 31, 105679. 2020.
Dudkov, I., Sivkov, V., Dorokhov, D., and Bashirova, L., “Multibeam Bathymetry Data from the Kane Gap and South-eastern Part of the Canary Basin (Eastern tropical Atlantic),” Data in Brief, vol. 32, 106055. 2020.
Gandulla, S., Waters, S., Schmidt, V.E., Marcus, C., Heffron, E., and Gee, L., “Searching for Shipwrecks in Thunder Bay National Marine Sanctuary,” Oceanography, vol. 33(1). The Oceanography Society, pp. 32-33, 2020.
Gardner, J.V., Peakall, J., Armstrong, A.A., and Calder, B.R., “The Geomorphology of Submarine Channel Systems of the Northern Line Islands Ridge, Central Equatorial Pacific Ocean,” Frontiers in Earth Science, p. 24, 2020.
Gee, L., Heffron, E., Kane, R., Peters, C., and Raineault, N.A., “E/V Nautilus 2019 Mapping: Filling the Gaps in Sea-floor Coverage of the Remote Pacific and Contributing to Global Seabed Mapping Initiatives,” Oceanography, vol. 33(1). The Oceanography Society, pp. 30-31, 2020.
APPENDIX D
JHC Performance Report302
APPENDIX D
Hogan, K., Jakobsson, M., Mayer, L.A., Reilly, B., Jennings, A., Stoner, J.S., Nielsen, T., Andresen, K.J., Kamla, E., Jerram, K., Stranne, C., and Mix, A., “Glacial Sedimentation, Fluxes and Erosion Rates Associated with Ice Retreat in Petermann Fjord and Nares Strait, North-West Greenland,” The Cryosphere, vol. 14. Copernicus Publications, pp. 261-286, 2020.
Jakobsson, M., Mayer, L.A., Nilsson, J., and Stranne, C., “Ryder Glacier in Northwest Greenland is Shielded from Warm Atlantic Water by a Bathymetric Sill,” Nature Communications Earth & Environment, vol. 45. Springer Nature, 2020.
Jakobsson, M., Mayer, L.A., and Bringensparr, C., “The International Bathymetric Chart of the Arctic Ocean Version 4.0,” Sci Data 7, vol. 176(2020). 2020.
Jakobsson, M., O'Regan, M., Mörth, C.-M., Stranne, C., Weidner, E., Hansson, J., Gyllencreutz, R., Humborg, C., Elfwing, T., Norkko, A., Norkko, J., Nilsson, B., and Sjöström, A., “Links Between Baltic Sea Submarine Terraces and Groundwater Sapping,” Earth Surface Dynamics, vol. 8. pp. 1-15, 2020.
Kates Varghese, H., Miksis-Olds, J., DiMarzio, N., Lowell, K., Linder, E., Mayer, L.A., and Moretti, D., “The Effect of Two 12 kHz Multibeam Mapping Surveys on the Foraging Behavior of Cuvier’s Beaked Whales Off of South-ern California,” Journal of the Acoustical Society of America, vol. 147(6). Acoustical Society of America, pp. 3849-3858, 2020.
Lowell, K., Calder, B.R., and Lyons, A.P., “Measuring Shallow-water Bathymetric Signal Strength in Lidar Point Attribute Data Using Machine Learning,” International Journal of Geographical Information Science, Taylor and Francis, 2020.
Masetti, G., Smith, M., Mayer, L.A., and Kelley, J.G., “Applications of the Gulf of Maine Operational Forecast System to Enhance Spatio-Temporal Oceanographic Awareness for Ocean Mapping,” Frontiers in Marine Science, vol. 6:804. Frontiers Media, 2020.
Mukasa, S.B., Andronikov, A., Brumley, K., Mayer, L.A., and Armstrong, A.A., “Basalts from the Chukchi Borderland: 40Ar/39Ar Ages and Geochemistry of Submarine Intraplate Lavas Dredged from the Western Arctic Ocean,” Journal of Geophysical Research: Solid Earth, vol. 125. American Geophysical Union, 2020.
Rychert, K.M. and Weber, T.C., “Tests of Acoustic Target Strength and Bubble Dissolution Models Using a Synthetic Bubble Generator,” Journal of Atmospheric and Oceanic Technology, American Meteorological Society, 2020.
Seger, K.D. and Miksis-Olds, J., “A Decade of Marine Mammal Acoustical Presence and Habitat Preference in the Bering Sea,” Polar Biology, vol. 43. pp. 1549–1569, 2020.
Sowers, D., Masetti, G., Mayer, L.A., Johnson, P., Gardner, J.V., and Armstrong, A.A., “Standardized Geomor-phic Classification of Seafloor within the United States Atlantic Canyons and Continental Margin,” Frontiers in Marine Science, vol. 7(9). pp. 1-9, 2020.
Stevens, A.H., Ware, C., Butkiewicz, T., Rogers, D.H., and Abram, G., “Hairy Slices II: Depth Cues for Visualizing 3D Streamlines Through Cutting Planes,” Eurographics Conference on Visualization, vol. 39(3). pp. 25-35, 2020.
Ware, C., Mayer, L.A., Johnson, P., Jakobsson, M., and Ferrini, V.L., “A Global Geographic Grid System for Visu-alizing Bathymetry,” Geoscientific Instrumentation Methods and Data Systems, vol. 9(2). European Geosciences Union, pp. 375-384, 2020.
Weidner, E., Stranne, C., Sundberg, J. Henati, Weber, T.C., Mayer, L.A., and Jakobsson, M., “Tracking the Spatiotemporal Variability of the Oxic–Anoxic Interface in the Baltic Sea with Broadband Acoustics,” ICES Journal of Marine Science. 2020.
APPENDIX D
JHC Performance Report 31 January 2021 303
APPENDIX D
Wheat, C.G., Becker, K., Villinger, H., Orcutt, B.N., Fournier, T., Hartwell, A.M., and Paul, C., “Subseafloor Cross‐Hole Tracer Experiment Reveals Hydrologic Properties, Heterogeneities, and Reactions in Slow‐Spreading Oceanic Crust,” Geochemistry, Geophysics, Geosystems, vol. 21(1). AGUpubs, pp. 1-15, 2020.
Conference PosterKastrisios, C., Ware, C., Calder, B.R., Butkiewicz, T., and Alexander, L., “An Improved Method for Portraying CATZOC in ECDIS,” 2020 Mariners' Workshop, Shipping Federation of Canada, Montreal, Canada, 2020.
Padilla, A.M., Waite, W.F., and Weber, T.C., “Observations from Controlled Experiments on the Dissolution of Free-Gas Bubbles and Hydrate-Coated Bubbles in Water,” 2020 Ocean Science Meeting, San Diego, CA, 2020.
ReportsKastrisios, C., Ware, C., Calder, B.R., Butkiewicz, T., and Alexander, L., “An Alternative Methodology (to the Star Symbols),” International Hydrographic Organization, Monaco, 2020.
Kennedy, C., Pappal, A.L., Bastidas, C., Calrton, J.T., David, A.A., Dijkstra, J.A., Duffey, S., Gibson, J., Grady, S.P., Green-Gavrielidis, L., Harris, L.G., Hobbs, N.- V., Mauk, A., McCuller, M., Neefus, C., O'Brien, B., Osborne, K., Pederson, J., Robidoux, J., Tyler, M., and Van Volkom, K., “Report on the 2018 Rapid Assessment Survey of Introduced, Cryptogenic, and Native Marine Species at New England Marinas Massachusetts to Maine,” Commonwealth of Massachusetts, Boston, MA, 2020.
Masetti, G., Rondeau, M., Barón, B.Jiménez, Wills, P., Petersen, Y. Morville, and Salmia, J., “Trusted Crowd-Sourced Bathymetry: From the Trusted Crowd to the Chart,” Danish Geodata Agency & Canadian Hydrographic Service, 2020.
Master's ThesesBrown, A.F., Real Time Motion Planning for Path Coverage with Applications in Ocean Surveying, University of New Hampshire, Durham, NH, 2020.
Gomes de Araujo, L., Potential for Non-Conventional Use of Split-Beam Phase Data in Bottom Detection, University of New Hampshire, Durham, NH, 2020.
Johnson, J., The Effect of Cold Pool Variability on Zooplankton Dynamics of the Eastern Bering Sea Shelf, University of New Hampshire, Durham, NH, 2020.
O'Heran, C., Horizontal Calibration of Vessel Lever Arms Using Non-Traditional Survey Methods, University of New Hampshire, Durham, NH, 2020.
APPENDIX D
JHC Performance Report304
APPENDIX E
Appendix E: Technical Presentations and SeminarsGiuseppe Masetti, Contributed, January 13–17. Leveraging Predictions from NOAA’s Oceanographic Forecast Models to Increase Environmental Variability Awareness in Ocean Mapping, American Meteorological Society’s 100th Meeting, Boston, MA.
Jenn Dijkstra, Keynote, January 18. Ocean Warming and Invasive Species in the Gulf of Maine, New Hampshire Divers Association, Annual Banquet of the New Hampshire Divers Association, Manchester, NH.
Derek Sowers, Invited, January 24. NOAA Office of Ocean Exploration and Research and NOAA Ship Okeanos Explorer: Onward and Downward, Accomplishments and Highlights from the 2019 Field Season, JHC/CCOM, Friday Seminar Series, Durham, NH. Over the past ten years, NOAA’s Office of Ocean Exploration and Research (OER)—utilizing “America’s Ship for Ocean Exploration” the Okeanos Explorer—has led over 100 exploratory ocean mapping missions covering a cumulative area of 1.9 million sq. km of seafloor. Key Okeanos highlights from the year, collaborations between NOAA OER and the CCOM community, and OER’s mechanisms to further ocean mapping were presented.
Giuseppe Masetti, Derek Sowers, Invited, January 24. BRESS Software Training Demo, National Park Service, Virtual. Derek Sowers provided a demonstration webinar to resource managers at the National Park Service (NPS) on how to use the BRESS software tool developed by Giuseppe Masetti. NPS aquatic resource managers are interested in potentially using this tool to help classify geoforms using the Coastal and Marine Ecological Classifi-cation Standard (CMECS).
Val E. Schmidt, Brian Calder, John Hughes Clarke, Glen Rice, Lynette Davis, Contributed, January 28–30. Auto-mated, Real-Time Data Quality Control for Autonomous Vessels, NOAA Office of Coast Survey (OCS) Field Pro-cedures Workshop, Norfolk, VA. Description of motivation behind developing automated, real-time data quality control for autonomous vessel; outline of goals, approach, and considerations; solicitation of input for additional considerations.
Val E. Schmidt, Invited, January 30. Autonomous Systems for Seafloor Mapping, NOAA Office of Coast Survey (OCS) Field Procedures Workshop, Norfolk, VA. An overview of currently underway and proposed research efforts was presented addressing specific subsystems to make autonomous surface vehicles operation practical and safe.
Larry Mayer, Invited, February 4. The Nippon Foundation/GEBCO Seabed 2030 Project, Atlantic Seafloor Mapping International Working Group, Brussels, Belgium,
Larry Mayer, Invited, February 5. Oceans, Global Warming and Law of the Sea, Directorate General MARE, European Commission, Brussels, Belgium,
Larry Mayer, Invited, February 6. Understanding UNCLOS Article 76 and its Application in the Arctic, Legal Services Directorate, European Commission, Brussels, Belgium,
Tom Weber, Alexandra Padilla, Contributed, February 16–21. Observations from Controlled Experiments on the Dissolution of Free-Gas Bubbles and Hydrate-Coated Bubbles in Water, Acoustical Society of America, Ocean Sciences Meeting, San Diego, CA
Tara Johnson, Contributed, February 18. ED24B-3607 Understanding the Membership of the National Marine Educators Association (NMEA) and What Drives Participation from Stakeholders, AGU Ocean Sciences 2020, San Diego, CA. This poster referenced the National Marine Educators Association Annual conference that Johnson co-chaired the previous summer, and the participation demographics from a survey that was sent out post-confer-ence.
Larry Mayer, Elizabeth Weidner, Contributed, February 18. A Broadband Acoustic Study of the Spatiotemporal Variability of the Baltic Sea Anoxic Zone, AGU Ocean Sciences 2020, San Diego, CA. Poster presentation.
APPENDIX E
JHC Performance Report 31 January 2021 305
APPENDIX E
Giuseppe Masetti, Contributed, February 24–27. The e-Learning Python for Ocean Mapping Project—Empow-ering the Next Generation of Ocean Mappers with Effective Programming Skills, 2020 Canadian Hydrographic Conference, Quebec City, Canada.
Christos Kastrisios, Contributed, February 24–28. Visualization and Integration of Bathymetric Data Uncertainty on ECDIS, DQWG Meeting, IHO Data Quality Working Group, Monaco.
Roland Arsenault, Contributed, February 25. A Mapping Focused Open-Sourced Software Framework for Auto-nomous Surface Vehicles, Canadian Hydrographic Conference 2020, Quebec City, Quebec, Canada. A software framework, dubbed “Project 11,” was developed as a backseat driver for Autonomous Surface Vehicles. Key design features include the ability to quickly and easily specify survey plans; monitoring of mission progress, even over unreliable wireless networks; and to provide an environment to develop advanced autonomous technologies.
Tom Weber, Johnathan Hamel, Contributed, February 26. Transmit Side Lobe Interference in Multibeam Phase Ramps, Canadian Hydrographic Conference 2020, Quebec City, Quebec, Canada.
Johnathan Hamel, Michael Smith, Shannon Hoy, John Hughes Clarke, Semme J. Dijkstra, Brian Calder, Casey O'Heran, Invited, February 26. Horizontal Calibration of Vessel Lever Arms Using Non-Traditional Survey Methods, Canadian Hydrographic Conference 2020, Quebec City, Quebec, Canada, The presentation encompassed work regarding calibration of vessels using drones.
Val E. Schmidt, Contributed, February 26. Operational Survey Trials of the DriX Autonomous Surface Vessel on the NOAA Ship Thomas Jefferson, Canadian Hydrographic Conference 2020, Quebec City, Quebec, Canada. Events and lessons learned from fall 2019 field trials of the DriX ASV aboard the NOAA Ship Thomas Jefferson. Presented by LCDR Charles Wisotzkey in Schmidt’s absence.
Johnathan Hamel, Contributed, February 26. Transmit Side Lobe Interference in Multibeam Phase Ramps, Canadi-an Hydrographic Conference 2020, Quebec City, Quebec, Canada. Hamel presented the result from his first year of graduate research, which eventually became his thesis. His presentation was about sources of noise in multi-beam echosounder phase ramps, with a particular focus on noise due to transmission side lobe interference.
Giuseppe Masetti, Brian Calder, Contributed, February 26. BAG 2.0: Continuing Development of an Open, Grid-based Data Transfer Format, Canadian Hydrographic Conference 2020, Quebec City, Quebec, Canada. Descrip-tion of history and current development plans for the BAG file format.
Larry Mayer, Invited, February 27. Understanding UNCLOS Article 76 and Its Application in the Arctic, Harvard Law School, Cambridge, MA.
Giuseppe Masetti, Michael Smith, Contributed, February 27. Open Backscatter Toolchain (OpenBST): A Commu-nity-Vetted Workflow for Backscatter Processing, Canadian Hydrographic Conference 2020, Quebec City, Quebec, Canada. Presented current state and progress on the OpenBST project. Work was well received.
Larry Mayer, Invited, February 27. Understanding UNCLOS Article 76 and Its Application in the Arctic, Harvard Law School, Cambridge, MA.
Shannon Hoy, Brian Calder, Contributed, February 27. Estimating Crowdsourced, Authoritative Observer, and Data Reputation, Canadian Hydrographic Society, Canadian Hydrographic Conference 2020, Quebec City, Quebec, Canada. Description of a reputation-based analysis of volunteer observers and the use of such reputation to assess the value of observer contributed data.
Larry Mayer, Invited, March 3. Understanding UNCLOS Article 76 and Its Application in the Arctic, Yale Law School, New Haven, CT.
Larry Mayer, Invited, March 12. Panel Member, White House Summit on Partnerships in Ocean Science and Technology: Ocean Exploration Session, Consortium of Ocean Leadership Public Policy Forum, Washington, DC.
APPENDIX E
JHC Performance Report306
APPENDIX E
Colin Ware, Invited, March 19. Cognitive Efficiency and Roles for Visual Thinking Tools, MIT Center for Research on Equitable and Open Scholarship, CREOS Lecture Series, Cambridge, MA. A discussion of perceptual and cognitive principles for the design of visual thinking tools.
Val E. Schmidt, Invited, March 31. Technologies to Support Autonomous Surface Vehicle Operations for Ocean Mapping, UNH, Guest Lecturer for Intro to Marine Robotics, UNH, Durham, NH. An overview of systems and technologies required for safe and practical operation of ASVs for ocean mapping, highlighting our current research and field programs.
Jenn Dijkstra, Invited, March 31. Invasive Species, Guest Lecturer for ZOO 721, UNH, Durham, NH.
Elizabeth Weidner, Contributed, April 20. Studying the Spatiotemporal Variability of the Anoxic Zone in the Baltic Sea Using Broadband Acoustics, UNH Graduate Research Conference, UNH, Durham, NH. Presented on anoxic zones in the Baltic Sea are associated with water column habitat loss, disruption of marine food webs, and altered nutrient cycling.
Larry Mayer, Invited, April 28. Update on Autonomous Vehicle Research and Development Program at the NOAA –UNH Joint Hydrographic Center/Center for Coastal and Ocean Mapping, JHC/CCOM, Hydrographic Services Review Panel, Online.
Colin Ware, Keynote, April 30. Visual Thinking about Scientific Data, Department of Energy, Computer Graphics Forum, On-line BlueJeans, NM. Theories of perception and cognition can tell us a lot about how to present data. This talk provide examples from both low level vision and high level cognition. In the first part it showed show how “channel theory” can be applied to displaying both layered data and to optimally displaying features using colormaps. The second part was an introduction to the modern theory of predictive cognition and its implications for presenting data effectively using visualization.
Paul Johnson, Tomer Ketter, Invited, May 4–5. Seabed 2030 Gridding Workshop, Stockholm, Sweden, Gridding workshop for the Seabed 2030 data centers, showing comparative work done on a subset of Arctic data, in order to evaluate different approaches to gridding and statistical calculations. The presentation detailed the GIS meth-od employed by the North Pacific team to perform large scale bathymetric gridding, its pros and cons and results.
Alexandra Padilla, Invited, May 11. NSF Graduate Student Internship Opportunity Workshop, USGS, NSF Gradu-ate Student Internship Opportunity Workshop, Newmarket, NH. Served as a panelist for the USGS-NSF Graduate Student Internship Opportunities Workshop which was conducted via Microsoft Teams.
Andrew Stevens, Contributed, May 26. Hairy Slices II: Depth Cues for Visualizing 3D Streamlines Through Cutting Planes, EuroVis Conference, Norrköping, Sweden. Presentation on the challenge of visualizing 3D vector fields because of occlusion problems and the difficulty of providing depth cues that adequately support the perception of direction of flow lines in 3D space.
Colin Ware, Contributed, May 26. Designing Pairs of Colormaps for Visualizing Bivariate Scalar Fields, EuroVis Conference, Norrköping, Sweden. Presentation on two solutions for meeting requirements for two colormaps to be used to represent two co-registered scalar fields.
Jenn Dijkstra, Invited, July 28. Surface Topography and Vegetation Study Team, NASA STV Coastal Processes Workshop, Online.
Val E. Schmidt, Invited, August 10. Lakebed 2030: Early Contributions in Thunder Bay National Marine Sanctuary, Great Lakes Observing System Webinar Series, Virtual. Webinar and panel discussion describing ASV mapping efforts and achievements in Thunder Bay National Marine Sanctuary in Summer 2019.
Rochelle Wigley, Invited, September 7. The Nippon Foundation / GEBCO Training Program Alumni: A Capacity Building Success as Demonstrated by Their International Impact, THSOA. Presentation highlighting the training program as a successful capacity building initiative with successes demonstrated by the international impact of training program alumni.
APPENDIX E
JHC Performance Report 31 January 2021 307
APPENDIX E
Giuseppe Masetti, Larry Ward, Larry Mayer, Derek Sowers, Invited, September 16. BRESS Software Training Demo, NOAA OCM, Tetra Tech, BRESS Software Training Demo, Virtual. Derek Sowers provided a webinar presentation to Tetra Tech consultants, NOAA OCM staff, and several Center faculty on how to use the BRESS software tool. This group is involved in an effort funded by NOAA OCM to develop geomorphic maps for the Gulf of Maine region.
Brian Calder, Contributed, September 23. Estimating Crowdsourced, Authoritative Observer, and Data Reputa-tion, UK Hydrographic Society, International Conference on Remote Hydrography, Online. Lightning talk video presented as prelude to the final meeting sometime next year after the pandemic stops.
Paul Johnson, Contributed, October 6. Multibeam Advisory Committee (MAC): Nine Years of Supporting the U.S. Academic Fleet’s Multibeam Echosounder Systems, Interagency Working Group on Ocean & Coastal Mapping, Standard Ocean Mapping Protocol Symposium, Durham, NH. Virtual presentation discussing the National Sci-ence Foundation funded Multibeam Advisory Committee to the Standard Ocean Mapping Protocol Symposium hosted by the Interagency Working Group on Ocean & Coastal Mapping.
Paul Johnson, Kevin Jerram, Contributed, October 6. NOAA/MAC Tools for Multibeam Testing and Remote Sup-port, NOAA Office of Coast Survey (OCS), Standard Ocean Mapping Protocol (SOMP) Symposium, Online. Based on experience with UNOLS, NOAA, and other Center partner vessels, this lightning talk presented an overview of survey report guidance, software tools, and test protocols in development by Multibeam Advisory Committee (MAC) and NOAA personnel as a model for routine performance testing and improved remote support to be con-sidered in the Standard Ocean Mapping Protocol.
Larry Mayer, Invited, October 7. Characterizing the Ocean, Global Oceans 2020, Online.
Larry Mayer, Invited, October 16. The U.S. National Committee for the Decade of Ocean Science, National Academy of Sciences, Online.
Larry Mayer, Invited, October 19. Ocean Mapping: The Quest to Make the Ocean Transparent, Institute of Geophysics and Planetary Physics, The Walter Munk Annual Lecture Celebrating the Founding Director of IGPP, Online.
Paul Johnson, Invited, October 19. Multibeam Advisory Committee Activities for 2020, 2020 UNOLS Council Meeting, Seattle, WA. Virtual presentation to the UNOLS Council on Multibeam Advisory Committee activities of 2020.
Giuseppe Masetti, Derek Sowers, Invited, October 21. Mapping and Geomorphic Characterization of Deep Sea Coral Ecosystems in the South Atlantic Region, South Atlantic Fishery Management Council, Habitat Protection and Ecosystem Based Management Advisory Panel Meeting, Online. Derek Sowers presented a component of his Ph.D. research that identified, quantified, and characterized cold-water coral mound habitat of the Blake Plateau region of the U.S. The South Atlantic Fishery Management Council has previously developed cold-water coral protection boundaries and uses updated information on the distribution of corals in their region to identify appropriate conservation and management strategies.
Paul Johnson, Kevin Jerram, Invited, October 28. Multibeam Advisory Committee (MAC) 2020 RVTEC Update, UNOLS Research Vessel Technical Enhancement Committee, RVTEC 2020, Online. The NSF-funded MAC dis-cussed ship visits and lessons learned over the last year, with a focus on increasing remote support. The MAC demonstrated new versions of Python tools for assessing system performance and reducing bandwidth for shore-based bathymetry processing. Additional topics included Global Multi-Resolution Topography (GMRT) tools for onboard data QA/QC that facilitate data integration; calibration site planning tools in development that improve terrain selection and highlight proven sites; and other resources for technicians and scientists collecting multi-beam data aboard UNOLS vessels.
APPENDIX E
JHC Performance Report308
Rochelle Wigley, Contributed, November 11. An Unmanned Bathymetric Survey in UK Waters: Utilising Teledyne CARIS Mira AI and the Globally-Distributed Nippon Foundation/GEBCO Training Program Alumni to Produce Data Products, Map the Gaps, Marine Autonomy & Technology Showcase Virtual MATS 2020, Durham, NH. Presentation of work undertaken by alumni of the Nippon Foundation/ GEBCO training program through Map the Gaps, working with CARIS Teledeyne, on remote processing of bathymetric data collected the USV Maxlimer.
Larry Mayer, Giuseppe Masetti, Jenn Dijkstra, Derek Sowers, Contributed, November 13. Utilizing Extended Continental Shelf (ECS) and Ocean Exploration Mapping Data for Standardized Marine Ecological Classification of the U.S. Atlantic Margin, Doctoral Dissertation, UNH, Durham, NH.
Larry Mayer, Keynote, November 18. Ocean Mapping: Establishing the Geospatial Context for the REST of the Planet, American Geophysical Union, GEOGRAPHY 2050–Annual Meeting, Online.
Elizabeth Weidner, Invited, November 19. Fieldwork Equity Seminar, ESCI 534, Department of Earth Sciences, UNH, Durham, NH. Led discussion with undergraduate student of issue of DEI in geosciences fieldwork and solutions for the future.
Larry Mayer, Invited, November 29. The U.S. National Committee on the Ocean Decade and Is a Truly Inter- national Arctic Research Program Possible? Norwegian Research Council and the IOC-UNESCO Symposium on Arctic Research in Support of the UN Decade of Ocean Science, Online.
Jenn Dijkstra, Invited, December 2. Intro to Invasive Species, Marine, Estuarine, and Freshwater 628, JHC/CCOM-Ocean Engineering Seminar Series, Durham, NH. Gave an introductory seminar on invasive species.
Larry Mayer, Invited, December 5. The Role of National Committees in the U.N. Decade for Ocean Science in Support of Sustainable Development, Youth Summit for the UN Ocean Decade, Online.
Larry Mayer, Keynote, December 9. Can We Map the Entire Global Ocean Seafloor by 2030? The Munk Award Lecture, Online.
Larry Mayer, Invited, December 9. The U.S. National Committee on the Decade of Ocean Science, American Geophysical Union Town Hall Meeting on the Decade of Ocean Science, Online.
Derek Sowers, Larry Mayer, Kristen L. Mello, Jenn Dijkstra, Invited, December 11. Fine-scale Mapping of Deep-Sea Communities Reveals Community and Species-specific Environmental Drivers, JHC/CCOM-Ocean Engineering Seminar Series, Durham, NH.
Alexandra Padilla, Contributed, December 14. Understanding Physical Properties of Gas Bubbles in the Ocean: How Does Reality Affect What We Think We Already Know? Thesis Proposal Defense, UNH, Durham, NH. Presen-tation of Alexandra Padilla's thesis proposal defense.
Tom Lippmann, Contributed, December 14. Observations and Modeling of Lagrangian Transport in the Gulf of Maine, AGU Fall Meeting, Online. Observations of 24 GPS surface drifters deployed in the Gulf of Maine. Drifter trajectories were modeled numerically with surface velocity fields from NOAA's Gulf of Maine Operational Fore-cast System (GOMOFS) coupled with an offline particle tracking model. Dispersion coefficients in the model were determined from the drifter observations. Results suggest that GOMOFS surface velocity fields reproduce the trajectories and dispersion of the drifters reasonably well, allowing the model to be used to conduct simulations to examine the behavior of lobster larval advection and dispersal and evaluate the expected settling locations and recruitment of hatched larvae from lobsters residing near the Isles of Shoals.
APPENDIX E
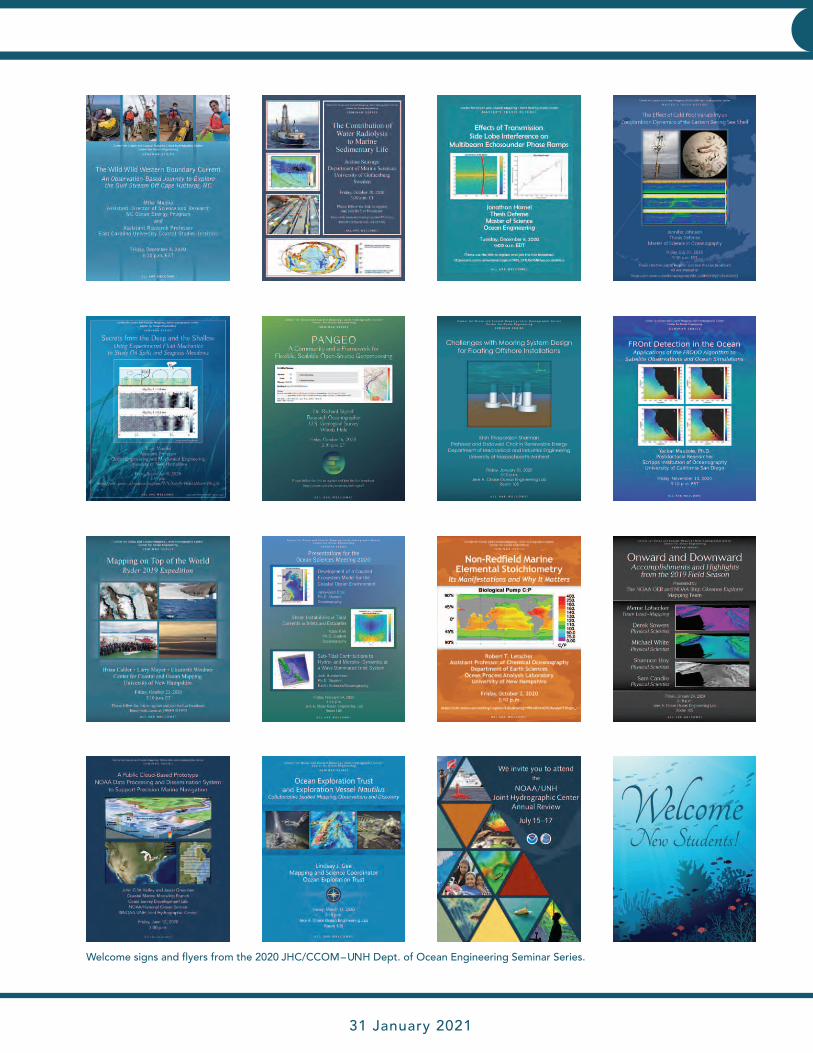
JHC Performance Report 31 January 2021 309
Welcome signs and flyers from the 2020 JHC/CCOM – UNH Dept. of Ocean Engineering Seminar Series.
APPENDIX E
NOAA-UNH Joint Hydrographic Center Center for Coastal and Ocean Mapping
Jere A. Chase Ocean Engineering Lab 24 Colovos Road
Durham, NH 03824603.862.3438 tel • 603.862.0839 fax
www.ccom.unh.edu
Principal Investigators
Larry A. MayerBrian Calder
John Hughes Clarke James Gardner
Colin Ware Thomas Weber
Co-PIs
Thomas Butkiewicz Jenn Dijkstra
Semme DijkstraPaul Johnson
Christos KastrisiosThomas Lippmann
Kim LowellAnthony Lyons
Jennifer Miksis-OldsGiuseppe Masetti
Yuri RzhanovVal Schmidt
Briana SullivanLarry Ward


