Embed Size (px)
Citation preview
Understanding waste management
practices in the commercial food service
sector
SN Matinise
orcid.org 0000-0001-9659-2052
Dissertation submitted in fulfilment of the requirements for the degree Master of Science in Geography and Environmental
Management at the North-West University
Supervisor: Dr C Roos
Co-supervisor: Prof SHH Oelofse
Graduation May 2019
28897803
i
ACKNOWLEDGEMENTS
I would like to thank God Almighty, for his grace and also for surrounding me with incredible
people during this research.
I would like to thank my supervisor, Dr Claudine Roos for her valuable scholarly input, continuous
advice and assistance. Without you this study could not have been successfully conducted. To
my co-supervisor, Prof Suzan Oelofse, thank you so much for your support and encouragement
during this exciting journey. Thank you for all the opportunities you have provided me in terms of
workshops and work experience which did not only contribute to the success of the study but also
aided to my growth as a researcher. I would like to extend my great appreciation to my mentor Mr
Aubrey Muswema for all the interesting discussions, valuable input, and positive criticism and for
guiding me. The skills that you taught me will always remain with me and hopefully in future I will
be able to implement them in the workplace. Thank you for helping me during the waste
characterisation, without your passionate participation and input, this study would not have been
successfully prepared.
I thank Mall1 and Mall2 centre management for allowing me to conduct the study in their premises.
I wish to extend my great appreciation to the malls waste managers who did not only provide me
space to conduct waste characterisation but also gave me extra hands to help with the sorting.
Thank you so much for also helping me with the recruitment of the participants of the study.
I wish to express my appreciation to the CSIR for the studentship and funding my studies, without
this assistance none of the research would have been completed. Experience gained and
opportunities offered would not have been possible.
Thanks to my family and friends, especially Noluthando Matinise for always being there for me.
Thanks to my cousin Bulelwa Swana for your assistance during the study. A special thanks to my
friend Mrs Zeria Adjorlolo for encouraging me to do a Master’s degree. This research is dedicated
to my late parents Mr Matobela Matinise and Lulama Matinise who believed so much in education.
The values and principles that you instilled in me are the ones that make me keep going and they
will never be forgotten.
ii
ABSTRACT
Long working hours, the increased participation of women in the labour force, the growing middle
class, as well as the convenience offered by restaurants have greatly accelerated the growth of
the commercial food service sector across the world. This is also true for South Africa where
eating outside of the home has become more prevalent. South African food consumption patterns
show a rise in the consumption of food outside home while consumption of home cooked meals
is decreasing. The expansion of the commercial food service sector comes with an increase in
the amount of waste generated by the sector, adding to the high volumes of waste that
municipalities are grappling with. Municipal efforts towards diversion of waste from landfill tend to
focus more on household waste, while waste coming from restaurants receives less attention. As
a result, most of the waste generated in restaurants is disposed at the landfills as mixed waste.
The aim of the study was to understand waste management practices in the commercial food
service sector to identify opportunities for waste reduction and recovery of resources through
source separation. The study was conducted in twenty restaurants of two malls located in
eThekwini metropolitan municipality. A triangulation approach, which involved the use of both
qualitative and quantitative research methods in one study, was adopted to understand waste
management practices in the commercial food service sector. A waste characterisation study was
conducted to understand waste composition and generation rates of restaurants; observations
were used to uncover waste management practices in the restaurants while semi-structured
interviews were used to understand sources and reasons for waste generation.
Based on the waste characterisation results, waste generation rates estimated indicate that 10.25
tonnes is generated by Mall1 restaurants and 9.41 tonnes by Mall2 restaurants annually. More
than 74% of waste generated by the sampled restaurants can be recovered through recycling
(paper, plastics, glass and tins) and composting/anaerobic digestion (food waste). Food waste
accounted for close to 50% of restaurant waste that was sorted in both Mall1 and Mall2.
Restaurant managers cited poor stock rotation, over-purchasing of stock, negligence from the
staff members, placing wrong orders, preparation of excessive amount of food, dissatisfaction
with the taste of food and people ordering more food than they can eat as the main reasons for
food waste generation. The results also showed that restaurant waste cooking oil ranged between
500ml to 150 litres per week. Currently, waste from restaurants is handled by the same service
provider contracted by the management of both shopping malls. Unsorted waste from the
restaurants is collected and sorted for recycling while residual waste is taken for landfilling.
iii
The composition of waste and current waste management practices by restaurants in both malls
highlight the need for improved waste management practices. With the expected growth in the
restaurant industry, improved waste management practices at the source of generation, which
appreciate waste as a resource and encourage diversion of waste away from landfill is required.
This may include implementation of source separation schemes to enhance recycling and ensure
diversion of clean recyclables. Waste prevention and reduction through reducing material
wastage and green purchasing should be given greater priority as dictated by the waste hierarchy.
Food waste can be reduced by providing training to restaurant staff members, procurement of
food that is needed in the business, carefully checking ingredients during receiving of goods,
practicing FIFO method, improving communication between staff member and customers during
order taking, giving surplus food to staff members and also measuring food waste.
Keywords
Restaurant waste, waste characterisation, packaging waste, food waste, mainline recyclables,
recovery rate, waste diversion, food supply chain
iv
TABLE OF CONTENTS
1.1 Background ...................................................................................................... 1
1.2 Problem statement ........................................................................................... 4
1.3 Scope of the study............................................................................................ 5
1.4 Aims and objectives ......................................................................................... 6
1.5 Research questions .......................................................................................... 6
1.6 Research Methodology .................................................................................... 6
1.7 Limitations of the study ................................................................................... 7
1.8 Outline of the chapters ..................................................................................... 8
2.1 Introduction .................................................................................................... 10
2.2 Solid waste management in South Africa ..................................................... 11
2.2.1 Waste generation in South Africa...................................................................... 11
2.2.2 Diversion of waste from landfilling..................................................................... 12
2.2.3 The importance of waste source separation ..................................................... 14
2.3 Review of the commercial food service sector in South Africa .................. 16
2.4 Green restaurants ........................................................................................... 18
2.4.1 Waste minimisation, recycling and composting ................................................. 19
2.4.2 Energy and water-efficient equipment ............................................................... 20
2.4.3 Green food ....................................................................................................... 20
2.5 Review of waste management in the commercial food service sector ....... 21
2.6 Review of food waste ..................................................................................... 21
2.6.1 Definitions of food waste ................................................................................... 21
v
2.6.2 Food waste in developing and developed countries .......................................... 22
2.6.3 Food waste in South Africa ............................................................................... 24
2.6.4 Socio-economic and environmental impacts of food waste ............................... 26
2.6.5 Food waste from the restaurants ...................................................................... 27
2.7 Review of packaging/ packaging waste ........................................................ 28
2.7.1 Function of packaging ....................................................................................... 28
2.7.2 Packaging waste generation and its environmental impacts ............................. 29
2.7.3 The role of packaging in reducing food waste ................................................... 29
2.7.4 Packaging waste from Commercial Food Service Sector .................................. 30
2.8 Waste cooking oil ........................................................................................... 31
2.9 Conclusion ...................................................................................................... 32
3.1 Research design ............................................................................................. 33
3.2 Description of the study area ........................................................................ 37
3.3 Sampling ......................................................................................................... 37
3.3.1 Selection of the study site ................................................................................. 38
3.3.2 Selection of the restaurants .............................................................................. 38
3.3.3 Selection of the participants .............................................................................. 38
3.3.4 Sample size ...................................................................................................... 39
3.4 Data collection methods ................................................................................ 39
3.4.1 Literature review ............................................................................................... 39
3.4.2 Waste characterisation study ............................................................................ 39
3.4.3 Semi-structured interviews................................................................................ 49
3.5 Observation .................................................................................................... 52
vi
3.6 Ethical consideration ..................................................................................... 52
3.7 Data analysis................................................................................................... 53
3.8 Conclusion ...................................................................................................... 54
4.1 Waste characterisation results ...................................................................... 56
4.1.1 Waste composition ........................................................................................... 56
4.1.2 Waste generation quantities ............................................................................. 72
4.2 Sources of food waste in the restaurants ..................................................... 72
4.3 Reasons for food waste generation from each stage of the restaurant
service ............................................................................................................. 76
4.3.1 Storage waste................................................................................................... 76
4.3.2 Preparation waste ............................................................................................. 77
4.3.3 Serving waste ................................................................................................... 77
4.3.4 Plate waste ....................................................................................................... 79
4.4 Other reasons for food waste generation ..................................................... 82
4.5 Most wasted food commodities in the restaurants ...................................... 83
4.6 Existing measures used to reduce food waste ............................................ 84
4.7 Waste management in the restaurants ......................................................... 89
4.8 Conclusion ...................................................................................................... 96
4.9 Waste cooking oil generation and disposal practices ................................. 98
5.1 General conclusion and recommendations ................................................ 100
5.2 Recommendations for future research ........................................................................ 106
vii
LIST OF TABLES
Table 3- 1: Link between objectives of the study and data collection methods ........................ 35
Table 3-2: Summary of the waste characterisation pilot study result and how the
challenges were addressed .......................................................................... 43
Table 3-3: Waste categories used when sorting ...................................................................... 46
Table 3-4: Illustration of waste collection and sorting ............................................................... 47
Table 3-5: Demographics of staff members ............................................................................. 51
Table 4-1: Kilograms of waste sorted from different types of restaurants ................................. 57
Table 4-2: Mann-Whitney U test results for the comparison of waste sorted from Mall1
restaurants between week and weekend sample ......................................... 64
Table 4- 3: Mann-Whitney U test results for the comparison of waste sorted from Mall2
restaurants between week and weekend sample ......................................... 65
Table 4- 4: Average waste composition and standard deviation across detailed categories
in Mall1 ........................................................................................................ 66
Table 4- 5: Average waste composition and standard deviation across detailed categories
in Mall2 ........................................................................................................ 67
Table 4-6: Reasons for food waste generation from each category ......................................... 81
Table 4-7: Reasons for not separating waste .......................................................................... 93
Table 5- 1: Possible waste minimisation options.................................................................... 101
Table 5-2: Summary of key findings ...................................................................................... 105
viii
LIST OF FIGURES
Figure 1- 1: Research methodology adopted in the study .......................................................... 7
Figure 1- 2: Outline of chapters ................................................................................................. 9
Figure 2- 1: Technology options used by private companies (Adapted from: DST, 2013) ........ 12
Figure 2- 2: Waste management technology used by private waste handlers and
municipalities (Adapted from: DST, 2013) .................................................... 13
Figure 2- 3: Approaches to waste management in Europe (Adapted from: Mazzanti,
Montini and Zoboli, 2008) ............................................................................. 14
Figure 2- 4: Classification by dividing the sector into two groups (left) and classification
based on the rationale of the business (Adapted from: Edwards, 2013) ....... 17
Figure 2- 5: Food waste along the food supply chain in South Africa (Adapted from:
Nahman and de Lange, 2013) ...................................................................... 25
Figure 2- 6: Packaging waste in the food industry (Adapted from: Aarnio and Hamalainen,
2008. p., 613) ...... 31Figure 3- 1: Restaurants that had already disposed waste
when the green plastic bags were distributed ............................................... 41
Figure 3- 2: Source separation of aluminium cans by a restaurant .......................................... 42
Figure 3- 3: PPE worn during sorting ....................................................................................... 45
Figure 3- 4: An example of how the codes and categories were developed ............................. 54
Figure 4- 1: Waste percentage composition for mall1 restaurants ........................................... 58
Figure 4- 2: Waste percentage composition for mall2 restaurants ........................................... 59
Figure 4- 3: Shows contaminated food contact cardboard packaging (left) found during
sorting and clean source separated corrugated cardboard (right) ................. 60
Figure 4- 4: Break down of food waste component in Mall and Mall2 ...................................... 61
Figure 4- 5: Waste percentage composition for Mall1 and Mall2 restaurants ........................... 62
Figure 4- 6: Composition variation of Mall 1 restaurants between week and weekend day ...... 63
ix
Figure 4- 7: Composition variation of Mall2 restaurants between week and weekend day ....... 63
Figure 4- 8: Waste composition by type of restaurant in Mall1 ................................................. 69
Figure 4- 9: Waste composition by type of restaurants in Mall2 ............................................... 70
Figure 4- 10: Recycling potential rate by type of restaurant in Mall1 ........................................ 71
Figure 4- 11: Recycling potential rate by type of restaurant in Mall2 ........................................ 72
Figure 4- 12: Comparing percentage of food waste in different stages of the service by
type of restaurant ......................................................................................... 73
Figure 4- 13: Inedible food waste from preparation stage ........................................................ 75
Figure 4- 14: Edible food waste from storage stage ................................................................. 76
Figure 4- 15: Stages at which food waste occurs and the reasons for food waste
generation .................................................................................................... 82
Figure 4- 16: Most waste food commodities in the restaurants ................................................ 84
Figure 4- 17: Food waste hierarchy (Adapted from: United States Environmental
Protection Agency, 2010.p.,3) ...................................................................... 85
Figure 4- 18: Cage for corrugated cardboard (left) and a poster (right) .................................... 90
Figure 4- 19: Lack of source separation in the malls ................................................................ 91
Figure 4- 20: Proposed solutions for improved source separation ........................................... 95
Figure 4- 21:Waste management of restaurant waste: A-waste bin in the restaurant
kitchen, B-Temporary waste area (recycling bins and cage for
cardboard), C-Cardboard baled for recycling, D-conveyer belt for sorting,
E-sorting table, F-food waste sorted for composting, G-Composting
machine, H-compaction of residual waste for landfilling, I-Recyclables in
bulk bags ..................................................................................................... 96
Figure 4- 22: Key stakeholders and their role in improving restaurant waste management ...... 97
Figure 4- 23: Average waste cooking generation per week ..................................................... 99
List of Abbreviations
x
CSIR Council for Scientific and Industrial Research
CSR Corporate Social Responsibility
DEA Department of Environmental Affairs
DSW Durban Solid Waste
DST Department of Science and Technology
EPA Environmental Protection Agency
EIU Economist Intelligence Unit
2Es Energy and Efficiency
FIFO First In First Out
FSC Food Supply Chain
FW Food Waste
GNI Gross National Income
GRA Green Restaurant Association
GDP Gross Domestic Product
IWMP Integrated Waste Management Plan
NAFTC Netherlands Agro Food and Technology Centres
NRA National Restaurant Association
NOWCS National Organic Waste Composting Strategy
3Rs Reduce, Re-use and Recycle
REC Research Ethics Committees
SOP Standard Operation Procedure
SSS Source Separation Scheme
RSA Republic of South Africa
1
CHAPTER 1: INTRODUCTION
1.1 Background
Environmental protection is widely acknowledged as a key principle in a business’s operation.
Heightened concern about environmental protection started as early as 1960 in response to
environmental impacts of industrial and economic growth (Paterson and Kotzé, 2009; Ismail,
Kassim and Zahari, 2010). Ever since then there has been an emphasis on businesses to change
from a profit focused business approach to a more integrated business approach which supports
adoption of green practices (Tan, Muzafar, Tan and Choon, 2017). Hospitality scholars often
conceptualize green practices under the framework of corporate social responsibilities (CSR)
(Ismail et al., 2010; Kwok, Huang and Hu, 2016). CSR is a company’s voluntary commitment to
environmentally friendly activities to reduce social and environmental effects that result from the
operation of the business (Choi and Parsa, 2007; Ismail et al., 2010). The inherent goal of CSR
is to encourage businesses to add value to the society through inclusion of the concept as a core
business activity instead of treating it as a separate consideration (Choi and Parsa, 2007).
The restaurant industry is one of the industries that have realized the need to engage in
environmentally friendly practices and contribute towards sustainable development (Choi and
Parsa, 2007; DiPietro, Gregory and Jackson, 2013; Jang, Chung and Kim, 2015; Kwok et al.,
2016). Although there is increasing concern about the environment among restaurants, there has
been little evidence of genuine long-term commitment (Faulkner, Carlisle and Viney, 2005).
Adoption of green practices within the restaurant industry has tended to be slower compared to
other components of the hospitality industry (DiPietro et al., 2013). This is particularly true in the
developing countries where economic and social equity issues are considered more important
than environmental issues (Kasim and Ismail, 2012). When investigating drivers and barriers
towards implementation of environmentally friendly practices in restaurants, Kasim and Ismail
(2012) pointed out that top managers are usually disinclined to invest in environmentally friendly
practices mainly because adoption of environmentally friendly practices is believed to impact
negatively on the performance of the business instead of creating sustainable and competitive
future gain (Faulkner et al., 2005). The view is that adoption of green practices deviates the
business from the primary objective of generating profit, controlling costs, creating efficient
production and maintaining markets which many businesses live by. However, there are
restaurants that have adopted environmentally friendly practices. McDonalds is the mostly cited
restaurant group when it comes to adoption of green practices (Wang, 2012; Kasim and Ismail,
2012; DiPietro et al., 2013; Ismail et al., 2010; Jang, Kim and Bonn, 2011). The green practices
2
implemented by this company include energy efficiency and innovation, sustainable packaging,
waste management and also green building design (Kasim and Ismail, 2012).
Several studies indicate that the restaurant operations evidently have a major effect on the
environment through use of natural resources and waste generation (Davies and Konisky, 2000;
Revell and Blackburn, 2007; Tibon, 2012; Kasim and Ismial, 2012). When investigating the
influence of green restaurant decision making, Teng, Wu and Huang (2014) reported that the
restaurants result in adverse environmental impacts through overconsumption of natural
resources and pollution. The restaurant industry is one of the most water and energy intensive
industries with energy usage almost five times more per square foot than any other type of
commercial building (Jauhari, 2014). Energy sources used for the operations of restaurants
includes electricity, fossil fuels and certain types of vehicle fuel. Most of this energy gets
consumed during preparation of the food and ventilation. For example, in the United Kingdom the
restaurant industry is estimated to contribute about 60% of carbon emissions per year (Revell and
Blackburn, 2007). Water plays a crucial role in the restaurant sector for undertaking activities such
as food preparation, dish washing, laundry and sanitation (VanSchenkhof, 2011; Jauhari, 2014).
In California about 6% of the total water usage in the commercial and industrial sectors takes
place in kitchens with restaurants being the largest user in this sector (Jauhari, 2014).
Overconsumption of resources and the resultant pollution usually highlight the need for
improvement (Chavan, 2005). Given that the industry is expecting to see considerable rates of
growth in the near future, it is beyond doubt that implementation of environmental practices is
crucial in the restaurant industry and that the industry needs to ensure that the environment is
protected, the carbon footprint reduced and harm to ecosystems avoided (Omidiani and
HashemiHezaveh, 2016).
Waste production and disposal is one of the most visible and obvious consequence of restaurant
operations. Researchers in the hospitality industry have explored “environmentally friendly” or
“green practices” in the restaurant industry from different standpoints (Choi and Parsa, 2007;
Ismail et al., 2010; Jang et al., 2011; Chou, Chen and Wang, 2012; Tibon, 2012; Wang, 2012;
Ismial and Kasim, 2012; DiPietro et al., 2013; Wang, Chen, Lee and Tsai, 2013; Teng et al., 2014;
Hilario, 2014; Jang et al., 2015; Chen, Cheng and Hsu, 2015; Kwok et al., 2016; Tan et al., 2017).
Kwok et al., (2016) has looked at the green attributes of restaurants with the aim of identifying the
important attributes of green practices from a consumer perspective and also to understand how
these attributes influence consumer’s behavioural intensions. Wang (2012) explored the
importance and the impacts of green practices in a restaurant. Hilario (2014) investigated
responsiveness of fast-food chain managers towards the implementation of green practices in
restaurants. However, there has been limited research specifically looking at waste management.
3
This topic tends to be overlooked in the hospitality literature and is usually submerged in the
literature discussing environmental management (including all aspects of the environment such
as water and energy use) and often does not include much on the waste management aspect of
the environment.
Nonetheless, restaurant waste is categorised as commercial waste, which also includes waste
that comes from streets, public areas and also institutions (Shekdar, 2009). In developing
countries, commercial waste is the second largest amount of waste (10–30%) after households
(55–80%) which generate the bulk of the municipal waste (Miezah, Obiri-Danso, Kadar, Fei-
Baffoe, and Mensah, 2015). The local authorities are usually the ones that are responsible for the
management of this service (Zhu, Asnani, Zurbrugg, Anapolsky and Mani, 2008). In South Africa,
Section 156 (1) (a) of the South African Constitution in conjunction with schedule 5-part B of the
constitution places solid waste disposal, refuse dumps and refuse removal as the sole
responsibility of the local government (RSA, 1996).
Municipal solid waste management has proven to be a challenge, especially in many developing
countries. In these countries, waste management is usually characterized by inefficient collection
services, littering, illegal dumping, and informal waste picking at the landfills (Ogawa, 2000 in
Manaf, Samah and Zukki, 2009). The problem of solid waste management is common in many
rapidly growing cities or towns due to increased waste generation. Increased waste generation
has been linked to rapid urbanisation, economic development, high living standards, ever
increasing population growth, geographic location, and administrative systems (Wang and Nie,
2001). Approximately 1.3 billion tonnes of municipal solid waste is generated per year globally
and projections show that this amount of waste is expected to rise to 2.2 billion tonnes by 2025
(World Bank / Hoornweg and Bhada-Tata, 2012). Exacerbating the issue of increased waste
generation is the limited space available to landfill the waste that is produced on a daily basis.
The threat posed to the natural ecosystem and human health by the ever increasing waste
generation, as well as lack of land for new landfills that are in close proximity to the points of
generation, is a concern.
Thus, sustainable waste management options are necessary in the restaurant industry. This will
help reduce waste generation and also encourage diversion of waste away from landfill thereby
alleviate the problem faced by the municipalities. Sustainable waste management options within
the restaurant industry will also lead to other benefits such as reduced waste disposal costs,
improved business image as well as health and safety benefits (Pirani and Arafat, 2016).
4
1.2 Problem statement
The hospitality sector is experiencing significant growth across the world (Pirani and Arafat, 2014).
For example, Japan’s food service industry recorded sales of R 3.99 trillion (1JPY = 0.12 ZAR) in
2016 (Otsuka, 2017). In India the restaurant sector is valued at R 60.05 billion (1USD = 13.47
ZAR) and is expected to grow to R 1009. 88 billion (1 USD = 13.47 ZAR) by 2021, with an annual
growth rate of 10 percent (Sood and Mishra, 2016). The South African food service sector is not
an exception, this has been highlighted in a study on “Expansion Opportunities in South Africa's
Competitive Fast Food Market” which showed that South Africa is expected to see significant
growth between the year 2015 and 2018 (BMI, 2015). The expansion of the food service sector
consequently comes with an increase in the amount of waste generated by the sector, adding to
the high volumes of waste that municipalities are grappling with. Theoretically, the food service
sector generates a significant amount of packaging, organic food waste and waste cooking oil.
Unfortunately, the majority of waste produced in the restaurants is disposed at the landfills as
mixed waste, which consequently imposes pressure on the landfills. Despite the considerable
amount and the reported high recyclability of waste generated by the commercial food service
sector, municipal efforts towards diversion of waste from the landfill tend to focus more on
household waste while neglecting the relative small amount coming from restaurants (Tatàno,
Caramiello, Paolini and Tripolone, 2017). According to Tatàno et al., (2017), a comprehensive
perspective of sustainable and integrated management should consider all waste, not only limited
to the majority that is generated by households but also considering the non-negligible
contributions of commercial and institutional waste, which includes restaurants as a significant
waste generation source. The reported composition of waste generated in the commercial food
service sector presents an opportunity for diversion of waste away from landfill through recycling.
Understanding the nature and the volume of the fractions comprising the waste stream will assist
in knowing the volume and fractions of waste that can be separated at source to enhance
recycling and potentially divert waste from landfills.
Also, the commercial food service sector together with other sectors including all types of
accommodation (bed and breakfast accommodation, hotels and guest lodges), transport as well
as tour and travel agencies form an important part of the tourism sector. Tourist’s expenditure on
food services is approximated to 20%, making it the third-biggest revenue stream in the tourism
industry after transport and accommodation (Kasim and Ismail, 2012). Given that tourism directly
depends on the environment, a disregard for environmental protection by each component of the
sector is self-destructive (Chou et al., 2012). Therefore, it is crucial for all components of the
sector (including restaurants) to contribute to environmental protection in order to ensure that the
sector remains viable.
5
Disposal of commercial and household organic waste (including food waste) has been identified
as one of the major gaps in the eThekwini Metropolitan Municipality (IWMP, 2016). Food waste
is a problematic waste stream because of its socio-economic and environmental implications.
Approximately 10.2 million tonnes of food waste is generated in South Africa (Nahman and de
Lange, 2013). About 5% of this waste is estimated to occur at the consumption stage of the food
supply chain (Nahman and de Lange, 2013). The food service sector contributes to food wastage
that occurs at the consumption stage. As one of the countries that are food insecure at household
level (Altman, Hart and Jacobs, 2009), food waste prevention and minimisation in South Africa is
of critical importance.
Furthermore, South Africa is considering a landfill ban on disposal of organic waste (DEA, 2013).
Therefore, diversion of food waste through prevention, minimisation and composting/anaerobic
digestion will require an understanding of the food service sector waste management practices
as well as the reasons and drivers for these practices. In line with this reasoning, landfills in some
South African cities such as the City of Johannesburg are fast reaching their full design capacity
(Letlape and Gumbo, 2016). With continuous landfilling of waste, the availability of landfill
airspace has become a concern suggesting alternative waste management options. Landfill
space is currently not a concern in eThekwini municipality, however the closure of the Bissar
landfill is an indication that the municipality might experience the same problem if actions to
conserve the available landfill space are not taken.
1.3 Scope of the study
The scope of the study focused on providing insight into waste management in the commercial
food service sector. Understanding waste management practices will assist in identifying potential
opportunities for reducing and recovering resources through source separation. To reduce and
recover waste within the commercial food service sector, there is a need for detailed research to
identify basic problems such as how much is wasted, what is wasted and when wastage occurs.
Therefore, this study aims to comprehensively investigate questions regarding waste
management practices, types of materials generated, activities that produce waste, disposal
practices as well as the reasons and drivers for these practices.
The study specifically focuses on twenty restaurants located in two malls (ten restaurants each
mall) of eThekwini Metropolitan Municipality. The sample size was determined prior to the
commencement of the research based on the timeframe of the study, resources available, as well
as on the aim of the study. Out of the twenty restaurants that agreed to participate in the study,
thirteen restaurants participated in the waste characterisation study, while seventeen restaurants
participated in the interviews. The purpose of the study was to gain an in-depth understanding of
6
waste management practices of the sampled restaurants, with no aim of generalising the findings.
Therefore, the findings of the study cannot be generalised to a wider population based on this
study alone. However, good waste management practices identified in the study may be used in
other restaurants or in other similar operations.
1.4 Aims and objectives
The aim of the study is to understand waste management practices in the commercial food service
sector to identify opportunities for waste reduction and recovering resources through source
separation. The study also aims to widen academic knowledge on commercial food service sector
waste in a South African context. To achieve the aim of the study the following objectives were
investigated:
1. Quantification and characterisation of the composition of restaurant waste;
2. Identifying sources of restaurant waste;
3. Determining attitudes towards reducing, re-using and recycling of waste;
4. Evaluating waste management practices at the restaurants;
5. Identifying opportunities for waste reduction and recovering of resources; and
6. Formulating recommendations for improved waste management in restaurants.
1.5 Research questions
The following research questions form the core of this research in addressing the objectives:
What is the amount of waste generated by restaurants?
What is the composition of the waste generated by restaurants?
What is the potential recycling rate of waste generated by restaurants?
How do restaurants manage their waste?
What can be done to improve waste management in restaurants?
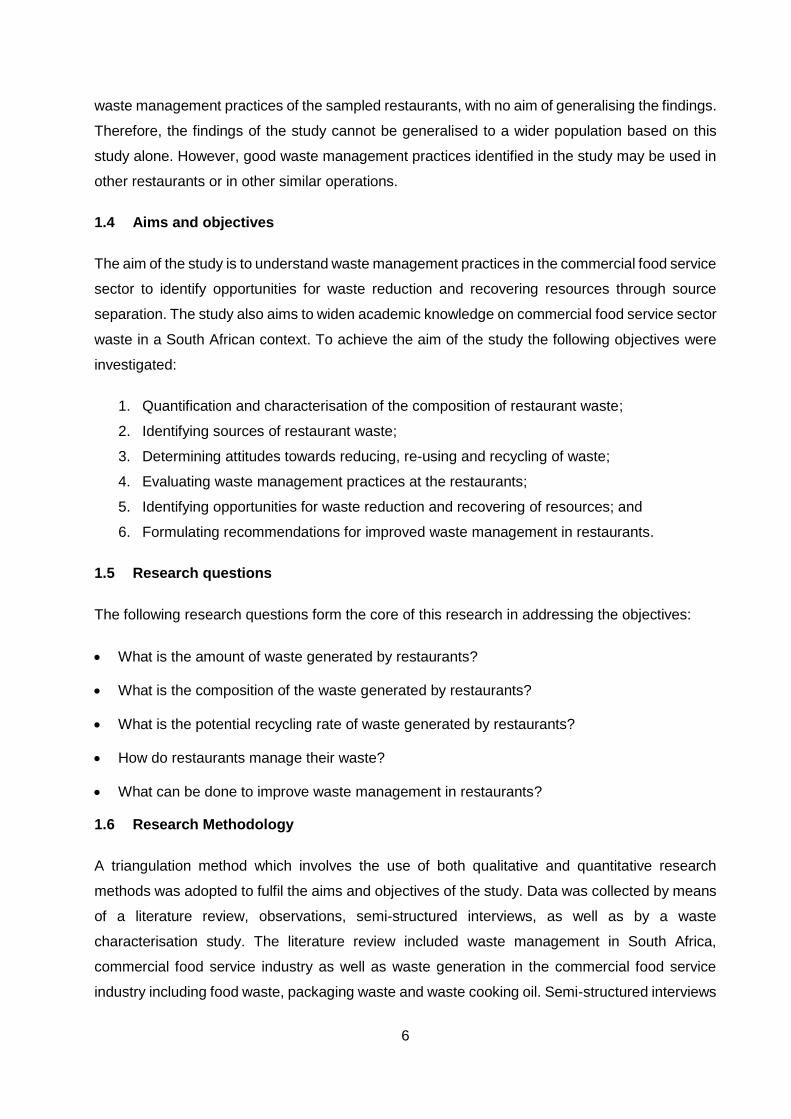
1.6 Research Methodology
A triangulation method which involves the use of both qualitative and quantitative research
methods was adopted to fulfil the aims and objectives of the study. Data was collected by means
of a literature review, observations, semi-structured interviews, as well as by a waste
characterisation study. The literature review included waste management in South Africa,
commercial food service industry as well as waste generation in the commercial food service
industry including food waste, packaging waste and waste cooking oil. Semi-structured interviews
7
and observations were used to identify activities that produce waste, disposal practices as well
as the reasons and drivers for these practices while a waste characterisation study was used to
quantify the waste generated and the percentage by weight contribution of each waste category
generated by restaurants. Figure 1-1 shows the research methodology that was adopted in the
dissertation.
1.7 Limitations of the study
There were some limitations encountered during the research. As it is the case in all research
studies involving human participants, one of the requirements of conducting this study was to
obtain an ethical clearance. Delays in ethical clearance approval was one major challenge that
was encountered during the study. Consequently, this resulted to time delays thereby hampering
the progress of the studies as it was not possible to commence with data collection. Due to time
delays, the initially planned sample size of thirty restaurants from three malls (10 restaurants each
mall) was reduced to twenty restaurants from two malls to ensure completion within the timeframe
of the study. This reduced sample size is, however, still regarded as appropriate for this study.
Figure 1-1: Research methodology adopted in the study
8
Another obstacle that was encountered during the study was the recruitment and ensuring that
the restaurants fully participate in the study, as the success of the research was dependent on
the participation of the restaurants. One of the roles of the participants in the study was to use
green plastic bags which were provided by the researcher to capture waste generated. On the
day of distribution some restaurants indicated that they still needed to get permission from the
owner of the restaurants even though they had agreed to use the plastic bags when they were
recruited while some took the plastic bags and never used them. This resulted to an overall
participation rate of 65% in terms of waste characterisation (seventeen out of the twenty
restaurants which were initially identified). Mistrust as to the nature of the study might have been
one of the reasons that restaurants were hesitant and or did not fully participate in the study.
Some restaurant managers admitted that they thought that the research was conducted to inform
decision making for increasing waste service fees as there has been an increase in electricity and
water fees.
During the literature review, it was difficult to find literature on waste management in the
commercial food service sector in a South African context. A comprehensive research on waste
management in the commercial service sector has never been done and therefore there was
generally no background information. This did not only result in lack of rich background to the
study, but it also highlighted the importance of the study in bridging the gap in the literature. Also,
during the interviews, some of the restaurants were closed due to renovation and that caused
further delays to the study.
Generally, waste characterisation studies should be undertaken over a period of one week to
provide a reasonable representation of the real situation (Dahlen and Lagerkvist, 2008). However,
in this study waste characterisation was carried out in two days (one day during the week and
one day over the weekend). Waste characterisation included only waste that was disposed in the
plastic bag and did not include waste materials that were separated at source such as corrugated
cardboards and aluminium cans. Thus collection of waste samples might have had an influence
on the findings of the study particularly on the amount of waste generation and composition as
well as the degree of variability of waste materials. Also, during sample collection for waste
characterisation, the researcher relied on the restaurant staff in ensuring that all and only waste
generated on the sampling day was put in the green plastic bags that they were provided with
(green plastic bags).
1.8 Outline of the chapters
This section of the dissertation presents and describes the chapters of the study and highlights
various topics that are covered. This dissertation comprises five chapters. Chapter one is the
9
introductory chapter which provides a background to waste management in the commercial food
service sector. The problem statement, limitations of the study and the overarching aims and
objectives are presented in this chapter. Chapter two of this study reviews literature on South
African commercial food service sector, waste management trends in South Africa, waste
management in the food service sector, green restaurants and the main waste materials (food
waste, packaging waste and waste cooking oil) generated by the restaurants. Chapter three
describes the study area together with the research methods employed including observations,
waste characterisation and interviews. Chapter four presents the results and discussion.
Chapter five draws conclusions from the findings and provides recommendations on how the
restaurants can improve their waste management practices. Figure 1- 2 shows outline of the
chapters.
Figure 1-2: Outline of chapters
Chapter 1
•Background to the study and problem statement
•Aims and objectives of the study
•Limitations of the study
Chapter 2
•Review of previous literature on waste managent in the commercial service sector
Chapter 3
•Describes research design, instruments employed and data analysis
•Description of the study area
Chapter 4
•Interpretation of the results and discussion
Chapter 5
•Conclusion and Recommendations
10
CHAPTER 2: LITERATURE REVIEW
2.1 Introduction
Improving waste management and diverting waste away from landfill have been recognised as a
key priorities in South Africa. The internationally accepted waste management hierarchy adopted
by South Africa acknowledges waste avoidance as the most favoured and important approach
towards sustainable waste management. Where waste cannot be avoided, the hierarchy
recommends waste reduction, re-use, recycling, recovery and landfilling as the last option. The
National Waste Management strategy (DEA, 2012) also promotes diversion of waste from landfill
through minimisation, re-use, recycling and recovery. Targets set under the National strategy
include diverting 25% of recyclable material from landfill and also introduction of source
separation programmes in metropolitan municipalities, secondary and large cities by 2016 (DEA,
2011).
However, in spite of the good policy in South Africa, landfilling continues to be the common
practice of waste management. The latest baseline study shows that approximately 90.1% of total
waste generated in South Africa was landfilled in 2011 (DEA, 2012). According to Trois and
Simelane (2010) municipal solid waste that is landfilled in South Africa contains more than 40%
of organic waste and more than 40% of recyclable waste. Landfilling takes up landfill space and
also more valuable land space. Additionally, landfilling is one of the contributors of climate change
(Rahman, Shams and Mahmud, 2010). Food waste disposed at the landfills decomposes and
releases methane gas thereby contributes to climate change. For example, disposal of organic
waste (including food waste) is estimated to contribute 4.3% to South Africa’s greenhouse gas
emissions (Oelofse and Nahman, 2013). Landfilling also means that resources that could have
been otherwise recovered and returned to the value chain, are lost.
To bridge the gap between policy and implementation, a more strategic approach focusing on
diversion of waste from landfills is required. Kuniyal, Jain and Shannigrahi (1998, p. 300) suggests
“involvement and participation of each individual or participatory group for complete segregation
at source, proper collection, transportation and environmentally sustainable disposal along with
sustainable practices of reuse and recycling”. Waste generators or service users have been
regarded as one of the most important stakeholders that play a pivotal role in shaping the waste
management system and these may include households, civil organisations, commercial and
industrial sectors. Guerrero, Maas and Hogland (2013) also highlight the importance of identifying
the stakeholders and understanding the role they have to play in the structure to establish an
efficient and effective system.
11
The commercial food service sector is one of the stakeholders which contribute to commercial
waste production. This industry is reported to produce a significant amount of packaging and
organic food waste (Davies and Konisky, 2000). Unfortunately, most of this waste ends up in
landfills. For example, in India, about 75 percent of the 600 000 tonnes of glass that is produced
by restaurants, cafes, bars and hotels every year is not recycled, it ends up in landfills (Singh,
Kaushik, Soni and Lamba, 2014). The reported composition (significant amount of packaging and
food waste) of the waste generated in restaurants shows that there is an opportunity to manage
restaurant waste in a sustainable manner that will support waste prevention and diversion of
waste away from the landfills. However, to manage waste in a sustainable manner there is a need
to understand waste management practices of restaurants in terms of the volume of waste
generated, composition of waste as well as the reasons and drivers for these practices.
2.2 Solid waste management in South Africa
Historically, waste management has been approached from a point of collection and disposal.
This waste management approach simply involved a process by which waste is collected from
the point of generation and taken away from the people to the landfill (Lincoln, 2011). It is apparent
that this approach to waste management is one of the fundamental reasons for the overweighing
burden placed on municipalities today. Because section 156 (1) (a) of the South African
Constitution in conjunction with schedule 5, part B of the constitution places solid waste disposal,
refuse removal and refuse dumps as the sole responsibility of the local government (RSA, 1996);
municipalities are faced with a challenge of managing high volumes of waste. Exacerbating the
issue of increased waste generation is the limited space available to landfill in some
municipalities. At the same time constructing a new landfill can be challenging due to lack of
suitable land in close proximity to the point of waste generation (Oelofse and Nahman, 2013).
2.2.1 Waste generation in South Africa
It is estimated that South Africa generated about 108 million tonnes of waste in 2011. The waste
generated comprised of 59 million tonnes of general waste, 1 million tonnes of hazardous waste
and 48 million tonnes of unclassified waste (DEA, 2012). General waste which forms the bulk of
waste generated in South Africa is mainly composed of non-recyclable municipal waste (35%),
construction and demolition waste (20%) followed by mainline recyclables (including paper,
plastics, glass and tyres) (19%), organic waste (13%) and metals (13%) (DEA, 2012). The
composition of the general waste presents a potential for diversion of 65% of waste generated
from landfill. However, landfilling remains the main waste management option in South Africa. A
national baseline study reported that about 90% of waste generated was disposed of to landfill in
2011 while only 10% was diverted away from the landfill through recycling (DEA, 2012).
12
2.2.2 Diversion of waste from landfilling
Ideally, diversion of waste from landfills should follow the waste hierarchy through implementation
of waste reduction strategies at source, re-use, recycling and finally recovery as the last option.
However, attention paid towards diversion of waste from landfills in South Africa has rather
focused on material recycling. Waste diversion in South Africa is encouraged by a strong
legislative framework. The National Waste Management Strategy promotes diversion of waste
from landfill through minimisation, re-use, recycling and recovery. Targets set under the National
strategy include diverting 25% of recyclable material from landfill and to initiate source separation
programmes in metropolitan municipalities, secondary and large cities by 2016 (DEA, 2011). In
line with the government’s aim to divert waste to recycling and recover energy from residual waste
(DST, 2012), diversion of waste from landfill has focused more on material recovery.
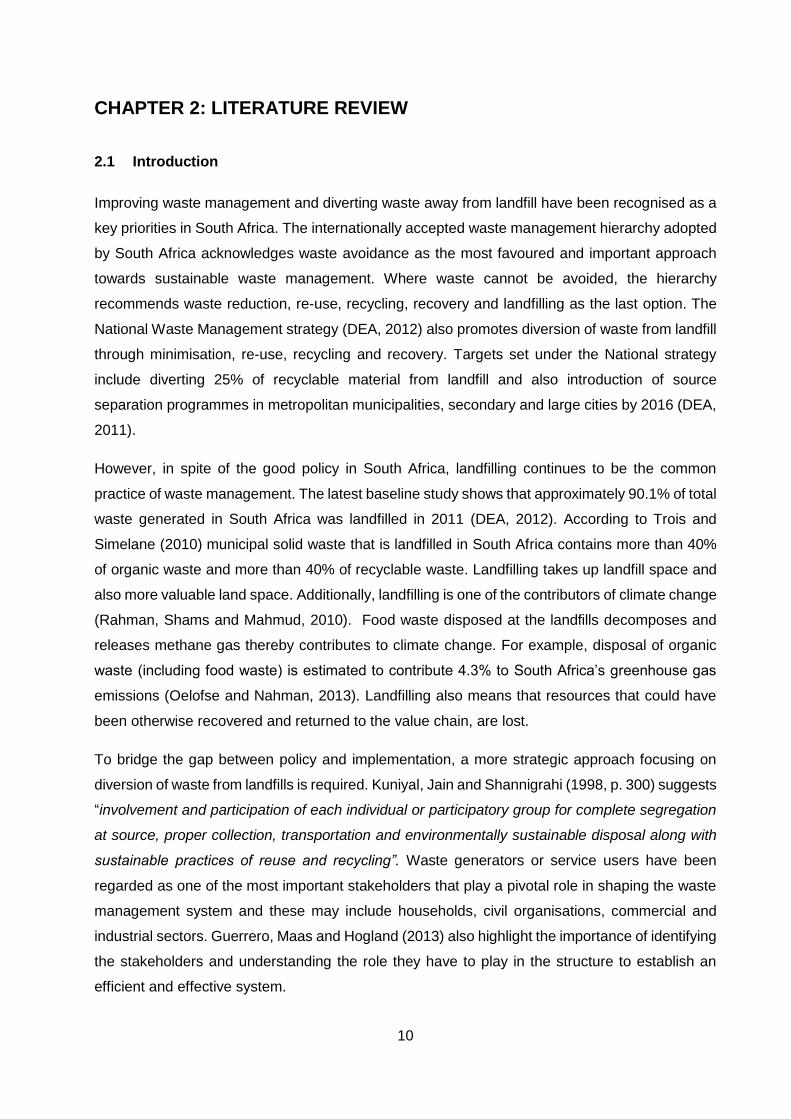
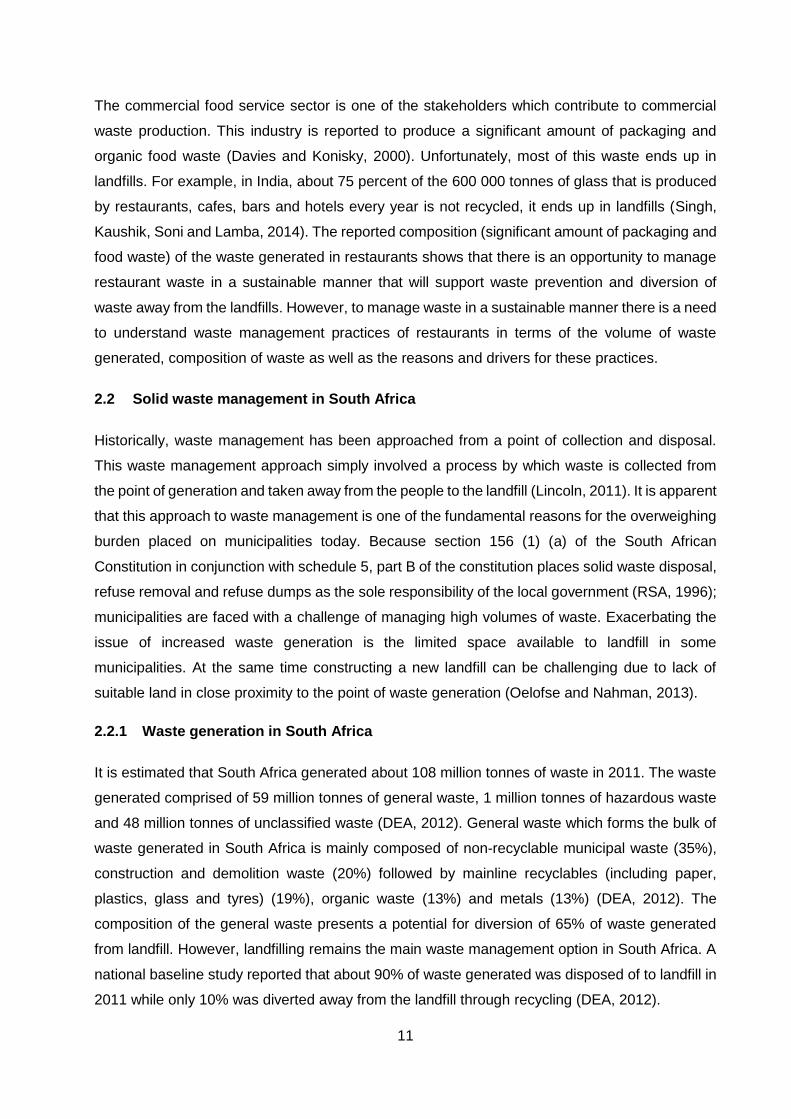
This has been evident in the National Waste Sector Survey for 2012 (DST, 2013) which showed
that material recycling is the mostly used treatment technology by both formal private waste
handlers and municipalities when compared to other technology options (including thermal,
chemical, biological, mechanical) (see Figure 2-1). Another notable finding from the study is the
transition of the private waste handlers towards the use of technology options that divert waste
from landfill while municipalities remain heavily reliant on landfilling (see Figure 2- 2).
Figure 2-1: Technology options used by private companies (Adapted from: DST, 2013)
23.0%
15.1%12.2%
7.2%
21.6%
37.4%
5.8%
0.0%
10.0%
20.0%
30.0%
40.0%
50.0%
60.0%
70.0%
80.0%
90.0%
100.0%
Landfilling Thermal Chemical Biological Mechanical Materialrecycling
Other
% P
riva
te e
nte
rpri
ces
Private: Handlers & Equpment Providers: Technology
13
Figure 2-2: Waste management technology used by private waste handlers and municipalities (Adapted from: DST, 2013)
The collection of recyclable material in South Africa is mainly conducted by the informal waste
pickers and the packaging/recycling industry. Approximately 85.000 waste pickers survive by
reclaiming re-usable and recyclable waste from streets and landfills (Van den Berg, 2014). In
2004, waste pickers diverted about 16 to 24 tonnes per picker per annum and are estimated to
have saved municipalities between R309.2 and R748.8 million in landfill airspace (Godfrey,
Strydom and Phukubye, 2016).
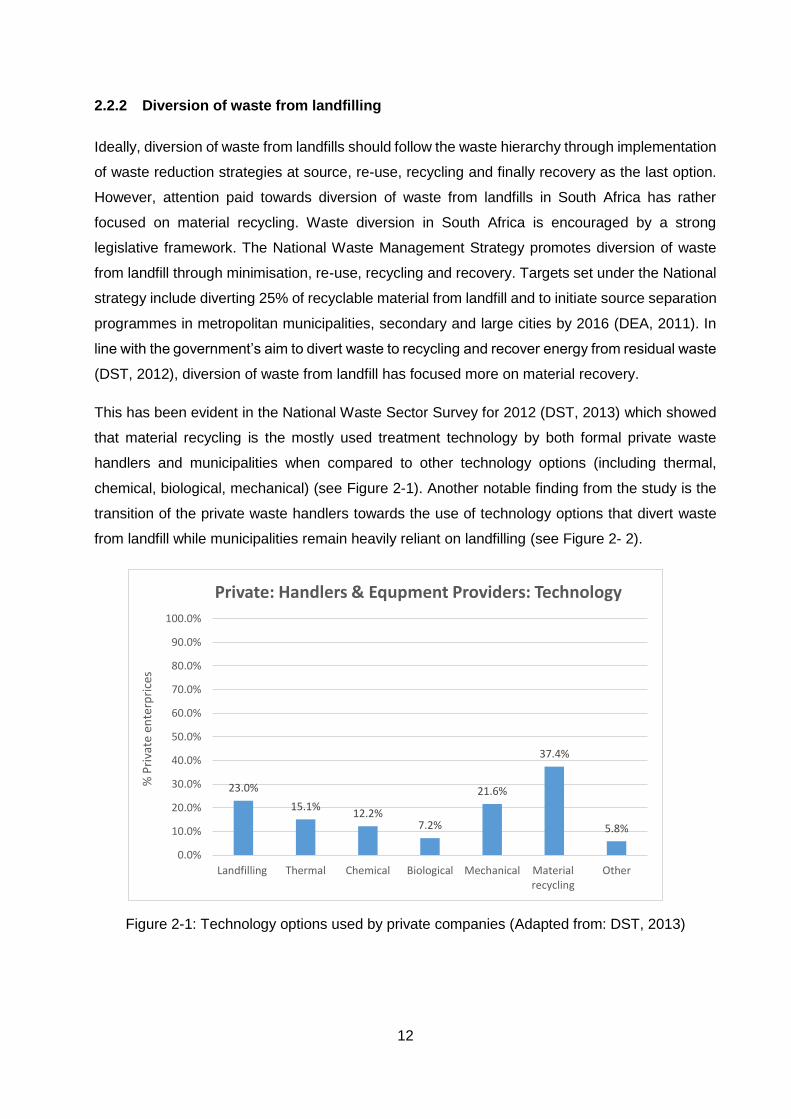
A similar trend has been observed in international countries where material recovery and
incineration with energy recovery have been the most favoured options used to divert waste
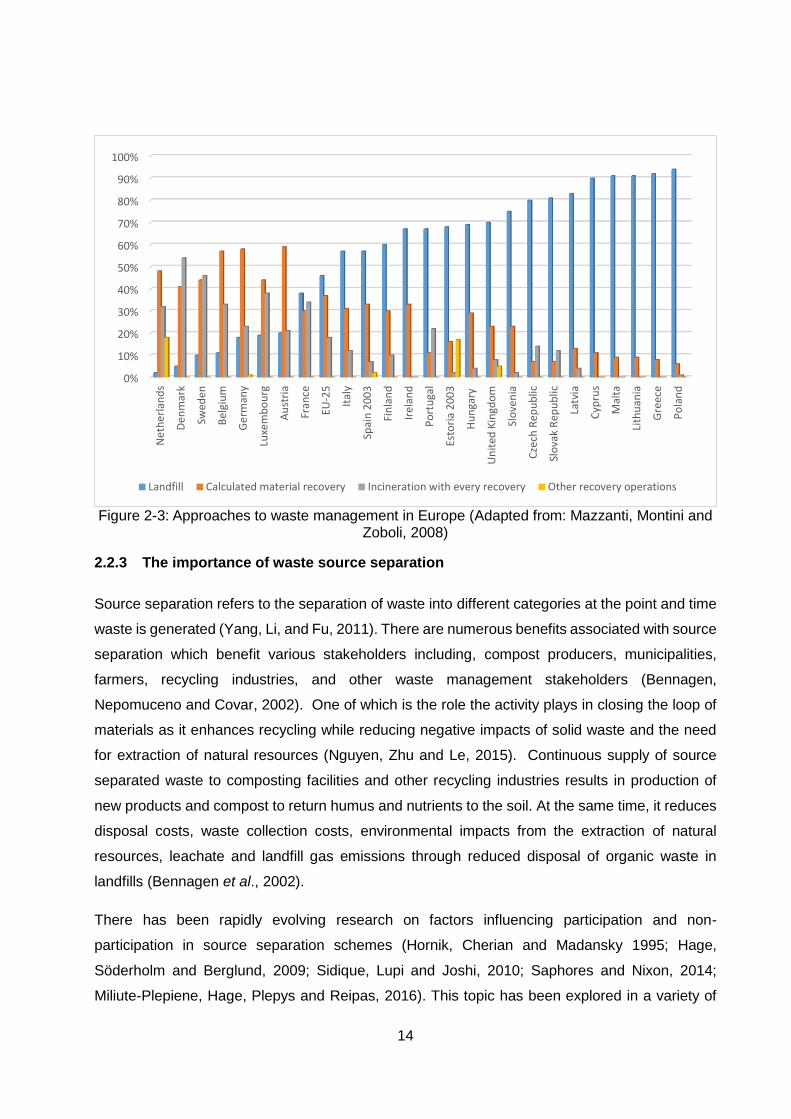
(Mazzanti, Montini and Zoboli, 2008). Figure 2-3 shows waste management options used in
different European countries and the rate at which these are used in each country. Countries such
as the Netherlands, Denmark, Sweden and Belgium have been successful in minimising the
amount of waste going to the landfills and this has been achieved mostly through material
recovery and incineration with energy recovery (Mazzanti et al., 2008). On the other hand,
countries such as the United Kingdom, Poland and Greece remain heavily reliant on landfilling
with low rates of material recovery.
89.9%
0.0% 1.4%
8.7% 7.2%
46.4%
2.9%
0.0%
10.0%
20.0%
30.0%
40.0%
50.0%
60.0%
70.0%
80.0%
90.0%
100.0%
Landfilling Thermal Chemical Bilogical Mechanical Materialrecycling
Other
% M
un
icip
alit
ies
Municipalities: Technology Solutions
14
Figure 2-3: Approaches to waste management in Europe (Adapted from: Mazzanti, Montini and Zoboli, 2008)
2.2.3 The importance of waste source separation
Source separation refers to the separation of waste into different categories at the point and time
waste is generated (Yang, Li, and Fu, 2011). There are numerous benefits associated with source
separation which benefit various stakeholders including, compost producers, municipalities,
farmers, recycling industries, and other waste management stakeholders (Bennagen,
Nepomuceno and Covar, 2002). One of which is the role the activity plays in closing the loop of
materials as it enhances recycling while reducing negative impacts of solid waste and the need
for extraction of natural resources (Nguyen, Zhu and Le, 2015). Continuous supply of source
separated waste to composting facilities and other recycling industries results in production of
new products and compost to return humus and nutrients to the soil. At the same time, it reduces
disposal costs, waste collection costs, environmental impacts from the extraction of natural
resources, leachate and landfill gas emissions through reduced disposal of organic waste in
landfills (Bennagen et al., 2002).
There has been rapidly evolving research on factors influencing participation and non-
participation in source separation schemes (Hornik, Cherian and Madansky 1995; Hage,
Söderholm and Berglund, 2009; Sidique, Lupi and Joshi, 2010; Saphores and Nixon, 2014;
Miliute-Plepiene, Hage, Plepys and Reipas, 2016). This topic has been explored in a variety of
0%
10%
20%
30%
40%
50%
60%
70%
80%
90%
100%N
eth
erl
and
s
Den
mar
k
Swed
en
Bel
giu
m
Ge
rman
y
Luxe
mb
ou
rg
Au
stri
a
Fran
ce
EU-2
5
Ital
y
Spai
n 2
00
3
Fin
lan
d
Irel
and
Po
rtu
gal
Esto
ria
20
03
Hu
nga
ry
Un
ited
Kin
gdo
m
Slo
ven
ia
Cze
ch R
epu
blic
Slo
vak
Rep
ub
lic
Latv
ia
Cyp
rus
Mal
ta
Lith
uan
ia
Gre
ece
Po
lan
d
Landfill Calculated material recovery Incineration with every recovery Other recovery operations
15
contexts including situational, socio-technical systems, individual behavioural determinants and
interactions between them. Yet, despite the contributions of these studies to understanding the
factors that influence recycling behaviour, an essential underlying question remains unanswered:
what are the factors that influence recycling behaviour? Hornik et al., (1995) reports that the
literature fails to develop a coherent and successful recycling research stream mainly because of
the lack of substantive ties between many disciplines that have conducted research in this space.
The literature depicts a complex picture covering a wide variety of factors that influence recycling
which makes it exceedingly difficult to identify a consistent set of results (Thomas and Sharp,
2013). Sidique et al., (2010) found distance, convenience, recycling infrastructure and social
pressure as the most important drivers of recycling behaviour. Comparing tools to change
recycling behaviour, Timlett and Williams (2008) found that providing feedback to households on
their sorting performance as the most effective, when compared to door stepping and offering
incentives. Thomas and Sharp (2013) looked at normalisation of source separation and
suggested use of innovative and unique communication and education awareness strategies to
ensure that households understand waste source separation in terms of what materials to sort,
how to sort the materials and why it is important for them to separate their waste. Other authors
identified convenience as a key determinant of recycling behaviour (Saphores and Nixon, 2014;
Miliute-Plepiene et al., 2016), while Hage et al., (2009) found norms and economic motivation as
the drivers of recycling behaviour.
Both developing and developed countries have been establishing strategies to realise the benefits
offered by separating waste at source. Source separation schemes differ from region to region
and may take different forms of collection including kerbside collection, drop-off and buy-back
collection system (Rousta, Bolton, Lundin and Dahlén, 2015). However, the actual segregating
responsibility lies significantly with the waste generator who remains key to the success of the
source separation scheme (Yang et al., 2011). While there are countries such as Japan where
source separation has become a normal activity from which lessons can be drawn (Zhang and
Wen, 2014), getting people to participate is still a challenge in many regions. Thomas and Sharp
(2013) report that recycling is not a normal activity for everyone hence even with provision of
infrastructure, and education and awareness campaigns, some people do not participate or fully
participate in source separation. This is common in cities of developing countries where source
separation programmes that have been implemented for decades yet they are still at pilot stage
(Nguyen et al., 2015). South Africa is one of the countries where source separation is not a normal
activity. Assessing household recycling behaviour in large urban areas as well as small towns
and rural areas, Strydom and Godfrey (2016) found that only 7.2% households showed dedicated
recycling in large urban areas while only 2.6% was found in small towns and rural areas in 2015.
The low levels of recycling behaviour in South Africa indicate a need for improvement through the
16
use of different instruments that are unique to the South African situation. Restaurant recycling
behaviour in a South African context is currently unknown. However, the low levels of household
recycling behaviour may be a reflection of the status of source separation in restaurants.
Research on the link between recycling behaviour at work and home shows that people that
recycle at home are more likely to recycle at work (Marans and Lee, 1993; Tudor, Barr and Gilg,
2007).
2.3 Review of the commercial food service sector in South Africa
The food service sector is a sector that offers food and beverages, which may be eaten inside or
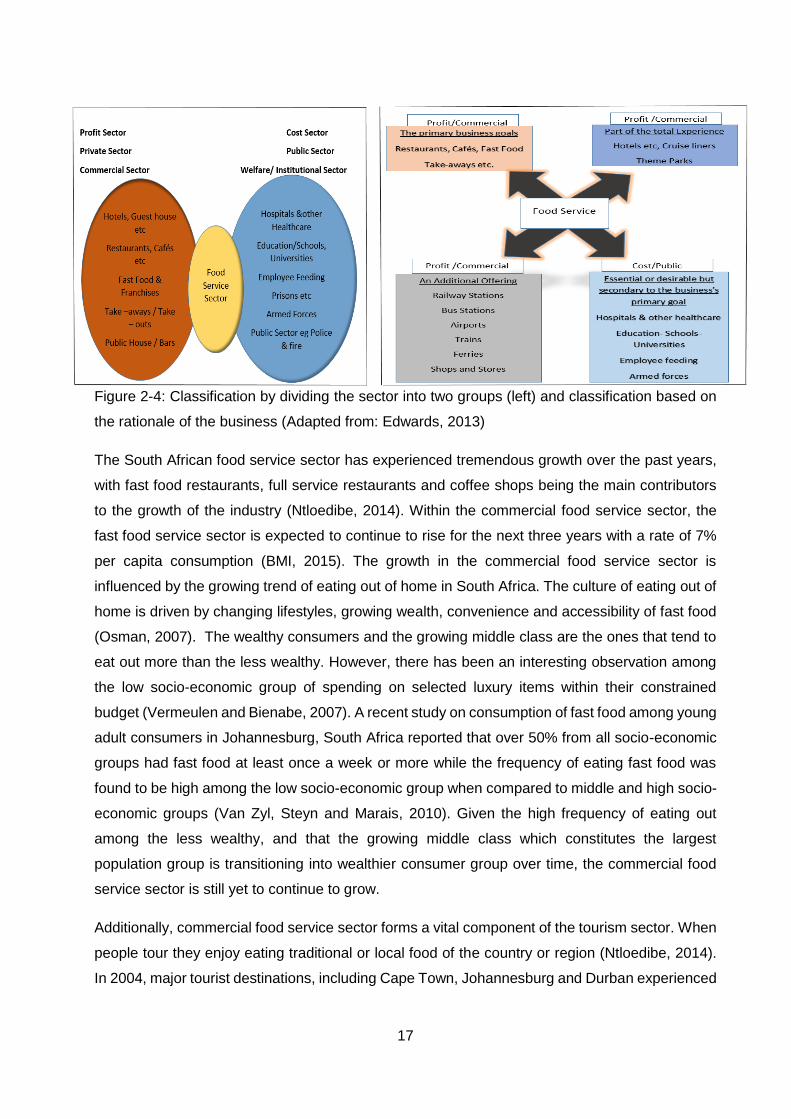
outside of the establishment and or institution. Edwards (2013) identifies two ways of classifying
the food service sector. This sector can be grouped into commercial, profit or private sector and
institutional/welfare, public or cost sector (see Figure 2- 4). Ntloedibe (2014) also classifies the
South African food service sector into commercial and institutional/service sectors. The
commercial food service sector includes hotels, all types of restaurants (restaurants, fast food
restaurants and buffet type restaurants) and clubs while the institutional service sector includes
transport services, health (public and private hospitals), educational institutions, and prisons
(Ntloedibe, 2014). Alternatively, the food service sector can be classified based on the business
rationale. This classification method considers whether the provision of food is the primary goal
or a complimentary service (see Figure 2- 4). Hence, an organisation whose primary goal is to
provide food is categorised as profit or commercial sector while in an organisation where the food
is offered as complimentary service to the primary business goal is referred to as public or
institutional sector.
17
Figure 2-4: Classification by dividing the sector into two groups (left) and classification based on
the rationale of the business (Adapted from: Edwards, 2013)
The South African food service sector has experienced tremendous growth over the past years,
with fast food restaurants, full service restaurants and coffee shops being the main contributors
to the growth of the industry (Ntloedibe, 2014). Within the commercial food service sector, the
fast food service sector is expected to continue to rise for the next three years with a rate of 7%
per capita consumption (BMI, 2015). The growth in the commercial food service sector is
influenced by the growing trend of eating out of home in South Africa. The culture of eating out of
home is driven by changing lifestyles, growing wealth, convenience and accessibility of fast food
(Osman, 2007). The wealthy consumers and the growing middle class are the ones that tend to
eat out more than the less wealthy. However, there has been an interesting observation among
the low socio-economic group of spending on selected luxury items within their constrained
budget (Vermeulen and Bienabe, 2007). A recent study on consumption of fast food among young
adult consumers in Johannesburg, South Africa reported that over 50% from all socio-economic
groups had fast food at least once a week or more while the frequency of eating fast food was
found to be high among the low socio-economic group when compared to middle and high socio-
economic groups (Van Zyl, Steyn and Marais, 2010). Given the high frequency of eating out
among the less wealthy, and that the growing middle class which constitutes the largest
population group is transitioning into wealthier consumer group over time, the commercial food
service sector is still yet to continue to grow.
Additionally, commercial food service sector forms a vital component of the tourism sector. When
people tour they enjoy eating traditional or local food of the country or region (Ntloedibe, 2014).
In 2004, major tourist destinations, including Cape Town, Johannesburg and Durban experienced
18
a massive rise in tourist’s arrivals which resulted in an increase in sales for outlets aimed at
catering for tourists.
2.4 Green restaurants
The restaurant industry is increasingly acknowledging its environmental impact and the need to
be environmentally responsible (Wang et al., 2013). Importance of environmental protection
within the food-service industry has been demonstrated by the growth of green restaurants
research (Wang et al, 2013). This topic has been explored from different aspects including
economic benefits of implementing green practices, development of green management
standards, consumers' perceptions and intentions to visit green restaurants. “Green restaurant”
is a label given to restaurants that perform environmentally friendly activities. Chen et al., (2015)
defines a green restaurant as a restaurant that offers a selection of green food menu options that
use locally grown food, as well as one that implements green practices. Hence, the operation and
management of these businesses is characterized by implementation of 3Rs (reduce, re-use,
recycle) and 2 Es (energy and efficiency). These restaurants place great emphasis on continuous
procedural modifications to reduce the environmental and social problems that arise directly or
indirectly from their operations while still generating profit and meeting consumer’s demand.
Adoption of green practices in restaurants should be aimed at reversing the environmental and
social problems that result directly or indirectly from their operations (Hilario, 2014), through
reducing the use of non-recyclable products, harmful chemical products and also reducing over-
use of resources. Evidence from the literature on adoption of green restaurants suggests that
while environmental benefits should be the main reason for adoption of green practices, it is not
the case in reality. Restaurants engage in green practices for various reasons. Legal compliance
is one of the reasons why businesses adopt green practices, to avoid cost and legal punishments
associated with non-compliance (Chou et al., 2012). For example, Wang et al., (2013) reports
that in Taiwan, implementation of green practices in the food and beverage industry is only
encouraged by laws or government policies. Conducting a study on reasons for going green in
serviced accommodation establishments, Tzschentke, Kirk and Lynch (2004) found cost saving
on the operation costs as the main reason for adoption of green practices in their study. They
report that rising waste disposal charges, energy and water through the introduction of metres
and taxes such as landfill tax and climate change levy were frequently mentioned as the reason
why the restaurants implement green practices. Thus, incorporation of water, energy, raw material
measures and waste minimisation strategies enables the companies to maximise profit at the
lowest operational costs. In line with this reasoning Tzschentke et al., (2004) reports that most of
the establishment’s commonly implemented green practices that benefited the businesses
financially. Chou’s et al., (2012) finding when they conducted a study on green practices in the
19
restaurant industry from an innovation adoption perspective in Taiwan shares Tzschentke’ et al.,
(2004) argument that adoption of green practices in restaurants is more influenced by financial
gains from implementing those practices rather than from benefiting the environment. Adoption
of green practices for creating an improved image, and a competitive advantage over other
competitors is another reason for implementation of green practices. For example, restaurant
owners in the United States of America (USA) adopt green practices for their business with the
purpose of improving their image (Hilario, 2014).
Going green or adopting green practices is not regulated by any law, however businesses
voluntarily adopt these practices or use going green as a self-regulation for economic benefits
and sustainability of the natural environment. In countries such as the United States of America,
green practices are promoted by non-governmental organisations such as Green Restaurant
Association (GRA) and National Restaurant Association (NRA). These non-governmental
organisations offer cost-effective and convenient techniques for restaurants to become
environmentally friendly (Hilario, 2014) by encouraging adoption of environmental policies in the
restaurants and providing training for restaurant employees around green practices. For example,
the GRA offers three types of certification options for existing restaurants, new buildings, and
events. Within each certificate there are standards which guide the restaurants in terms of what
environmental aspects to focus on and those guidelines may include (a) Building materials and
sustainable furnishings (only apply to new builds); (b) Use of non-toxic products; (c) Water
conservation and efficiency; (d) Pollution prevention; (e) Purchasing organic, sustainable and
local foods; (f) Composting and recycling (g) Energy efficiency and conservation (Hilario, 2014).
As indicated above, there are multiple green practices that can be employed by businesses.
Among the green practices mentioned above, waste minimisation, recycling and composting,
green food as well as energy and water efficiency appear to be the most common green practises.
Wang (2012) identifies green practices that can be implemented by restaurants as outlined in the
following sub-sections.
2.4.1 Waste minimisation, recycling and composting
Food waste forms the bulk of waste generated in the commercial food sector when measured in
weight while packaging forms the bulk of the waste when measured in volume (Davies and
Konisky, 2000). Packaging and food waste can be reduced through adoption of waste
minimisation strategies by restaurants. For food waste this may include reducing food over-
purchasing, adjusting menus to reduce frequently uneaten food, training staff to reduce
preparation waste and improper cooking, storing food properly to reduce spoilage and also
repurposing leftover food (United States Environmental Protection Agency, 2014). Packaging
20
waste on the other hand can be reduced by purchasing items in bulk, using reusable service ware
and using packaging that is recyclable (United States Environmental Protection Agency. 2014).
Better source separation of resources such as glass, plastic, metal, cardboard, and aluminum is
also important to improve the potential for recycling and increase the value as resource, if the
waste is clean. On the other hand, biological treatment (including composting and anaerobic
digestion) of food waste generated in the commercial food service sector could help reduce the
amount of waste that goes to the landfill and the resulting environmental impacts of food waste
at landfills.
2.4.2 Energy and water-efficient equipment
Energy and water efficient equipment can be any equipment that consumes less energy and
saves water. An example of energy efficient equipment could be the use of fluorescent light bulbs
as they last longer and save energy. For example, Starbucks which is one of the green restaurants
in the United States of America uses water efficient equipment and also uses energy-efficient
lighting in seating areas (Wang, 2012).
2.4.3 Green food
Green food is basically the use of organically and locally produced food. More specifically green
food is considered to include food that is grown with no use of pesticides, chemical fertilizers and
other chemical inputs. With the increasing health consciousness among consumers, organic food
has become a criterion for selecting a restaurant. Kwok et al., (2016) reports that green food tends
to appeal more on customers that are concerned with healthy food that is low in carbohydrates,
fat or calories. Investigating the influence of introducing green food on the frequency of patronizing
in a restaurant, Vieregge, Scanlon and Huss (2007) found that about 67% of participants
appreciate locally grown products, and 70.9% would visit the restaurant more frequently if locally-
grown food is offered.
Evidence suggest that implementation of green practices impact positively on a business.
According Llach, Perramon, Alonso-Almeida and Bagur-Femenías (2013) green practices in
restaurants bring economic benefits. Implementation and adoption of green practices can also
attract a new category of customer, further satisfy existing customers, improve a restaurant’s
image, and thus ensure a better overall position for the company in the market. A study conducted
by Dutta, Umashankar, Choi and Parsa (2008) in India and the United States revealed that
consumers are always willing to pay more for green practices. Implementation and adoption of
the green practices does not only influence the consumer’s behavior but also influences the
manager’s willingness to increase the price for green practices.
21
2.5 Review of waste management in the commercial food service sector
The commercial food service sector (i.e. full service restaurants, fast food outlets, hotels,
cafeterias and bars) generates a significant amount of wasted food, packaging waste (Davies and
Konisky, 2000) as well as waste cooking oil (Zein, Wazner, and Meylan, 2008). Food waste as
reported by Majid and Howee (2007) makes up the bulk of the waste generated (up to 70% by
weight). Packaging is reported to consist of paper, cans, plastics (i.e. bottles/bags), and glass. In
terms of volume, packaging forms the bulk of the waste when compared to food waste (Majid and
Howee, 2007).
Davies and Konisky (2000) identify three ways in which the food and beverage industry impacts
on the environment, namely upstream, downstream and direct environmental impacts. Upstream
environmental impacts refer to the environmental impacts that occur in the production,
manufacturing and transportation stage of products that are used in the restaurants. These may
include pollution produced by farm land supplying food outlets, manufacturers and suppliers.
Direct environment impacts on the other hand are the environmental impacts that occur as a result
of providing the services in the food outlets. These environmental impacts may include impacts
of waste generated from the restaurants, energy consumption and also air emission. The third
category of environmental impacts in a food and beverage industry is down-stream impacts which
relate to the relationship between the service companies, consumers and suppliers and also how
the service companies can influence a change in environmental behaviour of consumers and
suppliers through education and awareness.
2.6 Review of food waste
The following sub-sections provide an overview of food waste in the context of this study.
2.6.1 Definitions of food waste
There is no universally accepted definition of food waste. Food waste definitions vary greatly
depending on the region or research. Below are five different definitions of food waste:
I. A common definition is the one provided by Gustavsson, Cederberg, Sonesson, van
Otterdijk and Meybeck (2011) which defines food waste or loss as loss of food that
was meant for human consumption, excluding the inedible parts. This includes the
food that is intentionally used as feed or bioenergy. According to Gustavsson, et al.,
(2011) food waste occurs at the last stages of the food supply chain (retail and
consumer level) while food that is lost in the early stages of food supply chain is
referred to as food loss (post-harvest and processing stages).
22
II. In contrary to Gustavsson’s et al., (2011) definition is Bond, Meacham, Bhunnoo and
Benton’s (2013) definition which includes waste or loss of both edible, inedible food
(vegetable peelings, meat carcasses and teabags) as well as food of personal
preference (possibly avoidable). Possibly avoidable food may include items such as
bread crusts which some people choose not to eat and potato skins which can be
eaten when food is prepared in certain ways. According to Bond et al., (2013) this
definition is useful as it considers food waste infrastructure requirements that can be
employed (for example composting or anaerobic digestion) to divert biodegradable
food waste from the landfill.
III. Food waste may also be broadly defined as waste or by-product that occurs in different
stages of the food supply chain (from production, processing, distribution until
consumption) (Okazaki, Turn and Flachsbart, 2008).
IV. Similar to Okazaki’s et al., (2008) definition, Tielens and Candel, (2014) define food
waste as food that gets wasted in the food supply chain, irrespective of the stage of
the food supply chain at which it occurs.
V. Ostergren, Gustavsson, Bos-Brouwers, Timmermans, Hansen, Moller, Anderson,
O’Connor, Soethoudt, Quested and Easteal (2014) define food waste as all the food
that exits somewhere along the Food Supply Chain (FSC) for recovery or disposal.
For example, this may include food used for bio-energy production, composting as
well as food that is not harvested.
In this dissertation, Tielens and Candel’s (2014) definition which defines food waste as all the
food that gets wasted along the food supply chain, irrespective of the stage of the food supply
chain at which it occurs was used.
2.6.2 Food waste in developing and developed countries
There are disparities in the amount of food waste generated between developing and developed
countries. The difference is not necessarily on the total amount of food waste generated but on
the stages at which it occurs. Developed countries waste about 40% of their food at retail and
consumer level (Gustavsson et al., 2011). A study conducted by Ventour (2008) found that United
Kingdom (UK) household waste about 6.7 million tonnes of food every year. Approximately 21.7
million tonnes of food is purchased by the UK households and about one-third of that food does
not get consumed. Food waste at the end of the FSC may be largely due to a variety of factors
including high retail grading standards, poor stock rotation, affordability, attitudes, behaviours,
date labelling, discarding leftovers as well as poor meal planning and cooking abilities (Bond et
al., 2013).
23
Developing countries on the other hand experience great loss of their food in the early stages of
the FSC. Hence, food waste in developing countries has been linked to poor harvesting
technologies, poor storage and transport facilities (Lundqvist, de Fraiture and Molden, 2008).
Gustavsson’s et al., (2011) report on global food losses and food waste indicates that more than
40% of the food losses occur at post-harvest and processing levels and much less is wasted at
the end of the FSC. China and India are the main contributors of food waste generation in
developing countries. China is estimated to generate about 195 million tonnes of food waste
annually (Thi, Kumar and Lin, 2015), with storage waste contributing the most food lost at post-
harvest stage (Liu, 2013).
According to Parfitt, Barthel and Macnaughton (2010) there is a huge gap in the understanding
of food waste in transitional economies. Evidence from the literature shows that distribution of
food waste generation in the FSC may not be the same as reported by Gustavsson et al., (2011)
in developing countries. The literature highlights various factors influencing food waste generation
that were not considered in the global food losses which are likely to change the reported
distribution of food waste within the FSC, particularly in transitional countries. Factors such as
technological developments, dietary shift, urbanisation and socio-economic development were
not considered on the global food losses and food waste study due to limited and lack of reliable
data used to benchmark the study. Data used to estimate post-harvest food waste dates back to
1970’s and 1980’s and does not take into consideration the changes in the FSC as well as the
global changes (Baxter, 2016). This is particularly true for the transitional countries such as Brazil,
Russia, India, China and South Africa which undergo rapid socio-economic development.
Transition countries refer to those countries undergoing a shift from central planning towards free
markets and high national income status (Bond et al., 2013). These countries experience rapid
population growth, urbanisation, rising incomes, dietary shift as well as huge advances in
agricultural technologies which may have great influence on the amount of food waste generated
in those regions.
Technology plays a pivotal role in reducing the amount of food that gets lost in pre-consumer
stages of the FSC. This was observed in a study conducted by Economist Intelligence Unit (EIU)
(2014) which showed a strong relationship between food loss and technology when correlated.
Technological developments over the past twenty years are likely to have reduced pre-consumer
food waste in developing countries, especially in transitional countries. Baxter (2016) reports that
as countries progress in terms of development, the infrastructure used for production improves.
This results in a decrease in the amount of food waste occurring at production stages and an
increase in the late stages of the food supply chain. While food waste at consumption stage has
been a concern in developed countries, transitional countries are starting to follow the same trend
as developed countries where they waste a considerable volume of food at consumption stage.
24
For example, consumption food waste is already a concern in China where food waste generated
at consumption level (more than 50 Mt of grain) is greater than food that is lost at production stage
(35 Mt) annually (Liu, 2013). Another notable trend is that restaurants in China generate more
food waste than households, indicating high frequency of eating out.
Rising incomes in developing countries is likely to have increased post-harvest food waste over
the past years. Thi et al., (2015) estimated the status of food waste generation in developing
countries based on the Gross National Income (GNI). The study revealed that food waste
generation in developing countries increases with the increasing GNI which is a similar trend seen
in developed economies. According to Thi et al., (2015) economic growth along with urbanisation
and population growth in developing countries will increase food waste generation. Also, the
movement of people away from primary sources of food to urban areas in transitioning economies
is likely to further increase food waste generation (Parfitt et al., 2010). High population size and
income in urban areas comes along with high food quality consumer demands and aesthetics
standards (Liu, 2013). Therefore, meeting high food quality consumer demand may involve
discarding food that does not meet the consumer demands even if it is still good and fit for
consumption.
Rising income, growing affluence and escalating urbanisation in transitional countries has
resulted in nutritional transition from traditional staple food to more nutritious and healthy organic
food and meat. Given that vegetables and fruits account for highest food waste (Timmermans,
Ambuko, Belik and Huang, 2014), food waste generation will potentially increase in those regions.
2.6.3 Food waste in South Africa
There is generally little primary data in terms of the amount of food waste produced in South
Africa. This is partly due to a lack of waste data reporting, lack of accurate data as well as few
waste characterisation studies conducted at both national and municipal level (DEA, 2012). In the
National baseline study food waste is submerged under organic waste (which may also include
garden waste) and does not specifically provide quantification of food waste. As such, food waste
quantities in South Africa were calculated by applying percentages of food wastage in Sub-
Saharan Africa (Oelofse and Nahman, 2013). The percentages of food wastage in Sub-Saharan
Africa were taken from a study conducted by Gustavsson et al., (2011) on Global Food Losses
and Food Waste study.
Approximately 10.2 million tonnes of food waste is generated in South Africa (Oelofse, 2015). As
it is the case in developing countries, South Africa loses a great amount of its food in the early
stages of the FSC. Figure 2-5 shows, respectively food wasted in South Africa at different stages
of the food supply chain. It can be seen that food waste decreases as it moves from production
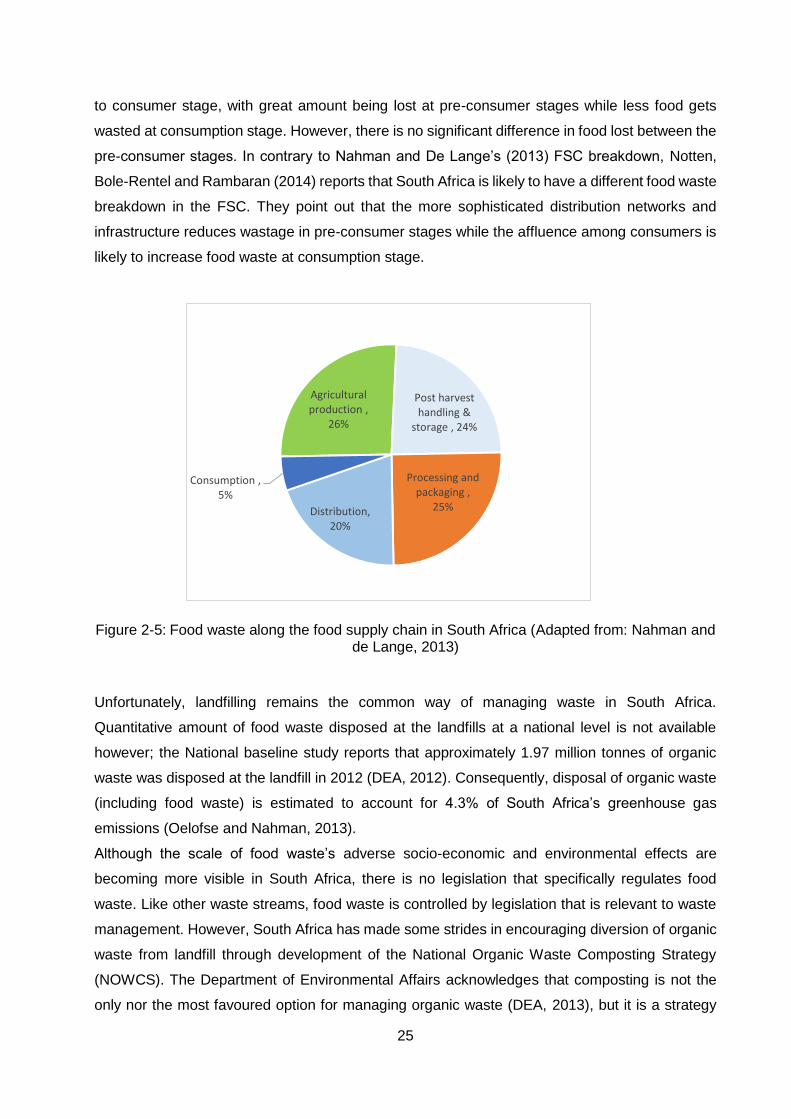
25
to consumer stage, with great amount being lost at pre-consumer stages while less food gets
wasted at consumption stage. However, there is no significant difference in food lost between the
pre-consumer stages. In contrary to Nahman and De Lange’s (2013) FSC breakdown, Notten,
Bole-Rentel and Rambaran (2014) reports that South Africa is likely to have a different food waste
breakdown in the FSC. They point out that the more sophisticated distribution networks and
infrastructure reduces wastage in pre-consumer stages while the affluence among consumers is
likely to increase food waste at consumption stage.
Figure 2-5: Food waste along the food supply chain in South Africa (Adapted from: Nahman and de Lange, 2013)
Unfortunately, landfilling remains the common way of managing waste in South Africa.
Quantitative amount of food waste disposed at the landfills at a national level is not available
however; the National baseline study reports that approximately 1.97 million tonnes of organic
waste was disposed at the landfill in 2012 (DEA, 2012). Consequently, disposal of organic waste
(including food waste) is estimated to account for 4.3% of South Africa’s greenhouse gas
emissions (Oelofse and Nahman, 2013).
Although the scale of food waste’s adverse socio-economic and environmental effects are
becoming more visible in South Africa, there is no legislation that specifically regulates food
waste. Like other waste streams, food waste is controlled by legislation that is relevant to waste
management. However, South Africa has made some strides in encouraging diversion of organic
waste from landfill through development of the National Organic Waste Composting Strategy
(NOWCS). The Department of Environmental Affairs acknowledges that composting is not the
only nor the most favoured option for managing organic waste (DEA, 2013), but it is a strategy
Agricultural production ,
26%
Post harvest handling &
storage , 24%
Processing and packaging ,
25%Distribution, 20%
Consumption , 5%
26
that responds to the goals set under the National Environmental Management: Waste Act (Act
59 of 2008) to “divert 25% of recyclables away from landfill for re-use, recycling, and recovery”
(DEA, 2013). In line with this reasoning, South Africa is considering a landfill ban on disposal of
organic waste (DEA, 2013).
Food recovery hierarchy sensibly dictates prevention of food waste, diversion to hungry people
and then to animals, processing to recover useful components, and finally disposal where the
above is not an option (United States Environmental Protection Agency, 2010). Availability of
sophisticated distribution networks and infrastructure in South Africa reduces the amount of food
that is lost in pre-consumer stages of the FSC (Notten et al, 2014). South Africa is also one of the
countries with Netherlands Agro Food and Technology Centres (NAFTC) aimed at representing
the Dutch agro-food business in emerging markets and facilitating business development. This is
a very important initiative as it allows joint creation of solutions by companies, knowledge
institutes and the government to contribute towards reduction of food waste (Tielens and Candel,
2014).
2.6.4 Socio-economic and environmental impacts of food waste
There is a diversity of social, economic and environmental impacts of food waste. Firstly, disposal
of food waste at the landfill site contributes to climate change. When food is disposed at the landfill
site it decomposes and releases methane, a greenhouse gas more effective at trapping heat in
the atmosphere than carbon dioxide. For example, the disposal of organic waste (including food
waste) is estimated to contribute 4.3% to South Africa’s greenhouse gas emissions (Oelofse and
Nahman, 2013). In addition, greenhouse gases are released during production (especially meat
production), transportation, processing and storage of food (Nahman, De Lange, Oelofse and
Godfrey, 2012).
Secondly, food waste also implies that the potential valuable resources that were used throughout
the supply chain to produce food that eventually ends up in the landfill are also lost. Because the
food system depends on the natural system and also on other agricultural inputs; when food is
wasted or lost water, land, energy, resources used to produce, process, store, distribute food are
also lost. Betz, Buchli, Göbel, and Müller (2015) reports that adverse impacts of food waste are
greater at the later stages of the FSC than at the farming stage due to the input of more resources
used to prepare the food ready for consumption. This is one main reason why the reduction of
food waste at the end of the value added chain (including the food service industry) is of major
importance.
The implications of food waste also include the cost of production, loss of revenue due to unsold
products at retail level, cost of disposal at landfill and agricultural inputs. Edible food waste is
estimated to cost South Africa about R61.5-billion a year (Nahman and de Lange, 2013). In the
United States the cost of food waste at household level is estimated between R19453.84 to
27
R32423.07 (1USD =14.24 ZAR) per year (Leib, Gunders, Ferro, Nielsen, Nosek and Qu, 2013)
while the cost of food waste in the United Kingdom is estimated to R 189.4- billion (1GBP = 18.56
ZAR) per year (Ventour, 2008).
Lastly, from a social point of view food waste prevention is perceived to be an important element
to consider towards improving food security (Gustavsson et al., 2011; Searchinger, Hanson,
Ranganathan, Lipinski, Waite, Winterbottom, Dinshaw and Heimlich, 2013; Parry, Bleazard and
Okawa, 2015). The notion is that reduction in food wasted will have a positive impact on food
insecurity. It is estimated that a reduction of food waste and loss by 50% in 2050 could bridge the
gap (by 20%) between calories required and those available (Searchinger et al., 2013). However,
the perceived link between waste and food security has been challenged by Tielens and Candel
(2014) in a study that focused on the relation between food security and food waste reduction.
The study reports that the assumption that reduction of food waste automatically contributes to
food security, particularly for poor consumers, is not evident. The argument is that, although a
reduction in food waste or loss would have a positive impact on the overall availability of nutrients
to individuals, evidence to show how and to what extent such reductions in the developed
countries would increase the availability and access to those nutrients for low-income countries
is still lacking. Timmermans et al., (2014) also reports that there is no evidence of the perceived
direct link between global food waste and the extent of global food insecurity. They report that
reductions in food waste in the developed countries will not essentially lead to increased
availability and supply in food-insecure countries. Additionally, causes of hunger and malnutrition
are complex in nature and may not be solved by addressing food waste and food availability
issues (Timmermans et al., 2014).
2.6.5 Food waste from the restaurants
There is a large body of literature on food waste generation in the food service sector [Darlington,
Staikos and Rahimifard (2009); Marthinsen, Kaysen and Kirkevaag (2012); Silvennoinen,
Katajajuuri, Hartikainen, Jalkanen, Koivupuro and Reinikainen (2012); Pirani and Arafat (2014);
Katajajuuri, Silvennoinen, Hartikainen, Heikkila and Reinikainen (2014); Muller (2015); Betz et al.,
(2015)]. Studies that have been done on food waste from the food service sector mainly focus on
the quantification and composition of food waste generated, drivers of food waste as well as food
waste minimisation options. Food waste forms the bulk of waste generated in the food service
sector when measured by weight (Davies and Konisky, 2000). A study on food waste volume
and composition within the food service industry revealed that about 75000–140000 tonnes of
edible food are wasted annually in the Finnish food industry. When combined, food services,
retailers and the food industry generate about 250000-320000 tonnes of food waste annually
(Silvennoinen et al., 2012).
28
Betz et al., (2015) identifies four stages at which food waste in a food service sector occurs and
these include storage losses, preparation losses, serving losses and plate waste. Storage losses
occur during storage, before and after the food has been prepared including food that gets
discarded because it has reached its expiry date or loss of food due to poor storage. Preparation
losses occur during preparation of food and cooking, for example burnt food. Serving losses is
the food that gets thrown away because it remained from the buffet and serving bowls while plate
waste refers to food that does not get eaten by the consumers.
Plate waste has been studied by Wrap (2012) with the main aim of understanding out of home
consumer food waste. Reasons for leaving food on the plate that were highlighted in the study
include “portion being too big”, health reasons (customers being weight conscious) and also food
not meeting consumer’s expectations. The study also highlighted that there are consumers who
think that it is normal to leave food at the end of a meal. Approximately three-fifths of the
consumers indicated that they were not concerned by leaving food at the end of their meal. Once
food is left over after a meal, restaurant operators have no choice but to dispose of the food as
restaurant waste, unless the customer takes the food for later consumption (Kantor, Lipton,
Manchester and Oliveira, 1997).
The amount and composition of food waste generated in the food service sector is greatly
influenced by the type of restaurant and the way it operates the business. Buffets menus are
reported to waste more food when compared to a la carte menus (Silvennoinen et al., 2012). High
food wastage in buffet menus can be due to mismanagement of kitchen processes, difficulty in
projecting customer demand, human error during food preparation as well legislation (how long a
buffet should be left out). Vegetables and chips are more likely to be left after a meal, followed by
meat, salad, potatoes, fat, bones and bread while rice, sauces, drinks, part of sandwich bread
and fish is less likely to be left over after a meal (Giorgi, 2013).
2.7 Review of packaging/ packaging waste
The following sub-sections provide an outline of packaging waste as it relates to this study.
2.7.1 Function of packaging
The function of food packaging is to preserve and contain food in a way that meets industry
standards and consumer needs and maintains food safety (Marsh and Bugusu, 2007). It is also
used as a communication tool between the manufacturer, retailers and consumers. Information
on how to store the product and its shelf-life is communicated through the use of packaging
(Jindal, 2010). Manufacturers/retailers also use packaging for advertising products (Jindal, 2010).
29
2.7.2 Packaging waste generation and its environmental impacts
The need to dispose and manage high volumes of packaging waste after using the content, places
packaging waste in bad light in public discussions (Opara and Mditshwa, 2013). This is because
environmental impacts of packaging are only based on the packaging itself (Williams, Wikström,
and Löfgren, 2008). Svanes, Vold, Møller, Pettersen, Larsen and Hanssen (2010) draws attention
to the need for a shift towards a systematic and holistic approach when assessing environmental
impacts of packaging. This means that environmental impacts must not only cover the impacts of
the packaging when it has reached its end of use but must also cover the ability to fulfil the
requirements of packaging which may include prevention of product loss. Nevertheless,
packaging waste has increased greatly in recent years. According to Jindal (2010, p. 1088)
“consumption and production of waste from packaging for consumer products arguably has
surpassed the fine line between necessary and excess packaging”. This is due to the type of
packaging material used for marketing or advertising as well as the growing over-reliance on
packaging which results in increased environmental impacts. Environmental impacts of packaging
occur throughout its life cycle, from its production until it reaches its end-use. The impacts of
packaging are believed to be more during material extraction and final product manufacturing
(Council on Environment and Water, 2011). When not recycled, disposal of packaging waste
puts pressure on the landfills.
Often left out when identifying environmental impacts of the packaging system is the impact of
packaging on food waste. Food waste in relation to packaging occurs at retail and consumption
stage. A study conducted by Williams, Wikström, Otterbring, Löfgren and Gustafsson (2012)
reported that about 20 to 25% of the food waste can be related to packaging. The main packaging
related causes of food waste that were identified in the study included ‘too big packages’,
‘packages that are difficult to empty’ as well as a ‘use-by and best-before dates’.
2.7.3 The role of packaging in reducing food waste
Consensus exists that improved packaging reduces postharvest food waste (Kerry, O’grady and
Hogan, 2006; Williams et al., 2012; Opara and Mditshwa, 2013; Verghese, Lewis, Lockrey and
Williams, 2013). Verghese et al., (2013) outlines different ways through which packaging can be
used to minimize food waste as it moves from the farm until it reaches the consumers and these
include:
I. Adoption of improved packaging such as active and intelligent packaging. Intelligent
packaging refers to packaging that monitors the quality of food. This type of packaging
informs the consumer, manufacturer and retailer about the changes in the quality of food
(Kerry et al., 2006). Active packaging on the other hand is packaging that protects food
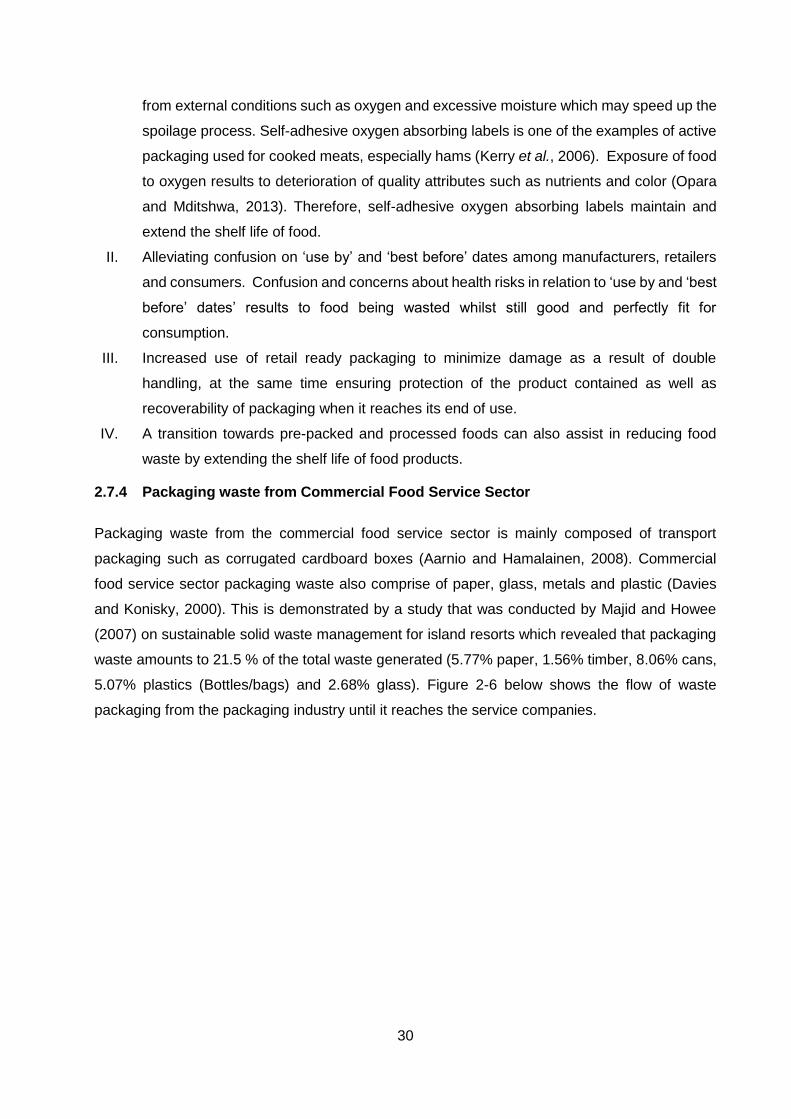
30
from external conditions such as oxygen and excessive moisture which may speed up the
spoilage process. Self-adhesive oxygen absorbing labels is one of the examples of active
packaging used for cooked meats, especially hams (Kerry et al., 2006). Exposure of food
to oxygen results to deterioration of quality attributes such as nutrients and color (Opara
and Mditshwa, 2013). Therefore, self-adhesive oxygen absorbing labels maintain and
extend the shelf life of food.
II. Alleviating confusion on ‘use by’ and ‘best before’ dates among manufacturers, retailers
and consumers. Confusion and concerns about health risks in relation to ‘use by and ‘best
before’ dates’ results to food being wasted whilst still good and perfectly fit for
consumption.
III. Increased use of retail ready packaging to minimize damage as a result of double
handling, at the same time ensuring protection of the product contained as well as
recoverability of packaging when it reaches its end of use.
IV. A transition towards pre-packed and processed foods can also assist in reducing food
waste by extending the shelf life of food products.
2.7.4 Packaging waste from Commercial Food Service Sector
Packaging waste from the commercial food service sector is mainly composed of transport
packaging such as corrugated cardboard boxes (Aarnio and Hamalainen, 2008). Commercial
food service sector packaging waste also comprise of paper, glass, metals and plastic (Davies
and Konisky, 2000). This is demonstrated by a study that was conducted by Majid and Howee
(2007) on sustainable solid waste management for island resorts which revealed that packaging
waste amounts to 21.5 % of the total waste generated (5.77% paper, 1.56% timber, 8.06% cans,
5.07% plastics (Bottles/bags) and 2.68% glass). Figure 2-6 below shows the flow of waste
packaging from the packaging industry until it reaches the service companies.
31
Figure 2- 6: Packaging waste in the food industry (Adapted from: Aarnio and Hamalainen, 2008. p., 613)
Although packaging from restaurants constitutes a relatively small amount of the total restaurant
waste, poor management of packaging waste can result to detrimental environmental impacts.
Packaging from fast food establishments often ends up as litter when consumers ate the food.
2.8 Waste cooking oil
Unlike other components of waste generated in the commercial food service sector, waste
cooking oil from a waste management point of view, is not well documented. Literature on waste
cooking oil makes reference to poor disposal of waste. Waste cooking oil appears in renewable
energy studies, particularly studies focusing on production of bio-diesel from waste cooking oil.
Waste cooking oil simply refers to cooking oil that has been used during food preparation. The
food service sector uses a large amount of cooking oil for a number of purposes including deep
frying; stir frying and shallow frying (Zein et al., 2008). China is reported to be a large producer of
cooking oil, with an estimate of 500 million tons of waste cooking oil generated annually (Zhang,
Mortimer and Wang, 2012).
Generally, in public restaurants, frying is conducted in the same oil for several days (Kulkarni and
Dalai, 2006. p., 2902). This has been demonstrated in China where the amount of waste cooking
oil reutilised is estimated between 200 and 300 million tons (Zhang et al., 2012). In South Africa
waste cooking oil is used as animal feed or consumed by the poor people (City of Cape Town,
2011). This poses serious health risks to both animal and human health. A study conducted by
Anelich, Kock, Roux, Botha, Bezuidenhout, Coetzee, Venter, (2001) on the quality of used frying
fats in South Africa revealed that 11.7% of the fast food outlets were over-using the cooking oil
32
and that consumption of this oil can cause cancer. The study also revealed that in some instances
waste cooking oil was disposed by distributing it to staff members or was sold to the poor at a
reduced price. This is a critical point of concern especially in a country that is already savaged
by HIV/AIDS.
Poor disposal of cooking oil does not only impact on people but also on the environment. Waste
cooking oil is also reportedly disposed down drains and this results in sewer system blockages
and contamination of water bodies. This affects rivers, lakes, seas and underground water
(Castellanelli and Mello, 2007).
2.9 Conclusion
The South African food service sector is growing at an exponential rate. The expansion of the
food service sector consequently comes with an increase in the amount of waste generated by
the sector. Theoretically, the food service sector generates a significant amount of packaging,
organic food waste and waste cooking oil. Unfortunately, most of the waste produced in the
restaurants is disposed at the landfills as mixed waste. This consequently imposes pressure on
the landfills. The reported composition of waste generated in the commercial food service sector
presents an opportunity for diversion of waste away from landfill through recycling.
33
CHAPTER 3: RESEARCH METHODOLOGY
This chapter presents the research design adopted in the study including sampling strategy, data
collection methods as well as how the participants of the study were protected during data
collection and publication of the information.
3.1 Research design
There are two main research approaches that are used to do research, namely quantitative and
qualitative approaches. Whether a researcher chooses to use qualitative or quantitative research
largely depends on the research problem and what the researcher aims to achieve (Petty,
Thomson and Stew, 2012). Qualitative research originates from sociology, psychology and
anthropology, basically social science that focuses on how people behave, their experiences and
their take on social phenomena. This approach is defined as “an emergent, inductive, interpretive
and naturalistic approach to the study of people, cases, phenomena, social situations and
processes in their natural settings in order to reveal in descriptive terms the meanings that people
attach to their experiences of the world” (Yilmaz, 2013. p., 312). It is grounded on the belief that
reality is socially constructed and holistic with greater emphasis placed on gaining deeper
understanding of the lived experiences of people when they interact with each other and the wider
social system. To gain access to the lived experiences and the meaning attached to those
experiences, the investigator has to interact directly with the participants, where the researcher
becomes an instrument (Yilmaz, 2013) while the topic of interest is typically the participant’s
experience. Hence, Yilmaz (2013) reports that a qualitative research is heavily dependent on the
interaction between the participant and the investigator. Another important characteristic of
qualitative research is that it involves the use of words to gain in-depth understanding of the
phenomena.
Conversely, quantitative research method stems from the natural sciences (Fekede, 2011) and
has been embraced by a lot of researchers including biologists, geologists and physicists who
are interested in exploring things that can be observed and measured (Antwi and Hamza, 2015).
This research approach is rooted in positivism which places great emphasis on objectivity,
replicability, and generalizability (Harwell, 2011; Williams, 2007). Positivists hold that reality exist
independently of social construction and that it can be measured. The assumption is based on
the notion that the “social world external to individual cognition is a real world made up of hard,
tangible and relatively immutable structures” (Li, 2016. p., 74). Embedded in this approach is the
perspective that, valid knowledge is obtained through observations and measurements without
the investigator’s thinking and logical reasoning. In essence, quantitative researchers are
34
expected to be detached from the researched by controlling any possible researcher’s influence
on the research. A popular identifier of quantitative research is the use of standardised scientific
methods (Williams, 2007), to generate numerical data including occurrences, volumes, or the size
of the associations between entities (Pietkiewicz and Smith, 2012; Gelo, Braakmann and
Benetka, 2008). Hence Williams (2007) states that quantitative research is suitable for research
requiring numerical data.
A triangulation approach, which involves the use of both qualitative and quantitative research
methods in one study, was adopted to understand waste management practices in the
commercial food service sector. In social sciences, triangulation was first introduced by Campbell
and Fisk in 1959 when they looked at convergent and discriminant validation by the multitrait-
multimethod matrix (Yeasmin and Rahman, 2012). This method has gained enormous recognition
among scholars and researchers especially in the field of social research (Yeasmin and Rahman,
2012). According to Adami and Kiger (2005) triangulation is the use of more than one method in
studying the same phenomena. This research method is applauded for giving rich and
comprehensive data while allowing the researchers to be confident with their results (Thurmond,
2001). The assumption is that using more than one method in one study neutralises the flaws of
one method with the strengths of the other method (Thurmond, 2001). Yeasmin and Rahman
(2012) also add that triangulation brings about the creation of innovative methods of exploring a
phenomenon to balance with the traditional data collection methods.
Yeasmin and Rahman (2012) identify various ways through which one can use triangulation
including (a) using two or more theoretical positions when interpreting data (theoretical
triangulation), (b) using multiple investigators instead of one (investigator triangulation), (c)
retrieving data from various sources to form one body of data (data triangulation) and lastly (d)
using two or more data collection method (methodological triangulation). Methodological
triangulation can be further categorised into within-method and across method (Bekhet and
Zauszniewski, 2012). Within-method refers to the use of different methods from the same
paradigm (quantitative or qualitative) while across method refers to use of different methods from
both qualitative and quantitative paradigm (Bekhet and Zauszniewski, 2012).
This study adopted ‘across methodological triangulation’. As mentioned above, this type of
triangulation involves the use of quantitative and qualitative research methods. Quantitative and
qualitative research approaches in this study played different but complementary roles, with one
method playing a role that could not played by the other. This study was built on the belief that
there are multiple realities and that those realities can be gained through interacting with the
participants of the study while at the same time recognising that a quantitative element would
bring valuable data to capture a complete picture of what was studied.
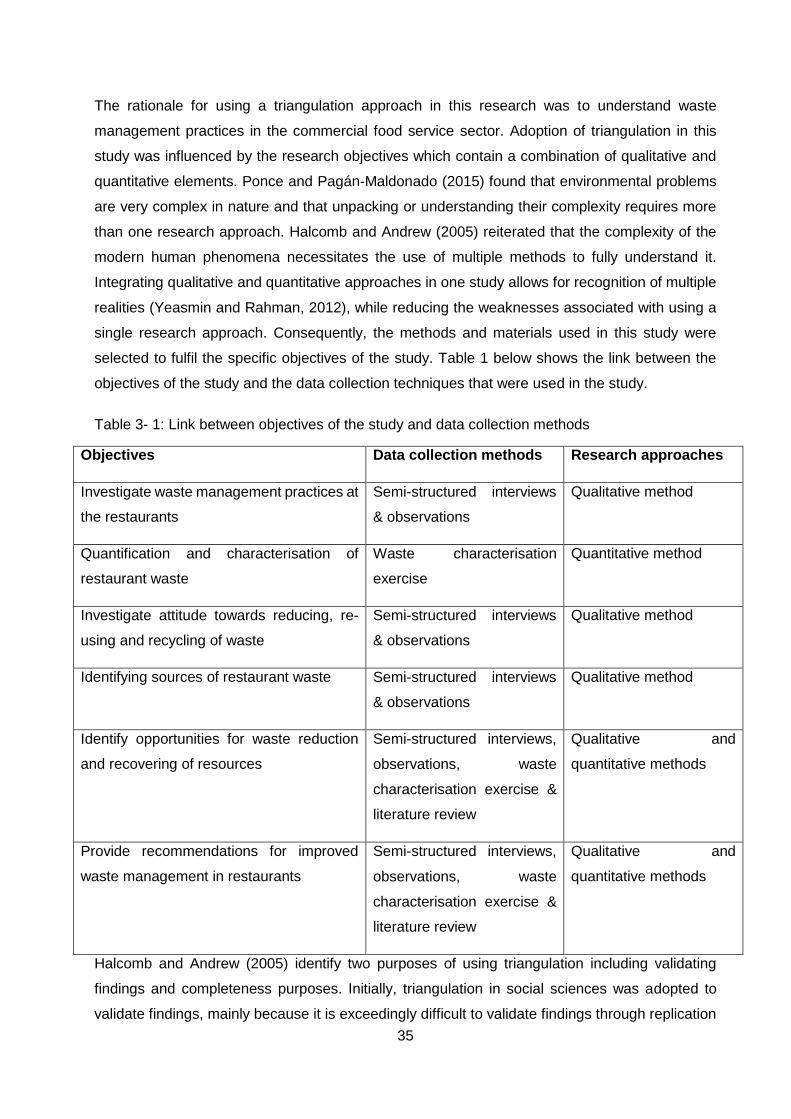
35
The rationale for using a triangulation approach in this research was to understand waste
management practices in the commercial food service sector. Adoption of triangulation in this
study was influenced by the research objectives which contain a combination of qualitative and
quantitative elements. Ponce and Pagán-Maldonado (2015) found that environmental problems
are very complex in nature and that unpacking or understanding their complexity requires more
than one research approach. Halcomb and Andrew (2005) reiterated that the complexity of the
modern human phenomena necessitates the use of multiple methods to fully understand it.
Integrating qualitative and quantitative approaches in one study allows for recognition of multiple
realities (Yeasmin and Rahman, 2012), while reducing the weaknesses associated with using a
single research approach. Consequently, the methods and materials used in this study were
selected to fulfil the specific objectives of the study. Table 1 below shows the link between the
objectives of the study and the data collection techniques that were used in the study.
Table 3- 1: Link between objectives of the study and data collection methods
Objectives Data collection methods Research approaches
Investigate waste management practices at
the restaurants
Semi-structured interviews
& observations
Qualitative method
Quantification and characterisation of
restaurant waste
Waste characterisation
exercise
Quantitative method
Investigate attitude towards reducing, re-
using and recycling of waste
Semi-structured interviews
& observations
Qualitative method
Identifying sources of restaurant waste Semi-structured interviews
& observations
Qualitative method
Identify opportunities for waste reduction
and recovering of resources
Semi-structured interviews,
observations, waste
characterisation exercise &
literature review
Qualitative and
quantitative methods
Provide recommendations for improved
waste management in restaurants
Semi-structured interviews,
observations, waste
characterisation exercise &
literature review
Qualitative and
quantitative methods
Halcomb and Andrew (2005) identify two purposes of using triangulation including validating
findings and completeness purposes. Initially, triangulation in social sciences was adopted to
validate findings, mainly because it is exceedingly difficult to validate findings through replication
36
as is the case in natural sciences. Human behaviour is greatly influenced by the setting in which
it occurs (Atieno, 2009). Hence, social research occurs in a natural, ‘real life’ situation which
always presents particular and unique characteristics, thereby making it impossible to generate
the same findings in a second setting, or even in the same setting at a different point in time. As
a result, triangulation has been used to increase confidence in the accuracy of the results (Carter,
Bryant-Lukosius, Dicenso, Blythe and Neville, 2014). Triangulation for completeness is another
purpose of triangulation that was seen to develop in the literature over the past years. Halcomb
and Andrew (2005) describe triangulation for completeness purposes as the use of more than
one method to gain an in-depth understanding of the phenomena under study. In this study the
investigator opted for triangulation for completeness purposes as it is useful for researching less
explored or unexplored research problems (Hussein, 2015; Yeasmin and Rahman, 2012). Waste
management practices in restaurants in a South African context is largely unexplored, similar
studies have been done in the UK.
The triangulation approach was also considered appropriate to capture objective and subjective
elements of the study. Qualitative methods captured experiences and opinions of mall and
restaurant managers on waste management practices, the reasons and drivers for these practices
which could not be captured through the use of a structured quantitative approach. Through the
use of a qualitative research approach the researcher has not only captured the experiences and
opinions but has gone beyond to determine the underlying factors influencing the practices. Also,
based on the gaps presented in the literature on waste management practices in the commercial
food service sector in a South African context, using qualitative methods was beneficial in
providing insights into waste management practices that were not known, which is in line to
Klassen, Creswell, Clark, Smith and Meissner’s (2012) contention that qualitative methods allow
for identification of previous processes, explanations of why and how phenomena occur and a
range of effects (Klassen et al., 2012. p. 378). Quantitative research methods on the other hand
were used to quantify the percentages of waste categories and fractions generated by restaurants
and also to determine the composition of waste they generate. This objective of the study was
particularly suited to be captured using quantitative research as it involved collection of numerical
data. Through the use of quantitative methods it was possible to objectively determine the
composition (percentages by weight) of waste generated by restaurants which could not be done
using qualitative research methods. Sharma and McBean (2007) reports that an understanding
of the quantities of each waste fraction within a waste stream is necessary for planning solid waste
management programs. In this study, this information assisted in identifying potential ways of
diverting waste away from landfills to more sustainable waste management options.
37
In essence triangulation enabled the investigator to generate empirical data about the volume and
composition of waste produced in mall restaurants while at the same time contributing to a deeper
understanding of waste management practices gained through restaurant and mall manager’s
experiences.
3.2 Description of the study area
The study was conducted in eThekwini Metropolitan Municipality in KwaZulu Natal. Waste
management services in this area are rendered by Durban Solid Waste (DSW). The DSW
provides collection service to 33 616 industrial and commercial customers, 421 329 informal
households as well as 524 582 formal households. eThekwini Metropolitan Municipality is one of
the municipalities that run source separation projects with over 800 000 households participating
in the programmes (eThekwini Municipality, undated). In addition, the municipality has four
landfills namely; Bisasar, Mariannhill, Lovu and Buffelsdraai landfill. Disposal of household and
commercial waste has been discontinued at Bisasar landfill due to lack of air space while
Mariannhill is expected to reach its full capacity in 3 years’ time. Landfilling airspace is currently
not a concern in Lovu (25 years life span) and Buffeldraai (65 years life span). However, diversion
of waste disposal from Bisasar to other landfills will decrease the lifespan of the receiving landfills.
Conducting the study in this area will provide background information for expansion of source
separation initiative to commercial food service sector. In line with this reasoning, South Africa is
considering a landfill ban on disposal of organic waste (DEA, 2013), therefore it is crucial for
restaurants to develop or improve organic waste management practices ahead of the organic
landfill ban.
3.3 Sampling
It is often almost impossible to cover the whole population of interest when conducting research.
As a result, researchers have a task of identifying a sub-set of the population that represents the
wider population of interest. Defined as a “portion, piece, or segment that is representative of a
whole” (Onwuegbuzie and Collin, 2007. p. 378), sampling largely depends on the research
question, research design and also on the time, money and resources available to the researcher.
Careful selection of the participants and the ability to balance time and resources is therefore
important to ensure good sampling and subsequent good quality findings of the study
(Onwuegbuzie and Collins, 2007). Shorten and Moorley (2014) state that good sampling
strengthens a study while saving time, money and resources. To ensure good sampling, Devers
and Frankel (2000) suggest development of a sampling frame which is done by identifying the
criteria for selecting sites, identifying participants that will provide rich information and also
ensuring that those participants participate in the study.
38
There are two sampling methods that could be used in research and these include probability and
non-probability sampling methods. Probability sampling refers to the selection of participants
through the use of a random sampling strategy where each person from the wider population has
an equal chance of participating in the study (Teddlie and Yu, 2007). Non-probability on the other
hand refers to purposive selection of the participants that will provide rich information to the study
(Teddlie and Yu, 2007). Unlike probability sampling which aims for representativeness, non-
probability sampling is particularly concerned with in-depth understanding of the phenomena of
interest (Teddlie and Yu, 2007). As previously stated, this study aimed to gain an in-depth
understanding of waste management practices in the commercial food service sector and
therefore non-probability sampling methods were employed.
3.3.1 Selection of the study site
The study selected twenty restaurants located in two shopping malls (10 restaurants per mall)
located in the eThekwini Metropolitan Municipality in KwaZulu-Natal. A convenience sampling
strategy which has been widely adopted by other researchers including Bernard and Mildred,
(2015); Asuamah, Kumi and Kwarteng, (2012); and Nyarai, Willard, Moses and Ngenzile, (2016)
was used to select the study sites. The selection of malls was based on their availability,
geographical proximity and the number of restaurants listed as tenants. Malls that are in close
proximity to the Council for Scientific and Industrial Research (CSIR) Durban offices with ten or
more different restaurants including cafés, bars, cafeterias, fast food restaurants and a la carte
type restaurants were selected.
3.3.2 Selection of the restaurants
Mall restaurants were selected because they are located close to one another which made it easy
for the researcher to move from one restaurant to another between interviews as opposed to
street restaurants which may be far apart from each other. Also malls have spacious waste
storage areas which provided ample space for the waste characterisation part of the study.
3.3.3 Selection of the participants
Participants in the study were selected based on their positions in the organisation in which they
are employed. Restaurant managers and mall management staff members were purposively
selected to be the participants of the study. As stated by Anderson (2010), purposive sampling
selects participants that provide rich information. Restaurants managers and mall management
members were selected because of their knowledge about the business operations as well as
their position as managers which put them in a better position to know waste related issues within
39
the businesses in terms of waste generation and how it is managed. In cases where the managers
were not available, interviews were conducted with a staff member nominated by the manager.
3.3.4 Sample size
A sample size is the number of participants that are included in a study. Qualitative research is
associated with small samples when compared to quantitative research which uses bigger sample
sizes with the aim of generalising the results. Anderson (2010) reports that the reason for
selection of small samples sizes in qualitative research is because qualitative research aims for
in-depth understanding of a phenomena. However, Onwuegbuzie and Collins (2007) caution that,
associating qualitative research to small sample sizes and quantitative to bigger sample sizes
may be misleading. They argue that in qualitative research, there are studies that require big
sample sizes while it may be appropriate to use small sample sizes in some studies. A sample
size of twenty restaurants selected from two shopping malls (10 restaurants per mall) was
purposively selected to participate in the study. The sample size was determined prior to the
commencement of the research based on the timeframe of the study, resources available as well
as on the aim of the study. The restaurants included cafes, fast food restaurants and full service
restaurants. Different types of restaurants were included to ensure relevance to the wider
population, given that waste generated in restaurants is influenced by the type of restaurant.
3.4 Data collection methods
Data was collected by means of a literature review, observations and semi-structured
interviews, as well as by a waste characterisation study. Details of the data collection methods
are provided in this section of the dissertation.
3.4.1 Literature review
The study commenced with a desktop review of academic reports, journal papers and books. The
literature highlights issues around waste management in South Africa, commercial food service
industry as well as waste generation in the commercial food service industry including food waste,
packaging waste and waste cooking oil.
3.4.2 Waste characterisation study
Waste characterisation is a method used to identify the composition and quantify the amount of
waste generated (Martinho, Silveira and Branco, 2008). Understanding the nature and the
magnitude of the waste types comprising the waste stream is very important in informing
alternative technology choices, baseline to monitor progress towards diversion and recycling
targets and also to inform waste collection systems (Oelofse, Muswema and Koen, 2016). A
40
waste characterisation exercise was conducted as part of the study to gather information that will
guide restaurant’s waste diversion programs and initiatives. The waste components that were
investigated included packaging and food waste which are reported to be the main waste
components generated in restaurants. Also, since the study was aimed at gathering information
to identify opportunities for diversion of waste from landfill through source separation, the waste
categories were recommended with this general aim in mind. Given that the amount of waste
generated by the restaurants varies depending on the day of the week (waste generation is high
during the weekends compared to weekdays), a waste characterisation of each restaurant waste
was carried over two days (one day during the week and one day during a weekend) to capture
variation in waste generation.
3.4.2.1 Waste characterisation pilot study conducted
A pilot study was conducted in two restaurants (a fast food restaurant and a full-service
restaurant). The primary aim of conducting a pilot study was to pre-test the data collection tools
that were going to be used during the main waste characterisation. This included identifying,
problems, gaps and faults that were going to compromise the success of the main waste
characterisation study and also to revise the techniques based on the findings of the pilot study.
The following are the specific objectives for conducting the pilot study:
To test if it was possible to isolate waste generated by each sampled restaurant, given
that the restaurants share a temporary waste storage area.
To inform the data collection sheet that was going to be used to record waste categories
and fractions generated by restaurants.
To test if it was possible to capture waste generated only on the day of sampling
To estimate time and resources that will be required for the main study. These included
time required for undertaking waste characterisation of each restaurant, number of plastic
bags to be distributed to restaurants and other instruments needed for waste
characterisation etc.
To test the efficiency of the equipment used during waste characterisation (eg. scale,
PPE).
The pilot study showed that it was possible to isolate waste generated by each sampled restaurant
through the use of green plastic bags marked with unique codes, without disrupting the restaurant
and mall’s operation. However, there seemed to be lack of understanding on how the green bags
should be used and what they are used for. As indicated above the plan was to capture only
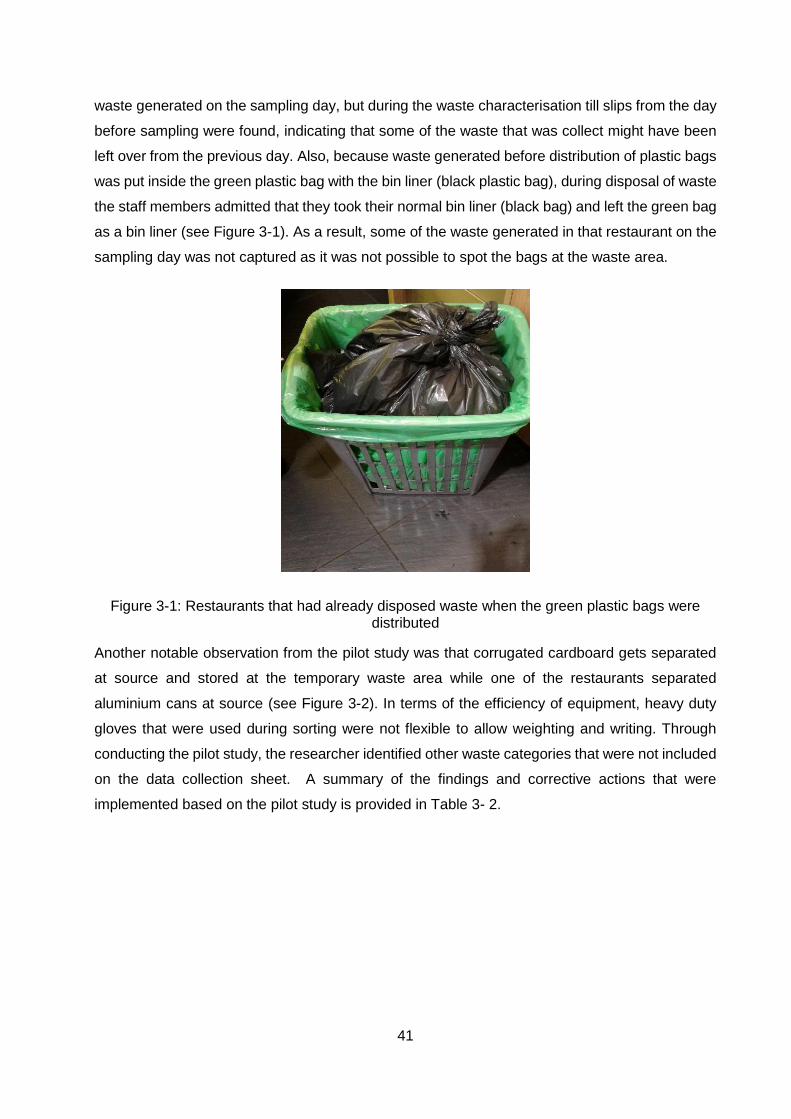
41
waste generated on the sampling day, but during the waste characterisation till slips from the day
before sampling were found, indicating that some of the waste that was collect might have been
left over from the previous day. Also, because waste generated before distribution of plastic bags
was put inside the green plastic bag with the bin liner (black plastic bag), during disposal of waste
the staff members admitted that they took their normal bin liner (black bag) and left the green bag
as a bin liner (see Figure 3-1). As a result, some of the waste generated in that restaurant on the
sampling day was not captured as it was not possible to spot the bags at the waste area.
Figure 3-1: Restaurants that had already disposed waste when the green plastic bags were distributed
Another notable observation from the pilot study was that corrugated cardboard gets separated
at source and stored at the temporary waste area while one of the restaurants separated
aluminium cans at source (see Figure 3-2). In terms of the efficiency of equipment, heavy duty
gloves that were used during sorting were not flexible to allow weighting and writing. Through
conducting the pilot study, the researcher identified other waste categories that were not included
on the data collection sheet. A summary of the findings and corrective actions that were
implemented based on the pilot study is provided in Table 3- 2.
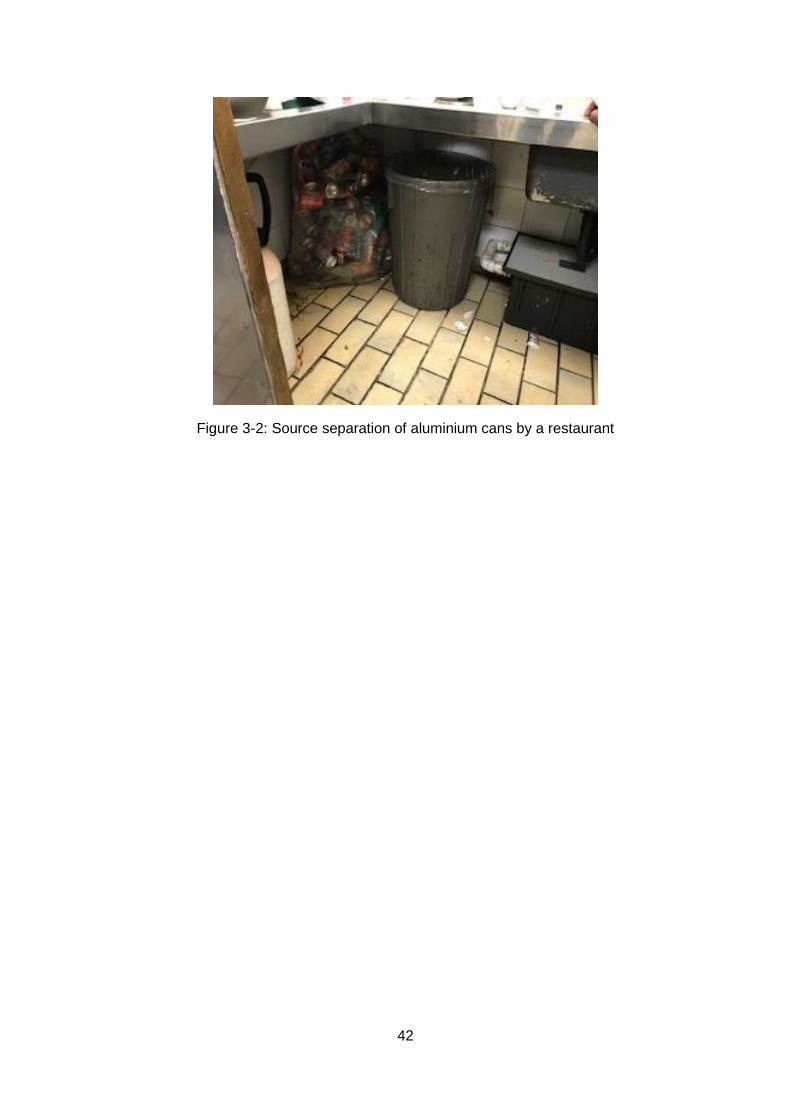
42
Figure 3-2: Source separation of aluminium cans by a restaurant
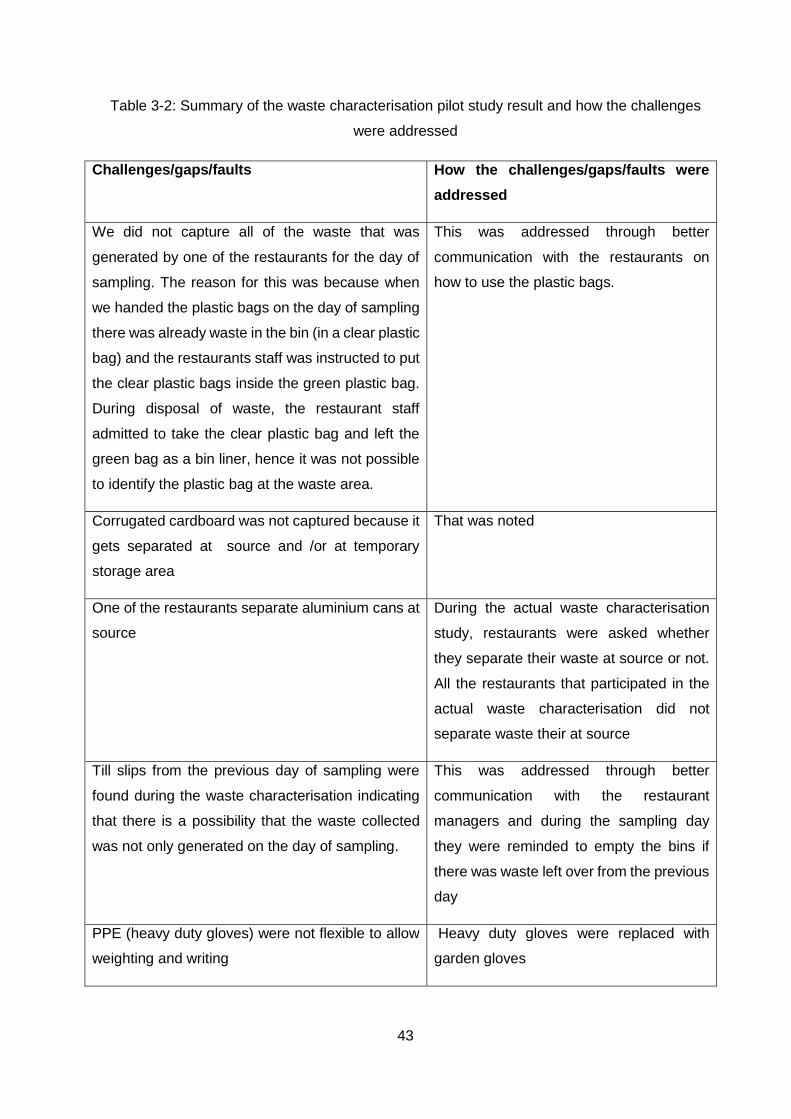
43
Table 3-2: Summary of the waste characterisation pilot study result and how the challenges
were addressed
Challenges/gaps/faults How the challenges/gaps/faults were
addressed
We did not capture all of the waste that was
generated by one of the restaurants for the day of
sampling. The reason for this was because when
we handed the plastic bags on the day of sampling
there was already waste in the bin (in a clear plastic
bag) and the restaurants staff was instructed to put
the clear plastic bags inside the green plastic bag.
During disposal of waste, the restaurant staff
admitted to take the clear plastic bag and left the
green bag as a bin liner, hence it was not possible
to identify the plastic bag at the waste area.
This was addressed through better
communication with the restaurants on
how to use the plastic bags.
Corrugated cardboard was not captured because it
gets separated at source and /or at temporary
storage area
That was noted
One of the restaurants separate aluminium cans at
source
During the actual waste characterisation
study, restaurants were asked whether
they separate their waste at source or not.
All the restaurants that participated in the
actual waste characterisation did not
separate waste their at source
Till slips from the previous day of sampling were
found during the waste characterisation indicating
that there is a possibility that the waste collected
was not only generated on the day of sampling.
This was addressed through better
communication with the restaurant
managers and during the sampling day
they were reminded to empty the bins if
there was waste left over from the previous
day
PPE (heavy duty gloves) were not flexible to allow
weighting and writing
Heavy duty gloves were replaced with
garden gloves
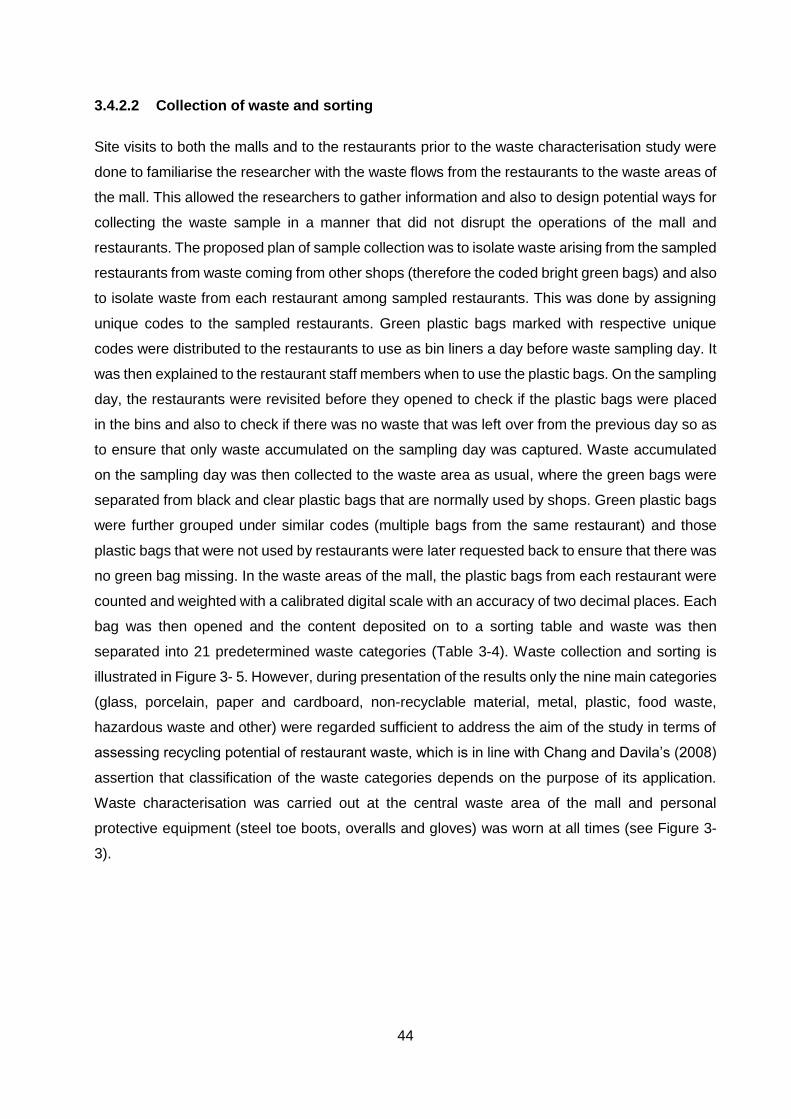
44
3.4.2.2 Collection of waste and sorting
Site visits to both the malls and to the restaurants prior to the waste characterisation study were
done to familiarise the researcher with the waste flows from the restaurants to the waste areas of
the mall. This allowed the researchers to gather information and also to design potential ways for
collecting the waste sample in a manner that did not disrupt the operations of the mall and
restaurants. The proposed plan of sample collection was to isolate waste arising from the sampled
restaurants from waste coming from other shops (therefore the coded bright green bags) and also
to isolate waste from each restaurant among sampled restaurants. This was done by assigning
unique codes to the sampled restaurants. Green plastic bags marked with respective unique
codes were distributed to the restaurants to use as bin liners a day before waste sampling day. It
was then explained to the restaurant staff members when to use the plastic bags. On the sampling
day, the restaurants were revisited before they opened to check if the plastic bags were placed
in the bins and also to check if there was no waste that was left over from the previous day so as
to ensure that only waste accumulated on the sampling day was captured. Waste accumulated
on the sampling day was then collected to the waste area as usual, where the green bags were
separated from black and clear plastic bags that are normally used by shops. Green plastic bags
were further grouped under similar codes (multiple bags from the same restaurant) and those
plastic bags that were not used by restaurants were later requested back to ensure that there was
no green bag missing. In the waste areas of the mall, the plastic bags from each restaurant were
counted and weighted with a calibrated digital scale with an accuracy of two decimal places. Each
bag was then opened and the content deposited on to a sorting table and waste was then
separated into 21 predetermined waste categories (Table 3-4). Waste collection and sorting is
illustrated in Figure 3- 5. However, during presentation of the results only the nine main categories
(glass, porcelain, paper and cardboard, non-recyclable material, metal, plastic, food waste,
hazardous waste and other) were regarded sufficient to address the aim of the study in terms of
assessing recycling potential of restaurant waste, which is in line with Chang and Davila’s (2008)
assertion that classification of the waste categories depends on the purpose of its application.
Waste characterisation was carried out at the central waste area of the mall and personal
protective equipment (steel toe boots, overalls and gloves) was worn at all times (see Figure 3-
3).
45
To provide guidance and to ensure consistency in the sorting procedure in both malls, waste
categories shown in Table 3- 4 were used during sorting. The waste categories covered waste
material that is likely to be generated in restaurants. These included mostly packaging waste from
transport packaging, packaging of ingredients and sales packaging of products (glass, cardboard,
metals, and plastic), food waste (inedible food waste generated during preparation, food left on a
customer’s plate), broken porcelain, fused fluorescent light bulbs (hazardous waste) and “other”
waste to provide a category for waste not catered for elsewhere.
Figure 3-3: PPE worn during sorting
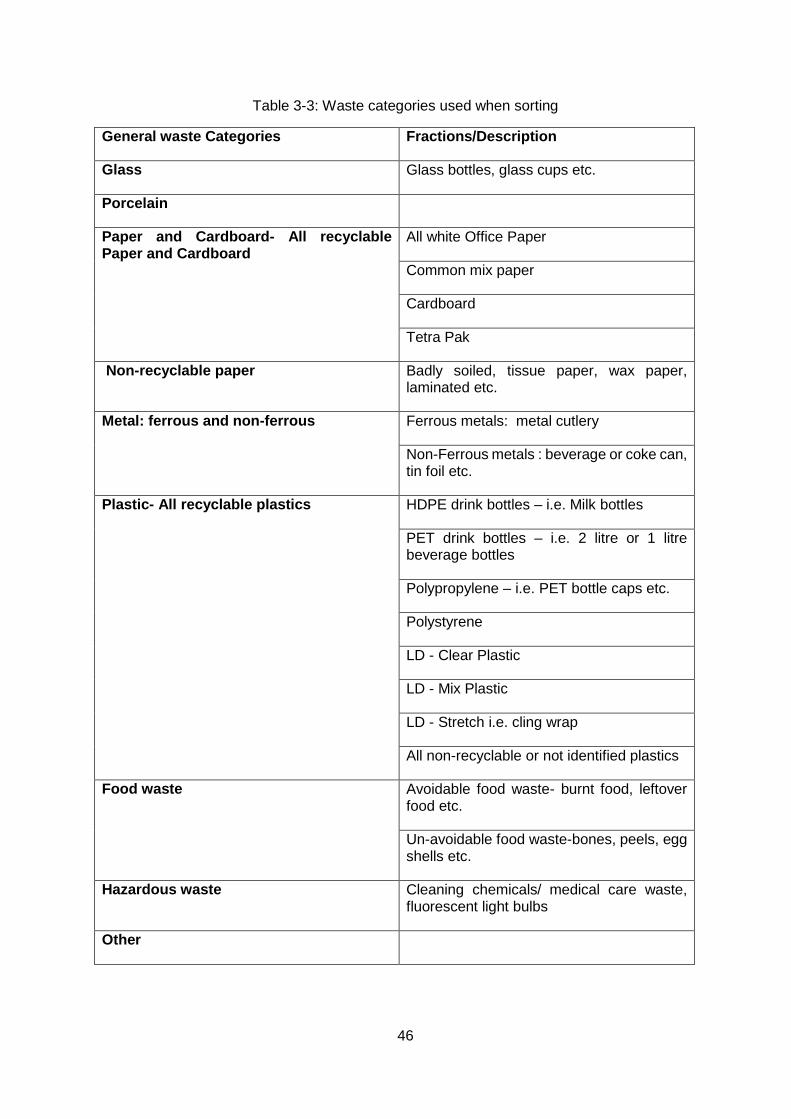
46
Table 3-3: Waste categories used when sorting
General waste Categories Fractions/Description
Glass Glass bottles, glass cups etc.
Porcelain
Paper and Cardboard- All recyclable Paper and Cardboard
All white Office Paper
Common mix paper
Cardboard
Tetra Pak
Non-recyclable paper Badly soiled, tissue paper, wax paper, laminated etc.
Metal: ferrous and non-ferrous Ferrous metals: metal cutlery
Non-Ferrous metals : beverage or coke can, tin foil etc.
Plastic- All recyclable plastics
HDPE drink bottles – i.e. Milk bottles
PET drink bottles – i.e. 2 litre or 1 litre beverage bottles
Polypropylene – i.e. PET bottle caps etc.
Polystyrene
LD - Clear Plastic
LD - Mix Plastic
LD - Stretch i.e. cling wrap
All non-recyclable or not identified plastics
Food waste Avoidable food waste- burnt food, leftover food etc.
Un-avoidable food waste-bones, peels, egg shells etc.
Hazardous waste Cleaning chemicals/ medical care waste, fluorescent light bulbs
Other
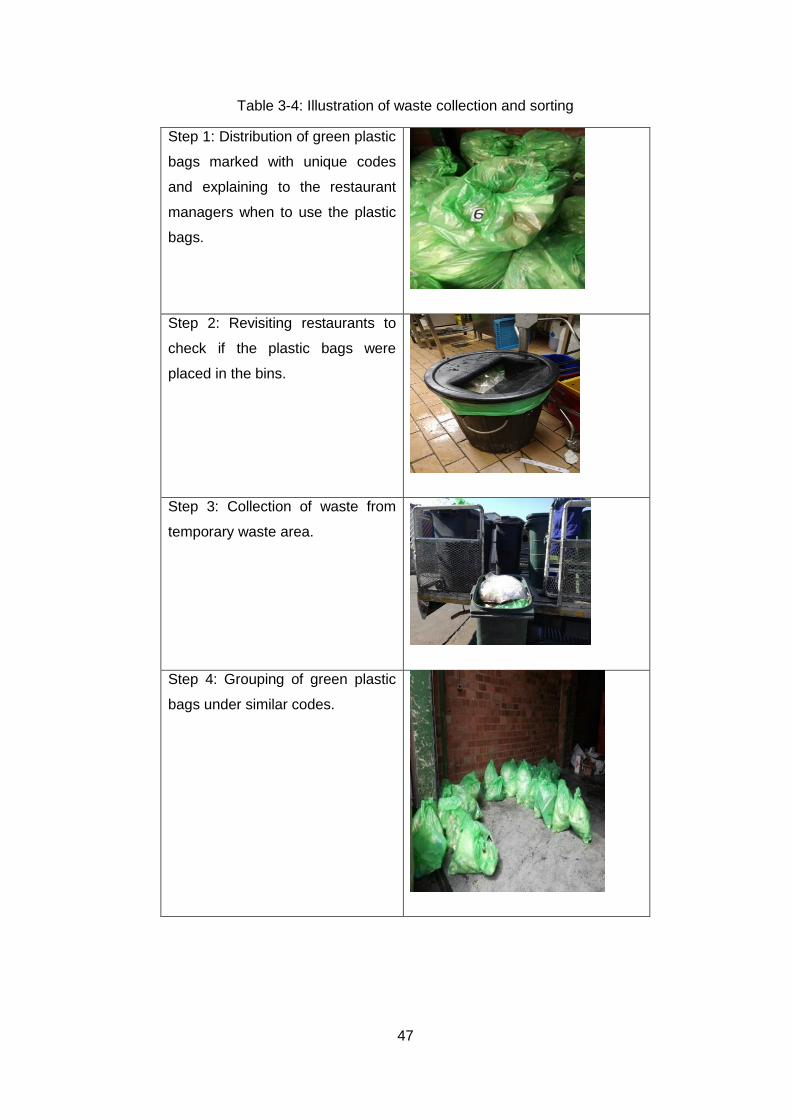
47
Table 3-4: Illustration of waste collection and sorting
Step 1: Distribution of green plastic
bags marked with unique codes
and explaining to the restaurant
managers when to use the plastic
bags.
Step 2: Revisiting restaurants to
check if the plastic bags were
placed in the bins.
Step 3: Collection of waste from
temporary waste area.
Step 4: Grouping of green plastic
bags under similar codes.
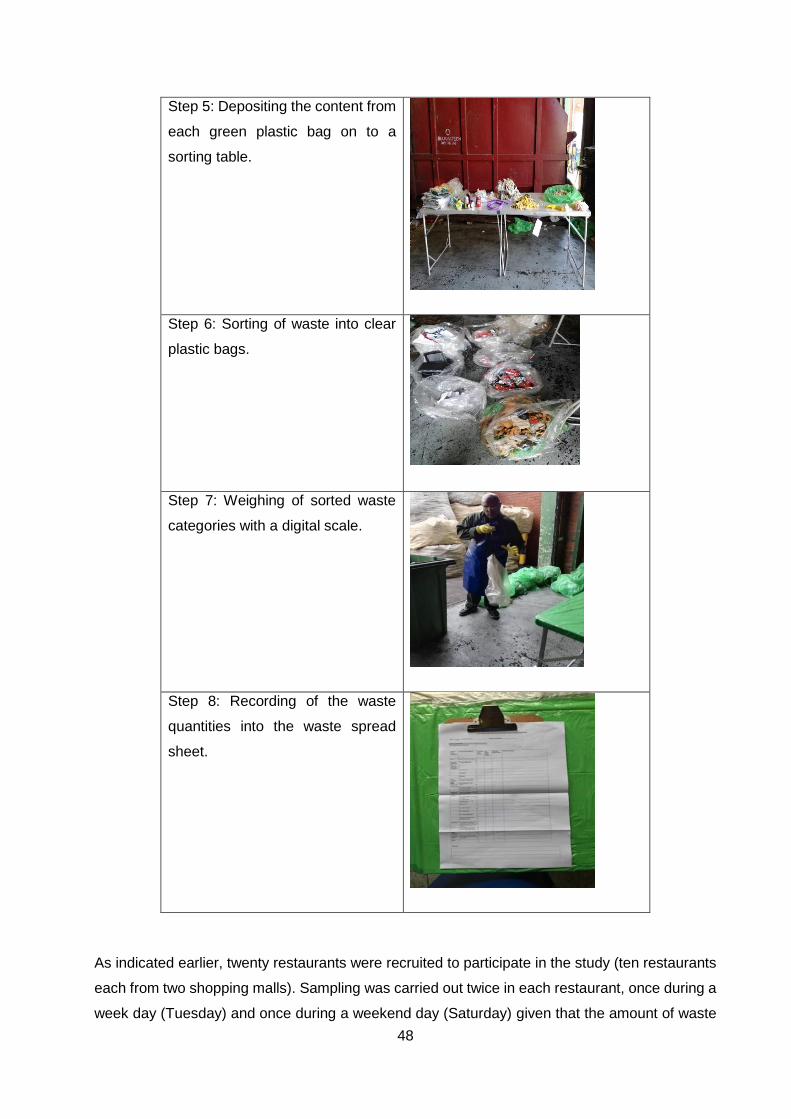
48
Step 5: Depositing the content from
each green plastic bag on to a
sorting table.
Step 6: Sorting of waste into clear
plastic bags.
Step 7: Weighing of sorted waste
categories with a digital scale.
Step 8: Recording of the waste
quantities into the waste spread
sheet.
As indicated earlier, twenty restaurants were recruited to participate in the study (ten restaurants
each from two shopping malls). Sampling was carried out twice in each restaurant, once during a
week day (Tuesday) and once during a weekend day (Saturday) given that the amount of waste
49
generated by the restaurants varies by days of the week (waste generation is high during the
weekends compared to weekdays). To fully participate in the study, the restaurants were required
to use green plastic bags for the collection of waste during both sampling days (week and
weekend day). Restaurants that did not participate on both sampling days were excluded from
the characterisation study. From the twenty restaurants, at least thirteen restaurants fully
participated (six in Mall1 and seven in Mall2). The restaurants included cafes, fast food
restaurants and full service restaurants.
3.4.3 Semi-structured interviews
Another data collection method that was employed in the study is semi-structured interviews.
Petty et al., (2012) define semi-structured interview method as the interaction between the
participant and the researcher through the use of predetermined questions as a guideline to the
interview. This method has been used in various disciplines particularly in social science where
the researchers are interested in understanding human behavior, attitudes, values, beliefs, and
motives. The strength of this method is that it is a ‘free’ interview style where the interview
becomes a conversation between the researcher and the participant (Miles and Gilbert, 2005).
Depending on the flow of the conversation, the interview guide may not be executed as it is,
however, it is the responsibility of the researcher to ensure that all pre-determined questions or
topics are covered. Miles and Gilbert (2005) report that the extent to which a semi-structured
interview should be structured depends on the research question and the data analysis method.
Complex research questions require use of less structured format while simple research requires
a good structure.
A semi-structured interview method was selected because of its flexibility as it allowed the
participants to provide their perspective of reality and the diversity of their experiences in their
own words compared to standardised questionnaires which do not allow the participants to
elaborate. These interviews enabled the researcher to collect rich and in-depth data by prompting
and probing deeper to the phenomena of interest (Stukey, 2013). Miles and Gilbert (2005) report
that semi-structured interviews also allow a researcher to identify contradictions from the
information and to address the contradictions by asking the participant to explain more on the
contradicting responses. The interviews were recorded and transcribed for purpose of data
analysis.
3.4.3.1 Interview pilot study conducted
The cornerstone to successful interviews is conducting a pilot study and this involves a process
of selecting a representative population of the sampled population to test a questionnaire or an
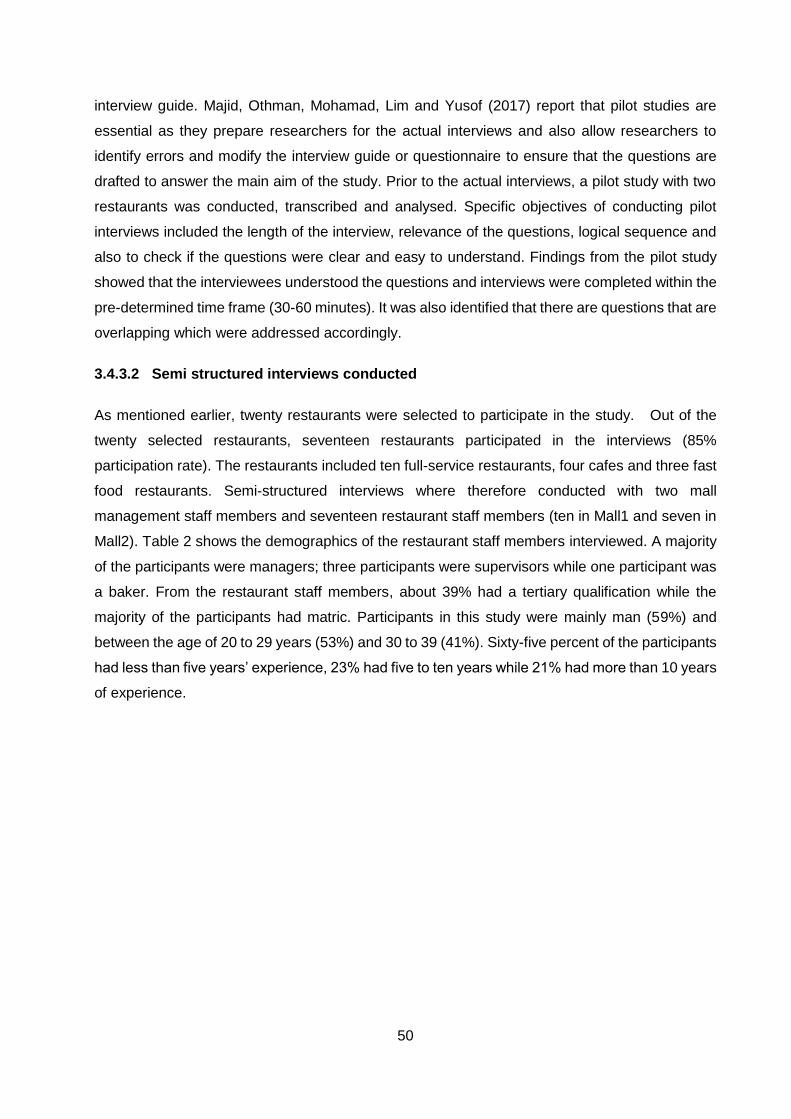
50
interview guide. Majid, Othman, Mohamad, Lim and Yusof (2017) report that pilot studies are
essential as they prepare researchers for the actual interviews and also allow researchers to
identify errors and modify the interview guide or questionnaire to ensure that the questions are
drafted to answer the main aim of the study. Prior to the actual interviews, a pilot study with two
restaurants was conducted, transcribed and analysed. Specific objectives of conducting pilot
interviews included the length of the interview, relevance of the questions, logical sequence and
also to check if the questions were clear and easy to understand. Findings from the pilot study
showed that the interviewees understood the questions and interviews were completed within the
pre-determined time frame (30-60 minutes). It was also identified that there are questions that are
overlapping which were addressed accordingly.
3.4.3.2 Semi structured interviews conducted
As mentioned earlier, twenty restaurants were selected to participate in the study. Out of the
twenty selected restaurants, seventeen restaurants participated in the interviews (85%
participation rate). The restaurants included ten full-service restaurants, four cafes and three fast
food restaurants. Semi-structured interviews where therefore conducted with two mall
management staff members and seventeen restaurant staff members (ten in Mall1 and seven in
Mall2). Table 2 shows the demographics of the restaurant staff members interviewed. A majority
of the participants were managers; three participants were supervisors while one participant was
a baker. From the restaurant staff members, about 39% had a tertiary qualification while the
majority of the participants had matric. Participants in this study were mainly man (59%) and
between the age of 20 to 29 years (53%) and 30 to 39 (41%). Sixty-five percent of the participants
had less than five years’ experience, 23% had five to ten years while 21% had more than 10 years
of experience.
51
Table 3-5: Demographics of staff members
Variables Frequency Percentage
Gender
Female 7 41
Male 10 59
Age
20-29 9 53
30-39 7 41
40-49 1 6
Level of education
Matric 10 59
Post matric certificate 2 12
Tertiary 5 29
Position
Supervisor 3 18
Baker 1 6
Manager 13 76
Experience
<5 years 11 65
5-10 years 4 23
More than 10 years 2 12
52
3.5 Observation
Defined as “observing and measuring the world around you, including observations of people and
other measurable events” (Driscoll, 2011. p.,154), observation was also selected to collect data
in this study. Data in observation is captured through the use of various instruments such as field
notes, photographs (pictures), audio-tape and video-tape. Once actions or experiences are
captured the researcher has the task of developing a theoretical framework to help give meaning
to the actions observed (Petty et al., 2012).
Driscoll (2011) points out two types of observations that may be used when observing people
including participant observation and unobtrusive observation. In participant observation the
researcher interacts with the participants and becomes involved in the given activity or situation
being studied. On the other hand, in unobtrusive observation the researcher captures events,
actions and experiences without being involved. In this research, unobtrusive observation was
used to take note of the activities that generate waste in restaurants and their waste management
practices. Also observing waste flow from restaurant kitchen until it gets to the waste area assisted
during planning of waste collection for the waste characterisation study. This data was captured
through the use of pictures and field notes. Data captured from the observations assisted in
validating some of the information obtained through interviews. Ritchie and Lewis (2003) reports
that visual observations are useful in gathering information about phenomena where non-verbal
communications are likely to be important as it allows experiences, events and actions to be 'seen'
through the eyes of the researcher, often without any construction on the part of those involved.
Petty et al., (2012) however cautions that the presence of an observer may result in a change in
behaviour thereby resulting in inaccurate data.
3.6 Ethical consideration
Ethical consideration is very important when dealing with human participants. Research ethics
involve requirements that a researcher works under from the beginning of the study until the
results of the study are presented. These requirements are implemented to protect the
participant’s dignity when the study is conducted until the information is published (Fouka and
Mantzorou, 2011). Ethical clearance for this study was obtained from the CSIR and North West
University Research Ethics Committees (REC). Therefore, the study followed the ethical
guidelines provided by the CSIR REC as well the North West University REC to protect the dignity
of the participants and to ensure that the research is conducted in an ethical manner.
To protect the dignity of the participants and to ensure that the research is conducted in an ethical
manner, permission to conduct this research was obtained from the top management of both
53
malls. Informed consent of mall managers and all restaurant staff members that participated in
the study was then obtained. Before obtaining consent, all the participants of the research were
guaranteed confidentiality and they were adequately informed about what the study entails and
how they are expected to participate in the study, their voluntary participation as well as the right
to withdraw from the study at any time. All the participants signed a consent form. A recording
device was used to capture data during the interviews after consent for recording was obtained
from the participants.
3.7 Data analysis
Data analysis is a step-by step process of organising and classifying data collected in a study.
This exercise enables the researchers to make sense out of large volumes of data collected in a
study and to draw conclusions (Bengtsson, 2016). In this study qualitative and quantitative data
was analysed separately.
Qualitative data was analysed inductively. This involved analysing data through detailed
examination of transcripts and observations to generate codes and categories. As it was the aim
of the study to present the views of the participants, there was no predetermined structure of data
analysis, codes and categories emerged from the raw data. This allowed the researcher to
present the mall and restaurant manager’s account of experiences which is very important as it
prevents loss of valuable information due to the use of predetermined structure of analysis.
Additionally, inductive qualitative analysis was appropriate for this study as it is used for less
explored studies (Burnard, Gill, Stewart, Treasure, Chadwick, 2008).
Qualitative data analysis commenced with data immersion (first stage of qualitative data analysis
processes) which involved repeated reading of transcripts and observations to get a sense of
what the data looks like. Data immersion encourages generation of ideas about the potential ways
through which the data can be analysed (Green, Willis, Hughes, Small, Welch, Gibbs and Daly,
2007). However, it also often goes further than this, and lays a foundation connecting disjointed
units of data into a clearer picture of the issue under study. After immersing with the data,
relations, similarities and dissimilarities were closely examined to organize data with similar ideas
in a stage called coding. According to Green et al., (2007) coding is a qualitative data analysis
method used to reduce data while not losing the meaning through examining and organizing the
information obtained during data collection. There are two fundamental approaches to coding
including emergent coding and priori coding. Priori coding refers to the use of predetermined
codes to organise similar aspects of the data while emergent coding refers to codes that emerge
from the raw data (Blair, 2015). Emergent coding is more in line with the aim of the study (to
ensure that the data represents participants' contributions to the study while generating rich and
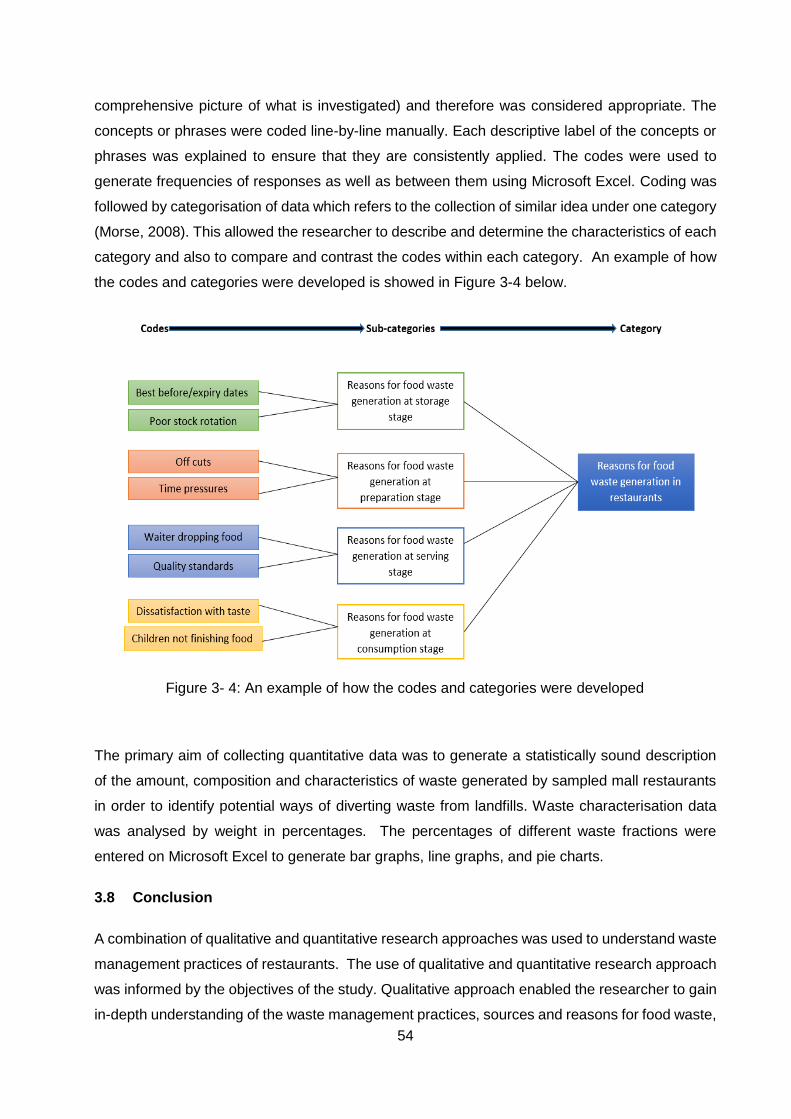
54
comprehensive picture of what is investigated) and therefore was considered appropriate. The
concepts or phrases were coded line-by-line manually. Each descriptive label of the concepts or
phrases was explained to ensure that they are consistently applied. The codes were used to
generate frequencies of responses as well as between them using Microsoft Excel. Coding was
followed by categorisation of data which refers to the collection of similar idea under one category
(Morse, 2008). This allowed the researcher to describe and determine the characteristics of each
category and also to compare and contrast the codes within each category. An example of how
the codes and categories were developed is showed in Figure 3-4 below.
The primary aim of collecting quantitative data was to generate a statistically sound description
of the amount, composition and characteristics of waste generated by sampled mall restaurants
in order to identify potential ways of diverting waste from landfills. Waste characterisation data
was analysed by weight in percentages. The percentages of different waste fractions were
entered on Microsoft Excel to generate bar graphs, line graphs, and pie charts.
3.8 Conclusion
A combination of qualitative and quantitative research approaches was used to understand waste
management practices of restaurants. The use of qualitative and quantitative research approach
was informed by the objectives of the study. Qualitative approach enabled the researcher to gain
in-depth understanding of the waste management practices, sources and reasons for food waste,
Figure 3- 4: An example of how the codes and categories were developed
55
existing measure used for reduction of food waste and quantities of waste cooking oil generated
in the restaurants. Quantitative research method on the other hand was used to quantify the
percentages of waste categories and fractions generated by restaurants and also to determine
the composition of waste they generate.
56
CHAPTER 4: RESULTS AND DISCUSSION
This chapter presents the results and discussion of the study. Firstly, this chapter presents
composition and waste generation rates of restaurants. This is followed by sources and reasons
for food waste generation as well as existing measures used to prevent food waste in the
restaurants. A descriptive account of waste management practices of restaurants including waste
storage, collection and disposal. Finally, generation rates and disposal of waste cooking oil by
restaurants is presented.
4.1 Waste characterisation results
This section provides the results of the waste characterisation component of the study. Waste
composition and generation rates of the malls are presented separately.
4.1.1 Waste composition
To determine waste composition of the sampled restaurants, a total of 799.35kg of waste from
two malls was sorted and the weight of each waste category was recorded. Waste produced on
the sampling days were accumulated and sorted the following day similar to the procedure
outlined in Dahlen and Lagerkvist’s (2008) time limitation procedure. Dahlen and Lagerkvist’
(2008) report that a waste sample should be sorted within two days of collection to avoid chemical
and physical changes to the sample. In Mall1, 135.10kg of waste was sorted for a week day
sample, and 252.95kg for a weekend sample while 148.05kg for a weekday sample, and 263.25kg
for a weekend sample was sorted in Mall2. The total waste available for sorting into fractions
during the week in both malls was comparably smaller than the total waste available for sorting
during the weekend, suggesting that restaurants generate more waste during the weekend than
during the week. Table 4- 1 shows total kilograms of waste sorted from different types of
restaurants in Mall1 and Mall2.
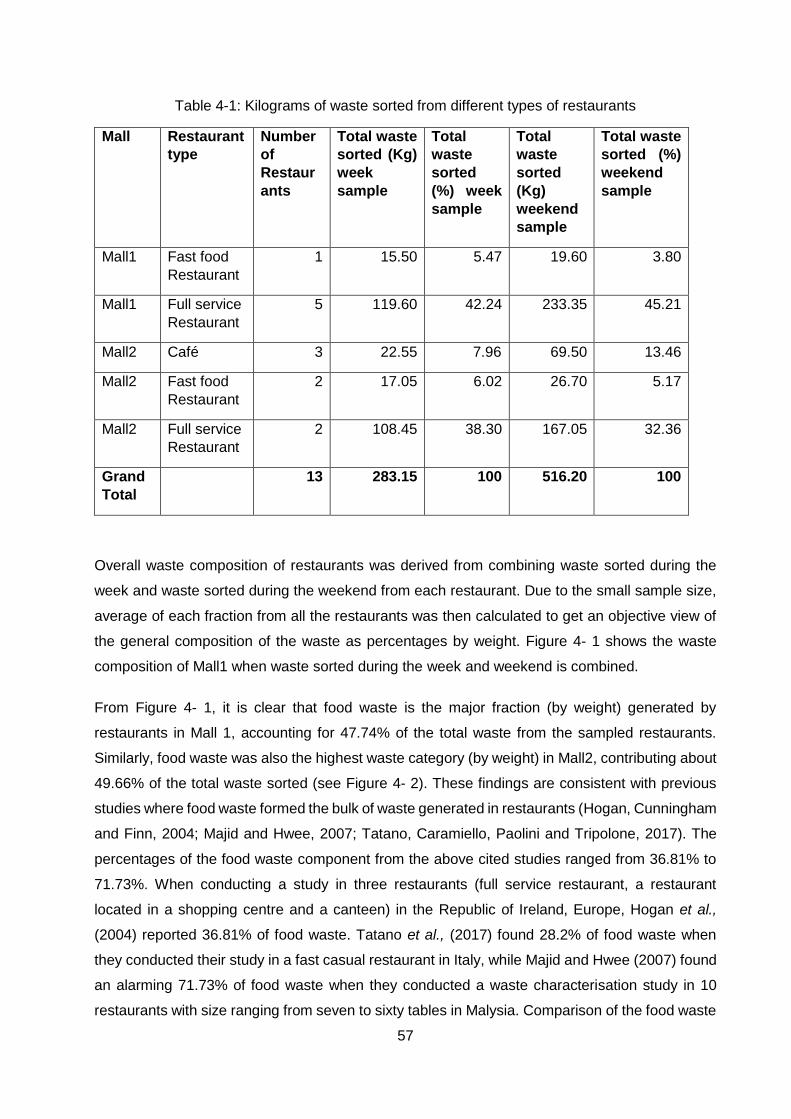
57
Table 4-1: Kilograms of waste sorted from different types of restaurants
Mall Restaurant
type
Number
of
Restaur
ants
Total waste
sorted (Kg)
week
sample
Total
waste
sorted
(%) week
sample
Total
waste
sorted
(Kg)
weekend
sample
Total waste
sorted (%)
weekend
sample
Mall1 Fast food
Restaurant
1 15.50 5.47 19.60 3.80
Mall1 Full service
Restaurant
5 119.60 42.24 233.35 45.21
Mall2 Café 3 22.55 7.96 69.50 13.46
Mall2 Fast food
Restaurant
2 17.05 6.02 26.70 5.17
Mall2 Full service
Restaurant
2 108.45 38.30 167.05 32.36
Grand
Total
13 283.15 100 516.20 100
Overall waste composition of restaurants was derived from combining waste sorted during the
week and waste sorted during the weekend from each restaurant. Due to the small sample size,
average of each fraction from all the restaurants was then calculated to get an objective view of
the general composition of the waste as percentages by weight. Figure 4- 1 shows the waste
composition of Mall1 when waste sorted during the week and weekend is combined.
From Figure 4- 1, it is clear that food waste is the major fraction (by weight) generated by
restaurants in Mall 1, accounting for 47.74% of the total waste from the sampled restaurants.
Similarly, food waste was also the highest waste category (by weight) in Mall2, contributing about
49.66% of the total waste sorted (see Figure 4- 2). These findings are consistent with previous
studies where food waste formed the bulk of waste generated in restaurants (Hogan, Cunningham
and Finn, 2004; Majid and Hwee, 2007; Tatano, Caramiello, Paolini and Tripolone, 2017). The
percentages of the food waste component from the above cited studies ranged from 36.81% to
71.73%. When conducting a study in three restaurants (full service restaurant, a restaurant
located in a shopping centre and a canteen) in the Republic of Ireland, Europe, Hogan et al.,
(2004) reported 36.81% of food waste. Tatano et al., (2017) found 28.2% of food waste when
they conducted their study in a fast casual restaurant in Italy, while Majid and Hwee (2007) found
an alarming 71.73% of food waste when they conducted a waste characterisation study in 10
restaurants with size ranging from seven to sixty tables in Malysia. Comparison of the food waste
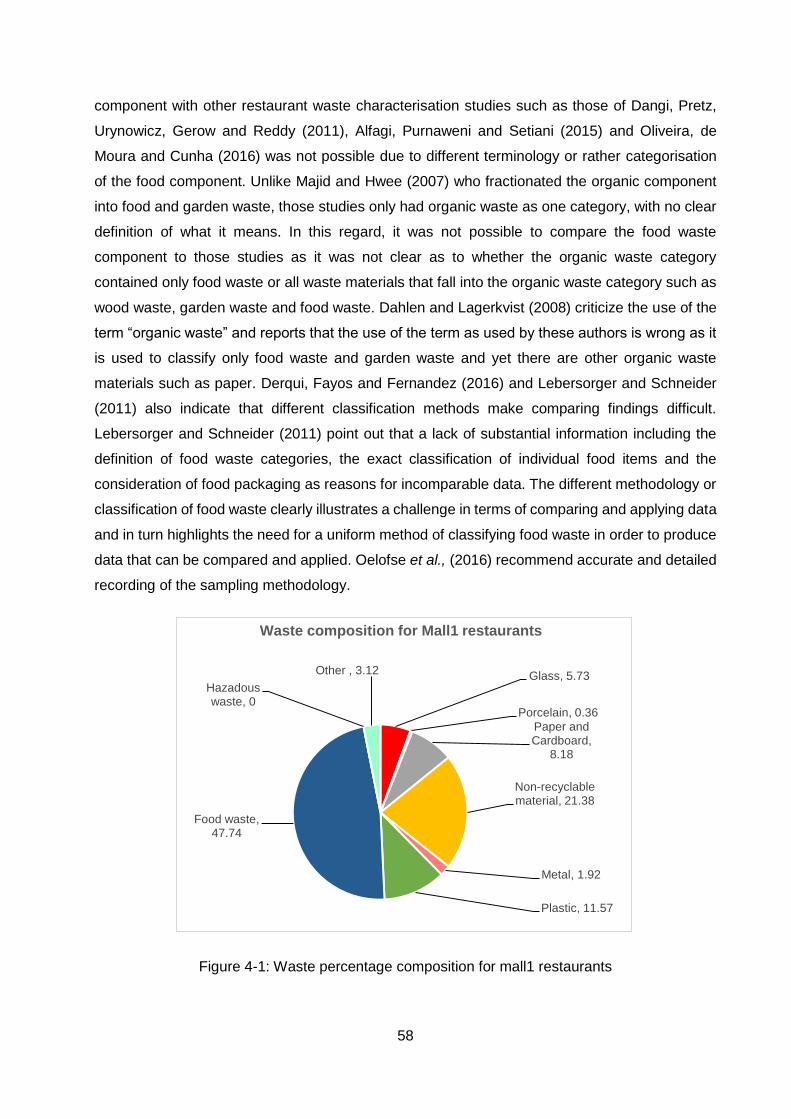
58
component with other restaurant waste characterisation studies such as those of Dangi, Pretz,
Urynowicz, Gerow and Reddy (2011), Alfagi, Purnaweni and Setiani (2015) and Oliveira, de
Moura and Cunha (2016) was not possible due to different terminology or rather categorisation
of the food component. Unlike Majid and Hwee (2007) who fractionated the organic component
into food and garden waste, those studies only had organic waste as one category, with no clear
definition of what it means. In this regard, it was not possible to compare the food waste
component to those studies as it was not clear as to whether the organic waste category
contained only food waste or all waste materials that fall into the organic waste category such as
wood waste, garden waste and food waste. Dahlen and Lagerkvist (2008) criticize the use of the
term “organic waste” and reports that the use of the term as used by these authors is wrong as it
is used to classify only food waste and garden waste and yet there are other organic waste
materials such as paper. Derqui, Fayos and Fernandez (2016) and Lebersorger and Schneider
(2011) also indicate that different classification methods make comparing findings difficult.
Lebersorger and Schneider (2011) point out that a lack of substantial information including the
definition of food waste categories, the exact classification of individual food items and the
consideration of food packaging as reasons for incomparable data. The different methodology or
classification of food waste clearly illustrates a challenge in terms of comparing and applying data
and in turn highlights the need for a uniform method of classifying food waste in order to produce
data that can be compared and applied. Oelofse et al., (2016) recommend accurate and detailed
recording of the sampling methodology.
Figure 4-1: Waste percentage composition for mall1 restaurants
Glass, 5.73
Porcelain, 0.36
Paper and Cardboard,
8.18
Non-recyclable material, 21.38
Metal, 1.92
Plastic, 11.57
Food waste, 47.74
Hazadous waste, 0
Other , 3.12
Waste composition for Mall1 restaurants
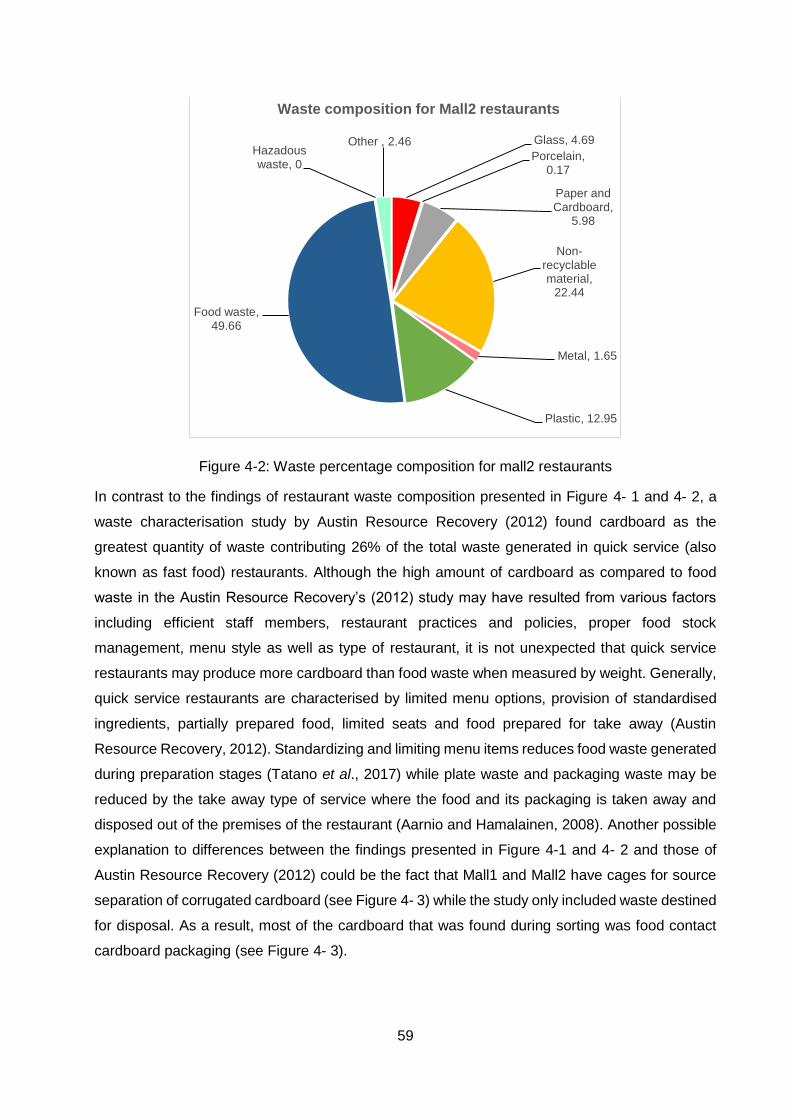
59
Figure 4-2: Waste percentage composition for mall2 restaurants
In contrast to the findings of restaurant waste composition presented in Figure 4- 1 and 4- 2, a
waste characterisation study by Austin Resource Recovery (2012) found cardboard as the
greatest quantity of waste contributing 26% of the total waste generated in quick service (also
known as fast food) restaurants. Although the high amount of cardboard as compared to food
waste in the Austin Resource Recovery’s (2012) study may have resulted from various factors
including efficient staff members, restaurant practices and policies, proper food stock
management, menu style as well as type of restaurant, it is not unexpected that quick service
restaurants may produce more cardboard than food waste when measured by weight. Generally,
quick service restaurants are characterised by limited menu options, provision of standardised
ingredients, partially prepared food, limited seats and food prepared for take away (Austin
Resource Recovery, 2012). Standardizing and limiting menu items reduces food waste generated
during preparation stages (Tatano et al., 2017) while plate waste and packaging waste may be
reduced by the take away type of service where the food and its packaging is taken away and
disposed out of the premises of the restaurant (Aarnio and Hamalainen, 2008). Another possible
explanation to differences between the findings presented in Figure 4-1 and 4- 2 and those of
Austin Resource Recovery (2012) could be the fact that Mall1 and Mall2 have cages for source
separation of corrugated cardboard (see Figure 4- 3) while the study only included waste destined
for disposal. As a result, most of the cardboard that was found during sorting was food contact
cardboard packaging (see Figure 4- 3).
Glass, 4.69
Porcelain, 0.17
Paper and Cardboard,
5.98
Non-recyclable material,
22.44
Metal, 1.65
Plastic, 12.95
Food waste, 49.66
Hazadous waste, 0
Other , 2.46
Waste composition for Mall2 restaurants
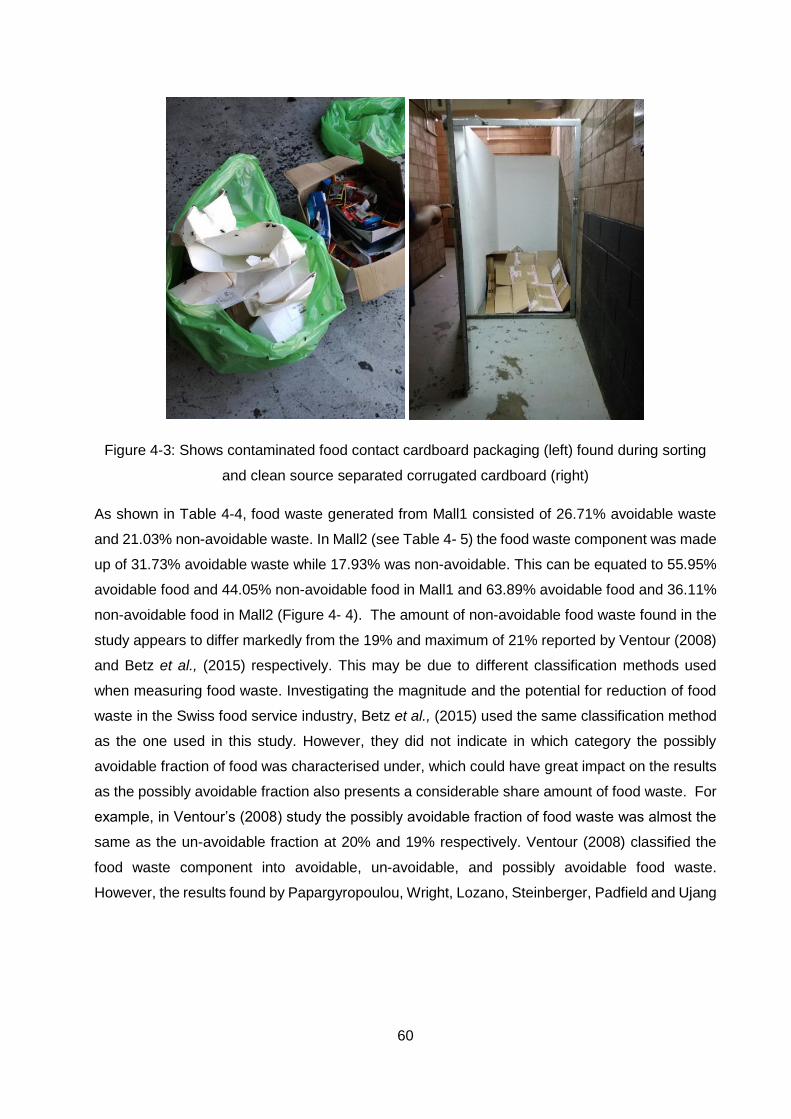
60
Figure 4-3: Shows contaminated food contact cardboard packaging (left) found during sorting
and clean source separated corrugated cardboard (right)
As shown in Table 4-4, food waste generated from Mall1 consisted of 26.71% avoidable waste
and 21.03% non-avoidable waste. In Mall2 (see Table 4- 5) the food waste component was made
up of 31.73% avoidable waste while 17.93% was non-avoidable. This can be equated to 55.95%
avoidable food and 44.05% non-avoidable food in Mall1 and 63.89% avoidable food and 36.11%
non-avoidable food in Mall2 (Figure 4- 4). The amount of non-avoidable food waste found in the
study appears to differ markedly from the 19% and maximum of 21% reported by Ventour (2008)
and Betz et al., (2015) respectively. This may be due to different classification methods used
when measuring food waste. Investigating the magnitude and the potential for reduction of food
waste in the Swiss food service industry, Betz et al., (2015) used the same classification method
as the one used in this study. However, they did not indicate in which category the possibly
avoidable fraction of food was characterised under, which could have great impact on the results
as the possibly avoidable fraction also presents a considerable share amount of food waste. For
example, in Ventour’s (2008) study the possibly avoidable fraction of food waste was almost the
same as the un-avoidable fraction at 20% and 19% respectively. Ventour (2008) classified the
food waste component into avoidable, un-avoidable, and possibly avoidable food waste.
However, the results found by Papargyropoulou, Wright, Lozano, Steinberger, Padfield and Ujang
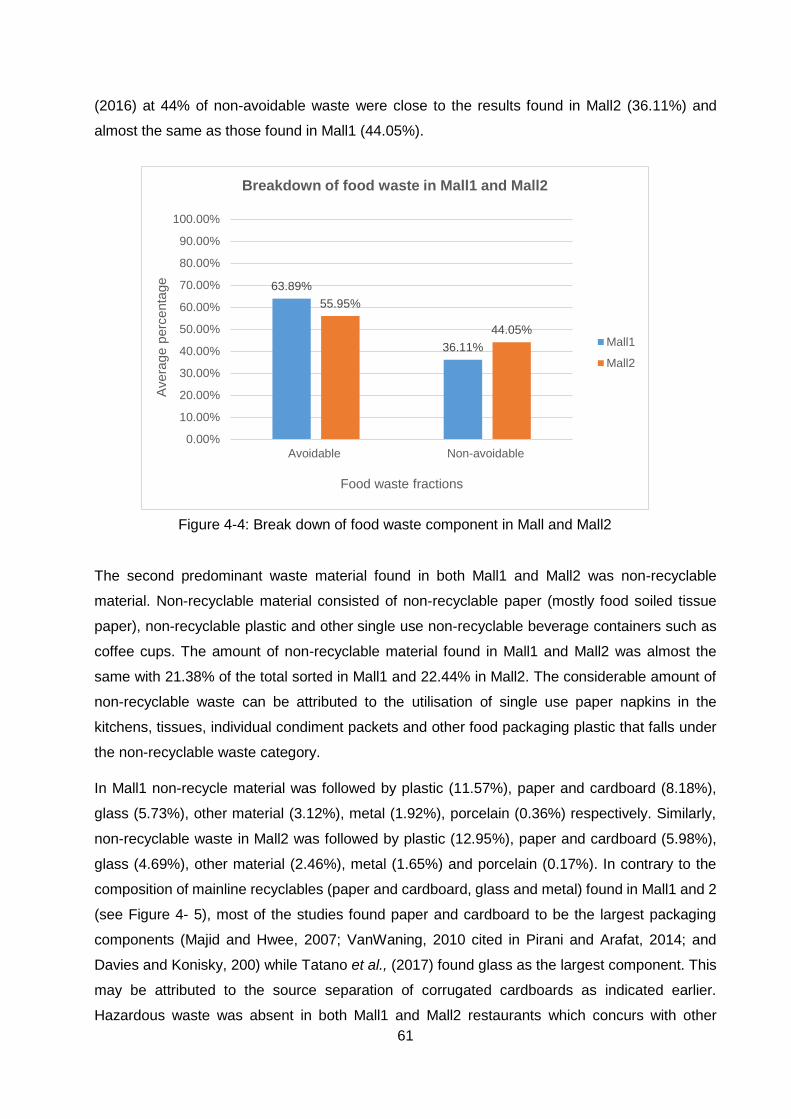
61
(2016) at 44% of non-avoidable waste were close to the results found in Mall2 (36.11%) and
almost the same as those found in Mall1 (44.05%).
The second predominant waste material found in both Mall1 and Mall2 was non-recyclable
material. Non-recyclable material consisted of non-recyclable paper (mostly food soiled tissue
paper), non-recyclable plastic and other single use non-recyclable beverage containers such as
coffee cups. The amount of non-recyclable material found in Mall1 and Mall2 was almost the
same with 21.38% of the total sorted in Mall1 and 22.44% in Mall2. The considerable amount of
non-recyclable waste can be attributed to the utilisation of single use paper napkins in the
kitchens, tissues, individual condiment packets and other food packaging plastic that falls under
the non-recyclable waste category.
In Mall1 non-recycle material was followed by plastic (11.57%), paper and cardboard (8.18%),
glass (5.73%), other material (3.12%), metal (1.92%), porcelain (0.36%) respectively. Similarly,
non-recyclable waste in Mall2 was followed by plastic (12.95%), paper and cardboard (5.98%),
glass (4.69%), other material (2.46%), metal (1.65%) and porcelain (0.17%). In contrary to the
composition of mainline recyclables (paper and cardboard, glass and metal) found in Mall1 and 2
(see Figure 4- 5), most of the studies found paper and cardboard to be the largest packaging
components (Majid and Hwee, 2007; VanWaning, 2010 cited in Pirani and Arafat, 2014; and
Davies and Konisky, 200) while Tatano et al., (2017) found glass as the largest component. This
may be attributed to the source separation of corrugated cardboards as indicated earlier.
Hazardous waste was absent in both Mall1 and Mall2 restaurants which concurs with other
63.89%
36.11%
55.95%
44.05%
0.00%
10.00%
20.00%
30.00%
40.00%
50.00%
60.00%
70.00%
80.00%
90.00%
100.00%
Avoidable Non-avoidable
Avera
ge p
erc
enta
ge
Food waste fractions
Breakdown of food waste in Mall1 and Mall2
Mall1
Mall2
Figure 4-4: Break down of food waste component in Mall and Mall2
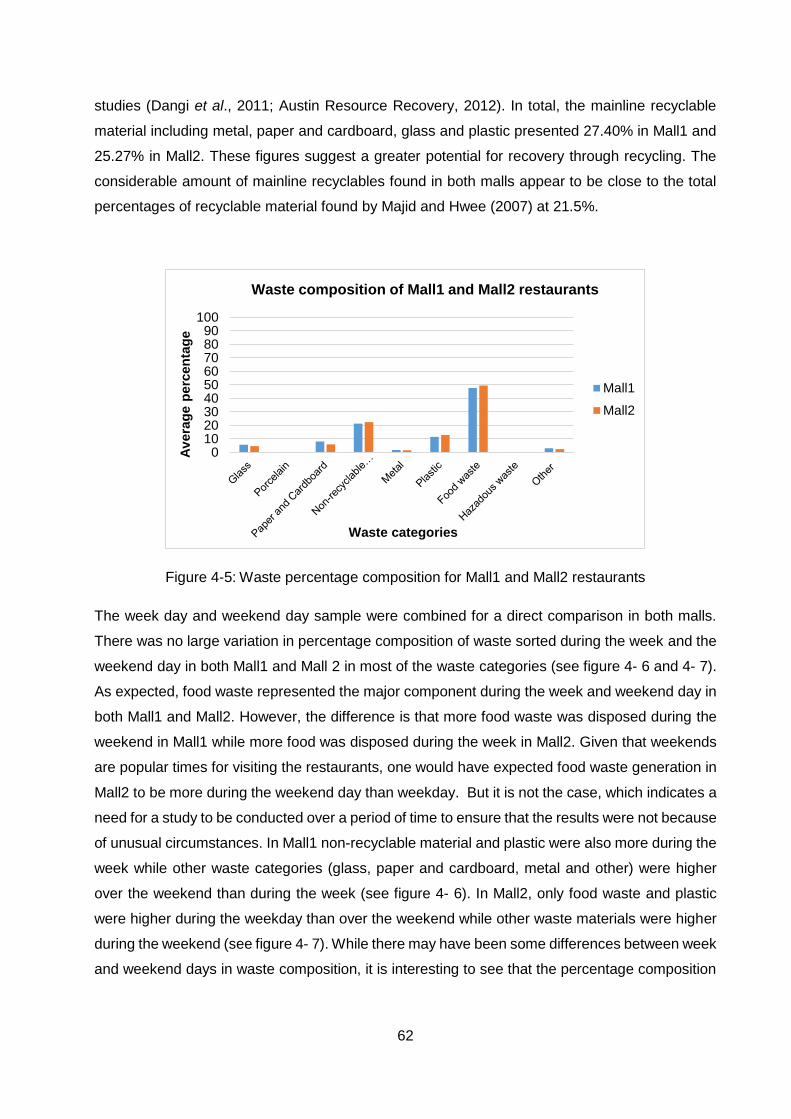
62
studies (Dangi et al., 2011; Austin Resource Recovery, 2012). In total, the mainline recyclable
material including metal, paper and cardboard, glass and plastic presented 27.40% in Mall1 and
25.27% in Mall2. These figures suggest a greater potential for recovery through recycling. The
considerable amount of mainline recyclables found in both malls appear to be close to the total
percentages of recyclable material found by Majid and Hwee (2007) at 21.5%.
Figure 4-5: Waste percentage composition for Mall1 and Mall2 restaurants
The week day and weekend day sample were combined for a direct comparison in both malls.
There was no large variation in percentage composition of waste sorted during the week and the
weekend day in both Mall1 and Mall 2 in most of the waste categories (see figure 4- 6 and 4- 7).
As expected, food waste represented the major component during the week and weekend day in
both Mall1 and Mall2. However, the difference is that more food waste was disposed during the
weekend in Mall1 while more food was disposed during the week in Mall2. Given that weekends
are popular times for visiting the restaurants, one would have expected food waste generation in
Mall2 to be more during the weekend day than weekday. But it is not the case, which indicates a
need for a study to be conducted over a period of time to ensure that the results were not because
of unusual circumstances. In Mall1 non-recyclable material and plastic were also more during the
week while other waste categories (glass, paper and cardboard, metal and other) were higher
over the weekend than during the week (see figure 4- 6). In Mall2, only food waste and plastic
were higher during the weekday than over the weekend while other waste materials were higher
during the weekend (see figure 4- 7). While there may have been some differences between week
and weekend days in waste composition, it is interesting to see that the percentage composition
0102030405060708090
100
Av
era
ge
pe
rcen
tag
e
Waste categories
Waste composition of Mall1 and Mall2 restaurants
Mall1
Mall2
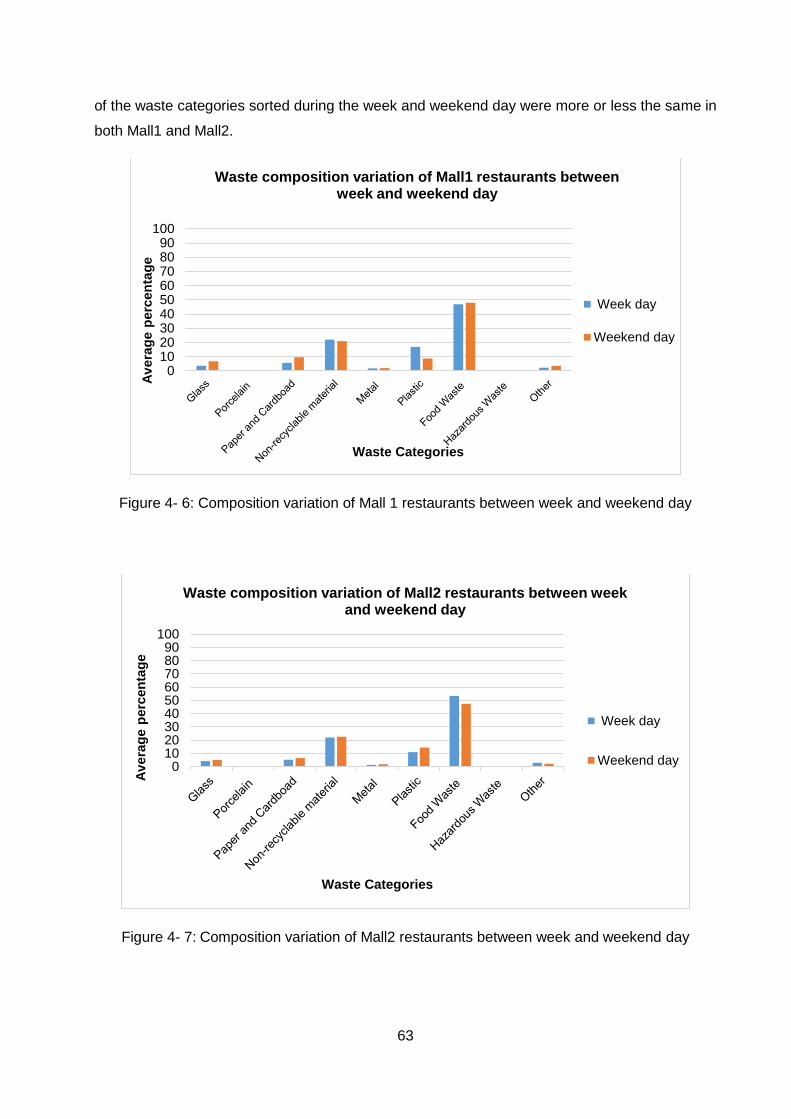
63
of the waste categories sorted during the week and weekend day were more or less the same in
both Mall1 and Mall2.
Figure 4- 6: Composition variation of Mall 1 restaurants between week and weekend day
Figure 4- 7: Composition variation of Mall2 restaurants between week and weekend day
0102030405060708090
100
Av
era
ge p
erc
en
tag
e
Waste Categories
Waste composition variation of Mall1 restaurants between week and weekend day
Week day
Weekend day
0102030405060708090
100
Av
era
ge p
erc
en
tag
e
Waste Categories
Waste composition variation of Mall2 restaurants between week and weekend day
Week day
Weekend day
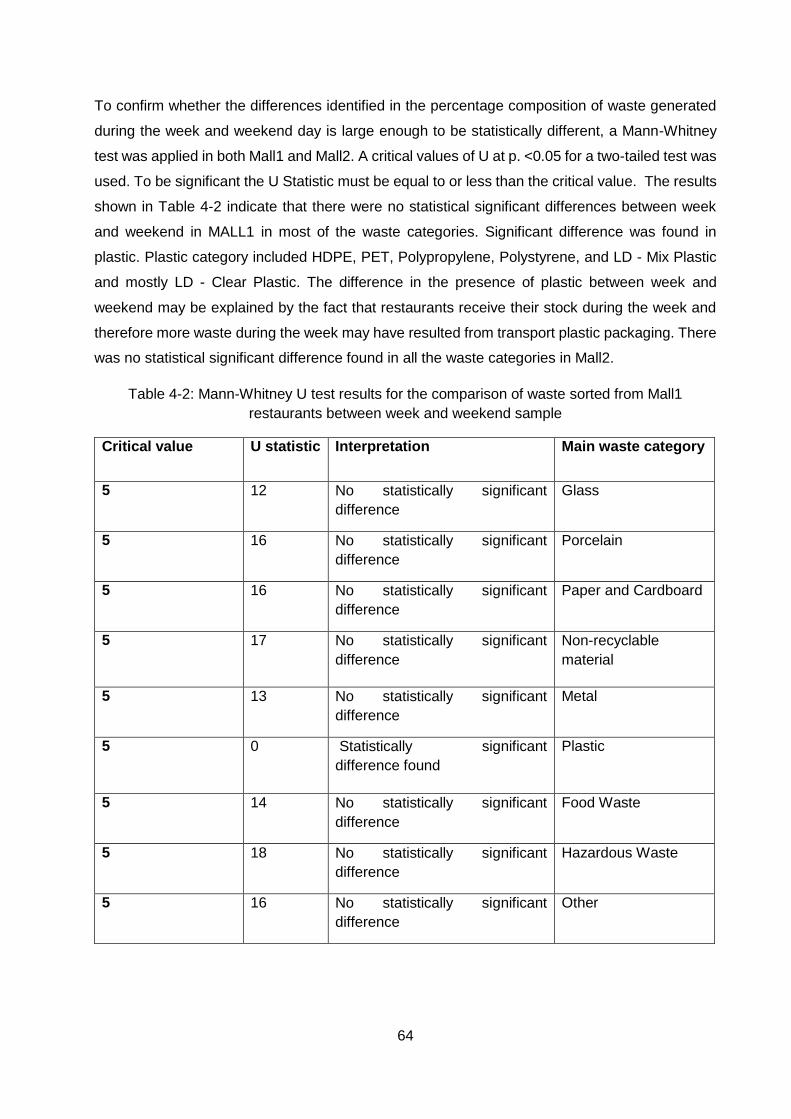
64
To confirm whether the differences identified in the percentage composition of waste generated
during the week and weekend day is large enough to be statistically different, a Mann-Whitney
test was applied in both Mall1 and Mall2. A critical values of U at p. <0.05 for a two-tailed test was
used. To be significant the U Statistic must be equal to or less than the critical value. The results
shown in Table 4-2 indicate that there were no statistical significant differences between week
and weekend in MALL1 in most of the waste categories. Significant difference was found in
plastic. Plastic category included HDPE, PET, Polypropylene, Polystyrene, and LD - Mix Plastic
and mostly LD - Clear Plastic. The difference in the presence of plastic between week and
weekend may be explained by the fact that restaurants receive their stock during the week and
therefore more waste during the week may have resulted from transport plastic packaging. There
was no statistical significant difference found in all the waste categories in Mall2.
Table 4-2: Mann-Whitney U test results for the comparison of waste sorted from Mall1
restaurants between week and weekend sample
Critical value U statistic Interpretation Main waste category
5 12 No statistically significant
difference
Glass
5 16 No statistically significant
difference
Porcelain
5 16 No statistically significant
difference
Paper and Cardboard
5 17 No statistically significant
difference
Non-recyclable
material
5 13 No statistically significant
difference
Metal
5 0 Statistically significant
difference found
Plastic
5 14 No statistically significant
difference
Food Waste
5 18 No statistically significant
difference
Hazardous Waste
5 16 No statistically significant
difference
Other
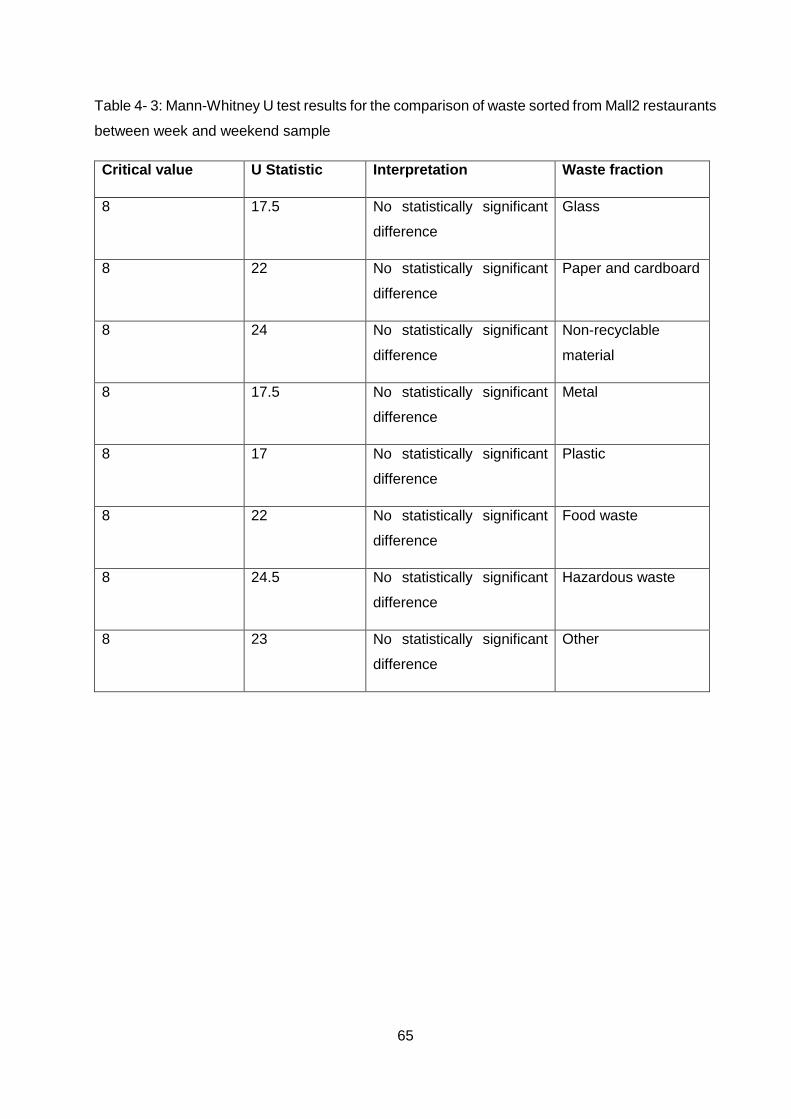
65
Table 4- 3: Mann-Whitney U test results for the comparison of waste sorted from Mall2 restaurants
between week and weekend sample
Critical value U Statistic Interpretation Waste fraction
8 17.5 No statistically significant
difference
Glass
8 22 No statistically significant
difference
Paper and cardboard
8 24 No statistically significant
difference
Non-recyclable
material
8 17.5 No statistically significant
difference
Metal
8 17 No statistically significant
difference
Plastic
8 22 No statistically significant
difference
Food waste
8 24.5 No statistically significant
difference
Hazardous waste
8 23 No statistically significant
difference
Other
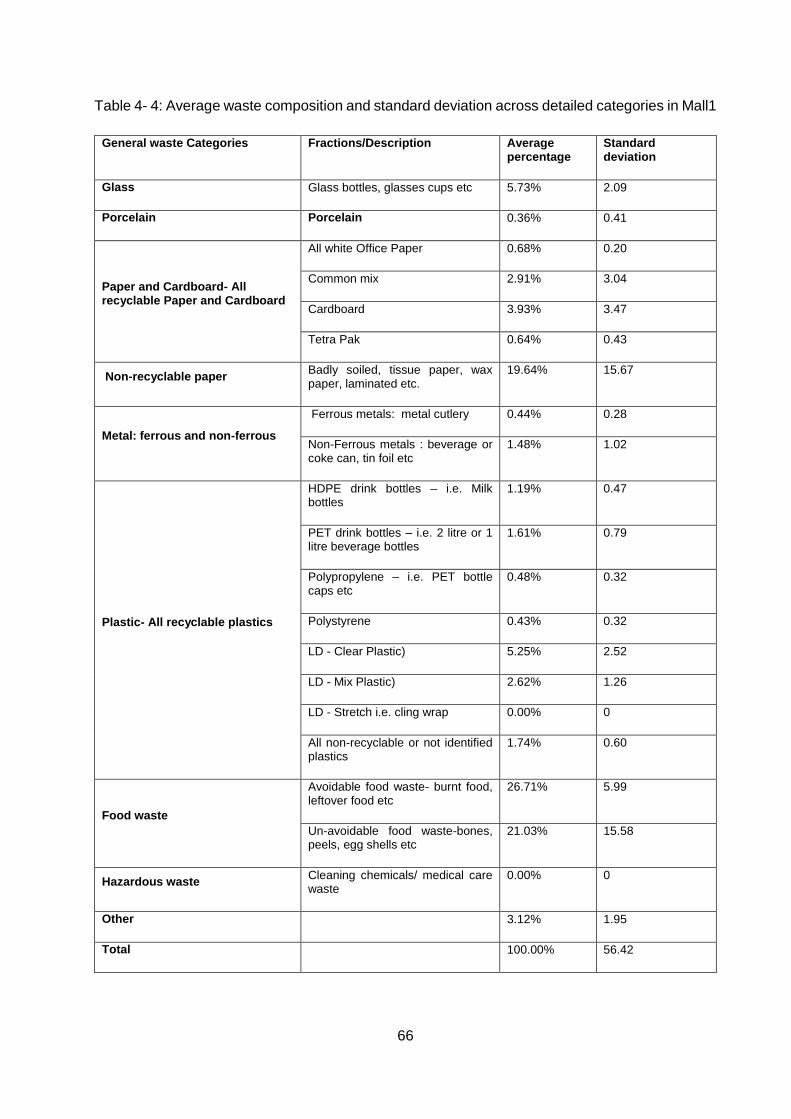
66
Table 4- 4: Average waste composition and standard deviation across detailed categories in Mall1
General waste Categories Fractions/Description Average percentage
Standard deviation
Glass Glass bottles, glasses cups etc 5.73% 2.09
Porcelain Porcelain 0.36% 0.41
Paper and Cardboard- All recyclable Paper and Cardboard
All white Office Paper 0.68% 0.20
Common mix 2.91% 3.04
Cardboard 3.93% 3.47
Tetra Pak 0.64% 0.43
Non-recyclable paper Badly soiled, tissue paper, wax paper, laminated etc.
19.64% 15.67
Metal: ferrous and non-ferrous
Ferrous metals: metal cutlery 0.44% 0.28
Non-Ferrous metals : beverage or coke can, tin foil etc
1.48% 1.02
Plastic- All recyclable plastics
HDPE drink bottles – i.e. Milk bottles
1.19% 0.47
PET drink bottles – i.e. 2 litre or 1 litre beverage bottles
1.61% 0.79
Polypropylene – i.e. PET bottle caps etc
0.48% 0.32
Polystyrene 0.43% 0.32
LD - Clear Plastic) 5.25% 2.52
LD - Mix Plastic) 2.62% 1.26
LD - Stretch i.e. cling wrap 0.00% 0
All non-recyclable or not identified plastics
1.74% 0.60
Food waste
Avoidable food waste- burnt food, leftover food etc
26.71% 5.99
Un-avoidable food waste-bones, peels, egg shells etc
21.03% 15.58
Hazardous waste Cleaning chemicals/ medical care waste
0.00% 0
Other
3.12% 1.95
Total
100.00% 56.42
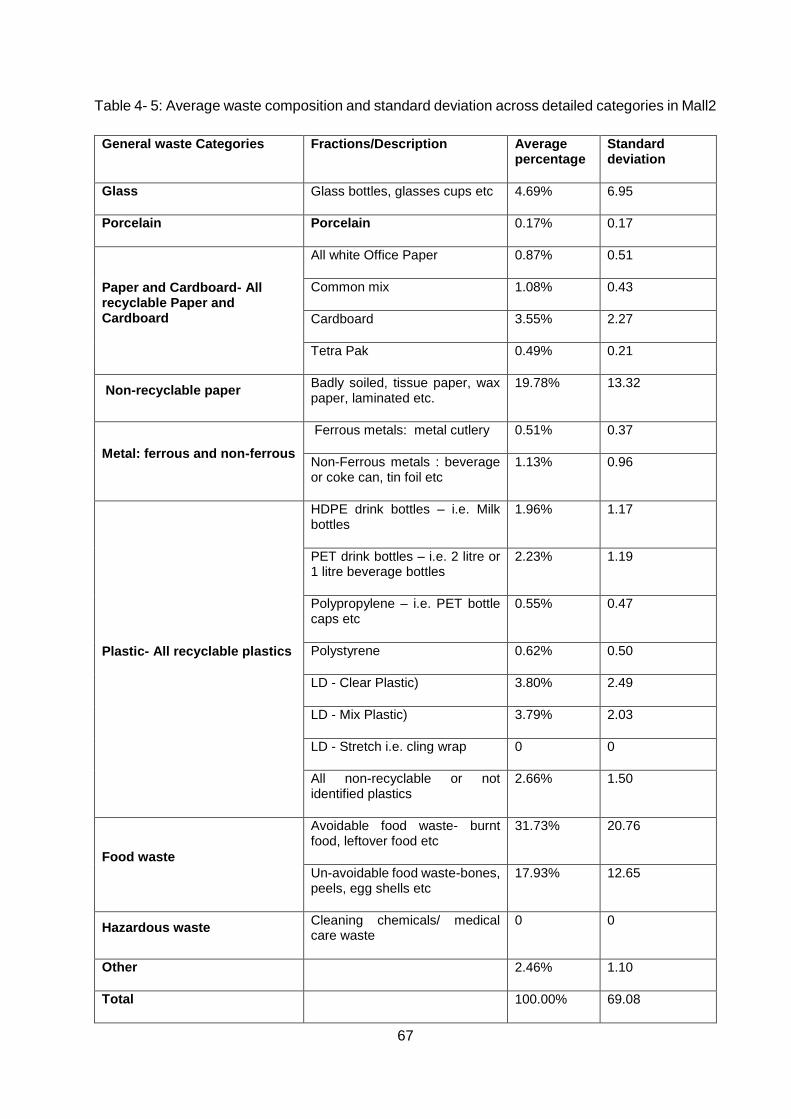
67
Table 4- 5: Average waste composition and standard deviation across detailed categories in Mall2
General waste Categories Fractions/Description Average percentage
Standard deviation
Glass Glass bottles, glasses cups etc 4.69% 6.95
Porcelain Porcelain 0.17% 0.17
Paper and Cardboard- All recyclable Paper and Cardboard
All white Office Paper 0.87% 0.51
Common mix 1.08% 0.43
Cardboard 3.55% 2.27
Tetra Pak 0.49% 0.21
Non-recyclable paper Badly soiled, tissue paper, wax paper, laminated etc.
19.78% 13.32
Metal: ferrous and non-ferrous
Ferrous metals: metal cutlery 0.51% 0.37
Non-Ferrous metals : beverage or coke can, tin foil etc
1.13% 0.96
Plastic- All recyclable plastics
HDPE drink bottles – i.e. Milk bottles
1.96% 1.17
PET drink bottles – i.e. 2 litre or 1 litre beverage bottles
2.23% 1.19
Polypropylene – i.e. PET bottle caps etc
0.55% 0.47
Polystyrene 0.62% 0.50
LD - Clear Plastic) 3.80% 2.49
LD - Mix Plastic) 3.79% 2.03
LD - Stretch i.e. cling wrap 0 0
All non-recyclable or not identified plastics
2.66% 1.50
Food waste
Avoidable food waste- burnt food, leftover food etc
31.73% 20.76
Un-avoidable food waste-bones, peels, egg shells etc
17.93% 12.65
Hazardous waste Cleaning chemicals/ medical care waste
0 0
Other
2.46% 1.10
Total
100.00% 69.08
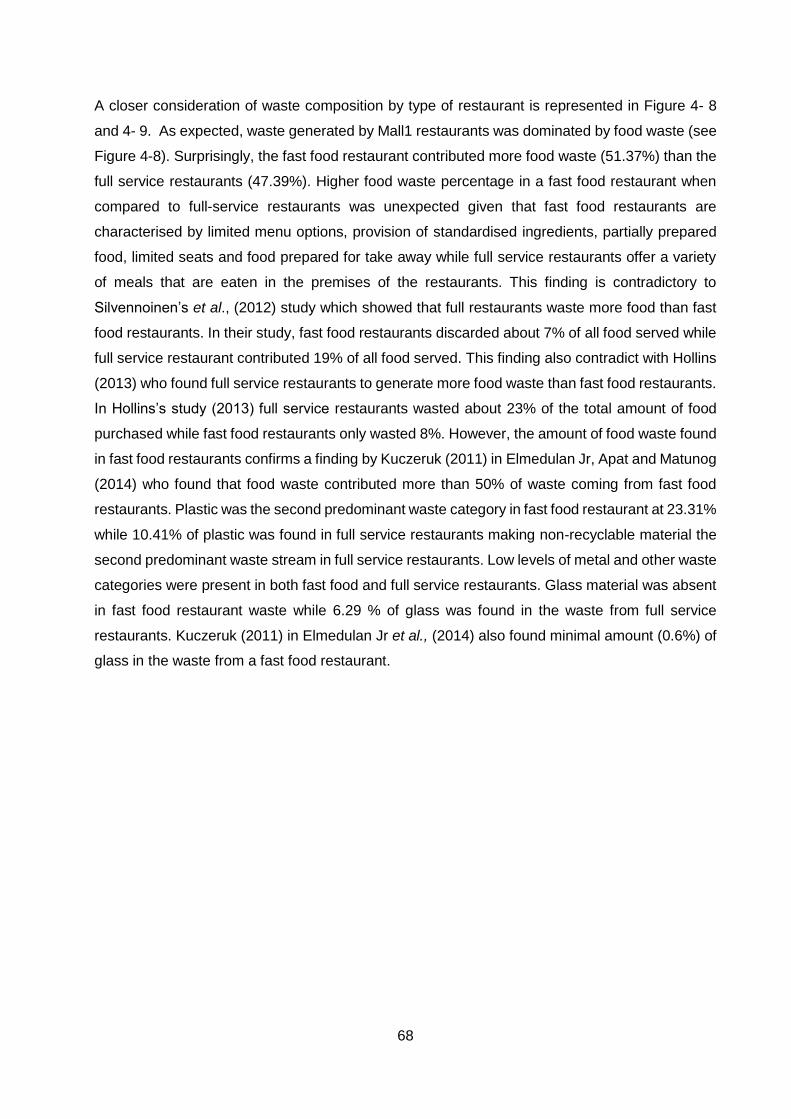
68
A closer consideration of waste composition by type of restaurant is represented in Figure 4- 8
and 4- 9. As expected, waste generated by Mall1 restaurants was dominated by food waste (see
Figure 4-8). Surprisingly, the fast food restaurant contributed more food waste (51.37%) than the
full service restaurants (47.39%). Higher food waste percentage in a fast food restaurant when
compared to full-service restaurants was unexpected given that fast food restaurants are
characterised by limited menu options, provision of standardised ingredients, partially prepared
food, limited seats and food prepared for take away while full service restaurants offer a variety
of meals that are eaten in the premises of the restaurants. This finding is contradictory to
Silvennoinen’s et al., (2012) study which showed that full restaurants waste more food than fast
food restaurants. In their study, fast food restaurants discarded about 7% of all food served while
full service restaurant contributed 19% of all food served. This finding also contradict with Hollins
(2013) who found full service restaurants to generate more food waste than fast food restaurants.
In Hollins’s study (2013) full service restaurants wasted about 23% of the total amount of food
purchased while fast food restaurants only wasted 8%. However, the amount of food waste found
in fast food restaurants confirms a finding by Kuczeruk (2011) in Elmedulan Jr, Apat and Matunog
(2014) who found that food waste contributed more than 50% of waste coming from fast food
restaurants. Plastic was the second predominant waste category in fast food restaurant at 23.31%
while 10.41% of plastic was found in full service restaurants making non-recyclable material the
second predominant waste stream in full service restaurants. Low levels of metal and other waste
categories were present in both fast food and full service restaurants. Glass material was absent
in fast food restaurant waste while 6.29 % of glass was found in the waste from full service
restaurants. Kuczeruk (2011) in Elmedulan Jr et al., (2014) also found minimal amount (0.6%) of
glass in the waste from a fast food restaurant.
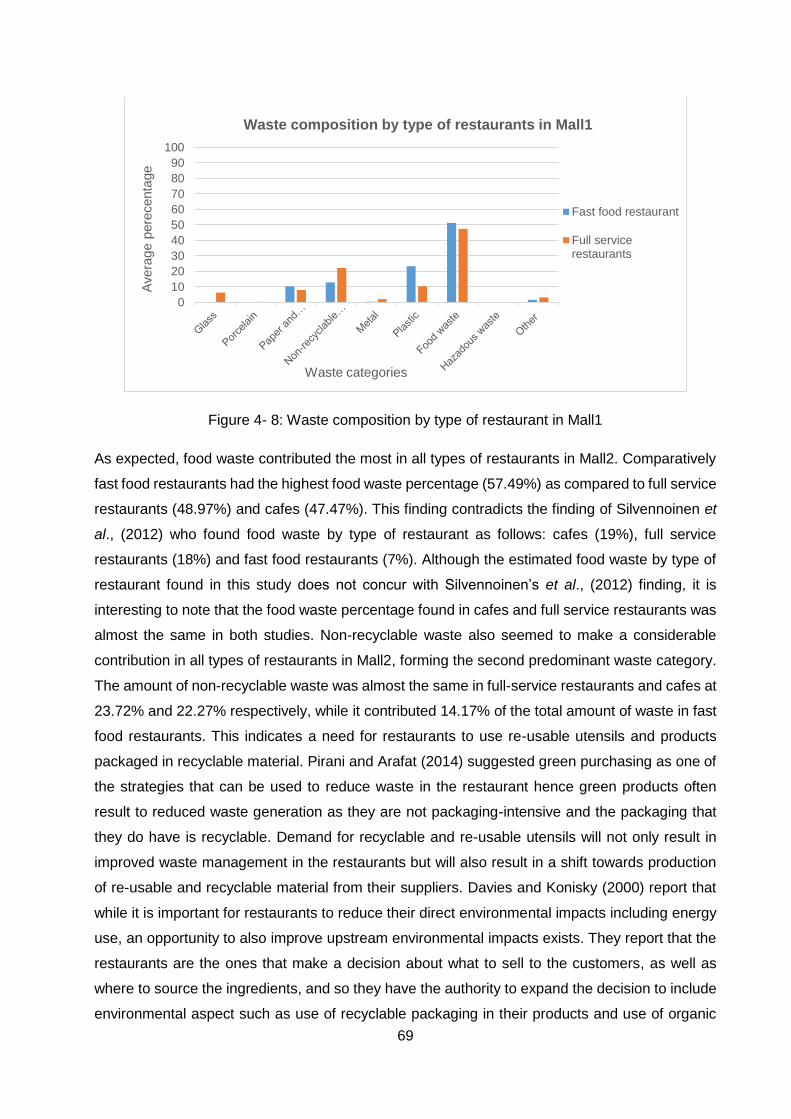
69
Figure 4- 8: Waste composition by type of restaurant in Mall1
As expected, food waste contributed the most in all types of restaurants in Mall2. Comparatively
fast food restaurants had the highest food waste percentage (57.49%) as compared to full service
restaurants (48.97%) and cafes (47.47%). This finding contradicts the finding of Silvennoinen et
al., (2012) who found food waste by type of restaurant as follows: cafes (19%), full service
restaurants (18%) and fast food restaurants (7%). Although the estimated food waste by type of
restaurant found in this study does not concur with Silvennoinen’s et al., (2012) finding, it is
interesting to note that the food waste percentage found in cafes and full service restaurants was
almost the same in both studies. Non-recyclable waste also seemed to make a considerable
contribution in all types of restaurants in Mall2, forming the second predominant waste category.
The amount of non-recyclable waste was almost the same in full-service restaurants and cafes at
23.72% and 22.27% respectively, while it contributed 14.17% of the total amount of waste in fast
food restaurants. This indicates a need for restaurants to use re-usable utensils and products
packaged in recyclable material. Pirani and Arafat (2014) suggested green purchasing as one of
the strategies that can be used to reduce waste in the restaurant hence green products often
result to reduced waste generation as they are not packaging-intensive and the packaging that
they do have is recyclable. Demand for recyclable and re-usable utensils will not only result in
improved waste management in the restaurants but will also result in a shift towards production
of re-usable and recyclable material from their suppliers. Davies and Konisky (2000) report that
while it is important for restaurants to reduce their direct environmental impacts including energy
use, an opportunity to also improve upstream environmental impacts exists. They report that the
restaurants are the ones that make a decision about what to sell to the customers, as well as
where to source the ingredients, and so they have the authority to expand the decision to include
environmental aspect such as use of recyclable packaging in their products and use of organic
0
10
20
30
40
50
60
70
80
90
100A
vera
ge p
ere
centa
ge
Waste categories
Waste composition by type of restaurants in Mall1
Fast food restaurant
Full servicerestaurants
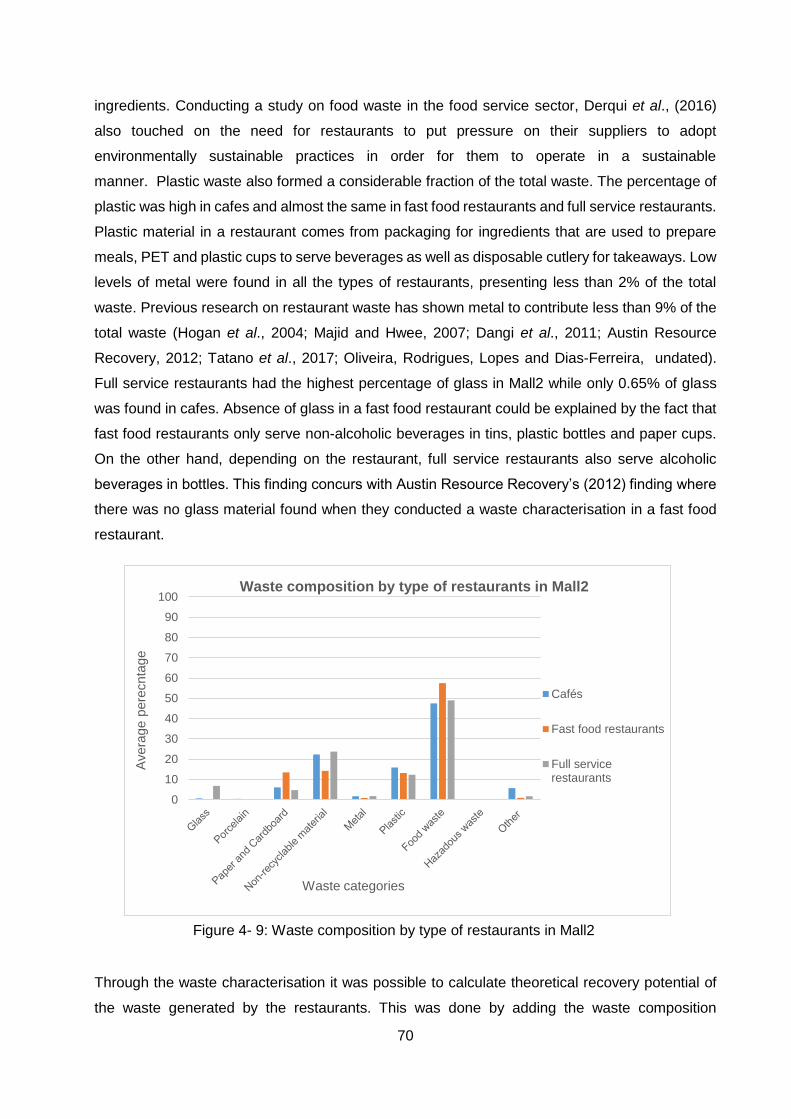
70
ingredients. Conducting a study on food waste in the food service sector, Derqui et al., (2016)
also touched on the need for restaurants to put pressure on their suppliers to adopt
environmentally sustainable practices in order for them to operate in a sustainable
manner. Plastic waste also formed a considerable fraction of the total waste. The percentage of
plastic was high in cafes and almost the same in fast food restaurants and full service restaurants.
Plastic material in a restaurant comes from packaging for ingredients that are used to prepare
meals, PET and plastic cups to serve beverages as well as disposable cutlery for takeaways. Low
levels of metal were found in all the types of restaurants, presenting less than 2% of the total
waste. Previous research on restaurant waste has shown metal to contribute less than 9% of the
total waste (Hogan et al., 2004; Majid and Hwee, 2007; Dangi et al., 2011; Austin Resource
Recovery, 2012; Tatano et al., 2017; Oliveira, Rodrigues, Lopes and Dias-Ferreira, undated).
Full service restaurants had the highest percentage of glass in Mall2 while only 0.65% of glass
was found in cafes. Absence of glass in a fast food restaurant could be explained by the fact that
fast food restaurants only serve non-alcoholic beverages in tins, plastic bottles and paper cups.
On the other hand, depending on the restaurant, full service restaurants also serve alcoholic
beverages in bottles. This finding concurs with Austin Resource Recovery’s (2012) finding where
there was no glass material found when they conducted a waste characterisation in a fast food
restaurant.
Through the waste characterisation it was possible to calculate theoretical recovery potential of
the waste generated by the restaurants. This was done by adding the waste composition
0
10
20
30
40
50
60
70
80
90
100
Avera
ge p
ere
cnta
ge
Waste categories
Waste composition by type of restaurants in Mall2
Cafés
Fast food restaurants
Full servicerestaurants
Figure 4- 9: Waste composition by type of restaurants in Mall2
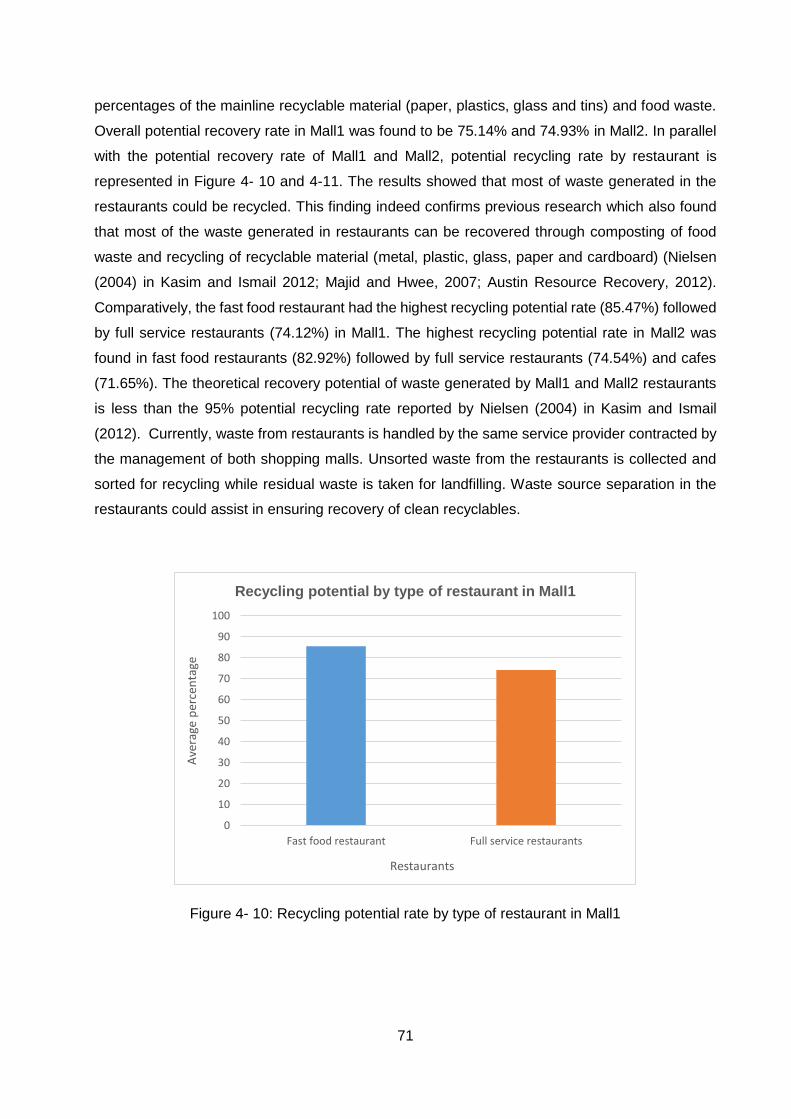
71
percentages of the mainline recyclable material (paper, plastics, glass and tins) and food waste.
Overall potential recovery rate in Mall1 was found to be 75.14% and 74.93% in Mall2. In parallel
with the potential recovery rate of Mall1 and Mall2, potential recycling rate by restaurant is
represented in Figure 4- 10 and 4-11. The results showed that most of waste generated in the
restaurants could be recycled. This finding indeed confirms previous research which also found
that most of the waste generated in restaurants can be recovered through composting of food
waste and recycling of recyclable material (metal, plastic, glass, paper and cardboard) (Nielsen
(2004) in Kasim and Ismail 2012; Majid and Hwee, 2007; Austin Resource Recovery, 2012).
Comparatively, the fast food restaurant had the highest recycling potential rate (85.47%) followed
by full service restaurants (74.12%) in Mall1. The highest recycling potential rate in Mall2 was
found in fast food restaurants (82.92%) followed by full service restaurants (74.54%) and cafes
(71.65%). The theoretical recovery potential of waste generated by Mall1 and Mall2 restaurants
is less than the 95% potential recycling rate reported by Nielsen (2004) in Kasim and Ismail
(2012). Currently, waste from restaurants is handled by the same service provider contracted by
the management of both shopping malls. Unsorted waste from the restaurants is collected and
sorted for recycling while residual waste is taken for landfilling. Waste source separation in the
restaurants could assist in ensuring recovery of clean recyclables.
Figure 4- 10: Recycling potential rate by type of restaurant in Mall1
0
10
20
30
40
50
60
70
80
90
100
Fast food restaurant Full service restaurants
Ave
rage
per
cen
tage
Restaurants
Recycling potential by type of restaurant in Mall1
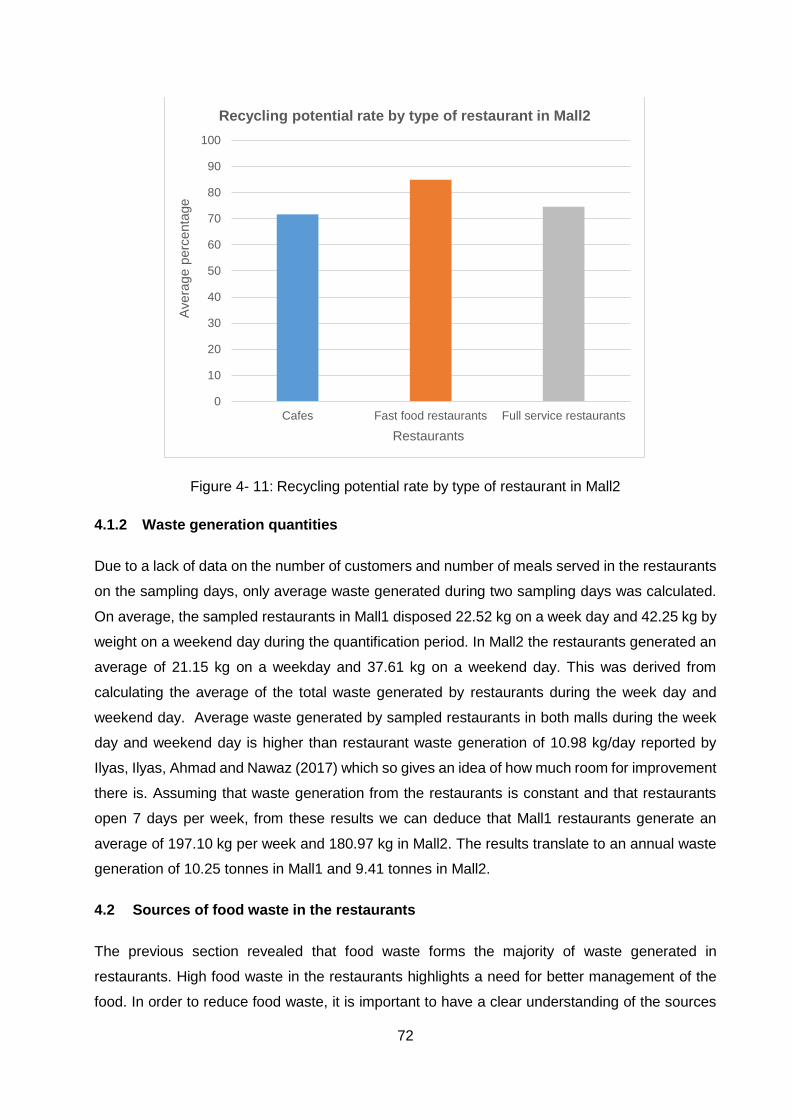
72
Figure 4- 11: Recycling potential rate by type of restaurant in Mall2
4.1.2 Waste generation quantities
Due to a lack of data on the number of customers and number of meals served in the restaurants
on the sampling days, only average waste generated during two sampling days was calculated.
On average, the sampled restaurants in Mall1 disposed 22.52 kg on a week day and 42.25 kg by
weight on a weekend day during the quantification period. In Mall2 the restaurants generated an
average of 21.15 kg on a weekday and 37.61 kg on a weekend day. This was derived from
calculating the average of the total waste generated by restaurants during the week day and
weekend day. Average waste generated by sampled restaurants in both malls during the week
day and weekend day is higher than restaurant waste generation of 10.98 kg/day reported by
Ilyas, Ilyas, Ahmad and Nawaz (2017) which so gives an idea of how much room for improvement
there is. Assuming that waste generation from the restaurants is constant and that restaurants
open 7 days per week, from these results we can deduce that Mall1 restaurants generate an
average of 197.10 kg per week and 180.97 kg in Mall2. The results translate to an annual waste
generation of 10.25 tonnes in Mall1 and 9.41 tonnes in Mall2.
4.2 Sources of food waste in the restaurants
The previous section revealed that food waste forms the majority of waste generated in
restaurants. High food waste in the restaurants highlights a need for better management of the
food. In order to reduce food waste, it is important to have a clear understanding of the sources
0
10
20
30
40
50
60
70
80
90
100
Cafes Fast food restaurants Full service restaurants
Avera
ge p
erc
enta
ge
Restaurants
Recycling potential rate by type of restaurant in Mall2
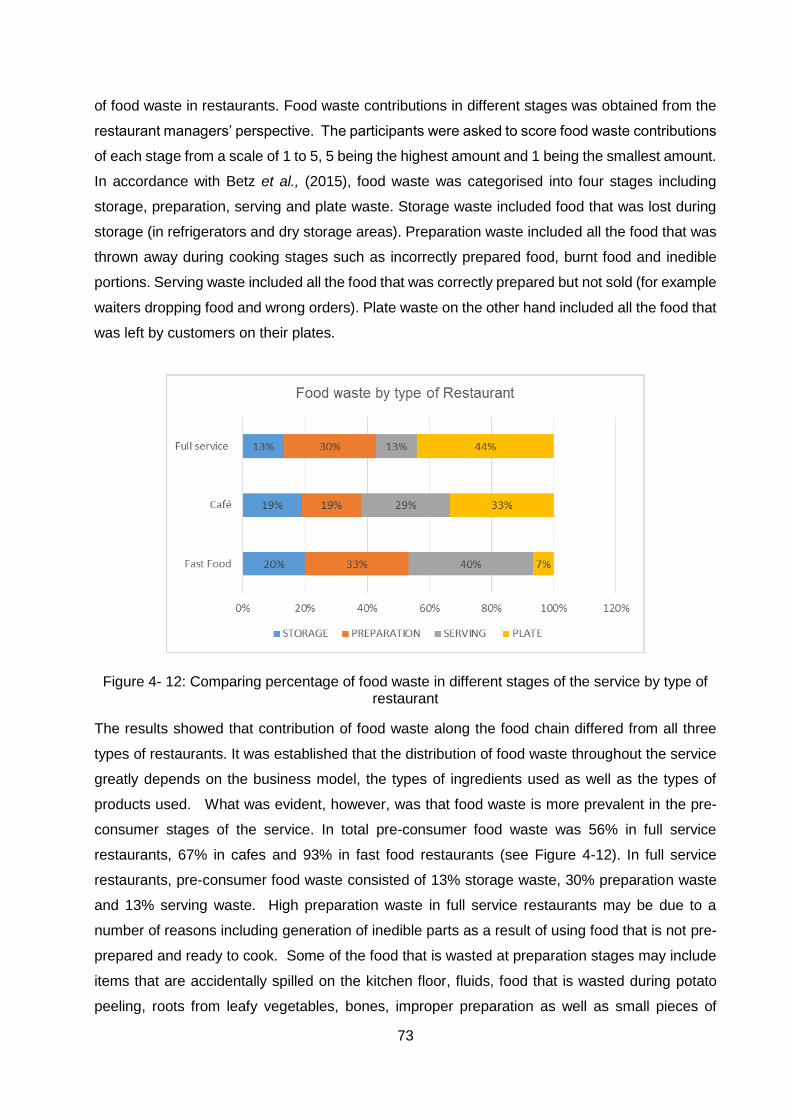
73
of food waste in restaurants. Food waste contributions in different stages was obtained from the
restaurant managers’ perspective. The participants were asked to score food waste contributions
of each stage from a scale of 1 to 5, 5 being the highest amount and 1 being the smallest amount.
In accordance with Betz et al., (2015), food waste was categorised into four stages including
storage, preparation, serving and plate waste. Storage waste included food that was lost during
storage (in refrigerators and dry storage areas). Preparation waste included all the food that was
thrown away during cooking stages such as incorrectly prepared food, burnt food and inedible
portions. Serving waste included all the food that was correctly prepared but not sold (for example
waiters dropping food and wrong orders). Plate waste on the other hand included all the food that
was left by customers on their plates.
Figure 4- 12: Comparing percentage of food waste in different stages of the service by type of restaurant
The results showed that contribution of food waste along the food chain differed from all three
types of restaurants. It was established that the distribution of food waste throughout the service
greatly depends on the business model, the types of ingredients used as well as the types of
products used. What was evident, however, was that food waste is more prevalent in the pre-
consumer stages of the service. In total pre-consumer food waste was 56% in full service
restaurants, 67% in cafes and 93% in fast food restaurants (see Figure 4-12). In full service
restaurants, pre-consumer food waste consisted of 13% storage waste, 30% preparation waste
and 13% serving waste. High preparation waste in full service restaurants may be due to a
number of reasons including generation of inedible parts as a result of using food that is not pre-
prepared and ready to cook. Some of the food that is wasted at preparation stages may include
items that are accidentally spilled on the kitchen floor, fluids, food that is wasted during potato
peeling, roots from leafy vegetables, bones, improper preparation as well as small pieces of
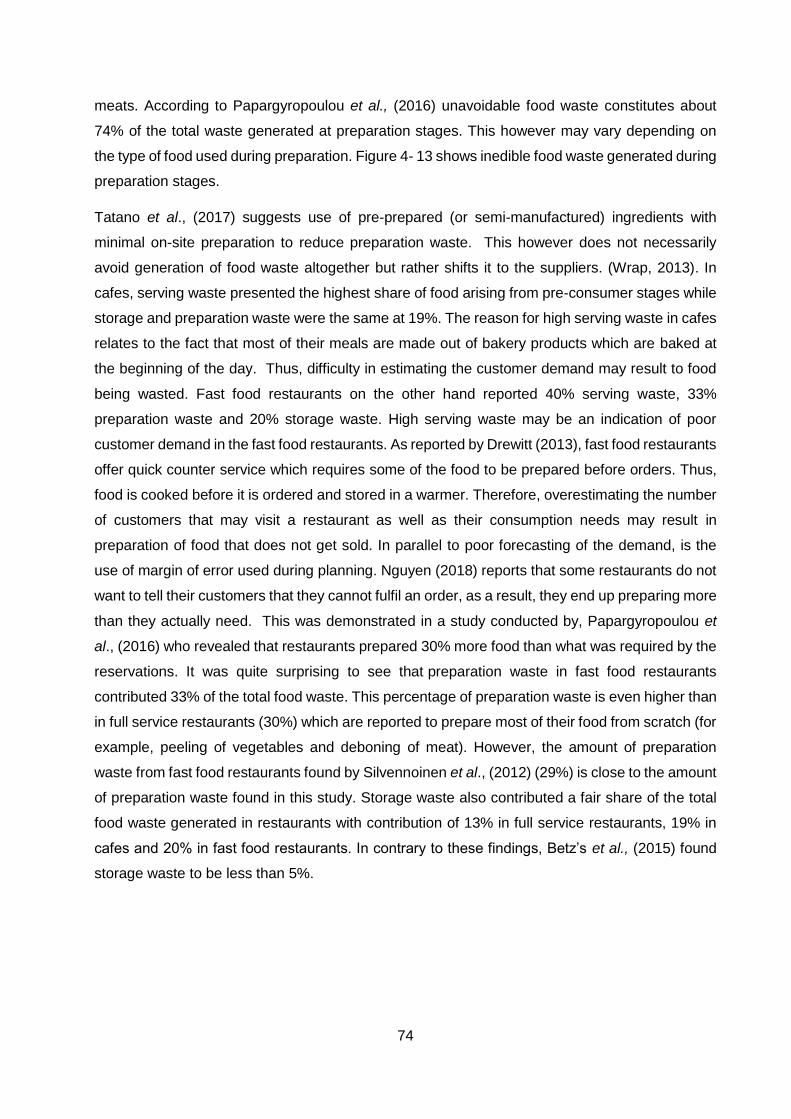
74
meats. According to Papargyropoulou et al., (2016) unavoidable food waste constitutes about
74% of the total waste generated at preparation stages. This however may vary depending on
the type of food used during preparation. Figure 4- 13 shows inedible food waste generated during
preparation stages.
Tatano et al., (2017) suggests use of pre-prepared (or semi-manufactured) ingredients with
minimal on-site preparation to reduce preparation waste. This however does not necessarily
avoid generation of food waste altogether but rather shifts it to the suppliers. (Wrap, 2013). In
cafes, serving waste presented the highest share of food arising from pre-consumer stages while
storage and preparation waste were the same at 19%. The reason for high serving waste in cafes
relates to the fact that most of their meals are made out of bakery products which are baked at
the beginning of the day. Thus, difficulty in estimating the customer demand may result to food
being wasted. Fast food restaurants on the other hand reported 40% serving waste, 33%
preparation waste and 20% storage waste. High serving waste may be an indication of poor
customer demand in the fast food restaurants. As reported by Drewitt (2013), fast food restaurants
offer quick counter service which requires some of the food to be prepared before orders. Thus,
food is cooked before it is ordered and stored in a warmer. Therefore, overestimating the number
of customers that may visit a restaurant as well as their consumption needs may result in
preparation of food that does not get sold. In parallel to poor forecasting of the demand, is the
use of margin of error used during planning. Nguyen (2018) reports that some restaurants do not
want to tell their customers that they cannot fulfil an order, as a result, they end up preparing more
than they actually need. This was demonstrated in a study conducted by, Papargyropoulou et
al., (2016) who revealed that restaurants prepared 30% more food than what was required by the
reservations. It was quite surprising to see that preparation waste in fast food restaurants
contributed 33% of the total food waste. This percentage of preparation waste is even higher than
in full service restaurants (30%) which are reported to prepare most of their food from scratch (for
example, peeling of vegetables and deboning of meat). However, the amount of preparation
waste from fast food restaurants found by Silvennoinen et al., (2012) (29%) is close to the amount
of preparation waste found in this study. Storage waste also contributed a fair share of the total
food waste generated in restaurants with contribution of 13% in full service restaurants, 19% in
cafes and 20% in fast food restaurants. In contrary to these findings, Betz’s et al., (2015) found
storage waste to be less than 5%.
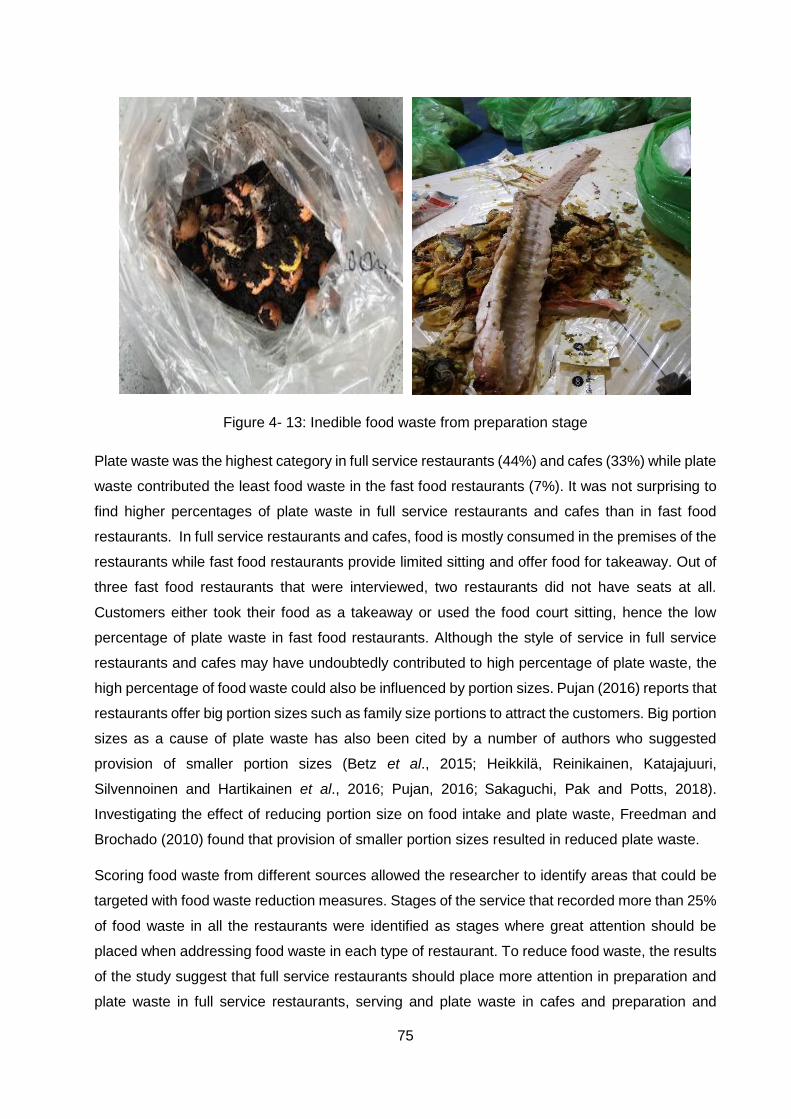
75
Figure 4- 13: Inedible food waste from preparation stage
Plate waste was the highest category in full service restaurants (44%) and cafes (33%) while plate
waste contributed the least food waste in the fast food restaurants (7%). It was not surprising to
find higher percentages of plate waste in full service restaurants and cafes than in fast food
restaurants. In full service restaurants and cafes, food is mostly consumed in the premises of the
restaurants while fast food restaurants provide limited sitting and offer food for takeaway. Out of
three fast food restaurants that were interviewed, two restaurants did not have seats at all.
Customers either took their food as a takeaway or used the food court sitting, hence the low
percentage of plate waste in fast food restaurants. Although the style of service in full service
restaurants and cafes may have undoubtedly contributed to high percentage of plate waste, the
high percentage of food waste could also be influenced by portion sizes. Pujan (2016) reports that
restaurants offer big portion sizes such as family size portions to attract the customers. Big portion
sizes as a cause of plate waste has also been cited by a number of authors who suggested
provision of smaller portion sizes (Betz et al., 2015; Heikkilä, Reinikainen, Katajajuuri,
Silvennoinen and Hartikainen et al., 2016; Pujan, 2016; Sakaguchi, Pak and Potts, 2018).
Investigating the effect of reducing portion size on food intake and plate waste, Freedman and
Brochado (2010) found that provision of smaller portion sizes resulted in reduced plate waste.
Scoring food waste from different sources allowed the researcher to identify areas that could be
targeted with food waste reduction measures. Stages of the service that recorded more than 25%
of food waste in all the restaurants were identified as stages where great attention should be
placed when addressing food waste in each type of restaurant. To reduce food waste, the results
of the study suggest that full service restaurants should place more attention in preparation and
plate waste in full service restaurants, serving and plate waste in cafes and preparation and
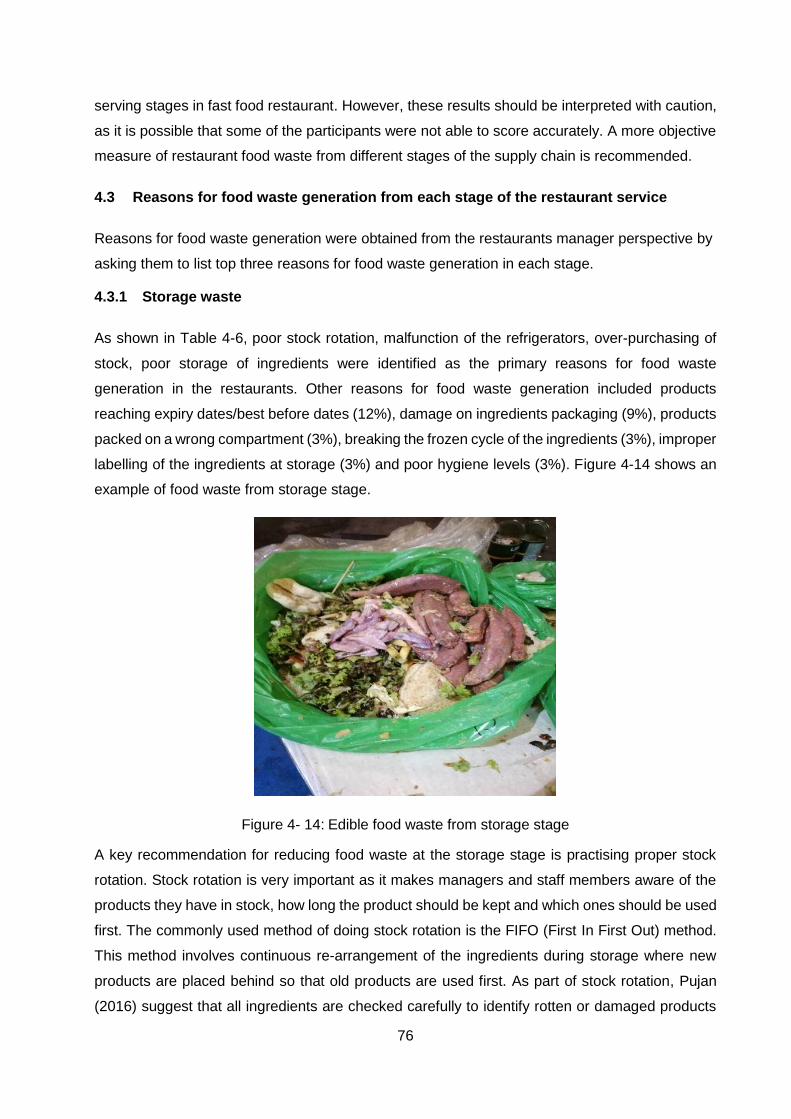
76
serving stages in fast food restaurant. However, these results should be interpreted with caution,
as it is possible that some of the participants were not able to score accurately. A more objective
measure of restaurant food waste from different stages of the supply chain is recommended.
4.3 Reasons for food waste generation from each stage of the restaurant service
Reasons for food waste generation were obtained from the restaurants manager perspective by
asking them to list top three reasons for food waste generation in each stage.
4.3.1 Storage waste
As shown in Table 4-6, poor stock rotation, malfunction of the refrigerators, over-purchasing of
stock, poor storage of ingredients were identified as the primary reasons for food waste
generation in the restaurants. Other reasons for food waste generation included products
reaching expiry dates/best before dates (12%), damage on ingredients packaging (9%), products
packed on a wrong compartment (3%), breaking the frozen cycle of the ingredients (3%), improper
labelling of the ingredients at storage (3%) and poor hygiene levels (3%). Figure 4-14 shows an
example of food waste from storage stage.
Figure 4- 14: Edible food waste from storage stage
A key recommendation for reducing food waste at the storage stage is practising proper stock
rotation. Stock rotation is very important as it makes managers and staff members aware of the
products they have in stock, how long the product should be kept and which ones should be used
first. The commonly used method of doing stock rotation is the FIFO (First In First Out) method.
This method involves continuous re-arrangement of the ingredients during storage where new
products are placed behind so that old products are used first. As part of stock rotation, Pujan
(2016) suggest that all ingredients are checked carefully to identify rotten or damaged products
77
and also to check if the food is stored under the correct temperature. Over-purchasing of stock
on the other hand can be addressed by reviewing stock purchasing procedures and training staff
to ensure that the food is used before it reaches its expiry date (Wrap, 2013).
4.3.2 Preparation waste
The results showed that a lot of food waste (edible portion) occurs as a result of human error
during the preparation stages. Out of six reasons for food waste generation identified by the
restaurant managers, only two reasons were not related to human error (malfunction of the fridge
in the preparation section and offcuts). Offcuts as one of the reasons for food waste generation
was mentioned by only one restaurant staff member could mean that they do not repurpose their
ingredients in their restaurant. In terms of frequency percentage, the top three reasons for food
waste generation were negligence from the staff members (42%) (burning and dropping food
were the frequently mentioned examples), incorrectly prepared food /not following the recipe
(23%) and improper portioning/ measuring of food (12%). Other reasons included malfunction of
the fridge in the preparation section (8%), staff not following the standard operating procedure
(SOP) (8%) and offcuts (4%). These findings seem to point to a possible need for improvement
of the staff performance. One of the most obvious strategies that can be used to reduce food
waste during preparation stage is training of the staff members. Continuous training and
acknowledgement of staff is necessary to ensure efficiency in the staff members and
consequently reduced food waste as a result of proper handling of food. (Ferreira, Liz Martins and
Rocha, 2013; Pirani and Arafat, 2014; Betz et al., 2015; Pujan, 2016). Training is recommended
to clarify problems and highlight potential for avoiding food waste (Betz et al., 2015). Using
different training methods increases the effectiveness of the training (United States Environmental
Protection Agency, 2014) and this can be achieved through the use of seminars, posters,
symposium and the use of billboards (Elmedulan Jr et al., 2014).
4.3.3 Serving waste
Placing a wrong order is one of the four causes of serving waste that were revealed during the
interviews. Papargyropoulou et al., (2016) also found wrong order taking as one of the causes of
food waste and attributed it to poor coordination and communication between the different
departments (sales department, kitchen and waiting staff) in charge of bookings. This was
reported to be more common in cases where the initial order was changed (Papargyropoulou et
al., (2016). According Nguyen (2018) miscommunication among restaurant staff members may
occur as a result of cultural gaps, physical layout of the operation or language and also because
of limited time.
78
The interviews revealed another contributing factor to serving waste as preparation of excessive
amounts of food. Preparation of excessive amounts of food can be attributed to poor forecast of
customer demand. Previous research shows that kitchen operators sometimes have difficulties
in estimating the number of customers that might visit their restaurant and also meals that may
be purchased (Derqui et al., 2016; Nguyen, 2018). Estimating demand is very important as it
helps in predicting the number of customers that may visit the restaurant and consequently the
amount of food that needs to be prepared for that day. Restaurant managers use predictive and
logical systems to estimate the demand by considering a variety of internal and external factors.
Internal factors may include previous sales and past clients while external factors may include
pay days, public holidays, weather and events close to the restaurants. Although restaurants
interviewed in this study did not mention customer demand forecasting as one of the reasons for
food waste generation, the research revealed that different forecasting practices exist in the
restaurant industry, with some companies using a tool while others use logic. Most of the
managers indicated to use logic to estimate the demand while only one manager reported to use
a tool. The restaurant manager reported that the benefit of using the tool is that it does not allow
the restaurant to prepare more food but allows them to prepare less food and thus encourages
food waste reduction. Wrap (2011) reports that although forecast error can be reduced through
the use of tools, the forecast error cannot be eliminated. Accurate forecast is key to reducing pre-
consumer food waste and the resultant costs to the business as it is ensured that the prepared
food has an end customer. Nguyen (2018) suggests studying the customer’s preferences and
other factors.
Another possible reason for preparation of excessive amounts of food may be the used margin
of error during planning. Evidence suggests that restaurants prepare more food than their
estimated demand (Ferreira et al., 2013; Papargyropoulou et al., 2016; Nguyen, 2018; Derqui et
al., 2016). While investigating food waste management in the hospitality sector, Nguyen (2018)
revealed that overproduction is regarded as a risk management strategy. This is because
restaurants do not want to take the risk of running out of food, hence they generate more food in
case more people visit their restaurants (Nguyen, 2018). However, more often than not the
excessive amount of food ends up as waste. This is a significant finding as it suggests a low level
of educational awareness surrounding food waste reduction and profitability. Overproduction
wastes constitute significant cost to the company as materials and resources in manufacturing
are wasted given that the finished (prepared) product no-longer has an end customer (Darlington
et al., 2009). Papargyropoulou et al., (2016) conducting a study of food waste generation and
prevention in the hospitality industry revealed that restaurants prepared 30% more food than what
is required. When questioned on the use of margin of error, about 15 restaurants that were
interviewed in this study reported to prepare food to meet the demand while two restaurants
79
declared to prepare more food so that they do not run out. One of the restaurant managers that
admitted to prepare more food than their demand reported that they increase their food quantities
by 10%.
Other causes of food waste generation during the serving stages included waiters dropping food
(24%) which could indicate a need for training of staff members. Restaurant managers also
identified customers ordering something that they do not know (14%) as one of the drivers of food
waste.
Restaurant manager: “There are dishes that are sent back by customers. This happens when the
customer’s orders something that they do not know and when the order arrives they do not want
the food, so they send it back. This mostly happens with eggs where a customer orders a sunny
side up egg, which is a very raw egg. When they get the order they say it’s very raw, I can’t eat
this, they send it back. In this case, the eggs are taken back to the kitchen for more cooking but
if the product can’t be fixed it becomes waste to the restaurant”.
4.3.4 Plate waste
In terms of plate waste, there are four drivers of food waste that were identified by the restaurant
managers. The first reason for plate waste generation was dissatisfaction with the taste of food.
Dissatisfaction with the taste of food as a driver of plate waster was also cited by Juvan, Grün,
and Dolnicar (2018). Customers usually have an expectation of how the food should taste like
when they visit a restaurant. When the expectations are not met, the food is sent back to the
kitchen through complaints. For example, this may occur when they are not happy with the taste
of certain ingredients, condiments, or the quality of the served food (Nguyen, 2018).
Consequently, this leaves the restaurant staff with no choice but to dispose the food as it cannot
be served or eaten by someone else. The second reason was customers leaving food because
they are full which may be attributed to provision of big portion sizes. The third reason for plate
waste generation was people ordering more than they can eat. A similar observation was made
in Papargyropoulou’s et al., 2016 study. They revealed a significant driver of food waste relating
to customer’s cultural belief by providing an example of a leader of the family ordering more food
than the family can eat to show that he can provide for the family. The fourth reason was children
not finishing food. According to Neff, Spiker and Truant (2015) children waste more food than
adults. It was also interesting to note Niaki, Moore, Chen and Cullen (2017) finding which revealed
that food wastage behaviour differs among children. In this study Niaki’s et al., (2017) investigated
food waste generation by elementary school students with the aim of assessing if there was a
difference in food waste generation between grades. They categorised the grades into pre-school
to grade 1, grade 2 to grade 3 and grade 4 to grade 5. The results showed that pre-school to
grade 1 category wasted more waste food than grade 2 to grade 3 and grade 4 to grade 5
80
categories. A lot of restaurants have meals tailored for children (Duursma, Vrenegoor and Kobus,
2016). However, woman and elderly who are reported to eat less food than men do not order
portion sizes tailored for them (Duursma et al., 2016). These findings are very important as they
show that standardised meals served in restaurants do not meet the appetite of every customer.
Although plate waste is consumer-related food waste, strategies to reduce it can be employed by
both restaurants and consumers. However, Derqui et al., (2016) reports that most of the
managers regard plate waste minimisation as a responsibility of the customer and not
responsibility of the restaurants. This is mainly because food left on the plate is paid for and does
not impact on the financial performance of the restaurant. (Derqui et al., 2016). Thus, restaurant
staff members are encouraged to reduce food waste occurring in the kitchen to maximise profit
(Wrap, 2013). However, they lack economic driver to reduce plate waste, because the more
consumers order, the more the profit they make (Wrap, 2013).
Ensuring provision of good quality service is one of the strategies that can be used by restaurants
to reduce plate waste. Investigating generation and collection of restaurant waste in Italy, Tatano
et al., (2017) revealed that restaurants use fresh locally grown food with good quality to avoid
waste as a result of poor quality and taste. Wrap (2013) suggests customisation of portion sizes
and use of various prices based on the portion sizes. To ensure correct portioning, Duursma et
al., (2016) suggested use of calibrated measuring tools such as cups and serving spoons. Other
strategies documented in the literature include the use of small serving plates and the offer versus
serve food provisioning method. Offer versus serve method is a food provisioning method where
the customers are given an opportunity to choose what they want. This method can help reduce
wastage of side dishes and accompaniments which are often left uneaten by customers in the
restaurants. On the other hand, customers can also play a crucial role in plate waste reduction by
ordering food that meets their appetite and also by taking their food as ‘doggy bag’ for later use
(Principato, 2018). Table 4- 6 shows the frequency percentage of the reasons why food is wasted
at each stage of the restaurant service.
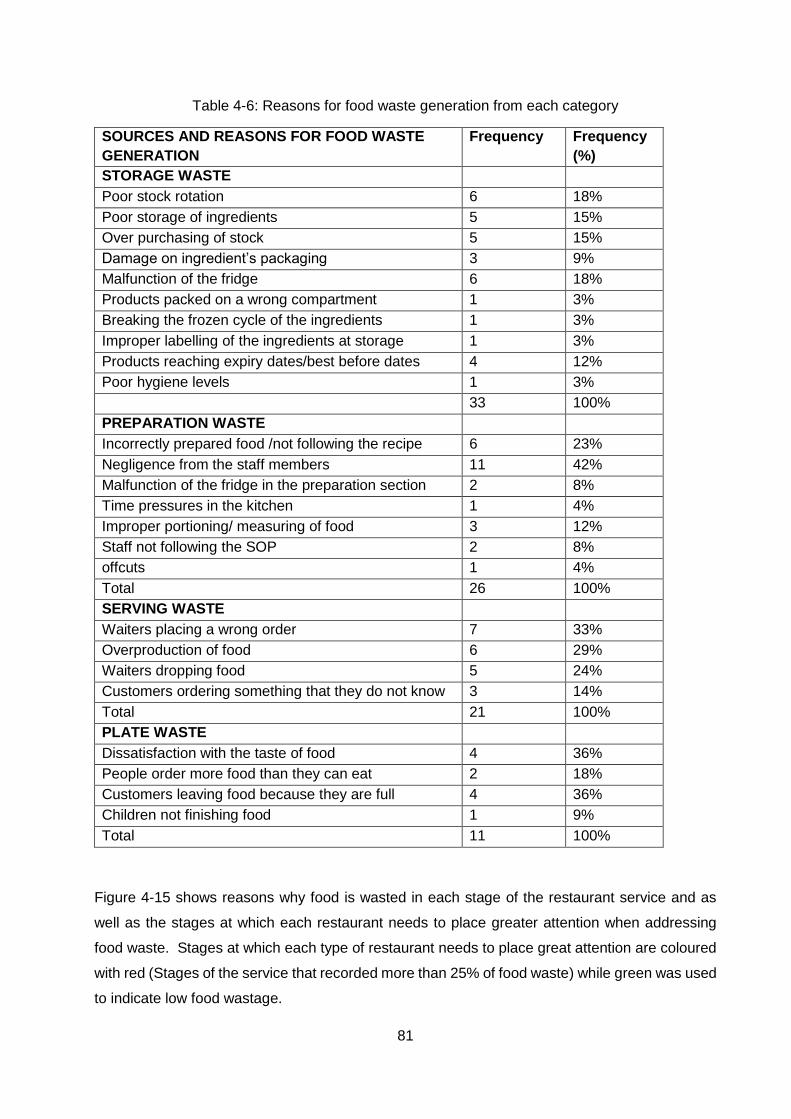
81
Table 4-6: Reasons for food waste generation from each category
SOURCES AND REASONS FOR FOOD WASTE
GENERATION
Frequency Frequency
(%)
STORAGE WASTE
Poor stock rotation 6 18%
Poor storage of ingredients 5 15%
Over purchasing of stock 5 15%
Damage on ingredient’s packaging 3 9%
Malfunction of the fridge 6 18%
Products packed on a wrong compartment 1 3%
Breaking the frozen cycle of the ingredients 1 3%
Improper labelling of the ingredients at storage 1 3%
Products reaching expiry dates/best before dates 4 12%
Poor hygiene levels 1 3%
33 100%
PREPARATION WASTE
Incorrectly prepared food /not following the recipe 6 23%
Negligence from the staff members 11 42%
Malfunction of the fridge in the preparation section 2 8%
Time pressures in the kitchen 1 4%
Improper portioning/ measuring of food 3 12%
Staff not following the SOP 2 8%
offcuts 1 4%
Total 26 100%
SERVING WASTE
Waiters placing a wrong order 7 33%
Overproduction of food 6 29%
Waiters dropping food 5 24%
Customers ordering something that they do not know 3 14%
Total 21 100%
PLATE WASTE
Dissatisfaction with the taste of food 4 36%
People order more food than they can eat 2 18%
Customers leaving food because they are full 4 36%
Children not finishing food 1 9%
Total 11 100%
Figure 4-15 shows reasons why food is wasted in each stage of the restaurant service and as
well as the stages at which each restaurant needs to place greater attention when addressing
food waste. Stages at which each type of restaurant needs to place great attention are coloured
with red (Stages of the service that recorded more than 25% of food waste) while green was used
to indicate low food wastage.
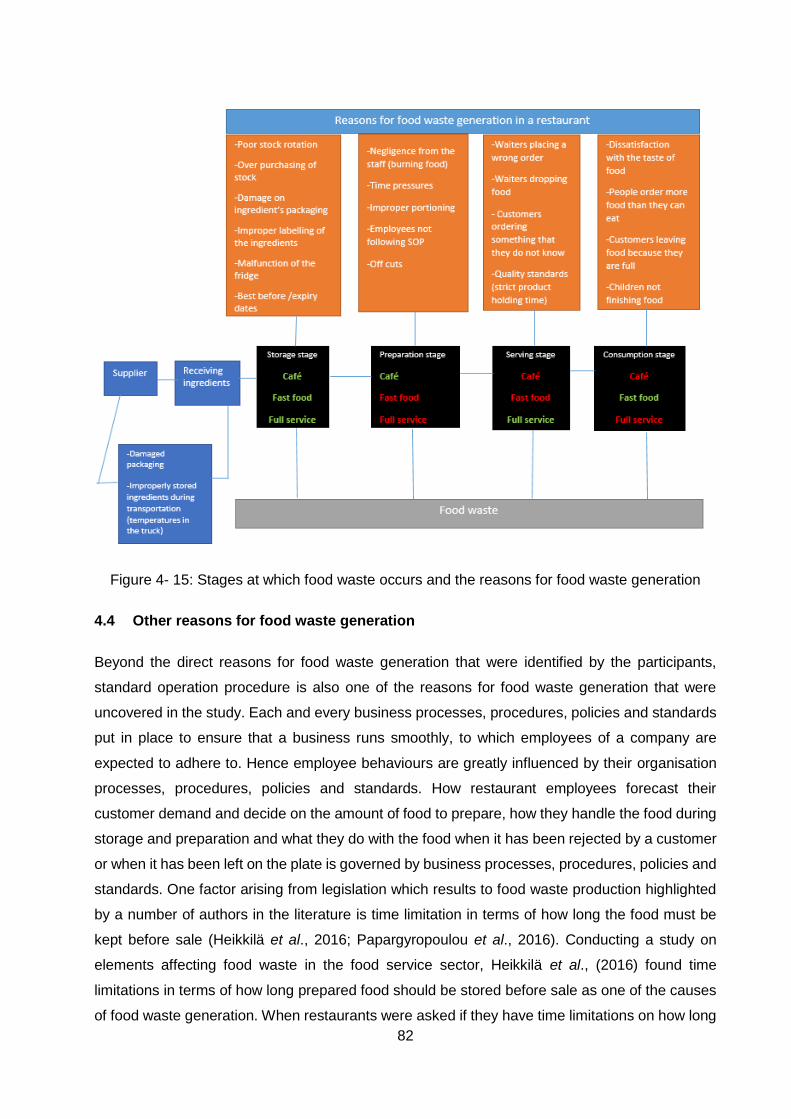
82
Figure 4- 15: Stages at which food waste occurs and the reasons for food waste generation
4.4 Other reasons for food waste generation
Beyond the direct reasons for food waste generation that were identified by the participants,
standard operation procedure is also one of the reasons for food waste generation that were
uncovered in the study. Each and every business processes, procedures, policies and standards
put in place to ensure that a business runs smoothly, to which employees of a company are
expected to adhere to. Hence employee behaviours are greatly influenced by their organisation
processes, procedures, policies and standards. How restaurant employees forecast their
customer demand and decide on the amount of food to prepare, how they handle the food during
storage and preparation and what they do with the food when it has been rejected by a customer
or when it has been left on the plate is governed by business processes, procedures, policies and
standards. One factor arising from legislation which results to food waste production highlighted
by a number of authors in the literature is time limitation in terms of how long the food must be
kept before sale (Heikkilä et al., 2016; Papargyropoulou et al., 2016). Conducting a study on
elements affecting food waste in the food service sector, Heikkilä et al., (2016) found time
limitations in terms of how long prepared food should be stored before sale as one of the causes
of food waste generation. When restaurants were asked if they have time limitations on how long
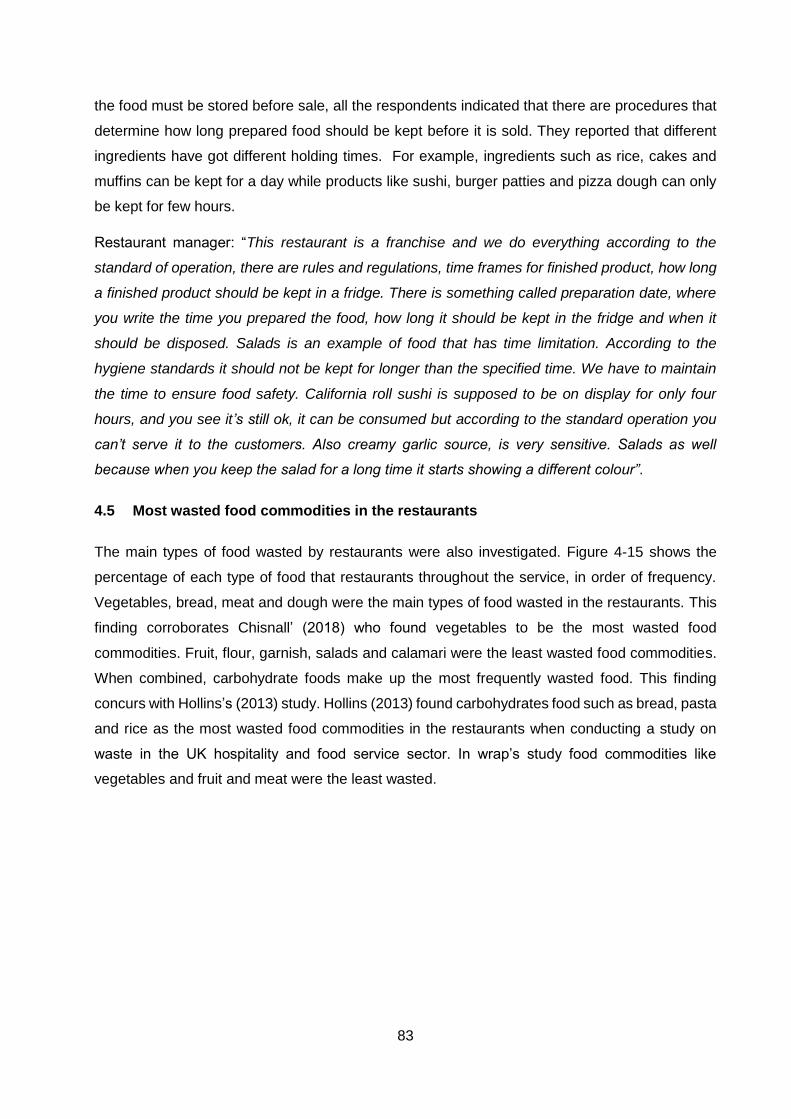
83
the food must be stored before sale, all the respondents indicated that there are procedures that
determine how long prepared food should be kept before it is sold. They reported that different
ingredients have got different holding times. For example, ingredients such as rice, cakes and
muffins can be kept for a day while products like sushi, burger patties and pizza dough can only
be kept for few hours.
Restaurant manager: “This restaurant is a franchise and we do everything according to the
standard of operation, there are rules and regulations, time frames for finished product, how long
a finished product should be kept in a fridge. There is something called preparation date, where
you write the time you prepared the food, how long it should be kept in the fridge and when it
should be disposed. Salads is an example of food that has time limitation. According to the
hygiene standards it should not be kept for longer than the specified time. We have to maintain
the time to ensure food safety. California roll sushi is supposed to be on display for only four
hours, and you see it’s still ok, it can be consumed but according to the standard operation you
can’t serve it to the customers. Also creamy garlic source, is very sensitive. Salads as well
because when you keep the salad for a long time it starts showing a different colour”.
4.5 Most wasted food commodities in the restaurants
The main types of food wasted by restaurants were also investigated. Figure 4-15 shows the
percentage of each type of food that restaurants throughout the service, in order of frequency.
Vegetables, bread, meat and dough were the main types of food wasted in the restaurants. This
finding corroborates Chisnall’ (2018) who found vegetables to be the most wasted food
commodities. Fruit, flour, garnish, salads and calamari were the least wasted food commodities.
When combined, carbohydrate foods make up the most frequently wasted food. This finding
concurs with Hollins’s (2013) study. Hollins (2013) found carbohydrates food such as bread, pasta
and rice as the most wasted food commodities in the restaurants when conducting a study on
waste in the UK hospitality and food service sector. In wrap’s study food commodities like
vegetables and fruit and meat were the least wasted.
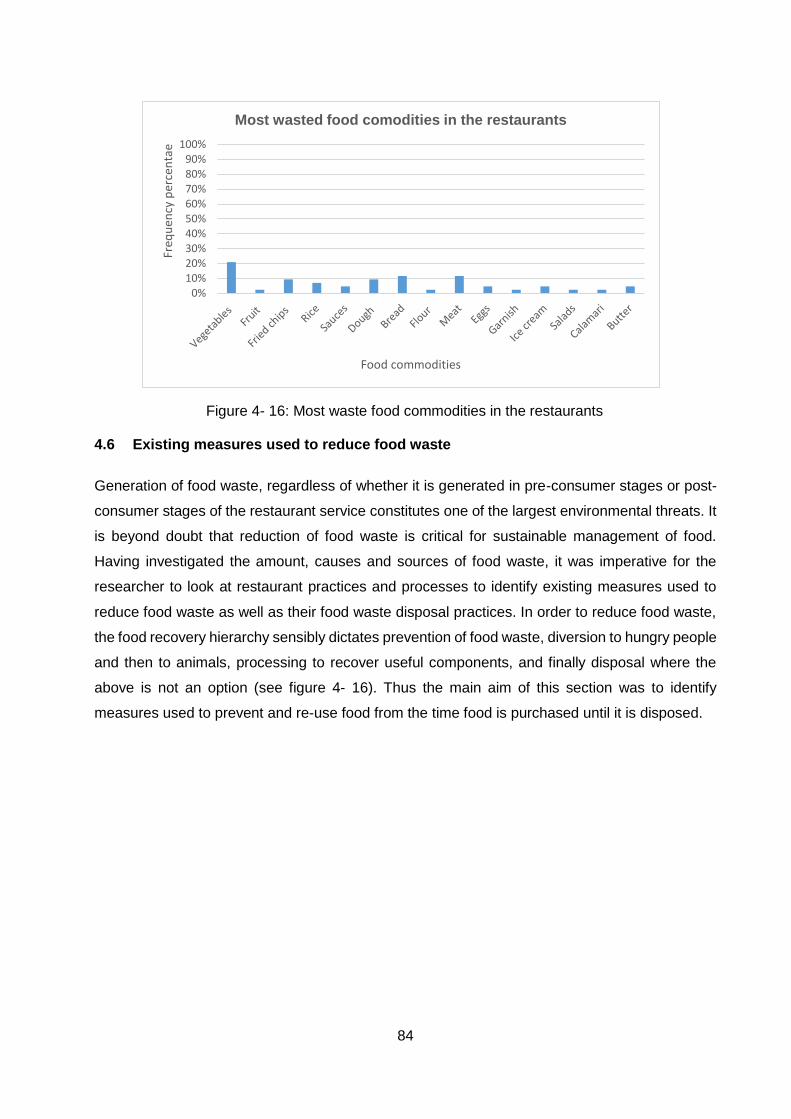
84
4.6 Existing measures used to reduce food waste
Generation of food waste, regardless of whether it is generated in pre-consumer stages or post-
consumer stages of the restaurant service constitutes one of the largest environmental threats. It
is beyond doubt that reduction of food waste is critical for sustainable management of food.
Having investigated the amount, causes and sources of food waste, it was imperative for the
researcher to look at restaurant practices and processes to identify existing measures used to
reduce food waste as well as their food waste disposal practices. In order to reduce food waste,
the food recovery hierarchy sensibly dictates prevention of food waste, diversion to hungry people
and then to animals, processing to recover useful components, and finally disposal where the
above is not an option (see figure 4- 16). Thus the main aim of this section was to identify
measures used to prevent and re-use food from the time food is purchased until it is disposed.
0%10%20%30%40%50%60%70%80%90%
100%
Freq
uen
cy p
erce
nta
e
Food commodities
Most wasted food comodities in the restaurants
Figure 4- 16: Most waste food commodities in the restaurants
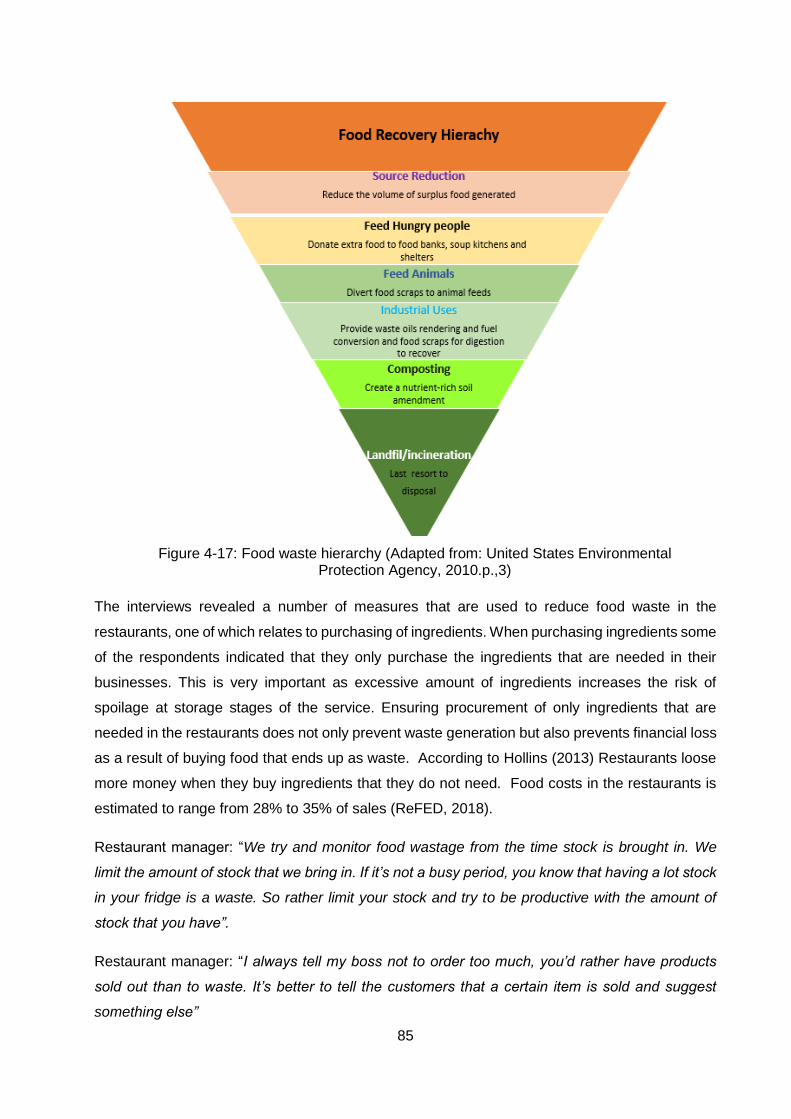
85
The interviews revealed a number of measures that are used to reduce food waste in the
restaurants, one of which relates to purchasing of ingredients. When purchasing ingredients some
of the respondents indicated that they only purchase the ingredients that are needed in their
businesses. This is very important as excessive amount of ingredients increases the risk of
spoilage at storage stages of the service. Ensuring procurement of only ingredients that are
needed in the restaurants does not only prevent waste generation but also prevents financial loss
as a result of buying food that ends up as waste. According to Hollins (2013) Restaurants loose
more money when they buy ingredients that they do not need. Food costs in the restaurants is
estimated to range from 28% to 35% of sales (ReFED, 2018).
Restaurant manager: “We try and monitor food wastage from the time stock is brought in. We
limit the amount of stock that we bring in. If it’s not a busy period, you know that having a lot stock
in your fridge is a waste. So rather limit your stock and try to be productive with the amount of
stock that you have”.
Restaurant manager: “I always tell my boss not to order too much, you’d rather have products
sold out than to waste. It’s better to tell the customers that a certain item is sold and suggest
something else”
Figure 4-17: Food waste hierarchy (Adapted from: United States Environmental Protection Agency, 2010.p.,3)
86
In line with purchasing of ingredients, another food waste prevention measure that was identified
in the study was the use of good quality ingredients. The majority of restaurants (franchises)
reported that they only get their ingredients from head office. The head office sources ingredients
from authorised suppliers. All the ingredients are checked for quality before they are distributed
to the restaurants. One of the respondents reported that because they are a franchise, food
purchased from their brand has to taste the same no matter where the restaurant is. A common
reason given for only getting ingredients from the head office was to ensure that the ingredients
they use are of good quality. Tatano et al. (2017) has also cited the use of good quality food as
one of the measures for reducing food waste. Some of the restaurants reported that they are
allowed to buy certain ingredients directly from suppliers, however, the supplier has to be
approved by the head office. For example, one of the respondents reported that “We are
authorized to buy fish from local fisherman, but I don’t believe in buying from local fisherman
because the fish might be contaminated. So I buy my products straight from the head office
because everything that comes from head office is tested, and standardised”. This example does
not only show how concerned the restaurant manager is when it comes to the quality of food, but
it also illustrates reluctance to buy locally produced food although several studies have shown a
growing consumer interest in local foods (Vieregge, et al., 2007; Jang et al., 2011; Chou et al.,
2012). From an environmental perspective, buying locally produced food reduces the distance
that the food has to travel from the producer to the end-user as well as other environmental
impacts associated with transporting food such as energy use and emission of carbon dioxide
(Wang, 2012; Jang et al., 2011).
Upon arrival of the stock, the respondents reported that the stock is checked to ensure that the
order is correct and that the food is in good condition upon receipt. When the food is not in a good
condition, they send it back to the head office or to the supplier. Examples given on the stock that
is returned back to the head office or to the supplier included broken burger patties, opened or
damaged packaging of the product, broken chicken pieces and tomatoes that are too ripe. The
respondents indicated that they have procedures that they follow when checking their products.
For example, with vegetables they check if they are dry (because if there is any liquid they get
spoiled very quickly), if the stock was stored in correct temperatures during transportation,
hygiene in the trucks as well as best before and expiry dates. With the best before and expiry
dates a person responsible for receiving stock checks if the dates on the primary packaging
correspond with the dates on the secondary packaging. Careful checking of stock that the
restaurants receive plays an important role in reducing food waste by rejecting poor quality
products and products that have a greater risk of spoilage. However, this does to prevent food
waste altogether, as rejected products become waste to the head office or the suppliers.
Accepted products are then taken to different storage areas. All the restaurants reported to use
87
the FIFO method which is a commonly used storage method where new products are kept behind
so that the new products are used first.
Another strategy used to prevent food waste that was identified in the study is the provision
training to staff members. The interviews revealed that restaurants use different training methods
such as on the job training, contracting service providers to provide training and distribution of a
leaflet containing everything about the store. Training as a critical measure for food waste
reduction has been cited by a number of authors (United States Environmental Protection Agency,
2014; Betz et al., 2015; Canali, Amani, Aramyan, Gheoldus, Moates, Östergren, Silvennoinen,
Waldron and Vittuari, 2016; Nguyen, 2018). Providing training helps improve the performance of
the employees. For example, one of the restaurants reported that training and experience in their
restaurant is very important as they prepare pizzas from open fire which may be difficult compared
to preparation with the use of calibrated stoves. To improve the performance of the staff members,
one of the restaurant mangers reported that every morning they have sessions called “fire up”
where they talk about the challenges that they encountered the previous day and address those
problems before they start a new day.
The type of food used during preparation has an influence on the amount of waste generated.
Use of pre-prepared or precut food reduces the amount of food waste generated during
preparation stages such as inedible portions of food and also incorrectly portioned food (Tatano
et al., 2017). The majority of fast food restaurants reported to use pre-prepared food while most
of the full service restaurants reported to prepare their food from scratch. Some cafes prepared
their food on site while others reported to get most of their products ready to sell.
Measuring the amount of waste generated in the restaurant is acknowledged as an important step
towards reducing food waste (United States Environmental Protection Agency, 2014). When
asked if they measure the amount of food waste they generate, all the participants reported that
they measure the amount of food waste they generate by recording the type of product and the
stage at which it was generated. One of the participants also stated that they are limited to waste
R100 and below a day. Once the restaurant exceeds the limit, the manager investigates the
sources of the food waste, the reason why it was wasted and the person responsible for wasting
the food. This is very important as it shows the staff members how important food waste reduction
is. Restaurant manager: “We have a waste sheet allocated to record all the waste we throw
away, then we try and minimised our waste because waste is not good for your profit? We identify
the reasons why food is wasted and we address those. It could be training needed, on the waiters
and production staff. For example, if you waste an item then you go write it down, you write I
wasted a quarter chicken, it was burnt, this staff member was involved and this is how it was
sorted. Even if a staff member throws away a wasted item we find it when we are doing a bin
88
check and then we follow up on that and discipline the staff member. However, before I discipline
a staff member I ask myself questions as a manager, that did I train the person, does she have
the correct equipment to do the job and if these were not done call the staff member teach the
staff member instead of demotivating her /him. But if the staff member continues then we give a
staff member a warning”.
However, when probed deeper on measuring of food waste, all the respondents admitted that
they only measure food waste that occurs at the pre-consumer stages. A majority of the
restaurants indicated that they are not concerned with waste that comes from the table. Lack of
concern in plate waste generation was also evident in the way one of the restaurants classified
food waste. He stated that waste food waste occurring in pre-consumer stages is classified as
waste while food occurring at the consumption stage is classified as left overs. This clearly shows
that food waste is classified based on its financial implication on the business.
Restaurant manager: “I am not concerned about any kind of waste from the table, I am concerned
about food that gets wasted before it reaches the table because that is where I might lose my
profit. Anything that comes from the table is classified as left overs and we have got nothing to do
with left overs”.
The example provided above supports Derqui’s et al., (2016) earlier finding that most of the
restaurant managers do not regard plate waste minimisation as their responsibility, mainly
because it does not affect the economic performance of the restaurant. While the findings point
to high levels of concern on food waste generation in the pre-consumer stages of the services
among restaurant managers, there were only three respondents that reported to repurpose their
ingredients. One the respondents reported that they have in-house specials which incorporate
the use of off-cuts. The respondents were then asked about surplus food management. About
59% of the participants reported that they give their surplus food to staff members while 41% of
the participants admitted to dispose food waste. Respondents cited poor quality of the food and
liability concerns regarding food safety as the reason why they do not give surplus food to the
staff members or donate it.
Restaurant manager: “Once the food passes the times limitation according to the procedure. It’s
not good for human consumption. That is why we do not give it to staff members. It’s very risky
to give the food to people because it is a procedure, we use processed food, so there is a reason
why they say it should be used within an hour. I am going to be liable for anything that happens,
if I give the food to the people”.
Another initiative that was used to reduce food waste was the use of incentive. One of the
managers reported that they get incentivised for good performance in their business and reducing
89
pre-consumer food waste is one of the areas that are considered. Incentives have been proven
to be effective in increasing recycling rates (Iyer and Kashyap, 2007; Yau, 2010; Li, Huang and
Harder, 2017) and have been recommended as one of the strategies that can be used to reduce
food waste in the restaurants (United States Environmental Protection Agency, 2010). Conducting
a study to evaluate the effectiveness of incentives in encouraging food waste diversion, Li et al.,
(2017) found that the use of incentives scheme had a great impact on food waste diversion. Timlett
and William, (2008) however caution that people are less likely to continue recycling when the
incentive has been withdrawn. Oke (2015) adds on to report that while the use of financial
incentives may have great impact in encouraging participation or increase in recycling rate, it has
limited to no impact in instigating a the recycling behaviour.
4.7 Waste management in the restaurants
This section provides a general overview of waste management practices employed by the
restaurants from waste generation until waste is disposed as un-wanted material. The available
disposal methods are presented and analysed, while possible interventions to improve the overall
management of wastes are discussed on the basis of the existing infrastructure. Waste
management practices were uncovered through observation and were later confirmed in the
interviews with centre management. In Mall1 interviews were conducted with a waste manager
and in Mall2 interviews were conducted with an operational manager.
Currently, waste from restaurants is handled by the same service provider contracted by the
management of both shopping malls. The mall uses a combination of a cage and recycling bins
to store waste coming from the shops (see Figure 4-17). Cages and bins placed in different
collection points in the mall (temporary waste area) are shared by shops and from there waste is
collected to the waste area where it is sorted. Waste from each collection point is collected three
times a day. Information about what and how to separate waste is communicated through the use
of posters in Mall2 (see figure 4- 7). The posters were only plagued in restaurant kitchen doors
as they were believed to be the main generators of food waste.
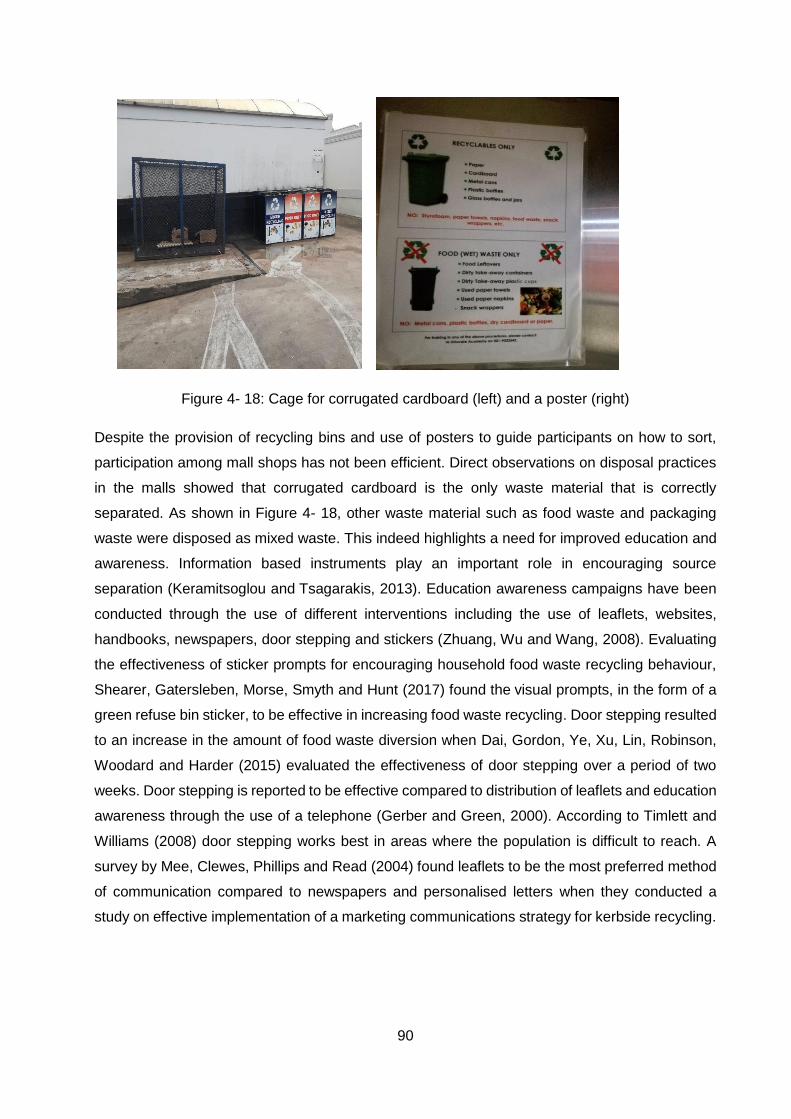
90
Figure 4- 18: Cage for corrugated cardboard (left) and a poster (right)
Despite the provision of recycling bins and use of posters to guide participants on how to sort,
participation among mall shops has not been efficient. Direct observations on disposal practices
in the malls showed that corrugated cardboard is the only waste material that is correctly
separated. As shown in Figure 4- 18, other waste material such as food waste and packaging
waste were disposed as mixed waste. This indeed highlights a need for improved education and
awareness. Information based instruments play an important role in encouraging source
separation (Keramitsoglou and Tsagarakis, 2013). Education awareness campaigns have been
conducted through the use of different interventions including the use of leaflets, websites,
handbooks, newspapers, door stepping and stickers (Zhuang, Wu and Wang, 2008). Evaluating
the effectiveness of sticker prompts for encouraging household food waste recycling behaviour,
Shearer, Gatersleben, Morse, Smyth and Hunt (2017) found the visual prompts, in the form of a
green refuse bin sticker, to be effective in increasing food waste recycling. Door stepping resulted
to an increase in the amount of food waste diversion when Dai, Gordon, Ye, Xu, Lin, Robinson,
Woodard and Harder (2015) evaluated the effectiveness of door stepping over a period of two
weeks. Door stepping is reported to be effective compared to distribution of leaflets and education
awareness through the use of a telephone (Gerber and Green, 2000). According to Timlett and
Williams (2008) door stepping works best in areas where the population is difficult to reach. A
survey by Mee, Clewes, Phillips and Read (2004) found leaflets to be the most preferred method
of communication compared to newspapers and personalised letters when they conducted a
study on effective implementation of a marketing communications strategy for kerbside recycling.
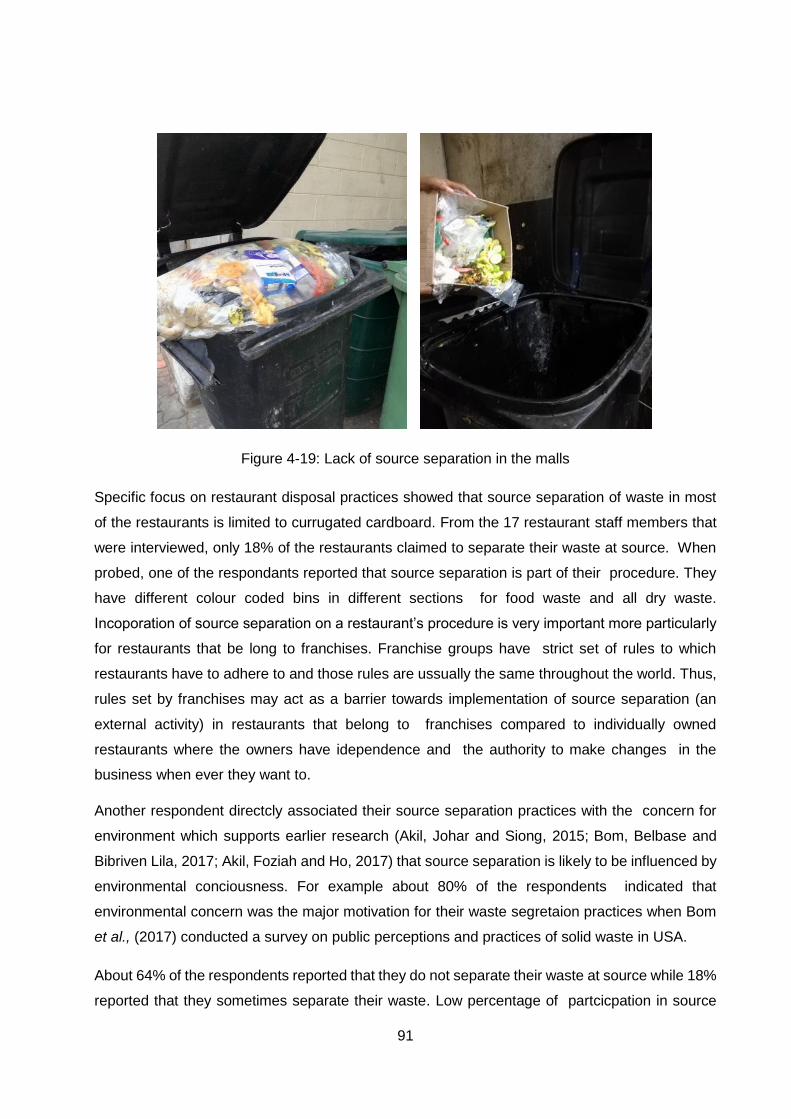
91
Figure 4-19: Lack of source separation in the malls
Specific focus on restaurant disposal practices showed that source separation of waste in most
of the restaurants is limited to currugated cardboard. From the 17 restaurant staff members that
were interviewed, only 18% of the restaurants claimed to separate their waste at source. When
probed, one of the respondants reported that source separation is part of their procedure. They
have different colour coded bins in different sections for food waste and all dry waste.
Incoporation of source separation on a restaurant’s procedure is very important more particularly
for restaurants that be long to franchises. Franchise groups have strict set of rules to which
restaurants have to adhere to and those rules are ussually the same throughout the world. Thus,
rules set by franchises may act as a barrier towards implementation of source separation (an
external activity) in restaurants that belong to franchises compared to individually owned
restaurants where the owners have idependence and the authority to make changes in the
business when ever they want to.
Another respondent directcly associated their source separation practices with the concern for
environment which supports earlier research (Akil, Johar and Siong, 2015; Bom, Belbase and
Bibriven Lila, 2017; Akil, Foziah and Ho, 2017) that source separation is likely to be influenced by
environmental conciousness. For example about 80% of the respondents indicated that
environmental concern was the major motivation for their waste segretaion practices when Bom
et al., (2017) conducted a survey on public perceptions and practices of solid waste in USA.
About 64% of the respondents reported that they do not separate their waste at source while 18%
reported that they sometimes separate their waste. Low percentage of partcicpation in source
92
separation among restaurants concides with the contention reported by Thomas and Sharp
(2013) that provision of infrstructure and education awareness is not enough to encourage source
separation, more particularly in developing countries. A similar observation was made by other
authors who found that restaurants do not practice source separation, their waste often ends up
in landfills (Henningsson, Hyde, Smith, and Campbell, 2004; Darlington et al., 2009; Singh et al.,
2014).
This conclusion somewhat conflicts with Elmedulan Jr’s et al., (2014) finding which showed that
more than 50% of fast food restaurants practiced waste separation. In their study, high source
separation in restaurants was achieved by manadating source separation. To ensure compliance,
the restaurants were required to incoporate source separation and waste reduction of waste as
the SOP (Elmedulan Jr et al.,2014). Mandatory source separation of waste is reported to be more
effective than voluntary schemes (Kasim, 2007; Cheung Chi-fai Research Office, 2017).
Inclussion of recycling as part of the business policy shows the business is serious about source
separation and also ensures that resources to support the programme will be provided when
needed (Snarr and Pezza, 2000).
Table 4- 7 presents the results on the reasons given for not separating waste at source in the
restaurants. In order of frequency, the restaurant managers cited lack of recycling bins and time
as the major reasons for not separating waste. About 24% of the respondents cited lack of time
as one of the reasons for not separating waste. Some of the restaurants that reported to sort
waste, admitted not to sort waste when it’s busy. Tatano et al., (2017) also found a co-relation
between source separation and peak time of serving meals where source separation was found
to be low during peak time of serving food. Lack of source separation during busy periods may
be due to the fact that source separation is viewed as an external activity and therefore activities
that are part of the business become a priority during those periods. In line with the business
activities one of the respondents reported that: It’s not part of the procedure, so it’s not the
important thing in the business because it does not benefit the business [restaurant manager].
Lack of time was closely followed by lack of separate bins for sorting waste. Lack of space was
another reason given for not separating waste. For example, one of the restaurants even reported
that if we were to separate our waste it would mean that we would have over 30 bins because we
have bins in different sections. Other reasons for lack of source separation included lack of
knowledge, laziness and that they are new in the business.
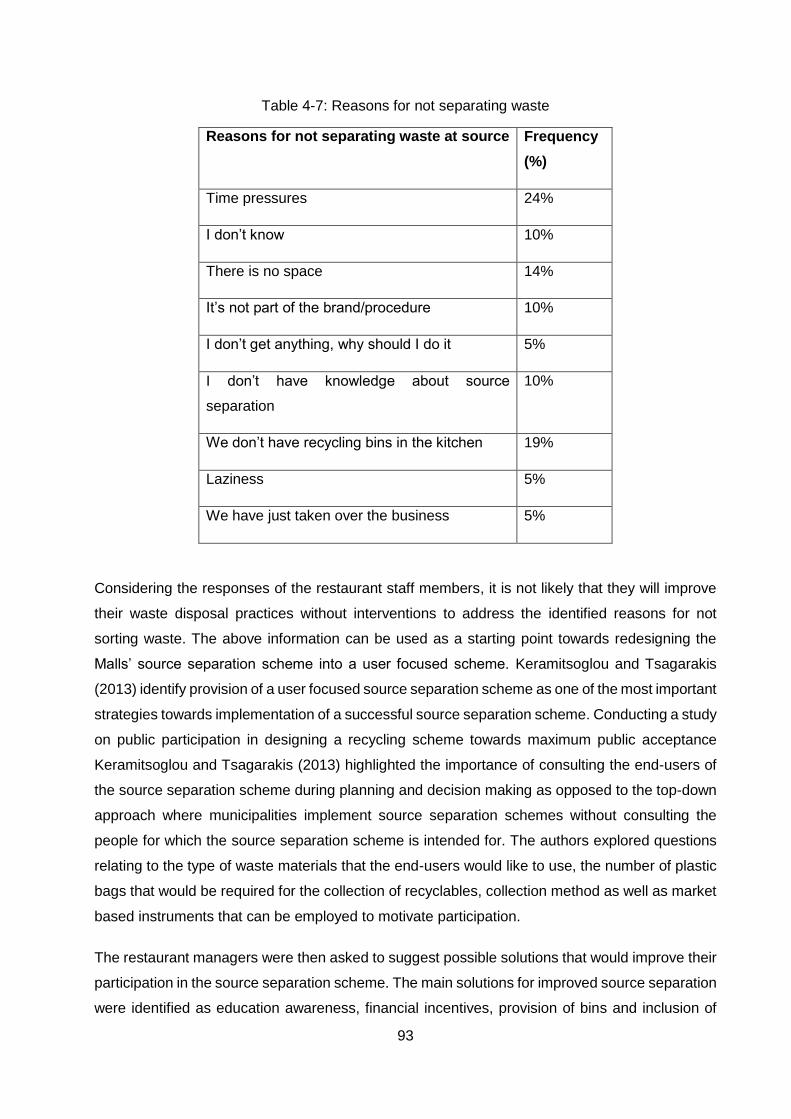
93
Table 4-7: Reasons for not separating waste
Reasons for not separating waste at source Frequency
(%)
Time pressures 24%
I don’t know 10%
There is no space 14%
It’s not part of the brand/procedure 10%
I don’t get anything, why should I do it 5%
I don’t have knowledge about source
separation
10%
We don’t have recycling bins in the kitchen 19%
Laziness 5%
We have just taken over the business 5%
Considering the responses of the restaurant staff members, it is not likely that they will improve
their waste disposal practices without interventions to address the identified reasons for not
sorting waste. The above information can be used as a starting point towards redesigning the
Malls’ source separation scheme into a user focused scheme. Keramitsoglou and Tsagarakis
(2013) identify provision of a user focused source separation scheme as one of the most important
strategies towards implementation of a successful source separation scheme. Conducting a study
on public participation in designing a recycling scheme towards maximum public acceptance
Keramitsoglou and Tsagarakis (2013) highlighted the importance of consulting the end-users of
the source separation scheme during planning and decision making as opposed to the top-down
approach where municipalities implement source separation schemes without consulting the
people for which the source separation scheme is intended for. The authors explored questions
relating to the type of waste materials that the end-users would like to use, the number of plastic
bags that would be required for the collection of recyclables, collection method as well as market
based instruments that can be employed to motivate participation.
The restaurant managers were then asked to suggest possible solutions that would improve their
participation in the source separation scheme. The main solutions for improved source separation
were identified as education awareness, financial incentives, provision of bins and inclusion of
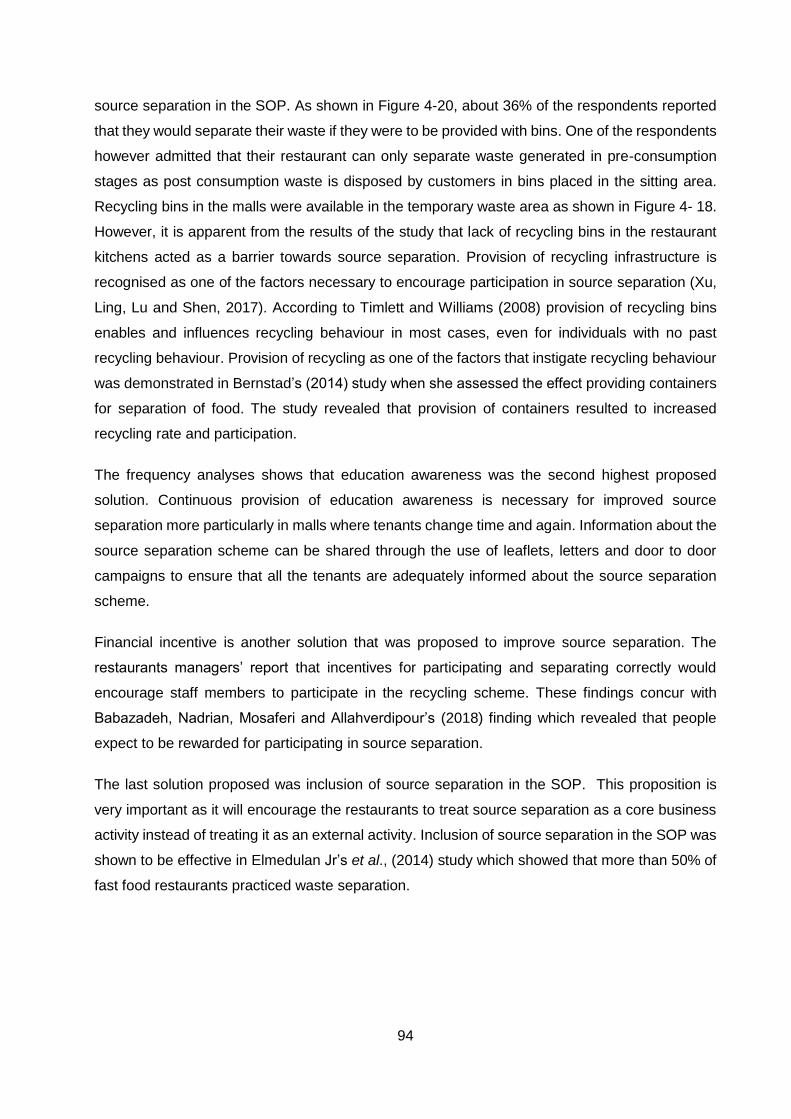
94
source separation in the SOP. As shown in Figure 4-20, about 36% of the respondents reported
that they would separate their waste if they were to be provided with bins. One of the respondents
however admitted that their restaurant can only separate waste generated in pre-consumption
stages as post consumption waste is disposed by customers in bins placed in the sitting area.
Recycling bins in the malls were available in the temporary waste area as shown in Figure 4- 18.
However, it is apparent from the results of the study that lack of recycling bins in the restaurant
kitchens acted as a barrier towards source separation. Provision of recycling infrastructure is
recognised as one of the factors necessary to encourage participation in source separation (Xu,
Ling, Lu and Shen, 2017). According to Timlett and Williams (2008) provision of recycling bins
enables and influences recycling behaviour in most cases, even for individuals with no past
recycling behaviour. Provision of recycling as one of the factors that instigate recycling behaviour
was demonstrated in Bernstad’s (2014) study when she assessed the effect providing containers
for separation of food. The study revealed that provision of containers resulted to increased
recycling rate and participation.
The frequency analyses shows that education awareness was the second highest proposed
solution. Continuous provision of education awareness is necessary for improved source
separation more particularly in malls where tenants change time and again. Information about the
source separation scheme can be shared through the use of leaflets, letters and door to door
campaigns to ensure that all the tenants are adequately informed about the source separation
scheme.
Financial incentive is another solution that was proposed to improve source separation. The
restaurants managers’ report that incentives for participating and separating correctly would
encourage staff members to participate in the recycling scheme. These findings concur with
Babazadeh, Nadrian, Mosaferi and Allahverdipour’s (2018) finding which revealed that people
expect to be rewarded for participating in source separation.
The last solution proposed was inclusion of source separation in the SOP. This proposition is
very important as it will encourage the restaurants to treat source separation as a core business
activity instead of treating it as an external activity. Inclusion of source separation in the SOP was
shown to be effective in Elmedulan Jr’s et al., (2014) study which showed that more than 50% of
fast food restaurants practiced waste separation.
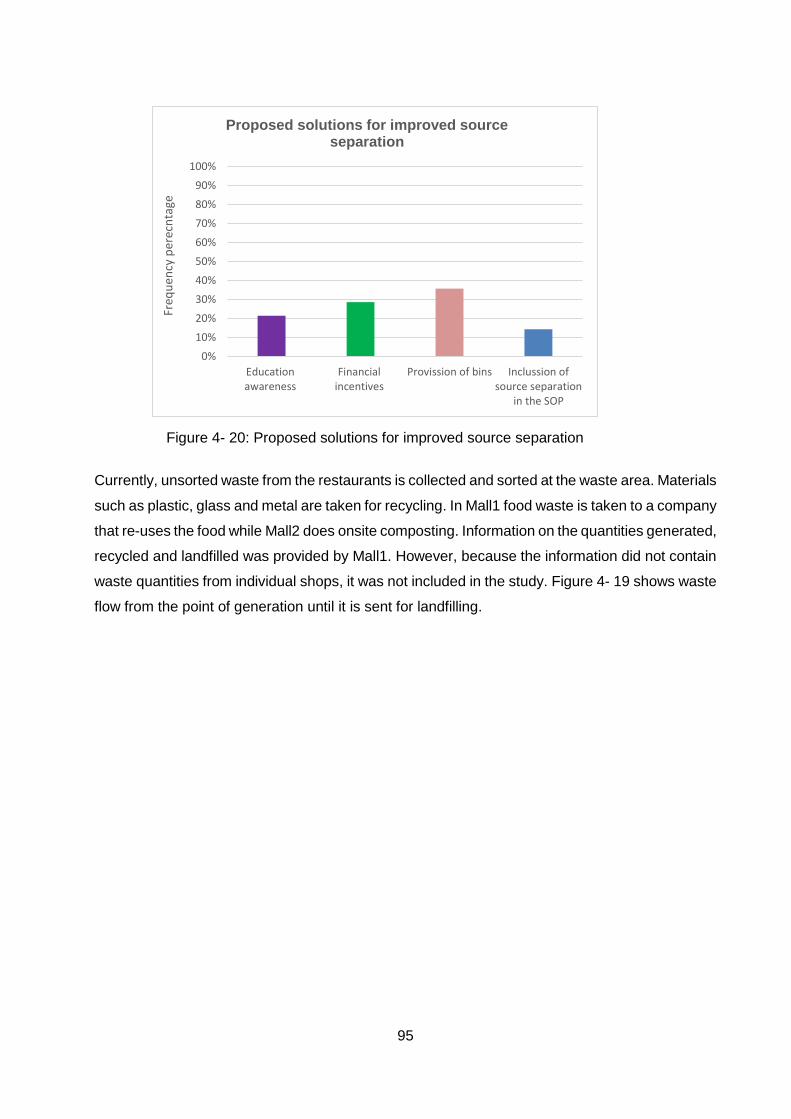
95
Currently, unsorted waste from the restaurants is collected and sorted at the waste area. Materials
such as plastic, glass and metal are taken for recycling. In Mall1 food waste is taken to a company
that re-uses the food while Mall2 does onsite composting. Information on the quantities generated,
recycled and landfilled was provided by Mall1. However, because the information did not contain
waste quantities from individual shops, it was not included in the study. Figure 4- 19 shows waste
flow from the point of generation until it is sent for landfilling.
0%
10%
20%
30%
40%
50%
60%
70%
80%
90%
100%
Educationawareness
Financialincentives
Provission of bins Inclussion ofsource separation
in the SOP
Freq
uen
cy p
erec
nta
ge
Proposed solutions for improved source separation
Figure 4- 20: Proposed solutions for improved source separation
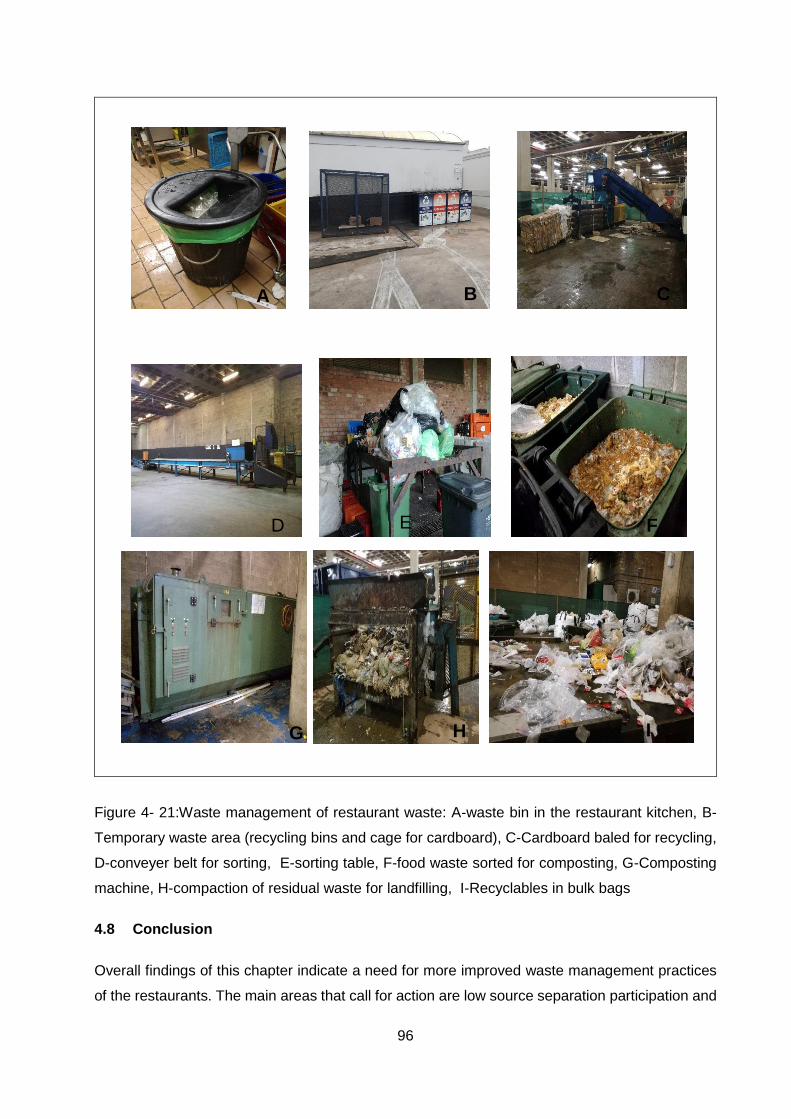
96
Figure 4- 21:Waste management of restaurant waste: A-waste bin in the restaurant kitchen, B-
Temporary waste area (recycling bins and cage for cardboard), C-Cardboard baled for recycling,
D-conveyer belt for sorting, E-sorting table, F-food waste sorted for composting, G-Composting
machine, H-compaction of residual waste for landfilling, I-Recyclables in bulk bags
4.8 Conclusion
Overall findings of this chapter indicate a need for more improved waste management practices
of the restaurants. The main areas that call for action are low source separation participation and
A B C
D E F
G H I
97
most importantly minimal efforts towards reducing waste in restaurants. Joseph (2006) reports
that provision of infrastructure alone cannot solve the waste problem and that participation of all
key stakeholders is necessary for improved waste management. Figure 4- 22, shows key
stakeholders and some of the roles that they can play to improve waste management of restaurant
waste. Cooperation by these stakeholders can be achieved through provision of household
education awareness on waste management by the government. Given that people that separate
their waste at home are more likely to separate it at work (Marans and Lee, 1993; Tudor et al,
2007), it is likely that household education about waste avoidance, reduction and recycling may
have an influence on how the malls, customers, restaurants and suppliers manage their waste.
The malls can contribute by providing continuous education awareness about the source
separation scheme (SSS). Restaurant head office can contribute by introducing customised
portion sizes and incorporating source separation as part of the standard operating procedure
while restaurants can ensure efficiency in the staff members, use of re-usable utensils and
separate waste at source. Offering ingredients packaged with recyclable material by suppliers
would enhance recycling of restaurant waste while customers can reduce food waste by ordering
food that meets their appetite and taking ‘doggy bags’ for later use.
Figure 4-22: Key stakeholders and their role in improving restaurant waste
management
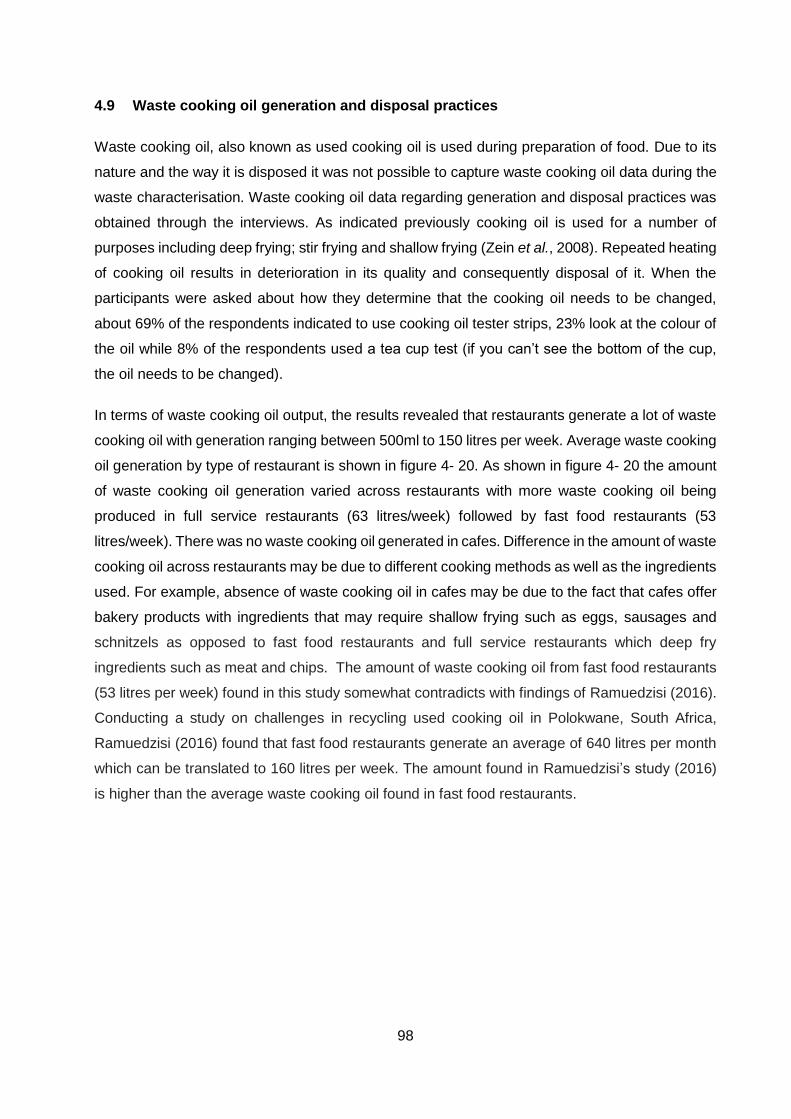
98
4.9 Waste cooking oil generation and disposal practices
Waste cooking oil, also known as used cooking oil is used during preparation of food. Due to its
nature and the way it is disposed it was not possible to capture waste cooking oil data during the
waste characterisation. Waste cooking oil data regarding generation and disposal practices was
obtained through the interviews. As indicated previously cooking oil is used for a number of
purposes including deep frying; stir frying and shallow frying (Zein et al., 2008). Repeated heating
of cooking oil results in deterioration in its quality and consequently disposal of it. When the
participants were asked about how they determine that the cooking oil needs to be changed,
about 69% of the respondents indicated to use cooking oil tester strips, 23% look at the colour of
the oil while 8% of the respondents used a tea cup test (if you can’t see the bottom of the cup,
the oil needs to be changed).
In terms of waste cooking oil output, the results revealed that restaurants generate a lot of waste
cooking oil with generation ranging between 500ml to 150 litres per week. Average waste cooking
oil generation by type of restaurant is shown in figure 4- 20. As shown in figure 4- 20 the amount
of waste cooking oil generation varied across restaurants with more waste cooking oil being
produced in full service restaurants (63 litres/week) followed by fast food restaurants (53
litres/week). There was no waste cooking oil generated in cafes. Difference in the amount of waste
cooking oil across restaurants may be due to different cooking methods as well as the ingredients
used. For example, absence of waste cooking oil in cafes may be due to the fact that cafes offer
bakery products with ingredients that may require shallow frying such as eggs, sausages and
schnitzels as opposed to fast food restaurants and full service restaurants which deep fry
ingredients such as meat and chips. The amount of waste cooking oil from fast food restaurants
(53 litres per week) found in this study somewhat contradicts with findings of Ramuedzisi (2016).
Conducting a study on challenges in recycling used cooking oil in Polokwane, South Africa,
Ramuedzisi (2016) found that fast food restaurants generate an average of 640 litres per month
which can be translated to 160 litres per week. The amount found in Ramuedzisi’s study (2016)
is higher than the average waste cooking oil found in fast food restaurants.
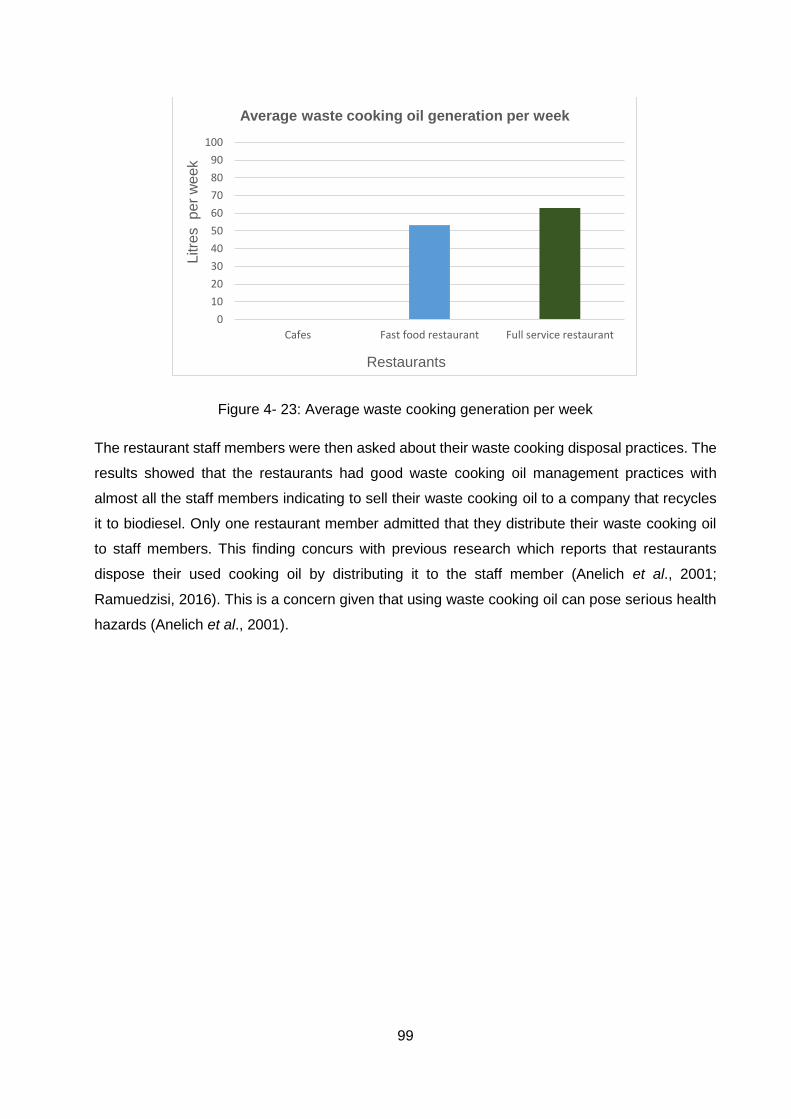
99
Figure 4- 23: Average waste cooking generation per week
The restaurant staff members were then asked about their waste cooking disposal practices. The
results showed that the restaurants had good waste cooking oil management practices with
almost all the staff members indicating to sell their waste cooking oil to a company that recycles
it to biodiesel. Only one restaurant member admitted that they distribute their waste cooking oil
to staff members. This finding concurs with previous research which reports that restaurants
dispose their used cooking oil by distributing it to the staff member (Anelich et al., 2001;
Ramuedzisi, 2016). This is a concern given that using waste cooking oil can pose serious health
hazards (Anelich et al., 2001).
0
10
20
30
40
50
60
70
80
90
100
Cafes Fast food restaurant Full service restaurant
Litre
s p
er
we
ek
Restaurants
Average waste cooking oil generation per week
100
CHAPTER 5: CONCLUSSION AND RECOMMENDATIONS
5.1 General conclusion and recommendations
This chapter draws conclusions on the findings of the study and provide recommendations. The
aim of the study was to understand waste management practices in the commercial food service
sector to identify opportunities for waste reduction and recovering resources through source
separation.
Waste characterisation studies in Mall1 and Mall2 revealed that more than 74% of waste
generated by the sampled restaurants has the potential to be diverted from landfill through
recycling (this includes paper, plastics, glass and tins) and composting/anaerobic digestion (food
waste), while all of the waste generated is currently being disposed as mixed waste. Potential
recycling rate by type of restaurant in Mall1 ranged from 74.12% to 85.47% and 71.65% to 84.92%
for Mall2. Food waste accounted for close to 50% of waste that was sorted in both Mall1 and
Mall2. Food waste generated from Mall1 consisted of 26.71% avoidable waste and 21.03% non-
avoidable waste. In Mall2 the food waste component was made up of 30.55% avoidable waste
while 19.07% was non-avoidable These figures demonstrate how significant food waste is as a
component of the restaurant waste and also highlights the need for diversion of waste through
composting or anaerobic digestion. Also, South Africa is considering a landfill ban on disposal of
organic waste (DEA, 2013), therefore it is crucial for restaurants to develop or improve organic
waste management programs ahead of the organic disposal ban. When combined, mainline
recyclables, presented 27.40% in Mall1 and 25.27% in Mall2, suggesting a greater potential for
recovery through recycling. Another notable observation in the study was the considerable
amount of non-recyclable waste owing to the use of single use of paper napkins, non-recyclable
food packaging, waxed disposable cups and other single use materials. With the expected growth
in the restaurant industry, improved waste management practices at the source of generation is
required. Waste generation estimates indicated that 10.25 tonnes is generated in Mall1 and 9.41
tonnes in Mall2. Possible waste minimisation options for each waste fraction was sourced from
the literature and are provided in table 5- 1 below.
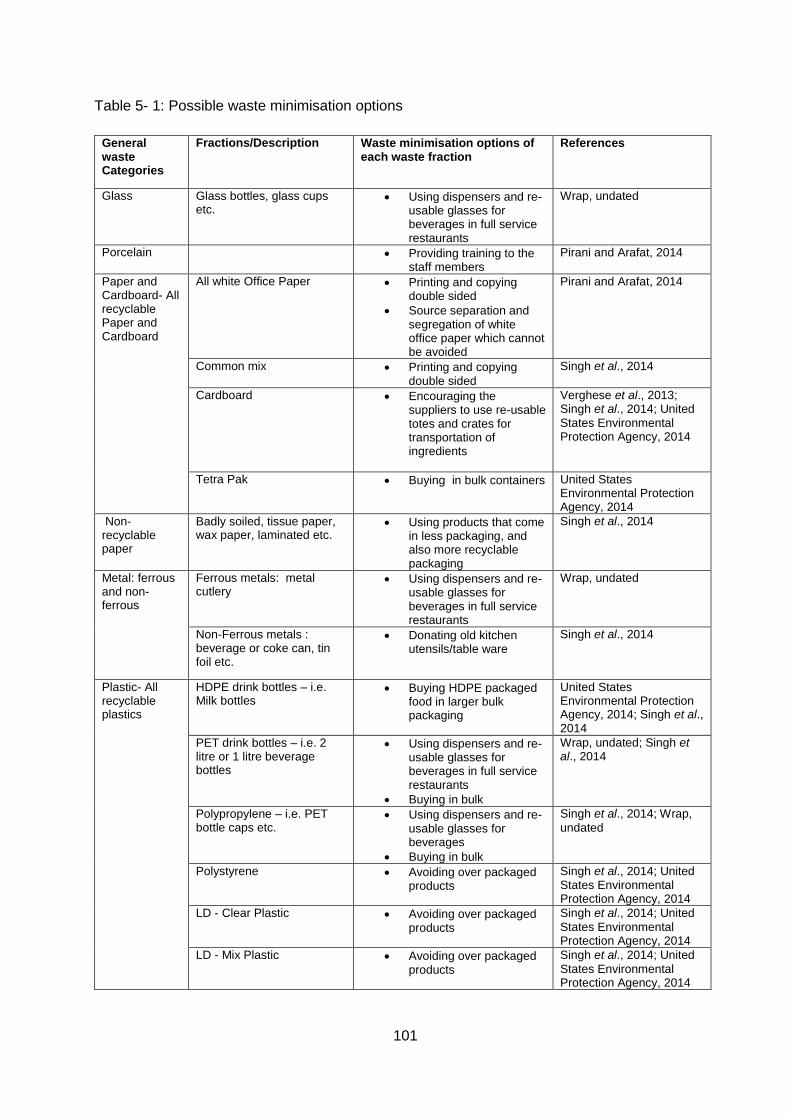
101
Table 5- 1: Possible waste minimisation options
General waste Categories
Fractions/Description Waste minimisation options of each waste fraction
References
Glass Glass bottles, glass cups etc.
Using dispensers and re-usable glasses for beverages in full service restaurants
Wrap, undated
Porcelain
Providing training to the staff members
Pirani and Arafat, 2014
Paper and Cardboard- All recyclable Paper and Cardboard
All white Office Paper Printing and copying double sided
Source separation and segregation of white office paper which cannot be avoided
Pirani and Arafat, 2014
Common mix Printing and copying double sided
Singh et al., 2014
Cardboard Encouraging the suppliers to use re-usable totes and crates for transportation of ingredients
Verghese et al., 2013; Singh et al., 2014; United
States Environmental Protection Agency, 2014
Tetra Pak Buying in bulk containers United States Environmental Protection Agency, 2014
Non-recyclable paper
Badly soiled, tissue paper, wax paper, laminated etc.
Using products that come in less packaging, and also more recyclable packaging
Singh et al., 2014
Metal: ferrous and non-ferrous
Ferrous metals: metal cutlery
Using dispensers and re-usable glasses for beverages in full service restaurants
Wrap, undated
Non-Ferrous metals : beverage or coke can, tin foil etc.
Donating old kitchen utensils/table ware
Singh et al., 2014
Plastic- All recyclable plastics
HDPE drink bottles – i.e. Milk bottles
Buying HDPE packaged food in larger bulk packaging
United States Environmental Protection Agency, 2014; Singh et al., 2014
PET drink bottles – i.e. 2 litre or 1 litre beverage bottles
Using dispensers and re-usable glasses for beverages in full service restaurants
Buying in bulk
Wrap, undated; Singh et al., 2014
Polypropylene – i.e. PET bottle caps etc.
Using dispensers and re-usable glasses for beverages
Buying in bulk
Singh et al., 2014; Wrap,
undated
Polystyrene Avoiding over packaged products
Singh et al., 2014; United States Environmental Protection Agency, 2014
LD - Clear Plastic Avoiding over packaged products
Singh et al., 2014; United
States Environmental Protection Agency, 2014
LD - Mix Plastic Avoiding over packaged products
Singh et al., 2014; United
States Environmental Protection Agency, 2014
102
General waste Categories
Fractions/Description Waste minimisation options of each waste fraction
References
LD - Stretch i.e. cling wrap Avoiding over packaged products
Singh et al., 2014; United
States Environmental Protection Agency, 2014
All non-recyclable or not identified plastics
Purchase of products with recyclable packaging
Using dispensers or refillable containers for condiments
Preventing the use of straws
Use condiment dispensers instead of individual packets
Pirani and Arafat, 2014; United States Environmental Protection Agency, 2014
Food waste Avoidable food waste- burnt food, leftover food etc.
Accurate customer demand forecasting
Staff training
Incentivising staff members for reducing food waste
Careful menu planning
Encouraging customer to take doggy bags
Storing food properly
Donating leftover food
Educating customers about food waste
Silvennoinen et al., 2012; Pirani and Arafat, 2016; Betz et al., 2015;United States Environmental Protection Agency, 2014
Un-avoidable food waste-bones, peels, egg shells etc.
Buying ready to cook food
Tatano et al., 2017
Given that food waste contributes close to 50% of the total waste generated by mall restaurants,
identifying the sources of food waste as well as why food is wasted in the restaurants was
paramount. The interviews revealed that causes of food waste in a restaurants are complex and
vary from stage to stage of the supply chain. as shown in figure 5-1, poor stock rotation, over-
purchasing of stock, negligence from the staff members, placing wrong orders, preparation of
excessive amount of food, dissatisfaction with the taste of food and people ordering more food
than they can eat were identified as the main reasons for food waste generation.
During interviews the participants of the study were requested to score the amount of food wasted
in each stage to identify areas where great attention should be placed when addressing food
waste. There was a clear difference in the distribution of food waste along the supply chain from
restaurant to restaurant. This study identified that a lot of food waste occurs during pre-
consumer’s stages of the service in all the restaurants. Although food waste was found to be
prevalent in the pre-consumer stages in all the restaurants, post-consumption waste also formed
a considerable portion of food waste with waste percentage of 44% in full service restaurants and
33% in cafes. To reduce food waste, the results of the study suggest that full service restaurants
103
should place more attention in preparation and plate waste, serving and plate waste in cafes as
well as preparation and serving stages in fast food restaurants. There are many strategies that
can be used to reduce food waste from the above mentioned stages. According to the food waste
recovery hierarchy preventing food waste from occurring is more important than re-using or
recycling it. Food waste education awareness among customers and restaurant staff members
certainly has major role to play in reducing food waste. These education awareness campaigns
should not only focus on the impacts, but also on how the food is grown and the amount of
resources that need to be used in order for a product to be ready for consumption. Lack of
knowledge on how the food is produced due to the movement of people away from the sources
of food has been cited as one of the reasons why it’s easy for people to waste food (Parfitt et al.,
2010). A number of strategies that can be employed to educate customers and restaurant staff
members such as door to door campaigns, websites, handbooks, newspapers, door stepping and
stickers have been highlighted through this research. In line with education awareness and
training of staff members it is crucial to ensure proper handling of food, when the stock comes in
until it is served to the customers. Training may include information to improve practising FIFO
method, storing the food correctly, portioning food correctly, and better communication between
restaurant staff during order taking as well proper preparation of the food. Rewards can also be
used to encourage staff to reduce food waste (2015). An effective manager is also crucial in
reducing food waste in a restaurant and managing people is one of the many aspects of
management. In a restaurant a manager can reduce food by continually monitoring and evaluating
staff’s performance and also by ensuring that the staff members follow the SOP. It is also the
manager's responsibility to ensure that each and every employee’s work performance meets the
expected standard. Suggestions of how to tackle food waste at each of these stages are provided
by Betz et al., (2015).
Although food waste was found to be the highest proportion of waste generated in all the
restaurants, this research showed that the restaurants have a positive attitude towards reduction
of food waste. Strategies used to reduce food waste were identified as procurement of food that
is needed in the business, carefully checking of ingredients during receiving of goods, practicing
FIFO method, giving surplus food to staff members and also measuring pre-consumer food waste.
From the interviews, it was clear that the restaurant staff members understood the economic
impacts of food waste in their restaurant. What seemed to be lacking is knowledge on
environmental and social impacts of food waste as the majority of the participants admitted that
they are not concerned about plate waste as it did not impact on the economic impact of the
business. This point to a need for extensive education awareness on the issue of food waste and
its implications.
104
Waste cooking oil is another waste component that was studied. The results showed that waste
cooking oil generation ranged from 500ml to 150 litres per week. There was a clear difference in
waste cooking oil by type of restaurant with full service restaurants contributing more waste
cooking oil, followed by fast food restaurants while no waste cooking oil was found in cafes. The
results showed that the restaurants had good waste cooking oil disposal management practices
with almost of all the restaurant staff members reporting to sell their cooking oil to a company that
converts it to biodiesel.
In terms of waste management, waste from restaurants is handled by the same service provider
contracted by the management of both shopping malls. The mall uses a combination of a cage
and a two bin system, one bin for organic waste and one bin for recyclable materials such as
metal, plastic, glass. Although the mall runs a source separation, the results revealed that a
majority of the restaurants do not separate their waste at source. Only separation of cardboard
was efficient. Reasons given for not separating waste included lack of time, lack of recycling bins,
lack of space, lack of knowledge about source separation, recycling is not part of the
brand/procedure. The participants proposed education awareness, financial incentives, provision
of bins and inclusion of source separation in the SOP as the key solution to low source separation
participation. This type of information will be of great importance to the mall in terms of improving
participation in the source separation scheme as it provides basis for development of user focused
source separation scheme. The current source separation scheme can be improved by educating
the restaurants about how to separate waste, what to separate and why it is necessary for them
to separate waste. Careful redesigning of the source separation scheme through a
comprehensive sorting process that begins in the restaurant kitchens and continues to the waste
area for further separation is necessary in both malls. Provision of recycling bins in the restaurant
kitchen might be effective in increasing participation, as bright coloured bins act as a signal of a
social norm or reminder to separate waste (Aschemann-Witzel, de Hooge, Amani, Bech-Larsen
and Oostindjer, 2015). Additionally, use of one bin with different compartments can be used to
address the issue of space identified by the participants of the study. Another area for
improvement in the malls relates to the bins provided for separating waste. There was no bin for
residual waste, as indicated earlier, the malls use a cage for corrugated cardboard and two bins
for food waste and recyclable. This collection method can create confusion when the participants
of the recycling scheme want to dispose non-recyclable waste, as there is no bin for that waste
category.
Given that the industry is expecting to see considerable rates of growth in the near future, there
is no doubt that improved waste management practices are crucial in the restaurants. It is evident
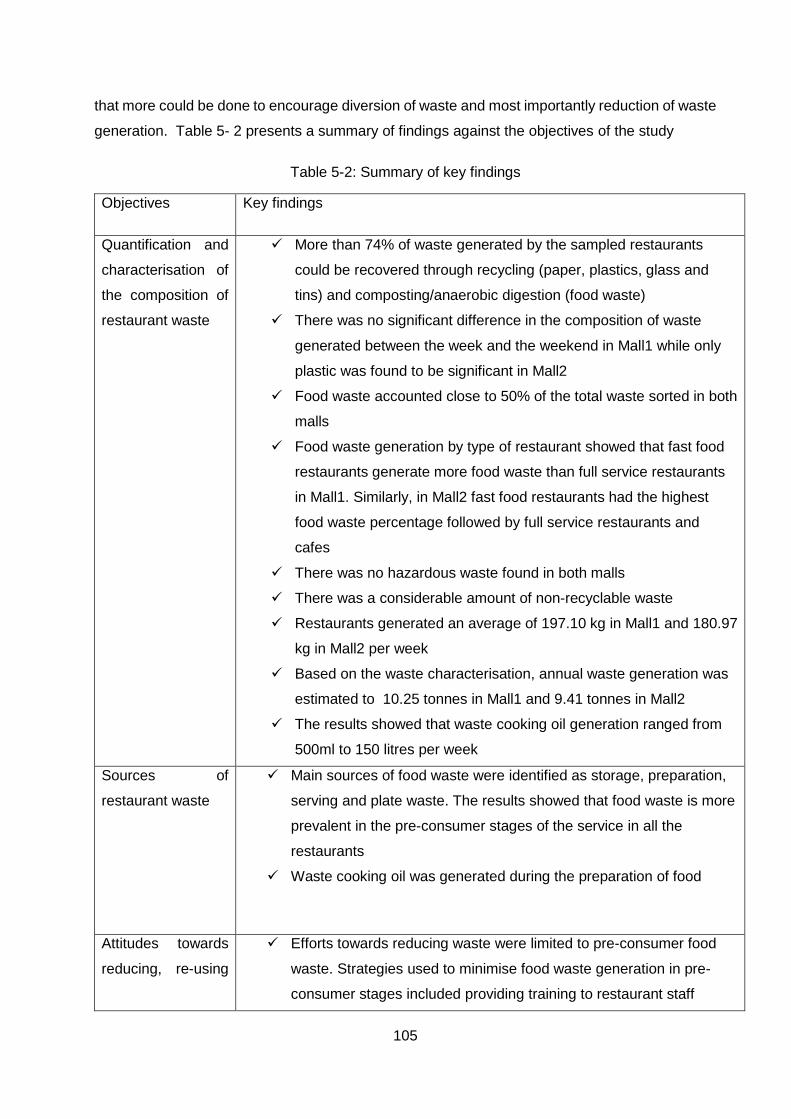
105
that more could be done to encourage diversion of waste and most importantly reduction of waste
generation. Table 5- 2 presents a summary of findings against the objectives of the study
Table 5-2: Summary of key findings
Objectives Key findings
Quantification and
characterisation of
the composition of
restaurant waste
More than 74% of waste generated by the sampled restaurants
could be recovered through recycling (paper, plastics, glass and
tins) and composting/anaerobic digestion (food waste)
There was no significant difference in the composition of waste
generated between the week and the weekend in Mall1 while only
plastic was found to be significant in Mall2
Food waste accounted close to 50% of the total waste sorted in both
malls
Food waste generation by type of restaurant showed that fast food
restaurants generate more food waste than full service restaurants
in Mall1. Similarly, in Mall2 fast food restaurants had the highest
food waste percentage followed by full service restaurants and
cafes
There was no hazardous waste found in both malls
There was a considerable amount of non-recyclable waste
Restaurants generated an average of 197.10 kg in Mall1 and 180.97
kg in Mall2 per week
Based on the waste characterisation, annual waste generation was
estimated to 10.25 tonnes in Mall1 and 9.41 tonnes in Mall2
The results showed that waste cooking oil generation ranged from
500ml to 150 litres per week
Sources of
restaurant waste
Main sources of food waste were identified as storage, preparation,
serving and plate waste. The results showed that food waste is more
prevalent in the pre-consumer stages of the service in all the
restaurants
Waste cooking oil was generated during the preparation of food
Attitudes towards
reducing, re-using
Efforts towards reducing waste were limited to pre-consumer food
waste. Strategies used to minimise food waste generation in pre-
consumer stages included providing training to restaurant staff
106
and recycling of
waste
members, procurement of food that is needed in the business,
carefully checking of ingredients during receiving of goods, practicing
FIFO method
Only corrugated waste was sorted at source, other waste materials
were disposed as mixed waste
Waste
management
practices at the
restaurants
Waste from restaurants is handled by the same service provider
contracted by the management of both shopping malls
The malls have recycling bins for source separation at the temporary
waste area
Unsorted waste from the restaurants is collected and sorted at the
waste area for recycling and composting
The restaurants had good waste cooking oil disposal management
practices (they sell their cooking oil to a company that converts it to
biodiesel).
Opportunities for
waste reduction
and recovering of
resources
74% of waste generated by the sampled restaurants can be recovered
through recycling (paper, plastics, glass and tins) and
composting/anaerobic digestion (food waste)
Reduction of plate waste, non-recyclable waste and packaging waste
Recommendations
for improved waste
management in
restaurants
Reduce amount of waste generated
Buying products packaged in recyclable material to enhance
recycling
Redesigning source separation scheme through a comprehensive
sorting process that begins in the restaurant kitchens and continues
to the waste area for further separation is necessary in both malls
5.2 Recommendations for future research
To improve waste management practices in the restaurants, the limitations and conclusions
drawn from this dissertation indicated the following areas as recommendations for future
research.
107
•This dissertation focused on twenty restaurants of two malls located in eThekwini Metropolitan
Municipality. It is recommended that future research should seek to investigate a representative
sample of restaurants.
•Reasons for plate waste generation in this dissertation were gathered from a manager’s
perspective. Examination of reasons for plate waste generation from a customer’s perspective in
a South African context is an important area of potential research as this aspect is gaining
attention in United Kingdom. Understanding current customer’s food wasting behaviour is
required to reduce plate waste. This may include investigations about food waste awareness,
how consumers understand food within the context of everyday lives and also how their food
waste behaviour differs at home and in restaurants. Also, food waste contributions in different
stages of the food supply chain was obtained from the restaurant managers’ perspective. It is
recommended that future research should consider a more objective measure of restaurant food
waste from different stages of the supply chain.
•Time limitations in terms of how long the food must be kept before sale is one of the reasons for
food waste that were uncovered in the study. Further research to what the time limitations mean,
how they are determined and even more importantly whether they relate to food safety or quality
is required. A clear understanding of what time limitations mean will help in identifying potential
ways through which the food can be recovered.
108
BIBLIOGRAPHY
Aarnio, T., Hamalainen, A., 2008. Challenges in packaging waste management in the fast food
industry. Resources, Conservation and Recycling (52) 612–621.
Adami, F. M., Kiger, A., 2005. The Use of Triangulation for Completeness Purposes. Nurse
Researcher, 12(4), pp.19-29.
Akil, A.M., Johar, F., Siong, H.C., 2015. Household participation in recycling programs: A case
study from Malaysia. Tataloka, 17(2), pp.64-75.
Akil, A.M., Foziah, J., Ho, C.S., 2017. Households Inclination in Waste Separation Program. Asian
Journal of Quality of Life, 2(6), pp.19-30.
Alfagi, A., Purnaweni, H., Setiani, O., 2015. Waste Management in KFC and Pizza Hut Case
Study in Semarang. Science Journal of Environmental Engineering Research ISSN: 2276-7495.
Available from: http://www.sjpub.org/sjeer/sjeer-285.pdf. [24/05/2018].
Altman, M., Hart, T.G., Jacobs, P.T., 2009. Household food security status in South
Africa. Agrekon, 48(4), pp.345-361.
Anderson, C., 2010. Presenting and Evaluating Qualitative Research. American Journal of
Pharmaceutical Education, 74(8), P.141.
Anelich, L.E.C.M., Kock, J.L.F., Roux, M. P., Botha, A., Bezuidenhout, A., Coetzee, D. J., Venter,
P., 2001. The quality of used frying fats in South Africa. South African Journal of Science.
Antwi, S.K., Hamza, K., 2015. Qualitative and Quantitative Research Paradigms in Business
Research: A Philosophical Reflection. European Journal of Business and Management, 7(3),
pp.217-225.
Aschemann-Witzel, J., de Hooge, I., Amani, P., Bech-Larsen, T. Oostindjer, M., 2015. Consumer-
related food waste: causes and potential for action. Sustainability, 7(6), pp.6457-6477.
Asuamah, S.Y., Kumi, E., Kwarteng, E., 2012. Attitude towards Recycling and Waste
Management: A Survey of Marketing Students in Sunyani Polytechnic. Advances in Arts, Social
Sciences and Education Research. Available from:
https://www.researchgate.net/publication/308020012_ATTITUDE_TOWARD_RECYCLING_AN
D_WASTE_MANAGEMENT_A_SURVEY_OF_MARKETING_STUDENTS_IN_SUNYANI_POL
YTECHNIC_GHANA. [24 October 2018]
Atieno, O.P., 2009. An Analysis of the Strengths and Limitation of Qualitative and Quantitative
Research Paradigms. Problems of Education in the 21st Century, 13(1), pp.13-38.
109
Austin Resource Recovery, 2012. Quick Service Restaurant Waste Composition Study. Accessed
from:
https://static1.squarespace.com/static/54d3a62be4b068e9347ca880/t/55a02366e4b0a2f986e57
62b/1436558182730/AustinFFStudy.pdf. [10 May 2018].
Babazadeh, T., Nadrian, H., Mosaferi, M., Allahverdipour, H., 2018. Identifying Challenges and
Barriers to Participating in the Source Separation of Waste Program in Tabriz, Northwest of Iran:
A Qualitative Study from the Citizens’ Perspective. Resources, 7(3), p.53.
Baxter, J., 2016. Food Waste in the Developing World: The potential impact of engineering less
waste. Sight and Life Vol. 30(1) | 2016.
Bekhet, A.K., Zauszniewski, J.A., 2012. Methodological Triangulation: An Approach to
Understanding Data. Nurse Researcher, 20(2), pp.40-43.
Bengtsson, M., 2016. How to plan and perform a qualitative study using content
analysis. NursingPlus Open, 2, pp.8-14.
Bennagen, M.E., Nepomuceno, G., Covar, R., 2002. Solid waste segregation and recycling in
Metro Manila: Household attitudes and behavior. Resource, Environment and Economic Centre
for Studies (REECS), Quezon City, 1109. Available from:
http://www.eepsea.org/pub/rr/2002_RR3.pdf. [08 June 2018].
Bernard, O., Mildred, O.A., 2015. Assessing household solid waste management systems in
baraton centre. Baraton Interdisciplinary Research Journal (2015), 5(Special Issue), pp 140-150
Bernstad, A., 2014. Household food waste separation behavior and the importance of
convenience. Waste management, 34(7), pp.1317-1323.
Betz, A., Buchli, J., Göbel, C., Müller, C., 2015. Food waste in the Swiss food service industry–
Magnitude and potential for reduction. Waste Management, 35, pp.218-226.
Blair, E., 2015. A reflexive exploration of two qualitative data coding techniques. Journal of
Methods and Measurement in the Social Sciences, 6(1), pp.14-29.
BMI., 2015. Expansion Opportunities in South Africa's Competitive Fast Food Market. Available
from: http://www.bmiresearch.com/news-and-views/expansion-opportunities-in-south-africas-
competitive-fast-food-market. [25 October 2016].
Bom, U.B., Belbase, S., Bibriven Lila, R., 2017. Public perceptions and practices of solid waste
recycling in the city of Laramie in Wyoming, USA. Recycling, 2(3), p.11.
110
Bond, M., Meacham, T., Bhunnoo, R., Benton, T.G., 2013. Food waste within global food systems.
A Global Food Security report. Available from:
https://pdfs.semanticscholar.org/6c91/c4a4bd7b73d2e51344f5fa8117532f80ceec.pdf. [12 June
2018].
Burnard, P., Gill, P., Stewart, K., Treasure, E., Chadwick, B., 2008. Analysing and presenting
qualitative data. British dental journal, 204(8), p.429.
Canali, M., Amani, P., Aramyan, L., Gheoldus, M., Moates, G., Östergren, K., Silvennoinen, K.,
Waldron, K., Vittuari, M., 2016. Food waste drivers in Europe, from identification to possible
interventions. Sustainability, 9(1), p.37.
Carter, N., Bryant-Lukosius, D., Dicenso, A., Blythe, J. Neville, A.J., 2014, The Use of
Triangulation in Qualitative Research. Oncology Nursing Forum 41 (5).
Castellanelli, C., Mello, C., 2007. Analyzes of the used fried oil under environmental perspective
and its possibilities for production of biodiesel. Department of Production Engineering, Federal
University of Santa Maria, Brazil.
Chang, N.B., Davila, E., 2008. Municipal solid waste characterisations and management
strategies for the Lower Rio Grande Valley, Texas. Waste Management, 28(5), pp.776-794.
Chavan, M., 2005. "An appraisal of environment management systems: A competitive advantage
for small businesses", Management of Environmental Quality: An International Journal, Vol. 16
Issue: 5, pp.444-463.
Chen, C.T., Cheng, C.C., Hsu, F.S., 2015. GRSERV scale: an effective tool for measuring
consumer perceptions of service quality in green restaurants. Total Quality Management &
Business Excellence, 26(3-4), pp.355-367.
Cheung Chi-fai Research Office., 2017. Separation and collection of household waste in selected
places. Available from: https://www.legco.gov.hk/research-publications/english/1617in08-
separation-and-collection-of-household-waste-in-selected-places-20170320-e.pdf. [22 August
2018].
Chisnall, S.J., 2018. A Taste for Consumption: Food Waste Generation in New Zealand Cafés
and Restaurants (Doctoral dissertation, University of Otago).
Choi, G., Parsa, H.G., 2007. Green practices II: Measuring restaurant managers' psychological
attributes and their willingness to charge for the “green practices”. Journal of Foodservice
Business Research, 9(4), pp.41-63.
111
Chou, C.J., Chen, K.S., Wang, Y.Y., 2012. Green practices in the restaurant industry from an
innovation adoption perspective: Evidence from Taiwan. International Journal of Hospitality
Management, 31(3), pp.703-711.
CoCT (City of Cape Town), 2011. Smart Living Handbook, Cape Town.
Council on Environment and Water, 2014. Packaging Impacts Decision Regulation Impact
Statement. Available from: http://nepc.gov.au/system/files/consultations/c299407e-3cdf-8fd4-
d94d-6181f096abc8/files/packaging-impacts-consultation-ris-december-2011.pdf. [16 June
2018].
Dahlén, L., Lagerkvist, A., 2008. Methods for Household Waste Composition Studies. Waste
Management, 28 (7), Pp.1100-1112.
Dangi, M.B., Pretz, C.R., Urynowicz, M.A., Gerow, K.G., Reddy, J.M., 2011. Municipal solid
waste generation in Kathmandu, Nepal. Journal of environmental management, 92(1), pp.240-
249.
Darlington, R., Staikos, T., Rahimifard, S. 2009. Analytical methods for waste minimisation in the
convenience food industry. Waste Management 29 (2009) 1274–1281.
Derqui, B., Fayos, T., Fernandez, V., 2016. Towards a more sustainable food supply chain:
opening up invisible waste in food service. Sustainability, 8(7), p.693.
Dai, Y.C., Gordon, M.P.R., Ye, J.Y., Xu, D.Y., Lin, Z.Y., Robinson, N.K.L., Woodard, R., Harder,
M.K., 2015. Why doorstepping can increase household waste recycling. Resources,
Conservation and Recycling, 102, pp.9-19.
Davies, T., Konisky, D. M., 2000.Environmental Implications of the Foodservice and Food Retail
Industries. Discussion Paper 00-11.
Department of Environmental Affairs (DEA). 2011. National Waste Management Strategy.
Republic of South Africa.
Department of Environmental Affairs (DEA). 2012. National Waste Information Baseline Report.
Department of Environmental Affairs. Pretoria, South Africa.
Department of Environmental Affairs (DEA). 2013. The National Organic Waste Composting
Strategy. Available From: Http://Sawic.Environment.Gov.Za/Documents/1824.Pdf. [04 August
2017].
Devers, K. J., Frankel, RM. 2000, ‘Study Design in Qualitative Research—2: Sampling and Data
Collection Strategies’, Education for Health, 13, Pp. 263–71.
112
DiPietro, R. B., Gregory, S., Jackson, A., 2013. Going green in quick-service restaurants:
customer perceptions and intentions. International Journal of Hospitality and Tourism
Administration. 14 (2), pp. 139-156.
Driscoll, D.L., 2011. Introduction to Primary Research: Observations, Surveys, and
Interviews. Writing Spaces: Readings on Writing, 2, Pp.153-174.
DST (Department of Science and Technology) (2012). A National Waste R&D and Innovation
Roadmap for South Africa: Phase 1 Status Quo Assessment. Current and required institutional
mechanisms to support waste innovation. Department of Science and Technology: Pretoria.
DST (Department of Science and Technology) (2013). South African Waste Sector – 2012. An
analysis of the formal private and public waste sector in South Africa. A National Waste RDI
Roadmap for South Africa: Phase 1 Status Quo Assessment.
Duursma, G., Vrenegoor, F., Kobus, S., 2016. Food waste reduction at Restaurant De Pleats:
Small steps for mankind. Research in Hospitality Management, 6(1), pp.95-100.
Dutta, K., Umashankar, V., Choi, G., Parsa, H. G., 2008. A Comparative Study of Consumers'
Green Practice Orientation in India and the United States: A Study from the Restaurant Industry,
Journal of Foodservice Business Research, 11:3, 269-285, DOI: 10.1080/15378020802316570.
Drewitt, T., 2013. Food waste prevention in quick service restaurants: A comparative case study
on the quantity, source, costs and cause. IIIEE Master Thesis.
Economist Intelligence Unit (EIU). 2014. Global food security index 2014: Food loss and its
intersection with food security. Available from:
https://www.google.co.za/search?ei=CwghW6DABIK3gQabiKz4CQ&q=Economist+Intelligent+U
nit+%28EIU%29+%282014%29+which+showed+a+strong+relationship+between+food+loss+an
d+technology&oq=Economist+Intelligent+Unit+%28EIU%29+%282014%29+which+showed+a+
strong+relationship+between+food+loss+and+technology&gs_l=psy-
ab.12...3592.10759.0.12817.16.9.0.0.0.0.393.393.3-1.1.0....0...1c.1j2.64.psy-
ab..15.1.392...0j0i67k1.0.IY8cJKWrPPA/. [13 June 2018].
Edwards, J.S., 2013. The foodservice industry: Eating out is more than just a meal. Food Quality
and Preference, 27(2), pp.223-229.
Elmedulan Jr, A.M., Apat, M.M., Matunog, V.E., 2014. Waste Management of Fast Food Chains
in Ozamiz City, Philippines. Journal of Multidisciplinary Studies Vol, 3(2), pp.108-122.
113
eThekwini Municipality., undated. Essentially better: DSW Booklet. Available from:
https://www.google.co.za/#q=DWS+waste+management+services+booklet+Municipality+%E2%
80%A2+DSW+%E2%80%93+Cleansing+and+Solid+Waste+Unit+%E2%80%A2+Strategic+and
+New+Development+%E2%80%A2+Operations+%E2%80%A2+Plant+and+Engineering+%E2
%80%A2+Training+Programmes+%E2%80%A2+DSW+Achievements+%E2%80%A2+Corporat
e+Social+Responsibility. [04/05/2016].
eThekwini Metropolitan Municipality. 2016. Integrated Waste Management Plan (IWMP) (Draft).
Available From:
http://www.durban.gov.za/City_Services/cleansing_solid_waste/Documents/eThekwini%20Muni
cipality%20Integrated%20Waste%20Management%20Plan%202016%202021.pdf. [08
November 2016].
Faulkner, D., Carlisle, Y.M., Viney, H.P., 2005. Changing corporate attitudes towards
environmental policy. Management of Environmental Quality: An International Journal, 16(5),
pp.476-489.
Fekede, T., 2011. The Basis of Distinction Between Qualitative And Quantitative Research In
Social Science: Reflection on Ontological, Epistemological And Methodological Perspectives.
Ethiopian Journal of Education and Sciences, 6 (1).
Ferreira, M., Liz Martins, M., Rocha, A., 2013. Food waste as an index of foodservice
quality. British Food Journal, 115(11), pp.1628-1637.
Fouka, F., Mantzorou, M., 2011. What Are the Major Ethical Issues in Conducting Research? is
there a Conflict Between the Research Ethics and the Nature Of Nursing? Health Science
Journal, 5(1).
Freedman, M.R., Brochado, C., 2010. Reducing portion size reduces food intake and plate
waste. Obesity, 18(9), pp.1864-1866.
Gelo, O., Braakmann, D. Benetka, G., 2008. Quantitative and Qualitative Research: Beyond the
Debate. Integrative Psychological and Behavioral Science, 42(3), Pp.266-290.
Gerber, A.S., Green, D.P., 2000. The effects of canvassing, telephone calls, and direct mail on
voter turnout: A field experiment. American political science review, 94(3), pp.653-663.
Giorgi, S., 2013. Understanding out of home consumer food waste.Final summary report.
Available from: http://www.wrap.org.uk/sites/files/wrap/OOH%20Report.pdf. [03/06/2016].
Godfrey, L., Strydom, W, Phukubye, R. 2016. Integrating The Informal Sector Into The South
African Waste And Recycling Economy In The Context Of Extended Producer Responsibility.
114
Available from:
http://www.csir.co.za/nre/pollution_and_waste/docs/Policy%20Brief_Informal%20Sector_CSIR
%20final.pdf. [26 September 2016].
Green, J., Willis, K., Hughes, E., Small, R., Welch, N., Gibbs, L., Daly, J., 2007. Generating Best
Evidence from Qualitative Research: The Role of Data Analysis. Australian and New Zealand
Journal of Public Health, 31(6), Pp.545-550.
Guerrero, L. A., Maas, G., Hogland, W., 2013. Solid waste management challenges for cities in
developing countries. Waste Management 33 (2013) 220–232.
Gustavsson, J., Cederberg, C., Sonesson, U., van Otterdijk, R., Meybeck, A. 2011. Global food
losses and food waste: Extent, Causes and Prevention. Study conducted for the International
Congress SAVE FOOD! At Interpack 2011, Düsseldorf, Germany. Food and Agriculture
Organisation of the United Nations, Rome, Italy.
Hage, O., Söderholm, P., Berglund, C., 2009. Norms and economic motivation in household
recycling: empirical evidence from Sweden. Resources, Conservation and Recycling, 53(3),
pp.155-165.
Halcomb, E.J. Andrew, S., 2005. Triangulation as a Method for Contemporary Nursing Research.
Nurse Researcher, 13(2), Pp.71-82.
Harwell, M.R., 2011, Research Design: Qualitative, Quantitative, and Mixed Methods: Pursuing
Ideas as the Keystone of Exemplary Inquir. In C Conrad & RC Serlin (Eds), The Sage Handbook
for Research in Education: Pursuing Ideas as the Keystone of Exemplary Inquir. Second Edition
Edn, Sage, Thousand Oaks, CA.
Heikkilä, L., Reinikainen, A., Katajajuuri, J.M., Silvennoinen, K., Hartikainen, H., 2016. Elements
affecting food waste in the food service sector. Waste Management, 56, pp.446-453.
Henningsson, S., Hyde, K., Smith, A., Campbell, M., 2004. The value of resource efficiency in the
food industry: a waste minimisation project in East Anglia, UK. Journal of Cleaner
Production, 12(5), pp.505-512.
Hilario, J., 2014. Responsiveness of fast-food chain managers along Far Eastern University (FEU-
Manila) towards the implementation of green practices in restaurants. International Research
Journal of Public and Environmental Health, 1(9), pp.183-191.
Hogan, J., Cunningham, D., Finn, J., 2004. Characterisation of Non-Household Municipal Waste
in Ireland and the Development of an Approach to Tracking Municipal Waste Composition.
Ireland: Environmental Protection Agency. Accessed from:
115
http://www.epa.ie/pubs/reports/research/waste/EPA_characterisation_non-
household_municipal_waste.pdf. [10 May 2018].
Hollins, O., 2013. Overview of waste in the UK Hospitality and Food Service sector. WRAP Report
HFS001-006.
Hornik, J., Cherian, J., Madansky, M., 1995. Determinants of recycling behavior: A synthesis of
research results. The Journal of Socio-Economics, 24(1), pp.105-127.
Hussein, A., 2015. The Use of Triangulation in Social Sciences Research: Can Qualitative and
Quantitative Methods be Combined?. Journal of Comparative Social Work, 4(1).
Ilyas, H., Ilyas, S., Ahmad, S.R., Nawaz, M.C.H., 2017. Waste generation rate and composition
analysis of solid waste in Gujranwala City Pakistan. International Journal of Waste
Resources, 7(297), p.2.
Iyer, E.S., Kashyap, R.K., 2007. Consumer recycling: Role of incentives, information, and social
class. Journal of Consumer Behaviour: An International Research Review, 6(1), pp.32-47.
Ismail, A., Kassim, A., Zahari, M.S., 2010. Responsiveness of restaurateurs towards the
implementation of environmentally-friendly practices. South Asian Journal of Tourism and
Heritage, 3(2): 1-10.
Jang, S. Y., Chung, J. Y., Kim, Y. G., 2015. Effects of environmentally friendly perceptions on
customers' intentions to visit environmentally friendly restaurants: an extended theory of planned
behavior. Asia Pacific Journal of Tourism Research, 20 (6), 599–618.
Jang, Y.J., Kim, W.G., Bonn, M.A., 2011. Generation Y consumers’ selection attributes and
behavioral intentions concerning green restaurants. International Journal of Hospitality
Management, 30(4), pp.803-811.
Jauhari, V., 2014. Managing Sustainability in the Hospitality and Tourism Industry: Paradigms
and Directions for the Future. Apple Academic Press. Toronto, Canada.
Jindal, M.K., 2010. Unpacking the packaging: Environmental impact of packaging wastes. Journal
of Environmental Research and Development, 4(4).
Juvan, E., Grün, B., Dolnicar, S., 2018. Biting off more than they can chew: food waste at hotel
breakfast buffets. Journal of Travel Research, 57(2), pp.232-242.
Kasim, A., 2007. Towards a wider adoption of environmental responsibility in the hotel
sector. International Journal of Hospitality & Tourism Administration, 8(2), pp.25-49.
116
Kasim, A., Ismail, A., 2012. Environmentally friendly practices among restaurants: drivers and
barriers to change. Journal of Sustainable Tourism, 20(4), pp.551-570.
Kantor, L. S., Lipton, k., Manchester, A., Oliveira, V., 1997. Estimating and Addressing America’s
Food Losses. Available from: http://gleaningusa.com/PDFs/USDA-Jan97a.pdf. [03/05/2016].
Katajajuuri, J.M., Silvennoinen, K., Hartikainen, H., Heikkilä, L., Reinikainen, A., 2014. Food waste
in the Finnish food chain. Journal of Cleaner Production, 73, pp.322-329.
Keramitsoglou, K.M., Tsagarakis, K.P., 2013. Public participation in designing a recycling
scheme towards maximum public acceptance. Resources, Conservation and Recycling, 70,
pp.55-67.
Kerry, J.P., O’grady, M.N., Hogan, S.A., 2006. Past, current and potential utilisation of active and
intelligent packaging systems for meat and muscle-based products: A review. Meat
science, 74(1), pp.113-130.
Klassen, A.C., Creswell, J., Clark, V.L.P., Smith, K.C., Meissner, H.I., 2012. Best Practices in
Mixed Methods for Quality of Life Research. Quality of Life Research, 21(3), Pp.377-380.
Kulkarni, M. G., Dalai, A. K., 2006. Waste Cooking Oils An Economical Source for Biodiesel: A
Review. Ind. Eng. Chem. Res. (45) 2901-2913.
Kuniyal, J.C., Jain, A. P., Shannigrahi, A.S., 1998. Public involvement in solid waste management
in Himalayan trails in and around the Valley of Flowers, India. Resources, Conservation and
Recycling 24 (1998) 299–322.
Kwok, L., Huang, Y., Hu, L., 2016. Green attributes of restaurants: What really matters to
consumers?. International Journal of Hospitality Management 55 (2016) 107–117.
Lebersorger, S., Schneider, F., 2011. Discussion on the methodology for determining food waste
in household waste composition studies. Waste Management, 31(9-10), pp.1924-1933.
Letlape, B., Gumbo, T.D., 2016. The role of innovations in municipal solid waste management to
attaining sustainable cities: case of City of Johannesburg. SAPI Conference 2016. Available from:
https://ujcontent.uj.ac.za/vital/access/manager/Repository/uj:21756. [24 October 2018].
Li, Y., 2016. Expatriate Manager's Adaption and Knowledge Acquisition. Personal Development
in Multi-National Companies in China. Xiamen, Fujian, China.
Li, C.J., Huang, Y.Y., Harder, M.K., 2017. Incentives for food waste diversion: Exploration of a
long term successful Chinese city residential scheme. Journal of Cleaner Production, 156,
pp.491-499.
117
Leib, E.B., Gunders, D., Ferro,J., Nielsen, A., Nosek, G., Qu, J., 2013. The Dating Game:
How Confusing Food Date Labels Lead to Food Waste in America. Available from:
https://www.nrdc.org/sites/default/files/dating-game-report.pdf. [26 September 2018].
Lincoln, J., 2011. South Africa: Waste Management. Swiss Business Hub South Africa. Pretoria.
Liu, G., 2013. Food losses and food waste in China: a first estimate. Available from:
https://www.oecd.org/site/agrfcn/Food%20losses%20and%20waste%20in%20China_Gang%20
Liu.pdf. [13 June 2018].
Llach, J., Perramon, J., Alonso-Almeida, M., Bagur-Femenías, L., 2013. Joint impact of quality
and environmental practices on firm performance in small service businesses: an empirical study
of restaurants. Journal of Cleaner Production 44 (2013) 96e104.
Lundqvist, J., de Fraiture, C., Molden, D., 2008. Saving water: from field to fork: curbing losses
and wastage in the food chain. Stockholm: Stockholm International Water Institute. Available
from:
http://dlc.dlib.indiana.edu/dlc/bitstream/handle/10535/5088/PB_From_Filed_to_Fork_2008.pdf?
sequence=1&isAllowed=y. [12 June 2018].
Majid, M.A.A., Othman, M., Mohamad, S.F., Lim, S.A.H., Yusof, A., 2017. Piloting for interviews
in qualitative research: Operationalisation and lessons learnt. International Journal of Academic
Research in Business and Social Sciences, 7(4), pp.1073-1080.
Majid, M.R., Howee, O.B., 2007. Sustainable solid waste management for island resorts: potential
for Perhentian Island, Terengganu. In: Presented at the 1st International Conference on Built
Environment in Developing Countries (ICBEDC 2007), Pulau Pinang, Malaysia., (December),
p.16.
Manaf, L. A., Samah, M. A. A., Zukki, N. I. M., 2009. Municipal solid waste management in
Malaysia: Practices and challenges. Waste Management (29) 2902–2906.
Marans, R.W., Lee, Y.J., 1993. Linking recycling behavior to waste management planning: A case
study of office workers in Taiwan. Landscape and Urban Planning, 26(1-4), pp.203-214.
Marsh, K., Bugusu, B., 2007. Food packaging—roles, materials, and environmental
issues. Journal of food science, 72(3).
Marthinsen, J., Kaysen, O., Kirkevaag, K., 2012. Prevention of Food Waste in Restaurants,
Hotels, Canteens and Catering. Nordic Council of Ministers, Copenhagen, Denmark
118
Martinho, M.D.M., Silveira, A.I., Branco, E.M.F.D., 2008. Report: New Guidelines for
Characterization of Municipal Solid Waste: The Portuguese Case. Waste Management Research.
26, 484–490.
Mazzanti, M., Montini, A., Zoboli, R., 2008. Municipal waste generation and socioeconomic
drivers: Evidence from comparing Northern and Southern Italy. The Journal of Environment &
Development, 17(1), pp.51-69.
Mee, N., Clewes, D., Phillips, P.S., Read, A.D., 2004. Effective implementation of a marketing
communications strategy for kerbside recycling: a case study from Rushcliffe, UK. Resources,
Conservation and Recycling, 42(1), pp.1-26.
Miezah, K., Obiri-Danso, K., Kádár, Z., Fei-Baffoe, B., Mensah, M.Y., 2015. Municipal solid waste
characterization and quantification as a measure towards effective waste management in
Ghana. Waste Management, 46, pp.15-27.
Miles, J., Gilbert, P., 2005. A Handbook of Research Methods for Clinical and Health Psychology.
Oxford University Press on Demand.
Miliute-Plepiene, J., Hage, O., Plepys, A., Reipas, A., 2016. What motivates households recycling
behaviour in recycling schemes of different maturity? Lessons from Lithuania and
Sweden. Resources, Conservation and Recycling, 113, pp.40-52.
Morse, J.M., 2008. Confusing Categories and Themes. Qualitative Health Research, 18(6),
Pp.727-728.
Müller, C., 2015. Food waste in the Swiss food service industry – Magnitude and potential for
reduction. Waste Management (35) 218–226.
Nahman, A., De Lange, W., Oelofse, S., Godfrey, L., 2012. The costs of household food waste in
South Africa. Waste Management, 32(11), pp.2147-2153.
Nahman, A., de Lange, W., 2013. Costs of food waste along the value chain: Evidence from South
Africa. Waste Management, 33(11), pp.2493-2500.
Neff, R.A., Spiker, M.L., Truant, P.L., 2015. Wasted food: US consumers' reported awareness,
attitudes, and behaviors. PloS one, 10(6), p.e0127881.
Nguyen, K. L., 2018. Food waste management in the hospitality industry Case study: Clarion
Hotel Helsinki. Bachelor’s Thesis. University of applied Sciences.
119
Nguyen, T.T.P., Zhu, D., Le, N.P., 2015. Factors influencing waste separation intention of
residential households in a developing country: Evidence from Hanoi, Vietnam. Habitat
International, 48, pp.169-176.
Niaki, S.F., Moore, C.E., Chen, T.A., Cullen, K.W., 2017. Younger elementary school students
waste more school lunch foods than older elementary school students. Journal of the Academy
of Nutrition and Dietetics, 117(1), pp.95-101.
Notten, P., Bole-Rentel, T., Rambaran, N., 2014. Understanding the Food Energy Water Nexus:
Developing an understanding of the energy implications of wasted food and waste disposal.
Available from:
http://www.health.uct.ac.za/sites/default/files/image_tool/images/91/2__a16245_developing_an
_understanding_of_the_energy_implications_of_wasted_food_lores.pdf
Ntloedibe, M., 2014. Food Service - Hotel Restaurant Institutional. Global Agricultural
Information Network. Available From: https://www.google.co.za/#q=Food+Service+-
+Hotel+Restaurant+Institutional+in+South+Africa+ntloedibe+. [07 November 2016].
Nyarai, M.P., Willard, Z., Moses, M., Ngenzile, M., 2016. Challenges of solid waste management
in Zimbabwe: a case study of Sakubva high density suburb. Journal of Environment and Waste
Management, 3(2), pp.142-155.
Oelofse, S.H., Nahman, A., 2013. Estimating the magnitude of food waste generated in South
Africa. Waste Management & Research, 31(1), pp.80-86.
Oelofse, S.H., 2015. Food waste in South Africa: Opportunities and challenges. Available from:
http://researchspace.csir.co.za/dspace/bitstream/handle/10204/8748/Oelofse4_2015.pdf?seque
nce=1. [01 October 2018]
Oelofse, S.H., Muswema, A.P., Koen, R., 2016. The Changing Face of Waste Management–
Considerations When Conducting a Waste Characterization Study. Proceedings of the 23rd
Wastecon Conference. 17-21 October 2016, Emperors Palace, Johannesburg, South Africa.
Okazaki, W.K., Turn, S.Q., Flachsbart, P.G., 2008. Characterization of food waste generators: A
Hawaii case study. Waste management, 28(12), pp.2483-2494.
Oke, A., 2015. Workplace waste recycling behaviour: A meta-analytical
review. Sustainability, 7(6), pp.7175-7194.
120
Oliveira, B., de Moura, A.P., Cunha, L.M., 2016. Reducing food waste in the food service sector
as a way to promote public health and environmental sustainability. In Climate Change and
Health (pp. 117-132). Springer, Cham.
Oliveira, V., Rodrigues, J., Lopes, P., Dias-Ferreira, C., undated. Characterization of waste
materials originating from restaurants and an assessment of recycling potential. Available from:
http://uest.ntua.gr/cyprus2016/proceedings/pdf/oliveira_et_al.pdf. [02 August 2018]
Omidiani, A., HashemiHezaveh, S., 2016. Waste management in hotel industry in India: A
review. International Journal of Scientific and Research Publications, 6(9), pp.670-680.
Onwuegbuzie, A. J., Collins, K. M. T., 2007. A Typology Of Mixed Methods Sampling Designs in
Social Science Research. The Qualitative Report 2 (12) 281-316.
Opara, U.L., Mditshwa. A., 2013. A review on the role of packaging in securing food system:
Adding value to food products and reducing losses and waste. African Journal of Agricultural
Research, 8(22), pp.2621-2630.
Osman, Z., 2007. An Appetite for Growth: Changing consumer lifestyles and growing wealth are
driving healthy gains in the consumer foodservices industry. Available From:
https://www.google.co.za/#q=growing+wealth%2C+convenience+and+accessibility+of+fast+foo
d+(Osman%2C+2007. [07 November 2016].
Ostergren, K., Gustavsson, J., Bos-Brouwers, H., Timmermans, T., Hansen, O.J., Moller, H.,
Anderson, G., O’Connor, C., Soethoudt, H., Quested, T., Easteal, S., 2014. FUSIONS definitional
framework for food waste. EU FUSIONS. Available from: http://www.eu-
fusions.org/phocadownload/Publications/FUSIONS%20Definitional%20Framework%20for%20F
ood%20Waste%202014.pdf.
Otsuka, M. A., 2017. Food Service - Hotel Restaurant Institutional: Japan HRI Food Service
Sector Report 2017. Available from:
https://gain.fas.usda.gov/Recent%20GAIN%20Publications/Food%20Service%20-
%20Hotel%20Restaurant%20Institutional_Tokyo%20ATO_Japan_12-22-2017.pdf. [06 February
2019].
Parfitt, J., Barthel, M., Macnaughton, S., 2010. Food waste within food supply chains:
quantification and potential for change to 2050. Philosophical Transactions of the Royal Society
B: Biological Sciences, 365(1554), pp.3065-3081.
Parry, A., Bleazard, P., Okawa, K., 2015. “Preventing Food Waste: Case Studies of Japan and
the United Kingdom”, OECD Food, Agriculture and Fisheries Papers, No. 76, OECD Publishing,
121
Paris. Available from: https://www.oecd-ilibrary.org/docserver/5js4w29cf0f7-
en.pdf?expires=1528974739&id=id&accname=guest&checksum=4B436DB24E28592F523636F
701EDD3C0. [14 June 2018].
Paterson, A., Kotzé, L.J., 2009. Environmental Compliance and Enforcement in South Africa –
Legal Perspectives. JUTA Law., Cape Town, South Africa.
Papargyropoulou, E., Wright, N., Lozano, R., Steinberger, J., Padfield, R., Ujang, Z., 2016.
Conceptual framework for the study of food waste generation and prevention in the hospitality
sector. Waste management, 49, pp.326-336.
Petty, N.J., Thomson, O.P., Stew, G., 2012. Ready For a Paradigm Shift? Part 2: Introducing
Qualitative Research Methodologies and Methods. Manual Therapy, 17 (5), Pp.378-384.
Pietkiewicz, I. Smith, J.A., 2012. A Practical Guide to Using Interpretative Phenomenological
Analysis in Qualitative Research Psychology. Psychological Journal 18 (2), Pp.361-369.
Pirani, S.I., Arafat, H.A., 2014. Solid waste management in the hospitality industry: A
review. Journal of environmental management, 146, pp.320-336.
Pirani, S.I., Arafat, H.A., 2016. Reduction of food waste generation in the hospitality
industry. Journal of cleaner production, 132, pp.129-145.
Ponce, O.A. Pagán-Maldonado, N., 2015. Mixed Methods Research in Education: Capturing the
Complexity of the Profession. International Journal of Educational Excellence, 1(1), Pp.111-135.
Principato, L., 2018. Food Waste at Consumer Level: A Comprehensive Literature Review.
Springer.
Pujan, S., 2016. Food Waste in Danish Restaurants. Master’s Thesis. Aalborg University.
Rahman, S.M., Shams, S., Mahmud, K., 2010. Study of solid waste management and its impact
on climate change: a case study of Dhaka City in Bangladesh. In Proceedings of International
Conference on Environmental Aspects of Bangladesh (ICEAB), September 4, 2010, University of
Kitakyushu, Kitakyushu, Japan (pp. 229-231).
Ramuedzisi, H.E., 2016. Challenges in recycling used cooking oil to produce biodiesel in
Polokwane. University of Limpopo. South Africa. Doctoral dissertation.
ReFED, 2018. Restaurant Food Waste Action Guide. Available from:
https://www.refed.com/downloads/Restaurant_Guide_Web.pdf. [25 September 2018].
Republic of South Africa (RSA) (1996) The Constitution of the Republic of South Africa, 1996 (Act
No 108 of 1996).
122
Revell, A., Blackburn, R., 2007. The business case for sustainability? An examination of small
firms in the UK's construction and restaurant sectors. Business strategy and the
environment, 16(6), pp.404-420.
Ritchie, J. Lewis, J. Eds., 2003. Qualitative Research Practice: A Guide for Social Science
Students and Researchers. Sage Publications. London; Thousand Oaks; New Delhi.
Rousta, K., Bolton, K., Lundin, M., Dahlén, L., 2015. Quantitative assessment of distance to
collection point and improved sorting information on source separation of household
waste. Waste management, 40, pp.22-30.
Sakaguchi, L., Pak, N., Potts, M.D., 2018. Tackling the issue of food waste in restaurants: Options
for measurement method, reduction and behavioral change. Journal of Cleaner Production, 180,
pp.430-436.
Saphores, J.D.M., Nixon, H., 2014. How effective are current household recycling policies?
Results from a national survey of US households. Resources, Conservation and Recycling, 92,
pp.1-10.
Sharma, M. Mcbean, E., 2007. A Methodology for Solid Waste Characterization Based on
Diminishing Marginal Returns. Waste Management, 27(3), Pp.337-344.
Searchinger, T., Hanson, C., Ranganathan, J., Lipinski, B., Waite, R., Winterbottom, R., Dinshaw,
A., Heimlich, R., 2013. “The Great Balancing Act.” Working Paper, Installment 1 of Creating a
Sustainable Food Future. Washington, DC: World Resources Institute.
Sidique, S.F., Lupi, F., Joshi, S.V., 2010. The effects of behavior and attitudes on drop-off
recycling activities. Resources, conservation and recycling, 54(3), pp.163-170.
Silvennoinen, K., Katajajuuri, J.M., Hartikainen, H., Jalkanen, L., Koivupuro, H.K., Reinikainen,
A., 2012. Food waste volume and composition in the Finnish supply chain: special focus on food
service sector. In: Proceedings Venice 2012. Presented at the Fourth International Symposium
on Energy from Biomass and Waste. Cini Foundation, CISA Publisher, Venice, Italy.
Shearer, L., Gatersleben, B., Morse, S., Smyth, M., Hunt, S., 2017. A problem unstuck?
Evaluating the effectiveness of sticker prompts for encouraging household food waste recycling
behaviour. Waste Management, 60, pp.164-172.
Shorten, A., Moorley, C. 2014. Selecting the Sample. Evidence Based Nursing, 17, 32-33.
Doi:10.1136/Eb-2014-101747.
123
Shekdar, A.V., 2009. Sustainable solid waste management: an integrated approach for Asian
countries. Waste management, 29(4), pp.1438-1448.
Singh, S. K., Kaushik, V., Soni, S., Lamba, N., 2014. Waste Management in Restaurants: A
Review. International Journal of Emerging Engineering Research and Technology Volume. 2,
Issue 2, May 2014, PP 14-24.
Snarr, J., Pezza, K., 2000. Recycling Guidebook for the Hospitality and Restaurant Industry.
Available from: http://infohouse.p2ric.org/ref/05/04032.pdf. [22/08/2018].
Sood, D., Mishra, S., 2016. Food Service - Hotel Restaurant Institutional: India’s foodservice
sector continues growing as restaurant dining and tourist numbers climb. Available from:
https://gain.fas.usda.gov/Recent%20GAIN%20Publications/Food%20Service%20%20Hotel%20
Restaurant%20Institutional_New%20Delhi_India_12-29-2016.pdf. [ 06 February 2019].
Strydom, W.F., Godfrey, L.K., 2016. Household waste recycling behaviour in South Africa-has
there been progress in the last 5 years?.
Svanes, E., Vold, M., Møller, H., Pettersen, M.K., Larsen, H., Hanssen, O.J., 2010. Sustainable
packaging design: a holistic methodology for packaging design. Packaging Technology and
Science, 23(3), pp.161-175.
Tan, S., Muzafar, S., Tan, S., Choon, S., 2017. “The impact of the dimensions of environmental
performance on firm performance in travel and tourism industry”, Journal of Environmental
Management, pp. 1-9.
Tatàno, F., Caramiello, C., Paolini, T., Tripolone, L., 2017. Generation and collection of restaurant
waste: Characterization and evaluation at a case study in Italy. Waste management, 61, pp.423-
442.
Teddlie, C., Yu, F., 2007. Mixed Methods Sampling: A Typology With Examples. Journal of Mixed
Methods Research, 1(1), Pp.77-100.
Teng, Y.M., Wu, K.S., Huang, D.M., 2014. The influence of green restaurant decision formation
using the VAB model: The effect of environmental concerns upon intent to
visit. Sustainability, 6(12), pp.8736-8755.
Thi, N.B.D., Kumar, G., Lin, C.Y., 2015. An overview of food waste management in developing
countries: current status and future perspective. Journal of environmental management, 157,
pp.220-229.
124
Thomas, C., Sharp, V., 2013. Understanding the normalisation of recycling behaviour and its
implications for other pro-environmental behaviours: A review of social norms and
recycling. Resources, Conservation and Recycling, 79, pp.11-20.
Thurmond, V.A., 2001. The Point Of Triangulation. Journal of Nursing Scholarship, 33(3), Pp.253-
258.
Tibon, M.V.P., 2012. Restaurant Sector’s Approach to Sustainable Tourism: Moving Beyond
Compliance. American International Journal of Contemporary Research, 2(4), pp.123-127.
Timlett, R.E., Williams, I.D., 2008. Public participation and recycling performance in England: A
comparison of tools for behaviour change. Resources, Conservation and Recycling, 52(4),
pp.622-634.
Tielens, J., Candel, J.J.L., 2014. Reducing food wastage, improving food security? An inventory
study on stakeholders’ perspectives and the current state. Food & Business Knowledge Platform.
Available from: http://knowledge4food.net/wp-content/uploads/2014/07/140702_fbkp_report-
foodwastage_DEF.pdf. [14 June 2018].
Timmermans, A.J.M., Ambuko, J., Belik, W. and Huang, J., 2014. Food losses and waste in the
context of sustainable food systems (No. 8). CFS Committee on World Food Security HLPE.
Available from:
http://www.fao.org/fileadmin/user_upload/hlpe/hlpe_documents/HLPE_Reports/HLPE-Report-
8_EN.pdf. [14 June 2018].
Trois, C., Simelane, O.T., 2010. Implementing separate waste collection and mechanical
biological waste treatment in South Africa: A comparison with Austria and England. Waste
Management, 30(8), pp.1457-1463.
Tudor, T., Barr, S., Gilg, A., 2007. A tale of two locational settings: is there a link between pro-
environmental behaviour at work and at home?. Local Environment, 12(4), pp.409-421.
Tzschentke, N., Kirk, D., Lynch, P.A., 2004. Reasons for going green in serviced accommodation
establishments. International journal of contemporary hospitality management, 16(2), pp.116-
124.
United States Environmental Protection Agency. 2014. Reducing Wasted Food & Packaging: A
Guide for Food Services and Restaurants. Available from: https://furtherwithfood.org/wp-
content/uploads/2016/12/reducing_wasted_food_pkg_tool.pdf. [13 August 2018].
Van den Berg, S., 2014. Integration of the informal sector in PET bottle collection and
recycling. Nieuwe Haven: Waste. Available from:
125
http://www.waste.nl/sites/waste.nl/files/informal_sector_and_pet_bottles_final.pdf. [11 October
2018]
VanSchenkhof, M., 2011. An investigation of water usage in casual dining restaurants in Kansas.
Kansas State University. Available from:
https://scholarworks.umass.edu/cgi/viewcontent.cgi?referer=https://scholar.google.co.za/&httpsr
edir=1&article=1154&context=gradconf_hospitality. [24/01/2018].
Van Zyl, M.K., Steyn, N.P., Marais, M.L., 2010. Characteristics and factors influencing fast food
intake of young adult consumers in Johannesburg, South Africa. South African Journal of Clinical
Nutrition, 23(3), pp.124-130.
Ventour, L., 2008. The food we waste. Wrap. Available from:
http://www.lefigaro.fr/assets/pdf/Etude%20gaspillage%20alimentaire%20UK2008.pdf. [12 June
2018].
Verghese, K., Lewis, H., Lockrey, S., Williams, H., 2013. The role of packaging in minimising food
waste in the supply chain of the future. RMIT University: Melbourne, Australia.
Vermeulen, H., Bienabe, E., 2007. What about the food ‘quality turn’ in South Africa? Focus on
the organic movement development. Poster Paper prepared for presentation at the 105th EAAE
Seminar ‘International Marketing and International Trade of Quality Food Products’, Bologna,
Italy, March 8-10, 2007.
Vieregge, M., Scanlon, N., Huss, J., 2007. Marketing locally grown food products in globally
branded restaurants: do customers care?. Journal of Foodservice Business Research, 10(2),
pp.67-82.
Wang, H., Nie, Y., 2001. Municipal Solid Waste Characteristics and Management in China,
Journal of the Air & Waste Management Association, 51:2, 250-263.
Wang, R., 2012. Investigations of Important and Effective Effects of Green Practices in
Restaurants. Procedia - Social and Behavioral Sciences ( 40 ) 94 – 98.
Wang, Y., Chen, S., Lee, Y., Tsai, C. S., 2013. Developing green management standards for
restaurants: An application of green supply chain management. International Journal of
Hospitality Management 34 (2013) 263– 273.
Williams, C., 2007. Research Methods. Journal of Business & Economics Research (JBER), 5(3).
Williams, H., Wikström, F., Löfgren, M., 2008. A life cycle perspective on environmental effects of
customer focused packaging development. Journal of Cleaner Production, 16(7), pp.853-859.
126
Williams, H., Wikström, F., Otterbring, T., Löfgren, M. and Gustafsson, A., 2012. Reasons for
household food waste with special attention to packaging. Journal of Cleaner Production, 24,
pp.141-148.
Wrap., Undated. Preventing Food Waste in the Hospitality & Food Service Sector. Available from:
http://www.wrap.org.uk/sites/files/wrap/EHP%20Food%20Waste%20Screencast%203.pdf. [13
August 2018].
Wrap, 2011. Fruit and vegetable resource maps. Available From:
http://www.wrapni.org.uk/sites/files/wrap/Resource_Map_Fruit_and_Veg_final_6_june_2011.fc4
79c40.10854.pdf. [19 September 2018]
Wrap., 2012. Understanding out of home consumer food waste. Available From:
https://www.google.co.za/#q=Understanding+out+of+home+consumer+food+waste. [07
November 2016].
Wrap., 2013. Where food waste arises within the UK hospitality and food service sector: spoilage,
preparation and plate waste. Available From:
http://www.wrap.org.uk/sites/files/wrap/Overview%20of%20Waste%20in%20the%20UK%20Hos
pitality%20and%20Food%20Service%20Sector%20FINAL.pdf. [19 September2018].
World bank.,Hoornweg, D., Bhada-Tata, P., 2012. What a Waste: A Global Review of Solid Waste
Management. Urban Development Series Knowledge Papers.No. 15.
Xu, L., Ling, M., Lu, Y., Shen, M., 2017. External influences on forming residents’ waste
separation behaviour: Evidence from households in Hangzhou, China. Habitat International, 63,
pp.21-33.
Yang, L., Li, Z.S., Fu, H.Z., 2011. Model of municipal solid waste source separation activity: A
case study of Beijing. Journal of the Air & Waste Management Association, 61(2), pp.157-163.
Yau, Y., 2010. Domestic waste recycling, collective action and economic incentive: The case in
Hong Kong. Waste Management, 30(12), pp.2440-2447.
Yeasmin, S., Rahman, K.F., 2012. Triangulation Research Method as the Tool of Social Science
Research. Bangladesh University of Professionals Journal, 1(1), Pp.154-163.
Yilmaz, K., 2013. Comparison of Quantitative and Qualitative Research Traditions:
Epistemological, Theoretical, and Methodological Differences. European Journal of
Education, 48(2), Pp.311-325.
127
.
Zein, K., Wazner, M. S., Meylan, G., 2008. Best Environmental Practices for the Hotel Industry.
Sustainable Business Associates (sba). Switzerland.
Zhang, H., Mortimer, S. R., Wang, Q., 2012. Waste cooking oil as an energy resource: Review of
Chinese policies. Renewable and Sustainable Energy Reviews (16) 5225–5231.
Zhang, H., Wen, Z.G., 2014. Residents’ household solid waste (HSW) source separation activity:
A case study of Suzhou, China. Sustainability, 6(9), pp.6446-6466.
Zhu, D., Asnani, P. U., Zurbrugg, C., Anapolsky, S., Mani.S. 2008. Improving Municipal Solid
Waste Management in India: A source book for policy-makers and Practitioners. The World Bank.
Washington, D. C.
Zhuang, Y., Wu, S.W., Wang, Y.L., Wu, W.X., Chen, Y.X., 2008. Source separation of
household waste: a case study in China. Waste Management, 28(10), pp.2022-2030.
128
ANNEXURES
ANNEXURE 1: RESTAURANT STAFF MEMBERS’ INTERVIEW GUIDE
1. General Information
Restaurant manager ………………………………………………………………………..Date…………………………............................
Contact number ……………………………………………………………….....Email address…………………………………………………..
Name of the Mall ……………………………………................Restaurant Name…………………………………………………………..
Type of restaurant a la carte type restaurant Buffet type restaurant Fast food restaurant
Full-service restaurant Café Other
If other, specify…………………………………………………………………………………………………………………………………………….....
What is the average number of meals served per day?........................................................................................
2. Purchasing of raw material
Where do you source your raw materials? ............................................................................................................
Do you buy your raw material? In bulk One by one
Which type of food do you buy? Pre-cut Uncut both pre-cut and uncut
Do you buy fffff Frozen? Fresh
Do you consider waste minimization when purchasing food?
Are there any products that you have substituted to reduce the amount of waste you generate?
3. Waste generation
Do you track the waste you generate? Yes No
How much waste do you generate per week? .........................................................................................................
Have you made efforts to reduce the amount of waste you generate? Yes No
If yes, please specify…………………………………………………………………………………………………………………………………………….
Where does most of your packaging waste come from? .........................................................................................
List top three reasons why food is discarded at these stages of the service in the table below
G
G G
G G
G G G
G G
G G
G
G G
129
Storage losses 1.
2.
3.
Preparation losses 1.
2.
3.
Serving losses 1.
2.
3.
From a scale of 1 to 5 (5 being the highest amount of food waste) how would you score food waste coming from
the stages listed below
Storage
Preparation
Serving
Plate waste
Which food commodities are wasted the most? .....................................................................................................
Are there any strategies put in place to prevent and or reduce food waste?..........................................................
4. Waste management
Who provides waste collection services for your restaurant? Private waste handler Municipality
What is the collection frequency? Every day One a week Other
Do you separate your waste at source? YES No
If yes, what is the amount of waste you send for recycling per week/month? ………………………………………………….
Which recyclable material do you send for recycling? ..........................................................................................
Who collects your recyclable material? ................................................................................................................
Who encouraged you to separate your waste? Company policy Private waste handler
Municipality Voluntary participated Other
Other, please specify…………………………………………………………………………………………………………………………………….....
What do you do with your left over food? Donate Give staff members Dispose as food waste
Other
Other, please specify………………………………………………………………………………………………………………………………………..
If you dispose your left over food, do you have any reason for not donating the food?
G
G G
G G G
G
G G
G G G
G G G
G
130
What do you do with your food waste? Landfill Compost Macerate donate for animals
Other, specify…………………………………………………………………………………………………………………………………………………..
What is the average amount of waste cooking oil you generate per week/month?
How do you dispose your waste cooking oil?
Do you have questions?
Is there any other information related to waste management that you feel we should take note of?
Thank you for your time!
ANNEXURE 2: MALL MANAGERS’ INTERVIEW GUIDE
1. General Information
Mall manager ………………………………………………………………………..Date………………………….............................................
Contact number ……………………………………………………………….....Email address……………………………………………………….
Name of the Mall ……………………………………................…………No of restaurants…………………………………………………….
2. Waste Management
Is the mall responsible for the waste generated by all the businesses? ..................................................................
Who provides waste collection services for the mall?
What is the collection frequency? Every day One a week Other
If other, specify…………………………………………………………………………………………………………………………………………………..
How much waste does the mall generate per month?
Do you track waste generated by each business?
If yes, what is an average amount of waste restaurants generates per month? ……………………………………………………
Do you recycle your waste?
If yes, (a) Do you receive source separated waste from the businesses? ................................................................
(b) What is the amount of waste you send for recycling per month? ............................................................
(c) Which waste material is targeted for recycling? ........................................................................................
(d) Who collects your recyclable material? ....................................................................................................
(e) Is recycling part of the policy? ..................................................................................................................
Does the mall have waste management policy? (please share if available).............................................................
Which waste management policies are imposed on the restaurants? ..................................................................... G G G G
1 1 1
131
Are there any businesses that do not comply with the waste management policies? ............................................
How do resolve non-compliance? ………………………………………………………………………………………………………………………
Do you have questions?
Is there any other information related to waste management that you feel we should take note of?
Thank you for your time!


