Embed Size (px)
Citation preview
Maritime Charities Funding Group
UK Seafarers' DemographicProfile
February 2015
Written by: Liz Cairncross
UK Seafarers' Demographic Profile February 2015
Contents
1 Introduction.......................................42 Methodology........................................52.1 Initial scoping.................................52.2 Data collection and analysis....................52.3 Overview of the data............................5
3 Royal Navy.........................................83.1 Serving in the Royal Navy.......................83.2 Age profile of serving RN seafarers.............93.3 Gender and ethnic origin.......................113.4 Former RN seafarers under and over retirement age
113.5 Projected RN numbers...........................143.5.1 Serving RN..................................143.5.2 Age profile of serving RN seafarers.........143.5.3 RN intake and outflow.......................15
3.6 Former RN – both under and over 65.............173.7 Royal Navy dependants..........................193.8 RN limiting long-standing illness and limitationswith Activities of Daily Living.....................223.9 Dementia.......................................263.10 Medical discharges and mental health..........283.11 Drug and alcohol problems.....................293.12 Other research................................303.13 Geographical spread of serving RN personnel...323.14 Geographical spread of former RN personnel....323.15 Summary.......................................33
4 Merchant Navy.....................................354.1 Length of service..............................374.2 Serving MN seafarers...........................37
UK Seafarers' Demographic Profile February 2015
4.2.1 Age profile of serving MN seafarers.........414.3 Former MN seafarers under and over 65..........424.3.1 Officers....................................434.3.2 Ratings.....................................454.3.3 Officers and ratings........................48
4.4 Projected MN Numbers...........................494.5 Former MN both under and over 65...............544.6 Superyachts....................................574.7 Merchant Navy Dependants.......................584.8 MN limiting long-standing illness and limitationswith Activities of Daily Living.....................614.9 Dementia.......................................644.10 Alcohol dependence............................664.11 Geographical location of beneficiaries........684.12 Summary.......................................69
5 Fishing Fleet.....................................715.1 Serving FF seafarers...........................715.2 Serving FF seafarers age distribution..........735.3 Former FF seafarers under and over 65..........745.4 Projected serving FF seafarers numbers.........765.5 Projected former FF seafarers numbers..........765.6 Fishing Fleet Dependants.......................795.7 FF seafarers limiting long-standing illness and limitations with Activities of Daily Living.........825.8 Dementia.......................................845.9 Alcohol problems...............................875.10 Geography.....................................905.11 Summary.......................................91
6 Research on seafarers’ health.....................926.1 Health and the Merchant Navy...................936.2 Health and the Fishing Fleet...................94
7 Conclusion........................................96
UK Seafarers' Demographic Profile February 2015
Appendix 1 – Organisations contacted.................100Appendix 2 – Royal Navy service personnel by year....101Appendix 3 – RMT Membership age distribution.........104Appendix 4: Number of fishermen employed on Scottish based vessels, by region: 2012.......................105Appendix 5: Fishermen numbers by administration port: 2012.................................................106
UK Seafarers' Demographic Profile February 2015
Acknowledgements
This project would not have been possible without the contributions of Valerie Coleman, Peter Coulson, Barry Bryant, Mick Howarth and Dennis Treleaven. The MCFG Steering Group is grateful to the many people who contributed information and advice, and in particular toDavid Parsons, David Dickens, Peter McEwen, Andrew Linnington, Paul Quinn, Peter Linstead Smith and Tim Carter who read and commented on drafts of the report.
UK Seafarers' Demographic Profile February 2015
Error: Reference source not found
Error: Reference source not found
1 Introduction The Maritime Charities Funding Group (MCFG) commissionedthe Institute of Public Care (IPC) at Oxford Brookes University to undertake a project to provide the MCFG with a UK demographic profile of the naval service, merchant navy and fishing fleet personnel and their dependants from 1945 to 2050. The start date was chosento cover the huge decline in naval personnel following the end of World War II, and the anticipated decline in the number of veterans from that era in the coming years.
In response to the changing profile and perceived continuing decline in the numbers of seafarers and theirdependants, the project sought to develop current and future demographic profiles of the three elements of theseafaring workforce and their dependants from 1945 to 2050. Where possible, information on age, gender, ethnicity, disability and health has been included. Theaim was to obtain a clear picture of how the demographicprofile is changing; and to use the available data to develop a credible and accessible dataset which can be used to inform service planning, decisions about the useof resources, and other activities by a wide range of stakeholders, including grant makers and service providers. It is however important to emphasise that the projections are dependent on the assumptions used inthe model. The further into the future they go, the more speculative they become.
UK Seafarers' Demographic Profile February 2015
The project follows and in part builds on an unpublishedprevious study by Kathleen Baster of the University of Hertfordshire in 2007 which was commissioned by the MCFG. This earlier work was reported in the MCFG’s wideranging 2007 ‘Supporting seafarers and their families’ report. The work by Baster provided projections up to 2020.
For both projects, the availability of data in some areas has placed constraints on the ability to project into the future. Consequently, different approaches have been adopted for some groups involving assumptions about flows of people into, and out of, the three seafaring groups. Changing the assumptions would generate changes in the projections.
The project brings together data from a number of sources including published reports and surveys, activity and pension data, and the views of experts. Weare grateful to those who have taken the time to providedata and comments on the project.
2 Methodology
2.1 Initial scoping
The initial scoping stage of the project involved a number of conversations with experts in the field on future trends in the maritime workforce in the UK to help develop thinking about likely trends in numbers between now and 2050 across the three workforce groups in the component countries of the UK. These interviews also helped to identify additional sources of relevant data. A list of organisations contacted is provided in Appendix 1.
2.2 Data collection and analysis
Following a review of the earlier MCFG study and other relevant literature, data were collected and assessed interms of quality and reliability. Where appropriate,
UK Seafarers' Demographic Profile February 2015
the data were then synthesised to obtain demographic data for past, present and future numbers of seafarers and their dependants.
Where there were gaps in the data, national data were used instead, for example: on life expectancy from the Office of National Statistics; on prevalence of ill-health and disability from prevalence rates used in the POPPI1 and PANSI2 information systems to develop projections for data on health and disability. The completed data set is available in a set of Excel files which accompany this report.
2.3 Overview of the data
A number of issues affected the projections:
Differences between the demographic past, present andfuture profiles of the three different seafarer populations. For example, numbers in the Royal Navy have fallen as a result of the government’s StrategicDefence Review, while there has been a slight rise inrecruitment to the Merchant Navy, and numbers in the Fishing Fleet appear to have stabilised.
New groups of seafarers - cruise ship staff in entertainment, and non-standard vessels such as super-yachts are resulting in new groups of seafarersabout whom relatively little is known.
A variety of factors have been identified which may affect future recruitment and seafarer numbers. These might include:
Royal Navy, Royal Marines and Royal Fleet Auxiliary (MN): changes in future government policy on defence and security.
Merchant Navy: changes in world trading patterns; future ship design; changes in manning levels;
1 www.poppi.org.uk2 www.pansi.org.uk
UK Seafarers' Demographic Profile February 2015
increased usage of non-UK national crews; changes in the flag composition of commercial shipping.
Fishing industry: changes to fishing stocks and fishing quotas; usage of non-UK national seafarerson UK registered fishing fleet boats.
Factors affecting the longevity of ex-seafarers – occupational and other factors affect the life expectancy of serving and ex-seafarers. For example,commercial fishing is Britain’s most hazardous occupation, whilst merchant seafaring is regarded by some as second only to this. Seafaring has other unique health issues. Outside customs controlled limits, there is easy access to duty free tobacco. There have always been a lot of smokers at sea and some merchant seafarers have heavy long-term nicotinedependency. Alcohol consumption, mainly shore-based binge drinking (as many ships are ‘dry’) is an issue for some groups of seafarers. The seafaring lifestyle is often quite sedentary, with little opportunity, or incentive, for good exercise (although the Royal Navy has given fitness a higher profile in recent years). This can affect fitness.
Changing patterns of need -The demographic information, within this report, is important when itcomes to predicting future numbers. Nevertheless it is also important to take into account changes in statutory provision of welfare, health and social care, pension arrangements, employment opportunities etc, all of which may seriously affect the lives of people eligible for support. A lot of these factors are impossible to predict.
Retirement age consistency – retirement ages differ across the three populations. This report has focused on age, rather than retirement age.
Double-counting –some seafarers move between the three types of seafaring work leading to the likelihood of some double-counting. For example, some Royal Navy personnel join the Merchant Navy after discharge, although the numbers are thought to
UK Seafarers' Demographic Profile February 2015
be low; and some Fishing Fleet personnel move to the Merchant Navy or vice versa.
The timespan of the results - the project aimed to develop a profile over a 105 year timespan up to 2050. Projecting 36 years into the future involved making assumptions about future recruitment and staffing levels, as well as life expectancy.
The availability of data - Some data were not available, while other data were not sufficiently detailed. This was a particular issue with the Fishing Fleet where data on inflows and outflows are not available, and to a lesser extent with the Merchant Navy. Data on adult and child dependents are also unavailable for the Fishing Fleet, and limited for the Merchant Navy. This meant that in some areas projections are based on a series of assumptions. We have tried to be clear about the assumptions made and the rationale for them.
The report begins with the Royal Navy, followed by the Merchant Navy, and lastly the Fishing Fleet. Projections relating to serving and former numbers and their dependants are presented in each section, along with health and disability. There is an overarching discussion of health and disability issues in a final section, covering some of the research across all three groups. The conclusion considers the implications of the results of the study and changing patterns of need for future service provision.
Numbers have been rounded up or down to the nearest ten so 27 becomes 30 and 23 becomes 20 to avoid misleading accuracy. However, there are some exceptions where the actual numbers are small.
UK Seafarers' Demographic Profile February 2015
Section A
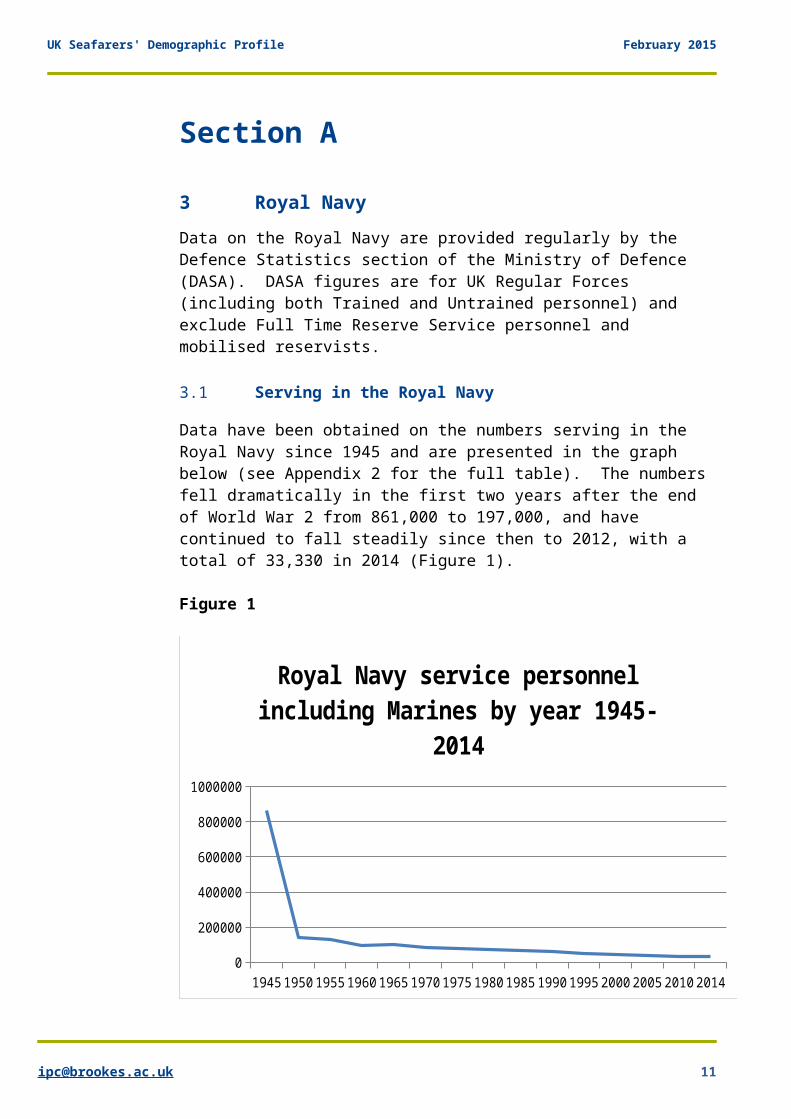
3 Royal NavyData on the Royal Navy are provided regularly by the Defence Statistics section of the Ministry of Defence (DASA). DASA figures are for UK Regular Forces (including both Trained and Untrained personnel) and exclude Full Time Reserve Service personnel and mobilised reservists.
3.1 Serving in the Royal Navy
Data have been obtained on the numbers serving in the Royal Navy since 1945 and are presented in the graph below (see Appendix 2 for the full table). The numbers fell dramatically in the first two years after the end of World War 2 from 861,000 to 197,000, and have continued to fall steadily since then to 2012, with a total of 33,330 in 2014 (Figure 1).
Figure 1
194519501955196019651970197519801985199019952000 2005201020140
200000
400000
600000
800000
1000000
Royal Navy service personnel including Marines by year 1945-
2014
UK Seafarers' Demographic Profile February 2015
Data from 1974 are available broken down between officerand other ranks and for some years by gender (see Table 1).
UK Seafarers' Demographic Profile February 2015
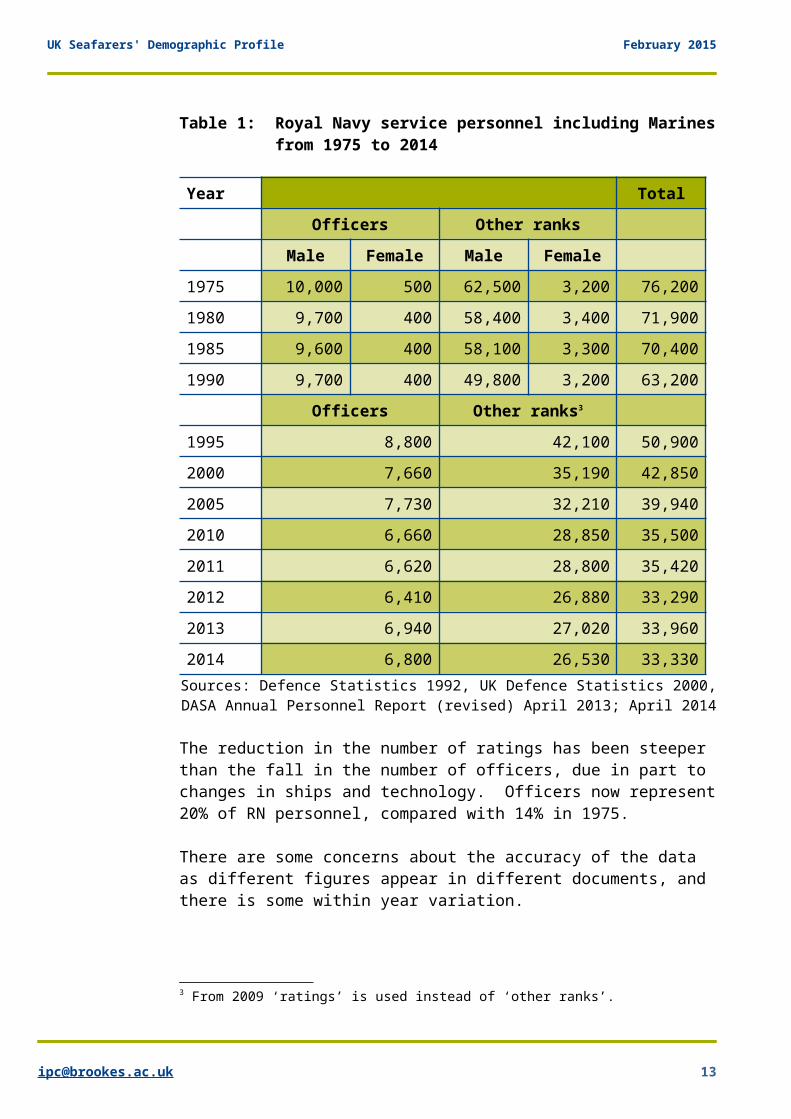
Table 1: Royal Navy service personnel including Marinesfrom 1975 to 2014
Year TotalOfficers Other ranks
Male Female Male Female1975 10,000 500 62,500 3,200 76,2001980 9,700 400 58,400 3,400 71,9001985 9,600 400 58,100 3,300 70,4001990 9,700 400 49,800 3,200 63,200
Officers Other ranks3
1995 8,800 42,100 50,9002000 7,660 35,190 42,8502005 7,730 32,210 39,9402010 6,660 28,850 35,5002011 6,620 28,800 35,4202012 6,410 26,880 33,2902013 6,940 27,020 33,9602014 6,800 26,530 33,330Sources: Defence Statistics 1992, UK Defence Statistics 2000,DASA Annual Personnel Report (revised) April 2013; April 2014
The reduction in the number of ratings has been steeper than the fall in the number of officers, due in part to changes in ships and technology. Officers now represent20% of RN personnel, compared with 14% in 1975.
There are some concerns about the accuracy of the data as different figures appear in different documents, and there is some within year variation.
3 From 2009 ‘ratings’ is used instead of ‘other ranks’.
UK Seafarers' Demographic Profile February 2015
3.2 Age profile of serving RN seafarers
The age profile of serving RN regular forces is providedbelow with comparable data for 2006 (drawn from the earlier MCFG report4). The proportion in different age categories is also presented:
4 Baster K (2007) The Maritime Charities Funding Group Research project, University of Hertfordshire.
UK Seafarers' Demographic Profile February 2015
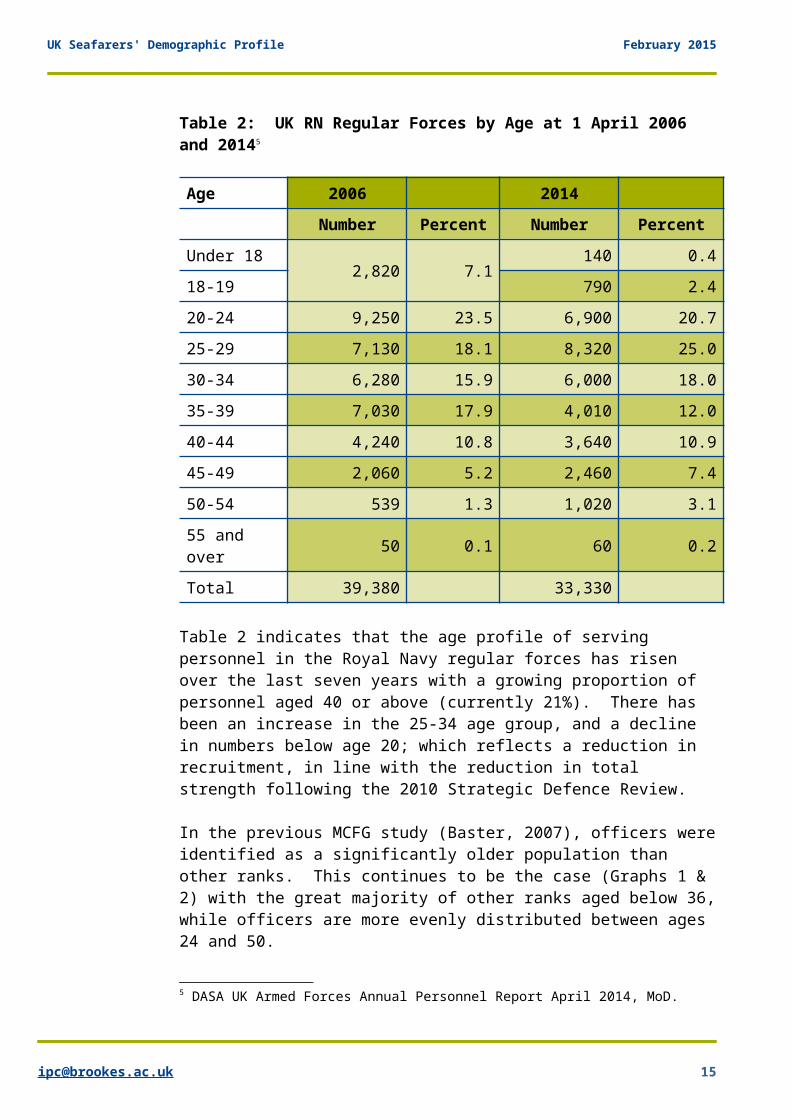
Table 2: UK RN Regular Forces by Age at 1 April 2006 and 20145
Age 2006 2014Number Percent Number Percent
Under 182,820 7.1
140 0.418-19 790 2.420-24 9,250 23.5 6,900 20.725-29 7,130 18.1 8,320 25.030-34 6,280 15.9 6,000 18.035-39 7,030 17.9 4,010 12.040-44 4,240 10.8 3,640 10.945-49 2,060 5.2 2,460 7.450-54 539 1.3 1,020 3.155 and over 50 0.1 60 0.2
Total 39,380 33,330
Table 2 indicates that the age profile of serving personnel in the Royal Navy regular forces has risen over the last seven years with a growing proportion of personnel aged 40 or above (currently 21%). There has been an increase in the 25-34 age group, and a decline in numbers below age 20; which reflects a reduction in recruitment, in line with the reduction in total strength following the 2010 Strategic Defence Review.
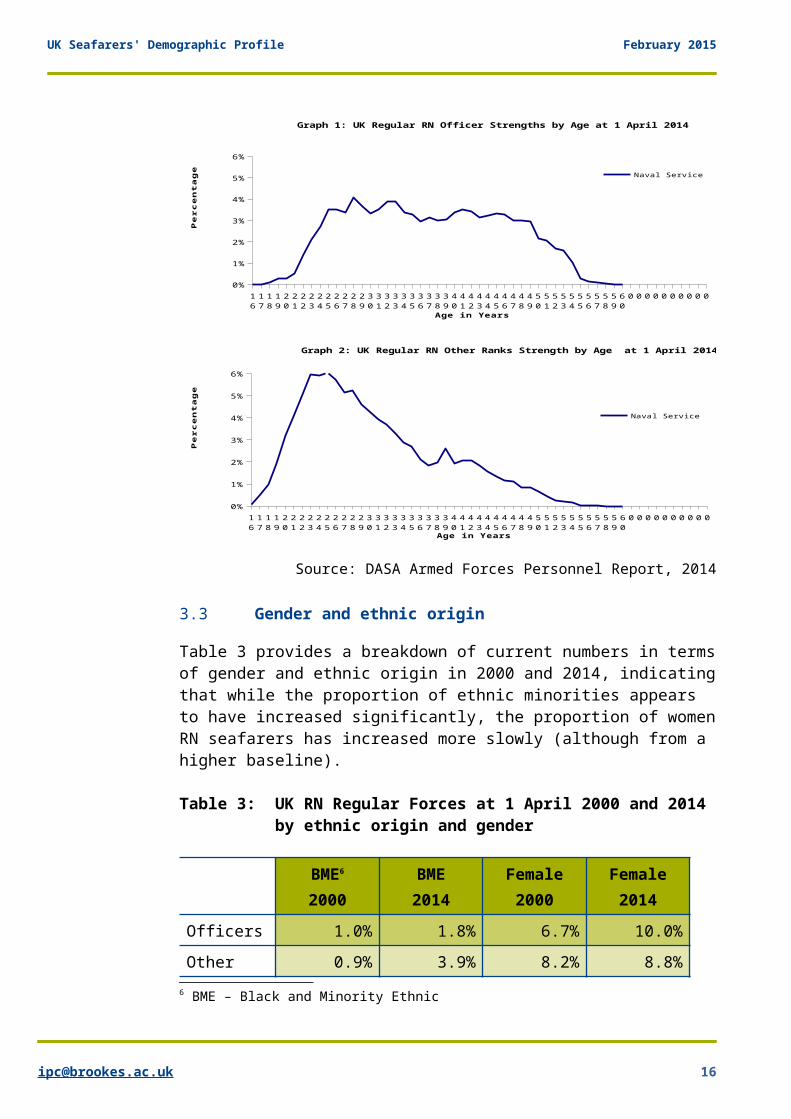
In the previous MCFG study (Baster, 2007), officers wereidentified as a significantly older population than other ranks. This continues to be the case (Graphs 1 & 2) with the great majority of other ranks aged below 36,while officers are more evenly distributed between ages 24 and 50.
5 DASA UK Armed Forces Annual Personnel Report April 2014, MoD.
UK Seafarers' Demographic Profile February 2015
1617181920212223242526272829303132333435363738394041424344454647484950515253545556575859600 0 0 0 0 0 0 0 0 0
0%
1%
2%
3%
4%
5%
6%
Graph 1: UK Regular RN Officer Strengths by Age at 1 April 2014
Naval Service
Age in Years
Percentage
1617181920212223242526272829303132333435363738394041424344454647484950515253545556575859600 0 0 0 0 0 0 0 0 0
0%
1%
2%
3%
4%
5%
6%
Graph 2: UK Regular RN Other Ranks Strength by Age at 1 April 2014
Naval Service
Age in Years
Percentage
Source: DASA Armed Forces Personnel Report, 2014
3.3 Gender and ethnic origin
Table 3 provides a breakdown of current numbers in termsof gender and ethnic origin in 2000 and 2014, indicatingthat while the proportion of ethnic minorities appears to have increased significantly, the proportion of womenRN seafarers has increased more slowly (although from a higher baseline).
Table 3: UK RN Regular Forces at 1 April 2000 and 2014 by ethnic origin and gender
BME6
2000BME2014
Female2000
Female2014
Officers 1.0% 1.8% 6.7% 10.0%Other 0.9% 3.9% 8.2% 8.8%
6 BME – Black and Minority Ethnic
UK Seafarers' Demographic Profile February 2015
ranksTotal 0.9% 3.5% 7.9% 9.1%Source: DASA Armed Forces Annual Personnel Report April 2014
3.4 Former RN seafarers under and over retirement age
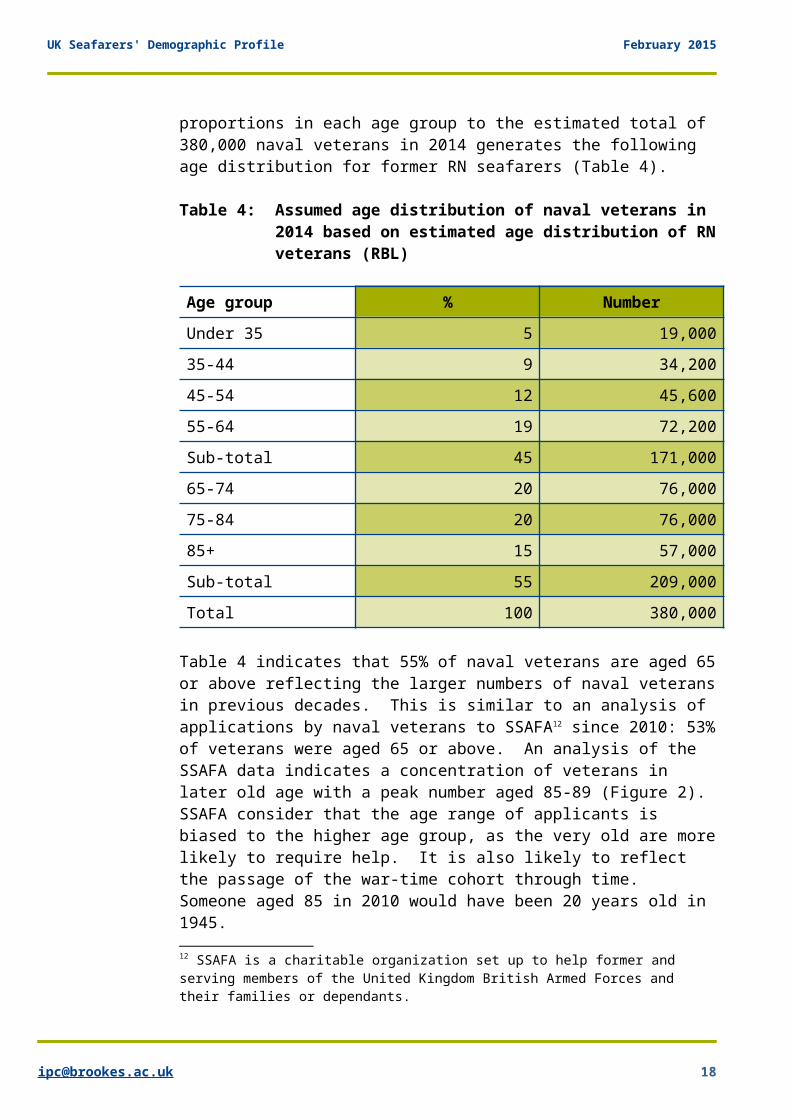
The Centre for Future Studies report in 20117 estimated that across the three services, there were 4.6 million veterans8. If we assume that 14% of veterans had servedin the Royal Navy (in line with the findings of the Royal British Legion report in 20059), this would indicate that the total number of Royal Navy/Marines andRNR/RNVR/RMR veterans in 2010 was 644,000. More recently, the Royal British Legion (RBL) has commissioned a large survey of tri-service veterans which indicates that there are in the region of 380,000 ex-RN/Marines, including 30,000 RNR/RNVR/RMR veterans10. This figure, although considerably lower than the 2010 figure, is considered by RBL to be more reliable due to a larger sample size. It reflects the passing of the World War II generation in recent years.
The RBL survey provided an age profile for the veteran population including reservists11. Applying the
7 Centre for Future Studies (2011) Legion welfare in the 2010s: a decade of change, Royal British Legion.8 Veteran here is defined as anyone who has previously served in any of the following ways and is eligible for welfare assistance from RBL: the UK Armed Forces, both Regular Forces (including National Service or the Home Guard), or Reserve/Auxiliary Forces; the Mercantile Marines in hostile waters; the Allied Civil Police Forces; full-time, in uniform for a Voluntary Aid Society in directsupport of the Armed Forces; or as British subject serving under British command in the forces of an allied nation.9 RBL (2005) Profile of the Ex-Service Community in the UK, RBL10 Compass Partnership (2014) A UK Household Survey of the Ex-Service Community 2014, FIMT, National Lottery, Compass Partnership.11 Reservist veterans are a small number of total veterans – although this may change in the future as government policy envisages an increase in the number of reservists.
UK Seafarers' Demographic Profile February 2015
proportions in each age group to the estimated total of 380,000 naval veterans in 2014 generates the following age distribution for former RN seafarers (Table 4).
Table 4: Assumed age distribution of naval veterans in 2014 based on estimated age distribution of RNveterans (RBL)
Age group % NumberUnder 35 5 19,00035-44 9 34,20045-54 12 45,60055-64 19 72,200Sub-total 45 171,00065-74 20 76,00075-84 20 76,00085+ 15 57,000Sub-total 55 209,000Total 100 380,000
Table 4 indicates that 55% of naval veterans are aged 65or above reflecting the larger numbers of naval veteransin previous decades. This is similar to an analysis of applications by naval veterans to SSAFA12 since 2010: 53%of veterans were aged 65 or above. An analysis of the SSAFA data indicates a concentration of veterans in later old age with a peak number aged 85-89 (Figure 2). SSAFA consider that the age range of applicants is biased to the higher age group, as the very old are morelikely to require help. It is also likely to reflect the passage of the war-time cohort through time. Someone aged 85 in 2010 would have been 20 years old in 1945. 12 SSAFA is a charitable organization set up to help former and serving members of the United Kingdom British Armed Forces and their families or dependants.
UK Seafarers' Demographic Profile February 2015
These estimates do not provide separate officer and rating figures. Given the higher number of ratings in the serving RN, it is expected that they also comprise agreater number of former RN.
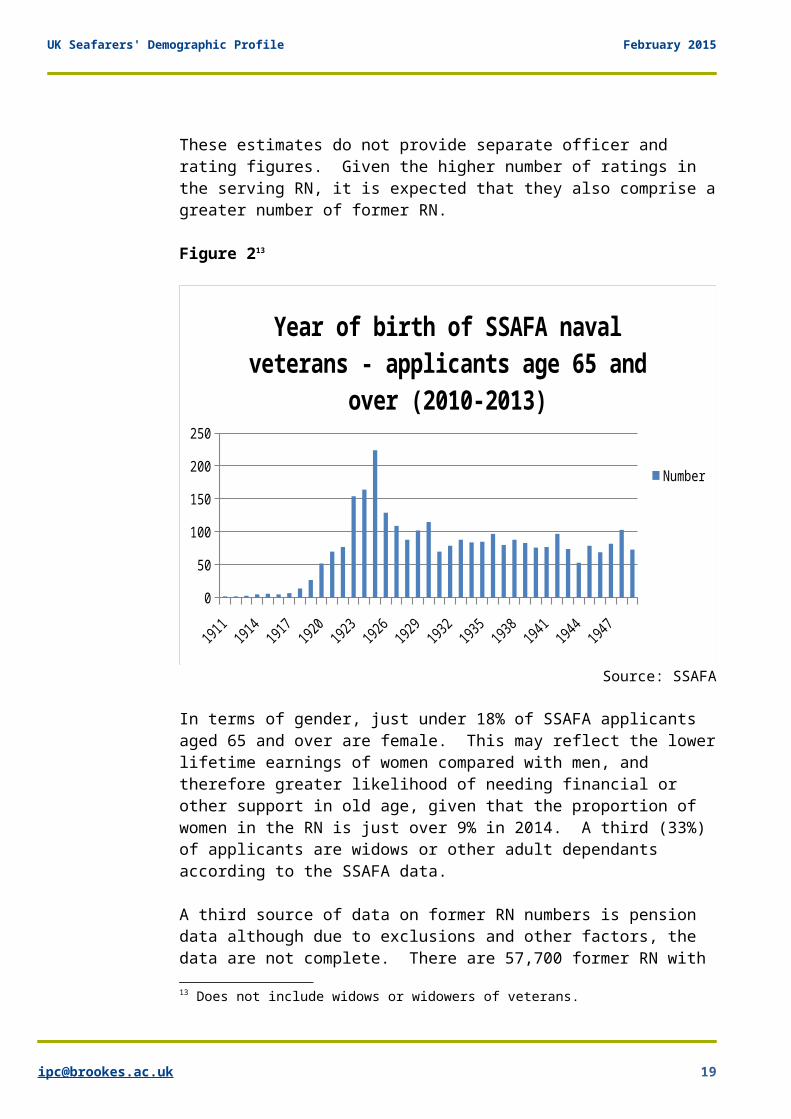
Figure 213
1911
1914
1917
1920
1923
1926
1929
1932
1935
1938
1941
1944
1947
0
50
100
150
200
250
Year of birth of SSAFA naval veterans - applicants age 65 and
over (2010-2013)
Number
Source: SSAFA
In terms of gender, just under 18% of SSAFA applicants aged 65 and over are female. This may reflect the lowerlifetime earnings of women compared with men, and therefore greater likelihood of needing financial or other support in old age, given that the proportion of women in the RN is just over 9% in 2014. A third (33%) of applicants are widows or other adult dependants according to the SSAFA data.
A third source of data on former RN numbers is pension data although due to exclusions and other factors, the data are not complete. There are 57,700 former RN with 13 Does not include widows or widowers of veterans.
UK Seafarers' Demographic Profile February 2015
deferred pensions under 65 years old, (70% of whom are aged between 40 and 6014), about one-third of the estimate based on the RBL data.
Because naval personnel reach an initial pension point after they reach age 40 and have 18 or more years’ service when an early departure payment becomes payable,and can therefore retire at a range of ages, we have notdivided the former population between under retirement age and over retirement age, but have instead focused onage itself.
3.5 Projected RN numbers
3.5.1 Serving RNSecuring Britain in an Age of Uncertainty – the Strategic Defence and Security Review, published by the Coalition Government in October 2010, envisages a reduction in numbers to a target of 30,000 naval personnel by 2015, and assumes that by 2020, the UK willrequire a Royal Navy of 29,000 personnel. It appears that projections of future numbers are no longer commissioned by the MoD. However, in the context of theReview, it seems likely that numbers will not alter significantly. It is reasonable to assume that numbers will remain constant from 2020 to 2050 as the figure of 29,000 is seen as a minimum level to provide national security.
A range of factors, such as the next Strategic Defence Review in 2015, and new ships coming on stream (eg HMS Queen Elizabeth with a planned crew of 679 sailors) may influence future numbers. Assuming that planned targetsare achieved and maintained, projected estimates are provided for 2014 – 2050 in Table 5 below.
14 Personal communication with DBS Vets-Pensions 12/6/14.
UK Seafarers' Demographic Profile February 2015
3.5.2 Age profile of serving RN seafarersTo estimate the projected age distribution of serving RNpersonnel, the proportionate age distribution of the intake and outflow of personnel in 2014 was applied to the numbers in each age group in 2014 and each successive year up to 2050. However, the result of thiswas that from 2025 onwards, there were no serving RN seafarers in some age groups. From discussions with theRN, it is clear that recruitment and retention practice is continually reviewed and adjusted to avoid this actually happening. It has therefore been assumed instead that the age distribution of current numbers will remain constant over time, with total numbers in line with the 2010 SDR (Table 5). The limitation of this approach is that it does not reflect cohort effectsas intake years pass through the system, however, it is assumed that the age distribution of serving RN has stabilised following previous rounds of redundancies.
UK Seafarers' Demographic Profile February 2015
Table 5: Actual and projected numbers by age group of serving RN assuming relative age distribution remains constant 2014-2050
2014 2015 2020 2025 2030 2035 2040 2045 2050
Under 18 140 120 120 120 120 120 120 120 120
18-19 790 720 700 700 700 700 700 700 700
20-24
6,900
6,200
5,990
5,990
5,990
5,990
5,990
5,990 5,990
25-29
8,320
7,500
7,240
7,240
7,240
7,240
7,240
7,240 7,240
30-34
6,000
5,400
5,210
5,210
5,210
5,210
5,210
5,210 5,210
35-39
4,010
3,600
3,470
3,470
3,470
3,470
3,470
3,470 3,470
40-44
3,640
3,270
3,160
3,160
3,160
3,160
3,160
3,160 3,160
45-49
2,460
2,210
2,150
2,150
2,150
2,150
2,150
2,150 2,150
50-54
1,020 920 900 900 900 900 900 900 900
55+ 60 60 60 60 60 60 60 60 60
Total
33,330
30,000
29,000
29,000
29,000
29,000
29,000
29,000
29,000
Note=Projection is based on planned reductions set out inStrategic Review 2010.
3.5.3 RN intake and outflowOutflow from UK RN Regular Forces includes personnel leaving the Services, deaths, recalled reservists on release (see Table 6).
Table 6 - UK Regular RN Forces Outflow by Age, 2013/1415
15 DASA Armed Forces Annual Personnel Report April 2014, MoD.
UK Seafarers' Demographic Profile February 2015
Age 2013/14
Officers Otherranks Total Outflow %
Under 18 - 40 40 1.1%18-19 - 180 180 4.7%20-24 30 770 800 21.1%25-29 50 710 760 20.1%30-34 50 390 440 11.6%35-39 50 270 320 8.4%40-44 80 560 640 16.9%45-49 90 240 330 8.7%50-54 120 110 230 6.1%55 and over 30 - 30 0.8%
Total 520 3,270 3,790 100
A peak for officers’ outflow is around 50, where normal retirement age for certain ranks is age 50; while outflow for other ranks peaks between 20 and 29 with a second peak around 40.
Table 7 presents the flows of personnel over the last 6 years. From 2010 to 2013, intake averaged 2,500, but intake has now increased. Outflows in recent years havebeen high due to the implementation of the Strategic Defence Review, but in 2013-14 have reduced. After three rounds of redundancies, outflows have now stabilised according to the RN16. However, the figures indicate that recruitment and retention may be adjusted year by year to take account of changing contexts and tomaintain strength.
Taking a three year average for the 2007/8 to 2009/10 – the years before the Strategic Review where numbers were16 Personal communication with IPC.
UK Seafarers' Demographic Profile February 2015
reasonably constant, indicates that the average outflow was 10.8% of the total personnel complement. It is assumed that the rate of outflow will stabilise in following years at a slightly lower level of 10%.
Table 7: Royal Navy intake and outflow – 2007/8-2012/13
2007/8 2008/9 2009/10
2010/11
2011/12
2012/2013
2013/1417
Strength at start of period
38,850
38,560
38,340
38,730
37,660 35,540 33,960
Intake(+) 4,040 4,240 4,130 2,550 2,220 2,770 3,180
Outflow (-) 4,330 4,440 3,720 3,630 4,320 4,350 3,790
Strength at end ofperiod
38,560
38,340
38,730
37,660
35,540 33,960 33,330
17 DASA Annual Personnel Report April 2014
UK Seafarers' Demographic Profile February 2015
In Table 7, strengths at the end of the period may not equal the sum of the strength at the beginning of the period and intervening intake and outflow. According toDASA, this is due to movements between the three Armed Services.
3.6 Former RN – both under and over 65
To estimate the numbers of former RN personnel by age over time, the RBL based estimates in Table 4 were used for the age distribution of former RN seafarers, and theoutflow from serving RN was added, and then the age specific mortality rates were applied. Mortality rates are assumed to be the same as standard mortality rates, provided by ONS.
In this way, it is possible to project forward estimatesfor the numbers of former RN personnel across all ages (Table 8).
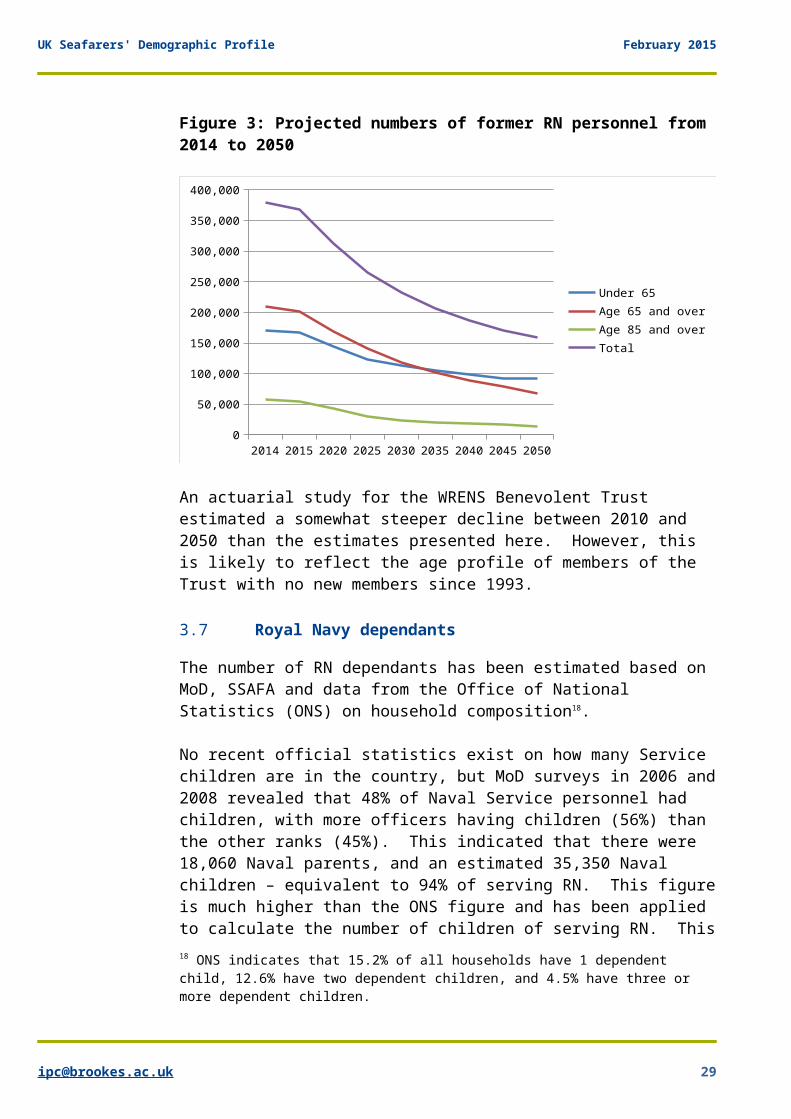
Table 8 and Figure 3 illustrate how the total number of former RN personnel is likely to decline between 2014 and 2050 to about 40% of current levels. The current proportion of former RN aged 85 and over is more than seven times that in the general population. As a proportion of total numbers, those aged 65 and over willdecrease from around 55% to 42% over the whole period; while the proportion of former RN personnel aged 85 and over (estimated at 15% in 2014) is projected to decline to 14% by 2020 and to 8% by 2050. Baster (2007) expected the number of former RN aged 85 and over to peak in 2015, while the current figures indicate that the population has already peaked.
Numbers of former RN are concentrated between age 65 and85. The RBL based data suggest that there are currently57,000 former RN personnel aged 85 and over. By 2020, numbers aged 85 and over are projected to have fallen toa little over 43,600; and by 2030 to 24,000, less than half the current estimate. The numbers thus indicate that deaths of former naval personnel will significantly
UK Seafarers' Demographic Profile February 2015
outnumber new entrants into the community of former naval personnel. The 85+ age group appears to have peaked and the final National Service generation is dying out.
The projected baseline total figure for former RN in 2015 is approximately 129,000 lower than the projection for 2015 provided in Baster’s 2007 report for MCFG. However, the 2007 report was based on the earlier RBL survey and therefore had a higher baseline. RBL consider the 2014 survey to be more reliable as it is based on a larger sample.
The zero number for former RN aged 95 and over is due tono respondents in this age group responding to the RBL survey. It can be assumed that there will be some people in this age group, although few of them are likely to be alive by 2020.
UK Seafarers' Demographic Profile February 2015
Table 8: Projected distribution of former RN personnel – 2014-20502014 2015 2020 2025 2030 2035 2040 2045 2050
Under 20 2,530 2,030 160 150 150 150 150 150 150
20-24 3,170 3,900 4,030 2,080 2,080 2,080 2,080 2,080 2,080
25-29 6,650 6,720 7,070 7,020 5,080 5,070 5,070 5,070 5,070
30-34 6,650 7,150 9,270 9,470 9,420 7,480 7,480 7,480 7,480
35-39 17,100 15,330 8,690 10,710 10,910 10,860 8,940 8,930 8,930
40-44 17,100 17,650 17,000 10,340 12,350 12,540 12,500 10,580 10,580
45-49 22,800 22,000 19,540 18,780 12,200 14,180 14,370 14,320 12,430
50-54 22,800 22,960 22,820 20,330 19,570 13,100 15,050 15,240 15,190
55-59 36,100 33,300 23,000 22,800 20,380 19,640 13,340 15,240 15,430
60-64 36,100 35,770 32,050 22,180 21,980 19,670 18,930 12,900 14,720
65-69 38,000 37,050 33,580 30,070 20,830 20,630 18,470 17,760 12,120
70-74 38,000 37,070 33,420 30,300 27,080 18,800 18,600 16,670 16,000
75-79 38,000 36,430 31,210 28,140 25,530 22,750 15,840 15,660 14,060
80-84 38,000 35,270 26,990 23,150 20,870 18,960 16,800 11,780 11,600
85-89 28,500 26,270 19,880 15,300 13,160 11,860 10,800 9,440 6,730
90-94 28,500 24,080 11,320 8,560 6,590 5,670 5,110 4,650 4,060
95+ 0 4,820 12,450 5,770 4,250 3,220 2,750 2,480 2,250
Total 209,000 200,990 168,850 141,280 118,300 101,880 88,380 78,430 66,810
UK Seafarers' Demographic Profile February 2015
65+Total85+ 57,000 55,170 43,640 29,630 24,000 20,750 18,670 16,570 13,040
Total 380,000 367,790 312,470 265,140 232,420 206,650 186,290 170,430 158,880
UK Seafarers' Demographic Profile February 2015
Figure 3: Projected numbers of former RN personnel from 2014 to 2050
2014 2015 2020 2025 2030 2035 2040 2045 20500
50,000
100,000
150,000
200,000
250,000
300,000
350,000
400,000
Under 65Age 65 and overAge 85 and overTotal
An actuarial study for the WRENS Benevolent Trust estimated a somewhat steeper decline between 2010 and 2050 than the estimates presented here. However, this is likely to reflect the age profile of members of the Trust with no new members since 1993.
3.7 Royal Navy dependants
The number of RN dependants has been estimated based on MoD, SSAFA and data from the Office of National Statistics (ONS) on household composition18.
No recent official statistics exist on how many Service children are in the country, but MoD surveys in 2006 and2008 revealed that 48% of Naval Service personnel had children, with more officers having children (56%) than the other ranks (45%). This indicated that there were 18,060 Naval parents, and an estimated 35,350 Naval children – equivalent to 94% of serving RN. This figureis much higher than the ONS figure and has been applied to calculate the number of children of serving RN. This18 ONS indicates that 15.2% of all households have 1 dependent child, 12.6% have two dependent children, and 4.5% have three or more dependent children.
UK Seafarers' Demographic Profile February 2015
could be due in part to the younger age profile of RN personnel, compared with the general population and therefore the greater likelihood that they will have dependent children. For former RN, where the ONS provides a rate for households with 3 or more children, it has been assumed there are three children in the household. The figures will therefore underestimate thetotal number of children.
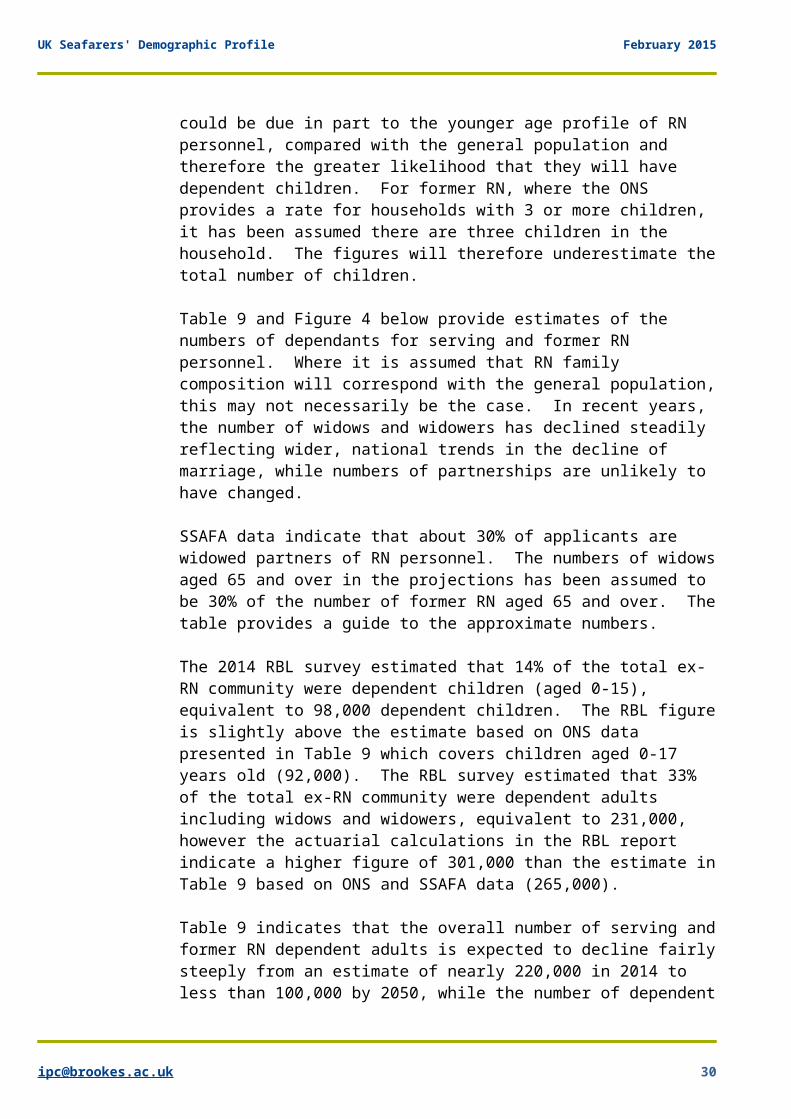
Table 9 and Figure 4 below provide estimates of the numbers of dependants for serving and former RN personnel. Where it is assumed that RN family composition will correspond with the general population,this may not necessarily be the case. In recent years, the number of widows and widowers has declined steadily reflecting wider, national trends in the decline of marriage, while numbers of partnerships are unlikely to have changed.
SSAFA data indicate that about 30% of applicants are widowed partners of RN personnel. The numbers of widowsaged 65 and over in the projections has been assumed to be 30% of the number of former RN aged 65 and over. Thetable provides a guide to the approximate numbers.
The 2014 RBL survey estimated that 14% of the total ex-RN community were dependent children (aged 0-15), equivalent to 98,000 dependent children. The RBL figureis slightly above the estimate based on ONS data presented in Table 9 which covers children aged 0-17 years old (92,000). The RBL survey estimated that 33% of the total ex-RN community were dependent adults including widows and widowers, equivalent to 231,000, however the actuarial calculations in the RBL report indicate a higher figure of 301,000 than the estimate inTable 9 based on ONS and SSAFA data (265,000).
Table 9 indicates that the overall number of serving andformer RN dependent adults is expected to decline fairlysteeply from an estimate of nearly 220,000 in 2014 to less than 100,000 by 2050, while the number of dependent
UK Seafarers' Demographic Profile February 2015
children in is expected to decline more gradually from 123,000 to just under 77,000.
Figure 4: Projected number of dependants of serving and former RN personnel
2014
2015
2020
2025
2030
2035
2040
2045
2050
0
50,000
100,000
150,000
200,000
250,000
300,000
Dependent adults (excl. widows)Widows aged 65 and overTotal dependent adultsTotal number of children
UK Seafarers' Demographic Profile February 2015
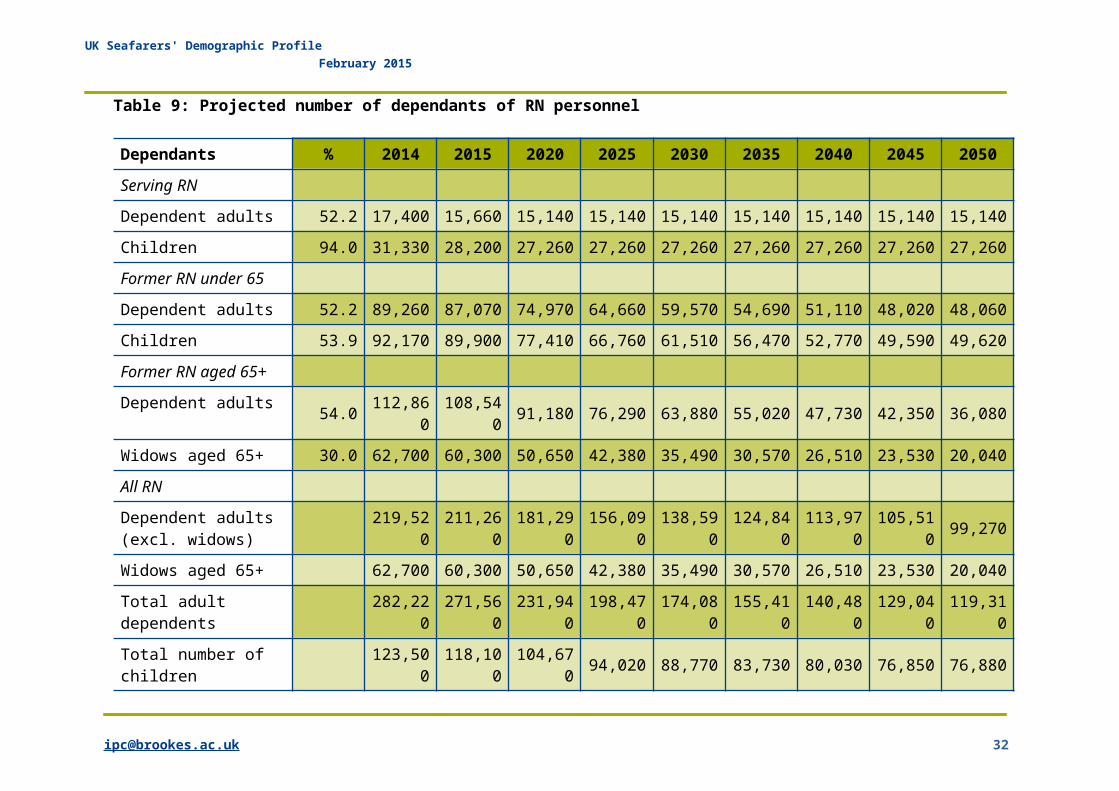
Table 9: Projected number of dependants of RN personnel
Dependants % 2014 2015 2020 2025 2030 2035 2040 2045 2050Serving RN
Dependent adults 52.2 17,400 15,660 15,140 15,140 15,140 15,140 15,140 15,140 15,140Children 94.0 31,330 28,200 27,260 27,260 27,260 27,260 27,260 27,260 27,260Former RN under 65
Dependent adults 52.2 89,260 87,070 74,970 64,660 59,570 54,690 51,110 48,020 48,060Children 53.9 92,170 89,900 77,410 66,760 61,510 56,470 52,770 49,590 49,620Former RN aged 65+
Dependent adults 54.0 112,860
108,540 91,180 76,290 63,880 55,020 47,730 42,350 36,080
Widows aged 65+ 30.0 62,700 60,300 50,650 42,380 35,490 30,570 26,510 23,530 20,040All RN
Dependent adults (excl. widows)
219,520
211,260
181,290
156,090
138,590
124,840
113,970
105,510 99,270
Widows aged 65+ 62,700 60,300 50,650 42,380 35,490 30,570 26,510 23,530 20,040Total adult dependents
282,220
271,560
231,940
198,470
174,080
155,410
140,480
129,040
119,310
Total number of children
123,500
118,100
104,670 94,020 88,770 83,730 80,030 76,850 76,880
UK Seafarers' Demographic Profile February 2015
Note: Dependent adults is based on households with one dependent adult Source: ONS, 2013,MOD and SSAFA data
UK Seafarers' Demographic Profile February 2015
The recent RBL survey (2014) indicates that including adult dependants but excluding children, in 2014, there are 651,000 people in the ex-RN community. They projecta fall to 471,000 in 2020, 396,000 in 2025, and 307,000 in 2030.
The Royal Navy and Royal Marines Children’s Fund found anumber of challenges which Service children can have to deal with above and beyond those of their peers19, including:
Stresses and strains on children when their parent isaway – 83% of Naval spouses say their children find it difficult when their serving father or mother has to go away for long periods of time.
Impact of moving homes, schools and communities – More than 20,000 Service families are on the move each year.
Dealing with parental illness or injury – Many Service personnel return to their families with physical injuries or mental scars which inevitably have both short and long-term impacts on the family’semotional, functional and financial well-being.
Dealing with divorce and family breakdown – 70% of Service spouses say that military operations have hada negative impact on their relationships, and sometimes the Service lifestyle can place so much strain on relationships that it leads to family breakdown and divorce.
In 2013, the Royal Navy and Royal Marines Children’s Fund helped nearly 2,000 children20, 44% of them from serving families. The annual report identified an upward trend in need.
19 The Royal Navy and Royal Marines Children’s Fund (2009) Overlooked Casualties of Conflict. 20 Royal Navy and Royal Marines Children’s Fund (2013) Fourteenth Annual Review, RNRMC.
UK Seafarers' Demographic Profile February 2015
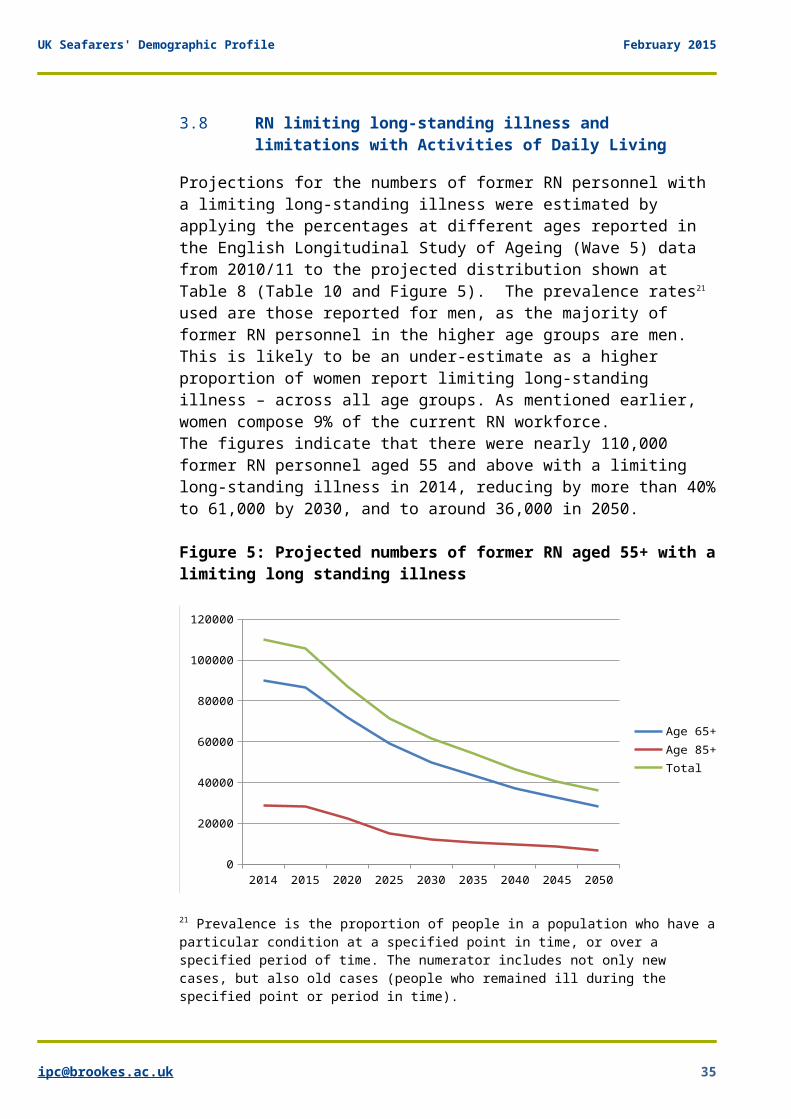
3.8 RN limiting long-standing illness and limitations with Activities of Daily Living
Projections for the numbers of former RN personnel with a limiting long-standing illness were estimated by applying the percentages at different ages reported in the English Longitudinal Study of Ageing (Wave 5) data from 2010/11 to the projected distribution shown at Table 8 (Table 10 and Figure 5). The prevalence rates21 used are those reported for men, as the majority of former RN personnel in the higher age groups are men. This is likely to be an under-estimate as a higher proportion of women report limiting long-standing illness – across all age groups. As mentioned earlier, women compose 9% of the current RN workforce.The figures indicate that there were nearly 110,000 former RN personnel aged 55 and above with a limiting long-standing illness in 2014, reducing by more than 40%to 61,000 by 2030, and to around 36,000 in 2050.
Figure 5: Projected numbers of former RN aged 55+ with alimiting long standing illness
2014 2015 2020 2025 2030 2035 2040 2045 20500
20000
40000
60000
80000
100000
120000
Age 65+Age 85+Total
21 Prevalence is the proportion of people in a population who have aparticular condition at a specified point in time, or over a specified period of time. The numerator includes not only new cases, but also old cases (people who remained ill during the specified point or period in time).
UK Seafarers' Demographic Profile February 2015
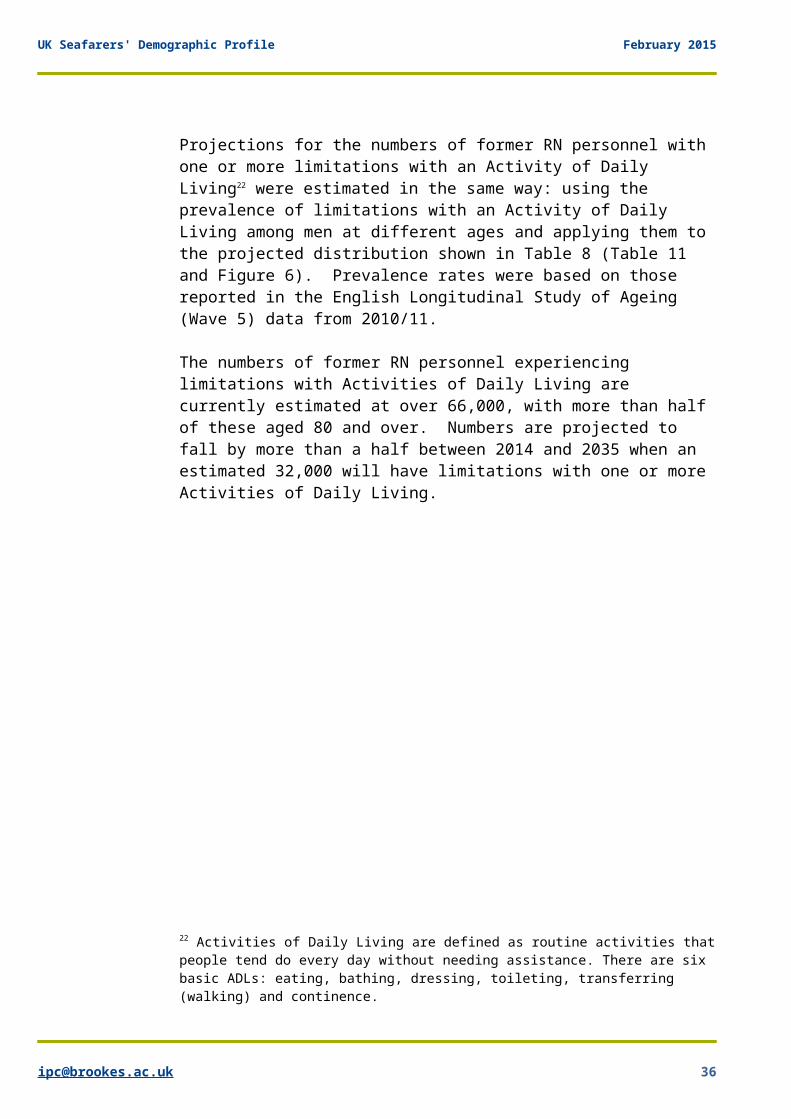
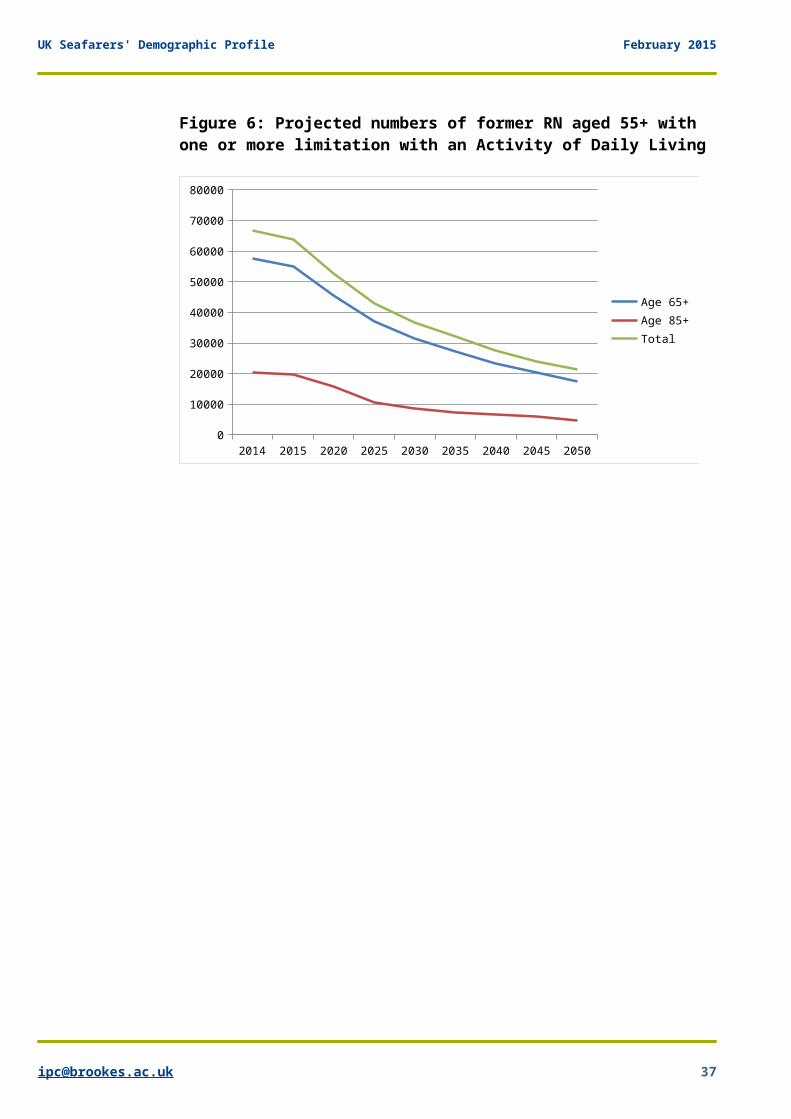
Projections for the numbers of former RN personnel with one or more limitations with an Activity of Daily Living22 were estimated in the same way: using the prevalence of limitations with an Activity of Daily Living among men at different ages and applying them to the projected distribution shown in Table 8 (Table 11 and Figure 6). Prevalence rates were based on those reported in the English Longitudinal Study of Ageing (Wave 5) data from 2010/11.
The numbers of former RN personnel experiencing limitations with Activities of Daily Living are currently estimated at over 66,000, with more than half of these aged 80 and over. Numbers are projected to fall by more than a half between 2014 and 2035 when an estimated 32,000 will have limitations with one or more Activities of Daily Living.
22 Activities of Daily Living are defined as routine activities thatpeople tend do every day without needing assistance. There are six basic ADLs: eating, bathing, dressing, toileting, transferring (walking) and continence.
UK Seafarers' Demographic Profile February 2015
Figure 6: Projected numbers of former RN aged 55+ with one or more limitation with an Activity of Daily Living
2014 2015 2020 2025 2030 2035 2040 2045 20500
10000
20000
30000
40000
50000
60000
70000
80000
Age 65+Age 85+Total
UK Seafarers' Demographic Profile February 2015
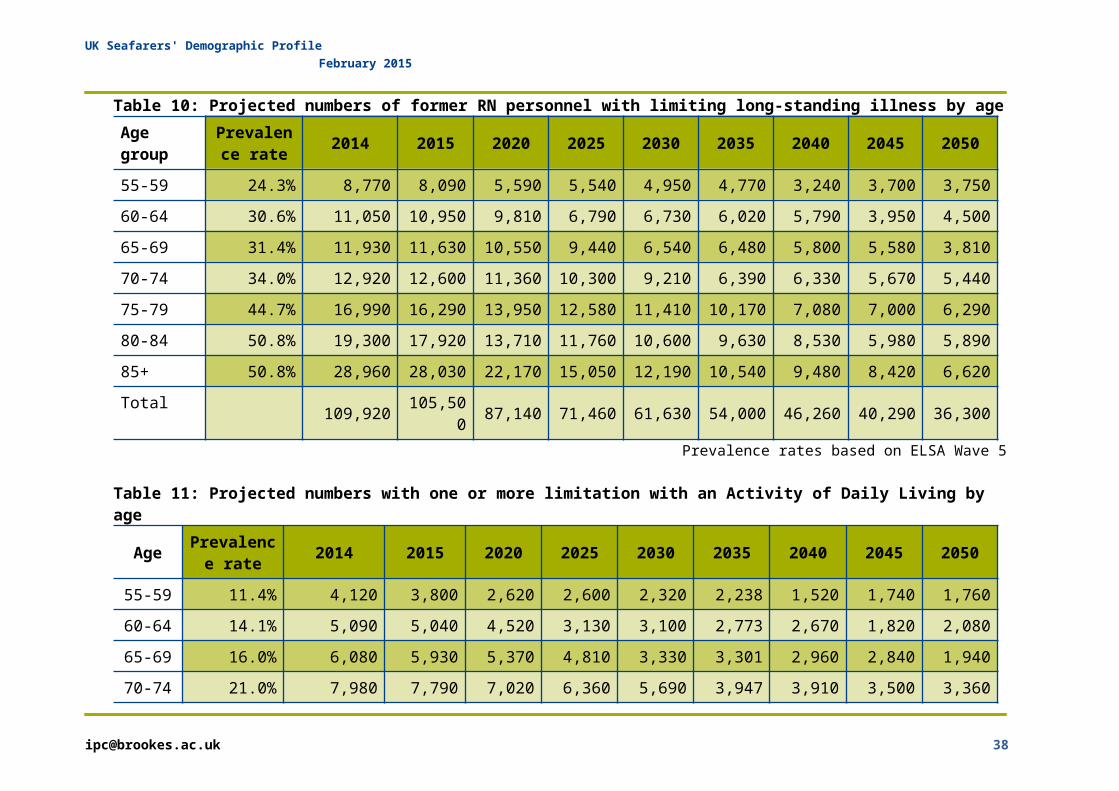
Table 10: Projected numbers of former RN personnel with limiting long-standing illness by ageAge group
Prevalence rate 2014 2015 2020 2025 2030 2035 2040 2045 2050
55-59 24.3% 8,770 8,090 5,590 5,540 4,950 4,770 3,240 3,700 3,75060-64 30.6% 11,050 10,950 9,810 6,790 6,730 6,020 5,790 3,950 4,50065-69 31.4% 11,930 11,630 10,550 9,440 6,540 6,480 5,800 5,580 3,81070-74 34.0% 12,920 12,600 11,360 10,300 9,210 6,390 6,330 5,670 5,44075-79 44.7% 16,990 16,290 13,950 12,580 11,410 10,170 7,080 7,000 6,29080-84 50.8% 19,300 17,920 13,710 11,760 10,600 9,630 8,530 5,980 5,89085+ 50.8% 28,960 28,030 22,170 15,050 12,190 10,540 9,480 8,420 6,620Total 109,920 105,50
0 87,140 71,460 61,630 54,000 46,260 40,290 36,300
Prevalence rates based on ELSA Wave 5
Table 11: Projected numbers with one or more limitation with an Activity of Daily Living by age
Age Prevalence rate 2014 2015 2020 2025 2030 2035 2040 2045 2050
55-59 11.4% 4,120 3,800 2,620 2,600 2,320 2,238 1,520 1,740 1,76060-64 14.1% 5,090 5,040 4,520 3,130 3,100 2,773 2,670 1,820 2,08065-69 16.0% 6,080 5,930 5,370 4,810 3,330 3,301 2,960 2,840 1,94070-74 21.0% 7,980 7,790 7,020 6,360 5,690 3,947 3,910 3,500 3,360
UK Seafarers' Demographic Profile February 2015
75-79 24.6% 9,350 8,960 7,680 6,920 6,280 5,596 3,900 3,850 3,46080-84 35.0% 13,640 12,660 9,690 8,310 7,490 6,805 6,030 4,230 4,16085+ 35.9% 20,460 19,810 15,670 10,640 8,620 7,450 6,700 5,950 4,680
Total 66,720 63,980 52,570 42,770 36,830 32,110 27,680 23,930 21,440Prevalence rates based on ELSA Wave 5
UK Seafarers' Demographic Profile November 2014
3.9 Dementia
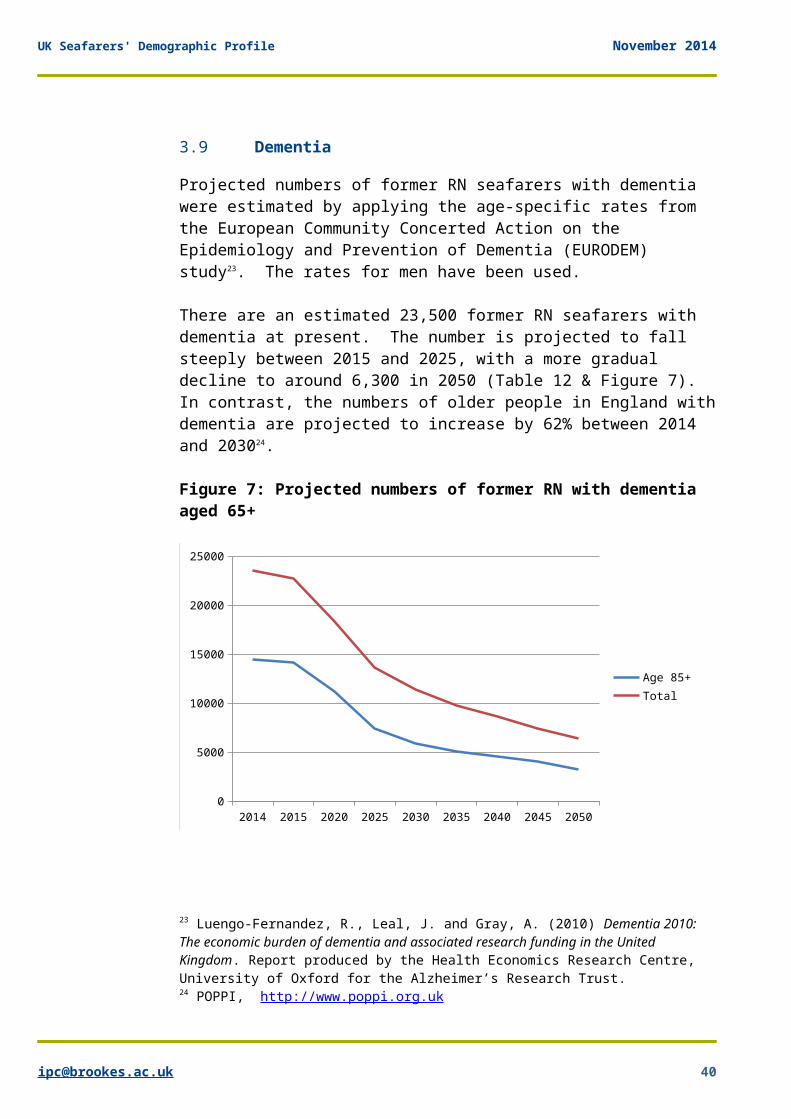
Projected numbers of former RN seafarers with dementia were estimated by applying the age-specific rates from the European Community Concerted Action on the Epidemiology and Prevention of Dementia (EURODEM) study23. The rates for men have been used.
There are an estimated 23,500 former RN seafarers with dementia at present. The number is projected to fall steeply between 2015 and 2025, with a more gradual decline to around 6,300 in 2050 (Table 12 & Figure 7). In contrast, the numbers of older people in England withdementia are projected to increase by 62% between 2014 and 203024.
Figure 7: Projected numbers of former RN with dementia aged 65+
2014 2015 2020 2025 2030 2035 2040 2045 20500
5000
10000
15000
20000
25000
Age 85+Total
23 Luengo-Fernandez, R., Leal, J. and Gray, A. (2010) Dementia 2010: The economic burden of dementia and associated research funding in the United Kingdom. Report produced by the Health Economics Research Centre, University of Oxford for the Alzheimer’s Research Trust.24 POPPI, http://www.poppi.org.uk

UK Seafarers' Demographic Profile February 2015
Table 12: Projected numbers of former RN with dementia aged 65+
Agegroup
Prevalence rate 2014 2015 2020 2025 2030 2035 2040 2045 2050
65-69 2.17% 830 800 730 650 450 450 400 390 26070-74 4.61% 1,750 1,710 1,540 1,400 1,250 870 860 770 74075-79 5.04% 1,920 1,840 1,570 1,420 1,290 1,150 800 790 71080-84 12.12% 4,610 4,280 3,270 2,810 2,530 2,300 2,040 1,430 1,41085-89 18.45% 5,260 4,850 3,670 2,820 2,430 2,190 1,990 1,740 1,24090-94 32.1% 9,150 7,730 3,630 2,750 2,120 1,820 1,640 1,490 1,31095+ 31.58% - 1,520 3,930 1,820 1,340 1,020 870 780 710Total 23,500 22,720 18,350 13,670 11,400 9,780 8,600 7,390 6,370
Prevalence rates based on Eurodem study
UK Seafarers' Demographic Profile January 2014
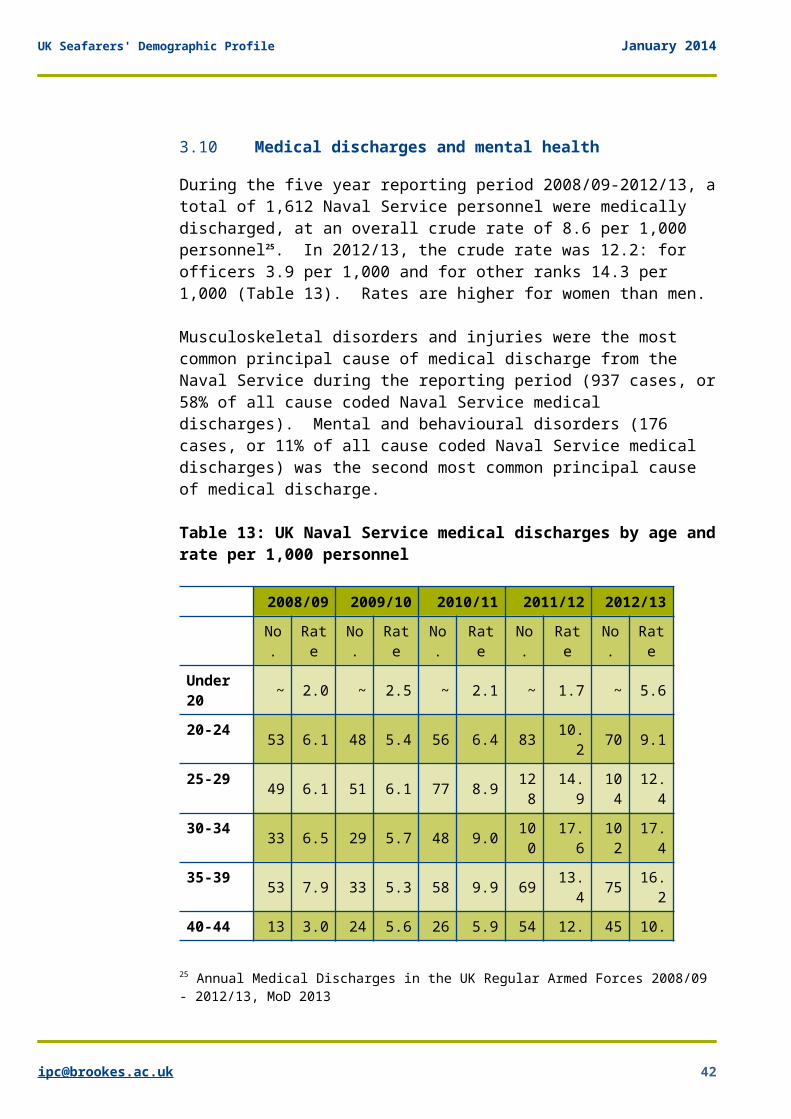
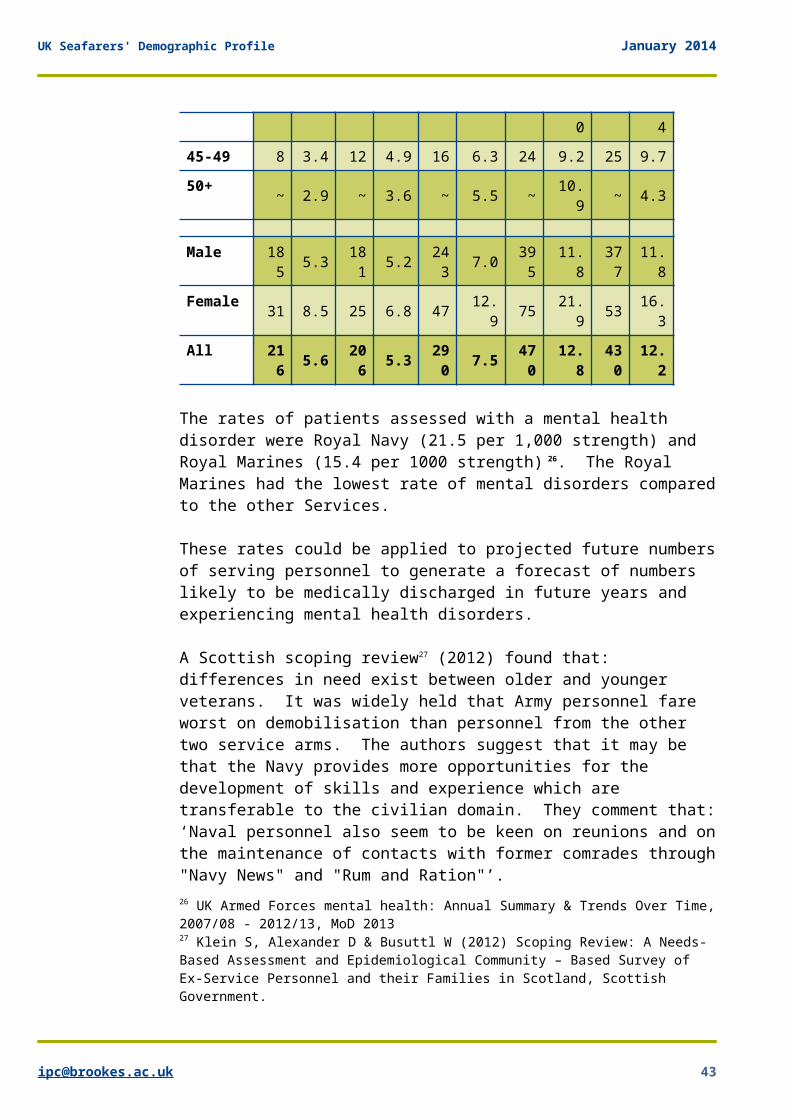
3.10 Medical discharges and mental health
During the five year reporting period 2008/09-2012/13, atotal of 1,612 Naval Service personnel were medically discharged, at an overall crude rate of 8.6 per 1,000 personnel25. In 2012/13, the crude rate was 12.2: for officers 3.9 per 1,000 and for other ranks 14.3 per 1,000 (Table 13). Rates are higher for women than men.
Musculoskeletal disorders and injuries were the most common principal cause of medical discharge from the Naval Service during the reporting period (937 cases, or58% of all cause coded Naval Service medical discharges). Mental and behavioural disorders (176 cases, or 11% of all cause coded Naval Service medical discharges) was the second most common principal cause of medical discharge.
Table 13: UK Naval Service medical discharges by age andrate per 1,000 personnel
2008/09 2009/10 2010/11 2011/12 2012/13No.
Rate
No.
Rate
No.
Rate
No.
Rate
No.
Rate
Under 20 ~ 2.0 ~ 2.5 ~ 2.1 ~ 1.7 ~ 5.6
20-24 53 6.1 48 5.4 56 6.4 83 10.2 70 9.1
25-29 49 6.1 51 6.1 77 8.9 128
14.9
104
12.4
30-34 33 6.5 29 5.7 48 9.0 100
17.6
102
17.4
35-39 53 7.9 33 5.3 58 9.9 69 13.4 75 16.
240-44 13 3.0 24 5.6 26 5.9 54 12. 45 10.
25 Annual Medical Discharges in the UK Regular Armed Forces 2008/09 - 2012/13, MoD 2013
UK Seafarers' Demographic Profile January 2014
0 445-49 8 3.4 12 4.9 16 6.3 24 9.2 25 9.750+ ~ 2.9 ~ 3.6 ~ 5.5 ~ 10.
9 ~ 4.3
Male 185 5.3 18
1 5.2 243 7.0 39
511.8
377
11.8
Female 31 8.5 25 6.8 47 12.9 75 21.
9 53 16.3
All 216 5.6 20
6 5.3 290 7.5 47
012.8
430
12.2
The rates of patients assessed with a mental health disorder were Royal Navy (21.5 per 1,000 strength) and Royal Marines (15.4 per 1000 strength) 26. The Royal Marines had the lowest rate of mental disorders comparedto the other Services.
These rates could be applied to projected future numbersof serving personnel to generate a forecast of numbers likely to be medically discharged in future years and experiencing mental health disorders.
A Scottish scoping review27 (2012) found that: differences in need exist between older and younger veterans. It was widely held that Army personnel fare worst on demobilisation than personnel from the other two service arms. The authors suggest that it may be that the Navy provides more opportunities for the development of skills and experience which are transferable to the civilian domain. They comment that:‘Naval personnel also seem to be keen on reunions and onthe maintenance of contacts with former comrades through"Navy News" and "Rum and Ration"’. 26 UK Armed Forces mental health: Annual Summary & Trends Over Time,2007/08 - 2012/13, MoD 201327 Klein S, Alexander D & Busuttl W (2012) Scoping Review: A Needs-Based Assessment and Epidemiological Community – Based Survey of Ex-Service Personnel and their Families in Scotland, Scottish Government.
UK Seafarers' Demographic Profile January 2014
A review of research for Forces in Mind by the Mental Health Foundation in 2013 concluded that the majority ofserving and ex-Service personnel have relatively good mental health. Much of the existing evidence is focusedon a minority of serving and ex-Service personnel who experience mental health problems; the most frequent being common mental health problems (e.g. depression or anxiety). The rates for these are broadly similar to the general population28. However, at present, the long-term effects of the operational stress from the Telic and Herrick campaigns is not yet known. A study by the King’s College Centre for Military Research is monitoring the effect of these campaigns is in its thirdand final stage.
3.11 Drug and alcohol problems
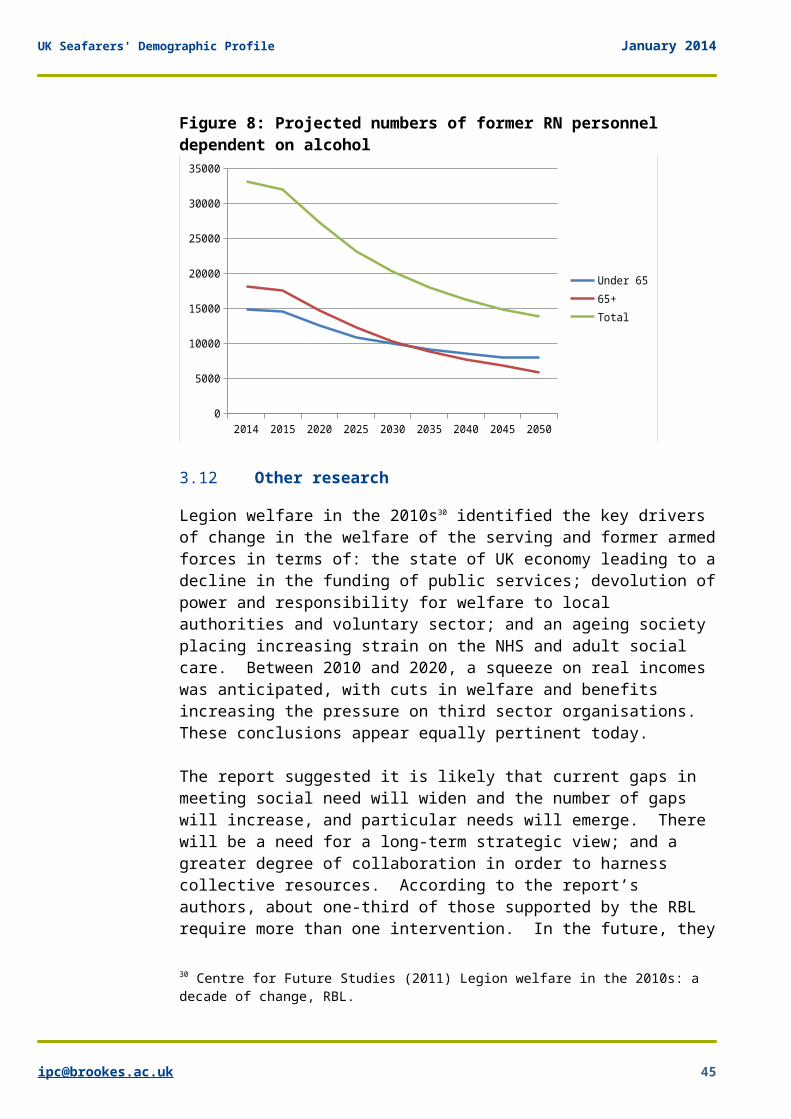
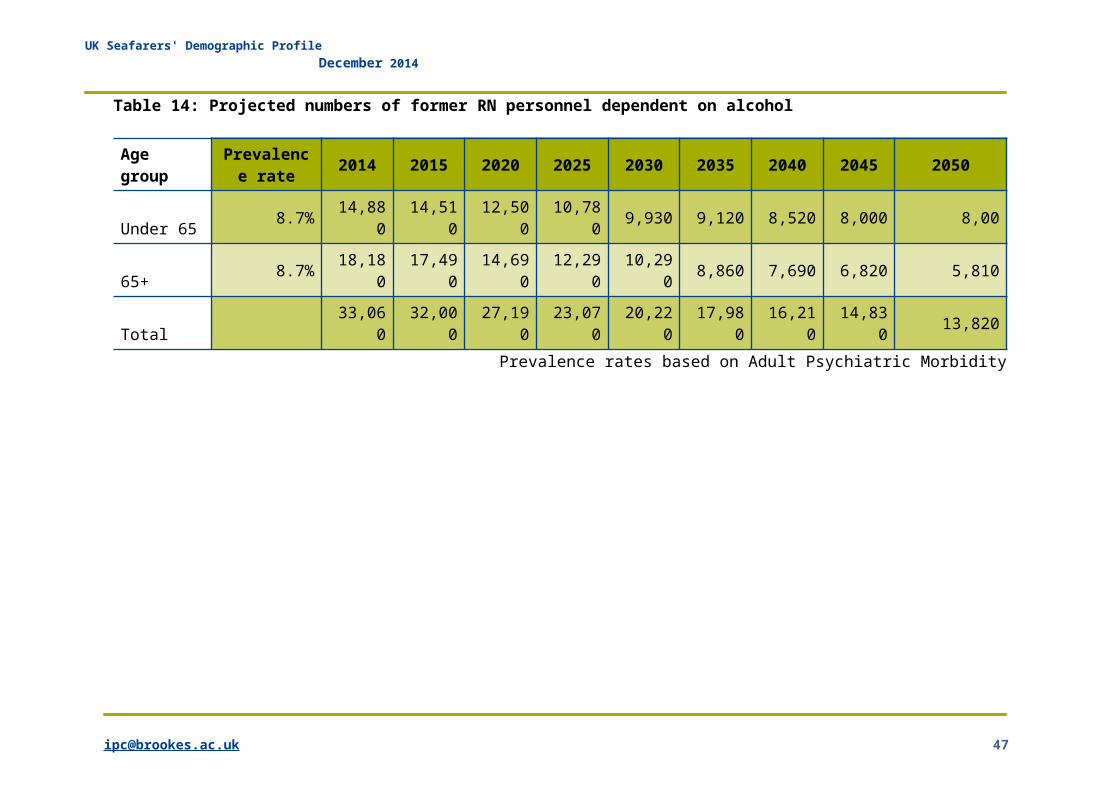
The Adult Psychiatric Morbidity survey in 2007 found that 8.7% of males were dependent on alcohol. Applying this rate (which is likely to be low for the RN) to former RN personnel, indicates that there are over 33,000 with a dependence on alcohol (Table 14 and Figure8). This is projected to fall by more than a third to 23,000 in 2025, and then fall below 14,000 by 2050. However, while the rate is likely to be higher than the general population, it is also likely that projected numbers in the very highest age groups are over-estimates as people who are dependent on alcohol are likely to die at younger ages. According to one research study, 15% of Royal Navy respondents were classed as problem drinkers29.
28 Semele, C (2013) The mental health of serving and ex-Service personnel: A review of the evidence and perspectives of key stakeholders, Forces in Mind/Mental Health Foundation.29 Henderson, A, Langston V & Greenberg N (2009) Alcohol misuse in the Royal Navy, Vol;59, pp25–31, Occupational Medicine.
UK Seafarers' Demographic Profile January 2014
Figure 8: Projected numbers of former RN personnel dependent on alcohol
2014 2015 2020 2025 2030 2035 2040 2045 20500
5000
10000
15000
20000
25000
30000
35000
Under 6565+Total
3.12 Other research
Legion welfare in the 2010s30 identified the key drivers of change in the welfare of the serving and former armedforces in terms of: the state of UK economy leading to adecline in the funding of public services; devolution ofpower and responsibility for welfare to local authorities and voluntary sector; and an ageing society placing increasing strain on the NHS and adult social care. Between 2010 and 2020, a squeeze on real incomes was anticipated, with cuts in welfare and benefits increasing the pressure on third sector organisations. These conclusions appear equally pertinent today.
The report suggested it is likely that current gaps in meeting social need will widen and the number of gaps will increase, and particular needs will emerge. There will be a need for a long-term strategic view; and a greater degree of collaboration in order to harness collective resources. According to the report’s authors, about one-third of those supported by the RBL require more than one intervention. In the future, they
30 Centre for Future Studies (2011) Legion welfare in the 2010s: a decade of change, RBL.
UK Seafarers' Demographic Profile January 2014
anticipate that while numbers may decrease, the need forinterventions may increase. The most vulnerable groups are identified as those aged 75 and over in poor health,living alone, those in financial distress, those needinghome care support, low-income families with dependent children, and young families dependent on welfare state support.
UK Seafarers' Demographic Profile December 2014
Table 14: Projected numbers of former RN personnel dependent on alcohol
Age group
Prevalence rate 2014 2015 2020 2025 2030 2035 2040 2045 2050
Under 65 8.7% 14,880
14,510
12,500
10,780 9,930 9,120 8,520 8,000 8,00
65+ 8.7% 18,180
17,490
14,690
12,290
10,290 8,860 7,690 6,820 5,810
Total33,06
032,00
027,19
023,07
020,22
017,98
016,21
014,83
0 13,820
Prevalence rates based on Adult Psychiatric Morbidity
UK Seafarers' Demographic Profile February 2015
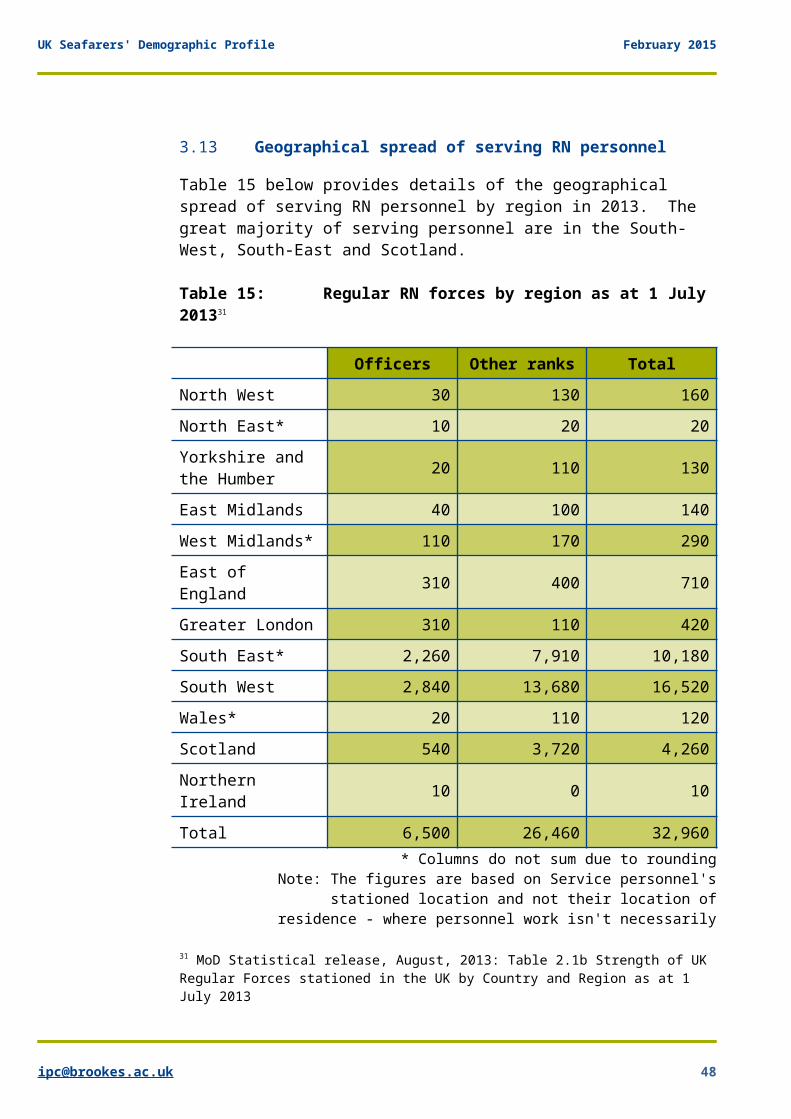
3.13 Geographical spread of serving RN personnel
Table 15 below provides details of the geographical spread of serving RN personnel by region in 2013. The great majority of serving personnel are in the South-West, South-East and Scotland.
Table 15: Regular RN forces by region as at 1 July 201331
Officers Other ranks TotalNorth West 30 130 160North East* 10 20 20Yorkshire and the Humber 20 110 130
East Midlands 40 100 140West Midlands* 110 170 290East of England 310 400 710
Greater London 310 110 420South East* 2,260 7,910 10,180South West 2,840 13,680 16,520Wales* 20 110 120Scotland 540 3,720 4,260Northern Ireland 10 0 10
Total 6,500 26,460 32,960* Columns do not sum due to rounding
Note: The figures are based on Service personnel'sstationed location and not their location of
residence - where personnel work isn't necessarily
31 MoD Statistical release, August, 2013: Table 2.1b Strength of UK Regular Forces stationed in the UK by Country and Region as at 1 July 2013
UK Seafarers' Demographic Profile February 2015
where they live. Personnel deployed on operationsto an area away from their stationed location are
shown against their most recent stationedlocation.
3.14 Geographical spread of former RN personnel
An analysis of data provided by the Royal Naval Association of members of their Shipmates campaign (a welfare and social association which is open to former RN personnel) indicates that the highest concentrations of members are in the following postcode areas: Portsmouth, Plymouth, Glasgow, Bath, Exeter, Kirkcaldy, Southampton, Newcastle, Nottingham, Liverpool, Cardiff, and Dorchester. An analysis of applications to SSAFA between 2010 and 2013 indicate a similar concentration around areas wherepeople have been stationed. The places where the greatest numbers of applicants came from were: Plymouth,Gosport, Birmingham, Glasgow and Liverpool. This appears to indicate that a significant proportion of former RN personnel remain close to the locations where they have been stationed.
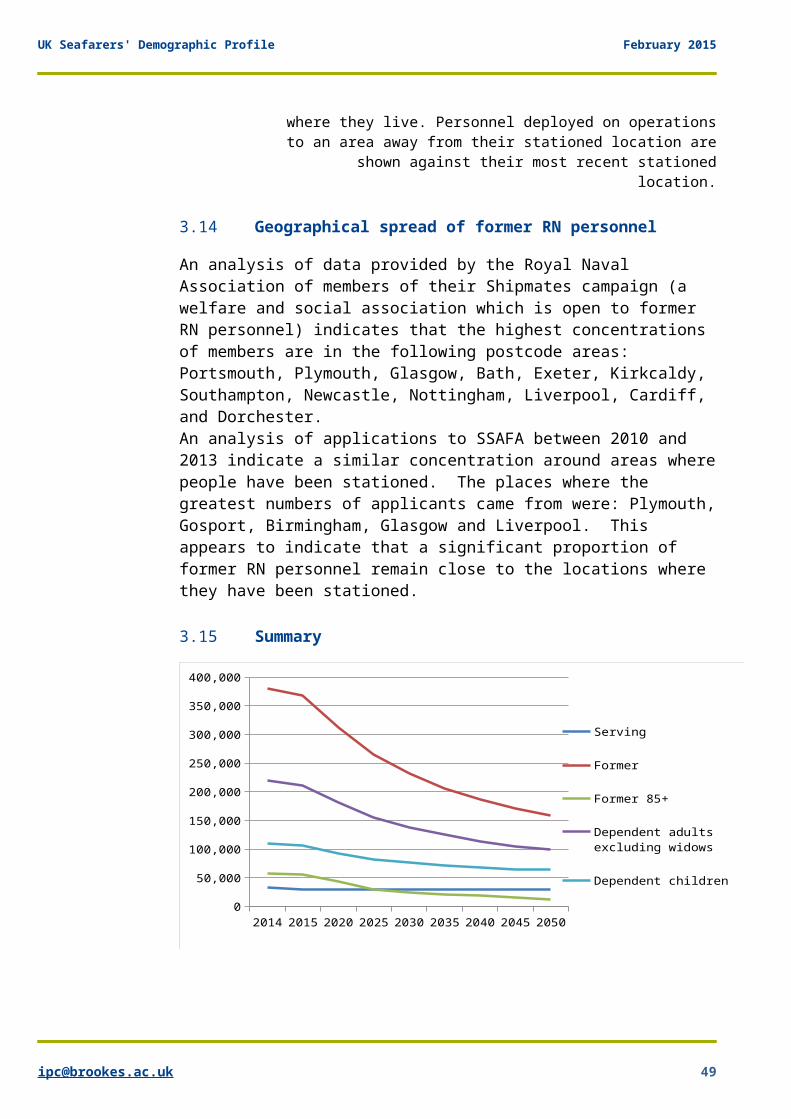
3.15 Summary
2014 2015 2020 2025 2030 2035 2040 2045 20500
50,000
100,000
150,000
200,000
250,000
300,000
350,000
400,000
Serving
Former
Former 85+
Dependent adults excluding widows
Dependent children
UK Seafarers' Demographic Profile February 2015
There are 33,330 serving RN seafarers in 2014. After the planned reduction to 29,000 by 2020, assuming the numbers proposed in the Strategic Defence Review are maintained, then the number of serving RN is unlikely tochange between 2020 and 2050. Currently, 22% of servingRN are aged 40 or above.
The projections indicate a continuing decline in the number of former RN from 380,000 in 2014 to 159,000 in 2050. More than half of naval veterans (55%) are aged 65 or above, more than one-third are aged 75 and above, and 15% are aged 85 or above. Between 2014 and 2050, the number of former RN aged 65 and over is projected tofall by 68%, and the number of former RN aged 85 or above is projected to fall by 89%.
The projected decline in the number of dependent children between 2014 and 2050 appears to be the least steep, reducing by 38%. The number of former RN widows is projected to drop to about one-third of the current number between now and 2050.
However, the fall in the oldest groups of former RN and in the numbers of dependent adults and children will notbe as steep as that projected by Baster in 2007.
Thus based on numbers alone, the level of need for care and support will decline considerably. However, other changes in the wider economy and society for example in terms of statutory services and welfare may contribute to a growing need for care and support among a reduced population.
UK Seafarers' Demographic Profile February 2015
Section B
4 Merchant NavyThe ILO Maritime Labour Convention 2006, effective in the UK from August 2014, defines a seafarer as ‘any person who is employed or engaged or works in any capacity on board a ship to which this Convention applies where a ship means a ship other than one which navigates exclusively in inland waters or waters within,or closely adjacent to, sheltered waters or areas where port regulations apply’. This definition does not include members of the Royal Fleet Auxiliary.
The Merchant Navy Welfare Board has provided some internal guidelines, for others to use, to define a British Merchant Navy seafarer as any person, of UK nationality (which includes Crown Dependencies - the Channel Isles and Isle of Man - and British Overseas Territories (e.g. Gibraltar, Falkland Islands), or living in the UK and who is serving, or has served, at sea in any capacity aboard a merchant vessel irrespective of the country of registry or ownership. This includes, but is not limited to, passenger liners, ferries, container ships, tankers, bulk carriers, and refrigerated cargo ships, Royal Fleet Auxiliaries (or their equivalent), coasters, specialist ships (e.g. deepsea tugs, salvage vessels, oil support vessels, lighthouse tenders etc.), plus large charter yachts withpaid crew members.
In normal circumstances, vessels and craft working in the confines of rivers and estuaries e.g. harbour tugs, launches, self-propelled barges and excursion boats, or those belonging to the RNLI, do not constitute part of the Merchant Navy (MN), although some will employ formermembers of the MN.
UK Seafarers' Demographic Profile February 2015
While demand for British MN officers is expected to remain high over the coming years; the decline in the number of ratings is anticipated to continue, reflectingthe relative ease with which they can be substituted by cheaper foreign workers32. Studies of the seafaring workforce note the decline in the British shipping industry due to changes in the pattern of trade, smallercrew numbers, globalisation, containerisation and other increasingly large vessels, low-wage foreign competition, and a low level of retention of experiencedseafarers (although retention is considered to have improved in recent years and may improve further with the extension of tonnage tax training provisions to ratings and the launch of a ratings apprenticeship scheme).
A survey by Nautilus (Nautilus International is the maritime trade union for officers in the UK, Netherlandsand Switzerland )33 of seafarers obtained responses from 1,200 members, including: passenger ferries 9%, cruise ships 8%, large yachts and superyachts 2%, RFA 5%, offshore support vessels 23%, container ships 6%, carriers 9%, crude oil tankers 6%, freight ferries 3%, general cargo ships 1%, and other 29%. This indicates the range of vessels on which MN seafarers are employed,and the growth of groups in the MN working on cruise ships in retail, entertainment and other employment – some of whom will not qualify for support from some maritime charities due to limited length of service.
One estimate cited by Deloitte and Oxford Economics indicates that more than half of deck and engine officers (57%) in the UK shipping industry are non-UK 32 Deloitte/Oxford Economics (2011) An independent review of the economic requirement for trained seafarers in the UK: Final report to DfT and Review Panel, Deloitte/Oxford Economics.33 Nautilus International (2010) Q&A – A Nautilus International Survey of Seafarers’ Living and Working Conditions, Accessed on-line 1.1.14 @ http://content.yudu.com/Library/A1nb2g/ShipboardSocialCondi/resources/index.htm?referrerUrl=http%3A%2F%2Fwww.yudu.com%2Fitem%2Fdetails%2F145295%2FQ-A---Seafarer-Living-and-Working-Conditions
UK Seafarers' Demographic Profile February 2015
personnel, and nearly three-quarters (73%) of deck and engine ratings are non-UK personnel. Some of these non-UK personnel working in the UK shipping industry may seek help from UK maritime charities.
The report by Deloitte and Oxford Economics projects an average increase of 3% per annum in UK shipping sector employment between 2010 and 2021, from 98,034 to 136,660(including non-UK personnel). Deloitte and Oxford Economics found that a consistent set of data on UK shipping34 was only available back to 2002, following theintroduction of the tonnage tax.
Many British MN seafarers, especially officers, are employed through manning agents, sailing on vessels under various flags and conditions. Some of these will not be included in government statistics, (particularly uncertificated officers and ratings). According to one crewing agency, 24% of the crew on their books were British, while Nautilus found 8% of respondents to their2010 membership survey were working through crewing agencies and 32% through third party ship managers.
Since the late 1970s, many UK owned ships have been registered outside the UK. However, according to Maritime UK, since 2000, as a result of the tonnage tax,the UK owned fleet has increased almost three-fold, and the UK registered fleet increased by a factor of 6. TheUK’s registered share of the world fleet has been stablesince 2004 at approximately 2 per cent in terms of number of vessels and gross tonnage.
4.1 Length of service
Some MN charities require a minimum length of service atsea of 10 or even 20 years for an applicant to be eligible for support. A Nautilus survey in 2010 indicated that 83% of respondents had been in the MN formore than 10 years, with another 10% working for between34 Deloitte and Oxford Economics refer to ‘UK shipping’ to refer to UK registered (or flagged) ships.
UK Seafarers' Demographic Profile February 2015
5 and 10 years. Nigel Palmer from the Maritime Skills Alliance cites an average length of service for those entering the industry as cadets and ultimately qualifying as certificated officers of 7 to 11 years35 inhis evidence to the Transport Committee36; while a reporton a recent European survey (based on over 1,800 responses from trainees, active and ex-seafarers) advised employers to assume a maximum length of service of 10-15 years37. More than 20% of trainees and active seafarers expected to be working at sea until retirement, while more than one quarter of ex-seafarers had served at sea for 10-15 years. However, as Nigel Palmer observed commenting on the availability of reliable data: ‘Record keeping is one of the issues we have as an industry’.
Many MN seafarers, particularly officers, take their skills ashore to work in the maritime industry. There are no statistics available for these personnel.
4.2 Serving MN seafarers
The Department for Transport provides annual data on thenumber of seafarers employed on UK registered and/or owned ships. The Department draws on the UK Chamber of Shipping’s membership survey which collects information on the number and type of seafarers employed by their members. These surveys have been annual since 2002. They provide the basis for the estimates of uncertificated officers (officers who are not required to hold Certificates of Competency) and ratings. According to DfT, this is also the only source of data that provides easily accessible information on the 35 Cadetships are normally for 4 years, after which cadets become qualified officers.36 House of Commons Transport Committee (HC 630) Sessions 2013-14, Q64. Accessed on-line 1.4.14 @ http://www.publications.parliament.uk/pa/cm201314/cmselect/cmtran/630/131118.htm37 ETF & ECSA (20134) Maritime Career Path Mapping 2013 Update. Accessed on-line 1.4.14 @ https://www.nautilusint.org/News-and-Events/Shared%20Documents/Career_Mapping_Report_2013.pdf
UK Seafarers' Demographic Profile February 2015
gender distribution of UK seafarers, and is a useful source of estimates for UK certificated officer numbers in UK employment. The DfT comment that this achieves virtually complete coverage of seafarers employed by Chamber members. However, not all UK seafarers will be employed by Chamber members, nevertheless the numbers employed elsewhere are thought by DfT to be small (although some organisations debate this). DfT statistics also pick up certificated officers working onnon-UK registered vessels through statistics on holders of UK Certificates of Competency.
According to DfT38, the total number of UK seafarers active at sea in 2013 is estimated to have been 22,830 (Table 1). In Table 1, the most recent data have been combined with the study by Baster (2007) for MCFG, Chamber of Shipping and Nautilus data to give the numbers of serving MN seafarers from 1950 to 2013.
The figures indicate considerable fluctuation across allgroups, but an overall decline of 11% between 2002 and 2013 (Figure 1). The most marked decline in recent years appears to be in the number of uncertificated officers. This was heavily influenced by a sharp drop in uncertificated officers reported by one of the largest UK shipping companies in 2013, following a 27 per cent decrease from 2011 to 2012 mainly due to another large company transferring their operations out of the UK. The majority of MN seafarers are officers: ratings make up less than 40% of UK MN seafarers active at sea.
Figure 1: Numbers of MN seafarers active at sea 2002-2013
38 DfT (2014) Seafarer statistics, 2013. DfT.
UK Seafarers' Demographic Profile February 2015
2002
2004
2006
2008
2010
2012
0
5,000
10,000
15,000
20,000
25,000
30,000
Certificated officersUncertificated officersRatingsOfficer traineesTotal
UK Seafarers' Demographic Profile February 2015
Table 1: All UK MN seafarers active at sea39 from 1950 to 2013
Certificated
officers
Uncertificated
officers
Ratings
Officer
trainees
Total
1950 140,000
1960 140,000
1970 100,000
1976 33,310 25,020 7,700 66,0301980 25,060 22,900 6,350 54,3101985 14,630 18,330 2,150 43,8801989 7,890 9,950 420 18,260
*1997 14,300 - - - -1998 13,550 - - - -1999 13,310 - - 780 -2000 12,510 - - 980 -2001 12,300 - - 1,020 -2002 12,440 2,750 9,510 1,010 25,7202003 13,100 3,740 10,490 1,002 28,3402004 13,150 3,260 10,430 1,030 27,8702005 13,240 2,910 9,380 1,050 26,5902006 13,570 2,460 9,750 1,110 26,890
39 DfT define active at sea as: “Any seafarer identified as working regularly in a sea-going activity. This includes those certificatedofficers who are identified as working regularly at sea, together with uncertificated officers, trainees, and ratings, who also work regularly at sea”.
UK Seafarers' Demographic Profile February 2015
Certificated
officers
Uncertificated
officers
Ratings
Officer
trainees
Total
2007 12,130 1,760 8,150 1,430 23,4602008 11,420 2,760 9,330 1,700 25,2102009 11,390 3,150 10,400 1,800 26,7402010 11,280 3,020 11,340 1,830 27,4602011 11,000 2,320 11,880 1,840 27,0102012 10,930 1,680 9,330 1,900 24,1002013 10,840 1,410 8,590 1,990 22,830
Source: DfT Table SFR110 (2014), Baster (2007),General Council of British Shipping and Nautilus
International* It is not clear why this figure is so much out
of kilter with the overall trend.Note: some data are missing from 1989 to 2002.
The review by Deloitte and Oxford Economics suggested that in 2010 there were a total of 98,000 seafarers in the UK shipping industry, including non-UK workers, marking a10% annual increase following three years of subdued growth after the 2007 financial crash. On average, theyfound employment in the UK shipping industry had grown by an annual rate of 7.4% between 2004 and 2010. Deloitte and Oxford Economics scaled up the DfT figures by a factor of 1.34 in 2010 yielding a higher estimate of UK MN seafarers active at sea of 32,734 in 201040. Deloitte and Oxford Economics scaled up the data becausethey considered the DfT figures not to be fully comprehensive, although becoming more representative.
The proportion of certificated officers assumed by DfT (in January 2014) not to be active at sea (i.e. shore-based) is 16% for all ages (assuming an average retirement age of 62). This would be equivalent to 2,065 certificated officers in 2013 (compared with
40 Deloitte/Oxford Economics (2011) Table 12.3c.
UK Seafarers' Demographic Profile February 2015
around 2,500 in 2005 according to Baster). It is worth noting a trend for officers to work beyond 62, accordingto some of those interviewed for this report.
The increase in the number of officer trainees has largely been ascribed to the influence of the tonnage tax. In 2013, there were 780 entrants under the SMarT1 scheme.
Many ratings are semi-skilled experienced workers who donot hold certificates of competence. Other personnel without specialist maritime training, such as entertainment, hotel, and catering staff also mostly have rating status. Over half (53%) of ratings in 2013 were employed in catering/hotel/other categories, 37% asdeck ratings and the remainder in the technical departments. Ratings are largely employed in the Royal Fleet Auxiliary, or by the cruise and ferry industry which can result in large fluctuations in numbers.
A review of government support for maritime training41 in 2011 predicted that the number of deck and engineer officers coming from the UK to meet UK industry needs was likely to fall from 11,200 to 7,300 between 2011 and2021 (a fall of 35%). The report concluded that in the absence of any action to tackle shortages, there would be unmet demand for around 3,500 UK deck and engineer officers at sea by 2021.
In terms of the gender composition, 21% of ratings are women and 7% of officers are women (Charts 1 and 2). There are no data on ethnic origin of UK MN seafarers. Information on gender and ratings was not included in the Baster report.
Charts 1 & 2: Proportion of male and female UK MN Officers and Ratings41 Independent Panel (2011) Review of Government Support for Maritime Training. Accessed on-line 1.4.14@ https://www.gov.uk/government/uploads/system/uploads/attachment_data/file/3697/independent-review-on-maritime-training.pdf
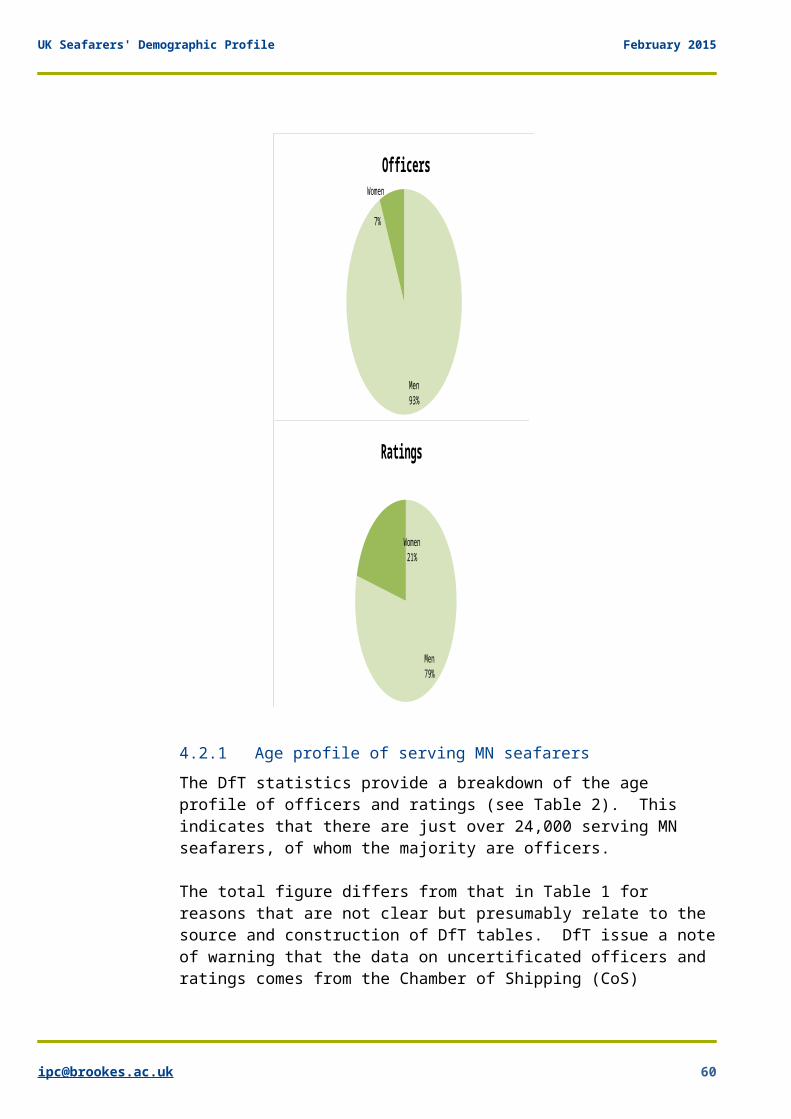
UK Seafarers' Demographic Profile February 2015
Men93%
OfficersWomen
7%
Men79%
Women21%
Ratings
4.2.1 Age profile of serving MN seafarersThe DfT statistics provide a breakdown of the age profile of officers and ratings (see Table 2). This indicates that there are just over 24,000 serving MN seafarers, of whom the majority are officers.
The total figure differs from that in Table 1 for reasons that are not clear but presumably relate to the source and construction of DfT tables. DfT issue a noteof warning that the data on uncertificated officers and ratings comes from the Chamber of Shipping (CoS)
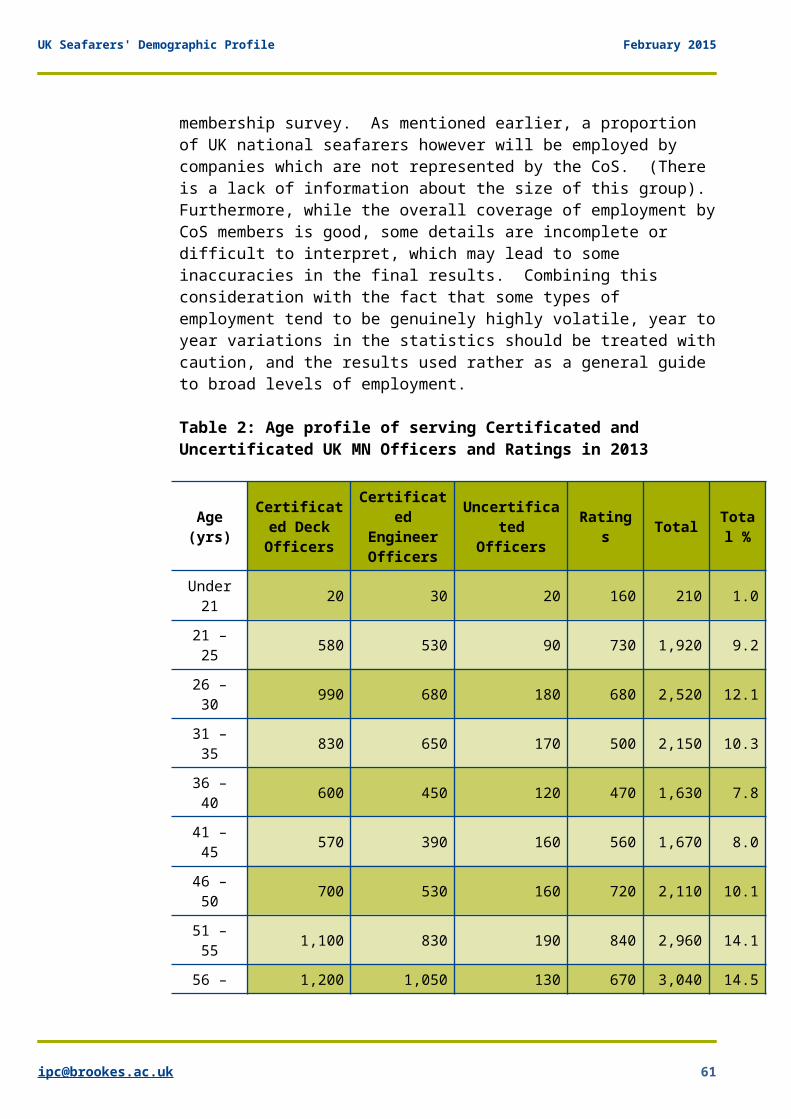
UK Seafarers' Demographic Profile February 2015
membership survey. As mentioned earlier, a proportion of UK national seafarers however will be employed by companies which are not represented by the CoS. (There is a lack of information about the size of this group). Furthermore, while the overall coverage of employment byCoS members is good, some details are incomplete or difficult to interpret, which may lead to some inaccuracies in the final results. Combining this consideration with the fact that some types of employment tend to be genuinely highly volatile, year toyear variations in the statistics should be treated withcaution, and the results used rather as a general guide to broad levels of employment.
Table 2: Age profile of serving Certificated and Uncertificated UK MN Officers and Ratings in 2013
Age(yrs)
Certificated DeckOfficers
Certificated
EngineerOfficers
Uncertificated
Officers
Ratings Total Tota
l %
Under21 20 30 20 160 210 1.0
21 –25 580 530 90 730 1,920 9.2
26 –30 990 680 180 680 2,520 12.1
31 –35 830 650 170 500 2,150 10.3
36 –40 600 450 120 470 1,630 7.8
41 –45 570 390 160 560 1,670 8.0
46 –50 700 530 160 720 2,110 10.1
51 –55 1,100 830 190 840 2,960 14.1
56 – 1,200 1,050 130 670 3,040 14.5
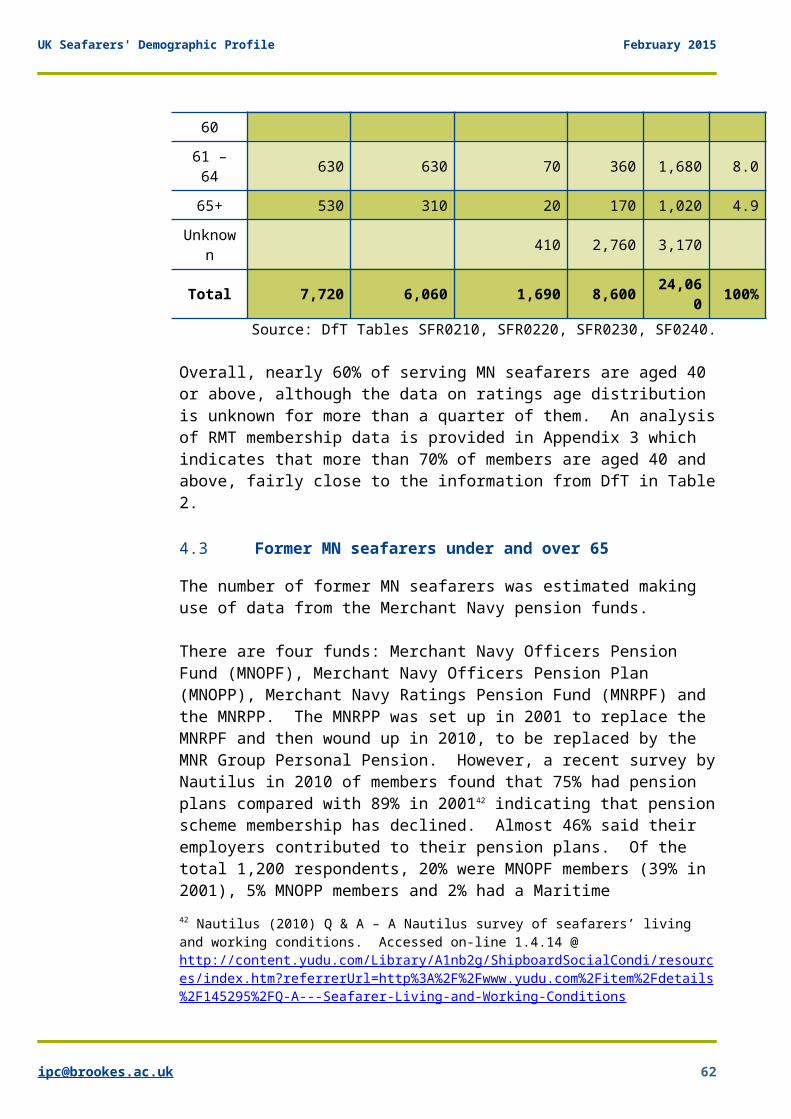
UK Seafarers' Demographic Profile February 2015
6061 –64 630 630 70 360 1,680 8.0
65+ 530 310 20 170 1,020 4.9Unknow
n 410 2,760 3,170
Total 7,720 6,060 1,690 8,600 24,060 100%
Source: DfT Tables SFR0210, SFR0220, SFR0230, SF0240.
Overall, nearly 60% of serving MN seafarers are aged 40 or above, although the data on ratings age distribution is unknown for more than a quarter of them. An analysisof RMT membership data is provided in Appendix 3 which indicates that more than 70% of members are aged 40 and above, fairly close to the information from DfT in Table2.
4.3 Former MN seafarers under and over 65
The number of former MN seafarers was estimated making use of data from the Merchant Navy pension funds.
There are four funds: Merchant Navy Officers Pension Fund (MNOPF), Merchant Navy Officers Pension Plan (MNOPP), Merchant Navy Ratings Pension Fund (MNRPF) and the MNRPP. The MNRPP was set up in 2001 to replace the MNRPF and then wound up in 2010, to be replaced by the MNR Group Personal Pension. However, a recent survey byNautilus in 2010 of members found that 75% had pension plans compared with 89% in 200142 indicating that pensionscheme membership has declined. Almost 46% said their employers contributed to their pension plans. Of the total 1,200 respondents, 20% were MNOPF members (39% in 2001), 5% MNOPP members and 2% had a Maritime 42 Nautilus (2010) Q & A – A Nautilus survey of seafarers’ living and working conditions. Accessed on-line 1.4.14 @ http://content.yudu.com/Library/A1nb2g/ShipboardSocialCondi/resources/index.htm?referrerUrl=http%3A%2F%2Fwww.yudu.com%2Fitem%2Fdetails%2F145295%2FQ-A---Seafarer-Living-and-Working-Conditions
UK Seafarers' Demographic Profile February 2015
Stakeholder Plan. Those with no provision said they were either dependent on savings or investment in property. Some had been victims of pension fund collapses.
The fall in membership of the MN and other pension schemes will have implications for future needs, as former MN seafarers are consequently likely to have greater need of financial support in later life. In addition, there has been no discretionary increase in pension payments for some time, and some seafarers will not have accrued much overall due to limited length of service. Some may also not have a full National Insurance contribution history so will not receive a full state retirement pension. An international survey by Nautilus in 201443 reports that ‘Pensions are of particular concern to seafarers in the UK and the Netherlands as the majority of them are over 50 and worried about how they will support themselves and their families when they do retire from the sea’.
4.3.1 OfficersThe MNOPP opened in 1996 to provide a defined contribution scheme to Merchant Navy officers. It is characterised as an industry-wide, multi-employer, occupational pension scheme, and remains open to new members. The MNOPF opened in 1938 to provide defined benefits to Merchant Navy officers. It is also characterised as an industry-wide, multi-employer, occupational pension scheme. On 5 April 1978, the Old Section was closed and kept separate to a New Section set up on 6 April 1978. As of 1 November 1996, the New Section was also closed to new members.
Data provided by the officers’ pension funds in 2013 indicate that there are: 1,394 active officers who are members of one of these pension funds, 22,219 former officers who are deferred members (including some who are over retirement age); and 19,597 who are pensioner
43 Nautilus (2014) Pensions Survey, Nautilus.
UK Seafarers' Demographic Profile February 2015
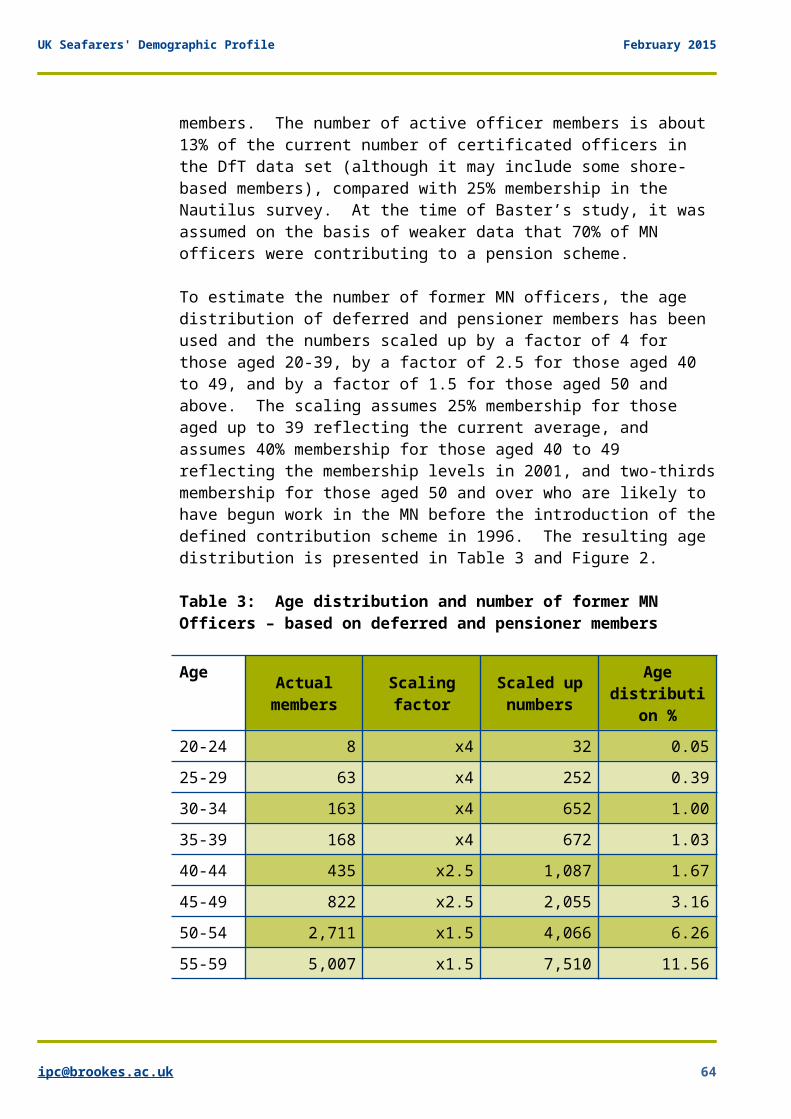
members. The number of active officer members is about 13% of the current number of certificated officers in the DfT data set (although it may include some shore-based members), compared with 25% membership in the Nautilus survey. At the time of Baster’s study, it was assumed on the basis of weaker data that 70% of MN officers were contributing to a pension scheme.
To estimate the number of former MN officers, the age distribution of deferred and pensioner members has been used and the numbers scaled up by a factor of 4 for those aged 20-39, by a factor of 2.5 for those aged 40 to 49, and by a factor of 1.5 for those aged 50 and above. The scaling assumes 25% membership for those aged up to 39 reflecting the current average, and assumes 40% membership for those aged 40 to 49 reflecting the membership levels in 2001, and two-thirdsmembership for those aged 50 and over who are likely to have begun work in the MN before the introduction of thedefined contribution scheme in 1996. The resulting age distribution is presented in Table 3 and Figure 2.
Table 3: Age distribution and number of former MN Officers – based on deferred and pensioner members
Age Actualmembers
Scalingfactor
Scaled upnumbers
Agedistributi
on %20-24 8 x4 32 0.0525-29 63 x4 252 0.3930-34 163 x4 652 1.0035-39 168 x4 672 1.0340-44 435 x2.5 1,087 1.6745-49 822 x2.5 2,055 3.1650-54 2,711 x1.5 4,066 6.2655-59 5,007 x1.5 7,510 11.56
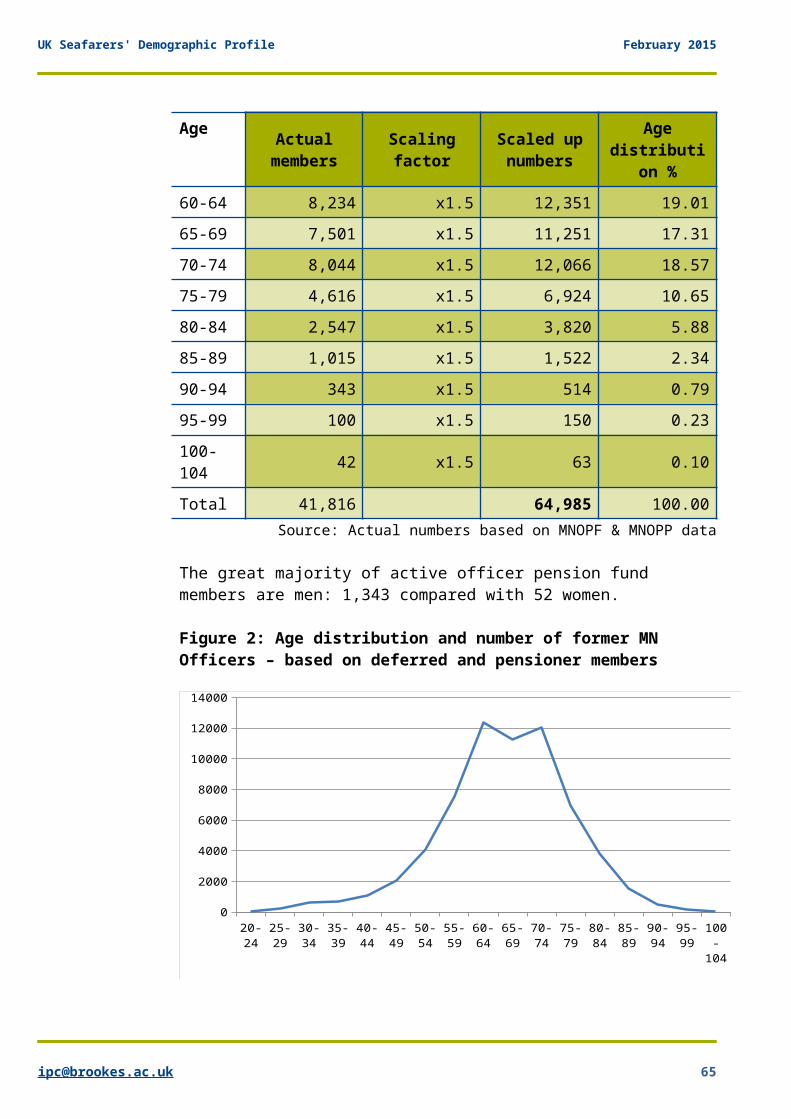
UK Seafarers' Demographic Profile February 2015
Age Actualmembers
Scalingfactor
Scaled upnumbers
Agedistributi
on %60-64 8,234 x1.5 12,351 19.0165-69 7,501 x1.5 11,251 17.3170-74 8,044 x1.5 12,066 18.5775-79 4,616 x1.5 6,924 10.6580-84 2,547 x1.5 3,820 5.8885-89 1,015 x1.5 1,522 2.3490-94 343 x1.5 514 0.7995-99 100 x1.5 150 0.23100-104 42 x1.5 63 0.10
Total 41,816 64,985 100.00Source: Actual numbers based on MNOPF & MNOPP data
The great majority of active officer pension fund members are men: 1,343 compared with 52 women.
Figure 2: Age distribution and number of former MN Officers – based on deferred and pensioner members
20-24
25-29
30-34
35-39
40-44
45-49
50-54
55-59
60-64
65-69
70-74
75-79
80-84
85-89
90-94
95-99
100-104
0
2000
4000
6000
8000
10000
12000
14000
UK Seafarers' Demographic Profile February 2015
The table indicates that 28,675 former MN officers are aged below 65; and 56% of former MN officers are aged 65and over. However, the figures would be sensitive to the assumed proportion of officers who are members of the pension funds.
4.3.2 RatingsThe MNRPF opened in 1978 to provide defined benefits to Merchant Navy Ratings. It is characterised as an industry-wide, multi-employer, occupational pension scheme. As of 31 May 2001, the Fund has been closed to new members and to future accrual. The membership rate for the MNRPF is likely to be lower than the officers’ funds. Data on the MNRPP were not obtained but there are believed to be between 900 and 1,000 members.
Data provided by the MNRPF pension fund indicate that there are 1,317 active members44, 16,380 deferred members, and 7,008 pensioner members. The number of active rating members is about 15% of the current numberof ratings in the DfT dataset.
The great majority of active ratings pension fund members are men: 1,171, compared with 146 women.
Before 1978 most ratings did not belong to a pension fund. In 1960 there were 140,000 seafarers, of which one source estimates 65%-70% (90,000>) were ratings. In1970 it had reduced to 100,000, of which probably 50%-60% were ratings. As the MNRPF was only established, in1978 - 36 years ago - there are now and will be in the foreseeable future, many ratings and their dependants who are not known to the pension fund, but are eligible for charitable help.
The number of MNRPF members below the age of 40 is very low due to the closure of the MNRPF in 2001, and it was 44 ‘Active’ refers to members still in the employment of an organisation which participates in the MNRPF though not contributing.
UK Seafarers' Demographic Profile February 2015
considered unsuitable for scaling up. Equally, there are former ratings with twenty or more years’ service who left the MN before the establishment of the MNRPF who will not show up in the available data, most of whomwill have no pension provision. Therefore, to estimate the number of former MN ratings, we have:
o Assumed that between the ages of 16 and 40, 8% per year of serving ratings become former seafarers, equivalent to 203 out of 2,540 in 2013. This is the same rate of wastage used for cadets in the Deloitte study. Assuming a constant rate of wastage over the 24 years from 16-40, this would mean 4,872 former ratings are currently in this age group (24x203).
o Used the 2013 age distribution of serving ratings to estimate how the figure of 4,872 is distributed across the age range of 16-40.
o Used the actual numbers of deferred and pensioner members in the age ranges 40 to 54, reflecting the period when the MNRPF was open (1978-2001).
o Used the estimates of officer numbers for ages 55 up,assuming similar numbers of ratings and officers aged55-64 and a ratio of 1.5 ratings to 1 officer for ages 65 and over, reflecting the higher proportion ofratings in the MN up to the 1970s.
The age distribution and estimated number of former MN ratings pension fund members is set out below (Table 4 and Figure 3).
UK Seafarers' Demographic Profile February 2015
Table 4: Age distribution and number of former MN Ratings – based on deferred and pensioner members and scaling from Table 3
Age
Actualmembers
Assumednumber
Scaling
factorof
officers’
estimate
Scaledup
fromTable3
Overallestimat
enumbers
Overallestimat
e %
16-19 242 242 0.3
20-24 1,414 1,414 1.6
25-29 1,316 1,316 1.5
30-34 4 974 974 1.1
35-39 125 926 926 1.0
40-44 965 965 1.1
45-49 3,322 3,322 3.7
50-54 5,527 5,527 6.2
55-59 3,478 x1 7,510 7,510 8.4
60-64 2,527 x1 12,351 12,351 13.9
65-69 2,818 x1.5 16,877 16,877 19.0
70-74 1,732 x1.5 18,099 18,099 20.3
UK Seafarers' Demographic Profile February 2015
Age
Actualmembers
Assumednumber
Scaling
factorof
officers’
estimate
Scaledup
fromTable3
Overallestimat
enumbers
Overallestimat
e %
75-79 1,300 x1.5 10,385 10,385 11.7
80-84 759 x1.5 5,730 5,730 6.4
85-89 465 x1.5 2,283 2,283 2.6
90-94 292 x1.5 771 771 0.9
95-99 116 x1.5 225 225 0.3
100-104 3 x1.5 95 95 0.1
Total 23,433 4,872 74,325 89,011 100.0
Source: Actual numbers based on MN pension funds data.
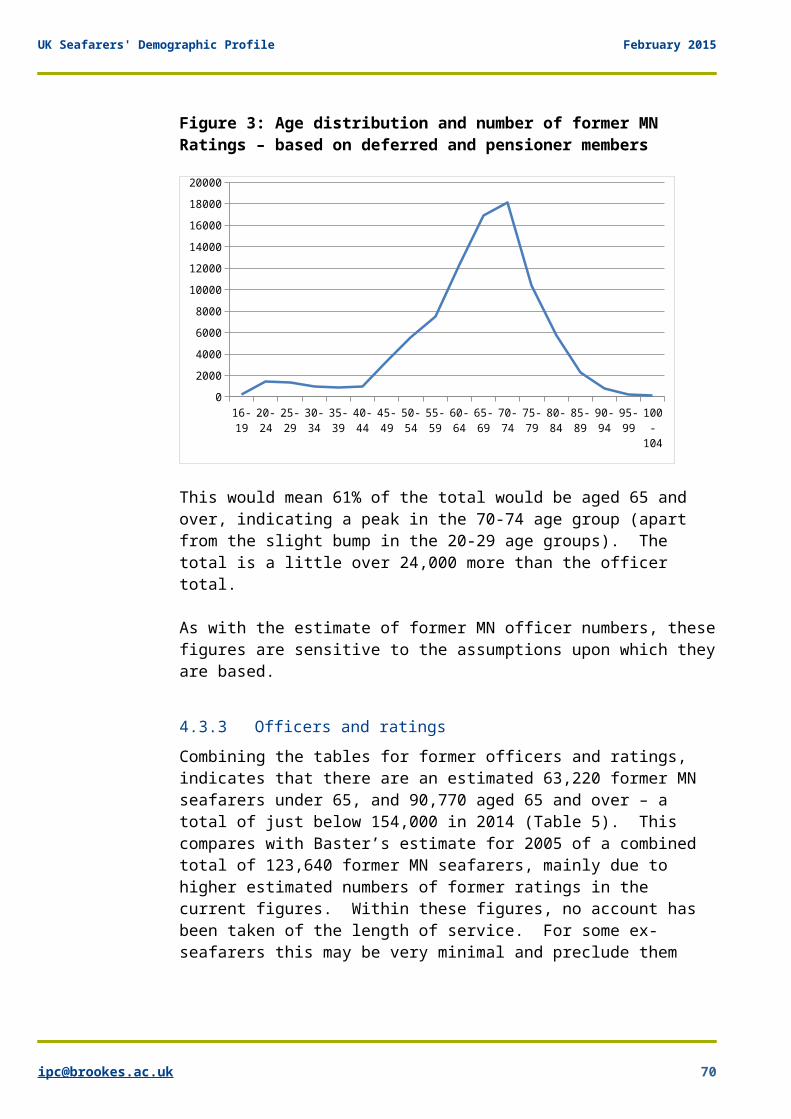
UK Seafarers' Demographic Profile February 2015
Figure 3: Age distribution and number of former MN Ratings – based on deferred and pensioner members
16-19
20-24
25-29
30-34
35-39
40-44
45-49
50-54
55-59
60-64
65-69
70-74
75-79
80-84
85-89
90-94
95-99
100-104
02000400060008000100001200014000160001800020000
This would mean 61% of the total would be aged 65 and over, indicating a peak in the 70-74 age group (apart from the slight bump in the 20-29 age groups). The total is a little over 24,000 more than the officer total.
As with the estimate of former MN officer numbers, thesefigures are sensitive to the assumptions upon which theyare based.
4.3.3 Officers and ratingsCombining the tables for former officers and ratings, indicates that there are an estimated 63,220 former MN seafarers under 65, and 90,770 aged 65 and over – a total of just below 154,000 in 2014 (Table 5). This compares with Baster’s estimate for 2005 of a combined total of 123,640 former MN seafarers, mainly due to higher estimated numbers of former ratings in the current figures. Within these figures, no account has been taken of the length of service. For some ex-seafarers this may be very minimal and preclude them
UK Seafarers' Demographic Profile February 2015
meeting the eligibility criteria of most maritime charities.
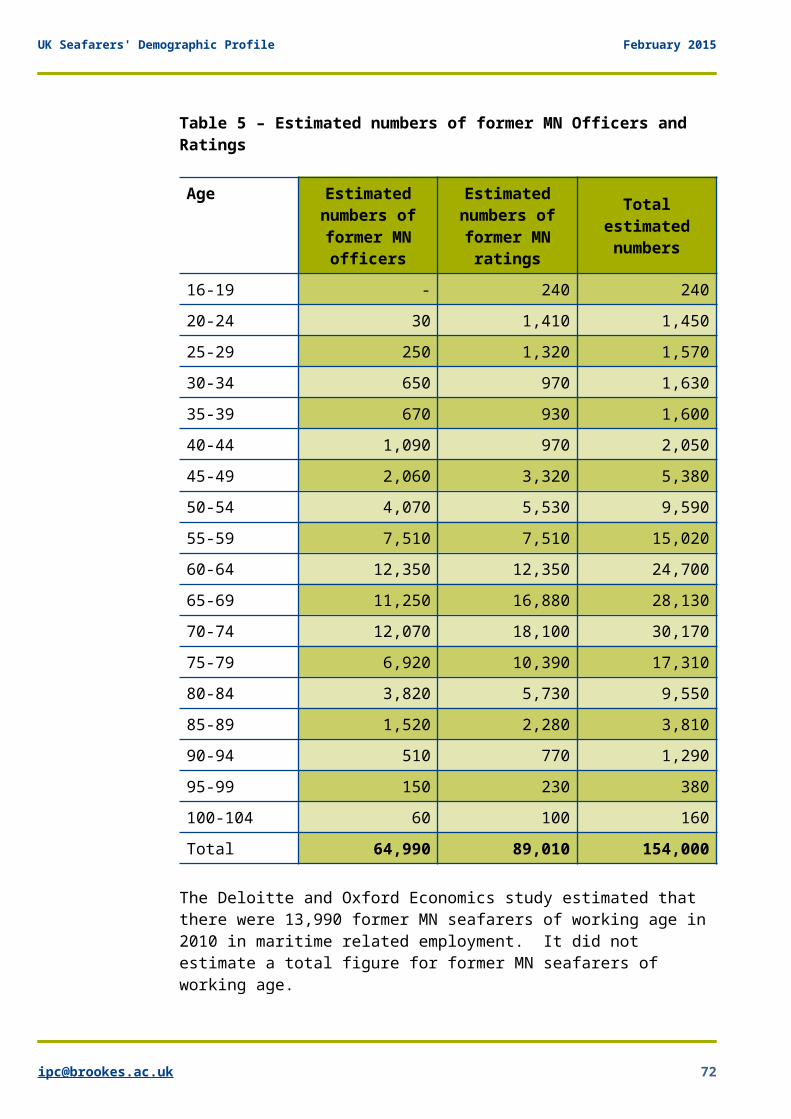
UK Seafarers' Demographic Profile February 2015
Table 5 – Estimated numbers of former MN Officers and Ratings
Age Estimatednumbers offormer MNofficers
Estimatednumbers offormer MNratings
Totalestimatednumbers
16-19 - 240 24020-24 30 1,410 1,45025-29 250 1,320 1,57030-34 650 970 1,63035-39 670 930 1,60040-44 1,090 970 2,05045-49 2,060 3,320 5,38050-54 4,070 5,530 9,59055-59 7,510 7,510 15,02060-64 12,350 12,350 24,70065-69 11,250 16,880 28,13070-74 12,070 18,100 30,17075-79 6,920 10,390 17,31080-84 3,820 5,730 9,55085-89 1,520 2,280 3,81090-94 510 770 1,29095-99 150 230 380100-104 60 100 160Total 64,990 89,010 154,000
The Deloitte and Oxford Economics study estimated that there were 13,990 former MN seafarers of working age in 2010 in maritime related employment. It did not estimate a total figure for former MN seafarers of working age.
UK Seafarers' Demographic Profile February 2015
4.4 Projected MN Numbers
Both the DfT and Deloitte and Oxford Economics provided some projections of future numbers of MN seafarers.
UK Seafarers' Demographic Profile February 2015
As part of their independent review of the economic requirement for trained seafarers in the UK, Deloitte and Oxford Economics completed a projection of UK seafarer numbers from 2010 to 2021 – both active at sea and in other employment.
Their estimates assume that:
o For UK officers, outflow from the shipping workforce is 6% per annum up to the age of 61, with an outflow of 34% from 62 to 70 and an assumed cut off at that point.
o For UK ratings, outflow from the shipping workforce is 6.75% per annum to age 61, with an outflow of 26% from 62 to 70 and assumed cut off at that point.
The report assumed the number of officer cadets would remain steady in the future at 800 per annum, with a drop-out rate of 8% per annum during the four year training period. A small number of other new officers will transfer from being a rating.
The projected total number of UK MN seafarers ‘active at sea’ from 2010 to 2021 is set out in Table 6 using the Deloitte/Oxford Economics estimates. Their calculation of numbers active at sea is based on a scaled up version of DfT figures, and are therefore higher than those for 2010 to 2013 in Table 1, and potentially an overestimate. However, they anticipate that their estimates and those of the DfT will converge over time due to changes in recording. Deloitte/Oxford Economics’ data indicate a steady fall in total numbers of active MN seafarers over the next 10 years, while thenumbers of ex-seafarers in maritime related employment is projected to increase.
Table 6: Projected numbers of UK MN seafarers active atsea and ex-seafarers in maritime related employment
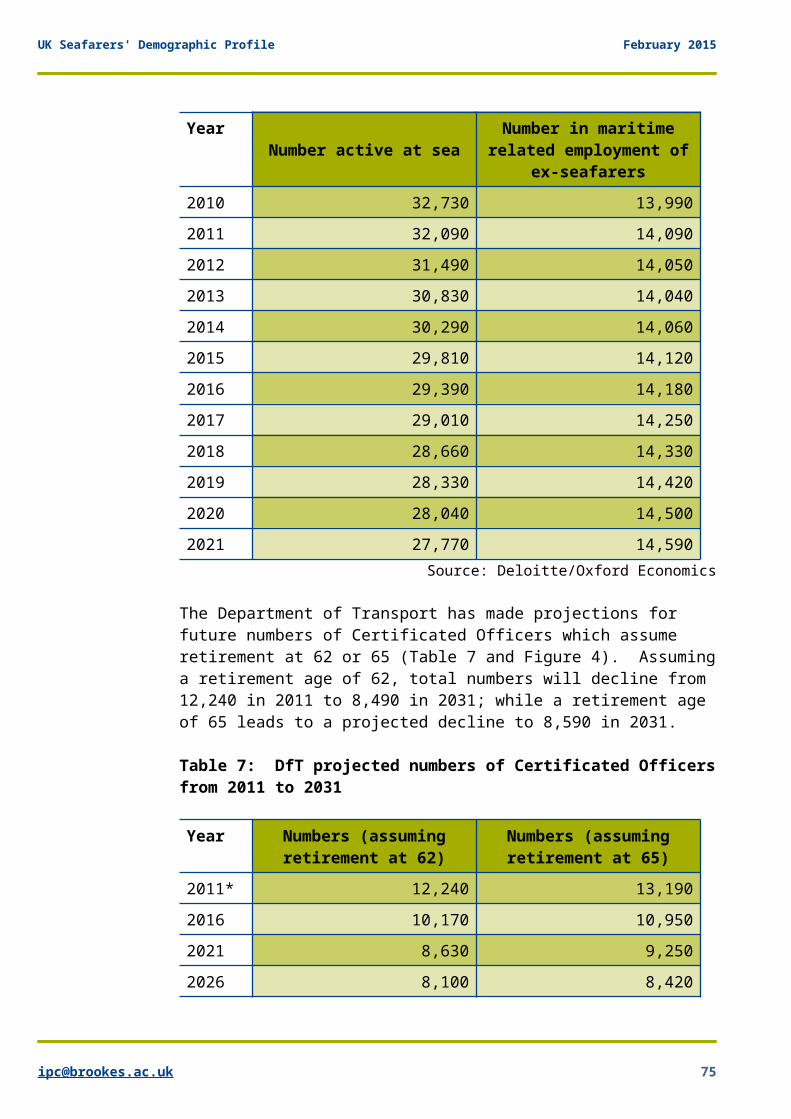
UK Seafarers' Demographic Profile February 2015
YearNumber active at sea
Number in maritimerelated employment of
ex-seafarers2010 32,730 13,9902011 32,090 14,0902012 31,490 14,0502013 30,830 14,0402014 30,290 14,0602015 29,810 14,1202016 29,390 14,1802017 29,010 14,2502018 28,660 14,3302019 28,330 14,4202020 28,040 14,5002021 27,770 14,590
Source: Deloitte/Oxford Economics
The Department of Transport has made projections for future numbers of Certificated Officers which assume retirement at 62 or 65 (Table 7 and Figure 4). Assuminga retirement age of 62, total numbers will decline from 12,240 in 2011 to 8,490 in 2031; while a retirement age of 65 leads to a projected decline to 8,590 in 2031.
Table 7: DfT projected numbers of Certificated Officersfrom 2011 to 2031
Year Numbers (assumingretirement at 62)
Numbers (assumingretirement at 65)
2011* 12,240 13,1902016 10,170 10,9502021 8,630 9,2502026 8,100 8,420
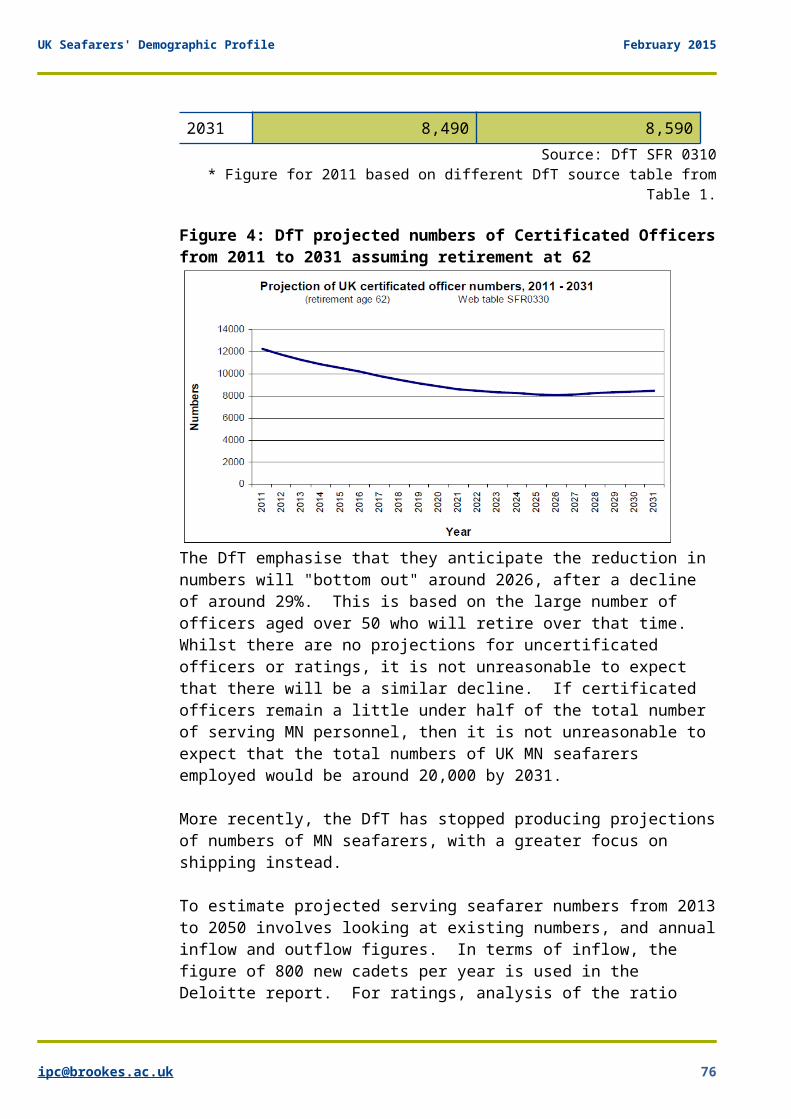
UK Seafarers' Demographic Profile February 2015
2031 8,490 8,590Source: DfT SFR 0310
* Figure for 2011 based on different DfT source table fromTable 1.
Figure 4: DfT projected numbers of Certificated Officersfrom 2011 to 2031 assuming retirement at 62
The DfT emphasise that they anticipate the reduction in numbers will "bottom out" around 2026, after a decline of around 29%. This is based on the large number of officers aged over 50 who will retire over that time. Whilst there are no projections for uncertificated officers or ratings, it is not unreasonable to expect that there will be a similar decline. If certificated officers remain a little under half of the total number of serving MN personnel, then it is not unreasonable to expect that the total numbers of UK MN seafarers employed would be around 20,000 by 2031.
More recently, the DfT has stopped producing projectionsof numbers of MN seafarers, with a greater focus on shipping instead.
To estimate projected serving seafarer numbers from 2013to 2050 involves looking at existing numbers, and annualinflow and outflow figures. In terms of inflow, the figure of 800 new cadets per year is used in the Deloitte report. For ratings, analysis of the ratio

UK Seafarers' Demographic Profile February 2015
between serving officers and cadets to ratings in the last 4 years, indicates an average of 60:40 (officers and cadets to ratings or 800:533). An inflow of ratingshas therefore been assumed in similar proportions, spread evenly over age ranges 18-22. Any changes in recruitment numbers in the future would affect the inflow, serving and outflow numbers.
The outflow rates used in the Deloitte report have been adjusted to estimate a combined officer and rating figure, the numbers have then been applied to generate projected numbers active at sea between 2021 and 2050 inTable 8 below. To generate a projected age distributionfor serving MN seafarers in 2021, the current age distribution (Table 2) was applied to the total figure projected for numbers active at sea in 2021 (Table 6). From 2021 forwards, the age distribution has been estimated following the assumptions about outflow made in the Deloitte/Oxford Economic report: between age 16 and 19 outflow is assumed to be 8% per annum; while between age 20 and 61, it is assumed outflow is at 6.25%per annum, rising to 30% per annum from then until 70 when there is a cut off. These rates are also similar to those used by Baster, although she assumed a wastage rate of 1% after age 50 which seems unlikely – Nautilus found most officers consider retiring between ages 55 and 6445.
The projected numbers of serving MN are presented in Table 8 below and totals in Figure 5.
45 Nautilus (2014) op cit.
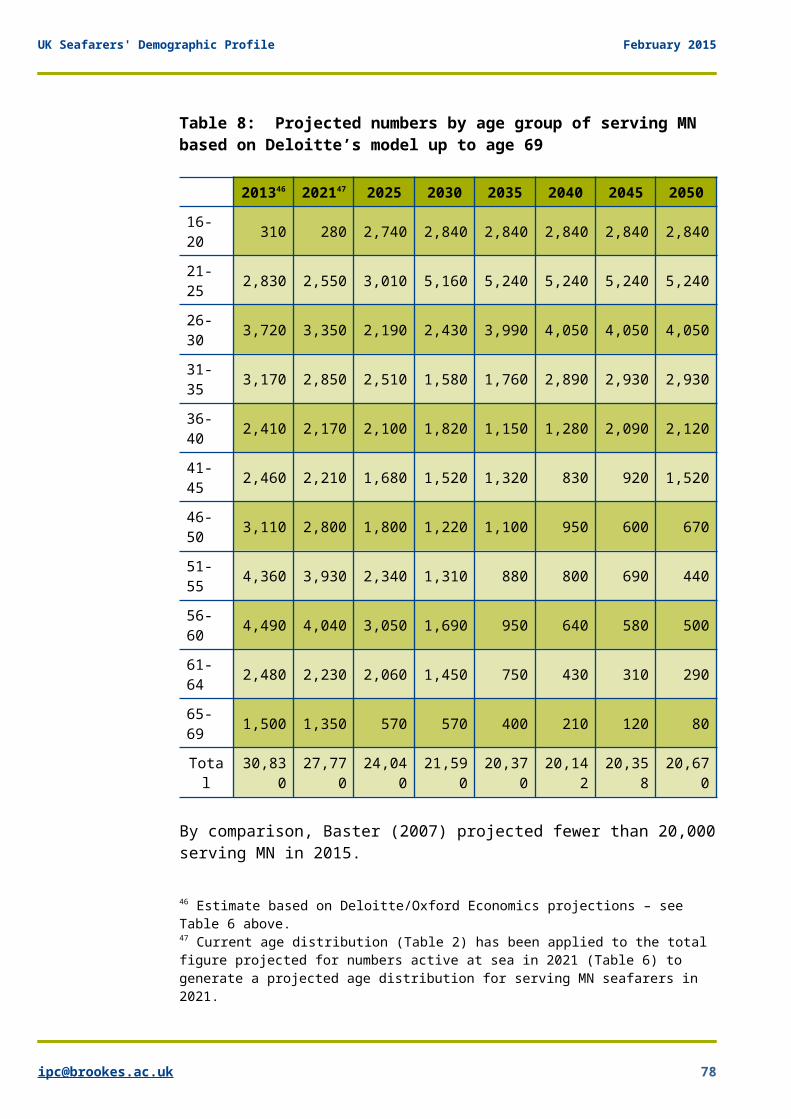
UK Seafarers' Demographic Profile February 2015
Table 8: Projected numbers by age group of serving MN based on Deloitte’s model up to age 69
201346 202147 2025 2030 2035 2040 2045 205016-20 310 280 2,740 2,840 2,840 2,840 2,840 2,840
21-25 2,830 2,550 3,010 5,160 5,240 5,240 5,240 5,240
26-30 3,720 3,350 2,190 2,430 3,990 4,050 4,050 4,050
31-35 3,170 2,850 2,510 1,580 1,760 2,890 2,930 2,930
36-40 2,410 2,170 2,100 1,820 1,150 1,280 2,090 2,120
41-45 2,460 2,210 1,680 1,520 1,320 830 920 1,520
46-50 3,110 2,800 1,800 1,220 1,100 950 600 670
51-55 4,360 3,930 2,340 1,310 880 800 690 440
56-60 4,490 4,040 3,050 1,690 950 640 580 500
61-64 2,480 2,230 2,060 1,450 750 430 310 290
65-69 1,500 1,350 570 570 400 210 120 80
Total
30,830
27,770
24,040
21,590
20,370
20,142
20,358
20,670
By comparison, Baster (2007) projected fewer than 20,000serving MN in 2015.
46 Estimate based on Deloitte/Oxford Economics projections – see Table 6 above.47 Current age distribution (Table 2) has been applied to the total figure projected for numbers active at sea in 2021 (Table 6) to generate a projected age distribution for serving MN seafarers in 2021.
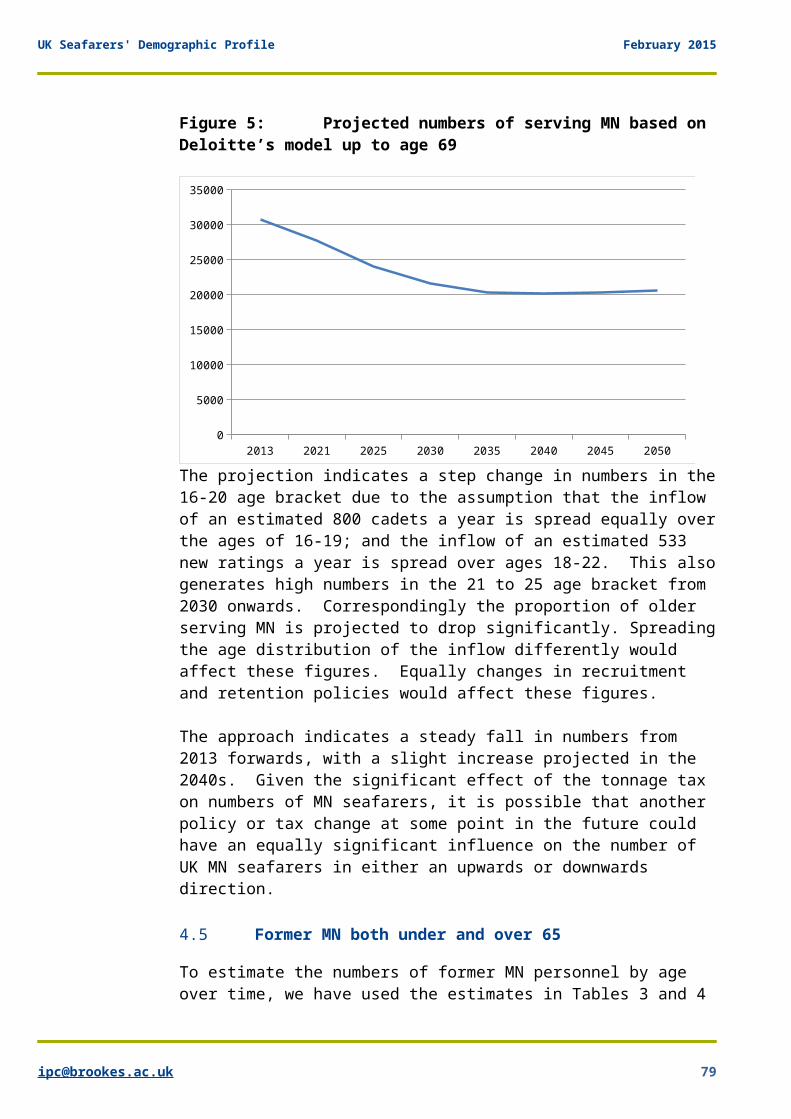
UK Seafarers' Demographic Profile February 2015
Figure 5: Projected numbers of serving MN based on Deloitte’s model up to age 69
2013 2021 2025 2030 2035 2040 2045 20500
5000
10000
15000
20000
25000
30000
35000
The projection indicates a step change in numbers in the16-20 age bracket due to the assumption that the inflow of an estimated 800 cadets a year is spread equally overthe ages of 16-19; and the inflow of an estimated 533 new ratings a year is spread over ages 18-22. This alsogenerates high numbers in the 21 to 25 age bracket from 2030 onwards. Correspondingly the proportion of older serving MN is projected to drop significantly. Spreadingthe age distribution of the inflow differently would affect these figures. Equally changes in recruitment and retention policies would affect these figures.
The approach indicates a steady fall in numbers from 2013 forwards, with a slight increase projected in the 2040s. Given the significant effect of the tonnage tax on numbers of MN seafarers, it is possible that another policy or tax change at some point in the future could have an equally significant influence on the number of UK MN seafarers in either an upwards or downwards direction.
4.5 Former MN both under and over 65
To estimate the numbers of former MN personnel by age over time, we have used the estimates in Tables 3 and 4
UK Seafarers' Demographic Profile February 2015
for the age distribution of former MN seafarers, and added the outflow from serving MN (using Deloitte’s age specific rates), and then applied the age specific mortality rates. Mortality rates are assumed to be the same as standard mortality rates, provided by ONS. MNOPFactuarial data indicate that officers’ life expectancy has improved significantly and has more or less caught up with that of the general population. The ratings pension fund was only open to new members between 1978 and 2001 and therefore does not provide a suitable data set. In this way, it is possible to project forward estimates for the numbers of former MN personnel across all ages (Table 9).
The majority of Merchant Navy officers, either in retirement now, or shortly due to retire, will have adequate pension provision. Many officers are now employed on short-term contracts which make joining a pension scheme very difficult. Some serving on foreign flag vessels, appointed through an overseas manning agent, will also not be paying NICs. The individual needs of these people and of many former ratings will almost certainly be considerable.
The current numbers of former MN appear to be highest inthe 70-74 age group, with 3.6% of the former MN population aged 85 and over, higher than the proportion in the general population (2%).
Table 9 indicates that by 2050, the total number of former MN seafarers is projected to be about two-fifths of current estimated levels in 2013. The total number of former MN seafarers is projected to decline continuously between now and 2050.
The number aged 65 and over is projected to continue rising from 2013 to a peak in 2020, before falling quitesteeply; while the number of former MN seafarers aged 85and above, although a small proportion of the total, is projected to continue rising until 2030 before it starts

UK Seafarers' Demographic Profile February 2015
to decline (Figure 6). Between 2013 and 2030, the number of former seafarers aged 85 and over is projectedto increase by more than 275%. Many in this group are likely to need high levels of care and support.
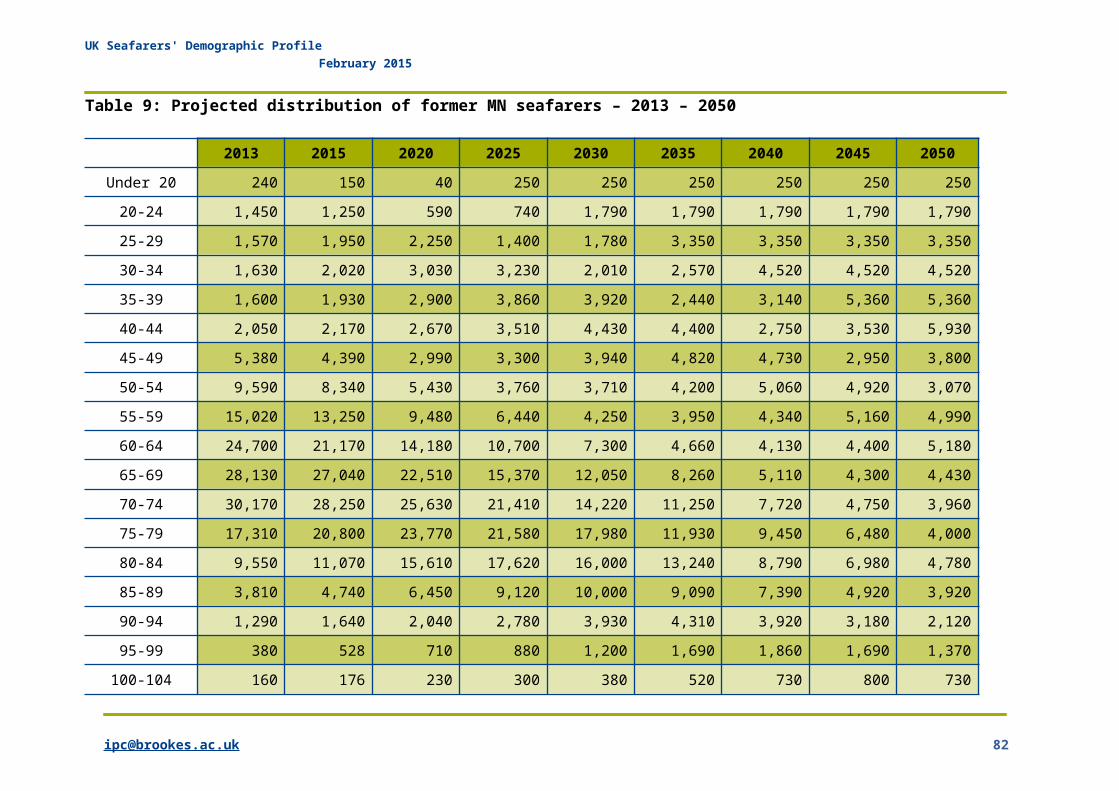
UK Seafarers' Demographic Profile February 2015
Table 9: Projected distribution of former MN seafarers – 2013 – 2050
2013 2015 2020 2025 2030 2035 2040 2045 2050Under 20 240 150 40 250 250 250 250 250 25020-24 1,450 1,250 590 740 1,790 1,790 1,790 1,790 1,79025-29 1,570 1,950 2,250 1,400 1,780 3,350 3,350 3,350 3,35030-34 1,630 2,020 3,030 3,230 2,010 2,570 4,520 4,520 4,52035-39 1,600 1,930 2,900 3,860 3,920 2,440 3,140 5,360 5,36040-44 2,050 2,170 2,670 3,510 4,430 4,400 2,750 3,530 5,93045-49 5,380 4,390 2,990 3,300 3,940 4,820 4,730 2,950 3,80050-54 9,590 8,340 5,430 3,760 3,710 4,200 5,060 4,920 3,07055-59 15,020 13,250 9,480 6,440 4,250 3,950 4,340 5,160 4,99060-64 24,700 21,170 14,180 10,700 7,300 4,660 4,130 4,400 5,18065-69 28,130 27,040 22,510 15,370 12,050 8,260 5,110 4,300 4,43070-74 30,170 28,250 25,630 21,410 14,220 11,250 7,720 4,750 3,96075-79 17,310 20,800 23,770 21,580 17,980 11,930 9,450 6,480 4,00080-84 9,550 11,070 15,610 17,620 16,000 13,240 8,790 6,980 4,78085-89 3,810 4,740 6,450 9,120 10,000 9,090 7,390 4,920 3,92090-94 1,290 1,640 2,040 2,780 3,930 4,310 3,920 3,180 2,12095-99 380 528 710 880 1,200 1,690 1,860 1,690 1,370100-104 160 176 230 300 380 520 730 800 730
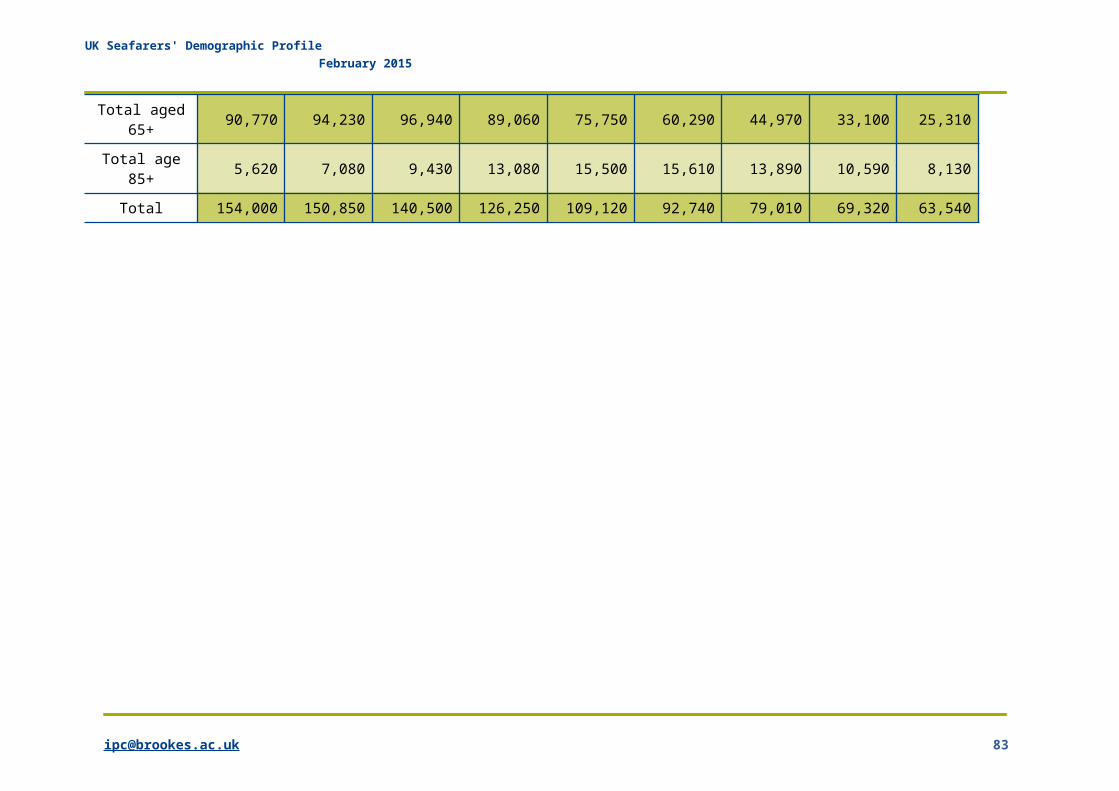
UK Seafarers' Demographic Profile February 2015
Total aged65+ 90,770 94,230 96,940 89,060 75,750 60,290 44,970 33,100 25,310
Total age85+ 5,620 7,080 9,430 13,080 15,500 15,610 13,890 10,590 8,130
Total 154,000 150,850 140,500 126,250 109,120 92,740 79,010 69,320 63,540
UK Seafarers' Demographic Profile February 2015
Figure 6: Projected numbers of former MN in different age groups 2013-2050
2013 2015 2020 2025 2030 2035 2040 2045 20500
20,000
40,000
60,000
80,000
100,000
120,000
140,000
160,000
180,000
Under 65Age 65 and overAge 85 and overTotal
Baster’s report projected a lower total number of formerMN in 2015, but also predicted a continuous decline in overall numbers with the population aged 62 and over peaking in 2018. Baster’s study did not attempt to estimate the numbers of former MN in the oldest age groups.
4.6 Superyachts
Whilst there have always been some UK nationals employedas crew in the “large yacht sector”, the number of thesevessels has increased greatly in recent years. It is believed that a high proportion of these personnel come from the UK or Commonwealth, but there are few statistics available. Globally there are an estimated 33,000 crew employed on yachts, of whom 2.9% are employed in the UK sector although it is unclear if these are UK nationals48. The Superyacht Intelligence Agency defines a superyacht as being 30 metres (98 feet)or more. The superyacht fleet has grown consistently 48 Economic Analysis of the Superyacht Industry (2012) SuperyachtIntelligence.com and personal communication with Lars Lippuner – Warsash Superyacht Academy.
UK Seafarers' Demographic Profile February 2015
over time from just over 1,000 in 1985 to an estimated 4,800 in 2014. Whilst the rapid growth that the fleet encountered in the last decade is not expected to continue, there is no question that the fleet will continue to grow. The requirements of the Maritime Labour Convention and Standards of Training, Certification and Watch-keeping (STCW) are likely to have a growing influence on the sector.
An estimated 2,000 young people enter a year, but turnover is high with many working for one to three years, especially in the case of crew such as housekeepers, chefs, stewards, etc. Although they must be considered part of the MN, their short length of service means that many are unlikely to be eligible for support from many maritime charities. Because of the nature of this sector many will serve at sea for severalyears, but almost certainly few will have any pension provision.
4.7 Merchant Navy Dependants
The number of MN dependants has been estimated based on national household data and pensions data. There are some data available from pension funds and grant giving organisations.
The MN Ratings Pension Fund reports 2,073 pensioner members who are widow(er)s or dependants and 45 deferredmembers in the widow(er)s or dependant category. The MNOfficers Pension Fund reports 6,605 pensioner members who are widow(er)s or dependants. These numbers are in addition to the figures for former MN pensioners reported in section 4.3 which excluded widow(ers) or dependants. In recent years, the number of widows and widowers had declined steadily reflecting wider, national trends in the decline of marriage, while numbers of partnerships are unlikely to have changed.
Between 2008 and 2013, more than 60% of grants on the MNWB database were to people age 60 and over, and just
UK Seafarers' Demographic Profile February 2015
over a quarter of this 60% have been to adult dependants. Their figures demonstrate that there has been a significant reduction in numbers of regular grants to older beneficiaries of around 20% over the five year period. The number of children supported has remained largely unchanged.
To estimate the family composition of MN seafarers, bothserving and former, data have been applied from the Office of National Statistics on household composition and pension data. Where the ONS provides a rate for households with 3 or more children, it has been assumed there are three children in the household49. The figureswill therefore underestimate the total number of children. Based on MN pensions data and similar figuresfor the RN, it has been assumed that about 30% of applicants are widowed partners of MN personnel. The numbers of widows aged 65 and over in the projections has been assumed to be 30% of the number of former MN aged 65 and over.
Table 10 and Figure 7 below provide estimates of the numbers of dependants for serving and former MN personnel, based on national household and pension data.Where it is assumed that MN family composition will correspond with the general population, this may not necessarily be the case. However, it provides a guide to the approximate numbers.
The table indicates that the overall number of dependentadults is expected to decline steadily over the coming decades to less than half the current figure; while the number of dependent children is projected to decline up to 2035 before starting to increase gradually.
Figure 7: Projected number of dependants of serving and former MN personnel 2013-2050
49 ONS indicates that 15.2% of households have 1 dependent child, 12.6% have two dependent children, and 4.5% have three or more dependent children.
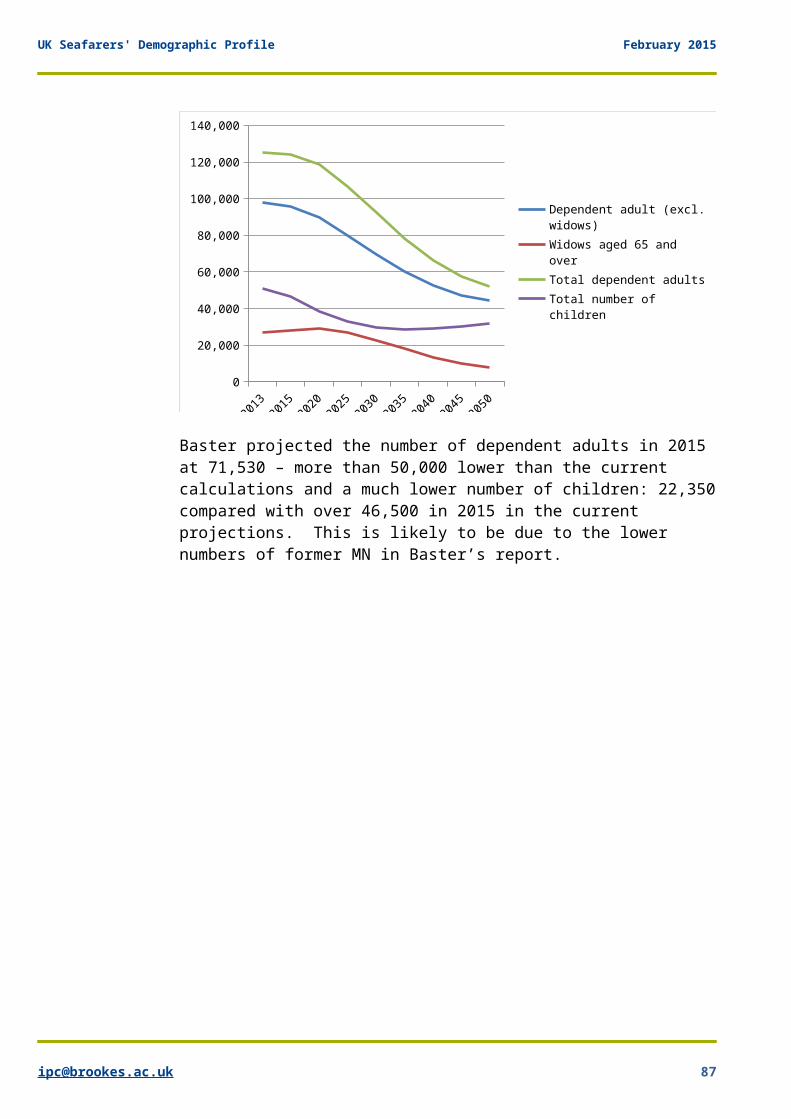
UK Seafarers' Demographic Profile February 2015
2013
2015
2020
2025
2030
2035
2040
2045
2050
0
20,000
40,000
60,000
80,000
100,000
120,000
140,000
Dependent adult (excl. widows)Widows aged 65 and overTotal dependent adultsTotal number of children
Baster projected the number of dependent adults in 2015 at 71,530 – more than 50,000 lower than the current calculations and a much lower number of children: 22,350compared with over 46,500 in 2015 in the current projections. This is likely to be due to the lower numbers of former MN in Baster’s report.
UK Seafarers' Demographic Profile February 2015
Table 10: Projected number of dependants of MN personnel
Dependants % 2013 2015 2020 2025 2030 2035 2040 2045 2050Serving MN
Dependent adults 52.2 16,090 15,560 14,500 12,550 11,270 10,630 10,510 10,630 10,790
Children 53.9 16,620 16,070 14,970 12,960 11,640 10,980 10,860 10,970 11,140Former MN under 65
Dependent adults 52.2 33,000 29,560 22,740 19,410 17,420 16,940 17,770 18,910 19,960
Children 53.9 34,080 30,520 23,480 20,040 17,990 17,490 18,350 19,530 20,610Former MN aged 65+
Dependent adults 54.0 49,020 50,880 52,350 48,090 40,900 32,560 24,280 17,870 13,670
Widows aged 65+ 30.0 27,230 28,270 29,080 26,720 22,730 18,090 13,490 9,930 7,590All MN
Dependent adults (excl. widows)
98,110 96,000 89,580 80,050 69,590 60,130 52,570 47,410 44,410
Widows aged 65+ 27,230 28,270 29,080 26,720 22,730 18,090 13,490 9,930 7,590
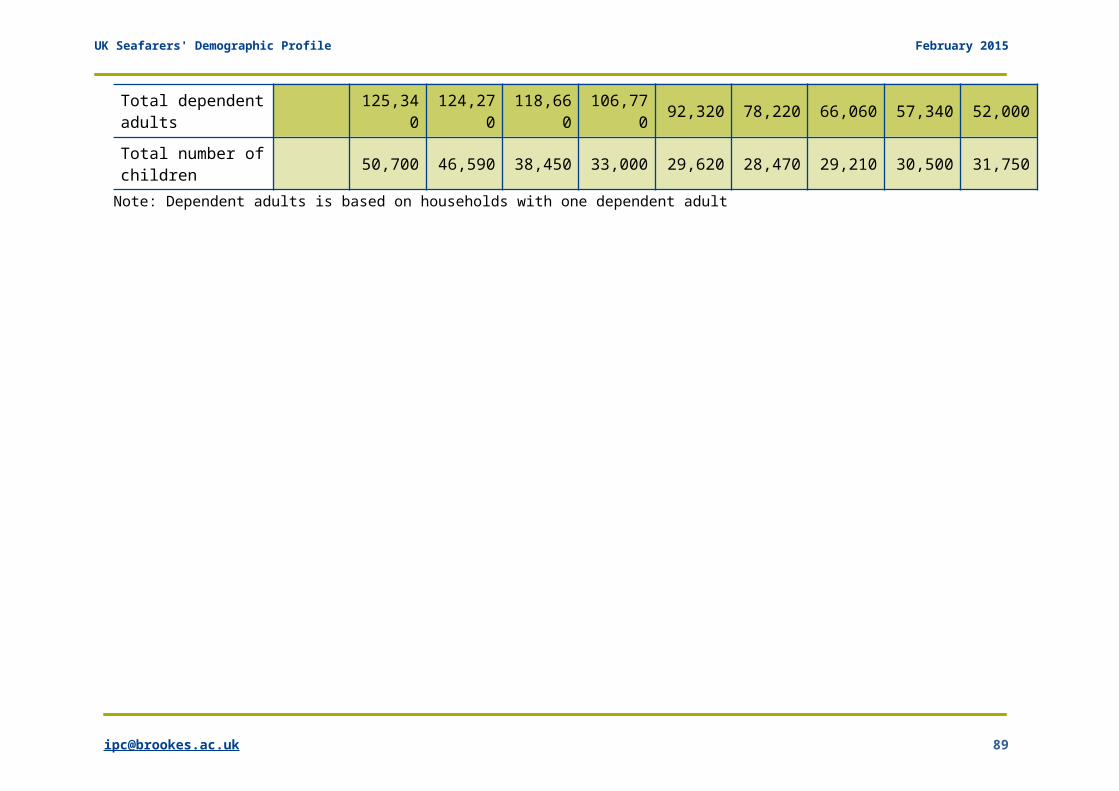
UK Seafarers' Demographic Profile February 2015
Total dependentadults
125,340
124,270
118,660
106,770 92,320 78,220 66,060 57,340 52,000
Total number ofchildren 50,700 46,590 38,450 33,000 29,620 28,470 29,210 30,500 31,750
Note: Dependent adults is based on households with one dependent adult
UK Seafarers' Demographic Profile February 2015
4.8 MN limiting long-standing illness and limitations with Activities of Daily Living
Projections for the numbers of former MN personnel with a limiting long-standing illness were estimated by applying the percentages at different ages reported in the English Longitudinal Study of Ageing (Wave 5) data from 2010/11 to the projected distribution shown at Table 9 (Table 11 and Figure 8). The percentages used are those reported for men, as the majority of former MNseafarers in the higher age groups are men. This is likely to be an under-estimate as a higher proportion ofwomen report limiting long-standing illness – across allage groups – and more than 20% of serving MN ratings arefemale.
The figures indicate that there were over 34,500 former MN seafarers aged 65 and over with a limiting long-standing illness in 2013, projected to rise to over 39,100 in 2020, before falling steeply to a little over 11,000 by 2050. The numbers aged 85 and over with a long-standing limiting illness are projected to continuerising until 2035 before declining more gradually up to 2050.
Figure 8: Projected numbers of former MN aged 55+ with limiting long-standing illness
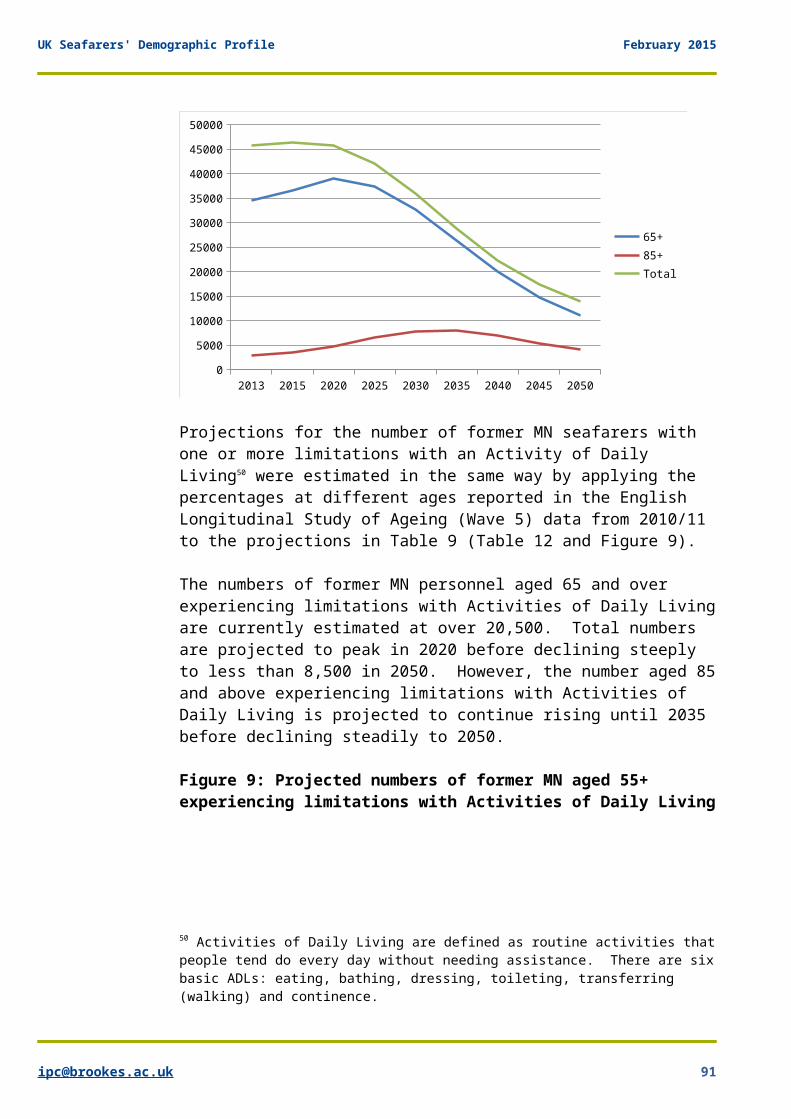
UK Seafarers' Demographic Profile February 2015
2013 2015 2020 2025 2030 2035 2040 2045 20500
5000
10000
15000
20000
25000
30000
35000
40000
45000
50000
65+85+Total
Projections for the number of former MN seafarers with one or more limitations with an Activity of Daily Living50 were estimated in the same way by applying the percentages at different ages reported in the English Longitudinal Study of Ageing (Wave 5) data from 2010/11 to the projections in Table 9 (Table 12 and Figure 9).
The numbers of former MN personnel aged 65 and over experiencing limitations with Activities of Daily Livingare currently estimated at over 20,500. Total numbers are projected to peak in 2020 before declining steeply to less than 8,500 in 2050. However, the number aged 85and above experiencing limitations with Activities of Daily Living is projected to continue rising until 2035 before declining steadily to 2050.
Figure 9: Projected numbers of former MN aged 55+ experiencing limitations with Activities of Daily Living
50 Activities of Daily Living are defined as routine activities thatpeople tend do every day without needing assistance. There are sixbasic ADLs: eating, bathing, dressing, toileting, transferring (walking) and continence.
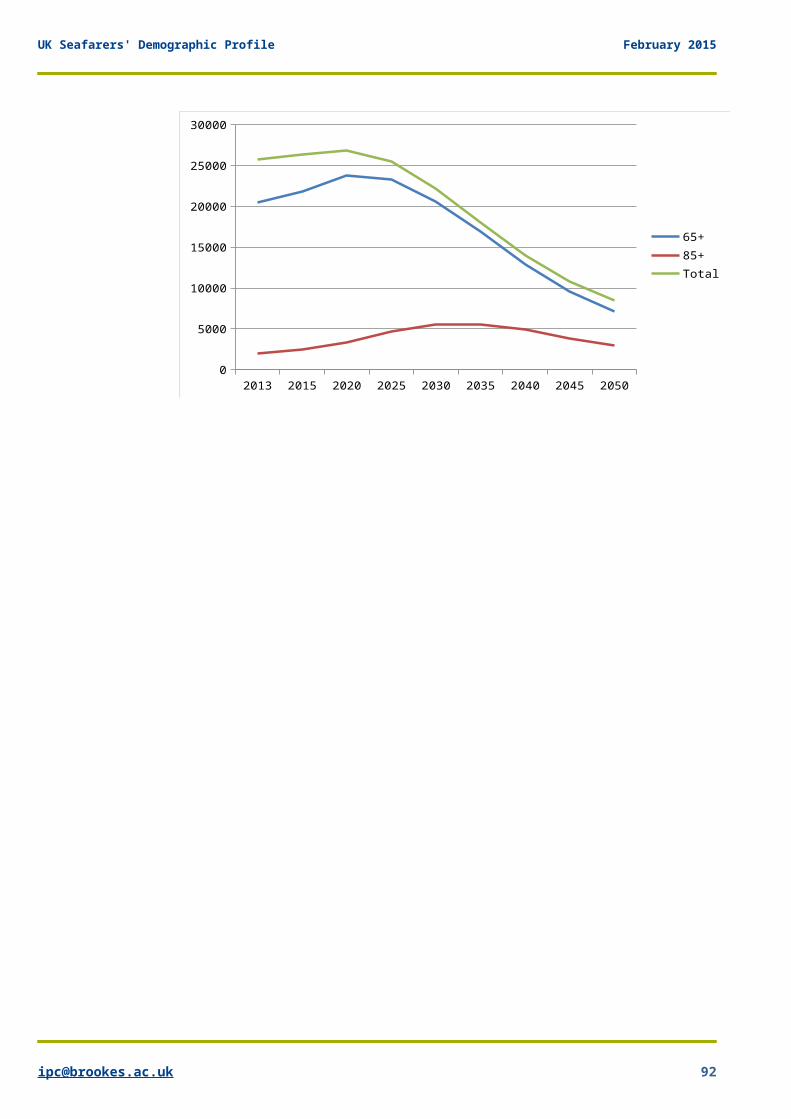
UK Seafarers' Demographic Profile February 2015
2013 2015 2020 2025 2030 2035 2040 2045 20500
5000
10000
15000
20000
25000
30000
65+85+Total
UK Seafarers' Demographic Profile February 2015
Table 11: Projected numbers of former MN personnel with limiting long-standing illness by ageAge group
Prevalence rate 2013 2015 2020 2025 2030 2035 2040 2045 2050
55-59 24.3% 3,650 3,220 2,300 1,560 1,030 960 1,050 1,250 1,210
60-64 30.6% 7,560 6,480 4,340 3,270 2,230 1,430 1,260 1,350 1,580
65-69 31.4% 8,830 8,490 7,070 4,830 3,780 2,590 1,600 1,350 1,390
70-74 34.0% 10,260 9,600 8,710 7,280 4,830 3,830 2,620 1,620 1,350
75-79 44.7% 7,740 9,300 10,630 9,650 8,040 5,330 4,230 2,900 1,790
80-84 50.8% 4,850 5,620 7,930 8,950 8,130 6,730 4,470 3,550 2,430
85+ 50.8% 2,860 3,600 4,790 6,650 7,880 7,930 7,060 5,380 4,130
Total 45,740 46,310 45,770 42,190 35,920 28,790 22,300 17,390 13,880
Prevalence rates based on ELSA Wave 5
Table 12: Projected numbers with one or more limitation with an Activity of Daily Living by ageAgegroup
Prevalence rate 2013 2015 2020 2025 2030 2035 2040 2045 2050
55-59 11.4% 1,710 1,510 1,080 730 490 450 490 590 570
60-64 14.1% 3,460 2,960 1,990 1,500 1,020 650 580 620 730
65-69 16.0% 4,500 4,330 3,600 2,460 1,930 1,320 820 690 710
70-74 21.0% 6,340 5,930 5,380 4,500 2,990 2,360 1,620 1,000 830
UK Seafarers' Demographic Profile February 2015
75-79 24.6% 4,260 5,120 5,850 5,310 4,420 2,940 2,330 1,600 990
80-84 35.9% 3,430 3,970 5,600 6,330 5,750 4,750 3,160 2,510 1,720
85+ 35.9% 2,020 2,540 3,380 4,700 5,570 5,600 4,990 3,800 2,920
Total 25,710 26,360 26,890 25,520 22,150 18,080 13,980 10,790 8,450
Prevalence rates based on ELSA Wave 5
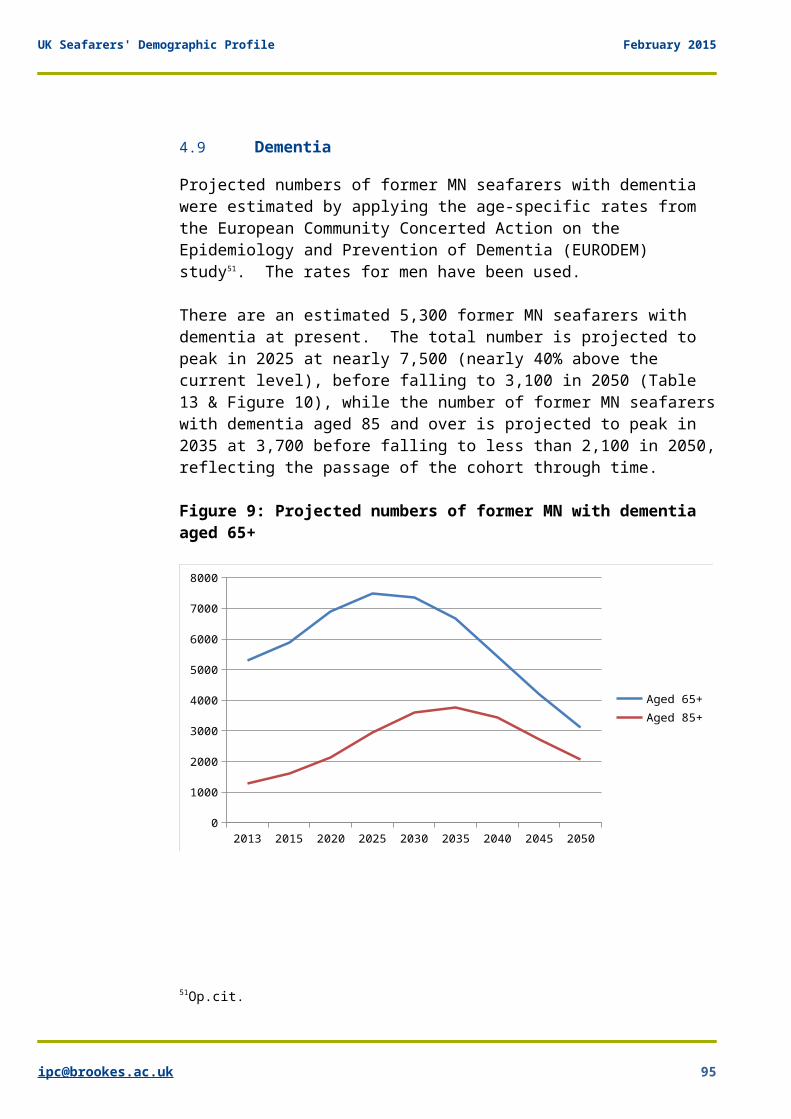
UK Seafarers' Demographic Profile February 2015
4.9 Dementia
Projected numbers of former MN seafarers with dementia were estimated by applying the age-specific rates from the European Community Concerted Action on the Epidemiology and Prevention of Dementia (EURODEM) study51. The rates for men have been used.
There are an estimated 5,300 former MN seafarers with dementia at present. The total number is projected to peak in 2025 at nearly 7,500 (nearly 40% above the current level), before falling to 3,100 in 2050 (Table 13 & Figure 10), while the number of former MN seafarerswith dementia aged 85 and over is projected to peak in 2035 at 3,700 before falling to less than 2,100 in 2050,reflecting the passage of the cohort through time.
Figure 9: Projected numbers of former MN with dementia aged 65+
2013 2015 2020 2025 2030 2035 2040 2045 20500
1000
2000
3000
4000
5000
6000
7000
8000
Aged 65+Aged 85+
51Op.cit.
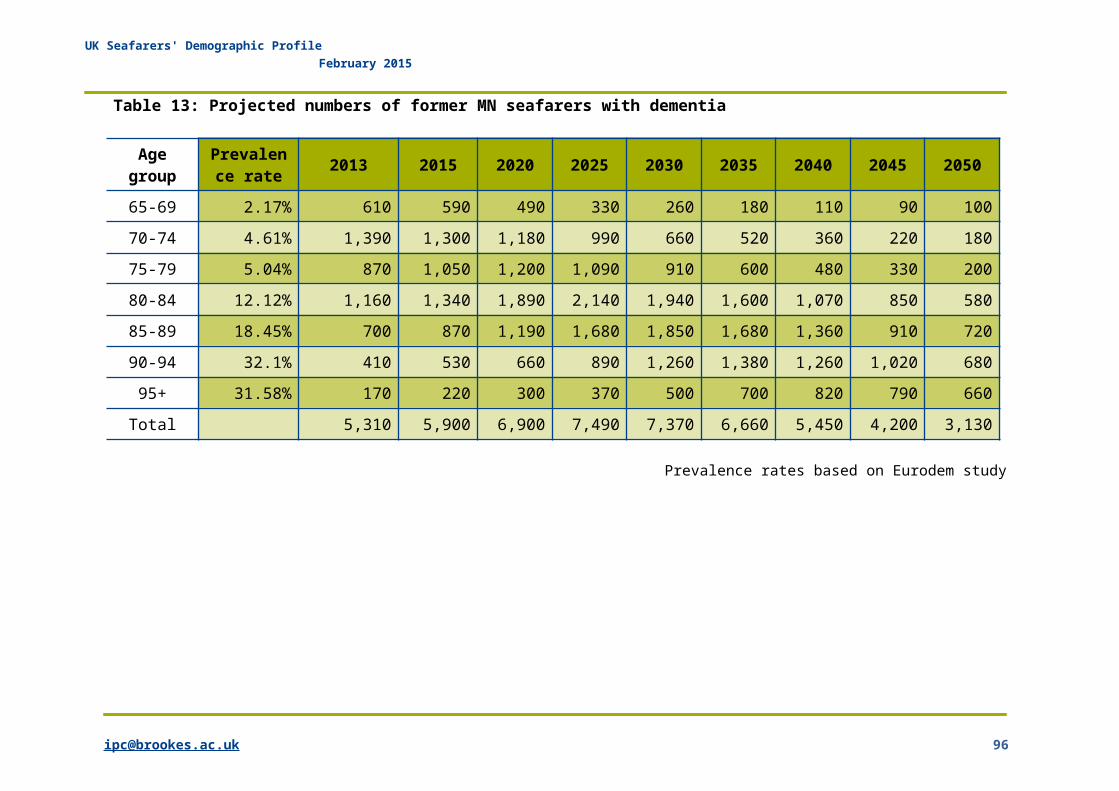
UK Seafarers' Demographic Profile February 2015
Table 13: Projected numbers of former MN seafarers with dementia
Agegroup
Prevalence rate 2013 2015 2020 2025 2030 2035 2040 2045 2050
65-69 2.17% 610 590 490 330 260 180 110 90 10070-74 4.61% 1,390 1,300 1,180 990 660 520 360 220 18075-79 5.04% 870 1,050 1,200 1,090 910 600 480 330 20080-84 12.12% 1,160 1,340 1,890 2,140 1,940 1,600 1,070 850 58085-89 18.45% 700 870 1,190 1,680 1,850 1,680 1,360 910 72090-94 32.1% 410 530 660 890 1,260 1,380 1,260 1,020 68095+ 31.58% 170 220 300 370 500 700 820 790 660
Total 5,310 5,900 6,900 7,490 7,370 6,660 5,450 4,200 3,130
Prevalence rates based on Eurodem study
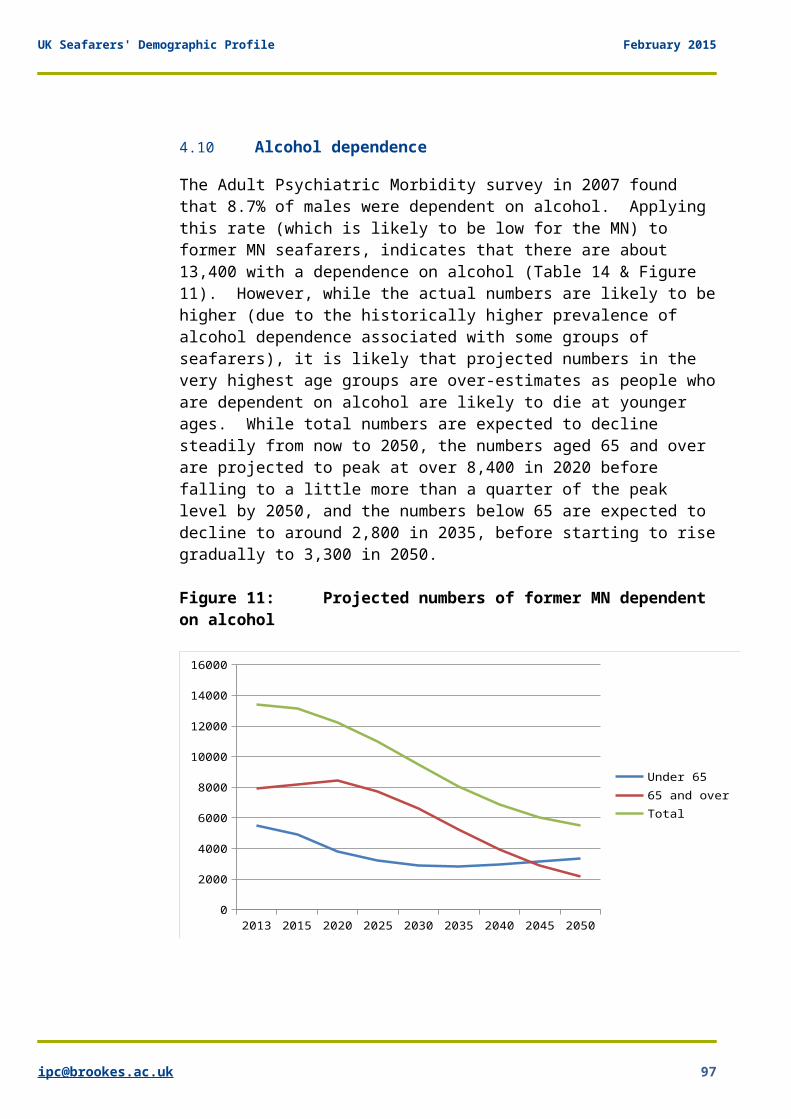
UK Seafarers' Demographic Profile February 2015
4.10 Alcohol dependence
The Adult Psychiatric Morbidity survey in 2007 found that 8.7% of males were dependent on alcohol. Applying this rate (which is likely to be low for the MN) to former MN seafarers, indicates that there are about 13,400 with a dependence on alcohol (Table 14 & Figure 11). However, while the actual numbers are likely to behigher (due to the historically higher prevalence of alcohol dependence associated with some groups of seafarers), it is likely that projected numbers in the very highest age groups are over-estimates as people whoare dependent on alcohol are likely to die at younger ages. While total numbers are expected to decline steadily from now to 2050, the numbers aged 65 and over are projected to peak at over 8,400 in 2020 before falling to a little more than a quarter of the peak level by 2050, and the numbers below 65 are expected to decline to around 2,800 in 2035, before starting to risegradually to 3,300 in 2050.
Figure 11: Projected numbers of former MN dependent on alcohol
2013 2015 2020 2025 2030 2035 2040 2045 20500
2000
4000
6000
8000
10000
12000
14000
16000
Under 6565 and overTotal
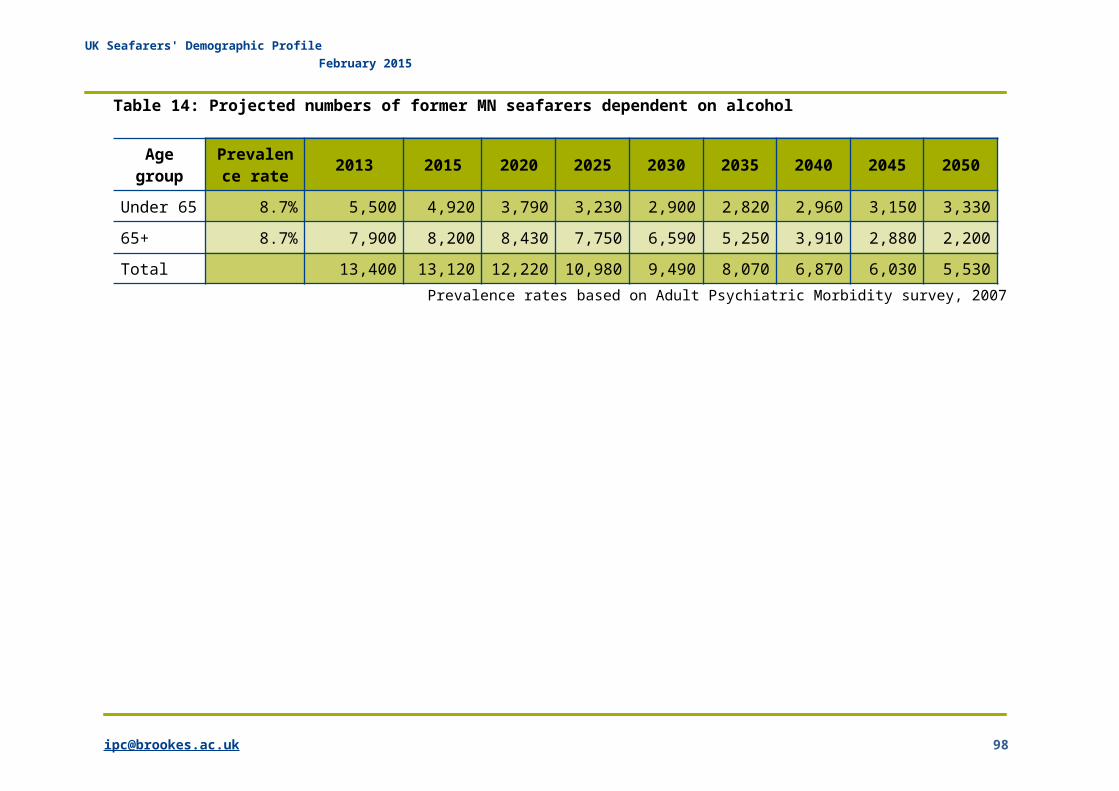
UK Seafarers' Demographic Profile February 2015
Table 14: Projected numbers of former MN seafarers dependent on alcohol
Agegroup
Prevalence rate 2013 2015 2020 2025 2030 2035 2040 2045 2050
Under 65 8.7% 5,500 4,920 3,790 3,230 2,900 2,820 2,960 3,150 3,33065+ 8.7% 7,900 8,200 8,430 7,750 6,590 5,250 3,910 2,880 2,200Total 13,400 13,120 12,220 10,980 9,490 8,070 6,870 6,030 5,530
Prevalence rates based on Adult Psychiatric Morbidity survey, 2007
UK Seafarers' Demographic Profile February 2015
4.11 Geographical location of beneficiaries
The Merchant Navy Welfare Board provided details of the location of beneficiaries of merchant navy charities’ grants between 2008 and 2013. The main post town areas where beneficiaries came from are:
Hull Aberdeen Doncaster Liverpool Newcastle Norwich
Followed by smaller but significant numbers from:
Blackpool Plymouth Cardiff Glasgow Chester Inverness Paisley East London Belfast Torquay Truro York
However, postcodes will cover wider areas than the post town in the postcode and some beneficiaries may come from other seafaring groups.
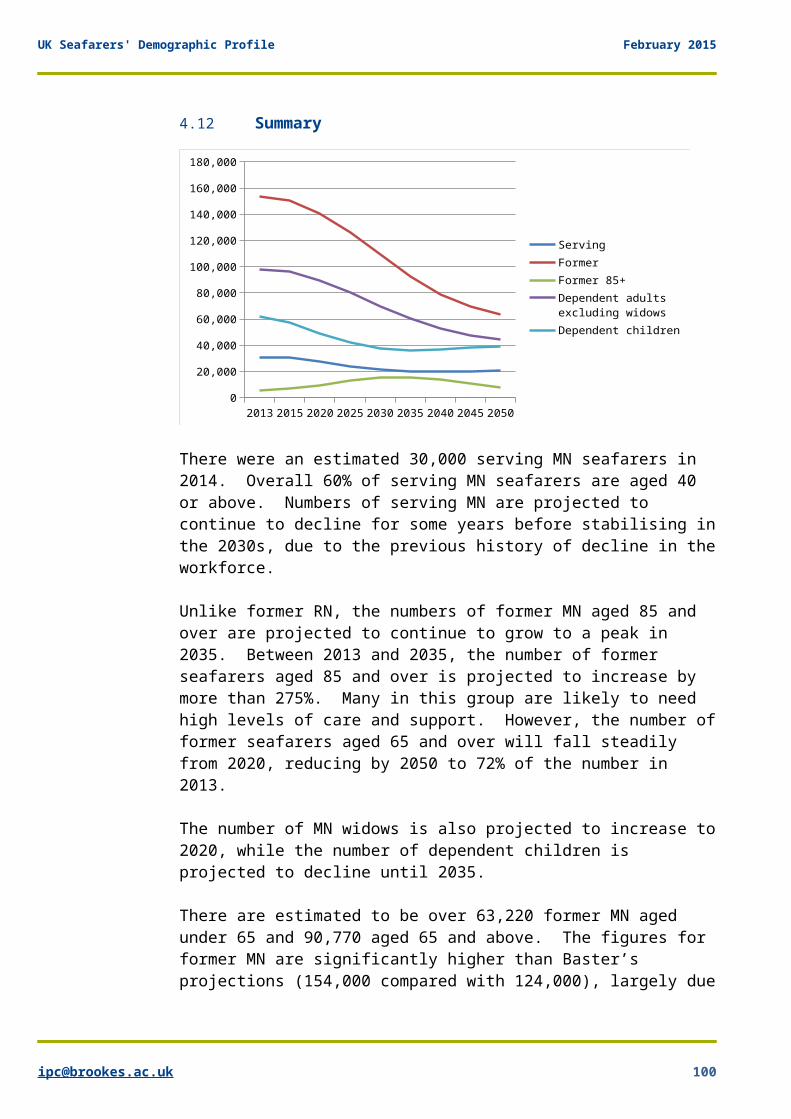
UK Seafarers' Demographic Profile February 2015
4.12 Summary
2013 2015 2020 2025 2030 2035 2040 2045 20500
20,000
40,000
60,000
80,000
100,000
120,000
140,000
160,000
180,000
ServingFormerFormer 85+Dependent adults excluding widowsDependent children
There were an estimated 30,000 serving MN seafarers in 2014. Overall 60% of serving MN seafarers are aged 40 or above. Numbers of serving MN are projected to continue to decline for some years before stabilising inthe 2030s, due to the previous history of decline in theworkforce.
Unlike former RN, the numbers of former MN aged 85 and over are projected to continue to grow to a peak in 2035. Between 2013 and 2035, the number of former seafarers aged 85 and over is projected to increase by more than 275%. Many in this group are likely to need high levels of care and support. However, the number offormer seafarers aged 65 and over will fall steadily from 2020, reducing by 2050 to 72% of the number in 2013.
The number of MN widows is also projected to increase to2020, while the number of dependent children is projected to decline until 2035.
There are estimated to be over 63,220 former MN aged under 65 and 90,770 aged 65 and above. The figures for former MN are significantly higher than Baster’s projections (154,000 compared with 124,000), largely due
UK Seafarers' Demographic Profile February 2015
to assuming a higher proportion of former MN outside theexisting pensions schemes than Baster’s model. Following from this, the numbers of children and adult dependants are also higher than Baster’s figures.
The fall in membership of the MN and other pension schemes will have implications for future needs, as former MN seafarers are consequently likely to have greater need of financial support in later life. In addition, there has been no discretionary increase in pension payments for some time, and some seafarers will not have accrued much overall due to limited length of service, particularly ratings. Other changes in the wider economy and society, for example, in terms of statutory services and welfare may contribute to a growing need for care and support among a reduced population.
UK Seafarers' Demographic Profile February 2015
Section C
5 Fishing Fleet
5.1 Serving FF seafarers
Data on the number of people working in the fishing fleet (FF) are limited. An additional complication is around definitions, as there are many people whose work at sea is occasional and intermittent. Based on their knowledge of the sector, the Fishermen’s Mission considers that there are significant numbers of casual and seasonal fishermen that are not captured by the official statistics, for example over 1,100 UK fishermenin Northern Ireland.
According to the Marine Management Organisation, there were around 12,150 fishermen in 2013. Numbers decreasedsteadily to 12,830 in 2005, since when they have stabilised (Figure 1). Part-time fishermen account for 17 per cent of the total.
The decrease in fishermen numbers was associated with reductions in fleet size, as well as decreased fishing opportunities. However, since 2011 the number of regular fishermen has increased by 2 per cent.
In 2012, the UK fishing industry had 6,406 fishing vessels compared with 7,578 in 2002, a reduction of 15 per cent52. However, the number of vessels has also stabilised in recent years.
Figure 1: Number of fishermen on UK registered vessels 2002-2012
52 Radford L (ed) (2013) UK Sea Fisheries Statistics 2012, Marine Management Organisation.
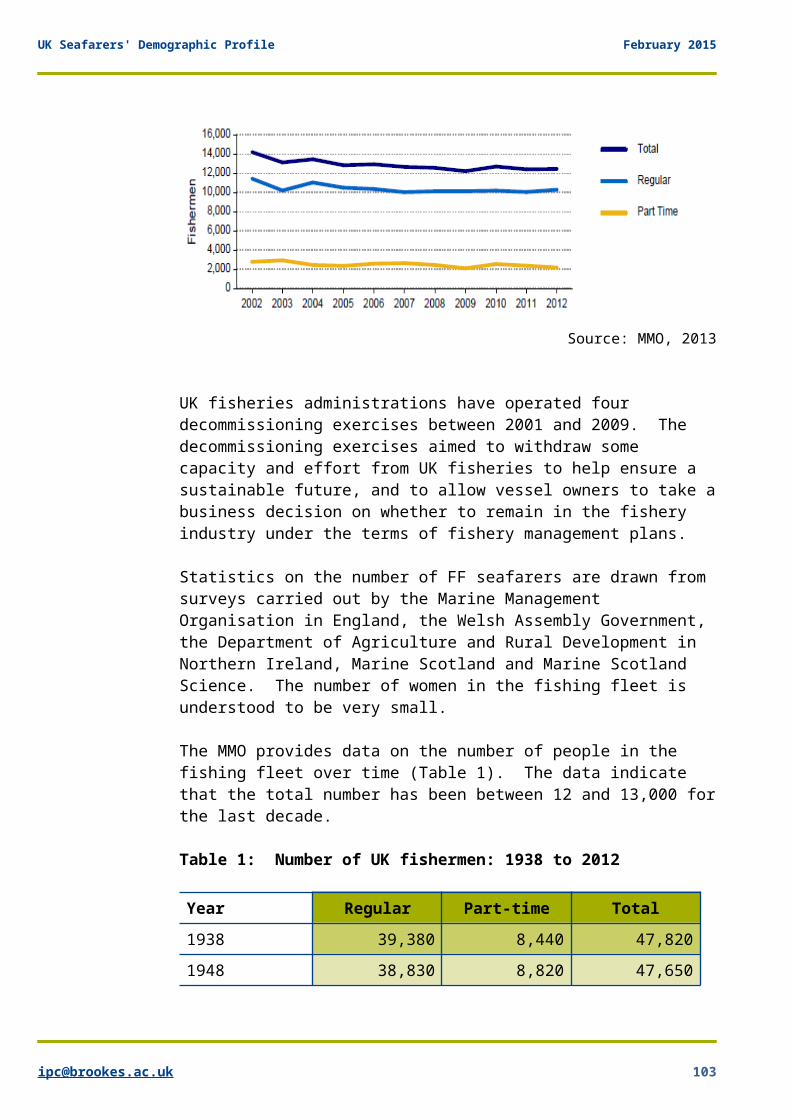
UK Seafarers' Demographic Profile February 2015
Source: MMO, 2013
UK fisheries administrations have operated four decommissioning exercises between 2001 and 2009. The decommissioning exercises aimed to withdraw some capacity and effort from UK fisheries to help ensure a sustainable future, and to allow vessel owners to take abusiness decision on whether to remain in the fishery industry under the terms of fishery management plans.
Statistics on the number of FF seafarers are drawn from surveys carried out by the Marine Management Organisation in England, the Welsh Assembly Government, the Department of Agriculture and Rural Development in Northern Ireland, Marine Scotland and Marine Scotland Science. The number of women in the fishing fleet is understood to be very small.
The MMO provides data on the number of people in the fishing fleet over time (Table 1). The data indicate that the total number has been between 12 and 13,000 forthe last decade.
Table 1: Number of UK fishermen: 1938 to 2012
Year Regular Part-time Total1938 39,380 8,440 47,8201948 38,830 8,820 47,650
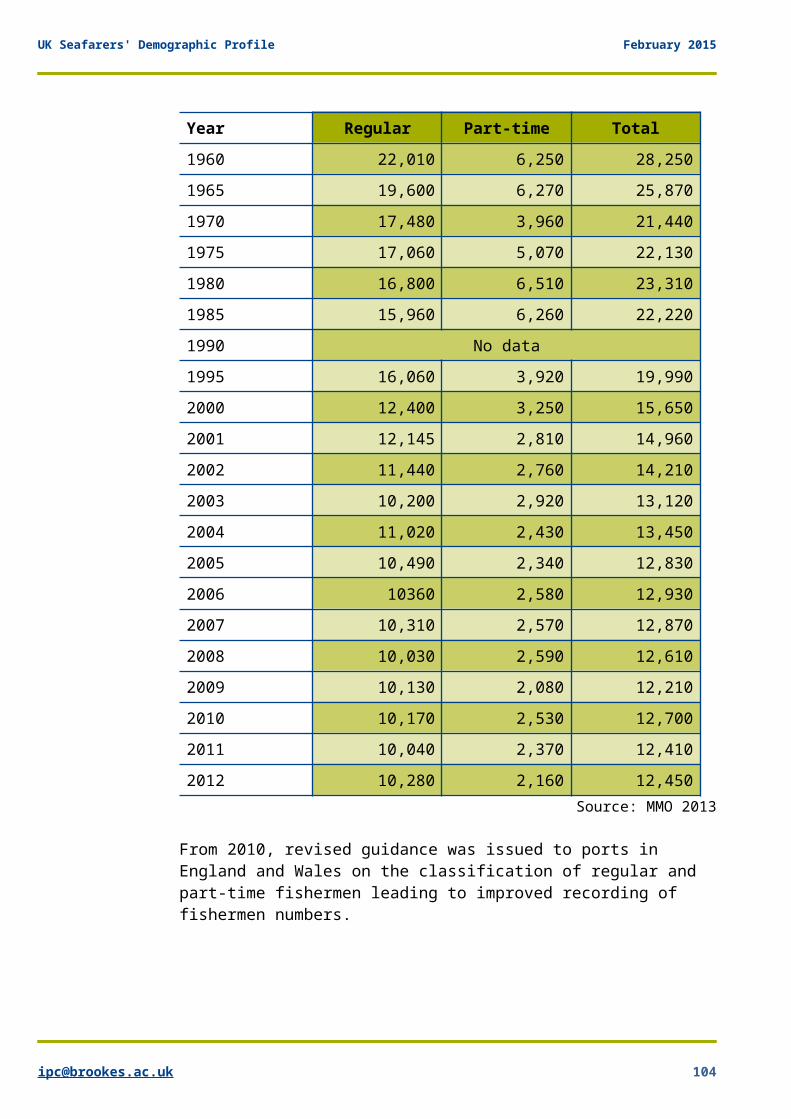
UK Seafarers' Demographic Profile February 2015
Year Regular Part-time Total1960 22,010 6,250 28,2501965 19,600 6,270 25,8701970 17,480 3,960 21,4401975 17,060 5,070 22,1301980 16,800 6,510 23,3101985 15,960 6,260 22,2201990 No data1995 16,060 3,920 19,9902000 12,400 3,250 15,6502001 12,145 2,810 14,9602002 11,440 2,760 14,2102003 10,200 2,920 13,1202004 11,020 2,430 13,4502005 10,490 2,340 12,8302006 10360 2,580 12,9302007 10,310 2,570 12,8702008 10,030 2,590 12,6102009 10,130 2,080 12,2102010 10,170 2,530 12,7002011 10,040 2,370 12,4102012 10,280 2,160 12,450
Source: MMO 2013
From 2010, revised guidance was issued to ports in England and Wales on the classification of regular and part-time fishermen leading to improved recording of fishermen numbers.
UK Seafarers' Demographic Profile February 2015
5.2 Serving FF seafarers age distribution
For the 2007 report for MCFG, Baster was able to obtain an age profile of current fishing fleet workforce from the Marine Management Organisation’s predecessor53. These data are not collected by the MMO anymore; howevera large sample survey of the crew of 13% of the Scottishfleet has provided data on the age distribution of serving FF seafarers54. There is limited information about the number of FF seafarers entering or leaving theoccupation.
The Scottish survey found a relatively stable workforce,particularly among British crew members and those holding more senior positions. The Scottish survey found that 7.7% of the total FF workforce was from the EU (ie non-UK) and 19.6% from outside the EU. Correspondingly, there are UK FF seafarers working on overseas boats, particularly American and Canadian boats.
In order to project the number of serving FF seafarers and to project future numbers of working FF seafarers and former seafarers, the age distribution of the Scottish survey has been used to calculate the spread ofserving UK FF seafarers. This would indicate an age distribution as set out in the table below:
53 Marine Fisheries Agency, UK Sea Fisheries Statistics 2005.54 Marine Analytical Unit (2014) Scottish Sea Fisheries Employment, 2013, Marine Scotland Science.
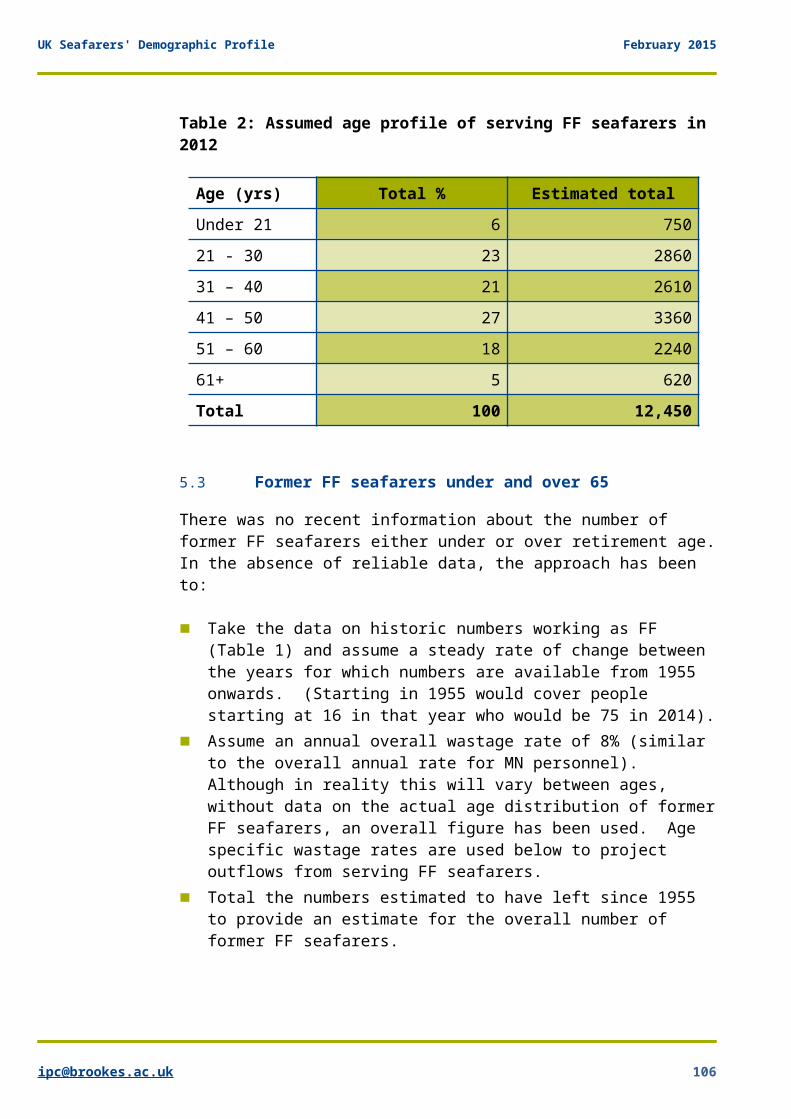
UK Seafarers' Demographic Profile February 2015
Table 2: Assumed age profile of serving FF seafarers in 2012
Age (yrs) Total % Estimated totalUnder 21 6 75021 - 30 23 286031 – 40 21 261041 – 50 27 336051 – 60 18 224061+ 5 620Total 100 12,450
5.3 Former FF seafarers under and over 65
There was no recent information about the number of former FF seafarers either under or over retirement age.In the absence of reliable data, the approach has been to:
Take the data on historic numbers working as FF (Table 1) and assume a steady rate of change between the years for which numbers are available from 1955 onwards. (Starting in 1955 would cover people starting at 16 in that year who would be 75 in 2014).
Assume an annual overall wastage rate of 8% (similar to the overall annual rate for MN personnel). Although in reality this will vary between ages, without data on the actual age distribution of formerFF seafarers, an overall figure has been used. Age specific wastage rates are used below to project outflows from serving FF seafarers.
Total the numbers estimated to have left since 1955 to provide an estimate for the overall number of former FF seafarers.
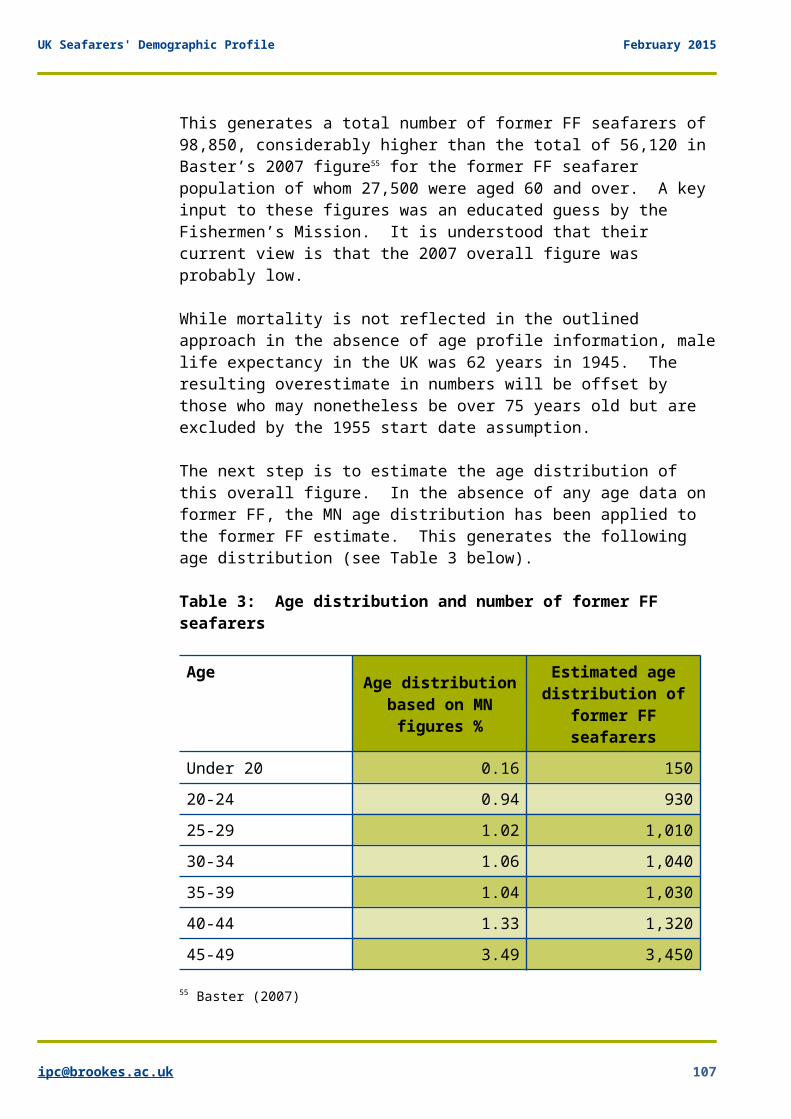
UK Seafarers' Demographic Profile February 2015
This generates a total number of former FF seafarers of 98,850, considerably higher than the total of 56,120 in Baster’s 2007 figure55 for the former FF seafarer population of whom 27,500 were aged 60 and over. A key input to these figures was an educated guess by the Fishermen’s Mission. It is understood that their current view is that the 2007 overall figure was probably low.
While mortality is not reflected in the outlined approach in the absence of age profile information, malelife expectancy in the UK was 62 years in 1945. The resulting overestimate in numbers will be offset by those who may nonetheless be over 75 years old but are excluded by the 1955 start date assumption.
The next step is to estimate the age distribution of this overall figure. In the absence of any age data on former FF, the MN age distribution has been applied to the former FF estimate. This generates the following age distribution (see Table 3 below).
Table 3: Age distribution and number of former FF seafarers
Age Age distributionbased on MNfigures %
Estimated agedistribution of
former FFseafarers
Under 20 0.16 15020-24 0.94 93025-29 1.02 1,01030-34 1.06 1,04035-39 1.04 1,03040-44 1.33 1,32045-49 3.49 3,450
55 Baster (2007)
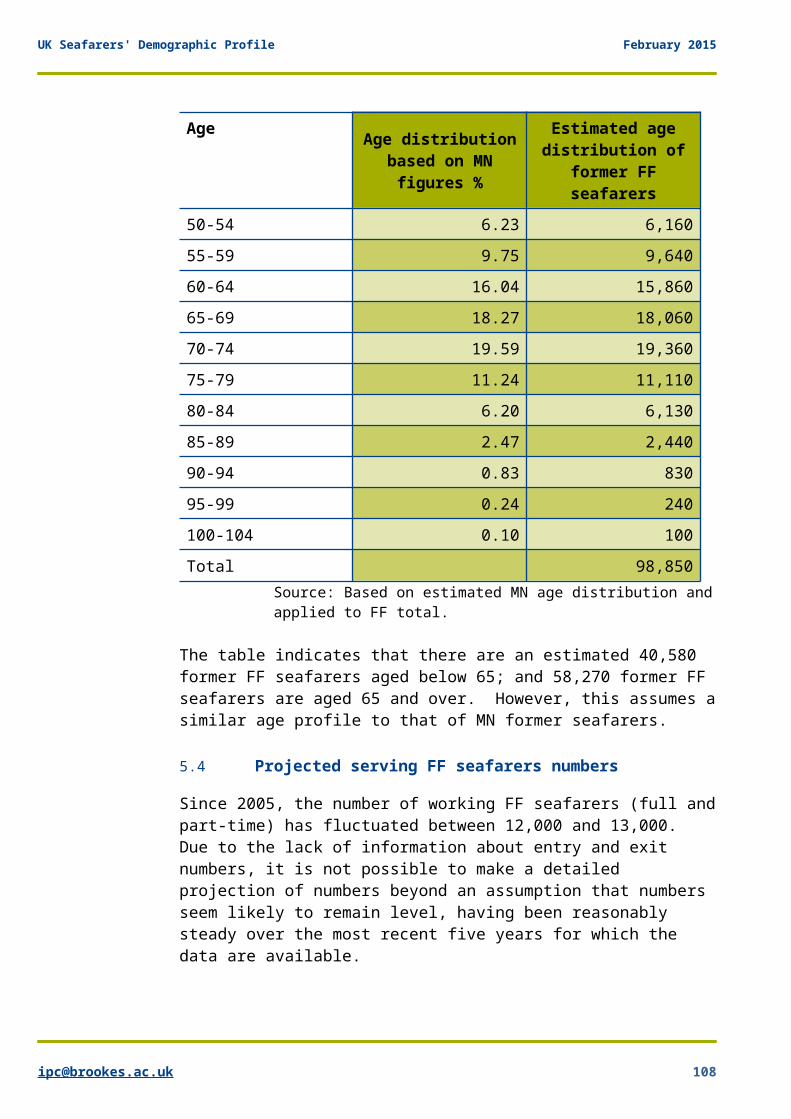
UK Seafarers' Demographic Profile February 2015
Age Age distributionbased on MNfigures %
Estimated agedistribution of
former FFseafarers
50-54 6.23 6,16055-59 9.75 9,64060-64 16.04 15,86065-69 18.27 18,06070-74 19.59 19,36075-79 11.24 11,11080-84 6.20 6,13085-89 2.47 2,44090-94 0.83 83095-99 0.24 240100-104 0.10 100Total 98,850
Source: Based on estimated MN age distribution andapplied to FF total.
The table indicates that there are an estimated 40,580 former FF seafarers aged below 65; and 58,270 former FF seafarers are aged 65 and over. However, this assumes asimilar age profile to that of MN former seafarers.
5.4 Projected serving FF seafarers numbers
Since 2005, the number of working FF seafarers (full andpart-time) has fluctuated between 12,000 and 13,000. Due to the lack of information about entry and exit numbers, it is not possible to make a detailed projection of numbers beyond an assumption that numbers seem likely to remain level, having been reasonably steady over the most recent five years for which the data are available.
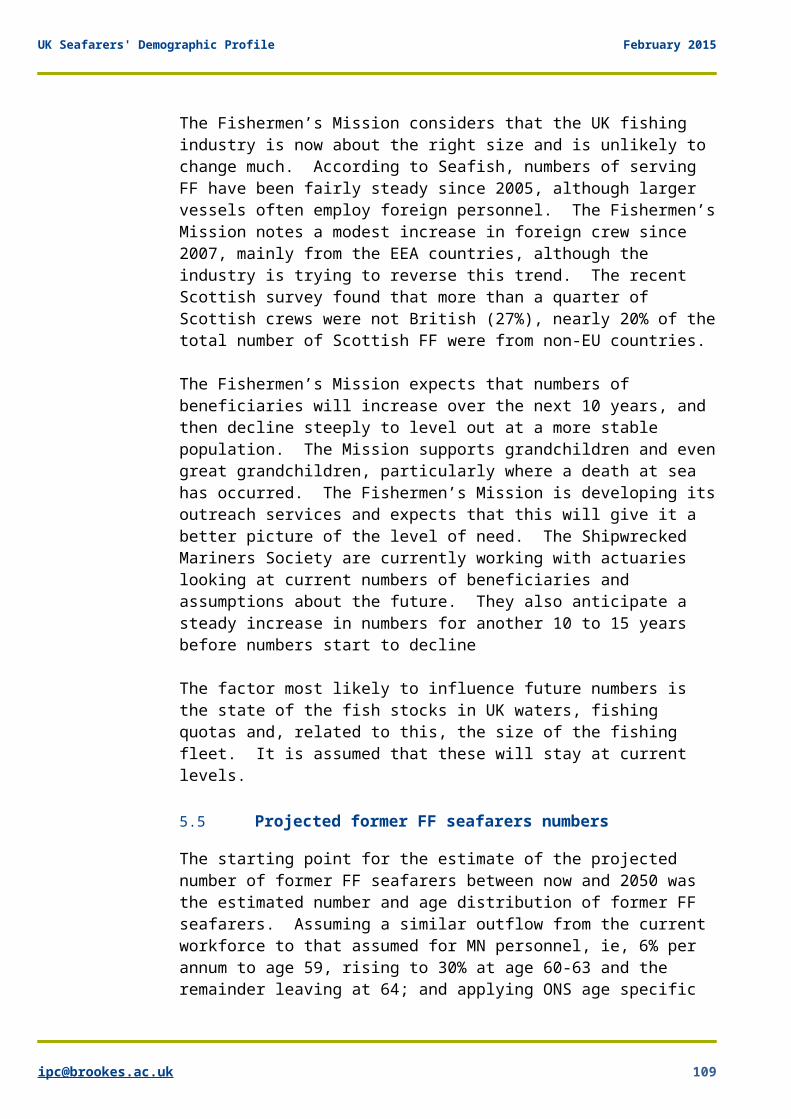
UK Seafarers' Demographic Profile February 2015
The Fishermen’s Mission considers that the UK fishing industry is now about the right size and is unlikely to change much. According to Seafish, numbers of serving FF have been fairly steady since 2005, although larger vessels often employ foreign personnel. The Fishermen’sMission notes a modest increase in foreign crew since 2007, mainly from the EEA countries, although the industry is trying to reverse this trend. The recent Scottish survey found that more than a quarter of Scottish crews were not British (27%), nearly 20% of thetotal number of Scottish FF were from non-EU countries.
The Fishermen’s Mission expects that numbers of beneficiaries will increase over the next 10 years, and then decline steeply to level out at a more stable population. The Mission supports grandchildren and evengreat grandchildren, particularly where a death at sea has occurred. The Fishermen’s Mission is developing itsoutreach services and expects that this will give it a better picture of the level of need. The Shipwrecked Mariners Society are currently working with actuaries looking at current numbers of beneficiaries and assumptions about the future. They also anticipate a steady increase in numbers for another 10 to 15 years before numbers start to decline
The factor most likely to influence future numbers is the state of the fish stocks in UK waters, fishing quotas and, related to this, the size of the fishing fleet. It is assumed that these will stay at current levels.
5.5 Projected former FF seafarers numbers
The starting point for the estimate of the projected number of former FF seafarers between now and 2050 was the estimated number and age distribution of former FF seafarers. Assuming a similar outflow from the current workforce to that assumed for MN personnel, ie, 6% per annum to age 59, rising to 30% at age 60-63 and the remainder leaving at 64; and applying ONS age specific
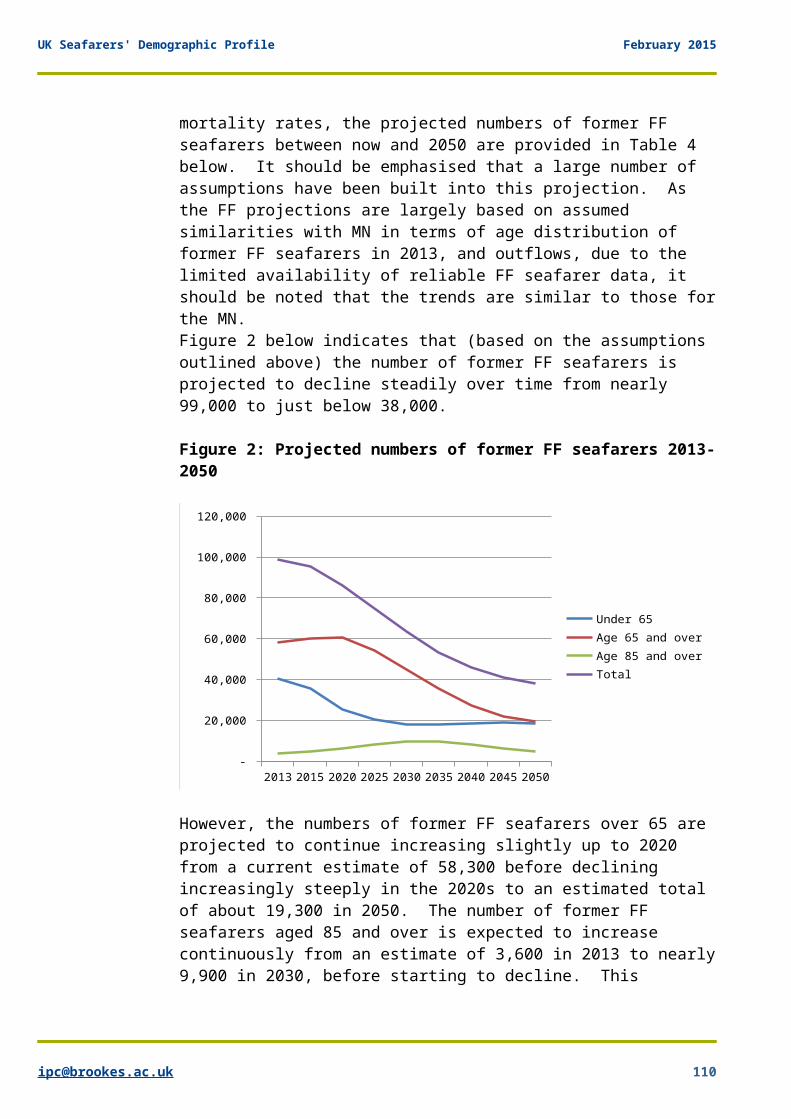
UK Seafarers' Demographic Profile February 2015
mortality rates, the projected numbers of former FF seafarers between now and 2050 are provided in Table 4 below. It should be emphasised that a large number of assumptions have been built into this projection. As the FF projections are largely based on assumed similarities with MN in terms of age distribution of former FF seafarers in 2013, and outflows, due to the limited availability of reliable FF seafarer data, it should be noted that the trends are similar to those forthe MN.Figure 2 below indicates that (based on the assumptions outlined above) the number of former FF seafarers is projected to decline steadily over time from nearly 99,000 to just below 38,000.
Figure 2: Projected numbers of former FF seafarers 2013-2050
2013 2015 2020 2025 2030 2035 2040 2045 2050 -
20,000
40,000
60,000
80,000
100,000
120,000
Under 65Age 65 and overAge 85 and overTotal
However, the numbers of former FF seafarers over 65 are projected to continue increasing slightly up to 2020 from a current estimate of 58,300 before declining increasingly steeply in the 2020s to an estimated total of about 19,300 in 2050. The number of former FF seafarers aged 85 and over is expected to increase continuously from an estimate of 3,600 in 2013 to nearly9,900 in 2030, before starting to decline. This
UK Seafarers' Demographic Profile February 2015
increase in the 85 plus age group is striking and will put significant demands on services for former FF seafarers.
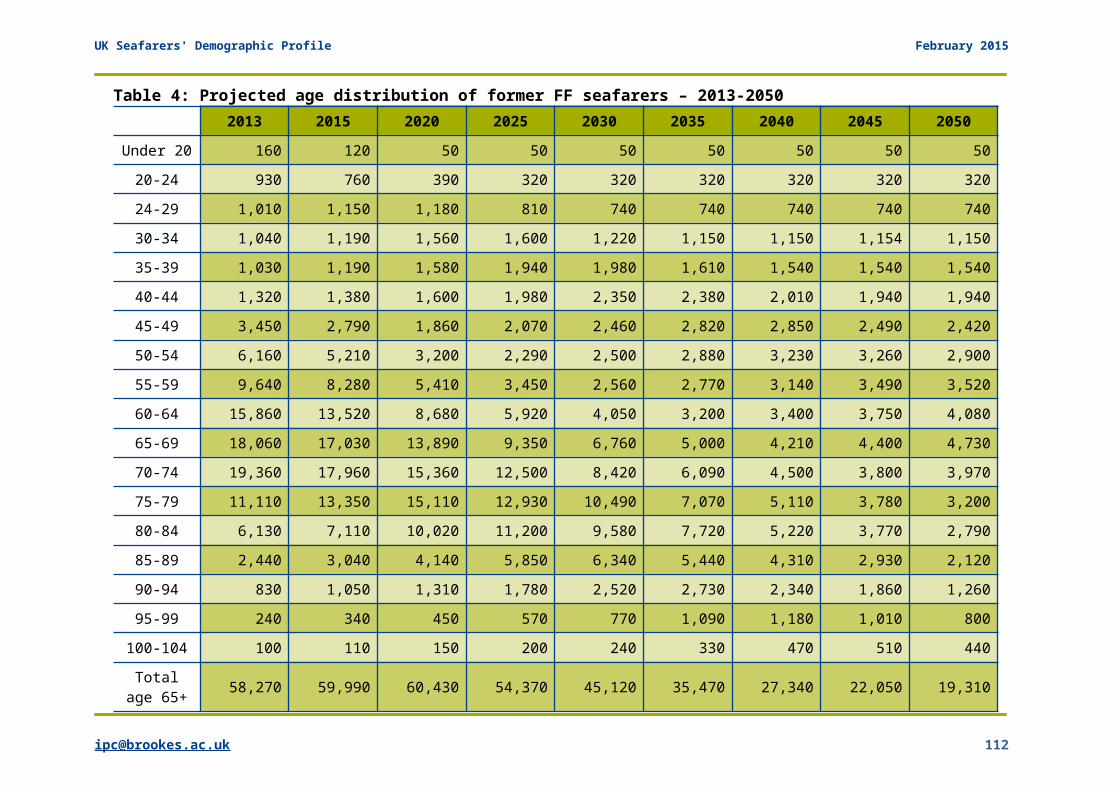
UK Seafarers' Demographic Profile February 2015
Table 4: Projected age distribution of former FF seafarers – 2013-20502013 2015 2020 2025 2030 2035 2040 2045 2050
Under 20 160 120 50 50 50 50 50 50 5020-24 930 760 390 320 320 320 320 320 32024-29 1,010 1,150 1,180 810 740 740 740 740 74030-34 1,040 1,190 1,560 1,600 1,220 1,150 1,150 1,154 1,15035-39 1,030 1,190 1,580 1,940 1,980 1,610 1,540 1,540 1,54040-44 1,320 1,380 1,600 1,980 2,350 2,380 2,010 1,940 1,94045-49 3,450 2,790 1,860 2,070 2,460 2,820 2,850 2,490 2,42050-54 6,160 5,210 3,200 2,290 2,500 2,880 3,230 3,260 2,90055-59 9,640 8,280 5,410 3,450 2,560 2,770 3,140 3,490 3,52060-64 15,860 13,520 8,680 5,920 4,050 3,200 3,400 3,750 4,08065-69 18,060 17,030 13,890 9,350 6,760 5,000 4,210 4,400 4,73070-74 19,360 17,960 15,360 12,500 8,420 6,090 4,500 3,800 3,97075-79 11,110 13,350 15,110 12,930 10,490 7,070 5,110 3,780 3,20080-84 6,130 7,110 10,020 11,200 9,580 7,720 5,220 3,770 2,79085-89 2,440 3,040 4,140 5,850 6,340 5,440 4,310 2,930 2,12090-94 830 1,050 1,310 1,780 2,520 2,730 2,340 1,860 1,26095-99 240 340 450 570 770 1,090 1,180 1,010 800100-104 100 110 150 200 240 330 470 510 440Totalage 65+ 58,270 59,990 60,430 54,370 45,120 35,470 27,340 22,050 19,310
UK Seafarers' Demographic Profile February 2015
Totalage 85+ 3,610 4,550 6,050 8,400 9,880 9,590 8,300 6,300 4,610
Total 98,850 95,570 85,920 74,800 63,350 53,380 45,780 40,790 37,980
UK Seafarers' Demographic Profile February 2015
5.6 Fishing Fleet Dependants
To estimate the family composition of FF seafarers, bothserving and former, we have applied data from the Officeof National Statistics on household composition. Where the ONS provides a rate for households with 3 or more children, it has been assumed there are three children in the household56. The figures will therefore underestimate the total number of children. We have estimated the numbers of widows aged 65 and over using the same assumptions made for RN and MN widows based on pension data where 30% of pension applicants are widowedpartners of personnel. The numbers of widows aged 65 and over in the projections has been assumed to be 30% of the number of former FF seafarers aged 65 and over
Table 5 and Figure 3 below provide estimates of the numbers of dependants for serving and former FF seafarers. Where it is assumed that FF family composition will correspond with the general population,this may not necessarily be the case. It is assumed that serving FF seafarer numbers remain constant betweennow and 2050. In recent years, the number of widows andwidowers has declined steadily reflecting wider trends in the decline of marriage, while numbers of partnerships are unlikely to have changed. The table provides a guide to the approximate numbers.
Figure 3: Projected number of dependants of serving and former FF seafarers 2013-2050
56 ONS indicates that 15.2% of households have 1 dependent child, 12.6% have two dependent children, and 4.5% have three or more dependent children.
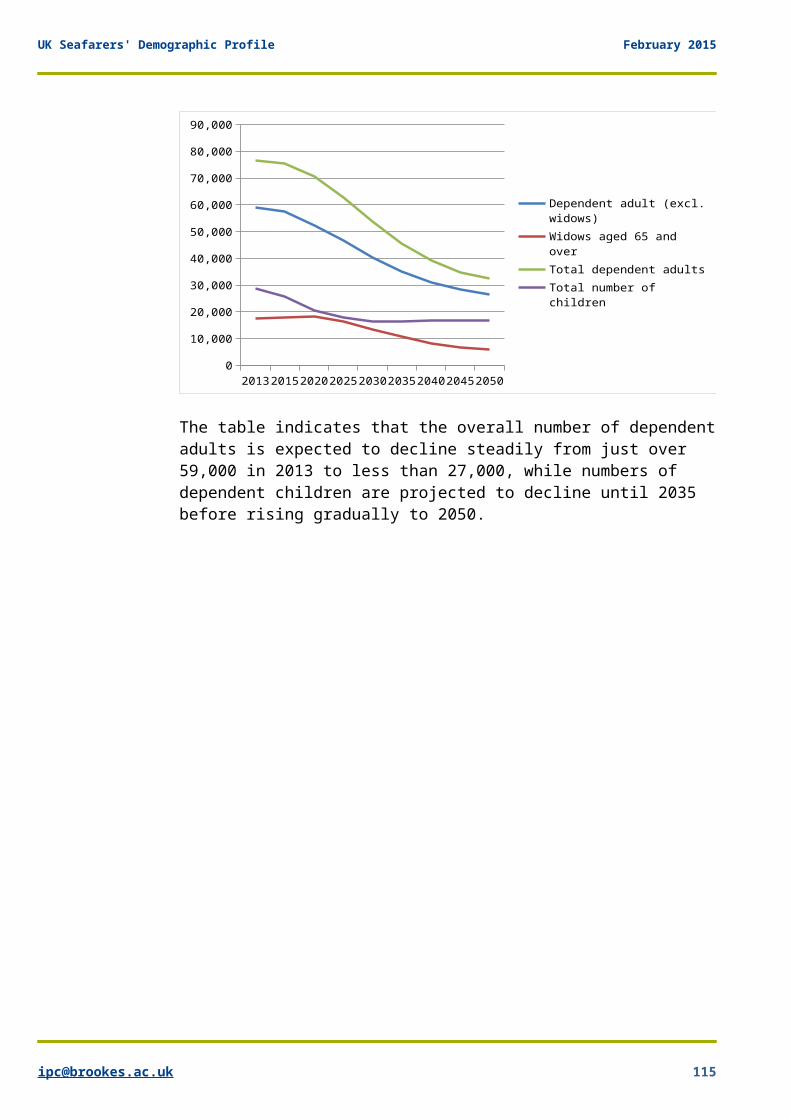
UK Seafarers' Demographic Profile February 2015
2013201520202025203020352040204520500
10,000
20,000
30,000
40,000
50,000
60,000
70,000
80,000
90,000
Dependent adult (excl. widows)Widows aged 65 and overTotal dependent adultsTotal number of children
The table indicates that the overall number of dependentadults is expected to decline steadily from just over 59,000 in 2013 to less than 27,000, while numbers of dependent children are projected to decline until 2035 before rising gradually to 2050.
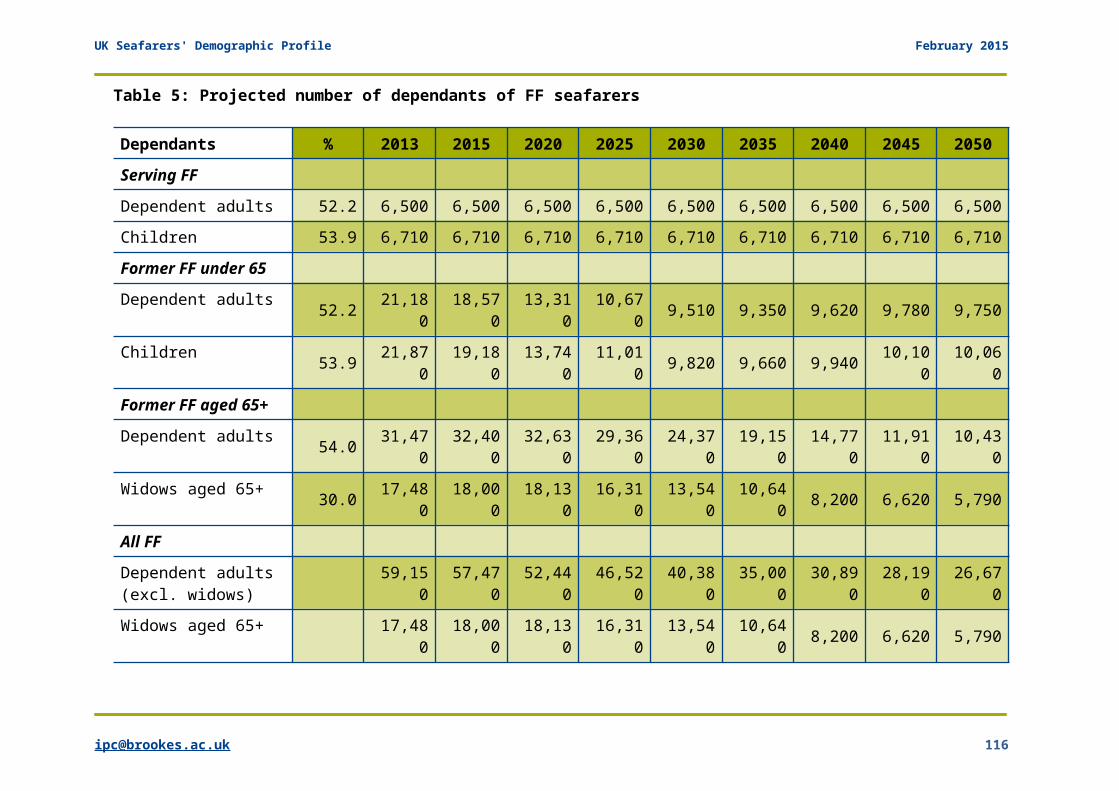
UK Seafarers' Demographic Profile February 2015
Table 5: Projected number of dependants of FF seafarers
Dependants % 2013 2015 2020 2025 2030 2035 2040 2045 2050Serving FF
Dependent adults 52.2 6,500 6,500 6,500 6,500 6,500 6,500 6,500 6,500 6,500Children 53.9 6,710 6,710 6,710 6,710 6,710 6,710 6,710 6,710 6,710Former FF under 65
Dependent adults 52.2 21,180
18,570
13,310
10,670 9,510 9,350 9,620 9,780 9,750
Children 53.9 21,870
19,180
13,740
11,010 9,820 9,660 9,940 10,10
010,06
0Former FF aged 65+
Dependent adults 54.0 31,470
32,400
32,630
29,360
24,370
19,150
14,770
11,910
10,430
Widows aged 65+ 30.0 17,480
18,000
18,130
16,310
13,540
10,640 8,200 6,620 5,790
All FF
Dependent adults (excl. widows)
59,150
57,470
52,440
46,520
40,380
35,000
30,890
28,190
26,670
Widows aged 65+ 17,480
18,000
18,130
16,310
13,540
10,640 8,200 6,620 5,790
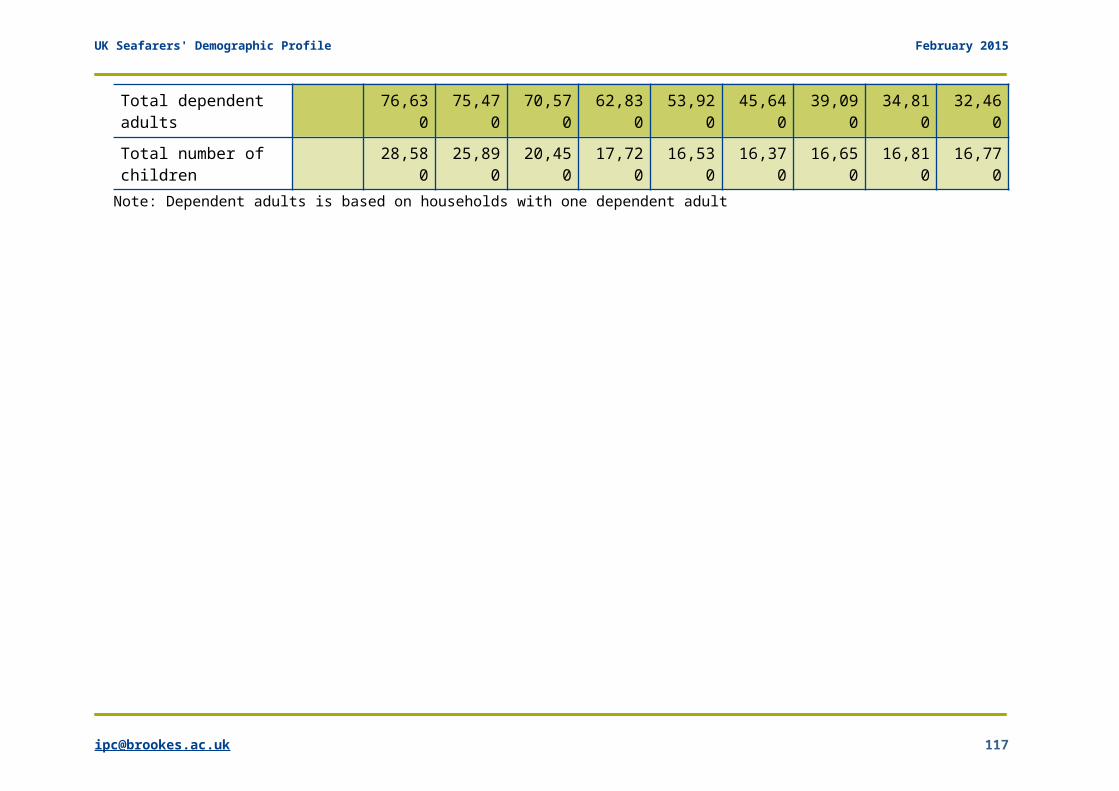
UK Seafarers' Demographic Profile February 2015
Total dependent adults
76,630
75,470
70,570
62,830
53,920
45,640
39,090
34,810
32,460
Total number of children
28,580
25,890
20,450
17,720
16,530
16,370
16,650
16,810
16,770
Note: Dependent adults is based on households with one dependent adult
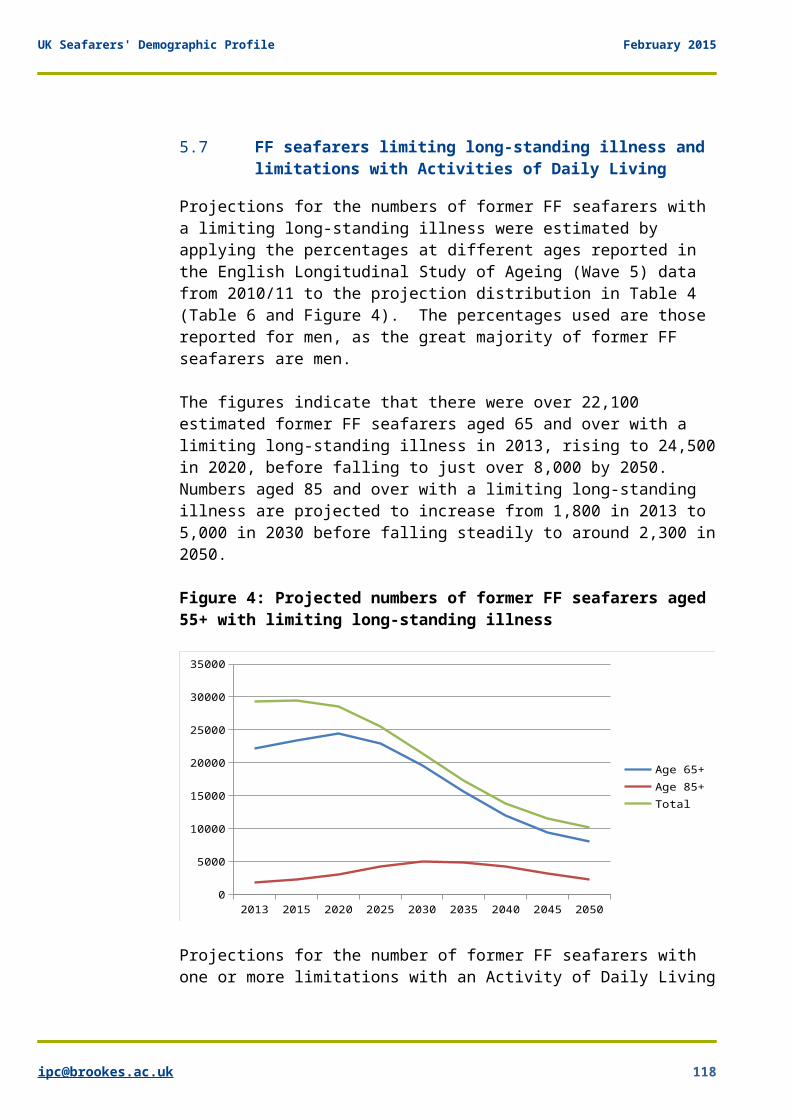
UK Seafarers' Demographic Profile February 2015
5.7 FF seafarers limiting long-standing illness and limitations with Activities of Daily Living
Projections for the numbers of former FF seafarers with a limiting long-standing illness were estimated by applying the percentages at different ages reported in the English Longitudinal Study of Ageing (Wave 5) data from 2010/11 to the projection distribution in Table 4 (Table 6 and Figure 4). The percentages used are those reported for men, as the great majority of former FF seafarers are men.
The figures indicate that there were over 22,100 estimated former FF seafarers aged 65 and over with a limiting long-standing illness in 2013, rising to 24,500in 2020, before falling to just over 8,000 by 2050. Numbers aged 85 and over with a limiting long-standing illness are projected to increase from 1,800 in 2013 to 5,000 in 2030 before falling steadily to around 2,300 in2050.
Figure 4: Projected numbers of former FF seafarers aged 55+ with limiting long-standing illness
2013 2015 2020 2025 2030 2035 2040 2045 20500
5000
10000
15000
20000
25000
30000
35000
Age 65+Age 85+Total
Projections for the number of former FF seafarers with one or more limitations with an Activity of Daily Living
UK Seafarers' Demographic Profile February 2015
were estimated in the same way by applying the percentages at different ages reported in the English Longitudinal Study of Ageing (Wave 5) data from 2010/11 to the projected numbers of former FF seafarers (Table 7and Figure 5).
The number of former FF seafarers experiencing limitations with Activities of Daily Living is currentlyestimated at over 29,000. Total numbers are projected to increase slightly to a peak in 2015, before falling more rapidly to over 10,000 in 2050.
UK Seafarers' Demographic Profile February 2015
Table 6: Projected numbers of former FF seafarers with limiting long-standing illness by ageAge gp
Prevalence rate 2013 2015 2020 2025 2030 2035 2040 2045 2050
55-59 24.3% 2,340 2,010 1,310 840 620 670 760 850 86060-64 30.6% 4,850 4,140 2,660 1,810 1,240 980 1,040 1,150 1,25065-69 31.4% 5,670 5,350 4,360 2,940 2,120 1,570 1,320 1,380 1,49070-74 34.0% 6,580 6,110 5,220 4,250 2,860 2,070 1,530 1,290 1,35075-79 44.7% 4,970 5,970 6,760 5,780 4,690 3,160 2,290 1,690 1,43080-84 50.8% 3,110 3,610 5,090 5,690 4,870 3,920 2,650 1,920 1,42085+ 50.8% 1,830 2,310 3,070 4,270 5,020 4,870 4,220 3,200 2,340Total 29,360 29,490 28,470 25,570 21,420 17,250 13,810 11,480 10,130
Prevalence rates based on ELSA Wave 5Table 7: Projected numbers of former FF seafarers with one or more limitation with an Activity of Daily Living by ageAgegp
Prevalence rate 2013 2015 2020 2025 2030 2035 2040 2045 2050
55-59 11.4% 1,100 940 620 390 290 320 360 400 40060-64 14.1% 2,240 1,910 1,220 840 570 450 480 530 58065-69 16.0% 2,890 2,730 2,220 1,500 1,080 800 670 700 76070-74 21.0% 4,070 3,770 3,230 2,630 1,770 1,280 950 800 83075-79 24.6% 2,730 3,290 3,720 3,180 2,580 1,740 1,260 930 79080-84 35.9% 2,200 2,550 3,600 4,020 3,440 2,770 1,870 1,350 1,000
UK Seafarers' Demographic Profile February 2015
85+ 35.9% 1,300 1,630 2,170 3,020 3,550 3,440 2,980 2,260 1,660Total 16,520 16,820 16,770 15,560 13,280 10,800 8,570 6,970 6,010
Prevalence rates based on ELSA Wave 5

UK Seafarers' Demographic Profile February 2015
While the numbers with a ADL limitation aged 65 and overare projected to peak in 2020, before declining steeply up to 2050, the numbers of those aged 85 and over with are projected to continue rising to a peak of over 3,500in 2030 before declining more gradually to 2050.
Figure 5: Projected numbers of former FF seafarers aged 55+ experiencing limitations with Activities of Daily Living
2013 2015 2020 2025 2030 2035 2040 2045 20500
2000
4000
6000
8000
10000
12000
14000
16000
18000
Age 65+Age 85+Total
5.8 Dementia
Projected numbers of former FF seafarers with dementia were estimated by applying the age-specific rates from the European Community Concerted Action on the Epidemiology and Prevention of Dementia (EURODEM) study57. The rates for men have been used.
There are an estimated 3,400 former FF seafarers with dementia at present (Table 8). The total number is projected to peak in 2025 at around 4,700, before falling steeply to just below 2,000 in 2050, while the numbers of former FF seafarers with dementia aged 85 andover is projected to continue increasing steadily to
57 Op.cit.
UK Seafarers' Demographic Profile February 2015
203-35 to over 2,200 before falling to less than half that number in 2050 (Figure 6).
UK Seafarers' Demographic Profile February 2015
Figure 6: Projected trends in dementia in former FF seafarers 2013-2050
2013 2015 2020 2025 2030 2035 2040 2045 20500
500
1000
1500
2000
2500
3000
3500
4000
4500
5000
Age 85+Total
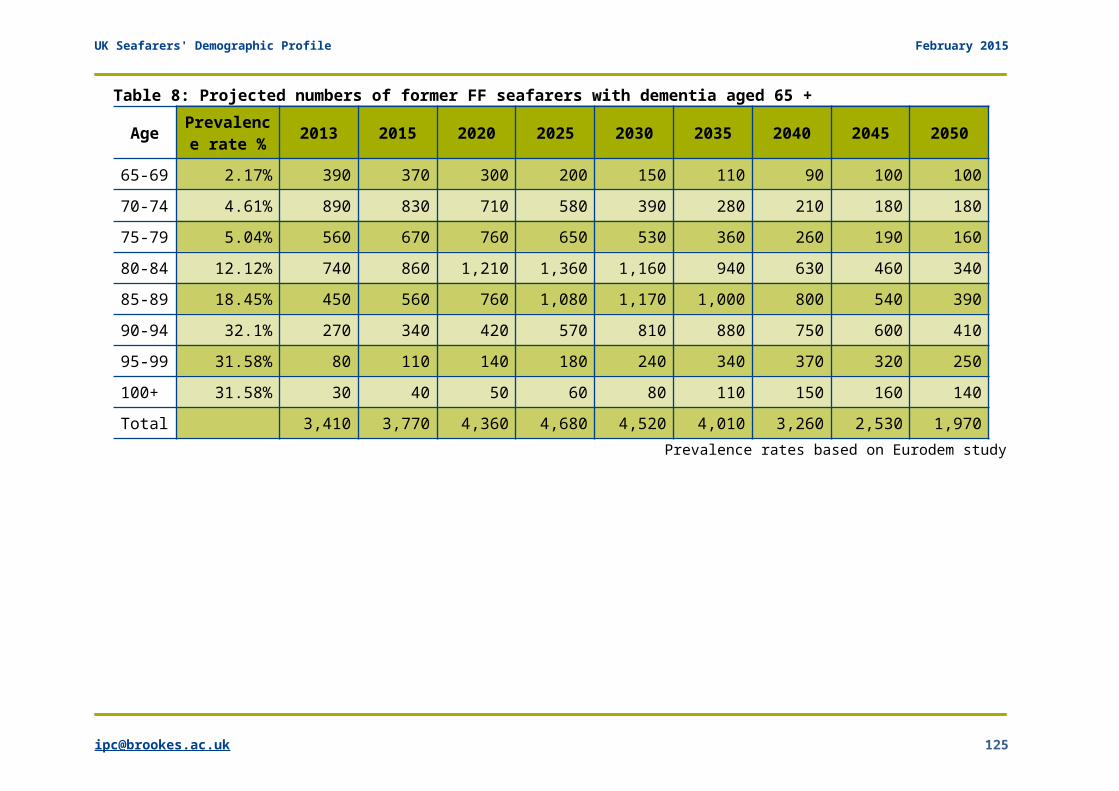
UK Seafarers' Demographic Profile February 2015
Table 8: Projected numbers of former FF seafarers with dementia aged 65 +
Age Prevalence rate % 2013 2015 2020 2025 2030 2035 2040 2045 2050
65-69 2.17% 390 370 300 200 150 110 90 100 10070-74 4.61% 890 830 710 580 390 280 210 180 18075-79 5.04% 560 670 760 650 530 360 260 190 16080-84 12.12% 740 860 1,210 1,360 1,160 940 630 460 34085-89 18.45% 450 560 760 1,080 1,170 1,000 800 540 39090-94 32.1% 270 340 420 570 810 880 750 600 41095-99 31.58% 80 110 140 180 240 340 370 320 250100+ 31.58% 30 40 50 60 80 110 150 160 140Total 3,410 3,770 4,360 4,680 4,520 4,010 3,260 2,530 1,970
Prevalence rates based on Eurodem study
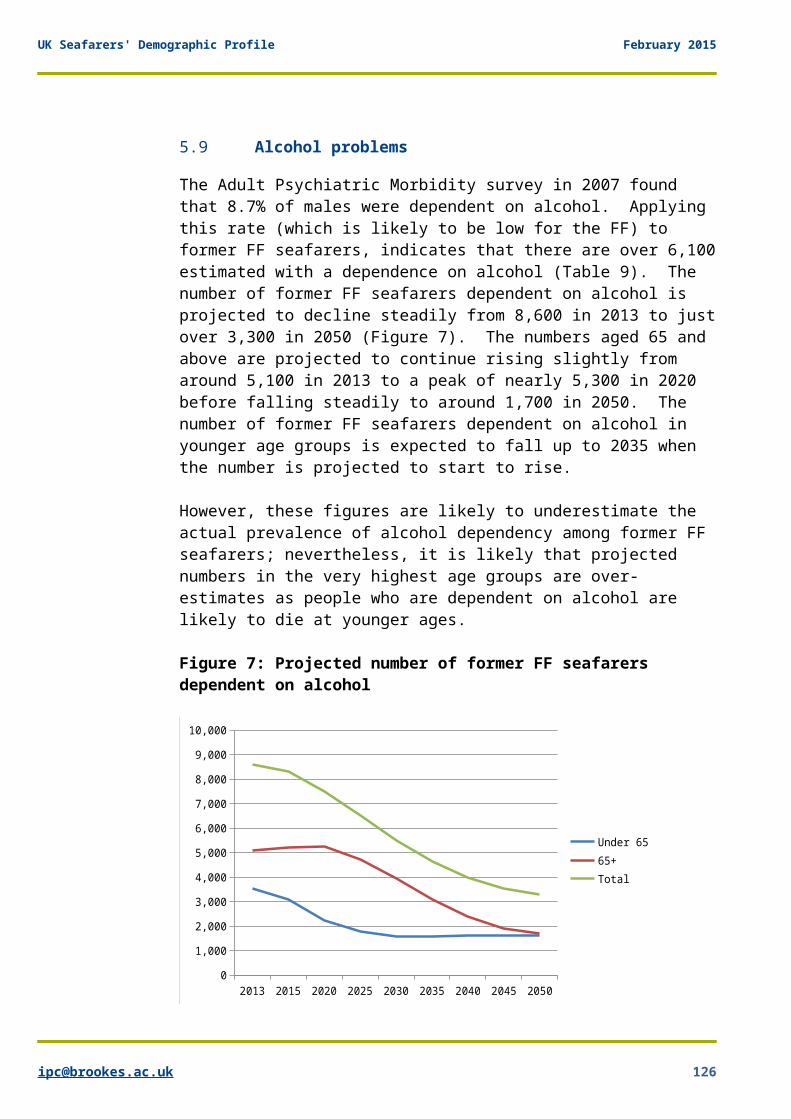
UK Seafarers' Demographic Profile February 2015
5.9 Alcohol problems
The Adult Psychiatric Morbidity survey in 2007 found that 8.7% of males were dependent on alcohol. Applying this rate (which is likely to be low for the FF) to former FF seafarers, indicates that there are over 6,100estimated with a dependence on alcohol (Table 9). The number of former FF seafarers dependent on alcohol is projected to decline steadily from 8,600 in 2013 to justover 3,300 in 2050 (Figure 7). The numbers aged 65 and above are projected to continue rising slightly from around 5,100 in 2013 to a peak of nearly 5,300 in 2020 before falling steadily to around 1,700 in 2050. The number of former FF seafarers dependent on alcohol in younger age groups is expected to fall up to 2035 when the number is projected to start to rise.
However, these figures are likely to underestimate the actual prevalence of alcohol dependency among former FF seafarers; nevertheless, it is likely that projected numbers in the very highest age groups are over-estimates as people who are dependent on alcohol are likely to die at younger ages.
Figure 7: Projected number of former FF seafarers dependent on alcohol
2013 2015 2020 2025 2030 2035 2040 2045 20500
1,000
2,000
3,000
4,000
5,000
6,000
7,000
8,000
9,000
10,000
Under 6565+Total
UK Seafarers' Demographic Profile February 2015
Some qualitative research in Scotland indicated that drug dependency is also a problem among some fishing communities58 (Williams, 2008). Williams’ respondents often believed the drug problem had started because dealers targeted the relatively rich young pelagic fishermen, and the problem then spread from there to become another aspect of the decline of the industry. However, it is not known whether this is widely spread, or specific to north east Scotland.
58 Williams, R (2008) Changing Constructions of Identity: Fisher Households and Industry Restructuring, Newcastle University, unpublished PhD Thesis
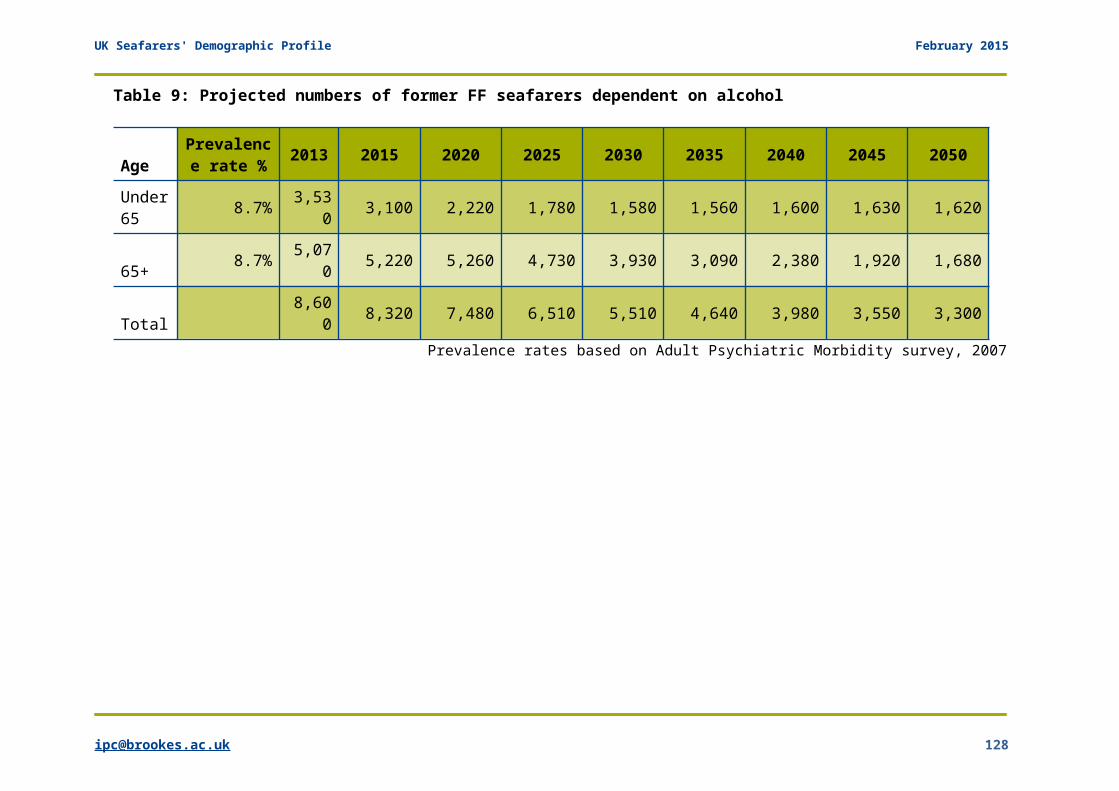
UK Seafarers' Demographic Profile February 2015
Table 9: Projected numbers of former FF seafarers dependent on alcohol
AgePrevalence rate % 2013 2015 2020 2025 2030 2035 2040 2045 2050
Under65 8.7% 3,53
0 3,100 2,220 1,780 1,580 1,560 1,600 1,630 1,620
65+ 8.7% 5,070 5,220 5,260 4,730 3,930 3,090 2,380 1,920 1,680
Total8,60
0 8,320 7,480 6,510 5,510 4,640 3,980 3,550 3,300
Prevalence rates based on Adult Psychiatric Morbidity survey, 2007
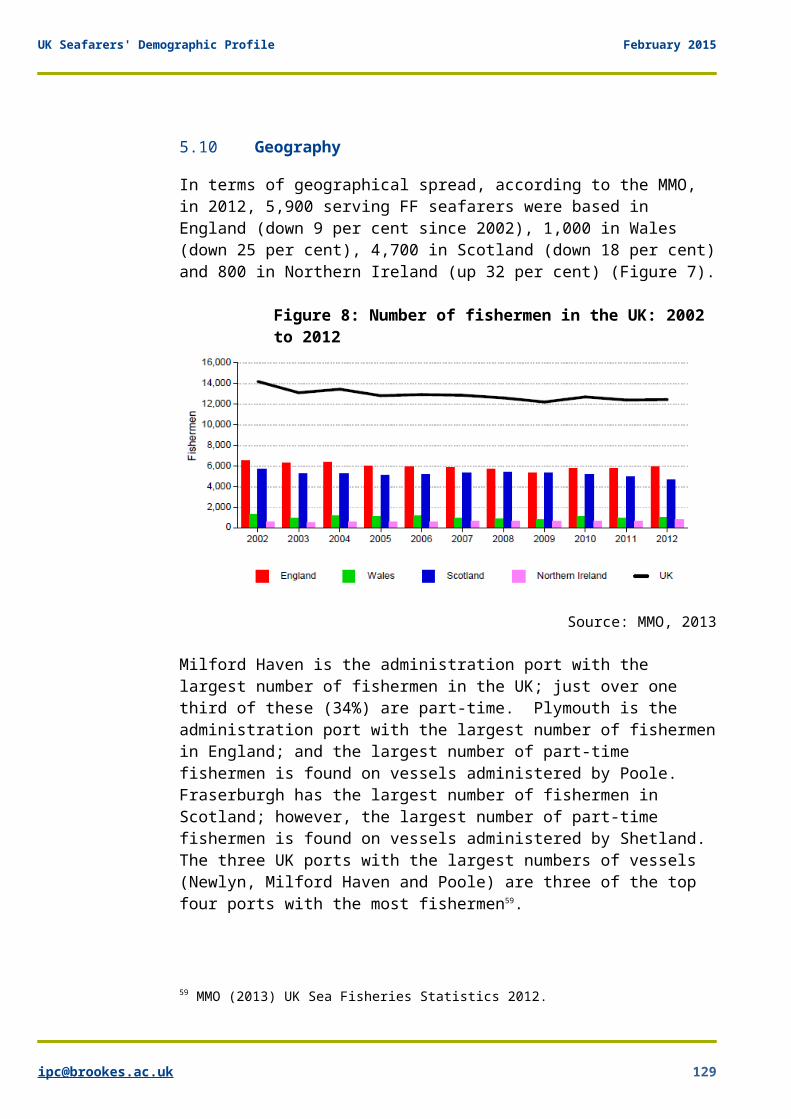
UK Seafarers' Demographic Profile February 2015
5.10 Geography
In terms of geographical spread, according to the MMO, in 2012, 5,900 serving FF seafarers were based in England (down 9 per cent since 2002), 1,000 in Wales (down 25 per cent), 4,700 in Scotland (down 18 per cent)and 800 in Northern Ireland (up 32 per cent) (Figure 7).
Figure 8: Number of fishermen in the UK: 2002 to 2012
Source: MMO, 2013
Milford Haven is the administration port with the largest number of fishermen in the UK; just over one third of these (34%) are part-time. Plymouth is the administration port with the largest number of fishermenin England; and the largest number of part-time fishermen is found on vessels administered by Poole. Fraserburgh has the largest number of fishermen in Scotland; however, the largest number of part-time fishermen is found on vessels administered by Shetland. The three UK ports with the largest numbers of vessels (Newlyn, Milford Haven and Poole) are three of the top four ports with the most fishermen59.
59 MMO (2013) UK Sea Fisheries Statistics 2012.
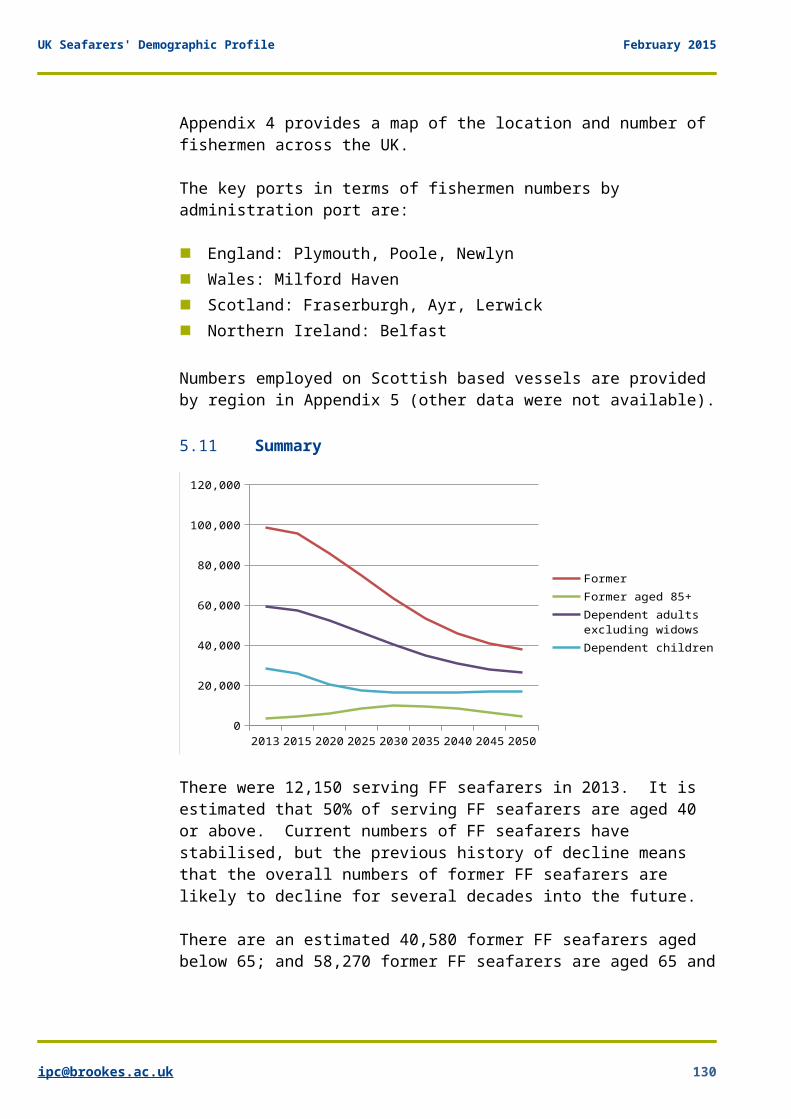
UK Seafarers' Demographic Profile February 2015
Appendix 4 provides a map of the location and number of fishermen across the UK.
The key ports in terms of fishermen numbers by administration port are:
England: Plymouth, Poole, Newlyn Wales: Milford Haven Scotland: Fraserburgh, Ayr, Lerwick Northern Ireland: Belfast
Numbers employed on Scottish based vessels are provided by region in Appendix 5 (other data were not available).
5.11 Summary
2013 2015 2020 2025 2030 2035 2040 2045 20500
20,000
40,000
60,000
80,000
100,000
120,000
FormerFormer aged 85+Dependent adults excluding widowsDependent children
There were 12,150 serving FF seafarers in 2013. It is estimated that 50% of serving FF seafarers are aged 40 or above. Current numbers of FF seafarers have stabilised, but the previous history of decline means that the overall numbers of former FF seafarers are likely to decline for several decades into the future.
There are an estimated 40,580 former FF seafarers aged below 65; and 58,270 former FF seafarers are aged 65 and
UK Seafarers' Demographic Profile February 2015
over. In comparison, Baster (2007) projected a total of53,000 former FF seafarers in 2013.
The numbers of former FF seafarers over 65 are projectedto continue increasing slightly up to 2020 from a current estimate of 58,300 before declining increasinglysteeply in the 2020s to an estimated total of about 19,300 in 2050. The number of former FF seafarers aged 85 and over is expected to increase continuously from anestimate of 3,600 in 2013 to nearly 9,900 in 2030, before starting to decline. Although absolute numbers are small in comparison with the former RN, this increase of more than 275% in the 85 plus age group up to 2030 is striking and will put significant demands on services for former FF seafarers and their dependants.
Lacking any occupational pension scheme, former FF seafarers are likely to be the group of seafarers in greatest need in the years between now and 2050. Other changes in the wider economy and society, for example, in terms of statutory services and welfare may contribute to a growing need for care and support among a reduced population.
UK Seafarers' Demographic Profile February 2015
Section D
6 Research on seafarers’ healthMost of the research in this section relates to studies of the Merchant Navy and Fishing Fleet. However, some of the issues raised relating to physical hazards for example, may be equally relevant to the Royal Navy.
Research by Mackay and Wright60 has shown that working atsea is one of the most hazardous occupations, presentingspecific health and safety concerns for seafarers that are often long term, including:
exposure to toxic and carcinogenic materials that areresponsible for many chronic illnesses (ILO, 2004)
physical hazards on board ship include noise, vibration, excessive heat and cold and harmful radiation from the sun; and seafarers are particularly prone to back injuries, affected by the motion of the ship (ILO, 2004)
mental health problems can arise, related to the conditions of onboard life, as well as prolonged absence from home, and high levels of stress have been reported, associated with poor sleep quality, noise and workload (ILO, 2004)
Mackay and Wright report many physical and psychosocial hazards of working at sea described by the seafarers interviewed for their study. Accidents or minor injuries, particularly trips, falls, cuts and burns, were viewed as commonplace by some seafarers, or an “inevitable part of the job” when the sea was rough. Musculo-skeletal problems were mentioned by all types ofseafarers, such as back pain, joint and knee problems and hernias. Several interviewees had problems with 60 Mackay S and Wright T (2008) Seafarers in a global world: the changing needs of seafarers for advice, support and representation,WLRI Working Paper 3.
UK Seafarers' Demographic Profile February 2015
arthritis, which they attributed to the movement of the ship and the damp working conditions. Added to these health problems is the fact that appropriate healthcare is not always immediately available and, particularly for more minor injuries or health complaints, seafarers would have to wait until they had reached the next port before they could obtain appropriate treatment.
Carter has summarised much of the international literature that can be extrapolated to UK61. He found that there is some evidence that fatal accident rates remain higher than those in the general population when seafarers are ashore. In terms of morbidity, many of the risks from working at sea, notably those from trauma, cease immediately. Carter noted that others maypersist, and identified a number of studies of cancer mortality, some with associated morbidity data, which have identified continuing risks. Several studies have found lung cancer excesses associated with cases of mesothelioma, indicating effects from asbestos, althoughsmoking is also relevant. Others have shown excess riskassociated with work on chemical tankers, suggesting a role for chemical exposure, especially where there are also increases in leukaemia or lymphoma.
There was a consensus among most interviewees that seafaring was not a healthy way of life, with the main lifestyle hazards being: alcohol, smoking, drugs, lack of exercise and poor fitness, poor diet, isolation, loneliness and boredom. Research shows that prolonged absence from home causes problems in maintaining family relationships, and that relationship breakdowns may be higher for seafarers (Thomas 2003)62. The interviewees spoke of particular needs for family support in maintaining contact with families when at sea.
61 Carter T (2010) Mapping the knowledge base for maritime health: 3illness and injury in seafarers, International Maritime Health (open access at http://czasopisma.viamedica.pl/imh/issue/archive,Vol 62, No 4 (2011). 62 Thomas, M. (2003) Lost at sea and lost at home. The predicament of seafaring families, Cardiff, Seafarers International Research Centre.
UK Seafarers' Demographic Profile February 2015
In a survey of over 1,200 working age seafarers by McCalman et al63, 56% reported an injury or illness whichhad prevented them from working (excluding coughs and colds), and many of these reported being off work for a significant period of time. The most common health conditions reported were conditions affecting the back and neck (25% of those reporting an injury/illness), broken bones (15%) and other injuries (15%). Musculo-skeletal issues were particularly common.
Overall, it is clear that seafaring, particularly in thefishing fleet and the Merchant Navy is a risky occupation and that the health needs of serving and former seafarers are likely to be higher than their shore bound contemporaries. Evidence of the risks associated with particular seafaring work is presented below.
6.1 Health and the Merchant Navy
Mackay and Wright64 identify specific health and safety concerns for Merchant Navy personnel, including:
high death rates for accidents at work in the merchant fleet (between seven and 20 times greater than for shore-based workers even in the safest national fleets) (Roberts, 2000)65
high mortality from cancers, cirrhosis, pancreatic and other alcohol-related diseases were found among British merchant seafarers (ILO, 2004)66
63 McCalman L, Shafrir A, Cowie H, Crawford J, & Ritchie P (2011) Seafarers’ Health Care -Health care needs and access to health care among merchant seafarers and fishermen of working age based in the UK, IoM.64 Mackay S and Wright T (2008) Seafarers in a global world: the changing needs of seafarers for advice, support and representation,WLRI Working Paper 365 Roberts, S. (2000) ‘Occupational mortality among British merchantseafarers (1986-1995)’, Maritime Policy & Management, 27: 3: 253-265.
UK Seafarers' Demographic Profile February 2015
obesity has been identified as a problem for UK seafarers, and traditionally there have been limited opportunities for Merchant Navy personnel to take part in physical activity, as well as a social life revolving around the bar in the past (Leonard, 2003)67
6.2 Health and the Fishing Fleet
Mackay and Wright68 also identify a number of specific health concerns for people working on the fishing fleets, including:
Fatal accident rates among UK deep-sea trawlermen were found to be 20 times greater than for coal miners by one study (Matheson et al, 2001).69
Less is known about the levels of occupational illness among FF seafarers, who have no mandatory health screening, but common illnesses identified include: gastrointestinal, respiratory and skin diseases, psychiatric or neurological conditions, with acute depression the most common, and some were alcohol-related (Matheson et al, 2001).
According to Lawrie et al (2001)70, fishermen display high risk taking behaviour, with higher rates of smoking, poorer diets and poorer health knowledge than the general population.
66 ILO (2004) The Global Seafarer: Living and working conditions in a globalized industry, Geneva: International Labour Organisation.67 Leonard, J.F. (2003) A Comparison of the Causes and Rates of Early Retirement upon Medical Grounds in personnel of the Royal Fleet Auxiliary Service with those in the Royal Navy, Thesis for the Diploma of Membership of the Faculty of Occupational Medicine.68 Mackay S and Wright T (2008) Seafarers in a global world: the changing needs of seafarers for advice, support and representation,WLRI Working Paper 369 Matheson, C., Morrison, S., Murphy, E., Lawrie, T., Ritchie, L. and Bond, C. (2001) ‘The health of fishermen in the catching sectorof the fishing industry: a gap analysis’, Occupational Medicine; 51: 5:305-11.70 Lawrie T, Matheson, C Ritchie L, Murphy E & Bond C (2004) The health and lifestyle of Scottish fishermen: a need for health promotion, Health Educ. Res., Aug. 19,4, pp373-9.
UK Seafarers' Demographic Profile February 2015
Among physical hazards mentioned were accidents, in the worst cases leading to deaths of colleagues, but more commonly damage to limbs, with several fishermenrecalling incidents when colleagues had lost parts offingers through catching them in fishing nets. Accidents or minor injuries, particularly trips, falls, cuts and burns, were viewed as commonplace by some seafarers, or an “inevitable part of the job” when the sea was rough.
Other physical hazards reported by Mackay and Wright’s interviewees included loss of circulation tothe hands (said to be common among FF seafarers).
In a convenience sample of 210 fishermen in 3 ports in the south-west of England, Grimsmo et al found a high rate of occupational injuries – in particular a large number of hand injuries – in the sample population71.
More worrying still, an analysis of 160 deaths from work-related accidents in the UK fishing industry from1996 to 2005, found that 86 arose from incidents involving fishing vessels and 74 were from personal accidents, with a fatal accident rate of 102 per 100,000fishermen-years. The authors concluded that commercial fishing is by far the most hazardous occupation in Britain.72
Another study identified fatigue as a problem for fishermen. Eighty-one fishermen were surveyed to establish the extent of fatigue in British fishermen. Whilst the authors note that the results cannot be considered representative of the British fishing population, 60% believed their personal safety had been at risk because of fatigue at work, and 16% had been involved in a fatigue related accident73.
71 Grimsmo-Powney H, Harris, EC, Reading I, & Coggon D (2010) Occupational Health Needs of Commercial Fishermen in South-West England. Occup Med (Lond) 60 (1) pp49-53 first published online September 21, 2009doi:10.1093/occmed/kqp137.72 Roberts S E, (2010) Britain’s most hazardous occupation: Commercial fishing, Accident Analysis and Prevention 42, pp44–49.
UK Seafarers' Demographic Profile February 2015
7 ConclusionThe collection and analysis of demographic data on the serving and former seafaring population and their dependants is constrained by gaps in the data and issuesof quality and reliability in relation to some aspects of these populations. In addition, a series of assumptions have been made in some areas in order to fill gaps in the data and project forward to 2050. A third caveat is the possibility for a range of factors to affect future populations in ways which cannot be foreseen in 2014.
From the available data, the Royal Navy appear to comprise the largest group of serving seafarers (33,000), followed by the Merchant Navy (30,000) and thefishing fleet (12,000). Thus the total serving seafaring population is estimated to be over 75,000.
The collection of data on past numbers indicates that the numbers of all three groups have reduced considerably since 1945, and that change in the size of the populations is likely to continue due to the wide range of factors that affect total numbers. In recent years, the number of RN personnel has reduced due to theStrategic Defence Review, although there has been a slight increase since 2012; while the reduction in the number of MN seafarers appears to have slowed, due in part to the tonnage tax and an increase in the number ofofficer trainees. The fishing fleet also appears to have stabilised in recent years, although some further slight reductions seem likely.
The tables below draw together key projections containedwithin the report. By far the largest group of former seafarers are the RN group, followed by the MN group which appears to be less than half the size of the
73 Allen P, Wellens B & Smith A (2010) Fatigue in British fishermen,Int Marit Health 2010; 61, 3, pp154–158.
UK Seafarers' Demographic Profile February 2015
former RN, and former FF seafarers – the smallest group projected to number less than 100,000 in 2015.
Former seafarers and all dependants
RN 2015 2020 2030 2040 2050Former 367,7
90312,4
70232,4
20186,2
90158,8
80
Former 85+ 55,170
43,640
24,000
18,670
13,040
All adult dependants(incl. widows)
271,560
231,940
174,080
140,480
119,310
Dependent children 118,100
104,670
88,770
80,030
76,880
UK Seafarers' Demographic Profile February 2015
MN 2015 2020 2030 2040 2050Former 150,85
0140,50
0109,12
0 79,010 63,540
Former 85+ 7,080 9,430 15,500 13,890 8,130
All adult dependants (incl. widows)
124,270
118,660 92,320 66,060 52,000
Dependent children 46,590 38,450 29,620 29,210 31,750
FF 2015 2020 2030 2040 2050Former 95,570 85,920 63,350 45,780 37,980
Former 85+ 4,550 6,050 9,880 8,300 4,610
All adult dependants (incl. widows)
75,470 70,570 53,920 39,090 32,460
Dependent children 25,890 20,450 16,530 16,650 16,770
The line chart below shows the projected change in numbers of former RN, MN and FF seafarers.
2015 2020 2030 2040 20500
50,000
100,000
150,000
200,000
250,000
300,000
350,000
400,000
Former RNFormer MNFormer FF
UK Seafarers' Demographic Profile February 2015
In terms of the former seafaring population, the number of former RN seafarers is projected to decline steadily over the coming years across all ages, as the World War II and National Service generation passes on. Among theformer MN and FF seafarers, although a decline in total numbers is projected, within these totals, further risesin the numbers aged 65 and over, aged 75 and over, and particularly 85 and above are projected. Numbers of former MN and FF seafarers aged 85 and over are projected to increase by more than 275% between now and the 2030s, while in the RN, the number of former seafarers aged 85 and above has already peaked.
The oldest former seafarers are the group most likely toneed help and support from maritime charities. They arekey drivers of demand for care and support services. The projected increase in numbers in terms of the over-75s and over-85s among the MN and FF groups, highlights the need for providers to understand how they can meet the needs of frailer seafarers whether through the provision of services themselves, or working in partnership with commissioners or other providers.
Least is known about the dependants of the three seafarer groups. The numbers of dependants across all seafaring groups are expected to continue to decline from the present to 2050 (although numbers of dependent children are projected to increase in the late 2040s). The numbers of adult dependants and widows correspond inrelative size to the size of the different seafarer groups. Wider contextual changes such as welfare reformand continuing public sector austerity measures are likely to create a range of needs for help and support among the adult and child dependants of seafarers. The projections in this report suggest that the demand for services will still be there, as suggested in Baster’s 2007 report, and this is backed up by the higher numbersof adult dependants.
However, the main beneficiary group will continue to be men. Not only are seafarers vulnerable to specific
UK Seafarers' Demographic Profile February 2015
health problems and conditions associated with their time at sea, but many, particularly former FF and some MN seafarers will have limited or no occupational pension provision. Recent evidence from the International Longevity Centre also highlights concerns about the growing generation of older men that are facing a future of increased isolation74, partly because the number of older men outliving their partner is expected to grow, as male life expectancy increases faster than female life expectancy.
A number of factors will interact and affect the projections made in this report. Continuing increases in longevity will increase the size of all the ex-seafarer populations, while further changes in pension age could reduce the need for support in old age. Changes in health and social care policy and provision will also affect levels and type of need. It is not known how much prevalence rates for some diseases may reduce over time due to improvements in medical treatment, or equally, the extent to which new problems related to obesity or other emerging health problems maycreate new demands. For example, new treatments for dementia or new forms of care provision may emerge between now and 2050 which affect the level and kind of needs of ex-seafarer populations.
Charities cannot hope to address all those in need who are eligible for support, and it is likely that requestsfor help will continue to represent only a proportion ofthose who may need help. The analysis of the demographic data indicates that there will be a continuing need for charitable help and support, particularly among the oldest former MN and FF seafarersfor many years to come. Within the wider context of welfare reform, austerity measures affecting health and social care, and apparently low membership of occupational pension schemes among some groups of
74 ILC (2014) Isolation: The emerging crisis for older men, ILC.
UK Seafarers' Demographic Profile February 2015
seafarers, although the overall numbers may decline, thelevel of need may actually increase.
UK Seafarers' Demographic Profile February 2015
Appendix 1 – Organisations contacted
The following organisations were contacted as part of the study:
Department of Transport – Maritime and Coastguard Agency
Office of National Statistics – including Census data Ministry of Defence - DASA Her Majesty’s Revenue and Customs (tax data) Government Actuary’s Department Welsh Assembly Government Department of Enterprise, Trade and Investment,
Northern Ireland Scottish Government Marine Management Organisation UK Chamber of Shipping Service Personnel and Veterans Agency Association of Royal Naval Officers Royal Naval Association Royal Naval Benevolent Trust Royal British Legion SSAFA WRVS Merchant Navy Officers Pension Fund Merchant Navy Ratings Pension Fund Merchant Navy Welfare Board Merchant Navy Training Board Shipwrecked Fishermen and Mariners Royal Benevolent
Society Royal National Mission to Deep Sea Fishermen Seafish Scottish Fishermen’s Federation Seafarers UK
UK Seafarers' Demographic Profile February 2015
Nautilus International National Union of Rail, Maritime and Transport
Workers UK Sailing Academy Crewing agents
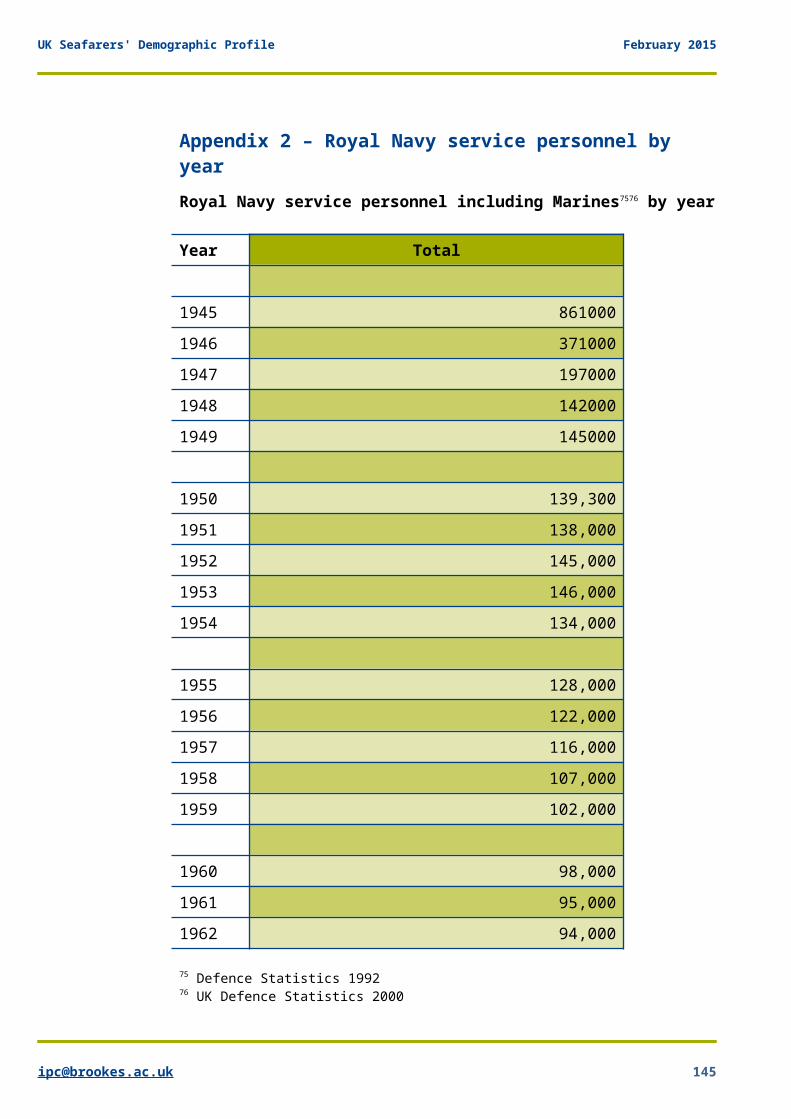
UK Seafarers' Demographic Profile February 2015
Appendix 2 – Royal Navy service personnel by yearRoyal Navy service personnel including Marines7576 by year
Year Total
1945 8610001946 3710001947 1970001948 1420001949 145000
1950 139,3001951 138,0001952 145,0001953 146,0001954 134,000
1955 128,0001956 122,0001957 116,0001958 107,0001959 102,000
1960 98,0001961 95,0001962 94,000
75 Defence Statistics 1992 76 UK Defence Statistics 2000
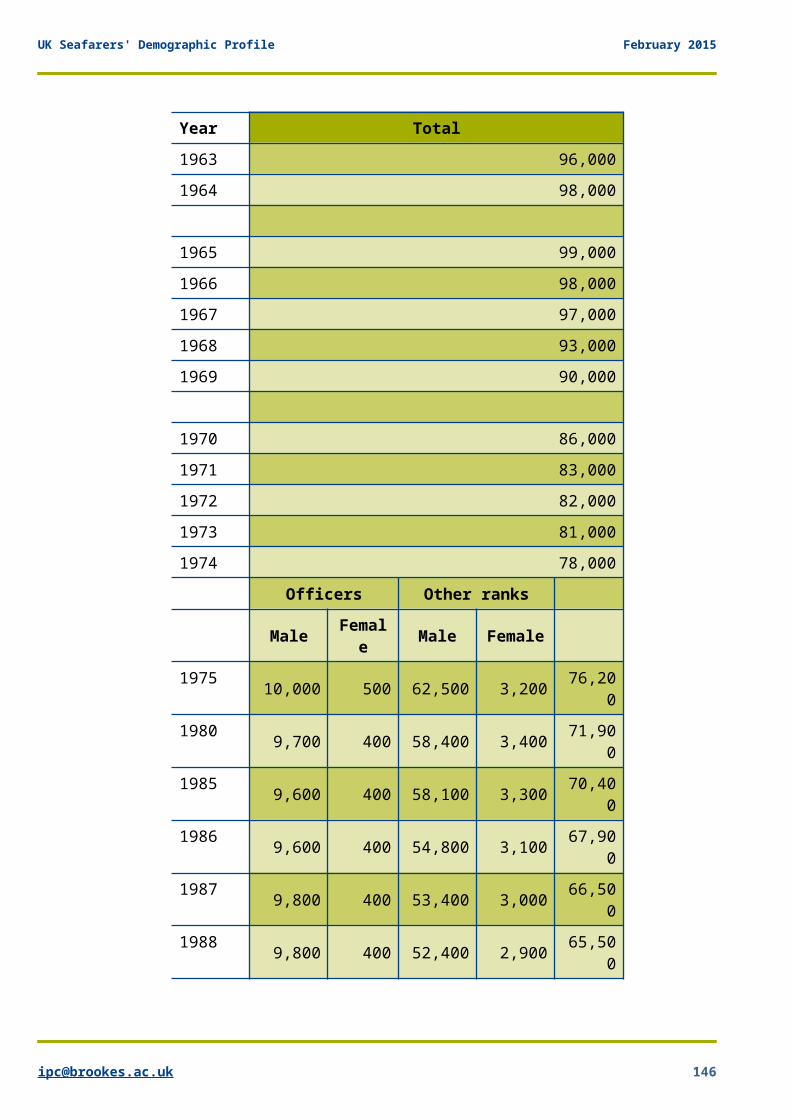
UK Seafarers' Demographic Profile February 2015
Year Total1963 96,0001964 98,000
1965 99,0001966 98,0001967 97,0001968 93,0001969 90,000
1970 86,0001971 83,0001972 82,0001973 81,0001974 78,000
Officers Other ranks
Male Female Male Female
1975 10,000 500 62,500 3,200 76,200
1980 9,700 400 58,400 3,400 71,900
1985 9,600 400 58,100 3,300 70,400
1986 9,600 400 54,800 3,100 67,900
1987 9,800 400 53,400 3,000 66,500
1988 9,800 400 52,400 2,900 65,500
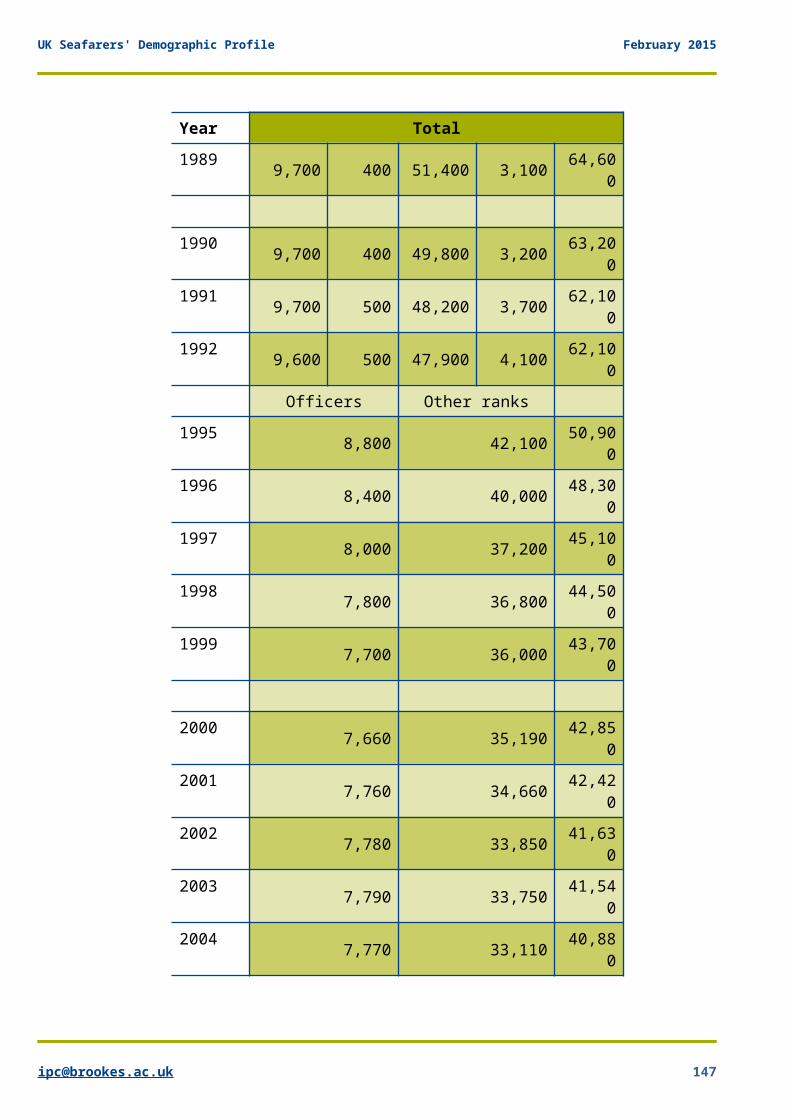
UK Seafarers' Demographic Profile February 2015
Year Total1989 9,700 400 51,400 3,100 64,60
0
1990 9,700 400 49,800 3,200 63,200
1991 9,700 500 48,200 3,700 62,100
1992 9,600 500 47,900 4,100 62,100
Officers Other ranks1995 8,800 42,100 50,90
01996 8,400 40,000 48,30
01997 8,000 37,200 45,10
01998 7,800 36,800 44,50
01999 7,700 36,000 43,70
0
2000 7,660 35,190 42,850
2001 7,760 34,660 42,420
2002 7,780 33,850 41,630
2003 7,790 33,750 41,540
2004 7,770 33,110 40,880
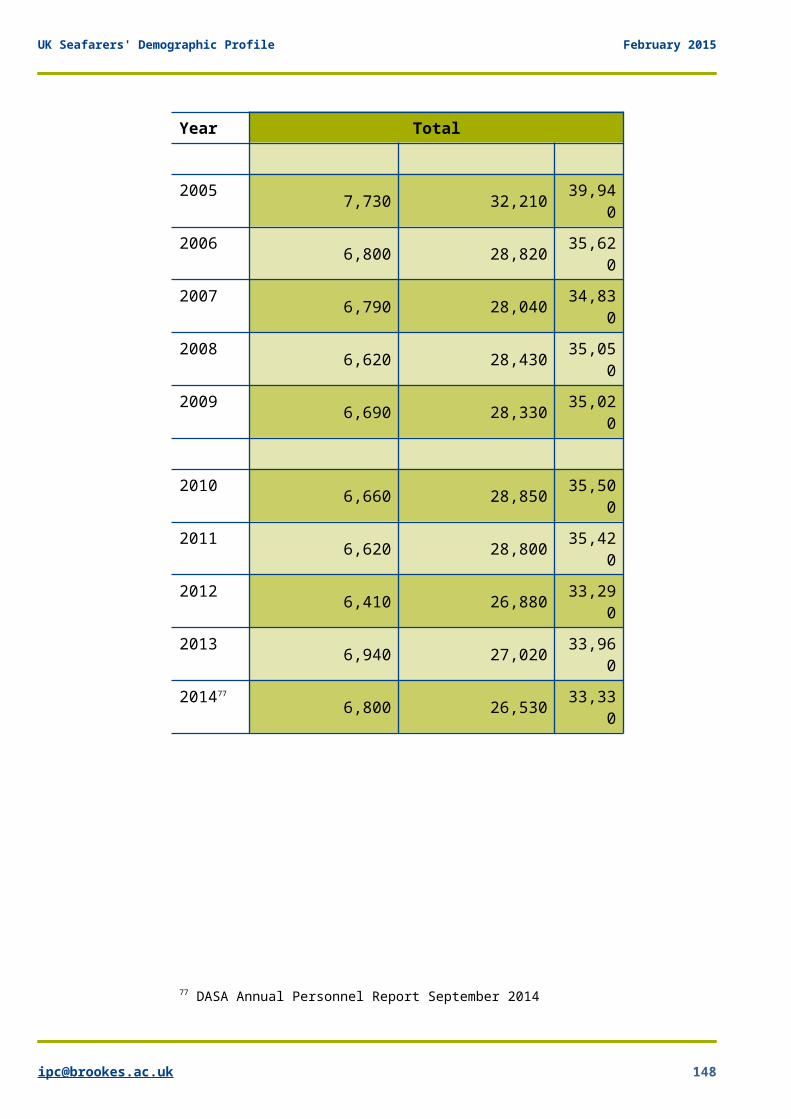
UK Seafarers' Demographic Profile February 2015
Year Total
2005 7,730 32,210 39,940
2006 6,800 28,820 35,620
2007 6,790 28,040 34,830
2008 6,620 28,430 35,050
2009 6,690 28,330 35,020
2010 6,660 28,850 35,500
2011 6,620 28,800 35,420
2012 6,410 26,880 33,290
2013 6,940 27,020 33,960
201477
6,800 26,530 33,330
77 DASA Annual Personnel Report September 2014
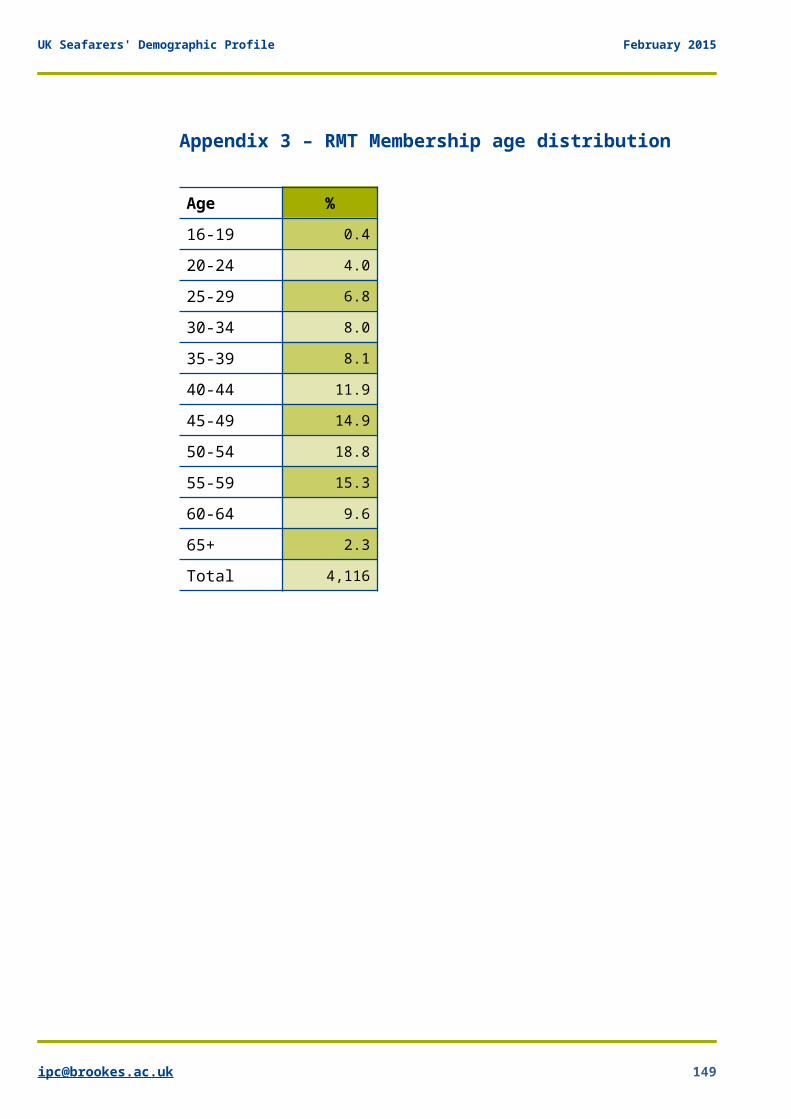
UK Seafarers' Demographic Profile February 2015
Appendix 3 – RMT Membership age distribution
Age %16-19 0.4
20-24 4.0
25-29 6.8
30-34 8.0
35-39 8.1
40-44 11.9
45-49 14.9
50-54 18.8
55-59 15.3
60-64 9.6
65+ 2.3
Total 4,116
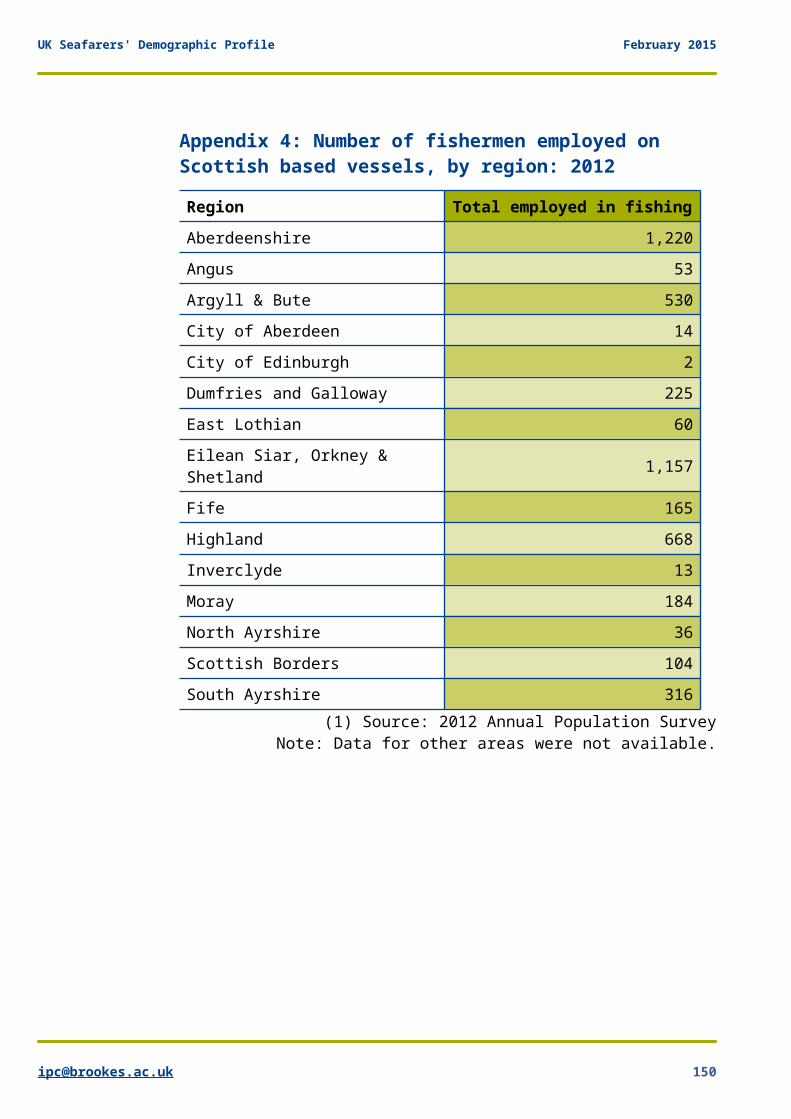
UK Seafarers' Demographic Profile February 2015
Appendix 4: Number of fishermen employed on Scottish based vessels, by region: 2012
Region Total employed in fishingAberdeenshire 1,220Angus 53Argyll & Bute 530City of Aberdeen 14City of Edinburgh 2Dumfries and Galloway 225East Lothian 60Eilean Siar, Orkney & Shetland 1,157
Fife 165Highland 668Inverclyde 13Moray 184North Ayrshire 36Scottish Borders 104South Ayrshire 316
(1) Source: 2012 Annual Population SurveyNote: Data for other areas were not available.
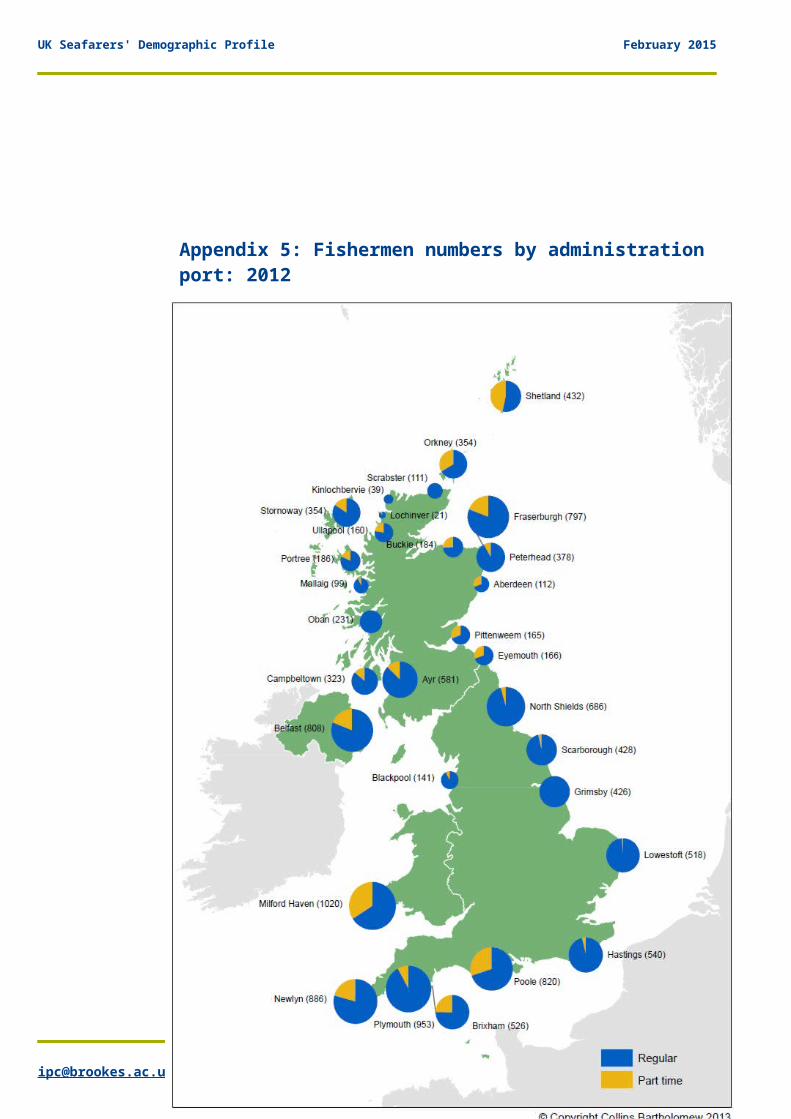
UK Seafarers' Demographic Profile February 2015
Appendix 5: Fishermen numbers by administration port: 2012


