Embed Size (px)
Citation preview
In vivo quantification of photosensitizerconcentration using fluorescencedifferential path-length spectroscopy:influence of photosensitizer formulationand tissue location
Sebastiaan A. H. J. de VisscherMax J. H. WitjesSlávka KašcákováHenricus J. C. M. SterenborgDominic J. RobinsonJan L. N. RoodenburgArjen Amelink
Downloaded From: http://biomedicaloptics.spiedigitallibrary.org/ on 02/24/2014 Terms of Use: http://spiedl.org/terms
In vivo quantification of photosensitizer concentrationusing fluorescence differential path-length spectroscopy:influence of photosensitizer formulation and tissue location
Sebastiaan A. H. J. de Visscher,a Max J. H. Witjes,a Slávka Kašcáková,b Henricus J. C. M. Sterenborg,bDominic J. Robinson,b Jan L. N. Roodenburg,a and Arjen Amelinka,baUniversity Medical Center Groningen, Department of Oral and Maxillofacial Surgery, Division of Oncology, The NetherlandsbErasmus Medical Center, Center for Optical Diagnostics and Therapy, Department of Radiation Oncology, Rotterdam, The Netherlands
Abstract. In vivo measurement of photosensitizer concentrations may optimize clinical photodynamic therapy(PDT). Fluorescence differential path-length spectroscopy (FDPS) is a non-invasive optical technique that hasbeen shown to accurately quantify the concentration of Foscan® in rat liver. As a next step towards clinical transla-tion, the effect of two liposomal formulations of mTHPC, Fospeg® and Foslip®, on FDPS response was investigated.Furthermore, FDPS was evaluated in target organs for head-and-neck PDT. Fifty-four healthy rats were intrave-nously injected with one of the three formulations of mTHPC at 0.15 mgkg−1. FDPS was performed on liver, ton-gue, and lip. The mTHPC concentrations estimated using FDPS were correlated with the results of the subsequentharvested and chemically extracted organs. An excellent goodness of fit (R2) between FDPS and extractionwas found for all formulations in the liver (R2 ¼ 0.79). A much lower R2 between FDPS and extraction wasfound in lip (R2 ¼ 0.46) and tongue (R2 ¼ 0.10). The lower performance in lip and in particular tongue was mainlyattributed to the more layered anatomical structure, which influences scattering properties and photosensitizer dis-tribution. © 2012 Society of Photo-Optical Instrumentation Engineers (SPIE). [DOI: 10.1117/1.JBO.17.6.067001]
Keywords: fluorescence; meso-tetra(hydroxyphenyl) chlorin; photodynamic therapy; spectroscopy.
Paper 12031 received Jan. 13, 2012; revised manuscript received Mar. 15, 2012; accepted for publication Apr. 10, 2012; publishedonline Jun. 4, 2012.
1 IntroductionPhotodynamic therapy (PDT) has been established as a localtreatment modality for several kinds of malignancies in variousorgans.1–7 PDT is based on the use of a light sensitive drug, aphotosensitizer, which is locally applied or systemically admi-nistered. The photosensitizer meta-tetra(hydroxyphenyl)chlorin(mTHPC or Temoporfin) is one of the most potent clinicallyused photosensitizers to date.8–10 Its development, study andclinical use was recently summarized in a comprehensivereview.11 The formulation of mTHPC in ethanol and propyleneglycol, Foscan®, is in use for both curative and palliative treat-ment of head and neck squamous cell carcinoma (SCC).7,12 Thetreatment involves excitation of the administered photosensitizerwith non-thermal light at the tumor site, which leads to the for-mation of cytotoxic reactive oxygen species.9,13–17 The amountof reactive oxygen species formed depends on the type of photo-sensitizer, its concentration, tissue oxygenation, and the rate ofirradiation. In head & neck tumors, treatment is typically per-formed using a mTHPC dose of 0.15 mg kg−1 and light fluenceof 20 J cm−2 at a fluence rate of 100 mWcm−2 delivered at652 nm.11 However, despite the fixed light fluence and adminis-tered drug dose differences in PDT response may occur. Mon-itoring PDT parameters such as oxygenation, light fluence, andphotosensitizer concentration during therapy could provideinsight in the complex and dynamic interactions that occurduring PDT and could give information on the deposited
PDT dose.18 Our group recently developed fluorescence differ-ential path-length spectroscopy (FDPS) as a tool to quantifyphotosensitizer concentration and micro vascular oxygen satura-tion, a surrogate marker of tissue oxygen concentration.19,20 Inprevious research, we were able to show that FDPS can be usedto measure photosensitizer concentration in vivo in rat liver.21
In this proof-of-concept study, our group used Foscan at0.3 mg kg−1 as the target photosensitizer. A good linear correla-tion was found between the mTHPC concentration measuredwith FDPS and the mTHPC concentration measured by chemi-cal extraction. As a next step towards clinical translation ofFDPS for monitoring PDT in head and neck tumors, we hereevaluate the performance of FDPS using a clinically relevantdrug dose of 0.15 mg kg−1 in target organs for head-and-neckPDT: the lip and the tongue. From a tissue optics point ofview it is more challenging to analyze oral mucosal tissues com-pared to liver tissue. For example, oral tissues such as the dor-sum of the tongue and palate are keratinized and are effectivelylayered media, while the inner lip and floor of the mouth are lessso. The keratinisation of the dorsal tongue is present in all mam-mals, although the degree of keratinisation varies among spe-cies.22 In the present study, we have investigated howaccurately FDPS measures photosensitizer concentrations inthese more optically heterogeneous media. Similar to our pre-vious proof-of-concept study, chemical extraction will serve asthe gold standard for mTHPC concentration in these tissues.
One of the problems of Foscan in pre-clinical and clinicalPDT is its poor water solubility, which results in aggrega-tion.11,23 Therefore, water soluble liposomal formulations haveAddress all correspondence to: Sebastiaan A. H. J. de Visscher, University Med-
ical Center Groningen, Department of Oral and Maxillofacial Surgery, RoomS3.214, Hanzeplein 1, P.O. Box 30.001, 9700 RB Groningen, The Netherlands.Tel: +31 50 361 3846; Fax: +31 50 361 1136; E-mail: [email protected] 0091-3286/2012/$25.00 © 2012 SPIE
Journal of Biomedical Optics 067001-1 June 2012 • Vol. 17(6)
Journal of Biomedical Optics 17(6), 067001 (June 2012)
Downloaded From: http://biomedicaloptics.spiedigitallibrary.org/ on 02/24/2014 Terms of Use: http://spiedl.org/terms
been designed as nanocarriers for mTHPC. A further advantageof liposomal drug-carrier systems is a reduced uptake by thereticuloendothelial system (RES) and an enhanced permeabilityand retention effect (EPR).24 Two liposomal mTHPC formula-tions that have been developed are Foslip® and Fospeg®.8,25–32
In Fospeg, the surfaces of the liposomes are coated by a hydro-philic polymer to further decrease recognition by the RESand thus increase circulation time over Foscan and Foslip.24,33
Both the incorporation of mTHPC into liposomes and thecomposition of different liposomes are known to significantlyinfluence the spectral properties.28,30 Furthermore, Foslip andFospeg are known to exhibit different redistribution patternsand liposomal stability in serum.30 We have therefore alsoinvestigated the influence of these nanocarriers on FDPSperformance.
2 Material and Methods
2.1 Animal and Procedures
Fifty-four male Wistar rats (HsdCpb:W) weighing between250 and 350 g, were purchased from Harlan NetherlandsB.V. (Horst, The Netherlands). Three different formulationsof mTHPC were kindly provided by Biolitec AG (Jena,Germany); Foscan® (4 mgmL−1 mTHPC), Fospeg®(1.5 mgmL−1 mTHPC) and Foslip® (1.38 mgmL−1 mTHPC).Prior to the experiment, Foscan, Foslip and Fospeg were dis-solved for intravenous injection under minimal light and keptat 4 °C in the dark, as recommended by the manufacturer.The dosage used was 0.15 mg kg−1 mTHPC and animalswere kept under reduced light conditions (<60 lux). Prior tothe experimental measurements the rats were anaesthetizedusing Isoflurane®/O2∕N2O as a general inhalation anesthetic.Variations in mTHPC concentrations are achieved by takingmeasurements at different time points in the pharmacokineticsprofile of each formulation. At 2, 4, 8, 24, 48, or 96 h after injec-tion (n ¼ 3 animals per formulation per time point) tissue con-centrations of mTHPC were measured using FDPS. In the oralcavity, four measurements were performed on the mucosa of thelip and six on the dorsum of the tongue, all at randomly chosenlocations. Next, tissue overlying the liver was dissected whichallowed measurements at six randomly chosen locations on theliver. Directly after the optical measurements the animals wereterminated by cervical dislocation. Lip, tongue and liver wereimmediately excised and snap-frozen in liquid nitrogen.FDPS measured the concentration of mTHPC in lip, tongueand liver based on the emitted fluorescence of mTHPC. Theconcentration estimates determined by FDPS were comparedto the concentration determined by chemical extraction. Theexperimental design for this study was approved by the experi-mental welfare committee of the University Medical CenterGroningen and conformed to Dutch and European regulationsfor animal experimentation.
2.2 Measurement of mTHPC Tissue Concentrationusing FDPS
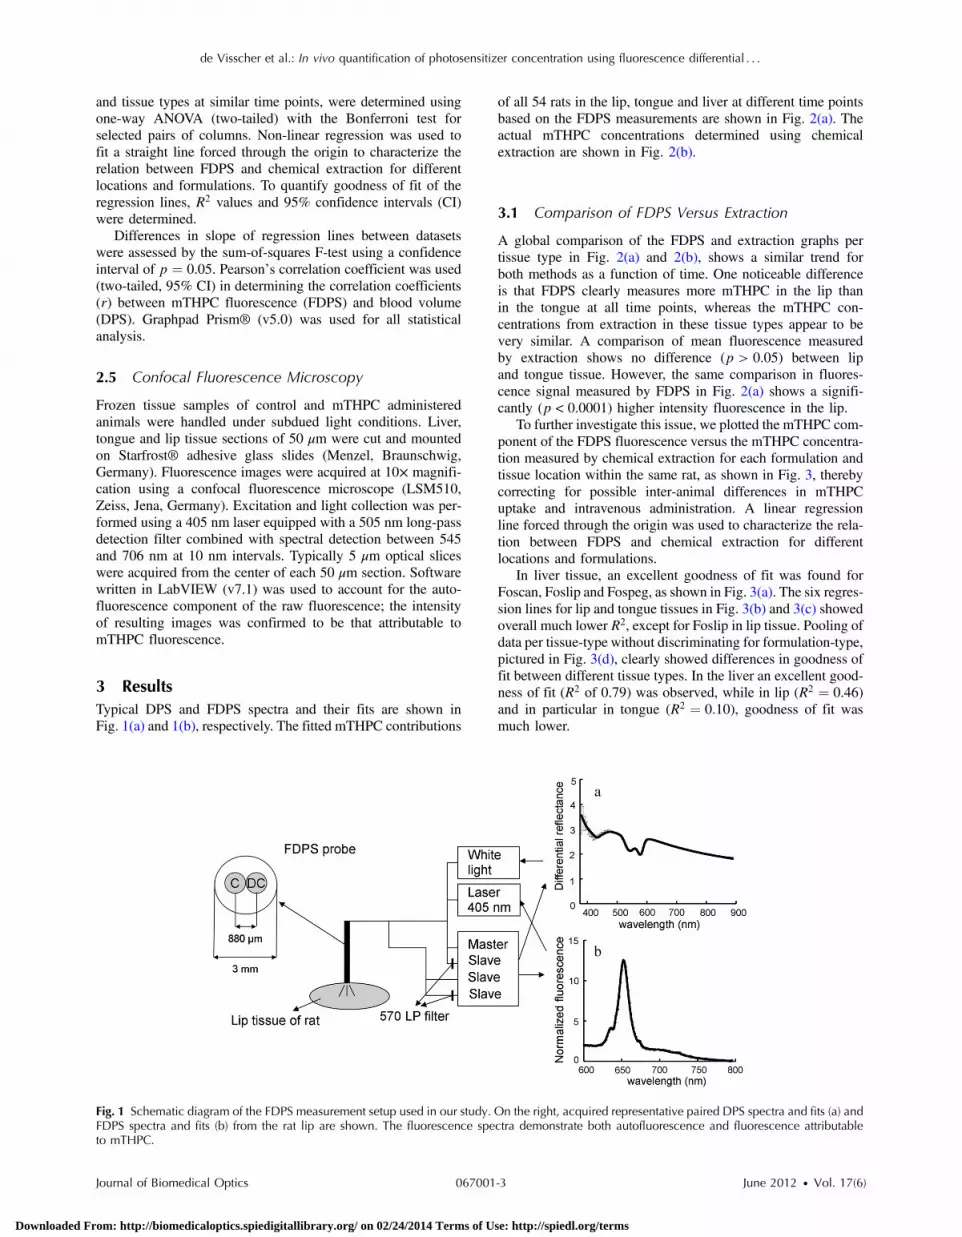
The measurement setup used, shown in Fig. 1, was based on thesetup described by the group of Amelink et al.19,21 In short,the measurement probe contained two 800 μm fibers at acore-to-core distance of 880 μm. The surface of the probewas polished under an angle of 15 deg to minimize specularreflections during the measurements. One 800 μm fiber, the
delivery-and-collection fiber (dc), is coupled to a bifurcated400 μm fiber, containing a “delivery” and a “collection” leg.The delivery leg is coupled to a 200 μm bifurcated fiber, oneleg of which is connected to a xenon light source (HPX-2000, Ocean Optics, Duiven, The Netherlands) and the otherleg is connected to a 405 nm diode laser (Power TechnologyInc., Arkansas, USA). The collection leg is coupled to anotherbifurcated 200 μm fiber, of which one leg directly leads to thefirst channel of spectrograph setup (MC-2000-4-TR2, OceanOptics, Duiven, The Netherlands), while the other leg leadsto a 570 nm long-pass filter before leading into the secondchannel of the spectrograph. The second 800 μm fiber of theprobe, the collection fiber (c), is coupled to a bifurcated400 μm fiber. One leg is directly coupled to the third channelof the spectrograph, while the other leg leads to the 570 nmlong-pass filter, before being coupled in to the fourth channelof the spectrograph.
Before every measurement, the FDPS system was calibratedas described previously.7,19 The measured DPS spectra werefitted to a model extensively described by our group in theliterature,20,21,34–36 which returned quantitative estimates ofblood volume fraction, micro-vascular blood oxygenation,and vessel diameter. The measured FDPS spectra are correctedfor the effect of absorption by multiplying it by the ratio of DPS-signals at the excitation wavelength without and with absorptionpresent, resulting in absorption-corrected FDPS spectra.37 Thecontribution of mTHPC to the spectra was extracted by usinga singular value decomposition (SVD) algorithm38,39 using auto-fluorescence, Protoporphyrin IX (PpIX), and mTHPC fluores-cence as basis spectra.
2.3 Measurement of mTHPC Tissue Concentrationusing Chemical Extraction
To determine the concentration of mTHPC in the excised frozentissues, the chemical extraction method of Kascakova wasused40 on small tissue samples (∼0.1 g) of lip, dorsum of thetongue, and liver. In liver it was possible to randomly obtainthree samples of liver tissue per animal, representative of tissuelocated on the liver surface as measured by FDPS. This way, wecould average multiple random locations in both optical andchemical concentrations measurements of the liver. In tongueand lip however, we could only obtain one macroscopicallyrepresentative tissue sample as measured by FDPS, due tothe small size of the lip and tongue of rats. All tissue samplesobtained were dissolved in 2 mL of the tissue solvent Solva-ble™ (Perkin Elmer, Groningen, The Netherlands) over 2 hat 50°C with regular stirring. Subsequently, the solubilised solu-tion was diluted further with Solvable™ to an optical density(OD) <0.1. The diluted samples were analyzed in a fluorimeter(Perkin Elmer, Groningen, The Netherlands) by using an exci-tation wavelength of 423 nm and a spectral detection band of450 to 800 nm with a resolution of 0.5 nm. The basis spectrumof mTHPCwas derived after correction for Solvable™ and auto-fluorescence components. The concentration of mTHPC wasderived from a known calibration curve.40
2.4 Statistics and Correlation
Confidence intervals on the individual parameters for the indi-vidual measurements were determined based on the covariancematrix generated for each fit as described by Amelink et al.41
Differences in fluorescence intensities between formulations
Journal of Biomedical Optics 067001-2 June 2012 • Vol. 17(6)
de Visscher et al.: In vivo quantification of photosensitizer concentration using fluorescence differential : : :
Downloaded From: http://biomedicaloptics.spiedigitallibrary.org/ on 02/24/2014 Terms of Use: http://spiedl.org/terms
and tissue types at similar time points, were determined usingone-way ANOVA (two-tailed) with the Bonferroni test forselected pairs of columns. Non-linear regression was used tofit a straight line forced through the origin to characterize therelation between FDPS and chemical extraction for differentlocations and formulations. To quantify goodness of fit of theregression lines, R2 values and 95% confidence intervals (CI)were determined.
Differences in slope of regression lines between datasetswere assessed by the sum-of-squares F-test using a confidenceinterval of p ¼ 0.05. Pearson’s correlation coefficient was used(two-tailed, 95% CI) in determining the correlation coefficients(r) between mTHPC fluorescence (FDPS) and blood volume(DPS). Graphpad Prism® (v5.0) was used for all statisticalanalysis.
2.5 Confocal Fluorescence Microscopy
Frozen tissue samples of control and mTHPC administeredanimals were handled under subdued light conditions. Liver,tongue and lip tissue sections of 50 μm were cut and mountedon Starfrost® adhesive glass slides (Menzel, Braunschwig,Germany). Fluorescence images were acquired at 10× magnifi-cation using a confocal fluorescence microscope (LSM510,Zeiss, Jena, Germany). Excitation and light collection was per-formed using a 405 nm laser equipped with a 505 nm long-passdetection filter combined with spectral detection between 545and 706 nm at 10 nm intervals. Typically 5 μm optical sliceswere acquired from the center of each 50 μm section. Softwarewritten in LabVIEW (v7.1) was used to account for the auto-fluorescence component of the raw fluorescence; the intensityof resulting images was confirmed to be that attributable tomTHPC fluorescence.
3 ResultsTypical DPS and FDPS spectra and their fits are shown inFig. 1(a) and 1(b), respectively. The fitted mTHPC contributions
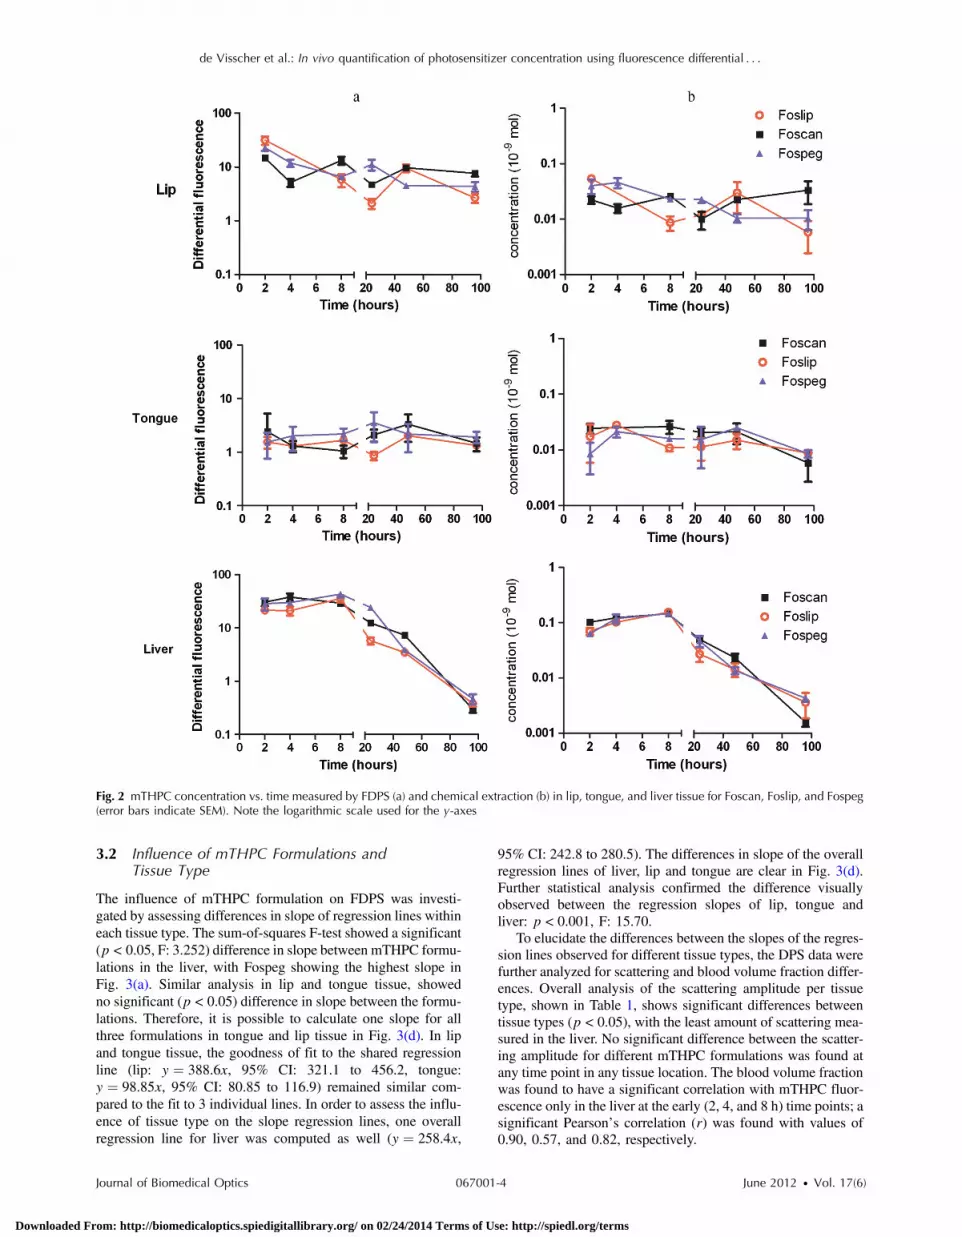
of all 54 rats in the lip, tongue and liver at different time pointsbased on the FDPS measurements are shown in Fig. 2(a). Theactual mTHPC concentrations determined using chemicalextraction are shown in Fig. 2(b).
3.1 Comparison of FDPS Versus Extraction
A global comparison of the FDPS and extraction graphs pertissue type in Fig. 2(a) and 2(b), shows a similar trend forboth methods as a function of time. One noticeable differenceis that FDPS clearly measures more mTHPC in the lip thanin the tongue at all time points, whereas the mTHPC con-centrations from extraction in these tissue types appear to bevery similar. A comparison of mean fluorescence measuredby extraction shows no difference (p > 0.05) between lipand tongue tissue. However, the same comparison in fluores-cence signal measured by FDPS in Fig. 2(a) shows a signifi-cantly (p < 0.0001) higher intensity fluorescence in the lip.
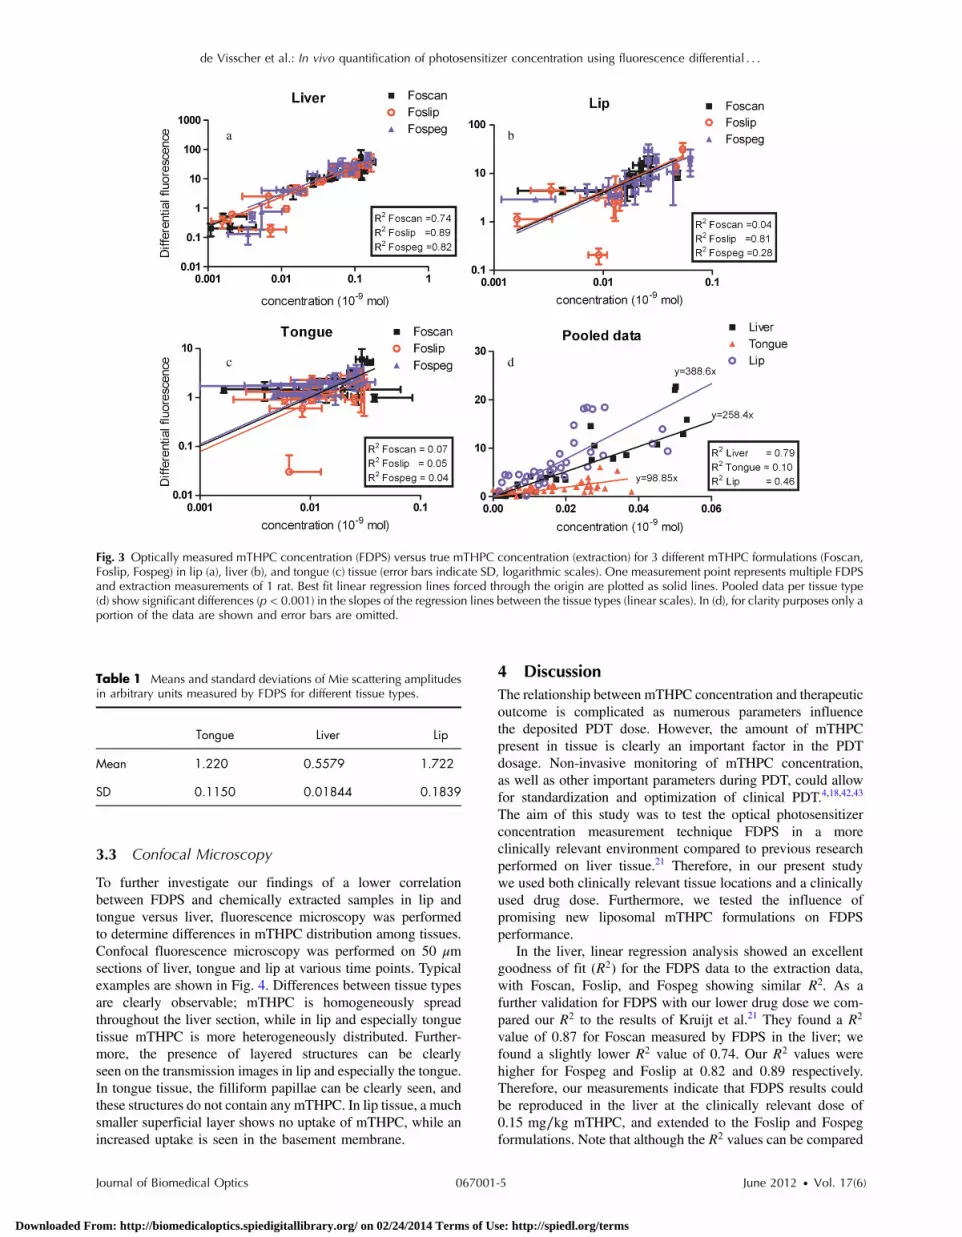
To further investigate this issue, we plotted the mTHPC com-ponent of the FDPS fluorescence versus the mTHPC concentra-tion measured by chemical extraction for each formulation andtissue location within the same rat, as shown in Fig. 3, therebycorrecting for possible inter-animal differences in mTHPCuptake and intravenous administration. A linear regressionline forced through the origin was used to characterize the rela-tion between FDPS and chemical extraction for differentlocations and formulations.
In liver tissue, an excellent goodness of fit was found forFoscan, Foslip and Fospeg, as shown in Fig. 3(a). The six regres-sion lines for lip and tongue tissues in Fig. 3(b) and 3(c) showedoverall much lower R2, except for Foslip in lip tissue. Pooling ofdata per tissue-type without discriminating for formulation-type,pictured in Fig. 3(d), clearly showed differences in goodness offit between different tissue types. In the liver an excellent good-ness of fit (R2 of 0.79) was observed, while in lip (R2 ¼ 0.46)and in particular in tongue (R2 ¼ 0.10), goodness of fit wasmuch lower.
Fig. 1 Schematic diagram of the FDPS measurement setup used in our study. On the right, acquired representative paired DPS spectra and fits (a) andFDPS spectra and fits (b) from the rat lip are shown. The fluorescence spectra demonstrate both autofluorescence and fluorescence attributableto mTHPC.
Journal of Biomedical Optics 067001-3 June 2012 • Vol. 17(6)
de Visscher et al.: In vivo quantification of photosensitizer concentration using fluorescence differential : : :
Downloaded From: http://biomedicaloptics.spiedigitallibrary.org/ on 02/24/2014 Terms of Use: http://spiedl.org/terms
3.2 Influence of mTHPC Formulations andTissue Type
The influence of mTHPC formulation on FDPS was investi-gated by assessing differences in slope of regression lines withineach tissue type. The sum-of-squares F-test showed a significant(p < 0.05, F: 3.252) difference in slope between mTHPC formu-lations in the liver, with Fospeg showing the highest slope inFig. 3(a). Similar analysis in lip and tongue tissue, showedno significant (p < 0.05) difference in slope between the formu-lations. Therefore, it is possible to calculate one slope for allthree formulations in tongue and lip tissue in Fig. 3(d). In lipand tongue tissue, the goodness of fit to the shared regressionline (lip: y ¼ 388.6x, 95% CI: 321.1 to 456.2, tongue:y ¼ 98.85x, 95% CI: 80.85 to 116.9) remained similar com-pared to the fit to 3 individual lines. In order to assess the influ-ence of tissue type on the slope regression lines, one overallregression line for liver was computed as well (y ¼ 258.4x,
95% CI: 242.8 to 280.5). The differences in slope of the overallregression lines of liver, lip and tongue are clear in Fig. 3(d).Further statistical analysis confirmed the difference visuallyobserved between the regression slopes of lip, tongue andliver: p < 0.001, F: 15.70.
To elucidate the differences between the slopes of the regres-sion lines observed for different tissue types, the DPS data werefurther analyzed for scattering and blood volume fraction differ-ences. Overall analysis of the scattering amplitude per tissuetype, shown in Table 1, shows significant differences betweentissue types (p < 0.05), with the least amount of scattering mea-sured in the liver. No significant difference between the scatter-ing amplitude for different mTHPC formulations was found atany time point in any tissue location. The blood volume fractionwas found to have a significant correlation with mTHPC fluor-escence only in the liver at the early (2, 4, and 8 h) time points; asignificant Pearson’s correlation (r) was found with values of0.90, 0.57, and 0.82, respectively.
Fig. 2 mTHPC concentration vs. time measured by FDPS (a) and chemical extraction (b) in lip, tongue, and liver tissue for Foscan, Foslip, and Fospeg(error bars indicate SEM). Note the logarithmic scale used for the y-axes
Journal of Biomedical Optics 067001-4 June 2012 • Vol. 17(6)
de Visscher et al.: In vivo quantification of photosensitizer concentration using fluorescence differential : : :
Downloaded From: http://biomedicaloptics.spiedigitallibrary.org/ on 02/24/2014 Terms of Use: http://spiedl.org/terms
3.3 Confocal Microscopy
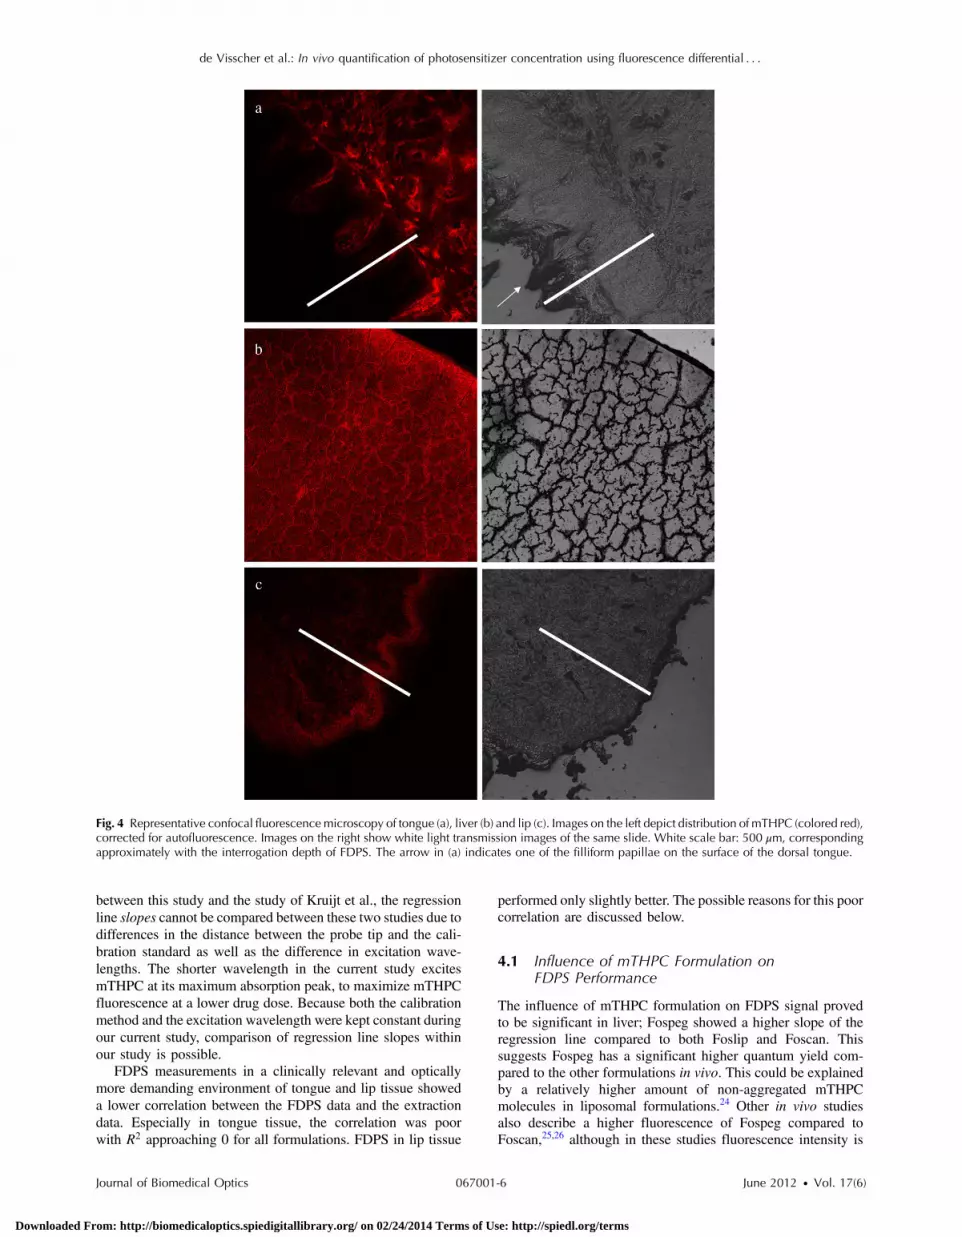
To further investigate our findings of a lower correlationbetween FDPS and chemically extracted samples in lip andtongue versus liver, fluorescence microscopy was performedto determine differences in mTHPC distribution among tissues.Confocal fluorescence microscopy was performed on 50 μmsections of liver, tongue and lip at various time points. Typicalexamples are shown in Fig. 4. Differences between tissue typesare clearly observable; mTHPC is homogeneously spreadthroughout the liver section, while in lip and especially tonguetissue mTHPC is more heterogeneously distributed. Further-more, the presence of layered structures can be clearlyseen on the transmission images in lip and especially the tongue.In tongue tissue, the filliform papillae can be clearly seen, andthese structures do not contain any mTHPC. In lip tissue, a muchsmaller superficial layer shows no uptake of mTHPC, while anincreased uptake is seen in the basement membrane.
4 DiscussionThe relationship between mTHPC concentration and therapeuticoutcome is complicated as numerous parameters influencethe deposited PDT dose. However, the amount of mTHPCpresent in tissue is clearly an important factor in the PDTdosage. Non-invasive monitoring of mTHPC concentration,as well as other important parameters during PDT, could allowfor standardization and optimization of clinical PDT.4,18,42,43
The aim of this study was to test the optical photosensitizerconcentration measurement technique FDPS in a moreclinically relevant environment compared to previous researchperformed on liver tissue.21 Therefore, in our present studywe used both clinically relevant tissue locations and a clinicallyused drug dose. Furthermore, we tested the influence ofpromising new liposomal mTHPC formulations on FDPSperformance.
In the liver, linear regression analysis showed an excellentgoodness of fit (R2) for the FDPS data to the extraction data,with Foscan, Foslip, and Fospeg showing similar R2. As afurther validation for FDPS with our lower drug dose we com-pared our R2 to the results of Kruijt et al.21 They found a R2
value of 0.87 for Foscan measured by FDPS in the liver; wefound a slightly lower R2 value of 0.74. Our R2 values werehigher for Fospeg and Foslip at 0.82 and 0.89 respectively.Therefore, our measurements indicate that FDPS results couldbe reproduced in the liver at the clinically relevant dose of0.15 mg∕kg mTHPC, and extended to the Foslip and Fospegformulations. Note that although the R2 values can be compared
Fig. 3 Optically measured mTHPC concentration (FDPS) versus true mTHPC concentration (extraction) for 3 different mTHPC formulations (Foscan,Foslip, Fospeg) in lip (a), liver (b), and tongue (c) tissue (error bars indicate SD, logarithmic scales). One measurement point represents multiple FDPSand extraction measurements of 1 rat. Best fit linear regression lines forced through the origin are plotted as solid lines. Pooled data per tissue type(d) show significant differences (p < 0.001) in the slopes of the regression lines between the tissue types (linear scales). In (d), for clarity purposes only aportion of the data are shown and error bars are omitted.
Table 1 Means and standard deviations of Mie scattering amplitudesin arbitrary units measured by FDPS for different tissue types.
Tongue Liver Lip
Mean 1.220 0.5579 1.722
SD 0.1150 0.01844 0.1839
Journal of Biomedical Optics 067001-5 June 2012 • Vol. 17(6)
de Visscher et al.: In vivo quantification of photosensitizer concentration using fluorescence differential : : :
Downloaded From: http://biomedicaloptics.spiedigitallibrary.org/ on 02/24/2014 Terms of Use: http://spiedl.org/terms
between this study and the study of Kruijt et al., the regressionline slopes cannot be compared between these two studies due todifferences in the distance between the probe tip and the cali-bration standard as well as the difference in excitation wave-lengths. The shorter wavelength in the current study excitesmTHPC at its maximum absorption peak, to maximize mTHPCfluorescence at a lower drug dose. Because both the calibrationmethod and the excitation wavelength were kept constant duringour current study, comparison of regression line slopes withinour study is possible.
FDPS measurements in a clinically relevant and opticallymore demanding environment of tongue and lip tissue showeda lower correlation between the FDPS data and the extractiondata. Especially in tongue tissue, the correlation was poorwith R2 approaching 0 for all formulations. FDPS in lip tissue
performed only slightly better. The possible reasons for this poorcorrelation are discussed below.
4.1 Influence of mTHPC Formulation onFDPS Performance
The influence of mTHPC formulation on FDPS signal provedto be significant in liver; Fospeg showed a higher slope of theregression line compared to both Foslip and Foscan. Thissuggests Fospeg has a significant higher quantum yield com-pared to the other formulations in vivo. This could be explainedby a relatively higher amount of non-aggregated mTHPCmolecules in liposomal formulations.24 Other in vivo studiesalso describe a higher fluorescence of Fospeg compared toFoscan,25,26 although in these studies fluorescence intensity is
Fig. 4 Representative confocal fluorescencemicroscopy of tongue (a), liver (b) and lip (c). Images on the left depict distribution of mTHPC (colored red),corrected for autofluorescence. Images on the right show white light transmission images of the same slide. White scale bar: 500 μm, correspondingapproximately with the interrogation depth of FDPS. The arrow in (a) indicates one of the filliform papillae on the surface of the dorsal tongue.
Journal of Biomedical Optics 067001-6 June 2012 • Vol. 17(6)
de Visscher et al.: In vivo quantification of photosensitizer concentration using fluorescence differential : : :
Downloaded From: http://biomedicaloptics.spiedigitallibrary.org/ on 02/24/2014 Terms of Use: http://spiedl.org/terms
also influenced by formulation specific pharmacokinetics suchas aggregation and EPR. The significant difference in slopebetween the regression lines of Fospeg and Foslip probablydepends on the detailed characteristics of the liposomes. It isknown that PEGylation of liposomes lengthens the plasmahalf-life of liposomes, thereby enabling a longer relative mono-meric state of mTHPC in Fospeg, and resulting in a relativelyhigher slope of the regression line compared to Foslip.
In both tongue and lip tissue, no significant difference inslope of the regression lines between the three mTHPC formu-lations was present. However, this may well be related to thelower goodness of fit and the broader CI of the regressionlines in tongue and lip compared to liver, making a significantdifference difficult to establish.
4.2 Influence of Tissue Type on FDPS Performance
Data analysis in Fig. 3(d) shows very distinct differences inFDPS performance by both the goodness of fit (R2) and theslope of the regression lines between tissue types. Fluorescencemicroscopy showed clear differences in the tissue-specific dis-tribution of mTHPC at all time points; in liver, mTHPC wasmuch more homogeneously distributed compared to both lipand tongue tissue. Furthermore, in tongue tissue an absenceof mTHPC fluorescence was seen in the most superficial, dorsallayer around the papillae. In contrast, in lip tissue the distinctbasement membrane close to the surface shows more mTHPCfluorescence compared to the stroma. Similar to the tongue, themost superficial layer shows almost no mTHPC fluorescence;however, in lip tissue this superficial layer of the lip is muchsmaller than in tongue tissue. These differences in distributionof mTHPC can be explained by the known difference in uptakeof the dye in various structures like epithelium, lamina propria,striated muscle, smooth muscle, glands and fibro-connectivetissue.44–47 While liver tissue consists of multiple similarlobules, lip and tongue have a more complicated, layered com-position.
The most important anatomical difference between lip andtongue tissue is the presence of keratinized stratified mucosain the dorsal tongue while the inner side of the lip is coveredby smooth non-keratinized mucosa. Besides tissue specificdifferences in mTHPC uptake, the biodistribution of mTHPCvaries greatly with time.46,48 However, the tissue specificmTHPC distribution is bound to have some influence on opticalconcentration measurements.
More challenging for our fluorescence measurement arethe structural differences between tissue types. The layered,heterogeneous anatomy will certainly influence the tissuespecific optical properties, in particular scattering properties.This difference is illustrated by significantly higher scatteringamplitudes for lip and tongue tissue compared to liver tissue.Further indication of heterogeneity of lip and tongue tissue isgiven by the overall larger standard deviations of the scatteringamplitude data compared to liver in Table 1.
With knowledge of the microscopic differences observed inanatomy and mTHPC distribution between tissue types, we canexplain the tissue specific differences in FDPS performance.
The significant difference we found between correlationcoefficients and slopes of the regression lines for different tissuetypes is potentially caused by a combination of three factors: 1.the layered biodistribution of photosensitizer in combinationwith the superficial sampling volume of FDPS versus thelarger sampling volume of chemical extraction, 2. inter-animal
variations in the thickness of the keratin layers, and 3. the largedifferences in scattering properties between tissue types.Although FDPS yields absorption-corrected data, it does notcorrect for inter- and intra-tissue scattering differences.19,21,37
As a result, the slope of the correlation between FDPSand extraction will be influenced by the average scatteringcoefficient of the tissue under investigation. Table 1 showsthat the scattering properties vary with tissue type, resultingin different correlation slopes; furthermore, intra- and inter-animal variations in scattering properties are more pronouncedin more heterogeneous, layered tissues, such as tongue, resultingin a poorer correlation. A future challenge in improving opticalconcentration measurement performance would therefore be theability to correct for scattering.49
With regard to the first two factors, the correlation coeffi-cients and slopes of the regression lines are also affected bya difference in interrogation volume of both techniques (extrac-tion and FDPS). The minimum interrogation volume necessaryto obtain accurate extraction data is ∼102 mm3, compared to∼0.2 mm3 for FDPS. This difference will influence the slopeof the regression line in tissue with a relatively heterogeneous,layered mTHPC distribution, as found in tongue and lip tissue.In tongue a large part of the FDPS interrogation volume∼500 μm of the dorsal tongue consists of filliform papillae,as seen in Fig. 4. Papillae in the rat can be up to 200 μm inlength50 and showed decreased mTHPC uptake. Thereforeonly roughly half the FDPS interrogation volume containsmTHPC, resulting in a lower slope of the regression linebetween FDPS-extracted mTHPC concentration and chemicalextraction in the tongue. Conversely, because the surface ofthe lip tissue has an increased uptake of mTHPC comparedto the surface of the tongue, the FDPS-measured mTHPC fluor-escence in the lip increases for the same chemically extractedmTHPC concentration. This explains the significant highermTHPC fluorescence as measured by FDPS in lip comparedto tongue tissue, whereas in the extraction the mTHPC concen-trations in these tissue types appear to be very similar. Further-more, a lower correlation will be found for tissues with moreheterogeneous photosensitizer distributions. Although multipleFDPS measurements are averaged for each animal on each tis-sue type, inter-animal variations in photosensitizer biodistribu-tion with tissue depth will not be averaged out and result in poorcorrelations. Similarly, inter-animal variations in average keratinlayer thickness will also result in poor correlations between thesuperficially localized FDPS measurement and the “bulk” che-mical extraction. The average thickness of the keratin layer inthe Wistar rat tongue is described by others as 150 μm(SD� 100), measured at a central portion of the dorsal tongue.51
However, the highly keratinized filliform papillae are wellknown to have substantial, intra-animal morphological variationamong differing sites of the dorsal rat tongue.50 This is sup-ported by the even higher variation in average thickness wefound for the whole dorsal tongue; 200 μm (SD� 120).
Extrapolation of our current results to the clinic is difficult;the dimensions and anatomy in normal human tissue are differ-ent compared to that of a rat.52 For example, in humans the ker-atin layer of normal tissues is on average much smaller than in arat, which is likely to pose less of a problem for the applicationof our technique on human tongue.22,52 Furthermore, the phar-macokinetics of mTHPC differs between humans and rodents.23
Another complicating factor is significant spatial variation inmTHPC biodistribution within tumors.48 Moreover, tumors of
Journal of Biomedical Optics 067001-7 June 2012 • Vol. 17(6)
de Visscher et al.: In vivo quantification of photosensitizer concentration using fluorescence differential : : :
Downloaded From: http://biomedicaloptics.spiedigitallibrary.org/ on 02/24/2014 Terms of Use: http://spiedl.org/terms
the oral cavity could also disrupt or change the keratin layer,and therefore influence the performance of our technique. Allthese aspects may lead to very different observations andvery different levels of homogeneity and heterogeneity inhuman healthy and tumor tissues. In our current pre-clinicalstudy, the emphasis has been on careful investigation of quan-titative mTHPCmeasurements in optically more challenging tis-sues and of the influence of liposomal formulations. Promisingnonetheless were the results of a recent clinical study usingFDPS in humans.37 The feasibility of clinical FDPS wasshown, as clinical PDT treatments were monitored in threepatients with SCCs of the oral cavity.
5 ConclusionThe non-invasive optical technique FDPS shows promisingresults in determining the mTHPC concentration in the ratliver for Foscan and for both liposomal formulations; Foslipand Fospeg. In liver, Fospeg showed a significant higher quan-tum yield compared to the other formulations. In opticallyhomogeneous liver, the correlation with the chemical extractiondata was excellent. In the more heterogeneous lip tissue the cor-relation was lower. In tongue tissue the correlation was poor.The most likely causes of these differences in correlation arethe more demanding optical characteristics of lip and especiallytongue tissue. In tongue tissue, FDPS performance is evenfurther decreased by a thick layer of keratinized epithelium,which influences the optically sampled mTHPC distribution.Furthermore, in order to accurately monitor mTHPC concentra-tion in heterogeneous tissue, a correction for scattering isneeded. This is particularly important for future monitoringof mTHPC in spatially heterogeneous tumor tissues.
References1. T. J. Dougherty, “An update on photodynamic therapy applications,”
J. Clin. Laser Med. Surg. 20(1), 3–7 (2002).2. S. B. Brown, E. A. Brown, and I. Walker, “The present and future role
of photodynamic therapy in cancer treatment,” Lancet Oncol. 5(8),497–508 (2004).
3. P. Lehmann, “Methyl aminolaevulinate-photodynamic therapy: a reviewof clinical trials in the treatment of actinic keratoses and nonmelanomaskin cancer,” Br. J. Dermatol. 156(5), 793–801 (2007).
4. B. C. Wilson and M. S. Patterson, “The physics, biophysics and tech-nology of photodynamic therapy,” Phys. Med. Biol. 53(9), R61–R109(2008).
5. C. M. Moore, D. Pendse, and M. Emberton, “Photodynamic therapy forprostate cancer—a review of current status and future promise,” Nat.Clin. Pract. Urol. 6(1), 18–30 (2009).
6. S. G. Bown et al., “Photodynamic therapy for cancer of the pancreas,”Gut 50(4), 549–557 (2002).
7. B. Karakullukcu et al., “Photodynamic therapy of early stage oralcavity and oropharynx neoplasms: an outcome analysis of 170 patients,”Eur. Arch. Otorhinolaryngol. 268(2), 281–288 (2011).
8. J. Berlanda et al., “Comparative in vitro study on the characteristicsof different photosensitizers employed in PDT,” J. Photochem. Photo-biol. B 100(3), 173–180 (2010).
9. T. J. Dougherty et al., “Photodynamic therapy,” J. Natl. Cancer Inst.90(12), 889–905 (1998).
10. S. Mitra and T. H. Foster, “Photophysical parameters, photosensitizerretention and tissue optical properties completely account for thehigher photodynamic efficacy of meso-tetra-hydroxyphenyl-chlorinvs Photofrin,” Photochem. Photobiol. 81(4), 849–859 (2005).
11. M. O. Senge and J. C. Brandt, “Temoporfin (Foscan(R), 5,10,15,20-tetra(m-hydroxyphenyl)chlorin)—a second-generation photosensiti-zer,” Photochem. Photobiol. 87(6), 1240–1296 (2011).
12. A. K. D’Cruz, M. H. Robinson, and M. A. Biel, “mTHPC-mediatedphotodynamic therapy in patients with advanced, incurable head and
neck cancer: a multicenter study of 128 patients,” Head Neck 26(3),232–240 (2004).
13. B. W. Henderson and T. J. Dougherty, “How does photodynamictherapy work?,” Photochem. Photobiol. 55(1), 145–157 (1992).
14. V. O. Melnikova et al., “Photodynamic properties of meta-tetra(hydro-xyphenyl)chlorin in human tumor cells,” Radiat. Res. 152(4), 428–435(1999).
15. M. Dewaele, H. Maes, and P. Agostinis, “ROS-mediated mechanisms ofautophagy stimulation and their relevance in cancer therapy,” Autop-hagy 6(7), 838–854 (2010).
16. E. Buytaert, M. Dewaele, and P. Agostinis, “Molecular effectors of mul-tiple cell death pathways initiated by photodynamic therapy,” Biochim.Biophys. Acta 1776(1), 86–107 (2007).
17. M. Ochsner, “Photophysical and photobiological processes in thephotodynamic therapy of tumours,” J. Photochem. Photobiol. B39(1), 1–18 (1997).
18. B. C. Wilson, M. S. Patterson, and L. Lilge, “Implicit and explicitdosimetry in photodynamic therapy: a new paradigm,” Lasers Med. Sci.12(3), 182–199 (1997).
19. A. Amelink et al., “Quantitative fluorescence spectroscopy in turbidmedia using fluorescence differential path length spectroscopy,”J. Biomed. Opt. 13(5), 054051 (2008).
20. A. Amelink and H. J. Sterenborg, “Measurement of the local opticalproperties of turbid media by differential path-length spectroscopy,”Appl. Opt. 43(15), 3048–3054 (2004).
21. B. Kruijt et al., “In vivo quantification of chromophore concentrationusing fluorescence differential path length spectroscopy,” J. Biomed.Opt. 14(3), 034022 (2009).
22. S. Iwasaki, “Evolution of the structure and function of the vertebratetongue,” J. Anat. 201(1), 1–13 (2002).
23. M. Triesscheijn et al., “The pharmacokinetic behavior of the photosen-sitizer meso-tetra-hydroxyphenyl-chlorin in mice and men,” CancerChemother. Pharmacol. 60(1), 113–122 (2007).
24. A. S. Derycke and P. A. de Witte, “Liposomes for photodynamic ther-apy,” Adv. Drug Deliv. Rev. 56(1), 17–30 (2004).
25. S. A. de Visscher et al., “Fluorescence localization and kinetics ofmTHPC and liposomal formulations of mTHPC in the window-chambertumor model,” Lasers Surg. Med. 43(6), 528–536 (2011).
26. J. Buchholz et al., “Optimizing photodynamic therapy: in vivo pharma-cokinetics of liposomal meta-(tetrahydroxyphenyl)chlorin in felinesquamous cell carcinoma,” Clin. Cancer Res. 11(20), 7538–7544(2005).
27. C. Compagnin et al., “Meta-tetra(hydroxyphenyl)chlorin-loaded lipo-somes sterically stabilised with poly(ethylene glycol) of different lengthand density: characterisation, in vitro cellular uptake and phototoxicity,”Photochem. Photobiol. Sci. 10(11), 1751–1759 (2011).
28. D. Kachatkou et al., “Unusual photoinduced response of mTHPC lipo-somal formulation (Foslip),” Photochem. Photobiol. 85(3), 719–724(2009).
29. T. Kiesslich et al., “Comparative characterization of the efficiency andcellular pharmacokinetics of Foscan- and Foslip-based photodynamictreatment in human biliary tract cancer cell lines,” Photochem. Photo-biol. Sci. 6(6), 619–627 (2007).
30. V. Reshetov et al., “Redistribution of meta-tetra(hydroxyphenyl)chlorin(m-THPC) from conventional and PEGylated liposomes to biologicalsubstrates,” Photochem. Photobiol. Sci. 10(6), 911–919 (2011).
31. J. Svensson et al., “Tumor selectivity at short times followingsystemic administration of a liposomal temoporfin formulation ina murine tumor model,” Photochem. Photobiol. 83(5), 1211–1219(2007).
32. M. J. Bovis et al., “Improved in vivo delivery of m-THPC via pegylatedliposomes for use in photodynamic therapy,” J. Control. Release 157(2),196–205 (2012).
33. B. Romberg, W. E. Hennink, and G. Storm, “Sheddable coatingsfor long-circulating nanoparticles,” Pharm. Res. 25(1), 55–71(2008).
34. A. Amelink et al., “In vivo measurement of the local optical propertiesof tissue by use of differential path-length spectroscopy,” Opt. Lett.29(10), 1087–1089 (2004).
35. A. Amelink et al., “Non-invasive measurement of the morphology andphysiology of oral mucosa by use of optical spectroscopy,” Oral Oncol.44(1), 65–71 (2008).
Journal of Biomedical Optics 067001-8 June 2012 • Vol. 17(6)
de Visscher et al.: In vivo quantification of photosensitizer concentration using fluorescence differential : : :
Downloaded From: http://biomedicaloptics.spiedigitallibrary.org/ on 02/24/2014 Terms of Use: http://spiedl.org/terms
36. R. L. van Veen et al., “Optical biopsy of breast tissue using differentialpath-length spectroscopy,” Phys. Med. Biol. 50(11), 2573–2581(2005).
37. B. Karakullukcu et al., “Clinical feasibility of monitoring m-THPCmediated photodynamic therapy by means of fluorescence differentialpath-length spectroscopy,” J. Biophoton. 4(10), 740–751 (2011).
38. B. Kruijt et al., “Monitoring ALA-induced PpIX photodynamic therapyin the rat esophagus using fluorescence and reflectance spectroscopy,”Photochem. Photobiol. 84(6), 1515–1527 (2008).
39. J. C. Finlay, S. Mitra, and T. H. Foster, “In vivo mTHPC photobleachingin normal rat skin exhibits unique irradiance-dependent features,”Photochem. Photobiol. 75(3), 282–288 (2002).
40. S. Kascakova et al., “Ex vivo quantification of mTHPC concentrationin tissue: influence of chemical extraction on the optical properties,”J. Photochem. Photobiol. B 91(2–3), 99–107 (2008).
41. A. Amelink, D. J. Robinson, and H. J. Sterenborg, “Confidence inter-vals on fit parameters derived from optical reflectance spectroscopymeasurements,” J. Biomed. Opt. 13(5), 054044 (2008).
42. B. Kruijt et al., “Monitoring interstitial m-THPC-PDT in vivo usingfluorescence and reflectance spectroscopy“ Lasers Surg. Med. 41(9),653–664 (2009).
43. D. J. Robinson et al., “Fluorescence photobleaching of ALA-inducedprotoporphyrin IX during photodynamic therapy of normal hairlessmouse skin: the effect of light dose and irradiance and the resultingbiological effect,” Photochem. Photobiol. 67(1), 140–149 (1998).
44. S. A. Blant et al., “Time-dependent biodistribution of tetra(m-hydroxyphenyl)chlorin and benzoporphyrin derivative monoacid ringA in the hamster model: comparative fluorescence microscopy study,”Photochem. Photobiol. 71(3), 333–340 (2000).
45. Q. Peng et al., “Uptake, localization, and photodynamic effect of meso-tetra(hydroxyphenyl)porphine and its corresponding chlorin in normaland tumor tissues of mice bearing mammary carcinoma,” Cancer Res.55(12), 2620–2626 (1995).
46. S. Andrejevic et al., “Measurements by fluorescence microscopy of thetime-dependent distribution of meso-tetra-hydroxyphenylchlorin inhealthy tissues and chemically induced “early” squamous cell carci-noma of the Syrian hamster cheek pouch,” J. Photochem. Photobiol. B36(2), 143–151 (1996).
47. S. A. Blant et al., “Uptake and localisation of mTHPC (Foscan) and its14C-labelled form in normal and tumour tissues of the hamster squa-mous cell carcinoma model: a comparative study,” Br. J. Cancer 87(12),1470–1478 (2002).
48. S. Mitra et al., “Temporally and spatially heterogeneous distribution ofmTHPC in a murine tumor observed by two-color confocal fluorescenceimaging and spectroscopy in a whole-mount model,” Photochem.Photobiol. 81(5), 1123–1130 (2005).
49. S. Kanick et al., “Semi-empirical model of the effect of scattering onsingle fiber fluorescence intensity measured on a turbid medium,”Biomed. Opt. Express 3(1), 137–152 (2012).
50. T. Nagato et al., “Three-dimensional architecture of rat lingual filiformpapillae with special reference to the epithelium-connective tissue inter-face,” J. Anat. 165, 177–189 (1989).
51. A. Kobayashi et al., “Morphological and histopathological changes intongues of experimentally developed acromegaly-like rats,” Horm.Metab. Res. 38(3), 146–151 (2006).
52. M. Toyoda et al., “Electron microscopic characterization of filiformpapillae in the normal human tongue,” Arch. Histol. Cytol. 61(3),253–268 (1998).
Journal of Biomedical Optics 067001-9 June 2012 • Vol. 17(6)
de Visscher et al.: In vivo quantification of photosensitizer concentration using fluorescence differential : : :
Downloaded From: http://biomedicaloptics.spiedigitallibrary.org/ on 02/24/2014 Terms of Use: http://spiedl.org/terms


