Embed Size (px)
Citation preview

Deep-Sea Research II 93 (2013) 16–32
Contents lists available at SciVerse ScienceDirect
Deep-Sea Research II
0967-06
http://d
n Corr
Science
fax: þ1
E-m
Nick.Ba
tonykna
carlson@1 Cu
journal homepage: www.elsevier.com/locate/dsr2
Two decades and counting: 24-years of sustained open oceanbiogeochemical measurements in the Sargasso Sea
M.W. Lomas a,n, N.R. Bates a, R.J. Johnson a, A.H. Knap a,1, D.K. Steinberg b, C.A. Carlson c
a Bermuda Institute of Ocean Sciences, St. George’s, GE01, Bermudab Virginia Institute of Marine Science, Gloucester Point, VA 23062, USAc Department of Ecology, Evolution and Marine Biology, University of California, Santa Barbara, CA 93106 3060, USA
a r t i c l e i n f o
Available online 16 January 2013
Keywords:
Bermuda Atlantic Time-series Study
Sargasso Sea
Carbon cycle
Biogeochemistry
Primary production
Zooplankton
45/$ - see front matter & 2013 Elsevier Ltd. A
x.doi.org/10.1016/j.dsr2.2013.01.008
esponding author. Current address: Bige
s, East Boothbay, ME 04544, USA. Tel.: þ1 20
202 747 3257.
ail addresses: [email protected] (M.W. Lo
[email protected] (N.R. Bates), [email protected]
[email protected] (A.H. Knap), debbies@vim
lifesci.ucsb.edu (C.A. Carlson).
rrent Address: Suite 729, 48 Par la ville Rd.
a b s t r a c t
The Bermuda Atlantic Time-series Study (BATS) program has sampled the northwestern Sargasso Sea on a
biweekly (January to April) to monthly basis since October 1988. The primary objective of the core BATS
program continues to be an improved understanding of the time-variable processes and mechanisms that
control the biogeochemical cycling of carbon and related elements in the surface ocean. With 24 years of
measurements for most chemical, physical and biological variables, we have moved beyond descriptions of
seasonal and interannual variability to examination of multi-year trends and potential controls, however
there remain substantial gaps in our knowledge of the ecosystem mechanisms related to organic matter
production, export and remineralization. While earlier BATS overviews have focused on describing seasonal
and year-to-year variability, this overview provides new information on three long-standing biogeochem-
ical questions in Sargasso Sea biogeochemistry. First, why is there a discrepancy between biological (i.e.,
sediment trap) and geochemical estimates of carbon export production? Winter storms and mesoscale
eddies have now been clearly shown to contribute to annual nutrient budgets and carbon export
production. Recent information on phytoplankton natural isotopic nitrogen composition, and data from
profiling floats suggests that small phytoplankton are important contributors to new production in summer
despite the apparent absence of a mechanism to entrain nitrate into the euphotic zone. These findings aid
in closing the gap between these two different estimates of carbon export production. Second, what
supports the seasonal drawdown of carbon dioxide in the absence of detectable nutrients? The zooplankton
timeseries at BATS highlights the importance of zooplankton as a conduit for carbon removal due to grazing
and vertical migration. Although increases in cellular elemental stoichiometry to values greater than the
canonical Redfield Ratio, and the seasonal (and interannual) accumulation of euphotic zone dissolved
organic carbon (DOC) without accumulation of DON in the surface ocean are also important explanations.
Lastly, what are the sources of the elevated nitrate to phosphate ratio in the seasonal thermocline (N:P430
on average)? While generally accepted that nitrogen fixation is the source of the additional nitrogen, new
research suggests that export and remineralization of non-diazotroph particulate matter enriched in
nitrogen (alternatively viewed as depleted in phosphorus) may also make substantial contributions. In
addition, the ratio of particulate nitrogen to phosphorus captured in sediment traps has decreased from
50–75 to o50, possibly due to enhanced nitrogen remineralization. These and other findings from the core
BATS observational program contribute to our improved understanding of biogeochemical cycles and
ecosystem mechanisms in the subtropical North Atlantic Ocean and how they are changing over time.
& 2013 Elsevier Ltd. All rights reserved.
ll rights reserved.
low Laboratory for Ocean
2 747 3255x311;
mas),
du (R.J. Johnson),
s.edu (D.K. Steinberg),
Hamilton HM11, Bermuda.
1. Introduction
The carbon dioxide (CO2) present in the atmosphere plays animportant role in biological, chemical and physical processes atthe earth’s surface, and as a major regulator of climate (IPCC,2001). Since the industrial revolution, anthropogenic activitieshave contributed to the observed increase in atmospheric CO2
leading to growing concerns about the consequences of climatechange (Houghton et al., 2001; Royal Society, 2005; Sarmientoand Wofsy, 1999; Wofsy and Harriss, 2001). Roughly one-quarter
M.W. Lomas et al. / Deep-Sea Research II 93 (2013) 16–32 17
of annual anthropogenic CO2 emissions are taken up into oceanicreservoirs that represent some of the largest exchangeable carbonpools in the global carbon system (Sabine et al., 2004; Takahashiet al., 2002). Moreover, the ocean’s ability to absorb and sequesterCO2 operates on timescales of decades to millennia and controlsthe atmospheric inventory of CO2 (IPCC, 2007). Therefore, anystudy of climate change and the global carbon cycle must havedetailed information on oceanic biogeochemical processes affect-ing the cycling and dynamics of carbon.
Photosynthesis by marine phytoplankton converts CO2 to organicmatter. The subsequent export of particulate organic matter (POM)via gravitational flux, vertical mixing and isopycnal exchange ofsuspended and dissolved organic matter (DOM), mixing and theactive transport via vertically migrating zooplankton remove theorganic matter to depth where it accumulates or is respired(Ducklow et al., 2001). This vertical separation of organic matterformation from respiration, termed the biological carbon pump, canlead to net sequestration of carbon within the ocean’s interior(Ducklow et al., 2001; Passow and Carlson, 2012; Volk andHoffert, 1985). Quantification of the biological carbon pump interms of both magnitude and variability has proven difficult (e.g.,Brix et al., 2006; Michaels et al., 1994b; Siegenthaler and Sarmiento,1993). In particular, it has become increasingly clear that theefficiency of particulate organic carbon (POC) export from thesurface ocean and its remineralization in the mesopelagic zone arerelated in part to euphotic zone plankton community structure by acomplex and as yet incompletely understood set of mechanisms(Boyd and Newton, 1995, 1999; Buesseler et al., 2007; Richardsonand Jackson, 2007). Traditionally, the food web paradigms describ-ing export of carbon from the euphotic zone have been roughlydefined by organism size (Legendre and Lefevre, 1995; Michaels andSilver, 1988). Large phytoplankton such as diatoms and dinoflagel-lates are thought to efficiently channel a fraction of primaryproduction to the deep ocean interior. In contrast, small phyto-plankton cells are thought to be rapidly consumed by small non-crustacean grazers (e.g., ciliates), and their primary productionwould be largely recycled through dissolved organic matter andbacteria back to phytoplankton (Azam et al., 1983; Pomeroy, 1974),with little carbon sinking into the deep ocean. In both types of foodweb paradigms, producer/consumer relationships govern the com-position and fate of particles and the magnitude of the energy andcarbon flow, although ocean physics play an important role(Legendre and Lefevre, 1995).
Given the above considerations, long-term timeseries are powerfultools for investigating ocean biogeochemistry and food webs andtheir synergistic effects and controls on the global carbon cycle.Seasonal, interannual and longer-scale dynamics of carbon andnutrient cycles in the upper ocean control ecosystem primaryproduction (PP), the vertical distribution of many biogenic elementsand the net exchange of CO2 and other important radiative gasesbetween the atmosphere and the surface ocean via the biologicalcarbon pump. Moreover, ocean time-series research programs pro-vide the observational context with which to test hypotheses throughprocess studies to develop and better understand the physical,biological, and chemical mechanisms controlling the ocean carboncycle. The focus of the Bermuda Atlantic Time-series Study (BATS)program continues to improve our understanding of the time-varyingcomponents of and controls on the ocean carbon cycle, relatedbiogenic elements of interest (e.g., nitrogen, phosphorus, silica, etc.),and identify the relevant physical, chemical and ecosystem processesresponsible for this variability. The longstanding specific goals of theBATS program are to:
1.
Document the seasonal, interannual and decadal scale ofvariability in hydrologic variables and rates, e.g., surface fluxesof heat, freshwater and momentum, and its implications forglobal climate.
2.
Document the seasonal, interannual and decadal scale varia-bility in carbon and macronutrient cycle parameters andprocesses. Including, for example, an understanding of thecontrols on the coupling/decoupling (relative to the Redfieldratio) of elemental cycles.3.
Quantify air–sea exchange of CO2 and carbon export to theocean interior. Carbon cycle studies include both inorganic andorganic carbon, and partitioning of carbon between them.4.
Document variability in planktonic community structure andfunction, and its impact on the ocean’s carbon cycle (includingnew and export production) and coupling with other macro-nutrient cycles.At the time of writing this manuscript, 287 research cruiseshave been completed as part of the BATS project spanning nearly25 years of repeated observations in the northwestern SargassoSea region of the North Atlantic Ocean. This overview provides asynthesis of progress in understanding ocean biogeochemistryand ecosystem dynamics in the region since a review by Steinberget al. (2001), and focuses particularly on new data collectedduring the last decade, for example the dissolved and particulatephosphorus time series initiated in 2005. In addition, this synth-esis paper summarizes recently published papers based upon theBATS dataset to provide context for other papers in this specialissue, presents new insights on outstanding biogeochemicalquestions (Steinberg et al., 2001), and describes how the SargassoSea planktonic ecosystem has changed over time.
2. Materials and methods
2.1. Site, cruise overview and sampling scheme
The history of the Sargasso Sea ocean time-series research, andbasic understanding of the physical and biological characteristicsof this region have been described in detail in prior reviews(Michaels and Knap, 1996; Steinberg et al., 2001). On each BATScruise, a quasi-lagrangian sampling scheme is employed andfor the purposes of this manuscript all CTD/hydro casts fallingwithin a 0.251 latitude by 0.251 longitude box centered aroundthe BATS site (311400N 0641100W) are presented. Samples for awide range of core measurements (Table 1) are collected on eachcruise from 23 to 37 depths over the surface to 4200 m. Samplesare drawn using standard procedures in the following order, gases(i.e., dissolved oxygen (DO), DIC, total alkalinity), dissolvednutrients (i.e., inorganic and organic nutrients, high-sensitivityphosphate) and particles (i.e., suspended particulate organiccarbon, nitrogen (PON) and phosphorus (PPhos), phytoplanktonpigments) (Knap et al., 1997b). An in situ primary productivityarray is deployed from dawn to dusk, along with surface-tetheredsediment traps on each monthly cruise. Further details of thesampling scheme, analytical methods, data quality control (QC)and quality assurance (QA), and history of sampling proceduresare available in the BATS methods manuals (Knap et al., 1997b,BATS data reports Knap et al., 1995; Knap et al., 1991, 1992, 1993,1994, 1997a; http://bats.bios.edu/), and in published papers(Bates et al., 1996a; Ducklow et al., 2001; Lohrenz et al., 1992;Michaels et al., 1994a). Brief descriptions of relevant methods arein the following sections.
2.2. Gases and hydrography
Dissolved oxygen samples are taken first to avoid compromis-ing the samples by atmospheric gas exchange, with 25% of the

Table 1Core measurements, depth ranges and instrumentation for the BATS program.
Parameter Depth (m) Technique/Instrument
Continuous Electronic Measurements
Temperature 0–4200 Seabird SBE 03f
Salinity 0–4200 Seabird SBE�04
Depth 0–4200 Digiquartz pressure sensor on Seabird SBE-911plus
Dissolved Oxygen 0–4200 Sea Bird Polarographic Oxygen Electrode SBE 43
Beam Attenuation 0–4200 Wet Labs 25 cm Transmissometer
Chlorophyll Fluorescence 0–4200 Chelsea Aquatracka II
Spectral Downwelling Irradiance 0–200 Profiling Multi-channel Radiometera
Spectral Upwelling Radiance 0–200 Profiling Multi-channel Radiometera
Meteorological measurements Sfc Standard ship’s meteorological sensors (RM Young)
Surface pCO2 Sfc NOAA sensor
Temperature/Salinity Sfc SeaBird SBE21Thermosalinigraph
Chlorophyll fluorescence Sfc Turner Designs 10-AU
Discrete Measurements from Niskin Bottles or nets
Salinity 0–4200 Conductivity on GuildlineAutosal8400B
Dissolved Oxygen 0–4200 Winkler Titration, automated UV endpoint detection
Total CO2 0–250 Automated coulometric analysis
Total Alkalinity 0–250 High precision titration
Nitrate 0–4200 CFAb w/autoanalyzer (Technicon AAII, Alpkem FS IV)
Nitrite 0–4200 CFA w/ autoanalyzer (Technicon AAII, Alpkem FS IV)
Phosphate 0–4200 CFA w/ autoanalyzer (Technicon AAII, Alpkem FS IV)
Silicate 0–4200 CFA w/ autoanalyzer (Technicon AAII, Alpkem FS IV)
MAGIC-SRP 0–250 Magnesium co-precipitation, manual analysis (2004-pres.)
Total organic carbon 0–4200 High-temperature, catalytic oxidation (HTCO)
Total organic nitrogen 0–4200 UV oxidation (1994–00), HTCO (2000-pres.)
Total organic phosphorus 0–250 High temperature chemical oxidation
Particulate organic carbon 0–1000 CE440 CHN elemental analyzer
Particulate organic nitrogen 0–1000 CE440 CHN elemental analyzer
Particulate organic phosphorus 0–500 High temperature chemical oxidation
Particulate biogenic silica 0–1000 Chemical digestion, colorometric analysis
Fluorometric chlorophyll a 0–250 Acetone extraction, Turner fluorometer
Phytoplankton accessory pigments 0–250 HPLC
Bacterial abundance 0–3000 DAPI stained, epifluorescence microscopy
Zooplankton biomass 0–200 Day/night tows w/ 200 mm mesh net, wet weight/dry weight mass
Picoplankton 0–250 Analytical flow cytometry
Rate Measurements:
Primary production 0–140 Trace-metal clean, in situ incubation, 14C uptake
Bacterial production 0–1000 On-deck 3H-thymidine incorporation
Particle Fluxes 150, 200, 300 Free-drifting cylindrical traps (MultiPITs)
Mass Gravimetric analysis
Total Carbon Manual swimmer removal, acidification, CHN analysis
Organic carbon Manual swimmer removal, acidification, CHN analysis
Organic nitrogen Manual swimmer removal, acidification, CHN analysis
Particulate phosphorus High temperature chemical oxidation
Hydrodynamics 160 Aanderaa current meter RCM9
a Analyzed by the collaborator Bermuda Bio-Optics Project.b Abbreviations: CFA–continuous flow analysis; MAGIC-SRP–magnesium induced co-precipitation–soluble reactive phosphorus; HPLC–high pressure liquid
chromatography; DAPI–40 ,6-diamidino-2-phenylindole.
M.W. Lomas et al. / Deep-Sea Research II 93 (2013) 16–3218
depths replicated including the surface, the deepest depth, andthe oxygen minimum. Samples are analyzed using an automatedWinkler titration method (Williams and Jenkinson, 1982) cali-brated to a commercially available potassium iodate solution(OSIL, UK).
Samples for dissolved inorganic carbon (DIC) and total alkali-nity (TA) are drawn after DO samples, or sampled first on asubsequent cast, and fixed with saturated mercuric chloridesolution (100 ml). DIC samples are analyzed using a precise(0.02%; 0.4 mmol kg�1) SOMMA-coulometer system (Bates et al.,1996a), while total alkalinity is determined by potentiometrictitration with a precision of �1 mmol kg�1 (Bates et al., 1996a).Sample accuracy has been maintained by routine analysis ofseawater certified reference materials (CRM’s; prepared anddistributed by Andrew Dickson, UCSD; Bates et al., 2012).
Salinity samples are capped with a plastic insert to minimizeevaporation, and analyzed within about one week of collection ona Guideline model 8400B Autosal Salinometer. Samples are
standardized against IAPSO Seawater Standards. The analyticalprecision of the method is 70.002 salinity units.
2.3. Dissolved inorganic and organic, and particulate nutrients
Samples for NO3�/NO2
� , NO2� and PO4
�3are filtered and frozen(�20 1C) in HDPE bottles until analysis (Dore et al., 1996). Duringevery sample run, commercially available certified standards,OSIL and Wako Chemical, are analyzed to maintain data quality,as well as ‘standard water’ from 3000 m that serves as an internalstandard. The Magnesium Induced Co-precipitation (MAGIC)soluble reactive phosphorus (SRP) method (Karl and Tien, 1992;Rimmelin and Moutin, 2005), was also used starting in late 2004(Lomas et al., 2010a). Sample accuracy was checked on each runwith a certified OSIL nutrient standard.
Total organic carbon (TOC) and total nitrogen (TN) concentrationswere determined using high temperature combustion techniques(Carlson et al., 2010; Hansell and Carlson, 2001; Li and Hansell, 2008).

M.W. Lomas et al. / Deep-Sea Research II 93 (2013) 16–32 19
Analytical performance and sample accuracy were checked byanalyses of consensus reference material (Hansell, 2005). Totalphosphorus concentrations are quantified using a high temperature/persulfate oxidation technique (Lomas et al., 2010a). Sample accuracywas checked by analysis of a certified standard (OSIL PhosphateNutrient Standard Solution) with each sample run.
Particulate organic carbon (POC) and nitrogen (PON) sampleswere filtered on precombusted (450 1C, 4 h) Whatman GF/F filtersand frozen until analysis on a Control Equipment 240-XA or440-XA elemental analyzer (Steinberg et al., 2001). Particulatephosphorus samples (PPhos) were analyzed using an ash-hydrolysis method with oxidation efficiency and standard recov-ery checks (Lomas et al., 2010a).
2.4. Particulate elemental fluxes
Sinking fluxes of C, N, P from the euphotic zone are quantifiedusing surface-tethered particle interceptor traps (Knauer et al.,1979; Lomas et al., 2010a;Steinberg et al., 2001). Fluxes arecalculated from the elemental mass of material captured in thesediment trap, its collection surface area and deployment length.
2.5. Pigments, pico-plankton, and bacterial abundance
Bulk phytoplankton biomass (chlorophyll-a) and specificaccessory pigments were analyzed by HPLC from 1990–2011using the method of Bidigare (1991) with the exception of2005–2009 during which the method of Van Heukelem andThomas (2001) was used. Phytoplankton groups in the deepchlorophyll maximum (DCM) were estimated from pigmentconcentrations as described in Lomas and Bates (2004).
Samples for pico- and nano-plankton enumeration were col-lected on each cruise from October 2001 to present (Lomas et al.,2010b). Pico-autotrophs were identified as either Synechococcus
or Prochlorococcus based upon cell size and the presence orabsence of phycoerythrin, respectively.
Samples for bacterioplankton enumeration were preservedwith particle free glutaraldehyde (final concentration of 1.0%),filtered onto blackened 0.2 mm polycarbonate filters, and stainedwith DAPI (4,6-Diaminino-2-phenylidole; Porter and Feig, 1980)and enumerated with epifluorescence microscopy. If slides couldnot be made within �24 h, samples were flash frozen in liquidnitrogen and then stored at �80 1C until processed (Gundersenet al., 1996).
2.6. Primary and bacterial production
Rates of primary production are calculated from the incorpora-tion of H14CO3
� into particles (i.e., particles nominally 40.7 mm)using an assumed ratio of total inorganic carbon present toradiocarbon added. From 1989 through 2005 samples werecollected with Go-Flo bottles on a Kevlar line, and from November2004 to present samples were collected from Niskin bottles onthe CTD rosette. Rates of primary production were corrected fordark carbon uptake, and integrated to a depth of 140 m (Lomasand Bates, 2004).
Bacterial production was measured using [3H-methyl] thymi-dine incorporation (Ducklow and Carlson, 1992; Fuhrman andAzam, 1980; Knap et al., 1997b) and converted to carbon-basedbacterial production rate estimates using standard equations(Carlson and Ducklow, 1996; Carlson et al., 1996).BacterialCarbon Demand (BCD) was estimated by dividing bacterialproduction rate by a bacterial growth efficiency of 0.14 (Carlsonand Ducklow, 1996).
2.7. Zooplankton biomass
Zooplankton were collected using vertically integrated (0 m toa targeted maximum depth between 150–200 m) double obliquetows conducted during the day (0900 to 1500) and night (2000 to0200) with a rectangular frame (0.8�1.2 m2) net with 202 mmmesh (Madin et al., 2001; Steinberg et al., 2012). Size-fractionatedsamples from sieves are washed onto smaller Nitex filters, rinsedwith milli-Q water to remove salt and dried to constant weight.
3. Results and discussion
3.1. Hydrography
The seasonal patterns in ocean hydrography at BATS (and atnearby ocean time-series Hydrostation S) have been well-documented over the past five decades (Menzel and Ryther,1960, 1961a; Michaels et al., 1994a; Steinberg et al., 2001) andare only briefly mentioned here. Seasonal changes in surface netheat flux and wind stress result in a strongly stratified surfacelayer in the summers and deep convective mixed layers inwinters (Fig. 1A, white line). Summer mixed layers are often asshallow as 10 m while winter mixed layer depths range from 100to 400 m depending largely on the phase and strength of theNorth Atlantic Oscillation (Bates, 2012; Bates et al., 2012;Worthington, 1976), but also due to interactions with eddiesimpinging the local area as in 2010 (Fig. 1A).
The wide range in the maximum depth of winter convectivemixing results in significant year-to-year variability in nutrientinput fluxes to the euphotic zone (Michaels et al., 1994a). Duringthe winters of 1995, 2001, and 2003, for example, NO3 concen-trations in the euphotic zone were at detectable levels for severalcruises compared to other years when NO3 concentrationsremained below limits of detection throughout the entire win-ter/spring period (i.e.,o0.03 mmol kg�1, Fig. 2). In addition, thevertical position and the temporal variability in the thickness ofthe underlying 18 1C Mode Water (i.e., eighteen degree water,EDW; shown by dashed lines in Fig. 1A) can have an apparentimpact on relative nutrient fluxes at BATS. From �1995 to 1997,for example, the mixed layer depths approached the upperboundary of the 18 1C water and this allowed for water with ahigher NO3:Si(OH)4 ratio (due to shorter remineralization lengthscale of N relative to Si) to be entrained into the euphotic zone.Subsequent to this event, a three year period (�1997–2000) ofelevated biogenic silica anomaly (which is used as a proxy fordiatom biomass) was observed at BATS. In the euphotic zone, theslow depletion of excess silicic acid concentrations extended forseveral years longer than the increase in EDW water thicknessand the diatom biomass anomaly(Krause et al., 2009a). However,over the available record of 1988 to 2003, biogenic silicaconcentrations have declined by �40% (Krause et al., 2009a).A continuation of that trend might explain the lack of silicic aciddrawn down from �2005 to 2010 and continuing to the present(Fig. 2D) when EDW water volume increased again (Fig. 1), but adetailed study of this process remains to be done.
Inorganic PO4 concentrations in the euphotic zone were, withvery rare exception, consistently below the nominal methoddetection limit of the autoanalyzer methods for nutrient analysesat BIOS (30 nmol kg�1; Fig. 2B). This is one of several lines ofevidence suggesting that the subtropical gyre of the Sargasso Seais severely P-stressed (Cavender-Bares et al., 2001; Lomas et al.,2010a; Mather et al., 2008). In late 2004, the MAGIC-SRP method(Karl and Tien, 1997) was implemented as a core measurement atBATS and the increased method sensitivity (method detectionlimit of �1 nmol kg�1) reveals that convective inputs of PO4

Fig. 1. Hydrography of the BATS station. (A) CTD temperature (1C) timeseries overlain by mixed layer depth (solid white line) determined by the variable sigma-t criterion
equivalent to a 0.2 1C temperature change (Sprintall and Tomczak, 1992); (B) CTD salinity; and (C) sy Sigma-theta (kg m�3). In each panel the approximate upper (dashed
black line) and lower (solid black line) boundaries of the 181 Mode Water are identified based upon the characteristic ranges of each parameter (Alfutis and Cornillon,
2001). X-axis ticks denote January 1st of each year.
M.W. Lomas et al. / Deep-Sea Research II 93 (2013) 16–3220
(in the order of 1–5 nmol kg�1 to the euphotic zone) generallyoccur (Fig. 2C) but still is insufficient to support observed rates ofprimary production.
The seasonal pattern of convective mixing controls in parttotal dissolved inorganic carbon (DIC) concentrations in the upperocean (�200 m) with highest concentrations in winter whenDIC-rich subsurface waters are ventilated (Bates, 2001). Assess-ment of a long-term trend in oceanic CO2 is complicated by thislarge seasonal variability (Bates et al., 2002; Brix et al., 2004; Doreet al., 2003; Gruber et al., 2002; Keeling et al., 2004); as well asthe variability imparted by spatial heterogeneity in the ocean as aresult of mesoscale and sub-mesoscale phenomena (McGillicuddyet al., 2007), and meridional and zonal physical gradients. Despitethis variability, euphotic zone (o100 m) salinity-normalized DIC
concentrations have increased significantly (P-valueo0.001) overthe course of the BATS record and longer (Fig. 3A, Bates, 2007).The impact of this slow acidification of the Sargasso Sea euphoticzone is currently unknown (Bates et al., 2012). In addition toelevated DIC in surface waters there has been an increase in DICin subeuphotic zone waters (Fig. 3A) including EDW. DIC con-centrations in the EDW are increasing at roughly twice the rateof euphotic zone concentrations related to a combination ofchanges in the volume of EDW formed and to winter mixed layerdepths (Bates et al., 2002), resulting in the dramatic shoaling(from �500 m to 200 m over the past �12 years) of the2100 mmol kg�1 DIC isocline. This subsurface increase appearsto be independent of changes in depth and/or volume of the EDWat BATS, and is greater than can reasonably be accounted for by

Fig. 2. Dissolved inorganic nutrients (mmol kg�1) time-series at the BATS station. (A) NO3�þNO2
�; (B) PO4�3 by standard autoanalyzer; (C) Soluble Reactive Phosphorus by
MAGIC-SRP method (see Methods); and (D) Si(OH)4. Note the different depth range for panel C. X-axis ticks denote January 1st of each year.
M.W. Lomas et al. / Deep-Sea Research II 93 (2013) 16–32 21
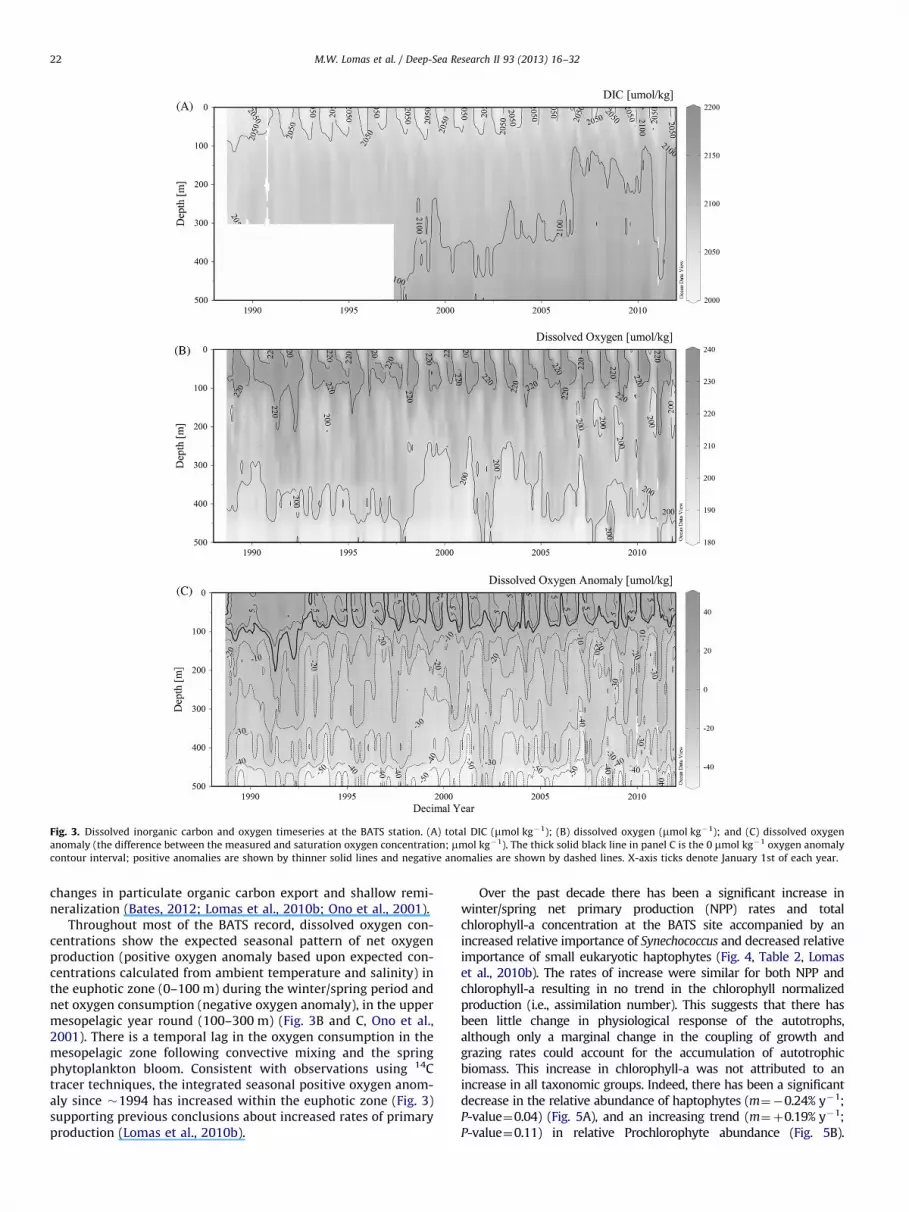
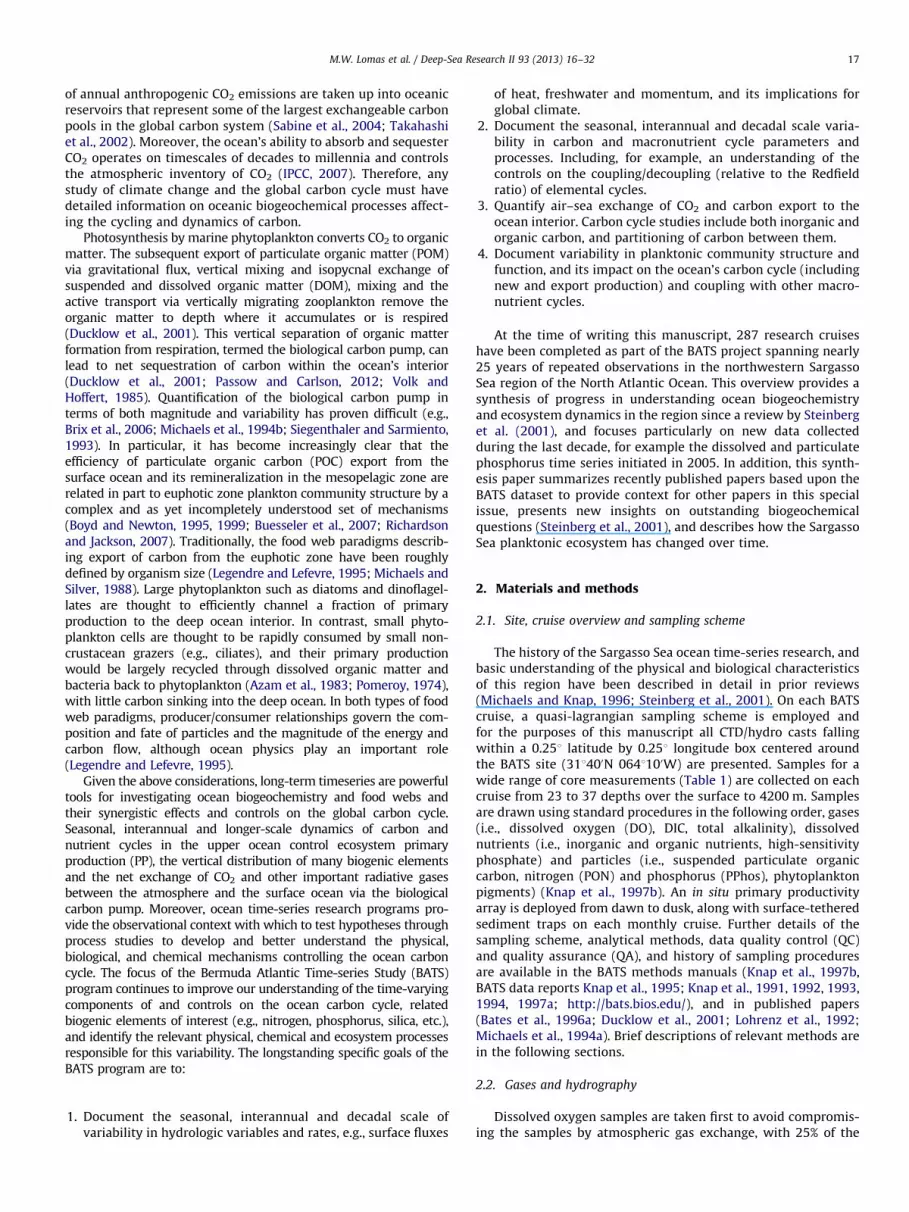
Fig. 3. Dissolved inorganic carbon and oxygen timeseries at the BATS station. (A) total DIC (mmol kg�1); (B) dissolved oxygen (mmol kg�1); and (C) dissolved oxygen
anomaly (the difference between the measured and saturation oxygen concentration; mmol kg�1). The thick solid black line in panel C is the 0 mmol kg�1 oxygen anomaly
contour interval; positive anomalies are shown by thinner solid lines and negative anomalies are shown by dashed lines. X-axis ticks denote January 1st of each year.
M.W. Lomas et al. / Deep-Sea Research II 93 (2013) 16–3222
changes in particulate organic carbon export and shallow remi-neralization (Bates, 2012; Lomas et al., 2010b; Ono et al., 2001).
Throughout most of the BATS record, dissolved oxygen con-centrations show the expected seasonal pattern of net oxygenproduction (positive oxygen anomaly based upon expected con-centrations calculated from ambient temperature and salinity) inthe euphotic zone (0–100 m) during the winter/spring period andnet oxygen consumption (negative oxygen anomaly), in the uppermesopelagic year round (100–300 m) (Fig. 3B and C, Ono et al.,2001). There is a temporal lag in the oxygen consumption in themesopelagic zone following convective mixing and the springphytoplankton bloom. Consistent with observations using 14Ctracer techniques, the integrated seasonal positive oxygen anom-aly since �1994 has increased within the euphotic zone (Fig. 3)supporting previous conclusions about increased rates of primaryproduction (Lomas et al., 2010b).
Over the past decade there has been a significant increase inwinter/spring net primary production (NPP) rates and totalchlorophyll-a concentration at the BATS site accompanied by anincreased relative importance of Synechococcus and decreased relativeimportance of small eukaryotic haptophytes (Fig. 4, Table 2, Lomaset al., 2010b). The rates of increase were similar for both NPP andchlorophyll-a resulting in no trend in the chlorophyll normalizedproduction (i.e., assimilation number). This suggests that there hasbeen little change in physiological response of the autotrophs,although only a marginal change in the coupling of growth andgrazing rates could account for the accumulation of autotrophicbiomass. This increase in chlorophyll-a was not attributed to anincrease in all taxonomic groups. Indeed, there has been a significantdecrease in the relative abundance of haptophytes (m¼�0.24% y�1;P-value¼0.04) (Fig. 5A), and an increasing trend (m¼þ0.19% y�1;P-value¼0.11) in relative Prochlorophyte abundance (Fig. 5B).

Fig. 4. Euphotic zone net primary production (NPP) and chlorophyll-a time-series at the BATS station. (A) NPP (mg C m�3 d�1); (B) chlorophyll-a (ng kg�1) determined by
HPLC; and C) chlorophyll-a normalized NPP (mg C mg Chl-a�1 d�1). X-axis ticks denote January 1st of each year.
M.W. Lomas et al. / Deep-Sea Research II 93 (2013) 16–32 23
Dinoflagellates have largely been overlooked as component of thephytoplankton community at BATS, in large part because theiraverage contribution is low (o5% on average) but they can reachas high as 20% in some cases (Fig. 5E). Most frequently, dinoflagellateshave a seasonal maximum during the winter/spring period (Bestet al., 2011; Lomas, unpublished data). Indeed a statistically signifi-cant (P-valueo0.001, m¼0.1% y�1) increase in dinoflagellate abun-dance over the past two decades has been driven entirely byincreases in this population during the winter/spring (Lomas, unpub-lished data). Despite the increase in dinoflagellate populations overtime, they have not quantitatively matched the respective loss ofdiatoms as a microplankton component during the winter/springbloom period (Krause et al., 2009a). As a result there has been a slowbut significant (P-valueo0.01) decline in the total microplanktoncontribution to chlorophyll over time, to be replaced by the slowincrease in prokaryote abundance. Based upon core paradigms in
biogeochemical oceanography, this long-term shift in the ecosystemshould have a meaningful impact on the carbon cycle in theSargasso Sea.
3.2. Bulk particulate cycling: organic matter production, export and
Sargasso Sea biogeochemistry
In the last overview paper of the BATS program, Steinberg et al.(2001) posed several important biogeochemical questions. Wenow have an additional decade of research in the region thathelps address these questions. First, short-term measurements ofnitrogen cycling indicate a high degree of recycling and lowexport (e-ratios o0.1), while long-term geochemical measure-ments of nitrogen cycling support high levels of net communityproduction (e-ratio40.3, Brix et al., 2006; Jenkins and Goldman,1985). This dichotomy was further exacerbated when direct 15N

Table 2
Annual euphotic zone integrated net primary production (R
NPP; 0–140 m), sediment trap POCexport at 150 m, e-ratio (ratio of POC export to NPP),
and Teff (transfer efficiency defined as 300 m POC flux/150 m POC flux; Buesseler et al., 2007). Year-over-year trend and direction, and significance
(P-value) evaluated by Model II linear regression (reduced major axis) on anomalies (calculated as annual value minus dataset average, all
normality and variance assumptions valid) are presented at the bottom.
YearR
NPP
(g C m�2 y�1)
Trap POC export
(g C m�2 y�1)
e-ratio Teff
1989 95.8 8.6 0.09 0.56
1990 126.1 10.4 0.08 0.53
1991 147.1 8.4 0.06 0.60
1992 195.8 8.1 0.04 0.48
1993 142.7 8.3 0.06 0.39
1994 109.8 10.2 0.09 0.64
1995 162.2 9.8 0.06 0.58
1996 165.4 12.3 0.07 0.54
1997 134.9 11.5 0.09 0.51
1998 124.4 11.0 0.09 0.49
1999 158.2 13.2 0.08 0.50
2000 156.4 10.0 0.06 0.55
2001 178.7 10.0 0.06 0.85
2002 207.1 10.6 0.05 0.74
2003 189.7 8.6 0.04 0.53
2004 147.0 n.d. n.d. n.d.
2005 158.2 12.9 0.08 0.41
2006 167.7 9.5 0.06 0.60
2007 149.6 14.4 0.10 0.30
2008 141.9 10.8 0.08 0.37
2009 164.6 11.0 0.07 0.49
2010 215.2 10.1 0.05 0.47
2011 173.2 12.3 0.07 0.71
Mean (7 1 S.D.) 157.0 (29.1) 10.5 (1.7) 0.06 (0.02) 0.52 (0.12)
Trend (7 1 S.D.) [P-value] þ2.170.8 [0.02] þ0.1070.05 [0.04] �0.0070.00 [0.82] �0.0070.00 [0.38]
M.W. Lomas et al. / Deep-Sea Research II 93 (2013) 16–3224
rate measurements supported the observations of high rates of newproduction (and implied export), but resulted in NO3 turnover timesat odds with the duration of detectable NO3 in the euphotic zone(Lipschultz, 2001; Lipschultz et al., 2002). Second, there is a draw-down of inorganic carbon during the summer in the absence ofmeasurable nutrients (Bates et al., 1996b; Michaels et al., 1994b)which has yet to be reconciled. Third, the coupled cycling of dissolvedpools of carbon, nitrogen and phosphorus, is not in line with thecanonical Redfield Ratio (Cotner et al., 1997; Michaels and Knap,1996), although direct information on the elemental ratios of parti-culate organic matter was scant a decade ago. Throughout theremainder of this manuscript we will present and discuss data fromBATS that may help answer these important biogeochemical ques-tions and also highlight the interconnectivity of these processes andchanges in the Sargasso Sea ecosystem.
3.2.1. Reconciling biological and geochemical new and export
production estimates in the Sargasso Sea
The seasonal pattern of NPP in the Northwestern Sargasso Seahas been well-documented over time with highest rates ofproduction occurring in the winter/spring period following con-vective mixing (Menzel and Ryther, 1960, 1961a; Michaels andKnap, 1996; Steinberg et al., 2001). Recently, Lomas et al. (2010b)have shown that winter/spring euphotic zone integrated NPPincreased by nearly 60% from the beginning of the BATS recorduntil 2007. It has been hypothesized that to support increasedrates of NPP, the water column at BATS is more frequently mixed(as opposed to one single deeper mixing event like in the NorthAtlantic) during the winter/spring period. As a result, nutrientsconsumed by phytoplankton are rapidly replaced by subsequentmixing events essentially allowing for more efficient mining ofsubeuphotic zone water while keeping measured residual nutri-ents at the detection limit (Lomas et al., 2010b). Such changes inmixing frequency are hypothesized to be related to changes in thephase of the NAO, which alters the frequency and strength of
storms impacting this region of the Sargasso Sea. If true, thismechanism could reconcile the extended presence of NO3 in theeuphotic zone despite the high NO3 turnover rates that have beenmeasured (Lipschultz, 2001). Indeed, recent studies designed totest this hypothesis show that there are short-term (hours todays) inputs of NO3 in response to the passage of winter stormsthat previously had not been accounted for, but that biologicalresponses (e.g., phytoplankton community shifts, primary, newand export production enhancement) are also occurring on asimilar time scale (Krause et al., 2009b; Lomas et al., 2009a;Lomas et al., 2009b). The rate of new production associated withsuch storm events has been calculated to represent 46–70% ofthe pre-stratification geochemical new production estimate of0.26 mol N m�2 period�1 (Jenkins, 1988; Jenkins and Doney,2003; Jenkins and Goldman, 1985; Jenkins and Wallace, 1992).This high periodicity in nutrient input and rapid biologicalresponse could help close the discrepancy between biologicaland geochemical new production measurements during thewinter/spring period. However, capturing these high frequencyperturbations with monthly shipboard occupations is challengingand present and future research requires a combination ofcoupled ocean-atmosphere, biogeochemical and ecosystem mod-els to properly assess their contribution to closing the gap in newproduction estimates. In addition, closing the gap in the imbal-ance between NPP rates and nutrient supply during the stratifiedperiod remains a significant challenge (e.g., Brix et al., 2006;Fawcett et al., 2011).
Mesoscale eddies are increasingly well understood and canalso be an important nutrient input term, contributing �40–70%of the estimated annual nitrate supply in the Sargasso Sea(McGillicuddy et al., 1998). Their impact during the winter/springcan be dramatic. In 1994, the presence of an anticyclonic eddynear the BATS station effectively prevented the occurrence of thespring bloom at BATS, whereas in 2010, the interaction of an eddyand convective mixing resulted in the deepest mixed layer depth(464 m) observed during the history of the BATS program with

Fig. 5. Timeseries of phytoplankton accessory pigments (ng kg�1) and relative contribution to total chlorophyll-a (%) in the deep chlorophyll maximum (DCM) at the BATS
station. (A) 190-hexanoyloxyfucoxanthin: indicator pigment for haptophytes; (B) chlorophyll-b: indicator pigment for Chlorophytes and Prochlorophytes (see Section 2.5
for further details); (C) Zeaxanthin: indicator pigment for non-Prochlorophyte cyanobacteria, predominantly Synechococcus; (D) fucoxanthin: indicator pigment for
diatoms; and (E) peridinin: indicator pigments for autotrophic dinoflagellates. The upper graph in each panel is the time-series depth plot of the specific indicator pigment,
and the lower graph in each panel is the mean (7 Std. Dev.) relative contribution to total Chl-a in the DCM (values between 80 and 120 m). Error bars are derived from the
2–3 samples between 80 and 120 m. X-axis ticks denote January 1st of each year.
M.W. Lomas et al. / Deep-Sea Research II 93 (2013) 16–32 25
associated increases in daily primary production. To our knowl-edge the magnitude of eddy-derived nutrient inputs have notbeen separated by pre-stratification and stratification periods.
3.2.2. Seasonal carbon drawdown
A well-documented feature of the western Sargasso Sea is thatthe majority of the seasonal drawdown in CO2 occurs afternutrients are depleted within the euphotic zone (Bates et al.,
1996b; Michaels et al., 1994b). It is critical to understand themechanisms behind this observed seasonal carbon drawdown,particularly if it arises from biological processes such as shiftingelemental ratios or the importance of vertically migrating auto-trophs such as the nitrogen fixer Trichodesmium, large diatom mats(Villareal and Lipschultz, 1995) or other autotrophs. In the lattercase, it does not appear that large vertically migrating autotrophsare abundant enough in this region to account for the carbonimbalance (Orcutt et al., 2001; Villareal and Lipschultz, 1995).

M.W. Lomas et al. / Deep-Sea Research II 93 (2013) 16–3226
Small eukaryotes growing during the height of summer stratifica-tion are isotopically heavy for N, suggesting growth on deep nitrate(Fawcett et al., 2011). It has been hypothesized that verticalmigration and nutrient mining may help explain this observation.Geochemical observations from profiling floats reach a similarconclusion by observing a vertical separation of nitrate disappear-ance and oxygen production at both the Hawaii Ocean Time-series(Johnson et al., 2010) and BATS (Johnson, personal communica-tion). Horizontal advection in the BATS region could help explainsome of the carbon drawdown, although this would require thatupstream water be nutrient-rich and/or relatively DIC-poor, char-acteristics not readily observed in the few spatial data sets in thevicinity of BATS. Possible explanations for the observed carbondrawdown could be greater importance of episodic events, such ashurricanes, on CO2 gas exchange (Bates et al., 1998), or activeremoval of carbon to depth by vertical migrators (Schnetzer andSteinberg, 2002; Steinberg et al., 2000). Seasonal changes in theelemental composition of living microbial/phytoplankton biomassand the biological partitioning of organic matter between thedissolved and particulate phases could also help explain thedisappearance of inorganic carbon. We focus on the latter twoexplanations.
Zooplankton timeseries studies near BATS span several dec-ades (Deevey, 1971; Menzel and Ryther, 1961b), but the mostcomprehensive time-series analyses of interannual and multi-year variation in zooplankton in the Sargasso Sea are described inMadin et al. (2001) and Steinberg et al. (2012). During an 18-yearperiod (1994–2011) total (4200 mm) annual zooplankton bio-mass increased in surface waters by nearly 70% (Fig. 6; adaptedand updated from Steinberg et al., 2012). Moreover, the compar-ison of zooplankton biomass in night and day tows, a proxy forvertically migrating biomass from depths deeper than 200 m, alsoincreased. Zooplankton biomass showed similar albeit weakcorrelations with year-to-year patterns of primary production.Overall the resultant changes in biogeochemical cycling asso-ciated with enhanced zooplankton biomass, and presumablygrazing, includes a comparable increase in carbon export bothby diel vertical migration and flux of zooplankton fecal pellets(Steinberg et al., 2012). These observations highlight the impor-tant role of zooplankton, especially vertical migrators, whichcurrently represent a poorly quantified term in the biologicalcarbon pump.
While the Redfield ratio has been a central tenet in biologicaloceanography for decades, global ocean patterns and relationshipsto microbial physiology remain poorly constrained (Geider andLaRoche, 2002). Indeed, the dominant groups of phytoplankton inthe Sargasso Sea, haptophytes and cyanobacteria (Fig. 5) are knownto substitute sulfolipids for phospholipids thus providing flexibilityin their ability to cope with phosphorus stress (Van Mooy et al.,2009). The eukaryotes however, are at a disadvantage by having to
Fig. 6. Time-series of annual integrated (0–150 m) mesozooplankton (4200 mm)
biomass at the BATS station from 1994–2010 (see Steinberg et al., 2012 for
additional details). Solid line is least squares Model I linear regression, dashed
lines are 95% confidence intervals.
synthesize some P-free lipids that contain N, whereas cyanobac-teria can synthesize lipids free of both P and N. Plots of suspendedPOC, PON and PPhos co-vary within and below the euphotic zone(Fig. 7), however, calculating the POC:PPhos or PON:PPhos ratiosfor comparison with the Redfield Ratio is not straightforward dueto the presence of variable amounts of detrital material (Minor andNallathamby, 2004; Lomas et al., 2010a). Estimated detrital POCand PON concentrationscan be subtracted from bulk measure-ments to estimate the ‘living’ material (Lomas et al., 2010a, 2010b).Based upon this ‘living’ biomass POC:PPhos ratio, the summersuspended PPhos concentrations (1.3 mmol m�2, assuming nearlyall is in living particles, Lomas et al., 2010a, 2010b), and an exportratio of 0.06 (Table 2), �4 mmol m�2 d�1of extra CO2 would bedrawn down during photosynthesis and potentially exported bythese carbon-rich particles, compared to growth at the RedfieldRatio. It is worth noting that all IPCC climate assessment modelsassume Redfield stoichiometry. The average daily CO2 drawdown is�20 mmol m�2 d�1, suggesting that these seasonal changes inplankton biochemistry could account for an important fraction ofthis extra inorganic carbon drawdown, assuming these small cellsare efficiently removed from the euphotic zone. Future researchshould focus efforts on quantifying and understanding the varia-bility of POC:PPhos or PON:PPhos ratios in living biomass and toexplicitly quantifying the detrital pool. This is particularly impor-tant given the hypothesized future increase in the areal extent ofsubtropical gyres (Polovina et al., 2008) and the dominance ofcyanobacteria in these regions. This process, coupled with recentobservations of small cells contributing significantly to carbonexport (Lomas and Moran, 2011; Richardson and Jackson, 2007)may provide a negative feedback on the inorganic carbon cycle notcurrently included in ocean biogeochemical models.
Another possible explanation for the drawdown of CO2in theabsence of nutrients relates to the partitioning of DOC and POC andthe potential uncoupling of biogeochemical cycles of C, N and P.Over the past 17-years, TOC (dominated by dissolved organiccarbon) within the euphotic zone (o100 m)has been accumulatingboth in terms of increasing concentrations and a deepening of the60 mmol l�1 isopleth by nearly 50 m (Fig. 8). Such accumulation ofTOC has occurred without a clear increase in either TON or TOP(Fig. 8). Indeed, TON is not accumulating, but rather decreasingwithin the euphotic zone. This is most apparent at the base of theeuphotic zone where the 4 mmol kg�1 isocline has shoaled bynearly 50 m since the beginning of the timeseries. The TOP time-series is too short for meaningful time-series interpretations, but ithas been suggested to be a bioavailable pool supporting a largefraction of NPP in the Sargasso Sea and therefore would not beexpected to accumulate (Lomas et al., 2010a). Such accumulationof TOC prior to 2010 could be due to a lack of consistent deep(4200 m) winter mixing (Hansell and Carlson, 2001) and/or theinability of euphotic zone bacterioplankton to metabolize surfaceTOC on seasonal and shorter time-scales (Carlson et al., 2002;Carlson et al., 2004). However in 2010–2011, with deep mixing,clearly show the importance of mixing as a control on carbonexport. Long-term patterns show that there has not been asignificant change in bacterial biomass over the duration of thetime-series record (Fig. 9). However, rates of bacterial productionhave significantly declined from the late 1990s to 2010 at whichpoint rates increased (Fig. 9). Total bacterial carbon demand hasthus also decreased (as a fixed bacterial growth efficiency of 14% isused in the calculation; Carlson et al., 1996) from 65762% of NPPfrom 1991 to 1999 to 34745% of NPP from 2000 to 2010. Thisdecline in bacterial carbon demand from the 1990s to 2010coincides with the slow increase in surface TOC and a deepeningof the 60 mmol l�1 isocline (Fig. 8). In the winter of 2010 and 2011,the deepest mixed layers were observed and the dilution of thissurface accumulating DOC is evident (Fig. 8). This, taken in the
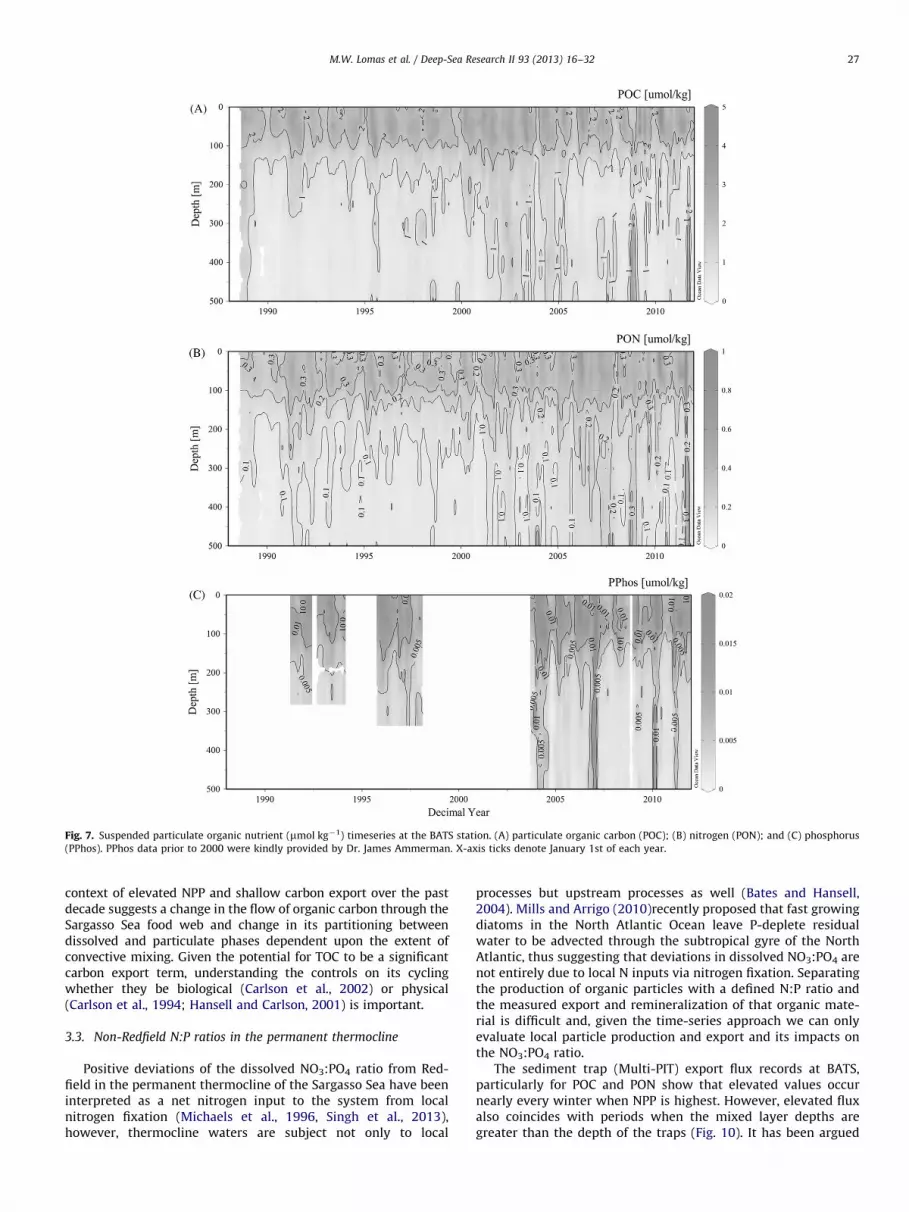
Fig. 7. Suspended particulate organic nutrient (mmol kg�1) timeseries at the BATS station. (A) particulate organic carbon (POC); (B) nitrogen (PON); and (C) phosphorus
(PPhos). PPhos data prior to 2000 were kindly provided by Dr. James Ammerman. X-axis ticks denote January 1st of each year.
M.W. Lomas et al. / Deep-Sea Research II 93 (2013) 16–32 27
context of elevated NPP and shallow carbon export over the pastdecade suggests a change in the flow of organic carbon through theSargasso Sea food web and change in its partitioning betweendissolved and particulate phases dependent upon the extent ofconvective mixing. Given the potential for TOC to be a significantcarbon export term, understanding the controls on its cyclingwhether they be biological (Carlson et al., 2002) or physical(Carlson et al., 1994; Hansell and Carlson, 2001) is important.
3.3. Non-Redfield N:P ratios in the permanent thermocline
Positive deviations of the dissolved NO3:PO4 ratio from Red-field in the permanent thermocline of the Sargasso Sea have beeninterpreted as a net nitrogen input to the system from localnitrogen fixation (Michaels et al., 1996, Singh et al., 2013),however, thermocline waters are subject not only to local
processes but upstream processes as well (Bates and Hansell,2004). Mills and Arrigo (2010)recently proposed that fast growingdiatoms in the North Atlantic Ocean leave P-deplete residualwater to be advected through the subtropical gyre of the NorthAtlantic, thus suggesting that deviations in dissolved NO3:PO4 arenot entirely due to local N inputs via nitrogen fixation. Separatingthe production of organic particles with a defined N:P ratio andthe measured export and remineralization of that organic mate-rial is difficult and, given the time-series approach we can onlyevaluate local particle production and export and its impacts onthe NO3:PO4 ratio.
The sediment trap (Multi-PIT) export flux records at BATS,particularly for POC and PON show that elevated values occurnearly every winter when NPP is highest. However, elevated fluxalso coincides with periods when the mixed layer depths aregreater than the depth of the traps (Fig. 10). It has been argued

Fig. 8. Total organic nutrient timeseries at the BATS station. (A) total organic carbon (TOC; mmol kg�1), (B) TON (mmol kg�1), and C) TOP (nmol kg�1). Inorganic NO3 and
PO4 have been subtracted from the latter two, and thus parameter represents both dissolved organic and particulate organic concentrations. X-axis ticks denote January 1st
of each year.
M.W. Lomas et al. / Deep-Sea Research II 93 (2013) 16–3228
that this and other hydrodynamic effects confound the interpre-tation of surface-tethered sediment traps, however a recenttimeseries using neutrally buoyant sediment traps suggests thatthese hydrodynamic effects may be less of a concern (Owenset al., 2013). The POC:PON ratio of exported material is close toRedfield at �6–8 mol:mol, consistent with elemental composi-tion of the suspended particulate pool (data not shown). Trends inthe POC flux record indicated a long term increase, though notsignificant for the entire data record (Table 2), and there is nosignificant change in the POC:PON ratio. The PPhos flux recordis much shorter, but shows a slightly different pattern in whichPPhos fluxes have increased significantly at all trap depths(150 m, P-value¼0.05; 200 m, P-value¼0.03; 300 m, P-value¼0.03) (Fig. 10). This has resulted in a significant (Model I
linear regression, P-value¼0.01) decrease in the PON:PPhos fluxratio over the past 5 years from values that were greater than thatof the euphotic zone PON:PPhos (corrected for detrital PON) tovalues that are now comparable to euphotic zone PON:PPhos andslightly higher than Redfield (data not shown). This decline couldbe due to changes in remineralization length scales of N or P,although given the very low phosphorus concentrations and thegrowing evidence for P-stress in the western North Atlantic Ocean(Ammerman et al., 2003; Lomas et al., 2004; Mather et al., 2008),it is hard to envision that P-remineralization rates woulddecrease. Indeed, over this same time frame, there has been asignificant (Model I linear regression, P-value¼0.005), albeitsmall, increase in the NO3:PO4 ratio below the euphotic zoneand above the EDW layer, which supports the notion that N is

Fig. 9. Time-series of bacterial carbon biomass and productivity at the BATS station. (A) bacterial carbon biomass (mg C m�3); (B) bacterial production (mg C m�3 d�1);
and (C) euphotic zone integrated (0–140 m) bacterial carbon biomass (upper plot) and net primary and bacterial productivity (lower plot). Bacterial productivity is
expressed as bacterial carbon demand determined using a growth efficiency of 14% (dashed line). Cell carbon and carbon:thymidine conversion factors and bacterial
growth efficiency taken from Carlson et al. (1996). X-axis ticks denote January 1st of each year.
M.W. Lomas et al. / Deep-Sea Research II 93 (2013) 16–32 29
being recycled faster and consistent with patterns in the PON:P-Phos ratio in sinking organic material. An alternative explanation,however, is that there has been a change in the quality and sourceof sinking particulate organic matter (i.e., shift in the planktoncommunity structure).
Relatively little is known about taxon-specific variability incellular C, N, P quotas under ambient conditions to determine ifthese changes in phytoplankton community are congruent withthe observation of a decreasing PON:PPhos ratio in sinkingmaterial. Moreover, POM export is a small fraction of primaryproduction in the Sargasso Sea (Lomas and Bates, 2004; Carlson etal., 1998), and so changes in the DON:DOP ratio of verticallyexported DOM should be considered to understand the dynamicsof thermocline NO3:PO4 in the Sargasso Sea.
3.4. Relevance of BATS and a vision for the future
The data collected as part of the BATS research program,available at http://bats.bios.edu, as well as at the Biological andChemical Oceanography Data Management Office (BCO-DMO;http://osprey.bco-dmo.org/program.cfm under ‘‘Projects’’) con-tinues to contribute significantly to the field of oceanography,providing a framework around which a diversity of hypotheseshave been developed on the functioning of the Sargasso Seaecosystem. These contributions have been in the form of aconsistent research platform for other researchers on whichsamples can be collected or instrument trials conducted, anextensive biogeochemical dataset that modelers can use tovalidate model outputs, and a comprehensive hydrographic and

Fig. 10. Time-series of particulate nutrient export fluxes at 150 m. POC
(mmol C m�2 d�1)—middle graph, PON (mmol N m�2 d�1)—middle graph, POP
(mmol P m�2 d�1)—lower graph. Short vertical dashes in each of the POC flux
panels represent those times when the mixed layer depth was greater than the
depth of the trap. X-axis ticks denote January 1st of each year.
M.W. Lomas et al. / Deep-Sea Research II 93 (2013) 16–3230
biogeochemical context in which to place ancillary researchprojects/results. Concerning the latter, a wide range of ancillaryprojects (research not funded or conducted as part of the coreBATS program and not presented in this overview but rather inother papers in this issue) have been and currently are supportedby BATS (http://bats.bios.edu/docs/BATS_ancillary_user_list.pdf)which provides a broad context for examining oceanographicparadigms and hypotheses.
Biogeochemical oceanographic time-series programs are anessential component of the emerging network of ocean-climateobservatories (Church et al., 2013). To this end, biogeochemicaltime-series programs must continue to prioritize measurementsand measurement systems critical to detecting and quantifyingtime-varying changes in the pools and fluxes of ecologically-significant elements and biodiversity of organisms, to help under-stand the influences of feedback loops in local- to basin-scaleclimate variability. This includes leveraging the implementation,testing, and validation of transformative sea-sensing technologiesat these sites to continue enriching our understanding of naturaland anthropogenic influences on the ocean-atmosphere system.Lastly, the utility of biogeochemical time-series data for formu-lating and validating ecosystem models should be promoted.Broader use of these data in modeling studies will improve ourmechanistic understanding of ocean dynamics at these sites,while further highlighting the utility of the time-seriesobservations.
Acknowledgments
The authors thank the captains and crews of the R/Vs Cape
Henlopen, Cape Hatteras, Weatherbird I & II, Oceanus, Edwin Link
and Atlantic Explorer as well as the BATS technicians and scien-tists, past and present, whose diligence and dedication hasresulted in the generation of the dataset presented in this manu-script. We thank the anonymous reviewers and handling EditorFrank Muller-Karger for their comments that have improved thismanuscript. We thank the National Science Foundation Chemicaland Biological Oceanography Programs for continued support ofthe BATS program through the following awards: OCE 88–01089,OCE 93–01950, OCE 9617795, OCE 0326885, OCE 0752366, andOCE-0801991. This is BIOS Contribution no. 2026. This is VirginiaInstitute of Marine Science Contribution no. XXX.
References
Alfutis, M., Cornillon, P., 2001. Annual and interannual changes in the NorthAtlantic STMW layer properties. J. Phys. Oceanogr. 31, 2066–2086.
Ammerman, J.W., Hood, R.R., Case, D., Cotner, J.B., 2003. Phosphorus deficiency inthe Atlantic: an emerging paradigm in oceanography. EOS 84, 165–170.
Azam, F., Fenchel, T., Field, J.G., Gray, J.S., Meyer-Reil, L.A., Thingstad, F., 1983. Theecological role of water column microbes in the sea. Mar. Ecol. 10, 257–263.
Bates, N., 2012. Multi-decadal uptake of carbon dioxide into subtropical modewaters of the North Atlantic Ocean. Biogeosci. Discuss. 8, 12451–12476.
Bates, N., Best, M., Neely, K., Garley, R., Dickson, A., Johnson, R., 2012. Indicators ofanthropogenic carbon dioxide uptake and ocean acidification in the NorthAtlantic Ocean. Biogeosci. Discuss. 8, 2011–2448.
Bates, N., Hansell, D., 2004. Temporal variability of excess nitrate in the subtropicalmode water of the North Atlantic Ocean. Mar. Chem. 84, 225–241.
Bates, N., Michaels, A., Knap, A., 1996a. Seasonal and interannual variability of theoceanic carbon dioxide system at the US JGOFS Bermuda Atlantic Time-seriessite. Deep Sea Res. II 43, 347–383.
Bates, N.R., 2001. Interannual variability of oceanic CO2 and biogeochemicalproperties in the Western North Atlantic subtropical gyre. Deep-Sea Res. PartII 48 (8–9), 1507–1528.
Bates, N.R., 2007. Interannual variability of the oceanic CO2 sink in the subtropicalgyre of the North Atlantic Ocean over the last two decades. J. Geophys. Res.112, C09013.
Bates, N.R., Knap, A.H., Michaels, A.F., 1998. Contribution of hurricanes to local andglobal estimates of air–sea exchange of CO2. Nature 395 (6697), 58–61.
Bates, N.R., Michaels, A.F., Knap, A.H., 1996b. Seasonal and interannual variabilityof oceanic carbon dioxide species at the US JGOFS Bermuda Atlantic Time-series Study (BATS) site. Deep-Sea Res. II 43 (2–3), 347.
Bates, N.R., Pequignet, A.C., Johnson, R.J., Gruber, N., 2002. A short-term sink foratmospheric CO2 in subtropical mode water of the North Atlantic Ocean.Nature 420 (6915), 489–493.
Best, C., Purdie, D., Lomas, M., 2011. Temporal dynamics of microplankton in theSargasso Sea. In: Proceedings of the American Society of Limnology andOceanograpy 2011 Meeting, San Juan Puerto Rico, Puerto Rico.
Bidigare, R., 1991. Analysis of algal chlorophylls and carotenoids. In: Hurd, D.,Spencer, D. (Eds.), Marine Particles: Analysis and Characterization. AmericanGeophysical Union, Washington, DC, pp. 119–123.
Boyd, P., Newton, P., 1995. Evidence of the potential influence of planktoniccommunity structure on the interannual variability of particulate organic-carbon flux. Deep-Sea Res. Part I 42 (5), 619–639.
Boyd, P., Newton, P., 1999. Does planktonic community structure determinedownward particulate organic carbon flux in different oceanic provinces?Deep-Sea Res. I 46, 63–91.
Brix, H., Gruber, N., Karl, D., Bates, N., 2006. Interannual variability of therelationship between primary, net community and export production in thesubtropical gyres. Deep-Sea Res. II 53, 698–717.
Brix, H., Gruber, N., Keeling, C.D., 2004. Interannual variability of the upper oceancarbon cycle at station ALOHA near Hawaii. Global Biogeochem. Cycles 18 (4),http://dx.doi.org/10.1029/2004GB002245.
Buesseler, K.O., Antia, A., Chen, M., Fowler, S.W., Gardner, W.D., Gustafsson, O.,Harada, K., Michaels, A.F., Rutgers van der Loeff, M., Sarin, M.M., Steinberg,D.K., Trull, T., 2007. As assessment of the use of sediment traps for estimatingupper ocean particles fluxes. J. Mar. Res. 65, 345–416.
Carlson, C., Ducklow, H., Michaels, A., 1994. Annual flux of dissolved organic carbonfrom the euphotic zone in the northwestern Sargasso Sea. Nature 371, 405–408.
Carlson, C., Hansell, D., Nelson, N., Siegel, D., Smethie, W., Khatiwala, S., Meyers, M.,Halewood, E., 2010. Dissolved organic carbon export and subsequent reminer-alization in the mesopelagic and bathypelagic realms of the North Atlanticbasin. Deep Sea Res. II 57, 1433–1445.
Carlson, C.A., Ducklow, H.W., 1996. Growth of bacterioplankton and consumptionof dissolved organic carbon in the Sargasso sea. Aquat. Microb. Ecol. 10, 69–85.
Carlson, C.A., Ducklow, H.W., Hansell, D.A., Smith, W.O., 1998. Organic carbonpartitioning during spring phytoplankton blooms in the Ross Sea polynya andthe Sargasso Sea. Limnol. Oceanogr. 43 (3), 375–386.
Carlson, C.A., Ducklow, H.W., Sleeter, T.D., 1996. Stocks and dynamics of bacter-ioplankton in the northwestern Sargasso Sea. Deep-Sea Res. Part I 43 (2–3),491–515.
Carlson, C.A., Giovannoni, S.J., Hansell, D.A., Goldberg, S.J., Parsons, R., Otero, M.P.,Vergin, K., Wheeler, B.R., 2002. Effect of nutrient amendments on bacterio-plankton production, community structure, and DOC utilization in the north-western Sargasso Sea. Aquat. Microb. Ecol. 30 (1), 19–36.
Carlson, C.A., Giovannoni, S.J., Hansell, D.A., Goldberg, S.J., Parsons, R., Vergin, K.,2004. Interactions among dissolved organic carbon, microbial processes, andcommunity structure in the mesopelagic zone of the northwestern SargassoSea. Limnol. Oceanogr. 49 (4), 1073–1083.
Cavender-Bares, K.K., Karl, D.M., Chisholm, S.W., 2001. Nutrient gradients in thewestern North Atlantic Ocean: relationship to microbial community structureand comparison to patterns in the Pacific Ocean. Deep-Sea Res. I 48,2373–2395.
Church, M.J., Lomas, M.W., Muller-Karger, F.E., 2013. Sea Change: charting thecourse for biogeochemical ocean time series research in a new millennium, 93,2–15.
Cotner, J.B., Ammerman, J.W., Peele, E.R., Bentzen, E., 1997. Phosphorus-limitedbacterioplankton growth in the Sargasso Sea. Aquat. Microb. Ecol. 13 (2), 141–149.

M.W. Lomas et al. / Deep-Sea Research II 93 (2013) 16–32 31
Deevey, G., 1971. The annual cycle in quantity and composition of the zooplanktonof the Sargasso Sea off Bermuda. I. The upper 500 m. Limnol. Oceanogr. 16,219–240.
Dore, J., Houlihan, T., Hebel, D., Tien, G., Tupas, L., Karl, D., 1996. Freezing as amethod of sample preservation for the analysis of dissolved inorganicnutrients in seawater. Mar. Chem. 53, 173–185.
Dore, J., Lukas, R., Sadler, D., Karl, D., 2003. Climate-driven changes to theatmospheric CO2 sink in the subtropical North Pacific Ocean. Nature 424,754–757.
Ducklow, H., Steinberg, D.K., Buesseler, K.O., 2001. Upper ocean carbon export andthe biological pump. Oceanography 14, 50–58.
Ducklow, H.W., Carlson, C.A., 1992. Oceanic baterial production. In: Marshall, K.C.(Ed.), Advances in Microbial Ecology. Plenum Press, New York, pp. 113–181.
Fawcett, S., Lomas, M., Casey, J., Ward, B., Sigman, D., 2011. Assimilation of upwellednitrate by small eukaryotes in the Sargasso Sea. Nat. Geosci. 4, 717–722.
Fuhrman, J.A., Azam, F., 1980. Bacterioplankton secondary production estimatesfor coastal waters of British Columbia, Antarctica and California. Appl. Environ.Microbiol. 39, 1085–1095.
Geider, R.J., LaRoche, J., 2002. Redfield revisited: variability of C:N:P in marinemicroalgae and its biochemical basis. Eur. J. Phycol. 37, 1–17.
Gruber, N., Keeling, C.D., Bates, N.R., 2002. Interannual variability in the NorthAtlantic Ocean carbon sink. Science 298 (5602), 2374–2378.
Gundersen, K., Bratbak, G., Heldal, M., 1996. Factors influencing the loss of bacteriain preserved seawater samples. Mar. Ecol. Progr. Ser. 137, 305–310.
Hansell, D., 2005. Dissolved organic carbon reference material program. EOS 86,318–319.
Hansell, D., Carlson, C., 2001. Biogeochemistry of total organic carbon and nitrogenin the Sargasso Sea: control by convective overturn. Deep-Sea Res. II 48,1649–1668.
Houghton, J.T., Ding, Y., Griggs, D.J., Noguer, M., van der Linden, P.J., Xiasou, D.,2001. Climate change 2001. The Scientific Basis. Cambridge University Press,New York 881p.
IPCC, 2001. Intergovernmental Panel on Climate Change (IPCC) Third AssessmentReport. Cambridge University Press, UK.
IPCC, 2007. Climate Change 2007 – Impacts, Adaptation and Vulnerability. Work-ing Group II contribution to the Fourth Assessment Report of the IPCC.Cambridge University Press, UK.
Jenkins, W., 1988. Nitrate flux into the euphotic zone near Bermuda. Nature 331,521–523.
Jenkins, W., Doney, S., 2003. The subtropical nutrient spiral. Global Biogeochem.Cycles 17 (4), http://dx.doi.org/10.1029/2003GB002085.
Jenkins, W., Goldman, J., 1985. Seasonal oxygen cycling and primary production inthe Sargasso Sea. J. Mar. Res. 43 (2), 465–491.
Jenkins, W., Wallace, D., 1992. Tracer-based inferences of new primary productionin the sea. In: Falkowski, P., Woodhead, A. (Eds.), Primar Productivity andBiogeochemical Cycles in the Sea. Plenum Publishing Corp, New York, pp.299–316.
Johnson, K., Riser, S., Karl, D., 2010. Nitrate supply from deep to near surfacewaters of the North Pacific subtropical gyre. Nature 465, 1062–1065.
Karl, D.M., Tien, G., 1992. MAGIC: A sensitive and precise method for measuringdissolved phosphorus in aquatic environments. Limnol. Oceanogr. 37,105–116.
Karl, D.M., Tien, G., 1997. Temporal variability in dissolved phosphorus concen-trations in the subtropical North Pacific ocean. Mar. Chem. 56, 77–96.
Keeling, C.D., Brix, H., Gruber, N., 2004. Seasonal and long-term dynamics of theupper ocean carbon cycle at Station ALOHA near Hawaii. Global Biogeochem.Cycles 18 (4), http://dx.doi.org/10.1029/2004GB002227.
Knap, A., Michaels, A., Dow, R., Johnson, R., Gundersen, K., Sorensen, J., Close, A.,Bates, N., Howse, F.A., Hammer, M.A., Best, M., Doyle, A., Michaels, C.M., Hansell,D., Waterhouse, T.Y., Kelly, R., Caporelli, E.A., Bahr, F., Little, R., 1995. US JointGlobal Ocean Flux Study. Bermuda Atlantic Time-series Study. Data Report forBATS 49-60. US JGOFS Planning Office, Woods Hole Oceanographic Institution.
Knap, A., Michaels, A., Dow, R., Johnson, R., Gundersen, K., Sorensen, J., Close, A.,Howse, F.A., Bates, N., Best, M., Hammer, M.A., Doyle, A., 1994. US Joint GlobalOcean Flux Study. Bermuda Atlantic Time-series Study. Data Report for BATS37–48. US JGOFS Planning Office, Woods Hole Oceanographic Institution.
Knap, A., Michaels, A., Hansell, D., Bahr, F., Bates, N., Becker, S., Caporelli, E.A.,Close, A., Doyle, A., Dow, R., Johnson, R., Kelly, R., Little, R., Gundersen, K.,Howse, F.A., Waterhouse, T.Y., 1997a. US Joint Global Ocean Flux Study.Bermuda Atlantic Time-series Study. Data Report for BATS 61-72. US JGOFSPlanning Office, Woods Hole Oceanographic Institution.
Knap, A., Michaels, A., Steinberg, D., Bahr, F., Bates, N., Bell, S., Countway, P., Close, A.,Doyle, A., Howse, F., Gundersen, K., Johnson, R., Little, R., Orcutt, K., Parsons, R.,Rathbun, C., Sanderson, M., Stone, S., 1997b. BATS Methods Manual Version 4.US JGOFS Planning Office, Woods Hole Oceanographic Institution.
Knap, A.H., Michaels, A., Dow, R., Johnson, R., Gundersen, K., Knauer, G.A., Lohrenz, S.E.,Asper, V.A., Tuel, M., Ducklow, H., Quinby, H.L., Brewer, P., 1991. US Joint GlobalOcean Flux Study. Bermuda Atlantic Time-series Study. Data Report for BATS 1–12.US JGOFS Planning Office, Woods Hole Oceanographic Institution.
Knap, A.H., Michaels, A., Dow, R., Johnson, R., Gundersen, K., Sorensen, J., Close, A.,Hammer, M.A., Knauer, G.A., Lohrenz, S.E., Asper, V.A., Tuel, M., Ducklow, H.,Quinby, H.L., Brewer, P., Bidigare, R., 1992. US Joint Global Ocean Flux Study.Bermuda Atlantic Time-series Study. Data Report for BATS 13–24. US JGOFSPlanning Office, Woods Hole Oceanographic Institution.
Knap, A.H., Michaels, A., Dow, R., Johnson, R., Gundersen, K., Sorensen, J., Close, A.,Howse, F.A., Hammer, M.A., Bates, N., Knauer, G.A., Lohrenz, S.E., Asper, V.A.,
Tuel, M., Ducklow, H., Quinby, H.L., 1993. US Joint Global Ocean Flux Study.Bermuda Atlantic Time-series Study. Data Report for BATS 25–36. US JGOFSPlanning Office, Woods Hole Oceanographic Institution.
Knauer, G., Martin, J., Bruland, K., 1979. Fluxes of particulate carbon, nitrogen, andphosphorus in the upper water column of the northeast Pacific. Deep-Sea Res.26, 97–108.
Krause, J., Lomas, M., Nelson, D., 2009a. Biogenic silica at the Bermuda Atlantictime-series study site in the Sargasso Sea: temporal changes and their inferredcontrols based on a 15-year record. Global Biogeochem. Cycles 23, GB3004.
Krause, J., Nelson, D.M., Lomas, M.W., 2009b. Biogeochemical responses to late-winter storms in the Sargasso Sea. II. Increased production and export ofbiogenic silica. Deep Sea Res. I,10.1016/j.dsr.2009.1001.1002.
Legendre, L., Lefevre, J., 1995. Microbial food webs and the export of biogeniccarbon in oceans. Aquat. Microb. Ecol. 9, 69–77.
Li, Q., Hansell, D., 2008. Nutrient distributions in baroclinic eddies of theoligotrophic North Atlantic and inferred impacts on biology. Deep Sea Res. II55, 1291–1299.
Lipschultz, F., 2001. A time-series assessment of the nitrogen cycle at BATS. Deep-Sea Res. II 48, 1897–1924.
Lipschultz, F., Bates, N.R., Carlson, C.A., Hansell, D.A., 2002. New production in theSargasso Sea: history and current status. Global Biogeochem. Cycles 16 (1),1001.
Lohrenz, S.E., Knauer, G.A., Asper, V.L., Tuel, M., Michaels, A.F., Knap, A.H., 1992.Seasonal variability in primary production and particle-flux in the North-western Sargasso Sea—United States JGOFS Bermuda Atlantic time-seriesstudy. Deep-Sea Res. Part A–Oceanogr. Res. Pap. 39 (7–8A), 1373–1391.
Lomas, M.W., Bates, N.R., 2004. Potential controls on interannual partitioning oforganic carbon during the winter/spring phytoplankton bloom at the BermudaAtlantic Time-series Study (BATS) site. Deep-Sea Res. Part I 51 (11),1619–1636.
Lomas, M.W., Burke, A., Lomas, D., Shen, C., Bell, D., Dyhrman, S.T., Ammerman, J.W.,2010a. Sargasso Sea phosphorus biogeochemistry: an important role fordissolved organic phosphorus (DOP). Biogeosciences 7, 695–710.
Lomas, M.W., Lipschultz, F., Nelson, D.M., Bates, N.R., 2009a. Biogeochemicalresponses to late-winter storms in the Sargasso Sea. I. Pulses of primary andnew production. Deep Sea Res. I 56, 843–860.
Lomas, M.W., Moran, S.B., 2011. Evidence for aggregation and export of cyano-bacteria and nano-eukaryotes from the Sargasso Sea euphotic zone. Biogeos-ciences 8, 203–216.
Lomas, M.W., Roberts, N.L., Lipschultz, F., Krause, J., Nelson, D.M., Bates, N.R.,2009b. Biogeochemical responses to late-winter storms in the Sargasso Sea. IVRapid succession of major phytoplankton groups. Deep Sea Res. I 56, 892–908.
Lomas, M.W., Steinberg, D.K., Dickey, T., Carlson, C.A., Nelson, N.B., Condon, R.H.,Bates, N.R., 2010b. Increased ocean carbon export in the Sargasso Sea iscountered by its enhanced mesopelagic attenuation. Biogeosciences 7, 57–70.
Lomas, M.W., Swain, A., Shelton, R., Ammerman, J.W., 2004. Taxonomic variabilityof phosphorus stress in Sargasso Sea phytoplankton. Limnol. Oceanogr. 49,2303–2310.
Madin, L.P., Horgan, E.F., Steinberg, D.K., 2001. Zooplankton at the BermudaAtlantic Time-series Study (BATS) station: diel, seasonal and interannualvariation in biomass, 1994–98. Deep-Sea Res. II 48 (8–9), 2063–2082.
Mather, R., Reynolds, S., Wolff, G., Williams, R.G., Torres-Valdes, S., Woodward, E.M.S.,Landolfi, A., Pan, X., Sanders, R.W., Achterberg, E., 2008. Phosphorus cycling in theNorth and South Atlantic Ocean subtropical gyres. Nature Geosci. 1, 439–443.
McGillicuddy, D., Robinson, A., Siegel, D., Jannasch, H., Johnson, R., Dickey, T.,McNeil, J., Michaels, A., Knap, A., 1998. Influence of mesoscale eddies on newproduction in the Sargasso Sea. Nature 394, 263–266.
McGillicuddy, D.J., Anderson, L., Bates, N.R., Bibby, T., Buesseler, K.O., Carlson, C.,Davis, C.S., Ewart, C., Falkowski, P.G., Goldthwait, S.A., Hansell, D., Jenkins, W.J.,Johnson, R., Kosnyrev, V.K., Ledwell, J., Li, Q., Siegel, D., Steinberg, D.K., 2007.Eddy/Wind interactions stimulate extraordinary mid-ocean plankton blooms.Science 316, 1021–1025.
Menzel, D.W., Ryther, J.H., 1960. The annual cycle of primary production in theSargasso Sea off Bermuda. Deep-Sea Res. 6, 351–367.
Menzel, D.W., Ryther, J.H., 1961a. Annual variations in primary production of theSargasso Sea off Bermuda. Deep Sea Res. 7, 282–288.
Menzel, D.W., Ryther, J.H., 1961b. Zooplankton in the Sargasso Sea off Bermuda and itsrelation to organic production. J. Conse. Perm. Int. Explor. Mer 26, 250–258.
Michaels, A., Knap, A., 1996. Overview of the US JGOFS Bermuda Atlantic Time-series Study and the Hydrostation S program. Deep-Sea Res. II 43 (2), 157–198.
Michaels, A., Knap, A., Dow, R., Gundersen, J., Johnson, R., Sorensen, J., Close, A.,Knauer, G., Lohrenz, S., Asper, V., Tuel, M., Bidigare, R., 1994a. Seasonalpatterns of ocean biogeochemistry at the US JGOFS Bermuda Atlantic Time-series study site. Deep-Sea Res. 41 (7), 1013–1038.
Michaels, A.F., Bates, N.R., Buesseler, K.O., Carlson, C.A., Knap, A.H., 1994b. Carbon-cycle imbalances in the Sargasso Sea. Nature 372 (6506), 537–540.
Michaels, A.F., Olson, D., Sarmiento, J.L., Ammerman, J.W., Fanning, K., Jahnke, R.,Knap, A.H., Lipschultz, F., Prospero, J.M., 1996. Inputs, losses and transforma-tions of nitrogen and phosphorus in the pelagic North Atlantic Ocean.Biogeochemistry 35 (1), 181–226.
Michaels, A.F., Silver, M.W., 1988. Primary production,sinking fluxes, and themicrobial food web. Deep-Sea Res. 35, 473–490.
Mills, M., Arrigo, K., 2010. Magnitude of oceanic nitrogen fixation influenced bythe nutrient uptake ratio of phytoplankton. Nat. Geosci. 3, 412–416.

M.W. Lomas et al. / Deep-Sea Research II 93 (2013) 16–3232
Minor, E.C., Nallathamby, P.S., 2004. ‘‘Cellular’’ vs. ‘‘detrital’’ POM: a preliminarystudy using fluorescent stains, flow cytometry, and mass spectrometry. Mar.Chem. 92 (1–4), 9–21.
Ono, S., Ennyu, A., Najjar, R., Bates, N., 2001. Shallow remineralization in theSargasso Sea estimated from seasonal variations in oxygen, dissolved inor-ganic carbon and nitrate. Deep-Sea Res. Part II 48 (8–9), 1567–1582.
Orcutt, K.M., Lipschultz, F., Gundersen, K., Arimoto, R., Michaels, A.F., Knap, A.H.,Gallon, J.R., 2001. A seasonal study of the significance of N2 fixation byTrichodesmium spp. at the Bermuda Atlantic Time-series Study (BATS) site.Deep-Sea Res. Part II 48 (8–9), 1583–1608.
Owens, S., Buesseler, K.O., Lamborg, C., Valdes, J.R., Lomas, M., Johnson, R.,Steinberg, D., Siegel, D., 2013. A new time series of particle export fromneutrally buoyant sediments traps at the Bermuda Atlantic Time-series Studysite. Deep Sea Res. I 72, 34–47.
Passow, U., carlson, C., 2012. The biological pump in a high CO2 world. Mar. Ecol.Prog. Ser. 470, 249–271.
Polovina, J., Howell, E., Abecassis, M., 2008. Ocean’s least productive waters areexpanding. Geophys. Res. Lett. 35, L03618.
Pomeroy, L., 1974. The ocean’s food web, a changing paradigm. BioScience 24, 499–504.Richardson, T., Jackson, G., 2007. Small phytoplankton and carbon export from the
surface ocean. Science 315, 838–840.Rimmelin, P., Moutin, T., 2005. Re-examination of the MAGIC method to determine
low orthophosphate concentration in seawater. Anal. Chim. Acta 548, 174–182.Royal Society T, 2005. Ocean Acidification Due to Increasing Atmospheric Carbon
Dioxide. The Royal Society, London 225p.Sabine, C., Feely, R.A., Gruber, N., Key, R., Bullister, J., Wanninkhof, R., Wong, C.,
Peng, T., Kozyr, A., Ono, T., Rios, A., 2004. The oceanic sink for anthropogenicCO2. Science 305, 367–371.
Sarmiento, J.L., Wofsy, S.C., 1999. A US carbon cycle science plan. A Report of theCarbon and Climate Working Group. 69p.
Schnetzer, A., Steinberg, D.K., 2002. Active transport of particulate organic carbonand nitrogen by vertically migrating zooplankton in the Sargasso Sea. Mar.Ecol. Progr. Ser. 234, 71–84.
Siegenthaler, U., Sarmiento, J.L., 1993. Atmospheric carbon-dioxide and the ocean.Nature 365 (6442), 119–125.
Singh, A., Lomas, M., Bates, N., 2013. Revisiting N2 fixation in the North AtlanticOcean: significance of deviations in Redfield Ratio, atmospheric deposition andclimate variability. Deep Sea Res. II, 93, 148–158.
Sprintall, J., Tomczak, M., 1992. Evidence of the barrier layer in the surface layer ofthe tropics. J. Geophys. Res.—Oceans 97, 7305–7316.
Steinberg, D., Lomas, M., Cope, J., 2012. Long-term increase in mesozooplanktonbiomass in the Sargasso Sea: linkage to climate and implications for
food web dynamics and biogeochemical cycling. Global Biogeochem. Cycles,26, http://dx.doi.org/10.1029/2010GB004026.
Steinberg, D.K., Carlson, C.A., Bates, N.R., Goldthwait, S.A., Madin, L.P., Michaels,A.F., 2000. Zooplankton vertical migration and the active transport of dissolved
organic and inorganic carbon in the Sargasso Sea. Deep-Sea Res. I 47, 137–158.Steinberg, D.K., Carlson, C.A., Bates, N.R., Johnson, R.J., Michaels, A.F., Knap, A.H., 2001.
Overview of the US JGOFS Bermuda Atlantic Time-series Study (BATS): a decade-scale look at ocean biology and biogeochemistry. Deep-Sea Res. II 48, 1405–1447.
Takahashi, T., Sutherland, S.G., Sweeney, C., Poisson, A.P., Metzl, N., Tilbrook, B.,
Bates, N.R., Wanninkhof, R.H., Feely, R.A., Sabine, C.L., Olafsson, J., 2002.Biological and temperature effects on seasonal changes of pCO2 in globalocean surface waters. Deep Sea Res. II 49, 1601–1622.
Van Heukelem, L., Thomas, C., 2001. Computer-assisted high-performance liquid
chromatography method development with applications to the isolation andanalysis of phytoplankton pigments. J. Chromatogr. A 910, 31–49.
Van Mooy, B.A.S., Fredricks, H.F., Pedler, B.E., Dyhrman, S.T., Karl, D.M., Koblızek,
M., Lomas, M.W., Mincer, T.J., Moore, L.R., Moutin, T., Rappe, M.S., Webb, E.A.,2009. Phytoplankton in the ocean use non-phosphorus lipids in response tophosphorus scarcity. Nature, http://dx.doi.org/10.1038/nature07659.
Villareal, T.A., Lipschultz, F., 1995. Internal nitrate concentrations in single cells of
large phytoplankton from the Sargasso Sea. J. Phycol. 31 (5), 689–696.Volk, T., Hoffert, M.I., 1985. Ocean carbon pumps: analysis of relative strengths
and efficiencies in ocean-driven atmospheric CO2 changes. In: Sundquist, E.,Broecker, W. (Eds.), The carbon cycle and atmospheric CO2: natural variations
Archean to Present. AGU, Washington, DC, pp. 99–110.Williams, P.J.l., Jenkinson, N., 1982. A transportable microprocessor-controlled
precise winkler titration suitable for field station and shipboard use. Limnol,Oceanogr, 27, 576–584.
Wofsy, S.C., Harriss, R.C., 2001. The North American Carbon Program Plan (NACP).
A Report of the Committee of the US Carbon Cycle Science Steering Group.Worthington, L., 1976. On the North Atlantic circulation. The Johns Hopkins
Oceanographic Studies.


