Embed Size (px)
Citation preview
Trophic niche of cave populations of Speleomantes italicus
LEONARDO VIGNOLI, FEDERICO CALDERA & MARCO A. BOLOGNA
Dipartimento di Biologia, Universita degli Studi Roma Tre, Rome, Italy
(Accepted 18 August 2006)
AbstractThis paper investigates the trophic niche of a poorly studied cave salamander, Speleomantes italicus.We examined Central Appennine hypogean populations that inhabit seven caves situated in threelimestone areas in Umbria Region (Italy). Adults displayed feeding activity from May to Decemberand the Vacuity Index analysis revealed a discontinuous trophic activity pattern throughout the yearrelated to prey phenology. According to the qualitative analysis of the trophic spectrum, thepopulations in question can be defined as euryphagous, while the quantitative analysis (in terms ofnumber and volume of preyed taxa) revealed a specialist strategy with a clear preference towardsDiptera Limnobiidae. Both sexes presented similar trophic niche breadth and a high diet overlap,showing no intersexual differences. The hypogean populations of S. italicus, similarly to S. strinatii,showed a narrower trophic niche than epigeans of the same species, probably due to the limited foodavailability in the cave habitat.
Keywords: Central Italy, Amphibia Salamander, Speleomantes italicus, trophic niche
Introduction
Speleomantes italicus (Dunn, 1923) is a member of a plethodontid genus endemic to
northern Italy and southern France (three species), and to Sardinia (four species) (Lanza
et al. 1995). All other plethodontids occur in North, Central, and South America (Frost
2004), except for a recently described species from Korea (Min et al. 2005). The
distribution of this family represents one of the most interesting examples of fragmented
ranges (e.g. Wake et al. 1978). European Tertiary and Quaternary fossils were discovered
in SE France, Italy, and Sardinia (Delfino et al. 2005), and recently in Slovakia (Venczel
and Sanchiz 2005). S. italicus is a monotypic species (the previous subspecies gormani
Lanza, 1952 is a synonym), distributed from the Provinces of Reggio Emilia and Lucca
southwards to the southeastern slope of the Gran Sasso Massif (Lanza et al. 1995, 2006;
Scalera et al. forthcoming). It is a eurizonal species, distributed from 80 to 1600 m a.s.l.,
inhabiting clefts in mesic and hygrophilic habitats, though often colonizing caves and
artificial cavities (Lanza et al. 2006). Only sparse information is available regarding the
Correspondence: Marco A. Bologna, Dipartimento di Biologia, Universita degli studi Roma Tre, Viale G. Marconi 446, 00146
Roma, Italy. Email: [email protected]
Published 1 December 2006
Journal of Natural History, 2006; 40(29-31): 1841–1850
ISSN 0022-2933 print/ISSN 1464-5262 online # 2006 Taylor & Francis
DOI: 10.1080/00222930600973598
ecology and ethology of this species (Casali et al. 2005; Pastorelli et al. 2005), as well as for
other species in the genus.
As far as the trophic niche of the Italian species is concerned, data on epigean and
hypogean populations of S. strinatii (Aellen, 1958) have been published by Morisi (1981,
quoted as italicus: study of faeces), by Salvidio (1990, 1992, 1996, quoted as ambrosii:
examination of stomach contents from both dissected and flushed animals), and by Salvidio
et al. (1994, quoted as ambrosii: examination of stomach contents). Lanza (1947) and
Bruno (1973) cited qualitative data about ingesta, respectively, of epigean and hypogean
Tuscan populations of S. italicus (both as subspecies gormani Lanza, 1952). No data at all
exist for any Sardinian species. Cimmaruta et al. (1999) and Oneto and Salvidio (2005)
studied the potential prey availability in epigean and hypogean populations of S. strinatii
and S. ambrosii. The aim of this paper is to examine the trophic niche of S. italicus and to
compare it with that of S. strinatii.
Study area
The research was carried out on Central Appennine hypogean populations of S. italicus, in
three limestone zones belonging to a homogeneous geomorphological unit (the ‘‘Central
Umbrian Valley’’; see Martelli 1994 for a geological outline of this area): (a) the Monte
Cucco Regional Park (near Costacciaro and Scheggia, Perugia Province—PG, Umbria
Region—U) on Monte Cucco itself, which extends for about 20 km along the boundary
between the Umbria and Marche Regions (maximum elevation 1566 m a.s.l.) (Cava di
Valdorbia, 600 m a.s.l.; Cava Motette, 540 m a.s.l.; Grotta Ferrata 406 U/PG, 1010 m
a.s.l.; Grotta del Fricchettone di Montagna 446 U/PG, 1010 m a.s.l.; Buca di Faggeto
Tondo 400 U/PG, 1200 m a.s.l.; Buca del Ferro 24 U/PG, 1370 U/PG; Buca della
Sorgente 348 U/PG, 1385 m a.s.l.); (b) at the base of Monte Ingino near Gubbio in the
same province and region (Grotta del Diavolo a M. Ingino 150 U/PG, 645 m a.s.l.; Grotta
Preistorica 126 U/PG, 630 m a.s.l.); (c) on the western slope of Monte Nerone Massif (near
Cagli, Pesaro and Urbino province—PU, Marche Region—MA) (Grotta delle Nottole 44
MA/PU, 700 m a.s.l.). The climate is subcontinental-temperate at the valley bottom and
subcontinental in the mountain areas. Annual average temperatures vary from 6 to 11uC(Menichetti 1987) and rainfall from 900 to 1440 (1900 at high altitudes) mm per year.
Eight caves were studied, five of them situated on Monte Cucco, two on Monte Ingino,
and one on Monte Nerone; three additional artificial cavities were examined in the Monte
Cucco Regional Park.
Material and methods
Caves were sampled monthly from November 2003 to December 2004 except when
adverse weather conditions occurred. Within the caves, salamanders were sampled
(authorization from the Italian Ministry for the Environment, DPN/2D/2006/10441) by
Visual Encounter Surveys (VES) (Heyer et al. 1994) and caught by hand, then sexed,
weighed, and measured (from the end of the snout to the posterior end of the cloaca) with
an electronic balance (0.01 g) and an electronic calliper (0.01 mm). These biometric
features will be used in a further study on population dynamics (F. Caldera et al.,
unpublished); individual weight is here compared with prey size. Digital photos were taken
of the dorsal and ventral colour patterns of salamanders to allow individual identification
1842 L. Vignoli et al.
(Heyer et al. 1994; Salvidio et al. 1994). Individuals smaller than the smallest captured
male with evident mental gland (typical of reproductive males) were considered juveniles,
because this sexual dimorphic hedonic gland is used by plethodontids during courtship
(Lanza 1959).
The Vacuity Index—the ratio between the number of empty stomachs and the total
number of analysed stomachs—was calculated monthly for both sexes. Adults, immediately
after capture, were subjected to the non-destructive and harmless procedure of stomach
flushing (Fraser 1976; Legler and Sullivan 1979) previously used for Speleomantes ambrosii
(Salvidio 1992), by means of a 20 ml syringe filled with water joined with a silicon catheter
(1.5 mm diameter). They were then released in the same location where they were
captured. The flushing procedure was repeated until no further prey items were ejected.
Data from recaptured specimens were not considered in the analysis. The stomach
contents were preserved in ethanol (70%). Juveniles, more vulnerable than adults (Salvidio
1992), were not subjected to flushing, to avoid any harm. No mortality was observed
during or after stomach flushing and recaptured specimens showed normal feeding activity.
Food items were recognized using a stereomicroscope and identified at the class level for
some groups (non-parasitic Nematoda, Gastropoda, Oligochaeta, Copepoda, Chilopoda,
and Diplopoda), or at the order level for the remaining prey, except the most common
Diptera and Hymenoptera, which were determined at family level.
Food items were photographed using a stereomicroscope with a digital camera and
analysed by IMAGE TOOL software (UTHCSA 3.00 version 2002), measuring the total
length and the width. Most of the adult prey volumes were calculated with the spheroid
volumetric formula: [V54/3p (length/2) (width/2)2] (Dunhan 1983); the volume of
Nematoda, Oligochaeta, Pseudoscorpiones, Chilopoda, Diplopoda, and larvae of
Hexapoda was calculated from the formula for a cylinder [V5length (width/2)2 p].
Following Hyslop (1980), both numerical and volumetric data were used to assess the
trophic niche. Cumulative curves of food items of males and females were constructed and
showed that data collected with the stomach-flushing technique were representative of the
trophic spectrum. The trophic strategy of cave salamanders was determined for both sexes
using Costello’s (1990) graphic visualization modified by Amundsen et al. (1996). This
graphic technique relates the prey-specific abundance to the frequency of occurrence. The
distribution of the food items in the plot is related to three directrices, allowing three
aspects of the trophic niche to be assessed: (1) alimentary strategy (specialization versus
generalization—the vertical axis represents predator strategy going from generalist to
specialist); (2) prey importance (dominant versus rare—first diagonal axis (/) represents
abundance increase along with prey importance); (3) niche breadth (high diversity among
individuals versus high diversity within an individual and tendency towards the same
resource use—second diagonal axis (\) represents resource use changing from BPC
(Between Phenotype Component, among individuals of population) to WPC (Within
Phenotype Component—tending towards the same resource use) (Amundsen et al. 1996).
In Costello’s graphic visualization, the prey specific abundance (Pi) is plotted against the
frequency of occurrence:
Pi~
PSiPSti
� �|100; ð1Þ
where Pi is the prey-specific abundance expressed in numeric and volumetric data; Si is the
abundance of the prey i in the stomachs and Sti is the total abundance of prey in the
stomach of those specimens that contain the prey i. Mann–Whitney U test was applied to
Trophic niche of cave populations of S. italicus 1843
the volumes of all the prey for both sexes, in order to evaluate differences of volume prey
selection in the diet of both males and females.
To compare our results to those in the literature on cave salamander species, both
Schoener (1968) (C) (2) and Pianka (1973) (O) (3) Indices were applied to analyse the
degree of overlap of the trophic niche in both sexes.
C~1{0:5X
i
pxi{pyi
�� �� !ð2Þ
Oxy~
Pni~1
pxipyi
Pni~1
p2xi
Pni~1
p2yi
� �1=2; ð3Þ
where pxi is the proportional utilization of prey i by form x and pyi is the proportional
utilization of prey i by form y. Both indices range from 0 (no prey in common in diet
spectrum) to 1 (same diet spectrum).
Because of limitations of niche overlap indices for arbitrary cutoffs (Feinsinger et al.
1981), we also compared the observed overlap values to an appropriate null model. The
distribution of the null model was created by using Ecosim software (version 7.68) (Gotelli
and Entsminger 2001) elaborating two simulations with 1000 randomized replications of
the data set. The simulations were generated using two randomization algorithms, the RA2
(Niche breadth relaxed/Zero States retained) and the RA3 (the ‘‘scrambled-zeros’’
randomization algorithm proposed by Winemiller and Pianka 1990). Statistical significance
was determined by comparing the observed overlap value to the null distribution; an
observed value greater than 95% of the simulated values indicates significant overlap at the
,0.05 level (Winemiller and Pianka 1990).
The Levins (1968) Index (4) and its standardized variant (5) (Hurlbert 1978) were
utilized to calculate the width of the trophic niche:
B~1Pn
i
p2ji
� ð4Þ
BA~B{1ð Þn{1ð Þ ; ð5Þ
where pji is the proportion of use of the trophic niche by j sex that consists in the i trophic
resource; n is the total number of trophic categories. B minimum value is 1, when the
species utilizes a unique resource and it increases with number of types of utilized resource.
When the resources are equally utilized B is maximum. BA ranges between 0 and 1.
Results
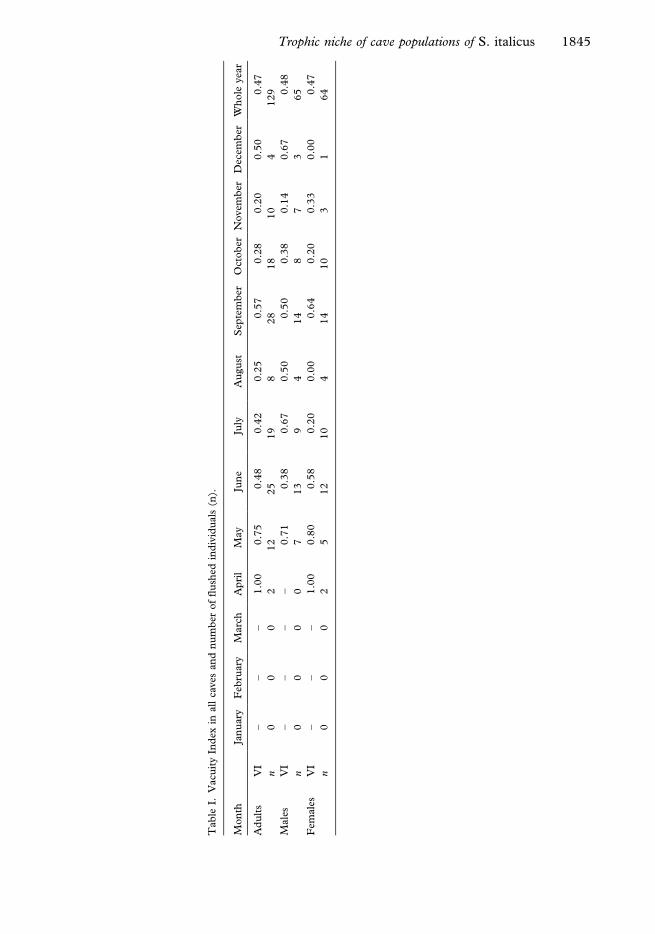
A total of 129 adult specimens (65 males and 64 females) was examined; no adults were
found in January, February, and March. In the examined caves, the first feeding activity
was recorded in May and ended in December, although only a few specimens were
observed in the last mentioned. Monthly and total Vacuity Index (VI) of adults (both
sexes), with number of specimens examined, are reported in Table I. The total VI of males
1844 L. Vignoli et al.
Table
I.V
acu
ity
Ind
exin
all
caves
an
dn
um
ber
of
flu
shed
ind
ivid
uals
(n).
Mon
thJa
nu
ary
Feb
ruary
Marc
hA
pri
lM
ay
Jun
eJu
lyA
ugu
stS
epte
mb
erO
ctob
erN
ovem
ber
Dec
emb
erW
hole
yea
r
Ad
ult
sV
I–
––
1.0
00.7
50.4
80.4
20.2
50.5
70.2
80.2
00.5
00.4
7
n0
00
212
25
19
828
18
10
4129
Male
sV
I–
––
–0.7
10.3
80.6
70.5
00.5
00.3
80.1
40.6
70.4
8
n0
00
07
13
94
14
87
365
Fem
ale
sV
I–
––
1.0
00.8
00.5
80.2
00.0
00.6
40.2
00.3
30.0
00.4
7
n0
00
25
12
10
414
10
31
64
Trophic niche of cave populations of S. italicus 1845
was very similar to that of females (0.48 and 0.47, respectively) and the average annual
values of both sexes showed no statistically significant differences (mean VImales50.494,
SD50.193; mean VIfemales50.417, SD50.356; t50.545; df515; P50.594; t test). An
analysis made on the caves in which at least five specimens of S. italicus were found showed
no correlation between the VI of each cave and its altitude (rSpearman520.27, n59;
P50.471).
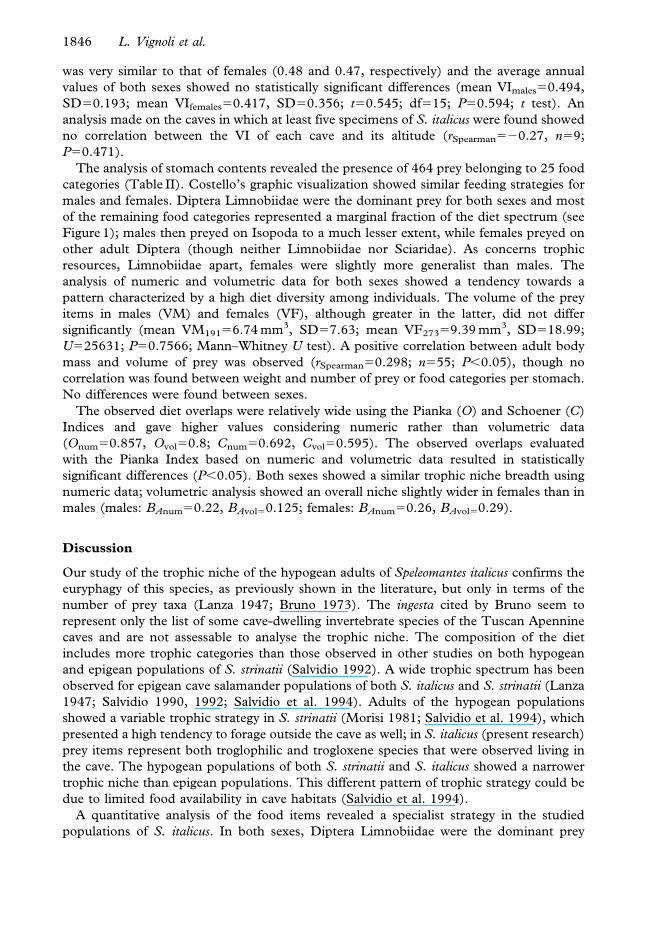
The analysis of stomach contents revealed the presence of 464 prey belonging to 25 food
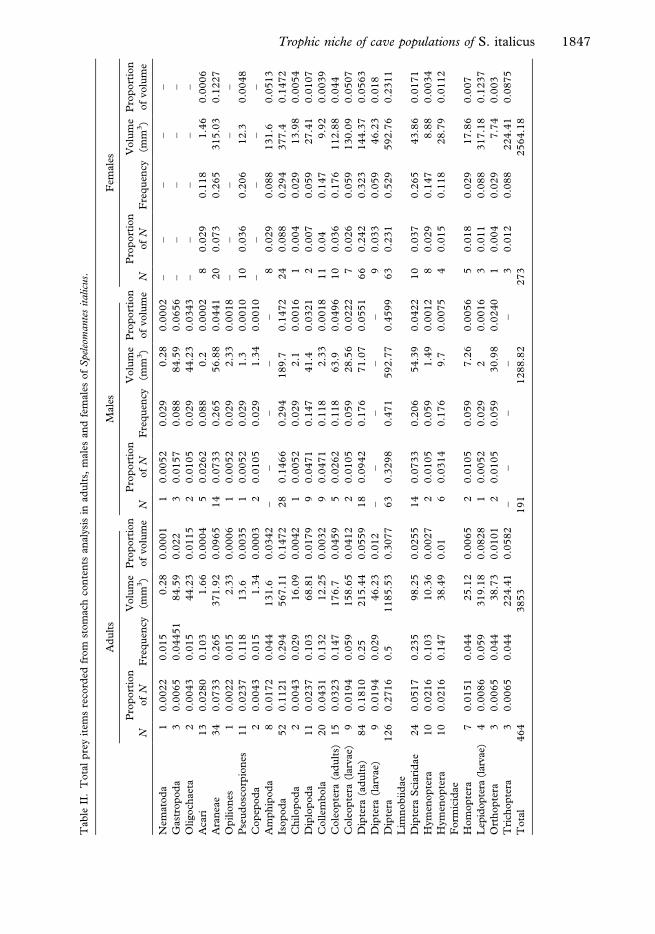
categories (Table II). Costello’s graphic visualization showed similar feeding strategies for
males and females. Diptera Limnobiidae were the dominant prey for both sexes and most
of the remaining food categories represented a marginal fraction of the diet spectrum (see
Figure 1); males then preyed on Isopoda to a much lesser extent, while females preyed on
other adult Diptera (though neither Limnobiidae nor Sciaridae). As concerns trophic
resources, Limnobiidae apart, females were slightly more generalist than males. The
analysis of numeric and volumetric data for both sexes showed a tendency towards a
pattern characterized by a high diet diversity among individuals. The volume of the prey
items in males (VM) and females (VF), although greater in the latter, did not differ
significantly (mean VM19156.74 mm3, SD57.63; mean VF27359.39 mm3, SD518.99;
U525631; P50.7566; Mann–Whitney U test). A positive correlation between adult body
mass and volume of prey was observed (rSpearman50.298; n555; P,0.05), though no
correlation was found between weight and number of prey or food categories per stomach.
No differences were found between sexes.
The observed diet overlaps were relatively wide using the Pianka (O) and Schoener (C)
Indices and gave higher values considering numeric rather than volumetric data
(Onum50.857, Ovol50.8; Cnum50.692, Cvol50.595). The observed overlaps evaluated
with the Pianka Index based on numeric and volumetric data resulted in statistically
significant differences (P,0.05). Both sexes showed a similar trophic niche breadth using
numeric data; volumetric analysis showed an overall niche slightly wider in females than in
males (males: BAnum50.22, BAvol50.125; females: BAnum50.26, BAvol50.29).
Discussion
Our study of the trophic niche of the hypogean adults of Speleomantes italicus confirms the
euryphagy of this species, as previously shown in the literature, but only in terms of the
number of prey taxa (Lanza 1947; Bruno 1973). The ingesta cited by Bruno seem to
represent only the list of some cave-dwelling invertebrate species of the Tuscan Apennine
caves and are not assessable to analyse the trophic niche. The composition of the diet
includes more trophic categories than those observed in other studies on both hypogean
and epigean populations of S. strinatii (Salvidio 1992). A wide trophic spectrum has been
observed for epigean cave salamander populations of both S. italicus and S. strinatii (Lanza
1947; Salvidio 1990, 1992; Salvidio et al. 1994). Adults of the hypogean populations
showed a variable trophic strategy in S. strinatii (Morisi 1981; Salvidio et al. 1994), which
presented a high tendency to forage outside the cave as well; in S. italicus (present research)
prey items represent both troglophilic and trogloxene species that were observed living in
the cave. The hypogean populations of both S. strinatii and S. italicus showed a narrower
trophic niche than epigean populations. This different pattern of trophic strategy could be
due to limited food availability in cave habitats (Salvidio et al. 1994).
A quantitative analysis of the food items revealed a specialist strategy in the studied
populations of S. italicus. In both sexes, Diptera Limnobiidae were the dominant prey
1846 L. Vignoli et al.
Tab
leII
.T
ota
lp
rey
item
sre
cord
edfr
om
stom
ach
con
ten
tsan
aly
sis
inad
ult
s,m
ale
san
dfe
male
sof
Spel
eom
ante
sitalicu
s.
Ad
ult
sM
ale
sF
emale
s
N
Pro
port
ion
of
NF
req
uen
cy
Volu
me
(mm
3)
Pro
port
ion
of
volu
me
N
Pro
port
ion
of
NF
req
uen
cy
Volu
me
(mm
3)
Pro
port
ion
of
volu
me
N
Pro
port
ion
of
NF
req
uen
cy
Volu
me
(mm
3)
Pro
port
ion
of
volu
me
Nem
ato
da
10.0
022
0.0
15
0.2
80.0
001
10.0
052
0.0
29
0.2
80.0
002
––
––
–
Gast
rop
od
a3
0.0
065
0.0
4451
84.5
90.0
22
30.0
157
0.0
88
84.5
90.0
656
––
––
–
Oligoch
aet
a2
0.0
043
0.0
15
44.2
30.0
115
20.0
105
0.0
29
44.2
30.0
343
––
––
–
Aca
ri13
0.0
280
0.1
03
1.6
60.0
004
50.0
262
0.0
88
0.2
0.0
002
80.0
29
0.1
18
1.4
60.0
006
Ara
nea
e34
0.0
733
0.2
65
371.9
20.0
965
14
0.0
733
0.2
65
56.8
80.0
441
20
0.0
73
0.2
65
315.0
30.1
227
Op
ilio
nes
10.0
022
0.0
15
2.3
30.0
006
10.0
052
0.0
29
2.3
30.0
018
––
––
–
Pse
ud
osc
orp
ion
es11
0.0
237
0.1
18
13.6
0.0
035
10.0
052
0.0
29
1.3
0.0
010
10
0.0
36
0.2
06
12.3
0.0
048
Cop
epod
a2
0.0
043
0.0
15
1.3
40.0
003
20.0
105
0.0
29
1.3
40.0
010
––
––
–
Am
ph
ipod
a8
0.0
172
0.0
44
131.6
0.0
342
––
––
–8
0.0
29
0.0
88
131.6
0.0
513
Isop
od
a52
0.1
121
0.2
94
567.1
10.1
472
28
0.1
466
0.2
94
189.7
0.1
472
24
0.0
88
0.2
94
377.4
0.1
472
Ch
ilopod
a2
0.0
043
0.0
29
16.0
90.0
042
10.0
052
0.0
29
2.1
0.0
016
10.0
04
0.0
29
13.9
80.0
054
Dip
lopod
a11
0.0
237
0.1
03
68.8
10.0
179
90.0
471
0.1
47
41.4
0.0
321
20.0
07
0.0
59
27.4
10.0
107
Collem
bola
20
0.0
431
0.1
32
12.2
50.0
032
90.0
471
0.1
18
2.3
30.0
018
11
0.0
40.1
47
9.9
20.0
039
Cole
op
tera
(ad
ult
s)15
0.0
323
0.1
47
176.7
0.0
459
50.0
262
0.1
18
63.9
0.0
496
10
0.0
36
0.1
76
112.8
80.0
44
Cole
op
tera
(larv
ae)
90.0
194
0.0
59
158.6
50.0
412
20.0
105
0.0
59
28.5
60.0
222
70.0
26
0.0
59
130.0
90.0
507
Dip
tera
(ad
ult
s)84
0.1
810
0.2
5215.4
40.0
559
18
0.0
942
0.1
76
71.0
70.0
551
66
0.2
42
0.3
23
144.3
70.0
563
Dip
tera
(larv
ae)
90.0
194
0.0
29
46.2
30.0
12
––
––
–9
0.0
33
0.0
59
46.2
30.0
18
Dip
tera
Lim
nobiid
ae
126
0.2
716
0.5
1185.5
30.3
077
63
0.3
298
0.4
71
592.7
70.4
599
63
0.2
31
0.5
29
592.7
60.2
311
Dip
tera
Sci
ari
dae
24
0.0
517
0.2
35
98.2
50.0
255
14
0.0
733
0.2
06
54.3
90.0
422
10
0.0
37
0.2
65
43.8
60.0
171
Hym
enop
tera
10
0.0
216
0.1
03
10.3
60.0
027
20.0
105
0.0
59
1.4
90.0
012
80.0
29
0.1
47
8.8
80.0
034
Hym
enop
tera
Form
icid
ae
10
0.0
216
0.1
47
38.4
90.0
16
0.0
314
0.1
76
9.7
0.0
075
40.0
15
0.1
18
28.7
90.0
112
Hom
opte
ra7
0.0
151
0.0
44
25.1
20.0
065
20.0
105
0.0
59
7.2
60.0
056
50.0
18
0.0
29
17.8
60.0
07
Lep
idopte
ra(l
arva
e)4
0.0
086
0.0
59
319.1
80.0
828
10.0
052
0.0
29
20.0
016
30.0
11
0.0
88
317.1
80.1
237
Ort
hop
tera
30.0
065
0.0
44
38.7
30.0
101
20.0
105
0.0
59
30.9
80.0
240
10.0
04
0.0
29
7.7
40.0
03
Tri
chop
tera
30.0
065
0.0
44
224.4
10.0
582
––
––
–3
0.0
12
0.0
88
224.4
10.0
875
Tota
l464
3853
191
1288.8
2273
2564.1
8
Trophic niche of cave populations of S. italicus 1847
category, similar to a Northern Apennine hypogean population of S. strinatii (Salvidio et al.
1994), though different from another subalpine cave population of this species (Morisi
1981) that feed predominantly outside the cave and display a more generalist strategy.
During spring and summer, Diptera Limnobiidae aggregate on the cave walls, forming a
rich and easily located trophic resource for cave salamanders. Sampled hypogean adults of
S. italicus showed trophic activity from May although some specimens were recorded in
activity in caves from April. Even if some food categories used by the examined population
Figure 1. Graphic representation of the diet strategy of the Speleomantes italicus studied population. Numeric and
volumetric data are represented by solid and empty circles, respectively. The position of the prey taxa is interpreted
considering three directrices in the plot: from top to bottom is the alimentary strategy (specialization versus
generalization); the first diagonal (/) represents prey importance (dominant versus rare); on the second diagonal
axis (\) niche breadth is displayed (high diversity among individuals versus high diversity within individual and
tendency towards the same resource use). Some food categories with low values of Pi and frequency of occurrence
are not labelled. ACA, Acari; AMP, Amphipoda; ARA, Araneae; CAD, Coleoptera (adults); CLA, Coleoptera
(larvae); COL, Collembola; COP, Copepoda; DAD, other Diptera (adults); DIP, Diplopoda; DLA, Diptera
(larvae); DLM, Diptera Limnobiidae; DSC, Diptera Sciaridae; GAS, Gastropoda; HFR, Hymenoptera
Formicidae; HOM, Homoptera; HYM, Hymenoptera; ISO, Isopoda; LLA, Lepidoptera (larvae); NEM,
Nematoda; OLI, Oligochaeta; ORT, Orthoptera; TRI, Trichoptera.
1848 L. Vignoli et al.
(Aranea and Isopoda) are available throughout the year, adult activity in the caves followed
Diptera phenology, as reported by Oneto and Salvidio (2005) for S. strinatii. The total
Vacuity Index did not differ between males and females, evidence of a similar rate of
alimentation.
The analysis of the trophic spectrum of adults showed a width overlap between males
and females, from both the numeric and volumetric analyses. As in other plethodontids,
particularly in the tribe Bolitoglossini (Salvidio and Bruce 2006), females of S. italicus are
significantly larger and heavier than males (F. Caldera et al., unpublished), and this
intersexual difference could be explained by the females selecting slightly larger prey than
those of males. Further, the trophic niche breadth on a volumetric basis is wider in females
than in males. This could be due to the need, for females, to feed on larger prey to sustain
the energetic effort of producing and caring for the eggs.
Acknowledgements
We wish to thank the speleologists of Costacciaro, Perugia, who helped us in the first phase
of the field research.
References
Amundsen PA, Gabler HM, Staldvik FJ. 1996. A new approach to graphical analysis of feeding strategy
from stomach contents data—modification of the Costello (1990) method. Journal of Fish Biology
48:607–614.
Bruno S. 1973. Anfibi d’Italia: Caudata. Natura—Societa Italiana Scienze Naturali, Milano 64:209–450.
Casali S, Suzzi Valli A, Busignani G, Tedaldi G. 2005. I costumi arboricoli di Speleomantes italicus (Dunn, 1923)
nella Repubblica di San Marino (Amphibia, Plethodontidae). Annali del Museo Civico di Storia Naturale
‘‘Giacomo Doria’’, Genova 97:145–152.
Cimmaruta R, Forti G, Nascetti G, Bullini L. 1999. Spatial distribution and competition in two parapatric sibling
species of European plethodontid salamanders. Ethology, Ecology and Evolution 11:383–398.
Costello MJ. 1990. Predator feeding strategy and prey importance: a new graphical analysis. Journal of Fish
Biology 36:261–263.
Delfino M, Razzetti E, Salvidio S. 2005. European plethodontids: palaeontological data and biogeographical
considerations (Amphibia). Annali del Museo Civico di Storia Naturale ‘‘Giacomo Doria’’, Genova
97:45–58.
Dunhan AE. 1983. Realized niche overlap. Resource abundance and intensity of interspecific competition. In:
Huey RB, Pianka ER, Schoener TW, editors. Lizard ecology: studies of a model organism. Cambridge
(MA): Harvard University Press. p 261–280.
Feinsinger P, Spears EE, Poole RW. 1981. A simple measure of niche breadth. Ecology 62:27–32.
Fraser DF. 1976. Coexistence of salamanders in the genus Plethodon: a variation of the Santa Rosalia theme.
Ecology 57:238–251.
Frost DR. 2004. Amphibian species of the world: an online reference. Version 3.0, 22 August. http://
research.amnh.org/herpetology/amphibia/index.html.
Gotelli NJ, Entsminger GL. 2001. Swap and fill algorithms in null model analysis: rethinking the Knight’s Tour.
Oecologia 129:281–291.
Heyer WR, Donnelly MA, McDiarmid RW, Hayek LC, Foster MS. 1994. Measuring and monitoring biological
diversity: standard methods for amphibians. Washington: Smithsonian Institution Press. 364 p.
Hurlbert SH. 1978. The measurement of niche overlap and some relatives. Ecology 59:67–77.
Hyslop EJ. 1980. Stomach contents analysis: a review of methods and their application. Journal of Fish Biology
17:411–429.
Lanza B. 1947. L’Hydromantes Gistel in Toscana e notizie sui suoi costumi (Amphibia; Caudata; Plethodontidae).
Archivio Zoologico Italiano 31:219–237.
Lanza B. 1959. Il corpo ghiandolare mentoniero dei ‘‘Plethodontidae’’ (‘‘Amphibia, Caudata’’). Monitore
Zoologico Italiano 67:15–53.
Trophic niche of cave populations of S. italicus 1849
Lanza B, Caputo V, Nascetti G, Bullini L. 1995. Morphologic and genetic studies of the European plethodontid
salamanders: taxonomic inferences (genus Hydromantes). In: Sindaco, Doria G, Razzetti E, Bernini F,
editors. Monografie Museo Regionale di Scienze Naturali, Torino 16:1–366.
Lanza B, Vanni S, Nistri A. 2006. Speleomantes italicus (Dunn, 1923). In: Sindaco RDoria GRazzetti EBernini F,
editors. Atlante degli Anfibi e dei Rettili d’Italia/Atlas of Italian amphibians and reptiles. Florence: Societas
Herpetologica Italica/Edizioni Polistampa. p 252–257.
Legler JM, Sullivan LJ. 1979. The application of stomach-flushing to lizards and anurans. Herpetologica
35:107–110.
Levins R. 1968. Evolution in changing environments: some theoretical explorations. Princeton (NJ): Princeton
University Press. 132 p.
Martelli G. 1994. Lineamenti geologici dell’Appennino umbro-marchigiano. Biogeographia (N.S.)
17(1993):17–24.
Menichetti M. 1987. Evoluzione spaziale e temporale del sistema carsico di Monte Cucco. Atti del Convegno
Nazionale di Speleologia Bari 731–762.
Min MS, Yang SY, Bonett RM, Vieites DR, Brandon RA, Wake DB. 2005. Discovery of the first Asian
plethodontid salamander. Nature 435:87–90.
Morisi A. 1981. Osservazioni sulla dieta in natura del geotritone ‘‘Hydromantes italicus’’ Dunn. Rivista Piemontese
di Storia Naturale 2:9–87.
Oneto F, Salvidio S. 2005. Res Ligusticae CCXLIX. Dati preliminari sulla distribuzione delle prede di
Speleomantes strinatii (Aellen, 1958) nella Stazione Biospeleologica di S. Bartolomeo (GE) (Amphibia,
Plethodontidae). Annali del Museo Civico di Storia Naturale ‘‘Giacomo Doria’’, Genova 97:161–168.
Pastorelli C, Laghi P, Scaravelli D. 2005. Spacing of Speleomantes italicus (Dunn, 1923): application of a
geographic information system (G.I.S.) (Amphibia, Plethodontidae). Annali del Museo Civico di Storia
Naturale ‘‘Giacomo Doria’’, Genova 97:169–177.
Pianka ER. 1973. The structure of lizard communities. Annual Review of Ecology and Systematics 4:53–74.
Salvidio S. 1990. Regime alimentaire d’une population epigee de Speleomantes ambrosii de la Ligurie centrale (Italie
septentrionale). Bulletin de la Societe Herpetologique de France 54:69–72.
Salvidio S. 1992. Diet and food utilization in a rockface population of Speleomantes ambrosii (Amphibia, Caudata,
Plethodontidae). Vie et Milieu 42:35–39.
Salvidio S. 1996. L’ecologia dei Pletodontidi europei: stato delle ricerche sul geotritone Speleomantes ambrosii.
Studi Trentini di Scienze Naturali, Acta Biologica 71:133–136.
Salvidio S, Bruce RC. 2006. Sexual dimorphism in two species of European plethodontid salamanders, genus
Speleomantes. Herpetological Journal 16:9–14.
Salvidio S, Lattes A, Tavano M, Melodia F, Pastorino MV. 1994. Ecology of a Speleomantes ambrosii population
inhabiting an artificial tunnel. Amphibia-Reptilia 15:35–45.
Scalera R, Venchi A, Carafa M, Pellegrini M, Capula M, Bologna MA. Forthcoming. Amphibians and reptiles of
the Majella National Park (Central Italy): distribution, ecology and conservation. Aldrovandia. 2.
Forthcoming.
Schoener TW. 1968. The Anolis lizards of Bimini: resource partitioning in a complex fauna. Ecology 49:704–726.
Venczel M, Sanchiz B. 2005. A fossil plethodontid salamander from the Middle Miocene of Slovakia (Caudata,
Plethodontidae). Amphibia-Reptilia 26:408–411.
Wake DB, Maxson LR, Wurst GZ. 1978. Genetic differentiation, albumin evolution, and their biogeographic
implications in plethodontid salamander of California and Southern Europe. Evolution 32:529–539.
Winemiller KO, Pianka ER. 1990. Organization in natural assemblages of desert lizards and tropical fishes.
Ecological Monographs 60:27–55.
1850 L. Vignoli et al.


